The outsourcing of R&D through acquisitions in the pharmaceutical industry
33
Journal of Financial Economics 80 (2006) 351–383 The outsourcing of R&D through acquisitions in the pharmaceutical industry $ Matthew J. Higgins a, , Daniel Rodriguez b a College of Management, Georgia Institute of Technology, Atlanta, GA 30308, USA b Department of Organization and Management, Goizueta Business School, Emory University, Atlanta, GA 30322, USA Received 6 January 2004; received in revised form 22 March 2005; accepted 18 April 2005 Available online 2 November 2005 Abstract We examine the performance of 160 pharmaceutical acquisitions from 1994 to 2001 and find evidence that on average acquirers realize significant positive returns. These returns are positively correlated with prior acquirer access to information about the research and development activities at target firms and a superior negotiating position. A unique Desperation Index is employed to determine the current status of a firm’s internal productivity. We find that firms experiencing declines in internal productivity or which are more desperate are more likely to engage in an outsourcing-type acquisition in an effort to replenish their research pipelines. r 2005 Elsevier B.V. All rights reserved. JEL classification: G34; D82 Keywords: Acquisitions; Asymmetric information; Pharmaceutical industry ARTICLE IN PRESS www.elsevier.com/locate/jfec 0304-405X/$ - see front matter r 2005 Elsevier B.V. All rights reserved. doi:10.1016/j.jfineco.2005.04.004 $ We received helpful comments and suggestions from Tamer Abdelgawad, George Benston, Gavin Drummond, Michael Hammock, Christina Kelton, Alan Petersen, Frank Rothaermel, Paula Stephan, Mike Stonebrook, Tom Thomas, Jerry Thursby, Marie Thursby, and Leslie Harris-Vincent as well as seminar participants at Emory University, Georgia Institute of Technology, University of Georgia, and the 2002 and 2003 Southern Economic Association meetings. We also thank the comments from an anonymous referee. Matthew J. Higgins acknowledges financial assistance from a National Science Foundation Integrative Graduate Education and Research Traineeship (IGERT) Fellowship (Grant # 0221600). Daniel Rodriguez acknowledges funding from a Goizueta Business School Research Fellowship. All remaining errors and omissions are our own. Corresponding author. Tel.: +1 404 894 4368; fax: +1 404 894 6030. E-mail address: [email protected] (M.J. Higgins).
-
Upload
independent -
Category
Documents
-
view
0 -
download
0
Transcript of The outsourcing of R&D through acquisitions in the pharmaceutical industry

ARTICLE IN PRESS
Journal of Financial Economics 80 (2006) 351–383
0304-405X/$
doi:10.1016/j
$We rece
Drummond,
Stonebrook,
participants a
Southern Eco
Higgins ackn
and Research
a Goizueta B�CorrespoE-mail ad
www.elsevier.com/locate/jfec
The outsourcing of R&D through acquisitionsin the pharmaceutical industry$
Matthew J. Higginsa,�, Daniel Rodriguezb
aCollege of Management, Georgia Institute of Technology, Atlanta, GA 30308, USAbDepartment of Organization and Management, Goizueta Business School, Emory University,
Atlanta, GA 30322, USA
Received 6 January 2004; received in revised form 22 March 2005; accepted 18 April 2005
Available online 2 November 2005
Abstract
We examine the performance of 160 pharmaceutical acquisitions from 1994 to 2001 and find
evidence that on average acquirers realize significant positive returns. These returns are positively
correlated with prior acquirer access to information about the research and development activities at
target firms and a superior negotiating position. A unique Desperation Index is employed to
determine the current status of a firm’s internal productivity. We find that firms experiencing declines
in internal productivity or which are more desperate are more likely to engage in an outsourcing-type
acquisition in an effort to replenish their research pipelines.
r 2005 Elsevier B.V. All rights reserved.
JEL classification: G34; D82
Keywords: Acquisitions; Asymmetric information; Pharmaceutical industry
- see front matter r 2005 Elsevier B.V. All rights reserved.
.jfineco.2005.04.004
ived helpful comments and suggestions from Tamer Abdelgawad, George Benston, Gavin
Michael Hammock, Christina Kelton, Alan Petersen, Frank Rothaermel, Paula Stephan, Mike
Tom Thomas, Jerry Thursby, Marie Thursby, and Leslie Harris-Vincent as well as seminar
t Emory University, Georgia Institute of Technology, University of Georgia, and the 2002 and 2003
nomic Association meetings. We also thank the comments from an anonymous referee. Matthew J.
owledges financial assistance from a National Science Foundation Integrative Graduate Education
Traineeship (IGERT) Fellowship (Grant # 0221600). Daniel Rodriguez acknowledges funding from
usiness School Research Fellowship. All remaining errors and omissions are our own.
nding author. Tel.: +1404 894 4368; fax: +1 404 894 6030.
dress: [email protected] (M.J. Higgins).

ARTICLE IN PRESSM.J. Higgins, D. Rodriguez / Journal of Financial Economics 80 (2006) 351–383352
1. Introduction
Researchers have shown that firms generally realize negative returns from acquisitionsor, at best, break even. We find that acquirers have been able to avoid the winner’s curse byobtaining information about the true underlying value of the target firm prior toacquisition. This information advantage for acquirers enables them to avoid the threemajor pitfalls that typically characterize unsuccessful acquisitions: (1) overbidding for thetarget firm, (2) selecting an incorrect target firm, and (3) failing at the post-acquisitionintegration process.Instead of investigating a heterogeneous sample of acquisitions, we focus on research
and development-directed acquisitions in the biopharmaceutical industry. This kind ofexamination has two main advantages. First, it allows us to use the extensive publiclyavailable data for both the acquiring and target firms involved in new drug research thatare related to informational asymmetries. Second, it provides measures of acquirer firmperformance subsequent to an acquisition directly related to research and development(R&D) productivity, specifically product pipeline improvements.We make four contributions to the literature. First, we find evidence consistent with the
proposition that deteriorating R&D productivity could be the motivation underlying theacquisition of research-intensive firms. An integrated data sample of four complementarydata sources allows us to test why and which firms engage in outsourcing R&D-typeacquisitions. Relatively few studies focus on the motivation behind a firm’s acquisitiondecision. Andrade et al. (2001) point out that ‘‘if mergers could be sorted by their trueunderlying motivations, it may be those which are undertaken for good reasons do benefitacquirers, but in the average statistics, they are canceled out by those with bad reasons.’’ Inthis paper, we find that firms that are experiencing the greatest deterioration in their R&Dproductivity are most likely to undertake the acquisition of a research-intensive firm.Second, we find evidence consistent with the proposition that biopharmaceutical firms
can successfully outsource R&D through acquisitions. These acquisitions appear toeffectively supplement a firm’s internal R&D efforts and R&D-focused alliances. Overall,we find positive announcement period cumulative abnormal returns for the acquiringcompanies of positive 3.91 percent (significant at the 1% level). This figure is greater thanprevious results reported in the existing literature.1 In addition to the significant financialgains to the sample acquirers, we find real measures of success. For example, 71% ofacquirers in our sample either maintain or improve their product pipelines or portfoliospost-acquisition.Third, we find that access to information by the acquirer during the pre-acquisition
period leads to greater success. Most acquisition research concludes that acquiringcompanies pay too much for a target and little or no value is created for their shareholderswhen a significant portion of the target firm’s value consists of intangible assets.(See Rodriguez and Higgins, 2003, for a notable exception among software acquisitions.)One reason for such overpayment is the difficulty in valuing intangible assets. To overcome
1Andrade et al. (2001) report average announcement period abnormal returns of negative 0.70% for acquiring
firms across 3688 different acquisitions from 1973 to 1998. These abnormal returns fell to negative 1.00% when
focused on 1864 deals from 1990 to 1998. Bruner (2002) provides a comprehensive review of the current literature
on mergers and acquisitions and summarizes the results for acquirer shareholders in Table III, which range from
negative 14.2% to positive 3.24% for nontender offer transactions.

ARTICLE IN PRESSM.J. Higgins, D. Rodriguez / Journal of Financial Economics 80 (2006) 351–383 353
these valuation difficulties, we hypothesize that an acquirer can obtain significantadditional information through pre-acquisition alliances with the target firm or allianceswith firms conducting research that is similar to that of the potential target firm. Theacquirer can also obtain additional insights into the underlying value of the target bydrawing upon its own internal research experience. We find that pre-acquisitioninformation-gathering activities are positively and significantly correlated with acquirersuccess.
Fourth, according to Samuelson and Bazerman (1985) acquirers engaged in bilateralnegotiations with a target firm that could have superior information regarding the truevalue of its assets tend to succumb to the winner’s curse. We find, though, that acquirerscan mitigate overbidding by bidding from an advantageous negotiating position. Ourresults indicate that acquirer gains are positively correlated with the pre-acquisitionstrength of the acquirer’s new product pipeline and exclusive products portfolio.
The remainder of the paper is organized as follows. Section 2 briefly discussesproductivity trends in the pharmaceutical industry; Section 3 provides a brief discussion ofthe relevant literature; Section 4 discusses the empirical methodology and data used in ouranalysis; Section 5 presents and discusses our empirical finding; and Section 6 bysummarizes the analysis and discusses the implications of our results.
2. Productivity trends in the pharmaceutical industry
Productivity in the pharmaceutical industry (as reflected by the overall industryexclusivity and patent horizon) declined in the late 1990s, because more drugs were comingoff exclusivity protection than were being replaced by new Food and Drug Administration(FDA)-approved products.2 Exclusivity refers to exclusive regulatory marketing rightsgranted by the FDA under 21 C.F.R. 314.108, which prevents generic products fromentering the market.
The pharmaceutical industry had a combined total of approximately 1,100 years ofaggregate exclusivity protection in 1998. The exclusivity horizon had fallen to just overeight hundred years by 2001 and the rate of decline has been fairly rapid. Fig. 1 plots thetotal number of exclusive years for each product currently approved by the FDA. Theaging of the overall industry product profile is one reason for this rapid decline. Inaddition, new products take an average of ten to fifteen years to develop from initialdiscovery to final FDA approval (DiMasi, 2001). From 1988 to 2001, the average time theFDA took to approve a new drug was approximately 20 months (Federal TradeCommission, 2002). Over the same time period, the cost of developing a new drug productincreased from $231 million in 1987 to $802 million in 2000 (DiMasi, 2001). Domesticresearch and development expenditures have followed the same trend. In 1990,R&D expenditures for US pharmaceutical companies totaled $6.8 billion and grewto over $21.3 billion in 2000. However, as a percentage of sales, R&D expenditures
2One explanation put forth by industry representatives for this decline is that the easy drugs have already been
developed and that the drugs currently under development are much more sophisticated and target more difficult
diseases. A second explanation, described in the Wall Street Journal (2004a), suggests that the heavy reliance on
combinatorial chemistry and high-throughput screening did not produce the hits that were initially hoped for
when this technology was adopted in the 1990s.

ARTICLE IN PRESS
0
200
400
600
800
1.000
1.200
1.400
1990 1991 1992 1993 1994 1995 1996 1997 1998 1999 2000 2001
To
tal y
ears
ofe
xclu
sivi
ty
Fig. 1. Total number of exclusivity years remaining for all patented products identified in the Food and Drug
Administration Orange Book for the period 1990–2001. This graph accounts for drugs that have been granted
additional exclusivity because of reformulations. However, it does not include extensions to exclusivity stemming
from litigation.
M.J. Higgins, D. Rodriguez / Journal of Financial Economics 80 (2006) 351–383354
have remained fairly stable at around 17% from 1990 to 2001, peaking at 20.4% of sales in1997 (Pharmaceutical Research and Manufacturers of America, 2002).In response to this decline in R&D productivity, pharmaceutical firms have pursued
several options: enhance their internal R&D efforts through the acquisition of smallerpharmaceutical or biotech companies or both; engage in large horizontal mergers toachieve greater economies of scale and scope in their research programs; acquire existingmature products through licensing agreements; increase organic internal R&D effortsindependently; increase alliance activity; and change their fundamental business model.These options are by no means mutually exclusive. In reality, companies usually engage ina number of these activities at varying levels. In this paper we explore the first response—the impact that the outsourcing of R&D through acquisition has had on individual firmR&D productivity.
3. Acquisitions and the outsourcing of R&D
3.1. Relevant research on merger and acquisitions
A significant quantity of research has been dedicated to understanding for whom andhow value is created through acquisitions. Many theories have emerged, for example, themonopoly theory of mergers (Mueller, 1985; Eckbo, 1992; Ravenscraft and Scherer, 1987)synergies approach (Bradley et al., 1988 economies of scale (Ravenscraft and Scherer,1989; Houston et al., 2001) gain market power (Anand and Singh, 1997; Baker andBresnehan, 1985; Barton and Sherman, 1984) redeployment of assets (Capron, 1999) anddiversification (Berger and Ofek, 1995).The conclusion one draws from the bulk of the research focusing on whether value is
created or destroyed is that the return to acquiring firm shareholders, on average, isessentially zero. (See Kohlers and Kohlers, 2000; Eckbo and Thorburn, 2000; Lyroudiet al., 1999; Schwert, 1996; and Andrade et al., 2001) The majority of the value flows to the

ARTICLE IN PRESSM.J. Higgins, D. Rodriguez / Journal of Financial Economics 80 (2006) 351–383 355
target firm shareholders (Houston et al., 2001; DeLong, 2001; Eckbo and Thorburn, 2000;Jensen and Ruback, 1983; Jarrell et al., 1988; and Bruner, 2002). Relatively few studieshave been able to demonstrate meaningful value gains on behalf of acquiring firms in nontender offer acquisitions. Andrade et al. (2001) suggest that the underlying strategicmotivation for a particular transaction could provide a fruitful avenue for identifying howvalue is created through acquisitions for acquirer shareholders. Because companies mergefor multiple reasons, it may be the case that companies engaging in mergers for badreasons are negating the gains to companies engaging in mergers for good reasons.Mitchell and Lehn (1990) show empirically that there are both good and bad transactionsfrom the viewpoint of the acquiring companies’ shareholders. Andrade et al. (2001) offerfive motivations for acquisition: (1) efficiency-related reasons that involve economies ofscale or other synergies (2) creation of market power (3) market discipline (4) self-servingattempts by acquirer management to over expand and (5) diversification. Each of thesestrategic motivations, however, has its own distinct set of problems and concerns. It couldbe the case, then, that by grouping all transactions together we are unable to clearly look atthem in any meaningful manner. By classifying acquisitions into appropriate categories oftransactions, we could be able to determine which strategic motivation for mergers isflawed, and thereby predisposed to destroy shareholder value. Researchers can then beginto focus on these different underlying motivations and determine why a particular strategyhas been successful or unsuccessful.
3.2. Outsourcing of research and development
Mergers and acquisitions as a method for outsourcing research and development is oneof the justifications for acquisition activity observed during the latter 1990s. Pharmaceu-tical companies, in particular, begin to supplement internal R&D efforts throughacquisition. Chesbrough (2003) discusses the importance of a company’s need to addressthe research gaps in a timely manner. One of the methods he suggests to fill these gaps isthrough the acquisition of external technologies. In addition, James (2002) discusses therole mergers and acquisitions can play in enhancing a firm’s internal capability. Forexample, in discussing the December 2002 acquisition of Triangle Pharmaceuticals, aGilead Sciences’ spokeswoman said, ‘‘We had a need to build our pipeline. This acquisitionbrings to Gilead not only a late-stage product that could launch next year, but a pipeline ofother drugs in development (Smartmoney.com, 2002).’’ Merck provides another exampleof this trend. In March 2002 Merck’s Chief Executive Officer (CEO) lauded the company’spipeline of products, which numbered 11 potential treatments that were slated to launchover the next few years. However, as of November 2003, only two of the products havelaunched. A third product was in the process of being filed. Two product’s filings havebeen delayed until 2006 and six products have been either canceled or delayed indefinitely(Wall Street Journal, 2003). These cancellations and failures have caused Merck’s pipelineto deteriorate significantly. Subsequently, in February 2004, Merck acquired AtonPharmaceuticals Inc., a privately held biotechnology company. In describing theacquisition Merck said ‘‘The acquisition will enhance its [Merck’s] internal researchefforts to develop potential new medicines for the treatment of cancer (Wall Street Journal,2004b).
In addition to having an understanding of what they are purchasing, acquiringcompanies must have the absorptive capacity to integrate the acquired research into their

ARTICLE IN PRESSM.J. Higgins, D. Rodriguez / Journal of Financial Economics 80 (2006) 351–383356
own R&D program. Cohen and Levinthal (1989) postulate that a firm’s absorptivecapacity is based on it’s own internal research and development efforts. As a result,regardless of the external R&D activities that an acquiring company could engage in, thefirm should continue to pursue a comprehensive internal research program (Chesbrough,2003).One challenge that acquirers face in these types of acquisitions is holding on to essential
target firm employees who could represent a significant portion of the firm’s value. Incontrast to the primary findings in the extant literature (for example, Andrade et al., 2001;Myers and Majluf, 1984) equity deals could be preferable to cash deals. Equity deals couldbe more effective in aligning the interests of employees at the target firm with those at theacquiring firm. This type of moral hazard problem is discussed by Jensen and Thursby(2001) within the context of university licensing agreements. They find that the use ofequity to induce scientists to continue to remain committed to a project is an effectivemeasure for reducing the moral hazard problem. In addition, the willingness of the targetfirm in these transactions to accept equity payment also serves as a signal to the marketregarding its on going commitment to research post-acquisition.
3.3. Information gathering and the winner’s curse
Asymmetric information in acquisitions is potentially a significant problem. For ourspecific example of acquisitions, this problem is compounded given the knowledge-intensive nature of the industry. Knowledge-based assets, in general, are more difficult toassess than tangible ones. One of the concerns for an acquiring company is its ability toaccurately value the target firm. Firms that attempt to make acquisitions outside of theircore competencies could have difficulty adding value to the firm (Williamson, 1975). Giventhis potential difficulty, it makes sense for knowledge-intensive firms to pursue targets withsimilar competencies. (In fact, 82% of the acquisitions in the current project are ones thatinvolve firms with complementary research.) Chatterjee and Wernerfelt (1991) andSamuelson and Bazerman (1985) suggest that when acquiring firms engage in negotiationswith target firms that have superior information regarding the true value of its assets, theacquiring firm tends to succumb to the winner’s curse and overpay for the target. Thewinner’s curse arises because of the uncertainty over the value of the target firm’s assets.We propose that firms pursuing knowledge-intensive acquisitions must engage in some
pre-acquisition information gathering, besides normal corporate due diligence, to diminishthe amount of asymmetric information between the acquirers and the target firms. The pre-acquisition information activities that we consider are alliances prior to an acquisition withthe target firm, alliances with other firms within the same therapeutic category as theacquisition, and internal research and prior sales experience within the same therapeuticcategory as the target firm. These activities function as a feedback mechanism, whichallows acquiring companies to generate information on a potential target. Thepharmaceutical acquirers in our sample have been and continue to be heavily focusedupon research and development. We can presume they are experts in evaluating the futureprofitability of basic research. As such, if an acquiring firm is engaged in similar research asa target firm, it should be able to place a more accurate value on the target research,potentially avoiding the typical overpayment associated with the winner’s curse. Inaddition, prior contact with the target firm through alliances gives the two firms anopportunity to learn about each other’s research and also meet and work with key

ARTICLE IN PRESSM.J. Higgins, D. Rodriguez / Journal of Financial Economics 80 (2006) 351–383 357
scientists and management. (Anand and Khanna, 2000, show that firms can learn to createvalue as their alliance experience accumulates over time.) In the current analysis, eachacquiring firm had, on average, four alliances with the target firm prior to the acquisition.This contact should provide the acquiring firm with sufficient information regarding thehuman capital of the target firm. Combined, these pre-acquisition activities should provideenough information to the acquirer so that it knows what it is buying. This type oforganizational learning perspective is broadly similar to that suggested by Hayward (2002).
In addition to providing information, Rothaermel (2001) finds that alliances withproviders of new technologies are positively correlated with new product development forthe incumbent firm and, in turn, new product development is positively associated withfirm performance. This finding is supported elsewhere in the literature, for example, Shanet al. (1994) and Deeds and Hill (1996).
Acquirers in the pharmaceutical industry are able to negotiate more effectively with thetarget firm when the exclusivity and patent horizon of their own product portfolios andtheir product pipelines are strong. We argue that they undertake acquisitions tosupplement their slowing R&D productivity as evidenced by an increase in theirDesperation Index (our unique quantitative measure of firm level productivity). Firmsare able to capture value from their acquisition activities by improving their stock ofknowledge or information about the target prior to the time of the acquisition. As such, wemake the following five predictions: (1) the probability that a given firm undertakes anR&D acquisition is positively related to its level of desperation just prior to an acquisition;(2) given that a firm makes an acquisition, the cumulative abnormal return, CAR, realizedfrom the acquisition is positively related to the stock of information accumulated by theacquirer in the period prior to an acquisition; (3) the CAR realized from an acquisition isnegatively related to the acquirer’s level of desperation; (4) post-acquisition improvementsin R&D productivity or pipeline health of an acquirer is positively related to acquirer’spre-acquisition information gathering activities; and (5) post-acquisition improvements inpipeline health of an acquirer is positively related to the acquirer’s level of desperationprior to an acquisition.
4. Empirical methodology and data sample
4.1. Empirical methodology
We use event study methodology to compute the cumulative abnormal returns aroundthe time of the acquisition announcement. Acquisition dates for the sample are gatheredfrom Securities Data Corporation (SDC) and verified using publicly available mediareports from the Wall Street Journal and other business publications. We run the eventstudy utilizing an event window of three days. The three-day window includes the day ofthe announcement as well as the day before and after. As a robustness check, we re-run theevent study utilizing a five-day window. The five day window includes the three days priorto an acquisition announcement, the day of the announcement as well as the day after.Finally, we checked for confounding events for each transaction with the Wall Street
Journal.One of the challenges in analyzing mergers and acquisitions is to find appropriate
measures of transactions success, in addition to the widely accepted cumulative abnormalreturns. Healey et al. (1992) use post-acquisition accounting data to test directly for

ARTICLE IN PRESSM.J. Higgins, D. Rodriguez / Journal of Financial Economics 80 (2006) 351–383358
changes in operating performance that result from mergers. This approach is notappropriate for the current analysis because it overlooks the health of the acquiringcompany’s product pipeline, which represents potential future significant cash flows thatare not recorded in available accounting data. We examine two measures of acquisitionsuccess in addition to cumulative abnormal returns. First, we look at the post-acquisitionchange in the research pipeline for the year following the acquisition. We quantitativelymeasure each company’s pipeline using a unique Score value. If pipeline products wereincluded in the acquisition, the company’s post-acquisition product pipeline Score valueshould increase. This would be one indication that the company was successful in makingimprovements to its product pipeline as a result of R&D acquisitions. Second, we look atpost-acquisition changes in revenues in the year following the acquisition. This measure isless precise for two reasons. First, because many of the acquisitions are smaller in size, evenif a company acquired a mature product with existing sales, those added sales may not beenough to counteract the firm’s existing loss in sales as a result of current products comingoff patent. Second, pipeline products that are acquired by a firm most likely do not havesales in the following year, unless the product has already been submitted for FDAapproval.3 To test our primary predictions, we employ regression analysis controlling forfirm characteristics and transaction characteristics expected to affect the value creationresulting from acquisitions in our sample using our standard measure of acquirer success,CARs, and two industry-specific measures of success, improved product pipeline and newdrug product sales.
4.2. Acquisition identification
We obtain acquisitions data from Thomson Financial’s Securities Data Corporation(SDC) database for the years 1994–2001. We identify transactions representative of thenew product-focused biotechnology industry acquisitions by the primary acquirerStandard Industry Code (SIC) and by SDC’s high-tech search variable. SIC codes 2833-2836 cover the pharmaceutical industry. The high-tech industry classification by SDCidentify firms within the biotechnology industry, but with SIC codes other than 2833-2836.This search method also identifies high-tech companies in different sectors. As a result, wefilter the data set using SDC’s business description and sector variables. Acquisitions thatclearly are outside of the biopharmaceutical sector are deleted from the data set. Unrelatedacquisitions are considered to be those that include over-the-counter or generic drugs,consumer products, medical devices and products, and manufacturing facilities. Inaddition to filtering the sample to verify the relevance of the acquisition in question, wecollect information from news stories from Factiva. First, we verify the value and methodof payment of the acquisition, when disclosed. Second, we note the company’s statedreason for entering into the acquisition. Third, the relatedness of the firms is coded. Firmsare coded as ‘‘related’’ if the target company’s research or products are within the sametherapeutic category as the acquiring company.4 The purpose of this classification is to
3The inability to extend this beyond one year post-acquisition is a function of our data range. Because our data
ends in 2001, we are limited to the number of years we can extend the analysis post-acquisition without losing data
points. Our current research project is looking at the status of the acquired pipeline products in the post-
acquisition period.4Firms were categorized into broad therapeutic categories based upon the Uniform Standard of Classification.
For coding purposes we looked at several sources for therapeutic information about firms. For example, we

ARTICLE IN PRESSM.J. Higgins, D. Rodriguez / Journal of Financial Economics 80 (2006) 351–383 359
determine whether firms were making acquisitions within their current competency orwhether they were venturing to build a new competency. This filtering process leftapproximately 180 transactions spanning 15 countries, with the majority of the acquirers andtargets, 76% and 80%, respectively, being based in the United States. We obtain domesticstock market returns data from the Center for Research in Security Prices (CRSP) andinternational returns data from Data Stream. Twenty transactions are dropped from thefinal sample because of inadequate data. In some of these cases, both parties are privateentities and information about the transaction is severely limited or not available.
4.3. Exclusivity horizon and patent profiles
4.3.1. Implications of Hatch– Waxman
Two types of patent protection exist for pharmaceutical companies. The first aretraditional patents granted and processed by the United States Patent and TrademarkOffice (USPTO). The Uruguay Round Agreements Act of 1994 extended patent lengthsfrom 17 years from the date the patent was granted to 20 years from the date theapplication was filed. Traditional patents can be filed anywhere along the developmentlifeline of a drug, and they can encompass a wide range of claims. Most approvedpharmaceutical products have several patents attached to them. For example, the Eli Lillydrug CialisTM has two separate patents associated with its new drug application (NDA).5
The second type of protection is regulatory in nature and granted by the FDA uponapproval of a new chemical entity (NCE). This type of protection is termed exclusivity andcould run concurrent with traditional patent protection. For a NCE, exclusivity is grantedfor a period of five years from the date of FDA approval.6 Exclusivity came about as animportant provision in the Drug Price Competition and Patent Term Act of 1984—morecommonly referred to as the Hatch–Waxman Act. The purpose of exclusivity was toprovide pharmaceutical companies five years of marketing protection during which othermanufacturers were prohibited from filing an application to sell a generic product.Exclusivity does not, however, prevent other manufacturers from seeking approval for adrug that uses the same therapeutic mechanism as an already approved drug. Theseproducts are often referred to as ‘‘me-too’’ drugs and are required to undergo the samerigorous clinical testing to garner FDA approval.7 For example, the erectile dysfunctiondrugs CialisTM and LevitraTM, direct competitors of the already marketed drug ViagraTM,were approved on November 21, 2003 and August 19, 2003, respectively. The exclusivity
(footnote continued)
utilized the therapeutic coding available from our proprietary sales data set, the NDA pipeline, company websites,
and the news releases about the acquisition itself.5Two patents, numbers 5859006 and 6140329, expiring on January 12, 2016 and July 11, 2016, are attached to
the NDA in the FDA Orange Book.6Orphan (for rare diseases and disorders) and pediatric drugs are granted longer exclusivity periods because of
their limited use. For example, orphan drugs are granted seven years of exclusivity protection.7This is in contrast to generic drugs, which, according to the Hatch–Waxman Act, only need to demonstrate
bioequivalence to an already approved brand-name drug to get FDA approval. Bioequivalence means that the
active ingredient in the generic drug is absorbed at the same rate as the brand-name drug. The test required to
demonstrate bioequivalence is much less costly than those undertaken by brand-name drugs. This provision in
Hatch–Waxman has allowed generics to enter the market quickly and at much lower cost. For example, prior to
Hatch–Waxman in 1983, only 35% of top-selling drugs with expired patents faced generic competition. By 1998,
that number was close to 100% (Congressional Budget Office, 1998).

ARTICLE IN PRESSM.J. Higgins, D. Rodriguez / Journal of Financial Economics 80 (2006) 351–383360
provision was designed to help firms that had no patent protection or had little time leftunder patent when a NCE was approved by the FDA.Our goal is to construct an exclusivity and patent profile for each pharmaceutical
company with an approved product. The purpose of such an exercise is to provide ameasure of the health of an individual company’s patented product profile. The FDAOrange Book indicates when an NCE is formally approved by the FDA. Along with thisapproval is the granting of exclusivity by the FDA. According to 21 C.F.R. Section 314.53,upon submission of a new drug application for consideration by the FDA, pharmaceuticalfirms are required to submit relevant and supporting patent information. For patentsissued after the approval of an NDA, firms are required to submit relevant patentinformation within 30 days.Unfortunately, several issues arise when trying to use the FDA Orange Book to
construct our exclusivity and patent profiles, which must be taken into consideration.First, exclusivity and patent lengths are not static. Companies are allowed to extend thelength of both their exclusivity and patent protection. The allowances for both of theseextensions flow from the Hatch–Waxman Act. In terms of patent protection, companiesthat have received approval for a NCE by the FDA can apply to have half the time thedrug spent in clinical trials (approximately four to eight years) plus all of the time spenthaving the FDA review (usually two years) its new drug application added onto its patentlength. There are three limitations. First, the extension cannot be longer than five years.Second, the total granted patent length of a drug cannot exceed 14 years after the drug hasbeen approved. Third, companies must apply for the extension within 60 days of FDAapproval (Congressional Budget Office, 1998). In addition, only one patent is eligible forthe Hatch–Waxman extension. As a result, most firms choose to extend the patent thatcovers the drug’s chemical compound or in the alternative, the patent that covers the use ofthe drug (Congressional Budget Office, 1998).The Hatch–Waxman Act also provides for extensions to exclusivity protection. The act
allows for the granting of three more years of exclusivity for a supplemental NDA if theapplication required additional clinical testing. Manufacturers often use this provision toobtain approval for new dosages of previously approved products. Schering used theseprovisions effectively in the follow-up introductions of Claritin-DTM and Claritin-D 24HourTM to there hit allergy medicine ClaritinTM, which was originally approved on April4, 1993. The logic behind this provision is to provide manufacturers an incentive tocontinually improve brand-name products (Congressional Budget Office, 1998).When a generic manufacturer makes an application (called an abbreviated new drug
approval or ANDA) to the FDA, the ANDA must contain a certification regarding eachof the patents listed in the Orange Book. Four possible certifications can be made (seeBulow, 2003). Of relevance to the current discussion as it relates to the extension ofexclusivity are Paragraph IV Certifications. With this certification a generic manufactureris challenging that a listed patent is either invalid or will not be infringed upon by thegeneric drug. The manufacturer making this claim must provide the patent holder with thefactual and legal basis for filing. The patent holder then has 45 days in which to file aninfringement suit. By filing an infringement suit, the FDA sets aside the approval processfor the ANDA until the earliest of the date the NDA patent being challenged expires, acourt ruling invalidates the patent, a court ruling of non infringement is made, or 30months pass after the patent holder was originally notified of the ANDA Paragraph IVcertification. The Federal Trade Commission (FTC) estimates that Paragraph IV

ARTICLE IN PRESSM.J. Higgins, D. Rodriguez / Journal of Financial Economics 80 (2006) 351–383 361
challenges, on average, take approximately 25 months to adjudicate (Federal TradeCommission, 2002). In effect, brand-name manufacturers are able to tack on another twoand one-half years of exclusivity protection thereby increasing their effective exclusivityperiod to seven and one-half years.8
Unfortunately, these provisions to extend exclusivity and patent protection have beenincreasingly used in an effort to stave off generic competition by brand-namemanufacturers.9 Bulow (2003) provides a more complete discussion of the type of gamingthat has taken place. As a result, the FDA Orange Book, which provides an accuratepicture of new drug approvals, could be missing relevant patent data.
4.3.2. Exclusivity and patent profiles
Three separate data sources are utilized in generating our firm and industry exclusivityand patent profiles. Because there is the possibility of underreporting in the FDA OrangeBook, Thomson Derwent and New England Research Application Center (NERAC) areused in an attempt to identify additional patents that could be used by the firm to extendprotections. The goal in utilizing these data sets is to attempt to capture additional,unreported patents that are relevant to a particular approved product. The net result ofusing this combination of data is that we create a bound for each of our profile measures.A lower bound is created by the use of the FDA Orange Book since there is potentialunderreporting of patents. An upper bound is created by the combination of Derwent andNERAC. An upper bound is generated because these data sets attempt to identifyadditional patents tied to a particular approved product that are not identified in the FDAOrange Book. Given that this process of attaching additional patents to a particularapproved product is rather subjective, some of the patents identified and attached to aproduct could be unusable by the firm in efforts to increase patent protection or stave offgeneric competition.10
In addition to these raw patent and exclusivity profiles, a third measure is created. Thismeasure is a sales-weighted exclusivity horizon. Because not all approved products areworth the same in terms of revenues, it makes sense that not all patents are worth the same.By sales weighting our exclusivity measure we are able to discern the status of the mostimportant patents to the firm, in terms of revenues. We construct this by obtainingproprietary sales data from IMS Health for every patented drug in the FDA Orange Bookfiles from 1994 to 2001.11 We combine the two data sets for each product to obtain aweighted product exclusivity horizon. Each product is weighted according to theproportion of sales represented by the average product life cycle of all drugs in theFDA Orange Book. The average product life cycle is determined as the proportion of salesin each year of exclusivity through three years following loss of exclusivity protection. Over
8In its report, the FTC noted that the prevalence of infringement suits increased after 1998 (see Federal Trade
Commission, 2002).9This process appears to have been abused in the past. For example, Bristol Meyers Squibb (BMS) announced
that it would pay a total of $670 million to settle antitrust suits relating to Buspar and Taxol. One of the
allegations made was that the improperly listed a patent in the Orange Book extending their exclusivity (see In re
Busprinoe Patent Litigation, MDL No. 1410 (S.D.N.Y.).10We thank a patent attorney specializing in biopharmaceutical patents, who requested to remain anonymous,
for spending countless hours answering questions relating to these issues.11One hundred fifty patented products identified in the Orange Book files did not have sales data identified in
IMS Health’s data set; this left 398 patented products with sales data.

ARTICLE IN PRESSM.J. Higgins, D. Rodriguez / Journal of Financial Economics 80 (2006) 351–383362
the entire Orange Book file, 74.19% of sales occurred during the five-year exclusivityprotection period, while an additional 15% of sales were realized in the three yearsfollowing the loss of exclusivity. We chose this weighting technique in an effort to reflecteach product’s position correctly within its individual product sales life cycle. This life-cycle measure also provides some empirical insight into potential gaming in the FDAOrange Book. Since 74.19% of sales across the FDA Orange book are occurring within adrug’s first five years of sales, this suggests that the impact of gaming is not yet thatsignificant. On average, the vast majority of pharmaceutical sales for a product are stilloccurring within their first five years of approval.The exclusivity horizon for the sector, regardless of the measure used, indicates that the
cumulative horizon is declining. Fig. 1 plots the cumulative number of years of exclusivemarketing rights remaining for all patented products for the years 1991 to 2002. The rangeis extended beyond our sample length of 1994 to 2001 to demonstrate the longer-run trend.Two potential extensions of the number of exclusive years are discussed; Fig. 1 takes intoconsideration one of those concerns. When companies apply for a supplemental NDA as aresult of a new dosage or use, those products are listed separately and, as a result, arecaptured in this measure. It is possible that some firms for some products could have alonger exclusivity horizon.The cumulative patent profile for the sector also follows a similar pattern as the
exclusivity profile. The cumulative exclusivity horizon peaked in 1998, while the overallpatent profile peaked in 1999. Two possible reasons explain that the cumulative years forthe patent profile exceed the cumulative years in the exclusivity profile. First, exclusivityprotection is granted only to products that have been approved by the FDA. Manyprojects in earlier stage testing have received regular patent protection but are ineligible forexclusivity protection. Second, an approved product is granted exclusivity only once, whileat the same time an approved product could have a series of patents tied to it that extendback to the early stage discovery process. For example, product X is given five years ofexclusivity protection (excluding any possible extensions), but could have several patentsassociated with it with varying lengths of protected time remaining.
4.3.3. New drug approval pipeline
In an effort to determine what products are in development for acquirer firms, we usethe NDA pipeline files from 1994 to 2001. These files contain information relating to thevarious stages of product development. For purposes of this study we focus on thefollowing phases: pre-clinical, Phase I, Phase II, Phase III, and FDA filed. Phase I involvessafety testing, Phase II focuses on small-scale human efficacy trials, and Phase III focuseson large-scale human efficacy trials. We group all pre-Phase I research into the pre-clinicalcategory. We were also able to identify the broad therapeutic categories, through theUniform Standard of Classification, where this research is focused. For example, over theentire time period, 18.56% of all treatments in various stages of development are related insome way to oncology. While the sheer numbers of potential treatments has grown, thenumber of treatments being taken to the last stage (filing with the FDA) has remainedrelatively constant. The ratio of treatments that make it to FDA filing over the number oftreatments in Phase III declined from 29% to 17% throughout the 1990s.Clinical probabilities are subsequently assigned to each of the phases of research. These
assigned clinical probabilities, based on existing research, reflect the chance a potentialtreatment has of receiving FDA approval (Krieger and Ruback, 2001). We subsequently
ARTICLE IN PRESS
0
100
200
300
400
500
600
1993 1994 1995 1996 1997 1998 1999 2000 2001
Nu
mb
er o
f dru
gs
Pre-clinical Phase I Phase II Phase III NDA
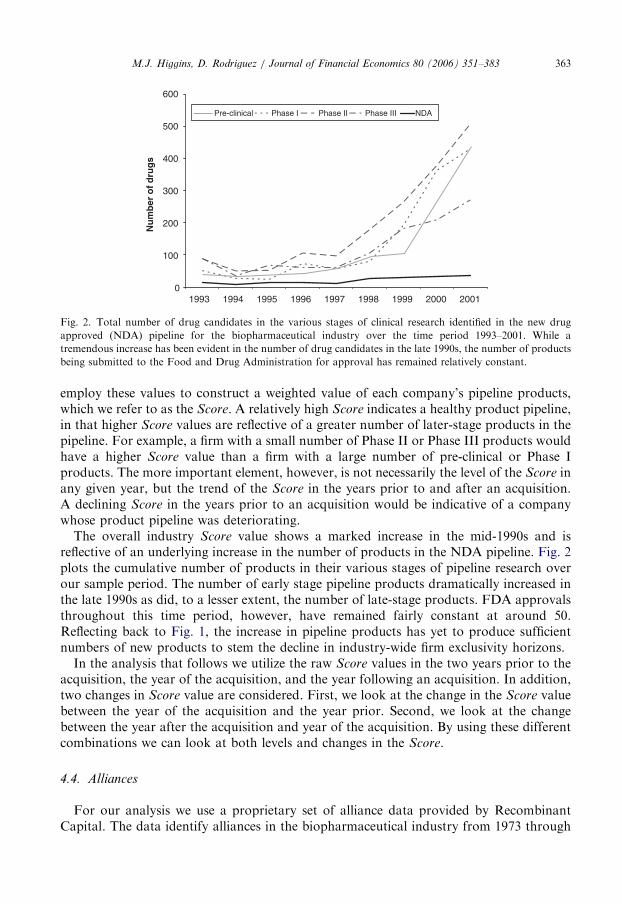
Fig. 2. Total number of drug candidates in the various stages of clinical research identified in the new drug
approved (NDA) pipeline for the biopharmaceutical industry over the time period 1993–2001. While a
tremendous increase has been evident in the number of drug candidates in the late 1990s, the number of products
being submitted to the Food and Drug Administration for approval has remained relatively constant.
M.J. Higgins, D. Rodriguez / Journal of Financial Economics 80 (2006) 351–383 363
employ these values to construct a weighted value of each company’s pipeline products,which we refer to as the Score. A relatively high Score indicates a healthy product pipeline,in that higher Score values are reflective of a greater number of later-stage products in thepipeline. For example, a firm with a small number of Phase II or Phase III products wouldhave a higher Score value than a firm with a large number of pre-clinical or Phase Iproducts. The more important element, however, is not necessarily the level of the Score inany given year, but the trend of the Score in the years prior to and after an acquisition.A declining Score in the years prior to an acquisition would be indicative of a companywhose product pipeline was deteriorating.
The overall industry Score value shows a marked increase in the mid-1990s and isreflective of an underlying increase in the number of products in the NDA pipeline. Fig. 2plots the cumulative number of products in their various stages of pipeline research overour sample period. The number of early stage pipeline products dramatically increased inthe late 1990s as did, to a lesser extent, the number of late-stage products. FDA approvalsthroughout this time period, however, have remained fairly constant at around 50.Reflecting back to Fig. 1, the increase in pipeline products has yet to produce sufficientnumbers of new products to stem the decline in industry-wide firm exclusivity horizons.
In the analysis that follows we utilize the raw Score values in the two years prior to theacquisition, the year of the acquisition, and the year following an acquisition. In addition,two changes in Score value are considered. First, we look at the change in the Score valuebetween the year of the acquisition and the year prior. Second, we look at the changebetween the year after the acquisition and year of the acquisition. By using these differentcombinations we can look at both levels and changes in the Score.
4.4. Alliances
For our analysis we use a proprietary set of alliance data provided by RecombinantCapital. The data identify alliances in the biopharmaceutical industry from 1973 through

ARTICLE IN PRESSM.J. Higgins, D. Rodriguez / Journal of Financial Economics 80 (2006) 351–383364
2003. They also provide a general description of the nature of these alliances. Thisinformation provides two important acquirer firm attributes for our analysis: (1) whetherthe acquiring company had any alliances with the target company prior to the acquisition;and (2) what type of alliances these were, for example, licensing, research, development,co-development, co-marketing, distribution, or manufacturing. We are also able todetermine whether an alliance was for an early- or late-stage product. In addition toalliances between our acquirer and target, we specify two other categories of alliances. Thefirst category is whether or not the acquiring company engaged in any alliances prior tothe acquisition with other firms other than the target. The second category is whether theacquiring company engaged in any other alliances within the same therapeutic category asthe target, but with a firm other than the target. We believe prior alliance activity with thetarget provides the most specific opportunity for an acquiring company to learn aboutthe target firm. In fact, 67% of the sample acquirers engaged in, on average, four allianceswith the target prior to the acquisition.12
4.5. Desperation Index
Through the combination of these data we construct a categorical Desperation Index.We place each firm in the sample into one of four categories of desperation based uponwhether or not the change in their Score value and sales-weighted exclusivity horizon isincreasing or decreasing in the year immediately prior (yeart – yeart�1) to an acquisition.The categories reflect an increasing level of desperation. Category I (strongest position)represents firms that have an increasing Score value and an increasing sales-weightedexclusivity horizon. Category II represents firms that have increasing Score values, but adeclining sales-weighted exclusivity horizon. In contrast, a Category III firm is generatingincreasing sales but has a declining Score value. Finally, Category IV (weakest position)represents firms that have both decreasing Score values and a decreasing sales-weightedexclusivity horizon. We place Category II firms ahead of those in Category III becausethey have greater potential for generating future products and, as a result, future sales. Forexample, a firm in the second category is one that is experiencing a decline in sales prior toan acquisition, but it is also experiencing an increase in Score value. The prospect exists forthe firm to be able to replace declining sales products with new ones in the future. Incontrast, a Category III firm is generating increasing sales, but its Score value is declining.This would be indicative of a firm whose product pipeline is deteriorating. Thus, this firmwould have a lower prospect for being able to replace current products with new ones inthe near future. Firms were assigned to corresponding Desperation Index categories priorto and subsequent to each acquisition. Sixty percent of firms were categorized as eitherCategory III or IV in the period prior to the acquisition. This is in contrast to the post-acquisition period, in which only 32% of firms were categorized as Category III or IV.Approximately 28% of the acquiring firms in our sample were able to remove themselvescompletely from these lower classifications. Whereas 59% of acquiring firms were able toimprove their categorical classification by at least one level, only 12% of these firmsremained at their pre-acquisition desperation level.In addition to our base definition, we consider other variations and combinations of the
variables in our Desperation Index to test the robustness of our results. First, we parse the
12Target firms, on average, had six alliances with firms other than the acquiring firm prior to the acquisition.

ARTICLE IN PRESSM.J. Higgins, D. Rodriguez / Journal of Financial Economics 80 (2006) 351–383 365
Desperation Index into its two component parts: the Score value and sales-weightedexclusivity horizon. This will allow us to test the levels of these variables versus theirchange. Next, we replace the sales-weighted exclusivity horizon variable with three otheralternatives. First, we test the raw number of exclusivity years remaining in the portfolio.This is a simple summation of exclusivity years as reported in the FDA Orange Book.Second, firms are potentially able to game the number of exclusive years for a product. Asa result, the first measure could understate the exclusivity horizon. Assuming that a firmdoes not engage in a patent infringement suit unless the marginal benefit of doing soexceeds the marginal cost of litigation, we add 30 months of exclusivity protection to drugsthat have sales equal to or in excess of $100 million in the year they would lose exclusivityprotection.13 A new summation of the exclusivity variable is then generated based on thisextension. While not a perfect measure, it should mimic more closely the response ofcompanies. Finally, we replace the sales-weighted exclusivity horizon with a summation ofregular patent years. Again, because of potential gaming of patents in the FDA OrangeBook, we use our second patent measure generated from NERAC and Thomson Derwent.These data attempt to identify relevant data not identified in the FDA Orange Book. As aresult, this variable could possibly be overstated. As such, the measure serves as an upper-bound, while the exclusivity horizon will serve as a lower bound.
5. Empirical analysis
5.1. Assessing acquirer desperation and propensity to engage in acquisitions
Pharmaceutical firms experiencing declines in either their research pipeline or patentedproduct portfolio can respond in several ways. We focus our analysis on the propensity offirms to engage in outsourcing acquisitions using probit regressions. Our sample for thisanalysis includes firms contained in Recombinant Capital’s alliance data set from 1994 to2001 and that have both sales and pipeline data available. This allows for a homogenoussample of firms engaged in similar activities and facing potentially similar constraints. Thedependent variable is an indicator variable, yit, that assumes a value of one for a given firm,i, in a specific year, t, if that firm undertakes an acquisition in a given year and is zerootherwise. For independent variables we use the change in Score, R&D intensity, the log ofmarket capitalization, a count variable identifying the number of alliances undertakenprior to the current year (includes all firms, not just target firms), indicator variablescorresponding to each category of our potential acquirer Desperation Index, and a timetrend. As a robustness check, we include the three other definitions and constructions ofthe components of the Desperation Index. We also refine the variable Count to include onlyalliances with the target firm. See Table 1 for variable definitions; Table 2 summarizes thevariables; and Table 3 presents the variable correlations.
We present the results of our probit regressions with White and Huber heteroskedas-ticity consistent standard errors in Table 4.14 Consistent with our hypothesis, we find that
13This process was repeated for drugs with $50 million and $75 million in revenues in the final year of
exclusivity.14The same analyses were performed with logit regressions. Unreported results are consistent with the probit
analyses reported in the paper. A Hausman test was run and rejected the hypothesis that the individual-level
effects were adequately modeled using a random effects approach. As such, a fixed effects model is utilized.

ARTICLE IN PRESS
Table 1
Definition and description of regression-model independent variables
Different dependent variables are utilized. Cumulative abnormal returns (CARj) are used in Table 7 and DScore and D Sales are used in additional cross section analyses presented in Table 9.
Variable Description
Score Weighted value (non monetary) of company research pipeline
D Score pre-acquisition Pre-acquisition change in weighted value of research pipeline (scoret2scoret�1)
D Score post-acquisition Post acquisition change in pipeline weighted value (scoretþ12scoret)
Log sales level Log value of real life-cycle-weighted pharmaceutical sales
D Sales pre-acquisition Pre-acquisition change in weighted sales (log sales levelt2logsaleslevelt�1)
D Sales post-acquisition Post acquisition change in weighted sales (log sales leveltþ12logsaleslevelt)
R&D intensity Research and development expenses/sales (real 1999 dollars)
Pipeline experience Dummy equals 1 if acquiring company has pipeline research in the same therapeutic
category as the target firm
Sales experience Dummy equals 1 if acquiring company has patented pharmaceutical product sales in
the same therapeutic category as the target firm
Alliance Dummy equals 1 if acquiring company has alliance with target firm prior to the
acquisition
Royalty Dummy equals 1 if acquiring company was paying a royalty to the target firm prior to
the acquisition
Early stage alliance Dummy equals 1 if acquiring company has early stage product alliance with
target firm prior to acquisition
Desperation Index (pre-
acquisition)
Dummy equals 1 if acquiring company was assigned to desperation
Categories III or IV
D Desperation Index
post-acquisition
Dummy equals 1if acquiring company improved level of desperation post-acquisition
Prior acquisition Dummy equals 1 if acquiring company has prior acquisition experience in the three
years before the latest acquisition
Stock deal Dummy equals 1 if acquisition was stock financed
Cash deal Dummy equals 1 if acquisition was cash financed
Contingent contract Dummy equals 1 if contingent contract was present
Related Dummy equals 1 if acquiring and target firms operate within the same therapeutic
category or categories
Sales force Dummy equals 1 if sales force personnel were part of acquisition
Free-cash flow Free-cash flow
Tobin Tobin’s Q
Log market cap Log of market capitalization
International Dummy equals 1 if acquiring firm was an international firm
M.J. Higgins, D. Rodriguez / Journal of Financial Economics 80 (2006) 351–383366
firms that are more desperate are more likely to engage in acquisitions. The Desperation
Index has two components: the change in Score value (representing progress in the firm’snew product pipeline) and the change in the sales-weighted exclusivity horizon(representing the state of the firm’s current product portfolio). Model 1 takes just oneof the component values, the change in Score, and uses it as an independent variable. Wereport a negative and significant correlation between the change in Score value and theprobability that a firm engaged in an acquisition. This result suggests that firms withimproving product pipelines are less likely to undertake an outsourcing acquisition. InModels 2 and 3, we incorporate each of our four classifications of the Desperation Index.Category III and IV firms, our most desperate firms, are experiencing a declining

ARTICLE IN PRESS
Table 2
Descriptive statistics for firms making 160 research and development related acquisitions in the 1994 to 2001
period
These variables are used in probit results analyzing the characteristics that impact the probability a firm engages
in an acquisition (Table 4), analysis of the event study results (Table 5), cross-section results that utilize the
cumulative abnormal return as the dependent variable (Table 7), and cross-section results that utilize two separate
measures of success as the dependent variable (Table 9).
Variable Mean Standard deviation Minimum value Maximum value
Free-cash flow 438.03 943.77 �250.87 4669.00
Tobin 3.69 3.53 �0.96 32.25
Log market cap 7.26 2.42 2.15 12.58
Score (in year of acquisition) 4.49 8.66 0 51.54
D Score pre-acquisition 1.39 5.06 �9.95 28.15
D Score post-acquisition 0.51 191.4 �10.6 114.4
Log sales level 3.51 5.67 0 15.58
Change Sales Level 0.30 1.72 �9.71 12.15
R&D intensity 3.06 26.05 0 324.98
Pipeline experience 0.36 0.48 0 1
Sales experience 0.23 0.42 0 1
Alliance 0.67 0.29 0 1
Royalty 0.03 0.17 0 1
Desperation Index 0.60 0.26 0 1
Prior acquisition 0.28 0.45 0 1
Stock deal 0.36 0.48 0 1
Cash deal 0.18 0.39 0 1
Contingent contract 0.21 0.41 0 1
Related 0.81 0.39 0 1
Sales force 0.13 0.34 0 1
International 0.24 0.43 0 1
M.J. Higgins, D. Rodriguez / Journal of Financial Economics 80 (2006) 351–383 367
sales-weighted exclusivity horizon. Category IV firms are also experiencing a decliningpipeline Score value. Of significant interest are the coefficient estimates on x7 and x8,
which correspond to Categories III and IV of the Desperation Index. In Model 2, bothCategory III and Category IV firms were more likely than Category I firms to engage in anacquisition. Category III firms were 11.41% and Category IV firms were 16.01% morelikely to engage in acquisitions. This result suggests that as firms fall from Category III toIV, their probability of engaging in an acquisition increases by approximately 4.6%.In Model 3, when the number of previous alliances indicator variable (Count) is removed,the coefficients and resulting probabilities remain fairly stable. Again, Category III andIV firms were more likely than Category I firms to engage in acquisitions. Category IIIfirms were 11.77% more likely and Category IV firms were 16.38% more likely.Model 4 takes two of the desperation categories and combines them into a singleindicator variable, Desperation Index, which equals one if the firm is either a Category IIIor IV firm. Using this specification, desperate firms were 13.86 percent more likely toengage in an acquisition than Category I and II firms. These findings support recent workby Danzon et al. (2004). They find a positive relationship between the motivationto merge and a percentage of a firm’s drugs that are old and at risk of losing patentprotection.

ARTICLE IN PRESS
Table
3
Correlationmatrix
forrelevantvariablesutilizedin
thefollowinganalyses:
probit
estimation(Table
4);
cumulativeabnorm
alreturn
cross-sectionalregressions
(Table
7);and,post-acquisitioncross-sectionalregressions(T
able
9)
Thenumberslisted
horizontallyacross
thetoprow
correspondto
thenumbersandvariableslisted
verticallyonthetable.See
Table
1forvariable
definitions.
12
34
56
78
910
11
12
13
14
15
1.Pipelineexperience
1.0000
2.Salesexperience
0.1292
1.0000
3.Royalty
�0.0669�0.0260
1.0000
4.Earlystagealliance�0.0474
0.0306�0.0007
1.0000
5.Equitystake
0.0428
0.1841
0.1921
0.2491
1.0000
6.DesperationIndex
0.1373
0.3467
0.0264
0.1888
0.1258
1.0000
7.R&D
intensity
�0.0494�0.0641�0.0010�0.0580�0.0109�0.0512
1.0000
8.Prioracquisition
0.1238
0.2685�0.0484
0.0824
0.0292
0.2744�0.0797
1.0000
9.Stock
deal
0.0861
0.0254
0.0017
0.1438
0.1692
0.0284�0.0821�0.0446
1.0000
10.Cash
deal
�0.0318
0.1644
0.1162�0.0871�0.0896
0.0199�0.0517
0.0574�0.3697
1.0000
11.Freecash
flow
0.1975
0.1786
0.0217
0.0689�0.0064
0.2630�0.0632
0.2848�0.0440
0.0527
1.0000
12.Tobin
�0.0077�0.0661�0.0663�0.0511�0.0575
0.0763�0.0224
0.0103�0.1106�0.0490
0.1642
1.0000
13.Logmarket
cap
0.0637
0.2251�0.0730
0.1195
0.0531
0.4156�0.1420
0.3667�0.0447
0.1032
0.5913
0.1421
1.0000
14.Contingentcontract
0.1865�0.1283�0.0139�0.0616
0.1009�0.1353
0.1784�0.0415
0.0468�0.0237�0.1558�0.1099�0.2093
1.0000
15.International
�0.0318
0.2948�0.0882
0.0079
0.0369
0.2325�0.0563
0.1802�0.0582
0.0431�0.0024�0.0058
0.2003�0.20461.0000
M.J. Higgins, D. Rodriguez / Journal of Financial Economics 80 (2006) 351–383368

ARTICLE IN PRESS
Table 4
Probit estimates for our data regress an acquisition indicator (equals 1 if an acquisition took place) on a series of
independent variables expected to impact a firm’s probability of engaging in an acquisition
The period for this analysis runs from 1994 to 2001. The universe of firms for this analysis includes all firms
contained in the Recombinant Capital alliance data set that have pipeline and patented product information
available. Count is defined as the total number of alliances that the acquiring firm is engaged in on a year-by-year
basis. Desperation Index Categories III and IV are the most severe levels of firm desperation. The variable
Desperation Index is an aggregated indicator variable that assumes a value of one if the acquirer is in Category III
or IV and is zero otherwise. F is the standard cumulative normal distribution. See Table 1 for all other variable
definitions. Firm and time effects were included. We use the White (1980) heteroskedasticity-consistent standard
errors to compute the appropriate test statistics included in parentheses below the coefficient estimates. We test
the model:
Pðyi;ta0 jxi;tÞ ¼ Fðx1i;t þ x2
i;t þ x3i;t þ x4
i;t þ x5i;t þ x6
i;t þ x7i;t þ x8
i;t þ x9i;t þ FE þ cÞ,
qF=qxi ¼ fðxbÞbi.
The dependent variable is Acquisition Indicator. *** denotes significance at the 1% level; ** denotes significance
at the 5% level; and * denotes significance at the 10% level.
Independent variable Model 1 Model 2 Model 3 Model 4
Model 1 qF=qx Model 2 qF=qx Model 3 qF=qx Model 4 qF=qx
x1: Change score (pre-
acquisition)
�0.0545 �0.0111
(1.91)*
x2: R&D intensity 0.0016 0.0003 0.0014 0.0003 0.0016 0.0003 0.0012 0.0002
(1.84)* (1.98)** (2.34)** (1.89)*
x3: Log market cap �0.0457 �0.0965 �0.0214 �0.0881 �0.0196 �0.0894 �0.0201
(1.09) (2.77)*** (2.83)*** (2.62)***
x4: Count 0.0086 0.0033 0.0019
(0.80) (0.37) (0.22)
x5: Desperation Index
(Category I)
x6: Desperation Index �0.4640 �0.4497
(Category II) (1.44) (1.39)
x7: Desperation Index 0.4416 0.1141 0.4537 0.1177
(Category III) (2.14)** (2.24)**
x8: Desperation Index 0.5668 0.1601 0.5776 0.1638
(Category IV) (1.83)* (1.86)*
x9: Desperation Index 0.5314 0.1386
(2.96)***
c: Constant �0.8285 �0.3479 �0.3874 �0.3867
(2.02)** (1.08) (1.21) (1.21)
Fixed effects Yes Yes Yes Yes
N 424 424 424 424
Pseudo R2 0.04 0.04 0.05 0.05
Log likelihood �122.96 �172.09 �172.17 �173.23
M.J. Higgins, D. Rodriguez / Journal of Financial Economics 80 (2006) 351–383 369

ARTICLE IN PRESSM.J. Higgins, D. Rodriguez / Journal of Financial Economics 80 (2006) 351–383370
The results suggest that we might anticipate lower or even negative abnormal returns foracquiring firms at higher levels of desperation. However, we do not find that target firmsare able to extract all of the acquiring firm gains, even when the acquirer is particularlydesperate to supplement its R&D program.In unreported regressions we test the robustness of the results to a change in definition of
the Desperation Index. First, we parse the Desperation Index into its two essentialcomponent parts (the Score and sales-weighted exclusivity horizon). We then use the levelsof these variables in the year prior to the acquisition to test whether a firm was more or lesslikely to engage in an acquisition. In a series of regressions, using the same independentvariables as Table 4, we consistently find a negative and significant relationship betweenour Score and Acquisition variables. These findings suggest that firms with large Score
values (or relatively healthy research pipelines) are less likely to engage in an acquisition.Likewise, firms with low Score values—or relatively unhealthy research pipelines—weremore likely to engage in an acquisition in the following calendar year. The sales-weightedexclusivity horizon variable did not produce the same result. The variable was consistentlynot significant across the additional specifications. This finding could suggest that thedecision to engage in a research-type acquisition is mainly driven by what is happeningwith a firm’s research pipeline and not their sales or revenues. This is consistent with thefindings of Danzon et al. (2004).When we replace the sales-weighted exclusivity horizon with our patent horizon
generated from our combination of NERAC and Thomson Derwent data sources we findresults similar to those reported in Table 4. Category II was not significant across anyspecification. Categories III and IV were both negative and significant. Marginalprobabilities were slightly larger, on average, than the results we report. Category IIIfirms were around 13% more likely to engage in an acquisition than Category I firms whileCategory IV firms were around 19% more likely. When we combine Category III and IVfirms together in Model 4 the marginal probability increases slightly to 15%. All resultsusing this modified definition of the Desperation Index are significant at least at the 5%level.The analysis produced several other results of note. Firms with greater R&D intensity
have a greater propensity to undertake R&D outsourcing acquisitions. This result isconsistent with the notion that higher levels of absorptive capacity on the part of research-focused firms are necessary for those firms to incorporate new research into their R&Dprograms effectively (Cohen and Levinthal, 1989). This view is supported by Chesbrough(2003), who stresses the importance of maintaining internal competencies even whileconsidering the use of outsourced research and development. In addition, we find thatsmaller firms have a greater tendency to undertake acquisitions. This is demonstrated bythe consistently negative and significant coefficient estimates for our log of marketcapitalization variable in Table 4. This result is consistent with the notion thatpharmaceutical R&D programs require increasing economies of scale (Cockburn andHenderson, 1996). For smaller firms to improve the productivity of their researchprograms, they can engage in R&D acquisitions to increase their scale. Finally, Andradeand Stafford (2004) find that firms with a high Tobin’s Q are significantly more likely toundertake both merger and non merger investment. In unreported regressions, we do notfind, for the current sample, any statistically significant relation between Tobin’s Q and theprobability that a firm engaged in an acquisition. High Q firms could engage in non mergerinvestment. However, that question is beyond the scope of the present study.

ARTICLE IN PRESSM.J. Higgins, D. Rodriguez / Journal of Financial Economics 80 (2006) 351–383 371
5.2. Assessing stock market returns
We present univariate CARs against various independent variables in Table 5. We focuson five specific independent variables: the relatedness of the transaction, financing method,alliance activity, sales experience, and research experience. The relatedness of thetransaction measures if both the acquirer and target operate within the same therapeuticcategory. Next, we focus on whether the deal was financed with stock or cash. Mixed
Table 5
Event study estimates evaluating the cumulative abnormal return versus the presence of various independent
variables
Type I transactions involve the acquisition of biotechnology research and development; Type II transactions
involve the acquisition of general research and development; and Type III transactions involve the acquisition of a
mature product along with research and development. T-test measures whether each of the subcategories (for the
overall sample) is statistically different from each other (difference of the means). t-statistics are reported in
parentheses. See Table 1 for definitions of variables. *** denotes significance at the 1% level; ** denotes
significance at the 5% level; and * denotes significance at the 10% level.
Overall t-test Type I Type II Type III
Acquirer CAR 3.91% 2.81% 4.29% 5.29%
(4.95)*** (2.61)*** (2.41)** (3.27)***
N ¼ 160 N ¼ 91 N ¼ 27 N ¼ 42
Relatedness 3.51% 2.49% 4.00% 4.32%
(4.24)*** (2.25)** (2.01)** (2.88)***
N ¼ 130 N ¼ 68 N ¼ 24 N ¼ 36
Financing 2.19**
Stock payment 3.87% 3.22% 3.36% 3.71%
(2.92)*** (2.13)** (0.68) (1.67)***
N ¼ 58 N ¼ 35 N ¼ 8 N ¼ 14
Cash payment 2.38% 2.35% 2.24% 4.08%
(2.47)** (1.36) (1.71)* (1.47)
N ¼ 29 N ¼ 13 N ¼ 7 N ¼ 9
Alliances 2.58***
Prior alliances 4.30% 4.58% 2.11% 4.22%
(4.14)*** (3.25)*** (1.39) (1.82)
N ¼ 94 N ¼ 54 N ¼ 18 N ¼ 21
No prior alliances 3.36% 0.17% 8.65% 6.37%
(2.73)*** (0.13) (2.07)** (2.77)***
N ¼ 66 N ¼ 35 N ¼ 9 N ¼ 21
Sales experience 2.12**
Prior sales 6.99% 4.28% 4.50% 10.56%
(3.29)*** (2.19)** (1.49) (1.91)*
N ¼ 128 N ¼ 75 N ¼ 17 N ¼ 31
No prior sales 3.08% 2.58% 4.17% 3.43%
(4.85)*** (2.46)** (4.36)*** (3.32)***
N ¼ 34 N ¼ 14 N ¼ 10 N ¼ 11
Research experience 2.10***
Prior experience 5.08% 2.40% 9.08% 12.35%
(3.71)*** (2.46)** (4.36)*** (3.32)***
N ¼ 103 N ¼ 61 N ¼ 15 N ¼ 25
No prior experience 3.24% 3.03% 6.95% 0.50%
(4.52)*** (2.19)** (1.49) (1.91)***
N ¼ 57 N ¼ 28 N ¼ 12 N ¼ 17

ARTICLE IN PRESS
Table 6
The dispersion of cumulative abnormal returns (CARs) are presented
Following Dodd and Warner (1983), standardized abnormal returns (SARs) are computed by dividing the
abnormal return (AR) by its standard deviation. These standardized abnormal returns (SARs) are then
aggregated over the number of the days in the event window, k, to generate a cumulative abnormal return.
Magnitude Number of observed abnormal returns
CARp� 15:0% 4
�15:0%oCARo� 10:0% 3
�10:0%pCARo� 5:0% 12
�5:0%pCARo0:0% 41
0:0%pCARo5:0% 38
5:0%pCARo10:0% 29
10:0%pCARo15:0% 17
15:0%pCAR 16
M.J. Higgins, D. Rodriguez / Journal of Financial Economics 80 (2006) 351–383372
financing deals were included in the overall sample, but not in this specific analysis, giventhe inability to attribute any potential CAR to a specific financing method. The alliancevariable is an indicator that equals one if the acquiring firm had an alliance with the targetprior to the acquisition. The sales experience variable is an indicator that equals one if theacquiring firm has patented product sales within the same therapeutic category as thetarget firm prior to the acquisition. If an acquiring company has a patented product thatmeets this criterion—we argue that the firm has to have some internal capabilities withrespect to products in that therapeutic category because it had to successfully completeclinical testing and the FDA approval process to begin to sell the product. Finally, weinclude research experience. The research experience variable is an indicator that equalsone if the acquiring firm has products in its own pipeline within the same therapeuticcategory as the target firm. We anticipate that with the presence of prior alliances, salesand research experience should generate greater CARs for acquiring firms. We present fourseparate specifications: univariate results for the entire sample as well as results for threesmaller sub samples. We break the sample into three types. Type I transactions are deals inwhich a biotechnology firm or technology was acquired. Type II transactions are thosedeals in which non biotechnology related research and development firms were purchased.Type III transactions are those involving a mature product along with research anddevelopment capabilities.The overall average abnormal return for acquiring firms, using a three-day window, is
3.91% and is significant at the 1% level.15 Average abnormal returns to target firms werearound 16.0%. The returns to the target firms are consistent with previous research. Wefind similar results across the various sub types of acquisitions. Average abnormal returnsfor these sub types were 2.81%, 4.29% and 5.29%, respectively. All are significant at the1% or 5% level. We provide the distribution of the overall average abnormal returns inTable 6. We include several controls to ensure that our results are not being driven byoutliers. Table 6 breaks down the individual abnormal returns into magnitude ranges.From this panel, we find that only four CARs are below negative 15.0% while sixteen
15Abnormal returns for our robustness measure for acquiring firms was 4.38% and significant at the 1% level.
This CAR was a combination of results from a three- and five-day window, as discussed in Section 4.2.

ARTICLE IN PRESSM.J. Higgins, D. Rodriguez / Journal of Financial Economics 80 (2006) 351–383 373
CARs are greater than positive 15%. In an unreported plot of the CARs against theirfrequency, the sample appears to be skewed slightly to the right of zero. No large outliersappear to exist. In addition to Table 6, we performed non parametric tests to determine thesensitivity to outliers.16
The extant literature finds that cash-financed transactions generate superior returns thanthose financed with stock (Andrade et al., 2001). Our findings contradict this result. Whilecash transactions, on average, produce average cumulative abnormal returns of 2.38%,those transactions financed with equity yielded returns of 3.87%. Both results aresignificant at least at the 5% level and are also significantly different from each other at the5% level. Equity payments in these acquisitions could help alleviate the moral hazardproblem and align the interests of target-firm employees with those of the acquiring firm.As there is generally a large disparity in size between acquirer and target in terms of marketcapitalization, acquiring firms need to ensure that target firm managers or scientists remaincommitted to the overall success of a particular research project as they move from beingowners of the firm’s research output to employees of the acquirer.
Our next three results examine different types of pre-acquisition information-gatheringactivities on the part of acquirers: prior alliances, sales experience, and research experience.We find that the presence of each of these activities generates greater abnormal returns forthe acquirer. Acquirers that engaged in alliances with the target firm prior to theacquisition generated average abnormal returns of 4.30% versus returns of 3.36% forthose firms that did not engage in these types of alliances. Both are significant at the 1%level and are notably different from each other at the 1% level. Acquiring firms that hadprior sales experience within the same therapeutic category as the acquisition hadsubstantially greater average abnormal returns than those firms that did not. Firms thathad prior sales experienced average abnormal returns of 6.99% while those that did notexperienced average abnormal returns of only 3.08%. Both are significant at the 1% leveland are significantly different from each other at the 5% level.17 Finally, acquiring firmsthat have existing research experience within the same therapeutic category as the targetgenerate greater average abnormal returns, 5.08% versus 3.24%. This result suggests thatfirms are rewarded for making acquisitions within their existing areas of expertise. Again,both are significant at the 1% level and are measurably different from each other at the 1%level. The presence of each of these activities allows the acquiring firm to learn about thetrue underlying value of the target. As a result, acquiring firms are able to place a moreaccurate value on the target firm and generate greater positive abnormal returns for theirshareholders. It is also likely that these pre-acquisition information-gathering activitieslead to more successful post-acquisition integration.
Cockburn and Henderson (2003) in their study of drug development performance find astrong correlation between the scope of a firm’s development efforts and the success
16We perform a Wilcoxon signed rank test, which considers both the sign and magnitude of each transaction’s
cumulative abnormal return. We reject the null hypothesis of zero CAR with a z-value of 5.692.17A robustness check on a slight change in definition was performed. Currently, the variable includes sales of a
patented product for which a firm could only be distributing the product and could have had limited or no
involvement in the development of the product. Our alliance data set was utilized in an effort to identify only
marketing deals. The relevant therapeutic category for these sales was removed from the acquiring company’s list
if it had no other sales experience for products that it internally or co-developed within that therapeutic category.
We were unable to identify any situations for which this would be necessary. As a result, we are confident in our
original measure.

ARTICLE IN PRESSM.J. Higgins, D. Rodriguez / Journal of Financial Economics 80 (2006) 351–383374
probability of individual projects. Scope is defined by the number of therapeutic categoriesin which a particular company operated. Our pipeline experience and sales experience
variables are not scope measures. Instead they are a measure of the complementaritybetween the acquiring and target firm’s research and product portfolios. As such, firmsundertaking these types of outsourcing of research and development acquisitions arechoosing to deepen their existing capabilities versus broadening their overall researchscope. The results for our relatedness variable support this claim. We find positive averagecumulative abnormal returns of 3.51% for acquirers that operate within the same broadtherapeutic category as the target firm, as opposed to average cumulative abnormal returnsof 2.57% for those firms that do not. In addition to the scope findings, Cockburn andHenderson (2003) conclude that past successes in a therapeutic category were positivelyassociated with successful outcomes of a project. These results were robust across all oftheir specifications. Our sales experience variable is a measure of exactly this. It measureswhether a firm has sales of a patented product, which serves an indicator that the firm hasexperience taking a product in that therapeutic category through the various researchphases, within the same therapeutic category as the research being acquired from the targetfirm. Their finding of a greater likelihood of development success could also provide analternative explanation for the magnitude of the positive abnormal return on the sales
experience variable.
5.3. Cross-sectional analysis of abnormal returns
5.3.1. Information-gathering activities
Firms that engage in one of the three pre-acquisition information-gathering activities(alliances, prior sales of patented products and research experience within the sametherapeutic category as the target) generate positive abnormal returns for theirshareholders. In addition, each of these significantly impacts the overall magnitude ofthe CAR. We report our cross-sectional regression estimates in Table 7. Table 7 presentsresults for six separate specifications that test a series of independent variableshypothesized to have an impact on the magnitude of the CAR, while various attributesof the firm and acquisition deals are controlled. The dependent variable for theseregressions is the acquirer three-day CAR for each acquisition in our sample. We includethree groups of independent variables in our analysis. The first three variables are our pre-acquisition information-gathering activities: prior research and sales experience andalliance activity. Next we have our Desperation Index measure and a measure of R&Dintensity, defined as research and development expenditures divided by sales. We alsoinclude an indicator of whether or not the firm had engaged in any acquisitions in theprevious three years. We include two financing variables indicators for cash and equitydeals. Three other variables control for various financial characteristics of the acquiringfirm: a measure of free-cash flow, Tobin’s Q, and the log value of the market capitalizationof the acquiring firm. Finally, dummies are included if the acquiring firm was based outsideof the United States and if there was a contingent contract present in the deal.Across the first four specifications we find mixed support for the pipeline experience
variable. The coefficient ranges between 0.0184 and 0.0249 and is significant only once atthe 10% level. Prior pipeline research (firms with products identified in the NDA pipeline)within the same therapeutic category as target firm positively impacts the overall

ARTICLE IN PRESS
Table 7
Cross-sectional regression estimates and independent variables from regressing the cumulative abnormal return
(CAR) on selected independent variables for 160 announcements of acquisitions relating to the outsourcing of
research and development
CARs are from the three-day event window. The period for this analysis runs from 1994 to 2001. Year fixed
effects are included in all specifications. The White (1980) heteroskedasticity-consistent t-statistics are reported in
parentheses. See Table 1 for variable definitions. *** denotes significance at the 1% level; ** denotes significance
at the 5% level; and * denotes significance at the 10% level.
The dependent variable is Acquirer CAR
Independent variable Model 1 Model 2 Model 3 Model 4 Model 5 Model 6
Pipeline experience 0.0249 0.0227 0.0184 0.0211
(1.73)* (1.11) (1.24) (1.14)
Sales experience 0.0565 0.0527 0.0544 0.0529 0.0557 0.0408
(3.01)*** (2.89)*** (3.12)*** (2.93)*** (3.12)*** (2.65)***
Alliance 0.0348 0.0374 0.0396 0.0347 0.0321 0.0355
(3.21)*** (3.28)*** (3.11)*** (3.59)*** (2.99)*** (2.67)***
Desperation Index �0.0442 �0.0428 �0.0436 �0.0406 �0.0362
(2.41)** (2.34)** (2.42)** (2.24)** (2.26)**
R&D intensity 0.0003 0.0004
(0.91) (0.95)
Prior acquisition �0.0211 �0.0204 �0.0185 �0.0204 �0.0174 �0.0219
(2.34)** (2.31)** (2.17)** (2.31)** (2.12)** (2.41)**
Stock deal �0.0117 �0.0069
(0.65) (0.42)
Cash deal �0.0202
(0.99)
Free-cash flow �0.0005 �0.0041 �0.0040
(0.41) (0.39) (0.45)
Tobin 0.0003 0.0002 0.0002 �0.0002
(1.14) (0.11) (0.11) (0.11)
Log market cap �0.0024 �0.0031 �0.0035 �0.0028 �0.0041 �0.0057
(0.45) (0.62) (0.98) (0.56) (1.22) (1.73)*
Contingent contract 0.0036
(0.16)
International 0.0108 0.0085 0.0159
(0.66) (0.54) (0.75)
Constant 0.0576 0.0591 0.0528 0.0535 0.0711 0.0816
(1.39) (1.58) (1.77)* (1.38) (2.43)** (2.86)***
N 155 155 160 155 160 155
R2 0.26 0.25 0.22 0.24 0.22 0.22
F-statistic 2.78 2.64 2.91 2.87 3.12 2.58
M.J. Higgins, D. Rodriguez / Journal of Financial Economics 80 (2006) 351–383 375
magnitude of the CAR. In this case, firms are positively rewarded for buying whatthey know.
Having prior sales experience, our proxy for FDA approved products, within the sametherapeutic category as the target firm also positively impacts the magnitude of the CAR.
We find strong evidence for this result across all six model specifications. Furthermore, thecoefficient remains fairly stable and is significant at the 1% level. In addition to having theresearch capabilities for a specific therapeutic category, having sales experience and as aresult having a product approved by the FDA demonstrates that the particular acquiring

ARTICLE IN PRESSM.J. Higgins, D. Rodriguez / Journal of Financial Economics 80 (2006) 351–383376
pharmaceutical firm has experience in taking that specific category of product through theformal FDA approval process. Phase III testing (human clinical trials) and the FDAapproval process are expensive and time-consuming. Firms have a clear advantage intaking new products into this process for which they already hold some experience. Inaddition, the introduction of a new product within an existing therapeutic category wouldrequire less time to train sales professionals and generate a new market than would a newclass of products. Again, these results imply that acquiring firm shareholders are beingrewarded for staying within areas in which they are already experts.Alliance experience with the target firm prior to an acquisition positively impacts the
magnitude of our CAR values across all specifications considered. Results ranged from0.0321 to 0.0396 and were significant at the 1% level. On average, there were four alliancesbetween the firms prior to the acquisition. Presumably this prior contact should providelearning opportunities for the acquiring firm resulting in a more appropriate valuationbeing placed on the target firm. These positive impacts are consistent with Chan et al.(1997) and Porrini (2004).Next, we look at the impact that the level of desperation has on the CAR. We find,
across five of the six model specifications, a negative impact on the overall magnitude ofthe CAR. Results are significant at the 5% level. More important, while the presence offirm level desperation negatively impacts the magnitude of the CAR, the overall CAR forthese desperate firms remains positive. The overall average abnormal return for the entiresample is 3.91%. Performing a univariate analysis similar to those in Table 5, the averageabnormal return for the most desperate firms was 1.73%, significant at the 10% level. Thissuggests that even the most desperate firms are still able to employ pre-acquisitioninformation-gathering activities to generate positive value for their firm’s shareholders.The lower abnormal returns for these firms could be attributable to such factors as a lowerinternal required rate of return for the acquiring firm in addition to the less favorablenegotiating position vis-a-vis target firms.Of the remaining independent variables, R&D intensity, stock deal, cash deal, free-cash
flow, Tobin’s Q, contingent contracts, and an international indicator, none is significant atany reasonable level across six specifications. However, acquiring firms experience anegative impact on their CAR if they engage in an acquisition within the three years priorto the current acquisition. This result is negative and significant at the 5% level across allsix specifications. This finding is in contrast to Fuller et al. (2002). One reason for thedifference could be that the market is penalizing companies that engage in either multipleacquisitions or a program of acquisitions in an effort to grow their R&D business. Themarket could perceive this type of firm as having a weak internal research and developmentprogram that is unable to develop new projects independently. Because new productdevelopment is the life-blood of any pharmaceutical firm, companies that are unable toproduce potential products internally could be at a competitive disadvantage. Anotherreason for the difference may be the selection of firms analyzed. Whereas this study focusessolely on the pharmaceutical sector, the same sector only totaled 1.3% of the total firmsanalyzed in their study.In additional unreported regression specifications, the public status of the target firm
had no significant statistical impact on the magnitude of the cumulative abnormal return.This finding, in contrast to the extant literature, suggests that a private company discountdoes not exist in the current study. One of the justifications for the private companydiscount is the difficulty in valuing a company. This lends support to our argument that
ARTICLE IN PRESSM.J. Higgins, D. Rodriguez / Journal of Financial Economics 80 (2006) 351–383 377
acquiring firms are able to use pre-acquisition information-gathering activities to lessen theuncertainty as to the underlying value of the target firm.
5.3.2. Sensitivity analysis
Additional specifications were tested to ensure the robustness of our main findings tochanges in definitions. Repeating our procedure we parse the Desperation Index into itstwo main components, the Score and sales-weighted exclusivity horizon. In the first seriesof regressions we tested the levels of these two variables in the year prior to the acquisition.Score, the weighted measure of the health of a firm’s research pipeline, while positive wasnot significant in the additional specifications. This would seem to suggest that a firm’spipeline status in the year prior to an acquisition has little impact on the abnormal returnsgenerated over the three-day event window. We found previously, however, that Score
played a significant role in the probability that a firm actually engaged in an acquisition. Incontrast, we found both positive and significant results for our sales-weighted exclusivityhorizon. We removed the exclusivity weighting and tested real sales and found similarresults. Finally, we removed the sales data completely and used just a straight measure ofthe number of exclusivity years remaining in a firm’s portfolio. Again, we found positiveand significant results. These findings are all consistent with our findings on Desperation
Index in Table 7. The desperation level of a firm negatively impacts the magnitude ofits CAR.
Given the potential pitfalls of using exclusivity as an adequate measure of the health of afirms patented product portfolio we employ additional measures. First, in an attempt tocontrol for some of the gaming that could take place to garner additional years ofexclusivity, for example, by engaging in patent litigation, we add 30 months of exclusivityonto each product in their last year of exclusivity if the drug had at least $100 million inrevenues.18 Arguably a company would not engage in the expense of patent litigation if themarginal benefit of doing so was less than the marginal cost. We find across variousspecifications a positive and significant (at the 5% level) impact on the magnitude of theCAR. Again, this finding is consistent with our reported Desperation Index findings inTable 7.
We next remove the exclusivity variable and replace it with our patent data variableconstructed from NERAC and Thomson Derwent to test robustness of our results acrossdiffering legal protections. Our findings are mixed. The coefficient remains positive,consistent with the exclusivity findings; however, the variable is only significant at the 10%level in a limited number of specifications. This finding only suggests a real potentialdifference between the impact a firm’s patent profile and a firm’s exclusivity profile has onthe magnitude of the CAR. Because this variable serves as an upper-bound measure, theseresults could be a function of the way the variable is constructed.
5.4. Cross-sectional analysis of post-acquisition success measures
In addition to the abnormal returns result, we find positive changes to the acquiringfirm’s Score value and product sales figures in the year following the acquisition. The Score
value for a firm is a weighted measure of the health of a firm’s research pipeline. An
18This process was repeated for drugs with $50 million and $75 million in revenues in the final year of
exclusivity.

ARTICLE IN PRESS
Table 8
Panel A: distribution of acquiring firms across desperation categories
Changes in Desperation Index pre- and post-acquisition. Classifications are as follows: Category I indicates firms
with increasing or constant score values and increasing weighted sales; Category II indicates firms with increasing
or constant score values and decreasing weighted sales; Category III indicates firms with decreasing score values
and increasing or constant weighted sales; and, Category IV indicates firms with decreasing score values and
decreasing weighted sales. Category I firms are less desperate than those firms in Category IV. 94 firms (59%)
improved their level of desperation. 19 firms (12%) had their level of desperation remain constant. 47 firms (29%)
had a worsening of their level of desperation.
Pre-acquisition Post-acquisition
Category Frequency Percent (%) Category Frequency Percent (%)
Category I 17 10.63 Category I 36 22.50
(least desperate)
Category II 47 29.38 Category II 72 45.00
Category III 24 15.00 Category III 33 20.63
Category IV 72 45.00 Category IV 19 11.88
(most desperate)
Panel B: distribution of acquiring firms across various post-acquisition measures
Changes in sales and pipeline score values in the calendar year following the acquisition. The Score value is a
proxy for the overall health of a firm’s research pipeline. An increase in score value would signal that the firm’s
pipeline has strengthened. D Score is defined as scoretþ12scoret,. D Sales is defined as salestþ12salest.
Classifications are as follows: Category I indicates firms with increasing or constant score values and increasing
weighted sales; Category II indicates firms with increasing or constant score values and decreasing weighted sales;
Category III indicates firms with decreasing score values and increasing or constant weighted sales; and Category
IV indicates firms with decreasing score values and decreasing weighted sales. Weighted sales values are log values
of 1999 constant dollars.
Variable and category Number of firms Mean Standard Deviation Minimum Maximum
D Score
Category I 36 116.91 167.14 0 636.2
Category II 72 40.83 142.34 0 1143.8
Category III 33 �173.10 228.06 �1059.6 �3
Category IV 19 �71.34 66.07 �273.6 �3
D Sales
Category I 36 1.0966 2.4109 0.2436 10.82
Category II 72 �0.2784 1.4465 �9.7067 �0.0067
Category III 33 0.4872 1.5877 0 6.5853
Category IV 19 �0.8373 3.2896 �14.345 �1.5194
M.J. Higgins, D. Rodriguez / Journal of Financial Economics 80 (2006) 351–383378
increase in the Score value of a firm after an acquisition is suggestive of improvements tothe underlying pipeline. We show the distribution of firms across the various levels ofdesperation, both pre- and post-acquisition, in Table 8. As presented in Panel A of Table 8,94 firms or 59% of the firms in our sample improved their level of desperation through theuse of acquisitions. This means that in the year following an acquisition, acquiring firmsmoved from one of the four levels of desperation to a less desperate level. In other words,through the use of acquisitions, firms are able to increase either their score value orweighted sales or both. Another 19 firms or 12% of firms maintained their level of

ARTICLE IN PRESSM.J. Higgins, D. Rodriguez / Journal of Financial Economics 80 (2006) 351–383 379
desperation. In total, 71% of firms either improved or maintained their level ofdesperation.
Panel B presents the average change in sales and score values for the distribution ofdesperation categories post-acquisition. This panel suggests that firms that were able toimprove their level of desperation in Category I (least desperate) or Category II were mostsuccessful in adding to their underlying research score value. As shown in Panel A, 67.50%of firms fell into one of these two categories post-acquisition. The average change in Score
value for a Category I firm (least desperate) post acquisition is positive, while the averagechange in Score value for a Category IV firm (most desperate) is negative. Moreover, theaverage change in sales for Category I firms was positive, while the average change in salesfor Category IV firms was negative. The post-acquisition change in product sales needs tobe viewed cautiously. As most research is acquired while still in phase testing, the salesimpact is not felt until some time in the future. The more important result, we feel, is thepost-acquisition change in the Score value given that this is a direct measure of the healthof a firm’s research portfolio.
Pisano (1991) suggests that acquisition of biotechnology firms can be a dangerousstrategy particularly when acquisitions are used to overcome a weakness in internalcapabilities. We find consistent with Chesbrough (2003) that this is not always the case.Table 9 presents cross-sectional regression results for these post-acquisition measures. Thechange in Score value (scoretþ12scoret) and change in product sales (salestþ12salest),respectively, are used as dependent variables. For both regression models we present fiveseparate specifications. We include and test a variety of independent variables that we feelhave an impact on the two dependent variables. We find in the first regression model(DScore post-acquisition is the dependent variable) that the coefficient on the variableDesperation Index is positive and significant at least at the 5% level. This result suggeststhat desperate firms are experiencing positive post-acquisition changes to their Score valuethrough the use of acquisitions. As the Score value is a measure of pipeline health, theseimprovements justify the use of acquisition activity as a tool to help improve the researchportfolio of the firm. The next regression model (D Sales post-acquisition is the dependentvariable) focuses on the post-acquisition changes in product sales. Again, these results needto be viewed with caution because many of the acquisitions contained products are still invarious stages of phase testing. As a result, the financial impacts of their presence may notbe realized until some period in the future, likely greater than one year after an acquisition.Some acquiring firms, however, did purchase either mature products along with researchcapabilities or products in late-stage or FDA approval process. Again, the coefficient onthe variable Desperation Index is positive and significant. Desperate firms that includedthese types of products in their acquisition were able to positively impact their post-acquisition change in product sales. Firms that acquired a sales force as part of theacquisition showed positive changes to their post-acquisition change in sales. This resultimplies that target firms that had a sales force present also had products generating sometype of revenue. As such, it is not surprising that the acquiring firm experienced a positivechange in post-acquisition sales.
6. Conclusion
The pharmaceutical industry is characterized by large amounts of research anddevelopment. It is also an industry dependent upon that research to be productive and
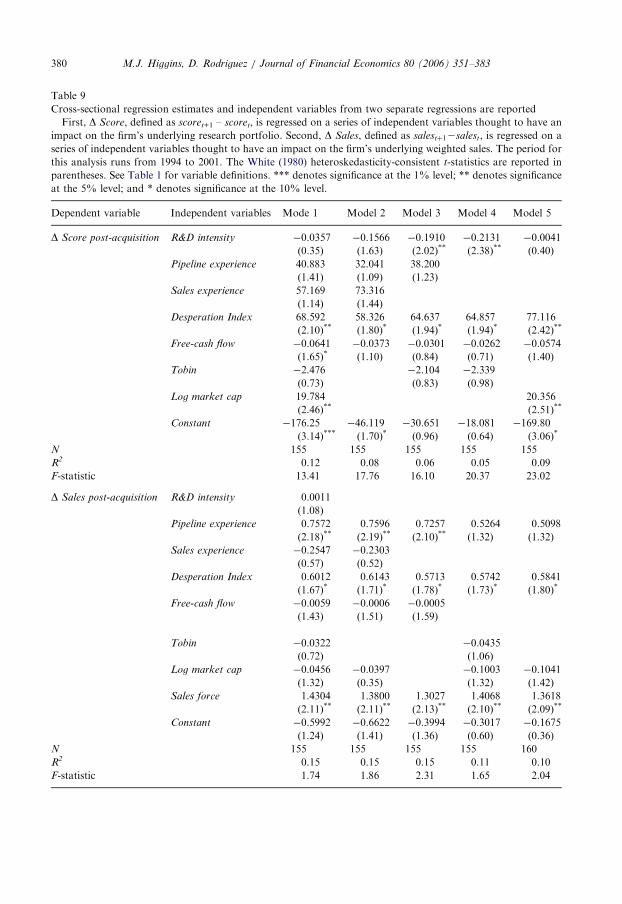
ARTICLE IN PRESS
Table 9
Cross-sectional regression estimates and independent variables from two separate regressions are reported
First, D Score, defined as scoret+1 – scoret, is regressed on a series of independent variables thought to have an
impact on the firm’s underlying research portfolio. Second, D Sales, defined as salestþ12salest, is regressed on a
series of independent variables thought to have an impact on the firm’s underlying weighted sales. The period for
this analysis runs from 1994 to 2001. The White (1980) heteroskedasticity-consistent t-statistics are reported in
parentheses. See Table 1 for variable definitions. *** denotes significance at the 1% level; ** denotes significance
at the 5% level; and * denotes significance at the 10% level.
Dependent variable Independent variables Mode 1 Model 2 Model 3 Model 4 Model 5
D Score post-acquisition R&D intensity �0.0357 �0.1566 �0.1910 �0.2131 �0.0041
(0.35) (1.63) (2.02)** (2.38)** (0.40)
Pipeline experience 40.883 32.041 38.200
(1.41) (1.09) (1.23)
Sales experience 57.169 73.316
(1.14) (1.44)
Desperation Index 68.592 58.326 64.637 64.857 77.116
(2.10)** (1.80)* (1.94)* (1.94)* (2.42)**
Free-cash flow �0.0641 �0.0373 �0.0301 �0.0262 �0.0574
(1.65)* (1.10) (0.84) (0.71) (1.40)
Tobin �2.476 �2.104 �2.339
(0.73) (0.83) (0.98)
Log market cap 19.784 20.356
(2.46)** (2.51)**
Constant �176.25 �46.119 �30.651 �18.081 �169.80
(3.14)*** (1.70)* (0.96) (0.64) (3.06)*
N 155 155 155 155 155
R2 0.12 0.08 0.06 0.05 0.09
F-statistic 13.41 17.76 16.10 20.37 23.02
D Sales post-acquisition R&D intensity 0.0011
(1.08)
Pipeline experience 0.7572 0.7596 0.7257 0.5264 0.5098
(2.18)** (2.19)** (2.10)** (1.32) (1.32)
Sales experience �0.2547 �0.2303
(0.57) (0.52)
Desperation Index 0.6012 0.6143 0.5713 0.5742 0.5841
(1.67)* (1.71)* (1.78)* (1.73)* (1.80)*
Free-cash flow �0.0059 �0.0006 �0.0005
(1.43) (1.51) (1.59)
Tobin �0.0322 �0.0435
(0.72) (1.06)
Log market cap �0.0456 �0.0397 �0.1003 �0.1041
(1.32) (0.35) (1.32) (1.42)
Sales force 1.4304 1.3800 1.3027 1.4068 1.3618
(2.11)** (2.11)** (2.13)** (2.10)** (2.09)**
Constant �0.5992 �0.6622 �0.3994 �0.3017 �0.1675
(1.24) (1.41) (1.36) (0.60) (0.36)
N 155 155 155 155 160
R2 0.15 0.15 0.15 0.11 0.10
F-statistic 1.74 1.86 2.31 1.65 2.04
M.J. Higgins, D. Rodriguez / Journal of Financial Economics 80 (2006) 351–383380

ARTICLE IN PRESSM.J. Higgins, D. Rodriguez / Journal of Financial Economics 80 (2006) 351–383 381
generate revenues to finance future research. As such, the protection and health of a firm’sresearch pipeline is of paramount importance. Managers are faced with several options onhow to go about replenishing that research pipeline. In this paper, we have sought tounderstand how pharmaceutical companies have employed acquisitions in an effort tocombat deteriorating research pipelines and declining patented product portfolios. Foracquisitions characterized by information asymmetries, we find evidence consistent withthe proposition that acquirers are able to avoid the winner’s curse. Specifically, we find apositive and significant correlation between acquirer returns and pre-acquisitioninformation-gathering activities. We also find, on average, that companies experiencinga deterioration of their research pipeline and product sales were more likely to engage in anacquisition. Moreover, these firms were either able to stabilize or to reverse the pipelinedeclines that they were experiencing.
We believe considerable opportunities exist for further empirical research into theseissues. It would be of interest to see if these results generalize across other high-techindustries; for example, the software industry. In this project, we employed a broad view offirm level research activities being undertaken by pharmaceutical firms. Extensions of thecurrent analysis such as tracking research further into the future post-acquisition shouldyield additional important insights. Finally, exploring more fully how firms employalliances to complement internal research programs should be a rewarding area for futureresearch.
References
Anand, J., Khanna, T., 2000. Do firms learn to create value? The case of alliances. Strategic Management Journal
21, 295–317.
Anand, J., Singh, J., 1997. Asset re-deployment, acquisitions and corporate strategies in declining industries.
Strategic Management Journal 18, 99–118.
Andrade, G., Stafford, E., 2004. Investigating the economic role of mergers. Journal of Corporate Finance 10,
1–16.
Andrade, G., Mitchell, M., Stafford, E., 2001. New evidence and perspectives on mergers. Journal of Economic
Perspectives 15, 103–120.
Baker, J., Bresnehan, T., 1985. The gains from merger and collusion in product-differentiated industries. Journal
of Industrial Economics 33, 427–433.
Barton, D.M., Sherman, R., 1984. The price and profit effects of horizontal merger: a case study. Journal of
Industrial Economics 33, 165–177.
Berger, P.G., Ofek, E., 1995. Diversification’s effects on firm value. Journal of Financial Economics 37, 39–65.
Bradley, M., Desai, A., Kim, E.H., 1988. Synergistic gains from corporate acquisitions and their divisions between
the stockholders of target and acquiring firms. Journal of Financial Economics 21, 3–40.
Bruner, R., 2002. Does M&A pay? A survey of evidence for the decision-maker. Journal of Applied Finance 12,
48–68.
Bulow, J., 2003. The gaming of pharmaceutical patents. Unpublished Working Paper, Stanford Business School,
Stanford, CA.
Capron, L., 1999. The long term performance of horizontal acquisitions. Strategic Management Journal 20,
987–1018.
Chan, S., Kensinger, J., Keown, A., Martin, J., 1997. Do strategic alliances create value? Journal of Financial
Economics 46, 199–221.
Chatterjee, S., Wernerfelt, B., 1991. The link between resources and type of diversification: theory and evidence.
Strategic Management Journal 12, 33–48.
Chesbrough, H.W., 2003. Open Innovation: the New Imperative for Creating and Profiting from Technology.
Harvard Business School Press, Boston, MA.

ARTICLE IN PRESSM.J. Higgins, D. Rodriguez / Journal of Financial Economics 80 (2006) 351–383382
Cockburn, I., Henderson, R., 1996. Scale, scope, and spillovers: the determinants of research productivity in drug
discovery. Rand Journal of Economics 27, 32–60.
Cockburn, I., Henderson, R., 2003. Scale and scope in drug development: unpacking the advantages of size in
pharmaceutical research. Journal of Health Economics 20, 1033–1057.
Cohen, W.M., Levinthal, D.A., 1989. Innovation and learning: the two faces of R&D. Economic Journal 99,
569–596.
Congressional Budget Office, 1998. How increased competition from generic drugs has affected prices and returns
in the Pharmaceutical industry. US Government Printing Office, Washington, DC, July.
Danzon, P., Epstein, A., Nicholson, S., 2004. Mergers and acquisitions in the pharmaceutical and biotech
industries. Working Paper Series, Paper 10536, National Bureau of Economic Research, Cambridge, MA.
Deeds, D.L., Hill, C.W.L., 1996. Strategic alliances and the rate of new product development: an empirical study
of entrepreneurial biotechnology firms. Journal of Business Venturing 11, 41–55.
DeLong, G., 2001. Stockholder gains from focusing versus diversifying bank mergers. Journal of Financial
Economics 59, 221–252.
DiMasi, J.A., 2001. New drug development in U.S. 1963–1999. Clinical Pharmacology and Therapeutics 69,
286–296.
Dodd, P., Warner, J., 1983. On corporate governance: a study of proxy contests. Journal of Financial Economics
11, 401–438.
Eckbo, E., 1992. Mergers and the value of antitrust deterrence. Journal of Finance 47, 1005–1030.
Eckbo, E., Thorburn, K., 2000. Gains to bidder firms revisited: domestic and foreign acquisitions in Canada.
Journal of Financial and Quantitative Analysis 35, 1–25.
Federal Trade Commission, 2002. Generic entry prior to patent expiration: FTC study. US Government Printing
Office, Washington, DC, July.
Fuller, K., Netter, J., Stegemoller, M., 2002. What do returns to acquiring firms tell us? Evidence from firms that
make many acquisitions. Journal of Finance 57, 1763–1793.
Hayward, M., 2002. When do firms learn from their acquisition experience? Evidence from 1990–1995. Strategic
Management Journal 23, 21–39.
Healey, P., Palepu, K., Ruback, R., 1992. Does corporate performance improve after mergers? Journal of
Financial Economics 31, 135–175.
Houston, J., James, C., Ryngaert, M., 2001. Where do merger gains come from? Bank mergers from the
perspective of insiders and outsiders. Journal of Financial Economics 60, 285–331.
James, A.D., 2002. The strategic management of mergers and acquisitions in the pharmaceutical industry:
developing a resource based perspective. Technology Analysis & Strategic Management 14 (3), 299–313.
Jarrell, G., Brickley, J., Netter, J., 1988. The market for corporate control: empirical evidence since 1980. Journal
of Economic Perspectives 2, 49–68.
Jensen, M., Ruback, R., 1983. The market for corporate control. Journal of Financial Economics 11, 5–50.
Jensen, R., Thursby, M., 2001. Proofs and prototypes for sale: the licensing of university inventions. American
Economic Review 91, 240–259.
Kohlers, N., Kohlers, T., 2000. The value creation potential of high-tech mergers. Financial Analysts Journal 56,
40–48.
Krieger, D., Ruback, R.S., 2001. Merck and Company: Evaluating a Drug Licensing Opportunity. Case 9-201-
023. Harvard Business School, Cambridge, MA.
Lyroudi, K., Lazaridis, J., Subeniotis, D., 1999. Impact of international mergers and acquisitions on shareholder’s
wealth: a European perspective. Journal of Financial Management and Analysis 12, 1–14.
Mitchell, M., Lehn, K., 1990. Do bad bidders become good targets? Journal of Political Economy 98, 372–398.
Mueller, D., 1985. Mergers and market share. Review of Economics and Statistics 67, 259–267.
Myers, S.C., Majluf, N.S., 1984. Corporate financing and investment decisions when firms have information that
investors do not have. Journal of Financial Economics 13, 187–221.
Pharmaceutical Research and Manufacturers of America, 2002. Industry Profile 2002, http://www.pharma.org
Pisano, G., 1991. The governance of innovation: vertical integration and collaborative arrangements in the
biotechnology industry. Research Policy 20, 237–249.
Porrini, P., 2004. Can a previous alliance between an acquirer and a target affect acquisition performance? Journal
of Management 30 (4), 545–562.
Ravenscraft, D., Scherer, F., 1987. Life after takeovers. Journal of Industrial Economics 36, 147–156.
Ravenscraft, D., Scherer, F., 1989. The profitability of mergers. International Journal of Industrial Organization
7, 101–116.

ARTICLE IN PRESSM.J. Higgins, D. Rodriguez / Journal of Financial Economics 80 (2006) 351–383 383
Rodriguez, D., Higgins, M., 2003. Growth or gluttony: binge acquisitions in the US software industry.
Unpublished Working Paper, Georgia Institute of Technology, Atlanta, GA.
Rothaermel, F., 2001. Complementary assets, strategic alliances, and the incumbent’s advantage: an empirical
study of industry and firm effects in the biopharmaceutical industry. Research Policy 30, 1235–1251.
Samuelson, W., Bazerman, M., 1985. Negotiation under the winner’s curse. In: Smith, V. (Ed.), Research in
Experimental Economics, vol. 3. JAI Press, Greenwich, CT.
Schwert, G., 1996. Markup pricing in mergers and acquisitions. Journal of Financial Economics 41, 153–162.
Shan, W., Walker, G., Kogut, B., 1994. Interfirm cooperation and startup innovation in the biotechnology
industry. Strategic Management Journal 15, 387–394.
Smartmoney.com, 2002. If you can’t beat em, join em. December 4.
Wall Street Journal, 2003. Under a microscope: Merck’s big bet on research by its scientists comes up short.
November 28.
Wall Street Journal, 2004a. Drug industry’s big push into technology falls short. February 24.
Wall Street Journal, 2004b. Merck to buy Aton Pharmaceuticals. February 24.
White, H., 1980. A heteroskedasticity-consistent covariance matrix estimator and a direct test for
heteroskedasticity. Econometrica 48, 817–838.
Williamson, O., 1975. Markets and hierarchies analysis and antitrust implications: a study in the economics of
internal organization. Free Press, New York.