Development of an Optimal Manufacturing Strategy for Low ...
The Optimal Strategy of Dynamic Skylight Hau-Wen Wu
Thesis Advisors: Erica Cochran, Flore Marion, Vivian Loftness and Azizan Aziz Master of Science in
Sustainable Design
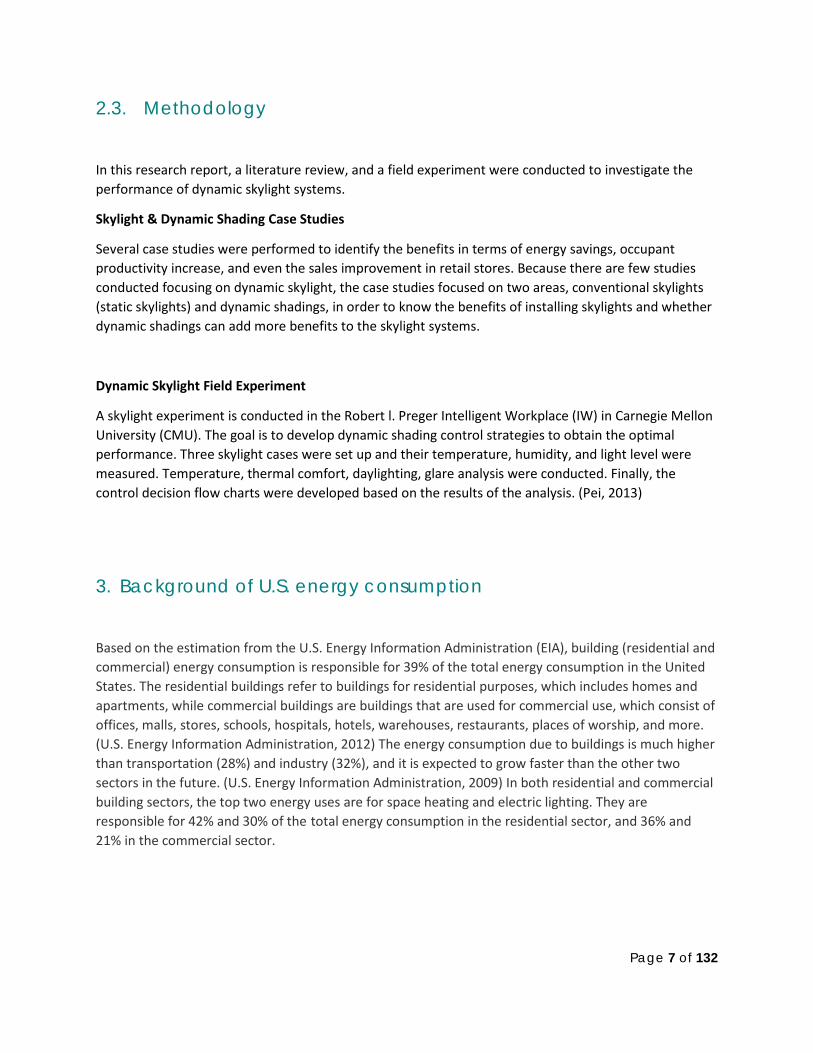
Source: Yellow Blue Designs (2014). Retrieved from: http://c437037.r37.cf2.rackcdn.com/wp-content/uploads/2012/04/img3.jpg
Page 1 of 132
Table of Contents 1. Abstract .............................................................................................................................................. 5
2. Introduction ....................................................................................................................................... 5
2.1. Objectives .................................................................................................................................. 6
2.2. Hypothesis .................................................................................................................................. 6
2.3. Methodology ............................................................................................................................ 7
3. Background of U.S. energy consumption ................................................................................. 7
4. Literature Review ............................................................................................................................. 9
4.1. Skylight Case Studies ................................................................................................................... 9
4.2. Dynamic Shading Case Studies ............................................................................................ 20
5. Dynamic Skylight Field Experiment ........................................................................................... 27
5.1. Experiment Objectives ......................................................................................................... 27
5.2. Site Context ............................................................................................................................. 27
5.3. Experiment Setup ................................................................................................................... 29
5.4. Study Scope and Limitations .............................................................................................. 37
6. Analysis & Results ............................................................................................................................ 39
6.1. Analysis Methodology .......................................................................................................... 39
6.2. Operative Temperature ....................................................................................................... 44
6.3. Thermal Comfort .................................................................................................................... 50
6.3.1. General Thermal Discomfort ........................................................................................... 50
6.3.2. Local Thermal Discomfort ................................................................................................ 60
6.3.3. Night Insulation Effect (R-value Estimation) ................................................................ 66
6.4. Daylighting ............................................................................................................................... 68
6.4.1. Luminance Ratio ................................................................................................................ 69
6.4.2. Illuminance .......................................................................................................................... 76
6.5. Integrated Dynamic Shading Recommendations ....................................................... 78
7. Limitations ........................................................................................................................................ 89
8. Conclusion ....................................................................................................................................... 92
9. Future Work ...................................................................................................................................... 93
10. Appendix ...................................................................................................................................... 94
10.1. Temperature and Illuminance ........................................................................................... 94
10.2. Skylight Surface Temperature........................................................................................... 123
Page 2 of 132
Table 1 Retrosolar Blinds Specifications (Köster Lichtplanung) ............................................ 30 Table 2 Lutron Tensioned Shade Specifications (Mermet Corporation, 2014) .................. 31 Table 3 Design typical day conditions .................................................................................... 40 Table 4 Measured dates of operative temperature analysis ............................................... 41 Table 5 Measured dates for thermal comfort analysis .......................................................... 41 Table 6 Measured dates for night insulation analysis ............................................................ 42 Table 7 Measured data for glare analysis ............................................................................... 42 Table 8 Operative temperature calculation .......................................................................... 44 Table 9 Operative temp. key findings ..................................................................................... 48 Table 10 Operative Temp. key findings ................................................................................... 49 Table 11 Measured days and calculated CLO ...................................................................... 53 Table 12 Key findings of Lutron Shade PPD ............................................................................. 54 Table 13 Key Findings of Retrosolar Blinds PPD ....................................................................... 55 Table 14 Night Insulation Calculation Factors ........................................................................ 67 Table 15 Night Insulation Results - R-value............................................................................... 67 Table 16 Night Insulation Results - U-value .............................................................................. 67 Figure 1 Share of total energy consumed by major sectors of the economy, 2012 (U.S. Energy Information Administration, 2012) ................................................................................. 8 Figure 2 Energy Use in Commercial Buildings (U.S. Energy Information Administration, 2012) ............................................................................................................................................... 8 Figure 3 Energy Use in Residential Buildings (U.S. Energy Information Administration, 2012)......................................................................................................................................................... 8 Figure 4 Skylight Case Studies ..................................................................................................... 9 Figure 5 Total energy savings and weather condition ............................................................ 9 Figure 6 Total energy savings and annual average sunshine .............................................. 10 Figure 7 Smith Middle School (VirginiaTech, 2014) ................................................................. 13 Figure 8 The skylight and shading system of CSAA (Daylighting Initiative, Pacific Gas and Electric Company, 1997) ........................................................................................................... 16 Figure 9 SunTrackerOne (Eco-$mart, Inc., n.d.) ..................................................................... 18 Figure 10 Measured Illuminance (8/22/08 – 9/10/08) ............................................................ 19 Figure 11 PetSmart Retail Store (Southern California Edison, 2008) ..................................... 19 Figure 12 Dynamic Shading Case Studies............................................................................... 21 Figure 13 Total Energy Savings by dynamic skylight system ................................................. 21 Figure 14 Energy Saving Potential for Exterior Shadings ........................................................ 22 Figure 15 The plan view of simulated residential building (left) and commercial building (right) (Yao & Xu, 2010) .............................................................................................................. 23 Figure 16 Diagram of the controlled experiment and dynamic blinds (Lee, DiBartolomeo, & Selkowitz, 1998) ....................................................................................................................... 24 Figure 17 The simulation model (left) and the illustration of three shading types: (a) Without blinds, (b) With fixed blinds, (c) With dynamic blinds. (Nielsen, Svendsen, & Jensen, 2011) ............................................................................................................................... 25
Page 3 of 132
Figure 18 Shading Performance by Orientation .................................................................... 25 Figure 19 2013/2014 Pittsburgh Weather Data (The Weather Channel, LLC, 2014) .......... 28 Figure 20 Sky cover rate in Pittsburgh (Cedar Lake Ventures, Inc, 2014) ........................... 28 Figure 21 Carnegie Mellon University Campus Map ............................................................. 29 Figure 22 North-facing skylights are blocked with chipboards ............................................ 29 Figure 23 Viracon silk-screen glass (left), Retrosolar Blinds (middle); Lutron Tensioned Shade (right) (Daylighting Lab, n.d.) ....................................................................................... 31 Figure 24 Shadings for skylights (Base Case, RETROSolar Venetian Blinds, Lutron Tensioned Shade) ....................................................................................................................... 32 Figure 25 Experiment Set Up ...................................................................................................... 32 Figure 26 Occupant level experiment set up ......................................................................... 32 Figure 27 Measuring Data, Equipment, and Period .............................................................. 33 Figure 28 Sectional View of measurement location .............................................................. 34 Figure 29 HOBO Temperature Sensor (left); Shielding Device (middle); Globe Thermometer (Pei, 2013) ............................................................................................................ 34 Figure 30 U12 HOBO Data Logger, FLIR Thermographic Camera, Fish Eye Camera (Patwardhan, 2012) .................................................................................................................... 35 Figure 31 The calibration platform ........................................................................................... 35 Figure 32 Ambient Temperature ............................................................................................... 36 Figure 33 Relative Humidity ....................................................................................................... 36 Figure 34 Lighting Intensity ......................................................................................................... 37 Figure 35 Measured location comparison .............................................................................. 38 Figure 36 Average daily temperature range (The Weather Channel, LLC, 2014) ............ 39 Figure 37 Weekly Raw Data from 3/3 to 3/9 ........................................................................... 43 Figure 38 Weekly Raw Data from 5/19 to 5/22 ....................................................................... 43 Figure 39 Operative Temperature Calculation ...................................................................... 44 Figure 40 Three modes of heat transfer (Innovative Insulation, Inc., 2014) ........................ 45 Figure 41 Operative Temperature - Hot Day .......................................................................... 45 Figure 42 Operative Temperature - Moderate Day .............................................................. 46 Figure 43 Operative Temperature - Cold Day ........................................................................ 47 Figure 44 Operative temperature difference between Lutron Shade and Base Case ... 48 Figure 45 Operative temperature difference between Blinds and Base Case ................. 49 Figure 46 ASHRAE thermal comfort satisfaction rate ............................................................. 50 Figure 47 The calculation spreadsheet of MRT ....................................................................... 52 Figure 48 The methodology of thermal comfort analysis ..................................................... 52 Figure 49 PMV-PPD Spreadsheet (TANABE Shin-ichi Laboratory, Waseda University) ...... 53 Figure 50 Lutron Shade PPD ...................................................................................................... 54 Figure 51 Retrosolar Blinds PPD ................................................................................................. 55 Figure 52 PMV - PPD of hot clear day ...................................................................................... 56 Figure 53 PMV - PPD of hot overcast day ............................................................................... 56 Figure 54 PMV - PPD of moderate clear day .......................................................................... 57 Figure 55 PMV - PPD of moderate overcast day ................................................................... 58 Figure 56 PMV - PPD of cold clear day .................................................................................... 58 Figure 57 PMV - PPD of cold overcast day ............................................................................. 59
Page 4 of 132
Figure 58 Radiant temperature asymmetry and local discomfort (Melikov, 2010) ........... 60 Figure 59 Skylight surface temp. 3/7/14................................................................................... 61 Figure 60 Skylight surface temp. 3/17/14................................................................................. 61 Figure 61 Skylight surface temp.7/20/14.................................................................................. 62 Figure 62 Skylight Surface Temp. 7/19/14 ................................................................................ 63 Figure 63 Temperature difference 3/7/14 ............................................................................... 63 Figure 64 Temperature difference 3/17/14 ............................................................................. 64 Figure 65 Temperature difference 7/20/14 ............................................................................. 65 Figure 66 Night Insulation Effect by outdoor temperature ................................................... 68 Figure 67 The illuminance and luminance (Ransen, 2014) ................................................... 69 Figure 68 Luminance Map......................................................................................................... 70 Figure 69 Measured Luminance Area (1. VDT screen, 2. Paper task, 3. Adjacent surroundings, 4. Nonadjacent surroundings) .......................................................................... 70 Figure 70 Luminance ratio in 3/29/14 ....................................................................................... 71 Figure 71 Lighting Intensity in 3/29 ............................................................................................ 72 Figure 72 Luminance Ratio in rainy day (07/19/14) ............................................................... 73 Figure 73 Lighting Intensity in rainy day (07/19/14) ................................................................ 73 Figure 74 Luminance Ratio in cloudy day (07/20/14) ........................................................... 74 Figure 75 Lighting Intensity in cloudy day (07/20/14) ............................................................ 74 Figure 76 Luminance ratio in sunny day (7/22/14) ................................................................. 75 Figure 77 Lighting Intensity in sunny day (07/22/14) .............................................................. 75 Figure 78 Lutron Shade Illuminance Level ............................................................................... 76 Figure 79 Retrosolar Blinds Illuminance Level .......................................................................... 77 Figure 80 Base Case Illuminance Level ................................................................................... 77 Figure 81 Lutron Shade Hot Clear Day Matrix......................................................................... 79 Figure 82 Lutron Shade Hot Overcast Day Matrix .................................................................. 79 Figure 83 Lutron Shade Moderate Clear Day Matrix ............................................................. 80 Figure 84 Lutron Shade Overcast Day Matrix ......................................................................... 81 Figure 85 Lutron Shade Cold Clear Day Matrix ...................................................................... 81 Figure 86 Lutron Shade Cold Overcast Day Matrix ............................................................... 82 Figure 87 Retrosolar Blinds Hot Clear Day Matrix .................................................................... 83 Figure 88 Retrosolar Blinds Hot Overcast Day Matrix ............................................................. 84 Figure 89 Retrosolar Blinds Moderate Clear Day Matrix ........................................................ 84 Figure 90 Retrosolar Blinds Moderate Overcast Day Matrix ................................................. 85 Figure 91 Retrosolar Blinds Cold Clear Day Matrix ................................................................. 86 Figure 92 Retrosolar Blinds Cold Overcast Day Matrix ........................................................... 86 Figure 93 Lutron Shade Flow Chart .......................................................................................... 87 Figure 94 Retrosolar Blinds Flow Chart ..................................................................................... 88 Figure 95 Example of thermal and lighting benefits using Lutron Shade ........................... 89
Page 5 of 132
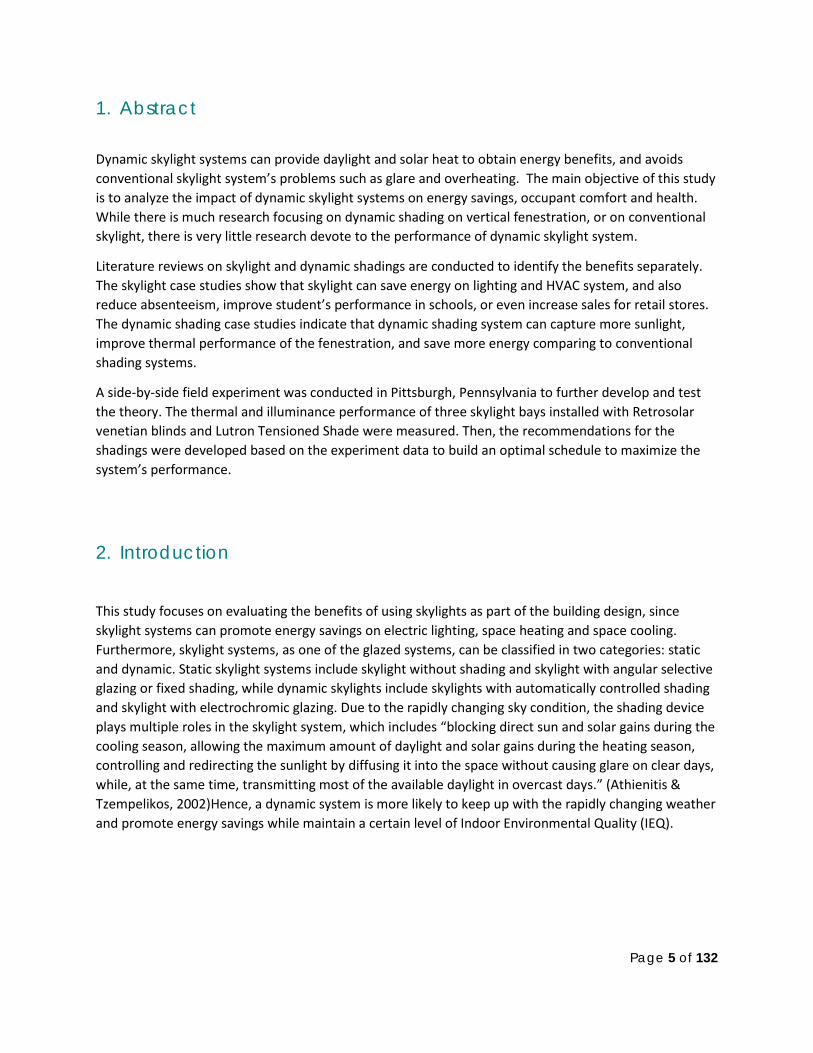
1. Abstract
Dynamic skylight systems can provide daylight and solar heat to obtain energy benefits, and avoids conventional skylight system’s problems such as glare and overheating. The main objective of this study is to analyze the impact of dynamic skylight systems on energy savings, occupant comfort and health. While there is much research focusing on dynamic shading on vertical fenestration, or on conventional skylight, there is very little research devote to the performance of dynamic skylight system.
Literature reviews on skylight and dynamic shadings are conducted to identify the benefits separately. The skylight case studies show that skylight can save energy on lighting and HVAC system, and also reduce absenteeism, improve student’s performance in schools, or even increase sales for retail stores. The dynamic shading case studies indicate that dynamic shading system can capture more sunlight, improve thermal performance of the fenestration, and save more energy comparing to conventional shading systems.
A side-by-side field experiment was conducted in Pittsburgh, Pennsylvania to further develop and test the theory. The thermal and illuminance performance of three skylight bays installed with Retrosolar venetian blinds and Lutron Tensioned Shade were measured. Then, the recommendations for the shadings were developed based on the experiment data to build an optimal schedule to maximize the system’s performance.
2. Introduction
This study focuses on evaluating the benefits of using skylights as part of the building design, since skylight systems can promote energy savings on electric lighting, space heating and space cooling. Furthermore, skylight systems, as one of the glazed systems, can be classified in two categories: static and dynamic. Static skylight systems include skylight without shading and skylight with angular selective glazing or fixed shading, while dynamic skylights include skylights with automatically controlled shading and skylight with electrochromic glazing. Due to the rapidly changing sky condition, the shading device plays multiple roles in the skylight system, which includes “blocking direct sun and solar gains during the cooling season, allowing the maximum amount of daylight and solar gains during the heating season, controlling and redirecting the sunlight by diffusing it into the space without causing glare on clear days, while, at the same time, transmitting most of the available daylight in overcast days.” (Athienitis & Tzempelikos, 2002)Hence, a dynamic system is more likely to keep up with the rapidly changing weather and promote energy savings while maintain a certain level of Indoor Environmental Quality (IEQ).
Page 6 of 132
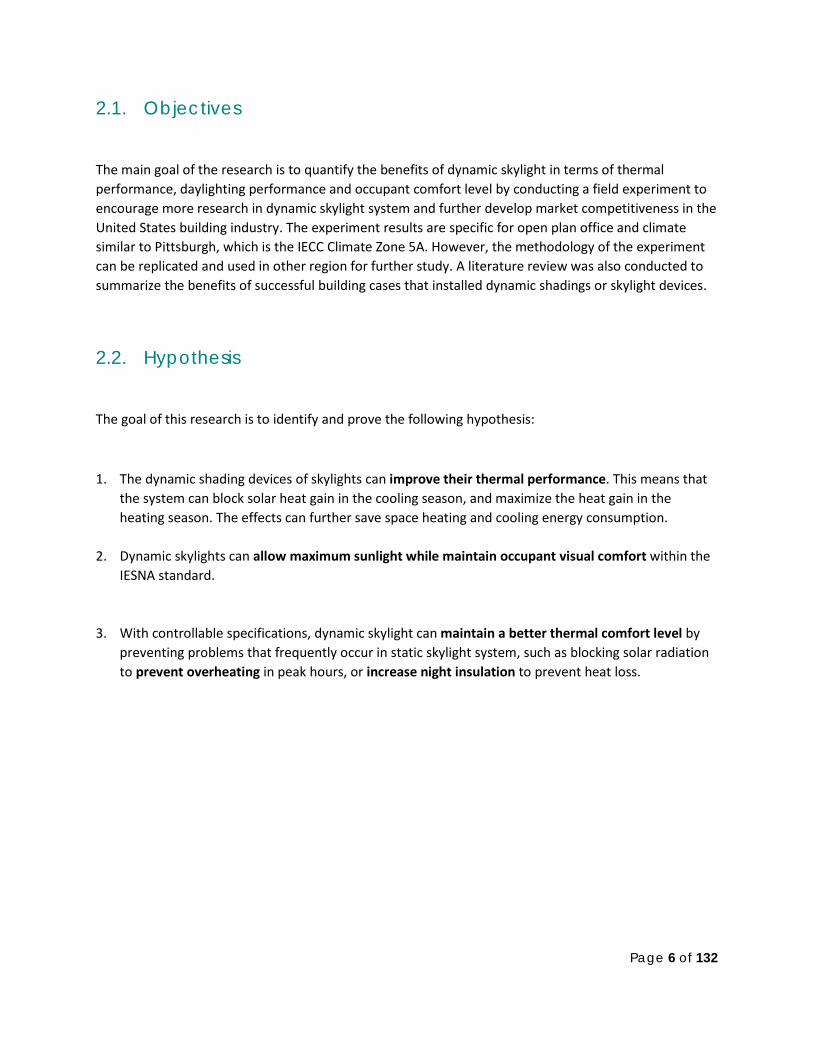
2.1. Objectives
The main goal of the research is to quantify the benefits of dynamic skylight in terms of thermal performance, daylighting performance and occupant comfort level by conducting a field experiment to encourage more research in dynamic skylight system and further develop market competitiveness in the United States building industry. The experiment results are specific for open plan office and climate similar to Pittsburgh, which is the IECC Climate Zone 5A. However, the methodology of the experiment can be replicated and used in other region for further study. A literature review was also conducted to summarize the benefits of successful building cases that installed dynamic shadings or skylight devices.
2.2. Hypothesis
The goal of this research is to identify and prove the following hypothesis:
1. The dynamic shading devices of skylights can improve their thermal performance. This means that the system can block solar heat gain in the cooling season, and maximize the heat gain in the heating season. The effects can further save space heating and cooling energy consumption.
2. Dynamic skylights can allow maximum sunlight while maintain occupant visual comfort within the IESNA standard.
3. With controllable specifications, dynamic skylight can maintain a better thermal comfort level by preventing problems that frequently occur in static skylight system, such as blocking solar radiation to prevent overheating in peak hours, or increase night insulation to prevent heat loss.
Page 7 of 132
2.3. Methodology
In this research report, a literature review, and a field experiment were conducted to investigate the performance of dynamic skylight systems.
Skylight & Dynamic Shading Case Studies
Several case studies were performed to identify the benefits in terms of energy savings, occupant productivity increase, and even the sales improvement in retail stores. Because there are few studies conducted focusing on dynamic skylight, the case studies focused on two areas, conventional skylights (static skylights) and dynamic shadings, in order to know the benefits of installing skylights and whether dynamic shadings can add more benefits to the skylight systems.
Dynamic Skylight Field Experiment
A skylight experiment is conducted in the Robert l. Preger Intelligent Workplace (IW) in Carnegie Mellon University (CMU). The goal is to develop dynamic shading control strategies to obtain the optimal performance. Three skylight cases were set up and their temperature, humidity, and light level were measured. Temperature, thermal comfort, daylighting, glare analysis were conducted. Finally, the control decision flow charts were developed based on the results of the analysis. (Pei, 2013)
3. Background of U.S. energy consumption
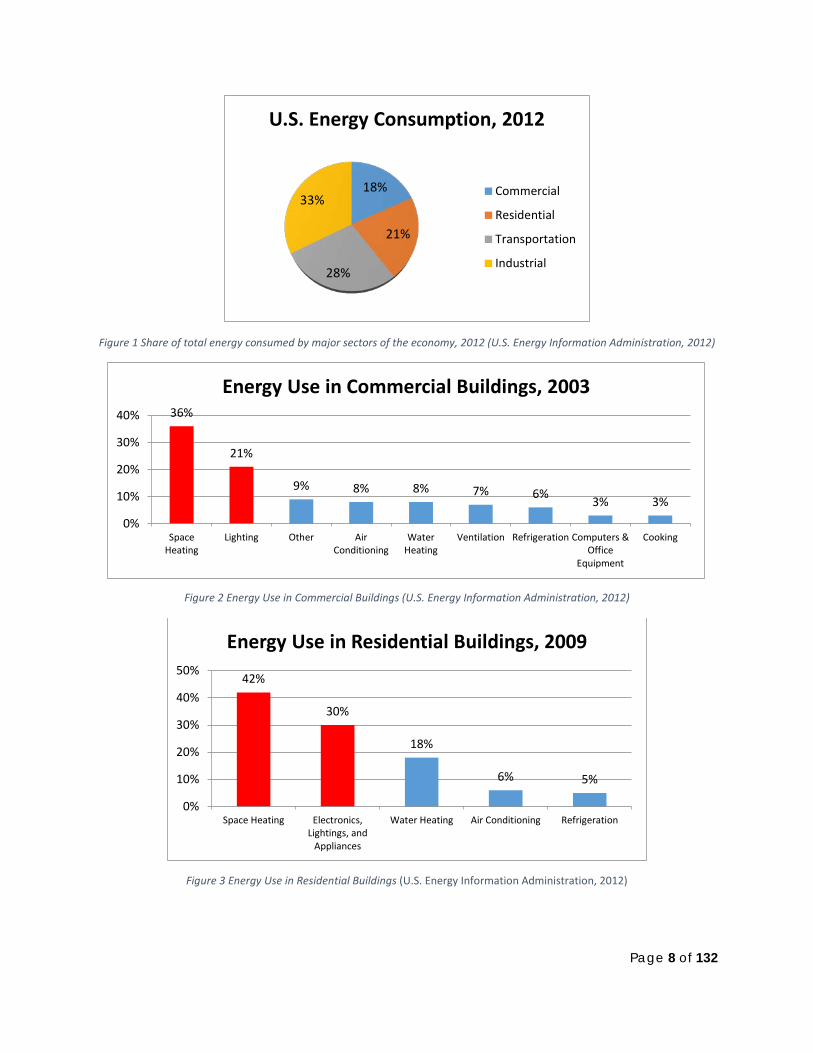
Based on the estimation from the U.S. Energy Information Administration (EIA), building (residential and commercial) energy consumption is responsible for 39% of the total energy consumption in the United States. The residential buildings refer to buildings for residential purposes, which includes homes and apartments, while commercial buildings are buildings that are used for commercial use, which consist of offices, malls, stores, schools, hospitals, hotels, warehouses, restaurants, places of worship, and more. (U.S. Energy Information Administration, 2012) The energy consumption due to buildings is much higher than transportation (28%) and industry (32%), and it is expected to grow faster than the other two sectors in the future. (U.S. Energy Information Administration, 2009) In both residential and commercial building sectors, the top two energy uses are for space heating and electric lighting. They are responsible for 42% and 30% of the total energy consumption in the residential sector, and 36% and 21% in the commercial sector.
Page 8 of 132
Figure 1 Share of total energy consumed by major sectors of the economy, 2012 (U.S. Energy Information Administration, 2012)
Figure 2 Energy Use in Commercial Buildings (U.S. Energy Information Administration, 2012)
Figure 3 Energy Use in Residential Buildings (U.S. Energy Information Administration, 2012)
18%
21%
28%
33%
U.S. Energy Consumption, 2012
Commercial
Residential
Transportation
Industrial
36%
21%
9% 8% 8% 7% 6% 3% 3%
0%
10%
20%
30%
40%
SpaceHeating
Lighting Other AirConditioning
WaterHeating
Ventilation Refrigeration Computers &Office
Equipment
Cooking
Energy Use in Commercial Buildings, 2003
42%
30%
18%
6% 5%
0%
10%
20%
30%
40%
50%
Space Heating Electronics,Lightings, and
Appliances
Water Heating Air Conditioning Refrigeration
Energy Use in Residential Buildings, 2009
Page 9 of 132
4. Literature Review 4.1. Skylight Case Studies
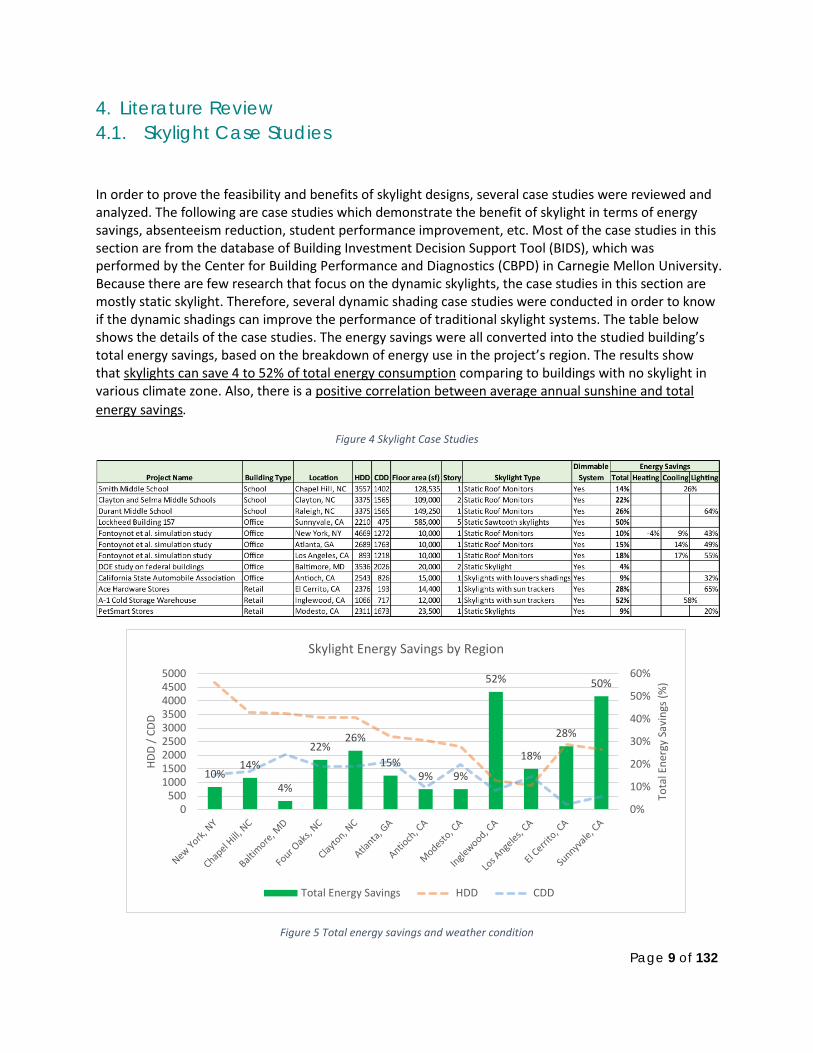
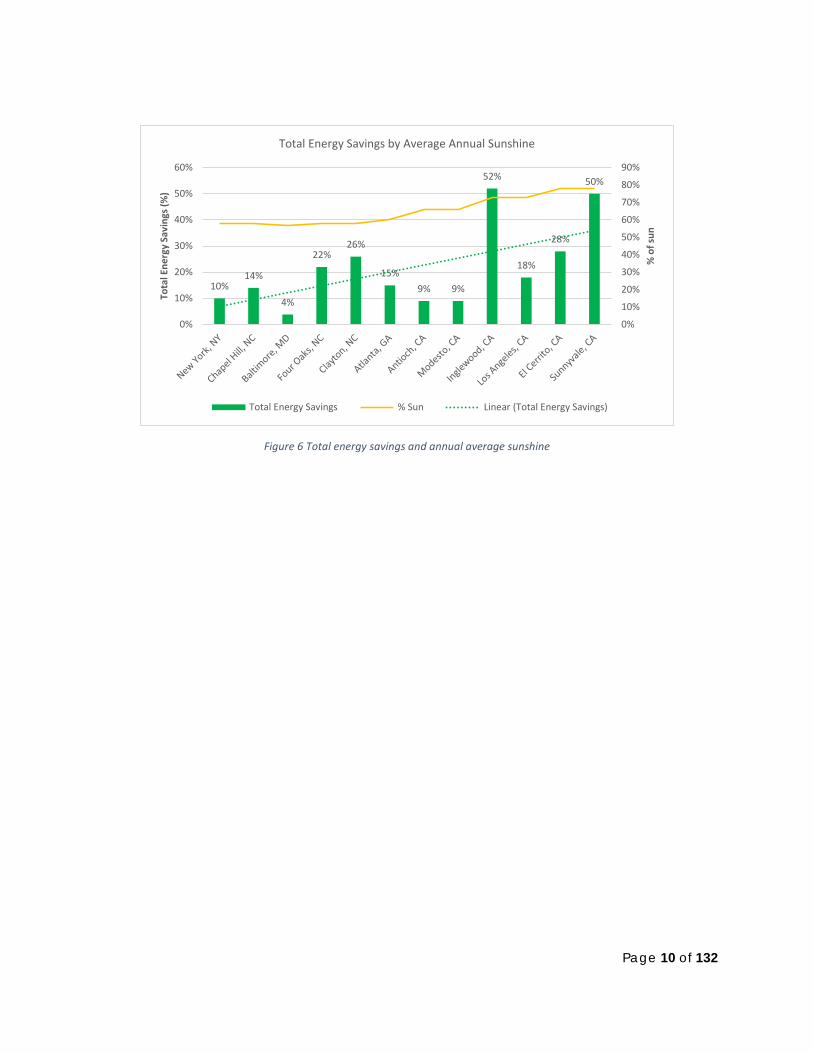
In order to prove the feasibility and benefits of skylight designs, several case studies were reviewed and analyzed. The following are case studies which demonstrate the benefit of skylight in terms of energy savings, absenteeism reduction, student performance improvement, etc. Most of the case studies in this section are from the database of Building Investment Decision Support Tool (BIDS), which was performed by the Center for Building Performance and Diagnostics (CBPD) in Carnegie Mellon University. Because there are few research that focus on the dynamic skylights, the case studies in this section are mostly static skylight. Therefore, several dynamic shading case studies were conducted in order to know if the dynamic shadings can improve the performance of traditional skylight systems. The table below shows the details of the case studies. The energy savings were all converted into the studied building’s total energy savings, based on the breakdown of energy use in the project’s region. The results show that skylights can save 4 to 52% of total energy consumption comparing to buildings with no skylight in various climate zone. Also, there is a positive correlation between average annual sunshine and total energy savings.
Figure 4 Skylight Case Studies
Figure 5 Total energy savings and weather condition
10% 14%
4%
22% 26%
15% 9% 9%
52%
18%
28%
50%
0%
10%
20%
30%
40%
50%
60%
0500
100015002000250030003500400045005000
Tota
l Ene
rgy
Savi
ngs (
%)
HDD
/ CDD
Skylight Energy Savings by Region
Total Energy Savings HDD CDD
Page 10 of 132
Figure 6 Total energy savings and annual average sunshine
10% 14%
4%
22% 26%
15% 9% 9%
52%
18%
28%
50%
0%
10%
20%
30%
40%
50%
60%
70%
80%
90%
0%
10%
20%
30%
40%
50%
60%
% o
f sun
Tota
l Ene
rgy
Savi
ngs (
%)
Total Energy Savings by Average Annual Sunshine
Total Energy Savings % Sun Linear (Total Energy Savings)

Page 11 of 132
Lockheed 157 (Thayer, 1995)
Built year: 1983
Background:
The office of Lockheed Martin in Sunnyvale is a five-story, 585,000 sf building with daylighting strategies. The building minimized the area of glazing in the west and east. There are two separate office area in each floor facing south and north. Between the office spaces is an 18,000 sf atrium from the ground floor to the roof in the middle of the building. The daylighting for office spaces is provided by the glazing on the north and south façade, and the skylight of the atrium. Also, both exterior and interior (atrium) façades have installed light shelves which enable the daylight to reach deeper into the office area. (Thayer, 1995)
Skylight Type:
4 rows of sawtooth shaped skylight with vertical north-facing clear glass and sloped south-facing diffusing glass.
Daylighting Strategies:
• 12 ft. interior light shelves and 4 ft. exterior light shelves (south). • Dimmable fluorescent lighting integrated with daylighting sensors. • Indirect lighting fixtures.
Benefits:
• Reduced 15% of absenteeism (originally 7%). • Saved $500,000 overall energy bill per year.
Page 12 of 132
K-5 Four Oaks Elementary School (Nicklas & Bailey, 1996)
Built Year: 1990
Background:
In 1988, the K-5 Four Oaks Elementary School in Johnston County, North Carolina was destroyed by fire. Only the school’s gym and cafeteria escaped the fire. A new 148,500 sf daylit school was built and the existing gym and cafeteria were renovated in 1990. The daylighting features allowed sunlight enter major occupied spaces, and were designed to provide over 70 foot-candles of daylight, over two-third of the school time. (Nicklas & Bailey, 1996)
Skylight Type:
South-facing roof monitors with suspended translucent fabric baffles to reduce glare.
Daylighting Strategies:
• Dimmable back-up lighting integrated with daylighting sensors.
Benefits:
• Improved 3% of average student CAT score from old school to new daylit school. • Saved 60% of overall energy consumption comparing to non-daylit school in Johnston County.
Clayton and Selma Middle School (Nicklas & Bailey, 1996)
Built Year: both 1993
Background:
Both the Clayton and Selma Middle School were located in Johnston County, North Carolina and have daylighting design strategies similar to the Four Oaks Elementary School. The daylighting features allowed sunlight enter major occupied spaces, and were designed to provide over 70 foot-candles of daylight, over two-third of the school time.
Skylight Type:
South-facing roof monitors with suspended translucent fabric baffles to reduce glare.
Daylighting Strategies:
• Dimmable back-up lighting integrated with daylighting sensors.
Benefits:
• Improved 5.5% of average student CAT score comparing to non-daylit school in Johnston County. • Saved 22% of overall energy consumption comparing to non-daylit school in Johnston County.

Page 13 of 132
Durant Road Middle School (Nicklas & Bailey, 1996)
Built Year: 1995
Background:
The 149,250 sf Durant Road Middle School is located in the Wake County, North Carolina. The school building is rectangular on east-west axis. The school has both north-facing and south-facing roof monitors for different functions. (Nicklas & Bailey, 1996)
Skylight Type:
South-facing and north-facing roof monitors with suspended translucent fabric baffles to reduce glare.
Daylighting Strategies:
• Dimmable lighting integrated with daylighting sensors and occupancy sensors. • Low-e windows on north and south façade. • 30% more glazing comparing to non-daylit, code-compliant school.
Benefits:
• Downsize and reduce the mechanical and electrical equipment cost by $115,000. • Saved 64% of lighting energy consumption comparing to code compliant school (Simulation
result).
Smith Middle School (Lighting Research Center, Rensselaer Polytechnic Institute, 2004)
Built Year: 2001
Background:
The 128,535 sf Smith Middle School is located in Chapel Hill, North Carolina. The school building is rectangular on east-west axis with roof monitors on top.
Figure 7 Smith Middle School (VirginiaTech, 2014)
Page 14 of 132
Skylight Type:
Fire-retardant, UV-resistant, south-facing roof monitors with suspended cloth baffles to reduce glare.
Daylighting Strategies:
• Dimmable lighting integrated with daylighting sensors and passive infrared and ultrasonic occupancy sensors.
• Recessed double low-e windows on the facades. • Anodized aluminum light shelves. • 30% more glazing comparing to non-daylit, code-compliant school. • White roofing membrane which reflects the sunlight to the roof monitors.
Benefits:
• Downsize the cooling system by 78 tons (19%) and reduce the equipment cost. • Saved 26% of electric energy consumption (Cooling + Lighting) comparing to code compliant
school (Simulation result).
Simulation study on Los Angeles, Atlanta, and New York (Fontoynot M., 1984)
Built Year: N/A
Background:
The simulation study was based on a 10,000 sf single-story office building in Los Angeles, Atlanta or New York City climate. Fontoynot compared the energy performance in with and without daylighting design by using the BLAST program. The strategies included roof monitors, daylight dimming control. The study tested two lighting power density model, 2.5 W/sf and 1.5 W/sf.
Skylight Type:
South-facing roof monitors.
Daylighting Strategies:
• Dimmable lighting integrated with daylighting sensors.
Benefits:
• Reduce 48% of annual lighting energy in 1.5 W/sf building in average. • Reduce 49% of annual lighting energy and 13% cooling energy in 2.5 W/sf building in average.
Page 15 of 132
Simulation study on prototypical federal government buildings (U.S. DOE & FEMP, 2002)
Built Year: N/A
Background:
The simulation study was based on a 20,000 sf two-story federal office building in the Middle Atlantic region climate. The base case model is code compliant to ASHRAE 90.1-1999, and the strategies are focused on equipment improvement. The energy simulation and cost analysis is done by using DOE.2e.
Skylight Type:
General skylight.
Daylighting Strategies:
• Dimmable lighting integrated with daylighting sensors.
Benefits:
• Reduce 3.8% of electricity consumption.
California State Automobile Association (Daylighting Initiative, Pacific Gas and Electric Company, 1997)
Built Year: 1997
Background:
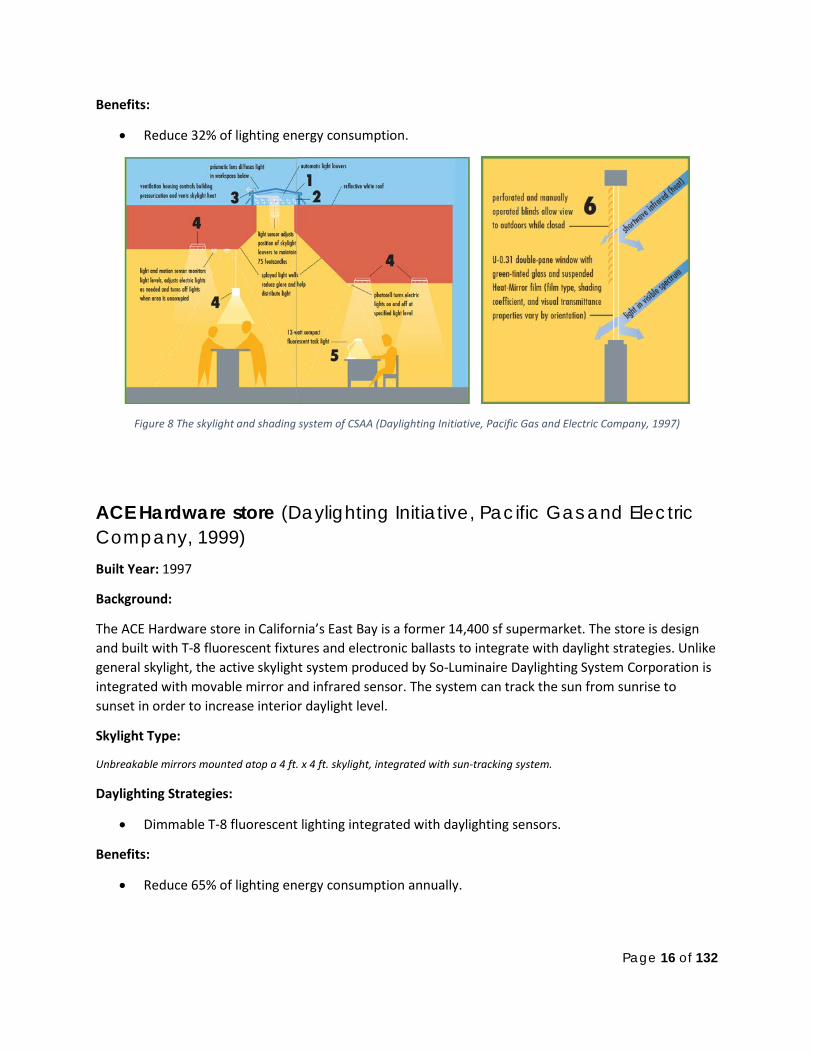
PG & E’s Daylighting Initiative had investigated the California State Automobile Association (CSAA) office in Antioch, CA. The office is 15,000 sf, single-story. The building is designed to gain daylight from perimeter windows and skylights. The skylight wells are 5 feet taller than the perimeter ceiling and are located every 20 feet in the office. The wells are also operable which allow ventilation to reduce heat gain from the skylight. The building also has dimmable lighting system which can reduce light power output from 100% to 20% and light input from 100% to 40%. 68% of the interior electric lighting is under the dimming control system. The energy savings are based on DOE2 energy simulation results.
Skylight Type:
Triple-pane, acrylic, low-glare skylight wells, with louvers integrated with light sensor.
Daylighting Strategies:
• Dimmable T-8 and compact fluorescent lighting integrated with daylighting sensors and occupancy sensors.
• Low-e, spectrally selective windows. • Fixed-pitch perforated window blinds.
Page 16 of 132
Benefits:
• Reduce 32% of lighting energy consumption.
Figure 8 The skylight and shading system of CSAA (Daylighting Initiative, Pacific Gas and Electric Company, 1997)
ACE Hardware store (Daylighting Initiative, Pacific Gas and Electric Company, 1999)
Built Year: 1997
Background:
The ACE Hardware store in California’s East Bay is a former 14,400 sf supermarket. The store is design and built with T-8 fluorescent fixtures and electronic ballasts to integrate with daylight strategies. Unlike general skylight, the active skylight system produced by So-Luminaire Daylighting System Corporation is integrated with movable mirror and infrared sensor. The system can track the sun from sunrise to sunset in order to increase interior daylight level.
Skylight Type:
Unbreakable mirrors mounted atop a 4 ft. x 4 ft. skylight, integrated with sun-tracking system.
Daylighting Strategies:
• Dimmable T-8 fluorescent lighting integrated with daylighting sensors.
Benefits:
• Reduce 65% of lighting energy consumption annually.
Page 17 of 132
Multiple retail stores (Heschong, 2002)
Built Year: 1999
Background:
The study is focusing on the relationship between the use of skylight and retail sales. The 108 retail stores are all owned by the same retailer, the interiors are similar in all the stores. Two-third of the retail stores installed skylights and the other one-third have no skylight. The skylights are integrated with dimmable electric lighting system, and the daylight is diffused to make the indoor area evenly illuminated. The study has conducted statistical analysis and revealed 5 factors which will affect the retail sales. The factors include presence of skylights, open hours, population in the area, average income in the neighborhood, and the year since the store was remodeled. The skylight factor has the strongest effect among all (p=0.000).
Skylight Type:
General skylight.
Daylighting Strategies:
• Dimmable electric lighting integrated with daylighting sensors.
Benefits:
• Increase 40% of sales in average, with range from 31% to 49%.
A-1 Cold Storage Warehouse (Ciralight)
Background:
The 12,000 sf warehouse located in Inglewood, California is built in 2003. The exterior walls are 8 inch thick concrete with no windows. The indoor area is used as office spaces and warehousing. The warehouse renovation done by Ciralight has create indoor daylighting with illumination equivalent to 19,200 watts of fluorescent lights. The daylighting strategies are focused only on ceiling skylights, which save the cost of constructing vertical fenestrations.
Skylight Type:
24 SunTrackerOneTM. The three mirror skylight system is integrated with GPS device which will track the path of the sun and harvest the maximum sunlight to illuminate indoor spaces. The skylight system has a U-value of 0.35 and SHGC 0.3196.
Page 18 of 132
Figure 9 SunTrackerOne (Eco-$mart, Inc.)
Benefits:
• Save $1000 utility bills per month. The amount of electricity reduction is equivalent to 1.2 million ft3 of CO2 emission annually.
Bradley Auto Care Plaza (Ciralight)
Background:
The 20,000 sf auto repair shop in Sun City, California is renovated by Ciralight with SunTrackerOneTM skylight system which its performance is equivalent to 800 watts of metal halide lighting. The daylighting system allows the tenants to turn off electric lightings up to 10 hours per day. The system also helps the building to comply with Title 24 of the California Energy Code for commercial buildings.
Skylight Type:
SunTrackerOneTM.
Benefits:
• Increase leasing rate from $1.15 – $1.25 to $1.50 per square foot, which is equal to extra $60,000 for the developer annually.
Page 19 of 132
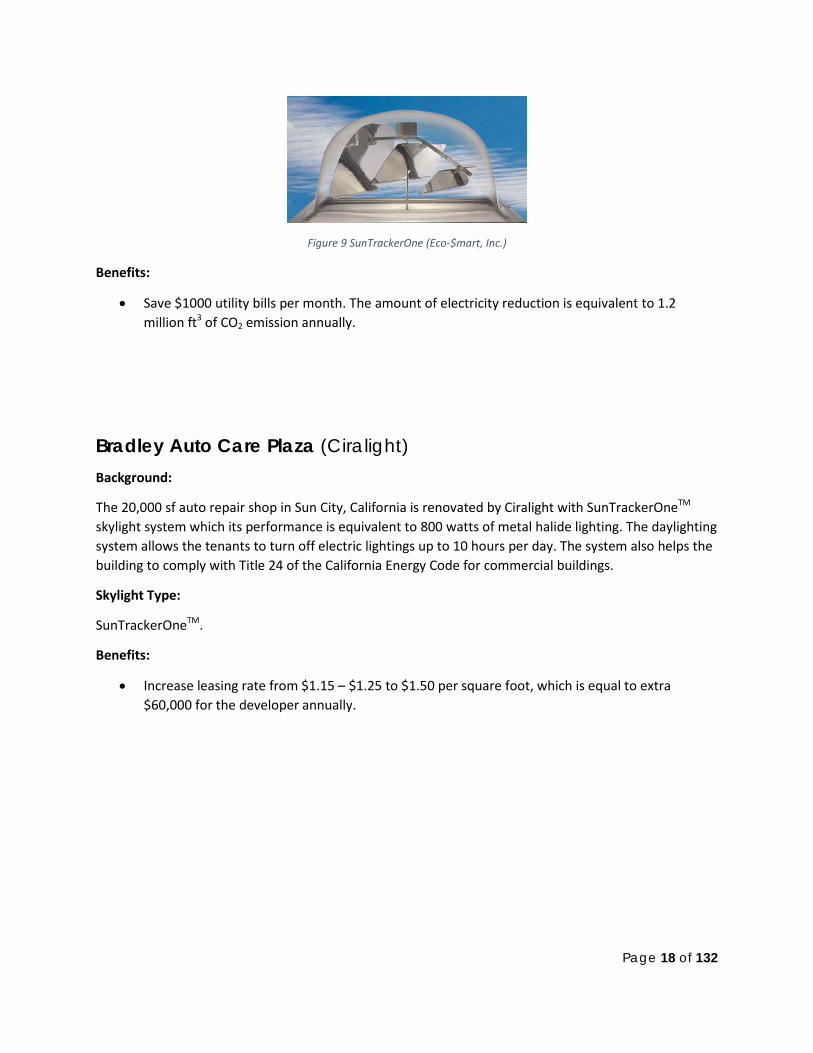
PetSmart Stores (Southern California Edison, 2008)
Built Year: 2008
Background:
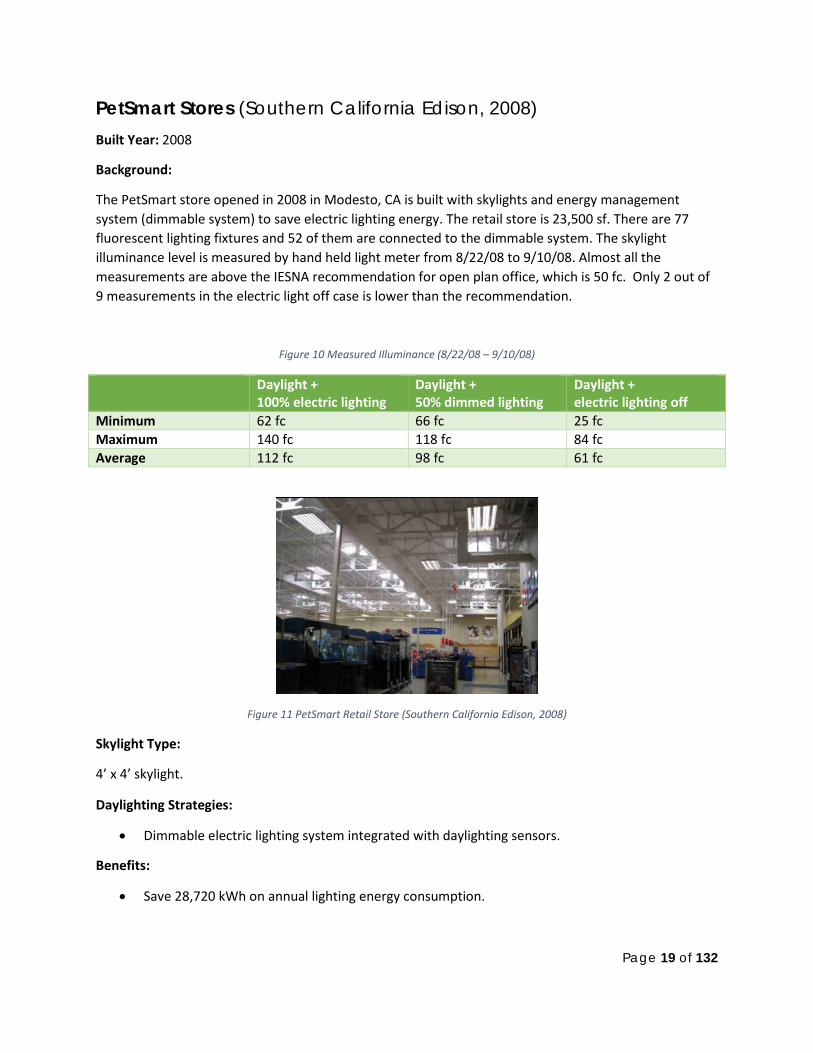
The PetSmart store opened in 2008 in Modesto, CA is built with skylights and energy management system (dimmable system) to save electric lighting energy. The retail store is 23,500 sf. There are 77 fluorescent lighting fixtures and 52 of them are connected to the dimmable system. The skylight illuminance level is measured by hand held light meter from 8/22/08 to 9/10/08. Almost all the measurements are above the IESNA recommendation for open plan office, which is 50 fc. Only 2 out of 9 measurements in the electric light off case is lower than the recommendation.
Figure 10 Measured Illuminance (8/22/08 – 9/10/08)
Daylight + 100% electric lighting
Daylight + 50% dimmed lighting
Daylight + electric lighting off
Minimum 62 fc 66 fc 25 fc Maximum 140 fc 118 fc 84 fc Average 112 fc 98 fc 61 fc
Figure 11 PetSmart Retail Store (Southern California Edison, 2008)
Skylight Type:
4’ x 4’ skylight.
Daylighting Strategies:
• Dimmable electric lighting system integrated with daylighting sensors.
Benefits:
• Save 28,720 kWh on annual lighting energy consumption.
Page 20 of 132
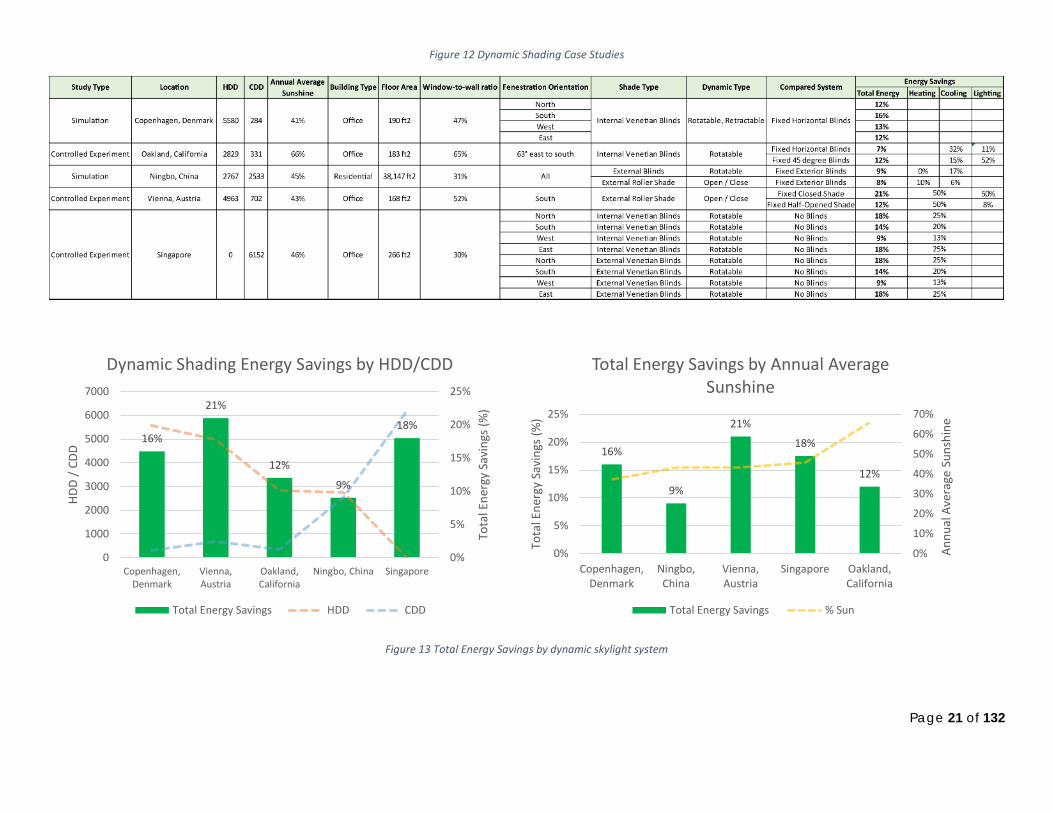
4.2. Dynamic Shading Case Studies To verify whether the dynamic skylight systems are a better sustainable solutions than static skylight, the following case studies are conducted. The case studies are mainly focusing on comparing the dynamic shading system with static shading. The results show that dynamic shadings can reduce 9 to 21% of total energy consumption comparing to static shadings. The energy savings results are all converted into total energy savings percentage based on the breakdown data of energy use in each project region.
Page 21 of 132
Figure 12 Dynamic Shading Case Studies
Figure 13 Total Energy Savings by dynamic skylight system
16%
21%
12%
9%
18%
0%
5%
10%
15%
20%
25%
0
1000
2000
3000
4000
5000
6000
7000
Copenhagen,Denmark
Vienna,Austria
Oakland,California
Ningbo, China Singapore
Tota
l Ene
rgy
Savi
ngs (
%)
HDD
/ CDD
Dynamic Shading Energy Savings by HDD/CDD
Total Energy Savings HDD CDD
16%
9%
21%
18%
12%
0%
10%
20%
30%
40%
50%
60%
70%
0%
5%
10%
15%
20%
25%
Copenhagen,Denmark
Ningbo,China
Vienna,Austria
Singapore Oakland,California
Annu
al A
vera
ge S
unsh
ine
Tota
l Ene
rgy
Savi
ngs (
%)
Total Energy Savings by Annual Average Sunshine
Total Energy Savings % Sun
Page 22 of 132
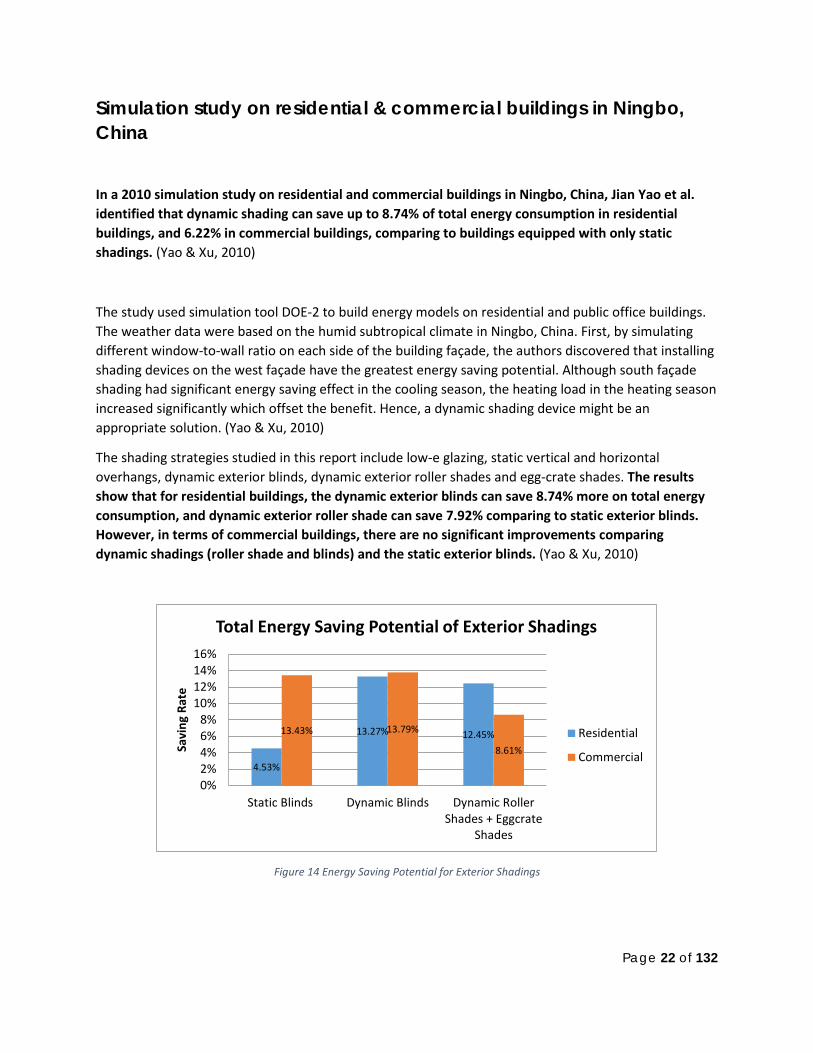
Simulation study on residential & commercial buildings in Ningbo, China
In a 2010 simulation study on residential and commercial buildings in Ningbo, China, Jian Yao et al. identified that dynamic shading can save up to 8.74% of total energy consumption in residential buildings, and 6.22% in commercial buildings, comparing to buildings equipped with only static shadings. (Yao & Xu, 2010)
The study used simulation tool DOE-2 to build energy models on residential and public office buildings. The weather data were based on the humid subtropical climate in Ningbo, China. First, by simulating different window-to-wall ratio on each side of the building façade, the authors discovered that installing shading devices on the west façade have the greatest energy saving potential. Although south façade shading had significant energy saving effect in the cooling season, the heating load in the heating season increased significantly which offset the benefit. Hence, a dynamic shading device might be an appropriate solution. (Yao & Xu, 2010)
The shading strategies studied in this report include low-e glazing, static vertical and horizontal overhangs, dynamic exterior blinds, dynamic exterior roller shades and egg-crate shades. The results show that for residential buildings, the dynamic exterior blinds can save 8.74% more on total energy consumption, and dynamic exterior roller shade can save 7.92% comparing to static exterior blinds. However, in terms of commercial buildings, there are no significant improvements comparing dynamic shadings (roller shade and blinds) and the static exterior blinds. (Yao & Xu, 2010)
Figure 14 Energy Saving Potential for Exterior Shadings
4.53%
13.27% 12.45% 13.43% 13.79%
8.61%
0%2%4%6%8%
10%12%14%16%
Static Blinds Dynamic Blinds Dynamic RollerShades + Eggcrate
Shades
Savi
ng R
ate
Total Energy Saving Potential of Exterior Shadings
Residential
Commercial
Page 23 of 132
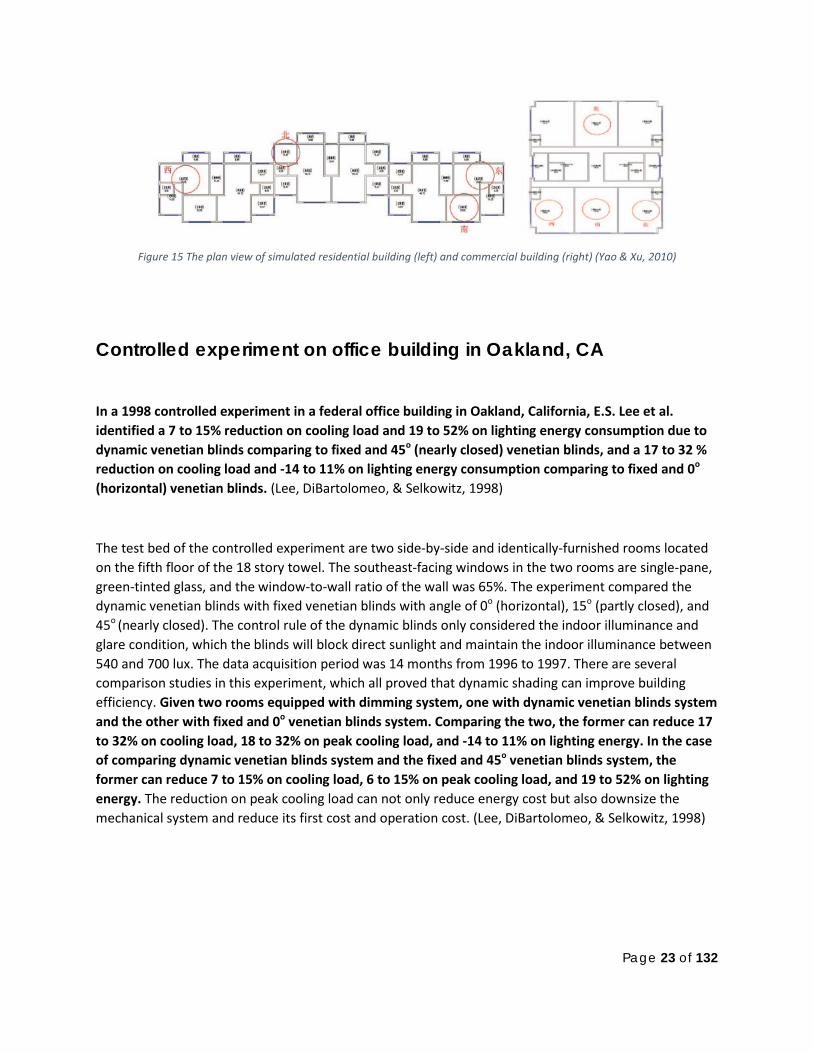
Figure 15 The plan view of simulated residential building (left) and commercial building (right) (Yao & Xu, 2010)
Controlled experiment on office building in Oakland, CA
In a 1998 controlled experiment in a federal office building in Oakland, California, E.S. Lee et al. identified a 7 to 15% reduction on cooling load and 19 to 52% on lighting energy consumption due to dynamic venetian blinds comparing to fixed and 45o (nearly closed) venetian blinds, and a 17 to 32 % reduction on cooling load and -14 to 11% on lighting energy consumption comparing to fixed and 0o (horizontal) venetian blinds. (Lee, DiBartolomeo, & Selkowitz, 1998)
The test bed of the controlled experiment are two side-by-side and identically-furnished rooms located on the fifth floor of the 18 story towel. The southeast-facing windows in the two rooms are single-pane, green-tinted glass, and the window-to-wall ratio of the wall was 65%. The experiment compared the dynamic venetian blinds with fixed venetian blinds with angle of 0o (horizontal), 15o (partly closed), and 45o (nearly closed). The control rule of the dynamic blinds only considered the indoor illuminance and glare condition, which the blinds will block direct sunlight and maintain the indoor illuminance between 540 and 700 lux. The data acquisition period was 14 months from 1996 to 1997. There are several comparison studies in this experiment, which all proved that dynamic shading can improve building efficiency. Given two rooms equipped with dimming system, one with dynamic venetian blinds system and the other with fixed and 0o venetian blinds system. Comparing the two, the former can reduce 17 to 32% on cooling load, 18 to 32% on peak cooling load, and -14 to 11% on lighting energy. In the case of comparing dynamic venetian blinds system and the fixed and 45o venetian blinds system, the former can reduce 7 to 15% on cooling load, 6 to 15% on peak cooling load, and 19 to 52% on lighting energy. The reduction on peak cooling load can not only reduce energy cost but also downsize the mechanical system and reduce its first cost and operation cost. (Lee, DiBartolomeo, & Selkowitz, 1998)
Page 24 of 132
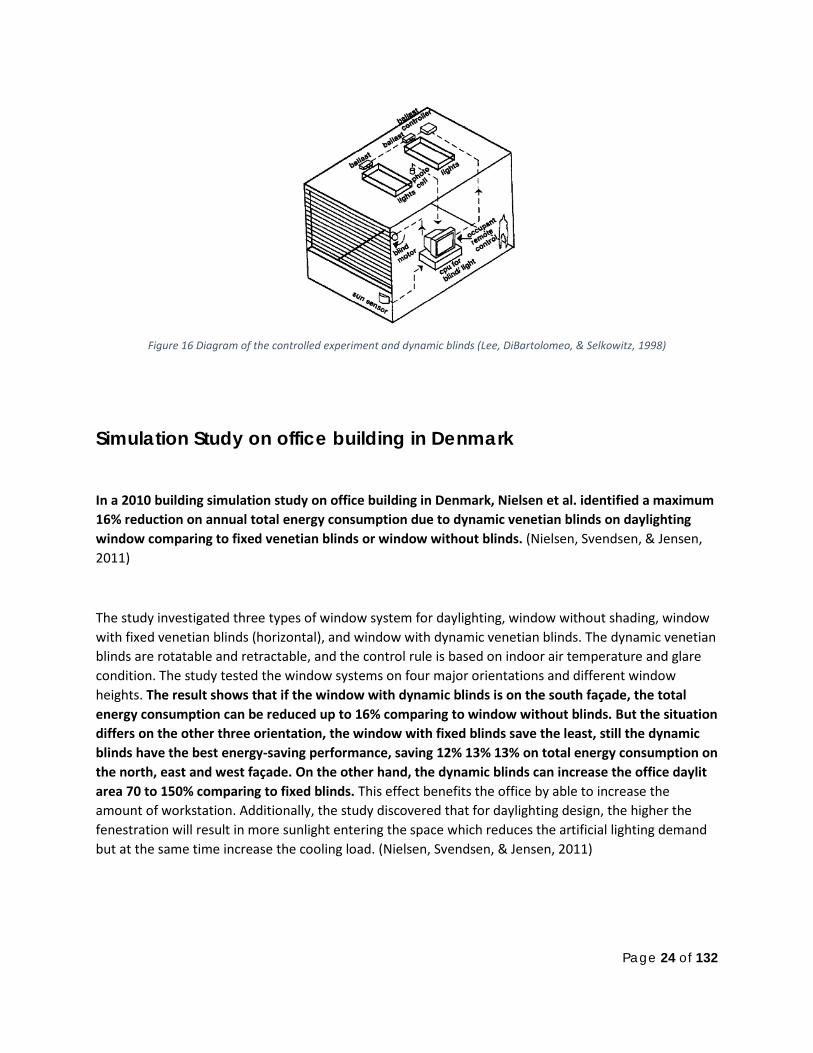
Figure 16 Diagram of the controlled experiment and dynamic blinds (Lee, DiBartolomeo, & Selkowitz, 1998)
Simulation Study on office building in Denmark
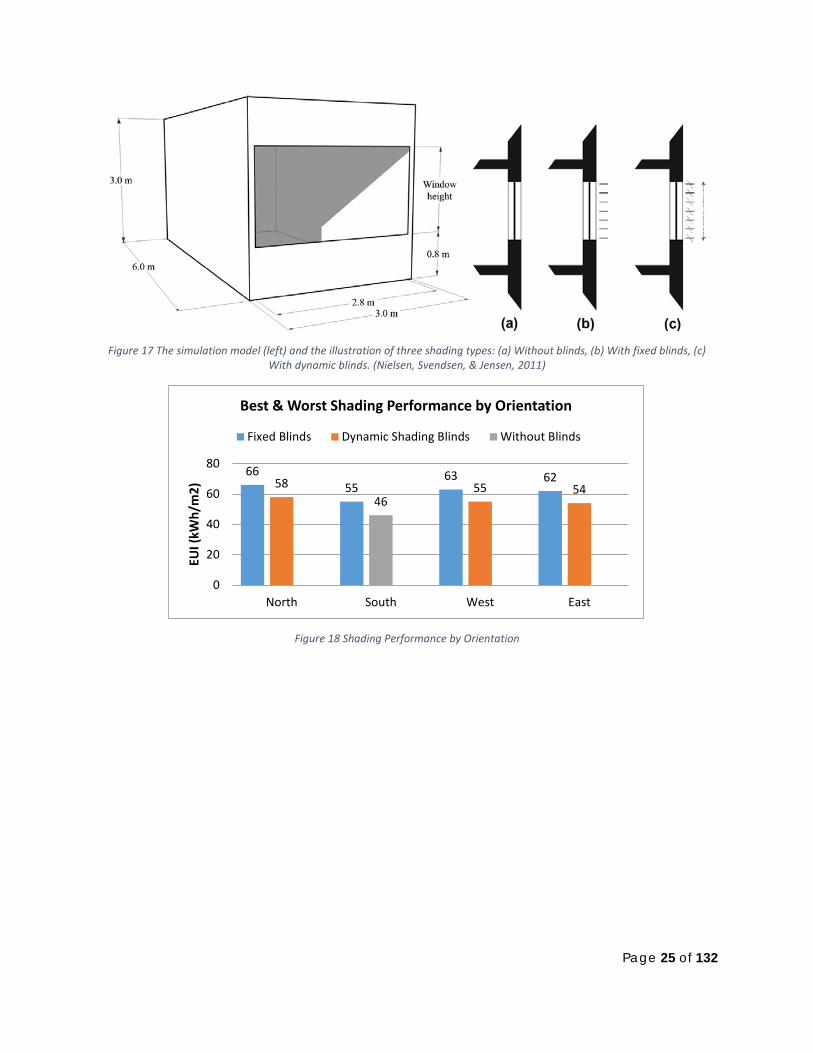
In a 2010 building simulation study on office building in Denmark, Nielsen et al. identified a maximum 16% reduction on annual total energy consumption due to dynamic venetian blinds on daylighting window comparing to fixed venetian blinds or window without blinds. (Nielsen, Svendsen, & Jensen, 2011)
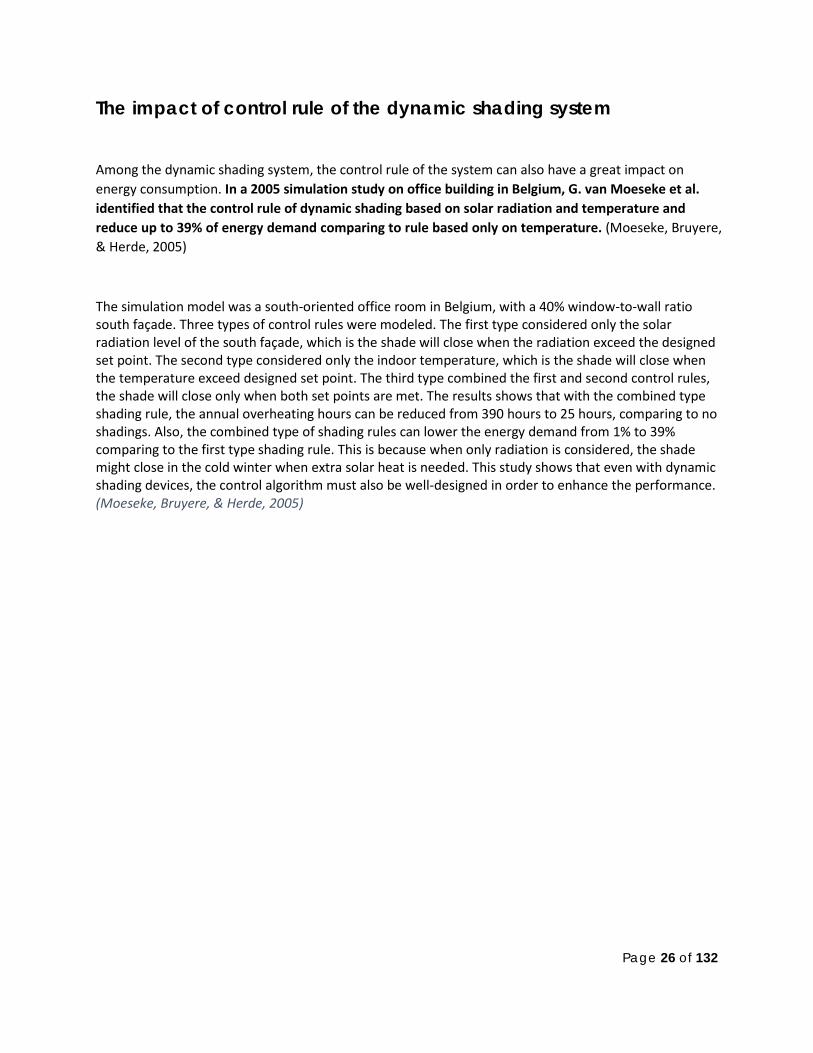
The study investigated three types of window system for daylighting, window without shading, window with fixed venetian blinds (horizontal), and window with dynamic venetian blinds. The dynamic venetian blinds are rotatable and retractable, and the control rule is based on indoor air temperature and glare condition. The study tested the window systems on four major orientations and different window heights. The result shows that if the window with dynamic blinds is on the south façade, the total energy consumption can be reduced up to 16% comparing to window without blinds. But the situation differs on the other three orientation, the window with fixed blinds save the least, still the dynamic blinds have the best energy-saving performance, saving 12% 13% 13% on total energy consumption on the north, east and west façade. On the other hand, the dynamic blinds can increase the office daylit area 70 to 150% comparing to fixed blinds. This effect benefits the office by able to increase the amount of workstation. Additionally, the study discovered that for daylighting design, the higher the fenestration will result in more sunlight entering the space which reduces the artificial lighting demand but at the same time increase the cooling load. (Nielsen, Svendsen, & Jensen, 2011)
Page 25 of 132
Figure 17 The simulation model (left) and the illustration of three shading types: (a) Without blinds, (b) With fixed blinds, (c)
With dynamic blinds. (Nielsen, Svendsen, & Jensen, 2011)
Figure 18 Shading Performance by Orientation
66 55
63 62 58 46
55 54
0
20
40
60
80
North South West East
EUI (
kWh/
m2)
Best & Worst Shading Performance by Orientation
Fixed Blinds Dynamic Shading Blinds Without Blinds
Page 26 of 132
The impact of control rule of the dynamic shading system
Among the dynamic shading system, the control rule of the system can also have a great impact on energy consumption. In a 2005 simulation study on office building in Belgium, G. van Moeseke et al. identified that the control rule of dynamic shading based on solar radiation and temperature and reduce up to 39% of energy demand comparing to rule based only on temperature. (Moeseke, Bruyere, & Herde, 2005)
The simulation model was a south-oriented office room in Belgium, with a 40% window-to-wall ratio south façade. Three types of control rules were modeled. The first type considered only the solar radiation level of the south façade, which is the shade will close when the radiation exceed the designed set point. The second type considered only the indoor temperature, which is the shade will close when the temperature exceed designed set point. The third type combined the first and second control rules, the shade will close only when both set points are met. The results shows that with the combined type shading rule, the annual overheating hours can be reduced from 390 hours to 25 hours, comparing to no shadings. Also, the combined type of shading rules can lower the energy demand from 1% to 39% comparing to the first type shading rule. This is because when only radiation is considered, the shade might close in the cold winter when extra solar heat is needed. This study shows that even with dynamic shading devices, the control algorithm must also be well-designed in order to enhance the performance. (Moeseke, Bruyere, & Herde, 2005)
Page 27 of 132
5. Dynamic Skylight Field Experiment 5.1. Experiment Objectives The main goal of the field experiment is to identify the indoor environmental quality (IEQ) improvements by using skylight and shading devices. Several previous case studies used simulation tools and discovered the energy savings of skylights and dynamic shading devices. However, there are few research investigate the occupant comfort level of the skylight area. The rapidly-changing sky condition might lead to problems such as glare or radiant temperature asymmetry, and make the occupants feel uncomfortable.
The field experiment was conducted over a period of ten months (October 2013 to July 2014) in a full-scale open plan office. Three types of skylight shading systems were set up to compare their performances. One of the three skylights are left unshaded as the baseline, while the other two skylights are shaded with Lutron Tensioned Shade and Retrosolar Venetian Blinds. Temperature, humidity, light level are measured and analyzed. In the first month (October 2013) of the experiment, the skylight with Retrosolar Blinds was originally shielded with Wizard Film Cling wall. Several analysis were conducted to achieve the following goals:
1. Increase occupant’s thermal comfort level. 2. Prevent excessive luminance ratio which can cause glare. 3. Reduce heat loss in the heating season and block unwanted solar heat in the cooling season to
lower the cooling and heating load. 4. Reduce light load by letting sunlight enter the indoor space.
The experiment is originally designed and setup by Zhengzhao Pei. (Pei, 2013)
5.2. Site Context The experiment site is in Pittsburgh, Pennsylvania. The city locates in a humid continental climate zone, and defined as climate zone 5A in the 2012 International Energy Conservation Code (IECC). This means that the area is humid and has an annual heating degree day between 7200 and 5400 in a 65 °F base. The data show that the city is in a heating dominant region, where the cooling load is relatively low.
The winter between 2013 and 2014 in Pittsburgh is recorded to be relatively longer than previous years. Hence, in this study, the period of heating season, cooling season and swing season is defined based on the monthly average temperature and cooling/heating degree days. The temperature data and results are shown below:
Page 28 of 132
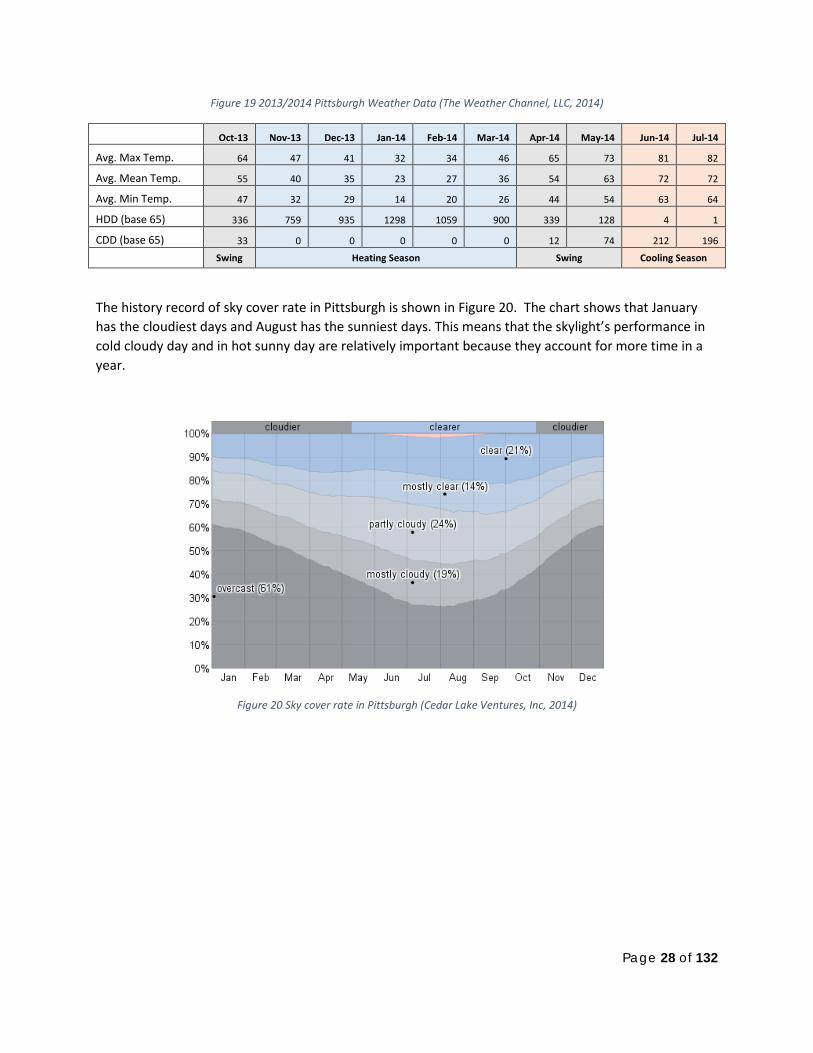
Figure 19 2013/2014 Pittsburgh Weather Data (The Weather Channel, LLC, 2014)
Oct-13 Nov-13 Dec-13 Jan-14 Feb-14 Mar-14 Apr-14 May-14 Jun-14 Jul-14
Avg. Max Temp. 64 47 41 32 34 46 65 73 81 82
Avg. Mean Temp. 55 40 35 23 27 36 54 63 72 72
Avg. Min Temp. 47 32 29 14 20 26 44 54 63 64
HDD (base 65) 336 759 935 1298 1059 900 339 128 4 1
CDD (base 65) 33 0 0 0 0 0 12 74 212 196
Swing Heating Season Swing Cooling Season
The history record of sky cover rate in Pittsburgh is shown in Figure 20. The chart shows that January has the cloudiest days and August has the sunniest days. This means that the skylight’s performance in cold cloudy day and in hot sunny day are relatively important because they account for more time in a year.
Figure 20 Sky cover rate in Pittsburgh (Cedar Lake Ventures, Inc, 2014)
Page 29 of 132
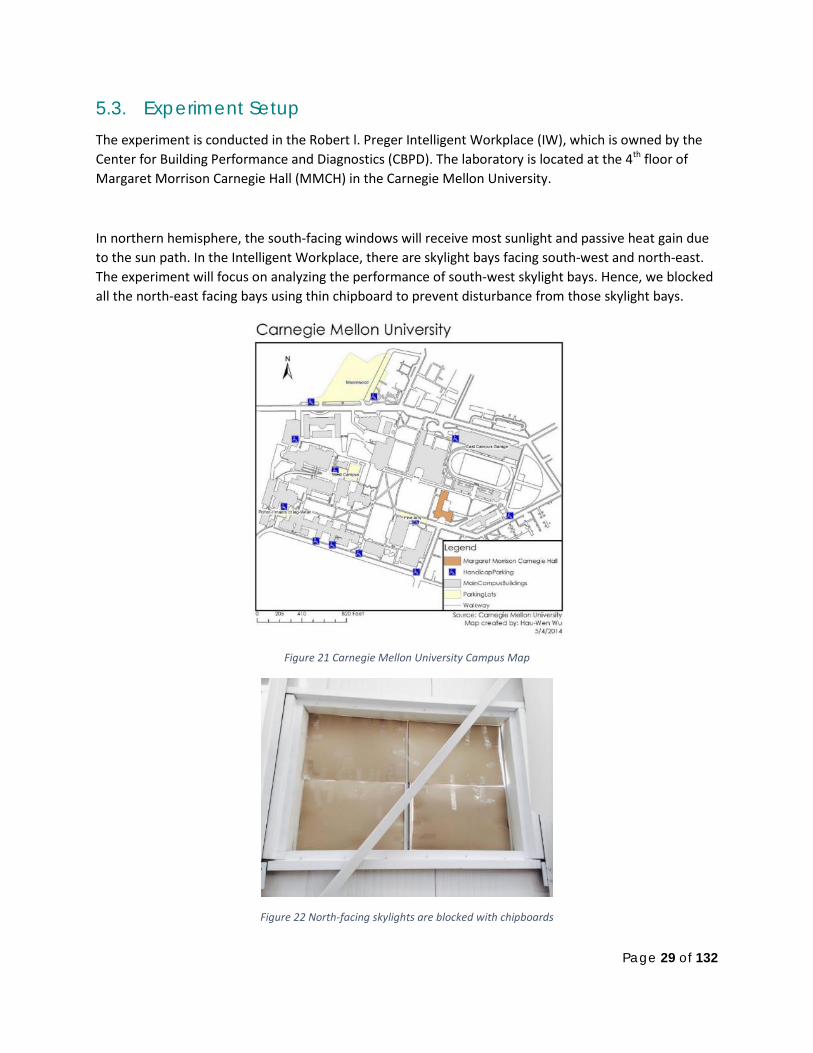
5.3. Experiment Setup The experiment is conducted in the Robert l. Preger Intelligent Workplace (IW), which is owned by the Center for Building Performance and Diagnostics (CBPD). The laboratory is located at the 4th floor of Margaret Morrison Carnegie Hall (MMCH) in the Carnegie Mellon University.
In northern hemisphere, the south-facing windows will receive most sunlight and passive heat gain due to the sun path. In the Intelligent Workplace, there are skylight bays facing south-west and north-east. The experiment will focus on analyzing the performance of south-west skylight bays. Hence, we blocked all the north-east facing bays using thin chipboard to prevent disturbance from those skylight bays.
Figure 21 Carnegie Mellon University Campus Map
Figure 22 North-facing skylights are blocked with chipboards

Page 30 of 132
Upper (Skylight) Level Setup
Three skylight shading systems were evaluated in this experiment. The baseline case is called “Base Case”, which is a static skylight system without shading. In all three skylight systems, the glasses are silk-screened with dot patterns. The glasses are fabricated by Viracon, a leading architectural glass fabricator. The silk screen allow the glasses to reduce glare and partially block the solar radiation from sun.
The second case, “Blinds”, is the silk-screening skylight covered with the Retrosolar Venetian Blinds. The blinds are pulled down in 90° position during the whole experiment period. This carefully designed, w-shaped blinds can reflect the unwanted high-angled sunlight (summer sun), and redirect the low-angled sunlight (winter sun) into the space for daylighting and solar heat gain. In this experiment, the Retrosolar Blinds are kept vertical to the glazing for the whole time.
The report made by Köster Lichtplanung has listed the characteristics of the blinds: (Köster Lichtplanung)
1. Minimal louver adjustment. 2. Very slim profile. 3. Optimized transmission. 4. Solar gain in winter.
The report also shows the specifications of Retrosolar Blinds. It is worth noting that the specifications are the combined effect of the skylight glazing and the blinds, the numbers shown here are the test results with skylight glass different from the Viracon glass. Hence, this table is presented only as a reference to show how much the blinds can improve the skylight performance.
Table 1 Retrosolar Blinds Specifications (Köster Lichtplanung)
Product Full Name RETROSolar RETROLux O SHGC (Glass 0.52) 0.13 SHGC (Glass 0.32) 0.10 VT 73%
The third case, “Shade”, is the silk-screening skylight covered with the Lutron Tensioned Shade. The shade is fully closed in the experiment. The Lutron Tensioned Shade is a roller shade specifically designed for skylights and tilted windows, the shade remains parallel to windows with minimal sag in various angles. There is also remote control that makes the adjustments more convenient. The system allows installation at angle between -135° and 135°.
Table 2 shows the specifications of Lutron Shade. Similarly, the numbers shown are the specifications of the shade plus a specific type of glass.
Page 31 of 132
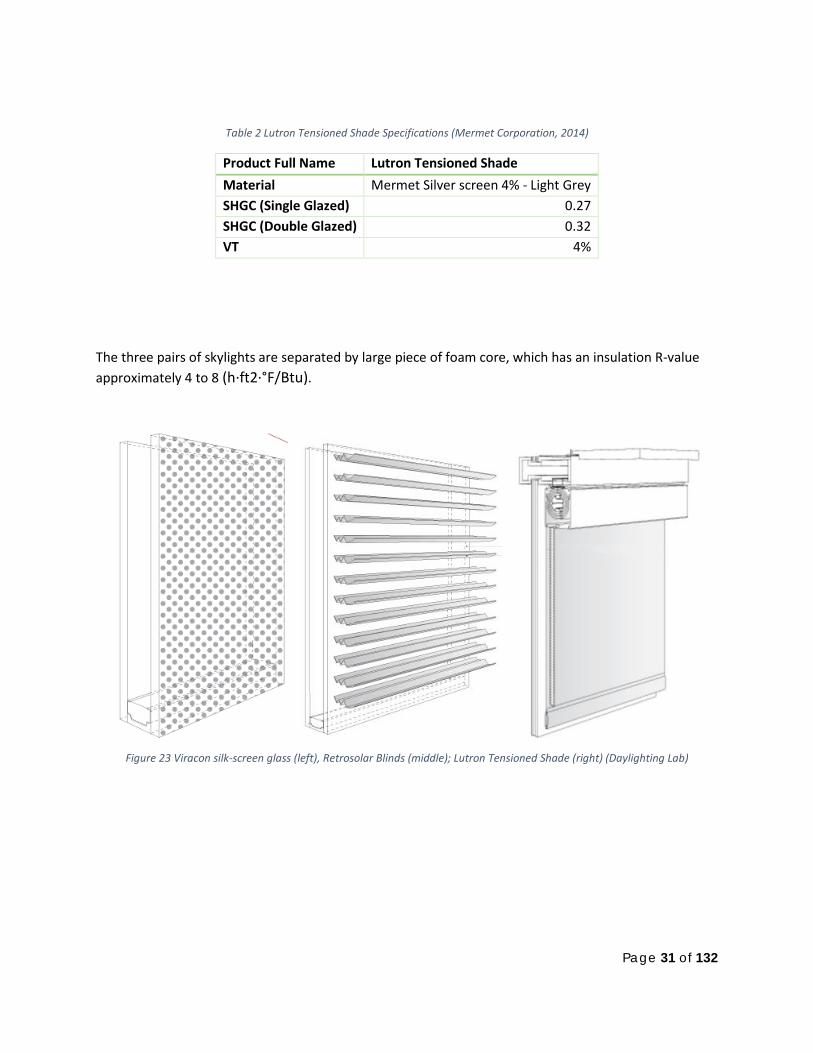
Table 2 Lutron Tensioned Shade Specifications (Mermet Corporation, 2014)
Product Full Name Lutron Tensioned Shade Material Mermet Silver screen 4% - Light Grey SHGC (Single Glazed) 0.27 SHGC (Double Glazed) 0.32 VT 4%
The three pairs of skylights are separated by large piece of foam core, which has an insulation R-value approximately 4 to 8 (h·ft2·°F/Btu).
Figure 23 Viracon silk-screen glass (left), Retrosolar Blinds (middle); Lutron Tensioned Shade (right) (Daylighting Lab)

Page 32 of 132
Figure 24 Shadings for skylights (Base Case, RETROSolar Venetian Blinds, Lutron Tensioned Shade)
Figure 25 Experiment Set Up
Lower (Skylight) Level Setup
In order to measure the luminance ratio near the task area, we set up display panels between each skylight area, and placed tables under the skylights to imitate personal workstations in general open plan office. The major light source of the workstations are the daylight from the skylights. The tables are 2.4 feet in height, which is the same height as the other tables in the Intelligent Workplace. The width of the workstation is 7.5 feet, and the table is set in the middle of the area. Additional foam cores are pinned on the panels to fully block the side lights.
Figure 26 Occupant level experiment set up
Page 33 of 132
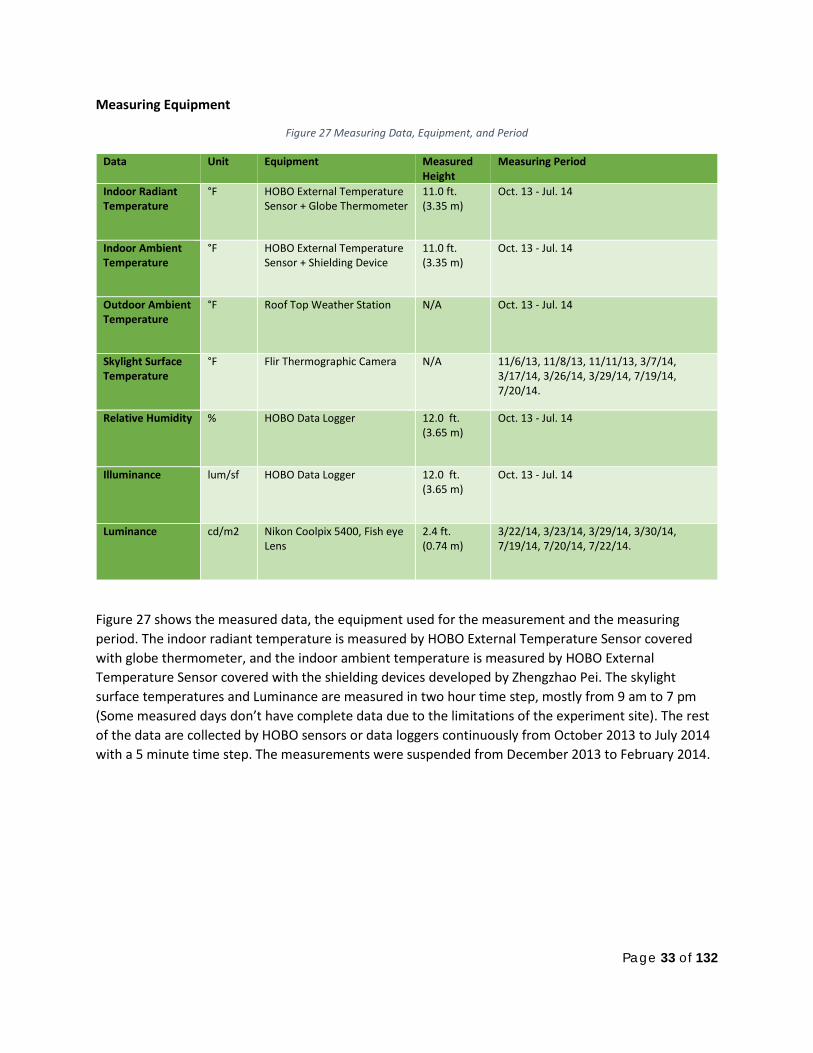
Measuring Equipment
Figure 27 Measuring Data, Equipment, and Period
Data Unit Equipment Measured Height
Measuring Period
Indoor Radiant Temperature
°F HOBO External Temperature Sensor + Globe Thermometer
11.0 ft. (3.35 m)
Oct. 13 - Jul. 14
Indoor Ambient Temperature
°F HOBO External Temperature Sensor + Shielding Device
11.0 ft. (3.35 m)
Oct. 13 - Jul. 14
Outdoor Ambient Temperature
°F Roof Top Weather Station N/A Oct. 13 - Jul. 14
Skylight Surface Temperature
°F Flir Thermographic Camera N/A 11/6/13, 11/8/13, 11/11/13, 3/7/14, 3/17/14, 3/26/14, 3/29/14, 7/19/14, 7/20/14.
Relative Humidity % HOBO Data Logger 12.0 ft. (3.65 m)
Oct. 13 - Jul. 14
Illuminance lum/sf HOBO Data Logger 12.0 ft. (3.65 m)
Oct. 13 - Jul. 14
Luminance cd/m2 Nikon Coolpix 5400, Fish eye Lens
2.4 ft. (0.74 m)
3/22/14, 3/23/14, 3/29/14, 3/30/14, 7/19/14, 7/20/14, 7/22/14.
Figure 27 shows the measured data, the equipment used for the measurement and the measuring period. The indoor radiant temperature is measured by HOBO External Temperature Sensor covered with globe thermometer, and the indoor ambient temperature is measured by HOBO External Temperature Sensor covered with the shielding devices developed by Zhengzhao Pei. The skylight surface temperatures and Luminance are measured in two hour time step, mostly from 9 am to 7 pm (Some measured days don’t have complete data due to the limitations of the experiment site). The rest of the data are collected by HOBO sensors or data loggers continuously from October 2013 to July 2014 with a 5 minute time step. The measurements were suspended from December 2013 to February 2014.
Page 34 of 132
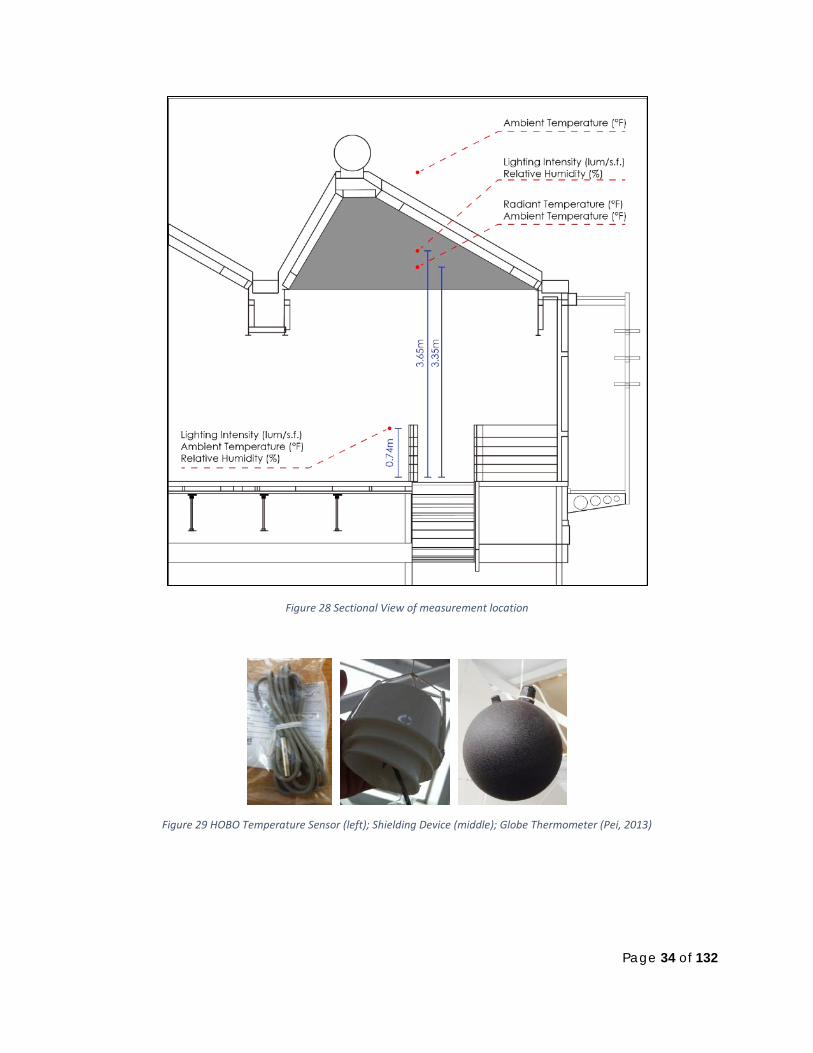
Figure 28 Sectional View of measurement location
Figure 29 HOBO Temperature Sensor (left); Shielding Device (middle); Globe Thermometer (Pei, 2013)
Page 35 of 132
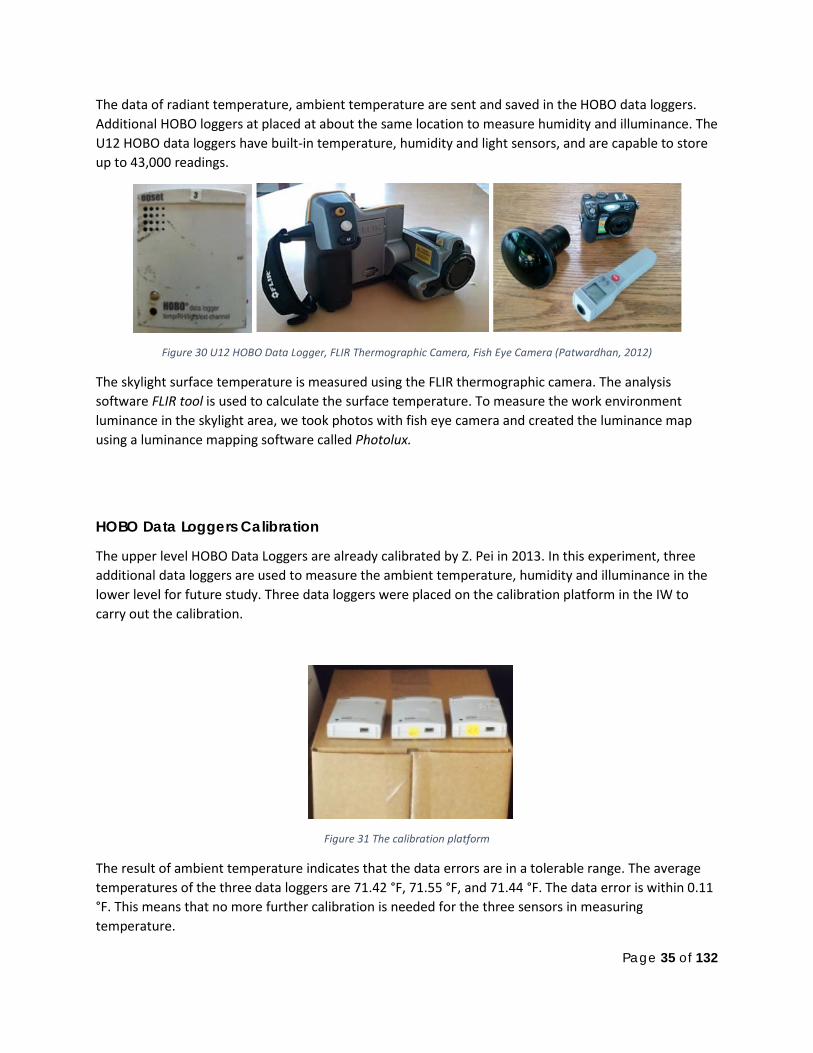
The data of radiant temperature, ambient temperature are sent and saved in the HOBO data loggers. Additional HOBO loggers at placed at about the same location to measure humidity and illuminance. The U12 HOBO data loggers have built-in temperature, humidity and light sensors, and are capable to store up to 43,000 readings.
Figure 30 U12 HOBO Data Logger, FLIR Thermographic Camera, Fish Eye Camera (Patwardhan, 2012)
The skylight surface temperature is measured using the FLIR thermographic camera. The analysis software FLIR tool is used to calculate the surface temperature. To measure the work environment luminance in the skylight area, we took photos with fish eye camera and created the luminance map using a luminance mapping software called Photolux.
HOBO Data Loggers Calibration
The upper level HOBO Data Loggers are already calibrated by Z. Pei in 2013. In this experiment, three additional data loggers are used to measure the ambient temperature, humidity and illuminance in the lower level for future study. Three data loggers were placed on the calibration platform in the IW to carry out the calibration.
Figure 31 The calibration platform
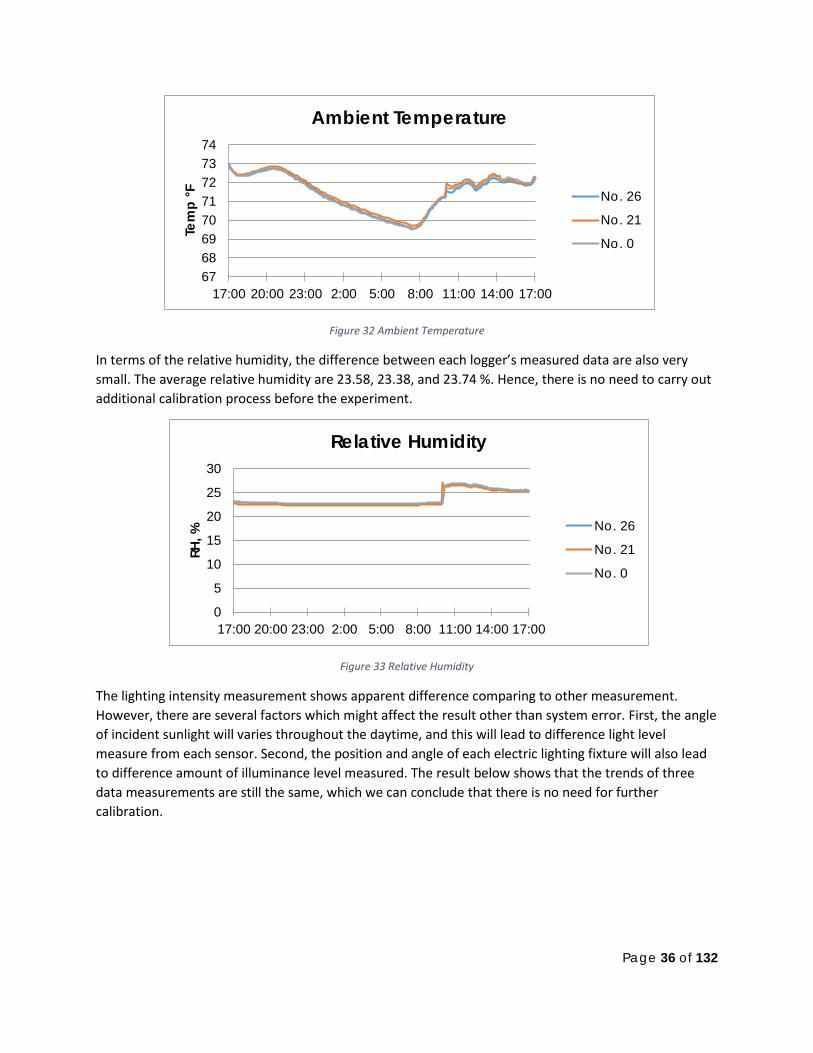
The result of ambient temperature indicates that the data errors are in a tolerable range. The average temperatures of the three data loggers are 71.42 °F, 71.55 °F, and 71.44 °F. The data error is within 0.11 °F. This means that no more further calibration is needed for the three sensors in measuring temperature.
Page 36 of 132
Figure 32 Ambient Temperature
In terms of the relative humidity, the difference between each logger’s measured data are also very small. The average relative humidity are 23.58, 23.38, and 23.74 %. Hence, there is no need to carry out additional calibration process before the experiment.
Figure 33 Relative Humidity
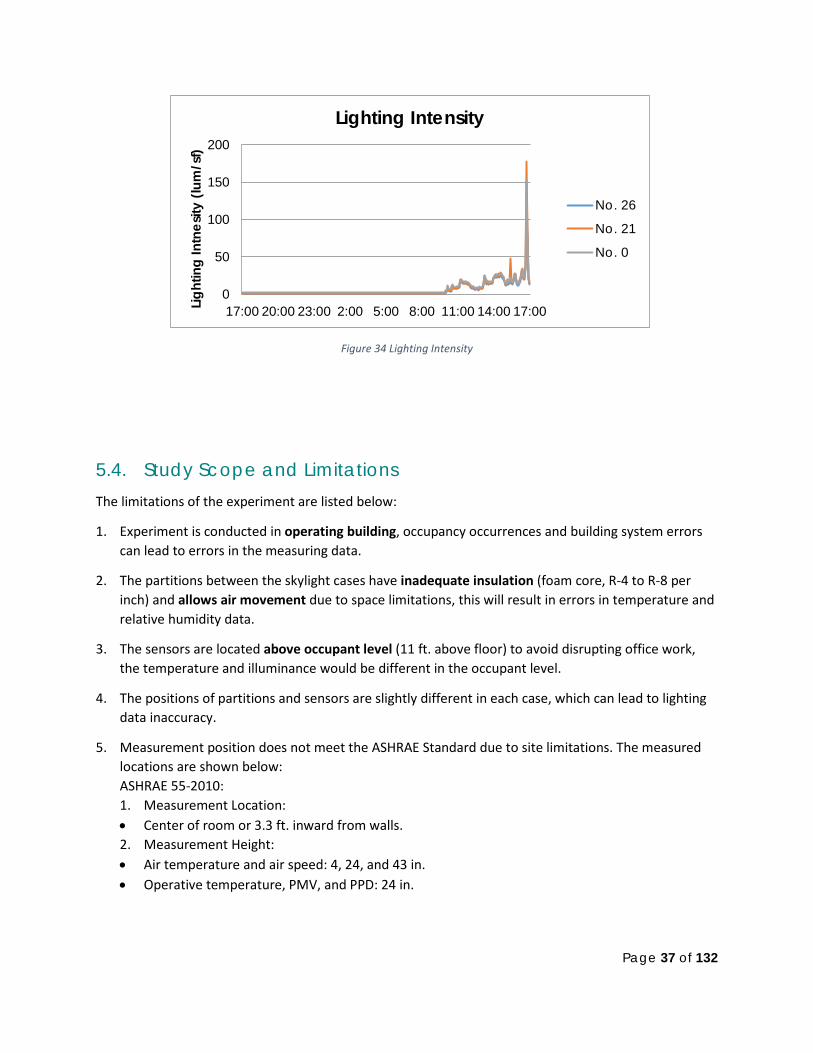
The lighting intensity measurement shows apparent difference comparing to other measurement. However, there are several factors which might affect the result other than system error. First, the angle of incident sunlight will varies throughout the daytime, and this will lead to difference light level measure from each sensor. Second, the position and angle of each electric lighting fixture will also lead to difference amount of illuminance level measured. The result below shows that the trends of three data measurements are still the same, which we can conclude that there is no need for further calibration.
6768697071727374
17:00 20:00 23:00 2:00 5:00 8:00 11:00 14:00 17:00
Tem
p °F
Ambient Temperature
No. 26
No. 21
No. 0
0
5
10
15
20
25
30
17:00 20:00 23:00 2:00 5:00 8:00 11:00 14:00 17:00
RH, %
Relative Humidity
No. 26
No. 21
No. 0
Page 37 of 132
Figure 34 Lighting Intensity
5.4. Study Scope and Limitations The limitations of the experiment are listed below:
1. Experiment is conducted in operating building, occupancy occurrences and building system errors can lead to errors in the measuring data.
2. The partitions between the skylight cases have inadequate insulation (foam core, R-4 to R-8 per inch) and allows air movement due to space limitations, this will result in errors in temperature and relative humidity data.
3. The sensors are located above occupant level (11 ft. above floor) to avoid disrupting office work, the temperature and illuminance would be different in the occupant level.
4. The positions of partitions and sensors are slightly different in each case, which can lead to lighting data inaccuracy.
5. Measurement position does not meet the ASHRAE Standard due to site limitations. The measured locations are shown below: ASHRAE 55-2010: 1. Measurement Location: • Center of room or 3.3 ft. inward from walls. 2. Measurement Height: • Air temperature and air speed: 4, 24, and 43 in. • Operative temperature, PMV, and PPD: 24 in.
0
50
100
150
200
17:00 20:00 23:00 2:00 5:00 8:00 11:00 14:00 17:00Light
ing
Intn
esity
(lum
/sf)
Lighting Intensity
No. 26
No. 21
No. 0
Page 38 of 132
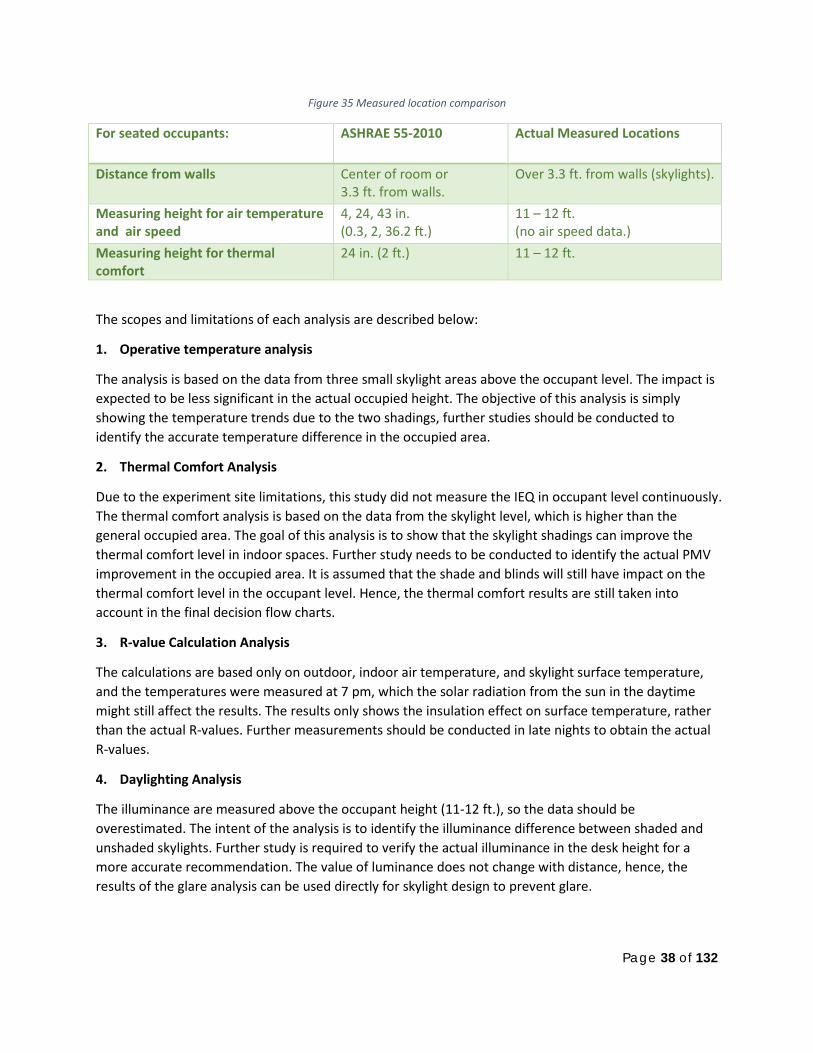
Figure 35 Measured location comparison
For seated occupants: ASHRAE 55-2010 Actual Measured Locations
Distance from walls Center of room or 3.3 ft. from walls.
Over 3.3 ft. from walls (skylights).
Measuring height for air temperature and air speed
4, 24, 43 in. (0.3, 2, 36.2 ft.)
11 – 12 ft. (no air speed data.)
Measuring height for thermal comfort
24 in. (2 ft.) 11 – 12 ft.
The scopes and limitations of each analysis are described below:
1. Operative temperature analysis
The analysis is based on the data from three small skylight areas above the occupant level. The impact is expected to be less significant in the actual occupied height. The objective of this analysis is simply showing the temperature trends due to the two shadings, further studies should be conducted to identify the accurate temperature difference in the occupied area.
2. Thermal Comfort Analysis
Due to the experiment site limitations, this study did not measure the IEQ in occupant level continuously. The thermal comfort analysis is based on the data from the skylight level, which is higher than the general occupied area. The goal of this analysis is to show that the skylight shadings can improve the thermal comfort level in indoor spaces. Further study needs to be conducted to identify the actual PMV improvement in the occupied area. It is assumed that the shade and blinds will still have impact on the thermal comfort level in the occupant level. Hence, the thermal comfort results are still taken into account in the final decision flow charts.
3. R-value Calculation Analysis
The calculations are based only on outdoor, indoor air temperature, and skylight surface temperature, and the temperatures were measured at 7 pm, which the solar radiation from the sun in the daytime might still affect the results. The results only shows the insulation effect on surface temperature, rather than the actual R-values. Further measurements should be conducted in late nights to obtain the actual R-values.
4. Daylighting Analysis
The illuminance are measured above the occupant height (11-12 ft.), so the data should be overestimated. The intent of the analysis is to identify the illuminance difference between shaded and unshaded skylights. Further study is required to verify the actual illuminance in the desk height for a more accurate recommendation. The value of luminance does not change with distance, hence, the results of the glare analysis can be used directly for skylight design to prevent glare.
Page 39 of 132
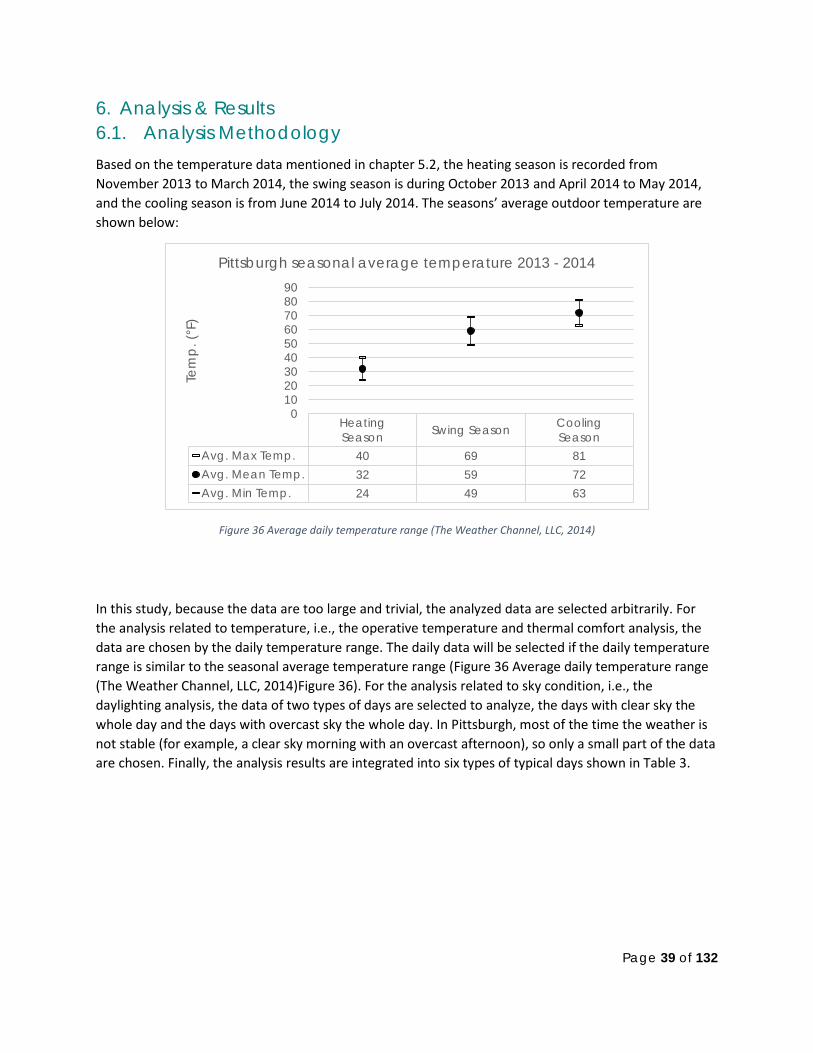
6. Analysis & Results 6.1. Analysis Methodology Based on the temperature data mentioned in chapter 5.2, the heating season is recorded from November 2013 to March 2014, the swing season is during October 2013 and April 2014 to May 2014, and the cooling season is from June 2014 to July 2014. The seasons’ average outdoor temperature are shown below:
Figure 36 Average daily temperature range (The Weather Channel, LLC, 2014)
In this study, because the data are too large and trivial, the analyzed data are selected arbitrarily. For the analysis related to temperature, i.e., the operative temperature and thermal comfort analysis, the data are chosen by the daily temperature range. The daily data will be selected if the daily temperature range is similar to the seasonal average temperature range (Figure 36 Average daily temperature range (The Weather Channel, LLC, 2014)Figure 36). For the analysis related to sky condition, i.e., the daylighting analysis, the data of two types of days are selected to analyze, the days with clear sky the whole day and the days with overcast sky the whole day. In Pittsburgh, most of the time the weather is not stable (for example, a clear sky morning with an overcast afternoon), so only a small part of the data are chosen. Finally, the analysis results are integrated into six types of typical days shown in Table 3.
HeatingSeason Swing Season Cooling
SeasonAvg. Max Temp. 40 69 81Avg. Mean Temp. 32 59 72Avg. Min Temp. 24 49 63
0102030405060708090
Tem
p. (
°F)
Pittsburgh seasonal average temperature 2013 - 2014
Page 40 of 132
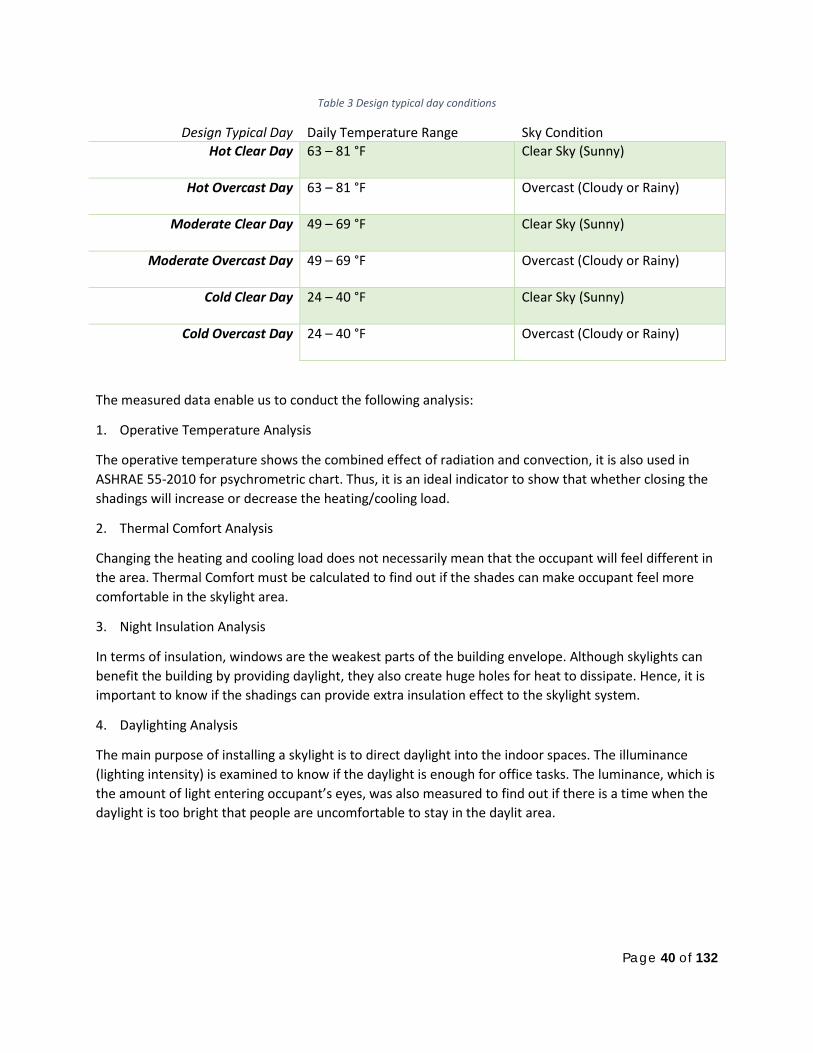
Table 3 Design typical day conditions
Design Typical Day Daily Temperature Range Sky Condition Hot Clear Day 63 – 81 °F Clear Sky (Sunny)
Hot Overcast Day 63 – 81 °F Overcast (Cloudy or Rainy)
Moderate Clear Day 49 – 69 °F Clear Sky (Sunny)
Moderate Overcast Day 49 – 69 °F Overcast (Cloudy or Rainy)
Cold Clear Day 24 – 40 °F Clear Sky (Sunny)
Cold Overcast Day 24 – 40 °F Overcast (Cloudy or Rainy)
The measured data enable us to conduct the following analysis:
1. Operative Temperature Analysis
The operative temperature shows the combined effect of radiation and convection, it is also used in ASHRAE 55-2010 for psychrometric chart. Thus, it is an ideal indicator to show that whether closing the shadings will increase or decrease the heating/cooling load.
2. Thermal Comfort Analysis
Changing the heating and cooling load does not necessarily mean that the occupant will feel different in the area. Thermal Comfort must be calculated to find out if the shades can make occupant feel more comfortable in the skylight area.
3. Night Insulation Analysis
In terms of insulation, windows are the weakest parts of the building envelope. Although skylights can benefit the building by providing daylight, they also create huge holes for heat to dissipate. Hence, it is important to know if the shadings can provide extra insulation effect to the skylight system.
4. Daylighting Analysis
The main purpose of installing a skylight is to direct daylight into the indoor spaces. The illuminance (lighting intensity) is examined to know if the daylight is enough for office tasks. The luminance, which is the amount of light entering occupant’s eyes, was also measured to find out if there is a time when the daylight is too bright that people are uncomfortable to stay in the daylit area.
Page 41 of 132
Data Selection
This study involved multiple aspects. The data for analysis are chosen independently to get a clear conclusion in each analysis. The results in each analysis are further discussed together in chapter 6.5.
1. Operative temperature analysis
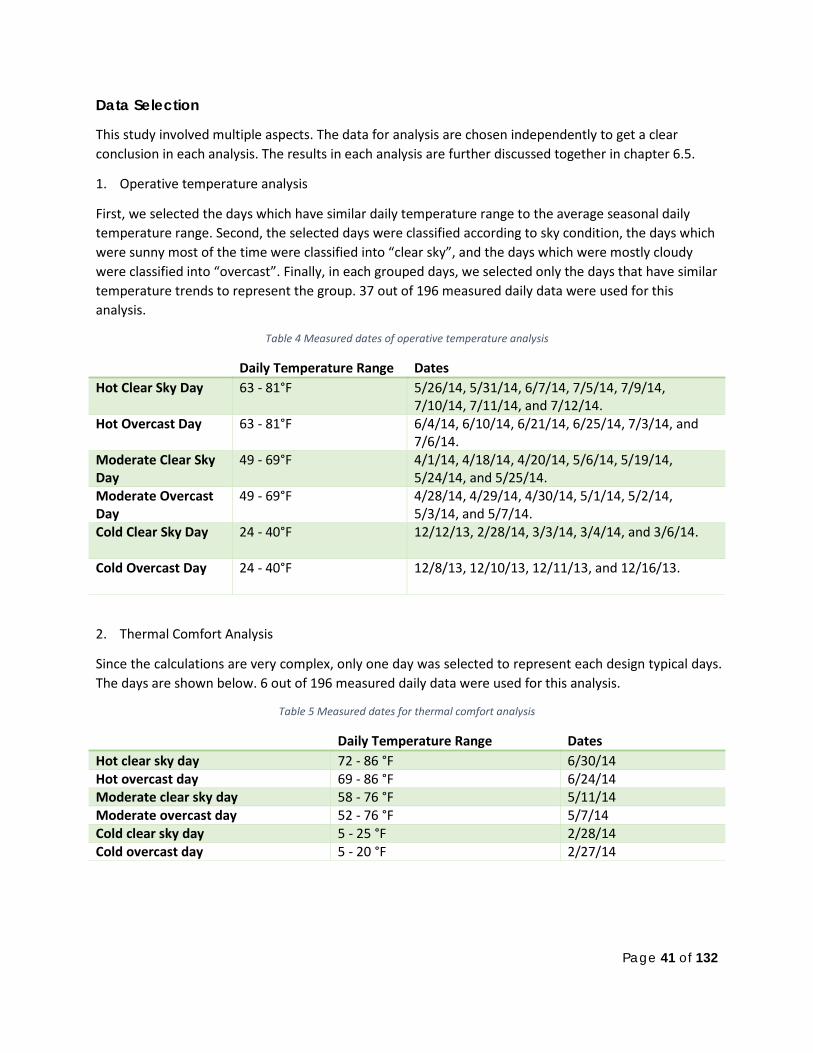
First, we selected the days which have similar daily temperature range to the average seasonal daily temperature range. Second, the selected days were classified according to sky condition, the days which were sunny most of the time were classified into “clear sky”, and the days which were mostly cloudy were classified into “overcast”. Finally, in each grouped days, we selected only the days that have similar temperature trends to represent the group. 37 out of 196 measured daily data were used for this analysis.
Table 4 Measured dates of operative temperature analysis
Daily Temperature Range Dates Hot Clear Sky Day 63 - 81°F 5/26/14, 5/31/14, 6/7/14, 7/5/14, 7/9/14,
7/10/14, 7/11/14, and 7/12/14. Hot Overcast Day 63 - 81°F 6/4/14, 6/10/14, 6/21/14, 6/25/14, 7/3/14, and
7/6/14. Moderate Clear Sky Day
49 - 69°F 4/1/14, 4/18/14, 4/20/14, 5/6/14, 5/19/14, 5/24/14, and 5/25/14.
Moderate Overcast Day
49 - 69°F 4/28/14, 4/29/14, 4/30/14, 5/1/14, 5/2/14, 5/3/14, and 5/7/14.
Cold Clear Sky Day 24 - 40°F 12/12/13, 2/28/14, 3/3/14, 3/4/14, and 3/6/14.
Cold Overcast Day 24 - 40°F 12/8/13, 12/10/13, 12/11/13, and 12/16/13.
2. Thermal Comfort Analysis
Since the calculations are very complex, only one day was selected to represent each design typical days. The days are shown below. 6 out of 196 measured daily data were used for this analysis.
Table 5 Measured dates for thermal comfort analysis
Daily Temperature Range Dates Hot clear sky day 72 - 86 °F 6/30/14 Hot overcast day 69 - 86 °F 6/24/14 Moderate clear sky day 58 - 76 °F 5/11/14 Moderate overcast day 52 - 76 °F 5/7/14 Cold clear sky day 5 - 25 °F 2/28/14 Cold overcast day 5 - 20 °F 2/27/14
Page 42 of 132
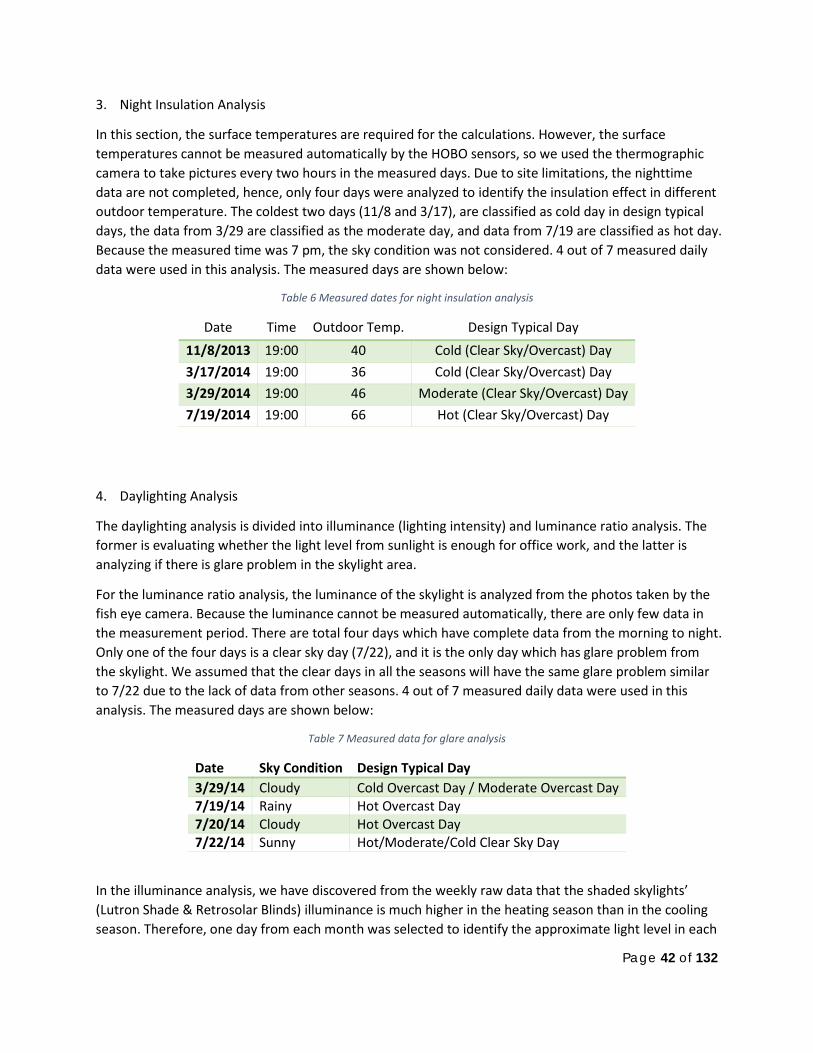
3. Night Insulation Analysis
In this section, the surface temperatures are required for the calculations. However, the surface temperatures cannot be measured automatically by the HOBO sensors, so we used the thermographic camera to take pictures every two hours in the measured days. Due to site limitations, the nighttime data are not completed, hence, only four days were analyzed to identify the insulation effect in different outdoor temperature. The coldest two days (11/8 and 3/17), are classified as cold day in design typical days, the data from 3/29 are classified as the moderate day, and data from 7/19 are classified as hot day. Because the measured time was 7 pm, the sky condition was not considered. 4 out of 7 measured daily data were used in this analysis. The measured days are shown below:
Table 6 Measured dates for night insulation analysis
Date Time Outdoor Temp. Design Typical Day 11/8/2013 19:00 40 Cold (Clear Sky/Overcast) Day 3/17/2014 19:00 36 Cold (Clear Sky/Overcast) Day 3/29/2014 19:00 46 Moderate (Clear Sky/Overcast) Day 7/19/2014 19:00 66 Hot (Clear Sky/Overcast) Day
4. Daylighting Analysis
The daylighting analysis is divided into illuminance (lighting intensity) and luminance ratio analysis. The former is evaluating whether the light level from sunlight is enough for office work, and the latter is analyzing if there is glare problem in the skylight area.
For the luminance ratio analysis, the luminance of the skylight is analyzed from the photos taken by the fish eye camera. Because the luminance cannot be measured automatically, there are only few data in the measurement period. There are total four days which have complete data from the morning to night. Only one of the four days is a clear sky day (7/22), and it is the only day which has glare problem from the skylight. We assumed that the clear days in all the seasons will have the same glare problem similar to 7/22 due to the lack of data from other seasons. 4 out of 7 measured daily data were used in this analysis. The measured days are shown below:
Table 7 Measured data for glare analysis
Date Sky Condition Design Typical Day 3/29/14 Cloudy Cold Overcast Day / Moderate Overcast Day 7/19/14 Rainy Hot Overcast Day 7/20/14 Cloudy Hot Overcast Day 7/22/14 Sunny Hot/Moderate/Cold Clear Sky Day
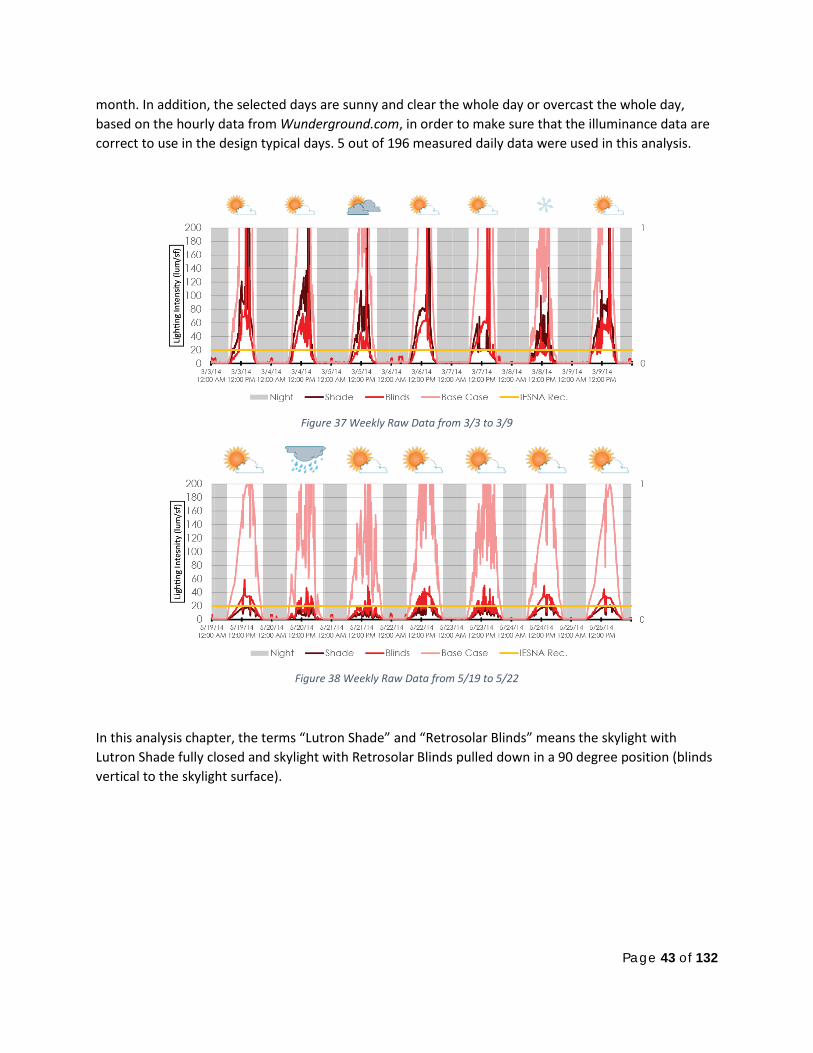
In the illuminance analysis, we have discovered from the weekly raw data that the shaded skylights’ (Lutron Shade & Retrosolar Blinds) illuminance is much higher in the heating season than in the cooling season. Therefore, one day from each month was selected to identify the approximate light level in each
Page 43 of 132
month. In addition, the selected days are sunny and clear the whole day or overcast the whole day, based on the hourly data from Wunderground.com, in order to make sure that the illuminance data are correct to use in the design typical days. 5 out of 196 measured daily data were used in this analysis.
Figure 37 Weekly Raw Data from 3/3 to 3/9
Figure 38 Weekly Raw Data from 5/19 to 5/22
In this analysis chapter, the terms “Lutron Shade” and “Retrosolar Blinds” means the skylight with Lutron Shade fully closed and skylight with Retrosolar Blinds pulled down in a 90 degree position (blinds vertical to the skylight surface).
Page 44 of 132
6.2. Operative Temperature
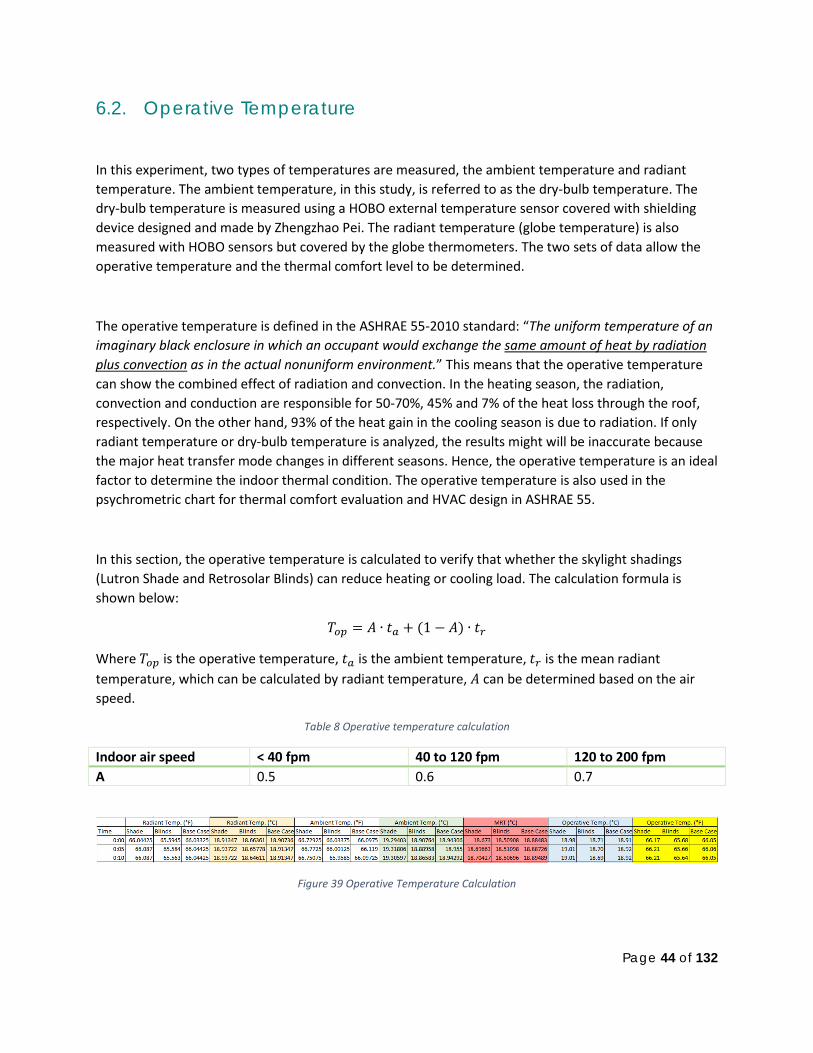
In this experiment, two types of temperatures are measured, the ambient temperature and radiant temperature. The ambient temperature, in this study, is referred to as the dry-bulb temperature. The dry-bulb temperature is measured using a HOBO external temperature sensor covered with shielding device designed and made by Zhengzhao Pei. The radiant temperature (globe temperature) is also measured with HOBO sensors but covered by the globe thermometers. The two sets of data allow the operative temperature and the thermal comfort level to be determined.
The operative temperature is defined in the ASHRAE 55-2010 standard: “The uniform temperature of an imaginary black enclosure in which an occupant would exchange the same amount of heat by radiation plus convection as in the actual nonuniform environment.” This means that the operative temperature can show the combined effect of radiation and convection. In the heating season, the radiation, convection and conduction are responsible for 50-70%, 45% and 7% of the heat loss through the roof, respectively. On the other hand, 93% of the heat gain in the cooling season is due to radiation. If only radiant temperature or dry-bulb temperature is analyzed, the results might will be inaccurate because the major heat transfer mode changes in different seasons. Hence, the operative temperature is an ideal factor to determine the indoor thermal condition. The operative temperature is also used in the psychrometric chart for thermal comfort evaluation and HVAC design in ASHRAE 55.
In this section, the operative temperature is calculated to verify that whether the skylight shadings (Lutron Shade and Retrosolar Blinds) can reduce heating or cooling load. The calculation formula is shown below:
𝑇𝑜𝑝 = 𝐴 ∙ 𝑡𝑎 + (1 − 𝐴) ∙ 𝑡𝑟
Where 𝑇𝑜𝑝 is the operative temperature, 𝑡𝑎 is the ambient temperature, 𝑡𝑟 is the mean radiant temperature, which can be calculated by radiant temperature, 𝐴 can be determined based on the air speed.
Table 8 Operative temperature calculation
Indoor air speed < 40 fpm 40 to 120 fpm 120 to 200 fpm A 0.5 0.6 0.7
Figure 39 Operative Temperature Calculation

Page 45 of 132
Figure 40 Three modes of heat transfer (Innovative Insulation, Inc., 2014)
Typical Hot Day (Outdoor temp. 63 – 81 °F)
*Shade: Skylight with Lutron Shade fully closed; Blinds: Skylight with Retrosolar Blinds pulled down in 90 degree position; Base Case: unshaded skylight.
Figure 41 Operative Temperature - Hot Day
The temperature of typical hot clear day is the average temperature of 5/26/14, 5/31/14, 6/7/14, 7/5/14, 7/9/14, 7/10/14, 7/11/14, and 7/12/14. The measured typical hot overcast days are 6/4/14,
707274767880828486
0:00
1:00
2:00
3:00
4:00
5:00
6:00
7:00
8:00
9:00
10:0
011
:00
12:0
013
:00
14:0
015
:00
16:0
017
:00
18:0
019
:00
20:0
021
:00
22:0
023
:00
Tem
p. (°
F)
Operative Temperature - Hot Clear Day
Shade Blinds Base Case
707274767880828486
0:00
1:00
2:00
3:00
4:00
5:00
6:00
7:00
8:00
9:00
10:0
011
:00
12:0
013
:00
14:0
015
:00
16:0
017
:00
18:0
019
:00
20:0
021
:00
22:0
023
:00
Tem
p. (°
F)
Operative Temperature - Hot Overcast day
Shade Blinds Base Case

Page 46 of 132
6/10/14, 6/21/14, 6/25/14, 7/3/14, and 7/6/14. In clear sky days, the temperature will rise to 85 °F, while in the overcast days the peak temperature is around 78 °F. The two charts show that closing Lutron Shade or Retrosolar Blinds will not have significant impact on the operative temperature. The maximum temperature differences are smaller than 1.5 °F.
Typical Moderate Day (Outdoor temp. 49 – 69 °F)
*Shade: Skylight with Lutron Shade fully closed; Blinds: Skylight with Retrosolar Blinds pulled down in 90 degree position; Base Case: unshaded skylight.
Figure 42 Operative Temperature - Moderate Day
The moderate clear day temperature is the average of 4/1/14, 4/18/14, 4/20/14, 5/6/14, 5/19/14, 5/24/14, and 5/25/14, and the overcast day temperature is the average of 4/28/14, 4/29/14, 4/30/14, 5/1/14, 5/2/14, 5/3/14, and 5/7/14. Based on the charts, closing the Lutron Shade or Retrosolar Blinds will not lower the operative temperature in either days. The maximum temperature difference is within 1.5 °F.
707274767880828486
0:00
1:00
2:00
3:00
4:00
5:00
6:00
7:00
8:00
9:00
10:0
011
:00
12:0
013
:00
14:0
015
:00
16:0
017
:00
18:0
019
:00
20:0
021
:00
22:0
023
:00
Tem
p. (°
F)
Operative Temperature - Moderate Clear Day
Shade Blinds Base Case
707274767880828486
0:00
1:00
2:00
3:00
4:00
5:00
6:00
7:00
8:00
9:00
10:0
011
:00
12:0
013
:00
14:0
015
:00
16:0
017
:00
18:0
019
:00
20:0
021
:00
22:0
023
:00
Tem
p. (°
F)
Operative Temperature - Moderate Overcast Day
Shade Blinds Base Case
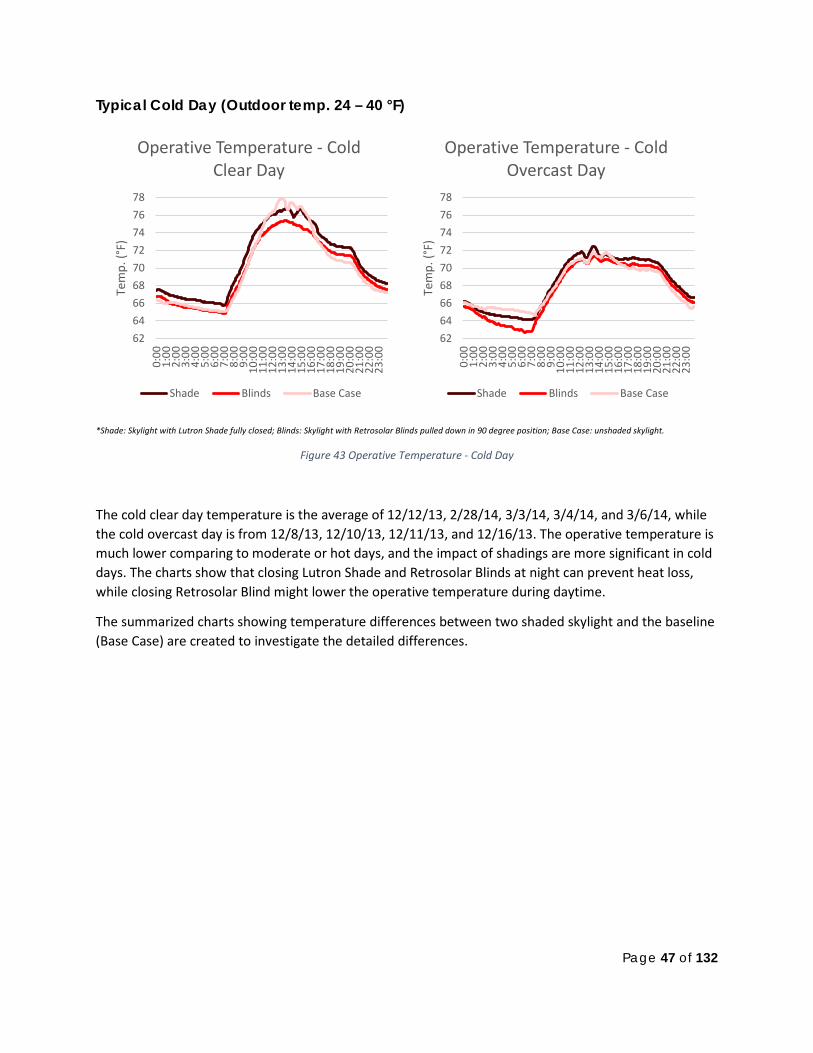
Page 47 of 132
Typical Cold Day (Outdoor temp. 24 – 40 °F)
*Shade: Skylight with Lutron Shade fully closed; Blinds: Skylight with Retrosolar Blinds pulled down in 90 degree position; Base Case: unshaded skylight.
Figure 43 Operative Temperature - Cold Day
The cold clear day temperature is the average of 12/12/13, 2/28/14, 3/3/14, 3/4/14, and 3/6/14, while the cold overcast day is from 12/8/13, 12/10/13, 12/11/13, and 12/16/13. The operative temperature is much lower comparing to moderate or hot days, and the impact of shadings are more significant in cold days. The charts show that closing Lutron Shade and Retrosolar Blinds at night can prevent heat loss, while closing Retrosolar Blind might lower the operative temperature during daytime.
The summarized charts showing temperature differences between two shaded skylight and the baseline (Base Case) are created to investigate the detailed differences.
626466687072747678
0:00
1:00
2:00
3:00
4:00
5:00
6:00
7:00
8:00
9:00
10:0
011
:00
12:0
013
:00
14:0
015
:00
16:0
017
:00
18:0
019
:00
20:0
021
:00
22:0
023
:00
Tem
p. (°
F)
Operative Temperature - Cold Clear Day
Shade Blinds Base Case
626466687072747678
0:00
1:00
2:00
3:00
4:00
5:00
6:00
7:00
8:00
9:00
10:0
011
:00
12:0
013
:00
14:0
015
:00
16:0
017
:00
18:0
019
:00
20:0
021
:00
22:0
023
:00
Tem
p. (°
F)
Operative Temperature - Cold Overcast Day
Shade Blinds Base Case
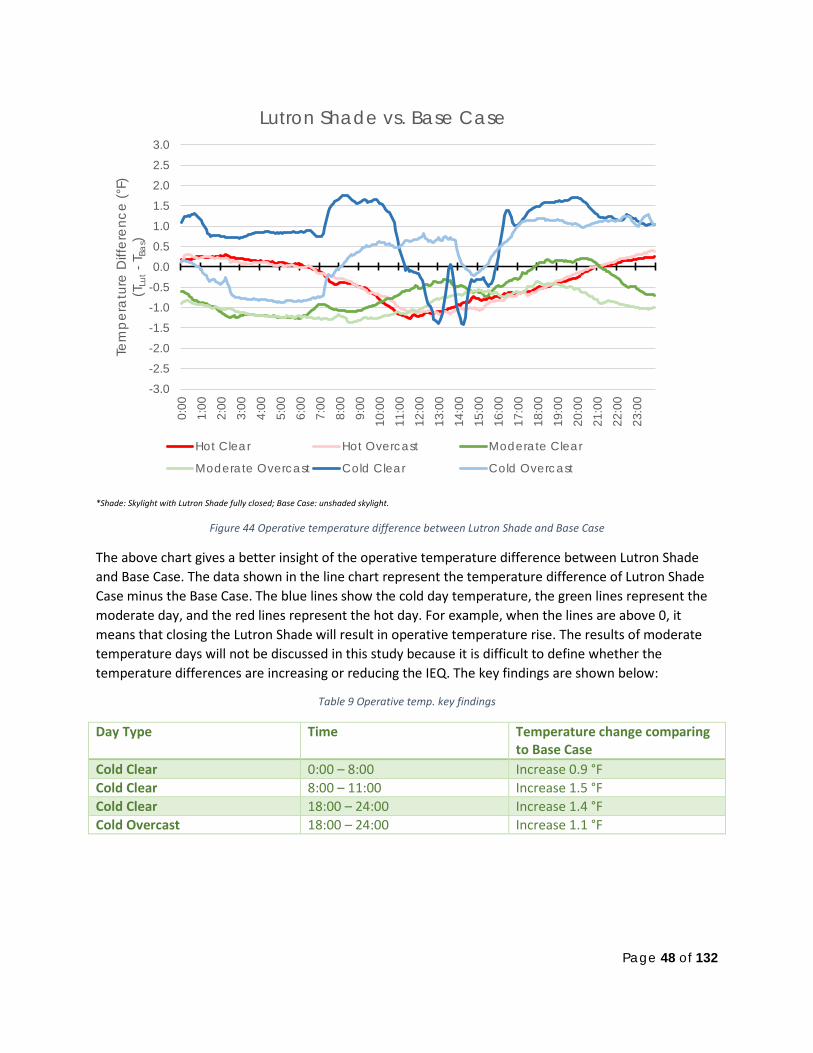
Page 48 of 132
*Shade: Skylight with Lutron Shade fully closed; Base Case: unshaded skylight.
Figure 44 Operative temperature difference between Lutron Shade and Base Case
The above chart gives a better insight of the operative temperature difference between Lutron Shade and Base Case. The data shown in the line chart represent the temperature difference of Lutron Shade Case minus the Base Case. The blue lines show the cold day temperature, the green lines represent the moderate day, and the red lines represent the hot day. For example, when the lines are above 0, it means that closing the Lutron Shade will result in operative temperature rise. The results of moderate temperature days will not be discussed in this study because it is difficult to define whether the temperature differences are increasing or reducing the IEQ. The key findings are shown below:
Table 9 Operative temp. key findings
Day Type Time Temperature change comparing to Base Case
Cold Clear 0:00 – 8:00 Increase 0.9 °F Cold Clear 8:00 – 11:00 Increase 1.5 °F Cold Clear 18:00 – 24:00 Increase 1.4 °F Cold Overcast 18:00 – 24:00 Increase 1.1 °F
-3.0-2.5-2.0-1.5-1.0-0.50.00.51.01.52.02.53.0
0:00
1:00
2:00
3:00
4:00
5:00
6:00
7:00
8:00
9:00
10:0
011
:00
12:0
013
:00
14:0
015
:00
16:0
017
:00
18:0
019
:00
20:0
021
:00
22:0
023
:00
Tem
per
atu
re D
iffer
ence
(°F)
(T
Lut -
TBa
s) Lutron Shade vs. Base Case
Hot Clear Hot Overcast Moderate Clear
Moderate Overcast Cold Clear Cold Overcast

Page 49 of 132
* Blinds: Skylight with Retrosolar Blinds pulled down in 90 degree position; Base Case: unshaded skylight.
Figure 45 Operative temperature difference between Blinds and Base Case
This chart shows the operative temperature difference of Retrosolar Blinds and Base Case. The major impacts of closing the Retrosolar Blinds are reducing the temperature in cold days, which the heating load might increase. The detailed key findings are shown below:
Table 10 Operative Temp. key findings
Day Type Time Temperature change comparing to Base Case
Cold Clear 12:00 – 16:00 Lower 2 °F Cold Overcast 3:00 – 7:00 Lower 2 °F
-3.0-2.5-2.0-1.5-1.0-0.50.00.51.01.52.02.53.0
0:00
1:00
2:00
3:00
4:00
5:00
6:00
7:00
8:00
9:00
10:0
011
:00
12:0
013
:00
14:0
015
:00
16:0
017
:00
18:0
019
:00
20:0
021
:00
22:0
023
:00
Tem
per
atu
re D
iffer
ence
(°F)
(T
Lut -
TBa
s) Retrosolar Blinds vs. Base Case
Hot Clear Hot Overcast Moderate Clear
Moderate Overcast Cold Clear Cold Overcast
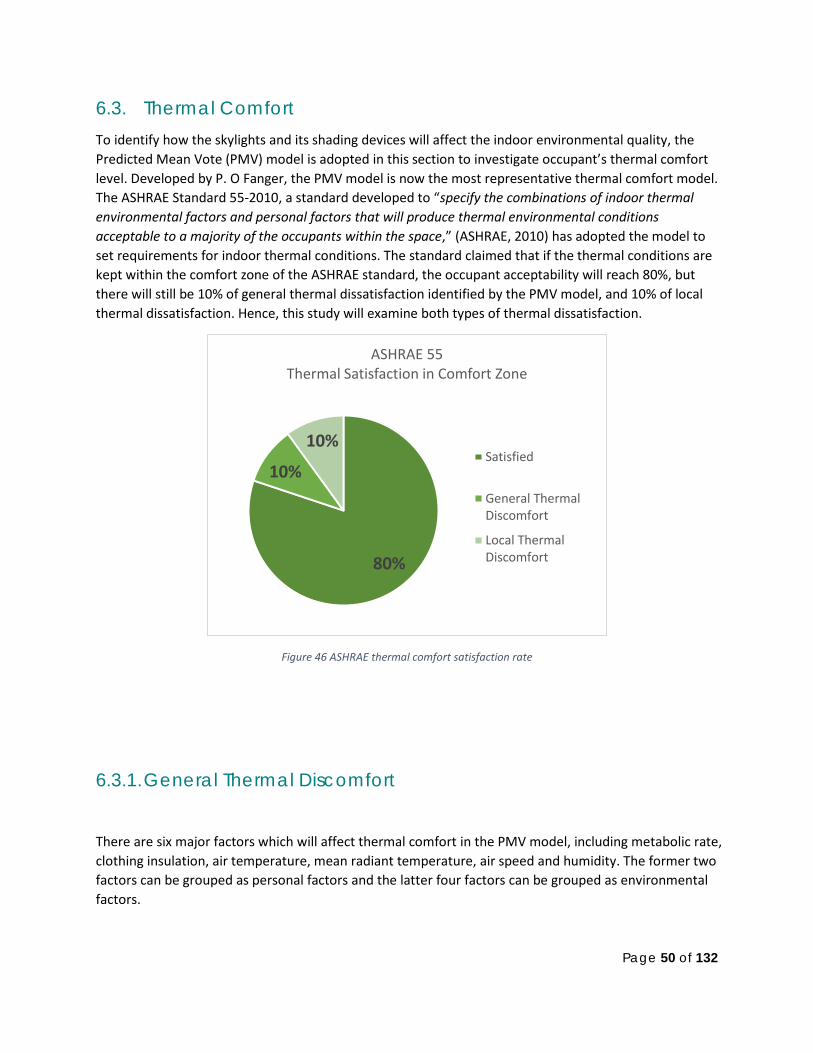
Page 50 of 132
6.3. Thermal Comfort To identify how the skylights and its shading devices will affect the indoor environmental quality, the Predicted Mean Vote (PMV) model is adopted in this section to investigate occupant’s thermal comfort level. Developed by P. O Fanger, the PMV model is now the most representative thermal comfort model. The ASHRAE Standard 55-2010, a standard developed to “specify the combinations of indoor thermal environmental factors and personal factors that will produce thermal environmental conditions acceptable to a majority of the occupants within the space,” (ASHRAE, 2010) has adopted the model to set requirements for indoor thermal conditions. The standard claimed that if the thermal conditions are kept within the comfort zone of the ASHRAE standard, the occupant acceptability will reach 80%, but there will still be 10% of general thermal dissatisfaction identified by the PMV model, and 10% of local thermal dissatisfaction. Hence, this study will examine both types of thermal dissatisfaction.
Figure 46 ASHRAE thermal comfort satisfaction rate
6.3.1. General Thermal Discomfort
There are six major factors which will affect thermal comfort in the PMV model, including metabolic rate, clothing insulation, air temperature, mean radiant temperature, air speed and humidity. The former two factors can be grouped as personal factors and the latter four factors can be grouped as environmental factors.
80%
10%
10%
ASHRAE 55 Thermal Satisfaction in Comfort Zone
Satisfied
General ThermalDiscomfort
Local ThermalDiscomfort
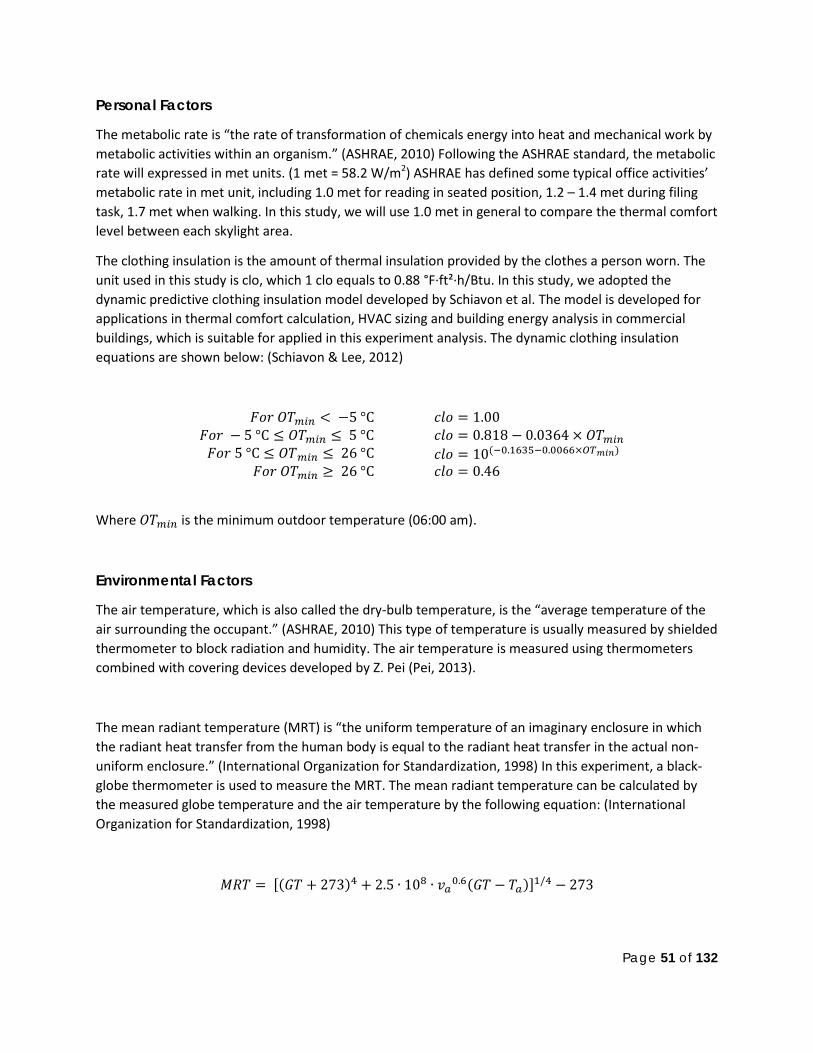
Page 51 of 132
Personal Factors
The metabolic rate is “the rate of transformation of chemicals energy into heat and mechanical work by metabolic activities within an organism.” (ASHRAE, 2010) Following the ASHRAE standard, the metabolic rate will expressed in met units. (1 met = 58.2 W/m2) ASHRAE has defined some typical office activities’ metabolic rate in met unit, including 1.0 met for reading in seated position, 1.2 – 1.4 met during filing task, 1.7 met when walking. In this study, we will use 1.0 met in general to compare the thermal comfort level between each skylight area.
The clothing insulation is the amount of thermal insulation provided by the clothes a person worn. The unit used in this study is clo, which 1 clo equals to 0.88 °F·ft²·h/Btu. In this study, we adopted the dynamic predictive clothing insulation model developed by Schiavon et al. The model is developed for applications in thermal comfort calculation, HVAC sizing and building energy analysis in commercial buildings, which is suitable for applied in this experiment analysis. The dynamic clothing insulation equations are shown below: (Schiavon & Lee, 2012)
𝐹𝑜𝑟 𝑂𝑇𝑚𝑖𝑛 < −5 °C 𝑐𝑙𝑜 = 1.00 𝐹𝑜𝑟 − 5 °C ≤ 𝑂𝑇𝑚𝑖𝑛 ≤ 5 °C 𝑐𝑙𝑜 = 0.818 − 0.0364 × 𝑂𝑇𝑚𝑖𝑛 𝐹𝑜𝑟 5 °C ≤ 𝑂𝑇𝑚𝑖𝑛 ≤ 26 °C 𝑐𝑙𝑜 = 10(−0.1635−0.0066×𝑂𝑇𝑚𝑖𝑛)
𝐹𝑜𝑟 𝑂𝑇𝑚𝑖𝑛 ≥ 26 °C 𝑐𝑙𝑜 = 0.46
Where 𝑂𝑇𝑚𝑖𝑛 is the minimum outdoor temperature (06:00 am).
Environmental Factors
The air temperature, which is also called the dry-bulb temperature, is the “average temperature of the air surrounding the occupant.” (ASHRAE, 2010) This type of temperature is usually measured by shielded thermometer to block radiation and humidity. The air temperature is measured using thermometers combined with covering devices developed by Z. Pei (Pei, 2013).
The mean radiant temperature (MRT) is “the uniform temperature of an imaginary enclosure in which the radiant heat transfer from the human body is equal to the radiant heat transfer in the actual non-uniform enclosure.” (International Organization for Standardization, 1998) In this experiment, a black-globe thermometer is used to measure the MRT. The mean radiant temperature can be calculated by the measured globe temperature and the air temperature by the following equation: (International Organization for Standardization, 1998)
𝑀𝑅𝑇 = [(𝐺𝑇 + 273)4 + 2.5 ∙ 108 ∙ 𝑣𝑎0.6(𝐺𝑇 − 𝑇𝑎)]1/4 − 273
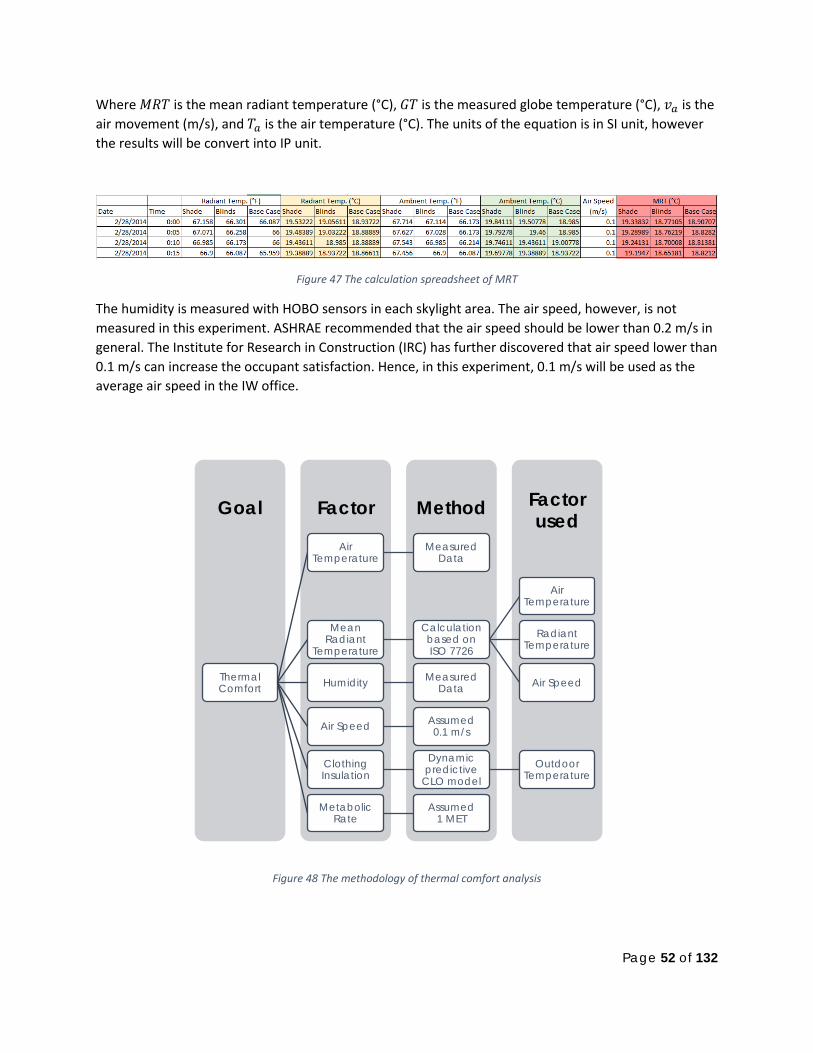
Page 52 of 132
Where 𝑀𝑅𝑇 is the mean radiant temperature (°C), 𝐺𝑇 is the measured globe temperature (°C), 𝑣𝑎 is the air movement (m/s), and 𝑇𝑎 is the air temperature (°C). The units of the equation is in SI unit, however the results will be convert into IP unit.
Figure 47 The calculation spreadsheet of MRT
The humidity is measured with HOBO sensors in each skylight area. The air speed, however, is not measured in this experiment. ASHRAE recommended that the air speed should be lower than 0.2 m/s in general. The Institute for Research in Construction (IRC) has further discovered that air speed lower than 0.1 m/s can increase the occupant satisfaction. Hence, in this experiment, 0.1 m/s will be used as the average air speed in the IW office.
Figure 48 The methodology of thermal comfort analysis
Factor used Method Factor Goal
Thermal Comfort
Air Temperature
Measured Data
Mean Radiant
Temperature
Calculation based on ISO 7726
Air Temperature
Radiant Temperature
Air Speed Humidity Measured Data
Air Speed Assumed 0.1 m/s
Clothing Insulation
Dynamic predictive
CLO model Outdoor
Temperature
Metabolic Rate
Assumed 1 MET

Page 53 of 132
Predicted Mean Vote (PMV) & Predicted Percentage Dissatisfied (PPD)
In this section, six measured days will be chosen to represent six types of typical weather conditions.
Table 11 Measured days and calculated CLO
Daily Temp. Range Dates OTmin (°F) OTmin (°C) CLO Hot clear sky day 72 - 86 °F 6/30/14 72.1 22.3 0.48 Hot overcast day 69 - 86 °F 6/24/14 69.5 20.8 0.50 Moderate clear sky day 58 - 76 °F 5/11/14 58.3 14.6 0.55 Moderate overcast day 52 - 76 °F 5/7/14 51.4 10.8 0.58 Cold clear sky day 5 - 25 °F 2/28/14 6.1 -14.4 1 Cold overcast day 5 - 20 °F 2/27/14 16.8 -8.4 1
In this study, the spreadsheet developed by the Tanabe Shin-ichi Laboratory was used to calculate the PMV and PPD. (TANABE Shin-ichi Laboratory, Waseda University)
Figure 49 PMV-PPD Spreadsheet (TANABE Shin-ichi Laboratory, Waseda University)
The Predicted Percentage Dissatisfied (PPD) results and key findings of Lutron Shade and Retrosolar Blinds are shown below:
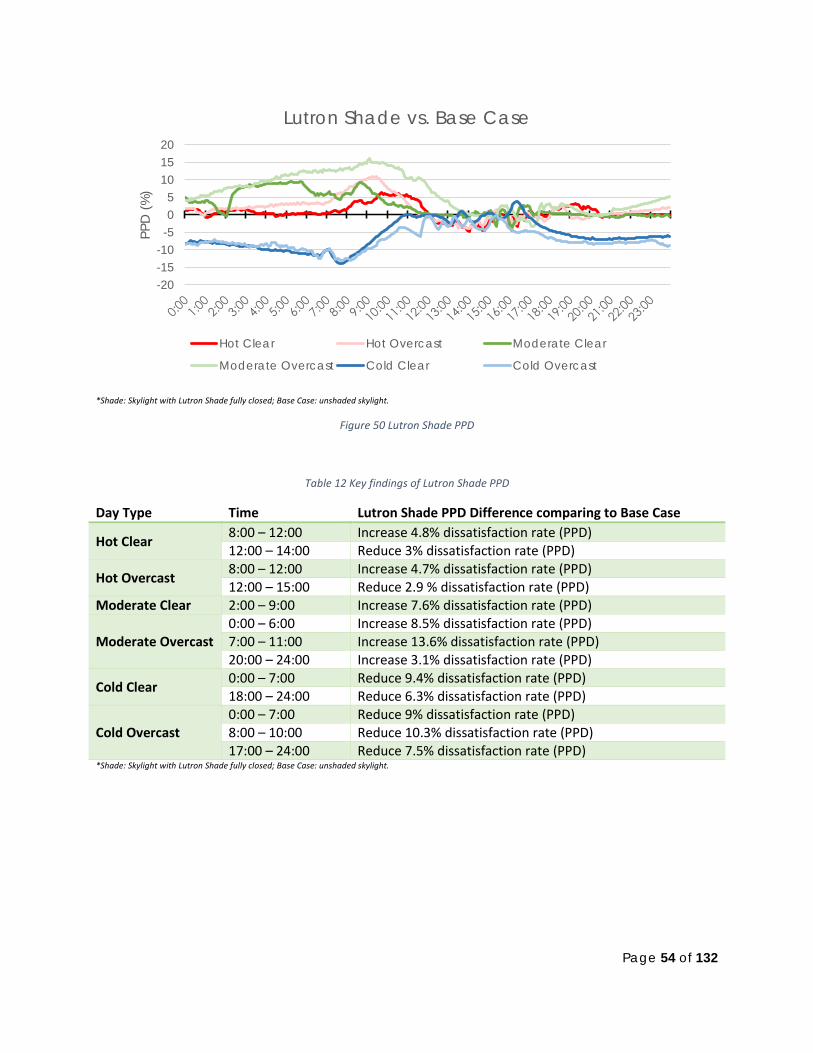
Page 54 of 132
*Shade: Skylight with Lutron Shade fully closed; Base Case: unshaded skylight.
Figure 50 Lutron Shade PPD
Table 12 Key findings of Lutron Shade PPD
Day Type Time Lutron Shade PPD Difference comparing to Base Case
Hot Clear 8:00 – 12:00 Increase 4.8% dissatisfaction rate (PPD) 12:00 – 14:00 Reduce 3% dissatisfaction rate (PPD)
Hot Overcast 8:00 – 12:00 Increase 4.7% dissatisfaction rate (PPD) 12:00 – 15:00 Reduce 2.9 % dissatisfaction rate (PPD)
Moderate Clear 2:00 – 9:00 Increase 7.6% dissatisfaction rate (PPD)
Moderate Overcast 0:00 – 6:00 Increase 8.5% dissatisfaction rate (PPD) 7:00 – 11:00 Increase 13.6% dissatisfaction rate (PPD) 20:00 – 24:00 Increase 3.1% dissatisfaction rate (PPD)
Cold Clear 0:00 – 7:00 Reduce 9.4% dissatisfaction rate (PPD) 18:00 – 24:00 Reduce 6.3% dissatisfaction rate (PPD)
Cold Overcast 0:00 – 7:00 Reduce 9% dissatisfaction rate (PPD) 8:00 – 10:00 Reduce 10.3% dissatisfaction rate (PPD) 17:00 – 24:00 Reduce 7.5% dissatisfaction rate (PPD)
*Shade: Skylight with Lutron Shade fully closed; Base Case: unshaded skylight.
-20-15-10-505
101520
PPD
(%)
Lutron Shade vs. Base Case
Hot Clear Hot Overcast Moderate Clear
Moderate Overcast Cold Clear Cold Overcast

Page 55 of 132
* Blinds: Skylight with Retrosolar Blinds pulled down in 90 degree position; Base Case: unshaded skylight.
Figure 51 Retrosolar Blinds PPD
Table 13 Key Findings of Retrosolar Blinds PPD
Day Type Time Retrosolar Blinds PPD Difference comparing to Base Case
Hot Clear 8:00 – 12:00 Increase 4.1% dissatisfaction rate (PPD) 12:00 – 14:00 Reduce 4.2% dissatisfaction rate (PPD)
Hot Overcast 8:00 – 12:00 Increase 4.0% dissatisfaction rate (PPD) 12:00 – 15:00 Reduce 4.2 % dissatisfaction rate (PPD)
Moderate Clear 2:00 – 9:00 Increase 5.0% dissatisfaction rate (PPD) 14:00 – 17:00 Increase 4.5% dissatisfaction rate (PPD)
Moderate Overcast 0:00 – 6:00 Increase 6.4% dissatisfaction rate (PPD) 7:00 – 11:00 Increase 10.1% dissatisfaction rate (PPD) 20:00 – 24:00 Increase 2.2% dissatisfaction rate (PPD)
Cold Clear 0:00 – 7:00 Reduce 2.7% dissatisfaction rate (PPD) 18:00 – 24:00 Reduce 3.1% dissatisfaction rate (PPD)
Cold Overcast 0:00 – 7:00 Reduce 2.9% dissatisfaction rate (PPD) 8:00 – 10:00 Reduce 3.6% dissatisfaction rate (PPD) 17:00 – 24:00 Reduce 3.3% dissatisfaction rate (PPD)
* Blinds: Skylight with Retrosolar Blinds pulled down in 90 degree position; Base Case: unshaded skylight.
-15.00
-10.00
-5.00
0.00
5.00
10.00
15.00
0:00
1:00
2:00
3:00
4:00
5:00
6:00
7:00
8:00
9:00
10:0
011
:00
12:0
013
:00
14:0
015
:00
16:0
017
:00
18:0
019
:00
20:0
021
:00
22:0
023
:00
PPD
(%)
Retrosolar Blinds vs. Base Case
Hot Clear Hot Overcast Moderate Clear
Moderate Overcast Cold Clear Cold Overcast

Page 56 of 132
Hot clear sky day
*Shade: Skylight with Lutron Shade fully closed; Blinds: Skylight with Retrosolar Blinds pulled down in 90 degree position; Base Case: unshaded skylight.
Figure 52 PMV - PPD of hot clear day
From 8 am to 12 pm, when the Base Case has 4.8% lower PPD comparing to Lutron Shade, and 4.1% lower comparing to Retrosolar Blinds. It is suggested that in the unshaded skylight, both air temperature and MRT rise faster in the morning, plus in the heating season occupant’s CLO is low, the Base Case performs better than the other two cases. However, the Shade and Blinds perform better at noon (12 pm to 2 pm), the Lutron Shade skylight and Retrosolar Blinds reduce 3.0% and 4.2% of PPD comparing to Base Case, Respectively.
Hot overcast day
*Shade: Skylight with Lutron Shade fully closed; Blinds: Skylight with Retrosolar Blinds pulled down in 90 degree position; Base Case: unshaded skylight.
Figure 53 PMV - PPD of hot overcast day
0
1
-2.00-1.50-1.00-0.500.000.501.001.502.00
0:00
1:00
2:00
3:00
4:00
5:00
6:00
7:00
8:00
9:00
10:0
011
:00
12:0
013
:00
14:0
015
:00
16:0
017
:00
18:0
019
:00
20:0
021
:00
22:0
023
:00
PMV - Hot clear sky day
Night Shade Blinds Base Case
0
1
0
10
20
30
40
50
60
0:00
1:00
2:00
3:00
4:00
5:00
6:00
7:00
8:00
9:00
10:0
011
:00
12:0
013
:00
14:0
015
:00
16:0
017
:00
18:0
019
:00
20:0
021
:00
22:0
023
:00
%
PPD - Hot clear sky day
Night Shade Blinds Base Case
0
1
-2.00-1.50-1.00-0.500.000.501.001.502.00
0:00
1:00
2:00
3:00
4:00
5:00
6:00
7:00
8:00
9:00
10:0
011
:00
12:0
013
:00
14:0
015
:00
16:0
017
:00
18:0
019
:00
20:0
021
:00
22:0
023
:00
PMV - Hot overcast day
Night Shade Blinds Base Case
0
1
0
10
20
30
40
50
60
0:00
1:00
2:00
3:00
4:00
5:00
6:00
7:00
8:00
9:00
10:0
011
:00
12:0
013
:00
14:0
015
:00
16:0
017
:00
18:0
019
:00
20:0
021
:00
22:0
023
:00
%
PPD - Hot overcast day
Night Shade Blinds Base Case

Page 57 of 132
In hot overcast days, the thermal comfort level are similar to hot clear sky day. Comparing to Lutron Shade and Retrosolar Blinds, the Base Case has 4.7% and 4.0% lower PPD from 8 am to 12 pm. In the afternoon, the Lutron Shade and Retrosolar Blinds has 2.9% and 4.2% less PPD comparing to Base Case from 12 pm to 3 pm.
Moderate clear sky day
*Shade: Skylight with Lutron Shade fully closed; Blinds: Skylight with Retrosolar Blinds pulled down in 90 degree position; Base Case: unshaded skylight.
Figure 54 PMV - PPD of moderate clear day
From 2:30 am to 9:30 am, the Base Case performs much better than shaded skylights, the Base Case’s PPD is 7.6% lower than Lutron Shade and 5.0% lower than Retrosolar Blinds. The biggest difference in the three sets of data during the period is the mean radiant temperature, which we believe is the main reason that affect the PPD. From 2:00 pm to 5:30 pm, the PPD of Retrosolar Blinds are 4.5% higher than Base Case, while Lutron Shade is only 0.2% higher. The data show that during the period, the mean radiant temperature of Retrosolar Blinds rises over 30 °F while the MRT of Base Case remains lower than 29 °F.
0
1
-1.50
-1.00
-0.50
0.00
0.50
1.00
1.50
2.00
0:00
1:00
2:00
3:00
4:00
5:00
6:00
7:00
8:00
9:00
10:0
011
:00
12:0
013
:00
14:0
015
:00
16:0
017
:00
18:0
019
:00
20:0
021
:00
22:0
023
:00
PMV - Moderate clear sky day
Night Shade Blinds Base Case
0
1
0
10
20
30
40
50
60
70
0:00
1:00
2:00
3:00
4:00
5:00
6:00
7:00
8:00
9:00
10:0
011
:00
12:0
013
:00
14:0
015
:00
16:0
017
:00
18:0
019
:00
20:0
021
:00
22:0
023
:00
%
PPD - Moderate clear sky day
Night Shade Blinds Base Case

Page 58 of 132
Moderate overcast day
*Shade: Skylight with Lutron Shade fully closed; Blinds: Skylight with Retrosolar Blinds pulled down in 90 degree position; Base Case: unshaded skylight.
Figure 55 PMV - PPD of moderate overcast day
From midnight to sunrise (12 am to 6 am), the unshaded skylight’s PPD is 8.5% and 6.4% lower in average comparing to Lutron Shade and Retrosolar Blinds. From 6 am to 11 am, the unshaded skylight’s PPD is 13.6% and 10.1% lower in average comparing to Lutron Shade and Retrosolar Blinds. We assumed this is because both shades are blocking too much radiant heat which results in a temperature that is too cold. There are no significant difference in the afternoon between the three skylight cases. However, the PPD of Lutron Shade and Retrosolar Blinds rise higher than the Base Case after sunset, and the PPD is 3.1% and 2.2% higher in average, respectively.
Cold clear sky day
*Shade: Skylight with Lutron Shade fully closed; Blinds: Skylight with Retrosolar Blinds pulled down in 90 degree position; Base Case: unshaded skylight.
Figure 56 PMV - PPD of cold clear day
0
1
-2.00-1.50-1.00-0.500.000.501.001.502.00
0:00
1:00
2:00
3:00
4:00
5:00
6:00
7:00
8:00
9:00
10:0
011
:00
12:0
013
:00
14:0
015
:00
16:0
017
:00
18:0
019
:00
20:0
021
:00
22:0
023
:00
PMV - Moderate overcast day
Night Shade Blinds Base Case
0
1
0
10
20
30
40
50
60
70
0:00
1:00
2:00
3:00
4:00
5:00
6:00
7:00
8:00
9:00
10:0
011
:00
12:0
013
:00
14:0
015
:00
16:0
017
:00
18:0
019
:00
20:0
021
:00
22:0
023
:00
%
PPD - Moderate overcast day
Night Shade Blinds Base Case
0
1
-2.00-1.50-1.00-0.500.000.501.001.502.00
0:00
1:00
2:00
3:00
4:00
5:00
6:00
7:00
8:00
9:00
10:0
011
:00
12:0
013
:00
14:0
015
:00
16:0
017
:00
18:0
019
:00
20:0
021
:00
22:0
023
:00
PMV - Cold clear sky day
Night Shade Blinds Base Case
0
1
0
10
20
30
40
50
60
70
0:00
1:00
2:00
3:00
4:00
5:00
6:00
7:00
8:00
9:00
10:0
011
:00
12:0
013
:00
14:0
015
:00
16:0
017
:00
18:0
019
:00
20:0
021
:00
22:0
023
:00
%
PPD - Cold clear sky day
Night Shade Blinds Base Case
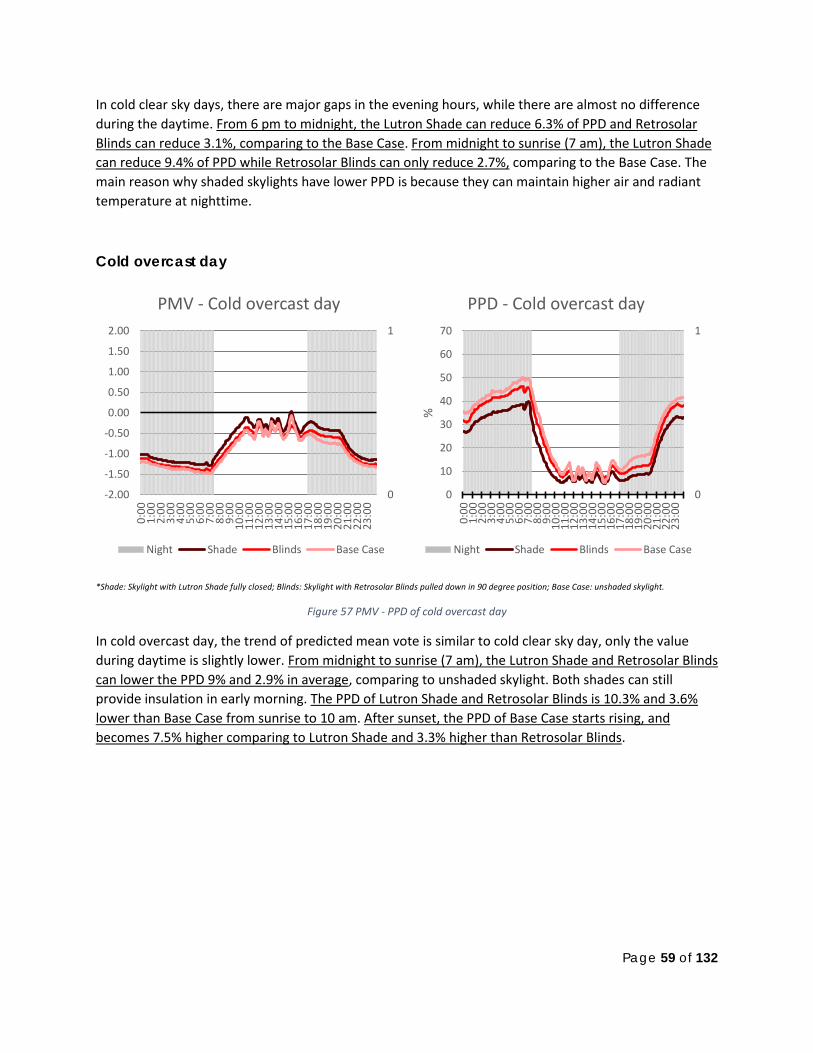
Page 59 of 132
In cold clear sky days, there are major gaps in the evening hours, while there are almost no difference during the daytime. From 6 pm to midnight, the Lutron Shade can reduce 6.3% of PPD and Retrosolar Blinds can reduce 3.1%, comparing to the Base Case. From midnight to sunrise (7 am), the Lutron Shade can reduce 9.4% of PPD while Retrosolar Blinds can only reduce 2.7%, comparing to the Base Case. The main reason why shaded skylights have lower PPD is because they can maintain higher air and radiant temperature at nighttime.
Cold overcast day
*Shade: Skylight with Lutron Shade fully closed; Blinds: Skylight with Retrosolar Blinds pulled down in 90 degree position; Base Case: unshaded skylight.
Figure 57 PMV - PPD of cold overcast day
In cold overcast day, the trend of predicted mean vote is similar to cold clear sky day, only the value during daytime is slightly lower. From midnight to sunrise (7 am), the Lutron Shade and Retrosolar Blinds can lower the PPD 9% and 2.9% in average, comparing to unshaded skylight. Both shades can still provide insulation in early morning. The PPD of Lutron Shade and Retrosolar Blinds is 10.3% and 3.6% lower than Base Case from sunrise to 10 am. After sunset, the PPD of Base Case starts rising, and becomes 7.5% higher comparing to Lutron Shade and 3.3% higher than Retrosolar Blinds.
0
1
-2.00
-1.50
-1.00
-0.50
0.00
0.50
1.00
1.50
2.00
0:00
1:00
2:00
3:00
4:00
5:00
6:00
7:00
8:00
9:00
10:0
011
:00
12:0
013
:00
14:0
015
:00
16:0
017
:00
18:0
019
:00
20:0
021
:00
22:0
023
:00
PMV - Cold overcast day
Night Shade Blinds Base Case
0
1
0
10
20
30
40
50
60
70
0:00
1:00
2:00
3:00
4:00
5:00
6:00
7:00
8:00
9:00
10:0
011
:00
12:0
013
:00
14:0
015
:00
16:0
017
:00
18:0
019
:00
20:0
021
:00
22:0
023
:00
%
PPD - Cold overcast day
Night Shade Blinds Base Case
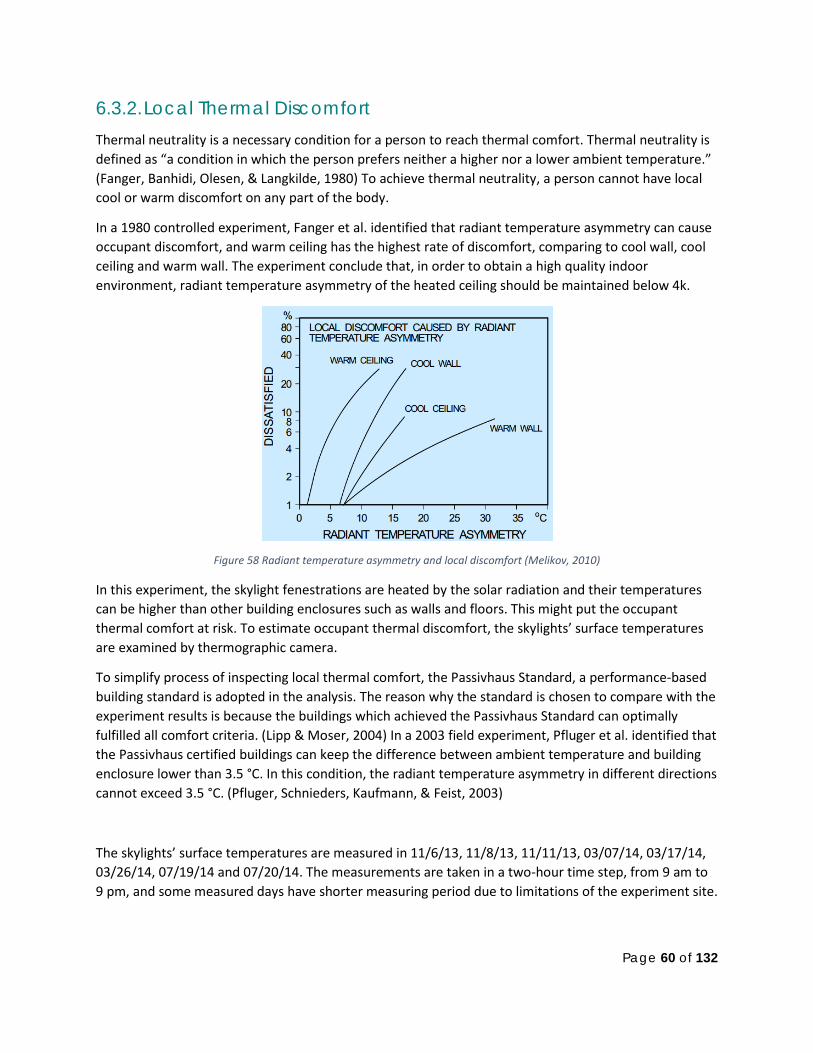
Page 60 of 132
6.3.2. Local Thermal Discomfort Thermal neutrality is a necessary condition for a person to reach thermal comfort. Thermal neutrality is defined as “a condition in which the person prefers neither a higher nor a lower ambient temperature.” (Fanger, Banhidi, Olesen, & Langkilde, 1980) To achieve thermal neutrality, a person cannot have local cool or warm discomfort on any part of the body.
In a 1980 controlled experiment, Fanger et al. identified that radiant temperature asymmetry can cause occupant discomfort, and warm ceiling has the highest rate of discomfort, comparing to cool wall, cool ceiling and warm wall. The experiment conclude that, in order to obtain a high quality indoor environment, radiant temperature asymmetry of the heated ceiling should be maintained below 4k.
Figure 58 Radiant temperature asymmetry and local discomfort (Melikov, 2010)
In this experiment, the skylight fenestrations are heated by the solar radiation and their temperatures can be higher than other building enclosures such as walls and floors. This might put the occupant thermal comfort at risk. To estimate occupant thermal discomfort, the skylights’ surface temperatures are examined by thermographic camera.
To simplify process of inspecting local thermal comfort, the Passivhaus Standard, a performance-based building standard is adopted in the analysis. The reason why the standard is chosen to compare with the experiment results is because the buildings which achieved the Passivhaus Standard can optimally fulfilled all comfort criteria. (Lipp & Moser, 2004) In a 2003 field experiment, Pfluger et al. identified that the Passivhaus certified buildings can keep the difference between ambient temperature and building enclosure lower than 3.5 °C. In this condition, the radiant temperature asymmetry in different directions cannot exceed 3.5 °C. (Pfluger, Schnieders, Kaufmann, & Feist, 2003)
The skylights’ surface temperatures are measured in 11/6/13, 11/8/13, 11/11/13, 03/07/14, 03/17/14, 03/26/14, 07/19/14 and 07/20/14. The measurements are taken in a two-hour time step, from 9 am to 9 pm, and some measured days have shorter measuring period due to limitations of the experiment site.
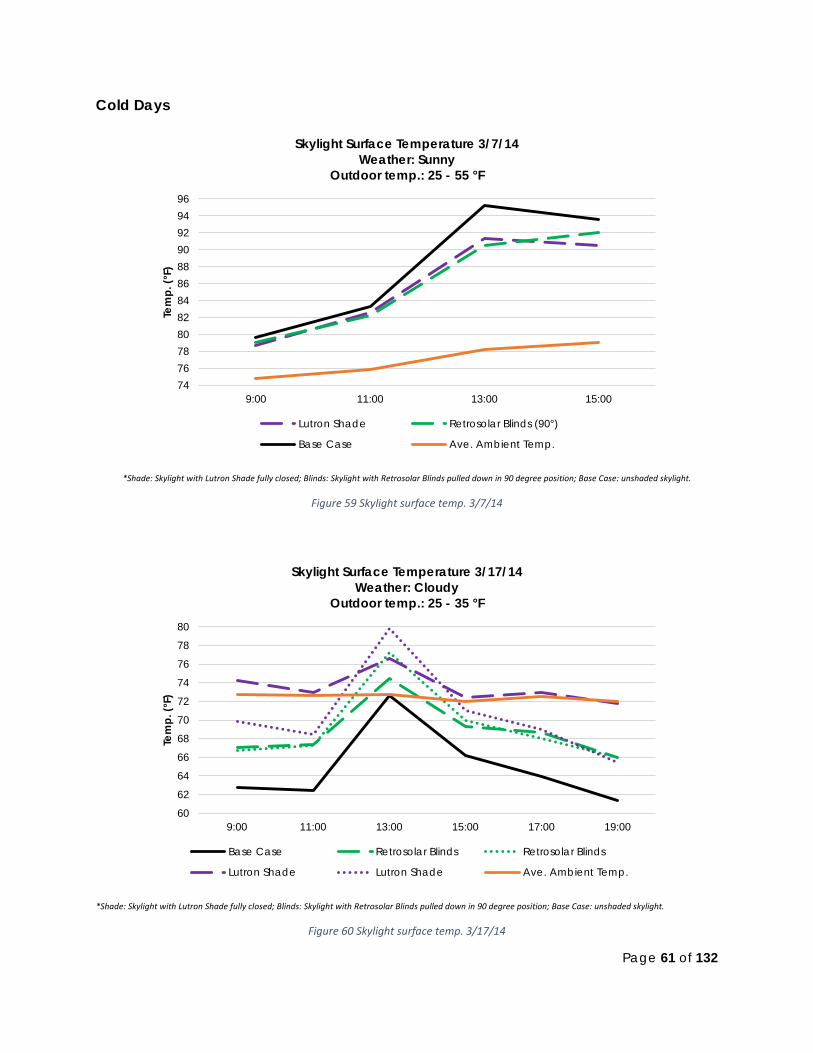
Page 61 of 132
Cold Days
*Shade: Skylight with Lutron Shade fully closed; Blinds: Skylight with Retrosolar Blinds pulled down in 90 degree position; Base Case: unshaded skylight.
Figure 59 Skylight surface temp. 3/7/14
*Shade: Skylight with Lutron Shade fully closed; Blinds: Skylight with Retrosolar Blinds pulled down in 90 degree position; Base Case: unshaded skylight.
Figure 60 Skylight surface temp. 3/17/14
747678808284868890929496
9:00 11:00 13:00 15:00
Tem
p. (°
F)
Skylight Surface Temperature 3/7/14 Weather: Sunny
Outdoor temp.: 25 - 55 °F
Lutron Shade Retrosolar Blinds (90°)
Base Case Ave. Ambient Temp.
60
62
64
66
68
70
72
74
76
78
80
9:00 11:00 13:00 15:00 17:00 19:00
Tem
p. (°
F)
Skylight Surface Temperature 3/17/14 Weather: Cloudy
Outdoor temp.: 25 - 35 °F
Base Case Retrosolar Blinds Retrosolar Blinds
Lutron Shade Lutron Shade Ave. Ambient Temp.
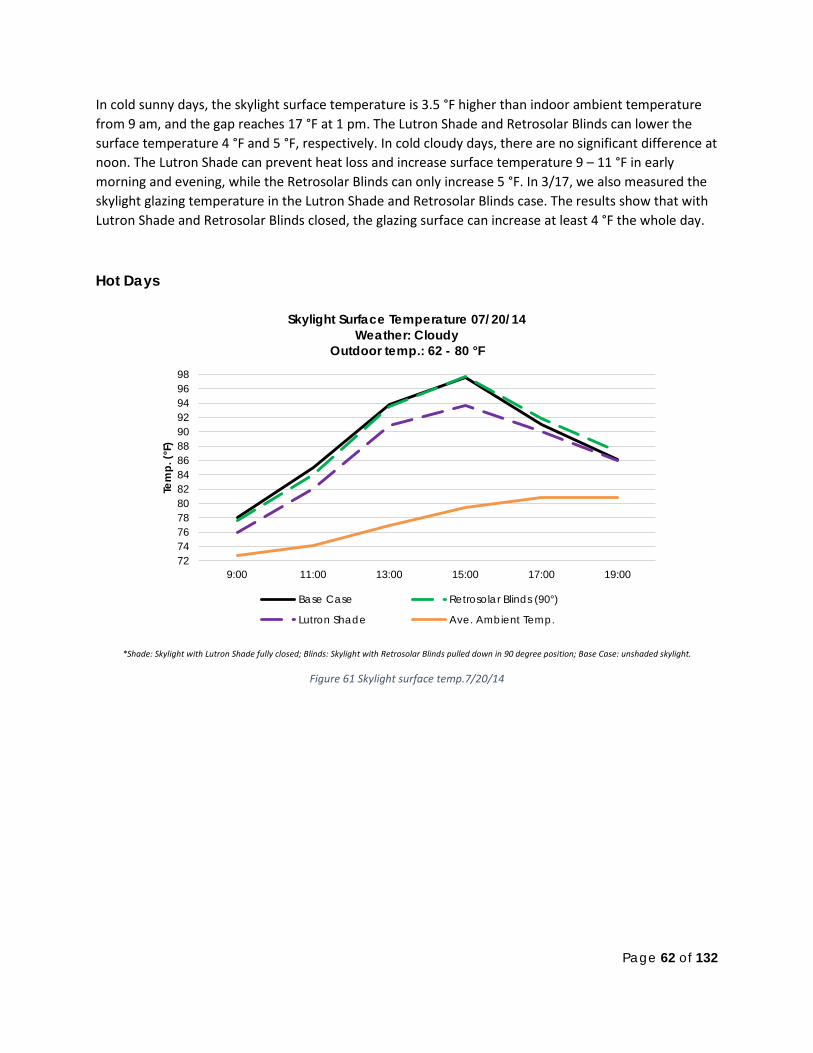
Page 62 of 132
In cold sunny days, the skylight surface temperature is 3.5 °F higher than indoor ambient temperature from 9 am, and the gap reaches 17 °F at 1 pm. The Lutron Shade and Retrosolar Blinds can lower the surface temperature 4 °F and 5 °F, respectively. In cold cloudy days, there are no significant difference at noon. The Lutron Shade can prevent heat loss and increase surface temperature 9 – 11 °F in early morning and evening, while the Retrosolar Blinds can only increase 5 °F. In 3/17, we also measured the skylight glazing temperature in the Lutron Shade and Retrosolar Blinds case. The results show that with Lutron Shade and Retrosolar Blinds closed, the glazing surface can increase at least 4 °F the whole day.
Hot Days
*Shade: Skylight with Lutron Shade fully closed; Blinds: Skylight with Retrosolar Blinds pulled down in 90 degree position; Base Case: unshaded skylight.
Figure 61 Skylight surface temp.7/20/14
7274767880828486889092949698
9:00 11:00 13:00 15:00 17:00 19:00
Tem
p. (°
F)
Skylight Surface Temperature 07/20/14 Weather: Cloudy
Outdoor temp.: 62 - 80 °F
Base Case Retrosolar Blinds (90°)
Lutron Shade Ave. Ambient Temp.
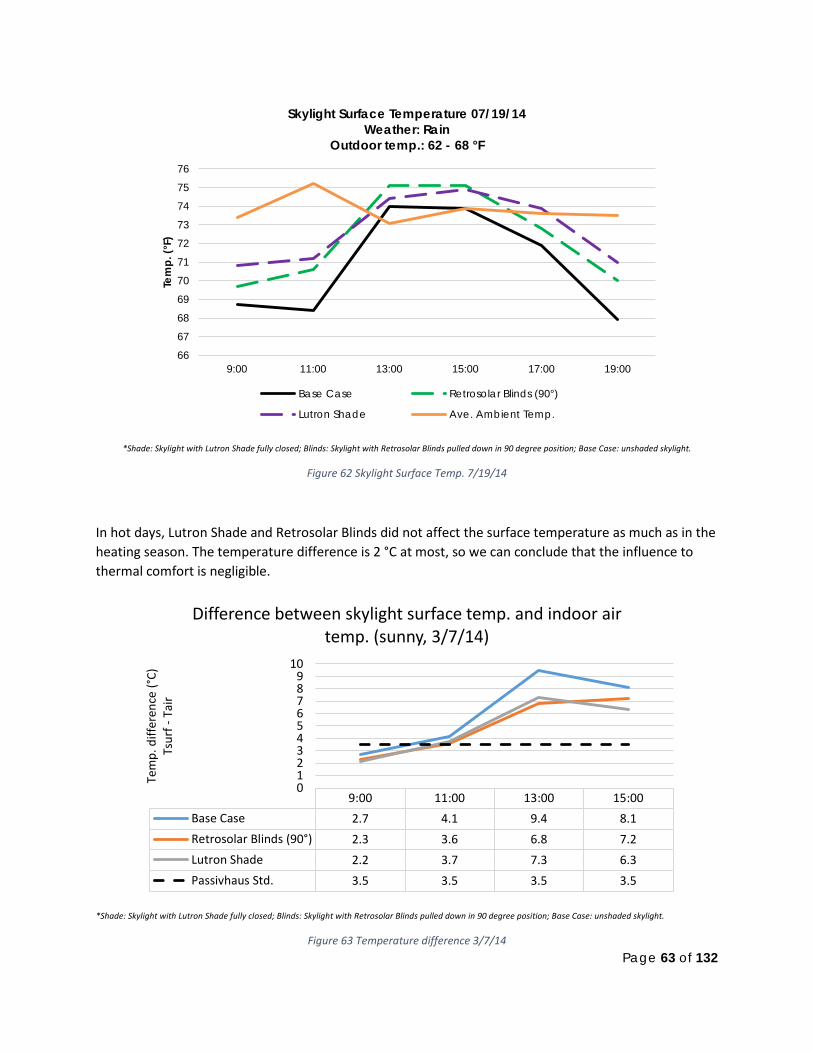
Page 63 of 132
*Shade: Skylight with Lutron Shade fully closed; Blinds: Skylight with Retrosolar Blinds pulled down in 90 degree position; Base Case: unshaded skylight.
Figure 62 Skylight Surface Temp. 7/19/14
In hot days, Lutron Shade and Retrosolar Blinds did not affect the surface temperature as much as in the heating season. The temperature difference is 2 °C at most, so we can conclude that the influence to thermal comfort is negligible.
*Shade: Skylight with Lutron Shade fully closed; Blinds: Skylight with Retrosolar Blinds pulled down in 90 degree position; Base Case: unshaded skylight.
Figure 63 Temperature difference 3/7/14
66
67
68
69
70
71
72
73
74
75
76
9:00 11:00 13:00 15:00 17:00 19:00
Tem
p. (°
F)
Skylight Surface Temperature 07/19/14 Weather: Rain
Outdoor temp.: 62 - 68 °F
Base Case Retrosolar Blinds (90°)
Lutron Shade Ave. Ambient Temp.
9:00 11:00 13:00 15:00Base Case 2.7 4.1 9.4 8.1Retrosolar Blinds (90°) 2.3 3.6 6.8 7.2Lutron Shade 2.2 3.7 7.3 6.3Passivhaus Std. 3.5 3.5 3.5 3.5
0123456789
10
Tem
p. d
iffer
ence
(°C)
Ts
urf -
Tai
r
Difference between skylight surface temp. and indoor air temp. (sunny, 3/7/14)
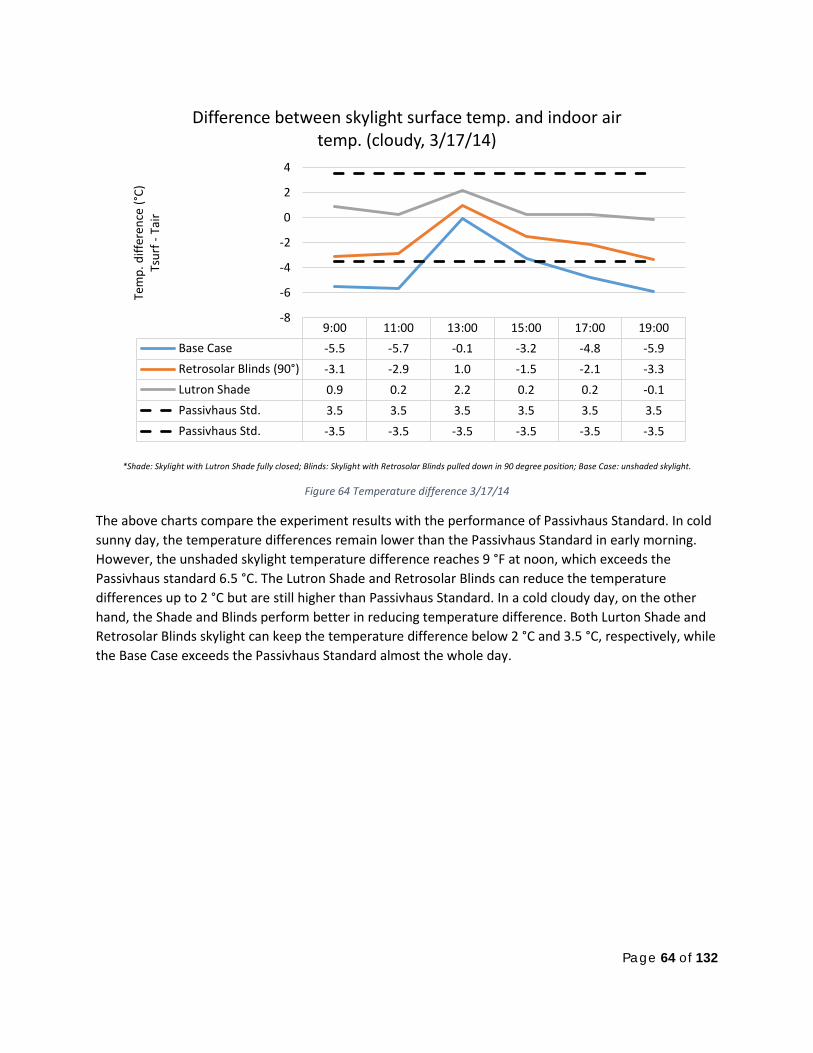
Page 64 of 132
*Shade: Skylight with Lutron Shade fully closed; Blinds: Skylight with Retrosolar Blinds pulled down in 90 degree position; Base Case: unshaded skylight.
Figure 64 Temperature difference 3/17/14
The above charts compare the experiment results with the performance of Passivhaus Standard. In cold sunny day, the temperature differences remain lower than the Passivhaus Standard in early morning. However, the unshaded skylight temperature difference reaches 9 °F at noon, which exceeds the Passivhaus standard 6.5 °C. The Lutron Shade and Retrosolar Blinds can reduce the temperature differences up to 2 °C but are still higher than Passivhaus Standard. In a cold cloudy day, on the other hand, the Shade and Blinds perform better in reducing temperature difference. Both Lurton Shade and Retrosolar Blinds skylight can keep the temperature difference below 2 °C and 3.5 °C, respectively, while the Base Case exceeds the Passivhaus Standard almost the whole day.
9:00 11:00 13:00 15:00 17:00 19:00Base Case -5.5 -5.7 -0.1 -3.2 -4.8 -5.9Retrosolar Blinds (90°) -3.1 -2.9 1.0 -1.5 -2.1 -3.3Lutron Shade 0.9 0.2 2.2 0.2 0.2 -0.1Passivhaus Std. 3.5 3.5 3.5 3.5 3.5 3.5Passivhaus Std. -3.5 -3.5 -3.5 -3.5 -3.5 -3.5
-8
-6
-4
-2
0
2
4
Tem
p. d
iffer
ence
(°C)
Ts
urf -
Tai
r
Difference between skylight surface temp. and indoor air temp. (cloudy, 3/17/14)
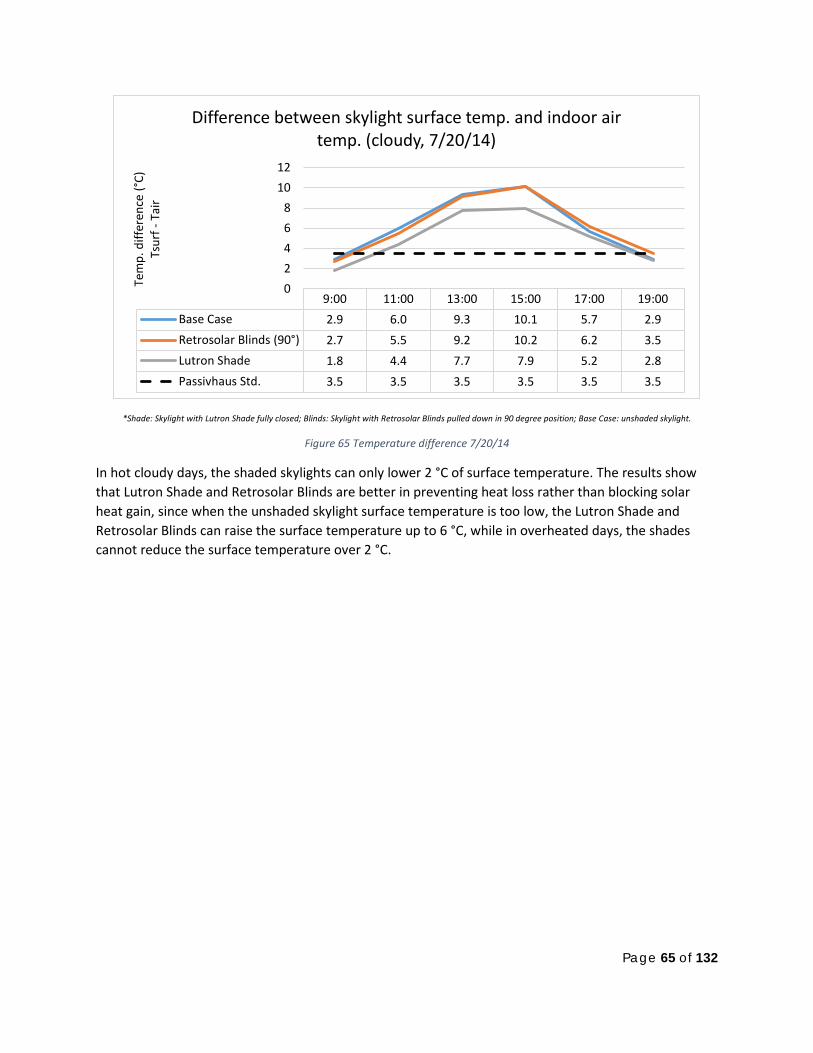
Page 65 of 132
*Shade: Skylight with Lutron Shade fully closed; Blinds: Skylight with Retrosolar Blinds pulled down in 90 degree position; Base Case: unshaded skylight.
Figure 65 Temperature difference 7/20/14
In hot cloudy days, the shaded skylights can only lower 2 °C of surface temperature. The results show that Lutron Shade and Retrosolar Blinds are better in preventing heat loss rather than blocking solar heat gain, since when the unshaded skylight surface temperature is too low, the Lutron Shade and Retrosolar Blinds can raise the surface temperature up to 6 °C, while in overheated days, the shades cannot reduce the surface temperature over 2 °C.
9:00 11:00 13:00 15:00 17:00 19:00Base Case 2.9 6.0 9.3 10.1 5.7 2.9Retrosolar Blinds (90°) 2.7 5.5 9.2 10.2 6.2 3.5Lutron Shade 1.8 4.4 7.7 7.9 5.2 2.8Passivhaus Std. 3.5 3.5 3.5 3.5 3.5 3.5
02468
1012
Tem
p. d
iffer
ence
(°C)
Ts
urf -
Tai
r
Difference between skylight surface temp. and indoor air temp. (cloudy, 7/20/14)
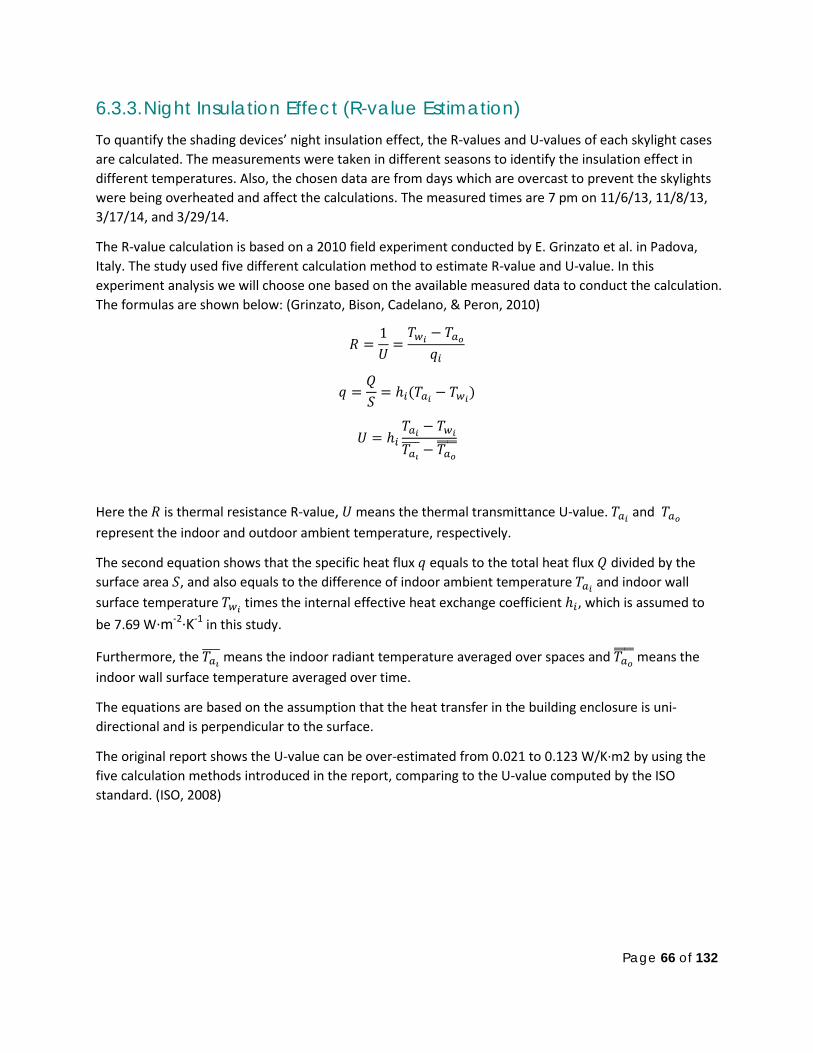
Page 66 of 132
6.3.3. Night Insulation Effect (R-value Estimation) To quantify the shading devices’ night insulation effect, the R-values and U-values of each skylight cases are calculated. The measurements were taken in different seasons to identify the insulation effect in different temperatures. Also, the chosen data are from days which are overcast to prevent the skylights were being overheated and affect the calculations. The measured times are 7 pm on 11/6/13, 11/8/13, 3/17/14, and 3/29/14.
The R-value calculation is based on a 2010 field experiment conducted by E. Grinzato et al. in Padova, Italy. The study used five different calculation method to estimate R-value and U-value. In this experiment analysis we will choose one based on the available measured data to conduct the calculation. The formulas are shown below: (Grinzato, Bison, Cadelano, & Peron, 2010)
𝑅 =1𝑈
=𝑇𝑤𝑖 − 𝑇𝑎𝑜
𝑞𝑖
𝑞 =𝑄𝑆
= ℎ𝑖(𝑇𝑎𝑖 − 𝑇𝑤𝑖)
𝑈 = ℎ𝑖𝑇𝑎𝑖 − 𝑇𝑤𝑖
𝑇𝑎𝚤���� − 𝑇𝑎𝑜����
Here the 𝑅 is thermal resistance R-value, 𝑈 means the thermal transmittance U-value. 𝑇𝑎𝑖 and 𝑇𝑎𝑜 represent the indoor and outdoor ambient temperature, respectively.
The second equation shows that the specific heat flux 𝑞 equals to the total heat flux 𝑄 divided by the surface area 𝑆, and also equals to the difference of indoor ambient temperature 𝑇𝑎𝑖 and indoor wall surface temperature 𝑇𝑤𝑖 times the internal effective heat exchange coefficient ℎ𝑖, which is assumed to be 7.69 W·m-2·K-1 in this study.
Furthermore, the 𝑇𝑎𝚤���� means the indoor radiant temperature averaged over spaces and 𝑇𝑎𝑜���� means the indoor wall surface temperature averaged over time.
The equations are based on the assumption that the heat transfer in the building enclosure is uni-directional and is perpendicular to the surface.
The original report shows the U-value can be over-estimated from 0.021 to 0.123 W/K·m2 by using the five calculation methods introduced in the report, comparing to the U-value computed by the ISO standard. (ISO, 2008)
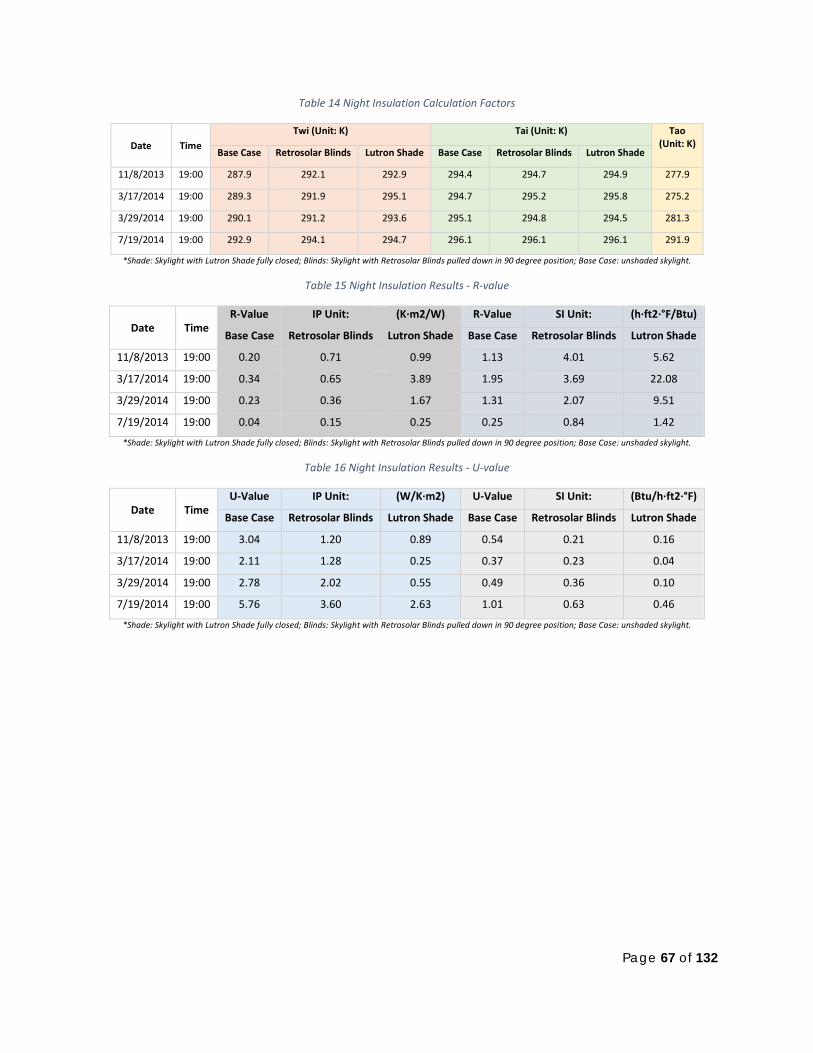
Page 67 of 132
Table 14 Night Insulation Calculation Factors
Date Time Twi (Unit: K) Tai (Unit: K) Tao
(Unit: K) Base Case Retrosolar Blinds Lutron Shade Base Case Retrosolar Blinds Lutron Shade
11/8/2013 19:00 287.9 292.1 292.9 294.4 294.7 294.9 277.9
3/17/2014 19:00 289.3 291.9 295.1 294.7 295.2 295.8 275.2
3/29/2014 19:00 290.1 291.2 293.6 295.1 294.8 294.5 281.3
7/19/2014 19:00 292.9 294.1 294.7 296.1 296.1 296.1 291.9
*Shade: Skylight with Lutron Shade fully closed; Blinds: Skylight with Retrosolar Blinds pulled down in 90 degree position; Base Case: unshaded skylight.
Table 15 Night Insulation Results - R-value
Date Time R-Value IP Unit: (K·m2/W) R-Value SI Unit: (h·ft2·°F/Btu)
Base Case Retrosolar Blinds Lutron Shade Base Case Retrosolar Blinds Lutron Shade
11/8/2013 19:00 0.20 0.71 0.99 1.13 4.01 5.62
3/17/2014 19:00 0.34 0.65 3.89 1.95 3.69 22.08
3/29/2014 19:00 0.23 0.36 1.67 1.31 2.07 9.51
7/19/2014 19:00 0.04 0.15 0.25 0.25 0.84 1.42
*Shade: Skylight with Lutron Shade fully closed; Blinds: Skylight with Retrosolar Blinds pulled down in 90 degree position; Base Case: unshaded skylight.
Table 16 Night Insulation Results - U-value
Date Time U-Value IP Unit: (W/K·m2) U-Value SI Unit: (Btu/h·ft2·°F)
Base Case Retrosolar Blinds Lutron Shade Base Case Retrosolar Blinds Lutron Shade
11/8/2013 19:00 3.04 1.20 0.89 0.54 0.21 0.16
3/17/2014 19:00 2.11 1.28 0.25 0.37 0.23 0.04
3/29/2014 19:00 2.78 2.02 0.55 0.49 0.36 0.10
7/19/2014 19:00 5.76 3.60 2.63 1.01 0.63 0.46
*Shade: Skylight with Lutron Shade fully closed; Blinds: Skylight with Retrosolar Blinds pulled down in 90 degree position; Base Case: unshaded skylight.
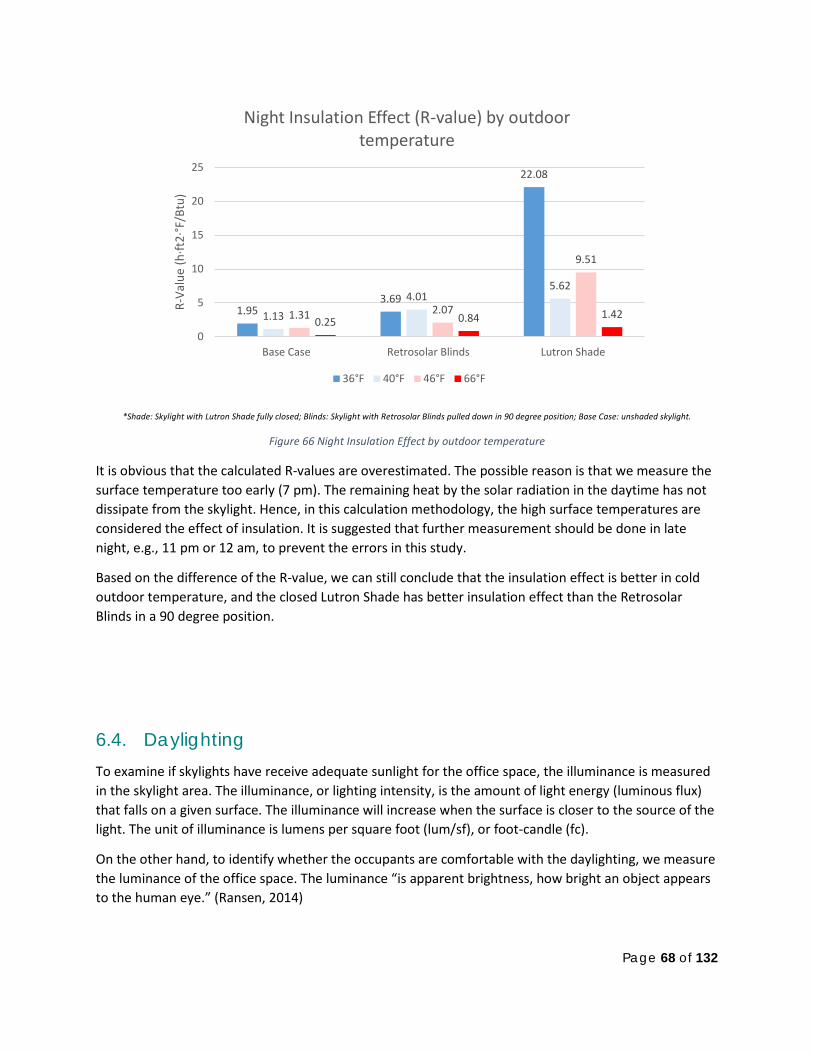
Page 68 of 132
*Shade: Skylight with Lutron Shade fully closed; Blinds: Skylight with Retrosolar Blinds pulled down in 90 degree position; Base Case: unshaded skylight.
Figure 66 Night Insulation Effect by outdoor temperature
It is obvious that the calculated R-values are overestimated. The possible reason is that we measure the surface temperature too early (7 pm). The remaining heat by the solar radiation in the daytime has not dissipate from the skylight. Hence, in this calculation methodology, the high surface temperatures are considered the effect of insulation. It is suggested that further measurement should be done in late night, e.g., 11 pm or 12 am, to prevent the errors in this study.
Based on the difference of the R-value, we can still conclude that the insulation effect is better in cold outdoor temperature, and the closed Lutron Shade has better insulation effect than the Retrosolar Blinds in a 90 degree position.
6.4. Daylighting To examine if skylights have receive adequate sunlight for the office space, the illuminance is measured in the skylight area. The illuminance, or lighting intensity, is the amount of light energy (luminous flux) that falls on a given surface. The illuminance will increase when the surface is closer to the source of the light. The unit of illuminance is lumens per square foot (lum/sf), or foot-candle (fc).
On the other hand, to identify whether the occupants are comfortable with the daylighting, we measure the luminance of the office space. The luminance “is apparent brightness, how bright an object appears to the human eye.” (Ransen, 2014)
1.95 3.69
22.08
1.13
4.01 5.62
1.31 2.07
9.51
0.25 0.84 1.42
0
5
10
15
20
25
Base Case Retrosolar Blinds Lutron Shade
R-Va
lue
(h·ft
2·°F
/Btu
)
Night Insulation Effect (R-value) by outdoor temperature
36°F 40°F 46°F 66°F
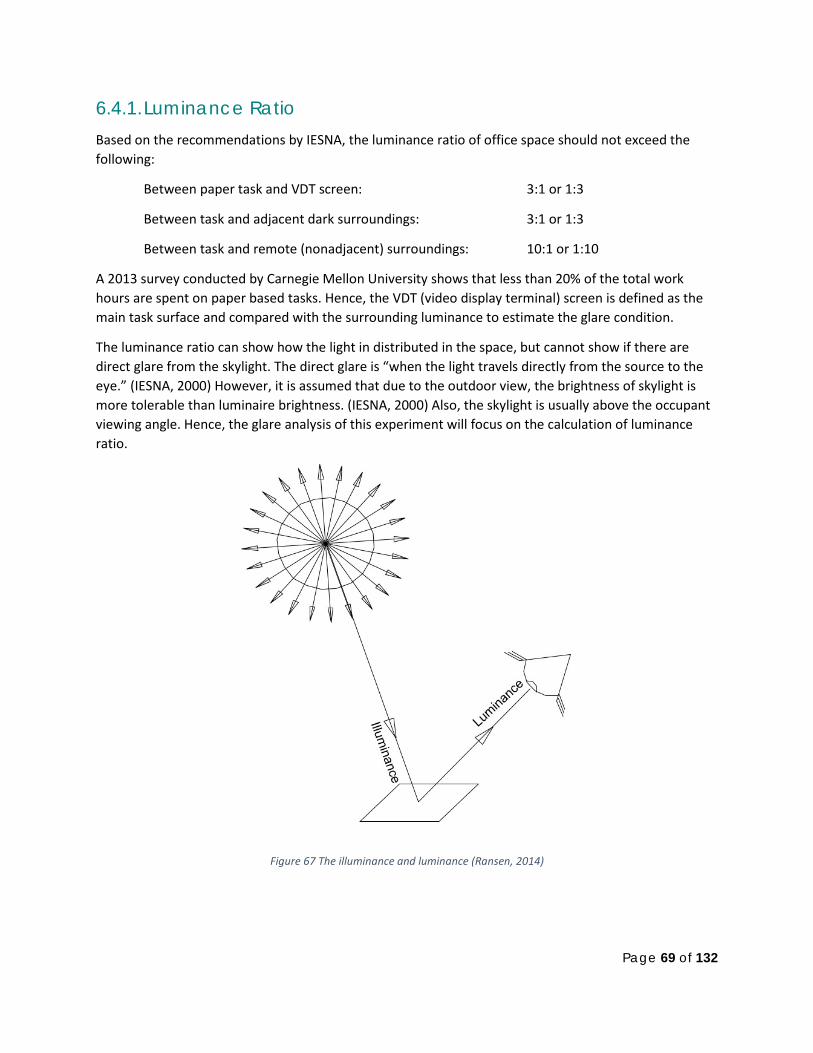
Page 69 of 132
6.4.1. Luminance Ratio Based on the recommendations by IESNA, the luminance ratio of office space should not exceed the following:
Between paper task and VDT screen: 3:1 or 1:3
Between task and adjacent dark surroundings: 3:1 or 1:3
Between task and remote (nonadjacent) surroundings: 10:1 or 1:10
A 2013 survey conducted by Carnegie Mellon University shows that less than 20% of the total work hours are spent on paper based tasks. Hence, the VDT (video display terminal) screen is defined as the main task surface and compared with the surrounding luminance to estimate the glare condition.
The luminance ratio can show how the light in distributed in the space, but cannot show if there are direct glare from the skylight. The direct glare is “when the light travels directly from the source to the eye.” (IESNA, 2000) However, it is assumed that due to the outdoor view, the brightness of skylight is more tolerable than luminaire brightness. (IESNA, 2000) Also, the skylight is usually above the occupant viewing angle. Hence, the glare analysis of this experiment will focus on the calculation of luminance ratio.
Figure 67 The illuminance and luminance (Ransen, 2014)
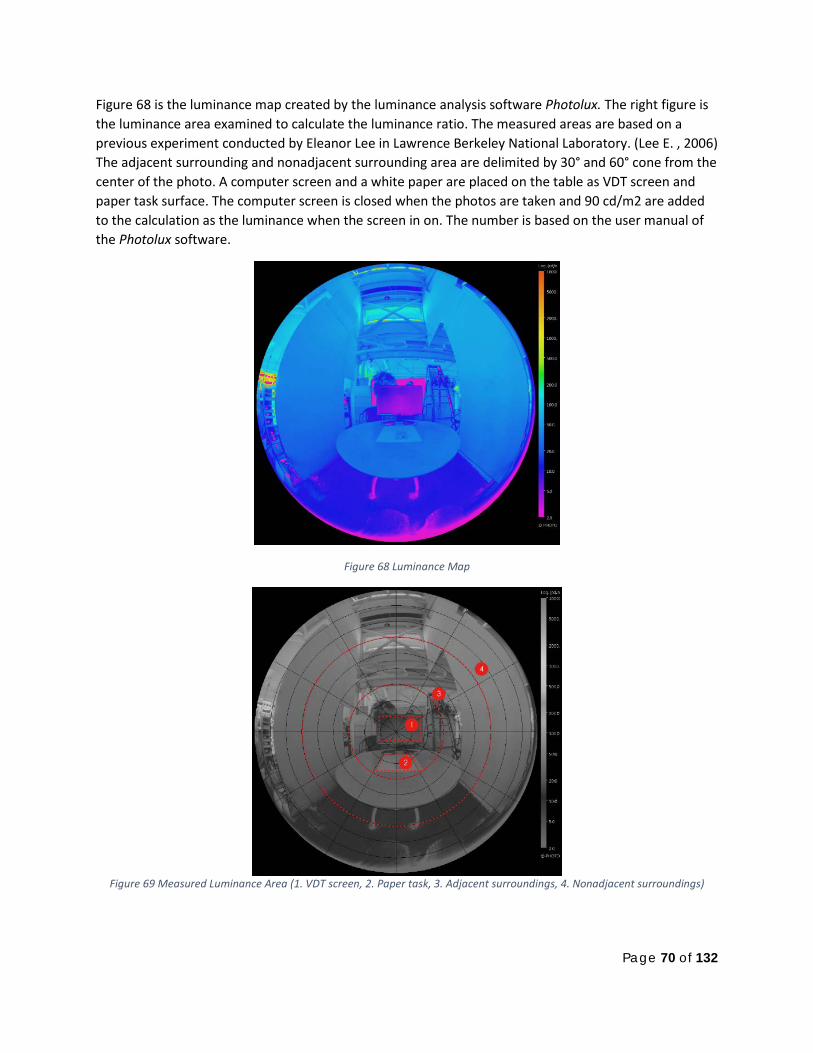
Page 70 of 132
Figure 68 is the luminance map created by the luminance analysis software Photolux. The right figure is the luminance area examined to calculate the luminance ratio. The measured areas are based on a previous experiment conducted by Eleanor Lee in Lawrence Berkeley National Laboratory. (Lee E. , 2006) The adjacent surrounding and nonadjacent surrounding area are delimited by 30° and 60° cone from the center of the photo. A computer screen and a white paper are placed on the table as VDT screen and paper task surface. The computer screen is closed when the photos are taken and 90 cd/m2 are added to the calculation as the luminance when the screen in on. The number is based on the user manual of the Photolux software.
Figure 68 Luminance Map
Figure 69 Measured Luminance Area (1. VDT screen, 2. Paper task, 3. Adjacent surroundings, 4. Nonadjacent surroundings)

Page 71 of 132
Sky Condition in Pittsburgh
In general, to prevent glare in building daylighting design is to prevent low-angle direct sunlight. However, this is usually used for daylight from vertical fenestrations at occupant level. In this experiment, the fenestrations are tilted and much higher than the occupants. To identify the glare problem in various sun angle, measurements are taken in both heating season and cooling season.
In Pittsburgh, there are more cloudy or overcast days in the winter and more clear and sunny days in summer.
Glare in Heating Season
In the heating season, the measured days are 3/22, 3/23, 3/29 and 3/30. The fisheye photos are taken every two hours from 11 am to 7 pm. Due to the limitation of the experiment site, only the data from 3/29 are complete, which the results are shown below:
*Shade: Skylight with Lutron Shade fully closed; Blinds: Skylight with Retrosolar Blinds pulled down in 90 degree position; Base Case: unshaded skylight.
Figure 70 Luminance ratio in 3/29/14
The luminance ratios of the Base Case skylight (without shading) remain under the IESNA recommendation at noon, and the surrounds become too dark at around 3 pm when the screen and paper task ratio exceeds 3:1. The ratio shows that the screen is 3.5 times brighter than the surroundings, which the screen has become the source of glare. The luminance ratios of skylights with Lutron Shade
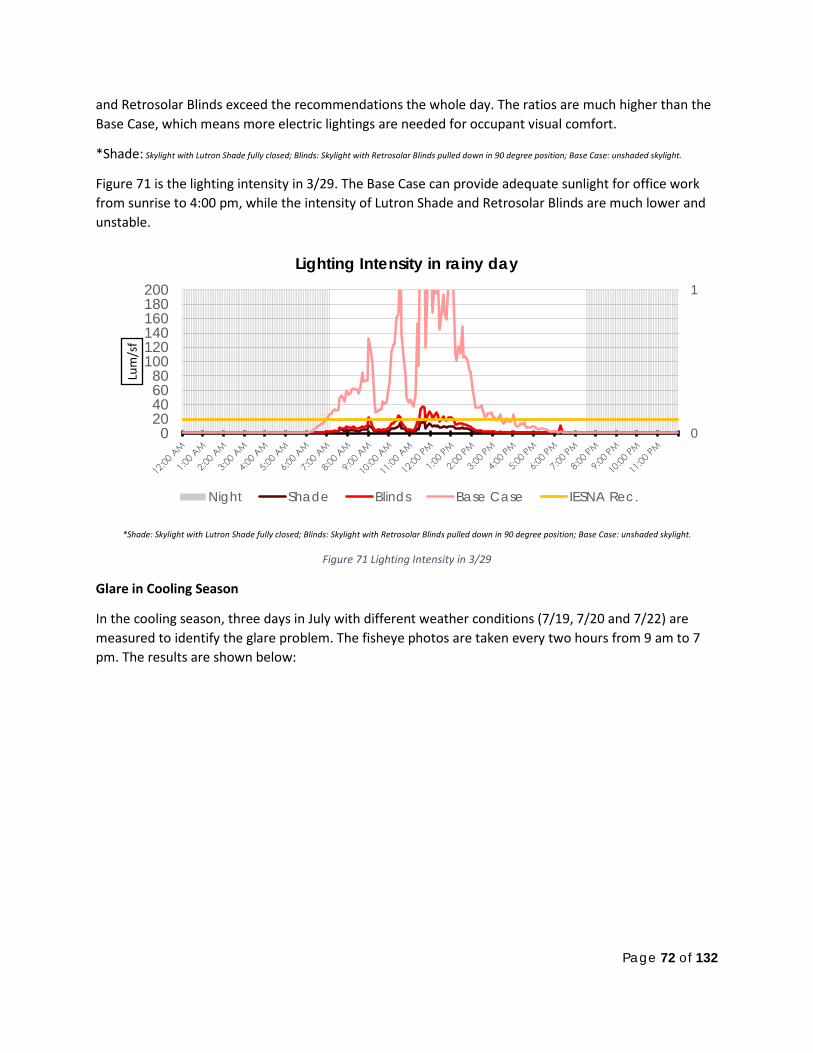
Page 72 of 132
and Retrosolar Blinds exceed the recommendations the whole day. The ratios are much higher than the Base Case, which means more electric lightings are needed for occupant visual comfort.
*Shade: Skylight with Lutron Shade fully closed; Blinds: Skylight with Retrosolar Blinds pulled down in 90 degree position; Base Case: unshaded skylight.
Figure 71 is the lighting intensity in 3/29. The Base Case can provide adequate sunlight for office work from sunrise to 4:00 pm, while the intensity of Lutron Shade and Retrosolar Blinds are much lower and unstable.
*Shade: Skylight with Lutron Shade fully closed; Blinds: Skylight with Retrosolar Blinds pulled down in 90 degree position; Base Case: unshaded skylight.
Figure 71 Lighting Intensity in 3/29
Glare in Cooling Season
In the cooling season, three days in July with different weather conditions (7/19, 7/20 and 7/22) are measured to identify the glare problem. The fisheye photos are taken every two hours from 9 am to 7 pm. The results are shown below:
0
1
020406080
100120140160180200
Lum
/sf
Lighting Intensity in rainy day
Night Shade Blinds Base Case IESNA Rec.
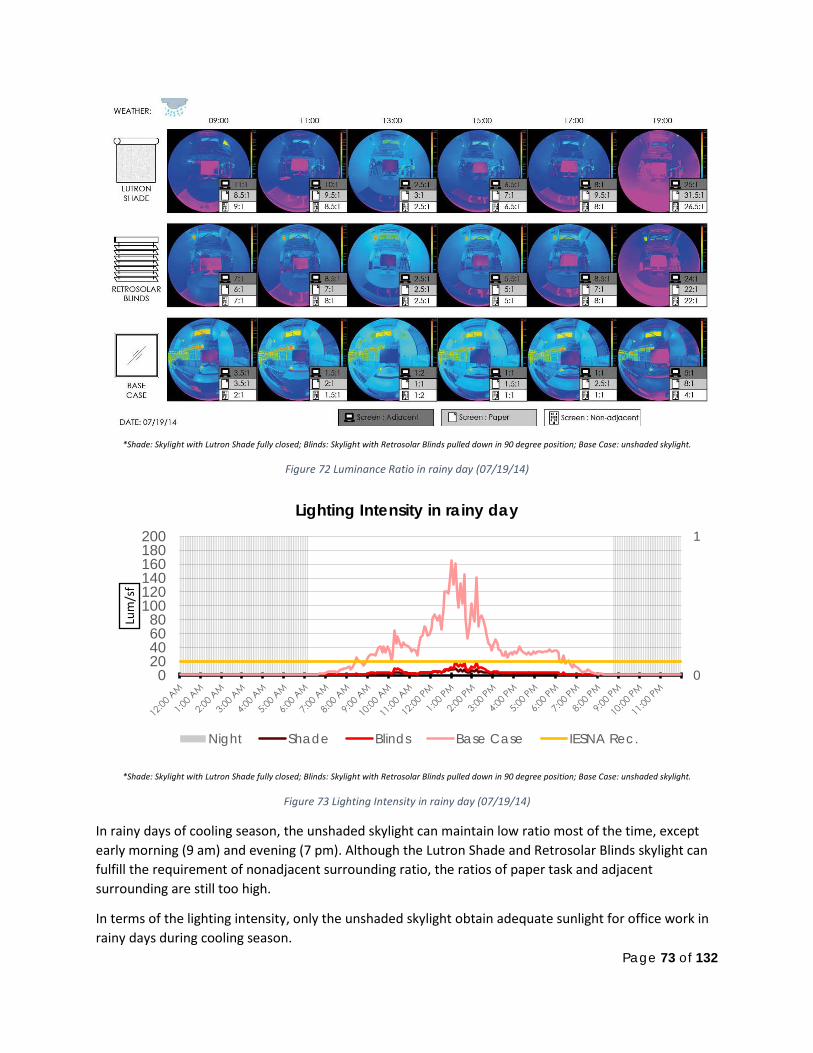
Page 73 of 132
*Shade: Skylight with Lutron Shade fully closed; Blinds: Skylight with Retrosolar Blinds pulled down in 90 degree position; Base Case: unshaded skylight.
Figure 72 Luminance Ratio in rainy day (07/19/14)
*Shade: Skylight with Lutron Shade fully closed; Blinds: Skylight with Retrosolar Blinds pulled down in 90 degree position; Base Case: unshaded skylight.
Figure 73 Lighting Intensity in rainy day (07/19/14)
In rainy days of cooling season, the unshaded skylight can maintain low ratio most of the time, except early morning (9 am) and evening (7 pm). Although the Lutron Shade and Retrosolar Blinds skylight can fulfill the requirement of nonadjacent surrounding ratio, the ratios of paper task and adjacent surrounding are still too high.
In terms of the lighting intensity, only the unshaded skylight obtain adequate sunlight for office work in rainy days during cooling season.
0
1
020406080
100120140160180200
Lum
/sf
Lighting Intensity in rainy day
Night Shade Blinds Base Case IESNA Rec.
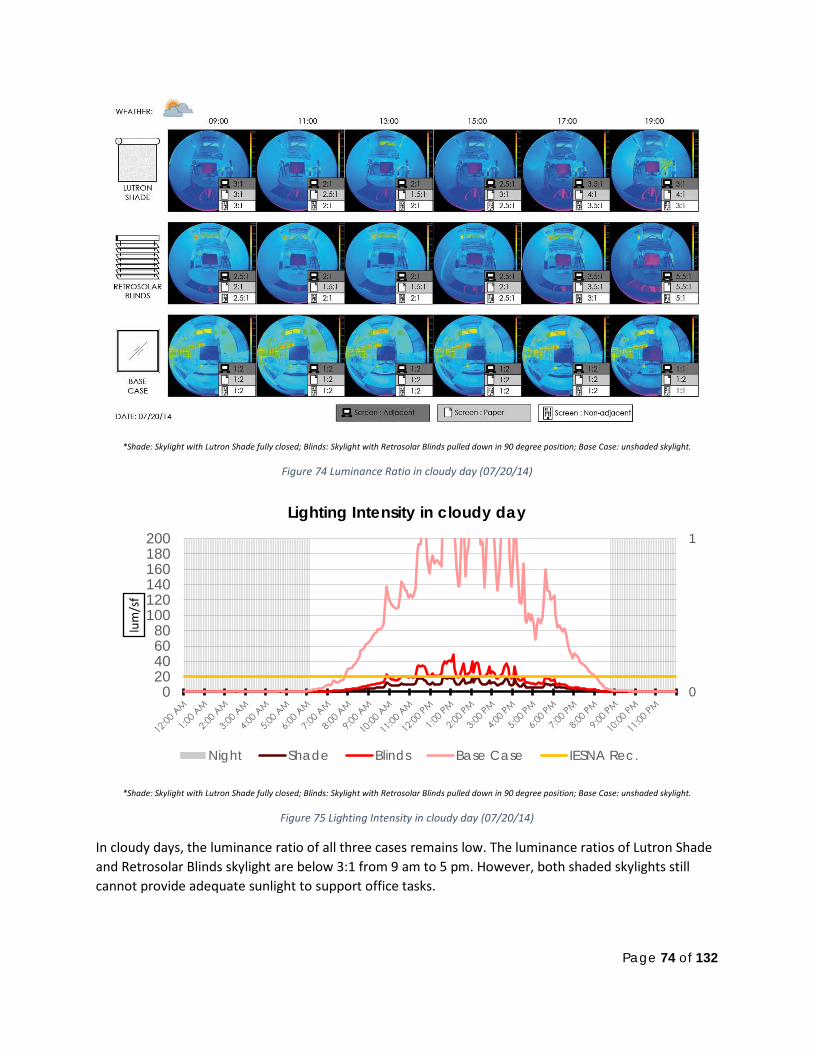
Page 74 of 132
*Shade: Skylight with Lutron Shade fully closed; Blinds: Skylight with Retrosolar Blinds pulled down in 90 degree position; Base Case: unshaded skylight.
Figure 74 Luminance Ratio in cloudy day (07/20/14)
*Shade: Skylight with Lutron Shade fully closed; Blinds: Skylight with Retrosolar Blinds pulled down in 90 degree position; Base Case: unshaded skylight.
Figure 75 Lighting Intensity in cloudy day (07/20/14)
In cloudy days, the luminance ratio of all three cases remains low. The luminance ratios of Lutron Shade and Retrosolar Blinds skylight are below 3:1 from 9 am to 5 pm. However, both shaded skylights still cannot provide adequate sunlight to support office tasks.
0
1
020406080
100120140160180200
lum
/sf
Lighting Intensity in cloudy day
Night Shade Blinds Base Case IESNA Rec.
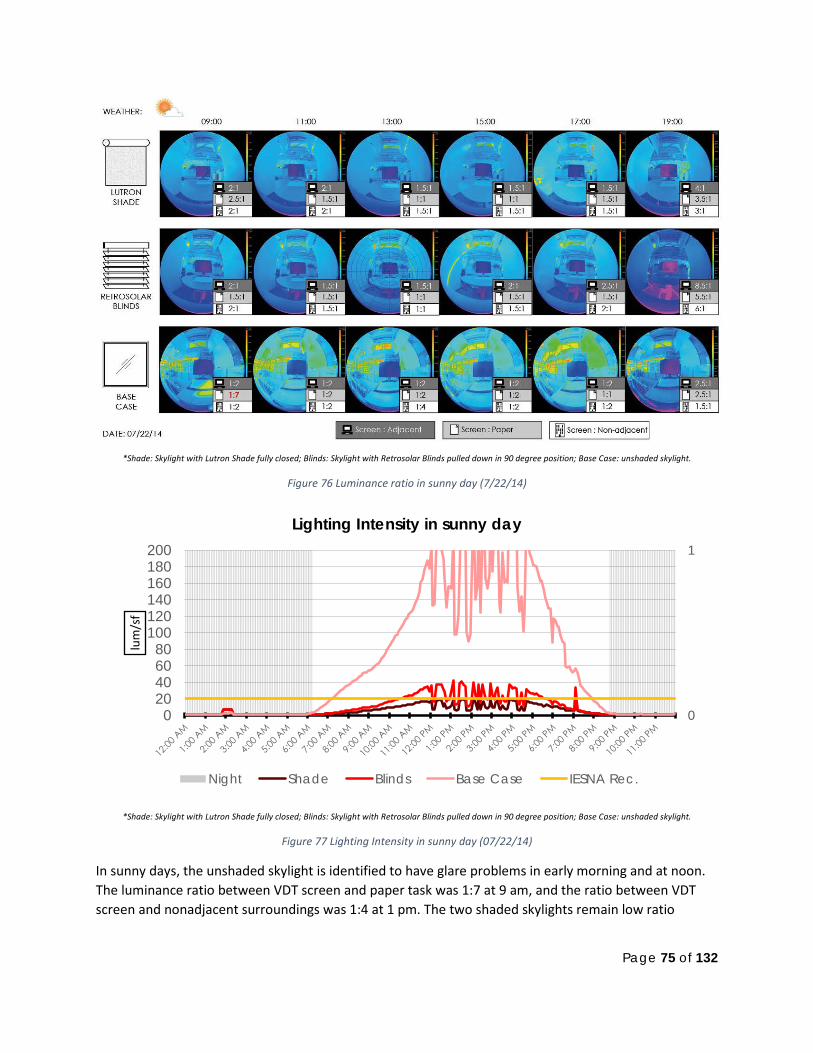
Page 75 of 132
*Shade: Skylight with Lutron Shade fully closed; Blinds: Skylight with Retrosolar Blinds pulled down in 90 degree position; Base Case: unshaded skylight.
Figure 76 Luminance ratio in sunny day (7/22/14)
*Shade: Skylight with Lutron Shade fully closed; Blinds: Skylight with Retrosolar Blinds pulled down in 90 degree position; Base Case: unshaded skylight.
Figure 77 Lighting Intensity in sunny day (07/22/14)
In sunny days, the unshaded skylight is identified to have glare problems in early morning and at noon. The luminance ratio between VDT screen and paper task was 1:7 at 9 am, and the ratio between VDT screen and nonadjacent surroundings was 1:4 at 1 pm. The two shaded skylights remain low ratio
0
1
020406080
100120140160180200
lum
/sf
Lighting Intensity in sunny day
Night Shade Blinds Base Case IESNA Rec.
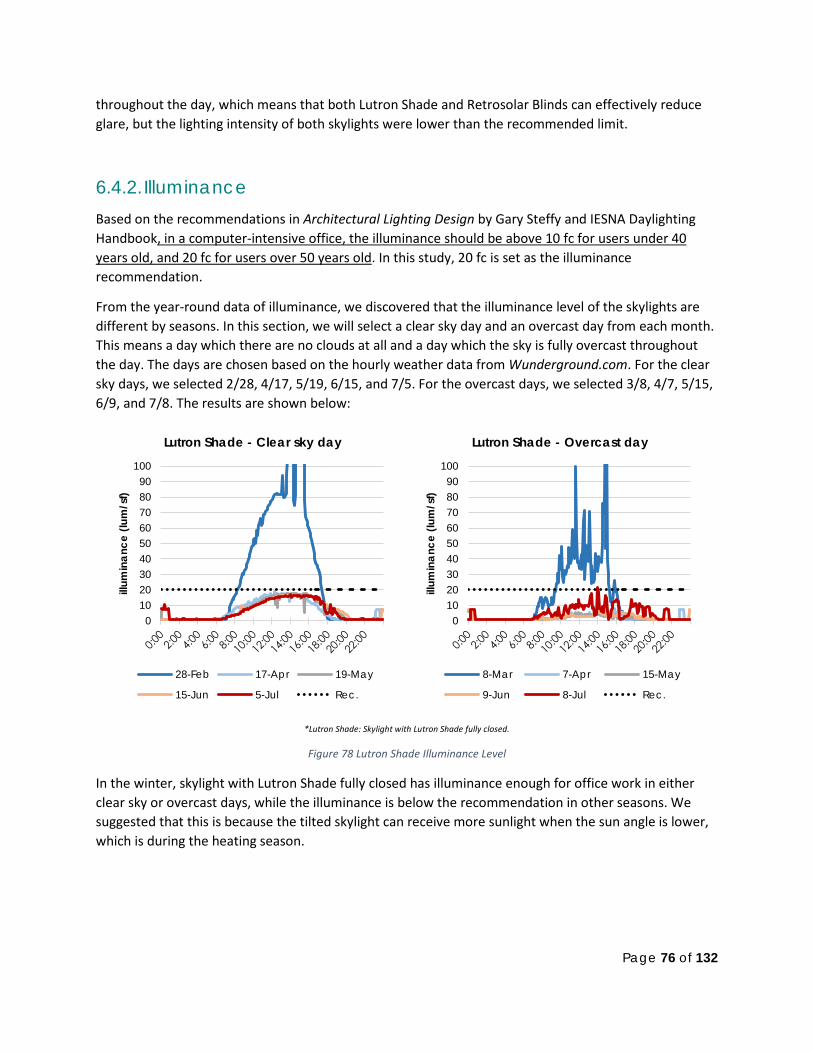
Page 76 of 132
throughout the day, which means that both Lutron Shade and Retrosolar Blinds can effectively reduce glare, but the lighting intensity of both skylights were lower than the recommended limit.
6.4.2. Illuminance Based on the recommendations in Architectural Lighting Design by Gary Steffy and IESNA Daylighting Handbook, in a computer-intensive office, the illuminance should be above 10 fc for users under 40 years old, and 20 fc for users over 50 years old. In this study, 20 fc is set as the illuminance recommendation.
From the year-round data of illuminance, we discovered that the illuminance level of the skylights are different by seasons. In this section, we will select a clear sky day and an overcast day from each month. This means a day which there are no clouds at all and a day which the sky is fully overcast throughout the day. The days are chosen based on the hourly weather data from Wunderground.com. For the clear sky days, we selected 2/28, 4/17, 5/19, 6/15, and 7/5. For the overcast days, we selected 3/8, 4/7, 5/15, 6/9, and 7/8. The results are shown below:
*Lutron Shade: Skylight with Lutron Shade fully closed.
Figure 78 Lutron Shade Illuminance Level
In the winter, skylight with Lutron Shade fully closed has illuminance enough for office work in either clear sky or overcast days, while the illuminance is below the recommendation in other seasons. We suggested that this is because the tilted skylight can receive more sunlight when the sun angle is lower, which is during the heating season.
0102030405060708090
100
illum
inan
ce (l
um/s
f)
Lutron Shade - Clear sky day
28-Feb 17-Apr 19-May
15-Jun 5-Jul Rec.
0102030405060708090
100
illum
inan
ce (l
um/s
f) Lutron Shade - Overcast day
8-Mar 7-Apr 15-May
9-Jun 8-Jul Rec.
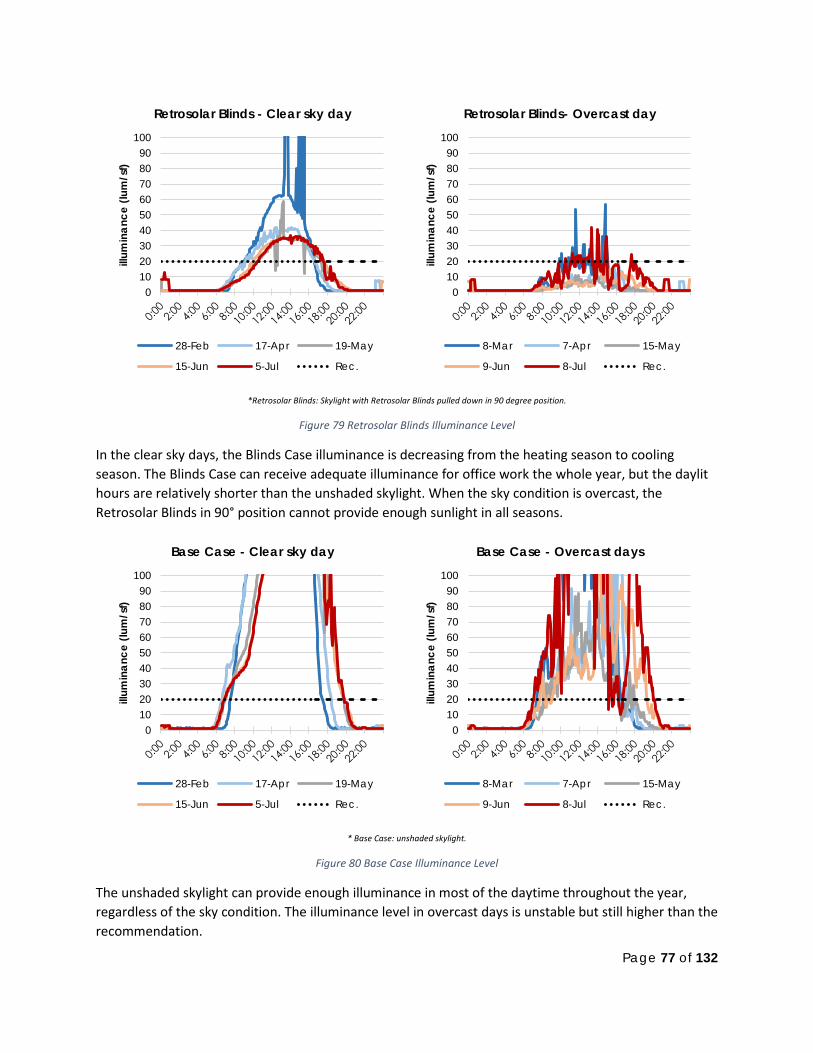
Page 77 of 132
*Retrosolar Blinds: Skylight with Retrosolar Blinds pulled down in 90 degree position.
Figure 79 Retrosolar Blinds Illuminance Level
In the clear sky days, the Blinds Case illuminance is decreasing from the heating season to cooling season. The Blinds Case can receive adequate illuminance for office work the whole year, but the daylit hours are relatively shorter than the unshaded skylight. When the sky condition is overcast, the Retrosolar Blinds in 90° position cannot provide enough sunlight in all seasons.
* Base Case: unshaded skylight.
Figure 80 Base Case Illuminance Level
The unshaded skylight can provide enough illuminance in most of the daytime throughout the year, regardless of the sky condition. The illuminance level in overcast days is unstable but still higher than the recommendation.
0102030405060708090
100ill
umin
ance
(lum
/sf)
Retrosolar Blinds - Clear sky day
28-Feb 17-Apr 19-May
15-Jun 5-Jul Rec.
0102030405060708090
100
illum
inan
ce (l
um/s
f)
Retrosolar Blinds- Overcast day
8-Mar 7-Apr 15-May
9-Jun 8-Jul Rec.
0102030405060708090
100
illum
inan
ce (l
um/s
f)
Base Case - Clear sky day
28-Feb 17-Apr 19-May
15-Jun 5-Jul Rec.
0102030405060708090
100
illum
inan
ce (l
um/s
f)
Base Case - Overcast days
8-Mar 7-Apr 15-May
9-Jun 8-Jul Rec.
Page 78 of 132
6.5. Integrated Dynamic Shading Recommendations To develop the dynamic shading strategies, we take the analysis results, including thermal comfort, illuminance, glare, operative temperature, and night insulation effect into account. Several matrix are created based on the data of each typical days to arrange the six decision factors. The recommendations made by the matrix are further used to develop the two decision flow charts.
The order of the priorities is glare, illuminance, thermal comfort, operative temperature, night insulation. Firstly, the glare problem is considered the most direct discomfort in this study. Second, the illuminance is the main purpose of installing a skylight. Therefore, the light factors are the top two priorities. The factors are listed in the matrix based on the priorities. However, the glare occurs only on clear sky mornings, the other glare problems mentioned in the matrix is because the VDT is too bright and the surroundings are too dark. This type of glare is considered less important than other factors.
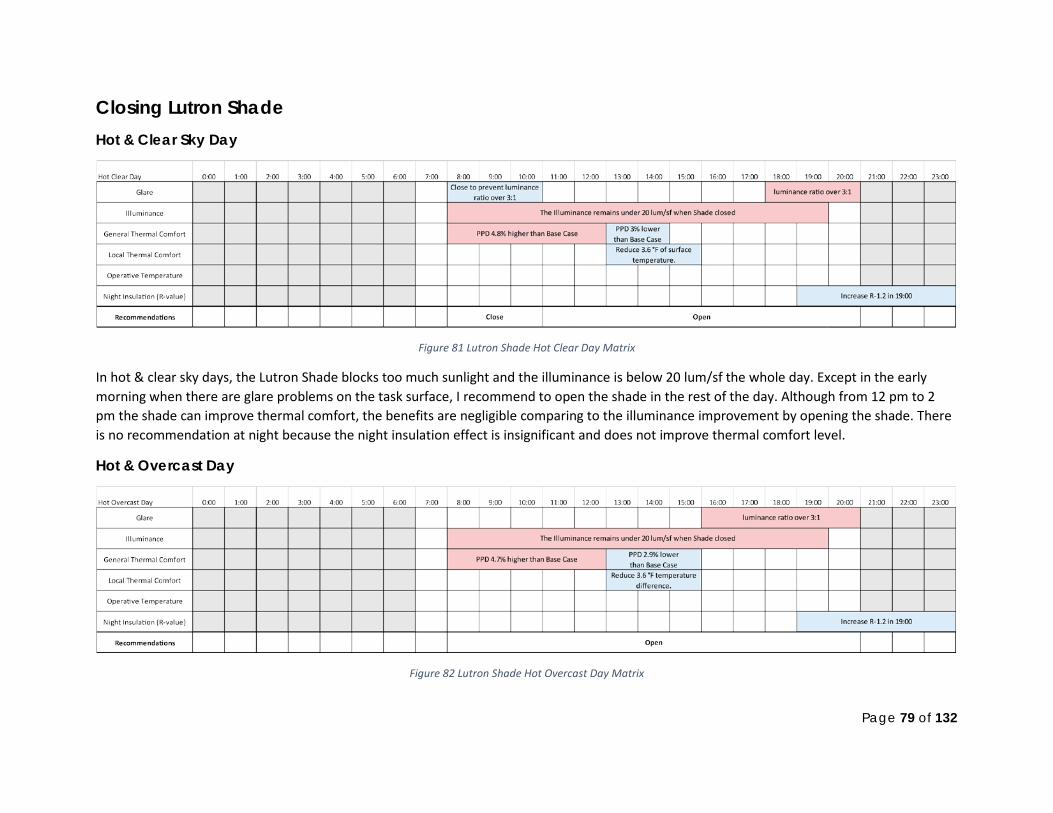
Page 79 of 132
Closing Lutron Shade Hot & Clear Sky Day
Figure 81 Lutron Shade Hot Clear Day Matrix
In hot & clear sky days, the Lutron Shade blocks too much sunlight and the illuminance is below 20 lum/sf the whole day. Except in the early morning when there are glare problems on the task surface, I recommend to open the shade in the rest of the day. Although from 12 pm to 2 pm the shade can improve thermal comfort, the benefits are negligible comparing to the illuminance improvement by opening the shade. There is no recommendation at night because the night insulation effect is insignificant and does not improve thermal comfort level.
Hot & Overcast Day
Figure 82 Lutron Shade Hot Overcast Day Matrix
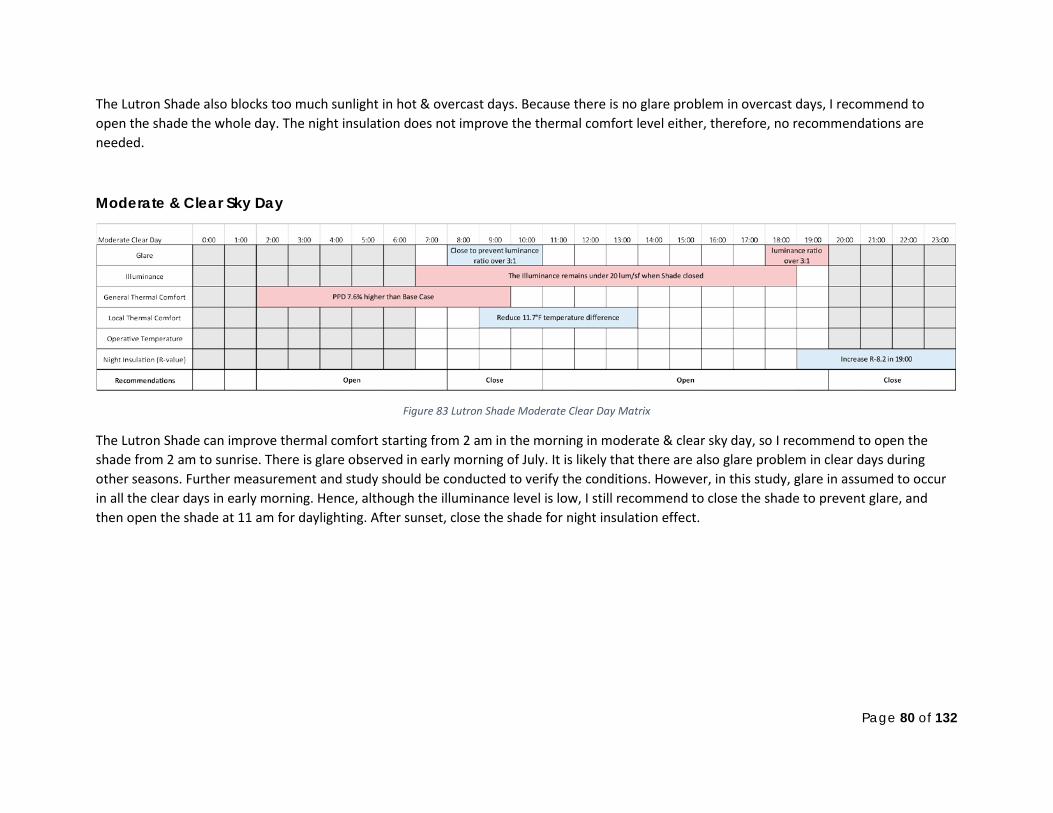
Page 80 of 132
The Lutron Shade also blocks too much sunlight in hot & overcast days. Because there is no glare problem in overcast days, I recommend to open the shade the whole day. The night insulation does not improve the thermal comfort level either, therefore, no recommendations are needed.
Moderate & Clear Sky Day
Figure 83 Lutron Shade Moderate Clear Day Matrix
The Lutron Shade can improve thermal comfort starting from 2 am in the morning in moderate & clear sky day, so I recommend to open the shade from 2 am to sunrise. There is glare observed in early morning of July. It is likely that there are also glare problem in clear days during other seasons. Further measurement and study should be conducted to verify the conditions. However, in this study, glare in assumed to occur in all the clear days in early morning. Hence, although the illuminance level is low, I still recommend to close the shade to prevent glare, and then open the shade at 11 am for daylighting. After sunset, close the shade for night insulation effect.
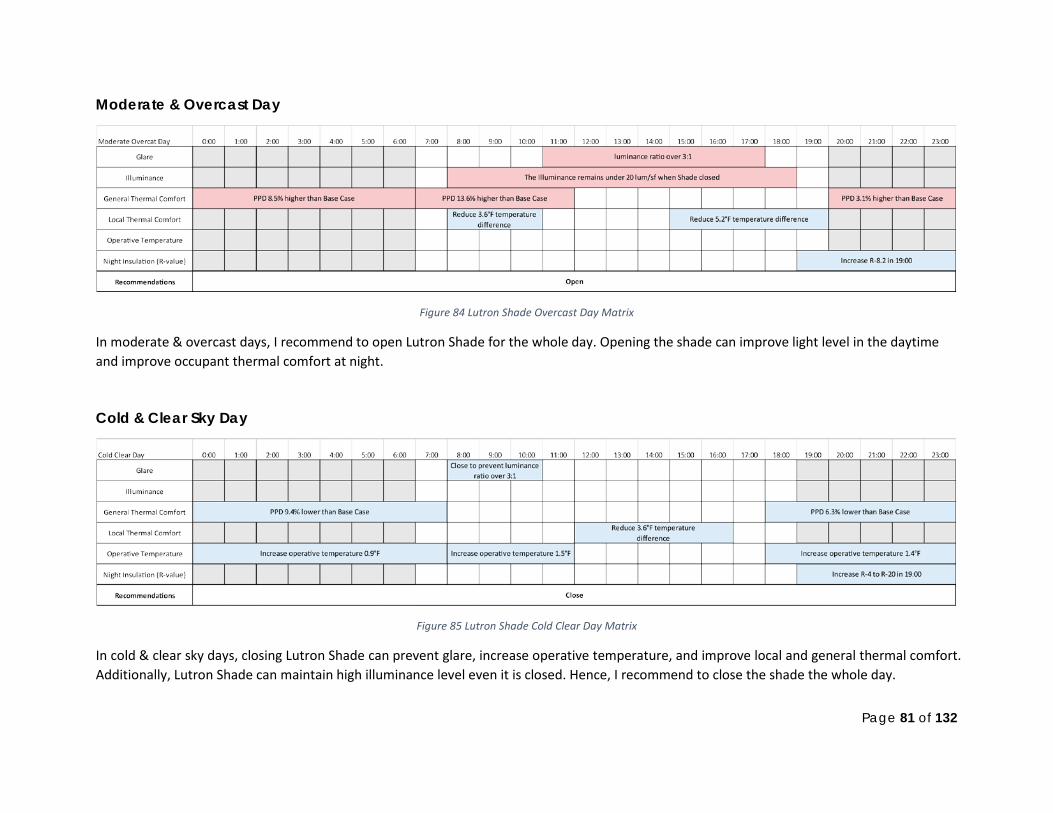
Page 81 of 132
Moderate & Overcast Day
Figure 84 Lutron Shade Overcast Day Matrix
In moderate & overcast days, I recommend to open Lutron Shade for the whole day. Opening the shade can improve light level in the daytime and improve occupant thermal comfort at night.
Cold & Clear Sky Day
Figure 85 Lutron Shade Cold Clear Day Matrix
In cold & clear sky days, closing Lutron Shade can prevent glare, increase operative temperature, and improve local and general thermal comfort. Additionally, Lutron Shade can maintain high illuminance level even it is closed. Hence, I recommend to close the shade the whole day.
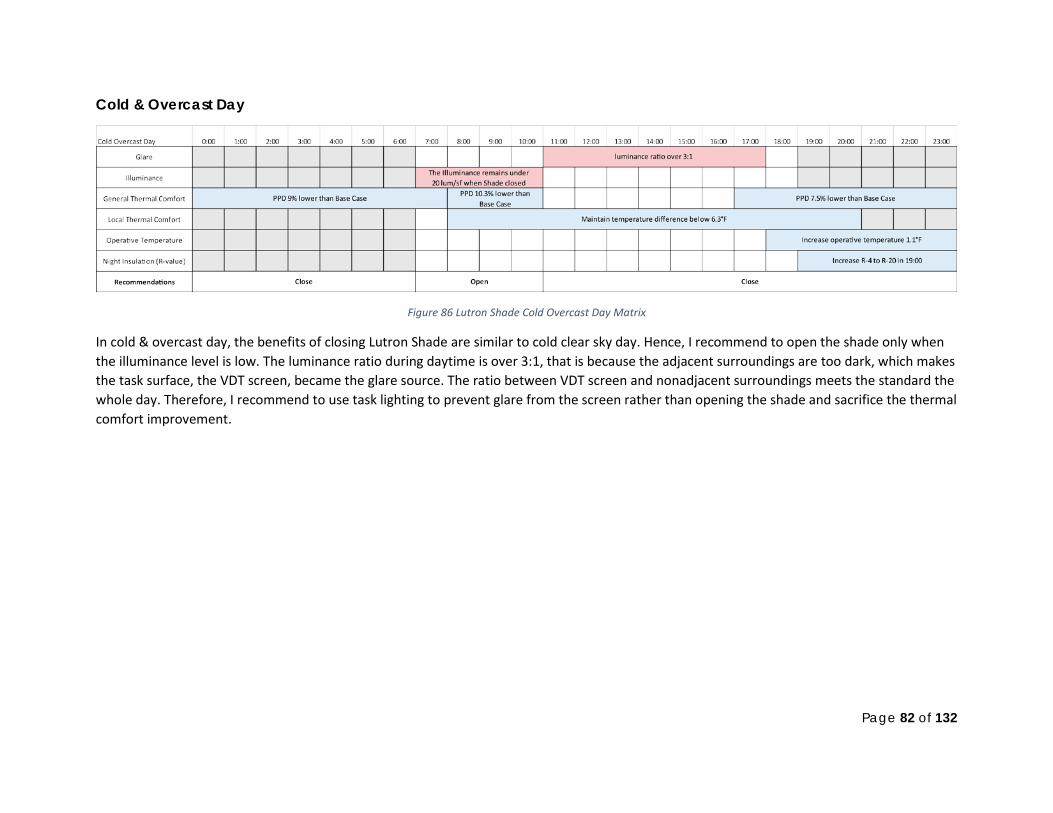
Page 82 of 132
Cold & Overcast Day
Figure 86 Lutron Shade Cold Overcast Day Matrix
In cold & overcast day, the benefits of closing Lutron Shade are similar to cold clear sky day. Hence, I recommend to open the shade only when the illuminance level is low. The luminance ratio during daytime is over 3:1, that is because the adjacent surroundings are too dark, which makes the task surface, the VDT screen, became the glare source. The ratio between VDT screen and nonadjacent surroundings meets the standard the whole day. Therefore, I recommend to use task lighting to prevent glare from the screen rather than opening the shade and sacrifice the thermal comfort improvement.
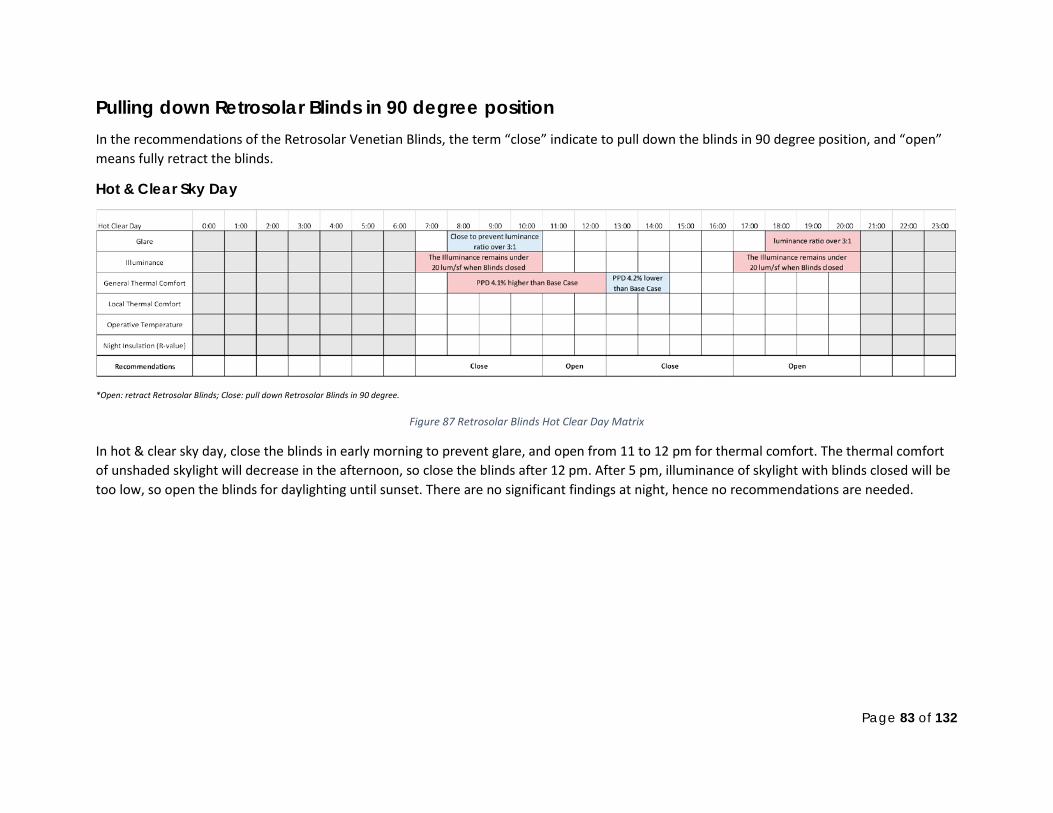
Page 83 of 132
Pulling down Retrosolar Blinds in 90 degree position In the recommendations of the Retrosolar Venetian Blinds, the term “close” indicate to pull down the blinds in 90 degree position, and “open” means fully retract the blinds.
Hot & Clear Sky Day
*Open: retract Retrosolar Blinds; Close: pull down Retrosolar Blinds in 90 degree.
Figure 87 Retrosolar Blinds Hot Clear Day Matrix
In hot & clear sky day, close the blinds in early morning to prevent glare, and open from 11 to 12 pm for thermal comfort. The thermal comfort of unshaded skylight will decrease in the afternoon, so close the blinds after 12 pm. After 5 pm, illuminance of skylight with blinds closed will be too low, so open the blinds for daylighting until sunset. There are no significant findings at night, hence no recommendations are needed.
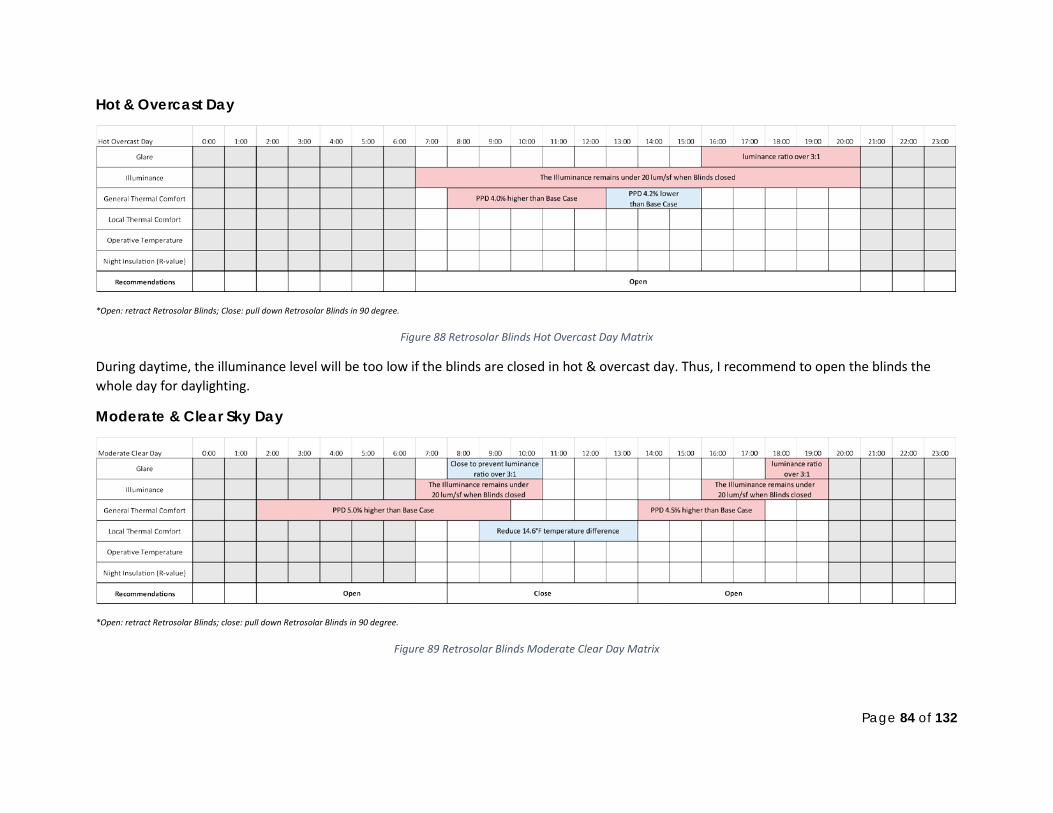
Page 84 of 132
Hot & Overcast Day
*Open: retract Retrosolar Blinds; Close: pull down Retrosolar Blinds in 90 degree.
Figure 88 Retrosolar Blinds Hot Overcast Day Matrix During daytime, the illuminance level will be too low if the blinds are closed in hot & overcast day. Thus, I recommend to open the blinds the whole day for daylighting.
Moderate & Clear Sky Day
*Open: retract Retrosolar Blinds; close: pull down Retrosolar Blinds in 90 degree.
Figure 89 Retrosolar Blinds Moderate Clear Day Matrix
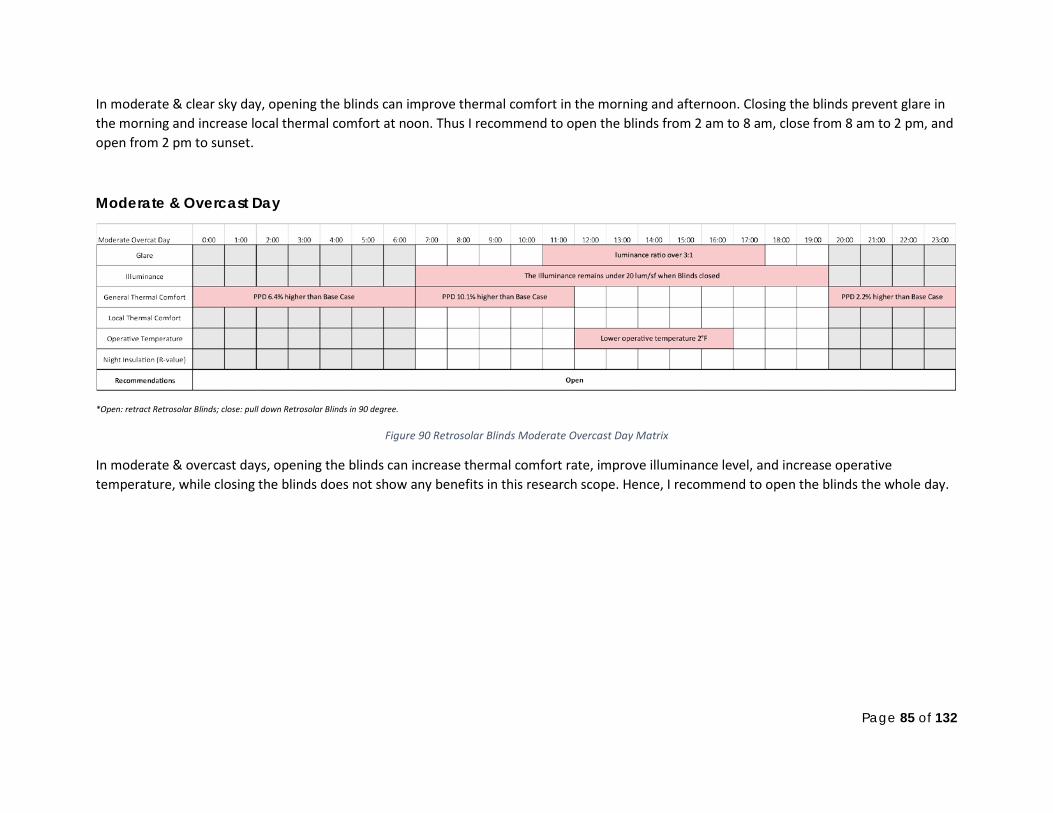
Page 85 of 132
In moderate & clear sky day, opening the blinds can improve thermal comfort in the morning and afternoon. Closing the blinds prevent glare in the morning and increase local thermal comfort at noon. Thus I recommend to open the blinds from 2 am to 8 am, close from 8 am to 2 pm, and open from 2 pm to sunset.
Moderate & Overcast Day
*Open: retract Retrosolar Blinds; close: pull down Retrosolar Blinds in 90 degree.
Figure 90 Retrosolar Blinds Moderate Overcast Day Matrix In moderate & overcast days, opening the blinds can increase thermal comfort rate, improve illuminance level, and increase operative temperature, while closing the blinds does not show any benefits in this research scope. Hence, I recommend to open the blinds the whole day.
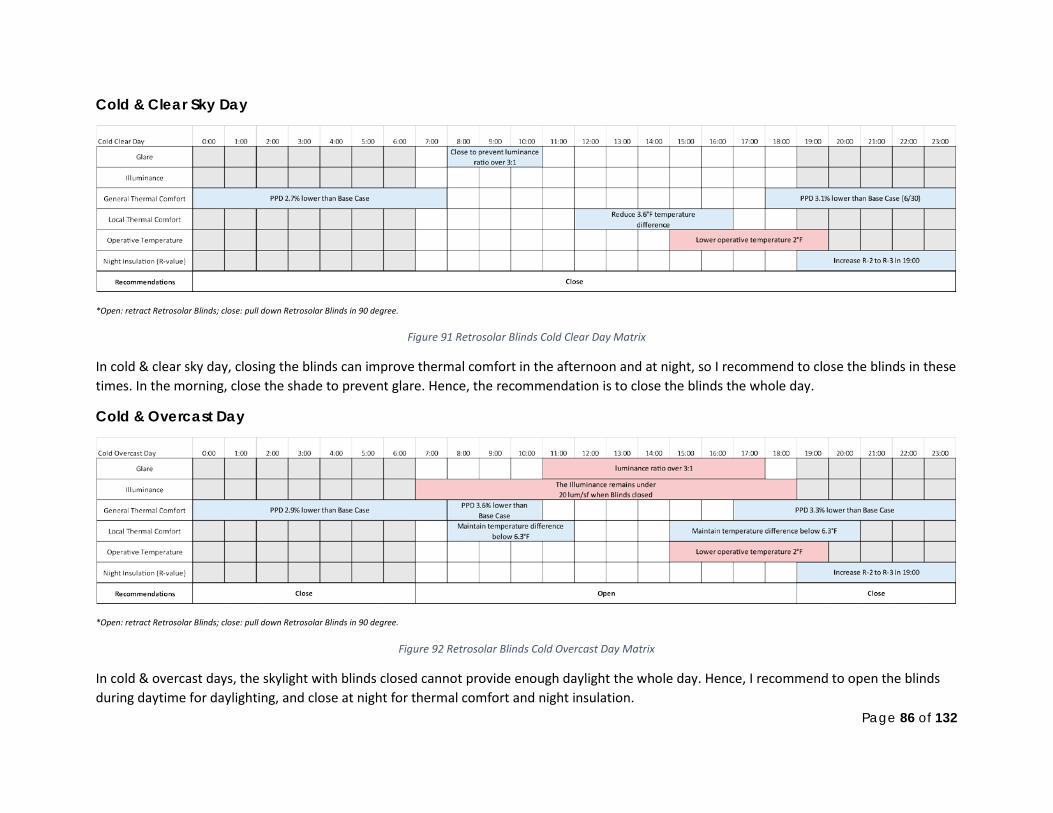
Page 86 of 132
Cold & Clear Sky Day
*Open: retract Retrosolar Blinds; close: pull down Retrosolar Blinds in 90 degree.
Figure 91 Retrosolar Blinds Cold Clear Day Matrix
In cold & clear sky day, closing the blinds can improve thermal comfort in the afternoon and at night, so I recommend to close the blinds in these times. In the morning, close the shade to prevent glare. Hence, the recommendation is to close the blinds the whole day.
Cold & Overcast Day
*Open: retract Retrosolar Blinds; close: pull down Retrosolar Blinds in 90 degree.
Figure 92 Retrosolar Blinds Cold Overcast Day Matrix
In cold & overcast days, the skylight with blinds closed cannot provide enough daylight the whole day. Hence, I recommend to open the blinds during daytime for daylighting, and close at night for thermal comfort and night insulation.
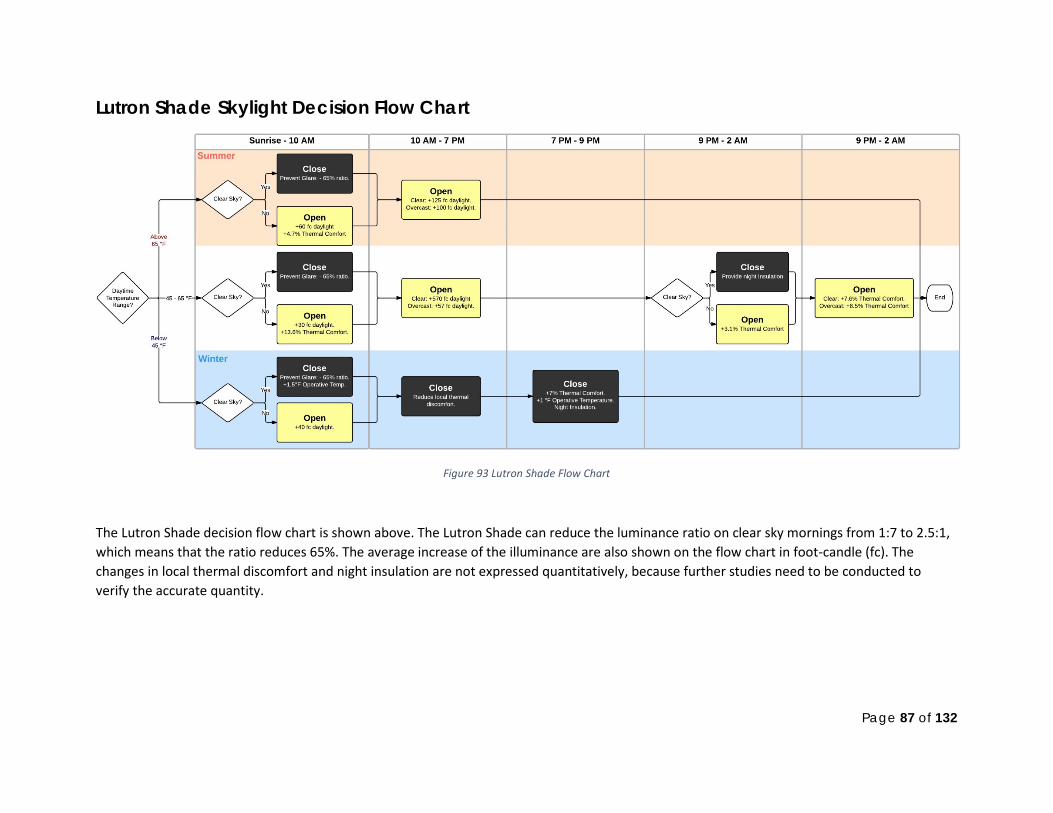
Page 87 of 132
Lutron Shade Skylight Decision Flow Chart
Figure 93 Lutron Shade Flow Chart
The Lutron Shade decision flow chart is shown above. The Lutron Shade can reduce the luminance ratio on clear sky mornings from 1:7 to 2.5:1, which means that the ratio reduces 65%. The average increase of the illuminance are also shown on the flow chart in foot-candle (fc). The changes in local thermal discomfort and night insulation are not expressed quantitatively, because further studies need to be conducted to verify the accurate quantity.
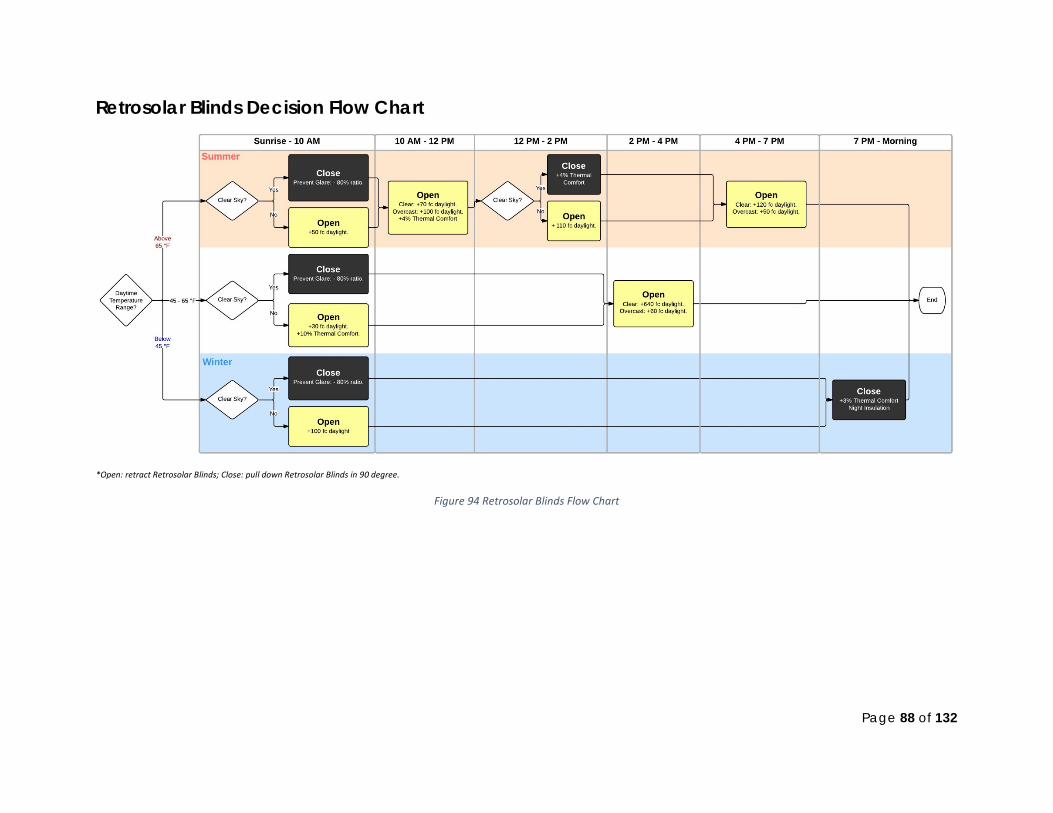
Page 88 of 132
Retrosolar Blinds Decision Flow Chart
*Open: retract Retrosolar Blinds; Close: pull down Retrosolar Blinds in 90 degree.
Figure 94 Retrosolar Blinds Flow Chart
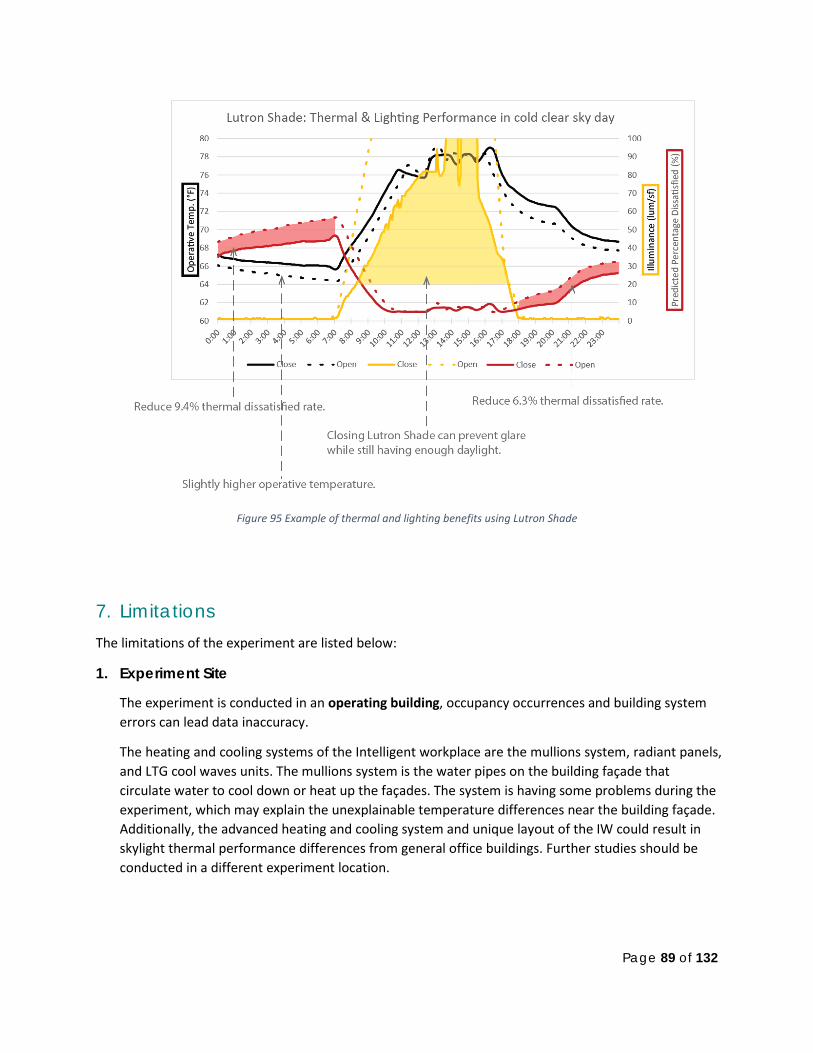
Page 89 of 132
Figure 95 Example of thermal and lighting benefits using Lutron Shade
7. Limitations The limitations of the experiment are listed below:
1. Experiment Site
The experiment is conducted in an operating building, occupancy occurrences and building system errors can lead data inaccuracy.
The heating and cooling systems of the Intelligent workplace are the mullions system, radiant panels, and LTG cool waves units. The mullions system is the water pipes on the building façade that circulate water to cool down or heat up the façades. The system is having some problems during the experiment, which may explain the unexplainable temperature differences near the building façade. Additionally, the advanced heating and cooling system and unique layout of the IW could result in skylight thermal performance differences from general office buildings. Further studies should be conducted in a different experiment location.
Page 90 of 132
2. Setting up the experiment
The sensors are located above occupant level (11 ft. above floor) to avoid disrupting office work, the temperature and illuminance would be different in the occupant level.
The skylights are located in the aisle area of the Intelligent Workplace, which the occupant level cannot be block during the office hours. Therefore, the measuring sensors are placed above the occupant level to avoid interrupting the office work.
Since the experiment location was also an occupied office, the occupant level measurements could only be taken intermittently. For continues measurements, the sensors were located at the skylight level (11 ft. above the finish floor). This led to the difficulty in choosing the partition material to block each skylight case. 0.5” thick Foam core was chosen as the material because it is light enough to hang on the skylight level and did not cause structural damage. However, the foam core can only provide limited insulation (R-4 to R-8 per inch), and allows air movement through gaps.
Because the partitions are not stably placed on the floor, they required frequent maintenance to keep them in place. Additionally, the sensors are not placed on a horizontal platform, which can lead to lighting data inaccuracy.
Measurement position does not meet the ASHRAE Standard due to site limitations. The measured locations are shown below:
ASHRAE 55-2010:
Measurement Location:
• Center of room or 3.3 ft. inward from walls.
Measurement Height:
• Air temperature and air speed: 4, 24, and 43 in. • Operative temperature, PMV, and PPD: 24 in.
3. Analyzing the data a. Operative temperature analysis
The original methodology of this analysis is to group the days with similar outdoor temperature and indoor temperature trend in each skylight cases, and integrate the recommendations into the final flow charts. There are three reasons that we stop using the methodology. First, we realized that the data of the grouped days will be too large and unable to analyze. Second, the temperature differences are mostly insignificant (1 – 2°F). Third, there are some days which there are no clear temperature trends between unshaded and shaded skylights. Due to the problems mentioned above, the alternative methodology was developed. To develop the methodology, standard CBPD methodologies were reviewed. This included the methodology utilized in a 2012 window shading experiment and an in depth analysis of the limitations of that experiment. First, six conditions were developed to represent the typical weather conditions in Pittsburgh. Second, we selected the days which have outdoor temperature similar to the six conditions and grouped for analysis.
Page 91 of 132
Thus, we excluded the days which have unique temperature trends because they are too miscellaneous to analyze. The goal of this analysis is to identify a general temperature trend, so it is reasonable to remove the unique data in the measurement.
In terms of the measured location, the analysis is based on the data from three small skylight areas above the occupant level. The impact is expected to be less significant in the actual occupied height. The objective of this analysis is simply showing the temperature trends due to the two shadings, further studies should be conducted to identify the accurate temperature difference in the occupied area.
b. Thermal Comfort Analysis
Due to the experiment site limitations, this study did not measure the IEQ in occupant level continuously. The thermal comfort analysis is based on the data from the skylight level, which is higher than the general occupied area. The goal of this analysis is to show that the skylight shadings can improve the thermal comfort level in indoor spaces. Further study needs to be conducted to identify the actual PMV improvement in the occupied area. It is assumed that the shade and blinds will still have impact on the thermal comfort level in the occupant level. Hence, the thermal comfort results are still taken into account in the final decision flow charts.
The calculation for the PMV model is very complex. First, the mean radiant temperature (MRT) is calculated using the radiant temperature, ambient temperature and air speed. Second, the clothing insulation is calculated based on the outdoor temperature. Third, use the calculated MRT, clothing insulation, the measured humidity, air temperature, the assumed air speed, and metabolic rate to calculate the PMV and PPD. Because the calculation is very complex, and the value is just for comparing the thermal comfort difference, only six days which have outdoor temperature similar to the typical conditions were selected to analyze.
c. R-value Calculation Analysis
The calculations are based only on outdoor, indoor air temperature, and skylight surface temperature, and the temperatures were measured at 7 pm, which the solar radiation from the sun in the daytime might still affect the results. The results only show the insulation effect on surface temperature, rather than the actual R-values. Further measurements should be conducted in late nights to obtain the actual R-values.
The reason for using the data in 7 pm is because the Intelligent Workplace usually closed around 7, so the latest data which can be measured is at 7. The detailed R-value calculation method is based on the indoor / outdoor temperature, and the surface temperature. If the surface temperatures are still affected by the solar heat, the calculation will take the high temperature as the result of the insulation effect, and lead to overestimation.
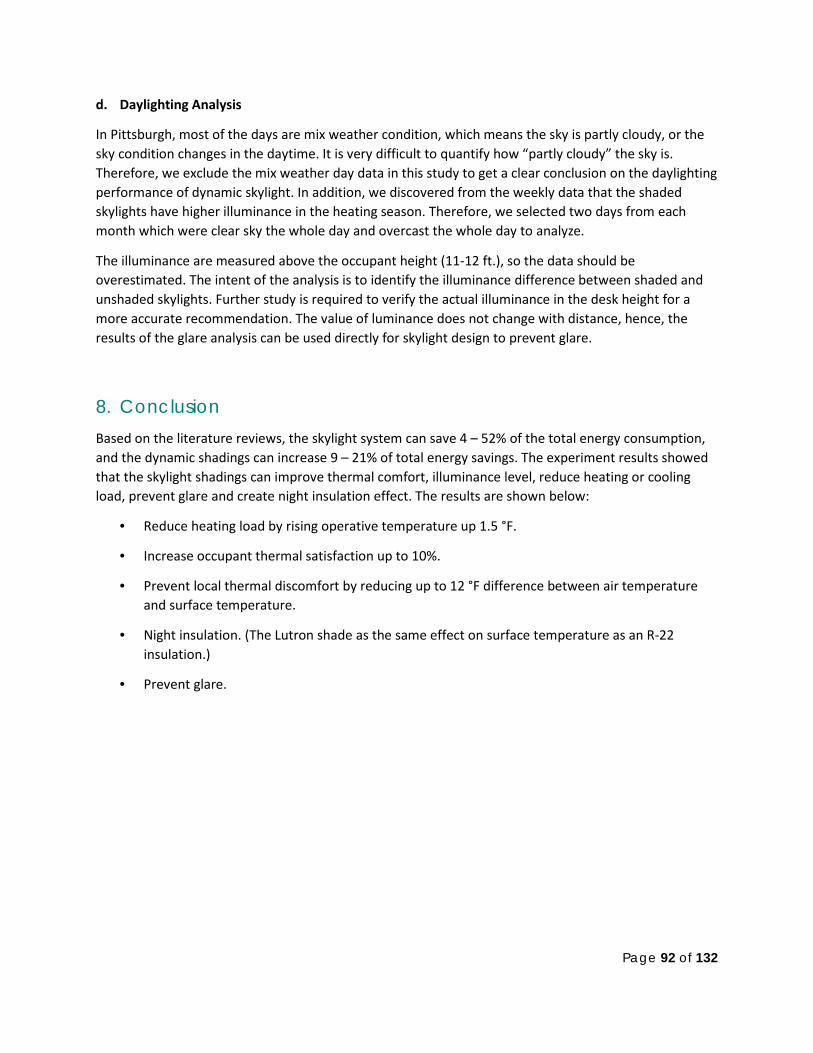
Page 92 of 132
d. Daylighting Analysis
In Pittsburgh, most of the days are mix weather condition, which means the sky is partly cloudy, or the sky condition changes in the daytime. It is very difficult to quantify how “partly cloudy” the sky is. Therefore, we exclude the mix weather day data in this study to get a clear conclusion on the daylighting performance of dynamic skylight. In addition, we discovered from the weekly data that the shaded skylights have higher illuminance in the heating season. Therefore, we selected two days from each month which were clear sky the whole day and overcast the whole day to analyze.
The illuminance are measured above the occupant height (11-12 ft.), so the data should be overestimated. The intent of the analysis is to identify the illuminance difference between shaded and unshaded skylights. Further study is required to verify the actual illuminance in the desk height for a more accurate recommendation. The value of luminance does not change with distance, hence, the results of the glare analysis can be used directly for skylight design to prevent glare.
8. Conclusion Based on the literature reviews, the skylight system can save 4 – 52% of the total energy consumption, and the dynamic shadings can increase 9 – 21% of total energy savings. The experiment results showed that the skylight shadings can improve thermal comfort, illuminance level, reduce heating or cooling load, prevent glare and create night insulation effect. The results are shown below:
• Reduce heating load by rising operative temperature up 1.5 °F.
• Increase occupant thermal satisfaction up to 10%.
• Prevent local thermal discomfort by reducing up to 12 °F difference between air temperature and surface temperature.
• Night insulation. (The Lutron shade as the same effect on surface temperature as an R-22 insulation.)
• Prevent glare.
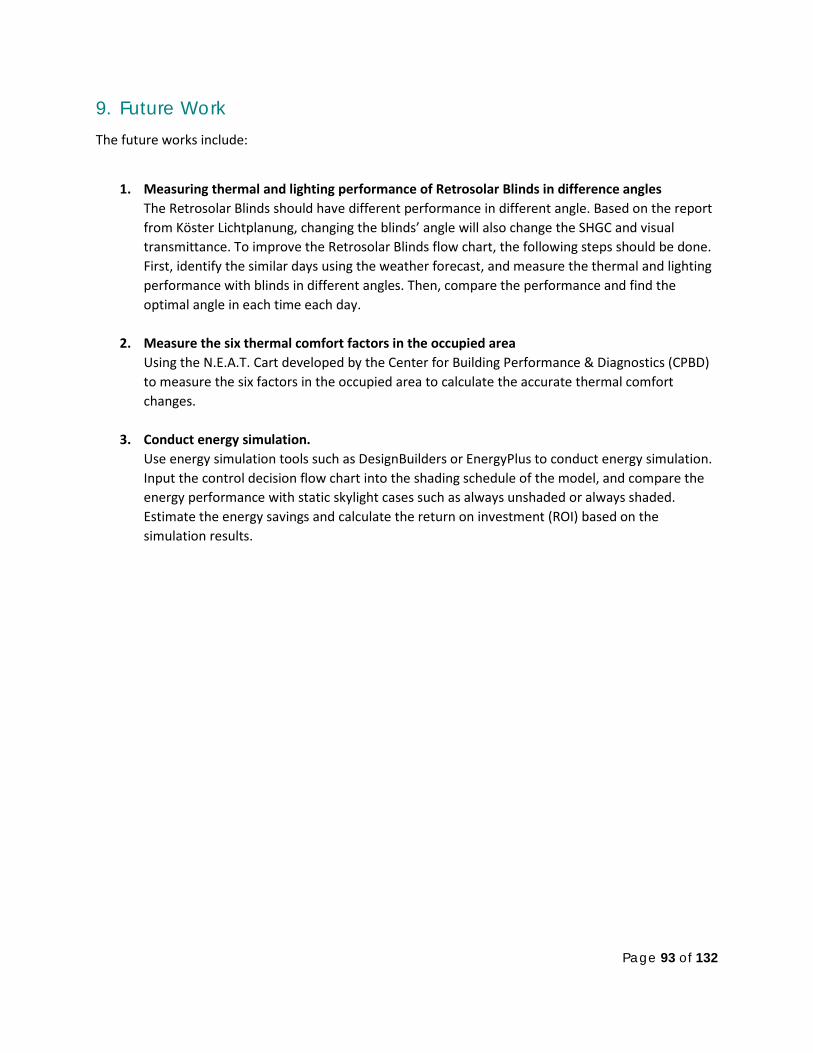
Page 93 of 132
9. Future Work The future works include:
1. Measuring thermal and lighting performance of Retrosolar Blinds in difference angles
The Retrosolar Blinds should have different performance in different angle. Based on the report from Köster Lichtplanung, changing the blinds’ angle will also change the SHGC and visual transmittance. To improve the Retrosolar Blinds flow chart, the following steps should be done. First, identify the similar days using the weather forecast, and measure the thermal and lighting performance with blinds in different angles. Then, compare the performance and find the optimal angle in each time each day.
2. Measure the six thermal comfort factors in the occupied area Using the N.E.A.T. Cart developed by the Center for Building Performance & Diagnostics (CPBD) to measure the six factors in the occupied area to calculate the accurate thermal comfort changes.
3. Conduct energy simulation. Use energy simulation tools such as DesignBuilders or EnergyPlus to conduct energy simulation. Input the control decision flow chart into the shading schedule of the model, and compare the energy performance with static skylight cases such as always unshaded or always shaded. Estimate the energy savings and calculate the return on investment (ROI) based on the simulation results.
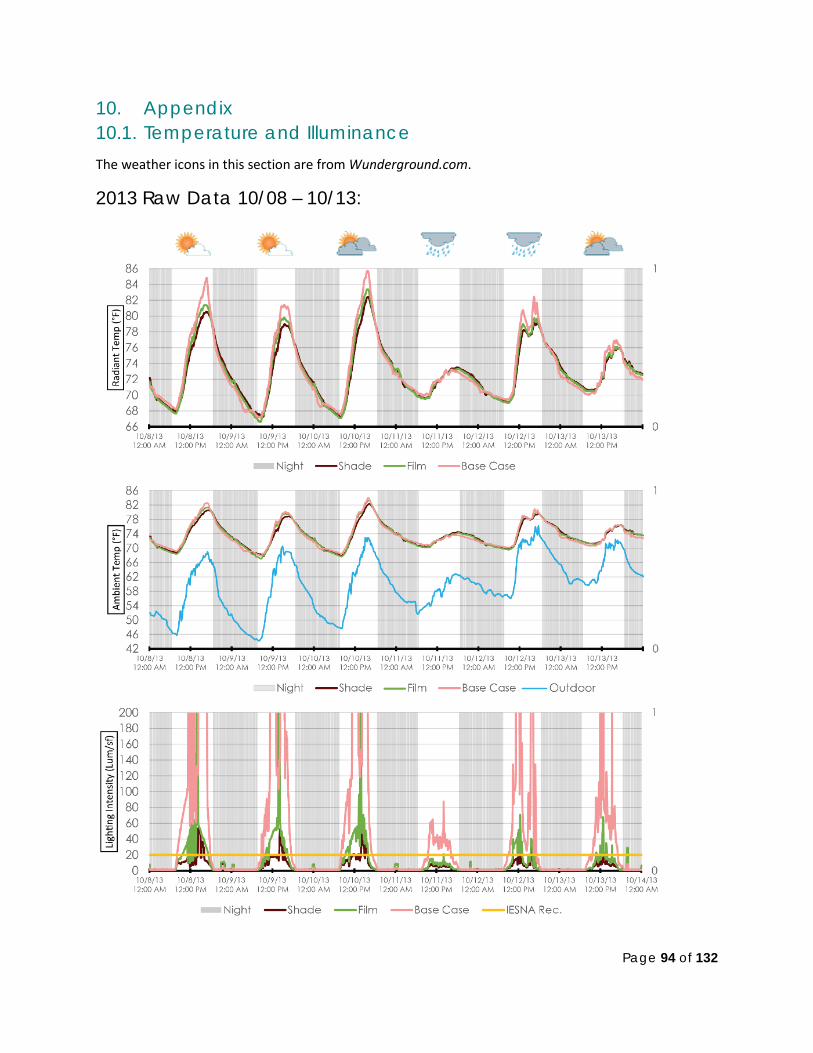
Page 94 of 132
10. Appendix 10.1. Temperature and Illuminance The weather icons in this section are from Wunderground.com.
2013 Raw Data 10/08 – 10/13:
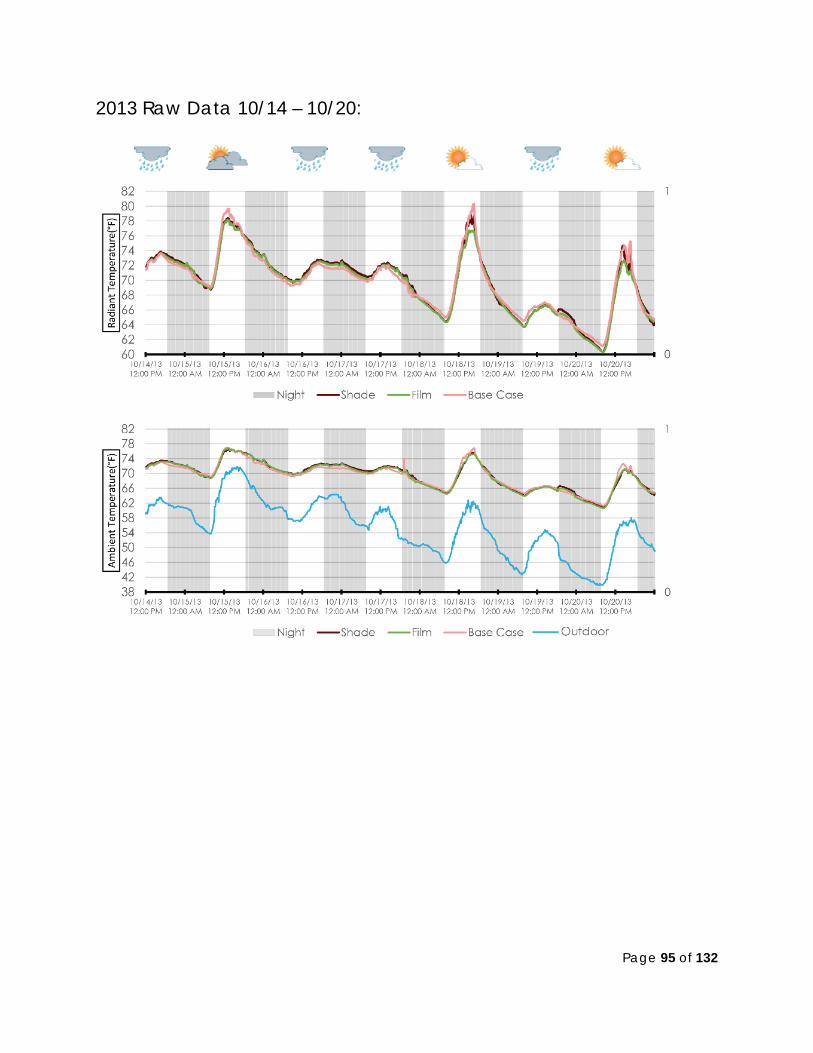
Page 95 of 132
2013 Raw Data 10/14 – 10/20:
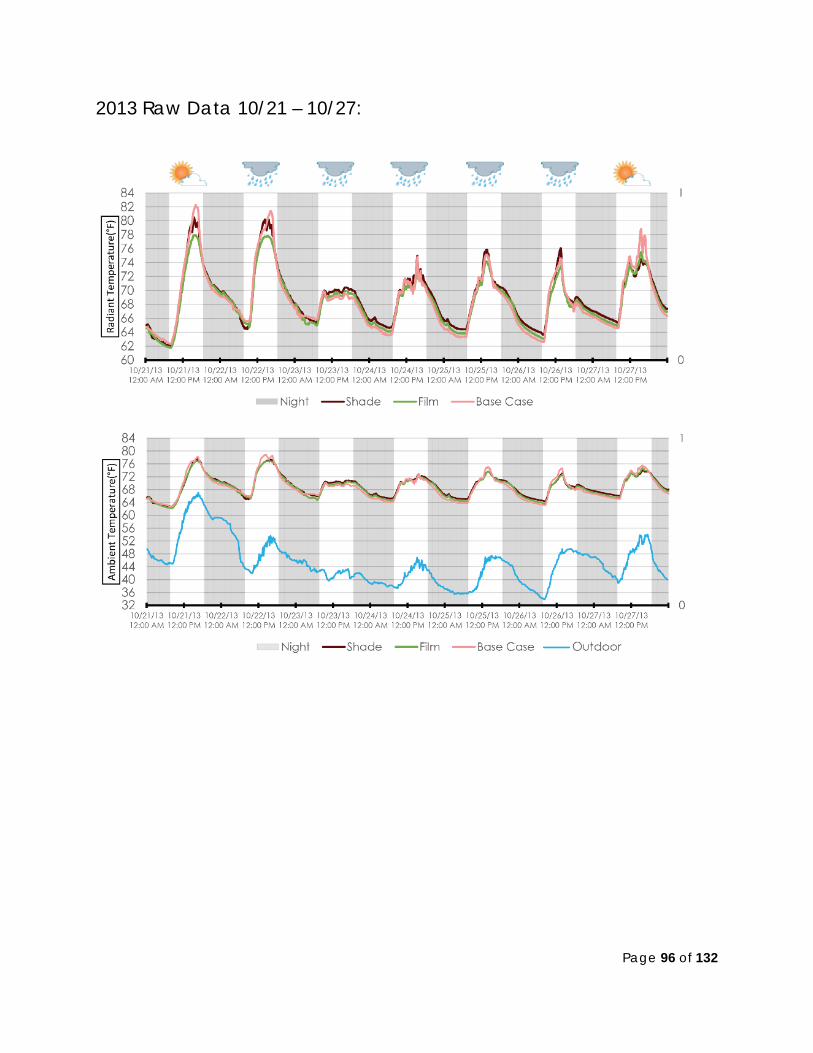
Page 96 of 132
2013 Raw Data 10/21 – 10/27:
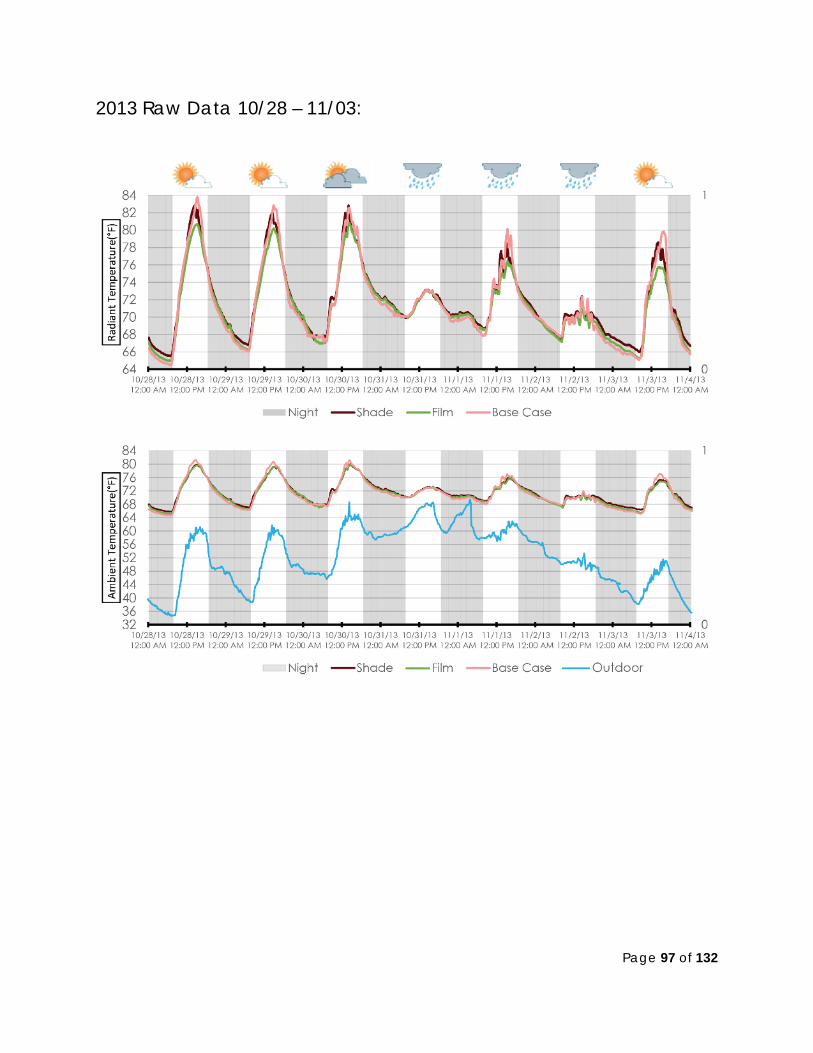
Page 97 of 132
2013 Raw Data 10/28 – 11/03:
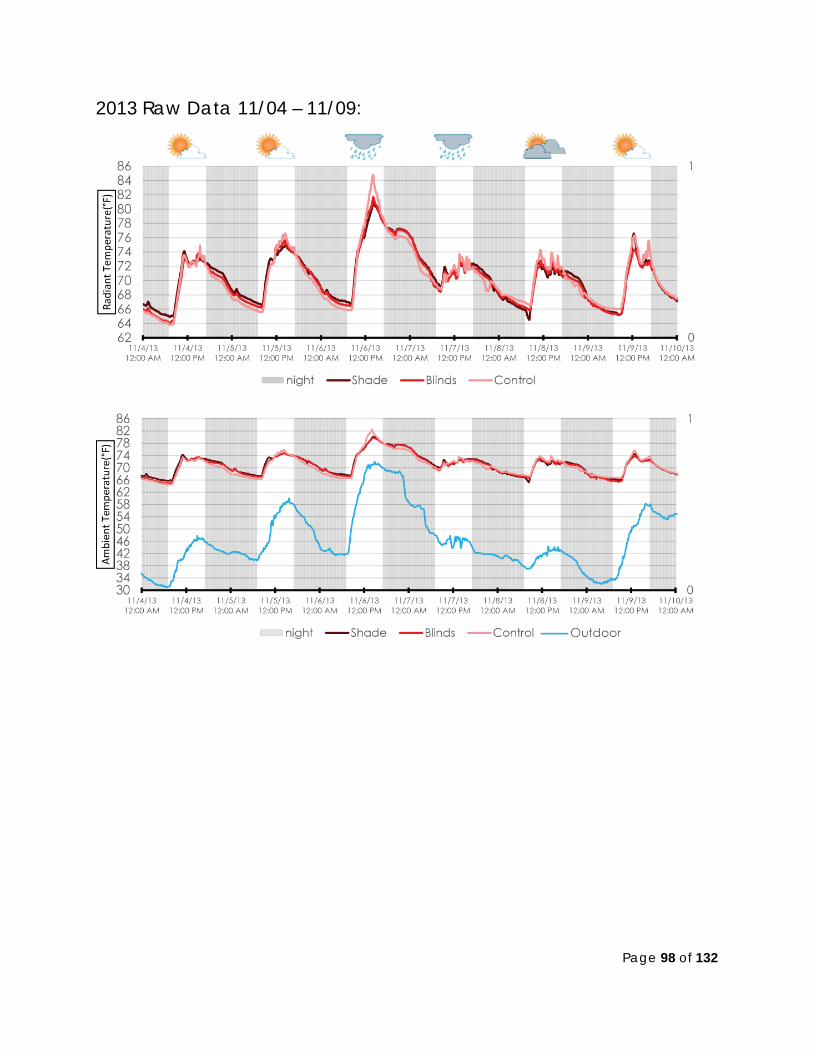
Page 98 of 132
2013 Raw Data 11/04 – 11/09:
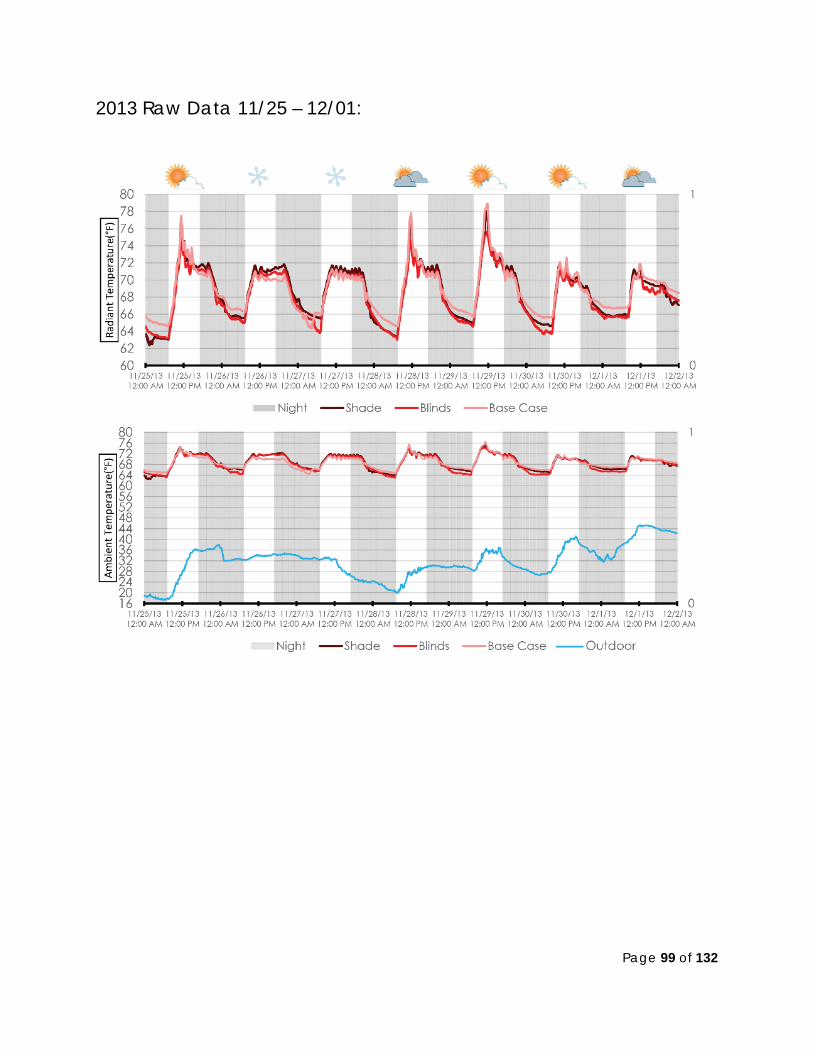
Page 99 of 132
2013 Raw Data 11/25 – 12/01:
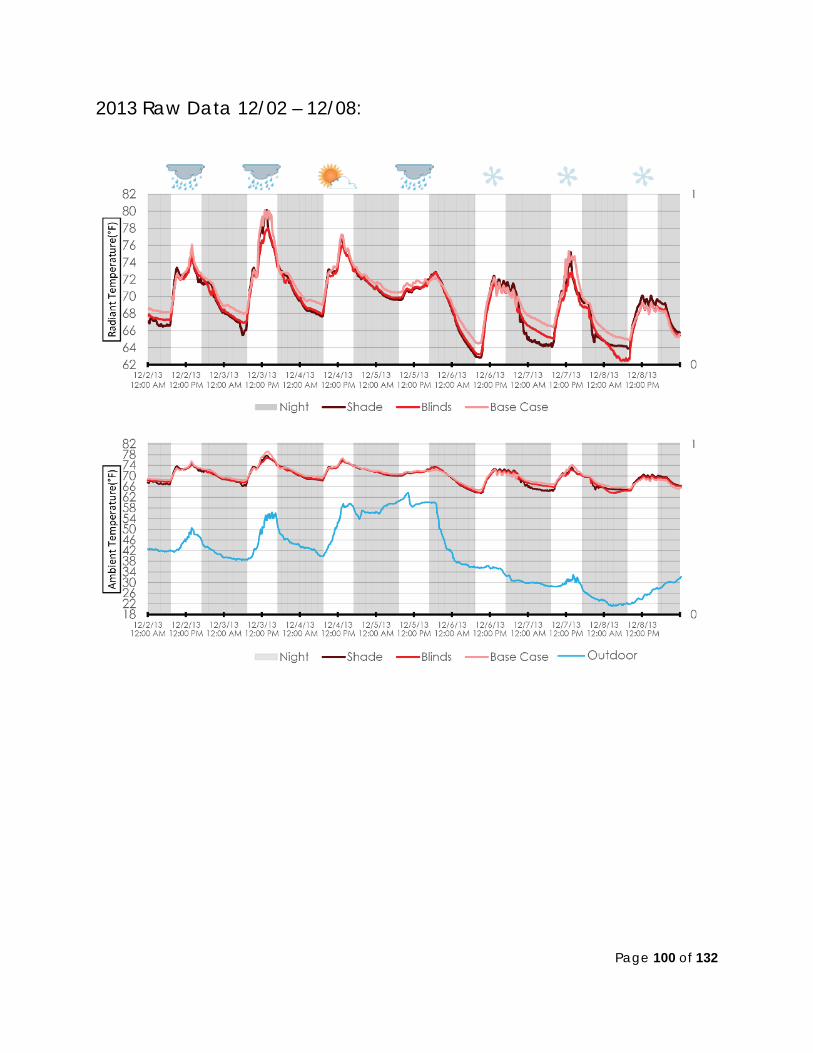
Page 100 of 132
2013 Raw Data 12/02 – 12/08:
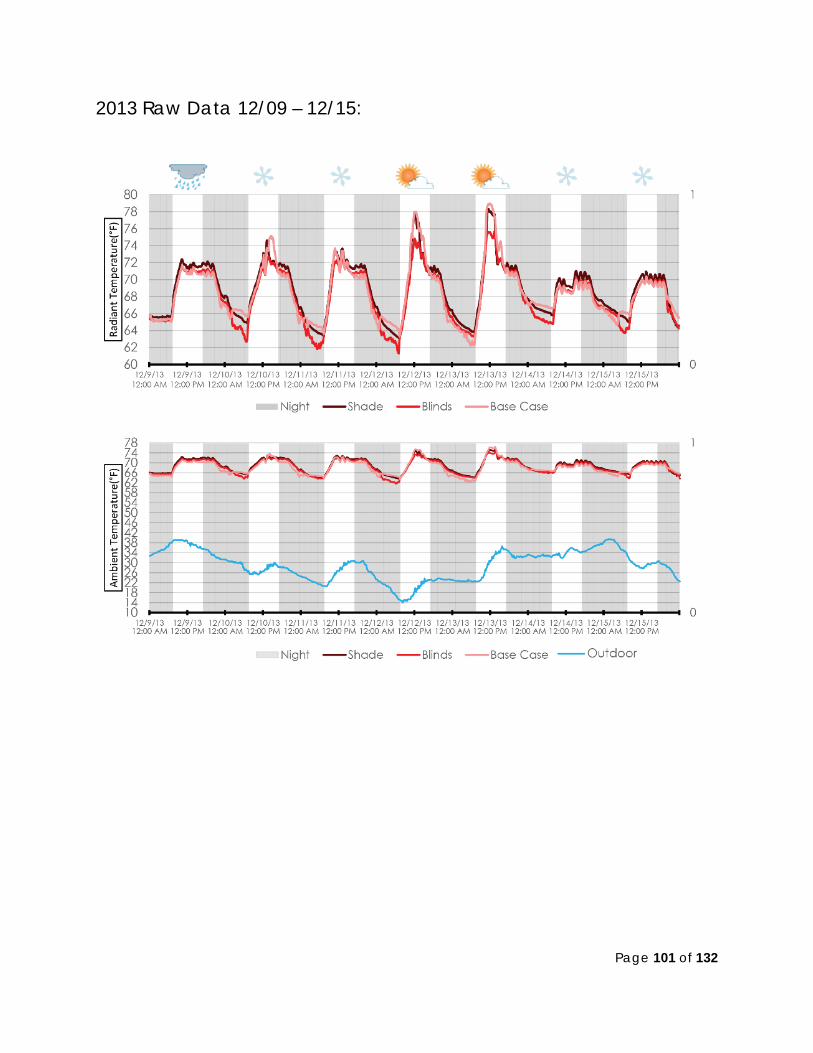
Page 101 of 132
2013 Raw Data 12/09 – 12/15:

Page 102 of 132
2013 Raw Data 12/16 – 12/21:
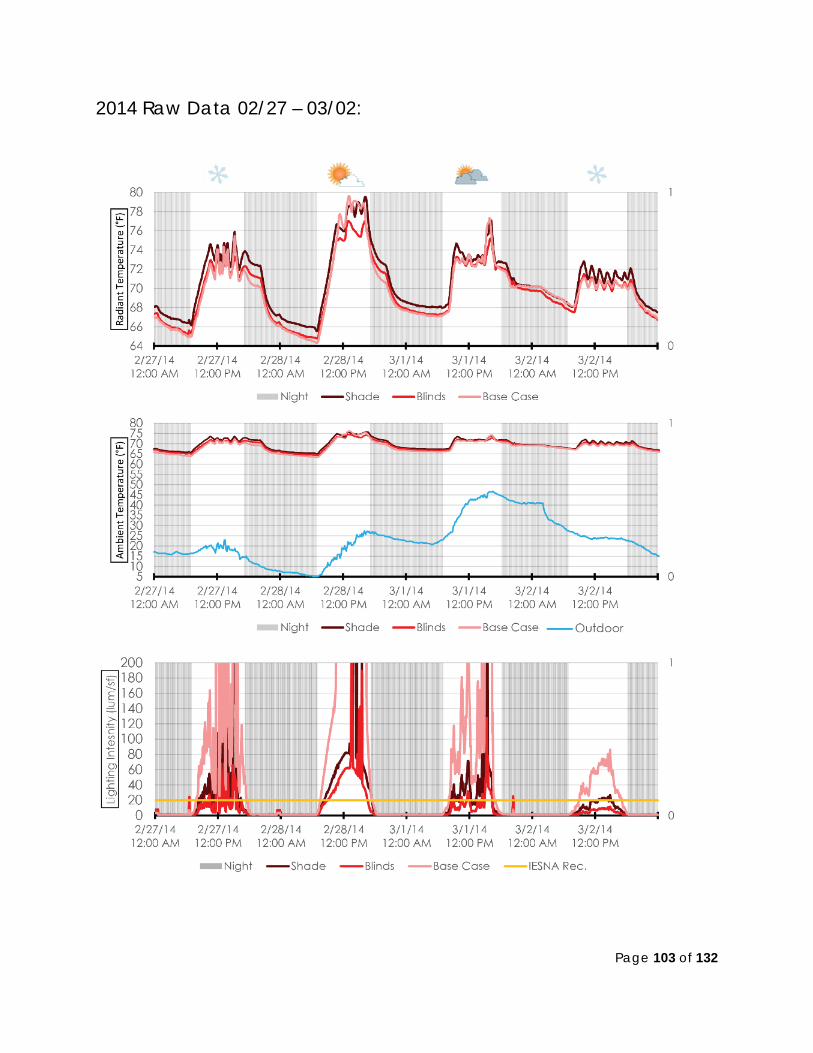
Page 103 of 132
2014 Raw Data 02/27 – 03/02:
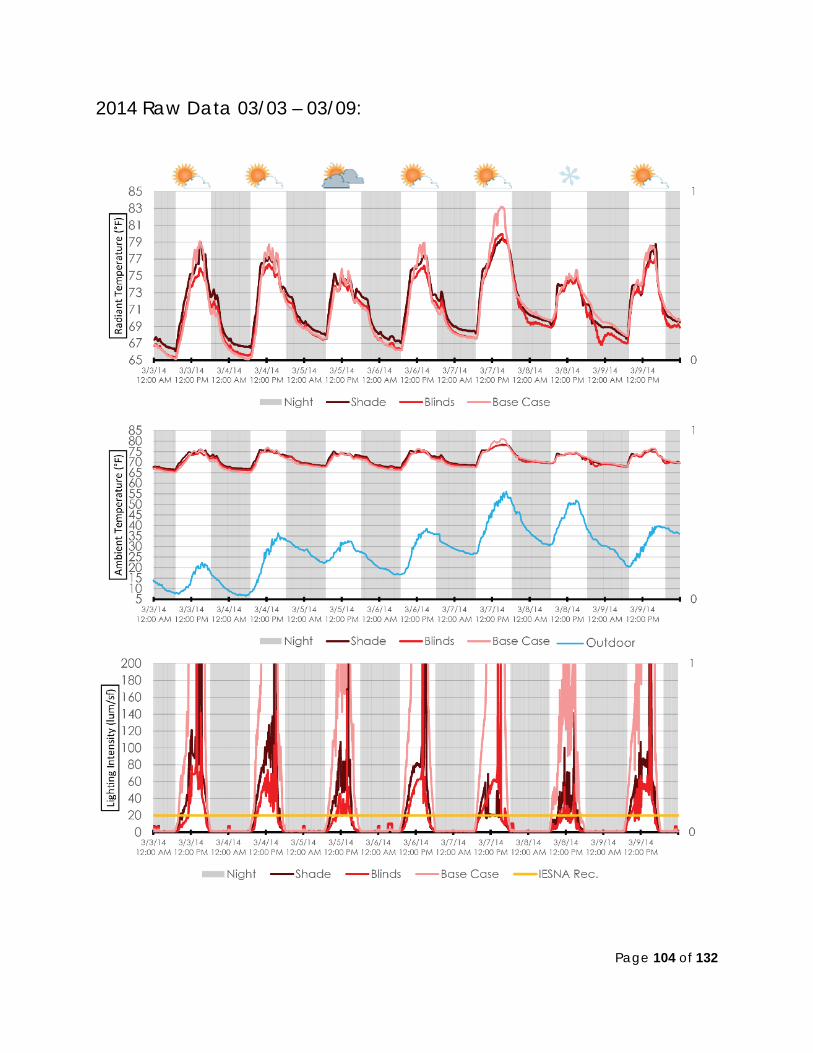
Page 104 of 132
2014 Raw Data 03/03 – 03/09:
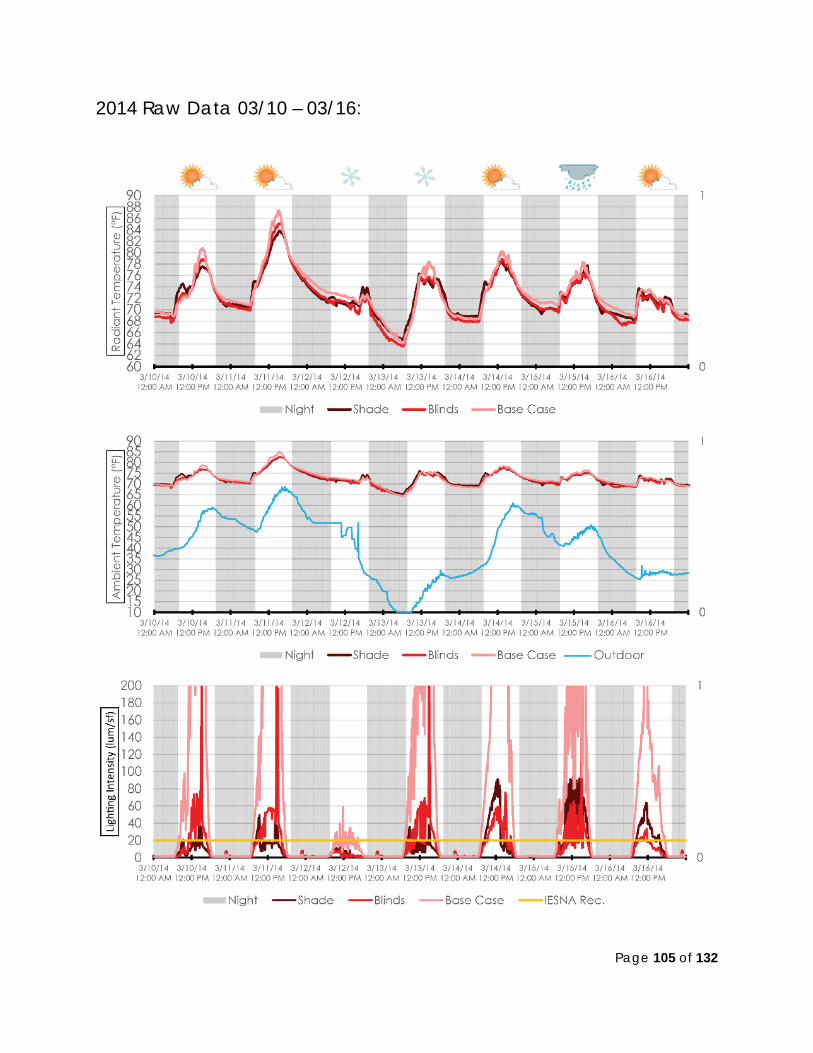
Page 105 of 132
2014 Raw Data 03/10 – 03/16:
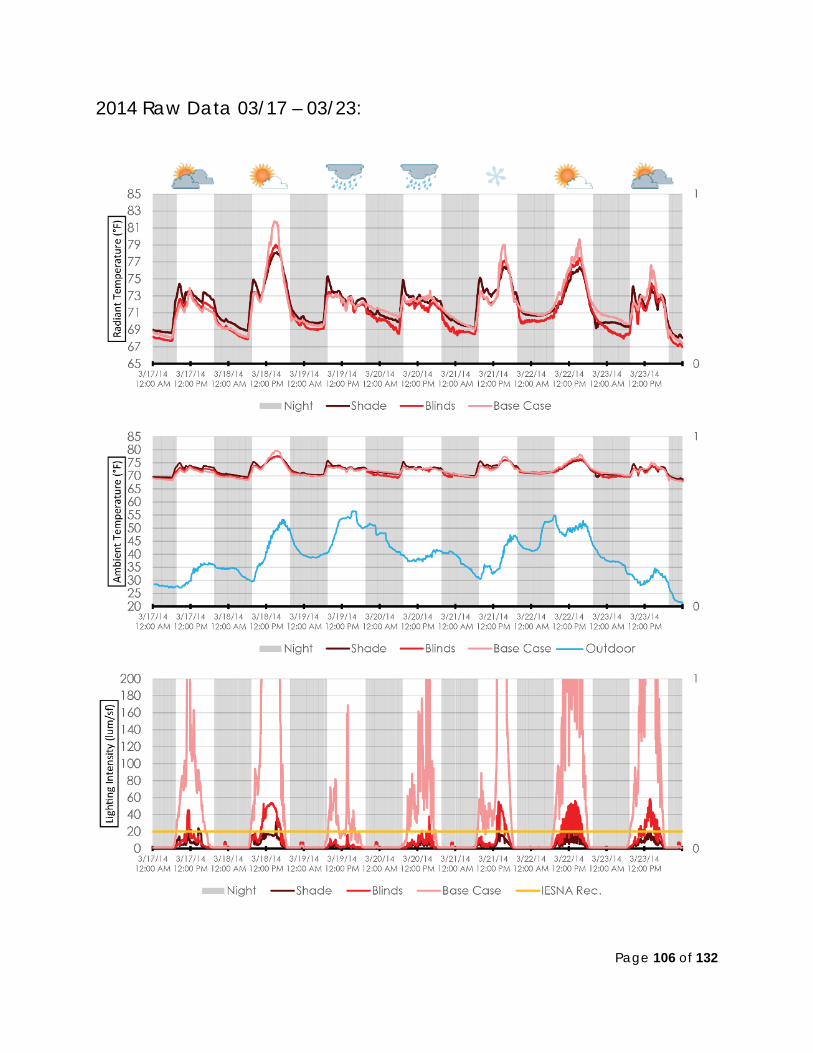
Page 106 of 132
2014 Raw Data 03/17 – 03/23:

Page 107 of 132
2014 Raw Data 03/24 – 03/30:
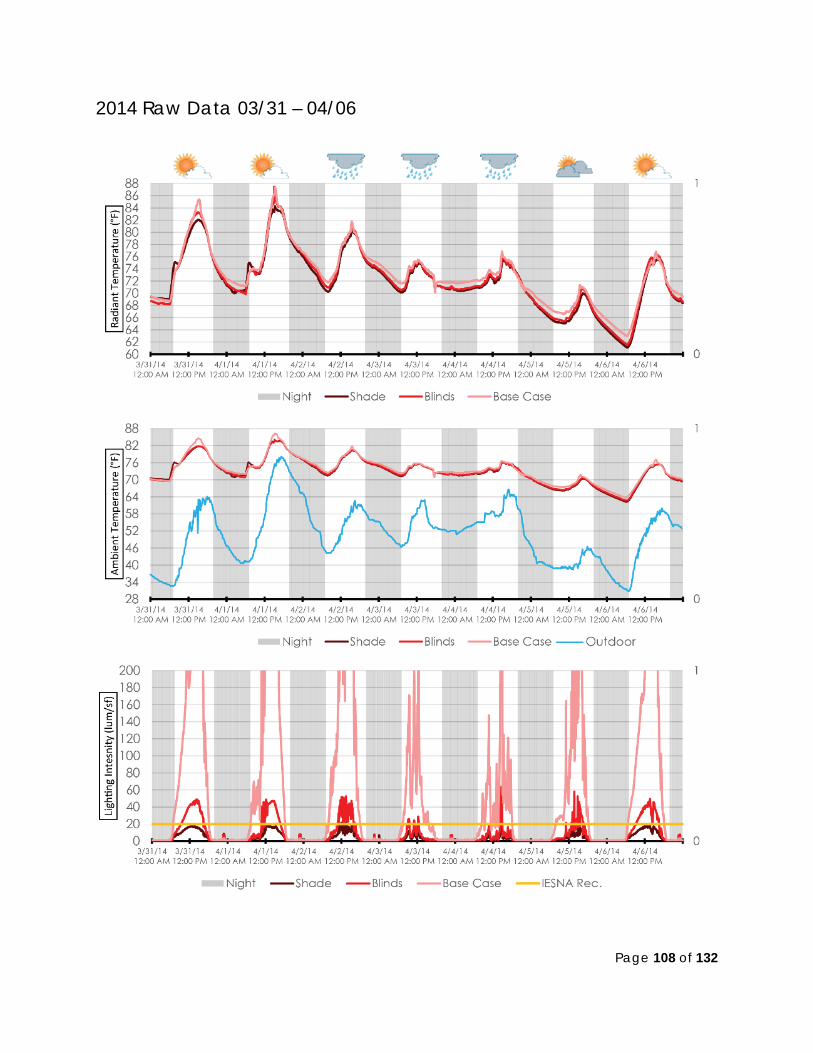
Page 108 of 132
2014 Raw Data 03/31 – 04/06
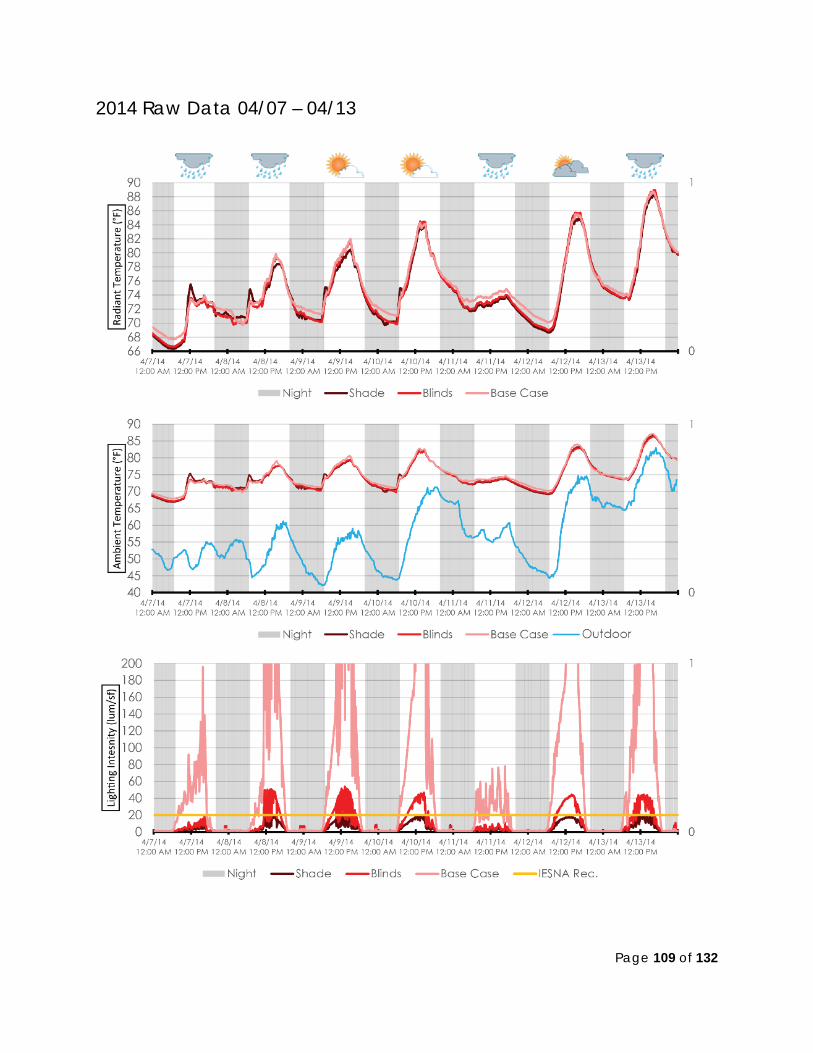
Page 109 of 132
2014 Raw Data 04/07 – 04/13
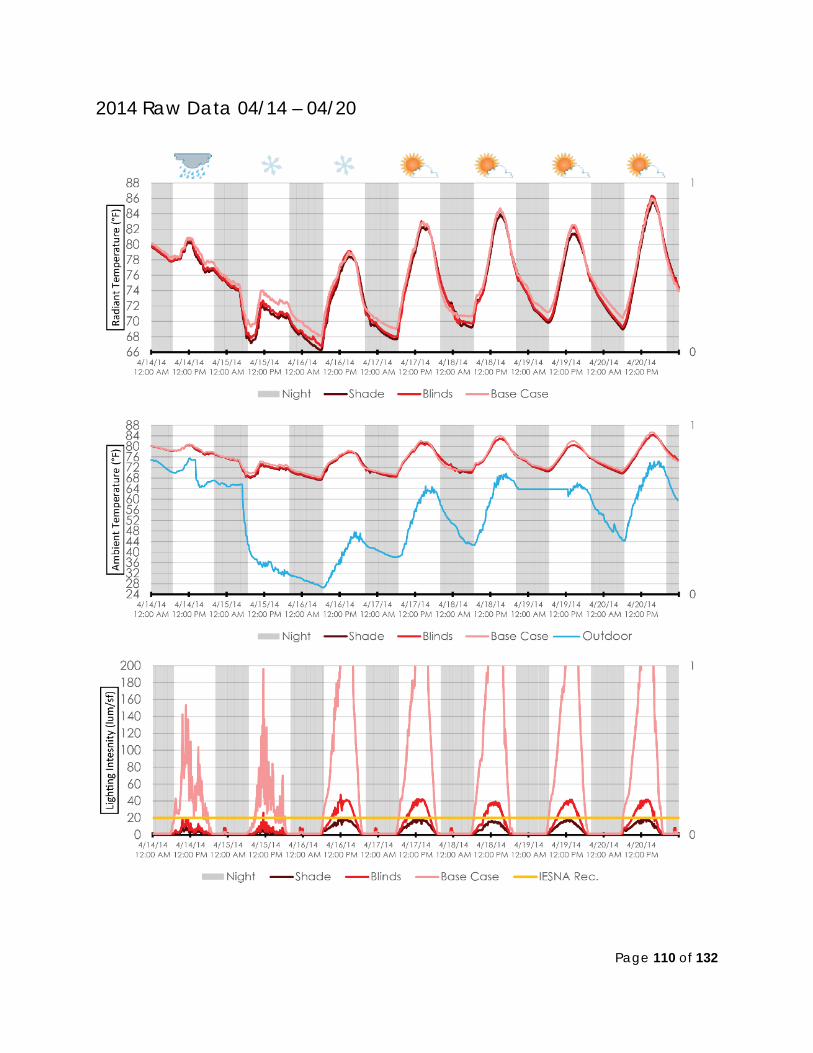
Page 110 of 132
2014 Raw Data 04/14 – 04/20
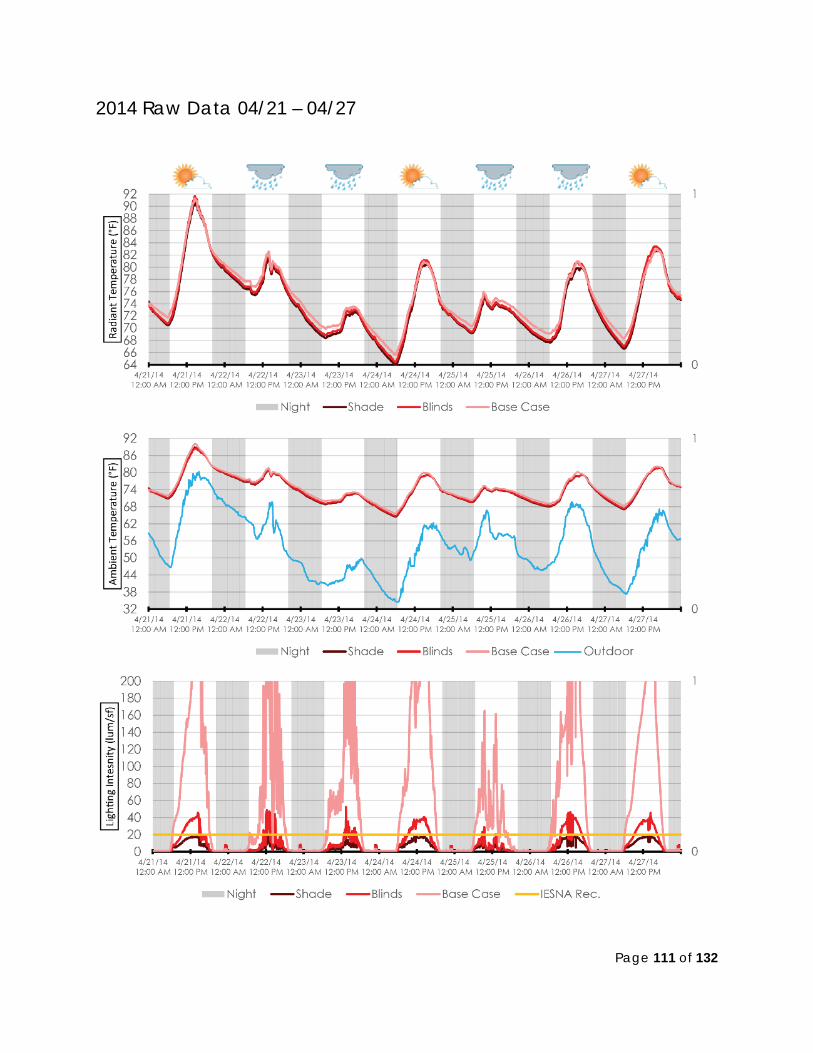
Page 111 of 132
2014 Raw Data 04/21 – 04/27
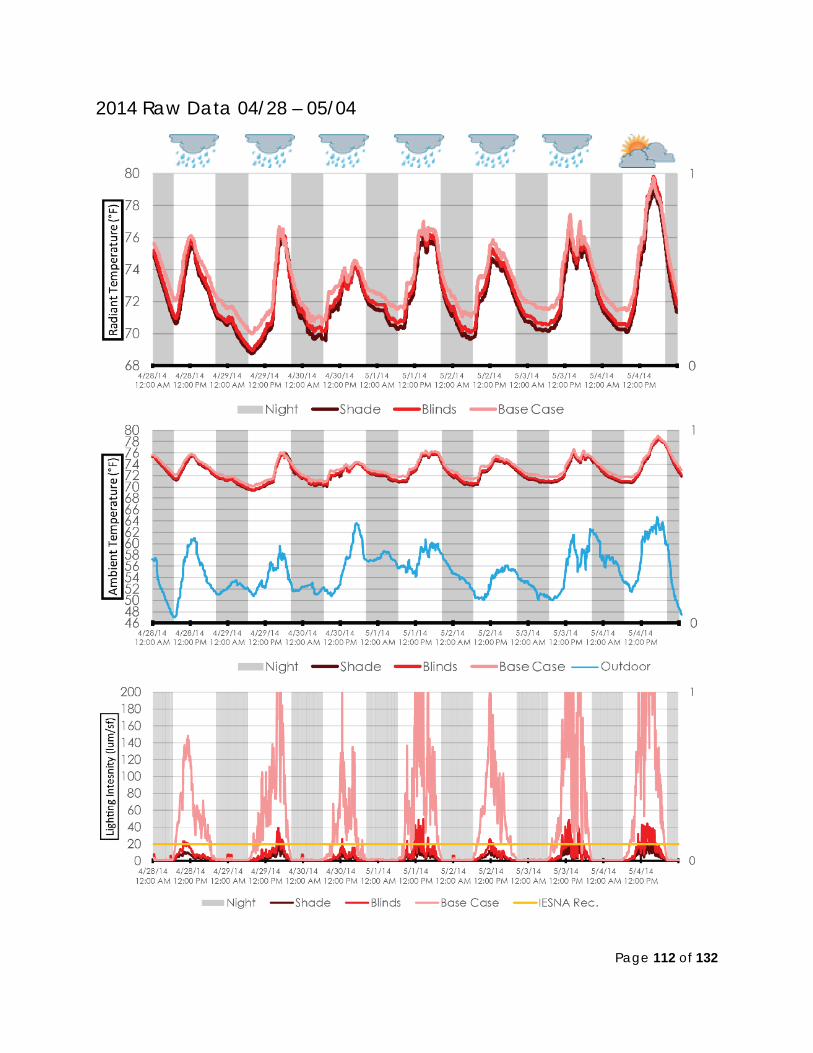
Page 112 of 132
2014 Raw Data 04/28 – 05/04

Page 113 of 132
2014 Raw Data 05/05 – 05/11
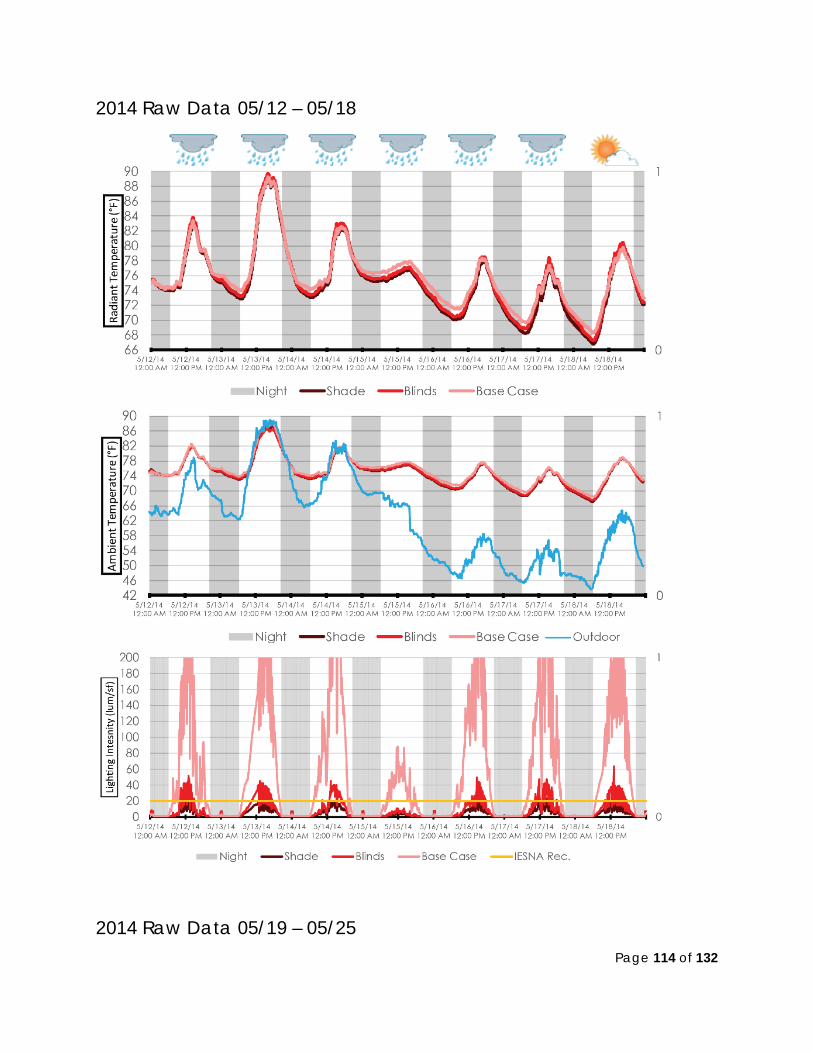
Page 114 of 132
2014 Raw Data 05/12 – 05/18
2014 Raw Data 05/19 – 05/25
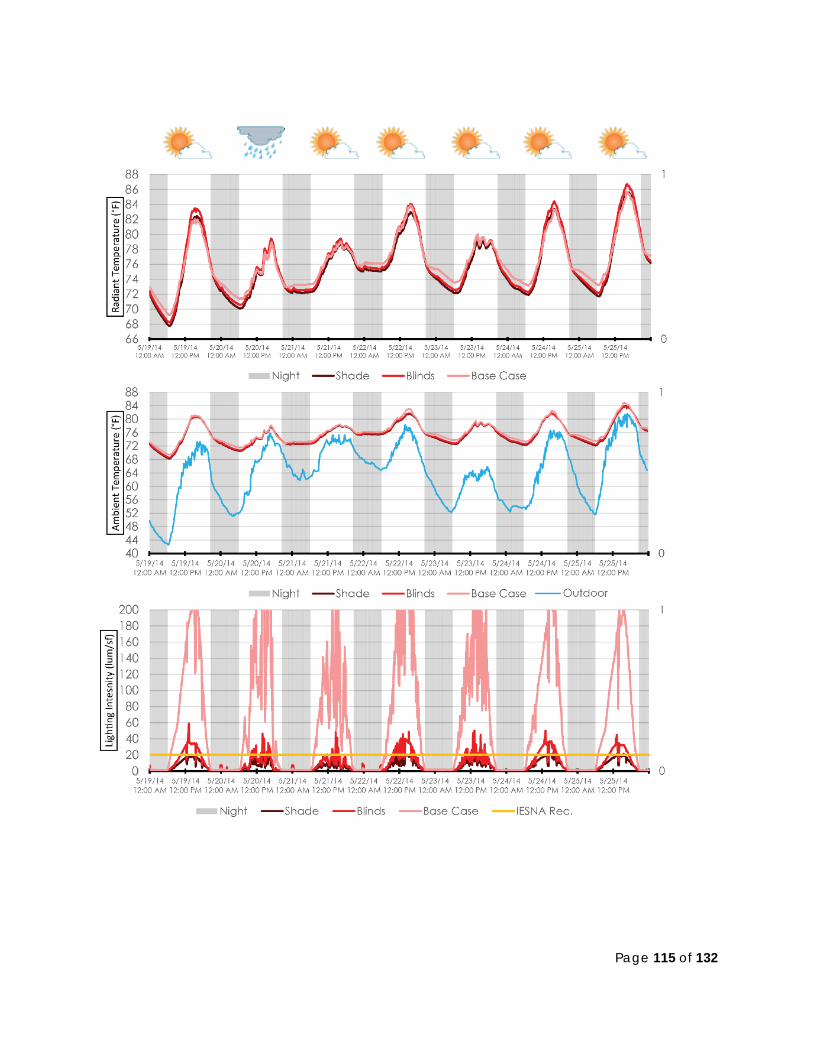
Page 115 of 132
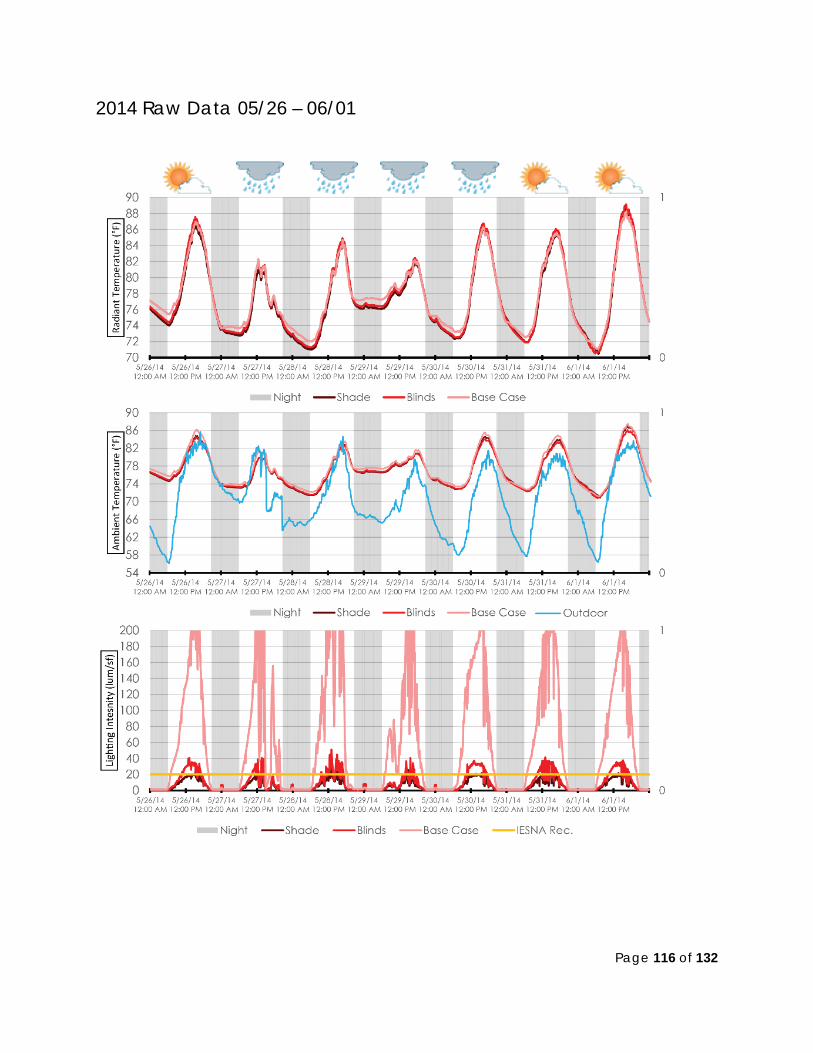
Page 116 of 132
2014 Raw Data 05/26 – 06/01
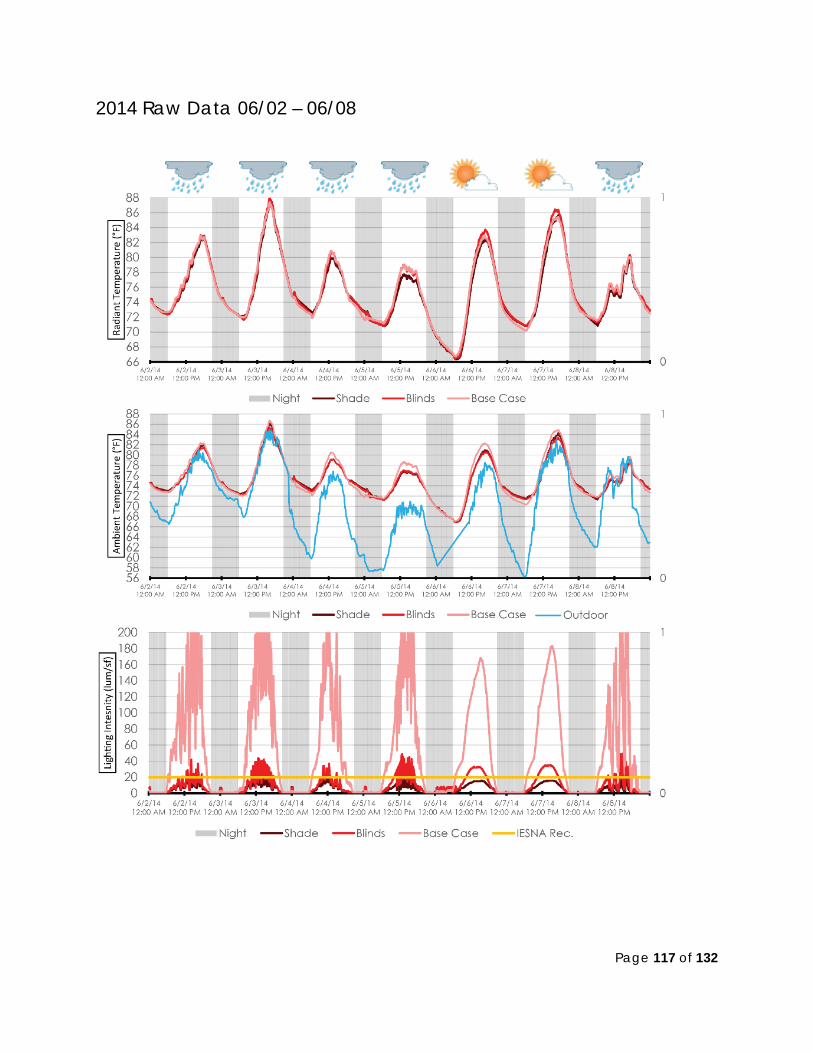
Page 117 of 132
2014 Raw Data 06/02 – 06/08
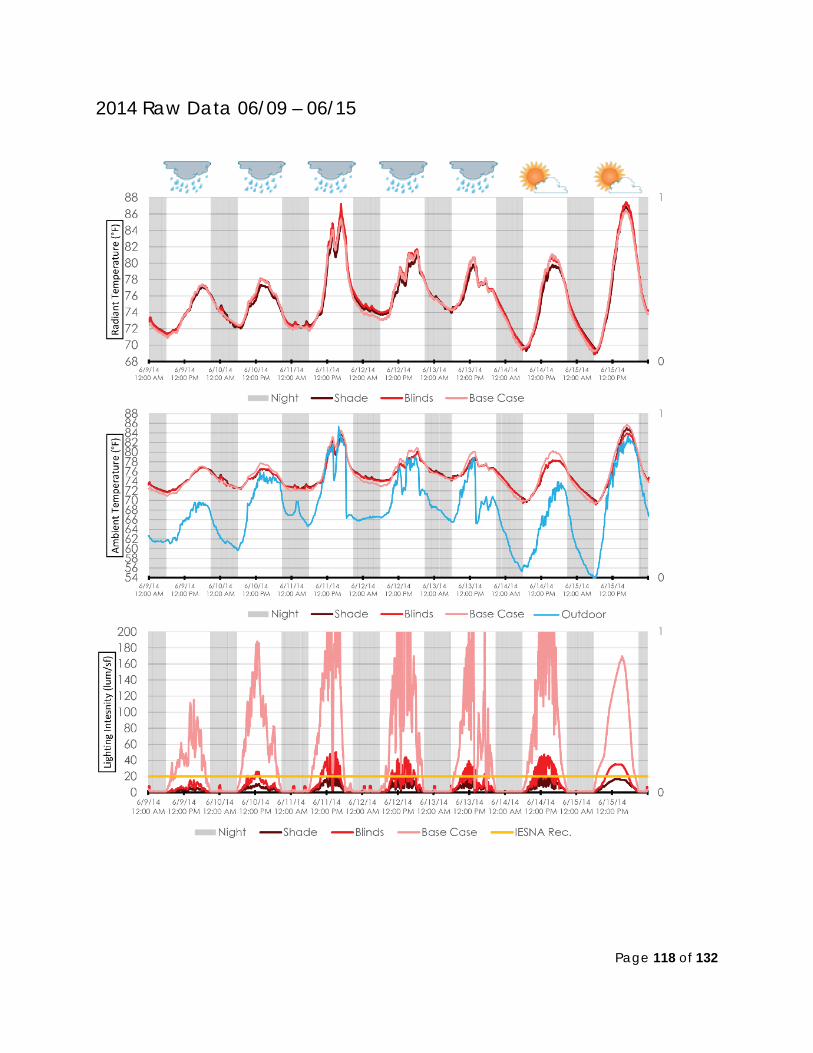
Page 118 of 132
2014 Raw Data 06/09 – 06/15
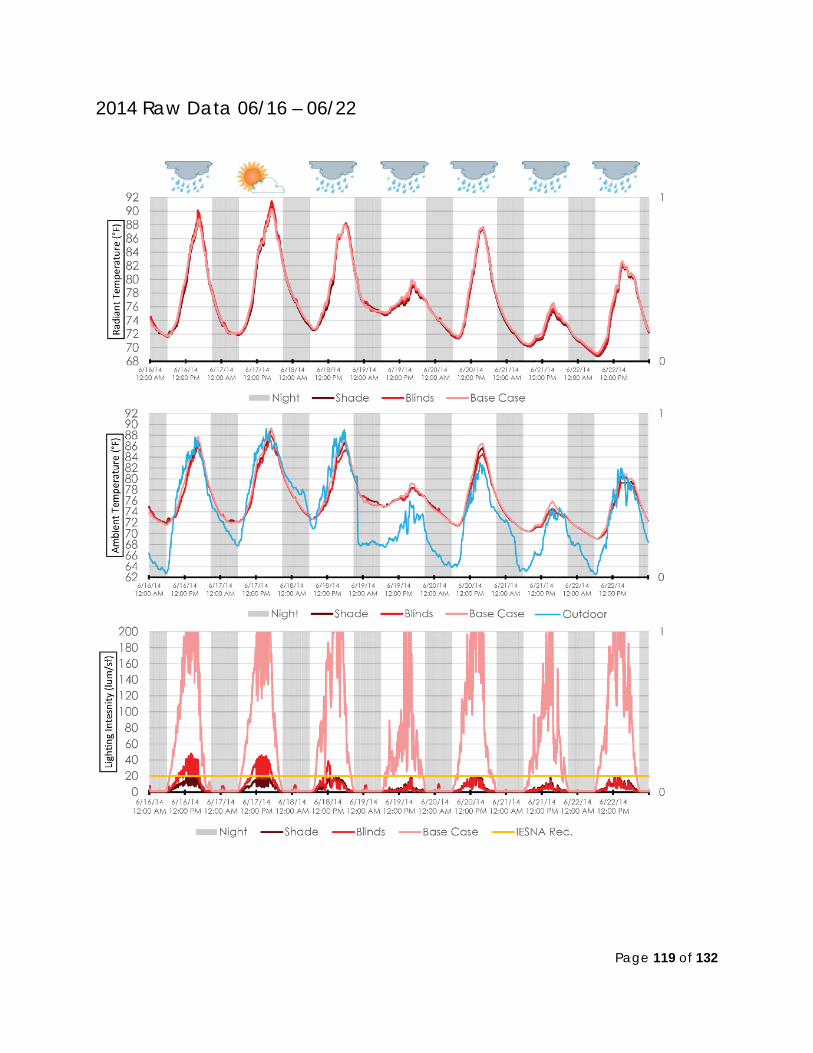
Page 119 of 132
2014 Raw Data 06/16 – 06/22
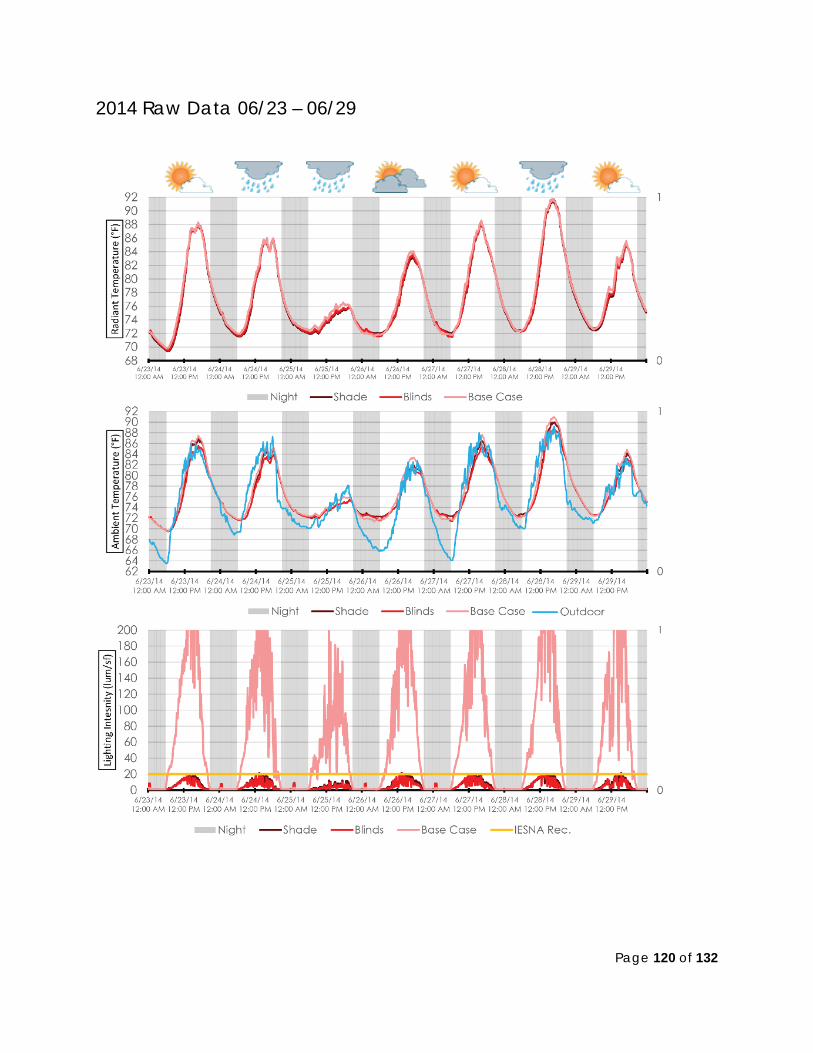
Page 120 of 132
2014 Raw Data 06/23 – 06/29
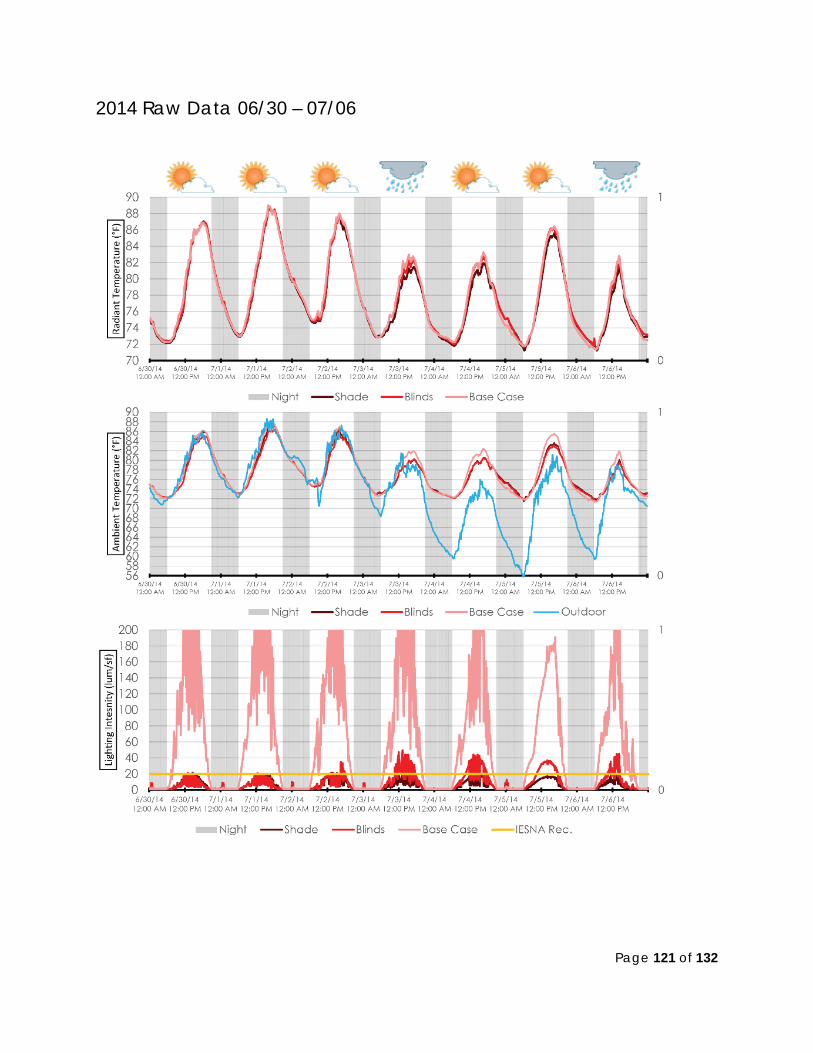
Page 121 of 132
2014 Raw Data 06/30 – 07/06
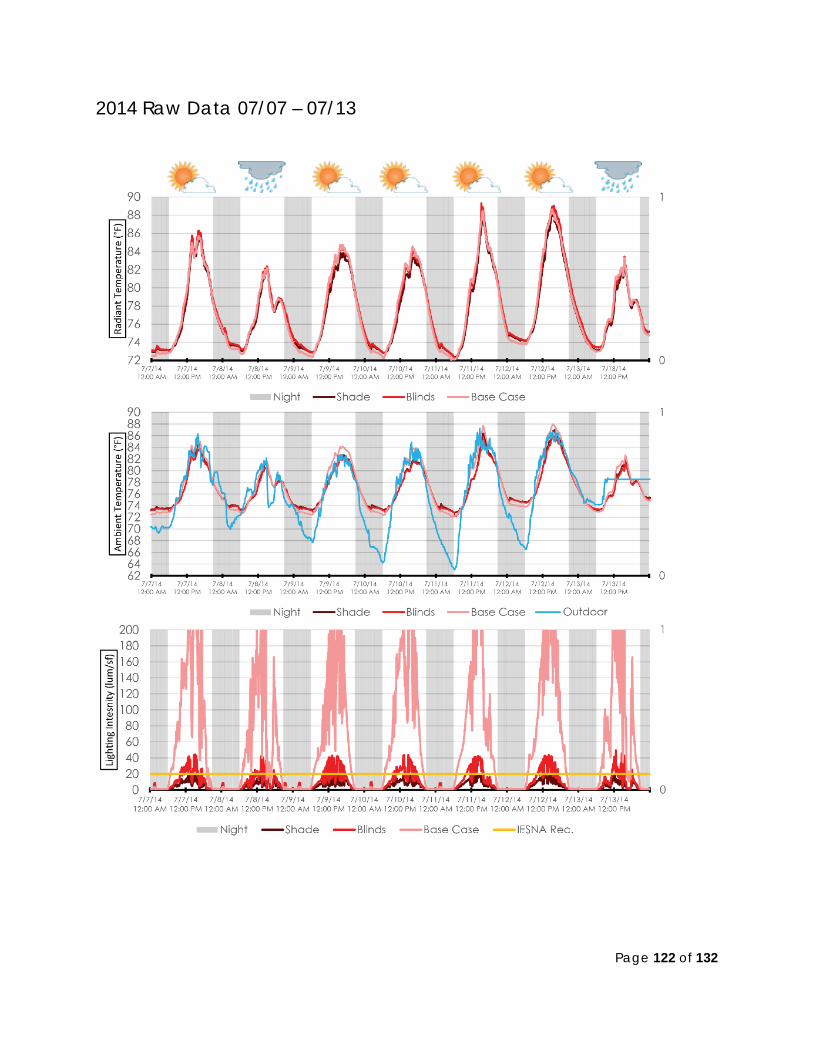
Page 122 of 132
2014 Raw Data 07/07 – 07/13
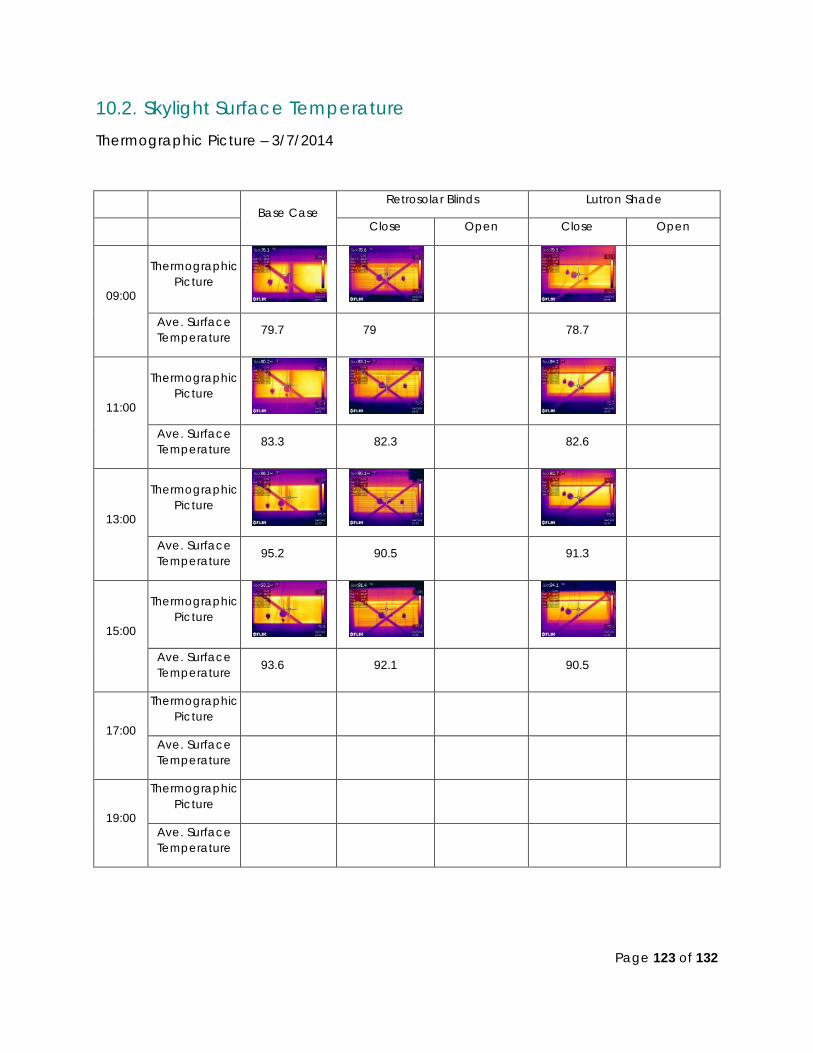
Page 123 of 132
10.2. Skylight Surface Temperature Thermographic Picture – 3/7/2014
Base Case Retrosolar Blinds Lutron Shade
Close Open Close Open
09:00
Thermographic Picture
Ave. Surface Temperature 79.7 79
78.7
11:00
Thermographic Picture
Ave. Surface Temperature 83.3 82.3
82.6
13:00
Thermographic Picture
Ave. Surface Temperature 95.2 90.5
91.3
15:00
Thermographic Picture
Ave. Surface Temperature 93.6 92.1
90.5
17:00
Thermographic Picture
Ave. Surface Temperature
19:00
Thermographic Picture
Ave. Surface Temperature
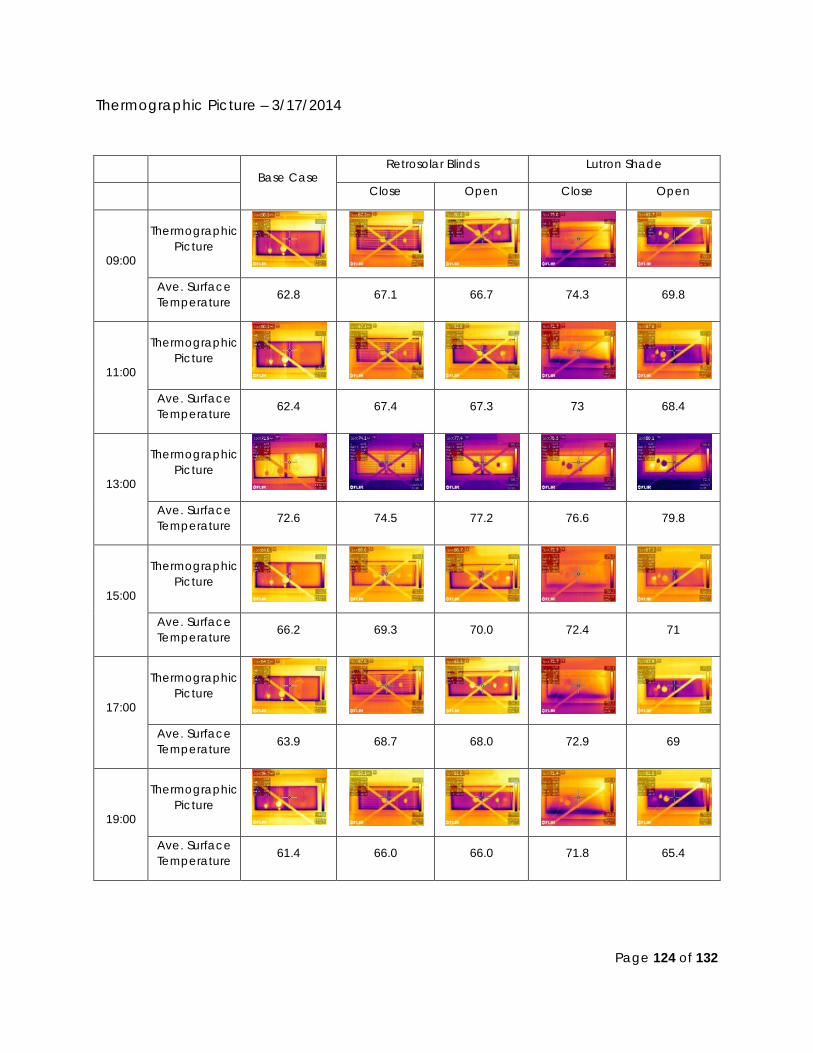
Page 124 of 132
Thermographic Picture – 3/17/2014
Base Case Retrosolar Blinds Lutron Shade
Close Open Close Open
09:00
Thermographic Picture
Ave. Surface Temperature 62.8 67.1 66.7 74.3 69.8
11:00
Thermographic Picture
Ave. Surface Temperature 62.4 67.4 67.3 73 68.4
13:00
Thermographic Picture
Ave. Surface Temperature 72.6 74.5 77.2 76.6 79.8
15:00
Thermographic Picture
Ave. Surface Temperature 66.2 69.3 70.0 72.4 71
17:00
Thermographic Picture
Ave. Surface Temperature 63.9 68.7 68.0 72.9 69
19:00
Thermographic Picture
Ave. Surface Temperature 61.4 66.0 66.0 71.8 65.4
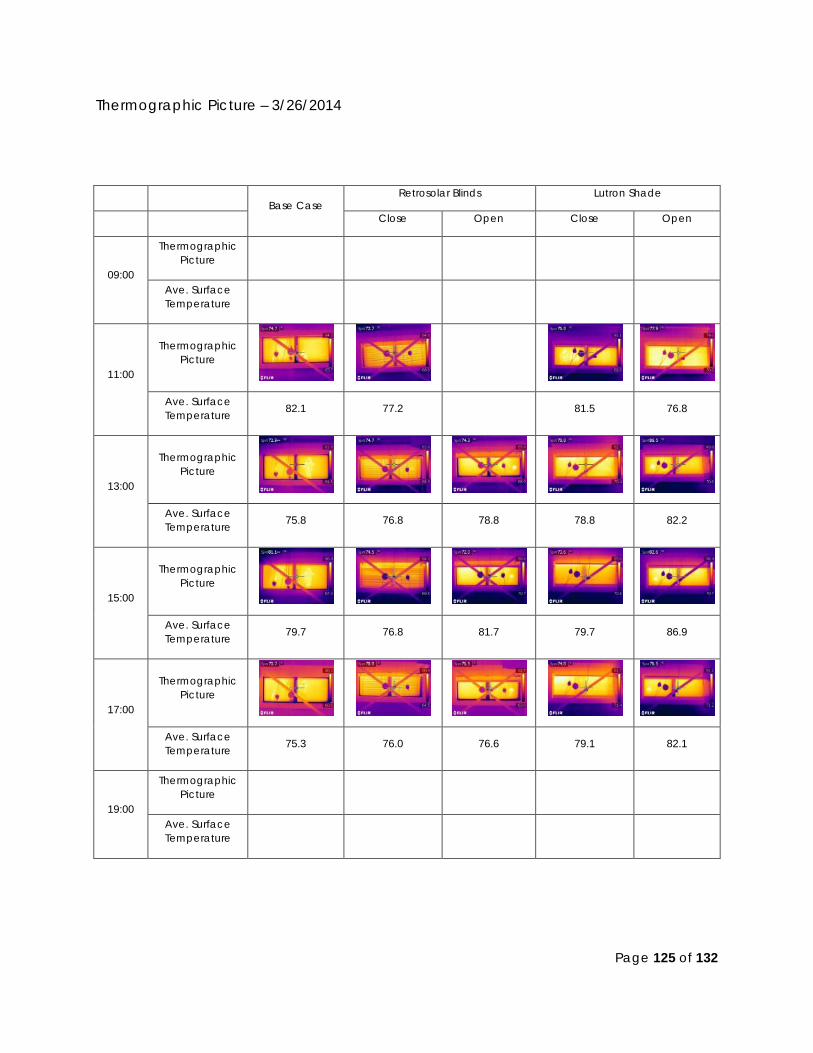
Page 125 of 132
Thermographic Picture – 3/26/2014
Base Case Retrosolar Blinds Lutron Shade
Close Open Close Open
09:00
Thermographic Picture
Ave. Surface Temperature
11:00
Thermographic Picture
Ave. Surface Temperature 82.1 77.2
81.5 76.8
13:00
Thermographic Picture
Ave. Surface Temperature 75.8 76.8 78.8 78.8 82.2
15:00
Thermographic Picture
Ave. Surface Temperature 79.7 76.8 81.7 79.7 86.9
17:00
Thermographic Picture
Ave. Surface Temperature 75.3 76.0 76.6 79.1 82.1
19:00
Thermographic Picture
Ave. Surface Temperature
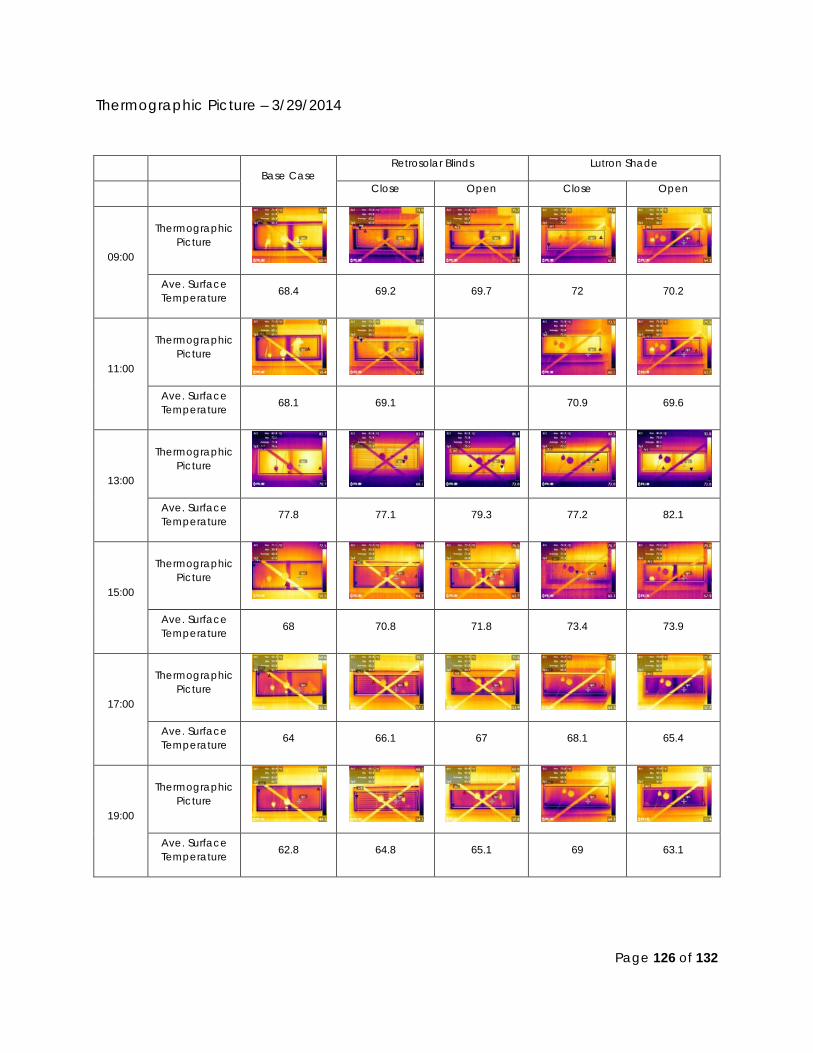
Page 126 of 132
Thermographic Picture – 3/29/2014
Base Case Retrosolar Blinds Lutron Shade
Close Open Close Open
09:00
Thermographic Picture
Ave. Surface Temperature 68.4 69.2 69.7 72 70.2
11:00
Thermographic Picture
Ave. Surface Temperature 68.1 69.1
70.9 69.6
13:00
Thermographic Picture
Ave. Surface Temperature 77.8 77.1 79.3 77.2 82.1
15:00
Thermographic Picture
Ave. Surface Temperature 68 70.8 71.8 73.4 73.9
17:00
Thermographic Picture
Ave. Surface Temperature 64 66.1 67 68.1 65.4
19:00
Thermographic Picture
Ave. Surface Temperature 62.8 64.8 65.1 69 63.1
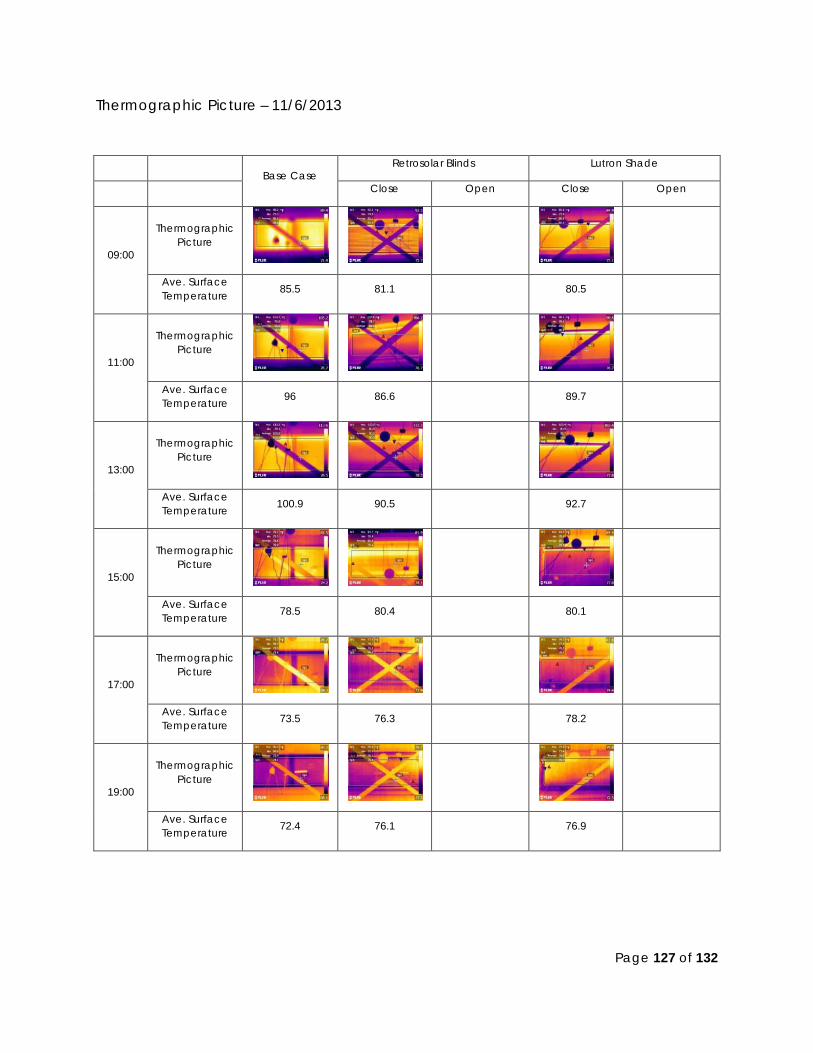
Page 127 of 132
Thermographic Picture – 11/6/2013
Base Case Retrosolar Blinds Lutron Shade
Close Open Close Open
09:00
Thermographic Picture
Ave. Surface Temperature 85.5 81.1
80.5
11:00
Thermographic Picture
Ave. Surface Temperature 96 86.6
89.7
13:00
Thermographic Picture
Ave. Surface Temperature 100.9 90.5
92.7
15:00
Thermographic Picture
Ave. Surface Temperature 78.5 80.4
80.1
17:00
Thermographic Picture
Ave. Surface Temperature 73.5 76.3
78.2
19:00
Thermographic Picture
Ave. Surface Temperature 72.4 76.1
76.9
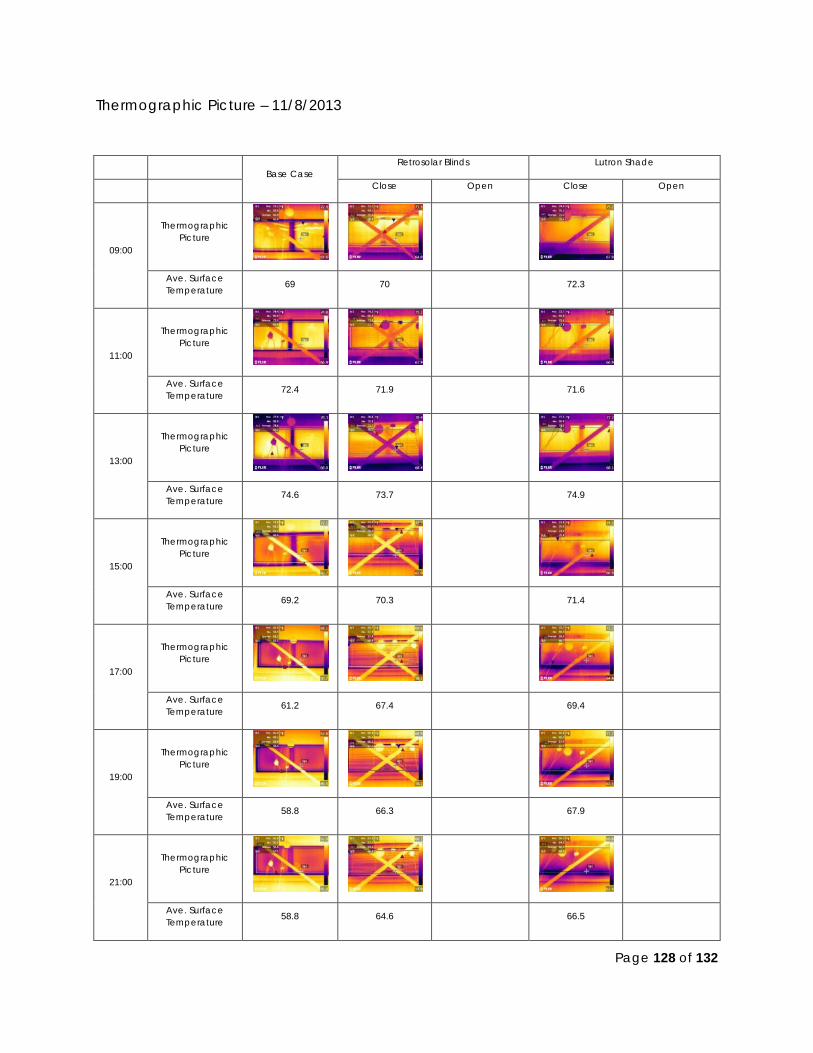
Page 128 of 132
Thermographic Picture – 11/8/2013
Base Case Retrosolar Blinds Lutron Shade
Close Open Close Open
09:00
Thermographic Picture
Ave. Surface Temperature 69 70
72.3
11:00
Thermographic Picture
Ave. Surface Temperature 72.4 71.9
71.6
13:00
Thermographic Picture
Ave. Surface Temperature 74.6 73.7
74.9
15:00
Thermographic Picture
Ave. Surface Temperature 69.2 70.3
71.4
17:00
Thermographic Picture
Ave. Surface Temperature 61.2 67.4
69.4
19:00
Thermographic Picture
Ave. Surface Temperature 58.8 66.3
67.9
21:00
Thermographic Picture
Ave. Surface Temperature 58.8 64.6
66.5
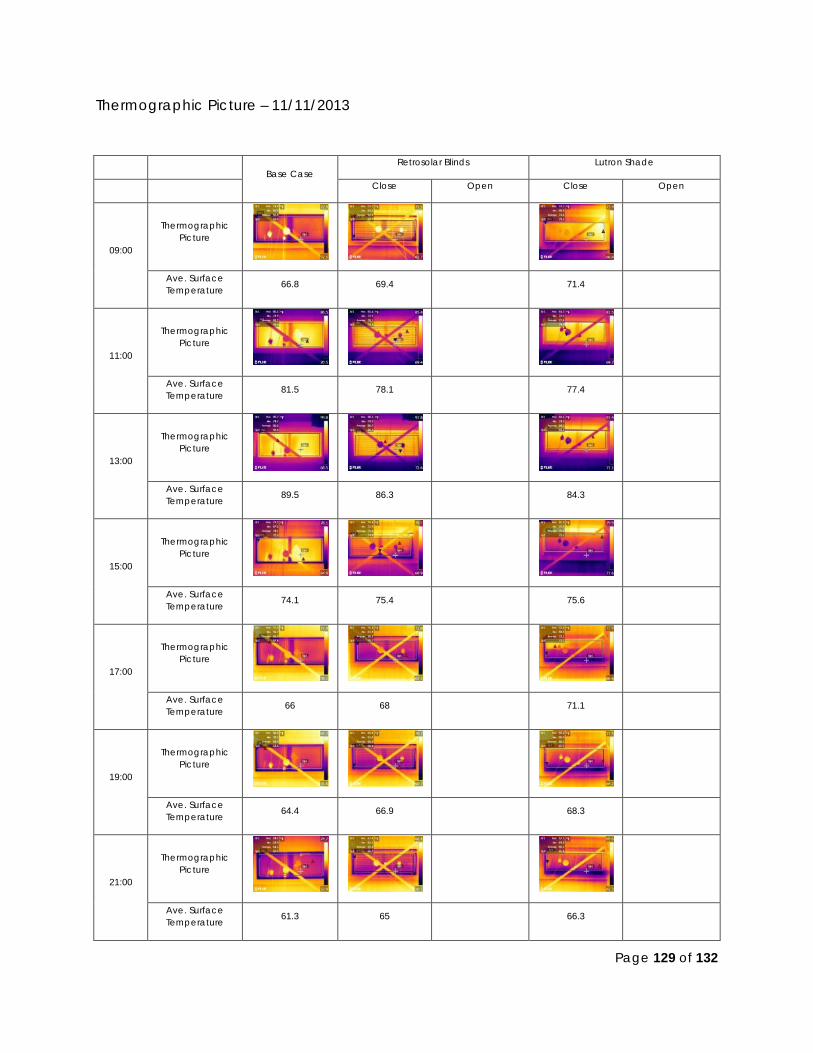
Page 129 of 132
Thermographic Picture – 11/11/2013
Base Case Retrosolar Blinds Lutron Shade
Close Open Close Open
09:00
Thermographic Picture
Ave. Surface Temperature 66.8 69.4
71.4
11:00
Thermographic Picture
Ave. Surface Temperature 81.5 78.1
77.4
13:00
Thermographic Picture
Ave. Surface Temperature 89.5 86.3
84.3
15:00
Thermographic Picture
Ave. Surface Temperature 74.1 75.4
75.6
17:00
Thermographic Picture
Ave. Surface Temperature 66 68
71.1
19:00
Thermographic Picture
Ave. Surface Temperature 64.4 66.9
68.3
21:00
Thermographic Picture
Ave. Surface Temperature 61.3 65
66.3

Page 130 of 132
Bibliography ASHRAE. (2010). Standard 55-2010 Thermal Environmental Conditions for Human .
Athienitis, A., & Tzempelikos, A. (2002, 1). A methodology for simulation of daylight room illuminance distribution and light dimming for a room with a controlled shading device.
Cedar Lake Ventures, Inc. (2014). Average Weather For Pittsburgh, Pennsylvania, USA. Retrieved from WeatherSpark.
Ciralight. (n.d.). In Sun City, California, The Sun Helps An Auto Plaza Earn Higher Leasing Rates.
Ciralight. (n.d.). Warehouse Finds A-1 Solution in Daylighting.
Cochran, E., & Kolosky, A. (2014). High Performance and Integrated Low Slope Roofs and Skylights.
Daylighting Initiative, Pacific Gas and Electric Company. (1997). California State Automobile Association.
Daylighting Initiative, Pacific Gas and Electric Company. (1999). From sunrise to sunset ---- this ACE is a well-lit place.
Daylighting Lab. (n.d.). D-LITE. Retrieved from The Database of Light Interacting Technologies for Envelopes.
Eco-$mart, Inc. (n.d.). SunTrackerOne. Retrieved from http://www.eco-smart.org/productdocs/1-SunTrackerOne_specifications.pdf
Fanger, P., Banhidi, L., Olesen, B., & Langkilde, G. (1980). Comfort Limits for heated ceilings.
Fontoynot M., P. W. (1984). Impact of Electric Lighting Efficiency on the Energy Saving Potential of Daylighting from Roof Monitors. Energy and Buildings.
Grinzato, E., Bison, P., Cadelano, G., & Peron, F. (2010). R-VALUE ESTIMATION BY LOCAL THERMOGRAPHIC ANALYSIS.
Heschong, L. W. (2002). Daylighting Impacts on Retail Sales Performance. Journal of the Illuminating Engineering Society.
IESNA. (2000). The IESNA Lighting Handbook.
Innova AirTech Instruments. (1997). Thermal Comfort.
Innovative Insulation, Inc. (2014). The physics of foil. Retrieved from Innovative Insulation, Inc.: http://www.radiantbarrier.com/physics-of-foil.htm
Page 131 of 132
International Organization for Standardization. (1998). ISO 7726. Ergonomics of the thermal environment - Instrument for measuring physical quantities. Geneva, Switzerland.
ISO. (1998). ISO 7726:1998 Ergonomics of the thermal environment -- Instruments for measuring physical quantities.
ISO. (2008). UNI EN 13790:2008 - Energy performance of buildings - Part 1: Evaluation of energy need for space heating and cooling.
Köster Lichtplanung. (n.d.). RETROLux.
Lee, E. (2006). ANALYSIS OF VISUAL COMFORT USING HIGH-DYNAMIC-RANGE LUMINANCE IMAGES. Lawrence Berkeley National Laboratory.
Lee, E., DiBartolomeo, D., & Selkowitz, S. (1998). Thermal and daylighting performance of an automated venetian blind and lighting system in a full-scale private office.
Lighting Research Center, Rensselaer Polytechnic Institute. (2004). Case study: Smith Middle School.
Lipp, B., & Moser, M. (2004). Heating systems and comfort: is comfort physiologically measureable? Passivhaus Institute.
Melikov, A. (2010). Thermal Comfort, Local Thermal Discomfort.
Mermet Corporation. (2014, 8 7). Products - SilverScreen™ 4%. Retrieved from Mermet: http://www.mermetusa.com/transparent/silverscreen.html
Moeseke, G., Bruyere, I., & Herde, A. (2005). Impact of control rules on the efficiency of shading devices and free cooling for office buildings.
National Research Council of Canada, Institute for Research in Construction (IRC). (2003). COPE Project Research Reports. Ottawa.
Nicklas, M., & Bailey, G. (1996). Energy Performance of Daylit Schools in North Carolina. Innovative Design, Inc.
Nielsen, M., Svendsen, S., & Jensen, L. (2011). Quantifying the potential of automated dynamic solar shading in office buildings through integrated simulations of energy and daylight.
Patwardhan, U. (2012). Reducing Energy Consumption & Improving Indoor Environmental Quality with Dynamic Solar Shading. Carnegie Mellon University.
Pei, Z. (2013). Application of Dynamic Skylight Technologies for Commercial Buildings in Northeast Region.
Pfluger, R., Schnieders, J., Kaufmann, B., & Feist, W. (2003). Highly insulating window systems: inspection and optimisation in the installed state.
Page 132 of 132
Ransen, O. (2014). Candelas, Lumens and Lux.
Schiavon, S., & Lee, K. (2012). Dynamic predictive clothing insulation models based on outdoor air and indoor operative temperatures.
Southern California Edison. (2008). Demand Reduction and Energy Savings Potential of Integrated Dimming Ballast Controls in Mid-Size Retail Facilities: PetSmart Stores. Southern California Edison.
TANABE Shin-ichi Laboratory, Waseda University. (n.d.). PMV Calculator.
Thayer, B. M. (1995). Daylighting & Productivity at Lockheed. Solar Today.
The Weather Channel, LLC. (2014). Weather Underground. Retrieved from http://www.wunderground.com/
U.S. Department of Energy. (2014, 5 4). Glossary. Retrieved from Energy Efficiency & Renewable Energy: http://www1.eere.energy.gov/tribalenergy/guide/glossary.html
U.S. DOE, & FEMP. (2002). The Business Case for Sustainable Design in Federal Facilities.
U.S. Energy Information Administration. (2009). Retrieved from http://www.eia.gov/
U.S. Energy Information Administration. (2012). Use of Energy in the United States Explained. Retrieved from http://www.eia.gov/energyexplained/index.cfm?page=us_energy_use
VirginiaTech. (2014). Retrieved from Center for High Performance Environments: http://www.chpe.arch.vt.edu/chpe_home/L_img_head_study.jpg
Yao, J., & Xu, J. (2010). Effects of different shading devices on building energy saving in hot summer and cold winter zone.
Copyright © 2022 FDOKUMEN