The optimal location of egg production in New Zealand
69
THE OPTIMAL LOCATION OF EGG PRODUCTION IN NEW ZEALAND A.C. Beck J.P. Rathbun C.D. Abbott RESEARCH REPORT NO. 158 OCTOBER 1984 Agricultural Economics Research Unit Lincoln College Canterbury New Zealand ISSN 0069-3790
-
Upload
khangminh22 -
Category
Documents
-
view
4 -
download
0
Transcript of The optimal location of egg production in New Zealand
THE OPTIMAL LOCATION OF EGG
PRODUCTION IN NEW ZEALAND
A.C. Beck
J.P. Rathbun
C.D. Abbott
RESEARCH REPORT NO. 158
OCTOBER 1984
Agricultural Economics Research UnitLincoln College
CanterburyNew Zealand
ISSN 0069-3790
THE AGRICULTURAL ECONOMICS RESEARCH UNITLincoln College, Canterbury, N.Z.
The Agricultural Economics Research Unit (AERU) was established in 1962 at LincolnCollege, University ofCanterbury. The aims of the Unit are to assist byway ofeconomicresearch those groups involved in the many aspects ofNew Zealand primary productionand product processing, distribution and marketing.Major sources of funding have been annual grants from the Department of Scientificand Industrial Research and the College. However, a substantial proportion of theUnit's budget is derived from specific project research under contract to governmentdepartments, producer boards, farmer organisations and to commercial and industrialgroups.The Unit is involved in a wide spectrum of agricultural economics and managementresearch, with some concentration on production economicS, natural resourceeconomics, marketing, processing and transportation. The results of research projectsare published as Research Reports or Discussion Papers. (For further informationregarding the Unit's publications see the inside back cover). The Unit also sponsorsperiodic conferences and seminars on topics of regional and national interest, often inconjunction with other organisations.The Unit is guided in policy formation by an Advisory Committee first established in1982.The AERU, the Department of Agricultural Economics and Marketing, and theDepartment of Farm Management and Rural Valuation maintain a close workingrelationship on research and associated matters. The heads of these two Departmentsare represented on the Advisory Committee, and together with the Director, constitutean AERU Policy Committee.
UNIT ADVISORY COMMITTEE
B.D. ChamberlinGunior Vice~President,Federated Farmers of New Zealand Inc.)
P.D. Chudleigh, B.Sc. (Hons), Ph.D.(Director, Agricultural Economics Research Unit, Lincoln College) (ex officio)
J. Clarke, C.M.G.(Member, New Zealand Planning Council)
J.B. Dent, B.Sc., M.Agr.Sc., Ph.D.(Professor & Head of Department ofFarm Management & Rural Valuation, Lincoln College)
Professor RH.M. Langer, B.Se. (Hans.), Ph.D., F.RS.N.Z.,F.A.N.Z.A.A.S., F.N.Z.LA.S.(Principal of Lincoln College)
A.T.G. McArthur, B.Sc.(Agr.), M.Agr.Sc., Ph.D.Head of Department ofAgricultural Economics & Marketing, Lincoln College)
J. Neilson, B.A.,B.Com., F.C.A., F.C.LS.(Lincoln College Council)P. Shirtcliffe, B.Com., ACA
(Nominee of Advisory Committee)E.J. Stonyer, B.Agr. Sc.
(Director, Economics Division, Ministry of Agriculture and Fisheries)
J.H. Troughton, M.Agr.Se., Ph.D.,D.Se., F.RS.N.Z.(Assistant Director-General, Department of Scientific & Industrial Research)
UNIT RESEARCH STAFF: 1984
Director
P.D. Chudleigh, B.Sc. (Hons), Ph.D.
Research Fellow in Agricultural Policy
J.G. Pryde, O.B.E., M.A., F.N.Z.LM.
Visiting Research FellowE. A. Attwood, B.A., Dip.Ag.Sc., M.A., Ph.D.
Senior Research Economists
A.C. Beck, B.Se.Agr., M.Ee.RD. Lough, B.Agr.Se.
RL. Sheppard, B.Agr.Se.(Hons), B.B.S.
Research EconomistRG. Moffitt, B.Hort.Se., N.D.H.
Research Sociologist "lR Fairweather, B.Agr.Sc.,B.A.,M.A.,Ph.D.
Assistant Research Economists
L.B. Bain, B.Agr., LL.B.D.E.Fowler, B.B.S., Dip. Ag. Econ.
G. Greer, B.Agr.Sc.(Hons) (D.S.I.R.5econdment)S.E. Gutbrie, B.A. (Hons) .
S.A. Hughes, B.Sc.(Hons), D.B.A.M.T. Laing, B.Com.(Agr), M.Com.(Agr) (Hons)
P.]. McCartin, B.Agr.Com.P.R McCrea, B.Com.(Agr), Dip. Tchg.J.P. Rathbun, B.Sc., M.Com.(Hons)
Post Graduate Fellowsc.K.G. Darkey, B.Sc., M.Se.
SecretaryG.S. McNicol
CONTENTS
LIST OF TABLES
LIST OF FIGURES
PREFACE
ACKNOWLEDGEMENTS
SUMMARY
CHAPTER 1 INTRODUCTION
1.1 Aims of the Study
1.2 Industry Background
Page
(i)
(i)
(iii)
(v)
(vii)
1.2.11.2.21.2.3
ProductionDistributionEntitlement policy
123
1.3 Important Aspects of the Industry
Feed supplyMethods of egg transport
CHAPTER 2 THE MODEL AND SOLUTION TECHNIQUE
2.1 Model Summary
2.2 Linear Prograwning
2.3 Model Structure
2.3.1 Model formulation assumptions
2.3.2 The objective function
2.3.3' Trausportation uetworks
2.4 Mathematical Formulation
2.5 Potential Uses for the Model
3
34
7
7
7
8
8
10
10
11
16
CHAPTER 3 DATA AND PARAMETER ASSUMPTIONS
3.1 Cost of Feed
3.2 Feed Availability
3.3 Non-Feed Costs of Production
3.4 Feed Coefficients of Egg Production
3.5 Egg Transfer Costs
Page
17
17
17
18
19
20
3.5.13.5.2
Intra-IslandInter-Island
2020
3.6 Direct Transfers
3.7 Direct Sales and Total Production of Eggs
3.8 Loss of Quality During Transport
3.9 Regional Commercial Demand for Eggs
3.10 Surplus Receipts Necessary to Meet DemandPeculiarities
3.11 Coefficients for Constraints RelatingTransfers to Local Supply and Demand
3.12 National Surplus
3.13 Egg Production Bounds
3.14 Surplus Processing Constraints
CHAPTER 4 RESULTS
4.1 Introduction
4.2 Optimal Location \dth Existing Facilities
21
21
21
22
22
23
23
24
24
25
25
25
4.2.14.2.2
4.2.3
SummaryNorth Island:transfersSouth Island:transfers
Optimum production and
Optimum production and
25
26
30
4.3 Allowing New Production Facilities
4.4 Explanation of Results
4.5 Sensitivity Analysis
31
34
34
4.5.14.5.24.5.3
New facilities in WellingtonReduction in shipping chargesFeed price relativities
Page
343535
4.6 Conclusions 37
CHAPTER 5 METHODS OF ACHIEVING A MORE EFFICIENT LOCATION OFPRODUCTION 39
5.1 Introduction 39
5.2 Redistribution of Quotas by the Poultry Boardwithout Regional Pricing 39
5.3 Regional Pricing 40
5.3.15.3.25.3.3
Transferable entitlementsEntitlements controlled by the BoardFree market
414242
CHAPTER 6 OVERVIEW AND CONCLUSIONS
REFERENCES
APPENDICES 1 Definition of Model Regions
2 Regional Variation in Non-feed Costs ofProduction
45
47
49
51

Table
1
2
3
4
Figure
1
LIST OF TABLES
Surplus Processing Plants at Each Egg Floor
Non-feed Production Costs
Feed Conversion Ratios and Production Rates
Responses to the Feed Price Differential Between Northand South Islands
LIST OF FIGURES
Regional Production Levels Under Differing OperatingConditions
(i)
Page
I J
19
20
36
Page
32

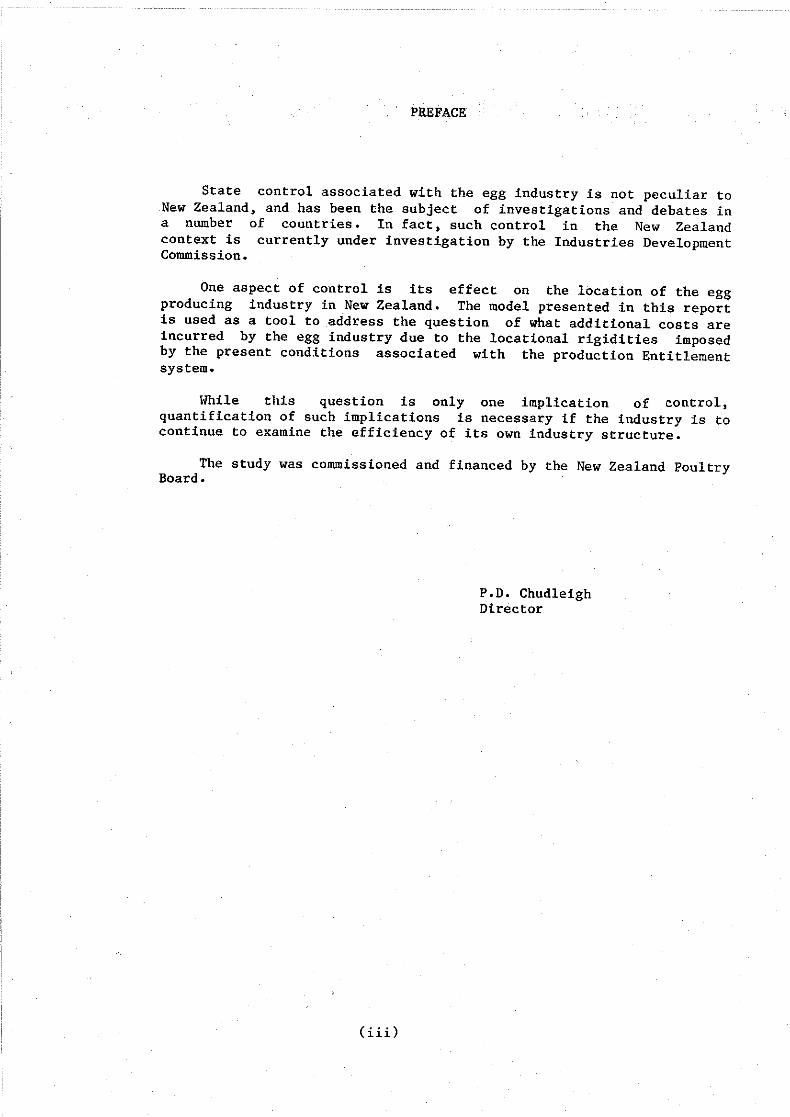
PREFACE
State control associated with the egg industry is not peculiar toNew Zealand, and has been the subject of investigations and debates ina number of countries. In fact, such control in the New Zealandcontext is currently under investigation by the Industries DevelopmentCommission.
One aspect of control is its effect on the location of the eggproducing industry in New Zealand. The model presented in this reportis used as a tool to .address the question of what additional costs areincurred by the egg industry due to the locational rigidities imposedby the present conditions associated with the production Entitlementsystem.
While this question is only one implication of control,quantification of such implications is necessary if the industry is tocontinue to examine the efficiency of its own industry structure.
The study was commissioned and financed by the New Zealand PoultryBoard.
P.D. ChudleighDirector
(iii)


ACKNOWLEDGEMENTS
The comments and suggestions of Messrs G.G. Kermode, A.W. Mitchelland A. Briggs and the staff and executive of the Poultry Board, whosupplied much of the information used in this study, is gratefullyacknowledged. Also the contribution to the study, particularly in thearea of production costs, by Mr Warwick Gay, of the Ministry ofAgriculture and Fisheries, has been appreciated.
Any opinions expressed in this Report are those of the authors anddo not necessarily reflect those of the New Zealand Poultry Board, itsmembers or staff.
(v)

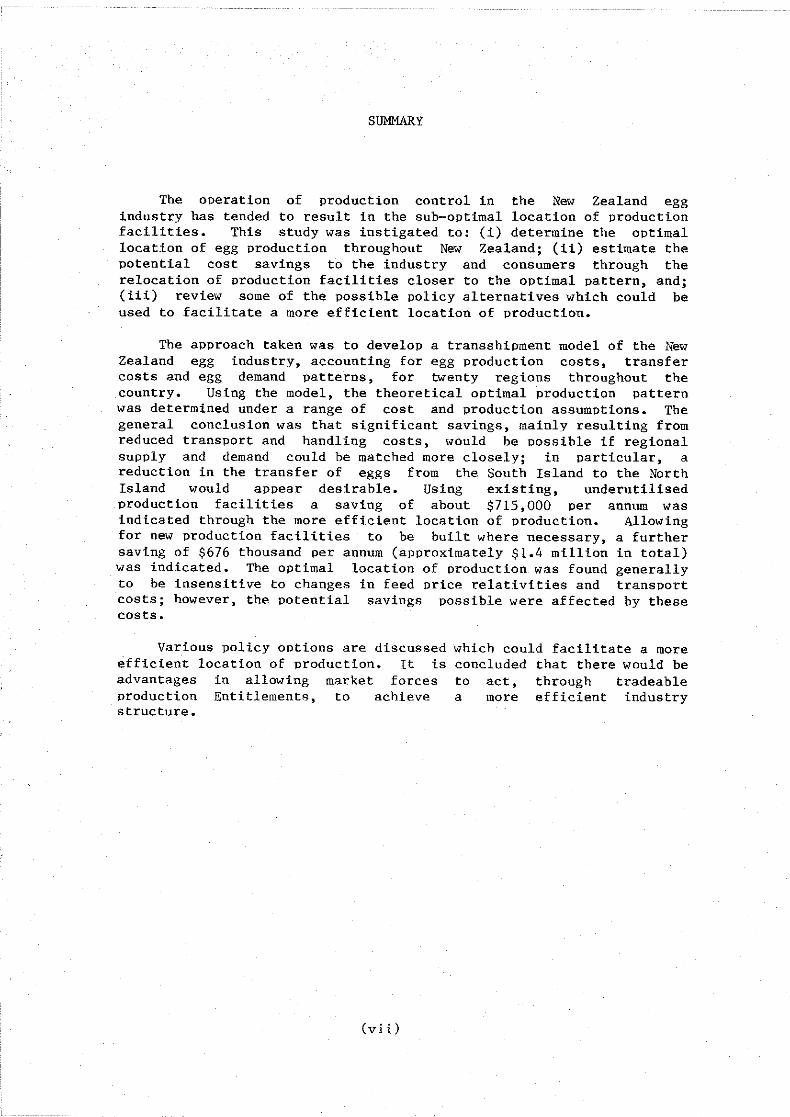
SUMMARY
The operation of production control in the New Zealand eggindustry has tended to result in the sub-oPtimal location of productionfacilities. This study was instigated to: (i) determine the optimallocation of egg production throughout New Zealand; (ii) estimate thepotential cost savings to the industry and consumers through therelocation of production facilities closer to the optimal pattern, and;(iii) review some of the possible policy alternatives which could beused to facilitate a more efficient location of production.
Tbe approach taken was to develop a transshipment model of the NewZealand egg industry, accounting for egg production costs, transfercosts and egg demand patterns, for twenty regions throughout thecountry. Using the model, the theoretical optimal production patternwas determined under a range of cost and production assumptions. Tbegeneral conclusion was that significant savings, mainly resulting fromreduced transport and handling costs, would be possible if regionalsupply and demand could be matched more closely; in particular, areduction in the transfer of eggs from the South Island to the NorthIsland would appear desirable. Using existing, underutilisedproduction facilities a saving of about $715,000 per annum wasindicated through the more efficient location of production. Allowingfor new production facilities to be built where necessary, a furthersaving of $676 thousand per annum (approximately $1.4 million in total)was indicated. The optimal location of production was found generallyto be insensitive to changes in feed price relativities and transportcosts; however, the potential savings possible were affected by thesecosts.
Various policy ootions are discussedefficient location of production. It isadvantages in allowing market forcesproduction Entitlements, to achievestructure.
(vii)
which could facilitate a moreconcluded that there would beto act, through tradeablea more efficient industry

CHAPTER 1
INTRODUCTION
1.1 Aims of the Study
The current location of egg production throughout New Zealand haslargely been determined by the 1970 Egg Marketing (ProductionEntitlement) Regulations, now incorporated into Poultry BoardRegulations (1980), which were introduced to minimise unprofitablesurplus production. The entitlement scheme (and subsequentdevelopments of it) depends on restricting the number of laying birdsheld by producers and has led to a closer matching of total nationalsupply and demand; however, the significance of regional imbalances hasincreased. As a result of changes in transport costs, populationdensities and costs of production throughout New Zealand, it appearedthat the current location of production could be resulting inunnecessary costs to the industry, associated with the transportationof eggs from surplus to deficit areas.
The first aim of this study, therefore, was to determine theoptimal location of egg production throughout New Zealand, accountingfor transport costs, population densities and production costs. Thesecond aim was then to estimate the potential savings to the industryand consumers from moving toward the optimal location of production.Given that such savings were found to be significant and a move towarda more efficient production pattern was justified, then productionwould have to be reduced in some areas and increased in others. Themethod and rate of these changes will be important; while a rapid moveto a more efficient pattern of production would be expected to lead toa more rapid realisation of the benefits, there are other issues to beconsidered. A policy of rapid change may be counter productive if itcauses undue hardship for some producers or leads to a seriousdisruption of supply. The third aim of this study was, therefore, toexamine alternative methods of achieving changes in the location ofproduction, in the light of the benefits and costs involved.
1.2 Industry Background
1.2.1 Production.
The N.Z. commercial egg industry cOlnprises approximately threemillion laying birds producing about 60 million dozen eggs per annum onsome 500 poultry farms scattered throughout New Zealand with particularconcentrations in Christchurch, Hastings, Tauranga and Auckland.Poultry farmers supply the bulk of their produce to egg floors forgrading, packaging and distribution to retailers. There are 19 eggfloors operating in New Zealand under license to the Poultry Board.
I.
2.
The commercial egg industry is augmented by backyard producers whooperate on a much less intensive scale but still contribute some 15million dozen eggs annually, all of which are consumed within NewZealand. Demand for commercially produced eggs is seasonal, sufferinga summer slump, due to the effect of backyard production which peaks atthis time.
Since the introduction of the entitlement scheme in 1970,mandatory and voluntary reductions in gross entitlements have been usedby the Poultry Board to m1n1m1se production surpluses. Nearly allfarmers reduce their operative entitlement voluntarily in return forreduced levies. This has led to a change in husbandry techniques withless intensive use of shed facilities. Most regions could accommodatean increase in entitlement by using existing shed facilities but beyondthis limit, additional birds would have to be housed in new and moreexpensive sheds. New management techniques coupled with new facilitieswould allow more economical use of feed, and other inputs, but theproblem of higher capital investment to attain these economies remains.
Feed requirements can vary between regions depending on climaticconditions, but this effect has largely been overcome by efficienthousing design. Feed rations for the industry are usually calculatedfor each region by the feed companies using least-cost formulationswhich satisfy nutrition requirements. Compared with grain, whichcomprises approximately 70-80 percent of the cost of all feed mixes,other ingredients have little impact on the total cost of feed.Transport costs play a significant role in the costing of grain asgrain production is concentrated around the Waikato, Hawkes Bay,Manawatu, Canterbury, Otago and Southland areas while egg production isdistributed throughout N.Z.
1.2.2 Distribution.
Although there is an overall surplus of eggs, variation inregional supply and demand requires that eggs must be moved around thecountry to satisfy demand in all regions. Surplus eggs are processed,at a cost to the industry, into unpasteurised pulp which is sold to thelocal baking trade, and pasteurised pulp and egg powder which areexported. Although most egg floors manufacture unpasteurised pulp,only three egg floors in New Zealand are capable of processing eggs forexport. Some surplus eggs therefore must also be transferred betweenegg floors for processing. The net cost of transporting and processingeggs is passed on to all farmers by way of a levy on their operativeenti tlement.
Most eggs produced on poultry farms are distributed through theclosest egg floor; however, farmers can deliver to more distant eggfloors if they bear the cost of transport or, if they are outsidenominated egg marketing areas, they can sell eggs direct to the publicor to retailers.
When eggs are received at an egg floor they are graded prior toresale or transfer and a cownission is charged for this service. Thisapplies even if the eggs received at an egg floor have been consignedfrom another egg floor although the commission charged is smaller than
3.
if they have been consigned directly from the farm. Hence, dependingon whether the eggs are transferred between egg floors, extracommission may be incurred. Typically I percent of eggs received fromfarms must be dumped as of no commercial value. Additional losses ofapproximately I percent occur for eggs transferred between egg floorsdue to increased age and damage from extra handling and travel. Another5-6 percent of gross receipts are fit only for processing into pulp orpowder. At each egg floor, sufficient eggs must be available tosatisfy retail demand, including an extra quantity to cover thedistribution of demand through the grades. Eggs surplus to retaildemand must either be processed into pulp or powder or transferred toanother egg floor. One of the functions of the N.Z. Poultry Board,under the Poultry Act of 1976 is "to ensure, as far as possible, asufficient supply of eggs and their equitable distribution in thegeneral interests of producers and consumers". In practice this meansthat the Poultry Board endeavours to supply all grades of eggs to allregions at all times; to achieve this objective the Poultry Boardtargets a shell egg surplus of up to five million dozen eggs annually.A significant proportion of the surplus is ultimately processed for .thedomestic bakery trade.
1.2.3 Entitlement policy.
In 1979/80 the Government completed a survey of the N.Z. eggindustry and recommended that the industry should remain controlled. Inaddition, it set a price of $5.00 per bird on sales of entitlements,which could only be sold to the Poultry Board. This price remainedvalid until 31 July, 1981 at which time the price dropped to $2.50 perbird. This price was maintained until 31 July, 1982, after which timeentitlements were deemed to have no value. The effect of this decisionwas that many entitlement holders considering leaving the industry, orholding unused entitlement license, sold their entitlements back to theBoard before 31 July, 1981. These sales to the Board allowed 287,000entitlements to be withdrawn from the industry. The Poultry Board havesubsequently proposed to the Government an alternative system ofentitlement transfer under which entitlements would still only be ableto be surrendered to the Poultry Board, but a price would be paid bythe Poultry Board for any entitlements received and they would beredistributed to deficit areas. The proposal is currently underGovernment scrutiny and seems likely to be accepted.
1.3 Important Aspects of the Industry
1.3.1 Feed supply.
The cost of feed accounts for just over 50 percent of the totalcost of egg production on a typical poultry farm. Feed rations arenormally based on a least-cost feed mix that satisfies knownnutritional requirements. Many grains (and meatmeals) are availablefor the mix. The energy requirement of the ration forces 70-75 percentby weight of the feed mix to be composed of one or more grains (andmeatmeals). The remaining 25-30 percent of the feed mix is composed ofa large number of ingredients present in very small amounts toguarantee hen health, shell strength, yolk colour, etc. The total cost
4.
of thesecost ofslightlyprices.
ingredients makes up approximately 35 percent of thefeed. Since the cost of non-grain ingredients varies
between regions, feed costs are highly dependent upon
totalonly
grain
Grain prices do vary significantly between regions, due to thedifferent types of grain grown and used in each region, and the highcosts of transporting grain. For example, maize production isconcentrated in the North Island areas of Waikato, the Bay of Plenty,East Coast and Hawkes Bay; wheat and barley production are concentratedin Canterbury, Otago, Southland, Wanganui and Manawatu, while oatsproduction is concentrated in Canterbury and Southland.
Obviously, grains are not grown for use by the egg industry alone.Wheat, for example, must be offered to the Wheat Board and if thequality is acceptable the wheat will be processed into flour. Thebyproducts of this process, notably bran and pollard, can then be soldto the feed industry for use in feed. The feed industry mixes feedsfor laying hens, meat poultry, pigs, and other animals. The price oflayer feed thus depends on a complex mix of grain production, thecompeting demands by other industries, and grain transport costs. Theprice of layer feed will also depend on the pricing policy of theindividual feed firms and this depends upon the objectives of the feedmiller as to profits and market share, and competition from rival feedmillers. Some feed millers attempt to set one price for the season,while others work more closely to a cost-plus system, with frequentprice rises throughout the year. Some feed millers include delivery inthe quoted price, others quote an ex-factory price only, and otherswill deliver free within a limited distance, and at a subsidised rateoutside this distance.
Some poultry farms'purchase the ingredientstreated as extra business
do notand mixactivity
purchase already-mixed feed, buttheir own feed. Such activity is
outside the ambit of this report.
1.3.2 Methods of egg transport.
On the farm, eggs are gathered at least daily and stored in coolstores. They are then transported by truck at least twice weekly tothe egg floors where they are again stored at cool temperaturesawaiting grading, packaging, and redistribution to retailers. Directsupply of eggs from poultry farms to egg floors in other regions occurin some cases with an associated saving in commission charges_ Egglosses occur through rough handling, and egg quality deteriorates withtime, much more rapidly at hotter temperatures. To ensure that eggsreaching the consumer are of high quality, egg transfers should be fastand in refrigerated vehicles.
Many egg floors will receive eggs that are surplus to theircurrent requirements. These surplus eggs must be disposed of either byprocessing into one or more of the three egg byproducts (unpasteurisedpulp, pasteurised pulp and powder), or by transferral to another eggfloor for resale or processing. As it is not economic to transfersmall nwnbers of eggs, eggs must accumulate until a batch of sufficient

size to justifyshort delay eggto be minimal asperiod.
5.
transferral is attained. As a consequence of thisquality may suffer, although any such effect is likelyeggs are stored under cool conditions during this
Rail transport of eggs has many disadvantages because rail wagonsare not refrigerated, and at each end of the journey eggs must behandled on and off trucks. The rail service may also be subject todelays. All these factors cause physical losses during the transfer ofeggs, as well as the less tangible drop in quality of retail gradeeggs. Road transport is quicker once the truck is filled it canleave immediately and travel directly to its destination. Roadtransport also allows the use of refrigerated vehicles, and reduceshandling; consequently, where possible and feasible, licences have beenobtained to transport eggs by road.
At present eggs are transferred, throughout the country, in thefollowing manner:-
(i) North Island.Eggs are transported between egg floors by road.
(ii) South Island.Eggs are transported by rail betweenwith the exception of consignmentswhich road transport is used.
South Island egg floorsto and from Nelson, for
(iii) Inter Island.Transfers of eggs between the South and North Island,excluding some to and from Christchurch, are made byrail-ferry. Recently sea shipping of eggs fromChristchurch to Wellington and Auckland has becomepossible. At present about 75 percent are consigned by seaand 25 percent by rail-ferry

CHAPTER 2
THE MODEL AND SOLUTION TECHNIQUE
2.1 Model Summary
To determine the optimal location of egg production throughout NewZealand a computer model was developed. For this purpose the countrywas divided up into 20 regions corresponding to the 18 egg floorsopera,ing throughout N.Z. (combining the two egg floors operating inthe Auckland area), with additional regions for the areas around oamaruand Greymouth. The regions cannot be combined as most egg floorsaccept and redistribute eggs within separate and identifiable regions.The fate of each region, particularly each egg floor, was also a matterof interest. The processing of surplus eggs must also be identifiedwith a specific egg floor, ,as the disposal cost of surplus eggs dependsto a large degree on the transportation costs of shifting the surplusto its final destination.
Feedtogetherregions.
(i)
and other production costs were determined for each regionwith the costs of transporting eggs and pulp between allThe various levels of transportation are:
Eggs from poultry farms to local and distant egg floors.
(ii) Eggs between egg floors to satisfy retail demand and meetprocessing requirements.
(iii) Unpasteurised pulp between egg floors to meet local demand.
Having estimated these costs the model was run to determine theleast-cost location of production to minimize total production andtransport costs, subject to the requirement that the demand for eggs bemet in all regions at all times.
2.2 Linear Programming
The technique chosen was to model the egg production anddistribution system using linear programming (LP). Problems suited toanalysis with, linear programming are generally those where an optimalallocation of scarce or limited resources is sought to meet statedobjectives, and where all relationships between variables are, or canbe assumed to be, linear, and the function to be optimised is alsolinear.
The formulation of an LP modeloperations of a system into termsrelating the essential elements ofmathematical formulation of the model
7.
requires the distillation of theof linear algebraic equations,the system to each other. Theis presented in Section 2.4.
8.
2.3 Model Structure
2.3.1 Model formulation assumptions.
Key assumptions made in the formulation of the model relate to thefollowing aspects of the problem:
(i) The number of regions
For ease of modelling and computation, it is desirable to keep thenumber of regions in a transshipment problem to a minimum. However,for validity the number of regions must be sufficient to accuratelyreflect actual production and transfer patterns. The model resultswill be used to suggest a new location pattern for egg product, thusexisting concentrations of egg production and their likely futureproduction levels were important in determining regions for thetransshipment model. Egg production was grouped into areascorresponding to the egg floors with distribution costs dependent onthe number and location of these egg floors. For the model 20 regionswere defined corresponding to the 18 egg floors operating throughoutNew Zealand (combining the two egg floors operating in the Aucklandarea), with additional regions specified for the areas around Oamaruand Greymouth. These regions are identified by the name of the city ortown in the region possessing an egg floor. In Appendix 1 each regionis defined in terms of local government areas.
(ii) The time period of the model
Model results will be used by the egg industry as an aid tomanagement in the long-term relocation of commercial egg productionthroughout New Zealand. This use suggests a yearly time period for themodel, as daily and weekly fluctuations are not of immediate relevance;however, seasonal supply and demand fluctuations within the year mustbe considered. Although hens have a definite laying cycle,fluctuations in commercial egg supply are minimal as most poultry farmsproduce with several flocks. Thus commercial egg supply was assumedconstant throughout the year.
Demand for commercial eggs, however, does fluctuate significantlythroughout the year due mainly to the effect of backyard production.The increased backyard production of eggs during the summer monthsleads to decreased demand for commercially produced eggs during thisperiod. Thus, although an egg floor may, on an annual basis, haveperfect balance of supply and demand, during the course of a year itmay be necessary to both transfer eggs into and out of the floor. Theassociated transport costs are a vital component of the total cost ofthe New Zealand commercial egg industry, and cannot be ignored in anyanalysis of the industry.
Decreasing the time period of the model to, say, 6 months, to copewith seasonality would have increased the model size proportionately,making the model too large to solve economically. Therefore, an annualmodel was chosen, but allowance was made for the fluctuations in demandthat cause many egg floors to transfer eggs both into and out of thefloor during the course of a year. The size of such transfers is afunction of the relationship between local supply and demand in a
9.
region. This relationship was established for each region by analysinghistorical data and relating, using regression techniques, the transferpattern with supply and demand. The resulting functions wereincorporated into the model as transfer constraints.
(iii) Heterogeneity of eggs
Eggs are graded at the egg floor, before sale, into six grades andthe payout to poultry farmers varies with these grades. Four gradesare eggs suitable for normal retail sale and are graded on the basis ofweight. Another grade is for eggs of "processing" quality - fit forhuman consumption but non-standard weights and/or possessing minorquality defects. The final category is "no-value" eggs, which areunfit for human consumption. Thus to producers, to the egg floors, andto consumers 'eggs' are not one product; rather 'eggs' consist of a fewproduct lines differentiated one from the other on the basis of weightand quali ty.
When creating a model of any system there is constant conflictbetween introducing more variables to further define the system, andreducing the number of variables to reduce computational effort andcosts and facilitate easy interpretation of the system. For this modelthe heterogeneity of the various egg grades is important because it isnecessary to ensure that at each egg floor there are sufficientquantities of all grades available to meet retail demand and thatsufficient quantities of eggs of less-than-retail quality are processedinto byproducts.
To allow for this in the model, eggs are treated as a homogeneousproduct but the requirement is imposed that enough eggs are supplied toensure the availability of all grades for retail sale and to ensure theprocessing of sufficient eggs into byproducts. Thus the model size iskept down, and the important aspect of egg heterogeneity is accountedfor (see Sections 2.4 and 3.10 for further detail).
(iv) Direct and gate sales
The level of direct egg supplies to retailers and gate sales is. mainly dependent on the distribution of poultry farms in a region. Asmost regions already have specific areas where most poultry farms are·located (and are likely to remain so) it was assumed that direct salesand gate sales remain at their present levels unless total productionin a region drops to less than twice the level of these sales.
(v) Egg demand
A survey carried out by the Poultry Board (pers. comm.) between1979 and 1981, showed no differences between regions in the level oftotal egg demand (commercial and backyard) throughout New Zealand.Thus the demand for commercially produced eggs in each region wasestimated using known population statistics (N.Z. Dept. ofStatistics) and Poultry Board estimates of backyard production.
10.
2.3.2 The objective function.
The problem was to determine the optimal pattern of egg productionand distribution which meets all demands for all egg products at theleast cost to the industry. Thus the objective function used in themodel was to minimise the total cost to the industry which includes thecost of egg production, the cost of egg transport from farm to eggfloor and between egg floors, and the cost of pulp transfer between eggfloors.
2.3.3 Transportation networks.
The egg production and distribution system is modelled as a seriesof five transport networks. The initial network of the model is theallocation of grain from various supply sources to egg productionregions, where the grain is consumed and converted into eggs. Eggproduction in each region has been split into two. sources to allow fordifferences in the cost of production associated with existing versusnew facilities. Production costs for new facilities accounts for thehigh capital cost of new poultry housing and the reduced grainrequirement due to the increased operating efficiency of new poultryhousing. Any differences in egg quality due to the standard of poultryhousing is insignificant and the egg production in each region can berecombined.
The second network of the system relates to the transfer of eggsfrom poultry farms to egg floors. For such transfers an allowance ismade for a small proportion of eggs which are lost to the system atgrading due to breakages and poor quality. Farm produced eggs may besold directly to consumers from the farm gate, and in areas notdesignated as licensed Egg Marketing Areas eggs may also be solddirectly to retailers. Allowance is made for these options in themodel.
Eggs must also be transferred between egg floors to satisfy allregional demands. Due to the increased delay before grading, and theextra handling, such transfers incur greater losses than the directtransfers from poultry farm to egg floor. This is the thirdtransportation network.
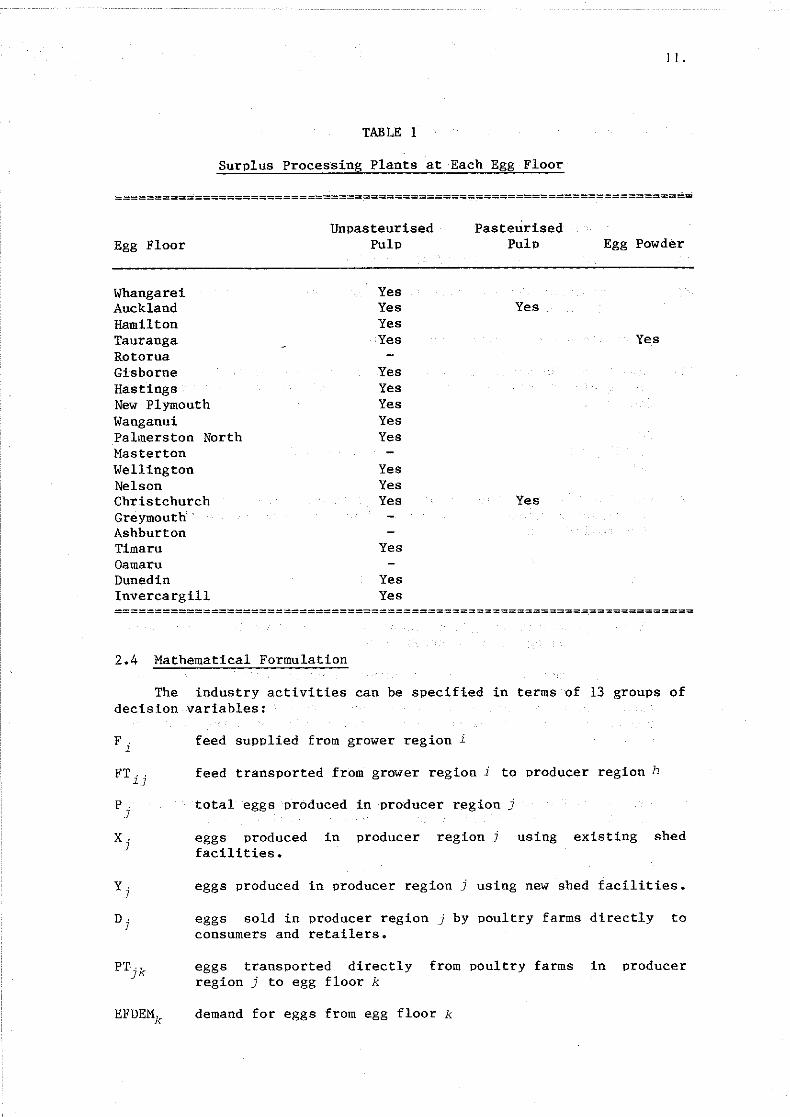
The fourth transportation network arises from the need to moveeggs between egg floors for processing. Retail demand is satisfiedthrough egg floor sales, but there are always surpluses of eggs at eggfloors as a result of grading. Such eggs are either unfit for sale aswhole eggs but acceptable for processing, or are of acceptable qualityfor sale but surplus to demand. Processing facilities for powder,pasteurised pulp and unpasteurised pulp are limited (see Table 1),therefore eggs must be transferred between egg floors to allow forprocessing.
The fifth and final transportationunpasteurised pulp from the producingdemand. The model ensures that domesticis also met.
network isegg floordemand for
the allocation ofto the regions of
unpasteurised pulp
II.
TABLE 1
Surplus Processing Plants at Each Egg Floor
========================================================================
Egg Floor
WhangareiAucklandHamiltonTaurangaRotoruaGisborneHastingsNew PlymouthWanganuiPalmers ton NorthMastertonWellingtonNelsonChristchurchGreymouthAshburtonTimaruOamaruDunedinInvercargill
UnpasteurisedPulp
YesYesYesYes
YesYesYesYesYes
YesYesYes
Yes
YesYes
PasteurisedPulp
Yes
Yes
Egg Powder
Yes
========================================================================
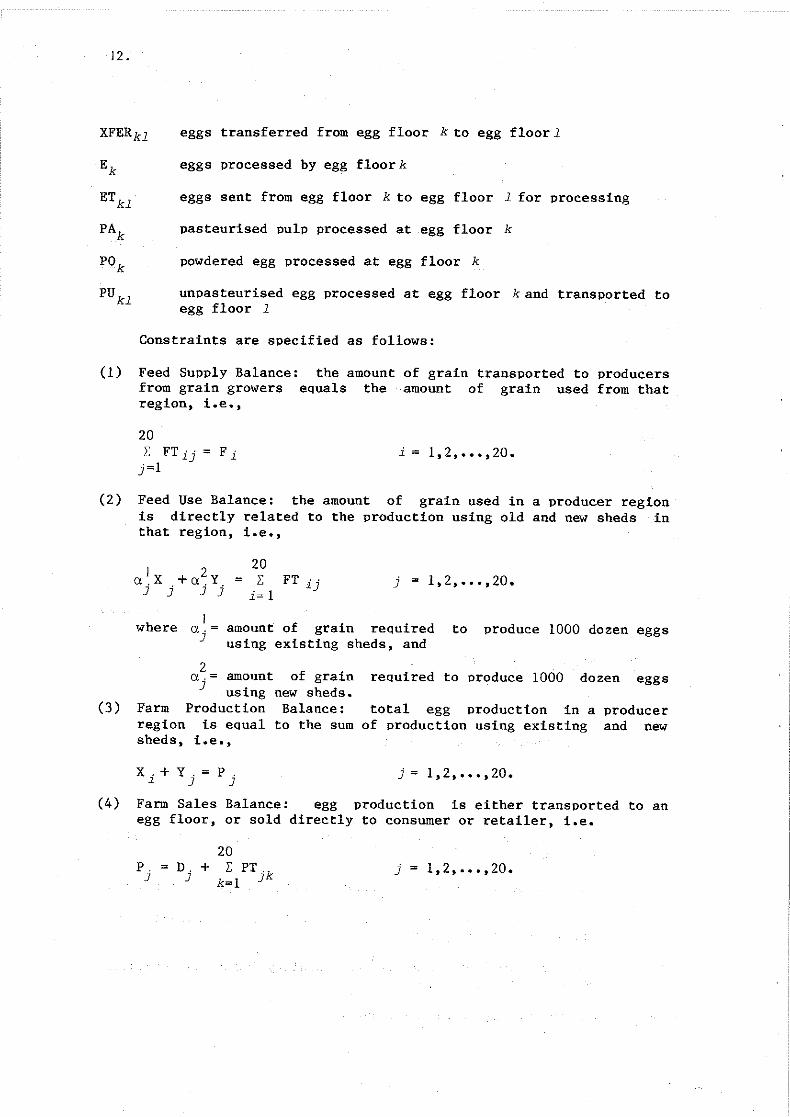
2.4 Mathematical Formulation
The industry activities can be specified in terms of 13 groups ofdecision variables:
F i
PTjk
feed supplied from grower region i
feed transported from grower region i to producer region h
total eggs produced in producer region j
eggs produced in producer region j using existing shedfacilities.
eggs produced in producer region j using new shed facilities.
eggs sold in producer region j by poultry farms directly toconsumers and retailers.
eggs transported directly from poultry farms in producerregion j to egg floor k
demand for eggs from egg floor k
12.
ETk1
PAk
POk
PUk1
eggs transferred from egg floor k to egg floor 1
eggs processed by egg floor k
eggs sent from egg floor k to egg floor 1 for processing
pasteurised pulp processed at egg floor k
powdered egg processed at egg floor k
unpasteurised egg processed at egg floor k and transported toegg floor 1
Constraints are specified as follows:
(l) Feed Supply Balance: the amountfrom grain growers equals theregion. i.e ••
20l: FT ij = F ij=l
of grain transported to producersamount of grain used from that
i = 1, 2, ••• , 20 •
(2) Feed Use Balance: the amount of grain used in a producer regionis directly related to the production using old and new sheds inthat region. i.e ••
20= l: FT ij
i= 1j 1,2, •.• ,20.
where 1a.= amount of grain required
] using existing sheds. andto produce 1000 dozen eggs
(3)
2a.= amount of grain
] us ing new sheds.Farm Production Balance:region is equal to the sumsheds, i.e.,
X.+Y.=P.~ ] ]
required to produce 1000 dozen eggs
total egg production in a producerof production using existing and new
j = 1.2••••• 20.
(4) Farm Sales Balance: egg production is either transported to anegg floor. or sold directly to consumer or retailer. i.e.
P.]
20D. + l: PT .k
] k=l ]j 1,2, .•• ,20.
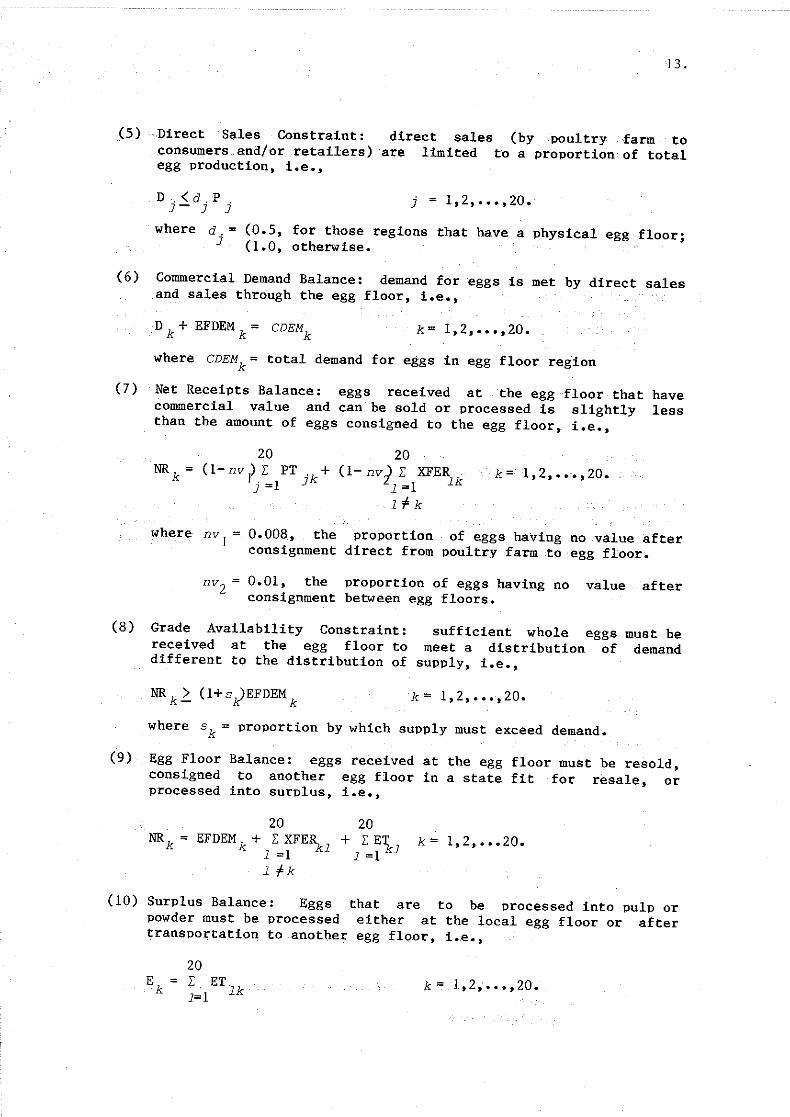
(5) Direct Sales Constraint:consumers and/or retailers)egg production, i.e.,
D. <d. P .J- J J
13.
direct sales (by poultry farm toare limited to a proportion of total
j :;:; 1,2, ... ,20.
k = 1,2, ••• ,20.
where d = (0.5, for those regions that have a physical egg floor;j ( 1.0, otherwise.
(6) Commercial Demand Balance: demand for ~ggs is met by direct salesand sales through the egg floor, i.e.,
Dk + EFDEM k = CDEMk
where CDEMk
= total demand for eggs in egg floor region
(7) Net Receipts Balance: eggs received at the egg floor thatcommercial value and can be sold or processed is slightlythan the amount of eggs consigned to the egg floor, i.e.,
haveless
NR =k
20(1-nv,) I PT 'k +
j =1 J
20(1- nv) I XF.ER
Zl =1 1k
rfk
k =, 1, 2, ••• , 20.
where nVJ
= 0.008, the proportion of eggs having no value afterconsignment direct from poultry farm to egg floor.
nV2
= 0.01, the proportion of eggs having no value afterconsignment between egg floors.
(8) Grade Availability Constraint:received at the egg floor todifferent to the distribution of
NR k!.. (l+sJEFDEM k
sufficient whole eggsmeet a distribution of
supply, i.e.,
k= 1,2, ••• ,20_
must bedemand
where s k = proportion by which supply must exceed demand.
(9 ) Egg Floorconsignedprocessed
Balance: eggs received at the egg floor must be resold,to another egg floor in a state fit for resale, or
into surplus, i.e.,
20NR k = EFDEM k + I XFERk1
1 =11 fk
20+ I ET
1 =17<1k=1,2, ••• 20.
(10) Surplus Balance: Eggs that are to be processed into pulp orpowder must be processed either at the local egg floor or aftertransportation to another egg floor, i.e.,
E =k
20I ET1=1 1k
k=l ,2,' •.• ,20.
14.
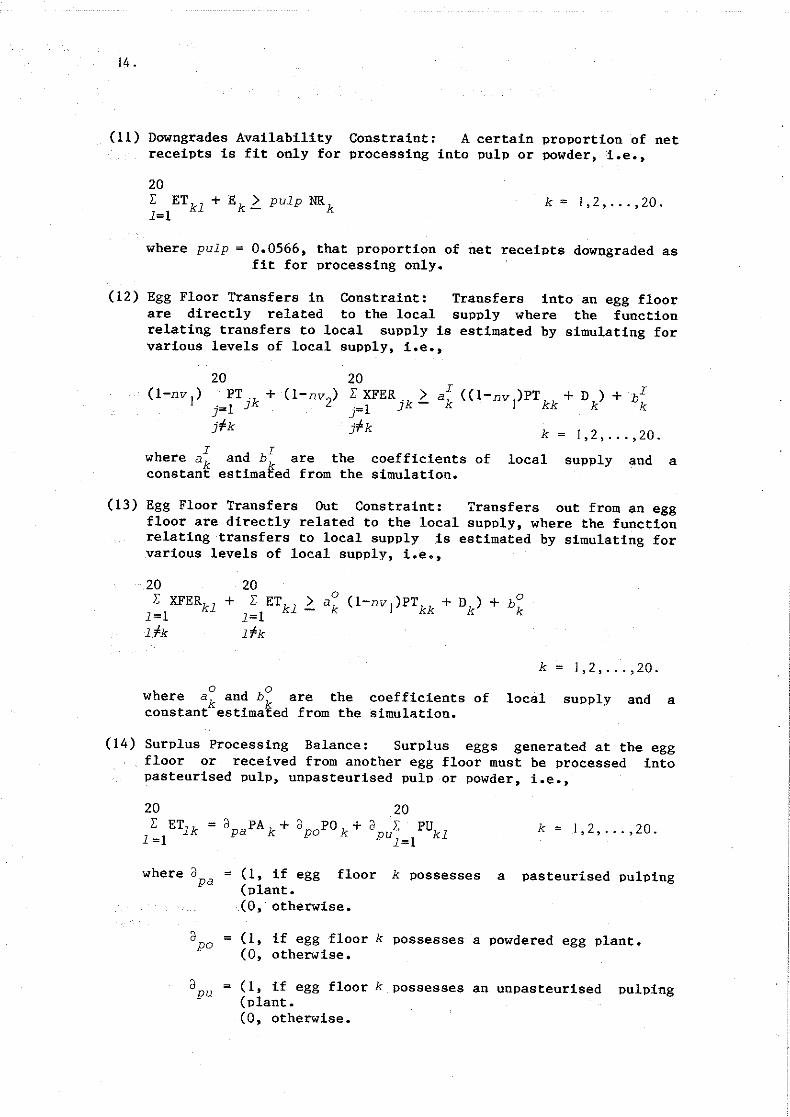
(11) Downgrades Availability Constraint: A certain proportion of netreceipts is fit only for processing into pulp or powder, i.e.,
20l: ETk1 + Ek~ pulp NR k1=1
k = 1,2, ... ,20.
where pulp = 0.0566, that proportion of net receipts downgraded asfit for processing only.
(12) Egg Floor Transfers in Constraint: Transfers into an egg floorare directly related to the local supply where the functionrelating transfers to local supply is estimated by simulating forvarious levels of local supply, i.e.,
20PT Ok +
j=1 ]j'fk
20l: XFER >j=1 jk-
jofkk = J, 2, ... ,20.
I Iwhere ak
and b are the coefficients of local supply and aconstant estima€ed from the simulation.
(13) Egg Floor Transfers Out Constraint: Transfers out from an eggfloor are directly related to the local supply, where the functionrelating transfers to local supply is estimated by simulating forvarious levels of local supply, i.e.,
20l: XFERk1 +
1=111k
20l: ET
k11=1l'h
k = 1,2, ... ,20.
o 0where a
kand b are the coefficients of local supply and a
constant estima~ed from the simulation.
(14) Surplus Processing Balance: Surplus eggs generated at the eggfloor or received from another egg floor must be processed intopasteurised pulp, unpasteurised pulp or powder, i.e.,
k = 1,2, ... ,20.
where apa
= (1, if egg floor(plant.(0,- otherwise.
k possesses a pasteurised pulping
apo
apu
= (1, if egg floor k possesses a powdered egg plant.(0, otherwise.
(1, if egg floor k possesses an unpasteurised pulping(plant.(0, otherwise.
15.
(15) Unpasteurised Pulp Sales Balance: The demand for unpasteurisedpulp must be met, i.e.,
20I: PUkl = PUSAL1k=1
1 = 1,2, .•• ,20.
where PUSAL1
= demand for unpasteurised pulp from egg floor
(16) National Surplus Constraint: To ensure demand is met at all timesa national surplus is required, i.e.,
20 20I: P > NS + I: CDEM.j =1 j j=1 J
where NS the national surplus of supply over demand.
(17) Rate of Change Constraint: It is desired in some instances toconstrain change to no more than a certain rate, i.e.,
20I: Y. < MAXY
j=1 J
where MAXY= the maximum annual change. expressed in new shedfacili ties.
The variables are subject to the following bounds:
(1) F. < MAXF.~ - ~
i = 1,2, ••• ,20.
where MAXF.= amount of grain that can be SUPPlied from within~grain growing region i at the existing price.
(2) x .< MAXX.J- J
j = 1, 2, ••• , 20.
where MAXX.= egg producing capacity using existing sheds inJ producer region j.
(3) D 3$ MAXD.where MAXDJ =
]currentfloor j
directj = 1, 2, ••• , 20.
sales in the region served by egg
(4) Ek> .. MINEk
k = 1,2, ••• ,20.
where MINEk
'= minimum surplus that must be processed at egg floor k
16.
maximum surplus that can be processed at egg floor kwhere MAXEk
The objective may be stated as:
k = 1,2, •• • ,20.
20 20 20 20 20 20 20Min l: f.F. + l: l: f ..FT .. + l: x .x. + l: YiYi+ l: E t jk PT jk
i=l~ ~
i=l j=l ~J ~J i=l~ ~ i=l j=l k=J
20 20 20 20+ l: l: t
k1(XFER
k1 + ETk1
) + l: l: pUk1 PUk1k~ 1 1 =1 k=l 1=1
1t-k 1-Fk
where f. = cost of grain in grain region i~
f .. = cost of transport of grain from grain region i to~J producer region j
X. = cost of production of eggs using existing sheds.~
Y. = cost of production of eggs using new sheds.]
t cost of transport of eggs directly from poultry farmsjk in producer region j to egg floor k
t' = cost of transport of eggs between egg floors k and 1k1
pUk1
= cost of transport of pulp between egg floors k and 1
The units of measurement are:
(i) Eggs - 1 thousand dozen eggs.
(ii) Feed - 1 tonne grain.
(iii) Costs - 1 dollar.
2.5 Potential Uses for the Model
In addition to facilitating this production location study, thedevelopment of the transshipment model provides the New Zealand eggindustry with an instrument to assist in other long-term planning. Somepotential uses of the model include the regular monitoring of theeffects of changes in feed costs, transport costs and populationdensities. Also the model could be used to investigate the effects ofentitlement transfers, the addition or removal of egg floors, therelocation and/or removal of egg processing facilities, and differingnational surplus targets.
CHAPTER 3
DATA AND PARAMETER ASSUMPTIONS
3.1 Cost of Feed
Long-term regional feed price relativities will be important indetermining the optimal egg production location; however, without adetailed study of the New Zealand stock-feed industry only limited dataare available in this area. In the absence of better information theassumption was made that future price relativities would be similarto those that have occurred in the recent past. The results of theanalysis should be interpreted in the light of this assumption andfurther research may be justified in this area.
Clearly a consistent data base, with which to compare regionalfeed prices, was essential. To this end the major feed suppliers weresurveyed to obtain information relating to plant location, basic feedprices, discounting policy and delivery charges. This information wasthen used, in conjunction with the proportion supplied by eachsupplier, and the location of farms supplied, to determine an averageon-farm feed price for each region. The distance of farms from thefeed supplier was accounted for in these regional prices. 1
While an effort was made to derive accurate on-farm feed prices(as at June 1983), it is inevitable that these prices and,consequently, feed price relativities will change over time. To testthe sensitivity of production location to changes in feed pricerelativities, some sensitivity analysis was undertaken by running themodel with varied feed price relativities.
3.2 Feed Availability
Feed availability may be an important factor in determining therate at which existing production patterns can change; however, as withfeed costs, little information is available in this respect. Forexample, in some areas local feed production is insufficient forstock-feed requirements and feed must be bought in. It is, however,difficult to determine where this feed comes from, and, moreimportantly, whether more feed would be available at the current price.Because of the uncertainty about feed availability and cost, the modelwas run without any restriction on feed availability i.e. it wasassumed that, if necessary, feed would be available for increasedproduction without changing past price relativities. Model resultswere then examined in the light of this .assumption.
1. The information madeconfidential and neitherprices can be published.
available by feed manufacturersit nor the derived regional on-farm
J 7.
wasfeed
18.
3.3 Non-Feed Costs of production
A representative budget, prepared by the Ministry of Agricultureand Fisheries (M.A.F.) poultry Division, for a 10,000 bird farm wasused as the basis for the calculation of the net cost of production.Regional production costs were estimated for both existing and newfacilities. This was necessary to allow the option, within the model,of increasing production in regions where this increase wouldnecessitate the building of new facilities. For the purposes of themodel the net cost was defined as the total cost of production (withthe exception of feed costs) less the revenue from the sale ofby-products. This net cost is expressed as cost per 1,000 dozen eggsproduced.
With respect to housing costs, poultry production and housingexperts (W. Gay, R. Patchell, pers. comm.) believe that producers inless favourable (colder) climates have largely compensated for this byproviding better insulated housing for birds. Therefore, climaticvariation was accounted for by altering bird housing costs, rather thanproduction rates and feed conversion ratios. Hence the birdenvironment and productivity was assumed to be independent of location.The net effect, in the model, was uniformity of production parametersthroughout New Zealand but sligbtly higher housing costs in regionswith unfavourable climatic conditions.
Tbe budget items exhibiting significant regional variation arelisted below. (More detail is provided in Appendix 2.)
(i) Housing - housing in warmer areas tends to be enclosed, but needsless insulation than those in cooler areas. All need ventilationcontrol. The model incorporates variation in capital expenditurebased on increasing insulation costs, from north to south.
(ii) Land values, rates and rents - these costs are mainly dependentupon demand from alternative land uses, and distance from centresof large population. Parameter estimates were based largely oninformation supplied by the Farm Management and Rural ValuationDepartment of Lincoln College.
(iii)Insurance and depreciation - these costs are influenced by thesize of investment in housing and land. They were estimated as afunction of these two investment parameters.
(iv) Electricity this item accounts for lighting,both cooling and heating. It is assumed to varyparticular temperature) conditions.
ventilation andwith climatic (in
Differences between production costs for new and existingfacilities were due largely to the capital outlay required to build newhousing. However this outlay is partially balanced by a decrease insome of the operating costs (e.g. electricity).
Total non-feed costs estimated for each region are presented inTable 2.
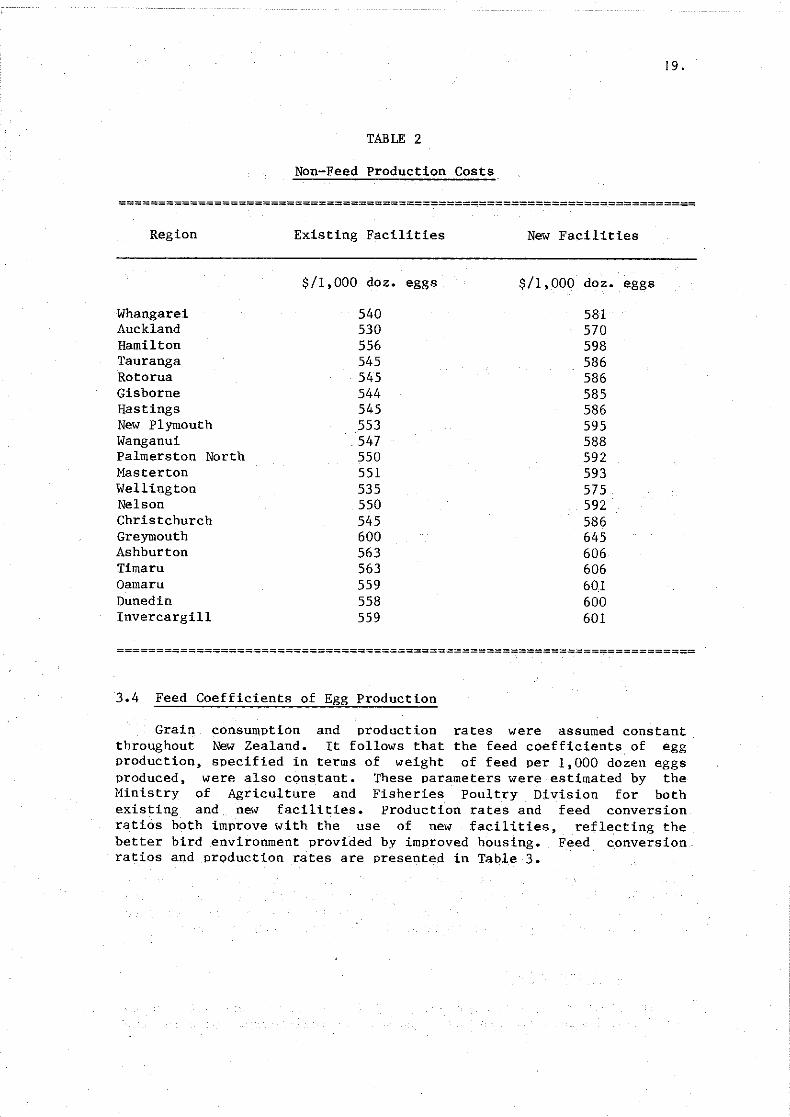
19.
TABLE 2
Non-Feed Production Costs
========================================================================
Region
WhangareiAucklandHamiltonTaurangaRotoruaGisborneHastingsNew PlymouthWanganuiPalmerston NorthMastertonWellingtonNelsonChristchurchGreymouthAshburtonTimaruOarnaruDunedinInvercargill
Existing Facilities
$/1,000 doz. eggs
540530556545545544545553547550551535550545600563563559558559
New Facilities
$/1,000 doz. eggs
581570598586586585586595588592593575592586645606606601600601
========================================================================
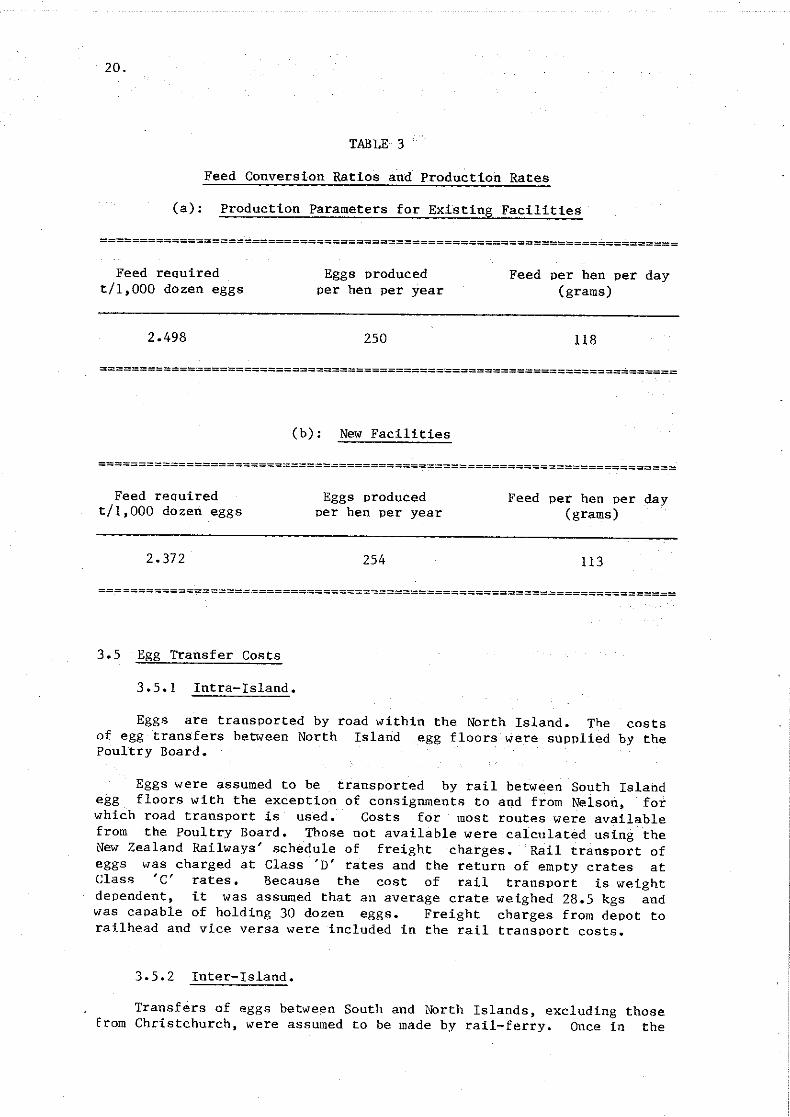
3.4 Feed Coefficients of Egg Production
Grain consumption and production rates were assumed constantthroughout New Zealand. It follows that the feed coefficients of eggproduction, specified in terms of weight of feed per 1,000 dozen eggsproduced, were also constant. These parameters were estimated by theMinistry of Agriculture and Fisheries poultry Division for bothexisting and new facilities. Production rates and feed conversionratios both improve with the use of new facilities, reflecting thebetter bird environment provided by improved hOllsing. Feed conversionratios and production rates are presented in Table 3.
20.
TABLE 3
Feed Conversion Ratios and Production Rates
(a): Production Parameters for Existing Facilities
========================================================================
Feed requiredtll,OOO dozen eggs
2.498
Eggs producedper hen per year
250
Feed per hen per day(grams)
118
========================================================================
(b): New Facilities
========================================================================
Feed requiredtll,OOO dozen eggs
2.372
Eggs producedper hen per year
254
Feed per hen per day(grams)
113
========================================================================
3.5 Egg Transfer Costs
3.5.1 Intra-Island.
Eggs are transported by road within the North Island. Theof egg transfers between North Island egg floors were suppliedPoultry Board.
costsby the
Eggs were assumed to be transported by rail between South Islandegg floors with the exception of consignments to and from Nelson, forwhich road transport is used. Costs for most routes were availablefrom the Poultry Board. Those not available were calculated using theNew Zealand Railways' schedule of freight charges. Rail transport ofeggs was charged at Class 'D' rates and the return of empty crates atClass 'c' rates. Because the cost of rail transport is weightdependent, it was assumed that an average crate weighed 28.5 kgs andwas capable of holding 30 dozen eggs. Freight charges from depot torailhead and vice versa were included in the rail transport costs.
3.5.2 Inter-Island.
Transfers of eggs between South and North Islands, excluding thosefrom Christchurch, were assumed to be made by rail-ferry. Once in tbe
21.
rail-ferry system, eggs generally continue to NOrth Island egg floorsby rail. Again egg freight was charged at Class 'D' rates and emptycrate returns at Class 'c' rates. The crates used are collapsible andcapable of holding 420 dozen eggs. Crate returns from Picton to anySouth Island egg floor were costed as free in accordance with actualpractice.
With respect to transfers from Christchurch, during 1983/84 about75 per cent were consigned by sea and 25 per cent by rail. Theseproportions were used to derive composite transfer costs betweenChristchurch and North Island egg floors.
3.6 Direct Transfers
Generally a producer will send eggs to the egg floor in the sameregion as his farm. While direct transfers to egg floors in otherregions are possible, it is generally not a practical or economicoption for most producers who must bear the cost but gain little or nobenefit. Thus, despite the fact that increased· direct transfers couldreduce industry costs through reduced commission charges, directtransfers of eggs from farms to other· than local egg floors wereconstrained in the model to match historical direct transfer patterns.
3.7 Direct Sales and Total Production of Eggs
Poultry farms are often clustered together on poor land. It canreasonably be assumed that any increase in a region's production ofeggs will be produced on existing or new farms in the same locality.Direct sales primarily depend upon the proximity of the poultry farm tothe consumer, thus any increase in production may not affect thecurrent level of direct sales unless direct demand is currentlyunsatisfied. This is not the case in any region, as poultry farms inall regions consign considerable quantities of eggs to egg floors.(The exception is Greymouth where there is no egg floor.) Within themodel, restrictions were imposed to limit the quantity of eggsSUPPlied directly from producers to consumers and retailers. Directsales, as a proportion of total production, were limited as follows:-
(1) In regions with an egg floor; a maximum of 50 per cent.(2) In regions not having an egg floor; a maximum of 100 per
cent.
3.8 Loss of Quality During Transport
All eggs that are not sold directly to consumers and retailers aregraded before sale into eight categories at the last egg floor tohandle the eggs (see Section 2.3.1). When considering thetransportation of eggs, account must betaken of the loss of qualityduring transport; there are ,two factors 'to consider. Firstly, someeggs may be broken or deteriorate in quality to the extent that theyare unfit for human consumption. These eggs are 'lost' to theindustry. Secondly, upon grading (and/or regrading) some eggs will bedown-graded from retail quality to commercial quality. These eggs
22.
cannot be used to meet retail demand.
The effect of these factors was determined by using Poultry Boardrecords to survey past consignments of eggs from poultry farms to eggfloors, and between egg floors. Transfers of eggs between egg floorsmay be of two types - either graded eggs, where the Quality loss can bemeasured directly, or ungraded eggs where the Quality loss can only bemeasured indirectly. Most eggs are transferred in graded form thus anaccurate estimate can be made of the loss of Quality due to transfer.
Variation in loss of Quality was found to be minimal with respectto the distance travelled. The loss of Quality could be adequatelydescribed by three parameters - one each to define the proportion of"no-value" eggs upon direct transfer from poultry farm to any egg floor(0.8 per cent), and between egg floors (1.0 per cent) and one for theproportion of consumable eggs received at the egg floor found fit forprocessing only (5.66 per cent).
3.9 Regional Commercial Demand for Eggs
From October 1979 to September 1981 the New Zealand Poultry Boardconducted a monthly survey of New Zealanders' egg consumption. Everymonth a different sample of 500 households throughout New Zealand wassurveyed to find out household details and the household's purchasesand usage of eggs over the previous week. It was found thatconsumption per person did not vary significantly throughout NewZealand during the Survey. The national average was 290 eggs per headper annum, which includes an allowance for eggs consumed as 'prepared'foods (restaurant meals, take-aways, etc.). The assumption was madethat this consumption average has not changed significantly over time.
Using the latest population figures available from the Departmentof Statistics it was possible to estimate total annual regionalconsumption of eggs. These eggs are supplied both by the commercialegg industry (as administered by the New Zealand Poultry Board) and bythe "backyard" egg industry which consists of all other egg productionwithin New Zealand. Estimates of production/hen provided by the MAF,and the known commercial hen population in each region, were then usedto calculate the total annual commercial production of eggs in eachregion. Direct sales are the residual of commercial production afterallowing for known transfers to egg floors (including directinter-regional transfers). Egg floor sales of commercially producedeggs in each region are known exactly. The demand for commerciallyproduced eggs in each region is the sum of egg floor sales and directsales. The balance of total demand is filled by "backyard" production.
3.10 Surplus Receipts Necessary to Meet Demand Peculiarities
Egg floors receive fresh ungraded eggs from poultry farms andgrade them according to rigid criteria as to weight and Quality. Theegg floor has no control over the grades of eggs received, therefore itis necessary for the egg floor to receive extra eggs to ensure that theconsumer retains the choice of all grades of eggs at all times.
23.
The Poultry Board maintains records of receipts and retail salesby grade on a four-weekly basis. To avoid undue emphasis being placedon unusual circumstances, the third-highest surplus receipts indicatedby an examination of the 13 observations in 1981/82 (a representativeyear) was used as the required surplus necessary to meet demandpeculiarities.
3.11 Coefficients for Constraints Relating Transfers to Local Supplyand Demand
Local supply is defined as local direct sales plus net transfersdirectly from poultry farms within the region to the local egg floor.Although local supply may exceed local commercial demand on an annualbasis, transfers into the egg floor may still be necessary during theyear in order to meet seasonal demand peaks. (If local commercialdemand exceeds local supply on an annual basis, transfers into the eggfloor will definitely be necessary during the year.) Similarly,transfers out of an egg floor must be made when the excess supplyexceeds the processing facilities available at that egg floor. Theminimum necessary transfer of eggs from an egg floor in anyone week isthat which reduces the excess supply to the maximum level which the eggfloor is capable of processing as surplus. Such transfers may occur aseggs for resale (graded and/or ungraded) and/or for processing.
The transport costs of such transfers are an important componentof the total cost of operating the industry and the amount and cost ofsuch transfers cannot be ignored. Using historical demand patterns foreach region and simulating for various levels of local supply it waspossible to estimate the necessary transfers into and out of each eggfloor on a weekly basis, and aggregate these to give the annual total.Ordinary Least Squares Regression was then used to express the level ofannual transfers into each egg floor as a function of annual localsupply. The regression equations formed the basis of the transferconstraints.
3.12 National Surplus
Production levels can be altered but the process takes time. Toincrease production hens must be reared from chicks to "point of lay" a process that takes five months. To decrease production there aremore options, but care must be taken that production will not need tobe increased soon afterwards.
At present the New Zealand Poultry Board resets targetedproduction levels infrequently by the determination of hen entitlementsfor every poultry farm in the country. Tbis is achieved by thecalculation of a single figure: the "operative" entitlement. Theoperative entitlement is expressed as a percentage of the grossentitlement, an historical figure directly related to the poultryfarm's carrying capacity when entitlements were first introduced in1970. The targeted production level is set to meet the variable demandfor all grades in all areas of the country at all times. This iscurrently believed to require a target national surplus of five milliondozen eggs. The actual level of national Sllrplus will depend upon
24.
sales.
3.13 Egg Production Bounds
New Zealand Poultry Board inspectors visit all poultry farmsthroughout New Zealand to inspect poultry housing, refrigerationequipment and hen numbers. As part of the inspection the existing shedcapacity of each farm is measured. Coupled to regional egg productionfigures, and allowing for the desirability of some unused capacity forhusbandry reasons, it was possible to calculate the potential forregional egg production using existing poultry housing.
3.14 Surplus Processing Constraints
Reductions in national production in the last ten years hasreduced the amount of processing carried out at egg floors and leftexcess processing capacity. The assumed maximum surplus that could beprocessed at each egg floor was, therefore, arbitrarily assessed at 150per cent of the maximum processed for the two years 1978/79 and1979/80.
CHAPTER 4
RESULTS
4.1 Introduction
Prior to estimating the optimal location of production it wasnecessary to establish, for purposes of comparison, a modelrepresentation of the current location of production based on estimatesof current regional production. Current regional production wasdefined to be the aggregate commercial egg production in a region. Thisproduction can be:-
(l) sold directly to consumers through either gate or retailsales
(2) consigned from farms to the local egg floor
{3) consigned from farms to egg floors outside the region;
Estimated current regional production and current major dire~t
transfers were used as inputs to the model to provide the . 'benchm,u'k'run. The results of this run provided an approximation of currentindustry operating costs ·and as such provided a base with which tocompare. alternative location strategies. This estimated cost is'likelyto be a lower limit on the current industry cost 'because it assUmesthat egg and pulp transfers are made in the optimal (least cost) way,which in practice may not always be the case.
In order to estimate regional production levels it was necessaryto know regional bird populations. To estimate regional birdpopulations, known base entitlement levels were adjusted to allow forthe effect of entitlement adjustments and voluntary reductions in flocksizes. These estimated regional bird populations were then used inconjunction with production rates to derive current regionalproduction. The Poultry Board supplied information relating to bothcurrent direct transfers and regional entitlement levels.
4.2 Optimal Location with Existing Facilities
4.2.1 Summary.
Due to the reduction in bird numbers associated with the operationof the Entitlement Scheme, most areas have some excess productioncapacity. The model was run initially to determine the extent ofsavings possible in the short-term using this capacity only.
A potential saving of about $700,000 per annum (or· about 1.2 centsper dozen eggs produced) compared with the 'benchmark' situation wasindicated through the more efficient location of production utilisingexisting production facilities. To achieve this saving, the model
25.
26.
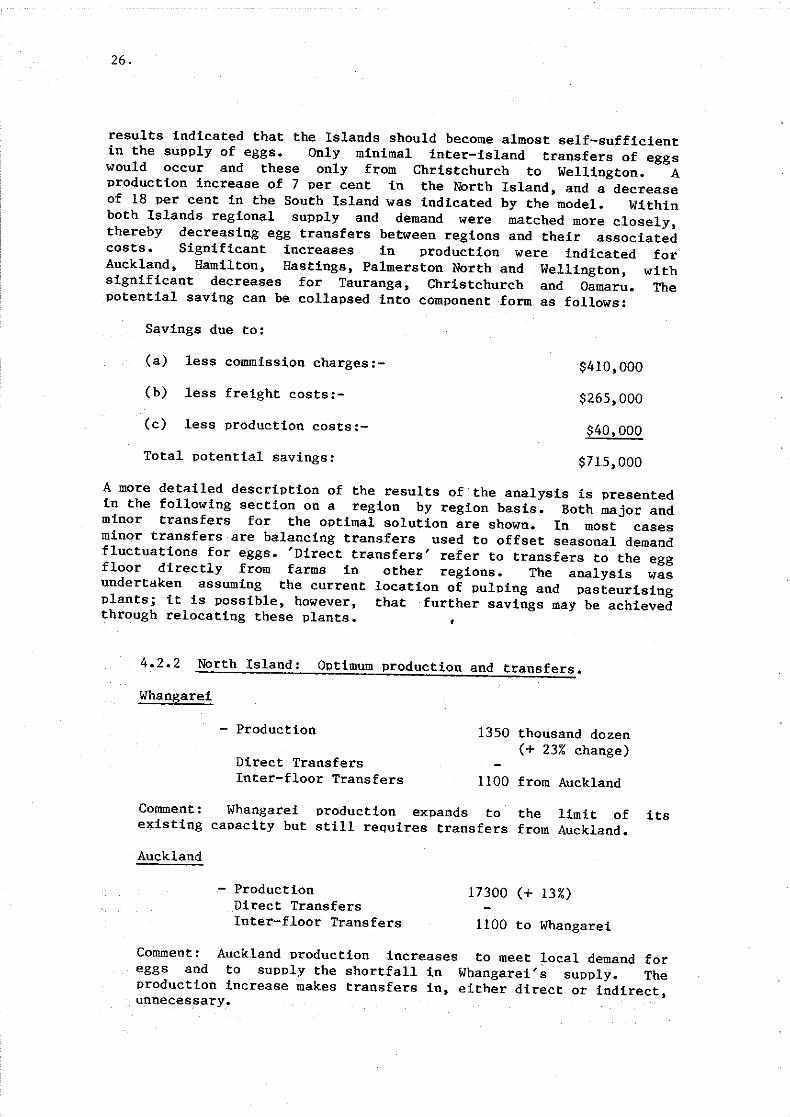
results indicated that the Islands should become almost self-sufficientin the supply of eggs. Only minimal inter-island transfers of eggswould occur and these only from Christchurch to Wellington. Aproduction increase of 7 per cent in the North Island, and a decreaseof 18 per cent in the South Island was indicated by the model. Withinboth Islands regional supply and demand were matched more closely,thereby decreasing egg transfers between regions and their associatedcosts. Significant increases in production were indicated forAuckland, Hamilton, Hastings, Palmerston North and Wellington, withsignificant decreases for Tauranga, Christchurch and Oamaru. Thepotential saving can be collapsed into component form as follows:
Savings due to:
(a) less commission charges:-
(b) less freight costs:-
(c) less production costs:-
Total potential savings:
$410,000
$265,000
$40,000
$715,000
A more detailed description of the results of the analysis is presentedin the following section on a region by region basis. Both major andminor transfers for the optimal solution are shown. In most casesminor transfers are balancing transfers used to offset seasonal demandfluctuations for eggs. 'Direct transfers' refer to transfers to the eggfloor directly from farms in other regions. The analysis wasundertaken assuming the current location of pulping and pasteurisingplants; it is possible, however, that further savings may be achievedthrough relocating these plants.
4.2.2 North Island: Optimum production and transfers.
Whangarei
- Production
Direct TransfersInter-floor Transfers
1350 thousand dozen(+ 23% change)
1100 from Auckland
Comment: Whangarei production expands to the limit of itsexisting capacity but still requires transfers from Auckland.
Auckland
- ProductionDirect TransfersInter-floor Transfers
17300 (+ 13%)
1100 to Whangarei
Comment: Auckland production increases to meet local demand foreggs and to supply the shortfall in Whangarei's supply. Theproduction increase makes transfers in, either direct or indirect,unnecessary.
27.
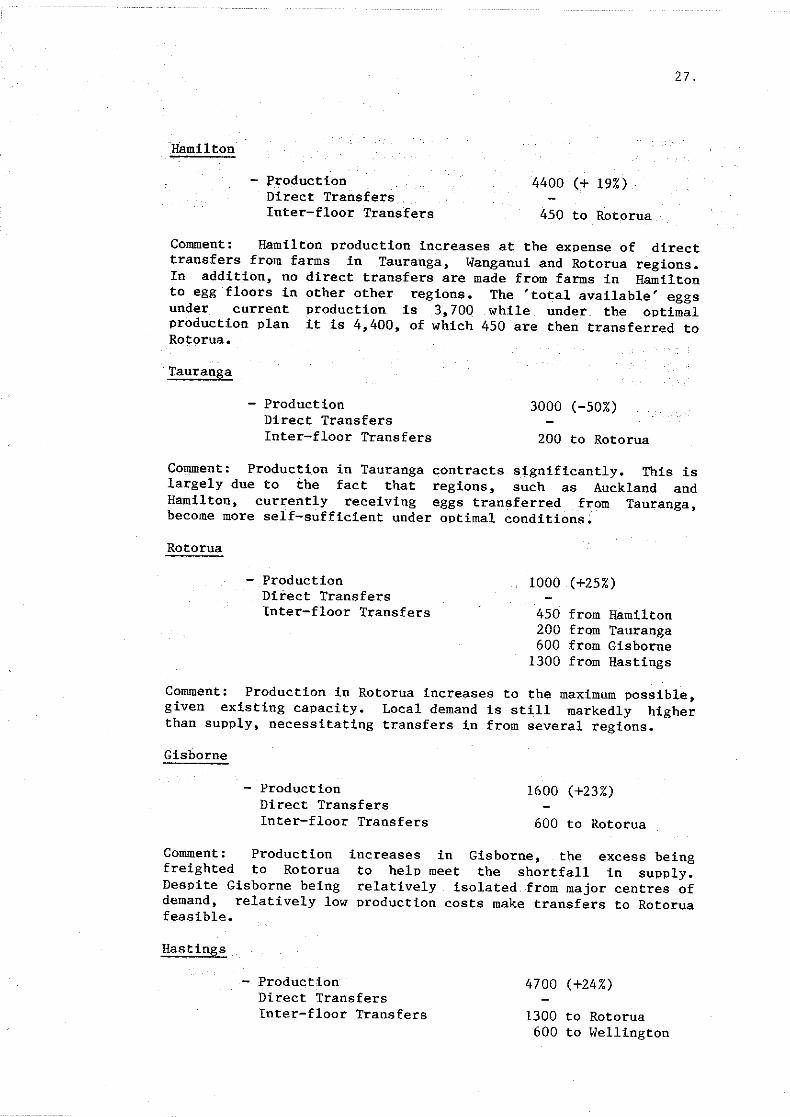
Hamilton
ProductionDirect TransfersInter-floor Transfers
4400 (+ 19%)
450 to Rotorua
Comment: Hamilton production increases at the expense of directtransfers from farms in Tauranga, Wanganui and Rotorua regions.In addition, no direct transfers are made from farms in Hamiltonto egg floors in other other regions. The 'total available' eggsunder current production is 3,700 while under the optimalproduction plan it is 4,400, of which 450 are then transferred toRotorua.
Tauranga
ProductionDirect TransfersInter-floor Transfers
3000 (-50%)
200 to Rotorua
Comment: Production in Tauranga contracts significantly. This islargely due to the fact that regions, such as Auckland andHamilton, currently receiving eggs transferred from Tauranga,become more self-sufficient under optimal conditions;
Rotorua
ProductionDirect TransfersInter-floor Transfers
1000 (+25%)
450 from Hamilton200 from Tauranga600 from Gisborne
1300 from Hastings
Comment: Production in Rotorua increases to the maximum possible,given existing capacity. Local demand is still markedly higherthan supply, necessitating transfers in from several regions.
Gisborne
- ProductionDirect TransfersInter-floor Transfers
1600 (+23%)
600 to Rotorua
Comment: Productionfreighted to RotoruaDespite Gisborne beingdemand, relatively lowfeasible.
Hastings
increases in Gisborne, the excess beingto help meet the shortfall in supply.relatively isolated from major centres ofproduction costs make transfers to Rotorua
- ProductionDirect TransfersInter-floor Transfers
4700 (+24%)
1300 to Rotorua600 to Wellington
28.
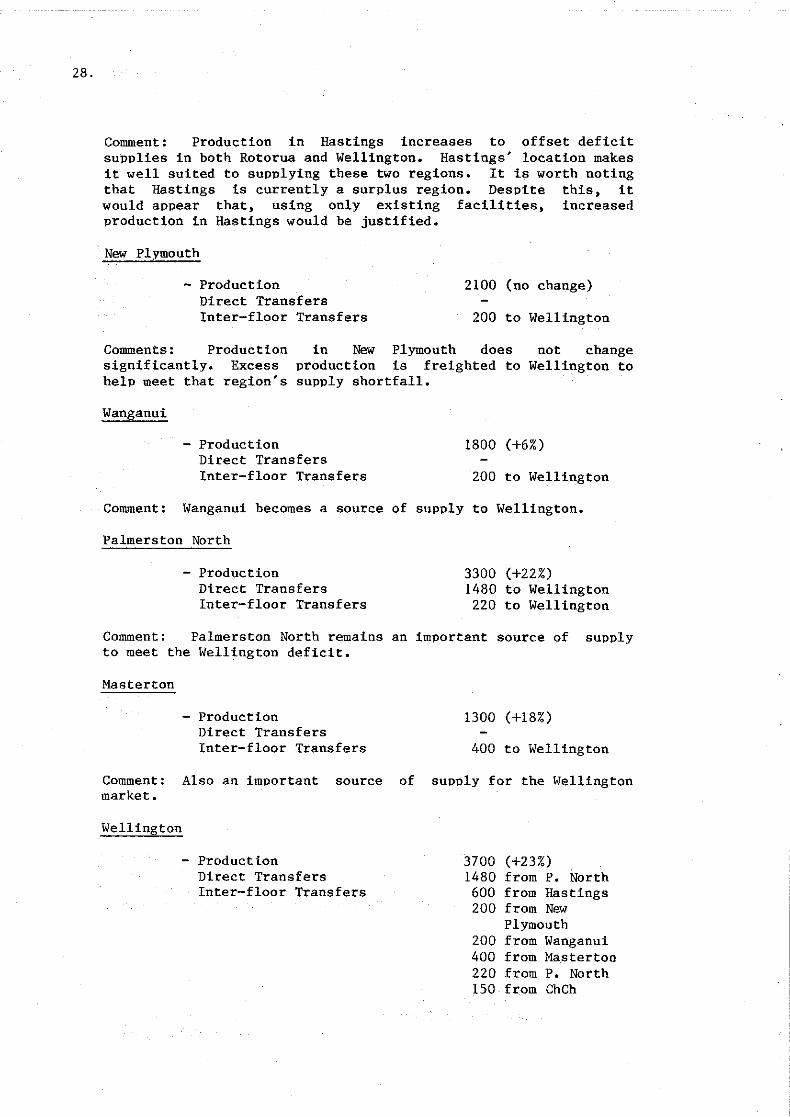
Comment: Production in Hastings increases to offset deficitsupplies in both Rotorua and Wellington. Hastings' location makesit well suited to supplying these two regions. It is worth notingthat Hastings is currently a surplus region. Despite this, itwould appear that, using only existing facilities, increasedproduction in Hastings would be justified.
New Plymouth
- ProductionDirect TransfersInter-floor Transfers
2100 (no change)
200 to Wellington
Comments: Productionsignificantly. Excesshelp meet that region's
Wanganui
in New Plymouth does not changeproduction is freighted to Wellington tosupply shortfall.
- ProductionDirect TransfersInter-floor Transfers
1800 (+6%)
200 to Wellington
Comment: Wanganui becomes a source of supply to Wellington.
Palmers ton North
ProductionDirect TransfersInter-floor Transfers
3300 (+22%)1480 to Wellington
220 to Wellington
Comment: Palmerston North remains an important source of supplyto meet the Wellington deficit.
Masterton
ProductionDirect TransfersInter-floor Transfers
1300 (+18%)
400 to Wellington
Comment: Also an important source of supply for the Wellingtonmarket.
Wellington
- ProductionDirect TransfersInter-floor Transfers
3700 (+23%)1480 from P. North600 from Hastings200 from New
Plymouth200 from Wanganui400 from Masterton220 from P. North150 from ChCh
29.
Comment: Wellington production increases by 23 per centrepresenting the extent of increase possible with existingfacilities. Substantial transfers into Wellington come fromHastings, New Plymouth, Wanganui, Palmers ton NOrth, Masterton andChristchurch.
Given that the North Island currently has two main deficitregions, Rotorua and Wellington, these results are logical. Wherepossible local supply has changed to meet lOcal demand. In regionswithout sufficient production capacity to meet local demand, transfersof eggs have come from the most efficient sources. A largeimprovement in efficiency appears possible by merely allowingproduction increases in the Wellington and Rotorua regions.
30.
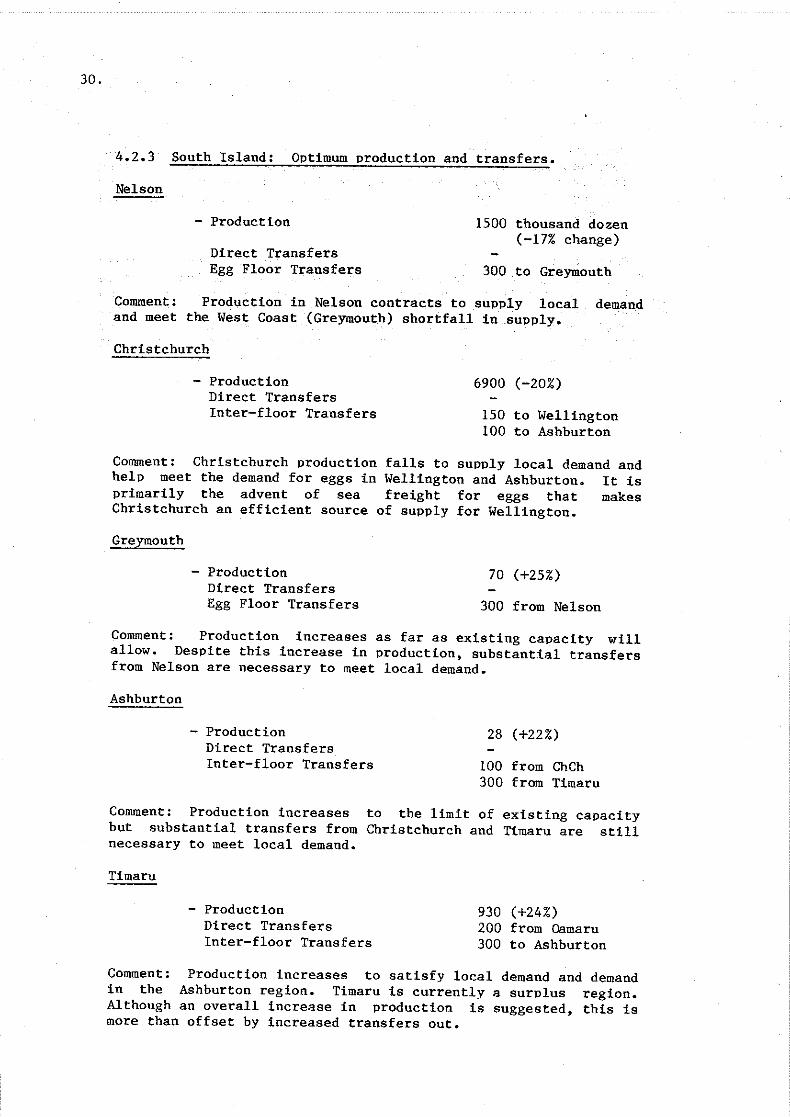
4.2.3 South Island: Optimum production and transfers.
Nelson
- Production
Direct TransfersEgg Floor Transfers
1500 thousand dozen(-17% change)
300 to Greymouth
Comment: Production in Nelson contracts to supply local demandand meet the West Coast (Greymouth) shortfall in supply.
Christchurch
ProductionDirect TransfersInter-floor Transfers
6900 (-20%)
150 to Wellington100 to Ashburton
Comment: Christchurch production falls to supply local demand andhelp meet the demand for eggs in Wellington and Ashburton. It isprimarily the advent of sea freight for eggs that makesChristchurch an efficient source of supply for Wellington.
Greymouth
ProductionDirect TransfersEgg Floor Transfers
70 (+25%)
300 from Nelson
Comment: Production increases as far as existing capacity willallow. Despite this increase in production, substantial transfersfrom Nelson are necessary to meet local demand.
Ashburton
ProductionDirect TransfersInter-floor Transfers
28 (+22%)
100 from ChCh300 from Timaru
Comment: Production increasesbut substantial transfers fromnecessary to meet local demand.
Timaru
to the limit of existing capacityChristchurch and Timaru are still
- ProductionDirect TransfersInter-floor Transfers
930 (+24%)200 from Oamaru300 to Ashburton
Comment: Production increases to satisfy local demand and demandin the Ashburton region. Timaru is currently a surplus region.Although an overall increase in production is suggested, this ismore than offset by increased transfers out.
31.
Oamaru
- ProductionDirect TransfersEgg Floor Transfers
750 (-58%)200 to Timaru200 to Dunedin
Comment: Damaru as a source of eggs for the Wellington market isreplaced by sources closer to Wellington.
Dunedin
- ProductionDirect TransfersEgg Floor Transfers
1900 (-12%)
200 from Oamaru
Comment: Production in Dunedin contracts in favour of transfersfrom Oamaru.
Invercargill
- ProductionDirect TransfersInter-floor Transfers
1550 (-3%)
Comment:demand.
Production contracts slightly to satisfy only local
The major changes to production location are the significantreductions in production in Oamaru and Christchurch. This resultsbecause South Island transfers to Wellington are largely replaced bysources closer to Wellington. Other alterations to South Islandregional production levels are due to a better matching of regionalsupply and demand, thereby reducing transfer costs.
4.3 Allowing New Production Facilities
To examine the further savings possible in the longer term, themodel was re-run allowing new facilities to be built in any region ifthey resulted in a reduction of the overall industry cost. The resultsindicated that a further $670 thousand per annum ($1.39 million or 2.3cents per dozen, in total) potential savings were possible throughrelocation of production into existing and new facilities. Theadditional savings involve the following components:
Savings due to:
(a) less commission charges:(b) less freight costs:-
(c) less production costs:-
Total additional savings:
$367,000$286,000
$23,000
$676,000
32.
EGGPRODUCTION
'000 DOZ
18000
17000
16000
15000
14000
. -~10000
9000
8000·
7000 .
6000
5000
4000
3000·
2000
1000
o~
I
I
Current Production
Optimal with ExistingFacilities
Optimal Allowing NewFac il it ies
REGIONS L..:WH=A____l~AU::.:C::_...L_...:H:::AM:::._.l_..:.TA:.:.U::..._.l_R::::O::..::T'__L....::G:..:::I.:::.S____l___..:::HA::::S::.._.L_...:N:.::E.::.W_L..::W.::.HA::.::N::""-L..:P:..:::A:::L:........J
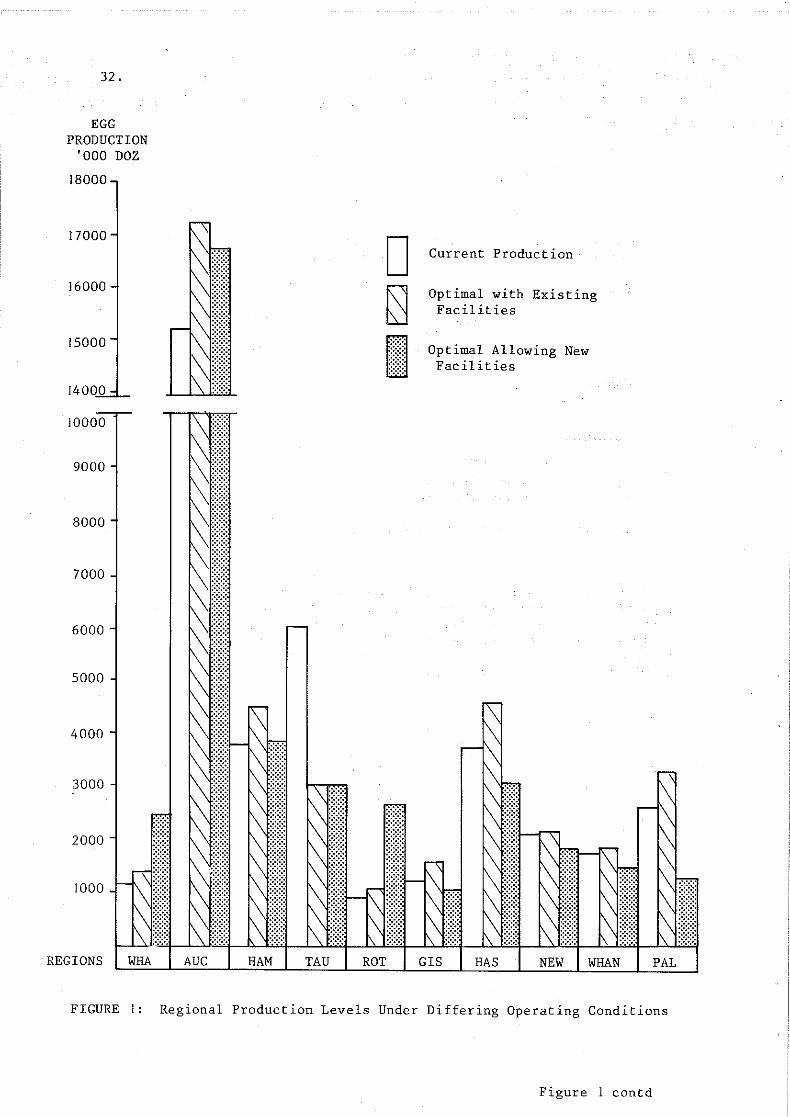
FIGURE I: Regional Production Levels Under Differing Operating Conditions
Figure 1 contd
EGGPRODUCTION
'000 DOZ18000
17000
16000
15000
1400
10000=.....
9000-
8000
7000·
6000
5000
4000 -
3000
-
%
I
.:.:.:.
D~
I
Current Production
Optimal with ExistingFac'ilities
Optimal Allowing NewFacilities
33.
2000
1000
1\.:.:.:. ,\.:.:.:.,::::::: :':':':1
r::::::'
o-~llillllREG I ONS '-..f.MA"""S!.......JL..!!WE-",",L_.l---,N",E",L,--,--"C",H",R,---,_G",R"E=<-.l-..f.A""S",H,---,,-.=.T.=.IM,,--,---,O'-!.A",M'---'L-",D.!!.U!:!.N_l--I",N",V!..........J
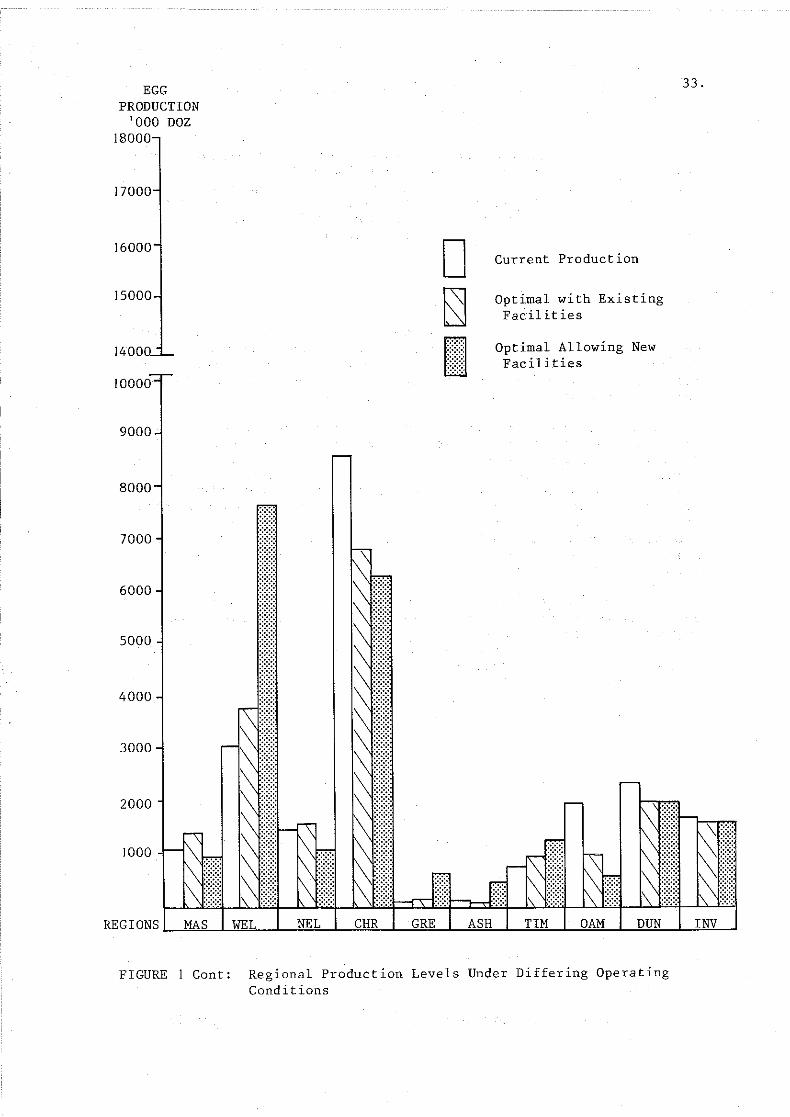
FIGURE I Cont: Regional Production Levels Under Differing OperatingConditions
~.
Once again savings due to lower overall production costsconstitute only a minor part of total possible savings. Production wasincreased through the use of new facilities in Whangarei, Rotorua,Wellington, Greymouth, Ashburton and Timaru. The levels of regionalproduction under: (i) current conditions; (ii) optimal relocationusing existing facilities; and (iii) optimal relocation allowing newfacilities are shown in Figure 1.
4.4 Explanation of Results
There are a number of regions with a shortfall between localsupply and local demand. The cheapest way of getting eggs to an eggfloor is, generally, to produce them locally. The model operates byfirst identifying deficit supply regions and then selecting the mostcost efficient method of meeting these deficits.
When the model was constrained to allow no new facilities,production in deficit regions was expanded using existing facilities.If this production increase was still insufficient to meet demand,transfers from other regions were selected. The criteria for selectionwas that the most cost efficient transfers were chosen first. Forexample, Wellington production was expanded to its maximum existingcapacity and transfers, mainly from Hastings, New Plymouth, Wanganui,Palmers ton North and Masterton, were used to meet the remainingshortfall in supply. As a result, production in these areas tended toincrease in the short-term.
When the model was allowed to use new facilities, production indeficit areas expanded further. The result was a closer matching ofregional supplies and demands, thereby minimising transfers betweenregions. For example, through the use of new facilities, Wellingtonbecame largely self-sufficient in eggs. Consequently, productioncontracted in regions, which in the short-term, had been sources ofeggs for Wellington. As a result production in Hastings, New Plymouth,Wanganui, Palmerston North, Masterton and Christchurch dropped in thelong-term.
4.5 Sensitivity Analysis
4.5.1 New facilities in Wellington.
Due to problems of land availability and feed supply the extent towhich production in the Wellington area would be able to increase, as aresult of new production facilities, is uncertain. To investigatethis, the model was re-run constraining the amount of new facilities inWellington. New facilities were constrained to an additional 10 percent of the current production capacity. Constraining new productionfacilities in Wellington adds about $200 thousand to the unconstrainedcost. This additional cost comprises the following components:
Cost due to:
(a) increased commission charges:- $76,000
(b) increased freight costs:-
(c) increased production costs:-
Total extra cost:
$87,000
$38,000
$201,000
35.
The major difference between this run and the unconstrained runwas that Wellington would no longer be self-sufficient in eggs.Transfers in would still be required from Hastings, New Plymouth,Wanganui, Palmerston North, Masterton and Christchurch. Consequently,production in these regions would not contract to the extent suggestedwhen no restrictions were made on new facilities in Wellington.
4.5.2 Reduction in shipping charges.
The model results indicated egg transfers from Christchurch toWellington of 150,000 dozen when current shipping charges and existingproduction capacities were used. To investigate the effect a reductionin shipping charges would have on relocation policy, the model. wasre-run with reduced shipping costs. The shipping costs fromChristchurch to both Auckland and Wellington were reduced by 10 percent and 25 per cent. Neither of these reductions changed the optimalrelocation strategy or the level of Christchurch-Wellington transfers.
The shipping cost from Christchurch to Wellington would have tofall by about 30 per cent before there would be any effect on theoptimal relocation strategy. A reduction of this magnitude wouldincrease transfers from Christchurch to Wellington at the expense ofproduction in Hastings i.e. Christchurch would begin to replaceHastings as a source of supply to Wellington.
4.5.3 Feed price relativities.
Feed costs account for just over 50 per cent of the total cost ofegg production on a typical poultry farm. Regional feed pricerelativities, rather than actual feed prices, will influence relocationstrategies. Of particular interest is the influence of feed pricerelativities between the North and South Islands, in determiningoptimal relocation policies. As at June 1983 the average on-farm priceof feed in the South Island was $271/tonne and in the North Island$297/tonne. The price differential between the two Islands was,therefore, $26/tonne. To investigate the effect of an increase ordecrease in this differential, the model was re-run with varied SouthIsland feed costs to provide differentials in the range $0-$100.Regional production was limited to existing capacity.
Transfers of eggs from the South to the North Island only occurredto supply Wellington. Table 4 shows optimal regional transfers intoWellington, for varied inter-island feed cost differentials. The feedprice differentials in Table 4 are the levels at which regions eitherbecome, or cease to be, sources of supply for Wellington.In summary, for a differential:
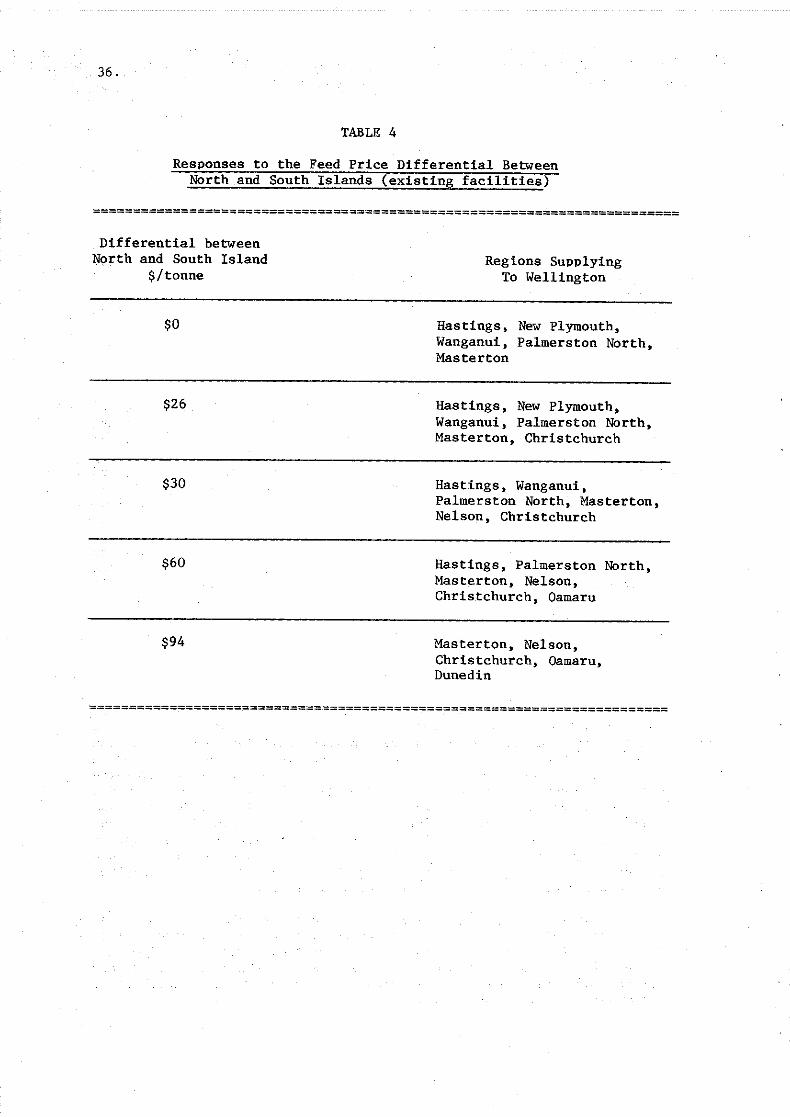
36.
TABLE 4
Responses to the Feed Price Differential BetweenNorth and South Islands (existing facilities)
=========================================================================
Differential betweenNorth and South Island
$/tonne
$0
$26
$30
$60
$94
Regions SupplyingTo Wellington
Hastings, New Plymouth,Wanganui, Palmers ton North,Masterton
Hastings, New Plymouth,Wanganui, Palmerston North,Masterton, Christchurch
Hastings, Wanganui,Palmerston North, Masterton,Nelson, Christchurch
Hastings, Palmerston NOrth,Masterton, Nelson,Christchurch, Oamaru
Masterton, Nelson,Christchurch, Oamaru,Dunedin
=============================~==========================================
37.
(l) $0 or less Christchurch is not an optimal source of supply.,
(2) $26 shows the current differential level with Christchurch theonly South Island supplier to Wellington.
(3) At $30 Nelson becomes a supplier to Wellington and New Plymouthis replaced as a source.
(4) At $60 Gamaru becomes a source of supply and Wanganui is replaced.
(5) At $94 Dunedin becomes a supplier to Wellington. Above thisdifferential level, Masterton is the only North island supplier toWellington.
The quantities actually transferred into Wellington, from thevarious regions, are also dependent upon the feed price differential.As the differential becomes greater both the number of South Island eggfloors supplying Wellington, and the quantity supplied by each,increases.
4.6 Conclusions
The results of this analysisrequires that the North andself-sufficient in eggs.
suggest that theSouth Islands
optimalbecome
solutionvirtually
The potential savings possible through relocation of production,into existing facilities, is about $700,000 per annum (1.2 cents perdozen). To achieve this saving North Island production would increaseby 7 per cent and South Island production decrease by 18 per cent.Significant production cuts are suggested for Tauranga, Christchurchand Gamaru. Production increases are indicated for Whangarei,Auckland, Hamilton, Hastings, Wanganui, Rotorua, Gisborne, PalmerstonNorth, Masterton, Wellington, Greymouth, Ashburton and Timaru. Despitethis relocation, Wellington, Rotorua, Whangarei, Greymouth andAshburton would remain deficit areas.
When the model was re-run allowing new production facilities, afurther saving of about $670,000 per annum (making a total of about$1.4 million or 2.3 cents per dozen) was indicated. New facilitieswere used in previously deficit regions. Inter-regional transfers ofeggs were needed mainly in response to the seasonality of demand.
The conclusions from the sensitivity analysis can be summarised asfollows:
(1) Restricting new facilities in Wellington: The result was a dropof about $200,000 per annum in potential savings.
(2) Reduced shipping charges between Christchurch and Wellington:Reductions, in these charges, of up to 25 per cent had no effecton the optimal relocation strategy. The charges would have todrop hy 30 per cent hefore there was any effect on the relocationstrategy.

38.
(3) Changes in the feed price differential between the North and SouthIslands. The differential would have to be at least $30 in favourof the South Island before the sources of supply to Wellingtonchanged.
The value of possible savings is largely dependent upon regionalfeed price relativities and consequently may differ from year to year.However, it is clear a significant potential gain to the industry as awhole is possible.
CHAPTER 5
METHODS OF ACHIEVING A MORE EFFICIENT. LOCATION OF
PRODUCTION
5.1 Introduction
The main cause of what would appear to be a sub-optimal locationof egg production throughout New Zealand is the equalised pricingsystem which allows trans.port costs to be distributed across. all
.producers rather than borne directly by those producers who incur them.This leads to a situation where producers have no incentive to reduceproduction or move production closer to markets in order to reduce thecosts to the industry as a whole. The situation is exacerbated. whenother production costs, such as feed and land costs, which are borne bythe producer, favour areas remote from the major markets. This appearsto be the situation in New Zealand where in some cases the productionadvantages of the South Island can be utilized to supply the· NorthIsland, without producers incurring the associated cost of transport.
There may be equity arguments in favour of an equalised priceacross the country; however, there is a conflict between equity andefficiency in this case. The equalised price represents across-subsidisation of producers remote from tnarkets by producers closeto markets, and a subsidy to the industry as a whole by consumers.
To achieve and maintain an efficienta regulated industry, such as the Newconditions would appear to be necessary:
distribution of production inZealand egg industry, three
(a) A mechanism which ensures that individual producers directly reapthe benefits and bear the costs associated with their location.
(b) A mechanism for facilitating the efficientproduction.
relocation of
(c) And possibly, a means of compensating producers who suffer as aconsequence of the relocation of production.
There would appear to be various policy options available toachieve a more efficient structure and minimise unnecessary costs forthe producer and consumer. These broad options, together with theadvantages and disadvantages of each, are discussed below:
5.2 Redistribution of Quotas by the Poultry Board Without RegionalPricing
This option would involve avoluntarily sold or surrendered to theareas wnerean increase inproductlol1
39.
system whereby entitlements,Board, could be redistributed tois justified. Such entitlements
40.
could be offered initially to existing entitlement holders with excessproduction capacity thus allowing production to increase quickly andwithout the need for substantial capital investment. While such apolicy would cause little disruption in the industry it is alsounlikely to lead to a significant improvement in the efficient locationof egg production throughout New Zealand. Such a policy wouldperpetuate the equalisation of transport costs across all producers andwould thus not provide any incentive for producers to move closer tothe major markets. Also the adjustment mechanism is likely to be slowas it relies on the somewhat random availability of entitlements. Theproblem of where to encourage and discourage production would have tobe faced by the Board and demand patterns, production costs andtransport costs would have to be constantly monitored by the Board sothat entitlements could be reissued in an efficient way. Furtherdiscussion on the difficulties of efficiently reallocating productionwithout using the influence of market forces is presented in Section5.3.2.
5.3 Regional Pricing
The second policy option would be to introduce some form ofregional pricing. Under such a scheme producers in each region would(eventually) reap all the benefits and bear the costs associated withthe advantages and disadvantages of their location. Such a schemewould provide a positive incentive for production to move to deficitareas and a disincentive for production to continue in areas wherethere is a significant surplus of eggs. The scheme could be introducedgradually, say over five years, by imposing a surcharge on theEntitlement Levy paid in egg surplus regions calculated as a proportionof the cost of disposing or transporting eggs from those areas.
This surcharge could be paid as a Levy rebate to producers inthose regions where there is a deficit of eggs and where production isto be encouraged. The proportion of the cost of disposing andtransporting eggs from surplus areas covered by the surcharge could beincreased gradually over the five years until at the end of that periodproducer returns in each region reflected only the costs and benefitsof production in that region. Also over this period, if adjustment inthe level and location of production is satisfactory, the Levy andsurcharge paid by producers in what were once surplus productionregions could be largely eliminated.
The question arises as to the appropriate number and geographiclocation of the regions in such a scheme. The analysis undertaken inthis study would suggest that a substantial proportion of the potentialbenefits of the relocation of production could be achieved by operatinga two region scheme with the North Island as one region and the SouthIsland as the other. Such a system would appear to have administrativeadvantages because of the clear separation of the regions.
Another alternative would be a three region scheme with the NorthIsland divided into two regions approximately north and south of LakeTaupo. The division of the North Island on this basis is alsosupported by the results of this study which indicate that, with theefficient location of production in the North Island, egg transfers
41.
tend to occur within such regions rather than between them. A schemeinvolving more regions, perhaps to the extent of
ca region cbased on each
egg floor, would have the advantage of more closely matching regionalsupply and demand; however administrative problems would be increased.
A regional pricing scheme would not preclude the possibility oftransfers of eggs between regions if it was found that the productioncost advantages in one region more than off-set the cost oftransporting eggs to another region.
While a regional pricing scheme could be effective in providingthe incentive to relocate production it is also necessary that thisrelocation of production is facilitated. Under a free market systemproducers can choose to set up production when and where they believethey will make the most profit. When production is controlled withproduction quotas (entitlements), one of two general systems isgenerally adopted to facilitate structural adjustment. Eitherentitlements are freely transferable or they are controlled by theBoard.
5.3.1 Transferable entitlements.
Freely transferable entitlements are generally favoured byeconomists (see Beck, 1974; O'Connor, 1978; B.A.E., 1983, for example)because they allow producers who are efficient by virtue of theirmanagement and location to purchase entitlements from less efficientproducers, so ensuring an increasing overall level of efficiency in theindustry. Transferable quotas also have the advantage of providingthose leaving the industry with sOlne compensation. Transferable quotaswill, however, only be effective if they are associated with a pricingscheme that adequately reflects the true costs and benefits ofproduction in different locations. This was probably not the casec whentransferable entitlements were operating in New Zealand prior to August1978, and it is possible that, under those circumstances, transferableentitlements did nothing to improve the efficiency of the location ofegg production in New Zealand.
A criticism of freely transferable production entitlements andquotas sometimes relates to the high price that they often acquire.However, this price merely reflects the level of benefits thatproducers are getting from holding entitlements; and it is this pricewhich facilitates the adjustment process. An entitlement buyer willonly offer a price that still allows him to make a profit, while anentitlement seller will only accept a price that makes it worthwhilefor him to leave the industry.
On equity grounds, producer boards may fear that transferableentitlements will become concentrated in the hands of a few largeproducers; however, this possibility could be avoided by maintaining amaximum limit on the number of entitlements that could be held by oneproducer or organisation; a maximum limit of 20,000 birds per producerexists at present.
42.
5.3.2 Entitlements controlled by the Board.
Without transferable entitlements the problem of efficientlyreallocating entitlements falls upon the Board. Lane and MacGregor(1979) in a study of quotas and quota values in Canada make thefollowing comment on such a situation:
"Can a board whose primary function is to improve the marketingsystem for a commodity be, at the same time, sufficiently aware ofand sensitive to continuing developments at the production levelto do a better job of allocating production or marketing rightsamong its producers than individual producers can do themselves.Given the diversity of resources available to each farmer and thedifferences in their individual goals and objectives it isunlikely that a board's decisions could be as progressive andequitable as those made by producers themselves.
A quota allocation and transfer system that was fully controlledby a board would tend to reduce the transfer of quota amongproducers. If the possibility of realising any capital gain byrelinquishing quota were eliminated, as it would be under thissystem, then farmers would have less incentive to dispose of theirquotas and leave the industry. This would be especially true forlow income producers since they would have less funds available tomake the adjustment. To the extent that this system provides lessincentive to transfer quota it would tend to impede structuraladjustment within the industry."
An advantage (from a Board's point of view) of a system where theBoard controls all transfer of entitlement, is that it enables theBoard to exercise direct control over the nature and rate of structuraladjustment in the industry. It would thus be attractive if the Boardsets a high priority on maintaining a large proportion of relativelysmall farms in the industry and moderating the disruption caused byrelocating production. The price, however, could be continuedstructural inefficiencies in the industry.
If such a policy were adopted in New Zealand it would be necessaryto regularly monitor cost and demand factors in the industry to ensurethat the reallocation of entitlements contributed to improving theefficiency of the industry. Despite constant monitoring, however,conflict between the Board and individual producers would seeminevitable as Board decisions were enacted. For example, the Board maywish to transfer available quota from a surplus to a deficit region,however, some efficient producers in the surplus region, by virtue oftheir cost structure, may be able to bear full transport costs andstill supply a distant market competitively. Such producers couldjustifiably make a case for access to available quota.
5.3.3 Free market.
In the interests of a complete examinationachieving a more efficient distribution of eggNew Zealand, the option of moving toward amentioned. Arguments against the operation of
of alternative ways ofproduction throughoutfree market should be
a free market in egg
43.
industries throughout the world tend to relate to problems of qualitycontrol, security of supply and the dangers of production becomingconcentrated in the hands of a few producers. Advantages of a freemarket tend to relate to the notion that free and competitiveenterprise promotes the most efficient location and method ofproduction, and encourages rapid adjustment to changing costs, pricesand demand patterns, while at the same time assuring a least-costproduct to the consumer.
A recent Committee of Inquiry into Egg Marketing in Victoria(Australia) examined these issues and concluded that a move toward afree market for eggs would be appropriate in that State. (See the"First and Second Reports to the Minister of Agriculture" published bythe Committee of Inquiry into Egg Marketing in Victoria). It is beyondthe scope of this study to determine if a free market would beappropriate in New Zealand, however, it should be noted this would beone way of achieving a more efficient location of production.

CHAPTER 6
OVERVIEW AND CONCLUSIONS
The analysis indicated that a saving of the order of $1.4 millionor approximately 2.3 cents per dozen is possible as a result ofrelocation of production in New Zealand. 2 Such a saving would appearto make some structural adjustment in the industry worthwhile butraises important Questions about how such adjustment might be achieved.Unfortunately, as is the case in many industries, the adjustmentnecessary to benefit the industry and the community as a whole must beborne by relatively few and it seemS reasonable that these producers begiven sufficient time and, in some cases, assistance to allow them toleave the industry in satisfactory circumstances.
The problems of how and when production in an industry should beencouraged or discouraged, and how and when producers leaving theindustry should be compensated, are difficult issues. Basically twoalternatives are available to handle these issues; either a Board musttake on all the responsibility of planning and controlling structuraladjustment; or Some market forces must be allowed to act to encourageproducers themselves, acting in their own best interest, to make therequired adjustment.
If a Board takes on the responsibility of planning and controllingall structural adjustment they place themselves in an unenviablesituation. Understandably, it would probably be easiest for the Boardto maintain the status QUO and only allow those changes that could beachieved with the minimum of disruption and dissension; however, such apolicy would be unlikely to achieve significant improvements in theefficiency of the industry structure and it is possible that, givencontinuing change in other parts of the economy, the industry mighteventually be forced to restructure.
Alternatively, if the Board, in the long-term interests of theindustry, actively pursued a policy of industry restructuring it wouldalmost inevitably lead to some dissension as producers in some areasappeared to be favoured over those in other areas. Also, if such apolicy was to be effective, it would require a careful and continuinganalysis of supply, demand and cost factors in the industry.
The option of allowing some market forces to operate in the formof regional pricing and transferable entitlements has the advantage ofputting the major adjustment decisions back into the hands of the
2. It should be noted that this saving relates to relocation ofproduction only and does not include perhaps more substantialsavings that could result from other forms of structural changesuch as changes in the size distribution of producers.
45.

46.
individual producers while still allowing the Board to maintain somecontrol over the adjustment process. Also the system automaticallyprovides some compensation for producers leaving the industry becausethey can sell their entitlements. In effect, producers who arebenefitting from a relocation of production are compensating those whocould otherwise be disadvantaged.
Beck. A.C. (1974).Australian EggEconomics. Vol.
REFERENCES
"The Social Cost of Production Control in theIndus try" • .:R:::e:..:v:.::i:;e:.:w,-~o::;f::--,Ma=:::.r.::k::e::tc:i:.:n:sg,--,a::n::d:....:Ag=r::.;i:::c::;1::11::;,::.tu;;:::r.:::ac=.l42. No.4.
Bureau of Agricultural Economics (1983).Arrangements in Australia. OccasionalPublishng Service. Canberra.
A Review ofPaper No.
Egg Marketing82. Aust. Gov.
Committee of Inquiry into Eggand Second Reports to theApril. 1981.
Marketing in Victoria (1980-81).Minister of Agriculture. Sept.
First1980.
Lane. S.H. and M.A. MacGregor (1970). Quotas and Quotaof Agricultural Economics and Extension Education.Guelph. Ontario. Canada.
Values. SchoolUniversity of
O'Connor. J.C. (1978). "Production Controls in Agriculture:Industry Case". Australian Agricultural EconomicsVictorian Branch. Seminar Series No. 20.
47.
The EggSociety.

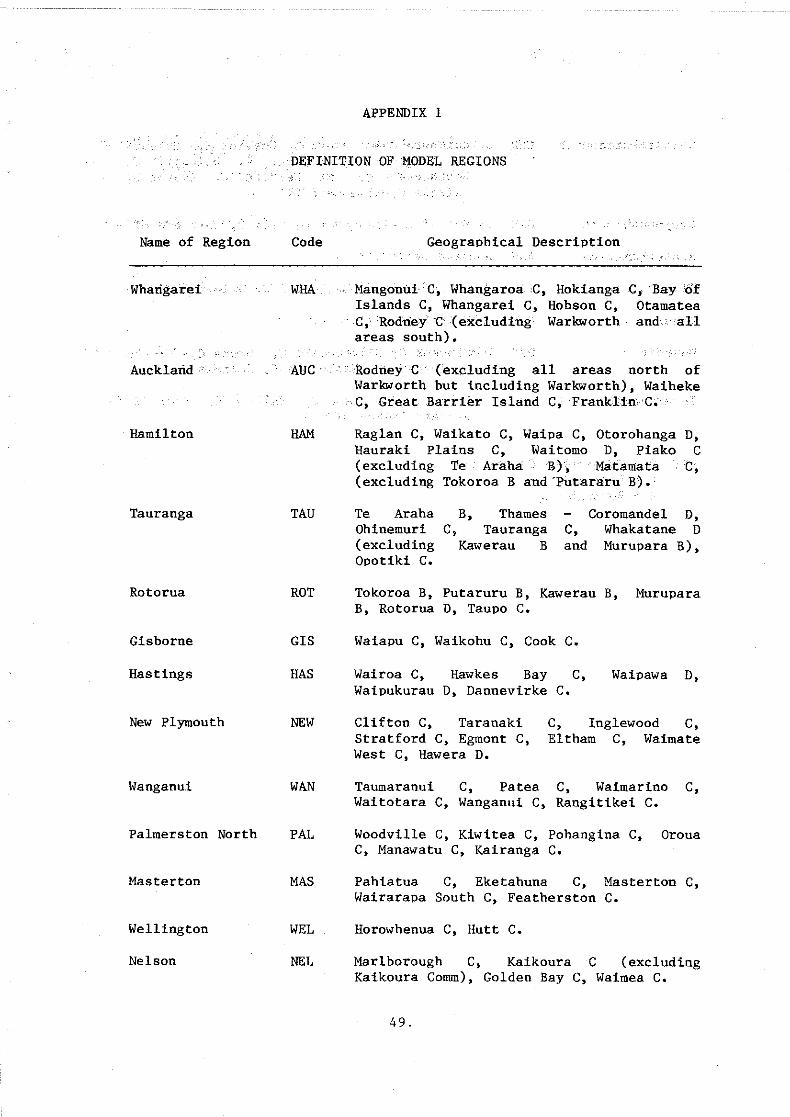
APPENDIX 1
DEFINITION OF MODEL REGIONS
Name of Region
Wharigarei"
Code
WHA
Geographical Description
M;angoniliC, Whangaroa ,C, Hok.iangaIslands C, Whangarei C, Hobson C,C,;RodneyD (excluding Warkworthareas south).
C, "Bay <:ifOtamateaand: all
Auckland
Hamilton
AUC
HAM
Rodriey·C (excluding all areas north ofWarkworth but .including Warkworth), Waiheke.C, Great Ba"rrier Island C, Frankl.i..n.;C.
Raglan C, Waikato C, Wa.ipa C, Otorohanga D,Hauraki Plains C, Waitomo D, Piako C(excluding Ie Araha B), Mlitamata C,(excluding Tokoroa Band "PutararuB).
Tauranga TAU Te ArahaOhinemuri(excludingOpotik.i C.
B, ThamesC, Tauranga
Kawerau B
Coromandel D,C, Whakatane Dand Murupara B),
Rotorua
Gisborne
ROT
GIS
Tokoroa B, Putaruru B, Kawerau B, MuruparaB, Rotorua D, Taupo C.
Waiapu C, Waikohu C, Cook C.
Hastings HAS Wairoa C, Hawkes Bay C,Waipukurau D, Dannevirke C.
Waipawa D,
New Plymouth NEW Clifton C, TaranakiStratford C, Egmont C,West C, Hawera D.
C, Inglewood C,Eltham C, Waimate
Wanganu.i
Palmers ton North
Masterton
Wellington
Nelson
WAN
PAL
MAS
WEL
NEL
Taumaranui C, Patea C, Waimarino C,Waitotara C, Wanganui C, Rang.it.ikei C.
Woodville C, Kiwitea C, Pohang ina C, OrouaC, Manawatu C, Kairanga C.
Pahiatua C, Eketahuna C, Masterton C,Wairarapa South C, Featherston C.
Horowhenua C, Hutt C.
Marlborough C, Ka.ikoura C (excludingKaikoura Comm), Golden Bay C, Waimea C.
49.

50.
Chriatchurch
Greymouth
Ashburton
Timaru
Oamaru
Dunedin
InvercargUl
CHR
GRE
ASH
TIM
OAM
DUN
INV
Kaikoura Comm, Amuri C, Cheviot C, HurunuiC,Rangiora 0, Paparua C, Waimairi C,Heathcote C, Mt Herbert C, Akaroa C,Wairewa C, Ellesmere C.
Buller C, Insngahua C, Grey C, Westland C.
Ashburton C.
Strathallan C, MacKenzie C, WaimateC.
Waitaki C, Oamaru B.
Vincent C, Silverpeaks C, Bruce C, CluthaC, Tuapeka C, Maniototo C, Waihemo C.
Lake C, Southland C, Wallace C, Fiord C,Stewart Island C.
KEY C = Geographic CountyD • DistrictB • Borough
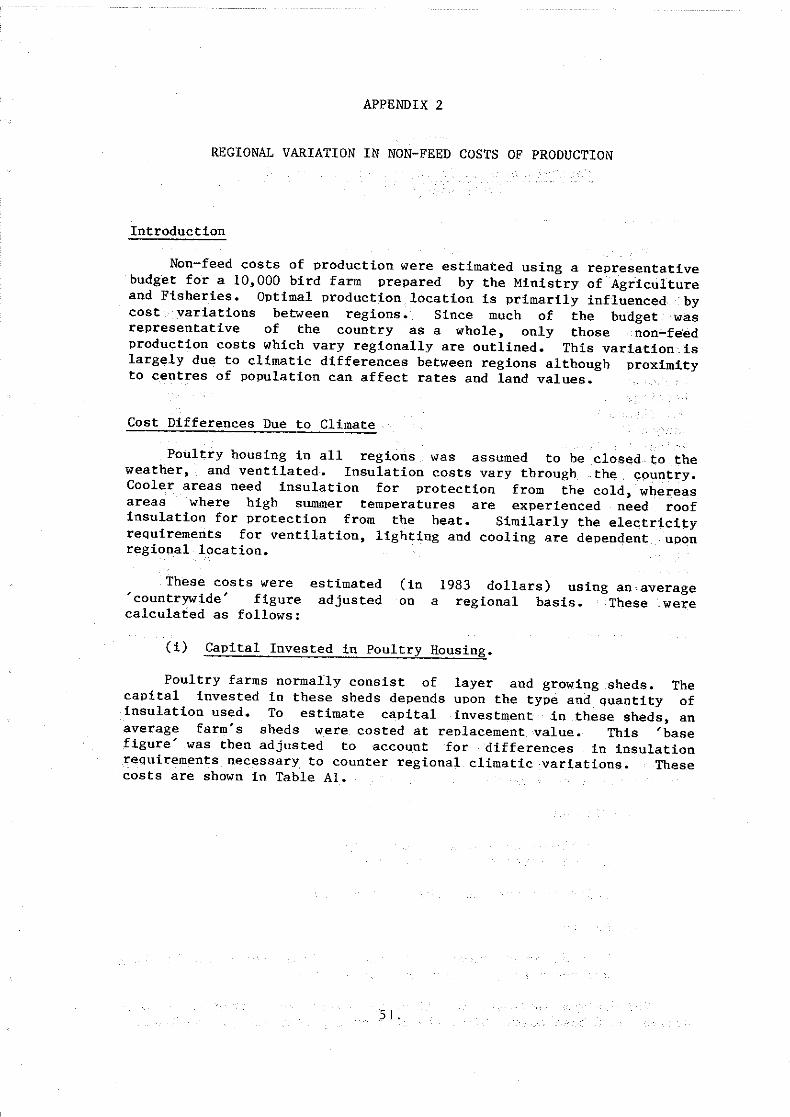
APPENDIX 2
REGIONAL VARIATION IN NON-FEED COSTS OF PRODUCTION
Introduction
Non-feed costs of production were estimated using a representativebudget for a 10,000 bird farm prepared by the Ministry of Agricultureand Fisheries. Optimal production location is primarily influenced bycost variations between regions. Since much of the budget wasrepresentative of the country as a whole, only those non~feed
production costs which vary regionally are outlined. This variation islargely due to climatic differences between regions although proximityto centres of population can affect rates and land values.
Cost Differences Due to Climate
Poultry housing in all regions was assumed to be closed to theweather, and ventilated. Insulation costs vary through .the. cpuntry.Cooler areas need insulation for protection from the cold,whereasareas where high summer temperatures are experienced need roofinsulation for protection from the heat. Similarly the electricityrequirements for ventilation, lighting and cooling are dependent uponregional location.
These costs were'countrywide' figurecalculated as follows:
estimatedadjusted
(in 1983 dollars) using an.averageon a regional basis. These. were
(i) Capital Invested in Poultry Housing.
Poultry farms normally consist of layer and growing sheds. Thecapital invested in these sheds depends upon the type and quantity ofinsulation used. To estimate capital investment in these sheds, anaverage farm's sheds were costed at reolacementvalue. This 'basefigure' was then adjusted to account for differences in insulationrequirements necessary to counter regional climatic variations. Thesecosts are shown in Table AI.
51.
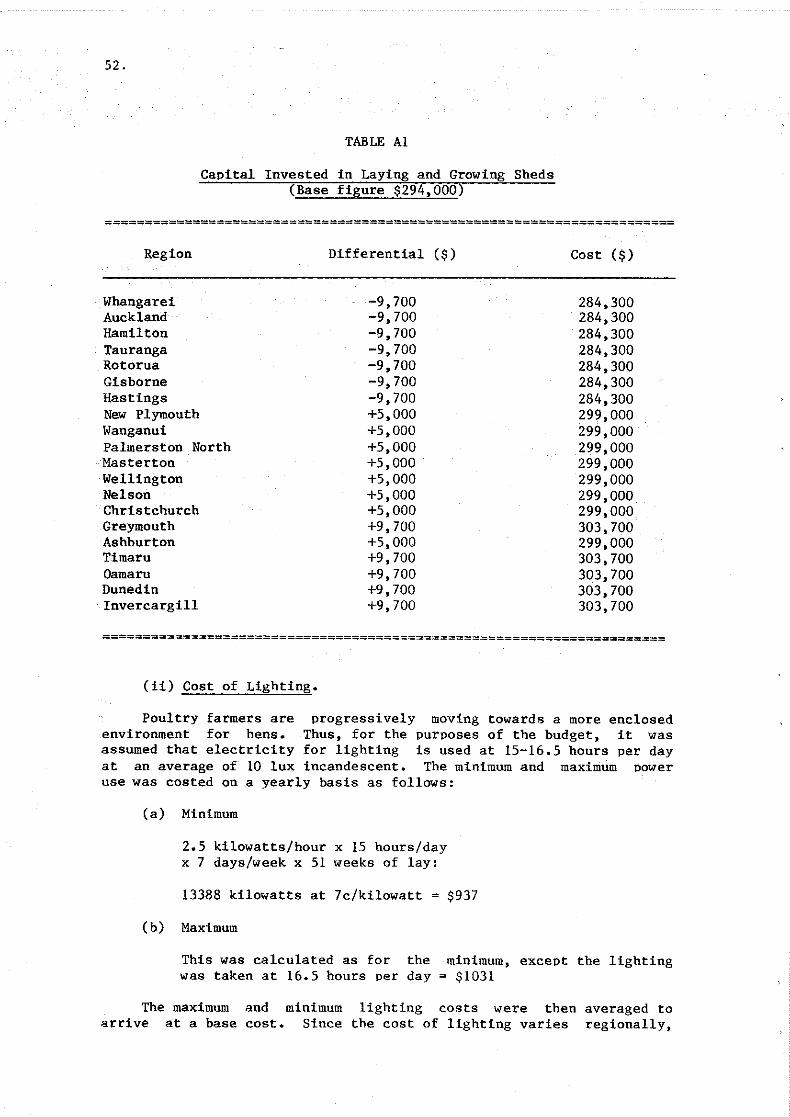
52.
TABLE Al
Capital Invested in Laying and Growing Sheds(Base figure $294,000)
=======================================================================
Region
WhangareiAucklandHamiltonTaurangaRotoruaGisborneHastingsNew PlymouthWanganuiPalmerston NorthMastertonWellingtonNelsonChristchurchGreymouthAshburtonTimaruOamaruDunedinInvercargill
Differential ($)
-9,700-9,700-9,700-9,700-9,700-9,700-9,700+5,000+5,000+5,000+5,000+5,000+5,000+5,000+9,700+5,000+9,700+9,700+9,700+9,700
Cost ($)
284,300284,300284,300284,300284,300284,300284,300299,000299,000299,000299,000299,000299,000299,000303,700299,000303,700303,700303,700303,700
======================================================================
(ii) Cost of Lighting.
Poultry farmers are progressively moving towards a more enclosedenvironment for hens. Thus, for the purposes of the budget, it wasassumed that electricity for lighting is used at 15-16.5 hours per dayat an average of 10 lux incandescent. The minimum and maximum poweruse was costed on a yearly basis as follows:
(a) Minimum
2.5 kilowatts/hour x 15 hours/dayx 7 days/week x 51 weeks of lay:
13388 kilowatts at 7c/kilowatt = $937
(b) Maximum
This was calculated as for the minimum, except the lightingwas taken at 16.5 hours per day = $1031
The maximum and minimum lighting costs were then averaged toarrive at a base cost. Since the cost of lighting varies regionally,
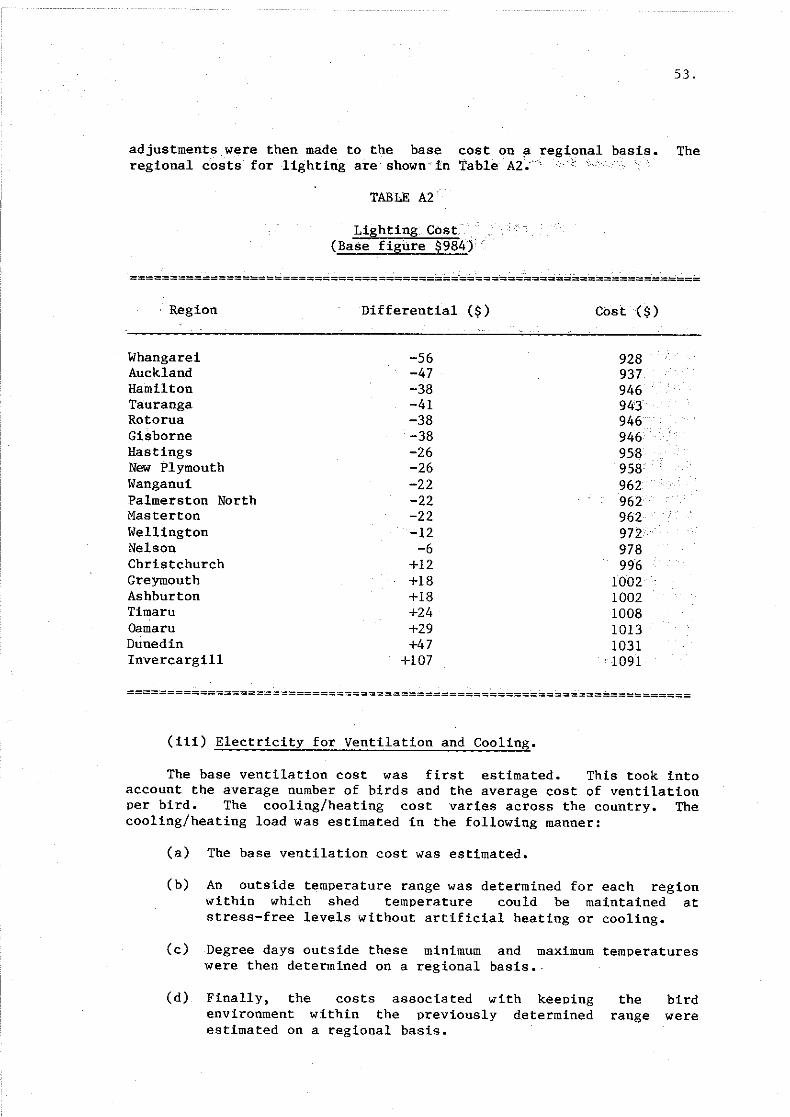
53.
adjustments were then made to the base cost on a regional basis. Theregional costs for lighting are' shown' in table' A2' ," ."
TABLE A2
Lighting Cost,(Base figure $984)
Region
WhangareiAucklandHamiltonTaurangaRotoruaGisborneHastingsNew PlymouthWanganuiPalmerston NorthMastertonWellingtonNelsonChristchurchGreymouthAshburtonTimaruOamaruDunedinInvercargill
Differential ($)
-56-47-38-41-38-38-26-26-22-22-22-12-6
+12+18+18+24+29+47
+107
Cost ($)
92893794694'3946'946958958 '962962962972978996
10021002100810131031109i
=======================================================~~=============
(iii) Electricity for Ventilation and Cooling.
The base ventilation cost was first estimated. This took intoaccount the average number of birds and the average cost of ventilationper bird. The cooling/heating cost varies across the country. Thecooling/heating load was estimated in the following manner:
(a) The base ventilation cost was estimated.
(b) An outside temperature range was determined for each regionwithin which shed temperature could be maintained atstress-free levels without artificial heating or cooling.
(c) Degree days outside these minimum and maximum temperatureswere then determined on a regional basis.,
(d) Finally, the costs associated with keepingenvironment within the previously determinedestimated on a regional basis.
the birdrange were
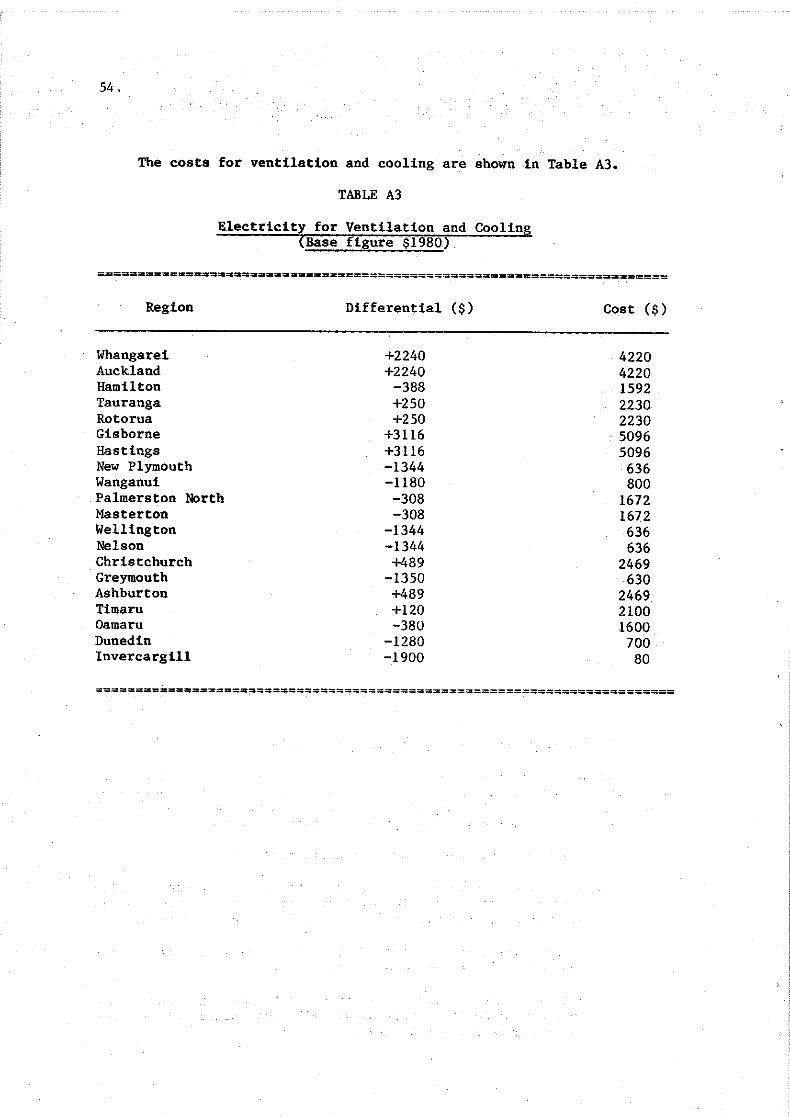
5.4 •
The costs for ventilation and cooling are shown in Table A3.
TABLE A3
Electricity for Ventilation and Cooling(Base figure $1980)
============~.=.=~=====================================================
Region
WhangareiAucklandHamiltonTaurangaRotoruaGisborneHastingsNew PlymouthWanganuiPalmerston NorthMastertonWellingtonNelsonChristchurchGreymouthAshburtonTimaruOamaruDunedinInvercargi1l
Differential ($)
+2240+2240
-388+250+250
+3116+3116-1344-1180-308-308
-1344-1344+489
-1350+489+120-380
-1280-1900
Cost ($)
4220422015922230223050965096
636800
16721672636636
2469630
246921001600
70080
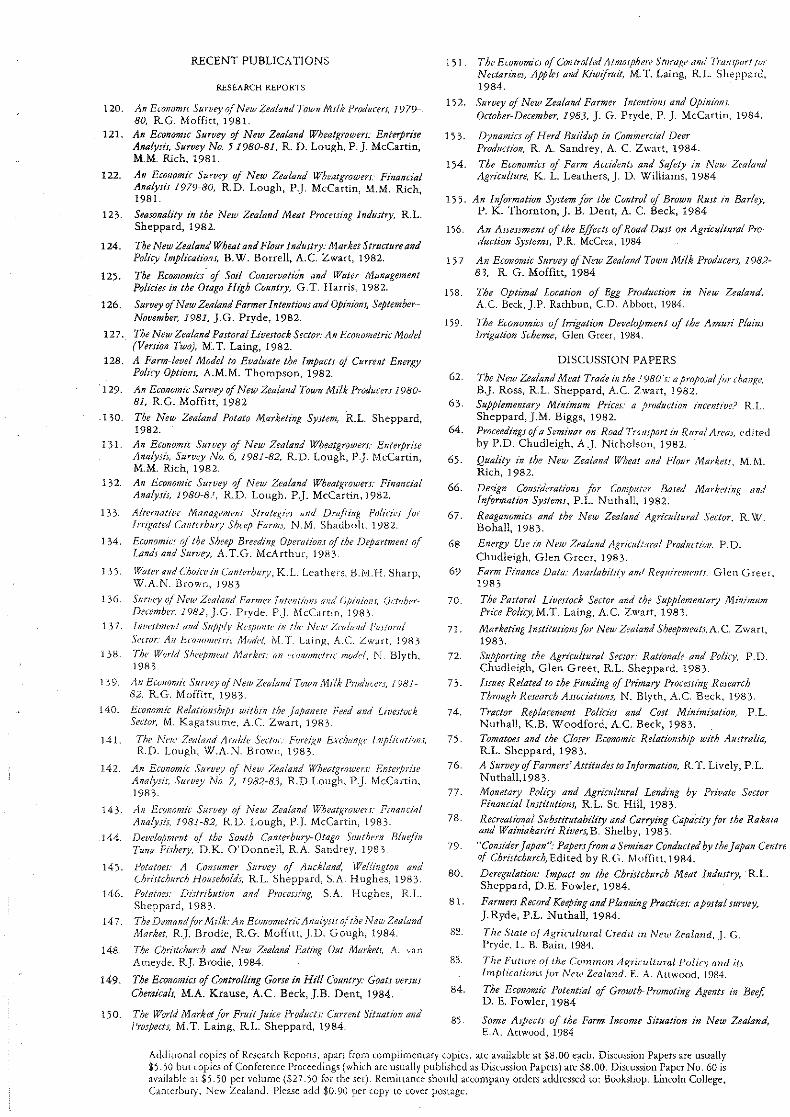
RECENT PUBLICATIONS
RESEARCH REPORTS
120. An Econumic Survey of New Zealand Town Mdk Producers, 197980, RG. Moffitt, 1981.
121. An Economic Survey of New Zealand WhlJatgrotlJcn: Enterprt!eAnalyJiJ, Survey No. .5 1980-81, R. D. Lough, P.]. McCartin,M.M. Rich, 1981.
122. An Economic Survey of New Zeolorid Wheatgrowen: FiT1uncialAntilysis 1979-80, R.D. Lough, P.]. McCartin, 1LM. Rich,1981.
123. Seasonality in the New Zealand Meat Procming Industry, R.t.Sheppard, 198.2-
124. The New Zealane.' Wheat and Flour Industry: Market StructlJreandPoliCY Impliea/fa.'ll, B.W. Borrell, A.C. Zwart, 1982.
125. The Ecomomics - of Sod Conservation and Water ManagementPolicies in the Otago High Country, G.T. Harris, 1982.
126. Survey ofNew Zealand Farmer IntentiOfIJ and Opinions, September-November, 1981, J.G. Pryde, 1982.
127. The New Zealand Pastoral Livestock Sector: An Econometric Model(Version Two), M. T. Laing, 1982.
128. A Farm-level Mode! to Evaluate the Impacts of Current EnergyPolicy Options, A.M.M. Thompson, 1982.
·129. An Economic SUr/ley ofNew Zealand Town Mtlk Producers 198081, RG. Moffitt, 1982
. 130. The New Zealand Potato Marketing System, R.L. Sheppard,1982.
131. An Economic Survey of New Zealand Wheatgrowers: EnterpriseAnalysis, Survey No. 6, 198]~82, R.D. Lough, P.J. I\;1cCartin,M.M. Rich, 1982.
132. An Economic Suruey of New Zealand WheatgrowerJ: FinancialAnalystS, 1980-8-', R.D. Lough, P.]. McCartin, 1982.
133. Alternative Manaxemmt Strall'xies lind Dra/ting Policies for{trigated Cafltahury S/;n:p FarmJ, N.M. Shadbolt, 1982.
134. Economics 0/ the Sheep Breeding Operatiolls 0/ the Departmeni 0/Lands and Sumey, A.T.G. McArthur, 1983.
1 _J). {"f/ater (aid Choice ill Ct/lltahur}', K. L. Leathers, B.lvI. H. Sharp,W.A.N. Brown, 1983
136. Survey 0/ New Zealarld Farm('/" Tnfentl:'Jfl[ {/fI[l O/)inion.f, October·December, 1982,].G. Pryde, PJ. lVlcCntin, 1983.
137. ltwe.rtmm! rind S1tPl,h' H",rpfJIISc iN tl/(' Nell' 7.m!al/tl PaJ/()I"t//
Sntor: All I:"am(JlJil'fric /Horld, IvLT. Laing, A.C. Zwart, 198_,
] )8. The World S/wepmm! Markel: (In cwrwmi'/l"1( model, N. Blyth,1983
139. An Economic Survey oj New Zealrmd Town /Vlilk Pmdli(l;,s, 198182. KG. Moffitt, 1983.
140. Economic Relationships within tbe .Japane5e Feed and LivestockSedor, M. Kagatsume, A.C. Zwart, 1983.
141. Tbe Nell' Zealand A rah!e Sector: Fl)rNi~!l Erclwngc frilp!ic{ltirJ!1J,R.D. Lough, W.A.N. Brown, 1983.
142, An Economic Survey 0/ New Zealand Whetztgrowers: EnterpriseAnalyJis, Survey No.7, 1982-83, RD.Lough, P.]. McCartin,1983.
143. An EcoNomic Survey of New Zealand Vlheatgrower.r: FinancialAnalySts, 1981-82, RD. Lough, P.]. McCartin, 1983.
144. Deue!opment 0/ the South Canterbury- Otago Southern Blur/inTuna FlJhery, D.K. O'Donnell, R.A. Sandrey, 1983.
145. Potatoes: A Consumer Survey of Auckland, Wellington andChriJtchurch Households, RL. Sheppard, S.A. Hughes, 1983.
146. PotatoeJ: Dlrtributiol2 and Processing, S.A. Hughes, RL.Sheppard, 1983.
147. The Demandfor Milk: An Econometric Analyst:r ofthe New ZealandMarket, RJ. Brodie, KG. Moffitt, J.D. Gough, 1984.
148. The Chr::rtchunh alld New Zealand Eating (Jut Marketr. A. vanAmeyde, RJ. Brodie, 1984.
149. The Economics of ControllifJg Gorse in Hill Country: Goats versusChemicals, M.A. Krause, A.C, Beck,].B. Dent, 1984.
150. The World Market for Fruit Juice Products: Current Situation andl'rospecfs, M.T. Laing, RL. Sheppard, 1984.
151. The Emnomic.r 0/ Controlled AtmoJphere Storage and l'rrlHJj!ort fIJI'
Nectarines, AppteJ and Kiwi/mit, M. T. Laing, RL. Sheppard,1984.
152. Survey of New Zealand Farmer [ntentir}!l.r and Opiniom.October~December, 1983, J. G. Pryde, P.]. McCartin, 1984.
153. Dynamics 0/ Herd Buildup in Commercial DeerP;oduction, R. A. Sandrey, A. C Zwart, 1984.
154. The Economics of Farm Acadents and Sa/ety in New ZealandAgriculture, K. 1.. Leathers, J. D. Williams, 1984
155. An Information System/or the Control 0/ Brown RUJt in Barley,P. K. Thornton, J. B. Dent, A. C. Beck, 1984
156. An Assessment of the Effects ofRoad Dust on Agricultural Production Systems, P.R. McCrea, 1984
157 An Economic Survey a/New Zealand Town Milk Producers, 198283, R G. Moffitt, 1984
158. The Optimal Location 0/ Egg Production in New Zealand,A.C. Beck, J.P. Rathbun, C.D. Abbott, 1984.
159. The Economics of Imgation Development of the AmU?i PlainsImgation Scheme, Glen Greer, 1984.
DISCUSSION PAPERS
62. The New Zealand Meat Trade in the .'980·J: a proposal/fir (hanKe,R]. Ross, R.1.. Sheppard, A.C Zwart, 1982.
63. Supplementary Minimum Prices: a /mJduction incelltive? R.L.Sheppard,].M. Biggs, 1982.
64. Proceedings 0/a Seminar on Road TrullJport in Rural AreaJ, editedby P.D. Chudleigh, A.J. Nicholson, 1982.
65. Quality in t"e New Zealalld Wheal and FlOHr Markets, M.lvLRich, 1982.
66. Design Considerations /01' CompllN,r Ba.red Marketing andInformation Systems, P.L. Nuthall, 1982.
67. Reaganomics and the New Zealand Agricultural Seelor. R W.Bohall, 1983.
68 Energy Use in New Zealand Agricul:/Ira! Production. P.D.Chudleigh, Glen Greer, 1983.
69 Farm Finance Data: Availahtiitv an/ Requiremn}fJ. Glen Greer.1983 .
70. The Pastoral Livestock Sector and the Supplementary MinimumPn'ce Policy,M.T. Laing, A.C. Zwart, 1983.
71. Marketing Institutions/or New Zealand Sheepmeat.r,A.C. Zwart,1983.
72. Supporting the Agricultural Sector: Rationale and Polit)!, P,D.Chudleigh, Glen Greer, R.L. Sheppard, 1983.
73. Issues Related to the Funding 0/ Primary Processing ResearchThrough Research ASJociatiol1s, N. Biyth, A.C. Beck, 1983.
74. Tractor Replacement Policies and COft Minimtsation, P.L.Nuthall, K.B. Woodford, A.C Beck, 1983.
7'5. Tomatoes and the Closer Economic Relatiomhtp with Australia,RL. Sheppard, 1983.
76. A Survey ofFarmers' Attitudes to Information, R. T. Lively, P.L.Nuthall,1983.
77. Monetary Policy and Agricultural Lending by Private SectorFinancial Institutions, RL. St. Hill, 1983.
78. Recreational Substitutabtlity and Carrying Capacity /or the Rakaiaand Waimakariri Riuers,B. Shelby, 1983.
79. "ConJtder.Japan": Papersfrom a Seminar Conducted by the.Japan CeNtreIJf Christchurch, Edited by KG. rvloflitt, 1984.
80. Deregulation: Impact on the Chrtstchurch Meat Industry, 'RL.Sheppard, D.E. Fowler, 1984.
81. Farmers Record Keeping andPlanning PracticeJ: apostal survey,]. Ryde, P.L. Nuthall, 1984.
82. Thr S'late of Agricultural Credit in New Zealand, J. G.Pryd(', 1.. B. Bain, 1984. .
83. The Future of the Common Agricultural {'o/i,v and itsImplicatiotH for New Zealand. E. A. Attwood, 19R4.
84. The Economic Potential of Growth- Promoting Agents in BeetD. E. Fowler, 1984
85. Some Aspects of the Farm .Income Situation in New Zealand,E.A. Attwood, 1984
Additional copies of Research Reports, apart from complimentary copies, are available at $8.00 e~ch. Discussion Papers are usually$5. ')0 but copies of Conference Proceedings (which are usually published as Discussion Papers) are $8.00. Discussion Paper No. 60 isavailable at $5. ')0 per volume ($27. ')0 for the set). Remittance should accompany orders addressed to: Bookshop, Lincoln College,Canterbury, New Zealand. Please add $0.90 per copy to cover postage.