Phonological variation and change in Australian and New Zealand Sign Languages: The location...
39
Phonological variation and change in Australian and New Zealand Sign Languages: The location variable A DAM S CHEMBRI University College London D AVID M C K EE ,R ACHEL M C K EE AND S ARA P IVAC Victoria University of Wellington T REVOR J OHNSTON AND D ELLA G OSWELL Macquarie University ABSTRACT In this study, we consider variation in a class of signs in Australian and New Zealand Sign Languages that includes the signs THINK, NAME, and CLEVER. In their citation form, these signs are specified for a place of articulation at or near the signer’s forehead or above, but are sometimes produced at lower locations. An analysis of 2667 tokens collected from 205 deaf signers in five sites across Australia and of 2096 tokens collected from 138 deaf signers from three regions in New Zealand indicates that location variation in these signs reflects both linguistic and social factors, as also reported for American Sign Language (Lucas, Bayley, & Valli, 2001). Despite similarities, however, we find that some of the particular factors at work, and the kinds of influence they have, appear to differ in these three signed languages. Moreover, our results suggest that lexical frequency may also play a role. An earlier version of this article, reporting on a subset of the Australian Sign Language data, was published by Gallaudet University Press (Schembri, Johnston, & Goswell, 2006). The illustrations in this article were produced by Shaun Fahey. This research was supported by Australian Research Council (Grant LP346973) under the Linkage Projects Scheme to the University of Newcastle and the Royal Institute for Deaf and Blind Children, by a Marsden Grant from the Royal Societyof New Zealand to the Deaf Studies Research Unit at Victoria University of Wellington, as well as by the Economic and Social Research Council of Great Britain (Grant RES-620-28-6001), and the Deafness, Cognition, and Language Research Centre. We gratefully acknowledge the assistance and support of Ceil Lucas, Bob Bayley, and Barbara Horvath, and thank the four anonymous reviewers for their feedback on this article. In Australia, Julia Allen, Kevin Cresdee, Patti Levitzke-Gray, Stephanie Linder, and Kim Pickering acted as our deaf community contact people. Robert Adam, Breda Carty, Donovan Cresdee, and Brent Phillips provided useful input, and Darlene Thornton assisted with data coding. We are grateful to the staff at the Deaf Society of New South Wales, Deaf Education Network, Renwick Centre, the Thomas Pattison School, the Western Australian Deaf Society, the Deaf Can Do (South Australia), the Victorian Deaf Society, and the Deaf Services Queensland for assistance during data collection. In New Zealand, Sonia Pivac, Margaret Bailey, Linda Allen, Ripeka Morgan, Pam Witko, Annette Scott, Rachel McMillian, Darryl Alexander, Joyce Ferguson, and Patty Still acted as deaf community contact people. George Major and Sarah Fraser- Clark assisted with data coding. We are especially grateful to the many deaf people across Australia and New Zealand who participated in this study. 193 Language Variation and Change, 21 (2009), 193–231. Printed in the U.S.A. © 2009 Cambridge University Press 0954-3945/09 $16.00 doi:10.1017/S0954394509990081
Transcript of Phonological variation and change in Australian and New Zealand Sign Languages: The location...

Phonological variation and change in Australian and NewZealand Sign Languages: The location variable
ADAM SCH EMB R I
University College London
DAV I D MCKE E , R AC H E L MCKE E A ND SA R A P I VAC
Victoria University of Wellington
TR E VO R J O H N S TO N A ND DE L L A GO SW E L L
Macquarie University
A B S T R AC T
In this study, we consider variation in a class of signs in Australian and New ZealandSign Languages that includes the signs THINK, NAME, and CLEVER. In their citation form,these signs are specified for a place of articulation at or near the signer’s forehead orabove, but are sometimes produced at lower locations. An analysis of 2667 tokenscollected from 205 deaf signers in five sites across Australia and of 2096 tokenscollected from 138 deaf signers from three regions in New Zealand indicates thatlocation variation in these signs reflects both linguistic and social factors, as alsoreported for American Sign Language (Lucas, Bayley, & Valli, 2001). Despitesimilarities, however, we find that some of the particular factors at work, and thekinds of influence they have, appear to differ in these three signed languages.Moreover, our results suggest that lexical frequency may also play a role.
An earlier version of this article, reporting on a subset of the Australian Sign Language data, waspublished by Gallaudet University Press (Schembri, Johnston, & Goswell, 2006). The illustrations inthis article were produced by Shaun Fahey. This research was supported by Australian ResearchCouncil (Grant LP346973) under the Linkage Projects Scheme to the University of Newcastle andthe Royal Institute for Deaf and Blind Children, by a Marsden Grant from the Royal Society of NewZealand to the Deaf Studies Research Unit at Victoria University of Wellington, as well as by theEconomic and Social Research Council of Great Britain (Grant RES-620-28-6001), and theDeafness, Cognition, and Language Research Centre. We gratefully acknowledge the assistance andsupport of Ceil Lucas, Bob Bayley, and Barbara Horvath, and thank the four anonymous reviewersfor their feedback on this article. In Australia, Julia Allen, Kevin Cresdee, Patti Levitzke-Gray,Stephanie Linder, and Kim Pickering acted as our deaf community contact people. Robert Adam,Breda Carty, Donovan Cresdee, and Brent Phillips provided useful input, and Darlene Thorntonassisted with data coding. We are grateful to the staff at the Deaf Society of New South Wales, DeafEducation Network, Renwick Centre, the Thomas Pattison School, the Western Australian DeafSociety, the Deaf Can Do (South Australia), the Victorian Deaf Society, and the Deaf ServicesQueensland for assistance during data collection. In New Zealand, Sonia Pivac, Margaret Bailey,Linda Allen, Ripeka Morgan, Pam Witko, Annette Scott, Rachel McMillian, Darryl Alexander, JoyceFerguson, and Patty Still acted as deaf community contact people. George Major and Sarah Fraser-Clark assisted with data coding. We are especially grateful to the many deaf people across Australiaand New Zealand who participated in this study.
193
Language Variation and Change, 21 (2009), 193–231. Printed in the U.S.A.© 2009 Cambridge University Press 0954-3945/09 $16.00doi:10.1017/S0954394509990081

This article presents findings from two parallel studies of sociolinguistic variationin a phonological feature of Australian Sign Language (Auslan) and New ZealandSign Language (NZSL). Recent projects undertaken in Australia (Schembri &Johnston, 2004; Schembri, Johnston, & Goswell, 2006) and New Zealand1
replicated an earlier quantitative investigation into sociolinguistic variation inAmerican Sign Language (ASL) conducted by Ceil Lucas and her colleagues(Lucas, Bayley, Rose, & Wulf, 2002; Lucas, Bayley, & Valli, 2001) in order toexplore the extent to which internal and external constraints on variation behaveconsistently across signed languages. In this article, we report further findingsabout variation in the location parameter in a class of signs that, in citation form,are produced in contact with or in proximity to the signer’s forehead or above.In Auslan and NZSL, this set includes signs such as THINK, NAME, and CLEVER.2
Like signs in the same phonological class in ASL, these are often produced inconnected discourse at locations lower than the forehead, either on or near lowerparts of the signer’s face (such as at the cheek or jawbone), or in the space infront of the signer’s face or chest. Here we present an analysis of 2667 tokens ofsigns from this class in a corpus of data collected from 205 deaf signers ofAuslan, and of 2096 tokens collected from 138 deaf signers of NZSL.3 In eachstudy, variation in the target location parameter was analyzed in relation to thesame set of independent variables. The results indicate that the variation foundin the location parameter of these signs as used in both language communitiescorrelates with both linguistic and social factors, as has also been reported forASL. Despite similarities with the ASL results, however, we find that some ofthe particular factors at work, and the degree of influence they have on variationin location, appear to differ across these three signed languages. Moreover, ourresults suggest that lexical frequency also plays a role, a factor not considered inthe ASL study.
The article is organized into four parts. First, we provide a brief overview ofsociolinguistic variation in Auslan and NZSL and review the previous work onlocation variation in ASL by Lucas et al. (2002). We then present themethodology used in our studies, followed by a description and comparisonof the results. Lastly, we discuss the implications of our findings for theunderstanding of sociolinguistic variation in signed and spoken languages.
A U S T R A L I A N S I G N L A N G UA G E A N D N EW Z E A L A N D
S I G N L A N GU AG E
Lexicostatistical comparison and mutual intelligibility indicate that Auslan andNZSL are closely related varieties of the British Sign Language (BSL) family(Johnston, 2003), which is historically distinct from ASL (McKee & Kennedy,2000). Auslan and NZSL have their roots in the signed varieties brought to thecolonies in the early nineteenth century by deaf immigrants and teachers of deafchildren from England, Scotland, and Ireland and developed locally amongsuccessive generations of signing communities that formed initially in and
194 A DAM S C H EMB R I E T A L .

around schools for deaf children and adult deaf missions (Carty, 2004; Collins-Ahlgren, 1989; Johnston, 1989). Conditions for the development and use ofsigned language differed between Australia and New Zealand, mainly becausesigned language remained a medium of instruction in early Australian schoolsfor the deaf, whereas it was strictly proscribed in New Zealand schools from1880 until 1979 (Collins-Ahlgren, 1989). Nevertheless, in both countries, signedlanguage flourished as the medium of social interaction between deaf childrenand adults.
Relatively little research has been conducted on Auslan or NZSL. New ZealandSign Language was first taught and documented in 1985 (Levitt, 1986), and in1987, the first curriculum for Auslan teaching was produced (Johnston, 1987).In 1989, doctoral dissertations describing the respective grammatical and lexicalcharacteristics of Auslan and NZSL were completed (Collins-Ahlgren, 1989;Johnston, 1989). These seminal analyses of Auslan and NZSL showed themto have many of the same morphosyntactic characteristics as previouslydocumented signed languages, such as ASL. Dictionaries of Auslan and ofNZSL, based on linguistic principles, have also been produced (Johnston, 1989,1997, 1998; Kennedy, Arnold, Dugdale, Fahey, & Moskovitz, 1997).
Sociolinguistic variation in Auslan and in NZSL
Johnston’s dissertation (Johnston, 1989), some of his later research (Johnston &Schembri, 1999, 2007), subsequent dictionaries of Auslan based on his work(Bernal & Wilson, 2004; Johnston, 1997, 1998; Johnston & Schembri, 2003),and Auslan teaching materials (Branson, Bernal, Toms, Adam, & Miller, 1995;Branson, Peters, Bernal, & Bernal, 1992) discussed sociolinguistic variation inthe language and have documented some of the many examples of regionalvariation in the Auslan lexicon (e.g., MORNING, see Figure 1).
FIGURE 1. Regional variants of MORNING.
T H E LO CAT I O N VA R I A B L E 195
Based on the traditional distribution of lexical variation in core areas of thelexicon, such as numbers (especially SIX to TWELVE) and colors (e.g., WHITE, BLUE,GREEN), Johnston (1989) proposed that Auslan could be divided into two majorregional varieties: the “northern” dialect (Queensland and New South Wales)and the “southern” dialect (Victoria, South Australia, Western Australia, andTasmania). It is possible that these two regional varieties have developed, atleast in part, from lexical variation in different varieties of BSL in the nineteenthcentury (similar lexical variation continues to exist in modern BSL, see Brien,1992), although primary sources documenting signed language use at the timeare lacking.
Together with signs, deaf people in Australia also make significant use of themanual alphabet to fingerspell English lexical items (Johnston, 1989). A small-scale study of fingerspelling use in Auslan by Schembri and Johnston (2007)found that deaf signers aged 51 years or older made significantly more frequentuse of the manual alphabet than those aged 50 or younger. These age-relateddifferences in fingerspelling usage (also reported for BSL, see Sutton-Spence,Woll, & Allsop, 1990) reflect the educational experiences of older deaf people,many of whom report that they were instructed using approaches thatemphasized the exclusive use of fingerspelling.
In NZSL, there is evidence of regional variation in the lexicon (see Kennedyet al., 1997), associated with three main concentrations of deaf populationaround historical schools for the deaf in north, central, and southern cities. Age-related variation in the lexicon of NZSL has also been noted (Collins-Ahlgren,1989; Forman, 2003; Kennedy et al., 1997; Levitt, 1986; McKee & McKee,2007). Natural intergenerational variation was artificially accelerated from 1979by the introduction of Australasian Signed English, a sign system based mainlyon Auslan vocabulary (some of which overlapped with local signs),supplemented by contrived signs to represent English functors (Johnston &Schembri, 2007). This system was adopted as the means of instruction in bothAustralian and New Zealand schools for deaf children in the 1970s (Leigh,1995). A study of variation in the numeral system in NZSL (McKee, McKee, &Major, 2006) demonstrates age-related change in the lexicon, and a progressiveleveling process whereby younger signers use fewer variants than older signers,who display considerable within-group variation. Region and gender were alsoshown to be associated with numeral variation. Pilot studies of sociolinguisticvariation in the use of fingerspelling (Alexander, 2008) and of mouthing spokenEnglish words accompanying signing (McKee, 2007), which are commonfeatures of contact between a signed and a spoken language (e.g., Boyes-Braem& Sutton-Spence, 2001; Lucas & Valli, 1992), also show patterned effects ofage and gender in NZSL.
In this article, our focus is on phonological variation. Although other work hasdiscussed or documented sociolinguistic variation in Auslan and NZSL, theresearch described here represents the first attempt to empirically investigatephonological variation in Auslan and NZSL and its relationship to bothlinguistic and social factors.
196 A D AM S C H EMB R I E T A L .

S I G N E D L A N G UAG E P H O N O LO GY : T H E PA R AM E T E R MO D E L
Since the seminal work of William Stokoe (1960), manual signs in signedlanguages have been analyzed as composed of three main formational elements:handshape, location, and movement. These features may be consideredanalogous to the parameters of speech production, such as voicing, place, andmanner of articulation. Signs are made from the combination of a limited set ofparameter values (there appear to be around 37 distinctive handshapes in Auslan,for example), and minimal pairs may be distinguished on the basis of differencesin these parameters (Johnston & Schembri, 2007). For example, the two variantsof MORNING in Figure 1 both use the same handshape (a bent “B” handshape)and the same movement (a repeated contacting of the body with the fingertips).They differ in location, with the northern dialect variant moving from anipsilateral location lower on the trunk to one higher, while the southern dialectvariant is produced at one location on the contralateral side of the chest.
Although there is debate about the relevance of some additional formationalelements (such as the orientation of the hands, see Sandler & Lillo-Martin,2006) and the nature of minimal pairs (Liddell & Johnson, 1989), evidence forthe sublexical compositionality of signs is well established, and includes notionsof well-formedness of signs shared by native signers (e.g., Johnston, 1989),signed language production errors (known as “slips of the hand”) (e.g.,Leuninger, Hohenberger, Waleschkowski, Menges, & Happ, 2004; Newkirk,Klima, Pedersen, & Bellugi, 1980), and stages of phonological development insigned language acquisition (e.g., Marentette & Mayberry, 2000).
Phonological variation: The location variable
Johnston (1989:33) observed that phonological variation in handshape, location,and orientation in Auslan might be related to the immediate phonologicalenvironment (similar claims for ASL were made by Liddell & Johnson, 1989):
Handshape and location and orientation can all undergo significant changes in fluentsigning with the immediate phonological environment of a sign influencing, forexample, whether handshapes are fully formed or not, or whether they absorbfeatures of previous or following handshapes; whether contact is actually made atlocations, simply suggested, not made at all or made at another location altogether,and so on.
Although Johnston noted that assimilation can occur in all three major parameters,our studies only examine variation in a single parameter—location. Morespecifically, our investigations of location variation examined this variable in theclass of signs that are produced in contact with or in proximity to the forehead,including the signs THINK, NAME, and CLEVER (as illustrated in Figure 2). Thisclass of signs includes both signs that primarily act as verbs (e.g., KNOW, NOT-KNOW,4 REMEMBER, FORGET, UNDERSTAND, WONDER, WORRY, DREAM) and signs that
T H E LO CAT I O N VA R I A B L E 197

generally function as nouns (e.g., MOTHER, NAME, MIND, SOCCER, GIRL, GERMANY). Italso includes a number of signs that may have an adjectival function (e.g.,STUPID, CLEVER, TALL, YELLOW, CRAZY, SOPHISTICATED, SILLY, GREEN). Althoughproduced on or near the forehead in citation form, these signs (as Johnstonnoted) may be made at lower locations. Their location may vary from theforehead region (i.e., in their citation form) to locations near the eye, on thecheek, at the jaw or at lower locations in the space near the signer’s body (asillustrated in Figure 3).
Our studies replicate the only other investigation of location variation in thisclass of signs in ASL (Lucas et al., 2002). In the original study, Lucas and hercolleagues coded 2862 examples of signs from the class exemplified by the ASLsign KNOW (most of which were produced in citation form in contact with orin proximity to the forehead region). These were selected from a corpusof conversational and interview data that was collected from 207 native and
FIGURE 2. THINK, NAME, and CLEVER.
FIGURE 3. Lowered variant of NAME.
198 A D AM S C H EMB R I E T A L .

near-native deaf signers of ASL in seven sites across the U.S. (Staunton, Virginia;Frederick, Maryland; Boston, Massachusetts; Olathe, Kansas; New Orleans,Louisiana; Fremont, California; and Bellingham, Washington). The corpusincluded a mix of men and women, both White and African American, from arange of different age groups, language backgrounds, and social classes. Theirresults suggested that location variation is a classic sociolinguistic variable,influenced by the sex, social class, age, ethnicity, and regional origin of thesigner, as well as by the grammatical function (i.e., noun, verb, adjective,preposition, or interrogative) and immediate phonological environment of thetarget sign (e.g., the location of the preceding sign). We explore the ASLfindings in more detail in the following discussion.
The Auslan and NZSL studies had two main aims. First, we wished to improveour understanding of the linguistic and social influences on phonological variationwithin each language. In particular, we wish to know whether location variation inthe class of signs exemplified by THINK, NAME, and CLEVER is random, or if theimmediate phonological environment is an important influence, as suggested byJohnston (1989). We are also interested in examining what other linguistic andsocial factors may influence this variation.
Second, replication of the ASL study enabled a cross-linguistic comparison oflocation variation in Auslan, NZSL, and ASL to determine whether locationvariation is indeed systematic and if it is subject to the same kind of social andlinguistic constraints in all three signed languages. The results of thiscomparison will enable to us to begin to develop hypotheses about the kinds offactors involved in phonological variation in signed languages (e.g., we mightexpect variation in more closely related signed varieties such as Auslan andNZSL to behave in a more similar way than that found in unrelated signedlanguages, such as Auslan and ASL), and how these compare with those foundin spoken languages.
M E T H O D O LO GY
As in the previous work on ASL (Lucas et al., 2002), we chose to undertakemultivariate analysis of the data using VARBRUL software (for an overview, seeTagliamonte, 2006). Two key principles that guide such research are theprinciple of quantitative modeling and the principle of multiple causes (Young& Bayley, 1996). The first principle refers to the need to carefully quantify bothvariation in a linguistic form and the relationship between a variant form andfeatures of its surrounding linguistic environment and social context. The secondprinciple reflects the assumption that no single linguistic or social factor canfully explain variation in natural language use.
We discuss the target signs for our investigation in the next section and outlinethe social and linguistic factors that are the focus of our study in our discussion ofsites, participants, data collection, and coding.
T H E LO CAT I O N VA R I A B L E 199

Target signs
Our data involved the coding of all examples of target signs found in our data, albeitwith an upper limit of 15–20 tokens from each participant (see Table 1 for a completelisting of all NZSL target signs and Table 2 for Auslan target signs). In all cases, thetarget signs were lexical items made in citation form at locations in contact with or inproximity to the forehead region or above, but were believed to vary in location.5 Thevariant forms of these signs (e.g., the two forms of NAME shown in Figures 2 and 3)clearly have the same referential meaning as the citation form and may be consideredtwoways of saying the same thing. Thismakes them an appropriate variable for studyusing VARBRUL analysis (Bayley, 2002).
The target signs in the NZSL and Auslan study substantially overlapped witheach other (due to a high degree of lexical similarity), but differed slightly incriteria from target signs in the ASL study in two ways (Lucas et al., 2002).First, we did not include signs that were made in citation form at locations lowerthan the forehead region. The signs investigated by Lucas and her colleaguesincluded, for example, ASL SEE (which moves forward from near the eye) andLOUSY (which moves down from the nose). Second, we also did not includelexicalized compound signs in which the second component was made at alocation lower than the forehead. Target signs in the ASL research included ASLBELIEVE and REMEMBER (in both these signs, the dominant hand moves down froma forehead location to make contact with the subordinate hand). This resulted ina set of signs in Auslan and NZSL that were more homogeneous in terms oflocation than the set of signs in the Lucas et al. (2002) study.
Sites
As we already mentioned, regional lexical variants in the Auslan and NZSL lexiconshave been documented but little is known about the relationship betweenphonological variation and region. We believed that regional influences may havean impact on location in variation in Auslan and NZSL, as has been found in ASL(Lucas et al., 2002). Previously unrecognized regional influences also appear to beat work in phonological variation in Australian and New Zealand English (e.g.,Horvath & Horvath, 2002). To obtain a representative sample of signed languageuse, it was necessary to collect data in a number of different sites across eachcountry. In Australia, we selected five communities: Adelaide, Brisbane,Melbourne, Sydney, and Perth. Over half of the entire population of Australia livesin these five state capitals, and demographic studies suggest a similarly largeproportion of the Australian deaf community can be found in these cities (Hyde &Power, 1991). These five urban areas are spread across the major regions of thecountry (Adelaide is in the central part of the south coast of the continent, Perth ison the west coast, and Brisbane, Sydney, and Melbourne cover the northern andsouthern parts of the relatively densely populated east coast). These cities are alsohome to the longest-established deaf communities, having traditionally been thesites of residential schools for deaf children (all of which were founded in thenineteenth century, Carty, 2004). Another reason we chose to collect data in these
200 A DAM S C H EMB R I E T A L .

TABLE 1. Target signs in NZSL data
Target signtypes
Number of tokensin database
% of tokens indatabase # þcf % þcf
Ranking inWCNZSL
1. THINK 388 18.4% 233 60.1% 232. KNOW 317 15.0% 168 53.0% 273. NOT-KNOW 146 6.9% 63 43.2% 884. REMEMBER 132 6.2% 68 51.5% 935. NAME 126 6.0% 94 74.6% 1086. MOTHER 112 5.3% 92 82.1% 467. UNDERSTAND 98 4.6% 30 30.6% 908. WONDER 65 3.1% 23 35.4% 1559. LEARN 61 2.9% 32 52.5% 92
10. MOTHER-1 61 2.9% 31 50.8% na11. FORGET 56 2.6% 23 41.1% 19212. KEEN 45 2.1% 40 88.9% na13. IDEA 38 1.8% 22 57.9% 58714. GO-OVER-HEAD 28 1.3% 5 17.9% 29115. GIRL 27 1.3% 6 22.2% 23116. STUPID 26 1.2% 16 61.5% 93217. FORGET-FLAT 25 1.2% 11 44.0% na18. WORRY-1 23 1.1% 14 60.9% 43719. COME-TO-MIND 22 1.0% 14 63.6% na20. DAD 21 1.0% 17 81.0% na21. SHOWER 20 .9% 14 70.0% 57222. KNOW-NOTHING 19 .9% 16 84.2% 47323. SILLY 17 .8% 16 94.1% 37624. MIND 14 .7% 13 92.9% 27425. LEARNER 14 .7% 11 78.6% 81326. NETBALL 13 .6% 8 61.5% 84427. CLEVER 12 .6% 6 50.0% na28. SUMMER 12 .6% 4 33.3% na29. COMMITTEE 10 .5% 8 80.0% 67830. FAMOUS 10 .5% 5 50.0% 63331. GERMANY 9 .4% 6 66.7% na32. NURSE 9 .4% 6 66.7% 78233. INDIA 9 .4% 9 100.0% na34. COW 8 .4% 4 50.0% 86735. ROYAL 8 .4% 6 75.0% na36. YELLOW 8 .4% 3 37.5% na37. BRIGHT 6 .3% 6 100.0% na38. DREAM 6 .3% 4 66.7% na39. MEMBER 6 .3% 6 100.0% na40. SUN 6 .3% 5 83.3% 102841. TRAIN 6 .3% 3 50.0% 76442. CHANGE-MIND 5 .2% 3 60.0% na43. SENSIBLE 5 .2% 4 80.0% na44. THINK-ABOUT 5 .2% 2 40.0% na45. COME-ON 4 .2% 3 75.0% na46. DESIRE 4 .2% 3 75.0% na47. EXPERIENCE 4 .2% 4 100.0% 29448. CAPTAIN 3 .1% 1 33.3% 98649. HEADACHE 3 .1% 3 100.0% na50. BLONDE 2 .1% 0 0.0% na51. CRAZY 2 .1% 2 100.0% na52. TAXI 2 .1% 2 100.0% na
Continued
T H E LO CAT I O N VA R I A B L E 201
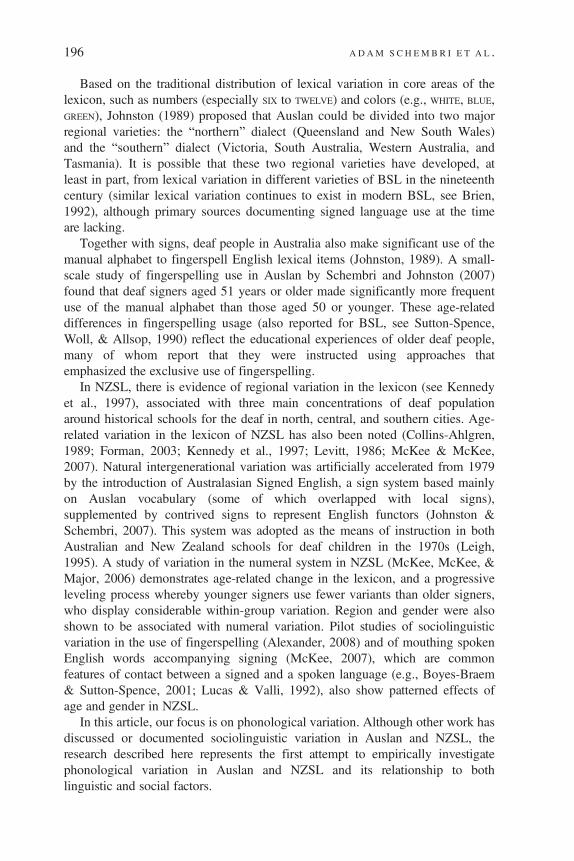
five urban areas relates to the size of the deaf communities in these cities. We felt itwould be much easier to obtain sufficient numbers of participants from a variety ofbackgrounds in each city because deaf communities outside these areas of Australiaare often particularly small. All data were collected between June 2003 andNovember 2004.
TheDictionary of New Zealand Sign Language (Kennedy et al., 1997) identifiesvariants with three major regions—Auckland, Wellington, and Christchurch—andin this study, we likewise focus on three regions that host the largest deafcommunities, although data were collected from deaf residents in five actualsites—Auckland (north region), Hawkes Bay, Palmerston North, Wellington(central region), and Christchurch (south region). Nearly two-thirds of the NewZealand population live in these five urban areas, and deaf schools weretraditionally located in Auckland, Palmerston North, and Christchurch. For thepurpose of analysis, we collapsed three sites into one central region (HawkesBay, Palmerston North, and Wellington) because they are in close proximity andassociate with each other regionally, and many residents attended the same deafschools. Data were collected between December 2005 and August 2006.
Participants
A total of 211 deaf Australians and 150 deaf New Zealanders were filmed. As inprevious work on ASL (Lucas et al., 2002), we used a judgment sample (i.e., weselected participants to fill preselected social categories) rather than a randomsample of the deaf population (for an overview of samples, see Tables 3 and 4).
TABLE 1. Continued
Target signtypes
Number of tokensin database
% of tokens indatabase # þcf % þcf
Ranking inWCNZSL
53. TALL 2 .1% 1 50.0% 60054. MEMORY 2 .1% 0 0.0% na55. FORGET-ABOUT-IT 1 ,.1% 1 100.0% na56. GULLIBLE 1 ,.1% 1 100.0% na57. HAIR 1 ,.1% 0 0.0% 87558. HEAD 1 ,.1% 1 100.0% 38059. IMAGINE 1 ,.1% 1 100.0% na60. MAKE-UP 1 ,.1% 0 0.0% na61. PUT-IN-MIND 1 ,.1% 1 100.0% na62. REMIND 1 ,.1% 0 0.0% na63. RESPECT 1 ,.1% 1 100.0% na64. SUSPECT 1 ,.1% 1 100.0% na65. SWITCH-OFF 1 ,.1% 1 100.0% na66. WILD 1 ,.1% 1 100.0% na67. WORRY-2 1 ,.1% 1 100.0% na68. WRONG-MIND 1 ,.1% 1 100.0% na
Total 2096
202 A DAM S C H EMB R I E T A L .

TABLE 2. Target signs in Auslan data
Target sign typesNumber of tokens
in database% of tokensin database # þcf % þcf
1. THINK 469 17.6% 285 60.8%2. KNOW 416 15.6% 184 44.2%3. NOT-KNOW 276 10.4% 145 52.5%4. MOTHER 178 6.7% 139 78.1%5. NAME 166 6.2% 112 67.5%6. REMEMBER-1 153 5.7% 58 37.9%7. FORGET 99 3.7% 36 36.4%8. UNDERSTAND 93 3.5% 35 37.6%9. TRAIN 73 2.8% 20 27.4%
10. BE-CALLED 72 2.8% 25 34.7%11. WONDER 61 2.3% 21 34.4%12. WORRY 40 1.5% 22 55.0%13. TENNIS 28 1.1% 15 53.6%14. MIND 25 .9% 23 92.0%15. DETERMINED 24 .9% 23 95.8%16. STUPID 24 .9% 8 33.3%17. NETBALL 23 .9% 2 8.7%18. CLEVER 20 .8% 12 60.0%19. DREAM 20 .8% 12 60.0%20. REMEMBER-2 20 .8% 18 90.0%21. SOCCER 20 .8% 16 80.0%22. GIRL 19 .7% 17 89.5%23. LEARN/PICK-UP 18 .7% 8 44.4%24. COME-TO-MIND 15 .6% 13 86.7%25. GERMANY 15 .6% 11 73.3%26. TALL 14 .5% 12 85.7%27. IDEA 14 .5% 13 92.9%28. SHOWER 12 .5% 8 66.7%29. YELLOW 12 .5% 9 75.0%30. SOPHISTICATED 11 .4% 10 90.9%31. SILLY 11 .4% 10 90.9%32. SLIP-MY-MIND 11 .4% 3 27.3%33. COMMITTEE 10 .4% 7 70.0%34. CRAZY 10 .4% 10 100.0%35. LEARN 10 .4% 4 40.0%36. LEARNER 10 .4% 6 60.0%37. GREEN 9 .3% 4 44.4%38. UNAWARE 9 .3% 8 88.9%39. FURIOUS 8 .3% 8 100.0%40. AIM 7 .3% 6 85.7%41. CREATE 7 .3% 5 71.4%42. SUN 7 .3% 3 42.9%43. HAIRCUT 6 .2% 1 16.7%44. CHANGE-MIND 6 .2% 4 66.7%45. HELLO 6 .2% 6 100.0%46. RELIEF 6 .2% 4 66.7%47. SUMMON 6 .2% 5 83.3%48. BLONDE 5 .2% 2 40.0%49. DONKEY 5 .2% 3 60.0%50. HAIR 5 .2% 3 60.0%51. IMAGINE 5 .2% 3 60.0%52. VISUALISE 5 .2% 4 80.0%
Continued
T H E LO CAT I O N VA R I A B L E 203

Thus, this number included deaf signers from a variety of backgrounds, with therequirement that all participants had been exposed to signed communicationbefore 12 years of age (over 95% of our Australian and 91% of our NewZealand participants reported that they had first began to sign by seven years ofage). We selected in each site both deaf people who had deaf parents (i.e., thosewho had learned to sign in the home, from birth), as well as deaf people whohad hearing parents (e.g., those who learned signed language from their peers atschool). Note that only 6.5% of the NZSL participants are native signers
TABLE 2. Continued
Target sign typesNumber of tokens
in database% of tokensin database # þcf % þcf
53. NURSE 4 .2% 3 75.0%54. QUEEN 4 .2% 4 100.0%55. SENSIBLE 4 .2% 4 100.0%56. KEEN 3 .1% 2 66.7%57. BOSS 3 .1% 3 100.0%58. BRAINY 3 .1% 2 66.7%59. COW 3 .1% 2 66.7%60. FAMOUS 3 .1% 3 100.0%61. FIREFIGHTER 3 .1% 1 33.3%62. FOUND-OUT 3 .1% 3 100.0%63. GO-OVER-ONE’S-HEAD 3 .1% 2 66.7%64. RABBIT 3 .1% 3 100.0%65. THINK-ABOUT 3 .1% 1 33.3%66. CELEBRATE 2 .1% 1 50.0%67. BALD 2 .1% 2 100.0%68. CAPTAIN 2 .1% 2 100.0%69. CHRISTEN 2 .1% 2 100.0%70. GUESS 2 .1% 2 100.0%71. HAT 2 .1% 2 100.0%72. KNOW-NOTHING 2 .1% 2 100.0%73. LEARN-ONE’S-LESSON 2 .1% 2 100.0%74. LIFESAVER 2 .1% 0 0.0%75. PRIZE 2 .1% 2 100.0%76. RABBIT 2 .1% 2 100.0%77. SCOUT 2 .1% 2 100.0%78. BRAIN-GROW 1 ,.1% 1 100.0%79. CHRISTIAN 1 ,.1% 0 0.0%80. CONCEPT 1 ,.1% 1 100.0%81. HAVE-IN-MIND 1 ,.1% 1 100.0%82. HEADACHE 1 ,.1% 1 100.0%83. HOT 1 ,.1% 1 100.0%84. INVENT 1 ,.1% 1 100.0%85. PHILOSOPHY 1 ,.1% 0 0.0%86. POLITICS 1 ,.1% 1 100.0%87. SUSPECT 1 ,.1% 1 100.0%88. TIPSY 1 ,.1% 1 100.0%89. WEIRD 1 ,.1% 0 0.0%90. WILD 1 ,.1% 0 0.0%
Total 2667
204 A DAM S C H EMB R I E T A L .
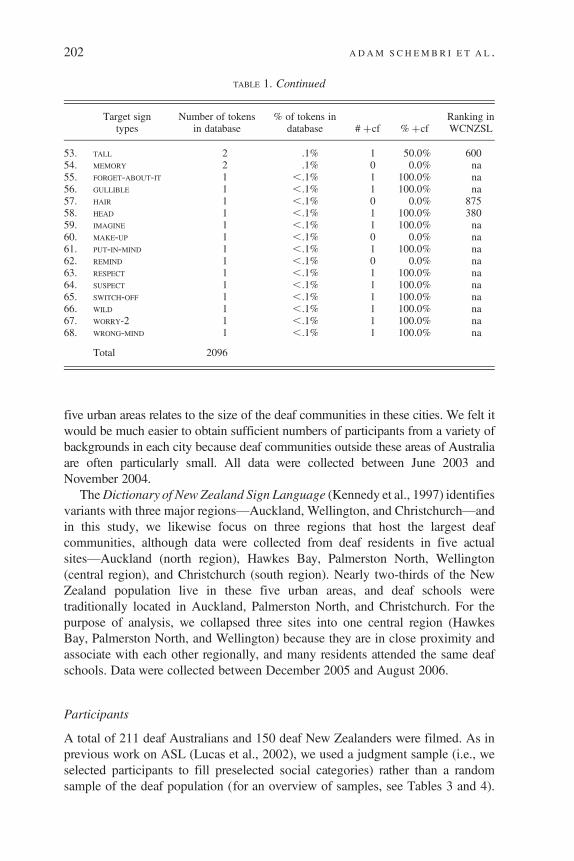
TABLE 3. Participants (Auslan)
Age Sex Social classLanguagebackground
Site Total Younger (,51) Older (.51) Female Male Working class Middle class Auslan Other
Adelaide 44 23 21 20 24 38 6 15 29Brisbane 38 17 21 21 17 30 8 9 29Melbourne 42 26 16 24 18 28 14 14 28Sydney 46 31 15 26 20 37 9 23 23Perth 35 21 14 17 18 28 7 9 26
Total 205 118 87 108 97 161 44 70 135
THE
LOCATIO
NVARIA
BLE
205

TABLE 4. Participants (NZSL)
Age Sex NZSL acquisition Ethnicity
Region Total 15–39 40–64 65þ Female Male Native ,7 yr ,12 yr Pakeha Maori
North 41 16 14 11 26 15 3 33 5 35 6Central 63 25 25 13 34 29 2 57 4 52 11South 34 10 12 12 18 16 4 27 3 33 1
Total 138 51 51 36 78 60 9 117 12 120 18
206ADAM
SCHEM
BRIET
AL.

compared with 34% in the Australian study. Like Lucas et al. (2002), we did notrecruit hearing signers (native or otherwise), nor those deaf people who acquiredAuslan or NZSL later in life, either as a significantly delayed first language or asa second language after the successful acquisition of English. This was done tominimize the possible effects on our data of English influence in the signedlanguage use of hearing native signers and deaf second-language learners (Lucas& Valli, 1992), or of late first-language acquisition in deaf late learners ofAuslan and NZSL (for an overview of research on late signers of ASL, seeEmmorey, 2002).
To ensure we filmed individuals who were representative of each region, weattempted to focus our recruitment of participants on long-term residents of eachcity and/or region. For example, slightly more than 90% (n = 194) of ourAustralian participants had lived 10 years or more in their local deafcommunities (i.e., just under 10% had moved to the city in which they werefilmed in the last 10 years), and just over 80% (n = 171) were lifelong residents.Similarly, in New Zealand, each participant’s region was identified by wherethey had lived for the preceding 10 years. Participants who had livedcontinuously in a smaller town or city outside the data collection site werecategorized in the closest of the three major regional centers. Exceptions to thiswere made for individuals who had spent most of their formative and adult yearsin the location of another large deaf community and moved recently to a smallertown without a sizable signing community, in which case they were identifiedby their original region. In fact, there are equally good ethnographic reasons forclassifying deaf people’s regional linguistic affiliation according to the locationof the deaf school they attended, which is for the majority of our participants,the primary site of enculturation into a deaf community and acquisition of signedlanguage. However, for comparability with the ASL study methodology, wedetermined region by the current place of longstanding residence.
Our samples included similar numbers of men and women, as well as a mix ofyounger and older age groups, and people from both middle-class and working-class backgrounds. We did not, however, select Australian participants on thebasis of ethnicity, a social factor that has been shown to be relevant in ASL(Lucas et al., 2001) and in sociolinguistic variation in spoken languages(Fought, 2002). The ethnic composition of the Australian deaf community isunknown, and it is difficult to obtain information about the incidence ofdeafness in the immigrant population. The general Australian population isapproximately 91% of European origin, with 7% of the population of Asianorigin (mainly from East Asia and the Middle East), and another 2% ofAboriginal or Torres Straight Islander background. In the 2001 Census,approximately 28% of the Australian population was born overseas, and 20%used a language other than English in the home. Other than the Anglo-Celticmajority, however, no single ethnic group is predominant, neither in thegeneral population nor in the deaf community. Given this, and the fact that theeducation of deaf children has never been segregated on the basis of race(unlike the situation in the U.S., see Lucas et al., 2001) and there are no deaf
T H E LO CAT I O N VA R I A B L E 207

clubs or associations based on ethnicity in Australia, there does not appear to bemuch evidence of systematic ethnic variation in Auslan.
Ethnicity was a variable we considered in the NZSL project, with the ethniccomposition of the NZSL sample being 13% Māori (indigenous Polynesian),and 87% Pakeha (European origin) and others; this is similar to the overall NewZealand population in which Māori make up approximately 15% (Statistics NewZealand, 2001). Māori and Pakeha deaf children have historically attendedschools together, and their social networks are strongly interconnected,providing little empirical reason to expect linguistic variation. Current localinterest in the construct of Māori deaf identity (Smiler, 2004) and its potentialmanifestation in the use of NZSL (McKee, McKee, Smiler, & Pointon, 2007), aswell as the ASL findings on ethnic variation, prompted us to include this as avariable in the study.
Sex or gender are among the most widely used social categories insociolinguistic research (Cheshire, 2002) and have been shown to play a role insociolinguistic variation in ASL (Lucas et al., 2001). As a result, we recruitedboth men and women for our study, although we were more successful atattracting female participants. As a result, both our Australian and New Zealanddata overall have a higher number of deaf women than men (97 men and 108women for Auslan; 60 men versus 78 women for NZSL).
Australian participants were recruited in four different age groups: (1) 15–30years, (2) 31–50 years, (3) 51–70 years, and (4) 71 years or older. Three agegroups were used to recruit New Zealand participants: (1) 15–39 years, (2)40–64 years, and (3) 65 years or over. Our age categories reflect two possibleinfluences on phonological variation in Auslan and NZSL. First, age-relatedvariation in language is well-documented for both spoken languages (Bailey,2002) and signed languages (e.g., Lucas et al., 2001; Sutton-Spence, Woll, &Allsop, 1990). Often this age-related variation at any point in time reflects alanguage change in progress (Labov, 1994). Second, the specific agegroupings were intended to reflect changes in language policy in the educationof deaf children during the twentieth century (similar changes have occurredin the U.S., see Lucas et al., 2001). Participants in the oldest age groups weremost likely to have been educated in residential schools for deaf children,often with approaches that emphasized the use of fingerspelling (in Australia)or oralism6 (in New Zealand). Signed language may have been used by schoolchildren with each other in the dormitories and in the playground, and someinstruction in some Australian schools would also have been by some meansof signed communication (Johnston, 1989). There are observable differencesbetween the NZSL of this older group and younger signers. For example, theolder signers exhibit a greater reliance on English word patterns on the mouth(McKee, 2007) and little use of a conventional manual alphabet (Alexander,2008; Forman, 2003).
Like the older group, Australian participants in the 51–70 years category wouldhave been educated in centralized schools for deaf children, although many wouldhave experienced the shift to oralism that occurred in a number of schools after the
208 A DAM S C H EMB R I E T A L .
SecondWorldWar. Those in the 31–50 years category would havewitnessedmajorchanges in deaf education: the greater use of assistive technology (e.g., hearingaids) and oralism, the move toward Total Communication7 and the use ofAustralasian Signed English, the closure of centralized schools for deaf childrenand the spread of mainstreaming (i.e., integrating deaf children into schools withhearing children).
New Zealand participants over the age of 40 were nearly all educated inresidential schools or deaf unit classes that used oralist teaching methods, butwhich also furnished sizeable communities of signing peers outside theclassroom. This generation’s signed language use was also potentially influencedby their adult exposure to the Australasian Signed English of younger deafpeople and to increasing contact with signed language users of other countriesthrough international travel and deaf immigration into the NZSL community.
Participants in the youngest group (15–30 years of age in Australia and 15–39 inNew Zealand) have seen the increasing recognition of their national signedlanguages by government, but many would have been educated in mainstreamsettings by teachers using Australasian Signed English. Some of the youngestmembers of this group would have been educated in bilingual schools usingAuslan or NZSL as the medium of instruction.
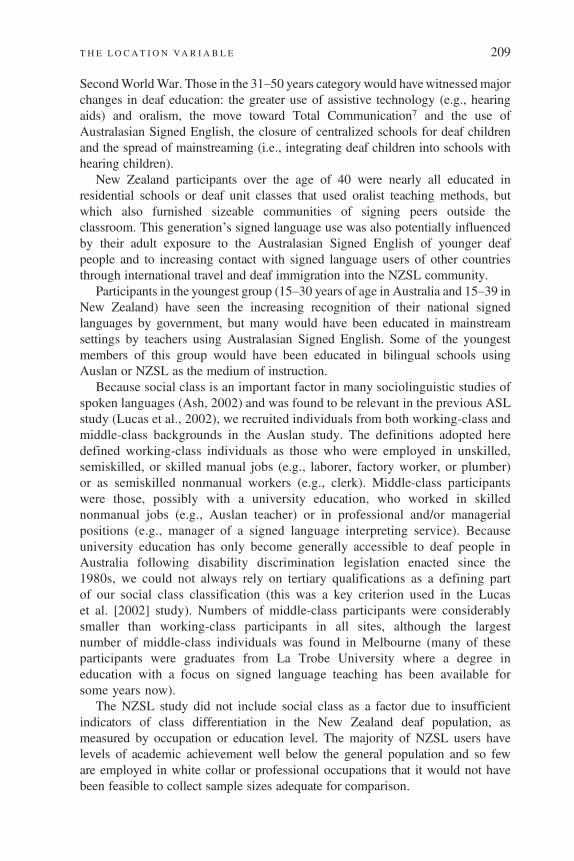
Because social class is an important factor in many sociolinguistic studies ofspoken languages (Ash, 2002) and was found to be relevant in the previous ASLstudy (Lucas et al., 2002), we recruited individuals from both working-class andmiddle-class backgrounds in the Auslan study. The definitions adopted heredefined working-class individuals as those who were employed in unskilled,semiskilled, or skilled manual jobs (e.g., laborer, factory worker, or plumber)or as semiskilled nonmanual workers (e.g., clerk). Middle-class participantswere those, possibly with a university education, who worked in skillednonmanual jobs (e.g., Auslan teacher) or in professional and/or managerialpositions (e.g., manager of a signed language interpreting service). Becauseuniversity education has only become generally accessible to deaf people inAustralia following disability discrimination legislation enacted since the1980s, we could not always rely on tertiary qualifications as a defining partof our social class classification (this was a key criterion used in the Lucaset al. [2002] study). Numbers of middle-class participants were considerablysmaller than working-class participants in all sites, although the largestnumber of middle-class individuals was found in Melbourne (many of theseparticipants were graduates from La Trobe University where a degree ineducation with a focus on signed language teaching has been available forsome years now).
The NZSL study did not include social class as a factor due to insufficientindicators of class differentiation in the New Zealand deaf population, asmeasured by occupation or education level. The majority of NZSL users havelevels of academic achievement well below the general population and so feware employed in white collar or professional occupations that it would not havebeen feasible to collect sample sizes adequate for comparison.
T H E LO CAT I O N VA R I A B L E 209
Data collection
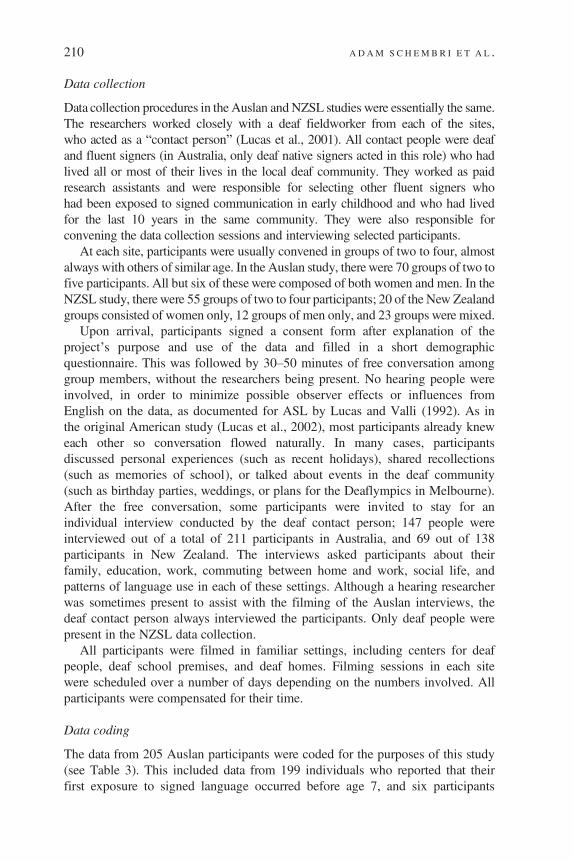
Data collection procedures in the Auslan andNZSL studies were essentially the same.The researchers worked closely with a deaf fieldworker from each of the sites,who acted as a “contact person” (Lucas et al., 2001). All contact people were deafand fluent signers (in Australia, only deaf native signers acted in this role) who hadlived all or most of their lives in the local deaf community. They worked as paidresearch assistants and were responsible for selecting other fluent signers whohad been exposed to signed communication in early childhood and who had livedfor the last 10 years in the same community. They were also responsible forconvening the data collection sessions and interviewing selected participants.
At each site, participants were usually convened in groups of two to four, almostalways with others of similar age. In the Auslan study, there were 70 groups of two tofive participants. All but six of these were composed of both women and men. In theNZSL study, there were 55 groups of two to four participants; 20 of the New Zealandgroups consisted of women only, 12 groups of men only, and 23 groups were mixed.
Upon arrival, participants signed a consent form after explanation of theproject’s purpose and use of the data and filled in a short demographicquestionnaire. This was followed by 30–50 minutes of free conversation amonggroup members, without the researchers being present. No hearing people wereinvolved, in order to minimize possible observer effects or influences fromEnglish on the data, as documented for ASL by Lucas and Valli (1992). As inthe original American study (Lucas et al., 2002), most participants already kneweach other so conversation flowed naturally. In many cases, participantsdiscussed personal experiences (such as recent holidays), shared recollections(such as memories of school), or talked about events in the deaf community(such as birthday parties, weddings, or plans for the Deaflympics in Melbourne).After the free conversation, some participants were invited to stay for anindividual interview conducted by the deaf contact person; 147 people wereinterviewed out of a total of 211 participants in Australia, and 69 out of 138participants in New Zealand. The interviews asked participants about theirfamily, education, work, commuting between home and work, social life, andpatterns of language use in each of these settings. Although a hearing researcherwas sometimes present to assist with the filming of the Auslan interviews, thedeaf contact person always interviewed the participants. Only deaf people werepresent in the NZSL data collection.
All participants were filmed in familiar settings, including centers for deafpeople, deaf school premises, and deaf homes. Filming sessions in each sitewere scheduled over a number of days depending on the numbers involved. Allparticipants were compensated for their time.
Data coding
The data from 205 Auslan participants were coded for the purposes of this study(see Table 3). This included data from 199 individuals who reported that theirfirst exposure to signed language occurred before age 7, and six participants
210 A D AM S C H EMB R I E T A L .
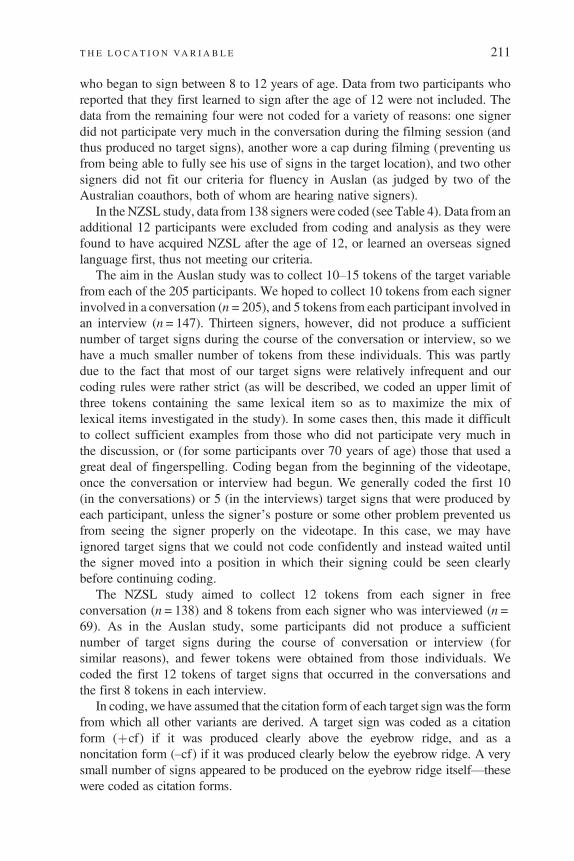
who began to sign between 8 to 12 years of age. Data from two participants whoreported that they first learned to sign after the age of 12 were not included. Thedata from the remaining four were not coded for a variety of reasons: one signerdid not participate very much in the conversation during the filming session (andthus produced no target signs), another wore a cap during filming (preventing usfrom being able to fully see his use of signs in the target location), and two othersigners did not fit our criteria for fluency in Auslan (as judged by two of theAustralian coauthors, both of whom are hearing native signers).
In the NZSL study, data from 138 signers were coded (see Table 4). Data from anadditional 12 participants were excluded from coding and analysis as they werefound to have acquired NZSL after the age of 12, or learned an overseas signedlanguage first, thus not meeting our criteria.
The aim in the Auslan study was to collect 10–15 tokens of the target variablefrom each of the 205 participants. We hoped to collect 10 tokens from each signerinvolved in a conversation (n = 205), and 5 tokens from each participant involved inan interview (n = 147). Thirteen signers, however, did not produce a sufficientnumber of target signs during the course of the conversation or interview, so wehave a much smaller number of tokens from these individuals. This was partlydue to the fact that most of our target signs were relatively infrequent and ourcoding rules were rather strict (as will be described, we coded an upper limit ofthree tokens containing the same lexical item so as to maximize the mix oflexical items investigated in the study). In some cases then, this made it difficultto collect sufficient examples from those who did not participate very much inthe discussion, or (for some participants over 70 years of age) those that used agreat deal of fingerspelling. Coding began from the beginning of the videotape,once the conversation or interview had begun. We generally coded the first 10(in the conversations) or 5 (in the interviews) target signs that were produced byeach participant, unless the signer’s posture or some other problem prevented usfrom seeing the signer properly on the videotape. In this case, we may haveignored target signs that we could not code confidently and instead waited untilthe signer moved into a position in which their signing could be seen clearlybefore continuing coding.
The NZSL study aimed to collect 12 tokens from each signer in freeconversation (n = 138) and 8 tokens from each signer who was interviewed (n =69). As in the Auslan study, some participants did not produce a sufficientnumber of target signs during the course of conversation or interview (forsimilar reasons), and fewer tokens were obtained from those individuals. Wecoded the first 12 tokens of target signs that occurred in the conversations andthe first 8 tokens in each interview.
In coding, we have assumed that the citation form of each target sign was the formfrom which all other variants are derived. A target sign was coded as a citationform (þcf) if it was produced clearly above the eyebrow ridge, and as anoncitation form (–cf) if it was produced clearly below the eyebrow ridge. A verysmall number of signs appeared to be produced on the eyebrow ridge itself—thesewere coded as citation forms.
T H E LO CAT I O N VA R I A B L E 211

Many target signs appeared in double-handed form in which the dominant andsubordinate hand have the same handshape and location and have identical orsymmetrical forms of movement. If the dominant hand was at a location abovethe eyebrow ridge, but the subordinate hand was not, the sign was coded as acitation form. Double-handed variants of the target signs were coded asnoncitation forms only if neither hand was in contact with or in proximity tolocations at or above the eyebrow ridge.
To reduce possible lexical effects associated with particular signs, we set a limiton the number of tokens coded with the same lexical item (an upper limit of threetokens with the same lexical item in the conversational data, and two in theinterview data). This was necessary because a small number of target signsoccurred much more frequently than the others in our dataset (e.g., just 10 signs—THINK, KNOW, NOT-KNOW, MOTHER, NAME, REMEMBER, FORGET, UNDERSTAND, TRAIN, andBE-CALLED—account for over 77% of all tokens in the Auslan database), and itwould have been very easy for the entire study to have been entirely based on datafrom a handful of very common lexical items.
Research has suggested that word frequency may be implicated inphonological variation and change (Bybee, 2002; Phillips, 1984), becausefrequent lexical items are known to behave differently than less frequent ones(although note that this is not true of all sound changes, see Labov, 2006). Forexample, highly frequent lexical items in English are produced with a 20%shorter duration than less frequent words in conversation (Bell, Gregory,Brenier, Jurafsky, Ikeno, & Girand, 2002). Duration is in turn associated withan increased likelihood of the reduction or assimilation of speech sounds(Thomas, 2002). Thus, it appears that high frequency words may undergogreater phonological reduction than low frequency words, and this reducedarticulatory effort may be part of a sound change in progress (Bybee, 2002;Dinkin, 2007; Phillips, 1984).
Table 1 shows the frequency ranking of the entire 68 target signs in the NZSLvariation dataset, and their distribution as citation and noncitation forms in our data.The top 10 most frequent target signs shown in Table 1 accounted for over 71% ofall tokens coded in the NZSL data analyzed here. Of the 10 most frequent signs inour NZSL data, 7 are verbs and 3 are nouns (including 2 variants of the lexical itemMOTHER).
Because it is possible that high frequency signs are also produced with shorterdurations and a greater tendency for reduction and assimilation, we opted to testfor the effects of frequent lexical items by coding for high frequency versus lowfrequency lexical items in our data. We coded as “high frequency” items those top10 most frequent lexical items in the NZSL dataset of 2096 tokens (i.e., the NZSLsigns THINK, KNOW, NOT-KNOW, REMEMBER, NAME, MOTHER, UNDERSTAND, WONDER,LEARN, MOTHER-1), and a similar set of 10 most frequent lexical items in theAuslan dataset of 2667 tokens (i.e., the Auslan signs THINK, KNOW, NOT-KNOW,MOTHER, NAME, REMEMBER, FORGET, UNDERSTAND, TRAIN, and BE-CALLED in Table 2).
Note that, although we are using token frequency in our data as the basis for thiscategorization, this coding decision is also supported by the frequency ranking of
212 A DAM S C H EMB R I E T A L .
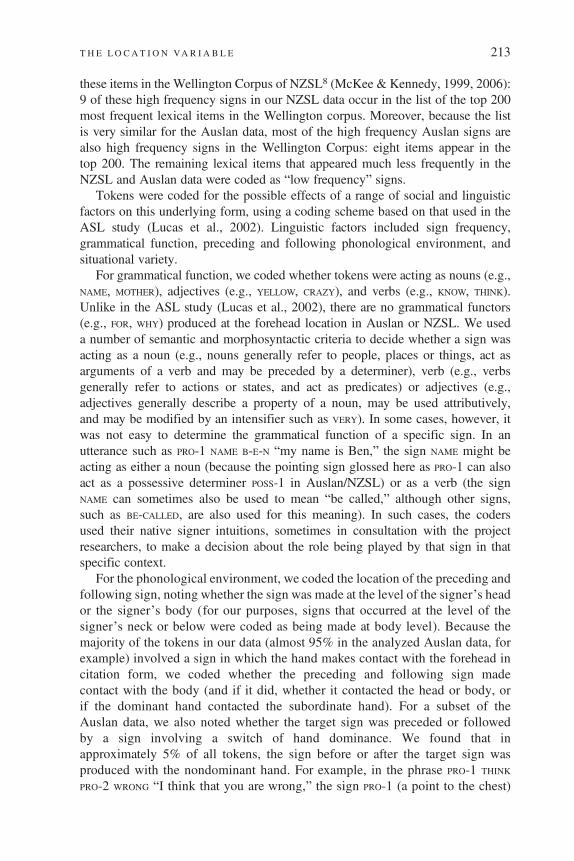
these items in the Wellington Corpus of NZSL8 (McKee & Kennedy, 1999, 2006):9 of these high frequency signs in our NZSL data occur in the list of the top 200most frequent lexical items in the Wellington corpus. Moreover, because the listis very similar for the Auslan data, most of the high frequency Auslan signs arealso high frequency signs in the Wellington Corpus: eight items appear in thetop 200. The remaining lexical items that appeared much less frequently in theNZSL and Auslan data were coded as “low frequency” signs.
Tokens were coded for the possible effects of a range of social and linguisticfactors on this underlying form, using a coding scheme based on that used in theASL study (Lucas et al., 2002). Linguistic factors included sign frequency,grammatical function, preceding and following phonological environment, andsituational variety.
For grammatical function, we coded whether tokens were acting as nouns (e.g.,NAME, MOTHER), adjectives (e.g., YELLOW, CRAZY), and verbs (e.g., KNOW, THINK).Unlike in the ASL study (Lucas et al., 2002), there are no grammatical functors(e.g., FOR, WHY) produced at the forehead location in Auslan or NZSL. We useda number of semantic and morphosyntactic criteria to decide whether a sign wasacting as a noun (e.g., nouns generally refer to people, places or things, act asarguments of a verb and may be preceded by a determiner), verb (e.g., verbsgenerally refer to actions or states, and act as predicates) or adjectives (e.g.,adjectives generally describe a property of a noun, may be used attributively,and may be modified by an intensifier such as VERY). In some cases, however, itwas not easy to determine the grammatical function of a specific sign. In anutterance such as PRO-1 NAME B-E-N “my name is Ben,” the sign NAME might beacting as either a noun (because the pointing sign glossed here as PRO-1 can alsoact as a possessive determiner POSS-1 in Auslan/NZSL) or as a verb (the signNAME can sometimes also be used to mean “be called,” although other signs,such as BE-CALLED, are also used for this meaning). In such cases, the codersused their native signer intuitions, sometimes in consultation with the projectresearchers, to make a decision about the role being played by that sign in thatspecific context.
For the phonological environment, we coded the location of the preceding andfollowing sign, noting whether the sign was made at the level of the signer’s heador the signer’s body (for our purposes, signs that occurred at the level of thesigner’s neck or below were coded as being made at body level). Because themajority of the tokens in our data (almost 95% in the analyzed Auslan data, forexample) involved a sign in which the hand makes contact with the forehead incitation form, we coded whether the preceding and following sign madecontact with the body (and if it did, whether it contacted the head or body, orif the dominant hand contacted the subordinate hand). For a subset of theAuslan data, we also noted whether the target sign was preceded or followedby a sign involving a switch of hand dominance. We found that inapproximately 5% of all tokens, the sign before or after the target sign wasproduced with the nondominant hand. For example, in the phrase PRO-1 THINK
PRO-2 WRONG “I think that you are wrong,” the sign PRO-1 (a point to the chest)
T H E LO CAT I O N VA R I A B L E 213

was produced by one signer with the left hand while the rest of the string wasproduced by the signer’s right hand. We reasoned that because THINK is thefirst sign in the string being produced on the right hand, the location of thesign PRO-1 on the left hand may have less effect on the location of target sign.Thus, both studies coded for hand dominance switching as an aspect of thephonological environment in case it turned out to be relevant for ourunderstanding of location variation.
We also coded whether the target sign was preceded or followed immediately byanother sign, or whether there was a pause before or after it. This was originallycoded together with location and contact features of the preceding or followingsign, but (following the reasoning adopted by Lucas et al., 2002) we created aseparate factor group to code whether a sign or a pause preceded or followed thetarget sign. Pauses in the location and contact factor groups were then coded asnot applicable, whereas signs were coded for location and contact. In codingpauses, we grouped together whether the target sign occurred at the beginning orthe end of a turn (in which case, the hands moved from or toward their restingposition on the signer’s lap or on the arm of the chair) or whether the sign waspreceded or followed by a discernible hold (i.e., there was a complete stop in theflow of signing). We reasoned that both beginning or resuming motion wouldinvolve overcoming the inertia of the hand, for example, and that this may havesimilar effects on location variation (i.e., physiological principles of economy ofeffort would predict that noncitation forms of signs may be more common aftera pause or hold).
We also coded for situational variation in which the target sign occurred, notingwhether the tokens were collected from conversations or interviews. We reasonedthat the more structured nature of the interview might have led to a somewhat moreformal variety of signing that included a greater use of citation forms.
As already described, we coded for the following social factors: gender (male orfemale), age (young, mature, older, and elderly), language background(participants with signing deaf parents or with hearing parents), and region. Inthe Auslan study, we also coded for social class (middle class or working class)and in the NZSL study, ethnicity (Māori, Pakeha).
The Auslan study conducted an inter-rater reliability study in which two codersindependently coded the linguistic factors in a subset of the tokens. We comparedthe coding of the linguistic factors, because only these factors were based onobservation of the videotaped data. The coding of social factors were based onthe participant’s responses to the demographic questionnaires. (This informationwas simply transferred to the coding sheets and involved little decision makingby the coders.) The two coders achieved an inter-rater reliability score of 93%,with all remaining disagreements about coding resolved by correcting errors onthe coding sheets that were due to lapses in attention, or by reviewing specificexamples on the videotapes. Inter-rater reliability was not investigated in theNZSL study. All coding judgments were made by one native signer researchassistant, in consultation with the primary researchers in problematic cases asneeded.
214 A D AM S C H EMB R I E T A L .

Analysis
To facilitate statistical analysis and cross-linguistic comparison with ASL results, thedata were analyzed using VARBRUL software. We used GOLDVARB 2.1, developedby David Rand and David Sankoff (1991) at the University of Montréal. VARBRULenables the simultaneous analysis of multiple factors that influence sociolinguisticvariation. The application of VARBRUL to the study of phonological variation insigned languages is described in more detail in Lucas et al. (2001).
R E S U LT S
The results of the VARBRUL analysis showed that location variation in Auslan andNZSL, as in ASL, is not random but is influenced by a number of linguistic andsocial factors. Unlike in the ASL data (Lucas et al., 2002), however, thenoncitation forms of these signs (i.e., those produced at locations on or near thebody lower than the forehead region) were less common than the citation formsin Auslan and NZSL. Citation forms account for approximately 55% of thetokens in Auslan (n = 1480) and 57% in NZSL (n = 1202) compared with47% in the ASL data, while noncitation forms represent 45% of tokens inAuslan (n = 1187) and 43% in NZSL (n = 894), but 53% in ASL.
Linguistic factors
Of the linguistic factors we analyzed, five proved significant at the .05 level: signtype, preceding location, following location, following sign or pause, andpreceding contact. The significant linguistic factors for Auslan are shown inTable 5 with their VARBRUL weights (with –cf as the application value), theirinput probability (the overall likelihood that signers will choose the noncitationform as a percentage), and the overall number of tokens with the relevant factor.
An early run of the Auslan data showed that both grammatical function and signfrequency were significant. Verbs appeared to favor the noncitation form, butadjectives and nouns appeared to disfavor it. High frequency signs (i.e., the 10most frequent lexical items) favored –cf, and low frequency items disfavored –cf.Closer inspection of the results, however, indicated some unexpected interactionbetween grammatical function and frequency. It was clear that only a subset ofverbs (the high frequency verbs, i.e., THINK, KNOW, NOT-KNOW, REMEMBER, FORGET,UNDERSTAND, and BE-CALLED) favored –cf, whereas all the remaining verbs, nouns,and adjectives disfavored –cf. A decision was thus made to combine these factorgroups to form a new factor group called “sign type” with all lexical items beingclassified into one of four groups: (1) high frequency verbs, (2) high frequencynouns and adjectives, (3) low frequency verbs, and (4) low frequency nouns andadjectives. The resulting factor group, sign type, proved to be the first-orderconstraint. We found that frequent verbs favored –cf (with a factor weight of.577), and all other signs types strongly disfavored –cf (.388).
T H E LO CAT I O N VA R I A B L E 215
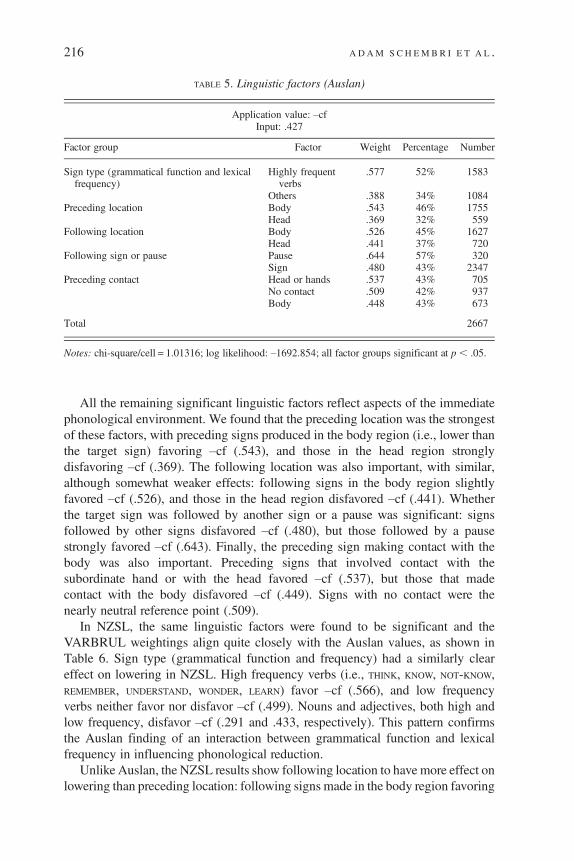
All the remaining significant linguistic factors reflect aspects of the immediatephonological environment. We found that the preceding location was the strongestof these factors, with preceding signs produced in the body region (i.e., lower thanthe target sign) favoring –cf (.543), and those in the head region stronglydisfavoring –cf (.369). The following location was also important, with similar,although somewhat weaker effects: following signs in the body region slightlyfavored –cf (.526), and those in the head region disfavored –cf (.441). Whetherthe target sign was followed by another sign or a pause was significant: signsfollowed by other signs disfavored –cf (.480), but those followed by a pausestrongly favored –cf (.643). Finally, the preceding sign making contact with thebody was also important. Preceding signs that involved contact with thesubordinate hand or with the head favored –cf (.537), but those that madecontact with the body disfavored –cf (.449). Signs with no contact were thenearly neutral reference point (.509).
In NZSL, the same linguistic factors were found to be significant and theVARBRUL weightings align quite closely with the Auslan values, as shown inTable 6. Sign type (grammatical function and frequency) had a similarly cleareffect on lowering in NZSL. High frequency verbs (i.e., THINK, KNOW, NOT-KNOW,REMEMBER, UNDERSTAND, WONDER, LEARN) favor –cf (.566), and low frequencyverbs neither favor nor disfavor –cf (.499). Nouns and adjectives, both high andlow frequency, disfavor –cf (.291 and .433, respectively). This pattern confirmsthe Auslan finding of an interaction between grammatical function and lexicalfrequency in influencing phonological reduction.
Unlike Auslan, the NZSL results show following location to have more effect onlowering than preceding location: following signs made in the body region favoring
TABLE 5. Linguistic factors (Auslan)
Application value: –cfInput: .427
Factor group Factor Weight Percentage Number
Sign type (grammatical function and lexicalfrequency)
Highly frequentverbs
.577 52% 1583
Others .388 34% 1084Preceding location Body .543 46% 1755
Head .369 32% 559Following location Body .526 45% 1627
Head .441 37% 720Following sign or pause Pause .644 57% 320
Sign .480 43% 2347Preceding contact Head or hands .537 43% 705
No contact .509 42% 937Body .448 43% 673
Total 2667
Notes: chi-square/cell = 1.01316; log likelihood: –1692.854; all factor groups significant at p, .05.
216 A D AM S C H EMB R I E T A L .

–cf (.534) and those in the head region strongly disfavoring –cf (.393). Precedingsigns in the body region slightly favor –cf (.518), and preceding signs in the headregion strongly disfavor –cf (.390). Consistent with Auslan, the presence of a pausefollowing the target sign was associated with lowering: signs followed by othersigns disfavor –cf (.483), whereas those followed by a pause strongly favor –cf(.684). Finally, preceding signs that make contact with the body or head disfavor–cf (.481), but preceding signs with no contact slightly favor –cf (.516).
In summary, the following linguistic factors favored citation forms: (a) nouns,adjectives, and low frequency verbs; (b) signs that were preceded or followed bysigns made in the head region; (c) signs that were preceded by signs, rather thanpauses; and (d) signs that were preceded by signs making contact with the body.The following linguistic factors all favored the lowered (noncitation) variants: (a)high frequency verbs; (b) those signs that were preceded or followed by signsmade in the body region; (c) signs that were followed by a pause. The followingfactors were found not to be significant in either language: whether or not (a)the following sign made contact with the body; (b) the target sign was precededby a pause, or (c) the target sign involved a switch in hand dominance whencompared with the preceding or following sign.
Social factors
In Auslan, three social factors were significant at the .05 level: age, region, andgender. These are shown in Table 7 with their VARBRUL weights, inputprobability, and number of tokens.
TABLE 6. Linguistic factors (NZSL)
Application value: –cfInput: .412
Factor group Factor Weight Percentage Number
Sign type (grammatical function andlexical frequency)
Highly frequent verbs .566 49% 1198
Low frequency verbs .499 42% 264Low frequency noun/adj.
.433 36% 238
Highly frequentnouns/adj.
.291 22% 396
Preceding location Body .518 44% 1692Head .390 29% 267
Following location Body .534 44% 1466Head .393 31% 458
Following sign or pause Pause .684 60% 172Sign .483 41% 1924
Preceding contact No contact .516 43% 937Contact .481 41% 1049
Total 2096
Notes: chi-square/cell = 1.0269; log likelihood: –1319.922; all factor groups significant at p, .05.
T H E LO CAT I O N VA R I A B L E 217

In Auslan, age was the second-order constraint, and the strongest of allsignificant social factors. Older signers (i.e., those over age 51) clearly disfavor–cf (.411), and younger signers favor the –cf (.565). An early run of VARBRULshowed that people aged 51–70 years and those aged 71þ years all tended touse fewer examples of –cf, whereas those aged 15–30 years and 31–50 yearstended to use more; so in later runs, we regrouped these four groups into two(“younger” represents those aged 15–50 years, and “older” those 51 years orover). The next most important constraint was region. Signers in the smallercities of Adelaide, Brisbane, and Perth disfavor –cf (.456), whereas those in thelarger cities of Sydney and Melbourne favor –cf (.554). These two groups resultfrom grouping together these five cities based on patterns found in an earlier runof VARBRUL. Lastly, male signers tend to disfavor –cf (.460), but femalesigners slightly favor –cf (.536).
In summary, older Auslan signers, signers in smaller state capitals, and men alldisfavor the noncitation forms of these signs, but young, female participants fromlarger cities tend to favor the lowered variants.
In NZSL, four social factors were significant at the .05 level: region, gender,ethnicity, and language background. These factors are shown in Table 8 withtheir VARBRUL weights, input, probability, and number of tokens. Region wasthe strongest social factor. VARBRUL analysis shows that signers from the twolargest urban communities, Auckland and Christchurch favor –cf (.544 and .604,respectively), whereas signers from the central region composed of smallercenters disfavour –cf (.417). Gender was significant as well: female signersfavored –cf (.536), whereas male signers tend to disfavor –cf (.460). Theseresults correspond with the Auslan pattern that residents of larger urban areasand women are more likely to use a lowered variant.
Analysis of ethnicity as a social factor shows that Pakeha signers slightly favor –cf(.513) and Māori signers disfavor –cf (.423). Additionally, language acquisitionbackground shows that native signers strongly favor –cf (.630), and those whoacquired NZSL in later childhood (between the ages of 7 to 12 years) also favor
TABLE 7. Social factors (Auslan)
Application value: –cfInput: .427
Factor group Factor Weight Percentage Number
Age Younger (aged under 51 years) .565 51% 1540Older (aged 51 years or over) .411 36% 1127
Region Sydney and Melbourne .554 50% 1197Adelaide, Brisbane, and Perth .456 40% 1470
Gender Female .536 48% 1401Male .460 40% 1266
Total 2667
Notes: chi-square/cell = 1.01316; log likelihood: –1692.854; all factor groups significant at p, .05.
218 A D AM S C H EMB R I E T A L .

–cf (.532), whereas early childhood signers (acquired before 7 years old) disfavor–cf (.491). This result should be interpreted with caution, because native signersaccounted for only 4% of all tokens and late childhood signers for 7% of alltokens, and the early signers produced most of the tokens.
In summary, NZSL signers from smaller urban areas, Māori signers, and malesigners favor the citation forms, whereas signers from larger urban areas, Pakehasigners, female signers, and native signers tend to favor lowered variants.Surprisingly, age was not a statistically significant factor in NZSL, unlike theAuslan study, although the data indicated a trend in the same direction.Language acquisition background appears to have an effect but our small sampleof native signers calls for further validation.
D I S C U S S I O N
Our results from both Auslan and NZSL show that location variation in the class ofsigns formed at the forehead location, exemplified by THINK, NAME, and CLEVER, is notrandom but is simultaneously influenced by a number of linguistic and social factorsin these two related signed language varieties. In this section, we shall compare ourresults with those from the original ASL study, consider the possibility that thelowering of these signs represents an example of language change in progress, anddiscuss the possible relationship between grammatical function and lexical frequency.
Comparison with ASL results
In terms of linguistic and social factors, our results both resemble and differ fromthe ASL findings. The results for ASL linguistic factors are shown in Table 9.
TABLE 8. Social factors (NZSL)
Application value: –cfInput: .412
Factor group Factor Weight Percentage Number
Region South .604 54% 519North .544 47% 601Central .417 34% 976
Ethnicity Pakeha .513 44% 1803Māori .423 32% 293
Gender Female .536 45% 1172Male .460 40% 924
Language background Native .630 64% 89Middle .532 48% 141Early .491 41% 1866
Total 2096
Notes: chi-square/cell = 1.0269; log likelihood: –1319.922; all factor groups significant at p, .05.
T H E LO CAT I O N VA R I A B L E 219

We will discuss here only those factors investigated in all three studies (i.e.,preceding and following location, contact with the body, and pauses).
All investigations show that the location of the preceding sign is important, butonly in the Auslan and NZSL results do we also see a significant role for thelocation of the following sign as well. In all cases, adjacent signs produced atthe neck or below resulted in the greater likelihood of a lowered target sign.Thus both anticipatory and preservatory assimilation to contiguous segments isat work in Auslan and NZSL, whereas only anticipatory assimilation is found inASL (it is interesting to note that anticipatory assimilation is the most commonform of assimilation in spoken languages as well).
Whether or not an adjacent sign makes contact with the body is also animportant factor in all three studies, although Lucas et al. (2002) found it wasonly significant in the sign following a target sign, whereas our data reveal a roleonly for the sign preceding a target sign. In addition, the types of influencein each language differ. In the ASL results, preceding signs that make no contactwith the body favor the noncitation form, and preceding signs that makecontact disfavor it. In the Auslan and NZSL studies, following signs that makecontact with the head or subordinate hand disfavor the noncitation form, andthose that contact the body favor the noncitation form. It is not clear how toaccount for these differences, although it may be related to methodologicaldifferences in the Australian, New Zealand, and American studies. One weaknessin all three studies, however, was that we did not code for variation in contact intarget signs themselves (i.e., whether or not target signs that have contact with thebody in citation form actually made contact with the body in our data), onlywhether they were produced in locations other than the forehead region. Theresults in relation to contact resemble a dissimilation effect, but we would need toknow more about the patterns of contact in the target signs to support this analysis.
Lastly, the Auslan and NZSL results also show that whether a sign or a pausefollows a target sign is important, with pauses strongly favoring noncitationforms. The results for following location (in which following locations on ornear the body rather than the head favored lowering) and for following sign orpause being significant may be related. If the hands are moving away from the
TABLE 9. Linguistic factors in ASL
Ranking ASL
1 Grammatical function Prepositions and interrogatives .581Nouns and verbs .486Adjectives .316
2 Preceding location Body .514Head .463
3 Following contact No contact .525Contact .466
Source: Lucas et al. (2002).
220 A D AM S C H EMB R I E T A L .

forehead region either to produce a sign in the body region or to allow the hands toreturn to a resting position, then this appears to favor the production of noncitationforms. Thus, our hypothesis that a preceding pause may influence the production ofnoncitation forms was not confirmed.
Overall, the Auslan and NZSL results indicate relatively more influence fromthe immediate phonological environment (four significant factor groups) than inASL (two significant factor groups). There may be two reasons for thisdifference. It is possible that the influence of phonological factors on locationvariation is greater in Auslan and NZSL than in ASL, and that the specificdetails of phonological variation differ from one signed language to the next, asis true of spoken languages. Alternatively, our different findings may reflectdifferent approaches to the investigation of location variation in the twolanguages. As previously explained, the target signs coded in the Auslan andNZSL studies were all produced in citation form at locations in contact with orin proximity to the signer’s forehead, whereas the target signs in the ASLresearch also included signs made in citation form at locations lower than theforehead, such as ASL SEE. In particular, Lucas et al. (2002) included lexicalizedcompounds, such as ASL BELIEVE, in which the second component of the signwas always produced at a lower location. This may have had an effect on thetypes of phonological environment that proved to be significant, particularlythose related to the following phonological environment (i.e., following locationand following sign or pause).
Turning to the social factors in ASL (as shown in Table 10), we find thatage was the most significant factor in both the Auslan and ASL results.In both communities, we see younger individuals disfavoring the citationform, and older people favoring it. We also see that regional variation isimportant, with Auslan, NZSL, and ASL signers in larger urban deaf
TABLE 10. Social factors in ASL
Ranking ASL
1 Age 15–25 .60226–54 .51755þ .416
2 Gender Male .544Female .451
3 Language background Hearing parents .519Deaf parents .444
4 Region California, Louisiana, Maryland, Massachusetts,Kansas, Missouri
.529
Washington .461Virginia .334
5 Ethnicity and social class White middle and working class .555African-American middle class .445African-American working class .314
Source: Lucas et al. (2002).
T H E LO CAT I O N VA R I A B L E 221

communities (e.g., Melbourne, Auckland, Boston) disfavoring the citation form,and those in smaller cities and/or deaf communities (e.g., Adelaide, Wellington,Staunton) favoring it.
Gender was also important in both sets of results, but it works differently inthe Auslan and NZSL data compared with the ASL data. In ASL, femalesigners tended to be conservative and disfavored the noncitation form, butmales favored it. In Auslan and NZSL, however, women favor thenoncitation form, and men disfavor it. The ASL results for gender appear toexemplify Labovian Principle Ia, which claims that women use a lowerfrequency of nonstandard forms than men do when the language change inprogress is somehow stigmatized (Labov, 1994). Lucas et al. (2001) pointedout the citation forms of signs in this class are the variants listed indictionaries, commonly taught in signed language classes and possibly usedin more formal situations, and thus the suggestion that they represent“standard” forms seems well-motivated.
Labovian Principle II states, however, that in most examples of languagechange “from below,” women are more likely than men to innovate or lead theuse of new forms (Labov, 2001). In the next section, we consider evidencethat the lowering of signs in the class of signs exemplified by THINK, NAME,and CLEVER represents a language change in progress in Auslan. Thus the factthat women use more noncitation forms in this instance is not surprising inlight of Principle II. It may be that in the American deaf community, whichmight be considered to have a more differentiated social structure than inAustralia or New Zealand, the change is stigmatized in some way (i.e.,lowering of this class of signs is considered a “lazy” form of signing) and thuswomen tend to avoid the incoming form because it is perceived asnonstandard usage, whereas the language change in Auslan is not yet widelyrecognized and thus occurring below the level of signers’ awareness. Thus, wemay have a change from “above” in the American deaf community, and onefrom “below” in Australia (Labov, 1994).
In ASL, the social factors of language background, ethnicity, and (to a limitedextent) social class proved important, whereas language background and socialclass were not significant in Auslan (ethnicity was not included in the Auslanstudy, as was already explained). In both NZSL and ASL, language backgroundand ethnicity appeared to be important, but with different effects: ASL signerswith deaf parents (i.e., native signers) favored the citation form, whereas signerswith hearing parents did not, but the opposite was true in NZSL (remember,however, that numbers of native signer participants were very low in the NewZealand study). Turning to ethnicity and class, White middle- and working-classsigners of ASL disfavored citation forms, but African-American working-classsigners strongly favored them. African-American middle-class signers alsofavored the citation form, but not to the same extent as working-class signers. InNZSL, Māori signers favored citation forms, as did African-Americans ingeneral. Thus in ASL and NZSL, ethnic minority signers appear to be moreconservative than White signers.
222 A D AM S C H EMB R I E T A L .

These differing results reflect different sociolinguistic factors at work in theAmerican, Australian, and New Zealand deaf communities. For example, socialclass differences in ASL location variation and the apparent lack of suchdifferences in Auslan (and the reason it was not included in the NZSL study)reflect the history of educational opportunities for deaf people in these countries.Due to the existence of specialized tertiary educational institutions such asGallaudet University, deaf Americans have had access to university educationfor a longer period of time than deaf Australians and New Zealanders have, andthis may have allowed more time for a middle class (and middle-class patterns oflanguage usage) to emerge. Lucas et al. (2002) suggested that the results basedon ethnicity are not surprising, given other research that suggests that African-American signers tend to use older forms of ASL in general (Lucas et al., 2001),but we have no independent evidence of conservatism in the Māori deafcommunity in NZSL. Native signers, they suggested, also may be moreprotective in their attitudes toward ASL and thus more inclined to use what areperceived as more standard forms. This does not appear to be the case for thesmall number of NZSL native signers, nor the relatively larger sample of Auslannative signer participants with deaf parents (70 individuals compared with 45 inthe ASL study). It may be that lowering of signs in these communities has notyet become the focus of any social awareness or stigmatization.
Grammatical function and lexical frequency insigned languages
As we have already discussed, we found grammatical function was significant in anearlier run in both Auslan and NZSL, but that it interacted with another significantfactor: lexical frequency. Our findings suggest that it was only a subclass of verbs—the high frequency verbs—that significantly favored noncitation forms in theAustralian and New Zealand data. There were no differences based ongrammatical function alone, because other types of verbs, nouns, and adjectivesall favored citation forms in the same way.
The ASL study (Lucas et al., 2001), however, reports clear differences in theinfluence of grammatical function on location variation, with prepositions (e.g.,FOR) and interrogatives (e.g., WHY) clearly favoring –cf, and adjectives (e.g.,DIZZY) clearly disfavoring it. In their discussion of the relationship betweengrammatical function and location variation in ASL, Lucas et al. (2001:146)acknowledged that “as yet unexplored phonological factors may play a role inthe patterning of grammatical constraints” on variation in location. Recentresearch shows that faster rates of target sign production together with targetsigns occupying initial positions in the phrase are all relevant factors forlowering in ASL (Mauk & Tyrone, 2007), factors that we have not consideredhere. Lucas et al. (2001) suggested that the fact that prepositions favor –cf maybe related to stress. In spoken languages, prepositions are often unstressed andthus more affected by phonological reduction, so this may equally be true ofsigned languages. Stress, however, is not yet well understood in ASL or other
T H E LO CAT I O N VA R I A B L E 223

signed languages (although some work has been undertaken, see Wilbur, 1990;Wilbur & Schick, 1987). As a result, there can be little consensus about howbest to code for stress in the kind of naturalistic data used in studies ofsociolinguistic variation, and thus it has not yet been attempted.
One variable that Lucas et al. (2001) did not consider is lexical frequency. Thisis not surprising, as little information about the frequency characteristics of mostsigned languages is available, and thus almost no studies of signed languagehave taken this factor into account (Morford & MacFarlane, 2003). As alreadymentioned, Bybee (2002), Dinkin (2007), and Philips (1984) noted that highfrequency words appear to undergo reduction at a greater rate than lowfrequency words do, and thus that lexical frequency may be relevant to ourunderstanding of language variation and change. It may be that some of theassociation between location variation and grammatical function described byLucas and her colleagues reflects lexical frequency effects. Grammaticalfunction words are much more frequent than many content words. In a small-scale study of the frequency characteristics of ASL reported by Morford andMacFarlane (2003), 7 of the 10 most frequent lexical items in their minicorpusof 4111 signs are function signs. The preposition FOR and the interrogative WHY
are also frequent in ASL conversations—they both appear on Morford andMacFarlane’s list of the top 37 most frequent signs (these 37 signs representthose lexical items that occur more than four times per 1000 signs in their corpus).
The Auslan and NZSL dataset both lacked functors; however, functors similar toASLWHY and FOR exist in both varieties but are not produced at the forehead location.Instead, we found that high frequency verbs appear to show significantly morelowering. Bybee (2007) claimed that there is an attested relationship betweenfrequency of use of specific lexical items and generality of meaning and/orpolysemy. For example, she explained that verbs (which are often polysemous)have a higher frequency in spoken language discourse. In English, there are morehigh frequency verbs than nouns and more low frequency nouns than verbs. Itmay be that our high frequency verbs, such as THINK and KNOW, are much morefrequent in signed discourse than our high frequency nouns such as MOTHER andNAME, and thus the phonological reduction is relatively greater. Certainly, our dataindicate this is the case, as the most common verbs were twice as frequent as themost common nouns. The number of Auslan tokens for THINK and KNOW, forexample, were 469 and 416, respectively, compared with 178 tokens for MOTHER
and 166 for NAME. Further support can be found in data from the WellingtonCorpus of NZSL, where THINK also occurred almost twice as frequently as MOTHER
(McKee & Kennedy, 1999, 2006).In addition, it may be that repetition of a sign leads to greater phonological
reduction. Auslan and NZSL lack a pro-verb, such as English do. Thus, inquestion and answer sequences (e.g., (a) PRO-2 KNOW DET MAN “Do you knowthat man?”; (b) YES KNOW “Yes, I do”), signers may respond with a repetition ofthe main verb. This may be less true of nouns, however, because the signer mayswitch to the use of a pronominal sign to refer back to a referent introduced by anominal sign. As with speakers, signers may thus economize on articulatory
224 A DAM S C H EMB R I E T A L .

effort when addressees can supplement the signed input with the kind of contextualinformation provided by repetition (Lindblom, 1990). Furthermore, frequencystrengthens memory representation for lexical items. Experimental studies haveshown that participants respond to tasks involving high frequency lexical itemsmore quickly than to tasks involving low frequency words (Bybee, 2007). Thus,recognition of high frequency verbs may occur more quickly, resulting in lessneed to produce phonologically fuller forms. More investigation is needed,however, to find possible differences in the use and accessibility of higherfrequency of signs such as THINK and KNOW compared with MOTHER and NAME thatcan account for our findings.
As with stress, more research is needed into lexical frequency in signedlanguages before firm conclusions can be drawn, but the Auslan and NZSLresults presented here suggest that this factor may be important for anunderstanding of phonological variation in signed languages. Work on ASL byMauk and Tyrone (2007) showed that future studies may also need to take rateof production and phrasal position into account.
Age, sign type, gender, and region
As Lucas et al. (2002) pointed out, the lowering of signs made in the foreheadregion in ASL appears to be an example of a language change in progress. Thisclaim is based first on the “apparent time hypothesis” (Bailey, 2002), whichsuggests that variation in the linguistic system used by speakers of different agesat a single point in time can indicate a change in progress. Although this rests onthe assumption that the linguistic usage of a particular age group will not changeas this group grows older, this inference has proven reliable in a large number ofstudies (Chambers, 1995). It also stems from the fact that the lowering of signsmade in the forehead region may reflect a more general pattern in ASL datingback to the nineteenth century. As was first observed by Frishberg (1975), ASLsigns previously produced in more peripheral areas of the visual field (e.g., HELP)appear to have moved toward more central areas over time.
Wewould like to draw on the apparent time hypothesis and the fact that loweringof signs is possibly also a historical process at work in the BSL family of signedlanguages (e.g., Kyle & Woll, 1985, pointed to historical evidence showing thatthe sign MAYBE in BSL has moved over time from a forehead location to one inneutral space) to suggest that the age variation we have found may also indicatea change in progress in Auslan. When we analyze the Auslan results by signtype and age (as shown in Figure 4), we find that the percentage of bothcategories of signs in noncitation is higher for younger than older signers, as isclearly shown in Figure 4. The NZSL data indicated a similar trend in youngerand older signers, but differences proved not to be statistically significant.
In addition, we find that the pattern of diffusion across the research sites alsoillustrates a typical spread of language change through a community. Researchon the pronunciation of vowels in the American English spoken in largenorthern cities in the U.S., such as Chicago and Detroit, shows that the standard
T H E LO CAT I O N VA R I A B L E 225

vowel /æ/ is raising and fronting to /ɛ/ so that bat sounds like bet (Labov, 1994).This change (known as the Northern Cities Vowel Shift) has started in theselarger, densely populated urban areas. Because of their importance as culturalcenters, the change has spread to other parts of the country, but it has not done
FIGURE 4. Age and sign type (Auslan): HFV stands for “high frequency verbs” and O is“other,” representing high frequency nouns and adjectives, low frequency nouns andadjectives, and low frequency verbs.
FIGURE 5. Age and region (Auslan).
226 A D AM S C H EMB R I E T A L .

so all at once. Research has shown that first it spread to moderately sized cities,followed by smaller cities, and finally to rural areas, in a pattern known as“cascade diffusion.”
Similarly, in Auslan and NZSL, we find that when we analyze our results by ageand region, we see that both younger and older signers in the larger urban centersuse a higher percentage of noncitation forms than younger and older signers in thesmaller cities do (see Figure 5 regarding Auslan).
Lastly, we find that an analysis of age and gender in the Auslan data (seeFigure 6) shows that younger women use more noncitation forms than olderwomen, younger men more than older men, and women use more than men inthe same age group. As already mentioned, this is an extremely common patternin language change.
C O N C L U S I O N S
Our results (drawing on the VARBRUL analysis of data from 205 deaf native andfluent signers in five cities of Australia, and 138 native and fluent signers from fivesites in New Zealand) indicate that location variation in the class of signsexemplified by THINK, NAME, and CLEVER is a textbook example of asociolinguistic variable influenced by linguistic and social factors, as has alsobeen reported for this class of signs in ASL. Our findings also resemble manyother examples of phonological variation in spoken languages (Chambers,Trudgill, & Schilling-Estes, 2002). Our results strongly suggest that, as has alsobeen proposed for ASL, the lowering of signs made in the forehead region is a
FIGURE 6. Age and gender (Auslan).
T H E LO CAT I O N VA R I A B L E 227

language change in progress in Auslan, led by younger signers and those in largeurban centers. Unlike the ASL results, we find that this change appears to be led bywomen, and we do not find evidence that differences in social class correlate withvariation in this phonological feature of Auslan. This result may reflect differencesin the social structure, history, and language attitudes in the Australian andAmerican deaf communities. Moreover, the linguistic factors indicate a relativelygreater role for assimilation in Auslan and NZSL than has been reported forASL, although this may partly reflect methodological differences between thestudies. Lastly, our combined findings suggest a role for lexical frequencyworking in tandem with grammatical function in Auslan and NZSL, somethingnot previously investigated in any signed language.
N O T E S
1. See project description at: http://www.victoria.ac.nz/lals/research/deafstudies/DSRUsite/NZSLvariation/variation project.aspx.2. As is common practice in the signed language linguistics literature, all signs are represented bymeans of glosses (using an English word or phrase similar in meaning to the sign) in small uppercaseletters.3. As mentioned in the source note, the Auslan results have previously been partially presented inSchembri et al. (2006). Note that, in this earlier article, a subset of 2446 Auslan tokens formed thedataset for the analysis presented in that article.4. Note that this sign is not a compound or phrase, but a single lexical sign.5. Although native signer intuitions suggest that all target signs in our lists may vary in location, sometarget signs exhibit no variation in the dataset used in this study (i.e., those lexical items in the NZSL andAuslan lists that show 100% or 0% in the % þ cf column). All of these lexical items are low frequencyitems in our dataset, and many of them occur only once. In total, these signs account for nomore than 3%of the data, so we have opted not to exclude them.6. Oralism refers to educational policies for deaf children that focus exclusively on the development ofspeech, listening, and speech-reading skills.7. Total Communication is an educational philosophy that encourages the use of a range ofcommunication modes with deaf children, such as spoken language, signed language, writing andother visual aids, depending on the particular needs of the child.8. The Wellington Corpus of NZSL is a transcription of 100,000 signs, taken from approximately 50hours of conversational NZSL collected from 80 deaf signers (see McKee & Kennedy, 2006). This wascollected separately from the dataset used in the NZSL study on location variation reported here.
R E F E R E N C E S
Alexander, Sara. P. (2008). Sociolinguistic variation in fingerspelling in New Zealand Sign Language.M.A. dissertation, Victoria University of Wellington.
Ash, Sharon. (2002). Social class. In J. K. Chambers, P. Trudgill, & N. Schilling-Estes (eds.), Thehandbook of language variation and change. Oxford: Blackwell. 402–422.
Bailey, Guy. (2002). Real and apparent time. In J. K. Chambers, P. Trudgill, & N. Schilling-Estes (eds.),The handbook of language variation and change. Oxford: Blackwell. 312–322.
Bayley, Robert. (2002). The quantitative paradigm. In J. K. Chambers, P. Trudgill, & N. Schilling-Estes(eds.), The handbook of language variation and change. Oxford: Blackwell. 117–141.
Bell, Alan, Gregory, Michelle L., Brenier, JasonM., Jurafsky, Daniel, Ikeno, Ayako, & Girand, Cynthia.(2002). Which predictability measures affect content word durations? In Proceedings of thePronunciation Modeling and Lexicon Adaptation for Spoken Language Technology Workshop,September 14–15, 2002. Estes Park, CO. 1–5.
Bernal, Brian, &Wilson, Lyn. (eds.) (2004).Dictionary of Auslan: English to Auslan (with regional signvariations). Melbourne: Deaf Children Australia.
Boyes-Braem, Penny, & Sutton-Spence, Rachel. (2001). The hands are the head of the mouth: Themouth as articulator in sign languages. Hamburg: Signum Press.
Branson, Jan, Bernal, Brian, Toms, Jennifer, Adam, Robert, & Miller, Don. (1995). Introduction toAuslan, level 2: Student workbook. Melbourne: La Trobe University.
228 A D AM S C H EMB R I E T A L .

Branson, Jan, Peters, Graham, Bernal, Jennifer, & Bernal, Brian. (1992). Introduction to Auslan: Level1. Melbourne: National Institute for Deaf Studies and Sign Language Research& La Trobe UniversityLanguage Centre.
Brien, David. (ed.) (1992). Dictionary of British Sign Language/English. London: Faber & Faber.Bybee, Joan L. (2002). Word frequency and context of use in the lexical diffusion of phoneticallyconditioned sound change. Language Variation and Change 14:261–290.
. (2007). Frequency of use and the organization of language. New York: Oxford.Carty, Breda M. (2004).Managing their own affairs: The Australian deaf community during the 1920sand 1930s. Ph.D. dissertation, Griffith University.
Chambers, J. K. (1995). Sociolinguistic theory: Linguistic variation and its social significance. Oxford:Blackwell.
Chambers, J. K., Trudgill, Peter, & Schilling-Estes, Natalie. (2002). The handbook of languagevariation and change. Oxford: Blackwell.
Cheshire, Jenny. (2002). Sex and gender in variationist research. In J. K. Chambers, P. Trudgill, &N. Schilling-Estes (eds.), The handbook of language variation and change. Oxford: Blackwell.423–443.
Collins-Ahlgren, Marianne. (1989). Aspects of New Zealand Sign Language. Ph.D. dissertation,Victoria University of Wellington.
Dinkin, Aaron. (2007). The real effect of word frequency on phonetic variation. Paper presented at the31st Penn Linguistics Colloquium, Philadelphia, PA.
Emmorey, Karen. (2002). Language, cognition, and the brain: Insights from sign language research.Mahwah, NJ: Lawrence Erlbaum Associates.
Forman, Wayne. (2003). The ABCs of New Zealand Sign Language: Aerial spelling. Journal of DeafStudies and Deaf Education 8(1):92–96.
Fought, Carmen. (2002). Ethnicity. In J. K. Chambers, P. Trudgill, & N. Schilling-Estes (eds.), Thehandbook of language variation and change. Oxford: Blackwell. 444–472.
Frishberg, Nancy. (1975). Arbitrariness and iconicity: Historical change in American Sign Language.Language 51:696–719.
Horvath, Barbara, & Horvath, Ronald. (2002). The geolinguistics of /l/ vocalization in Australia andNew Zealand. Journal of Sociolinguistics 6(3):319–346.
Hyde, Merv, & Power, Desmond J. (1991). The use of Australian Sign Language by Deaf people.Brisbane: Centre for Deafness Studies and Research, Griffith University.
Johnston, Trevor. (1987). A curriculum outline for teaching Australian Sign Language (Auslan) as asecond language. Adelaide: TAFE National Centre for Research and Development.
. (1989). Auslan: The sign language of the Australian deaf community. Ph.D. dissertation,University of Sydney.
. (ed.) (1997). Signs of Australia on CD-ROM: A dictionary of Auslan (Version 1.0 forWindows). North Rocks, NSW: North Rocks Press.
. (ed.) (1998). Signs of Australia: A new dictionary of Auslan. North Rocks, NSW: North RocksPress.
. (2003). BSL, Auslan and NZSL: Three signed languages or one? In A. Baker, B. van denBogaerde, & O. Crasborn (eds.), Cross-linguistic perspectives in sign language research: Selectedpapers from TISLR 2000. Hamburg: Signum Verlag. 47–69.
Johnston, Trevor, & Schembri, Adam. (1999). On defining lexeme in a sign language. Sign Language &Linguistics 2(1):115–185.
. (2007). Australian Sign Language: An introduction to the linguistics of sign languages.Cambridge: Cambridge University Press.
. (eds.) (2003). The survival guide to Auslan: A beginner’s pocket dictionary of Australian SignLanguage. Sydney: North Rocks Press.
Kennedy, Graeme, Arnold, Richard, Dugdale, Pat, Fahey, Shaun, & Moskovitz, David. (1997). ADictionary of New Zealand Sign Language. Auckland: Auckland University Press with BridgetWilliams Books.
Kyle, Jim, & Woll, Bencie. (1985). Sign language: The study of deaf people and their language.Cambridge: Cambridge University Press.
Labov, William. (1994). Principles of linguistic change: Internal factors. Oxford: Blackwell.. (2001). Principles of linguistic change: Social factors. Oxford: Blackwell.. (2006). A sociolinguistic perspective on sociophonetic research. Journal of Phonetics 34:500–515.
Leigh, Gregory R. (1995). Teacher’s use of the Australasian Signed English system for simultaneouscommunication with their hearing-impaired students. Ph.D. dissertation, Monash University.
T H E LO CAT I O N VA R I A B L E 229

Leuninger, Helen, Hohenberger, Annette, Waleschkowski, Eva, Menges, Elke, & Happ, Daneila.(2004). The impact of modality on language production: Evidence from slips of the tongue andhand. In T. Pechman & C. Habel (eds.), Multidisciplinary approaches to language production.Berlin: Mouton de Gruyter. 219–277.
Levitt, Dan. (1986). Introduction to New Zealand Sign Language. Auckland: Deaf Association andNational Foundation for the Deaf.
Liddell, Scott K., & Johnson, Robert E. (1989). American Sign Language: The phonological base. SignLanguage Studies 64:195–277.
Lindblom, Bjorn. (1990). Explaining phonetic variation: A sketch of the H&H theory. InW. J. Hardcastle & A. Marchal (eds.), Speech production and speech modelling. Dordrecht, TheNetherlands: Kluwer Academic Publishers. 403–440.
Lucas, Ceil, & Valli, Clayton. (1992). Language contact in the American deaf community. San Diego:Academic Press.
Lucas, Ceil, Bayley, Robert, & Valli, Clayton. (2001). Sociolinguistic variation in American SignLanguage. Washington, DC: Gallaudet University Press.
Lucas, Ceil, Bayley, Robert, Rose, Mary, & Wulf, Alyssa. (2002). Location variation in American SignLanguage. Sign Language Studies 2(4):407–440.
Marentette, Paula, & Mayberry, Rachel I. (2000). Principles for an emerging phonological system: Acase study of early ASL acquisition. In C. Chamberlain, J. Morford, & R. I. Mayberry (eds.),Language acquisition by eye. Mahwah, NJ: Lawrence Erlbaum Associates. 71–90.
Mauk, Claude E., & Tyrone, Martha E. (2007). Motion capture in the study of sign phonetics. Paperpresented at the Western Conference on Linguistics, San Diego, November 2007.
McKee, David, & Kennedy, Graeme. (1999). A list of 1,000 frequently used signs in New Zealand SignLanguage. In G. Kennedy (ed.), New Zealand Sign Language: Distribution, origins, reference(Occasional Publication 2). Wellington: Deaf Studies Research Unit, Victoria University. 17–25.
. (2000). Lexical comparison of signs from American, Australian, British and New Zealand SignLanguages. In K. D. Emmorey & H. Lane (eds.), The signs of language revisited: An anthology tohonor Ursula Bellugi and Edward Klima. Mahwah, NJ: Lawrence Erlbaum Associates. 49–76.
. (2006). The distribution of signs in New Zealand Sign Language. Sign Language Studies 6(4):372–390.
McKee, David, McKee, Rachel, & Major, Georgina. (2006). Sociolinguistic variation in New ZealandSign Language numerals. Paper presented at Ninth International Conference on Theoretical Issues inSign Language Research, Florianopolis, Brazil.
McKee, Rachel, &McKee, David. (2007).New Zealand Sign Language Grammar: A guide for learners(Revised version). Wellington: Deaf Studies Research Unit, Occasional Paper Publication No. 3,Victoria University of Wellington.
McKee, Rachel, McKee, David, Smiler, Kirsten, & Pointon, Karen. (2007). “Maori Signs”: Theconstruction of indigenous Deaf identity in New Zealand Sign Language. In D. Quinto-Pozos(ed.), Signed Languages in Contact. Washington, DC: Gallaudet University Press. 31–84.
McKee, Rachel. (2007). Hand to mouth: The role of mouthing in NZSL. Across the Board: AustralianAssociation of Sign Language Interpreters (Victoria) 2(4):3–12.
Morford, Jill, & MacFarlane, James. (2003). Frequency characteristics of American Sign Language.Sign Language Studies 3(2):213–225.
Newkirk, Don, Klima, Edward S., Pedersen, Candy C., & Bellugi, Ursula. (1980). Linguistic evidencefrom slips of the hand. In V. Fromkin (ed.), Errors in linguistic performance: Slips of the tongue, ear,pen and hands. New York: Academic Press. 165–198.
Phillips, Betty. (1984). Word frequency and the actuation of sound change. Language 60:320–342.Rand, David, & Sankoff, David. (1991). GoldVarb 2.1: A variable rule application for the Macintosh.Montréal: Centre de recherches mathématiques, Université de Montréal.
Sandler, Wendy, & Lillo-Martin, Diane. (2006). Sign language and linguistic universals. Cambridge:Cambridge University Press.
Schembri, Adam, & Johnston, Trevor. (2004). Sociolinguistic variation in Auslan (Australian SignLanguage): A research project in progress. Deaf Worlds: International Journal of Deaf Studies 20(1):78–90.
. (2007). Sociolinguistic variation in the use of fingerspelling in Australian Sign Language(Auslan): A pilot study. Sign Language Studies 7(3):319–347.
Schembri, Adam, Johnston, Trevor, & Goswell, Della. (2006). NAME dropping: Location variation inAustralian Sign Language. In C. Lucas (ed.), Multilingualism and sign languages: From the GreatPlains to Australia. Washington, DC: Gallaudet University Press. 121–156.
230 A D AM S C H EMB R I E T A L .

Smiler, Kirsten. (2004).Maori Deaf: Perceptions of cultural and linguistic identity of Maori members ofthe New Zealand Deaf community. Masters thesis, Victoria University of Wellington.
Statistics New Zealand. (2001). National Maori Population Projections (2001–2021). Wellington:Statistics New Zealand.
Stokoe, William C. (1960). Sign language structure: An outline of the visual communication systems ofthe American deaf. Silver Spring, MD: Linstok Press.
Sutton-Spence, Rachel, Woll, Bencie, & Allsop, Lorna. (1990). Variation and recent change infingerspelling in British Sign Language. Language Variation and Change 2:313–330.
Tagliamonte, Sali A. (2006). Analyzing sociolinguistic variation. Cambridge: Cambridge UniversityPress.
Thomas, Erik R. (2002). Instrumental phonetics. In J. K. Chambers, P. Trudgill, & N. Schilling-Estes(eds.), The handbook of language variation and change. Oxford: Blackwell. 168–200.
Wilbur, Ronnie B. (1990). An experimental investigation of stressed sign production. InternationalJournal of Sign Linguistics 1(1):41–60.
Wilbur, Ronnie B., & Schick, Brenda. (1987). The effects of linguistic stress on ASL signs. Languageand Speech 30(4):301–324.
Young, Richard, & Bayley, Robert. (1996). VARBRUL analysis for second language acquisition. InR. Bayley & D. R. Preston (eds.), Second language acquisition and linguistic variation.Amsterdam: John Benjamins. 253–306.
T H E LO CAT I O N VA R I A B L E 231