The Ontogeny of Basicranial Flexion in Children of African and ...
85
University of Pennsylvania ScholarlyCommons Anthropology Senior eses Department of Anthropology Spring 4-24-2019 e Ontogeny of Basicranial Flexion in Children of African and European Ancestry Catarina M. Conran University of Pennsylvania Follow this and additional works at: hps://repository.upenn.edu/anthro_seniortheses Part of the Anthropology Commons is paper is posted at ScholarlyCommons. hps://repository.upenn.edu/anthro_seniortheses/190 For more information, please contact [email protected]. Recommended Citation Conran, Catarina M., "e Ontogeny of Basicranial Flexion in Children of African and European Ancestry" (2019). Anthropology Senior eses. Paper 190.
-
Upload
khangminh22 -
Category
Documents
-
view
4 -
download
0
Transcript of The Ontogeny of Basicranial Flexion in Children of African and ...
University of PennsylvaniaScholarlyCommons
Anthropology Senior Theses Department of Anthropology
Spring 4-24-2019
The Ontogeny of Basicranial Flexion in Children ofAfrican and European AncestryCatarina M. ConranUniversity of Pennsylvania
Follow this and additional works at: https://repository.upenn.edu/anthro_seniortheses
Part of the Anthropology Commons
This paper is posted at ScholarlyCommons. https://repository.upenn.edu/anthro_seniortheses/190For more information, please contact [email protected].
Recommended CitationConran, Catarina M., "The Ontogeny of Basicranial Flexion in Children of African and European Ancestry" (2019). AnthropologySenior Theses. Paper 190.

The Ontogeny of Basicranial Flexion in Children of African and EuropeanAncestry
AbstractThis study examined ontogenetic changes in the cranial base angle in individuals between the ages of 2 and 25years old. Also, variation in the cranial base angle between males and females, and between blacks and whiteswas examined. This study was initially conceived as an examination of the spectrum of human variation in thegrowth and development of the basicranium, as well as its possible correlation to language development. Thisstudy was designed to replicate Lieberman and McCarthy’s 1999 examination of the processes of basicranialflexion, with additional consideration of variation by sex and by race. To that end, this study assessed a sampleof 39 individuals, composed of 10 black males, 10 black females, 10 white males, and 9 white females.Individuals were drawn from the Krogman Growth Study, a mixed longitudinal and cross-sectional datasethoused at the Penn Museum. A total of 7 cranial base angles were measured, of which 5 were borrowed fromLieberman and McCarthy (designated CBA 1-5), and 2 from Zuckerman (1955) (designated Z1-2), to morethoroughly capture changes in spatial relationships between cranial bones. Results largely indicated that nosignificant increase or decrease in cranial base angle occurs after the cessation of brain growth at age 2.However, the mean values of 5 out of the 7 cranial base angles were shown to be statistically significantlydifferent by sex, and 3 out of 7 angles revealed statistically significant difference by race. An examination of theZ1-2 angles against CBA 1-5 using regression indicated that, although Zuckerman’s angles did not capture anynew variation by sex compared to CBA 1-5, they did reveal an additional spatial relationship which varied byrace. Therefore, results confirm Lieberman and McCarthy’s assessment that cranial base flexion does notchange significantly past the age of two. In addition, results of this study indicate that cranial base angle is alsodimorphic by race, a factor which Lieberman and McCarthy did not assess. No conclusions could be drawn asto the relationship of CBA 5 to language development.
Keywordsontogeny, basicranium, cranial base, flexion, angle, sex, race, Homo, children, growth
DisciplinesAnthropology
This thesis or dissertation is available at ScholarlyCommons: https://repository.upenn.edu/anthro_seniortheses/190

THE ONTOGENY OF BASICRANIAL FLEXION IN CHILDREN OF AFRICAN AND EUROPEAN ANCESTRY
By
Catarina Conran
In
Anthropology
Submitted to the
Department of Anthropology
University of Pennsylvania
Thesis Advisor: Dr. Janet Monge
2019
i
Table of Contents ABSTRACT .................................................................................................................................................................. II CHAPTER 1: BACKGROUND AND INTRODUCTION ............................................................................................ 3
Background: Toward the Modern Techniques of Cranial Analysis .............................................................. 3 Introduction to the Cranial Base Angle ............................................................................................................ 12 Context for and Aims of the Present Study ...................................................................................................... 23
CHAPTER 2: MATERIALS AND METHODS .......................................................................................................... 29 Samples ............................................................................................................................................................. 29 Methods ............................................................................................................................................................ 30
CHAPTER 3: RESULTS AND DISCUSSION ........................................................................................................... 36 Results ............................................................................................................................................................... 36 Discussion .......................................................................................................................................................... 61
CHAPTER 4: CONCLUSION ..................................................................................................................................... 68 Summary of Results .......................................................................................................................................... 68 Further Study ..................................................................................................................................................... 72
REFERENCES CITED ................................................................................................................................................ 74
ii
Abstract
This study examined ontogenetic changes in the cranial base angle in individuals between the ages of 2 and 25 years old. Also, variation in the cranial base angle between males and females, and between blacks and whites was examined. This study was initially conceived as an examination of the spectrum of human variation in the growth and development of the basicranium, as well as its possible correlation to language development. This study was designed to replicate Lieberman and McCarthy’s 1999 examination of the processes of basicranial flexion, with additional consideration of variation by sex and by race. To that end, this study assessed a sample of 39 individuals, composed of 10 black males, 10 black females, 10 white males, and 9 white females. Individuals were drawn from the Krogman Growth Study, a mixed longitudinal and cross-sectional dataset housed at the Penn Museum. A total of 7 cranial base angles were measured, of which 5 were borrowed from Lieberman and McCarthy (designated CBA 1-5), and 2 from Zuckerman (1955) (designated Z1-2), to more thoroughly capture changes in spatial relationships between cranial bones. Results largely indicated that no significant increase or decrease in cranial base angle occurs after the cessation of brain growth at age 2. However, the mean values of 5 out of the 7 cranial base angles were shown to be statistically significantly different by sex, and 3 out of 7 angles revealed statistically significant difference by race. An examination of the Z1-2 angles against CBA 1-5 using regression indicated that, although Zuckerman’s angles did not capture any new variation by sex compared to CBA 1-5, they did reveal an additional spatial relationship which varied by race. Therefore, results confirm Lieberman and McCarthy’s assessment that cranial base flexion does not change significantly past the age of two. In addition, results of this study indicate that cranial base angle is also dimorphic by race, a factor which Lieberman and McCarthy did not assess. No conclusions could be drawn as to the relationship of CBA 5 to language development.
3
Chapter 1: Background and Introduction
Background: Toward the Modern Techniques of Cranial Analysis
For much of recorded history, human beings have sought to answer the fundamental
question: “who are we?” What is it that makes us human, and how do we distinguish ourselves
from the world around us? As is immortalized in Diogenes Laërtius’ third-century work, Lives
and Opinions of the Eminent Philosophers, “Plato defined man thus: ‘Man is a two-footed,
featherless animal,’ and was much praised for the definition; so Diogenes plucked a cock and
brought it into his school, and said, ‘This is Plato’s man.’ On which account this addition was
made to the definition, ‘With broad flat nails’ (Laërtius: 232).” The spirit of scientific curiosity
was not satisfied with this definition, however, and intellectuals continued to search for a method
of classifying man’s place in nature.
One of the most enduring systems of classification was introduced in the 18th century by
Swedish naturalist Carolus Linnaeus (1707-1788). The system of Linnaean taxonomy classified
all life along a hierarchy according to biological characteristics, firmly separating man from
chicken once and for all. However, by placing man at the top of the hierarchy, Linnaeus
effectively set humans apart from the natural world, on a pedestal of superiority, an ideal which
would become central to Western scientific inquiry. Linnaeus also sowed the seeds of what
would later evolve into scientific racism, classifying the genus Homo into four subdivisions –
Europeaeus, Americanus, Asiaticus, and Africanus – based on the physical and behavioral
characteristics of each race (Smedley, 2011: 218). These early assumptions by Linnaeus reflect
the tendency of 18th-century European science to conflate biological race with (assumed) innate
behavioral characteristics (Smedley, 2011: 219).

4
The central question had now become “how do we distinguish ourselves from each
other?” By the latter part of the 18th century, German professor Johann Blumenbach (1752-
1840) had proposed the classification of humankind into five “varieties” or “races”
corresponding to the major regions of the world (Blumenbach, 1781; Smedley, 2011: 220).
These five “races” – Caucasian, Mongolian, Ethiopian, American, and Malay – are still widely
used today (Blumenbach, 1781; Smedley, 2011: 220). The popularization of Blumenbach’s
theories of race coupled with the rise of comparative anatomy and new anthropometric
measuring techniques in the late 18th century encouraged a confluence of these early
conceptions of race science with the much older field of cranial study.
Since the days of Herodotus (c.480-c.429 BCE), the human skull has been the focus of
study by physicians and intellectuals (Meijer, 1999: 101).i However, it was not until the late 15th
and early 16th century that Renaissance artists and anatomists (such as, Andreas Vesalius,
Bartolomeo Eustachi, and Albrecht Dürer) began to systematically and empirically study the
form and components of the skull that variations in skull shape were truly noted (Meijer, 1999:
101-2; Kemp, 2010). This practice of precise, systematic measurement of the skull that had
begun to emerge by the early 16th century was the beginning of what is now known as
craniology. Craniology, or the study of the skull, employed measurements of the size of the
braincase, the angle of the face, or other cranial features to quantify human variation
(Sowerwine, 2003: 294).
In the 18th century, the evolution of craniometric techniques was driven in large part by
the development of scientific racism. The earliest application of these techniques to questions of
race can be traced to anatomist Pieter Camper’s (1722-1789) 1770 study of the “facial angle”
between various human races and apes (Meijer, 1999: 108). This angle, connecting the line
between the front of the incisor teeth and the most prominent part of the forehead (the frontal
5
bone) with a line drawn from the earhole (external auditory canal) to the base of the nose,
measured the slope of the forehead and the degree of projection of the jaw (Meijer, 1999: 102-
108). This measurement provided a means of reducing a variety of head shapes to a single
quantifiable factor (Meijer, 1999: 102, 108). Influenced in particular by Dürer’s studies of human
proportion, Camper identified the facial angle as an objective marker of “ideal beauty” (Meijer,
1999: 107, 160). A larger facial angle, corresponding to a higher forehead and a less-projecting
jaw, as seen in Europeans, was considered superior, as it approached the (unattainable) Greco-
Roman archetype of beauty, while a lower angle, as seen in Africans, was dismissed by Camper
as inferior and more closely resembling apes (Meijer, 1999: 107; Brace, 2005: 33). In the same
vein, Blumenbach’s five “varieties” of man, which he proposed in 1775, were categorized into
“races” according to features of cranial morphology (Blumenbach, 1781: 99, 303-319).
Following the publication of Camper and Blumenbach’s conceptualization of the “races” through
cranial measurement, craniology was cemented as a distinct field of study and would go on to
focus primarily on the differentiation of the human “races” from each other and, in comparison
to the primates (Meijer, 1999: 171-2).
By the 19th century, the evident variations in skull shape and size led to the increasingly
popular assumption among naturalists that skull size (brain size in particular) was correlated with
intelligence (Haller, 1971: 18). This association had its roots primarily in the principles of
phrenology, a pseudo-science founded in the late 18th century by German physiologist Franz
Joseph Gall (1758-1828) (Gall, 1810; Haller, 1971: 14; Serletis and Pait, 2016: 1868). Originally
termed “cranioscopy,” phrenology claimed to be able to infer localization of specific brain
functions through the examination of external anatomical landmarks of the cranium (Serletis and
Pait, 2016: 1867-8). Although phrenology was discredited and disavowed by the scientific
community by the mid-19th century, (Serletis and Pait, 2016: 1868) the link between cranial
6
morphology and brain function had been made, and, as with Linnaeus’s classifications of race,
physical traits and behavioral attributes were again conflated.
Firmly grounded in the 18th-century scientific paradigm, Philadelphia physician Samuel
George Morton (1799-1851) subscribed to the principles of phrenology and accepted the
assumption that brain size corresponded directly to intellectual capacity (Morton, 1839: i).
Widely known as the father of scientific racism, Morton is most famous for his claims that the
shape of the cranium and the volume of the braincase could objectively define racial categories
(Renschler and Monge, 2008: 34). Ultimately, Morton aimed to understand human racial
variations through objectivity and the scientific method (Renschler and Monge, 2008: 34). To
this end, Morton amassed a collection of 867 skulls, the largest in the world, and systematically
measured the internal volume of each skull in an effort to determine the average brain size of
each racial category (Morton, 1849: iii-iv; Gould, 1996: 85). Morton defined five races similar to
Blumenbach’s arrangement – Caucasian, Mongolian, Malay, American, and Ethiopian –
according to physical and behavioral characteristics (Morton, 1839: 5-6; Morton, 1849: ix).
Morton also identified several subfamilies, or “primary races” within each larger racial category
(Morton, 1849: ix).
Morton thoroughly analyzed the cranial dimensions of each skull, measuring a total of
thirteen cranial features, including longitudinal diameter, parietal diameter, frontal diameter,
vertical diameter, inter-mastoid arch, inter-mastoid line, occipito-frontal arch, horizontal
periphery, internal capacity, capacity of the anterior chamber, capacity of the posterior chamber,
capacity of the coronal region, and facial angle (Morton, 1839). The internal capacity, in
particular, was measured by filling the cranial cavity with lead shot (or BBs) measuring 1/8 inch
in diameter and recording the volume using a graduated cylinder (Gould, 1996: 85). On the
whole, as illustrated in his Catalogue of Skulls of Man and the Inferior Animals (1849), Morton’s

7
measurements revealed distinctly different mean brain sizes between the racial categories that he
had identified – with the Caucasian group average ranking first, and the Negro group last
(Morton, 1849; Gould, 1996: 86). According to the principles of phrenology, Morton’s
craniometric data supported the pre-existing Western conceptions of racial hierarchy and
‘proved’ that brain size, and, therefore, intelligence and intellectual capacity, were stratified by
race (Morton, 1839: 276-277; Gould, 1996: 100).
Recently, Morton’s analysis has faced accusations of unconscious bias, most famously by
Stephen Jay Gould in his 1981 work The Mismeasure of Man. Gould claimed that Morton’s
racial groupings were inaccurate and biased, that his measurements were inconsistent, and that
the influence of body size (allometry) on each racial average was overlooked (Gould, 1996: 100).
However, in the years since Gould’s publication, a team of scientists at the Penn Museum of
Archaeology and Anthropology, where Morton’s cranial collection is housed, re-measured
Morton’s crania using his technique and compared the results against his reported data
(Renschler and Monge, 2008: 30; Lewis et al., 2011: 5). This study determined that, despite
failing to acknowledge that sex or stature may have influenced his reported Means, Morton’s
measurements were, on the whole, very accurate (Lewis et al., 2011: 5).
Following from the assumption that brain size correlated with intelligence, craniology
and cranial measurements became established as the basis for physical anthropology
(Sowerwine, 2003: 294). Paul Broca (1824-1880), a renowned French surgeon, neurologist, and
anthropologist, and a leading expert in craniology, instilled this paradigm in his School of
Anthropology of Paris, where it soon emerged as the central axiom of 19th century thought
(Sowerwine, 2003: 290-294; Sagan, 1979: 8).
However, in 1912, a significant blow was delivered to the racialized foundations of
craniology by American anthropological giant Franz Boas (1858-1942). Boas was perhaps the
8
single most active combatant of racism and race science among all American scientists (Barkan,
1992: 281). Boas’s 1912 study, “Changes in the Bodily Form of Descendants of Immigrants,”
revealed that, between immigrant parents and their American-born children, inheritance/heredity
of the cephalic index (a ratio of the maximum breadth of the skull to its maximum length) was
very low (Boas, 1912: 546, 550). In Boas’s own words, “… the two races in Europe are quite
distinct, but their descendants born in America are very much alike” (Boas, 1912: 550). The
cranial dimensions of these American-born children, Boas discovered, correlated directly with
stature and weight, which were themselves dependent on the size of the family (Boas, 1912:
530). Thus, Boas concluded that, regardless of race, the environment rather than heredity was the
driving factor behind changes in cranial morphology across generations (Boas, 1912: 530). This,
and many other studies and anti-racist efforts by Boas, endeavored to show that “individual
heredity and racial heredity are entirely different things and that while we may find that certain
characteristic traits are inherited in a family, the race is altogether too complex to infer that racial
characteristics as such are inherited” (Barkan, 1992: 283). As a result of this and subsequent
studies, racism (and the dominance of craniology) slowly began to retreat from professional
science (Barkan, 1992: 285).
After the outbreak of World War II, American opinions shifted even further away from
Nazi ideology, openly condemning not only Nazi race science, but also racism in general. As a
result of this complete reversal in attitudes towards racial separation and biologically
determinable intelligence, the practice of craniology was finally cast aside. In its place arose the
system of “New Physical Anthropology” (Fuentes, 2010: 2). Proposed by Sherwood Washburn
in 1951, the “New Physical Anthropology” represented a move away from measurement and
classification and towards a multidisciplinary and interdisciplinary focus on the processes and
mechanisms of evolutionary change (Fuentes, 2010: 2). In light of innovations in evolutionary

9
thinking during the 1930s-1950s, namely the rise of the modern synthesis, which emphasized the
importance of the environment on phenotypic variation, Washburn determined that the practices
of measurement and forming of taxonomies without consideration to behavior, form, and
development were inhibiting true understanding of evolution, form, and function (Washburn,
1951; Fuentes, 2010: 3). The model of physical anthropology proposed by Washburn was,
therefore, inclusive of human behavior, biology, and history, and is, as a result, both biological
and anthropological (Washburn, 1951; Fuentes, 2010: 2).ii
Under the new model, hierarchical classifications of race and the link between brain size
and intelligence espoused by Morton and Broca were left by the wayside as a result of the shift
away from outdated methodologies and perspectives (Fuentes, 2010: 4). However, despite
innovations in methods, the forms of measurement and classification that arose in the 19th
century were not abandoned, and many are still used today in studies of paleoanthropology,
forensic anthropology, human variation, and medicine (Fuentes, 2010: 5). Nonetheless, these
measurements are no longer limited to physical crania and are now often performed on digitally
produced scans, which by their nature require new measurement methods and techniques of
analysis. Some of the most well-known of these imaging techniques include radiographs (or X-
Rays), computed tomography (CT) scans, and magnetic resonance imaging (MRI) scans.
These modern methods of scanning allow for greater visibility of the various bones and
internal structures of the cranium (Renschler and Monge, 2008: 35; Finlay, 1980: 321). In
addition, they are also highly suited to mathematical analysis (CT scans and MRIs, in particular),
and, using newly developed software, cranial features and geometry can be measured, and
internal cranial volume calculated quickly and to a high degree of accuracy (Renschler and
Monge, 2008: 35; Nave et al., 2018: 1). Radiographs are among the older of the “modern”
methods and have been used to image skulls since the 1930s,iii yet they remain one of the most

10
widely used tools of cephalometric analysis today. The introduction of radiograph images to
cranial analysis opened up new avenues of analysis and led to the development of new
craniometric and cephalometric measurements (Finlay, 1980: 321). Apart from its importance to
biological anthropology (and centrality to the present study), radiographic cephalometry remains
the most widely used method for the treatment and correction of dental structures (Finlay, 1980:
312).
The cranial base angle in particular (which will be the focus of this study) is most
commonly measured from lateral cephalometric radiographs (Simpson, 2014). Although other
methods exist, such as the surgical implantation and tracking the locations of metallic markers at
various points in the cranium (Bjork and Skieller, 1972), non-invasive methods are preferable in
studies of human samples. However, despite their widespread use, some drawbacks of the use of
radiographs have been noted (Bookstein, 1983; Moyers and Bookstein, 1979; Quintero et al.,
1999). Because a radiograph is a two-dimensional representation of a three-dimensional
structure, tracings made, and angles measured from radiographs do not necessarily capture the
“anatomic truth” (Quintero et al., 1999: 491; Bookstein, 1983; Moyers and Bookstein, 1979;
Simpson, 2014). The flattening effect of rendering a three-dimensional structure in two-
dimensions also results in some degree of parallax, which may affect the perceived alignment
and positioning of cranial structures relative to their distance from the imaging plane (Quintero et
al., 1999: 492; Bookstein, 1983; Moyers and Bookstein, 1979; Simpson, 2014). In addition, the
popular technique of measuring lines and angles between points on radiographs neglects to
consider that growth is not always linear along the midline, which may result in
mischaracterizations of growth trends (Bookstein, 1983; Moyers and Bookstein, 1979; Simpson,
2014).

11
Further drawbacks include distorted or blurry images, poorly defined outlines of cranial
bones, and inconsistent patient positioning, all of which cause heightened uncertainty in cranial
landmark location and measurement error (Quintero et al., 1999; Wei, 1968). In fact, this form of
uncertainty is very common among studies conducted on radiographs, and many authors
emphasize the importance of establishing the reliability of landmark location before drawing
conclusions (Quintero et al., 1999; Bookstein, 1983; Moyers and Bookstein, 1979; Simpson,
2014). However, despite these limitations, radiographs have several significant advantages:
exposure and measurement protocols are easily standardized across studies, the process is non-
invasive, a longitudinal series can easily be produced for one individual over many years, and a
large, comprehensive pool of radiographs and accompanying demographic information is already
well established (Simpson, 2014). As a result, radiographs remain one of the most commonly
used tools in cephalometric analysis (Quintero et al., 1999).
So, what can the human skull actually reveal about the nature of humans? This question
has driven human cranial studies for centuries, spanning several centuries and several schools of
thought. Perspectives on racism and race science were central to the development of cranial
measurement and analytical techniques. Modern cephalometric analysis, in its questions and
assessments, should be conducted in light of the history of the discipline, so as not to repeat the
mistakes of the past. Thus, it is into this context that the present study is introduced. Cognizant of
the biases and mischaracterizations that shaped the field, the author will review and reexamine
previous standards of craniofacial growth in the context of age, sex, and race, primarily through
an examination of lateral cranial radiographs to determine ontogenetic trends in the cranial base
angle.
12
Introduction to the Cranial Base Angle
What We Know About the Cranial Base: A Brief Review of the Literature
The cranial base, also called the basicranium, has been identified as the oldest component
of the modern human craniofacial skeleton – the result of anterior cephalization occurring early
in animal evolution (Kardong, 1995; Larsen, 1998; Simpson, 2014). Composed of the ethmoid,
sphenoid, and basioccipital bones, the cranial base is closely related to many cranial structures
and processes. The cranial base acts as a support for the braincase and a suspensory structure for
the soft tissue structures responsible for respiration, swallowing, and vocalization (Simpson,
2014). It is also closely associated with the development of the neurocranium and facial skeleton,
including the inner ear, nasal fossa, and eye orbits (Simpson, 2014). As a result, the cranial base
is central to cranial anatomy and development and has been widely studied in the contexts of
primatology, comparative anatomy, and human evolution (Lieberman & McCarthy, 1999: 487;
Simpson, 2014).
Over the course of human development, both prenatal and postnatal, the endocranial
bones comprising the cranial base undergo flexion or extension relative to each other (Lieberman
& McCarthy, 1999: 487). Flexion and extension occur when the inferior aspect of the angle
between three points on the cranial base (or between two basicranial planes) decreases or
increases, respectively (Lieberman & McCarthy, 1999: 487). These spatial relationships can be
quantified through the measurement of the cranial base angle. The cranial base angle (or CBA) is
a collective measure of the angles between various cranial points in the prechordal and
postchordal planes (Lieberman and McCarthy, 1999: 489). Flexion and extension of CBA occur
at the spheno-ethmoid synchondrosis (SES), the mid-sphenoidal synchondrosis (MSS), and/or
the spheno-occipital synchondrosis (SOS) (Lieberman and McCarthy, 1999: 488). These occur
either through a rotation of each bone on either side of the synchondrosis due to deposition and

13
resorption of bone or through interstitial growth at the synchondrosis, which results in a hinge-
like movement that reduces CBA (Lieberman and McCarthy, 1999: 489). There is much
variation in the timing and type of synchondrosis alteration between humans and primates, and
studies of these processes have drawn conflicting conclusions about the timing of fusion of these
features (Lieberman and McCarthy, 1999: 489; Zuckerman, 1955).
Although the primate order is unique among mammals due to a highly flexed CBA,
humans, especially, possess an acutely flexed CBA, which has been widely researched in
conjunction with many associated aspects of craniofacial anatomy and development (Ross and
Henneberg, 1995; Lieberman et al., 2001: 126). In order to contextualize the present study within
the current state of research, extant literature surrounding the cranial base and its relation to
craniofacial morphology will be reviewed. To that end, popular hypotheses correlating
basicranial flexion with bipedal posture, neural development, facial kyphosis, and vocal tract and
upper respiratory structures will be discussed.
Within the published literature, studies of the cranial base tend to examine the feature in
relation to a) bipedalism and posture (Weidenreich, 1924, 1941, 1945; Dabelow, 1929; Dmoch,
1975, 1976; Ashton, 1957; Bolk, 1915; Strait, 2001; Strait and Ross, 1999; Solow and Tallgren,
1976; Moss, 1961; Riesenfeld, 1967, 1969), b) neural growth (Gould, 1977; Ross, 1993; Ross
and Henneberg, 1995; Ross and Ravosa, 1993; Strait, 1998; Strait and Ross, 1999; Moss, 1958;
Biegert, 1963; Enlow, 1968; Gould, 1977; Dean, 1988; Spoor, 1997), c) facial kyphosis (Ashton,
1957; Biegert, 1963; Sirianni & Swindler, 1979; Enlow, 1990), and d) speech and language
capacity (Laitman, 1976; Laitman et al., 1978; Laitman and Heimbuch, 1982; Laitman, 1985;
Lieberman and Crelin, 1971, Lieberman et al., 1972). While these four approaches are not
mutually exclusive, each occasionally necessitates the use of differing measures of the cranial
base angle to quantify differing spatial relationships between various cranial bones.

14
The basicranium has a complex topography, and, as such, flexion is capable of being
calculated from various points, either endocranially or exocranially (Laitman et al., 1978, 469).
Table 1: Summary of the most commonly used cranial base angles (after Lieberman and McCarthy, 1999).

15
Table 1 above (after Lieberman et al., 1999: 490) summarizes the most commonly used cranial
base angles. As Lieberman explains, the basion-sella-nasion (Ba-S-Na) angle is the most
commonly used throughout cranial base studies; however, it introduces variation relative to nasal
and overall facial growth, which is not a part of the cranial base (Lieberman and McCarthy,
1999). Other angles used to attempt to correct for this problem may capture other sources of
variation, due to the differential growth rates and patterns of the many cranial bones, each of
which changes independently (Lieberman and McCarthy, 1999). Many studies have employed
slightly different measures of cranial base flexion in order to capture the spatial relationships of
interest. For example, studies of the correlation between the basicranium and vocal tract
structures by Laitman made use of exocranial measurements (as well as endocranial) of CBA in
order to test the relationship of the cranial base to directly underlying soft tissue structures
(Laitman, 1976, 1978, 1979, 1982).
Perhaps the earliest approach to studying the basicranium was in its structural relation to
bipedalism. Studies of the basicranial line conducted by Bolk in 1915 and Ashton in 1957
examined the position and tilt of the foramen magnum in various species of monkeys and apes.
These studies revealed that the foramen magnum is positioned near the occipital in basal,
arboreal primates, while anthropoid apes show a more ventrally shifted foramen magnum
compared to its positioning in the center of the skull in modern humans and hominin fossils
(Bolk, 1915; Ashton, 1957; Simpson, 2014). Based on these trends, Strait (2001) suggested that,
as a result of changing skeletal architecture, the shifting center of mass that accompanied the
evolution of bipedalism required a re-positioning of the foramen magnum, and, therefore a more
flexed cranial base (Bolk, 1915; Ashton, 1957; Strait, 2001; Simpson, 2014).
However, posture is not the only factor associated with increased basicranial flexion.
Ashton (1957) also acknowledged that postnatal growth changes in the basicranial axis revealed
16
that differences in growth between monkeys, apes, and humans were primarily the result of
variations in relative cranial size and facial morphology rather than posture (Ashton, 1957). In
addition, recent studies of basicranial flexion relative to the positioning of the head over the neck
in modern humans by Strait and Ross in 1999 and Strait in 2001 concluded that brain size was
equally if not more influential than posture on the morphology of the basicranium (Strait and
Ross, 1999; Strait, 2001). Strait (2001) also concluded that while CBA was correlated with the
positioning of the head relative to the neck in cercopithecoids, in humans CBA was more closely
associated with brain size (although the correlation was not strong) (Strait, 2001).
The correlation between increased basicranial flexion and increased brain size gained
further support from Gould (1977), Ross and Ravosa (1993), Ross and Henneberg (1995), Spoor
(1997), and Strait (1999). Ross and Ravosa (1993) investigated haplorrhine and strepsirrhine
primates, while Spoor (1997) examined modern humans and other hominins (Ross and Ravosa,
1993; Spoor, 1997). Both concluded that increased flexure of the cranial base was related to a
shortened basicranium, an inferiorly facing foramen magnum, and an increase in brain size,
likely indicating that postural adaptations and increased brain size are not mutually exclusive in
their effects on the basicranium (Ross and Ravosa, 1993; Spoor, 1997). However, interestingly,
Ross and Ravosa discovered that this trend was present in haplorrhines, yet not in strepsirrhines
(Ross and Ravosa, 1993). However, trends of flexion in CBA do not correlate exactly with
increasing brain size. Although Strait (1999) observed a significant correlation between brain
size and CBA in various primate species, Ross and Henneberg (1995) determined through an
examination of basicranial flexion and brain volume in fossil hominins that cranial base flexion
has remained largely unchanged since Australopithecus africanus, and has therefore reached
maximum angulation, regardless of continuing increases in brain volume (Ross and Henneberg,
1995).
17
However, according to Strait (1999), although there is evidence for the presence of a
correlation between brain size and increasing basicranial flexion across various primate taxa, the
relationship is not directly causal, indicating the presence of additional factors (Strait, 1999).
Further research has indicated that the cranial base is also closely influenced by the morphology
of the facial skeleton. In his study of postnatal growth changes in primates, Ashton (1957)
concluded that differences in ontogeny of the CBA are related to variations in both cranial and
facial dimensions (Ashton, 1957). In addition, Ashton determined that the foramino-basal angle,
in particular, became more acute in response to the eruption of the permanent teeth, further
indicating that CBA is influenced by facial morphology (Ashton, 1957). Many other researchers,
including Biegert (1963), Sirianni & Swindler (1979), and Kasai et al. (1995), have lent
additional support to this hypothesis.
Furthermore, variation in facial morphology, and therefore in cranial base flexion,
resulting from both sexual and racial variation has been examined. Neaux et al. (2015) found
evidence for sexual dimorphism in basicranial flexion, while Kasai et al. (1993), Kavitha and
Karthik (2012), and Cossio et al. (2016) noted that the shape and flexion of the basicranium are
also influenced by race. Neaux et al. examined cranial base flexion in Pan, Gorilla, and Homo
and determined that sexual dimorphism was present not only in the more obviously dimorphic
chimpanzees and gorillas but also to a significant degree in humans as well. Facial prognathism
was also found to be significantly distinct between the sexes for all three taxa. In addition, Enlow
(1971) determined that the morphology of the cranial base is related to maxillary growth and is
therefore influenced by facial prognathism.
Interestingly, however, although significant evidence for sexual dimorphism in cranial
base flexion has been found in these studies, others have failed to find any significant sexual
dimorphism (Mathias de Almieda et al., 2017). These conflicting results may suggest that sexual
18
dimorphism in the cranial base may be more pronounced in some populations than in others, or
that sexual dimorphism in facial morphology is only one of many factors affecting the cranial
base. Therefore, in light of these conflicting results, the present study will contribute to this
debate by conducting an analysis of variation in basicranial morphology by sex.
Research has also indicated evidence for racial variation in cranial base morphology.
Kavitha and Karthik (2012) determined that, between Africans, Mongoloids, and Caucasians,
craniofacial variation was statistically significantly distinct, not only in overall head shape but
also in facial morphology and prognathism. In addition, Mathias de Almieda et al. (2017) found
the length of the cranial base to be greater in Japanese than in Caucasian females. Chin et al.
(2014) and Kasai (1995), in an assessment of angular and linear cranial base morphology,
hypothesized that the cranial base angle was directly related to the sagittal position of the jaws,
or the degree of prognathism of the maxilla and mandible, which has been observed to vary
between races (Chin et al. 2014, Kasai 1995). Kasai (1995) also found evidence to suggest that
both cranial base shape and size are related to facial morphology, specifically facial length,
inclination of the maxilla, and maxillary and mandibular prognathism (Kasai 1995). Although it
does not appear as though racial dimorphism in the cranial base is disputed, many studies that
have examined the influence of race on cranial base morphology tend to focus on the effect of
the cranial base on the prevalence of dental malocclusions. This results in what is perhaps a
unilateral approach to the measurement and analysis of racial variation in the cranial base.
Therefore, this study will also attempt to analyze racial variation in the cranial base using a
variety of angle measures that may not be as directly influenced by maxillary prognathism.
It also has been suggested that changes in the positioning of the face not only resulted in
changes to the basicranium, but also led to a reduction in the horizontal dimensions of the vocal
tract, resulting in the rearrangement of the position of the vocal tract, tongue, and hyoid bone

19
(Enlow, 1990). Such an association implies a potential connection between the basicranium and
the spatial arrangement of the oral cavity and upper airway. In line with these findings, several
studies spearheaded by Laitman in the late 1970s suggested a possible structural association
between the basicranium and the capacity for speech production. The cranial base forms the roof
of the pharynx, which is responsible for resonance and the production of intonation. The larynx,
responsible for the production of phonation through the modulation of airflow from the lungs,
lies below. Laitman (1976) introduced the theory that basicranial flexion exerts a structural
influence on the position and orientation of the larynx and pharynx (Laitman, 1982: 324;
Laitman and Crelin, 1976; Laitman et al., 1978; Lieberman et al., 1992). In 1978, 1982, and
1985, Laitman fleshed out this theory further, exploring the relationship between changes in
basicranial flexion and the upper respiratory systems of humans and several species of primates
(Laitman et al., 1978: 467).
Unlike many of the previous studies discussed, Laitman et al. measured exocranial
flexion from five points on the external surface of the cranial base: the prosthion, the staphylion,
the hormion, the sphenobasion, and the basion (Laitman, 1978; Lieberman, 1999). Ontogenetic
changes in exocranial flexion were then correlated with the positioning of the upper respiratory
structures (Laitman et al., 1978: 467-9; Lieberman and McCarthy, 1999: 491). Laitman observed
that flexure of the basicranium correlated with the process of hyo-laryngeal descent, in which the
tongue and larynx descend into their adult positioning in the neck by the second year of life
(Laitman et al., 1978: 467; Lieberman et al., 2001: 119). Thus, Laitman concluded that
exocranial flexion was directly correlated (at least structurally, and, possibly, functionally) to the
position of the tongue and larynx as well as to the orientation of pharyngeal constrictor muscles –
integral aspects of the formation of speech (Laitman et al., 1987: 481).
20
While his earlier works describe the correlation between cranial base morphology and
vocal tract structures, Laitman’s later works, in 1982 and 1992, particularly Laitman et al.
(1992), describe the airway’s importance for speech formation (Lieberman et al., 1992: 448). In
humans, the descent of the posterior third of the tongue into the neck results in the formation of
the upper anterior wall of the pharynx and the lowering of the larynx, which separates the
epiglottis from the soft palate (Laitman et al., 1982: 334). As a result of these changes, the
supralaryngeal region of the pharynx is expanded (Laitman et al., 1982: 334). As explained by
Laitman, phonation, or the sounds that make up speech, are produced by the interplay of the
larynx and the supralaryngeal vocal tract (SVT) (Lieberman et al., 1992: 448). The larynx
produces what is known as the fundamental frequency (F0), which is perceived as pitch by
listeners (Lieberman et al., 1992: 450). By contrast, the SVT filters phonemes into speech,
thinning the acoustic energy more at some frequencies than others and producing formant
frequencies (Lieberman et al., 1992: 452). Thus, the SVT enables the production of vowels and
consonants (Lieberman et al., 1992: 454, 456). Raising and lowering the larynx, as occurs during
speech, changes the length of the SVT, thus altering the formant frequencies and producing
various pitches, as in the English vowels "i" and "u" (Lieberman et al., 1992: 457, 462). In other
words, the “baseline” pitch of an individual’s voice is determined primarily by the length of the
larynx and the resulting frequency is further modulated by the SVT.
Laitman’s theories have sparked some controversy, encouraging critique and support
from many sources. While Reidenberg et al. (1991) found evidence of a mechanical relationship
between basicranial flexion and the position and angulation of the larynx and hyoid through
experiments performed on rats, Philip and Daniel Lieberman, in collaboration with several other
authors, have proven more skeptical (Lieberman et al., 1992; Lieberman and McCarthy, 1999;
Lieberman et al., 2000; Lieberman et al., 2001; Lieberman, 2007). Lieberman and McCarthy

21
(1999) and Lieberman et al. (2000) examined ontogenetic changes in CBA and determined that
the larynx and hyoid continue to descend after the base of the cranium has become fully flexed
(Lieberman and McCarthy, 1999: 117; Lieberman et al., 2000: 155). In addition, Lieberman et
al. (2001) argued that the rate of hyo-laryngeal descent is primarily constrained by the
development of swallowing ability, or deglutition since the surrounding hard and soft tissue
structures must remain proportionally stable throughout ontogeny to make deglutition possible
(Lieberman et al., 2001: 124). Therefore, Lieberman argues against Laitman's claim that the
cranial base and other aspects of cranial morphology impact the rate and degree of hyo-laryngeal
descent, nor can it be used to predict whether a fossil possessed modern adult human vocal tract
morphology (Lieberman et al., 2001: 126; Lieberman, 2007: 46; Laitman and Crelin, 1976;
Laitman et al., 1978).
However, although Lieberman attributes deglutition to the ontogeny of hyo-laryngeal
descent, he does not rule out a correlation between aspects of cranial shape (particularly the
shortening of the face and retraction of the palate under the cranium, both of which are
associated with decreased CBA) and the rate of hyo-laryngeal descent (Lieberman et al., 2001:
126). In fact, Lieberman considers structural and spatial constraints imposed by cranial base
flexion to be the primary reason for the oropharynx’s failure to expand during ontogeny
(Lieberman et al., 2001: 126).
Thus, as revealed by this brief review of the current literature surrounding the
basicranium, cranial base flexure is influenced by a number of spatial relationships both within
and beyond the cranium itself. None of the theories presented here are mutually exclusive, but
rather supplement each other in an increasingly nuanced understanding of the complex spatial
interactions that affect the morphology and ontogeny of the basicranium.
22
Growth Trends of the Basicranium
As revealed over several decades of study, the various cranial bones comprising and
influencing the cranial base experience differential growth patterns, thus affecting the ontogeny
of the cranial base. The three primary bones of the cranial base: the occipital, sphenoid, and
ethmoid bones, ossify endochondrally in a pattern corresponding to the ossification of vertebrae
(Kjaer, 1990; Kjaer et al., 1993). Cartilaginous precursors of these bones develop around the
40th day of gestation, and ossification progresses caudo-rostrally from the basioccipital to the
ethmoid (Kjaer, 1990). As a result, at birth, the main growth centers in the cranial base lie
between the basisphenoid and the basioccipital (known as the spheno-occipital synchondrosis)
and between the presphenoid and the frontal bones, which results in elongation between the
frontal and sphenoid bones (Ford, 1958). At birth, between 30% and 60% of all craniofacial
growth is complete (Myer, 1995). While the growth of the spheno-occipital synchondrosis
continues into and beyond adolescence, growth ceases at the spheno-mesethmoid synchondrosis
by age seven, and at the cribriform plate by age two (Ford, 1958). By age six, 80% of cranial
base growth is complete (Myer, 1995).
Researchers have shown that various areas of the cranial base, depending on their origins
and functions relative to the braincase and facial skeleton, follow either a neural or somatic
pattern of growth. The neural pattern (or the growth pattern of the brain and associated
structures) is characterized by rapid growth during early development, which begins to decrease
around the second year of life, and eventually plateaus around seven to eight years (Simpson,
2014). By contrast, somatic growth patterns increase from birth to adulthood, with a growth spurt
in adolescence (Simpson, 2014). Areas between the nasion and foramen caecum (Na-Fc) and
between the sella and basion (S-Ba) follow the somatic growth pattern, while the sagittal length
of the foramen magnum and the area between the foramen caecum and sella (Fc-S) follow a
23
neural growth pattern (Ford, 1958; Zuckerman, 1955). Upon closer examination, the anterior
aspects of the cranial base more closely follow the growth of the facial skeleton, while the
posterior regions of the cranial base follow the growth of the brain (or endocranial cavity)
(Michejda, 1975).
Evidence of sexual dimorphism in basicranial growth has also been found. Boys were
found to experience a growth spurt in overall cranial dimensions at puberty while girls did not, a
factor which may affect the morphology of the basicranium (Lewis et al., 1985). In a study
comparing growth trends between boys and girls, Ursi et al. (1993) found that the timing of
various growth events varied. While overall, the anterior cranial base reached mature form
earlier than the posterior cranial base, followed by various elements of the facial skeleton,
females tended to reach mature form earlier than males (Ursi et al., 1993; Buschang et al., 1983).
Also, important to note are trends of individual variation in craniofacial growth observed
by several researchers making use of longitudinal data (Brodie, 1941; Björk, 1955; Zuckerman,
1955). While average values tend to show fairly constant increases or decreases in angulation, a
closer examination reveals significant fluctuation around a mean angle value within one
individual (Simpson, 2014).
Context for and Aims of the Present Study
The primary aim of the present study is to investigate and attempt to replicate a portion of
the aforementioned investigation conducted by Lieberman and McCarthy in 1999, which is
summarized here. In this study, Lieberman and McCarthy sought to fill a gap in the literature
surrounding the specific processes of cranial base ontogeny in humans and non-human primates
and the degree of variation in these processes both within and between these species. The authors
explicitly identified three main questions: a) how do different measures of CBA differ
24
throughout ontogeny due to changing spatial relationships between cranial bones? b) what is the
extent to which ontogenetic differences between humans and other species make otherwise
comparable measures of CBA misleading? and c) to what extent does CBA affect pharyngeal
dimensions?
To answer these questions, Lieberman and McCarthy compared CBA within and between
longitudinal radiographs of humans and chimpanzees divided into age bins. Specifically, they
compared five measures of CBA (four internal and one external) between humans and
chimpanzees, examined the ontogeny of these five angle measures relative to pharyngeal growth,
and tested whether pharyngeal dimensions could be estimated using these and other craniofacial
measurements. Radiographs of the human sample were drawn from the Denver Growth Study.
Their sample included 15 males and 13 females of European descent.
Results of their study showed that, in humans, there was a statistically significant (P <
0.05) difference in mean CBA between successive age intervals in all CBA before the age of 2,
decreasing between 8.6° and 15.3° (depending on which CBA measure was used), yet there was
no statistically significant change after 2 years of age. Similarly, CBA 5, the measure of external
CBA, showed a cessation of flexion in humans by age 2. CBA 5 was not measured for P.
troglodytes. Specifically, for all internal CBA (1-4), humans younger than 1 year and 9 months
showed much higher flexion (more acute angulation) than all humans older than 2 years and 9
months, at a confidence interval of P < 0.001. This pattern of flexion is synchronous with brain
growth in humans. In chimpanzees, all CBA continue to widen (extend) with age, showing a
fairly linear increase (skeletal growth trajectory), statistically significant at P < 0.05. No
significant difference was observed in CBA 1-4 between males and females across all age groups
in either humans or chimpanzees. These results revealed that humans and chimpanzees are
subject to different types and degrees of ontogenetic changes in the angle of the cranial base
25
(flexion vs. extension). Chimpanzees also experienced a higher degree of postcranial extension
than H. sapiens (more than double), ranging between 15.5° and 27.1° (depending on which angle
was used).
Correlations between internal CBA (CBA 1-4) and external CBA were significant,
although fairly low (between 0.25 and 0.49). No statistically significant relationship was found
between either internal cranial base angles (CBA 1-4) or the external cranial base angle (CBA 5)
and the vertical and horizontal dimensions of the vocal tract. The authors, therefore, determined
that the vocal tract experienced a skeletal growth trajectory, while all CBA corresponded more
closely with a neural growth trajectory, plateauing by the second age bracket. However, the
authors did find strong linear relationships between the hyoid, larynx, and the base of the
mandible, as well as evidence of sexual dimorphism in hyoid depth (from the palatal plane), with
a lower hyoid in males than females (P < 0.05).
Lieberman and McCarthy conclude that their results indicate that postnatal basicranial
flexion is unique to humans, and most likely stimulated by the expansion of the brain. In
contrast, the majority of cranial base extension in chimpanzees occurs after cessation of brain
growth and is, therefore, more closely linked to facial growth than it is in humans. However, the
authors acknowledge that some researchers (Cousin et al., 1981; Zuckerman, 1955) have found
the trajectory of cranial base angulation to be longer in humans, continuing to change up to
between 4-8 years of age, significantly beyond the cessation of brain growth at age two.
However, the authors attribute this difference to the use of cross-sectional samples rather than
longitudinal.
Although the authors attribute these differences to sampling technique, the present study
hypothesizes that this difference was too large to be due only to the use of a cross-sectional
sample. Although cross-sectional studies can be less precise, an examination of the Cousin et al.
26
(1981) and Zuckerman (1955) studies revealed additional differences in sampling and methods
not discussed by Lieberman and McCarthy. Although the 1981 study by Cousin et al. was
examined, the authors’ use of the vestibular method (measured in relation to the vestibular
horizontal) is not conventional within the literature on human cranial anatomy and, as such,
Cousin et al.’s measurements were ultimately not comparable to those employed by Lieberman
and McCarthy. The Zuckerman (1955) study, however, was investigated more closely as a foil to
Lieberman and McCarthy’s conclusions surrounding basicranial ontogeny and is accordingly
summarized below.
The goal of Zuckerman’s study was simply to determine whether age-related basicranial
changes occurred in humans. Zuckerman’s investigation was conducted on a single sample of
190 skulls belonging to both sexes and multiple races. The samples were not separated and
analyzed according to these categories, however. Although Zuckerman acknowledged that doing
so may have introduced additional variation or obscured age-based differences, he argued that
the sample size was too small to determine trends of any significance within such divisions.
Despite this, within each of Zuckerman’s age bins, the number of individuals was mostly
comparable to Lieberman and McCarthy’s sample size (13 girls, 15 boys), although Zuckerman’s
sample for the 9-14 age bin was quite small (4 individuals). Therefore, Zuckerman divided the
skulls into the following age groups based on dental age: Under 1, 1-2, 3-5, 6-8, 9-14, 15-21,
Adult, and Senile. Several points were marked using lead slugs, and the skulls were then X-
rayed. The distances between various points (basion, opisthion, nasion, and prosphenion) were
measured, and two diagnostic angle measures (foramino-basal and spheno-ethmoidal angles)
were recorded. As an extra step, to correct for any error or parallax introduced by the
radiographs, the same distances were measured on the skulls using calipers and all X-ray
27
measurements were converted to “actual” measurements (a step which was not possible for the
sample used by Lieberman and McCarthy, or for the sample used in this study).
Results showed a markedly longer trend in cranial base flexion than that observed by
Lieberman and McCarthy. By approximately age 8, the cranial base was determined to have
completed only half of its total antero-posterior growth, as the basioccipital, basisphenoid,
presphenoid, and ethmoid bones (which comprise various aspects of the cranial base) continue
growing into adulthood. Although analysis of variance revealed significant differences within
each age group, t-tests conducted at a significance of P < 0.02 showed the basicranium to be
increasing significantly in length throughout development, with growth after puberty remaining
significant. Comparable trends were observed in the nasion-pituitary point distance. However, no
significant change was observed in the size of the foramen magnum following the eruption of
permanent teeth, around 6-8 years of age. However, while significant growth trends were
observed in the linear dimensions of the basicranium, changes in angulation were much less
pronounced. Although the changes were small, analysis of variance indicated that differences in
angulation were nevertheless significant across age groups. At a significance level of P < 0.02,
flexion of the foramino-basal and spheno-ethmoidal angles increased significantly between the
1-2, 3-5, 6-8, and adult age groups.
Therefore, Zuckerman concludes that the posterior part of the basicranium ceases to grow
earlier than the central and anterior parts, which continue to grow until and even beyond puberty.
As a result of Zuckerman’s variable dataset (including individuals of multiple races) and the
structure of his study, his results reveal only very general growth trends, yet do not capture
individual or within-group growth patterns. By contrast, Lieberman and McCarthy do not
consider the effects of race on their sample, as the Denver Growth Study dataset used in their
analysis is composed only of children of European descent. Therefore, in comparing

28
Zuckerman’s results to those obtained by Lieberman and McCarthy, factors worth considering
include the type of sample (longitudinal or cross-sectional), the races and sexes included in the
sample, and the measurements used to describe growth trends.
Therefore, the goals of this study are threefold: 1) to test Lieberman and McCarthy’s
(1999) conclusions concerning the stabilization of cranial base flexion at approximately age 2
using the Krogman Dataset, 2) to test whether observed trends in cranial base angulation vary
according to race and sex, and 3) to determine whether differing sampling and measuring
techniques capture different spatial relationships and therefore influence observed flexion
patterns.
29
Chapter 2: Materials and Methods Samples
The samples used in this study were taken from a collection of mixed cross-sectional and
longitudinal radiographs collected by Dr. Wilton Krogman’s KCRCGD Growth Study and
housed at the Penn Museum of Archaeology and Anthropology.
Dr. Krogman (1903-1987), an American anthropologist and a pioneer in the fields of
physical and forensic anthropology, was interested in human craniofacial and skeletal growth
and development (J. Monge, personal communication, June 26, 2018). To that end, Krogman set
out to develop standards of growth for normal, healthy children of elementary and high school
age, founding the W.M. Krogman Center for Research in Child Growth and Development
(KCRCGD) (J. Monge, personal communication, June 26, 2018). Beginning in 1948, Krogman
collected cross-sectional and longitudinal data from a sample of several thousand children,
including boys and girls of both African and European descent (Blacks and Whites) from the
greater Philadelphia metropolitan area (J. Monge, personal communication, June 26, 2018).
The dataset includes extensive anthropometric measurements including height, weight,
body mass index (BMI), as well as several thousand radiographs including hand/wrist, frontal
(anterior-posterior), and lateral cephalograms (J. Monge, personal communication, June 26,
2018). The KCRCGD dataset is the largest longitudinal study ever conducted on child growth in
the U.S., and the largest dataset in the world of people of African ancestry (J. Monge, personal
communication, June 26, 2018). The X-ray images and physiological records collected during
this study fill seventeen filing cabinets at the University of Pennsylvania (J. Monge, personal
communication, June 26, 2018). The remainder of the dataset, which contains personal, social,
and contextual information of all children studied, comprises a total of seventy-two filing
30
cabinets in the records of the National Collaborative Perinatal Project (NCPP) (J. Monge,
personal communication, June 26, 2018).
Although at the time consent forms were not commonly used, participation was
voluntary, and families were able to view their children’s files and medical information at any
time (J. Monge, personal communication, June 26, 2018). Due to the age of these materials, the
dataset has been determined to have no current clinical significance (J. Monge, personal
communication, June 26, 2018). In addition, as the data have no primary researcher or single
permanent home, they are now considered “orphaned” (J. Monge, personal communication, June
26, 2018).
All identifying information was coded and de-identified prior to collection. Following a
consultation with the Internal Review Board, this project was determined to be exempt from
HSERA. Of the extensive information recorded for each individual, only case numbers, age, sex,
and race were recorded in this study. Because the radiographs had already been collected as part
of the initial KCRCGD study, no radiographs were taken by the author.
A total sample size of 39 individuals was examined, comprising 20 black individuals (10
male and 10 female) and 19 white individuals (10 male and 9 female) for a total of 148
radiographs. Initially, radiographs of 10 white females were collected, but the tenth was
excluded, not only because her race had been incorrectly recorded and she was, in fact, black, but
also because her age exceeded the bounds of this study.
Methods
In the interest of accuracy and to eliminate possible error introduced by dark or blurry
radiographs, all hard-copy radiographs were scanned onto the computer. The scans were then
uploaded into Adobe Photoshop, where brightness and contrast were adjusted to provide better

31
visibility. Landmark points and planes were identified and marked on the image of the
radiograph in Photoshop, and the zoom function was used to ensure that the points were placed
accurately and consistently. All angle measurements were made using Adobe Photoshop’s ruler
tool, which reported the marked angle to one decimal place.
All landmarks, planes, and angles used in this study were drawn from Lieberman and
McCarthy (1999) and Zuckerman (1955). A total of seven angles were measured, five of which
were drawn directly from Lieberman and McCarthy (CBA 1-5), and two of which were taken
from Zuckerman (Z1-2). These angles were chosen in order to facilitate comparisons between
the results of this study and the results obtained by Lieberman and McCarthy (1999) as well as to
determine whether the angles measured by Lieberman and McCarthy and Zuckerman captured
substantially different spatial relationships in angle ontogeny. Tables 2.1, 2.2, and 2.3 report the
landmarks, planes, and angles identified and measured, including abbreviations and definitions
for each as well as the source study (Lieberman and McCarthy 1999 or Zuckerman 1955) from
which the point, plane, or angle was drawn.
Landmarks included: basion (Ba), sella (S), sphenoidale (Sp), foramen caecum (FC),
hormion (H), sphenobasion (Sb), opisthion (Op), pituitary point (PP), prosphenion (Pr), and
nasion (Na). However, over the course of this study, the quality of the Krogman radiographs
necessitated some slight adjustment of the points Op and Pr in order to ensure that they were
visible across all radiographs so that the points could be recorded consistently and accurately.
The adjusted position of these landmarks is shown in Figure 2.
Planes were drawn between basion and sella (SP), sella and foramen caecum (FCP),
sphenoidale to the planum sphenoidum point (PSP), basion to a point on the dorsal margin of the
occipital clivus (CP), basion to the pituitary point (BP), and prosthion to nasion (PN).
32
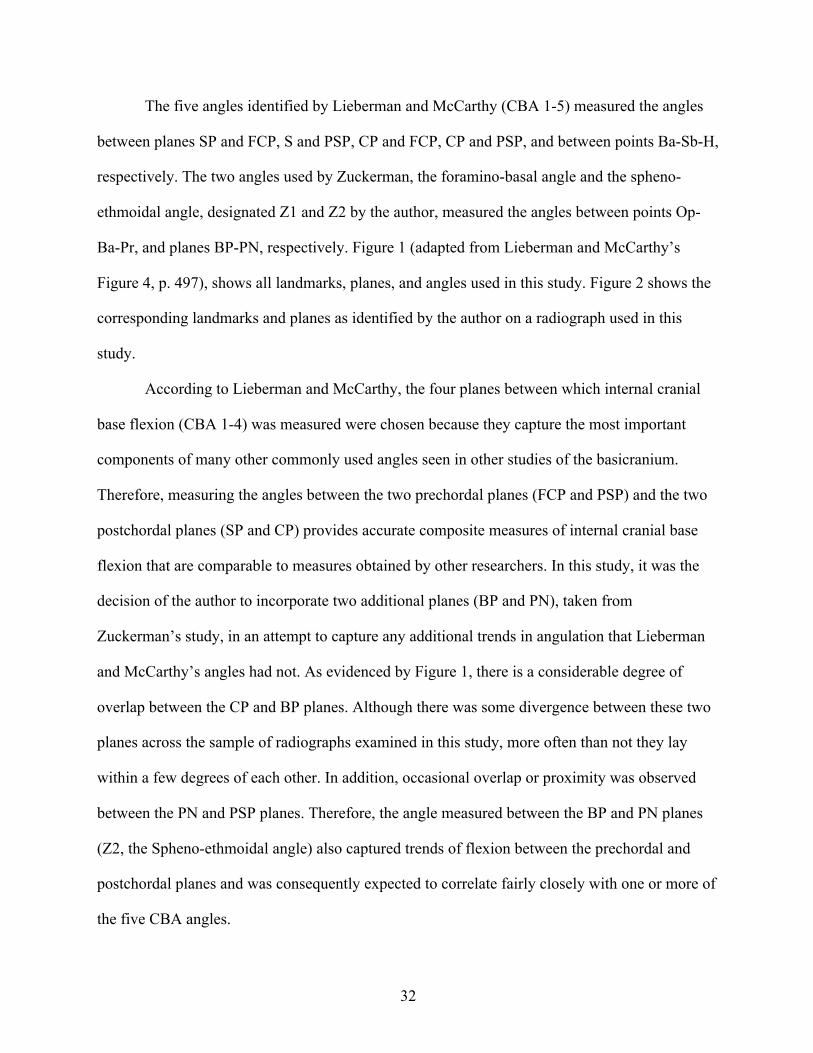
The five angles identified by Lieberman and McCarthy (CBA 1-5) measured the angles
between planes SP and FCP, S and PSP, CP and FCP, CP and PSP, and between points Ba-Sb-H,
respectively. The two angles used by Zuckerman, the foramino-basal angle and the spheno-
ethmoidal angle, designated Z1 and Z2 by the author, measured the angles between points Op-
Ba-Pr, and planes BP-PN, respectively. Figure 1 (adapted from Lieberman and McCarthy’s
Figure 4, p. 497), shows all landmarks, planes, and angles used in this study. Figure 2 shows the
corresponding landmarks and planes as identified by the author on a radiograph used in this
study.
According to Lieberman and McCarthy, the four planes between which internal cranial
base flexion (CBA 1-4) was measured were chosen because they capture the most important
components of many other commonly used angles seen in other studies of the basicranium.
Therefore, measuring the angles between the two prechordal planes (FCP and PSP) and the two
postchordal planes (SP and CP) provides accurate composite measures of internal cranial base
flexion that are comparable to measures obtained by other researchers. In this study, it was the
decision of the author to incorporate two additional planes (BP and PN), taken from
Zuckerman’s study, in an attempt to capture any additional trends in angulation that Lieberman
and McCarthy’s angles had not. As evidenced by Figure 1, there is a considerable degree of
overlap between the CP and BP planes. Although there was some divergence between these two
planes across the sample of radiographs examined in this study, more often than not they lay
within a few degrees of each other. In addition, occasional overlap or proximity was observed
between the PN and PSP planes. Therefore, the angle measured between the BP and PN planes
(Z2, the Spheno-ethmoidal angle) also captured trends of flexion between the prechordal and
postchordal planes and was consequently expected to correlate fairly closely with one or more of
the five CBA angles.
33
Figure 1. Simplified outline of lateral radiograph showing all landmarks and planes measured. See Tables 1.1, 1.2, and 1.3 for detailed descriptions (after Lieberman and McCarthy, 1999: 497).
Figure 2. Landmarks and planes located on a radiograph used in this study. Landmarks are labeled in lowercase, and planes in capital letters.
34
(after Lieberman and McCarthy 1999: 498 and Zuckerman 1955: 521)
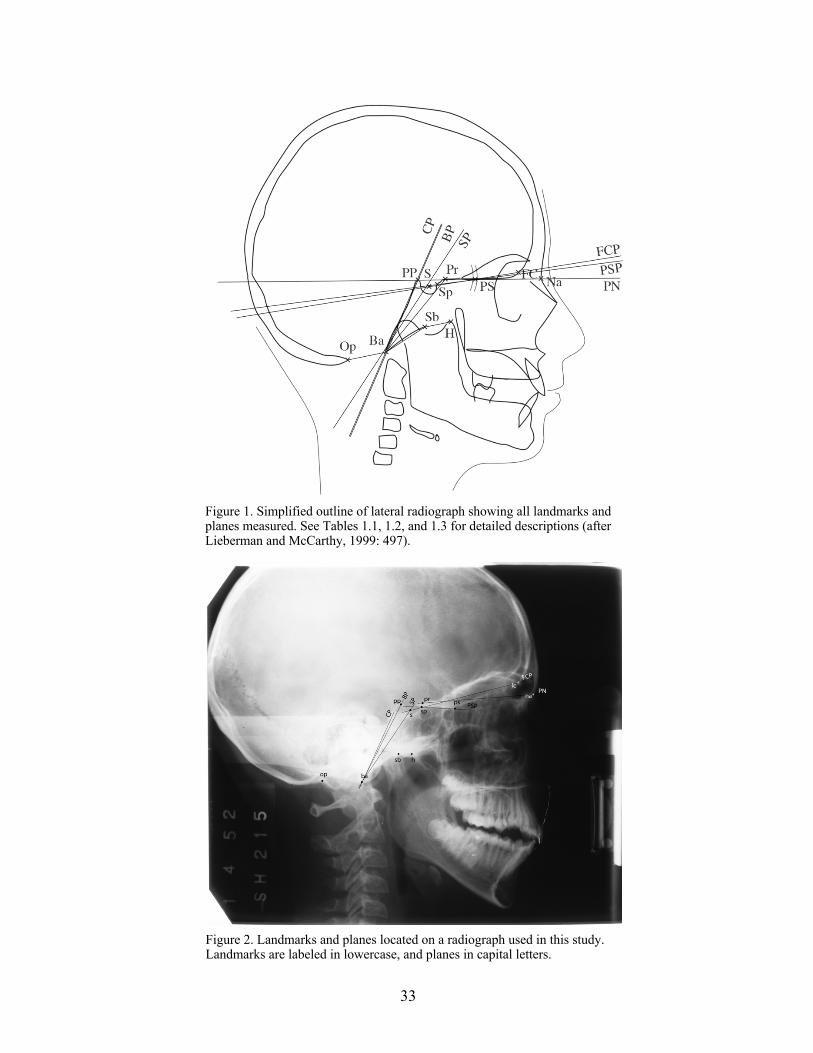
Table 2.1: Landmarks used
Landmark Abbreviation Definition Source
Opisthion Op Posterior point of the foramen magnum Zuckerman, 1955
Basion Ba The midsagittal point on the anterior margin of the foramen magnum
Lieberman and McCarthy, 1999
Sphenobasion Sb
The point in the middle of the spheno-occipital suture on the external portion of the clivus, at the junction of the basioccipital and sphenoid bones
Lieberman and McCarthy, 1999
Pituitary Point PP
The anterior edge of the groove for the optic chiasma, just in front of the pituitary fossa Zuckerman, 1955
Sella S
The center of the sella turcica (determined independently of the contours of the clinoid process)
Lieberman and McCarthy, 1999
Sphenoidale Sp
The most posterior and superior midline point on the tuberculum sellae
Lieberman and McCarthy, 1999
Planum Sphenoidum PS
The superior-most point on the sloping surface of the pit in which the cribriform plate is set (as defined by Ross and Ravosa, 1993)
Lieberman and McCarthy, 1999
Hormion H Posterior-most midline point on the vomer
Lieberman and McCarthy, 1999
Prosphenion Pr The anterior limit of the presphenoid Zuckerman, 1955
Foramen Caecum FC
Pit on the cribriform plate between the crista galli and the endocranial wall of the frontal bone
Lieberman and McCarthy, 1999
Nasion Na The most anterior point of the frontonasal suture Zuckerman, 1955

35
(after Lieberman and McCarthy 1999: 498 and Zuckerman 1955: 521)
(after Lieberman and McCarthy 1999: 498 and Zuckerman 1955: 521)
Table 2.2: Planes used
Plane Abbreviation Definition Source
Sella Plane SP Plane extending from basion to sella
Lieberman and McCarthy, 1999
Clival Plane CP
Plane from basion to a point on the clivus before the dorsum sellae curves posteriorly
Lieberman and McCarthy, 1999
Focamen Caecum Plane FCP
Plane from sella to foramen caecum
Lieberman and McCarthy, 1999
Planum Sphenoidum Plane PSP
Plane from sphenoidale to the planum sphenoideum point
Lieberman and McCarthy, 1999
Basion Plane BP Plane from basion to the pituitary point Zuckerman, 1955
Prosthion-Nasion Plane PN Plane from prosthion to nasion Zuckerman, 1955
Table 2.3: Angles measured
Angle Measured between Definition Source
CBA 1 SP-FCP Angle between the sella and foramen caecum planes
Lieberman and McCarthy, 1999
CBA 2 SP-PSP Angle between the sella and pre-sphenoid planes
Lieberman and McCarthy, 1999
CBA 3 CP-FCP Angle between the clival and foramen caecum planes
Lieberman and McCarthy, 1999
CBA 4 CP-PSP Angle between the clival and pre-sphenoid planes
Lieberman and McCarthy, 1999
CBA 5 Ba-Sb-H
Angle between the external clival plane and the hormion plane, measured between basion, sphenobasion, and hormion
Lieberman and McCarthy, 1999
Z1 Op-Ba-Pr
Foramino-basal angle, measured between the basicranial axis and the plane of the foramen magnum Zuckerman, 1955
Z2 BP-PN
Spheno-ethmoidal angle, measured between the basicranial axis and the presphenoid-nasion plane Zuckerman, 1955
36
Chapter 3: Results and Discussion Results
Following Lieberman and McCarthy’s example, in order to determine the average
measurement error introduced as a result of inconsistent radiograph quality or human error, a
single factor analysis of variants (ANOVA) was used to compare five sets of measurements,
repeatedly taken from the same radiograph on five different days. The null hypothesis (H0) being
tested was that all replicative measurements were the same. Results of the ANOVA showed that,
for the most part, none of the angle measures recorded were statistically significantly different
from each other. However, the fifth test appeared to differ significantly from test one and test
two, but not from test three and test four – a relatively common outcome of repeated measures
analyses. Measurement error averaged across all angles was ± 0.0028°.
Despite this fairly low measurement error, however, repeated angle measures taken at
various time intervals revealed a significant amount of variation within each individual. Across
every angle in every individual, fluctuation around a mean angle value was observed over time.
These fluctuations most likely resulted either from measurement error or the cumulative effects
of a small sample size and relatively few longitudinal data points. This tendency toward
fluctuation in cranial base angulation has been observed by previous studies examining
longitudinal data (Brodie, 1941; Björk, 1955; Zuckerman, 1955), although analyses conducted
on all aggregated individuals tend not to be affected by this individual variation. In this study as
well, as results will show, individual variation appeared not to be significant enough to reveal
differences in cranial base angulation by age. However, no satisfactory explanation has yet been
offered for this fluctuation.
Prior to conducting statistical analysis, univariate descriptive statistics (numerical and
graphical) were generated for all seven cranial base angles grouped by age, sex, and race
37
categories using IBM SPSS statistical software in order to characterize each distribution. Once
the assumption of normality was evaluated and accepted, means and standard deviations of each
group (age, sex, and race) were compared, and the data were analyzed using single factor
ANOVA and independent sample t-tests. A single factor ANOVA was used to examine trends in
cranial base angle by age groups. Independent sample t-tests were used to examine trends in
cranial base angle by sex and by race. Correlation between Lieberman and McCarthy’s original
five angles was then examined using least-squares (LSR) regression. The results of these
analyses are presented below.
Statistical Description
Descriptive statistics were generated for all cranial base angles by age, sex, and race.
From these statistics, the assumption of normality was accepted for all broader groups (age, sex,
race).
Age Because the ages of each individual sampled were recorded in decimal notation, the data
were re-coded into age bins. While the majority of the samples fell between ages 9 and 16, many
of the younger and older ages were represented by only one sample. With the exception of age
bin 17, which was represented by 2 samples, and age bin 21, which was represented by 3
samples, all ages that were grouped into the 2-8 and 17-25 age bins were represented by only one
sample each. As a result of these extremely small sample sizes, the more well-represented ages
9-16 were separated into age bins of width one year, while ages below 8 and above 16 were
grouped into one age bin each. In all graphs and tables, age bin 0-8 is designated ‘8,’ while age

38
bin 17-25 is designated ’17.’ Therefore, over a range of ages from 2 to 25, the data were split
into nearly equal thirds.
Histograms generated for each angle across all age bins represented in multiple samples
revealed that nearly all distributions approached the normal curve, although, age bins with fewer
representative samples tended to be slightly skewed. A series of boxplots generated for each
angle across all age bins revealed significant fluctuation around the mean. These boxplots are
reproduced in Figure 3. Across all distributions, 95% Confidence Intervals for the mean showed
significant overlap. The means, sample sizes, and standard deviations of all seven cranial base
angles are reported for all age bins in Table 3.1.
Sex Histograms generated for each angle by sex revealed distributions approaching the
normal curve, although there did appear to be a slight tendency towards bimodality in the female
distributions for CBA 2 and CBA 4, and a tendency towards bimodality in the male distribution
in Z2. Nevertheless, measures of skewness were very low in all groups. Boxplots generated for
male and female groups across all angles reveal a greater spread (greater range of data) in the
male distributions for CBA 1-5, but a comparable spread between males and females in Z1, and a
greater spread in the female distribution than in males in Z2. These boxplots are reproduced in
Figure 4. 95% Confidence Intervals for the mean did not overlap for CBA 1, CBA 3, CBA 5, Z1
and Z2, although significant overlap was observed in CBA 2 and CBA 4. The means, sample
sizes, and standard deviations for all cranial base angles in each sex category (male/female) are
reported in Table 3.2.
Race
Histograms generated for each angle by race revealed distributions closely approaching
the normal curve (although the distribution for whites for angle Z2 appeared to be slightly
39
bimodal). Measures of skewness were very low in all groups. 95% Confidence Intervals for the
mean overlapped for the majority of the angles (CBA 1, CBA 3, CBA 5, Z1, and Z2), although
overlap was not observed for CBA 2, CBA 4. Also worthy of note is that the number of
radiographs is fairly different for each race category since a greater percentage of individuals
sampled longitudinally were black. Therefore, n = 53 for the white sample while n = 94 for the
black sample. Boxplots (Figure 5) reveal that the spread of the black sample was generally
smaller than that of the white sample, likely due to sample size. The means, sample sizes, and
standard deviations for all cranial base angles in each race category (black/white) are reported in
Table 3.3.

40
Figure 3. Boxplots showing the overall distribution of each angle by age bin. These data reveal significant fluctuation of angle measures around a semi-consistent median value. Open circles represent moderate outliers, while asterisks indicate extreme outliers. All outliers are labeled by case number

41
Figure 4. Boxplots showing the distribution of each angle by sex. Outliers are labeled by case number. Boxplots for all angles except Z1 and Z2 show the spread of cranial angles to be greater in males than in females.
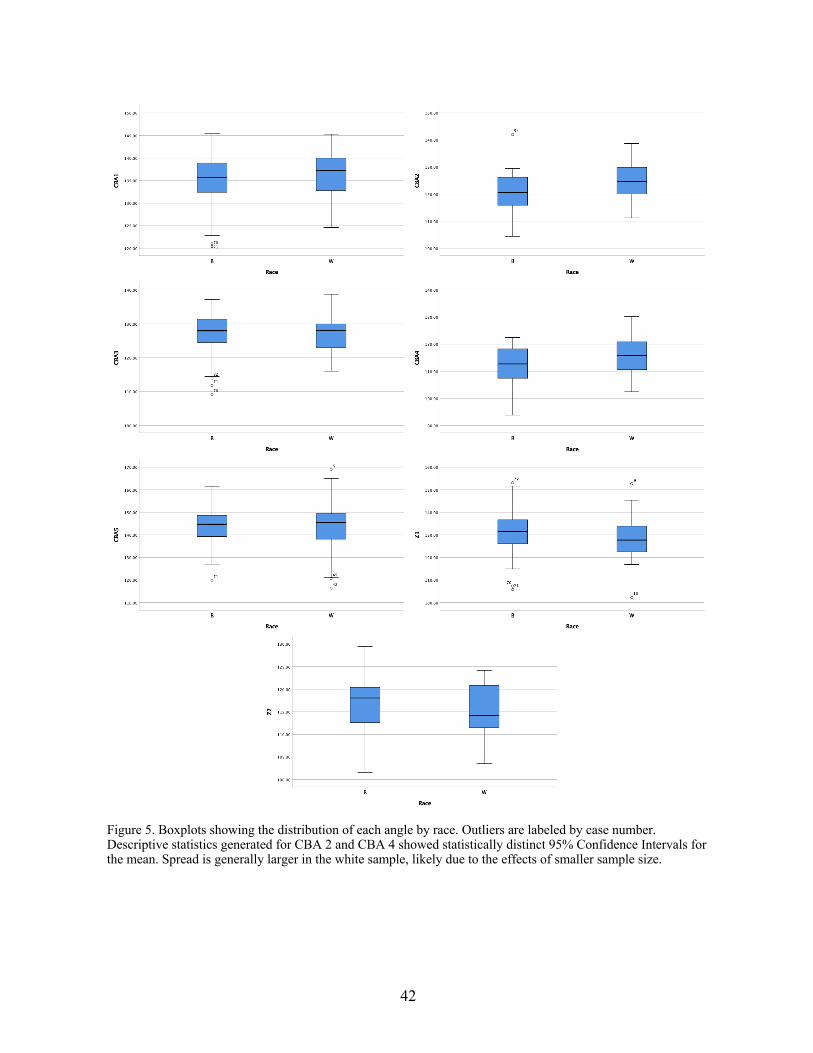
42
Figure 5. Boxplots showing the distribution of each angle by race. Outliers are labeled by case number. Descriptive statistics generated for CBA 2 and CBA 4 showed statistically distinct 95% Confidence Intervals for the mean. Spread is generally larger in the white sample, likely due to the effects of smaller sample size.
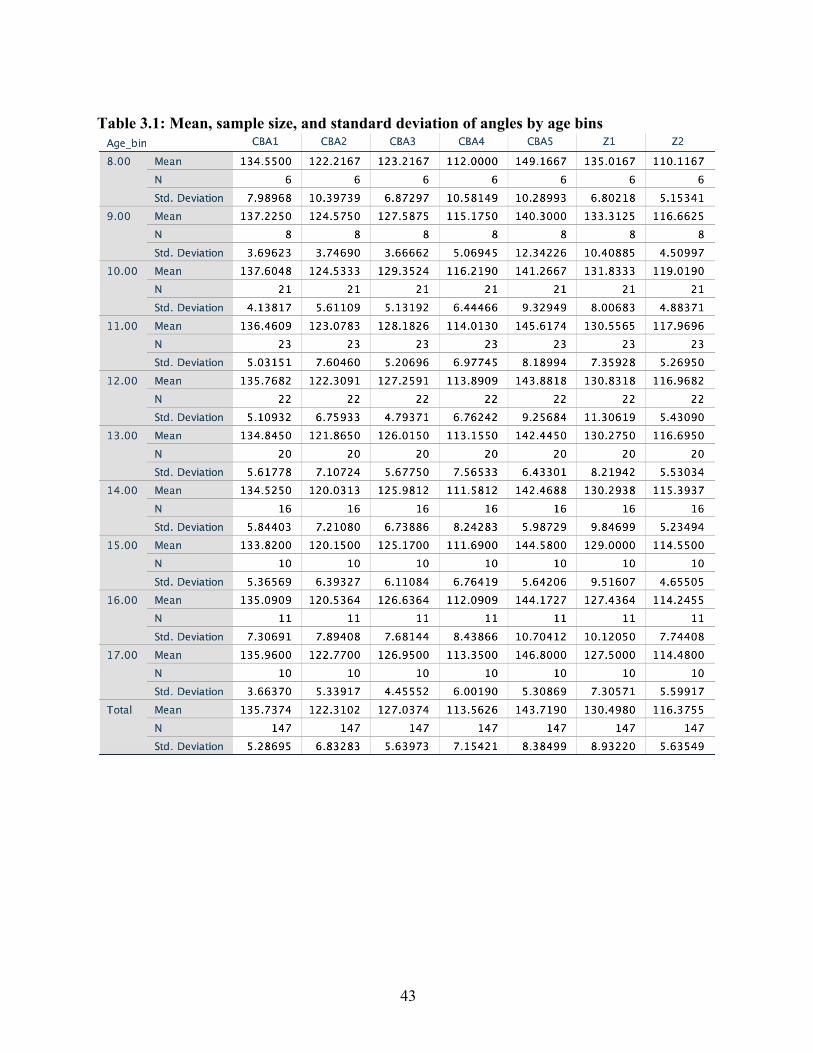
43
Table 3.1: Mean, sample size, and standard deviation of angles by age bins

44
Table 3.2: Mean, sample size, and standard deviation of angles by sex
Table 3.3: Mean, sample size, and standard deviation of angles by race
Hypothesis Testing
The overall distributions of the seven cranial base angle measures were grouped by age
bin, by sex, and by race, and statistical tests were performed on each group using IBM SPSS
statistical software.
Age A single factor ANOVA test was used to determine whether the fluctuations observed in
cranial base angle across age groups were statistically significant at α = 0.05. The null hypothesis
(H0) being evaluated was that there is no significant difference in cranial base angle by age. A
Test of Homogeneity of Variance was run, and the Levene statistic was not significant (P > 0.05)
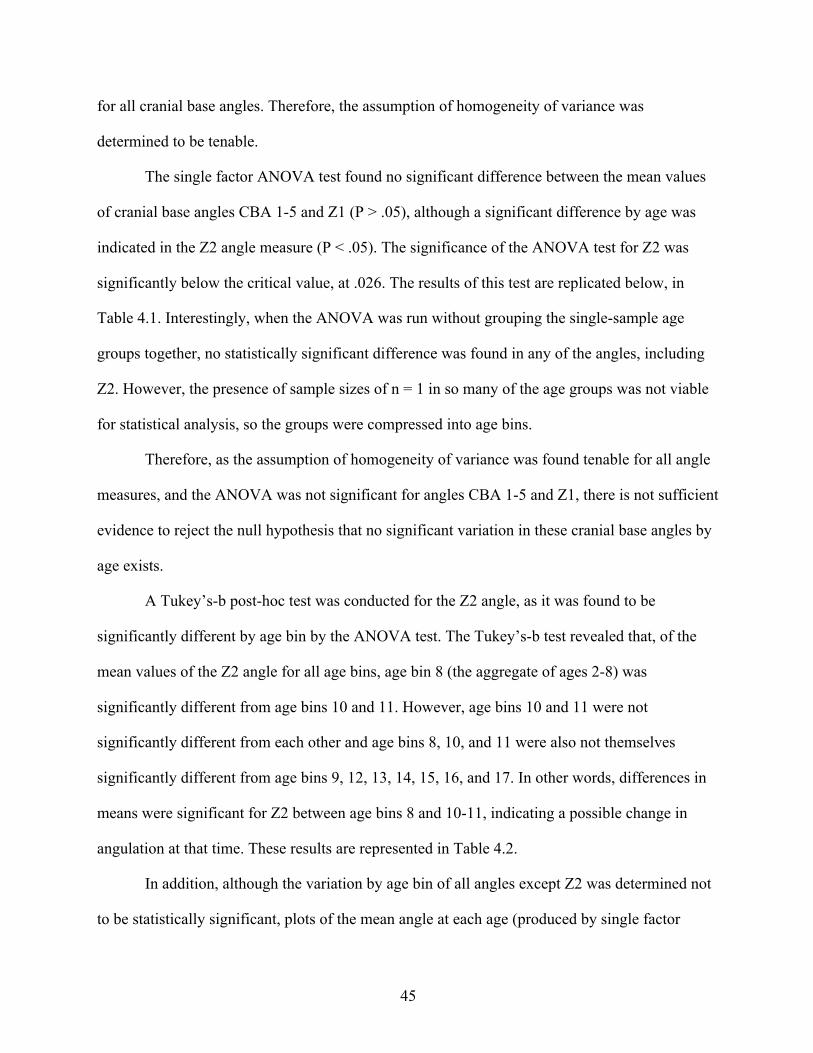
45
for all cranial base angles. Therefore, the assumption of homogeneity of variance was
determined to be tenable.
The single factor ANOVA test found no significant difference between the mean values
of cranial base angles CBA 1-5 and Z1 (P > .05), although a significant difference by age was
indicated in the Z2 angle measure (P < .05). The significance of the ANOVA test for Z2 was
significantly below the critical value, at .026. The results of this test are replicated below, in
Table 4.1. Interestingly, when the ANOVA was run without grouping the single-sample age
groups together, no statistically significant difference was found in any of the angles, including
Z2. However, the presence of sample sizes of n = 1 in so many of the age groups was not viable
for statistical analysis, so the groups were compressed into age bins.
Therefore, as the assumption of homogeneity of variance was found tenable for all angle
measures, and the ANOVA was not significant for angles CBA 1-5 and Z1, there is not sufficient
evidence to reject the null hypothesis that no significant variation in these cranial base angles by
age exists.
A Tukey’s-b post-hoc test was conducted for the Z2 angle, as it was found to be
significantly different by age bin by the ANOVA test. The Tukey’s-b test revealed that, of the
mean values of the Z2 angle for all age bins, age bin 8 (the aggregate of ages 2-8) was
significantly different from age bins 10 and 11. However, age bins 10 and 11 were not
significantly different from each other and age bins 8, 10, and 11 were also not themselves
significantly different from age bins 9, 12, 13, 14, 15, 16, and 17. In other words, differences in
means were significant for Z2 between age bins 8 and 10-11, indicating a possible change in
angulation at that time. These results are represented in Table 4.2.
In addition, although the variation by age bin of all angles except Z2 was determined not
to be statistically significant, plots of the mean angle at each age (produced by single factor

46
ANOVA) reveal interesting trends in the fluctuation of each angle. These plots are reproduced in
Figure 6.
Table 4.1: ANOVA results for variation in cranial base angle by age bin for all individuals

47
Table 4.2: Results of Tukey’s-b post-hoc test for angle Z2
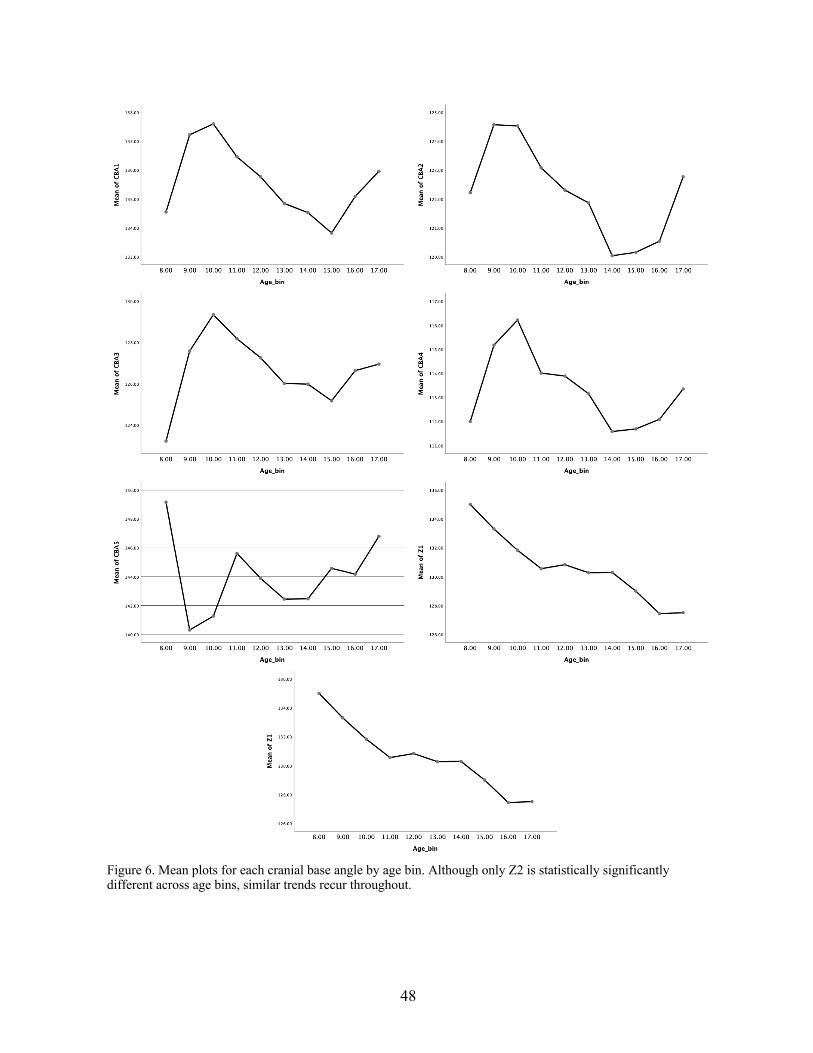
48
Figure 6. Mean plots for each cranial base angle by age bin. Although only Z2 is statistically significantly different across age bins, similar trends recur throughout.
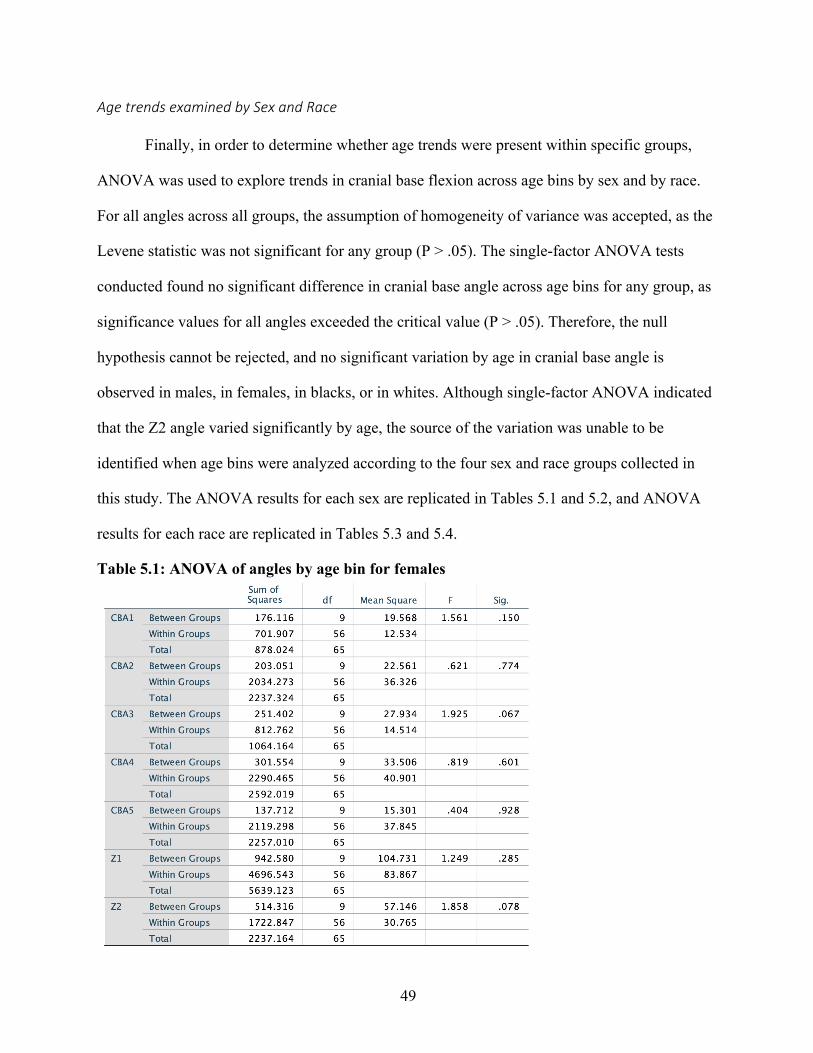
49
Age trends examined by Sex and Race
Finally, in order to determine whether age trends were present within specific groups,
ANOVA was used to explore trends in cranial base flexion across age bins by sex and by race.
For all angles across all groups, the assumption of homogeneity of variance was accepted, as the
Levene statistic was not significant for any group (P > .05). The single-factor ANOVA tests
conducted found no significant difference in cranial base angle across age bins for any group, as
significance values for all angles exceeded the critical value (P > .05). Therefore, the null
hypothesis cannot be rejected, and no significant variation by age in cranial base angle is
observed in males, in females, in blacks, or in whites. Although single-factor ANOVA indicated
that the Z2 angle varied significantly by age, the source of the variation was unable to be
identified when age bins were analyzed according to the four sex and race groups collected in
this study. The ANOVA results for each sex are replicated in Tables 5.1 and 5.2, and ANOVA
results for each race are replicated in Tables 5.3 and 5.4.
Table 5.1: ANOVA of angles by age bin for females
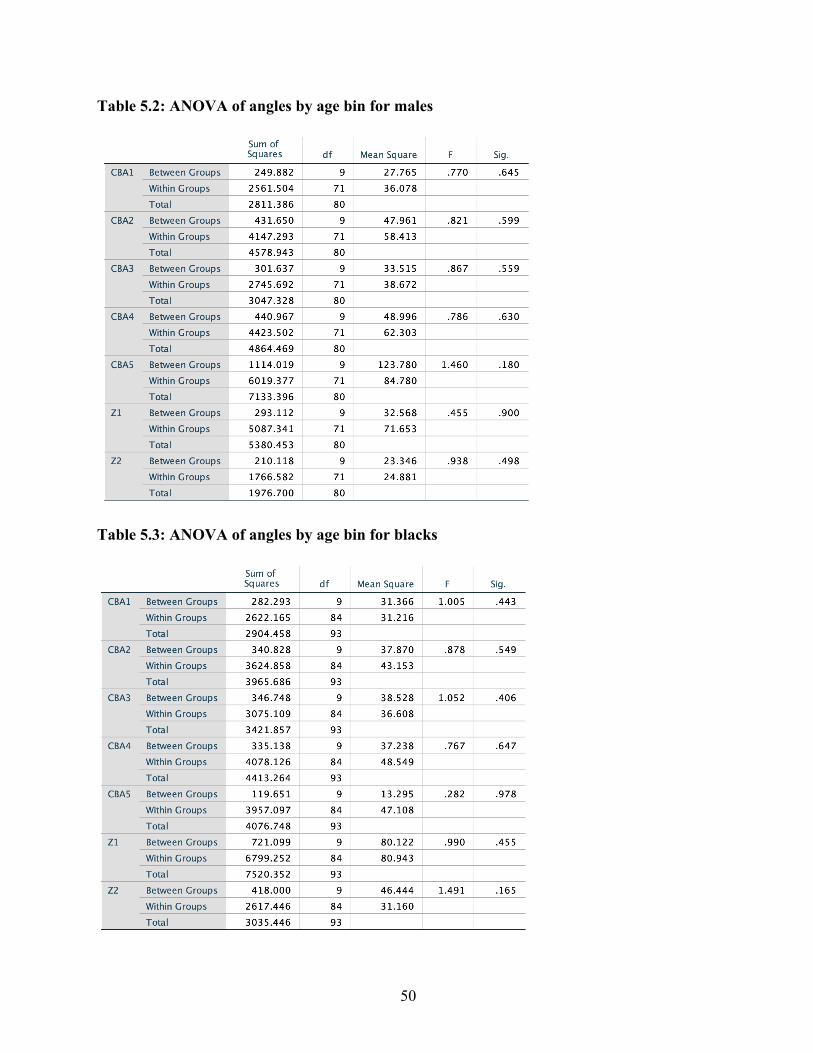
50
Table 5.2: ANOVA of angles by age bin for males
Table 5.3: ANOVA of angles by age bin for blacks
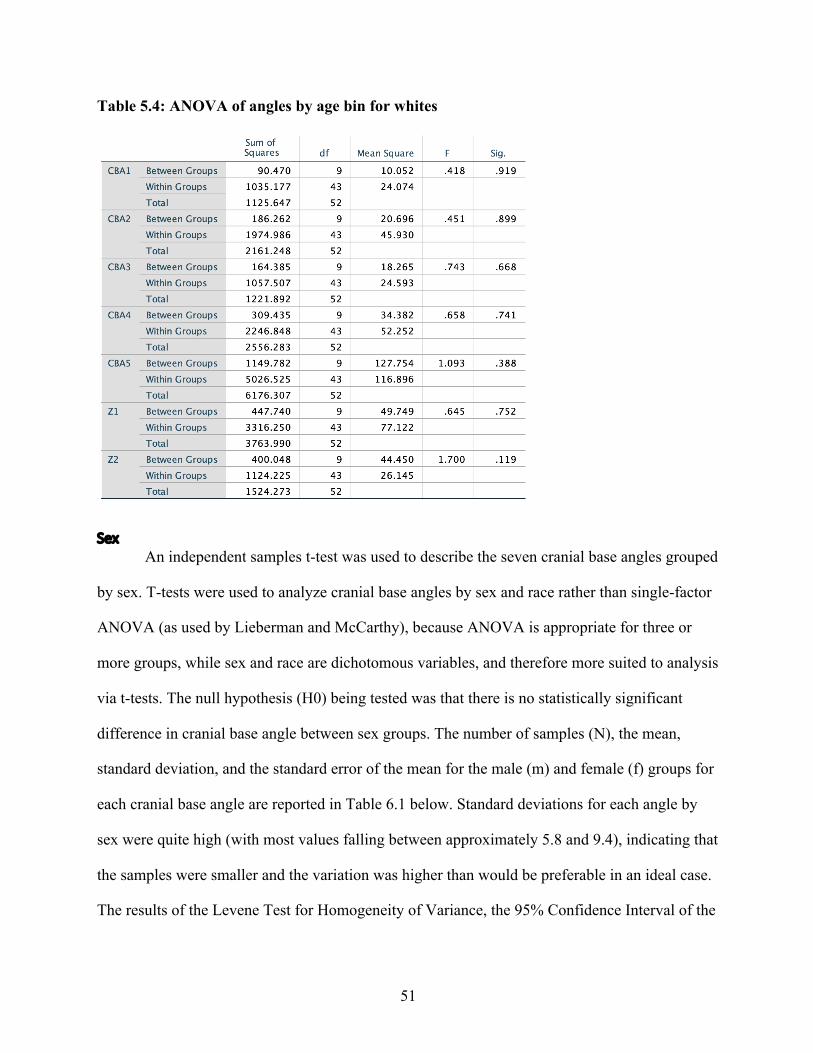
51
Table 5.4: ANOVA of angles by age bin for whites
Sex An independent samples t-test was used to describe the seven cranial base angles grouped
by sex. T-tests were used to analyze cranial base angles by sex and race rather than single-factor
ANOVA (as used by Lieberman and McCarthy), because ANOVA is appropriate for three or
more groups, while sex and race are dichotomous variables, and therefore more suited to analysis
via t-tests. The null hypothesis (H0) being tested was that there is no statistically significant
difference in cranial base angle between sex groups. The number of samples (N), the mean,
standard deviation, and the standard error of the mean for the male (m) and female (f) groups for
each cranial base angle are reported in Table 6.1 below. Standard deviations for each angle by
sex were quite high (with most values falling between approximately 5.8 and 9.4), indicating that
the samples were smaller and the variation was higher than would be preferable in an ideal case.
The results of the Levene Test for Homogeneity of Variance, the 95% Confidence Interval of the

52
difference in means between the male and female groups, and the results of the independent-
samples t-test are reported in Table 6.2.
According to Levene’s Test for Equality of Variances, equal variances cannot be
assumed for CBA 1, CBA 3, and CBA 5, as the significance of the Levene statistic for those
angles was lower than the critical value (P < .05). Therefore, the variances of the distributions of
CBA 1, 3, and 5 are significantly different for males and females. Equal variances can be
assumed for CBA 2, CBA 4, Z1, and Z2, as the significance of the Levene statistic for those
angles was higher than the critical value (P > .05). This indicates that the distributions of these
angles were not significantly different between males and females. Levene statistics are
highlighted in Table 6.2.
Results of the t-tests showed that CBA 1, CBA 3, CBA 5, Z1, and Z2 had values of t that
fell below the critical value (P < .05). Therefore, the null hypothesis (that there is no statistically
significant difference between the mean angle of each sex group) can be rejected for these
angles. T-values for angles CBA 2 and CBA 4, however, fell above the critical value (P > .05).
The null hypothesis, therefore, cannot be rejected for these angles. These results are further
substantiated by the 95% confidence interval of the difference between means of each sex group,
which includes zero for those angles with a non-significant t-value (P > .05) and does not include
zero for angles with a t-value of significance (P < .05). Interpreted t-values are highlighted in
Table 6.2.
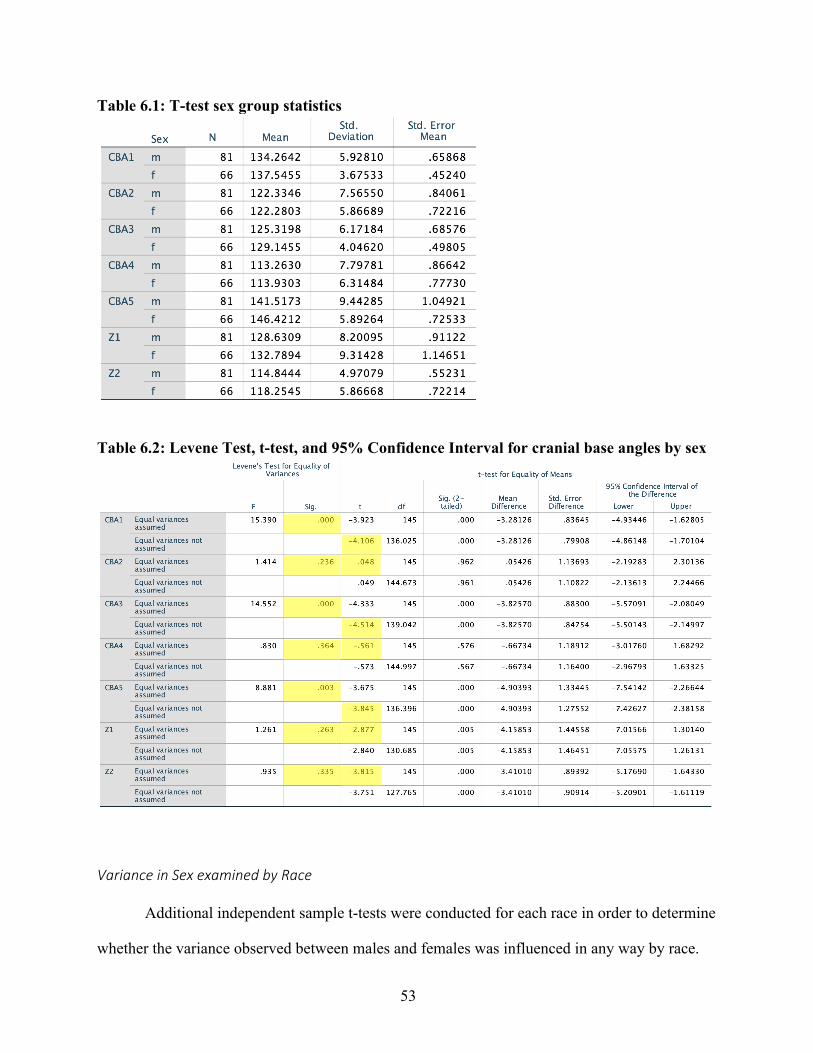
53
Table 6.1: T-test sex group statistics
Table 6.2: Levene Test, t-test, and 95% Confidence Interval for cranial base angles by sex
Variance in Sex examined by Race
Additional independent sample t-tests were conducted for each race in order to determine
whether the variance observed between males and females was influenced in any way by race.
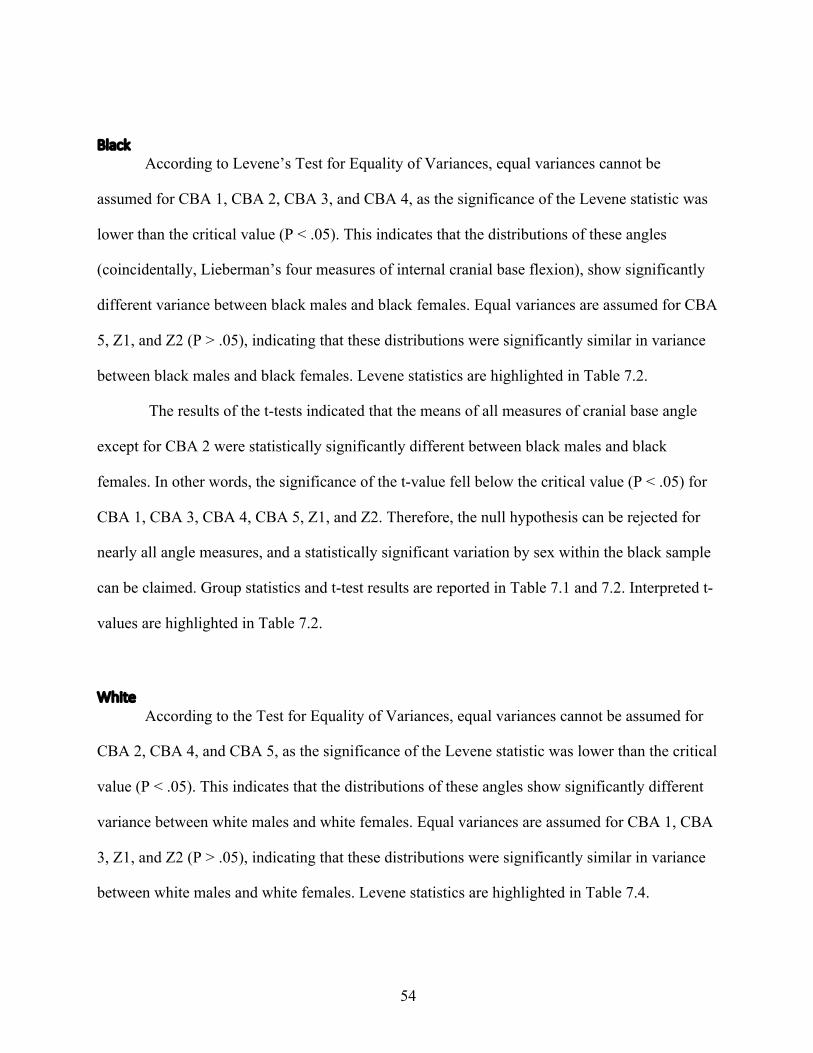
54
Black According to Levene’s Test for Equality of Variances, equal variances cannot be
assumed for CBA 1, CBA 2, CBA 3, and CBA 4, as the significance of the Levene statistic was
lower than the critical value (P < .05). This indicates that the distributions of these angles
(coincidentally, Lieberman’s four measures of internal cranial base flexion), show significantly
different variance between black males and black females. Equal variances are assumed for CBA
5, Z1, and Z2 (P > .05), indicating that these distributions were significantly similar in variance
between black males and black females. Levene statistics are highlighted in Table 7.2.
The results of the t-tests indicated that the means of all measures of cranial base angle
except for CBA 2 were statistically significantly different between black males and black
females. In other words, the significance of the t-value fell below the critical value (P < .05) for
CBA 1, CBA 3, CBA 4, CBA 5, Z1, and Z2. Therefore, the null hypothesis can be rejected for
nearly all angle measures, and a statistically significant variation by sex within the black sample
can be claimed. Group statistics and t-test results are reported in Table 7.1 and 7.2. Interpreted t-
values are highlighted in Table 7.2.
White According to the Test for Equality of Variances, equal variances cannot be assumed for
CBA 2, CBA 4, and CBA 5, as the significance of the Levene statistic was lower than the critical
value (P < .05). This indicates that the distributions of these angles show significantly different
variance between white males and white females. Equal variances are assumed for CBA 1, CBA
3, Z1, and Z2 (P > .05), indicating that these distributions were significantly similar in variance
between white males and white females. Levene statistics are highlighted in Table 7.4.

55
The results of the t-tests indicated that only the mean of CBA 5 was statistically
significantly different between white males and white females, as the significance of the t-value
fell below the critical value (P < .05). For all other angles, no statistically significant difference
was observed in the mean angle between white males and white females (P > .05). Therefore,
only for CBA 5 can the null hypothesis be rejected, and a statistically significant variation by sex
within the white sample claimed. Group statistics and t-test results are reported in Table 7.3 and
7.4. Interpreted t-values are highlighted in Table 7.4.
Table 7.1: t-test group statistics of CBA by sex for blacks

56
Table 7.2: Levene Test, t-test, and 95% Confidence Interval for cranial base angles by sex for blacks
Table 7.3: t-test group statistics of CBA by sex for whites
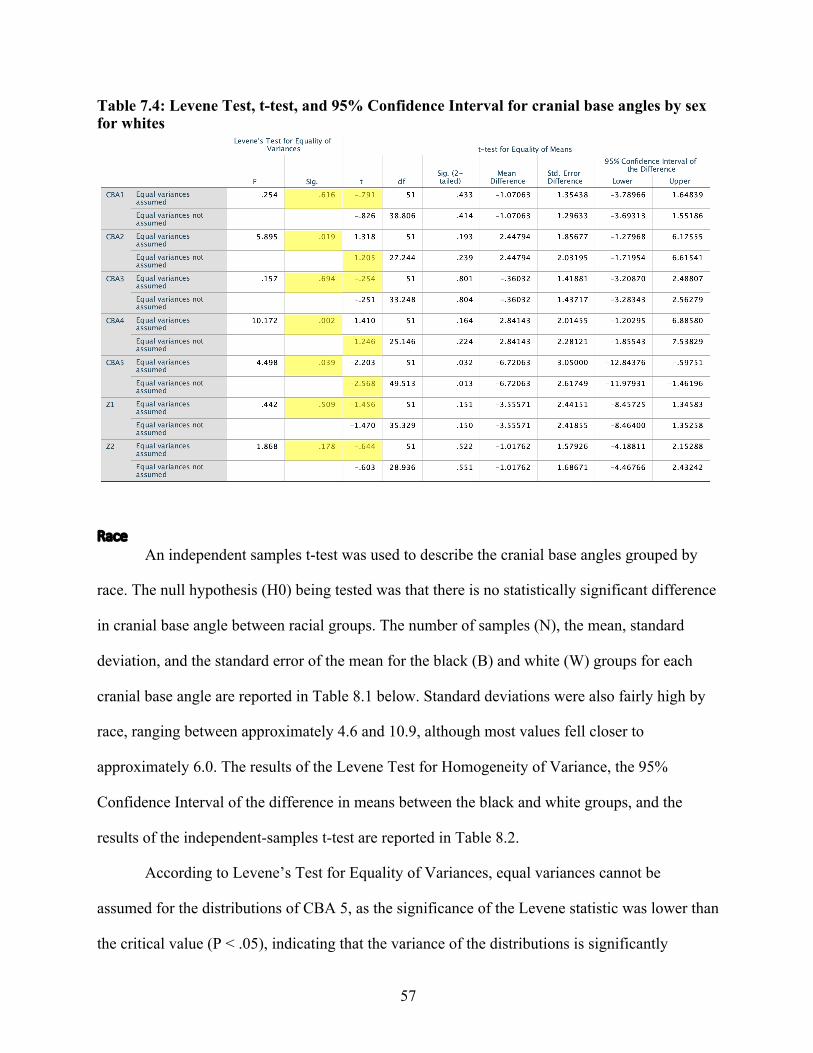
57
Table 7.4: Levene Test, t-test, and 95% Confidence Interval for cranial base angles by sex for whites
Race
An independent samples t-test was used to describe the cranial base angles grouped by
race. The null hypothesis (H0) being tested was that there is no statistically significant difference
in cranial base angle between racial groups. The number of samples (N), the mean, standard
deviation, and the standard error of the mean for the black (B) and white (W) groups for each
cranial base angle are reported in Table 8.1 below. Standard deviations were also fairly high by
race, ranging between approximately 4.6 and 10.9, although most values fell closer to
approximately 6.0. The results of the Levene Test for Homogeneity of Variance, the 95%
Confidence Interval of the difference in means between the black and white groups, and the
results of the independent-samples t-test are reported in Table 8.2.
According to Levene’s Test for Equality of Variances, equal variances cannot be
assumed for the distributions of CBA 5, as the significance of the Levene statistic was lower than
the critical value (P < .05), indicating that the variance of the distributions is significantly
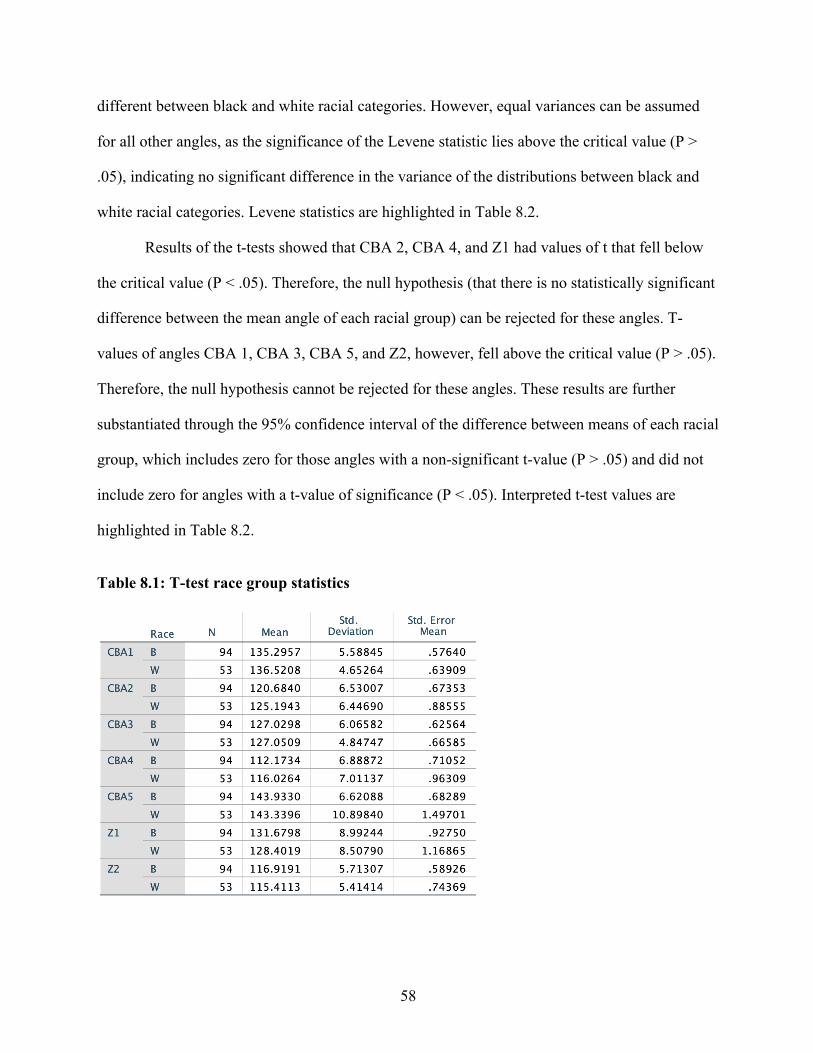
58
different between black and white racial categories. However, equal variances can be assumed
for all other angles, as the significance of the Levene statistic lies above the critical value (P >
.05), indicating no significant difference in the variance of the distributions between black and
white racial categories. Levene statistics are highlighted in Table 8.2.
Results of the t-tests showed that CBA 2, CBA 4, and Z1 had values of t that fell below
the critical value (P < .05). Therefore, the null hypothesis (that there is no statistically significant
difference between the mean angle of each racial group) can be rejected for these angles. T-
values of angles CBA 1, CBA 3, CBA 5, and Z2, however, fell above the critical value (P > .05).
Therefore, the null hypothesis cannot be rejected for these angles. These results are further
substantiated through the 95% confidence interval of the difference between means of each racial
group, which includes zero for those angles with a non-significant t-value (P > .05) and did not
include zero for angles with a t-value of significance (P < .05). Interpreted t-test values are
highlighted in Table 8.2.
Table 8.1: T-test race group statistics
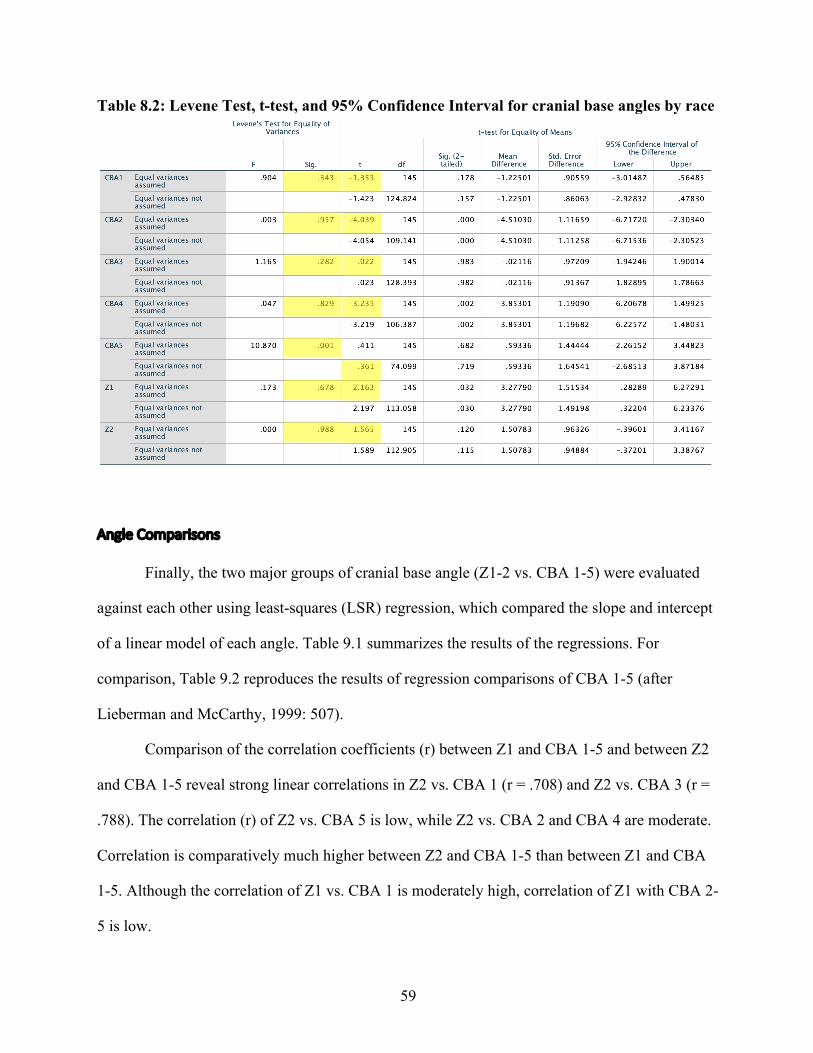
59
Table 8.2: Levene Test, t-test, and 95% Confidence Interval for cranial base angles by race
Angle Comparisons Finally, the two major groups of cranial base angle (Z1-2 vs. CBA 1-5) were evaluated
against each other using least-squares (LSR) regression, which compared the slope and intercept
of a linear model of each angle. Table 9.1 summarizes the results of the regressions. For
comparison, Table 9.2 reproduces the results of regression comparisons of CBA 1-5 (after
Lieberman and McCarthy, 1999: 507).
Comparison of the correlation coefficients (r) between Z1 and CBA 1-5 and between Z2
and CBA 1-5 reveal strong linear correlations in Z2 vs. CBA 1 (r = .708) and Z2 vs. CBA 3 (r =
.788). The correlation (r) of Z2 vs. CBA 5 is low, while Z2 vs. CBA 2 and CBA 4 are moderate.
Correlation is comparatively much higher between Z2 and CBA 1-5 than between Z1 and CBA
1-5. Although the correlation of Z1 vs. CBA 1 is moderately high, correlation of Z1 with CBA 2-
5 is low.

60
Table 9.1: Regression comparisons of cranial base angle groups (Z1 and Z2 vs. CBA 1-5) Regression LSR Intercept LSR Slope r
Z1 vs. CBA 1 38.352 0.679 0.402 Z1 vs. CBA 2 90.012 0.331 0.253 Z1 vs. CBA 3 62.184 0.538 0.34 Z1 vs. CBA 4 97.892 0.287 0.23 Z1 vs. CBA 5 73.479 0.397 0.372 Z2 vs. CBA 1 14.002 0.754 0.708 Z2 vs. CBA 2 57.844 0.479 0.58 Z2 vs. CBA 3 16.311 0.788 0.788 Z2 vs. CBA 4 58.976 0.505 0.642 Z2 vs. CBA 5 87.712 0.199 0.297
Table 9.2: Regression comparisons of cranial base angles CBA 1-5 (after Lieberman and McCarthy, 1999: 507)

61
Discussion
Statistical testing showed no significant increase or decrease in cranial base angulation
across age categories greater than two years old, although 5 of the cranial base angles were
observed to differ significantly by sex, and 3 to vary significantly by race (with the Z1 angle
varying by both sex and race). It was also determined that the Z1 angle captured a significantly
different spatial relationship than CBA 1-5.
Age
As descriptive statistics showed, the distribution for the more central age ranges (9-16)
approached normal due to larger sample sizes (approximately 10-20 individuals per age bin),
while the lower and upper age bins tended to be more skewed due to lower sample size (6 and 10
individuals, respectively). While 95% Confidence Intervals revealed no significant difference in
all cranial base angle measures across age groups, ANOVA analysis showed a significant
increase in mean Z2 between age bins 8 (ages 2-8) and 10-11. Therefore, the angle Z2 appeared
to increase (extend) significantly between age bins 8 and 11. Interestingly, this overall trend
observed in Z2 is similar in timing to that described by Zuckerman, although his results indicated
a decrease in, or flexion of the spheno-ethmoidal angle (Z2) with increasing age (Zuckerman
1955: 538), while these results show an increase in angulation (or extension).
Although the observed trends in Z2 may indicate that the angle captured an additional
spatial relationship that resulted in the extension of the angle between the BP and PN planes
around ages 8-11, a closer examination of age trends by sex and race casts doubt upon that
assumption. When the data were broken down by sex and by race and angulation across age bins
was examined, single-factor ANOVA tests showed no significant variation or trends. Therefore,
the significant difference observed overall could not be attributed to any one sex or race
category, potentially indicating that the significant result was due to a type I error (a false
62
positive). This is most likely due to the effects of small sample size (as halving an already small
sample made trends more difficult to detect) as well as simply an increased degree of variation
overall due to the aggregation of blacks and white, and males and females (as in Zuckerman’s
sample). Therefore, these results corroborate Lieberman and McCarthy’s conclusions regarding
sexual dimorphism in cranial base angulation, as Lieberman and McCarthy’s examination of
CBA 1-4 by sex found no statistically significant difference in angulation for all age groups
(Lieberman and McCarthy 1999: 501).
The mean plots produced by the ANOVA test (Figure 6) were also included, as there is a
great deal of similarity evident in trends of angulation. Although most of these fluctuations are
not significant, it is worthy of note that CBA 1-4 showed nearly identical trends of angulation,
peaking around age 10, while CBA 5 at first showed a marked decrease in angulation with the
most flexion occurring at age 9, before increasing again to peak at age 11. On the other hand, the
Z1 and Z2 angles showed nearly identical trends of angulation, characterized by a fairly linear
decrease with a slight period of equilibrium between ages 11 and 14. Therefore, Lieberman’s
four measures of internal cranial base flexion, CBA 1-4, appear to correlate very closely with
each other, as do Zuckerman’s two measures. CBA 5, however, appears to capture a unique
trend, possibly as it was intended (as stated by Lieberman and McCarthy) to be a measure of
external base flexion which correlated with the soft tissue structures of the upper airway. In
addition, the average angles for age bin 2-8 began low in CBA 1-4, yet began high in CBA 5 and
Z1-2, indicating a potentially inverse relationship at earlier ages, which were also the site of
conflicting conclusions by Lieberman and McCarthy (1999) and Zuckerman (1955) and Cousin
et al. (1981) surrounding trends in angulation. However, it is important to bear in mind that the
first and final data points produced on these mean plots are the average values of an aggregate of
age bins that were condensed due to low sample size. In addition, as a single-factor ANOVA
63
determined, the difference in means between age bins for nearly all angles is not large enough to
be significant, and as a result, no conclusions can be drawn about the significance of these trends
in relation to each other. Further analysis with a larger sample size may either accentuate or
eliminate these trends.
Sex Although descriptive statistics (histograms) seemed to indicate some slight bimodal
tendencies in CBA 2 and CBA 4 for the female sample and in Z2 for the male sample, these data
approached the normal distribution closely enough to proceed with classical hypothesis testing as
t-tests are relatively conservative at small sample sizes, which tend to have more uncertainty
around them. The Levene statistic indicated that equal variances could not be assumed for CBA
1, CBA 3, and CBA 5, meaning that only in those three angles did the distributions of angulation
in males and females show significantly different variance. These trends were not evident from
the numerical or graphical descriptive statistics (see Figure 4).
Descriptive statistics also revealed differences in the spread of the distribution between
males and females for some angles. As noted previously, in CBA 1-5, the distribution of
angulation in the male samples had a greater spread than in females, although this trend is
reversed in Z1-2. This appears to indicate that Z1 and Z2 capture different spatial relationships;
however, this initial assumption is only slightly corroborated by regression analysis (discussed in
more detail below).
According to hypothesis testing, the mean values of CBA 1, CBA 3, CBA 5, Z1, and Z2
were all determined to be significantly different between males and females across all age
ranges. Results indicate that males and females show significantly different mean values for the
majority (5/7) of the cranial base angles examined in this study. These results, therefore,
corroborate previous works (such as Lewis & Roche, 1977 and Ursi et al., 1993) that also

64
encountered significant differences in cranial base angle between males and females. Of those
four angles, this study indicates a significant difference by sex in CBA 1 and CBA 3, indicating
that the individuals sampled by Krogman appear to represent differing trends of angulation as
measured between the planes SP-FCP and CP-FCP.
Interestingly, CBA 5, which was utilized by Lieberman and McCarthy as a measure of
external cranial base flexion that they believed was most likely to correlate with pharyngeal
dimensions, was shown by this analysis to be significantly different in males than in females. In
humans, vocal pitch is a consistently sexually dimorphic trait. At puberty, males experience a
thickening of the larynx and vocal cords, which does not occur in females. However, analysis of
temporal trends in all cranial base angles by sex revealed no statistically significant changes in
angulation in males around the time of puberty (between the ages of 12 and 16) compared to
females. Therefore, these results do not support a correlation between cranial base angulation
and the development of vocal pitch dimorphism in humans.
Based on the analyses of sexual dimorphism in cranial base angle by race conducted
above, it appears as though the majority of variation between males and females was introduced
by the black sample. However, it is important to bear in mind that the black sample was nearly
twice the size of the white sample, and, as a result, exerted a larger influence on cumulative
analyses.
Race Descriptive statistics produced for each angle measure by racial category showed that all
distributions closely approached normal, apart from Z2, in which the white sample appeared to
be very slightly bimodal. Of the confidence intervals for the mean, only CBA 2 and CBA 4
showed no overlap, indicating that the mean angle value was significantly different for only
those two angles. According to the Levene statistic, the distribution of CBA 5 was significantly

65
different between black and white categories, while all other angles showed similar distributions
between both categories.
Hypothesis testing revealed that CBA 2, CBA 4, and Z1 were significantly different
between blacks and whites across all age groups. These results indicate that fewer than half the
angles measured (3/7) showed significant variation by race. As a point of note, although
numerical descriptive statistics generally proved to be an accurate predictor of emergent trends
indicated by hypothesis testing, the significant difference found in the distribution of Z1 was not
previously represented by the confidence interval generated for the mean. These results,
therefore, suggest that the angles CBA 2 (SP-PSP), CBA 4 (CP-PSP), and Z1 (Op-Ba-Pr) capture
trends in spatial relationships of the basicranium that vary significantly by race.
Interestingly, the Z1 angle was the only angle shown to be statistically significantly
distinct between both sex and racial categories. In order to determine whether trends seen in this
angle measure differ significantly from those patterns captured by CBA 1-5, a least-squares
(LSR) regression was used.
Angle Comparisons LSR regression was used to compare the slopes, intercepts, and correlation coefficients of
Z1 and Z2 vs. CBA 1-5. Since Z1 and Z2 were included in this study primarily to determine
whether Zuckerman’s two angle measures captured substantially different trends of cranial base
angulation than did Lieberman and McCarthy’s five angles (CBA 1-5), comparisons using
regression were able to test the correlation between them (Table 5). As evidenced by Figure 1,
there is a great deal of overlap between the CP plane (from Lieberman and McCarthy) and the
BP plane (from Zuckerman). Also, there is occasional overlap between Lieberman and
McCarthy’s PSP plane and Zuckerman’s PN plane. Therefore, the angle measured between the
BP and PN planes (Z2) was expected to correlate fairly strongly with at least one of Lieberman
and McCarthy’s angles. This expectation was supported by the results of the regression.
66
Results of the regression showed a strong correlation between Z2 and CBA 1 and
between Z2 and CBA 3, as well as moderate correlations between Z2 and CBA 2, Z2 and CBA
4, and Z1 and CBA 1. Therefore, trends of significant variation in angulation by sex and race
should be reexamined with these correlations in mind. In terms of variation by sex, for which
angles CBA 1, CBA 3, CBA 5, Z1 and Z2 were found to be significantly different, angles Z1 and
Z2 do not appear to reveal any new trends. Z2 correlates strongly with both CBA 1 and CBA 3,
and Z1 correlates moderately with CBA 1, CBA 3, and CBA 5. It is, therefore, unlikely that
these angles reveal any additional spatial variation in this case.
With respect to difference by race, however, it appears that the Z1 angle does capture an
additional source of variation. Significant differences were found by race for angles CBA 2,
CBA 4, and Z1. Z1 correlates only weakly with both CBA 2 and CBA 4, and it is, therefore, less
likely that those angles influence trends in Z1. In addition, Z1 correlates most strongly with CBA
1, which was not found to be significantly different by race. Therefore, it appears that Z1 was
able to summarize a meaningfully different spatial relationship than Lieberman and McCarthy’s
angle measures that varies in terms of race.
Interestingly, for those angles measured between two planes, trends seemed to be driven
primarily by prechordal planes. For example, CBA 1 and CBA 3 were both determined to be
dimorphic by sex and were measured between the SP-FCP and CP-FCP planes, respectively.
Similarly, CBA 2 and CBA 4, measured respectively between the SP-PSP and CP-PSP planes,
were determined to be dimorphic by race. Therefore, angles sharing the same prechordal plane
(either FCP or PSP) tended to follow similar trends in dimorphism of the mean. Although the SP
and CP planes lie near each other (Figure 1), according to regression analysis done by Lieberman
and McCarthy, two angles that share the SP plane (CBA 1 and CBA 2) are only weakly
correlated (r = .38), while two angles that share the CP plane (CBA 3 and CBA 4) are moderately

67
correlated (r = .50). A comparison of CBA 1 to CBA 3, however, reveals an extremely strong
linear correlation (r = .90). CBA 2 and CBA 4 are even more strongly correlated (r = .94),
indicating that the influence of the FCP and PSP planes on the resulting angle measure is
comparatively stronger than that of the SP or CP planes. Therefore, it seems likely that
dimorphic trends in the prechordal area of the cranium, such as facial kyphosis, are responsible
for the statistically different means observed between sexes and races in these angles.
68
Chapter 4: Conclusion Summary of Results
With regards to the initial question asked by this study – whether the use of samples
including individuals of multiple races influenced Zuckerman’s and Lieberman and McCarthy’s
differing conclusions surrounding the ontogeny of basicranial flexion – these results show that,
in a sample including individuals from multiple races, significant basicranial flexion was
observed only in angle Z2 (Zuckerman’s spheno-ethmoidal angle). However, an analysis of
flexion across age bins by sex and by race showed no significant changes for any sex-race
grouping. Therefore, because the temporal variation in angulation seen in Z2 overall was not able
to be detected within individual groups, it was most probably the result of variation introduced
by measurement error or by the collective presence of multiple races and sexes. However, it is
important to note that sample sizes for each of the examined sub-categories were also quite small
(20b, 19w, 20m, 19f), and may have therefore failed to reveal trends that would have been
evident with a larger sample. In addition, temporal fluctuation around a mean angle value was
observed within all individuals for all angles – a phenomenon which occurred despite fairly
accurate point placement and angle measurement. However, this fluctuation appeared to be
consistent regardless of sex or race and was not indicated by hypothesis testing for angles by age.
This occurrence has been noted by other researchers but has yet to be explained. One possible
explanation may be that changes in facial morphology and body size coupled with the influence
of environmental factors and daily life may result in small changes to the basicranium which,
once aggregated into a larger sample, are not significant.
These results only partially corroborate Zuckerman’s conclusion that the central and
anterior parts of the basicranium continue to grow until puberty, as a significant difference was
observed in the Z2 angle (borrowed from Zuckerman) beyond age 2, although these results

69
demonstrate extension rather than flexion. Although the observance of changes in basicranial
flexion in the adolescent age ranges is common to both Zuckerman’s results and the results of
this study, the observance of extension rather than flexion may be reflective of additional
characteristics that are different between Zuckerman’s sample and the sample examined in this
study. Also, the pattern of extension observed in this study may be related to small sample sizes.
In that case, it is possible that an analysis conducted with a larger sample would more closely
reflect Zuckerman’s findings.
Ultimately, despite a smaller than desired sample size, the results of this study indicate
that Zuckerman’s use of a mixed-race sample was likely not the driving factor behind his
observed ontogenetic trends in cranial base angulation since no individual group examined by
the present study showed significantly different trends in angulation over time. Consequently,
this study primarily corroborates Lieberman and McCarthy’s conclusions concerning the
cessation of flexion after age 2 and the absence of sexual dimorphism by age group. However,
the inclusion of multiple races certainly introduced additional variation, which, in this study, may
have manifested as significant variation in the Z2 angle by age overall. Similarly, Zuckerman’s
sample, which consisted of many races and sexes, also may have been affected by this
cumulative variation.
Significant variation in cranial base angulation was also observed according to race and
sex. Although no definitive trends in angulation were observed, since fluctuations by age within
sex and race groups were not significant, the average means between both groups differed by a
significant amount, indicating different spatial relationships between the prechordal and
postchordal planes between the sexes and the races. In addition, race appeared to be a significant
contributor to observed patterns of sexual dimorphism in mean cranial base angle. Analyses of
sexual dimorphism for each racial category showed that the black sample had a much higher

70
degree of sexual dimorphism than the white sample. However, it must be acknowledged that the
black sample (n = 94) was nearly twice the size of the white sample (n = 53), which may have
influenced trends detected by statistical analysis. Nevertheless, this study was able to identify
race as another source of variation which Lieberman and McCarthy did not consider (due to their
use of an entirely European-heritage dataset).
In terms of the specific variation between sexes and races, it appears as though the angles
which vary by sex (CBA 1, CBA 3, CBA 5, Z1, and Z2) are a nearly complete inverse of the
angles which vary by race (CBA 2, CBA 4, and Z1). This appears to indicate that the variation
that is present between the sexes is distinct from the variation that is present between races.
Although Z1 was observed to differ significantly by sex and by race, regression analysis of the
various angles against each other indicates that Z1 correlates most strongly with CBA 1, CBA 3,
and CBA 5, yet only weakly with CBA 2 and CBA 4. Therefore, Z1 should have behaved fairly
similarly to CBA 1, 3, and 5. The fact that Z1 was observed to vary by race as well was an
interesting result, and trends of variation may become more evident with larger sample sizes.
Although this may indicate a slight overlap in the spatial placement of variation by sex and by
race, it also may be reflective of measurement error, or high variation due to small sample size.
CBA 5 in particular, which was originally intended by Lieberman and McCarthy to
illustrate external cranial base flexion in terms of pharyngeal dimensions and position, was
observed to vary significantly by sex. This difference was initially a point of interest, as Laitman
(1976, 1978, 1982, 1992) had proposed that the basicranium might exert a structural influence on
the upper airway, particularly on the pharynx, and may, therefore, be related to the production of
speech. In addition, vocal pitch is distinctly sexually dimorphic in humans, lowering in males at
the onset of puberty, around the ages of 12-16. However, when all cranial base angles were
analyzed across age bins by sex, no significant trends of flexion or extension were observed in

71
males at puberty. Consequently, this study cannot conclude that vocal pitch changes are related
to the morphology of the basicranium, or to the structural influence that it may exert on the
airway. Therefore, it remains most likely that vocal pitch dimorphism in humans is the result of
hormonal changes that occur at puberty (Dabbs and Mallinger, 1998; Puts et al., 2006; Dixson,
2009).
The results of these analyses by age, sex, and race, as well as additional segregation and
analysis conducted of age trends by sex, age trends by race, and sexual dimorphism by race,
reveal that the angles used by both researchers did, in fact, quantify slightly different spatial
relationships between cranial bones, although all measures were correlated to some degree.
Overall, dimorphism of the cranial base angle was observed by sex and by race, although no
notable temporal trends could be detected by either category. Also, the sample drawn from the
Krogman dataset that was used in this study appeared to reveal differing trends in cranial base
angle to those observed in both the Lieberman and McCarthy and Zuckerman studies. Although
it is possible that these differences are due to the small sample sizes relied on by these analyses,
both Lieberman and McCarthy and Zuckerman also made use of comparable sample sizes. Since
smaller than desired sample sizes in this and other studies may be the source of some of the
previously discussed variation, perhaps larger samples would be more conducive to identifying
the source of the variation identified here. Regardless, as indicated by the results presented
above, basicranial flexion and its variation by age, sex, and race is a more complex phenomenon
than either Lieberman and McCarthy or Zuckerman described. Therefore, it is perhaps not so
easily described by a single model that is common across all groups, or even across all samples.
As a result of these findings, this study further contributes to the literature surrounding not only
the complex structure of the basicranium but also the ongoing inquiry into the evolution of the
human voice.

72
Further Study
Although the questions asked by this study would benefit from a re-examination using a
larger sample size, additional avenues of inquiry exist. For instance, although the samples were
divided into racial categories, no allowance was made for the nuances within those categories.
As noted by Franz Boas, individuals of multiple races that are born and raised within the same
cultural context display similarities in cranial dimensions (Boas, 1912). Therefore, in light of
Boas’s conclusions that cranial dimensions, and perhaps facial morphology as well, are highly
dependent on environmental factors, a simple racial dichotomy may not be the most revealing
way to explore differences in basicranial morphology. This is especially true, as the majority of
the samples examined in this study were drawn from West and North Philadelphia, and therefore
represent a relatively narrow range of geographic variation. Also, upon closer inspection, it
appears that the majority of the individuals that made up the white sample examined by this
study are of Russian or Ukrainian heritage. Therefore, a re-examination of previous conclusions
in this light may be revealing, particularly as it concerns the comparatively lesser degree of
sexual dimorphism in basicranial flexion observed in the white sample compared to the black
sample.
In conclusion, a useful follow-up study to the research presented here would examine
multiple groups within each broader racial group to determine whether a) individuals of various
races sampled from the same cultural context reveal convergence in patterns of basicranial
angulation, and b) subsets within larger racial categories are characterized by varying degrees of
basicranial flexion. This study, which should ideally be conducted on a larger sample size than
presented here, may be able to uncover more nuanced patterns of basicranial flexion, if any exist,
within each racial group. The Krogman dataset would be well suited to this proposed

73
continuation of the study, as the KCRCGD Growth Study collected extensively detailed
information surrounding the social and economic conditions, nutritional condition, and disease
profiles of each individual sampled. This comprehensive picture of the social context of each
individual provides a unique picture into the developmental circumstances and potential
environmental factors influencing child growth.

74
References Cited Arensburg, B., L. A. Schepartz, A. M. Tillier, B. Vandermeersch, and Y. Rak. (1990). A
Reappraisal of the Anatomical Basis for Speech in Middle Palaeolithic Hominids. American Journal of Physical Anthropology, 83(2), 137-46. doi:10.1002/ajpa.1330830202.
Ashton, E.H. (1957) Age changes in the basicranial axis of the anthropoidea. Proceedings of the
Zoological Society of London, 129, 61-74. Barkan, E. (1992). The Retreat of Scientific Racism: Changing Concepts of Race in Britain and
the United States Between the World Wars. Cambridge: Cambridge University Press. Bastir, M., Rosas, A., & O’Higgins, P. (2006). Craniofacial levels and the morphological
maturation of the human skull. Journal of Anatomy, 209(5), 637-654. doi:10.1111/j.1469-7580.2006.00644.x.
Biegert, J. (1963). The evaluation of characters of the skull, hands and feet for primate
taxonomy. In (S. L. Washburn, Ed) Classification and Human Evolution, pp. 116–145. Chicago: Aldine de Gruyter.
Björk, A. (1955) Cranial base development. American Journal of Orthodontics, 41, 198-
225. Blumenbach, J.F. (1781). De Generis Humani Varietate Nativa Liber. Goettingae: Apud
Viduam Abr. Vandenhoek. Boas, F. (1912). Changes in the Bodily Form of Descendants of Immigrants. American
Anthropologist, 14(3), 530-62. doi:10.1525/aa.1940.42.2.02a00010. Bookstein, F. L. (1983). The geometry of craniofacial growth invariants. American Journal of
Orthodontics, 83, 221-234. Bookstein, F. L., Gunz, P., Mitterœcker, P., Prossinger, H., Schæfer, K., & Seidler, H. (2003).
Cranial integration in Homo: Singular warps analysis of the midsagittal plane in ontogeny and evolution. Journal of Human Evolution, 44(2), 167-187. doi:10.1016/s0047-2484(02)00201-4
Bolk, L. (1915). Über lagerung, verscheibung und negung des foramen magnum am schädel des primaten. Zeitschrift fur Morphologie und Anthropologie, 17, 611- 692.
Brace, C. L. (2005). "Race" Is a Four-Letter Word: The Genesis of the Concept. New York:
Oxford University Press. Brodie, A. G. (1941). On the growth pattern of the human head from the 3rd month to the
8th year of life. American Journal of Anatomy, 68, 209-262.
75
Buschang, P.H., Baume, R.M., and Nass, G. (1983). A craniofacial growth maturity gradient for males and females between 4-16 years of age. American Journal of Physical Anthropology, 61, 373-381.
Chin, A., Perry, S., Liao, C., and Yang, Y. (2014). The Relationship between the
Cranial Base and Jaw Base in a Chinese Population. Head & Face Medicine, 10(1). doi:10.1186/1746-160x-10-31.
Cossio, L., López, J., Rueda, Z.V., and Botero-Mariaca, P. (2016). Morphological
Configuration of the Cranial Base among Children Aged 8 to 12 years. BMC Research Notes, 9(1), 1-8. doi:10.1186/s13104-016-2115-2.
Cousin, R., Fenart, R., & Deblock, R. (1981). Variations ontogéniques des angles basi-crâniens
et faciaux. Etudes comparatives chez Homo et chez Pan. Bulletins Et Mémoires De La Société Danthropologie De Paris, 8(2), 189-212. doi:10.3406/bmsap.1981.3818
Dabbs, J. M., and Mallinger, A. (1999). High Testosterone Levels Predict Low Voice
Pitchamong Men. Personality and Individual Differences, 27(4), 801-04. doi:10.1016/s0191-8869(98)00272-4.
Dabelow, A. (1929). Über korrelationen in der phylogenetischen entwicklung der
scädelform I. Die beziehungen zwischen rumpf und schädelform. Gegenbaurs Morphologisches Jahrbuch, 63, 1-54.
Dean, M. C. (1988). Growth processes in the cranial base of hominoids and their bearing on
morphological similarities that exist in the cranial base of Homo and Paranthropus. In (F. E. Grine, Ed.) Evolutionary History of the Robust Australopithecines, pp. 107–112. New York: Aldine de Gruyter.
Dixson, A. F. (2009). Sexual Selection and the Origins of Human Mating Systems. Oxford:
Oxford University Press. Dmoch, R. (1975a). Beiträge zum formenwandel des primatencraniums mit bemerkungen zu den
sagit- talen knickungsverhältnissen. II Streckenanalyse, I, Neurocranium. Geg. Morph. Jb, 121, 521–601.
Dmoch, R. (1975b). Beiträge zum formenwandel des primatencraniums mit bemerkungen zu den
sagit- talen knickungsverhältnissen. IV. Komplexueber- brueckende merkmale und winkelanalyse. Geg. Morph. Jb, 121, 625–668.
Dmoch, R. (1976). Beiträge zum formenwandel des primatencraniums mit bemerkungen zu den
sagit- talen knickungsverhältnissen. V. Schlussbetrachtung, zussamenfassung, literatur und tabellenanhang. Geg. Morph. Jb, 122, 1–81.
Enlow, D. H. (1968). The Human Face. New York: Harper and Row. Enlow D.H. (1990), Facial growth. Philadelphia: W B Saunders Company.
76
Enlow D.H., and Moyers R.E. (1971). Growth and architecture of the face. Journal of the American Dental Association, 82, 763-74.
Finlay, L. M. (1980). Craniometry and Cephalometry: A History Prior to the Advent of
Radiography. The Angle Orthodontist, 50(4), 312-21. Fitch, W. T. (1997). Vocal Tract Length and Formant Frequency Dispersion Correlate with
Body Size in Rhesus Macaques. The Journal of the Acoustical Society of America, 101(5), 3136. doi:10.1121/1.419022.
Ford, E. H. R. (1958). Growth of the human cranial base. American Journal of Orthodontics,
44, 498-506. Fuentes, A. (2010). The New Biological Anthropology: Bringing Washburns New Physical
Anthropology into 2010 and Beyond-The 2008 AAPA Luncheon Lecture. Yearbook of Physical Anthropology, 53, 2-12. doi:10.1002/ajpa.21438.
Galton, F. (1883). Inquiries into Human Faculty and Its Development. 1st ed. Macmillan. Galton, F. (1904). Eugenics: Its Definition, Scope, and Aims. American Journal of Sociology,
10(1), 1-25. doi:10.1086/211280. German, R. Z., and Palmer, J. B. (2006). Anatomy and Development of Oral Cavity and
Pharynx. GI Motility Online. doi:10.1038/gimo5. Gould, S. J. (1996). The Mismeasure of Man. New York: W. W. Norton & Co. Gould, S. J. (1977). Ontogeny and phylogeny. Cambridge: Becknap Press of Harvard University
Press. González, J. (2004). Formant Frequencies and Body Size of Speaker: A Weak Relationship in
Adult Humans. Journal of Phonetics, 32(2), 277-87. doi:10.1016/s0095-4470(03)00049-4.
Grant, M. (1916). The Passing of the Great Race; Or, the Racial Basis of European History. 1st
ed. New York: Charles Scribner's Sons. Haller, J. S. (1971). Outcasts from Evolution: Scientific Attitudes of Racial Inferiority, 1859-
1900. Chicago: University of Illinois Press. Herrnstein, R. J., and Murray, C. (1994). The Bell Curve: Intelligence and Class Structure in
American Life. New York: Free Press. Hill, A. K., and Puts, D. A. (2016). Vocal Attractiveness. Encyclopedia of Evolutionary
Psychological Science, 2016, 1-5. doi:10.1007/978-3-319-16999-6_1880-1. Hodges-Simeon, C. R., Gurven, M., Puts, D. A., and Gaulin, S. J. C. (2014). Vocal Fundamental
77
and Formant Frequencies Are Honest Signals of Threat Potential in Peripubertal Males. Behavioral Ecology, 25(4), 984-88. doi:10.1093/beheco/aru081.
Huxley, T. H. (1959). Evidence as to Man's Place in Nature. MI: University of Michigan
Press. Jeffery, N. (2005). Cranial Base Angulation and Growth of the Human Fetal Pharynx. The
Anatomical Record Part A: Discoveries in Molecular, Cellular, and Evolutionary Biology, 284A(1), 491-99. doi:10.1002/ar.a.20183.
Kardong, K. V. (1995). Vertebrates: Comparative anatomy, function, evolution. Dubuque: W C
Brown Publishers. Kasai K., Richards L. C., Brown T. (1993). Comparative study of craniofacial morphology in
Japanese and Australian aboriginal populations. Human Biology, 65, 821–834. Kasai K., Moro T., Kanazawa E., and Iwasawa, T. (1995). Relationship between cranial base and
maxillofacial morphology. European Journal of Orthodontics, 17, 403- 410. Kavitha L., Karthik, K. (2012). Comparison of cephalometric norms of caucasians and non-
caucasians: A forensic aid in ethnic determination. Journal of Forensic Dental Science, 4, 53–55.
Kemp, M. (2010). Style and Non-style in Anatomical Illustration: From Renaissance Humanism
to Henry Gray. Journal of Anatomy, 216(2), 192-208. doi:10.1111/j.1469-7580.2009.01181.x.
Kjaer, I. (1990). Ossification of the human fetal basicranium. Journal of Craniofacial Genetics
and Developmental Biology, 10, 29-38. Kjaer, I., Kjaer, T.W., and Graem, N. (1993). Ossification sequence of occipital bone and
vertebrae in human fetuses. Journal of Craniofacial Genetics and Developmental Biology, 13, 83-88.
Kühl, S. (2002). The Nazi Connection: Eugenics, American Racism, and German National
Socialism. New York: Oxford University Press. Laërtius, D. (1853). The Lives and Opinions of Eminent Philosophers. Translated by Charles
Duke Yonge. London: H. G. Bohn. Laitman, J. T., and Crelin, E. S. (1976). Postnatal development of the basicranium and vocal
tract region in man. In (J. Bosma, Ed.) Symposium on Development of the Basicranium, pp. 206-219. Washington, D.C.: U.S. Government Printing Office.
Laitman, J. T., Heimbuch, R.C., and Crelin., E.S. (1978). Developmental Change in
a Basicranial Line and Its Relationship to the Upper Respiratory System in Living Primates. American Journal of Anatomy, 152(4), 467-82. doi:10.1002/aja.1001520403.
78
Laitman, J. T., and Heimbuch, R.C. (1982). The Basicranium of Plio-Pleistocene Hominids as an Indicator of Their Upper Respiratory Systems. American Journal of Physical Anthropology, 59(3), 323-43. doi:10.1002/ajpa.1330590315.
Laitman, J. T. (1985). Evolution of the hominid upper respiratory tract: The fossil evidence. In
PV Tobias (ed.): Hominid evolution: Past, present and future. New York: A.R. Liss, Inc, pp. 281-286.
Larsen, W. J. (1998). Essentials of human embryology. New York: Churchill Livingstone. Lewis, A.B., Roche, A.F., and Wagner, B. (1985). Pubertal spurts in cranial base and mandible.
The Angle Orthodontist, 55, 7-30. Lewis, J. E., Degusta, D., Meyer, M.R., Monge, J.M., Mann, A.E., and Holloway, R.L. (2011).
The Mismeasure of Science: Stephen Jay Gould versus Samuel George Morton on Skulls and Bias. PLoS Biology, 9(6), 1-6. doi:10.1371/ journal.pbio.1001071.
Lieberman, P., and Crelin, E. S. (1971). On the speech of Neanderthal man. Ling. Inq., 1, 201- 223.
Lieberman, P., Crelin, E. S., and Klatt, D. H. (1972). Phonetic ability and related anatomy of the
newborn and adult human, Neanderthal man, and the chimpanzee. Am. Anthropol., 74, 287-307.
Lieberman, P., Laitman, J.T., Reidenberg, J.S., and Gannon, P.J. (1992). The Anatomy,
Physiology, Acoustics and Perception of Speech: Essential Elements in Analysis of the Evolution of Human Speech. Journal of Human Evolution, 23(6), 447-67. doi:10.1016/0047-2484(92)90046-c.
Lieberman, D. E., and Mccarthy, R.C. (1999). The Ontogeny of Cranial Base Angulation in
Humans and Chimpanzees and Its Implications for Reconstructing Pharyngeal Dimensions. Journal of Human Evolution, 36(5), 487-517. doi:10.1006/jhev.1998.0287.
Lieberman, D. E., Ross, C.F., and Ravosa, M.J. (2000). The Primate Cranial Base:
Ontogeny, Function, and Integration. American Journal of Physical Anthropology, 43, 117-69.
Lieberman, D. E., McCarthy, R.C., Hiiemae, K.M., and Palmer, J.B. (2001). Ontogeny of
Postnatal Hyoid and Larynx Descent in Humans. Archives of Oral Biology, 46(2), 117-28. doi:10.1016/s0003-9969(00)00108-4.
Lieberman, P. (2007). The Evolution of Human Speech. Current Anthropology, 48(1),
39-66. doi:10.1086/509092. Mann, A. (2009). The Origins of American Physical Anthropology in Philadelphia." Yearbook of
Physical Anthropology, 52, 155-63. doi:10.1002/ajpa.21189. Mathias De Almeida, K. C., Raveli, T.B., Vieira, C.I.V., Dos Santos-Pinto, A., and Raveli, D.B.
79
(2017). Influence of the Cranial Base Flexion on Class I, II and III Malocclusions: A Systematic Review. Dental Press Journal of Orthodontics, 22(5), 56-66. doi:10.1590/2177-6709.22.5.056-066.oar.
McCloud, S. (2007). Divine Hierarchies: Class in American Religion and Religious Studies.
Chapel Hill: University of North Carolina Press. Meijer, M. C. (1999). Race and Aesthetics in the Anthropology of Petrus Camper: 1722-1789.
Atlanta, GA: Rodopi. Michejda, M. (1975). Ontogenetic growth changes of the skull base in four genera of nonhuman
primates. Acta Anatomica, 91, 110-117. Morton, S. G. (1839). Crania Americana: Or, a Comparative View of the Skulls of Various
Aboriginal Nations of North and South America: To Which Is Prefixed an Essay on the Varieties of the Human Species: Illustrated by Seventy-five Plates, Two Hundred Engravings on Wood, and a Coloured Map, Shewing the Geographical Distribution of the Races of Men. Philadelphia, PA: John Pennington.
Morton, S. G. (1844). Crania Aegyptiaca: Or, Observations on Egyptian Ethnography,
Derived from Anatomy, History, and the Monuments. Philadelphia, PA: John Pennington. Morton, S. G. (1849). Catalogue of Skulls of Man and the Inferior Animals in the Collection
of Samuel George Morton. 3rd ed. Philadelphia: Merrihew and Thompson, Printers. Moss. M. L. (1958). The pathogenesis of artificial cranial deformation. American Journal of
Physical Anthropology, 116, 269-286. Moss, M. L. (1961). Rotation of the otic capsule in bipedal rats. American Journal of Physical
Anthropology, 19, 301-307.
Moyers, R. E., and Bookstein, F. L. (1979). The inappropriateness of conventional cephalometrics. American Journal of Orthodontics, 75, 599-617.
Myer, C. M. R. (1995). Growth of the pediatric skull base: Assessment using magnetic resonance
imaging. Laryngoscope 105, 1-10. Nave, G., Jung, W.H., Linnér, R.K., Kable, J.W., and Koellinger, P.D. (2018). Are Bigger Brains
Smarter? Evidence from a Large-Scale Preregistered Study. Psychological Science, 1-12. doi:10.1177/0956797618808470.
Neaux, D., Gilissen, E., Coudyzer, W., and Guy, F. (2015). Integration between the Face and the
Mandible of Pongo and the Evolution of the Craniofacial Morphology of Orangutans. American Journal of Physical Anthropology, 158(3), 475-86. doi:10.1002/ajpa.22807.
Ponce de León, M. S., & Zollikofer, C. P. (2001). Neanderthal cranial ontogeny and its
80
implications for late hominid diversity. Nature, 412(6846), 534-538. doi:10.1038/35087573
Provine, W. B. (1973). Geneticists and the Biology of Race Crossing: Geneticists Changed Their
Minds about the Biological Effects of Race Crossing. Science, 182(4114), 790-96. doi:10.1126/science.182.4114.790.
Puts, D. A., Gaulin, S.J.C., and Verdolini, K. (2006). Dominance and the Evolution of Sexual
Dimorphism in Human Voice Pitch. Evolution and Human Behavior, 27(4), 283-96. doi:10.1016/j.evolhumbehav.2005.11.003.
Puts, D. A., Hill, A.K., Bailey, D.H., Walker, R.S., Rendall, D., Wheatley, J.R., Welling, L.L.M.,
Dawood, K., Cárdenas, R., Burriss, R.P., Jablonski, N.G., Shriver, M.D., Weiss, D., Lameira, A.R., Apicella, C.L., Owren, M.J., Barelli, C., Glenn, M.E., and Ramos-Fernandez, G. (2016). Sexual Selection on Male Vocal Fundamental Frequency in Humans and Other Anthropoids. Proceedings of the Royal Society B: Biological Sciences, 283(1829), 2015-2830. doi:10.1098/rspb.2015.2830.
Quintero, J.C., Troisen, A., Hatcher, D., and Kapila, S. (1999). Craniofacial imaging in orthodontics: Historical perspective, current status, and future developments. The Angle Orthodontist, 69, 491-506.
Reidenberg, J. S., and Laitman, J.T. (1991). Effect of Basicranial Flexion on Larynx and Hyoid
Position in Rats: An Experimental Study of Skull and Soft Tissue Interactions. The Anatomical Record, 230(4), 557-69. doi:10.1002/ar.1092300416.
Rendall, D., Kollias, S., Ney, C., and Lloyd, P. (2005). Pitch (F0) and Formant Profiles
of Human Vowels and Vowel-like Baboon Grunts: The Role of Vocalizer Body Size and Voice-acoustic Allometry. The Journal of the Acoustical Society of America, 117(2), 944-55. doi:10.1121/1.1848011.
Renschler, E. S., and Monge, J. (2008). The Samuel George Morton Collection: Historical
Significance and New Research. Expedition, 30-38. Riesenfeld, A. (1967). Biodynamics of head form and cranio-facial relationships. Homo, 18, 233-
251. Riesenfeld, A. (1969). Head balance and brachycephalization. Homo, 20, 81-90. Ross, C. F., & Ravosa, M. J. (1993). Basicranial flexion, relative brain size, and facial kyphosis
in nonhuman primates. American Journal of Physical Anthropology, 91(3), 305-324. doi:10.1002/ajpa.1330910306
Ross, C. F., and Henneberg, M. (1995). Basicranial flexion, relative brain size, and facial
kyphosis in Homo sapiens and some fossil hominids. American Journal of Physical Anthropology, 98, 575-593.
Ross, C. F., and Ravosa, M.J. (1993). Basicranial flexion, relative brain size, and facial

81
kyphosis in nonhuman primates. American Journal of Physical Anthropology, 91.
Sagan, C. (1979). Broca's Brain: Reflections on the Romance of Science. New York: Ballantine
Books. Serletis, D., and Pait, T.G. (2016). Early Craniometric Tools as a Predecessor to
Neurosurgical Stereotaxis. Journal of Neurosurgery, 124, 1867-874. doi:10.3171/2015.6.jns15424.
Simpson, E. K. (2014). Variation in Cranial Base Flexion and Craniofacial Morphology in
Modern Humans. (doctoral dissertation). University of Adelaide, Australia. Sirianni, J. E. & Swindler, D. R. (1979). A review of postnatal craniofacial growth in Old World
monkeys and apes. Yearb. Phys. Anthrop., 22, 80–104. Smedley, A., and Smedley, B.D. (2011). Race in North America: Origin and Evolution of a
Worldview. San Francisco: Westview Press. Solow, B., and Tallgren, A. (1976). Head posture and craniofacial morphology. American
Journal of Physical Anthropology, 44, 417-436. Sowerwine, C. (2003). Womans Brain, Mans Brain: Feminism and Anthropology in Late
Nineteenth-century France." Women's History Review, 12(2), 289-308. doi:10.1080/09612020300200358.
Spoor, F. (1997). Basicranial architecture and relative brain size of Sts 5 (Australopithecus
africanus) and other Plio-Pleistocene hominids. South African Journal of Science, 93, 182-186.
Strait, D. S. (1998). Evolutionary integration in the hominid cranial base (Abstract). Ph.D., State
University of New York at Stony Brook, Stony Brook. Strait, D. S. (1999). The scaling of basicranial flexion and length. Journal of Human Evolution,
37, 701-719. Strait, D. S. (2001). Integration, phylogeny and the hominid cranial base. American Journal of
Physical Anthropology, 114, 273-297. Strait, D. S., and Ross, C.F. (1999). Kinematic data on primate head and neck posture:
implications for the evolution of basicranial flexion and an evaluation of registration planes used in paleoanthropology. American Journal of Physical Anthropology, 108, 205-222.
Tomlinson, S. (2013). Head Masters: Phrenology, Secular Education, and Nineteenth-Century
Social Thought. Tuscaloosa, AL: University of Alabama Press.
Ursi, W. J., Trotman, C.A., McNamara, J.A.J., and Behrents, R.G. (1993). Sexual dimorphism in

82
normal craniofacial growth. The Angle Orthodontist, 63, 47-55. Washburn, S. L. (1951). The new physical anthropology. Transactions of the New York Academy
of Science, 13(2), 298-304. Wei, S. H. Y. (1968). The variability of roentgenographic cephalometric lines of reference. The
Angle Orthodontist, 38, 74-78. Weidenreich, F. (1924). Die sonderform des menschenschädels als anpassung an den aufrechten
gang [The special form of the human skull in adaptation to the upright gait]. Zeitschrift fur Morphologie und Anthropologie, 24, 157-189.
Weidenreich, F. (1941). The brain and is role in the phylogenetic transformation of the human
skull. Trans. Am. phil. Soc., 31, 328–442. Weidenreich, F. (1945). The brachycephalization of modern mankind. Southwest Journal of
Anthropology, 1, 1–54.
i Herodotus noted the occurrence of skulls without sutures and characterized Persian skulls as “more slender” than those of the Egyptians (Meijer, 1999: 101, from Paul Topinard, Elements d’anthropologie generale (Paris: Delahaye and Lecrossnier, 1885), p. 67) ii As a result of Washburn’s transformative ideas, the modern form of physical anthropology (now often referred to as biological anthropology) now defines itself as “a biological science that deals with the adaptations, variability, and evolution of human beings and their living and fossil relatives. Because it studies human biology in the context of human culture and behavior, physical anthropology is also a social science (Fuentes, 2010: 2).” iii X-Rays themselves were discovered in 1895 by German professor Wilhelm Conrad Roentgen (1845-1923), although the technology was not widely applied to medicine until 1931 (Finlay, 1980: 320-321).