The Occupational Concentration and Mobility of Asian Immigrants in Australia
45
Macquarie University ResearchOnline This is the author version of an article published as: Parr, N. & Guo, F. (2005). Occupational concentration and mobility of Asian immigrants in Australia. Asian and Pacific migration journal, 14(3), 351-380. Copyright: Scalabrini Migration Center Permission to publish online supplied by the Publisher
Transcript of The Occupational Concentration and Mobility of Asian Immigrants in Australia

Macquarie University ResearchOnline
This is the author version of an article published as: Parr, N. & Guo, F. (2005). Occupational concentration and mobility of Asian
immigrants in Australia. Asian and Pacific migration journal, 14(3), 351-380.
Copyright: Scalabrini Migration Center
Permission to publish online supplied by the Publisher
The Occupational Concentration and Mobility of Asian Immigrants in Australia Paper Published in Asian and Pacific Migration Journal. 14(3):351-380. Copyright reserved by the Scalabrini Migration Center. Permission to publish on website kindly supplied by Scalabrini Migration Center Nick Parr Department of Business Macquarie University Sydney NSW 2109 Australia Tel: 61-2-98508570 Fax: 61-2-98506065 Email: [email protected] Fei Guo Department of Business Macquarie University Sydney NSW 2109 Australia Tel: 61-2-98508445 Fax: 61-2-98506065 Email: [email protected]
1

The Occupational Concentration and Mobility of Asian Immigrants in Australia
Abstract Using data from the 1996 and 2001 censuses of Australia, this study provides a detailed
description of the diverse patterns of occupational concentration and mobility of a selection of
Asian immigrant groups. The study shows that the Asian-Australian population includes not
only groups which remain relatively concentrated in “low-end” occupations, but also many
others which are more likely than the Australia-born to be in “high-end” professional
occupations, and that almost all the selected groups experienced some degree of upwards
occupational mobility between 1996 and 2001. However, after controlling for a range of
demographic and human capital characteristics the participation of most groups in the
managerial and professional occupations is shown to be below that for the Australia-born.
Hence, the high occupational status of most Asian groups does not mean they are advantaged.
2

Introduction
Since the abolition of the “White Australia” policy in the mid-1970s, Australia has accepted a
substantial number of immigrants from countries in South-east, North-east and South Asia.
By 2002 the estimated number of Australian residents who were born in these regions had
risen to 1.117 million (5.7% of the total population and 24.5% of the overseas-born) (ABS
2004). Although the numbers of people migrating from these regions of Asia fell between the
early 1990s and the late 1990s they nonetheless remain significant sources of migrants to
Australia.
The allocation of visas for permanent residence in Australia is based on the grounds of
skills, of family connections with existing citizens or permanent migrants, and on refugee or
humanitarian grounds. In addition health and character criteria must be met. The largest
components of the skills intake use points tests which assess eligibility for migration in terms
of skills and work experience, age and English language ability. A few groups, most notably
New Zealand citizens, are allowed to settle in Australia without having a permanent residence
visa. The emphasis placed on selection on the basis of skills has increased in recent years,
especially since the first election of the Howard government in 1996. After 1996 period the
proportion of migrants who were selected on the basis of skills increased such that by 2003-
2004 nearly 50% of the eligibility of settler arrivals was on the basis of skills. This compares
with the 28% of settler arrivals in the equivalent categories in 1995-96 (DIMIA, 2002, 2005a).
As a consequence a high proportion of newly arrived migrants in Australia have relatively
high socioeconomic status occupations, with 23% of settler arrivals in 2003-04 who stated
their occupation prior to arrival in Australia stating they had a professional occupation. The
proportions of recent arrivals from North-East (62 per cent in 2003-04), South (73 per cent)
3
and South-East Asia (58 per cent) who are selected of the grounds of skills all have risen to
over one-half.
One of the more striking changes in movement to Australia in recent years has been
the upsurge in moves for which the intended length of stay in Australia is more than one year
but which are not intended to be permanent (“long-term arrivals”). A significant component
of this increase has been due to increased numbers of international students studying in
Australia. In 2003/2004, more than 171,000 student visas were issued, which was a 17 per
cent increase since 2000/2001 (DIMIA, 2005b). In recent years students from Asia have
made up the majority of Australia’s overseas student population, with the largest groups being
from Singapore, Hong Kong, China, Malaysia, India and Indonesia (Cameron, 2001, DEST,
2004). Most of the overseas students, especially those from Asia, have enrolled in the courses
that would eventually lead them into the occupations such as accountants, economic and
financial analysts, business administrators, IT professionals, and scientists and engineers
(DEST, 2004). Government initiatives in immigration policy since 1998, including the
introduction of a points allocation for Australian qualifications and the wavering of work
experience requirements for those with such qualifications, have resulted in more overseas
students, especially students from Asia, seeking migration after completing their university
studies in Australia and subsequently joining the Australian labour force (Birrell, 2003: 154).
However, even before the implementation of the new initiatives, many overseas Asian
students opted to seek permanent residence in Australia after completing their studies. The
skills level of the migrant population was also increased by has also been a significant
increase in numbers of people in Australia on skills-related temporary visas (Hugo 2004,
DIMIA 2005c)
The occupations of Australia’s post WWII migrants tended to be those at the lower
end of the spectrum, particularly for migrants from Southern Europe and Western Asia
4

(Wooden, 1990:252). However, as a new pattern of migration to Australia with increased
numbers of skilled and business migrants increased emerged in the late 1970s and early 1980s,
a number of studies using data from the 1986 census started to challenge the applicability to
some Asian groups of the stereotypical view of migrants being part of an underclass (Inglis
and Wu, 1992). While most Indochina-born migrant workers were to be found in blue-collar
occupations (e.g. tradespersons and labourers and related workers), migrant workers with
Chinese ancestry had levels of skill almost as high as the native-born workers, and one in four
worked in professional and associate professional occupations (Coughlan, 1992, Jones, 1992,
Coughlan, 1998). Using 1991 census data, Knapman (1997) showed that Asia-born migrants
in Australia tended to be over-represented in professional occupations, but under-represented
in managerial occupations. However, the Vietnamese-born community in Australia has shown
little upwards occupational mobility. According to Coughlan (1998) their labour market
performance was mainly determined by what happened to them soon after their arrival in
Australia, and impacts of migrants’ previous human capital variables on their occupational
mobility did not appear to be significant.
The characterisation of the occupational outcomes of some migrant groups as either
“better” or “worse” than the Australia-born may be oversimplistic. Recent labour force
statistics in Australia show a seemingly polarised pattern of occupational attainment among
the overseas born population – that is a concentration in such ‘high-end” occupations as
professionals and also in such “low-end” occupations as labourers and related workers. In
2003, around 27% of all professionals in Australia were born overseas, which was noticeably
higher than that of total employed persons (24%). At the same time, about 27% of all
labourers and related workers were born overseas (ABS, 2003). Such a pattern has also been
observed in some Asian migrant groups (Knapman, 1997).
5

The disruption of migrants’ working careers as a result of migration may adversely
affect migrants’ job status in their early years of settlement. McAllister’s (1995) study of
occupational mobility, which focused on migrant cohorts arriving in Australia in 1960s and
1970s, concluded that migrants’ economic disadvantages were mainly caused by the act of
migration per se and the impacts of migration on migrants’ labour market performance were
long lasting. For many migrants migration represented a major economic dislocation. The
lower occupational status at the beginning of their Australian working career determined their
subsequent occupational status and economic disadvantages.
Migrants’ success in the labour market has been shown to be related to the selection
criteria under which they entered Australia (Khoo et al., 1994, Richardson et al., 2004).
Skilled migrants have performed much better than migrants in other admissions categories,
and also have a better chance to move upward in the labour market. Comparing two very
different categories of migrants – skilled migrants and refugees, Khoo et al. (1994) showed
that skilled migrants were very much less likely to be dependent upon government welfare,
even after controlling for other factors, while refugees tended to be the most likely to become
dependent on welfare payments. They also showed that the dissimilarity of the occupations
of various Asian country of birth groups from the Australia-born reduced for most groups as
the duration of residence increased. Cobb’s (2000) study also suggested that skilled and
business migrants were much more likely than migrants in other admission categories to
participate in the job market shortly after their arrival.
Clearly differences in success in education have important implications for differences
in rates of occupational mobility between country of birth groups (Knapman, 1997). Parr and
Mok (1995) showed that in New South Wales students from Asian birthplaces were more
likely to participate in higher education than the Australia-born. Such differences reflect both
success in examinations and that a higher proportion of senior secondary school Asian-
6

Australians aspire to higher education, as opposed to other alternatives such as entry to the
labour force. Marks, McMillan and Hilman (2001) showed that students from Asian
backgrounds on average gained higher university administration scores than students whose
fathers were born in Australia. The better academic performance of Asia background students
persisted after controlling for socioeconomic status. Parental attitudes may help to explain the
participation of Asian-Australians in higher education. Parr and Mok showed the importance
that children see their parents placing on their children going to university was higher for
Asian birthplace groups. Greater use of personal tutors and coaching colleges, and rising
proportions attending private (as opposed to public or catholic) schools are likely to be other
factors behind the continuing success in education of Asian-Australians.
The importance of English proficiency as a determinant of the labour market
performance of migrants in Australia is now well established in the literature (Burnley et al.,
1997, Knapman, 1997, Richardson et al., 2004). In response to this, in the 1990s the
Australian government increased the emphasis placed on English language proficiency in the
selection of migrants for Australia (Birrell, 2003:153). The time of arrival and the
occupational sectors in which migrants have concentrated are other factors related to their
labour market outcomes (Burnley, et al 1997). The significant reduction in Australia’s
unemployment rate between the early 1990s and the mid 1990s and the more gradual decline
since 1997 would have contributed to the improved the labour market outcomes achieved by
more recent newly-arrived migrants (ABS 2005a, Richardson et al 2004). Burnley et al. (1997)
speculate that the under-representation of Asia-Pacific migrants in the rapidly growing service
sector may adversely affect their occupational mobility.
The labour market success of migrants in Australia appears to be in contrast with the
pattern of migrants in general being worse off economically compared with their native-born
counterparts which has been observed for many other developed countries (Tienda and Lii
7

1987). For example migrants to Canada generally tend to be disadvantaged in the labour
market compared with local residents. However, female migrants tended to perform better
than their male counterparts (Shamsuddin 1998, Richardson and Lester 2004).
This paper aims to probe further into the changing patterns of occupational attainment
and concentration with an aim of providing a better understanding of the patterns and their
major contributing factors. Unlike some of the previous studies that consider all migrants
groups as one general group, this study examines the diversified patterns of occupational
attainment of a selection of major Asian immigrant groups – Mainland China, Hong Kong,
India, Indonesia, Japan, Korea (South), Malaysia, the Philippines, Sri Lanka, Taiwan, and
Vietnam. It aims to not only paint a general picture of occupational attainment of migrants,
but also capture the specific differences among groups. It attempts to examine the extent to
the differing patterns of occupation are explained by individual characteristics. Using data
from the 1996 and 2001 censuses, this study analyses the aggregate-level changes in
immigrants’ occupational patterns over the period of five years. The effect of recent migration
on these changes is assessed. Differences between the occupations of males and females are
analysed. This study also compares Asian immigrants with locally born residents over time.
Data and Methods
The data used for this study are from the 1996 and 2001 censuses of Australia. Data
on a person’s occupation were collected specifically for the main job held in the week before
the census. Responses were coded using the Australian Bureau of Statistics’ (ABS) Australian
Standard Classification of Occupations (ASCO). This classification has a hierarchical
structure and includes 9 major (1 digit code) groups of occupations, 35 sub-major (2 digit
code) groups, 81 minor (3 digit code) groups, and 445 unit (4 digit code) groups (ABS 2002).
The classification of occupations, which reflects the level and type of skills they involve, was
8

identical for the 1996 and 2001 censuses. It differs somewhat from the classification used for
earlier censuses (ABS, 1997).
Eleven Asian birthplace groups have been selected for this study; China (excluding
Hong Kong SAR and Taiwan), Hong Kong (Special Administrative Region of China), India,
Indonesia, Japan, Republic of Korea (South Korea), Malaysia, Philippines, Sri Lanka, Taiwan,
and Vietnam. The Australia-born is used as the reference group in comparison with the
selected Asian birthplace groups. The rationale of selecting these groups includes: first, the
selected groups represent a significant proportion of total migrant intake in recent years; and
secondly that the patterns of occupation attainment for this diverse range of selected groups
has not been well understood so far.
An index of dissimilarity is constructed to measure the extent of the differences of
occupational patterns (as measured using major occupational groups) between the selected
birthplace groups and the Australia-born (Siegel, 2002:26). The formula is as follows:
Index of Dissimilarity for A = iΣ |pai - pri| /2
where
pai is the proportion of all people in classifiable occupations in birthplace group A who are in
occupational category i,
pri is the proportion of all people in classifiable occupations in the reference group (the
Australia-born) who are in occupational category i.
The values of the index of dissimilarity range between 0 (A has an identical occupational
distribution to the reference group) and 1 (all members of A are in one particular occupational
category and all members of the reference group are in a different occupational category). The
absolute values of an index of dissimilarity will be affected by the number of categories over
which the variable being measured is divided.
9

An index of heterogeneity is also constructed to measure the unevenness of the spread
of the occupations of the selected birthplace groups between the nine major occupational
groups (Siegel 2002:339). This is calculated as follows:
Index of Heterogeneity for A = 1 - iΣ pai2
where
pai is the proportion of all people in classifiable occupations in birthplace group A who
are in occupational category i,
The minimum value possible of the index of heterogeneity (0) indicates all members
of A are in one particular occupational category. The maximum will depend on the number of
categories. If the occupations of A are evenly distributed over nine categories (the number of
major groups in the ASCO) the value of the index of heterogeneity will be 0.89 (Siegel,
2002:339).
In addition, indirectly standardised indices (i.e. the ratios of the actual numbers of
people in particular birthplace groups in the managerial and administrative occupations and in
the professional occupations to the corresponding numbers which would be expected if the
proportions of the Australia-born in the various age, sex, highest level of education and
English-speaking proficiency categories in these occupational groups are applied to the
distribution of employed people in the birthplace group by this combination of variables) are
employed to examine the extent to which differences between migrant groups’ participation in
the top-end occupations differ from the Australia-born after controlling for the differences in
the above-mentioned characteristics between the migrant group and the Australia-born.
10

Occupational Concentration
The indices of dissimilarity show all the Asian country of birth groups have very
different occupational profiles from the Australia born (Table 1). Generally the extent of the
dissimilarity with the occupations of the Australia-born tends to be greater for males than for
females. Indeed, for all the Asian country of birth groups the occupational distributions of
males and females exhibit a greater degree of similarity to each other than is the case for
Australia-born males and Australia-born females. For males the dissimilarities of occupations
tend to be greatest for three East Asian groups, namely the Japan-born, Hong Kong-born and
Taiwan-born. The value of the dissimilarity index for Malaysia-born males also is relatively
large. However for females it is three South-East Asian groups, namely the Vietnam-born,
Philippines-born and Malaysia-born, which are the most dissimilar in their occupations from
the Australia-born.
For males across the eleven countries of birth the two largest components of the index
of dissimilarity tend to be the differences from the Australia-born in the percentages in
professional occupations and in trades and related occupations (Table 2). The percentages of
males in professional occupations are higher for all the Asian country of birth groups, except
the Philippines-born, than for the Australia-born. This would reflect that for all of the selected
Asian country of birth groups the percentage of those in employment who had bachelor
degrees or above was higher than for the Australia-born. Taiwan-born workers are the most
highly educated (Table 3). The three Asian source countries with the highest percentages of
males in professional occupations (all have more than double the percentage of Australia-born
males in these occupations), the Hong Kong-born, Malaysia-born and India-born, are all
former British colonies from which a high percentage of migrants to Australia have entered
under the skills migration schemes. They also have relatively high percentages who speak
11

English only, and the overwhelming majority of the remainder report speaking English well
or very well. Significant proportions of the India-born (and to a lesser extent of the Hong
Kong-born) who speak English only would be people of British or Irish ancestry who moved
on to Australia (Khoo and Lucas, 2004:38-39).
All the Asian groups have a lower percentage of males in the trades and related
occupations than the Australia-born (Table 2). Whilst almost all groups have a higher
percentage of males in professional occupations than the Australia-born do, only the Japan-
born and Taiwan-born also have a higher percentage in managerial and administrative
occupations. Some of the higher representation of the Australia-born in managerial and
administrative occupations would be attributable to their having a higher percentage than
most of the Asian groups (the exceptions being the India-born and Sri Lanka-born) in the over
55 years age group. The two Asian groups with a higher percentage in managerial and
administrative occupations are both groups in which high percentages of migrants have
entered under the business skills schemes in recent years.
A bipolar pattern with overrepresentation at both the high end and at the low end of
the occupational distribution is evident in some groups of males (Table 2). For example, as
well as being overrepresented in the professions, the China-born, Korea-born, Vietnam-born
and Indonesia-born males are overrepresented in labouring and related occupations. The first
three of these are groups in which, as well as there being high percentages with university
degrees, there are also high percentages who report not speaking English well or not speaking
English at all (Table 3).
For females the differences from the Australia-born in the percentages in professional
occupations tend to be the largest components of the index of dissimilarity, with the
Malaysia-born and Hong Kong-born having particularly large percentages of employed
females in this category. As for males, in all the Asian groups the percentage of females with
12

a bachelor’s degree or higher is above that for the Australia-born (Table 3). The dissimilarity
of the occupations of Philippines-born females and the Vietnam-born females from the
Australia-born is due mostly to higher percentages at the lower end of the occupational
spectrum, particularly to the high percentages of females in these groups in labouring and
related occupations. In the case of Vietnam-born females a high percentage who either do not
speak English well or do not speak English at all may help to explain this. However such an
explanation is not tenable for the concentration of Philippines-born females in “low end” jobs,
since hardly any are unable to speak English well.
A comparison of Tables 4 and 5 shows that for most groups there remains a pattern of
the more recent arrivals (those who arrived after 1996) tending to have lower occupational
status than those with a longer duration of residence in Australia. However, for China-born
males, Philippines-born males and India-born males and females it is the more recently
arrived migrants who are more likely to be in professional occupations. Whilst for most
groups it is those with longer residence which are the more likely to be in managerial or
administrative occupations, for Taiwanese males and females and Japanese males it is the
more recent migrants who are the more likely to be in these occupations. The exceptions are
groups in which high percentages of recent arrivals have entered under the business skills
scheme. In the case of Japanese males a significant number of long-term temporary moves by
managerial staff who are sent to work in Australia by their employers would also be an
important contributory factor. Data from DIMIA (2003) show that in 2001-02 among all long
term temporary business visa recipients, the proportion from Japan (7%) was significantly
higher than the proportion of all arrivals from this country. Many of these Japanese long
term temporary business migrants, especially males, came to Australia to take up managerial
positions in multi-national companies or Japanese owned companies operated in Australia.
Similarly, the proportion of independent executive migrants from Taiwan (3% of all
13

independent executive migrants in 2001-02) is higher than the proportion of migrant arrivals
from this source (DIMIA, 2003; ABS, 2002).
The values of the index of heterogeneity show that both for males and for females for
most groups the occupational distributions of the selected country of birth tend to be more
highly concentrated in particular major occupational groups than is the case for the Australia-
born (Table 1). However whilst for Australia-born males the main occupational area of
concentration is in trades and related occupations for all the Asian country of birth groups,
except the Philippines-born and the Vietnam-born, the main area of concentration is the
professions. Moreover, whilst for Australia-born females the main occupational area of
concentration is in intermediate clerical, sales and service occupations, for just over half the
Asian groups studied there are more females in professional occupations than in any other
occupational group. Both for males and for females the three groups with the highest degree
of concentration are the Hong Kong-born, Japan-born and Malaysia-born. The high
occupational concentration of the Malaysia-born and the Hong Kong-born males and females
is mainly due to the high percentages in professional occupations. The relatively high
concentration of the occupations of the Japan-born males reflects the high percentages in
professional occupations and in managerial occupations. However the explanation of the high
degree of concentration of Japan-born females is due mostly to their concentration in the
intermediate clerical, sales and service workers occupational group.
Differences in Participation in Particular Professions
For most of the birthplace groups, the professionals show a clear pattern of
concentration in a small number of particular professions (Table 6). The differences from the
Australia-born in the percentages are widest for computing professionals, accountants,
auditors and corporate treasurers, and school teachers. The differences in the percentages who
14

are medical practitioners and nursing professionals are also relatively large.
For all the chosen Asian birthplace groups the percentages of males and females who
are computing professionals are significantly higher than for the Australia-born. The India-
born and the Hong Kong-born have particularly high percentages of both males and females
who are employed as computing professionals, with the percentage of these groups in this
profession being more than five times that for the Australia-born.
For males for all groups except for the Japan-born and the Vietnam-born, and for
females for all eleven Asian groups the percentages who are employed as accountants,
auditors and corporate treasurers are higher than for the Australia-born. For most groups the
percentages in these professions are also higher than for the total overseas-born. The
Malaysia-born and the Hong Kong-born are the most likely of the selected country of birth
groups to be accountants, auditors or corporate treasurers (for both males and females more
than three times as likely as the Australia-born), and, interestingly, whilst for the Australia-
born males are more likely to be employed as accountants, auditors and corporate treasurers
than females are, for all the Asian groups, except the two South Asian groups, females are
more likely to be in this profession than males. The differing age distributions of the Asian
groups and the Australia-born may contribute to the explanation of this pattern. A higher
percentage of the Australia-born are in the later working ages than for most of the Asian
groups (the exceptions are the two South Asian groups) and in contrast to the predominance
of females below age 30, in the later working ages the overwhelming majority of accountants,
auditors and corporate treasurers are male (Parr and Murray, 2004).
Interestingly, apart from the Japan-born, the percentages of males and females who are
school teachers are lower for all the selected Asian country of birth groups than for the
Australia-born, and in most cases also lower than the figures for migrants as a whole. The
high percentage of the Japan-born who are employed as school teachers reflects the popularity
15

of Japanese in Australian schools in recent years, the presence of Japanese schools, and that
Japanese teachers were identified in the list of “Migration Occupations in Demand” for many
years. Statistics from the Department of Education, Science and Training (2002) show that
among all foreign language programs offered in Australian high schools Japanese has been
the most popular choice since the mid-1990s, accounting for more than 20% of all year 12
enrolments in foreign language courses. The Vietnam-born, the Philippines-born and the
China-born are the least likely to be schoolteachers.
For males all the selected Asian groups except for the Philippines-born are more likely
to be medical practitioners than the Australia-born, whilst for females all groups except the
Japan-born are more likely than the Australia-born to be in this profession. For both males
and females the Malaysia-born are the most likely to be medical practitioners. The India-born,
the Sri Lanka and the Hong Kong-born also have relatively high propensities to be in this
profession. As is the case for the Australia-born, for almost all the Asian groups studied males
are more likely than females to be medical practitioners. In contrast, nursing professionals are
overwhelmingly female, and, with the notable exceptions of the Malaysia-born, Philippines-
born and Hong Kong-born, most of the Asian groups are less likely to be nursing
professionals than the Australia-born.
The concentration of professional migrants in the selected Asian groups in particular
professions would partly be due to the differential allocation of points on the Australian
Government’s “Skilled Occupations” list and to some components of these groups being
identified as “Migration Occupations in Demand” in recent years. Information technology
professionals and most accounting occupations receive more points than many other types of
professionals. That the expansion of some of these professions, particularly information
technology, has coincided with the main periods of migration from these countries to
Australia is another factor. Differences in the percentages completing different types of
16

university degree courses by country of birth would also be another contributory factor.
Higher education statistics show that in 2003 about 45% of all overseas students in Australia
were enrolled in commerce subjects and a further 16% were in information technology
subjects, compared to 28% of domestic students in commerce subjects and 8% in information
technology subjects (DEST 2003). The under-representation of most of the groups in teaching
in part may be linked to teaching becoming an “Occupation Requiring English” somewhat
earlier than most of the other professions (Birrell, 2003: 153). The slower growth of the
school-age population and relatively low rates of recruitment into teaching in the period since
the arrival of these most members of these groups into Australia would be other explanatory
factors.
Controlling for the Effects of Demographic and Human Capital Factors on Occupational
Concentration
The higher percentages are in professional occupations of most of the selected Asian
groups is attributable to their demographic characteristics and levels of education. Table 7
shows that after standardising for age, sex, highest level of education and English-speaking
ability most groups have a lower percentage in professional occupations than the Australia-
born. The exceptions are the Hong Kong-born and the Malaysia-born, both countries from
which a relatively large proportion of graduates have travelled to obtain their qualifications in
Western countries.
After standardising most groups also have a lower percentage in managerial and
administrative occupations than the Australia-born. The exceptions are the Japan-born the
Taiwan-born and the Korea-born. In each of these North-east Asian groups the higher
standardised rate is largely due to higher male (as opposed to female) propensities to be in
17
managerial or administrative work. As noted earlier, in the case of the first two groups, the
explanation may be linked to the high percentages which have entered under the business
skills program and to temporary movers with managerial occupations.
Occupational Mobility
Between 1996 and 2001 the most notable change shown by the index of dissimilarity
for males was the marked convergence of the occupational distribution of the Vietnam-born
with that for the Australia-born. For females the major change was the convergence of the
occupations of the China-born and the Vietnam-born (the two groups which previously were
most dissimilar to the Australia-born) with those of the Australia-born. For most groups the
changes in the indexes of dissimilarity were slight.
The main components of the convergence of the occupational distributions of the
Vietnam-born males with the Australia-born males were the increased percentages in the
professional occupations and the reduced percentages in intermediate production and
transport occupations. A greater increase in the percentage in professions than the Australia-
born and a much greater reduction in the percentage in intermediate transport and production
occupations are the main components of the reductions in the dissimilarities of the
occupations of China-born and Vietnam-born females with those of the Australia-born.
Between 1996 and 2001 change in the index of heterogeneity was generally slight, with the
greatest change being the reduction in the heterogeneity of the occupations of Hong Kong-
born females (Table 1). This was mostly due to a rising proportion in the professional
occupations.
Between 1996 and 2001 for females for all the selected Asian country of birth groups
and for males for all except the Japan-born the percentage of employed persons in
18

professional occupations increased, with most increases being greater than for the Australia-
born (Tables 2 and 8). The Taiwan-born showed the greatest increase in the percentage of
males employed in professional occupations, followed by the China-born, the Vietnam-born
and the Indonesia-born. In 2001 the Vietnam-born males, a group whose disadvantage has
received much attention in the literature, had risen above the corresponding figure for the
Australia-born. Except for the Taiwan-born and the Japan-born, the percentage of males in
managerial and administrative occupations increased, albeit slightly, for all the selected Asian
groups. This contrasts with a slight decline for the Australia-born.
For females the China-born and the Vietnam-born were the two groups in which the
percentage of females in professional occupations increased most. The percentages of females
in managerial and administrative occupations also rose significantly in these two groups, in
contrast to a slight decline for the Australia-born. There were also significant increases in the
percentages of employed females in professional occupations for the Hong Kong-born,
Taiwan-born, India-born and Sri Lanka-born females, and a significant increase in the
percentage of Indonesia-born females in managerial and administrative occupations.
The upwards occupational mobility observed for most of the Asian groups may in part
be due to increased levels of education and improvements in English-speaking abilities over
the period (Table 3). In particular the upwards occupational mobility of the China-born and
Vietnam-born coincides with marked increases in the educational levels and improvements in
English-speaking abilities over this period, with the improvements for females being greater
than those for males. Some of the upwards occupational mobility over this period may also be
due to abnormally long processing times for permanent residence visas in 1996 having
disrupted the entry of some recently-arrived skilled migrants into professional occupations in
Australia.
19

Comparison of Tables 5 and 8 shows there was upwards mobility in almost all the
Asian groups between 1996 and 2001 among those who arrived before 1996, and,
interestingly, females who arrived in Australia before 1996 tended to show a greater upwards
mobility than males. The percentages of pre-1996 arrival China-born and Vietnam-born
females and Indonesia-born males in professional occupations increased markedly. For the
Taiwan-born who arrived before 1996 both for males and for females there was a marked
increase in the percentage in professional occupations, but also a marked reduction in the
percentage in managerial and administrative occupations. The one group of pre-1996 arrivals
to show a marked downwards occupational mobility was the Japan-born males, whose
percentage in managerial and administrative occupations fell markedly. The number of Japan-
born males who arrived before 1996 fell markedly from 1996 to 2001 it may be that
outmigration of Japan-born managers, including significant numbers who arrived on
temporary visas, can explain this pattern.
People who migrated since the 1996 census formed over 30 per cent of the employed
Indonesia-born and Japan-born, and more than 20 per cent of the China-born, India-born and
Korea-born, but less than 10 per cent of the Hong Kong-born and Vietnam-born (Table 9). In
the case of the China-born males a significant component of the increased percentage of
professionals is due the significant number of migrants over the 1996 to 2001 period being
somewhat more likely than those who had arrived before 1996 to work in professional
occupations (Tables 4 and 5). However, the increased percentage of the Vietnam-born in
professional occupations cannot be explained this way, both because the percentage of the
employed population formed by post-1996 migrants is small and because the percentage of
post 1996 migrants who were employed in professional occupations is far below the average
for those who arrived earlier. By comparing Tables 6 and 9 we see the main reason for the
upwards occupational mobility of the Vietnam-born is the marked improvement over the five
20

years in the percentage employed in professional occupations among those who arrived in
Australia prior to 1996. Much of this would be attributable to the success in education of
Vietnam-born who arrived in Australia at younger ages and were educated in Australia and
the flow on effect of their graduation into the professions (Parr and Mok 1995).
There were marked differences between the Australia-born and the Asian country of
birth groups in the pattern of growth in the percentage in professional occupations by age. For
the Australia-born the increases in the percentage in professional occupations were slightly
larger between the ages of 45 and 64 than in the younger ages. In contrast, with the exception
of the Japan-born, for most of the Asian groups the increases were much greater below the
age of 40 than above it. The distribution of the increased percentage of professionals in the
Asian groups would be linked to the graduation of Asian-Australian students from universities
and for some groups the influx of highly skilled migrants. Differences between different age
groups in the changes in the percentages of employed people in managerial and administrative
occupations were generally not large.
Some of the changes in the occupational structures of the selected birthplace groups in
this study would be the product of the increased number of Asian students in Australia who
have stayed on and obtained permanent residence. The achievement of upwards occupational
mobility by Asian groups, that is, the percentage in “high-end” occupations has increased
while the percentage in “low-end” occupations decreased, may reflect the greater recognition
of Australian qualifications, as opposed to the recognition of qualifications obtained overseas.
A greater awareness of and attunement to the Australian labour market and the development
of networks and contacts during their study period may also have facilitated the ready entry
into “high-end” jobs of the growing numbers who were overseas students in Australia and
stayed on to become permanent residents.
21

Discussion
The results of this study serve to illustrate not only the differences in their occupations
between the various East, South-East and South Asian country of birth groups covered and
the Australia-born and also the marked differences between the various Asian groups. The
Asian population includes groups, such as the Philippines-born, which remain relatively
concentrated in “low- end” occupations, many groups which are more likely than the native-
born to be in “high-end” professional occupations, and also some groups which show a
bipolar distribution of occupations, with concentrations at both the low and the high ends.
Asian migrants as a group are not economically worse-off compared to their Australia-born
counterparts, as the proportions of people employed in “high-end” professional occupations
for most groups are higher than for the Australia-born. Some of these differences would be
explained by differences in the timing of the migration to Australia and the differences in
migrant selection over time. The arrival of birthplace groups is in Australia has been
characterised by a series of waves, with arrivals being concentrated in a particular time period
(Hugo 1995). The bipolar patterns of occupational distribution of some Asian migrant worker
groups may reflect an emerging trend of polarisation in the labour markets of the developed
countries. While the demand for highly trained specialists increases, there are also growing
numbers of low-skilled jobs in low-end occupational categories (Castles, 1992).
The results of this study may reflect that the act of migration per se, at least for
migrants in the selected birthplace groups, in recent years is not such a disadvantageous factor
affecting migrants’ occupational attainment in the Australian labour market as it was in the
past. For many, migration per se would be the process of obtaining an advanced university
degree, which in turn may have enhanced their competitive position in Australian labour
22
market. In an increasingly globalised social and economic environment, migration need not
be such a disruption of one’s working career. Except for the professions such as medical
practitioners, lawyers, and other occupations that are subjected to a strict process of
“credential recognition” for the degrees obtained overseas, many professions enjoy a much
less strict recognition process, for example IT professionals and engineers. A certificate from
Microsoft, or working experience using PeopleSoft software, for example, may bear equal
weight in Australia and many overseas labour markets. This seems quite different from the
observations in a previous study (McAllister, 1995), which investigated migrant cohorts
arriving in Australia in 1960s and 1970s. That study indicated that the act of migration per se
had long-lasting impacts on migrants’ labour market performance as it was a disruption of
migrants’ working careers.
The higher percentages of most of the Asian birthplace groups in professional
occupations do not mean that these groups are advantaged. After standardisation for education
the propensity to be in professional occupations of most of these groups is below that of the
Australia-born, showing it is the human capital these groups either arrive with or attain in
Australia which explains the relatively high status of their occupations. In other words simply
being in one of the selected Asian birthplace groups does not necessarily enhance one’s
position in the labour market. On the other hand, this study also shows that simply having
been born an Australian does not necessarily guarantee one’s position in the labour market. It
is one’s human capital, especially one’s educational qualifications that are more important in
determining one’s labour market performance. The lower standardised rates of employment
in professional and managerial occupations of many of the Asian groups may at least in part
be attributable to discrimination and a “glass-ceiling” in some sections of the labour market
faced by Asian-Australians.
23
The results from this study also show that almost all the selected Asian birthplace
groups experienced some degree of occupational mobility, represented by the increase in the
percentage in “high-end” occupations in some groups, or decrease in “low-end” occupations
in the other groups. Whilst a significant component of the increased percentage in
professional occupations in some of the selected Asian birthplace groups, particularly the
China-born and the India-born, is attributable to an increasing influx of highly skilled
migrants which has occurred since the first election of the Howard Government in 1996, for
most of the groups covered by this study overwhelmingly the main reason component of the
increase is the upwards mobility of those who were already resident in Australia before then.
The success of Asian migrants is education in Australia may well be the major reason for their
upwards occupational mobility (Parr and Mok 1995, Marks, McMillan and Hillman 2001).
The occupational mobility of the selected Asian groups would have been affected by
return migration. Iredale, Guo and Rozario (2003) have shown the return of skilled and
business migrants to some Asian countries, including China, Vietnam and Taiwan, from
Australia and other developed nations benefited Australia and the other developed countries
from which the returns were made. The international links between offshore businesses and
Australia provided by the return migrants that began to emerge since the 1990s are a valuable
form of cultural capital. The cultural capital associated with these international business links
may produce some increase in the skill level in some “high-end” occupations among migrants.
However, the return migration of less successful migrants to Asia is unlikely to have played a
major role in the upwards occupational mobility of the Asian birthplace groups, since rates of
return migration for most groups have been low.
An important finding of this paper is that the improvements in occupational status
have been most marked among two groups with relatively low status; the China-born and the
Vietnam-born. The significant upward mobility of the Vietnam-born, recorded in this study, is
24
in marked contrast to previous studies (Coughlan, 1994, 1998) which found little upward
mobility in this group. The upward mobility of the Vietnamese is only among the younger
adults, particularly those in their 20s. In view of the relatively low occupational status of
recent Vietnamese migrants, the explanation of the upward mobility of this group must lie in
their success in the Australian education system. A graduate employment market which has
improved considerably since the recession of the early 1990s, particularly in New South
Wales and Victoria where most Vietnamese-Australians live, may also have assisted.
For the China-born, with over a fifth of the employed having arrived in the 1996 to
2001 period and the recent male arrivals tending to occupy higher status jobs than longer
established male residents, the selectivity of recent migration has undoubtedly been a
significant cause of their upwards occupational mobility. It may also be that many Chinese
having participated as overseas students in Australian higher education before achieving a
permanent residence visa and the more favourable economic climate, particularly in Sydney
the main destination for Chinese immigration, have facilitated the entry of recent Chinese
migrants into the higher status occupations. Whilst the China-born and the Vietnam-born
both have achieved significant upwards mobility in recent years, the explanations for their
success are clearly contrasting, particularly in relation to the role of recent migration, The
effects on the relationships between generations in many of the Asian birthplace groups of the
percentages of younger workers in “top end” jobs being much higher than for older age
groups also may merit further consideration.
25
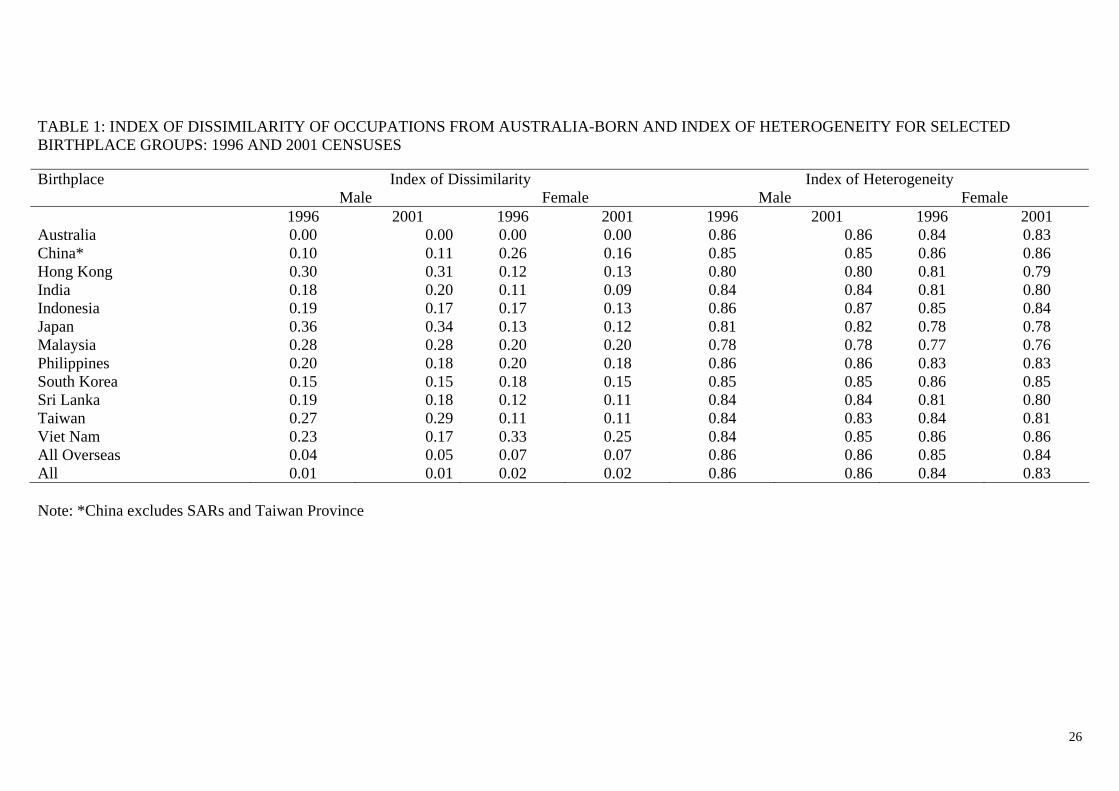
TABLE 1: INDEX OF DISSIMILARITY OF OCCUPATIONS FROM AUSTRALIA-BORN AND INDEX OF HETEROGENEITY FOR SELECTED BIRTHPLACE GROUPS: 1996 AND 2001 CENSUSES Birthplace Index of Dissimilarity Index of Heterogeneity
Male
Female
Male
Female 1996 2001 1996 2001 1996 2001 1996 2001
Australia
0.00 0.00 0.00 0.00 0.86 0.86 0.84 0.83China* 0.10 0.11 0.26 0.16 0.85 0.85 0.86 0.86Hong Kong 0.30 0.31 0.12 0.13 0.80 0.80 0.81 0.79India 0.18 0.20 0.11 0.09 0.84 0.84 0.81 0.80Indonesia 0.19 0.17 0.17 0.13 0.86 0.87 0.85 0.84Japan 0.36 0.34 0.13 0.12 0.81 0.82 0.78 0.78Malaysia 0.28 0.28 0.20 0.20 0.78 0.78 0.77 0.76Philippines 0.20 0.18 0.20 0.18 0.86 0.86 0.83 0.83South Korea 0.15 0.15 0.18 0.15 0.85 0.85 0.86 0.85 Sri Lanka 0.19 0.18 0.12 0.11 0.84 0.84 0.81 0.80 Taiwan 0.27 0.29 0.11 0.11 0.84 0.83 0.84 0.81Viet Nam 0.23 0.17 0.33 0.25 0.84 0.85 0.86 0.86 All Overseas
0.04 0.05 0.07 0.07 0.86 0.86 0.85 0.84
All 0.01 0.01 0.02 0.02 0.86 0.86 0.84 0.83 Note: *China excludes SARs and Taiwan Province
26

TABLE 2: PERCENTAGE DISTRIBUTION OF EMPLOYED BY OCCUPATIONAL GROUP FOR SELECTED BIRTHPLACE GROUPS BY SEX: 2001 CENSUS Birthplace Managerial
& Administrative
Professionals AssociateProfessionals
Trades & Related
Advanced Clerical &
Service
Intermediate Clerical,
Sales, & Service
Intermediate Production
& Transport
Elementary Clerical,
Sales & Service
Labourers &
Related
N
Males Australia
12.8 15.3 12.2 20.8 0.8 8.9 12.9 6.2 10.1 3,267,137China* 9.2 19.3 18.3 18.2 0.6 6.8 11.3 5.1 11.3 33,775Hong Kong
8.2 36.2 19.3 10.1 0.9 11.5 4.3 4.9 4.6 16,412
India 10.7 30.7 12.0 9.3 0.9 10.7 10.7 8.8 6.2 32,226Indonesia 7.8 19.4 12.0 8.9 1.0 10.6 14.7 9.4 16.1 9,594Japan 22.2 22.0 21.8 6.5 0.9 17.0 1.8 4.3 3.4 4,854Malaysia 10.8 40.0 14.5 8.0 1.2 9.4 5.8 4.7 5.6 21,953Philippines 3.6 14.9 9.5 15.5 1.0 13.4 17.7 9.5 14.9 22,287South Korea 11.0 20.4 15.0 17.4 0.4 7.4 5.2 5.7 17.5 7,337Sri Lanka 9.4 29.9 11.8 9.2 1.0 11.5 10.6 7.2 9.3 17,694Taiwan 19.2 29.0 15.3 4.7 1.2 12.2 4.8 8.7 4.8 3,035Viet Nam 5.7 15.4 9.7 16.7 0.5 5.7 21.9 6.6 17.8 41,532 All Overseas 11.4 19.1 12.7 18.9 0.7 8.4 13.0 5.6 10.1 1,109,852All 12.4 16.3 12.3 20.3 0.8 8.8 12.9 6.1 10.1 4,376,989 Females Australia 6.0 21.4 11.7 3.0 7.6 27.1 2.1 14.8 6.3 2,776,465China* 5.3 21.1 12.2 4.6 4.2 18.8 8.6 11.4 13.7 27,628Hong Kong
5.0 33.9 11.6 1.9 7.1 24.3 2.6 9.4 4.3 14,704
India 4.7 28.2 10.5 0.9 8.1 29.1 2.0 10.1 6.2 20,918
27

Indonesia
3.8 17.6 9.1 3.3 5.1 25.0 3.7 20.2 12.2 8,945Japan 4.3 24.8 10.4 2.3 5.2 35.2 0.5 14.1 3.2 6,219Malaysia 5.1 40.9 11.4 1.9 5.9 20.6 1.5 8.0 4.6 22,282Philippines 2.3 16.4 7.6 1.9 4.2 26.8 5.6 16.1 19.1 35,814South Korea 5.4 19.4 13.2 5.9 3.6 19.2 2.6 16.6 14.2 5,976 Sri Lanka 3.6 24.5 9.4 1.5 6.9 32.3 3.0 10.4 8.5 12,284Taiwan 8.8 29.0 10.6 1.5 7.7 24.0 1.4 12.8 4.1 3,372Viet Nam 3.9 17.6 8.2 6.2 3.0 17.0 14.3 13.5 16.4 29,818All Overseas 5.4 22.7 11.6 3.1 7.0 24.8 3.8 11.7 9.9 848,960All 5.8 21.7 11.7 3.0 7.5 26.5 2.5 14.1 7.1 3,625,425 Note: *China excludes SARs and Taiwan Province
28

TABLE 3: PERCENT OF EMPLOYED PEOPLE WHO HAVE A BACHELOR DEGREE OR ABOVE AND PERCENT OF EMPLOYED PEOPLE WHO SPEAK ENGLISH NOT WELL OR NOT AT ALL FOR SELECTED COUNTRY OF BIRTH GROUPS: 1996 AND 2001 CENSUSES Birthplace Percent With Bachelor’s Degree Percent Speak English Not Well or Not At All
Male
Female
Male
Female
1996 2001 1996 2001 1996 2001 1996 2001
Australia
29.4 30.4 45.8 48.9 0.1 0.1 0.1 0.1China* 59.9 65.9 56.0 63.2 30.6 27.6 32.9 27.5Hong Kong
70.3 71.2 61.1 69.2 11.0 10.9 9.2 8.2
India 63.7 67.3 75.4 78.0 1.0 0.9 1.1 1.1Indonesia 52.0 60.7 54.6 58.8 10.8 5.7 10.3 5.1Japan 79.7 77.0 63.4 60.3 20.0 18.8 15.2 9.8Malaysia 72.9 73.5 61.7 68.5 3.1 2.8 2.4 2.0Philippines 65.9 58.8 80.6 72.6 1.1 0.8 0.8 0.7South Korea 70.4 72.3 72.0 69.1 31.7 27.7 36.6 26.9Sri Lanka 54.2 55.0 55.4 56.8 3.9 1.2 2.0 1.0Taiwan 77.0 79.0 68.8 76.5 23.9 16.3 19.5 14.6Viet Nam 58.5 59.8 56.6 61.9 30.8 26.4 34.2 27.8All Overseas
37.8 42.0 51.2 54.5 5.1 4.7 4.8 4.2
Total 31.7 33.3 47.1 50.4 1.4 1.3 1.2 1.0Note: *China excludes SARs and Taiwan Province
29
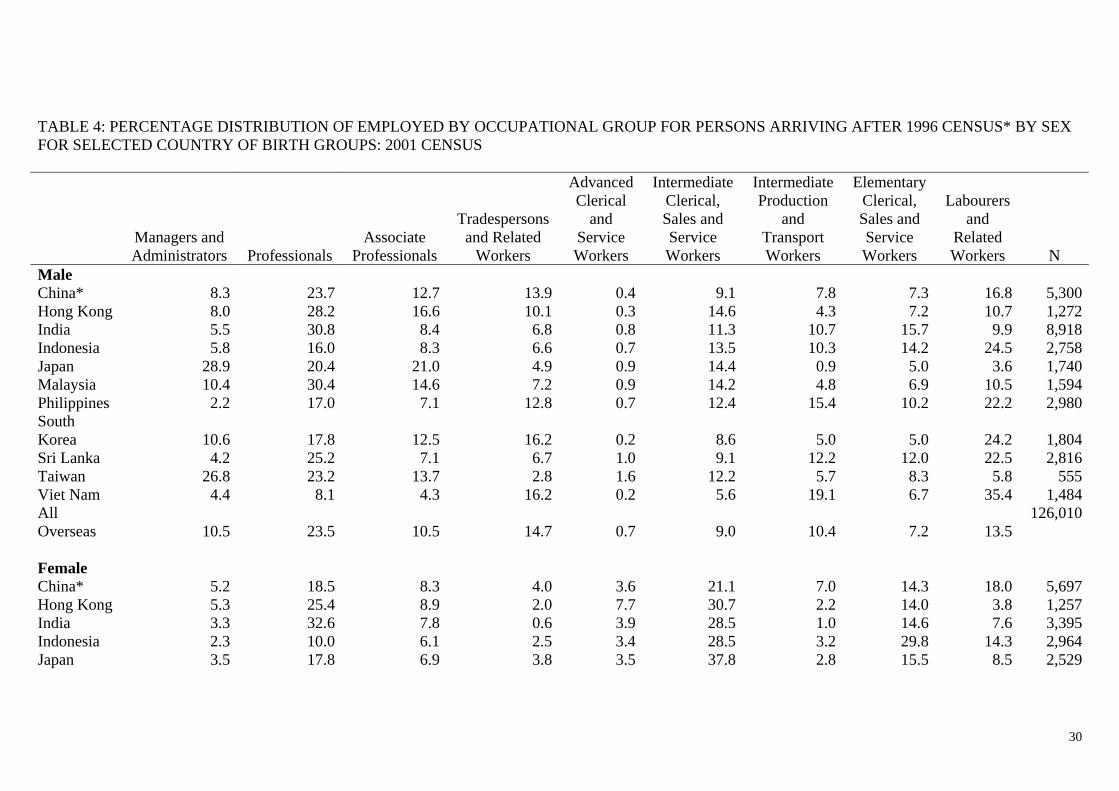
TABLE 4: PERCENTAGE DISTRIBUTION OF EMPLOYED BY OCCUPATIONAL GROUP FOR PERSONS ARRIVING AFTER 1996 CENSUS* BY SEX FOR SELECTED COUNTRY OF BIRTH GROUPS: 2001 CENSUS
Managers and Administrators Professionals
Associate Professionals
Tradespersons and Related
Workers
Advanced Clerical
and Service Workers
Intermediate Clerical, Sales and Service Workers
Intermediate Production
and Transport Workers
Elementary Clerical, Sales and Service Workers
Labourers and
Related Workers N
Male China*
8.3 23.7 12.7 13.9 0.4 9.1 7.8 7.3 16.8 5,300Hong Kong 8.0 28.2 16.6 10.1 0.3 14.6 4.3 7.2 10.7 1,272 India 5.5 30.8 8.4 6.8 0.8 11.3 10.7 15.7 9.9 8,918Indonesia 5.8 16.0 8.3 6.6 0.7 13.5 10.3 14.2 24.5 2,758Japan 28.9 20.4 21.0 4.9 0.9 14.4 0.9 5.0 3.6 1,740Malaysia 10.4 30.4 14.6 7.2 0.9 14.2 4.8 6.9 10.5 1,594Philippines 2.2 17.0 7.1 12.8 0.7 12.4 15.4 10.2 22.2 2,980South Korea 10.6 17.8 12.5 16.2 0.2 8.6 5.0 5.0 24.2 1,804Sri Lanka 4.2 25.2 7.1 6.7 1.0 9.1 12.2 12.0 22.5 2,816 Taiwan 26.8 23.2 13.7 2.8 1.6 12.2 5.7 8.3 5.8 555Viet Nam 4.4 8.1 4.3 16.2 0.2 5.6 19.1 6.7 35.4 1,484 All Overseas
10.5 23.5 10.5 14.7 0.7 9.0 10.4 7.2 13.5
126,010
Female China* 5.2 18.5 8.3 4.0 3.6 21.1 7.0 14.3 18.0 5,697Hong Kong 5.3 25.4 8.9 2.0 7.7 30.7 2.2 14.0 3.8 1,257 India 3.3 32.6 7.8 0.6 3.9 28.5 1.0 14.6 7.6 3,395Indonesia 2.3 10.0 6.1 2.5 3.4 28.5 3.2 29.8 14.3 2,964Japan 3.5 17.8 6.9 3.8 3.5 37.8 2.8 15.5 8.5 2,529
30

Malaysia
4.7 30.3 10.8 2.4 5.0 29.1 1.1 11.6 5.0 1,736Philippines 1.6 14.0 6.0 1.4 2.9 26.3 5.2 19.4 23.2 4,058South Korea 4.6 16.3 10.1 7.3 1.2 25.4 1.7 17.0 16.2 1,489Sri Lanka 2.5 23.4 5.0 2.6 2.7 29.7 2.9 16.4 14.7 1,283 Taiwan 10.7 22.7 11.1 0.7 6.3 29.9 0.6 12.2 5.8 818Viet Nam 2.5 6.7 2.8 7.6 2.0 15.0 16.1 17.2 30.3 1,794 All Overseas 4.9 24.6 9.6 2.9 4.9 25.6 3.0 13.1 11.3
93,254
Notes: + Based on the assumption that 5/12 of arrivals in 1996 occurred after Census. *China excludes SARs and Taiwan Province
31

TABLE 5: PERCENTAGE DISTRIBUTION OF EMPLOYED BY OCCUPATIONAL GROUP FOR PEOPLE WHO ARRIVED IN AUSTRALIA BEFORE 1996 CENSUS BY SEX FOR SELECTED COUNTRY OF BIRTH GROUPS: 2001 CENSUS
Managers and Administrators Professionals
Associate Professionals
Tradespersons and Related
Workers
Advanced Clerical
and Service Workers
Intermediate Clerical, Sales and Service Workers
Intermediate Production
and Transport Workers
Elementary Clerical, Sales and Service Workers
Labourers and
Related Workers N
Male China*
9.3 18.5 19.3 19.1 0.6 6.2 12.1 4.7 10.1 27,536Hong Kong 8.2 37.1 19.6 10.2 1.0 11.0 4.3 4.7 4.0 14752India 12.8 30.6 13.4 10.4 0.9 10.5 10.7 6.1 4.7 22,521Indonesia 8.7 20.9 13.5 10.0 1.1 9.6 16.6 7.4 12.2 6,549Japan 18.6 22.4 22.8 7.3 1.1 18.5 2.3 4.1 2.9 2,790Malaysia 10.9 41.1 14.4 7.9 1.2 9.1 5.8 4.5 5.1 19,679Philippines 3.8 14.6 9.8 16.0 1.1 13.5 18.1 9.4 13.6 18,663South Korea 11.2 21.5 16.1 17.6 0.5 7.2 5.3 5.7 14.9 5,181Sri Lanka 10.4 31.1 12.8 9.7 0.9 12.0 10.2 6.2 6.7 14,488 Taiwan 17.1 30.6 15.7 5.0 1.1 12.3 4.8 8.7 4.6 2,385Viet Nam 5.6 15.7 9.9 16.6 0.5 5.7 22.1 6.7 17.1 38,697 All Overseas 11.6 18.7 13.0 19.4 0.7 8.3 13.4 5.3 9.6
942,571
Female China* 5.3 21.7 13.6 4.7 4.4 18.0 9.5 10.4 12.4 19,544Hong Kong 5.1 34.4 11.9 1.8 7.1 23.4 2.6 9.2 4.6 13,243India 5.0 27.6 11.1 1.0 9.2 29.0 2.2 9.1 5.7 16,781Indonesia 3.8 21.1 10.5 3.3 5.4 22.7 4.3 15.3 13.6 6,126
32

Japan
5.3 27.1 11.4 2.6 5.7 27.2 2.3 12.7 5.7 4,941Malaysia 5.2 42.0 11.4 1.9 6.0 19.8 1.6 7.6 4.5 19,768Philippines 2.4 17.0 7.9 2.0 4.5 27.2 5.5 15.5 18.0 30,164South Korea 6.0 21.7 14.3 4.8 4.6 17.5 3.0 15.8 12.2 4,398Sri Lanka 3.7 24.7 10.0 1.7 7.3 32.2 2.9 9.9 7.7 10,604Taiwan 6.9 31.7 10.1 1.2 7.2 24.1 1.6 12.0 5.2 2,918Viet Nam 3.8 18.6 8.6 5.9 3.2 17.4 14.0 13.2 15.2 27,090 All Overseas 5.5 22.6 11.8 3.1 7.3 24.7 3.9 11.5 9.7
725,587
Notes: + Based on the assumption that 7/12 of arrivals in 1996 occurred before 1996 Census. *China excludes SARs and Taiwan Province
33

TABLE 6: PERCENTAGE OF EMPLOYED IN SELECTED PROFESSIONS BY SEX FOR SELECTED COUNTRY OF BIRTH GROUPS: 2001 CENSUS
Birthplace Computing Professionals Accountants, Auditors
and Corporate Treasurers School Teachers Medical Practitioners Nursing Professionals Male Australia
1.8 1.5 1.7 0.6 0.3China* 5.2 1.9 0.4 1.0 0.2 Hong Kong 9.8 5.1 0.8 3.6 0.7 India 9.7 2.3 1.1 3.5 0.2Indonesia 5.4 2.6 0.7 1.0 0.3Japan 2.8 1.4 2.6 0.8 0.1Malaysia 6.9 6.2 1.5 6.8 1.2Philippines 5.1 1.9 0.2 0.4 1.1South Korea 5.1 1.7 0.5 0.9 0.0 Sri Lanka 6.0 4.9 0.9 2.8 0.4 Taiwan 7.0 2.1 0.9 2.4 0.1Viet Nam 5.4 1.3 0.4 1.0 0.1 All Overseas 3.4 1.6 1.2 1.3 0.4 All 2.2 1.5 1.6 0.7 0.3
Female Australia 0.6 1.2 5.6 0.3 4.2China 2.8 5.1 1.4 0.6 2.6Hong Kong 4.2 7.3 1.6 1.6 5.9 India 4.3 2.1 5.2 2.7 3.5Indonesia 2.1 3.8 1.6 0.6 1.6Japan 1.2 1.6 5.8 0.1 1.1Malaysia 3.2 6.2 3.1 2.8 12.2Philippines 2.2 2.4 0.8 0.3 6.6
34

South Korea 1.4 2.6 2.2 0.4 3.4 Sri Lanka 2.2 4.2 2.6 3.0 3.4 Taiwan
2.7 5.4 3.6 1.8 2.0Viet Nam 3.2 3.5 0.9 0.7 1.1 All Overseas 1.4 2.0 3.5 0.8 4.6 All 0.8 1.4 5.1 0.4 4.3Note: *China excludes SARs and Taiwan Province
35

TABLE 7: AGE, SEX, HIGHEST LEVEL OF EDUCATION AND ENGLISH-SPEAKING PROFICIENCY INDIRECTLY STANDARDISED RATIOS FOR PERCENTAGES IN SELECTED OCCUPATIONAL GROUPS FOR SELECTED BIRTHPLACE GROUPS: 2001 CENSUS Birthplace Managerial and Administrative ProfessionalAustralia 1.00 1.00China*
0.75 0.74Hong Kong 0.77 1.11 India 0.71 0.79Indonesia 0.74 0.70Japan 1.37 0.71Korea 1.02 0.67Malaysia 0.79 1.07Philippines 0.33 0.49Sri Lanka 0.68 0.98 Taiwan 1.49 0.83Viet Nam 0.54 1.00 Note: Australia-born used as standard Note: *China excludes SARs and Taiwan Province
36
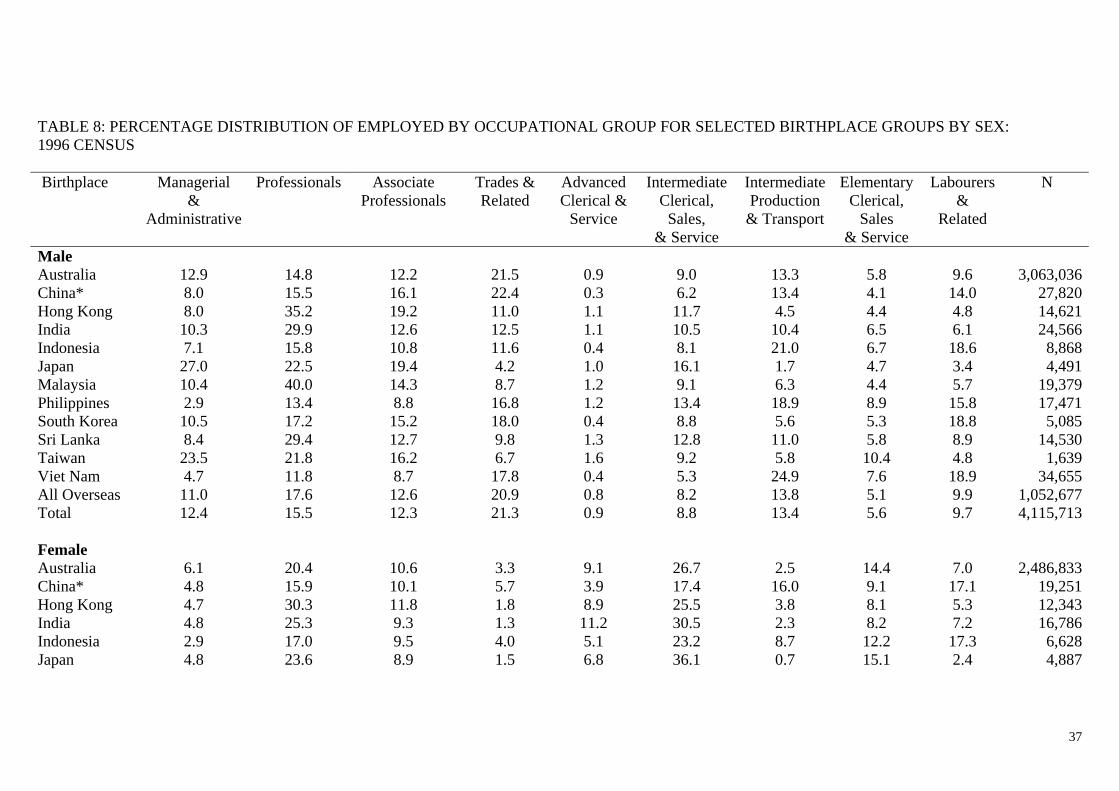
TABLE 8: PERCENTAGE DISTRIBUTION OF EMPLOYED BY OCCUPATIONAL GROUP FOR SELECTED BIRTHPLACE GROUPS BY SEX: 1996 CENSUS Birthplace Managerial
& Administrative
Professionals Associate Professionals
Trades & Related
Advanced Clerical &
Service
Intermediate Clerical,
Sales, & Service
Intermediate Production
& Transport
Elementary Clerical,
Sales & Service
Labourers &
Related
N
Male Australia
12.9 14.8 12.2 21.5 0.9 9.0 13.3 5.8 9.6 3,063,036China* 8.0 15.5 16.1 22.4 0.3 6.2 13.4 4.1 14.0 27,820 Hong Kong
8.0 35.2 19.2 11.0 1.1 11.7 4.5 4.4 4.8 14,621
India 10.3 29.9 12.6 12.5 1.1 10.5 10.4 6.5 6.1 24,566Indonesia 7.1 15.8 10.8 11.6 0.4 8.1 21.0 6.7 18.6 8,868Japan 27.0 22.5 19.4 4.2 1.0 16.1 1.7 4.7 3.4 4,491Malaysia 10.4 40.0 14.3 8.7 1.2 9.1 6.3 4.4 5.7 19,379Philippines 2.9 13.4 8.8 16.8 1.2 13.4 18.9 8.9 15.8 17,471South Korea 10.5 17.2 15.2 18.0 0.4 8.8 5.6 5.3 18.8 5,085Sri Lanka 8.4 29.4 12.7 9.8 1.3 12.8 11.0 5.8 8.9 14,530 Taiwan 23.5 21.8 16.2 6.7 1.6 9.2 5.8 10.4 4.8 1,639Viet Nam 4.7 11.8 8.7 17.8 0.4 5.3 24.9 7.6 18.9 34,655All Overseas
11.0 17.6 12.6 20.9 0.8 8.2 13.8 5.1 9.9 1,052,677
Total 12.4 15.5 12.3 21.3 0.9 8.8 13.4 5.6 9.7 4,115,713
Female Australia 6.1 20.4 10.6 3.3 9.1 26.7 2.5 14.4 7.0 2,486,833
China* 4.8 15.9 10.1 5.7 3.9 17.4 16.0 9.1 17.1 19,251Hong Kong
4.7 30.3 11.8 1.8 8.9 25.5 3.8 8.1 5.3 12,343
India 4.8 25.3 9.3 1.3 11.2 30.5 2.3 8.2 7.2 16,786Indonesia 2.9 17.0 9.5 4.0 5.1 23.2 8.7 12.2 17.3 6,628Japan 4.8 23.6 8.9 1.5 6.8 36.1 0.7 15.1 2.4 4,887
37

Malaysia
4.9 40.4 9.7 2.0 7.0 21.4 2.1 7.5 5.1 18,737Philippines 2.3 15.7 6.7 2.1 5.2 27.2 6.8 12.1 21.9 27,910South Korea 5.4 17.6 13.3 5.8 5.0 16.4 4.8 14.3 17.3 3,783 Sri Lanka 3.3 21.6 9.3 1.7 10.2 33.6 4.0 8.1 8.2 9,758Taiwan 11.3 25.2 10.6 1.4 9.6 21.1 1.8 14.4 4.6 1,864Viet Nam 3.3 12.2 7.0 7.8 2.9 16.3 20.3 12.9 17.5 23,471All Overseas
5.4 20.5 10.8 3.4 8.5 24.2 5.2 10.7 11.3
761,208
Total 5.9 20.4 10.7 3.3 8.9 26.1 3.1 13.5 8.0 3,248,041 Note: *China excludes SARs and Taiwan Province
38

TABLE 9: ESTIMATED PERCENT OF EMPLOYED PERSONS WHO HAVE ARRIVED IN AUSTRALIA SINCE THE 1996 CENSUS FOR SELECTED COUNTRY OF BIRTH GROUPS: 2001 CENSUS Birthplace Percent Arrived Since 1996 Census Males FemalesChina*
16.1 23.7Hong Kong 7.9 8.4 India 28.4 17.2Indonesia 29.6 32.2Japan 38.4 31.8Malaysia 7.5 8.3Philippines 13.8 12.3South Korea 25.8 24.8 Sri Lanka 16.3 11.1 Taiwan 18.9 19.0Vietnam 3.7 6.2All Overseas 11.8 11.4 Note: *China excludes SARs and Taiwan Province
39


41
References Australian Bureau of Statistics 1997 Australian Standard Classification of Occupations (ASCO) Second Edition.
Catalogue Number 1220.0. Canberra: Commonwealth of Australia. Australian Bureau of Statistics 2002 Overseas Arrivals and Departures. Canberra: Commonwealth of Australia. Australia Bureau of Statistics 2003 The Labour Force. Canberra: Commonwealth of Australia. Australian Bureau of Statistics 2004 Migration. Catalogue Number 3412.0. Canberra: Commonwealth of Australia. Australian Bureau of Statistics 2005a The Labour Force. Canberra: Commonwealth of Australia. Australian Bureau of Statistics 2005b Australian Labour Force Statistics. Canberra: Commonwealth of Australia. Birrell, Bob 2003 “The management of immigration: patterns of reform,” in The Transformation
of Australia’s Population 1970-2030, edited by Khoo, Siew-Ean and Peter McDonald. Sydney: UNSW Press.
Bureau of Immigration and Population Research 1994 Community Profiles 1991 Census: China-born. Canberra: Australian
Government Publishing Service. Burnley, Ian, Peter Murphy, and Robert Fagan 1997 Immigration and Australian Cities. Sydney: Federation Press. Cameron, N. 2001 “Australian education on top.” Business Asia 9(August): 20-21. Castles, Stephen 1992 “The “new” migration and Australian immigration policy,” in Inglis, C., S.
Gunasekaran, G. Sullivan, and C. T. Wu (ed.) Asians in Australia: The Dynamics of Migration and Settlement, Sydney: Allen & Unwin Pty Ltd.
Cobb-Clark, Deborah 2000 “Do selection criteria make a difference? Visa category and labour market
status of immigrations to Australia.” Economic Record 76(232):15-31. Coughlan, James E. 1992 “Patterns of settlement in Australia of Indochinese refugees,” in Inglis, C., S.
Gunasekaran, G. Sullivan, and C. T. Wu (ed.) Asians in Australia: The Dynamics of Migration and Settlement, Sydney: Allen & Unwin Pty Ltd.
Coughlan, James E. 1994 “Occupational mobility within Australia’s Vietnamese community: fact or
fallacy?” People and Place 2(1):15-21. Coughlan, James E.

42
1998 “Occupational mobility of Australia’s Vietnamese community: its direction and human capital determinants”. International Migration Review 32(1): 175-201.
Department of Education, Science and Training 2002 Executive Summary of the Review of the Australian Government Languages
Other than English Programme (LOTE) – Report. http://www.dest.gov.au/sectors/school_education/publications_resources/lote_programme_review
Department of Education, Science and Training 2004 Students 2004: Selected Higher Education Statistics.
http://www.dest.gov.au/sectors/higher_education/publications_resources/profiles/students_2004_full_year_selected_higher_education.htm
Department of Immigration and Multicultural Affairs 2000a Community Profiles 1996 Census: China-born. Canberra. Department of Immigration and Multicultural Affairs 2000b Immigration Update: June Quarter. Canberra: Commonwealth of Australia. Department of Immigration and Multicultural and Indigenous Affairs. 2002 Australian Immigration Consolidated Statistics. Canberra: Commonwealth of
Australia. Department of Immigration and Multicultural and Indigenous Affairs 2003 Immigration, Population and Citizenship Digest. Canberra: Commonwealth of
Australia. Department of Immigration and Multicultural and Indigenous Affairs. 2005a Immigration Update. Canberra: Commonwealth of Australia. Department of Immigration and Multicultural and Indigenous Affairs. 2005b Student Visa Statistics. www.immi.gov.au/study/overview/index.htm#statistics. Department of Immigration and Multicultural and Indigenous Affairs. 2005c Temporary Residence in Australia. www.immi.gov.au/facts/47temporary_residence.htm#5 Hugo, G.J. 1995 Understanding Where Migrants Live, Bureau of Immigration, Multicultural and Population Research, Canberra. Hugo, G.J. 2004 Australia’s Most Recent Immigrants, 2001 Catalogue No. 2053.0 ABS, Canberra. Inglis, Christine and Chung-Tong Wu 1992 “The ‘new’ migration of Asian skills and capital to Australia,” in Inglis, C., S.
Gunasekaran, G. Sullivan, and C. T. Wu (ed.) Asians in Australia: The Dynamics of Migration and Settlement, Sydney: Allen & Unwin Pty Ltd.
Iredale, Robyn, Fei Guo and Santi Rozario 2003 Return Migration in the Asia Pacific, Cheltenham: Edward Elgar Publishing.

43
Jones, F. L. 1992 “Labour market outcomes among the Chinese at the 1986 Census,” in Inglis, C.,
S. Gunasekaran, G. Sullivan, and C. T. Wu (ed.) Asians in Australia: The Dynamics of Migration and Settlement, Sydney: Allen & Unwin Pty Ltd.
Khoo, Siew-Ean. 1994 “Correlates of welfare dependency among immigrants in Australia.”
International Migration Review 28(1): 68-91. Khoo, Siew-Ean and David Lucas, 2004 Australians’ Ancestries. Canberra: Commonwealth of Australia. Khoo, Siew-Ean, K. Pookong, T. Dang, and J. Shu. 1994 “Asian immigrant settlement and adjustment in Australia.” Asian and Pacific
Migration Journal 3(2-3):339-372. Knapman, B. 1997 “The labour force status of Asia-born immigrants in Australia,” pp99-119, in
J.E. Coughlan, and D. McNamara (eds), Asians in Australia. Melbourne: MacMillan.
Marks, G.N., J. McMillan, and K. Hillman. 2001 Tertiary Entrance Performance: the Role of Student Background and School
Factors. Research Report No 22. Camberwell, Victoria: Australian Council for Higher Education.
McAllister, I. 1995 “Occupational mobility among immigrants: the impacts of migration on
economic success in Australia.” International Migration Review, 29(2): 441-468.
Parr, Nick and Magdalena Mok 1995 “Differences in the educational achievements, aspirations and values of
birthplace groups in New South Wales.” People and Place 3(2):1-8. Parr, Nick and Peter Murray 2004 “Gender unmasked: the implications for policy of demographic shifts and
gender discrimination,” in Making the Link: Affirmative Action and Employment Relations. Edited by Edward, M. Davis, and Valerie Pratt. Sydney: CCH
Richardson, Sue, and Laurence Lester 2004 A Comparison of Australian and Canadian Immigration Policies and Labour
Market Outcomes. Canberra: AGPS Richardson, Sue, Josh Healy, Sue Stack, Diana Ilsley, Laurence Lester and John Horrocks 2004 The Changing Labour Force Experience of New Migrants. Canberra: AGPS. Shamsuddin, A. F. M. 1998 “The double-negative effect on the earnings of foreign-born females in
Canada.” Applied Economics 30(9):1187-1201. Siegel, Jacob S. 2002 Applied Demography. Academic Press: San Diego.

44
Tienda, M. and Lii D. 1987 “Minority concentration and earnings inequality: blacks, Hispanics and Asians
compared.” American Journal of Sociology 93:141-165. Wooden, M. 1990 “The labour market experience of migrants.” Pp227-292, in Wooden, M., R.
Holton, G. Hugo, and J. Sloan. Australian Immigration: A Survey of the Issues. Canberra: AGPS.