
The NOMAD experiment at the CERN SPS
41
EUROPEAN ORGANIZATION FOR NUCLEAR RESEARCH CERN–PPE/97–059 26 May 1997 THE NOMAD EXPERIMENT AT THE CERN SPS The NOMAD Collaboration J. Altegoer 6 M. Anfreville 20 C. Angelini 18 P. Astier 15 M. Authier 20 D. Autiero 9 A. Baldisseri 20 M. Baldo-Ceolin 14 G. Ballocchi 9 M. Banner 15 S. Basa 10 G. Bassompierre 2 K. Benslama 10 I. Bird 10 B. Blumenfeld 3 F. Bobisut 14 J. Bouchez 20 S. Boyd 22 A. Bueno 1,4 S. Bunyatov 7 L. Camilleri 9 A. Cardini 11 A. Castera 15 P.W. Cattaneo 16 V. Cavasinni 18 V. Cavestro† 14 O. Clou´ e 20 G. Conforto 23 C. Conta 16 R. Cousins 11 A. De Santo 18 T. Del Prete 18 L. Di Lella 9 T. Dignan 4 E. do Couto e Silva 9 I.J. Donnelly 21,22 J. Dumarchez 15 L. Dumps 9 C. Engster 9 T. Fazio 2 G.J. Feldman 4 R. Ferrari 16 D. Ferr` ere 9 V. Flaminio 18 M. Fraternali 16 G. Fumagalli† 16 J.-M. Gaillard 2 P. Galumian 10 E. Gangler 15 A. Geiser 9 D. Geppert 6 D. Gibin 14 S. Gninenko 13 J.-J. Gomez-Cadenas 1,9 J. Gosset 20 C. G¨ oßling 6 M. Gouan` ere 2 A. Grant 9 G. Graziani 8 A. Guglielmi 14 C. Hagner 20 J. Hernando 1 D. Hubbard 4 P. Hurst 4 W. Huta 9 N. Hyett 12 E. Iacopini 8 C. Joseph 10 D. Kekez 24 M. Kirsanov 8,13 B. Khomenko 9 O. Klimov 7 A. Kovzelev 13 V. Kuznetsov 7 A. Lanza 16 L. La Rotonda 5 M. Laveder 14 C. Lazzeroni 18 A. Letessier-Selvon 15 J.-M. Levy 15 L. Linssen 9 A. Ljubiˇ ci´ c 24 J. Long 3 A. Lupi 8 E. Manola-Poggioli 2 A. Marchionni 8 F. Martelli 23 J.-P. Mendiburu 2 J.-P. Meyer 20 M. Mezzetto 14 S.R. Mishra 4 G.F. Moorhead 12 L. Mossuz 2 P. N´ ed´ elec 2,9 Yu. Nefedov 7 C. Nguyen-Mau 10 D. Orestano 16,19 J.-P. Pass´ erieux 20 F. Pastore 16,19 L.S. Peak 22 E. Pennacchio 23 J.-P. Perroud 10 H. Pessard 2 P. Petitpas 2 R. Petti 16 A. Placci 9 H. Plothow-Besch 9 A. Pluquet 20 J. Poinsignon 20 G. Polesello 16 D. Pollmann 6 B.G. Pope 9 B. Popov 7,15 C. Poulsen 12 P. Rathouit 20 G. Renzoni 18 C. Roda 9 A. Rubbia 9 F. Salvatore 16 K. Schahmaneche 15 B. Schmidt 6 A. Sconza 14 M. Serrano 15 M.E. Sevior 12 D. Sillou 2 C. Sobczynski 9 F.J.P. Soler 22 G. Sozzi 10 D. Steele 3 M. Steininger 10 M. Stipˇ cevi´ c 24 T. Stolarczyk 20 G.N. Taylor 12 V. Tereshchenko 7 A. Toropin 13 A.-M. Touchard 15 S.N. Tovey 12 M.-T. Tran 10 E. Tsesmelis 9 J. Ulrichs 22 V. Uros 15 M. Valdata-Nappi 5,17 V. Valuev 7,2 F. Vannucci 15 K.E. Varvell 21,22 M. Veltri 23 V. Vercesi 16 D. Verkindt 2 J.-M. Vieira 10 M.-K. Vo 20 S. Volkov 13 F. Weber 9,4 T. Weisse 6 M. Werlen 10 P. Wicht 9 F.F. Wilson 9 L.J. Winton 12 B.D. Yabsley 22 and H. Zaccone 20 Submitted to Nucl. Instrum. Methods Phys. Res. A
-
Upload
biomerieux -
Category
Documents
-
view
0 -
download
0
Transcript of The NOMAD experiment at the CERN SPS

EUROPEAN ORGANIZATION FOR NUCLEAR RESEARCH
CERN–PPE/97–05926 May 1997
THE NOMAD EXPERIMENT AT THE CERN SPS
The NOMAD Collaboration
J. Altegoer6 M. Anfreville20 C. Angelini18 P. Astier15 M. Authier20 D. Autiero9 A. Baldisseri20
M. Baldo-Ceolin14 G. Ballocchi9 M. Banner15 S. Basa10 G. Bassompierre2 K. Benslama10
I. Bird10 B. Blumenfeld3 F. Bobisut14 J. Bouchez20 S. Boyd22 A. Bueno1,4 S. Bunyatov7
L. Camilleri9 A. Cardini11 A. Castera15 P.W. Cattaneo16 V. Cavasinni18 V. Cavestro†14
O. Cloue20 G. Conforto23 C. Conta16 R. Cousins11 A. De Santo18 T. Del Prete18 L. Di Lella9
T. Dignan4 E. do Couto e Silva9 I.J. Donnelly21,22 J. Dumarchez15 L. Dumps9 C. Engster9
T. Fazio2 G.J. Feldman4 R. Ferrari16 D. Ferrere9 V. Flaminio18 M. Fraternali16 G. Fumagalli†16
J.-M. Gaillard2 P. Galumian10 E. Gangler15 A. Geiser9 D. Geppert6 D. Gibin14 S. Gninenko13
J.-J. Gomez-Cadenas1,9 J. Gosset20 C. Goßling6 M. Gouanere2 A. Grant9 G. Graziani8
A. Guglielmi14 C. Hagner20 J. Hernando1 D. Hubbard4 P. Hurst4 W. Huta9 N. Hyett12
E. Iacopini8 C. Joseph10 D. Kekez24 M. Kirsanov8,13 B. Khomenko9 O. Klimov7 A. Kovzelev13
V. Kuznetsov7 A. Lanza16 L. La Rotonda5 M. Laveder14 C. Lazzeroni18 A. Letessier-Selvon15
J.-M. Levy15 L. Linssen9 A. Ljubicic24 J. Long3 A. Lupi8 E. Manola-Poggioli2 A. Marchionni8
F. Martelli23 J.-P. Mendiburu2 J.-P. Meyer20 M. Mezzetto14 S.R. Mishra4 G.F. Moorhead12
L. Mossuz2 P. Nedelec2,9 Yu. Nefedov7 C. Nguyen-Mau10 D. Orestano16,19 J.-P. Passerieux20
F. Pastore16,19 L.S. Peak22 E. Pennacchio23 J.-P. Perroud10 H. Pessard2 P. Petitpas2
R. Petti16 A. Placci9 H. Plothow-Besch9 A. Pluquet20 J. Poinsignon20 G. Polesello16
D. Pollmann6 B.G. Pope9 B. Popov7,15 C. Poulsen12 P. Rathouit20 G. Renzoni18 C. Roda9
A. Rubbia9 F. Salvatore16 K. Schahmaneche15 B. Schmidt6 A. Sconza14 M. Serrano15
M.E. Sevior12 D. Sillou2 C. Sobczynski9 F.J.P. Soler22 G. Sozzi10 D. Steele3 M. Steininger10
M. Stipcevic 24 T. Stolarczyk20 G.N. Taylor12 V. Tereshchenko7 A. Toropin13 A.-M. Touchard15
S.N. Tovey12 M.-T. Tran10 E. Tsesmelis9 J. Ulrichs22 V. Uros15 M. Valdata-Nappi5,17
V. Valuev7,2 F. Vannucci15 K.E. Varvell21,22 M. Veltri23 V. Vercesi16 D. Verkindt2
J.-M. Vieira10 M.-K. Vo20 S. Volkov13 F. Weber9,4 T. Weisse6 M. Werlen10 P. Wicht9
F.F. Wilson9 L.J. Winton12 B.D. Yabsley22 and H. Zaccone20
Submitted to Nucl. Instrum. Methods Phys. Res. A

1) Univ. of Massachusetts, Amherst, MA, USA2) LAPP, Annecy, France3) Johns Hopkins Univ., Baltimore, MD, USA4) Harvard Univ., Cambridge, MA, USA5) Univ. of Calabria and INFN, Cosenza, Italy6) Dortmund Univ., Dortmund, Germany7) JINR, Dubna, Russia8) Univ. of Florence and INFN, Florence, Italy9) CERN, Geneva, Switzerland
10) University of Lausanne, Lausanne, Switzerland11) UCLA, Los Angeles, CA, USA12) University of Melbourne, Melbourne, Australia13) Inst. Nucl. Research, INR Moscow, Russia14) Univ. of Padova and INFN, Padova, Italy15) LPNHE, Univ. of Paris, Paris VI and VII, France16) Univ. of Pavia and INFN, Pavia, Italy17) Now at Perugia Univ., Perugia, Italy18) Univ. of Pisa and INFN, Pisa, Italy19) Now at Roma-III Univ., Rome, Italy20) DAPNIA, CEA Saclay, France21) ANSTO Sydney, Menai, Australia22) University of Sydney, Sydney, Australia23) Univ. of Urbino, Urbino, and INFN Florence, Italy24) Rudjer Boskovic Institute, Zagreb, Croatia†) Deceased

Abstract
The NOMAD experiment is a short base-line search for νµ → ντ oscillations in theCERN neutrino beam. The ντ ’s are searched for through their charged-current inter-actions followed by the observation of the resulting τ− through its electronic, muonicor hadronic decays. These decays are recognized using kinematical criteria necessitat-ing the use of a light target which enables the reconstruction of individual particlesproduced in the neutrino interactions. This paper describes the various componentsof the NOMAD detector: the target and muon drift chambers, the electromagneticand hadronic calorimeters, the preshower and transition radiation detectors, and theveto and trigger scintillation counters. The beam and data acquisition system are alsodescribed. The quality of the reconstruction of individual particles is demonstratedthrough the ability of NOMAD to observe K0
s ’s, Λ0’s and π0’s. Finally, the observa-tion of τ− through its electronic decay being one of the most promising channels inthe search, the identification of electrons in NOMAD is discussed.


1 INTRODUCTION
The main goal of the NOMAD (Neutrino Oscillation MAgnetic Detector) experi-ment is to search for the appearance of tau neutrinos (ντ ) in the CERN SPS widebandneutrino beam. This beam has a mean energy of 24 GeV and the predominant neutrinotype is νµ. As a by-product the experiment can set limits on νµ → νe oscillations.
The NOMAD detector measures and identifies most of the particles, charged andneutral, produced in neutrino interactions within the detector. The active target is aset of drift chambers with a fiducial mass of about 2.7 tons and a low average density(98.6 kg/m3). The detector is located in a dipole magnetic field of 0.4 T which allowsthe determination of the momenta of charged tracks via their curvature, with minimaldegradation due to multiple scattering. The active target is followed by a TransitionRadiation Detector (TRD) to identify electrons, an electromagnetic calorimeter includinga preshower detector, a hadronic calorimeter, and muon chambers. This paper describesthe detector in detail.
In three years’ running at the CERN SPS, NOMAD should collect data with morethan 1 million charged current (CC) νµ events.
The ντ will be searched for via its CC interactions: ντ + N → τ− + X. Given thelifetime of the τ− and the energies considered here, the τ− will travel about 1 mm beforedecaying. The spatial resolution of NOMAD, while good, is not sufficient to recognizethe non-zero impact parameter associated with such tracks. Instead, the decays of the τ−
will be identified using kinematic criteria, based on a precise measurement of the missingtransverse momentum in the final state.
In order to be sensitive to a large fraction of the τ− decay modes and to be able toselect events with high acceptance and low background, the NOMAD detector must beable to:
– Measure the momenta of charged particles in the drift chamber target with goodprecision.
– Identify and measure electrons and photons.
– Identify and measure muons.
– Achieve a high level of rejection against tracks which fake electrons and muons.
As will be discussed below the NOMAD detector is well on the way to achievingthese goals.
In addition to searching for neutrino oscillations, the large sample of data in adetector with a target density of a hydrogen bubble chamber will permit NOMAD toexplore many other processes involving neutrinos.
The next section of this paper describes the NOMAD subdetectors. The followingsection documents its excellent performance.
2 THE DETECTOR AND BEAM
The NOMAD detector [1] is shown schematically in Fig. 1 (side view) and Fig. 2(top view). It consists of a number of subdetectors most of which are located in a dipolemagnet [2] with a field volume of 7.5× 3.5× 3.5 m3. Moving downstream along the beamdirection we find a veto counter, a front calorimeter, a large active target consisting of driftchambers, a transition radiation detector, a preshower, an electromagnetic calorimeter,a hadron calorimeter, and an iron filter followed by a set of large drift chambers usedfor muon identification. Upstream and downstream of the transition radiation detector
1
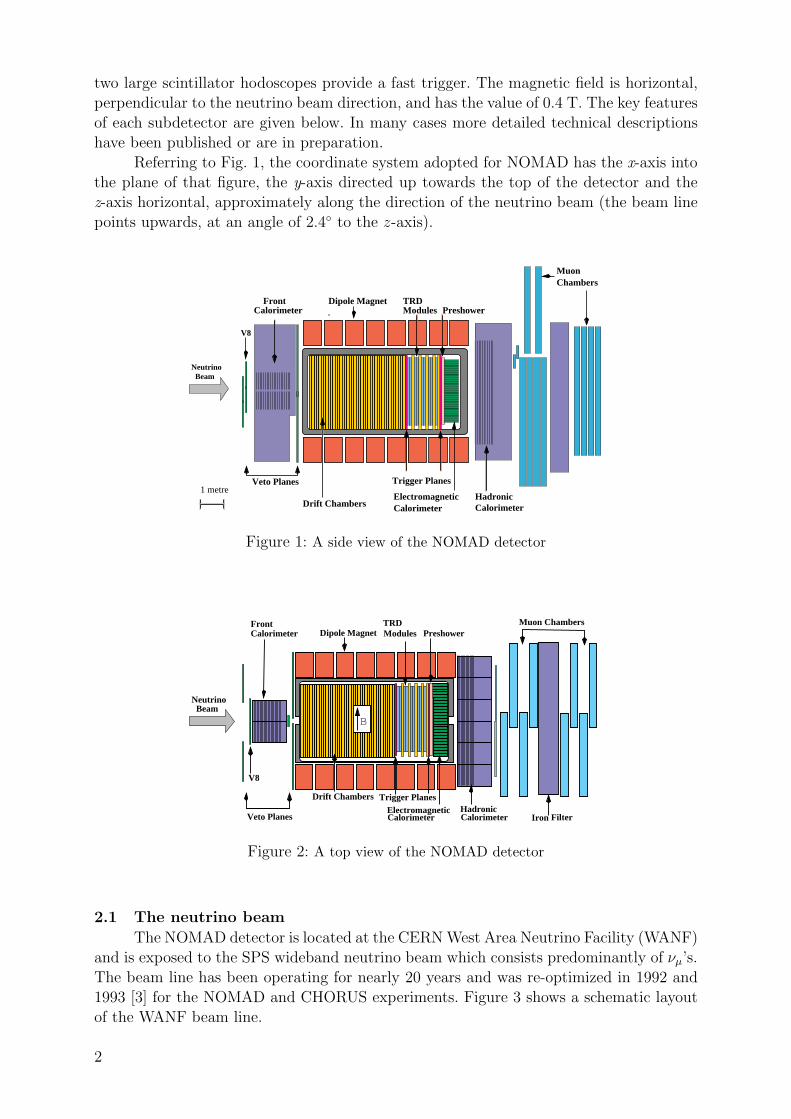
two large scintillator hodoscopes provide a fast trigger. The magnetic field is horizontal,perpendicular to the neutrino beam direction, and has the value of 0.4 T. The key featuresof each subdetector are given below. In many cases more detailed technical descriptionshave been published or are in preparation.
Referring to Fig. 1, the coordinate system adopted for NOMAD has the x-axis intothe plane of that figure, the y-axis directed up towards the top of the detector and thez-axis horizontal, approximately along the direction of the neutrino beam (the beam linepoints upwards, at an angle of 2.4◦ to the z-axis).
ChambersMuon
BeamNeutrino
V8
CalorimeterHadronic
1 metre
PreshowerModulesTRDDipole Magnet
Trigger Planes
ElectromagneticCalorimeterDrift Chambers
CalorimeterFront
Veto Planes
Figure 1: A side view of the NOMAD detector
CalorimeterElectromagnetic
Drift Chambers Trigger Planes
TRD
V8
Muon Chambers
Filter
Modules PreshowerDipole MagnetCalorimeterFront
Veto Planes IronHadronicCalorimeter
BBeam
Neutrino
Figure 2: A top view of the NOMAD detector
2.1 The neutrino beam
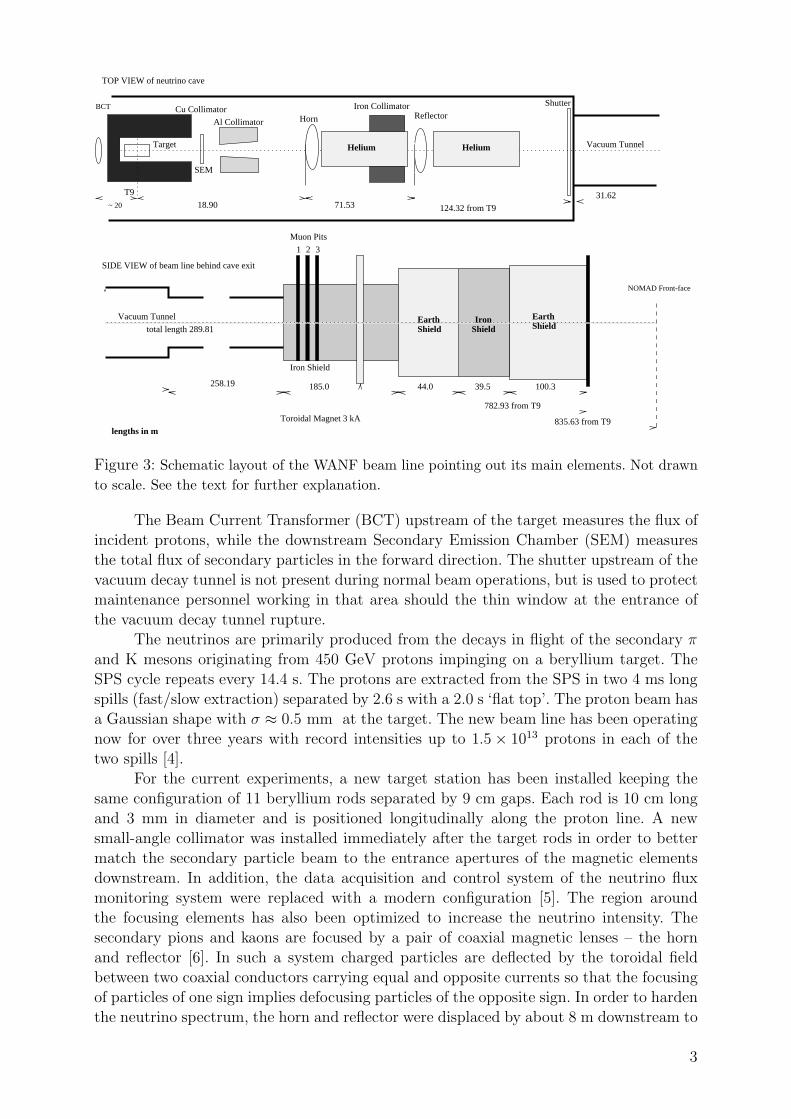
The NOMAD detector is located at the CERN West Area Neutrino Facility (WANF)and is exposed to the SPS wideband neutrino beam which consists predominantly of νµ’s.The beam line has been operating for nearly 20 years and was re-optimized in 1992 and1993 [3] for the NOMAD and CHORUS experiments. Figure 3 shows a schematic layoutof the WANF beam line.
2
SIDE VIEW of beam line behind cave exit
2 31
Iron Shield
Target
Cu Collimator
Al Collimator
18.90 71.53 124.32 from T9
Shutter
total length 289.81
31.62
258.19 185.0
Toroidal Magnet 3 kA
44.0 39.5 100.3
782.93 from T9
lengths in m
T9
BCT
~ 20
SEM
Iron Collimator
Helium Helium
ReflectorHorn
835.63 from T9
NOMAD Front-face
Muon Pits
EarthShield Shield
Iron EarthShield
Vacuum Tunnel
Vacuum Tunnel
TOP VIEW of neutrino cave
Figure 3: Schematic layout of the WANF beam line pointing out its main elements. Not drawnto scale. See the text for further explanation.
The Beam Current Transformer (BCT) upstream of the target measures the flux ofincident protons, while the downstream Secondary Emission Chamber (SEM) measuresthe total flux of secondary particles in the forward direction. The shutter upstream of thevacuum decay tunnel is not present during normal beam operations, but is used to protectmaintenance personnel working in that area should the thin window at the entrance ofthe vacuum decay tunnel rupture.
The neutrinos are primarily produced from the decays in flight of the secondary πand K mesons originating from 450 GeV protons impinging on a beryllium target. TheSPS cycle repeats every 14.4 s. The protons are extracted from the SPS in two 4 ms longspills (fast/slow extraction) separated by 2.6 s with a 2.0 s ‘flat top’. The proton beam hasa Gaussian shape with σ ≈ 0.5 mm at the target. The new beam line has been operatingnow for over three years with record intensities up to 1.5× 10¹³ protons in each of thetwo spills [4].
For the current experiments, a new target station has been installed keeping thesame configuration of 11 beryllium rods separated by 9 cm gaps. Each rod is 10 cm longand 3 mm in diameter and is positioned longitudinally along the proton line. A newsmall-angle collimator was installed immediately after the target rods in order to bettermatch the secondary particle beam to the entrance apertures of the magnetic elementsdownstream. In addition, the data acquisition and control system of the neutrino fluxmonitoring system were replaced with a modern configuration [5]. The region aroundthe focusing elements has also been optimized to increase the neutrino intensity. Thesecondary pions and kaons are focused by a pair of coaxial magnetic lenses – the hornand reflector [6]. In such a system charged particles are deflected by the toroidal fieldbetween two coaxial conductors carrying equal and opposite currents so that the focusingof particles of one sign implies defocusing particles of the opposite sign. In order to hardenthe neutrino spectrum, the horn and reflector were displaced by about 8 m downstream to
3

new positions of 20 m and 90 m from the target respectively. The higher neutrino energyincreases the sensitivity of the experiments to detect charged current ντ interactions,which have an energy threshold of 3.5 GeV.
In addition, the sections between the horn and reflector and between the reflectorand decay tunnel, which were formerly open to air, have been enclosed in helium tubesof 80 cm diameter and total length of about 60 m in order to reduce the absorption ofthe secondary particles. A large-angle collimator has been installed between the horn andreflector to reduce the ν contamination by intercepting the defocused negative secondariesbefore they decay.
The mesons are allowed to decay in a 290 m long vacuum tunnel. Shielding madefrom iron and earth follows to range out the muons and absorb the hadrons. A toroidalmagnet, operated at 3 kA, located at the entrance of the iron shielding, bends muonswhich would pass outside the shielding either further outwards or back into the iron plugwhich provides sufficient absorption. The NOMAD (CHORUS) detectors are located atabout 835 m (823 m) from the target. The average distance between the meson decaypoint and NOMAD is 620 m.
A neutrino beam monitoring system (the muon ‘pits’) [7], based on the detection ofmuon yields at several depths in the iron shield, is built into the line. The silicon detectorsin these muon pits also provide an absolute flux measurement. The absolute calibration ofthe silicon detectors is performed periodically using emulsion measurements in the pits.An independent measurement of the flux is given by the number of protons incident onthe target, estimated from a pair of beam current transformers located upstream of thetarget (BCT1 and BCT2).
A detailed GEANT [8] simulation of the beam line was used to predict the neutrinoenergy and radial position distributions at the NOMAD detector. These distributions,calculated for a fiducial area of 2.6× 2.6 m2 and for 109 protons on target (p.o.t.) areshown in Figs. 4 and 5.
Neutrino Flux
1
10
10 2
10 3
10 4
10 5
10 6
0 20 40 60 80 100 120Neutrino Energy (GeV)
Neu
trin
os /
m2 /
3 G
eV /
109 p
.o.t.
Figure 4: The predicted energy spectra of neutrinos at NOMAD
4

Neutrino Position Distribution
0
200
400
600
800
1000
1200
1400
1600
1800
x 10 2
-100 -50 0 50 100Transverse Position X (cm)
Neu
trin
os /
2.6
cm /
109 p
.o.t.
Figure 5: The predicted transverse position distribution of neutrinos at NOMAD in the hori-zontal direction. (Owing to the beam line symmetry similar spectra are obtained in the othertransverse direction.)
The parameters of the various neutrino components are summarized in Table 1.The neutrino beam simulation is affected by uncertainties due mostly to the limitedknowledge of the π and K yields from the hadronic interactions in the beryllium target.The measurement by the SPY collaboration [9] of the production rates of π and K mesonsand of their ratio for 450 GeV protons incident on a beryllium target will reduce theseuncertainties.
The intrinsic ντ component in the beam, from the prompt reaction:
p + N→ D±s + X,D±s → τ± +(ν
)
τ
followed by τ± → ντ + X has been calculated to be negligible [10, 11]. The relativenumber of ντ ’s produced from the above reaction and interacting via the CC in the fiducialvolume of NOMAD has been calculated to be (4–5)×10−6 the number of νµ CC events.After selection criteria, the resulting intrinsic ντ signal is much less than one observedevent in the total duration of the NOMAD experiment.
Table 1: Monte Carlo predictions at NOMAD for a fiducial area of 2.6× 2.6 m2 and 2.4× 10¹⁹
p.o.t.
Average Eν (GeV) Rel. flux abundance ν CC events
νµ 23.6 1.00 1.15× 10⁶
νµ 22.7 0.07 0.39× 10⁵
νe 37.0 10−2 0.17× 10⁵
νe 33.2 3× 10⁻³ 0.22× 10⁴
5

2.2 Veto counters
The veto system consists of an arrangement of 59 scintillation counters [12] coveringan area of 5× 5 m2 at the upstream end of the NOMAD detector. The scintillators havea thickness of 2 cm, a width of 21 cm, and are of two lengths, 300 cm and 210 cm.Most (56) of the counters are viewed at both ends by photomultipliers; the remaining(3) counters have single-ended readout. The counters are arranged in a geometry whichprovides optimal rejection of charged particles produced upstream of NOMAD, of thoseproduced in neutrino interactions in the iron detector support, and of large-angle cosmicrays travelling in the same and in the opposite direction to the neutrino beam. A smallfraction of interactions in the central region of the iron cannot be excluded, as the supportbeam for the steel structure (the ‘basket’) in which the central detector is mounted passesthrough the space in which scintillators would ideally be placed. Similarly, interactions inthe upstream part of the magnet coil are not vetoed, but can be distinguished from targetinteractions by reconstruction of the event vertex.
The two photomultiplier outputs connected to each scintillation counter are fed viadiscriminators to the inputs of mean-timer modules [13], the timing of which provides anoutput signal independent in time of the position at which the detected charged particletraversed the counter. A single mean-timer module can take up to 16 inputs (8 pairs ofdiscriminated photomultiplier outputs), and produces 8 outputs, which are passed to a96-channel Fastbus TDC module. The unit used is a LeCroy 1876 100 module with a binwidth of 1 ns. In addition, each module produces a single output consisting of the logicalOR of all eight output signals. For central detector triggers, the veto signal is formedby the combined OR of all mean-timer modules, excluding six counters at the upper-leftand upper-right of the veto. In general, muons crossing these counters did not cross theNOMAD trigger planes, but their inclusion increased the dead time due to the veto. Thesignals from these counters are still recorded and are available off line. For triggers in thefront calorimeter, which instruments the central region of the front detector support, theveto is formed from the subset of 10 counters (denoted V8) mounted on the front face ofthe support, see Figs. 1 and 2.
The charged particle rejection efficiency of the NOMAD veto is constantly monitoredand has remained stable at a level of 96–97%. Averaged over the two neutrino spills, thecontribution of the veto system to the overall dead time of NOMAD is 4%.
2.3 Front calorimeter
The detector is suspended from iron pillars (the I’s) at the two ends of the magnet.The front pillar was instrumented with scintillators to provide an additional massive activetarget for neutrino interactions. Physics topics to be addressed by this Front Calorime-ter (FCAL) include multi-muon physics and searches for neutral heavy objects producedin neutrino interactions.
The FCAL consists of 23 iron plates which are 4.9 cm thick and separated by 1.8 cmgaps. Twenty out of the 22 gaps are instrumented with long scintillators [14] which areread out on both ends by 3 inch photomultipliers. The dimensions of the scintillators are175 × 18.5 × 0.6 cm3. To achieve optimal light collection and a reasonable number ofelectronic channels, five consecutive scintillators along the beam axis are ganged togetherby means of twisted light guides and form a module. Ten such modules are placed aboveeach other and form a stack. Along the beam axis are four such stacks, as shown in Fig. 6.The area of the FCAL ‘seen’ by the neutrino beam is 175× 190 cm2. The detector has adepth of about five nuclear interaction lengths and a total mass of about 17.7 tons.
6

-beam
175 cm
ν
Figure 6: Top view of the FCAL
Since the FCAL is part of the structural components of the NOMAD detector, itcannot easily be calibrated in a test beam of known hadronic energy. The calibrationprocedure applied is therefore somewhat more sophisticated:
– A module-to-module calibration is achieved by determining the energy deposition byhighly relativistic muons, a reasonable approximation of minimally ionizing parti-cles (m.i.p.). These muons are copiously produced in the beam lines upstream of theNOMAD experiment and cross the detector in the time between the neutrino spills.
– The absolute energy scale (i.e. the hadronic energy equivalent of a m.i.p.) can bedetermined in several ways:
• A first-level calibration can be obtained from Monte Carlo simulation of neutrinointeractions in the FCAL by comparing the energy deposit (calibrated in unitsof the m.i.p. energy deposit) with the simulated hadronic energy.
• A more accurate calibration can be performed by exploiting the fact that theshape of the yBjorken-distribution in neutrino charged-current interactions is wellknown. Given the very precise momentum measurement of the muon produced inthe interaction, a mismeasurement of the hadronic energy results in a distorteddistribution in yBjorken. This method has been used successfully in previous neu-trino experiments (see, for example Ref. [15]). The absolute energy scale in theFCAL has been determined by this method with a precision of 2%. The resultsshow that the Monte Carlo method mentioned above is accurate to 8%.
A minimum-ionizing particle traversing the whole FCAL has an equivalent hadronicenergy of 430 MeV.
2.4 Drift chambers
The drift chambers, which provide at the same time the target material and thetracking of particles, are a crucial part of the detector. They were designed with the con-flicting requirements that their walls should be as heavy as possible in order to maximizethe number of neutrino interactions and as light as possible in order to minimize mul-tiple scattering of particles, secondary particle interactions, and photon conversions. To
7

minimize the total number of radiation lengths for a given target mass, the chambers aremade of low density and low atomic number materials; there is less than 1% of a radiationlength between two consecutive measurements.
2Ar(40%)-C H (60%)
6
honeycomb (Aramid)Kevlar-epoxy
1 cm
Cut of a drift chamber by a plan orthogonal to the wires
Details of a drift cell
-3200 V
+1750 V
Mylar
anode
cathode
4 mm
Aluminium strips
2.8 mm
Cu-Be 100 micrometres
gold-plated tungsten 20 micrometres
3.2
cm
Figure 7: An overview of the drift chamber layout
8

The chambers (see Fig. 7) are built on panels made of Aramid fibres in a honeycombstructure. These panels are sandwiched between two Kevlar-epoxy resin skins. These skinsgive the mechanical rigidity and flatness necessary over the large (3× 3 m2) surface area.Each drift chamber consists of four panels. The three 8 mm gaps between the panels arefilled with an argon (40%) – ethane (60%) mixture at atmospheric pressure. Because thepanels are not completely gas tight, the gas circulates permanently in a closed circuit witha purifier section that removes oxygen and water vapour.
The central gap is equipped with sense wires at 0 degrees and the outer gaps withwires at +5 and −5 degrees with respect to the magnetic field direction. These sensewires are 20 µm in diameter and are made of gold-plated tungsten. They are interleavedwith 100 µm potential wires, made of Cu-Be. These wires are equally spaced vertically toprovide drift cells of ± 3.2 cm around each sense wire. Field-shaping aluminium strips,2.8 mm wide, 12 µm thick, and separated by 1.2 mm, are printed on Mylar glued to thepanels. The strip foils are glued on the Aramid panels with a precision better than 500 µm.The 3 m long wires are glued to support rods at three points to keep them at a constant4 mm distance from the cathode planes and decrease the electrostatic and gravitationaldisplacements of these wires. The gap is maintained at 8 mm using nine spacers facingmelamine inserts embedded in the honeycomb structure of the panels. The potential wiresare held at –3200 V and the anode wires at +1750 V. The potentials on the strips providea drift field of 1 kV/cm. With this electric field and the gas mixture used, the ionizationelectrons drift with a velocity of about 50 mm/µs. In order to compensate for the Lorentzangle and to keep a drift direction parallel to the planes when the magnetic field is turnedon, the potentials on the strips are set at different values on the two sides of each gap.
There are 49 chambers in the complete detector corresponding to 147 sense wireplanes and a total of 6174 wires. The target chambers are mounted in 11 modules of fourchambers each in the front part of the detector. Five additional chambers are installedindividually in the TRD region and are used to improve the lever arm for tracking andfor a better extrapolation of the tracks to the rest of the subdetectors.
Each chamber contributes 0.02 radiation length. The total fiducial mass of thechambers is 2.7 tons over an area of 2.6 × 2.6 m2.
The chambers are operated at a voltage 100 V above the beginning of the plateau,which was found to be 200 V wide. Under these conditions, the typical wire efficiency is97%, most of the loss being due to the supporting rods. Wire signals are fed to a pream-plifier and a fast discriminator, allowing track separation down to 1 mm. Discriminatoroutput signals are fed to Lecroy 1876 TDCs described above.
Space resolution has been studied using straight tracks (muons) crossing the detectorduring data taking. The distribution of residuals has been obtained after a careful align-ment of all wires (fitted in several segments along the wires to take mechanical defects andelectrostatic effects into account) as well as a detailed description of the time-to-distancerelation. The distribution (Fig. 8) has a sigma of about 150 µm. The dependence of thisquantity on drift distance and polar angle is shown in Fig. 9. The 5◦ stereo angles give aresolution along the wires of 1.5 mm.
The momentum resolution provided by the drift chambers is a function of momen-tum and track length. For charged hadrons and muons travelling normal to the plane ofthe chambers, it can be parametrized as:
σpp≈ 0.05√
L⊕ 0.008p√
L5(1)
9

where the momentum p is in GeV/c and the track length L in metres. The first termis the contribution from multiple scattering and the second term comes from the single-hit resolution of the chambers. For a momentum of 10 GeV/c, multiple scattering is thedominant contribution for track lengths longer than 1.3 m.
Drift chambers resolution
cm
entr
ies
0
10000
20000
30000
40000
50000
60000
70000
-0.1 -0.08 -0.06 -0.04 -0.02 0 0.02 0.04 0.06 0.08 0.1
Figure 8: Residuals for a sample of straight tracks at normal incidence on the drift chambers
Drift chambers resolution
cm
µm
0
200
400
600
800
1000
0 0.5 1 1.5 2 2.5 3
Figure 9: The dependence of the track residuals on drift distance and angle
10

Table 2 shows the resolution for some typical values of p and L.The excellent track reconstruction obtained is demonstrated in Section 3.1 where
the observed K0s signal is presented.
The tracking is more difficult for electrons as they radiate photons via the brems-strahlung process as they traverse the non-zero-density tracking system. This results in acontinuously changing curvature. In this case, the resolution is worse and electron energiesare measured by combining information from the drift chambers and the electromagneticcalorimeter.
Table 2: Resolutions obtained in the NOMAD drift chambers, for different track lengths andmomenta
p [GeV/c] L [m] σp/p [%]
1.0 1.5 4.13.5 2.7
10.0 1.5 5.03.5 2.7
50.0 1.5 15.13.5 3.2
Most neutrino interactions in the NOMAD active target occur in the passive panelsof the drift chambers. Interaction vertices are reconstructed by extrapolating the tracksof charged secondary-interaction products measured in the chambers. Figure 10 showsthe distribution of vertices in the plane perpendicular to the beam. A fiducial cut of−120 ≤ x, y ≤ 120 cm is imposed. The gradual diminishing of the beam intensity withradius is easily discernible. The nine square spots of high intensity are caused by themelamine inserts which are built into the chambers in order to maintain the 8 mm gapwidths.
Figure 11 shows the distribution of vertices along the beam direction. The infor-mation from the 44 drift chambers has been overlayed to cover the ≈ ±5 cm about thecentre of each chamber. The eight ‘spikes’ in this distribution correspond to the Kevlarskins of the drift chambers, see Fig. 7. Regions in z with a low interaction rate correspondto the three gas-filled drift gaps and the honeycomb panels.
A much more detailed description of these chambers will be given in a forthcomingpublication [16].
2.5 Trigger counters
Two trigger planes are installed in the NOMAD detector: the first plane follows theactive target and the second plane is positioned behind the TRD region. Each of themcovers a fiducial area of 280×286 cm2 and consists of 32 scintillation counters with single-ended photomultiplier readout. The scintillators have a thickness of 0.5 cm and a widthof 19.9 cm. Twenty-eight of the counters are installed horizontally and have a length of124 cm. In order to increase the fiducial area of the trigger planes, four counters of 130 cmlength are installed vertically to cover the light guides of the horizontal counters.
11

Primary Vertex (Data)
Xvtx (cm)
Yvt
x (c
m)
-100
-50
0
50
100
-100 -50 0 50 100
Figure 10: The positions of reconstructed neutrino interaction vertices in the plane perpendic-ular to the beam; see text.
Primary Vertex (Data)
z (cm)
Ent
ries
0
500
1000
1500
2000
2500
3000
3500
4000
4500skinsKevlar
Gas
gap
Hon
eyco
mb
Hon
eyco
mb
Hon
eyco
mb
Hon
eyco
mb
Gas
gap
Gas
gap
–5 –4 –3 –2 –1 0 1 2 3 4 5
Figure 11: The positions of reconstructed neutrino interaction vertices as measured along thebeam direction; see text.
12

The scintillators are connected by adiabatic light guides to 16-dynode photomulti-pliers of the proximity mesh type [17], which are oriented parallel to the magnetic field.The field of 0.4 T reduces the response of these photomultipliers by only 30%. They havean intrinsic time resolution of 1 ns and a noise rate of less than 50 Hz. The discriminatedphotomultiplier signals are input into a trigger module (LeCroy 4564) where a logical ORis performed for each plane. A coincidence between the two planes is required for a validtrigger. The discriminated photomultiplier signals are also sent to a TDC (LeCroy 1876Module 100), which allows the individual counter time to be determined offline.
The average efficiency of the trigger counters, for single tracks, has been determinedwith data and found to be 97.5± 0.1%.
2.6 Transition Radiation Detector
The NOMAD Transition Radiation Detector (TRD) has been designed to separateelectrons from pions with a pion rejection factor greater than 103 for a 90% electron effi-ciency in the momentum range from 1 GeV/c to 50 GeV/c. This factor, together with theadditional rejection provided by the preshower and electromagnetic calorimeter, is neededin the oscillation search in the τ− → e−ντ νe decay channel in order to eliminate neutralcurrent neutrino interaction events in which an isolated pion track fakes an electron.
The large rejection factor required and the large lateral dimensions of the detector(2.85×2.85 m2) make the NOMAD TRD one of the largest transition radiation detectorsever built. Its design was optimized by detailed simulation and after several test beammeasurements [18, 19]. It takes into account two main experimental constraints: the lim-ited longitudinal space inside the NOMAD magnet and the requirement that there be lessthan 2% of a radiation length added between two consecutive measurements in the driftchambers.
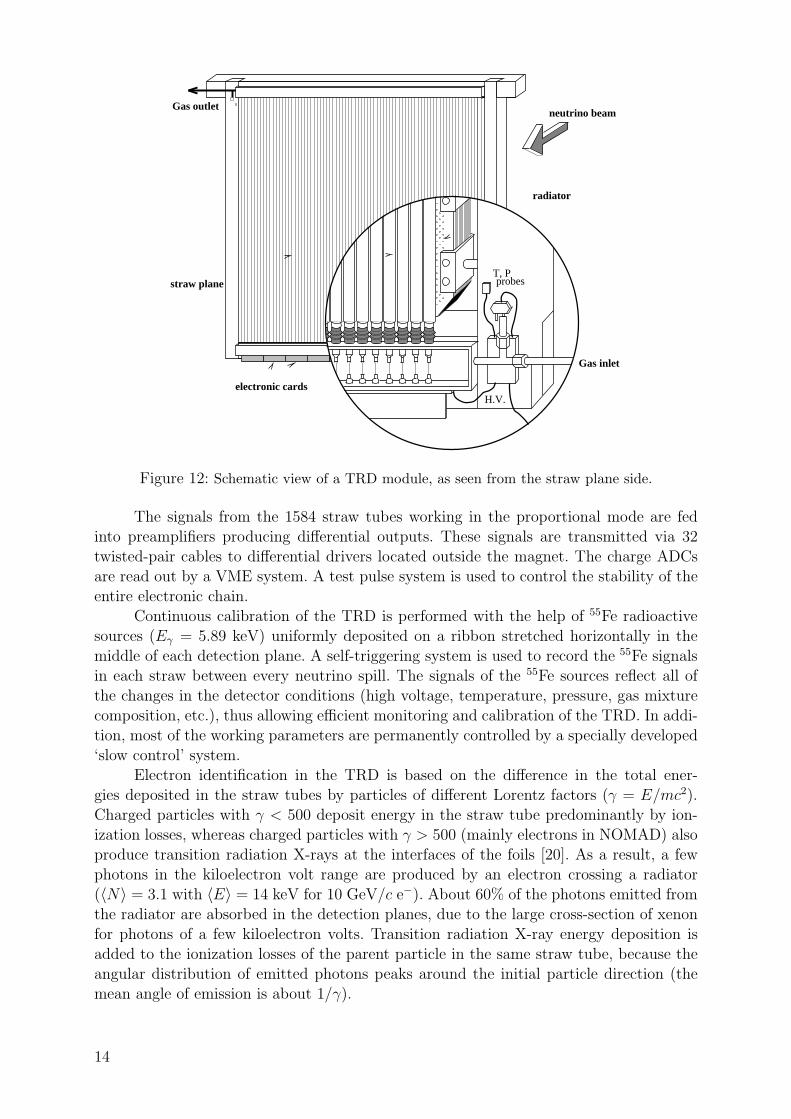
The TRD is located after the first trigger plane and consists of nine identical mod-ules. The first eight modules are paired into four doublets. In order to provide a precisetrack extrapolation from the drift chamber target to the calorimeter, five drift chambersare embedded in the TRD, one after each TRD doublet and one after the last module,see Figs. 1 and 2. Each TRD module includes a radiator followed by a detection planewith the following design (see Fig. 12):
– The radiator is a set of 315 polypropylene foils, each 15 µm thick and 2.85× 2.85 m2
in area, separated by 250 µm air gaps. The foils are stretched on an aluminiumframe and embossed to ensure a regular spacing in spite of their large size and ofelectrostatic effects.
– The detection plane consists of 176 vertical straw tubes, each 3 m long and 16 mm indiameter, separated by 0.2 mm. The straw tubes are fed in parallel with a 80% xenon– 20% methane gas mixture. They are made of two shifted 12.5 µm thick ribbons ofaluminized (115 nm of aluminium) Mylar rolled and glued along a 16 mm diameterhelix. The sensitive anode is a 50 µm diameter gold-plated tungsten wire stretchedwith a tension of 100 g. In order to protect the gas mixture in the straw tubes fromwater and oxygen contamination, each TRD module is covered by two aluminizedMylar skins with a permanent flow of dry N2 between them.
13
radiator
straw plane
electronic cards
probesT, P
H.V.
Gas outlet
Gas inlet
neutrino beam
Figure 12: Schematic view of a TRD module, as seen from the straw plane side.
The signals from the 1584 straw tubes working in the proportional mode are fedinto preamplifiers producing differential outputs. These signals are transmitted via 32twisted-pair cables to differential drivers located outside the magnet. The charge ADCsare read out by a VME system. A test pulse system is used to control the stability of theentire electronic chain.
Continuous calibration of the TRD is performed with the help of 55Fe radioactivesources (Eγ = 5.89 keV) uniformly deposited on a ribbon stretched horizontally in themiddle of each detection plane. A self-triggering system is used to record the 55Fe signalsin each straw between every neutrino spill. The signals of the 55Fe sources reflect all ofthe changes in the detector conditions (high voltage, temperature, pressure, gas mixturecomposition, etc.), thus allowing efficient monitoring and calibration of the TRD. In addi-tion, most of the working parameters are permanently controlled by a specially developed‘slow control’ system.
Electron identification in the TRD is based on the difference in the total ener-gies deposited in the straw tubes by particles of different Lorentz factors (γ = E/mc2).Charged particles with γ < 500 deposit energy in the straw tube predominantly by ion-ization losses, whereas charged particles with γ > 500 (mainly electrons in NOMAD) alsoproduce transition radiation X-rays at the interfaces of the foils [20]. As a result, a fewphotons in the kiloelectron volt range are produced by an electron crossing a radiator(〈N〉 = 3.1 with 〈E〉 = 14 keV for 10 GeV/c e−). About 60% of the photons emitted fromthe radiator are absorbed in the detection planes, due to the large cross-section of xenonfor photons of a few kiloelectron volts. Transition radiation X-ray energy deposition isadded to the ionization losses of the parent particle in the same straw tube, because theangular distribution of emitted photons peaks around the initial particle direction (themean angle of emission is about 1/γ).
14

The algorithm developed for electron identification [21] is based on a likelihoodratio method and relies on test beam measurements and detector simulation. The TRDsimulation has been extensively tested in situ using the muons (5 GeV/c < pµ < 50 GeV/c)crossing the detector during the flat top between the two neutrino spills. Figure 13 shows acomparison between the experimental and simulated distributions of the energy depositedin straw tubes by 5 GeV/c muons (ionization losses only) and by δ-ray electrons with amean momentum of about 2 GeV/c, emitted by muons (sum of ionization losses anddetected transition-radiation photons).
A pion rejection factor greater than 1000 is obtained with the nine TRD modulesin the momentum range from 1 GeV/c to 50 GeV/c, while retaining an electron efficiencyof 90% (see Section 3.4).
0
20
40
60
80
100
120
140
0 10 20 30 40 50 60
5 GeV/c muons
δ-ray electrons
E (keV)
dN/d
E (
arbi
trar
y un
its)
Figure 13: Comparison of experimental (points with error bars) and simulated (solid lines)distributions of the energy deposited in TRD straw tubes by 5 GeV/c muons (open circles) and2 GeV/c electrons (closed circles).
2.7 Preshower detector
The Preshower (PRS) detector, which is located just in front of the electromagneticcalorimeter, is composed of two planes of proportional tubes (286 horizontal and 288vertical tubes) preceded by a 9 mm (1.6 X0) lead–antimony (96%–4%) converter, seeFig. 14.
The proportional tubes are made from extruded aluminium profiles and are gluedto two aluminium end-plates of 0.5 mm thickness. Each tube has a square cross-sectionof 9 × 9 mm2 and the walls are 1 mm thick. The 30 µm gold-plated tungsten anode isstrung with a tension of 50 g and secured at each end in hollow copper pins. In order toavoid wire vibrations, the anodes are also glued in the middle of the preshower on small
15
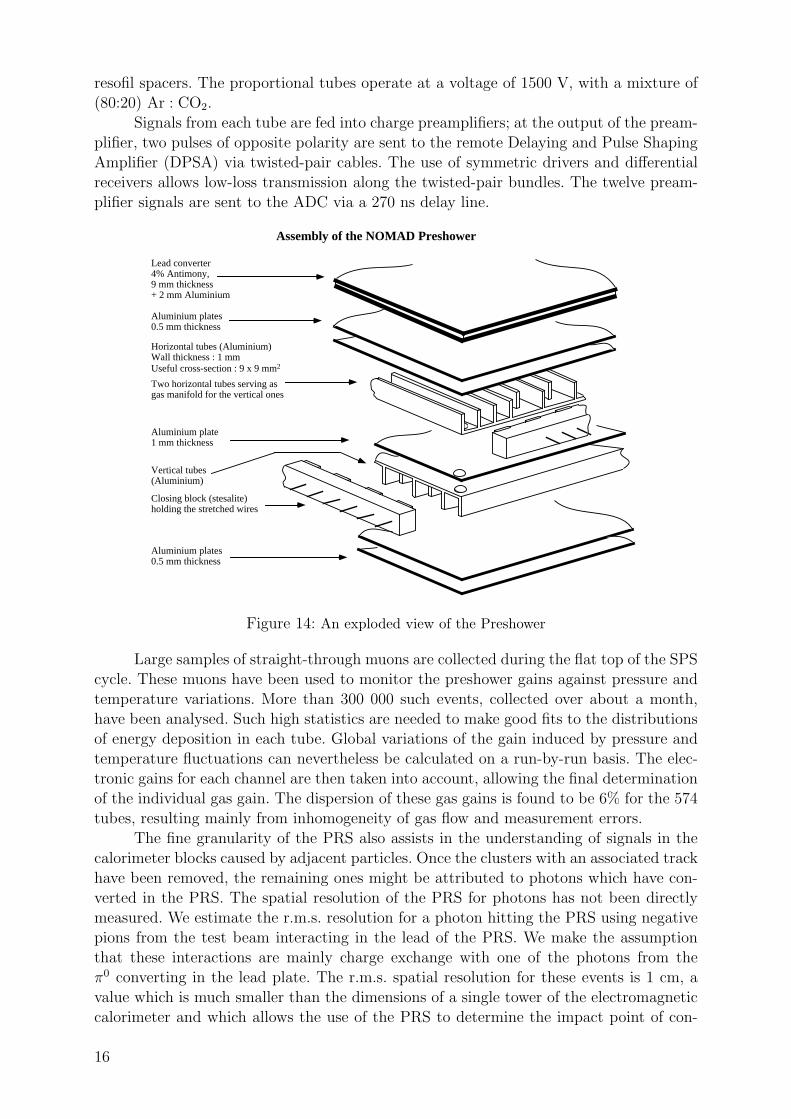
resofil spacers. The proportional tubes operate at a voltage of 1500 V, with a mixture of(80:20) Ar : CO2.
Signals from each tube are fed into charge preamplifiers; at the output of the pream-plifier, two pulses of opposite polarity are sent to the remote Delaying and Pulse ShapingAmplifier (DPSA) via twisted-pair cables. The use of symmetric drivers and differentialreceivers allows low-loss transmission along the twisted-pair bundles. The twelve pream-plifier signals are sent to the ADC via a 270 ns delay line.
Aluminium plates0.5 mm thickness
Horizontal tubes (Aluminium)Wall thickness : 1 mmUseful cross-section : 9 x 9 mm2
Two horizontal tubes serving asgas manifold for the vertical ones
Aluminium plate1 mm thickness
Vertical tubes(Aluminium)
Aluminium plates0.5 mm thickness
Lead converter4% Antimony,9 mm thickness+ 2 mm Aluminium
Assembly of the NOMAD Preshower
Closing block (stesalite)holding the stretched wires
Figure 14: An exploded view of the Preshower
Large samples of straight-through muons are collected during the flat top of the SPScycle. These muons have been used to monitor the preshower gains against pressure andtemperature variations. More than 300 000 such events, collected over about a month,have been analysed. Such high statistics are needed to make good fits to the distributionsof energy deposition in each tube. Global variations of the gain induced by pressure andtemperature fluctuations can nevertheless be calculated on a run-by-run basis. The elec-tronic gains for each channel are then taken into account, allowing the final determinationof the individual gas gain. The dispersion of these gas gains is found to be 6% for the 574tubes, resulting mainly from inhomogeneity of gas flow and measurement errors.
The fine granularity of the PRS also assists in the understanding of signals in thecalorimeter blocks caused by adjacent particles. Once the clusters with an associated trackhave been removed, the remaining ones might be attributed to photons which have con-verted in the PRS. The spatial resolution of the PRS for photons has not been directlymeasured. We estimate the r.m.s. resolution for a photon hitting the PRS using negativepions from the test beam interacting in the lead of the PRS. We make the assumptionthat these interactions are mainly charge exchange with one of the photons from theπ0 converting in the lead plate. The r.m.s. spatial resolution for these events is 1 cm, avalue which is much smaller than the dimensions of a single tower of the electromagneticcalorimeter and which allows the use of the PRS to determine the impact point of con-
16
verting photons for the 70% of the photons which convert in the lead radiator. Using theabove value as spatial resolution of photons and the energy resolution of the electromag-netic calorimeter, a rough estimation of the π0 mass resolution is found to be 11 MeV/c2,in good agreement with the observed π0 mass distribution, see Section 3.2.
2.8 Electromagnetic calorimeter
The search for ντ events in NOMAD relies strongly on electron identification as wellas on a very accurate determination of the total transverse momentum in the event.
While electron identification is performed using the Transition Radiation Detector(TRD), the Electromagnetic Calorimeter (ECAL) is crucial for accurate measurement ofelectron and gamma energies from 100 MeV up to 100 GeV and for the determination ofthe neutral component of the transverse momentum. The large energy range to be coveredrequires a large dynamic range in the response of the detector and of the associated elec-tronics. A lead-glass detector was chosen for its excellent energy resolution and uniformityof response. In NOMAD the electromagnetic calorimeter combined with the PreshowerDetector (PRS) was also used to help improve the electron identification provided by theTRD.
The ECAL consists of 875 lead-glass Cerenkov counters of TF1-000 type arranged ina matrix of 35 rows and 25 columns. Each counter is a 19 radiation lengths deep block witha rectangular cross section of 79×112 mm2. The direction of the B = 0.4 T magnetic field,perpendicular to the counter axis, imposes severe constraints on the mechanical assemblyof the light detection system (Fig. 15). The light detectors (two-stage photomultipliers,tetrodes, with a typical gain of 40 in the operating conditions of NOMAD) are coupledto the back face of the lead-glass blocks. This face is cut at 45◦ with respect to the blockaxis, in such a way that the symmetry axis of the tetrodes forms an angle of 45◦ withrespect to the field direction, thus keeping the signal reduction caused by the magneticfield to less than 20%. This reduction was found to be very constant and uniform. Alow-noise electronic chain, composed of a charge preamplifier followed by a shaper anda peak sensing ADC with a resolution of 12 bits, provides a calorimeter response in adynamic range larger than 4× 10³.
A fast analog signal from each shaper, discriminated and ORed over groups of16 adjacent counters, is also provided for time measurements in order to reject energydepositions not associated with the triggered event. The obtained time resolution is a fewnanoseconds for energy depositions larger than 1 GeV. In addition the fast analog signals,summed over groups of 64 counters, are discriminated and ORed over all the groups toform an ECAL trigger, as explained in Section 2.11.
Monitoring of the lead-glass response is performed using two blue Light EmittingDiodes (LED) per counter mounted on the same face of the block on which the tetrodesare positioned; a detailed description of this monitoring system is given elsewhere [22].The LEDs are driven by highly stable current pulses, generated by specially designedcurrent drivers. This system has been shown to be very stable over periods of severalmonths as seen in Fig. 16(a) and (b) where the ratio of the LED signals to a referencemeasurement and its spread are shown.
17

z
ν beam
Magnetic fieldx
y
Figure 15: Schematic view of some lead-glass counters with phototetrodes
Figure 16: The signal in ECAL from LED and muon monitoring: (a) LED stability in timeover two years of data collection, (b) spread of the ratio of the LED signals to a referencemeasurement, (c) µ peak position vs. time over two years of data collection.
18

Before the final assembly in NOMAD, the lead-glass blocks were individually cali-brated using a 10 GeV/c electron beam having a small momentum spread (∆p/p = 1%).The response of each block to the LED pulses, measured immediately after the corre-sponding electron calibration, was also recorded and used to convert to the NOMADoperating conditions the calibration obtained at the test beam in the absence of a mag-netic field. The effect of the magnetic field on the calibration was taken into account byLED measurements performed with and without magnetic field.
The linearity of the calorimeter response to electrons was verified at the test beam inthe energy range 1.5–80 GeV. Deviations from linearity are kept below 1.0% by applyinga logarithmic correction to the cluster energy as explained in Ref. [23].
A detailed study of the energy resolution was performed. After the deconvolution ofthe electronic noise from the data, a two-parameter fit of the energy resolution ∆E/E =a+ b/
√E, where E is in GeV, gives a = (1.04± 0.01)% and b = (3.22± 0.07)%.
The ECAL response as a function of the impact point of the incoming electrons hasbeen measured to be uniform within ± 0.5%; the response to electrons entering at normalincidence in the gaps between adjacent blocks has shown that ECAL is ‘hermetic’ at morethan 99%. A weak dependence of the total energy release on the angle of incidence θ ofthe incoming electrons has been found both in the test beam measurements and in theMonte Carlo simulations: this dependence, which has been empirically parametrized asE(θ) = E
√cos(θ), can be attributed to the small variation with angle of the Cerenkov light
collection efficiency. In addition, the number of towers receiving contributions from a givenshower increases with angle. However, this does not affect the overall energy resolutionthat remains insensitive to both shower position and angle. The shower position has beenmeasured with an average resolution of about 4 mm in each direction (6 mm at the centreof the block and 2 mm at the edges).
The calibration and the calorimeter response to low-energy photons have beenchecked by measuring the π0 mass both in a dedicated test-beam and during the NO-MAD data taking. The following results were found using test beam data:
mπ = (133.7± 1.2) MeV/c2 , σm = 16 MeV/c2.
The analogous results obtained during the normal NOMAD data taking are dis-cussed in Section 3.2.
The calorimeter response to muons corresponds to a peak value for the energydeposition of (0.566 ± 0.003) GeV, as shown in Fig. 17. The muon signals were foundto be stable within ±1% over a two-year period providing an independent check of thestability in calorimeter response; this is complementary to the one provided by the LEDmonitoring that is continuously running during normal data-taking. Figure 16(c) showsthe average energy deposited by muons crossing ECAL as a function of time.
Triggers based on the ECAL energy deposition are currently being acquired, to-gether with the ‘normal’ neutrino triggers described elsewhere. The large mass of ECAL(≈ 20 t) gives a trigger rate of ≈ 2.5 interactions/neutrino spill. The large acceptancemakes such events very useful for physics purposes as well as for monitoring the beamconditions.
A more detailed description of ECAL is given elsewhere [24]. The performance ofECAL when exposed to test beams of electrons, pions, and muons is reported in Ref. [23].
19

Figure 17: The signal in ECAL from muons crossing the detector during normal data taking. Acorrection has been applied to account for the differences in impact angle of the muons on thedetector.
2.9 Hadronic calorimeter
The Hadron Calorimeter (HCAL) is intended to detect neutral hadrons and to pro-vide a measurement of the energy of charged hadrons complementary to that derived frommomentum measurements in the drift chambers. Knowledge of neutral hadrons is impor-tant when constructing kinematic quantities such as missing transverse momentum, andcalorimetric measurements of charged particles can be used both as a consistency checkon the momentum measurement of the charged particles and as an aid in distinguishingbetween muons and charged hadrons.
The HCAL is an iron–scintillator sampling calorimeter. The NOMAD detector issuspended from iron pillars (the I’s) at the two ends of the magnet. The downstreampillar was instrumented with scintillators to construct the HCAL. The I’s consist of 23iron plates, 4.9 cm thick, separated by 1.8 cm gaps, and six of these modules form awall 5.4 m wide, 5.8 m high, and 1.5 m deep. This wall acts as a filter for the largemuon chambers downstream and as a support for the ‘basket’ which contains much of theNOMAD detector.
The active elements of the calorimeter are scintillator paddles 3.6 m long, 1 cmthick, and (on average) 18.3 cm wide. Tapered acrylic light pipes are glued to each endof the scintillator paddle to form an assembly 5.52 m long. Eleven of these assemblies
20

are threaded horizontally through the first 11 gaps in the iron wall to form a calorimetermodule 18.3 cm high, and approximately 3.1 interaction lengths (λint) deep. Scintillationlight is directed through adiabatic light guides to a 5 inch phototube at each end of themodule. Eighteen of these modules are stacked vertically to form a calorimeter with anactive area 3.6 m wide by 3.5 m high. A schematic front view of the HCAL, showing thescintillators and tapered acrylic light pipes, is given in Fig. 18.
Scintillator BoltsLight Pipes Iron Pillars
350 cm
360 cm
5 inch
Photomultiplier
Figure 18: A front view of the HCAL; see the text for details.
The output from each phototube is split. One signal is delayed and sent to a charge-integrating ADC, while the second is discriminated and sent to a multihit TDC. The ADCsignals are used for energy and position measurements, while the TDC signals are used todetermine event timing. The discriminated signals can also be used, in conjunction witha majority logic circuit, to form a trigger.
The energy deposited in a given module is obtained from the geometric mean of thetwo phototube signals, and the horizontal position of the energy deposit is determinedfrom the attenuation length of the scintillator and the ratio of the phototube signals.Vertical positions are determined from the pattern of energy sharing between the modules.Figure 19 shows the energy response to muons which traverse the calorimeter; the peakof the minimum-ionizing distribution is at 1.5 GeV and the expected Landau shape isclearly seen. Figure 20 shows the difference between the predicted horizontal positionand the position measured by the hadron calorimeter for muons passing through a singlecalorimeter module; typical position resolutions are of the order of 20 cm.
There is a high probability that hadrons will begin to shower in the approximately2.1 λint of material upstream of the hadron calorimeter, and so the total hadronic energyis taken to be a weighted sum of the energies deposited in the hadron and electromagneticcalorimeters.
21

HCAL Response to Muons GeV
0
500
1000
1500
2000
2500
0 1 2 3 4 5 6
Figure 19: Minimum-ionizing peak for muons passing through the hadron calorimeter
cmHCAL Measured X - Predicted X cm
0
200
400
600
800
1000
1200
1400
1600
-100 -80 -60 -40 -20 0 20 40 60 80 100
Figure 20: Horizontal position resolution for muons passing through a single hadron calorimetermodule
22
2.10 Muon chambers
The NOMAD muon detector consists of 10 drift chambers previously used in theUA1 experiment [25]. Each chamber has an active area of 3.75× 5.55 m2 with two planesof drift tubes in the horizontal and two in the vertical directions. In total there are 1210drift tubes, each with a maximum drift distance of 7 cm.
The chambers are arranged in pairs (modules) for track segment reconstruction. Thefirst muon station consists of three modules and is placed behind the hadron calorimeter.It is followed by an 80 cm thick iron absorber and a second muon station of two modules.In 1995 there was a small gap between the muon chambers in station 1. For the 1996 runthis gap was closed with several small scintillation counters, the ‘muon veto’, which areshown in Figs. 1 and 2.
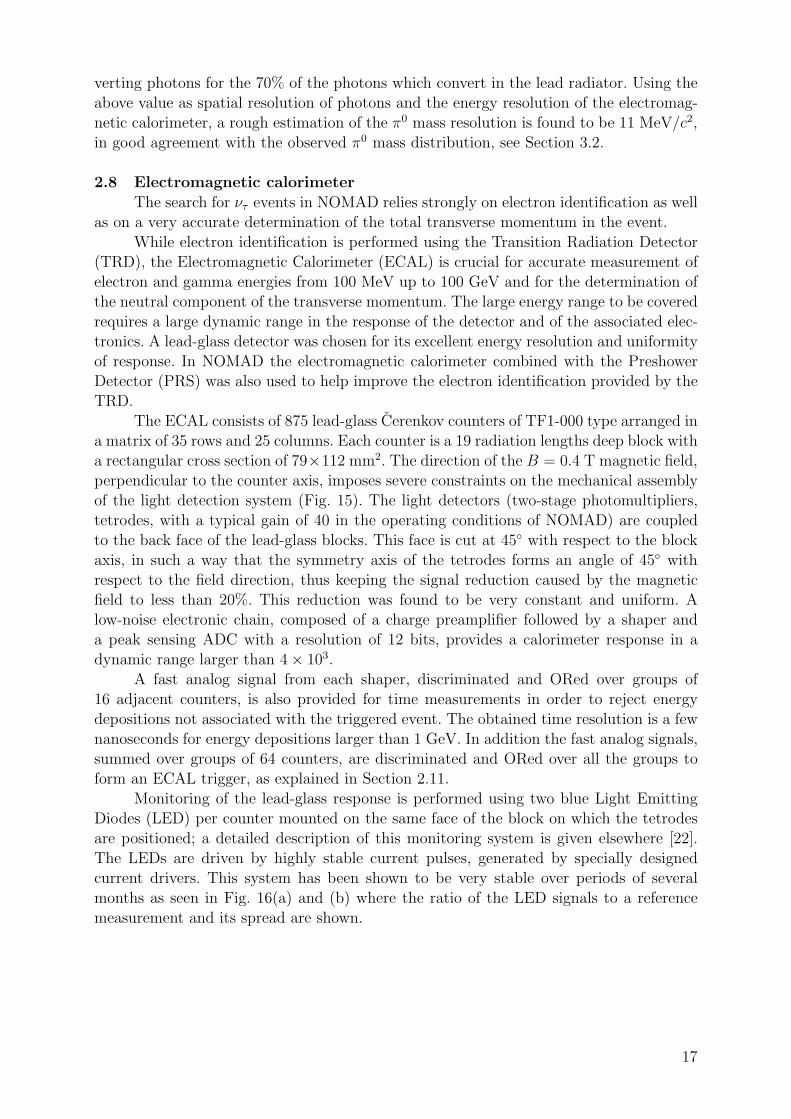
Track segments are reconstructed separately for each station from (typically) threeor four hits per projection, see Fig. 21. The measured efficiency for the reconstruction oftrack segments is 97%.
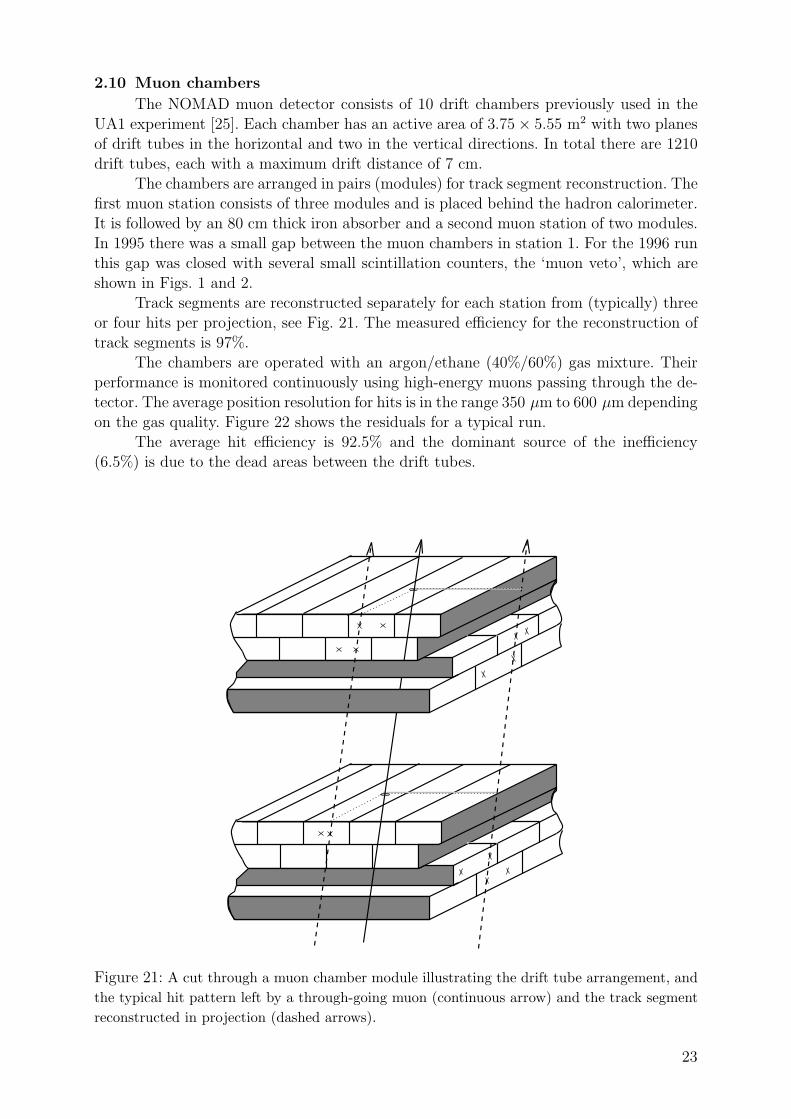
The chambers are operated with an argon/ethane (40%/60%) gas mixture. Theirperformance is monitored continuously using high-energy muons passing through the de-tector. The average position resolution for hits is in the range 350 µm to 600 µm dependingon the gas quality. Figure 22 shows the residuals for a typical run.
The average hit efficiency is 92.5% and the dominant source of the inefficiency(6.5%) is due to the dead areas between the drift tubes.
Figure 21: A cut through a muon chamber module illustrating the drift tube arrangement, andthe typical hit pattern left by a through-going muon (continuous arrow) and the track segmentreconstructed in projection (dashed arrows).
23
Track residuals
Residuals (mm)
Ent
ries
σ=360 µm
0
500
1000
1500
2000
2500
3000
3500
-2.5 -2 -1.5 -1 -0.5 0 0.5 1 1.5 2 2.5
Figure 22: Residuals for 4-point tracks in the muon chambers for a typical run
2.11 Triggering
The trigger logic is performed by the VME-based MOTRINO module, which wasespecially designed for NOMAD. The versatility of the module allows one to operate it intwo modes. Six modules function in the trigger-receiver or slave mode and two modules inthe trigger-formation or master mode. MOTRINO has the following functionalities [26]:
– Generation of time signals in the master module to synchronize with the SPS neutrinobeam cycle. Two gates are generated for the neutrino bursts and one for the flat top.
– Logical combination of up to eight subdetector signals for trigger formation. A max-imum of six different trigger types is possible in each of the gates.
– Distribution of the trigger signals to the subdetectors using the module-specific dif-ferential bus. The gates and busy signals are also transmitted via this bus.
– Treatment of the busy signals from the different slave modules.
– Storing of the trigger time relative to the SPS cycle in the master and slave modules.The time stamp that each trigger receives serves as a control for data integrity.
– Recording of the status of the trigger bits. The information is stored as soon as thefirst trigger fires and again, 200 ns later, to record any additional trigger bit set.
– Determination of the live time for the various trigger types using an external clockwhich reflects the time structure of the neutrino beam.
– Moderation of trigger rates. This feature, achieved by introducing dead time in aparticular trigger, is extensively used during the flat top between neutrino spills inorder to adjust individual calibration and alignment trigger rates and thus to limitthe total number of events.
24

The following triggers were set up for the study of neutrino interactions in NOMAD:
– V×T1×T2. This trigger allows a study of neutrino interactions in the drift chambertarget region. At least one hit in both trigger planes T1 and T2 is required. To preventtriggering on through-going muons, no hit should have occurred in the veto counters(V). The rate for this trigger is∼ 5.0/1013 p.o.t. and the live time is (86±4)%. Of thesetriggers, about 0.5 are potentially interesting candidates for neutrino interactions inthe drift chambers. The remaining triggers consist of ‘cosmics’ (about 1), non-vetoedmuons (1.5) and neutrino interactions in the magnet (2.0).
– V8×FCAL. Neutrino interactions in the front calorimeter with an energy depositionof at least 4 m.i.p. fire this trigger. Through-going muons are vetoed by the vetosubset V8. On average 6.5 neutrino interactions occur in the FCAL for 1013 p.o.t.The live time is (90± 3)%.
– V8 × T1 × T2 × FCAL′. This trigger is set up to study quasi-elastic like events inthe FCAL. Such events allow a relative flux measurement of the neutrino beam as afunction of the neutrino energy. For this trigger, an energy deposition between 1 and3 m.i.p. in the FCAL is required. The rate for this trigger is ∼ 1.5/1013 p.o.t. andthe live time (90± 3)%.
– T1 × T2 × ECAL. The electromagnetic calorimeter is also used as a target. Physicstopics that will be addressed using events from this trigger include νµ → νe andνµ → ντ oscillations. An energy deposition of more than ∼ 1.0 GeV in the ECALenables this trigger, which has an average rate of 2/1013 p.o.t. and a live time of(88± 3)%.
– RANDOM. A random trigger which allows a study of detector occupancy.
Approximately 15 neutrino candidate triggers are taken in each neutrino spill.In addition various triggers are used in the 2.6 s long flat-top between the two
neutrino bursts. These are used for:
– The drift chamber alignment.
– The calibration of the different subdetectors.
– A measurement of the trigger counter efficiency.
One of the triggers is a selection of electrons, from muon decay or delta rays, whichallows a study of the behaviour of electrons in the detector. In total, about 60 triggersare taken in each flat top.
2.12 Data acquisition system
NOMAD operates in the burst mode, where triggers arrive in short intervals (spills)separated by relatively long intervals without beam. In order to minimize the dead time,the digitized information is buffered internally on FASTBUS electronics and read outimmediately after the end of each spill.
Signals from each subdetector arrive at some combination of three types of FAST-BUS modules: twelve-bit charge-integrating ADCs, twelve-bit peak-sensing ADCs, andsixteen-bit TDCs with one nanosecond resolution. Both types of ADCs were designed atCERN, accommodating 64 channels and a 256 event memory. The LeCroy 1876 Model
25

100 TDCs provide input for 96 channels with a 64-kilobyte buffer as well as internalzero-suppression. There are a maximum of 11 648 channels to read out per event.
Five VME-based boards (FIC 8234 [27]) with Motorola 68040 processors controlthe readout of the front-end electronics through an extended VME Subsystem Bus (VSB)connected to slave controllers (F68B7) in each of 12 FASTBUS crates. Each FASTBUScontroller card provides four megabytes of additional memory for event buffering. TheVME controllers perform block transfers of the available data to local buffers, assemblethe data into subevents, and check for consistency and integrity. They then pass thesubevents through a VME interconnect bus (VIC) to a sixth VME processor (the ‘eventbuilder’) which assembles all the pieces into complete events together with informationabout the beam extraction and writes them to one of two nine-gigabyte disks via a high-level networking package (NIC) developed at CERN. Twice daily, a separate processtransfers the data to a tape vault for storage on high capacity DLT tapes. Several SunSparc workstations monitor the quality of the data and the status of the detectors.
The data-acquisition software centres around elements known as stages. These stagesuse the CERN-designed CASCADE [28] software which provides a well-organized frame-work for DAQ development including scheduling, buffer management, and event accessfacilities. The arrival of data drives the stages; hence, stages must have at least one inputsource along with any number of output sources. The standard configuration for NOMADis shown in Fig. 23.
beamcalibration
beaminformation scaler info.
miscellaneous
monitoring &slow control
external data stageLegend:
drift chambers
TRD
veto/fcal/hcalpreshower/trigger
ECAL
muon chambers
builderevent recorder
spool disk
Figure 23: Data-acquisition software configuration
The event-builder stage also asynchronously receives beam calibration data, sum-maries of monitoring information, and detector status information whenever they change.
The slow control system consists of a Sun workstation and several Apple Macintoshcomputers running LabView graphical software [29]. The Macintoshes monitor all high andlow voltages, gas systems, and temperature probes in the experiment, and pass slow controldata to the Sun workstation. Alarms are generated in the event of detector problems.Periodic samples of slow control data, along with all alarm records, are passed from theSun to the event builder stage and saved for offline use.
Monitoring programs for each of the nine subdetectors as well as for beam, scaler andtrigger information connect to the stages via ethernet and generate summary histograms.Shift personnel use the resulting histograms to verify the quality of the data. Additionally,a separate monitoring task reconstructs all the muon events received during the flat topof each SPS cycle and records them in a separate data stream.
26

The run-control consists of a finite-state machine implemented in C++ with an X-windows interface. It uses a database both to record the current state of all the stages andmonitoring programs and to determine rules for transitions between the various states.Periodically, the offline software retrieves summary information for completed runs fromthis database and combines them with tape information for use during reconstruction andanalysis.
The system records over 1.5 megabytes of data per minute, with a typical assembledneutrino event containing around 2000 32-bit words before reconstruction. Additionally,approximately six times this quantity flows through the acquisition in the form of cal-ibration events which are not recorded. In the neutrino spills, the data-acquisition hasa typical dead time of 10% arising from digitizations. The data-taking time lost due todown-time and inter-run transitions is less than 3%.
3 PERFORMANCE
Figure 24 shows a candidate νµ CC event detected in NOMAD. One energeticparticle penetrates to the muon chambers, and satisfies all other criteria to be a muon.A hadronic jet of charged particles is clearly visible at the primary vertex, and a photonconversion in the drift chambers is also evident.
Figure 25 shows a candidate νe CC event detected in NOMAD. One very straightsecondary track, identified as an electron by the TRD, is seen to deposit a large amountof energy in a few cells of ECAL, as indicated by the large ‘bar’ in the event display. Notethat in this view a second, positive track appears to be produced at the same space angleas the electron, indicating that the event might be caused by an asymmetric Dalitz decayof a π0. However the orthogonal view, not shown, indicates that these two tracks are wellseparated in angle at the primary vertex, which is very unlikely in a Dalitz pair.
3.1 Identification of K0s
K0s mesons observed in NOMAD are used as a quality check of the reconstruction
program and of the detector performance. Using an algorithm looking for ‘V0’ vertices,K0
s → π+π− and Λ0 → pπ− decays and γ → e+e− conversions are reconstructed.Figure 26 shows the π+π− mass distribution, where the following selection criteria
were applied:
– A pair of oppositely charged tracks, not positively identified as electrons or muons,emerges from a secondary vertex distinct from the primary.
– The reconstructed momentum of the pair was required to point to the primary vertex.
– The invariant mass of the pair, taken to be a π+π−, was required to be greater than300 MeV/c2.
– The invariant mass of the pair, taken to be a pπ−, was required to differ from the Λ0
mass by more than 50 MeV/c2.
The K0 peak stands out clearly over a small background. A fit gives a value for themass of (497.3± 0.4) MeV/c2. The resolution is 11 MeV/c2 which is consistent with themeasured momentum resolution of NOMAD.
Figure 27 shows the proper distance travelled by the K0s before decaying. The fit
gives a lifetime of (892± 65)× 10−13 s. Both the mass and lifetime of the K0s given above
are consistent with the values given in Ref. [30].
27

Figure 24: A candidate νµ CC event; see text for details.
Figure 25: A candidate νe CC event; see text for details.
K0 mass
V0 Mass GeV
Ent
ries
0
10
20
30
40
50
60
70
80
0.44 0.46 0.48 0.5 0.52 0.54 0.56
Figure 26: The invariant mass distribution of (π+π−) pairs from secondary vertices
28

K0 lifetime
cτ cm
Ent
ries
0
50
100
150
200
250
300
350
0 2 4 6 8 10 12 14
Figure 27: The product cτ of K0s mesons observed in NOMAD
3.2 Reconstruction of π0 mesons
Gamma-rays from π0 decays represent the best electromagnetic probe available inNOMAD to test the ECAL response. In spite of the fact that the π0 flux from neutrinointeractions is too small to allow an individual calibration of each ECAL block, the π0
signal can still be used to test the overall energy response.Figure 28 shows the γγ invariant mass distribution obtained for two-charged-track
events with a vertex in the DC region and two neutral clusters in ECAL. The ECALenergy is corrected as explained in Ref. [23]. The peak position is well centred on the π0
mass and the width (σ = 11 MeV/c2) is in good agreement with the expected resolution.A similar distribution is obtained requiring one neutral cluster in ECAL and a γ-ray
converted and reconstructed in the DC (Fig. 29). Again the peak position and the widthare in agreement with the π0 mass and the experimental resolution respectively.
3.3 Muon identification and veto
The muon chambers in NOMAD are arranged in two ‘stations’ as described inSection 2.10. Muons are identified if they penetrate more than 8 interaction lengths (λint)of absorber material in order to reach muon station 1, or 13 λint for muon station 2. Forperpendicular incidence, the momentum thresholds to reach the muon chambers (with50% probability) are measured to be 2.3 GeV/c for station 1, and 3.7 GeV/c for station 2.
The geometrical acceptance in order to hit either of the two stations is about 98%.This number applies to primary muons from charged-current interactions, averaged overtheir production point in the NOMAD target, and does not include muons which ‘rangeout’ in the absorber material.
29

γγ invariant mass
GeV/c2
Com
bina
tion
s/0.
02G
eV
0
50
100
150
200
250
300
0 0.1 0.2 0.3 0.4 0.5 0.6
Figure 28: The γγ invariant mass where both γ energies are measured in ECAL
(e+e-)γ invariant mass
GeV/c2
Com
bina
tion
s / 0
.02
GeV
0
50
100
150
200
250
300
0 0.1 0.2 0.3 0.4 0.5 0.6
Figure 29: The γγ invariant mass where one γ converts in the DC and a second one is measuredin ECAL
30

The muon momentum is measured in the central drift chambers with a precisionof typically 3% for momenta below 20 GeV/c, where the error is dominated by multi-ple scattering. For larger momenta the error slowly rises as measurement errors start todominate, but the muon charge can be reliably measured for momenta up to 200 GeV/c.
A muon typically leaves a signal in the ECAL which is equivalent to a ≈ 550 MeVelectromagnetic shower, and a signal in the HCAL equivalent to a ≈ 1.5 GeV hadronicshower.
Tracks are reconstructed from the hits in the muon chambers (see Section 2.1) andthe extrapolated central drift chamber tracks are matched to these tracks. If this matchingsatisfies certain quality criteria (e.g. cuts on matching distance and χ2), which may varyfor different analyses, then the track is identified as having been made by a muon. Itis clear from Fig. 30 that the muon reconstruction efficiency is essentially momentum-independent above 5 GeV/c.
muon reconstruction efficiency
0
0.2
0.4
0.6
0.8
1
0 2 4 6 8 10 12 14 16 18 20muon momentum / GeV/c
effi
cien
cy
Figure 30: Typical muon reconstruction efficiency as a function of muon momentum for νµ CCevents. This includes tracking, vertex association, the probability for a muon to emerge fromthe iron absorbers, the geometrical efficiency and the matching efficiency, (multiple scattering).
It is very important for many NOMAD analyses to identify events which do not con-tain a primary muon. Very low momentum muons can only be eliminated using kinematiccriteria, such as pT cuts. For higher momentum tracks the consistency of the ECAL andHCAL energy deposition can be checked. For muons well above the momentum thresholdto reach the muon chambers, the efficiency to detect at least 2 hits is about 98%. As anexample, requiring that no muon chamber hits be associated to candidate hadrons withina certain road, and that the energy deposition in the ECAL and HCAL be inconsistentwith a minimum-ionizing particle, a residual muon contamination of about 10−3 can beachieved for hadrons with p > 4 GeV/c with 90% efficiency.
31

3.4 Electron identification
Information from the Transition Radiation Detector (TRD), Preshower (PRS), andElectromagnetic Calorimeter (ECAL) is combined to separate electrons from charged π-mesons.
3.4.1 Using the transition radiation detector
The NOMAD TRD (see Section 2.6) is designed to separate electrons from heaviercharged particles, mainly pions.
A ‘hit’ in the TRD is a straw tube with an energy deposition above the pedestalvalue. A set of hits collected along the road around a drift chamber track is associated tothis track. Energy depositions in associated hits are then compared to the expectationsfor two possible hypotheses: electron (e) and pion (π). The momentum of the particlemeasured in the drift chambers is taken into account to evaluate the expected energydeposition.
Two cases are considered for particle identification:
– A set of hits is produced by a single isolated particle.– Several particles cross and give signals in the same straw tubes, producing a set of
‘shared’ hits.
Depending upon the topology of the event, two different identification proceduresare applied.
The signature of an isolated particle is defined from a likelihood ratio L computedfrom the responses of all of the straw tubes crossed by an incident track:
L =N∑i=1
logP (εi | e)
P (εi | π)(2)
where:
– N is the number of hits assigned to a track.– P (εi | e) and P (εi | π) are the probability density functions for an electron e and a
pion π with a given momentum to deposit the energy εi in the i-th straw tube.The distributions of probability density P (εi | e) and P (εi | π) that a given energy
deposition εi belongs to an electron or pion have been obtained from detailed simulation,extensive test beam, and in situ measurements (for details see Ref. [21]). The desiredelectron efficiency defines a threshold on the total likelihood ratio, see Fig. 31. An electron(pion) is associated with a likelihood ratio above (below) this threshold. A pion rejectionbetter than 103 at 90% electron efficiency has been achieved for isolated particles crossingall nine TRD modules in a wide momentum range from 1 GeV/c to 50 GeV/c.
About 25% of νe CC interactions in NOMAD lead to tracks having ‘shared’ hitsin the TRD. An assignment of a total deposited energy in shared hits to each of thenon-isolated tracks would lead to particle misidentifications. For example, more than 95%of two pions with all nine hits shared would fake an electron signal.
The identification procedure for non-isolated particles takes into account the numberof tracks producing each hit and their momenta. While for an isolated track a decision ismade between two hypotheses e(p) and π(p), for non-isolated tracks one has to considerfour hypotheses π(p1) ·π(p2), e(p1) ·π(p2), π(p1) ·e(p2) and e(p1) ·e(p2), p1 and p2 being themomenta of the tracks. A detailed description of the procedure can be found in Ref. [21],and a summary of the identification algorithm is presented below.
32

– If two tracks have at most three ‘shared’ hits, the particle identification procedurefor isolated tracks is applied to ‘non-shared’ hits only.
– If two tracks have more than three ‘shared’ hits, four likelihood estimators are com-puted for the energy depositions in ‘shared’ hits from the corresponding two-particleprobability distributions. The decision on the nature of each of the two particles ismade by selecting the hypothesis corresponding to the maximum likelihood value.
0
0.005
0.01
0.015
0.02
0.025
0.03
0.035
-25 -20 -15 -10 -5 0 5 10 15 20 25
Pions
Electrons
90% electron cut
LthLikelihood ratio L
dN/d
L, a
rbit
rary
uni
ts
Figure 31: The likelihood ratio distributions for pions and electrons with track momenta10 GeV/c crossing nine TRD modules (Monte Carlo simulation). Pion rejection is better than1000:1 at 90% electron efficiency.
The main goal of the algorithm developed for the identification of non-isolatedparticles is to reduce the number of fake electrons caused by non-isolated hadrons. It allowsa correct identification of 84% of the non-isolated pions produced in νe CC interactionsin NOMAD, with 15% of π · π combinations being misidentified as e · π and only 1% ase · e.
The performance of the identification algorithms has been studied on a sample ofmuons producing energetic δ-ray electrons (pδ > 500 MeV/c) selected from NOMAD data(Section 2.6). Using the electron identification algorithm for isolated tracks, (86± 3)% ofδ-ray electrons were correctly identified at a 103 level of muon rejection, which agrees withthe expectations for the electrons in the range from 0.5 to 2.5 GeV/c. The identificationprocedure for non-isolated tracks has been tested by summing the energy depositions ofmuons and their associated δ-ray electrons. About (72 ± 3)% of the e · µ combinationswere properly identified, which is in agreement with the 75% expected.
The NOMAD TRD reaches a 103 pion rejection factor for isolated tracks in the1 GeV/c to 50 GeV/c momentum range with a 90% electron detection efficiency. Thealgorithm developed for the identification of non-isolated tracks allows the number ofmisidentified particles to be reduced, particularly in large-multiplicity events.
33

3.4.2 Using the preshower and the electromagnetic calorimeter
A PRS prototype consisting of two layers of 10 tubes each was exposed to beamsof electrons and π mesons at the CERN PS and SPS accelerators. Based on the dataobtained, a procedure was developed for electron identification. The PRS pulse-height(measured in m.i.p.) was required to be larger than:
0.836 + 6.86 ln(E)− 0.22(ln(E))2
where E is the energy of the particle in GeV, corrected for linearity and for the energyloss in the PS, as explained in Ref. [23].
For energies greater than 4 GeV this yields an efficiency of 90% with a residual πcontamination smaller than 10%.
The π/e separation is substantially improved when ECAL is used in associationwith the PRS. Using a test-beam set-up comprising PRS and ECAL prototypes, theresponse to both electrons and pions was measured. Figure 32 shows the scatter plots ofPRS vs. ECAL pulse-height for 5 GeV electrons and pions. The rectangular regions in thefigure correspond to events in which the energy deposited by electrons is consistent withthe beam energy within the resolution of ECAL, and the PRS pulse-height satisfies thecondition described above. A rejection factor against pions of about 103 is obtained in theenergy range 2–10 GeV, while retaining an overall efficiency of 90% to detect electrons.An additional rejection factor of about 2–3 has been obtained using the information onenergy sharing among nearby towers in test-beam data [23].
a) Electrons
ECAL pulse height (GeV)
PR
S pu
lse
heig
ht (
mip
)
ECAL pulse height (GeV)
b) Pions
0
10
20
30
40
50
60
70
80
90
100
0 2 4 60
10
20
30
40
50
60
70
80
90
100
0 2 4 6
Figure 32: Scatter plots of the PRS vs. ECAL signals for 5 GeV/c incident electrons (a) andpions (b)
4 CONCLUSIONS
The NOMAD detector described in this paper collected data in 1995 and 1996 andhas accumulated about 600 000 νµ CC events resulting from the interactions of 2.25×10¹⁹
protons incident on the beryllium target. The data collection is continuing in 1997 and
34

the possibility of extending the run in 1998 has been raised. All the detector componentshave been shown to function well. The reconstruction of individual particles produced inneutrino interactions and the identification of muons and electrons has been proved tobe feasible. The search for ντ appearance is therefore proceeding as planned. Preliminaryresults based on a reduced data sample have already been presented at conferences. Inaddition, the data will permit the study, with enhanced statistics, of more conventionalprocesses in neutrino interactions previously made in bubble chambers.
Acknowledgements
We would like to thank A. Beer, C. Detraz, G. Fetchenhauer, G. Gallay, E. Less-mann, J. Mulon and S. Soulie for their invaluable technical help. We are grateful to P. Far-thouat for providing advice on the design of the electronics. We acknowledge the contri-butions from G. Linser, responsible for the experimental hall, and from H.D. Graskampfor the operation of the magnet. We thank J.M. Maugain and his team for the smoothoperation of the West Area Neutrino Facility. We are grateful to the SPS operation crewfor the superb performance of the accelerator and of the proton extraction system.
The Australian groups would like to thank the Australian Research Council (ARC)and the Department of Industry, Science and Technology (DIST) for their support.
The French groups thank the Institut National de Physique Atomique et des Partic-ules (IN2P3) and the Commissariat a l’Energie Nucleaire for their financial contributions,and the technical staff of the three participating laboratories for their very competentwork.
The Italian groups would like to thank the Istituto Nazionale di Fisica Nucleare(INFN) for financial support; the technical staff of the Cosenza, Firenze, Padova, Paviaand Pisa are gratefully acknowledged for their contributions.
The Johns Hopkins group was supported by the U.S. National Science Foundationunder grant PHY-9526278. The work of the Harvard and U.C.L.A. groups was supportedin part by the U.S. Department of Energy.
The Dortmund group would like to thank the BMBF for support under contract05 6DO52 I. Thanks are also due to H. Noffke, N. Koch, T. Villet and the staff of theirworkshops for their excellent work.
The Lausanne group acknowledges the financial support of the Fonds NationalSuisse de la Recherche Scientifique.
The Dubna group acknowledges the financial support of the Russian Foundationfor Fundamental Research under grant 96-02-18562.
The Moscow group gratefully acknowledges the support of the Institute for NuclearResearch of the Russian Academy of Sciences.
The LAPP, PARIS VI and VII and JINR groups thank the French Ministere del’Education Nationale, de l’Enseignement superieur et de la Recherche for its supportthrough the creation of the Reseau de Formation et de Recherche JINR-Dubna, LAPP-Annecy, and LPNHE-Paris VI and VII.
Many of the the graduate students in NOMAD were supported by grants from theirrespective national agencies, which are gratefully thanked. A. Bueno thanks D.G.I.C.Y.T.and M.E.C. for financial support.
35

References
[1] P. Astier et al., Search for the oscillation νµ → ντ , CERN-SPSLC/91–21, CERN-SPSLC/91–48, CERN-SPSLC/91–3.
[2] The magnet was previously used in the UA1 experiment. See: M. Barranco-Luque etal., Nucl. Instr. and Meth. A176 (1980) 175.
[3] G. Acquistapace et al., CERN-ECP/95–14 (July 1995).[4] L. Casagrande et al., The alignment of the CERN West Area Neutrino Facility, CERN
96–06 (August 1996).[5] H. Butler et al., CERN-ECP/93–22 (November 1993).[6] M. Giesch, S. Van der Meer, G. Pluym and K.M. Vahlbruch, CERN-NPA-Int 63–26.[7] E. Heijne, Muon flux measurement with silicon detectors in the CERN neutrino
beams, CERN 83–06 (July 1983).[8] GEANT: Detector description and simulation tool, CERN Programming Library
Long Writeup W5013.[9] SPY Collaboration, G. Ambrosini et al., CERN-SPSLC/96–01.
[10] B. Van de Vyver and P. Zucchelli, CERN-PPE/96–113 (August 1996).[11] M.C. Gonzalez-Garcia and J.J. Gomez-Cadenas, CERN-TH/96–220 (August 1996).[12] The scintillation counters and electronics used in the veto were previously used in the
‘n n 2’ experiment at I.L.L. Grenoble: M. Baldo-Ceolin et al., Z. Phys. C63 (1994)409.
[13] A Cavestro et al., Nucl. Instr. and Meth. A 305 (1991) 488–491.[14] The scintillators and photomultipliers were previously used in the CDHS experiment:
M. Holder et al., Nucl. Instr. and Meth. 148 (1978) 235. Test measurements showedthat the quality of the material was still satisfactory.
[15] W.K. Sakumoto et al., Nucl. Instr. and Meth. A294 (1990) 179.[16] M. Anfreville et al.,The drift chambers of the NOMAD detector, to be submitted to
Nucl. Instr. and Meth. (1997).[17] Hamamatsu R2490–05; Hamamatsu product catalogue.[18] T. Fazio, Le detecteur a rayonnement de transition de l’experience NOMAD pour
l’identification du τ dans le canal τ− → e−νeντ , these pour obtenir le titre de Docteurde l’Universite Joseph Fourier - Grenoble 1 (April 1995).
[19] G. Bassompierre et al., A large area transition radiation detector for the NOMADexperiment, to be submitted to Nucl. Instr. and Meth. (1997).
[20] G.M. Garibian, JETP 6 (1958) 1079;G.M. Garibian, JETP 10 (1960) 372;K.A. Barsukov, JETP 10 (1960) 787;G.M. Garibian et al., Nucl. Instr. and Meth. 125 (1975) 133.
[21] G. Bassompierre et al., Performances of the NOMAD transition radiation detector,to be submitted to Nucl. Instr. and Meth. (1997).
[22] D. Autiero et al., Nucl. Instr. and Meth. A372 (1996) 556.[23] D. Autiero et al., Nucl. Instr. and Meth. A387 (1997) 352.[24] D. Autiero et al., Nucl. Instr. and Meth. A373 (1996) 358.[25] K. Eggert et al., Nucl. Instr. and Meth. A176 (1980) 217.
36

[26] J. Altegoer et al., The trigger system of the NOMAD experiment, to be published inNucl. Instr. and Meth.
[27] Creative Electronic Systems, Geneva, CH.[28] Y. Perrin et al., CASCADE: a toolkit for the construction of distributed, real-time,
data-acquisition systems, CERN-ECP/93–13 (October 1993).[29] LabView User Manual for Sun (September 1994 Edition), National Instruments Cor-
poration, Austin, TX, 1992, 1994.[30] Particle Data Group, Phys. Rev. D54 (1996) 412.
37