The new csr a clear focus
80
THE NEW CSR A CLEAR FOCUS CSR LIMITED ANNUAL REPORT 2011
Transcript of The new csr a clear focus

The new csr a clear focus
csr limited annual rePorT 2011

a sTrong PlaTform for growThHigHligHts• $90.2 million – net profit after tax (before significant items) from continuing operations up by 13 per cent• 14.3 cents1 – full year dividend per share, fully-franked• BBB+ stable outlook – long term credit rating from standard & Poor’s• $1,281 million – net assets post sale of sucrogen• 86,000 – number of csr shareholders1 Adjusted for the 3:1 share consolidation.
Contents1 chairman’s review3 managing direcTor’s review5 board of direcTors6 corPoraTe governance12 remuneraTion rePorT31 direcTors’ rePorT33 financial rePorT73 indePendenT audiTor’s rePorT75 share informaTion 76 shareholder informaTion
17.8c
earnings Per sHare from Continuing oPerations year ended 31 march (cenTs Per share – before significanT iTems)
$503.4m
rePorted net Profit after taxyear ended 31 march ($ million)
$1,914m
trading revenue from Continuing oPerations year ended 31 march ($ million)
3,925
number of Csr emPloyeesyear ended 31 march (emPloyees)
net Profit after tax from Continuing oPerationsyear ended 31 march ($ million – before significanT iTems)
$90.2m
$1.72
amount distributed to sHareHolders for tHe year1 year ended 31 march ($ Per share)
1 adjusted for the 3:1 share consolidation.
0.00 1.95 3.90 5.85 7.80
7.3
4.7
6.0
5.4
5.6
2011*
2009
2010*
2007
2008
LOST TIME INJURY FREQUENCY RATEYEAR ENDED 31 MARCH
* Excludes Asian insulation
0.000000 28.379999 56.759998 85.139997 113.519997 141.899996
ALUMINIUM EBIT YEAR ENDED 31 MARCH ($ MILLION)
111.92011
2009
2010
2007
2008
123.5
110.7
136.7
141.9
0.000000 17.425001 34.850002 52.275003 69.700005
PROPERTY EBIT YEAR ENDED 31 MARCH ($ MILLION)
2011
2009
2010
2007
2008
14.6
12.8
25.1
45.4
69.7
0.000000 29.519999 59.039997 88.559996 118.079994 147.599993
BUILDING PRODUCTS EBIT*
YEAR ENDED 31 MARCH ($ MILLION)
96.6
106.2
103.82011
2009
2010
2007
2008
79.1
87.2
* Excludes Asian insulation
-2.000000 10.825000 23.650000 36.474999 49.299999
VIRIDIAN EBIT YEAR ENDED 31 MARCH ($ MILLION)
2011
2010
3.6
(1.6)
2009
2008*
33.4
49.3
* Includes 9 months of Pilkington, 6 months of DMS
25.23
19.4
36.7
27.4
29.48
2011*
2009
2010*
2007
2008
TOTAL RECORDABLE INJURY FREQUENCY RATEYEAR ENDED 31 MARCH
* Excludes Asian insulation
0.000000 9.174999 18.349998 27.524997 36.699996
cover image: hebel® Powerblock™ Csr limited abn 90 000 001 276
csr annual rePorT 2011 1
The 12 months ended 31 march 2011 was a landmark year in the 155 year history of csr.
in line with our long held strategy to create additional shareholder value by simplifying our conglomerate structure, we successfully sold the sugar business, sucrogen, to wilmar international for a$1.75 billion.
csr also sold its asian insulation business to rockwool group for a$128 million.
The board believes these transactions are a positive outcome for shareholders.
firstly, the prices we achieved for these businesses represent very good value.
with total net proceeds of approximately $1.8 billion, csr was able to return 53 cents per share to our shareholders during the year in a tax effective and timely manner.
we believe this was a prudent return of funds which also enabled csr to repay all outstanding debt to ensure the company is capitalised to grow its business while also taking into account the interests of all our stakeholders.
secondly, the consistent feedback from investment markets is that investors prefer to invest in more focused companies. as a result of the separation, csr now has a solid platform for growth as a focused building products business with an investment in a cost competitive aluminium smelter.
finally, the transactions ensure that csr remains in a very strong financial position.
This has been a particular focus of the board in steering the company through the global financial crisis and establishing a strong platform for the future.
as a result of csr’s strong financial position, standard & Poor’s affirmed its bbb+ long term corporate credit rating on csr with a stable outlook.
oPerating resultsfor the year ended 31 march 2011, csr’s reported total group net profit after tax was $503.4 million. This amount includes the part-year contribution and also the profit on sales of the sucrogen and asian insulation businesses. group net profit after tax (pre significant items) for continuing operations (which do not include sucrogen and asian insulation) was $90.2 million, an increase of 13 per cent on the previous year.
in a challenging year, which included these company-transforming transactions, it is pleasing to see csr continuing to improve its underlying business performance.
csr will also benefit from its low debt profile and resulting savings in finance related costs.
The board has resolved to pay a final dividend of 5.3 cents per share, fully-franked which brings the full year dividend to 14.3 cents per share. This final dividend payment is in addition to the special dividend and capital return payment made to shareholders, bringing the total amount returned to shareholders during the year to $1.72 per share (adjusted for the 3:1 share consolidation).
chairman’s review
a milesTone year for csr
iAn BlAckBurne
2 csr annual rePorT 2011
we have established a new dividend reinvestment Plan (“drP”) which will be in operation for the final dividend payable on 5 July 2011.
The drP gives shareholders a way to increase their shareholding in csr by reinvesting all or part of their dividend entitlements in more shares rather than being paid in cash.
we had feedback from a number of shareholders about the drP and we are pleased to once again offer this facility to shareholders.
shareholders can find further information about the performance and financial results of each of our divisions in this annual report.
board and management
as part of this strategy, rob sindel was appointed ceo of csr building Products with a view to becoming the ceo of csr ltd once we had completed the separation process. rob has successfully led our building products business during a very challenging period and was appointed managing director and ceo of csr on 1 January 2011. rob succeeded Jeremy sutcliffe, who was appointed as interim ceo for a period of up to 12 months from 1 april 2010, with the primary responsibility of completing our separation strategy.
rob is a very experienced executive in the building and construction industry both in australia and overseas and brings significant expertise to csr. i wish him every success in his new role.
with the sale of sucrogen now complete, and part of the proceeds successfully returned to shareholders, there have been some changes to csr’s board.
rick lee and nick burton Taylor retired from the board on 11 may 2011. both rick and nick have significant experience in the australian agricultural sector and it was envisaged that they would have joined the board of sucrogen if the demerger to create a separately listed sugar company proceeded.
as a result of the sale of sucrogen the demerger did not proceed.
both rick and nick have made important contributions to csr during their time on the board and i would like to acknowledge their particular efforts throughout 2009 and 2010 in steering csr through the complex business separation process.
as csr’s transition to a more focused business is well underway, i have also decided that now is an appropriate time to retire as chairman and also from the board of csr.
it has been an honour to have served as chairman for the past eight years and i am very grateful to csr shareholders for their ongoing support of the company during this time.
it is my intention to retire immediately after the agm on 7 July 2011 at which time Jeremy sutcliffe will become the new chairman of csr. having already made a significant contribution both as a non-executive board member and as interim managing director and ceo, Jeremy brings vast experience to csr.
PeoPle csr has always been fortunate to have teams of dedicated staff across every area of our company.
To our 4,000 people who comprise our business in csr today, i want to thank you for your commitment and dedication in what was once again a challenging year.
while the past year marks a historic transition for csr i believe the company is now in a very good position to deliver sustainable value to shareholders.
i look forward to watching csr’s continuing progress.
ian blaCkburnechairman
chairman’s review (conTinued)
one important aspect in pursuing our separation strategy was to ensure csr’s businesses had greater independence and focus with their own senior management teams.

builT on sTrong foundaTions
roB sindel
csr annual rePorT 2011 3
This is my first year in presenting our annual results and strategy. i am honoured to have been offered the opportunity to become the managing director of csr at an important and transitional time in the company’s long history.
overview of finanCial resultsduring a period where csr conducted two significant transactions as part of the transition to a more focused building products and aluminium company, we made steady progress in our core businesses.
importantly, csr continues to deliver strong profitability and generate good cash flows at the bottom of the construction cycle.
group net profit after tax (pre significant items) for continuing operations was $90.2 million for the year ended 31 march 2011, an increase of 13 per cent on the previous year.
continuing operations do not include the sucrogen business and the asian insulation business which were both sold on 22 december 2010.
earnings before interest and tax (ebiT) for continuing operations was $212.0 million compared to $218.0 million the previous year.
despite the impacts of wet weather in the last quarter of the year and the sudden termination of the insulation rebate scheme, building Products ebiT (including viridian) of $107.4 million was slightly higher than last year.
aluminium ebiT of $111.9 million was 9 per cent lower than last year but above market guidance as a result of an increase in the unhedged price of aluminium towards the end of the financial year.
The Queensland floods delayed the completion of a residential property development sale at brendale. despite this delay, Property ebiT of $14.6 million for the year was 14 per cent higher than the previous year. The sale is expected to be completed in the first half of this financial year.
as a result of the significant corporate restructuring undertaken during the year, including the landmark sale of sucrogen, csr incurred a number of one-off costs which have been classified as significant items for the full year result.
These included the impact of asset write downs in the viridian and bricks businesses, costs associated with the termination of the insulation rebate scheme and other one-off significant items which amounted to $168.2 million after tax.
strategiC Priorities having now sold the sucrogen business, csr is well placed to grow as a focused building products company with a strong balance sheet. we also continue to generate good cash flows and earnings from our investment in the Tomago aluminium smelter.
we have the market’s most trusted and recognised brands in building products, a national manufacturing footprint and enduring customer relationships with strong channels to market.
managing direcTor’s review

4 csr annual rePorT 2011
our goal is to grow our market position and adapt our portfolio to the changing trends in construction to deliver sustainable value for our shareholders. our initial priority remains on improving those parts of our business which currently are not delivering an acceptable return on funds employed.
a specific priority is the viridian business which has been impacted by a number of external factors, including the appreciating australian dollar which impacts pricing and margins and the ongoing weakness in commercial construction markets which impacts volume.
while the macro environment remains tough for glass manufacturing, we are focused on improving our distribution capabilities through continued investment in our floatliner delivery system and also on product differentiation to improve our market share and overall competitive position.
in glass processing, our challenge is to continue to educate the industry and lobby governments about the incremental benefits from the increased use of higher performance and energy efficient glass products in construction. as part of that, we are launching a new energy efficient glass product range, viridian smartglassTm.
more broadly across our building Products portfolio, we have identified a number of opportunities to reduce our overall manufacturing cost base through energy cost savings and also through process improvements.
Through the CSR Way in manufacturing, which brings together the operational functions across our manufacturing network, we are focused on opportunities which have quick pay-backs which will lower our cost base to assist in improving our margin and return on funds employed.
addressing tHe marketin terms of addressing the changing market dynamics, our strategy is centred on developing product solutions which target three specific areas:
Affordability – building houses faster, using more lightweight materials to bring down the cost of construction.
energy efficiency – developing solutions which will reduce the cost of heating and cooling of residential and commercial buildings; and
multi-residential – ensuring our portfolio is sufficiently positioned to respond to the market shift more towards multi-residential dwellings (units, townhouses and apartments).
as a more focused company, we are already benefiting from an increased concentration on our core business products such as hebel and cemintel which are well placed to provide solutions in lightweight construction. in both businesses, we have launched new products over the past year which are proving successful in the market.
across our portfolio, but more specifically in viridian and bradford, we are well positioned to provide energy efficient solutions in residential and commercial construction. There is no question that energy prices will continue to increase and the built environment is a significant consumer of energy.
however, despite good intentions, there has been a lack of coordinated response by state and federal governments to address this issue. as a result, australia continues to significantly lag other western economies in tackling energy efficiency in buildings. we will continue to actively press this issue.
our strategy also includes acquisition opportunities within our core markets. we are currently assessing a number of investment opportunities which complement our building Products portfolio to further strengthen our position across our key markets.
outlook
leading indicators (finance and housing approvals) point to a moderation of housing activity in the year ahead. successive interest rate rises towards the end of 2010 and the withdrawal of government stimulus indicate that the total number of housing starts in australia will decline year on year.
we estimate that total housing starts in australia on a one quarter lag basis will be around 150,000 for the year ended 31 march 2012 – a decline of approximately 11 per cent on the prior year.
however, within that total, we expect the social housing segment (which has less product demand) to decline as a proportion of overall housing starts in response to the stimulus withdrawal. while there are some tentative signs of recovery in commercial markets, particularly in victoria, conditions are expected to remain flat in the near term. housing starts in new Zealand (ex christchurch) are expected to remain flat in the near term.
we expect continued earnings improvement in our bricks and viridian business, together with an increased contribution from our hebel, cemintel and commercial ceilings businesses which are already benefiting from a more focused business structure.
longer term housing demand in australia remains estimated at around 180,000 dwellings per year with a current housing shortfall of over 200,000 dwellings, according to bis shrapnel estimates. notwithstanding supply-side constraints and affordability issues, csr remains well placed to capitalise on these demand factors to drive further earnings growth.
in aluminium, us$ spot metal prices generally improved at the start of this calendar year, however the continuing high australian dollar continues to limit the benefit of this increase. for yem12 gove aluminium finance (gaf) has contracts in place for approximately 93 per cent of its share of expected production. meanwhile, gaf has continued to rebuild its hedge book following a period of historically low metal prices and as at 30 april 2011 had approximately 50 per cent of net aluminium exposure for yem12 hedged at a$3,092 per tonne.
Property markets have started a slow recovery following a period of extended weakness, with increased interest in csr’s industrial and wholesale residential development sites. we expect to complete the delayed sale of the residential development site at brendale in the first half of this financial year. for the full year, earnings will continue to be subject to the timing of specific transactions.
rob sindelmanaging director
managing direcTor’s review (conTinued)

csr annual rePorT 2011 5
ian blaCkburnebsc (hons), Phd, mba, age 65
chairman, is a member of the risk & audit committee, safety, health & environment committee and remuneration & human resources committee. ian joined the board in 1999 and was last re-elected in 2010. an independent director, ian is a former managing director of caltex australia limited. he has been a director of Teekay corporation for eight years, and in december 2009 was appointed to the board of aristocrat leisure limited becoming chairman in december 2010. in april 2008, he ceased to be a director of symbion health limited after three years, and in august 2010 he ceased to be a director of suncorp-metway limited after ten years.
rob sindelbeng, mba, gaicd. age 46
appointed to the board as an executive director in december 2010 and managing director in January 2011. Joined csr in april 2008 as executive general manager of csr lightweight systems. in october 2009 he was appointed ceo of csr building Products. formerly the managing director of civil & marine (uk), a subsidiary of the global building materials company, hanson, now part of the heidelberg cement group. rob has also held the position of commercial trading director for hanson aggregates (uk). Previously rob was with Pioneer australia, where he worked for over 13 years.
katHleen Conlonba (econ) (disT), mba, age 47
chairman of the remuneration & human resources committee and is a member of the safety, health & environment committee and risk & audit committee. kathleen joined the board in 2004 as an independent director after seven years as a partner and director of the boston consulting group (bcg) where she led bcg’s asia Pacific operational effectiveness Practice area and, previously, the sydney office. she is a member of chief executive women, a nsw council member of the australian institute of company directors and a non-executive director of rea group limited.
ray HorsburgH ambeng (chem), hon d univ, faicd, fie ausT, age 68
chairman of the safety, health & environment committee and is a member of the remuneration & human resources committee. he joined the board in october 2006 as an independent director. ray has had a distinguished record of managing manufacturing businesses, including leading a number of mergers and acquisitions. he was managing director of smorgon steel group limited for 15 years until its merger with onesteel limited in august 2007. This followed a 31 year career with the australian consolidated industries group, primarily in senior roles in the glass and packaging businesses. in september 2007, he was appointed chairman of Toll holdings limited where he has served as a director for four years. ray is also a director of Traffic Technologies limited, national can industries limited, essendon football club and the Ponting foundation.
JoHn storyba, llb, faicd, age 65
chairman of the risk & audit committee and is a member of the remuneration & human resources committee. John joined the board in 2003. an independent director, he has a great depth of experience as a senior lawyer advising on corporate and commercial law. in 2007, he retired as non-executive chairman of the law firm corrs chambers westgarth, where he was a partner for 36 years until his retirement as a partner in 2006. John is chairman of suncorp-metway limited, where he has been a director for 13 years. in november 2007, he was appointed as chairman of Tabcorp holdings limited where he has been a director since 2004. Previously, he had been a director of Jupiters limited.
Jeremy sutCliffellb (hons), maicd, age 53
a member of the safety, health & environment committee and remuneration & human resources committee. Jeremy joined the board in 2008 as an independent director. he held the position of interim ceo and managing director from 1 april to 31 december 2010. Jeremy was a director of sims metal management limited until 2009 and was group ceo from 2002 until 2008. he is a non-executive director of amcor limited and holds advisory board positions with scholz ag and veolia environmental australia.
ComPany seCretary
debbie sCHroederbed (hons), llb
company secretary since July 2010 and csr legal counsel. she joined csr in september 2001, managing workers compensation from 2003 to 2006 and human resources for the sugar division from 2006 to 2008. debbie was appointed legal counsel for csr limited in 2008. she was previously a lawyer at Tress cocks & maddox and lander & rogers. debbie has extensive experience in dispute resolution, employment law, insurance and trade practices. debbie holds a graduate diploma in applied corporate governance and is a member of chartered secretaries australia.
board of direcTors
1. ian blackburne 2. rob sindel3. Jeremy suTcliffe 4. John sTory 5. kaThleen conlon 6. ray horsburgh am7. debbie schroeder
1
5
2
6
3
7
4

6 csr annual rePorT 2011
Csr’s corporate governance is the system by which the company is directed and managed. it is the framework of rules, relationships, systems and processes which underpin Csr’s long established values and behaviours and the way it does business and within which:
• the Csr board of directors is accountable to shareholders for the operations, profit performance and growth of the company; and
• the risks of business are identified and managed.
csr actively reviews australian and international developments in corporate governance and considers the views of shareholders, regulators and other stakeholders. The csr board adopts those arrangements which it considers are in the best interests of csr and its shareholders.
The directors of csr are committed to ensuring that the company maintains an effective system of corporate governance and that good corporate governance is an integral part of the culture and business practices of the csr group.
The csr board fully supports the Corporate Governance Principles and Recommendations published by the asX corporate governance council (asX cgc).
Throughout the reporting period, the year ended 31 march 2011, csr complied with the recommendations contained in the asX cgc’s revised Corporate Governance Principles and Recommendations (second edition) dated august 2007, including the 2010 amendments.
charters and policies referred to in this corporate governance statement have been reviewed in light of asX cgc’s revised principles and recommendations (including the 2010 amendments) and are also available on csr’s internet site, w w w .csr.com.au, under ‘investors’.
csr’s constitution (available on csr’s internet site), which sets out the provisions that govern the internal management of the company, can only be amended by special resolution of shareholders. under the constitution, shareholders elect directors whose function is to represent shareholders by ensuring that the best interests of the company are protected.
This corporate governance statement is organised under headings reflecting the asX cgc’s current principles and recommendations (including 2010 amendments).
roles and resPonsibilities: Csr has established and disclosed the respective roles and responsibilities of the board and management (asx CgC Principle 1)The board strives to create shareholder value and ensure that shareholders’ funds are prudently safeguarded.
the roles of board and managementThe board has adopted a formal board charter (available on the company’s internet site) which establishes those matters reserved for the board and authority delegated to management. The board’s functions, as summarised in the board charter, include:
• approving csr strategies, budgets, plans and policies;
• assessing performance against business plans to monitor both the performance of management as well as the continuing suitability of business strategies;
• reviewing operating information to understand at all times the state of the company;
• considering management recommendations on proposed acquisitions, divestments and significant capital expenditure;
• considering management recommendations on capital management, the issue or allotment of equity, borrowings and other financing proposals, guarantees of non-group liabilities, and restructures;
• ensuring that the company operates an appropriate corporate governance structure, in particular ensuring that csr acts legally and responsibly on all matters and that the highest ethical standards are maintained;
• approving csr’s risk management strategy and frameworks and monitoring their effectiveness;
• considering the social, ethical and environmental impact of csr’s activities and monitoring compliance with csr’s sustainability policies and practices;
• maintaining a constructive and ongoing relationship with the exchanges, regulators and shareholders approving policies regarding disclosure and communications with the market and shareholders; and
• monitoring internal governance including delegated authorities, and monitoring resources available to senior executives.
day-to-day management of the company’s affairs and the implementation of strategy and policy initiatives are formally delegated by the board to the managing director and senior executives.
letters of appointmentThe managing director’s responsibilities and terms of employment, including termination entitlements, are set out in a formal executive service agreement. a summary of the main elements and terms of the agreement is available on csr’s internet site.
letters of appointment are prepared for non-executive directors and senior executives, covering duties, time commitments, induction and company policies and corporate governance.
induction of senior executivesnew executives undertake a structured induction program when they join the company. This includes comprehensive briefings and information on the company’s businesses, and its policies and procedures. additionally, the program includes site visits and meetings with people in key internal and external roles in order to build the relationships necessary to meet the requirements of their role.
as discussed further below and in the remuneration report, key performance indicators are agreed with each executive to ensure goals and performance measures are fully and accurately understood and disclosed.
Performance evaluation of senior executivescsr’s high performance management framework requires that a balanced scorecard of annual key performance indicators (including financial and non-financial measures) is set for each senior executive. every half year, each senior executive discusses their performance with their manager. at the end of the year, as part of a formal review process, each manager’s performance is reviewed against compliance with the performance indicators. also, each individual’s performance and behaviour are compared and measured against the performance of their peers and measures adjusted. csr conducted evaluations of its senior executives in september 2010 and march 2011.
The process for evaluating the performance of senior executives and the remuneration policy for senior executives are discussed in the remuneration report.
board of direCtors: Csr has a board of effective composition, size and commitment to adequately discharge its responsibilities and duties (asx CgC Principle 2)The board charter prescribes the structure of the board and its committees, the framework for independence and some obligations of directors.
corPoraTe governance

csr annual rePorT 2011 7
size and composition of the boardThe board considers that its membership should comprise directors with an appropriate mix of skills, experience and personal attributes that allow the directors individually and the board collectively, to:
• discharge their responsibilities and duties under the law effectively and efficiently;
• understand the suite of csr businesses and the environment in which csr operates these businesses so as to be able to agree with management the objectives, goals and strategic direction which will maximise shareholder value; and
• assess the performance of management in meeting those objectives and goals.
while csr owned sucrogen and up to 11 may 2011, the board comprised eight members, varying between six or seven non-executive directors and one or two executive director(s) – the managing director and chief financial officer. had csr proceeded with its original intention to demerge sucrogen to create a separately listed sugar and renewable energy company, some directors would have joined the board of sucrogen.
as a result of the successful sale of sucrogen to wilmar international, completed in december 2010, the demerger did not proceed. going forward, csr will have a board comprising five or six non-executive directors and one executive director. as noted in the chairman’s review (page 2), two directors retired from the csr board on 11 may 2011. as a result, there have been changes to the size and composition of board sub-committees, which are detailed elsewhere in this report.
The chairman is appointed by the board and provides leadership to ensure that a high standard of values, processes and constructive interaction are maintained. The chairman represents the views of the board to shareholders and conducts the annual general meeting to canvass properly the views of stakeholders.
information about directors is on page 5. The board keeps under review the balance of skills and experience of its members, their independence and access to advice and information. The board strives to achieve diversity in its composition.
directors’ independenceeach of the non-executive directors, including the chairman, is independent of csr and its management, having no business or other relationships that could compromise his or her autonomy as a director.
The board’s framework for determining director independence is included in the board charter. any past or present relationship with the company is regularly carefully examined to assess the likely impact on a director’s ability to be objective and exercise independent judgement.
mr sutcliffe, who has been a non-executive director of csr since his appointment in 2008, assumed the role of managing director on an interim basis from 1 april 2010, following the resignation of mr maycock. he held this role until mr sindel was appointed ceo and managing director on 1 January 2011 at which time he resumed his role as a non-executive director. The board considers that mr sutcliffe remains capable of fulfilling his role of an independent director, notwithstanding his tenure as interim managing director from 1 april 2010 to 31 december 2010. The board reached this view based on the short term and interim nature of his appointment and also his full time responsibility for managing the separation of the sucrogen business from csr, rather than the day-to-day operations of its businesses. The latter was the responsibility of the ceos of sucrogen and csr building Products respectively.
dealing with conflict of interestThe board has in place a process to ensure that conflicts of interest are managed appropriately. if a potential conflict of interest arises, the director concerned does not receive the relevant board papers and leaves the board meeting while the matter is considered. directors must advise the board immediately of any interests that could potentially conflict with those of csr.
election of directorsThe csr board, being smaller than previously, takes on the role of the nominations and governance committee, which includes the following functions:
• determining the appropriate size and composition of the board (in accordance with the company’s constitution);
• determining the appropriate criteria (necessary and desirable skills and experience) for appointment of directors;
• recommending the appointment and removal of directors;
• defining the terms and conditions of appointment to and retirement from the board;
• continuing the education and induction programs for non-executive directors;
• evaluating the board’s performance; and
• reviewing the board succession plans.
The company aims to have a board which, as a whole, has the range of skills, knowledge and experience to govern csr, made up of individuals of high integrity with sound commercial judgement and inquiring minds and able to work cohesively with other directors. csr seeks a combination of former chief executives and individuals experienced in manufacturing, finance, the law and, ideally, the industries in which csr participates.
csr undertakes a rigorous process when selecting new directors. specifically, csr develops a matrix of required skills and experience. This matrix is developed by taking into account csr’s desire to ensure a diverse range of gender, background and experience is maintained on the board at all times, and also ensuring directors are appropriately qualified.
external consultants are engaged, where appropriate, to advise on potential appointees. The reputation and ethical standards of appointees must be beyond question. Prospective directors confirm that they will have sufficient time to meet their obligations and that they will keep the company informed of their other commitments.
non-executive directors are subject to re-election by rotation at least every three years and, under the company’s constitution (except where this requirement is prohibited by law) must retire not later than their 70th birthday. newly appointed directors must seek re-election at the first general meeting of shareholders following their appointment. non-executive directors appointed from 2001 shall not seek re-election after serving for 10 years, unless requested to do so by the board.
board committeesTo increase its effectiveness, the board has three committees consisting of the risk & audit committee, safety, health & environment committee and the remuneration & human resources committee. it is the policy of the board that a majority of the members of each committee be independent directors, that all risk & audit committee members be independent directors and that the remuneration & human resources committee and the safety, health & environment committee be chaired by independent directors.
each committee has a charter which includes a more detailed description of its duties and responsibilities. The charters are available on csr’s internet site. The risk & audit committee, the safety, health & environment committee and the remuneration & human resources committees each comprise at least three non-executive directors and are chaired by directors other than the board chairman. during yem11 the board continued its additional committee, the demerger due diligence committee, for the purposes of overseeing the due diligence and separation process. This committee was chaired by an independent director and consisted of an additional two independent directors.
8 csr annual rePorT 2011
as the interim managing director until 31 december 2010, mr sutcliffe attended meetings of board committees by invitation. he was not present at these meetings where it was considered that his presence could compromise the objectivity of proceedings. similarly, the new managing director, mr sindel, attends meetings of board committees by invitation. he is not present if this could compromise the objectivity of proceedings.
mr gannon, the former chief financial officer and former executive director, attended meetings of board committees by invitation. he was not present if this could compromise the objectivity of proceedings.
committee papers are copied to all directors before the meetings. minutes of committee meetings are included in the papers for the next board meeting and the director chairing the committee reports to the board on matters addressed by the committee. The membership of these committees, the number of meetings held and each director’s attendance record last year are shown in the ‘directors’ meetings’ table on page 11.
the work of directorsin addition to attending board and committee meetings, non-executive directors allocate time for strategy and budget sessions, preparation for meetings and inspections of operations.
The chairman commits additional time and meets regularly with the managing director to review business and strategic issues and to agree board meeting agendas. The non-executive directors usually meet with no managers present at the commencement of board meetings and on occasions meet separately.
except where the directors need to meet privately, the company secretary attends all board meetings.
in yem11, the directors visited the viridian glass and bradford insulation operations at ingleburn, nsw to understand better the issues facing each of the businesses and their people; and the safety, health & environment committee visited the sucrogen facility at glebe island and the bradford insulation factory at brendale. The latter visit is part of a series of safety, health and environment focused visits that the safety, health & environment committee undertakes as part of it usual activities.
directors’ induction, education and access to informationThe board strives to ensure that directors have the knowledge and information needed to operate effectively.
The chairman briefs new directors on their roles and responsibilities. They receive a comprehensive information pack as part of this induction, as well as special briefings from management and visits to key operating sites to assist them to understand rapidly csr’s businesses and issues.
Time is allocated at board and committee meetings for continuing education on significant issues facing the company and changes to the regulatory environment.
To help directors maintain their understanding of the businesses and to assess the people managing them, directors are briefed regularly by each member of the senior management team. directors also have access to a wide range of employees at all levels during inspections of operations and in other meetings.
directors receive a comprehensive monthly performance report from the managing director – whether or not a board meeting is scheduled – and have unrestricted access to company records and information.
at specially organised functions, directors meet customers, business partners, suppliers and other stakeholders of the company.
directors may obtain independent professional advice at csr’s expense on matters arising in the course of their board and committee duties, after obtaining the chairman’s approval. The board charter requires that all directors be provided with a copy of such advice and be notified if the chairman’s approval is withheld.
The board appoints and removes the company secretary. all directors have direct access to the company secretary who is accountable to the managing director and, through the chairman, to the board on all governance matters.
board evaluationThe performance of the board is regularly reviewed. The board undertakes a self assessment of both its collective performance and that of individual directors and seeks specific feedback from the senior management team on particular aspects of its performance. The board establishes procedures and oversees this annual performance assessment program. The process may be assisted by an independent third party facilitator. The results and any action plans flowing from this annual assessment are documented, together with specific performance goals that are agreed for the coming year.
in addition, each board committee undertakes a regular self assessment on the performance of the committee and achievement of committee objectives.
The performance of the managing director is reviewed at least annually, through a formal performance appraisal process conducted by the board.
Code of ConduCt: Csr actively promotes ethical and responsible decision making (asx CgC Principle 3)csr has a robust framework of policies, underpinned by its goals and values and code of business conduct and ethics. csr’s code of business conduct and ethics and policies discussed below set the standards for dealing with obligations to external stakeholders. a statement of csr’s community engagement is detailed in the shareholder review which has been sent to all shareholders. a statement on csr’s approach to climate change is included in the sustainability report, which is also available on csr’s internet website. The underlying principle of the csr code of business conduct and ethics is that ethical behaviour is required of directors, executives and all other employees, as well as advisers, consultants and contractors.
Code of business conduct and ethicsThe board has endorsed a code of business conduct and ethics (available on the company’s internet site) that formalises the longstanding obligation of all csr people, including directors, to behave ethically, act within the law, avoid conflicts of interest and act honestly in all business activities.
csr’s code of business conduct and ethics reinforces the company’s commitment to giving proper regard to the interests of people and organisations dealing with the company. each csr person is required to respect and abide by the company’s obligations to employees, shareholders, customers, suppliers and the communities in which we operate.
in addition, the board has adopted specific policies in key areas, including trade practices; safety, health and the environment; fairness, respect and diversity in employment; capital investment; dealing with price sensitive and other confidential information; trading in csr shares; privacy; indemnification of employees; and requirements for authorising and entering into business transactions on behalf of csr.
csr employees are required to sign a certificate of compliance each year signifying that they have read and complied with the code of business conduct and ethics and are not aware of any beaches of that policy.
further, csr employees are encouraged to report potential breaches to a confidential line. csr’s whistleblowers’ Protection Policy provides that an employee will not be subject to retaliation by csr for reporting in good faith a possible violation of the code of business conduct and ethics.
corPoraTe governance (conTinued)
csr annual rePorT 2011 9
diversitycsr strives to ensure diversity within the organisation. csr’s policy on diversity is contained within its policy on fairness, respect and diversity. a summary of this People & employment Policy is available on csr’s internet site, w w w .csr.com.au. in light of recent amendments to the asX cgc’s corporate governance Principles and recommendations, the board is currently considering suitable diversity targets to work towards achieving greater diversity at csr at all levels of the workforce and the board. The objectives will be adopted by the board and will then be assessed by the board on an annual basis.
trading in Csr sharesdirectors’ shareholdings at 11 may 2011 are shown in the table ‘directors’ interests in csr shares’ on page 11.
under the company’s share trading policy (available on csr’s internet site), directors and senior managers may only buy or sell csr shares, or give instructions to the trustee of csr’s employee share acquisition Plan, during one month periods commencing 24 hours after the date of the yearly and half yearly results announcements and the annual general meeting. also, they are prohibited from dealing in any financial products relating to csr securities or entering into hedging arrangements in respect of csr securities they hold, or which are held on their behalf. under the policy, all directors and employees are prohibited from buying or selling csr shares at any time if they are aware of any price sensitive information that has not been made public. all csr share dealings by directors are notified to the asX within the required time.
audit: Csr has a structure to independently verify and safeguard the integrity of the company’s financial reporting (asx CgC Principle 4)
risk and audit CommitteeThe risk and audit committee is chaired by mr story. up to 11 may 2011, the other members were dr blackburne, mr burton Taylor, ms conlon and mr lee, all of whom were independent directors. from 11 may 2011, mr story continued to chair the committee, and the other members were dr blackburne, ms conlon and mr sutcliffe. The external audit firm partner in charge of the csr audit attends risk & audit committee meetings by invitation, together with the internal audit manager and relevant senior executives.
The committee advises the board on all aspects of internal and external audit, the adequacy of accounting and risk management procedures, systems, controls and financial reporting.
The committee’s specific responsibilities include:
• review of the scope of the annual audit plans of the external auditor and internal auditor and oversight of the work performed by the auditors throughout the year;
• consideration of and recommendations to the board on significant accounting policies and material estimates and judgements in financial reports;
• review and monitoring of internal controls and risk management across the group;
• review and recommendations to the board for the adoption of the company’s half year and annual financial statements; and
• reviewing of the effectiveness and performance of internal and external auditors.
The committee is a direct link for providing the views of internal and external auditors to the board, when necessary, independent of management influence. Time is allocated for detailed questioning of the material presented and separate sessions with each of the external auditor, internal auditor and chief financial officer.
The committee seeks to ensure the independence of the external auditor. The policy on auditor independence applies to services supplied by the external auditor and their related firms to csr. under the policy on auditor independence (which is available on csr’s internet site):
• the external auditor is not to provide non-audit services under which the auditor assumes the role of management, becomes an advocate for the group, or audits its own professional expertise;
• significant permissible non-audit assignments awarded to the external auditors must be approved in advance by the committee or, between committee meetings, the committee chair; and
• the external audit engagement partner and review partner must be rotated every five years.
The external auditor annually confirms its independence within the meaning of applicable legislation and professional standards.
financial report accountabilitycsr’s managing director and chief financial officer, who are present for board discussion of financial matters, are required to state to the board, in writing, that the company’s financial reports present a true and fair view, in all material respects, of the company’s financial condition and operational results and are in accordance with relevant accounting standards.
disClosure: Csr promotes timely and balanced disclosure of all material matters concerning the company (asx CgC Principle 5)
Continuous disclosurecsr believes that shareholders, regulators, ratings agencies and the investment community generally, should be informed of all major business events and risks that influence csr in a factual, timely and widely available manner. csr has a long established practice of providing relevant and timely information to stakeholders, supported by its share market disclosure policy which details comprehensive procedures to ensure compliance with all legal obligations. it is csr’s policy that any price sensitive material for public announcement, including annual and interim profit announcements, release of financial reports, presentations to investors and analysts and other prepared investor briefings for csr will be:
• lodged with the asX as soon as practical and before external disclosure elsewhere; and
• posted on csr’s internet site.
The policy limits external briefings in the periods between the end of a financial year or half year and the release to the asX of the relevant results. csr’s continuous disclosure committee meets as required, and often on very short notice, to ensure compliance with disclosure requirements. members of this committee are the managing director, chief financial officer, company secretary, and the general manager, investor relations and corporate communications. The managing director approves all disclosures before they are released. The board is involved in disclosures that are significant.
The company secretary is responsible for communications with the asX.
Commentary on financial resultscsr provides a review of operations and financial performance in the 2011 shareholder review and this annual report includes the company’s financial report. results announcements to the asX, analyst presentations and the full text of the chairman’s and managing director’s addresses at the company’s annual general meeting are made available on the company’s internet site.
sHareHolders: Csr respects the rights of shareholders and facilitates the effective exercise of those rights (asx CgC Principle 6)csr strives to communicate effectively with shareholders about the company’s performance, presenting the 2011 shareholder review and this annual report and other corporate information in clear language, supported by descriptive graphics and tables.

10 csr annual rePorT 2011
where practicable, the company uses the latest widely available electronic technology to communicate openly and continually with shareholders – and the share market in general. announcements to the asX, significant briefings, notices of meetings and speeches at annual general meetings are promptly posted on the company’s internet site and retained there for three years.
shareholders and other interested parties can receive e-mails with links to the newly posted annual report and can lodge proxies electronically for the annual general meeting. csr keeps summary records for internal use of the issues discussed at group and one-on-one briefings with investors and analysts.
The annual general meeting and profit announcement briefings are available via a live webcast from the company’s internet site, to allow access by all interested parties.
The company’s policy on shareholder communication is available on the company’s internet site.
auditor attendance at the annual general meetingThe external audit firm partner in charge of the csr audit is available to answer shareholder questions at the company’s annual general meeting.
risk management: Csr has a sound system of risk oversight and management and internal control (asx CgC Principle 7)There are many risks in the markets in which csr operates. a range of factors, some of which are beyond csr’s control, can influence performance across csr’s businesses. in many of these businesses, csr constantly and deliberately assumes certain levels of risk in a calculated and controlled manner. csr has in place limits and a range of policies and procedures to monitor the risk in its activities and these are periodically reviewed by the board. csr’s risk management Policy, which sets out the framework for risk management, internal compliance and control systems, is available on csr’s internet site. There are several layers that assist the board in ensuring the appropriate focus is placed on the risk management framework:
• the risk & audit committee – reviews and reports to the board in relation to the company’s financial reporting, internal control structure, risk management systems and the internal and external audit functions. The risk & audit committee recommends to the board the appointment or dismissal of the internal auditor, who is independent of the external auditor;
• the safety, health & environment committee – reviews and reports to the board on the management of the company’s safety, health and environment liabilities and legal responsibilities; and
• the senior management team – manages and reports to the board on business and financial risks and overall compliance.
risk management is sponsored by the board, and is a top priority for senior managers, starting with the managing director.
The board oversees the risk appetite and profile of csr and ensures that business developments are consistent with the risk appetite and goals of csr.
The risk management framework covering business risk, financial risk, financial integrity and legal compliance, including the establishment of policies for the control of these risks, is in place. The board, through the risk & audit committee receives recommendations in relation to the risk profile of csr, breaches of the policy framework and external developments which may impact on the effectiveness of the risk management framework. it also approves significant changes to the risk management framework and related policies.
The risk & audit committee has responsibility for monitoring compliance with the risk management framework approved by the board for internal control and compliance matters. in this role, the risk & audit committee monitors and reviews the effectiveness of the internal audit and compliance functions. The continuous disclosure committee has responsibility for any governance matters. committees exist at the executive management level to ensure the necessary elements of expertise are focused on specific risk areas. beneath this level, other committees exist where senior specialists focus on specific risks as appropriate.
The risk management framework is designed to ensure policies and procedures are in place to manage the risk arising within each business unit. application varies in detail from one part of csr to another; however, the same risk management framework applies across all business activities without exception.
risk management accountabilityas part of the process of approving the financial statements, at each reporting date the managing director and other responsible senior executives provide statements in writing to the board on the quality and effectiveness of the company’s risk management and internal compliance and control systems. The statements are substantiated in part by an annual review using applicable elements of the frameworks provided by the committee of sponsoring organizations of the Treadway commission (coso) on internal control and enterprise risk management.
The board has also received statements from the managing director and the chief financial officer certifying that, having made all reasonable enquiries and to the best of their knowledge and belief:
• the statements made in relation to the financial integrity of the group financial reports are founded on a sound system of risk management and internal compliance and control;
• the system of risk management in operation at 31 march 2011 implements the policies adopted and delegated by the board and of the other decision making bodies operating within the csr group and was operating effectively; and
• the systems relating to financial reporting were operating effectively in all material respects.
further, the board received the relevant declarations required under section 295a of the corporations act 2001 and the relevant assurances required under recommendation 7.3 of the revised asX cgc principles.
remuneration: Csr ensures that the level and composition of remuneration is sufficient and reasonable and that its relationship to performance is clear (asx CgC Principle 8)csr’s policy is to reward executives with a combination of fixed remuneration and short and long term incentives structured to drive improvements in shareholder value. non-executive directors receive no incentive payments. executives and directors may forgo part of their cash remuneration or, for non-executive directors, their directors’ fees to acquire shares in csr. employees cannot approve their own remuneration, nor can they review that of their direct subordinates without their manager’s approval.
remuneration & Human resources CommitteeThe remuneration & human resources committee during yem11 comprised mr lee (chairman), dr blackburne, mr horsburgh and mr story. mr sutcliffe did not sit on this committee while he was managing director (from 1 april 2010 to 31 december 2010); however, he re-joined from 1 January 2011. from 11 may 2011, the committee comprised ms conlon (chairman), dr blackburne, mr horsburgh, mr story and mr sutcliffe.
Together with an overview of people issues, particularly succession and development planning for senior managers, the committee advises the board on remuneration policies and practices, evaluates the performance of the managing director against pre-agreed goals and makes recommendations to the board on remuneration for the managing director and senior managers reporting to him. The committee considers independent advice on policies and practices to attract, motivate, reward and retain strong performers.
The remuneration & human resources committee regularly obtains and considers advice received from external advisors on relevant matters.
The remuneration report includes further details on csr’s remuneration policy and its relationship to the company’s performance last year (pages 12 to 30). it also includes details of the remuneration of directors and key managers last year. shareholders are invited to vote on the adoption of the report at the company’s annual general meeting.
equity based executive remunerationkey features of the employee share plans used by csr, the company’s policy on share ownership and details of csr shares beneficially owned by directors and key managers appear in the remuneration report on pages 26 to 29.
corPoraTe governance (conTinued)

csr annual rePorT 2011 11
safety, health & environment (sHe) responsibilitiesan important part of csr’s governance commitments includes protection for its people’s safety and occupational health, and for the environment. The board endorsed she policy (available on the csr internet site) details the company’s and individuals’ obligations.
The board’s safety, health & environment committee oversees and reports to the board on the management of the company’s she responsibilities. during yem11, the she committee comprised mr horsburgh (chairman), dr blackburne, mr burton Taylor, ms conlon and mr sutcliffe attended by invitation whilst an executive director. from 11 may 2011, the committee comprised mr horsburgh (chairman), dr blackburne, ms conlon and mr sutcliffe.
The committee receives regular reports from management, reviews the adequacy of she management systems and performance, and ensures appropriate improvement targets and benchmarks. it monitors potential liabilities, changes in legislation, community expectations, research findings and technological changes.
Corporate governance and disclosurecsr considers that the above corporate governance practices comply with the asX cgc’s Principles and recommendations (as applying to the relevant reporting period).
The company’s corporate governance framework is kept under review. a report is provided to the board by the company secretary at least annually, recommending any improvements necessary to respond to changes to the company’s business or applicable legislation and standards.
statement as at 11 may 2011.
direCtors’ interests in Csr sHaresas aT 11 may total 2011 1 ToTal 2010
ian blackburne 102,357 307,607nicholas burton Taylor 36,036 108,100kathleen conlon 28,372 85,113shane gannon 2 8,487 25,461ray horsburgh 19,791 35,768richard lee 58,004 174,009John story 61,943 185,825rob sindel 3 15,344 41,293Jeremy sutcliffe 25,467 74,312
1 Post 3:1 share consolidation.2 mr gannon retired from the board on
15 december 2010.3 mr sindel was appointed to the board as
an executive director on 15 december 2010. mr sindel’s shareholdings listed above do not include cash award share Plan shares or Performance rights Plan shares.
direCtors’ meetings safeTy, healTh & remuneraTion & risk & audiT environmenT human resources due diligence year ended csr board commiTTee commiTTee commiTTee commiTTee31 march 2011 held a aTTended b held a aTTended b held a aTTended b held a aTTended b held a aTTended b
ian blackburne 16 16 4 4 4 4 6 6nicholas burton Taylor 16 15 4 4 4 4kathleen conlon 16 16 4 4 4 4 6 6shane gannon 1 12 12ray horsburgh 2 16 10 4 3 6 4richard lee 16 14 4 4 6 6John story 16 16 4 4 6 6 6 5Jeremy sutcliffe 3 16 16 1 1 1 1 6 5rob sindel 4 4 4
a meetings held while a member.b meetings attended.1 mr gannon retired as an executive director on 15 december 2010.2 mr horsburgh, due to personal circumstances, was granted leave of absence by the board from august to december 2010.3 mr sutcliffe was an executive director from 1 april 2010 to 31 december 2010, and therefore was not a member of any board sub-committee during that time.4 mr sindel was appointed as an executive director from 15 december 2010.

12 csr annual rePorT 2011
tHis rePort forms Part of tHe direCtors’ rePort for tHe year ended 31 marCH 2011
introduCtionThis remuneration report provides a summary of csr’s remuneration policy and practices during the past financial year as they apply to csr directors and senior executives.
The report begins with an executive summary intended to provide a ‘plain english’ explanation for shareholders as to how the csr remuneration framework works, and key outcomes and events that occurred during the financial year. The report then outlines the role of the csr remuneration & human resources committee, details csr’s remuneration policy and practice and provides information on the remuneration and shareholdings of directors and key management personnel (kmP).
key points to note in relation to this report are:
• the disclosures set out in this report have been prepared in accordance with the requirements of section 300a of the corporations act 2001 and corporations regulation 2m.3.03;
• the report has been audited by our external auditor;
• kmP are as defined by the accounting standard aasb 124 related Party disclosures; and
• for consistency in this report, the terms ‘executives’ and ‘non-executive directors’ (‘neds’) are used. in some cases, where aspects apply only to senior roles within the executive group, the term ‘senior executives’ is also used.
Contentsa executive summary;
• overview of executive remuneration approach and framework;
• overview of non-executive director remuneration;
• year ended 31 march 2011 remuneration framework update;
• implications of the sale of sucrogen for remuneration of csr executives; and
• executive changes in yem11.
b The remuneration & human resources committee’s role;
c executive remuneration policy;
d executive remuneration framework;
e link between remuneration and company performance;
f executive contracts;
g remuneration and shareholdings for yem11 (and comparatives); and
h non-executive director remuneration.
a – exeCutive summary
overview of executive remuneration approach and frameworkcsr’s remuneration framework is based on the following principles:
• remuneration is performance driven;
• aligns with shareholder interests; and
• provides market competitive remuneration opportunities.
The key features of csr’s executive remuneration framework are outlined below. detail is provided in the body of the remuneration report.
• market positioning: fixed remuneration is positioned at the market median against the hay group industrial and services index for roles of comparative size, or relative to their counterparts in related industries. variable remuneration provides executives the opportunity to earn upper quartile total remuneration for stretch performance.
• fixed pay/variable mix: Total remuneration is comprised of fixed plus variable (or ‘at risk’) remuneration. a significant portion of the total remuneration opportunity for senior executives is variable, and ‘at risk’ based on performance.
• short term incentive (‘sti’) plan: The sTi plan provides rewards for achievement of business financial performance goals (60% weighting) and individual performance goals which are focused on non-financial performance (40% weighting). weightings of 50% financial and 50% personal goals may also apply to lower job grades.
financial performance for yem11 was measured by earnings before interest and Tax (‘ebiT’), focused at the organisational level which best reflects the role’s influence. for instance, corporate roles were measured on csr ebiT before significant items (continuing operations only), while business roles were rewarded based on a combination of their business’ and csr’s ebiT outcome. return on funds employed (‘rofe’) is employed as a secondary metric for the sTi plan to ensure effective utilisation of assets.
non-financial performance reflects an individual’s objectives which are linked to business strategy implementation. Payment for the individual component is normally independent of the business’ financial result. however, if the business’ financial result is below expectations, there is discretion to reduce any incentive for individual performance.
• long term incentive (‘lti’) plan: The Performance rights Plan (‘PrP’) provides csr executives with grants of performance rights that vest based on csr’s three year Total shareholder return (‘Tsr’) relative to the Tsr of the other s&P asX 200 index constituents (the ‘peer group’).
any performance rights which vest will be converted automatically into shares. holders of performance rights are not entitled to dividends until the awards have vested and converted into shares.
• equity sacrifice: executives are eligible to elect to forgo a portion of their pre-tax fixed remuneration or sTi to purchase restricted csr shares, up to the $5,000 annual limit as provided under the tax legislation that applies from 1 July 2009.
• Hedging prohibition: csr’s share Trading Policy prohibits participants in any lTi plan from hedging their exposure to unvested shares or reducing the risk associated with the performance hurdles applicable to those shares in any way.
overview of non-executive director remuneration• market comparison: neds are paid
a base fee for service to the board and an additional fee for service to board committees. The fees are set with consideration to the fees paid in companies of a similar size and complexity.
• fee pool: The fee pool is currently $1,450,000 per annum.
• voluntary fee sacrifice: neds can elect to forgo up to $5,000 of pre-tax fees annually to purchase csr shares.
yem11 remuneration framework updatefollowing the implementation of the revised executive reward framework in yem10, there have been no significant changes to csr’s remuneration policy and practice during yem11. an adjustment was made to csr’s sTi plan in order to maintain the plan’s ongoing effectiveness, as follows:
• The sTi plan for yem11 was changed so that ebiT before significant items was measured as a primary outcome, underpinned by minimum rofe thresholds. rofe measures effective utilisation of assets and was seen as being an appropriate metric for csr during the global financial crisis (‘gfc’). ebiT was viewed as a more appropriate sTi metric for the post-gfc business environment as increases in ebiT translate to increased earnings Per share (‘ePs’) and therefore the quantum of return to shareholders. rofe continues to act as a secondary metric for the sTi plan to ensure continued effective utilisation of assets.
remuneraTion rePorT

csr annual rePorT 2011 13
in terms of remuneration outcomes for yem11, the following applied:
• Total remuneration: overall, total expensed remuneration increased for all disclosed executives from yem10 to yem11. for continuing executives, increases were due primarily to the promotion of the current managing director and chief financial officer into their new corporate roles during the year. The increase in total expensed remuneration for departing executives was related to the inclusion of termination payments made to them under contractual arrangements and one-off payments related to the sale of sucrogen.
• sTi outcomes: The component of yem11 sTi plan payments linked to financial metrics reduced from yem10, primarily due to a reduced level of financial performance, which for the majority of business units lay between the threshold and target levels approved by the board. overall sTi payments to kmP increased due to the promotion of continuing executives during the year with associated increases in sTi opportunity and participation by some departing executives in the enhanced sTi retention plan ‘enhanced sTi Plan’ relating to the sale of sucrogen detailed in section d2.
• lTi outcomes: for csr’s lTi plans, which are measured on the Tsr performance of csr, none of the lTi grants currently undergoing performance hurdle testing vested during yem11.
The following table sets out the actual value of remuneration received by senior executives who are kmP and includes the company’s five highest remunerated company and group executives for the financial year, derived from the various components of their remuneration during yem11. This table differs from the more detailed remuneration disclosures provided in section g on pages 26 to 29 due to the exclusion of lTi amounts not vested.
Table 1: actual remuneration received by senior executives shorT long Term fiXed Term incenTive TerminaTion oTher $ year ended 31 march 2011 remuneraTion incenTive (earned) a benefiTs b benefiTs c ToTal
Currently employed as at 31 march 2011 d
rob sindel (managing director from 1 Jan 2011) 900,000 550,000 – – 8,250 1,458,250greg barnes (chief financial officer from 15 dec 2010) 414,583 189,583 – – 2,488 606,654total currently employed executives 1,314,583 739,583 – – 10,738 2,064,904
terminated employment during yem11Jeremy sutcliffe (managing director until 31 dec 2010) e 975,000 1,300,000 n/a 354,243 – 2,629,243chris bertuch (general counsel & company secretary for full year) f 542,719 545,042 – 739,951 – 1,827,712shane gannon (chief financial officer until 15 dec 2010) g 548,934 647,853 – 792,269 – 1,989,056ian glasson (chief executive officer, sucrogen, left csr on 22 dec 2010) h 688,406 475,000 – 425,500 21,255 1,610,161total terminated executives 2,755,059 2,967,895 – 2,311,963 21,255 8,056,172
a represents the value of any lTi awards that were vested or paid during yem11. excludes the value of any unvested lTi granted or expensed during the year.b amounts exclude some previously accrued statutory entitlements paid on termination. for a detailed breakdown of termination payments including these amounts,
please refer to section f.c in yem11, other benefits included an allowance for long service leave for senior executives and spouse travel.d includes remuneration paid to messrs sindel and barnes for their tenure in building products roles prior to promotion into corporate roles during yem11.e The termination benefit disclosed for mr sutcliffe includes $25,343 of annual leave already accrued and paid to him (refer to section f for details) and $3,900 of
long service leave accrued but not paid after he moved from the managing director to an ned role.f sTi for mr bertuch includes the enhanced sTi accrued during yem11 (refer to section d2 for more information). Termination benefits include the settlement paid in
respect of forfeited shares previously held in the cash award share Plan (casP – refer section d3 for more detail on casP settlement) along with severance and statutory entitlements in accordance with the terms of his employment contract. in addition to his termination benefit of $739,951 disclosed above he was paid an additional $228,221 of statutory entitlements already accrued (refer section f for detail).
g sTi for mr gannon includes the enhanced sTi accrued during yem11 (refer to section d2 for more information). in addition to his termination benefit of $792,269 he was paid an additional $89,403 of statutory entitlements already accrued (refer to section f for detail).
h sTi includes the enhanced sTi paid to mr glasson; termination benefits represent the settlement paid in respect of forfeited shares previously held in the casP – refer section d3 for more detail on casP settlement.
The csr board is considering the following initiatives for implementation in yem12:
• the PrP grant performance hurdle will be adjusted so that 50% of the grant is subject to the same relative Tsr grant as previous PrP grants, and 50% of the grant is made subject to an ePs performance hurdle. This adjustment is intended to continue to align with best practice and improve executive’s line of sight over lTi reward outcomes; and
• introduction of a new approach to implementation of a minimum csr shareholding policy for csr executives.
detail of these initiatives will be disclosed in the yem12 remuneration report.
implications of the sale of sucrogen for remuneration of Csr executivesdue to the sale of the sucrogen business, there were changes to several corporate executive roles within csr. These are summarised below. Termination payments for departing executives are detailed in section f3.
The employment tenure of departing sucrogen executives was transferred from csr to wilmar international limited, and as such there was no payment of redundancy, notice, statutory entitlements, or yem11 sTi plan payments to these executives at the time of the sale.
a retention plan, the ‘enhanced sTi Plan’, was put in place in yem11 only for five executives who were critical to the success of the sale process. executives nominated to be included in this plan were expected to eventually be made redundant or leave the csr group as a result of the transaction. The details of the enhanced sTi Plan are outlined in section d2 – short Term incentive Plans.
The treatment of existing lTi awards held by departing corporate executives and sucrogen executives on their departure from the csr group is detailed in section d3 – long Term incentive Plans.
a capital return was paid on 3 march 2011 to shareholders as a result of the sale. as there was no payment of the capital return to holders of performance rights under the PrP, csr sought, and received, shareholder approval to make a corresponding adjustment to the number of shares underlying the PrP that would be awarded should these grants vest in the future. This adjustment was made in order to ensure that PrP holders were not disadvantaged as a result of the capital return to shareholders (refer to section d3 for details).

14 csr annual rePorT 2011
executive changes in yem11due to the sale of the sucrogen business during yem11, several changes occurred to csr senior executive roles. in summary:
• mr rob sindel joined the csr board on 15 december 2010 and was promoted into the role of managing director, csr, with effect from 1 January 2011;
• mr Jeremy sutcliffe was appointed to the role of managing director on an interim basis on 1 april 2010 in order to oversee the completion of the sale of the sucrogen business. following completion of the sale transaction, mr sutcliffe’s executive role ceased effective 31 december 2010. mr sutcliffe will continue to serve on the csr board as an independent non-executive director;
• as a result of the sale, the role of mr shane gannon, chief financial officer (of the pre-sale entity), was made redundant effective on 15 december 2010;
• mr greg barnes, who commenced employment with csr on 6 July 2009, was promoted to the role of chief financial officer for the post-sale csr business, effective 15 december 2010;
• following the sale of sucrogen on 22 december 2010, sucrogen employees were no longer employed by the csr group. The ceo of sucrogen, mr ian glasson, continued in his role as part of wilmar international from this date; and
• mr chris bertuch resigned as company secretary effective 6 april 2011, and his role was made redundant on 29 april 2011. ms debbie schroeder remains as company secretary of csr limited.
more detail is provided in section f3 – Payments to departing executives.
b – tHe remuneration & Human resourCes Committee’s roleThe composition and functions of the remuneration and human resources committee, which oversees remuneration issues and human resources matters, are set out in the charter available from the csr internet site. The charter was reviewed and updated during the year.
The role of the committee is to review and make recommendations to the board on (but not limited to):
• remuneration of neds;
• remuneration of the managing director and senior executives;
• remuneration incentive policies, and guidelines for executives and senior managers;
• talent management – including succession planning; and
• diversity.
support to the committee was provided through csr’s general manager, human resources, and external advisers.
C – exeCutive remuneration PoliCy
C1 – key principlesTable 2 below outlines the key principles on which csr’s executive remuneration policy are based:
Table 2: key principles of csr’s executive remuneration policy
Performance driven remuneration should reward executives based on annual performance against business plans and longer term shareholder returns.
a significant proportion of executive remuneration should be ‘at risk’ and performance dependent.
Performance measurement is mainly focused at the organisational level which best reflects the role’s influence.alignment with shareholder interests
incentive plans and performance measures are aligned with csr’s short and long term success.
ownership of csr shares is encouraged through the use of equity as the vehicle for the lTi plan and the ability to forgo part of fixed remuneration to acquire shares.
market competitive remuneration opportunities
remuneration opportunities, including those elements which can be earned subject to performance, are set at competitive levels that will attract, motivate and retain high quality executives.
remuneraTion rePorT (conTinued)

csr annual rePorT 2011 15
C2 – ensuring executive remuneration is performance drivenThe variable components of remuneration (both short term and long term) are driven by challenging targets focused on both external and internal measures of financial and non-financial performance. details of the performance measures used are set out in sections d2 – sTi plans and d3 – lTi plans. further detail on the link between performance and remuneration is set out in section e.
a significant proportion of executive remuneration is ‘at risk’. The following target remuneration mix chart sets out the remuneration mix as fixed remuneration, on-target sTi and half of the lTi expense (representing target lTi) for senior executives and the managing director.
chart 1: Target remuneration mix for the managing director and senior executives
target remuneration mix
Senior executives (average)
Managing director
0 10 20 30 40 50 60 70 80 90 100%
Fixed STI LTI
C3 – alignment with shareholder interestsexecutives’ remuneration is aligned with shareholder interests via a significant emphasis on variable (incentive) remuneration. These awards are linked to short term and long term performance benchmarks that support csr’s business strategy and future success, and lTi awards are in the form of csr equity.
in order to encourage executive share ownership and further increase the alignment with shareholder interests, executives can forgo salary to acquire shares in csr.
C4 – ensuring market competitive remunerationexecutive remuneration is reviewed annually. csr aims to provide market competitive remuneration against jobs of comparable size and responsibility (as measured by the hay group job evaluation system and by position matching against equivalent roles from organisations with similar market capitalisation) as follows:
• fixed remuneration for executives is targeted at market median; and
• variable remuneration (through sTi and lTi) provides the opportunity to earn total remuneration (fixed remuneration plus variable remuneration) that reaches the top quartile of the market for superior performance.
d – exeCutive remuneration frameworkThe executive remuneration framework consists of:
fixed remuneration • base salary
• superannuation
• other short term benefitsvariable remuneration • sTi
• lTi
d1 – fixed remunerationfixed remuneration comprises salary, superannuation and other short term benefits provided by the company.
as discussed above, fixed remuneration is targeted at the median of the market for jobs of comparable size and responsibility. in some cases, superior performance or strong market demand for specific job categories may justify above median fixed remuneration.
employees are able to forgo part of their fixed remuneration to acquire csr shares under the employee share acquisition Plan (esaP), discussed in section d4 – other equity incentive plans, up to a maximum salary sacrifice of $5,000 annually.
d2 – short term incentive Planscsr’s executives all participate in an sTi plan. Typically, the sTi plan is weighted 60% to financial metrics and 40% to individual metrics.
ebiT before significant items (continuing operations only) was the primary financial metric for the yem11 sTi plan. The yem10 plan had relied on rofe as the principle metric for the sTi.
driving achievement of csr’s ebiT objectives represented a key focus of csr’s business strategy for yem11, which reflected changes in the broader business environment. while rofe measures effective utilisation of assets and was seen as being an appropriate metric for csr during the gfc, ebiT was viewed as a more appropriate metric for the yem11 sTi as increases in ebiT translate to increased ePs and therefore the quantum of return to shareholders.
rofe continues to act as a secondary metric for the sTi plan to ensure continued effective utilisation of assets. in order to earn sTi payments, rofe goals were also required to be met as a secondary objective. minimum rofe gateways must be met in order to earn an incentive above threshold, target and stretch levels, while ebiT results determine the quantum of the incentive.
senior executive roles have an sTi opportunity of 50% of fixed remuneration for target level achievement against financial and individual objectives. if no objectives are achieved the executive may receive no sTi for that financial year, while stretch performance could result in an sTi of up to 100% of fixed remuneration. managing director and ceo roles in yem11 had an sTi target opportunity of 70% of fixed remuneration and maximum opportunity for stretch performance of up to 100% of fixed remuneration.

16 csr annual rePorT 2011
Table 3: short term incentive plans – summary
Purpose To drive individual and team performance to deliver annual business plans and increase shareholder value. frequency and timing awards are determined on an annual basis with performance measured over the year to 31 march.
Payment is normally made in July following the end of the performance year. financial measures The quantum of any sTi is determined by ebiT before significant items (continuing operations only), which assesses in
the amount of pre-tax profit generated by the business. minimum rofe thresholds must also be met in order to qualify for a sTi payment at threshold, target or stretch levels.
The measures used in the yem11 sTi plans are:
• Corporate roles: ebiT* of csr’s continuing operations (100%**);
• divisional executive roles: divisional ebiT* (50%**) and csr ebiT* (50%**);
• business unit executive roles: business unit ebiT* (66.6%**) and divisional ebiT* (33.3%**);
• Profit centre managers: ebiT* (50% or greater**) and working capital (up to 50%**); and
• managers with narrower responsibilities: sub-components of the profit centre managers’ measures may be used as appropriate.
The financial targets are set each year by the managing director, in consultation with the business unit and corporate leaders, and approved by the board. The managing director’s targets are set each year by the board.* before significant items.** expressed as a percentage of sTi financial component. sTi financial component typically comprises 60% of target sTi.
individual objectives used (and rationale)
individual objectives are constructed for each executive chosen because they are critical to csr’s short term and long term success, and are aligned to the business plan. These cover areas including:
• safety, health and environment;
• meeting customer needs and becoming supplier of choice;
• leadership and development of people;
• personal sales targets;
• operational improvement;
• restructuring and rationalisation;
• production targets;
• growth; and
• other personally attributable budget goals. assessment of performance against measures
at the end of the csr financial year, each executive’s performance is assessed based on financial results for csr and the respective businesses, a review by the executive’s manager and, where appropriate, 360 degree feedback (i.e. feedback provided by the executive’s immediate manager, peers and employees reporting to the executive).
sTi assessments and recommendations are made by an executive’s immediate manager, as he or she is best placed to assess the individual’s performance. The recommendations are then approved by the remuneration & human resources committee so as to ensure group-wide consistency.
Payment for the individual component is normally independent of the business financial result. however, if the business financial result is below expectations, there is discretion to reduce the payout for performance against non-financial measures.
The payout, based on performance, is between the threshold of 0% and a maximum of 200% of target.discretionary override The intention is to minimise discretionary adjustments to the plan outcomes. however, the board and the managing
director do retain discretion in certain circumstances to alter payments having regard to:
• csr’s overall financial performance;
• occurrence of a fatality, regardless of fault;
• maintenance and preservation of the company’s assets;
• development and attention to customer relationships;
• any short term action which causes market share loss or other damage to csr; and
• other special circumstances (e.g. acquisitions and divestments). service condition new starters with csr or people promoted into eligible roles can participate in the sTi with pro-rata entitlements if they
have been in the role for more than three months of the relevant financial year.
for staff who retire, die or are retrenched during the performance period, the managing director and the board have discretion in awarding a payment.
no payment will be made to participants who cease employment voluntarily, or have their employment terminated for inadequate performance or misconduct, before the end of the performance year.
remuneraTion rePorT (conTinued)

csr annual rePorT 2011 17
enhanced sTi plana retention plan specifically related to the sucrogen sale, the ‘enhanced sTi Plan’, was put in place on 17 may 2010 for five senior executives who were critical to the transaction for yem11 only. This plan provided an sTi payment that could be earned subject to eligible individuals remaining employed in their roles for the duration of the sale of sucrogen, and to their making an adequate contribution to the sale process. This plan was established in order to retain key executives whose roles were likely to be made redundant or to be departing the csr group for the period that their contribution would be required.
kmP who participated in this plan were shane gannon (chief financial officer), chris bertuch (general counsel and company secretary) and ian glasson (ceo sucrogen).
sTi quantum would be equivalent to 50% of fixed remuneration as at 17 may 2010. Payment to qualifying executives will be made on or around 30 June 2011, or was made in some cases when they left the csr group.
while payment to qualifying executives will in some cases not be made until 30 June 2011 in accordance with the terms of the plan, the accounting expense for enhanced sTi payments is incurred in yem11. accordingly these payments are included in table h which details remuneration for kmP.
d3 – long term incentive PlansPurposeduring the financial year, eligible executives were invited to participate in csr’s lTi program, which aims to:
• provide executives with performance rights in order to build their interest in csr equity; and
• attract, motivate and retain the necessary executive talent to deliver and sustain business performance and increase returns to shareholders.
all securities referred to in this report are granted by csr limited.
csr’s executive lTi plansThe PrP has been csr’s executive lTi plan since yem10.
under the PrP, participants are granted performance rights subject to a three year vesting period with an associated performance hurdle. half of the performance rights will vest if the Tsr of csr equals the median Tsr of the constituents of the s&P asX 200 index (defined at date of grant), and 100% will vest for upper quartile performance. on vesting of performance rights, csr shares will be provided at no cost to the participant. if there is no, or partial, vesting of the performance rights after the initial performance hurdle test, there will be opportunities for re-testing of performance on the fourth and fifth grant date anniversaries;
Particular features of the PrP are as follows:
• lTi participation eligibility is restricted to the managing director, direct reports and selected critical corporate roles within csr;
• under the PrP, participants are not entitled to dividends in respect of unvested performance rights;
• the csr share Trading Policy adopted by the board prohibits participants hedging their exposure to unvested shares or reducing the risk associated with the performance hurdles applicable to those shares in any way. under the policy, participants are required to forfeit their interest in unvested shares (i.e. shares that have not met the performance hurdles) if they enter into any hedging transaction in relation to those shares; and
• for yem12, the PrP grant performance hurdle will be adjusted so that 50% of the grant is subject to the same relative Tsr grant as previous PrP grants, and 50% of the grant is made subject to an ePs performance hurdle. This adjustment is intended to continue to align with best practice and improve executive’s line of sight over lTi reward outcomes.
historically the csr executive lTi plan was the casP. while new grants under this plan have been discontinued, the details of the casP are disclosed in this report as historical grants under the plan have a three to five year vesting period and remain subject to ongoing performance hurdle testing. The 2005 casP grant lapsed with no vesting after it failed to meet the final scheduled performance hurdle test on 25 July 2010. There are four outstanding live casP grants (see table 5 on page 21 for key dates).
changes to csr lTi plans and policy in yem11Previously, any shares allocated in respect of vested performance rights would be placed in trust for up to seven years from date of grant. in considering evolving market practice and the tightened disposal restrictions on shares held in trust associated with the revised tax legislation governing employee share schemes, the board elected to remove post-vesting disposal restrictions for any future vesting of existing and future grants of performance rights. as a result, any performance rights under the PrP that vest in the future will result in associated shares being transferred directly to the participants.
on 3 march 2011, csr shares underwent a 3:1 consolidation. The consolidation applied to existing grants under csr’s lTi plans which equated to a reduction in the number of shares or rights by two-thirds. The impact of the share consolidation on lTi grants to kmP under the casP and the PrP is disclosed in section g.
Treatment of existing lTi grants following the sale of sucrogennon-continuing csr executives – The existing PrP or casP grants held by csr corporate executives whose tenure with csr would not continue following the sucrogen sale were treated individually on a case by case basis. The treatment of unvested lTi grants for mr bertuch and mr gannon is detailed in section f.
continuing csr executives – existing PrP or casP grants held by csr executives who continued to be employed by csr following the sale of sucrogen to wilmar international in december 2010 will remain subject to performance hurdles. some adjustments have been made in order to prevent continuing csr executives from being disadvantaged by the reduction in market capitalisation resulting from the sale:
• for holders of existing performance rights grants under the PrP, there is no entitlement to any capital return made to csr shareholders. in order to ensure that holders of existing csr performance rights were not disadvantaged by the capital return following the sale of sucrogen, csr sought and received shareholder approval to adjust the PrP rules in order to allow an additional number of shares to be awarded if and when the performance rights vest. The additional number of shares reflects the cash amount per share returned to shareholders as a result of the capital return. The objective of this adjustment is to ensure that holders of performance rights were not disadvantaged by the capital return; and
• for holders of casP grants who continue employment with csr, their existing unvested grants will remain subject to ongoing performance hurdles and vesting periods. under the casP plan rules, holders of vested and/or unvested casP shares are the beneficiaries of any distributions to csr shareholders, including the special dividend and capital return related to the sale.
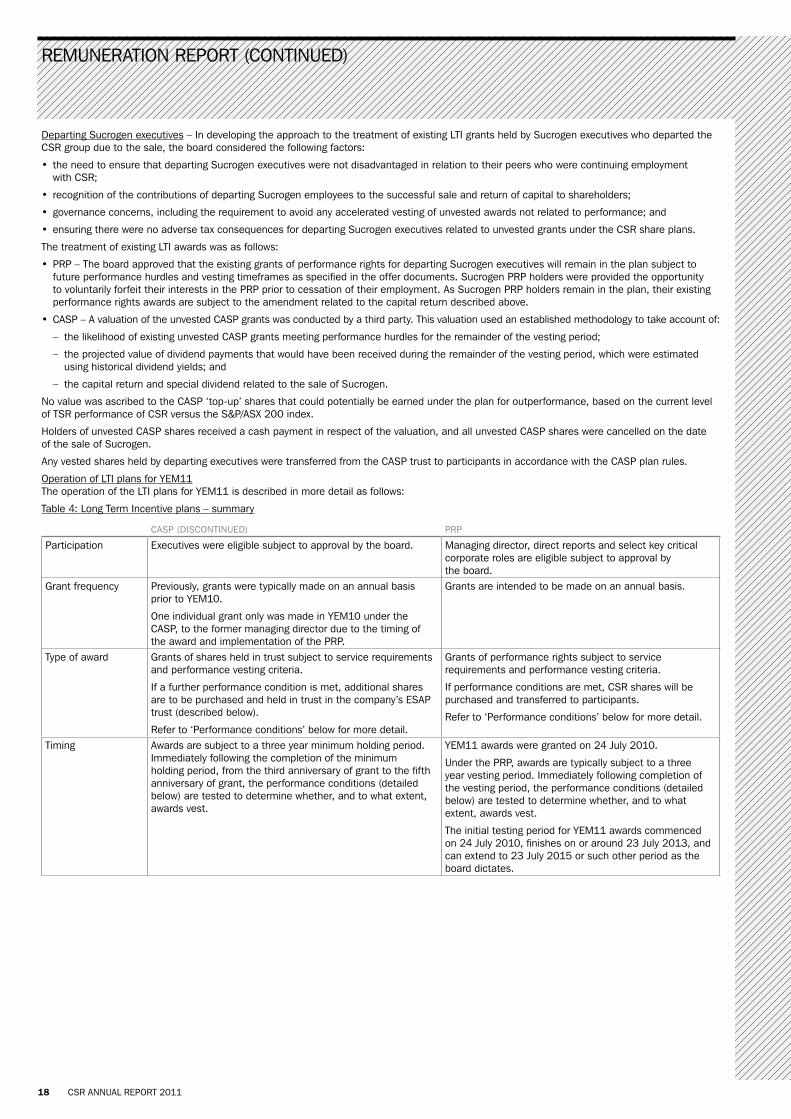
18 csr annual rePorT 2011
departing sucrogen executives – in developing the approach to the treatment of existing lTi grants held by sucrogen executives who departed the csr group due to the sale, the board considered the following factors:
• the need to ensure that departing sucrogen executives were not disadvantaged in relation to their peers who were continuing employment with csr;
• recognition of the contributions of departing sucrogen employees to the successful sale and return of capital to shareholders;
• governance concerns, including the requirement to avoid any accelerated vesting of unvested awards not related to performance; and
• ensuring there were no adverse tax consequences for departing sucrogen executives related to unvested grants under the csr share plans.
The treatment of existing lTi awards was as follows:
• PrP – The board approved that the existing grants of performance rights for departing sucrogen executives will remain in the plan subject to future performance hurdles and vesting timeframes as specified in the offer documents. sucrogen PrP holders were provided the opportunity to voluntarily forfeit their interests in the PrP prior to cessation of their employment. as sucrogen PrP holders remain in the plan, their existing performance rights awards are subject to the amendment related to the capital return described above.
• casP – a valuation of the unvested casP grants was conducted by a third party. This valuation used an established methodology to take account of:
– the likelihood of existing unvested casP grants meeting performance hurdles for the remainder of the vesting period;
– the projected value of dividend payments that would have been received during the remainder of the vesting period, which were estimated using historical dividend yields; and
– the capital return and special dividend related to the sale of sucrogen.
no value was ascribed to the casP ‘top-up’ shares that could potentially be earned under the plan for outperformance, based on the current level of Tsr performance of csr versus the s&P/asX 200 index.
holders of unvested casP shares received a cash payment in respect of the valuation, and all unvested casP shares were cancelled on the date of the sale of sucrogen.
any vested shares held by departing executives were transferred from the casP trust to participants in accordance with the casP plan rules.
operation of lTi plans for yem11The operation of the lTi plans for yem11 is described in more detail as follows:
Table 4: long Term incentive plans – summary
casP (disconTinued) PrP
Participation executives were eligible subject to approval by the board. managing director, direct reports and select key critical corporate roles are eligible subject to approval by the board.
grant frequency Previously, grants were typically made on an annual basis prior to yem10.
one individual grant only was made in yem10 under the casP, to the former managing director due to the timing of the award and implementation of the PrP.
grants are intended to be made on an annual basis.
Type of award grants of shares held in trust subject to service requirements and performance vesting criteria.
if a further performance condition is met, additional shares are to be purchased and held in trust in the company’s esaP trust (described below).
refer to ‘Performance conditions’ below for more detail.
grants of performance rights subject to service requirements and performance vesting criteria.
if performance conditions are met, csr shares will be purchased and transferred to participants.
refer to ‘Performance conditions’ below for more detail.
Timing awards are subject to a three year minimum holding period. immediately following the completion of the minimum holding period, from the third anniversary of grant to the fifth anniversary of grant, the performance conditions (detailed below) are tested to determine whether, and to what extent, awards vest.
yem11 awards were granted on 24 July 2010.
under the PrP, awards are typically subject to a three year vesting period. immediately following completion of the vesting period, the performance conditions (detailed below) are tested to determine whether, and to what extent, awards vest.
The initial testing period for yem11 awards commenced on 24 July 2010, finishes on or around 23 July 2013, and can extend to 23 July 2015 or such other period as the board dictates.
remuneraTion rePorT (conTinued)

csr annual rePorT 2011 19
casP (disconTinued) PrP
Performance conditions
Performance period and testing approach
csr’s Tsr performance is measured from the date of grant up to the relevant testing date.
Tsr is the percentage growth in shareholder value, taking into account share price growth, dividends and capital returns.
The testing dates fall within a two year period starting from the third anniversary of grant and ending on the fifth anniversary of grant (‘performance testing period’).
csr’s Tsr is measured over this period to ensure that the long term measurement of performance under the plan is not distorted by business and commodity cycles or capital investment decisions.
The performance conditions for the 2005, 2006 and 2007 grants were tested in six consecutive four month windows during the performance testing period.
The performance conditions for 2008 and 2009 grants are based on the 20 trading day volume weighted average price (‘vwaP’) up to and including the last day of the three year performance period and, to the extent the grant has not vested, the fourth and fifth anniversaries of the date of grant.
The performance period is initially the three-year period over which csr’s relative Tsr performance is measured. Tsr is the percentage growth in shareholder value, taking into account share price growth, dividends and capital returns. To the extent any performance rights remain unvested at the end of the initial three year period, the performance period will be extended and performance will be re-tested at the end of the four and five year period to determine if any additional vesting is available.
csr’s Tsr is measured over this period to ensure that the long term measurement of performance under the plan is not distorted by business and commodity cycles or capital investment decisions.
for the purposes of the Tsr calculation, the start and end share prices will be calculated based on 10 trading day volume weighted average share prices.
Performance condition 1
if csr’s Tsr exceeds the percentage increase in the s&P/asX 200 accumulation index for a minimum of 20 trading days within any of the six four month windows (2005, 2006 and 2007 grants) or three windows of 20 trading days preceding the third, fourth or fifth anniversaries of the grant date (2008 and 2009 grants), the shares will vest at the end of the trading window in which the performance condition is met.
if the performance condition is not met by the fifth anniversary of the date of grant, participants will forfeit their interests in the unvested shares (and the opportunity to be granted additional shares).
if csr’s Tsr equals the median Tsr of the constituents of the s&P/asX 200 index over the performance period, 50% of the grant of performance rights will vest.
if csr’s Tsr equals the upper quartile Tsr of the constituents of the s&P/asX 200 index over the performance period, 100% of the grant of performance rights will vest.
for Tsr performance between the median and the upper quartile Tsr of the constituents of the s&P/asX 200 index over the performance period, each percentile improvement will result in an additional 2% vesting (i.e. straight-line vesting between 50% and 100%).
To the extent that performance rights have not vested following the three and four year testing dates, the performance period will be extended as described above.
if the performance condition is not met by the fifth anniversary of the date of grant, participants will forfeit their interests in any unvested performance rights.
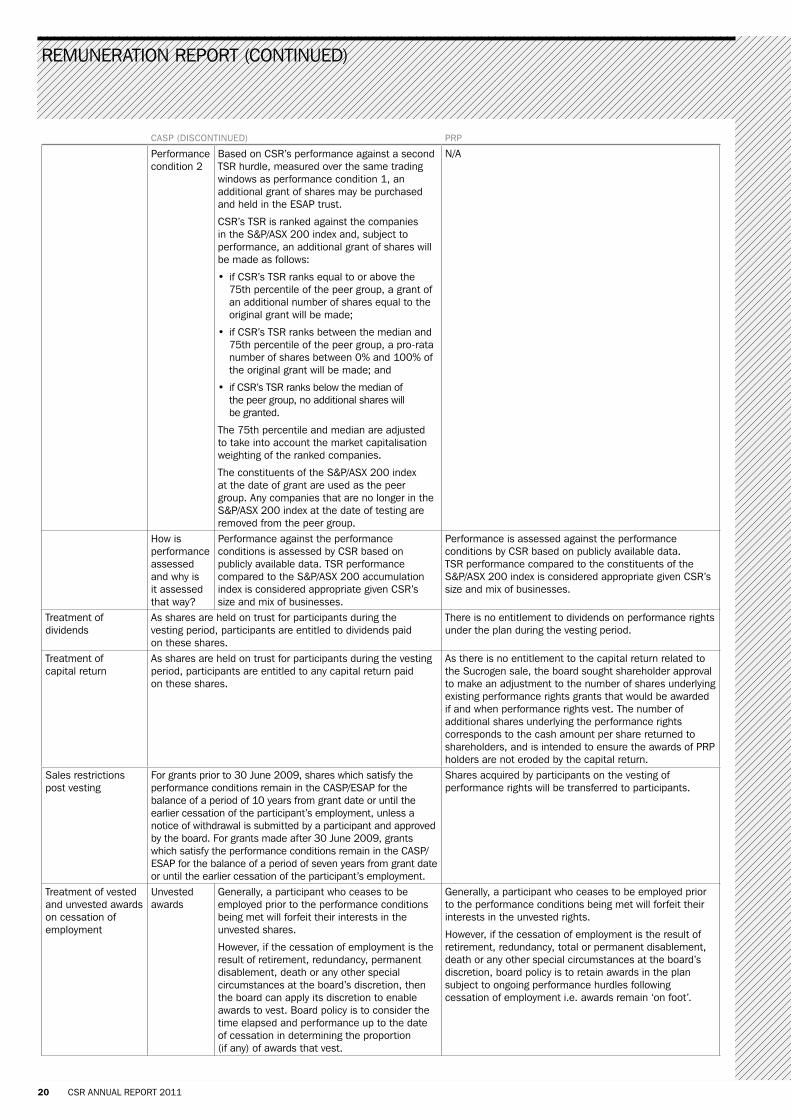
20 csr annual rePorT 2011
casP (disconTinued) PrP
Performance condition 2
based on csr’s performance against a second Tsr hurdle, measured over the same trading windows as performance condition 1, an additional grant of shares may be purchased and held in the esaP trust.
csr’s Tsr is ranked against the companies in the s&P/asX 200 index and, subject to performance, an additional grant of shares will be made as follows:
• if csr’s Tsr ranks equal to or above the 75th percentile of the peer group, a grant of an additional number of shares equal to the original grant will be made;
• if csr’s Tsr ranks between the median and 75th percentile of the peer group, a pro-rata number of shares between 0% and 100% of the original grant will be made; and
• if csr’s Tsr ranks below the median of the peer group, no additional shares will be granted.
The 75th percentile and median are adjusted to take into account the market capitalisation weighting of the ranked companies.
The constituents of the s&P/asX 200 index at the date of grant are used as the peer group. any companies that are no longer in the s&P/asX 200 index at the date of testing are removed from the peer group.
n/a
how is performance assessed and why is it assessed that way?
Performance against the performance conditions is assessed by csr based on publicly available data. Tsr performance compared to the s&P/asX 200 accumulation index is considered appropriate given csr’s size and mix of businesses.
Performance is assessed against the performance conditions by csr based on publicly available data. Tsr performance compared to the constituents of the s&P/asX 200 index is considered appropriate given csr’s size and mix of businesses.
Treatment of dividends
as shares are held on trust for participants during the vesting period, participants are entitled to dividends paid on these shares.
There is no entitlement to dividends on performance rights under the plan during the vesting period.
Treatment of capital return
as shares are held on trust for participants during the vesting period, participants are entitled to any capital return paid on these shares.
as there is no entitlement to the capital return related to the sucrogen sale, the board sought shareholder approval to make an adjustment to the number of shares underlying existing performance rights grants that would be awarded if and when performance rights vest. The number of additional shares underlying the performance rights corresponds to the cash amount per share returned to shareholders, and is intended to ensure the awards of PrP holders are not eroded by the capital return.
sales restrictions post vesting
for grants prior to 30 June 2009, shares which satisfy the performance conditions remain in the casP/esaP for the balance of a period of 10 years from grant date or until the earlier cessation of the participant’s employment, unless a notice of withdrawal is submitted by a participant and approved by the board. for grants made after 30 June 2009, grants which satisfy the performance conditions remain in the casP/esaP for the balance of a period of seven years from grant date or until the earlier cessation of the participant’s employment.
shares acquired by participants on the vesting of performance rights will be transferred to participants.
Treatment of vested and unvested awards on cessation of employment
unvested awards
generally, a participant who ceases to be employed prior to the performance conditions being met will forfeit their interests in the unvested shares.
however, if the cessation of employment is the result of retirement, redundancy, permanent disablement, death or any other special circumstances at the board’s discretion, then the board can apply its discretion to enable awards to vest. board policy is to consider the time elapsed and performance up to the date of cessation in determining the proportion (if any) of awards that vest.
generally, a participant who ceases to be employed prior to the performance conditions being met will forfeit their interests in the unvested rights.
however, if the cessation of employment is the result of retirement, redundancy, total or permanent disablement, death or any other special circumstances at the board’s discretion, board policy is to retain awards in the plan subject to ongoing performance hurdles following cessation of employment i.e. awards remain ‘on foot’.
remuneraTion rePorT (conTinued)
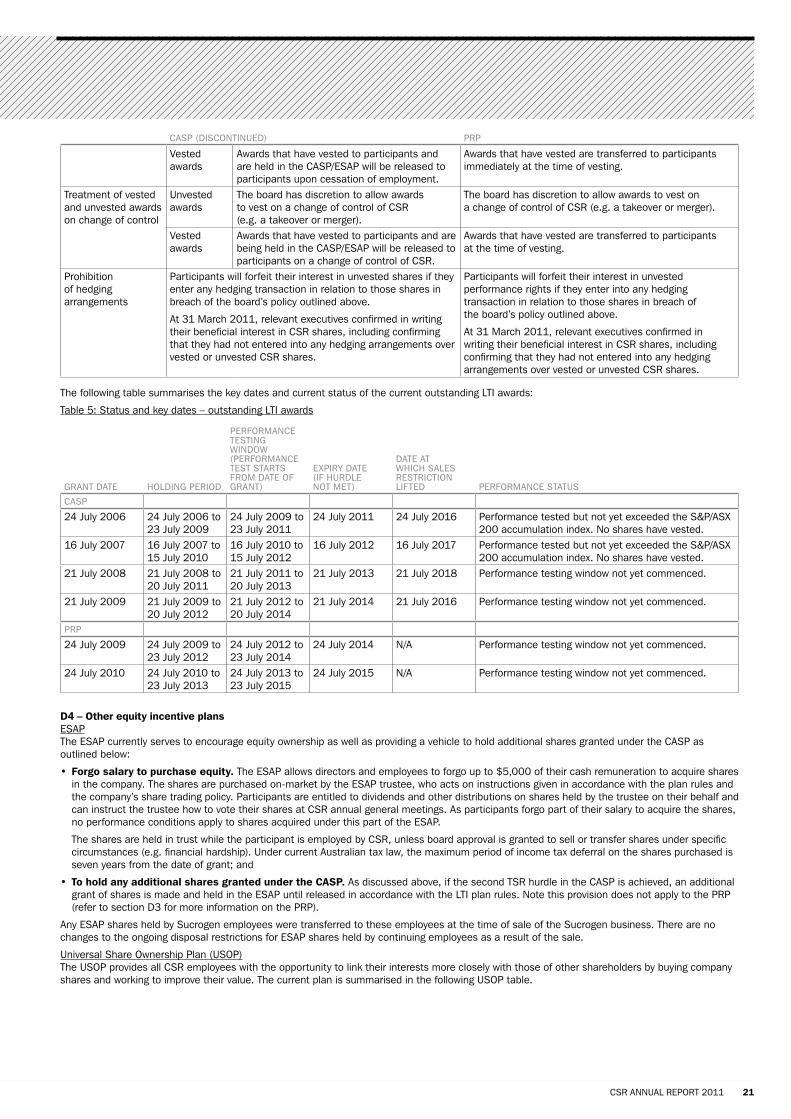
csr annual rePorT 2011 21
casP (disconTinued) PrP
vested awards
awards that have vested to participants and are held in the casP/esaP will be released to participants upon cessation of employment.
awards that have vested are transferred to participants immediately at the time of vesting.
Treatment of vested and unvested awards on change of control
unvested awards
The board has discretion to allow awards to vest on a change of control of csr (e.g. a takeover or merger).
The board has discretion to allow awards to vest on a change of control of csr (e.g. a takeover or merger).
vested awards
awards that have vested to participants and are being held in the casP/esaP will be released to participants on a change of control of csr.
awards that have vested are transferred to participants at the time of vesting.
Prohibition of hedging arrangements
Participants will forfeit their interest in unvested shares if they enter any hedging transaction in relation to those shares in breach of the board’s policy outlined above.
at 31 march 2011, relevant executives confirmed in writing their beneficial interest in csr shares, including confirming that they had not entered into any hedging arrangements over vested or unvested csr shares.
Participants will forfeit their interest in unvested performance rights if they enter into any hedging transaction in relation to those shares in breach of the board’s policy outlined above.
at 31 march 2011, relevant executives confirmed in writing their beneficial interest in csr shares, including confirming that they had not entered into any hedging arrangements over vested or unvested csr shares.
The following table summarises the key dates and current status of the current outstanding lTi awards:
Table 5: status and key dates – outstanding lTi awards
granT daTe holding Period
Performance TesTing window (Performance TesT sTarTs from daTe of granT)
eXPiry daTe (if hurdle noT meT)
daTe aT which sales resTricTion lifTed Performance sTaTus
casP
24 July 2006 24 July 2006 to 23 July 2009
24 July 2009 to 23 July 2011
24 July 2011 24 July 2016 Performance tested but not yet exceeded the s&P/asX 200 accumulation index. no shares have vested.
16 July 2007 16 July 2007 to 15 July 2010
16 July 2010 to 15 July 2012
16 July 2012 16 July 2017 Performance tested but not yet exceeded the s&P/asX 200 accumulation index. no shares have vested.
21 July 2008 21 July 2008 to 20 July 2011
21 July 2011 to 20 July 2013
21 July 2013 21 July 2018 Performance testing window not yet commenced.
21 July 2009 21 July 2009 to 20 July 2012
21 July 2012 to 20 July 2014
21 July 2014 21 July 2016 Performance testing window not yet commenced.
PrP
24 July 2009 24 July 2009 to 23 July 2012
24 July 2012 to 23 July 2014
24 July 2014 n/a Performance testing window not yet commenced.
24 July 2010 24 July 2010 to 23 July 2013
24 July 2013 to 23 July 2015
24 July 2015 n/a Performance testing window not yet commenced.
d4 – other equity incentive plansesaPThe esaP currently serves to encourage equity ownership as well as providing a vehicle to hold additional shares granted under the casP as outlined below:
• forgo salary to purchase equity. The esaP allows directors and employees to forgo up to $5,000 of their cash remuneration to acquire shares in the company. The shares are purchased on-market by the esaP trustee, who acts on instructions given in accordance with the plan rules and the company’s share trading policy. Participants are entitled to dividends and other distributions on shares held by the trustee on their behalf and can instruct the trustee how to vote their shares at csr annual general meetings. as participants forgo part of their salary to acquire the shares, no performance conditions apply to shares acquired under this part of the esaP.
The shares are held in trust while the participant is employed by csr, unless board approval is granted to sell or transfer shares under specific circumstances (e.g. financial hardship). under current australian tax law, the maximum period of income tax deferral on the shares purchased is seven years from the date of grant; and
• to hold any additional shares granted under the CasP. as discussed above, if the second Tsr hurdle in the casP is achieved, an additional grant of shares is made and held in the esaP until released in accordance with the lTi plan rules. note this provision does not apply to the PrP (refer to section d3 for more information on the PrP).
any esaP shares held by sucrogen employees were transferred to these employees at the time of sale of the sucrogen business. There are no changes to the ongoing disposal restrictions for esaP shares held by continuing employees as a result of the sale.
universal share ownership Plan (usoP)The usoP provides all csr employees with the opportunity to link their interests more closely with those of other shareholders by buying company shares and working to improve their value. The current plan is summarised in the following usoP table.

22 csr annual rePorT 2011
Table 6: usoP
Purpose To encourage share ownership through enabling executives and employees to benefit from a favourable australian tax treatment ($1,000 tax exemption available where certain conditions met).
Participation all executives and employees (except executive directors), who have the equivalent of at least one year’s service.form and quantum of award
each year, the board sets a maximum number of shares that can be issued to each eligible participant, up to a maximum of $1,000 (being the limit of the tax exemption).
The award is structured such that participants buy shares which are then matched one-for-one by the company at no additional cost to participants.
vesting period shares vest immediately upon acquisition by participants. The shares can only be sold three years after the date of grant, unless the participant’s employment ceases before then.
absence of a performance condition
The usoP grants are designed to encourage share ownership among the broad employee population and therefore do not have any performance conditions attached.
dividends and voting rights
Participants are entitled to dividends and have full voting rights during the three year holding period.
The csr board has approved making an offer to staff under the usoP for yem12.
for any sucrogen employees who left the csr group as a result of the sale who held usoP shares still subject to the two year disposal restriction period, disposal restrictions remain in place for the duration of the restriction period. This was required to ensure compliance with the tax-exemption requirements of taxation legislation.
There are no changes to the ongoing disposal restrictions for usoP shares held by continuing employees as a result of the sale.
e – link between remuneration and ComPany PerformanCea key underlying principle of the executive reward strategy is that remuneration should be linked to performance.
sTi payments are based on a variety of performance conditions, both financial and non-financial. The key financial measure in yem11, depending on role and seniority, was ebiT before significant items from continuing operations (while rofe was maintained as an underpinning metric). significant items (both positive and negative) are excluded when measuring performance for sTis as they are not considered part of the ordinary trading results for csr. csr’s earnings and other performance measures are affected by external economic factors, including aluminium prices and foreign exchange rates. csr’s dividend policy is to pay dividends to shareholders based on net profit before significant items.
in yem11, the performance of csr’s continuing businesses declined on the prior year with ebiT (from continuing operations and pre significant items) decreasing by 3% to $212.0 million and net profit after tax (from continuing operations and pre significant items) increasing by 13% to $90.2 million. rofe increased across csr’s core businesses.
The following table provides reported financial information on which sTis have been based for the last five years. note that csr disposed of a significant proportion of its business and undertook a share consolidation during yem11, so the pre-2011 information is not directly comparable. refer to detailed footnotes for explanation.
Table 7: key financialsyear ended 31 march 1 2011 2010 2009 2008 2007
ebiT ($ million) 2 212.0 364.1 320.1 386.3 406.1earnings before interest, tax, depreciation and amortisation (ebiTda) 308.0 522.1 474.9 536.5 531.9shareholders’ funds ($ million) 1,281.3 1,818.2 1,586.5 1,590.7 1,264.2rofe based on year end funds employed 3 18.2% 14.1% 11.3% 13.6% 23.4%net profit before significant items ($ million) 90.2 173.4 134.0 192.8 240.5net profit (loss) after significant items ($ million) 503.4 (111.7) (326.5) 177.4 273.3basic earnings per share before significant items (cents) 4 17.8 12.7 12.2 20.9 27.0dividend per share (cents) 5 41.6 8.5 7.5 15.0 15.0share price as of 31 march ($) 6 3.28 1.66 1.20 3.20 3.41
1 all years represent results for the full csr group, with the exception of 2011. 2011 represents results from ‘continuing operations’ i.e. excludes businesses sold during the financial year with the exception of the 2011 ‘net profit (loss) after significant items’ figure which includes the full csr group.
2 ebiT excludes significant items and represents the primary financial metric used in the yem11 sTi plan.3 rofe is calculated as ebiT/funds employed (restated to exclude the fair value of hedges from equity) as at 31 march of the respective year. sTi payments for yem11
were awarded taking into consideration both the average funds employed balance throughout the financial year and the impact of significant items on funds employed.4 ePs excludes significant items and is based on net profit after tax from continuing operations. ePs results for 2011 reflect the impact of the 3:1 share consolidation
of 3 march 2011, while prior ePs results reflect pre-consolidation share numbers.5 dividend (cents) is comprised of the following:
2011 2010interim dividend 9.0 2.5special dividend 27.3 –final dividend 5.3 6.0
total 41.6 8.5
note the 2011 interim dividend and special dividend have been adjusted (x 3) to account for the share consolidation for consistency with the final dividend. Prior year dividend amounts have not been restated for the impact of the share consolidation.
6 2011 share price represents the csr share price after the 3:1 share consolidation of 3 march 2011. share prices for 2006–2010 represent pre-consolidation share prices.
remuneraTion rePorT (conTinued)

csr annual rePorT 2011 23
in yem11, the building products business did not meet the ebiT threshold set by the board, while csr (continuing operations) met the ebiT target set by the board. accordingly, the financial sTi component of those individuals exposed to building products did not qualify for a financial sTi payment, while payment around target was made for the financial sTi component of those individuals exposed to csr (continuing operations), representing 60% of the potential overall sTi payment. This result was reflected in yem11 financial sTis of messrs sindel, barnes, bertuch and gannon. note that apparent year-on-year increases in sTi quantum for these kmP (disclosed in section g) were predominantly influenced by:
• promotion into corporate roles for messrs sindel and barnes with associated increases in sTi opportunity (pro-rated for time spent in their divisional and corporate roles); and
• participation in the enhanced sTi Plan for messrs bertuch and gannon (resulting in an enhanced sTi payment in addition to a yem11 sTi payment – refer to section d2 for details).
The sTi payment for mr sutcliffe was related directly to the board’s assessment of the successful sale of the sucrogen business.
lTis have been linked to company performance as follows:
• awards comprise shares (under the casP) or performance rights (under the PrP) whose value ultimately depends on share price performance; and
• awards vest subject to csr’s relative Tsr performance compared against the constituents of the s&P/asX 200 index.
The chart shows csr’s Tsr performance over the past five years against the s&P/asX 200 accumulation index.
Csr’s tsr fell below that of the s&P/asx 200 accumulation index for the period april 2006 to april 2011.
no existing casP grants vested in yem11, as csr’s relative Tsr performance did not reach the performance threshold necessary for vesting. during yem11, the 2005 casP grant did not reach its performance threshold and all 2005 casP shares were forfeited.
chart 2: Tsr and s&P/asX 200 accumulation index five year comparison
(80%)
(60%)
(40%)
(20%)
0%
20%
40%
60%
80%
100%
120%
3 Apr 06 3 Apr 07 3 Apr 08 3 Apr 09 3 Apr 10 31 Mar 11
CSR TSR S&P/ASX 200 accumulation index
f – exeCutive ContraCts
f1 – executivesThe details of the contracts of csr’s senior executives named in the remuneration tables (excluding the managing director) can be summarised as:
• all executives, other than the former managing director, mr Jeremy sutcliffe, have ongoing contracts of no fixed term. mr sutcliffe’s role as managing director ceased on 31 december 2010;
• the contracts may be terminated by the individual giving between three to six months’ notice, or by the company giving between six and 12 months’ notice or payment in lieu of that notice;
• upon termination, executives are entitled to:
– payment of annual and long service leave;
– at the discretion of the board, an sTi payment may be awarded on a pro-rata basis reflective of the executive’s achievement of financial and personal objectives during the year;
– lTi awards that have vested, as discussed under section d3; and
– at the discretion of the board and under board policy, if an executive ceases employment due to retrenchment, death, disablement or retirement:
– unvested casP shares may vest depending on the performance against hurdles prior to termination. if performance hurdles are not achieved during the testing window(s) specified by the board, no vesting would occur in relation to unvested casP awards; and
– unvested PrP grants may be left in the plan subject to ongoing performance hurdles; and
• if an executive is retrenched, executives will receive payment in lieu of 6–12 months’ notice, or (for those executives covered by the csr redundancy & retrenchment agreement) the executive will receive the greater of the entitlement to severance pay plus notice under the csr redundancy & retrenchment agreement* or payment in lieu of 12 months’ notice and, subject to board discretion, a pro-rata sTi payment for the proportion of the financial year served. under the federal government’s new executive termination benefit legislation, a shareholder vote would be required in the event that kmP or directors in publicly listed companies appointed from november 2009 were to receive a termination payment in excess of one year’s salary. none of the termination payments paid to departing executives during yem11 were sufficient to require a shareholder vote. of currently employed kmP, mr rob sindel (managing director) and mr greg barnes (chief financial officer) may in the future fall under the new termination provisions due to changes to contractual arrangements since november 2009.
* entitlement for eligible employees under the csr redundancy & retrenchment agreement is three months’ base salary plus 0.7 months per year of completed service up to a maximum of two years.

24 csr annual rePorT 2011
f2 – former managing directormr Jeremy sutcliffe was appointed as interim managing director on 1 april 2010 for a fixed term. mr sutcliffe’s executive role ceased with effect from 31 december 2010 and he resumed his ned role on the csr board.
mr sutcliffe’s remuneration package is summarised as follows:
Table 8: former managing director’s remuneration package
fixed remuneration mr sutcliffe was entitled to an annual fixed remuneration of $1,300,000 inclusive of superannuation contributions effective from 1 april 2010.
sTi mr sutcliffe was entitled to a discretionary sTi up to a target of $910,000 based on performance against key performance indicators developed by the board in consultation with mr sutcliffe and up to a further $390,000 for exceptional performance.
Target key performance indicators related primarily to the achievement of goals in connection with the separation of the sucrogen and csr businesses.
The performance of mr sutcliffe against these measures was assessed and the payment determined by the board, as the board was best placed to assess this performance.
lTi given the interim nature of his appointment, mr sutcliffe was not entitled to receive any lTi.
mr sutcliffe’s other material terms of employment are summarised as follows:
Table 9: former managing director’s terms of employment
duration mr sutcliffe’s employment was for a fixed term of 12 months, and was to expire 31 march 2011. mr sutcliffe’s executive role ceased on 31 december 2010 and he resumed acting as an ned.
Termination by mr sutcliffe or csr
except in circumstances of summary dismissal, neither csr nor mr sutcliffe could terminate his employment prior to 1 october 2010.
after 1 october 2010, either party could terminate his employment by providing three months’ written notice.Termination benefits mr sutcliffe was not entitled to any termination benefit, other than payment in lieu of notice and statutory entitlements.
f3 – Payments to departing executivesThree executives identified as kmP in the yem11 remuneration report have ceased employment with csr, while the former managing director has reverted to an ned role.
mr sutcliffe (interim managing director)following the successful conclusion of the sale of the sucrogen business, mr sutcliffe and csr agreed to cease his executive employment in accordance with his contract with three months’ notice from 31 december 2010. mr sutcliffe immediately resumed his role as a ned on the csr board from 1 January 2011 onwards.
in accordance with his contract, mr sutcliffe received a payment in lieu of notice of $325,000 and statutory entitlements of $25,343 (payment of outstanding leave balances). The board approved an sTi payment based on achievement of contractual objectives.
There was no entitlement to any lTi award related to his tenure as managing director.
mr bertuch (general counsel and company secretary)as a result of the sale, the role of mr chris bertuch, general counsel and company secretary (who commenced work with csr on 29 november 1993), was made redundant effective on 29 april 2011 on the basis of csr changing from being a conglomerate to a building products and aluminium company, and a significant associated reduction in market capitalisation.
mr bertuch’s termination payment consisted of a severance payment calculated in accordance with the csr redundancy and retrenchment agreement, and statutory entitlements on termination in accordance with his employment contract.
mr bertuch received a yem11 sTi payment of $282,542, which was based on achievement of financial and individual objectives agreed by the board. he will be entitled to a payment of $262,500 under the enhanced sTi Plan related to the sale of sucrogen.
as part of the leaving settlement negotiated with the csr board, mr bertuch’s 55,916 post-consolidation* unvested casP shares were forfeited in lieu of a cash settlement of $112,595. This payment was calculated according to a third party valuation (refer to section d3 for more information). mr bertuch’s 24,175 post-consolidation* vested casP shares granted in 2003 and 2004 that previously had met performance hurdles but were held in trust were transferred to him free of disposal restrictions in accordance with the plan rules.
mr bertuch elected to forfeit all his 149,343 post-consolidation* unvested performance rights granted to him under the yem10 and yem11 PrP grants as part of his leaving settlement negotiated with the csr board. he has no further holdings under any of csr’s lTi plans.
mr gannon (chief financial officer)as a result of the sale, the role of mr shane gannon, chief financial officer (who commenced work with csr on 14 July 2008), was made redundant effective on 15 december 2010 on the basis of csr changing from being a conglomerate to a building products and aluminium company, and a significant associated reduction in market capitalisation.
mr gannon’s termination payment consisted of 12 months’ redundancy payment and statutory entitlements on termination in accordance with his employment contract.
mr gannon received a yem11 sTi payment of $270,353 which was pro-rated according to the proportion of yem11 spent in employment with csr, and was based on achievement of financial and individual objectives agreed by the board. he will be entitled to a payment of $377,500 under the enhanced sTi Plan related to the sale of sucrogen.
following mr gannon’s cessation of employment with csr, all unvested lTi awards previously granted will remain in the plan subject to ongoing performance hurdles and vesting conditions as specified in the original offer documents. This will cover 48,497 post-consolidation* unvested casP shares granted in 2008 and 157,798 post-consolidation* performance rights granted under the PrP in 2010. none of these lTi awards will vest if performance hurdles are not met.
remuneraTion rePorT (conTinued)

csr annual rePorT 2011 25
mr glasson (chief executive officer, sucrogen)following the sale of sucrogen on 22 december 2010, sucrogen employees were no longer employed by the csr group. The ceo of sucrogen, mr ian glasson, continued in his role as part of wilmar international from this date. as there was no formal cessation of mr glasson’s employment arrangement, there were no termination related payments in respect of severance, notice periods or statutory entitlements.
due to leaving the csr group, mr glasson’s 129,510 post-consolidation* unvested casP shares were forfeited in lieu of a cash settlement of $425,500. This payment was calculated according to a third party valuation (refer to section d3 for more information).
in relation to mr glasson’s unvested PrP awards previously granted, all will remain in the plan subject to ongoing performance hurdles and vesting conditions as specified in the original offer documents. This will cover a total of 303,125 post-consolidation* unvested performance rights granted under the PrP in yem10 and yem11. none of these lTi awards will vest if performance hurdles are not met.* note that the term ‘post-consolidation’ refers to the number of shares or rights adjusted under the csr share consolidation of 3 march 2011. on 3 march 2011 the
company’s share capital was consolidated through the conversion of every three fully paid ordinary shares in csr into one fully paid ordinary share. The 3:1 consolidation applied to casP shares (both vested and unvested) and performance rights.
Table 10: components of termination payments to departing executives
PaymenT TyPe amounT PaymenT elemenT TreaTmenT on TerminaTion
mr Chris bertuch former general counsel and company secretaryseverance payment $616,502 severance calculated under the csr redundancy and
retrenchment agreement.statutory entitlements $239,076 annual & long service leave Payment of outstanding accrued leave balances.lTi $112,595 casP following mr bertuch’s redundancy, at the discretion of
the csr board all 55,916 unvested post consolidation casP shares were cancelled, and a subsequent payment was made in accordance with a valuation of the shares conducted by a third party. in addition, the payment included a valuation of future dividends forgone during the remaining vesting period. The total settlement made to mr bertuch was $112,595.
total termination payment
$968,173
mr shane gannon former chief financial officerseverance payment $788,975 Payment in lieu of notice equivalent to 12 months’ salary.statutory entitlements $92,696 annual & long service leave Payment of outstanding accrued leave balances.
total termination payment
$881,671
mr ian glasson Chief executive officer, sucrogenlTi $425,500 casP following mr glasson’s departure from the csr group,
unvested casP shares previously granted were subject to the treatment of the casP for departing sucrogen employees approved by the board. This resulted in cancellation of all 129,510 post-consolidation unvested casP shares, and a subsequent payment according to a valuation of the shares conducted by a third party. in addition, the payment included a valuation of future dividends forgone during the remaining vesting period. The total settlement made to mr glasson was $425,500.
total termination payment
$425,500
f4 – Present managing director
mr rob sindel was appointed as managing director of csr effective 1 January 2011.
mr sindel’s remuneration package is summarised as follows:
Table 11: managing director’s remuneration package
fixed remuneration The managing director receives an annual fixed remuneration of $1,050,000 inclusive of superannuation contributions effective from 1 January 2011. fixed remuneration is reviewed annually commencing 1 april 2012.
sTi The annual maximum sTi opportunity is 100% of fixed annual remuneration for exceptional performance.
achievement of target performance would result in 70% of the maximum sTi being paid.
The sTi is weighted 60% on financial performance and 40% on individual performance.lTi The managing director is able to participate in the PrP. The potential value of any award of performance rights he
may earn is not less than 100% of fixed remuneration. grants of performance rights are subject to performance hurdles and vesting criteria set by the board (refer to section d3 for details).
There was no sign-on incentive associated with mr sindel’s appointment as managing director.
The contract is for an indefinite duration. under the executive service agreement, mr sindel’s employment can be terminated by:
• the company giving him 12 months’ notice of termination; or
• mr sindel giving six months’ notice of resignation.

26 csr annual rePorT 2011
under his executive services agreement, mr sindel’s incentives are treated in the event of termination, or a change of control, as follows:
Table 12: Treatment of the managing director’s incentives on termination
circumsTance shorT Term incenTive*
long Term incenTive
unvesTed Performance righTsshares allocaTed in resPecT of vesTed Performance righTs
notice by company sTi will be paid on a pro-rata basis board discretion to allow awards to vest or remain subject to performance hurdles after termination
vested performance rights are released at time of vesting
death or permanent disability sTi will be paid on a pro-rata basis board discretion to allow awards to vest
vested performance rights are released at time of vesting
change of control and subsequent material change to managing director’s role**
sTi will be paid on a pro-rata basis board discretion to allow awards to vest or remain subject to performance hurdles after termination
vested performance rights are released at time of vesting
* any sTi payments will be paid according to the normal annual sTi payment timeframe (i.e. payment timing will not be accelerated).
** note – if the managing director resigned due to a material change in the managing director’s status (including the company undergoing a change of control), there would be an entitlement to a payment equivalent to 12 months’ notice of termination.
g – remuneration and sHareHoldings for yem11 (and ComParatives)
managing director and key managers’ long term incentives
number of casP shares included in remuneraTion unvesTed shares held in TrusT balance imPacT of share balance aT year ended under The casP a aT 1 aPril granTed vesTed laPsed b consolidaTion c 31 march d 31 march e
executive directorsrob sindel 2010 67,895 – – – – 67,895 22,632 2011 67,895 – – – (5,263) 22,632 7,544shane gannon f 2010 145,490 – – – – 145,490 48,497 2011 145,490 – – – (96,993) 48,497 16,166
senior executivesgreg barnes 2010 – – – – – – – 2011 – – – – – – –chris bertuch g 2010 205,549 – – – – 205,549 45,670 2011 205,549 – – (37,803) (111,830) 55,916 9,699ian glasson h 2010 388,532 – – – – 388,532 93,652 2011 388,532 – – (388,532) n/a – 20,476
a unvested casP shares may vest if the Tsr of csr exceeds the s&P/asX 200 accumulation index during the prescribed testing dates. an additional equivalent number of ‘top-up’ shares may be awarded if the Tsr of csr exceeds the 75th percentile of the s&P/asX 200 index during the prescribed testing dates (refer to section d3 for more detail).
b for mr bertuch, lapsed shares (representing 18% of his unvested casP shares) had been granted under the 2005 casP grant and did not meet the performance hurdle during the prescribed testing dates. as a departing sucrogen executive, 100% of mr glasson’s unvested casP shares were forfeited and a cash settlement was paid based on a third party valuation (refer to section d3 for more detail).
c on 3 march 2011, csr shares underwent a 3:1 consolidation. This column indicates the impact of the consolidation on casP shares (which equated to a reduction by two-thirds).
d balance at 31 march includes unvested shares granted under the following casP grants: mr sindel – 2008 casP grant; mr gannon – 2008 casP grant; mr bertuch – 2005 (lapsed during yem11), 2006, 2007 and 2008 casP grants; and mr glasson – 2006, 2007 and 2008 casP grants (all forfeited).
e for yem11, one-third of the casP shares purchased in 2008 at $2.062 per share.f mr gannon left the employ of csr on 15 december 2010; however, his casP shares remain on foot.g all of mr bertuch’s 55,916 post consolidation unvested casP shares were forfeited at the time of his redundancy (29 april 2011) and a cash settlement based
on a third party valuation was paid at the time of his redundancy. he has no further entitlement to any shares under the casP.h mr glasson’s unvested casP shares were forfeited on termination of employment but a cash settlement based on a third party valuation was paid at the time
of the sale of sucrogen.
note – number of performance rights granted under the PrP represents the maximum award for stretch performance, whereas under the CasP the number of shares granted represented the award for target level performance with an out-performance ‘top-up’ granted at a later date if the second performance hurdle was achieved.
remuneraTion rePorT (conTinued)

csr annual rePorT 2011 27
number of Performance righTs righTs righTs – shares – included in righTs imPacT righTs csr shares remuneraTion unvesTed righTs granTed balance righTs righTs righTs of share balance aT eligible for year ended under The PrP aT 1 aPril a granTed vesTed laPsed consolidaTion b 31 march on vesTing c 31 march d
executive directorsrob sindel 2010 473,394 – – 473,394 473,394 108,092 2011 473,394 390,087 – – (575,654) 287,827 384,951 82,289shane gannon e 2010 473,394 – – 473,394 473,394 108,092 2011 473,394 – – – (315,596) 157,798 211,045 121,767
senior executivesgreg barnes 2010 135,256 – – 135,256 135,256 30,883 2011 135,256 137,678 – – (181,956) 90,978 121,677 25,507chris bertuch f 2010 243,460 – – 243,460 243,460 55,590 2011 243,460 204,570 – – (298,687) 149,343 199,737 42,621ian glasson g 2010 473,394 – – 473,394 473,394 108,092 2011 473,394 435,980 – – (606,249) 303,125 405,410 267,094
a There were no PrP grants prior to 2010. yem10 PrP grants were expensed at $1.06 per right while yem11 PrP grants were expensed at $1.23 per right, amortised aver the vesting period. valuations of performance rights were determined by a third party accounting valuation.
b on 3 march 2011, csr shares underwent a 3:1 consolidation. This column indicates the impact of the consolidation on performance rights (which equated to a reduction by two-thirds).
c represents the number of shares that will be granted if performance rights vest. in 2010 performance rights were eligible for 1 share per 1 vested performance right. in 2011 performance rights were worth 1.337 shares per performance rights following the adjustment for the capital return on 3 march 2011. shares acquired on vesting are fully paid ordinary shares and the amount payable by kmP to acquire these shares is nil.
d for continuing executives, represents a pro-rated portion of three year vesting period from grant date for first year and one-third for previous year based on the accounting valuation described in note (a). for departing executives, all remaining performance rights (that were forfeited) not previously expensed were expensed in yem11.
e mr gannon left the employ of csr on 15 december 2010. his performance rights remain in the plan subject to ongoing performance hurdles.f mr bertuch’s remaining post consolidation 199,737 performance rights were forfeited for no consideration at the time of his redundancy (29 april 2011).g mr glasson left the csr group on 22 december 2010. his performance rights remain in the plan subject to ongoing performance hurdles.
managing director’s and senior executives’ shareholdings a
number of csr shares oPening imPacT balance included in sold or of share balance aT aT 1 aPril remuneraTion acQuired Transferred consolidaTion b 31 march
managing directorrob sindel c 2010 24,828 – 16,465 – 41,293 2011 41,293 – 4,735 – (30,684) 15,344
senior executivesgreg barnes 2010 – – 2,500 – 2,500 2011 2,500 – 2,959 – (3,638) 1,821
chris bertuch 2010 365,607 – 99,796 – 465,403 2011 465,403 – 1,100 – (311,001) 155,502
shane gannon 2010 – – 25,461 – 25,461 2011 25,461 – – – (16,974) 8,487
ian glasson 2010 60,856 – 40,952 – 101,808 2011 101,808 – 3,999 – (70,537) 35,270
a csr shares in which the senior executive has a beneficial interest, including shares held under the esaP and casP trusts or via their related parties, but excluding shares held under the casP which have not vested. it also includes spouse share holdings. shares held under the casP trust which have not vested are disclosed in the table “managing director and key managers’ long Term incentives” above.
b on 3 march 2011 csr underwent a 3:1 share consolidation. This column indicates the impact of the consolidation on the shareholding (which equated to a reduction by two thirds).
c mr sindel was not a director until 15 december 2010, and was appointed as managing director on 1 January 2011.

28 csr annual rePorT 2011
managing director’s and senior executives’ remunerationThe remuneration table below shows a higher level of disclosed remuneration for the kmP in yem11 versus yem10. The increases in the disclosed remuneration quantum are a result of (a) the promotions for mr sindel and mr barnes from divisional to corporate level roles and associated revised remuneration arrangements and (b) the participation of mr bertuch in the enhanced sTi Plan related to the sale of sucrogen.
$ year ended fiXed lTi oTher ToTal (incl aT vesTed ToTal acTual 31 march remuneraTion a sTi b usoP accrual c benefiTs d accrued lTi) risk e aT risk f remuneraTion g
managing directorrob sindel 2010 650,000 576,000 – 161,233 3,900 1,391,133 53% 41% 1,229,900 2011 900,000 550,000 – 323,559 8,250 1,781,809 49% 31% 1,458,250
senior executivesgreg barnes h 2010 240,217 153,075 – 32,733 50,000 476,025 39% 32% 443,292 2011 414,583 189,583 – 86,453 2,488 693,107 40% 27% 606,654
a fixed remuneration may be allocated at the executive’s discretion to cash, superannuation (subject to legislative minimums), motor vehicles and certain other benefits.
b The minimum entitlement to an sTi payment is zero and the target entitlement as a % of fixed remuneration for the year ended 31 march 2011 is 50% for senior executives, and 70% for the managing director. maximum potential sTi entitlement is 100% of fixed remuneration. sTi payments may be allocated at the executive’s discretion to cash or additional superannuation contributions.
c ‘long term incentive accrual’ is as defined in the accounting standards. includes the amortised expenses for the 2008 casP grant, and for the yem10 and yem11 PrP grants (for participating employees – refer to tables on pages 26–27 for lTi grant participation by kmP).
d in the years ended 31 march 2010 and 31 march 2011, other benefits included an allowance for long service leave for senior executives. other benefits for year ended 31 march 2011 also included spouse travel for rob sindel.
e sTi plus lTi, as a percentage of total remuneration.f represents the proportion of total remuneration (including accrued lTi) that has vested.g represents the total of all remuneration package components excluding any lTi amounts that were accrued but not vested. There was no vesting of lTi awards
from previous years in the year ended 31 march 2011. This figure represents what was actually earned by the executive for the year ended 31 march 2011.h mr barnes was not a kmP until he assumed the role of cfo of csr limited on 15 december 2010.
former managing director’s and senior executives’ remuneration$ long Term Termin- year ended fiXed shorT Term incenTive aTion oTher ToTal (incl aT vesTed ToTal acTual 31 march remuneraTion a incenTive b usoP accrual c benefiTs d benefiTs e accrued lTi) risk f aT risk g remuneraTion h
managing directorJeremy sutcliffe (managing director) i
2010 – – – – – – – – – –2011 975,000 1,300,000 – – 354,243 – 2,629,243 49% 49% 2,629,243
senior executiveschris bertuch (general counsel & company secretary) j
2010 512,500 462,000 – 178,920 – 10,250 1,163,670 55% 40% 984,7502011 542,719 545,042 – 230,242 739,951 – 2,057,954 38% 26% 1,827,712shane gannon (chief financial officer) k
2010 755,000 649,000 – 100,000 – 6,603 1,510,603 50% 43% 1,410,6032011 548,934 647,853 – 601,973 792,269 – 2,591,029 48% 25% 1,989,056ian glasson (chief executive officer sucrogen) l
2010 815,000 701,000 – 357,899 – 13,302 1,887,201 56% 37% 1,529,3022011 688,406 475,000 – 1,050,154 425,500 21,255 2,660,315 57% 34% 1,610,161Total senior executives (excluding the managing director)2010 2,082,500 1,812,000 – 636,819 – 30,155 4,561,474 54% 40% 3,924,6552011 1,780,059 1,667,895 – 1,882,369 1,957,720 21,255 7,309,298 49% 29% 5,426,929
a fixed remuneration may be allocated at the executive’s discretion to cash, superannuation (subject to legislative minimums), motor vehicles and certain other benefits.
b The minimum entitlement to an sTi payment is zero and the target entitlement as a % of fixed remuneration for the year ended 31 march 2011 is 50% for senior executives. maximum potential sTi entitlement is 100% of annual fixed remuneration. sTi payments may be allocated at the executive’s discretion to cash or additional superannuation contributions.
c ‘long term incentive accrual’ is as defined in the accounting standards. includes the amortised expenses for the 2008 casP grant, and for the yem10 and yem11 PrP grants (for participating employees – refer to tables on pages 26–27 for lTi grant participation by kmP).
d includes severance payments, current year’s long service leave accrual and payments to messrs glasson and bertuch associated with cancellation of their unvested casP shares (see footnotes j and l below). excludes any long service leave or annual leave accrued in previous years and paid out on termination of employment.
e in yem10, other benefits included an allowance for long service leave for senior executives. any allowance for long service leave in yem11 is included in ‘termination benefits’ for terminated executives. other benefits for yem11 also included spouse travel for mr glasson.
f sTi plus lTi, as a percentage of total remuneration.g represents the proportion of total remuneration (including accrued lTi) that has vested.h This figure represents what was actually earned by the executive for the year. represents the total of all remuneration package components excluding any lTi
amounts that did not vest during the year.i mr sutcliffe was employed as a ned from January to march 2011, and his 2010 disclosed remuneration excludes his ned fees, which are disclosed under the
‘director’s remuneration’ table. he acted as interim managing director from 1 april 2010 until 31 december 2010. an sTi payment of $1,300,000 was approved by the board. under the terms of his contract, mr sutcliffe was not entitled to any lTi, and was entitled to three months’ notice at the cessation of his executive role. his his termination benefit included $25,343 of annual leave already accrued (refer to section f for detail). a long service leave accrual of $3,900 is included in the termination benefit disclosed above but was not paid out.
remuneraTion rePorT (conTinued)
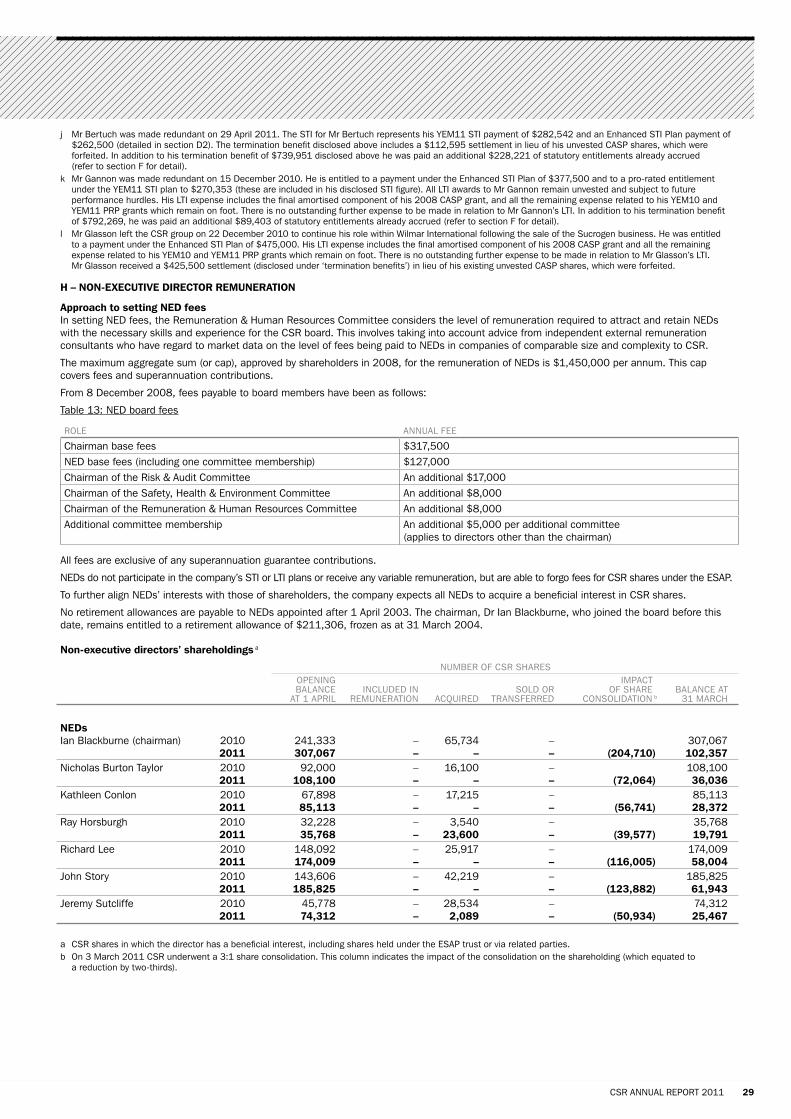
csr annual rePorT 2011 29
j mr bertuch was made redundant on 29 april 2011. The sTi for mr bertuch represents his yem11 sTi payment of $282,542 and an enhanced sTi Plan payment of $262,500 (detailed in section d2). The termination benefit disclosed above includes a $112,595 settlement in lieu of his unvested casP shares, which were forfeited. in addition to his termination benefit of $739,951 disclosed above he was paid an additional $228,221 of statutory entitlements already accrued (refer to section f for detail).
k mr gannon was made redundant on 15 december 2010. he is entitled to a payment under the enhanced sTi Plan of $377,500 and to a pro-rated entitlement under the yem11 sTi plan to $270,353 (these are included in his disclosed sTi figure). all lTi awards to mr gannon remain unvested and subject to future performance hurdles. his lTi expense includes the final amortised component of his 2008 casP grant, and all the remaining expense related to his yem10 and yem11 PrP grants which remain on foot. There is no outstanding further expense to be made in relation to mr gannon’s lTi. in addition to his termination benefit of $792,269, he was paid an additional $89,403 of statutory entitlements already accrued (refer to section f for detail).
l mr glasson left the csr group on 22 december 2010 to continue his role within wilmar international following the sale of the sucrogen business. he was entitled to a payment under the enhanced sTi Plan of $475,000. his lTi expense includes the final amortised component of his 2008 casP grant and all the remaining expense related to his yem10 and yem11 PrP grants which remain on foot. There is no outstanding further expense to be made in relation to mr glasson’s lTi. mr glasson received a $425,500 settlement (disclosed under ‘termination benefits’) in lieu of his existing unvested casP shares, which were forfeited.
H – non-exeCutive direCtor remuneration
approach to setting ned feesin setting ned fees, the remuneration & human resources committee considers the level of remuneration required to attract and retain neds with the necessary skills and experience for the csr board. This involves taking into account advice from independent external remuneration consultants who have regard to market data on the level of fees being paid to neds in companies of comparable size and complexity to csr.
The maximum aggregate sum (or cap), approved by shareholders in 2008, for the remuneration of neds is $1,450,000 per annum. This cap covers fees and superannuation contributions.
from 8 december 2008, fees payable to board members have been as follows:
Table 13: ned board fees
role annual fee
chairman base fees $317,500ned base fees (including one committee membership) $127,000chairman of the risk & audit committee an additional $17,000chairman of the safety, health & environment committee an additional $8,000chairman of the remuneration & human resources committee an additional $8,000additional committee membership an additional $5,000 per additional committee
(applies to directors other than the chairman)
all fees are exclusive of any superannuation guarantee contributions.
neds do not participate in the company’s sTi or lTi plans or receive any variable remuneration, but are able to forgo fees for csr shares under the esaP.
To further align neds’ interests with those of shareholders, the company expects all neds to acquire a beneficial interest in csr shares.
no retirement allowances are payable to neds appointed after 1 april 2003. The chairman, dr ian blackburne, who joined the board before this date, remains entitled to a retirement allowance of $211,306, frozen as at 31 march 2004.
non-executive directors’ shareholdings a
number of csr shares oPening imPacT balance included in sold or of share balance aT aT 1 aPril remuneraTion acQuired Transferred consolidaTion b 31 march
nedsian blackburne (chairman) 2010 241,333 – 65,734 – 307,067 2011 307,067 – – – (204,710) 102,357nicholas burton Taylor 2010 92,000 – 16,100 – 108,100 2011 108,100 – – – (72,064) 36,036kathleen conlon 2010 67,898 – 17,215 – 85,113 2011 85,113 – – – (56,741) 28,372ray horsburgh 2010 32,228 – 3,540 – 35,768 2011 35,768 – 23,600 – (39,577) 19,791richard lee 2010 148,092 – 25,917 – 174,009 2011 174,009 – – – (116,005) 58,004John story 2010 143,606 – 42,219 – 185,825 2011 185,825 – – – (123,882) 61,943Jeremy sutcliffe 2010 45,778 – 28,534 – 74,312 2011 74,312 – 2,089 – (50,934) 25,467
a csr shares in which the director has a beneficial interest, including shares held under the esaP trust or via related parties.b on 3 march 2011 csr underwent a 3:1 share consolidation. This column indicates the impact of the consolidation on the shareholding (which equated to
a reduction by two-thirds).

30 csr annual rePorT 2011
non-executive directors’ remuneration$ year ended 31 march year direcTors’ fees suPerannuaTion ToTal
non-executive directorsian blackburne (chairman) a 2010 317,500 28,575 346,075 2011 317,500 28,575 346,075nicholas burton Taylor 2010 144,000 12,960 156,960 2011 132,000 11,880 143,880kathleen conlon 2010 144,000 12,960 156,960 2011 132,000 11,880 143,880ray horsburgh 2010 147,000 13,230 160,230 2011 135,000 12,150 147,150richard lee 2010 155,000 13,950 168,950 2011 135,000 12,150 147,150John story 2010 164,000 14,760 178,760 2011 144,000 12,960 156,960Jeremy sutcliffe b 2010 157,000 14,130 171,130 2011 33,000 2,970 35,970Total non-executive directors c 2010 1,228,500 110,565 1,339,065 2011 1,028,500 92,565 1,121,065
a as dr blackburne did not receive any committee fees for participation in the due diligence committee meetings in 2010, his remuneration did not decrease from 2010 to 2011 as occurred for other the csr neds.
b 2011 figures represent what mr sutcliffe earned as an ned from January to march 2011. from april to december 2010, mr sutcliffe was interim managing director, and remuneration for this period is disclosed on page 28.
c The reduction in total fees from 2010 to 2011 was due to inclusion of one-off due diligence committee fees related to the separation of the sucrogen business that were expensed during yem10, and were previously detailed in the yem10 csr remuneration report.
remuneraTion rePorT (conTinued)

csr annual rePorT 2011 31
The directors of csr limited (csr) present their report of the consolidated entity, being csr and its controlled entities (csr group), for the year ended 31 march 2011 and the auditor’s report thereon. information in the annual report referred to in this report, including the remuneration report, or contained in a note to the financial statements referred to in this report, forms part of, and is to be read as part of, this report.
review of oPerations and resultsa review of csr group operations and the results for the year ended 31 march 2011 are set out on the inside front cover to page 4 and pages 33 to 74 of the annual report. This includes information on the csr group’s financial position, and the business strategies and prospects of the csr group for future years. This report omits information about strategies and prospects for future years that would unreasonably prejudice csr.
signifiCant CHangeson 22 december 2010, csr completed the sale of:
• its sucrogen business to wilmar international limited for an enterprise value of a$1.75 billion; and
• its asian insulation business to rockwool group for a$128 million.
PrinCiPal aCtivitiesThe principal activities of entities in the csr group during the year included the manufacture and supply of building products in australia, new Zealand, china, malaysia, singapore and Thailand (noting the asian insulation business was sold in december 2010).
in australia, the csr group has an interest in the smelting of aluminium through its 70% interest in gove aluminium finance limited, which owns 36.05% of the Tomago aluminium smelter. also in australia, csr maximises returns from the sale of industrial land by advancing sites through stages of the development process.
until 22 december 2010, the csr group milled raw sugar from sugarcane as well as producing renewable electricity and ethanol in australia, and manufactured and distributed refined sugar products in australia and new Zealand. The csr group no longer carries out these activities following the sale of its sucrogen business to wilmar international limited.
events after balanCe dateno matter or circumstance has arisen since the end of the year that has significantly affected or may significantly affect the csr group’s operations, the results of those operations or the csr group’s state of affairs in future financial years.
likely develoPmentslikely developments in the operations of the csr group in the future and the expected results are set out in the inside front cover to page 4 and pages 33 to 74. This report omits information about likely developments and expected future results that would unreasonably prejudice csr. developments which have arisen by the time of the annual general meeting on Thursday 7 July 2011 will be reported to the meeting.
PerformanCe in relation to environmental regulationThe board places a high priority on environmental issues and is satisfied that adequate systems are in place for the management of the csr group’s compliance with applicable environmental regulations under the laws of the commonwealth, states and Territories. csr is not aware of any pending prosecutions relating to environmental issues last year, nor is csr aware of any environmental issues, not provided for, which would materially affect the business as a whole.
PolitiCal donationscsr contributed $40,086 excluding gsT in direct and indirect donations to political parties in the year ended 31 march 2011 (2010: $64,805). csr’s businesses are often involved in a degree of interaction with all levels of government. csr assists all sides of politics in the development of policy in fields where csr has specific expertise. all donations are disclosed in accordance with csr’s obligations to the australian electoral commission.
dividends and distributions to sHareHoldersa final dividend for the year ended 31 march 2011 of 5.3 cents per ordinary share, fully-franked, will be paid on 5 July 2011. dividends and the capital return paid and declared during the year are in notes 24 and 27 to the financial statements on pages 54 and 55. other than those disclosed in notes 24 and 27, no other distributions were paid, declared or recommended during the year.
direCtors, seCretaries, direCtors’ meetings and direCtors’ sHareHoldingsas noted in the chairman’s review on page 2, there have been significant changes to csr’s board throughout the last 12 months. The names of directors who held office at 12 may 2011, as well as details about current directors’ period of appointment, qualifications, age, experience, special responsibilities, current directorships and directorships for the past three years of other listed companies, are on page 5. The qualifications and experience of the company secretary at 12 may 2011 are also on page 5.
details about meetings of the board and of board committees, including attendance, are on page 11 and the directors’ relevant interests in shares in csr or a related body corporate as at the date of this report are on page 11. other than as disclosed elsewhere in this report, no director:
• has any relevant interest in debentures of, or interests in a registered scheme made available by, csr or a related body corporate;
• has any rights or options over shares in, debentures of or interests in a registered scheme made available by, csr or a related body corporate; or
• is a party to or entitled to a benefit under any contracts that confer a right to call for or deliver shares in, debentures of or interests in a registered scheme made available by csr or a related body corporate.
oPtions over sHare CaPitalother than as disclosed in the remuneration report:
• no csr options were granted to executives or non-executive directors during the year;
• there were no unissued shares or interests in csr subject to options at the date of this report; and
• no csr shares or interests were issued pursuant to exercised options during or since the end of the year.
indemnities and insuranCeunder clause 101 of csr’s constitution, csr indemnifies every person who is or has been an officer of csr, to the extent permitted by law and subject to the restrictions in sections 199a and 199b of the corporations act against:
• liability to third parties (other than related csr companies) arising out of conduct undertaken in good faith in their capacity as a csr officer; and
• the costs and expenses of defending legal proceedings arising out of conduct undertaken in their capacity as a current or former csr officer, unless the defence is unsuccessful.
for the purposes of clause 101 of csr’s constitution, “officer” means a director, secretary and executive officer (as previously defined in the corporations act 2001). csr has entered into a deed of indemnity with current and former directors of csr and its subsidiaries. The deeds of indemnity are substantially in the form approved by shareholders in July 1999.
The company has a similar policy covering all employees.
direcTors’ rePorT
32 csr annual rePorT 2011
csr’s external auditor is not indemnified under clause 101 of csr’s constitution or any other agreement.
during the year, csr paid premiums in respect of insurance contracts for the year ended 31 march 2011 and since the end of the year csr has paid, or agreed to pay, premiums in respect of such contracts for the year ending 31 march 2012. The insurance contracts insure against certain liability (subject to exclusion) incurred by persons who are or have been directors or officers of csr and its controlled entities. in accordance with normal commercial practice, the insurance contract prohibits disclosure of the nature of the liability covered by, or the premium payable under, the contract of insurance. no claims under the indemnities have been made against csr during or since the end of the year.
auditor indePendenCeThere is no current or former partner or director of deloitte Touche Tohmatsu, csr’s auditor, who is, or was at any time during the year ended 31 march 2011, an officer of the csr group. no auditor played a significant role in the csr group audit for the year ended 31 march 2011 in reliance on a declaration made under section 342a of the corporations act 2001 (i.e. the asic relaxation of requirements to rotate persons who play a significant role in the audit every five years). The auditor’s independence declaration (made under section 307c of the corporations act 2001) is set out on page 74 and forms part of this report.
non-audit serviCesdetails of the amounts paid or payable to the csr group auditor, deloitte Touche Tohmatsu, for non-audit services provided by that firm during the year are shown in note 30 to the financial statements on page 57. in accordance with written advice provided by the risk & audit committee, the directors are satisfied that the provision of non-audit services during the year by deloitte Touche Tohmatsu:
• is compatible with the general standard of independence for auditors imposed by the corporations act 2001; and
• did not compromise the auditor independence requirements of the corporations act 2001 in view of the materiality of the amounts, the nature of the services and the processes established to monitor the independence of the auditors.
ProCeedings on beHalf of Csrno proceedings have been brought, or intervened in, on behalf of csr, nor has any application for leave been made in respect of csr under section 237 of the corporations act 2001 (which allows current and former members and officers and certain other persons to bring proceedings on behalf of a company).
remuneration of direCtors and senior exeCutivesThe remuneration report on pages 12 to 30, which forms part of the directors’ report, provides a summary of the board’s remuneration policy and practices during the past year as they apply to directors and executives (including ‘key management personnel’ as defined by the accounting standard aasb 124 ‘related Party disclosures’); the relationship between remuneration policy and the csr group’s performance; a detailed summary of performance rights granted to executives (including the applicable performance conditions, why they were chosen and how performance is measured against them); and the remuneration details for each director and executive.
ian blaCkburne chairman
rob sindel managing director
11 may 2011
direcTors’ rePorT (conTinued)
csr annual rePorT 2011 33
csr limiTed and iTs conTrolled enTiTies (csr grouP)year ended 31 march 2011
statement of financial performance 34
statement of financial position 35
statement of comprehensive income 36
statement of changes in equity 37
statement of cash flows 38
significant accounting policies 39
notes to the financial statements 42
1 segment information 422 reconciliation of retained profits (losses) 443 other income and expenses from continuing operations 444 significant items from continuing operations 455 net finance cost – continuing operations 466 interest income – continuing operations 467 depreciation and amortisation – continuing operations 468 income taxes – continuing operations 469 discontinued operations and controlled entities disposed during the year 4810 cash and cash equivalents 4911 inventories 4912 receivables 5013 other financial assets 5014 other assets 5015 Property, plant and equipment 5116 movements in property, plant and equipment 5117 goodwill 5118 other intangible assets 5219 Payables and other liabilities 5220 borrowings 5221 other financial liabilities 5322 credit facilities and maturity profile 5323 Provisions 5324 issued capital 5425 reserves 5426 non-controlling interests 5527 dividends and franking credits 5528 related party information 5529 interest in joint venture operation 5730 auditor’s remuneration 5731 csr limited disclosures 5832 superannuation commitments 5933 financial risk management 6134 equity accounting information 6635 Particulars relating to controlled entities 6736 contracted operational expenditure 6837 contracted capital expenditure 6838 contingent liabilities 6839 Product liability 6940 acquisitions of controlled entities and businesses 7141 subsequent events 71
directors’ declaration 72
independent auditor’s report to the members of Csr limited 73
auditor’s independence declaration to the directors of Csr limited 74
financial rePorT

34 csr annual rePorT 2011
csr limiTed and iTs conTrolled enTiTiesyear ended 31 march
sTaTemenT of financial Performance
csr grouP($ million) noTe 2011 2010
Continuing operationsTrading revenue – sale of goods 1,913.6 1,936.3cost of sales (1,323.0) (1,341.8)gross margin from continuing operations 590.6 594.5warehouse and distribution costs (184.2) (187.9)selling costs (159.9) (155.8)administration and other operating costs (62.1) (72.1)share of net profit of associates 10.5 10.8operating profit from continuing operations 194.9 189.5other income 3 19.9 34.4other expenses 3 (222.3) (279.5)loss from continuing operations before finance and income tax (7.5) (55.6)interest income 6 11.2 1.4finance cost 5 (68.2) (95.8)loss from continuing operations before income tax (64.5) (150.0)income tax benefit (expense) from continuing operations 8 9.5 (14.1)net loss from continuing operations (55.0) (164.1)net profit from discontinued operations a 589.0 88.8net profit (loss) 534.0 (75.3)net profit from continuing operations attributable to non-controlling interests 23.0 22.4net profit from discontinued operations attributable to non-controlling interests 7.6 14.0net profit attributable to non-controlling interests 30.6 36.4net loss from continuing operations attributable to shareholders of csr limited (78.0) (186.5)net profit from discontinued operations attributable to shareholders of csr limited 9 581.4 74.8net profit (loss) attributable to shareholders of Csr limited 503.4 (111.7)net profit before significant items from continuing operations attributable to shareholders of csr limited 4 90.2 80.0net profit before significant items from discontinued operations attributable to shareholders of csr limited 9 39.3 93.4net profit before significant items attributable to shareholders of Csr limited 129.5 173.4
(cenTs)
from continuing and discontinued operationsbasic earnings per share – based on net profit (loss) attributable to shareholders of csr limited b 99.6 (24.5)diluted earnings per share – based on net profit (loss) attributable to shareholders of csr limited b 99.6 (24.5)
from continuing operationsbasic earnings per share – based on net loss attributable to shareholders of csr limited b (15.4) (40.9)diluted earnings per share – based on net loss attributable to shareholders of csr limited b (15.4) (40.9)
a discontinued operations relate to sucrogen and asian insulation businesses sold prior to 31 march 2011.b weighted number of ordinary shares on issue used in the calculation of earnings per share is 505.6 million (2010: 456.2 million). The 2010 amount has been
restated for the 3:1 share consolidation completed on 3 march 2011.
notes to the financial statements are annexed.
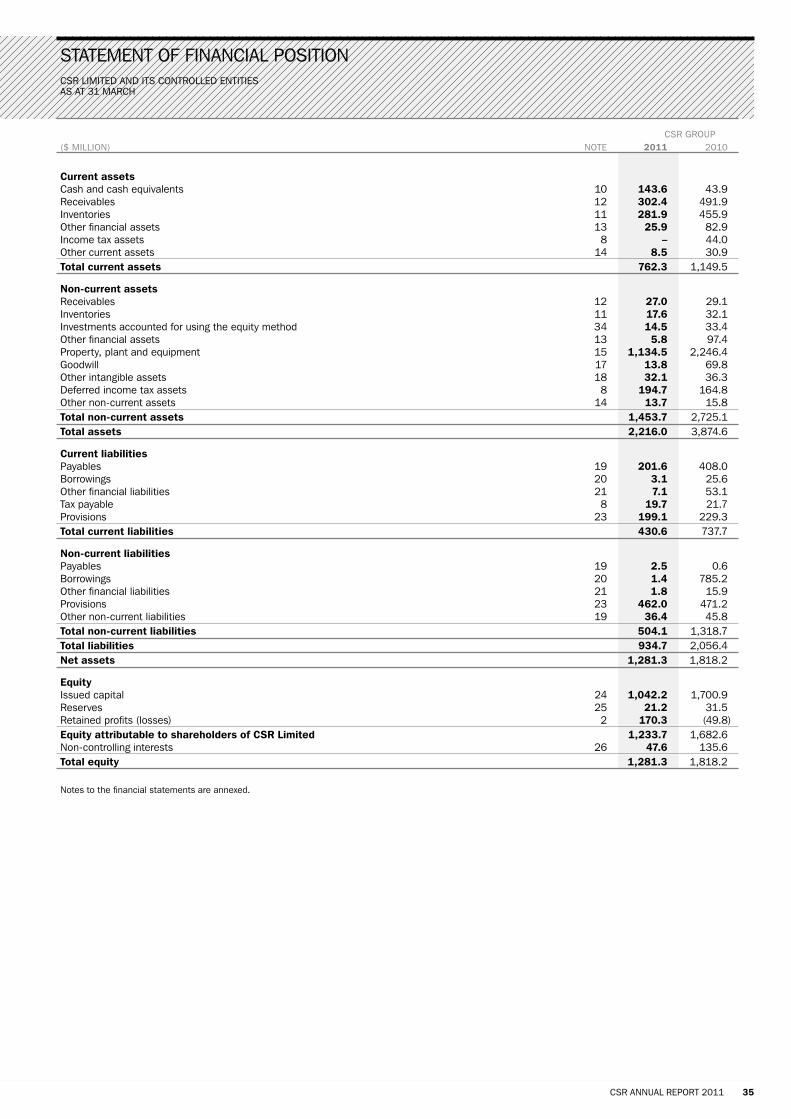
csr annual rePorT 2011 35
csr limiTed and iTs conTrolled enTiTiesas aT 31 march
sTaTemenT of financial PosiTion
csr grouP($ million) noTe 2011 2010
Current assetscash and cash equivalents 10 143.6 43.9receivables 12 302.4 491.9inventories 11 281.9 455.9other financial assets 13 25.9 82.9income tax assets 8 – 44.0other current assets 14 8.5 30.9total current assets 762.3 1,149.5
non-current assetsreceivables 12 27.0 29.1inventories 11 17.6 32.1investments accounted for using the equity method 34 14.5 33.4other financial assets 13 5.8 97.4Property, plant and equipment 15 1,134.5 2,246.4goodwill 17 13.8 69.8other intangible assets 18 32.1 36.3deferred income tax assets 8 194.7 164.8other non-current assets 14 13.7 15.8total non-current assets 1,453.7 2,725.1total assets 2,216.0 3,874.6
Current liabilitiesPayables 19 201.6 408.0borrowings 20 3.1 25.6other financial liabilities 21 7.1 53.1Tax payable 8 19.7 21.7Provisions 23 199.1 229.3total current liabilities 430.6 737.7
non-current liabilitiesPayables 19 2.5 0.6borrowings 20 1.4 785.2other financial liabilities 21 1.8 15.9Provisions 23 462.0 471.2other non-current liabilities 19 36.4 45.8total non-current liabilities 504.1 1,318.7total liabilities 934.7 2,056.4net assets 1,281.3 1,818.2
equityissued capital 24 1,042.2 1,700.9reserves 25 21.2 31.5retained profits (losses) 2 170.3 (49.8)equity attributable to shareholders of Csr limited 1,233.7 1,682.6non-controlling interests 26 47.6 135.6total equity 1,281.3 1,818.2
notes to the financial statements are annexed.

36 csr annual rePorT 2011
csr limiTed and iTs conTrolled enTiTiesyear ended 31 march
sTaTemenT of comPrehensive income
csr grouP($ million) 2011 2010
net loss from continuing operations (55.0) (164.1)net profit from discontinued operations 589.0 88.8net profit (loss) 534.0 (75.3)
other comprehensive (expense) income from continuing operationsexchange differences arising on translation of foreign operations (3.5) (1.0)hedge profit recognised in equity 2.3 4.8hedge loss transferred to the statement of financial performance (20.5) (67.4)actuarial (loss) gain on superannuation defined benefit plans (11.8) 51.9income tax relating to components of other comprehensive income 9.1 3.2other comprehensive expense for the period (net of tax) from continuing operations (24.4) (8.5)
other comprehensive (expense) income from discontinued operationsexchange differences arising on translation of foreign operations (2.4) (32.1)fair value adjustment for sugar Terminals limited – 4.1reclassification adjustments relating to foreign currency translation and hedge reserves 93.5 –hedge (loss) profit recognised in equity (108.2) 36.3hedge (loss) profit transferred to the statement of financial performance (9.3) 32.1income tax relating to components of other comprehensive income 35.2 (20.6)other comprehensive income for the period (net of tax) from discontinued operations 8.8 19.8Total comprehensive expense from continuing operations (79.4) (172.6)Total comprehensive income from discontinued operations 597.8 108.6total comprehensive income (expense) 518.4 (64.0)
Total comprehensive income (expense) attributable to:shareholders of csr limited 480.5 (75.8)non-controlling interests 37.9 11.8total comprehensive income (expense) 518.4 (64.0)
shareholders of csr limited from continuing operations (98.4) (180.6)non-controlling interests from continuing operations 19.0 8.0Total comprehensive expense from continuing operations (79.4) (172.6)
shareholders of csr limited from discontinued operations 578.9 104.8non-controlling interests from discontinued operations 18.9 3.8Total comprehensive income from discontinued operations 597.8 108.6total comprehensive income (expense) 518.4 (64.0)
notes to the financial statements are annexed.

csr annual rePorT 2011 37
csr limiTed and iTs conTrolled enTiTiesyear ended 31 march
sTaTemenT of changes in eQuiTy
aTTribuTable foreign To csr currency emPloyee reTained limiTed non- issued hedge TranslaTion share oTher (losses)/ share- conTrolling csr grouP ($ million) caPiTal reserve reserve reserve reserves ProfiTs holders inTeresTs ToTal
balance at 1 april 2010 1,700.9 32.3 (18.7) 12.6 5.3 (49.8) 1,682.6 135.6 1,818.2net profit – – – – – 503.4 503.4 30.6 534.0exchange differences arising on translation of foreign operations – – (6.3) – – – (6.3) 0.4 (5.9)reclassification adjustments relating to foreign currency translation and hedge reserves on discontinued operations – 81.1 12.4 – – – 93.5 – 93.5Hedge (loss) profit recognised in equity – (119.6) – – – – (119.6) 13.7 (105.9)Hedge loss transferred to the statement of financial performance – (25.9) – – – – (25.9) (3.9) (29.8)actuarial loss on superannuation defined benefit plans – – – – – (11.8) (11.8) – (11.8)income tax relating to components of other comprehensive income – 43.7 – – – 3.5 47.2 (2.9) 44.3total comprehensive (expense) income – (20.7) 6.1 – – 495.1 480.5 37.9 518.4shares issued 2.6 – – 2.6 – – 5.2 – 5.2Payment of ordinary dividends – – – – – (136.4) (136.4) (32.2) (168.6)Payment of special dividend – – – – – (138.6) (138.6) – (138.6)Capital return (661.3) – – – – – (661.3) – (661.3)recognition of share based payments – – – 1.7 – – 1.7 – 1.7net contribution to joint venture partner (4.7) (4.7)disposal of non-controlling interests – – – – – – – (89.0) (89.0)balance at 31 march 2011 1,042.2 11.6 (12.6) 16.9 5.3 170.3 1,233.7 47.6 1,281.3
balance at 1 april 2009 1,329.2 3.9 14.2 12.6 – 73.0 1,432.9 153.6 1,586.5net (loss) profit – – – – – (111.7) (111.7) 36.4 (75.3)exchange differences arising on translation of foreign operations – – (32.9) – – – (32.9) (0.2) (33.1)fair value adjustment for sugar Terminals limited – – – – – 4.1 4.1 – 4.1hedge profit (loss) recognised in equity – 52.4 – – – – 52.4 (11.3) 41.1hedge loss transferred to the statement of financial performance – (11.7) – – – – (11.7) (23.6) (35.3)actuarial gain on superannuation defined benefit plans – – – – – 51.9 51.9 – 51.9income tax relating to components of other comprehensive income – (12.3) – – – (15.6) (27.9) 10.5 (17.4)Total comprehensive income (expense) – 28.4 (32.9) – – (71.3) (75.8) 11.8 (64.0)shares issued 371.7 – – – – – 371.7 – 371.7Payment of dividends – – – – – (51.5) (51.5) (19.2) (70.7)net contribution from joint venture partner 5.6 5.6Purchase of non-controlling interests – – – – 5.3 – 5.3 (16.2) (10.9)balance at 31 march 2010 1,700.9 32.3 (18.7) 12.6 5.3 (49.8) 1,682.6 135.6 1,818.2
notes to the financial statements are annexed.

38 csr annual rePorT 2011
csr limiTed and iTs conTrolled enTiTiesyear ended 31 march
sTaTemenT of cash flows
csr grouP($ million) noTe 2011 2010
Cash flows from operating activitiesreceipts from customers 3,400.2 4,101.7Payments to suppliers and employees (3,141.6) (3,687.1)dividends and distributions received 7.3 19.5interest received 13.3 1.4income tax paid (64.6) (39.2)
net cash from operating activities before derivative margin calls 214.6 396.3derivative margin calls paid (29.3) (18.1)net cash from operating activities 185.3 378.2
Cash flows from investing activitiesPurchase of property, plant and equipment and other non-current assets (143.1) (239.7)Proceeds from sale of property, plant and equipment and other non-current assets 48.8 45.2net cash from disposal of discontinued operations (net of payments for transaction costs) 9 1,873.7 –Tax instalment paid on disposal of discontinued operations (60.1) –Purchase of controlled entities and businesses, net of cash acquired 40 (2.4) –Purchase of non-controlling interests – (10.9)loans and receivables repaid (advanced) 2.3 (2.0)net cash from (used in) investing activities 1,719.2 (207.4)
Cash flows from financing activitiesProceeds from issue of shares to csr limited shareholders 2.6 363.7net repayment of borrowings (794.5) (383.7)dividends paid (307.2) (65.7)capital return to csr limited shareholders (661.3) –interest and other finance costs paid (41.4) (59.0)net cash used in financing activities (1,801.8) (144.7)
net increase in cash held 102.7 26.1net cash at the beginning of the financial year 43.9 14.3effects of exchange rate changes (4.3) 3.5net cash at the end of the financial year 10 142.3 43.9
reconciliation of net profit (loss) attributable to shareholders of Csr limited to net cash from operating activitiesnet profit (loss) attributable to shareholders of csr limited 503.4 (111.7)net profit attributable to non-controlling interests 30.6 36.4depreciation and amortisation 141.8 158.0net change in provisions (33.2) (6.4)gain on disposal of discontinued operations (542.1) –significant items from continuing operations (non-cash) 149.6 250.0interest expense 38.4 57.5Profit on disposal of assets, asset write downs and associated costs (15.7) (15.8)net change in trade receivables (87.7) 28.7net change in current inventories (7.1) (18.7)net change in trade payables 36.5 (7.7)derivative margin calls paid (29.3) (18.1)other 0.1 26.0net cash from operating activities 185.3 378.2
credit facilities are shown in note 22.
notes to the financial statements are annexed.

csr limiTed and iTs conTrolled enTiTiesyear ended 31 march 2011
csr annual rePorT 2011 39
significanT accounTing Policies
basis of aCCountingThis general purpose financial report is prepared in accordance with the corporations act 2001, applicable accounting standards and interpretations, and complies with other requirements of the law.
The financial report includes the consolidated financial statements of the csr group. accounting standards include australian equivalents to international financial reporting standards (a-ifrs). compliance with a-ifrs ensures that the financial statements and notes of the csr group comply with international financial reporting standards (ifrs).
The financial report is based on historical cost, except for certain assets which are at deemed cost and the revalued amount of certain assets. in preparing this financial report, the csr group is required to make estimates and assumptions about carrying values of assets and liabilities. These estimates and assumptions are based on historical experience and various other factors that are believed to be reasonable under the circumstances. actual results may differ from these estimates. The estimates and underlying assumptions are reviewed on an ongoing basis.
The accounting policies adopted are consistent with those of the previous year, unless otherwise stated. details of the significant accounting policies adopted by the csr group are given below.
PrinCiPles of ConsolidationThe consolidated financial statements have been prepared by aggregating the financial statements of all the entities that comprise the csr group, being csr limited and its controlled entities. in these consolidated financial statements:
• results of each controlled entity are included from the date csr limited obtains control and until such time as it ceases to control an entity; and
• all inter-entity balances and transactions are eliminated.
entities controlled by csr limited are under no obligation to accept responsibility for liabilities of other common controlled entities except where such an obligation has been specifically undertaken.
CritiCal aCCounting Judgements and key sourCes of estimation unCertaintyThe following are critical judgements and key assumptions that management has made in the process of applying the csr group’s accounting policies and that have the most significant effect on the amounts recognised in the financial statements:
Product liability: csr limited and/or certain subsidiaries (csr) were involved in mining asbestos and manufacturing and marketing products containing asbestos in australia, and exporting asbestos to the united states. as a result of these activities, csr has been named as a defendant in litigation in australia and the united states.
at 31 march 2011, a provision of $448.9 million (2010: $455.3 million) has been made for all known claims and reasonably foreseeable future claims. refer note 39 for further details of the key assumptions and uncertainties in estimating this liability.
asset impairment: assets are reviewed for impairment at each reporting date in accordance with the accounting policy. where a valuation is required, the valuation is determined using discounted cash flows. management judgement is required in these valuations to forecast future cash flows and a suitable discount rate in order to calculate the present value. future cash flows take into consideration forecast changes in the building cycle, aluminium prices and exchange rates.
statement of CasH flowsnet cash is defined as cash at banks and on hand and cash equivalents, net of bank overdrafts. cash equivalents include highly liquid investments which are readily convertible to cash, and loans which are not subject to a term facility.
new and amended aCCounting standards and interPretationsThe group has adopted the following new and amended australian accounting standards and aasb interpretations as of 1 april 2010 as they are applicable for financial periods commencing on or after 1 July 2009.
• aasb 3 (revised) business combinations; and
• aasb 127 (revised) consolidated and separate financial statements.
where the adoption of the standard or interpretation is deemed to have a material impact on the financial statements or performance of the csr group, its impact is described below:
aasb 3 (revised) business combinationsThe revised standard results in a number of changes to accounting for business combinations. The changes include treatment of contingent consideration and subsequent adjustments on acquisition, measurement of non-controlling interests and acquisition related costs; and
aasb 127 (revised) consolidated and separate financial statementsThe revised standard principally affects the accounting for transactions or events that result in a change in the csr group’s interest in its subsidiaries.
aCquisition of assetsassets acquired are recorded at the cost of acquisition, being the purchase consideration determined as at the date of acquisition. in the event that settlement of all or part of the cash consideration given in the acquisition of an asset is deferred, the fair value of the purchase consideration is determined by discounting the amounts payable in the future to their value as at the date of acquisition.
leasesleases in which a significant portion of the risks and rewards of ownership are not transferred to the csr group as lessee are classified as operating leases. Payments made under operating leases (net of any incentives received by the lessor) are charged to the statement of financial performance on a straight-line basis over the period of the lease.
PayablesTrade and other payables are recognised when the csr group becomes obliged to make future payments resulting from the purchase of goods and services.
CurrenCyunless otherwise shown in the financial statements, amounts are in australian currency.
dePreCiationdepreciable assets are depreciated at rates based upon their expected economic life using the straight-line method. The economic lives of property, plant and equipment assets are detailed in note 15.
renewable energy CertifiCatesrenewable energy certificates are recognised as other assets when they have been generated and the csr group has obtained the necessary government approvals to sell them. They are valued at fair value.
intangible assetsgoodwill represents the excess of the cost of acquisition over the fair value of the identifiable assets and liabilities acquired. goodwill is not amortised, but tested annually or whenever there is an indication that the goodwill may be impaired. any impairment is recognised immediately in the statement of financial performance and is not subsequently reversed. certain trade names determined as having an indefinite life are not amortised but are assessed annually for impairment. internal costs relating to acquired intangible assets are expensed.
The cost of developing new systems, including purchased software, is deferred and subsequently amortised over the period over which the benefits are expected to arise; in most cases, this is five years.
borrowingsborrowings are recorded initially at fair value, net of transaction costs. subsequent to initial recognition, borrowings are measured at amortised cost with any difference between the initial recognised amount and the redemption value being recognised in profit or loss over the period of the borrowing using the effective interest rate method.
CaPitalisation of interestinterest is expensed as incurred except where it relates to the financing of major projects constructed for internal use, where it is capitalised up to the date of commissioning. following commissioning, the total capitalised cost including interest is amortised over the expected useful life of the asset.

csr limiTed and iTs conTrolled enTiTiesyear ended 31 march 2011
40 csr annual rePorT 2011
significanT accounTing Policies (conTinued)
inventoriesinventories are valued at the lower of cost and net realisable value. costs included in inventories consist of materials, labour and manufacturing overheads which are related to the purchase and production of inventories. The value of inventories is derived by the method most appropriate to each particular class of inventories. The major portion is valued on either a first-in-first-out or average cost basis.
signifiCant itemssignificant items are those which by their size, nature or incidence are relevant in explaining the financial performance of the csr group, and as such are disclosed separately.
revenue reCognitionsales revenue is measured at the fair value of the consideration receivable, and is recognised when each of the following conditions is met:
• persuasive evidence of an arrangement exists, which is usually in the form of a contractual arrangement;
• the significant risks and rewards of ownership of the goods have transferred from the csr group to the buyer;
• the seller’s price to the buyer is fixed or determinable; and
• collectibility is reasonably assured.
other than raw sugar sales, other products and services are sold on normal trade terms and conditions. in the case of raw sugar sold by the csr group, revenue was recognised on a provisional basis at the time of title transfer to the centralised marketing authority, based on prevailing prices, and was subject to final adjustment when the final price was advised by the centralised marketing authority. in the current and prior years, this financial adjustment was not material.
Provision for restoration and environmental reHabilitationThe net present value of estimated costs of environmental rehabilitation of commercial sites which require remediation of existing conditions resulting from present and past operations is taken up as a provision. The liability is immediately recognised when the environmental exposure is identified and the rehabilitation costs can be reliably estimated. The estimate is revised annually and the provision is adjusted accordingly.
emPloyee benefitsProvision is made for benefits accruing to employees in respect of wages and salaries, annual leave, long service leave and other employee obligations (based on wage rates expected at the time of settling the liability) when it is probable that settlement will be required and they are capable of being reliably measured.
Provisions made in respect of employee benefits expected to be settled within 12 months are measured at their nominal values using the remuneration rate expected to apply at the time of settlement.
Provisions made in respect of employee benefits which are not expected to be settled within 12 months are measured as the present value of the estimated future cash outflows to be made by the csr group.
for superannuation defined benefit plans, the cost of providing benefits is determined using the aggregate funding method (harwood superannuation fund) and the projected unit credit method (Pilkington (australia) superannuation scheme), with actuarial valuations being carried out at each reporting date. actuarial gains and losses are recognised in full, directly in retained profits, in the period in which they occur, and are presented in the statement of comprehensive income. Past service cost is recognised immediately to the extent that the benefits are already vested, and otherwise is amortised on a straight-line basis over the average period until the benefits become vested. The defined benefit obligation recognised in the statement of financial position represents the present value of the defined benefit obligation, adjusted for unrecognised past service cost, net of the fair value of the plan assets. any asset resulting from this calculation is limited to past service cost, plus the present value of available refunds and reductions in future contributions to the plan.
contributions to superannuation defined contribution plans are expensed when incurred and the csr group’s legal or constructive obligation is limited to these contributions.
tax Consolidationlegislation to allow groups, comprising a parent entity and its australian resident wholly owned entities, to elect to consolidate and be treated as a single entity for income tax purposes, was substantively enacted on 21 october 2002.
The csr group has elected for those entities within the csr group that are wholly owned australian resident entities to be taxed as a single entity from 1 april 2004.
Prior to the adoption of the tax consolidation system, csr limited, as the head entity in the tax consolidated group, agreed to compensate or be compensated by its wholly owned controlled entities for the balance of their current tax liability/(asset) and any tax loss related deferred tax asset assumed by csr limited. due to the existence of a tax funding arrangement between the entities in the tax consolidated group, amounts are recognised as payable to or receivable by csr limited and each member of the group in relation to the tax contribution amounts paid or payable between csr limited and the other members of the tax consolidated group in accordance with the arrangement.
inCome taxcurrent tax is calculated by reference to the amount of income taxes payable or recoverable in respect of the taxable income for the financial year. it is calculated using tax rates and tax laws that have been enacted or substantively enacted by the reporting date. current tax for current and prior periods is recognised as a liability (or asset) to the extent that it is unpaid (or refundable).
deferred tax is accounted for using the comprehensive balance sheet liability method in respect of temporary differences arising from differences between the carrying amount of assets and liabilities in the financial statements and the corresponding tax base of those items. in principle, deferred tax assets or liabilities are recognised for all taxable temporary differences. deferred tax assets are recognised to the extent that it is probable that sufficient taxable amounts will be available against which deductible temporary differences or unused tax losses and tax offsets can be utilised. a deferred tax liability is not recognised in relation to taxable temporary differences arising from goodwill.
deferred tax assets and liabilities are measured at the tax rates that are expected to apply to the period(s) when the asset and liability giving rise to them are realised or settled, based on tax rates (and tax laws) that have been enacted or substantively enacted by reporting date. The measurement of deferred tax assets and liabilities reflects the tax consequences that would follow from the manner in which the csr group expects, at the reporting date, to recover or settle the carrying amount of its assets and liabilities.
deferred tax assets and liabilities are not recognised for temporary differences between the carrying amount and tax bases of investments in controlled entities where the parent entity is able to control the timing of the reversal of the temporary differences and it is probable that the differences will not reverse in the foreseeable future.
deferred tax assets and liabilities are offset when they relate to income tax levied by the same taxation authority and when the csr group intends to settle the tax assets and liabilities on a net basis.
no provision for withholding tax has been made on undistributed earnings of overseas controlled entities where there is no intention to distribute those earnings.
current and deferred tax is recognised as an expense in the statement of financial performance except when it relates to items credited or debited directly to equity, in which case the deferred tax is also recognised directly in equity, or where it arises from an initial accounting for a business acquisition, in which case it is taken into account in the determination of goodwill.
csr limiTed and iTs conTrolled enTiTiesyear ended 31 march 2011
csr annual rePorT 2011 41
significanT accounTing Policies (conTinued)
ProduCt liabilityThe csr group’s provision for product liability is determined using reports provided by independent experts in each of australia and the united states. The csr group has included within the provision an appropriate prudential margin. refer to note 39 for further information on the basis for determining the product liability provision.
Joint venture and assoCiate entitiesinvestments in joint venture and associate entities have been accounted for under the equity method in the csr group financial statements.
Joint venture oPerationsinterests in joint venture operations are recorded in the financial statements by including the entity’s share of assets employed, the share of liabilities incurred, and the share of any expenses incurred in relation to joint venture operations in their respective categories.
sHare based PaymentsThe fair value determined at the grant date of the equity-settled share based payments is expensed on a straight-line basis over the vesting period, based on the csr group’s estimate of shares that will eventually vest.
foreign CurrenCyall foreign currency transactions during the financial year have been brought to account using the exchange rate in effect at the date of the transaction. foreign currency monetary items at reporting date are translated at the exchange rate existing at that date. exchange differences are brought to account in profit or loss in the period in which they arise except if designated as cash flow hedges.
on consolidation, the financial statements of the csr group’s overseas operations are translated at exchange rates prevailing at reporting date. exchange differences are recognised in the foreign currency translation reserve and recognised in profit or loss on disposal of the operation.
finanCial instrumentsderivatives are initially recognised at fair value on the date a derivative contract is entered into and are subsequently remeasured to their fair value at each reporting date. The resulting gain or loss is recognised in profit or loss immediately unless the derivative is designated and effective as a hedging instrument, in which event the timing of the recognition in income depends on the nature of the hedge relationship. The csr group designates certain derivatives as either hedges of the fair value of recognised assets or liabilities or firm commitments (fair value hedges), or hedges of highly probable forecast transactions (cash flow hedges).
fair value hedgeschanges in the fair value of derivatives that are designated and qualify as fair value hedges are recorded in profit or loss immediately, together with any changes in the fair value of the hedged asset or liability that is attributable to the hedged risk.
cash flow hedgesThe effective portion of changes in the fair value of derivatives that are designated and qualify as cash flow hedges are deferred in equity. The profit or loss relating to the ineffective portion is recognised immediately in profit or loss. amounts deferred in equity are recycled in profit or loss in the periods when the hedged item is recognised in profit or loss.
embedded derivativesderivatives embedded in other financial instruments or other host contracts are treated as separate derivatives when their risks and characteristics are not closely related to those of the host contracts.
trade reCeivablesTrade receivables are recognised initially at fair value and subsequently measured at amortised cost. an allowance for doubtful debts is raised based on a review of outstanding balances at balance date. bad debts are written off against the allowance account and any other change in the allowance account is recognised in the statement of financial performance.
borrowing Costsunwinding of the interest component of discounted assets and liabilities is treated as interest (finance cost).
roundingunless otherwise shown in the financial statements, amounts have been rounded to the nearest tenth of a million dollars and are shown by $ million. csr limited is a company of the kind referred to in the asic class order 98/100 issued 10 July 1998.
finanCial assetsfinancial assets are classified as available for sale financial assets, or loans and receivables (stated at amortised cost less impairment). The classification depends on the nature and purpose of the financial asset and is determined at the time of initial recognition.
certain shares held by the csr group (as part of the discontinued operations) are classified as being available for sale and are stated at fair value. fair value is determined in accordance with a discounted cash flow analysis. gains and losses arising from changes in fair value are recognised directly in equity, until the investment is disposed of or is determined to be impaired, at which time the cumulative gain or loss previously recognised in equity is included in profit or loss for the period.
imPairment of assetsgoodwill and intangible assets that have an indefinite useful life are not subject to amortisation and are tested annually for impairment, or more frequently if events or changes in circumstances indicate that they might be impaired.
other assets are reviewed for impairment at each reporting date to determine whether there is any indication that those assets have suffered an impairment loss. if any such indication exists, the recoverable amount of the asset is estimated in order to determine the extent of the impairment loss. if the recoverable amount of a cash generating unit is estimated to be less than its carrying amount, the carrying amount of the cash generating unit is reduced to its recoverable amount. an impairment loss is recognised in profit or loss immediately. where an impairment loss subsequently reverses (except for goodwill), the carrying amount of the asset is increased to the revised estimate of its recoverable amount, but only to the extent that the increased carrying amount does not exceed the carrying amount that would have been determined had no impairment loss been recognised for the asset. The reversal of an impairment loss is recognised immediately in profit or loss.
oPerating segmentsan operating segment is a component of an entity that engages in business activities from which it may earn revenues and incur expenses (including revenues and expenses relating to transactions with other components of the same entity), whose operating results are regularly reviewed by the entity’s chief operating decision makers – being the board of directors – to make decisions about resources to be allocated to the segment and assess its performance and for which discrete financial information is available. The csr group aggregates two or more operating segments when they have similar economic characteristics, and the segments are similar in respect of the nature of products, production processes, type of customer and the methods used to distribute the product. operating segments that meet the qualitative criteria as prescribed by aasb 8 operating segments are reported separately. however, an operating segment that does not meet the quantitative criteria is still reported separately where information about the segment would be useful to users of the financial statements.

42 csr annual rePorT 2011
aCCounting standards and interPretations not yet effeCtiveThe following australian accounting standards and interpretations have not yet been adopted by the csr group:
• aasb 124 (revised) related Party disclosures applicable to the csr group for the financial year ending 31 march 2012;
• aasb 2009-12 amendments to australian accounting standards applicable to the csr group for the financial year ending 31 march 2012;
• aasb 2009-14 amendments to australian interpretation – Prepayments of a minimum funding requirement applicable to the csr group for the financial year ending 31 march 2012;
• aasb 2010-3 amendments to australian accounting standards arising from the annual improvements Project applicable to the csr group for the financial year ending 31 march 2012;
• aasb 2010-4 further amendments to australian accounting standards arising from the annual improvements Project applicable to the csr group for the financial year ending 31 march 2012;
• aasb 2010-6 amendments to australian accounting standards – disclosures on Transfers of financial assets applicable to the csr group for the financial year ending 31 march 2013;
• aasb 9 financial instruments applicable to the csr group for the financial year ending 31 march 2014; and
• aasb 2010-7 amendments to australian accounting standards arising from aasb 9 applicable to the csr group for the financial year ending 31 march 2014.
The csr group does not anticipate that the adoption of these standards will have a material effect on its financial statements as currently presented. There will be no effect on reported income or net assets; however, presentation of financial statements and notes may be different when the accounting standards are adopted.
1. segment informationidentification of reportable segments The csr group has identified its operating segments based on the internal reports that are reviewed and used by the board of directors (the chief operating decision makers) in assessing performance and in determining the allocation of resources. The operating segments are identified by management and the board of directors based on the nature of the product sold and production processes involved. The reportable segments are based on aggregated operating segments determined by the similarity of the products produced and sold as these are the sources of the csr group’s major risks and has the most effect on the rates of return. each of the business units disclosed below has been determined as both an operating segment and a reportable segment.
types of products and servicesbuilding ProductsThe csr group’s building Products segment encompasses:
• lightweight systems (gyprock plasterboard, hebel aerated autoclaved concrete products, cemintel fibre cement, fricker ceiling systems, and rondo rollformed steel products) and insulation (bradford insulation and edmonds ventilation systems); and
• bricks and roofing (Pgh bricks, monier and wunderlich roofing, mysteel roofing solutions and Topcat safety rail).
glassThe glass business includes the operations of viridian, australia’s leading glass provider and the only manufacturer of float glass and hardcoated performance products in australia. it operates two main businesses – manufacturing clear float and coated glass from float lines in victoria and nsw and downstream value-added processing of glass from a number of facilities across australia and new Zealand.
aluminiumThe aluminium business unit relates to the csr group’s effective 25.24% interest in the Tomago aluminium smelter joint venture via a 70% interest in gove aluminium finance limited. Products from the aluminium business include aluminium ingots, billets and slabs.
PropertyThe Property business unit generates returns from the sale of industrial sites by advancing the sites through various stages of the development cycle. in addition, this business is currently involved in a small number of large-scale developments in nsw, Queensland and victoria. These projects, in most cases, are in-fill developments (currently vacant land within otherwise built up areas) located in metropolitan regions.
sucrogen (discontinued operations)The csr group’s sucrogen segment encompasses three main businesses being cane Products, sweeteners and bioethanol. The cane Products business mills sugar. it also produces by-products such as molasses (which is distilled and fermented to produce ethanol and is used as a livestock feed additive). The mills generate their own electricity, with excess electricity sold into the Queensland electricity grid. The sweeteners business refines raw sugar to produce food-grade products. The bioethanol business produces ethanol, which is used in fuels and also in pharmaceuticals, food and beverages, cosmetics, printing, aerosols and paint. This business also produces agricultural fertiliser. This segment was sold on 22 december 2010 and was included as a discontinued operation for the financial year.
accounting policies and inter-segment transactions The accounting policies used by the csr group in reporting segments internally are the same as those disclosed in the significant accounting policies included within these financial statements.
asset transfersTransfers of assets between segments are recognised at cost.
inter-segment salesfrom time to time, renewable energy certificates (recs) produced by the sucrogen segment were sold to the building Products and aluminium segments. sales of recs between segments are recorded at fair value.
it is the csr group’s policy that if items of revenue and expense are not allocated to operating segments, then any associated assets and liabilities are also not allocated to segments. This is to avoid asymmetrical allocations within segments which management believes would be inconsistent. reporting provided to the board of directors in respect of earnings is primarily measured based on earnings before interest and tax (ebiT).
The following items and associated assets and liabilities are not allocated to operating segments as they are not considered part of the core trading operations of any segment:
• corporate overheads;
• restructuring and provisions;
• net finance costs; and
• significant items.
csr limiTed and iTs conTrolled enTiTiesyear ended 31 march 2011
noTes To The financial sTaTemenTssignificanT accounTing Policies (conTinued)csr limiTed and iTs conTrolled enTiTiesyear ended 31 march 2011

csr limiTed and iTs conTrolled enTiTiesyear ended 31 march 2011
noTes To The financial sTaTemenTs
csr annual rePorT 2011 43
ProfiT (loss) before non-conTrolling income TaX income TaX inTeresTs neT ProfiT (loss)($ million) 2011 2010 2011 2010 2011 2010 2011 2010
1. segment information (Continued)business segments from continuing operationsbuilding Products 103.8 106.2 27.7 28.1 0.3 1.2 75.8 76.9glass 3.6 (1.6) 1.0 (0.5) – – 2.6 (1.1)aluminium 111.9 123.5 31.1 36.4 23.6 25.6 57.2 61.5Property 14.6 12.8 4.4 2.1 – – 10.2 10.7segment total for continuing operations 233.9 240.9 64.2 66.1 23.9 26.8 145.8 148.0corporate a (19.0) (18.6) (5.7) (5.0) – – (13.3) (13.6)restructuring and provisions b (2.9) (4.3) (0.3) (10.5) – – (2.6) 6.2earnings before interest and significant items 212.0 218.0 58.2 50.6 23.9 26.8 129.9 140.6net finance cost (57.0) (94.4) (16.4) (29.4) (0.9) (4.4) (39.7) (60.6)Continuing operations total before significant items 155.0 123.6 41.8 21.2 23.0 22.4 90.2 80.0significant items (note 4) (219.5) (273.6) (51.3) (7.1) – – (168.2) (266.5)Continuing operations total after significant items (64.5) (150.0) (9.5) 14.1 23.0 22.4 (78.0) (186.5)business segments from discontinued operationssucrogen 69.4 135.7 25.2 32.4 7.6 10.5 36.6 92.8asian insulation business 7.0 10.4 2.1 1.5 – 0.5 4.9 8.4net finance cost (2.3) (6.7) (0.1) (1.9) – 3.0 (2.2) (7.8)significant items (note 9) 692.1 (26.6) 150.0 (8.0) – – 542.1 (18.6)segment total for discontinued operations 766.2 112.8 177.2 24.0 7.6 14.0 581.4 74.8group total after significant items 701.7 (37.2) 167.7 38.1 30.6 36.4 503.4 (111.7)
addiTions To share of neT ProfiT dePreciaTion and non-currenT ToTal revenue c of associaTes amorTisaTion d asseTs e
2011 2010 2011 2010 2011 2010 2011 2010
business segments from continuing operationsbuilding Products 1,048.7 1,053.1 10.5 10.8 41.7 40.5 38.2 62.9glass 348.8 379.7 – – 26.1 23.6 20.1 33.9aluminium 519.6 513.6 – – 27.5 28.6 7.9 8.5Property 16.4 14.1 – – – 0.3 15.6 14.8segment total for continuing operations 1,933.5 1,960.5 10.5 10.8 95.3 93.0 81.8 120.1corporate a – – – – 0.7 0.4 – 14.1restructuring and provisions b – 10.2 – – – – – –interest income 11.2 1.4Continuing operations total before significant items 1,944.7 1,972.1 10.5 10.8 96.0 93.4 81.8 134.2significant items (note 4) – – – – – – – –Continuing operations total after significant items 1,944.7 1,972.1 10.5 10.8 96.0 93.4 81.8 134.2business segments from discontinued operationssucrogen 1,368.5 1,758.4 3.0 4.6 43.4 61.2 62.4 89.0asian insulation business 60.2 81.8 – – 2.4 3.4 0.3 13.3interest income 0.2 –significant items (note 9) 692.1 – – – – – – –segment total for discontinued operations 2,121.0 1,840.2 3.0 4.6 45.8 64.6 62.7 102.3group total after significant items 4,065.7 3,812.3 13.5 15.4 141.8 158.0 144.5 236.5
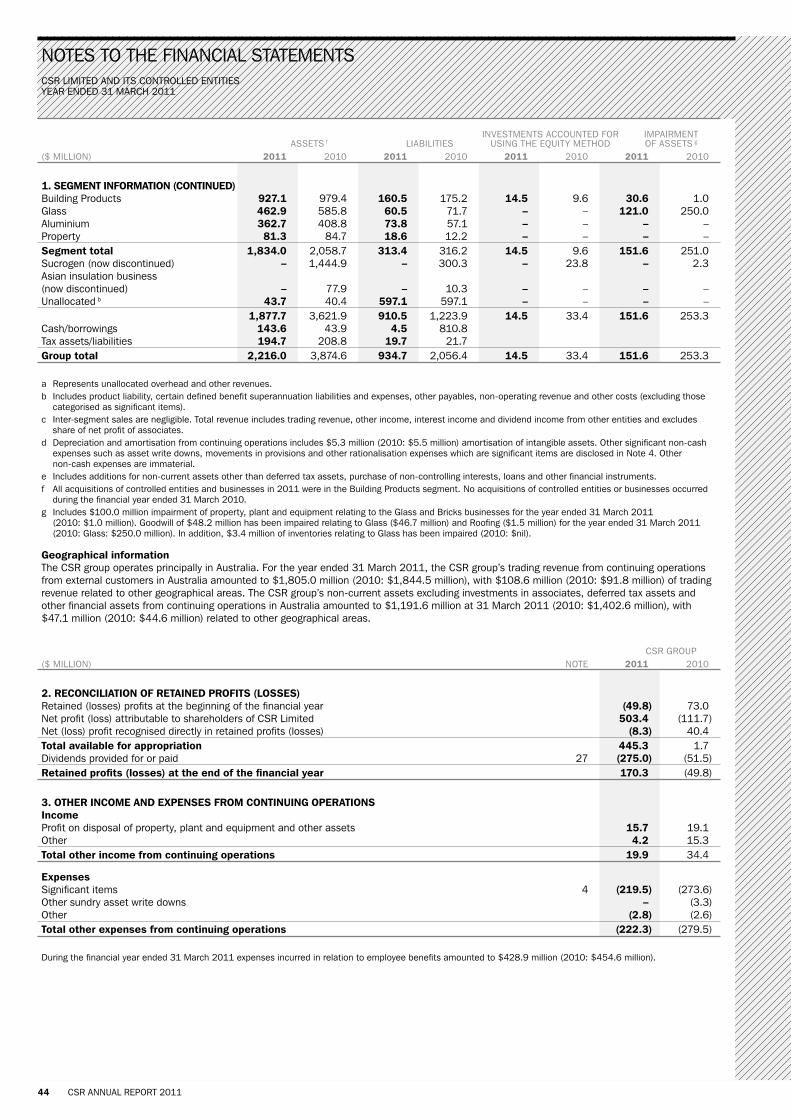
csr limiTed and iTs conTrolled enTiTiesyear ended 31 march 2011
44 csr annual rePorT 2011
noTes To The financial sTaTemenTs
invesTmenTs accounTed for imPairmenT asseTs f liabiliTies using The eQuiTy meThod of asseTs g
($ million) 2011 2010 2011 2010 2011 2010 2011 2010
1. segment information (Continued)building Products 927.1 979.4 160.5 175.2 14.5 9.6 30.6 1.0glass 462.9 585.8 60.5 71.7 – – 121.0 250.0aluminium 362.7 408.8 73.8 57.1 – – – –Property 81.3 84.7 18.6 12.2 – – – –segment total 1,834.0 2,058.7 313.4 316.2 14.5 9.6 151.6 251.0sucrogen (now discontinued) – 1,444.9 – 300.3 – 23.8 – 2.3asian insulation business (now discontinued) – 77.9 – 10.3 – – – –unallocated b 43.7 40.4 597.1 597.1 – – – – 1,877.7 3,621.9 910.5 1,223.9 14.5 33.4 151.6 253.3cash/borrowings 143.6 43.9 4.5 810.8Tax assets/liabilities 194.7 208.8 19.7 21.7group total 2,216.0 3,874.6 934.7 2,056.4 14.5 33.4 151.6 253.3
a represents unallocated overhead and other revenues.b includes product liability, certain defined benefit superannuation liabilities and expenses, other payables, non-operating revenue and other costs (excluding those
categorised as significant items).c inter-segment sales are negligible. Total revenue includes trading revenue, other income, interest income and dividend income from other entities and excludes
share of net profit of associates.d depreciation and amortisation from continuing operations includes $5.3 million (2010: $5.5 million) amortisation of intangible assets. other significant non-cash
expenses such as asset write downs, movements in provisions and other rationalisation expenses which are significant items are disclosed in note 4. other non-cash expenses are immaterial.
e includes additions for non-current assets other than deferred tax assets, purchase of non-controlling interests, loans and other financial instruments.f all acquisitions of controlled entities and businesses in 2011 were in the building Products segment. no acquisitions of controlled entities or businesses occurred
during the financial year ended 31 march 2010.g includes $100.0 million impairment of property, plant and equipment relating to the glass and bricks businesses for the year ended 31 march 2011
(2010: $1.0 million). goodwill of $48.2 million has been impaired relating to glass ($46.7 million) and roofing ($1.5 million) for the year ended 31 march 2011 (2010: glass: $250.0 million). in addition, $3.4 million of inventories relating to glass has been impaired (2010: $nil).
geographical information The csr group operates principally in australia. for the year ended 31 march 2011, the csr group’s trading revenue from continuing operations from external customers in australia amounted to $1,805.0 million (2010: $1,844.5 million), with $108.6 million (2010: $91.8 million) of trading revenue related to other geographical areas. The csr group’s non-current assets excluding investments in associates, deferred tax assets and other financial assets from continuing operations in australia amounted to $1,191.6 million at 31 march 2011 (2010: $1,402.6 million), with $47.1 million (2010: $44.6 million) related to other geographical areas.
csr grouP($ million) noTe 2011 2010
2. reConCiliation of retained Profits (losses)retained (losses) profits at the beginning of the financial year (49.8) 73.0net profit (loss) attributable to shareholders of csr limited 503.4 (111.7)net (loss) profit recognised directly in retained profits (losses) (8.3) 40.4total available for appropriation 445.3 1.7dividends provided for or paid 27 (275.0) (51.5)retained profits (losses) at the end of the financial year 170.3 (49.8)
3. otHer inCome and exPenses from Continuing oPerationsincomeProfit on disposal of property, plant and equipment and other assets 15.7 19.1other 4.2 15.3total other income from continuing operations 19.9 34.4
expensessignificant items 4 (219.5) (273.6)other sundry asset write downs – (3.3)other (2.8) (2.6)total other expenses from continuing operations (222.3) (279.5)
during the financial year ended 31 march 2011 expenses incurred in relation to employee benefits amounted to $428.9 million (2010: $454.6 million).

csr limiTed and iTs conTrolled enTiTiesyear ended 31 march 2011
csr annual rePorT 2011 45
noTes To The financial sTaTemenTs
csr grouP($ million) 2011 2010
4. signifiCant items from Continuing oPerationstermination of federal government’s energy efficient Homes Package a
stock obsolescence and inventory management costs (23.6) –income tax benefit 7.1 – (16.5) –
asset write downs and restructuring b
goodwill (48.2) (250.0)Property, plant and equipment (100.0) –other c (9.8) (6.4)Total asset write downs (158.0) (256.4)income tax benefit 32.8 1.9 (125.2) (254.5)
expense relating to product liability provision d
charge to provision (12.6) (17.2)income tax benefit 3.8 5.2 (8.8) (12.0)
legal disputes and warranties and land remediation e
charge to provision (25.3) –income tax benefit 7.6 – (17.7) –
total significant items from continuing operationssignificant items before income tax (219.5) (273.6)income tax benefit on significant items 51.3 7.1total significant items from continuing operations after income tax (168.2) (266.5)net profit before significant items from continuing operations attributable to shareholders of csr limited 90.2 80.0net loss from continuing operations attributable to shareholders of Csr limited (78.0) (186.5)
a costs of $23.6 million were incurred as a result of the abrupt termination of the federal government’s energy efficient homes Package including stock obsolescence, disposal and inventory management costs.
b csr reviews the carrying value of its assets as required under australian accounting standards. cash flows are reforecast annually, covering the next ten years and a valuation was calculated using a post-tax discount rate of 10.2%. discounted cash flows over a ten year period are appropriate given the cyclical nature of the respective industries in which csr operates. The first five years represent financial plans approved by management, based on the csr group’s view of the respective cycle, with years six to ten applying averaging assumptions to ensure cash flows in year ten are sufficiently stable to apply the terminal value. a terminal value was included from year eleven onwards including an annual growth rate of 2.5%.
viridian despite an improvement in the financial performance of the viridian business (reported as the glass segment) over the last 12 months, the csr group has reforecast future cash flows from this business to reflect current macro factors affecting this business, including the change in outlook for the australian dollar, the deterioration in commercial construction activity and a mixed commitment by government to drive energy efficient building code changes.
in relation to the valuation model prepared, the key assumptions relate to the australian dollar versus us dollar exchange rate, commercial building activity levels, average sale prices, the take up of energy efficient glass, housing starts and market share.
These assumptions were determined with reference to current performance and expected changes taking into account external forecast information where available. This valuation resulted in an impairment to the viridian business of $121.0 million, of which $46.7 million was allocated against goodwill balances, $3.4 million to inventories and the remainder to plant and equipment. in the prior financial year, an impairment of $250.0 million of goodwill was recorded.
bricks The csr group has undertaken a review of the bricks business (reported as part of the building Products segment) and has reforecast future cash flows to reflect the current outlook for housing starts and the strategic decision to reallocate land which is surplus to the bricks’ operations (and the associated forecast cash flows) to the Property segment.
in relation to the valuation model prepared, the key assumptions relate to housing starts, market share and average sale price. These assumptions were determined with reference to current performance and expected changes taking into account external forecast information where available. This valuation has resulted in an impairment being recorded against the bricks business of $29.1 million which has been allocated against property, plant and equipment.
c other items mainly relate to redundancy costs associated with the continued restructuring of the building Products and viridian businesses to secure ongoing efficiencies to better align the business with the current market, along with some corporate restructure (2010: $6.4 million).
d in the year ended 31 march 2011, the csr group recorded a charge of $12.6 million in relation to its product liability provision, reflecting an increase in the routine estimate of future asbestos related claims in the united states (after cash payments and adjustments for the present value of future claims), (2010: $17.2 million).
e during the year ended 31 march 2011, the csr group remeasured provisions in relation to land remediation obligations for some legacy factory sites and ongoing legal disputes as these matters have been advanced towards settlement.
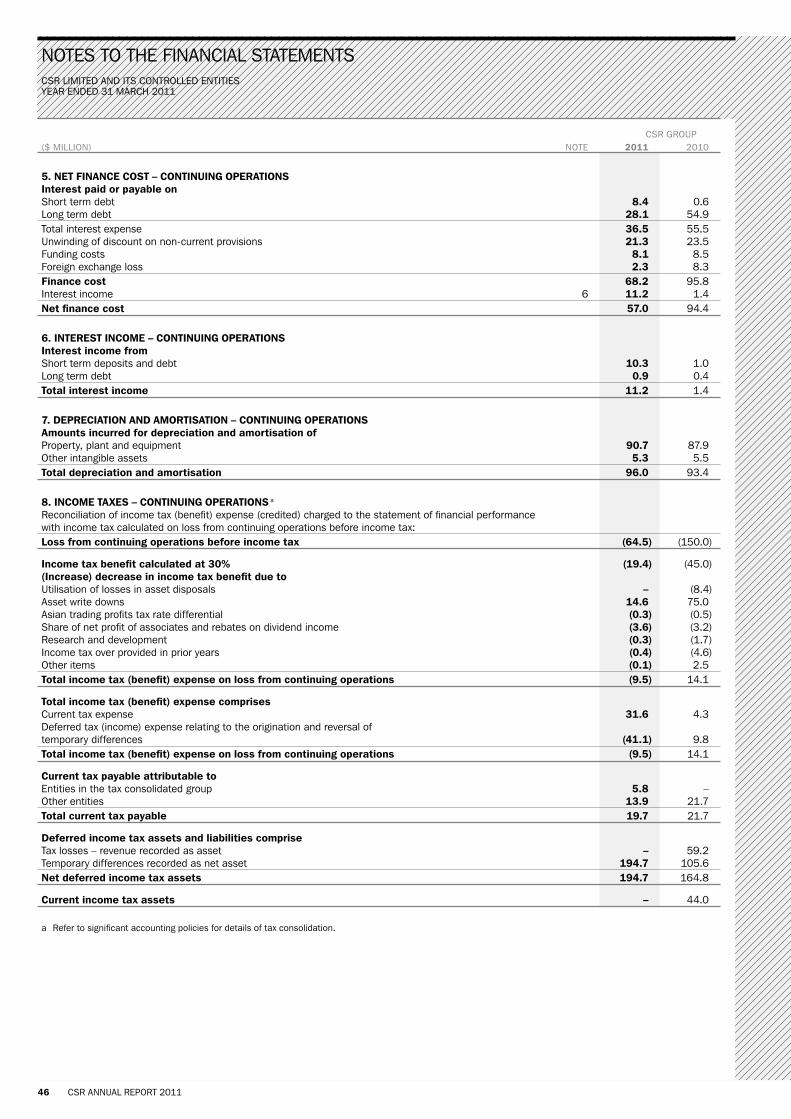
csr limiTed and iTs conTrolled enTiTiesyear ended 31 march 2011
46 csr annual rePorT 2011
noTes To The financial sTaTemenTs
csr grouP($ million) noTe 2011 2010
5. net finanCe Cost – Continuing oPerationsinterest paid or payable onshort term debt 8.4 0.6long term debt 28.1 54.9Total interest expense 36.5 55.5unwinding of discount on non-current provisions 21.3 23.5funding costs 8.1 8.5foreign exchange loss 2.3 8.3finance cost 68.2 95.8interest income 6 11.2 1.4net finance cost 57.0 94.4
6. interest inCome – Continuing oPerationsinterest income fromshort term deposits and debt 10.3 1.0long term debt 0.9 0.4total interest income 11.2 1.4
7. dePreCiation and amortisation – Continuing oPerationsamounts incurred for depreciation and amortisation ofProperty, plant and equipment 90.7 87.9other intangible assets 5.3 5.5total depreciation and amortisation 96.0 93.4
8. inCome taxes – Continuing oPerations a
reconciliation of income tax (benefit) expense (credited) charged to the statement of financial performancewith income tax calculated on loss from continuing operations before income tax:loss from continuing operations before income tax (64.5) (150.0)
income tax benefit calculated at 30% (19.4) (45.0)(increase) decrease in income tax benefit due toutilisation of losses in asset disposals – (8.4)asset write downs 14.6 75.0asian trading profits tax rate differential (0.3) (0.5)share of net profit of associates and rebates on dividend income (3.6) (3.2)research and development (0.3) (1.7)income tax over provided in prior years (0.4) (4.6)other items (0.1) 2.5total income tax (benefit) expense on loss from continuing operations (9.5) 14.1
total income tax (benefit) expense comprisescurrent tax expense 31.6 4.3deferred tax (income) expense relating to the origination and reversal oftemporary differences (41.1) 9.8total income tax (benefit) expense on loss from continuing operations (9.5) 14.1
Current tax payable attributable toentities in the tax consolidated group 5.8 –other entities 13.9 21.7total current tax payable 19.7 21.7
deferred income tax assets and liabilities compriseTax losses – revenue recorded as asset – 59.2Temporary differences recorded as net asset 194.7 105.6net deferred income tax assets 194.7 164.8
Current income tax assets – 44.0
a refer to significant accounting policies for details of tax consolidation.

csr limiTed and iTs conTrolled enTiTiesyear ended 31 march 2011
csr annual rePorT 2011 47
noTes To The financial sTaTemenTs
8. inCome taxes – Continuing oPerations (Continued)
csr grouP crediTed (charged) crediTed oPening To ProfiT (charged) Closing ($ million) balance or loss To eQuiTy disPosed b oTher balanCe
2011movement in net deferred income tax assets (liabilities) attributable to temporary differencesfair value of hedges (17.8) – 6.3 4.5 – (7.0)Property, plant and equipment (69.8) 25.6 0.1 35.9 – (8.2)superannuation defined benefit plans 13.4 (2.9) 1.8 (1.4) – 10.9Product liability provision 136.6 (1.9) – – – 134.7employee benefits provisions 42.9 (4.3) – (11.2) – 27.4other provisions 22.0 16.3 (0.2) (7.5) – 30.6spares and stores (20.6) (2.0) – 9.4 – (13.2)Transaction costs 8.0 8.6 – – – 16.6other (9.1) 1.7 1.1 2.8 6.4 2.9 105.6 41.1 9.1 32.5 6.4 194.7
2010movement in net deferred income tax assets (liabilities) attributable to temporary differencesfair value of hedges (13.8) (2.2) (1.8) – – (17.8)Property, plant and equipment (67.9) (1.9) – – – (69.8)superannuation defined benefit plans 31.3 (2.3) (15.6) – – 13.4Product liability provision 136.6 – – – – 136.6employee benefits provisions 45.1 (2.2) – – – 42.9other provisions 24.0 (2.0) – – – 22.0spares and stores (23.0) 2.4 – – – (20.6)Transaction costs – 8.0 – – – 8.0other (7.9) (1.2) – – – (9.1) 124.4 (1.4) (17.4) – – 105.6
b disposed amounts relate to deferred tax balances for the sucrogen and asian insulation businesses as at 1 april 2010 as these businesses were sold during the year and do not form part of continuing operations.
csr grouP($ million) 2011 2010
deferred income tax assets not taken to account c
balance at the beginning of the financial year 17.2 18.0assets now taken to account (17.2) (5.8)assets not recognised – 5.0balance at the end of the financial year d – 17.2
c includes capital tax losses – csr group $nil as at 31 march 2011 (2010: $6.6 million).d These benefits will only be obtained if the csr group derives the necessary future assessable income and capital gains in the relevant jurisdiction, and there are no
adverse changes in relevant income tax legislation.

csr limiTed and iTs conTrolled enTiTiesyear ended 31 march 2011
48 csr annual rePorT 2011
noTes To The financial sTaTemenTs
9. disContinued oPerations and Controlled entities disPosed during tHe year
9.1 disposal of the sucrogen business on 5 July 2010, csr limited announced that it had agreed to sell its sucrogen business to wilmar international limited for an enterprise value of $1.75 billion. The sale was completed on 22 december 2010; due to settlement adjustments, wilmar international limited paid a total of $1.84 billion on completion.
9.2 disposal of the asian insulation business on 6 July 2010, csr limited announced that it had agreed to sell its asian insulation business to the rockwool group for consideration of $128.0 million. The transaction was completed on 22 december 2010 and due to working capital adjustments the final consideration was $126.8 million.
9.3 analysis of profit from discontinued operations The combined results of the discontinued operations (i.e. sucrogen and asian insulation businesses) included as discontinued operations in the statement of financial performance are set out below. The comparative profit and cash flows from discontinued operations have been re-presented to include those operations classified as discontinued in the current period.
csr grouP($ million) 2011 2010
Profit from discontinued operationsTrading revenue 1,420.9 1,818.6other income from operating activities 8.0 21.6 1,428.9 1,840.2expenses (1,354.8) (1,700.8)Profit before tax 74.1 139.4attributable income tax expense (27.2) (32.0)net profit 46.9 107.4net profit attributable to non-controlling interests 7.6 14.0net profit before significant items from discontinued operations attributable to shareholders of csr limited 39.3 93.4
significant items from discontinued operationsgain (loss) on disposal of operations 692.1 (26.6)attributable income tax (expense) benefit (150.0) 8.0Total significant items after income tax a 542.1 (18.6)net profit from discontinued operations attributable to shareholders of csr limited b 581.4 74.8
a significant items for the year ended 31 march 2010 include transaction costs related to separation of the sucrogen business. for the year ended 31 march 2011, these costs have been deducted from the gain on disposal of operations.
b net profit from discontinued operations attributable to shareholders of csr limited of $581.4 million for the year ended 31 march 2011 excludes non-controlling interests of $7.6 million. net profit from discontinued operations including non-controlling interests for the year ended 31 march 2011 is $589.0 million.
Cash flows from discontinued operationsnet cash flows from operating activities 13.7 195.3net cash flows from investing activities 1,752.3 (100.7)net cash flows from financing activities (22.0) (12.6)net cash inflows 1,744.0 82.0
9.4 Controlled entities disposed during the year on 22 december 2010, the csr group disposed of all the controlled entities comprising the sucrogen and asian insulation businesses.
2011 asian gain on disPosal of conTrolled enTiTies ($ million) sucrogen insulaTion ToTal
equity consideration 1,347.0 126.8 1,473.8settlement of inter-group debt balances 493.8 – 493.8Total consideration 1,840.8 126.8 1,967.6
indemnities in relation to continuing liabilities 22.8 – 22.8net assets disposed of (1,169.7) (69.7) (1,239.4)non-controlling interests 89.0 – 89.0hedge and foreign currency reserves reclassified from equity on loss of control of subsidiary (92.8) (0.7) (93.5)divestment expenses (44.1) (10.3) (54.4)gain on disposal before tax expense 646.0 46.1 692.1Tax expense (148.9) (1.1) (150.0)gain on disposal of controlled entities 497.1 45.0 542.1
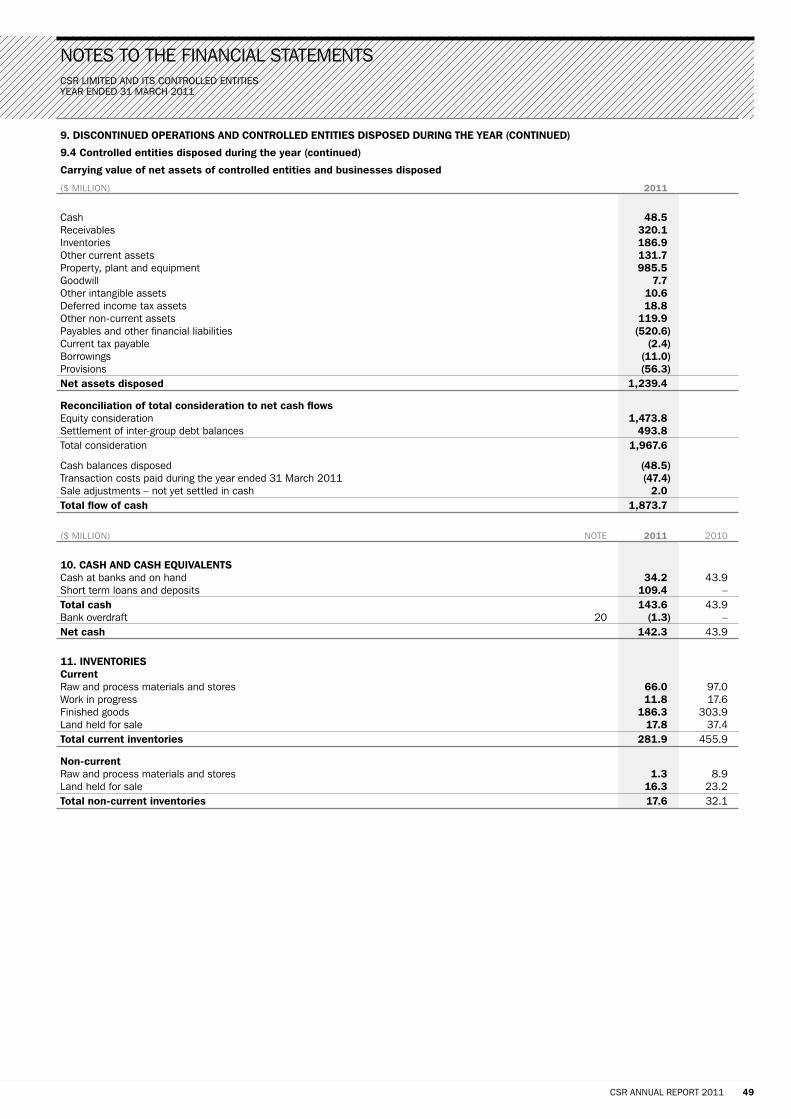
csr limiTed and iTs conTrolled enTiTiesyear ended 31 march 2011
csr annual rePorT 2011 49
noTes To The financial sTaTemenTs
9. disContinued oPerations and Controlled entities disPosed during tHe year (Continued)
9.4 Controlled entities disposed during the year (continued)
Carrying value of net assets of controlled entities and businesses disposed
($ million) 2011
cash 48.5receivables 320.1inventories 186.9other current assets 131.7Property, plant and equipment 985.5goodwill 7.7other intangible assets 10.6deferred income tax assets 18.8other non-current assets 119.9Payables and other financial liabilities (520.6)current tax payable (2.4)borrowings (11.0)Provisions (56.3)net assets disposed 1,239.4
reconciliation of total consideration to net cash flowsequity consideration 1,473.8settlement of inter-group debt balances 493.8Total consideration 1,967.6
cash balances disposed (48.5)Transaction costs paid during the year ended 31 march 2011 (47.4)sale adjustments – not yet settled in cash 2.0total flow of cash 1,873.7
($ million) noTe 2011 2010
10. CasH and CasH equivalentscash at banks and on hand 34.2 43.9short term loans and deposits 109.4 –total cash 143.6 43.9bank overdraft 20 (1.3) –net cash 142.3 43.9
11. inventoriesCurrentraw and process materials and stores 66.0 97.0work in progress 11.8 17.6finished goods 186.3 303.9land held for sale 17.8 37.4total current inventories 281.9 455.9
non-currentraw and process materials and stores 1.3 8.9land held for sale 16.3 23.2total non-current inventories 17.6 32.1
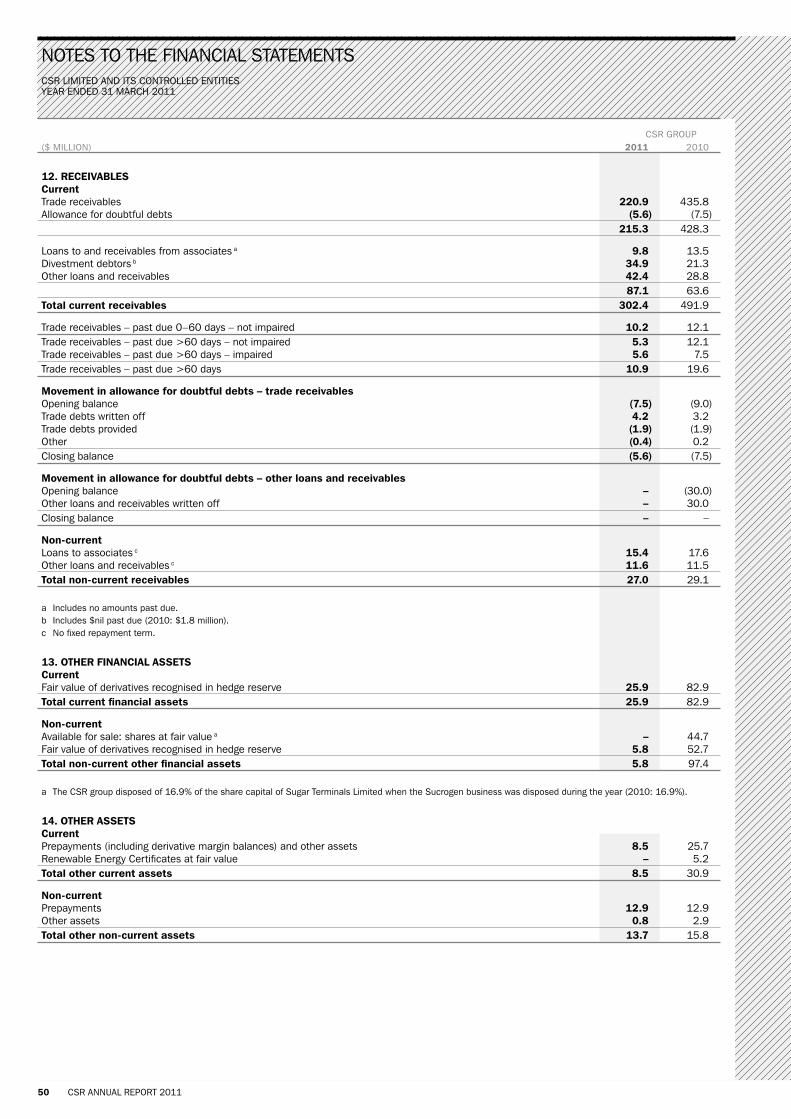
csr limiTed and iTs conTrolled enTiTiesyear ended 31 march 2011
50 csr annual rePorT 2011
noTes To The financial sTaTemenTs
csr grouP($ million) 2011 2010
12. reCeivablesCurrentTrade receivables 220.9 435.8allowance for doubtful debts (5.6) (7.5) 215.3 428.3
loans to and receivables from associates a 9.8 13.5divestment debtors b 34.9 21.3other loans and receivables 42.4 28.8 87.1 63.6total current receivables 302.4 491.9
Trade receivables – past due 0–60 days – not impaired 10.2 12.1Trade receivables – past due >60 days – not impaired 5.3 12.1Trade receivables – past due >60 days – impaired 5.6 7.5Trade receivables – past due >60 days 10.9 19.6
movement in allowance for doubtful debts – trade receivablesopening balance (7.5) (9.0)Trade debts written off 4.2 3.2Trade debts provided (1.9) (1.9)other (0.4) 0.2closing balance (5.6) (7.5)
movement in allowance for doubtful debts – other loans and receivablesopening balance – (30.0)other loans and receivables written off – 30.0closing balance – –
non-currentloans to associates c 15.4 17.6other loans and receivables c 11.6 11.5total non-current receivables 27.0 29.1
a includes no amounts past due.b includes $nil past due (2010: $1.8 million).c no fixed repayment term.
13. otHer finanCial assetsCurrentfair value of derivatives recognised in hedge reserve 25.9 82.9total current financial assets 25.9 82.9
non-currentavailable for sale: shares at fair value a – 44.7fair value of derivatives recognised in hedge reserve 5.8 52.7total non-current other financial assets 5.8 97.4
a The csr group disposed of 16.9% of the share capital of sugar Terminals limited when the sucrogen business was disposed during the year (2010: 16.9%).
14. otHer assetsCurrentPrepayments (including derivative margin balances) and other assets 8.5 25.7renewable energy certificates at fair value – 5.2total other current assets 8.5 30.9
non-currentPrepayments 12.9 12.9other assets 0.8 2.9total other non-current assets 13.7 15.8
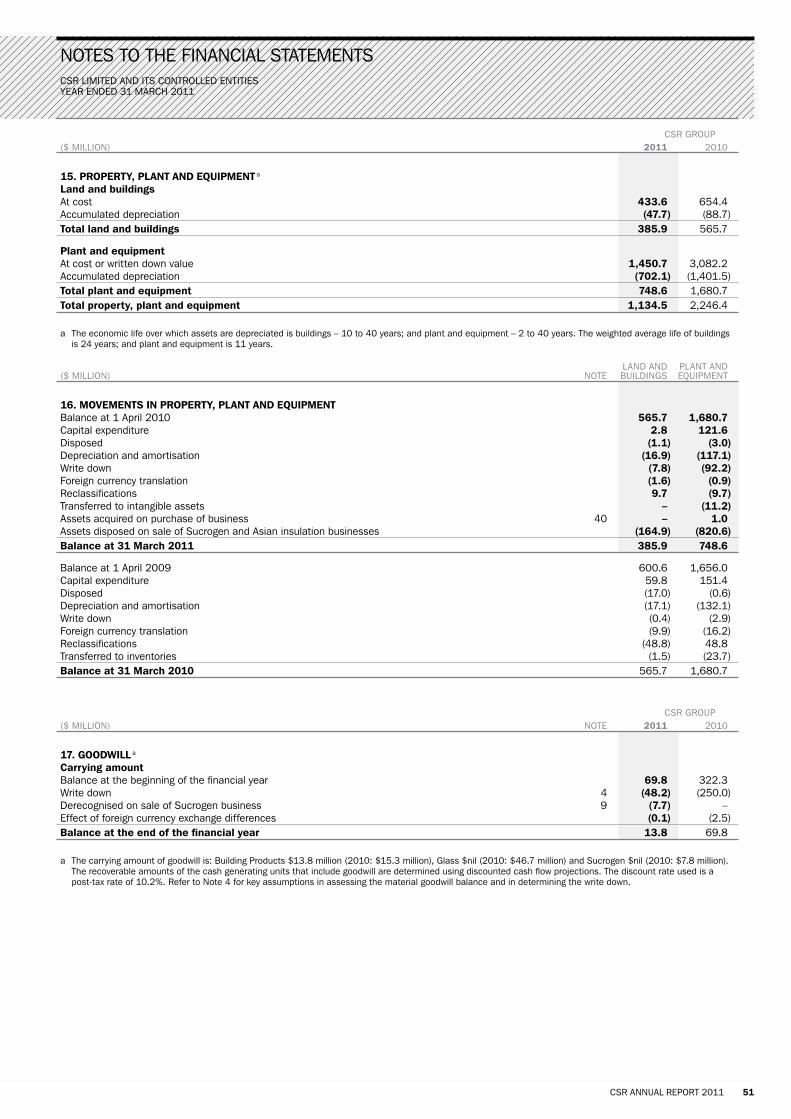
csr limiTed and iTs conTrolled enTiTiesyear ended 31 march 2011
csr annual rePorT 2011 51
noTes To The financial sTaTemenTs
csr grouP($ million) 2011 2010
15. ProPerty, Plant and equiPment a
land and buildingsat cost 433.6 654.4accumulated depreciation (47.7) (88.7)total land and buildings 385.9 565.7
Plant and equipmentat cost or written down value 1,450.7 3,082.2accumulated depreciation (702.1) (1,401.5)total plant and equipment 748.6 1,680.7total property, plant and equipment 1,134.5 2,246.4
a The economic life over which assets are depreciated is buildings – 10 to 40 years; and plant and equipment – 2 to 40 years. The weighted average life of buildings is 24 years; and plant and equipment is 11 years.
land and PlanT and ($ million) noTe buildings eQuiPmenT
16. movements in ProPerty, Plant and equiPmentbalance at 1 april 2010 565.7 1,680.7capital expenditure 2.8 121.6disposed (1.1) (3.0)depreciation and amortisation (16.9) (117.1)write down (7.8) (92.2)foreign currency translation (1.6) (0.9)reclassifications 9.7 (9.7)Transferred to intangible assets – (11.2)assets acquired on purchase of business 40 – 1.0assets disposed on sale of sucrogen and asian insulation businesses (164.9) (820.6)balance at 31 march 2011 385.9 748.6
balance at 1 april 2009 600.6 1,656.0capital expenditure 59.8 151.4disposed (17.0) (0.6)depreciation and amortisation (17.1) (132.1)write down (0.4) (2.9)foreign currency translation (9.9) (16.2)reclassifications (48.8) 48.8Transferred to inventories (1.5) (23.7)balance at 31 march 2010 565.7 1,680.7
csr grouP($ million) noTe 2011 2010
17. goodwill a
Carrying amountbalance at the beginning of the financial year 69.8 322.3write down 4 (48.2) (250.0)derecognised on sale of sucrogen business 9 (7.7) –effect of foreign currency exchange differences (0.1) (2.5)balance at the end of the financial year 13.8 69.8
a The carrying amount of goodwill is: building Products $13.8 million (2010: $15.3 million), glass $nil (2010: $46.7 million) and sucrogen $nil (2010: $7.8 million). The recoverable amounts of the cash generating units that include goodwill are determined using discounted cash flow projections. The discount rate used is a post-tax rate of 10.2%. refer to note 4 for key assumptions in assessing the material goodwill balance and in determining the write down.
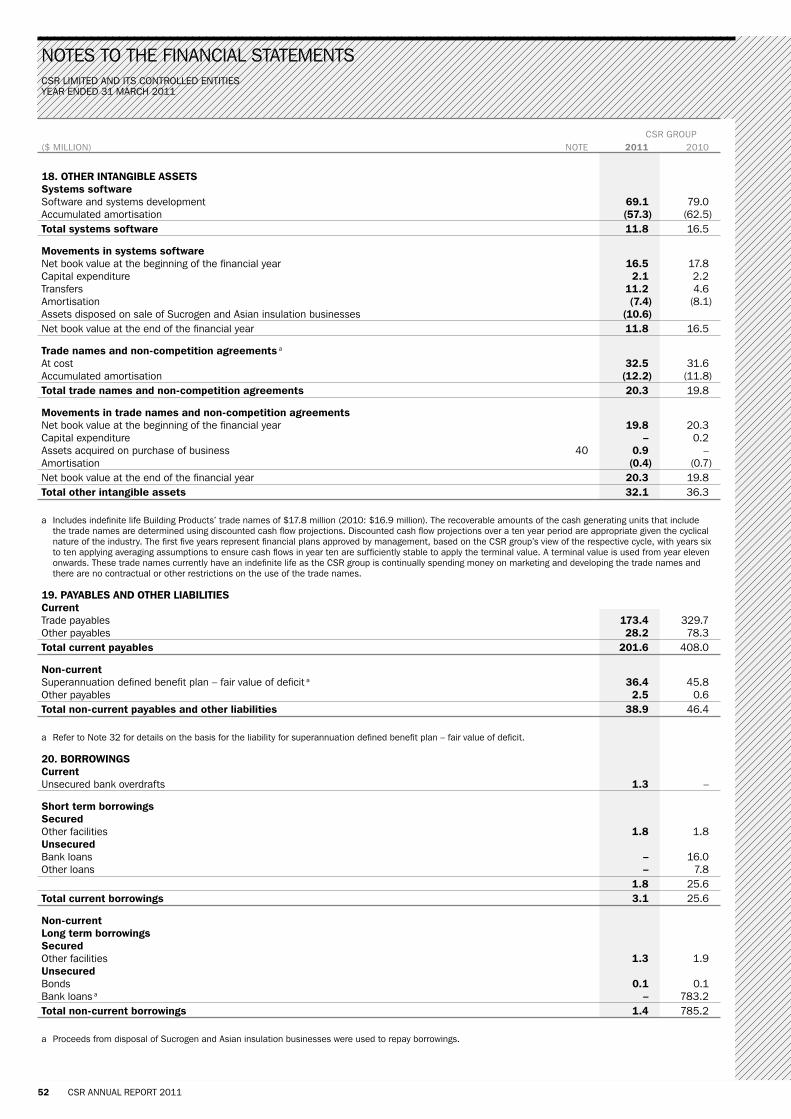
csr limiTed and iTs conTrolled enTiTiesyear ended 31 march 2011
52 csr annual rePorT 2011
noTes To The financial sTaTemenTs
csr grouP($ million) noTe 2011 2010
18. otHer intangible assetssystems softwaresoftware and systems development 69.1 79.0accumulated amortisation (57.3) (62.5)total systems software 11.8 16.5
movements in systems softwarenet book value at the beginning of the financial year 16.5 17.8capital expenditure 2.1 2.2Transfers 11.2 4.6amortisation (7.4) (8.1)assets disposed on sale of sucrogen and asian insulation businesses (10.6)net book value at the end of the financial year 11.8 16.5
trade names and non-competition agreements a
at cost 32.5 31.6accumulated amortisation (12.2) (11.8)total trade names and non-competition agreements 20.3 19.8
movements in trade names and non-competition agreementsnet book value at the beginning of the financial year 19.8 20.3capital expenditure – 0.2assets acquired on purchase of business 40 0.9 –amortisation (0.4) (0.7)net book value at the end of the financial year 20.3 19.8total other intangible assets 32.1 36.3
a includes indefinite life building Products’ trade names of $17.8 million (2010: $16.9 million). The recoverable amounts of the cash generating units that include the trade names are determined using discounted cash flow projections. discounted cash flow projections over a ten year period are appropriate given the cyclical nature of the industry. The first five years represent financial plans approved by management, based on the csr group’s view of the respective cycle, with years six to ten applying averaging assumptions to ensure cash flows in year ten are sufficiently stable to apply the terminal value. a terminal value is used from year eleven onwards. These trade names currently have an indefinite life as the csr group is continually spending money on marketing and developing the trade names and there are no contractual or other restrictions on the use of the trade names.
19. Payables and otHer liabilitiesCurrentTrade payables 173.4 329.7other payables 28.2 78.3total current payables 201.6 408.0
non-currentsuperannuation defined benefit plan – fair value of deficit a 36.4 45.8other payables 2.5 0.6total non-current payables and other liabilities 38.9 46.4
a refer to note 32 for details on the basis for the liability for superannuation defined benefit plan – fair value of deficit.
20. borrowingsCurrentunsecured bank overdrafts 1.3 –
short term borrowingssecuredother facilities 1.8 1.8unsecuredbank loans – 16.0other loans – 7.8 1.8 25.6total current borrowings 3.1 25.6
non-currentlong term borrowingssecuredother facilities 1.3 1.9unsecuredbonds 0.1 0.1bank loans a – 783.2total non-current borrowings 1.4 785.2
a Proceeds from disposal of sucrogen and asian insulation businesses were used to repay borrowings.

csr limiTed and iTs conTrolled enTiTiesyear ended 31 march 2011
csr annual rePorT 2011 53
noTes To The financial sTaTemenTs
csr grouP($ million) 2011 2010
21. otHer finanCial liabilitiesCurrentfair value of derivatives recognised in hedge reserve 7.1 53.1total current other financial liabilities 7.1 53.1
non-currentfair value of derivatives recognised in hedge reserve 1.8 15.9total non-current other financial liabilities 1.8 15.9
2011 csr grouP average financial year($ million) 2011 2010 raTe % Pa of maTuriTy
22. Credit faCilities and maturity Profilelong term maturities of borrowingsunited states dollar debtbonds 0.1 0.1 7.7 2026australian dollar debtbank loans – 737.0 5.0 2012–2013other loans 1.3 1.9 5.6 2012–2018new Zealand dollar debtbank loans – 18.7 3.8 2012Chinese yuan debtbank loans a – 27.5 6.6 total non-current borrowings 1.4 785.2
a disposed as part of asian insulation business in december 2010.
Credit standby facilities The csr group has a total of $1,160 million (2010: $1,522 million) committed standby facilities. These facilities have fixed maturity dates as follows: $580 million in financial year 2012, with the balance $580 million in financial year 2013. as at 31 march 2011, $1,160 million of the standby facilities were undrawn.
31 march recognised/ seTTled/ unwinding 31 marCH ($ million) 2010 remeasured Transferred of discounT disPosed oTher 2011
23. ProvisionsCsr groupCurrentemployee benefits 139.5 16.5 (11.7) – (52.6) (1.0) 90.7fringe benefits tax 1.9 2.3 (2.5) – (1.0) 0.3 1.0restructure and rationalisation 14.5 8.0 (10.5) – – – 12.0Product liability a 29.0 47.9 (37.9) – – – 39.0restoration and environmental rehabilitation 11.1 18.2 (3.5) – – – 25.8uninsured losses and future claims b 4.0 13.5 (10.1) – (2.4) – 5.0other c 29.3 9.5 (12.6) – – (0.6) 25.6total Csr group current provisions 229.3 115.9 (88.8) – (56.0) (1.3) 199.1
non-current Product liability a 426.3 (35.3) – 18.9 – – 409.9restoration and environmental rehabilitation 1.4 – – – – (0.4) 1.0uninsured losses and future claims b 43.3 (8.7) – 2.4 – – 37.0other c 0.2 6.2 8.0 – (0.3) – 14.1total Csr group non-current provisions 471.2 (37.8) 8.0 21.3 (0.3) (0.4) 462.0
a refer to note 39 and the significant accounting policies for details of the basis for the product liability provision.b uninsured losses and future claims mainly relate to the csr group’s self insurance for workers’ compensation program.c includes provision for anticipated disposal costs of Tomago aluminium smelter’s spent pot lining.
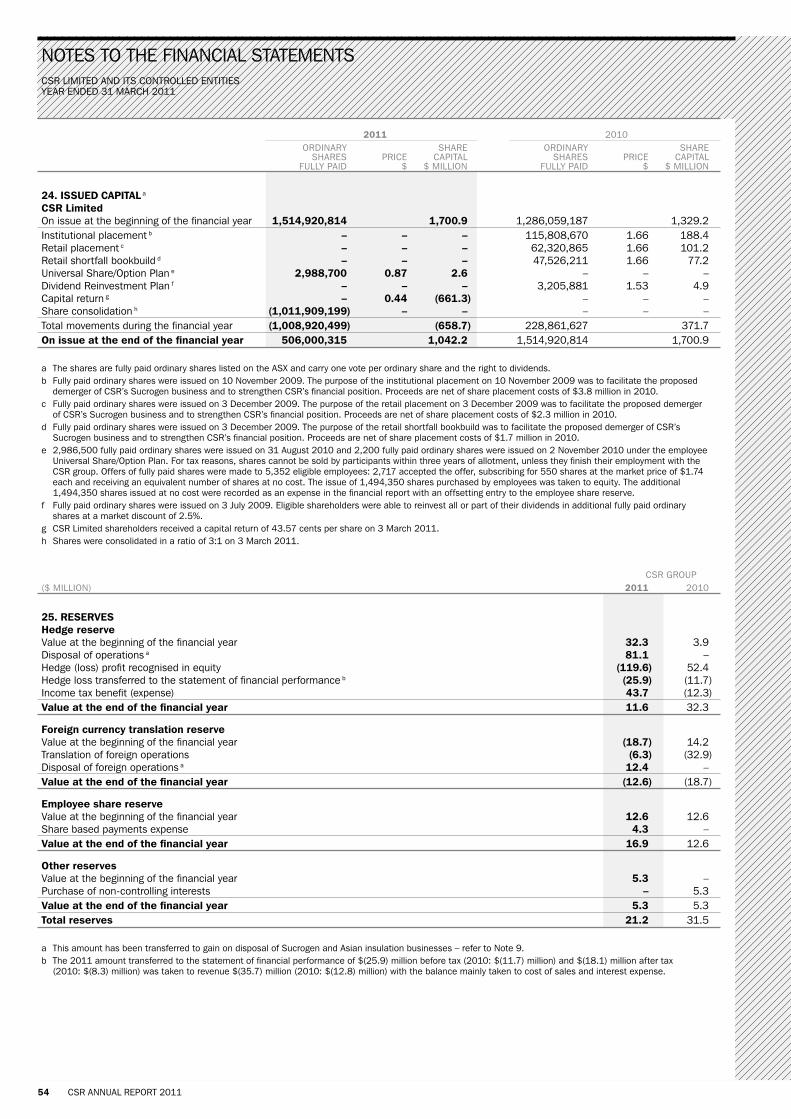
csr limiTed and iTs conTrolled enTiTiesyear ended 31 march 2011
54 csr annual rePorT 2011
noTes To The financial sTaTemenTs
2011 2010 ordinary share ordinary share shares Price caPiTal shares Price caPiTal fully Paid $ $ million fully Paid $ $ million
24. issued CaPital a
Csr limitedon issue at the beginning of the financial year 1,514,920,814 1,700.9 1,286,059,187 1,329.2institutional placement b – – – 115,808,670 1.66 188.4retail placement c – – – 62,320,865 1.66 101.2retail shortfall bookbuild d – – – 47,526,211 1.66 77.2universal share/option Plan e 2,988,700 0.87 2.6 – – –dividend reinvestment Plan f – – – 3,205,881 1.53 4.9capital return g – 0.44 (661.3) – – –share consolidation h (1,011,909,199) – – – – –Total movements during the financial year (1,008,920,499) (658.7) 228,861,627 371.7on issue at the end of the financial year 506,000,315 1,042.2 1,514,920,814 1,700.9
a The shares are fully paid ordinary shares listed on the asX and carry one vote per ordinary share and the right to dividends.b fully paid ordinary shares were issued on 10 november 2009. The purpose of the institutional placement on 10 november 2009 was to facilitate the proposed
demerger of csr’s sucrogen business and to strengthen csr’s financial position. Proceeds are net of share placement costs of $3.8 million in 2010.c fully paid ordinary shares were issued on 3 december 2009. The purpose of the retail placement on 3 december 2009 was to facilitate the proposed demerger
of csr’s sucrogen business and to strengthen csr’s financial position. Proceeds are net of share placement costs of $2.3 million in 2010.d fully paid ordinary shares were issued on 3 december 2009. The purpose of the retail shortfall bookbuild was to facilitate the proposed demerger of csr’s
sucrogen business and to strengthen csr’s financial position. Proceeds are net of share placement costs of $1.7 million in 2010.e 2,986,500 fully paid ordinary shares were issued on 31 august 2010 and 2,200 fully paid ordinary shares were issued on 2 november 2010 under the employee
universal share/option Plan. for tax reasons, shares cannot be sold by participants within three years of allotment, unless they finish their employment with the csr group. offers of fully paid shares were made to 5,352 eligible employees: 2,717 accepted the offer, subscribing for 550 shares at the market price of $1.74 each and receiving an equivalent number of shares at no cost. The issue of 1,494,350 shares purchased by employees was taken to equity. The additional 1,494,350 shares issued at no cost were recorded as an expense in the financial report with an offsetting entry to the employee share reserve.
f fully paid ordinary shares were issued on 3 July 2009. eligible shareholders were able to reinvest all or part of their dividends in additional fully paid ordinary shares at a market discount of 2.5%.
g csr limited shareholders received a capital return of 43.57 cents per share on 3 march 2011.h shares were consolidated in a ratio of 3:1 on 3 march 2011.
csr grouP($ million) 2011 2010
25. reservesHedge reservevalue at the beginning of the financial year 32.3 3.9 disposal of operations a 81.1 – hedge (loss) profit recognised in equity (119.6) 52.4 hedge loss transferred to the statement of financial performance b (25.9) (11.7)income tax benefit (expense) 43.7 (12.3)value at the end of the financial year 11.6 32.3
foreign currency translation reservevalue at the beginning of the financial year (18.7) 14.2 Translation of foreign operations (6.3) (32.9)disposal of foreign operations a 12.4 – value at the end of the financial year (12.6) (18.7)
employee share reservevalue at the beginning of the financial year 12.6 12.6 share based payments expense 4.3 – value at the end of the financial year 16.9 12.6
other reservesvalue at the beginning of the financial year 5.3 – Purchase of non-controlling interests – 5.3 value at the end of the financial year 5.3 5.3 total reserves 21.2 31.5
a This amount has been transferred to gain on disposal of sucrogen and asian insulation businesses – refer to note 9.b The 2011 amount transferred to the statement of financial performance of $(25.9) million before tax (2010: $(11.7) million) and $(18.1) million after tax
(2010: $(8.3) million) was taken to revenue $(35.7) million (2010: $(12.8) million) with the balance mainly taken to cost of sales and interest expense.
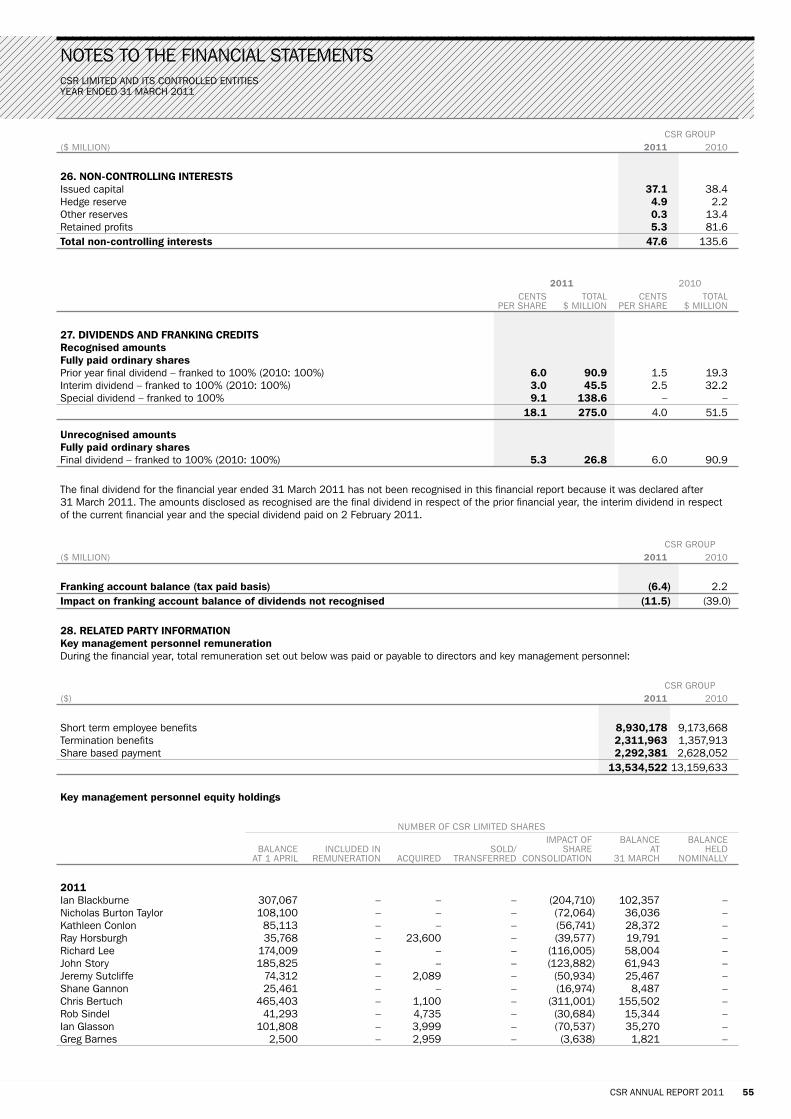
csr limiTed and iTs conTrolled enTiTiesyear ended 31 march 2011
csr annual rePorT 2011 55
noTes To The financial sTaTemenTs
csr grouP($ million) 2011 2010
26. non-Controlling interestsissued capital 37.1 38.4 hedge reserve 4.9 2.2 other reserves 0.3 13.4 retained profits 5.3 81.6 total non-controlling interests 47.6 135.6
2011 2010 cenTs ToTal cenTs ToTal Per share $ million Per share $ million
27. dividends and franking Creditsrecognised amountsfully paid ordinary sharesPrior year final dividend – franked to 100% (2010: 100%) 6.0 90.9 1.5 19.3interim dividend – franked to 100% (2010: 100%) 3.0 45.5 2.5 32.2special dividend – franked to 100% 9.1 138.6 – – 18.1 275.0 4.0 51.5
unrecognised amountsfully paid ordinary sharesfinal dividend – franked to 100% (2010: 100%) 5.3 26.8 6.0 90.9
The final dividend for the financial year ended 31 march 2011 has not been recognised in this financial report because it was declared after 31 march 2011. The amounts disclosed as recognised are the final dividend in respect of the prior financial year, the interim dividend in respect of the current financial year and the special dividend paid on 2 february 2011.
csr grouP ($ million) 2011 2010
franking account balance (tax paid basis) (6.4) 2.2 impact on franking account balance of dividends not recognised (11.5) (39.0)
28. related Party informationkey management personnel remuneration during the financial year, total remuneration set out below was paid or payable to directors and key management personnel:
csr grouP ($) 2011 2010
short term employee benefits 8,930,178 9,173,668 Termination benefits 2,311,963 1,357,913 share based payment 2,292,381 2,628,052 13,534,522 13,159,633
key management personnel equity holdings
number of csr limiTed shares imPacT of balance balance balance included in sold/ share aT held aT 1 aPril remuneraTion acQuired Transferred consolidaTion 31 march nominally
2011ian blackburne 307,067 – – – (204,710) 102,357 –nicholas burton Taylor 108,100 – – – (72,064) 36,036 –kathleen conlon 85,113 – – – (56,741) 28,372 –ray horsburgh 35,768 – 23,600 – (39,577) 19,791 –richard lee 174,009 – – – (116,005) 58,004 –John story 185,825 – – – (123,882) 61,943 –Jeremy sutcliffe 74,312 – 2,089 – (50,934) 25,467 –shane gannon 25,461 – – – (16,974) 8,487 –chris bertuch 465,403 – 1,100 – (311,001) 155,502 –rob sindel 41,293 – 4,735 – (30,684) 15,344 –ian glasson 101,808 – 3,999 – (70,537) 35,270 –greg barnes 2,500 – 2,959 – (3,638) 1,821 –

csr limiTed and iTs conTrolled enTiTiesyear ended 31 march 2011
56 csr annual rePorT 2011
noTes To The financial sTaTemenTs
28. related Party information (Continued)key management personnel equity holdings (continued)
number of csr limiTed shares imPacT of balance balance balance included in sold/ share aT held aT 1 aPril remuneraTion acQuired Transferred consolidaTion 31 march nominally
2010ian blackburne 241,333 – 65,734 – 307,067 –Jerry maycock 523,299 – 4,085 – 527,384 –nicholas burton Taylor 92,000 – 16,100 – 108,100 –kathleen conlon 67,898 – 17,215 – 85,113 –ray horsburgh 32,228 – 3,540 – 35,768 –richard lee 148,092 – 25,917 – 174,009 –John story 143,606 – 42,219 – 185,825 –Jeremy sutcliffe 45,778 – 28,534 – 74,312 –shane gannon – – 25,461 – 25,461 –chris bertuch 365,607 – 99,796 – 465,403 –rob sindel 24,828 – 16,465 – 41,293 –ian glasson 60,856 – 40,952 – 101,808 –John hodgkinson 144,221 – – 144,221 – –
details of remuneration and the csr limited equity holdings of directors and key management personnel are shown in the remuneration report.
Csr limited transactions with controlled entities during the financial years ended 31 march 2011 and 2010, csr limited advanced and repaid loans, sold and purchased goods and services, and provided accounting and administrative assistance to its controlled entities.
all loans advanced to and payable to these related parties are unsecured and subordinate to other liabilities.
loans between members of the australian tax consolidation group are not on normal terms and conditions.
during the year, csr building Products ltd issued 65,000,000 “a” class ordinary shares to csr limited at a cost of $2 per share. The consideration received from csr limited was applied to the loan owing by csr building Products ltd to csr limited.
other related parties other than transactions with associate entities disclosed in note 34, no material amounts were receivable from, or payable to, other related parties as at 31 march 2011 or 2010, and no material transactions with other related parties occurred during those years.
details of payments to defined benefit superannuation plans are shown in note 32.
employee share plan interest free loans and other transactions with directors or key management personnel no new loans, loan repayments or loan balances occurred between the csr group and directors and key management personnel of the csr group during the financial year ended 31 march 2011 or 2010.
Transactions entered into during the financial year with directors of csr limited and key management personnel of the csr group and with their closely related entities which are within normal customer or employee relationships on terms and conditions no more favourable than those available to other customers, employees or shareholders included:
• acquisition of shares in csr limited under the employee share plans, the share purchase plan and the dividend reinvestment Plan;
• dividends from shares in csr limited;
• sale and purchase of goods and services;
• contracts of employment and reimbursement of expenses; and
• contracts of employment with relatives of directors on either a full time or work experience basis.

csr limiTed and iTs conTrolled enTiTiesyear ended 31 march 2011
csr annual rePorT 2011 57
noTes To The financial sTaTemenTs
csr grouP ($ million) 2011 2010
29. interest in Joint venture oPerationinterest in the tomago aluminium smelter joint venture operation a b
is included in the financial statements in the following categories
Current assetscash and receivables 3.0 3.1inventories 33.9 28.4other 2.5 1.8total current assets 39.4 33.3
non-current assetsreceivables 0.7 0.6Property, plant and equipment 240.4 260.2other 13.0 13.2total non-current assets 254.1 274.0total assets 293.5 307.3
total current liabilities 116.1 43.8total non-current liabilities 14.0 75.0total liabilities 130.1 118.8net assets 163.4 188.5
Contracted capital expenditure 2.3 2.2
Contingent liabilities – –
a The csr group’s joint venture interest of 36.05% (2010: 36.05%) is held through a controlled entity in which the csr group has a 70% interest, resulting in an effective interest in the joint venture of 25.24%.
b Principal activity: aluminium production.
csr grouP($ Thousand) 2011 2010
30. auditor’s remunerationauditing and reviewing the financial report of the Csr groupdeloitte Touche Tohmatsu in australia 1,118 1,345deloitte Touche Tohmatsu outside of australia 87 255 1,205 1,600
other servicesdeloitte Touche Tohmatsu in australia 258 900deloitte Touche Tohmatsu outside of australia 24 – 282 900total auditor’s remuneration 1,487 2,500
other services compriseTaxation strategy and compliance 13 143services related to the capital return to shareholders of csr limited 58 –services related to separation of the sucrogen business 125 663other 86 94 282 900
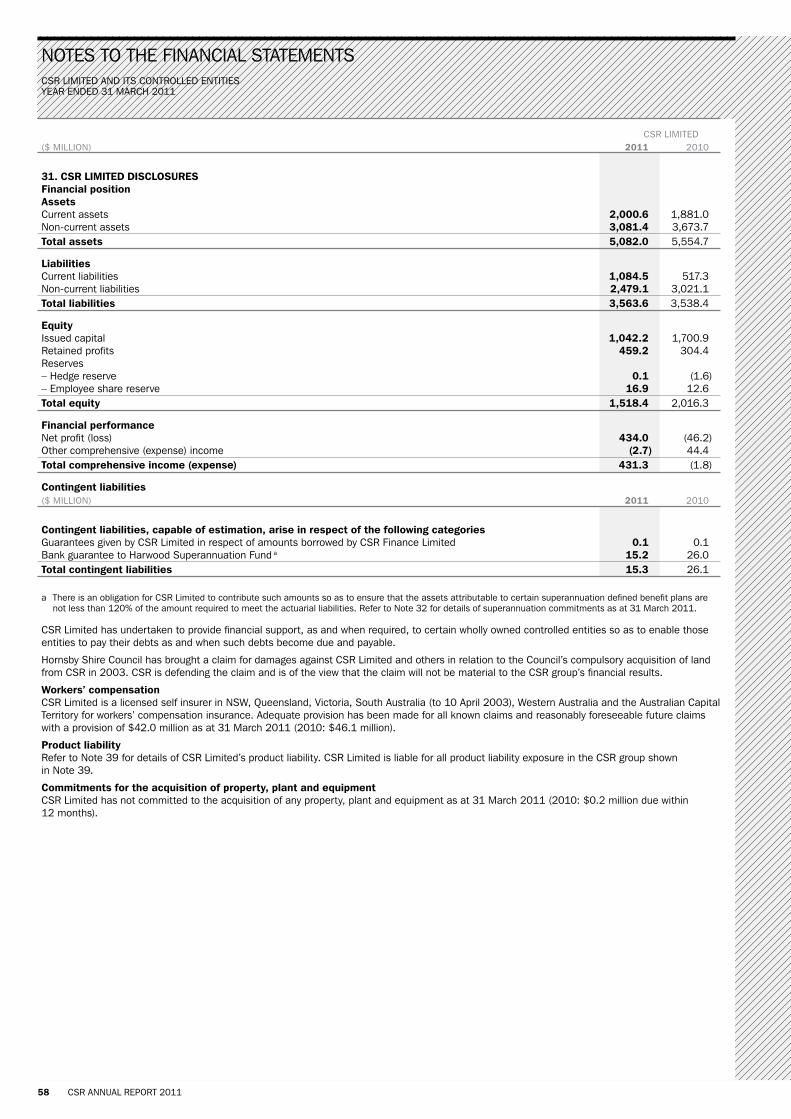
csr limiTed and iTs conTrolled enTiTiesyear ended 31 march 2011
58 csr annual rePorT 2011
noTes To The financial sTaTemenTs
csr limiTed ($ million) 2011 2010
31. Csr limited disClosuresfinancial positionassetscurrent assets 2,000.6 1,881.0non-current assets 3,081.4 3,673.7total assets 5,082.0 5,554.7
liabilitiescurrent liabilities 1,084.5 517.3non-current liabilities 2,479.1 3,021.1total liabilities 3,563.6 3,538.4
equityissued capital 1,042.2 1,700.9retained profits 459.2 304.4reserves– hedge reserve 0.1 (1.6)– employee share reserve 16.9 12.6total equity 1,518.4 2,016.3
financial performancenet profit (loss) 434.0 (46.2)other comprehensive (expense) income (2.7) 44.4total comprehensive income (expense) 431.3 (1.8)
Contingent liabilities($ million) 2011 2010
Contingent liabilities, capable of estimation, arise in respect of the following categoriesguarantees given by csr limited in respect of amounts borrowed by csr finance limited 0.1 0.1bank guarantee to harwood superannuation fund a 15.2 26.0total contingent liabilities 15.3 26.1
a There is an obligation for csr limited to contribute such amounts so as to ensure that the assets attributable to certain superannuation defined benefit plans are not less than 120% of the amount required to meet the actuarial liabilities. refer to note 32 for details of superannuation commitments as at 31 march 2011.
csr limited has undertaken to provide financial support, as and when required, to certain wholly owned controlled entities so as to enable those entities to pay their debts as and when such debts become due and payable.
hornsby shire council has brought a claim for damages against csr limited and others in relation to the council’s compulsory acquisition of land from csr in 2003. csr is defending the claim and is of the view that the claim will not be material to the csr group’s financial results.
workers’ compensation csr limited is a licensed self insurer in nsw, Queensland, victoria, south australia (to 10 april 2003), western australia and the australian capital Territory for workers’ compensation insurance. adequate provision has been made for all known claims and reasonably foreseeable future claims with a provision of $42.0 million as at 31 march 2011 (2010: $46.1 million).
Product liability refer to note 39 for details of csr limited’s product liability. csr limited is liable for all product liability exposure in the csr group shown in note 39.
Commitments for the acquisition of property, plant and equipment csr limited has not committed to the acquisition of any property, plant and equipment as at 31 march 2011 (2010: $0.2 million due within 12 months).

csr limiTed and iTs conTrolled enTiTiesyear ended 31 march 2011
csr annual rePorT 2011 59
noTes To The financial sTaTemenTs
32. suPerannuation CommitmentsThe csr group participates in a number of superannuation funds (funds) in australia, new Zealand and other countries where it operates. The funds provide benefits either on a cash accumulation or defined benefit basis, for employees (and spouses) on retirement, resignation or disablement, or to their dependants on death. employer contributions are legally enforceable, with the right to terminate, reduce or suspend those contributions upon giving written notice to the trustees. csr limited and its australian controlled entities are required to provide a minimum level of superannuation support for employees under the australian superannuation guarantee legislation.
australian superannuation funds in australia, the csr group participates in the harwood superannuation fund and the Pilkington (australia) superannuation scheme for those employees and pensioners who are currently members of these funds and any new employees who become members of those funds.
retirement funds The contributions to the funds for the year ended 31 march 2011 were: csr group: $43.0 million (2010: $39.2 million).
accumulation funds The benefits provided by accumulation funds are based on the contributions and income thereon held by the funds on behalf of the members. contributions are made by the members and the company based on a percentage of the members’ salary, as specified by the rules of the fund. These contributions are expensed in the period they are incurred.
defined benefit funds The benefits provided by defined benefit divisions of funds (dbds) are based on length of service or membership and salary of the member at or near retirement. member contributions, based on a percentage of salary, are specified by the rules of the fund. employer contributions generally vary based on actuarial advice and may be reduced or cease when a fund is in actuarial surplus. The accounting treatment of the superannuation defined benefit plans is discussed in the significant accounting policies.
asset backing The assets of the funds at 31 march 2011 were insufficient to satisfy all benefits which would have been vested in the event of termination of the funds, or in the event of the voluntary or compulsory termination of the employment of each employee. The funds have obligations of $36.4 million in excess of the fair value of assets as at 31 march 2011 (2010: $45.8 million). The csr group is making contributions to the funds as follows:
harwood superannuation fund – dbd csr $89,000 per month from 1 april 2011 – dbd monier Pgh 15.8% of eligible salary plus $96,000 per month
from 1 april 2011
Pilkington (australia) superannuation scheme – dbd 14.6% of eligible salary plus $185,000 per month from 1 april 2011
csr viridian (new Zealand) limited – dbd 9.66% of eligible salary plus nZ$448,000 superannuation scheme per annum.
The last actuarial assessment for harwood superannuation fund and Pilkington (australia) superannuation scheme was completed as at 30 June 2010. The contribution rates were reviewed post this actuarial assessment. The aggregate funding method was used to determine the contribution rates for the harwood superannuation fund and the projected unit credit funding method for the Pilkington (australia) superannuation scheme.
expected rate of return on defined benefit fund assets The expected return on assets is determined by weighting the expected long term return for each asset class by the target allocation of assets to each asset class. The returns used for each asset class are net of investment fees and investment tax (if applicable).
defined benefit funds sponsored by the Csr group
defined benefiT fair value of conTribuTions ($ million) obligaTion fund asseTs liabiliTy Paid
harwood superannuation fund – dbd csr a b 189.3 165.8 (23.5) 5.5 – dbd monier Pgh c 50.8 49.8 (1.0) 5.3 Pilkington (australia) superannuation scheme – dbd c 55.0 45.3 (9.7) 4.6 csr viridian (new Zealand) limited superannuation scheme – dbd d 4.3 2.1 (2.2) 0.2
a actuarial liabilities are determined to be past service liabilities based on membership accrued up to 31 march 2011. These amounts are calculated at 31 march 2011 based on the assumptions used in the last actuarial review performed on 30 June 2010 by k knapman fiaa.
b There is an obligation for csr limited to contribute such amounts so as to ensure that the assets attributable to the dbd csr fund are not less than 120% of the amount required to meet the actuarial liabilities of the dbd csr fund. csr limited currently has a funding position of 111% and has therefore made available to the trustee of the fund a bank guarantee of $15.2 million (2010: $26.0 million) to satisfy the balance of its commitment if assets fall below 120%. The bank guarantee has been disclosed in note 31 and note 38 as a contingent liability.
c These amounts are calculated at 31 march 2011 based on assumptions used in the last actuarial review performed on 30 June 2010.d These amounts are calculated at 31 march 2011 based on assumptions used in the last actuarial review performed on 31 march 2009.

csr limiTed and iTs conTrolled enTiTiesyear ended 31 march 2011
60 csr annual rePorT 2011
noTes To The financial sTaTemenTs
32. suPerannuation Commitments (Continued) csr grouP($ million) 2011 2010
amounts recognised in the statement of financial performance (administration and other operating costs) in respect of the defined benefit planscurrent service cost 4.5 5.4finance cost 13.6 11.1expected return on assets (18.6) (14.2)total expense (income) included in the statement of financial performance (0.5) 2.3
actuarial (losses) gains incurred during the financial year and recognised in the statement of comprehensive income a (5.3) 51.9
Cumulative actuarial losses recognised in the statement of comprehensive income (69.1) (63.8)
a actuarial (losses) gains in the statement of comprehensive income for the year ended 31 march 2011 of $11.8 million includes $5.3 million (detailed above) relating to actuarial losses for the csr group in addition to revaluation of a balance receivable from sucrogen in relation to the superannuation defined benefit plan of $6.5 million.
net liability of superannuation defined benefit plansPresent value of liabilities 299.4 307.4fair value of assets (263.0) (261.6)net liability 36.4 45.8
included in the statement of financial positionPayables and other non-current liabilities (note 19) 36.4 45.8net liability 36.4 45.8
movements in the present value of the defined benefit plan liabilities were as followsliabilities at the beginning of the financial year 307.4 329.0acquisitions, transfers and revaluations 0.9 3.5current service cost 4.5 5.4finance cost 13.6 11.1contributions from participants 1.3 1.3actuarial losses 5.1 2.9benefits paid (33.4) (45.8)liabilities at the end of the financial year 299.4 307.4
movements in the present value of the defined benefit plan assets were as followsassets at the beginning of the financial year 261.6 226.0acquisitions, transfers and revaluations (0.5) 2.5return on plan assets – expected 18.6 14.2return on plan assets – actuarial (0.2) 54.8contributions from the employer 15.6 8.6contributions from participants 1.3 1.3benefits paid (33.4) (45.8)assets at the end of the financial year 263.0 261.6
csr grouP(%) 2011 2010
key assumptions and parameters (expressed as weighted averages)discount rate (after tax) 5.3 5.5expected return on plan assets (after tax) 6.7 6.9expected salary increase 3.5 3.5asset class allocation – equity instruments 51.8 51.1 – debt instruments 36.4 37.4 – property 7.6 8.1 – other 4.2 3.4
csr grouP($ million) 2011 2010 2009 2008 2007
net liability of superannuation defined benefit plansPresent value of liabilities 299.4 307.4 329.0 312.6 236.3fair value of assets (263.0) (261.6) (226.0) (323.6) (285.7)net liability (asset) 36.4 45.8 103.0 (11.0) (49.4)
The history of experience adjustments is as followsexperience (loss) gain on plan liabilities (7.5) (24.8) 6.5 (22.0) 0.4experience (loss) gain on plan assets (0.2) 54.8 (87.2) (35.5) 12.4
csr limiTed and iTs conTrolled enTiTiesyear ended 31 march 2011
csr annual rePorT 2011 61
noTes To The financial sTaTemenTs
33. finanCial risk managementThe csr group’s activities expose it to a variety of financial risks: credit risk, liquidity risk and market risk (including commodity price risk, currency risk and interest rate risk). The csr group uses a variety of derivative instruments to manage financial and commodity price risks. The csr group does not use derivative or financial instruments for speculative or trading purposes.
csr Treasury provides services to the businesses, coordinates access to financial markets, monitors and manages the financial risks relating to the operations of the csr group through internal risk reports that analyse exposures by degree and magnitude of risks as detailed further in this note. The use of financial derivatives is governed by the policies approved by the board of directors. The policies provide specific principles in relation to foreign exchange risk, interest rate risk, credit risk, the use of derivatives and the investment of excess liquidity. compliance with policies and procedures is reviewed by csr internal audit on a routine basis.
Capital management The csr group manages its capital to ensure that entities in the csr group will be able to continue as a going concern while maximising the return to shareholders through the optimisation of the debt and equity balances.
since 31 march 2010, the csr group has used the proceeds of the sale of the sucrogen and asian insulation businesses to repay all bank debt, leaving a small residual debt balance as at 31 march 2011.
The capital structure of the csr group consists of debt which includes the borrowings disclosed in note 20, cash and cash equivalents disclosed in note 10, issued capital and reserves disclosed in notes 24 and 25 and retained profits. The csr group reviews the capital structure regularly and balances its overall capital structure through the payment of dividends, new share issues, share consolidations and share buy-backs, as well as the issue of new debt or the redemption of existing debt.
fair value The fair values of financial assets and liabilities are determined as follows:
• the fair values of financial assets and liabilities with standard terms and conditions and traded on active liquid markets are determined with reference to quoted market prices;
• the fair values of other financial assets and financial liabilities (excluding derivatives) are determined in accordance with generally accepted pricing models based on discounted cash flow analysis using prices from observable current market transactions and dealer quotes for similar instruments; and
• the fair values of derivative instruments are calculated using quoted market prices. where such prices are not available, a discounted cash flow analysis is performed using the applicable yield curve for the duration of the instruments for non-optional derivatives, and option pricing models for optional derivatives. foreign currency forward contracts are measured using quoted exchange rates and yield curves derived from quoted interest rates matching maturities of the contract. interest rate swaps are measured at the present value of future cash flows estimated and discounted based on the applicable yield curves derived from quoted interest rates.
The assumptions and methods used to estimate fair value for the following financial assets and financial liabilities were:
commodity futures: The fair value is based on the closing price on the applicable futures exchange;
foreign currency contracts, foreign exchange options, currency swaps and commodity swaps: The fair value is estimated using market quoted spot and forward exchange rates and commodity prices and applicable yield curves following market accepted formulae and practices;
cash, short term loans and deposits, receivables, payables and short term borrowings: The carrying amounts of these financial instruments approximate fair value because of their short maturity;
long term borrowings: The present value of expected cash flows has been used to determine fair value using interest rates derived from market parameters that accurately reflect their term structure. certain estimates and judgements were required to develop the fair value amounts; and
interest rate swaps: The present value of expected cash flows has been used to determine fair value using yield curves derived from market parameters that accurately reflect their term structure. certain estimates and judgements were required to develop the fair value amounts.
The fair value amounts shown below are not necessarily indicative of the amounts that the csr group would realise upon disposition, nor do they indicate the csr group’s intent or ability to dispose of the financial instrument.
Credit risk The csr group is exposed to credit related losses in the event of non-performance by counterparties to these derivative and financial instruments. The counterparties as at both 31 march 2011 and 31 march 2010 were predominantly prime financial institutions, with the majority of them with a standard & Poor’s or moody’s rating of at least a– or a3 respectively.
The csr group controls risk through the use of credit limits and monitoring procedures. The csr group does not usually require collateral or other security to support financial instruments with credit risk.
credit exposure of foreign currency and commodity price derivatives is represented by the fair value of the contracts. The carrying amounts of financial assets included in the csr group’s financial statements represent its exposure to credit risk in relation to these assets.
as at 31 march 2011, the csr group had no significant concentration of credit risk for derivative instruments with any single counterparty or group of counterparties. concentrations of credit risk with respect to receivables are limited due to the large number of clients and markets in which the csr group does business, as well as the dispersion across many geographic areas. refer to note 12 for more information on credit risk on receivables.
liquidity risk liquidity risk management requires maintaining sufficient cash, bank facilities and reserve borrowing facilities by continuously monitoring forecast and actual cash flows and matching the maturity profiles of financial assets and liabilities. details of credit facilities and the maturity profile are detailed in note 22.

csr limiTed and iTs conTrolled enTiTiesyear ended 31 march 2011
62 csr annual rePorT 2011
noTes To The financial sTaTemenTs
33. finanCial risk management (Continued)The table below analyses the csr group’s financial liabilities and derivative financial instruments into relevant maturity groupings based on the remaining period at the reporting date to maturity date. The amounts are not discounted.
maTuriTy grouPingliquidity risk 1 year 1 To 3 3 To 5 over ($ million) or less year(s) years 5 years ToTal
2011current payables 201.6 – – – 201.6 non-current other payables – 2.5 – – 2.5 borrowings (including interest) a 1.9 0.1 0.1 1.5 3.6 commodity financial instruments b 6.1 1.8 – – 7.9 foreign currency financial instruments b 1.0 – – – 1.0 total 210.6 4.4 0.1 1.5 216.6
2010current payables 408.0 – – – 408.0 non-current other payables – 0.6 – – 0.6 borrowings (including interest) a 66.4 827.0 – 2.1 895.5 commodity financial instruments b 47.4 11.6 1.0 – 60.0 foreign currency financial instruments b 4.8 – – – 4.8 interest rate swaps 1.0 3.7 – – 4.7 Total 527.6 842.9 1.0 2.1 1,373.6
a over five years includes repayment of borrowings in July 2025 – csr group $0.1 million (2010: $0.2 million). bank overdrafts are not included in this analysis as they are part of a set-off arrangement of cash balances with commonwealth bank of australia.
b settlement of commodity and foreign currency financial instruments will be offset by revenue from the sale of commodities.
market risk Commodity price and risk management The csr group has exposure to aluminium commodity prices. The aluminium price exposure arises from sales contracts that commit the csr group to supply aluminium in future years. Prices for product supplied under these contracts are a function of the us dollar market price at the time of delivery. The csr group has a policy of maintaining a minimum, but declining, level of hedging for up to the next five years at acceptable prices to manage its commodity price exposure, with the objective of ensuring more predictable revenue cash flows.
The csr group no longer has exposure to sugar commodity prices due to the sale of the sucrogen business.
PrinciPal/maTuriTiesCommodity PriCe risk exPosure average 1 year 1 To 3 3 To 5 over fair value($ million) Price a b or less year(s) years 5 years ToTal asseT liabiliTy
2011aluminiumaluminium commodity swaps c 2,626.1 133.2 58.3 – – 191.5 2.7 7.7sold aluminium call option 2,800.0 4.7 – – – 4.7 – 0.2PulpPulp commodity swaps 870.0 1.4 – – – 1.4 0.2 –total 2.9 7.9
2010aluminiumaluminium commodity swaps c 2,563.8 86.8 54.8 – – 141.6 11.8 3.0raw sugarnew york board of Trade sugar no 11 futures buy contracts c 453.0 150.3 4.8 – – 155.1 0.4 30.5new york board of Trade sugar no 11 futures sell contracts c 419.1 170.8 0.2 – – 171.0 27.3 0.7sugar commodity swaps c 339.2 160.5 191.1 11.1 – 362.7 8.5 25.8sugar commodity options c 407.9 9.5 – – – 9.5 1.5 –Total 49.5 60.0
a average prices for the individual periods do not materially differ from the overall average price disclosed.b us dollars per metric tonne.c $4.9 million of commodity contract losses (2010: $10.8 million losses) was deferred in 2011 as the losses relate to hedges of highly probable forecast
transactions. The expected timing of recognition based on the fair values at 31 march 2011 is one year or less: $3.6 million loss (2010: $8.2 million loss); one to three year(s): $1.3 million loss (2010: $1.6 million loss); and three to five years: $nil (2010: $1.0 million loss). no commodity contract gains or losses relating to fair value hedges were recognised in 2011 (2010: $0.3 million gain).

csr limiTed and iTs conTrolled enTiTiesyear ended 31 march 2011
csr annual rePorT 2011 63
noTes To The financial sTaTemenTs
33. finanCial risk management (Continued)The following table details the csr group’s sensitivity to an increase in the commodity prices assuming a constant exchange rate. a decrease would have the opposite impact to the amounts shown in the table. The sensitivity analysis of the csr group’s exposure to commodity price risk at the reporting date has been determined based on the balances as at reporting date.
PriCe CHange sensitivity aluminium Price – 10% PulP Price – 10% sugar Price – 30%($ million) 2011 2010 2011 2010 2011 2010
Profit or loss – (decrease) (0.2) – – – – – other equity – (decrease) increase (19.7) (13.1) 0.2 – – (110.6)
foreign exchange and risk management The csr group uses a variety of foreign exchange risk management instruments, including spot, forward and swap currency contracts and currency options, to hedge foreign currency denominated receipts resulting from revenue denominated in foreign currencies and payments for raw materials and capital equipment, with the key objective of achieving more predictable australian dollar equivalent revenues.
The csr group’s major foreign currency exposure relates to its us dollar aluminium (and sugar commodity price exposure before the sale of the sucrogen business) and consequently it has a currency hedging policy which complements the commodity price hedging policy by providing minimum but declining levels of hedging for up to the next five years using forward exchange rate contracts.
other foreign exchange exposures are relatively small with the csr group policy outlining guidelines for hedging for up to 18 months. The policy requires that material foreign currency denominated purchases of capital equipment be fully hedged to the domestic currency to eliminate currency exposure. similarly, the policy also requires that all material foreign currency assets and liabilities are hedged to the relevant entity’s domestic currency.
The table below provides information about the csr group’s significant exchange rate exposures:
average PrinciPal/maTuriTiesforeign exCHange risk exPosure eXchange 1 year 1 To 3 3 To 5 over fair value c
($ million) raTe a or less year(s) years 5 years ToTal asseT liabiliTy
2011forward exchange rate agreements b
us dollarbuy us dollar 1.00 27.1 0.2 – – 27.3 – 0.6 sell us dollar 0.82 120.7 7.8 – – 128.5 28.6 – new Zealand dollar sell new Zealand dollar 1.35 33.2 – – – 33.2 0.2 0.2 eurobuy euro 0.71 6.5 – – – 6.5 – 0.1 sell euro 0.72 1.0 – – – 1.0 – – great british poundbuy great british pound 0.61 1.4 – – – 1.4 – 0.1 Canadian dollar buy canadian dollar 0.98 0.2 – – – 0.2 – – total 28.8 1.0
2010forward exchange rate agreements b
us dollarbuy us dollar 0.89 198.4 4.4 – – 202.8 0.6 4.4 sell us dollar 0.77 346.2 255.5 11.1 – 612.8 83.7 – new Zealand dollarbuy new Zealand dollar 1.29 0.5 – – – 0.5 – – sell new Zealand dollar 1.27 4.9 – – – 4.9 0.1 – eurobuy euro 0.66 6.3 – – – 6.3 – 0.2 sell euro 0.68 0.1 – – – 0.1 – – great british poundbuy great british pound 0.52 0.6 – – – 0.6 – 0.1 Japanese yenbuy Japanese yen 82.66 4.7 – – – 4.7 – – sell Japanese yen 81.36 0.6 – – – 0.6 – – singaporean dollarbuy singaporean dollar 1.37 0.2 – – – 0.2 – – sell singaporean dollar 1.37 0.1 – – – 0.1 – – Total 84.4 4.7
a average rates for the individual periods do not materially differ from the overall average rates disclosed.b $27.8 million of net foreign exchange contract gains (2010: $79.1 million gains) have been deferred as the gains relate to hedges of highly probable forecast
transactions. The expected timing of recognition based on the fair values at 31 march 2011 are one year or less: $22.4 million gain (2010: $38.1 million gain); one to three years: $5.4 million gain (2010: $39.4 million gain); and three to five years: $nil (2010: $1.6 million gain).
c as at reporting date, the aggregate amount of unrealised gains under forward foreign exchange contracts relating to anticipated future transactions is $27.8 million (2010: unrealised gains of $79.1 million). These unrealised gains have been deferred in the hedge reserve to the extent the hedge is effective.
at 31 march 2011, had the australian dollar strengthened/weakened by 10% against the respective foreign currencies with all other variables held constant, the post-tax profit would have been materially unchanged mainly as a result of the effectiveness of the hedging in place. equity would have been $11.9 million higher/$14.5 million lower (2010: $39.0 million higher/$47.7 million lower) had the australian dollar strengthened/weakened by 10% against the respective foreign currencies arising mainly from foreign forward exchange contracts designated as cash flow hedges.
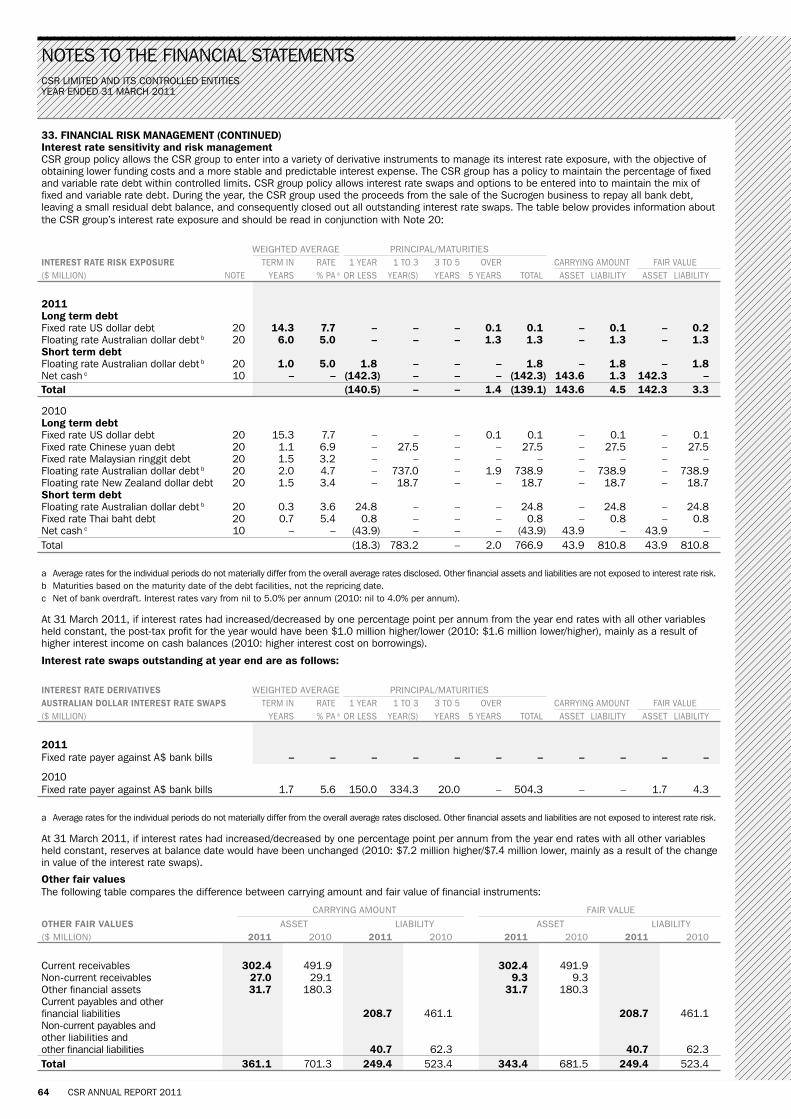
csr limiTed and iTs conTrolled enTiTiesyear ended 31 march 2011
64 csr annual rePorT 2011
noTes To The financial sTaTemenTs
33. finanCial risk management (Continued)interest rate sensitivity and risk management csr group policy allows the csr group to enter into a variety of derivative instruments to manage its interest rate exposure, with the objective of obtaining lower funding costs and a more stable and predictable interest expense. The csr group has a policy to maintain the percentage of fixed and variable rate debt within controlled limits. csr group policy allows interest rate swaps and options to be entered into to maintain the mix of fixed and variable rate debt. during the year, the csr group used the proceeds from the sale of the sucrogen business to repay all bank debt, leaving a small residual debt balance, and consequently closed out all outstanding interest rate swaps. The table below provides information about the csr group’s interest rate exposure and should be read in conjunction with note 20:
weighTed average PrinciPal/maTuriTiesinterest rate risk exPosure Term in raTe 1 year 1 To 3 3 To 5 over carrying amounT fair value($ million) noTe years % Pa a or less year(s) years 5 years ToTal asseT liabiliTy asseT liabiliTy
2011long term debtfixed rate us dollar debt 20 14.3 7.7 – – – 0.1 0.1 – 0.1 – 0.2floating rate australian dollar debt b 20 6.0 5.0 – – – 1.3 1.3 – 1.3 – 1.3short term debtfloating rate australian dollar debt b 20 1.0 5.0 1.8 – – – 1.8 – 1.8 – 1.8net cash c 10 – – (142.3) – – – (142.3) 143.6 1.3 142.3 –total (140.5) – – 1.4 (139.1) 143.6 4.5 142.3 3.3
2010long term debtfixed rate us dollar debt 20 15.3 7.7 – – – 0.1 0.1 – 0.1 – 0.1fixed rate chinese yuan debt 20 1.1 6.9 – 27.5 – – 27.5 – 27.5 – 27.5fixed rate malaysian ringgit debt 20 1.5 3.2 – – – – – – – – –floating rate australian dollar debt b 20 2.0 4.7 – 737.0 – 1.9 738.9 – 738.9 – 738.9floating rate new Zealand dollar debt 20 1.5 3.4 – 18.7 – – 18.7 – 18.7 – 18.7short term debtfloating rate australian dollar debt b 20 0.3 3.6 24.8 – – – 24.8 – 24.8 – 24.8fixed rate Thai baht debt 20 0.7 5.4 0.8 – – – 0.8 – 0.8 – 0.8net cash c 10 – – (43.9) – – – (43.9) 43.9 – 43.9 –Total (18.3) 783.2 – 2.0 766.9 43.9 810.8 43.9 810.8
a average rates for the individual periods do not materially differ from the overall average rates disclosed. other financial assets and liabilities are not exposed to interest rate risk.b maturities based on the maturity date of the debt facilities, not the repricing date.c net of bank overdraft. interest rates vary from nil to 5.0% per annum (2010: nil to 4.0% per annum).
at 31 march 2011, if interest rates had increased/decreased by one percentage point per annum from the year end rates with all other variables held constant, the post-tax profit for the year would have been $1.0 million higher/lower (2010: $1.6 million lower/higher), mainly as a result of higher interest income on cash balances (2010: higher interest cost on borrowings).
interest rate swaps outstanding at year end are as follows:
interest rate derivatives weighTed average PrinciPal/maTuriTiesaustralian dollar interest rate swaPs Term in raTe 1 year 1 To 3 3 To 5 over carrying amounT fair value($ million) years % Pa a or less year(s) years 5 years ToTal asseT liabiliTy asseT liabiliTy
2011fixed rate payer against a$ bank bills – – – – – – – – – – –
2010fixed rate payer against a$ bank bills 1.7 5.6 150.0 334.3 20.0 – 504.3 – – 1.7 4.3
a average rates for the individual periods do not materially differ from the overall average rates disclosed. other financial assets and liabilities are not exposed to interest rate risk.
at 31 march 2011, if interest rates had increased/decreased by one percentage point per annum from the year end rates with all other variables held constant, reserves at balance date would have been unchanged (2010: $7.2 million higher/$7.4 million lower, mainly as a result of the change in value of the interest rate swaps).
other fair values The following table compares the difference between carrying amount and fair value of financial instruments:
carrying amounT fair value
otHer fair values asseT liabiliTy asseT liabiliTy($ million) 2011 2010 2011 2010 2011 2010 2011 2010
current receivables 302.4 491.9 302.4 491.9 non-current receivables 27.0 29.1 9.3 9.3 other financial assets 31.7 180.3 31.7 180.3 current payables and other financial liabilities 208.7 461.1 208.7 461.1non-current payables and other liabilities and other financial liabilities 40.7 62.3 40.7 62.3total 361.1 701.3 249.4 523.4 343.4 681.5 249.4 523.4

csr limiTed and iTs conTrolled enTiTiesyear ended 31 march 2011
csr annual rePorT 2011 65
noTes To The financial sTaTemenTs
33. finanCial risk management (Continued)fair value measurements recognised in the statement of financial position
The following table provides an analysis of financial instruments that are measured subsequent to initial recognition of fair value, grouped into level(s) 1 to 3 based on the degree to which the fair value is observable:
• level 1 fair value measurements are those derived from quoted prices (unadjusted) in active markets for identical assets or liabilities;
• level 2 fair value measurements are those derived from inputs other than quoted prices included within level 1 that are observable for the asset or liability, either directly (i.e. as prices) or indirectly (i.e. derived from prices); and
• level 3 fair value measurements are those derived from valuation techniques that include inputs for the asset or liability that are not based on observable market data (unobservable inputs).
($ million) 2011
level 1 level 2 level 3 totalfinancial assets at fair valuealuminiumaluminium commodity swaps – 2.7 – 2.7
Pulp Pulp commodity swaps – 0.2 – 0.2
other financial instrumentsforward exchange rate agreements – 28.8 – 28.8 total – 31.7 – 31.7
($ million) 2011
level 1 level 2 level 3 totalfinancial liabilities at fair valuealuminiumaluminium commodity swaps – 7.7 – 7.7 sold aluminium call option – 0.2 – 0.2
other financial instrumentsforward exchange rate agreements – 1.0 – 1.0 total – 8.9 – 8.9
($ million) 2010
level 1 level 2 level 3 Totalfinancial assets at fair valuealuminiumlondon metal exchange aluminium futures sell contracts a – 6.8 – 6.8 aluminium commodity swaps – 5.0 – 5.0
raw sugarnew york board of Trade sugar no 11 futures buy contracts 0.4 – – 0.4 new york board of Trade sugar no 11 futures sell contracts 27.3 – – 27.3 sugar commodity swaps – 8.5 – 8.5 sugar commodity options – 1.5 – 1.5
other financial instrumentsforward exchange rate agreements – 84.4 – 84.4 interest rate swaps and options – 1.7 – 1.7 available for sale: shares at fair value – – 44.7 44.7 total 27.7 107.9 44.7 180.3
($ million) 2010
level 1 level 2 level 3 Totalfinancial liabilities at fair valuealuminiumaluminium commodity swaps – 3.0 – 3.0
raw sugarnew york board of Trade sugar no 11 futures buy contracts 30.5 – – 30.5 new york board of Trade sugar no 11 futures sell contracts 0.7 – – 0.7 sugar commodity swaps – 25.8 – 25.8
other financial instrumentsforward exchange rate agreements – 4.7 – 4.7 interest rate swaps and options – 4.3 – 4.3 total 31.2 37.8 – 69.0
a while aluminium futures transactions are conducted on a recognised futures exchange, the calculation of fair value involves the application of a discounted cash flow analysis.
There have been no movements of financial assets or liabilities between levels during the year.

csr limiTed and iTs conTrolled enTiTiesyear ended 31 march 2011
66 csr annual rePorT 2011
noTes To The financial sTaTemenTs
33. finanCial risk management (Continued)reconciliation of level 3 fair value measurements available for sale: shares aT fair value($ million) 2011 2010
opening balance 44.7 42.7 disposal of interest a (44.7) – capital return – reduction in carrying value of the investment – (2.1)revaluation gain in retained profits – 4.1 closing balance – 44.7
a The investment in shares of sugar Terminals limited was disposed with the sale of the sucrogen business in december 2010.
ownershiP inTeresT carrying amounT 2011 2010 2011 2010 % $ million
34. equity aCCounting informationname of entity a Principal activityc. czarnikow limited b sugar brokering – 43 – 23.8rondo Pty limited building products 50 50 10.0 6.8other non-material associates 4.5 2.8total investments accounted for using the equity method 14.5 33.4
csr grouP($ million) 2011 2010
equity accounted amount of investments at the beginning of the financial year 33.4 30.2share of associate entities’ profit before income tax b 19.3 21.8share of income tax b (5.8) (6.4)dividends and distributions received (5.7) (12.5)disposal of sucrogen business (26.8) –foreign currency translation and other 0.1 0.3equity accounted amount of investments at the end of the financial year 14.5 33.4
share of revenue and reserves attributable to associate entitiesrevenue 101.5 153.4retained profits c 10.8 27.6asset revaluation reserves c – 0.2other reserves c 0.3 3.8
summarised statement of financial position of associate entitiesassets– cash and cash equivalents 7.6 75.8– other current assets 50.9 406.1– Property, plant and equipment 16.1 17.5– other non-current assets 2.2 7.0liabilities– current payables 15.1 75.9– current borrowings and other liabilities 23.7 335.6– non-current liabilities 16.6 22.8net assets 21.4 72.1
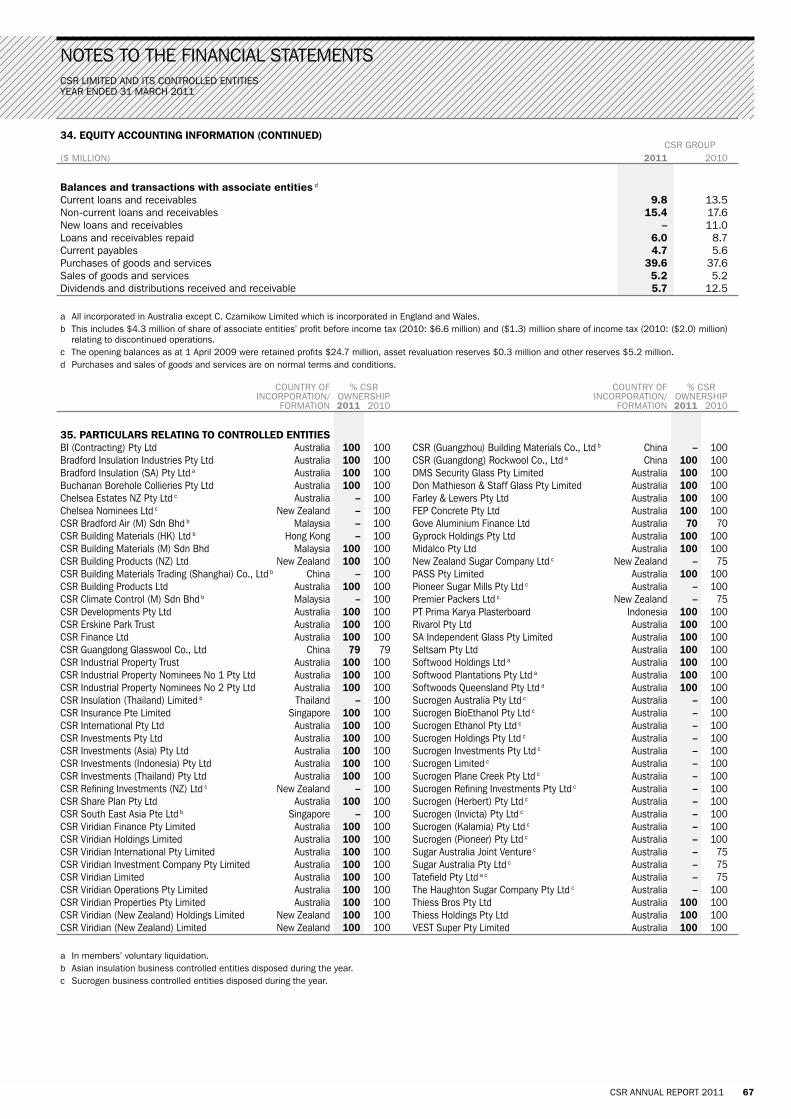
csr limiTed and iTs conTrolled enTiTiesyear ended 31 march 2011
csr annual rePorT 2011 67
noTes To The financial sTaTemenTs
34. equity aCCounting information (Continued) csr grouP($ million) 2011 2010
balances and transactions with associate entities d
current loans and receivables 9.8 13.5non-current loans and receivables 15.4 17.6new loans and receivables – 11.0loans and receivables repaid 6.0 8.7current payables 4.7 5.6Purchases of goods and services 39.6 37.6sales of goods and services 5.2 5.2dividends and distributions received and receivable 5.7 12.5
a all incorporated in australia except c. czarnikow limited which is incorporated in england and wales.b This includes $4.3 million of share of associate entities’ profit before income tax (2010: $6.6 million) and ($1.3) million share of income tax (2010: ($2.0) million)
relating to discontinued operations.c The opening balances as at 1 april 2009 were retained profits $24.7 million, asset revaluation reserves $0.3 million and other reserves $5.2 million.d Purchases and sales of goods and services are on normal terms and conditions.
counTry of % csr counTry of % csr incorPoraTion/ ownershiP incorPoraTion/ ownershiP formaTion 2011 2010 formaTion 2011 2010
35. PartiCulars relating to Controlled entitiesbi (contracting) Pty ltd australia 100 100 csr (guangzhou) building materials co., ltd b china – 100bradford insulation industries Pty ltd australia 100 100 csr (guangdong) rockwool co., ltd a china 100 100bradford insulation (sa) Pty ltd a australia 100 100 dms security glass Pty limited australia 100 100buchanan borehole collieries Pty ltd australia 100 100 don mathieson & staff glass Pty limited australia 100 100chelsea estates nZ Pty ltd c australia – 100 farley & lewers Pty ltd australia 100 100chelsea nominees ltd c new Zealand – 100 feP concrete Pty ltd australia 100 100csr bradford air (m) sdn bhd b malaysia – 100 gove aluminium finance ltd australia 70 70csr building materials (hk) ltd b hong kong – 100 gyprock holdings Pty ltd australia 100 100csr building materials (m) sdn bhd malaysia 100 100 midalco Pty ltd australia 100 100csr building Products (nZ) ltd new Zealand 100 100 new Zealand sugar company ltd c new Zealand – 75csr building materials Trading (shanghai) co., ltd b china – 100 Pass Pty limited australia 100 100csr building Products ltd australia 100 100 Pioneer sugar mills Pty ltd c australia – 100csr climate control (m) sdn bhd b malaysia – 100 Premier Packers ltd c new Zealand – 75csr developments Pty ltd australia 100 100 PT Prima karya Plasterboard indonesia 100 100csr erskine Park Trust australia 100 100 rivarol Pty ltd australia 100 100csr finance ltd australia 100 100 sa independent glass Pty limited australia 100 100csr guangdong glasswool co., ltd china 79 79 seltsam Pty ltd australia 100 100csr industrial Property Trust australia 100 100 softwood holdings ltd a australia 100 100csr industrial Property nominees no 1 Pty ltd australia 100 100 softwood Plantations Pty ltd a australia 100 100csr industrial Property nominees no 2 Pty ltd australia 100 100 softwoods Queensland Pty ltd a australia 100 100csr insulation (Thailand) limited b Thailand – 100 sucrogen australia Pty ltd c australia – 100csr insurance Pte limited singapore 100 100 sucrogen bioethanol Pty ltd c australia – 100csr international Pty ltd australia 100 100 sucrogen ethanol Pty ltd c australia – 100csr investments Pty ltd australia 100 100 sucrogen holdings Pty ltd c australia – 100csr investments (asia) Pty ltd australia 100 100 sucrogen investments Pty ltd c australia – 100csr investments (indonesia) Pty ltd australia 100 100 sucrogen limited c australia – 100csr investments (Thailand) Pty ltd australia 100 100 sucrogen Plane creek Pty ltd c australia – 100csr refining investments (nZ) ltd c new Zealand – 100 sucrogen refining investments Pty ltd c australia – 100csr share Plan Pty ltd australia 100 100 sucrogen (herbert) Pty ltd c australia – 100csr south east asia Pte ltd b singapore – 100 sucrogen (invicta) Pty ltd c australia – 100csr viridian finance Pty limited australia 100 100 sucrogen (kalamia) Pty ltd c australia – 100csr viridian holdings limited australia 100 100 sucrogen (Pioneer) Pty ltd c australia – 100csr viridian international Pty limited australia 100 100 sugar australia Joint venture c australia – 75csr viridian investment company Pty limited australia 100 100 sugar australia Pty ltd c australia – 75csr viridian limited australia 100 100 Tatefield Pty ltd a c australia – 75csr viridian operations Pty limited australia 100 100 The haughton sugar company Pty ltd c australia – 100csr viridian Properties Pty limited australia 100 100 Thiess bros Pty ltd australia 100 100csr viridian (new Zealand) holdings limited new Zealand 100 100 Thiess holdings Pty ltd australia 100 100csr viridian (new Zealand) limited new Zealand 100 100 vesT super Pty limited australia 100 100
a in members’ voluntary liquidation.b asian insulation business controlled entities disposed during the year.c sucrogen business controlled entities disposed during the year.
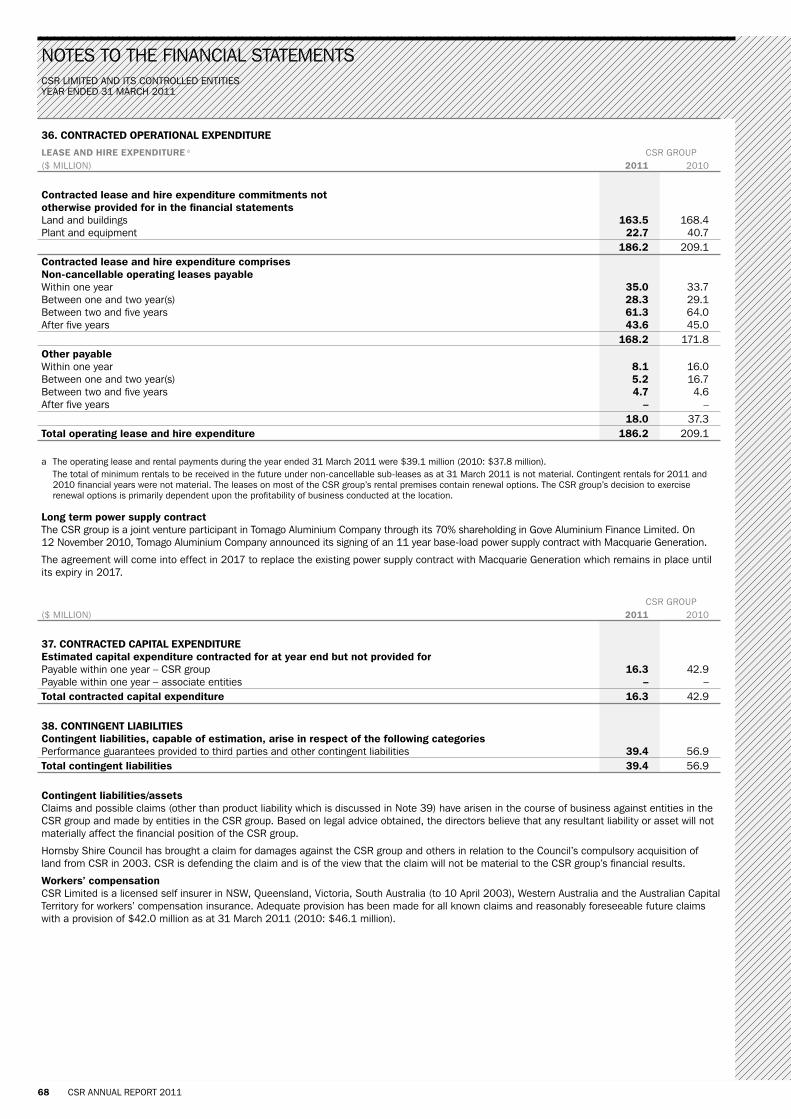
csr limiTed and iTs conTrolled enTiTiesyear ended 31 march 2011
68 csr annual rePorT 2011
noTes To The financial sTaTemenTs
36. ContraCted oPerational exPenditure
lease and Hire exPenditure a csr grouP($ million) 2011 2010
Contracted lease and hire expenditure commitments not otherwise provided for in the financial statementsland and buildings 163.5 168.4 Plant and equipment 22.7 40.7 186.2 209.1 Contracted lease and hire expenditure comprisesnon-cancellable operating leases payablewithin one year 35.0 33.7 between one and two year(s) 28.3 29.1 between two and five years 61.3 64.0 after five years 43.6 45.0 168.2 171.8 other payablewithin one year 8.1 16.0 between one and two year(s) 5.2 16.7 between two and five years 4.7 4.6 after five years – – 18.0 37.3 total operating lease and hire expenditure 186.2 209.1
a The operating lease and rental payments during the year ended 31 march 2011 were $39.1 million (2010: $37.8 million). The total of minimum rentals to be received in the future under non-cancellable sub-leases as at 31 march 2011 is not material. contingent rentals for 2011 and
2010 financial years were not material. The leases on most of the csr group’s rental premises contain renewal options. The csr group’s decision to exercise renewal options is primarily dependent upon the profitability of business conducted at the location.
long term power supply contract The csr group is a joint venture participant in Tomago aluminium company through its 70% shareholding in gove aluminium finance limited. on 12 november 2010, Tomago aluminium company announced its signing of an 11 year base-load power supply contract with macquarie generation.
The agreement will come into effect in 2017 to replace the existing power supply contract with macquarie generation which remains in place until its expiry in 2017.
csr grouP($ million) 2011 2010
37. ContraCted CaPital exPenditureestimated capital expenditure contracted for at year end but not provided forPayable within one year – csr group 16.3 42.9 Payable within one year – associate entities – – total contracted capital expenditure 16.3 42.9
38. Contingent liabilitiesContingent liabilities, capable of estimation, arise in respect of the following categoriesPerformance guarantees provided to third parties and other contingent liabilities 39.4 56.9 total contingent liabilities 39.4 56.9
Contingent liabilities/assets claims and possible claims (other than product liability which is discussed in note 39) have arisen in the course of business against entities in the csr group and made by entities in the csr group. based on legal advice obtained, the directors believe that any resultant liability or asset will not materially affect the financial position of the csr group.
hornsby shire council has brought a claim for damages against the csr group and others in relation to the council’s compulsory acquisition of land from csr in 2003. csr is defending the claim and is of the view that the claim will not be material to the csr group’s financial results.
workers’ compensation csr limited is a licensed self insurer in nsw, Queensland, victoria, south australia (to 10 april 2003), western australia and the australian capital Territory for workers’ compensation insurance. adequate provision has been made for all known claims and reasonably foreseeable future claims with a provision of $42.0 million as at 31 march 2011 (2010: $46.1 million).
csr limiTed and iTs conTrolled enTiTiesyear ended 31 march 2011
csr annual rePorT 2011 69
noTes To The financial sTaTemenTs
39. ProduCt liabilitycsr limited and/or certain subsidiaries (csr) were involved in mining asbestos and manufacturing and marketing products containing asbestos in australia, and exporting asbestos to the united states. csr’s involvement in asbestos mining, and the manufacture of products containing asbestos, began in the early 1940s and ceased with the disposition of the wunderlich asbestos cement business in 1977. as a result of these activities, csr has been named as a defendant in litigation in australia and the united states.
in australia, asbestos related personal injury claims have been made by employees and ex-employees of csr, by others such as contractors and transporters and by users of products containing asbestos. as at 31 march 2011, there were 627 such claims pending.
in the united states, claims are made by people who allege exposure to asbestos fibre used in the manufacture of products containing asbestos or in the installation or use of those products. as at 31 march 2011, there were 990 such claims pending.
csr has been settling claims since 1989. as at 31 march 2011, csr had resolved 3,005 claims in australia and approximately 135,600 claims in the united states.
csr’s recent claims experience can be summarised as follows:
year ended 31 march 2011 2010 2009 2008 2007
number of claims received 412 514 553 546 1,489number of claims resolved 634 986 1,246 575 2,680amount spent on settlements (a$ million) a 32.5 33.4 41.6 28.2 23.5average cost per resolved claim (a$) 51,300 33,916 33,371 49,128 8,767
a excludes external legal costs.
The annual amounts paid by csr in respect of asbestos related claims vary year on year depending on the number and types of claims received and resolved during each year, the litigation or other determination of particular claims or issues and any determination by management to resolve claims that may have been received in earlier years.
basis of provision csr includes in its financial statements a product liability provision covering all known claims and reasonably foreseeable future asbestos related claims. This provision is reviewed every six months. The provision recognises the best estimate of the consideration required to settle the present obligation for anticipated compensation payments and legal costs as at the reporting date. The provision is net of anticipated workers’ compensation payments from available workers’ compensation insurers. csr does not believe there is any other significant source of insurance available to meet its asbestos liabilities. csr no longer has general insurance coverage in relation to its ongoing asbestos liabilities.
in determining the product liability provision, csr has obtained independent expert advice in relation to the future incidence and value of asbestos related claims in each of the united states and australia. csr has appointed Taylor fry Pty limited, consulting actuaries, as the independent expert to estimate the australian liabilities. csr has appointed navigant consulting, inc as the independent expert to estimate the united states liabilities. The independent experts make their own determination of the methodology most appropriate for estimating csr’s future liabilities. The assessments of those independent experts project csr’s claims experience into the future using modelling techniques that take into account a range of possible outcomes. The present value of the liabilities is estimated by discounting the estimated cash flows using the pre-tax rate that reflects the current market assessment of the time value of money and risks specific to those liabilities.
many factors are relevant to the independent experts’ estimates of future asbestos liabilities, including:
• numbers of claims received by disease and claimant type and expected future claims numbers, including expectations as to when claims experience will peak;
• expected value of claims;
• the presence of other defendants in litigation or claims involving csr;
• the impact of and developments in the litigation and settlement environment in each of australia and the united states;
• estimations of legal costs;
• expected claims inflation; and
• the discount rate applied to future payments.
There are a number of assumptions and limitations that impact on the assessments made by csr’s experts, including the following:
• assumptions used in the modelling are based on the various considerations referred to above;
• the future cost of asbestos related liabilities are inherently uncertain for the reasons discussed in this note;
• uncertainties as to future interest rates and inflation;
• the analysis is supplemented by various academic material on the epidemiology of asbestos related diseases that is considered by the experts to be authoritative;
• the analysis is limited to liability in the respective jurisdictions of australia and the united states that are the subject of the analysis of that expert and to the asbestos related diseases that are currently compensated in those jurisdictions; and
• the effect of possible events that have not yet occurred which are currently impossible to quantify, such as medical and epidemiological developments in the future in treating asbestos diseases, future court and jury decisions on asbestos liabilities, and legislative changes affecting liability for asbestos diseases.
csr limiTed and iTs conTrolled enTiTiesyear ended 31 march 2011
noTes To The financial sTaTemenTs
70 csr annual rePorT 2011
39. ProduCt liability (Continued)in australia the methodology used by Taylor fry Pty limited produces a range of potential outcomes, including a central estimate, or most likely outcome. at 31 march 2011 the central estimate was a$180.1 million calculated using a discount rate of 6%. on an undiscounted and inflated basis that central estimate would be a$366.4 million over the period to 2060, being the period that the australian independent expert advises csr is relevant for the estimation of csr’s future australian asbestos liabilities.
in the united states the methodology used by navigant consulting, inc produces a base case estimate or most likely outcome. at 31 march 2011 the base case estimate was us$191.8 million calculated using a discount rate of 4.2%. on an undiscounted and inflated basis that base case estimate would be us$283.0 million over the anticipated further life of the united states liability (45 years).
The product liability provision is determined every six months by aggregating the australian and united states estimates noted above, translating the united states base case estimate to australian dollars using the exchange rate prevailing at the balance date and adding a prudential margin. The prudential margin is determined by the csr directors at the balance date, having regard to the prevailing litigation environment, any material uncertainties that may affect future liabilities and the applicable long term australian dollar to united states dollar exchange rate. as evidenced by the analysis below, due, in particular, to the fluctuations in exchange rate, the prudential margin has been variable over the past five years. The directors anticipate that the prudential margin will continue to fluctuate within a range approximating 10% to 30% depending on the prevailing circumstances at each balance date.
The table below shows csr’s asbestos provision from 2007 to 2011:
year ended 31 march ($ million) 2011 2010 2009 2008 2007
united states base case estimate us$ 191.8 159.5 153.6 120.6 111.2united states base case estimate a$ 185.9 173.7 225.9 131.7 137.7australian central estimate a$ 180.1 184.8 187.8 172.9 152.1sub total a$ 366.0 358.5 413.7 304.6 289.8
Prudential margin a$ 82.9 96.8 41.4 66.9 98.2Prudential margin % 22.7% 27.0% 10.0% 22.0% 33.9%total product liability provision a$ 448.9 455.3 455.1 371.5 388.0
at 31 march 2011, a provision of $448.9 million (2010: $455.3 million) has been made for all known claims and reasonably foreseeable future claims, and includes a prudential margin of $82.9 million above the aggregate most likely estimate of the future asbestos liabilities in australia and the united states as determined by Taylor fry and navigant consulting respectively.
having regard to the extremely long tailed nature of the liabilities and the long latency period of disease manifestation from exposure, the estimation of future asbestos liabilities is subject to significant complexity. as such, there can be no certainty that the product liability provision as at 31 march 2011 will definitively estimate csr’s future asbestos liabilities. if the assumptions adopted by csr’s experts prove to be incorrect, the current provision may be shown to materially under or over state csr’s asbestos liability.
however, taking into account the provision already included in csr’s financial statements and current claims management experience, csr is of the opinion that asbestos litigation in the united states and australia will not have a material adverse impact on the csr group’s financial condition.
Process agreed with the foreign investment review board (firb) on 22 december 2010, csr sold its sucrogen business to wilmar international limited (wilmar). The sale of sucrogen to wilmar required approval from the commonwealth Treasurer (via the firb).
as part of the approval process, and as further evidence of csr’s commitment to responsibly managing its asbestos related liabilities, csr has put in place a process for the external oversight of any repatriation of capital by csr to its shareholders during the period of seven years following the sale of sucrogen (subject to limited earlier termination provisions).
as part of this process, csr has entered into an agreement with an independent body, The Trust company (TTc), pursuant to which csr must demonstrate that csr has fulfilled certain requirements prior to any repatriation of funds to its shareholders other than half yearly or annual dividends paid by csr in accordance with its usual practice and its dividend policy in force from time to time.
These requirements include that:
• csr’s asbestos liabilities have been reviewed by an additional independent expert;
• csr intends to retain its ‘investment grade’ credit rating following any repatriation; and
• an approved accounting firm has expressed an opinion that the decision of csr’s directors that a particular repatriation of capital would not materially prejudice creditors, including current and reasonably foreseeable future asbestos claimants, was formed on a reasonable basis.
in accordance with the agreement with TTc, documentation was provided by csr to TTc to demonstrate that the above requirements were fulfilled in relation to the special dividend and the capital return which were paid to csr shareholders on 2 february and 3 march 2011 respectively.
csr limiTed and iTs conTrolled enTiTiesyear ended 31 march 2011
noTes To The financial sTaTemenTs
csr annual rePorT 2011 71
40. aCquisitions of Controlled entities and businessesbusinesses acquired during the year on 14 may 2010, the csr group acquired the assets of commercial ceiling and educational products businesses, comprador Pacific (based in australia) and Potters interior systems (based in new Zealand). The acquired businesses contributed revenues of $26.8 million and earnings before interest and tax (ebiT) of $0.3 million and net profit of $0.2 million for the period from 14 may 2010 to 31 march 2011. if the acquisition had occurred on 1 april 2010, revenues, ebiT and net profit for the year ended 31 march 2011 would have been approximately $31.1 million, $0.4 million and $0.3 million respectively including the estimated benefits from synergies before interest expense. These amounts have been estimated using a consistent basis to the period since acquisition.
The primary reason for the acquisition was to continue csr’s growth in commercial ceiling tiles and related products.
The acquisition related costs expensed were $0.3 million.
The initial accounting for the acquisition has been fully determined at 31 march 2011. at the date of finalisation of this report, the necessary market valuations and other calculations have been finalised and the fair value of the plant and equipment, associated deferred tax liabilities and goodwill noted below have been determined based on the directors’ best estimate of the likely fair value of the plant and equipment.
details of the purchase consideration and the fair value of assets and liabilities acquired are given below.
no acquisitions were made during the year ended 31 march 2010.
($ million) 2011 2010
Purchase consideration 2.1 –fair value of net identifiable assets acquired (refer to below) 2.1 –goodwill acquired (refer to below) – –
value of net assets of controlled entities and businesses acquired csr grouP acQuisiTions fair value ($ million) 2011 2010
inventories 6.1 –other current assets 0.3 –Property, plant and equipment 1.0 –intangible assets 0.9 –deferred income tax assets 0.3 –other non-current assets 0.1 –Trade payables (5.9) –borrowings (0.1) –Provisions (0.6) –net identifiable assets acquired 2.1 –goodwill acquired – –total consideration 2.1 –cash balances acquired – –acquisition expenses paid 0.3 total flow of cash 2.4 –
41. subsequent eventsdividends for dividends declared after 31 march 2011, refer to note 27.
csr limiTed and iTs conTrolled enTiTiesyear ended 31 march 2011
72 csr annual rePorT 2011
direcTors’ declaraTion
The directors declare that:
(a) in the directors’ opinion, there are reasonable grounds to believe that csr limited will be able to pay its debts as and when they become due and payable;
(b) in the directors’ opinion, the attached financial statements are in compliance with international financial reporting standards, as disclosed in the significant accounting policies;
(c) in the directors’ opinion, the attached financial statements and notes thereto are in accordance with the corporations act 2001, including compliance with accounting standards and giving a true and fair view of the financial position and performance of the consolidated entity; and
(d) the directors have been given the declarations required by s.295a of the corporations act 2001 from the chief executive officer and chief financial officer for the financial year ended 31 march 2011.
signed in accordance with a resolution of the directors made pursuant to s.295(5) of the corporations act 2001.
ian blaCkburne chairman 11 may 2011
rob sindel managing director
11 may 2011

csr limiTed and iTs conTrolled enTiTiesyear ended 31 march 2011
csr annual rePorT 2011 73
indePendenT audiTor’s rePorT To The members of csr limiTed
rePort on tHe finanCial rePortwe have audited the accompanying financial report of csr limited, which comprises the statement of financial position as at 31 march 2011, the statement of financial performance, the statement of comprehensive income, the statement of cash flows and the statement of changes in equity for the year ended on that date, notes comprising a summary of significant accounting policies and other explanatory information, and the directors’ declaration of the consolidated entity comprising the company and the entities it controlled at the year’s end or from time to time during the financial year as set out on pages 33 to 72.
directors’ responsibility for the financial reportThe directors of the company are responsible for the preparation of the financial report that gives a true and fair view in accordance with australian accounting standards and the Corporations Act 2001 and for such internal control as the directors determine is necessary to enable the preparation of the financial report that is free from material misstatement, whether due to fraud or error. in “significant accounting policies” the directors also state, in accordance with accounting standard aasb 101 Presentation of Financial Statements, that the consolidated financial statements comply with international financial reporting standards.
auditor’s responsibilityour responsibility is to express an opinion on the financial report based on our audit. we conducted our audit in accordance with australian auditing standards. Those standards require that we comply with relevant ethical requirements relating to audit engagements and plan and perform the audit to obtain reasonable assurance whether the financial report is free from material misstatement.
an audit involves performing procedures to obtain audit evidence about the amounts and disclosures in the financial report. The procedures selected depend on the auditor’s judgement, including the assessment of the risks of material misstatement of the financial report, whether due to fraud or error. in making those risk assessments, the auditor considers internal control, relevant to the entity’s preparation of the financial report that gives a true and fair view, in order to design audit procedures that are appropriate in the circumstances, but not for the purpose of expressing an opinion on the effectiveness of the entity’s internal control. an audit also includes evaluating the appropriateness of accounting policies used and the reasonableness of accounting estimates made by the directors, as well as evaluating the overall presentation of the financial report.
we believe that the audit evidence we have obtained is sufficient and appropriate to provide a basis for our audit opinion.
auditor’s independence declarationin conducting our audit, we have complied with the independence requirements of the Corporations Act 2001. we confirm that the independence declaration required by the Corporations Act 2001, which has been given to the directors of csr limited, would be in the same terms if given to the directors as at the time of this auditor’s report.
opinionin our opinion:
(a) the financial report of csr limited is in accordance with the Corporations Act 2001, including:
(i) giving a true and fair view of the consolidated entity’s financial position as at 31 march 2011 and of its performance for the year ended on that date; and
(ii) complying with australian accounting standards and the Corporations Regulations 2001; and
(b) the consolidated financial statements also comply with international financial reporting standards as disclosed in significant accounting policies.
rePort on tHe remuneration rePortwe have audited the remuneration report included in pages 12 to 30 of the directors’ report for the year ended 31 march 2011. The directors of the company are responsible for the preparation and presentation of the remuneration report in accordance with section 300a of the Corporations Act 2001. our responsibility is to express an opinion on the remuneration report, based on our audit conducted in accordance with australian auditing standards.
opinionin our opinion the remuneration report of csr limited for the year ended 31 march 2011, complies with section 300a of the Corporations Act 2001.
deloitte touCHe toHmatsu samantHa lewis
Partner chartered accountants sydney, 11 may 2011
liability limited by a scheme approved under Professional standards legislation. member of deloitte Touche Tohmatsu limited
deloitte Touche Tohmatsua.b.n. 74 490 121 060
grosvenor Place225 george streetsydney nsw 2000Po box n250 grosvenor Placesydney nsw 1220 australia
dX 10307sseTel: +61 (0) 2 9322 7000fax: +61 (0) 2 9322 7001www .deloitte.com.au

csr limiTed and iTs conTrolled enTiTiesyear ended 31 march 2011
74 csr annual rePorT 2011
audiTor’s indePendence declaraTion To The direcTors of csr limiTed
The directors csr limited Triniti 3 39 delhi road norTh ryde nsw 2113
11 may 2011
dear directors,
Csr limited
in accordance with section 307c of the corporations act 2001, i am pleased to provide the following declaration of independence to the directors of csr limited.
as lead audit partner for the audit of the financial statements of csr limited for the financial year ended 31 march 2011, i declare that to the best of my knowledge and belief, there have been no contraventions of:
(i) the auditor independence requirements of the corporations act 2001 in relation to the audit; and
(ii) any applicable code of professional conduct in relation to the audit.
yours sincerely
deloitte touCHe toHmatsu samantHa lewis
Partner chartered accountants sydney, 11 may 2011
liability limited by a scheme approved under Professional standards legislation. member of deloitte Touche Tohmatsu limited
deloitte Touche Tohmatsua.b.n. 74 490 121 060
grosvenor Place225 george streetsydney nsw 2000Po box n250 grosvenor Placesydney nsw 1220 australia
dX 10307sseTel: +61 (0) 2 9322 7000fax: +61 (0) 2 9322 7001www .deloitte.com.au

csr annual rePorT 2011 75
20 largest Holders of ordinary sHaresas aT 11 may 2011 rank name uniTs % of uniTs
1 hsbc custody nominees (australia) limited 81,843,103 16.172 J.P. morgan nominees australia limited 80,072,382 15.823 national nominees limited 58,930,930 11.654 citicorp nominees Pty limited 15,676,588 3.105 gPg australia nominees ltd 14,505,271 2.876 rbc dexia investor services australia nominees Pty limited 14,003,820 2.777 cogent nominees Pty limited 9,358,882 1.858 J.P. morgan nominees australia limited 6,247,141 1.239 amP life limited 3,832,535 0.7610 rbc dexia investor services australia nominees Pty limited 3,433,702 0.6811 ubs nominees Pty ltd 2,923,009 0.5812 citicorp nominees Pty limited 2,900,000 0.5713 The senior master of the supreme court 2,863,028 0.5714 Queensland investment corporation 2,636,439 0.5215 australian foundation investment company limited 2,445,725 0.4816 citicorp nominees Pty limited 2,342,849 0.4617 australian reward investment alliance 1,680,652 0.3318 csr share Plan Pty limited 1,641,690 0.3219 rbc dexia investor services australia 1,620,160 0.3220 gPg nominees Pty limited 1,392,816 0.28total: top 20 holders of issued capital 310,350,722 61.33total remaining holders balance 195,649,593 38.67
substantial sHareHolders of Csr limitedPerpetual limited and its subsidiaries advised that as at 12 october 2010, it and its associates had an interest in 76.4 million shares, which represented 5.03 per cent of csr’s issued capital at that time.
national australia bank limited advised that as at 12 november 2010, it and its associates had an interest in 80.4 million shares, which represented 5.29 per cent of csr’s issued capital at that time.
distribution of sHareHolders and sHareHoldingas aT 11 may 2011 uniTs uniTs % holders holders %
australia 486,681,455 96.20 83,405 96.45new Zealand 3,143,948 0.62 2,005 2.32united kingdom 14,959,713 2.95 405 0.47united states of america 108,291 0.02 184 0.21other 1,106,908 0.21 475 0.55total 506,000,315 100.00 86,474 100.00
as aT 11 may 2011 ToTal % of range holders uniTs issued caPiTal
1 – 1,000 47,975 20,425,484 4.041,001 – 5,000 31,865 71,035,158 14.045,001 – 10,000 4,337 30,550,645 6.0410,001 – 100,000 2,186 46,944,613 9.28100,001 and over 111 337,044,415 66.60total 86,474 506,000,315 100.00unmarketable parcels (holdings of 170 or less shares) 10,806 1,130,590
sHare issuescsr issued 2,986,500 fully paid ordinary shares on 31 august 2010 and 2,200 fully paid ordinary shares on 2 november 2010 under the employee universal share/option Plan.
reCent Csr dividends franked amounT dividend Per share daTe Paid TyPe of dividend Per share franking aT 30% TaX
december 2006 interim 6 cents 100% 6 centsJuly 2007 final 9 cents 100% 9 centsdecember 2007 interim 6 cents 100% 6 centsJuly 2008 final 9 cents 100% 9 centsdecember 2008 interim 6 cents 100% 6 centsJuly 2009 final 1.5 cents 100% 1.5 centsdecember 2009 interim 2.5 cents 100% 2.5 centsJuly 2010 final 6 cents 100% 6 centsdecember 2010 interim 3 cents 100% 3 centsfebruary 2011 special 9.1 cents 100% 9.1 cents
share informaTion

76 csr annual rePorT 2011
shareholder informaTion
sHareHolders’ timetable a 2011csr year end 31 marchfull year profit and final dividend announced 11 mayannual report, notice of meeting and Proxy form released 7 Juneshares begin trading ex-dividend 7 Junerecord date for final dividend 14 Junefinal dividend paid 5 JulyProxy returns close 10.00 am sydney 5 Julyannual general meeting 10.00 am melbourne 7 Julycsr half year end 30 septemberhalf year profit and half year dividend announced 9 november
a Timing of events is subject to change.
annual general meetingannual general meeting 10.00 am Thursday 7 July 2011 The skyline room melbourne and olympic Parks batman avenue melbourne victoria 3000
CorPorate rePortsThe csr shareholder review, annual report and sustainability report are all available to view online or download, visit w w w .csr.com.au
registry information all inquiries and correspondence regarding shareholdings should be directed to csr’s share registry: computershare investor services Pty limited level 4, 60 carrington street sydney nsw 2000 australia gPo box 2975, melbourne vic 3001 australia
Telephone 1800 676 061 international +61 3 9415 4033 facsimile (03) 9473 2500 international +61 3 9473 2500 e-mail [email protected] www .computershare.com.au
Csr limited abn 90 000 001 276
Triniti 3, level 5, 39 delhi road north ryde nsw 2113 australia locked bag 1345, north ryde bc 1670
Telephone (02) 9235 8000 international +61 2 9235 8000 facsimile (02) 8362 9013 international +61 2 8362 9013 e-mail [email protected] w w w .csr.com.au

The CSR Shareholder Review, Annual Report and Sustainability Report are all available to view online or download, visit w w w .csr.com.au
The new csr a clear focus
csr limited shareholder review 2011
w w w.csr.com.au
This Annual Report has been printed on Monza Recycled. It contains 55% recycled fibre (25% post consumer and 30% pre consumer) and FSC Certified pulp, which ensures that all virgin pulp is derived from well-managed forests and controlled sources. It is manufactured by an ISO 14001 certified mill. Monza Recycled is an FSC Mixed Sources Certified paper.
BACK COveR IMAge: PgH™ BRICKS FROM THe MOdeRn LIvIng COLLeCTIOn 2 RAnge