Fiscal Policy and Inflation Targets: Does Credibility Matters
Upload
khangminh22Category
view
4download
0
1
The influence of online logistics service mode on
customer loyalty: the moderation effect of signal
credibility and switching costs
A Thesis Submitted in accordance with the Requirements of the
University of Liverpool for the degree of Master in philosophy
by
Yingqiao He
Management studies
Management school
University of Liverpool
March 2018
2
Table of Contents
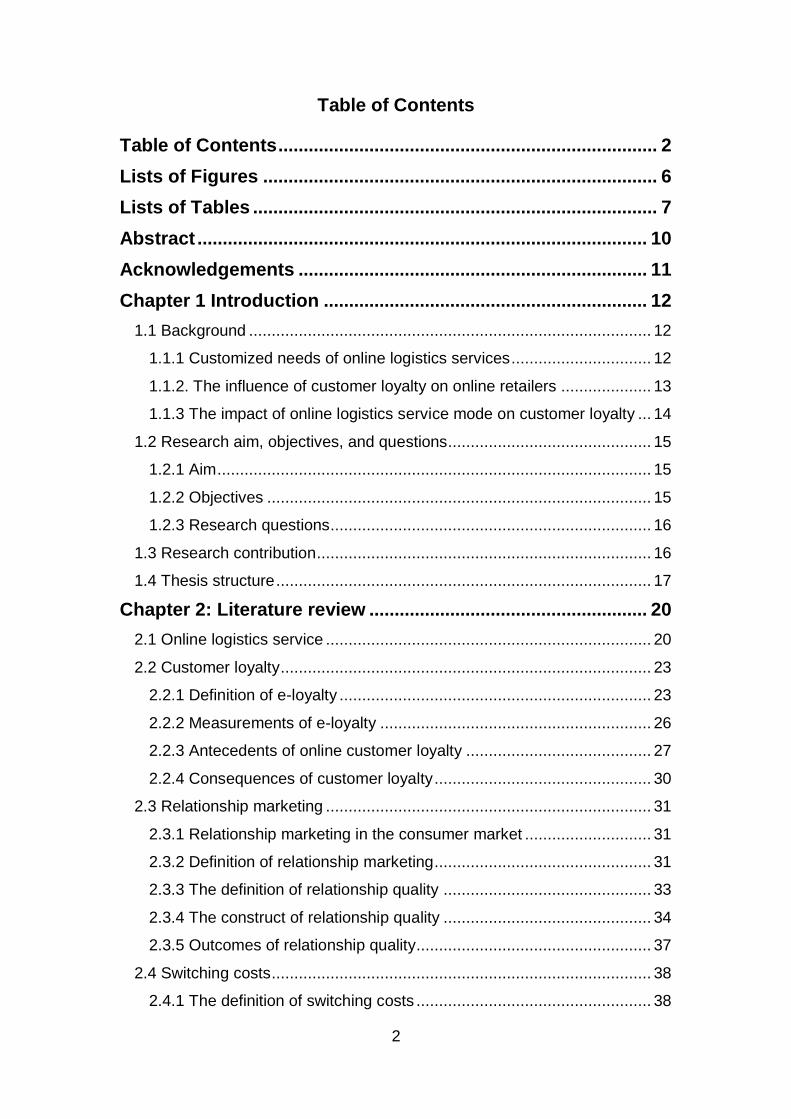
Table of Contents ........................................................................... 2
Lists of Figures .............................................................................. 6
Lists of Tables ................................................................................ 7
Abstract ......................................................................................... 10
Acknowledgements ..................................................................... 11
Chapter 1 Introduction ................................................................ 12
1.1 Background ......................................................................................... 12
1.1.1 Customized needs of online logistics services ............................... 12
1.1.2. The influence of customer loyalty on online retailers .................... 13
1.1.3 The impact of online logistics service mode on customer loyalty ... 14
1.2 Research aim, objectives, and questions............................................. 15
1.2.1 Aim ................................................................................................ 15
1.2.2 Objectives ..................................................................................... 15
1.2.3 Research questions ....................................................................... 16
1.3 Research contribution .......................................................................... 16
1.4 Thesis structure ................................................................................... 17
Chapter 2: Literature review ....................................................... 20
2.1 Online logistics service ........................................................................ 20
2.2 Customer loyalty .................................................................................. 23
2.2.1 Definition of e-loyalty ..................................................................... 23
2.2.2 Measurements of e-loyalty ............................................................ 26
2.2.3 Antecedents of online customer loyalty ......................................... 27
2.2.4 Consequences of customer loyalty ................................................ 30
2.3 Relationship marketing ........................................................................ 31
2.3.1 Relationship marketing in the consumer market ............................ 31
2.3.2 Definition of relationship marketing ................................................ 31
2.3.3 The definition of relationship quality .............................................. 33
2.3.4 The construct of relationship quality .............................................. 34
2.3.5 Outcomes of relationship quality.................................................... 37
2.4 Switching costs .................................................................................... 38
2.4.1 The definition of switching costs .................................................... 38
3
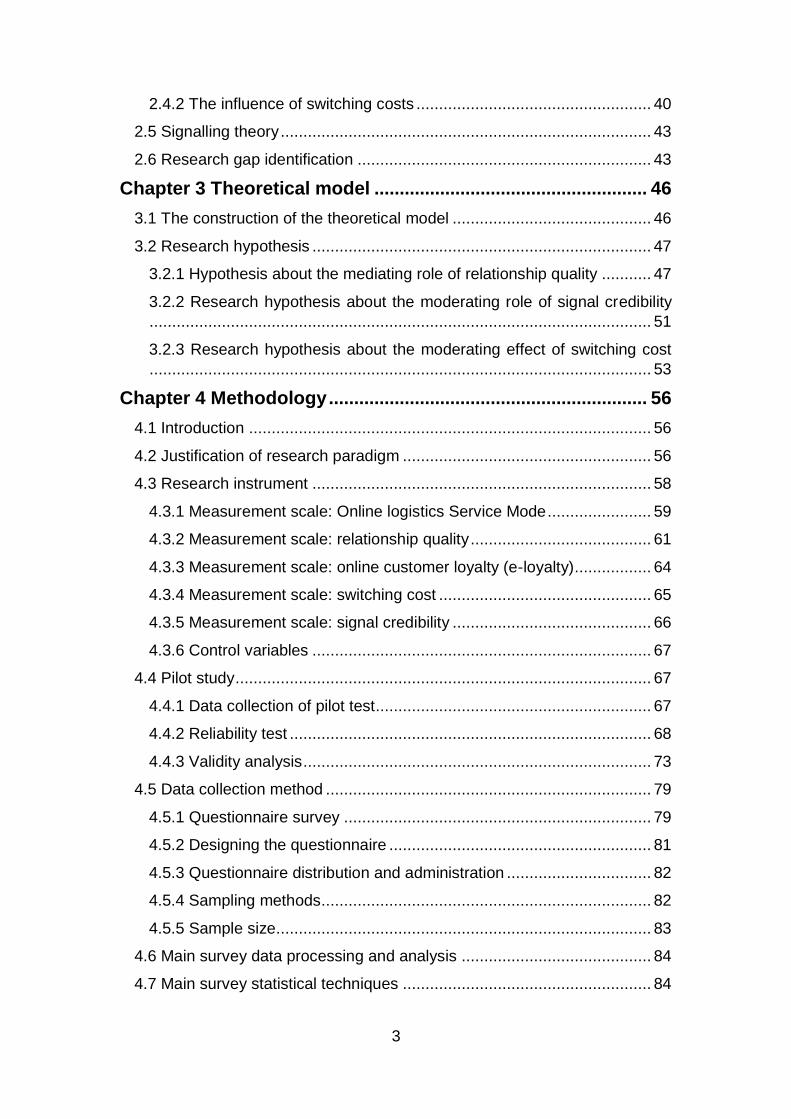
2.4.2 The influence of switching costs .................................................... 40
2.5 Signalling theory .................................................................................. 43
2.6 Research gap identification ................................................................. 43
Chapter 3 Theoretical model ...................................................... 46
3.1 The construction of the theoretical model ............................................ 46
3.2 Research hypothesis ........................................................................... 47
3.2.1 Hypothesis about the mediating role of relationship quality ........... 47
3.2.2 Research hypothesis about the moderating role of signal credibility
............................................................................................................... 51
3.2.3 Research hypothesis about the moderating effect of switching cost
............................................................................................................... 53
Chapter 4 Methodology ............................................................... 56
4.1 Introduction ......................................................................................... 56
4.2 Justification of research paradigm ....................................................... 56
4.3 Research instrument ........................................................................... 58
4.3.1 Measurement scale: Online logistics Service Mode ....................... 59
4.3.2 Measurement scale: relationship quality ........................................ 61
4.3.3 Measurement scale: online customer loyalty (e-loyalty) ................. 64
4.3.4 Measurement scale: switching cost ............................................... 65
4.3.5 Measurement scale: signal credibility ............................................ 66
4.3.6 Control variables ........................................................................... 67
4.4 Pilot study ............................................................................................ 67
4.4.1 Data collection of pilot test ............................................................. 67
4.4.2 Reliability test ................................................................................ 68
4.4.3 Validity analysis ............................................................................. 73
4.5 Data collection method ........................................................................ 79
4.5.1 Questionnaire survey .................................................................... 79
4.5.2 Designing the questionnaire .......................................................... 81
4.5.3 Questionnaire distribution and administration ................................ 82
4.5.4 Sampling methods......................................................................... 82
4.5.5 Sample size................................................................................... 83
4.6 Main survey data processing and analysis .......................................... 84
4.7 Main survey statistical techniques ....................................................... 84
4
4.7.1 Descriptive statistics ...................................................................... 84
4.7.2 Correlation analysis ....................................................................... 85
4.7.3 Factor analysis .............................................................................. 85
4.7.4 Structural Equation Modelling (SEM) ............................................. 87
4.8 Ethical considerations .......................................................................... 87
Chapter 5 Data Analysis .............................................................. 89
5.1 Introduction ......................................................................................... 89
5.2 Response rate and validity .................................................................. 89
5.3 Data cleaning and screening ............................................................... 89
5.3.1 Normality ....................................................................................... 90
5.4 Descriptive statistics for demographic variables .................................. 92
5.4.1 Profiles of respondents .................................................................. 92
5.4.2 The effects of demographic variables ............................................ 93
5.5 Reliability and validity analysis of the main survey ............................. 100
5.5.1 Reliability of the main survey ....................................................... 100
5.5.2 Validity analysis of the main survey ............................................. 101
5.5.3 The confirmatory factor analysis (CFA) ....................................... 102
5.5.4 The measurement model............................................................. 105
5.6 Common method bias ....................................................................... 109
5.7 Structural equation model .................................................................. 110
5.7.1 The testing of H1 (H1a, H1b, H1c) .............................................. 111
5.7.2 The testing of H2 (H2a, H2b, H2c) .............................................. 112
5.8 The mediating effect of relationship quality ........................................ 113
5.8.1 The testing of H3 (H3a, H3b, H3c) .............................................. 113
5.9 Moderation effects ............................................................................. 114
5.9.1 Simple moderation effects ........................................................... 114
5.9.2 The simple moderation effect of signal credibility (the testing of H4)
............................................................................................................. 115
5.9.3 The simple moderation effect of switching cost (testing H6) ........ 121
5.9.4 Moderated mediation effects ....................................................... 124
5.9.5 Moderated mediation effect of signal credibility (the testing of H5)
............................................................................................................. 125
5.9.6 Moderated mediation effect of switching costs (the testing of H7) 126
5
Chapter 6 Discussion on the findings ..................................... 128
6.1 Introduction ....................................................................................... 130
6.2 Discussion of the proposed conceptual model: Confirmatory factor
analysis ................................................................................................... 130
6.3 Discussion of the proposed conceptual model: Structural equation
modeling.................................................................................................. 130
6.3.1 Discussion of the relationship between OLSM and relationship quality
............................................................................................................. 131
6.3.2 Discussion of the relationship between relationship quality and e-
loyalty ................................................................................................... 133
6.3.3 Discussion of the mediation effect of relationship quality ............. 135
6.4 Discussion of the moderation effect ................................................... 136
6.4.1 Discussion of the moderation effect of signal credibility ............... 136
6.4.2 Discussion of the moderation effect of switching costs ................ 138
Chapter 7 Conclusions .............................................................. 140
7.1 Overview ........................................................................................... 140
7.2 Theoretical contributions ................................................................... 141
7.3 Managerial contributions ................................................................... 143
7.3.1 Optimization of OLSM ................................................................. 143
7.3.2 Improvement of the signal credibility of OLSM............................. 145
7.3.3 Taking advantage of the moderation effect of switching costs ..... 146
7.4 Limitations and future directions ........................................................ 146
Reference .................................................................................... 148
Appendix (A) ............................................................................... 165
APPENDIX (B) ............................................................................. 167
APPENDIX (C) ............................................................................. 174
APPENDIX (D) ............................................................................. 174
6
Lists of Figures
Figure 2-1 The proposed structure of this thesis ........................................... 19
Figure 3-1 Theoretical model of this thesis ................................................... 47
Figure 5-1The pooled measurement model ................................................ 106
Figure 5-2 The structural model of the relationship among OLSM, e-satisfaction,
e-trust and e-commitment ........................................................................... 110
Figure 5-3 Signal credibility as the moderator between OLSM and e-satisfaction
................................................................................................................... 117
Figure 5-4 Signal credibility as the moderator between OLSM and e-trust .. 119
Figure 5-5 Signal credibility as the moderator between OLSM and e-
commitment ................................................................................................ 120
Figure 5-6 Switching costs as the moderator between OLSM and e-satisfaction
................................................................................................................... 122
7
Lists of Tables
Table 2-1 Elements of the logistics service ................................................... 22
Table 2-2 Concepts of E-loyalty .................................................................... 25
Table 2-3 Measurements of online customer loyalty ..................................... 26
Table 2-4 Antecedents of e-loyalty ............................................................... 28
Table 2-5 Constructs of relationship quality .................................................. 34
Table 2-6 The influence of switching costs in offline market ......................... 40
Table 2-7 The influence of switching costs in e-commerce ........................... 42
Table 4-1 Measurement Items of Customisation ........................................... 59
Table 4-2 Designed Measurement Items of OLSM ....................................... 61
Table 4-3 Designed Measurement Items of online customer satisfaction ...... 62
Table 4-4 Designed Measurement Items of online customer trust ................ 63
Table 4-5 Designed Measurement Items of online customer commitment .... 63
Table 4-6 Designed Measurement Items of online customer loyalty ............. 64
Table 4-7 Designed Measurement Items of switching cost ........................... 65
Table 4-8 Designed Measurement Items of Signal Credibility ....................... 66
Table 4-9 Reliability Statistics of OLSM ........................................................ 69
Table 4-10 Item-Total Statistics of OLSM ..................................................... 69
Table 4-11 Reliability of E-satisfaction Initial Measurement .......................... 70
Table 4-12 Reliability of E-trust Initial Measurement ..................................... 71
Table 4-13 Reliability of E-commitment Initial Measurement ......................... 71
Table 4-14 Reliability of E-loyalty Initial Measurement .................................. 72
Table 4-15 Reliability of Signal Credibility Initial Measurement ..................... 72
Table 4-16 Reliability of Switching Cost Initial Measurement ........................ 73
Table 4-17 KMO and Bartlett’s Test of OLSM ............................................... 76
Table 4-18 Total Variance Explained of OLSM ............................................. 76
8
Table 4-19 Communalities of each item in OLSM ......................................... 77
Table 4-20 Component Matrix (a) ................................................................. 77
Table 4-21 The results of Exploratory Factor Analysis for rest scales ........... 78
Table 4-22 One factor analysis for rest scales .............................................. 78
Table 5-1 Sample Descriptive Statistics ........................................................ 90
Table 5-2 Individual Characteristics Descriptive Statistics ............................ 92
Table 5-3 Influences of Gender on ES, ET, EC and EL ................................ 94
Table 5-4 Influences of Age on ES, ET, EC and EL ...................................... 95
Table 5-5 Influences of education level on ES, ET, EC and EL..................... 96
Table 5-6 Influences of Monthly Income on ES, ET, EC and EL ................... 97
Table 5-7 Multiple Comparisons of Monthly Income ..................................... 98
Table 5-8 Influences of Shopping Years on ES, ET, EC and EL ................... 99
Table 5-9 Multiple Comparisons of Shopping Years ................................... 100
Table 5-10 Recommended Criteria of Various Fit Indices Used for Model
Assessments .............................................................................................. 103
Table 5-11 The results of CFA and Reliability analysis ............................... 106
Table 5-12 Correlation matrix between the constructs ................................ 108
Table 5-13 Goodness-OF Fit Statistic for a Structural Model of the Relation
among OLSM, E-satisfaction, E-trust and E-commitment ........................... 111
Table 5-14 Path analysis results of the structural model ............................. 111
Table 5-15 Specific mediation effect of ES, ET and EC .............................. 113
Table 5-16 Results of Hierarchical regression analysis (ES as the dependent
variable)...................................................................................................... 116
able 5-17 Results of Hierarchical regression analysis (ET as the dependent
variable)...................................................................................................... 118
Table 5-18 Results of Hierarchical regression analysis (EC as the dependent
variable)...................................................................................................... 120
9
Table 5-19 Results of Hierarchical regression analysis (ES as the independent
variable)...................................................................................................... 122
Table 5-20 Results of Hierarchical regression analysis (ET as the independent
variable)...................................................................................................... 123
Table 5-21 Results of Hierarchical regression analysis (EC as the independent
variable)...................................................................................................... 124
Table 5-22 Results of moderated mediation of signal credibility.................. 126
Table 5-23 Results of moderated mediation of switching costs ................... 127
Table 5-24 Results of hypotheses test ........................................................ 128
10
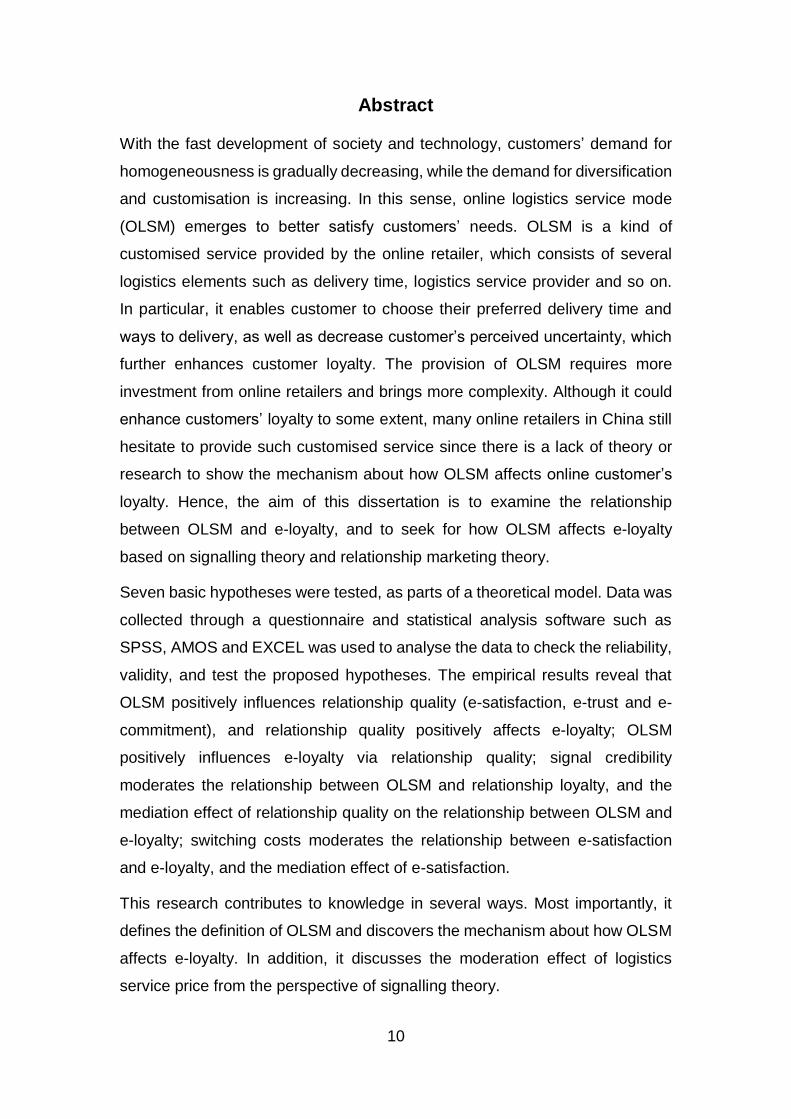
Abstract
With the fast development of society and technology, customers’ demand for
homogeneousness is gradually decreasing, while the demand for diversification
and customisation is increasing. In this sense, online logistics service mode
(OLSM) emerges to better satisfy customers’ needs. OLSM is a kind of
customised service provided by the online retailer, which consists of several
logistics elements such as delivery time, logistics service provider and so on.
In particular, it enables customer to choose their preferred delivery time and
ways to delivery, as well as decrease customer’s perceived uncertainty, which
further enhances customer loyalty. The provision of OLSM requires more
investment from online retailers and brings more complexity. Although it could
enhance customers’ loyalty to some extent, many online retailers in China still
hesitate to provide such customised service since there is a lack of theory or
research to show the mechanism about how OLSM affects online customer’s
loyalty. Hence, the aim of this dissertation is to examine the relationship
between OLSM and e-loyalty, and to seek for how OLSM affects e-loyalty
based on signalling theory and relationship marketing theory.
Seven basic hypotheses were tested, as parts of a theoretical model. Data was
collected through a questionnaire and statistical analysis software such as
SPSS, AMOS and EXCEL was used to analyse the data to check the reliability,
validity, and test the proposed hypotheses. The empirical results reveal that
OLSM positively influences relationship quality (e-satisfaction, e-trust and e-
commitment), and relationship quality positively affects e-loyalty; OLSM
positively influences e-loyalty via relationship quality; signal credibility
moderates the relationship between OLSM and relationship loyalty, and the
mediation effect of relationship quality on the relationship between OLSM and
e-loyalty; switching costs moderates the relationship between e-satisfaction
and e-loyalty, and the mediation effect of e-satisfaction.
This research contributes to knowledge in several ways. Most importantly, it
defines the definition of OLSM and discovers the mechanism about how OLSM
affects e-loyalty. In addition, it discusses the moderation effect of logistics
service price from the perspective of signalling theory.

11
Acknowledgements
Looking back on the process of finishing this dissertation, I really appreciate
and want to express my sincere thanks to my supervisor Dr. Dong, Li for his
continued guidance and encouragement. He has supported me throughout my
thesis with his patience, motivation, enthusiasm, helpful advice and useful
criticism. Without his kind help and supervision, this dissertation would not have
been possible to complete. I have benefitted a lot from meetings and emails I
have had with him.
I also owe sincere gratitude to my PhD friends Mr. Xingjie Xing and Mr. Jingshi,
who provide me with useful suggestions and support throughout the work. I am
grateful to the enthusiastic participants for helping me finish the survey.
My deepest thanks and love go to my family especially my parents and my
girlfriend for their spiritual and financial support during the long years of my
work.
Besides, I would acknowledge my parents, who provide me with not only
financial support for my study, but also spiritual support for my final project.
Lastly, I would like to thank all my friends for their kindness and support, who
encourage and urge me to work on my dissertation.
12
Chapter 1 Introduction
1.1 Background
1.1.1 Customised needs of online logistics services
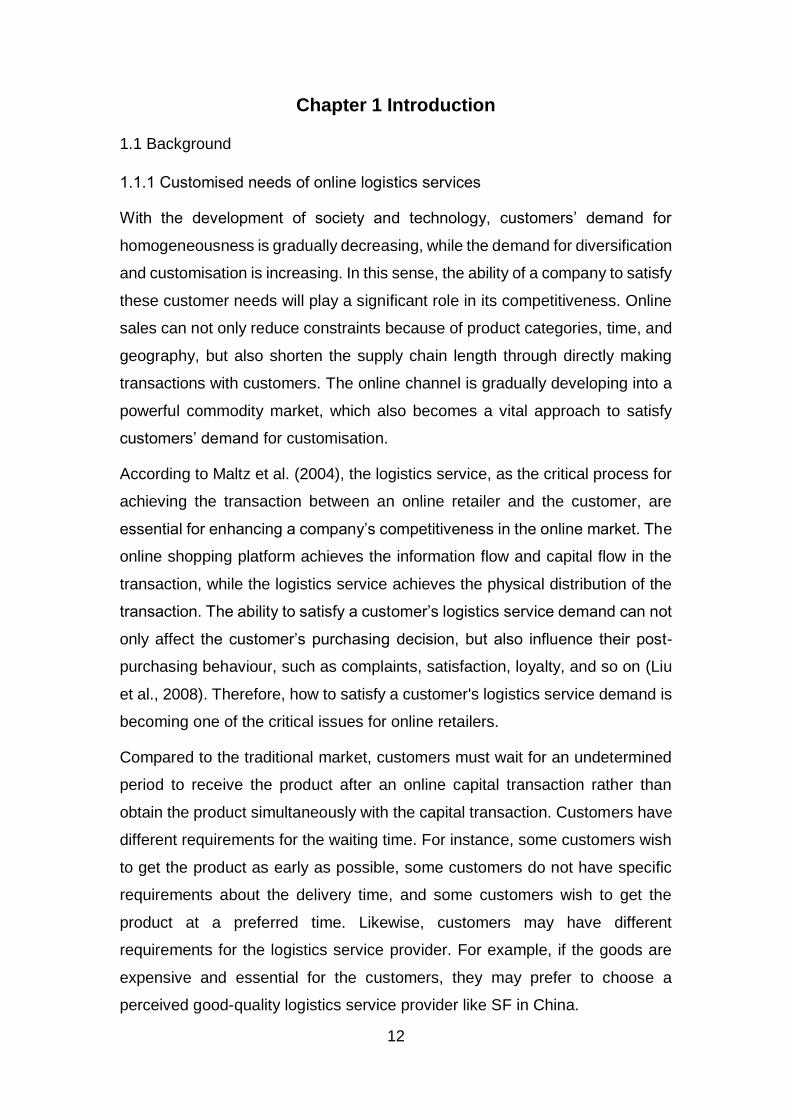
With the development of society and technology, customers’ demand for
homogeneousness is gradually decreasing, while the demand for diversification
and customisation is increasing. In this sense, the ability of a company to satisfy
these customer needs will play a significant role in its competitiveness. Online
sales can not only reduce constraints because of product categories, time, and
geography, but also shorten the supply chain length through directly making
transactions with customers. The online channel is gradually developing into a
powerful commodity market, which also becomes a vital approach to satisfy
customers’ demand for customisation.
According to Maltz et al. (2004), the logistics service, as the critical process for
achieving the transaction between an online retailer and the customer, are
essential for enhancing a company’s competitiveness in the online market. The
online shopping platform achieves the information flow and capital flow in the
transaction, while the logistics service achieves the physical distribution of the
transaction. The ability to satisfy a customer’s logistics service demand can not
only affect the customer’s purchasing decision, but also influence their post-
purchasing behaviour, such as complaints, satisfaction, loyalty, and so on (Liu
et al., 2008). Therefore, how to satisfy a customer's logistics service demand is
becoming one of the critical issues for online retailers.
Compared to the traditional market, customers must wait for an undetermined
period to receive the product after an online capital transaction rather than
obtain the product simultaneously with the capital transaction. Customers have
different requirements for the waiting time. For instance, some customers wish
to get the product as early as possible, some customers do not have specific
requirements about the delivery time, and some customers wish to get the
product at a preferred time. Likewise, customers may have different
requirements for the logistics service provider. For example, if the goods are
expensive and essential for the customers, they may prefer to choose a
perceived good-quality logistics service provider like SF in China.
13
Therefore, it is vital for online retailers to pay more attention to how to better
satisfy customers’ customised logistics service demand. In this sense, online
logistics service mode, as a kind of customised service, is proposed. Online
logistic service mode enables customers to choose their preferred ways of
delivery, delivery time, logistics service provider and so on.
The application of Online logistics service mode is mature in America and UK,
and most online retailers in the US and UK can meet the relatively higher
degree of customised logistics service demand. However, it is not as
widespread in the Chinese online market, as only a few online retailers can
provide such service. The possible reasons may be the difference in the market
environment, cultural differences, the scale’s difference, and so on. It is worth
noting that the ambiguity of the mechanism of how the online logistics service
mode influences customer loyalty is another vital factor.
1.1.2. The influence of customer loyalty on online retailers
Customer loyalty appears to be closely linked with the market competitiveness
of the business, which in turn has a significant role in the profit and future
development of the business. In the traditional retail market, a 5% increase in
customer loyalty can contribute to a 25% to 95% increase in the retailer's profit,
while the positive impact of customer loyalty on the retailer enhances in the
context of the retail e-commerce market (Reicheld and Schefter, 2000). Loyal
customers can not only bring more sales for the retailers, but also recommend
the retailers to their friends. Undoubtedly, the development of the internet and
technology makes it possible for customers to provide their recommendations
more quickly, which in turn decreases the cost for the company to seek new
potential customers. Hence, compared to the traditional market, customer
loyalty is much more critical for the online retail market.
However, although online companies know that it is quite crucial for them to
develop customer loyalty, it is more difficult for them to maintain a stable
relationship with customers compared to the traditional market. On the one
hand, the cost for customers to switch from one retailer to another retailer is
low, while the possible switching cost for customers in the context of the
traditional market is high due to the limitations of factors like geography and
14
time. In this sense, the online switching cost is low enough to be ignored by the
customers usually, and it is common for customers to switch to other online
stores. On the other hand, generally speaking, customer satisfaction and trust
with the online retailer are essential prerequisites for the development of
customer loyalty. However, due to the low barriers to entering online markets
and imperfect regulations or policies in the online markets, the quality of
products or services cannot be guaranteed. Meanwhile, customers have no
insight into the products/services and the process of logistics due to information
asymmetry, leading to low trust in online companies. The uncertainty and
complexity of online markets increase the difficulty of obtaining customer
satisfaction and trust. Nevertheless, once the customer’s loyalty has developed,
the customer is unlikely to switch to other stores.
Based on the above analysis, the development of customer loyalty has
excellent value for online retailers. Yet, how to develop customer loyalty in the
online market is a significant challenge for e-retailers.
1.1.3 The impact of online logistics service mode on customer loyalty
According to Toufaily et al. (2013), many factors influence customer loyalty,
including product or service attributes, customer characteristics, company or
retailer characteristics, environmental characteristics, and website
characteristics. The logistics service is gradually becoming an essential factor
affecting customer behaviour apart from the price of the product. Rao et al.
(2011) note that meeting the needs of the logistics service preferred by
customers is the key to developing customer loyalty in the e-commerce market.
Customer loyalty refers to the willingness to maintain a stable relationship with
a preferred supplier and to repeat visits or purchases, deciding to prioritise the
supplier’s website among alternatives (Toufaily et al., 2013). This loyalty is
grounded in favourable beliefs and emotions towards the online supplier,
regardless of situational influences and marketing efforts that may result in
switching behaviour (Toufaily et al., 2013). Online Logistics Service Mode
(OLSM), as a kind of customised service, can meet customers’ customised
needs and satisfy customers’ demands, which in turn stimulates customer
satisfaction. Moreover, the provision of the selection of preferred time and
15
logistics service provider for the customer can make the customer feel
emotional and psychological concern from the retailer, leading to a high
possibility of repurchasing behaviour. Therefore, OLSM is a crucial factor that
can help to develop customer loyalty.
However, the implementation of OLSM requires online retailers to invest more
resources. For example, the provision of the selection of logistics providers for
customers forces online retailers to consider cooperating with different logistics
service providers, which disperses a customer’s selection and decreases the
scale effect. This leads to low bargaining power of online retailers when they
cooperate with the logistics service provider. Furthermore, the selection of
preferred delivery time also increases the cost and complexity of delivery, since
online retailers must invest more to guarantee the punctuality of delivery.
Although the implementation of OLSM will definitely increase the investment
and complexity of management, the increased value and profit brought by
increased customer loyalty may be higher. Online retailers should pay more
attention to how OLSM influences customer loyalty in order to formulate more
rational logistics service policies in the future.
1.2 Research aim, objectives, and questions
1.2.1 Aim
This dissertation aims to evaluate how online logistics service mode influences
customer loyalty in the context of the online retail market, to discover related
factors and approaches, providing a solid foundation and theory for online
retailers when they formulate logistics service policies.
1.2.2 Objectives
In order to meet the aim of this study, the following objectives are pursued:
Objective 1: Identify the definition of OLSM.
Objective 2: Evaluate the effect of OLSM on relationship quality (customer
satisfaction, trust, and commitment) and verify the impact of relationship
quality on customer loyalty.
16
Objective 3: Explore the mechanism of how OLSM influences customer
loyalty in detail.
1.2.3 Research questions
In order to achieve the objectives as mentioned above, this study must answer
the following questions:
1. What is OLSM?
2. Does OLSM have an effect on relationship quality and does relationship
quality have an influence on customer loyalty in the context of the online
retail market?
3. Does relationship quality play a mediation role in the influence of OLSM
on e-loyalty?
4. Do switching cost and signal credibility play moderation roles in the
mediation effect of relationship quality?
1.3 Research contribution
This research explicitly defines OLSM, which is a kind of customised service
consisting of several elements of the logistics service. Moreover, it discovers
how OLSM affects customer loyalty in the context of e-commerce in China,
which practically and theoretically helps to increase the operational
management level of the online market in China.
OLSM is a critical factor that distinguishes the online market from the traditional
market, which has a significant influence on customer behaviour. In the current
online market in China, most online retailers have similar logistics service
policies. For instance, they only provide one or two fixed logistics service
providers and unfixed and uncertain delivery times, like Taobao, ignoring
customers’ customised logistics service needs like the opportunity to choose a
preferred logistics service provider and delivery time. OLSM is a corresponding
product resulting from customers’ customised logistics service needs.
In the past, scholars (Rao et al., 2011; Liu et al., 2008; Lee and Whang, 2001
etc.) mainly focused on how e-logistics service quality, logistics performance,
or some individual elements of a logistics service affect customer behaviour in
the field of online logistics services, ignoring the research about how OLSM, as
17
the integration of several elements of logistics services, affects customer
behaviour and loyalty. For example, Rao et al. (2011) note that electronic
logistics service quality (E-LSQ) can play a decisive role in customers’ purchase
satisfaction and retention. In this study, the author not only defines OLSM, but
also studies how OLSM affects customer loyalty based on signalling theory,
relationship marketing theory, and previous literature. Through empirical
research, the author discovers the ways through which OLSM influences
customer loyalty combined with the moderation role of signal credibility and
switching cost. The author suggests that online retailers optimise logistics
services through integrating different logistics service elements like logistics
service provider, delivery time, self-pick-up, and so on. This research not only
fills the gap of the lack of research on OLSM, but also provides a solid
foundation for online retailers to improve their logistics services.
Also, the author studies the moderation effect of logistics service prices based
on signalling theory, which is the different approach from previous research
about logistics service prices from the perspective of economics. The present
study offers a theoretical foundation for the pricing policy when online retailers
set up a logistics service price.
1.4 Thesis structure
The following section describes and outlines the contents of this research. More
specifically, it displays the principal purposes of the remaining chapters.
Chapter One: This chapter presents an outline of why this research was
conducted, along with the description of the aims, objectives, and questions of
the research. In addition, the practical and theoretical contributions of the
research are reported and discussed. Finally, an overview of all the chapters in
this study and a graphic view of the research procedures are displayed.
Chapter 2: Following by the introduction section, this chapter offers the
literature review for the present Master of Philosophy thesis, which helped the
author to narrow down the research field and provide a solid foundation for the
research. It covers the definition of OLSM, along with some primary aspects of
electronic customer loyalty. In addition, it explores the relationships between
18
customised service and customer loyalty, including the exploration of two
variables that may affect the relationships in a particular approach.
Chapter 3: This chapter aims to construct the theoretical research model based
on the literature previously discussed in Chapter 2. In addition, several
hypotheses are discussed and proposed in accordance with the established
theoretical model to be addressed and proved in later chapters.
Chapter 4: This chapter describes the methodological approach of the research
in detail in order to achieve the study’s objectives and answer its questions. It
highlights the rationale concerning choosing the approach to the research, the
data collection method, research samples, and the measurement items. More
specifically, this study adopts an empirical research method and leans more
towards a deductive and quantitative methodology, since all the variables,
including OLSM, electronic customer satisfaction, customer trust, customer
loyalty, and so on, can be measured through a quantitative approach, and
survey questionnaires are used to collect the primary data in this study. In
addition, the planned analysis strategies such as correlation analysis,
confirmatory factor analysis, and so on are provided, followed by a discussion
of the ethical issues associated with the research design.
Chapter 5: In this chapter, a quantitative methodology is used to answer the
questions. The data in this part has been collected through survey
questionnaires and analysed quantitatively using the Statistical Package for
Social Sciences (SPSS) software to clean and screen the data and describe
the sample. Structural Equation Modelling (SEM) was used to measure the
direct and indirect relationships between the dependent and independent
variables through exploring the pathways between variables. The latest version
of Amos 24.0, a software package used for SEM, was adopted by the author to
perform CFA and SEM to test some of the proposed hypotheses (H1 to H3).
Moreover, SPSS was adopted to conduct hierarchical regression to verify the
rest of the proposed hypotheses (H4 to H7).
Chapter 6: This chapter mainly discusses the results presented in Chapter 5.
More specifically, the possible reasons why the hypotheses are proven or
rejected are discussed.
19
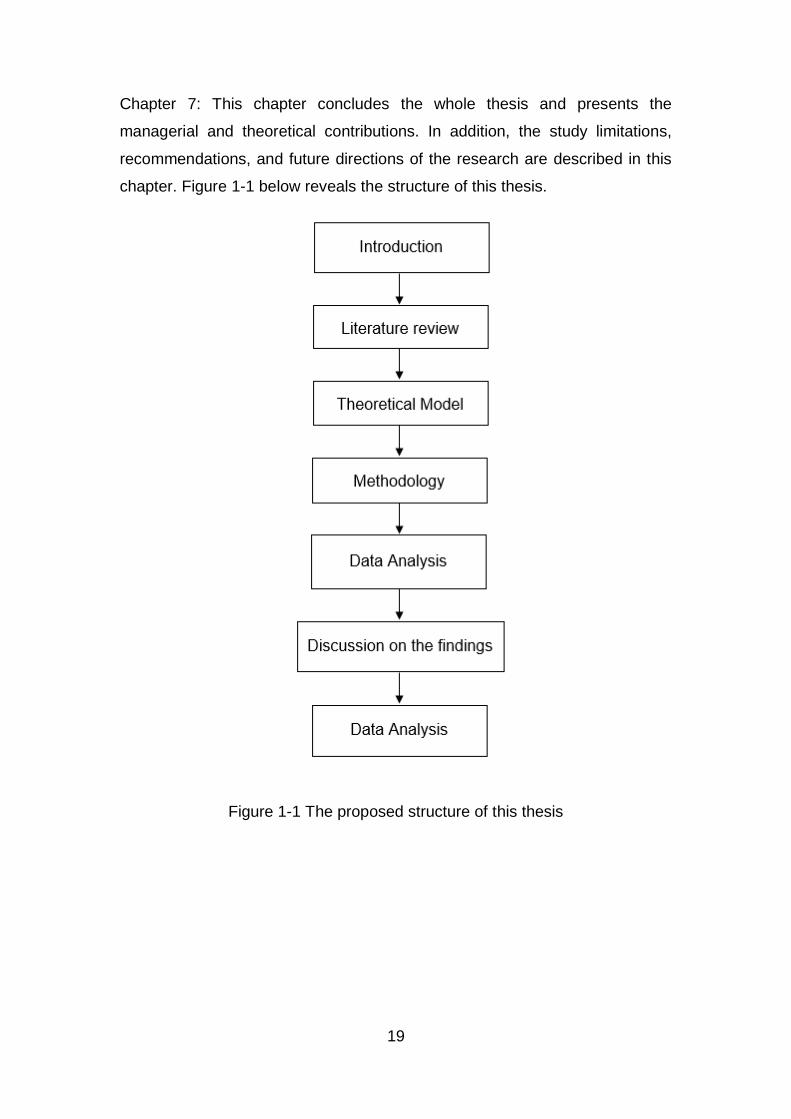
Chapter 7: This chapter concludes the whole thesis and presents the
managerial and theoretical contributions. In addition, the study limitations,
recommendations, and future directions of the research are described in this
chapter. Figure 1-1 below reveals the structure of this thesis.
Figure 1-1 The proposed structure of this thesis
20
Chapter 2: Literature review
This section reviews the literature relating to several topics, which helped to
narrow down the research area and provide a foundation for later theory and
empirical research. Section 2.1 addresses the online logistics service literature,
in which the OLSM is proposed by the author. In addition, section 2.2 focuses
on the literature on customer loyalty, in which the definition and components of
customer loyalty, as well as the antecedents of customer loyalty, will be
introduced. Section 2.3 introduces the relationship marketing theory, followed
by the definition, constructs, and outcomes of relationship quality. Section 2.4
defines the switching cost and discusses the influence of switching cost. Finally,
signalling theory is introduced in section 2.5.
2.1 Online logistics service
As a significant element of the e-retailing supply chain, logistics services have
an essential role in the influence of customer behaviour. During the last two
decades, the electronic logistics service quality (e-LSQ) appears to be
recognized as an efficient way to obtain and sustain an organization’s
competitiveness and a strategic issue for long-term success (Parasuraman et
al., 2005). E-LSQ plays a critical role in customer online satisfaction (Liu et al.,
2008), which in turn has a significant influence on customer loyalty (Bouzaabia
et al., 2013). Moreover, Saura et al. (2008) propose four dimensions of logistics
service quality, namely timeliness, personnel, information, and order quality.
The authors assert that these four dimensions have a tremendously positive
influence on customer satisfaction, which further affects customer loyalty.
Similarly, Rao et al. (2011) note that e-LSQ can play a decisive role in
customers’ purchase satisfaction and retention. They further claim that
customers who experience low e-LSQ will decrease their order frequency and
total order value and face higher anxiety with the next purchase (Rao et al.,
2011). However, Lin et al. (2016) found that although e-LSQ contributes to
customer satisfaction remarkably, e-LSQ did not indirectly affect customer
loyalty through customer satisfaction with logistics service quality, which is
contrary to the findings of Saura et al. (2008).
21
It is worth noting that various elements of logistics services have emerged in
the evolution of the e-retailing supply chain, including logistics service providers,
the mode of delivery, and inventory management. From the perspective of
logistics service providers (LSPs), Xu and Li (2017) indicate that e-retailers can
either provide their own delivery service or cooperate with a third-party logistics
company to establish a flexible distribution, and the quality and quantity of third-
party logistics providers (3PLP) appears to be an issue in e-retailing. Anderson
et al. (2011) explain why e-retailers are willing to choose 3PLP, grounded in
transaction costs theory and network theory.
There are two methods of delivery, namely customer self-pickup and drop-off.
The research by Lee and Wang (2001) demonstrates that the choice of delivery
modes is affected by product attributes. For example, customers are willing to
pick up their purchased goods in the store when the product has the
characteristics of high value and is easy to take. Although the online retailers
who provide the choice of logistics service elements will be appreciated by
customers, since customers are likely to enjoy a customised logistics service,
the online retailers still need to compare the cost to provide such a logistics
service and its potential benefit (Mahar et al., 2014).
Most online logistics services are accomplished by 3PLP, and most online
retailers just cooperate with one fixed 3PLP, which makes it impossible for
online retailers to provide a high-quality logistics service responding to
customers’ increased customisation requirements. Newton (2011) proposed
that customers have different logistics service requirements according to
product attributes. Thirumalai and Sinha (2005) note that customers’
satisfaction with the order fulfillment changes with the change of product
category, and the online retailers must personalize the order fulfillment based
on the product category. Ghezzi et al. (2012) divide online logistics service
problems into four categories based on product features (value density, product
range, obsolescence risk, product-specific needs) and the level of customer
service (returns management, order cycle time, punctuality, flexibility). This
includes product-side complexity, service-side complexity, high-complexity,
and comparatively easy issues.
22
Esper et al. (2003) posit that displaying the name of the logistics service
provider can enhance customers’ perceived quality of the logistics service,
while Thirumalai and Sinha (2011) found that the customisation of the process
of online transactions will influence customer satisfaction with the process of
the transaction. Further, delivery service is one ingredient of the process of the
transaction, although the authors did not provide detailed elements of a
customised delivery service.
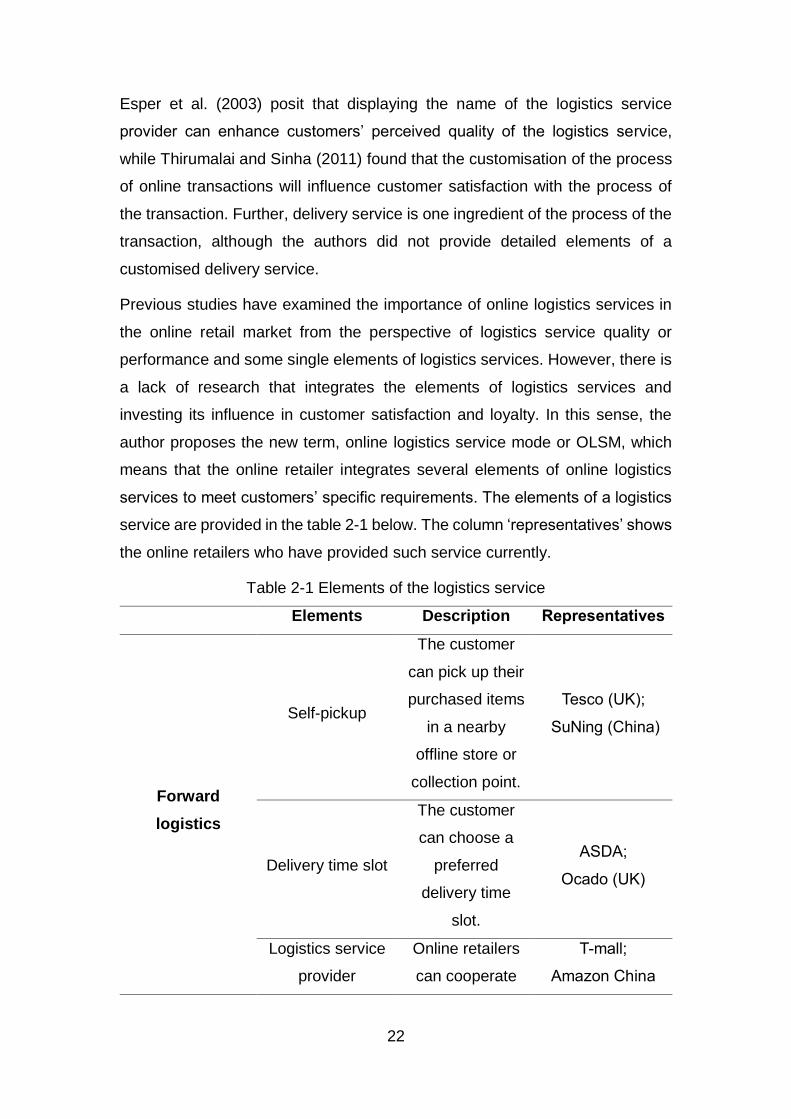
Previous studies have examined the importance of online logistics services in
the online retail market from the perspective of logistics service quality or
performance and some single elements of logistics services. However, there is
a lack of research that integrates the elements of logistics services and
investing its influence in customer satisfaction and loyalty. In this sense, the
author proposes the new term, online logistics service mode or OLSM, which
means that the online retailer integrates several elements of online logistics
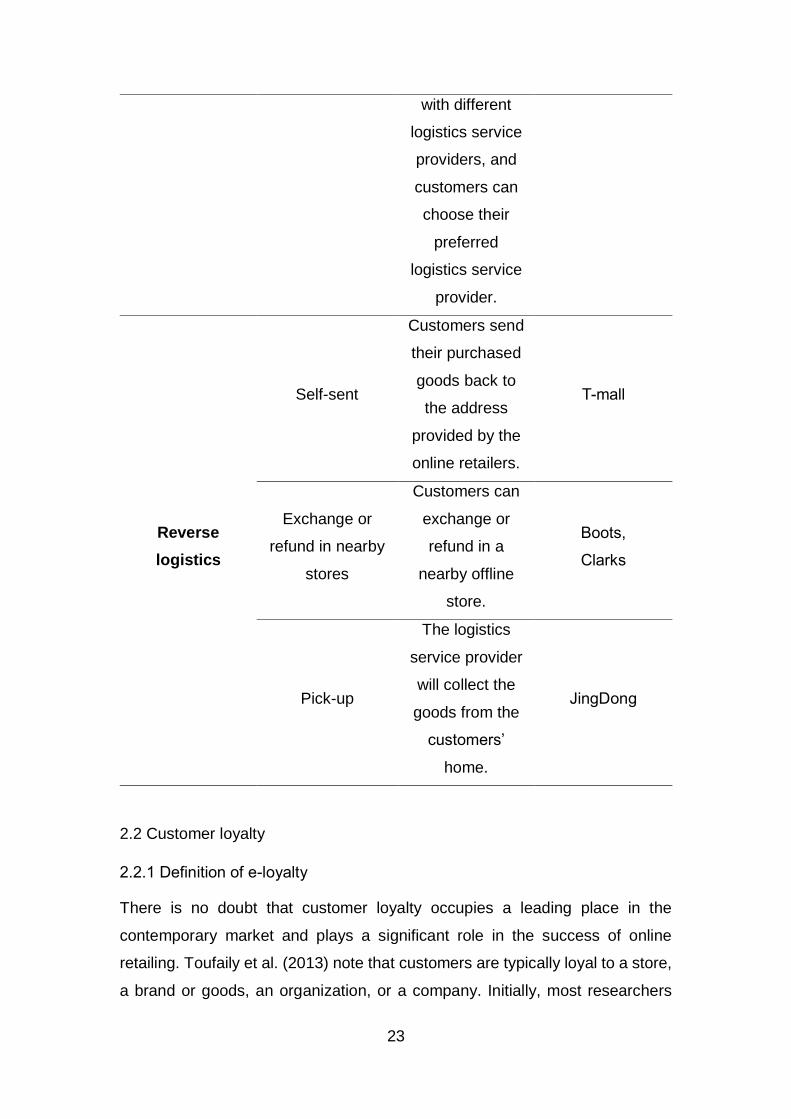
services to meet customers’ specific requirements. The elements of a logistics
service are provided in the table 2-1 below. The column ‘representatives’ shows
the online retailers who have provided such service currently.
Table 2-1 Elements of the logistics service
Elements Description Representatives
Forward
logistics
Self-pickup
The customer
can pick up their
purchased items
in a nearby
offline store or
collection point.
Tesco (UK);
SuNing (China)
Delivery time slot
The customer
can choose a
preferred
delivery time
slot.
ASDA;
Ocado (UK)
Logistics service
provider
Online retailers
can cooperate
T-mall;
Amazon China
23
with different
logistics service
providers, and
customers can
choose their
preferred
logistics service
provider.
Reverse
logistics
Self-sent
Customers send
their purchased
goods back to
the address
provided by the
online retailers.
T-mall
Exchange or
refund in nearby
stores
Customers can
exchange or
refund in a
nearby offline
store.
Boots,
Clarks
Pick-up
The logistics
service provider
will collect the
goods from the
customers’
home.
JingDong
2.2 Customer loyalty
2.2.1 Definition of e-loyalty
There is no doubt that customer loyalty occupies a leading place in the
contemporary market and plays a significant role in the success of online
retailing. Toufaily et al. (2013) note that customers are typically loyal to a store,
a brand or goods, an organization, or a company. Initially, most researchers
24
simplified loyalty as a customer's repurchasing behaviours from the perspective
of behaviour. For instance, McConnell (1968) reported the times that customers
repurchase the same brands as the measurement of customer loyalty to a
brand. Likewise, Neal (1999) defined customer loyalty to a company as the
number of times that customers patronise an individual company to enjoy a
specific service or buy some products. This is explained regarding the
customers’ total number of times buying the same services or products.
However, in contrast to the views of McConnell (1968) and Neal (1999), Jacoby
and Kyner (1973) asserted that it is not convincing enough to explain customer
loyalty just from a behavioural point of view since loyalty can be true or false.
For example, if there are insufficient companies or products offered for
customers, their repurchasing behaviour may not be regarded as real loyalty,
since they can switch to other companies or products if there are more choices.
Jacoby and Kyner (1973) explained brand loyalty by using six conditions,
namely “a biased response, a behavioural response, expressed over time, by
one or more decision-making units, where several alternatives are possible,
and a function of a psychological process.” Similarly, Han et al. (2011) claim
that there is a possibility that behaviour loyalty may not capture the actual levels
of customer loyalty, since their repurchasing behaviour may not be attributed to
their psychological commitment to a specific company or brand through a
decision-making process.
Although there are diverse conceptions about loyalty, one of the most common
conceptions is that the formation of loyalty is a sequential process that
constitutes four stages, including cognition, affection, conation, and action
(Toufaily et al., 2013). Taking loyalty to the product as an example, in the first
stage, the customer selects a specific product through a series of processes
like searching, evaluation, and decision making, thus developing cognition of
the product. The second stage, defined as affective loyalty development,
contains emotions and satisfaction. It reveals the customer’s affective
responses associated with the product he bought based on cumulatively
satisfying usage occasions. After that, the customer may develop a repurchase
or rebuy intention about the product if he shows positive cognitive and affective
responses to the product. Fang et al. (2016) agree, and they categorize the
25
cognitive, affective, and conative loyalty phases as an intentional loyalty phase
and define the action loyalty stage as the behavioural stage.
Obviously, loyal customers contribute to a great share of profits for
organizations or brands that they usually patronise, especially for e-commerce
markets. According to Kunttner (1998), improved symmetric information in the
online market made it convenient for customers to switch to other companies
or stores, leading to fierce challenges for contemporary online organizations
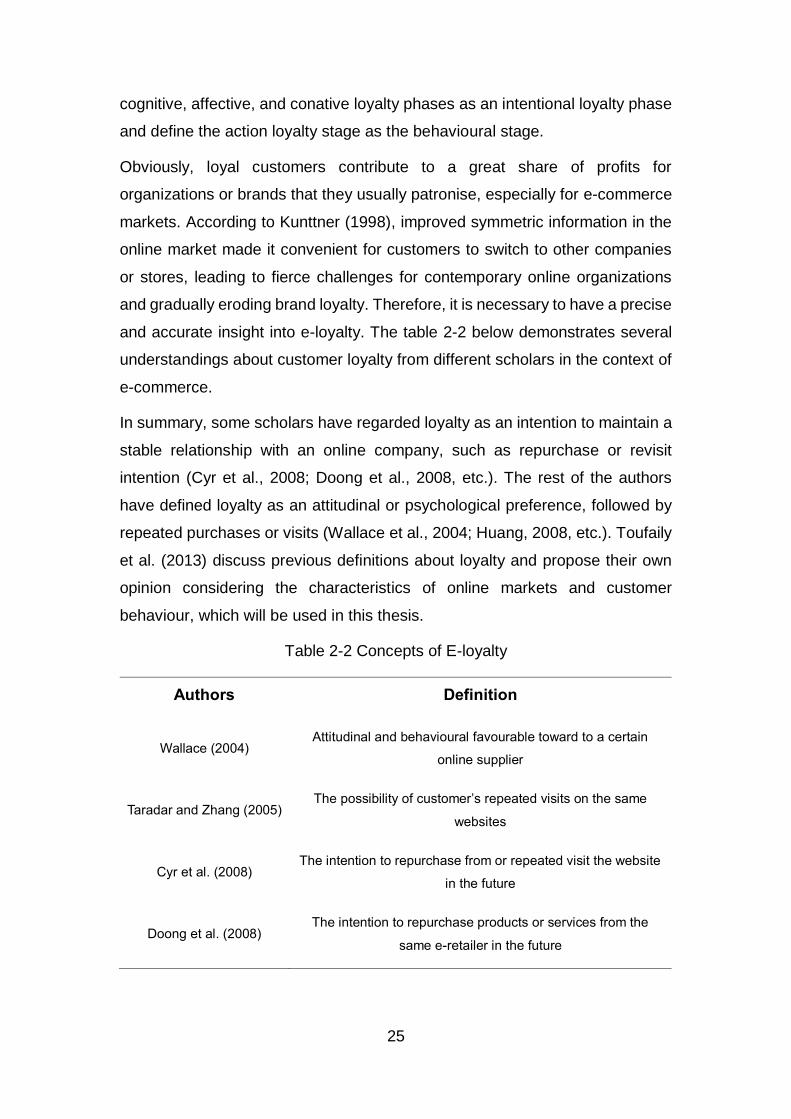
and gradually eroding brand loyalty. Therefore, it is necessary to have a precise
and accurate insight into e-loyalty. The table 2-2 below demonstrates several
understandings about customer loyalty from different scholars in the context of
e-commerce.
In summary, some scholars have regarded loyalty as an intention to maintain a
stable relationship with an online company, such as repurchase or revisit
intention (Cyr et al., 2008; Doong et al., 2008, etc.). The rest of the authors
have defined loyalty as an attitudinal or psychological preference, followed by
repeated purchases or visits (Wallace et al., 2004; Huang, 2008, etc.). Toufaily
et al. (2013) discuss previous definitions about loyalty and propose their own
opinion considering the characteristics of online markets and customer
behaviour, which will be used in this thesis.
Table 2-2 Concepts of E-loyalty
Authors Definition
Wallace (2004) Attitudinal and behavioural favourable toward to a certain
online supplier
Taradar and Zhang (2005) The possibility of customer’s repeated visits on the same
websites
Cyr et al. (2008) The intention to repurchase from or repeated visit the website
in the future
Doong et al. (2008) The intention to repurchase products or services from the
same e-retailer in the future
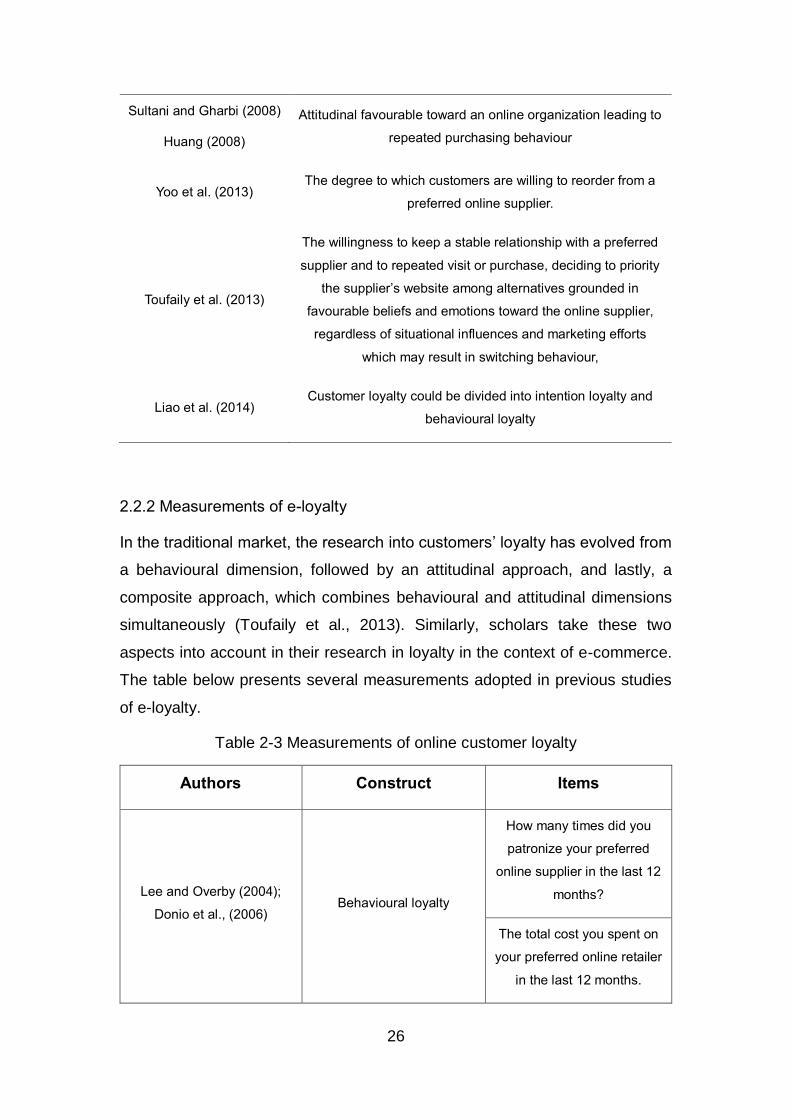
26
Sultani and Gharbi (2008)
Huang (2008)
Attitudinal favourable toward an online organization leading to
repeated purchasing behaviour
Yoo et al. (2013) The degree to which customers are willing to reorder from a
preferred online supplier.
Toufaily et al. (2013)
The willingness to keep a stable relationship with a preferred
supplier and to repeated visit or purchase, deciding to priority
the supplier’s website among alternatives grounded in
favourable beliefs and emotions toward the online supplier,
regardless of situational influences and marketing efforts
which may result in switching behaviour,
Liao et al. (2014) Customer loyalty could be divided into intention loyalty and
behavioural loyalty
2.2.2 Measurements of e-loyalty
In the traditional market, the research into customers’ loyalty has evolved from
a behavioural dimension, followed by an attitudinal approach, and lastly, a
composite approach, which combines behavioural and attitudinal dimensions
simultaneously (Toufaily et al., 2013). Similarly, scholars take these two
aspects into account in their research in loyalty in the context of e-commerce.
The table below presents several measurements adopted in previous studies
of e-loyalty.
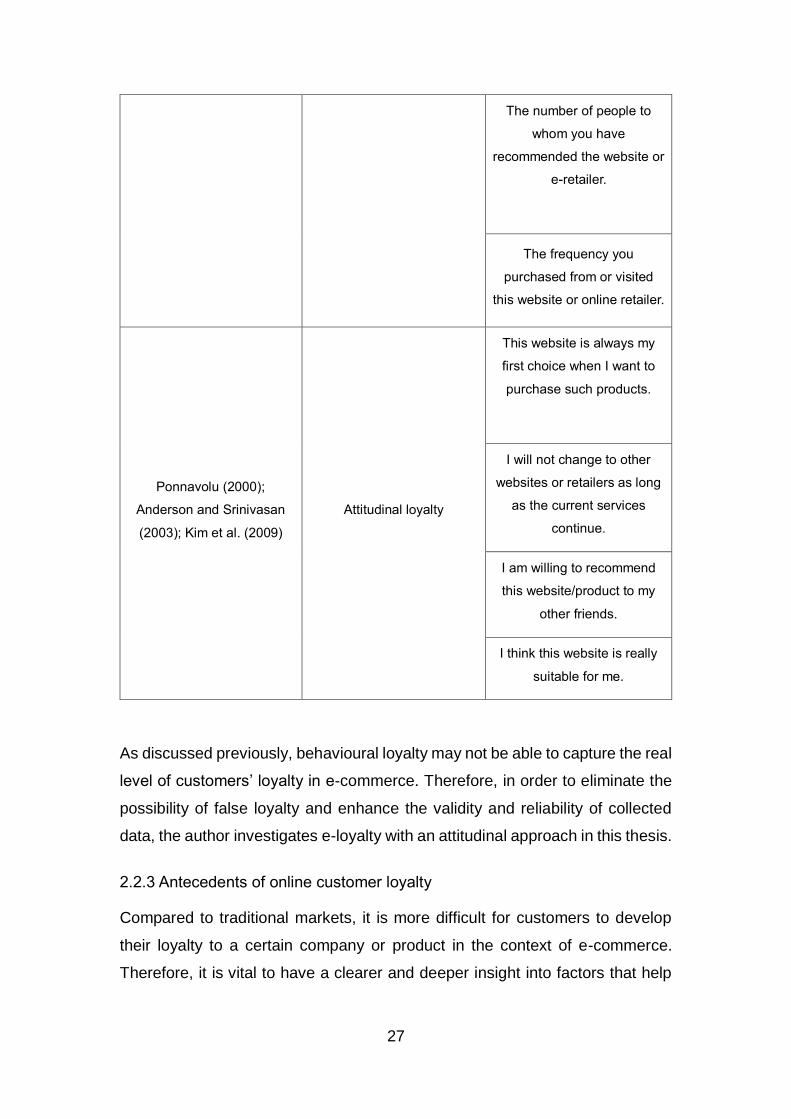
Table 2-3 Measurements of online customer loyalty
Authors Construct Items
Lee and Overby (2004);
Donio et al., (2006) Behavioural loyalty
How many times did you
patronize your preferred
online supplier in the last 12
months?
The total cost you spent on
your preferred online retailer
in the last 12 months.
27
The number of people to
whom you have
recommended the website or
e-retailer.
The frequency you
purchased from or visited
this website or online retailer.
Ponnavolu (2000);
Anderson and Srinivasan
(2003); Kim et al. (2009)
Attitudinal loyalty
This website is always my
first choice when I want to
purchase such products.
I will not change to other
websites or retailers as long
as the current services
continue.
I am willing to recommend
this website/product to my
other friends.
I think this website is really
suitable for me.
As discussed previously, behavioural loyalty may not be able to capture the real
level of customers’ loyalty in e-commerce. Therefore, in order to eliminate the
possibility of false loyalty and enhance the validity and reliability of collected
data, the author investigates e-loyalty with an attitudinal approach in this thesis.
2.2.3 Antecedents of online customer loyalty
Compared to traditional markets, it is more difficult for customers to develop
their loyalty to a certain company or product in the context of e-commerce.
Therefore, it is vital to have a clearer and deeper insight into factors that help
28
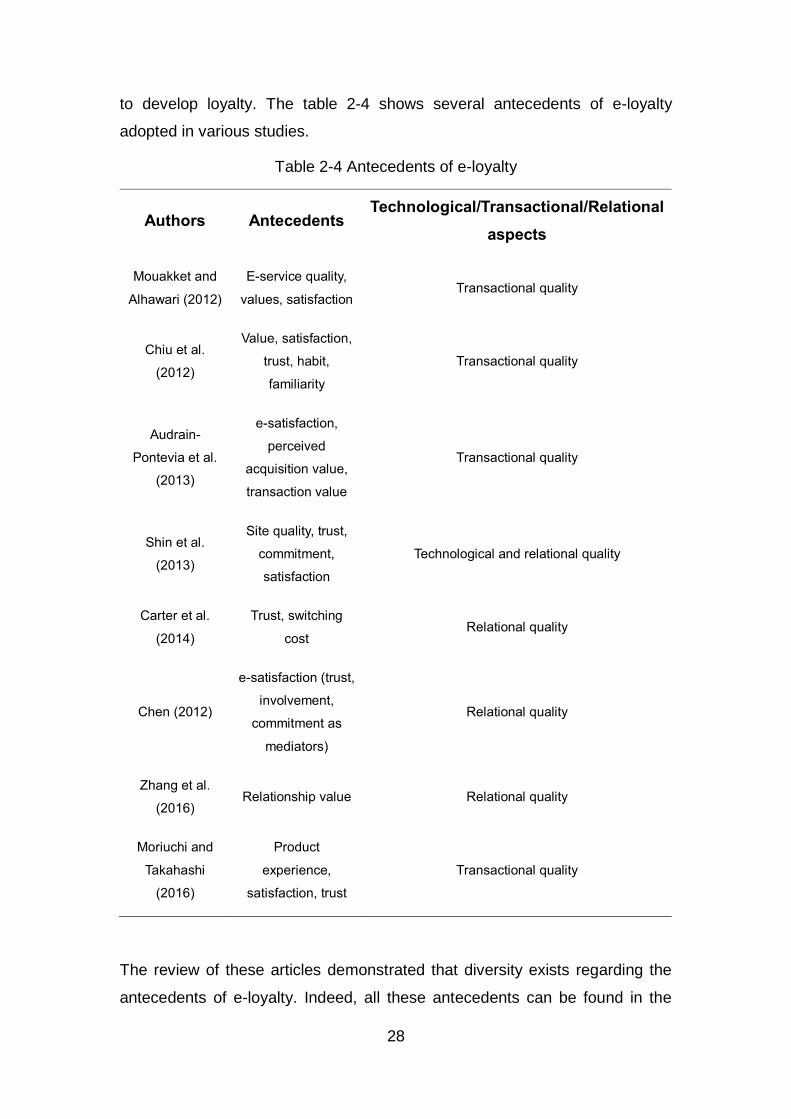
to develop loyalty. The table 2-4 shows several antecedents of e-loyalty
adopted in various studies.
Table 2-4 Antecedents of e-loyalty
Authors Antecedents Technological/Transactional/Relational
aspects
Mouakket and
Alhawari (2012)
E-service quality,
values, satisfaction Transactional quality
Chiu et al.
(2012)
Value, satisfaction,
trust, habit,
familiarity
Transactional quality
Audrain-
Pontevia et al.
(2013)
e-satisfaction,
perceived
acquisition value,
transaction value
Transactional quality
Shin et al.
(2013)
Site quality, trust,
commitment,
satisfaction
Technological and relational quality
Carter et al.
(2014)
Trust, switching
cost Relational quality
Chen (2012)
e-satisfaction (trust,
involvement,
commitment as
mediators)
Relational quality
Zhang et al.
(2016) Relationship value Relational quality
Moriuchi and
Takahashi
(2016)
Product
experience,
satisfaction, trust
Transactional quality
The review of these articles demonstrated that diversity exists regarding the
antecedents of e-loyalty. Indeed, all these antecedents can be found in the
29
study of Toufaily et al. (2013), who categorize antecedents into five overarching
types, including customer characteristics, environmental characteristics,
product/service attributes, company/retailer characteristics, and website
characteristics. However, Toufaily et al. (2013) do not further study the
mediating or moderating role of each factor in the development of e-loyalty.
Thus, this thesis will analyse and prove the moderating or mediating role of
several factors based on their study.
Previous studies have revealed that the factors mentioned by Toufaily et al.
(2013), such as switching cost, customer satisfaction, gender, perceived value,
and so on, play a mediating role in customer loyalty. The study of Anderson
and Srinivasan (2003) demonstrates that although e-loyalty is affected by e-
satisfaction to some extent, the relationship between them is moderated by
individual customer-level factors like convenience motivation, purchase size,
and inertia, and business-level variables including trust and perceived value.
Based on 1,211 effective returned questionnaires, the authors found that
convenience motivation and purchasing size will positive moderate the
relationship between e-satisfaction and e-loyalty, while inertia plays a negative
moderating role in the relationship. In addition, Sanchez-Franco (2009)
collected data from 815 online shopping customers in Spanish and state that
gender can moderate the relationship between relationship quality and
customer loyalty. The results further show that “the influence of trust on
commitment and commitment on loyalty was significantly stronger for females
than males, while the effects of satisfaction on commitment and the trust on
loyalty were significantly stronger for males.” Paramaporn et al. (2016) studied
the moderating role of age in the influence of network quality and customer
service on customer satisfaction, commitment, and customer loyalty through
analysing data obtained from 1,989 internet users. Studies about switching cost
reveal that it has both moderating (Lam et al., 2004; Lee et al., 2001) and
mediating (Aydin and Ozer, 2006; Chuah et al., 2017) role in the satisfaction-
loyalty relationship. Moreover, Carter et al. (2014) tested 299 repeat users in
terms of online travel services and found that trust has a higher influence on e-
loyalty compared to switching cost, and the trust can also influence the effect
of switching costs on e-loyalty. In relation to customer loyalty, other scholars
30
like Chen (2014) and Samar (2016) also studied the moderating role of culture
in the relationship between service quality and e-loyalty and the moderating role
of brand image in the relationship between customers’ perceived value and
customers’ perceptions of public relations respectively.
Other factors such as customer satisfaction, commitment, and trust play
mediating roles in customer loyalty. Kassin and Abdullah (2008) propose that
customer satisfaction and trust can mediate the relationship between website
service quality and customer loyalty based on the analysis of 241 online
shoppers. Likewise, Kim (2009) analysed data from 182 online customers and
found that the reliability of e-retailer, website design, security/privacy, and
responsiveness can influence e-loyalty through the mediating effect of e-
satisfaction and e-trust. Furthermore, Chou et al. (2015) focused on the study
of female online purchasing behaviour and asserted that website design and
delivery quality could indirectly influence e-loyalty through e-satisfaction, while
website design, security, and privacy can affect e-loyalty through e-trust
indirectly. Luarn and Lin (2003) studied 180 customers related to online
traveling services and claimed that e-satisfaction, e-trust, and perceived value
not only have a direct influence on e-loyalty, but also indirectly influence e-
loyalty through customer commitment. In addition, Ramanathan (2010) also
found that logistics performance of a website significantly affects customer
loyalty.
Based on the literature review above, it is clear that diversity exits in the field
regarding how switching cost, e-satisfaction, trust, and commitment influence
e-loyalty. Hence, in-depth analysis is necessary to determine the role of these
factors.
2.2.4 Consequences of customer loyalty
According to Smith (2000), the most notable benefit brought by customer loyalty
is that increasing the price of products has only a small influence on the
purchasing intention of loyal customers. In other words, customer loyalty
decreases customers’ price sensitivity. Similarly, Choi et al. (2006) found that
loyal behaviour plays a negative role in customers’ price sensitivity, while
disloyal behaviour has a clear and positive role in customers’ price sensitivity,
31
through analysing a questionnaire-based survey with 159 effective responses.
Moreover, Liang et al. (2008) claim that both intentional (attitudinal) and
behavioural loyalty can increase organizations’ benefits. Toufaily et al. (2013)
concluded the consequences of e-loyalty from eight studies and claim that e-
loyalty can increase cross-sales, the number of patrons to the site, willingness
to pay more, and so on, regardless of the type of loyalty. The authors further
assert that e-loyalty can promote customers’ online purchasing behaviour and
satisfaction and retention while decreasing their sensitivity to price and the
switching possibility. Hence, developing customer loyalty is important for online
retailers to gain more benefits and become more competitive. Different
strategies should be considered by online retailers to obtain more loyal
customers.
2.3 Relationship Quality
2.3.1 Relationship marketing in the consumer market
Relationship marketing was initially investigated as a way to establish, maintain,
and enhance the relationship between the buyer and the seller in the context of
business to business (B2B). With the increase in fierce competition between
companies, the relationship marketing gets more attention in not only B2B but
also business to customer (B2C) markets due to the importance of relationship
marketing. Bhattacharya and Bolton (2000) claim that business and consumer
relationship marketing contributes to developing relational bonds that will result
in reliable repeat business. Likewise, Kumar et al. (2003) suggest that
customers’ positive attitudes towards the suppliers are more likely long-term
when they have a high trust in and affinity with the company instead of being
opportunistic; thus, they are more willing to pay more to maintain the ongoing
relationship.
2.3.2 Definition of relationship marketing
The phrase ‘relationship marketing’ was first defined by Berry (1983) as
“attracting, maintaining, and-in multi-service organisations-enhancing customer
relationships” in the context of services marketing. According to Morgan and
Hunt (1993), relationship marketing refers to all the marketing activities held by
32
the companies in order to develop and maintain a successful exchange
relationship with customers, and the key to maintaining a stable relationship is
to understand every customer’s needs. A similar definition has been offered by
Evans and Lasking (1994), who regard relationship marketing as “the process
in which a firm builds long-term alliances with current and potential clients in
such a way that the buyer and seller both work towards a common set of
specific goals.” Moreover, Tzokas and Saren (1997) state that relationship
marketing is “the process of planning, developing and nurturing a relationship
climate that will promote a dialogue between a firm and its customers which
aims to imbue an understanding, confidence, and respect of each other's
capabilities and concerns when enhancing their role in the marketplace and
society.”
It seems that the definitions above defined by prior scholars differ from each
other somewhat. However, all of them agree on the critical elements of
relationship marketing, including mutual benefit, process and effort to
understand and satisfy customer's needs, confidence in and respect for each
other, and a dialogue with customers. Thus, the aim of relationship marketing
is to develop customers’ lifelong loyalty through offering goods and services
associated with customers’ specific needs, resulting in an increase in the
number of sales and revenue.
According to Henning-Thurau et al. (2002), the goal of reviewing relationship
marketing theory is to determine the key drivers that affect the relational
outcomes like customer loyalty. The two most promising approaches including
relationship quality and relational outcomes have been recognized to explain
relationships between service suppliers and customers. The relational benefit
approach depends on the assumption that a relationship produces customer
loyalty according to different types of benefits, while the relationship quality
approach depends on the belief that “customer loyalty is largely determined by
a limited number of constructs reflecting the degree of appropriateness of a
relationship” (Lu, 2007). The focus of this dissertation is relationship quality,
and the next section discusses the definition, construct, and outcomes of
relationship quality.
33
2.3.3 The definition of relationship quality
In the context of service marketing, consumers always experience uncertainty
deriving from factors like intangibility, complexity, lack of service familiarity, and
uncertain delivery service (Crosby et al., 1990). Uncertainty may lead to the
potential for service failure and negative outcomes. Hence, relationship quality
is achieved through the salesperson’s ability to reduce the customer’s
perceived uncertainty from the interpersonal influencing perspective, and high
relationship quality means that “the customer is able to rely on the
salesperson’s integrity and has confidence in the salesperson’s future
performance because the level of past performance has been consistently
satisfactory.” In addition, Levitt (1986) regards relationship quality as “a bundle
of intangible values which augments products or services and results in an
expected interchange between buyers and sellers.” However, Jarvelin and
Lehtinen (1996) posit that relationship quality stands for customers’ perceptions
of how well the buyer-seller relationship fulfils the predicted, desired, and
expected goals of the customer. Smith (1998) proposes a widely accepted
definition of relationship quality, in which relationship quality is regarded as “a
higher-order construct of a variety of positive relationship outcomes that mirror
the overall strength of a relationship and the degree to which it meets the parties’
needs and expectations.” Likewise, Henning-Thurau et al. (2002) define
relationship quality as a meta-construct consisting of several key components
reflecting the overall nature of relationships between companies and customers.
Anderson and Gerbing (1988) claim that relationship quality is a higher-order
construct consisting of at least trust and satisfaction. Furthermore, Zhang et al.
(2011) hold the same view that relationship quality is a higher-order construct
made up of trust and satisfaction in the context of the online retailing market.
Liang et al. (2008) also insist that relationship quality refers to an overall
assessment of the strength of a relationship.
As concluded from the above studies, the author in this dissertation defines
relationship quality as a higher-order construct consisting of some critical
components reflecting the overall nature of relationships between consumers
and online retailers. This relationship quality is achieved through the online
retailer’s ability to reduce the customer’s perceived uncertainty.
34
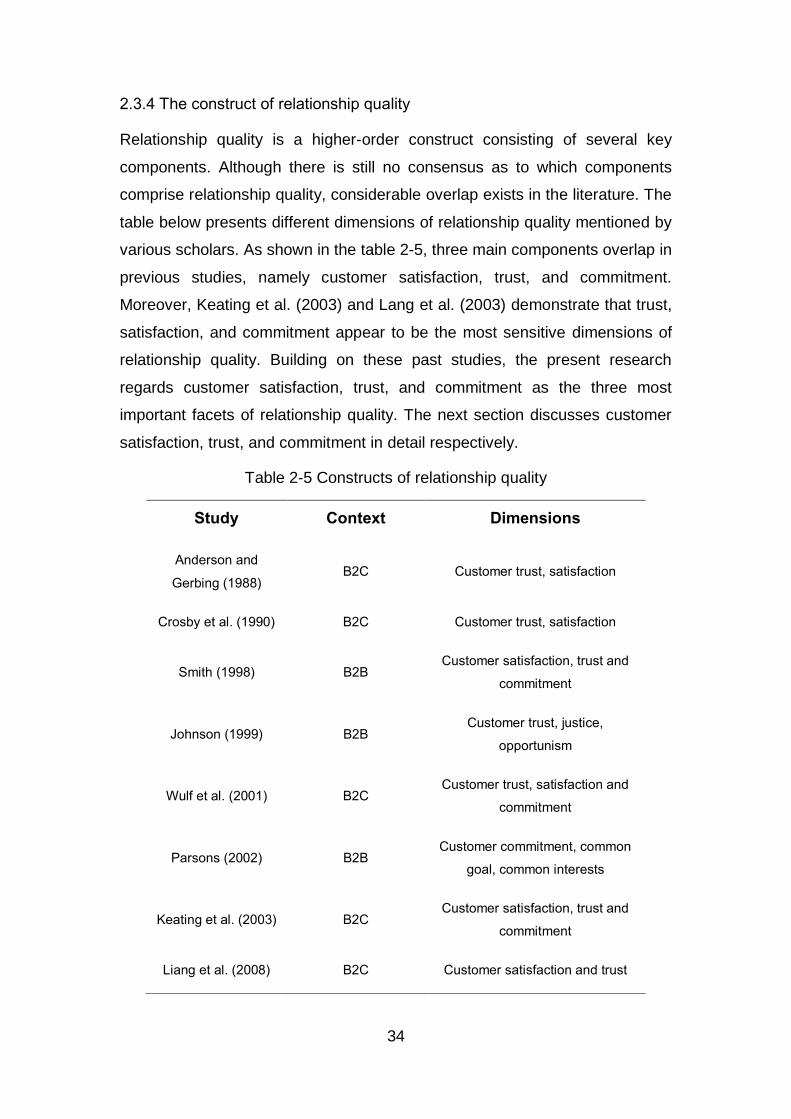
2.3.4 The construct of relationship quality
Relationship quality is a higher-order construct consisting of several key
components. Although there is still no consensus as to which components
comprise relationship quality, considerable overlap exists in the literature. The
table below presents different dimensions of relationship quality mentioned by
various scholars. As shown in the table 2-5, three main components overlap in
previous studies, namely customer satisfaction, trust, and commitment.
Moreover, Keating et al. (2003) and Lang et al. (2003) demonstrate that trust,
satisfaction, and commitment appear to be the most sensitive dimensions of
relationship quality. Building on these past studies, the present research
regards customer satisfaction, trust, and commitment as the three most
important facets of relationship quality. The next section discusses customer
satisfaction, trust, and commitment in detail respectively.
Table 2-5 Constructs of relationship quality
Study Context Dimensions
Anderson and
Gerbing (1988) B2C Customer trust, satisfaction
Crosby et al. (1990) B2C Customer trust, satisfaction
Smith (1998) B2B Customer satisfaction, trust and
commitment
Johnson (1999) B2B Customer trust, justice,
opportunism
Wulf et al. (2001) B2C Customer trust, satisfaction and
commitment
Parsons (2002) B2B Customer commitment, common
goal, common interests
Keating et al. (2003) B2C Customer satisfaction, trust and
commitment
Liang et al. (2008) B2C Customer satisfaction and trust
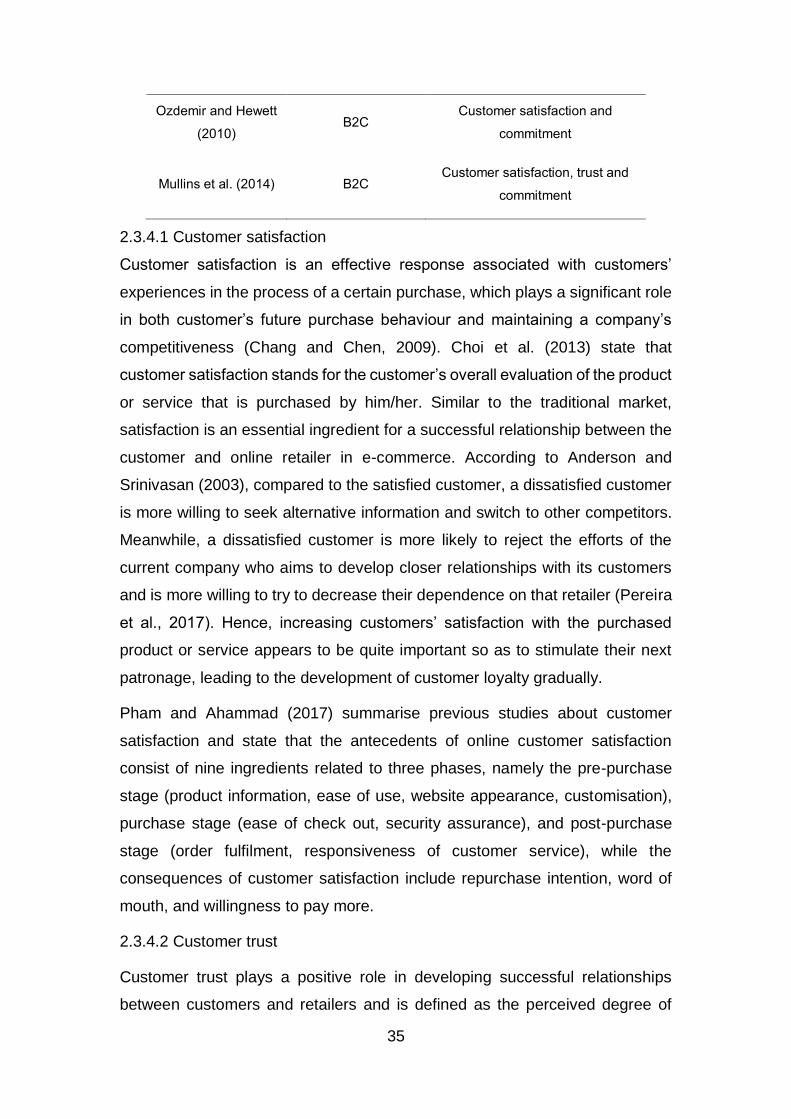
35
Ozdemir and Hewett
(2010) B2C
Customer satisfaction and
commitment
Mullins et al. (2014) B2C Customer satisfaction, trust and
commitment
2.3.4.1 Customer satisfaction
Customer satisfaction is an effective response associated with customers’
experiences in the process of a certain purchase, which plays a significant role
in both customer’s future purchase behaviour and maintaining a company’s
competitiveness (Chang and Chen, 2009). Choi et al. (2013) state that
customer satisfaction stands for the customer’s overall evaluation of the product
or service that is purchased by him/her. Similar to the traditional market,
satisfaction is an essential ingredient for a successful relationship between the
customer and online retailer in e-commerce. According to Anderson and
Srinivasan (2003), compared to the satisfied customer, a dissatisfied customer
is more willing to seek alternative information and switch to other competitors.
Meanwhile, a dissatisfied customer is more likely to reject the efforts of the
current company who aims to develop closer relationships with its customers
and is more willing to try to decrease their dependence on that retailer (Pereira
et al., 2017). Hence, increasing customers’ satisfaction with the purchased
product or service appears to be quite important so as to stimulate their next
patronage, leading to the development of customer loyalty gradually.
Pham and Ahammad (2017) summarise previous studies about customer
satisfaction and state that the antecedents of online customer satisfaction
consist of nine ingredients related to three phases, namely the pre-purchase
stage (product information, ease of use, website appearance, customisation),
purchase stage (ease of check out, security assurance), and post-purchase
stage (order fulfilment, responsiveness of customer service), while the
consequences of customer satisfaction include repurchase intention, word of
mouth, and willingness to pay more.
2.3.4.2 Customer trust
Customer trust plays a positive role in developing successful relationships
between customers and retailers and is defined as the perceived degree of
36
reliability and integrity of the exchange partner (Morgan and Hunt, 1994). In an
online situation, e-customer trust is generally defined as “reliance on a specific
firm by its stakeholders with respect to the firm’s business activities in the
electronic medium generally, and specifically on its website” (Shankar et al.,
2002).
In the context of e-commerce, the transaction environment becomes
uncontrollable due to asymmetric information and the lack of related policies or
laws, resulting in increasing uncertainties perceived by customers. A customer
will not trust the retailer because of inadequate information, which can be
adopted to help him judge whether the retailer is trustworthy or not. If there is a
lack of solutions to reduce the complexity and uncertainty of an online purchase,
it is not possible for the customer and online retailer to develop a long-term and
stable relationship. Kim and Peterson (2017) analysed ten antecedents of
online trust, including perceived risk, disposition to trust, perceived security,
perceived privacy, perceived reputation, perceived usefulness, perceived
system quality, perceived information quality, perceived service quality, and
perceived design quality. The authors also summarise six consequences of
online trust, namely satisfaction, attitude, purchase intention, repeat purchase
intention, intention to use website, and loyalty. Therefore, it is important to
develop customer trust if the online retailer wants to be more competitive.
Customer trust can be measured through three main attributes, integrity, ability,
and benevolence (Lee and Turban, 2001). Integrity means that the online
retailer can provide corresponding products or services as stated by them;
ability refers to the technology and capacity of the online retailer to solve certain
problems in a specific situation; and benevolence means the degree of amity
between online retailers and customers (Lee and Turban, 2001).
2.3.4.3 Customer commitment
Commitment refers to the belief of an exchange partner that the relationship
with another (the supplier) is worth maintaining and continuing (Morgan and
Hunt, 1994). In this dissertation, online customer commitment is regarded as
the customer’s desire to maintain and continue the relationship with an online
retailer. Although there is no consensus regarding the facets of commitment,
37
most scholars agree on the three general types, namely affective, calculative,
and normative commitment (Allen and Meyer, 1990).
As for affective commitment, Allen and Meyer (1990) state that it refers to a
person’s emotional and psychological attachment to, identification with, and
involvement with the exchange partner. Calculative commitment, also called
continuance commitment, depends on the customer’s recognition of the costs
related to leaving the company. For instance, if the costs of changing to other
organizations are high, the calculative commitment may be relatively high.
Furthermore, normative commitment depends on the sense of obligation to the
exchange partner. However, only the affective and calculative commitment is
considered in the majority of studies on customer loyalty. In the situation of
online retailing, normative commitment is expected to be less relevant in
relationships between customers and an online retailer due to the absence of
direct human contact. Moreover, Rafiq et al. (2013) claim that the effect of
calculative commitment is more likely to be considered and tested where
investments in the relationship are high, and switching costs are very high, or
there are normally numerous alternatives. However, in the context of online
retailing, customer investment tends to be not very high, and numerous
alternatives may be available. In this sense, an affective commitment-based
relationship is more likely to last much longer compared to a calculative
commitment-based relationship. Advocates (Kumar et al., 1994; Wetzels et al.,
1998) believe that more affectively committed partners show a much stronger
intention to stay than customers who feel more calculatively committed,
because calculative commitment positively affects the development of
alternatives and opportunism. Given this, the author mainly focuses on the
effect of affective commitment in terms of e-commitment in this study. For
calculative commitment, one of its antecedents switching cost, which will be
investigated in a later section.
2.3.5 Outcomes of relationship quality
This section describes a series of benefits derived from building and
maintaining good relationship quality with customers. According to Henning-
Thurau et al. (2002) and Roberts et al. (2003), the relationship quality between
38
customers and their exchange partners directly influences behavioural
intentions, which are posited to result in positive behavioural outcomes and
increase customer lifetime value. Marie and Maggie (2010), for example, claim
that higher relationship quality between customers and suppliers will trigger
stronger will of purchase and result in more purchase behaviour. Similarly,
Ozdenmir and Hewett (2011) investigated the influence of relationship quality
on customer behavioural intention in the context of service marketing, and they
found that high relationship quality will result in right word of mouth, good
recommendations, and repurchase intention. Meanwhile, based on previous
literature, Verma et al. (2015) propose a meta-analytic framework for
relationship marketing in online retailing, in which they found that a high quality
of a relationship between customers and retailers positively affects customers’
expectations of continuity, word of mouth, and loyalty respectively. The authors
also categorize six antecedents (relationship benefits, dependence on the
seller, relationship investment, seller expertise, communication, and similarity)
of relationship quality into three types, namely customer-focused, seller-
focused, and dyadic antecedents. In the e-commerce context, online retailers
try to release different kinds of market signals to help customers reduce
perceived uncertainty. The market signal can also be regarded as a kind of
relationship investment, which may influence the quality of the relationship
between customers and retailers. Hence, the author will take the market signal
into account in this paper, and it will be described in a later section.
2.4 Switching costs
2.4.1 The definition of switching costs
Switching costs have been investigated and presented in the literature for more
than three decades. The research into switching costs derives from the
phenomenon that traditional retailers may experience that loyal customers are
not satisfied, and satisfied customers are not loyal when the retailers provide
their services or goods (Jones et al., 2000). This phenomenon has revealed
that customer satisfaction cannot entirely affect customer loyalty and other
factors may exist. Jones et al. (2000) further claim that many factors will
influence customer loyalty, and the switching cost will have an impact on
39
customers’ behaviour, especially when customer satisfaction diminishes to a
certain degree.
In traditional retailing, Porter (1980) states that switching costs can be regarded
as the one-time cost that customers endure when switching to another supplier
from one supplier, as opposed to the ongoing costs. Likewise, Burnham et al.
(2003) define switching cost as the one-time cost that customers associate with
the process of changing from one supplier to another. This cost is categorized
into three types, namely procedural switching cost, financial switching cost, and
relational switching cost. More specifically, procedural switching costs contain
an economic risk cost, evaluation cost, set-up cost, and learning cost. Financial
switching cost consists of benefit and monetary loss costs, and the relational
cost is divided into personal and brand relationship loss costs respectively. Lee
et al. (2001) propose two sub-constructs of switching cost, including searching
cost and transaction cost, and they argue that the time spent by the customers
to seek the new alternative providers should also belong to customers’
perceived switching cost. Meanwhile, Jones et al. (2002) introduce six sub-
dimensions of switching cost in the field of services, namely lost performance
costs, uncertainty costs, pre-switching search and evaluation costs, post-
switching behavioural and cognitive costs, setup costs, and sunk costs.
Furthermore, Liu et al. (2010) believe that switching cost includes the cost of
time, money, and the effort related to changing service providers, which may
entail “search costs resulting from the geographic dispersion of service
alternatives, as well as learning costs resulting from the customised nature of
many service encounters.” The switching cost will not make sense until
customers begin to consider whether or not to transfer to another supplier.
Scholars like Bakos (1997) and Friedman (1999) claim that the switching cost
is almost negligible since the competing firm is ‘just a click away’ in the context
of e-commerce and too low to affect the customer when they consider switching
to other providers. However, the switching cost does exist in the online retailing
market and will influence customers’ behaviour to some extent. For instance,
when customers consider switching to another supplier, they must look for the
alterative online retailers first, then try to adapt to the new environment, and
have more insight into the quality of goods and services provided by the
40
alternative retailers. Therefore, customers must sacrifice their own time, energy,
and effort to switch to another supplier; thus, the switching cost emerges.
Chen and Hitt (2002) define the switching cost faced by online customers as
“any perceived disutility a customer would experience from switching service
providers,” which is made up of setup costs, learning costs, and highly
customised service. Meanwhile, Ray and Morris (2012) propose that the
constructs of switching cost in the electronic market are vendor-related and
user-related switching costs respectively. The vendor-related switching costs
consist of benefit-loss costs, service-uncertainty costs, and brand relationship
costs, while user-related switching costs are categorized into search and
evaluation costs, transfer costs, and learning costs. However, Yen et al. (2010)
hold a different view that an online customer will not face tangible costs of
switching between different retailers like setup costs and learning costs; instead,
customers will face economic or psychological switching costs such as
searching costs, service quality provided by the alternative retailers, and so on.
Based on previous literature, this study defines the online customer’s switching
cost as a one-time cost due to the switching behaviour of the customer from
one retailer to another, which consists of searching cost and monetary loss cost.
2.4.2 The influence of switching costs
A review of empirical studies of switching costs from marketing streams has
shown mixed findings of the role of switching cost in customer repurchase
behaviour or loyalty formation. Some scholars agree with the direct impact of
switching cost in loyalty formation in both B2C online and offline retailing, and
other scholars focus on investigating and discussing the moderation effect of
switching cost in the marketing stream. The table 2-6 below summarises some
studies associated with the effect of switching costs in the context of the
traditional retail market.
Table 2-6 The influence of switching costs in offline market
Research (offline) Context Findings
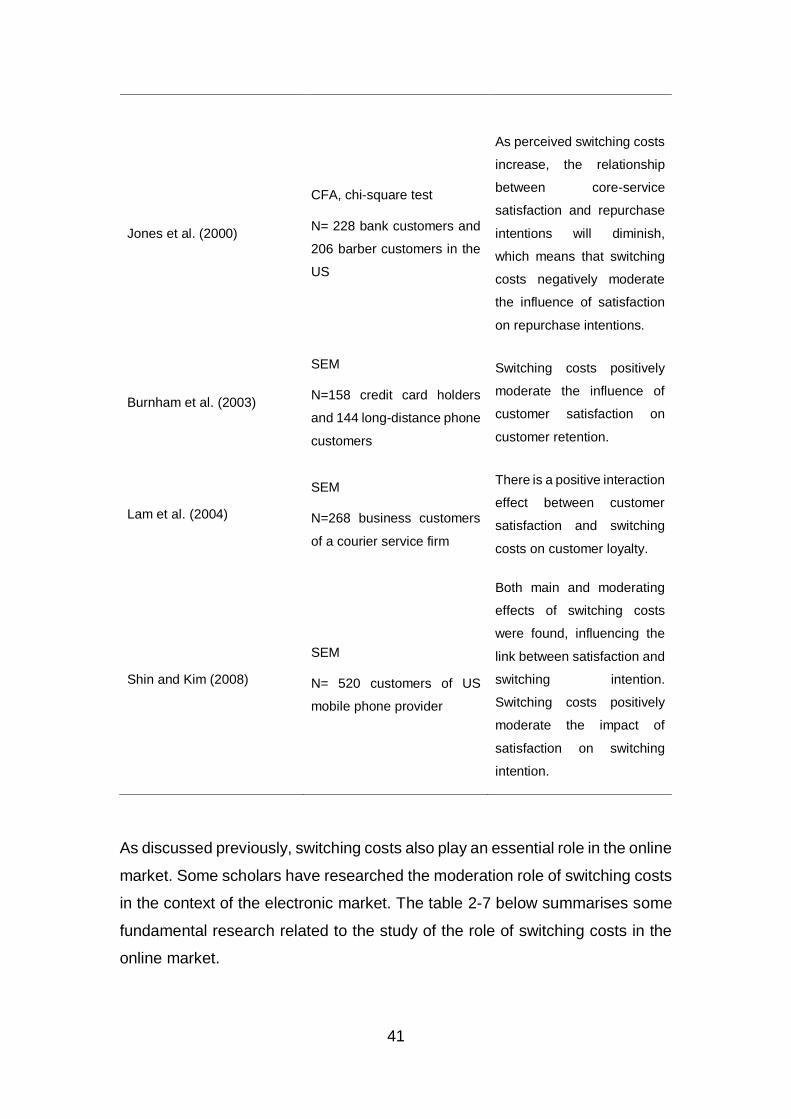
41
Jones et al. (2000)
CFA, chi-square test
N= 228 bank customers and
206 barber customers in the
US
As perceived switching costs
increase, the relationship
between core-service
satisfaction and repurchase
intentions will diminish,
which means that switching
costs negatively moderate
the influence of satisfaction
on repurchase intentions.
Burnham et al. (2003)
SEM
N=158 credit card holders
and 144 long-distance phone
customers
Switching costs positively
moderate the influence of
customer satisfaction on
customer retention.
Lam et al. (2004)
SEM
N=268 business customers
of a courier service firm
There is a positive interaction
effect between customer
satisfaction and switching
costs on customer loyalty.
Shin and Kim (2008)
SEM
N= 520 customers of US
mobile phone provider
Both main and moderating
effects of switching costs
were found, influencing the
link between satisfaction and
switching intention.
Switching costs positively
moderate the impact of
satisfaction on switching
intention.
As discussed previously, switching costs also play an essential role in the online
market. Some scholars have researched the moderation role of switching costs
in the context of the electronic market. The table 2-7 below summarises some
fundamental research related to the study of the role of switching costs in the
online market.
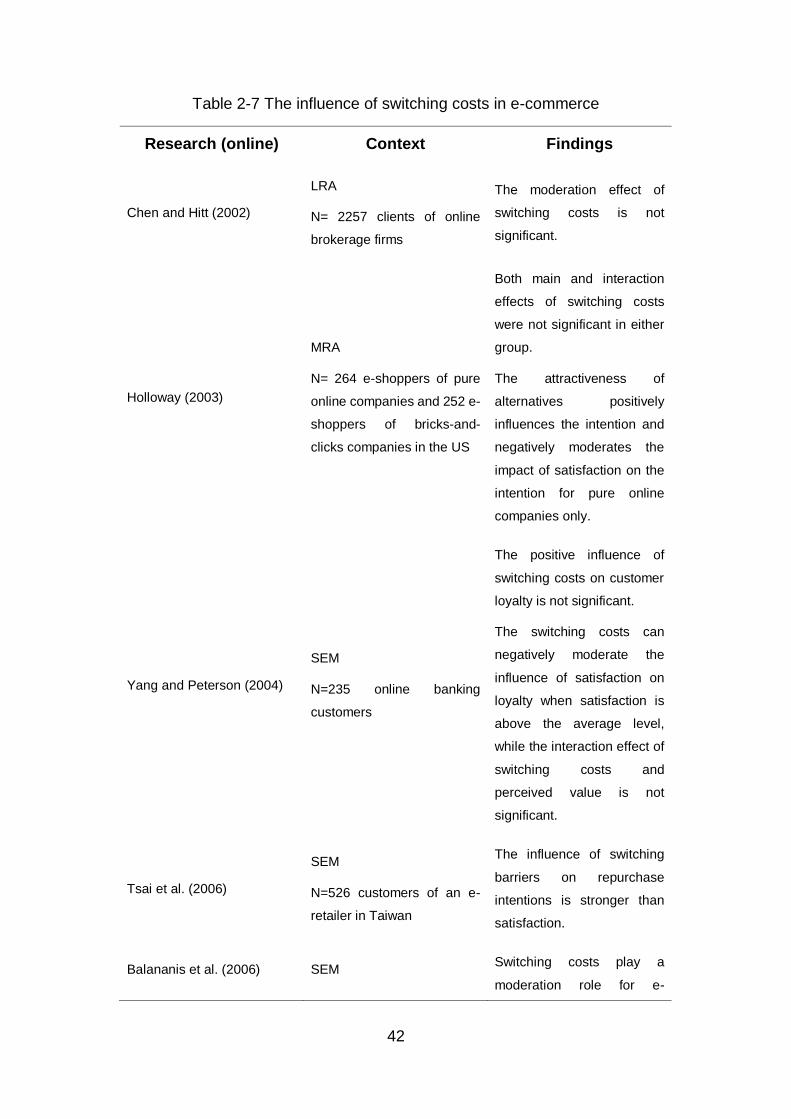
42
Table 2-7 The influence of switching costs in e-commerce
Research (online) Context Findings
Chen and Hitt (2002)
LRA
N= 2257 clients of online
brokerage firms
The moderation effect of
switching costs is not
significant.
Holloway (2003)
MRA
N= 264 e-shoppers of pure
online companies and 252 e-
shoppers of bricks-and-
clicks companies in the US
Both main and interaction
effects of switching costs
were not significant in either
group.
The attractiveness of
alternatives positively
influences the intention and
negatively moderates the
impact of satisfaction on the
intention for pure online
companies only.
Yang and Peterson (2004)
SEM
N=235 online banking
customers
The positive influence of
switching costs on customer
loyalty is not significant.
The switching costs can
negatively moderate the
influence of satisfaction on
loyalty when satisfaction is
above the average level,
while the interaction effect of
switching costs and
perceived value is not
significant.
Tsai et al. (2006)
SEM
N=526 customers of an e-
retailer in Taiwan
The influence of switching
barriers on repurchase
intentions is stronger than
satisfaction.
Balananis et al. (2006) SEM Switching costs play a
moderation role for e-
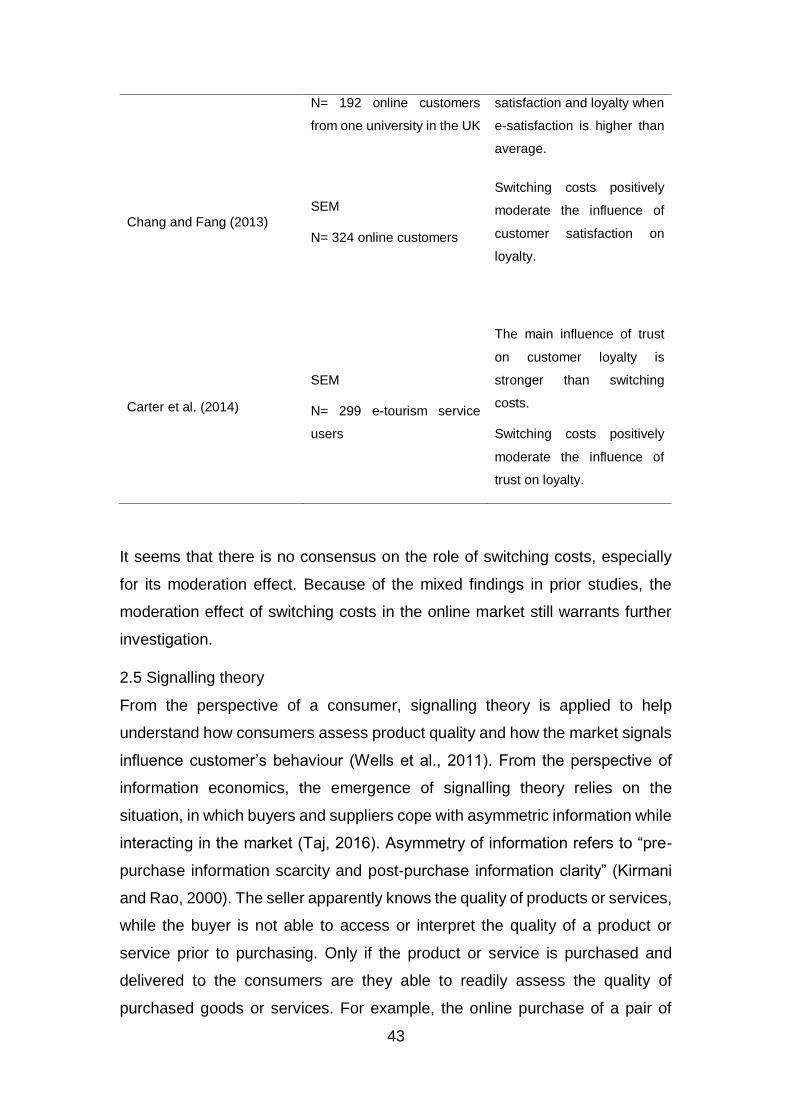
43
N= 192 online customers
from one university in the UK
satisfaction and loyalty when
e-satisfaction is higher than
average.
Chang and Fang (2013)
SEM
N= 324 online customers
Switching costs positively
moderate the influence of
customer satisfaction on
loyalty.
Carter et al. (2014)
SEM
N= 299 e-tourism service
users
The main influence of trust
on customer loyalty is
stronger than switching
costs.
Switching costs positively
moderate the influence of
trust on loyalty.
It seems that there is no consensus on the role of switching costs, especially
for its moderation effect. Because of the mixed findings in prior studies, the
moderation effect of switching costs in the online market still warrants further
investigation.
2.5 Signalling theory
From the perspective of a consumer, signalling theory is applied to help
understand how consumers assess product quality and how the market signals
influence customer’s behaviour (Wells et al., 2011). From the perspective of
information economics, the emergence of signalling theory relies on the
situation, in which buyers and suppliers cope with asymmetric information while
interacting in the market (Taj, 2016). Asymmetry of information refers to “pre-
purchase information scarcity and post-purchase information clarity” (Kirmani
and Rao, 2000). The seller apparently knows the quality of products or services,
while the buyer is not able to access or interpret the quality of a product or
service prior to purchasing. Only if the product or service is purchased and
delivered to the consumers are they able to readily assess the quality of
purchased goods or services. For example, the online purchase of a pair of
44
shoes has a high level of pre-purchase information scarcity, since it is not
possible for the customer to physically inspect or try on this pair of shoes. After
purchasing and delivering, however, the consumer will have a precise and
accurate insight into the fit and durability of the shoes.
According to Taj (2016), the signaller, signal, and the receiver appear to be the
key elements of signalling theory. Signallers are insiders, like retailers, who
obtain information about the product or service. Signals are informational cues
sent out by insiders to outsiders in order to influence expected outcomes (Taj,
2016), and signals are always extrinsic cues (Wells et al., 2011). Intrinsic cues
refer to goods’ attributes associated with the fundamental nature of the product,
while extrinsic cues are product-related attributes, whose changes will not
influence the original nature of the product (Richardson et al., 1994). According
to Wells et al. (2011), typical extrinsic cues include brand, price, advertisement,
retailer reputation, warranties, and store environment. Compared to intrinsic
cues, extrinsic cues are more important and influential when consumers try to
assess the quality of offered products or services, since extrinsic cues are more
likely to be captured and recognized than intrinsic issues (Zeithaml, 1998).
In the current market, in order to decrease information asymmetry and the
customer’s perceived uncertainty about the product or service and positively
affect desired outcomes, the insiders usually send out positive signals to
outsiders and avoid sending out negative information cues. Therefore, signals
are critical and vital to help consumers distinguish good retailers. It is worth
noting that the market signal cannot only influence pre-purchasing behaviours,
such as the perceptions of the quality of the product or service, but also have a
positive impact on post-purchasing behaviours, like customer complaints and
post-purchasing comments (Hu et al., 2015).
Signal credibility, also referred to as bond credibility, plays a vital role in making
the signal an efficient mechanism for conveying high product quality. Higher
signal credibility occurs when the customer believes that the seller can provide
the same quality of products or services as stated in the signals; the seller
makes a significant investment associated with signals, so the investment is
risky if the signal is false. Such a situation is defined as separating equilibrium
(Boulding and Kirmani, 1993). Conversely, a pooling equilibrium occurs when
45
customers cannot distinguish right retailers from bad retailers (Bergen et al.,
1992).
Compared to traditional retailers, it is much more critical for online retailers to
guarantee the signal credibility, since electronic word of mouth helps to ensure
that online retailers will be penalized for providing low credibility signals. Online
customers can easily share their opinions and comments through e-mail, online
referrals, and so on, which in turn affects future sales (Reichheld and Schefter,
2000).
Online logistics service quality plays a significant role in online customer
behaviour. However, it is difficult for customers to perceive the logistics service
quality prior to purchasing. The provision of OLSM enables customers to
choose a preferred logistics service provider and delivery time slot, diminishing
the uncertainty of perceptions of logistics service quality. Hence, the author
regards OLSM as a reflection of the market signal released by online retailers.
2.6 Research gap identification
Previous studies have examined the importance of online logistics services in
the online retail market from the perspective of logistics service quality or
performance and some single elements of logistics services. For example, Rao
et al. (2011) noted that e-LSQ can play a decisive role in customers’ purchase
satisfaction and retention, Ramanathan (2010) also found that logistics
performance of a website significantly affects customer loyalty. In addition, Xu
and Li (2017) indicate that e-retailers can either provide their own delivery
service or cooperate with a third-party logistics company to establish a flexible
distribution, and the quality and quantity of third-party logistics providers (3PLP)
appears to be an issue in e-retailing, the research by Lee and Wang (2001)
demonstrates that the choice of delivery modes (self-pick or drop-off) is affected
by product attributes. OLSM is a kind of customised service, which integrate
several logistics service elements. And it is gradually becoming more and more
important in e-commerce. However, there is still a lack of focus on OLSM and
the mechanisms about how OLSM influence customer loyalty are still ambiguity.
Therefore, this thesis aims to address this research gap.
46
Chapter 3 Theoretical model
3.1 The construction of the theoretical model
The more e-retailers the customer can choose from, the more challenges the
e-retailer must face. For an online business, its goals are not only to seek and
attract potential customers, but also to maintain a stable relationship with
customers to encourage the development of customer loyalty. It is worth noting
that the key to developing customer loyalty is to enhance the relationship quality
(customer satisfaction, trust, and commitment) between customers and
retailers. In the context of e-commerce, relationship quality is achieved through
the ability of online retailers to decrease the uncertainty perceived by customers.
In the online market, it is always difficult for customers to have a clear insight in
e-logistics service quality. Instead, other signals are necessary for them to
decrease perceived uncertainty. As discussed in Chapter 2, the author
proposes a new term, online logistics service mode, which refers to a kind of
customised logistics service, in which online retailers integrate different
elements of logistics services. The provision of OLSM makes it possible for
customers to choose a preferred logistics service provider, preferred delivery
time, and so on, which in turn enhances the customer’s control of the e-logistics
service and simultaneously decrease the customer’s perceived uncertainty
about the e-logistics service. Hence, OLSM can be regarded as a kind of market
signal to help reduce consumers’ perceived uncertainty from the perspective of
signalling theory. Meanwhile, from the perspective of relationship marketing,
the customised service offered by a business can be regarded as one tactic of
relationship marketing investments (Huang, 2015).
According to relationship marketing theory, the lower the customer’s perceived
uncertainty resulting from the release of market signals, the higher the ability of
companies to decrease consumers’ perceived uncertainty and the higher the
relationship quality between retailers and consumers. Moreover, Verma et al.
(2015) posit that relationship investments can affect customer loyalty through
relationship quality. Therefore, based on the above analysis, the basic model
can be confirmed, which is that OLSM will influence e-loyalty indirectly through
relationship quality. Since signal credibility has a significant influence on the
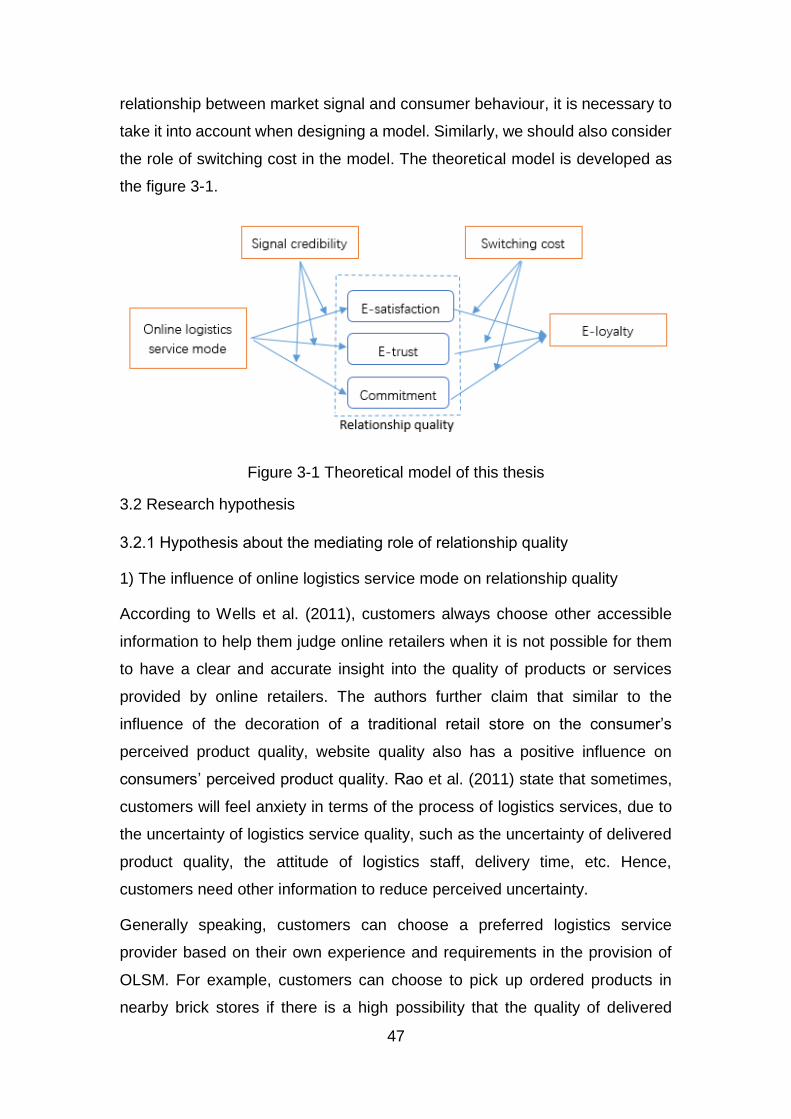
47
relationship between market signal and consumer behaviour, it is necessary to
take it into account when designing a model. Similarly, we should also consider
the role of switching cost in the model. The theoretical model is developed as
the figure 3-1.
Figure 3-1 Theoretical model of this thesis
3.2 Research hypothesis
3.2.1 Hypothesis about the mediating role of relationship quality
1) The influence of online logistics service mode on relationship quality
According to Wells et al. (2011), customers always choose other accessible
information to help them judge online retailers when it is not possible for them
to have a clear and accurate insight into the quality of products or services
provided by online retailers. The authors further claim that similar to the
influence of the decoration of a traditional retail store on the consumer’s
perceived product quality, website quality also has a positive influence on
consumers’ perceived product quality. Rao et al. (2011) state that sometimes,
customers will feel anxiety in terms of the process of logistics services, due to
the uncertainty of logistics service quality, such as the uncertainty of delivered
product quality, the attitude of logistics staff, delivery time, etc. Hence,
customers need other information to reduce perceived uncertainty.
Generally speaking, customers can choose a preferred logistics service
provider based on their own experience and requirements in the provision of
OLSM. For example, customers can choose to pick up ordered products in
nearby brick stores if there is a high possibility that the quality of delivered
48
goods perceived by customers is low. Meanwhile, they can select preferred
delivery time, resulting from the perceived uncertainty of delivery time.
Therefore, the provision of OLSM can reduce consumers’ perceived uncertainty.
Further, as discussed previously, the higher the ability of companies to
decrease consumers’ perceived uncertainty, the higher the relationship quality
between retailers and consumers. Therefore, based on the above analysis, the
provision of OLSM has a positive influence on relationship quality. Since
relationship quality consists of customer satisfaction, trust, and commitment,
the author will further analyse the influence of OLSM on these three elements
respectively.
According to expectation confirmation theory, the degree of satisfaction
depended on the difference between perceived actual obtained products or
services and expected obtained products or services. Thirumalai and Sinha
(2011) argue that a customised service can reach customers’ expectations
more realistically, which positively affects online customers’ satisfaction. OLSM
can be regarded as one kind of customised service that can properly satisfy
customers’ requirements for a logistics service. Hence, OLSM has a positive
influence on e-satisfaction. According to Arora et al. (2008), customisation
stands for the process or situation in which customers proactively specify one
or more elements of their marketing mix. That is to say, customers are expected
to be involved in the process of the purchase transaction in order to satisfy their
specific requirements. The customisation is a point of differentiation, resulting
in the generation of higher customer satisfaction and loyalty. The provision of
OLSM makes it possible for customers to choose their preferred delivery
method and/or logistics service provider to fit their specific needs.
Based on Morgan and Hunt (1994), trust develops when the consumer has
confidence in the retailer’s or exchange partner’s reliability and integrity.
Compared to the traditional market, the environment of e-commerce is more
complicated and uncontrollable, leading to a higher level of uncertainty.
Customers cannot judge whether the online retailer is trustworthy or not due to
the lack of adequate available information (Wirtz and Lihotzky, 2003). However,
OLSM enables the customer to obtain enough information about the logistics
service, which will contribute to the development of trust. Moreover, Koufaris
49
and Hampton-Sosa (2004) state that enterprise ability is one factor that
influences customers’ trust, and a customised service can be treated as a kind
of enterprise capacity. OLSM is a kind of customised service, and it not only
requires more investment from online businesses, but also increases the
complexity of e-commerce supply chain management. In other words, OLSM
stands for the operational ability of online retailers. Hence, OLSM positively
affects e-trust.
Nowadays, the majority of online retailers cooperate with one third-party
logistics service provider, and they also will not provide a specific delivery time
for customers in China. Yet, OLSM enables customers to select preferred
delivery time and logistics service provider, which can be regarded as a kind of
value-added service. Hsieh et al. (2005) claim that the provision of value-added
services makes customers feel respect from exchange partners, resulting in
emotional or psychological dependence, which in turn enhances customer
commitment. Therefore, OLSM contributes to the development of e-
commitment.
In summary, the author proposes several hypotheses as follows:
H1: OLSM has a positive influence on relationship quality.
H1a: OLSM has a positive influence on customer e-satisfaction.
H1b: OLSM has a positive influence on e-trust.
H1c: OLSM has a positive influence on e-commitment.
2) The influence of relationship quality on e-loyalty
Relationship quality stands for the ability of online retailers to reduce customers’
perceived uncertainty. High relationship quality means high confidence and
trust of customers in the retailers based on their previous purchasing
experience. Previous studies show that an increase in relationship quality can
contribute to the development of customer loyalty in the context of e-commerce.
As discussed previously, customer satisfaction develops when customers’
perceived actual quality of obtained products or services is higher than
expected value, which in turn leads to possible repurchasing behaviour.
Compared to satisfied customers, dissatisfied customers may be easily

50
attracted by or switch to other retailers. Anderson and Srinivasan (2003) also
claim that dissatisfied customers prefer not to establish a deeper relationship
with previous companies. Safa and Ismail (2013) reveal that customer
satisfaction will positively influence the development of customer loyalty.
Compared to the traditional market, it is easier for customers to switch to other
online retailers due to a higher transparency of information and lower switching
cost. Walsh et al. (2010) propose that customer satisfaction has a higher
influence on customer loyalty in the context of e-commerce compared to the
traditional market. Therefore, the author posits that relationship quality
contributes to the development of e-loyalty.
Apart from satisfaction, trust also plays a critical role in the formation of
customer loyalty (Wang et al., 2006). Customer trust can enhance relationship
quality between consumers and retailers, leading to the development of loyalty
(Safa and Ismail, 2013). More specifically, when consumers trust an online
retailer, they will have more confidence in the quality of products or services
provided by the online retailer, and they are more willing to disclose their
personal information, which will contribute to the formation of e-loyalty (Ismail
and Safa, 2014). Palvia (2009) also argues that trust in the online retailer is the
prerequisite for the formation of loyalty to the retailer.
Consumer commitment develops when consumers are keen on a certain
business and feel emotional or psychological dependence on the business
(Fullerton, 2005). The higher commitment represents a higher level of
customers’ dependence on the business. In other words, customers are more
willing to maintain and rely on current relationships with retailers, leading to
higher revisiting intention and higher possibility of repurchasing behaviour.
Henning-Thurau et al. (2002) state that commitment has a positive impact on
customer loyalty. Moreover, Izogo (2015) asserts that commitment plays a
positive mediating role in attitudinal loyalty.
Based on the above analysis and combining it with hypothesis 1, the author
proposes hypotheses 2 and 3 as follows.
H2: Relationship quality plays a positive role in e-loyalty.
H2a: e-satisfaction plays a positive role in e-loyalty.
51
H2b: e-trust plays a positive role in e-loyalty.
H2c: e-commitment plays a positive role in e-loyalty.
H3: OLSM has a positive and indirect influence on e-loyalty through relationship
quality.
H3a: OLSM has a positive and indirect influence on e-loyalty through e-
satisfaction.
H3b: OLSM has a positive and indirect influence on e-loyalty through e-trust.
H3c: OLSM has a positive and indirect influence on e-loyalty through e-
commitment.
3.2.2 Research hypothesis about the moderating role of signal credibility
According to signalling theory, sellers will release some signals to convey
product quality information to consumers in order to reduce customers’
perceived uncertainty and stimulate a purchase or exchange (Wells et al., 2011).
Hu et al. (2015) found that the credibility degree of a signal will influence to what
extent the market signal will affect customer behaviour. Signals, including brand
names, prices, advertising expenditures, security policies, and so on, play a
critical role in helping consumers to distinguish bad retailers from good retailers
(Boulding and Kirmani, 1993). However, if online retailers release the same
signals, customers must consider the signal credibility before making decisions.
High signal credibility occurs when customers believe that the retailers are able
to provide services or products as indicated by the signal (Wells et al., 2011).
Accordingly, higher signal credibility represents that the customer can have
stronger confidence in the online retailer who releases the signals. On the other
hand, if the signal credibility is low, this market signal has little or even a
negative influence on customers’ purchasing behaviour, since customers will
think that the sellers are dishonest and will not be willing to patronize them (Hu
et al. 2015). Furthermore, Wells et al. (2011) propose that website quality can
be treated as a signal of product quality and the investment of website design
is regarded as signal credibility. They further state that signal credibility can
enhance the relationship between website quality and perceived product quality.
52
From the perspective of signalling theory, OLSM is a kind of market signal
released by online retailers to help customers reduce uncertainty about the
perceptions of logistics service quality, which positively influences customer
behaviour. However, the selection of a logistics service provider will also
influence customers’ behaviour. For example, although two online retailers offer
the same market signal (OMSM) to customers, they can choose different
cooperating service providers. Imagine that one online retailer provides a
selection of some famous logistics service providers, while another retailer only
offers some small and obscure logistics service providers. In this case, there is
no doubt that the former will help reduce perceived uncertainty more efficiently.
Therefore, the author includes signal credibility in the theoretical model.
Generally speaking, the higher the quality provided by the logistics service
provider, the higher the price, since higher cost is needed to achieve a higher
quality of logistics services. Moreover, higher logistics price implies that
customers can have higher perceptions of logistics service quality (Rabinovich
and Bailey, 2004). Hence, the logistics price can be regarded as the ability of
online retailers to achieve high logistics service quality, representing the
credibility of the market signal (OLSM) released by the online retailers. A lower
logistics price means lower signal credibility, which weakens the function of
OLSM to differentiate good retailers, while a higher logistics price as higher
market signal credibility can strengthen the function of OLSM to differentiate
good retailers from bad retailers. Gumus et al. (2013) propose that free shipping
possibly does not mean actual free delivery, as most retailers who provide free
delivery simply add the shipping fees to the original product price. For
customers, it is not honest for online retailers to provide unclear delivery fees,
which may in turn increase the uncertainty perceived by customers in terms of
logistics service quality. In contrast, a higher logistics price will improve
customers’ confidence in perceived quality.
A lower logistics price means that OLSM has less influence on relationship
quality, while a higher logistics price means that OLSM has a higher influence
on relationship quality. Take a famous Chinese online business, Jing Dong, as
an example. Jing Dong did not set up a corresponding price for the logistics
service at different times. Although customers can select preferred delivery time,
53
packages are always not available to be delivered on time. This phenomenon
makes it not possible for customers to judge and perceive the logistics service
quality provided by Jing Dong based on the released market signal (OLSM),
leading to a negative influence on customer purchasing behaviour and a
positive effect on complaint behaviour. For example, some customers complain
about the logistics service on the Jing Dong website.
Based on above analysis, the author proposes the following hypotheses:
H4: Signal credibility positively moderates the influence of OLSM on
relationship quality.
H4a: Signal credibility positively moderates the influence of OLSM on e-
satisfaction.
H4b: Signal credibility positively moderates the influence of OLSM on e-trust.
H4c: Signal credibility positively moderates the influence of OLSM on e-
commitment.
In addition, it is assumed that OLSM positively influences e-loyalty indirectly
through relationship quality in H3. In this sense, assuming signal credibility will
moderate the mediation effect of relationship quality between OLSM and e-
loyalty is rational and logical (Edwards and Lambert, 2007). Thus, hypothesis
5 is proposed as follows:
H5: Signal credibility positively moderates the indirect influence of relationship
quality on the relationship between OLSM and e-loyalty.
H5a: Signal credibility positively moderates the indirect influence of e-
satisfaction on the relationship between OLSM and e-loyalty.
H5b: Signal credibility positively moderates the indirect influence of e-trust on
the relationship between OLSM and e-loyalty.
H5b: Signal credibility positively moderates the indirect influence of e-
commitment on the relationship between OLSM and e-loyalty.
3.2.3 Research hypothesis about the moderating effect of switching costs
Switching costs refer to all the costs due to customers’ switching behaviour from
one retailer to another retailer, including time, effort, learning, transactions,
54
searching costs, etc. (Burnham et al., 2003). Previous studies from Chuah et
al. (2017) and Lam et al. (2004) show that switching costs play both a direct
and moderating role in customer loyalty. The higher the switching costs, the
lower the influence of customer satisfaction on loyalty. For instance, when the
switching costs are high, the possibility of switching to other good retailers for
dissatisfied consumers may be low, and the satisfied consumers will also not
consider other retailers. In this sense, there is only a small difference between
dissatisfied consumers and satisfied consumers in terms of their loyalty to the
retailers. Nevertheless, when the switching cost is low, those dissatisfied
consumers may purchase from other retailers, while satisfied consumers still
show their interest in the original retailer. In this sense, customer satisfaction
has a distinct influence on customer loyalty. Therefore, although e-satisfaction
positively influences e-loyalty, the influence will become weaker if the switching
cost increases. Likewise, the higher the switching costs, the lower the influence
of customer trust (or commitment) on loyalty. For example, when the switching
costs are higher than customer’s perceived benefits brought from switching to
other online retailers, the possibility for low trust and commitment customers to
switch to other online retailers may be low even if they do not have strong
emotional or psychological dependence on the online retailers or strong belief
to maintain the relationship with retailers, and high trust and commitment
customers will also not consider other retailers. In this sense, there is only a
small difference between low and high trust (or commitment) in terms of their
loyalty to the retailers. However, when the switching cost is low enough, low
trust (or commitment) customers may switch to other new retailers if they think
the benefits brought from such switching behaviour are more than switching
costs, while high trust (or commitment) customers may still choose to keep
exchange relationship with this retailer. Therefore, the influence of customer
trust and commitment on customer loyalty will decrease with the raise of
switching costs.
In a word, when the relationship quality between consumers and online retailers
is deficient, customers may adopt several approaches to search for new online
retailers. However, if the switching cost is very high, customers must spend
more time and money to search for new retailers, and consumers may prefer
55
maintaining the current relationship with the former retailer when the benefit
brought by switching to new retailers is lower than the switching cost. In this
sense, the relationship quality has a low degree of influence on customer loyalty.
In contrast, if the switching cost is low, customers can easily change to other
retailers, and they may prefer not maintaining the relationship with the former
retailer when the benefit brought by switching to new retailers is higher than the
switching cost. In this condition, relationship quality has an enormous impact
on the development of e-loyalty. Based on above analysis, although
relationship quality positively influences e-loyalty, the influence will become
weaker if the switching cost increases.
To summarise, the hypotheses about the moderating effect of switching cost
are as follows:
H6: Switching cost negatively moderates the impact of relationship quality on
e-loyalty.
H6a: Switching cost negatively moderates the impact of e-satisfaction on e-
loyalty.
H6b: Switching cost negatively moderates the impact of e-trust on e-loyalty.
H6c: Switching cost negatively moderates the impact of e-commitment on e-
loyalty.
Moreover, it is assumed that OLSM positively influences e-loyalty indirectly
through relationship quality. Similar to hypothesis 5, the author proposes the
following:
H7: Switching cost negatively moderates the indirect influence of relationship
quality on the relationship between OLSM and e-loyalty.
H7a: Switching cost negatively moderates the indirect influence of e-
satisfaction on the relationship between OLSM and e-loyalty.
H7b: Switching cost negatively moderates the indirect influence of e-trust on
the relationship between OLSM and e-loyalty.
H7c: Switching cost negatively moderates the indirect influence of e-
commitment on the relationship between OLSM and e-loyalty.
56
Chapter 4 Methodology
4.1 Introduction
Having reviewed the relevant literature associated with customized service,
customer satisfaction, trust and commitment, customer loyalty, switching cost,
and signal credibility, the research gaps were highlighted in Chapter 2. Seven
hypotheses and a proposed model framework were formulated in Chapter 3 to
address the research objectives. This chapter begins with a discussion of the
philosophical debate underlying the choice of methodology, followed by the
introduction of the data collection method and research samples. Then, the
process of developing measurement items will be displayed in this chapter as
well as the results of a pilot study. Furthermore, this chapter introduces the
planned analysis strategy to test the hypotheses proposed in Chapter 3. The
final section consists of ethical considerations associated with the research
design of this study and conclusions of the whole chapter.
4.2 Justification of research paradigm
As a foundation of a study, the paradigm or worldview always reveals the
perspective that authors or researchers hold towards about world. According to
Creswell and Plano Clark (2011), the primary elements differ in terms of
different worldviews, and the essential elements appear to be ontology (“the
view on nature of being, existence or reality”), epistemology (“the way to gain
knowledge of what we know about the reality”), axiology (“the role value in the
research”), rhetoric (“research language”), and methodology (“the process of
research”).
As mentioned above, epistemology is about how we gain knowledge and know
reality. A more detailed explanation by Hamlyn (1995) shows that epistemology
addresses the questions of “the nature of knowledge, its possibility, scope and
general basis.” Klein (2005) further claims that epistemology is a branch of
philosophy that addresses “nature, sources and limits of knowledge.”
Knowledge here refers to “propositional knowledge” that is “distinct from ‘belief’
in that it requires that we give reasons for saying that something is so and can
potentially convince others” (Porta and Keating, 2008).
57
In the natural sciences, shared criteria of evidence, argument, and logic are
adopted to address such questions. However, it is not the same in the social
sciences. Although some social scientists call for objective evidence similar to
the natural sciences, others firmly believe that there are other possible forms of
knowledge (Porta and Keating, 2008). In this sense, different philosophical
foundations or bases for deciding possible kinds of knowledge and ways of
ensuring that they are not only adequate but also legitimate are influenced and
even determined by different epistemological points of view. Hence, it is
necessary to identify, clarify, and explain our epistemological stances before
the start of any particular study.
Although paradigms have been defined differently by previous researchers, two
fundamental paradigms with broad agreement and identification have
frequently emerged in previous papers, namely positivism and interpretivism.
Glogowska (2011) also asserts that these two paradigms are usually used in
quantitative and qualitative research respectively. Historically, researchers who
focused on marketing and consumer behaviours always side with positivism.
Positivism is always linked and coordinated with ‘objectivist’ ontology (Crotty,
1998). Crotty further explains that objectivist ontology means that people regard
reality as an independent existence and the meaning of any existing objects will
not be affected or decided by the operation of any consciousness. In other
words, the object itself always exists objectively without caring about any other
people’s consciousness. For instance, a desk in an office is a desk (objective
thing), regardless of whether any people have noticed its existence or not.
David and Sutton (2011) further state that “such a ‘positivist’ knowledge
requires the non-normative, non-judgmental detachment of the researcher in
relation to what they are studying, and the commitment to ‘evidence’ and the
rejection of all speculation and conjecture that cannot be grounded and/ or
tested with reference to evidence.” As mentioned above, the positivism
paradigm is always associated with quantitative research. Likewise, positivist
epistemology is usually linked with hypothetic-deductive research. Under such
epistemology, what is true or false will be tested through neutral data input used
to guarantee the measuring and computing of theories. According to Russell
(1979), positivists insist that the social phenomena can be measured and
58
generalized, which is in many ways quite similar to the natural sciences. This is
echoed by Porta and Keating (2008), who state that “positivist approaches
share the assumption that, in natural as in social sciences, the researcher can
be separated from the object of his research and therefore observe it in a
neutral way and without affecting the overserved object.” Such a viewpoint and
quantitative research can be added into ethnographic research when pursuing
the ‘truth’ to enrich and diversify the research process of social sciences.
In this study, all the variables like customer satisfaction and customer loyalty
can be measured by a quantitative approach. Apparently, the author maintained
a stance of positivism, as it lends itself to a deductive and quantitative
methodology, which is in accordance with the dominant tendency in this
research field.
After explaining the paradigm in this study, the next section will discuss the
methods and approaches adopted related to the development of measurement
items and questionnaires. Since the data for this study were collected through
questionnaires, it was essential to ensure that the instrument was able to gather
reliable and valid information to test previous hypotheses and fulfil the research
objectives.
4.3 Research instrument
The instrument used in this dissertation consisted of six measurement scales.
Excluding the last section, which focused on understanding the demographic
information and additional suggestions from the participants, the other five
measurement scales included ‘OLSM’; ‘relationship quality’, ‘market signal’,
‘switching cost’, and ‘customer loyalty’, which were taken directly or derived
from valid measurements in previous studies. It is worth noting that relationship
quality was divided into three parts, namely ‘e-satisfaction,' ‘e-trust,' and ‘e-
commitment.' In the following section, description of the measurement scales
adopted in this dissertation as well as detailed contents of these measurement
scales will be introduced.
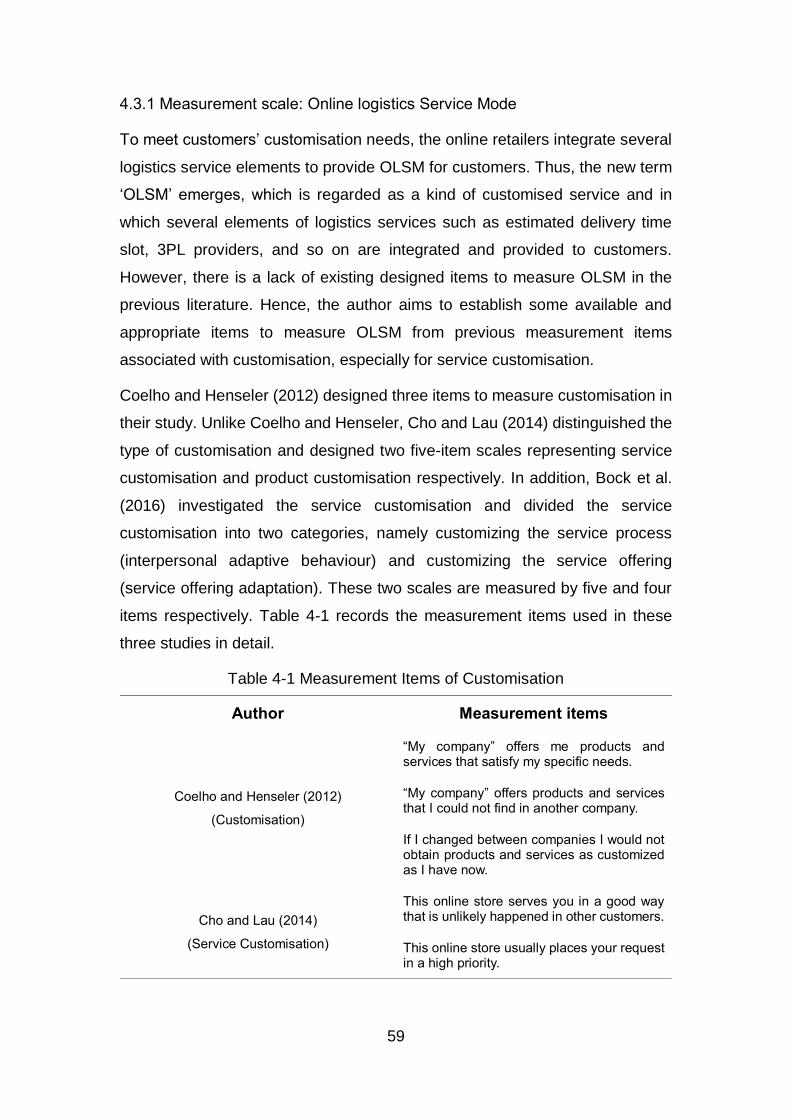
59
4.3.1 Measurement scale: Online logistics Service Mode
To meet customers’ customisation needs, the online retailers integrate several
logistics service elements to provide OLSM for customers. Thus, the new term
‘OLSM’ emerges, which is regarded as a kind of customised service and in
which several elements of logistics services such as estimated delivery time
slot, 3PL providers, and so on are integrated and provided to customers.
However, there is a lack of existing designed items to measure OLSM in the
previous literature. Hence, the author aims to establish some available and
appropriate items to measure OLSM from previous measurement items
associated with customisation, especially for service customisation.
Coelho and Henseler (2012) designed three items to measure customisation in
their study. Unlike Coelho and Henseler, Cho and Lau (2014) distinguished the
type of customisation and designed two five-item scales representing service
customisation and product customisation respectively. In addition, Bock et al.
(2016) investigated the service customisation and divided the service
customisation into two categories, namely customizing the service process
(interpersonal adaptive behaviour) and customizing the service offering
(service offering adaptation). These two scales are measured by five and four
items respectively. Table 4-1 records the measurement items used in these
three studies in detail.
Table 4-1 Measurement Items of Customisation
Author Measurement items
Coelho and Henseler (2012)
(Customisation)
“My company” offers me products and services that satisfy my specific needs.
“My company” offers products and services that I could not find in another company.
If I changed between companies I would not obtain products and services as customized as I have now.
Cho and Lau (2014)
(Service Customisation)
This online store serves you in a good way that is unlikely happened in other customers.
This online store usually places your request in a high priority.
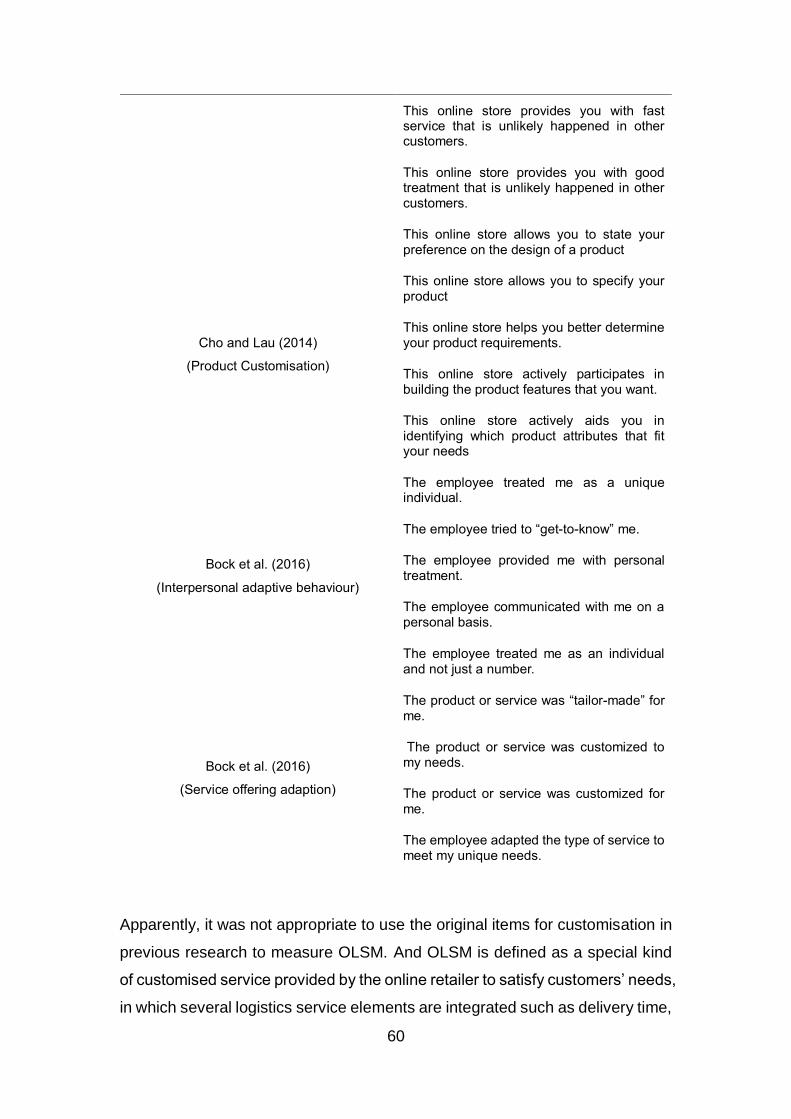
60
Apparently, it was not appropriate to use the original items for customisation in
previous research to measure OLSM. And OLSM is defined as a special kind
of customised service provided by the online retailer to satisfy customers’ needs,
in which several logistics service elements are integrated such as delivery time,
This online store provides you with fast service that is unlikely happened in other customers.
This online store provides you with good treatment that is unlikely happened in other customers.
Cho and Lau (2014)
(Product Customisation)
This online store allows you to state your preference on the design of a product
This online store allows you to specify your product
This online store helps you better determine your product requirements.
This online store actively participates in building the product features that you want.
This online store actively aids you in identifying which product attributes that fit your needs
Bock et al. (2016)
(Interpersonal adaptive behaviour)
The employee treated me as a unique individual.
The employee tried to “get-to-know” me.
The employee provided me with personal treatment.
The employee communicated with me on a personal basis.
The employee treated me as an individual and not just a number.
Bock et al. (2016)
(Service offering adaption)
The product or service was “tailor-made” for me.
The product or service was customized to my needs.
The product or service was customized for me.
The employee adapted the type of service to meet my unique needs.
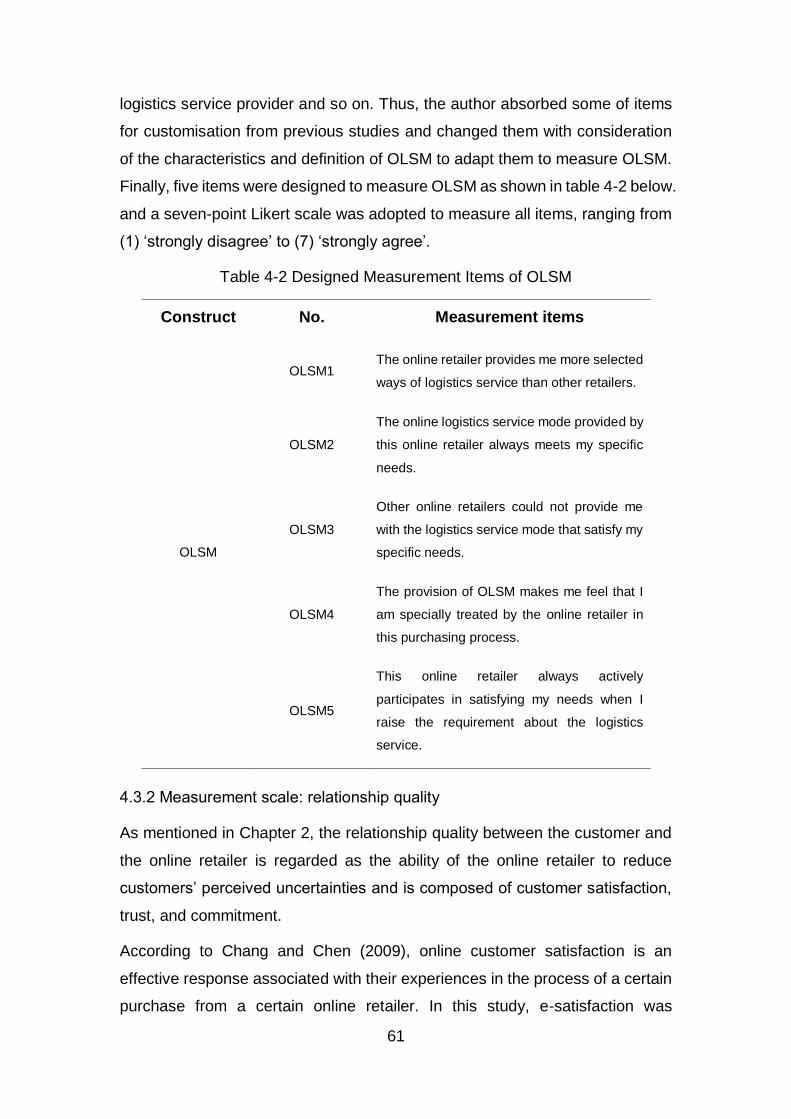
61
logistics service provider and so on. Thus, the author absorbed some of items
for customisation from previous studies and changed them with consideration
of the characteristics and definition of OLSM to adapt them to measure OLSM.
Finally, five items were designed to measure OLSM as shown in table 4-2 below.
and a seven-point Likert scale was adopted to measure all items, ranging from
(1) ‘strongly disagree’ to (7) ‘strongly agree’.
Table 4-2 Designed Measurement Items of OLSM
Construct No. Measurement items
OLSM
OLSM1 The online retailer provides me more selected
ways of logistics service than other retailers.
OLSM2
The online logistics service mode provided by
this online retailer always meets my specific
needs.
OLSM3
Other online retailers could not provide me
with the logistics service mode that satisfy my
specific needs.
OLSM4
The provision of OLSM makes me feel that I
am specially treated by the online retailer in
this purchasing process.
OLSM5
This online retailer always actively
participates in satisfying my needs when I
raise the requirement about the logistics
service.
4.3.2 Measurement scale: relationship quality
As mentioned in Chapter 2, the relationship quality between the customer and
the online retailer is regarded as the ability of the online retailer to reduce
customers’ perceived uncertainties and is composed of customer satisfaction,
trust, and commitment.
According to Chang and Chen (2009), online customer satisfaction is an
effective response associated with their experiences in the process of a certain
purchase from a certain online retailer. In this study, e-satisfaction was
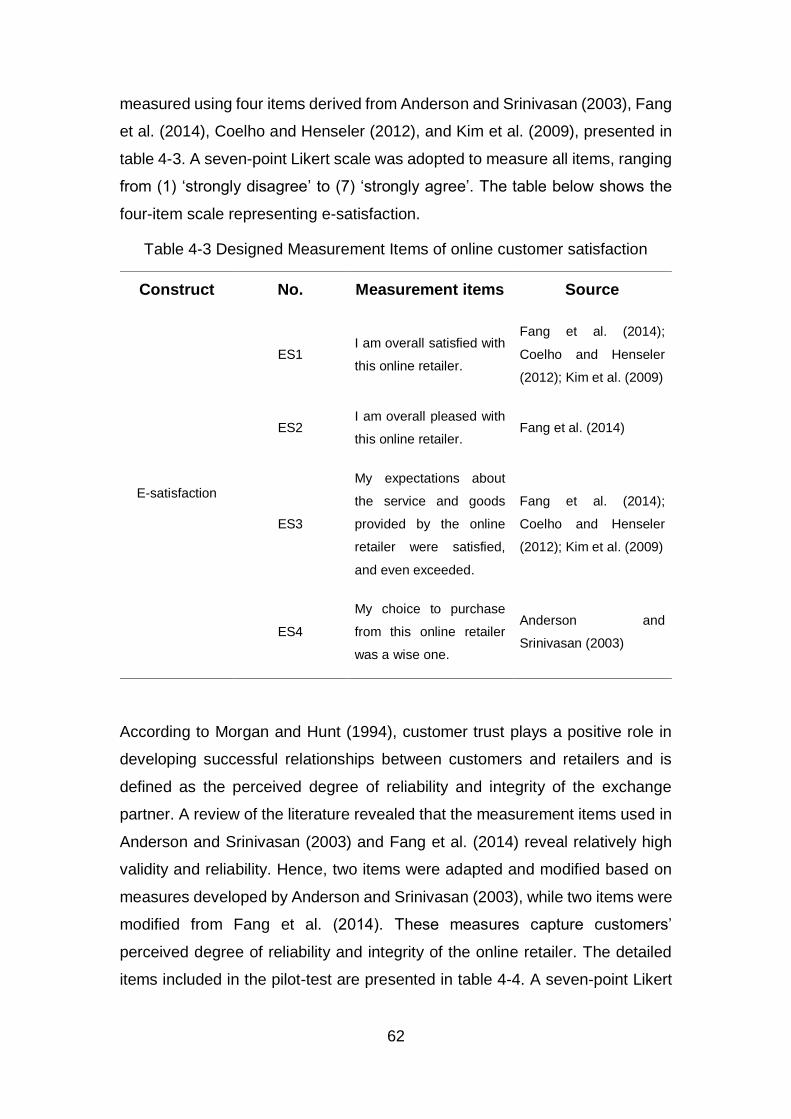
62
measured using four items derived from Anderson and Srinivasan (2003), Fang
et al. (2014), Coelho and Henseler (2012), and Kim et al. (2009), presented in
table 4-3. A seven-point Likert scale was adopted to measure all items, ranging
from (1) ‘strongly disagree’ to (7) ‘strongly agree’. The table below shows the
four-item scale representing e-satisfaction.
Table 4-3 Designed Measurement Items of online customer satisfaction
Construct No. Measurement items Source
E-satisfaction
ES1 I am overall satisfied with
this online retailer.
Fang et al. (2014);
Coelho and Henseler
(2012); Kim et al. (2009)
ES2 I am overall pleased with
this online retailer. Fang et al. (2014)
ES3
My expectations about
the service and goods
provided by the online
retailer were satisfied,
and even exceeded.
Fang et al. (2014);
Coelho and Henseler
(2012); Kim et al. (2009)
ES4
My choice to purchase
from this online retailer
was a wise one.
Anderson and
Srinivasan (2003)
According to Morgan and Hunt (1994), customer trust plays a positive role in
developing successful relationships between customers and retailers and is
defined as the perceived degree of reliability and integrity of the exchange
partner. A review of the literature revealed that the measurement items used in
Anderson and Srinivasan (2003) and Fang et al. (2014) reveal relatively high
validity and reliability. Hence, two items were adapted and modified based on
measures developed by Anderson and Srinivasan (2003), while two items were
modified from Fang et al. (2014). These measures capture customers’
perceived degree of reliability and integrity of the online retailer. The detailed
items included in the pilot-test are presented in table 4-4. A seven-point Likert
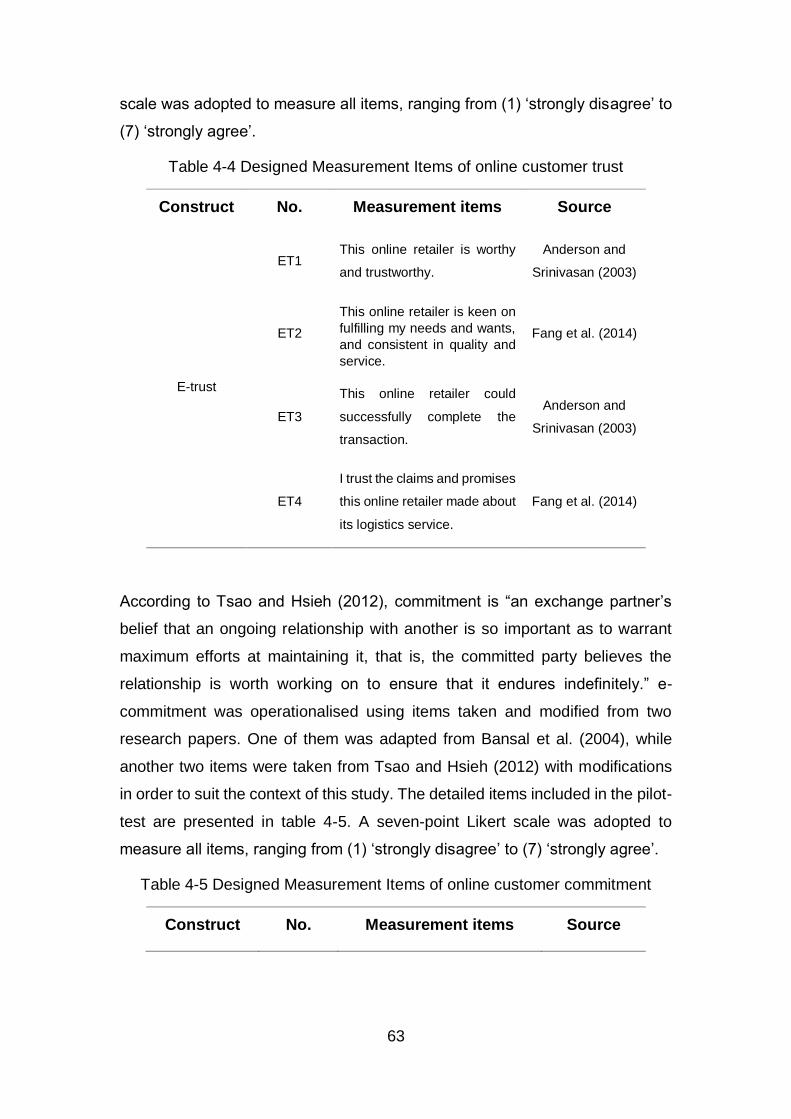
63
scale was adopted to measure all items, ranging from (1) ‘strongly disagree’ to
(7) ‘strongly agree’.
Table 4-4 Designed Measurement Items of online customer trust
Construct No. Measurement items Source
E-trust
ET1 This online retailer is worthy
and trustworthy.
Anderson and
Srinivasan (2003)
ET2
This online retailer is keen on
fulfilling my needs and wants,
and consistent in quality and
service.
Fang et al. (2014)
ET3
This online retailer could
successfully complete the
transaction.
Anderson and
Srinivasan (2003)
ET4
I trust the claims and promises
this online retailer made about
its logistics service.
Fang et al. (2014)
According to Tsao and Hsieh (2012), commitment is “an exchange partner’s
belief that an ongoing relationship with another is so important as to warrant
maximum efforts at maintaining it, that is, the committed party believes the
relationship is worth working on to ensure that it endures indefinitely.” e-
commitment was operationalised using items taken and modified from two
research papers. One of them was adapted from Bansal et al. (2004), while
another two items were taken from Tsao and Hsieh (2012) with modifications
in order to suit the context of this study. The detailed items included in the pilot-
test are presented in table 4-5. A seven-point Likert scale was adopted to
measure all items, ranging from (1) ‘strongly disagree’ to (7) ‘strongly agree’.
Table 4-5 Designed Measurement Items of online customer commitment
Construct No. Measurement items Source
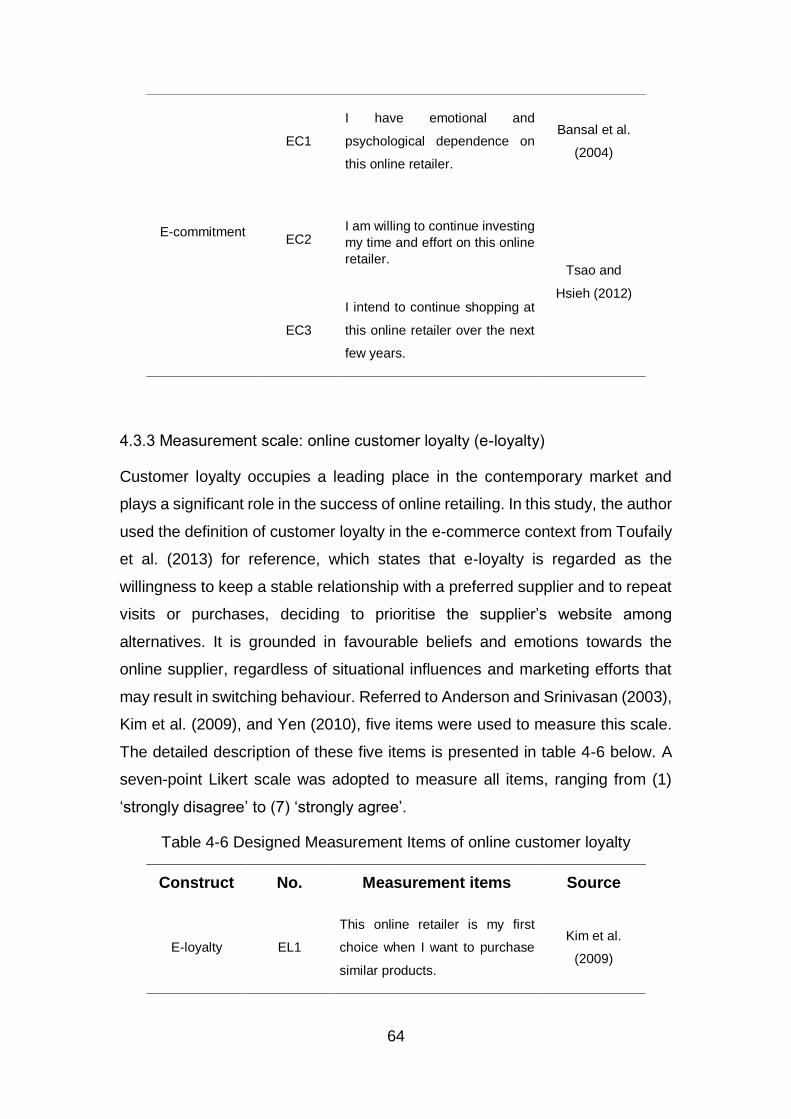
64
E-commitment
EC1
I have emotional and
psychological dependence on
this online retailer.
Bansal et al.
(2004)
EC2 I am willing to continue investing
my time and effort on this online
retailer. Tsao and
Hsieh (2012)
EC3
I intend to continue shopping at
this online retailer over the next
few years.
4.3.3 Measurement scale: online customer loyalty (e-loyalty)
Customer loyalty occupies a leading place in the contemporary market and
plays a significant role in the success of online retailing. In this study, the author
used the definition of customer loyalty in the e-commerce context from Toufaily
et al. (2013) for reference, which states that e-loyalty is regarded as the
willingness to keep a stable relationship with a preferred supplier and to repeat
visits or purchases, deciding to prioritise the supplier’s website among
alternatives. It is grounded in favourable beliefs and emotions towards the
online supplier, regardless of situational influences and marketing efforts that
may result in switching behaviour. Referred to Anderson and Srinivasan (2003),
Kim et al. (2009), and Yen (2010), five items were used to measure this scale.
The detailed description of these five items is presented in table 4-6 below. A
seven-point Likert scale was adopted to measure all items, ranging from (1)
‘strongly disagree’ to (7) ‘strongly agree’.
Table 4-6 Designed Measurement Items of online customer loyalty
Construct No. Measurement items Source
E-loyalty EL1
This online retailer is my first
choice when I want to purchase
similar products.
Kim et al.
(2009)
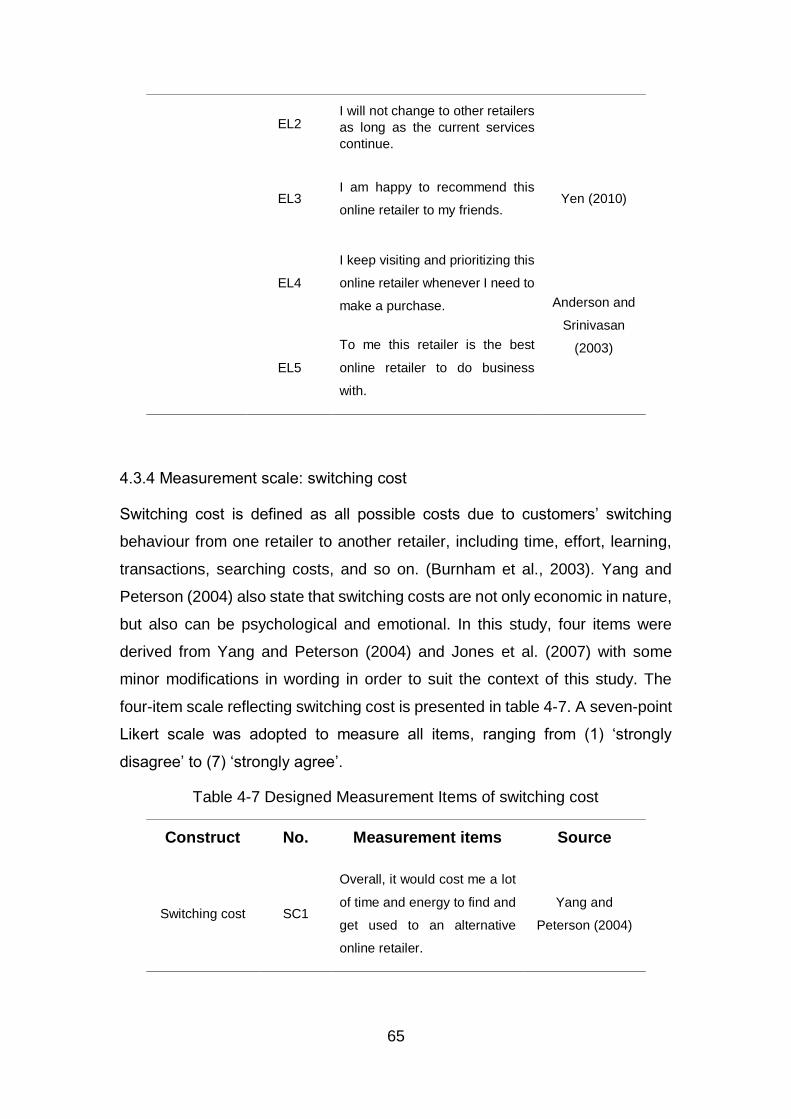
65
EL2 I will not change to other retailers
as long as the current services
continue.
EL3 I am happy to recommend this
online retailer to my friends. Yen (2010)
EL4
I keep visiting and prioritizing this
online retailer whenever I need to
make a purchase. Anderson and
Srinivasan
(2003)
EL5
To me this retailer is the best
online retailer to do business
with.
4.3.4 Measurement scale: switching cost
Switching cost is defined as all possible costs due to customers’ switching
behaviour from one retailer to another retailer, including time, effort, learning,
transactions, searching costs, and so on. (Burnham et al., 2003). Yang and
Peterson (2004) also state that switching costs are not only economic in nature,
but also can be psychological and emotional. In this study, four items were
derived from Yang and Peterson (2004) and Jones et al. (2007) with some
minor modifications in wording in order to suit the context of this study. The
four-item scale reflecting switching cost is presented in table 4-7. A seven-point
Likert scale was adopted to measure all items, ranging from (1) ‘strongly
disagree’ to (7) ‘strongly agree’.
Table 4-7 Designed Measurement Items of switching cost
Construct No. Measurement items Source
Switching cost SC1
Overall, it would cost me a lot
of time and energy to find and
get used to an alternative
online retailer.
Yang and
Peterson (2004)
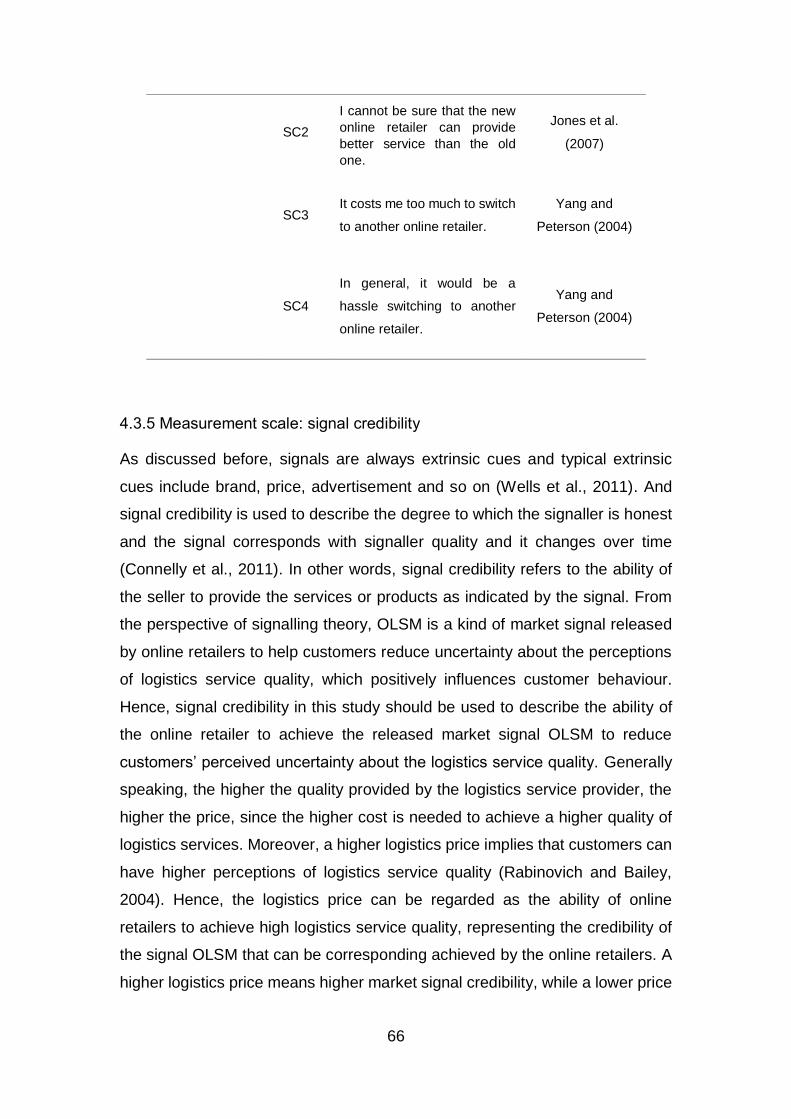
66
SC2
I cannot be sure that the new
online retailer can provide
better service than the old
one.
Jones et al.
(2007)
SC3 It costs me too much to switch
to another online retailer.
Yang and
Peterson (2004)
SC4
In general, it would be a
hassle switching to another
online retailer.
Yang and
Peterson (2004)
4.3.5 Measurement scale: signal credibility
As discussed before, signals are always extrinsic cues and typical extrinsic
cues include brand, price, advertisement and so on (Wells et al., 2011). And
signal credibility is used to describe the degree to which the signaller is honest
and the signal corresponds with signaller quality and it changes over time
(Connelly et al., 2011). In other words, signal credibility refers to the ability of
the seller to provide the services or products as indicated by the signal. From
the perspective of signalling theory, OLSM is a kind of market signal released
by online retailers to help customers reduce uncertainty about the perceptions
of logistics service quality, which positively influences customer behaviour.
Hence, signal credibility in this study should be used to describe the ability of
the online retailer to achieve the released market signal OLSM to reduce
customers’ perceived uncertainty about the logistics service quality. Generally
speaking, the higher the quality provided by the logistics service provider, the
higher the price, since the higher cost is needed to achieve a higher quality of
logistics services. Moreover, a higher logistics price implies that customers can
have higher perceptions of logistics service quality (Rabinovich and Bailey,
2004). Hence, the logistics price can be regarded as the ability of online
retailers to achieve high logistics service quality, representing the credibility of
the signal OLSM that can be corresponding achieved by the online retailers. A
higher logistics price means higher market signal credibility, while a lower price
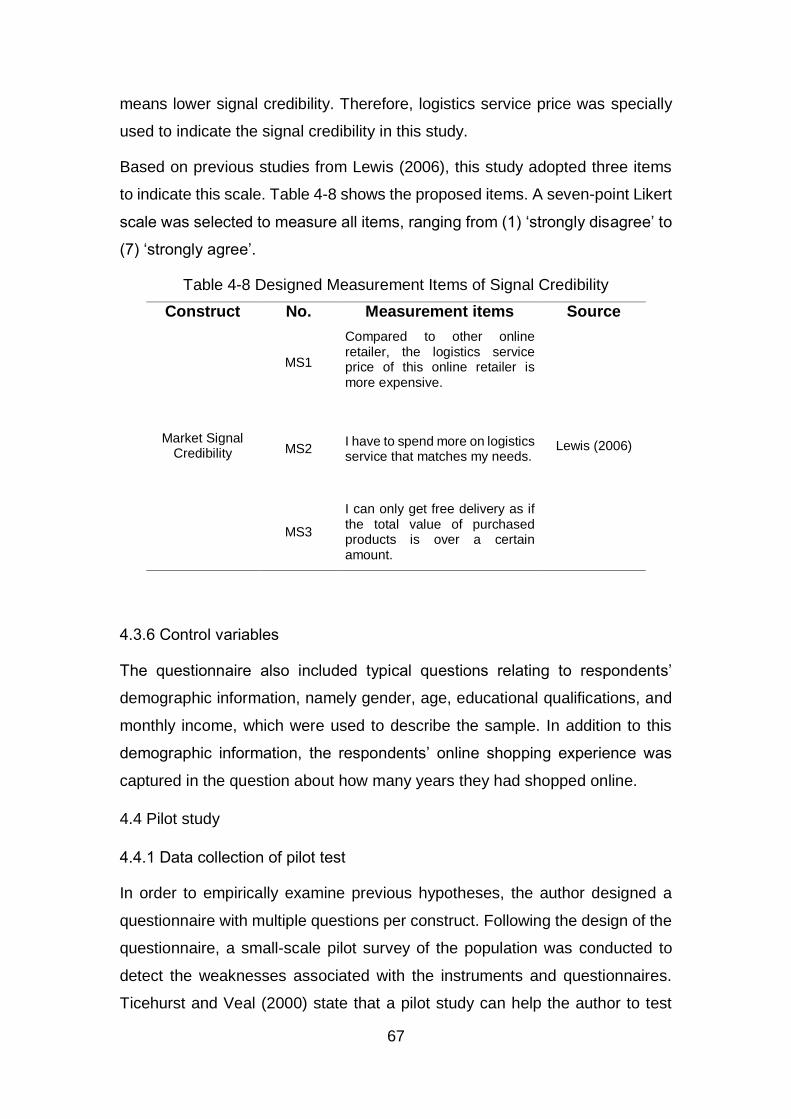
67
means lower signal credibility. Therefore, logistics service price was specially
used to indicate the signal credibility in this study.
Based on previous studies from Lewis (2006), this study adopted three items
to indicate this scale. Table 4-8 shows the proposed items. A seven-point Likert
scale was selected to measure all items, ranging from (1) ‘strongly disagree’ to
(7) ‘strongly agree’.
Table 4-8 Designed Measurement Items of Signal Credibility
Construct No. Measurement items Source
Market Signal Credibility
MS1
Compared to other online retailer, the logistics service price of this online retailer is more expensive.
Lewis (2006) MS2 I have to spend more on logistics service that matches my needs.
MS3
I can only get free delivery as if the total value of purchased products is over a certain amount.
4.3.6 Control variables
The questionnaire also included typical questions relating to respondents’
demographic information, namely gender, age, educational qualifications, and
monthly income, which were used to describe the sample. In addition to this
demographic information, the respondents’ online shopping experience was
captured in the question about how many years they had shopped online.
4.4 Pilot study
4.4.1 Data collection of pilot test
In order to empirically examine previous hypotheses, the author designed a
questionnaire with multiple questions per construct. Following the design of the
questionnaire, a small-scale pilot survey of the population was conducted to
detect the weaknesses associated with the instruments and questionnaires.
Ticehurst and Veal (2000) state that a pilot study can help the author to test
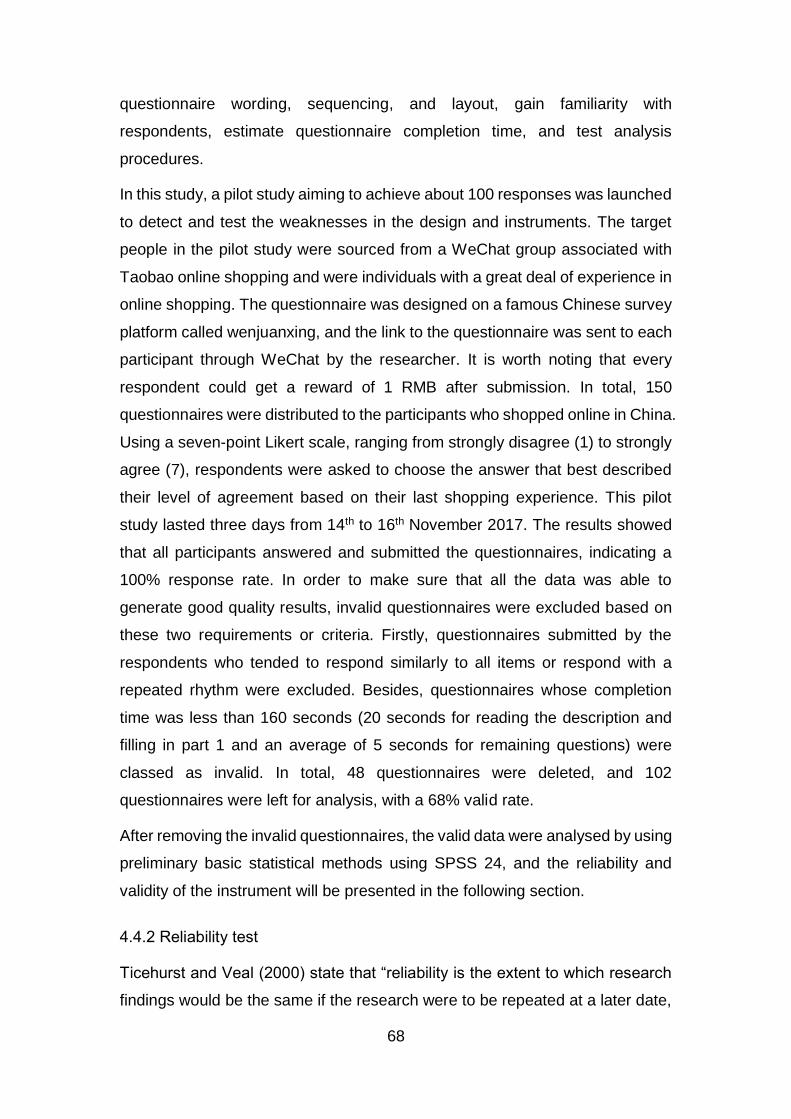
68
questionnaire wording, sequencing, and layout, gain familiarity with
respondents, estimate questionnaire completion time, and test analysis
procedures.
In this study, a pilot study aiming to achieve about 100 responses was launched
to detect and test the weaknesses in the design and instruments. The target
people in the pilot study were sourced from a WeChat group associated with
Taobao online shopping and were individuals with a great deal of experience in
online shopping. The questionnaire was designed on a famous Chinese survey
platform called wenjuanxing, and the link to the questionnaire was sent to each
participant through WeChat by the researcher. It is worth noting that every
respondent could get a reward of 1 RMB after submission. In total, 150
questionnaires were distributed to the participants who shopped online in China.
Using a seven-point Likert scale, ranging from strongly disagree (1) to strongly
agree (7), respondents were asked to choose the answer that best described
their level of agreement based on their last shopping experience. This pilot
study lasted three days from 14th to 16th November 2017. The results showed
that all participants answered and submitted the questionnaires, indicating a
100% response rate. In order to make sure that all the data was able to
generate good quality results, invalid questionnaires were excluded based on
these two requirements or criteria. Firstly, questionnaires submitted by the
respondents who tended to respond similarly to all items or respond with a
repeated rhythm were excluded. Besides, questionnaires whose completion
time was less than 160 seconds (20 seconds for reading the description and
filling in part 1 and an average of 5 seconds for remaining questions) were
classed as invalid. In total, 48 questionnaires were deleted, and 102
questionnaires were left for analysis, with a 68% valid rate.
After removing the invalid questionnaires, the valid data were analysed by using
preliminary basic statistical methods using SPSS 24, and the reliability and
validity of the instrument will be presented in the following section.
4.4.2 Reliability test
Ticehurst and Veal (2000) state that “reliability is the extent to which research
findings would be the same if the research were to be repeated at a later date,
69
or with a different sample of subjects.” In other words, the reliability of a
measure reveals the extent to which the bias (being error-free) is not included
in the measure, and hence, consistent measurements across time and different
items in the instrument are offered (Alhaiou, 2011). The most popular indicator,
Cronbach’s coefficient alpha, was adopted in this study to assess the reliability
of a measurement scale with multi-point items, which reflected the homogeneity
of the items in the scale. Sekaran (2000) claims that a reliability result of less
than 0.6 is unacceptable, a result of at least 0.7 is acceptable, and results over
0.8 are considered to be good. Apart from the Cronbach’s alpha, another
indicator, Corrected Item-Total Correlation (CITC), which is the correlation
between scores on each item and the total scale scores, can help the author to
measure something different from the scale as a whole (Pallant, 2010).
4.4.2.1 Reliability test of OLSM
The Cronbach's Alpha value shown in the reliability statistics table is 0.863
(>0.8), suggesting outstanding internal consistency reliability for the scale with
this sample.
Table 4-9 Reliability Statistics of OLSM
Cronbach’s Alpha Cronbach’s Alpha Based
on Standardized items N of Items
0.863 0.865 5
In addition, the CITC values shown in Table 4-10 demonstrate an indication of
the degree to which each item correlates with the total score. Low values (less
than 0.3) indicate that the item is measuring something different to the scale as
a whole (Pallant, 2010). DeVellis (2003) also mentioned that items whose CITC
values are over 0.5 should be kept and values below should be rejected. In this
study, all CITC values from OLMS1 to OLMS5 are over 0.5. In addition,
comparing the values in the column for Cronbach’s Alpha, if an item is deleted
with the final alpha value obtained, the final value of 0.863 is the highest, which
means that there is no need to consider removing any item from the scale.
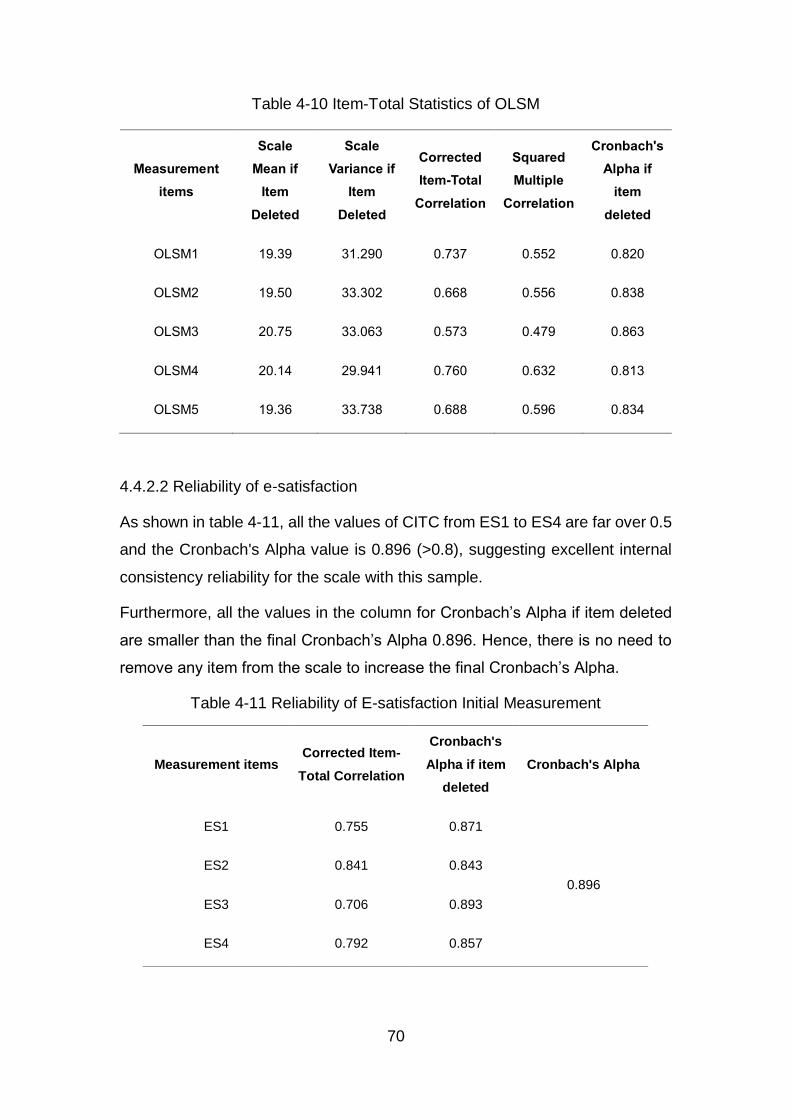
70
Table 4-10 Item-Total Statistics of OLSM
Measurement
items
Scale
Mean if
Item
Deleted
Scale
Variance if
Item
Deleted
Corrected
Item-Total
Correlation
Squared
Multiple
Correlation
Cronbach's
Alpha if
item
deleted
OLSM1 19.39 31.290 0.737 0.552 0.820
OLSM2 19.50 33.302 0.668 0.556 0.838
OLSM3 20.75 33.063 0.573 0.479 0.863
OLSM4 20.14 29.941 0.760 0.632 0.813
OLSM5 19.36 33.738 0.688 0.596 0.834
4.4.2.2 Reliability of e-satisfaction
As shown in table 4-11, all the values of CITC from ES1 to ES4 are far over 0.5
and the Cronbach's Alpha value is 0.896 (>0.8), suggesting excellent internal
consistency reliability for the scale with this sample.
Furthermore, all the values in the column for Cronbach’s Alpha if item deleted
are smaller than the final Cronbach’s Alpha 0.896. Hence, there is no need to
remove any item from the scale to increase the final Cronbach’s Alpha.
Table 4-11 Reliability of E-satisfaction Initial Measurement
Measurement items Corrected Item-
Total Correlation
Cronbach's
Alpha if item
deleted
Cronbach's Alpha
ES1 0.755 0.871
0.896
ES2 0.841 0.843
ES3 0.706 0.893
ES4 0.792 0.857
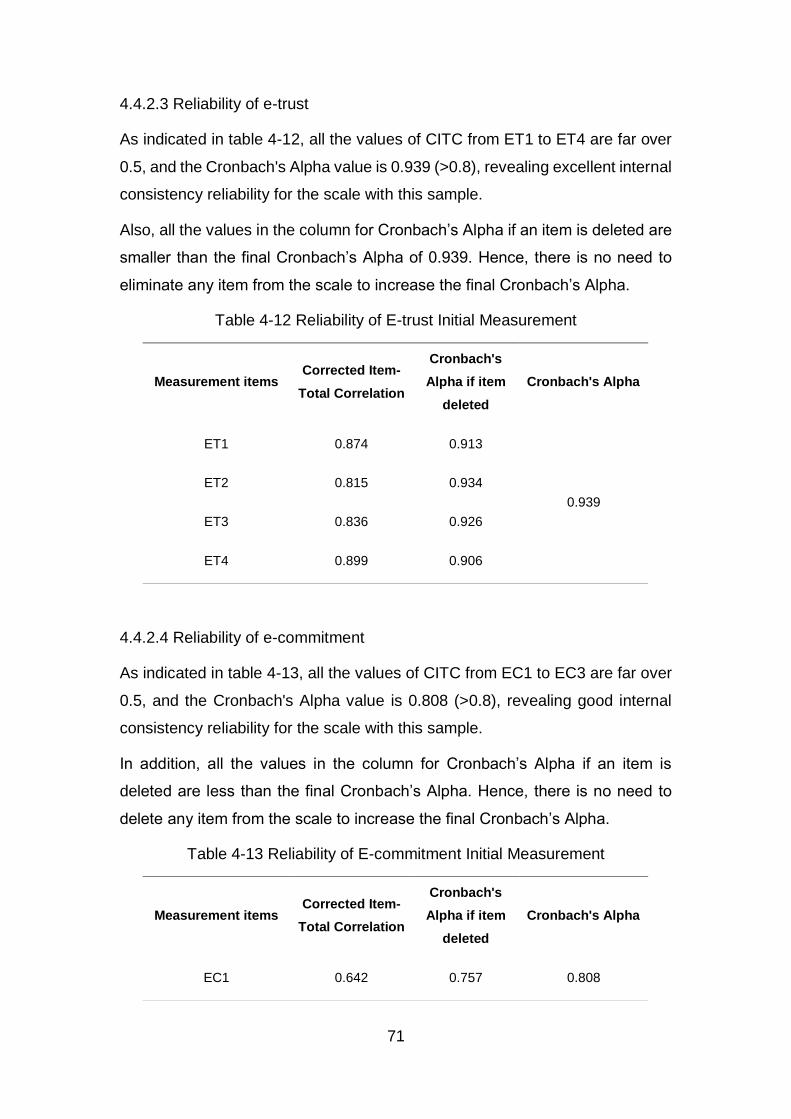
71
4.4.2.3 Reliability of e-trust
As indicated in table 4-12, all the values of CITC from ET1 to ET4 are far over
0.5, and the Cronbach's Alpha value is 0.939 (>0.8), revealing excellent internal
consistency reliability for the scale with this sample.
Also, all the values in the column for Cronbach’s Alpha if an item is deleted are
smaller than the final Cronbach’s Alpha of 0.939. Hence, there is no need to
eliminate any item from the scale to increase the final Cronbach’s Alpha.
Table 4-12 Reliability of E-trust Initial Measurement
4.4.2.4 Reliability of e-commitment
As indicated in table 4-13, all the values of CITC from EC1 to EC3 are far over
0.5, and the Cronbach's Alpha value is 0.808 (>0.8), revealing good internal
consistency reliability for the scale with this sample.
In addition, all the values in the column for Cronbach’s Alpha if an item is
deleted are less than the final Cronbach’s Alpha. Hence, there is no need to
delete any item from the scale to increase the final Cronbach’s Alpha.
Table 4-13 Reliability of E-commitment Initial Measurement
Measurement items Corrected Item-
Total Correlation
Cronbach's
Alpha if item
deleted
Cronbach's Alpha
ET1 0.874 0.913
0.939
ET2 0.815 0.934
ET3 0.836 0.926
ET4 0.899 0.906
Measurement items Corrected Item-
Total Correlation
Cronbach's
Alpha if item
deleted
Cronbach's Alpha
EC1 0.642 0.757 0.808
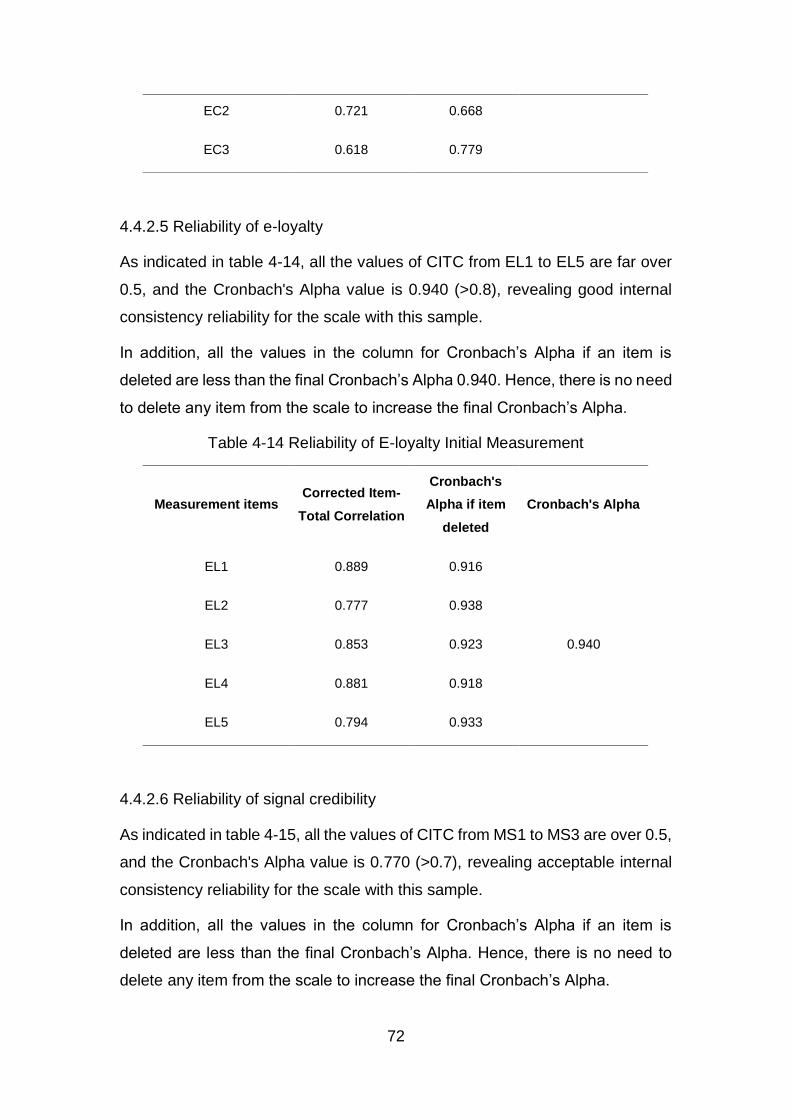
72
4.4.2.5 Reliability of e-loyalty
As indicated in table 4-14, all the values of CITC from EL1 to EL5 are far over
0.5, and the Cronbach's Alpha value is 0.940 (>0.8), revealing good internal
consistency reliability for the scale with this sample.
In addition, all the values in the column for Cronbach’s Alpha if an item is
deleted are less than the final Cronbach’s Alpha 0.940. Hence, there is no need
to delete any item from the scale to increase the final Cronbach’s Alpha.
Table 4-14 Reliability of E-loyalty Initial Measurement
4.4.2.6 Reliability of signal credibility
As indicated in table 4-15, all the values of CITC from MS1 to MS3 are over 0.5,
and the Cronbach's Alpha value is 0.770 (>0.7), revealing acceptable internal
consistency reliability for the scale with this sample.
In addition, all the values in the column for Cronbach’s Alpha if an item is
deleted are less than the final Cronbach’s Alpha. Hence, there is no need to
delete any item from the scale to increase the final Cronbach’s Alpha.
EC2 0.721 0.668
EC3 0.618 0.779
Measurement items Corrected Item-
Total Correlation
Cronbach's
Alpha if item
deleted
Cronbach's Alpha
EL1 0.889 0.916
0.940
EL2 0.777 0.938
EL3 0.853 0.923
EL4 0.881 0.918
EL5 0.794 0.933
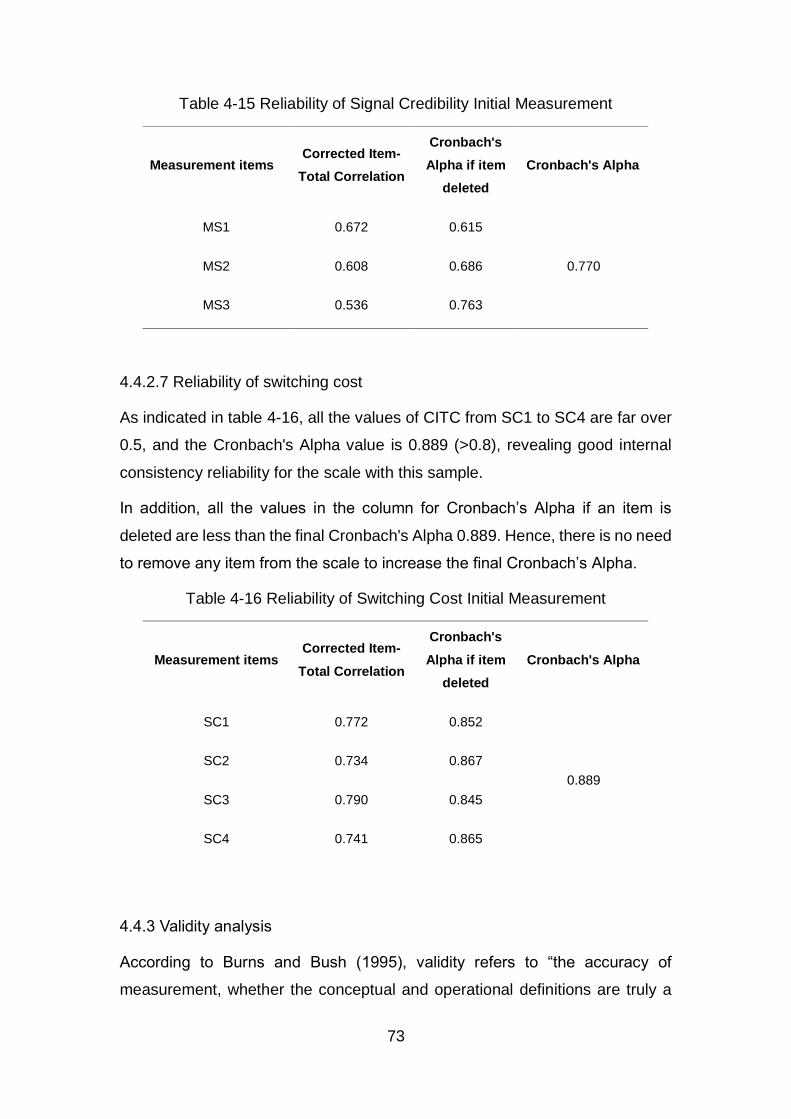
73
Table 4-15 Reliability of Signal Credibility Initial Measurement
4.4.2.7 Reliability of switching cost
As indicated in table 4-16, all the values of CITC from SC1 to SC4 are far over
0.5, and the Cronbach's Alpha value is 0.889 (>0.8), revealing good internal
consistency reliability for the scale with this sample.
In addition, all the values in the column for Cronbach’s Alpha if an item is
deleted are less than the final Cronbach's Alpha 0.889. Hence, there is no need
to remove any item from the scale to increase the final Cronbach’s Alpha.
Table 4-16 Reliability of Switching Cost Initial Measurement
4.4.3 Validity analysis
According to Burns and Bush (1995), validity refers to “the accuracy of
measurement, whether the conceptual and operational definitions are truly a
Measurement items Corrected Item-
Total Correlation
Cronbach's
Alpha if item
deleted
Cronbach's Alpha
MS1 0.672 0.615
0.770 MS2 0.608 0.686
MS3 0.536 0.763
Measurement items Corrected Item-
Total Correlation
Cronbach's
Alpha if item
deleted
Cronbach's Alpha
SC1 0.772 0.852
0.889
SC2 0.734 0.867
SC3 0.790 0.845
SC4 0.741 0.865
74
reflection of the underlying concept to be measured.” Sekaran (2003) states
that there are three types of validity tests, namely content validity, criterion-
related validity, and construct validity.
Content validity mainly refers to the extent of subjective agreement from
professionals that the measurement scales are able to accurately reflect what
is supposed to be measure (Cooper and Schindler, 2001). In this study, content
validity was tested by: (1) all items except items for measuring OLSM, which
were derived from the previous literature review; (2) discussing with a group of
professors, doctors, and Ph.D. students in terms of the items used to measure
OLSM; (3) asking a number of people who have experiences in online shopping
to provide their suggestions about whether each question was clear enough to
answer.
Construct validity refers to “the extent to which the constructs relate to one
another to measure a concept based on the theories underlying a research
study” (Alhaiou, 2011). According to Pallant (2010), factor analysis is always
used to test construct validity, including exploratory and confirmatory factor
analysis. Exploratory factor analysis is often used in the early stages of
research to gather information to explore the interrelationships among a set of
variables. In contrast, confirmatory factor analysis is much more complex and
complicated and will be used later in the research process to test or confirm
specific hypotheses or theories concerning the structure underlying a set of
variables. Leandre and Duane (2011) also state that exploratory factor analysis
is useful to not only assist in identifying the key constructs needed to account
for a particular area of inquiry, but also help to assess constructs in the process
of development of measurement instruments. For the purpose of the pilot study,
exploratory factor analysis was adopted to test the construct validity of
measurement items in the scale.
4.4.3.1 Exploratory factor analysis
Exploratory factor analysis tries to group inter-correlated variables together into
more general and manageable variables. More specifically, the aim of EFA is
to decrease “the dimensionality of the original space and to give and
interpretation to the new space, spanned by a reduced number of new
75
dimensions which are supposed to underlie the old ones” (Rietveld and Van,
1993) or to explain the variance in the observed variables in terms of underlying
latent factors” (Habing, 2003). It is worth noting that EFA is particularly suitable
for a preliminary analysis when there is a lack of solid theory about the relations
of the indicators to the underlying constructs or scales (Gerbing and Anderson,
1988).
Generally speaking, the first step in conducting EFA is to assess the suitability
of the data for factor analysis. Pallant (2010) asserts that two main issues are
worth being considered in terms of determining whether a particular data set is
suitable for factor analysis, including sample size and the strength of the
relationships among each variable or item. Although there is a lack of
agreement on how large a suitable sample should be, the general
recommendation is the larger, the better and the minimum size should be 100.
For the second issue, an inspection of the correlation matrix for evidence of
coefficients greater than 0.3 is proposed by Pallant (2010). He also states that
two statistical measures are generated by SPSS to help assess the factorability
of the data, namely Bartlett’s test of sphericity and the Kaiser-Meyer-Olkin
(KMO) measure of sampling adequacy. According to Tabachnic and Fidell
(2007), the KMO index ranges from 0 to 1, with a minimum of 0.6 suggested as
an acceptable value for good factor analysis, while the Bartlett's test of
sphericity should be significant (p<0.05) for appropriate factor analysis.
In the EFA, there are various approaches that can be used to extract the
number of underlying factors or dimensions, including principal components,
principal factors, image factoring, and so on, and the most commonly used
approach appears to be principal components analysis. In the process of
principal components analysis, only factors with an eigenvalue of 1.0 or more
are retained for further investigation. The eigenvalue of a factor stands for the
extent to which the total variance can be explained by that factor (Pallant, 2010).
According to Hair et al. (2010), the factor extracting process will not stop until
the extracted factors occupy 95 per cent of the variance or until the last factor
only accounts for less than 5 per cent of the variance in the natural sciences.
In contrast, it is common to consider a solution that takes up 60 per cent of the
total variance explained as satisfactory in the social sciences.
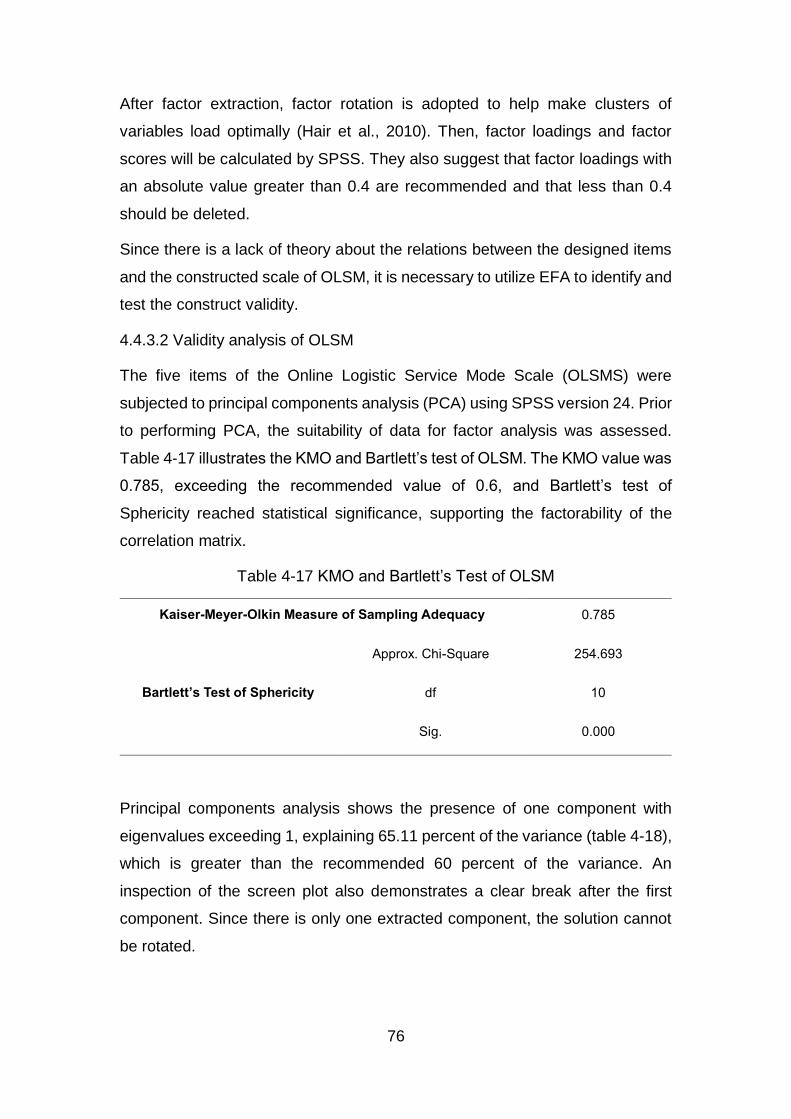
76
After factor extraction, factor rotation is adopted to help make clusters of
variables load optimally (Hair et al., 2010). Then, factor loadings and factor
scores will be calculated by SPSS. They also suggest that factor loadings with
an absolute value greater than 0.4 are recommended and that less than 0.4
should be deleted.
Since there is a lack of theory about the relations between the designed items
and the constructed scale of OLSM, it is necessary to utilize EFA to identify and
test the construct validity.
4.4.3.2 Validity analysis of OLSM
The five items of the Online Logistic Service Mode Scale (OLSMS) were
subjected to principal components analysis (PCA) using SPSS version 24. Prior
to performing PCA, the suitability of data for factor analysis was assessed.
Table 4-17 illustrates the KMO and Bartlett’s test of OLSM. The KMO value was
0.785, exceeding the recommended value of 0.6, and Bartlett’s test of
Sphericity reached statistical significance, supporting the factorability of the
correlation matrix.
Table 4-17 KMO and Bartlett’s Test of OLSM
Kaiser-Meyer-Olkin Measure of Sampling Adequacy 0.785
Bartlett’s Test of Sphericity
Approx. Chi-Square 254.693
df 10
Sig. 0.000
Principal components analysis shows the presence of one component with
eigenvalues exceeding 1, explaining 65.11 percent of the variance (table 4-18),
which is greater than the recommended 60 percent of the variance. An
inspection of the screen plot also demonstrates a clear break after the first
component. Since there is only one extracted component, the solution cannot
be rotated.
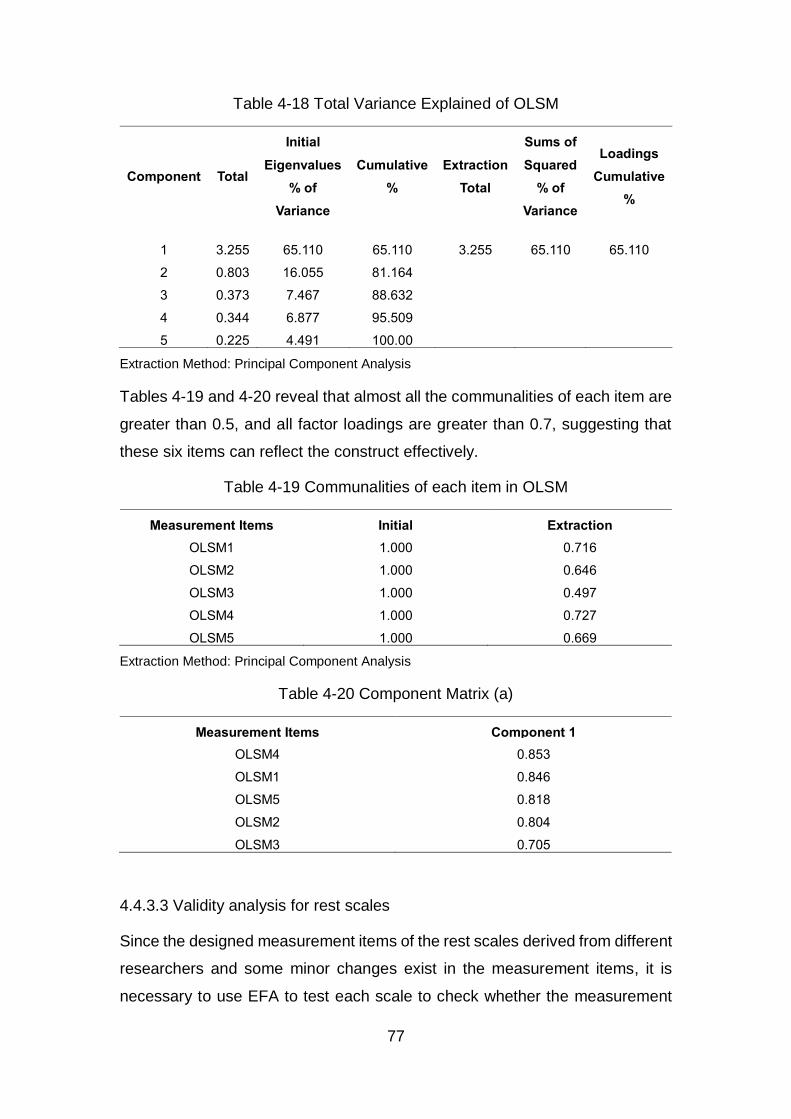
77
Table 4-18 Total Variance Explained of OLSM
Component Total
Initial
Eigenvalues
% of
Variance
Cumulative
%
Extraction
Total
Sums of
Squared
% of
Variance
Loadings
Cumulative
%
1 3.255 65.110 65.110 3.255 65.110 65.110
2 0.803 16.055 81.164
3 0.373 7.467 88.632
4 0.344 6.877 95.509
5 0.225 4.491 100.00
Extraction Method: Principal Component Analysis
Tables 4-19 and 4-20 reveal that almost all the communalities of each item are
greater than 0.5, and all factor loadings are greater than 0.7, suggesting that
these six items can reflect the construct effectively.
Table 4-19 Communalities of each item in OLSM
Measurement Items Initial Extraction
OLSM1 1.000 0.716
OLSM2 1.000 0.646
OLSM3 1.000 0.497
OLSM4 1.000 0.727
OLSM5 1.000 0.669
Extraction Method: Principal Component Analysis
Table 4-20 Component Matrix (a)
Measurement Items Component 1
OLSM4 0.853
OLSM1 0.846
OLSM5 0.818
OLSM2 0.804
OLSM3 0.705
4.4.3.3 Validity analysis for rest scales
Since the designed measurement items of the rest scales derived from different
researchers and some minor changes exist in the measurement items, it is
necessary to use EFA to test each scale to check whether the measurement
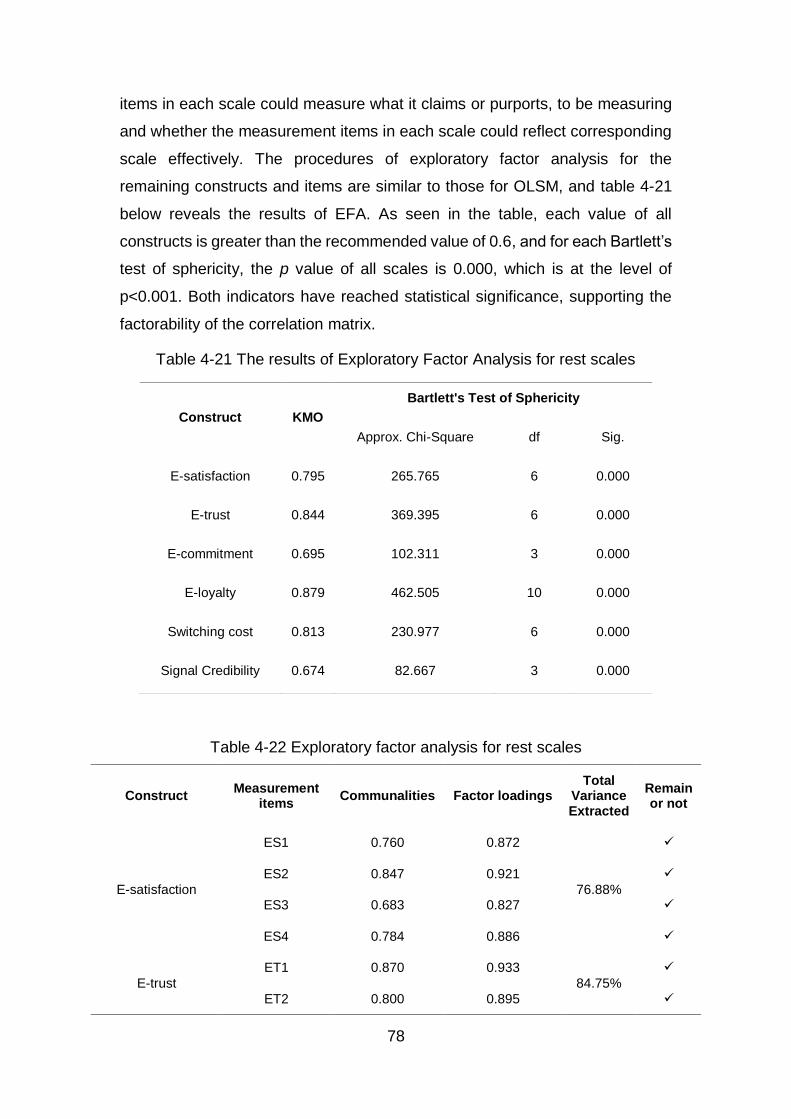
78
items in each scale could measure what it claims or purports, to be measuring
and whether the measurement items in each scale could reflect corresponding
scale effectively. The procedures of exploratory factor analysis for the
remaining constructs and items are similar to those for OLSM, and table 4-21
below reveals the results of EFA. As seen in the table, each value of all
constructs is greater than the recommended value of 0.6, and for each Bartlett’s
test of sphericity, the p value of all scales is 0.000, which is at the level of
p<0.001. Both indicators have reached statistical significance, supporting the
factorability of the correlation matrix.
Table 4-21 The results of Exploratory Factor Analysis for rest scales
Table 4-22 Exploratory factor analysis for rest scales
Construct KMO
Bartlett's Test of Sphericity
Approx. Chi-Square df Sig.
E-satisfaction 0.795 265.765 6 0.000
E-trust 0.844 369.395 6 0.000
E-commitment 0.695 102.311 3 0.000
E-loyalty 0.879 462.505 10 0.000
Switching cost 0.813 230.977 6 0.000
Signal Credibility 0.674 82.667 3 0.000
Construct Measurement
items Communalities Factor loadings
Total Variance Extracted
Remain or not
E-satisfaction
ES1 0.760 0.872
76.88%
ES2 0.847 0.921
ES3 0.683 0.827
ES4 0.784 0.886
E-trust
ET1 0.870 0.933
84.75%
ET2 0.800 0.895
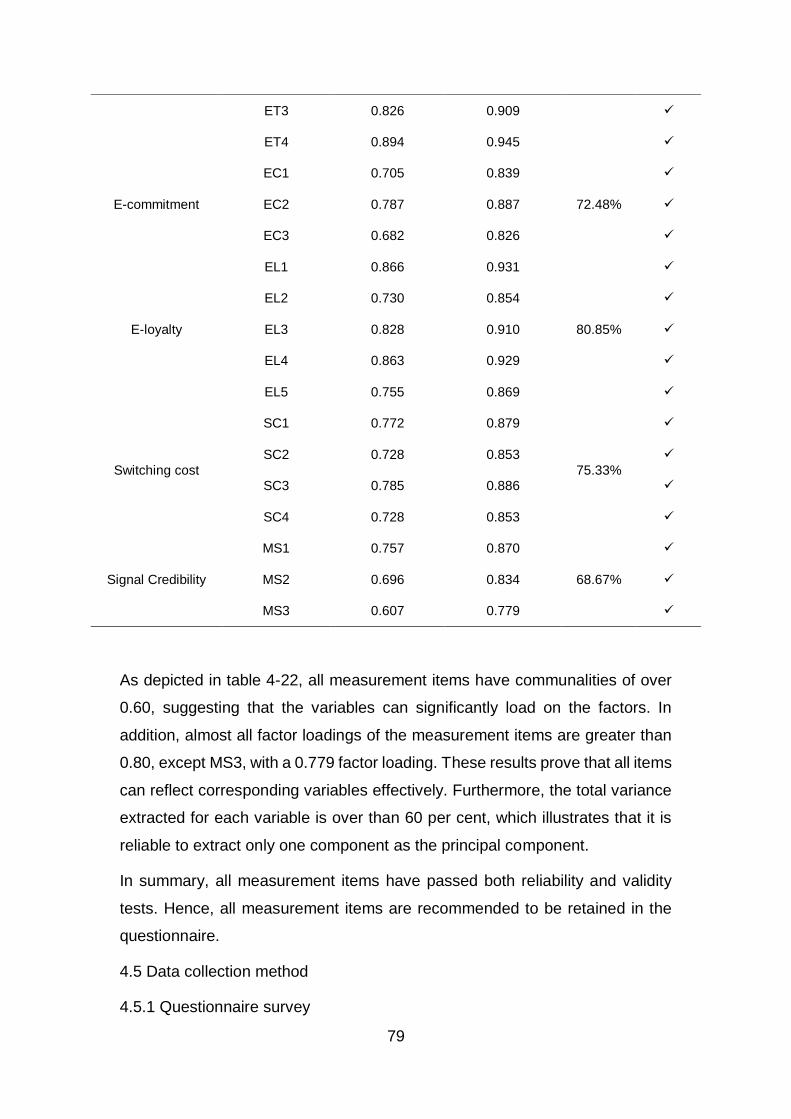
79
As depicted in table 4-22, all measurement items have communalities of over
0.60, suggesting that the variables can significantly load on the factors. In
addition, almost all factor loadings of the measurement items are greater than
0.80, except MS3, with a 0.779 factor loading. These results prove that all items
can reflect corresponding variables effectively. Furthermore, the total variance
extracted for each variable is over than 60 per cent, which illustrates that it is
reliable to extract only one component as the principal component.
In summary, all measurement items have passed both reliability and validity
tests. Hence, all measurement items are recommended to be retained in the
questionnaire.
4.5 Data collection method
4.5.1 Questionnaire survey
ET3 0.826 0.909
ET4 0.894 0.945
E-commitment
EC1 0.705 0.839
72.48%
EC2 0.787 0.887
EC3 0.682 0.826
E-loyalty
EL1 0.866 0.931
80.85%
EL2 0.730 0.854
EL3 0.828 0.910
EL4 0.863 0.929
EL5 0.755 0.869
Switching cost
SC1 0.772 0.879
75.33%
SC2 0.728 0.853
SC3 0.785 0.886
SC4 0.728 0.853
Signal Credibility
MS1 0.757 0.870
68.67%
MS2 0.696 0.834
MS3 0.607 0.779
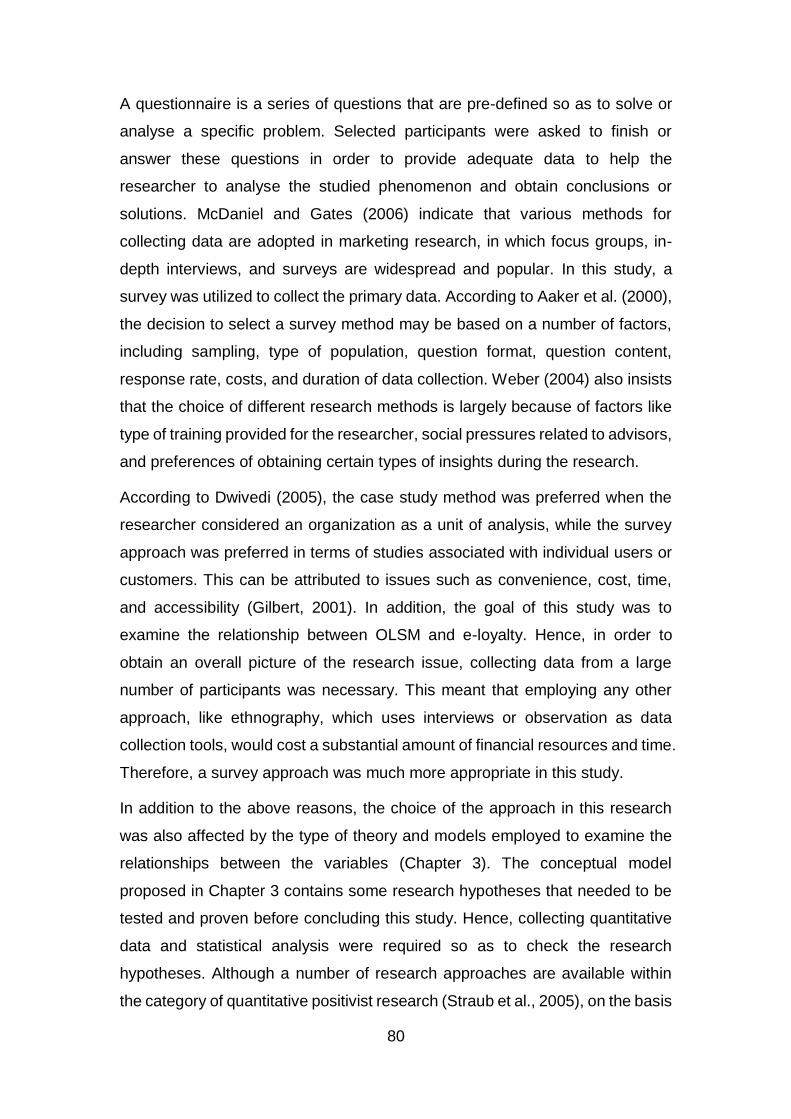
80
A questionnaire is a series of questions that are pre-defined so as to solve or
analyse a specific problem. Selected participants were asked to finish or
answer these questions in order to provide adequate data to help the
researcher to analyse the studied phenomenon and obtain conclusions or
solutions. McDaniel and Gates (2006) indicate that various methods for
collecting data are adopted in marketing research, in which focus groups, in-
depth interviews, and surveys are widespread and popular. In this study, a
survey was utilized to collect the primary data. According to Aaker et al. (2000),
the decision to select a survey method may be based on a number of factors,
including sampling, type of population, question format, question content,
response rate, costs, and duration of data collection. Weber (2004) also insists
that the choice of different research methods is largely because of factors like
type of training provided for the researcher, social pressures related to advisors,
and preferences of obtaining certain types of insights during the research.
According to Dwivedi (2005), the case study method was preferred when the
researcher considered an organization as a unit of analysis, while the survey
approach was preferred in terms of studies associated with individual users or
customers. This can be attributed to issues such as convenience, cost, time,
and accessibility (Gilbert, 2001). In addition, the goal of this study was to
examine the relationship between OLSM and e-loyalty. Hence, in order to
obtain an overall picture of the research issue, collecting data from a large
number of participants was necessary. This meant that employing any other
approach, like ethnography, which uses interviews or observation as data
collection tools, would cost a substantial amount of financial resources and time.
Therefore, a survey approach was much more appropriate in this study.
In addition to the above reasons, the choice of the approach in this research
was also affected by the type of theory and models employed to examine the
relationships between the variables (Chapter 3). The conceptual model
proposed in Chapter 3 contains some research hypotheses that needed to be
tested and proven before concluding this study. Hence, collecting quantitative
data and statistical analysis were required so as to check the research
hypotheses. Although a number of research approaches are available within
the category of quantitative positivist research (Straub et al., 2005), on the basis
81
of the above-mentioned analysis, it was decided that the survey was one of the
most appropriate and practicable research approaches for conducting this
research.
4.5.2 Designing the questionnaire
The survey questionnaire was divided into the following parts:
An introductory section about the research objectives by the
author to the participants.
Designed questions by the researcher for participants to fill in.
The questions in the survey questionnaire consisted of three parts. The first
section addressed individual demographic information, such as gender, age,
level of education, monthly income, and number of years associated with online
shopping. The second part of the survey questionnaire comprised eight
questions related to the logistics service in participants’ last shopping
experience, in which individuals were asked to answer how they felt about the
online retailer’s OLSM and logistics service price. The final part was made up
of 20 questions and dealt with the features of the remaining five constructs in
the research model.
As stated in the operationalisation of each construct, all the items in the second
and third sections were measured by using a seven-point Likert scale, ranging
from 1 ‘strongly disagree’ to 7 ‘strongly agree’. Symonds (1924) was the first to
suggest that seven categories gives the most reliable results, and Finn’s (1972)
research bore that out, suggesting that reliability is maximized with seven-point
scales. Furthermore, similar conclusions were drawn by Oaster (1989) with
regards to test-retest reliability and inter-item consistency. Therefore, a seven-
point Likert scale was selected for this research due to its high reliability and
appropriateness for the nature of the research.
Similar as the process adopted by Farrgwia (2012), the questionnaire was
designed in English, the source language, and then translated into Chinese, the
target language, by the researcher. A panel of experts was invited to validate
the questionnaire (Brislin, 1970), including three marketing and logistics
academicians and two bilingual translators (English/Chinese), with the aim of
82
ensuring that the questions were free from ambiguous wording or errors and
participants could understand it easily (Burns and Bush, 2002). After revising
the designed questionnaire, the final Chinese version was used for data
collection.
4.5.3 Questionnaire distribution and administration
A self-administered survey was adopted in this study. According to Grossnickle
and Raskin (2011), a self-administered questionnaire is a questionnaire that
has been designed specifically to be filled in by the participants without any
intervention of the researchers. In other words, participants are able to carefully
consider and answer the questions at their direction, which in turn increases
the effectiveness of the data. In addition, self-administered surveys enable
researchers to reach a large number of potential participants in a variety of
locations, especially when using online questionnaires (Kassim, 2001). Kassim
(2001) also states other advantages of self-administered surveys, such as a
higher response rate of almost 100%, better privacy for respondents, and a
higher degree of control over sample selection.
4.5.4 Sampling methods
Oates (2006) claims that sampling methods refers to how the researcher chose
the actual participants of the study, including probability sampling and non-
probability sampling. Probability sampling means that every unit in the
population has a chance greater than zero of being selected in the sample, and
this probability can be accurately determined. In contrast, non-probability
sampling is a method in which some elements of the population have no chance
of selection or the probability of selection cannot be accurately determined.
According to Alhaiou (2011), probability sampling is always used when the
purpose of the research is to draw conclusions or make predictions affecting
the population as a whole, while non-probability sampling is always adopted
when it is not necessary to have a representative sample or when it is not
possible to obtain it. This study aimed to investigate online shoppers. However,
the internet represents a common problem for surveying, as there is no central
registry of all online shoppers. As such, this research attempted to select a
83
subset of online shoppers to participate. Online customers from some Wechat
groups on the topic of ‘online shopping’ were selected, and convenience
sampling was adopted to enable the researcher to collect data from these
participants efficiently. Although random sampling techniques are not usually
employed due to the lack of generalization in the research, it was found that the
sample characteristics of this study could represent the target population to
some extent.
4.5.5 Sample size
In this study, a total of 33 observed items were included: five items for
demographic information, five items for online logistics service mode, four items
for e-satisfaction, three items for e-trust, four items for e-commitment, five items
for e-loyalty, four items for switching cost, and three items for signal credibility.
The sample size determination for this research depended on Structural
Equation Modelling (SEM), which is quite sensitive to sample size and lack of
stableness when estimated from small samples (Tabachnick and Fidell, 2011).
Currently, there is still no consistent criteria for minimum sample size. Minimum
sample size recommendations are based on having a sufficient sample size to
reduce the likelihood of convergence problems and to obtain unbiased
estimates or standard errors. Several guidelines associated with determining
adequate sample size for SEM in the literature have been introduced. Kline
(1998) argues that almost any type of SEM analysis may be untenable with a
small sample size less than 100. Similarly, Anderson and Gerbing (1984)
indicate that the model fails to converge with a sample size equal to 100.
Jackson (2001) offers rough guidelines for the optimal SEM sampling size,
suggesting that the minimum sample size should be between 200 and 400.
Apart from specific numbers for sample size, the ratio of cases to free
parameters is commonly used for minimum recommendations. Tanaka (1987)
and Bentler and Chou (1987) state that the minimum sample size is required to
be at least five times and ten times greater than the observed variables
respectively, which suggests that in the case of this research, 165 and 330
respondents were needed respectively. Moreover, Stevens (1996) suggests
that 15 cases per predictor are necessary for a reliable equation in terms of

84
social sciences research, which implies that in case of this research, at least
495 respondents were needed to get a reliable equation.
Considering the model complexity of this study and the rough guidelines from
previous research, an estimation of a minimum 500 sample size was felt to be
necessary to meet the requirements for SEM analysis. In the end, a total of 563
valid questionnaires were received within two weeks.
4.6 Main survey data processing and analysis
After collecting the data through the survey questionnaire, the following
processes were used to check and code the data. Checking the data involves
checking the missing data, outliers, and normality. However, outliers do not
really exist in Likert scales. In other words, answering at the extreme (1 or 7) is
not really a representative outlier behaviour. Hence, there is no need to check
the outliers in the later analysis of data. Coding the data was done by assigning
a number to the data. This can be done in two ways, namely pre-coding and
post-coding (Wong, 1999). In this study, pre-coding was used in questions 6-
33, giving a number corresponding to a particular selection, while post-coding
was needed to code the first demographic part. For example, the author coded
the gender ‘male’ as 1 and ‘female’ as 2.
After processing the data, the collated data was analysed using SPSS version
24.0, AMOS version 24.0 and Process 3.0.
4.7 Main survey statistical techniques
The final step is to select the appropriate statistical analysis techniques.
According to Malhotra (1999), in order to select proper techniques in the study,
some research elements, including the research problem, objectives,
characteristics of the data, and the underlying properties of the statistical
techniques, are considered. In order to reach the goals of this research, the
following statistical analysis techniques were utilized.
4.7.1 Descriptive statistics
Kassim (2001) and Zikmund (2000) state that descriptive statistics involves the
transformation of raw data into a form that can provide information to describe
a set of factors in a way that will make them easy to understand and interpret.
85
Descriptive analysis is “a univariate analysis which consists of frequency tables,
diagrams, measures of central tendency (mean, median, and mode) and
measures of dispersion” (Bryman and Bell, 2003). In this research, descriptive
methods were used to organize, describe, and summarise data to not only gain
views about the different characteristics of the sample structure and distribution,
but also obtain the different effects of the different characteristics of the sample
on scales like e-satisfaction, e-trust, and so on.
4.7.2 Correlation analysis
Correlation is a term that stands for the degree of association between two
variables, where a high or strong correlation means that these two or more
variables have a strong relationship with each other, while a low or weak
correlation implies that the variables are hardly related (Pallant, 2010). Hence,
correlation analysis aims to examine the direction and strength of relationships
between variables with available statistical data. According to Robson (2002),
a correlation matrix contains the values of the correlation coefficients for the
variables involved. Pfeifer (2005) states that the correlation appears to be very
low if the value of the coefficient is under 0.20, low between 0.21 and 0.40,
moderate between 0.41 and 0.70, and high between 0.71 and 0.91.
The most common type of correlation coefficient is the Pearson r. This analysis
assumes that the two variables being analysed are measured on at least
interval scales, meaning that they are measured with a range of increasing
values. The coefficient is calculated by taking the covariance of the two
variables and dividing it by the product of their standard deviations (Pallant,
2010). In this study, Pearson r was used to search for the relationships between
each measured variable and latent variable respectively.
4.7.3 Factor analysis
According to Rummel (1967), factor analysis contributes to reducing the
information from a large number of variables into a small number of factors,
which is a statistical technique used for a large set of variables to establish
interrelationships between such variables. As discussed before, factor analysis
is always used to test construct validity, including EFA and confirmatory factor
86
analysis (CFA). Since a detailed description of EFA has been provided in the
previous section, the next section will introduce CFA in detail.
4.7.3.1 Confirmatory factor analysis (CFA)
CFA is a multivariate statistical technique used to test and verify the factor
structure of a set of measured variables (Diana, 2001). CFA and EFA are potent
techniques used to test construct validity. As mentioned previously, EFA is
often used in the early stages of research to gather information to explore the
possible underlying factor structure of a set of observed variables without
imposing a preconceived structure on the outcomes. In contrast, CFA is used
later in the research process to test or confirm specific hypotheses or theories
concerning the structure underlying a set of variables. CFA is a tool that is used
to confirm or reject the measurement theory. CFA “allows the researcher to test
the hypothesis that a relationship between observed variables and their
underlying latent constructs exists” (Fox, 2010). In addition, the researcher uses
“knowledge of the theory, empirical research, or both, postulates the
relationship pattern a priori and then tests the hypothesis statistically” (Noar,
2003).
CFA is a unique form of SEM. According to Child (1990), the CFA process
checks whether the proposed structure provides an excellent fit to the data, or
in other words, that a relationship between the observed variables and their
underlying latent, unobserved, or unmeasured scales exists. Truxillo (2003)
demonstrates several steps for performing CFA as follows:
a) Determine the model based on previous theory.
b) Collect data to test the model.
c) Conduct preliminary descriptive statistical analysis to check for
data cleaning and screening including missing data, outliers,
multivariate normality, and so on.
d) Run the CFA procedure using AMOS and obtain both the
parameter estimates and model fit indices.
e) Assess model fit and interpret the results.
87
4.7.4 Structural Equation Modelling (SEM)
SEM typically refers to a general statistical modelling technique used to
investigate and seek causal relationships between latent or unobserved
variables (Hox and Bechger, 2005). It is widely used in the behavioural sciences,
especially for theory testing. According to Hox and Bechger (2005), SEM can
be regarded as a combination of factor analysis and regression or path analysis.
The interest in SEM is often on theoretical constructs, which are represented
by the latent factors. SEM provides a very general and convenient framework
for statistical analysis and contains several traditional multivariate procedures,
such as factor analysis, regression analysis, canonical correlation, and so on.
According to Fatthwia (2012), SEM is composed of two main parts, including a
measurement model and a structural model, in which the measurement model
for both CFA and SEM is a multivariate regression model that describes the
relationships between a set of observed dependent variables and a set of
continuous latent variables. The structural model illustrates three types of
relationships in a set of multivariate regression equations, namely the
relationships among factors, the relationships among observed variables, and
the relationships between factors and observed variables that are not factor
indicators. Structural equation models are usually visualized by a graphical path
diagram. According to Norgate (2009), there are four advantages of SEM
compared to traditional techniques. Firstly, it makes the assumptions,
constructs, and hypothesized relationships in theory explicit. In addition, it adds
a degree of precision to theory and permits a more complete representation of
elaborate theories. Finally, a formal framework for constructing and testing both
theories and measures is provided.
4.8 Ethical considerations
According to Saunders et al. (2016), ethical issues are always considered at
the stage of designing project and gaining access. At the start of designing a
project, the harmlessness of the research should be confirmed, and appropriate
research methods should be chosen. Moreover, ethical issues (e.g. pressure
must not be put any participants) should be taken into account when
researchers seek access to the data. In this study, the survey contained a
88
participant information sheet and a consent form to explain the purpose and
objectives of the study and describe the potential risks derived from the survey
platform. The documents indicated that taking part was voluntary and if
participants did not want to take part, they did not need to give a reason and no
pressure would be put on them to try and change their mind. Also, the
information was collected anonymously, and all the information collected from
participants was confidential and used for this study only. The data was
collected and stored on the secured server of the online questionnaire platform
provider. Only researchers of this study have access to the data, and the data
will be destroyed immediately as soon as the study is finished.
89
Chapter 5 Data Analysis
5.1 Introduction
In the previous chapter, the research methodology was identified and justified
for this study. A pilot study was conducted with the aim of checking the reliability
and validity of designed constructs. This chapter will discuss the results of the
quantitative data collected from questionnaires completed by participants with
online shopping experiences. This data will be used to discuss the relationships
between the dependent and independent variables mentioned in the proposed
structures in Chapter 3. Firstly, the data will be examined, including data
cleaning and screening. The descriptive analysis will be analysed in section 5.3,
to reveal the influence of demographic characteristics on e-satisfaction, e-trust,
e-commitment, and e-loyalty. Following section 5.3, the reliability and validity of
the main survey data and the measurement model will be conducted using
SPSS 24.0 (or 22.0) and AMOS 24.0 (Confirmatory Factor Analysis; CFA).
Then, structural equation modeling (SEM) will be applied to measure the
relationships between the dependent and independent variables, to test the
hypotheses, and to examine the mediating effects. Finally, SPSS will be used
to test the moderating effects.
5.2 Response rate and validity
Questionnaires were distributed to 1000 participants with the online shopping
experience, in online shopping groups on WeChat. All participants finished and
submitted their questionnaires, a 100% response rate. After eliminating 437
invalid questionnaires, based on the criteria mentioned in Chapter 4, 563 valid
questionnaires were left, a 56.3% validity rate. The number of valid
questionnaires exceeded the suggested minimum size for structural equational
modeling, which was discussed in Chapter 4.
5.3 Data cleaning and screening
This section discusses the process of cleaning and screening the data, before
it was analysed. There was no missing data in the returned questionnaires. As
mentioned in Chapter 4, there were no outliers in the Likert scale. As a result,
this section introduces the normality test of the data.
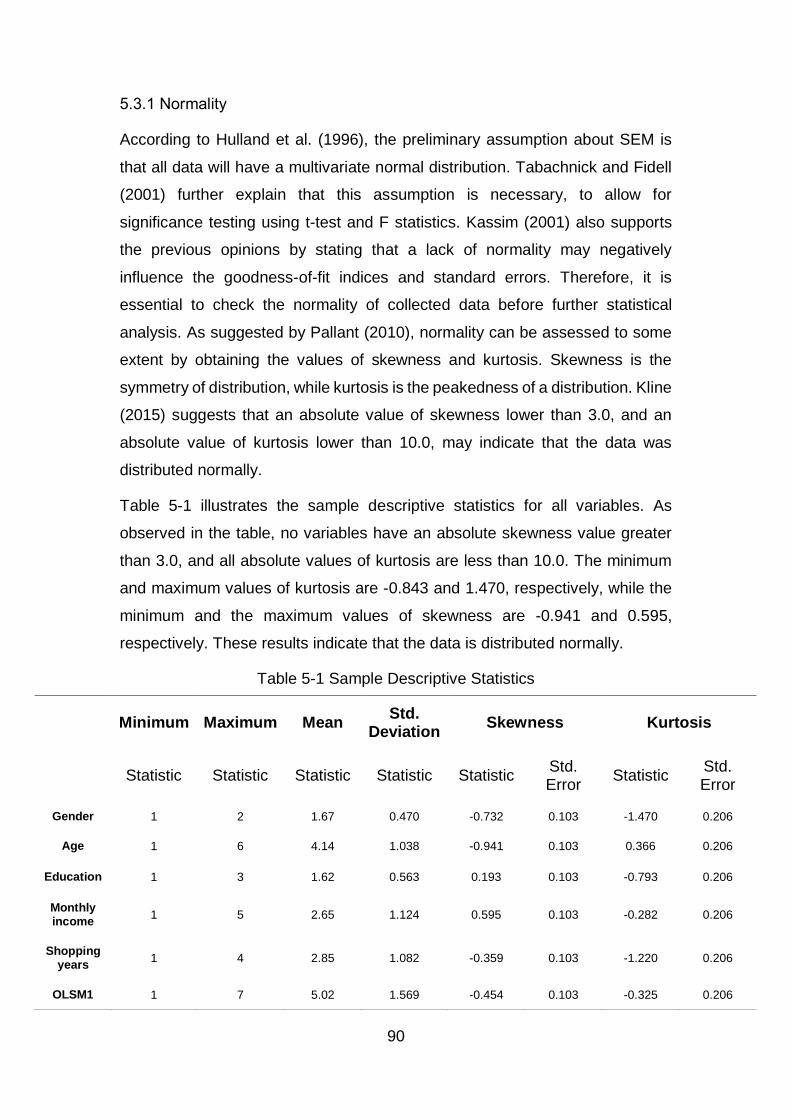
90
5.3.1 Normality
According to Hulland et al. (1996), the preliminary assumption about SEM is
that all data will have a multivariate normal distribution. Tabachnick and Fidell
(2001) further explain that this assumption is necessary, to allow for
significance testing using t-test and F statistics. Kassim (2001) also supports
the previous opinions by stating that a lack of normality may negatively
influence the goodness-of-fit indices and standard errors. Therefore, it is
essential to check the normality of collected data before further statistical
analysis. As suggested by Pallant (2010), normality can be assessed to some
extent by obtaining the values of skewness and kurtosis. Skewness is the
symmetry of distribution, while kurtosis is the peakedness of a distribution. Kline
(2015) suggests that an absolute value of skewness lower than 3.0, and an
absolute value of kurtosis lower than 10.0, may indicate that the data was
distributed normally.
Table 5-1 illustrates the sample descriptive statistics for all variables. As
observed in the table, no variables have an absolute skewness value greater
than 3.0, and all absolute values of kurtosis are less than 10.0. The minimum
and maximum values of kurtosis are -0.843 and 1.470, respectively, while the
minimum and the maximum values of skewness are -0.941 and 0.595,
respectively. These results indicate that the data is distributed normally.
Table 5-1 Sample Descriptive Statistics
Minimum Maximum Mean Std.
Deviation Skewness Kurtosis
Statistic Statistic Statistic Statistic Statistic Std. Error
Statistic Std. Error
Gender 1 2 1.67 0.470 -0.732 0.103 -1.470 0.206
Age 1 6 4.14 1.038 -0.941 0.103 0.366 0.206
Education 1 3 1.62 0.563 0.193 0.103 -0.793 0.206
Monthly income
1 5 2.65 1.124 0.595 0.103 -0.282 0.206
Shopping years
1 4 2.85 1.082 -0.359 0.103 -1.220 0.206
OLSM1 1 7 5.02 1.569 -0.454 0.103 -0.325 0.206
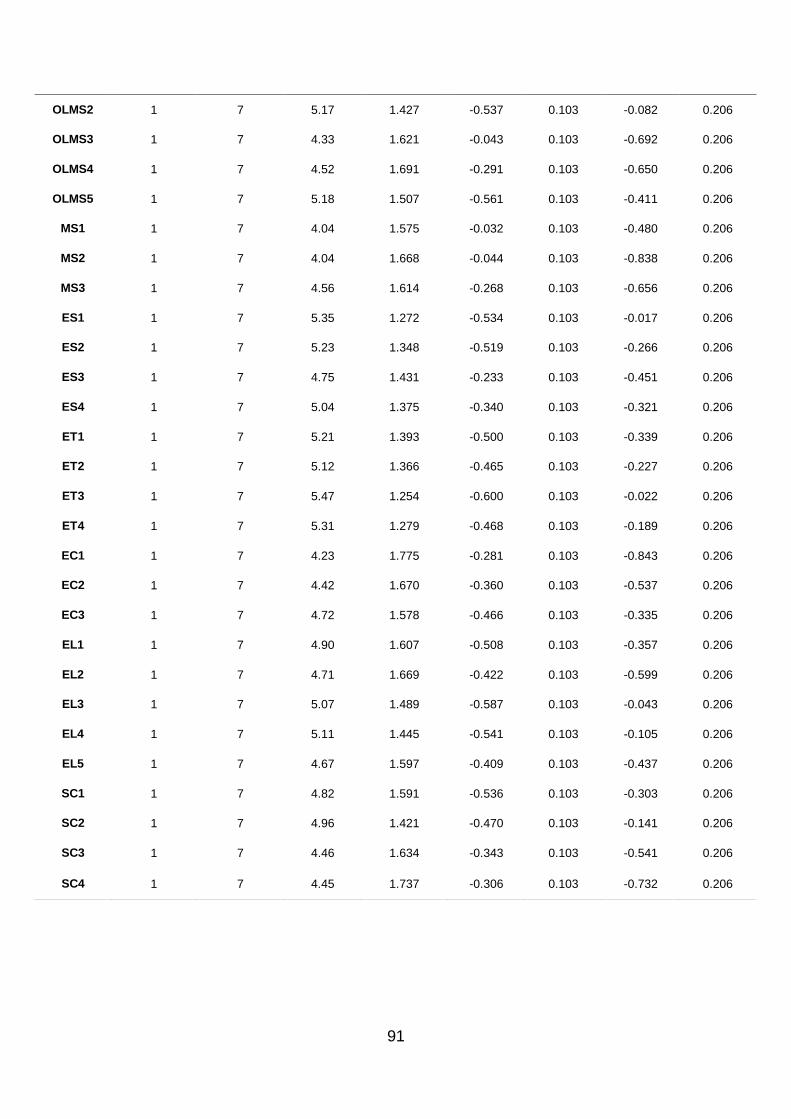
91
OLMS2 1 7 5.17 1.427 -0.537 0.103 -0.082 0.206
OLMS3 1 7 4.33 1.621 -0.043 0.103 -0.692 0.206
OLMS4 1 7 4.52 1.691 -0.291 0.103 -0.650 0.206
OLMS5 1 7 5.18 1.507 -0.561 0.103 -0.411 0.206
MS1 1 7 4.04 1.575 -0.032 0.103 -0.480 0.206
MS2 1 7 4.04 1.668 -0.044 0.103 -0.838 0.206
MS3 1 7 4.56 1.614 -0.268 0.103 -0.656 0.206
ES1 1 7 5.35 1.272 -0.534 0.103 -0.017 0.206
ES2 1 7 5.23 1.348 -0.519 0.103 -0.266 0.206
ES3 1 7 4.75 1.431 -0.233 0.103 -0.451 0.206
ES4 1 7 5.04 1.375 -0.340 0.103 -0.321 0.206
ET1 1 7 5.21 1.393 -0.500 0.103 -0.339 0.206
ET2 1 7 5.12 1.366 -0.465 0.103 -0.227 0.206
ET3 1 7 5.47 1.254 -0.600 0.103 -0.022 0.206
ET4 1 7 5.31 1.279 -0.468 0.103 -0.189 0.206
EC1 1 7 4.23 1.775 -0.281 0.103 -0.843 0.206
EC2 1 7 4.42 1.670 -0.360 0.103 -0.537 0.206
EC3 1 7 4.72 1.578 -0.466 0.103 -0.335 0.206
EL1 1 7 4.90 1.607 -0.508 0.103 -0.357 0.206
EL2 1 7 4.71 1.669 -0.422 0.103 -0.599 0.206
EL3 1 7 5.07 1.489 -0.587 0.103 -0.043 0.206
EL4 1 7 5.11 1.445 -0.541 0.103 -0.105 0.206
EL5 1 7 4.67 1.597 -0.409 0.103 -0.437 0.206
SC1 1 7 4.82 1.591 -0.536 0.103 -0.303 0.206
SC2 1 7 4.96 1.421 -0.470 0.103 -0.141 0.206
SC3 1 7 4.46 1.634 -0.343 0.103 -0.541 0.206
SC4 1 7 4.45 1.737 -0.306 0.103 -0.732 0.206
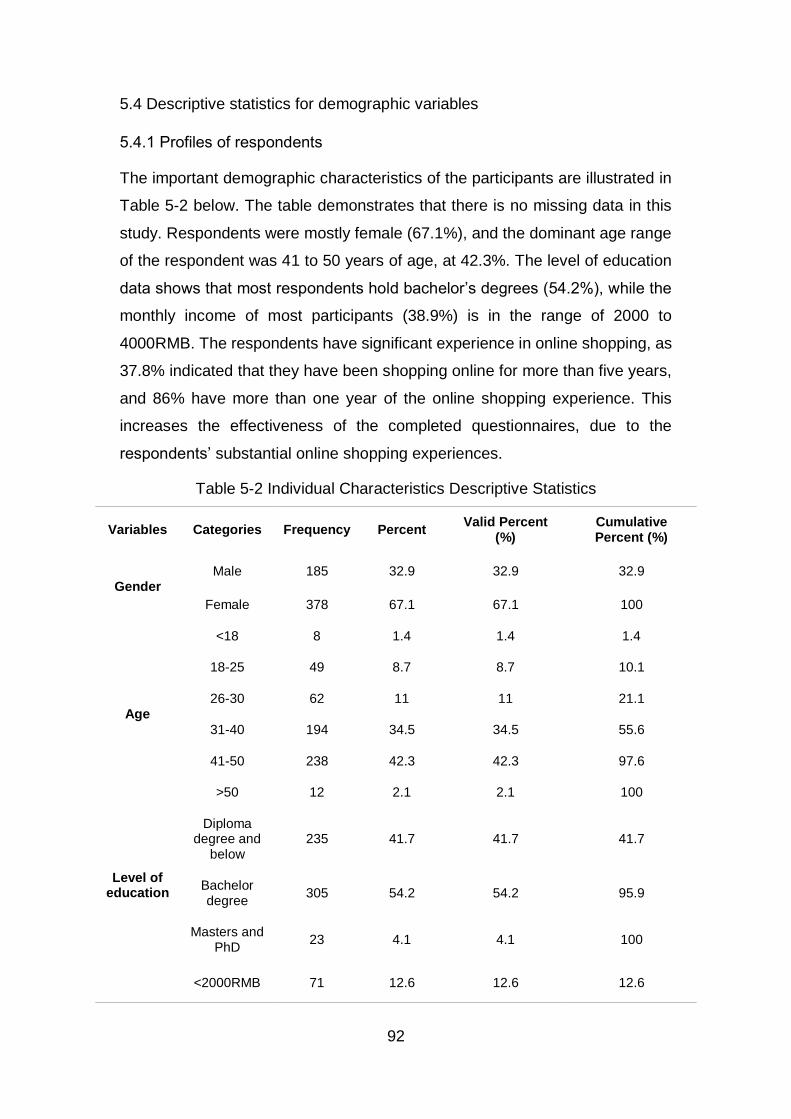
92
5.4 Descriptive statistics for demographic variables
5.4.1 Profiles of respondents
The important demographic characteristics of the participants are illustrated in
Table 5-2 below. The table demonstrates that there is no missing data in this
study. Respondents were mostly female (67.1%), and the dominant age range
of the respondent was 41 to 50 years of age, at 42.3%. The level of education
data shows that most respondents hold bachelor’s degrees (54.2%), while the
monthly income of most participants (38.9%) is in the range of 2000 to
4000RMB. The respondents have significant experience in online shopping, as
37.8% indicated that they have been shopping online for more than five years,
and 86% have more than one year of the online shopping experience. This
increases the effectiveness of the completed questionnaires, due to the
respondents’ substantial online shopping experiences.
Table 5-2 Individual Characteristics Descriptive Statistics
Variables Categories Frequency Percent Valid Percent
(%) Cumulative Percent (%)
Gender Male 185 32.9 32.9 32.9
Female 378 67.1 67.1 100
Age
<18 8 1.4 1.4 1.4
18-25 49 8.7 8.7 10.1
26-30 62 11 11 21.1
31-40 194 34.5 34.5 55.6
41-50 238 42.3 42.3 97.6
>50 12 2.1 2.1 100
Level of education
Diploma degree and
below 235 41.7 41.7 41.7
Bachelor degree
305 54.2 54.2 95.9
Masters and PhD
23 4.1 4.1 100
<2000RMB 71 12.6 12.6 12.6
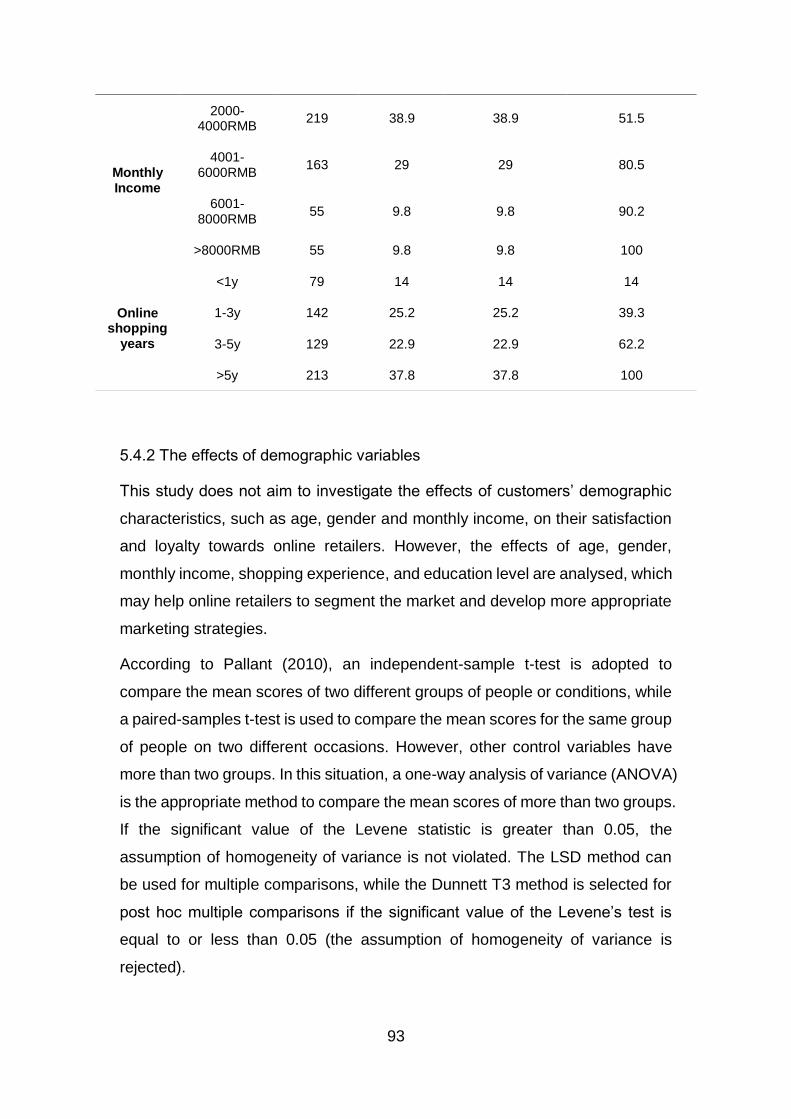
93
5.4.2 The effects of demographic variables
This study does not aim to investigate the effects of customers’ demographic
characteristics, such as age, gender and monthly income, on their satisfaction
and loyalty towards online retailers. However, the effects of age, gender,
monthly income, shopping experience, and education level are analysed, which
may help online retailers to segment the market and develop more appropriate
marketing strategies.
According to Pallant (2010), an independent-sample t-test is adopted to
compare the mean scores of two different groups of people or conditions, while
a paired-samples t-test is used to compare the mean scores for the same group
of people on two different occasions. However, other control variables have
more than two groups. In this situation, a one-way analysis of variance (ANOVA)
is the appropriate method to compare the mean scores of more than two groups.
If the significant value of the Levene statistic is greater than 0.05, the
assumption of homogeneity of variance is not violated. The LSD method can
be used for multiple comparisons, while the Dunnett T3 method is selected for
post hoc multiple comparisons if the significant value of the Levene’s test is
equal to or less than 0.05 (the assumption of homogeneity of variance is
rejected).
Monthly Income
2000-4000RMB
219 38.9 38.9 51.5
4001-6000RMB
163 29 29 80.5
6001-8000RMB
55 9.8 9.8 90.2
>8000RMB 55 9.8 9.8 100
Online shopping
years
<1y 79 14 14 14
1-3y 142 25.2 25.2 39.3
3-5y 129 22.9 22.9 62.2
>5y 213 37.8 37.8 100

94
5.4.2.1 The effect of gender
There are two categories of gender, male and female, so an independent-
sample t-test is used in this section. It is worth noting that when the significant
value for Levene’s test is greater than 0.05 (p>0.05), the first line named equal
variances assumed should be used, while the second line called equal
variances not assumed is available if p<0.05. The results of the independent-
sample t-test of gender are recorded in the table below, in which e-satisfaction
(ES), e-trust (ET), e-commitment (EC) and e-loyalty (EL) are entered as test
variables. As indicated in Table 5-3, the male group’s satisfaction, trust,
commitment, and loyalty are higher than that of the female group, but the results
are not significant.
Table 5-3 Influences of Gender on ES, ET, EC and EL
5.4.2.2 The effect of age
There are six categories of age in this study: younger than 18, 18 to 25, 26 to
30, 31 to 40, 41 to 50 and older than 50. As a result, a one-way ANOVA will be
used to test the influence of age on ES, ET, EC and EL. As shown in Table 5-
4, the age variable does not have a significant influence on ES (F=1.214,
p>0.05), ET (F=0.525, p>0.05), EC (F=1.500, p>0.05), or EL (F=0.657, p>0.05).
Test
Variables Gender Number Mean SD
Levene’s
test Sig. t
ES
Male 185 5.162 1.333
0.026 0.872 0.336
Female 378 5.122 1.345
ET
Male 185 5.111 1.378
0.299 0.585 0.177
Female 378 5.089 1.344
EC
Male 185 4.899 1.537
0.430 0.512 0.422
Female 378 4.840 1.589
EL
Male 185 5.058 1.357
0.031 0.859 1.401
Female 378 4.889 1.344
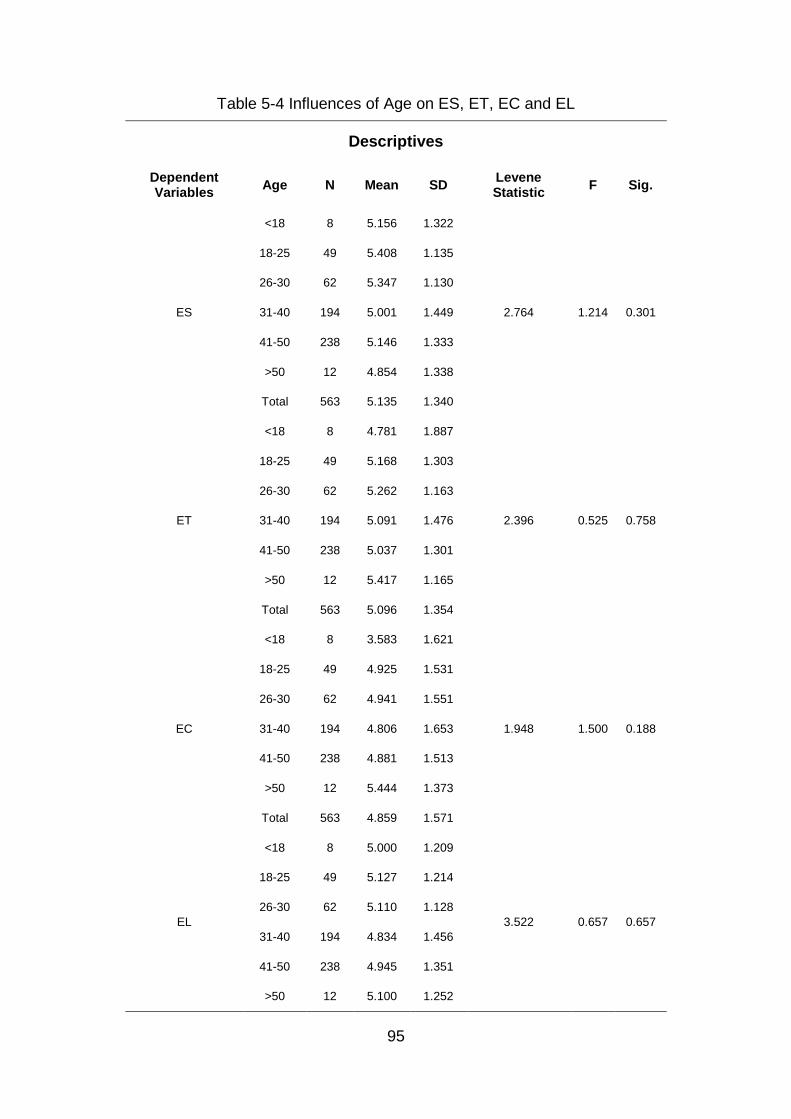
95
Table 5-4 Influences of Age on ES, ET, EC and EL
Descriptives
Dependent Variables
Age N Mean SD Levene Statistic
F Sig.
ES
<18 8 5.156 1.322
2.764 1.214 0.301
18-25 49 5.408 1.135
26-30 62 5.347 1.130
31-40 194 5.001 1.449
41-50 238 5.146 1.333
>50 12 4.854 1.338
Total 563 5.135 1.340
ET
<18 8 4.781 1.887
2.396 0.525 0.758
18-25 49 5.168 1.303
26-30 62 5.262 1.163
31-40 194 5.091 1.476
41-50 238 5.037 1.301
>50 12 5.417 1.165
Total 563 5.096 1.354
EC
<18 8 3.583 1.621
1.948 1.500 0.188
18-25 49 4.925 1.531
26-30 62 4.941 1.551
31-40 194 4.806 1.653
41-50 238 4.881 1.513
>50 12 5.444 1.373
Total 563 4.859 1.571
EL
<18 8 5.000 1.209
3.522 0.657 0.657
18-25 49 5.127 1.214
26-30 62 5.110 1.128
31-40 194 4.834 1.456
41-50 238 4.945 1.351
>50 12 5.100 1.252
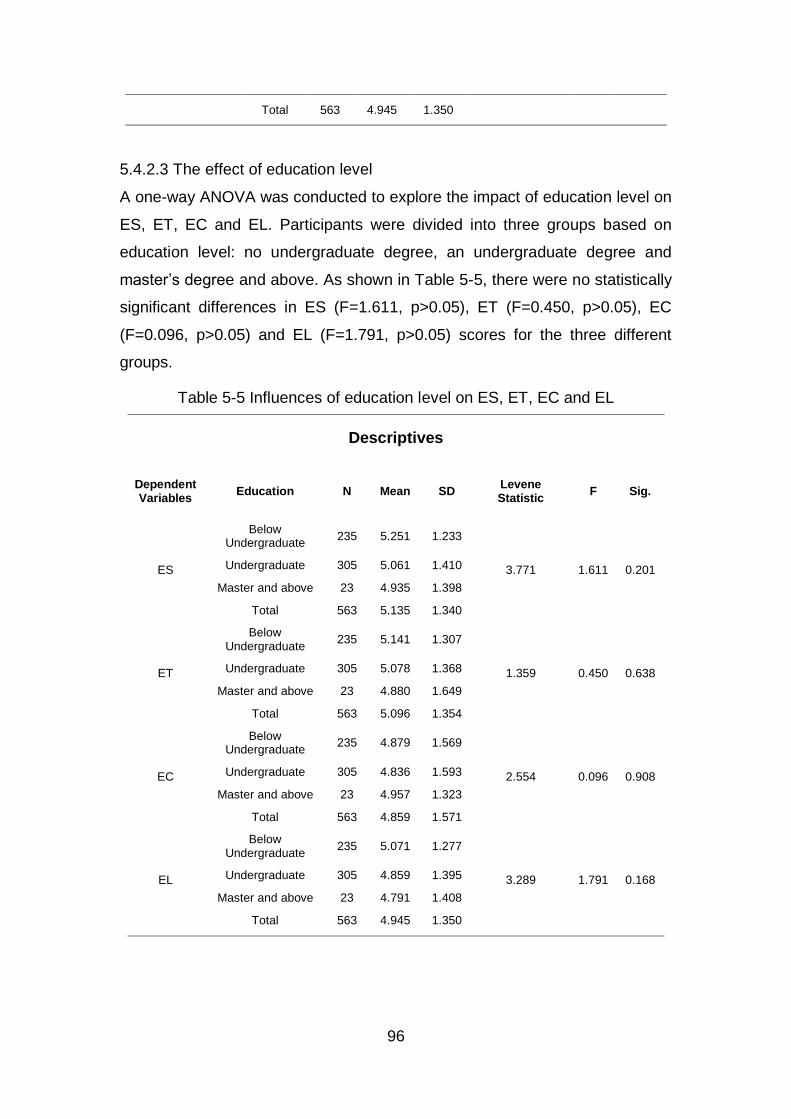
96
Total 563 4.945 1.350
5.4.2.3 The effect of education level
A one-way ANOVA was conducted to explore the impact of education level on
ES, ET, EC and EL. Participants were divided into three groups based on
education level: no undergraduate degree, an undergraduate degree and
master’s degree and above. As shown in Table 5-5, there were no statistically
significant differences in ES (F=1.611, p>0.05), ET (F=0.450, p>0.05), EC
(F=0.096, p>0.05) and EL (F=1.791, p>0.05) scores for the three different
groups.
Table 5-5 Influences of education level on ES, ET, EC and EL
Descriptives
Dependent Variables
Education N Mean SD Levene Statistic
F Sig.
ES
Below Undergraduate
235 5.251 1.233
3.771 1.611 0.201 Undergraduate 305 5.061 1.410
Master and above 23 4.935 1.398
Total 563 5.135 1.340
ET
Below Undergraduate
235 5.141 1.307
1.359 0.450 0.638 Undergraduate 305 5.078 1.368
Master and above 23 4.880 1.649
Total 563 5.096 1.354
EC
Below Undergraduate
235 4.879 1.569
2.554 0.096 0.908 Undergraduate 305 4.836 1.593
Master and above 23 4.957 1.323
Total 563 4.859 1.571
EL
Below Undergraduate
235 5.071 1.277
3.289 1.791 0.168 Undergraduate 305 4.859 1.395
Master and above 23 4.791 1.408
Total 563 4.945 1.350
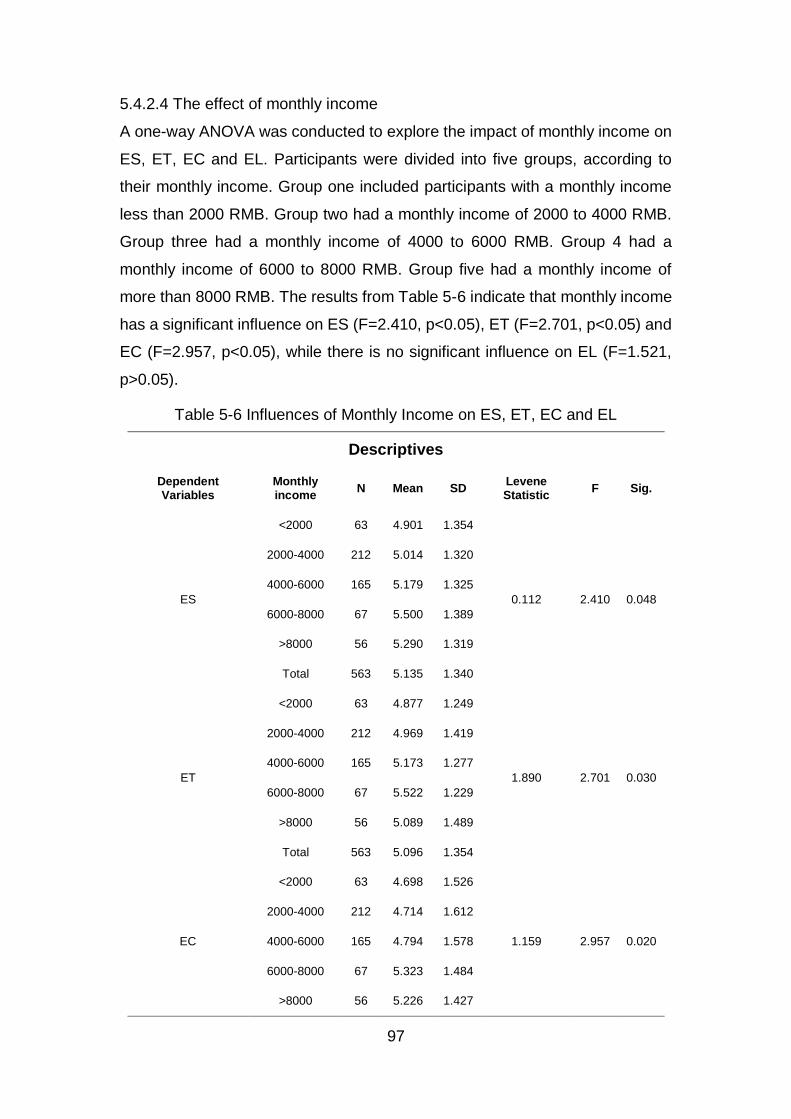
97
5.4.2.4 The effect of monthly income
A one-way ANOVA was conducted to explore the impact of monthly income on
ES, ET, EC and EL. Participants were divided into five groups, according to
their monthly income. Group one included participants with a monthly income
less than 2000 RMB. Group two had a monthly income of 2000 to 4000 RMB.
Group three had a monthly income of 4000 to 6000 RMB. Group 4 had a
monthly income of 6000 to 8000 RMB. Group five had a monthly income of
more than 8000 RMB. The results from Table 5-6 indicate that monthly income
has a significant influence on ES (F=2.410, p<0.05), ET (F=2.701, p<0.05) and
EC (F=2.957, p<0.05), while there is no significant influence on EL (F=1.521,
p>0.05).
Table 5-6 Influences of Monthly Income on ES, ET, EC and EL
Descriptives
Dependent Variables
Monthly income
N Mean SD Levene Statistic
F Sig.
ES
<2000 63 4.901 1.354
0.112 2.410 0.048
2000-4000 212 5.014 1.320
4000-6000 165 5.179 1.325
6000-8000 67 5.500 1.389
>8000 56 5.290 1.319
Total 563 5.135 1.340
ET
<2000 63 4.877 1.249
1.890 2.701 0.030
2000-4000 212 4.969 1.419
4000-6000 165 5.173 1.277
6000-8000 67 5.522 1.229
>8000 56 5.089 1.489
Total 563 5.096 1.354
EC
<2000 63 4.698 1.526
1.159 2.957 0.020
2000-4000 212 4.714 1.612
4000-6000 165 4.794 1.578
6000-8000 67 5.323 1.484
>8000 56 5.226 1.427
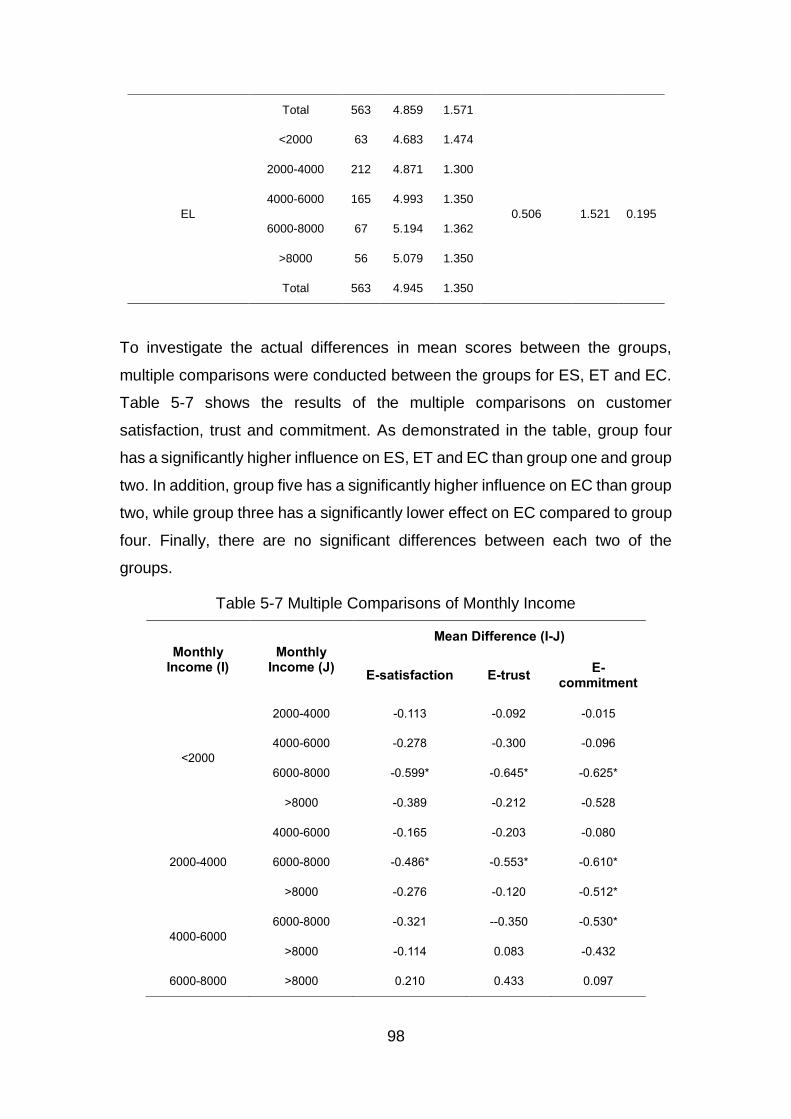
98
Total 563 4.859 1.571
EL
<2000 63 4.683 1.474
0.506 1.521 0.195
2000-4000 212 4.871 1.300
4000-6000 165 4.993 1.350
6000-8000 67 5.194 1.362
>8000 56 5.079 1.350
Total 563 4.945 1.350
To investigate the actual differences in mean scores between the groups,
multiple comparisons were conducted between the groups for ES, ET and EC.
Table 5-7 shows the results of the multiple comparisons on customer
satisfaction, trust and commitment. As demonstrated in the table, group four
has a significantly higher influence on ES, ET and EC than group one and group
two. In addition, group five has a significantly higher influence on EC than group
two, while group three has a significantly lower effect on EC compared to group
four. Finally, there are no significant differences between each two of the
groups.
Table 5-7 Multiple Comparisons of Monthly Income
Monthly Income (I)
Monthly Income (J)
Mean Difference (I-J)
E-satisfaction E-trust E-
commitment
<2000
2000-4000 -0.113 -0.092 -0.015
4000-6000 -0.278 -0.300 -0.096
6000-8000 -0.599* -0.645* -0.625*
>8000 -0.389 -0.212 -0.528
2000-4000
4000-6000 -0.165 -0.203 -0.080
6000-8000 -0.486* -0.553* -0.610*
>8000 -0.276 -0.120 -0.512*
4000-6000
6000-8000 -0.321 --0.350 -0.530*
>8000 -0.114 0.083 -0.432
6000-8000 >8000 0.210 0.433 0.097
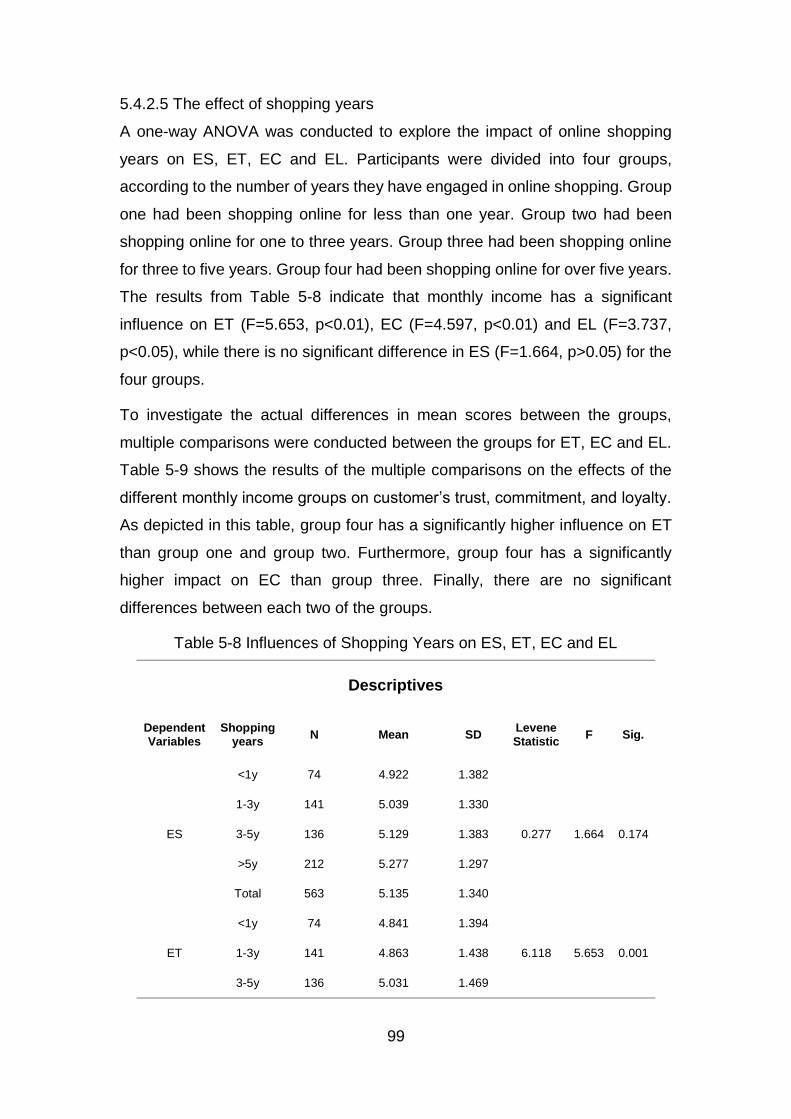
99
5.4.2.5 The effect of shopping years
A one-way ANOVA was conducted to explore the impact of online shopping
years on ES, ET, EC and EL. Participants were divided into four groups,
according to the number of years they have engaged in online shopping. Group
one had been shopping online for less than one year. Group two had been
shopping online for one to three years. Group three had been shopping online
for three to five years. Group four had been shopping online for over five years.
The results from Table 5-8 indicate that monthly income has a significant
influence on ET (F=5.653, p<0.01), EC (F=4.597, p<0.01) and EL (F=3.737,
p<0.05), while there is no significant difference in ES (F=1.664, p>0.05) for the
four groups.
To investigate the actual differences in mean scores between the groups,
multiple comparisons were conducted between the groups for ET, EC and EL.
Table 5-9 shows the results of the multiple comparisons on the effects of the
different monthly income groups on customer’s trust, commitment, and loyalty.
As depicted in this table, group four has a significantly higher influence on ET
than group one and group two. Furthermore, group four has a significantly
higher impact on EC than group three. Finally, there are no significant
differences between each two of the groups.
Table 5-8 Influences of Shopping Years on ES, ET, EC and EL
Descriptives
Dependent Variables
Shopping years
N Mean SD Levene Statistic
F Sig.
ES
<1y 74 4.922 1.382
0.277 1.664 0.174
1-3y 141 5.039 1.330
3-5y 136 5.129 1.383
>5y 212 5.277 1.297
Total 563 5.135 1.340
ET
<1y 74 4.841 1.394
6.118 5.653 0.001 1-3y 141 4.863 1.438
3-5y 136 5.031 1.469
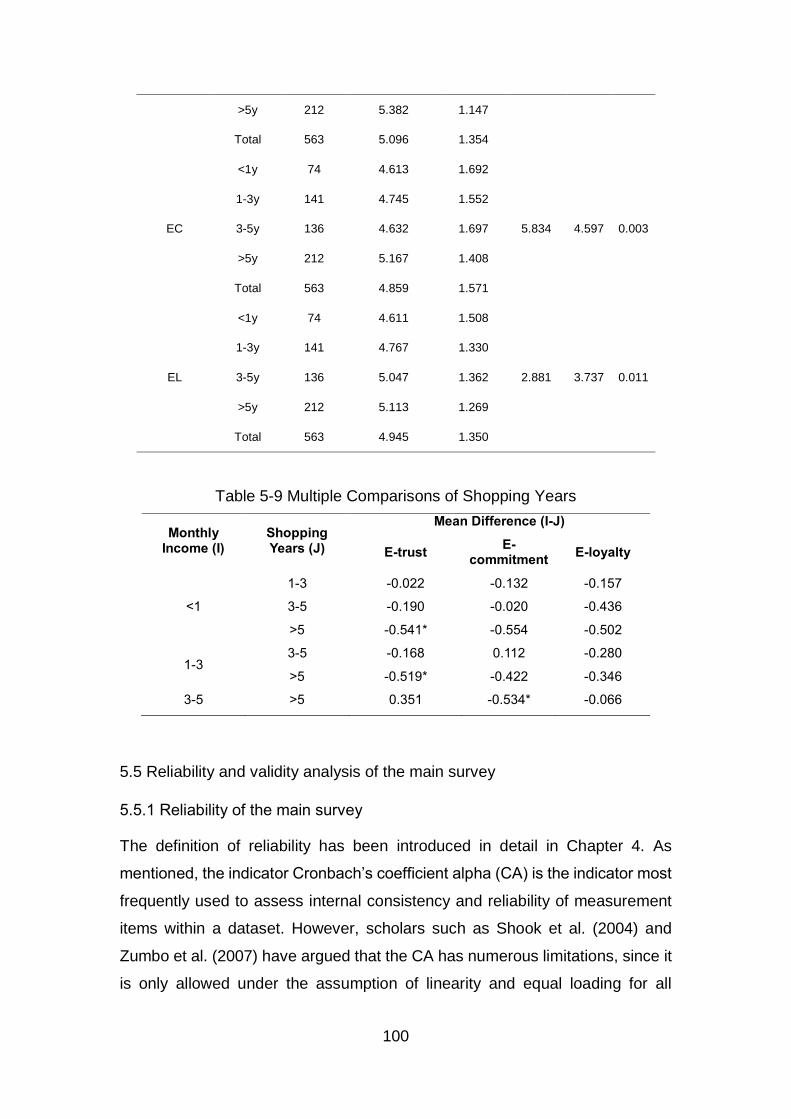
100
>5y 212 5.382 1.147
Total 563 5.096 1.354
EC
<1y 74 4.613 1.692
5.834 4.597 0.003
1-3y 141 4.745 1.552
3-5y 136 4.632 1.697
>5y 212 5.167 1.408
Total 563 4.859 1.571
EL
<1y 74 4.611 1.508
2.881 3.737 0.011
1-3y 141 4.767 1.330
3-5y 136 5.047 1.362
>5y 212 5.113 1.269
Total 563 4.945 1.350
Table 5-9 Multiple Comparisons of Shopping Years
Monthly Income (I)
Shopping Years (J)
Mean Difference (I-J)
E-trust E-
commitment E-loyalty
<1
1-3 -0.022 -0.132 -0.157
3-5 -0.190 -0.020 -0.436
>5 -0.541* -0.554 -0.502
1-3 3-5 -0.168 0.112 -0.280
>5 -0.519* -0.422 -0.346
3-5 >5 0.351 -0.534* -0.066
5.5 Reliability and validity analysis of the main survey
5.5.1 Reliability of the main survey
The definition of reliability has been introduced in detail in Chapter 4. As
mentioned, the indicator Cronbach’s coefficient alpha (CA) is the indicator most
frequently used to assess internal consistency and reliability of measurement
items within a dataset. However, scholars such as Shook et al. (2004) and
Zumbo et al. (2007) have argued that the CA has numerous limitations, since it
is only allowed under the assumption of linearity and equal loading for all
101
manifest variables, even though it is the most common measure of reliability.
Shook et al. (2004) and Zumbo et al. (2007) stated that composite reliability
(CR) is a superior choice, due to its ability to draw on the standardized
regression weights and measurement correlation errors for each item. Hence,
although the CA and CR present different values, they both work to prove
whether the data results are consistent. Consequently, both CA and CR will be
adopted in this phase to determine reliability. Usually, a CA value of less than
0.6 is unacceptable, while values in the 0.7 range are acceptable, and values
over 0.8 are considered to be good (Sekaran, 2000). CR values greater than
0.6 are acceptable, and those over 0.7 are considered to have high reliability
(Peterson and Kim, 2013; Bagozzi and Yi, 1988).
5.5.2 Validity analysis of the main survey
As introduced in Chapter 4, validity is the extent to which the conceptual and
operational definitions are truly and accurately a reflection of the underlying
concept to be measured (Burns and Bush, 1995). In this study, the content
validity depended on (1) determining the measurement items of each variable
with regards to previous literature and (2) asking several experts in the field and
professionals with abundant online shopping experience to provide their
judgement and suggestions on the questionnaire, especially on the items in
each concept. As a result, some overlapping and confusing questions were
deleted or simplified.
Construct validity includes convergent validity and discriminant validity.
Convergent validity is “the item’s implicit intention to measure the same
construct correlates positively with one another” (Alhaiou, 2011). In other words,
it assesses the extent to which two observed factors of the same latent factor
are correlated, with high correlation suggesting that the scale is measuring its
planned concept. To test the convergent validity, factor loading and the
measure of average variance extracted (AVE) were adopted, with both 0.5 as
acceptable (Fornell and Larcker, 1981). Discriminant validity is the extent to
which measures of theoretically unrelated scales do not correlate highly with
one another (Alhaiou, 2011). In other words, it requires less correlation between
any two items from different scales or between any two scales. Discriminant
102
validity is present in criteria where the square root of the AVE of each construct
is more than the correlation coefficients of other constructs, and the correlation
coefficient of each scale must be less than 0.85 (Barclay and Smith, 1995;
Fornell and Larcker, 1981).
5.5.3 The confirmatory factor analysis (CFA)
As mentioned in Chapter 4, factor analysis is used to check construct validity,
and contains exploratory analysis and confirmatory analysis. For the main
survey, a confirmatory factor analysis was used to test the convergent and
discriminant validity of the measures. AMOS 24.0 was used to conduct the CFA.
Several fit indices were employed to assess the fit of the model. Since CFA is
a special case of SEM, the selection of indices and the corresponding criteria
of the CFA used to test the fit of the model are similar to SEM.
There are two kinds of fit indices which should be used for reporting the results
of SEM. According to Lin (2005), absolute fit can assess the degree to which
the covariance implied by the proposed model matches the observed
covariance. The indices of incremental fit are used to assess the degree to
which the proposed model is superior to an alternative model. More specifically,
absolute fit indices typically gauge ‘badness of fit’, while indices of incremental
fit gauge ‘goodness of fit’. Although there is no consensus about the best index
to use when reporting structural equational models, the most widely reported
absolute fit indices contains 2, 2/𝑑𝑓, GFI, AGFI, SRMR and RMSEA, while
the most commonly used incremental fit indices include NFI, NNFI and CFI.
Table 5-10 demonstrates the indices and the recommended criteria for the most
frequently reported indices in previous research.
The index 2 will not be used in this study, although it appears to be the most
popular index, due to its high sensitivity to sample size. According to Ghazali
(2011), when the sample size increases, the 2 statistic tends toward statistical
significance, increasing the possibility of model rejection, irrespective of
whether the model is true or false (a type II error). Instead, the degree of
freedom was considered when using the chi-square to make the value
meaningful. In addition, the values of GFI and AGFI were not considered to
reject the model in this study, since they are strongly affected by sample size
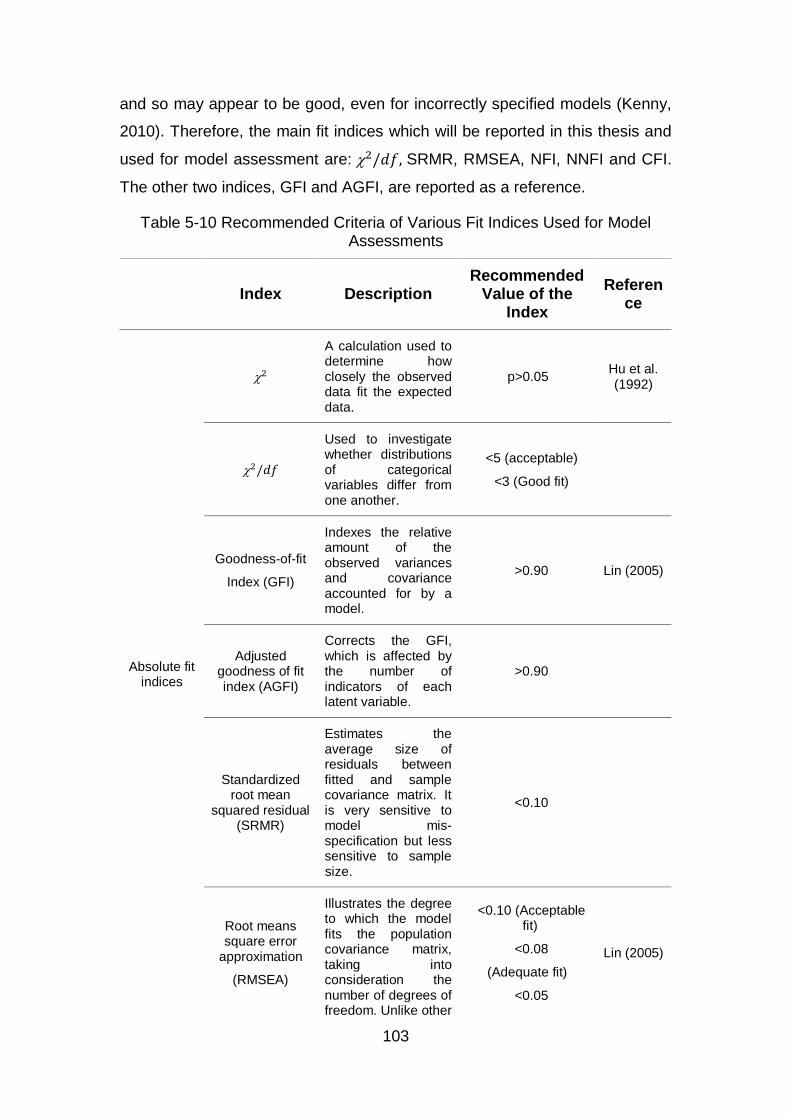
103
and so may appear to be good, even for incorrectly specified models (Kenny,
2010). Therefore, the main fit indices which will be reported in this thesis and
used for model assessment are: 2/𝑑𝑓, SRMR, RMSEA, NFI, NNFI and CFI.
The other two indices, GFI and AGFI, are reported as a reference.
Table 5-10 Recommended Criteria of Various Fit Indices Used for Model Assessments
Index Description Recommended
Value of the Index
Reference
Absolute fit indices
2
A calculation used to determine how closely the observed data fit the expected data.
p>0.05 Hu et al. (1992)
2/𝑑𝑓
Used to investigate whether distributions of categorical variables differ from one another.
<5 (acceptable)
<3 (Good fit)
Goodness-of-fit
Index (GFI)
Indexes the relative amount of the observed variances and covariance accounted for by a model.
>0.90 Lin (2005)
Adjusted goodness of fit index (AGFI)
Corrects the GFI, which is affected by the number of indicators of each latent variable.
>0.90
Standardized root mean
squared residual (SRMR)
Estimates the average size of residuals between fitted and sample covariance matrix. It is very sensitive to model mis-specification but less sensitive to sample size.
<0.10
Root means square error
approximation
(RMSEA)
Illustrates the degree to which the model fits the population covariance matrix, taking into consideration the number of degrees of freedom. Unlike other
<0.10 (Acceptable fit)
<0.08
(Adequate fit)
<0.05
Lin (2005)
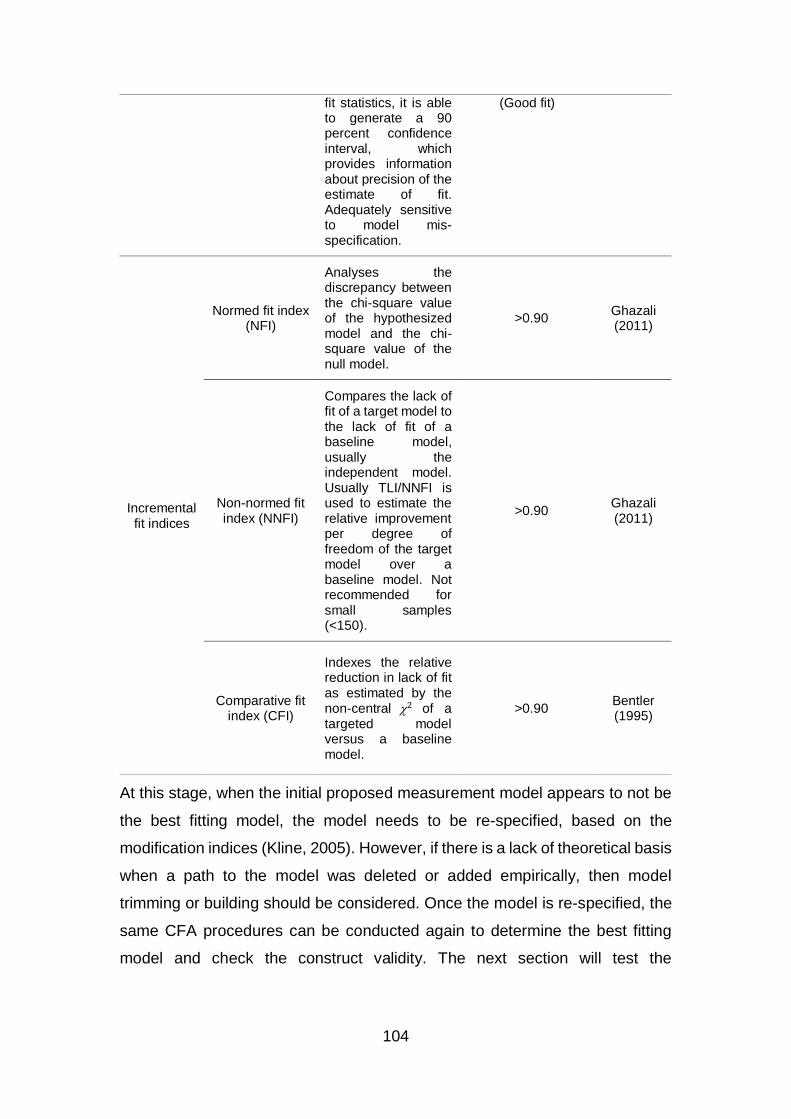
104
At this stage, when the initial proposed measurement model appears to not be
the best fitting model, the model needs to be re-specified, based on the
modification indices (Kline, 2005). However, if there is a lack of theoretical basis
when a path to the model was deleted or added empirically, then model
trimming or building should be considered. Once the model is re-specified, the
same CFA procedures can be conducted again to determine the best fitting
model and check the construct validity. The next section will test the
fit statistics, it is able to generate a 90 percent confidence interval, which provides information about precision of the estimate of fit. Adequately sensitive to model mis-specification.
(Good fit)
Incremental fit indices
Normed fit index (NFI)
Analyses the discrepancy between the chi-square value of the hypothesized model and the chi-square value of the null model.
>0.90 Ghazali (2011)
Non-normed fit index (NNFI)
Compares the lack of fit of a target model to the lack of fit of a baseline model, usually the independent model. Usually TLI/NNFI is used to estimate the relative improvement per degree of freedom of the target model over a baseline model. Not recommended for small samples (<150).
>0.90 Ghazali (2011)
Comparative fit index (CFI)
Indexes the relative reduction in lack of fit as estimated by the non-central 2 of a targeted model versus a baseline model.
>0.90 Bentler (1995)
105
measurement model of all latent scales. Fit indices will be considered to
determine the fit of the model.
5.5.4 The measurement model
According to Awang (2012), the CFA can be run either for each construct model
separately or for the pooled measurement models together. The author pointed
out that the CFA for the pooled measurement models is more efficient and
highly suggested. The measurement model for all constructs involved in the
research should be assessed together at once if possible although many
researchers have to run the CFA for each measurement model separately since
their models have too many latent constructs. Awang (2012) further
demonstrated that there is no problem in model identification, even though
certain scales have less than four items, as the combined constructs will raise
the degrees of freedom for the model. In this study, the CFA for the pooled
measurement models will be conducted together. The model was evaluated
using AMOS 24.0 to test the construct validity of the items against the sample
dataset. In this section, factor loading, AVE, and CR were obtained based on
the results of fit for the measurement model. In addition, the CA of each
construct was analysed using SPSS 24.0 and displayed in the results table, to
check the reliability of the measurement items.
The OLSM scale, e-satisfaction, e-trust, e-commitment, e-loyalty, signal
credibility (MS) and switching cost (SC) can be measured by five, four, four,
three, five, three and four items respectively. Figure 5-1 shows the hypothetical
model of all latent constructs; Table 5-12 displays the results of CFA and the
reliability analysis.
As illustrated in Table 5-11, all fit indices meet the criteria stated in Table 5-10
above, in which the GFI, AGFI, NFI, NNFI, CFI and SRMR indices are far above
the desired level. The other two fit indices, 2/𝑑𝑓 and RMSEA, have reached
good fit, indicating the initial pooled measurement model fits the data
reasonably well. All the measurement items indicate that the factor loading of
the items model have very good factor loading where each item loads more
than 0.75, except OLSM2, with a value of 0.746, which is far more than the
proposed standard value of 0.5. This implies that the indicators are good
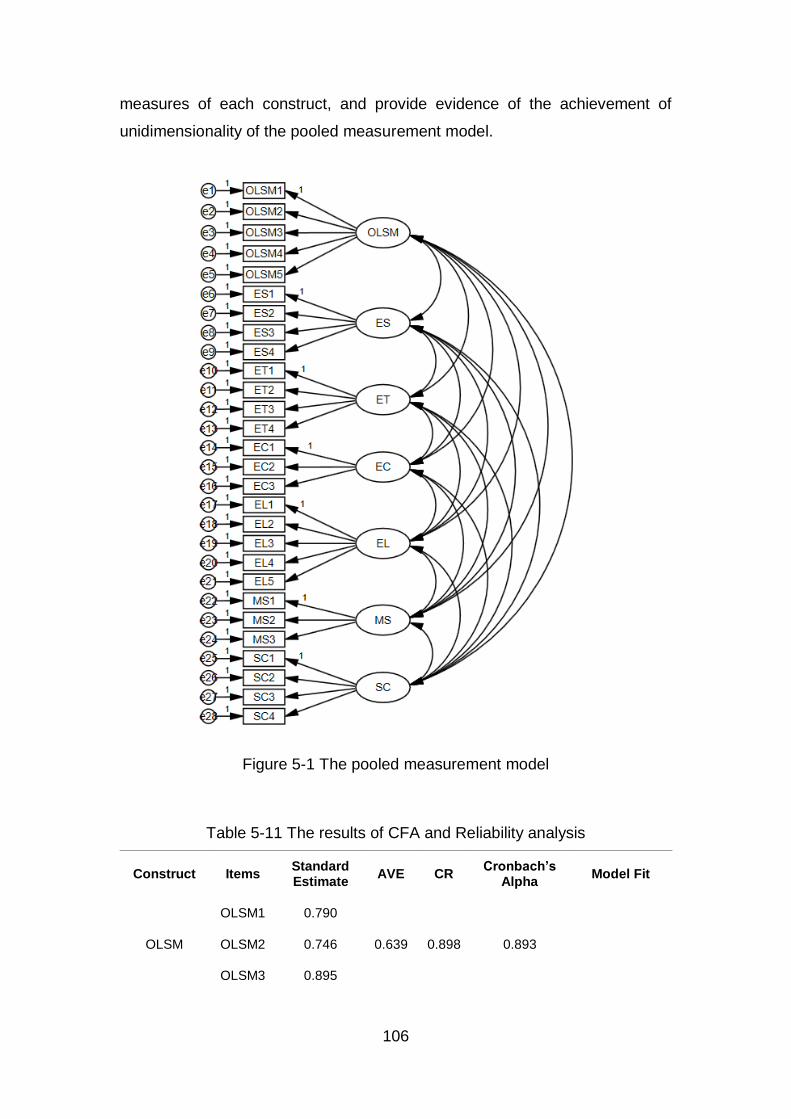
106
measures of each construct, and provide evidence of the achievement of
unidimensionality of the pooled measurement model.
Table 5-11 The results of CFA and Reliability analysis
Construct Items Standard Estimate
AVE CR Cronbach’s
Alpha Model Fit
OLSM
OLSM1 0.790
0.639 0.898 0.893
OLSM2 0.746
OLSM3 0.895
Figure 5-1 The pooled measurement model Figure 5-1 The pooled measurement model
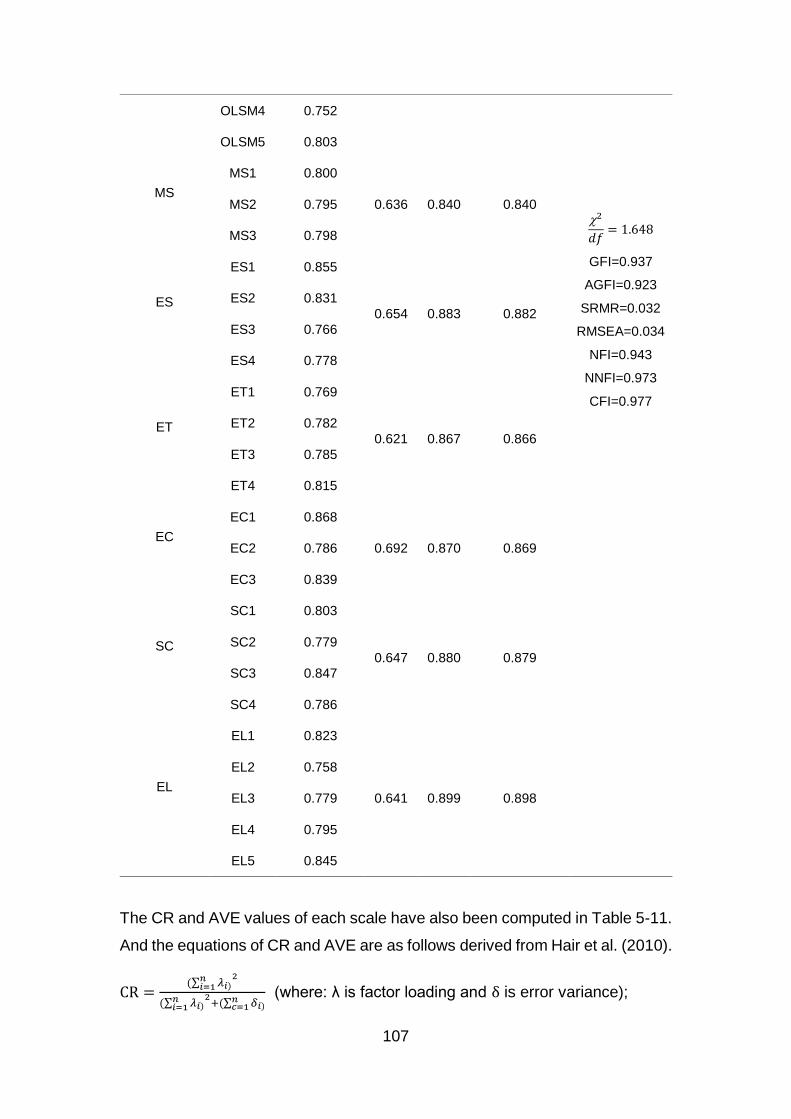
107
The CR and AVE values of each scale have also been computed in Table 5-11.
And the equations of CR and AVE are as follows derived from Hair et al. (2010).
CR =(∑ 𝜆𝑖)
𝑛𝑖=1
2
(∑ 𝜆𝑖)𝑛𝑖=1
2+(∑ 𝛿𝑖)
𝑛𝑐=1
(where: λ is factor loading and δ is error variance);
OLSM4 0.752
2
𝑑𝑓= 1.648
GFI=0.937
AGFI=0.923
SRMR=0.032
RMSEA=0.034
NFI=0.943
NNFI=0.973
CFI=0.977
OLSM5 0.803
MS
MS1 0.800
0.636 0.840 0.840 MS2 0.795
MS3 0.798
ES
ES1 0.855
0.654 0.883 0.882
ES2 0.831
ES3 0.766
ES4 0.778
ET
ET1 0.769
0.621 0.867 0.866
ET2 0.782
ET3 0.785
ET4 0.815
EC
EC1 0.868
0.692 0.870 0.869 EC2 0.786
EC3 0.839
SC
SC1 0.803
0.647 0.880 0.879
SC2 0.779
SC3 0.847
SC4 0.786
EL
EL1 0.823
0.641 0.899 0.898
EL2 0.758
EL3 0.779
EL4 0.795
EL5 0.845
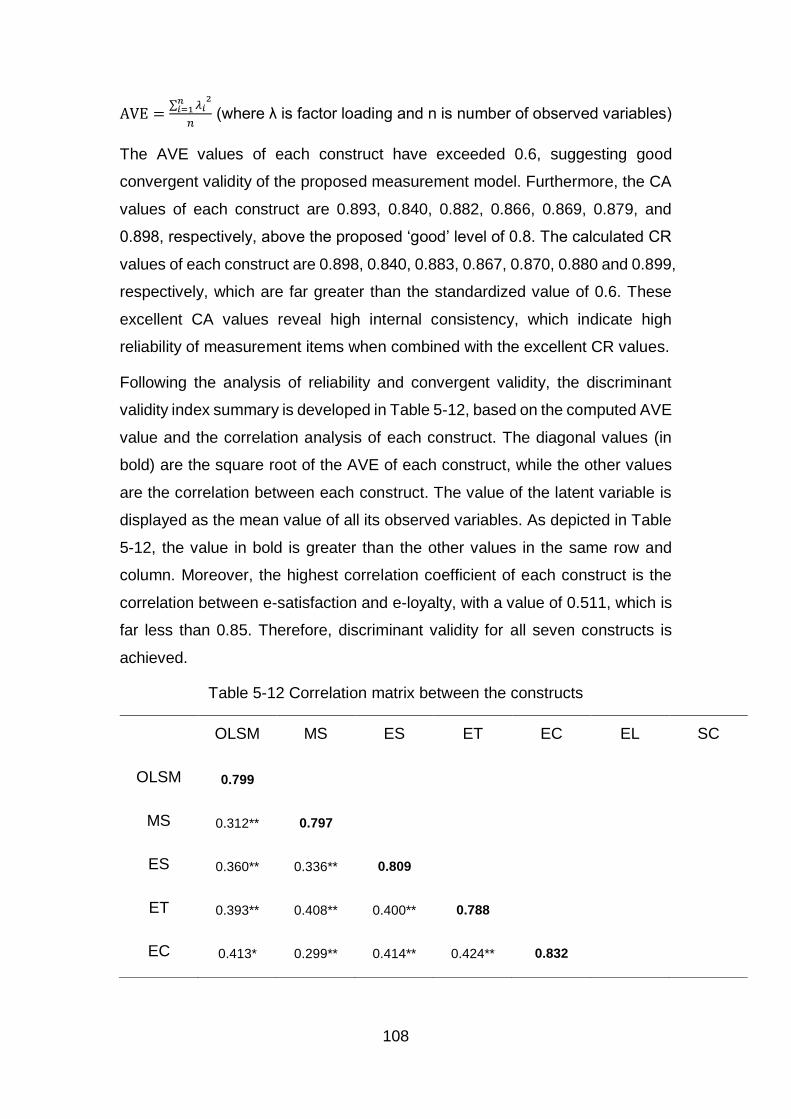
108
AVE =∑ 𝜆𝑖
𝑛𝑖=1
2
𝑛 (where λ is factor loading and n is number of observed variables)
The AVE values of each construct have exceeded 0.6, suggesting good
convergent validity of the proposed measurement model. Furthermore, the CA
values of each construct are 0.893, 0.840, 0.882, 0.866, 0.869, 0.879, and
0.898, respectively, above the proposed ‘good’ level of 0.8. The calculated CR
values of each construct are 0.898, 0.840, 0.883, 0.867, 0.870, 0.880 and 0.899,
respectively, which are far greater than the standardized value of 0.6. These
excellent CA values reveal high internal consistency, which indicate high
reliability of measurement items when combined with the excellent CR values.
Following the analysis of reliability and convergent validity, the discriminant
validity index summary is developed in Table 5-12, based on the computed AVE
value and the correlation analysis of each construct. The diagonal values (in
bold) are the square root of the AVE of each construct, while the other values
are the correlation between each construct. The value of the latent variable is
displayed as the mean value of all its observed variables. As depicted in Table
5-12, the value in bold is greater than the other values in the same row and
column. Moreover, the highest correlation coefficient of each construct is the
correlation between e-satisfaction and e-loyalty, with a value of 0.511, which is
far less than 0.85. Therefore, discriminant validity for all seven constructs is
achieved.
Table 5-12 Correlation matrix between the constructs
OLSM MS ES ET EC EL SC
OLSM 0.799
MS 0.312** 0.797
ES 0.360** 0.336** 0.809
ET 0.393** 0.408** 0.400** 0.788
EC 0.413* 0.299** 0.414** 0.424** 0.832
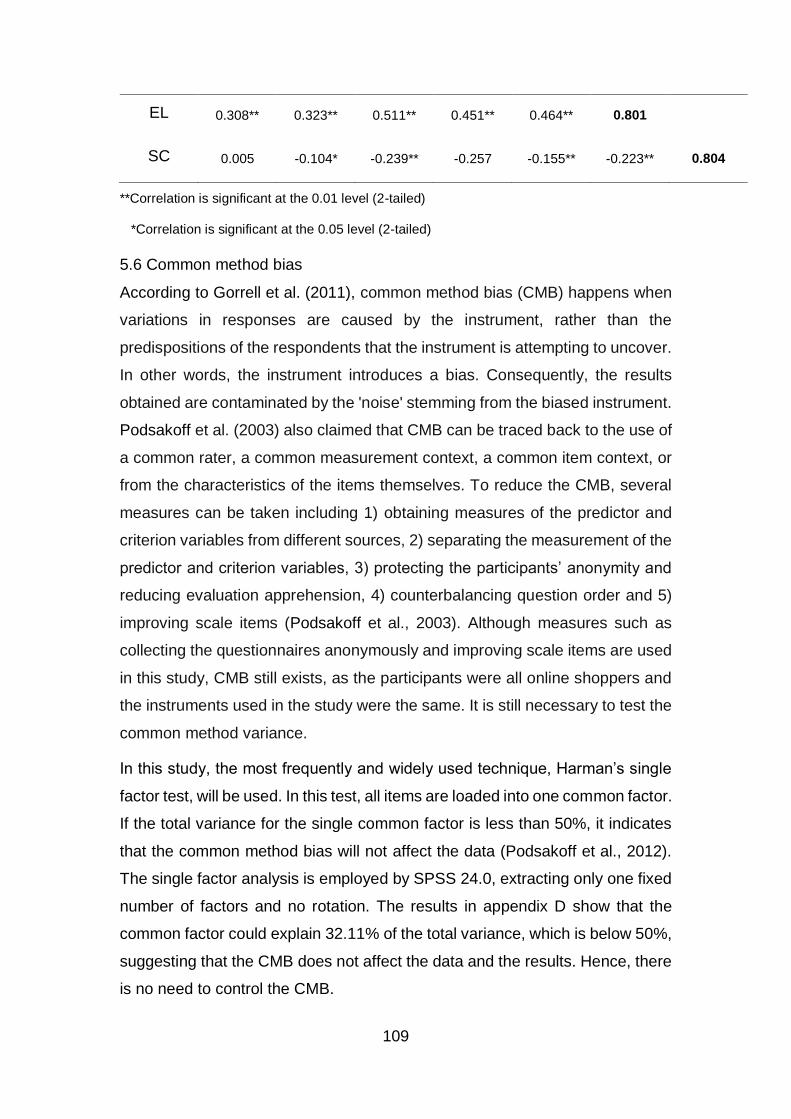
109
EL 0.308** 0.323** 0.511** 0.451** 0.464** 0.801
SC 0.005 -0.104* -0.239** -0.257 -0.155** -0.223** 0.804
**Correlation is significant at the 0.01 level (2-tailed)
*Correlation is significant at the 0.05 level (2-tailed)
5.6 Common method bias
According to Gorrell et al. (2011), common method bias (CMB) happens when
variations in responses are caused by the instrument, rather than the
predispositions of the respondents that the instrument is attempting to uncover.
In other words, the instrument introduces a bias. Consequently, the results
obtained are contaminated by the 'noise' stemming from the biased instrument.
Podsakoff et al. (2003) also claimed that CMB can be traced back to the use of
a common rater, a common measurement context, a common item context, or
from the characteristics of the items themselves. To reduce the CMB, several
measures can be taken including 1) obtaining measures of the predictor and
criterion variables from different sources, 2) separating the measurement of the
predictor and criterion variables, 3) protecting the participants’ anonymity and
reducing evaluation apprehension, 4) counterbalancing question order and 5)
improving scale items (Podsakoff et al., 2003). Although measures such as
collecting the questionnaires anonymously and improving scale items are used
in this study, CMB still exists, as the participants were all online shoppers and
the instruments used in the study were the same. It is still necessary to test the
common method variance.
In this study, the most frequently and widely used technique, Harman’s single
factor test, will be used. In this test, all items are loaded into one common factor.
If the total variance for the single common factor is less than 50%, it indicates
that the common method bias will not affect the data (Podsakoff et al., 2012).
The single factor analysis is employed by SPSS 24.0, extracting only one fixed
number of factors and no rotation. The results in appendix D show that the
common factor could explain 32.11% of the total variance, which is below 50%,
suggesting that the CMB does not affect the data and the results. Hence, there
is no need to control the CMB.

110
5.7 Structural equation model
After evaluating the pooled measurement model and the CMB, the next step is
to evaluate the depicted structural models through structural equation
modelling, to determine the relationship between the variables. Figure 5-2
below depicts the structural model of the relationship. As seen in the figure, e-
loyalty is the dependent variable; OLSM is an independent variable; and e-
satisfaction, e-trust and e-commitment are independent variables in relation to
e-loyalty, but dependent variables in relation to OLSM. The model includes five
factors, with a total of 21 items.
Figure 5-2 The structural model of the relationship among OLSM, e-
satisfaction, e-trust and e-commitment
Table 5-13 below demonstrates the goodness-of-fit statistics of the above
structural model. The results indicate a good-fit to data: 2/𝑑𝑓 =2.596,
RMSEA=0.053, SRMR=0.087, GFI=0.924, AGFI=0.904, NFI=0.935, IFI=0.959,
TLI=0.953 and CFI=0.959. Although the values of AGFI and SRMR are only
slightly greater than the threshold of 0.9 and 0.1 respectively, the values of the
other indices appear to be far above the desired level, indicating that the initial
pooled measurement model fits the data reasonably well.
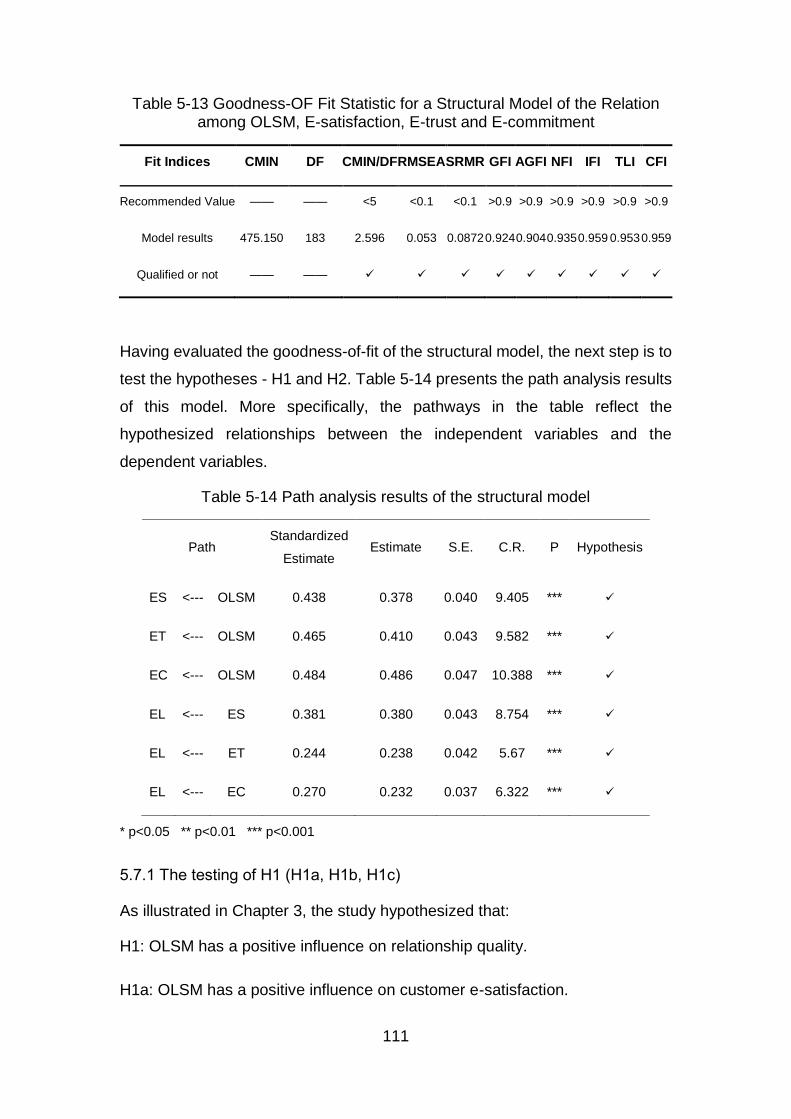
111
Table 5-13 Goodness-OF Fit Statistic for a Structural Model of the Relation among OLSM, E-satisfaction, E-trust and E-commitment
Fit Indices CMIN DF CMIN/DF RMSEA SRMR GFI AGFI NFI IFI TLI CFI
Recommended Value —— —— <5 <0.1 <0.1 >0.9 >0.9 >0.9 >0.9 >0.9 >0.9
Model results 475.150 183 2.596 0.053 0.0872 0.924 0.904 0.935 0.959 0.953 0.959
Qualified or not —— ——
Having evaluated the goodness-of-fit of the structural model, the next step is to
test the hypotheses - H1 and H2. Table 5-14 presents the path analysis results
of this model. More specifically, the pathways in the table reflect the
hypothesized relationships between the independent variables and the
dependent variables.
Table 5-14 Path analysis results of the structural model
Path Standardized
Estimate Estimate S.E. C.R. P Hypothesis
ES <--- OLSM 0.438 0.378 0.040 9.405 ***
ET <--- OLSM 0.465 0.410 0.043 9.582 ***
EC <--- OLSM 0.484 0.486 0.047 10.388 ***
EL <--- ES 0.381 0.380 0.043 8.754 ***
EL <--- ET 0.244 0.238 0.042 5.67 ***
EL <--- EC 0.270 0.232 0.037 6.322 ***
* p<0.05 ** p<0.01 *** p<0.001
5.7.1 The testing of H1 (H1a, H1b, H1c)
As illustrated in Chapter 3, the study hypothesized that:
H1: OLSM has a positive influence on relationship quality.
H1a: OLSM has a positive influence on customer e-satisfaction.
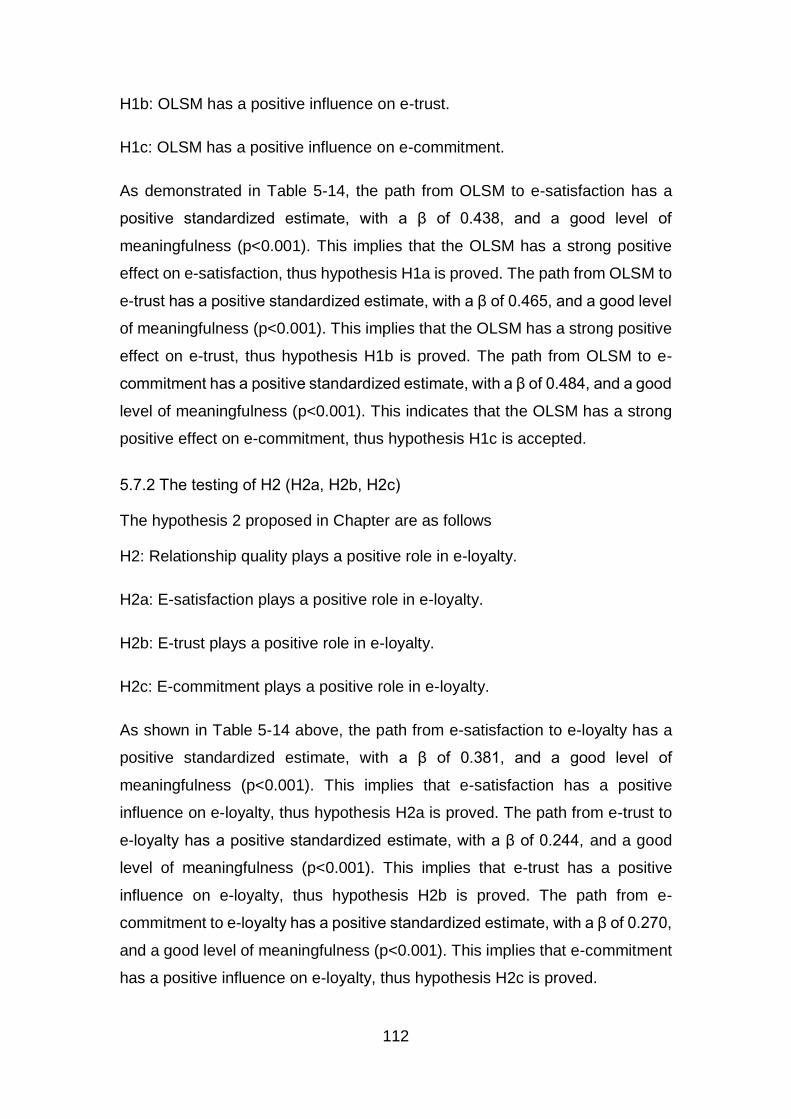
112
H1b: OLSM has a positive influence on e-trust.
H1c: OLSM has a positive influence on e-commitment.
As demonstrated in Table 5-14, the path from OLSM to e-satisfaction has a
positive standardized estimate, with a β of 0.438, and a good level of
meaningfulness (p<0.001). This implies that the OLSM has a strong positive
effect on e-satisfaction, thus hypothesis H1a is proved. The path from OLSM to
e-trust has a positive standardized estimate, with a β of 0.465, and a good level
of meaningfulness (p<0.001). This implies that the OLSM has a strong positive
effect on e-trust, thus hypothesis H1b is proved. The path from OLSM to e-
commitment has a positive standardized estimate, with a β of 0.484, and a good
level of meaningfulness (p<0.001). This indicates that the OLSM has a strong
positive effect on e-commitment, thus hypothesis H1c is accepted.
5.7.2 The testing of H2 (H2a, H2b, H2c)
The hypothesis 2 proposed in Chapter are as follows
H2: Relationship quality plays a positive role in e-loyalty.
H2a: E-satisfaction plays a positive role in e-loyalty.
H2b: E-trust plays a positive role in e-loyalty.
H2c: E-commitment plays a positive role in e-loyalty.
As shown in Table 5-14 above, the path from e-satisfaction to e-loyalty has a
positive standardized estimate, with a β of 0.381, and a good level of
meaningfulness (p<0.001). This implies that e-satisfaction has a positive
influence on e-loyalty, thus hypothesis H2a is proved. The path from e-trust to
e-loyalty has a positive standardized estimate, with a β of 0.244, and a good
level of meaningfulness (p<0.001). This implies that e-trust has a positive
influence on e-loyalty, thus hypothesis H2b is proved. The path from e-
commitment to e-loyalty has a positive standardized estimate, with a β of 0.270,
and a good level of meaningfulness (p<0.001). This implies that e-commitment
has a positive influence on e-loyalty, thus hypothesis H2c is proved.
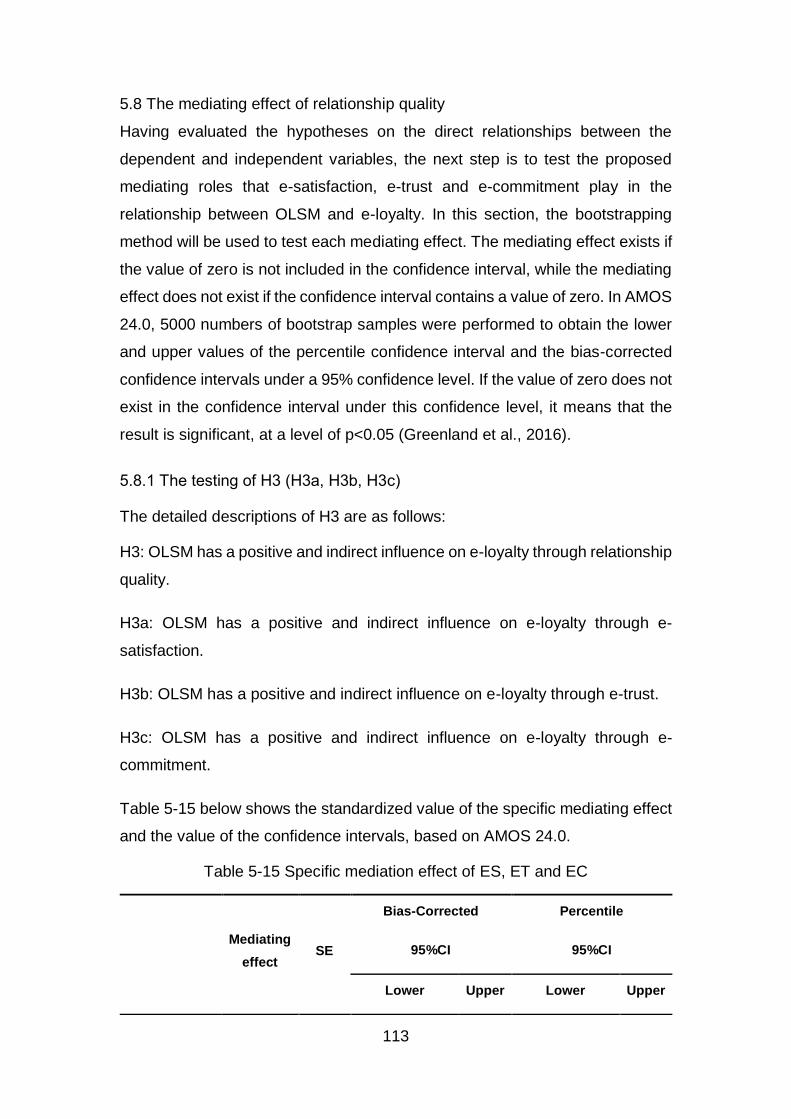
113
5.8 The mediating effect of relationship quality
Having evaluated the hypotheses on the direct relationships between the
dependent and independent variables, the next step is to test the proposed
mediating roles that e-satisfaction, e-trust and e-commitment play in the
relationship between OLSM and e-loyalty. In this section, the bootstrapping
method will be used to test each mediating effect. The mediating effect exists if
the value of zero is not included in the confidence interval, while the mediating
effect does not exist if the confidence interval contains a value of zero. In AMOS
24.0, 5000 numbers of bootstrap samples were performed to obtain the lower
and upper values of the percentile confidence interval and the bias-corrected
confidence intervals under a 95% confidence level. If the value of zero does not
exist in the confidence interval under this confidence level, it means that the
result is significant, at a level of p<0.05 (Greenland et al., 2016).
5.8.1 The testing of H3 (H3a, H3b, H3c)
The detailed descriptions of H3 are as follows:
H3: OLSM has a positive and indirect influence on e-loyalty through relationship
quality.
H3a: OLSM has a positive and indirect influence on e-loyalty through e-
satisfaction.
H3b: OLSM has a positive and indirect influence on e-loyalty through e-trust.
H3c: OLSM has a positive and indirect influence on e-loyalty through e-
commitment.
Table 5-15 below shows the standardized value of the specific mediating effect
and the value of the confidence intervals, based on AMOS 24.0.
Table 5-15 Specific mediation effect of ES, ET and EC
Mediating
effect SE
Bias-Corrected Percentile
95%CI 95%CI
Lower Upper Lower Upper
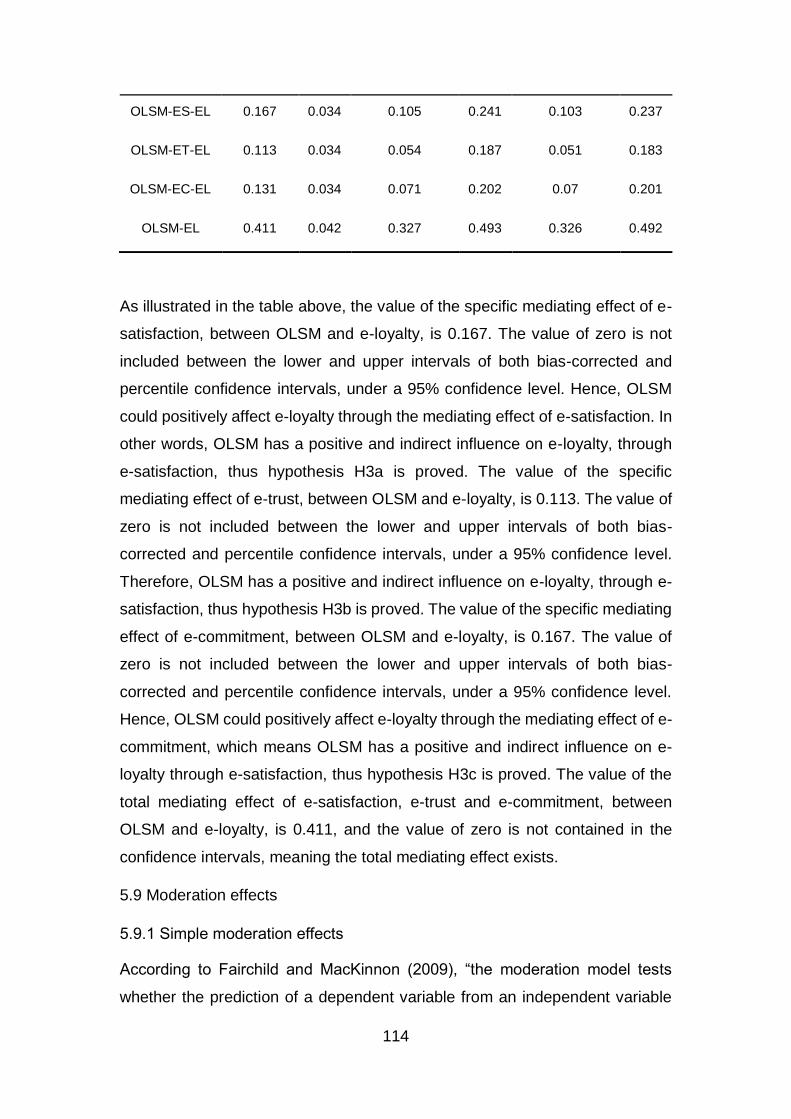
114
OLSM-ES-EL 0.167 0.034 0.105 0.241 0.103 0.237
OLSM-ET-EL 0.113 0.034 0.054 0.187 0.051 0.183
OLSM-EC-EL 0.131 0.034 0.071 0.202 0.07 0.201
OLSM-EL 0.411 0.042 0.327 0.493 0.326 0.492
As illustrated in the table above, the value of the specific mediating effect of e-
satisfaction, between OLSM and e-loyalty, is 0.167. The value of zero is not
included between the lower and upper intervals of both bias-corrected and
percentile confidence intervals, under a 95% confidence level. Hence, OLSM
could positively affect e-loyalty through the mediating effect of e-satisfaction. In
other words, OLSM has a positive and indirect influence on e-loyalty, through
e-satisfaction, thus hypothesis H3a is proved. The value of the specific
mediating effect of e-trust, between OLSM and e-loyalty, is 0.113. The value of
zero is not included between the lower and upper intervals of both bias-
corrected and percentile confidence intervals, under a 95% confidence level.
Therefore, OLSM has a positive and indirect influence on e-loyalty, through e-
satisfaction, thus hypothesis H3b is proved. The value of the specific mediating
effect of e-commitment, between OLSM and e-loyalty, is 0.167. The value of
zero is not included between the lower and upper intervals of both bias-
corrected and percentile confidence intervals, under a 95% confidence level.
Hence, OLSM could positively affect e-loyalty through the mediating effect of e-
commitment, which means OLSM has a positive and indirect influence on e-
loyalty through e-satisfaction, thus hypothesis H3c is proved. The value of the
total mediating effect of e-satisfaction, e-trust and e-commitment, between
OLSM and e-loyalty, is 0.411, and the value of zero is not contained in the
confidence intervals, meaning the total mediating effect exists.
5.9 Moderation effects
5.9.1 Simple moderation effects
According to Fairchild and MacKinnon (2009), “the moderation model tests
whether the prediction of a dependent variable from an independent variable
115
differs across levels of a third moderator variable”. The moderator variables
influence the strength and/or direction of the relationship between the
independent and dependent variables, enhancing, decreasing or changing the
influence of the independent variables. Fairchild and McQuillin (2010) also state
that moderation effects are always regarded as statistical ‘interactions’ in the
literature associated with social science. This section aims to test whether the
moderators, signal credibility and switching cost, could influence the
relationship between OLSM and relationship quality and the relation between
the relationship quality and online customer loyalty.
Hierarchical multiple regression analysis is always adopted to test the
moderation effect (Fairchild and McQuillin, 2010). In the progress of hierarchical
regression analysis, each variable is referred to the mean of all measurement
items associated with this variable. All continuous variables will be centered to
avoid multicollinearity issues and to increase the interpretability of various
parameters in the models that contain interaction terms, before running the
regression model (Muller et al., 2005). Based on the hierarchical regression
analysis derived from Pallant (2010), the steps to test the simple moderation
model, in which only predictors, outcomes and the moderators are included,
are as follows. First, the target dependent variable is entered and the
demographic predictor variables are block-entered, providing the variance
accounted for in this group of independent variables. Second, the targeted
independent variable is entered into the model as a block. Third, the targeted
moderating variable is entered. Fourth, the interaction terms formed by
multiplying the dependent and independent variables are entered. To test
moderation, the focus is on the coefficient of the interaction terms, and whether
this effect is significant.
5.9.2 The simple moderation effect of signal credibility (the testing of H4)
In this simple moderation model, age, gender, shopping experience, education
level and monthly income are the control variables. OLSM is an independent
variable, e-satisfaction, e-trust and e-commitment are dependent variables, and
the signal credibility is the moderator. The detailed description of H4 are as
follows.
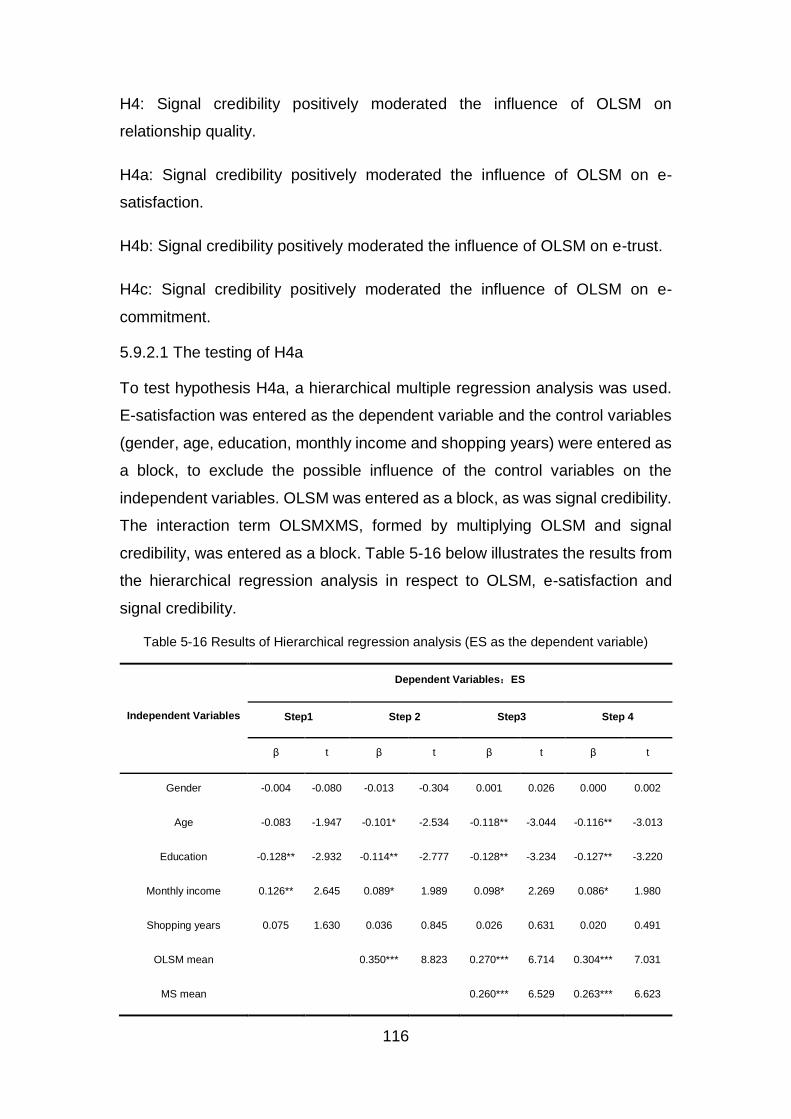
116
H4: Signal credibility positively moderated the influence of OLSM on
relationship quality.
H4a: Signal credibility positively moderated the influence of OLSM on e-
satisfaction.
H4b: Signal credibility positively moderated the influence of OLSM on e-trust.
H4c: Signal credibility positively moderated the influence of OLSM on e-
commitment.
5.9.2.1 The testing of H4a
To test hypothesis H4a, a hierarchical multiple regression analysis was used.
E-satisfaction was entered as the dependent variable and the control variables
(gender, age, education, monthly income and shopping years) were entered as
a block, to exclude the possible influence of the control variables on the
independent variables. OLSM was entered as a block, as was signal credibility.
The interaction term OLSMXMS, formed by multiplying OLSM and signal
credibility, was entered as a block. Table 5-16 below illustrates the results from
the hierarchical regression analysis in respect to OLSM, e-satisfaction and
signal credibility.
Table 5-16 Results of Hierarchical regression analysis (ES as the dependent variable)
Independent Variables
Dependent Variables:ES
Step1 Step 2 Step3 Step 4
β t β t β t β t
Gender -0.004 -0.080 -0.013 -0.304 0.001 0.026 0.000 0.002
Age -0.083 -1.947 -0.101* -2.534 -0.118** -3.044 -0.116** -3.013
Education -0.128** -2.932 -0.114** -2.777 -0.128** -3.234 -0.127** -3.220
Monthly income 0.126** 2.645 0.089* 1.989 0.098* 2.269 0.086* 1.980
Shopping years 0.075 1.630 0.036 0.845 0.026 0.631 0.020 0.491
OLSM mean 0.350*** 8.823 0.270*** 6.714 0.304*** 7.031
MS mean 0.260*** 6.529 0.263*** 6.623
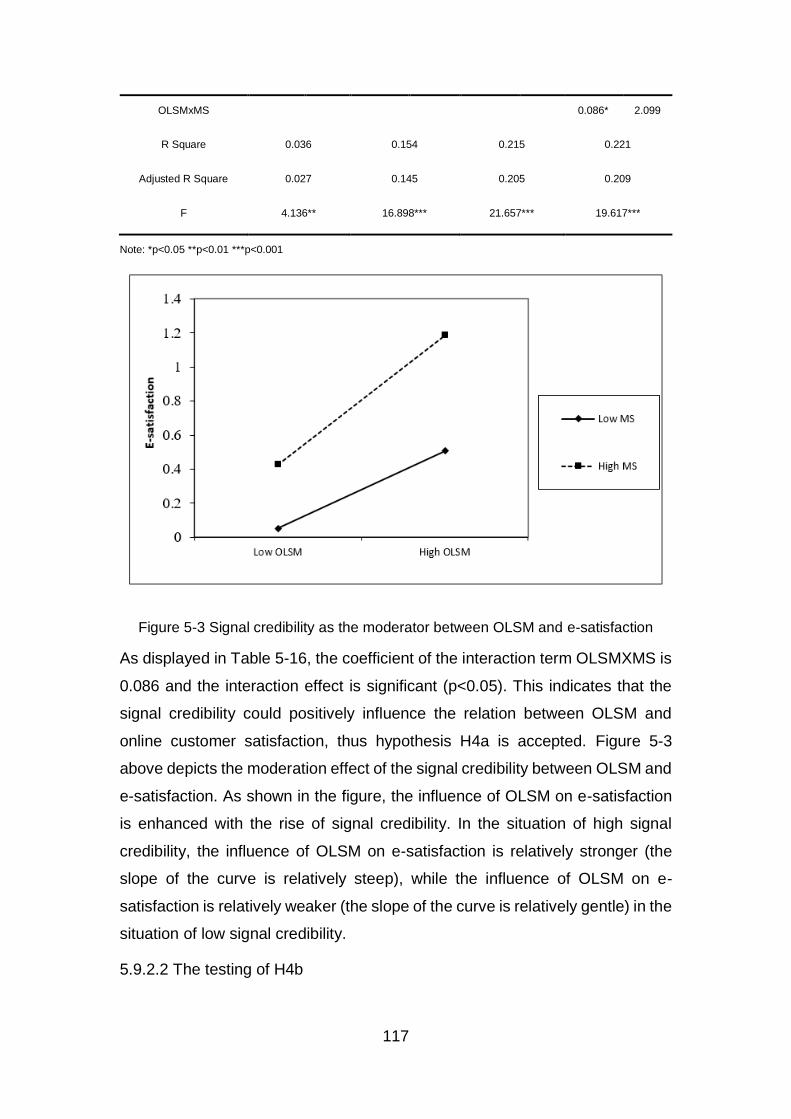
117
OLSMxMS 0.086* 2.099
R Square 0.036 0.154 0.215 0.221
Adjusted R Square 0.027 0.145 0.205 0.209
F 4.136** 16.898*** 21.657*** 19.617***
Note: *p<0.05 **p<0.01 ***p<0.001
Figure 5-3 Signal credibility as the moderator between OLSM and e-satisfaction
As displayed in Table 5-16, the coefficient of the interaction term OLSMXMS is
0.086 and the interaction effect is significant (p<0.05). This indicates that the
signal credibility could positively influence the relation between OLSM and
online customer satisfaction, thus hypothesis H4a is accepted. Figure 5-3
above depicts the moderation effect of the signal credibility between OLSM and
e-satisfaction. As shown in the figure, the influence of OLSM on e-satisfaction
is enhanced with the rise of signal credibility. In the situation of high signal
credibility, the influence of OLSM on e-satisfaction is relatively stronger (the
slope of the curve is relatively steep), while the influence of OLSM on e-
satisfaction is relatively weaker (the slope of the curve is relatively gentle) in the
situation of low signal credibility.
5.9.2.2 The testing of H4b
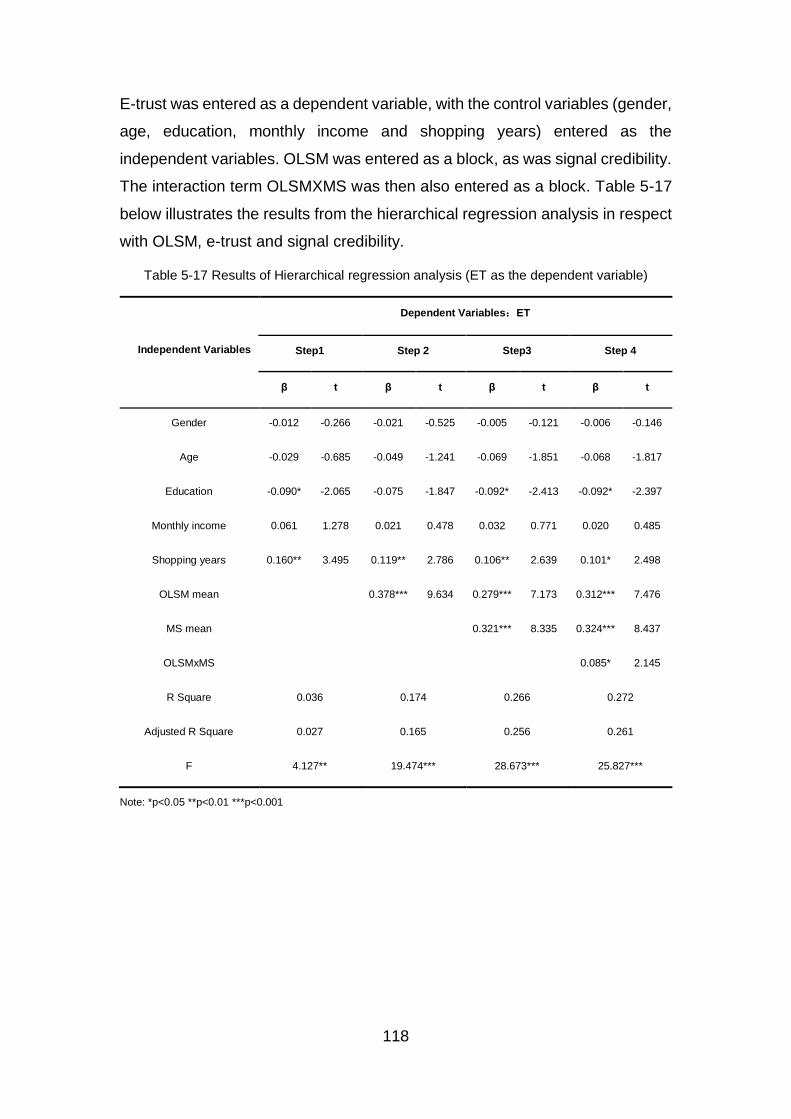
118
E-trust was entered as a dependent variable, with the control variables (gender,
age, education, monthly income and shopping years) entered as the
independent variables. OLSM was entered as a block, as was signal credibility.
The interaction term OLSMXMS was then also entered as a block. Table 5-17
below illustrates the results from the hierarchical regression analysis in respect
with OLSM, e-trust and signal credibility.
Table 5-17 Results of Hierarchical regression analysis (ET as the dependent variable)
Independent Variables
Dependent Variables:ET
Step1 Step 2 Step3 Step 4
β t β t β t β t
Gender -0.012 -0.266 -0.021 -0.525 -0.005 -0.121 -0.006 -0.146
Age -0.029 -0.685 -0.049 -1.241 -0.069 -1.851 -0.068 -1.817
Education -0.090* -2.065 -0.075 -1.847 -0.092* -2.413 -0.092* -2.397
Monthly income 0.061 1.278 0.021 0.478 0.032 0.771 0.020 0.485
Shopping years 0.160** 3.495 0.119** 2.786 0.106** 2.639 0.101* 2.498
OLSM mean 0.378*** 9.634 0.279*** 7.173 0.312*** 7.476
MS mean 0.321*** 8.335 0.324*** 8.437
OLSMxMS 0.085* 2.145
R Square 0.036 0.174 0.266 0.272
Adjusted R Square 0.027 0.165 0.256 0.261
F 4.127** 19.474*** 28.673*** 25.827***
Note: *p<0.05 **p<0.01 ***p<0.001
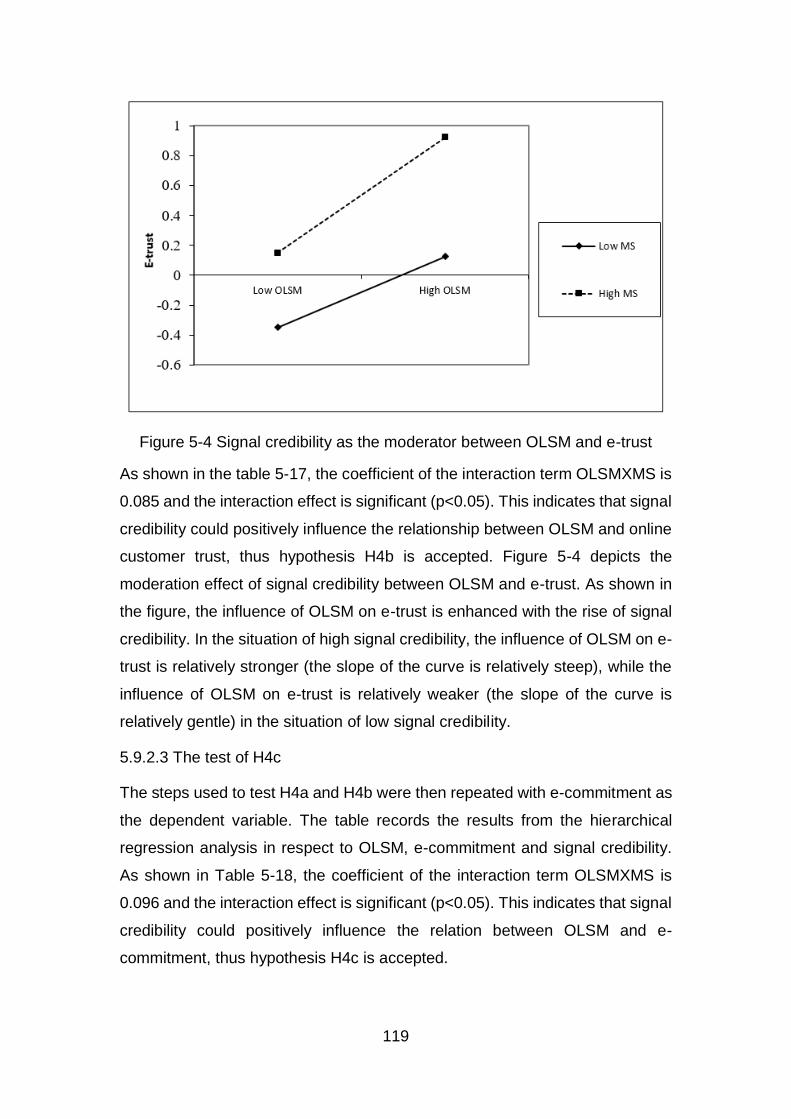
119
Figure 5-4 Signal credibility as the moderator between OLSM and e-trust
As shown in the table 5-17, the coefficient of the interaction term OLSMXMS is
0.085 and the interaction effect is significant (p<0.05). This indicates that signal
credibility could positively influence the relationship between OLSM and online
customer trust, thus hypothesis H4b is accepted. Figure 5-4 depicts the
moderation effect of signal credibility between OLSM and e-trust. As shown in
the figure, the influence of OLSM on e-trust is enhanced with the rise of signal
credibility. In the situation of high signal credibility, the influence of OLSM on e-
trust is relatively stronger (the slope of the curve is relatively steep), while the
influence of OLSM on e-trust is relatively weaker (the slope of the curve is
relatively gentle) in the situation of low signal credibility.
5.9.2.3 The test of H4c
The steps used to test H4a and H4b were then repeated with e-commitment as
the dependent variable. The table records the results from the hierarchical
regression analysis in respect to OLSM, e-commitment and signal credibility.
As shown in Table 5-18, the coefficient of the interaction term OLSMXMS is
0.096 and the interaction effect is significant (p<0.05). This indicates that signal
credibility could positively influence the relation between OLSM and e-
commitment, thus hypothesis H4c is accepted.
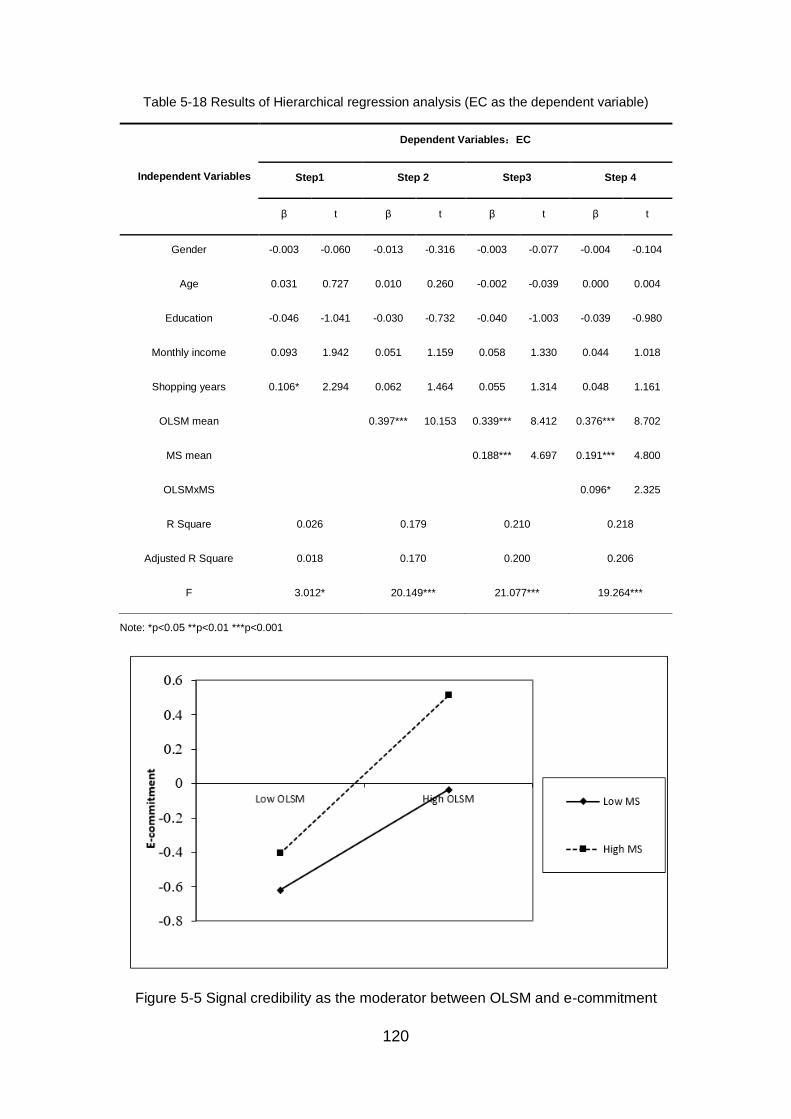
120
Table 5-18 Results of Hierarchical regression analysis (EC as the dependent variable)
Independent Variables
Dependent Variables:EC
Step1 Step 2 Step3 Step 4
β t β t β t β t
Gender -0.003 -0.060 -0.013 -0.316 -0.003 -0.077 -0.004 -0.104
Age 0.031 0.727 0.010 0.260 -0.002 -0.039 0.000 0.004
Education -0.046 -1.041 -0.030 -0.732 -0.040 -1.003 -0.039 -0.980
Monthly income 0.093 1.942 0.051 1.159 0.058 1.330 0.044 1.018
Shopping years 0.106* 2.294 0.062 1.464 0.055 1.314 0.048 1.161
OLSM mean 0.397*** 10.153 0.339*** 8.412 0.376*** 8.702
MS mean 0.188*** 4.697 0.191*** 4.800
OLSMxMS 0.096* 2.325
R Square 0.026 0.179 0.210 0.218
Adjusted R Square 0.018 0.170 0.200 0.206
F 3.012* 20.149*** 21.077*** 19.264***
Note: *p<0.05 **p<0.01 ***p<0.001
Figure 5-5 Signal credibility as the moderator between OLSM and e-commitment
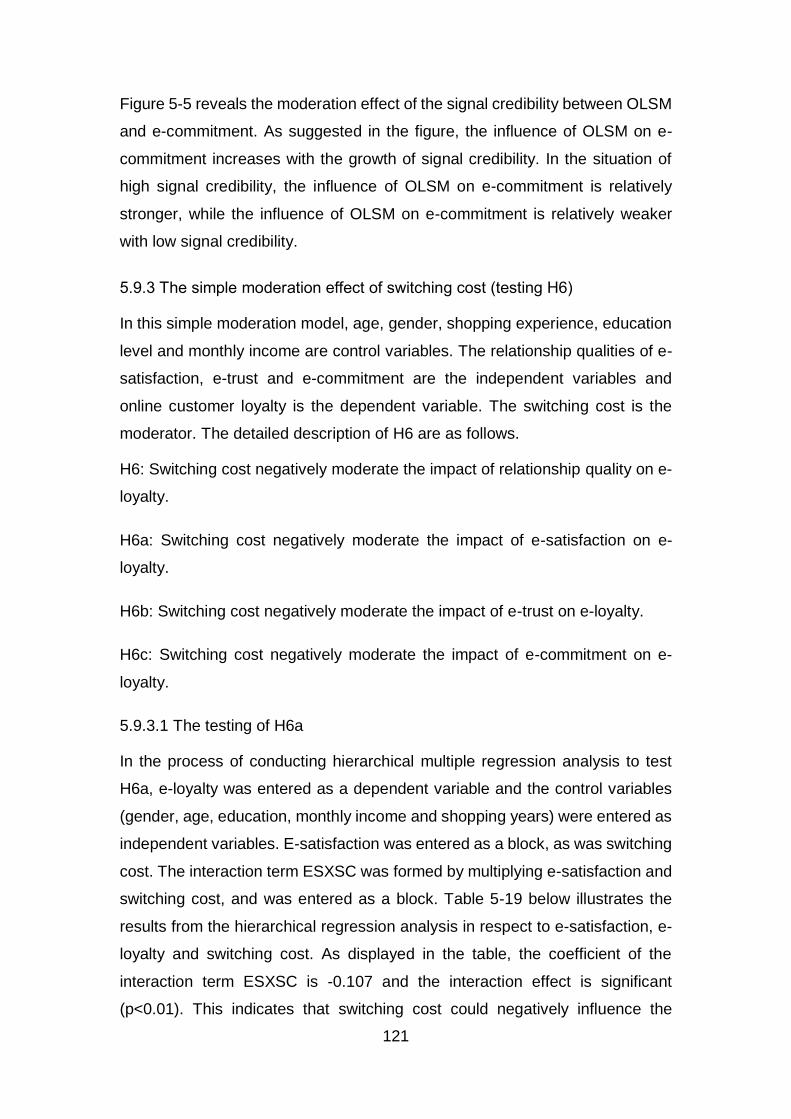
121
Figure 5-5 reveals the moderation effect of the signal credibility between OLSM
and e-commitment. As suggested in the figure, the influence of OLSM on e-
commitment increases with the growth of signal credibility. In the situation of
high signal credibility, the influence of OLSM on e-commitment is relatively
stronger, while the influence of OLSM on e-commitment is relatively weaker
with low signal credibility.
5.9.3 The simple moderation effect of switching cost (testing H6)
In this simple moderation model, age, gender, shopping experience, education
level and monthly income are control variables. The relationship qualities of e-
satisfaction, e-trust and e-commitment are the independent variables and
online customer loyalty is the dependent variable. The switching cost is the
moderator. The detailed description of H6 are as follows.
H6: Switching cost negatively moderate the impact of relationship quality on e-
loyalty.
H6a: Switching cost negatively moderate the impact of e-satisfaction on e-
loyalty.
H6b: Switching cost negatively moderate the impact of e-trust on e-loyalty.
H6c: Switching cost negatively moderate the impact of e-commitment on e-
loyalty.
5.9.3.1 The testing of H6a
In the process of conducting hierarchical multiple regression analysis to test
H6a, e-loyalty was entered as a dependent variable and the control variables
(gender, age, education, monthly income and shopping years) were entered as
independent variables. E-satisfaction was entered as a block, as was switching
cost. The interaction term ESXSC was formed by multiplying e-satisfaction and
switching cost, and was entered as a block. Table 5-19 below illustrates the
results from the hierarchical regression analysis in respect to e-satisfaction, e-
loyalty and switching cost. As displayed in the table, the coefficient of the
interaction term ESXSC is -0.107 and the interaction effect is significant
(p<0.01). This indicates that switching cost could negatively influence the
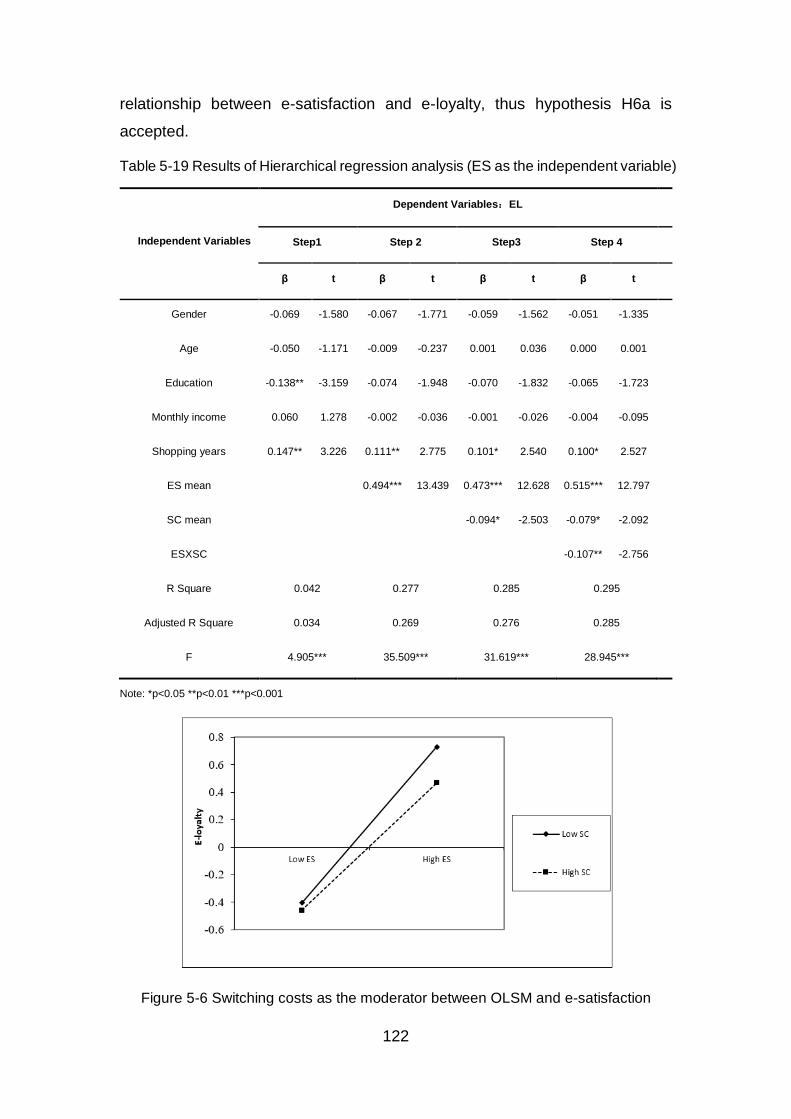
122
relationship between e-satisfaction and e-loyalty, thus hypothesis H6a is
accepted.
Table 5-19 Results of Hierarchical regression analysis (ES as the independent variable)
Independent Variables
Dependent Variables:EL
Step1 Step 2 Step3 Step 4
β t β t β t β t
Gender -0.069 -1.580 -0.067 -1.771 -0.059 -1.562 -0.051 -1.335
Age -0.050 -1.171 -0.009 -0.237 0.001 0.036 0.000 0.001
Education -0.138** -3.159 -0.074 -1.948 -0.070 -1.832 -0.065 -1.723
Monthly income 0.060 1.278 -0.002 -0.036 -0.001 -0.026 -0.004 -0.095
Shopping years 0.147** 3.226 0.111** 2.775 0.101* 2.540 0.100* 2.527
ES mean 0.494*** 13.439 0.473*** 12.628 0.515*** 12.797
SC mean -0.094* -2.503 -0.079* -2.092
ESXSC -0.107** -2.756
R Square 0.042 0.277 0.285 0.295
Adjusted R Square 0.034 0.269 0.276 0.285
F 4.905*** 35.509*** 31.619*** 28.945***
Note: *p<0.05 **p<0.01 ***p<0.001
Figure 5-6 Switching costs as the moderator between OLSM and e-satisfaction
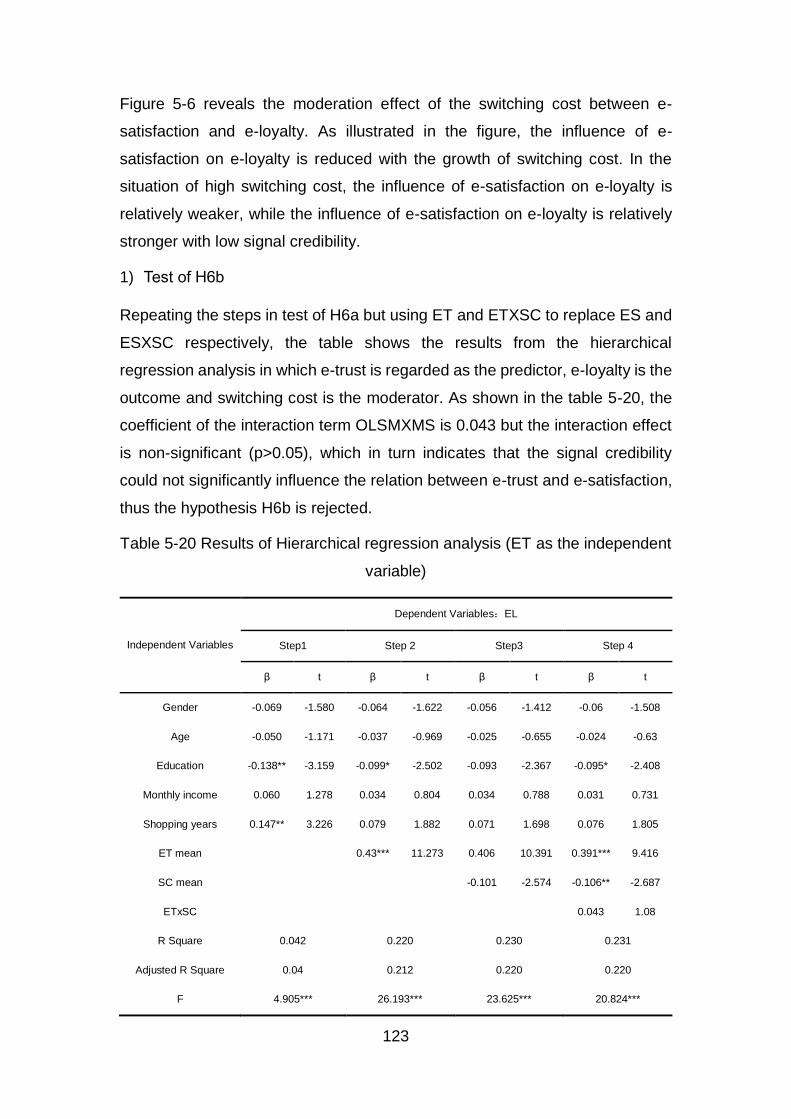
123
Figure 5-6 reveals the moderation effect of the switching cost between e-
satisfaction and e-loyalty. As illustrated in the figure, the influence of e-
satisfaction on e-loyalty is reduced with the growth of switching cost. In the
situation of high switching cost, the influence of e-satisfaction on e-loyalty is
relatively weaker, while the influence of e-satisfaction on e-loyalty is relatively
stronger with low signal credibility.
1) Test of H6b
Repeating the steps in test of H6a but using ET and ETXSC to replace ES and
ESXSC respectively, the table shows the results from the hierarchical
regression analysis in which e-trust is regarded as the predictor, e-loyalty is the
outcome and switching cost is the moderator. As shown in the table 5-20, the
coefficient of the interaction term OLSMXMS is 0.043 but the interaction effect
is non-significant (p>0.05), which in turn indicates that the signal credibility
could not significantly influence the relation between e-trust and e-satisfaction,
thus the hypothesis H6b is rejected.
Table 5-20 Results of Hierarchical regression analysis (ET as the independent
variable)
Independent Variables
Dependent Variables:EL
Step1 Step 2 Step3 Step 4
β t β t β t β t
Gender -0.069 -1.580 -0.064 -1.622 -0.056 -1.412 -0.06 -1.508
Age -0.050 -1.171 -0.037 -0.969 -0.025 -0.655 -0.024 -0.63
Education -0.138** -3.159 -0.099* -2.502 -0.093 -2.367 -0.095* -2.408
Monthly income 0.060 1.278 0.034 0.804 0.034 0.788 0.031 0.731
Shopping years 0.147** 3.226 0.079 1.882 0.071 1.698 0.076 1.805
ET mean 0.43*** 11.273 0.406 10.391 0.391*** 9.416
SC mean -0.101 -2.574 -0.106** -2.687
ETxSC 0.043 1.08
R Square 0.042 0.220 0.230 0.231
Adjusted R Square 0.04 0.212 0.220 0.220
F 4.905*** 26.193*** 23.625*** 20.824***
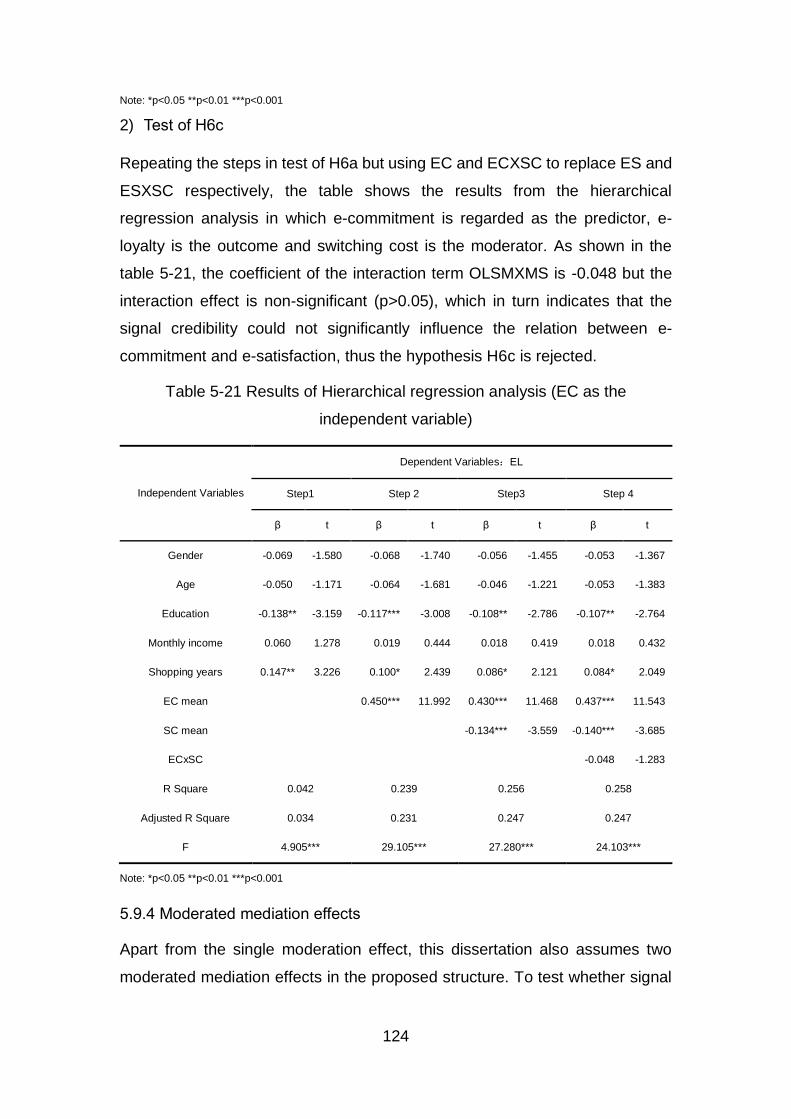
124
Note: *p<0.05 **p<0.01 ***p<0.001
2) Test of H6c
Repeating the steps in test of H6a but using EC and ECXSC to replace ES and
ESXSC respectively, the table shows the results from the hierarchical
regression analysis in which e-commitment is regarded as the predictor, e-
loyalty is the outcome and switching cost is the moderator. As shown in the
table 5-21, the coefficient of the interaction term OLSMXMS is -0.048 but the
interaction effect is non-significant (p>0.05), which in turn indicates that the
signal credibility could not significantly influence the relation between e-
commitment and e-satisfaction, thus the hypothesis H6c is rejected.
Table 5-21 Results of Hierarchical regression analysis (EC as the
independent variable)
Independent Variables
Dependent Variables:EL
Step1 Step 2 Step3 Step 4
β t β t β t β t
Gender -0.069 -1.580 -0.068 -1.740 -0.056 -1.455 -0.053 -1.367
Age -0.050 -1.171 -0.064 -1.681 -0.046 -1.221 -0.053 -1.383
Education -0.138** -3.159 -0.117*** -3.008 -0.108** -2.786 -0.107** -2.764
Monthly income 0.060 1.278 0.019 0.444 0.018 0.419 0.018 0.432
Shopping years 0.147** 3.226 0.100* 2.439 0.086* 2.121 0.084* 2.049
EC mean 0.450*** 11.992 0.430*** 11.468 0.437*** 11.543
SC mean -0.134*** -3.559 -0.140*** -3.685
ECxSC -0.048 -1.283
R Square 0.042 0.239 0.256 0.258
Adjusted R Square 0.034 0.231 0.247 0.247
F 4.905*** 29.105*** 27.280*** 24.103***
Note: *p<0.05 **p<0.01 ***p<0.001
5.9.4 Moderated mediation effects
Apart from the single moderation effect, this dissertation also assumes two
moderated mediation effects in the proposed structure. To test whether signal
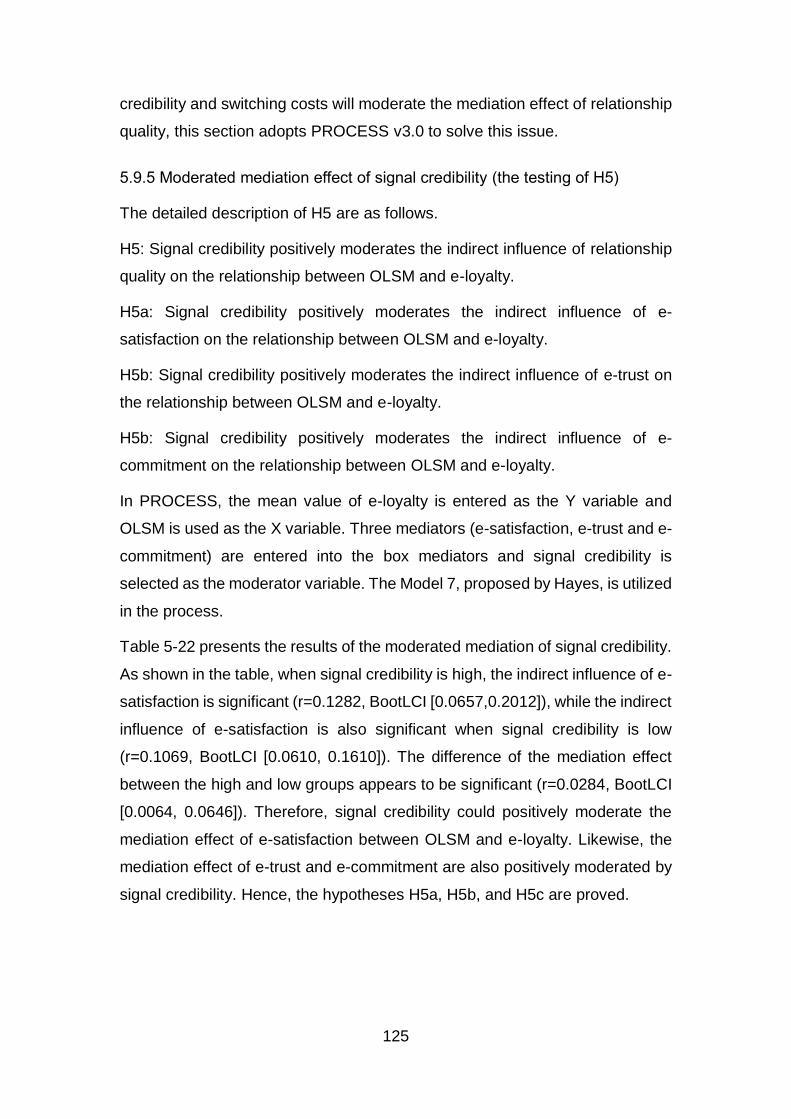
125
credibility and switching costs will moderate the mediation effect of relationship
quality, this section adopts PROCESS v3.0 to solve this issue.
5.9.5 Moderated mediation effect of signal credibility (the testing of H5)
The detailed description of H5 are as follows.
H5: Signal credibility positively moderates the indirect influence of relationship
quality on the relationship between OLSM and e-loyalty.
H5a: Signal credibility positively moderates the indirect influence of e-
satisfaction on the relationship between OLSM and e-loyalty.
H5b: Signal credibility positively moderates the indirect influence of e-trust on
the relationship between OLSM and e-loyalty.
H5b: Signal credibility positively moderates the indirect influence of e-
commitment on the relationship between OLSM and e-loyalty.
In PROCESS, the mean value of e-loyalty is entered as the Y variable and
OLSM is used as the X variable. Three mediators (e-satisfaction, e-trust and e-
commitment) are entered into the box mediators and signal credibility is
selected as the moderator variable. The Model 7, proposed by Hayes, is utilized
in the process.
Table 5-22 presents the results of the moderated mediation of signal credibility.
As shown in the table, when signal credibility is high, the indirect influence of e-
satisfaction is significant (r=0.1282, BootLCI [0.0657,0.2012]), while the indirect
influence of e-satisfaction is also significant when signal credibility is low
(r=0.1069, BootLCI [0.0610, 0.1610]). The difference of the mediation effect
between the high and low groups appears to be significant (r=0.0284, BootLCI
[0.0064, 0.0646]). Therefore, signal credibility could positively moderate the
mediation effect of e-satisfaction between OLSM and e-loyalty. Likewise, the
mediation effect of e-trust and e-commitment are also positively moderated by
signal credibility. Hence, the hypotheses H5a, H5b, and H5c are proved.
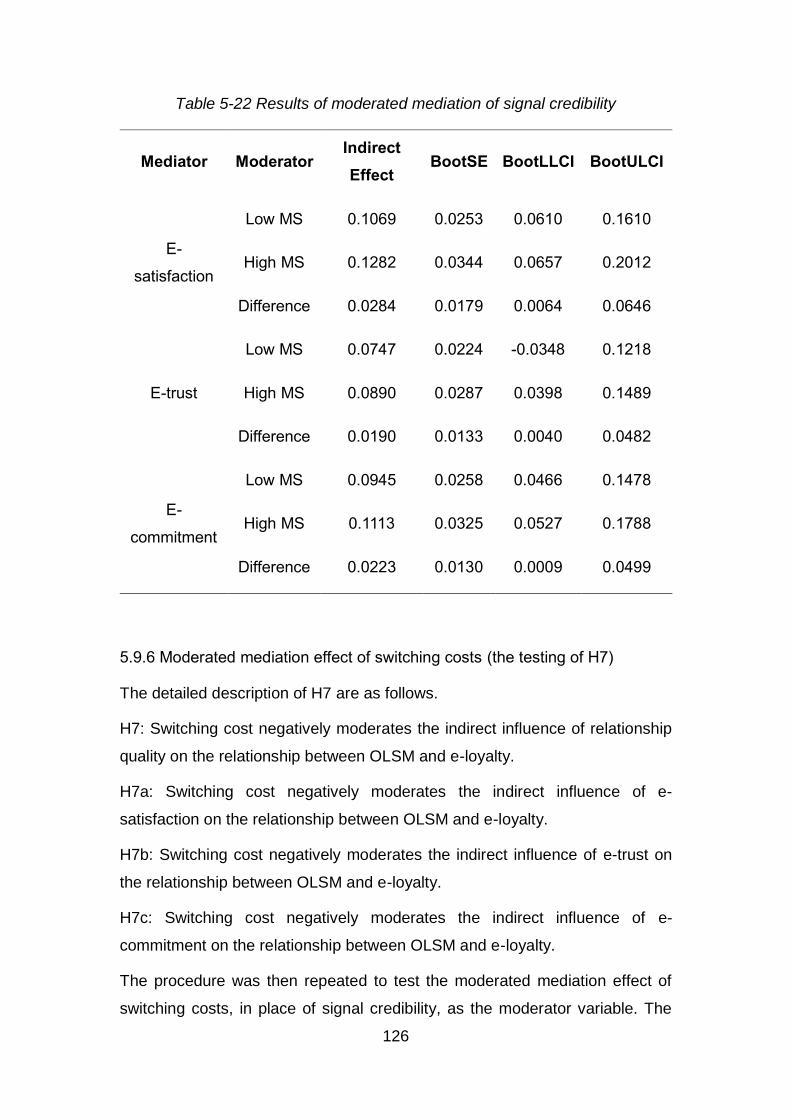
126
Table 5-22 Results of moderated mediation of signal credibility
Mediator Moderator Indirect
Effect BootSE BootLLCI BootULCI
E-
satisfaction
Low MS 0.1069 0.0253 0.0610 0.1610
High MS 0.1282 0.0344 0.0657 0.2012
Difference 0.0284 0.0179 0.0064 0.0646
E-trust
Low MS 0.0747 0.0224 -0.0348 0.1218
High MS 0.0890 0.0287 0.0398 0.1489
Difference 0.0190 0.0133 0.0040 0.0482
E-
commitment
Low MS 0.0945 0.0258 0.0466 0.1478
High MS 0.1113 0.0325 0.0527 0.1788
Difference 0.0223 0.0130 0.0009 0.0499
5.9.6 Moderated mediation effect of switching costs (the testing of H7)
The detailed description of H7 are as follows.
H7: Switching cost negatively moderates the indirect influence of relationship
quality on the relationship between OLSM and e-loyalty.
H7a: Switching cost negatively moderates the indirect influence of e-
satisfaction on the relationship between OLSM and e-loyalty.
H7b: Switching cost negatively moderates the indirect influence of e-trust on
the relationship between OLSM and e-loyalty.
H7c: Switching cost negatively moderates the indirect influence of e-
commitment on the relationship between OLSM and e-loyalty.
The procedure was then repeated to test the moderated mediation effect of
switching costs, in place of signal credibility, as the moderator variable. The
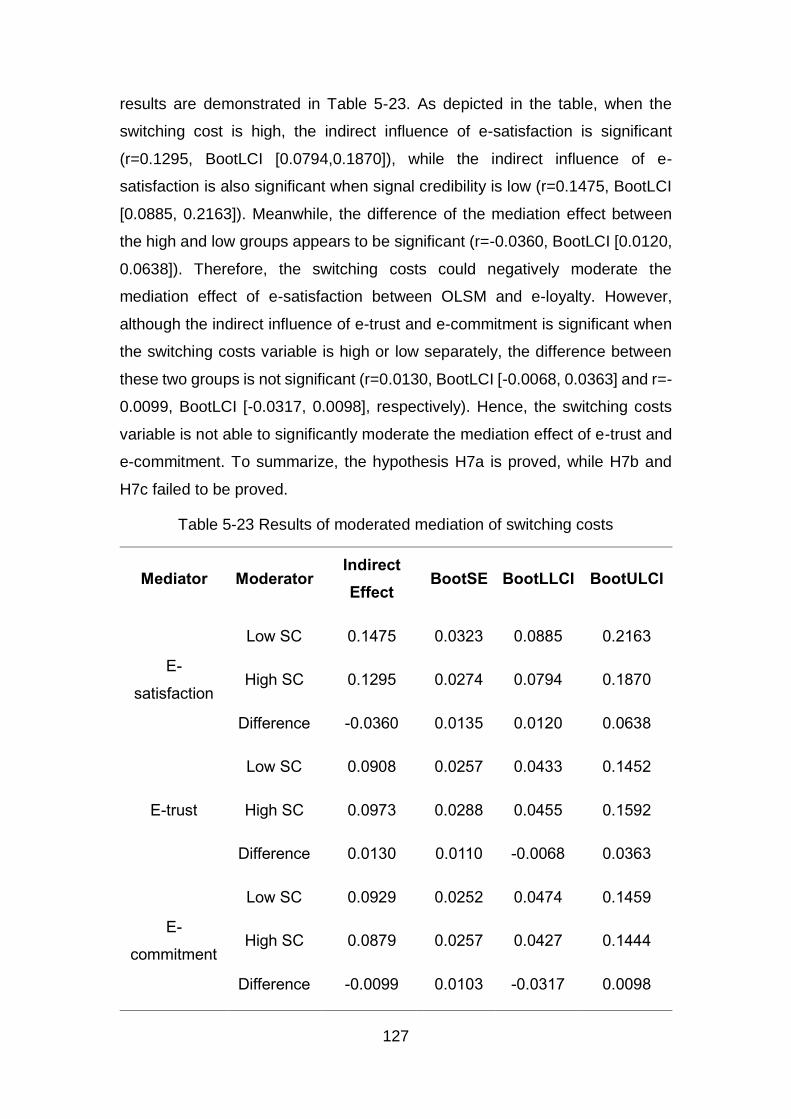
127
results are demonstrated in Table 5-23. As depicted in the table, when the
switching cost is high, the indirect influence of e-satisfaction is significant
(r=0.1295, BootLCI [0.0794,0.1870]), while the indirect influence of e-
satisfaction is also significant when signal credibility is low (r=0.1475, BootLCI
[0.0885, 0.2163]). Meanwhile, the difference of the mediation effect between
the high and low groups appears to be significant (r=-0.0360, BootLCI [0.0120,
0.0638]). Therefore, the switching costs could negatively moderate the
mediation effect of e-satisfaction between OLSM and e-loyalty. However,
although the indirect influence of e-trust and e-commitment is significant when
the switching costs variable is high or low separately, the difference between
these two groups is not significant (r=0.0130, BootLCI [-0.0068, 0.0363] and r=-
0.0099, BootLCI [-0.0317, 0.0098], respectively). Hence, the switching costs
variable is not able to significantly moderate the mediation effect of e-trust and
e-commitment. To summarize, the hypothesis H7a is proved, while H7b and
H7c failed to be proved.
Table 5-23 Results of moderated mediation of switching costs
Mediator Moderator Indirect
Effect BootSE BootLLCI BootULCI
E-
satisfaction
Low SC 0.1475 0.0323 0.0885 0.2163
High SC 0.1295 0.0274 0.0794 0.1870
Difference -0.0360 0.0135 0.0120 0.0638
E-trust
Low SC 0.0908 0.0257 0.0433 0.1452
High SC 0.0973 0.0288 0.0455 0.1592
Difference 0.0130 0.0110 -0.0068 0.0363
E-
commitment
Low SC 0.0929 0.0252 0.0474 0.1459
High SC 0.0879 0.0257 0.0427 0.1444
Difference -0.0099 0.0103 -0.0317 0.0098
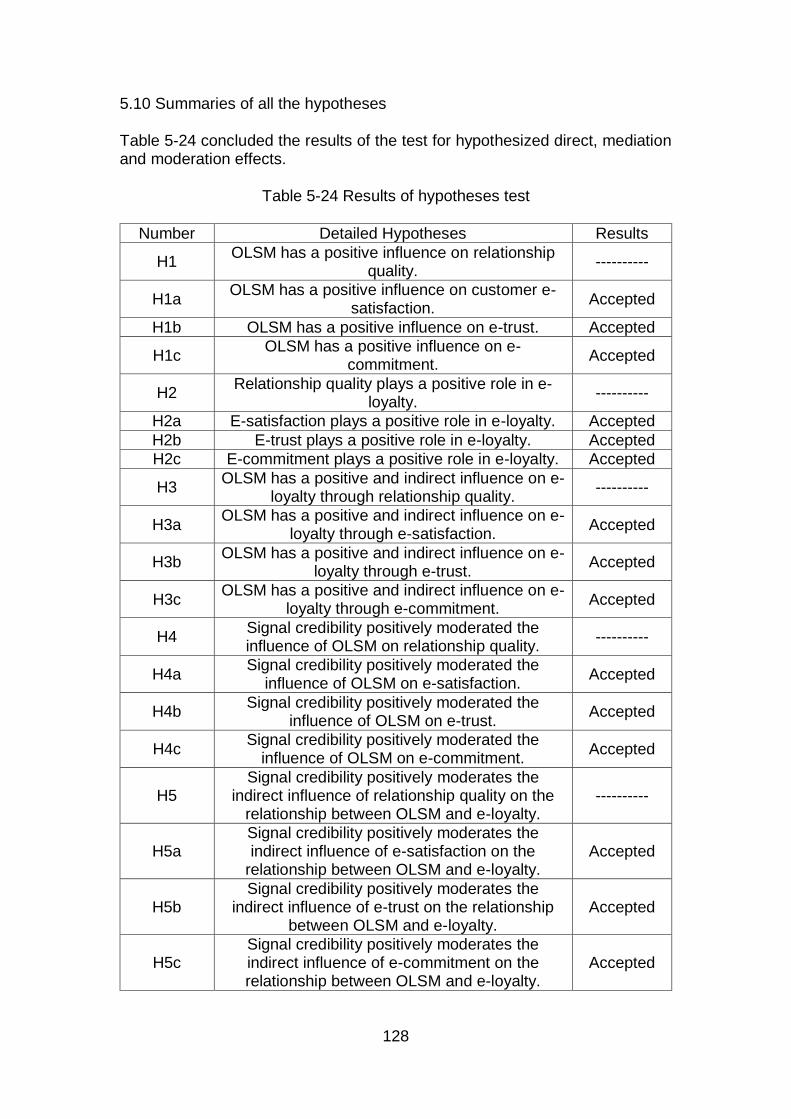
128
5.10 Summaries of all the hypotheses
Table 5-24 concluded the results of the test for hypothesized direct, mediation and moderation effects.
Table 5-24 Results of hypotheses test
Number Detailed Hypotheses Results
H1 OLSM has a positive influence on relationship
quality. ----------
H1a OLSM has a positive influence on customer e-
satisfaction. Accepted
H1b OLSM has a positive influence on e-trust. Accepted
H1c OLSM has a positive influence on e-
commitment. Accepted
H2 Relationship quality plays a positive role in e-
loyalty. ----------
H2a E-satisfaction plays a positive role in e-loyalty. Accepted
H2b E-trust plays a positive role in e-loyalty. Accepted
H2c E-commitment plays a positive role in e-loyalty. Accepted
H3 OLSM has a positive and indirect influence on e-
loyalty through relationship quality. ----------
H3a OLSM has a positive and indirect influence on e-
loyalty through e-satisfaction. Accepted
H3b OLSM has a positive and indirect influence on e-
loyalty through e-trust. Accepted
H3c OLSM has a positive and indirect influence on e-
loyalty through e-commitment. Accepted
H4 Signal credibility positively moderated the influence of OLSM on relationship quality.
----------
H4a Signal credibility positively moderated the
influence of OLSM on e-satisfaction. Accepted
H4b Signal credibility positively moderated the
influence of OLSM on e-trust. Accepted
H4c Signal credibility positively moderated the
influence of OLSM on e-commitment. Accepted
H5 Signal credibility positively moderates the
indirect influence of relationship quality on the relationship between OLSM and e-loyalty.
----------
H5a Signal credibility positively moderates the indirect influence of e-satisfaction on the
relationship between OLSM and e-loyalty. Accepted
H5b Signal credibility positively moderates the
indirect influence of e-trust on the relationship between OLSM and e-loyalty.
Accepted
H5c Signal credibility positively moderates the indirect influence of e-commitment on the relationship between OLSM and e-loyalty.
Accepted
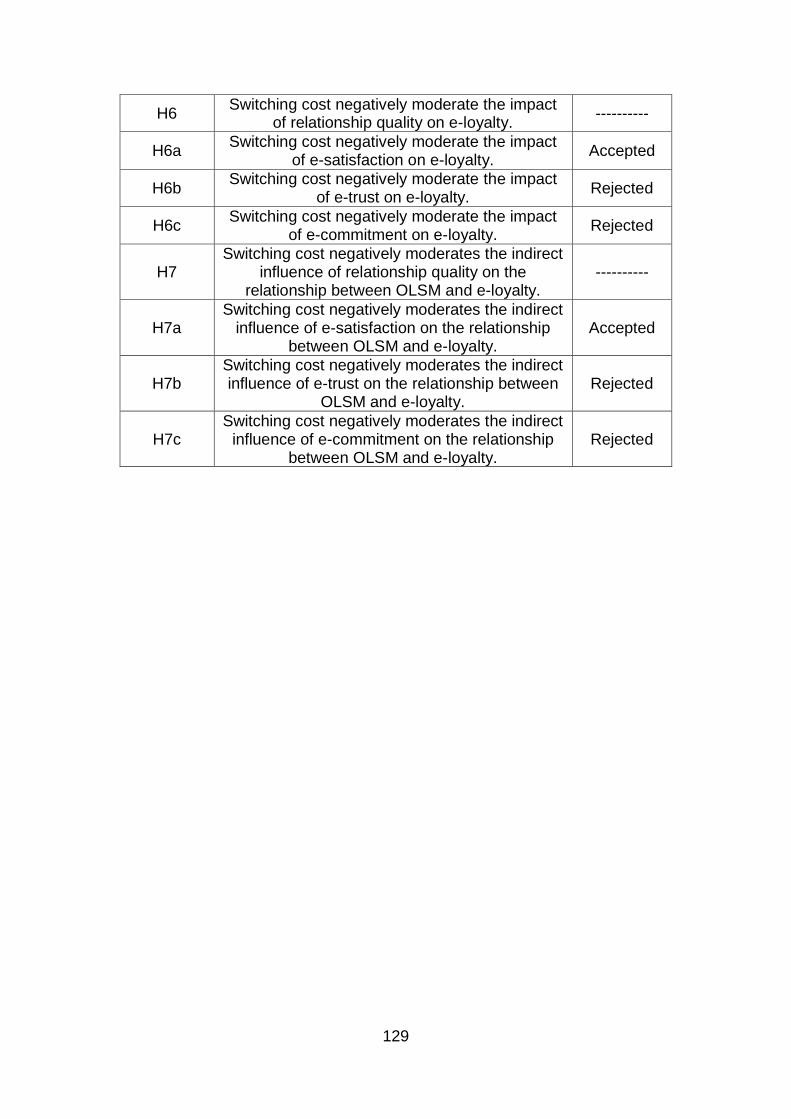
129
H6 Switching cost negatively moderate the impact
of relationship quality on e-loyalty. ----------
H6a Switching cost negatively moderate the impact
of e-satisfaction on e-loyalty. Accepted
H6b Switching cost negatively moderate the impact
of e-trust on e-loyalty. Rejected
H6c Switching cost negatively moderate the impact
of e-commitment on e-loyalty. Rejected
H7 Switching cost negatively moderates the indirect
influence of relationship quality on the relationship between OLSM and e-loyalty.
----------
H7a Switching cost negatively moderates the indirect
influence of e-satisfaction on the relationship between OLSM and e-loyalty.
Accepted
H7b Switching cost negatively moderates the indirect influence of e-trust on the relationship between
OLSM and e-loyalty. Rejected
H7c Switching cost negatively moderates the indirect
influence of e-commitment on the relationship between OLSM and e-loyalty.
Rejected
130
Chapter 6 Discussion on the findings
6.1 Introduction
The aim of this chapter is to discuss the results of the data analysis described
in Chapter 5. It contains three main sections: the first section views and
presents the results and rationale behind the confirmatory factor analysis of the
entire sample, the second section includes a discussion of the results of the
structural equation modeling and the relationship between online logistics
service mode (OLSM), relationship quality, and online customer loyalty, and the
third section includes a discussion of the moderation effect of signal credibility
and the moderation effect of switching cost.
6.2 Discussion of the proposed conceptual model: Confirmatory factor analysis
The results of the confirmatory factor analysis for the whole sample show good
model fit indices and excellent standardized estimates greater than 0.50, with
corresponding significant p-values. Moreover, the calculated average variance
explained (AVE) value and composite ratio (CR) value of each scale are much
higher than the expected criteria. Therefore, no validity issues are reported (see
Table 5-11, Chapter 5). The validity tests are necessary as they indicate the
validity of the conceptual framework and prove that the results are reliable and
valid across samples (Padenga, 2016). Padenga (2016) and Podsakoff et al.
(2003) stated that the process of confirmatory factor analysis could be
underpinned and assisted by checking for common method bias (CMB). The
results of the CMB test in Chapter 5 indicate that CMB does not affect the data
and the results.
6.3 Discussion of the proposed conceptual model: Structural equation modeling
The model fit results for the proposed structural model confirm a fit to the data
(see Table 5-13: Chapter 5). This shows that the structural model is suitable for
both obtaining the path coefficients between latent variables (i.e., OLSM, E-
satisfaction, E-trust, E-commitment, and E-loyalty) and testing the mediation
effect of relationship quality. The discussion in this section is sub-divided into
three parts: 1) a discussion of the relationship between OLSM and relationship
quality; 2) a discussion of the relationship between relationship quality and
electronic customer loyalty; 3) a discussion of the mediation effects of
131
relationship quality. Crosby (1990) stated that relationship quality is the ability
of the salesman to reduce customers’ perceived uncertainty. This report applies
this definition to the relationship between customers and online retailers.
Relationship quality consists of three dimensions: customer satisfaction, trust,
and commitment.
6.3.1 Discussion of the relationship between OLSM and relationship quality
Hypothesis H1a examined whether OLSM influences electronic customer
satisfaction.
H1a: OLSM has a positive influence on customer e-satisfaction.
The results of this study suggest that there is a positive relationship between
OLSM and customer e-satisfaction (r=0.438, p<0.001). This result is expected
as it is in accordance with the definition of customer satisfaction. According to
Chang and Chen (2009), customer satisfaction refers to an affective response
associated with customers’ experiences during the process of purchasing and
an overall evaluation of the product or service that is purchased from the last
online retailer.
The adoption of OLSM makes it possible for customers to choose their
preferred logistics mode in terms of delivering or returning purchased goods.
Consequently, the use of OLSM could meet customers’ personalized demands
relating to logistics services. This would, in turn, enhance the satisfaction
associated with their shopping experiences. The provision of a series of third-
party logistics service providers and delivery time slots for customers may also
contribute to an increase in customers’ perceived control of the logistics service,
which in turn may decrease customers’ anxiety associated with the uncertainty
of the logistics and increase their satisfaction.
Hypothesis H1b examined whether OLSM influences online customer trust.
H1b: OLSM has a positive influence on e-trust.
The results of this study suggest that there is a positive relationship between
OLSM and customer e-trust (r=0.465, p<0.001). According to Morgan and Hunt
(1994), customer trust refers to the perceived reliability and integrity of the
exchange partner. This means that OLSM could help to increase the perceived
132
reliability and integrity of online retailers when customers purchase goods or
services from them. According to Wirtz and Lihotzky (2003), customers cannot
judge whether an online retailer is trustworthy or not as there is a lack of
information.
In a sense, the adoption of OLSM could reflect the willingness of online retailers
to provide personalized services to customers and would allow customers to
obtain information about the logistics service. In addition, the provision of OLSM
will increase both the cost and the complexity of e-commerce supply chain
management, which in turn requires more investment from the online retailer.
To some extent, OLSM reflects the operational ability of an online retailer to
achieve its personalized service.
The results of this study not only agree with the findings of Dooney and Cannon
(1997), i.e., the willingness of an offline company to provide personalized
service positively affects customers’ trust, but also supports the findings of
Koufaris and Hampton-Sosa (2004) that online enterprise ability appears to be
a critical factor that helps develop customer trust.
Hypothesis H1c examined whether OLSM influences online customer
commitment.
H1c: OLSM has a positive influence on e-commitment.
The results of this study indicate that there is a positive relationship between
OLSM and customer e-commitment (r=0.484, p<0.001). The provision of OLSM
enables customers to select their preferred delivery method, time slot, and the
third-party logistics service provider, all of which is perceived as value-added
services. The results of this study support the findings of Hsieh et al. (2005)
that the offer of value-added services positively influences customer
commitment. OLSM, as a value-added service, makes customers feel
respected and valued by online retailers, leading to emotional or psychological
dependence on the retailers and a willingness to maintain a relationship with
them.
With the development of the online market, online shopping has become more
and more popular. Customers pay more attention to the quality of products and
logistics services. Logistics services are becoming an increasingly significant
133
part of customers’ shopping experiences and re-purchasing intentions. The
provision of OLSM aims to improve the whole logistics service to reduce
customers’ perceived uncertainty of logistics services, subsequently improving
the relationship between customers and online retailers. The results of this
research also reveal that OLSM could positively affect relationship quality.
Therefore, online retailers should provide OLSM and optimize the elements of
OLSM to increase online customer satisfaction, trust, and commitment.
6.3.2 Discussion of the relationship between relationship quality and e-loyalty
Hypothesis H2a examined whether online customer satisfaction influences
online customer loyalty.
H2a: E-satisfaction plays a positive role in e-loyalty.
The results of this study suggest that there is a positive relationship between e-
satisfaction and e-loyalty (r=0.381, p<0.001). This result supports the findings
of Anderson and Srinivasan (2003) and Safa and Ismail (2013), who argued
that dissatisfied customers do not establish deep relationships with companies
and that customer satisfaction has a positive effect on the development of
customer loyalty.
Typically, if online customers feel satisfied with their most recent shopping
experience, they are more likely to recommend the retailer to their friends. They
may also be willing to repurchase from the same retailer, resulting in the
development of loyalty. If a customer’s demands are not met, however, they
may seek alternative retailers and even complain about the retailer who let them
down to their friends. Therefore, customer satisfaction is a necessary ingredient
when cultivating loyal customers and it is vital for online retailers to pay attention
to customers' demands and expectations to increase customer satisfaction.
Hypothesis H2b examined whether online customer trust influences online
customer loyalty.
H2b: E-trust plays a positive role in e-loyalty.
The results of this study indicate that there is a positive relationship between e-
trust and e-loyalty (r=0.244, p<0.001). This supports the findings of Wang et al.
(2006) and Palvia (2009). Compared to traditional retailing market, more risks
134
and uncertainties exist in the e-commerce market as customers cannot observe
or pre-use the products or services provided by the online retailers.
Consequently, it is difficult for customers to judge the online retailer based on
standardized criteria due to the lack of available information. This prevents the
development of customer trust. Once consumers trust an online retailer,
however, they may have more confidence in the quality of products or services
provided by them. They will, therefore, be more willing to maintain the buyer-
seller relationship with the retailer rather, leading to the development of
customer loyalty.
Hypothesis H2c examined whether online customer commitment influences
online customer loyalty.
H2c: E-commitment plays a positive role in e-loyalty.
The results of the study suggest that there is a positive relationship between e-
commitment and e-loyalty (r=0.270, p<0.001). This finding is consistent with the
previous literature in relationship marketing (Morgan and Hunt, 1994;
Bendapudi and Berry, 1997). This result demonstrates that customers with high
levels of commitment to the online retailer are more likely to say positive and
meaningful things about the retailer and to recommend and encourage friends
to use this retailer. This implies that customer commitment not only results in
frequent repurchase behavior, but also contributes to positive customer
attitudes.
Customer commitment refers to the customer’s belief that their ongoing
relationship with the retailer is worth maintaining (Tsao and Hsieh, 2012).
Committed customers have favorable attitudes towards the online retailer and
are willing to become advocates for the store and promote their products or
services. Therefore, online retailers need to encourage customer commitment
by rewarding loyal customers and providing excellent after-sale service.
The results of this study show that all three hypotheses, H2a, H2b, and H2c,
are correct and that relationship quality (e-satisfaction, e-trust, and e-
commitment) plays a positive role in the development of online customer loyalty.
Higher relationship quality prompts positive customer attitudes towards the
online retailer and contributes to repurchase behavior, resulting in the
135
development of customer loyalty. Therefore, it is important for online retailers
to improve the quality of their relationships with customers in order to gain their
loyalty.
6.3.3 Discussion of the mediation effect of relationship quality
Hypothesis H3 examined whether the quality of the relationship between online
retailers and customers mediates the relationship between OLSM and online
customer loyalty. H3 contains three parts:
H3a: OLSM has a positive and indirect influence on e-loyalty through e-
satisfaction.
H3b: OLSM has a positive and indirect influence on e-loyalty through e-trust.
H3c: OLSM has a positive and indirect influence on e-loyalty through e-
commitment.
The results of this study indicate that online customer satisfaction, trust, and
commitment mediates the relationship between OLSM and online customer
loyalty. The specific mediating effect coefficients of e-satisfaction, e-trust, and
e-commitment are 0.167, 0,113, and 0.131, respectively (all p<0.05). This
indicates that OLSM has a positive and indirect influence on e-loyalty by
positively impacting relationship quality (e-satisfaction, e-trust, and e-
commitment).
According to signaling theory, the market signal is released to help reduce
consumers’ perceived uncertainty. The provision of OLSM makes it possible for
customers to choose their preferred logistics service, thus enhancing their
perceived control and decreasing their perceived uncertainty regarding the
logistics service. OLSM can, therefore, be regarded as a kind of market signal
that improves the quality of customer-retailer relationships.
In addition, the results of this research support the findings of Verma et al. (2015)
regarding relationship investment. Relationship investment refers to the
resources and efforts that customers think online retailers invest in the
maintenance or enhance of their relationships with them. Relationship
investment could impact customer loyalty by influencing relationship quality.
136
As discussed previously, the provision of OLSM requires more investment from
online retailers to meet customers’ demands and expectations. Therefore,
OLSM can be treated as a specific relationship investment that affects the
quality of the relationship between the online retailers and customers, thus
influencing online customer loyalty.
What is more, by comparing the specific mediating effect coefficient of these
three variables, it can be seen that the mediating effect of customer satisfaction
is the highest, followed by the effect of customer commitment, and finally the
mediating effect of customer trust. This provides online retailers with an insight
into how they can influence e-loyalty by affecting the different dimensions of
relationship quality.
Customer loyalty plays a vital role in successful businesses. Compared to
customer loyalty in the traditional retail market, it is more difficult, but more
meaningful, to develop customer loyalty in the e-commerce market. OLSM
could positively influence the development of e-loyalty by positively affecting
relationship quality (e-satisfaction, e-trust, and e-commitment). This means that
OLSM is very important in the online market. Therefore, to maintain their
relationships with existing customers and attract new customers, online
retailers should provide OLSM. They should also optimize OSLM by providing
selected third-party logistics service providers and offering detailed delivery
time slots.
6.4 Discussion of the moderation effect
This section discusses the proposed moderation effect in this study and is
divided into two sub-sections: a discussion of the moderation effect of signal
credibility and a discussion of the moderation effect of switching costs.
6.4.1 Discussion of the moderation effect of signal credibility
Hypothesis H4 examined whether signal credibility moderates the relationship
between OLSM and relationship quality, while hypothesis H5 examined
whether signal credibility moderates the mediation effect of relationship quality
on OLSM and online customer loyalty. Each hypothesis consists of three parts:
137
H4a: Signal credibility positively moderates the influence of OLSM on e-
satisfaction.
H4b: Signal credibility positively moderates the influence of OLSM on e-trust.
H4c: Signal credibility positively moderates the influence of OLSM on e-
commitment.
H5a: Signal credibility positively moderates the indirect influence of e-
satisfaction on the relationship between OLSM and e-loyalty.
H5b: Signal credibility positively moderates the indirect influence of e-trust on
the relationship between OLSM and e-loyalty.
H5b: Signal credibility positively moderates the indirect influence of e-
commitment on the relationship between OLSM and e-loyalty.
The results of this study suggest that signal credibility positively moderates
online customer satisfaction, trust, and commitment, and that signal credibility
positively moderates the mediation effect of relationship quality on OLSM and
online customer loyalty. In other words, an increase in signal credibility leads to
an increase in the positive influence of OLSM on relationship quality and the
mediation effect of relationship quality.
The verification of H4 and H5 indicates that the influence of OLSM on
relationship quality and the indirect influence of OLSM on e-loyalty through
relationship quality are both affected by a change in logistics service price. The
higher the logistics service price, the higher the influence. The logistics service
price could refer to the integrity of the online retailer and the logistics service
quality to some extent.
It is better for online retailers to provide free delivery services when customers
spend a certain amount rather than providing free delivery services without any
specific requirements. For online shoppers, although some third-party logistic
providers offer a low delivery price, these providers are not the shoppers’
preferred choice as they are perceived to be of low quality. This could also
explain why some online retailers with high delivery prices have so many loyal
customers.
138
6.4.2 Discussion of the moderation effect of switching costs
Hypothesis H6 examined whether switching costs moderate the relationship
between relationship quality and e-loyalty, while hypothesis H7 examined
whether switching costs moderate the mediation effect of relationship quality
on OLSM and online customer loyalty. Each hypothesis consists of three parts:
H6a: Switching costs negatively moderate the impact of e-satisfaction on e-
loyalty.
H6b: Switching costs negatively moderate the impact of e-trust on e-loyalty.
H6c: Switching costs negatively moderate the impact of e-commitment on e-
loyalty.
H7a: Switching cost negatively moderates the indirect influence of e-
satisfaction on the relationship between OLSM and e-loyalty.
H7b: Switching cost negatively moderates the indirect influence of e-trust on
the relationship between OLSM and e-loyalty.
H7c: Switching cost negatively moderates the indirect influence of e-
commitment on the relationship between OLSM and e-loyalty.
The results of this study suggest that switching costs negatively moderate
online customer satisfaction and the mediation effect of e-satisfaction on OLSM
and online customer loyalty. These results agree with the findings of
Ranaweera and Prabhu (2000) and Aydin et al. (2005), who argued that the
perceived switching costs reduce customers’ sensitivity to the level of customer
satisfaction. This could be due to the fact that if customers perceive the
switching costs to be higher than the potential benefits of changing online
retailers, they may decide to stay with the previous retailer even if they were
not satisfied with them.
Hypotheses H6b, H6c, H7b, and H7c are rejected, however, as the influence of
OLSM on e-trust (e-commitment) and the mediation effect of e-trust (e-
commitment) are not significantly moderated by switching costs. One of the
possible reasons for this may be that when customers believe that an online
retailer is trustworthy and have strong confidence in the retailer, they may be
firmly loyal to them, thus the impact of switching costs weakens.
139
According to Tulin et al. (2002), brand trust contributes to the reduction of
customers’ price sensitivity. A retailer can be regarded as a type of brand and
customer trust could reduce the impact of external rational factors, such as
switching costs. Likewise, committed customers may have the emotional and
psychological dependence on a retailer and believe that their chosen supplier
is the best in its field, thus the impact of rational factors like switching costs
weakens. Hofmeyr and Rice (2003) argued that the more committed a
consumer is to a brand or retailer, the less important price becomes in their
purchase decision.
140
Chapter 7 Conclusions
7.1 Overview
Due to the development of the Internet and technology in recent years, more
and more customers choose to shop online. Fierce competition exists in the
online retail market, which forces online retailers to try their best to meet
customers’ demands. Logistics services play a significant role in customers’
intentions and behaviors. Therefore, meeting customers’ demands and
expectations regarding logistics services is an important way of developing
customer loyalty and increasing a retailer’s competitiveness.
To obtain new customers and improve relationships with existing customers,
online retailers integrate several kinds of logistics service elements to provide
a particular kind of customized service: OLSM. The provision of OLSM makes
it possible for customers to choose their preferred estimated delivery time, their
preferred third-party logistics providers and so on. It also seems that OLSM
impacts customer loyalty, however, how OLSM influences customer loyalty
remains unidentified, and the proposed strategies of online retailers that are
associated with logistics services lack theoretical foundations. Therefore, this
study aimed to identify the mechanism of how OLSM affects customer loyalty.
By referring to signaling theory and relationship marketing theory, this study
puts forward a proposed theoretical model containing several variables, such
as OLSM, relationship quality, e-loyalty, signal credibility, and switching costs.
In this model, relationship quality is assumed to have a mediating effect and
signal credibility and switching costs are assumed to have a moderating effect.
In this study, relationship quality consists of customer satisfaction, trust, and
commitment, and signal credibility refers to the logistics service price. The main
findings are as follows:
(1) OLSM could affect online customer loyalty through relationship quality.
OLSM positively influences three dimensions of relationship quality (i.e. e-
satisfaction, e-trust, and e-commitment), and these three dimensions have a
positive influence on online customer loyalty. It is worth noting that online
customer loyalty can also be positively and indirectly affected by OLSM through
these three dimensions as relationship quality mediates the relationship
141
between OLSM and online customer loyalty. In addition, the greatest mediation
influence of OLSM on e-loyalty appears to exist in online customer satisfaction,
followed by e-commitment and then e-trust.
(2) Signal credibility positively moderates the influence of OLSM on e-loyalty.
Signal credibility, which in this study refers to the logistics service price, could
positively moderate the relationship between OLSM and relationship quality (e-
satisfaction, e-trust and e-commitment). This means that the higher the signal
credibility, the stronger the positive impact of OLSM on relationship quality.
Furthermore, signal credibility could positively moderate the indirect influence
of OLSM on e-loyalty by positively affecting relationship quality. In other words,
the indirect influence of OLSM on e-loyalty through relationship quality also
increases if signal credibility increases, while the mediation effect of relationship
quality weakens with a decrease in signal credibility.
(3) Switching costs negatively moderate the influence of OLSM on e-loyalty.
Switching costs negatively moderate the relationship between OLSM and
online customer satisfaction. This means that the higher the switching costs,
the weaker the positive impact of OLSM on e-satisfaction. In addition, switching
costs can negatively moderate the indirect influence of OLSM on e-loyalty by
positively affecting e-satisfaction. This means that the indirect influence of
OLSM on e-loyalty through e-satisfaction weakens if the switching costs
increase, while the mediation effect of e-satisfaction increases with a decrease
in switching costs.
7.2 Theoretical contributions
This dissertation highlights some of the limitations of previous studies. The
theoretical contributions of this thesis are as follows:
Firstly, there is limited knowledge about the integration of logistics service
elements. Previous research has tended to focus on single logistics service
elements such as logistics service price, logistics service quality, lead time, etc.
This thesis comprehensively considers the main elements in terms of logistics
service and integrates these elements to put forward a new term ‘OLSM’, which
is regarded as a kind of personalized service to meet customers’ specific needs.
The impact of OLSM was then considered and studied from the perspective of
142
personalized service. Therefore, this research has conducted a more
comprehensive investigation and expanded the research field of logistics
services.
Secondly, this research makes a significant contribution in terms of how OLSM
influences online customer loyalty. Previous studies relating to personalized
service, signaling theory, relationship marketing theory, and so on were used
by this study to highlight a number of significant relationships between OLSM,
relationship quality (e-satisfaction, e-trust, and e-commitment), switching costs,
signal credibility, and e-loyalty that were not confirmed empirically in the extant
literature, i.e.:
(1) The mediation effect of relationship quality (e-satisfaction, e-trust and e-
commitment) on the relationship between OLSM and e-loyalty.
(2) The catalytic effect of signal credibility on the influence of OLSM on e-
loyalty.
(3) The moderation effect of switching costs on weakening the impact of
OLSM on e-loyalty.
Thirdly, this thesis provides a new viewpoint regarding the investigation of
logistics service price. Different from the previous research related to logistics
service price, which mainly investigated the price from the perspective of
economics, this thesis regards OLSM as the released market signal and the
logistics service price as the signal credibility for OLSM. The moderation effect
of the logistics service price is then investigated from the perspective of
signaling theory and the moderation effect of the logistics service price on the
influence of OLSM on e-loyalty is highlighted.
Fourthly, this thesis supports two theories adopted in this study, namely
signalling theory and relationship marketing theory. According to relationship
marketing theory, relationship investment through activities or services by the
suppliers could enhance the relationship between suppliers and customers. In
this study, OLSM is a kind of investment by the online retailers, and the result
shows that OLSM could enhance relationship quality, which means that the
provision of OLSM enhances the relationship between online retailers and
customers. In addition, signalling theory pointed out that the release of credible
143
market signal could help reduce customers’ perceived uncertainty about the
products or services, which in turn enhance the relationship between suppliers
and customers. OLSM can be regarded as a market signal to help reduce
customers’ uncertainty about the logistics service quality, and the results prove
that the signal OLSM could contribute to the enhancement of relationship
between customers and retailers.
7.3 Managerial contributions
Apart from the theoretical contributions for future research, this dissertation also
provides a number of practical implications for online retailers that will be
discussed in this section. The previous findings indicate that OLSM could
positively influence e-loyalty by positively influencing relationship quality (e-
satisfaction, e-trust, and e-commitment), that signal credibility could positively
moderate the mediation effect of relationship quality on OLSM and e-loyalty,
and that switching costs could negatively moderate the mediation effect of e-
satisfaction on OLSM and e-loyalty. Based on these findings, some practical
applications are put forward to provide online retailers with clearer insights into
operational management in terms of logistics services.
7.3.1 Optimization of OLSM
The research reveals that the provision of OLSM could reduce customers’
perceived uncertainty of logistics services, which improves the quality of the
relationships between customers and online retailers and increases customer
loyalty. Referring to the definition of OLSM, in this study it is defined as a kind
of personalized service provided by online retailers, in which the online retailers
integrate several logistics service elements. In forward logistics, the logistics
service elements consist of self-pick-up, delivery time slots, and logistics
service providers, while other logistics service elements, including exchange or
return in nearby retail stores, pick up from customers’ homes, and customer
returns, can be selected by customers in reverse logistics.
This means that online retailers could integrate different logistics service
elements to optimize OLSM, thus increasing customer satisfaction, customer
trust, and subsequently, customer loyalty. Three suggestions are described in
detail based on the definition of OLSM:
144
1) To design and refine the delivery time slot.
Compared to the traditional retail market, the online retail market appears to be
more complicated and uncertain. The uncertainty of the process of online
shopping prevents customers from using online retailers. In China, the delivery
times of many online retailers are uncertain and customers often have to wait
for their products. The uncertainty of the estimated delivery time may increase
customer anxiety and disappointment and even result in customer complaints,
especially if the customer misses their delivery.
In addition, if customers miss their package, the couriers have to deliver again
on another day, which is a waste of times and resources. Therefore, it would
be beneficial to design shorter and clearer delivery time slots so customers can
know exactly when they have to stay at home and wait for their package.
Shorter delivery time slots reduce the uncertainty of delivery times, which in
turn enhances the relationship between customers and online retailers.
Customers may be more likely to choose online retailers who provide a
selection of clear delivery time slots and maintain a stable buyer-seller
relationship. Online retailers could also coordinate with third-party logistics
service providers if they want to set up more precise estimated delivery time
slots.
2) To provide a greater selection of third-party logistics providers.
The quality of logistics services differs among providers, and different
customers may have different perceived values for the same providers. In
China, most online retailers in Taobao only provide one or two fixed logistics
service providers for customers to choose from as this helps online retailers
reduce their costs due to scale effect and makes it more convenient to manage
their business. If customers think the provided third-party logistics providers are
too slow or are not their preferred choice, however, they may feel emotional or
psychological rejection towards the online retailer and seek alternatives.
Therefore, it is important for online retailers to offer a greater range of third-
party logistics providers to choose from.
As brand effect exists for third-party logistics providers, customers could select
their most familiar and favorite brand, which reduces the uncertainty of delivery.
145
Although coordination with more third-party logistics providers will weaken the
scale effect, resulting in rising operational costs, it could increase customer
loyalty by making customers feel more in control. Furthermore, the provision of
different third-party logistics providers may intensify the competition among
providers, leading to an improvement in logistics service quality.
3) To coordinate with the offline retail stores.
The integration of online and offline channels makes it possible for customers
to collect their purchased goods from nearby stores and exchange or return
goods they are not satisfied with. This reduces customers’ anxiety regarding
uncertain delivery times as they could choose to collect their goods after
receiving an email or message saying that their purchased items have arrived.
Moreover, they could choose to check the quality of the items in the store and
return them immediately if the items do not match their expectations. Therefore,
online retailers should coordinate with offline retail stores to provide collection,
exchange, and return services in nearby stores. This could result in improved
relationship quality and customer commitment.
7.3.2 Improvement of the signal credibility of OLSM
The release of market signals could be useful for reducing customers’
perceived uncertainty and thus increasing their pre-purchasing and post-
purchasing intention and behaviors. Signal credibility plays a vital role in making
the signal an effective mechanism for conveying high product quality. In this
study, logistics service price is defined as the credibility of the released signal
OLSM. The results of this study indicate that logistics service price positively
moderates the mediation effect of relationship quality on OLSM and e-loyalty.
This means that setting up low logistics service prices would not make sense
as if the logistics service price is very low, the logistics service quality cannot
be guaranteed, which may delay the estimated delivery time or damage the
delivery items. This could lead to the collapse of the relationship between
customers and online retailers.
In addition, it is not wise to attract customers by decreasing the logistics service
price. Customers who choose to use an online retailer due to its low logistics
service price are price-sensitive and likely to seek alternative online retailers if
146
they think they can find a lower price. As many online retailers have not
recognized the positive moderation effect of logistics service price, many of
them prefer to reduce the logistics service price at the cost of decreasing its
quality. This negatively impacts customers’ shopping experiences. Several
pricing strategies for logistics services should be considered by online retailers:
1) Different prices for different third-party logistics providers.
Online retailers could set up different prices for different third-party logistics
providers. Online retailers could charge higher prices for high quality third-party
logistics providers, such as ShunFeng, and relatively lower prices for lower
quality third-party logistics providers, such as BaiShi and Tiantian Express.
2) Different prices for different delivery times.
The earlier the estimated delivery time, the higher the logistics service price,
and the later the estimated delivery time, the lower the logistics service price.
For example, the next day delivery service provided by ShunFeng Express is
higher than the normal delivery service.
7.3.3 Taking advantage of the moderation effect of switching costs
The results indicate that the influence of OLSM on e-satisfaction and the
indirect influence of OLSM on e-loyalty through e-satisfaction are negatively
moderated by switching costs. In other words, when the switching costs are
perceived as high, the effect of customer satisfaction on customer loyalty is
reduced and the indirect effect of OLSM on customer loyalty is also low. And
there is low possibility for customers to switch to other online retailers
regardless of the optimization of OLSM, and it may be not wise to choose to
optimize OLSM since the possible benefits of optimizing OLSM might be less
than the required investment. On the contrary, when the switching costs are
relatively low, the indirect effect of OLSM on e-loyalty is enhanced, and
customers’ switching behaviours will be influenced by the provision of OLSM.
In this situation, it is considerable to optimize OLSM.
In a word, online retailers could slightly decrease switching costs to enhance
the effect of OLSM on customer loyalty. For instance, online retailers could
slightly reduce negative switching costs such as fees to join in as the members,
147
value card and so on. In this sense, the effect of OLSM is enhanced. Moreover,
if the fees to join in the retailer as members are relatively high, although
dissatisfied customers may still choose to stay in this online retailer, customers
may complain about it, and the bad word of mouth may affect the patronisation
of future potential customers.
7.4 Limitations and future directions.
This research has a number of limitations and flaws that could be improved in
the future.
Firstly, this thesis adopts non-probability convenience sampling technique and
it is argued that a convenience sample is not able to represent the
characteristics inherent in the general population. Hence, it seems that it is
difficult to generalize the results of this study. Future empirical work is needed
to demonstrate whether or not these findings are not unique to this particular
sample. Quota and snowball sampling methods can be used to make sure that
the collected sample characteristics could represent the target population to
more extent.
Secondly, this research is conducted exclusively on online shoppers in China,
it is possible that this brings a bias. For example, the field of the study is
restricted to those Chinese customers who shop online. It is unclear at this
stage whether the same pattern would occur in online retailing market in other
cultures. Future research could conduct across-cultural study on this topic to
investigate whether or not the influence of OLSM on online customers is
affected by the culture and find out to what extent these results are country
specific or can be generalized to other countries.
Thirdly, this study mainly focuses on the investigation of the relationships
between online retailers and customer, and how OLSM affect the relationships.
Future research could invest the mechanism about how OLSM affect the
relationships between online retailer and online logistics service provider.
Fourthly, the categories of purchased goods can be considered in the future to
discover whether or not it will affect the influence of OLSM on customer loyalty.
148
Fifthly, this study shows that the online retailers could adopt strategy like
different prices for different third-party logistics providers and Different prices
for different delivery times. Future research could invest how different logistics
service price strategies affect customer behaviours.
149
Reference
Alhaiou, T.A. (2011) A study on the Relationship between E-CRM Features and
E-loyalty: the case in UK. PhD. Brunel Business School.
Allen, N. J. and Meyer, J. P. (1990). The measurement and antecedents of
affective, continuance, and normative commitments to the organization. Journal
of Occupational Psychology, 63 (1), pp. 1-18.
Anderson, E. J., Coltman, T., Devinney, T. M. and Keating, B. (2011) ‘What
drives the choice of a third-party logistics provider?’. Journal of Supply Chain
Management. 47 (2) pp. 91-115.
Anderson, J. C. and Gerbing, D.W. (1984). The effect of sampling error on
convergence, improper solutions, and goodness-of-fit indices for maximum
likelihood confirmatory factor analysis. Psychometrika, 49, pp.155–173.
Anderson, J. C. and Gerbing, D.W. (1988). ‘Structural Equation Modelling in
Practice: A Review and Recommended Two-Step Approach’. Psychological
Bulletin, 103 (3), 411-23.
Anderson, R. E. and Srinivasan, S. S. (2003). E-satisfaction and e-loyalty: A
contingency framework. Psychology and Marketing, 20 (2), pp. 123–138.
Audrain-Pontevia, A., N’Goala, G. and Poncin, I. (2013) ‘A good deal online:
The impacts of acquisition and transaction value on e-satisfaction and e-loyalty’.
Journal of Retailing and Consumer Services, (2013), pp. 445–452.
Awang, Z. (2012) Structural Equation Modelling Using Amos Graphic. UITM
Press.
Aydin, S., Ozer, G. and Arasil, O. (2006) ‘How switching costs affect subscriber
loyalty in the Turkish mobile phone market: an exploratory study’. Journal of
Targeting, Measurement and Analysis for Marketing. 14(2), pp. 41-55.
Bagozzi, R. P. and Yi, Y. (1988) ‘On the evaluation of structural equation
models’. J Acad Mark Sci. 16(1), pp.74–94.
Bakos, J. Y. (1997). ‘Reducing buyer search costs: implications for electronic
marketplaces’. Management Science, 43(12), 1676–92.
150
Balabanis, G., Reynolds, N. and Simintiras, A. (2006). ‘Bases of E-Store Loyalty:
Perceived Switching Barriers and Satisfaction’. Journal of Business Research,
59(2), 214-224.
Barcly, M.J. and Smith, J.C.W. (1995) ‘The maturity structure of corporate Debt’.
Journal of Finance, 50(2), pp.609-631.
Bendapudi, N. and Berry, L.L. (1997) ‘Customers’ motivations for maintaining
relationships with service providers’. Journal of Retailing, 73(1), pp. 15-37.
Bentler, P. M., and Chou, C.-P. (1987). ‘Practical issues in structural equation
modelling’. Sociological Methods and Research, 16, pp.78–117.
Bergen, M., Dutta, S., Orville, C. and Walker, J. (1992) ‘Agency relationships in
marketing: a review of the implications and applications of agency and related
theories’. Journal of Marketing. 56(3), pp.1-24.
Berry, L. L. (1983) Relationship Marketing. American Marketing Association,
Chicago.
Bock, D.E., Mangus, S.M. and Folse, J.A.G. (2016) ‘The road to customer
loyalty paved with service customisation’. Journal of Business Research.
69(10), pp.3923-3932.
Boulding, W. and Kirmani, A. (1993) ‘A consumer-side experimental
examination of signalling theory: Do consumers perceive warranties as signals
of quality’. Journal of Consumer Research. 20(1), pp.111-123.
Bouzaabia, R., Bouzaabia, O. and Capatina, A. (2013). ‘Retail Logistics service
quality: a crosscultural survey on customer perceptions’. International Journal
of Retail and Distribution Management. 41(8), pp.627-647.
Brislin, R. (1970) ‘Back-Translation for Cross Cultural Research.’ Journal of
Cross-Cultural Psychology. 1. pp. 185-191.
Bryman, A. and Bell, E. (2003), Business Research Methods. New York.
Burnham, J.K., Thomas, A., Frels, V.M. (2003). ‘Consumer switching costs: a
typology, antecedents, and consequences’. Journal of the Academy of
Marketing Science, 31(2), 109-126.
151
Burns, A.C. and Bush, R. F. (2002) Marketing research. Prentice Hall
International, Inc. New Jersey.
Carter, M., Wright, R. and Thatcher, J.B. (2014) ‘Understanding online
customers’ ties to merchants: The moderating influence of trust on the
relationship between switching costs and e-loyalty’. European Journal of
Information Systems. 23(2), pp. 185-204.
Chang, H.H. and Chen, S. (2009) ‘Customer perception of interface quality,
security, and loyalty in electronic commerce’. Information Management. 46,
pp.411-417.
Chang, Y.S. and Fang, S.R. (2013) ‘Antecedents and distinctions between
online trust and distrust: predicting high-and Low-risk Internet Behaviors’.
Journal of Electronic Commerce Research. 14(2), pp. 149-166.
Chen, J.V., Yen, D.C. and Pornprophet, W. (2014). ‘E-commerce website
loyalty: a cross cultural comparison’. Information Systems Frontiers.17(6),
pp.1283-1299.
Chen, P.Y. and Hitt, L.M. (2002). ‘Measuring Switching costs and the
determinants of customer retention in Internet-Enabled Business: A study of the
Online Brokerage Industry’. Information Systems Research. 13(3), pp.255-274.
Chen, S. (2012). ‘The customer satisfaction–loyalty relation in an interactive e-
service setting: The mediators’. Journal of Retailing and Consumer Services.
19 (2), pp. 202–210
Child, D. (1990). The essentials of factor analysis. 2nd ed. London: Cassel
Educational Limited.
Chiu, C., Hsu, M., Lai, H. and Chang, C. (2012). ‘Re-examining the influence of
trust on online repeat purchase intention: The moderating role of habit and its
antecedents’. Decision Support Systems. 53 (4), pp. 835–845.
Choi, D.H., Kim, C.M. and Kim, S.I. (2006). ‘Customer loyalty and disloyalty in
Internet Retail Stores: Its antecedents and its effect on customer price
sensitivity’. International Journal of Management. 23(4), pp.925.
152
Choi, E.K., Wilson, A. and Fowler, D. (2013) ‘Exploring customer experiential
components and the conceptual framework of customer experience, customer
satisfaction, and actual behavior’. Foodserv. Bus. Res. 16(4), pp.347-358.
Chou, S., Chen, C. and Lin, J. (2015) ‘Female online shoppers: Examining the
mediating roles of E-satisfaction and e-trust on e-loyalty development’. Internet
Research. 25(4), pp. 542-561.
Cho, V. and Lau, C. (2014) ‘An integrative framework for customisations on
satisfaction: The case of an online jewellery business in China’. Journal of
Service Science and Management. 7, pp. 165-181.
Chuah, S.H-W., Marimuthu, M., Kandampulty, J. and Bilhihan, A. (2017) ‘What
drives Gen Y loyalty? Understanding the mediated moderating roles of
switching costs and alternative attractiveness in the value-satisfaction-loyalty
chain’. Journal of Retailing and Consumer Services. 36, pp.124-136.
Coelho, P.S. and Henseler, J. (2012) ‘Creating customer loyalty through service
customisation’. European Journal of Marketing. 46(3), pp.331-356.
Connelly, B.L., Certo, S.T., Duane, R. and Reutzel, C.R. (2011) ‘Signalling
Theory: A Review and Assessment’. Journal of Management. 37(1). pp.39-67.
Crosby, L. A., Evans, K. R. and Cowles, D. (1990). ‘Relationship Quality in
Services Selling: An Interpersonal Influence Perspective’. Journal of Marketing,
54, 68-81.
Cyr, D., Kindra, G.S. and Dash, S. (2008). ‘Website design, trust, satisfaction
and e-loyalty: The Indian experience’. Online Information Review, 32 (6), pp.
773–790.
DeVellis, R.F. (2003). Scale development: Theory and applications. 2nd ed.
Thousand Oaks, CA: Sage Publications, Inc.
Donio, J., Massari, P., and Passiante, G. (2006). ‘Customer satisfaction and
loyalty in a digital environment: An empirical test’. Journal of Consumer
Marketing. 23 (7), pp. 445–457.
Doong, H.S., Wang, H.C. and Shih, H.C. (2008). ‘Exploring loyalty intention in
the electronic marketplace’. Electronic Markets. 12(2), pp.142-149.
153
Dwyer, F.R., Schurr, P.H., and Oh, S. (1987). ‘Developing buyer– seller
relationships’. Journal of Marketing, 51(2), 11 –27.
Evans, J.R. and Lasking, R.L. (1994), ‘The Relationship Marketing Process: A
Conceptualization and Application’. Industrial Marketing Management, 23(4),
pp.39-452.
Fairchild, A.J. and MacKinnon, D.P. (2009) ‘A general model for testing
mediation and moderation effects’. Prey Sci. 10(2), pp.87-99.
Fairchild, A.J. and McQuillin, S.D. (2010) ‘Evaluating mediation and moderation
effects in school psychology: A presentation of methods and review of current
practice’. Journal of Social Psychology, 48(1), pp.53-84.
Fang, J. M., Shao, Y. F. and Wen, C. (2016). ‘Transactional quality, relational
quality, and consumer e-loyalty: Evidence from SEM and fsQCA’. International
Journal of Information Management. 36(6), pp. 1205-1217.
Fang, J., Wen, C., George, B. and Prybutok, V. (2016). ‘Consumer
heterogeneity, perceived value, and repurchase decision-making in online
shopping: the role of gender, age, and shopping motives’. Journal of Electronic
Commerce Research. 17(2), pp.116-137.
Fatthwia, A. (2012) The effect of electronic customer relationship on customer
satisfaction: A study on web banking in Saudi Arabia. PhD. University of
Huddersfield.
Finn, R. H. (1972). ‘Effects of some variations in rating scale characteristics on
the means and reliabilities of ratings’. Educational and Psychological
Measurement, 34, 885-892.
Fornell, C. and Larcker, D.F. (1981) ‘Evaluating structural equation models with
unobservable variables and measurement error’, Journal of Marketing
Research, 18(1), pp.39-50.
Fox, J. (2010). ‘Structural Equation Modeling with the sem Package in R’.
Structural Equation Modeling: A Multidisciplinary Journal. Vol.13, pp. 465–486.
Friedman, T. L. (1999). Amazon. You: New York Times.
154
Fullerton, G. (2005) ‘When does commitment lead to loyalty’. Journal of Service
Research. 5(4), pp.333-344.
Gerbing, D. W. and Anderson, J. C. (1988) ‘An updated Paradigm for Scale
Development Incorporating Unidimensionality and Its Assessment’. Journal of
Marketing Research, 25(2), pp. 186-192.
Ghezzi, A., Mangiaracina, R. and Perego, A. (2012) ‘Shaping the e-commerce
logistics strategy: a Decision Framework’. International Journal of Engineering
Business Management. 4(13).
Greenland, S., Senn, S. J. Rothman, K. J., Carlin, J. B., Poole, C., Goodman,
S. N. and Altman, D. G. (2016) ‘Statistical tests, P values, confidence intervals,
and power: a guide to misinterpretations’. European Journal of Epidemiology.
31(4). pp. 337-350.
Grossnickle, J. and Raskin, O. 2001. Handbook of Online Marketing Research.
New York, USA.
Gumus, M., Li, S. and Oh, W. (2013) ‘Shipping Fees or shipping free? A tale of
two price partitioning strategies in online retailing’. Production and operations
management. 22(4), pp.758-776.
Hair, J.F., Black, W.C., Babin, B. J. and Anderson, R.J. (2010) Multivariate data
analysis: a global perspective. 7th ed.
Han, H., Kim, Y., and Kim, E. (2011). ‘Cognitive, affective, conative, and action
loyalty: Testing the impact of inertia’. International Journal of Hospitality
Management. 30(4), pp.1008-1019.
Hennig-Thuaru, T., Gwinner, K.P. and Gremler, D.D. (2009) ‘Understanding
relationship marketing outcomes an integration of relational benefits and
relationship quality’. Journal of Services Research. 4(3), pp.230-247.
Hofmeyr, J. and Rice, B. (2003) Commitment-Led Marketing: The key to brand
profits is in the customer’s mind. 1st ed. Juta and Co Ltd. Lansdowne.
Holloway, B. B. (2003). The Role of Switching Barriers in the Online Service
Recovery Process. PhD. The University of Alabama.
155
Hox, J.J. and Bechger, T.M. (2005) ‘An Introduction to Structural Equation
Modeling’. Family Science Review, 11, pp.354-373.
Hsieh, Y.C., Chiu, H.C. and Chiang, M.Y. (2005) ‘Maintaining a committed
online customer: a study across search-experience-credence products’.
Journal of Retailing. 81(1), pp.75-82.
Huang, L. (2008). ‘Exploring the determinants of e-loyalty among travel
agencies’. The services Industries Journal. 28(2), pp.239-254.
Huang, M. (2015) ‘The influence of relationship marketing investments on
customer gratitude in retailing’. Journal of Business Research. 68(6), pp. 1318-
1323.
Hu, M., Rabinovich, E. and Hou, H. (2015) ‘Customers complaints in online
shopping: the role of signal credibility’. Journal of electronic commerce
Research. 16(2), pp. 95-108.
Ismail, M.A. and Safa, N.S. (2014) ‘Trust, Satisfaction, and Loyalty formation in
electronic commerce’. Journal of Industrial and Intelligent Information. 2(3),
pp.228-232.
Izogo, E. E. (2015) ‘Determinants of attitudinal loyalty in Nigerian telecom
service sector: Does commitment play a mediating role?’. Journal of Retailing
and Consumer Services. 23, pp.107-117.
Jackson, D. L. (2001). ‘Sample size and number of parameter estimates in
maximum likelihood confirmatory factor analysis: A Monte Carlo investigation’.
Structural Equation Modeling, 8, pp.205–223.
Jacoby, J. and Kyner, D.B. (1973). ‘Brand loyalty vs. Repeat purchasing
behavior’. Journal of Marketing Research.10(1), pp.1-9.
Jones, M.A., Mothersbaugh, D.L., and Beatty, S.E. (2000). ‘Switching barriers
and repurchase intentions in services’. Journal of Retailing, 76(2), 259-274.
Jones, M.A., Mothersbaugh, D.L., and Beatty, S. E. (2002). ‘Why customers
stay: measuring the underlying dimensions of services switching costs and
managing their differential strategic outcomes’. Journal of Business Research,
55(6), 441-450
156
Kassim, N.M. (2001). Determinants of customer satisfaction and retention in
the cellular phone market of Malaysia. PhD. Southern Cross University.
Kassim, N.M. and Abduliah, N.A. (2008). ‘Customer loyalty in e-commerce
settings: an empirical study’. Electronic Markets. 18(3), pp. 275-290.
Keabdre, R.F. and Duane, T. W. (2011) Exploratory Factor Analysis. University
Press scholarship online.
Keating, B., Rugimbana, R. and Quazi, A. (2003). ‘Differentiating between
service quality and relationship quality in cyberspace’. Managing Service
Quality, 13(3), pp. 217-232
Kirmani, A. and Rao, A.R. (2000) ‘No pain, no gain: a critical review of the
literature on signaling unobservable product quality’. Journal of Marketing,
64(2), pp.66-79.
Kim. D., Ferrin, D.L., and Rao, H.R. (2009) ‘Trust and satisfaction, two stepping
stones for successful e-commerce relationships: a longitudinal exploration’.
Information systems Res. 20(2), pp.237-257.
Kim, Y.K. and Peterson, R.A. (2017) ‘A meta-analysis of online trust
relationships in E-commerce’. Journal of Interactive Marketing. 38, pp.44-54.
Koufaris, M. and Hampton-Sosa, W. (2004) ‘The development of Initial trust in
an online company by new customers’. Information and Management. 41(3),
pp.377-397.
Krauter, S. G. and Kaluscha, E. A. (2003) ‘Empirical research in on-line trust: a
review and critical assessment’. International Journal of Human-Computer
Studies, 58, pp. 783-812.
Kuttner, R. (1998). The next: a Market Too Perfect for profits. Business Week.
3577(11), pp.20.
Lam, S.Y., Shankar, V., Erramilli, M.K. and Murthy, B. (2004) ‘Customer value,
satisfaction, loyalty, and switching costs: an illustration from a business-to-
business service context’. Journal Academy of Marketing Science, 32(3), pp.
293-311.
Lang, B. and Colgate, M. (2003). ‘Relationship quality, on-line banking and the
157
information technology gap’. International Journal of Bank Marketing. 21(1), pp.
29-37.
Lee, E.J. and Overby, J.W. (2004). ‘Creating value for online shoppers:
Implications for satisfaction and loyalty’. Journal of Consumer Satisfaction,
Dissatisfaction and Complaining Behavior. 17, pp. 54–64
Lee, H.L. and Whang, S. (2001). ‘Winning the last mile of E-commerce’. MIT
Sloan Management Review, 42(4), pp.54-62.
Lee, J., Lee, J. and Feick, L. (2001). ‘The impact of switching costs on the
customer satisfaction- loyalty link: mobile phone service in France’. Journal of
Services Marketing, 15(1), 35-48.
Lee, M.K.O. and Turban, E. (2001) ‘A Trust Model for Consumer Internet
Shopping’. International Journal of Electronic Commerce. 6(1), pp.75-92.
Levitt, T. (1981). ‘Marketing Intangible Products and Products and Products
Intangibles’. Harvard Business Review, 59, pp. 95-102.
Lewis, M. (2006) ‘The effect of shipping fees on customer acquisition, customer
retention, and purchase quantities’. Journal of Retailing. 82(1). pp. 13-23.
Liang, C.J., Chen, H.J. and Wang, W.H. (2008). ‘Does online Relationship
Marketing Enhances Customer Retention and Cross-Buying?’. The service
industries Journal. 28(6), pp.769-787.
Lin, C.C. (2005) Evaluating Effects of Customer Satisfaction, Customer Loyalty,
and Store Image on Customer Retention: An Examination in Retail Setting. PhD.
University of Manchester.
Lin, Y., Luo, J., Cai, S.Q., Ma, S.H. and Rong, K. (2016) ‘Exploring the service
quality in the e-commerce context: a triadic view’. Industrial Management and
Data Systems. 116(3), pp. 388-415.
Liao, Y. W., Wang, Y. S. and Yeh, C.H. (2014). ‘Exploring the relationship
between intentional and behavioural loyalty in the context of e-tailing’. Internet
Research. 24(5), pp.668-686.
158
Liu, H.H.J., Yen, T.F. and Huan, T.C. (2010) ‘Effects of switching barriers or
visitors on satisfaction-commitment relationship’. International Journal of
Agricultural Travel and Tourism. 1(1), 28-40.
Liu, X., He, M., and Gao, F. (2008). ‘An empirical study of online shopping
customer satisfaction in China: A holistic perspective’. International Journal of
Retail and Distribution Management. 36(11), pp.919-940.
Luarn, P and Lin, H.H. (2003). ‘A customer loyalty model for e-service context’.
Electron Commerce Res. 4(4), pp.156-167.
Lu, X.M. (2007) Relationship quality and customer loyalty in internet grocery
shopping in the UK. PhD. Loughborough University.
Mahar, S., Wright, P.D. and Bretthauer, K.M. (2014) ‘Optimizing marketer costs
and consumer benefits across ‘click’ and ‘bricks’. Journal of the Academy of
Marketing Sciences. 42(6), pp.619-641.
Maltz, A. B., Rabinovich, E. and Sinhaiv, R. (2004) ‘Logistics: The key to E-
retail Success’. Supply Chain Management Review. 8(3). pp.
Mcconnell, J.D. (1968). The development pf brand loyalty: An experimental
study. Journal of Marketing Research. 5(1), pp.13-19.
Morgan, R. M. and Hunt, S. D. (1994) ‘The commitment-trust theory of
relationship marketing’. The Journal of Marketing. 58(3), pp.20-38.
Mouakket, S. and Al-hawari, M. (2012). ‘Examining the antecedents of e-loyalty
intention in an online reservation environment’. The Journal of High Technology
Management Research. 23 (1), pp. 46–57
Muller, D., Judd, C.M. and Yzerbyt, V.Y. (2005) ‘When moderation is mediated
and mediation is moderated’. Journal of Personality and Social Psychology.
89(6), pp.852-863.
Neal, W.D. (1999). ‘Satisfaction is nice, but value drives loyalty’. Marketing
Research. 11(1), pp.20-23.
Noar, S. M. (2003). ‘The role of structural equation model in scale development’.
Structural Equation Modeling and Multidisciplinary Journal. 10(4), pp. 622-647.
159
Norgate, G. (2009) Corporate governance and performance, the moderating
effect of the entrepreneurial organization. PhD. Kingston University.
Oaster, T. R. F. (1989). ‘Number of alternatives per choice point and stability of
Likert-type scales’. Perceptual and Motor Skills, 68, pp.549-550.
Ozdemir, V.E. and Hewett, K. (2010) ‘The effect of collectivism on the
importance of relationship quality and service quality for behavioural intentions:
A cross-national and cross-contextual analysis’. Journal of International
Marketing. 18(1), pp. 41-62.
Pallant, J. (2010) SPSS survival manual: a step by step guide to data analysis
using SPSS. 4th ed.
Paramaporn, T., Antonio, L. and Nguyen, Q. T. (2016) ‘The moderating role of
age in customer loyalty formation process’. Services Marketing Quarterly, 37(1),
pp:52-70.
Parasuraman, A., Zeithaml, V.A., and Malhotra, A. (2005). ‘E-S-Qual: A
Multiple-Item Scale for Assessing Electronic Service Quality’. Journal of
Service Research. 7(3), pp.213–33.
Pereira, H.G., Salhieiro, M.F. and Rita, P. (2017) ‘Online determinants of e-
customer satisfaction: application to website purchases in tourism’. Service
Business. 11(2), pp.375-403.
Peterson, R.A. and Kim, Y. (2013) ‘On the relationship between coefficient
alpha and composite reliability’. J Appl Psychol. 98(1), pp.194–198.
Pfeifer, P. (2005). ‘The optimal ratio of acquisition and retention costs’. Journal
of Targeting Measurement and Analysis for Marketing. 13(2), pp. 179-188.
Pham, T.S.H. and Ahammad, M.F. (2017) ‘Antecedents and consequences of
online customer satisfaction: A holistic process perspective’. Technological
Forecasting and Social Change.
Podsakoff, P. M., MacKenzie, S. B., Lee, J.-Y. and Podsakoff, N. P. (2003).
‘Common method biases in behavioral research: A critical review of the
literature and recommended remedies’. Journal of Applied Psychology, 88(5),
pp.879-903
160
Podsakoff, P. M., MacKenzie, S. B. and Podsakoff, N. P. (2012). ‘Sources of
method bias in social science research and recommendations on how to control
it’. Annual Review of Psychology, 63(1), pp.539-569.
Ponnavolu, K. (2000). Customer loyalty in interactive media: An exploration of
its antecedents and consequences. PhD. Drexel University.
Porter, M.E. (1980). Competitive strategy. New York: Free Press.
Rabinovich, E. and Bailey, J.P. (2004) ‘Physical distribution service quality in
internet retailing: service pricing, transaction attributes, and firm attributes’.
Journal of Operations Management. 21(6), pp.651-672.
Rafiq M, Fulford H, and Lu X. (2013) ‘Building customer loyalty in online retailing:
The role of relationship quality’. Journal of Marketing Management. 29(3-4),
494-517.
Ramanathan, R. (2010) ‘The moderating roles of risk and efficiency on the
relationship between logistics performance and customer loyalty in e-
commerce’. Transportation Research Part E: Logistics and Transportation
Review. 46(6), pp. 950-962.
Rao, S., Griffis, S.E. and Goldsby, T.J. (2011). ‘Failure to deliver? Linking online
order fulfillment glitches with future purchase behaviour’. Journal of Operations
Management. 29(7), pp.692-703.
Ray, S. and Morris, S.S.K.J. (2012) ‘Online user’s switching costs: Their nature
and formation’. Information Systems Research. 23(1), pp.197-213.
Robson, C. (2002). Real World Research. 2nd ed. Oxford: Blackwell.
Reicheld, F. and Schefter, P. (2000). ‘E-loyalty: Your secret Weapon on the
Web’. Harvard Business Review. 78(4). pp.105-113.
Richardson, P.S., Dick, A.S., and Jain, A.K. (1994) ‘Extrinsic and Intrinsic cue
effects on perceptions of store brand quality’. Journal of Marketing. 58(4), pp.
28-36.
Rietveld, T. and Van Hout, R. (1993). Statistical Techniques for the Study of
Language and Language Behaviour. Berlin – New York: Mouton de Gruyter.
161
Roberts, K., Varki, S. V. and Brodie, R. (2003). ‘Measuring the quality of
relationships in consumer services: An empirical study’. European Journal of
Marketing, 37 (1/2), pp. 169-197.
Safa, N.S. and Ismail. M. A. (2013) ‘A customer loyalty formation model in
electronic commerce’. Economic Modelling. 35, pp. 559-564.
Sanchez-Franco, M.J., Ramos, A.F.V. and Velicia, F.A.M. (2009). ‘The
moderating effect of gender on relationship quality and loyalty toward internet
service providers’. Information and Management. 46(3), pp.196-202.
Saura, I.G., Frances, D.S., Contri, G.B. and Blasco, M.F. (2008). ‘Logistics
service quality: a new way to loyalty’. Industrial Management and Data Systems
(108)5, 650-668.
Shankar, V., Urban, G.L., and Sultan, F. (2002) ‘Online trust: a stakeholder
perspective, concepts, implications, and future directions’. The Journal of
Strategic Information Systems. 11(344), pp.325.
Shin, D.H and Kim, W.Y. (2008). ‘Forecasting Customer Switching Intention in
Mobile Service: An Exploratory Study of Predictive Factors in Mobile Number
Portability’. Technological Forecasting and Social Change, 75(6), 854-874.
Shin, J., Chung, K., Oh, J. and Lee, C. (2013). ‘The effect of site quality on
repurchase intention in Internet shopping through mediating variables: The
case of university students in South Korea’. International Journal of Information
Management. 33 (3), pp. 453–463.
Shook, C. L., Ketchen, D. J., Hult, G. T. M., and Kacmar, K. M. (2004). ‘An
assessment of the use of structural equation modeling in strategic management
research’. Strategic management journal, 25(4), pp.397-404.
Smith, E.R. (2000) ‘The seven steps to designing an e-loyalty strategy’.
Brandweek. 41(45), pp.30-34.
Smith, J. B. (1998). ‘Buyer-Seller relationships: Similarity, relationship
management, and quality’. Psychology and Marketing, 15 (1), pp. 3-21.
Sultani, I. and Gharbi, J.E. (2008). ‘Determinants and consequences of the
website perceived value’. Journal of Internet Banking and E-commerce. 13(1),
pp.1-13.
162
Symonds, P. M. (1924). ‘On the loss of reliability in ratings due to coarseness
of the scale’. Journal of Experimental Psychology, 7, pp.456-461.
Taj, S.A. (2016) ‘Application of signaling theory in management research:
Addressing major gaps in theory’. European Management Journal. 34(4), pp.
338-348.
Tarafdar, M. and Zhang, J. (2008). ‘Determinants of reach and loyalty—A study
of website performance and implications for website design’. The Journal of
Computer Information Systems, 48 (2), pp. 16–24.
Thirumalai, S. and Sinha, K.K (2011) ‘Customisation of the online purchase
process in electronic retailing and customer satisfaction: an online field study’.
Journal of Operations Management. 29(5), pp.477-487.
Ticehurst, G.W. and Veal, A.J. (2000). Business research methods: a
managerial approach, Longman. French Forest, NSW.
Toufaily, E., Ricard, L., and Perrien, J. (2013). ‘Customer loyalty to a
commercial website: descriptive meta-analysis of the empirical literature and
proposal of an Integrative model’. Journal of Business Research. 66(9).
pp.1436-1447.
Truxillo, C. (2003). Multivariate Statistical Methods. Practical Research
Applications Course Notes. Cary, N.C, SAS Institute.
Tsai, H.T., Huang, H.C., Jaw, T.L., and Chen, W.K. (2006). ‘Why Online
Customers Remain with a Particular E-Retailer: An Integrative Model and
Empirical Evidence’. Psychology and Marketing, 23(5), 447-464.
Tzokas, N. and Saren, M. (1997), "Building Relationship Platforms in Consumer
Markets: A Value Chain Approach," Journal of Strategic Marketing, 5, 105-120.
Verma, V., Sharma, D., Sheth, J. (2015) ‘Does relationship marketing matter in
online retailing? A meta-analytic approach’. Journal of the Academy of
Marketing Science. 44(2), pp.206-217.
Wallace, D.W., Giese, J.L. and Johnson, J.L. (2004). ‘Customer retailer loyalty
in the context of multiple channel strategies. Journal of Retailing. 880(4),
pp.249-263.
163
Wang, H.C., Pallister, J.G. and Foxall, G.R. (2006) ‘Innovativeness and
involvement as determinants of website loyalty: II. Determinants of customer
loyalty in B2C e-commerce’. Technovation, 26(12), pp.1366-1373.
Walsh, G., Henning-Thurau, T. and Sassenberg, K. (2010) ‘Does relationship
quality matter in e-services? A comparison of online and offline retailing’.
Journal of Retailing and Consumer Services. 17(2), pp.123-138.
Weber, K. (2004) ‘The development and testing of the instructional interaction
theory’. Journal of Communication Education. 60. pp. 51-74.
Wells, J.D., Valacich, J.S. and Hess, T.J. (2011) ‘What signals are you sending?
How website quality influences perceptions of product quality and purchase
intentions’. MIS quarterly. 35(2), pp.373-396.
Wetzels, M., Ruyter, K.D. and Birhelen, M.V. (1998) ‘Marketing service
relationships: the role of commitment’. Journal of Business and Industrial
Marketing. 13(4), pp.406-423.
Wirtz, B.W. and Lihotzky, N. (2003) ‘Customer retention Management in the
B2C Electronic business’. Long Range Planning. 36(6), pp.517-532.
Xu, W. and Li, B. (2017). ‘The Third Party Logistics Partner Selection of B2C
E-Commerce Enterprise’. MATEC Web of Conferences, 100, pp. 02-32.
Yang, Z.L. and Peterson, R.T. (2004). ‘Customer Perceived Value, Satisfaction,
and Loyalty: The Role of Switching Costs’. Psychology and Marketing, 21(10),
799-822.
Yoo, C.W., Sanders, G.L. and Moon, J. (2013). ‘Exploring the effect of e-WOM
participation on e-Loyalty in e-commerce’. Decision Support Systems. 55(3), pp.
669-678.
Zeithaml, V. (1988) ‘Consumer perceptions of Price, quality and value: A
Means-End Model and Synthesis of Evidence’. Journal of Marketing. 52(3),
pp.2-22.
Zhang, K., Benyoucef, M. and Zhao, S. (2016). ‘Building brand loyalty in social
commerce: The case of brand microblogs’. Electronic Commerce Research
and Applications. 15, pp. 14–25.
164
Zhang, Y., Fang, Y. and Wei, K-K. (2011) ‘Repurchase intention in B2C E-
commerce -a relationship quality respective’. Information and Management.
48(6), pp. 192-200.
Zikmund, W.G. (2000). Exploring marketing research. 7th ed. Dryden Press,
Forth Worth.
165
Appendix (A)
Participant Information Sheet
My name is Yingqiao He. I am a postgraduate student studying at the University
of Liverpool. We are working on a project looking at the influence of online
logistics service mode on online customer loyalty. The online logistics service
mode includes forward and reverse logistics. In terms of forward logistics, the
provision of logistics service mode includes self-pick-up, delivery time slot and
logistics service provider, while the reverse logistics contains pick up, refund in
the nearby store and self-redelivery.
You are being invited to participate in a research study. Before you decide
whether to participate, it is important for you to understand why the research is
being done and what it will involve. Please take time to read the following
information carefully and feel free to discuss this with your friends and relatives
if you wish. We would like to stress that you do not have to accept this invitation
and should only agree to take part if you want to.
This study aims to invest the relationship between online logistics service mode
and online customer loyalty, providing theoretical and practical insight for future
online logistics service.
We invited you to take part in this study because you are in the data base of
the online retailers who are interested in knowing the relationship of the
provision of logistics service mode and customer loyalty. More than 1000
participants are expected to receive this questionnaire.
Taking part is voluntary. If you don’t want to take part, you are free to reject to
fill the questionnaire. And once you choose to start the questionnaire, you are
also free to suspend it at any time until you choose to submit the completed
answers.
The information will be collected anonymously. And all the information you give
us will be confidential and used for the purposes of this study only. More
specifically, the data will be collected through the online questionnaire, all you
have to do is just to fill out the questionnaire, and there is no need for you to
submit the questionnaire to the author’s Wechat specially. Hence, the

166
information you provided will not be identified by any people. In addition, the
data will be stored in the secured server of wenjuanxing. The server is based
on Elastic Compute Service (ALi Cloud), which is famous for its stability and
security. And wenjuanxing adopts Reduntant Array of independent Disks
storage to store data and install enterprise-level firewall to protect the data. In
short, the data is stored safely. Furthermore, only Yingqiao He and his
supervisor Dr DongLi have access to the data with the account number and
password of wenjuanxing. However, since the data is stored by a third company,
there is still low probability of data leak. Finally, the data is planned to be stored
for about 6 months. As long as the analysis of data is finished, the author will
delete all histories of the questionnaire in the platform and request wenjuanxing
to destroy the back-up information simultaneously.
Thank you very much for your help!
Mr Yingqiao He Dr Dong Li
Phone: 00447934704471
00441517953607
167
APPENDIX (B)
Survey Questionnaire-In English
Dear Participants,
Thanks very much for participating this survey about ‘the influence of online
logistics service mode on customer loyalty’. This survey aims to discover the
relationship between online logistics service mode and online customer loyalty.
It will take approximately 5 minutes to be completed. Thanks very much for your
participation again.
Please answer the questions according to your last experience of online
shopping, and rate the extent to which you agree with the following statements:
(1=strongly disagree, 7=strongly agree).
Note: The online logistics service mode in this questionnaire includes both
forward and reverse logistics. The selection of logistics service mode provided
by the online retailers contains delivery time, the logistics service provider, self-
pick-up and so on in the field of forward logistics, while the online logistics
service mode in reverse logistics includes self-sent by consumer, exchange or
refund in nearby stores and so on.
What is your gender?
◻ Male ◻ Female
What is your age?
◻<18 ◻18-24 ◻25-34 ◻35-44 ◻45-54 ◻>54
What is your education level?
◻Below undergraduate ◻Undergraduate ◻Postgraduate and Above
What is your monthly income?
◻<2000 ◻2000-4000 RMB ◻4000-6000 ◻6000-8000 ◻>8000
What is your online shopping ages?
◻1 year and below ◻1-3 years ◻3-5 years ◻Above 5 years
The online retailer provides me more selected ways of logistics service than
other retailers.
168
Strongly disagree ◻1 ◻2 ◻3 ◻4 ◻5 ◻6 ◻7 Strongly agree
The online logistics service mode provide by this online retailer always meets
my specific needs.
Strongly disagree ◻1 ◻2 ◻3 ◻4 ◻5 ◻6 ◻7 Strongly agree
Other online retailers could not provide me the logistics service mode that
satisfy my specific needs.
Strongly disagree ◻1 ◻2 ◻3 ◻4 ◻5 ◻6 ◻7 Strongly agree
The provision of OLSM makes me feel that I am specially treated by the online
retailer in this purchasing process.
Strongly disagree ◻1 ◻2 ◻3 ◻4 ◻5 ◻6 ◻7 Strongly agree
This online retailer always actively participates in satisfying my needs when I
raise the requirement about the logistics service.
Strongly disagree ◻1 ◻2 ◻3 ◻4 ◻5 ◻6 ◻7 Strongly agree
Compared to other online retailer, the logistics service price of this online
retailer is more expensive.
Strongly disagree ◻1 ◻2 ◻3 ◻4 ◻5 ◻6 ◻7 Strongly agree
I have to spend more on logistics service that matches my needs.
Strongly disagree ◻1 ◻2 ◻3 ◻4 ◻5 ◻6 ◻7 Strongly agree
I can only get free delivery as if the total value of purchased products is over a
certain amount.
Strongly disagree ◻1 ◻2 ◻3 ◻4 ◻5 ◻6 ◻7 Strongly agree
I am overall satisfied with this online retailer.
Strongly disagree ◻1 ◻2 ◻3 ◻4 ◻5 ◻6 ◻7 Strongly agree
I am overall pleased with this online retailer.
Strongly disagree ◻1 ◻2 ◻3 ◻4 ◻5 ◻6 ◻7 Strongly agree
My expectations about the service and goods provided by the online retailer
were satisfied, and even exceeded.

169
Strongly disagree ◻1 ◻2 ◻3 ◻4 ◻5 ◻6 ◻7 Strongly agree
My choice to purchase from this online retailer was a wise one.
Strongly disagree ◻1 ◻2 ◻3 ◻4 ◻5 ◻6 ◻7 Strongly agree
This online retailer is worthy and trustworthy.
Strongly disagree ◻1 ◻2 ◻3 ◻4 ◻5 ◻6 ◻7 Strongly agree
This online retailer is keen on fulfilling my needs and wants, and consistent in
quality and service.
Strongly disagree ◻1 ◻2 ◻3 ◻4 ◻5 ◻6 ◻7 Strongly agree
This online retailer could successfully complete the transaction.
Strongly disagree ◻1 ◻2 ◻3 ◻4 ◻5 ◻6 ◻7 Strongly agree
I trust the claims and promises this online retailer makes about its logistics
service.
Strongly disagree ◻1 ◻2 ◻3 ◻4 ◻5 ◻6 ◻7 Strongly agree
I have emotional and psychological dependence on this online retailer.
Strongly disagree ◻1 ◻2 ◻3 ◻4 ◻5 ◻6 ◻7 Strongly agree
I am willing to continue investing my time and effort on this online retailer.
Strongly disagree ◻1 ◻2 ◻3 ◻4 ◻5 ◻6 ◻7 Strongly agree
I intend to continue shopping at this online retailer over the next few years.
Strongly disagree ◻1 ◻2 ◻3 ◻4 ◻5 ◻6 ◻7 Strongly agree
This online retailer is my first choice when I want to purchase similar products.
Strongly disagree ◻1 ◻2 ◻3 ◻4 ◻5 ◻6 ◻7 Strongly agree
I will not change to other retailers as long as the current services continue.
Strongly disagree ◻1 ◻2 ◻3 ◻4 ◻5 ◻6 ◻7 Strongly agree
I am happy to recommend this online retailer to my friends.
Strongly disagree ◻1 ◻2 ◻3 ◻4 ◻5 ◻6 ◻7 Strongly agree
I keep visiting and prioritizing this online retailer whenever I need to make a
purchase.
170
Strongly disagree ◻1 ◻2 ◻3 ◻4 ◻5 ◻6 ◻7 Strongly agree
To me this retailer is the best online retailer to do business with.
Strongly disagree ◻1 ◻2 ◻3 ◻4 ◻5 ◻6 ◻7 Strongly agree
Overall, it would cost me a lot of time and energy to find and get used to an
alternative online retailer.
Strongly disagree ◻1 ◻2 ◻3 ◻4 ◻5 ◻6 ◻7 Strongly agree
I cannot be sure that the new online retailer can provide better service than the
old one.
Strongly disagree ◻1 ◻2 ◻3 ◻4 ◻5 ◻6 ◻7 Strongly agree
It costs me too much to switch to another online retailer.
Strongly disagree ◻1 ◻2 ◻3 ◻4 ◻5 ◻6 ◻7 Strongly agree
In general, it would be a hassle switching to another online retailer.
Strongly disagree ◻1 ◻2 ◻3 ◻4 ◻5 ◻6 ◻7 Strongly agree
If you have any suggestion about this questionnaire, feel free to email to
Thanks for your cooperation again.
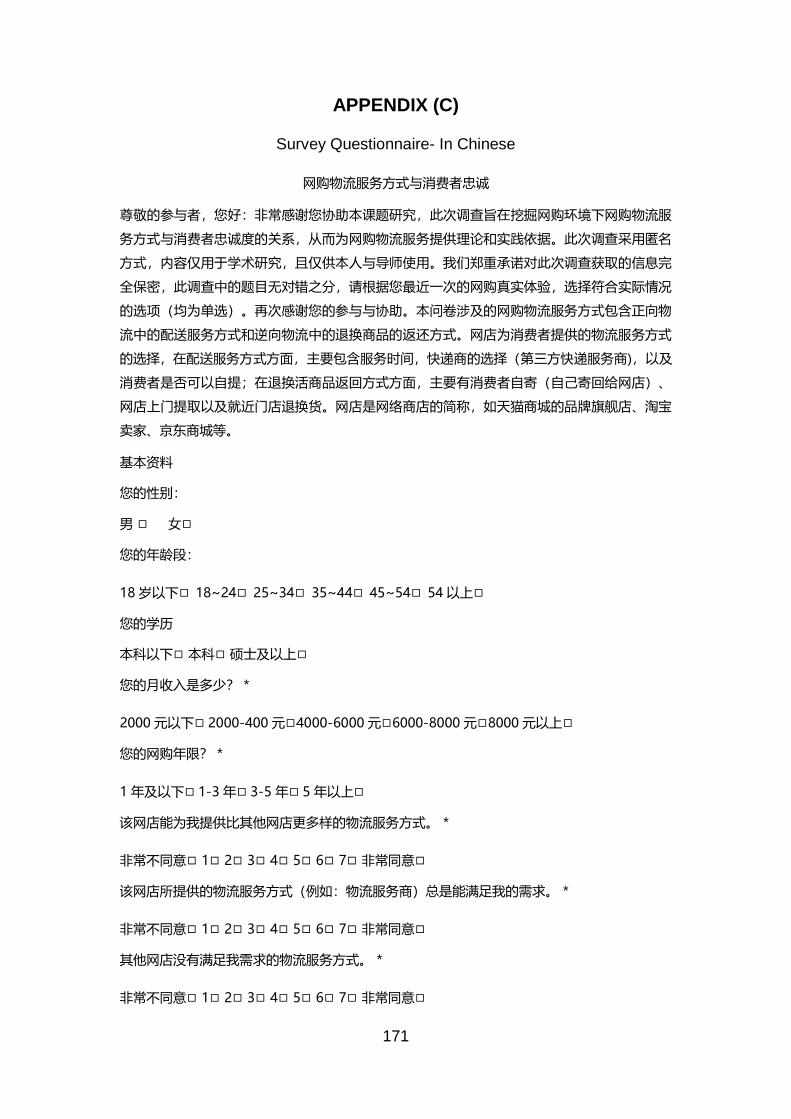
171
APPENDIX (C)
Survey Questionnaire- In Chinese
网购物流服务方式与消费者忠诚
尊敬的参与者,您好:非常感谢您协助本课题研究,此次调查旨在挖掘网购环境下网购物流服
务方式与消费者忠诚度的关系,从而为网购物流服务提供理论和实践依据。此次调查采用匿名
方式,内容仅用于学术研究,且仅供本人与导师使用。我们郑重承诺对此次调查获取的信息完
全保密,此调查中的题目无对错之分,请根据您最近一次的网购真实体验,选择符合实际情况
的选项(均为单选)。再次感谢您的参与与协助。本问卷涉及的网购物流服务方式包含正向物
流中的配送服务方式和逆向物流中的退换商品的返还方式。网店为消费者提供的物流服务方式
的选择,在配送服务方式方面,主要包含服务时间,快递商的选择(第三方快递服务商),以及
消费者是否可以自提;在退换活商品返回方式方面,主要有消费者自寄(自己寄回给网店)、
网店上门提取以及就近门店退换货。网店是网络商店的简称,如天猫商城的品牌旗舰店、淘宝
卖家、京东商城等。
基本资料
您的性别:
男 ◻ 女◻
您的年龄段:
18 岁以下◻ 18~24◻ 25~34◻ 35~44◻ 45~54◻ 54 以上◻
您的学历
本科以下◻ 本科◻ 硕士及以上◻
您的月收入是多少? *
2000 元以下◻ 2000-400 元◻4000-6000 元◻6000-8000 元◻8000 元以上◻
您的网购年限? *
1 年及以下◻ 1-3 年◻ 3-5 年◻ 5 年以上◻
该网店能为我提供比其他网店更多样的物流服务方式。 *
非常不同意◻ 1◻ 2◻ 3◻ 4◻ 5◻ 6◻ 7◻ 非常同意◻
该网店所提供的物流服务方式(例如:物流服务商)总是能满足我的需求。 *
非常不同意◻ 1◻ 2◻ 3◻ 4◻ 5◻ 6◻ 7◻ 非常同意◻
其他网店没有满足我需求的物流服务方式。 *
非常不同意◻ 1◻ 2◻ 3◻ 4◻ 5◻ 6◻ 7◻ 非常同意◻

172
此次网购过程中,网店所提供的物流服务方式让我感受自己得到了特殊待遇。 *
非常不同意◻ 1◻ 2◻ 3◻ 4◻ 5◻ 6◻ 7◻ 非常同意◻
当提出物流服务需求时,该网店尽力满足了我。 *
非常不同意◻ 1◻ 2◻ 3◻ 4◻ 5◻ 6◻ 7◻ 非常同意◻
相比于其他网店,该网店的物流费用较高。 *
非常不同意◻ 1◻ 2◻ 3◻ 4◻ 5◻ 6◻ 7◻ 非常同意◻
我需要支付更高的物流费用以满足自己的物流需求。 *
非常不同意◻ 1◻ 2◻ 3◻ 4◻ 5◻ 6◻ 7◻ 非常同意◻
在该网店需要购买超过一定金额的商品才能获得免邮服务。 *
非常不同意◻ 1◻ 2◻ 3◻ 4◻ 5◻ 6◻ 7◻ 非常同意◻
总体而言,我对整个购物过程很满意。 *
非常不同意◻ 1◻ 2◻ 3◻ 4◻ 5◻ 6◻ 7◻ 非常同意◻
在该网店的网购经历使我愉悦。 *
非常不同意◻ 1◻ 2◻ 3◻ 4◻ 5◻ 6◻ 7◻ 非常同意◻
该商店提供的商品和服务符合甚至超过了我的期望。 *
非常不同意◻ 1◻ 2◻ 3◻ 4◻ 5◻ 6◻ 7◻ 非常同意◻
选择该网店是明智的。 *
非常不同意◻ 1◻ 2◻ 3◻ 4◻ 5◻ 6◻ 7◻ 非常同意◻
该网店是诚实并值得信任的。 *
非常不同意◻ 1◻ 2◻ 3◻ 4◻ 5◻ 6◻ 7◻ 非常同意◻
该网店致力于满足我的需求,并提供高质量的商品和服务。 *
非常不同意◻ 1◻ 2◻ 3◻ 4◻ 5◻ 6◻ 7◻ 非常同意◻
该网店能顺利地完成我们之间的交易。 *
非常不同意◻ 1◻ 2◻ 3◻ 4◻ 5◻ 6◻ 7◻ 非常同意◻
我相信该网店对他的物流服务和商品所做出的承诺。 *
非常不同意◻ 1◻ 2◻ 3◻ 4◻ 5◻ 6◻ 7◻ 非常同意◻
我对该网店有情感和心理上的依赖。 *

173
非常不同意◻ 1◻ 2◻ 3◻ 4◻ 5◻ 6◻ 7◻ 非常同意◻
我很愿意继续花费更多时间和精力在该网店上。 *
非常不同意◻ 1◻ 2◻ 3◻ 4◻ 5◻ 6◻ 7◻ 非常同意◻
我打算在未来的几年内继续在该网点消费。 *
非常不同意◻ 1◻ 2◻ 3◻ 4◻ 5◻ 6◻ 7◻ 非常同意◻
下次购买同类商品时,该网店是我的第一选择。 *
非常不同意◻ 1◻ 2◻ 3◻ 4◻ 5◻ 6◻ 7◻ 非常同意◻
只要该网店能继续提供当前的服务和商品,我不会考虑转移到其他网店。 *
非常不同意◻ 1◻ 2◻ 3◻ 4◻ 5◻ 6◻ 7◻ 非常同意◻
我很乐意推荐该网店给我的其他朋友。 *
非常不同意◻ 1◻ 2◻ 3◻ 4◻ 5◻ 6◻ 7◻ 非常同意◻
我会继续关注并浏览该网店。 *
非常不同意◻ 1◻ 2◻ 3◻ 4◻ 5◻ 6◻ 7◻ 非常同意◻
该网店是最好的卖家。 *
非常不同意◻ 1◻ 2◻ 3◻ 4◻ 5◻ 6◻ 7◻ 非常同意◻
如果舍弃该网店,我需要花费更多的时间和精力去寻找并适应新的满足我需求的网店。 *
非常不同意◻ 1◻ 2◻ 3◻ 4◻ 5◻ 6◻ 7◻ 非常同意◻
我不确定新的网店是否能提供比该网店更好的服务和商品。 *
非常不同意◻ 1◻ 2◻ 3◻ 4◻ 5◻ 6◻ 7◻ 非常同意◻
总而言之,从该网店转到其他网店的成本较高。 *
非常不同意◻ 1◻ 2◻ 3◻ 4◻ 5◻ 6◻ 7◻ 非常同意◻
转换到其他网店让我感到烦恼。 *
非常不同意◻ 1◻ 2◻ 3◻ 4◻ 5◻ 6◻ 7◻ 非常同意◻
如果您对该研究有更好的建议,或对任何题项有任何疑问,请邮件联系我们:
[email protected]. 再次感谢您的配合!
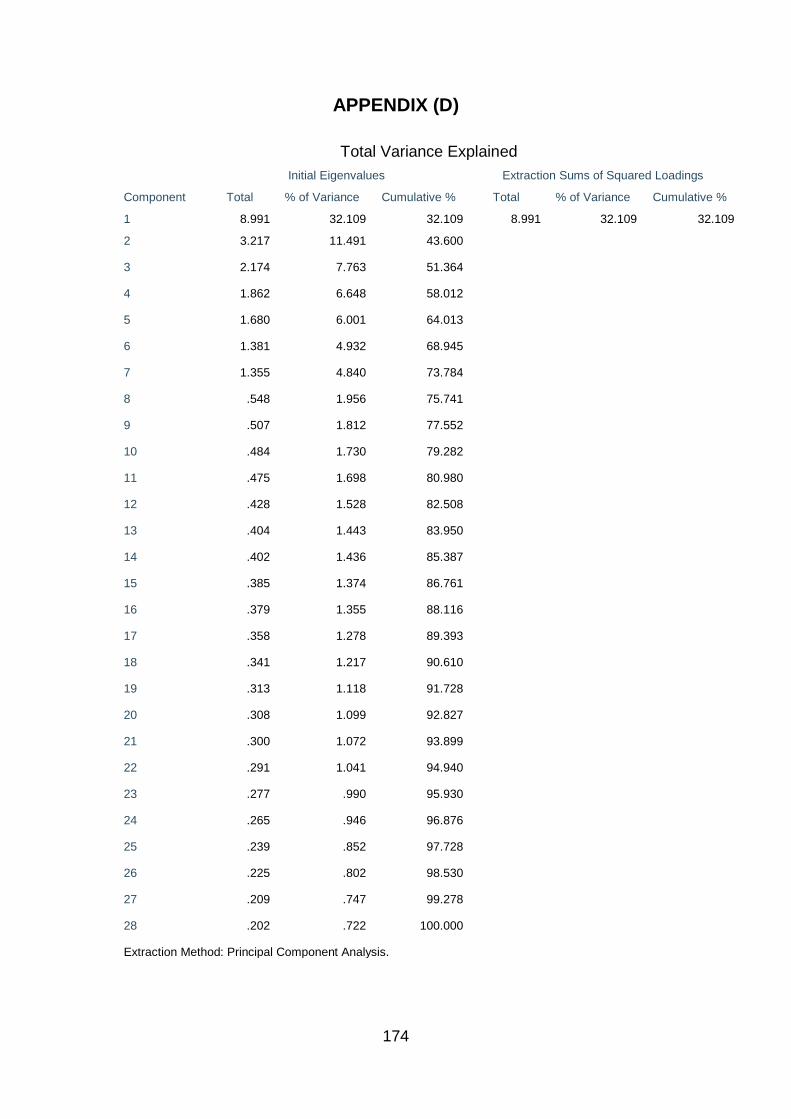
174
APPENDIX (D)
Total Variance Explained
Component
Initial Eigenvalues Extraction Sums of Squared Loadings
Total % of Variance Cumulative % Total % of Variance Cumulative %
1 8.991 32.109 32.109 8.991 32.109 32.109
2 3.217 11.491 43.600
3 2.174 7.763 51.364
4 1.862 6.648 58.012
5 1.680 6.001 64.013
6 1.381 4.932 68.945
7 1.355 4.840 73.784
8 .548 1.956 75.741
9 .507 1.812 77.552
10 .484 1.730 79.282
11 .475 1.698 80.980
12 .428 1.528 82.508
13 .404 1.443 83.950
14 .402 1.436 85.387
15 .385 1.374 86.761
16 .379 1.355 88.116
17 .358 1.278 89.393
18 .341 1.217 90.610
19 .313 1.118 91.728
20 .308 1.099 92.827
21 .300 1.072 93.899
22 .291 1.041 94.940
23 .277 .990 95.930
24 .265 .946 96.876
25 .239 .852 97.728
26 .225 .802 98.530
27 .209 .747 99.278
28 .202 .722 100.000
Extraction Method: Principal Component Analysis.
Copyright © 2022 FDOKUMEN