The Mobile Stress Meter: A New Way to Measure Stress Using ...
10
The Mobile Stress Meter: A New Way to Measure Stress Using Images Sophia Haim Dartmouth College [email protected] Lorie Loeb Dartmouth College [email protected] Rui Wang Dartmouth College [email protected] Xia Zhou Dartmouth College [email protected] Sarah E. Lord Dartmouth College [email protected] Andrew T. Campbell Dartmouth College [email protected] Permission to make digital or hard copies of all or part of this work for personal or classroom use is granted without fee provided that copies are not made or distributed for profit or commercial advantage and that copies bear this notice and the full citation on the first page. Copyrights for components of this work owned by others than ACM must be honored. Abstracting with credit is permitted. To copy otherwise, or republish, to post on servers or to redistribute to lists, requires prior specific permission and/or a fee. Request permissions from [email protected]. Ubicomp/ISWC’15 Adjunct , September 07-11, 2015, Osaka, Japan c 2015 ACM. ISBN 978-1-4503-3575-1/15/09. . . $15.00 DOI: http://dx.doi.org/10.1145/2800835.2804398 Abstract Stress is an important aspect of human psychology. Many measures of stress have been developed over the years, but different issues exist for most of these measures. This study introduces the mobile stress meter, a new way to measure stress in which a user simply selects an image that best captures his or her stress level. Such a tool allows researchers to quickly measure stress in real time and in natural environ- ments less onerous for the user. Our results show that the mobile stress meter is a valid measure of stress. Users find it easy and actually enjoyable to use. Our results also show that the mobile stress me- ter is strongly correlated with the Perceived Stress Scale, a validated multi-item stress scale. The corre- lation has an r-value of 0.5559 and a p-value of less than 0.001. We conclude that the mobile stress me- ter can be applied effectively in research experiments and advance the research on stress. Introduction Stress has been defined in many ways. Possibly the simplest definition of stress is a physical or psycho- logical state of strain [1]. A more complete definition describes stress as the physiological or psychological response to internal or external stressors [14], where a stressor is a thought or event that conveys threat,
-
Upload
khangminh22 -
Category
Documents
-
view
4 -
download
0
Transcript of The Mobile Stress Meter: A New Way to Measure Stress Using ...

The Mobile Stress Meter: A NewWay to Measure Stress UsingImages
Sophia HaimDartmouth [email protected]
Lorie LoebDartmouth [email protected]
Rui WangDartmouth [email protected]
Xia ZhouDartmouth [email protected]
Sarah E. LordDartmouth [email protected]
Andrew T. CampbellDartmouth [email protected]
Permission to make digital or hard copies of all or part of this work for personalor classroom use is granted without fee provided that copies are not made ordistributed for profit or commercial advantage and that copies bear this noticeand the full citation on the first page. Copyrights for components of this workowned by others than ACM must be honored. Abstracting with credit ispermitted. To copy otherwise, or republish, to post on servers or to redistributeto lists, requires prior specific permission and/or a fee. Request permissionsfrom [email protected]/ISWC’15 Adjunct , September 07-11, 2015, Osaka, Japanc© 2015 ACM. ISBN 978-1-4503-3575-1/15/09. . . $15.00
DOI: http://dx.doi.org/10.1145/2800835.2804398
AbstractStress is an important aspect of human psychology.Many measures of stress have been developed overthe years, but different issues exist for most of thesemeasures. This study introduces the mobile stressmeter, a new way to measure stress in which a usersimply selects an image that best captures his or herstress level. Such a tool allows researchers to quicklymeasure stress in real time and in natural environ-ments less onerous for the user. Our results showthat the mobile stress meter is a valid measure ofstress. Users find it easy and actually enjoyable touse. Our results also show that the mobile stress me-ter is strongly correlated with the Perceived StressScale, a validated multi-item stress scale. The corre-lation has an r-value of 0.5559 and a p-value of lessthan 0.001. We conclude that the mobile stress me-ter can be applied effectively in research experimentsand advance the research on stress.
IntroductionStress has been defined in many ways. Possibly thesimplest definition of stress is a physical or psycho-logical state of strain [1]. A more complete definitiondescribes stress as the physiological or psychologicalresponse to internal or external stressors [14], wherea stressor is a thought or event that conveys threat,
harm, or loss [7].
The normal stress response is actually beneficial:it promotes adaptive changes when faced with anacute threat. These changes can include increasedvigilance, attention and arousal, as well as a shut-down of feeding behaviors [3]. The stress responseis designed to ensure that enough energy is suppliedto the organs needed to assure survival. Stress re-sponses can also assist cognitive performance levelsand enhance emotional learning and memory [7]. Allof these adaptations allow humans to more readilyface a threat. This suggests that stress responsescan enhance performance, characterizing stress as apositive effect. In addition to this biological response,individuals can react to stress with behaviors thatmight be positive, negative, or neutral [6].
Biological responses to stress, though initially posi-tive, can start to have negative effects if sustained [3].Stress has been shown to have negative effects onhealth [6]. Over time, prolonged stress responses candamage tissue, weaken the immune system, causeheart damage, and lead to a range of other healthproblems. In addition, stress can lead to harmful be-haviors, such as smoking, excessive drinking, drugabuse, and loss of appetite [1, 7]. Stress has alsobeen associated with depression and anxiety disor-ders [7].
Finding ways to effectively measure stress is an im-portant area of research, as it is the first step in rec-ognizing and potentially reducing stress, thereforeminimizing the adverse mental and physical effectsof stress. There are several existing methods to mea-sure stress, ranging from analyzing cortisol levels insaliva [6], administering multi-item questionnaires [6],
to recognizing stress levels in speech [8]. While manyof these methods are effective, they are invasive, ex-pensive, annoying for users, somewhat unreliable asa measure of stress, or susceptible to recall bias. Toadvance the research on measuring stress, we seeka tool that can reliably measure stress, is easy to ad-minister and use, and can be administered in a sub-ject’s natural environment, e.g., the tool can be ad-ministered on mobile phones and thus is quick andeasy to use on the go.
We present a tool called the mobile stress meter,which seeks to fulfill all the above objectives. Themobile stress meter was inspired by PAM, the Pho-tographic Affect Meter [11], but is designed to mea-sure stress instead of affect. We follow a very similarmethodology to what was used in PAM in designingour new measure of stress. The mobile stress me-ter is designed to be administered on smartphones,which have become very common, making it veryeasy for subjects to use in their natural environmentat any time. Users are shown a grid of sixteen im-ages, each of which is associated with a particularlevel of stress. Individuals are asked to touch the im-age that best represents their current stress level, andare given the option of requesting more images if theywould like more options (the full image set consists of48 images).
We carry out two studies to test the mobile stressmeter. The first study asks users to choose an im-age and then take the Perceived Stress Scale (PSS),which has been validated in several samples and isconsidered the “global measure of stress” [2, 6]. Thegoal of this study is to determine if the mobile stressmeter is a valid measure of stress, by comparing

the resulting mobile stress meter scores to the PSSscores. In the second study, 19 Dartmouth studentsuse the mobile stress meter to record their stresslevel at least three times a day for seven days, start-ing from the second-to-last day of classes through thesecond-to-last day of finals. The goal of this study isto find out whether the mobile stress meter is effec-tive and unobtrusive in actual use. These two studieslead us to conclude that the mobile stress meter is areliable measure of stress that can easily and unob-trusively measure stress in a subject’s natural environ-ment at any time.
These results imply that a simple smartphone appcan use the mobile stress meter to effectively mea-sure stress. This is important because it will allowresearchers to assess stress levels at key momentsand in context, without being unpleasant to the user.This creates opportunities for a range of studies in thesubject’s natural environment. As smartphones havebecome commonplace, such studies would not re-quire costly tools in the stress measurement process.The mobile stress meter opens up a whole new rangeof possibilities for stress-associated research.
Related WorkIn an effort to make assessment of stress less in-vasive and burdensome for the subject, several re-cent studies have attempted to find ways to mea-sure stress using smartphones and wearables. Onestudy [12] used a wrist sensor (for accelerometer andskin conductance information), the mobile phone us-age (call, SMS, location, whether the screen was onor off), and surveys (on stress, mood, sleep, tired-ness, general health, alcohol intake, caffeine intake,and electronics usage) to find physiological and be-
havioral markers for stress. These results showed thatboth mobile phone usage and wearable sensor dataincluded features related to the stress level. In par-ticular, fewer or shorter sent SMS and certain screenon/off patterns were related to higher reported stresslevels [12].
In another study [10], the authors designed a wear-able sensor to unobtrusively measure electrodermalactivity (EDA)/GSR over a long term. The study foundevidence that the distal forearm, where the sensorwas placed, is a viable alternative to the traditionalencumbering palmar sites for EDA measurement.This new compact, low-cost, unobtrusive sensor of-fers the ability to perform comfortable, long-term, in-situ assessments of GSR [10]. Although there will stillbe the issue of environmental and organismal factorshaving an influence on GSR measurement, this newtechnology eliminated many of the burdensome as-pects of assessing EDA/GSR. This product evolvedinto the Q sensor.
StressSense [8] uses smartphones to unobtrusivelyrecognize stress from human voice. StressSense istested on multiple individuals in several environmentsto make sure it can adapt to different scenarios. Itprovides an easy and non-intrusive way to measurestress in real-life situations. AutoSense is a wearableintended to unobtrusively and robustly measure stressin the field [5]. In a study in both the lab and the field,with over 20 subjects, AutoSense was shown to pro-vide 90% accuracy as a model of stress.
Ecological Momentary Assessment (EMA) seeks toeliminate the recall bias and lab environment issuespresented in the traditional self-report surveys. EMAinvolves repeated, often random, samples of subjects’
experiences and behaviors in real time and in sub-jects’ natural environments. Because subjects willhave to complete the same assessment many times,it is important to consider that any small annoyancecan become extremely irritating when encounteredover and over again [13].
Mobile Stress Meter Design
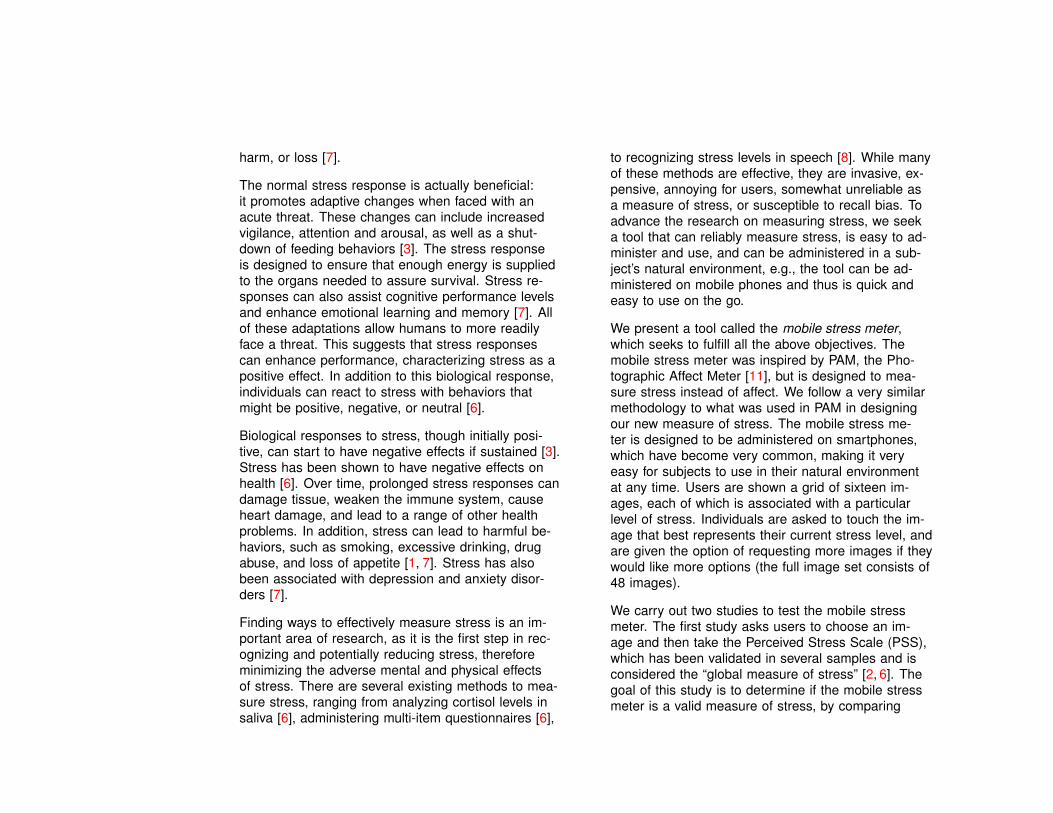
Figure 1: The mobile stressmeter user interface.
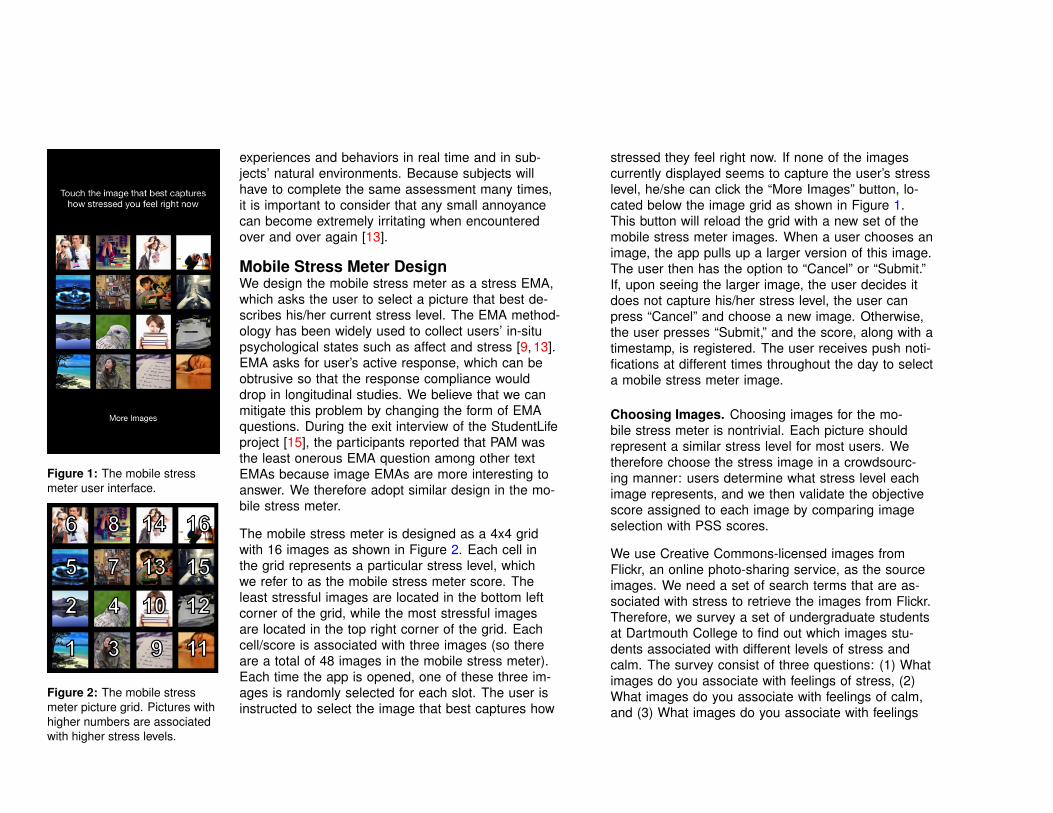
Figure 2: The mobile stressmeter picture grid. Pictures withhigher numbers are associatedwith higher stress levels.
We design the mobile stress meter as a stress EMA,which asks the user to select a picture that best de-scribes his/her current stress level. The EMA method-ology has been widely used to collect users’ in-situpsychological states such as affect and stress [9, 13].EMA asks for user’s active response, which can beobtrusive so that the response compliance woulddrop in longitudinal studies. We believe that we canmitigate this problem by changing the form of EMAquestions. During the exit interview of the StudentLifeproject [15], the participants reported that PAM wasthe least onerous EMA question among other textEMAs because image EMAs are more interesting toanswer. We therefore adopt similar design in the mo-bile stress meter.
The mobile stress meter is designed as a 4x4 gridwith 16 images as shown in Figure 2. Each cell inthe grid represents a particular stress level, whichwe refer to as the mobile stress meter score. Theleast stressful images are located in the bottom leftcorner of the grid, while the most stressful imagesare located in the top right corner of the grid. Eachcell/score is associated with three images (so thereare a total of 48 images in the mobile stress meter).Each time the app is opened, one of these three im-ages is randomly selected for each slot. The user isinstructed to select the image that best captures how
stressed they feel right now. If none of the imagescurrently displayed seems to capture the user’s stresslevel, he/she can click the “More Images” button, lo-cated below the image grid as shown in Figure 1.This button will reload the grid with a new set of themobile stress meter images. When a user chooses animage, the app pulls up a larger version of this image.The user then has the option to “Cancel” or “Submit.”If, upon seeing the larger image, the user decides itdoes not capture his/her stress level, the user canpress “Cancel” and choose a new image. Otherwise,the user presses “Submit,” and the score, along with atimestamp, is registered. The user receives push noti-fications at different times throughout the day to selecta mobile stress meter image.
Choosing Images. Choosing images for the mo-bile stress meter is nontrivial. Each picture shouldrepresent a similar stress level for most users. Wetherefore choose the stress image in a crowdsourc-ing manner: users determine what stress level eachimage represents, and we then validate the objectivescore assigned to each image by comparing imageselection with PSS scores.
We use Creative Commons-licensed images fromFlickr, an online photo-sharing service, as the sourceimages. We need a set of search terms that are as-sociated with stress to retrieve the images from Flickr.Therefore, we survey a set of undergraduate studentsat Dartmouth College to find out which images stu-dents associated with different levels of stress andcalm. The survey consist of three questions: (1) Whatimages do you associate with feelings of stress, (2)What images do you associate with feelings of calm,and (3) What images do you associate with feelings

in between stress and calm. We survey a total of 28students, and come up with 200 search terms. Someexamples of the search terms we use are “beach” and“cup of tea” as calm search terms, “people yelling,”“piles of books,” and “face in hands” as stress searchterms, and “to do list” and “running” as “in between”search terms. We pull images from the Flickr Cre-ative Commons site using these search terms to puttogether an initial set of 624 images.
We find the candidate pictures for each stress level intwo steps. We first narrow down the image set to geta smaller and more relevant stress image set. Thenwe use the Perceived Stress Scale to help us deter-mine the stress level that each image represents.
To narrow down this image set and create the subsetof images with which students would be most likelyto identify, we create an early version of the mobilestress meter, which is a webpage with 104 imageslots, with 6 images assigned to each slot. Whenthe webpage loads, each slot is randomly filled withone of the six images designated for that slot. Im-ages are roughly assigned to slots based on whetherthe search term used to find the image that has beenclassified by surveyed students as representing stress,calm, or something in between. “Calm” images areplaced on the left, “stressful” images on the right,and “in between” ones in the middle. Users are in-structed to select the image that best captures howstressed they feel right now. They are encouragedto scroll all the way down and look at all the imagesbefore making a selection. The user can click on a“More Photos” button to reload all the slots with a newrandom set of images. If the user keeps clicking the“More Photos” button, it will not show repeats until all
six photos have been shown for each slot. This web-page is sent out to undergraduate students at Dart-mouth and received 817 responses. Based on theresults, we choose the images that have been clickedon most often to narrow our image set down to 96 im-ages.
We then arrange the photos in a 4x4 grid. Each gridhas 6 assigned images. These images are arrangedfrom the most “calm” in the bottom left, to the most“stressful” in the top right, the same arrangement asthe final version of the mobile stress meter. We sendthis webpage to undergraduate students at DartmouthCollege and received 535 responses. We also col-lect the students’ responses to the Perceived StressScale survey as the groundtruth. We change the timescale of each PSS prompt from “In the past month” to“Recently” to capture the student’s most recent stresslevel.
EvaluationWe conduct two studies using the mobile stress me-ter to establish its validity and to determine if it can beused effectively to frequently measure stress in sub-jects’ natural environments. The first study involvescomparing the mobile stress meter to the PerceivedStress Scale to ascertain its validity. We choose thePSS as our comparison measure because it is themost commonly employed assessment of stress [6]and it was validated for two samples of college stu-dents [2]. Because the entire process of designingand testing the mobile stress meter is done with col-lege students, we want to compare it with a question-naire that has been validated for a similar group. Inthe second study, a group of undergraduate studentsare asked to use an iPhone implementation of the

mobile stress meter for a week. They are instructedto select the mobile stress meter image that best rep-resents their stress level three times a day for sevendays. This allows us to assess the effectiveness ofthe mobile stress meter in an actual experimental set-ting.
Study 1: Validation of the mobile stress meter with PSSThe first study is designed to validate the mobile stressmeter by comparing the mobile stress meter scores toPSS scores. For this study, we create a webpage withthe mobile stress meter assessment. Users are in-structed to select the image that best captures howstressed they feel right now. After selecting an image,the user is taken to a web-based version of PSS. Thetime scale of each PSS prompt is changed from “Inthe past month” to “Recently” to better gauge currentstress levels.
The webpage is sent out to Dartmouth undergraduatestudents and 388 individuals participated. The mo-bile stress meter score ranges from 1 to 16. The PSSscore ranges from 0 to 37. The mean of the mobilestress meter score is 9.41 with a standard deviation of4.24, while the mean of the PSS Score is 19.14 witha standard deviation of 7.25.
We use Pierson correlation to determine the relationsbetween the mobile stress meter scores and PSSscores. The mobile stress meter scores are stronglycorrelated with PSS scores with r = 0.5559, p < 0.001.
Study 2: Use of the mobile stress meter in an Experimen-tal SettingThe goal of this study is to ensure that the mobilestress meter can be easily and unobtrusively com-pleted several times a day for an extended period of
time. This provides more evidence to validate the mo-bile stress meter as a measure of stress.
This study involves 16 undergraduate students (8male, 8 female). Subjects are recruited via emails,in which the study is briefly described, and studentsare offered compensation for participating in the study.Because the mobile stress meter is initially designedfor iPhones, students have to have an iPhone to par-ticipate. All the study participants are undergradu-ates at Dartmouth College. The student participantsare between the age of 20 and 26, and the majorityare 22. 12 of the students select White/Caucasianas their race, two select Hispanic or Latino, one se-lect Black or African American, and one select Asianor Pacific Islander. The students are from a range ofmajors, including Economics, Computer Science, Gov-ernment, Music, Engineering, English, and Environ-mental Studies.
Each subject downloads the mobile stress meter apponto their phone, and is instructed to complete themobile stress meter assessment each time they re-ceive a push notification. Subjects are told not to betoo concerned if they missed a notification, but to tryto complete the assessment at least three times aday. The study is administered over the seven-day pe-riod starting from the second-to-last day of classesand ending on the second-to-last day of finals. Acrossall participants, the mobile stress meter assessment iscompleted a total of 480 times over the course of theseven-day study.
Table 1: Results from regressing the mobile stress meterscores on academic characteristics.
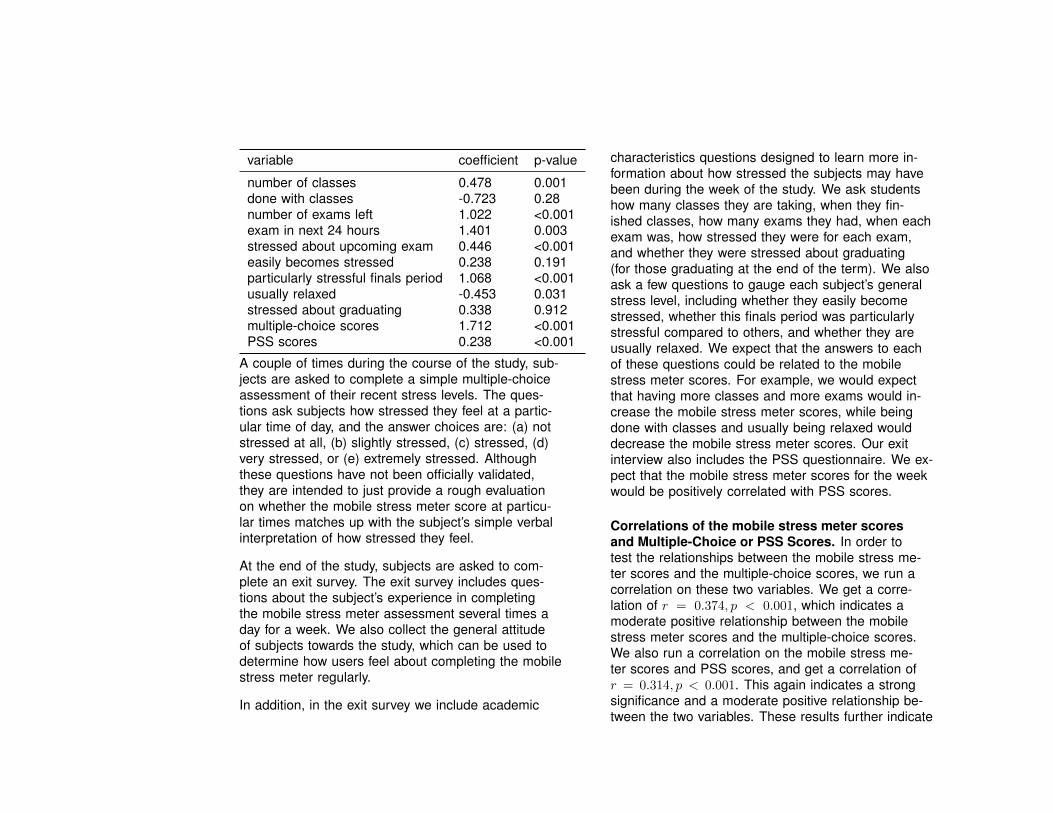
variable coefficient p-value
number of classes 0.478 0.001done with classes -0.723 0.28number of exams left 1.022 <0.001exam in next 24 hours 1.401 0.003stressed about upcoming exam 0.446 <0.001easily becomes stressed 0.238 0.191particularly stressful finals period 1.068 <0.001usually relaxed -0.453 0.031stressed about graduating 0.338 0.912multiple-choice scores 1.712 <0.001PSS scores 0.238 <0.001
A couple of times during the course of the study, sub-jects are asked to complete a simple multiple-choiceassessment of their recent stress levels. The ques-tions ask subjects how stressed they feel at a partic-ular time of day, and the answer choices are: (a) notstressed at all, (b) slightly stressed, (c) stressed, (d)very stressed, or (e) extremely stressed. Althoughthese questions have not been officially validated,they are intended to just provide a rough evaluationon whether the mobile stress meter score at particu-lar times matches up with the subject’s simple verbalinterpretation of how stressed they feel.
At the end of the study, subjects are asked to com-plete an exit survey. The exit survey includes ques-tions about the subject’s experience in completingthe mobile stress meter assessment several times aday for a week. We also collect the general attitudeof subjects towards the study, which can be used todetermine how users feel about completing the mobilestress meter regularly.
In addition, in the exit survey we include academic
characteristics questions designed to learn more in-formation about how stressed the subjects may havebeen during the week of the study. We ask studentshow many classes they are taking, when they fin-ished classes, how many exams they had, when eachexam was, how stressed they were for each exam,and whether they were stressed about graduating(for those graduating at the end of the term). We alsoask a few questions to gauge each subject’s generalstress level, including whether they easily becomestressed, whether this finals period was particularlystressful compared to others, and whether they areusually relaxed. We expect that the answers to eachof these questions could be related to the mobilestress meter scores. For example, we would expectthat having more classes and more exams would in-crease the mobile stress meter scores, while beingdone with classes and usually being relaxed woulddecrease the mobile stress meter scores. Our exitinterview also includes the PSS questionnaire. We ex-pect that the mobile stress meter scores for the weekwould be positively correlated with PSS scores.
Correlations of the mobile stress meter scoresand Multiple-Choice or PSS Scores. In order totest the relationships between the mobile stress me-ter scores and the multiple-choice scores, we run acorrelation on these two variables. We get a corre-lation of r = 0.374, p < 0.001, which indicates amoderate positive relationship between the mobilestress meter scores and the multiple-choice scores.We also run a correlation on the mobile stress me-ter scores and PSS scores, and get a correlation ofr = 0.314, p < 0.001. This again indicates a strongsignificance and a moderate positive relationship be-tween the two variables. These results further indicate

the validity of the mobile stress meter as a measureof stress, and show that users are able to representtheir stress levels accurately using the mobile stressmeter assessment.
Regressing the mobile stress meter scores onacademic characteristics. To examine which aca-demic characteristics influence the mobile stress me-ter score, we regress the mobile stress meter scoreon each variable. The results are shown in Table 1.Our results are very similar to our expectations. Tak-ing more classes tend to increase the mobile stressmeter scores, with a coefficient of 0.478 and a p-value of 0.001. Being done with classes has a neg-ative coefficient, as predicted, but is not significant.Having more exams left, having an exam coming upin the next 24 hours, and being more stressed aboutan upcoming exam all have positive and significantcoefficients, confirming our expectation. Having moreexams left has a coefficient of 1.022 and a p-value ofless than 0.001, having an exam in the next 24 hourshas a coefficient of 1.401 and a p-value of 0.003, andbeing more stressed about an upcoming exam has acoefficient of 0.446 and a p-value of less than 0.001.Being easily stressed and being stressed about grad-uating both have positive coefficients, but are not sig-nificant. Having a particularly stressful finals periodtend to increase the mobile stress meter scores aswell, with a coefficient of 1.068 and a p-value of lessthan 0.001. Being usually relaxed tend to decreasethe mobile stress meter scores, as we predict, witha coefficient of -0.453 and a p-value of 0.031. Fi-nally, indicating a higher level of stress in the multi-ple choice questions and in the PSS questionnaireare both associated with higher mobile stress meterscores. The level of stress indicated in the multiple
choice questions has a coefficient of 1.712 and a p-value of less than 0.001, indicating that marking onehigher level of stress on the multiple-choice questionsis associated with a 1.712 point increase in the mo-bile stress meter score. This positive, significant coef-ficient confirms our expectation that the mobile stressmeter scores are higher during times of day when stu-dents verbally assess their stress level as higher. Thecoefficient for PSS score is 0.238, with a p-value ofless than 0.001. Although some of these coefficientsare not significant, all of them align with our expecta-tions.
The mobile stress meter user experience. We usethis study to assess how subjects feel about using themobile stress meter as a measure of stress. We askusers to indicate their level of agreement/disagreementwith several statements about the app in the exit sur-vey. Overall, the responses show that users find theapp easy to use, not burdensome, and actually en-joyable. Subjects are comfortable using the app andgenerally have a positive experience.
Each statement and the responses to the statementsare shown in Table 2. Lower average rating indicatesthat the subjects agree more on the question. Mostsubjects respond more than the required three timesa day, indicating that they probably enjoy perform-ing the task. In discussing EMA, we mention thatit is important to make sure that tasks that have tobe completed repeatedly are not annoying for theuser, as such tasks can become extremely annoy-ing when performed over and over [13]. The mobilestress meter definitely follows this suggestion, sinceusers generally like completing the task, and do notfind it annoying. These reactions to the use of the

Table 2: The mobile stress meter user experience responses.
How much do you agree with each of these statements?
Answer Options Strongly Disagree Neutral Agree Strongly RatingDisagree Agree Average
I found completing the mobile stress meter assessment burdensome 12 4 0 0 0 1.25I enjoyed completing the mobile stress meter assessment. 0 0 4 7 5 4.06I felt comfortable using the app. 0 0 0 3 13 4.81I found it easy to learn how to use the app. 0 0 0 2 14 4.88I found the app difficult to use. 14 2 0 0 0 1.13My overall impression of using the app was positive. 0 0 1 8 7 4.38My overall impression of using the app was negative. 12 3 1 0 0 1.31
mobile stress meter three times a day for a week indi-cate that the mobile stress meter can be used to fre-quently assess stress in experimental contexts withoutcreating an extra burden to the subjects.
DiscussionOur results clearly show that the mobile stress meteris a valid and effective measure of stress. We havesuccessfully designed a measure of stress that iseasy to administer using smartphones, is not bur-densome or annoying for users, and can effectivelyproduce a valid real-time measure of stress in naturalenvironments.
One concern about self-assessment measures ofstress that we have not addressed is the concern thatsuch measures cannot be adapted to other culturalcontexts [6]. In fact, this study is specifically designedand tested with college students. That being said, themethodology used in this paper will not be difficult toreplicate in another cultural context. Because the en-tire design process begins with surveying a subsam-ple of students to generate search terms, it is straight-
forward to carry out the same design process in an-other environment. One would simply request searchterms in a similar way, this time from a subsample ofanother cultural group. By starting the design processover in this way, the set of images could be specifi-cally adapted to a new cultural context, and then ver-ified in that context. The main concept of measuringstress with images would remain, as all types of cul-tures are likely to have some association betweencertain images and feelings of stress and calm. Theapp would simply have to be altered slightly to show adifferent set of images.
In several cases, single-item assessments have poorpsychometric properties [6]. This does not mean thatsingle-item assessments are invalid; in some casesthey have been proven to be a valid measure of stressable to replace longer scales [4]. Furthermore, weprove the validity of the mobile stress meter, a single-item assessment, in this study. That being said, de-spite our positive results regarding the mobile stressmeter, it should not replace PSS. There are severalscenarios in which PSS would be the appropriate
measure. As with PAM, the mobile stress meter isintended specifically for situations where researcherswould like to quickly measure real-time stress levelsin different natural environments. It should be used tocapture variability in stress levels around daily events,but the PSS questionnaire can still be used at theend of the study to assess general levels of stressthroughout the experiment. In addition, the mobilestress meter can be integrated into health-trackingapps, as an additional measure of the user’s health.
ConclusionOur study showed that the mobile stress meter is avalid measure of stress. The mobile stress meterscores strongly correlate with PSS scores, demon-strating that the mobile stress meter is an effectivemeasure of stress. In addition, the mobile stress me-ter was tested in an experiment in which studentscompleted the assessment on their smartphones sev-eral times a day for a week. This experiment furtherconfirmed the validity of the mobile stress meter, andillustrated that the mobile stress meter is an unobtru-sive tool to measure stress levels in real time.
References[1] CHAPLIN, J. P. Dictionary of psychology. Dell, 2010.
[2] COHEN, S., KAMARCK, T., AND MERMELSTEIN, R. A globalmeasure of perceived stress. Journal of health and socialbehavior (1983), 385–396.
[3] CRAIGHEAD, W. E., AND NEMEROFF, C. B. The Corsini en-cyclopedia of psychology and behavioral science, vol. 4. JohnWiley & Sons, 2002.
[4] ELO, A.-L., LEPPÄNEN, A., AND JAHKOLA, A. Validity of asingle-item measure of stress symptoms. Scandinavian journalof work, environment & health (2003), 444–451.
[5] ERTIN, E., STOHS, N., KUMAR, S., RAIJ, A., AL’ABSI, M., ANDSHAH, S. Autosense: unobtrusively wearable sensor suite for
inferring the onset, causality, and consequences of stress in thefield. In Proceedings of the 9th ACM Conference on EmbeddedNetworked Sensor Systems (2011), ACM, pp. 274–287.
[6] ICE, G. H., AND JAMES, G. D. Measuring stress in humans.Cambridge University Press, 2006.
[7] KAZDIN, A. E., ASSOCIATION, A. P., ET AL. Encyclopediaof psychology, vol. 8. American Psychological AssociationWashington, DC, 2000.
[8] LU, H., FRAUENDORFER, D., RABBI, M., MAST, M. S., CHIT-TARANJAN, G. T., CAMPBELL, A. T., GATICA-PEREZ, D., ANDCHOUDHURY, T. Stresssense: Detecting stress in uncon-strained acoustic environments using smartphones. In Pro-ceedings of the 2012 ACM Conference on Ubiquitous Comput-ing (2012), ACM, pp. 351–360.
[9] MOSKOWITZ, D. S., AND YOUNG, S. N. Ecological momentaryassessment: what it is and why it is a method of the future inclinical psychopharmacology. Journal of Psychiatry and Neuro-science 31, 1 (2006), 13.
[10] POH, M.-Z., SWENSON, N. C., AND PICARD, R. W. A wearablesensor for unobtrusive, long-term assessment of electrodermalactivity. Biomedical Engineering, IEEE Transactions on 57, 5(2010), 1243–1252.
[11] POLLAK, J. P., ADAMS, P., AND GAY, G. Pam: a photographicaffect meter for frequent, in situ measurement of affect. InProceedings of the SIGCHI conference on Human factors incomputing systems (2011), ACM, pp. 725–734.
[12] SANO, A., AND PICARD, R. W. Stress recognition using wear-able sensors and mobile phones. In Affective Computing andIntelligent Interaction (ACII), 2013 Humaine Association Confer-ence on (2013), IEEE, pp. 671–676.
[13] SHIFFMAN, S., STONE, A. A., AND HUFFORD, M. R. Ecologicalmomentary assessment. Annu. Rev. Clin. Psychol. 4 (2008),1–32.
[14] VANDENBOS, G. R. APA Dictionary of Psychology. AmericanPsychological Association, 2007.
[15] WANG, R., CHEN, F., CHEN, Z., LI, T., HARARI, G., TIGNOR,S., ZHOU, X., BEN-ZEEV, D., AND CAMPBELL, A. T. Stu-dentlife: Assessing mental health, academic performance andbehavioral trends of college students using smartphones. InProceedings of the 2014 ACM International Joint Conferenceon Pervasive and Ubiquitous Computing (New York, NY, USA,2014), UbiComp ’14, ACM, pp. 3–14.