THE MIDAS TOUCH: A THEORY OF RESOURCE CURSES ...
333
THE MIDAS TOUCH: A THEORY OF RESOURCE CURSES by Daniel Arbucias A dissertation submitted to the Faculty of the University of Delaware in partial fulfillment of the requirements for the degree of Doctor of Philosophy in Political Science and International Relations Fall 2018 © Copyright 2018 Daniel Arbucias All Rights Reserved
-
Upload
khangminh22 -
Category
Documents
-
view
1 -
download
0
Transcript of THE MIDAS TOUCH: A THEORY OF RESOURCE CURSES ...
THE MIDAS TOUCH:
A THEORY OF RESOURCE CURSES
by
Daniel Arbucias
A dissertation submitted to the Faculty of the University of Delaware in partial fulfillment of the requirements for the degree of Doctor of Philosophy in Political
Science and International Relations
Fall 2018
© Copyright 2018 Daniel Arbucias All Rights Reserved
THE MIDAS TOUCH:
A THEORY OF RESOURCE CURSES
by
Daniel Arbucias Approved: ___________________________________________________________ David P. Redlawsk, Ph.D. Chair of the Department of Political Science and International Relations Approved: ___________________________________________________________ John A. Pelesko, Ph.D. Interim Dean of the College of Arts and Sciences Approved: ___________________________________________________________ Douglas J. Doren, Ph.D. Interim Vice Provost for Graduate and Professional Education
I certify that I have read this dissertation and that in my opinion it meets the academic and professional standard required by the University as a dissertation for the degree of Doctor of Philosophy.
Signed: ___________________________________________________________ Daniel P. Kinderman, Ph.D. Professor in charge of dissertation I certify that I have read this dissertation and that in my opinion it meets the
academic and professional standard required by the University as a dissertation for the degree of Doctor of Philosophy.
Signed: ___________________________________________________________ Lawrence Agbemabiese, Ph.D. Member of dissertation committee
I certify that I have read this dissertation and that in my opinion it meets the academic and professional standard required by the University as a dissertation for the degree of Doctor of Philosophy.
Signed: ___________________________________________________________ Benjamin E. Bagozzi, Ph.D. Member of dissertation committee I certify that I have read this dissertation and that in my opinion it meets the
academic and professional standard required by the University as a dissertation for the degree of Doctor of Philosophy.
Signed: ___________________________________________________________ Julio F. Carrión, Ph.D. Member of dissertation committee
iv
ACKNOWLEDGMENTS
Several people deserve recognition for providing support throughout this journey,
on a professional and personal level. I would like to thank Daniel P. Kinderman, Ph.D.
for his steadfast and continuous advice, guidance, and academic support since the
inception of this project. As chair of the dissertation committee, his early contributions
helped orient and tailor the theory of resource curses in its nascent stages, which
provided the groundwork for future hypothesis testing and policy recommendations. I
would additionally like to vehemently thank Benjamin E. Bagozzi, Ph.D. for his sharp
and instructive advice, which helped tailor the statistical components of this dissertation
into a more focused analysis. It is with his firm support, which went above and beyond
his duties as a professor, that this dissertation has been completed in a timely fashion. His
advice on theoretical matters, combined with his perceptive guidance on this
dissertation’s methods, cannot be overstated. Furthermore, his proofreading of this work
has greatly improved the final product from its original version. Committee members
Julio F. Carrión, Ph.D. and Lawrence Agbemabiese, Ph.D. also deserve my heartfelt
appreciation for their valuable insights and advice contributing to this project.
Other professors at the University of Delaware also deserve sincere and special
appreciation. Jennifer K. Lobasz, Ph.D. helped narrow down the focus of this dissertation
in its nascent stages, Jason D. Mycoff, Ph.D. founded the base of the statistical analysis
for this work, and Matthew S. Weinert, Ph.D. taught me how to think critically.
v
My professional friends and colleagues, who have supported and helped me
throughout my graduate education also deserve special appreciation. My cohort has
played a special role in not only providing academic feedback, but motivation and
emotional support as well. Finally, I have been blessed with wonderful parents who have
consistently supported and encouraged my educational pursuits and provided me with a
stable and loving founding on which to build a career. This manuscript is dedicated to
them for their unending proofreading and unconditional love.
vi
TABLE OF CONTENTS
LIST OF TABLES…………………..……………..…………………..…………….....viii LIST OF FIGURES…………………..…………………..……………..………………..ix ABSTRACT…………………..…………………..………..…………………..………...xi Chapter 1 INTRODUCTION…………………………..…………………..………...1 Resource Curse Definitions…………………..……………..………….…5 2 LITERATURE REVIEW…………………..…………..………………..14 3 A THEORY OF RESOURCE CURSES…………………..…………….28 Hypotheses…………………..…………….…………………..…………48 Political Resource Curse Hypotheses……………………………49 Violent Resource Curse Hypotheses……………………………..49 Economic Resource Curse Hypotheses………………………….49 Diamonds…………………………………..…………………………….53 Petroleum…………………..………………………………..…………...55 Case Selection…………………..……………………………..…………57 4 THE POLITICAL RESOURCE CURSE (PART 1)………………….…65 Testing Hypothesis 1…………………..……………………………..…..66 The Case of Venezuela…………………..………..……………..73 The Case of Tanzania…………………..…………..…………….88 Analysis…………………..…………..…………………..………97 Testing Hypothesis 2…………………..……………………………..…104 Analysis…………………..……………………………..………110 Chapter Conclusions…………………..…………………..……………124 5 THE POLITICAL RESOURCE CURSE (PART 2)………………...…126
vii
Testing Hypothesis 3…………………..………………………………..126 Results…………………..…………..…………………..………132 Testing Hypothesis 4…………………..………………….………….…151 Analysis…………………..…………………..…………..……..171 Chapter Conclusions………………..…………………..………………179 6 THE VIOLENT RESOURCE CURSE…………………..…………..…181 Testing Hypothesis 5…………………..…………………..………..…..182 The Algerian Civil War…………………..…………………….189 The Cabinda War & Angolan Civil War……………………….197 The Cabinda War (1975 – Present)…………..…………201 The Angolan Civil War (1977 – 2002)…………………208 The Sierra Leonean Civil War………………………………….222 Hypothesis Conclusions………………………………………...226 Testing Hypothesis 6…………………..……..…………………………228 Quantitative Results…………………..…………..…………….234 The Iran-Iraq War…………………..………….……………….237 7 POLICY RECOMMENDATIONS & CONCLUSIONS…………..…..250 Policy Recommendations…………………..…………..……….257 BIBLIOGRAPHY…………..…………..…………………..……………………..……266 Appendices Appendix A (Testing Hypothesis 2)………………..…………………..………297 Appendix B (Testing Hypothesis 3)…………………..…………………..…….305 Petroleum States…………………..…………………..………..……….306 Diamond States…………………..…………………..………..………..315 Appendix C (Testing Hypothesis 4)…………………..…………………..…….317 Appendix D (Testing Hypothesis 5)………………….…………………..…….319
viii
LIST OF TABLES
Table 1 Characteristics of Government-MNC Strife in Venezuela and Tanzania….....72 Table 2 Cross Section Analysis - Resource Class in Petroleum and Diamond
States………………………………………………………………………..115 Table 3 Bivariate Regressions (Resource Class and Value Per Capita/Gini
Coefficient)…………………………………………………………………..117 Table 4 Nationalization Coefficient & Strength of Nationalized Industry…………..135 Table 5 T-tests for Nationalization Coefficients for Petroleum and Diamond
States………………………………………………………………...………137 Table 6 T-tests for Nationalized Ratios for Petroleum and Diamond States……..….138 Table 7 Difference of the Means Test – Nationalization Coefficient (VN / VP) + (VP /
GDPC)……………………………………………………………………..…148 Table 8 Difference of the Means Test - Ratio (VN / VP)……………………………..149 Table 9 T-test – Property Rights by Resource.………………………………………174 Table 10 T-test – Economic Freedom Score by Resource…………………………....175 Table 11 Cross Section Analysis: Property Rights and Economic Freedom Scores....177 Table 12 Characteristics of Rebel Activity Regarding Diamonds and Petroleum……228 Table 13 Bivariate Regression (Resource Production and Type of Violence)……….235 Table 14 Dissertation Hypotheses Results…………………………………………....250 Table 15 Resource Curse Policy Recommendations…………………………………258
ix
LIST OF FIGURES
Figure 1 Two Dimensions of Resource Appropriability………………………………24 Figure 2 Petroleum and the Theory of Resource Curses……………………………...36 Figure 3 Diamonds and the Theory of Resource Curses……………………………...44 Figure 4 Value Per Capita of Diamonds and Petroleum in Resource Curse States...…51 Figure 5 US Jewelry Store Sales from 2012 to 2016………………………………...109 Figure 6 Resource Class by State – Raw Comparison……………………………….111 Figure 7 Value Per Capita (log) and Resource Class……………………………...…112 Figure 8 Value Per Capita (log) and Resource Class (log)…………………………..113 Figure 9 Scatterplot of Resource Class (log) v. Top 10% Share of Income (Petroleum
States)..……………………………………………………………………...119 Figure 10 Scatterplot of Resource Class (log) v. Top 1% Share of Income (Petroleum
States)..…………………………………………………………………….120 Figure 11 Russia (Diamonds v. Petroleum) Top 10% Share……………………..…..121 Figure 12 Russia (Diamonds v. Petroleum) Top 1% Share…………………………..122 Figure 13 Nationalized Value v. Total Value (2015 US Dollars)…………………….139 Figure 14 Nationalized Value (log) v. Total Value (log) in 2015 US Dollars………..140 Figure 15 Nationalized Value v. Total Value (as % of GDP)……………………..…141 Figure 16 Nationalized Value v. Total Value (as % of GDP per Capita)…………….142 Figure 17 Nationalized Value (log) v. Total Value (log) as % of GDP per Capita…..143 Figure 18 Total Value v. Nationalization Coefficient (Petroleum States)…………...145 Figure 19 Total Value v. Nationalization Coefficient (Diamond States)……………145
x
Figure 20 Total Value v. Nationalization Coefficient (All States) …………………..146 Figure 21 Bivariate Scatterplot of Natural Resource Value Per Capita (log) v. Property
Rights............................................................................................................172 Figure 22 Bivariate Scatterplot of Natural Resource Value Per Capita (log) v.
Composite Property Rights Score…………………………………………173 Figure 23 Map of Algeria’s Oil fields and Pipelines…………………………………195 Figure 24 Major Conflict Zones during Algerian Civil War…………………………196 Figure 25 Map of Cabinda and Angola………………………..……………………...200 Figure 26 Diamond-rich regions of Angola…………………………………………..216 Figure 27 Bar Graph of Civil and International Violence……………………………234 Figure 28 Map of Khuzestan Province……………………………………………….241 Figure 29 Map of Iranian Oil Fields………………………………..………………...242 Figure A.1 Oil production in Kuwait, Qatar, and UAE……………………………….303 Figure A.2 Russia (Diamonds v. Petroleum) Top 10% Share (2004-2014).................304 Figure A.3 Russia (Diamonds v. Petroleum) Top 1% Share (2004-2014)…………...305
xi
ABSTRACT
This work conducts a comparative analysis on how diamonds and petroleum produce
different outcomes in resource curse states. Much of the extant literature seeks to uncover
why certain states experience the resource curse while others do not, ignoring vast
variations in processes and outcomes among those states experiencing a curse.
Conversely, this work does not engage in such ontological arguments, but is rather
concentrated on decoupling differences among resource curse states rather than
identifying why some states fall into this trap. The theory of resource curses hypothesizes
that different resources lead not only to different outcomes among resource curse states,
but in fact to different resource curses. Many analyses of the resource curse treat
resources only as important as the revenues they generate, ignoring unique material and
social qualities those resources possess. This theory considers revenues salient factors in
determining differences among cursed states without ignoring how resources’ intrinsic
qualities influence political, economic, and civil outcomes. Six hypotheses will be tested
to evaluate competing resource curses. A quantitative assessment of thirty-five resource
curse states will establish distinct linkages between resources and resource curses.
Additionally, qualitative perspectives will analyze how diamonds and petroleum may
lead to different economic, political, and violent resource curses.
1
Chapter 1
INTRODUCTION
In drafting the moral conundrums of Metamorphoses, Ovid, the Roman poet
living during the reign of Augustus, penned the legend of King Midas and his golden
touch. According to legend, the old master of Midas was found inebriated in his rose
garden by some peasants and was taken to the king for judgment. Once a wise and
prudent leader, King Midas pardoned his former schoolmaster for his drunkenness. When
Bacchus, the Roman god of wine, noticed this act of clemency, he granted the wise leader
one wish. King Midas answered with, “Grant me that whatever my body touches will turn
into gold” (Ovid 2004:373, Book XI). In one stroke, the wise king turned fool, and even
though he could scarcely imagine greater wealth, “he was unable to relieve / his empty
stomach or his burning throat / so justly tortured by the hateful gold” (Ovid 2014:374).
Greedy and hungry, Midas learned to detest wealth and scorn his foolishness, but it was
only after he attempted to swallow liquid gold that he realized his mistake. In a similar
way, and just like the wise King Midas acted foolishly, many countries tend to
mismanage their newfound wealth in foolish ways. This may not lead to a Midas Touch
per se, but it can lead to a resource curse.
The legend of King Midas is two millennia old, but the lesson still applies. When
encountered with the potential of great wealth, sovereign states oftentimes act foolishly,
misspending resource revenues, encouraging rent-seeking behavior, and tumbling into
violent conflict. Much like the fabled King Midas who lusted for gold, this may also lead
to their demise. Instead of attempting to explain why certain states experience the
2
resource curse while others do not, this dissertation seeks to decouple differences among
resource curse states, hypothesizing that different resources lead to different curses. By
singling out two resources, diamonds and petroleum, this dissertation will illustrate how
both the intrinsic qualities of these resources combined with the revenues they generate
result in different outcomes among states. The aim is to establish a link between
diamonds and petroleum, and the processes and outcomes of resource curse states.
According to the theory of resource curses proposed in this dissertation, these
resource-backed institutions, in turn, determine outcomes and the type of resource curse
befalling states. Thirty-five states demarcated into two major categories will be
evaluated. The first category is comprised of thirteen diamond states and includes the
following countries: Angola, Cameroon, Republic of the Congo, Democratic Republic of
the Congo, Cote d’Ivoire, Ghana, Guinea, Guyana, Liberia, Russia, Sierra Leone,
Tanzania, and Zimbabwe. The second category composes the group dubbed petroleum
states, including the following 24 states: Algeria, Angola, Bahrain, Brunei, Ecuador,
Equatorial Guinea, Gabon, Iran, Iraq, Kazakhstan, Kuwait, Libya, Malaysia, Mexico,
Nigeria, Oman, Qatar, Russia, Saudi Arabia, Sudan, Syria, United Arab Emirates,
Venezuela, and Yemen. The astute reader would have noticed some overlap in states;
Russia and Angola both have diamonds and petroleum, and they will be coded as such
throughout the dissertation.
In examining the resource curse, scholars blithely dub a whole host of ills that a
state may suffer from as a ‘resource curse.’ For the purposes of this work, relegating such
complex phenomena under one umbrella term, without distinguishing dissimilarities
between types of resources and their respective consequences (which tend to be infinite)
3
oversimplifies the intricacies of the resource curse and takes, in my humble opinion, a
theoretical shortcut.1 The resource curse has become a catchall phrase detailing any ill
befalling a resource-rich state. It is no wonder then that the literature on this subject is so
far-reaching; scholars are explaining different phenomena while relying on the same
blanket term—resource curse. This heuristic approach to understanding how resources
influence policymaking and outcomes leaves vital questions unanswered, while
incentivizing analysts to gravitate toward the question of whether or not the resource
curse exists at all.
On the one hand, resource rents have significantly destabilized governments. For
instance, diamonds in Sierra Leone have enticed rebel groups to capture this resource and
fund rebellious activity with revenues from blood diamonds. Rebels, namely the
Revolutionary United Front (RUF) overran diamond mines and managed to smuggle this
resource into neighboring Liberia through underground channels of smugglers, illicit
buyers, and child soldiers. Yet, on the other hand, oil money can help keep incumbents in
power, such as during the Arab Spring. Learning from the mistakes of its neighbors, the
Saudi monarchy deployed trained loyal security forces and tapped into their political
patronage networks, including the clerics, to quell potential rebellions (Gause 2011:6-8).
Partially due to their oil wealth, Saudi Arabia was one of the few Arab states left
relatively untouched by the Arab Spring protests2 and was able to stave off much of these
1 Some scholars (e.g., Barma et al 2012) offer three-pronged symptoms of the resource curse, but consider them to be three outcomes of the same overarching curse. 2 Effectively, by remaining a rentier state, Saudi Arabia was capable of absorbing the costs from Arab Spring spillovers by quelling any disruption with oil money; yet, Riyadh must know that such a solution can only be temporary.
4
by issuing massive payouts to its citizenry to the tune of $130 billion for public work
projects and increased salaries for government employees (Gause 2011:6).
With such divergence in processes and outcomes among resource curse states, can
we really consider all of these maladies to be caused by the same curse? This dissertation
seeks to fill some of those analytical gaps by suggesting that scholars may need a more
theoretically vigorous model for explaining differences among resource curse states. For
the purposes of this dissertation, the resource curse will not be considered a single
monolith. Rather, this dissertation champions the theory of resource curses.
The potential implications of Sierra Leone’s resource curse of illicit diamond
smuggling are very different from those of Saudi Arabia’s resource curse placing
restrictions on women’s abilities to drive. Many factors influence states to reach such
drastically diverse outcomes, ranging from economic development to cultural differences.
This dissertation adds another dimension to the literature, contending that the resources
present in these states entice policymakers to create, erode, and influence state
institutions, which, in turn, shape state behavior. Primarily, and contrary to much of the
prevailing literature, this dissertation does not consider the resource curse to be one single
phenomenon. Instead of lumping all ills befalling diamond- and petroleum-rich states into
one resource curse bucket, this dissertation argues that scholars are observing different
phenomena, tabulating resource curses into three broad categories: economic, political,
and violent.
Before continuing to discuss differences among resource curse states and delving
into the present work’s correlations, it is incumbent to first define previous conceptions
of the resource curse and how it influences state behavior. By defining scholarly
5
interpretations of the resource curse, we are able to 1) set parameters around the
dissertation, 2) accentuate how different definitions of the resource curse influence
academic attitudes toward analyzing this phenomenon, and 3) develop and ensconce the
theory of resource curses by exposing gaps in extant literature.
Resource Curse Definitions
Up until recently, resource-rich states were just as poor and (un)democratic as
resource-poor ones. Yet, since the 1970s, with the advent of globalization, when
economists would have expected a boom among resource-rich states,3 they noticed either
similar or slower economic development as compared to resource-poor states (Ross
2012:63). Since then, a large literature in economics has asked how resources influence
development and growth (e.g., van der Ploeg 2011; Wick & Bulte 2009). Instinctively,
one may expect that possessing vast petroleum or diamond deposits would industrialize
the economy and enrich communities. Ideally, states would be able to capture these
resources, export them for profit, and reinvest those monies domestically. This is
oftentimes not the case, with the opposite phenomenon occurring. Scholars have labeled
this scenario the ‘paradox of plenty,’ but Richard Auty’s pithy term, ‘resource curse,’ has
been proven to stand the test of time.
Richard Auty first coined the term ‘resource curse’ in 1993 indicating “the
adverse effects of a country’s natural resource wealth on its economic, social, or political
well-being” (Ross 2015:240; Auty 1993). Originally, academics studying this
3 According to Ross (1999:297-298), in 1970, over 80% of the developing world’s revenue came from the export of primary commodities. This number dropped precipitously to 34% by 1993, partially due to fast growth in manufacturing sectors in Latin America and Asia.
6
phenomenon focused on the economic impacts of the resource curse, where states with
abundant natural resources tended to grow slower than others possessing fewer resources
(e.g., Barma et al. 2012). Later, a more dangerous and subtle phenomenon was
uncovered: the threat was not that resource-rich states grow at slower paces than their
resource-poor counterparts, but that they grow at the same pace as their resource-
deprived neighbors (Ross 2012).
The original understanding of the resource curse was defined in economic terms,
such as Dutch Disease,4 but the trend over the past several years has been to define the
phenomenon in more political terms (Collier 2010b:1105). For scholars such as Paul
Collier, defining the resource curse by analyzing the political machinations of the state
allows them to create formal models to explain this phenomenon. Collier, for example,
creates a model of the social value of resources and the quality of the political system that
4 Dutch Disease is a possible side-effect of an oil boom and can occur when there is an upward swing in oil prices that creates an increase in money appreciation, spending, price of non-traded goods relative to traded goods, shifts in labor, and an account deficit (Frankel 2010:18). Dutch Disease occurs when states overdevelop their extraction industry, thereby marginalizing other potentially profitable trades. The sudden rise of the value of petroleum exports creates an appreciation of real exchange rates, rendering the export of other, non-tradable, products more expensive and less competitive in the market (Humphreys et al 2007:5). This is especially true when non-tradable products are labor-intensive, rather than capital-intensive (Ismail 2010:13). Even if prices remain high then the industry accounts for a disproportionate percentage of the workforce, GDP, and capital of the state (Frankel 2010:18). In the end, Dutch Disease becomes a plague when a boom in natural resource extraction causes a decline in the manufacturing and agriculture sectors of the economy (Ross 2012:48). Scholars largely agree on the existence of Dutch Disease and can anecdotally point to instances where this curse has plagued a state (e.g., gold wealth in 16th century Spain, the Australian gold rush in the 19th century, UK and Norway’s currency appreciation during the 1970s and 1980s due to North Sea Oil exports, and Venezuela’s oil exports cause economic downturns in the 2000s). Some scholars have even pointed to ransom monies from Somali pirates as a trigger for Dutch Disease in the failed state (Jablonski 2015). Others have noticed a variety of Dutch Disease prevalent with recipients of remittances from exiled groups (Acosta et al 2009).
7
plays out in a co-constitutive fashion: politics influences exploitation of resources, and
resources influence politics (Collier 2010b:1106). Whereas Auty (2001a) denoted the
resource curse as the effects of natural resource endowments, Collier modified the
definition to mean the politics revolving around said resources.
Collier drives the definition of the resource curse from being an economic one to
a more political anomaly. Yet, Michael Ross (2012) takes another route, narrowing the
resource curse further to denote one type of resource: minerals. He does so because the
resource curse does not seem to affect most agricultural products, though they may
comprise a significant portion of earnings and exports for the state (Ross 2012:1).
According to Ross, the renewability of agricultural products does not seem to influence
state behavior in the same way non-renewable minerals sway institutional capacity.5 The
exception to this definition are goods that may be refined into what is considered
‘contraband,’ such as coca leaves in Colombia or poppy seeds in Afghanistan (Ross
2015:250). Analyses of other agricultural products have rendered inconclusive results.
When evaluating coffee price shocks at the sub-national level in Colombia, Dube and
Vargas (2013) saw a decrease in violence, likely due to an increase in the labor force for
the now more profitable resource. These results were congruent with Dal Bó and Dal Bó
(2011), discovering that exogenous shocks to an industry may increase or decrease
violence contingent upon capital- or labor-intensive nature of the industry (Ross
2015:251). Conversely, in an analysis of the coffee boom in Costa Rica, Barboza and
Cordero (2001) noticed the boom led to a relaxation rather than a strengthening of
economic reforms. While coffee remains out of the scope of this dissertation, according
5 Because a state can renew agricultural resources, the race to extract and sell the product in the world is more cyclical and not as pressing.
8
to the theory of resource curses, states with contraband resources, such as cocaine or
opium, would experience distinct effects of a curse, fundamentally different from those
states suffering a curse stemming from oil or diamond wealth.
Definitions of the resource curse may also be time-bound, determining how the
volatility of oil prices influences state action. Mansoob Murshed, for instance, defined a
‘winner’s curse.’ In this situation, states with large natural resource endowments may be
blessed for a time but if commodity prices drop, they will be cursed later on (2001:113).
Institutional-minded scholars attack the resource curse from a widely different
approach. Notable among these scholars is Victor Menaldo. According to Menaldo, a
resource curse is the direct and joint result of both resources and bad institutions
(Menaldo 2016:11). In this sense, Menaldo concurs with the common theme to all
resource curse definitions—policy determines whether or not a resource curse occurs
(Auty 2001b:315). Resources exist but are not agential. Since resources do not act in and
of themselves, resource policy becomes the barometer by which scholars must analyze
any curse, as resources can only (dis)incentivize agents to react to their presence. State-
developed policies are the dimmer switch for the resource curse; they can dull the effects
enough so that the state may prosper, or intensify them so much that a state experiences a
resource curse. For example, Norway for a long time set aside petro-revenues to be
invested at a later date. However, prudent governments need not reinvest all of their oil
revenues; it was positioned to adopt this policy because “Norway has already invested a
lot of money in Norway”6 (Collier 2010a:113). Chile also implemented prudent fiscal
6 So-called experts have asked Norway to speed up oil production. Norway’s prime minister once remarked, “We don’t want it. The point is to be sensible and careful” (Karl 1997:221).
9
policy, such that the Chilean government saves the majority of extra revenue from high
copper prices. Consequently, if a price shock of ten percent occurs, then it would increase
output by less than one percent creating a slight decrease in inflation (Medina & Soto
2007).
Scholars such as Terry Lynn Karl have a broader definition of what is considered
a resource curse, oftentimes with resources playing an epiphenomenal role in the curse.
Her central contention is that institutional incentives tend to frame decision-making
processes—this framework holds the key to understanding state behavior (Karl
1997:xvi). For Karl, in developing states, it is “the interaction between this framework for
decision-making and the leading export sector, not the properties of a commodity per se,
that determines whether a particular product is a blessing or a curse” (Karl 1997:xvi, her
italics).
The theory of resource curses challenges Karl’s notion that the properties of the
resources do not influence state behavior. While Karl makes a good point that
frameworks of decision-making determine the extent of the curse, this dissertation argues
that the resources themselves are capable of influencing these reproducing frameworks.
Karl, along with many other scholars, considers resources only as important as the
revenues they generate. This holds for high-value commodities, such as petroleum, where
governments may potentially live off rents. However, this logic breaks down when
analyzing other resources, such as diamonds, that do not generate enough rents to bring
an entire state out of poverty but are lucrative enough to fund rebellions. The theory of
resource curses also challenges Menaldo’s resource-less resource curse, where
institutions themselves are firstly responsible for economic development. Rather, this
10
dissertation’s understanding of the resource curse stems from the qualities (both intrinsic,
monetary, and social) of the resource and the rents they potentially generate. Non-
agential resources shape preferences in decision-making, leading to different processes
and outcomes among resource curse states.
Resource curse literature has recently become proliferated with case studies,
analyses, examples, and counterexamples of states succumbing to this curse. This sudden
flurry of research has produced thousands of manuscripts seeking to depict how resources
and institutions may or may not lead to a curse. While the theory of resource curses seeks
to answer a different question, it is necessary to conduct a thorough literature review
before expanding upon the theory. Chapter 2 examines current research in resource curse
literature and points out where this dissertation is theoretically located.
Chapter 3 will develop the theory of resource curses, depicting where it fits in the
extant literature and how it differs from most analyses of the resource curse. Primarily,
the theory of resource curses expects different resources to lead to different curses. By
analyzing pathways and outcomes for different resource curses, the theory seeks to
triangulate how seemingly insignificant processes lead to drastically dissimilar results.
These results will be compartmentalized into three types of curses: economic, political,
and violent resource curses. From these curses, this dissertation postulates ten hypotheses
to test the theory: four economic hypotheses, four political hypotheses, and two violent
hypotheses. This dissertation, being an international relations work, will only test the
political and violent resource curse hypotheses.
Chapter 4 will assess the first two hypotheses postulated by the theory of resource
curses, finding that diamond- and petroleum-rich resource curse states suffer through

11
government-MNC strife differently. The qualitative analysis of Tanzania and Venezuela
in Chapter 4 finds that both states experience different types of strife between
governments and MNCs. Tanzania largely falls victim to intermittent and sudden strife in
relation to its diamonds while government-MNC strife in Venezuela tends to become
protracted, internationalized, and contingent upon the price of petroleum. The second
hypothesis tested in Chapter 4 measures inequality by the determining the strength of the
resource class in diamond- and petroleum-rich resource curse states. This hypothesis
finds that, in terms of wealth, petroleum-rich resource curse states possess much stronger
resource classes, than their diamond counterparts. Particularly in Russia, there was a
positive relationship between the petroleum resource class and the top 10% and top 1%
share of income, while the results show a negative relationship between these same
variables for diamonds.
Chapter 5 analyzes the next two political resource curse hypotheses. The first
hypothesis in this chapter finds that petroleum states possess stronger nationalized
industries than diamond states. While not a characteristic of a political resource curse per
se, nationalized industries point to a crossroads in resource extraction. With nationalized
industries, governments have the option of wielding a very powerful political and
economic weapon. While the findings from this hypothesis indicate that every petroleum
state enjoys this capability, very few diamond states have this option open to them. To be
clear, the threat here is not the nationalized industry itself; the threat is how it is used. In a
vacuum, nationalized industries are neutral parties in the economy. Rather, this
dissertation is interested in denoting which options are available to diamond- and
petroleum-rich resource curse states. If a resource is not valuable enough to be
12
nationalized, then it holds that the host state will neither suffer from nationalized industry
ills nor benefit from a well-governed nationalized extraction process. In this sense, this
hypothesis measures the options that are available to petroleum states and comparably
unavailable to diamond states, suggesting that petroleum states are likely to trickle along
a different political path than diamond states, not because of their nationalized industry,
but due to the resources they possess. The second hypothesis tested in Chapter 5
measures the enforcement of property rights, finding that petroleum-rich resource curse
states enjoy stronger property rights enforcements than diamond-rich states. However, the
evidence is inconclusive in suggesting that petroleum-rich states enjoy these stronger
enforcements because of their resource. Given the results, it is possible that petroleum-
rich states experience stronger property rights enforcements because they tend to be
wealthier than diamond states.
Chapter 6 examines how resources may impact violent conflict in diamond- and
petroleum-rich states. The first hypothesis in this chapter predicts that despite
petroleum’s comparative abundance and wealth, rebels will seek to capture diamond
mines before turning to oil fields. Interestingly enough, the results from this hypothesis
suggest that rebels are even less likely to sabotage oil fields or pipelines, despite the fact
that the petroleum running through this infrastructure funds their opponents. In a
qualitative analysis of three civil wars in Africa occurring throughout mostly the same
period (Algeria, Angola, and Sierra Leone), this hypothesis finds that diamonds intrigued
rebel activity much more than petroleum, even when opportunities to sabotage oil fields
or pipelines were available. The last hypothesis of this dissertation seeks to decouple the
types of violence resource curse states tend to experience. The subsequent results depict
13
that petroleum-rich states were the only resource curse states to experience international
violence, while civil violence was prevalent throughout all resource curse states in this
analysis. The bivariate regressions also indicate a strong positive correlation between
diamond production and civil violence. Furthermore, an analysis of the Iran-Iraq War
demonstrated that petroleum played direct and indirect roles in the conflict, further
supporting this hypothesis.
The last chapter of this dissertation offers some policy recommendations and
conclusions. Given the spirit of this dissertation, the recommendations are different for
diamond- and petroleum-rich states. Many recommendations for diamond states reference
stronger institutions for artisanal diamond mining, not only their legality and
infrastructure, but also the property rights associated with this type of enterprise. Due to
the comparative wealth of petroleum, the most notable policy recommendation for petro-
states is to ensure that oil rents do not only flow to one governmental body. Rather, the
current work recommends redirecting petro-rents to provincial and local governments—
as well as federal bodies—to disincentive centralized governments from using their
nationalized oil industries for political reasons.
The next chapter will engage with resource curse literature, showing how it has
evolved, where gaps still exist, and where theoretical concepts postulated in this
dissertation fit into the works of other scholars.
14
Chapter 2
LITERATURE REVIEW
Before analyzing where the theory of resource curses fits in the literature, it is
important to note that there is no consensus among scholars as to whether 1) the resource
curse exists, or 2) resources, as opposed to other factors, are the cause of a curse. Mixed
messages debating ontological arguments for the resource curse accounts for the vast
majority of the literature. Some scholars believe that, in the words of Paul Collier, “the
resource curse is real and severe” (2010b:1105), while there are others, who, while
analyzing the same data, consider the resource curse to be a red herring (e.g., van der
Ploeg & Poelhekke 2010) or else caused by poor institutions (Menaldo 2016). Much of
the resource curse literature dates back to Mahdavy’s (1970) postulation that petroleum-
related rents allowed governments to tax their populations less, rendering them
unaccountable to their constituencies and oftentimes delaying advances to civil society.
This has led to a contentious scholarly dichotomy on the roots of economic and political
underdevelopment in states with natural resource wealth—are resources or institutions
the culprit? The theory of resource curses, while respectful of institution-minded
analyses, considers resources salient factors in economic, political, and social
(under)development. Yet, there are certain gaps in the literature that, if exploited, may
lead analysts to a deeper understanding of how resources influence policymaking and
outcomes.
Ontological debates on the resource curse capture the majority of scholarly
attention. In the same way King Midas befell to greed when presented with the option of
15
immense wealth, scholars consider a similar phenomenon to occur at the state level,
understanding resource wealth to be an intervening variable influencing decision-making
and policy outcomes. This influence may be positive as in the case of Norway’s vibrant
economy,7 or negative as in Liberia’s bloody civil wars. Michael Ross, a giant among
resource curse scholars, singles out petroleum as a salient factor in hindering economic
development, political stability, and women’s rights (Ross 2012). Ross notes that since
1980, the world has become richer, safer, and more democratic, but not among states with
disproportionate endowments of petroleum. In the first paragraph of The Oil Curse, Ross
states that before 1980 “there was little evidence of a resource curse” (Ross 2012:1), but,
according to Morrison, he never says why this is the case (2013:1119). Victor Menaldo
(2016) may have an answer, postulating that poor institutions, rather than resources,
provoke economic underdevelopment. As previously mentioned, for Menaldo, weak
states and bad institutions determine whether or not a state experiences a resource curse
(2016:11). Resources do not causally lead to economic underdevelopment, bad
institutions do (Menaldo 2016:22). As if to further cement his point, Menaldo quips that
for all intents and purposes, “an oil-poor Kuwait would be as equally authoritarian as its
oil-rich doppelganger” (2016:64).
Historicist outlooks take more agnostic approaches to the existence of the
resource curse. For historicist scholar, Timothy Mitchell, most analysts who write about
the resource curse have little to say on the resources themselves, but rather place undue
focus on the revenues they generate (2013:1). From this perspective, Mitchell captures a
different element of the resource curse. Whereas coal had a democratizing effect on states
7 In 1900, Norway was Europe’s poorest state, but is now one of the richest, partially because of oil production and exports (Mehlum et al 2006:2).
16
due to the capacity of miners waging strikes and bottlenecking energy supply, the
political economy of oil is quite different. Unlike in coalmines, where workers were able
to unionize and were forced to work together (indeed, their lives depended on it),
petroleum extraction and refining is capital-intensive, with workers spread out over the
entire world. So, according to Mitchell (2013) for the same reason coal can democratize,
the oil industry does not. By adopting this historicist outlook, Mitchell provides an
alternative explanation for understanding authoritarian-petroleum correlations in
developing states and the former developed world.
In examining the resource curse, analysts tend to single out unique determinants,
such as those resource rents that Mitchell (2013) sidelines, which influence state behavior
and politico-economic outcomes. Resource rents, especially those generated from
petroleum, tend to be huge, and for this reason, receive the lion’s share of scholarly
attention, especially if the state has nationalized its extraction industry. Hypothesis 3 will
measure the strength of nationalized industries among diamond- and petroleum-rich
states. Barma et al (2012) detail how, due to their disproportionality, rents themselves
become a sort of political currency (2012:47), hence the term ‘rentier’ state,8 and end up
playing an outsized role in the political economy of the state. Oil yields “government
revenues that are unusually large, do not come from taxation, are extremely volatile, and
can easily be concealed from public scrutiny” (Barma et al 2012:48). Ross (2012) also
takes issue with this secrecy revolving around petro-rents. In essence, oil leads to
8 A rentier state is one deriving the majority of its income from the export of natural resources. Due to the immense wealth acquired from petro-revenue, rentier states often delay advances to civil society and democratization because they can afford to provide numerous benefits to their population without taxation (Schwarz 2004:5). This lack of taxation, social contract theory tells us, erodes the relationship of accountability between the state and its citizens (Moss 2011:4; Bräutigam 2008).
17
corruption in developing states because revenues are uncommonly large, unstable, and
can be easily hidden. Menaldo concurs, maintaining that because oil rents generate more
revenue than any other activity, tyrants can afford to tax their population less, and once
they do not have to tax their people, they are free from asking them for their consent and
input in the decision-making process (2016:3). Further cementing these postulations,
Gylfason (2001) finds support for the uniqueness of oil rents. When examining OPEC
states, Karl (1997:3) noted that on average their GDP decreased by 1.3% annually from
1965 to 1998, despite oil booms during this time period and government revenues
jumping eleven-fold from 1970 to 1974. Additionally, Vicente (2007) studied the
differences between São Tomé and Príncipe and Cape Verde. Both of these island
microstates are small archipelagos off the coast of Africa with a similar Portuguese
colonial history. However, when São Tomé and Príncipe discovered petroleum and later
experienced an oil boom, Vicente (2007) found an increase in corruption (and perceived
corruption) ranging from 21-38% on their subjective scale in comparison to Cape Verde,
which experienced no such oil shock.
Rents remain the most powerful monetary tool for maintaining political power.
Extractive economies can become more stable if they reinvest those earnings into a
diversified economy that includes human capital (Hamilton 2001:46). However, if poorly
executed, rents may accumulate in the government’s hands or in those of favored
businesses, leading to more inequality and slower growth, with Dutch Disease creeping
into the economic system (Birdsall et al 2001:57). This dissertation’s second hypothesis
focuses on how diamonds and petroleum may lead to different levels of inequality in
national economies. Political pressures deriving from rents may compel states to act in
18
paternalistic manners, as in Saudi Arabia (Auty 2001b). Such practices may lead to more
corruption and embezzlement (Collier 2010a:52; Ross 2012), and relax constraints to
growth (Di John 2011:167). Ironically, in Venezuela, due to the petrolization of social
services, finance ministers found that their most valued excuse ‘no hay dinero’ (there is
no money) falls apart during oil booms (Karl 1997:160, quoting Venezuelan Finance
Minister Héctor Hurtado). Hypothesis 1 of this work seeks to address an aspect of this
relationship, specifically strife between governments and multinational corporations.
Mehlum, Moene, and Torvik (2006) understand resource rents to be processed
through institutional machinations determining either productive activities generating
linkages and profits or unproductive grabbers eroding institutional capabilities.
Conversely, analysts have noted that resource rents may be moderated through the
political power balance. Bjorvatn et al (2012) illustrate how, with a “strong government,
resource wealth can generate growth even in an environment of poorly developed
institutions, while adding oil revenues to a weak government may have damaging effects
on the economy” (2012:1308). Basedau and Lay (2009) note how states with massive
petro-wealth do not experience a curse at all, due to political power and a ‘rentier peace’
purchased by oil rents. In these cases—and from a Foucauldian perspective—rents fuel
massive state-making machines (Watts 2004:73).
Findings also vary among scholars who ask if resources legitimize authoritarian
regimes. Cuaresma et al (2010), analyzing a dataset of 106 dictatorships, find that petro-
wealth prolongs authoritarian regimes. Andersen and Aslaksen (2013) expand this
analysis to include over six hundred political regimes, though not all authoritarian,
finding similar results. When only looking at African states, Omgba (2009) noticed that
19
oil, but no other natural resource, helped incumbents remain in office. While petroleum
may allow for authoritarian regimes to persist, apparently, they also help legitimize
democracies (Smith 2004). Only Venezuela, which went from being authoritarian to a
democracy at the height of its oil wealth, remains a salient anomaly to this logic (Karl
1997). Conversely, Caselli and Tesei (2016) document the exact opposite phenomenon,
finding that oil windfalls strengthen autocrats yet have little influence on democratic
regimes.
When analyzing petroleum, scholars are seeking to identify causal linkages
between production and curse. Yet, these causal linkages are muddied by the likelihood
of both democracy and petro-revenues being endogenous to the process of
industrialization in a state (Brooks & Kurtz 2016:279). Further complicating this is that
scholars seek to infer causality when correlation is produced using a method that exploits
cross-country variance (Haber & Menaldo 2011:2). Many of these analyses are also static
and time-bound, thereby not allowing consideration for the resource curse to be
considered as an evolving process. Haber and Menaldo seek to change this by adopting a
time-series method that constructs original country-year time series whose history
extends back to before they became reliant on petroleum. By measuring the Polity score9
against oil income per capita and fiscal reliance on resources, they believe that they can
measure whether or not there is a correlation between policymaking and resource
production. Contrary to the deductions of resource curse believers, Haber and Menaldo
(2011), after running many regressions, conclude that oil and mineral reliance “does not
9 This is data taken from Marshall and Jaggers (2008) that includes “an index of the competitiveness of political participation, the openness and competitiveness of executive recruitment, and the constraints on the chief executive that is coded for every country in the world” (Haber & Menaldo 2011:4).
20
promote dictatorship over the long run. If anything, the opposite is true” (2011:25). In the
end, their analysis is unable to reject the null hypothesis, with their regressions not
producing any findings suggesting that the resource curse is real (Haber & Menaldo
2011:25). Brooks and Kurtz take advantage of the data and method provided in Haber
and Menaldo’s article (2011) to adopt a mixed-methods approach in analyzing the
resource curse. Their findings agree with Haber and Menaldo (2011), illustrating that oil
itself is not a curse, and that it can actually contribute to democratization, as was the case
of Venezuela in the 1970s.
Resource curse outcomes may stem from faulty governmental policies, but there
are other political outcomes that have been linked to the resource curse. For instance
Collier and Hoeffler (1998) found a strong and positive relationship between lootable
resources and violent conflict. Yet in their case study of Ghana, Snyder and Bhavnani
(2005) detail how lootable resources may not escape the capture of governments or lead
to a resource curse, claiming that “alluvial diamonds are actually more likely to be
associated with peace than war” (2005:564). In an astute analysis of violence in Sierra
Leone, Voors et al (2017) succinctly depict the mixed signals from scholars on whether
or not resources causally lead to more violent conflict. Brückner and Ciccone (2010) find
that downturns in commodity prices precede violent outbreaks. Bazzi and Blattman
(2013) also concur, finding little evidence that price spikes trigger violent conflict,
arguing, “higher commodity prices are associated with an increased likelihood of the
cessation of violence” (Voors et al 2017:280). However, once one delves into specific
case studies, the results tend to be different from the cross-country analysis depicted
above. Cases in Colombia (Angrist & Kugler 2008; Dube & Vargas 2013), Sierra Leone
21
(Bellows & Miguel 2009; Humphreys & Weinstein 2008), and Sudan (Olsson & Fors
2004) tend to be at odds with the hypotheses espoused above.
Le Billon (2001) demonstrates how differences between scarce resource wars and
abundant resource wars fail to account for the social constructions surrounding the
resources (2001:565). In accounting for geographic location, concentration, and
fragmentation, and peripheralization of resources, Le Billon (2001) develops a typology
of resource-linked armed conflicts. But, as Ross (2015) notes, several studies, including
Le Billon’s, have attempted to “explain why different resources seem to have different
political consequences, but no explanation has been subject to careful testing” (Ross
2015:242). To a certain extent, this dissertation seeks to fill the gap that Ross (2015) is
referring to, teasing out process and outcome differences between diamond- and
petroleum-related curses rooted in their resource capabilities. Similar to Le Billon (2001),
the present work not only analyzes the physical characteristics of resources, but also their
social and societal implications.
Lujala (2010) expands upon Le Billon’s (2001) analysis, accounting for the
location of petroleum in determining the extent of the resource curse. In her research on
onshore and offshore petroleum, she notices how offshore deposits have no connection to
violence or conflict in the mainland. Yet, when onshore petroleum is discovered,
conflicts tend to increase and become more prolonged. This is even true whether or not
the resource is extracted! Simply having the resource present is enough to incite violence
among local groups. Even if capturing the state is unrealistic, access to natural resources
makes rebellions more enticing (Collier 2010b:1111). Hypothesis 5 seeks to develop this
22
train of thought more, seeking to illustrate how rebels choose to sack lootable diamond
mines over oil fields despite the latter’s comparatively larger economic benefits.
The reality of potential rebellions has led analysts to determine how the lootability
of resources influences agential forces in resource curse states. According to Snyder and
Bhavnani (2005:565), lootable resources are those high-value resources with few barriers
to entry, such as alluvial diamonds. Conversely, non-lootable resources are those with
higher barriers to entry, including petroleum and kimberlite diamonds (Snyder and
Bhavnani 2005:568). They base their analysis on recent studies of contemporary civil
wars, pointing to a positive relationship between lootable resources and violence (Collier
& Hoeffler 1998; Keen 1998; de Soysa 2000). Along this vein, Ross (2003:12) postulated
that the more non-lootable a resource is, the more likely it will lead to separatist conflicts.
He also postulates its logical corollary: the more lootable a resource is, the more it will
benefit rebels, while the more non-lootable a resource is, the more it will benefit the
government (Ross 2003:13). This dissertation’s sixth hypothesis seeks to expand upon
the predictions Ross (2003) makes, seeking to decouple differences between civil and
international violence among diamond- and petroleum-rich resource curse states. Related
to the lootability of resources is how they are screened through the state’s institutional
capacity. States with stronger institutions are less likely to suffer from diamonds being
smuggled across borders, whereas those with weaker institutions may not only suffer
from these consequences, but may also experience violence due to the diamond
smuggling.
Boschini et al (2007) depict how resources may either be good or bad for an
economy, but this is contingent upon how resources are filtered through a state’s
23
institutions. These scholars believe some resources are more likely to cause problems,
either due to their economic or technical challenges, or because they may induce rent-
seeking behavior or trigger violent conflict. For Boschini et al (2007) states are only
cursed if they have poor institutions, such as in Sierra Leone or Venezuela, but these
curses turn into blessings if states enjoy powerful institutions, as in Norway or Canada.
The combination of the type of resources with the quality of institutions is what these
authors label as the appropriability of the resource curse, capturing the likelihood that
resources may lead to rent-seeking behavior, corruption, and conflict. Similar to Mitchell
(2013), they expand upon how unique characteristics of resources may create different
environments at the state level. For example, they note in the working paper for their
future article how resources that “are very valuable, can be stored, are easily transported
(or smuggled), and are easily sold are, for obvious reasons, more attractive to anyone
interested in short-term illegitimate gains” (Boschini 2005:3), suggesting that diamonds
are more likely to lead to conflict. Borrowing heavily from Acemoglu et al (2002), who
argues that the initial conditions shaped by colonialism favor certain institutional
arrangements over others (e.g., extractive industries), Boschini et al (2007) emphasize the
filtering of resources through matrices of institutions. According to their hypothesis, there
are two dimensions of the resource curse, appropriability and institutional quality. Below
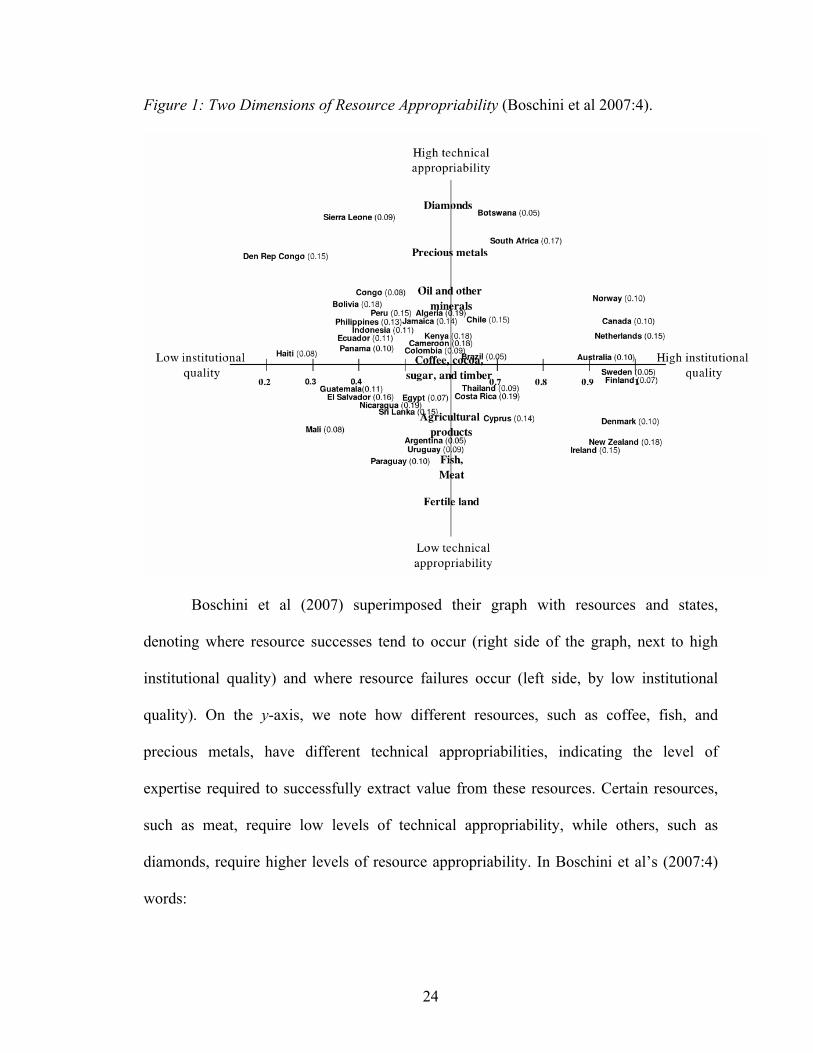
is their graph detailing how the intrinsic qualities of resources interact with the qualities
of institutions.
24
Figure 1: Two Dimensions of Resource Appropriability (Boschini et al 2007:4).
Boschini et al (2007) superimposed their graph with resources and states,
denoting where resource successes tend to occur (right side of the graph, next to high
institutional quality) and where resource failures occur (left side, by low institutional
quality). On the y-axis, we note how different resources, such as coffee, fish, and
precious metals, have different technical appropriabilities, indicating the level of
expertise required to successfully extract value from these resources. Certain resources,
such as meat, require low levels of technical appropriability, while others, such as
diamonds, require higher levels of resource appropriability. In Boschini et al’s (2007:4)
words:
25
The potential problem of having technically appropriable resources can be countered by good institutions, implying that the impact of resource abundance on economic performance is predicted to be non-monotonic in institutional quality. Resources such as diamonds, precious metals or oil are expected to be negative for economic performance only in countries where measures of institutional qualities are low, while they will have a positive impact on the economy of countries with good institutions. As resources become less technically appropriable, the relative importance of institutions is predicted to be less decisive (Boschini et al 2007:4).
The scope of this dissertation can be ensconced in the upper part of Boschini et
al’s (2007) graph, focusing on the interaction between resources and institutions vis-à-vis
diamonds and petroleum. As Boschini et al (2007) notes, this is where the resource curse
is more likely to occur, as fertile land and fish largely do not contribute to any curse.
While this dissertation is greatly influenced by their work, it parts with Boschini et al’s
(2007) thought on certain key elements: first, while they agree that different resources
may produce different outcomes, Boschini et al (2007) always pin outcomes back to
economic dysfunction. For example, whereas they believe diamonds are more likely to
cause violent conflict, they only measure how this conflict may deter economic growth,
sidelining other blowbacks from violence in resource curse states, such as child soldiers,
mass rape, or broader political destabilization. This dissertation is interested in closing
part of this gap by accounting for a violent resource curse, which should not be measured
in terms of economic dysfunction. In this sense, the theory of resource curses adds to the
extant literature by defining other dimensions diamond- and petroleum-rich states are
susceptible to experience.
Second, Boschini et al (2007) draw upon Robinson et al (2002) and Mehlum et al
(2002) in assuming resources to be non-monotonic in institutional quality. This non-
monotonicity effectively insinuates that resources have the potential to influence
26
institutional behavior, making good ones better while rendering bad institutions worse.
The theory of resource curses parts from this thought in that institutions do not simply
become ‘better or worse.’ Rather, they are profoundly altered in diamond- and petroleum-
rich states—to the point that we may consider these states to have completely different
curses. For example, a nationalized industry is not automatically better or worse than a
liberalized market-based industry, but it is fundamentally different. When analyzing only
resource curse states, poor institutional quality is assumed; the dilemma is how they
differ from each other. Boschini et al (2005) hypothesize that “more appropriable
resources are more problematic, unless a country has sufficiently good institutions”
(2005:16). This may be true, but instead of following the pathways that lead to different
institutions, Boschini et al (2007) simply label institutions as either good or bad. The
theory of resource curses seeks to fill part of this gap in the literature by exposing how
different pathways, though initially small, may lead to drastically different outcomes in
diamond- and petroleum-rich states. However, congruent with the scholarship of
Boschini et al (2007), the theory of resource curses assumes resources are filtered
through institutions in a non-monotonic fashion, ultimately leading to different outcomes
contingent upon the resource. This non-monotonicity may manifest itself in an economic,
political, or violent form. As part of this, the reader will note how this dissertation differs
from current trends in international relations research that assume the social construction
of institutions and policymaking.
Third, Boschini et al’s (2007) placement of states in their graph denotes the share
of primary exports as it relates to GDP. This dissertation considers exports necessary for
economic growth, but will largely focus on resource production, rather than exports, in
27
order to not oversample states consuming few of their own resources. For example,
though Qatar produces an extraordinary amount of petroleum for its size, the Qatari
people consume much of their own resource, thereby leaving less petroleum to be
exported. This is not the case for Yemen, which consumes a smaller percentage of the oil
it produces.
Finally, Boschini et al (2007), similar to many other scholars, seek to answer why
certain states fall into a resource curse trap while others do not. This dissertation is more
attuned to determining differences in curses rather than pointing out which states
experience a curse. In this sense, ontological questions of the existence of the resource
curse remain exogenous to the present study.
Resource curse literature is not only vast and growing; it is also remarkably
inconclusive and inconsistent. For every time scholars point to a catastrophic failure due
to resources, they can also note incredible successes. Despite this bleak outlook on the
future of resource curse scholarship, there are certain avenues for future research. With
the notable exception of Mitchell (2013), scholars are much more interested in processes
and machinations of institutions once they receive resource rents rather than the complex
formulaic structures and conjunctive processes before rents are collected. These
processes are governed by the challenges posed by intrinsic and social qualities endemic
to the resources. The next chapter details a comparative analysis highlighting how
different resources causally shape policymakers’ preferences and structure institutional
patterns, both of which influence outcomes. It is in this theoretical space that the theory
of resource curses is most explanatory.
28
Chapter 3
A THEORY OF RESOURCE CURSES As discerned from the literature review, there is no consensus on whether or not
the resource curse exists or which variables exacerbate or enhance economic
development or violent conflict. Scholars tend to agree that some resource-rich states
experience political and economic dysfunction, but disagree on whether or not they are
caused by resources per se. Some analysts offer compelling evidence that the curse is a
statistical artifact created by endogenous variables within quantitative datasets. Others are
more interested in export-related datasets, arguing export-based economies are better
positioned to spur domestic economic growth sidelining how resource production alters
local economies. Common to most resource curse studies is the comparison between
resource curse states and non-resource curse states. In an effort to find patterns among
resource-rich states, academics have sought to compare cursed states to blessed states.
While such analyses are important to enrich academic understanding of the resource
curse vis-à-vis ontological arguments, this work seeks to answer a different question: do
resource curse states suffer from different curses? The theory of resource curses seeks to
answer this question and fill in this theoretical gap in the literature, arguing that different
resources lead to different curses.
This work contends that if analysts are to study the resource curse and how it
influences state behavior, writings ought to pit resources against each other to determine
their influence over state institutions and divergences in outcomes. Only from this
perspective, and not from measuring cursed states against blessed states, can analysts
29
flesh out patterned variances among diamond- and petroleum-rich states and how they
react to the presence of resources. To be sure, institutions matter; but they are influenced
by the resources that fuel them. For this reason, this work considers resource curses to
manifest themselves differently in each state. For example, this work’s third hypothesis
seeks to measure the strength of nationalized industries in diamond and petroleum
resource curse states. If the resource curse exists, and this dissertation assumes that it
does for certain states, then the main theoretical point becomes whether or not states
suffer from the resource curse in different manners. And if states ride on different
pathways leading to curses, then we ought to argue differences among resource curses,
and not assume that there is a singular curse for all states.
The theory of resource curses contends that the type of resource influences state
behavior (e.g., policymaking, economic institutions, government actions and culture, etc.)
not only because of the rents they generate, but also because of the intrinsic and social
qualities they embody. In this sense, resources are agentless organizing forces
incentivizing and restricting states to act in peculiar (and oftentimes suicidal) manners.
To a great extent, the presence of resources constricts host states, as resource-rich states
are hardly motivated to leave their resources in the ground. Resources may be agentless
units, but dissimilarities among resource curse states are contingent upon how states
interact with those resources. The theory of resource curses asserts that states would react
differently to diamonds than to petroleum.
Barring discoveries of new deposits, resources themselves are static; they can be
extracted today or tomorrow and are generally unchanged. The intervening variable is
institutional reactions to the presence of resources; this factor is always in flux, as
30
resources do not compel states to act in specific ways once, but continuously do so over
time. Furthermore, the prices of resources change (e.g., oil shocks), implying that
governmental responses to these shocks are paramount in determining whether or not
states experience a curse. The presence of resources may be agentless and static, but state
reactions to them are not. Accordingly, scholars should analyze the specific pathways
guiding states from the discovery of resources to how governments use the rents they
may generate. From these pathways, academics may peek into state actions and
determine how possessing different resources may lead a state to become drastically
different from others enjoying different resources. The theory of resource curses
postulates that behind the bright, blooming, and buzzing intricacies between resource
curse states, there is a simple reason as to why they experience this curse in such
drastically distinctive fashions: different resources lead to different resource curses. As
observed in the previous chapter, scholars sometimes account for various resources in
their analyses, however, as Ross (2015:242) noted, not in a systematic or testable fashion
analyzing differences between resources. In filling this theoretical gap, this dissertation
forwards the postulation of different resource curses.
A vital aspect of this dissertation is to qualify the theory of resource curses, first
by offering a conditional hypothesis limiting the theory only to ‘cursed’ states. States
may not experience the resource curse due to numerous reasons—all of which are still
debated by scholars—ranging from strong institutions, 10 prudent trade practices, 11
10 Strong institutions allow states to diversify their economy away from the non-renewable resource, stimulating agricultural and manufacturing sectors along with the extraction industry. Connections and linkages between numerous economic sectors allow industrialized states to not experience a large-scale resource curse at the economic level in the same way institution-poor states are more susceptible to this curse. States such as
31
powerful negotiating capabilities,12 or resource reinvestment in local communities.13
Instead, this dissertation will compare and contrast resource curses against each other,
rather than comparing them against successful states. It is well known that successful
states manage to direct their resources toward profitable practices, enjoy strong
institutional frameworks, and do not suffer from constant rebellions. Comparing resource
curse states to developed states, such as OECD member states, may be akin to comparing
apples to oranges. Although analysts strive to determine why some states succumb to the
resource curse while others thrive, the present work is dedicated to disentangling how
states experience different curses, potentially better isolating specific qualities leading to
suboptimal results.
This dissertation seeks to tease out differences between resource curse states to
better predict which curses may afflict states, offer preventive measures, and create
pathways out of the resource curse. By analyzing the pathways leading to different
curses, analysts may be able to track the opposite phenomenon as well; if scholars can
Norway and Canada enjoy strong institutions without experiencing a bona fide resource curse partially due to their diversified economy. 11 Resource-rich states are often encouraged by practitioners to implement export controls. In an analysis of rice markets, Frankel expands upon this notion, stating, “capped exports from the exporting countries and price controls in the importing countries both work to exacerbate the magnitude of the upswing of the price for the (artificially reduced) quantity that is still internationally traded. If the producing and consuming countries in the rice market could cooperatively agree to refrain from government intervention, volatility would probably be lower, not higher.” (2010:23) 12 Frankel also suggests resource-rich states should hedge the market by selling petroleum at the future price instead of selling petroleum at the ‘spot’ price, which requires negotiation (2010:25). 13 Resource curse scholars, such as Michael Ross, suggest abiding by the Hartwick Rule where states that rely on non-renewables reinvest a portion of their revenues back into the community in productive and diversifiable endeavors (Ross 2012:206).
32
observe the way in to the resource curse, they may be able to find an escape route out of
the resource curse as well. The last chapter of this dissertation offers some policy
recommendations to this end, based off the tested hypotheses. Once root causes of
resource curses are properly defined, potentially unique for every state, then
policymakers have a roadmap future progress. As this dissertation will illustrate, resource
curse states suffer from this malady in various ways, and comparing these states to curse-
free states is a moot point. Since the resource curse is unique to each state, only by
comparing them to similar states, can scholars find patterned differences among
processes and outcomes, and become better positioned to provide policy changes for
states.
This dissertation values the work of previous scholars seeking to uncover why the
resource curse exists; however, that is not the question this project is answering. This
dissertation does not ignore the hard work of previous scholars—quite the contrary. This
work is ensconced in current resource curse literature considering the existence of this
phenomenon to be real and severe. Possessing vast amounts of resources invites the
potential for a resource curse, but does not causally necessitate one. Scholars know this,
but what interests the theory of resource curses is the variation in how these resources
have shaped state structures and institutions, effectively leading to completely different
curses. Institution-minded scholars point to institutions as catalysts for economic
development and political stability. They further note how institutions may become
deformed or malfunction due to a state’s resources, leading to greater inequality, a
concept Hypothesis 2 will tackle. They seem to be correct; institutions clearly are very
important facets of state-behavior. Nonetheless, this theory contends that the state’s
33
resources may underpin those institutions and their continued (mal)functioning.
Institutions are important but so are resources.
The theory of resource curses considers two distinct aspects of resources: their
inherent qualities and the revenues they generate. Specific qualities unique to both
diamonds and petroleum influence policymakers’ preferences, shape agendas, and act as
filters for potential resource curse outcomes, but do so in different manners. These
pathways, in turn, determine how a state experiences a resource curse. To be sure, enough
violence becomes a political problem, which might trigger an economic downturn;
economic hardships may also incite violence and pose political obstacles; and political
corruption influences FDI investment into the economy, which could spur internal
violence and rebellions. Once a state begins to experience a resource curse, the causal
arrows flow in every direction. Yet, some states are more prone to international violence;
others must contend with systematic government corruption; and some face economic
underdevelopment.
By pinpointing the type of resource curse a state suffers from—be it economic,
political, or violent—and tracking pathways from resource discovery to revenues they
generate, then future scholarship would be better equipped to understand root causes of
different resource curses. As mentioned in the introduction, where this theory deviates
from current literature is that the resource curse is not the singular outcome scholars
assume it to be; rather, the typology of three types of curses—economic, political, and
violent—distinguishes differences among resource curse states. The theory is simple:
different resources lead to different resource curses.
34
An abstract model14 is useful in illustrating the theory of resource curses. In the
same way an airplane enthusiast designs a model airplane, below we will create two
models—for diamonds and petroleum—of the theory or resource curses. Similar to the
airplane, a model of resource curses must include certain prominent features that are
typical for states plagued by these curses. The opposite of this is also unfortunately true:
instead of incorporating more and more factors that only marginally make the model
work better, up to the point that we end up re-creating reality in a futile attempt to explain
it,15 the model must purposefully ignore some features of resource curses, though they
may prove useful for other types of studies. Since models are supposed to represent
reality without duplicating it, model-makers ought to determine which are the most
peculiar characteristics of an airplane that distinguish them from other objects, and
replicate them at a miniature level—hence the (perhaps undue) focus on parsimony. By
this logic, as Kenneth Waltz (1979) repeatedly reminds us, the power of the theory is
contingent upon its utility.
14 In determining what an abstract model actually consists of, the model airplane is a useful analogy. The goal of making a model airplane is to mimic certain distinguishable aspects of a real airplane, fully cognizant that the model is not supposed to operate as a bona fide airplane (e.g., it doesn’t fly, it fits in a drawer, etc.). Though it is understood that the model airplane is not functional or useful in transporting people, it still possesses certain features, such as wings and a fuselage, which distinguishes it from other objects. The model is a simplification of reality. Therefore, if someone creates a model that can fly and carry people, it has stopped being a model and has become a fully-fledged airplane. In this sense, the flowcharts below do not seek to replicate reality, but rather to “construct a reality, but no one can ever say that it is the reality” (Jackson 2016a:124). 15 The transcendental thought of Jorge Luis Borges proves useful in elucidating upon this point. In El Hacedor, Borges wrote a satirical short story, ‘Del rigor en las ciencias’ (On the rigor of science), regarding a similar dilemma where fictional cartographers sought to map out an empire with exact precision. In their haste to recreate reality as precisely as possible, the cartographers’ map ended up becoming as large as the empire itself, rendering it completely useless, and eventually being discarded in a far-away desert.
35
It is precisely the very unrealism of a model that renders it useful. James Rogers
(2006) expands on this notion, illustrating his point by depicting the difference between a
map of a city and a city block itself. It is clear that the topological differences between
the two are extreme, yet it is the purposeful simplification of a map that makes it useful,
though it blatantly distorts reality. Rodgers expands on this concept:
The map utterly distorts what is really there and leaves out numerous details about what a particular area looks like. But it is precisely because the map distorts reality—because it abstracts away from a host of details about what is really there—that it is a useful tool. A map that attempted to portray the full details of a particular area would be too cluttered to be useful in finding a particular location or would be too large to be conveniently stored (Rogers 2006:267). With this background knowledge, we can develop two purposefully simplified
models for the theory resource curses associated with diamonds and petroleum. The
flowcharts below track pathways from resources to the potential for economic, political,
and violent resource curses. These flowcharts are based off of the scholarship of other
workers and the postulations forwarded in the present work. For example, scholars such
as Ross (2003) refer to the lootability of diamonds as a catalyst for violence. Therefore,
in the flowchart for diamonds, there is an arrow stemming from the lootability of the
resource and pointing to a violent resource curse. Other scholars, such as Barma et al
(2012:49), note how shifts in bargaining power may cause strife between governments
and multinational corporations. The arrow connecting shifts in bargaining power to a
political resource curse for petroleum states is also depicted in the flowchart. Below is the
model for how petroleum influences resource curse states. This section will also begin to
dissect how diamonds and petroleum influence state behavior through different mediums
and channels.
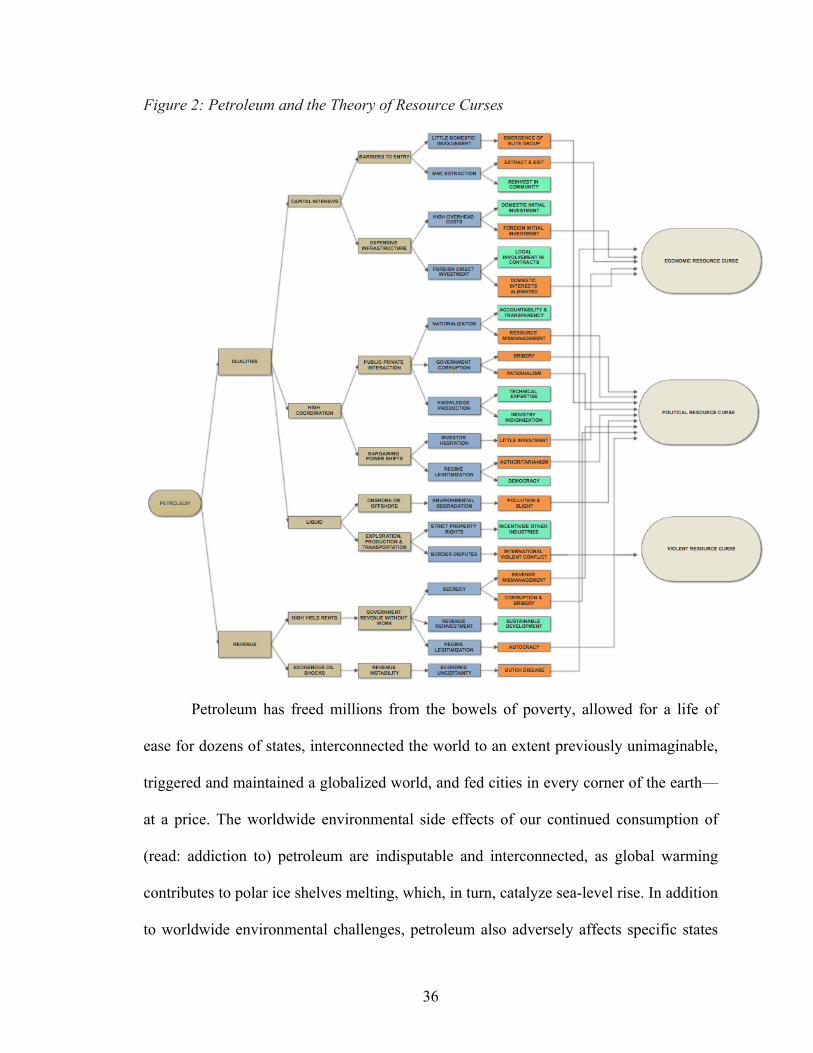
36
Figure 2: Petroleum and the Theory of Resource Curses
Petroleum has freed millions from the bowels of poverty, allowed for a life of
ease for dozens of states, interconnected the world to an extent previously unimaginable,
triggered and maintained a globalized world, and fed cities in every corner of the earth—
at a price. The worldwide environmental side effects of our continued consumption of
(read: addiction to) petroleum are indisputable and interconnected, as global warming
contributes to polar ice shelves melting, which, in turn, catalyze sea-level rise. In addition
to worldwide environmental challenges, petroleum also adversely affects specific states
37
from where this resource is extracted, leading to a double exposure of sorts. These states
not only have to contend with the global effects of climate change, but localized ones
stemming from oil production as well.
The theory of resource curses argues that specific qualities associated with
petroleum lead states to experience a different resource curse than those with diamonds.
The flowchart above details the pathway (arrows) of petroleum leading to a potential
resource curse. The qualities of petroleum are depicted in brown, processes in blue, and
likely resource curse outcomes in either green or orange. Green boxes indicate outcomes
that lead to no resource curse, and thus, there are no arrows leading away from the green
boxes. On the other hand, the orange boxes are state and sub-state ailments that
potentially lead to a specific type of resource curse—economic, political, or violent. The
flowchart above depicts many arrows pointed to economic and political resource curses,
while only one arrow points to violent resource curse—internationalized violence. A
close inspection of the flowchart also reveals that there are several pathways that lead to
similar conclusions. For example, corruption and bribery may occur in nationalized oil
industries or as a result of large revenue streams from oil rents.
To be clear, it is not suggested that scholars draw causal conclusions from a visual
reading of the flowchart. However, similar to the model airplane, the flowchart is a useful
model detailing pathways that may lead to different resource curses, and importantly,
how these pathways (and the ultimate curse outcomes) are contingent upon specific
qualities of the resource itself. The flowchart does not represent likelihood of outcomes
or intensity of the resource curse, but it does illustrate that there are more pathways for a
petro-state to experience political and economic-based resource curses relative to
38
diamond states, while suggesting that any violent resource curse would likely befall a
state from international conflicts rather than domestic sources or gang-related activity.
This is not to suggest that petroleum-rich resource curse states will not experience civil or
domestic violence. They may very well suffer from local and ethnic conflicts; however,
the flowchart does suggest that these conflicts will likely not stem from petroleum itself,
but rather from reasons exogenous to this analysis. Separatist movements in Chechnya or
Arab Spring pro-democracy demonstrations in Manama stem from a variety of ethnic,
economic, and ideological differences unrelated to petroleum and diamond extraction in
Russia and Bahrain. Hypothesis 6 will explore this relationship in greater detail.
Analysts may draw various hypotheses from the flowchart above. The next few
sections will detail how different processes, stemming from social and intrinsic qualities
of petroleum, potentially lead to different resource curses. Regarding an economic
resource curse, it may come as no surprise that petroleum-rich states may be more
susceptible to Dutch Disease. Beyond this economic malady, the theory of resource
curses would hypothesize the pathway of what is dubbed the ‘extract and exit’
phenomenon: transnational oil conglomerates irresponsibly drill in a foreign country and
extract their resources while leaving the population with comparably little revenue. They
may employ a small percentage of native workers in menial labor positions, but due to
the capital-intensive nature of petroleum extraction, this would not alter the political
economy of the state in a meaningful fashion. More often, international oil companies
bring previously-trained expatriates from Western states to work on their oil rigs rather
than investing money in training local workers. Unlike the path toward Dutch Disease,
39
which may be derived from the revenues petroleum generates, this process originates
from the intrinsic qualities petroleum possesses.
Other pathways leading to an economic resource curse stem from the capital-
intensive nature of petroleum discovery and extraction. Large technical and logistical
coordination, involving dozens of companies along with local and federal governments,
is required to successfully discover, extract, refine, and transport petroleum. This calls for
extensive infrastructure, with high overhead costs and a large capital investment. In the
past, drilling for oil was a simpler endeavor. But times have changed. Extraction only
begins after a lengthy process attempting to discover petroleum deposits and building
necessary pipes, derricks, and storage tanks. Oil wells naturally produce their own
pressure. To extract petroleum, the company must drill into the oil well until there is a
lower pressure at the surface than in the oil field below, which causes petroleum to rise
through the well. Yet, once the oil is extracted, the company needs to build standing
pools for residue. After a while, however, sea level and oil field pressures equalize, so
secondary recovery becomes necessary. In order to keep oil field pressures high, a
company needs to inject water into the oil field through a separate steam injector. In arid
climates, water may be scarce, meaning that this water must be transported to the oil well
over long distances. Additionally, the water must be kept in a storage container, and huge
pumps must be built to push that water underground. These pumps nonetheless use
gasoline, requiring a gas power line transporting fuel to them. Only after all of this is
completed may the petroleum be separated from the water, sulfur, and mud that comes
with it and be transported to a separate processing facility for refinery (Menaldo
2016:141-142). Oftentimes, due to a lack of political or economic capital, oil refineries
40
are located in different countries than where the petroleum is extracted.16 For this reason,
the theory of resource curses predicts initial investments (and therefore interests) from
foreign companies rather than local ones, which may be fiscally unprepared to finance
such ambitious projects. This pathway is also detailed in Figure 2 as the final arrow
pointing toward the economic resource curse. Related to these high overhead costs,
domestic interests may be marginalized in lieu of foreign ones, though this may also
include an influx of foreign direct investment (FDI).
Political repercussions to petroleum extraction also abound, as will be presented
in Hypothesis 1. The first arrow potentially contributing to a political resource curse
involves the relationship between the government and multinational corporations (MNC).
When governments become too dependent upon rents from petroleum, they not only may
be more susceptible to Dutch Disease, they also lose bargaining power against the
companies extracting oil (Barma et al 2012:49; Nolan et al 2012; Peters & Richards
1998). The flip side of this scenario is the initial investment phase of petroleum
extraction, called an obsolescent bargain. MNCs lose bargaining power after they invest
in an oil field because of the overhead costs and logistical coordination required to extract
petroleum (Ross 2012:41). Oil wells, pumps, and pipelines cannot be easily moved or
used for other purposes, so when MNCs commit to these investments, they lose
bargaining power to the state’s government (Ross 2012:41). This would incentivize
governments to nationalize their industries to reap the benefits of petro-extraction without
paying for the infrastructure, which, in turn, may hinder initial infrastructure investment.
16 Some resource curse states, such as Iraq, have very few refineries, meaning that they must export their crude oil at market value to have it refined in a foreign country, just to buy back their own petroleum, now refined, at a markup price.
41
Scenarios such as these would be especially true in states with a history of nationalization
or unstable political climates.
The theory of resource curses hypothesizes the emergence of a strong, wealthy,
and elite class revolving around the petroleum industry—as indicated by the pathway
leading to a political resource curse—even if the government nationalizes facets of
petroleum discovery, extraction, refining, and transportation. For example, Saudi
ARAMCO cannot disengage itself from the whims of the royal family (Gross 2017).
Paradoxically, in Venezuela, the upper echelons of the elite class actually benefit from
the bolivar’s hyperinflation and the downward economic spiral—they use the dollar
(Brodzinsky 2015). This reality is not ipso facto a resource curse, but poses political
representation and economic inequality dilemmas for states with already weakened
institutions. This dissertation considers possessing a strong and effective resource class to
be a process (not an outcome) states take to reaching a political resource curse, as shown
in Hypothesis 2.
One of the most influential factors in petro-rich resource curse states is whether or
not a state nationalizes their oil industry. Under certain circumstances, nationalization
may benefit a society (e.g., British Petroleum before the wave of privatization hit the UK
in the 1980s), while under others it may mismanage their resources (e.g., PDVSA in
Venezuela). Nationalizing the petroleum industry allows states to hedge against ‘extract
and exit’ policies by MNCs and potentially ensures petro-revenues remain in the country.
Among resource curse states, nationalization may have two broad trajectories. On one
side of the spectrum, revenue generated from petroleum may be reinvested in the
community in a diversified fashion leading to sustainable development at a macro-level.
42
On the other side, severe mismanagement of resources may deplete revenue streams in
unproductive activities compounded by corruption, paternalism, and bribery among
government officials. Most resource curse states fall somewhere in between these two
extremes. A partial reason why states cannot seem to escape the corruption and
paternalism plaguing petro-states is the secrecy involved in collecting rents from
petroleum. As Ross pithily notes, “if foreign companies were the problem, then
nationalization should have been the cure” (2012:4). Due to revenue secrecy embedded
into the oil industry, this has not been the case. This pathway can be traced from ‘rents’
in the bottom part of Figure 2 to the political resource curse and is expanded upon in
Hypothesis 3.
Hypothesis 4 considers petroleum-rich states to foster and enforce stricter
property rights than diamond states to incentivize and facilitate petro-production and
exploration. Since the time of the Romans, governments have laid claims to mineral
rights found under private property17 (Ross 2012:33). However, because petroleum is a
liquid, two doctrines jar against each other regarding petro-extraction: the rule of capture
and the correlative rights doctrine. These paradigms will be analyzed later on, but the
crux of this branch of the theory of resource curses is predicting that petroleum states
would have stricter property rights than diamond states to 1) promote private investment
in extracting petroleum, 2) as a necessity due to the contentious nature of petroleum
extraction, and 3) to ensure that the extracted wealth does not dissipate into a more
communal pot. To be sure, this hypothesis investigates the enforcement of property rights
17 The two major exceptions to this rule are the United States and Canada. The California and Klondike Gold Rush forced the American and Canadian governments to grant mineral rights to those who bought land in order to populate those regions (Ross 2012:34).
43
and how they may either contribute to a deeper political resource curse, or offer a way
out of this entrapment, as possessing strong property rights does not render a state
immune to the resource curse.
The theory of resource curses considers petroleum to cause less violence among
resource curse states, as indicated by the only arrow—labeled international violence—
pointing to a violent resource curse in the flowchart above. However, the wording here is
important: petroleum-rich resource curse states may experience violence, but said
violence may occur for reasons exogenous to the production of petroleum. Unlike
diamonds, due to the technological demands that petroleum extraction requires, rebel
gangs are unlikely to attempt to commandeer an oil well to sell petroleum in the black
market.18 The theory of resource curses considers this high barrier to entry a deterrent for
rebel gangs. This relationship will be explored in more detail in Hypothesis 5.
For petroleum-rich resource curse states, the theory of resource curses expects
more coordinated international violence to occur in petroleum-rich, rather than diamond-
rich states. The Iran-Iraq War (1980-1988), Iraqi invasion of Kuwait (1990), and Iraq
War (2003-2011), among others, lends credence to this hypothesis. This dichotomy will
be explored in greater detail in Hypothesis 6, also expecting diamond states to suffer from
more civil violence than petroleum-rich states.
Petroleum is the world’s most traded commodity, but diamonds represent
substantial revenue sources as well. Botswana has become rich off its diamonds, and has
seen many of its investments returned a hundred-fold. Lesotho also relies heavily on its
diamond mining. India produces and polishes most of the world’s diamonds. This
18 The notable exception to this rule is the manner in which ISIS has seized oil fields and crudely refined petroleum by burning it.
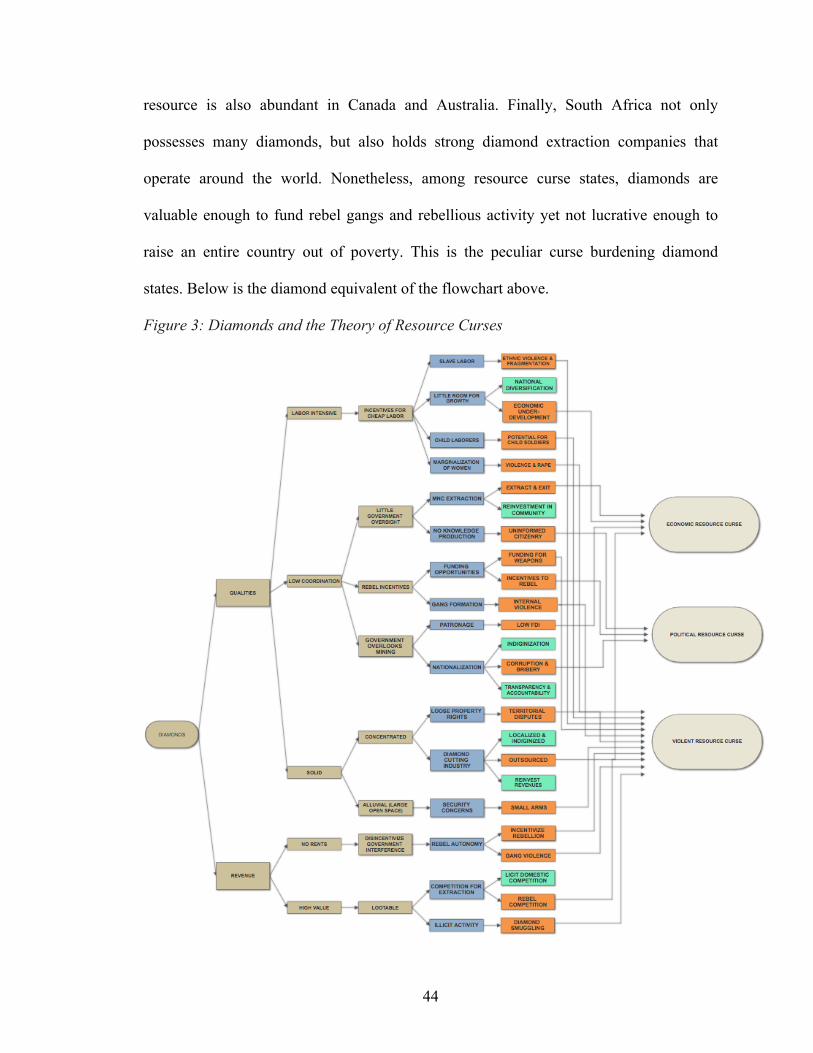
44
resource is also abundant in Canada and Australia. Finally, South Africa not only
possesses many diamonds, but also holds strong diamond extraction companies that
operate around the world. Nonetheless, among resource curse states, diamonds are
valuable enough to fund rebel gangs and rebellious activity yet not lucrative enough to
raise an entire country out of poverty. This is the peculiar curse burdening diamond
states. Below is the diamond equivalent of the flowchart above.
Figure 3: Diamonds and the Theory of Resource Curses
45
Diamonds are not particularly rare. They are kept artificially scarce by companies
withholding them to keep prices high. And the great marketing scheme romantically
recounting that ‘diamonds are forever’ has a point: diamonds do not decompose. Unlike
petroleum, diamonds are also not the lifeblood of the world economy, needed to transport
people and goods around the globe. Yet, especially in the West, diamonds hold valuable
social and productive power, especially during Valentine’s Day (a synthetic construct to
be sure). For the theory of resource curses, diamonds pose inherently different problems
than petroleum and therefore lead to different resource curses. A cursory glance at the
pathways above indicates a higher susceptibility to violent resource curses than economic
or political ones, especially in comparison to petroleum.
There are two prevalent types of diamond mining: alluvial diamond mining and
kimberlite diamond mining. Below is a brief explanation of how these differences
influence resource curses, but in the next section, this dissertation will delve into further
details regarding the two types of diamond mining. Alluvial diamond mining is a highly
labor-intensive process, requiring hundreds of low-skilled workers sifting through dirt
looking for diamonds near rivers. Kimberlite diamond mining is less labor-intensive than
alluvial mining, but nowhere near as capital-intensive as petroleum extraction. While in
developed states, diamond mines may appear as funnel-shaped open pits reaching 500
meters in depth, incorporate heavy machinery, railroads, miles of reinforced tunnels, and
skilled labor, this is oftentimes not the case in resource curse states. Alluvial diamonds,
those washed in riverbeds, require nothing more than dozens of people and simple tools.
Unlike the capital-intensive petroleum extraction process, diamond mining is quite
straightforward. The labor-intensive nature of especially alluvial diamond mining
46
encourages the possibility of slave labor, child labor (with the potential of child soldiers),
and the marginalization of women in the workforce. Unlike the coal miners of yesteryear
who could unionize and halt the fuel lighting cities, diamond mining does little to disrupt
urban economies; quite the opposite would occur—diamond prices would simply
continue to increase. Many of these factors would result in a violent resource curse, and
their pathways are indicated in Figure 3. On the other hand, positive externalities include
a temptation to diversify the economy due to the little room for growth within the
diamond industry. However, vis-à-vis resource curse states, the labor-intensive nature of
diamonds would spell out certain economic differences. Due to the comparably little
revenue generated from diamonds, this theory expects more economic underdevelopment
in diamond-rich states than in petroleum-rich states.
Comparably low levels of coordination and technological assets for diamond
mining are in striking contrast to drilling for oil. With the government largely absent
from diamond extraction, MNCs, artisanal diamond mining companies, or even rebel
groups have much more autonomy over the extraction process. Such autonomy may
incentivize MNCs to adopt an ‘extract and exit’ policy or reinvest diamond revenue back
into the community (if only for public relations purposes). If rebel groups have access to
these mines—or even think that they may have access to them—then the government is
facing a potential for rebellion, especially if rebels manage to fund themselves through
diamond mining. On the other hand, if the government does involve itself in matters of
diamond mining, this theory would expect less autonomy over the industry itself,
potentially leading to a nationalized diamond industry. In this case, the theory of resource
curses would expect noticeable externalities. Positive ones would be a concerted effort to
47
render the industry more transparent and accountable while indigenizing the extraction
process. Negative externalities would be derived from paternalism if the industry is not
nationalized, and corruption and bribery if it were nationalized. This pathway for these
conditions is depicted above leading to an economic resource curse.
Similar to the petroleum industry, governments may not nationalize the entire
diamond mining process. Once diamonds are mined, they must be expertly cut to create
the brilliance associated with them in the West. As indicated above, this process may be
indigenized or may be outsourced, leading to another economic-related curse. Some
diamond-rich states, such as Angola, have national diamond companies, but in many
cases they must compete with large MNCs for access to resources. Even more
problematic is that national diamond companies may not own the entire minefield in
which they operate. Endiama, the Angolan national diamond company, for example,
shares ownership of many mines with Russian, South African, and Brazilian companies,
some of which may not even be in the mining business at all (e.g., the large-scale
engineering firm, Odebrecht, in Catoca, Angola).
As previously stated, violence may be the most common externality to diamond
mining in resource curse states, with many arrows pointed at the violent resource curse in
Figure 3. Part of this originates from the lootability of diamonds, potentially financing
rebel groups, fuelling civil wars, encouraging diamond-smuggling, and funding militias.
To be sure, if diamond mines do not escape the government’s clutches, it could lead to
licit extraction, such as in Ghana (Snyder & Bhavnani 2005:587). However, the
lootability of diamonds provides a great temptation to rebel groups. When they fight each
other, human rights abuses range from systematic rape to child soldiers and illicit
48
weapons sales. This theory predicts that, unlike petro-rich states, diamond-rich states are
more vulnerable to civil violence, rather than international wars, because of this resource.
Again, civil violence may exist in petroleum-rich resource curse states, but the theory of
resource curses does not expect this violence to originate from petroleum production.
This expectation in the theory bifurcates previous literature on the subject asserting that
on average, “oil and lootable resources favor violent conflict” (Basedau & Lay 2009:758;
Ross 2004). Whereas most resource curse literature analyzes violence, this theory of
resource curses decouples international from civil violence, predicting that petroleum-
rich states would suffer from more international violence while diamond-rich states
would undergo more civil violence. This hypothesis is partially based off of the alarming
rate of border disputes in the Middle East, such as the Iraqi claim over the Shatt al-Arab,
Saddam Hussein accusing Kuwait of slant drilling, and border disputes between Saudi
Arabia and Qatar.
Hypotheses
Drawing on the discussions of the distinct resource curse pathways for diamond
and petroleum dependence discussed above, the present subsection outlines a set of six
specific and testable hypotheses. Below is the list of six hypotheses generated from the
theory of resource curses highlighting differences between diamond- and petroleum-rich
states. These hypotheses capture some, but not all pathways for resource curse states and
are designed to illustrate divergences among petroleum- and diamond-rich states between
two trajectories—political and violent curses. Since many of the hypotheses below are
esoteric topics that resource curse scholars normally do not analyze in their studies, this
49
dissertation will present more tailored motivations for each hypothesis in the chapters
below.
Political Resource Curse
Hypothesis 1: Petroleum-rich and diamond-rich states will experience different types of government-MNC strife due to asymmetric shifts in bargaining power.
Hypothesis 2: Petroleum-rich states are more likely to possess a larger and more powerful elite resource class than diamond-rich states.
Hypothesis 3: Petroleum-rich states are more likely to have stronger nationalized industries than diamond-rich states.
Hypothesis 4: Petroleum-rich states are more likely to exercise stricter property rights than diamond-rich states.
Violent Resource Curse
Hypothesis 5: Rebels seeking to overthrow the government are more likely to attempt to leverage diamond mines than oil fields.
Hypothesis 6: Petroleum-rich states are more susceptible to international conflict and, conversely, diamond-rich states are more likely to experience civil violence.
Astute readers would have noticed that these hypotheses target only political and
violent curses even though the theory details how economic woes can also curse a
diamond- or petroleum-rich state. Four other economic resource curse hypotheses will be
postulated, but not tested, in this dissertation. As an international relations dissertation,
this work does not seek to creep into economic-based analyses of how resources
influence state processes and outcomes. Empirically testing these hypotheses requires an
economist trained in dissecting macro-economic patterns, rendering it outside of this
work’s expertise. Below are the untested hypotheses.
Economic Resource Curse
Hypothesis 7: Petroleum-rich states are more likely to experience Dutch Disease than diamond-rich states.
50
Hypothesis 8: Petroleum-rich and diamond-rich states are just as likely to experience extract and exit policies from MNCs.
Hypothesis 9: Petroleum-rich states will attract more FDI than diamond-rich states.
Hypothesis 10: Diamond-rich states are more likely to diversify their economy than petroleum-rich states due to the disparity in rent generation stemming from diamonds and petroleum.
Before continuing with the plagues influencing diamond- and petroleum-rich
states, it is important reiterate that diamonds are not plentiful or valuable enough to raise
an entire state out of poverty. Assuming perfect distribution of resources—a theoretical
construct, for sure—this dissertation will make use of the per capita of value diamonds
and petroleum. This per capita value quantifies how much individuals in each resource
curse state would earn assuming the resources were evenly distributed throughout the
population. With this in mind, two charts are superimposed together to determine the
differences among diamonds and petroleum with the two states having the highest
monetary gain from their resource on the right. Diamond states are depicted in red and
petroleum states are shown in blue. The resource curse state with the most petroleum per
capita is Kuwait, with the average Kuwaiti theoretically ‘earning’ $25,004 annually from
petroleum. The story is very different for diamonds. Angolans, on an annual per capita
basis, make only $48.94 off diamonds, though they are the resource curse state with the
most diamonds per capita. When discussing macro-economic resource curses, it makes
little sense to consider diamond-rich states to be on par with petroleum-rich states, as
even assuming perfect distribution, diamond-generated rents pale in comparison to petro-
rents. Unlike petroleum-rich states, governments in diamond-rich states cannot hope to
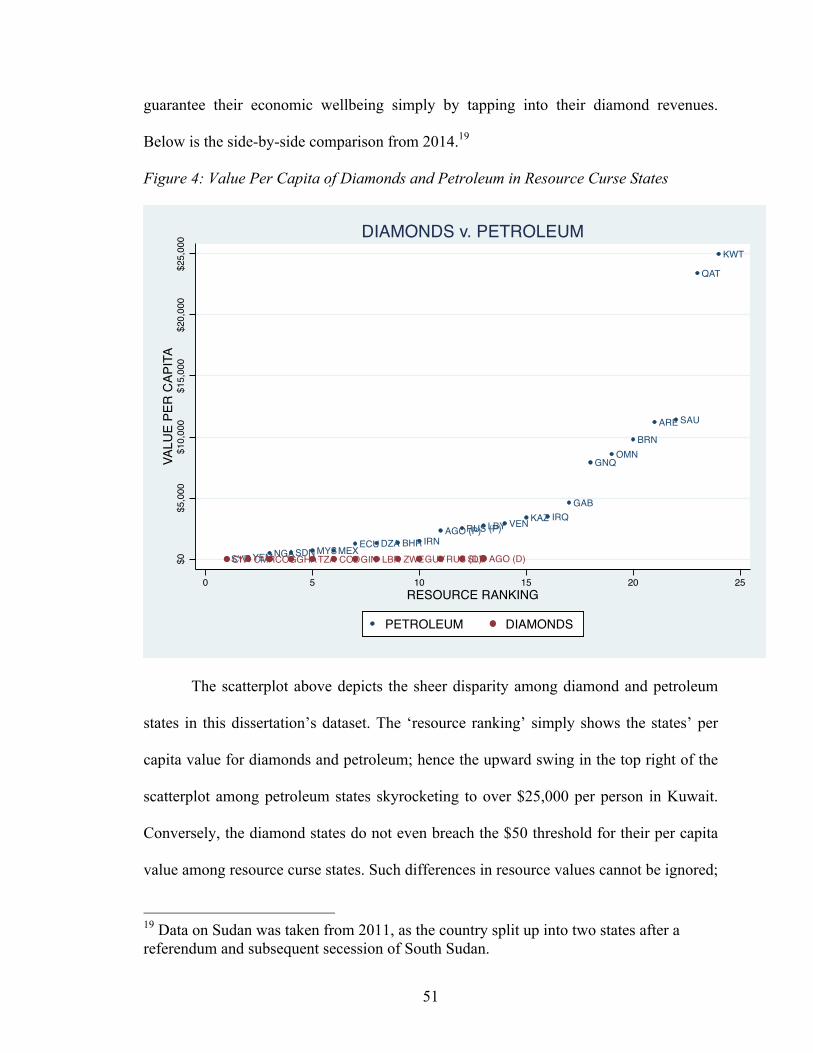
51
guarantee their economic wellbeing simply by tapping into their diamond revenues.
Below is the side-by-side comparison from 2014.19
Figure 4: Value Per Capita of Diamonds and Petroleum in Resource Curse States
The scatterplot above depicts the sheer disparity among diamond and petroleum
states in this dissertation’s dataset. The ‘resource ranking’ simply shows the states’ per
capita value for diamonds and petroleum; hence the upward swing in the top right of the
scatterplot among petroleum states skyrocketing to over $25,000 per person in Kuwait.
Conversely, the diamond states do not even breach the $50 threshold for their per capita
value among resource curse states. Such differences in resource values cannot be ignored;
19 Data on Sudan was taken from 2011, as the country split up into two states after a referendum and subsequent secession of South Sudan.
SYR YEMNGASDN MYSMEXECU DZA BHR IRNAGO (P)RUS (P)LBY VEN KAZ IRQ
GAB
GNQOMN
BRN
ARE SAU
QAT
KWT
CIV CMRCOGGHATZA CODGIN LBR ZWEGUYRUS (D)SLE AGO (D)$0$5
,000
$10,
000
$15,
000
$20,
000
$25,
000
VALU
E PE
R CA
PITA
0 5 10 15 20 25RESOURCE RANKING
PETROLEUM DIAMONDS
DIAMONDS v. PETROLEUM
52
however, they do not fully explain resource curse outcomes. For a more complete
analysis, the present work will amalgamate resource values with other, intrinsic values
attributed to the resources themselves.
Economic-minded readers will likely point to this fiscal disparity as a reason for
differing results among the hypotheses postulated in this dissertation. This would likely
be the case for the economic resource curse that was forwarded above. Although this
work does not test degrees of Dutch Disease (Hypothesis 7), extract and exit policies
(Hypothesis 8), foreign direct investment (Hypothesis 9), or diversification efforts
(Hypothesis 10), it would expect results to be reflective of disparities in resource revenue.
For these hypotheses, significant differences between petroleum and diamond rents
would be a necessary, but not sufficient condition, to explain the results in the subsequent
chapters. Such logic may hold for some other tested hypotheses in this dissertation, such
as Hypothesis 3, which measures nationalization rates. However, if this were a hard and
fast rule, the results from Hypothesis 1, which tests government-MNC strife, would clash
against such economically fixed opinions. As we will later note, in order to keep a stable
stream of petro-rents, Venezuela ought to do little to antagonize international oil
companies that pay rents to Caracas; yet this is not the case. Furthermore, the logic falls
apart when studying violence. For Hypothesis 5, as this dissertation will later show, the
cost-benefit analysis of tapping or sabotaging petroleum infrastructure is greater than that
of diamonds, yet rebels continue to seek diamond mines rather than oil fields, casting
doubt upon homo economicus theories prevalent in economic-based studies of the
resource curse.
53
Given the shockingly different economic disparities between diamonds and
petroleum, it behooves the reader to familiarize themselves with the two resources. While
it is not necessary to delve into a critical reading of the intricacies of the diamond and
petroleum trade, background information is valuable in understanding the differences
between these resources.
Diamonds
As mentioned in Chapter 2, there is a marked difference between alluvial and
kimberlite diamonds. Snyder and Bhavnani (2005) make a sharp distinction between the
lootability of these two different types of diamonds. Alluvial diamonds, such as those
found in Sierra Leone, are those deposited by moving water, such as in a riverbed.
Oftentimes, by the time they are collected, the material around alluvial diamonds has
been eroded by water, leaving the uncut stone exposed. Because most alluvial diamonds
are deposited over large swaths of land, capital-intensive diamond extraction becomes
less competitive. Since these diamonds are moving along with the river, largely unskilled
laborers sifting through the river can successfully uncover diamonds in between rocks,
mud, and sand. These few barriers to entry, combined with the high value of the resource,
render alluvial diamonds as lootable.
On the other hand, diamonds are also found in kimberlite, an igneous rock
produced in vertical columns, commonly known as kimberlite pipes, along the earth’s
crust. Kimberlite pipes are formed from volcanic eruptions approximately 40 million
years ago (Barrera 2017). Diamonds are found in the earth’s mantle, and during these
volcanic eruptions, diamonds are violently pushed toward the earth’s surface, creating
54
these pipes. The igneous rock created from volcanic eruptions tend to house these
diamonds, called kimberlite after the town Kimberley, South Africa, where diamonds
were once discovered in these rocks. Diamond exploration companies target kimberlite
pipes as they potentially hold high concentrations of diamonds. The search for these pipes
may take decades, as only a small fraction of kimberlite pipes possess enough
concentrations of diamonds to render extraction profitable (Barrera 2017). Two of the
largest kimberlite pipes are located in resource curse states: the Camafuca Pipe in Angola
and the Mwadui Pipe in Tanzania (Treble 2012). The capital-intensive nature of
kimberlite diamond mining, combined with the technical expertise and experience
required to commence drilling, renders these diamonds as non-lootable resources though
kimberlite diamonds are chemically and physically similar to alluvial diamonds.
A blood (or conflict) diamond is a term used to define a diamond mined to fund or
aid a war or an insurgency, or by using illicit child labor. Blood diamonds may be used to
fund a warlord’s activity and finance rebellious enterprises. Since the denouement of the
Sierra Leonean Civil War in 2002, the United Nations has taken a keen interest in
preventing the proliferation of blood diamonds in the world market. In response to this,
they formed the Kimberley Process. In their words, the Kimberley Process is a “joint
government, industry and civil society initiative to stem the flow of conflict diamonds –
rough diamonds used by rebel movements to finance wars against legitimate
governments” (Kimberley Process 2017). This scheme has been largely successful, and is
currently removing 99.8% of conflict diamonds from the world supply chain. Much of
the data concerning blood diamonds originates from the Kimberley Process, allowing the
55
analyst to account for total diamond production by 2015 US dollars, carats, and value per
carat.
Petroleum
Not all petroleum is created equally. Petroleum has many characteristics and can
be classified through two different properties: API gravity and sulfur content. Other
qualities, such as onshore and offshore petroleum, are important in the discovery and
extraction process. The American Petroleum Institute (API) gravity is the unit measuring
the density of petroleum. The lighter the petroleum, the more it floats in water, while
heavier petroleum tends to sink. For most petroleum-based products, a lighter API gravity
is coveted as it renders the refining process less expensive. Heavier crude oil, on the other
hand, must be processed much more than light petroleum. To render heavy crude oil as
profitable as possible, it behooves the refining company to convert it into a heavier
petroleum-based product, such as asphalt, rather than a lighter product, such as jet fuel.
The API gravity of petroleum is calculated by the result of (141.5/Specific Gravity) –
131.5 at 60° Fahrenheit. ‘Light’ crude oil has an API gravity of 31° or higher, and needs
to be processed less than medium or heavy crude classifications of petroleum.
Confusingly, some types of petroleum market themselves as ‘light’ petroleum, though
they may be considered of medium density. For example, Basrah Light from southern
Iraq is marketed as a light petroleum, though this crude does not reach the 31° threshold
and ought to be publicized as a medium crude (BP 2018). Crude oil of around 50-60°
tends to be called ‘condensate,’ meaning that it is a gas inside the oil field, but condenses
into a liquid as it gets extracted. Anything higher than 60° is generally considered natural
56
gas that can also be used for fuel. Lower API gravities, such as those found in the
Orinoco Belt of Venezuela, tend to hover at the 15-20° range. API gravities of 10° or
lower mean that said petroleum neither floats nor sinks in water.
The sulfur content of petroleum is the second measure of the quality of oil that
may influence the price and refining process; it is common to find significant amounts of
hydrogen sulfide (sulfur) in crude oil. ‘Sweet’ crude oil has low levels of hydrogen
sulfide (< 1%) while ‘sour’ crude has levels over 1% of sulfur in the petroleum. Since
sulfur must be purified from crude oil in order for it to be turned into a finished product,
sweet crude is generally worth more than sour crude because it can be refined to a smaller
degree. Generally speaking, some of the sweetest petroleum is found in Malaysia,
Norway, United Kingdom, Indonesia, United States, and Australia. Crude petroleum
blends from the Persian Gulf tend to hover between 0.5-1.5% sulfur levels. Notably, the
OPEC basket of crude petroleum tends to be sourer than the world average. Perhaps this
is part of the reason why OPEC-member states decided to consolidate into a cartel,
despite their cultural, religious, and ethnic animosity. The sourest petroleum tends to
come from shale oil, especially found in Venezuela and Canada. Orinoco Belt and
Maracaibo region petroleum in Venezuela reach as high as 5.40% sulfur.
There are a few petroleum benchmarks traded in global stock markets.
Traditionally, Brent Crude, from the North Sea is considered as the world benchmark.
Other regional-specific benchmarks include the West Texas Intermediate (WTI) in North
America, Bonny Light from Nigeria in Africa, and Dubai Crude in the Middle East.
These benchmarks are largely mixtures of many different types of petroleum so that the
same product in terms of API gravity and sulfur content are consistently reached. For
57
example, Brent Oil has an API gravity of 38.3° and a sulfur content of 0.37%. However,
this petroleum comes not from only the Brent oil field in the North Sea, but also from the
Forties and Ekofisk oil fields, which are co-shared with Norway. Oftentimes, denser
petroleum is mixed with lighter varieties to create a recognizable mixture that can be
bought and sold with the buyer knowing exactly what they are purchasing.
Case Selection
There are over 190 states in the world, all with many different resources.
However, not all of them experience any resource curse. OECD states, for example, seem
to be exempt from this phenomenon. Asian tigers, banking microstates, and resource poor
states also do not experience the type of curses analyzed above. As briefly mentioned in
the introduction, thirty-five states will be analyzed, but what are the parameters by which
this dissertation considers states to suffer from a type of resource curse?
One avenue to explore is dependency on a single resource by analyzing a state’s
exports. High exports of a single resource often equate to high dependency, indicating a
lack of diversification in the state economy. However, states may consume much of their
own resources, as many petro-states do not export vast quantities of their petroleum
because it is used domestically. This is still a dependency on the resource though it may
not appear in export percentages. For diamond states, not only do they not rely on exports
to the same degree as oil states, their resource does not deplete in the same way
petroleum is consumed. Additionally, if blood diamonds lead to a resource curse, then we
can hardly expect smuggled diamonds to pop up in a state’s exports. The combination of
58
these reasons leads this dissertation to consider resource production, rather than resource
exports, as a more indicative measure of dependency.
Since part of the theory of resource curses analyzes political resource curses,
another possibility is to explore the types of governments in place. Among oil states,
dictatorships may be a result of a political resource curse20 (e.g., Kazakhstan, Equatorial
Guinea, Libya under Gaddhafi, Iraq under Saddam Hussein, etc.). Furthermore, populist-
leaning states potentially legitimized by rents from their resources blur the lines of
democratically elected governments (e.g., Venezuela, Russia, Angola, and to lesser
extents, Mexico and Ecuador). Finally, there are resource-rich monarchies fueled by their
petro-wealth that other scholars, such as Menaldo (2016) have considered to be resource
curse states in their analyses. These states include Oman, Saudi Arabia, Qatar, Kuwait,
UAE, and, to a lesser extent Bahrain. Monarchies not only may hamper democratic
developments in Middle East states; some laws prevalent in monarchies are alarmingly
dictatorial. For example, restricting women’s abilities to drive in Saudi Arabia borders on
a human rights abuse.21 Oil-rich monarchies are not endemic to the Gulf; Brunei and
Malaysia also have monarchs ruling over their petro-states, marginalizing democratic
advances in their states, though they provide their citizenry with good-enough, albeit
undemocratic, government. Still other states may suffer not only from political
malformations but also from economic woes despite their resource wealth (e.g., Yemen,
20 Dictators also govern plenty of resource-poor states (e.g., Cuba under Castro, Somalia under General Aidid, North Korea under Kim Jong-un, etc.). However, because these states do not possess unusual amounts of petroleum or diamonds, they lay outside of the realm of this dissertation. 21 Furthermore, and raising eyebrows, according to multiple news sources, a man was kicked out of Saudi Arabia in 2013 for allegedly being too handsome (Reilly 2013; Lau 2013; Kuruvilla 2013).
59
Algeria, Sudan, and Syria). Regarding oil states, either a single factor, or a combination
thereof, may expose a state to experience some type of resource curse. In short, oil buys
many things, but not democracy.
Conversely, diamond states are often beacons of democracy in otherwise
dictatorial regions. For example, Ellen Johnson Sirleaf, the Nobel Prize winning Harvard-
educated politician, became president of Liberia in 2008 and Africa’s first democratically
elected female leader. Though democracy (currently) abounds in West Africa, diamond
states may still experience abject poverty, systemic violence, and government corruption.
Although many states around the world possess vast diamond deposits, ranging from
Canada to Australia, very few enjoy enough diamonds to make a noticeable difference in
their domestic and international affairs. Complicating matters is that many states export
cut diamonds that are already mounted into profitable jewels (e.g., Hong Kong, Belgium,
Israel, Luxembourg, and Singapore) indicating that analysts should not observe exports if
they are to focus on bona fide diamond-producing states. India stands out as a state
importing large percentages of uncut diamonds, polishing them into valuable gems, and
then exporting them to the West or selling them domestically. However, for the purposes
of the theory of resource curses, states producing diamonds and experiencing the
symptoms scholars associate with the resource curse are of special interest. Except for
Guyana and Russia, these states tend to reside in Africa.
There is a gray area in selecting diamond states susceptible to resource curses.
First, diamond states are selected because they are signatories of the Kimberley Process,
which provides one of the few public and reliable datasets regarding diamond production.
To complicate matters, especially in recent years, many diamond states have begun to
60
discover petroleum. Revenue from this newfound resource has easily outstripped
(reported) diamond revenue. Liberia, for example, began auctioning off offshore blocks
for petroleum production, with many contracts sold to international corporations, such as
Chevron and the Spanish-based Repsol (Dean 2004). Offshore oil was discovered in
Ivory Coast in the late 1970s with production commencing a few years later. Other
diamond states have enjoyed large oil profits for years before 1980, when this analysis
begins, and well into the 1980s and 1990s, only to see business progressively decline
over the past 30 years. Still others, such as the Republic of the Congo, while diamond-
rich, and coded as a diamond state, produce and export enough petroleum to be
considered a petro-state as well. Nonetheless, the acute reason as to why Republic of the
Congo and others are documented as diamond states is that blood diamonds have
wreaked havoc in these states while petroleum, though lucrative, has neither led to civil
and gang violence of such scale nor to the illicit export of resources (e.g., Goldman 2014;
Deibert 2007). Other states, such as Cameroon, are not great producers of diamonds,
neither in terms of value or carats. Yet, due to the location of diamond mines on the
Cameroon-Central African Republic border, diamonds have been smuggled across
borders, leading to the state’s failure to implement Kimberley Process goals (Jamasmie
2016). Still other states, such as the Democratic Republic of the Congo (DRC), are
blessed with enormous reserves of gold, copper, cobalt, timber, and uranium, on top of
diamonds. Nevertheless, as Jones (2004) notes, diamonds are by far the DRC’s most
valuable resource, acting as a pillar for their struggling economy. Along this vein, this
dissertation can only incorporate disclosed diamond production, as smuggled gems will
not appear in any public dataset.

61
A peculiar question may arise from the different resource curses stemming from
diamonds or petroleum: is it possible for a state to suffer from multiple resource curses,
especially if they have both diamonds and petroleum? From an empirical standpoint, only
two states in this dataset, Angola and Russia, are likely candidates for such a scenario, as
they are the only two states with substantial amounts of diamonds and petroleum. As this
work will later depict, a single state with both diamonds and petroleum may suffer from
different resource curses. From Hypothesis 2, it is evident that Russia may experience a
disparity in inequality stemming from their diamond and oil production.22 In addition,
Hypothesis 5 analyzes how Angola suffered from separatist movements in Cabinda
partially stemming from its petro wealth, while simultaneously experiencing rebel
violence in the mainland over diamond mines, leading to different curses. From such
quantitative and qualitative evidence, it appears that a state may suffer from more than
one resource curse if they have both diamonds and petroleum. It also seems to be the case
that diamonds and petroleum catalyzes states to react differently. Drawing from Figures
2 and 3, this work allows for the theoretical potential of Russia and Angola suffering
from stronger economic and political resource curses in relation to their petroleum and
stronger violent resource curses stemming from diamond production. To some extent,
Hypotheses 2 and 5 illustrate the divergence in curses as they relate to their resources.
However, the question remains: can a state with one resource suffer from multiple
resource curses? Theoretically, the arrows in the flowcharts found in Figures 2 and 3
allow for this reality. Yet empirically, since this work is not examining the existence of
22 The regression lines in Figures 11 and 12 depict how the top 1% and 10% in Russia become wealthier as petroleum production increases yet become poorer as diamond production increases.
62
an economic resource curse, it has not found reliable evidence of a state suffering from an
economic resource curse and a political or violent curse. By the same logic, systematic
political problems may result in violence and vice versa. However, as this work
concentrates on the original tracks resource curse states take, the causal arrows have not
yet flowed in more than one direction. Theoretically, a state may adopt a path leading to a
political resource curse while simultaneously taking another path following an economic
resource curse, and additionally triggering a violent resource curse. There is an important
gap in the literature here that deserves more attention. However, as this dissertation is
concentrated on determining non-monotonic differences between resource curse states
and not seeking to answer how many curses a state may suffer from, such questions,
though interesting, remain exogenous to the present work.
Drawing upon the logic outlined above, and as noted in the introduction, thirty-
five states will be quantitatively analyzed and often will be abbreviated by their UN-
designated 3-digit codes listed next to their names: Algeria (DZA), Angola (AGO),
Bahrain (BHR), Brunei (BRN), Cameroon (CMR), Republic of the Congo (COG),
Democratic Republic of the Congo (COD), Cote d’Ivoire (CIV), Ecuador (ECU),
Equatorial Guinea (GNQ), Gabon (GAB), Ghana (GHA), Guinea (GUI), Guyana (GUY),
Iran (IRN), Iraq (IRQ), Kazakhstan (KAZ), Kuwait (KWT), Liberia (LBR), Libya
(LBY), Malaysia (MYS), Mexico (MEX), Nigeria (NGA), Oman (OMN), Qatar (QAT),
Russia (RUS), Saudi Arabia (SAU), Sierra Leone (SLE), Sudan (SDN), Syria (SYR),
Tanzania (TZA), United Arab Emirates (ARE), Venezuela (VEN), Yemen (YEM), and
Zimbabwe (ZWE).
63
Triangulating resource curses requires a large-N quantitative analysis combined
with qualitative case studies. Hypotheses 2, 3, and 4 adopt quantitative measures to assess
the strength of resource classes, nationalization levels, and property rights enforcements,
respectively, among resource curse states. Hypotheses 1 and 5 are specifically tailored for
a qualitative analysis to pinpoint agential incentives in resource curse states. Hypothesis 1
analyzes differences in government-MNC strife among diamond- and petroleum-rich
states and will assess how friction between governments and multinational companies
differs contingent upon the resource in question. This hypothesis will test differences
between Tanzania’s expropriation of Petra Holding’s diamonds and the Venezuelan
government’s spearheaded campaign to increase petro-rents from international oil
companies (IOC).23 Hypothesis 5 seeks to determine how resources incentivized rebel
activity during three separate civil wars during the 1990s in Africa, comparing roles
resources played in determining outcomes throughout these conflicts. Algeria, Angola,
and Sierra Leone all had civil wars throughout the 1990s, yet their resources played
different roles in these conflicts. Hypothesis 5 will determine the differences between
petroleum’s role in the Algerian Civil War (1991-2002), the roles of petroleum and
diamonds in the Angolan Civil War and Cabinda War (1975-2002), and the role of
diamonds in the Sierra Leonean Civil War (1991-2002). These hypotheses are
purposefully picked to analyze drastically different pathways and outcomes among
resource curse states. The hypotheses are intended to capture differences among
23 International oil companies (IOC) are, by their nature, multinational corporations (MNC). Because of this, the terms IOC and MNC will be used interchangeably for the rest of this dissertation when referring to international oil companies. Diamond companies, on the other hand, may be MNCs (e.g., De Beers), but can never be IOCs because they do not extract petroleum.
64
diamond- and petroleum-rich states before the causal arrows of a full-on resource curse
flow in every direction. To avoid endogeneity issues and collinearity among the
hypotheses, they purposefully measure unique crossroads resource-rich states ultimately
face, such as whether or not to nationalize their extraction industries. It is from the
differences between diamond and petroleum states found these hypotheses that the theory
of resource curses suggests that resources influence institutional capacity in non-
monotonic manners, ultimately leading states to experience vastly different outcomes.
Since this mixed-methods approach to understanding the resource curse involves
different methods to testing each hypothesis, the methods will be discussed before each
hypothesis. Additionally, since each hypothesis deals with more specific facets of the
resource curse, ranging from private property enforcement to civil and international
violence, the introductions to each hypothesis will incorporate a literature review along
with background information. The next three chapters will comprise of the bulk of the
dissertation, discussing various facets of the political and violent resource curses.
Hypotheses 1 to 4 will measure political resource curse processes and outcomes while
Hypotheses 5 and 6 determine differences in violence among diamond- and petroleum-
rich states.
65
Chapter 4
THE POLITICAL RESOURCE CURSE (PART 1)
As developed in the previous chapter, the theory of resource curses expects that
states with different resources will suffer from different curses. With this in mind, the
theory develops ten hypotheses, six of which will be tested. The first four, though
applicable, are mostly related to economics rather than political science, and thus will not
be tested. As for the six testable hypotheses, four are political processes (Hypotheses 1-4)
and two are violent outcomes (Hypotheses 5 & 6). By focusing on both processes and
outcomes, the current work seeks to decouple the differences between resource curse
states that possess diamonds and petroleum.
The first political resource curse hypothesis measures differences in government-
MNC strife in diamond- and petroleum-rich states along eight separate tracks. This
qualitatively tested hypothesis will include valuable background information and set the
stage for the next hypotheses, which will largely be evaluated by quantitative means.
Common to all the hypotheses tested in this chapter is their highlighting of the political
differences in diamond- and petroleum-rich states stemming from their resources. Prima
facie initial pathways resource-rich states adopt when extracting diamonds or petroleum
may seem insignificant, but they often lead to diverging results. These hypotheses will
accentuate how these divergences develop over time, ultimately leading to different
resource curses.
66
Testing Hypothesis 1
Petroleum-rich and diamond-rich states will experience different types of government-MNC strife due to asymmetric shifts in bargaining power. Drilling for petroleum and mining for diamonds consist of drastically different
processes, not only regarding technological capabilities and skilled labor, but also in
government contracts, deployment of resources, infrastructure malleability, and time
horizon differences. These factors ultimately lead to asymmetric shifts in bargaining
power between governments and multinational corporations (MNC). Hypothesis 1 is
designed to highlight these shifts, teasing out differences between resources and
government-MNC strife. On account of the prohibitive overhead costs, esoteric and
immobile infrastructure, capital-intensive nature, and the highly skilled workforce
necessary for petroleum extraction, Hypothesis 1 predicts that petroleum MNCs, also
called international oil companies (IOC), will experience more consistent strife with
governments than their diamond counterparts. Unlike the expensive infrastructure
necessary to extract petroleum, where returns on investments (ROI) take years, small-
scale companies mining for alluvial diamonds do not require such a lengthy or expensive
process. Furthermore, alluvial diamond mining is a low-skilled enterprise where
specialties and responsibilities are concentrated in security personnel and managers rather
than with ROI-incentivized workers. Oil rigs, on the other hand, are capital-intensive,
requiring a highly skilled workforce where each individual is responsible for not only
operating heavy equipment, but also the safety of their coworkers on site. This cannot be
said for the low-skilled labor extant in diamond fields. From the perspective of C-level
directors, the up front costs of oil rigs (especially offshore ones) are both prohibitive and
67
risky, indicating that IOCs will bargain heavily with governments for concession rights
and long-term contracts. Without this concrete bargaining process, oil companies run the
risk of not breaking even in their petroleum investments. Diamond MNCs, especially
artisanal diamond miners, do not have such expensive up front costs and their presence in
mines does not represent such high-priced investments.
In petroleum states, scholars have noted how shifts in bargaining power may lead
to strife between governments and MNCs. From the perspective of the MNC, they
require governmental ‘credibility of intertemporal commitments’ seeking political
stability and no deviation from the law (Barma et al 2012:11), as MNCs are unlikely to
invest in a state if the government has a reputation for expropriating businesses and
infrastructure. Furthermore, MNCs are aware of potential risks governmental
nationalization efforts would have if the state expropriated their infrastructure, as
concessions, wells, pumping stations, and pipelines all must be in place before petroleum
is extracted. Because the infrastructure cannot be easily moved, or implemented for other
purposes, the IOC loses bargaining power to the government after initial investments
(Ross 2012:41). Such scenarios often lead to obsolescent bargains between both parties.
From the state’s perspective, the government loses bargaining power with MNCs if it
finds itself to be dependent upon petroleum, as it cannot quickly inject money into the
economy without petro-rents. Despite the ‘primacy of the state,’ governments do not
enjoy complete control over concession rights; rather, elites, both in and out of the
government, bargain for resource power (Barma et al 2012:49). Particularly, rent-seeking
pseudo-entrepreneurs enjoy ‘umbilical relationships’ with the government (Dauderstädt
& Schildberg 2006:21; Barma et al 2012:48). This public-private relationship, if
68
successful, blurs the distinction between the government and MNCs (Vatansever &
Gillies 2009:15), and if unsuccessful, potentially leads to strife among the parties.
From the diamonds perspective, no state is completely reliant on this resource,
simply because there are not enough diamonds in any state to secure highly valuable rents
or lift a resource curse state out of poverty. As mentioned in the literature review,
diamonds are found in two main types of deposits—alluvial and kimberlite. Alluvial
diamond mining is largely labor-intensive and has few barriers to entry. Kimberlite
diamond mining is more complex and generally involves more advanced machinery, yet
the infrastructure needed for kimberlite diamond mining is not as esoteric as what is
found on oil rigs. Important among resource curse writings is the focus on artisanal
diamond mining (ADM), referring to small-scale diamond operations conducted by locals
using basic mechanized equipment. In many resource curse states, artisanal diamond
mining plays an important economic role, with estimates from the Communities and
Small-Scale Mining (CASM), a World Bank-backed initiative, suggesting that up to 100
million individuals are dependent upon ADM in over 50 states (Vlassenroot & Van
Bockstael 2008:3; CASM 2008). Due to the well-received benefits of ADM, many
developing economies seek to incentivize locally driven diamond mining over foreign-
held MNC operations. Similar to any enterprise, ADM comes with potential drawbacks:
smuggling, bribery, tax evasion, and illicit border trading remain symptomatic of this
largely unwatched enterprise (Lujala, Gleditsch, & Gilmore 2005; Vlassenroot & Van
Bockstael 2008; Ross 2003). The Janus-faced struggle of incentivizing either local ADM
or backing foreign MNC initiatives leaves governments with a peculiar shift in
69
bargaining power, unrelated to neither the price of diamonds nor the infrastructure MNCs
invest in diamond mines.
With these conditions in mind, two states, a petroleum-rich state and a diamond-
rich state, will be assessed to determine differences in governmental-MNC strife. States
reliant on petroleum are better candidates for testing this hypothesis than others
possessing more diversified economies, though they may be petroleum-rich, such as
Russia or Mexico. Conversely, states that remain too reliant on petroleum are more likely
to allow their nationalized industries to become hegemonic in petro-extraction, thereby
controlling almost every aspect of the petroleum trade. ARAMCO in Saudi Arabia, the
Kuwaiti Petroleum Corporation in Kuwait, and the National Iranian Oil Company in Iran
are emblematic of this omnipresence in nationalized oil industries. Their preponderant
power in oil states leave little room for other MNCs to conduct business, rendering them
practically ineligible as case studies for Hypothesis 1. However, Venezuela, though
wielding a powerful nationalized oil company, Petróleos de Venezuela, Sociedad
Autónoma (PDVSA), holding valuable political clout in Caracas, still conducts business
with foreign oil companies, including Chevron, ENI, Total, and Statoil (now Equinor).
As PDVSA competes with these foreign companies, Hypothesis 1 expects not only
governmental favoritism but also active and consistent strife between the state and
foreign MNCs.
From the vantage point of diamond states, there are a few prospective choices.
Sierra Leone is rich in diamonds, but because of its civil war and the subsequent UN
interference, its resources have been very well regulated by outside forces. Angola is
another candidate and is the state with the most diamonds per capita considered in this
70
dissertation. Yet, due to the omnipresence of their nationalized diamond mining
company, Endiama, combined with the long-lasting Angolan Civil War (1975-2002),
Angola is not a perfect fit for Hypothesis 1. Tanzania is another state, albeit with fewer
diamonds, that has experienced strife between the government and foreign MNCs over its
resources. The Williamson Diamond Mine, in the Shinyaga region near Lake Victoria,
contains most of Tanzania’s diamonds and has become a lightning rod for government
attention, triggering pushbacks from Petra Diamonds, the operator of most of the mine.
The case studies below will accentuate eight key distinctions in Venezuela and
Tanzania, found below in Table 1, paying particular attention to highlighting the
differences in resources, and how these they compelled states to behave differently.
These eight characteristics of strife are quite apparent in Venezuela and Tanzania, but
these patterns potentially reach beyond these states to others enjoying these resources.
Particularly, the second, sixth, and eighth characteristics of government-MNC strife are
conditional upon the resource in question, indicating more external validity among these
tracks. As seen from export ratios, many petroleum-rich resource curse states become
overly reliant on petro-exports, while no diamond state possesses enough diamonds to
reach such levels of dependency. The capital- or labor-focused nature of government-
MNC strife is conditional upon the resource, as petroleum extraction has become a
capital-intensive enterprise, while diamond extraction, especially ADM, remains a much
more labor-intensive endeavor. Finally, due to the preponderance of petroleum as the
world’s principal fuel source, IOCs can counter governmental advances through
71
international legal means.24 Diamond companies have legal backing as well, but there is
neither the extent of legal precedent nor the institutionalized means of suing a state for
expropriating company resources.
While the second, sixth, and eighth indicators of government-MNC strife are to a
large extent generalizable, the other characteristics are differentiating patterns found in
Venezuela and Tanzania that may bestow less external validity to other resource curse
states. For example, while it is neither expected for every oil-state to experience
consistent strife with IOCs nor every diamond state to suffer from intermittent strife with
foreign companies, Venezuela and Tanzania are emblematic of larger patterns in resource
curse analyses. Indeed, some petroleum-rich states do not experience strife with foreign
companies because IOCs are not allowed to operate in-country. Additionally, not every
petroleum-rich resource curse state will be plagued by the internationalization and inter-
sectional strife that Venezuela suffers from, but due to the more interconnected nature of
the petroleum trade, this characteristic seems more plausible than in diamond states. In
short, there is little external validity to this analysis; however, such differences in strife
are useful in comparing how resources influence governmental institutions and
policymaking. Further research must be conducted to definitively support the external
validity of the first, third, fourth, fifth, and seventh characteristics of government-MNC
strife. Nevertheless, this work will illustrate how all eight characteristics embattling
24 For example, China’s Sinopec is suing Venezuela over unpaid bills (Pham 2017), and recently ConocoPhillips was also awarded $2 billion in arbitration against PDVSA (Wernau 2018). Additionally, US shareholders filed a wide-ranging civil lawsuit against the Russian government and a slew of Russian oil companies claiming the parties conspired to re-nationalize the oil giant without compensating its owners (Kirchgaessner 2005).
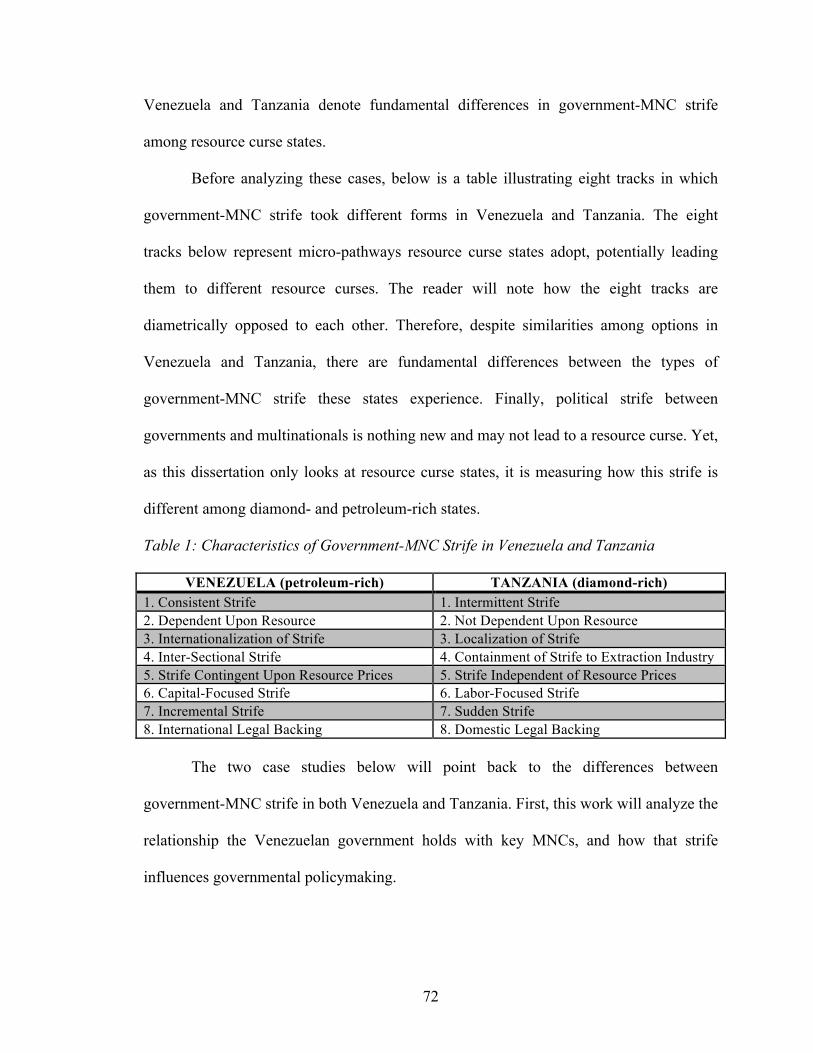
72
Venezuela and Tanzania denote fundamental differences in government-MNC strife
among resource curse states.
Before analyzing these cases, below is a table illustrating eight tracks in which
government-MNC strife took different forms in Venezuela and Tanzania. The eight
tracks below represent micro-pathways resource curse states adopt, potentially leading
them to different resource curses. The reader will note how the eight tracks are
diametrically opposed to each other. Therefore, despite similarities among options in
Venezuela and Tanzania, there are fundamental differences between the types of
government-MNC strife these states experience. Finally, political strife between
governments and multinationals is nothing new and may not lead to a resource curse. Yet,
as this dissertation only looks at resource curse states, it is measuring how this strife is
different among diamond- and petroleum-rich states.
Table 1: Characteristics of Government-MNC Strife in Venezuela and Tanzania
VENEZUELA (petroleum-rich) TANZANIA (diamond-rich) 1. Consistent Strife 1. Intermittent Strife 2. Dependent Upon Resource 2. Not Dependent Upon Resource 3. Internationalization of Strife 3. Localization of Strife 4. Inter-Sectional Strife 4. Containment of Strife to Extraction Industry 5. Strife Contingent Upon Resource Prices 5. Strife Independent of Resource Prices 6. Capital-Focused Strife 6. Labor-Focused Strife 7. Incremental Strife 7. Sudden Strife 8. International Legal Backing 8. Domestic Legal Backing The two case studies below will point back to the differences between
government-MNC strife in both Venezuela and Tanzania. First, this work will analyze the
relationship the Venezuelan government holds with key MNCs, and how that strife
influences governmental policymaking.
73
The Case of Venezuela
Throughout the 1960s and 1970s, Venezuela was one of the richest and most
advanced states in Latin America. Bolstered by relatively high oil prices and the stable
governance of Rómulo Betancourt, Venezuela experienced a sustained period of peace
and prosperity. Unlike most resource curse states, Venezuela ironically transitioned from
a dictatorship to a democracy at the height of its oil wealth during this period (Karl
1997). Throughout this time, the government in Caracas did what all petroleum resource
curse states end up doing—they invested heavily in the oil industry. Though Venezuela
was largely a petro-exporter, the government also managed to diversify their revenue
base by developing large agricultural and tourism sectors. While these parts of the
economy were not the moneymaking machines that the petro-industry was, they were
labor-intensive and employed many locals. These industries also acted as buffers should
oil prices tumble; the Venezuelan people could continue working in variegated sectors of
the economy despite low oil prices affecting export revenues.
After the two oil crises in the 1970s, two things happened: first, industrialized
states learned how effective a cartelized oil embargo could shut down their economies.
As a result of this, they began hedging against another embargo by searching for oil in
non-OPEC25 states. Petroleum began flowing from fields in Malaysia, Mexico, Canada,
Australia, and Norway. This not only diminished OPEC’s bargaining power as a
cartelized bloc, it also lowered oil prices since diversified supply was almost guaranteed.
25 Founded in Baghdad in 1960, the Organization of Petroleum Exporting Countries (OPEC) was originally comprised of only five states: Iran, Iraq, Kuwait, Saudi Arabia, and Venezuela. Importantly, these states decided to cartelize their primary moneymakers rather than fight IOCs alone, despite the fact that many of the original OPEC-member states would end up fighting each other.
74
Industrialized states also learned that liberalizing their oil economies would ensure that
no state, bloc, or cartel could effectively embargo them in the future. By quantitatively
restricting petro-exports to ensure a steady income for member states, OPEC effectively
manipulates the price of oil, thereby limiting free trade and driving against neoclassical
economic theory (de la Vega Navarro 2008). Yet, OPEC is capable of limiting petro-
sales, thereby defining the real price of oil, only in the form of quotas (Kaufmann 2004);
it has no other economic weapon. It is up to its members to abide by these quotas to
ensure high prices of petroleum. Yet, there is always the incentive to cheat and produce
more than the allotted quota to sell more petroleum at the higher set price (Colgan
2012:2; Molchanov 2003). Not only is this the most common source of instability in
cartels, OPEC’s demographic heterogeneity (Stigler 1964; Smith 2008:4-5) leaves
Venezuela—and to a lesser extent, Ecuador—as major unprotected satellites of this cartel
in the Americas.
Second, in response to an upswing in non-OPEC oil, members of this cartel had to
contend with competition from other states by increasing their own production,
consequently further driving down the price of petroleum. This contributed to the
debilitation of the Venezuelan economy, which had already tapped all of its easily
accessible petroleum, and began drilling offshore, especially in the Maracaibo Basin
(e.g., Escobar et al 1997). While the Bachaquero-01 petroleum found in Lake Maracaibo
is sweeter and has a less API gravity than other Venezuelan oil, such as in the Orinoco
Belt, it is considered less valuable than other worldwide light crude petroleum varieties.
Due to the economic slowdowns partially due to drops in oil prices, anti-government
movements began to spring up all over the country in the 1980s, including the
75
Movimiento Bolivariano Revolucionario-200, the Revolutionary Bolivarian Movement-
200 (MBR-200).26 Founded by Hugo Chávez in 1982, this leftist movement sought to
destabilize the governing elite in Caracas.
Yet it was not until 1992 that the MBR-200 attempted to overthrow the
government of Carlos Andrés Pérez. Hugo Chávez, now a lieutenant colonel
commanding a paratrooper division, attempted to overtake key military and
communications installations near Caracas as part of the attempted coup. Government
forces narrowly defeated the movement and Chávez was jailed. However, the
government of Pérez, suffering from stagnant economic development, was so unpopular
that the attempted coup made Chávez a hero in the eyes of many Venezuelans (Coppedge
2002:3). He would carry on this fame throughout his imprisonment and ultimately win
the 1998 elections by a 16-point margin of victory (Reich et al 1999). Chavista-style
government ruled Venezuela from 1998 until Chávez’s death in 2013, and would be
succeeded by the increasingly authoritarian Nicolás Maduro to the present day.27 It is
with this backdrop that Hypothesis 1 will analyze governmental-MNC strife in Caracas
during the Chávez and Maduro regimes.
As posited in Table 1, the price of oil played a significant role in Venezuelan
government-MNC strife. Petroleum traded at a stable rate for most of the 1990s. With the
exception of the spike in oil prices during the Persian Gulf War (1990-1991), crude oil
hovered between $17 and $30 per barrel. Coinciding with the beginning of Chávez’s
26 The ‘200’ at the end of the title of the movement commemorates the 200th anniversary of Simón Bolívar’s birthday. 27 Before Maduro became President of Venezuela, he was the Minister of Foreign Affairs for seven years before becoming Chávez’s Vice President a few months before he died.
76
tenure, world oil prices increased from $17 per barrel in 1998 to $38, adjusted for
inflation, just two years later (McMahon 2017). Perhaps in response to this increase in
prices, in November 2001, the Venezuelan government decreed a new Hydrocarbon Law,
reversing a policy that allowed foreign MNCs to hold majority interests in partnerships
with Petróleos de Venezuela, Sociedad Autónoma (PDVSA), the petro-arm and
nationalized oil company (NOC) of the Venezuelan government (Lifsher 2001).
Geopolitically, Venezuela’s Hydrocarbon Law accomplished two goals. First,
Chávez’s ideology was one of anti-US imperialism, and housing US oil companies in
Venezuela likely clashed with his vision of how Venezuela’s resources ought to be
managed. Though a few years in the making, this law came into effect right after the 9/11
attacks, as Washington was seeking to loosen its dependence on Middle East petroleum,
indicating that the US would have to rely more on Mexico, Canada, Venezuela, and, to a
lesser extent, Nigeria. Attacking US petroleum interests in Venezuela would decrease the
bargaining power of many American IOCs operating in Venezuela, as Washington had
little choice but to tap into oil markets outside of the Middle East. The timing of this
Hydrocarbon Law forced American IOCs to unwillingly accept Chávez’s decree because
of their restrictions elsewhere. Second, from Chávez’s perspective, this law was one of
many to update the antiquated and colonialist Venezuelan legal and judicial system.
Since Chávez viewed petroleum as a public Venezuelan good, allowing MNCs to tap and
sell their resource abroad was seen as a mercantilist form of imperialism. There would be
two ways to combat this: raise taxes on MNCs to replace their activities with PDVSA-
backed initiatives or simply expropriate MNC infrastructure. Ultimately, Chávez decided
to pursue both paths, but at different times. This dissertation will first analyze the
77
Hydrocarbon Law of 2001, and how it was a first step to increase taxes on oil companies
operating in Venezuela.
As part of the Hydrocarbon Law, the new royalty structure would increase the tax
of extracted petroleum from 16.6% to between 20% and 30%, rendering oil extraction for
many MNCs operating in Venezuela, such as Conoco, Chevron, and Phillips Petroleum,
largely unprofitable (Lifsher 2001). Conversely, because of these disincentives for petro-
companies, Venezuela can potentially lose out on much-needed revenues, as petroleum in
2001 accounted for 80% of Venezuela’s exports. From the perspective of any IOC
extracting petroleum in Venezuela, it is in their best interest to grumble and threaten to
leave the country. Mazhar al-Shereidah, an oil economist who worked on Venezuela’s
petroleum committee who studied the Hydrocarbon Law, stated, “if I am a giant
multinational, and I hear the terms are going to change, then it is in my interest to foment
criticism, to say I am going to go away” (Forero 2001, quoting al-Shereidah). The
incrementalization of taxes contributed to government-MNC strife, but more importantly,
it gave the government in Caracas a view into how much IOCs could resist before they
pull out of the country. This incremental strife is consistent with point three in Table 1.
Tax hikes, such as these, are a delicate balance of increasing government revenue without
pushing out potential taxpayers; in contrast with what the reader will observe in
Tanzania, the Venezuelan government chose to increase taxes on IOCs rather than
outright seize IOC petroleum.
On one hand, government officials pointed to the increase in revenue from the tax
hike. In the government’s eyes, these rents were guaranteed because Venezuela’s vast
resources will always lure foreign MNCs to operate in the state (Forero 2001). Since
78
Chávez’s administration had promised to funnel oil money to improve the lives of the
poor in Venezuela, the government counted on high taxes to fund education, sanitation,
healthcare, and infrastructure projects. On the other hand, oil prices can drop. And if
prices fall and investment by MNCs drop, then the Venezuelan government is looking at
a ‘shrinking pool of resources’ (quoting Sondra Scott, Forero 2001) on top of a society
dependent upon petroleum extraction.
Luckily for Chávez, two things happened. First, oil prices remained high for the
next few years, reaching record-breaking levels in 2008. Due to skyrocketing oil prices,
while IOCs complained and grumbled about the tax hike from 2001, they still managed to
stay in Venezuela for the time being, as they were buffered by higher prices per each
barrel of oil that was extracted. Second, the United States became embroiled in the Iraq
War, beginning in 2003 and continued for eight years. Wars consume a lot of petroleum,
and the Iraq War was no different—especially since Iraq is a major oil producer (e.g.,
Downey 2009). These factors greatly contributed to higher world oil prices. As
mentioned above, the post-9/11 world also saw an increase in demands to diversify
American oil supply, meaning that if the US wanted to depend less on Middle East oil, it
would have to rely more on other states, especially nearby Venezuela. While many
MNCs threatened to leave Venezuela due to the 2001 tax hike, they were clearly more
encouraged to stay, for the time being, because of higher oil prices. Paradoxically
however, in petroleum-rich resource curse states, increases in petroleum prices point to
higher levels of governmental-MNC strife.
The post-9/11 world coincided with an unprecedented upswing in oil prices,
shooting up to over $140 per barrel in 2008 (Read 2008) from the $30 per barrel the
79
world saw in 2003 (Jackson 2016b). Prima facie, the reader may consider such an
increase in prices a blessing for Venezuela. However, as is often the case with resource
curse states, the opposite occurred. With rising oil prices, in 2007 the Venezuelan
government began setting demands that foreign companies develop outlines to reduce
their roles in extracting Venezuela’s resources (Hays & Otis 2007). The government
furthermore began taking a majority stake, sometimes as high as 60% (Crooks 2017), in
some of the country’s largest petro-projects, in an effort to combat what Chávez called
US imperialism (Miller Llana 2008).
After taking majority stakes in oil fields, as oil prices soared in 2007, Chávez
sought to have MNCs operating in Venezuela turn oil projects over to PDVSA, claiming
that Caracas had the right to a greater share of petro-profits than oil companies. In
response to this action, ConocoPhillips 28 walked away from their investments in
Venezuela, writing off their $4.5 billion losses in the country (Hays & Otis 2007). The
combination of these increasingly harsh measures incentivized ExxonMobil to also walk
away from a potential $25 to $30 billion oil project. From the perspective of IOCs, the
costs of caving to government pressures in Venezuela set a precedent for other states to
adopt similar policies that would further hinder their operations abroad (Hays & Otis
2007, quoting Patrick Esteruelas). Conversely, resisting government pressures
simultaneously emboldens other MNCs to follow suit (Miller Llana 2008). Even though
28 ConocoPhillips, as the name suggests, is a merger between two oil giants, Conoco, Inc. and Phillips Petroleum Company. Beginning with the merger between BP and Amoco in 1998, a wave of consolidation spread across the petroleum industry, as other international oil companies were forced to compete with the new oil conglomerate (Yergin 2012:90). As Yergin notes, such large-scale consolidation practices are nothing new to the oil industry; indeed, these strategies are what John D. Rockefeller used to consolidate his power over the then-nascent industry (2012:88-89).
80
ConocoPhillips and ExxonMobil drew a line in the sand regarding the Venezuelan
government, earlier that year, they had already turned over operations to PDVSA “under
a decree issued by Chávez, a critic of the Bush administration and the years-old contracts
giving foreign operators majority control over Orinoco projects” (Miller Llana 2008).
While talks were expected to continue, when prices rose, MNCs lost bargaining power—
and profits—in Venezuela.
Chávez began implementing these measures in 2007 likely for two reasons. First,
as previously mentioned, oil prices soared in the mid-2000s. Second, these measures took
effect after many IOCs invested in petroleum extraction and transportation infrastructure
in Venezuela. By reducing the stakes IOCs hold over oil fields, the Venezuelan
government essentially decreases their profits, despite the overhead infrastructure costs
IOCs incurred to implement upstream petroleum production.29 In 2000, the French petro-
giant, Total, began upstream and downstream development of the Orinoco Belt, building
terminals, derricks, and pipelines that produced approximately 200,000 barrels per day.
However, within one year of Chávez’s reforms, Total saw its stake in Venezuelan Sincor
oil—a heavy crude located in the Orinoco Belt—drop from 47% to 30.3% (Total 2008).
As part of the government’s deal, they had to turn over operations to PDVSA, despite
their investments in infrastructure before this legislation took effect. According to Total,
they were not alone in suffering losses. Statoil, now Equinor, the Norwegian oil company
that also invested in upstream petroleum production, also saw its stakes fall from 15% to
9.7% (Total 2008). While Chevron kept its 30% interest in Venezuela’s Hamaca oil, it
29 Upstream production is an industry term denoting all projects taken to discover and extract petroleum. Midstream refers to all refining and processing practices to mold crude petroleum into useable products. Downstream processes are transportation-related endeavors, such as pipelines, moving processed petroleum from one location to another.
81
was no longer the operator of the hydrocarbon plant. Only BP maintained its 16% interest
in Cerro Negro petroleum, also in the Orinoco Belt (Hays & Otis 2007).
Venezuela’s resource nationalism has been met not only with resistance but also
with lawsuits. ExxonMobil, for example, was unable to come to terms with the
Venezuelan government regarding the value of its petroleum assets. In doing so, they
demanded arbitration to settle, which would freeze the government’s assets abroad,
effectively guaranteeing that PDVSA would have the cash to cover ExxonMobil if they
won in arbitration (Miller Llana 2008). By suing the Venezuelan government in
American, Dutch, and British courts, ExxonMobil used this as a negotiation tactic to
pressure the government into extracting a higher value per barrel of petroleum (Miller
Llana 2008, quoting Roger Tissot). Due to the internationalization of petroleum trade,
ExxonMobil has such recourse available in times of crisis. Used sparingly, such options
work in the IOC’s favor. ExxonMobil went on to win the arbitration case and froze $12
billion of Venezuela’s global assets. This IOC’s bold stance against the Venezuelan
government may inspire other MNCs, however:
…it has to be acknowledged that although at the upper end of the cycle of resource nationalism the host state might get away with anything under the banner of ‘oil sovereignty,’ it cannot be said that the rule of law is irrelevant or has no use or value. The rule of law is always an elixir in times of crisis of resource nationalism or beyond. Having recourse to it is up to the victims. Political considerations may prevail over the application of the rule of law in practical exigencies as mentioned above. However, the rule of law could operate as the sword of Damocles hanging over the perpetrator (Maniruzzaman 2009:89). Paradoxically enough, the sword of Damocles hangs over oil companies when
prices are at their highest. With drops in energy prices, oil companies may not resist
government actions with such vigor, though they may consider this a breach of their
82
rights. As Maniruzzaman notes, the rule of law can ‘proceduralize conflict’ making
inevitable changes smoother (2009:89-90). Meanwhile oil and gas MNCs must contend
with undulating changes in bargaining power due to exogenous factors, such as the
changes in world price of petroleum.
World oil prices could not remain high forever. And by the time they came
crashing down in 2009, it was too late for Venezuela to recover. Economically, Dutch
Disease took over the oil-reliant government. Whereas in 2001, petroleum accounted for
80% of Venezuela’s exports, currently, petroleum accounts for 91% of all exports (OEC
2018c), indicating that Venezuela has done a poor job of diversifying its economic
structure and exports. As is often the case in resource curse states, sudden increases in oil
prices equate to equally abrupt surges in government spending. When prices plummet, as
they did in 2009, governments are left with an overdeveloped petroleum industry that
suddenly is generating less than half of the revenue it used to provide. Meanwhile, this
petro-overdevelopment marginalized formerly less profitable industries, such as
agriculture and tourism. These other industries were vital aspects of the Venezuelan
economy in the 1970s that diversified government revenue and the broader economy.
However, the focus on petroleum stunted the growth of these industries during the oil
boom years.
Perhaps the most recognizable change in Venezuela due to the oil boom and
Chávez’s response to it is that it “has fostered a rentier and clientelistic mentality among
Venezuelans” (Wilpert 2003). In this sense, rent seeking has become the ‘central
organizing principle’ of life in Venezuela, perpetuated by the ‘ossified political
institutions’ that so entrenched both the people and the government (Karl 1997:184).

83
As cultural anthropologist Fernando Coronil further notes, the oil wealth the
Venezuelan government enjoys that can cover the costs of any project at no cost to the
populace makes them appear to have ‘magical powers’ to the destitute poor (Wilpert
2003, quoting Coronil 1997:4). Operating in concert with the Venezuelan peoples’
attitudes toward the government is the Venezuelan military. Being a former lieutenant
colonel, Chávez was comfortable deploying government troops to enforce some of his
2007 reforms, even at the point of a gun if necessary (Crooks 2017). As we saw, two US
companies, ExxonMobil and ConocoPhillips, walked away from their investments in
Venezuela and ended up winning their lawsuits. However, what happened to the others
that decided to stay despite the troops, oil reforms, and tax increases?
As Chávez handed PDVSA majority stakes in many developed oil fields in the
Orinoco Belt, some companies still managed to maintain somewhat profitable operations,
including Statoil (Norwegian), ENI (Italian), Total (French), Chevron (American), BP
(British), and Repsol (Spanish). Rather than call it quits, these companies determined that
retaining minority stakes was still a better option than leaving altogether, hoping prices
would rise. To be sure, the only reason why these MNCs would reach such conclusions is
because they already invested millions in infrastructure, labor, and administrative projects
in Venezuela. Chávez must have known this, and was betting that these companies would
stay even with minority stakes. Chávez must also have known that PDVSA had neither
the resources nor technology to extract and refine the billions of barrels of petroleum
reserves in the Orinoco Belt. As a result, he had to rely on MNCs to put the infrastructure
there, and only then claim majority stakes and present them to PDVSA. But as we will
see, ham-fisted approaches characteristic of populist governments seeking to restructure
84
the economy are met with strong backlash, not only from IOCs, but also from foreign
investors and foreign banks.
The fundamental problem is that PDVSA is not just an NOC. In the words of
Venezuelan energy economist, Francisco Monaldi, PDVSA is not a company; it’s a set of
fiefdoms (Crooks 2017, quoting Monaldi). Sometimes it even operates in a vacuum and
against Chávez’s wishes. This is evidenced by the Venezuelan president’s actions against
PDVSA in 2002 when workers went on strike to try to force Chávez from office. In
response to this, he fired 18,000 out of the 40,000 PDVSA employees, including many
senior managers. Chávez then stuffed the nationalized company with tens of thousands of
party loyalists (The Economist 2012). In this two-month strike, not only did mid- and
high-level employees leave PDVSA, bringing production to a standstill, oil ships also
joined in the strike, leaving Venezuela unable to export its petroleum. In the immediate
aftermath of the strike, PDVSA production plummeted from 3.1 million barrels per day
to only 100,000, and the only reason it did not drop to zero was to maintain pressure in
their system and pipelines (Alvarez & Fiorito 2015:15).
As a nationalized oil company, PDVSA does not operate in unison with a unified
vision. Instead of simply supplying petroleum and delivering rents to the government,
PDVSA has become a social engineering project for the Venezuelan government. In a
rare display of ingenuity, Chávez actually combined many of PDVSA’s goals as being
more involved in the development of social programs for the Venezuelan people, and not
just oil exploration and production. By doing so, he maintained a tighter grip over his
main supply of revenues as his constituency becomes even more dependent upon both
Chávez and petroleum. In this sense, PDVSA is a de facto ‘social and developmental
85
ministry’ (Monaldi 2018). This development ministry soon began losing valuable
revenue once oil prices bottomed out, leaving the Venezuelan economy and people in
free-fall. Chávez was fortunate to die right before oil prices plummeted. He was seen as a
savior in the eyes of many Venezuelans due to how PDVSA invested oil profits in social
service programs. However, after oil prices dropped and with Chávez dead, there were no
hints that the economy would recover.
Continuity has not improved since Chávez’s very timely and opportune death,
given the drop in oil prices since he passed away in 2013. His successor, Nicolás Maduro,
appointed Major General Manuel Quevedo as chair of the PDVSA, though he is a career
soldier with no apparent interest or aptitude in the energy field. As Quevedo sets in,
PDVSA is facing another issue—it cannot repay its loans to the China Development
Bank, and access to credit is drying up (Myers Jaffe 2018). Oftentimes, debt to Chinese
and Russian investors is paid for in free petroleum. The present work will show below
how these troubles have compounded, as Venezuela also has to face non-petroleum
multinational investors.
Despite the bleak outlook of the Venezuelan oil industry, there is some good news
on the horizon for PDVSA and its relations with other MNCs and outside investors.
Notwithstanding the fact that Venezuela cannot feed its people,30 it is still the country
with the largest oil reserves. This has incentivized some companies to invest in
Venezuelan bonds, as Goldman Sachs controversially did for $2.8 billion in 2017 at 31
cents on the dollar (Wigglesworth 2017; Myers Jaffe 2018). This move has raised
30 When Venezuela ran out of bread, Maduro’s government figured that bakers were the problem, beginning to detain them and forcing bakers to stop producing croissants (Wyss 2017).
86
eyebrows that Wall Street is exploiting the resources of the Venezuelan poor for its own
gain. Furthermore, some in Washington, especially US Senator Marco Rubio, are uneasy
that Goldman Sachs is providing a cash infusion to an increasingly despotic government
(Wigglesworth 2017). However, just five days after Goldman Sachs invested in PDVSA,
Maduro stated that the government is planning on restructuring their bonds, indicating
that they will not honor some foreign investments. This would translate to a $54 million
loss in less than a week for Goldman Sachs (Wigglesworth 2017). Maduro’s bait and
switch would likely be met with even more expensive lawsuits against the Venezuelan
government whose only lifeline is oil exports. Additionally, if strife between Maduro and
investors continues, this lifeline may be “vulnerable to seizures from litigious creditors”
(Wigglesworth 2017). Complicating matters is that the Venezuelan government does not
only experience strife with other IOCs and Wall Street investors, but also with allied
governmental banks.
The China Development Bank (CDB), a state-owned institution, has been happy
to lend Venezuela money, which Maduro must repay in petroleum. However, in 2016,
Venezuela paid only a fraction of the required petroleum back to China. The CDB
invested $60 billion in Venezuela, but the 450,000 barrels per day that Venezuela
returned to China is not only less than half of the volume the Chinese expected, it is
barely enough to cover the interest payments on Venezuelan loans (Myers Jaffe 2018,
quoting Energy Intelligence Group). Complicating matters is that allegedly, some of the
petroleum delivered to China is so poor in quality that it is being sent back as
unacceptable payment for loans (Myers Jaffe 2018). Venezuela has to additionally face
the fact that most of the oil PDVSA produces is being sent to China, Russia, and India
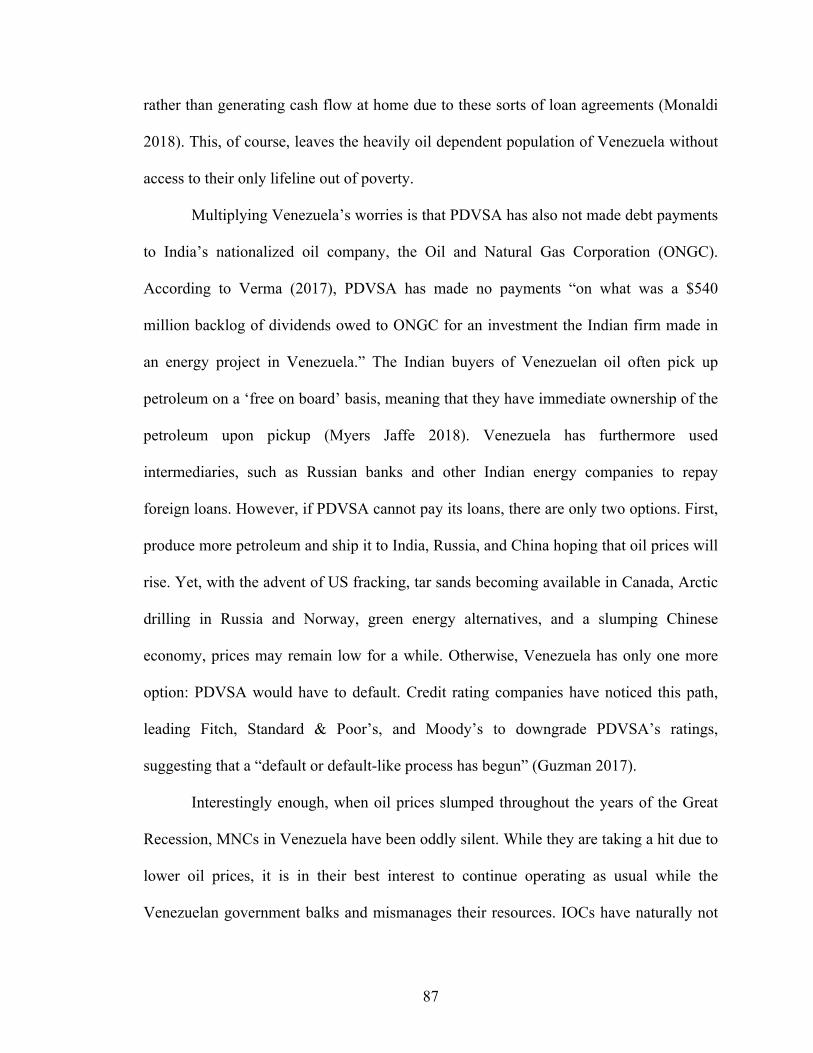
87
rather than generating cash flow at home due to these sorts of loan agreements (Monaldi
2018). This, of course, leaves the heavily oil dependent population of Venezuela without
access to their only lifeline out of poverty.
Multiplying Venezuela’s worries is that PDVSA has also not made debt payments
to India’s nationalized oil company, the Oil and Natural Gas Corporation (ONGC).
According to Verma (2017), PDVSA has made no payments “on what was a $540
million backlog of dividends owed to ONGC for an investment the Indian firm made in
an energy project in Venezuela.” The Indian buyers of Venezuelan oil often pick up
petroleum on a ‘free on board’ basis, meaning that they have immediate ownership of the
petroleum upon pickup (Myers Jaffe 2018). Venezuela has furthermore used
intermediaries, such as Russian banks and other Indian energy companies to repay
foreign loans. However, if PDVSA cannot pay its loans, there are only two options. First,
produce more petroleum and ship it to India, Russia, and China hoping that oil prices will
rise. Yet, with the advent of US fracking, tar sands becoming available in Canada, Arctic
drilling in Russia and Norway, green energy alternatives, and a slumping Chinese
economy, prices may remain low for a while. Otherwise, Venezuela has only one more
option: PDVSA would have to default. Credit rating companies have noticed this path,
leading Fitch, Standard & Poor’s, and Moody’s to downgrade PDVSA’s ratings,
suggesting that a “default or default-like process has begun” (Guzman 2017).
Interestingly enough, when oil prices slumped throughout the years of the Great
Recession, MNCs in Venezuela have been oddly silent. While they are taking a hit due to
lower oil prices, it is in their best interest to continue operating as usual while the
Venezuelan government balks and mismanages their resources. IOCs have naturally not
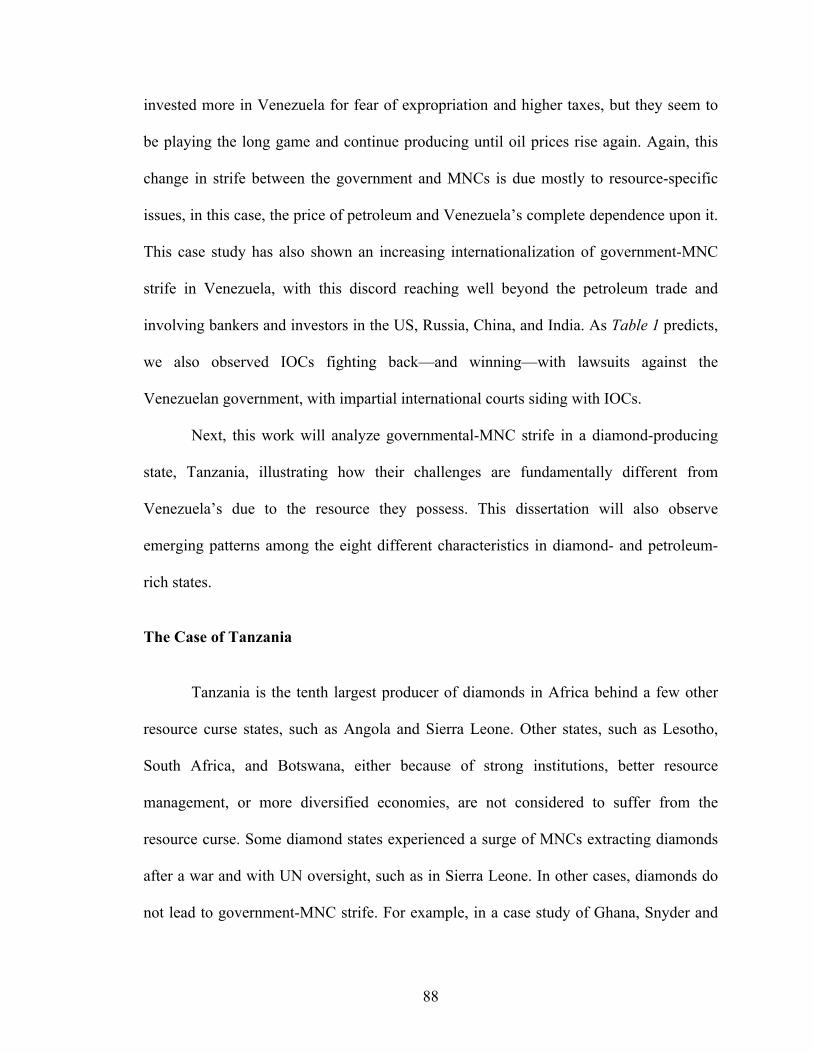
88
invested more in Venezuela for fear of expropriation and higher taxes, but they seem to
be playing the long game and continue producing until oil prices rise again. Again, this
change in strife between the government and MNCs is due mostly to resource-specific
issues, in this case, the price of petroleum and Venezuela’s complete dependence upon it.
This case study has also shown an increasing internationalization of government-MNC
strife in Venezuela, with this discord reaching well beyond the petroleum trade and
involving bankers and investors in the US, Russia, China, and India. As Table 1 predicts,
we also observed IOCs fighting back—and winning—with lawsuits against the
Venezuelan government, with impartial international courts siding with IOCs.
Next, this work will analyze governmental-MNC strife in a diamond-producing
state, Tanzania, illustrating how their challenges are fundamentally different from
Venezuela’s due to the resource they possess. This dissertation will also observe
emerging patterns among the eight different characteristics in diamond- and petroleum-
rich states.
The Case of Tanzania
Tanzania is the tenth largest producer of diamonds in Africa behind a few other
resource curse states, such as Angola and Sierra Leone. Other states, such as Lesotho,
South Africa, and Botswana, either because of strong institutions, better resource
management, or more diversified economies, are not considered to suffer from the
resource curse. Some diamond states experienced a surge of MNCs extracting diamonds
after a war and with UN oversight, such as in Sierra Leone. In other cases, diamonds do
not lead to government-MNC strife. For example, in a case study of Ghana, Snyder and
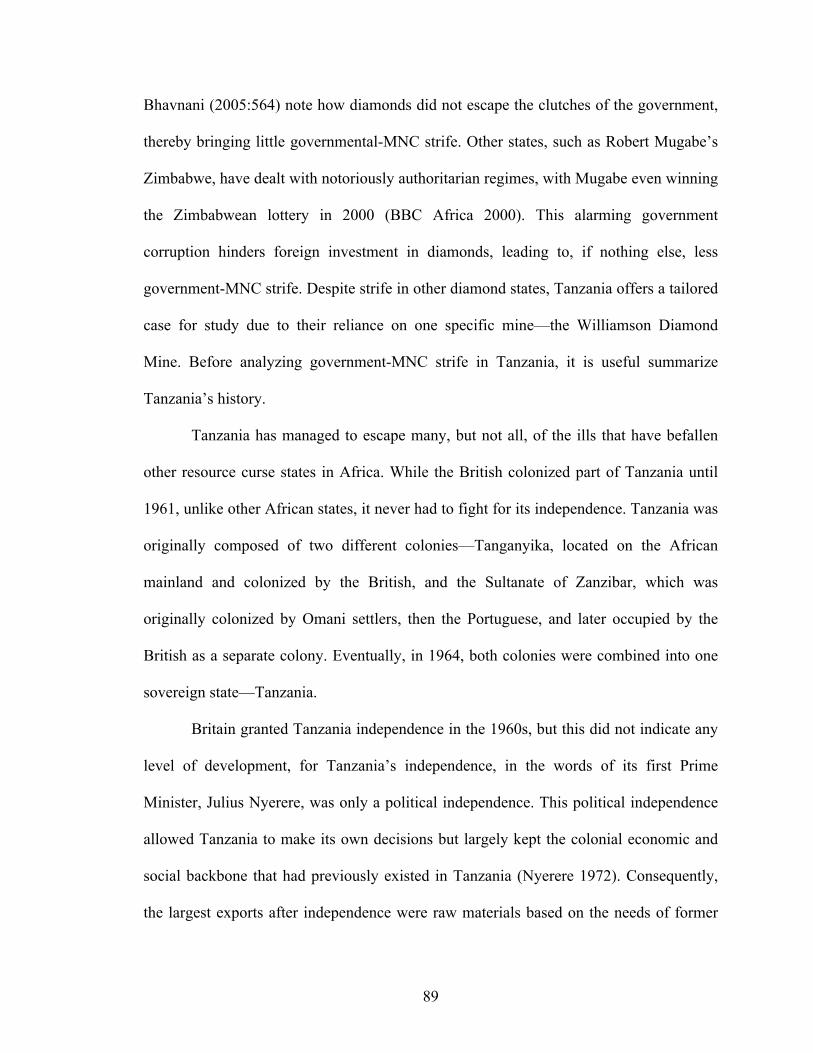
89
Bhavnani (2005:564) note how diamonds did not escape the clutches of the government,
thereby bringing little governmental-MNC strife. Other states, such as Robert Mugabe’s
Zimbabwe, have dealt with notoriously authoritarian regimes, with Mugabe even winning
the Zimbabwean lottery in 2000 (BBC Africa 2000). This alarming government
corruption hinders foreign investment in diamonds, leading to, if nothing else, less
government-MNC strife. Despite strife in other diamond states, Tanzania offers a tailored
case for study due to their reliance on one specific mine—the Williamson Diamond
Mine. Before analyzing government-MNC strife in Tanzania, it is useful summarize
Tanzania’s history.
Tanzania has managed to escape many, but not all, of the ills that have befallen
other resource curse states in Africa. While the British colonized part of Tanzania until
1961, unlike other African states, it never had to fight for its independence. Tanzania was
originally composed of two different colonies—Tanganyika, located on the African
mainland and colonized by the British, and the Sultanate of Zanzibar, which was
originally colonized by Omani settlers, then the Portuguese, and later occupied by the
British as a separate colony. Eventually, in 1964, both colonies were combined into one
sovereign state—Tanzania.
Britain granted Tanzania independence in the 1960s, but this did not indicate any
level of development, for Tanzania’s independence, in the words of its first Prime
Minister, Julius Nyerere, was only a political independence. This political independence
allowed Tanzania to make its own decisions but largely kept the colonial economic and
social backbone that had previously existed in Tanzania (Nyerere 1972). Consequently,
the largest exports after independence were raw materials based on the needs of former
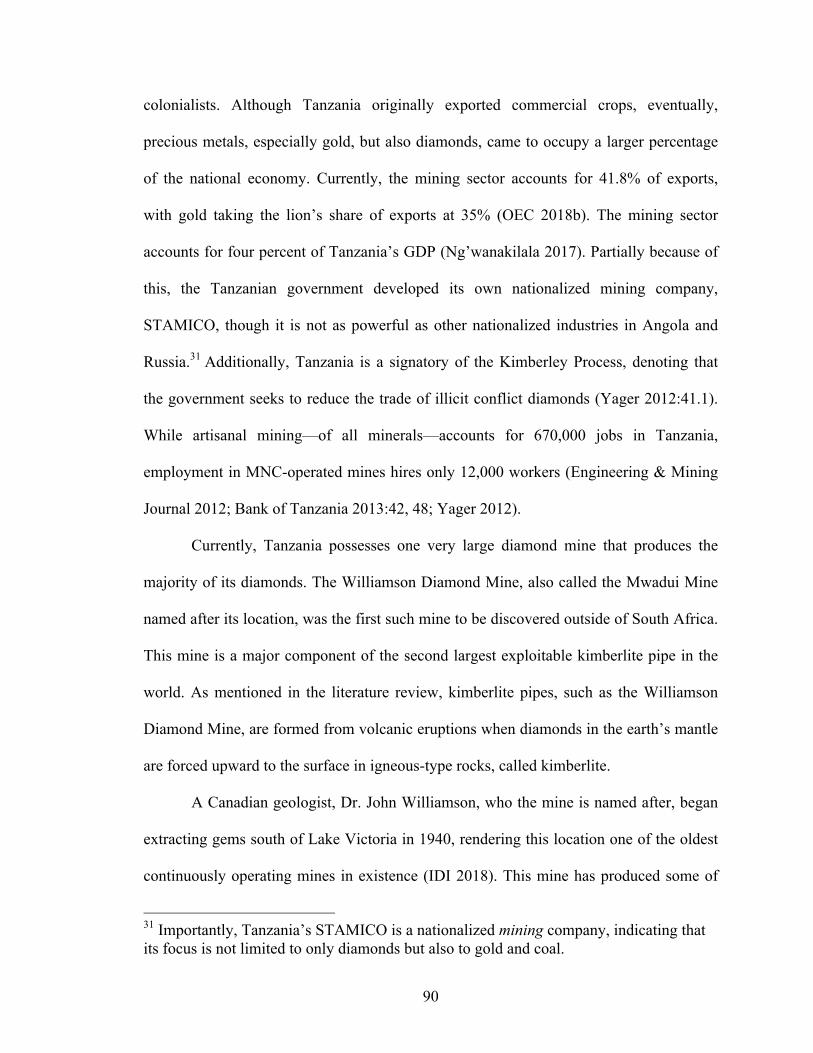
90
colonialists. Although Tanzania originally exported commercial crops, eventually,
precious metals, especially gold, but also diamonds, came to occupy a larger percentage
of the national economy. Currently, the mining sector accounts for 41.8% of exports,
with gold taking the lion’s share of exports at 35% (OEC 2018b). The mining sector
accounts for four percent of Tanzania’s GDP (Ng’wanakilala 2017). Partially because of
this, the Tanzanian government developed its own nationalized mining company,
STAMICO, though it is not as powerful as other nationalized industries in Angola and
Russia.31 Additionally, Tanzania is a signatory of the Kimberley Process, denoting that
the government seeks to reduce the trade of illicit conflict diamonds (Yager 2012:41.1).
While artisanal mining—of all minerals—accounts for 670,000 jobs in Tanzania,
employment in MNC-operated mines hires only 12,000 workers (Engineering & Mining
Journal 2012; Bank of Tanzania 2013:42, 48; Yager 2012).
Currently, Tanzania possesses one very large diamond mine that produces the
majority of its diamonds. The Williamson Diamond Mine, also called the Mwadui Mine
named after its location, was the first such mine to be discovered outside of South Africa.
This mine is a major component of the second largest exploitable kimberlite pipe in the
world. As mentioned in the literature review, kimberlite pipes, such as the Williamson
Diamond Mine, are formed from volcanic eruptions when diamonds in the earth’s mantle
are forced upward to the surface in igneous-type rocks, called kimberlite.
A Canadian geologist, Dr. John Williamson, who the mine is named after, began
extracting gems south of Lake Victoria in 1940, rendering this location one of the oldest
continuously operating mines in existence (IDI 2018). This mine has produced some of
31 Importantly, Tanzania’s STAMICO is a nationalized mining company, indicating that its focus is not limited to only diamonds but also to gold and coal.

91
the most impressive stones in the world, and is especially famous for rare pink diamonds.
Perhaps its most remarkable diamond is the Williamson Pink Diamond,32 a 54-carat
flawless pink stone, which was given to then-Princess Elizabeth for her marriage to
Prince Phillip in 1947 (Treble 2012). This mine has also produced a 388-carat giant
diamond in 1990 (IDI 2018). In the past, the mine produced about thirty carats of
diamonds per hundred tons of kimberlite. However, recently net gains are down to six
carats per hundred tons, pointing to a decrease in the efficiency of the mine (IDI 2018).
Including reserves, the mine’s gross diamond resources are expected to be at 39 million
carats as of 2012 (Mining Technology 2018b), signifying that while many incredible
gems have been extracted from the mine, it still remains a profitable enterprise for large
multinational companies to exploit. However, due to the decrease in the kimberlite to
diamond ratio, artisanal diamond mining would likely be unprofitable as a strategy for
economic generation.
By the 1950s, Williamson Diamond Mine contributed to about three percent of
the colony of Tanzania’s GDP and accounted for around fifteen percent of its earnings
(Lemelle 1986). John Williamson died in the late 1950s, and De Beers bought out the
mine in an equal partnership with the government of Tanganyika—the precursor to
Tanzania before independence and merger with Zanzibar (Chachage 1995). De Beers
operated the mine until 1973, and then STAMICO, Tanzania’s state mining organization,
controlled the mine until 1993 (Mining Technology 2018b). Once again, De Beers
seesawed back and gained 75% ownership of the mine until 2009, when it decided to sell
interest in the mine to Petra Diamonds, who currently owns 75 percent of the mine, with
32 It is even rumored that this giant pink diamond is the inspiration for the 1963 hit, The Pink Panther.
92
the Tanzanian government retaining the other 25 percent (Mining Technology 2018b;
Tanzania Invest 2018). More recently, the mine produced 202,000 carats in 2015, with
Petra having plans to increase this production to 350,000 carats by 2017 (Tanzania Invest
2018).
As the Williamson Diamond Mine changed hands from one operator to another,
Tanzania has developed its own state mining corporation, STAMICO, formed in 1972. In
its nascent years, this diamond mining company struggled financially. By the late 1970s,
the Tanzanian diamond industry was operating at sub-par capabilities, especially in the
face of higher oil prices and a cash-strapped economy. In response to this, the
government established the Mining Act of 1979, allowing “Tanzanians to register mining
claims in areas designated for prospecting and mineral mining and to engage in mining
activities that did not require large investment expenditures and specialized equipment”
(Bryceson 2013:16). Throughout the 1980s and 1990s, STAMICO went through various
economic policy reforms overhauling the previous modes of operations (Stamico 2018).
This allowed for artisanal diamond mining to continue, but also allowed for
consolidation, meaning that small firms had to compete with larger foreign
conglomerates in the mining industry (Butler 2004; Emel & Huber 2008; Bryceson
2013). Increases of foreign investments marginalized artisanal diamond mining in
Tanzania, resulting in criticism of the government’s capacity of controlling its natural
resources effectively (Bryceson 2013:16). While larger corporations can extract
diamonds at faster and more efficient rates than artisanal diamond mining, there is
significant evidence that ADM may reduce poverty rates in Africa (Fisher et al 2009),
93
with significant increases in wages and economic development among rural communities
(Dreschler 2001).
Partially due to increasing dissatisfaction with the government’s handling of
Tanzania’s minerals, in 2009, the same year Petra Diamonds took over the Williamson
Diamond Mine, the Tanzanian government passed a New Mineral Policy, replacing the
1997 legislation and heightening the intention of Dar es Salaam to participate in future
mining investments (Stamico 2018). The New Mineral Policy of 2009 is largely (foreign)
investor-friendly, but it does extend artisanal mining licenses from five years to seven
years. It also renders it more difficult to obtain speculative mining licenses, restraining
the practice of large corporations seizing exploration licenses without extracting
diamonds. With large swaths of kimberlite pipes bought out by foreign investors,
artisanal diamond miners were further marginalized (Bryceson 2013:17). However, the
new legislation would hope to curtail such practices to incentivize a labor-focused
approach to diamond mining, as shown in Table 1. Following in the footsteps of the new
Mineral Policy, the Mining Act of 2010 provides “for free-carried interest in mining
ventures for the Government [… and] STAMICO is earmarked to oversee the
Government interests” (Stamico 2018). By 2012, the government “issued new regulations
requiring all foreign-owned mining companies to cede 50% of their shares in their
Tanzanian operations to the Tanzanian public” (Yager 2012:41.1). This fifty percent
threshold could be met by handing over half of the shares to STAMICO or by listing half
of the company’s shares on the Dar es Salaam Stock Exchange and selling operation’s
shares to the Tanzanian people (Kabukuru 2013:48-49). This is not a bona fide
expropriation of resources, but MNCs are likely to resist such governmental
94
encroachment. From the Tanzanian government’s perspective, subsoil minerals, such as
diamonds, are the property of the Tanzanian people. Yet, MNCs expect that because they
bought the land to extract resources, then the diamonds belong to them. The 50/50 split
seems to be fair only if each party contributes to half of the work.
There will always be some resistance between mining companies and national
governments. On one hand, governments fear that MNCs will extract their resources and
export them without paying royalty fees. On the other hand, companies fear that they may
be held hostage by unhappy and cash-strapped governments. Yet, as previously
mentioned, Petra Diamonds holds 75% of the shares of the Williamson Diamond Mine,
while the government owns the other 25%. Additionally, in 2012, the Tanzanian
government sought to split in half mining operations. Petra Diamonds managed to escape
this law, still holding on to 75% of its share of the Williamson Diamond Mine, while
simultaneously remaining listed in the London Stock Exchange, establishing itself as
London’s ‘largest quoted diamond mining group’ (Petra 2018) with no hint of shares
being sold in the Dar es Salaam Stock Exchange. After John Magufuli was elected in
2015, he cited, perhaps correctly, ‘irregularities’ in the process by which Petra Diamonds
held on to three quarters of the Williamson Diamond Mine (Davies 2017). Petra,
conversely maintains that all business conducted in the mine has been in compliance with
Tanzanian legislation (Hume & Megaw 2017). Tense relations then came to a head, when
the Magufuli administration confronted Petra.
In 2017, the nationalist government of John Magufuli seized millions of dollars
worth of diamonds bound for Antwerp, Belgium at the Dar es Salaam Airport (Kazeem
2017). While the government claimed that Petra Diamonds, the operator of the
95
Williamson Diamond Mine, was undervaluing the value of their resource, Petra asserts
that this seizure of the 71,600 carats33 of diamonds was unwarranted. While Petra states
that the value of the diamonds was estimated at $14.7 million, the government of
Tanzania believed the diamonds to be worth much more, around $29.5 million, indicating
that royalty fees to the government ought to have been higher (Kazeem 2017). In a
statement released by the government, Tanzania’s Finance and Planning Ministry
declared that among “the legal action to be taken include the nationalization of all the
diamonds seized after it was established that there was cheating involved in declaring the
actual value of the minerals” (Ng’wanakilala 2017). As the government issued this
statement, they also arrested the officials involved in the shipment and halted the export
of diamond shipments from Petra while ordering an investigation to accurately value the
diamonds. According to the Tanzanian government, the state is losing around $46 million
to under-cleared diamond exports through the Dar es Salaam Airport (Ng’wanakilala
2017, quoting Tanzania’s Finance and Planning Minister, Philip Mpango).
From Petra’s perspective, they declare that their business is conducted in an
honest and transparent manner, yet after this incident, Petra’s shares fell seven percent in
a day (Rukmangadhan & Shabalala 2017). By the end of the week, their shares had fallen
an additional 17 percent, wiping around $160 million from the value of the company
(Kottasová 2017). After a four-day shutdown, Petra eventually resumed activities in the
Williamson Diamond Mine, albeit with hesitation. Their chief executive, Johann
Dippenaar, stated, “we won’t be stupid and just keep on pumping in money if it’s clear it
33 For comparison’s sake, and noting the sheer lootability of diamonds, 71,600 carats weighs 31.57 pounds, is worth tens of millions, and can be easily carried by one individual. Conversely, less than 5 gallons of crude oil weigh 31 pounds, worth slightly over eight dollars.
96
will come to naught” (Sanderson 2017). This is especially true because Petra Diamonds
has a net debt of $555 million and their banking covenants could be breached if it cannot
resume exporting diamonds by the end of the year (Sanderson 2017). Compounding
governmental-MNC strife is that Magufuli’s administration levied a value-added tax
(VAT) on minerals, and though Petra’s debt is large, it is expecting delays in receiving
their VAT refunds from the government totaling over $15 million (Rukmangadhan &
Shabalala 2017).
These governmental moves are generally aimed at foreign mining companies
operating in Tanzania, with Petra Diamonds being the largest such corporation. Yet they
were not the only operators adversely affected by Magufuli’s nationalist shutdowns.
Acacia Mining, a gold mining company in Tanzania headquartered in London, was
forced to shut down production after the government banned gold and copper concentrate
exports (Rukmangadhan & Shabalala 2017). In July 2017, the government also levied
higher royalty fees and imposed another clearing fee on mineral exports (Kottasová
2017). Nonetheless, the largest hit to Acacia was an unsuspected blow by the Magufuli
administration, fining Acacia $190 billion, “worth two centuries of the firm’s revenue or
four times the size of Tanzania’s GDP” over allegedly unpaid taxes and accumulated
interest (Kazeem 2017).
While Magufuli’s decisions are largely oriented as populist-esque tactics to gain
domestic support, they leave mining companies with little choice but to negotiate or
leave. As Dan Paget writes, “until the tax bill was tabled, it seemed as though Magufuli
wanted a new settlement with the mining companies. Now it looks as though he wants
new mining companies” (Paget 2017). From Magufuli’s perspective, mining companies
97
in Tanzania have had an easy ride. While many of them export billions worth of
diamonds, in the past, they have only had to pay an 8% tax on these minerals (Forstater &
Readhead 2017). Mining companies have had ‘golden tax deals’ in the words of Forstater
and Readhead (2017), but the government’s findings are hard to believe. For a $190
billion fine, the scale of hidden mineral exports would have to be huge, suggesting that
Tanzania would be the world’s largest mineral producer although, in fact, they are
Africa’s tenth largest producer. It is unclear if MNCs, such as Petra, have engaged in
what the government calls ‘economic sabotage’ (Sanderson 2017), however, Magufuli’s
administration undid their harm by exaggerating Tanzania’s mineral wealth. Even though
the Tanzanian government still holds 25% of shares of the Williamson Diamond Mine, it
is investigating whether or not to repossess the mine in its entirety (Materu 2017). The
investigation is ongoing, though Petra has resumed operations in the Williamson
Diamond Mine.
Analysis
This section will briefly compare and contrast the differences in government-
MNC strife in Venezuela and Tanzania, referring back to Table 1. There are a few key
points that should be further emphasized regarding the eight different characteristics of
government-MNC strife in Venezuela and Tanzania. From the perspective of the resource
curse analyst, Venezuela, as a petro-state, offers some acute insights into the peculiar
curse oil states may face. First, as the first row of Table 1 explains, governmental-MNC
strife is rampant throughout the time period analyzed. Every government decision
reflected the price of petroleum at the time and was met with resistance from MNCs, who
98
perceived it as encroachment and responded accordingly. The revealing aspect of this
strife is how it changed due to bargaining power shifts between the government and
MNCs.
As observed from the analysis above, Venezuela was more tempted to raise taxes
and claim larger stakes after MNCs invested in the state, as the sixth row of Table 1
explains. While these actions may be inspired by the raising prices of petroleum, the
government was also incentivized to raise taxes and claim majority stakes because MNCs
already funded infrastructure projects in oil fields—the government only needed to
nationalize this infrastructure. Notably, once IOCs began extracting petroleum, the
Venezuelan government also had more access to information—Caracas knew how much
petroleum was produced, to what extent it had to be refined, what type of petroleum was
being extracted, where it could be transported to, how much it would sell for, how much
labor and capital was necessary to undertake the project, and an estimation of barrels in
reserve. This asymmetric shift in governmental knowledge would also tempt petroleum-
rich resource curse states to raise taxes and stakes on MNCs working in-country, as
Venezuela did throughout Chávez’s and Maduro’s tenures, thereby leading to
incremental strife, according to the seventh row of Table 1.
Conversely, when prices dropped, the Venezuelan government was forced to seek
capital from whatever avenues were available, as depicted in point 5 of Table 1. Ranging
from Chinese loans to paying Russia with petroleum, PDVSA had to make ends meet
with whatever oil they had, naturally leaving the Venezuelan people with less petroleum,
and, as Table 1’s point 3 suggests, lending strife an international component. Notice how
when oil prices dropped, governmental-MNC strife not only affected oil companies, but
99
also spread to non-petroleum industries, such as investors and banks, congruent with
point 4’s inter-sectional strife of Table 1. Strife with foreign MNCs also ends up hurting
not only Venezuela and PDVSA’s credit rating, but also their respect abroad. In a sense,
this strife is perhaps worse than governmental strife with oil companies. Investors, banks,
and foreign countries permeate into many different aspects of Venezuelan life in both
foreign and domestic capacities. IOCs meanwhile had the opportunity to counteract
decisions made in Caracas by suing the Venezuelan government in international courts,
as reflected in the eighth row of Table 1.
As observed from the case of Venezuela, IOCs faced strong governmental
opposition when prices soared as Chávez attempted to capture a higher percentage of
petroleum rents. However, when prices dropped, IOCs, though losing money, had fewer
worries vis-à-vis the government. This would not be as likely in diamond-rich resource
curse states, since the price of diamonds is significantly more stable. The steadily
increasing price of diamonds would incentivize governments to take a steady, long-term
view of their resource. Throughout the same period of analysis (1980 to present), huge
spikes and troughs in the price of petroleum are common, usually due to embargoes,
OPEC quotas, wars, and advances in technology (e.g., fracking). The unpredictably
erratic price of petroleum compels governments to sacrifice long-term wins for short-
term gains, increasing strife, not only with IOCs, but also with investors and foreign
banks.
Compounding problems for petroleum-rich resource curse states is that more
often than not, their economy depends on the export of oil, as point 2 in Table 1 suggests.
This is not the case for diamonds. Many diamond-rich resource curse states may extract
100
diamonds to diversify their economy or provide jobs for low-income residents, but it is
not their lifeline out of poverty. Because of this, while government-MNC strife may exist,
it is not nearly as pervasive and ubiquitous as in petroleum-rich states.
When looking at Tanzania, government-MNC strife differs strikingly from
Venezuela. First, while the Williamson Diamond Mine is one of the oldest continuously
active diamond mines in the world, strife between the government and Petra only began
in 2015 and peaked in 2017. This is denoted as ‘intermittent strife’ in Table 1. The
Tanzanian government, through multiple initiatives and legislative priorities has
prioritized artisanal diamond mining, which is both an avenue out of poverty for rural
communities and a labor-intensive economic project. Nevertheless, government-MNC
strife reached a peak when Tanzania seized 71,600 carats of diamonds, worth either $14.7
million or $29.5 million depending on which party is believed. The suddenness of this
strife is show in point 7 of Table 1. This nationalization of differs slightly from
Venezuelan-style nationalism (they took the diamonds rather than the minefield), but the
effects are largely similar: the governments believed that MNCs were taking their
resource without paying their fair share and thus nationalized the resources. The only
differences are that the government of Venezuela sought to nationalize infrastructure
while Tanzania took the resource itself. The ‘lootability’ of diamonds may benefit the
government in cases such as these, while oil companies can rest assured that governments
will likely not take their product—it’s a small comfort though, as the government is then
more likely to seize their infrastructure.
Prima facie, it appears as if the Venezuelan and Tanzanian governments are
acting similarly. Both states seek to increase the government’s power and revenue stream.
101
The difference is how and when they accomplish this goal. Venezuela cracked down on
MNCs when oil prices were high, then when prices dropped, they left oil companies
relatively alone, instead having to deal with foreign investors in Russia and China. While
initially there was little friction between Venezuela and those investors, once PDVSA
could not pay back loans (or even interest on the loans), government-MNC strife
invariably began. On the other hand, when Tanzania cracked down on Petra Diamonds,
the point of contention was the valuation of the diamonds, and not the price of their final
product.
Additionally, why has Venezuela struggled with government-MNC strife for
years, yet it was not until a few months ago that Tanzania had significant contention with
Petra Diamonds and other mining companies? The theory of resource curses would point
to how the world economy runs on petroleum, and not on diamonds. Contention could
have existed for Tanzania for years, but it only came to a head in 2017. Meanwhile, as
Venezuela had to contend with large peaks and troughs in the price of oil, spurring the
government to act in a consistently erratic fashion. On the other hand, the Tanzanian
government, knowing that the price of diamonds was more predictable, could afford to
wait and capture Petra’s diamonds when they were least expecting it as Table 1’s fifth
point predicts.
The reader will notice how the goals of Venezuela and Tanzania are similar, but
their actions are different. Venezuela needs rents from petroleum to fuel its rentier state,
with social and infrastructure projects dependent upon petro-revenues. When these
revenues dried up, this assessment observed the Venezuelan people taking to the streets
in protest. However, Tanzania was never dependent upon diamond revenues since they
102
are not valuable enough to raise the country out of poverty, as shown in point 2 of Table
1. Furthermore, in testing Hypothesis 1, this observation noticed that Venezuela was
targeting the industry to collect rents that would be funneled to social engineering
programs while Tanzania would rather rid itself of foreign MNCs and invest in artisanal
diamond mining that is much more labor intensive. Venezuela can afford to pay off its
constituency with oil rents, but since Tanzania cannot do that, it must instead put its
people to work in artisanal diamond mining programs.
This observation saw Tanzania struggling to engage in artisanal diamond mining
rather than depending upon large machinery and foreign companies; yet, Venezuela is not
attempting similar projects. This is not due to the price of petroleum or the lootability of
diamonds, but rather due to the high barriers of entry in the petroleum industry, and the
comparably lower barriers in diamond mining. Due to these low barriers to entry,
Tanzania can get away with espousing artisanal diamond mining projects that are labor-
intensive—as shown in point 6 of Table 1—while rejecting foreign MNCs. Venezuela
does not have this luxury. Whereas the government of Tanzania has the option of
extracting diamonds through artisanal diamond mining, which potentially employs
670,000 people as opposed to the 12,000 jobs foreign MNCs provide (Engineering &
Mining Journal 2012), Venezuela can only hope to provide a few jobs for its people. The
fundamentally capital-intensive nature of petroleum extraction and refining does not
guarantee many jobs for Venezuelans. The results were the government pushing for
nationalization and higher taxes. On the other hand, the potentially labor-intensive nature
of artisanal diamond mining offers the Tanzanian government the opportunity to push for
these incentives, as we saw with their Mineral Policies of 2009 and 2010.
103
Finally, government-MNC strife in Venezuela took on an internationalized
component when Caracas began borrowing money from foreign investors and
international banks, with PDVSA incapable of even paying off interest on its loans. Since
Tanzania’s economy is not dependent upon the diamond trade and the price of diamonds
is relatively stable, it never sought to pay off loans with this resource, leading to little
internationalization of this strife, as Table 1’s third row explains. Moreover, due to the
internationalization of the petroleum trade, this industry enjoys a legal space governing
processes and practices. For example, ExxonMobil managed to pressure the Venezuelan
government into extracting higher values per barrel of petroleum, eventually winning the
case in arbitration freezing $12 billion of Venezuela’s assets despite the ‘primacy of the
state’ over its resources (Miller Llana 2008). On the other hand, as the fourth row of
Table 1 suggests, Petra Diamonds, as of yet, has not resorted to similar measures
regarding the expropriation of the diamonds from the Dar es Salaam Airport.
Furthermore, the reader will notice how the Tanzanian government sought to make
diamond companies public within the Dar es Salaam stock exchange and selling shares to
Tanzanian people (Kabukuru 2013:48-49). Such moves partially keep government-MNC
strife as domestic disputes rather than internationalized issues, as point eight of Table 1
shows.
Testing Hypothesis 1 illustrates key differences in government-MNC strife among
diamond- and petroleum-rich states, painting a rough picture of how these differences
may influence processes and outcomes. Government-MNC strife is a process, and not
necessarily endemic to resource curse states. Public and private sectors clash in most
states; however, for the purposes of this research, resource curse states may experience
104
different types of government-MNC strife contingent upon the resources they are
endowed with, as Hypothesis 1 sought to illustrate. The next hypothesis seeks to further
fill in some of these gaps by illustrating how diamonds and petroleum lead to different
resource classes among resource curse states.
Testing Hypothesis 2
Petroleum-rich states are more likely to possess a larger and more powerful elite resource class than diamond-rich states.
Both the petroleum and diamonds trades conjure images of wealthy executives
benefiting from the mineral extraction businesses. The differences in both markets reside
in magnitude—as has been emphasized, the petroleum industry is much larger than the
diamond trade. However, as there are fewer individuals involved in the diamond
business, it is uncertain which industry creates more inequality among workers,
executives, and the neighboring industries, such as jewelry stores or paint products.
Hypothesis 2 seeks to fill this theoretical gap among resource curse states, predicting that
petroleum-rich states are more likely to possess a wealthier, and therefore more powerful,
elite class than diamond-rich states. Testing Hypothesis 2 segregates a state’s income
inequality from that of the resource in question—diamonds or petroleum—to determine
the strength of financial capabilities of a state’s resource class. There is an inherent
assumption (and risk) in this logic: the greater financial capabilities the resource class
enjoys directly correlates to the political power it wields. Given the state of world affairs,
the present work views this as a risk worth taking.
105
Testing this hypothesis dissects income inequality at the product level while
accounting for a state’s general income inequality along with the aggregate value of the
resource produced. The model would have to be recalibrated for states that refine
petroleum to account for the added expenditure of the refining process. To measure the
resource class this dissertation will use a synthetic control method common in statistics
and inspired by Hartmann et al’s (2015:9) Product Gini Index (PGI). Hartmann et al
(2015) do not create the Product Gini Index ex nihilo. They develop this theory from
economic development pioneers emphasizing the economic ‘structural transformations’
resources may produce in a state (Rosenstein-Rodan 1943; Singer 1950; Hirschman
1958). More recently, scholars have also introduced measurements of ‘economic
complexity’ that have expanded scholars’ abilities “to quantify a country’s productive
structure and have revived interest in the macroeconomic role of structural
transformations” (Hartmann et al 2015:2; Rodrik 2006; Hausmann, Hwang & Rodrik
2006; Hidalgo et al 2007; Hidalgo & Hausmann 2009; Felipe 2009; Abdon & Felipe
2011; Bustos et al 2012; Caldarelli et al 2012; Cristelli et al 2013; Hausmann et al 2014;
Cristelli, Tacchella & Pietronero 2015). As Hartmann et al (2015:2) note, these measures
can be predictive of future economic growth, are relevant for social welfare programs,
and measure poverty prevention (Bourguignon 2004; Ravallion 2004). Furthermore, the
combination of products produced or extracted from a state determine available
occupations, strength of unions, and advanced learning opportunities (Hartmann et al
2015:2), potentially contributing to a new middle class in emerging economies 34
(Milanovic 2012).
34 Interestingly, as Hartmann et al (2015:2-3) note, this may have the opposite effect in
106
While Hartmann et al’s (2015) PGI is a valuable tool for analysts, certain
variables must be changed to determine the strength of the resource class, as the PGI is
determined by state exports and not state production. If this work were to use Hartmann
et al’s (2015) PGI in its equations, it would overestimate states exporting a lot of
petroleum or diamonds while underestimate states consuming much of their own
resource. For example, Nigeria is a resource curse state producing a lot of petroleum, but
because much of this resource is domestically consumed, its exports would be
comparably lower than if it did not consume its own petroleum. Conversely, a smaller
resource curse state, such as Yemen, which consumes relatively little of its own oil,
would show a comparatively larger percentage export to GDP ratio. Due to this
dilemma,35 this dissertation alters Hartmann et al’s (2015) formula to account for oil and
diamond production, rather than oil and diamond exports.
Largely based off of Hartmann et al’s (2015) scholarship, this dissertation
develops a formal model to determine the relative strength of a resource class in a state.
Formally, we would define each country’s Resource Class (RCc) as the following:
4.1) 𝑅𝐶! = 1𝑆!"#!"
𝑀!" 𝑆!"#!"𝐺𝑖𝑛𝑖!𝑉!𝐷!
where Ginic is the Gini Index of a specific country, (Vp/Dc) is the per capita value of the
resource produced in a given year, and SGDPcp is the share of a state’s production of a
industrialized economies, leading to de-industrialization and de-unionization in highly competitive markets. Many industrial workers in these states may be forced to work in lower paying jobs or may decrease unions’ capabilities of negotiating for higher wages (Gustafsson & Johansson 1999; Acemoglu, Aghion & Violante 2001). 35 In reality, this dilemma influences petroleum producers more than diamond states, as Sierra Leone or Zimbabwe are unlikely to buy too many of their own diamonds. On the other hand, economic development requires the consumption of petroleum, is more likely to be consumed by its producing country.
107
product divided by GDP. It should be noted here that a state’s GDP is partially composed
of revenue from their resources as the revenues from p production ultimately are counted
as a sometimes-large fraction of a state’s c GDP. This is not a problem in testing
Hypothesis 2, as this hypothesis does not seek to determine what a state would look like
without diamonds or petroleum, but will become problematic and addressed later on in
this dissertation. Finally, Mcp is equal to 1 if state c’s production of product p has a
revealed comparative advantage greater than or equal to 1, and is 0 if it is not, as depicted
here:
4.2) 𝑀!" = 1 𝑅𝐶𝐴!" ≥ 1 0 𝑜𝑡ℎ𝑒𝑟𝑤𝑖𝑠𝑒
The binomial operator in this equation forces this work to add a synthetic control
method outside of the summation, where 𝑆!"#!"! is equal to the sum of each state’s
share of production of petroleum or diamonds compared to its overall GDP. In order to
calculate Mcp, the revealed comparative advantage (RCA) must be accounted for in each
specific state. This index is used to calculate the relative (dis)advantage of a state for
exporting a specific resource. Similar to SGDPcp, the RCA, in past research, has been used
to account for export share of a commodity, but as this hypothesis is analyzing
production of a resource, the formula is slightly altered to fit the above conditions. A
resource class is determined by production of a resource, and not necessarily by its
export. We can define RCAcp and hence Mcp as the following:
4.3) 𝑅𝐶𝐴!" =
𝑆!"𝑆!"𝑆!"!𝑆!"!!
108
where Scp is a state’s c production of a resource p and 𝑆!" measures the state’s entire
market value of all goods and services (GDP) in 2014 US dollars. This nominator would
allow the analyst to determine the percentage of a state’s production stemming from the
resource in question, while the denominator would adopt the same formula for world
production of the resource in comparison to world GDP. This ratio illustrates the revealed
comparative advantage (RCA) of a state per resource. If there is a comparative
advantage, meaning that RCAcp is greater than or equal to 1, then the equation continues,
otherwise, the answer would be zero.
This method filters out economically disadvantaged states that do not produce
enough diamonds or petroleum to warrant a bona fide domestic resource class, as their
Mcp would equal 0; only those with scores greater than 1 would be taken into account.
Additionally, the equation multiplies this number SGDPcp by the total per capita value of
the resource (Vp/Dc) and accounts for the Gini Index Ginic to give the analyst the income
inequality of the production of the resource. The state’s Gini Index then divides this
number and the share of the resource in the economy to illustrate the economic vibrancy
of the resource class.
Complete information on obtained data from the CIA World Factbook, Qualities
of Governance Database (Teorell et al 2017), Ross and Mahdavy’s (2015) Oil and Gas
Dataset, Kimberley Process Dataset, and World Bank Gini Indices can be found in
Appendix 1 of this dissertation. This work adopts the country GDP data from the CIA
World Factbook, incorporating mostly 2016 data. Part of the equation above requires
collection of diamond and petroleum production in comparison to state GDP. The same
holds true for world diamond and petroleum production in order to compare the share of
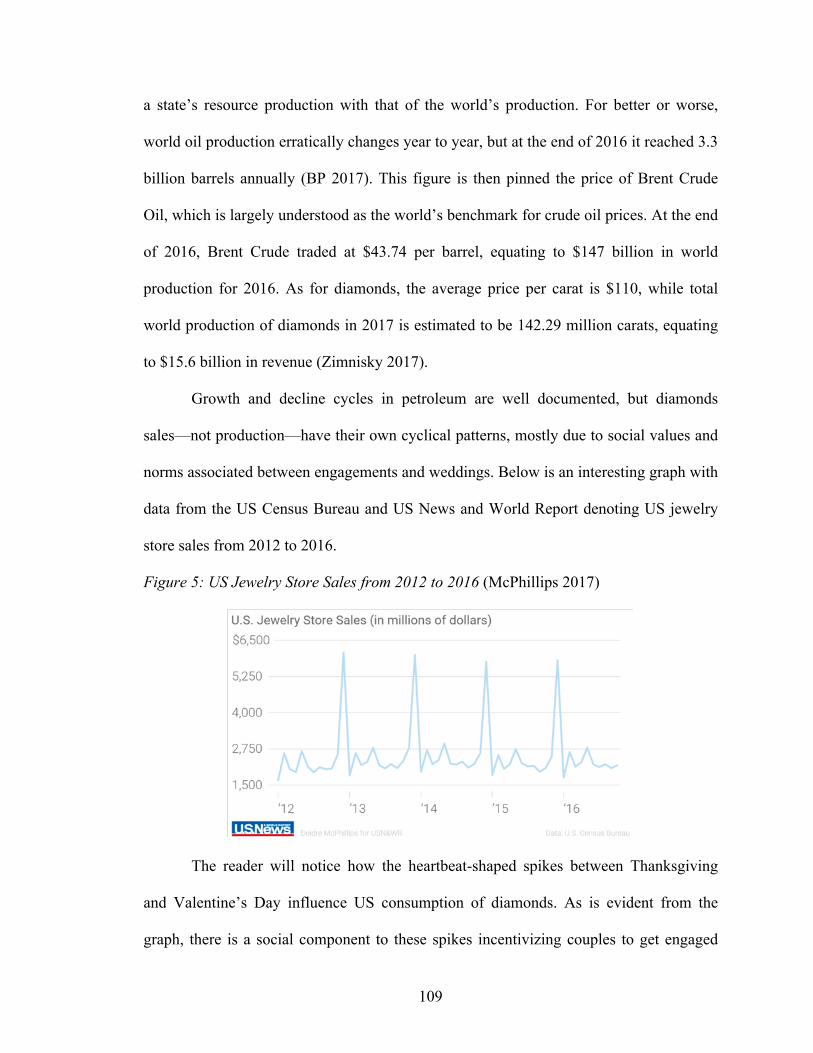
109
a state’s resource production with that of the world’s production. For better or worse,
world oil production erratically changes year to year, but at the end of 2016 it reached 3.3
billion barrels annually (BP 2017). This figure is then pinned the price of Brent Crude
Oil, which is largely understood as the world’s benchmark for crude oil prices. At the end
of 2016, Brent Crude traded at $43.74 per barrel, equating to $147 billion in world
production for 2016. As for diamonds, the average price per carat is $110, while total
world production of diamonds in 2017 is estimated to be 142.29 million carats, equating
to $15.6 billion in revenue (Zimnisky 2017).
Growth and decline cycles in petroleum are well documented, but diamonds
sales—not production—have their own cyclical patterns, mostly due to social values and
norms associated between engagements and weddings. Below is an interesting graph with
data from the US Census Bureau and US News and World Report denoting US jewelry
store sales from 2012 to 2016.
Figure 5: US Jewelry Store Sales from 2012 to 2016 (McPhillips 2017)
The reader will notice how the heartbeat-shaped spikes between Thanksgiving
and Valentine’s Day influence US consumption of diamonds. As is evident from the
graph, there is a social component to these spikes incentivizing couples to get engaged
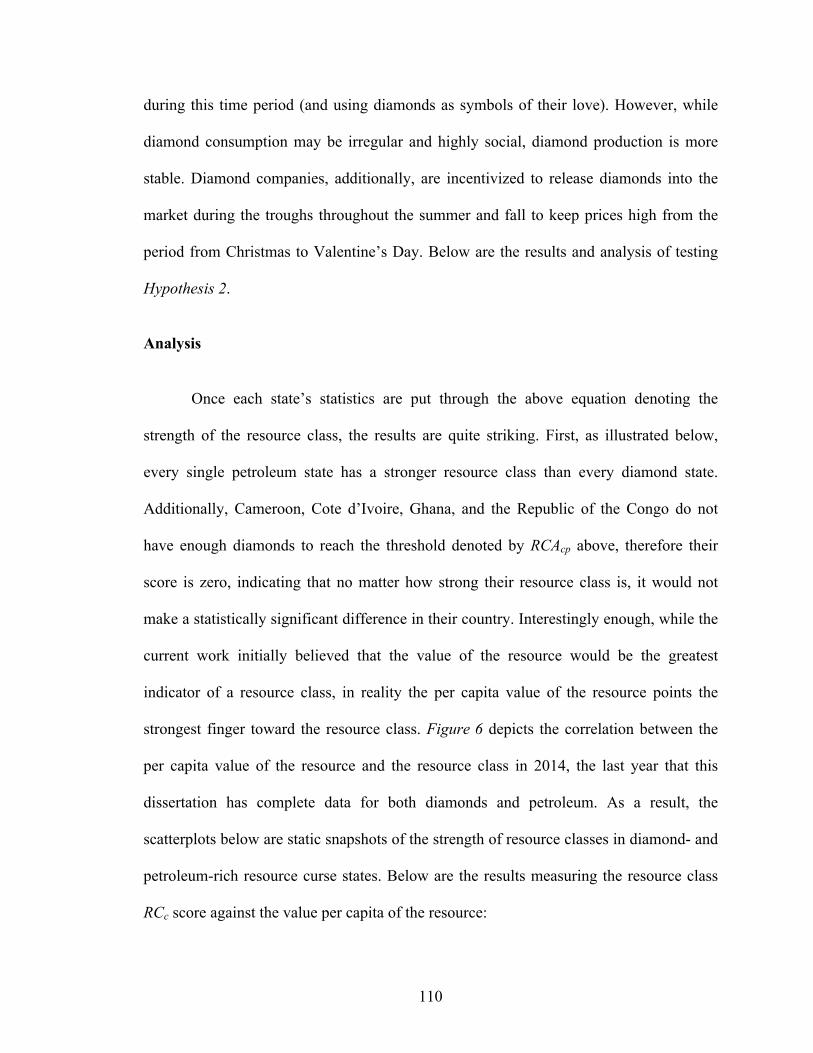
110
during this time period (and using diamonds as symbols of their love). However, while
diamond consumption may be irregular and highly social, diamond production is more
stable. Diamond companies, additionally, are incentivized to release diamonds into the
market during the troughs throughout the summer and fall to keep prices high from the
period from Christmas to Valentine’s Day. Below are the results and analysis of testing
Hypothesis 2.
Analysis
Once each state’s statistics are put through the above equation denoting the
strength of the resource class, the results are quite striking. First, as illustrated below,
every single petroleum state has a stronger resource class than every diamond state.
Additionally, Cameroon, Cote d’Ivoire, Ghana, and the Republic of the Congo do not
have enough diamonds to reach the threshold denoted by RCAcp above, therefore their
score is zero, indicating that no matter how strong their resource class is, it would not
make a statistically significant difference in their country. Interestingly enough, while the
current work initially believed that the value of the resource would be the greatest
indicator of a resource class, in reality the per capita value of the resource points the
strongest finger toward the resource class. Figure 6 depicts the correlation between the
per capita value of the resource and the resource class in 2014, the last year that this
dissertation has complete data for both diamonds and petroleum. As a result, the
scatterplots below are static snapshots of the strength of resource classes in diamond- and
petroleum-rich resource curse states. Below are the results measuring the resource class
RCc score against the value per capita of the resource:
111
Figure 6: Resource Class by State – Raw Comparison
Analyzing the raw data shows the sheer disparity between diamond- and
petroleum-rich resource curse states. As seen from the figure above, petroleum-rich states
are spread out over the entire scatterplot while diamond states are huddled in the bottom
corner. In order to guard against major outliers among petroleum states in this analysis,
this work will now take the log of value per capita to better display the more subtle
differences in resource class among diamond- and petroleum-rich states. The scatterplot
DZAAGO (P)
BHR
BRN
ECU
GNQ
GAB
IRNIRQKAZ
KWT
LBY
MYSMEXNGA
OMN
QAT
RUS (P)
SAU
SNDSYR
ARE
VEN
YEMAGO (D)CMRCIVCODGHAGUIGUYLBRCOGRUS (D)SLETZAZWE$0$1
0,00
0$2
0,00
0$3
0,00
0$4
0,00
0VA
LUE
PER
CAPI
TA
0 500000 1000000RESOURCE CLASS
PETROLEUM DIAMONDS
RAW COMPARISON (DIAMONDS v. PETROLEUM)
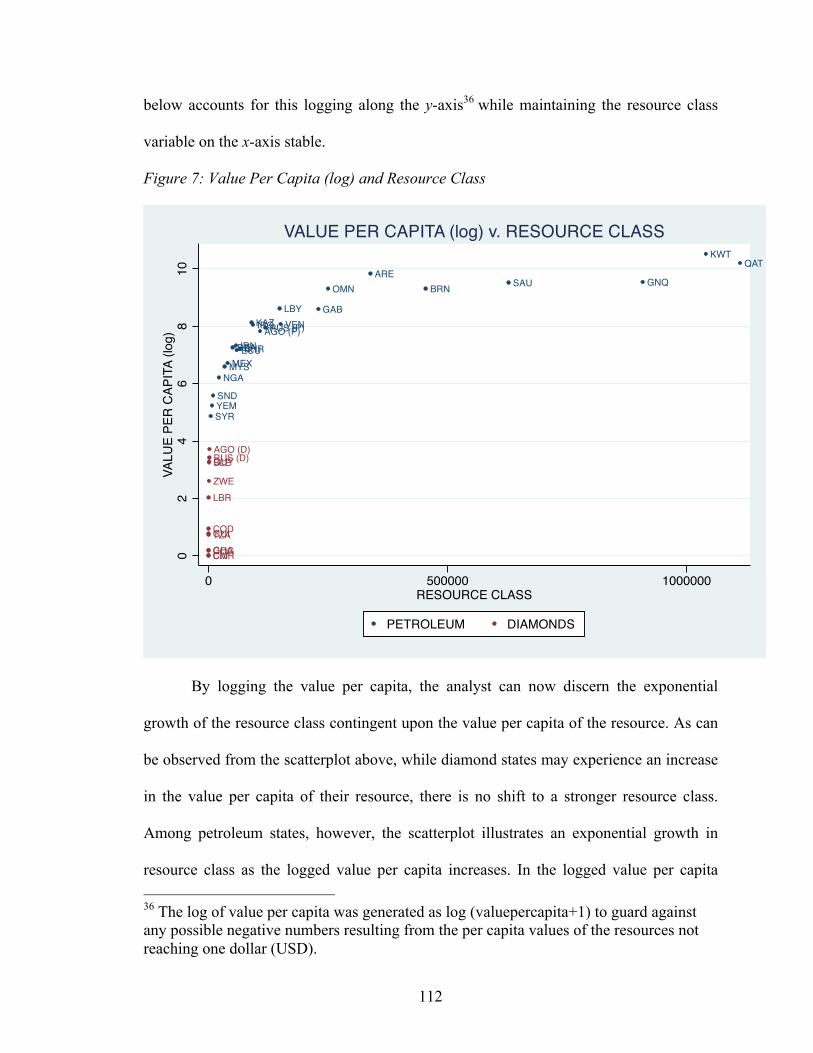
112
below accounts for this logging along the y-axis36 while maintaining the resource class
variable on the x-axis stable.
Figure 7: Value Per Capita (log) and Resource Class
By logging the value per capita, the analyst can now discern the exponential
growth of the resource class contingent upon the value per capita of the resource. As can
be observed from the scatterplot above, while diamond states may experience an increase
in the value per capita of their resource, there is no shift to a stronger resource class.
Among petroleum states, however, the scatterplot illustrates an exponential growth in
resource class as the logged value per capita increases. In the logged value per capita 36 The log of value per capita was generated as log (valuepercapita+1) to guard against any possible negative numbers resulting from the per capita values of the resources not reaching one dollar (USD).
DZAAGO (P)
BHR
BRN
ECU
GNQ
GAB
IRN
IRQKAZ
KWT
LBY
MYSMEXNGA
OMN
QAT
RUS (P)
SAU
SND
SYR
ARE
VEN
YEM
AGO (D)
CMRCIV
COD
GHAGUI
GUY
LBR
COG
RUS (D)SLE
TZA
ZWE
02
46
810
VALU
E PE
R CA
PITA
(log
)
0 500000 1000000RESOURCE CLASS
PETROLEUM DIAMONDS
VALUE PER CAPITA (log) v. RESOURCE CLASS
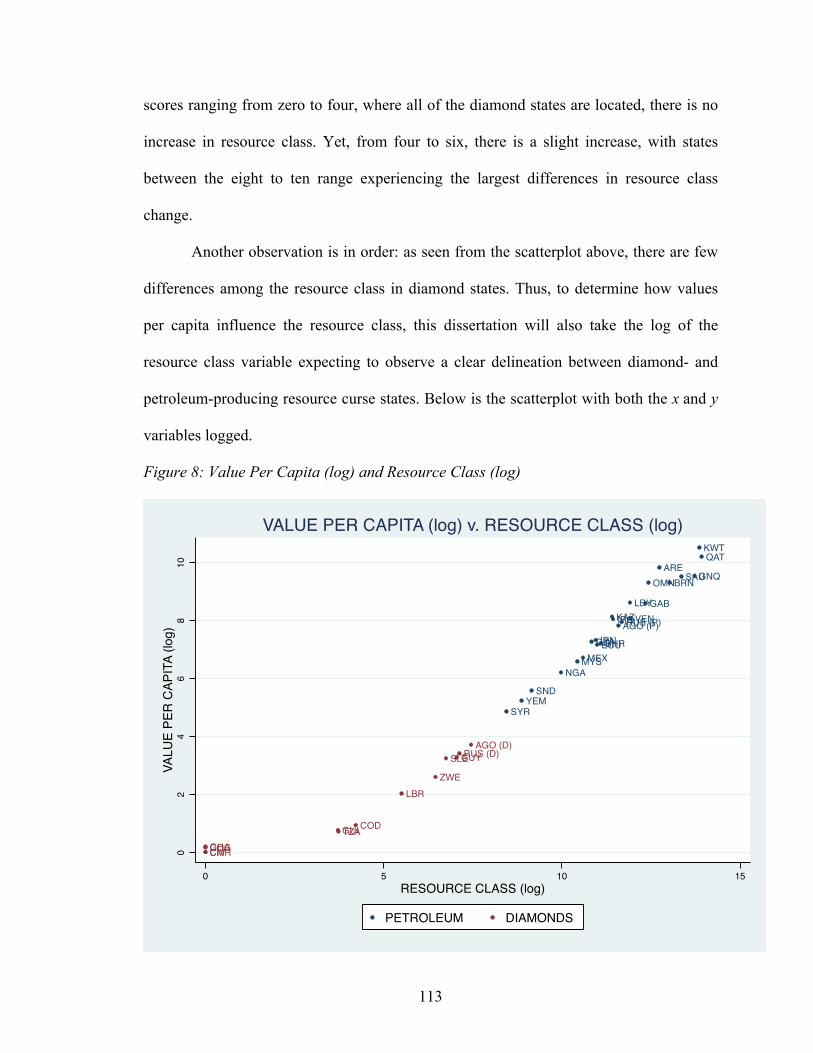
113
scores ranging from zero to four, where all of the diamond states are located, there is no
increase in resource class. Yet, from four to six, there is a slight increase, with states
between the eight to ten range experiencing the largest differences in resource class
change.
Another observation is in order: as seen from the scatterplot above, there are few
differences among the resource class in diamond states. Thus, to determine how values
per capita influence the resource class, this dissertation will also take the log of the
resource class variable expecting to observe a clear delineation between diamond- and
petroleum-producing resource curse states. Below is the scatterplot with both the x and y
variables logged.
Figure 8: Value Per Capita (log) and Resource Class (log)
DZAAGO (P)
BHR
BRN
ECU
GNQ
GAB
IRN
IRQKAZ
KWT
LBY
MYSMEXNGA
OMN
QAT
RUS (P)
SAU
SND
SYR
ARE
VEN
YEM
AGO (D)
CMRCIV
COD
GHAGUI
GUY
LBR
COG
RUS (D)SLE
TZA
ZWE
02
46
810
VALU
E PE
R CA
PITA
(log
)
0 5 10 15RESOURCE CLASS (log)
PETROLEUM DIAMONDS
VALUE PER CAPITA (log) v. RESOURCE CLASS (log)
114
With both the values per capita and resource classes logged, this scatterplot again
illustrates the disparity between diamond- and petroleum-producing states. Notice how
states that did not meet the RCAcp threshold remained at a score of zero along the x-axis.
Again, petroleum states, largely due to the value per capita of their resource, are more
likely to experience stronger resource classes than diamond states. Of particular note,
there seems to be a gap in the middle of the scatterplot above between Angola (D) and
Syria, separating diamond and petroleum states’ resource classes.
As previously mentioned, this is a static assessment of the strength of resource
classes in 2014. Next, this dissertation will analyze correlations between diamond- and
petroleum-rich states over time. The number of observations in the static dataset is
insufficient to illustrate statistically significant correlations between diamond- and
petroleum-rich states, and their respective resource classes. Therefore, to add variation to
variables of interest, this work will account for changes from 1980 to 2016, the last year
for which there was data on diamonds. Below is the multivariate regression analysis for
the resource class, separated into petroleum states, diamond states, and both petroleum
and diamond resource curse states.
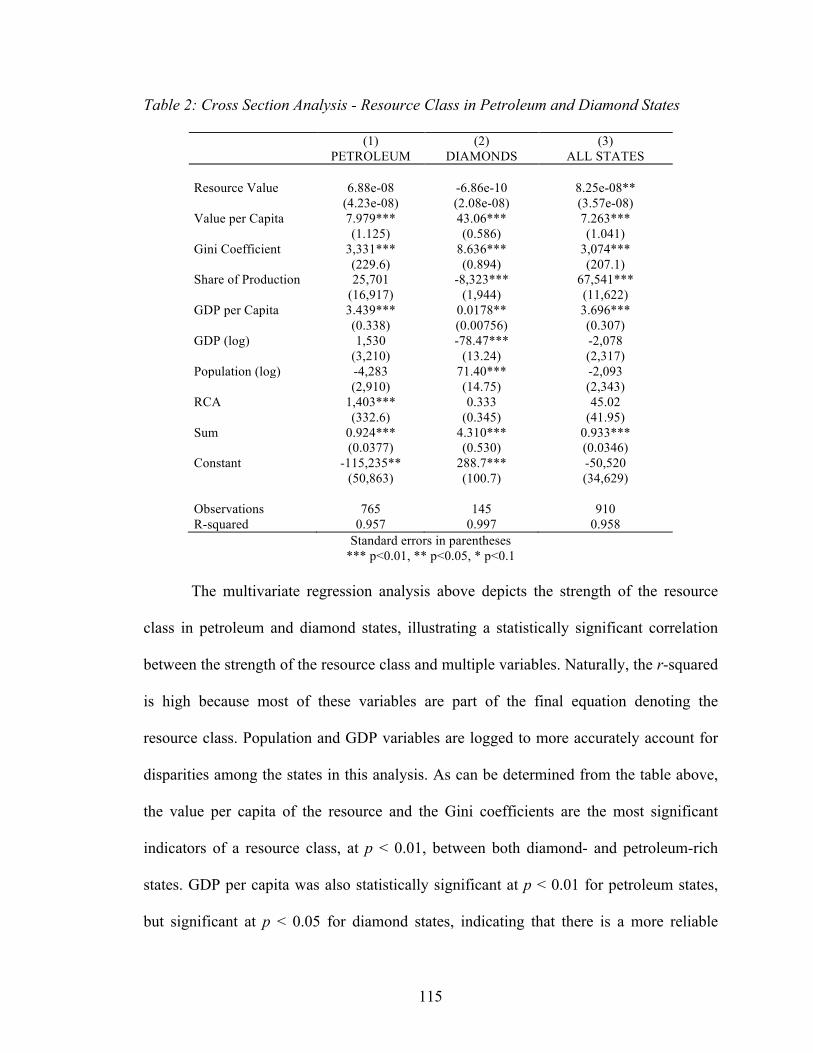
115
Table 2: Cross Section Analysis - Resource Class in Petroleum and Diamond States
(1) (2) (3) PETROLEUM DIAMONDS ALL STATES Resource Value 6.88e-08 -6.86e-10 8.25e-08** (4.23e-08) (2.08e-08) (3.57e-08) Value per Capita 7.979*** 43.06*** 7.263*** (1.125) (0.586) (1.041) Gini Coefficient 3,331*** 8.636*** 3,074*** (229.6) (0.894) (207.1) Share of Production 25,701 -8,323*** 67,541*** (16,917) (1,944) (11,622) GDP per Capita 3.439*** 0.0178** 3.696*** (0.338) (0.00756) (0.307) GDP (log) 1,530 -78.47*** -2,078 (3,210) (13.24) (2,317) Population (log) -4,283 71.40*** -2,093 (2,910) (14.75) (2,343) RCA 1,403*** 0.333 45.02 (332.6) (0.345) (41.95) Sum 0.924*** 4.310*** 0.933*** (0.0377) (0.530) (0.0346) Constant -115,235** 288.7*** -50,520 (50,863) (100.7) (34,629) Observations 765 145 910 R-squared 0.957 0.997 0.958
Standard errors in parentheses *** p<0.01, ** p<0.05, * p<0.1
The multivariate regression analysis above depicts the strength of the resource
class in petroleum and diamond states, illustrating a statistically significant correlation
between the strength of the resource class and multiple variables. Naturally, the r-squared
is high because most of these variables are part of the final equation denoting the
resource class. Population and GDP variables are logged to more accurately account for
disparities among the states in this analysis. As can be determined from the table above,
the value per capita of the resource and the Gini coefficients are the most significant
indicators of a resource class, at p < 0.01, between both diamond- and petroleum-rich
states. GDP per capita was also statistically significant at p < 0.01 for petroleum states,
but significant at p < 0.05 for diamond states, indicating that there is a more reliable
116
positive correlation between GDP per capita and resource classes among petroleum states
than among diamond states.37
Furthermore, there is a negative correlation among the share of production and
log of GDP against resource class in diamond states, significant at p < 0.01 levels. This
may indicate that the poorer the diamond state is, the smaller the share of resource
production, and the comparably stronger its resource class becomes. This change in both
direction and magnitude illustrates a key difference among diamond- and petroleum-rich
resource curse states, as there is a positive, though not statistically significant,
relationship between petroleum-rich state resource classes against their log of GDP and
share of production.
As the table illustrates, the two most highly significant correlations with a
resource class were the value per capita of the resource, along with the Gini coefficient.
However, this dissertation is also seeking to determine which of these variables accounts
for most of the variance among diamond- and petroleum-rich states. Below is the
regression analysis accounting for only the correlation between per capita values of the
resource in determining the strength of the resource class.
37 There is additionally a strong correlation between ‘sum’ and the strength of the resource class because this ‘sum’ accounts for all of the variables in the equation for Hypothesis 2 without including the binomial operator, 𝑆!"#!"! , which is a synthetic control method outside of the summation.
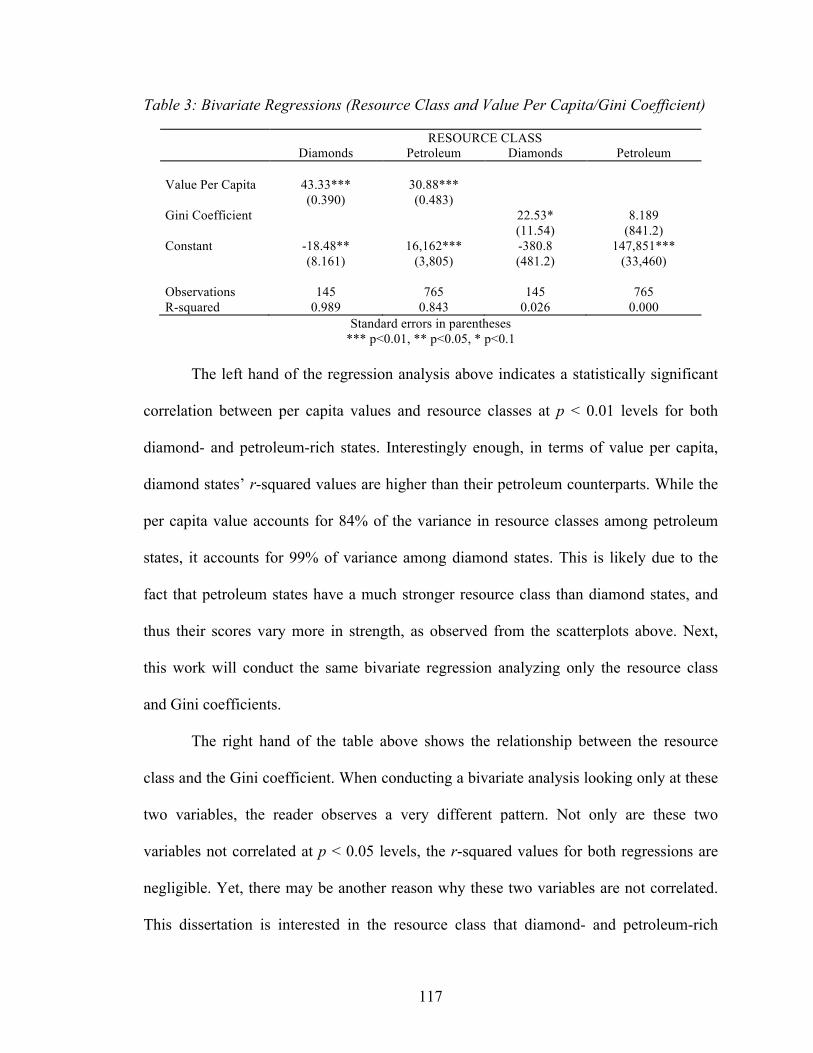
117
Table 3: Bivariate Regressions (Resource Class and Value Per Capita/Gini Coefficient)
RESOURCE CLASS Diamonds Petroleum Diamonds Petroleum Value Per Capita 43.33*** 30.88*** (0.390) (0.483) Gini Coefficient 22.53* 8.189 (11.54) (841.2) Constant -18.48** 16,162*** -380.8 147,851*** (8.161) (3,805) (481.2) (33,460) Observations 145 765 145 765 R-squared 0.989 0.843 0.026 0.000
Standard errors in parentheses *** p<0.01, ** p<0.05, * p<0.1
The left hand of the regression analysis above indicates a statistically significant
correlation between per capita values and resource classes at p < 0.01 levels for both
diamond- and petroleum-rich states. Interestingly enough, in terms of value per capita,
diamond states’ r-squared values are higher than their petroleum counterparts. While the
per capita value accounts for 84% of the variance in resource classes among petroleum
states, it accounts for 99% of variance among diamond states. This is likely due to the
fact that petroleum states have a much stronger resource class than diamond states, and
thus their scores vary more in strength, as observed from the scatterplots above. Next,
this work will conduct the same bivariate regression analyzing only the resource class
and Gini coefficients.
The right hand of the table above shows the relationship between the resource
class and the Gini coefficient. When conducting a bivariate analysis looking only at these
two variables, the reader observes a very different pattern. Not only are these two
variables not correlated at p < 0.05 levels, the r-squared values for both regressions are
negligible. Yet, there may be another reason why these two variables are not correlated.
This dissertation is interested in the resource class that diamond- and petroleum-rich
118
states produce, but perhaps Gini coefficients are vestiges of a bygone era in measuring
global inequality.
Critics may rightly argue that Gini coefficients are outdated methods for
measuring income inequality, and using them in such a systematic fashion for Hypothesis
2 potentially misrepresents true inequality in a state. As a result, this dissertation is also
incorporating Piketty et al’s World Wealth Indicators (2015) from the World Inequality
Database as intervening variables in measuring the strength of the resource class. While
not as complete as the Gini Index, this database measures the income of the top 10% of
earners in a state, rather than the Gini coefficient’s ratio. It also measures changes in the
top 1% of earners and the total wealth, as opposed to income, of the top 10% and 1% of
the population. These indicators, though neither as complete as Gini coefficients nor
compiled annually, may lend a breadth of support to the findings in Hypothesis 2. The
two states with the most data in Piketty et al’s (2015) dataset are Malaysia (14 years) and
Russia (26 years). Most other states have only one or two datapoints, and are mostly
located in the Gulf, indicating that Piketty et al’s (2015) data heavily samples some states
over others. Furthermore, large-scale petroleum producers, such as Algeria and Angola
do not have data. There is also no available data on any diamond state except for Ivory
Coast and Russia. Due to the lack of data, time series regression analyses cannot be
conducted. Finally, while Piketty et al’s (2015) database possesses fountains of data
regarding the top 10% and top 1% of wealth in a state, this information is mostly limited
to OECD-member states, which naturally are not reflected in this work, as they are not
resource curse states.
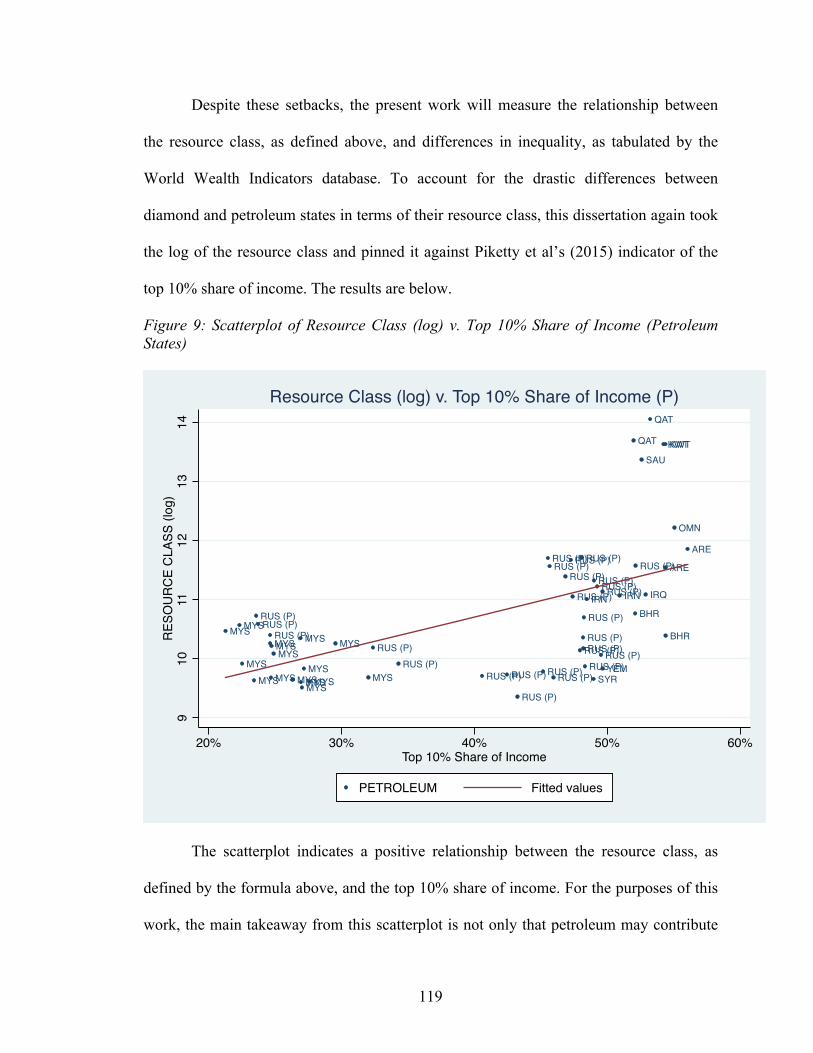
119
Despite these setbacks, the present work will measure the relationship between
the resource class, as defined above, and differences in inequality, as tabulated by the
World Wealth Indicators database. To account for the drastic differences between
diamond and petroleum states in terms of their resource class, this dissertation again took
the log of the resource class and pinned it against Piketty et al’s (2015) indicator of the
top 10% share of income. The results are below.
Figure 9: Scatterplot of Resource Class (log) v. Top 10% Share of Income (Petroleum States)
The scatterplot indicates a positive relationship between the resource class, as
defined by the formula above, and the top 10% share of income. For the purposes of this
work, the main takeaway from this scatterplot is not only that petroleum may contribute
BHR
BHR
IRNIRN IRQ
KWTKWT
MYS MYS
MYSMYSMYSMYSMYS
MYSMYSMYS
MYS
MYSMYS
MYSMYSMYS
OMN
QAT
QAT
RUS (P)RUS (P)
RUS (P)RUS (P)
RUS (P)RUS (P)RUS (P)
RUS (P)RUS (P)
RUS (P)
RUS (P)
RUS (P)RUS (P)RUS (P)RUS (P)
RUS (P)
RUS (P)RUS (P)RUS (P)
RUS (P)
RUS (P)RUS (P)
RUS (P)RUS (P)RUS (P)RUS (P)
SAU
SYR
ARE
ARE
YEM
910
1112
1314
RESO
URCE
CLA
SS (l
og)
30%20% 40% 50% 60%Top 10% Share of Income
PETROLEUM Fitted values
Resource Class (log) v. Top 10% Share of Income (P)
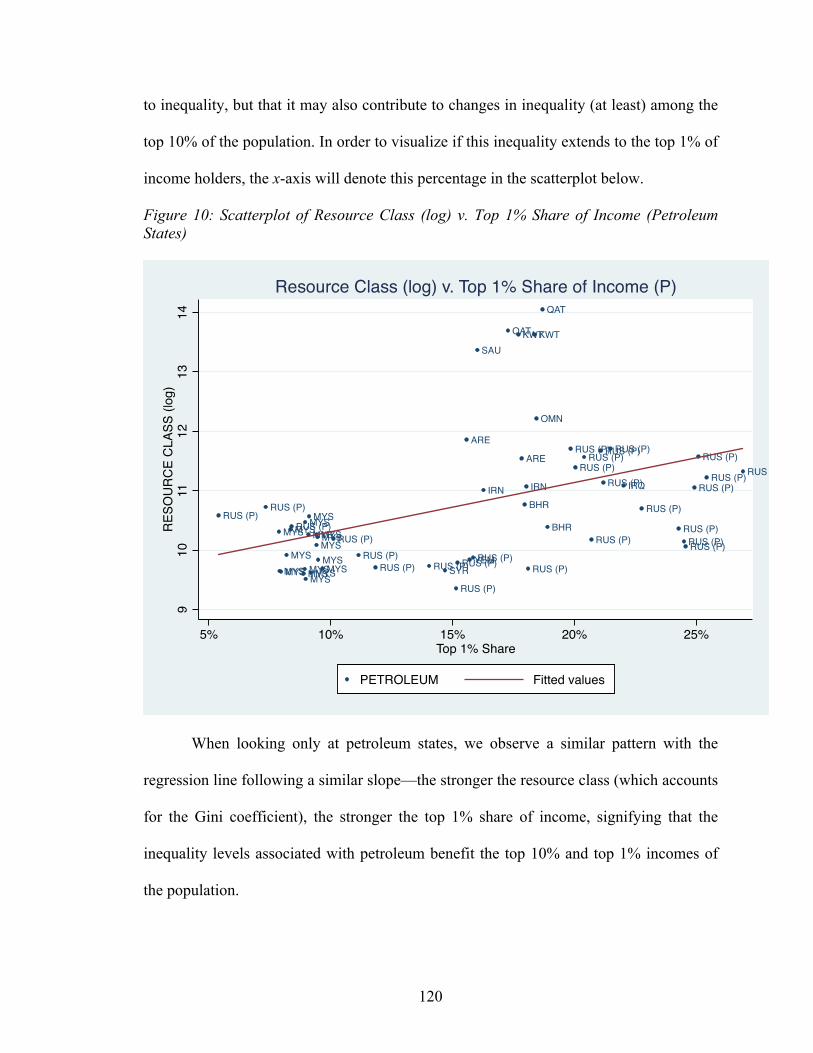
120
to inequality, but that it may also contribute to changes in inequality (at least) among the
top 10% of the population. In order to visualize if this inequality extends to the top 1% of
income holders, the x-axis will denote this percentage in the scatterplot below.
Figure 10: Scatterplot of Resource Class (log) v. Top 1% Share of Income (Petroleum States)
When looking only at petroleum states, we observe a similar pattern with the
regression line following a similar slope—the stronger the resource class (which accounts
for the Gini coefficient), the stronger the top 1% share of income, signifying that the
inequality levels associated with petroleum benefit the top 10% and top 1% incomes of
the population.
BHR
BHR
IRNIRN IRQ
KWTKWT
MYSMYSMYS
MYSMYS MYSMYSMYS
MYSMYS MYS
MYS
MYSMYSMYS
MYSMYS
OMN
QAT
QAT
RUS (P)RUS (P)
RUS (P)RUS (P)
RUS (P)RUS (P) RUS (P)
RUS (P)RUS (P)
RUS (P)
RUS (P)
RUS (P) RUS (P)RUS (P)RUS (P)
RUS (P)
RUS (P)RUS (P)RUS (P)
RUS (P)
RUS (P)RUS (P)
RUS (P)RUS (P)RUS (P)RUS (P)
SAU
SYR
ARE
ARE
YEM
910
1112
1314
RESO
URCE
CLA
SS (l
og)
5% 10% 15% 20% 25%Top 1% Share
PETROLEUM Fitted values
Resource Class (log) v. Top 1% Share of Income (P)
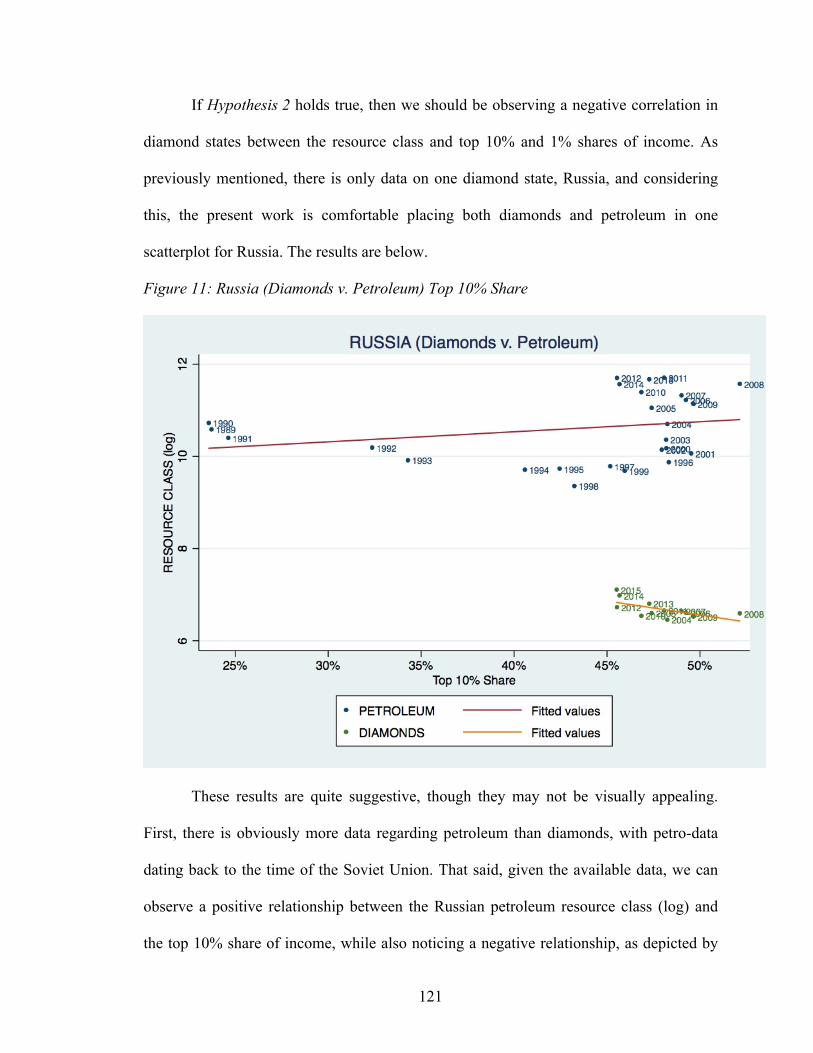
121
If Hypothesis 2 holds true, then we should be observing a negative correlation in
diamond states between the resource class and top 10% and 1% shares of income. As
previously mentioned, there is only data on one diamond state, Russia, and considering
this, the present work is comfortable placing both diamonds and petroleum in one
scatterplot for Russia. The results are below.
Figure 11: Russia (Diamonds v. Petroleum) Top 10% Share
These results are quite suggestive, though they may not be visually appealing.
First, there is obviously more data regarding petroleum than diamonds, with petro-data
dating back to the time of the Soviet Union. That said, given the available data, we can
observe a positive relationship between the Russian petroleum resource class (log) and
the top 10% share of income, while also noticing a negative relationship, as depicted by
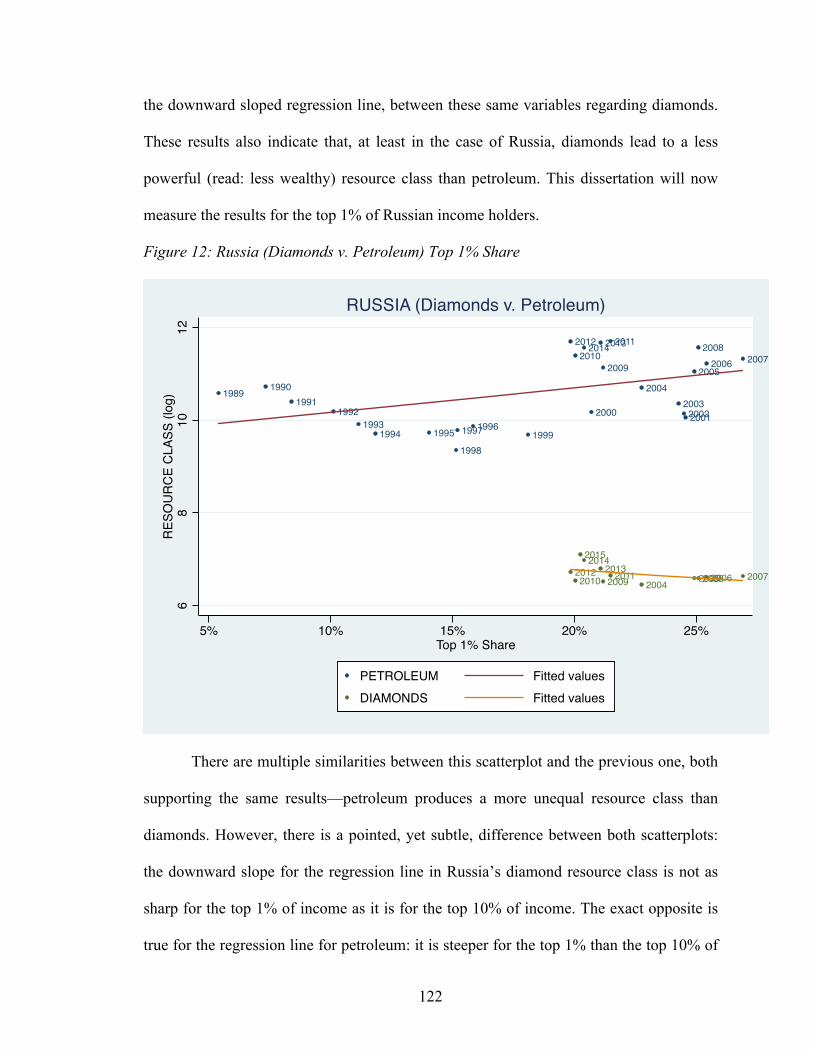
122
the downward sloped regression line, between these same variables regarding diamonds.
These results also indicate that, at least in the case of Russia, diamonds lead to a less
powerful (read: less wealthy) resource class than petroleum. This dissertation will now
measure the results for the top 1% of Russian income holders.
Figure 12: Russia (Diamonds v. Petroleum) Top 1% Share
There are multiple similarities between this scatterplot and the previous one, both
supporting the same results—petroleum produces a more unequal resource class than
diamonds. However, there is a pointed, yet subtle, difference between both scatterplots:
the downward slope for the regression line in Russia’s diamond resource class is not as
sharp for the top 1% of income as it is for the top 10% of income. The exact opposite is
true for the regression line for petroleum: it is steeper for the top 1% than the top 10% of
1989 19901991
19921993
1994 1995 19961997
19981999
2000 200120022003
20042005
2006 20072008
20092010
20112012 20132014
2004 20052006 2007200820092010 20112012 201320142015
68
1012
RESO
URCE
CLA
SS (l
og)
5% 10% 15% 20% 25%Top 1% Share
PETROLEUM Fitted valuesDIAMONDS Fitted values
RUSSIA (Diamonds v. Petroleum)
123
income. Both of these regression lines further indicate the disparity in resource classes
among diamond and petroleum states, even though this dissertation is employing the
same variables for the same state. These findings also indicate that the diamond resource
class in Russia is not as powerful as the petroleum resource class, as the top 1% of the
Russian petro-class has a steeper slope than its 10% counterpart while the top 1%
downward slope for diamonds is not as steep as its 10% counterpart. Though subtle, these
results show that the top 1% of the Russian petroleum class is comparably more powerful
than the top 10% of the petro-class. On the other hand, while the top 1% of the Russian
diamond class is more powerful than the top 10%, it is not as strongly correlated, as the
slope on the regression line is gentler.
The data taken from Piketty et al’s (2015) World Wealth Indicators database
allowed for another degree of testing, and the results support Hypothesis 2 on a more
nuanced level, at least in Russia. Instead of taking the Gini coefficient and using that as a
proxy for inequality, Piketty et al’s (2015) data segregates inequality into the top 10%
and top 1% of income. This not only lends another dimension to these results, it also
allows this work to compare differences among inequalities within one state, as was the
case with Russia. All of these regressions and scatterplots combined indicate a positive
relationship between petroleum and a stronger resource class, and diamonds with a
weaker resource class. There is, however, one weakness in testing Piketty et al’s (2015)
data against the results from the resource class in Russia. When analyzing only the years
in which there is data on diamonds and petroleum (2004-2014), the regression lines go in
the same direction for the share of wealth for Russia’s top 10% and top 1%, casting doubt
on the difference between diamonds and petroleum in Russian inequality and suggesting
124
that changes in the resource class are exogenous to the diamond and petroleum industries.
Importantly, this is only the case when analyzing the logged value of the resource class
and not the resource class per se. Additionally, though the slopes are similar in the
scatterplots, the fact remains that the petroleum resource class is consistently found to be
stronger and wealthier than the diamond resource class. The regression lines simply
indicate that an increase in diamonds and petroleum production correlates with an
increase in the strength of the resource class. The scatterplots illustrating this similarity
are depicted in Figures 2 and 3 of Appendix 1.
Despite the slight anomaly in Russia from 2004 to 2014, there is considerable
evidence suggesting that diamonds and petroleum foment different strengths among elites
in their respective resource classes. This evidence supports Hypothesis 2 along various
nuanced levels.
Chapter Conclusions
When analyzing the results from the political resource curse, we note sharp
differences between diamond and petroleum states. Hypothesis 1 measured government-
MNC strife along eight different tracks, finding that, at least in the case of Venezuela,
strife was consistent, internationalized, and contingent upon oil prices. However, when
analyzing Tanzania, the opposite seemed to be true. Tanzania’s strife with Petra
Diamonds was erratic and spontaneous, with the government seizing Petra’s rough
diamonds bound for Antwerp. Additionally, strife was limited to only the extraction
industry and did not permeate into other industries or become internationalized. Strife
was also not dependent upon the world-trading price of diamonds, but rather on a dispute
125
on what the diamonds were worth. These results suggest that diamond and petroleum
states suffer from government-MNC strife in different ways.
Hypothesis 2 seeks to uncover differences in inequality among diamond- and
petroleum-rich resource curse states, finding that diamonds generate a less powerful
resource class than petroleum. Every petroleum state in this analysis enjoyed a wealthier
resource class than their diamond counterparts. Furthermore, in the case of Russia, we
noticed how petroleum led to a stronger resource class while diamonds led to a weaker
resource class, at least among the top 1% and 10% share of wealth given available data.
When incorporating Piketty et al’s (2015) dataset against this analysis, we also found a
correlation between the strength of the resource class and the percent of wealth the upper
echelons of society held. The disparities among diamond and petroleum states support
Hypothesis 2 and lend credence to how states may experience a political resource curse in
different ways.
The next chapter continues the analysis of the political resource curse, examining
differences among diamond- and petroleum-rich states along the lines of the strength of
the nationalized industry and property rights enforcement.
126
Chapter 5
THE POLITICAL RESOURCE CURSE (PART 2)
Testing Hypothesis 3
Petroleum-rich states are more likely to have stronger nationalized industries than diamond-rich states.
This hypothesis is aimed at highlighting the differences between diamond and oil
resource curse states at the institutional level. As emphasized by the scholarship of
Menaldo (2016), the resource curse is greatly influenced by the capabilities of state
institutions. For Menaldo and others (e.g., Collier 2010a; Karl 1997; van der Ploeg &
Poelhekke 2010) institutions are the sole determining factor in whether a state suffers
from a resource curse. For the theory of resource curses, while institutions are important
factors, the resources themselves underpin institutional capacity. In this spirit, Hypothesis
3 seeks to tease out differences between diamond- and petroleum-rich states, specifically
in how they develop institutions around their resources. If their resources are different,
then it follows that they may influence institutions and institutional capacity in different
ways. Since resources, especially petroleum, are paramount for the state economies, it
behooves the analyst to assess how nationalized industries differ in diamond- and
petroleum-rich resource curse states. Hypothesis 3 expects petroleum-rich states to not
only be more likely to nationalize their industries than diamond-rich states, but also
possess stronger nationalized industries than their diamond state counterparts in terms of
total values, as percentages of GDP, and GDP per capita.
127
As mentioned time and again in this dissertation, the revenues generated from
petroleum far outstrip those of diamonds. This hypothesis predicts that petroleum-rich
states are more likely to nationalize and possess stronger resource industries than
diamond states. Hypothesis 3 is largely predicated on the significant revenue stream
generated from petroleum rents. Conversely, diamonds, because of the comparably little
value in terms of rents, are less tempting for state nationalization efforts. While this may
be the case, Hypothesis 3 still predicts some nationalized diamond industries to be
powerful in diamond states (e.g., Endiama in Angola). Nevertheless, Hypothesis 3
expects nationalized oil companies (NOC) in petroleum-rich states to be more powerful
than their diamond counterparts (e.g., Saudi ARAMCO, Sonangol, PDVSA, etc.).
To be clear, simply because an industry is nationalized does not imply
governmental corruption or that the nationalized industry acts as a sinister arm of the
incumbent. Many analysts would remind us that some nationalized industries, such as
British Petroleum38 in the 1970s and state-owned Equinor in Norway, may provide an
economic benefit to the state. Equinor, specifically, (re)invests petroleum profits into the
national Oljefondet, which acts as a sovereign wealth fund for Norwegian state. Among
resource curse states, other nationalized industries, such as Kuwait Petroleum
Corporation and Qatar Petroleum, seem to manage their wealth prudently, albeit at the
expense of keeping the existing monarchies in power and delaying advances to
democracy. Other nationalized industries fund educational opportunities in their host
states, such as Petronas in Malaysia and OOC in Oman. Still others, such as
KazMunayGas, Petroecuador, and Pemex, operate in a relatively neutral light, despite
38 The British government sold over 400 million shares of BP from 1979 to 1987, as part of Thatcher’s privatization doctrine (Reuters 1987).
128
sporadic accusations of corruption and controversies (Weissenstein & Rodriguez 2013;
Alexander 2010; Goodley 2010). Once again, possessing a nationalized resource industry
does not spell out a resource curse. Incumbents may use their nationalized industries for
the benefit of the governed, for their personal gain, or a combination of the two. For
example, PDVSA funded social welfare programs in Venezuela (Monaldi 2018), and
Ecuador’s Rafael Correa bought over 16,000 public vehicles for Petroecuador rather than
for trash collection or policing (Montenegro 2018). Rather, this hypothesis suggests that
possessing a nationalized industry lends incumbents the opportunity to use the industry
for the benefit of their people, their own gains, or a combination of the two. If this work
can track pathways and incentives for the potential of a resource curse, then scholars
would be better positioned to triangulate differences among resource curse states
contingent upon their resources. If Hypothesis 3 holds true, and petroleum states possess
stronger nationalized industries than their diamond counterparts, then this is a pathway
petro-states may take to or out of the resource curse at their discretion; diamond states
have no such luxury.
As hinted in the literature review, this hypothesis is put forward as part of the
theory of resource curses to determine how the government could use a nationalized
industry, whether oil or diamonds, to further its oftentimes-shortsighted goals. There is a
long string of resource curse research indicating that resources aid incumbents to remain
in power for longer periods of time. For example, during the Arab Spring, Saudi Arabia
learned from Egyptian and Tunisian mistakes and deployed loyal security forces and
mobilized the clergy to quell rebellious behavior in the Kingdom (Gause 2011:6-8). At
the macro level, Cuaresma et al (2010) discovered that petroleum allows authoritarian
129
regimes to remain in power for longer periods of time than non-authoritarian regimes.
Andersen and Aslaksen (2013) find similar results. Omgba (2009) realized that oil, but
not diamonds or any other natural resource, helped incumbents remain in office in
African states. According to Smith (2004), petroleum may allow for authoritarian
regimes to persist, but they also legitimize democracies. Hypothesis 3 anticipates
authoritarian regimes, monarchies, weak democracies, and other resource curse
governments will chose to nationalize oil industries rather than tempt private companies
to practice ‘extract and exit’ policies. Nationalized oil companies (NOC) also allow
governments to form blocs, such as OPEC, and act in unison by collectively embargoing
Western states, as Arab members39 of OPEC did in 1973 and 1979. Executing such wide-
scale embargoes would be impossible if states had multiple private companies extracting
petroleum and hoping to keep a solid revenue stream. Precisely because diamonds are not
the lifeblood of the world economy, such a devastating embargo would not be possible
with this resource, even if states would nationalize their diamond industries.
Testing Hypothesis 3 offers many challenges and is often messy. The main
challenge is collecting production data from so many NOCs, as there is likely no such
uniform dataset. As the reader will notice, sometimes data is collected from news sources
informing the public about crude oil production, as the NOCs themselves do not supply
much data. Sometimes data may come in barrels per day or per year, while other times,
the data may be presented in dollars or in local currencies, meaning that all of this
information must be synthesized in a useful fashion before analyzing it. Additionally,
39 Technically, the oil embargo of 1973 was orchestrated by OAPEC, the Organization of Arab Petroleum Exporting Countries, which includes most Arab members of OPEC, but also includes less petroleum-rich states, such as Egypt.

130
states may not nationalize the entire oil industry. Even Saudi Arabia, with its ARAMCO
behemoth, shares some work with other MNCs. Further complicating matters is that oil
companies are often built and designed laterally and not vertically. For example, many oil
companies focus only on upstream (discovery and extraction), midstream (refining and
processing), or downstream (transportation and pipelines) processes of the oil market. So
how should analysts quantify this information? Three or more companies may be
involved in discovering, extracting, refining, and transporting the same barrels of
petroleum, so aggregating results would end with inaccurate information. Luckily, many
NOCs are conglomerates, meaning that they engage in ‘vertically’ upstream, midstream,
and downstream endeavors. However, if there were any exceptions, they would be
pointed out separately. Another variable is the change in oil production throughout the
year and the constant fluctuation in price of petroleum. Sometimes even the publicly
accepted value of production of an NOC outstrips the production of the state itself,
though oil prices remain constant. 40 The media sometimes comments on these
discrepancies, but it should be noted that for microstates, such as Brunei and Bahrain,
their data reflects partnerships with larger companies (e.g., Shell in the case of Brunei) or
the NOCs are more interested in refining petroleum rather than producing it (Bahrain’s
BAPCO). NOCs may also extract petroleum outside of a state’s borders, such as
Rosneft’s activities in Canada, Brazil, and the United States. Finally, petro-states may be
collecting revenues from non-nationalized industries, or may work in conjunction with
MNCs to collect rents, meaning that the nationalized industry is not their only way to
penetrate the resource industry.
40 A common example is Venezuela’s PDVSA’s public production of petroleum outstripping Venezuela’s total oil production (e.g., Parraga & El Gamal 2017).
131
Diamond-mining companies do not have the same challenges NOCs face.
Discovery and extraction often go hand-in-hand, while polishing and setting is mostly
outsourced to Hong Kong, India, and Singapore. Diamond companies analyzed in this
hypothesis are designed laterally rather than vertically, as in petro-states. Rough
diamonds are often extracted from the states mentioned in this analysis and then polished
in another country. Conversely, because petroleum extraction lifts a lot of water from the
ground and because it is oftentimes cheaper to partially refine petroleum on-site, rather
than transport crude petroleum along with its residue, NOCs seem to be designed more
vertically. Nevertheless, unlike NOCs, access to reliable diamond production information
is less common among diamond-rich resource curse states. Additionally, nationalized
diamond companies are often not completely owned by the government, indicating that
some of the revenues may be siphoned off to offshore players (e.g., Anhui in the
Democratic Republic of the Congo).
With this in mind, this work will create a nationalization coefficient, measuring
the degree of nationalization of an industry per diamond- and petroleum-rich state, and
discern how fiscally powerful it is in relation to the state’s GDP. The prediction is that oil
states would have a coefficient greater than 1, whereas diamond states would have
coefficients less than 1. While perfect correlation is not expected, this hypothesis predicts
diamond states to possess comparably weaker nationalized industries than their petroleum
counterparts.
Formally, this hypothesis would define a resource curse state’s degree of
nationalization (NATc) as the following:
5.1) 𝑁𝐴𝑇! =𝑉!𝑉!+
𝑉!𝐺𝐷𝑃!
132
where VN is the nationalized value of the production of either petroleum or diamonds in a
specific state. This number will be divided by the value of the total production VP of a
state’s resource, (VN / VP), forming a simple ratio determining the comparative strength of
the nationalized industry within the state’s total oil or diamond output. This ratio will be
added to another ratio, which determines the strength of the resource industry within the
state economy (VP / GDPC).41 If the value of these two ratios were greater than or equal
to 1, this hypothesis will consider this nationalized coefficient of a state NCC to be strong,
whereas a value of less than 1 would indicate a weaker nationalized industry. Formally, it
would be written as such:
5.2) 𝑁𝐶! = 𝑠𝑡𝑟𝑜𝑛𝑔 𝑁𝐴𝑇! ≥ 1 𝑤𝑒𝑎𝑘 𝑜𝑡ℎ𝑒𝑟𝑤𝑖𝑠𝑒
Before delving into the results, a note on the process of data collection of each
state’s nationalized diamond and oil industries is in order. Every petroleum state enjoys a
national oil company, while six out of the eleven diamond states have a nationalized
diamond company. Due to fuzzy data, a few states must be eliminated from the equation.
First, there is no current data on the Yemeni NOC; Bahrain is more focused on refining
petroleum than producing it, and Brunei’s NOC far outstrips its host state’s production by
a factor of ten. Second, while some diamond states may possess nationalized diamond
companies, there is little production data on them. This was the case for Tanzania’s
STAMICO, which mines not only diamonds but also gold and coal, and Sierra Leone’s
Diminco. The full details on data collection for the nationalized industries of petroleum-41 Again, this work is cognizant that accounting for a state’s GDP also counts for total petroleum revenue. However, as this work is interested in creating a ratio to determine the strength of the resource industry and not seeking to understand what a state would look like without the resource industry, the above formula will be used to triangulate the strength of the nationalized industry in a state.
133
rich resource curse states can be found in Appendix 2. The petroleum states to be
analyzed in Hypothesis 3 are the following: Algeria, Angola, Ecuador, Equatorial Guinea,
Gabon, Iran, Iraq, Kazakhstan, Kuwait, Libya, Malaysia, Mexico, Nigeria, Oman, Qatar,
Russia, Saudi Arabia, Sudan, Syria, United Arab Emirates, and Venezuela.
While every single petroleum state has a nationalized oil industry, diamond states
offer a very different story. Diamond production will be measured in carats and the dollar
value for those carats. Unlike crude oil, whose value can be measured by the
benchmarks—Brent Crude, West Texas Intermediate, Bonny Light, Dubai, and so on—
each diamond must be measured individually, with some states producing higher quality
diamonds than others. Also unlike petroleum, diamonds cannot be mixed or blended with
other diamonds to form a predictable product. Perhaps because of this, there are very few
nationalized diamond industries in resource curse states. Interestingly enough, it is not
until recent years that diamond states have begun to threaten nationalizing their mines
and creating extraction companies. Tactics for nationalizing diamond industries seem
sloppier than petroleum industries. Instead of creating a national diamond company,
many states have resorted to nationalizing the mines themselves, though they are often
shared with local and foreign-owned diamond companies. Additionally, crude tactics,
such as expropriating extracted diamonds from private companies as analyzed in
Hypothesis 1, seems to be quite common in resource curse diamond states (e.g.,
Tanzania). Perhaps predictably, diamond states are home to artisanal diamond mining.
While artisanal mining may be an important socio-economic component of resource
curse states, sometimes it lends itself to exploitation. While individuals engaging in
artisanal mining often band together, their efforts hardly count as a bona fide for-profit
134
company. Additionally, unlike professional mining companies, these individuals often
use hand-made tools for panning and not large-scale and specialized machinery
associated with diamond companies. As a result, very few diamond states possess
powerful nationalized governmental arms. Details on data collection for diamond states
can be found in Appendix 2.
Out of the thirteen diamond-producing states in this analysis, six have
nationalized industries—Angola, the Democratic Republic of the Congo, Russia, Sierra
Leone, Tanzania, and Zimbabwe. However, Sierra Leone’s nationalized industry became
defunct in 1993 (Martinez 2001), neither the DRC nor Russia own 100% of the shares of
their companies, and there is no reliable production data on STAMICO in Tanzania
outside of its share in the Williamson Diamond Mine. Only Angola published the average
carat value of its diamonds mined through Endiama, so this dissertation is adopting the
Kimberley Process data to estimate the average value of diamonds in the remaining
states. The average dollar value per carat in the Democratic Republic of the Congo is
$10.63, in Russia $88.75, and in Zimbabwe $50.00. Due to lack of production data, only
four diamond states will be analyzed in Hypothesis 3: Angola, Democratic Republic of
the Congo, Russia, and Zimbabwe.
Results
The documented evidence largely supports Hypothesis 3. Every petroleum
resource curse state owns and operates a nationalized oil company while only six of the
thirteen diamond states possess a national diamond company. Generally, it will be
understood that the more powerful nationalized companies are those with larger earnings
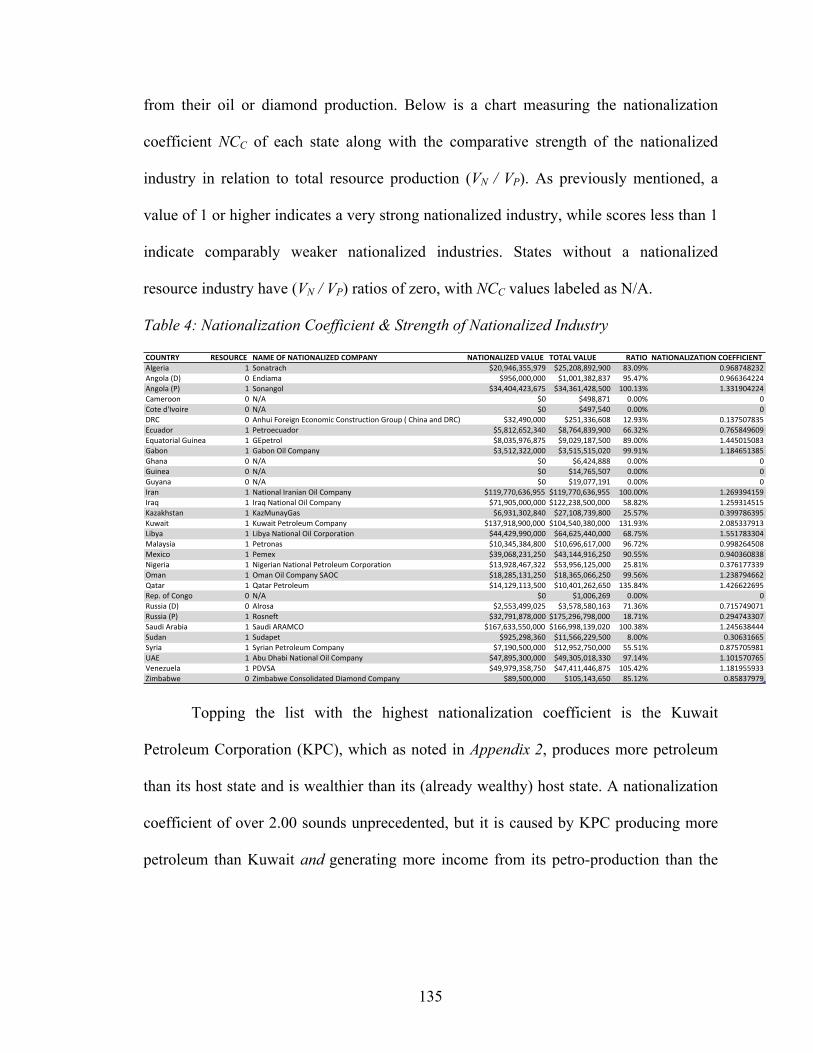
135
from their oil or diamond production. Below is a chart measuring the nationalization
coefficient NCC of each state along with the comparative strength of the nationalized
industry in relation to total resource production (VN / VP). As previously mentioned, a
value of 1 or higher indicates a very strong nationalized industry, while scores less than 1
indicate comparably weaker nationalized industries. States without a nationalized
resource industry have (VN / VP) ratios of zero, with NCC values labeled as N/A.
Table 4: Nationalization Coefficient & Strength of Nationalized Industry
Topping the list with the highest nationalization coefficient is the Kuwait
Petroleum Corporation (KPC), which as noted in Appendix 2, produces more petroleum
than its host state and is wealthier than its (already wealthy) host state. A nationalization
coefficient of over 2.00 sounds unprecedented, but it is caused by KPC producing more
petroleum than Kuwait and generating more income from its petro-production than the
COUNTRY RESOURCE NAMEOFNATIONALIZEDCOMPANY NATIONALIZEDVALUE TOTALVALUE RATIO NATIONALIZATIONCOEFFICIENTAlgeria 1 Sonatrach $20,946,355,979 $25,208,892,900 83.09% 0.968748232Angola(D) 0 Endiama $956,000,000 $1,001,382,837 95.47% 0.966364224Angola(P) 1 Sonangol $34,404,423,675 $34,361,428,500 100.13% 1.331904224Cameroon 0 N/A $0 $498,871 0.00% 0Coted'Ivoire 0 N/A $0 $497,540 0.00% 0DRC 0 AnhuiForeignEconomicConstructionGroup(ChinaandDRC) $32,490,000 $251,336,608 12.93% 0.137507835Ecuador 1 Petroecuador $5,812,652,340 $8,764,839,900 66.32% 0.765849609EquatorialGuinea 1 GEpetrol $8,035,976,875 $9,029,187,500 89.00% 1.445015083Gabon 1 GabonOilCompany $3,512,322,000 $3,515,515,020 99.91% 1.184651385Ghana 0 N/A $0 $6,424,888 0.00% 0Guinea 0 N/A $0 $14,765,507 0.00% 0Guyana 0 N/A $0 $19,077,191 0.00% 0Iran 1 NationalIranianOilCompany $119,770,636,955 $119,770,636,955 100.00% 1.269394159Iraq 1 IraqNationalOilCompany $71,905,000,000 $122,238,500,000 58.82% 1.259314515Kazakhstan 1 KazMunayGas $6,931,302,840 $27,108,739,800 25.57% 0.399786395Kuwait 1 KuwaitPetroleumCompany $137,918,900,000 $104,540,380,000 131.93% 2.085337913Libya 1 LibyaNationalOilCorporation $44,429,990,000 $64,625,440,000 68.75% 1.551783304Malaysia 1 Petronas $10,345,384,800 $10,696,617,000 96.72% 0.998264508Mexico 1 Pemex $39,068,231,250 $43,144,916,250 90.55% 0.940360838Nigeria 1 NigerianNationalPetroleumCorporation $13,928,467,322 $53,956,125,000 25.81% 0.376177339Oman 1 OmanOilCompanySAOC $18,285,131,250 $18,365,066,250 99.56% 1.238794662Qatar 1 QatarPetroleum $14,129,113,500 $10,401,262,650 135.84% 1.426622695Rep.ofCongo 0 N/A $0 $1,006,269 0.00% 0Russia(D) 0 Alrosa $2,553,499,025 $3,578,580,163 71.36% 0.715749071Russia(P) 1 Rosneft $32,791,878,000 $175,296,798,000 18.71% 0.294743307SaudiArabia 1 SaudiARAMCO $167,633,550,000 $166,998,139,020 100.38% 1.245638444Sudan 1 Sudapet $925,298,360 $11,566,229,500 8.00% 0.30631665Syria 1 SyrianPetroleumCompany $7,190,500,000 $12,952,750,000 55.51% 0.875705981UAE 1 AbuDhabiNationalOilCompany $47,895,300,000 $49,305,018,330 97.14% 1.101570765Venezuela 1 PDVSA $49,979,358,750 $47,411,446,875 105.42% 1.181955933Zimbabwe 0 ZimbabweConsolidatedDiamondCompany $89,500,000 $105,143,650 85.12% 0.85837979
136
microstate of Kuwait earns in a year.42 This is complemented by the 131.93% ratio,
suggesting that KPC wields more economic power than the combined petroleum output
of Kuwait. Additionally, also as noted in Appendix 2, Qatar Petroleum produces more oil
than its host state, likely due to foreign assets.
Eleven other states have strong nationalized industries—Libya, 43 Equatorial
Guinea, Qatar, Angola (P), Iran, Iraq, Saudi Arabia, Oman, Gabon, Venezuela, and the
United Arab Emirates. As Hypothesis 3 expects, all of these are petroleum-producing
states with nationalized coefficient scores over 1, while not one diamond state reaches
this threshold. However, not all of the oil states in this dataset topped at over a value of 1.
Malaysia’s Petronas powerhouse could be due to round off error, but Algeria, Mexico,
Syria, Ecuador, Kazakhstan, Nigeria, Sudan, and Russia (P) all are oil states with values
less than 1. Many of these states have invited MNCs from the West and China to extract
petroleum and pay rents, suggesting that while oil still plays a large role in their
economies, they can only collect rents from other companies and not manipulate the
resource industry as if it were an overwhelmingly powerful NOC.
The four diamond states in this dataset were below the cutoff value of 1, but in the
case of Angola’s Endiama, just barely. Endiama’s strength as a nationalized diamond
company is truly impressive, with Angola (D) possessing a nationalization coefficient of
96.6. Zimbabwe, Russia (D), and the Democratic Republic of the Congo had lower
42 If Kuwait, Qatar, or other states have a substantial amount of debt that accounts for a significant portion of their GDP, this will lower their publicized GDP values and distort their nationalization coefficients. States with powerful banks, such as Luxembourg, Switzerland, and Singapore, tend to possess high levels of debt. This may also hold true for emirates, as they possess both strong financial institutions and low population levels. 43 Libya’s ratio is high because the only available data is from 2011, before Gaddhafi’s ousting, and when the average price of Brent Crude traded at $110.66 per barrel.
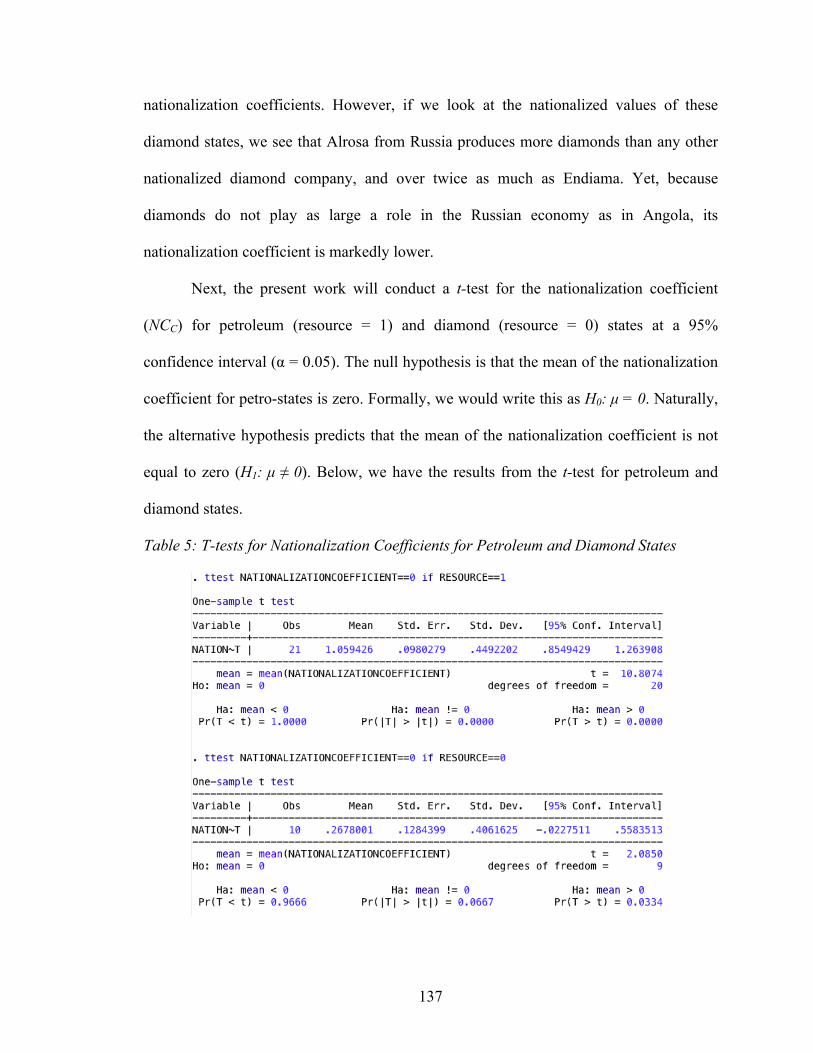
137
nationalization coefficients. However, if we look at the nationalized values of these
diamond states, we see that Alrosa from Russia produces more diamonds than any other
nationalized diamond company, and over twice as much as Endiama. Yet, because
diamonds do not play as large a role in the Russian economy as in Angola, its
nationalization coefficient is markedly lower.
Next, the present work will conduct a t-test for the nationalization coefficient
(NCC) for petroleum (resource = 1) and diamond (resource = 0) states at a 95%
confidence interval (α = 0.05). The null hypothesis is that the mean of the nationalization
coefficient for petro-states is zero. Formally, we would write this as H0: µ = 0. Naturally,
the alternative hypothesis predicts that the mean of the nationalization coefficient is not
equal to zero (H1: µ ≠ 0). Below, we have the results from the t-test for petroleum and
diamond states.
Table 5: T-tests for Nationalization Coefficients for Petroleum and Diamond States
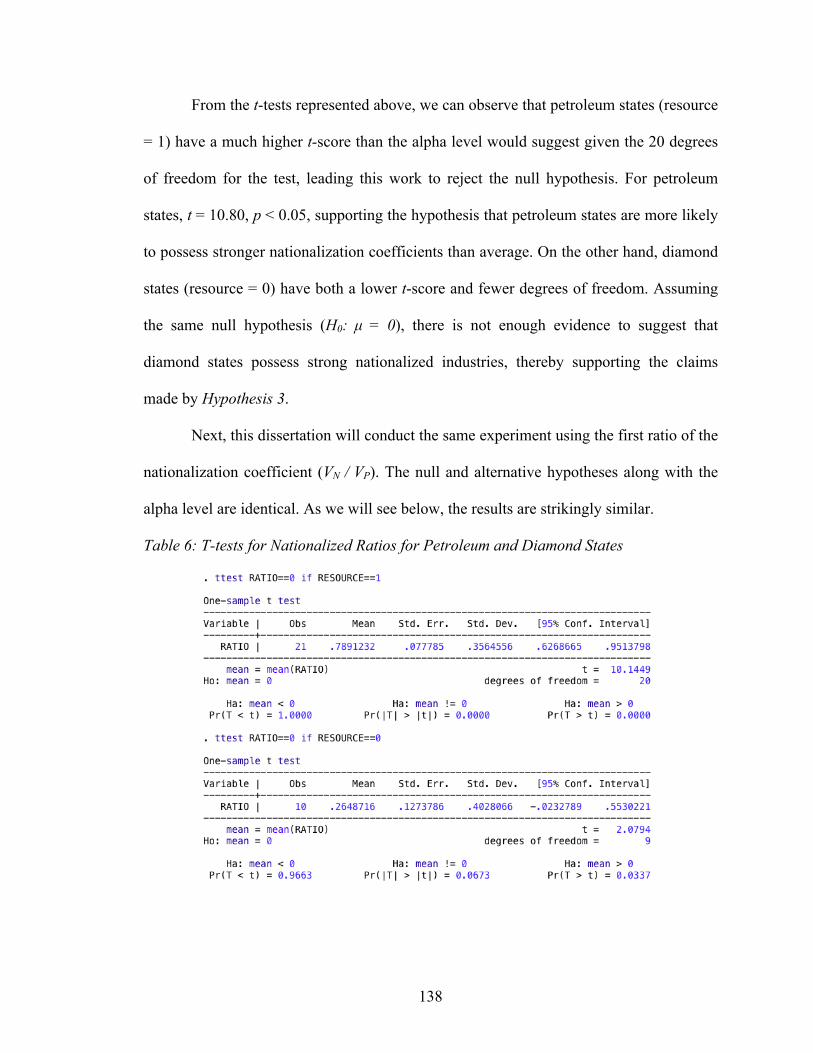
138
From the t-tests represented above, we can observe that petroleum states (resource
= 1) have a much higher t-score than the alpha level would suggest given the 20 degrees
of freedom for the test, leading this work to reject the null hypothesis. For petroleum
states, t = 10.80, p < 0.05, supporting the hypothesis that petroleum states are more likely
to possess stronger nationalization coefficients than average. On the other hand, diamond
states (resource = 0) have both a lower t-score and fewer degrees of freedom. Assuming
the same null hypothesis (H0: µ = 0), there is not enough evidence to suggest that
diamond states possess strong nationalized industries, thereby supporting the claims
made by Hypothesis 3.
Next, this dissertation will conduct the same experiment using the first ratio of the
nationalization coefficient (VN / VP). The null and alternative hypotheses along with the
alpha level are identical. As we will see below, the results are strikingly similar.
Table 6: T-tests for Nationalized Ratios for Petroleum and Diamond States
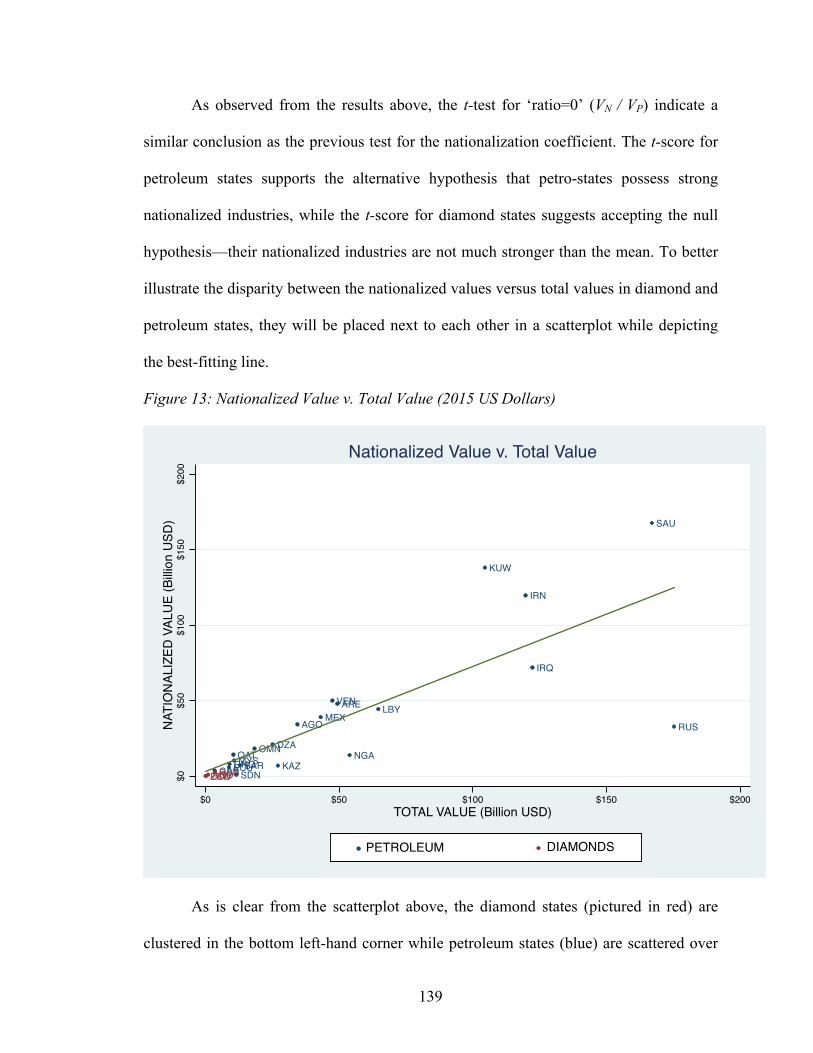
139
As observed from the results above, the t-test for ‘ratio=0’ (VN / VP) indicate a
similar conclusion as the previous test for the nationalization coefficient. The t-score for
petroleum states supports the alternative hypothesis that petro-states possess strong
nationalized industries, while the t-score for diamond states suggests accepting the null
hypothesis—their nationalized industries are not much stronger than the mean. To better
illustrate the disparity between the nationalized values versus total values in diamond and
petroleum states, they will be placed next to each other in a scatterplot while depicting
the best-fitting line.
Figure 13: Nationalized Value v. Total Value (2015 US Dollars)
As is clear from the scatterplot above, the diamond states (pictured in red) are
clustered in the bottom left-hand corner while petroleum states (blue) are scattered over
GABECUGNQQATMYSSDNSAR
OMNDZA
KAZ
AGOMEX
VENARE
NGA
LBY
KUW
IRN
IRQ
SAU
RUS
ZBWCODAGORUS$0$5
0$1
00$1
50$2
00NA
TIO
NALI
ZED
VALU
E (B
illion
USD
)
$0 $50 $100 $150 $200TOTAL VALUE (Billion USD)
PETROLEUM DIAMONDS
Nationalized Value v. Total Value
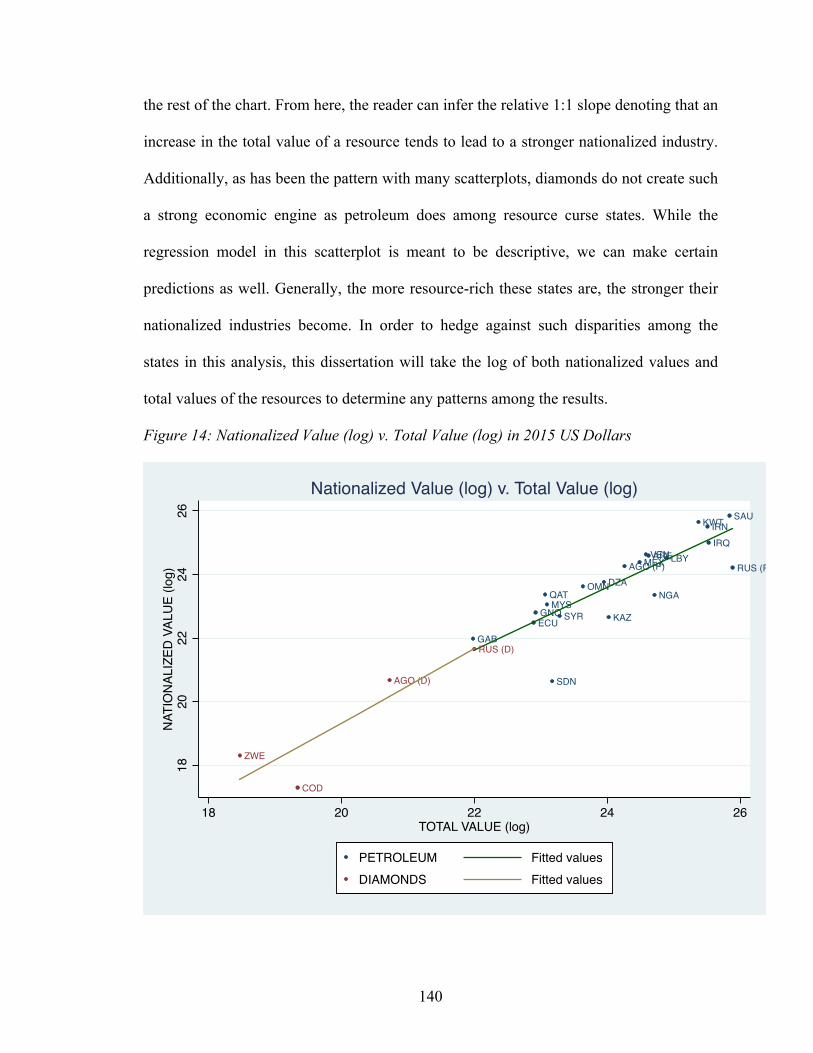
140
the rest of the chart. From here, the reader can infer the relative 1:1 slope denoting that an
increase in the total value of a resource tends to lead to a stronger nationalized industry.
Additionally, as has been the pattern with many scatterplots, diamonds do not create such
a strong economic engine as petroleum does among resource curse states. While the
regression model in this scatterplot is meant to be descriptive, we can make certain
predictions as well. Generally, the more resource-rich these states are, the stronger their
nationalized industries become. In order to hedge against such disparities among the
states in this analysis, this dissertation will take the log of both nationalized values and
total values of the resources to determine any patterns among the results.
Figure 14: Nationalized Value (log) v. Total Value (log) in 2015 US Dollars
GABECUGNQ
QATMYS
SDN
SYR
OMNDZA
KAZ
AGO (P)MEXVENARE
NGA
LBY
KWTIRNIRQ
SAU
RUS (P)
ZWE
COD
AGO (D)
RUS (D)
1820
2224
26NA
TIO
NALI
ZED
VALU
E (lo
g)
18 20 22 24 26TOTAL VALUE (log)
PETROLEUM Fitted valuesDIAMONDS Fitted values
Nationalized Value (log) v. Total Value (log)
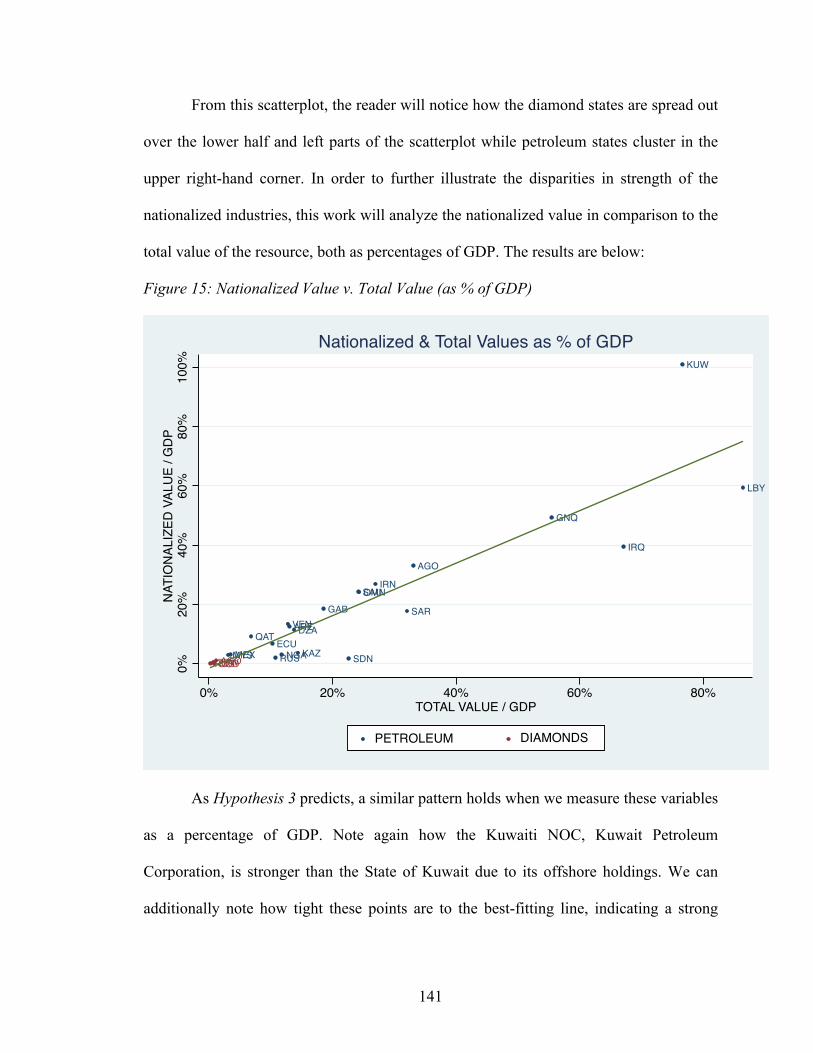
141
From this scatterplot, the reader will notice how the diamond states are spread out
over the lower half and left parts of the scatterplot while petroleum states cluster in the
upper right-hand corner. In order to further illustrate the disparities in strength of the
nationalized industries, this work will analyze the nationalized value in comparison to the
total value of the resource, both as percentages of GDP. The results are below:
Figure 15: Nationalized Value v. Total Value (as % of GDP)
As Hypothesis 3 predicts, a similar pattern holds when we measure these variables
as a percentage of GDP. Note again how the Kuwaiti NOC, Kuwait Petroleum
Corporation, is stronger than the State of Kuwait due to its offshore holdings. We can
additionally note how tight these points are to the best-fitting line, indicating a strong
MYSMEX
QATECURUSNGA
VENAREDZA
KAZ
GAB
SDN
SAUOMNIRN
SAR
AGO
GNQ
IRQ
KUW
LBY
RUSZBWCODAGO0%20
%40
%60
%80
%10
0%NA
TIO
NALI
ZED
VALU
E / G
DP
0% 20% 40% 60% 80%TOTAL VALUE / GDP
PETROLEUM DIAMONDS
Nationalized & Total Values as % of GDP

142
correlation between the two variables.44 In the next scatterplot, we see the same pattern
forming between diamond and petroleum countries, but notice how the states themselves
change order.
Figure 16: Nationalized Value v. Total Value (as % of GDP per Capita)
The reader will yet again observe a similar pattern among diamond and petroleum
states; but the states themselves appear in a different order. The value of the nationalized
and total product for Iran, Iraq, Angola, Saudi Arabia, and Nigeria largely surpass the
nationalized and total values of all diamond states. Notice, however, that the richer
Emirate states in the Gulf are less influenced by these variables. This is likely due to the
44 Because this scatterplot measures percentages, it makes little sense to log the values of the variables.
QATGABGNQAREOMNMYSECU
KUW
KAZ
VENMEXDZALBYSAR
SAU
SDN
AGO
RUS
IRN
NGA
IRQ
ZBWRUSAGOCOD05
1015
20NA
TIO
NALI
ZED
VALU
E / G
DP P
ER C
APIT
A (M
illion
)
0 5 10 15 20 25TOTAL VALUE / GDP PER CAPITA (Million)
PETROLEUM DIAMONDS
Nationalized Value v. Total Value (GDP Per Capita)
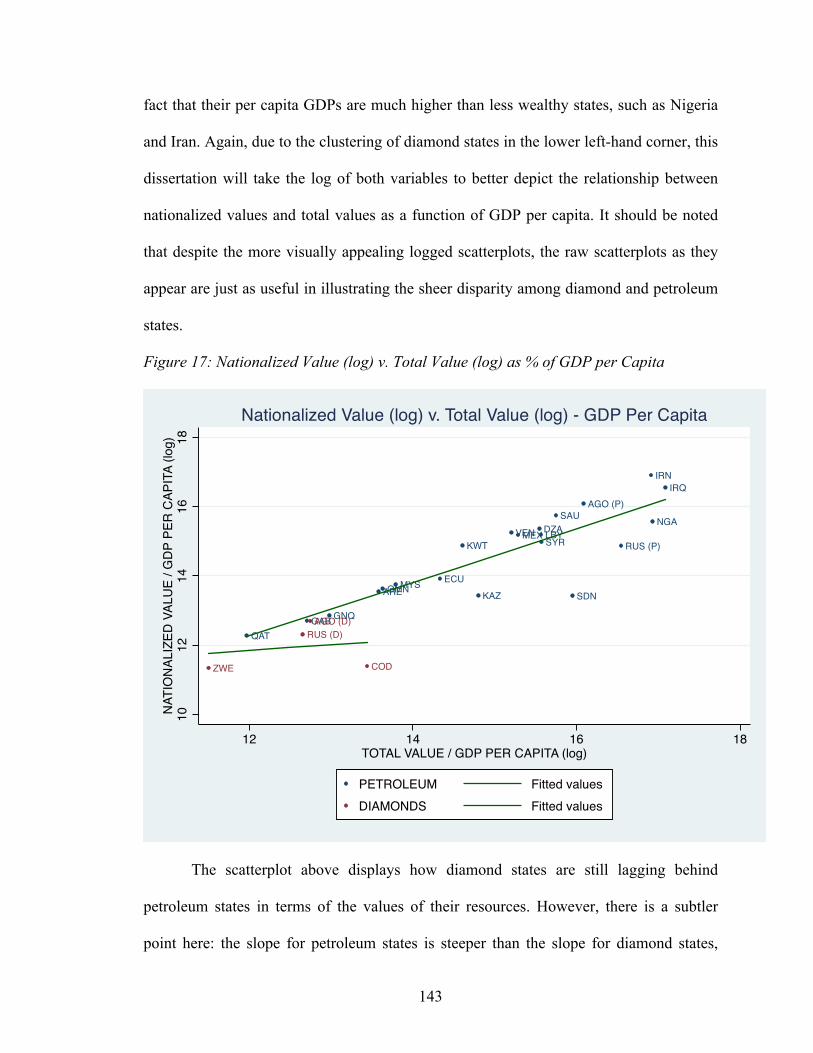
143
fact that their per capita GDPs are much higher than less wealthy states, such as Nigeria
and Iran. Again, due to the clustering of diamond states in the lower left-hand corner, this
dissertation will take the log of both variables to better depict the relationship between
nationalized values and total values as a function of GDP per capita. It should be noted
that despite the more visually appealing logged scatterplots, the raw scatterplots as they
appear are just as useful in illustrating the sheer disparity among diamond and petroleum
states.
Figure 17: Nationalized Value (log) v. Total Value (log) as % of GDP per Capita
The scatterplot above displays how diamond states are still lagging behind
petroleum states in terms of the values of their resources. However, there is a subtler
point here: the slope for petroleum states is steeper than the slope for diamond states,
QATGAB GNQ
AREOMNMYS ECU
KWT
KAZ
VENMEXDZALBYSYR
SAU
SDN
AGO (P)
RUS (P)
IRN
NGA
IRQ
ZWE
RUS (D)AGO (D)
COD
1012
1416
18NA
TIO
NALI
ZED
VALU
E / G
DP P
ER C
APIT
A (lo
g)
12 14 16 18TOTAL VALUE / GDP PER CAPITA (log)
PETROLEUM Fitted valuesDIAMONDS Fitted values
Nationalized Value (log) v. Total Value (log) - GDP Per Capita
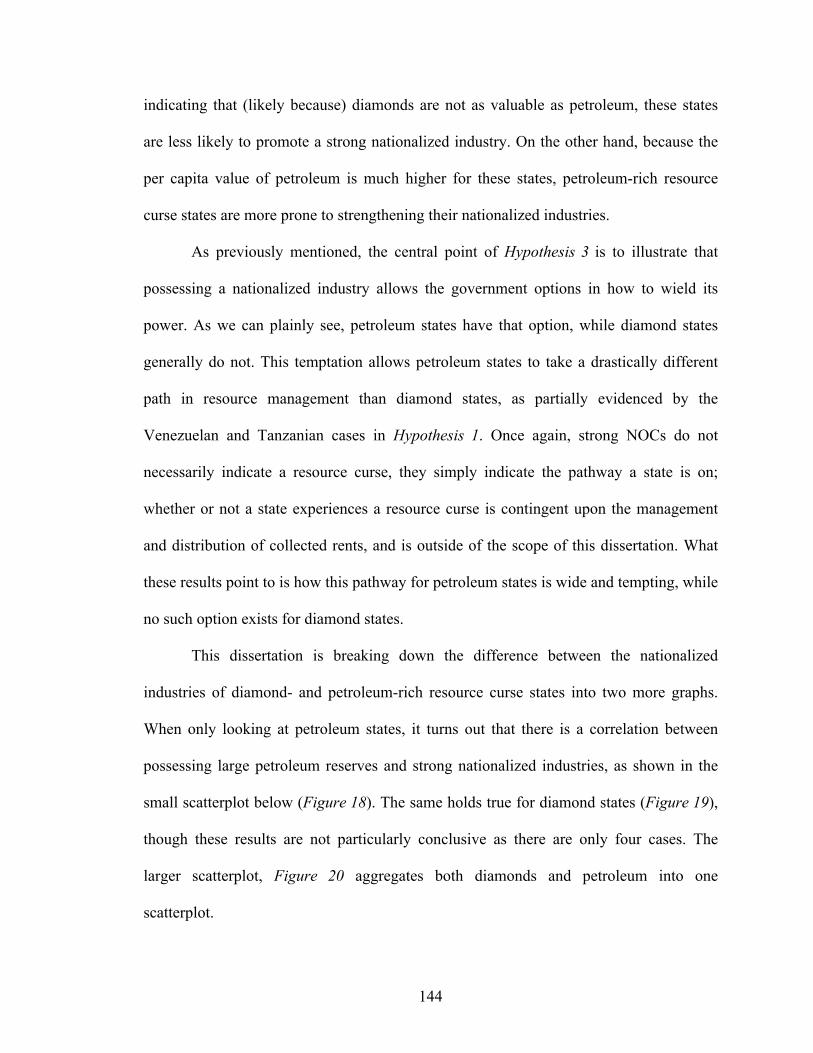
144
indicating that (likely because) diamonds are not as valuable as petroleum, these states
are less likely to promote a strong nationalized industry. On the other hand, because the
per capita value of petroleum is much higher for these states, petroleum-rich resource
curse states are more prone to strengthening their nationalized industries.
As previously mentioned, the central point of Hypothesis 3 is to illustrate that
possessing a nationalized industry allows the government options in how to wield its
power. As we can plainly see, petroleum states have that option, while diamond states
generally do not. This temptation allows petroleum states to take a drastically different
path in resource management than diamond states, as partially evidenced by the
Venezuelan and Tanzanian cases in Hypothesis 1. Once again, strong NOCs do not
necessarily indicate a resource curse, they simply indicate the pathway a state is on;
whether or not a state experiences a resource curse is contingent upon the management
and distribution of collected rents, and is outside of the scope of this dissertation. What
these results point to is how this pathway for petroleum states is wide and tempting, while
no such option exists for diamond states.
This dissertation is breaking down the difference between the nationalized
industries of diamond- and petroleum-rich resource curse states into two more graphs.
When only looking at petroleum states, it turns out that there is a correlation between
possessing large petroleum reserves and strong nationalized industries, as shown in the
small scatterplot below (Figure 18). The same holds true for diamond states (Figure 19),
though these results are not particularly conclusive as there are only four cases. The
larger scatterplot, Figure 20 aggregates both diamonds and petroleum into one
scatterplot.
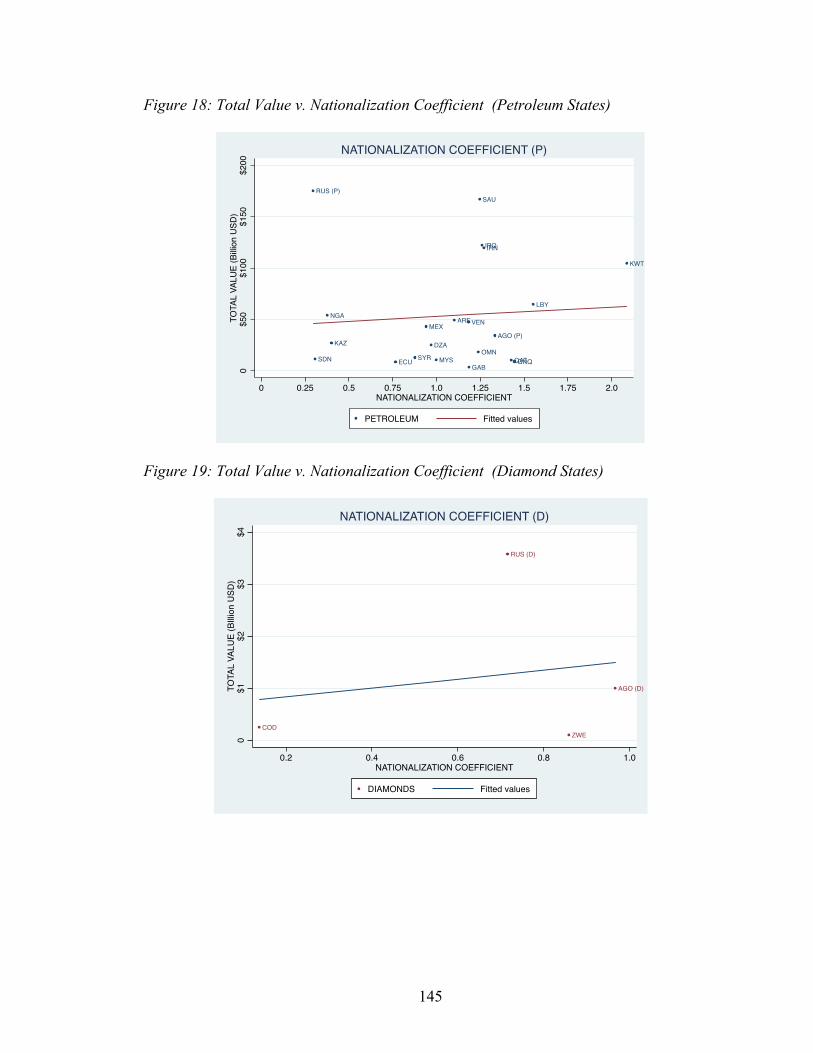
145
Figure 18: Total Value v. Nationalization Coefficient (Petroleum States)
Figure 19: Total Value v. Nationalization Coefficient (Diamond States)
RUS (P)
SDN
NGA
KAZ
ECU SYR
MEX
DZA
MYS
AREVEN
GAB
OMN
SAU
IRQIRN
AGO (P)
QATGNQ
LBY
KWT
0$5
0$1
00$1
50$2
00TO
TAL
VALU
E (B
illion
USD
)
0 1.5 1.750.25 0.5 0.75 1.0 1.25 2.0NATIONALIZATION COEFFICIENT
PETROLEUM Fitted values
NATIONALIZATION COEFFICIENT (P)
COD
RUS (D)
ZWE
AGO (D)
0$1
$2$3
$4TO
TAL
VALU
E (B
Illion
USD
)
0.2 0.4 0.6 0.8 1.0NATIONALIZATION COEFFICIENT
DIAMONDS Fitted values
NATIONALIZATION COEFFICIENT (D)
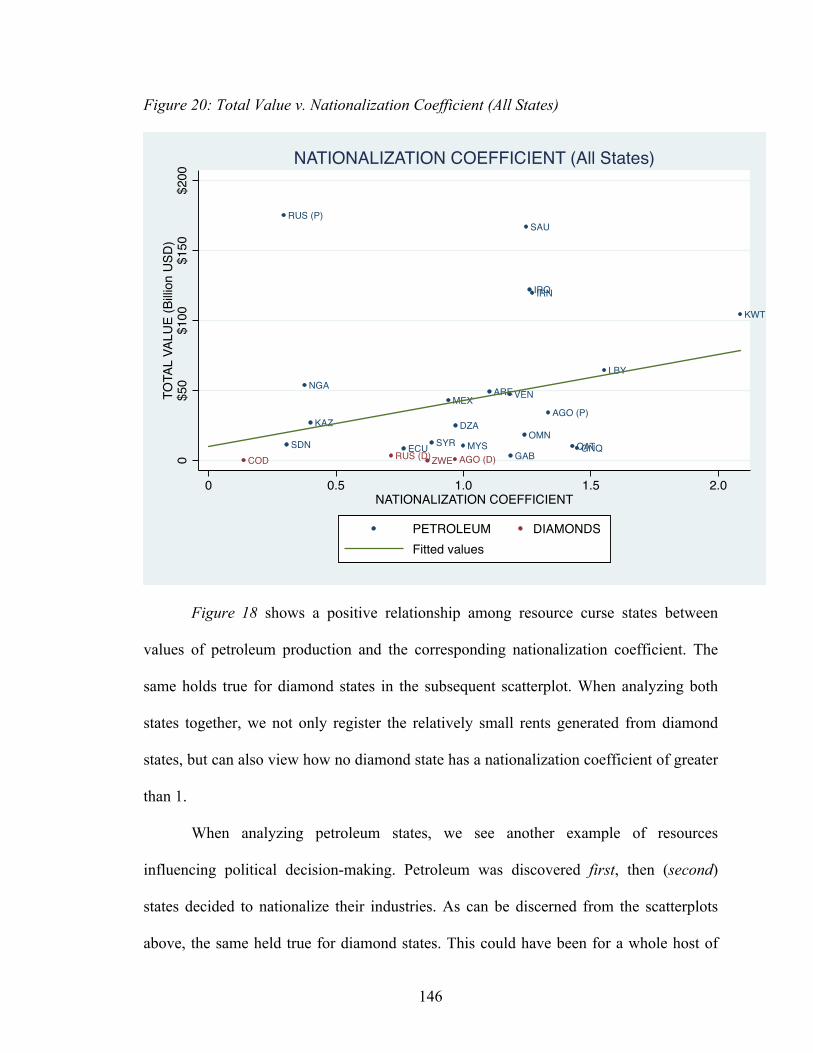
146
Figure 20: Total Value v. Nationalization Coefficient (All States)
Figure 18 shows a positive relationship among resource curse states between
values of petroleum production and the corresponding nationalization coefficient. The
same holds true for diamond states in the subsequent scatterplot. When analyzing both
states together, we not only register the relatively small rents generated from diamond
states, but can also view how no diamond state has a nationalization coefficient of greater
than 1.
When analyzing petroleum states, we see another example of resources
influencing political decision-making. Petroleum was discovered first, then (second)
states decided to nationalize their industries. As can be discerned from the scatterplots
above, the same held true for diamond states. This could have been for a whole host of
RUS (P)
SDN
NGA
KAZ
ECU SYR
MEX
DZA
MYS
AREVEN
GAB
OMN
SAU
IRQIRN
AGO (P)
QATGNQ
LBY
KWT
COD RUS (D)ZWE AGO (D)0$5
0$1
00$1
50$2
00TO
TAL
VALU
E (B
illion
USD
)
0 0.5 1.0 1.5 2.0NATIONALIZATION COEFFICIENT
PETROLEUM DIAMONDSFitted values
NATIONALIZATION COEFFICIENT (All States)
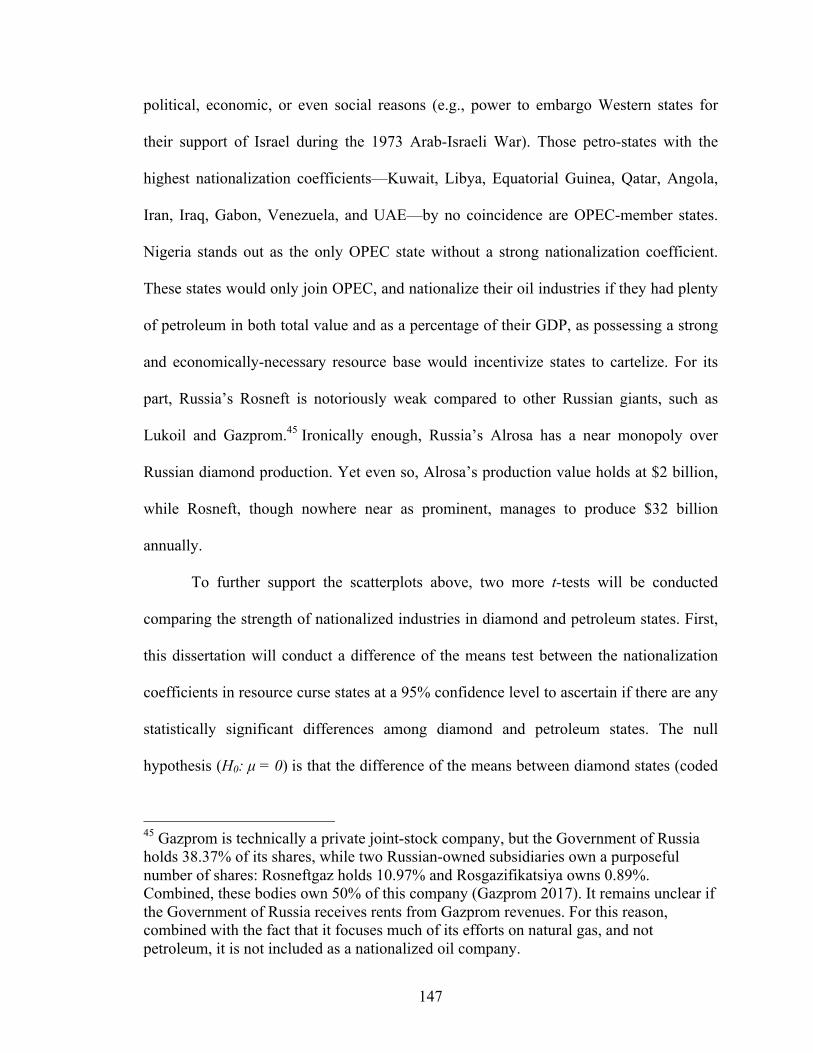
147
political, economic, or even social reasons (e.g., power to embargo Western states for
their support of Israel during the 1973 Arab-Israeli War). Those petro-states with the
highest nationalization coefficients—Kuwait, Libya, Equatorial Guinea, Qatar, Angola,
Iran, Iraq, Gabon, Venezuela, and UAE—by no coincidence are OPEC-member states.
Nigeria stands out as the only OPEC state without a strong nationalization coefficient.
These states would only join OPEC, and nationalize their oil industries if they had plenty
of petroleum in both total value and as a percentage of their GDP, as possessing a strong
and economically-necessary resource base would incentivize states to cartelize. For its
part, Russia’s Rosneft is notoriously weak compared to other Russian giants, such as
Lukoil and Gazprom.45 Ironically enough, Russia’s Alrosa has a near monopoly over
Russian diamond production. Yet even so, Alrosa’s production value holds at $2 billion,
while Rosneft, though nowhere near as prominent, manages to produce $32 billion
annually.
To further support the scatterplots above, two more t-tests will be conducted
comparing the strength of nationalized industries in diamond and petroleum states. First,
this dissertation will conduct a difference of the means test between the nationalization
coefficients in resource curse states at a 95% confidence level to ascertain if there are any
statistically significant differences among diamond and petroleum states. The null
hypothesis (H0: µ = 0) is that the difference of the means between diamond states (coded
45 Gazprom is technically a private joint-stock company, but the Government of Russia holds 38.37% of its shares, while two Russian-owned subsidiaries own a purposeful number of shares: Rosneftgaz holds 10.97% and Rosgazifikatsiya owns 0.89%. Combined, these bodies own 50% of this company (Gazprom 2017). It remains unclear if the Government of Russia receives rents from Gazprom revenues. For this reason, combined with the fact that it focuses much of its efforts on natural gas, and not petroleum, it is not included as a nationalized oil company.
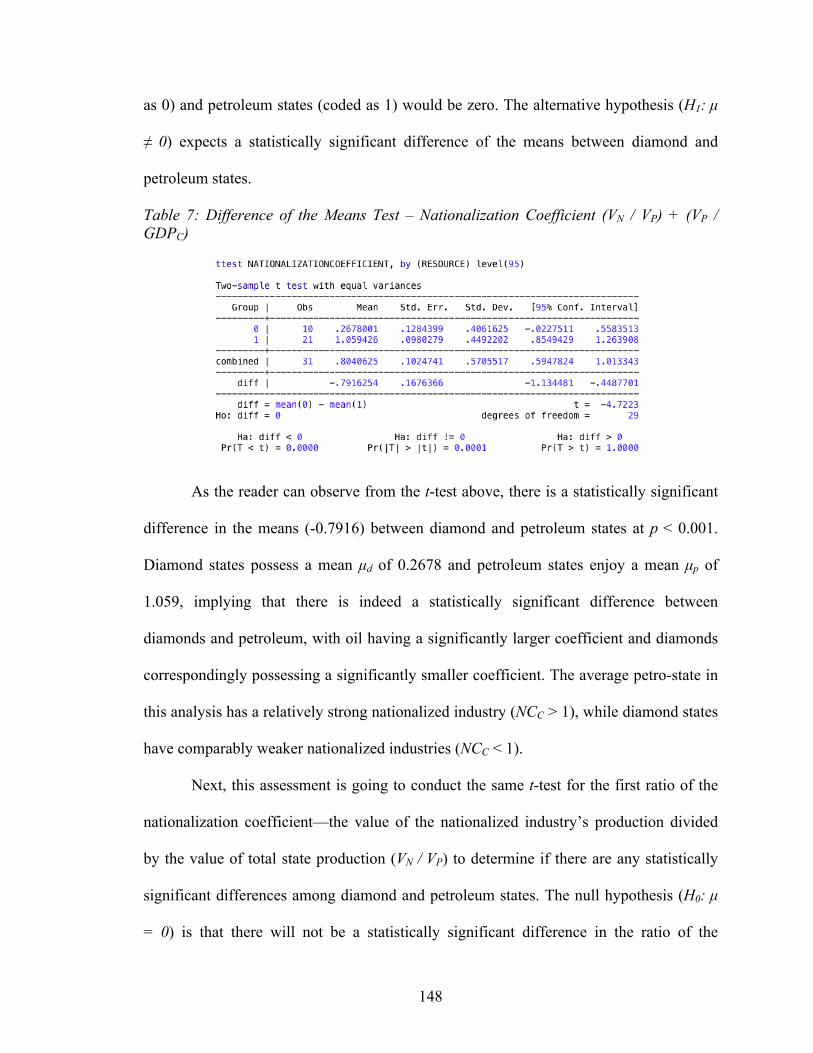
148
as 0) and petroleum states (coded as 1) would be zero. The alternative hypothesis (H1: µ
≠ 0) expects a statistically significant difference of the means between diamond and
petroleum states.
Table 7: Difference of the Means Test – Nationalization Coefficient (VN / VP) + (VP / GDPC)
As the reader can observe from the t-test above, there is a statistically significant
difference in the means (-0.7916) between diamond and petroleum states at p < 0.001.
Diamond states possess a mean µd of 0.2678 and petroleum states enjoy a mean µp of
1.059, implying that there is indeed a statistically significant difference between
diamonds and petroleum, with oil having a significantly larger coefficient and diamonds
correspondingly possessing a significantly smaller coefficient. The average petro-state in
this analysis has a relatively strong nationalized industry (NCC > 1), while diamond states
have comparably weaker nationalized industries (NCC < 1).
Next, this assessment is going to conduct the same t-test for the first ratio of the
nationalization coefficient—the value of the nationalized industry’s production divided
by the value of total state production (VN / VP) to determine if there are any statistically
significant differences among diamond and petroleum states. The null hypothesis (H0: µ
= 0) is that there will not be a statistically significant difference in the ratio of the
149
nationalized industry (VN / VP) between diamond- and petroleum-rich resource curse
states, whereas the alternative hypothesis (H1: µ ≠ 0) expects statistically significant
differences between the means.
Table 8: Difference of the Means Test - Ratio (VN / VP)
Once again, the results from this t-test further support Hypothesis 3’s postulation
that petroleum resource curse states possess stronger nationalized industries in relation to
the total resource industry. The reader will notice a statistically significant difference (-
0.5242) of the means at p < 0.001, with diamond states having a mean µd of 0.2648 and
petroleum states with a comparably stronger mean µp at 0.7891. These results suggest
rejecting the null hypothesis, thereby supporting the alternative hypothesis.
As previously hinted, the results from these t-tests may be due to the value of the
resource and the subsequent incentive to cartelize into international organizations, such as
OPEC. Specifically in regards to OPEC, nationalizing member states’ oil industries
makes a lot of sense. It would be very difficult, if not impossible, to coordinate a
successful embargo if states liberalized their oil industries. While normative questions on
whether or not a state ought to nationalize resource industries is beyond the scope of this
dissertation, the general point stands: by possessing the capability to nationalize their oil
150
industries for large profits, petroleum states are susceptible to fundamentally different
problems and dilemmas than diamond states, which neither have the inclination nor the
profitable resources to develop strong nationalized industries. This result runs against
contemporary scholarly trends suggesting that there is a fundamentally social
underpinning to policymaking, including decision-making processes that lead to a
resource curse. Whereas the current narrative suggests a ‘turtles all the way down’ theme
in resource curse literature (and social sciences in general), these results do not seem to
support such a hypothesis. In the case of Hypothesis 3, first came the resource, then the
policy (then the curse). Naturally, some petro-states create good policies aimed at
benefiting their populace, while others take a more populist approach, which benefits
incumbents’ short-term goals at the expense of long-term benefits to the public. Missing
from the discussion, of course, is every diamond state that had no opportunity to either
develop a country-saving Equinor in Norway or a political arm of an increasingly
autocratic regime, such as PDVSA in Venezuela. Because of the low-dollar value of
diamonds in comparison to petroleum, combined with the fact that the world economy is
pinned upon the latter, diamond states cannot nationalize their industries nor wield
similar economic power over the West as petroleum states have done (e.g., the 1973 and
1979 oil embargos). This is the peculiar curse diamonds states must bear—their resource
is not profitable enough to raise themselves out of poverty, yet it remains lootable enough
to entice gangs and rebels to engage in illicit activity and fund rebellions.
In the final hypothesis testing the political resource curse, this work will assess
potential differences between diamond- and petroleum-rich resource curse states in
151
relation to the enforcement of their property rights, predicting that petroleum-rich states
will enforce property rights more than their diamond-rich counterparts.
Testing Hypothesis 4
Petroleum-rich states are more likely to exercise stricter property rights than diamond-rich states. This hypothesis is geared to illustrate differences among diamond and petroleum
states vis-à-vis the enforcement of property rights within their states. As will be expanded
upon later on, strong property rights enforcements are necessary, but insufficient
conditions for evading the resource curse. However, suffering from weak property rights
enforcement allows for ‘might is right’ practices to the dictate resource extraction
process, thereby allowing strongmen or gangs to exploit weaker groups. All of the
hypotheses testing the political resource curse are aimed at triangulating differences
between diamond- and petroleum-rich resource curse states. As part of this effort and to
avoid collinearity among this work’s hypotheses, Hypothesis 4 examines a very different
facet of the inner workings of resource curse states—property rights enforcement. In
testing government-MNC strife, strength of the resource class, strength of nationalized
industries, and enforcement of property rights, this chapter seeks to shed light on
differences among the inner workings of diamond- and petroleum-rich resource curse
states over time. Similar to other hypotheses, this postulation attempts to evaluate
divergences in governing practices among petroleum and diamond states. Hypothesis 4 is
grounded on the material differences between petroleum and diamonds, suggesting that
these differences contribute to the disparity in resource curses states experience. This is
152
the final politically-based hypothesis designed to show how diamond- and petroleum-rich
resource curse states experience different resource curses. Again, this hypothesis is
specifically designed to assess state actions at a certain crossroads—in this case property
rights enforcement—to analyze whether diamond and petroleum states react differently
because of the resources they possess. Hypothesis 4, similar to the other political resource
curse hypotheses, analyzes an esoteric and isolated variable of the resource curse in an
attempt to triangulate how diamond- and petroleum-rich states suffer from curses in
distinct manners. Furthermore, this work is seeking to avoid collinearity among its
hypotheses. While it is always tempting (as this dissertation does for Hypotheses 2 and 6)
to compare petroleum and diamonds only in terms of their monetary value, a vital part of
the theory of resource curses is pinned on how the material differences between
petroleum and diamonds leads states to adopts different paths in their tracks in or out of
the resource curse.
With this in mind, there are two major material differences between petroleum
and diamonds. First, as is clearly evident by the price, diamonds are scarcer than
petroleum. However, because they last forever, as the saying goes, private companies can
keep them off the market to maintain prices synthetically inflated. Additionally, because
diamonds are small, they can be stored in relatively compact and secure locations, which
would decrease costs for the extracting company; it is also for this reason that they are
considered to be lootable. Obviously, petroleum can be stored for thousands of years in
the right conditions, but after it is extracted, crude oil is exposed to light and air, which
begins to photochemically degrade and evaporate, meaning that it must be consumed in a
timely fashion. The second major difference is deceptively simple and obvious, but it is
153
what Hypothesis 4 is concerned with—oil is a liquid and diamonds are solid. Because
diamonds are solid, they cannot leak or evaporate as petroleum does once they are mined.
This also means that diamonds cannot be moved through pipelines in the same way
petroleum and natural gas is transported.46 While prima facie this hypothesis may be of
little consequence, there may be long-lasting governmental responses to such a simple
difference in resource, namely in the form of property rights.
Especially in the Arabian Peninsula, petroleum states originally made little effort
to delineate their territories before the oil era. Yet after Arabian sweet petroleum became
a major export, these states made considerable strides in defining frontiers, sometimes
leading to border disputes (IBP 2011:103). Qatar, for example, had border issues with its
neighbor Bahrain, which was finally settled in 2001 by a World Court order47 (Peterson
2006:742). At the sub-state level, there is a vibrant literature on the evolution and
enforcement of property rights, which will be examined in greater detail before testing
this hypothesis.
Hypothesis 4 predicts that the liquid nature of petroleum would incentivize oil
states to create stricter enforcements of property rights, so as to avoid future quarreling
among parties. As diamonds are solids and found in high concentration in mines, the
hypothesis maintains that they will be clustered in one location and not be as contentious
as drilling for oil. Mining for diamonds can be restricted to one relatively concentrated
location without infringing upon the property rights of others. The same cannot be said
46 Distinguishing oil from the world’s former largest energy source, coal, is petroleum’s mobility; it can be pumped and transported through pipelines rather than carted on wagons (Strange 1999:193). 47 Qatari-Bahraini relations considerably improved after the dispute and currently there are projects underway to connect the two countries with a ‘Friendship Bridge.’
154
for an oil field, however. To think of an oil field as a subterranean pool of fossil fuels
would be a mistake. Rather, petroleum is found embedded in between multiple layers of
rocks, all of which are at different strata below the surface. Even the word ‘petroleum’
lends to this reality, stemming from the Greek word for rock, πέτρα (petra), and the Latin
word for oil, oleum. Fields of this ‘oil in between rocks’ can encompass many different
properties, and a company drilling for petroleum in one site potentially influences the
property value of other sites, especially if companies begin drilling horizontally under the
surface. It is in instances such as these that the ‘I drink your milkshake’ logic from There
Will be Blood comes into play,48 as do the specific property rights associated with
petroleum extraction.
There are a few assumptions and contentious points that must be addressed for
this hypothesis. The first assumption is that property rights are fluid and change over
time. This hypothesis actually presumes that their enforcement would change contingent
upon the resources discovered in the state. Second, the assumption is that former colonial
powers, such as Britain and France, would leave their footprint in their colonies, which
would, in turn, mimic the laws and rights enforcements of their former colonizers. Due to
this, Hypothesis 4 will test colonial property rights using a slightly different formula than
non-colonies, such as Russia. A caveat is needed here: this colonial influenced formula
only applies to states that gained their independence after WWII. Some states, such as
Venezuela and Mexico, were Spanish colonies that fought for independence from the
48 In the final scene of this film, the main character, masterfully played by Daniel Day-Lewis, hints at the importance of property rights in the petroleum industry by screaming that if a company buys a lot near an oil field, they can figuratively take a big straw and drink someone else’s milkshake.
155
crown in the early 19th century. While it is clear that Spain left its imprint over these
states, mass extraction of oil and diamonds did not proliferate until the 20th century.
Another point deserves to be made. States enjoying strong enforcements of
property rights are not immune to resource curses. Dozens of democratically elected
governments suffer from increasingly populist governments and a growing rate of
inequality, despite (or, according to some, due to) strictly enforcing their property rights.
However, resource curse states suffer weaker property rights enforcements in relation to
their resources. As Wenar (2008) notes, the major flaw in international trade is that
consumers buy stolen goods every day, sometimes taken from the poorest people in the
world; these goods “flow through the system of global commerce under cover of a rule
that is little more than a cloak for larceny” (2008:2). In this sense, the globalization
movement that has anchored the economic world since the 1970s, has not only created
inequality along global lines, it potentially violates the rule of property rights among
mineral-rich states. Authoritarian governments, rebel gangs, and crooked bureaucrats
may smuggle, steal, or sell a state’s natural resource base. In these scenarios, loose
property rights enforcements would facilitate such activities for stronger parties, while
exploiting the work of weaker groups. Scholars have noted how this phenomenon leads to
suboptimal resource distribution and economic underdevelopment, ultimately
contributing to a resource curse (Wenar 2008; Hodler 2004; Frankel 2010; Besley &
Ghatak 2010; Persson 2005). Alternatively, mineral-rich states with strong property rights
may escape the resource curse, such as in the case of Botswana (Hodler 2004:2).
However, as this hypothesis will later depict, possessing strong property rights
enforcements do not render a state immune to the resource curse; many states, especially
156
in the Gulf, enjoy relatively strong property rights enforcements yet suffer from
undemocratic monarchies and political underrepresentation for minority groups and
immigrants.
It is important to note that this hypothesis does not measure property rights per se;
it measures property right enforcement. The data is taken from the Heritage Foundation,
and, in their words, these datapoints measure “the degree to which a country’s laws
protect private property rights and the degree to which its government enforces those
laws. It also assesses the likelihood that private property will be expropriated and
analyzes the independence of the judiciary, the existence of corruption within the
judiciary, and the ability of individuals and businesses to enforce contracts” (Heritage
2018). It is important to note here that property rights extend further than simply land
rights; rather, property rights are those rights individuals enjoy in owning possessions,
whatever they may be. Land rights, which is what this hypothesis is basing its theory on,
comprises the core of property rights enforcement, but these rights may extend to non-
land possessions, such as diamonds. Of note, a spillover effect from land rights to other
property rights is assumed, as states adopting strong land rights tend to espouse equally
strong general property rights enforcements.
Finally, even though a state’s former colonizer may influence their original
property rights, the enforcement of said rights remains largely in the current
government’s control. Yet, the thought process remains the same for colonial powers—if
the former colonial power did not enforce property rights, it seems likely that the colony
would follow it their footsteps. By the same token, when accounting for the property
rights enforcement of the former colony, the data assesses current property rights
157
enforcement, and not those from the early 20th century. While this is nowhere a perfect
measurement, and cannot encompass the horror that many African states experienced
under French, Belgian, and British rule during the early 20th century, this dissertation is
using this extra variable as a way to control for the direct colonial influence over some
states in this analysis. Even though this dissertation cannot perfectly account for a state’s
property rights trajectory over time, and property rights may be partially determined
before oil or diamonds were discovered, the enforcement of these rights remains a current
issue, with consequences that may extend beyond the resource industry.
Before comparing the differences in diamond and petroleum states regarding
property rights enforcement, the current work will present a brief literature review on the
topic, and pinpoint where Hypothesis 4 is integrated in the current literature. The
literature review below is specific only to this hypothesis, and since it is not immediately
related to the study of the resource curse, it will be presented as part of this hypothesis
and not in Chapter 2.
There are two legal doctrines surrounding the extraction of petroleum—the rule of
capture and the correlative rights doctrine. As the name suggests, the rule of capture
establishes ownership of a resource if caught in one’s own property, even though, in the
case of oil, that resource may have been drained from another’s property. Unlike the
‘finders keepers’ logic associated with rule of capture, the correlative rights doctrine
limits the rights of landowners to whatever a ‘reasonable share’ is determined to be. In
this spirit, the Texas Railroad Commission developed conservation laws to limit oil well
production, a move that would later be copied by many resource curse states, contributing
to the inclusion of Hypothesis 4 among the testable predictions in this dissertation. As we
158
will later observe, the American oil industry property rights evolution, largely taken from
the Texas Railroad Commission, would become a model for the developing world. The
hypothesis expects that because of petroleum’s large-scale grabs, combined with the
fuzzy rights nature of extraction, petroleum-rich states have had no choice but to develop
stricter and more complicated property rights laws. On the other hand, because of the
relatively simple nature of diamond extraction, these states have not needed to develop or
enforce such advanced property laws.
There are two primary trains of thought in the formation and evolution of former
colonial states. One doctrine, espoused by Engerman and Sokoloff (1997), and later
joined by Acemoglu, Johnson, and Robinson (2001), believed that initial property rights
to be determined by the amalgamation of land, labor, and the environment. Yet, after the
initial property rights were established, they morphed contingent upon economies of
scale, such as in Latin America, where the emerging property rights reflected
characteristics of inequality and economic exploitation (Alston, Harris, & Mueller
2012:2). Conversely, in many states with small-scale agricultural economies, initial
property rights exhibited a more egalitarian approach, so as to benefit many small-scale
farmers. Early property rights became key determinants in power within the
policymaking process, evolving into a strong force determining power distribution over
time. This “persistence works through the choices of immigration, education, and land
policies as well as the franchise, and patterns of banking and capital formation, inter alia,
so that colonies which started with unequal and exclusionary arrangements would
continue to have those same characteristics whereas those that started with greater
equality and inclusion saw those same characteristics persist and pervade their future
159
societies” (Alston, Harris, & Mueller 2012:2-3). One potential outcome of this
developmental pattern is a ‘reversal of fortune,’ where the colonies with fewer economic
opportunities ended up developing faster than others because the “equality and openness
of its property rights institutions are seen as being more conducive to entrepreneurship,
innovation and wealth accumulation” (Alston, Harris, & Mueller 2012:3).
The second approach to property rights in developing states values the political
economy of these states more than any physical or technological endowment at the initial
stages of property rights development. Nugent and Robinson (2005) argue that the
physical and endowments of colonies in Latin America49 were very similar when they
first gained their independence. Rather, for these scholars, the decisive determinants in
these states were the political economies they employed rather than initial endowments.
Common to both strands of thought is that “although initial factor endowments are
crucial determinants of the property rights that emerge, and although those initial
institutions do tend to be highly inertial, this does not preclude other forces from
dramatically altering the path of development along the way” (Alston, Harris, & Mueller
2012:4). While these two schools of thought disagree on the effects of initial
endowments, they agree on the evolution of property rights over time. When we apply
these schools of thought to the resource extraction industry, we can better grasp how
property rights may be enforced differently in diamond and petroleum resource curse
states, leading to their current (non)enforcement.
49 Even though their scholarship focused on Central and South America, the logic may also apply to West African states in this dataset, such as Guinea, Sierra Leone, Liberia, Ghana, and Equatorial Guinea, which possess similar physical and technological endowments.
160
In 1967, Harold Demsetz developed a now well-known theory on the evolution of
property rights, advancing the concept that the development of property rights extends
from price changes and how we use goods (Demsetz 1967). Libecap and Smith (2002)
expand this notion, finding an evolutionary pattern supporting Demsetz’s predictions in
the US oil and gas industry. They show how “the process of institutional change is
affected by political demands from competing constituencies in ways not anticipated
using a strict balancing of economic costs and benefits” (2002:590). In the United States,
“it is not just technology and the level of prices but the unpredictability (volatility) of
relative prices that has shaped the development of property rights to petroleum resources”
(2002:590). Nineteenth century oil extraction operated largely by the anarchic laws of the
‘Wild West,’ where companies sought out crude petroleum without too many laws
governing their extraction. When this became unsustainable, companies began to seek for
different extraction methods, with increased governmental regulation. Twentieth and
twenty-first century petroleum extraction has been characterized by buyouts (where a
single producer buys the competition’s oil wells) and unitization, “in which the separate
producers exchange their individual holdings in the reservoir for shares of a single,
commonly managed enterprise that encompasses the entire pool” (Libecap & Smith
2002:590).
Petroleum becomes inefficient if too many wells are placed next to each other, as
their production volume decreases with every new well. Due to this decrease in volume,
placing a well at the edge of one property may adversely influence the extraction of
petroleum in a neighboring property. Furthermore, “it became known that drilling too
many wells in particular parts of a reservoir could cause reservoir water or gas to break
161
through the producing column of oil, thus trapping significant volumes of unrecoverable
oil” (Libecap & Smith 2002:593). In their history of the evolution of the petroleum
industry in the United States, Libecap and Smith (2002) note how regulatory agencies,
such as the Texas Railroad Commission, began setting production levels and restricting
producer’s rights in extracting from the common pool of petroleum, thereby limiting the
scope for the negotiating of private contracts (2002:594).
In its nascent stages, the petroleum industry was painfully susceptible to boom
and bust, contingent upon the inconsistent demand, supply-side shortages, and tariffs
blocking imports of foreign oil into the United States. Although the Texas Railroad
Commission grew haphazardly, it rewrote “the book on production and even, to some
degree, on what constituted ‘ownership’ of oil reserves. […] And it established a new
direction for the American oil industry. Many years later, others operating on an even
larger scale would seize on it as a compelling model” (Yergin 1992:241). These ‘others’
Daniel Yergin was referring to was OPEC, and the ‘larger scale’ was the quotas the cartel
had set up to limit production. Libecap and Smith consider these per-well quotas as
property rights, encouraging waste, but becoming a staple feature of regulation
(2002:595). The US may have influenced OPEC-member states in its involvement—
some call it regulation—in resource extraction industries. There are some differences:
since the time of the Romans, governments have laid claims to mineral rights found
under private property, but two major exceptions to this rule are the United States and
Canada. The California and Klondike Gold Rush forced the American and Canadian
governments to grant mineral rights to those who bought the land, thereby encouraging
the settling of California and the Yukon (Ross 2012:33-34).
162
While petroleum extraction is governed by two competing doctrines firmly
delineating property rights, diamond state property rights play by different rules.
Artisanal diamond mining (ADM), the low-grade diamond mining done in remote rural
regions of resource curse states by peasants with rudimentary equipment, has recently
taken center-stage in diamond mining property rights research. In Liberia, for example,
USAID’s Property Rights and Artisanal Diamond Development (PRADD) has reviewed
the legal and regulatory framework governing this diamond-rich resource curse state.50
According to USAID, in the “absence of artisanal mining regulations, the terms and
conditions that accompany a Class C ADM license are unclear and contradictory in key
areas, or have no basis in law. Miners are uncertain about the license application process
and find it complicated and expensive to comply” (USAID 2011:vi). USAID further
comments, “Liberian law presently only recognizes formally registered private property
rights. All unregistered land is treated as ‘public land,’ which GOL [Government of
Liberia] can sell or encumber with long-term leases and concessions for natural resource
exploitation (USAID 2011:vi). Consequently, rural communities do directly benefit from
diamond extraction in their communal land. This phenomenon is not limited to Liberia.
For example, in Sierra Leone scholars have noted that not only is a post-conflict
development plan necessary to remove Sierra Leonean reliance on natural resources, but
also a fundamental redefinition of the property rights involved (Powlick 2005:4). The
Revolutionary United Front (RUF) managed to seize control of Sierra Leone’s diamond-
producing region because property rights enforcement in the state was so weak. While
Sierra Leone’s property rights may seem anarchical, other states, such as Tanzania,
50 PRADD originally began as a pilot program in the Central African Republic and then spread into other African states.
163
considerably restrict land ownership. According to the US Department of State’s Office
of Investment Affairs, all land in Tanzania belongs to the state. While there may be
procedures for obtaining leases and certificates of occupancy, they are often lengthy and
handled manually at the local level. In order to conduct business in Tanzania, foreign
investors “may occupy land for investment purposes through a government-granted right
of occupancy, or through sub-leases through a granted right of occupancy” (OIA 2016b).
Foreign investors, such as diamond companies, can partner with leaseholders to obtain
land access. While, according to the OIA, Tanzania leases land for up to 99 years, it is
illegal for locals to sell land to foreigners.
Property rights enforcement is not much better in Cameroon. GAN Integrity
Solutions, a Danish professional services firm, warns that in Cameroon, companies
should beware “that legal rights, including contract and property claims, can be difficult
to protect due to extensive corruption in courts,” which are unreliable, very slow and
selective in enforcing legislation (GAN 2017; ICS 2016). Furthermore, the process of
acquiring property remains problematic in Cameroon, as corruption is widespread and
enforcement of legislation is inconsistent. This effect is compounded by the reality that
nearly “half of businesses expect to give gifts in order to get a construction permit”
(GAN 2017; Enterprise Surveys 2016). Gifts to Cameroonian officials are one thing, but
the economic crisis, spurred by hyperinflation, reveals a gloomy outlook for Zimbabwe.
The pre-Mugabe days in Zimbabwe depicted a system of property rights that was
largely adequate, though highly colonial-based.51 However, with recent hyperinflation
reaching upwards of 11 million percent, property itself largely disappeared. This has led
51 Even Zimbabwe’s former name, Rhodesia, likened after Cecil Rhodes, the founder of De Beers, is a testament to Zimbabwe’s colonial past.
164
to unofficial land grabs, poaching wildlife (sometimes for sustenance in the case of
Zimbabweans and sometimes by illegal hunters from South Africa), and lack of
investment in infrastructure and agricultural projects (Bate 2006).
Tetra Tech, a leading consulting and engineering firm, explains how artisanal
miners only generate around 9% of total diamond profits from the mines they extract
(Tetra Tech 2018). Partially in response to this, USAID has also doubled their
commitment to artisanal diamond mining property rights—PRADD II—in Côte d’Ivoire
and Guinea, both resource curse states. As for Tetra Tech’s part, they are basing their
“approach on the premise that secure property rights create positive incentives for miners
to be good stewards of the land” (Tetra Tech 2018), thereby offering ADM workers
stakes in their labor. Yet, for the purposes of this dissertation, the only reason for a
consulting and engineering company to get involved in such a messy prospect as artisanal
diamond mining is because these states have not developed (or have not sufficiently
enforced) property rights for extraction industries.
Out of Africa, Guyana’s private property enforcement is not encouraging for
industry. The US Office of Investment Affairs laments that Guyana’s property rights
system “is overly bureaucratic and complex, with regulations that are overlapping and
competing, overloaded, and nontransparent” (OIA 2016a). The office further comments
that this influences proper effectiveness and enforcement of property rights. Meanwhile,
the judicial system is generally understood to be ineffective its enforcement of legal
contracts.
In light of the anecdotal cases above, Hypothesis 4 seeks to disaggregate the
property rights enforcement difference between diamond and petroleum states. Due to the
165
tricky distinctions between the rule of capture and the correlative rights doctrine,
petroleum states have been forced to develop intricate property rights laws, or else suffer
dire consequences. Diamond states never had to deal with such contentious policies, and
have therefore developed laxer property rights.
There is some anecdotal evidence to suggest that diamond states listed in this
analysis have looser conceptions of property rights. PRADD’s work in Africa is an
outcome of this. Meanwhile, the evolutionary history of property rights concerning
petroleum extraction in the United States may be symbolic of a larger phenomenon
worldwide. Discrepancies in the right of capture and correlative rights doctrine suggest
that petroleum discoveries may compel governments to create stricter property rights
laws, especially in light of the Texas Railroad Commission’s unknowing influence over
OPEC. While US petroleum property rights may be relatively strict, it is worthy to note
that most states consider subsoil minerals to be the property of the state and not
accessible to private ownership. That said, many petro-rich states grant concessions to
NOCs and IOCs for petroleum extraction, suggesting that there may be significant
unitization of oil blocks. With this in mind, Hypothesis 4 seeks to answer the question:
does the quantitative evidence match the anecdotal cases presented above?
The section below specifies why certain variables are accounted for in this
analysis, beginning with land area. Resource extraction may play a role in property rights
enforcement, but there is also academic literature suggesting that developing formerly
rural areas may also have an influence. According to Tuan (1974), Hummon (1992), and
Hiss (1990), individuals form an emotional attachment to the physical landscape around
them, rendering resource extraction in formerly rural areas as problematic. Furthermore,
166
areas with a high density of resources, such as diamond mines, may lead to suboptimal
results. Buonanno et al (2012) depict how weak property rights enforcement protecting
Sicilian sulfur mines contributed to the rise of the mafia. Olstrom and Schlager
(1992:249) find that owners are not the only resource users making long-term
investments in improving resource allocation, lending credence to the externalities of
property rights enforcements across non-resource industries. This further supports the
logic that there may be a spillover effect from resource-based land rights to other
property rights enforcements. Along a slightly different track, it behooves the analyst to
control for area when comparing large states, such as Russia, with smaller states, such as
Equatorial Guinea, in such an assessment. This dissertation will thus develop a resource
density variable, largely inspired by the works of others (e.g., Le Billon 2001) where the
value of the resource is divided by the total area, in terms of square kilometers, of a
state.52
In testing this hypothesis, there will be two dependent variables, based off of the
Heritage Foundation’s annualized dataset found in the Qualities of Governance (Teorell
et al 2017) database. The first measure is property rights, which “scores the degree to
which a country’s laws protect private property rights and the degree to which its
government enforces those laws. It also accounts for the possibility that private property
will be expropriated. In addition, it analyzes the independence of the judiciary, the
existence of corruption within the judiciary, and the ability of individuals and businesses
to enforce contracts” (Teorell et al 2017:353; Heritage 2018). The second measure is the
composite score of economic freedom as denoted by the Heritage Foundation, which is
52 Sudan’s area will be counted at pre-2011 levels, former Soviet Republics are accounted for after 1991, and Yemen’s data will begin in 1994.
167
an aggregated score measuring business freedom, trade freedom, fiscal freedom, freedom
from government, monetary freedom, investment freedom, financial freedom, property
rights, freedom from corruption, and labor freedom. As expected, there will be some
collinearity between the two dependent variables, as property rights enforcement is a
factor in measuring the economic freedom score. For continuity’s sake, Hypothesis 4 is
adopting information from the World Bank’s World Development Indicators (WDI)
dataset accounting for state GDP in terms of PPP in constant US 2010 dollars, as this
work has done for the other hypotheses. In the same spirit, in testing this hypothesis, the
present work is also using Ross and Mahdavy’s (2015) oil production dataset and
Kimberley Process diamond extraction information, as it did with Hypothesis 2 and 3.
These two dependent variables are useful measures for a variety of reasons. First,
their data is separated by both year and state, allowing the analyst to track changes over
time. Second, property rights enforcements PRC captures one, rather idiosyncratic,
element of the resource curse. As such, this measure is a link straddling both economics,
and their subsequent discussions about private property evolution and the rule of law,
with political science studies on the implications of the resource curse. The second
dependent variable is the composite economic freedom score, labeled the Economic
Freedom Index EFIC by the Heritage Foundation. This variable not only measures
property rights enforcement, but also a number of the economic freedoms listed above.
The composite score adds granularity to this analysis, as it averages out many economic
freedom estimates into one score. Finally, this economic freedoms index is largely based
off public data collected by the Economist Intelligence Unit’s Country Commerce (2009–
2012) dataset, the US Department of Commerce’s Country Commercial Guide (2009–
168
2012) index, and the US Department of State’s Country Reports on Human Rights
Practices (2009–2012).
Below are the four estimating equations to test Hypothesis 4 seeking to determine
statistically significant differences between diamond and petroleum resource curse states
in this dissertation. The first two equations measure property rights enforcement and
composite economic freedom scores in states that were not colonized.53 The third and
fourth formulas offer control variables for property rights and economic freedom scores
for former colonies. These extra variables are β5PRE for former colonizers’ property
rights and β5EFIE for former colonizers’ economic freedom scores for equations three
and four, respectively. Further below, this work will then estimate these equations with
ordinary least squares regressions. The property rights estimating equation for non-
colonies reads below as the following:
5.3) 𝑃𝑅! = β!𝑥! + β!𝑉!𝐷!
+ β!𝐺𝐷𝑃! − 𝑉!
𝐷!+ β!𝑙𝑜𝑔 𝐴! + β!𝑙𝑜𝑔 𝑃𝑂𝑃! + ε
where PRC is the property rights score as determined by the Heritage Foundation and
found in the Qualities of Governance database, and x0 is the y-intercept. The beta terms β
are the linear model’s corresponding coefficient estimates. The first independent variable
is the value of resource VP divided by the population of a state DC to give us the value per
capita of the resource. The second independent variable is the value of a state’s c GDP
minus the value of its resource production VP, which would account for the GDP of a
53 This dissertation is not counting Russia as a colony of the Soviet Union, though it was clearly influenced by the superpower. The Russian economic model has largely shifted to one of a liberal market economy since the fall of the Berlin Wall. Additionally, as previously mentioned, states that gained their independence in the 19th century (e.g., Mexico, Ecuador, and Venezuela) will not be counted as colonies.
169
state if it did not possess petroleum or diamonds.54 This number is divided by the
population D of the state c. Similar to Hypothesis 2 and 3, because this analysis
encompasses very different states in terms of area and population, this dissertation will
take the log of these variables log(AC) and log(POPC) to guard against major outliers
among large states in the dataset.55 Finally, a normally distributed error term ε finishes off
the estimating equation.
The second regression model for non-colonies is based off of the composite score
of the economic freedom index EFIC. Formally, we would write this as the following:
5.4) 𝐸𝐹𝐼! = β!𝑥! + β!𝑉!𝐷!
+ β!𝐺𝐷𝑃! − 𝑉!
𝐷!+ β!𝑙𝑜𝑔 𝐴! + β!𝑙𝑜𝑔 𝑃𝑂𝑃! + ε
The dependent variable EFIC is the composite economic freedom score of a state.
EFI scores are partially composed of the property rights score, but are also comprised of
scores measuring judicial effectiveness, government integrity, tax burden, government
spending, business health, business freedom, labor freedom, monetary freedom, trade
freedom, investment freedom, and financial freedom. The same independent variables are
accounted for as in the previous regression model.
Because colonial powers held great influence over the initial conception of
property rights in their colonies, they must be accounted for in the following regressions.
In order to reflect the colonial past of former colonies, estimating equations 1 and 2 will
remain largely the same, but another control variable will be added. For property rights
54 Technically, accounting for the total value of production VP and GDPC in this estimating equations would both work as control variables, albeit while adding collinearity between them in a manner that would have made it more difficult to identify true effects in either. 55 Area is included in this analysis because property rights may be more contentious in smaller states where parties are more eager to delineate their territories.
170
enforcement and composite economic freedom scores, this work will account for the
colonizing state’s scores as a control variable. To be sure, this extra control does not
capture the totality of how colonial powers influenced property rights in their colonies.
Nor do the current property rights and composite economic freedom scores of Great
Britain, France, Portugal, Spain, and Belgium reflect the institutional makeup of their
former colonies. Below are the estimating equations for the former colonies in this
analysis.
5.5) 𝑃𝑅! = β!𝑦! + β!𝑉!𝐷!
+ β!𝐺𝐷𝑃! − 𝑉!
𝐷!+ β!𝑙𝑜𝑔 𝐴! + β!𝑙𝑜𝑔 𝑃𝑂𝑃! + β!𝑃𝑅! + ε
5.6) 𝐸𝐹𝐼! = β!𝑦! + β!
𝑉!𝐷!
+ β!𝐺𝐷𝑃! − 𝑉!
𝐷!+ β!𝑙𝑜𝑔 𝐴! + β!𝑙𝑜𝑔 𝑃𝑂𝑃! + β!𝐸𝐹𝐼! + ε
where the independent variables remain identical except for PRE and EFIE, which account
for the former colonizing powers in Europe. This extra variable is added, cognizant that
the current property rights score of a former colonizer is not an adequate representation
of the effects of a colonizer upon the colonized. That said, since property rights
enforcement scores are unavailable throughout colonial times, this score is incorporated
to measure, however minute, the effect of the colonizing state on resource curse states.
Most states in this dataset were one-time colonies. However, as previously mentioned,
many gained their independence in the 19th century and early 20th century, indicating that
while they were influential, this influence is diminished when measuring current property
rights enforcement in their former colonies. Because of this, the former colonial powers’
property rights enforcement scores will only be accounted for those states that gained
their independence after WWII. A full description of how the states were categorized is
available in Appendix 3.
171
Analysis
Before conducting regression analyses as defined in equations 1 and 2
determining if resources play a role in shaping private property enforcement, this
dissertation will visually assess the current state of property rights in both diamond and
petroleum resource curse states. Naturally, due to the sheer difference in value between
diamond and petroleum resource curse states, this work incorporated the log function of
the value per capita to observe more clearly if there is any correlation between diamond
and petroleum states along the lines of property rights and the composite score given to
these states by the Heritage Foundation. Below is the first scatterplot for the year 2014,
which is the most recent year with complete data.56
56 Oil production values by state are still incomplete for 2015 onward, possibly because of the severe drop in prices due to US-led fracking and the subsequent oil glut.
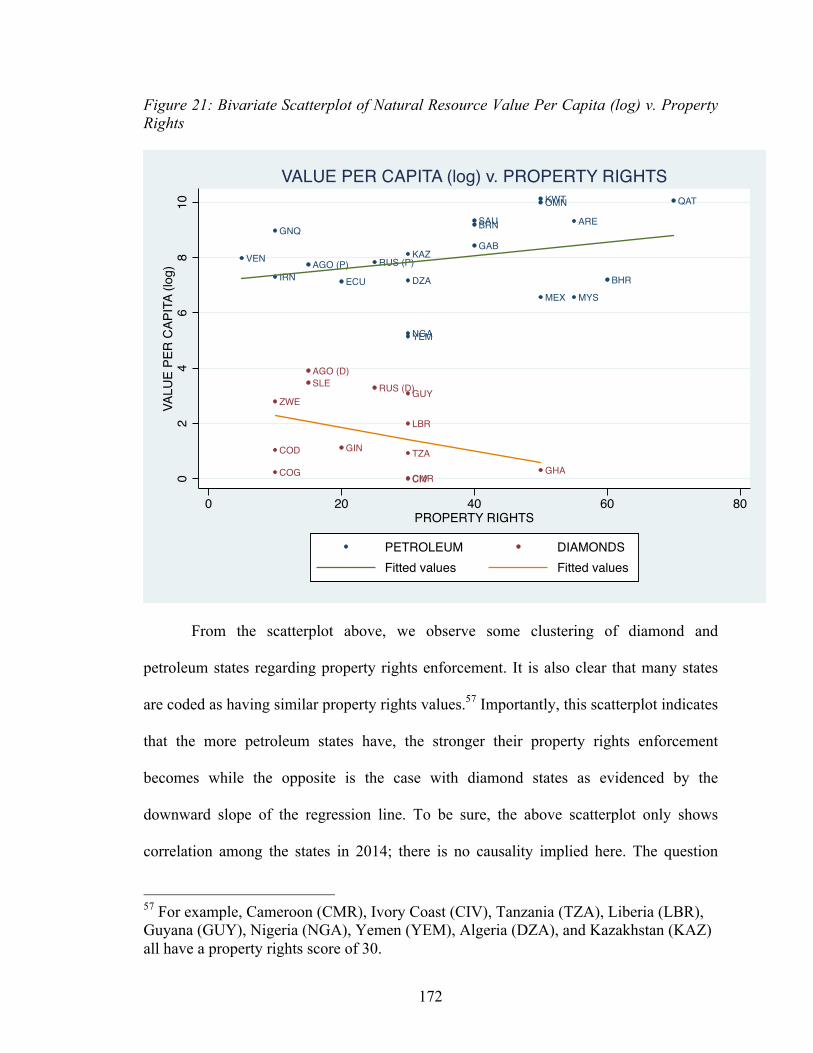
172
Figure 21: Bivariate Scatterplot of Natural Resource Value Per Capita (log) v. Property Rights
From the scatterplot above, we observe some clustering of diamond and
petroleum states regarding property rights enforcement. It is also clear that many states
are coded as having similar property rights values.57 Importantly, this scatterplot indicates
that the more petroleum states have, the stronger their property rights enforcement
becomes while the opposite is the case with diamond states as evidenced by the
downward slope of the regression line. To be sure, the above scatterplot only shows
correlation among the states in 2014; there is no causality implied here. The question
57 For example, Cameroon (CMR), Ivory Coast (CIV), Tanzania (TZA), Liberia (LBR), Guyana (GUY), Nigeria (NGA), Yemen (YEM), Algeria (DZA), and Kazakhstan (KAZ) all have a property rights score of 30.
VEN
GNQ
IRNAGO (P)
ECU
RUS (P)KAZ
NGAYEM
DZA
SAUBRN
GAB
KWT
MEX
OMN
ARE
MYS
BHR
QAT
COD
ZWE
COG
SLEAGO (D)
GIN
RUS (D)
CMR
GUY
TZA
CIV
LBR
GHA02
46
810
VALU
E PE
R CA
PITA
(log
)
0 20 40 60 80PROPERTY RIGHTS
PETROLEUM DIAMONDSFitted values Fitted values
VALUE PER CAPITA (log) v. PROPERTY RIGHTS
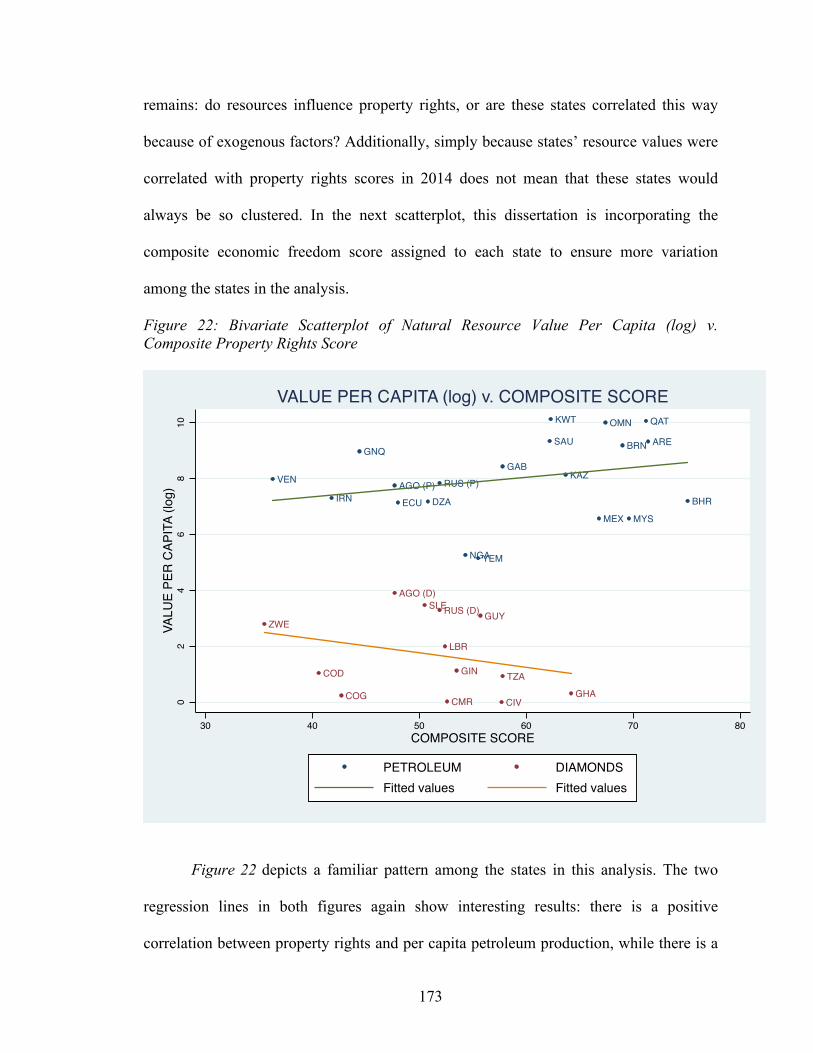
173
remains: do resources influence property rights, or are these states correlated this way
because of exogenous factors? Additionally, simply because states’ resource values were
correlated with property rights scores in 2014 does not mean that these states would
always be so clustered. In the next scatterplot, this dissertation is incorporating the
composite economic freedom score assigned to each state to ensure more variation
among the states in the analysis.
Figure 22: Bivariate Scatterplot of Natural Resource Value Per Capita (log) v. Composite Property Rights Score
Figure 22 depicts a familiar pattern among the states in this analysis. The two
regression lines in both figures again show interesting results: there is a positive
correlation between property rights and per capita petroleum production, while there is a
VEN
IRN
GNQ
AGO (P)
ECU DZA
RUS (P)
NGAYEM
GAB
SAU
KWT
KAZ
MEX
OMN
BRN
MYS
QAT
ARE
BHR
ZWE
COD
COG
AGO (D)SLERUS (D)
LBR
CMR
GIN
GUY
CIV
TZA
GHA
02
46
810
VALU
E PE
R CA
PITA
(log
)
30 40 50 60 70 80COMPOSITE SCORE
PETROLEUM DIAMONDSFitted values Fitted values
VALUE PER CAPITA (log) v. COMPOSITE SCORE
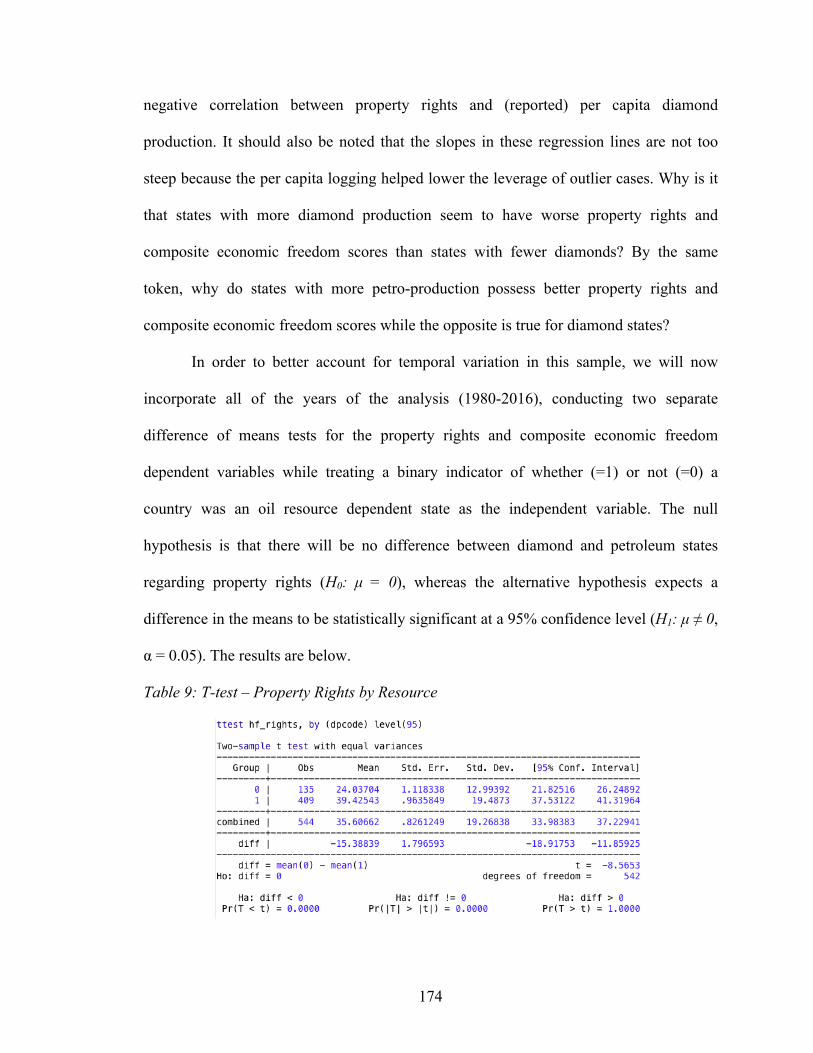
174
negative correlation between property rights and (reported) per capita diamond
production. It should also be noted that the slopes in these regression lines are not too
steep because the per capita logging helped lower the leverage of outlier cases. Why is it
that states with more diamond production seem to have worse property rights and
composite economic freedom scores than states with fewer diamonds? By the same
token, why do states with more petro-production possess better property rights and
composite economic freedom scores while the opposite is true for diamond states?
In order to better account for temporal variation in this sample, we will now
incorporate all of the years of the analysis (1980-2016), conducting two separate
difference of means tests for the property rights and composite economic freedom
dependent variables while treating a binary indicator of whether (=1) or not (=0) a
country was an oil resource dependent state as the independent variable. The null
hypothesis is that there will be no difference between diamond and petroleum states
regarding property rights (H0: µ = 0), whereas the alternative hypothesis expects a
difference in the means to be statistically significant at a 95% confidence level (H1: µ ≠ 0,
α = 0.05). The results are below.
Table 9: T-test – Property Rights by Resource
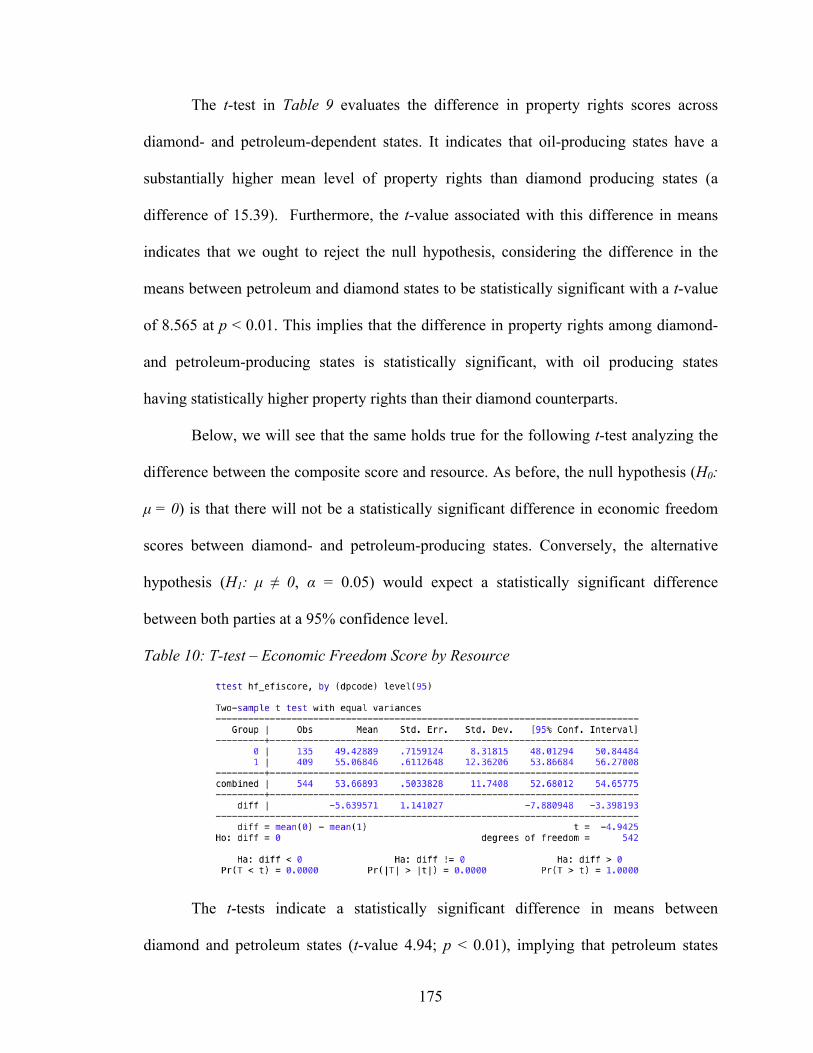
175
The t-test in Table 9 evaluates the difference in property rights scores across
diamond- and petroleum-dependent states. It indicates that oil-producing states have a
substantially higher mean level of property rights than diamond producing states (a
difference of 15.39). Furthermore, the t-value associated with this difference in means
indicates that we ought to reject the null hypothesis, considering the difference in the
means between petroleum and diamond states to be statistically significant with a t-value
of 8.565 at p < 0.01. This implies that the difference in property rights among diamond-
and petroleum-producing states is statistically significant, with oil producing states
having statistically higher property rights than their diamond counterparts.
Below, we will see that the same holds true for the following t-test analyzing the
difference between the composite score and resource. As before, the null hypothesis (H0:
µ = 0) is that there will not be a statistically significant difference in economic freedom
scores between diamond- and petroleum-producing states. Conversely, the alternative
hypothesis (H1: µ ≠ 0, α = 0.05) would expect a statistically significant difference
between both parties at a 95% confidence level.
Table 10: T-test – Economic Freedom Score by Resource
The t-tests indicate a statistically significant difference in means between
diamond and petroleum states (t-value 4.94; p < 0.01), implying that petroleum states
176
have stronger property rights enforcement than diamond states. While diamond states
possess a mean µd of 49.429, petroleum states enjoy a stronger EFI mean µp at 55.068,
with a difference of the means of -5.639.
However, these t-tests do not bestow causality, as the means may be different for
a variety of reasons, such as the potential that the associations accounted for are arising
due to omitted variables. To better account for this eventuality, this work will run
multivariate regressions while including a set of plausible omitted variables as controls
using the complete dataset (1980 – 2014). Meanwhile, this dissertation will hold constant
the effects of area, population, former colonial power scores, and GDP minus value of
production per capita [(GDPC – VP) / DC] rates. In the case of Oman, petroleum
production exceeds GDP, largely due to Omani foreign debt reaching nearly 30% of total
GDP (IMF 2018), thereby lowering their GDP values. However, this sultanate will still
be included for descriptive purposes. Below is the table for the regression analyses
adopting property rights as the dependent variable and disaggregating the dataset into
petroleum and diamond states.
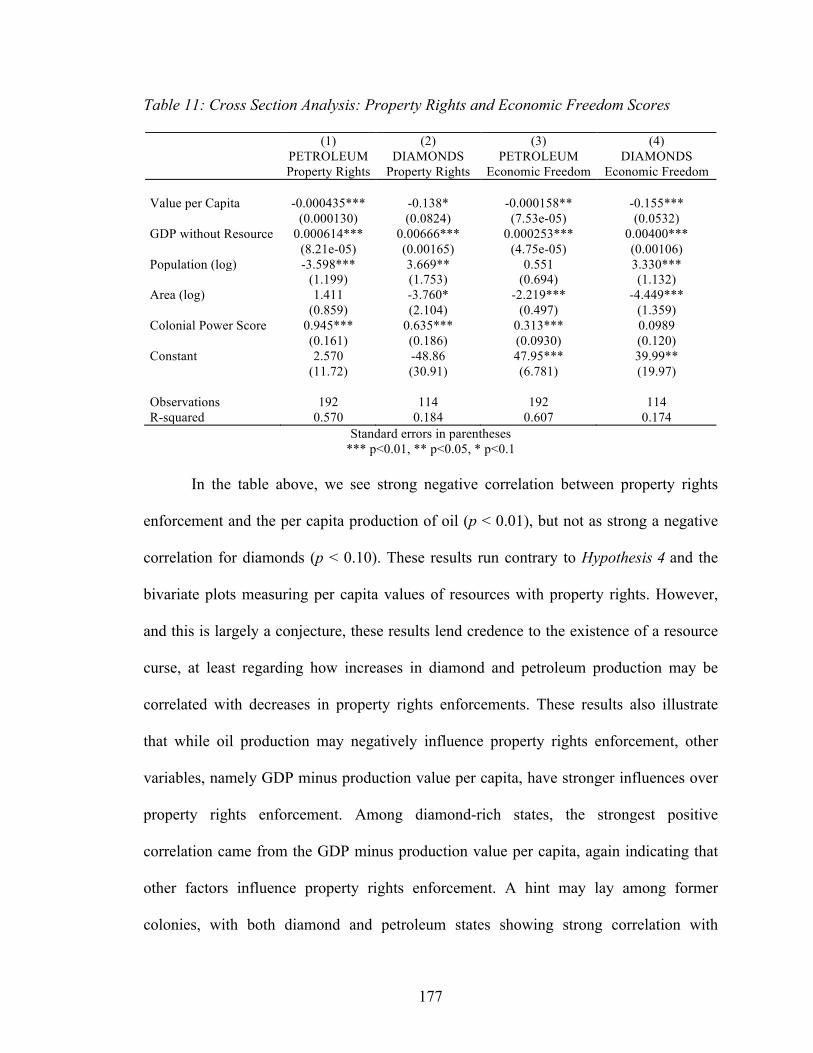
177
Table 11: Cross Section Analysis: Property Rights and Economic Freedom Scores (1) (2) (3) (4) PETROLEUM
Property Rights DIAMONDS
Property Rights PETROLEUM
Economic Freedom DIAMONDS
Economic Freedom Value per Capita -0.000435*** -0.138* -0.000158** -0.155*** (0.000130) (0.0824) (7.53e-05) (0.0532) GDP without Resource 0.000614*** 0.00666*** 0.000253*** 0.00400*** (8.21e-05) (0.00165) (4.75e-05) (0.00106) Population (log) -3.598*** 3.669** 0.551 3.330*** (1.199) (1.753) (0.694) (1.132) Area (log) 1.411 -3.760* -2.219*** -4.449*** (0.859) (2.104) (0.497) (1.359) Colonial Power Score 0.945*** 0.635*** 0.313*** 0.0989 (0.161) (0.186) (0.0930) (0.120) Constant 2.570 -48.86 47.95*** 39.99** (11.72) (30.91) (6.781) (19.97) Observations 192 114 192 114 R-squared 0.570 0.184 0.607 0.174
Standard errors in parentheses *** p<0.01, ** p<0.05, * p<0.1
In the table above, we see strong negative correlation between property rights
enforcement and the per capita production of oil (p < 0.01), but not as strong a negative
correlation for diamonds (p < 0.10). These results run contrary to Hypothesis 4 and the
bivariate plots measuring per capita values of resources with property rights. However,
and this is largely a conjecture, these results lend credence to the existence of a resource
curse, at least regarding how increases in diamond and petroleum production may be
correlated with decreases in property rights enforcements. These results also illustrate
that while oil production may negatively influence property rights enforcement, other
variables, namely GDP minus production value per capita, have stronger influences over
property rights enforcement. Among diamond-rich states, the strongest positive
correlation came from the GDP minus production value per capita, again indicating that
other factors influence property rights enforcement. A hint may lay among former
colonies, with both diamond and petroleum states showing strong correlation with
178
property rights enforcement with those of their former colonizers (petroleum: t-value
5.88; p < 0.01 and diamonds: t-value 3.41; p < 0.01).
When looking at economic freedom scores, unlike the property rights analysis,
there is neither a not a strong correlation among petroleum production and composite
economic freedom scores, nor a strong correlation between economic freedom scores and
those of their former colonialists. Regarding diamond states, we find statistically
significant negative correlation between economic freedom scores and per capita values
of diamonds (t-value -3.03; p < 0.01), lending some credence to Hypothesis 4. There is no
statistically significant correlation between diamond states’ economic freedom scores and
those of their former colonial empires.
While the regressions do not show any causality singling out resource extraction
as a causal factor in property rights, the t-tests indicate strong differences in the means of
property rights between diamond- and petroleum-dependent states. Furthermore, when
examining the bivariate plots of property rights enforcement and economic freedom
composite scores in 2014, we find considerable clustering between diamond and
petroleum states. More to the point is that an increase in petroleum production equated to
an increase of property rights enforcement and economic freedom composite scores,
while an increase in diamond production led to a decrease among these results for
diamond states. We also find statistically significant correlations between GDP minus
production value, population, and former colonial powers. To some extent, this makes
theoretical sense, as wealthier and more populated states would seek stricter property
rights enforcements to protect and encourage private investments. Do we find a similar
correlation between property rights and diamond production—yes, but not as strong (p <
179
0.10). There are no statistically significant results at an alpha level of 0.05 differentiating
diamond states vis-à-vis property rights.
Petroleum states do in fact possess stronger property rights than diamond states,
as is evidenced by the scatterplots. However, the results from the regressions are
inconclusive and do not suggest that petroleum states enjoy stronger property rights
because of their resource. Clearly, given the scatterplots and t-tests, possessing more
petroleum correlates with enjoying stronger property rights while having more diamonds
corresponds with fewer property rights, but we cannot say that petroleum causes stronger
property rights or that diamonds cause weaker property rights. This incongruence
between the anecdotal and qualitative data on one hand, and the quantitative data on the
other, leads this dissertation to conclude that results collected for Hypothesis 4 remain
inconclusive.
Chapter Conclusions
Hypothesis 3 measured nationalization coefficients among diamond and
petroleum states, finding that petro-states nationalized their industries more often (in
every resource curse state in this analysis), possessed more powerful nationalized
industries, and, judging from the slope on the regression lines in the scatterplots, were
more tempted to nationalize their industries if they possessed greater resources. Diamond
states, on the other hand, were less likely to nationalize their industries, and if they did,
they often partnered with foreign companies, as in the Democratic Republic of the
Congo, or nationalized the entire mining industry, as in Tanzania. Meanwhile, NOCs
were often used as petro-arms of resource curse states, sometimes acting in unison with
180
other states via OPEC. Hypothesis 4 measures property rights enforcement in diamond-
and petroleum-rich states, finding that petroleum-rich states are more likely to enforce
stricter property rights. Nonetheless, the evidence is inconclusive as to whether these
property rights are more enforced because of petroleum, as there was a statistically
significant correlation with many other independent variables.
This dissertation will now turn to the violent resource curse, testing Hypotheses 5
and 6 to determine how differences between diamond and petroleum states may lead
them to suffer from different violent curses.
181
Chapter 6
THE VIOLENT RESOURCE CURSE
Two hypotheses will be tested to determine if diamond- and petroleum-rich
resource curse states suffer from different violent resource curses. As elucidated in the
theory chapter, resources potentially influence policymaking differently in diamond and
petroleum states. This chapter is dedicated to understanding the subtle differences in how
these resources shape violent conflict. The first hypothesis tested in this chapter,
Hypothesis 5, seeks to demonstrate processes leading to rebel funding and activity,
especially against sitting governments. In this sense, Hypothesis 5 is evaluating the
contention that diamonds and petroleum create different pathways for rebel activity.
Meanwhile, Hypothesis 6 displays the results of these pathways, decoupling differences
between civil and international conflict and predicting this discrepancy among diamond-
and petroleum-rich resource curse states. While many resource curse scholars focus on
how states may experience violence, this dissertation seeks to tease out differences
between diamond- and petroleum-rich states on the types of violence they face. If
analysts are better equipped to pinpoint these differences in violence, then perhaps
policymakers would be better positioned to avoid certain practices leading to such
conflict.
182
Testing Hypothesis 5
Rebels seeking to overthrow the government are more likely to leverage diamond mines than oil fields. Inspired by the scholarship of Timothy Mitchell (2013), this hypothesis focuses
on how the intrinsic and material properties of diamonds and petroleum lead actors to
pursue different activities in relation to their resources. As referenced in the literature
review in Chapter 2, Mitchell’s (2013) analysis describes how coal led to democratizing
results in nineteenth century Britain. Due to coal’s extreme concentration—as opposed to
previous energy sources, such as timber in Germany or wind in the Netherlands—coal
miners possessed vast powers in their hands. Through the concentration of coal,
combined with the brotherhood created in mines, coal workers were empowered to strike
and stop the flow of energy to large cities in Britain. These strikes led miners to possess
unusual amounts of power, destabilizing aristocratic power realms, eventually leading to
a democratizing effect in Britain. While Hypothesis 5 is not geared to determine
democratization efforts, it follows in the stead of Mitchell’s (2013) work, understanding
that intrinsic values of resources persuade agents to act differently. While economic
factors, such as rents generated from petroleum, will not be ignored, this chapter will
show how material considerations influence rebel behavior in times of conflict.
Hypothesis 5 could be tested quantitatively or qualitatively; however, due to the
dearth of quantitative data on differences in violent conflict, this dissertation will conduct
a qualitative study analyzing agential motives in resource exploitation during violent
conflicts. Appendix 4 provides a complete description detailing why quantitative methods
were not implemented to test this hypothesis. To determine why rebels act the way they
183
do, we must conduct a qualitative analysis. Quantitative methods do not provide insight
into the behaviors of actors within conflicts. There is plenty of qualitative evidence
depicting how agents use resources to fund rebellions, disrupt government revenue
streams, and influence exports. As often acknowledged, the world economy is reliant on
petroleum, and any major disruption to the flow of oil would make headlines, not only
domestically, but in Wall Street, the London Stock Exchange, and perhaps merit an
official international response. Regarding diamonds, thanks to the Kimberley Process,
along with multiple other non-governmental organizations, a wealth of information
regarding violent conflict and diamond production is now publicly available.
Rebels may use a variety of strategies to overthrow governments. During the Arab
Spring,58 for example, many oil-rich and oil-poor Arab states experienced pro-democracy
movements and rebellions. Oil-poor states, such as Tunisia, Egypt, and Morocco saw
their governments concede to pro-democratic pressures relatively quickly. Meanwhile,
oil-rich states managed to either hold on to their power or fight rebels. While oil-rich
Libya and Syria are fighting protracted civil wars against rebels, others in the Gulf tapped
into their petro-wealth to appease dissidents. The Saudi monarchy, as previously
mentioned, was left untouched by Arab Spring protests by providing massive payouts for
public work projects and better salaries for government employees (Gause 2011:6). The
Arab Spring provides a tailored case study for differences between oil-rich and oil-poor
states. However, as this dissertation seeks to find differences between diamond- and
petroleum-rich states, the Arab Spring offers little help.
58 We should note that while protestors are not calling for Pan-Arabism, the constructivist argument is that the demonstrations spread across the Middle East so quickly and efficiently is because many citizens consider themselves part of a larger Arab nation.
184
Conflicts abound in other resource curse states. Mineral-rich Democratic Republic
of the Congo had to contend with the spillover from the Rwandan genocide in the 1990s.
Yet, many conflicts were largely socio-economic and cultural, rather than resource
driven. Russia has dealt with two separatist wars in Chechnya, neither related to
resources. Ecuador and Peru had border scrimmages unrelated to petroleum or diamonds.
The Iran-Iraq War was driven by conflicts dating back to antiquity, but the reality is that
Saddam Hussein first invaded Iran’s oil-rich Khuzestan province in 1980. Nonetheless,
two oil-rich states fighting each other, painful though it may be, does not provide for an
adequate case study for Hypothesis 5.
Venezuela also suffered through an attempted coup in the early 1990s. Hugo
Chávez’s Revolutionary Bolivarian Movement-200 attempted to overthrow the
government in 1992, accounting for around 300 casualties. Instead of occupying oil
fields, they sought to overtake key military and communications installations. The coup
eventually failed and Chávez was sent to jail. However, he was later released, founded
his own political party, won the 1998 election, and held on to power almost until his
death in 2013.
Oil smuggling also exists, especially in Nigeria, where valuable resources, weak
governance, and cheap labor abound. These oil smugglers are a combination of
government officials, Niger Delta militants, and locals wishing to make money. By ‘hot
tapping’ or ‘pressure tapping’ pipelines, they manage to diverge the flow of small
percentages of petroleum to other reservoirs and sell them in the black market for profit.
Because the percentage of diverted petroleum is miniscule in comparison to the pipeline
installed by the MNC, this smuggled petroleum tends to go undetected, as pipeline
185
pressures remain almost identical given the comparably small amounts of siphoned off
petroleum (Ikelegbe 2005:221). This siphoning of petroleum has grown in intensity and
scale since the mid-1980s. Buyers of illegally obtained petroleum are oftentimes
Nigerian, but may also be from neighboring countries, seeking to purchase petroleum at a
discount. According to Oduniyi (2003), when the price of a barrel of crude oil was $26
USD, the smuggled petroleum was sold for around $7 USD per barrel.
Another interesting anomaly is ISIS, which also tends to fund itself by smuggling
petroleum. ISIS controlled territory is known to be oil-rich, and while ISIS does not
specifically target oil fields in its fighting (as Saddam Hussein did during the invasion of
Kuwait), ISIS does extract, refine, and smuggle petroleum. This smuggled petroleum,
originating in Iraq and Syria, is often sold in Turkey, whose high gas prices have
incentivized unscrupulous parties to buy smuggled petroleum, even if it’s from their
enemy (Bronstein & Griffin 2014). Differently from Niger Delta rebels, ISIS operates as
a massive organized crime group that has become so powerful to more or less be
considered a state. But oil is not the only revenue source for ISIS—they tax their people
and force them to make ‘voluntary’ contributions to ISIS (Bronstein & Griffin 2014). The
Nigerian smugglers and ISIS illustrate how petroleum may be used as a tool to finance
rebel groups and even help create a pseudo-state almost ex nihilo.
The Nigerian and ISIS cases indicate that petroleum can be smuggled and become
profitable enough to sustain rebel groups in the Niger Delta and a militaristic pseudo-
state such as ISIS. Rebels tapping into Nigerian pipelines have sparked increases in
armed conflict in the region, but the country never experienced a civil war. ISIS
indirectly has contributed to a civil war in Syria, but because this case is simply too much
186
of an anomaly, there is no mere comparison among diamond-rich states. The Venezuelan
case may provide for some variation in this analysis, but the coup was not necessarily a
civil war that embroiled the entire country. With this background information, this
chapter will qualitatively analyze the role resources play in three civil wars in Africa.
First, we will observe the relatively minor role petroleum played in the Algerian Civil
War. Then this work will compare the roles diamonds and petroleum played in the
Angolan Civil War along with its corollary in the Cabinda War. These two qualitative
case studies will be pitted against the role diamonds played in the Sierra Leonean Civil
War. These three states are not just resource-rich. They all experienced bloody civil
wars—none of which were separatist movements, and all were designed to overthrow the
existing government throughout more or less the same time period. Furthermore, the
following conflicts were all grievance-based and triggered for reasons exogenous to
resources, yet they all came to involve either petroleum or diamonds for sabotage or
funding purposes.
First, oil-rich Algeria suffered through a bloody civil war (1991-2002) taking the
lives of around 200,000 people during the conflict. The Algerian Civil War was an armed
conflict between the government and various Islamist groups. Second, Angola has the
most diamonds and oil per capita than any other state in this analysis. They also
experienced a protracted civil war from 1975 to 2002 with over 500,000 civilians left
dead, and garnering a lot of international attention, especially surrounding Angola’s
resources. Third, diamond-rich Sierra Leone endured a bloody eleven-year civil war from
1991 to 2002, with the Revolutionary United Front (RUF) financing their activities
through blood diamonds, and the former Liberian president, Charles Taylor, intervening
187
in the conflict. Civilian casualties are unclear, but they range from 50,000 to 300,000
deaths, not including the horrors that come with war, such as refugees, internally
displaced people, mass rape, and child soldiers, that are not accounted for in casualties.
During the same time period, Africa suffered through three civil wars in resource-rich
states. Each state in this analysis possesses a different resource and a different former
colonial master. Algeria is oil-rich and a former French colony; Angola is bestowed with
both oil and diamonds and is a former Portuguese colony; and Sierra Leone is diamond-
rich and former British colony.
Hypothesis 5 is quite similar to Ross’s second hypothesis, as defined in the
literature review, stating that non-lootable resources are more likely to lead to separatist
conflicts while lootable resources are more likely to benefit rebels. In a separate
hypothesis, Ross also postulates that non-lootable resources are more likely to benefit the
government (Ross 2004:12-13). While Ross’s hypothesis holds true for Angola and
Sierra Leone, it did not hold true for the Algerian Civil War (as this work will later
show), as their non-lootable petroleum was in a remote location in the Sahara, yet they
did not experience a separatist movement. Rather, Hypothesis 5 partially agrees with
Snyder and Bhavnani’s definitions of lootability (2005:565), considering the resource
themselves, including the economic barriers to entry as defined by their lootability, to be
central in determining whether or not rebels seek to capture the resource. However, it
would expand this definition to the post-capture period of the resource, not simply the
economic barriers that Snyder and Bhavnani describe (2005:568). It’s not enough to take
over an oil field and refine the petroleum; rebels would have to develop an extensive
network of consistent and reliable clients for their product. They would also have to

188
conduct regular assays, market their petroleum as different from other varieties, tailor
their refineries to produce different petroleum-based products, transport the resource, and
spread these activities throughout thousands of miles to turn a profit (e.g. ISIS manages
to do this and sell illicit petroleum to Turkey). These are characteristics unique to
petroleum, and no other non-lootable resource, such as copper or gold. These
characteristics are also not economic barriers, as defined by Snyder and Bhavnani
(2005:568), but rather material barriers unique to petroleum. Kimberlite diamonds, such
as those found in Angola, are not only non-lootable, according to Snyder and Bhavnani
(2005:568), but also highly concentrated in one location. Kimberlite diamonds also have
their own non-economic barriers to entry: smuggling diamonds out of a country requires
bribery, illicit trade routes, customers, and countless middlemen before blood diamonds
are mixed with legally extracted diamonds.
In the subsequent analysis, this dissertation will show how different resources
have incentivized rebels and gangs to act differently during each civil war. As will be
shown in the conclusion of this section, diamond states are more likely to suffer from
rebel activity taking over mines, using diamond revenues to fund their conflict, and
develop an organization to secure those mines, which often includes child soldiers.
Petroleum states, on the other hand, do not suffer from these plagues, but rebels do seem
more likely to sabotage government efforts in exporting petroleum. Angola, which
suffered from two separate, but interrelated wars, found itself subjugated to both
characteristics of conflict.
189
First, we will begin with the Algerian Civil War, borrowing from the scholarship
of Miriam Shabafrouz’s (2010), among others, excellent analyses of the role petroleum
played during the conflict.
The Algerian Civil War
There are still numerous questions regarding the factors leading to the Algerian
Civil War (1991-2002) that claimed the lives of thousands, some of them pointing to the
influence of petroleum in the onset of the war. Algeria has experienced numerous violent
outbreaks since its independence from France, which, unlike many other former-French
colonies, was a bloody affair. Since Algeria’s independence, the African state has been
riddled with social, economic, and political unrest. A population explosion during post-
independence times combined with a sharp fall in oil prices once non-OPEC oil began to
flood the market. Politically, one socialist-leaning party, the Front de Libération
Nacionale, the National Liberation Front (FLN), ruled the state since its independence in
1962. However, with the rising population and stagnant economy, dissatisfaction with the
FLN in Algiers began to grow until, in 1988, a series of street-level protests and riots
rocked the capital. Not to be left out, the Islamists soon joined the riots and marched with
Algerian youth, leaving hundreds dead (Shabafrouz 2010:10).
These street-level riots, beginning in Algiers and extending to other regions of the
state, brought out a new constitution that allowed for political parties other than the FLN
to participate in government, the most successful of which was the Sunni Islamist Front
Islamique du Salut, the Islamic Salvation Front (FIS). By appealing to both religious
businessmen and the increasingly angry and unemployed youth, the FIS grew in numbers
190
and power for several years. Then in May 1991, the FIS called for a general strike to
change electoral laws that they saw as favoring the ruling FLN party. While this civil
disobedience was largely peaceful, according to the International Crisis Group, at least 20
people were killed when army commanders intervened (ICG 2004:7). Later on that year,
the FIS won 47% of the first round of parliamentary elections, and just before the second
round, on January 11, 1992, President Chadli Benjedid resigned under military pressure
(Shabafrouz 2010:10). This led to a rapid escalation in conflict and a civil war that would
last until 2002.
Initially, violent Islamists only targeted governmental forces and military targets,
but they eventually attacked intellectuals, journalists, and political union activists
(Zerrouky 2002:92). They also formed a quasi-group, known as the Grupe Islamique
Armé, the Armed Islamic Group (GIA), who believed the FIS to be too moderate and
conciliatory. The GIA turned into an urban fighting force, killing many foreigners,
including international oil personnel (Fearon & Laiton 2006:21). Over time, especially
given the GIA’s tactics of planting bombs, more civilians began to be killed. The
government, for its part, also killed armed Islamists, along with their sympathizers
(Shabafrouz 2010:11). Then in June 1992, one of the founders of the FLN, Mohamed
Boudiaf, was assassinated by one of his bodyguards, who turned out to be an FIS
sympathizer, on live television, which further escalated the violence (Stora 1995:329).
Even though, with some effort, the GIA had the capabilities of attacking oil installations,
they mostly targeted journalists and intellectuals, especially those writing in French, the
former colonial language. The GIA housed enormous animosity against these groups,
who were viewed as supporting a secular regime in Algeria (Vriens 2009). Precisely
191
because journalists, and not petroleum, posed the greatest threat to the GIA’s ideology,
they intentionally targeted them, even publicly announcing that “those who fight by the
pen shall die by the sword” (St. John 1996).
The Algerian Civil War then took on an international component when foreigners
began disappearing and GIA Islamists hijacked Air France Flight 8969 at the Houari
Boumedienne Airport in Algiers on Christmas Eve. Contributing to the violence were the
midnight raids on small towns leaving between 50 and 400 civilians dead (Shabafrouz
2010:11; Cordesman 2002:120). According to Shabafrouz, sometimes oil and gas
infrastructure would be damaged as a result of the war. In an attempt to disrupt
governmental control over petroleum, Algeria’s chief export, the GIA bombed the Trans-
Mediterranean (Trans-Med) pipeline in 1997. This pipeline transcends half of Africa.
Commencing in Nigeria, the pipeline travels north, through Niger and Algeria, and then
underwater to Spain and Italy. When terrorists bombed the pipeline, they managed to stop
oil exports to Italy for five days, but ENI had enough surplus petroleum for this bombing
to not affect Italian consumers (Hayes 2004:37).
As is often the case when the government fights civilians, the total death toll in
the Algerian Civil war remains in question. Figures range from 44,000 to 200,000
casualties. Many civilians are still missing—6,000 according to Werenfels (2005:9) and
also noted in Shabafrouz (2010:11). However, something interesting happened during the
civil war. Except for the Islamist bombing of the Trans-Med pipeline and the sporadic
disappearance of some oil workers, oil played a very small role during the conflict.
Scholars, such as Clement Henry, are more likely to point to Algeria’s colonial past
rather than petroleum. According to Henry, “the original sin, then, was not the 1956
192
discovery of oil, but the 1830–31 French invasion of Algeria and subsequent destruction
of the Ottoman governing infrastructure” (Henry 2004:76). Oil may have played a role,
but it was an indirect one. Rebels made no bona fide effort to capturing oil fields, selling
petroleum, or stealing it from pipelines. Instead, they chose to sabotage an existing
pipeline and kill some oil workers while not seeking to use the petroleum in any
meaningful way.
As Hypothesis 5 expects, the economic and material barriers to entry for
petroleum deterred rebels from tapping into this resource, despite the fact that petroleum
accounted for a significant portion of Algeria’s GDP and the government was likely
using these revenues to fight rebel activity. As observed from Hypothesis 2, the oil per
capita income of Algeria ranged from $273 to $615 per year. These relatively low dollar
values are attributed to Algeria’s high population rather than low oil production.
Furthermore, Algeria’s petroleum, the Algerian Saharan Blend, is quite ‘sweet’ in sulfur
content and has a low API gravity, especially in comparison to OPEC’s more ‘sour’
basket. Perhaps because the Saharan Blend is so valuable, Algeria is highly dependent
upon this resource, with petroleum accounting for 94% of Algerian exports (OEC 2018a).
The 1979 oil crisis saw the price of petroleum double from $20 to almost $40 in
one year. However, many states, Algeria included, failed to prepare for the subsequent
drop in oil prices, which hit its economic sector just as it saw an explosion in population.
According to Cordon and Neary (1982), Algeria began to wrongfully invest more in its
petro-sector, thereby disregarding less profitable enterprises, such as manufacturing and
industry. This Dutch Disease further contributed to the blow that came with plummeting
oil prices. Furthermore, while economic benefits from the oil trade were meant to spur
193
local economic development in Algeria, the drop in oil prices in the early 1980s exposed
the inefficiencies of this program and highlighted Algerian dependence upon the resource
(Aïssaoui 2001:231; Shabafrouz 2010:15). Algeria was (and remains) highly dependent
upon petroleum, but how did the physical and intrinsic qualities of this resource influence
rebel behavior during the Algerian Civil War?
As previously noted, petroleum is difficult to discover, requires expensive
machinery to extract, and must be processed in costly refineries before it can be sold for
as a finished product. Furthermore, unlike alluvial diamonds that are sometimes found at
the surface, most world petroleum found at the surface has already been extracted and
consumed. Humans tend to retrieve the easiest and best of a resource first, and then
proceed to drill in more remote places, such as offshore. These powerful barriers to entry,
so to speak, not only dis-incentivize small companies from entering the oil trade they also
discourage rebels from attempting to capture the resource, illustrating a fundamental
difference between diamonds and petroleum. This is not to say that oil did not play a role
in the Algerian Civil War. As scholars have argued (Dillman 2000; Sheikhzadegan 2003),
Algerian dependence upon petroleum economically contributed to the Algerian Civil
War, though this economic struggle had been brewing for a decade before the first shots
were fired. When assessing the Algerian Civil War, the only direct connections between
petroleum and rebels were the GIA’s killing of international oil workers and one rebel
attempt to disrupt the government’s exports by sabotaging the Trans-Med pipeline in
1997. Even so, while this interference may have slightly hurt Algeria’s economy, it was
so minor that it did not disrupt Italian consumers. This sort of sabotage seems to be a
194
problem oil states are more likely to suffer from (e.g., Saddam Hussein burning Kuwaiti
oil fields) rather than outright theft of their resources.
The reader will additionally note how the Algerian Civil War took on an
international perspective. This did not happen when oil markets were threatened or
overtaken by rebels—they were not—but rather when the GIA began killing oil workers
and Air France flights were getting hijacked. Although it cannot be said for certain, but if
Algerian oil exports had suffered during the war, perhaps we would have observed more
international interference in the conflict. Precisely because petroleum—and not
diamonds—is the lifeblood of the world economy, a disruption would attract more
international attention, due to supply-side concerns that generally determine petroleum’s
price and economic elasticity.
In the Algerian case study, we should also note that the petroleum was
concentrated in inaccessible places. As Shabafrouz (2010:16) notes, “as the hydrocarbon
resources are located in remote areas and as their extraction requires very sophisticated
technical equipment, the resources can be considered ‘not lootable’ in the sense of Ross
(2004) and thus difficult for rebels to seize [sic].” To further illustrate the remoteness of
petroleum in the Algerian Civil War, below is a map of Algeria’s oil fields and pipelines
leading to the Mediterranean Sea.
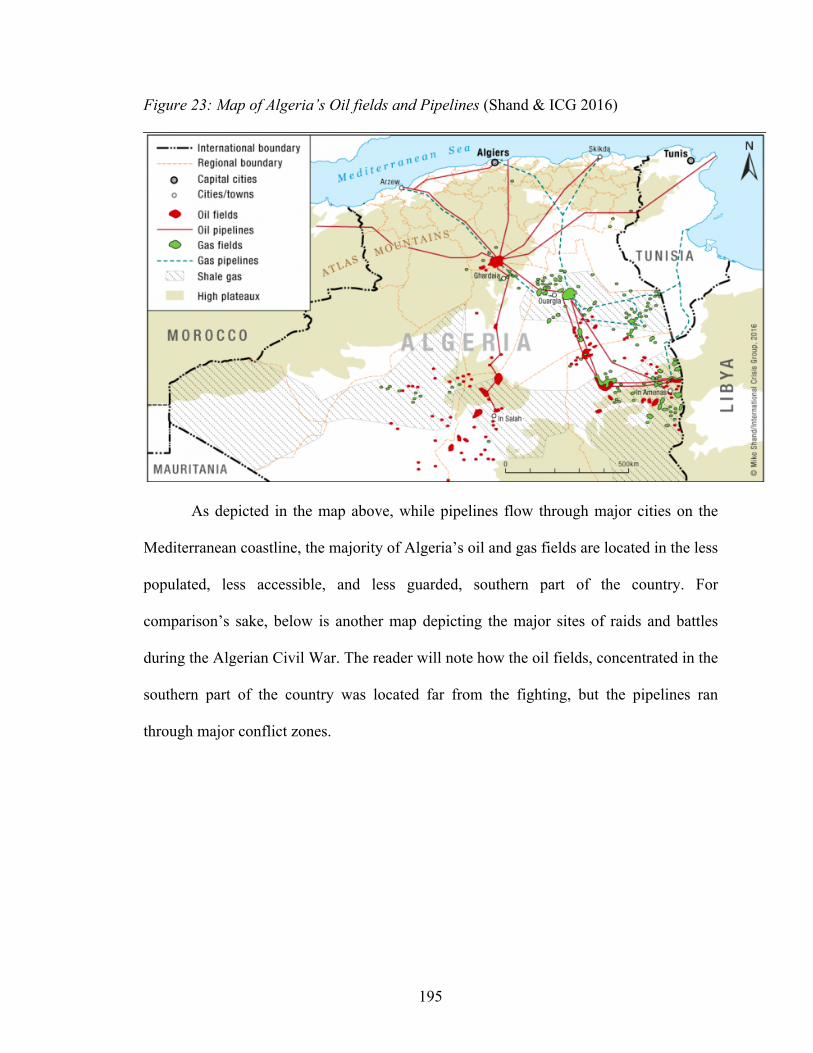
195
Figure 23: Map of Algeria’s Oil fields and Pipelines (Shand & ICG 2016)
As depicted in the map above, while pipelines flow through major cities on the
Mediterranean coastline, the majority of Algeria’s oil and gas fields are located in the less
populated, less accessible, and less guarded, southern part of the country. For
comparison’s sake, below is another map depicting the major sites of raids and battles
during the Algerian Civil War. The reader will note how the oil fields, concentrated in the
southern part of the country was located far from the fighting, but the pipelines ran
through major conflict zones.
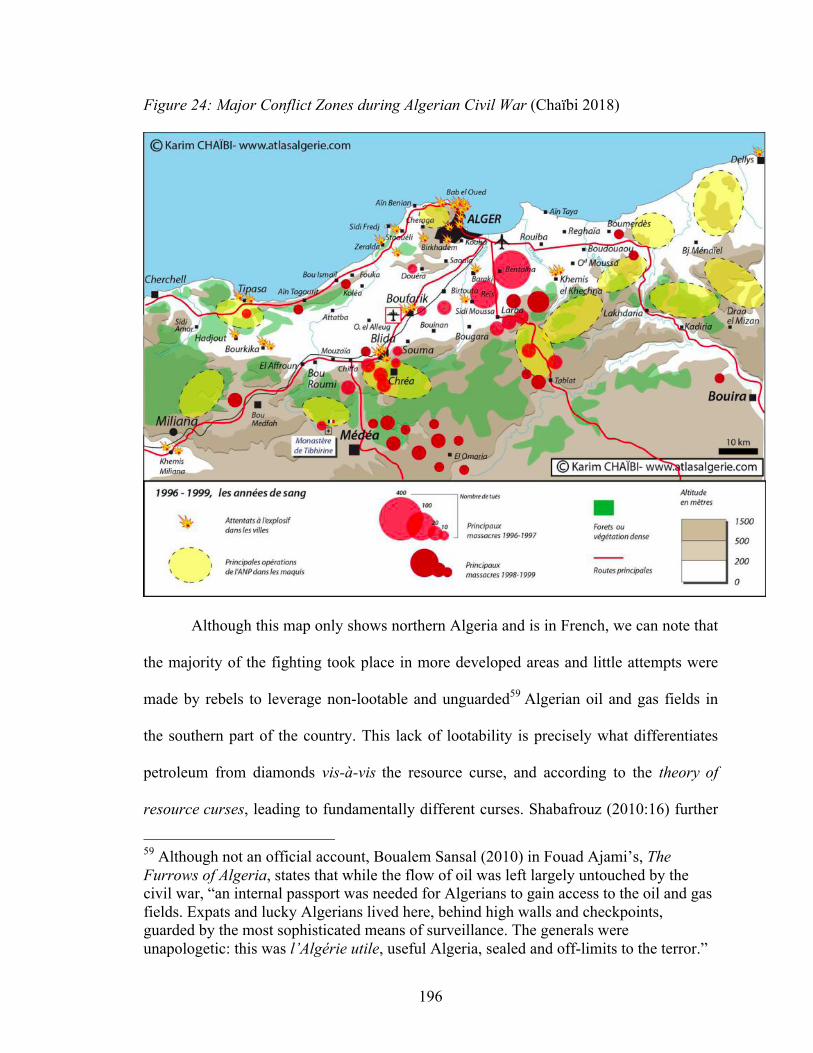
196
Figure 24: Major Conflict Zones during Algerian Civil War (Chaïbi 2018)
Although this map only shows northern Algeria and is in French, we can note that
the majority of the fighting took place in more developed areas and little attempts were
made by rebels to leverage non-lootable and unguarded59 Algerian oil and gas fields in
the southern part of the country. This lack of lootability is precisely what differentiates
petroleum from diamonds vis-à-vis the resource curse, and according to the theory of
resource curses, leading to fundamentally different curses. Shabafrouz (2010:16) further
59 Although not an official account, Boualem Sansal (2010) in Fouad Ajami’s, The Furrows of Algeria, states that while the flow of oil was left largely untouched by the civil war, “an internal passport was needed for Algerians to gain access to the oil and gas fields. Expats and lucky Algerians lived here, behind high walls and checkpoints, guarded by the most sophisticated means of surveillance. The generals were unapologetic: this was l’Algérie utile, useful Algeria, sealed and off-limits to the terror.”
197
paraphrases Cordesman (2002:149) in discussing how Algerian oil and gas infrastructure
was largely unguarded, an idea incomprehensible for diamond mines. While the
remoteness of the petroleum may have dis-incentivized rebels from capturing the
resource, the idea that the infrastructure was left unguarded must have tempted rebel
Islamists, especially since Sonatrach, Algeria’s nationalized oil company had a monopoly
over the industry and used its profits to fund the government’s military combatting the
GIA. Incentives aside, the only case we have of petroleum playing a direct role in the
Algerian Civil War was that of minor sabotage and killing some oil workers.
We have observed how an oil-rich African state suffered through a civil war in the
1990s with its petroleum industry largely left intact. Let’s now examine another African
state, with both petroleum and diamonds that also experienced a civil war during the
1990s. The Angolan Civil War lasted longer than Algeria’s, but this case should provide
a good benchmark to determine differences between petroleum and diamonds in times of
civil, international, and extrasystemic conflict. Notably, Angola’s possession of both
resources ultimately led it to experience both types of violent resource curses.
The Cabinda War & Angolan Civil War
The Angolan Civil War (1975-2002) may be (mis)understood as one conflict that
ended up becoming a proxy war for the United States and the Soviet Union. A thoughtful
analysis of the war, however, would disaggregate the violence into two separate conflicts,
both stemming from former Portuguese colonization. The first conflict is the ongoing
Cabinda War (1975—present), which is a separatist movement in the oil-rich enclave of
Cabinda, where rebels are attempting to secede from Angola. Second is the central armed
198
conflict between the Movimento Popular de Libertação de Angola – Partido do
Trabalho, the People’s Movement for the Liberation of Angola – Labor Party (MPLA),
backed by the Soviet Union, against the União Nacional para a Independência Total de
Angola, the National Union for the Total Independence of Angola (UNITA) and the
Frente Nacional de Libertação de Angola, the National Front for the Liberation of
Angola (FNLA), both hesitantly and sporadically backed by the United States. This civil
war sprung out of the Angolan war for independence from Portugal (1961-1975), itself a
theatre of a broader Portuguese war against many of its former colonies, including
Mozambique and Guinea-Bissau. This dissertation will first begin with a brief history of
Angola and Cabinda.
At the height of Portuguese power, the small European country nestled in the
Iberian Peninsula managed to colonize a large portion of South America, parts of
Southern Africa, and held ports in Goa, Hong Kong, Sri Lanka, Nagasaki, and Macau.
Angola and Mozambique were Portugal’s two largest colonies in Africa, with Brazil
being the largest in the Americas. The Portuguese colonized Angola in 1575 and kept
control over this region for exactly 400 years until 1975, after the Angolans joined
Mozambique and Guinea-Bissau to declare their simultaneous independence from the
Portuguese crown.60 Throughout their colonization, the Portuguese also managed to settle
the nearby port of Cabinda, formerly known as Portuguese Congo. The Portuguese
explorer, Diogo Cão, was the first European to land in Cabinda in 1483, paving the way
60 Their independence was not only precipitated by a lengthy war of independence, but also a military coup in Lisbon that overthrew the Salazar-backed Estado Novo. Military officers opposing the fascist regime overtook the government with very little resistance. The coup is known as the Carnation Revolution, largely because it was a relatively bloodless coup and civilians celebrated by putting carnations in rifles after the takeover was announced.
199
for his home country to colonize the region for the next four hundred years. While
Portugal was the de facto colonizer of Cabinda for much of the sixteenth and seventeenth
centuries, it was not until 1885 in the Treaty of Simulambuco, itself a response to the
Treaty of Berlin, that Cabinda was officially recognized as a Portuguese protectorate.
These treaties were meant to divide Africa into European colonies to regulate trade and
discourage war during the era of European imperialism. In these treaties, the Portuguese
treated Cabinda and Angola as separate colonies (De Leon 1886:106). However, after
independence was declared in 1975, Cabinda and Angola were both lumped into one
colony—Angola. Cultural and ethnic differences aside, Cabinda and Angola are not
contiguous; Cabinda is often seen as an enclave of larger Angola. Below is a map
depicting the separation.
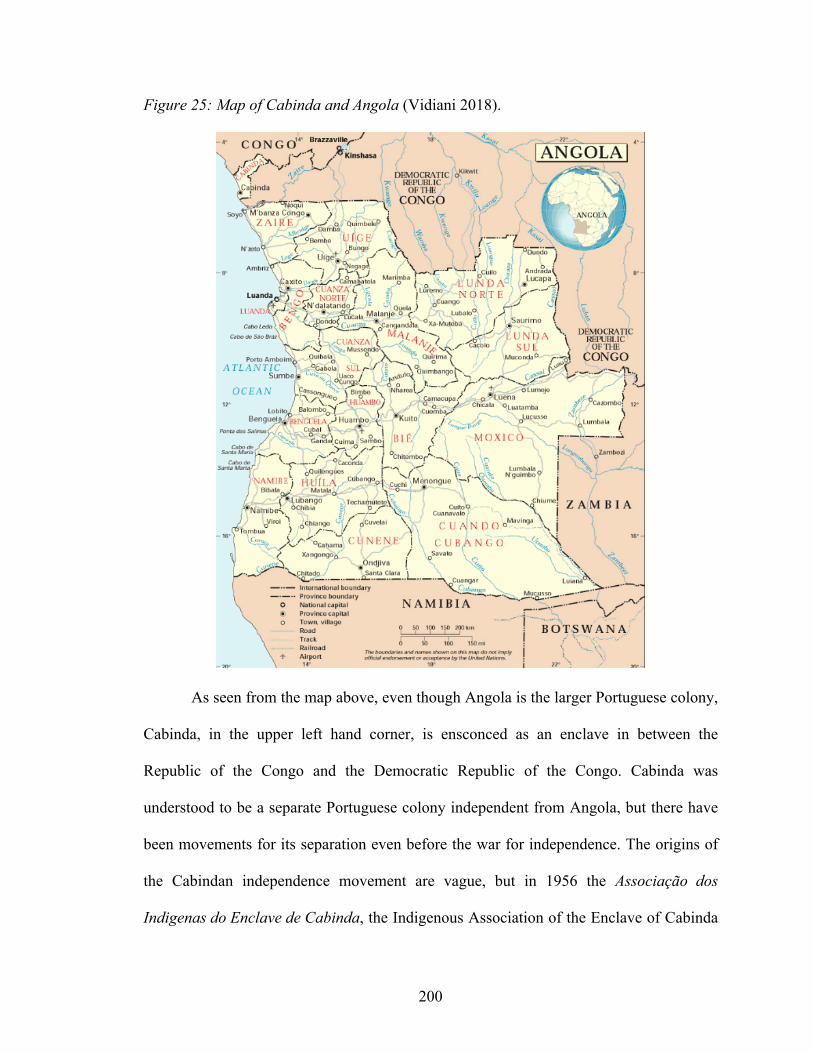
200
Figure 25: Map of Cabinda and Angola (Vidiani 2018).
As seen from the map above, even though Angola is the larger Portuguese colony,
Cabinda, in the upper left hand corner, is ensconced as an enclave in between the
Republic of the Congo and the Democratic Republic of the Congo. Cabinda was
understood to be a separate Portuguese colony independent from Angola, but there have
been movements for its separation even before the war for independence. The origins of
the Cabindan independence movement are vague, but in 1956 the Associação dos
Indigenas do Enclave de Cabinda, the Indigenous Association of the Enclave of Cabinda
201
(AlEC), formed with the stated goal of separating itself from Portuguese rule and
incorporated as a Belgian colony (part of Zaire, now DRC) or a French colony (part of
French Congo, now Republic of the Congo). The beginning of the Angolan independence
movement in 1961 put pressure on Cabindan independence groups to become more
assertive in their movements. This led to the amalgamation of many groups to form the
Frente para a Libertação do Enclave de Cabinda, the Front for the Liberation of the
Enclave of Cabinda (FLEC), later becoming FLEC-FAC as they merged to become part
of an even larger group. Citing the Treaty of Simulambuco, FLEC sought direct
communication with Portugal for independence, arguing that they were fundamentally
distinct from the larger Portuguese colony of Angola (McCormick 1992:4). This action
was supported by then-dictator of Zaire, Mobutu Sese Seko, and the Republic of the
Congo, possibly eyeing an annexation of the region.
The Angolan War for Independence left between 30,000 and 50,000 civilians
dead, granting Angola freedom from the Portuguese Crown and its Salazar-backed
Estado Novo at a hefty cost. Yet, immediately after Angola received independence, the
civil war commenced in conjunction with the Cabindan separatist movement. We will
first examine the Cabindan separatist movement and the role petroleum played in the
conflict. Then we will examine the broader Angolan Civil War and how resources were
used to fund rebellious activities.
The Cabinda War (1975—Present) Three independence movements in Angola, the FLNA, MPLA, and UNITA,
signed the Alvor Agreement (1975) that effectively ended the post-Salazar Portuguese
202
colonization of Angola. Absent from the roundtable denoting the terms of the treaty was
FLEC-FAC or any other Cabindan voice. Despite efforts to tie up the three movements
into one national group, the parties failed to accomplish these aims, spurring diplomatic
conflict. Then a few things happened at once: FNLA and UNITA ministers fled Luanda,
the South African army invaded Angola from the south, and CIA-backed troops and
mercenaries from Zaire occupied the north (Dos Santos 1983:102; Stockwell 1978).
During the Alvor Agreement, the MPLA declared Angola free from ‘Cabinda to
Cunene,’61 cementing Cabinda’s status as an Angolan enclave rather than an independent
state. However, as Dos Santos informs us, one historical problem remains: the state
“apparatus the MPLA took possession of at the moment of independence, as a colonial
legacy left to Angolans, is an artificial one, as it was built along the lines of European
bourgeois interests whose ultimate aims were to support economic exploitation and
protect metropolitan profits” (Dos Santos 1983:103).
Partially because FLEC was not invited to Alvor, they operated a guerrilla-type
war, attacking troops and economic targets, and, for the purposes of this dissertation,
kidnapping foreign employees working in the offshore oil industry (Gomes 2003:5). Due
to these rebellions, the Angolan government was forced to keep 2,000 soldiers in
Cabinda; this number increased to 15,000 as the Angolan Civil War flared up in 1993.
Talks were supposed to begin in the mid-1990s when FLEC had control of most of the
Cabindan countryside, but not the city. Yet, according to Gomes (2003) these talks never
took place. Throughout the early 1990s, the rebels avoided direct attacks on Cabinda oil
61 According to Newsweek, this slogan was actually a Cuban recommendation referring to the northernmost and southernmost provinces to envelop Cabinda as part of Angola, despite Cabinda’s geographic and colonial past (Vines 2016).
203
platforms or on expatriate oil workers, many of whom were Americans. However,
Cabindan separatists have warned that unless “Luanda made greater concessions, like
encouraging economic development, self-determination and eventually independence, the
oil installations could become a target” (Noble 1992). They eventually became a target a
few years later.
Throughout 1997, FLEC fighters mounted fifteen attacks against Angolan
military targets. Then, after a period of relative calm, FLEC “started to target foreigners,
kidnapping a number of construction and oil workers, in an attempt to gain international
attention for its independence fight” (Al Jazeera 2010). Yet, these kidnappings remain
relatively rare.62 While they may be high-intensity, they seem to be sporadic (Cropley
2016). In 2016, FLEC-FAC supporters travelling by speedboat managed to board an
offshore natural gas platform and told Chevron workers to leave Cabinda. Eventually
they managed to leave the platform without further incident (Cropley 2016). Aggressions
such as these seem to be an increasingly rare occurrence in Cabinda, but this may be the
calm before the storm.
While the conflict is ongoing, the Cabindan Republic currently exists only in
paper. Currently, Cabinda and FLEC have an exiled government in France still seeking
independence from Angola. According to the US Department of Justice Report from
2007, the conflict has left around 30,000 dead since 1975, and human rights activists
have 20 pages of testimonies of alleged abuse, rape, torture, and looting. Although
victims claim abuses on both sides, the overwhelming number of accusations point to
government forces rather than FLEC (US Justice 2007:3-4). The conflict remains hinged
62 Unrelated to petroleum, Cabindan gunmen shot up a bus carrying Togo’s soccer team, killing the assistant coach, bus driver, and team spokesman (Cropley 2016).
204
on two irreconcilable positions: for the Angolan government, Cabinda is not only a
province, but is one of the two provinces named in their popular designation of ‘Angola
from Cabinda to Cunene,’ with Luanda consistently emphasizing its commitment to
keeping Cabinda as part of Angola. On the other hand, Cabindan separatists consider
Cabinda to have its own history, culture, and colonial past. They believe Cabinda to have
been invaded by the MPLA when Angola received their independence. Their palindromic
motto reflects their stance: ‘We wish Peace for Angola and wish that Angola leave us in
Peace’ (Gomes 2003:7). Though there was a 2007 peace deal, FLEC somewhat
irregularly continues to wage a guerrilla-style war against Angola (Coroado & Strydom
2016). So other than the sporadic kidnapping and threats to foreign oil workers, what role
did natural resources play in the Cabinda war?
In 1962, the Cabinda Gulf Oil Company (CABGOC) discovered offshore
petroleum in Cabindan waters, first extracting oil from the Malongo Oil Field in 1968
after conducting seismic activity tests (Corkin 2017:3; Koning 2014). Since Cabinda was
a Portuguese colony at the time, the Portuguese government granted concession rights to
Chevron to extract petroleum out of Cabinda’s Block 0, and the MNC subsequently
bought out much of CABGOC (Corkin 2017:3; Koning 2012). With these concessions
came a large share of social investment programs by Chevron and other IOCs working in
Angola that they are contractually bound to provide (HRW 2004:8). Congruent with oil
extraction’s capital-intensive business model, the petroleum industry in Cabinda offers
few employment opportunities for locals in comparison to the revenues petroleum
generates. Furthermore, neither the local government nor any MNCs made significant
205
attempts to develop secondary manufacturing or agricultural industries based off oil
money (HRW 2004:8).
With a total GDP of just over $100 billion, Angola produced around $62 billion
worth of petroleum in 2014, securing Angola’s oil-state status. However, the enclave of
Cabinda currently accounts for about two-thirds of Angola’s total oil production and 90%
of the Angolan government’s expenditures (Corkin 2017:3). At around $41 million
annually, Cabinda is an economic powerhouse for Angola, but it remains one of the
poorest provinces of this African state. Angola’s offshore oil is divided into 35 blocks,
with Cabindan oil fields comprising of Blocks 0 to 4 (Corkin 2017:5). According to
Luxner (2004), while Angola possesses some onshore oil, 70 percent of its petroleum
comes from offshore reserves, especially in Cabinda, leading Corkin to dub Cabinda as
an ‘oil enclave economy.’
Since the MPLA took over Angola, it has been a socialist state. Even the Angolan
flag, though depicting a gear and a knife, largely resembles a hammer and sickle. Due to
this largely centralized political nature, the petroleum produced in Cabinda and elsewhere
in Angola is centrally managed in Luanda. Because of this, Cabinda never sees much oil
revenue, as this money is directly sent to Luanda first, and then distributed to Angolan
provinces. It is unclear how the Ministério da Assistência e da Reinserção Social, the
Ministry of Assistance and Social Reintegration (MINARS) distributes oil revenue, as
they operate on a project-by-project basis (HRW 2004:9; KPMG 2002). Transparency
issues aside, much of the Cabindan population lives in wooden huts and without
electricity, despite their oil-rich seashore. Compounding problems, many foreigners
working on oil rigs drive up local prices onshore, rendering Cabinda even more
206
expensive for locals (Redvers 2012). Influx of foreign monies from these workers drives
up necessary food and healthcare items in Cabinda without spurring much economic
development in the local economy, leaving residents with a combination of higher prices
and not enough work.
Similar to the Algerian Civil War, the petroleum in Cabinda is located in a remote
location. While Cabindan oil is not located in the middle of the desert, its offshore status
has somewhat protected Angola, and its nationalized oil company, Sonangol, from rebel
sabotage. This has allowed Angola to extract petroleum from Cabinda in a fairly safe and
consistent manner, while simultaneously supporting large oil MNCs operating in Angola,
such as Chevron, ENI, and Total. Even so, rebels managed to kidnap foreign oil workers
and somehow even visit an offshore oil platform. While they did not attempt to sabotage
the oil platform, they managed to threaten workers on the oil rig in a somewhat
unorganized fashion. This work will later show how the opposite was the case for
diamond mines. As Hypothesis 5 expects, petroleum did not play a large role in rebel
activity despite it being used to the government’s advantage. For its part, Luanda has a
clear economic interest in holding on to Cabinda. This enclave is important to Angola not
only for economic reasons, but also for geopolitical ones as well. Since it is often the prey
of neighboring states (and sometimes colonial powers) seeking to annex the resource-rich
region, Angola has been forced to concentrate a lot of its military and diplomatic
resources on preserving the connection between Cabinda and Angola and creating a
united Angolan-Cabindan raison d’etre (Dos Santos 1983:103). Yet this clearly does not
sit well with most Cabindans, especially militant separatists.
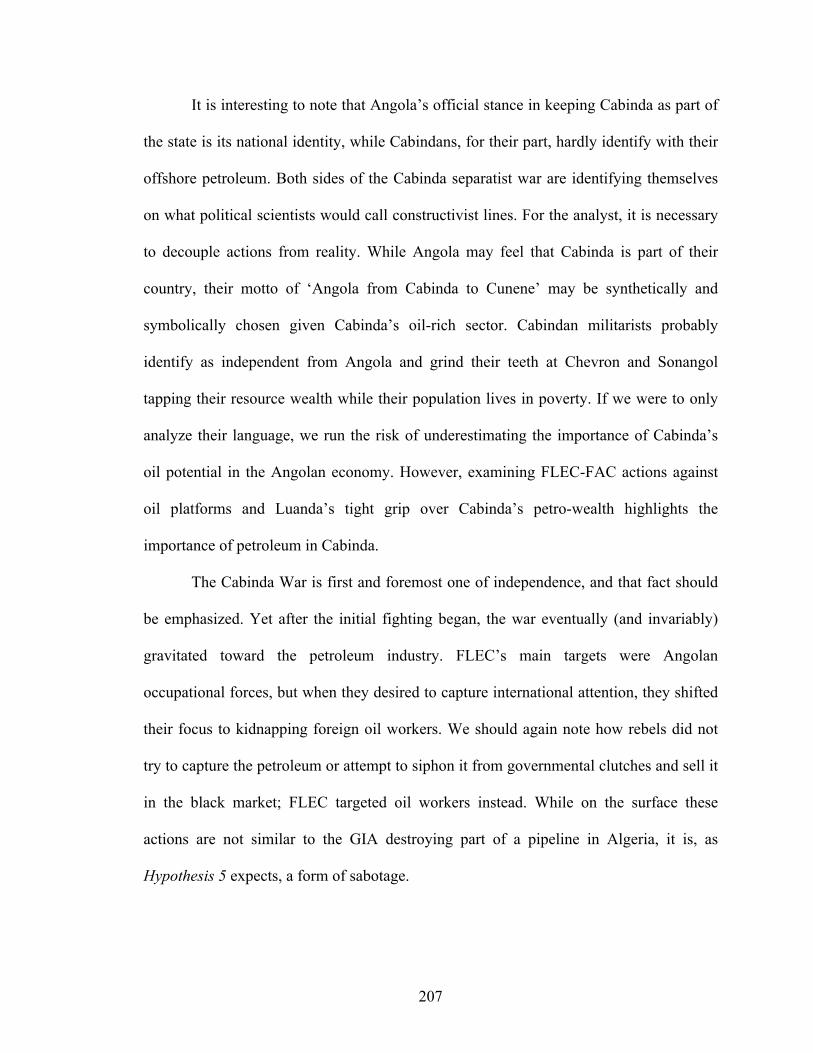
207
It is interesting to note that Angola’s official stance in keeping Cabinda as part of
the state is its national identity, while Cabindans, for their part, hardly identify with their
offshore petroleum. Both sides of the Cabinda separatist war are identifying themselves
on what political scientists would call constructivist lines. For the analyst, it is necessary
to decouple actions from reality. While Angola may feel that Cabinda is part of their
country, their motto of ‘Angola from Cabinda to Cunene’ may be synthetically and
symbolically chosen given Cabinda’s oil-rich sector. Cabindan militarists probably
identify as independent from Angola and grind their teeth at Chevron and Sonangol
tapping their resource wealth while their population lives in poverty. If we were to only
analyze their language, we run the risk of underestimating the importance of Cabinda’s
oil potential in the Angolan economy. However, examining FLEC-FAC actions against
oil platforms and Luanda’s tight grip over Cabinda’s petro-wealth highlights the
importance of petroleum in Cabinda.
The Cabinda War is first and foremost one of independence, and that fact should
be emphasized. Yet after the initial fighting began, the war eventually (and invariably)
gravitated toward the petroleum industry. FLEC’s main targets were Angolan
occupational forces, but when they desired to capture international attention, they shifted
their focus to kidnapping foreign oil workers. We should again note how rebels did not
try to capture the petroleum or attempt to siphon it from governmental clutches and sell it
in the black market; FLEC targeted oil workers instead. While on the surface these
actions are not similar to the GIA destroying part of a pipeline in Algeria, it is, as
Hypothesis 5 expects, a form of sabotage.
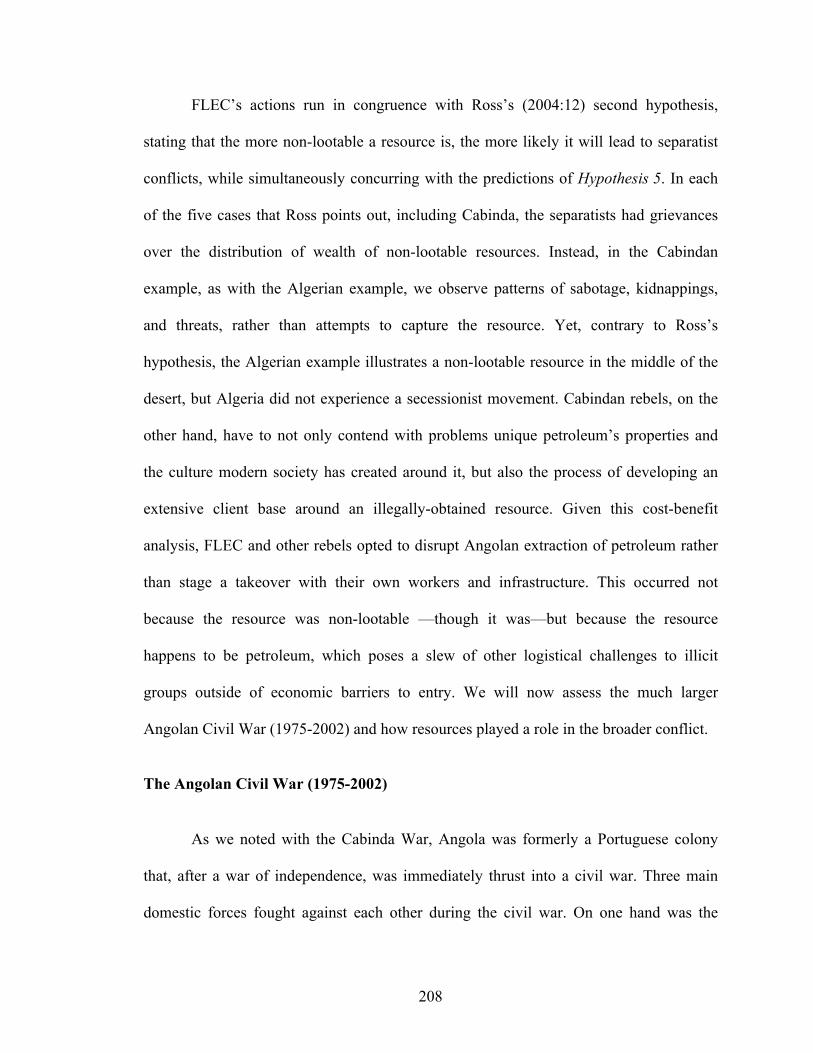
208
FLEC’s actions run in congruence with Ross’s (2004:12) second hypothesis,
stating that the more non-lootable a resource is, the more likely it will lead to separatist
conflicts, while simultaneously concurring with the predictions of Hypothesis 5. In each
of the five cases that Ross points out, including Cabinda, the separatists had grievances
over the distribution of wealth of non-lootable resources. Instead, in the Cabindan
example, as with the Algerian example, we observe patterns of sabotage, kidnappings,
and threats, rather than attempts to capture the resource. Yet, contrary to Ross’s
hypothesis, the Algerian example illustrates a non-lootable resource in the middle of the
desert, but Algeria did not experience a secessionist movement. Cabindan rebels, on the
other hand, have to not only contend with problems unique petroleum’s properties and
the culture modern society has created around it, but also the process of developing an
extensive client base around an illegally-obtained resource. Given this cost-benefit
analysis, FLEC and other rebels opted to disrupt Angolan extraction of petroleum rather
than stage a takeover with their own workers and infrastructure. This occurred not
because the resource was non-lootable —though it was—but because the resource
happens to be petroleum, which poses a slew of other logistical challenges to illicit
groups outside of economic barriers to entry. We will now assess the much larger
Angolan Civil War (1975-2002) and how resources played a role in the broader conflict.
The Angolan Civil War (1975-2002)
As we noted with the Cabinda War, Angola was formerly a Portuguese colony
that, after a war of independence, was immediately thrust into a civil war. Three main
domestic forces fought against each other during the civil war. On one hand was the
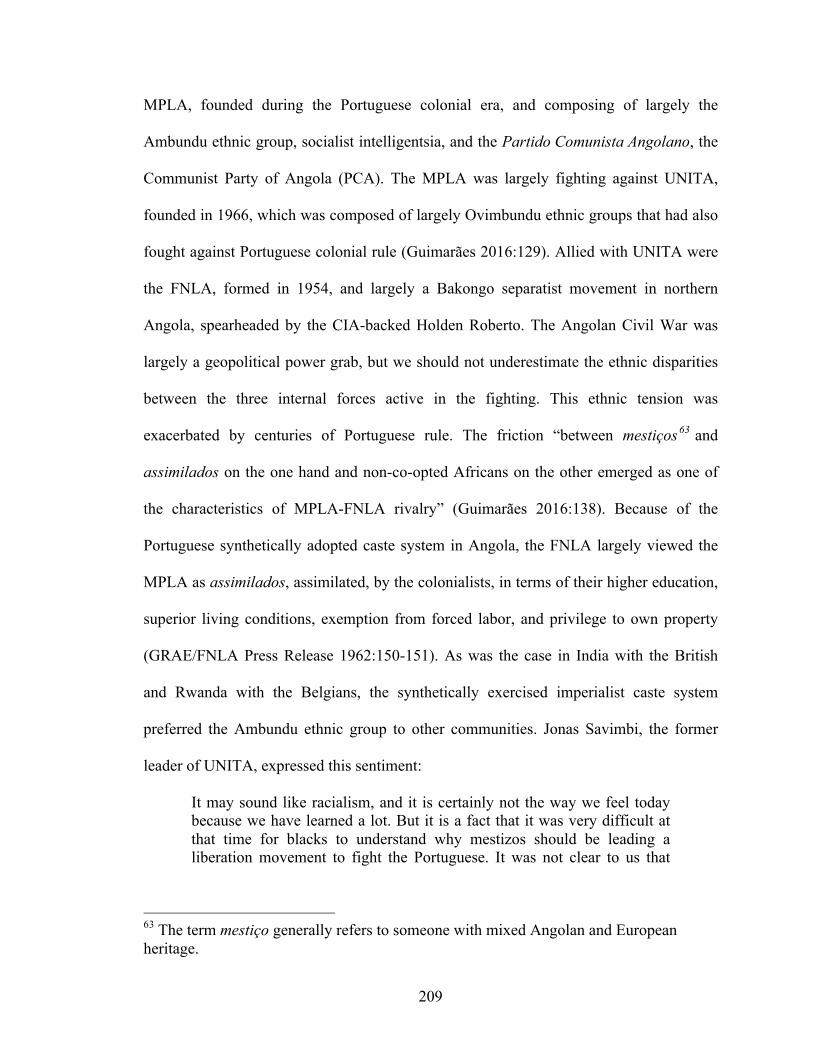
209
MPLA, founded during the Portuguese colonial era, and composing of largely the
Ambundu ethnic group, socialist intelligentsia, and the Partido Comunista Angolano, the
Communist Party of Angola (PCA). The MPLA was largely fighting against UNITA,
founded in 1966, which was composed of largely Ovimbundu ethnic groups that had also
fought against Portuguese colonial rule (Guimarães 2016:129). Allied with UNITA were
the FNLA, formed in 1954, and largely a Bakongo separatist movement in northern
Angola, spearheaded by the CIA-backed Holden Roberto. The Angolan Civil War was
largely a geopolitical power grab, but we should not underestimate the ethnic disparities
between the three internal forces active in the fighting. This ethnic tension was
exacerbated by centuries of Portuguese rule. The friction “between mestiços63 and
assimilados on the one hand and non-co-opted Africans on the other emerged as one of
the characteristics of MPLA-FNLA rivalry” (Guimarães 2016:138). Because of the
Portuguese synthetically adopted caste system in Angola, the FNLA largely viewed the
MPLA as assimilados, assimilated, by the colonialists, in terms of their higher education,
superior living conditions, exemption from forced labor, and privilege to own property
(GRAE/FNLA Press Release 1962:150-151). As was the case in India with the British
and Rwanda with the Belgians, the synthetically exercised imperialist caste system
preferred the Ambundu ethnic group to other communities. Jonas Savimbi, the former
leader of UNITA, expressed this sentiment:
It may sound like racialism, and it is certainly not the way we feel today because we have learned a lot. But it is a fact that it was very difficult at that time for blacks to understand why mestizos should be leading a liberation movement to fight the Portuguese. It was not clear to us that
63 The term mestiço generally refers to someone with mixed Angolan and European heritage.
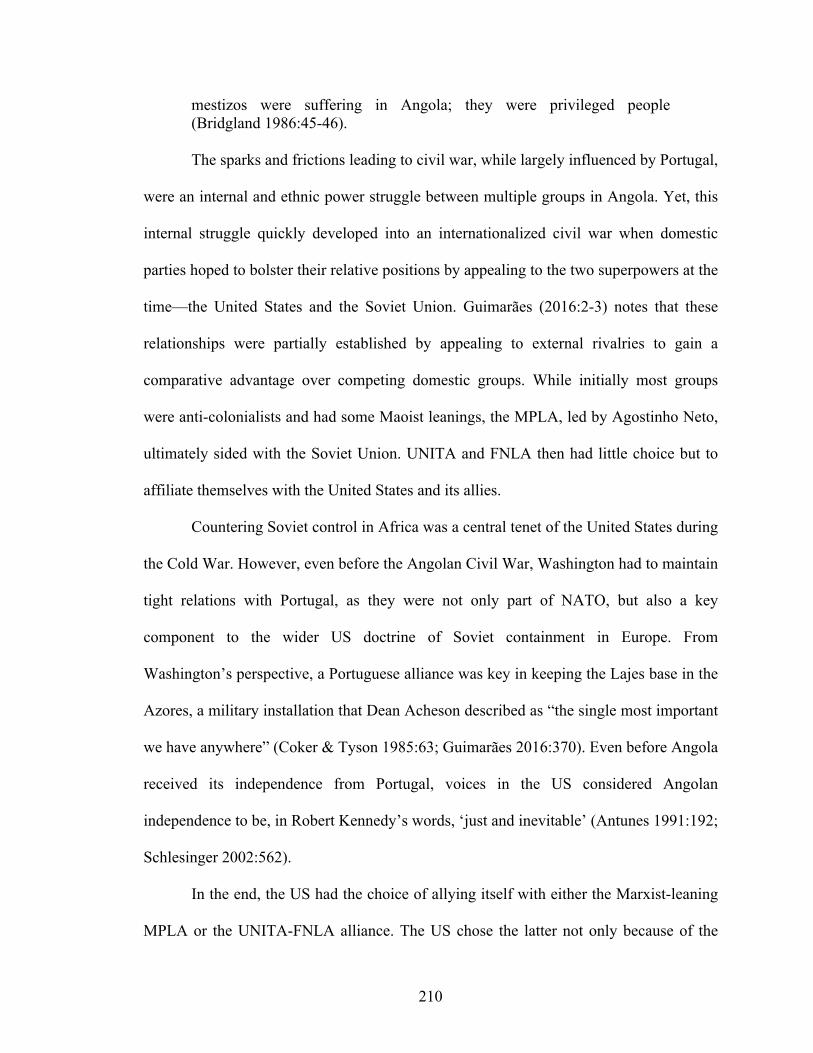
210
mestizos were suffering in Angola; they were privileged people (Bridgland 1986:45-46).
The sparks and frictions leading to civil war, while largely influenced by Portugal,
were an internal and ethnic power struggle between multiple groups in Angola. Yet, this
internal struggle quickly developed into an internationalized civil war when domestic
parties hoped to bolster their relative positions by appealing to the two superpowers at the
time—the United States and the Soviet Union. Guimarães (2016:2-3) notes that these
relationships were partially established by appealing to external rivalries to gain a
comparative advantage over competing domestic groups. While initially most groups
were anti-colonialists and had some Maoist leanings, the MPLA, led by Agostinho Neto,
ultimately sided with the Soviet Union. UNITA and FNLA then had little choice but to
affiliate themselves with the United States and its allies.
Countering Soviet control in Africa was a central tenet of the United States during
the Cold War. However, even before the Angolan Civil War, Washington had to maintain
tight relations with Portugal, as they were not only part of NATO, but also a key
component to the wider US doctrine of Soviet containment in Europe. From
Washington’s perspective, a Portuguese alliance was key in keeping the Lajes base in the
Azores, a military installation that Dean Acheson described as “the single most important
we have anywhere” (Coker & Tyson 1985:63; Guimarães 2016:370). Even before Angola
received its independence from Portugal, voices in the US considered Angolan
independence to be, in Robert Kennedy’s words, ‘just and inevitable’ (Antunes 1991:192;
Schlesinger 2002:562).
In the end, the US had the choice of allying itself with either the Marxist-leaning
MPLA or the UNITA-FNLA alliance. The US chose the latter not only because of the
211
ideological difference between Washington and the MPLA, but also because the FNLA
leader, Holden Roberto, was an ally of the US-supported government of Mobutu Sese
Seko in Zaire. By the time the FNLA began receiving US aid—via the CIA—Holden
Roberto had an extensive list of contacts in the US and had already met with President
Kennedy (Schlesinger 2002:562). While the exact figures detailing US support for
UNITA and the FNLA are inexact, Washington’s support for the rebels was largely
sporadic, contingent upon not worsening relations with Portugal, yet ensuring that the
Soviets made no inroads in Angola. Then, sometime after the Angolan independence, the
CIA had a meeting with Kissinger, affirming that despite the FNLA’s propensity for
corruption and military incapacity, they would provide “the most stable and reliable
government” (Morris 1976:20) while simultaneously indicating to Sese Seko in Zaire that
Washington was sympathetic to their ally in Angola (Bender 1978:75). As geopolitical
forces moved in Washington and Moscow, the CIA officer in charge of operations on the
ground in Angola, John Stockwell, wrote a book titled In Search of Enemies critiquing
Washington’s involvement in the war. According to reviews, Washington’s goal in
Angola “was not to keep out the Cubans and Soviets but to make their imperial efforts as
costly as possible to prove that, after Vietnam, [the US was] still capable of a response,
however insane” (Galbraith 1984). According to Stockwell, US involvement in Angola
was never meant to win the war for the UNITA-FNLA alliance; rather it was to bleed out
the Soviet-backed MPLA so that Moscow would not win an easy war in Africa.
Unease with US arms sales to Angola soon began to brew in Washington, leading
Senator Dick Clark (D, IA) to attach an amendment to the US Arms Exports of 1976
barring aid to private military groups in Angola. This motion, known as the Clark
212
Amendment, in the eyes of the CIA did not have a decisive effect on the military
situation on the ground (Gates 1983:2). According to the same document, without the
Clark Amendment, South African forces “might well have remained involved in the
conflict for a time, but it is debatable whether Pretoria would have been willing over the
long term to pay the domestic and international political costs of a protracted struggle”
(Gates 1983:3). The CIA furthermore doubted that South African forces would be enough
to overpower the combined Soviet and Cuban efforts, and that Pretoria must have known
this by 1976 (Gates 1983:3). In any case, after the Clark Amendment passed, the CIA
began lobbying other counties, such as Morocco, through which to train and support
UNITA by proxy (Mamdani 2002:769).
Naturally, if the US backed the FNLA and UNITA, the Communist bloc
supported the MPLA. However, it was not the Soviet Union, but Cuba, which sent
upwards of 35,000 troops to Angola. After an initial meeting with Che Guevara in 1965,
the Cubans began training the MPLA in the Congo, increasing their support over the
1970s and 1980s (Vines 2016). Naturally, the Cubans and MPLA had similar Marxist
ideologies, but there were other, more subtle connections between both groups. From the
Angolan perspective, Cubans “carry impeccable ideological credentials” and for the
Cubans, “the Angolan mission is seen as a means of reviving revolutionary spirit in a
younger generation. Moreover, the Cubans, with their Afro-Latin roots, blend in easily”
(Brooke 1987).
Even though the Cubans became embroiled in the Angolan Civil War to the point
that it became known as ‘Cuba’s Vietnam’ (Nash 1987), their MPLA allies did not
always appreciate their presence. Few Cubans bothered to learn Portuguese, instead
213
relying on portuñol (portunhol in Portuguese), a salad of Spanish and Portuguese. From a
more cynical standpoint, many Angolans were hesitant to allow a new group of
foreigners to fight in their country after they had finally shaken off the Portuguese (Nash
1987). According to Newsweek, originally, Cuba had no interest “in long-term
engagement, but the MPLA was able to cleverly draw on Cuba’s foreign strategy of
internationalist solidarity, whereby the West African country paid for the services it
received in a mixture of foreign currency and local kwanzas. Far from “being a clientelist
relationship, this enabled the Angolan government to influence the process and it locked
Cuba into a longer-term commitment than it had initially anticipated” (Vines 2016). From
the Cuban perspective, this war was purely ideological, as Cuba had few geopolitical
gains from a prolonged war in Angola. The Soviet Union, meanwhile, got the best of both
worlds; without having to sacrifice blood and (much) money, it allowed a Latin American
ally to do its work for them while reaping the resource benefits that an oil-rich ally could
provide, while ensuring a geopolitical base in the Southern Atlantic.
Cuban engagement in Angola was aimed primarily to support the MPLA’s
strategic position of power, and they made no effort to encourage reconciliation. The
driver “for that came from declined oil prices of the mid-1980s and the knock-on effect
of Cuba increasingly looking to reduce its exposure in Angola and the MPLA
government concluding that it had no choice but to try to negotiate with UNITA and its
enemies” (Vines 2016). This opened the possibility for the New York Accords, resulting
in the withdrawal of Cuban soldiers under UN supervision in 1992 (Vines 2016). Cuba
was much more involved in supporting the MPLA than the Soviet Union, but this
superpower still managed to influence the outcome of the war.
214
While Holden Roberto was developing a rapport with Washington officials,
Agostinho Neto began making contacts in the Soviet Union (Klinghoffer 1980:4). Soviet
arms deliveries began during the Angolan war for independence and continued even after
the MPLA gained a strategic advantage not only over the FNLA and UNITA, but also
against the South African invasion from the south (Klinghoffer 1980:4). Moscow not
only provided Cuban-MPLA forces with small arms, but also conducted airlifts, military
transports, and delivered ammunition, tanks, and other heavy equipment (CIA 1977:4).
While Moscow’s primary goal was to weaken the US-backed UNITA-FNLA alliance, a
secondary goal was to force back South African forces, whose apartheid stance stood in
direct contrast to Soviet ideologies.64 Beyond the immediate goal of securing an MPLA
victory, Moscow was interested in reestablishing its revolutionary credentials, halting
Chinese65 advances in Africa, demonstrating their capabilities after failures in Chile and
Portugal, and securing a base for maritime and air activities in Angola (CIA 1977:4-5).
As the reader will note, the Soviet buildup, Cuban intervention, and US involvement in
the Angolan Civil War was largely a proxy war for the superpowers, but what role did
resources play in this conflict?
Until its civil war began, Angola’s economy was quite diversified and enjoying
substantial growth. As Ross (2004) notes, from its time as a Portuguese colony in 1960 to
64 South Africa’s stance in the Angolan Civil War was largely non-committal, though they did invade from the south. In the late 1970s and early 1980s, South Africa, due to its apartheid status quo, found itself with very few international allies, especially in the Western bloc. From the US perspective, President Reagan expressed his displeasure with South African racial policies by naming Edward J. Perkins, an African-American foreign service diplomat, as US ambassador to South Africa. 65 President Nixon began reaching out to China in 1972 to drive a wedge between the Sino-Soviet bloc. His meetings with Mao Zedong and Zhou En Lai acted as catalysts for increasing strain between Moscow and Beijing.
215
the year before the civil war, 1974, Angola sustained a consistent economic growth of
8%. However, once the civil war began in 1975, the economic structure collapsed due to
both the conflict and the new socialist government’s policies (Ross 2004:338). Then,
during the war, industrial output dropped by almost half, rendering Angola even more
dependent upon natural resources (Minter 1994). This is the duality of extreme natural
resource wealth pinned against extreme poverty that plagues Angola.
As observed from the previous section, Cabinda is oil-rich, but what resources
does mainland Angola possess? Le Billon (2001b:565-566) illustrates how not only
Angola is diamond-rich, we also dub it as ‘rich’ because we socially constructed an
industry around diamonds and wedding rings. Diamonds are not only recognized as a
‘girl’s best friend,’ they are also the best friends of Angolan rebels and belligerents. The
major diamond mining sectors of Angola are in Huambo (formerly, Nova Lisboa), near
where UNITA’s headquarters were, and in the eastern Lunda region. Additionally, the
Catoca Diamond Mine, located in northern Lunda, is the fourth largest diamond mine in
the world. Importantly, it is also a deposit of kimberlite diamonds (Mining Technology
2018a), rendering it ‘non-lootable’ by Snyder and Bhavnani’s (2005:565) standards.
Below is a map showing diamond-rich regions of Angola.

216
Figure 26: Diamond-rich regions of Angola (de Boeck 2001:548).
According to scholars, such as de Boeck (2001), diamond smuggling in Angola
has not changed much since Portuguese imperialist times. Throughout the 1980s and
1990s, the “diamond trade, the modes of commerce, the use of caravans to carry wealth
in things or in people into Angola, even the trade routes themselves, did not differ
drastically from their colonial and pre-colonial counterparts” (2001:551). Yet it was in
the mid-1980s that UNITA began attacking diamond mines in Lunda, driving out local
firms, and disrupting world diamond supply. Throughout the same period, there was a
steady increase in Congolese diamond output, not only by artisanal diamond miners but
217
also from the influx of Angolan diamonds smuggled into Congo through informal
channels. The Congolese, for their part, began to cross the border66 into Angola and sold
commodities, ranging from gunpowder to chewing gum, in return for Angolan diamonds
(de Boeck 2001:552-553).
Illicit diamond mining became rampant toward the 1990s. UNITA attempted to
drive the MPLA out of the Cafunfo diamond mine twice, eventually succeeding in 1992
“killing the expatriate staff, sabotaging the mine's equipment and executing those
suspected to be anti-mutim”67 (de Boeck 2001:553). UNITA then brought in tens of
thousands of garimpeiros, unlicensed diggers, to work on their diamond mines. Most
garimpeiros were penniless Congolese youngsters from urban areas and forced into hard
labor mining for diamonds in Angola (Misser & Vallée 1997; de Boeck 2001:554; Bayart
et al 2009). From inside the camp, internal security was not only controlled by UNITA,
but also by artivistes—UNITA-backed security responsible to punish, arrest, and execute
miscreants. They also safeguarded diamond extraction, making sure nobody stole
diamonds (de Boeck 2001:554). Foreign currencies were used as part of this measure.
The sudden dollarization of Angola throughout this period even caused a strong
devaluation of local and national currencies, not only in Angola but also in the Congo
(Kalala & Ponyo 1997). The sedentarization of diamond camp life, control of mines by
artivistes, and the influx of new currencies for illicit ‘blood’ diamonds supports the
66 According to de Boeck, “when people started to swallow diamonds to prevent soldiers and rebels from robbing them of their stones, many people ended up having their intestines slit open by these diamond-hungry soldiers and rebels” (2001:553). 67 The anti-mutim were anti-terrorist rebels founded by MPLA but viewed by UNITA as mostly MPLA spies.
218
distinction made by Hypothesis 5, believing diamond states to suffer from more
organized rebel groups in relation to the resources they capture.
Diamond mining was a lucrative business for UNITA, helping fund their
resistance to the MPLA. According to de Boeck (2001:558), experts estimated that the
Lozamba diamond mines, slightly south of Cafunfo, earned UNITA from $300 to $600
million annually (Financial Times 1996). In contrast, Endiama, Angola’s national
diamond company, likely generated between $100 and $150 million in diamond revenues
during the same period (de Boeck 2001:558). Naturally, the Angolan government neither
wanted UNITA rebels to fund their activities through blood diamonds nor miss out on
revenues from potentially lucrative exports. With this in mind, they created the Angola
Selling Corporation (ASCORP) in conjunction with Belgian and Israeli firms to increase
state revenue (Dietrich 2001). According to de Boeck, ASCORP did their job very well;
it also managed to contain the garimpo situation and “prevent diamonds mined by
UNITA from being exported through the official channels in Luanda as frequently
happened in the period between 1995-1998, when Angolan government and army
officials regularly engaged in deals with UNITA in Lunda Norte” (de Boeck 2001:559;
Hodges 2001:160). This aspect of the Angolan Civil War gets even muddier when army
generals and members of the MPLA began to “acquire concessions for minimal fees
before transferring most of the operating costs and risks to their foreign partners” (Le
Billon 2001a:70). This not only allowed the Angolan government some sovereignty over
diamond production, but ironically, partially incorporated diamonds into the
government’s patronage programs (Le Billon 2001a:70).
219
Diamond revenues may have escaped the government’s clutches, but Sonangol,
Angola’s NOC, holds a tight grip over Angolan offshore petroleum (especially in
Cabinda). According to Le Billion (2001:61), Sonangol employs fewer than 10,000
nationals with very few local contractors working in the oil industry. Furthermore, oil
rents have seldom been used to spearhead economic development or industrial
diversification. Much of the public spending stemming from Sonangol profits goes to
government administration and the military. Worsening this mismanagement is the
uneven centralization of rents focusing on the MPLA-heavy Luanda, and particularly
neglecting UNITA-backed Ovimbundu populations (Le Billon 2001a:63). Petroleum,
then, has actually exacerbated conditions on the ground due to Luanda’s predisposition of
utilizing oil rents for military objectives at the expense of social services that would
benefit the population, thereby reinforcing economic distortions (Savoye 1997; Le Billon
2001a:63). Not only do such policies purposefully alienate ethnic populations, they allow
considerable opportunities for corruption (McGreal 1999). While petroleum may have
helped the MPLA stave off advances from apartheid South Africa and UNITA’s rebels, it
came at the expense of mass economic underdevelopment. Finally, many in the
international community believed petroleum to be to the MPLA what diamonds are to
UNITA—a way to fund an increasingly militarized conflict in Angola.
For the purposes of Hypothesis 5, we must assess the differences between how
diamonds were exploited in comparison to (non-Cabindan) petroleum. First, if we are to
view resource curses as offering multiple outcomes, then the reader will see different
trajectories for diamonds and petroleum in Angola. The Angolan Civil War supports
Ross’s (2004:13) assertion—the lootability of (alluvial) diamonds is a much greater
220
temptation for rebels than petroleum. UNITA never attempted to commandeer oil fields,
but managed to raid and capture some diamond mines, providing them with a generous
revenue stream despite the fact that oil remained the government’s most lucrative
resource. Additionally, the lootability of diamonds clearly influences outcomes of what
Macartan Humphreys (2005:508) calls the rebel greed hypothesis. A homo economicus
perspective of resource extraction would predict rebel takeovers of oil fields rather than
diamond mines, due to petroleum’s exponentially larger revenue stream. However, as
predicted by Ross (2004), the lootability of diamonds overrides rebel greed, as they
sought out the easier targets despite oil’s larger profits.
Second, the results from the Angolan government’s (mis)use of petroleum rents
ended up funding the military. Revenues were not only spent on administrative costs for
the government and clientelist redistributions targeting the presidential entourage, but
also the state nomenklatura,68 and the political elite (Le Billon 2001a:65). Diamond
revenues, on the other hand, were spent solely on funding rebels. UNITA espoused no
social or welfare programs for the masses from their diamond revenues—after all, they
were the rebels and not the government. While the MPLA’s reliance on petroleum
produced economic distortions that influenced the entire state, UNITA’s diamond
production led to no economic resource curse—rather it was an increasingly violent curse
Angolans felt.
Third, international responses to the Angolan Civil War were different contingent
upon the resources in question. For example, after the war formally ended in 2002, the
United Nations convened to create the Kimberley Process attempting to rid the world of
68 The nomenklatura, nomenclature, are categories of people meant to hold governmental or administrative positions in a state.
221
blood diamonds in response to not only the civil war in Angola, but also that of Sierra
Leone. However, we see no such project for Angolan petroleum, even though oil was
used to fund MPLA’s increasingly militaristic objectives. The US never boycotted
Angolan petroleum, even though rents from this resource were used to undermine
Cabinda’s independence and fight against the US-backed UNITA. This lends credence to
Stockwell’s assertion that Washington never wanted the UNITA-FNLA alliance to
overthrow the MPLA, but rather watch them bleed while the Soviets wasted resources in
Africa. Since the world economy is predicated on oil—and not diamonds—Angolan
petroleum was never blockaded while concerted international efforts were made to curb
blood diamonds.
Finally, while the Eastern bloc may have only funded one side of this civil war,
the Western bloc funded both sides. Cuban and Soviet support for the MPLA provided
them with artillery, logistic support, and heavy armaments. It remains unclear and
unlikely that many Cubans or Soviets purchased diamonds that would have been
smuggled out of UNITA’s mines. However, the Western bloc not only provided arms and
support to UNITA, but also their consumers likely (unknowingly or unwillingly) bought
smuggled diamonds. Furthermore, while the West was funding UNITA and possibly
buying diamonds, it was also keeping Sonangol’s oil spigots open and purchasing
Angolan petroleum, though these rents were primarily used to fund the Soviet-backed
MPLA. The contradiction here lies in the shoulders of the West and its policymakers.
The final case study will analyze the impact of diamonds on the Sierra Leonean
Civil War (1991-2002). Similar to the other cases, the Sierra Leonean Civil War was
222
triggered by political power grabs that ended up becoming resource-related, with blood
diamonds financing a large percentage of rebel activities.
The Sierra Leonean Civil War
The history preceding the Sierra Leonean Civil War (1991-2002) is strikingly
similar to that of Algeria. Yet, as the reader will observe, since Sierra Leone and Algeria
do not enjoy the same resources, their wars became radically different. The British
occupied what is now known as Sierra Leone until 1961. Unlike the Portuguese, who
waged war against the Angolans, Sierra Leone sent a delegation to Great Britain to
negotiate terms for independence. One this was granted by the British crown, Sierra
Leone adopted a weak post-independence democracy. After its first president, Sir Milton
Margai, the government began spiraling into patterns of corruption and despotism,
following with economic and political decline (Smillie et al 2000:8). Throughout the
1970s and 1980s, Prime Minister Siaka Stevens, with Cuban and Soviet help,
consolidated power and turned Sierra Leone into a one-party state. His terms in office,
first as Prime Minister and then as President, are largely characterized as despotic, rife
with corruption and exploitation. By 1985, Stevens, now in his 80s, retires and hands
over power to his former army chief, Joseph Momoh, who relaxes some of Stevens’
policies, but is largely viewed as inept (Smillie et al 2000:10).
Then in 1989, Gaddhafi’s protégé, Charles Taylor, from neighboring Liberia,
forms the National Patriotic Front of Liberia, and, from the Ivory Coast, invades Liberia,
toppling Samuel Doe’s government in less than one year, triggering the First Liberian
Civil War (1989-1997). The Liberian Civil War quickly spilled over into Sierra Leone in
223
1990, with 80,000 Liberian refugees pouring into Sierra Leone (Smillie et al 2000:10).
By 1991, Foday Sankoh and some allies created the Revolutionary United Front (RUF).
The RUF was originally a group of Sierra Leoneans who were part of Charles Taylor’s
National Patriotic Front of Liberia (NPFL), who attempted to replicate Taylor’s success
in Sierra Leone. Unlike many non-state groups and revolutionary forces, the RUF made
little attempt to win over the hearts of Sierra Leoneans. Instead of seeking civilian
approval for logistic support and a political backbone, the RUF’s environment was
characterized by brutal atrocities, widely unpopular both in Sierra Leone and
internationally (Milton 2008:2).
Rather than having a coherent political and military strategy, much of the RUF’s
“rank-and-file membership comprised of child soldiers, many of whom had been forcibly
recruited, the RUF represented a largely illiterate, politically and socially dislocated body
of brutalized youths, who despite possessing a myriad of legitimate grievances, were ill-
equipped to return (or be introduced) to civil society and channel these grievances
through peaceful political discourse” (Mitton 2008:2). Instead of killing civilians, the
RUF’s strategy was to indiscriminately amputate civilians’ arms, legs, lips, and ears.
Largely viewed as the most effective way of spreading fear and terror in the civilian
population, the RUF purposefully targeted infants and children. According to a Vietnam
War veteran who was volunteering in Sierra Leone at the time, David Evans, “if you kill
somebody, they go away. They’re gone. […] But if you mutilate someone, they are a
walking billboard for terrorists” (Quiñones 2006). By 1994, with the help of child
soldiers and teenagers high on drugs, the RUF overran Sierra Leonean diamond mines,
essentially bankrupting the economy, leaving 50,000 dead and half of the Sierra Leonean
224
population displaced (Smillie et al 2000:10). The RUF got a reputation for specifically
targeting village chiefs, and deliberately sending child soldiers to attack their native
towns and villages, which left deep scars on their friends and families (Keen 2005:60).
The next year, the government of Sierra Leone, led by Valentine Strasser,
contracts Executive Outcomes, a South African paramilitary group of mercenaries, to
combat RUF. By May, Executive Outcomes manages to free the diamond mines from the
RUF’s clutches. The next year, however, Strasser is ousted in another palace coup and
replaced by Julius Maada Bio, who begins talks with the RUF. Negotiations were marred
by RUF violence, yet Foday Sankoh of the RUF and Sierra Leone’s new president,
Ahmed Tejan Kabbah, manage to sign a temporary peace accord. Kabbah promised
amnesty in return for peace, suggesting that military action would be the price to pay if
the RUF continued activities. Interestingly enough, it was this threat that proved most
significant in commencing negotiations (Mitton 2008:5). The Abidjan Accord, as it came
to be called, offered the RUF no meaningful governmental positions for key leaders. In
this sense, “rather than politically incorporating the RUF into the existing regime where it
could share power, the government sought to incorporate it into the democratic system
where it would have to contend for power” (Mitton 2008:5).
The Abidjan Peace Accord perhaps predictably fell apart, and by 1997 RUF
soldiers ended up releasing 600 prisoners who created the Armed Forces Ruling Council
(AFRC). Amazingly, this group eventually allied themselves with their former captors
when RUF Major Johnny Paul Koroma, the former coup plotter, invited the AFRC to join
in the RUF-led government. Characterizing AFRC-RUF rule is “systematic murder,
225
torture, looting, rape, and shutdown of all formal banking and commerce in the country”
(Smillie et al 2000:11).
As conditions worsened, the Economic Community of West African States
Monitoring Group (ECOMOG) is called to step in the Sierra Leonean Civil War,
launching an offensive that drives the RUF out of Freetown, Sierra Leone’s capital.
ECOMOG forces eventually capture Foday Sankoh in Nigeria—he is freed before being
recaptured. Meanwhile, in January 1999, the AFRC-RUF alliance re-captures Freetown,
leading to more killings, raping, and dismemberments. Additionally, parts of the city are
razed, 6000 civilians die, and 2000 children are missing in two weeks (Smillie et al
2000:11). The Nigerian forces of ECOMOG suffer between 800 to 1200 casualties and
Abuja planned to back out of ECOMOG and be replaced with UNAMSIL, the United
Nations Mission in Sierra Leone. This force was 17,000 strong and managed the
disarmament of Sierra Leone throughout the post-conflict years (Gberie 2002).
The role diamonds played in the Sierra Leonean Civil War has attracted a lot of
scholarly attention. Kabbah, the former President of Sierra Leone that managed to bring
the RUF to the negotiating table, stated, “ours was not a civil war. It was not a war based
on ideology, religion or ethnicity, nor was it a ‘class war’... It was a war of proxy aimed
at permanent rebel control of our rich diamond fields for the benefit of outsiders”
(Kabbah 2001). According to Gberie (2002:2), although estimates of conflict diamonds
range between 4 and 15 percent of world totals, this figure can equate to over $1 billion
in revenues for rebels controlling the mines. Still others consider one fifth of diamonds to
have been illicitly traded, either through violence, smuggling, money laundering, or tax
226
evasion (Smillie 2002). In Sierra Leone, the UN estimates that the RUF traded between
$25 and $125 million worth of diamonds (UN 2000; Gberie 2002:2).
Diamonds are easily smuggled, and they provided funding for RUF rebels, while
simultaneously keeping those monies away from government forces. As long as the
country remained at war, diamond smuggling would be possible, and for this reason,
diamond profits represented a valuable incentive for every armed group to continue
fighting (Keen 2005:50). Even after the UN force came to Sierra Leone, it was not for
another year that they could oust the RUF from their diamond mines in the Kono district.
Many of the civilians working those mines were RUF captives laboring under indentured
statuses (Gberie 2002:4). Additionally, even after UNAMSIL was on the ground in Sierra
Leone, smugglers still managed to trade diamonds without their knowledge, notably to
Lebanese traders in communication with al-Qaeda operating in Sierra Leone (Farah
2001). These instances were more than mere speculation. According to Gberie, a UN
Expert Panel reported that Issa Sesay, the RUF leader at that time, “flew to Abidjan late
in 2001 with 8,000 carats of diamonds which he sold to two dealers of undisclosed
identity. Apparently these dealers were ‘using a Lebanese businessman’ who ran errands
for them between Abidjan and the Liberian capital, Monrovia” (2002:4; UN 2000).
Hypothesis Conclusions
Unlike the petro-trade, the RUF only needed a few smugglers to mix blood
diamonds with legally mined ones. Whereas to smuggle petroleum out of a state to fund a
rebel group would require a multitude of buyers, this is not the case with diamond
smugglers. As we see with the Sierra Leonean case, a few Lebanese smugglers are
227
sufficient to mix illicit and licit diamonds. This is one of the main differences between
diamonds and petroleum, and likely the reason why Islamist rebels never bothered to
capture Algerian oil deposits.
Consistent with Ross’s (2004) hypotheses, the lootability of diamonds contributed
to the RUF’s attempts to overthrow the Sierra Leonean government. In every case
analyzed for Hypothesis 5, the violence began due to non-resource related reasons.
However, once the violence commenced, resources began playing a larger role in the
conflict. The purpose of Hypothesis 5 is to illustrate that petroleum and diamonds play
different roles in civil conflict. Whereas Ross (2004) expects non-lootable resources to
lead to separatist movements, this work argues that the intrinsic value of petroleum is a
greater force in determining rebel activity than its non-lootability. Securing consistent
buyers and high up front costs of infrastructure are barriers to entry that dis-incentivize
rebel groups. Furthermore, the inherent international attention garnered for disrupting the
flow of petroleum in the world market is another barrier for rebels unrelated to the non-
lootability of oil. This is not the case for diamonds. As we clearly saw, and as Ross
(2004) postulates, while extracting diamonds from a mine is logistically difficult, the
barriers of selling these gems are much lower than petroleum, indicating that rebels are
more likely to capture this resource over petroleum. We furthermore noticed no sabotage
of diamond mines and a larger network of control over these mines by rebel groups to
ensure production of resources, two phenomena absent from rebel activity regarding the
petroleum trade.
Below is a chart detailing the differences between the civil wars in Algeria,
Angola, and Sierra Leone illustrating how diamonds and petroleum led to different
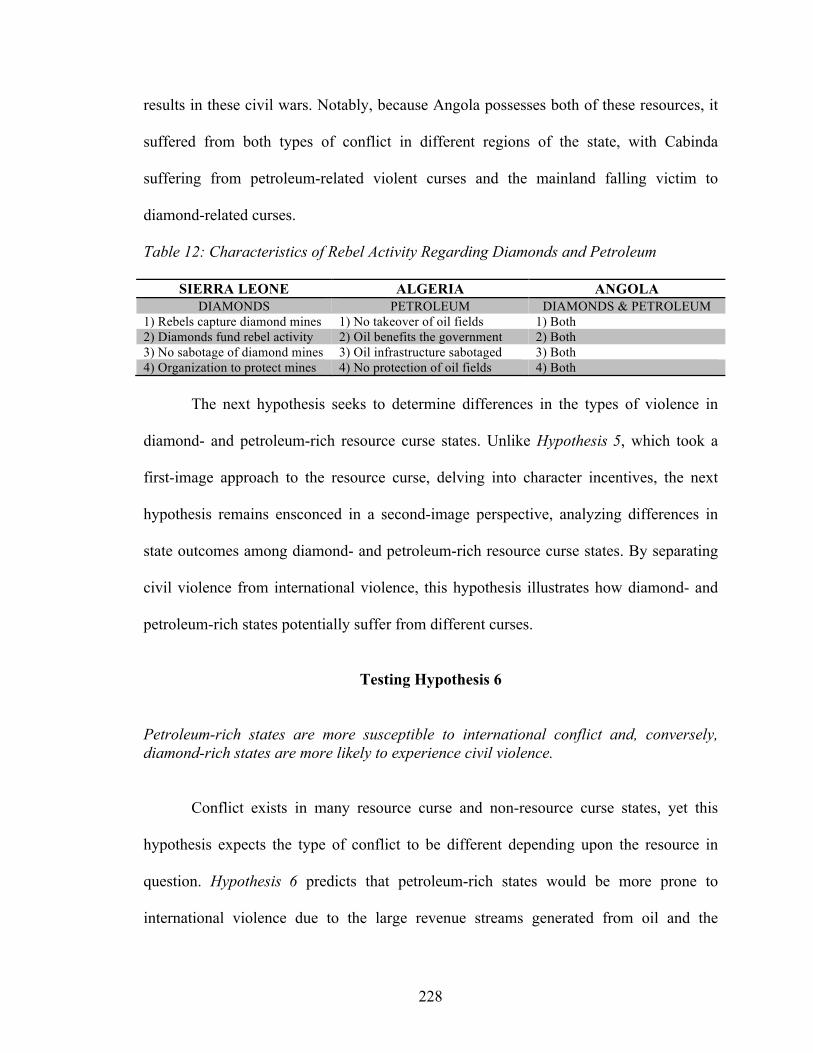
228
results in these civil wars. Notably, because Angola possesses both of these resources, it
suffered from both types of conflict in different regions of the state, with Cabinda
suffering from petroleum-related violent curses and the mainland falling victim to
diamond-related curses.
Table 12: Characteristics of Rebel Activity Regarding Diamonds and Petroleum
SIERRA LEONE ALGERIA ANGOLA DIAMONDS PETROLEUM DIAMONDS & PETROLEUM
1) Rebels capture diamond mines 1) No takeover of oil fields 1) Both 2) Diamonds fund rebel activity 2) Oil benefits the government 2) Both 3) No sabotage of diamond mines 3) Oil infrastructure sabotaged 3) Both 4) Organization to protect mines 4) No protection of oil fields 4) Both
The next hypothesis seeks to determine differences in the types of violence in
diamond- and petroleum-rich resource curse states. Unlike Hypothesis 5, which took a
first-image approach to the resource curse, delving into character incentives, the next
hypothesis remains ensconced in a second-image perspective, analyzing differences in
state outcomes among diamond- and petroleum-rich resource curse states. By separating
civil violence from international violence, this hypothesis illustrates how diamond- and
petroleum-rich states potentially suffer from different curses.
Testing Hypothesis 6
Petroleum-rich states are more susceptible to international conflict and, conversely, diamond-rich states are more likely to experience civil violence.
Conflict exists in many resource curse and non-resource curse states, yet this
hypothesis expects the type of conflict to be different depending upon the resource in
question. Hypothesis 6 predicts that petroleum-rich states would be more prone to
international violence due to the large revenue streams generated from oil and the
229
technical expertise associated with the extraction of this resource. As described in the
previous hypothesis, the large network and expensive infrastructure necessary for
petroleum extraction render it non-lootable for rebels. Conversely, this hypothesis
expects diamond-rich states to be more likely to experience domestic or gang-related
(read: civil) violence due to the lootability, high value, and few barriers to entry for this
resource. Some may consider such a distinction to be splitting hairs, as it matters very
little to the victim if they are being attacked my domestic or international forces.
However, if there is a correlation between civil violence with diamonds, and international
violence with petroleum, then scholars may ultimately have a better understanding of
resource curse conflict. If analysts consistently observe patterns of different types of
violence among resource curse states, then we have a theoretical springboard from which
we may launch a qualitative analysis to peek into each state’s inner conflict.
In order to test this hypothesis, this dissertation will adopt conflict and violence
data from the Center for Systemic Peace, and pin it to Ross and Mahdavy’s (2015) oil
and gas dataset, along with the Kimberley Process data on diamonds. The Center for
Systemic Peace, based out of Vienna, measures magnitude scores for different types of
political violence, internally displaced persons, high casualty terrorist bombings, coup
d’états, and state failures. For this ratio-based dataset, a score of 0 indicates no systemic
violence and scores with larger numbers denote increased levels of violence.69 Some
69 The UCDP/PRIO Armed Conflict Dataset is another resource; yet, it comes with some drawbacks—either incomplete data or too finely grained data. The UCDP/PRIO data is segregated into extra-systemic armed conflict, interstate-armed conflict, internal armed conflict, and internationalized internal armed conflict; but it measures instances of civil and international violence, rather than disaggregating magnitude of violence. The two codes for magnitude are 1 for fewer than 1000 conflict deaths, and 2 for over 1000 conflict-related casualties. The dataset is conveniently separated into topics relevant to
230
problems immediately arise with this line of thinking—both theoretical and empirical.
This dissertation will begin with the theoretical. Increases in international or civil
violence do not necessary spell out a resource curse or may result as a consequence of the
resource at all. It is in cases such as these that we need to supplement the statistical
analyses with qualitative data. Furthermore, large-N quantitative data does not capture the
fine-grained, disaggregated domestic and international processes that are so important in
understanding differences among resource curses. On a more empirical level, it may also
be the case that there exists ethnic and civil strife within a state but unrelated and distant
from the discovery of petroleum and diamonds. Some literature explores how diamonds
and petroleum may prolong certain conflicts and incite wars. As previously stated in the
literature review, Omgba (2009) found that petroleum, but no other resource, allowed
African incumbents to remain in power. Brückner and Ciccone (2010) additionally found
that downturns in the prices of necessary commodities precede outbreaks in violence.
Bazzi and Blattman’s (2013) support this logic, finding that increases in commodity
prices lead to pauses of violence.
Another challenge in measuring the relationship between violence and resource
production involves the how diamond extraction is measured. This work is measuring
reported production of petroleum and diamonds. It may be acceptable to trust the World
Bank, IMF, OPEC, and Ross and Mahdavy’s (2015) datasets for petroleum production, as
they are generally reliable, but the same cannot be said for diamond production.
the theory of resource curses, but due to the lack of granularity in the magnitude of conflict, this dissertation hesitates to use it for testing Hypothesis 6. On the other hand, UCDP/PRIO offers too finely grained data as well, accounting for types of violence, dyad names, sources, and even longitude and latitude. While the dataset is impressive, it is simultaneously sliced too thinly or too broadly for testing this hypothesis.
231
Compendiums of petroleum production, exports, and imports tend to be gathered mostly
for industry and scholarly purposes, whereas diamond production measurements are
driven by human rights incentives. Additionally, and most importantly, blood diamonds
are often smuggled out of a country, meaning that they will not be reported in official
datasets. Once diamonds are smuggled out of Sierra Leone, Liberia, or Angola, they are
purposefully mixed in with other diamonds from India, Russia, and Canada, and cannot
be traced back to their origins in West Africa. Naturally, these conflict diamonds do not
appear in official datasets, rendering it difficult for the analyst to accurately measure
diamond production. However, if the statistical analysis shows that diamond-rich states
are more susceptible to civil conflict, we must ask ourselves if diamonds are contributing
to this upswing in violence? The same would be true for petroleum. Since numbers can
only take us so far and one cannot control for every variable, a supplemental qualitative
analysis is necessary to evaluate the quantitative empirical support for this hypothesis.
This hypothesis will qualitatively analyze a unique scenario among resource curse states,
when two petroleum-rich states fought each other during the Iran-Iraq War (1980-1988).
First, this dissertation will quantitatively measure instances and magnitude of civil
and international violence in resource curse states, as depicted from the Center for
System Peace’s dataset.70 Additionally, the present work is collapsing the variables for
civil violence, civil war, and ethnic conflict into one composite score. While the Center’s
70 According to the Qualities of Governance dataset, the Center for Systemic Peace determines major episodes of political violence as “annual, cross-national, time-series data on interstate, societal, and communal warfare magnitude scores (independence, interstate, ethnic, and civil; violence and warfare) for all countries.” The full set (1946-2012) “includes both country data and scores for neighboring countries and regional context for all independent countries (does not include independence wars)” (Teorell et al 2017:152).
232
dataset is very useful, separating each state into yearly numbers and creating slightly
different categories for intrastate violence may be slicing it too thin for the purposes of
testing Hypothesis 6. With this in mind, this work is also creating a composite score of
civil violence and warfare, entitled ‘composite_civ’ in the bivariate regressions below.
The same strategy will be implemented for international violence and international
warfare, which will be combined into one score, ‘composite_int.’ Even though there are
still many states scoring ‘0’ (thankfully), this combined data should provide more testable
measures for Hypothesis 6.
Quantitative Results
The bar graph below shows the variation in civil and international violence among
the resource curse states in this dataset, with the red bars depicting international violence
while the blue bars denote civil violence. As can be seen below, only petroleum-rich
states experienced significant international violence from 1980 to 2016. It should be
noted that except for a blip in Russia and Ecuador’s violence, and another in Syria during
their ongoing civil war, only three petroleum-rich states experienced substantial
international violence—Iran, Iraq, and Kuwait. These three states have not only suffered
external invasions (e.g., US invasion of Iraq), but have mostly been attacking each other.
The Iran-Iraq War lasted from 1980 to 1988, and Saddam Hussein invaded Kuwait in
1990, which resulted in the Gulf War (1990-1991). Rumors and speculation also abound
regarding connections between the US invasion of Iraq and petroleum, with many
233
suggesting that the war was a mercantilist-style oil grab71 (Juhasz 2013; Shamoo et al
2007). Placing the US invasion of Iraq aside, the Iraqi invasion of Kuwait was largely
due to petroleum deposits on the Iraq-Kuwaiti border. Additionally, as Iraqi troops
retreated, they took care to burn Kuwaiti oil fields, leaving an economic and
environmental disaster in their wake.
On the other hand, no diamond-rich state experienced international violence
during the same time period.72 Although petroleum-rich states were more likely to suffer
from international violence, there does not seem to be such a disparity regarding civil
violence; petroleum-rich and diamond-rich states seem to be just as likely to experience
civil violence. Naturally, some states are more peaceful than others on the petroleum side
(e.g., Bahrain, Gabon, Malaysia, etc.) but the same is true for diamond states (e.g.,
Guyana and Tanzania). As can also be seen below, Angola and Russia, coded as petro-
states to eliminate their duplication, experienced significant civil violence but relatively
little international violence during the same time period. Figure 27 shows the differences
in types of violence between diamond- and petroleum-rich states.
71 Gen. John Abizaid, the former leader of US Central Command and Military Operations in Iraq, stated that “of course [the Iraq War] is about oil; we can’t really deny that” (Juhasz 2013). Former Federal Reserve Chairman Alan Greenspan echoed these thoughts, stating that the “Iraq War is largely about oil” and “people say we’re not fighting for oil. Of course we are” (Shamoo et al 2007). Additionally, then-Senator, and future Defense Secretary, Chuck Hagel, agreed, ironically exclaiming, “we’re not there for figs” (Shamoo et al 2007). 72 A potential exception is Russia, coded as both a diamond and petroleum state, which experienced some violence due to the Russian invasion of Georgia in 2008. Russia also invaded Ukraine in 2014, right after the Winter Olympics in Sochi. These invasions are depicted as a small blip on Russia’s bar, and are likely not linked to diamonds. Supporting Hypothesis 6, there is a stronger case for the link between the Russian intervention in Ukraine and petroleum, as the port at Sevastopol is a prime location for access for oil tankers in the Black Sea.
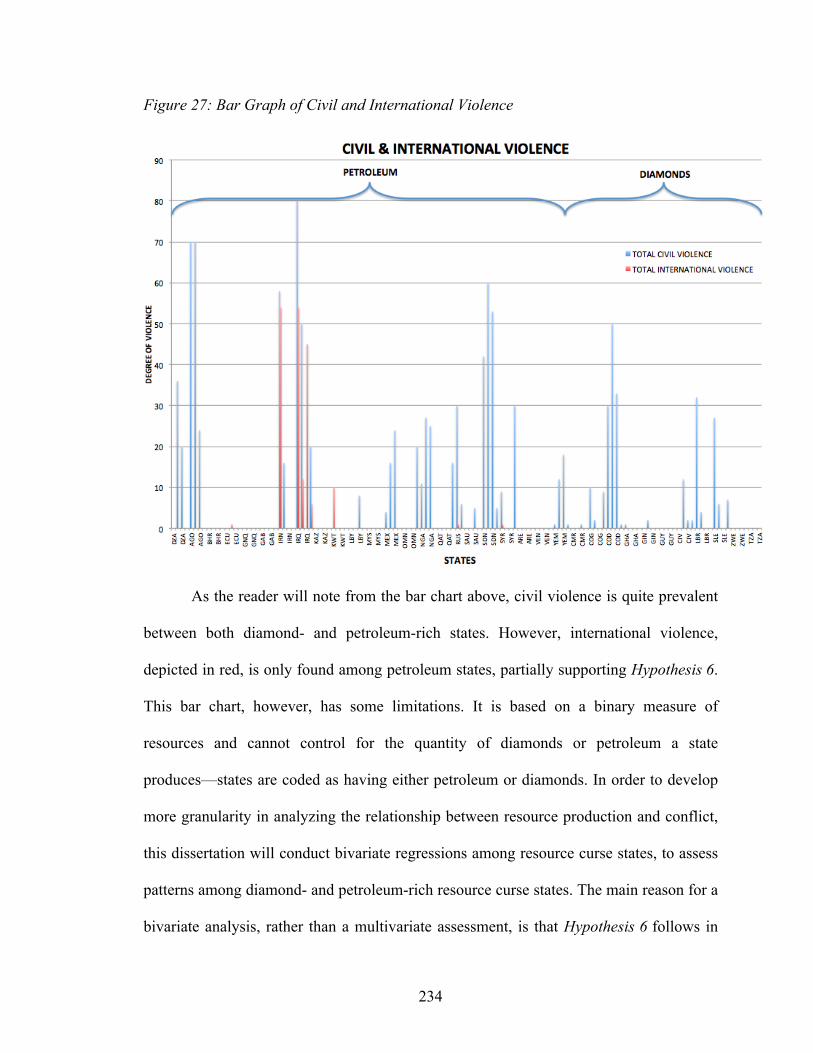
234
Figure 27: Bar Graph of Civil and International Violence
As the reader will note from the bar chart above, civil violence is quite prevalent
between both diamond- and petroleum-rich states. However, international violence,
depicted in red, is only found among petroleum states, partially supporting Hypothesis 6.
This bar chart, however, has some limitations. It is based on a binary measure of
resources and cannot control for the quantity of diamonds or petroleum a state
produces—states are coded as having either petroleum or diamonds. In order to develop
more granularity in analyzing the relationship between resource production and conflict,
this dissertation will conduct bivariate regressions among resource curse states, to assess
patterns among diamond- and petroleum-rich resource curse states. The main reason for a
bivariate analysis, rather than a multivariate assessment, is that Hypothesis 6 follows in
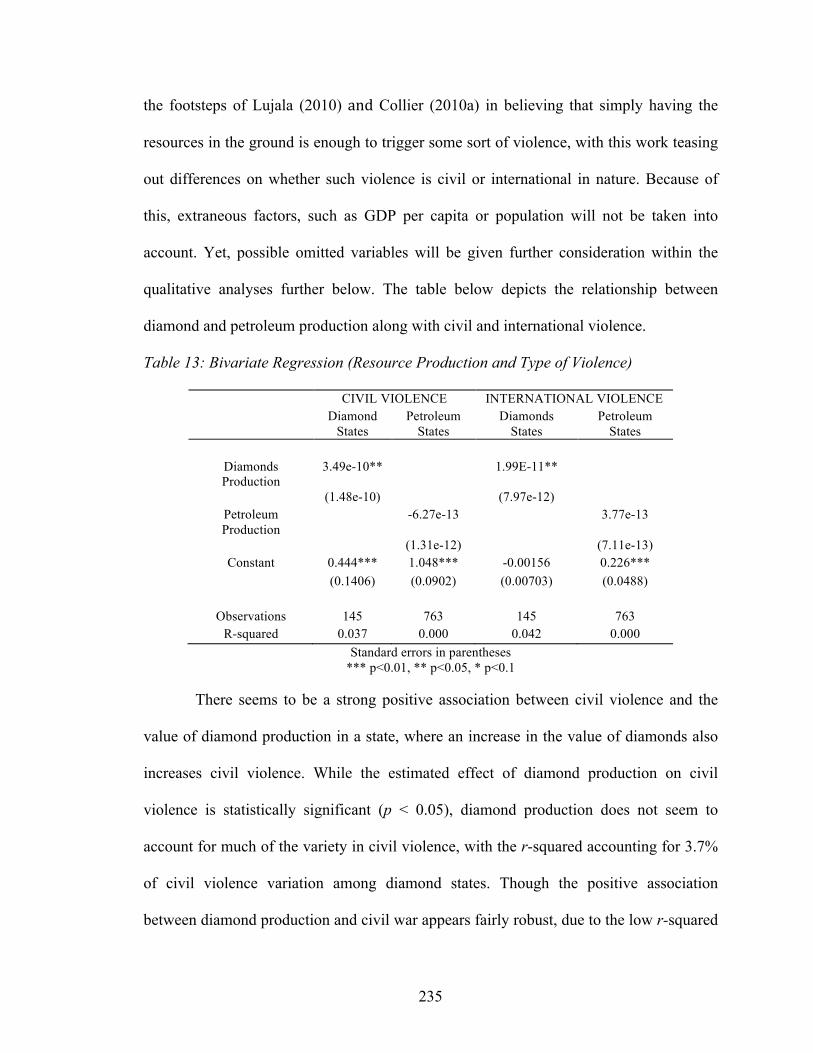
235
the footsteps of Lujala (2010) andCollier (2010a) in believing that simply having the
resources in the ground is enough to trigger some sort of violence, with this work teasing
out differences on whether such violence is civil or international in nature. Because of
this, extraneous factors, such as GDP per capita or population will not be taken into
account. Yet, possible omitted variables will be given further consideration within the
qualitative analyses further below. The table below depicts the relationship between
diamond and petroleum production along with civil and international violence.
Table 13: Bivariate Regression (Resource Production and Type of Violence)
CIVIL VIOLENCE INTERNATIONAL VIOLENCE Diamond
States Petroleum
States Diamonds
States Petroleum
States
Diamonds Production
3.49e-10** 1.99E-11**
(1.48e-10) (7.97e-12) Petroleum Production
-6.27e-13 3.77e-13
(1.31e-12) (7.11e-13) Constant 0.444*** 1.048*** -0.00156 0.226***
(0.1406) (0.0902) (0.00703) (0.0488)
Observations 145 763 145 763 R-squared 0.037 0.000 0.042 0.000
Standard errors in parentheses *** p<0.01, ** p<0.05, * p<0.1
There seems to be a strong positive association between civil violence and the
value of diamond production in a state, where an increase in the value of diamonds also
increases civil violence. While the estimated effect of diamond production on civil
violence is statistically significant (p < 0.05), diamond production does not seem to
account for much of the variety in civil violence, with the r-squared accounting for 3.7%
of civil violence variation among diamond states. Though the positive association
between diamond production and civil war appears fairly robust, due to the low r-squared
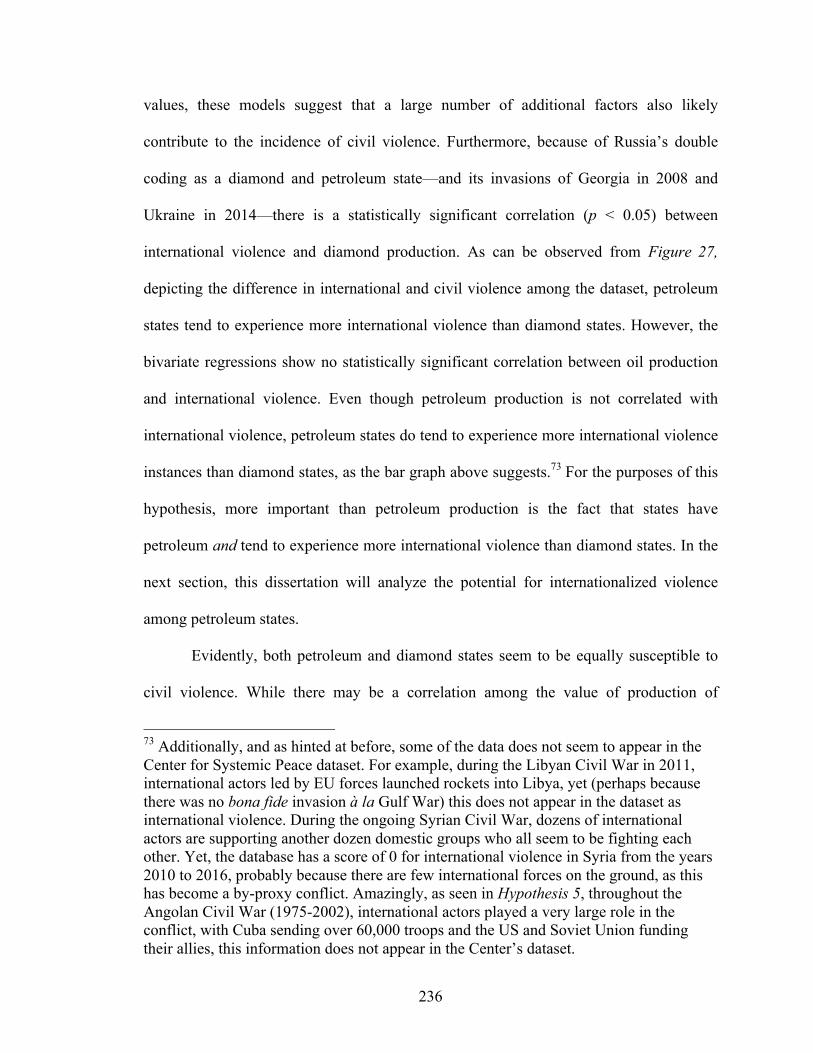
236
values, these models suggest that a large number of additional factors also likely
contribute to the incidence of civil violence. Furthermore, because of Russia’s double
coding as a diamond and petroleum state—and its invasions of Georgia in 2008 and
Ukraine in 2014—there is a statistically significant correlation (p < 0.05) between
international violence and diamond production. As can be observed from Figure 27,
depicting the difference in international and civil violence among the dataset, petroleum
states tend to experience more international violence than diamond states. However, the
bivariate regressions show no statistically significant correlation between oil production
and international violence. Even though petroleum production is not correlated with
international violence, petroleum states do tend to experience more international violence
instances than diamond states, as the bar graph above suggests.73 For the purposes of this
hypothesis, more important than petroleum production is the fact that states have
petroleum and tend to experience more international violence than diamond states. In the
next section, this dissertation will analyze the potential for internationalized violence
among petroleum states.
Evidently, both petroleum and diamond states seem to be equally susceptible to
civil violence. While there may be a correlation among the value of production of
73 Additionally, and as hinted at before, some of the data does not seem to appear in the Center for Systemic Peace dataset. For example, during the Libyan Civil War in 2011, international actors led by EU forces launched rockets into Libya, yet (perhaps because there was no bona fide invasion à la Gulf War) this does not appear in the dataset as international violence. During the ongoing Syrian Civil War, dozens of international actors are supporting another dozen domestic groups who all seem to be fighting each other. Yet, the database has a score of 0 for international violence in Syria from the years 2010 to 2016, probably because there are few international forces on the ground, as this has become a by-proxy conflict. Amazingly, as seen in Hypothesis 5, throughout the Angolan Civil War (1975-2002), international actors played a very large role in the conflict, with Cuba sending over 60,000 troops and the US and Soviet Union funding their allies, this information does not appear in the Center’s dataset.
237
diamonds and civil violence, there is no such correlation with the value of petroleum
production. As can be seen from Figure 27, diamond-rich and oil-rich states tend to
experience similar (and high) amounts of civil violence. International violence seems to
be much more limited to petroleum-rich states, as Figure 27 does not show one diamond-
rich state, again, except for Russia, experiencing international violence. However, even
though the bar graph illustrates only petroleum states suffering from international
violence, the bivariate regression does not. In order to account for this disparity, this
work will conduct a qualitative study of the Iran-Iraq War (1980-1988), which was
triggered for reasons exogenous to resource production, but came to involve Iran’s—and
later Kuwait’s—petroleum reserves.
The Iran-Iraq War (1980-1988)
With the notable exception of the Korean War, the post-World War II period saw
the United States relying more heavily on the newly created Central Intelligence Agency
(CIA), formerly the Office of Strategic Services (OSS). Throughout the 1950s, the CIA
supported the overthrow of foreign governments unfaithful to the United States or
sympathetic to Soviet ideologies. Along with the State Department, the CIA ousted
Jacobo Árbenz Guzmán in Guatemala after he supported an agrarian reform program in
the Central American country. A few years later, the CIA additionally supported the
failed Bay of Pigs invasion in 1961 to oust Fidel Castro from Cuba without success, after
Kennedy pulled out while the invasion was underway. In contrast to the failed operation
238
in Cuba,74 the CIA paired with MI6 to overthrow Mohammad Mosaddegh in 1953 in
Iran, after his regime, which was once democratic, became increasingly dictatorial. The
US replaced Mosaddegh with the Washington-backed Shah, Mohammed Reza Pahlavi.
The Shah soon began losing favor with a majority of the clerics due to his stance
on the laïcité, or secularization, of Iran. The Shah’s policy of laïcité combined with the
relatively rapid modernization of the country left key sectors of society behind, which
increased demonstrations against his regime. As Skocpol (1982:267) notes, the Iranian
Revolution was marked by a unique characteristic: the 300,000-strong military was
rendered woefully ineffective in protecting the Shah despite not suffering from a military
defeat in a foreign war. Not only was the military unable to protect the Shah, it was also
incapable of replacing him with a junta or another military-backed regime that could
preserve existing Iranian institutions. Saddam Hussein in Iraq seems to have noticed this
inability, and found a weakness in the Shi’a Crescent that nearly surrounds Iraq.
In Baghdad, the Ba’ath Party had been in power for eleven years before Saddam
Hussein became the leader of Iraq in 1979, the same year the Shah was overthrown in
neighboring Iran. According to Workman (1991:6), there were multiple social origins for
the Iran-Iraq War characterized in racial (Aryan Iran versus Semite Iraq), sectarian (Shi'a
Iran against Sunni Iraq), ethnic (Persian Iran and Arab Iraq) and religious (‘secular’ Iraq
and fundamentalist Iran) relations (Workman 1991:6; Farhang 1985; al-Khalil 1989).
74 The CIA would doggedly continue to overthrow Castro, sometimes engaging in bizarre attempts to assassinate the Cuban leader, ranging from poisoning cigars to exploding multicolored seashells where he would habitually go scuba diving. According to Fabián Escalante (2006), the CIA attempted to kill Fidel Castro 634 different times, using techniques ranging from femme fatale to attempting to discredit him by dusting his shoes with thallium salts, which would make his beard fall off.
239
Pan-Islamist, often (mis)understood as Pan-Shi’a ideologies dominant in Iran ran afoul of
Saddam Hussein’s Arab nationalism and his sense of creeping Shi’ism in the Gulf.
From the geopolitical perspective, tensions between the two states were
dominated by disagreements over the ownership of Shatt al-Arab, known in Iran as
Arvand Rud, a small river formed by the confluence of the Tigris and Euphrates
demarcating the border between Iran and Iraq. Strategically, this river is also Iraq’s only
outlet to the Persian Gulf, meaning that if it loses control of the river, Iraq would become
a landlocked country. For its part, Iraq felt that sharing the river with Iran would leave it
vulnerable to Iranian attacks, especially since Iraq did not enjoy solid relations with other
neighbors, such as Turkey, Syria, or Kuwait (Karsh 1990:258). Worsening tensions
between the two states was the purposefully fragmented demographic composition of
Iraq—part Shi’a and part Sunni, part Arab and part Kurdish—which impeded the
crystallization of the country (Karsh 1990:259). Throughout the 1960s and 1970s, Iran
sought to drive a wedge between these discrepancies in the Iraqi demographic makeup,
supporting Kurdish rebels75 during the First and Second Iraqi-Kurdish Wars (US State,
CIA & DIA 1975:2). In 1975, both states met to come to an agreement over the status of
the Shatt al-Arab after a sporadic border clashes continued to mar relations. The Algiers
Accord, as the summit came to be called, was the first genuine bilateral negotiation
between the two states to ostensibly solve this dispute, while simultaneously halting
Kurdish aggression in Iraq (Karsh 1990; Shofield 1986:62).
75 Saddam Hussein would later use chemical weapons against the Iranian-supported Kurds during the Iran-Iraq War (Salih 1995:24). It should be noted that Iran is quite keen on supporting the Iraqi Kurds fighting against strongman Hussein, and not necessarily the thousands of Kurds living in Iran.
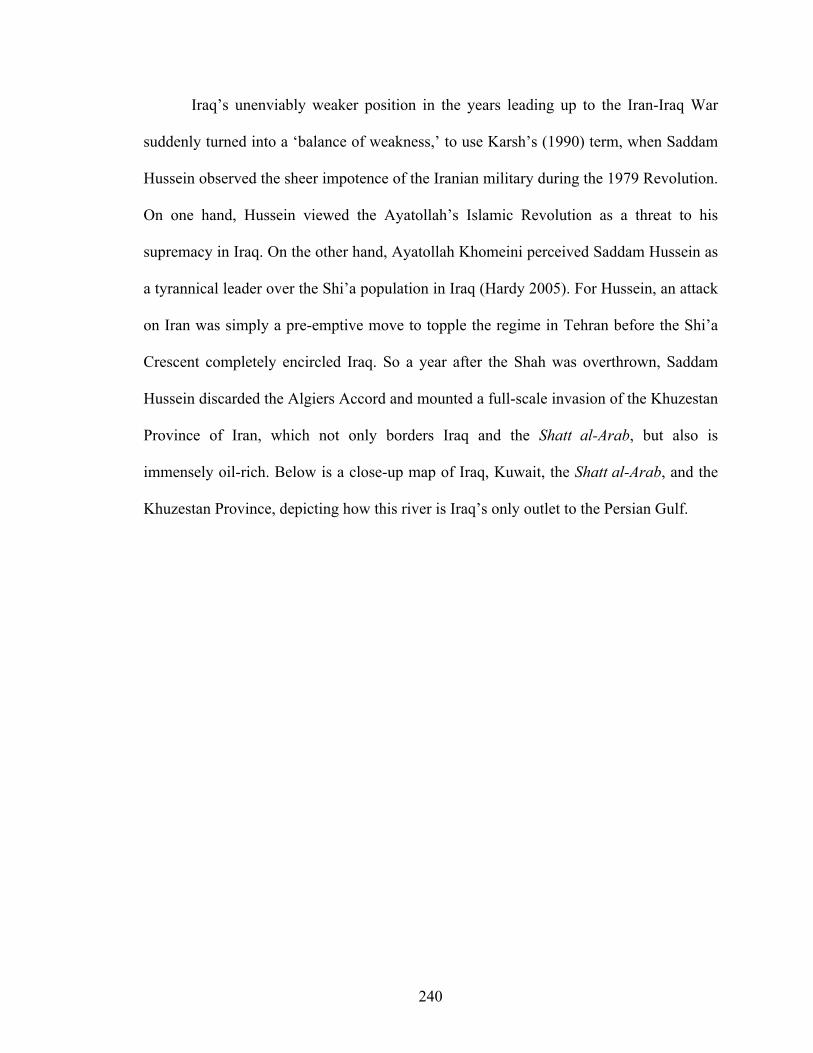
240
Iraq’s unenviably weaker position in the years leading up to the Iran-Iraq War
suddenly turned into a ‘balance of weakness,’ to use Karsh’s (1990) term, when Saddam
Hussein observed the sheer impotence of the Iranian military during the 1979 Revolution.
On one hand, Hussein viewed the Ayatollah’s Islamic Revolution as a threat to his
supremacy in Iraq. On the other hand, Ayatollah Khomeini perceived Saddam Hussein as
a tyrannical leader over the Shi’a population in Iraq (Hardy 2005). For Hussein, an attack
on Iran was simply a pre-emptive move to topple the regime in Tehran before the Shi’a
Crescent completely encircled Iraq. So a year after the Shah was overthrown, Saddam
Hussein discarded the Algiers Accord and mounted a full-scale invasion of the Khuzestan
Province of Iran, which not only borders Iraq and the Shatt al-Arab, but also is
immensely oil-rich. Below is a close-up map of Iraq, Kuwait, the Shatt al-Arab, and the
Khuzestan Province, depicting how this river is Iraq’s only outlet to the Persian Gulf.
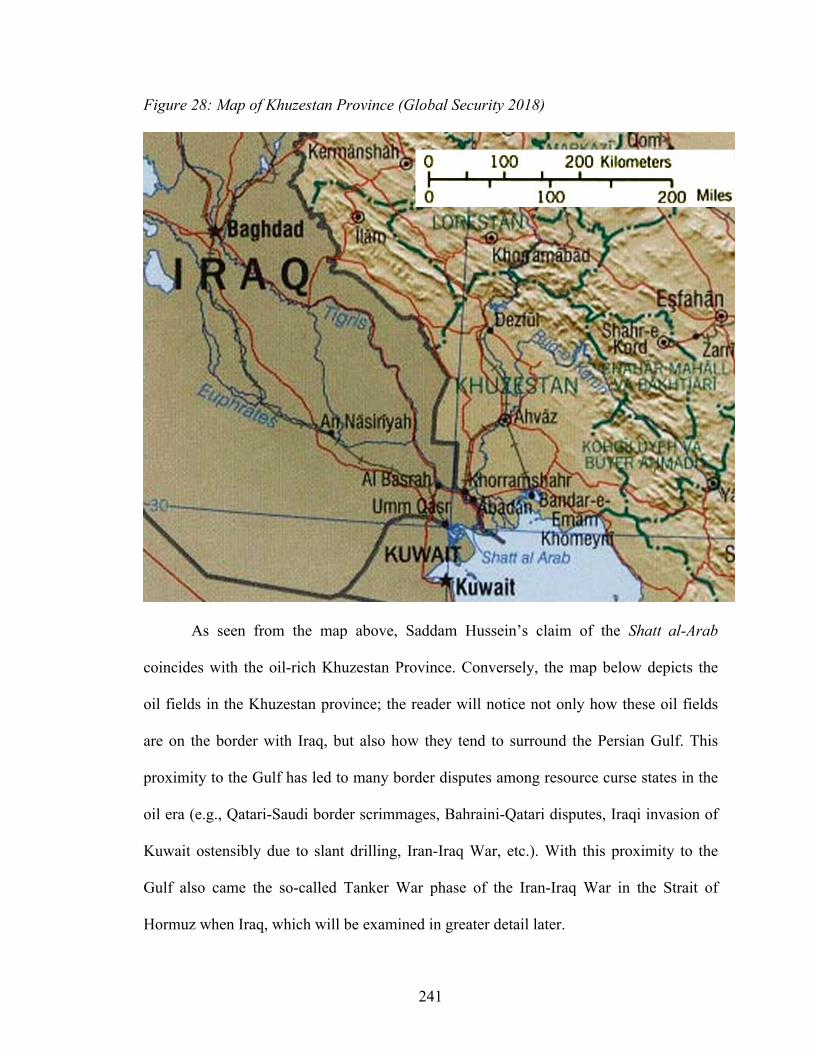
241
Figure 28: Map of Khuzestan Province (Global Security 2018)
As seen from the map above, Saddam Hussein’s claim of the Shatt al-Arab
coincides with the oil-rich Khuzestan Province. Conversely, the map below depicts the
oil fields in the Khuzestan province; the reader will notice not only how these oil fields
are on the border with Iraq, but also how they tend to surround the Persian Gulf. This
proximity to the Gulf has led to many border disputes among resource curse states in the
oil era (e.g., Qatari-Saudi border scrimmages, Bahraini-Qatari disputes, Iraqi invasion of
Kuwait ostensibly due to slant drilling, Iran-Iraq War, etc.). With this proximity to the
Gulf also came the so-called Tanker War phase of the Iran-Iraq War in the Strait of
Hormuz when Iraq, which will be examined in greater detail later.
242
Figure 29: Map of Iranian Oil Fields (EIA 2018; Sustainable Race 2018)
As can be seen from the map above, Iran’s oil-rich region lies tantalizingly close
to Iraq. In the present work’s opinion, petroleum played three key roles in the Iran-Iraq
War: the price of oil, territorial disputes over the Shatt al-Arab, and the Tanker War. We
must first begin, as always, with oil prices. For the purposes of testing Hypothesis 6, the
price of oil is considered an indirect player in the Iran-Iraq War.
Despite their differences, Iran and Iraq found a way to put their differences aside
and became two founding members of OPEC. Not only did these embargoes contribute to
skyrocketing oil prices in the West, they also decreased a valuable revenue stream for
OPEC-member states embargoing their main consumers. After the overthrow of
Mosaddegh, the Shah’s plan of modernization, though to a degree beneficial for the West,
243
resulted in the marginalization of the bazaar class of merchants and traders that ended up
costing the monarchy valuable support. The Shah’s efforts to diversify the economy and
loosen Iran’s independence upon oil by bolstering agrarian projects continuously fell
short (Workman 1991:10). As a result, the Iranian economy, for better or worse, was
pinned to the price of oil in the world market—a variable that no single state can control.
Thus, at the time, Iran was OPEC’s second largest oil producer—after Saudi Arabia—
with petro-revenues accounting for 90% of export earnings and 60% of government
revenues (Central Bank of Iran 2008). As Farzanegan et al (2008:2) note, under these
conditions, any shock to the oil market would send the economy into free-fall, thereby
making it appear “that oil price changes highly influence the welfare and subsidization
programs of the government” (2008:3). As is common with many petroleum-rich
resource curse states, Dutch Disease characterized the Iranian economy throughout the
1970s, leading to growing disenchantment with the Shah regime (e.g., Corden & Neary
1982; Corden 1984; van Wijnbergen 1984), and ultimately contributing to his overthrow
in 1979.
Iraq was also impacted by the price of oil throughout the 1970s. By 1972, the
same year the US reached peak oil, Baghdad had fully nationalized the Iraq Petroleum
Company. It was with this nationalization that Iraq could join in with other OPEC states
and successfully embargo the West. Once these revenue streams were secured, oil rents
“allowed the political direction of the Ba'ath to proceed according to its own logic, a
logic fundamentally guided by the imperative of regime maintenance” (Workman
1991:15). As Workman states, it would be incorrect to argue that petroleum triggered the
war; rather petroleum allowed the Ba’athist Party to pursue policies that reduced Iraqi
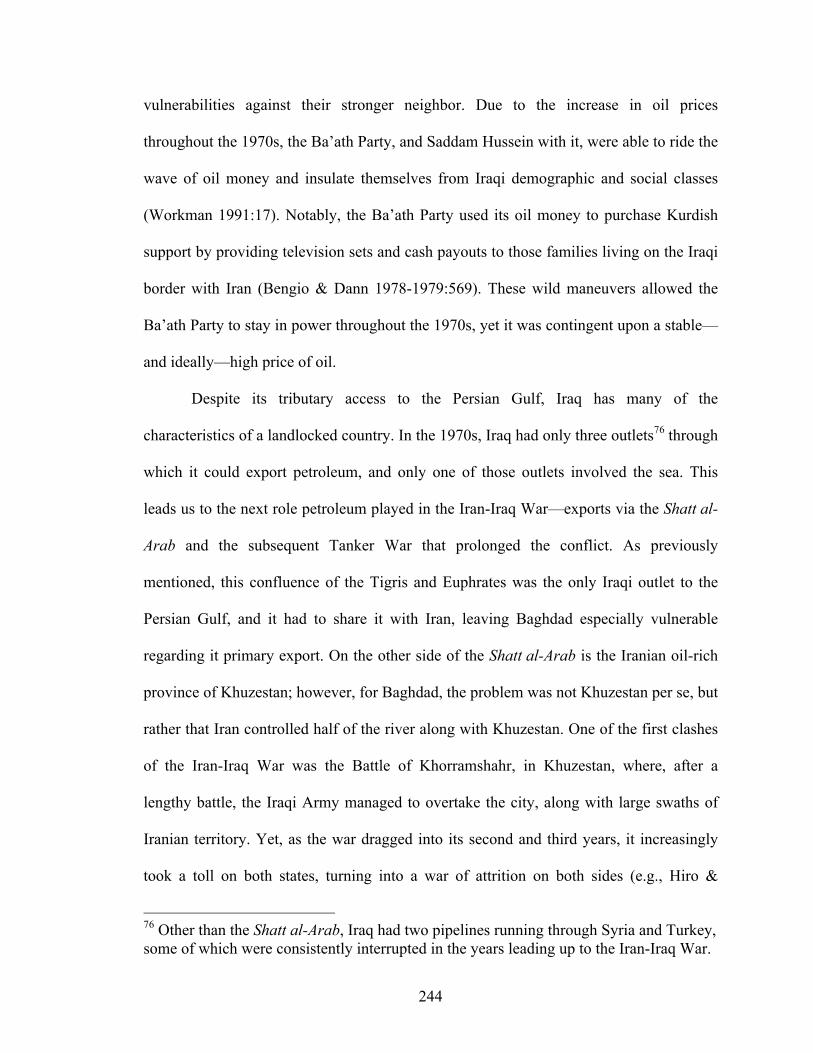
244
vulnerabilities against their stronger neighbor. Due to the increase in oil prices
throughout the 1970s, the Ba’ath Party, and Saddam Hussein with it, were able to ride the
wave of oil money and insulate themselves from Iraqi demographic and social classes
(Workman 1991:17). Notably, the Ba’ath Party used its oil money to purchase Kurdish
support by providing television sets and cash payouts to those families living on the Iraqi
border with Iran (Bengio & Dann 1978-1979:569). These wild maneuvers allowed the
Ba’ath Party to stay in power throughout the 1970s, yet it was contingent upon a stable—
and ideally—high price of oil.
Despite its tributary access to the Persian Gulf, Iraq has many of the
characteristics of a landlocked country. In the 1970s, Iraq had only three outlets76 through
which it could export petroleum, and only one of those outlets involved the sea. This
leads us to the next role petroleum played in the Iran-Iraq War—exports via the Shatt al-
Arab and the subsequent Tanker War that prolonged the conflict. As previously
mentioned, this confluence of the Tigris and Euphrates was the only Iraqi outlet to the
Persian Gulf, and it had to share it with Iran, leaving Baghdad especially vulnerable
regarding it primary export. On the other side of the Shatt al-Arab is the Iranian oil-rich
province of Khuzestan; however, for Baghdad, the problem was not Khuzestan per se, but
rather that Iran controlled half of the river along with Khuzestan. One of the first clashes
of the Iran-Iraq War was the Battle of Khorramshahr, in Khuzestan, where, after a
lengthy battle, the Iraqi Army managed to overtake the city, along with large swaths of
Iranian territory. Yet, as the war dragged into its second and third years, it increasingly
took a toll on both states, turning into a war of attrition on both sides (e.g., Hiro &
76 Other than the Shatt al-Arab, Iraq had two pipelines running through Syria and Turkey, some of which were consistently interrupted in the years leading up to the Iran-Iraq War.
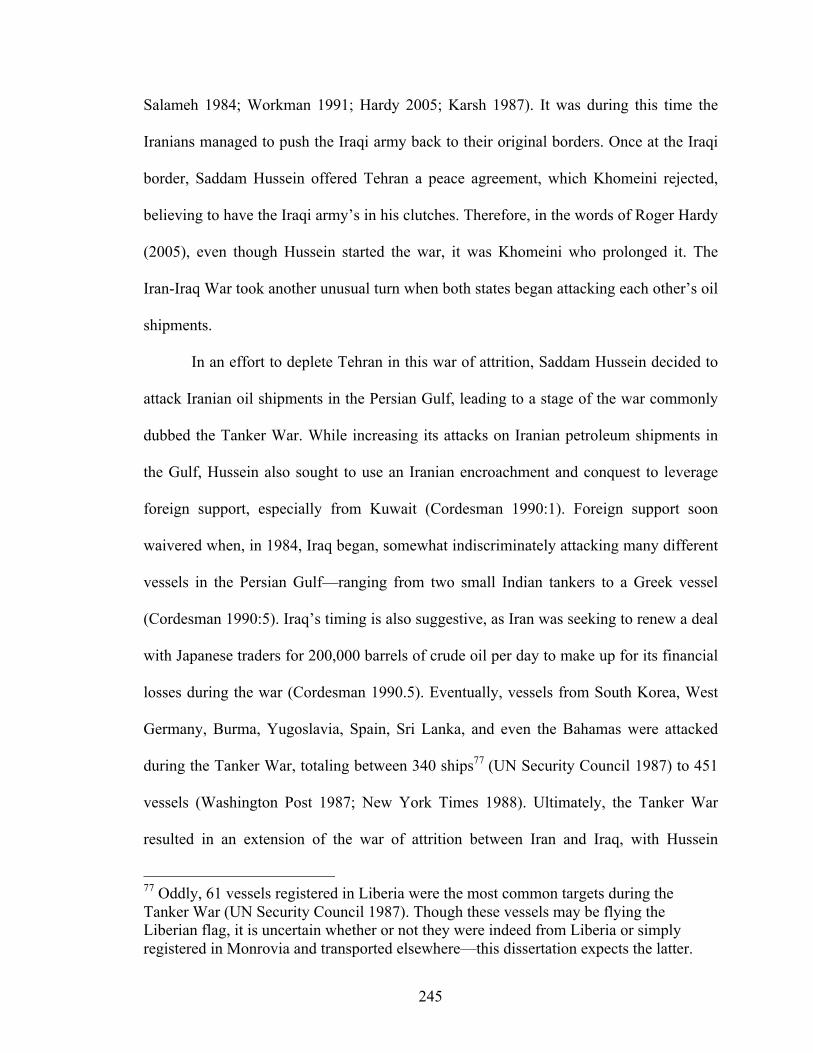
245
Salameh 1984; Workman 1991; Hardy 2005; Karsh 1987). It was during this time the
Iranians managed to push the Iraqi army back to their original borders. Once at the Iraqi
border, Saddam Hussein offered Tehran a peace agreement, which Khomeini rejected,
believing to have the Iraqi army’s in his clutches. Therefore, in the words of Roger Hardy
(2005), even though Hussein started the war, it was Khomeini who prolonged it. The
Iran-Iraq War took another unusual turn when both states began attacking each other’s oil
shipments.
In an effort to deplete Tehran in this war of attrition, Saddam Hussein decided to
attack Iranian oil shipments in the Persian Gulf, leading to a stage of the war commonly
dubbed the Tanker War. While increasing its attacks on Iranian petroleum shipments in
the Gulf, Hussein also sought to use an Iranian encroachment and conquest to leverage
foreign support, especially from Kuwait (Cordesman 1990:1). Foreign support soon
waivered when, in 1984, Iraq began, somewhat indiscriminately attacking many different
vessels in the Persian Gulf—ranging from two small Indian tankers to a Greek vessel
(Cordesman 1990:5). Iraq’s timing is also suggestive, as Iran was seeking to renew a deal
with Japanese traders for 200,000 barrels of crude oil per day to make up for its financial
losses during the war (Cordesman 1990.5). Eventually, vessels from South Korea, West
Germany, Burma, Yugoslavia, Spain, Sri Lanka, and even the Bahamas were attacked
during the Tanker War, totaling between 340 ships77 (UN Security Council 1987) to 451
vessels (Washington Post 1987; New York Times 1988). Ultimately, the Tanker War
resulted in an extension of the war of attrition between Iran and Iraq, with Hussein
77 Oddly, 61 vessels registered in Liberia were the most common targets during the Tanker War (UN Security Council 1987). Though these vessels may be flying the Liberian flag, it is uncertain whether or not they were indeed from Liberia or simply registered in Monrovia and transported elsewhere—this dissertation expects the latter.
246
bombing Iranian oil loading docks so the Iranians could not export their petroleum.
Despite these bombing raids, it became apparent that Iraq could not cope with escalation
of the Tanker War, as they had no maritime patrol craft (Cordesman 1990:6). The
escalation of a formerly land conflict to maritime warfare focused on oil tankers naturally
attracted the attention of international actors, especially the United States, who ultimately
supplied both sides with weapons.
US response to the Iran-Iraq War has long been the topic of contention. After
Eisenhower facilitated the coup ousting Mosaddegh, Washington remained allied with
the Shah until the 1979 Revolution. However, soon before the Revolution, it transpired
that Mohammad Reza Pahlavi was dying of lymphatic cancer (Rosen 2016). He
eventually sought treatment in the United States, and when President Carter refused to
return him to Iran, protestors overtook the US Embassy of Tehran and detained over 50
State Department employees for 444 days (US State 2018). This preoccupation with the
hostages colored US foreign policy in favor of an invading country—Iraq (Naff 1985:72).
US support for Iraq was marked by an unusual initiative, dubbed Project Babylon, which
was an effort to build the largest ‘supergun’ in the world that theoretically could launch
projectiles into the stratosphere before having them fall upon an enemy city thousands of
miles away (Park 2016). Washington’s support for Iraq ultimately wavered, and the
supergun project, often nicknamed Project Babylon, was suspended before it was used in
warfare. The chief engineer of this supergun, Gerald Bull, was assassinated outside his
home in Brussels in 1990, rumored to be the work of Mossad (Toolis 1990). However,
once the hostages were freed from Tehran, the Shah had died, Iraq escalated the war, and
the supergun project collapsed, Washington’s support for Baghdad faltered, with Reagan
247
eventually selling weapons to Iran despite the US arms embargo against that country, and
then using that money to fund rebels in Nicaragua. The ensuing scandal, often called the
Iran-Contra Affair, enveloped the Reagan Administration. Yet, it was Kissinger who
summarized US government sentiments best during the Iran-Iraq War stating, “too bad
they can’t both lose” (Chubin & Tripp 1989:207).
The prominence of petroleum for both states not only helped trigger the war, but
also elongated and exacerbated the conflict; additionally, with the commencement of the
Tanker War, the conflict took on a new dimension. By attacking each other’s main
exports, the Tanker War became less a mercantilist struggle for territory and more of a
resource-based war of economic and military attrition. The Iran-Iraq War stands quite
alone for its brutality and futility. After eight years of bloody fighting, and nearly 1.5
million people dead, the war ended with a status quo ante bellum. Neither side had
achieved any reasonable objective, though, of course, both sides claimed victory.
Khomeini could not depose of the strongman in Baghdad, and Hussein neither secured
Khuzestan nor Iraq’s control over the Shatt al-Arab. Often compared to the trench
warfare of World War I, the Iran-Iraq War became a classic war of attrition, with soldiers
and civilians dying on both sides without meaningful gains by either party. The
antiquated tactics of quasi-modern warfare implemented by both parties exacerbated the
conflict: similar to World War I, Saddam Hussein used chemical weapons against the
Iranians, and eventually against the Kurds in Iraq, whom he considered unfaithful to
Baghdad (Hardy 2005). Khomeini meanwhile implemented ‘human-wave’ tactics that
sent thousands of Iranian fighters to their death with little territorial gain to show for the
effort (Hardy 2005).

248
Petroleum lent Saddam Hussein and the Ba’ath Party a certain degree of
confidence in the period leading up to the Iran-Iraq War, which eventually incentivized
him to take a riskier foreign policy in relation to his larger neighbor once he noticed their
weakness. Indirectly, petroleum rents also allowed the Ba’ath Party to dominate politics
despite Iraqi demographic and cultural asymmetries. Iran, on the other hand, possessed a
more industrialized economy by the commencement of the war, despite suffering from a
revolution the prior year. Interestingly enough, petroleum seemed to play a different role
for Iran than Iraq: whereas petroleum in Iraq allowed Hussein to take a more adventurous
foreign policy, the Shah was attempted to diversify the Iranian economy off of petroleum
roughly throughout the same period. Nonetheless, since the dispute over the Shatt al-
Arab, petroleum acted as a catalyst for what would become a territorial conflict masked
as a cultural war. The Tanker War phase of the Iran-Iraq War further worked to protract
the conflict and garner more international attention, not over carnage or body counts,
though those shot up into the millions, but over oil prices and the world economy.
Ultimately, the evidence found in this dissertation largely, but not completely,
supports Hypothesis 6. First, the bar graph in Figure 27 depicts how international
violence has only influenced petroleum-rich states, as no diamond states have suffered
from foreign attacks. However, when analyzing the same graph, we note that both
diamond- and petroleum-rich states suffer from civil violence at more or less the same
rates. This casts some doubts over the latter half of Hypothesis 6. Nonetheless, this work
found a strong, positive and statistically significant correlation (p <0.05) between the
degree of civil violence and the value of diamonds produced in resource curse states. On
the other hand, there was no such correlation regarding petroleum states. In order to
249
account for this discrepancy, this dissertation conducted a study of the Iran-Iraq War.
This qualitative study found that not only did petroleum play an indirect role in triggering
the conflict—it also helped protract the war when the conflict turned to the sea. More
subtly, petroleum allowed both states to wage a war of attrition against each other, as
both Iran and Iraq were capable of exporting petroleum and leveraging these funds to
wage war. These qualitative findings support the first half of Hypothesis 6, suggesting
that petroleum leads to increased international violence among resource curse states.
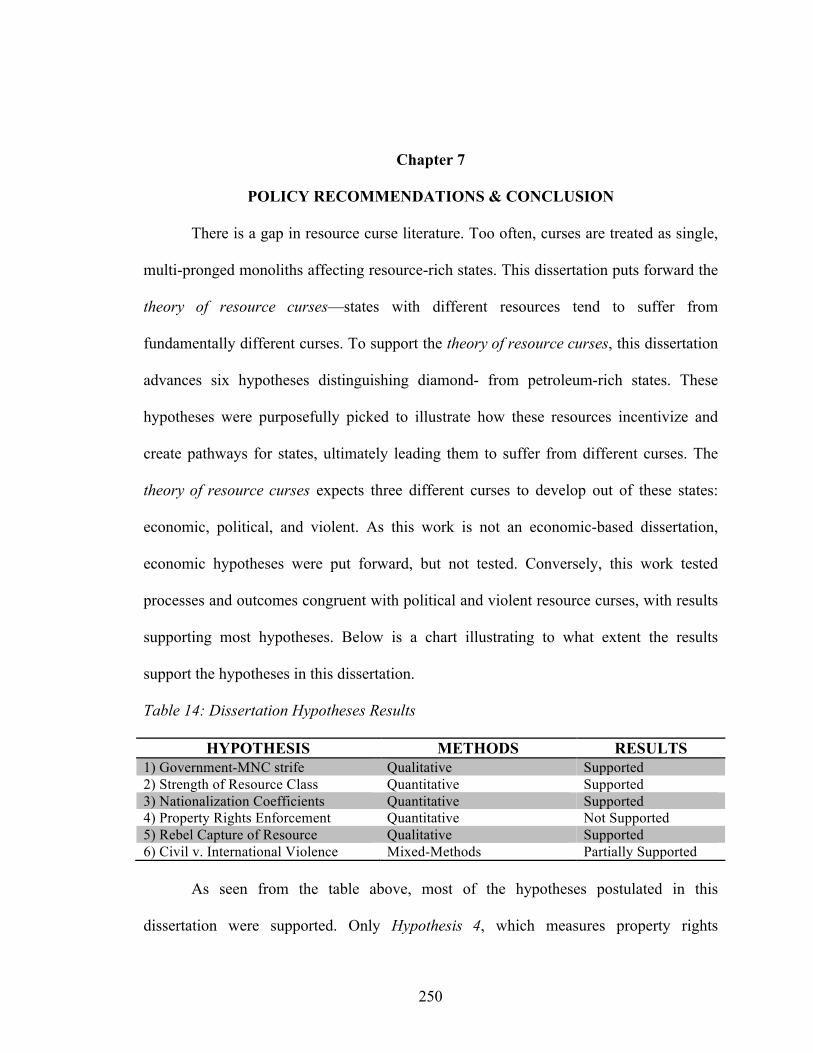
250
Chapter 7
POLICY RECOMMENDATIONS & CONCLUSION
There is a gap in resource curse literature. Too often, curses are treated as single,
multi-pronged monoliths affecting resource-rich states. This dissertation puts forward the
theory of resource curses—states with different resources tend to suffer from
fundamentally different curses. To support the theory of resource curses, this dissertation
advances six hypotheses distinguishing diamond- from petroleum-rich states. These
hypotheses were purposefully picked to illustrate how these resources incentivize and
create pathways for states, ultimately leading them to suffer from different curses. The
theory of resource curses expects three different curses to develop out of these states:
economic, political, and violent. As this work is not an economic-based dissertation,
economic hypotheses were put forward, but not tested. Conversely, this work tested
processes and outcomes congruent with political and violent resource curses, with results
supporting most hypotheses. Below is a chart illustrating to what extent the results
support the hypotheses in this dissertation.
Table 14: Dissertation Hypotheses Results
HYPOTHESIS METHODS RESULTS 1) Government-MNC strife Qualitative Supported 2) Strength of Resource Class Quantitative Supported 3) Nationalization Coefficients Quantitative Supported 4) Property Rights Enforcement Quantitative Not Supported 5) Rebel Capture of Resource Qualitative Supported 6) Civil v. International Violence Mixed-Methods Partially Supported As seen from the table above, most of the hypotheses postulated in this
dissertation were supported. Only Hypothesis 4, which measures property rights
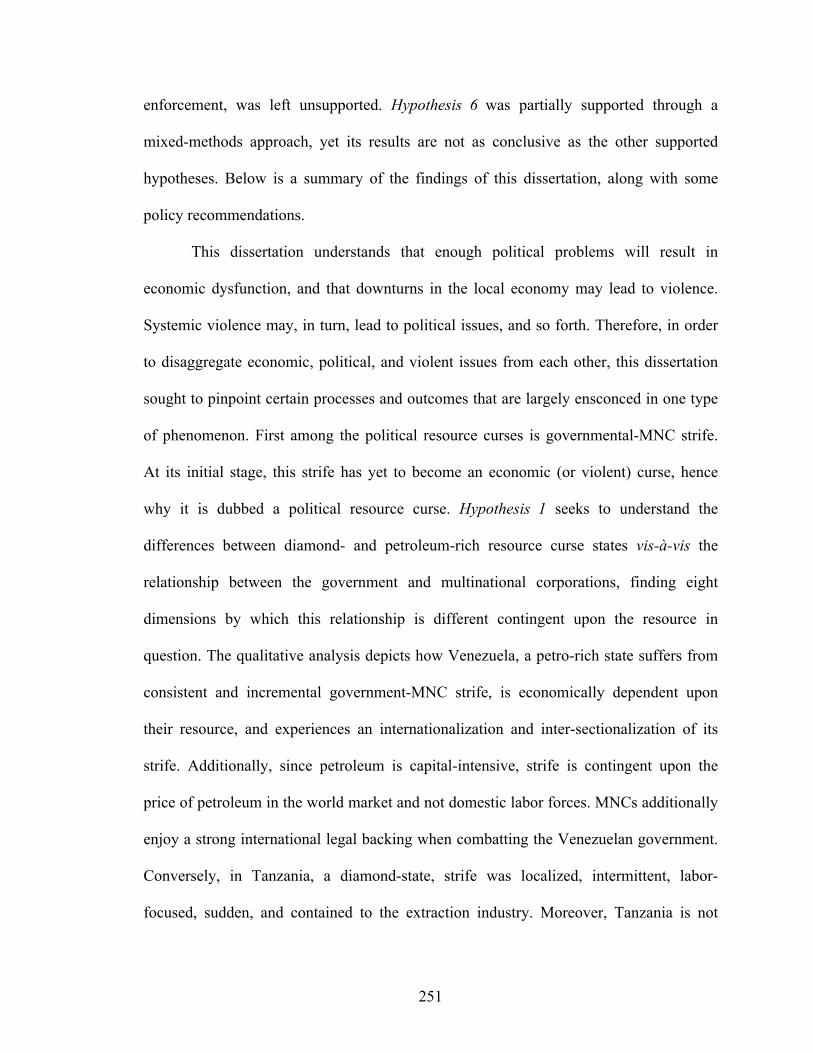
251
enforcement, was left unsupported. Hypothesis 6 was partially supported through a
mixed-methods approach, yet its results are not as conclusive as the other supported
hypotheses. Below is a summary of the findings of this dissertation, along with some
policy recommendations.
This dissertation understands that enough political problems will result in
economic dysfunction, and that downturns in the local economy may lead to violence.
Systemic violence may, in turn, lead to political issues, and so forth. Therefore, in order
to disaggregate economic, political, and violent issues from each other, this dissertation
sought to pinpoint certain processes and outcomes that are largely ensconced in one type
of phenomenon. First among the political resource curses is governmental-MNC strife.
At its initial stage, this strife has yet to become an economic (or violent) curse, hence
why it is dubbed a political resource curse. Hypothesis 1 seeks to understand the
differences between diamond- and petroleum-rich resource curse states vis-à-vis the
relationship between the government and multinational corporations, finding eight
dimensions by which this relationship is different contingent upon the resource in
question. The qualitative analysis depicts how Venezuela, a petro-rich state suffers from
consistent and incremental government-MNC strife, is economically dependent upon
their resource, and experiences an internationalization and inter-sectionalization of its
strife. Additionally, since petroleum is capital-intensive, strife is contingent upon the
price of petroleum in the world market and not domestic labor forces. MNCs additionally
enjoy a strong international legal backing when combatting the Venezuelan government.
Conversely, in Tanzania, a diamond-state, strife was localized, intermittent, labor-
focused, sudden, and contained to the extraction industry. Moreover, Tanzania is not
252
dependent upon diamonds for revenue purposes, and therefore strife is independent from
the price of diamonds in the world market. Furthermore, unlike in the petroleum industry,
foreign diamond companies in Tanzania have not (yet) sought international legal backing
for the expropriation of their resources. While at the initial stages of resource-related
strife, the differences between Venezuela and Tanzania were not that apparent, the
repeated iterations of decades of a certain type of strife between the Venezuelan
government and IOCs—and the lack thereof in Tanzania—resulted in different outcomes
between both states.
The second political resource curse hypothesis quantitatively tests the strength of
the resource class in diamond- and petroleum-rich states, seeking statistically significant
differences between states possessing these resources. Inspired by the work of Hartmann
et al’s (2015:9) Product Gini Index (PGI), Hypothesis 2 sought to test how different
resources may lead to inequality among classes, developing the term ‘resource class.’
This dissertation found that petroleum leads to a stronger (read: wealthier) resource class
than diamonds among resource curse states. Not only was there significant clustering
among both groups of states, this work noticed a positive correlation between petroleum
and a wealthier resource class among oil states and the opposite phenomenon among
diamond states. When looking only at Russia, Hypothesis 2’s findings illustrate that over
the years when there is available data, petroleum led to an increase in the wealth of the
top 1% and 10% of Russians while diamonds had the opposite effect. However, when
assessing only years for which scholars have available data on both oil and diamonds, the
regression lines point in the same direction, suggesting that variables other than resources
are at play in determining Russian resource class strengths. Despite this anomaly, the
253
results largely support Hypothesis 2’s expectations, with petroleum extraction leading to
a stronger resource class than diamond production.
Hypothesis 3 turns to another facet of governmental policy—the nationalization of
the resource industry. This work remains agnostic on whether or not a nationalized
extraction industry is beneficial for the state; rather it is more interested in discovering if
resources play a role in incentivizing states to nationalize their industries. Testing this
hypothesis finds that petroleum-rich resource curse states are more likely to nationalize
their oil industries than diamond-rich states, with every single oil state possessing a
nationalized industry. On the other hand, only six out of the thirteen diamond states
possess a nationalized industry, with some, such as STAMICO in Tanzania, owning a
nationalized mining industry, extracting not only diamonds, but also gold and coal.
Hypothesis 3 also sought to establish if nationalized industries in resource curse states
tend to be more powerful in oil states than in diamond states, finding congruent
correlations through t-tests and scatterplots. Nationalized industries do not automatically
spell out a resource curse; there are many nationalized oil companies benefiting the host
state (e.g., Equinor in Norway). However, for every beneficial nationalized industry, this
work can point to some deleterious nationalized industries, such as PDVSA in Venezuela.
Key to the results of Hypothesis 3 is that while petroleum states may opt to nationalize
their industry, diamond states tend to liberalize their mining industries. Whereas, at the
point of nationalization, petroleum states have the option to turn their extraction industry
into a Equinor or a PDVSA, diamond states have no such luxury.
The only postulation forwarded by this dissertation that was left unsupported by
results was Hypothesis 4, considering petroleum states to enjoy stronger property rights
254
enforcements than diamond states. The scatterplots mapping out property rights
enforcements among diamond and petroleum states find suggestive results: the more
petroleum states possess, the stronger their property enforcement becomes while the
more diamond-rich a state is the weaker their property rights scores become. The present
work additionally found similar results regarding total economic freedom scores,
accounting for previous colonial power’s scores. Furthermore, when conducting t-tests
measuring differences among the means between diamond and oil states, this work found
statistically significant results among both groups, further suggesting a fundamental
difference in property rights enforcement between diamond- and petroleum-rich resource
curse states. However, when conducting multivariate regressions between property rights
scores and the per capita values of states’ resources, this work found statistically
significant results not only with the per capita value of the resource, but also between
GDP per capita, population, and total area of the state. These finding suggest that while
petroleum-rich states may enjoy stronger property rights enforcements than their diamond
counterparts, they do not do so because of their petroleum. While there may be a
correlation between property rights enforcements and resources, the current work cannot
show any causation between the two variables.
Two hypotheses tested how different types of violence affect diamond- and
petroleum-rich resource curse states. Hypothesis 5 follows in the footsteps of Lujala
(2010), who noticed increases in violence in resource curse states even though resources
may not have been extracted. Simply having the resources in the ground proved to be
strong enough to trigger violent reactions. To some extent, Hypothesis 5 tests this rebel
greed hypothesis, predicting that they will seek out diamond mines over oil fields despite
255
petroleum’s comparatively larger revenue stream. All three cases analyzed in this
hypothesis occurred at roughly the same time, all were grievance-based civil wars, in all
cases war broke out for reasons other than resources, and in all cases resources were
involved in protracting the war. The qualitative analysis points to how rebels in Sierra
Leone captured (not sabotage) diamond mines, organized themselves to maintain control
over these mines, and funded their activities through diamond smuggling. In Algeria, the
opposite phenomena occurred: rebels did not take over (or protect) oil fields, and
sabotaged pipelines despite the fact that petroleum was used to fund governmental
activities against rebels. Angola, with both petroleum and diamonds, suffered from both
plagues in different parts of the country.
Unlike Hypothesis 5, which largely measures civil violence, Hypothesis 6 is more
interested in whether or not resources play a role in determining the type of violence
resource curse states experience. The bar chart finds a partial correlation between
international and civil violence, depicting civil violence as steady among most resource
curse states, while international violence is endemic only to petroleum states. The
subsequent bivariate regressions illustrate positive and statistically significant results (p <
0.05) for diamond production and civil and international violence. This is the peculiar
curse diamond states must suffer: their resource is valuable enough to incentivize rebels
to take up arms against the government, but not valuable enough to raise their population
out of poverty. While there were statistically significant results among diamond states,
due to the relative peace in many high-powered oil rich states (Saudi Arabia, Qatar,
Venezuela, Mexico, etc.), there were no statistically significant results correlating
petroleum production with either civil or international violence. In order to address this
256
issue, this work conducted a qualitative assessment of the Iran-Iraq War finding that oil
rents allowed Saddam Hussein to take riskier chances in foreign policy and lent the
Ba’ath Party the opportunity to crystalize an otherwise demographically heterogeneous
country. In this sense, oil helped shape Iraqi institutions, bestowing upon Saddam
Hussein a disproportionate amount of power and confidence in foreign affairs. As the
Shatt al-Arab was Iraq’s only outlet to the Persian Gulf, Hussein considered this estuary
Iraq’s Achilles Heel, incentivizing him to invade Iran’s oil-rich Khuzestan Province right
after the Shah was deposed. Due to Iran’s petroleum-based economy, this province
offered not only an historic value, but also was an economic powerhouse for Tehran.
Petroleum then led to the prolongation of the war when both sides began attacking each
other’s tankers, taking this war of attrition to the sea and lending an economic component
to the struggle. Ultimately, support for Hypothesis 6 was found through mixed methods.
Quantitatively, an increase in the production of diamonds has a statistically significant
positive effect on civil violence; however, this was not the case for petroleum production.
When analyzing the Iran-Iraq War, two oil states fighting each other, we qualitatively
observe how petroleum helped spark, fund, and prolong the war.
If there is any room for the advancement of academic knowledge in resource
curse literature, this dissertation considers it to be located in Lujala’s (2010) findings that
conflicts increase irrespective of whether or not resources are extracted. Simply knowing
that resources are below one’s feet is enough to incite violence among groups. A
psychological assessment of how resources influence the Weberian (1992:33) conception
257
of auri sacra fames, the accursed lust for gold,78 may pinpoint internal decision-making
process among leaders and states. This phenomenon is nothing new; as the title of this
dissertation suggests, a certain psychological reckoning occurs within those who
potentially benefit from resource extraction. And sometimes, as the mythical King Midas
discovered, such auri sacra fames may lead to one’s demise. The resource curse has been
analyzed from many angles, but in this work’s humble opinion, a valuable and
interdisciplinary path for future study would include a psychological assessment of the
resource curse.
Policy Recommendations
This dissertation has some policy recommendations for resource curse states
stemming from each hypothesis tested. The table below summarizes these
recommendations. Predictably, and given the tone of this dissertation, they are separated
into two categories, contingent upon the resource in question. It should be noted that
these policy recommendations are general guidelines based on the hypotheses that were
tested. While these guidelines may broadly apply to diamond- or petroleum-rich resource
curse states as a whole, they are not meant for any single resource curse state. Policy
recommendations for each of the thirty-five states in this analysis ought to be tailored
individually though they may be based off those below. Naturally, these
recommendations are especially suited for Angola and Russia, as they possess both
diamonds and petroleum. The policy recommendations do not perfectly correlate to each
78 To be sure, Weber was not subtle about his feelings toward greed, considering the auri sacra fames to be a vestige of the pre-capitalist individual (1992:33) and a perverse instinct leading to idleness and a quasi-hedonistic enjoyment of life (1992:108).
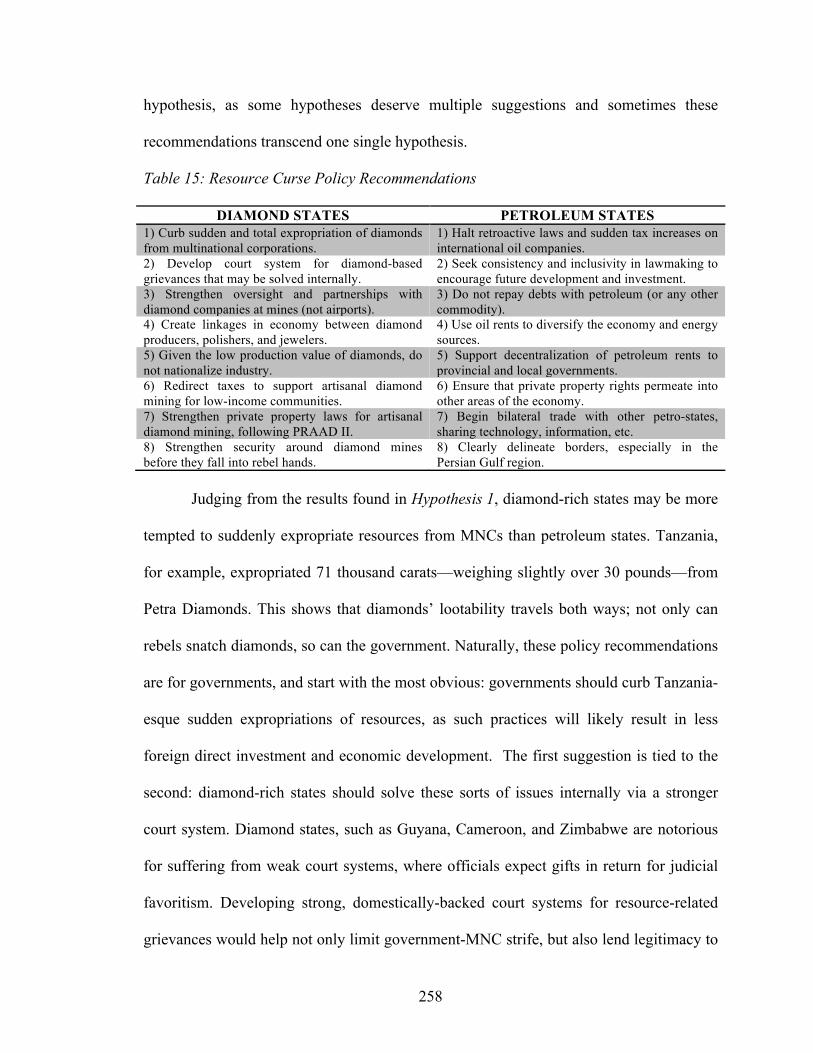
258
hypothesis, as some hypotheses deserve multiple suggestions and sometimes these
recommendations transcend one single hypothesis.
Table 15: Resource Curse Policy Recommendations
DIAMOND STATES PETROLEUM STATES 1) Curb sudden and total expropriation of diamonds from multinational corporations.
1) Halt retroactive laws and sudden tax increases on international oil companies.
2) Develop court system for diamond-based grievances that may be solved internally.
2) Seek consistency and inclusivity in lawmaking to encourage future development and investment.
3) Strengthen oversight and partnerships with diamond companies at mines (not airports).
3) Do not repay debts with petroleum (or any other commodity).
4) Create linkages in economy between diamond producers, polishers, and jewelers.
4) Use oil rents to diversify the economy and energy sources.
5) Given the low production value of diamonds, do not nationalize industry.
5) Support decentralization of petroleum rents to provincial and local governments.
6) Redirect taxes to support artisanal diamond mining for low-income communities.
6) Ensure that private property rights permeate into other areas of the economy.
7) Strengthen private property laws for artisanal diamond mining, following PRAAD II.
7) Begin bilateral trade with other petro-states, sharing technology, information, etc.
8) Strengthen security around diamond mines before they fall into rebel hands.
8) Clearly delineate borders, especially in the Persian Gulf region.
Judging from the results found in Hypothesis 1, diamond-rich states may be more
tempted to suddenly expropriate resources from MNCs than petroleum states. Tanzania,
for example, expropriated 71 thousand carats—weighing slightly over 30 pounds—from
Petra Diamonds. This shows that diamonds’ lootability travels both ways; not only can
rebels snatch diamonds, so can the government. Naturally, these policy recommendations
are for governments, and start with the most obvious: governments should curb Tanzania-
esque sudden expropriations of resources, as such practices will likely result in less
foreign direct investment and economic development. The first suggestion is tied to the
second: diamond-rich states should solve these sorts of issues internally via a stronger
court system. Diamond states, such as Guyana, Cameroon, and Zimbabwe are notorious
for suffering from weak court systems, where officials expect gifts in return for judicial
favoritism. Developing strong, domestically-backed court systems for resource-related
grievances would help not only limit government-MNC strife, but also lend legitimacy to
259
the resource-rich state. The third policy recommendation for diamond states stemming
from Hypothesis 1 suggests strengthening oversight and partnerships with diamond
companies on location, rather than at airports where resources are ready to be exported.
Not only do sudden expropriation of diamonds at airports raise eyebrows, they are
ineffective in solving the root of the problem. Additionally, working with diamond
extraction MNCs on-site would allow for exchanges of knowledge and working
understandings between private and public industries to alleviate unnecessary
government-MNC strife.
Despite the lootability of diamonds, they are not always smuggled out of states.
Every state subscribing to the Kimberley Process reports licit diamond production and
exports. Yet there is a link missing within this plan: the diamonds are cut and polished in
other states. Perhaps for good reason, governments and multinational diamond
corporations are hesitant to allow diamonds to pass through too many hands before they
are sold to jewelers due to diamonds’ infamous lootability. Yet, with enough controls,
diamond states could begin cutting, polishing, and fitting diamonds at home, and then
exporting the finished product abroad. This would create necessary linkages within the
domestic economy that are still resource-based but also labor-intensive and skilled.
Investing in economic linkages such as these would allow diamond states to improve
their economic development at home while taking fuller advantage of the resources they
possess. Potential plans could include nudges from diamond-rich governments to entice
diamond companies to create polishing stations at home. Naturally, this would involve
delicate foreign policies toward states, such as Belgium, Hong Kong, Singapore, and
most notably, India, which have advanced diamond-polishing centers. Notably, the town
260
of Surat,79 India, about 250 km north of Mumbai in the Gujarat State, is known as
‘Diamond City,’ for its diamond polishing centers consisting of over 100,000 units and
employing over 700,000 people (Gaitonde 2013). Smaller diamond states cannot hope to
compete with Surat, but they may be able to increase economic development at home by
subsidizing infrastructure for diamond polishing programs or facilitate training for local
workers.
Given the results of Hypothesis 3, nationalizing only a diamond industry does not
seem worth the effort, as rents are not significant enough to meaningfully shape domestic
policy. Results may be different if states nationalize the entire mining industry to include
copper, gold, and coal. However, those resources are outside of the focus of this work.
Rather, what states ought to do is encourage artisanal diamond mining (ADM) by using
revenue from diamonds to provide for training and simple tools for would-be miners.
ADM is labor-intensive work that potentially aids employment and modernizes low-
income communities previously marginalized from the diamond extraction process.
Related to this policy recommendation is to strengthen private property rights, especially
regarding ADM and the extraction industry. As Hypothesis 4 shows, private property
enforcement in diamond states is considerably weaker than in petroleum states (and the
rest of the world). Strengthening property rights enforcements, especially by following
the guidelines set in PRAAD and PRAAD II, may help incentivize ADM in diamond
states, while potentially causing a spillover effect into other industries. In this sense, by
79 According to Aruna Gaitonde (2013), Gujarat alone “houses 80% of all the processing of diamonds produced in the country, with a concentration of 90% in diamond cutting companies in the single city of Surat.”
261
strengthening extraction-related property rights, other industries, such as agriculture and
manufacturing, may find indirect benefits in their sectors.
The last policy recommendation is supported by the results of Hypothesis 5, and
to a lesser extent, Hypothesis 6. If diamond states have an Achilles Heel, it is their
diamond mines. Due to their relative concentration and lootability of the resources found
there, diamond mines attract rebels like lightning rods attract electricity. To prevent
unnecessary civil violence and preemptively halt any funding stream for rebels, it is in
the government’s best interest to secure diamond mines themselves or legislate that
MNCs provide enough security for their mining projects. Since the Sierra Leonean Civil
War and the ensuing UN-backed group securing diamond mines, this has largely been the
case. However, instances such as the UN peacekeeping force, UNAMSIL’s, struggle in
removing the RUF from diamond mines (Gberie 2002:4), cast doubt on how forceful
government involvements can be in diamond mines. This last suggestion for diamond
states is a preemptive one to avoid states falling into the trap Sierra Leone did during its
civil war.
Given the results of this dissertation, petroleum states have distinctly different
policy recommendations than diamond states. First and foremost, since petro-states seem
to suffer from economic and political resource curses, government relations with MNCs
are extremely valuable in securing investments necessary for economic development.
While petroleum rents are enticing for governments, sudden tax hikes and retroactive
legislation creates an unfriendly environment for IOCs, thereby limiting future economic
development and simultaneously incentivizing cheating among IOCs. By seeking
consistency and inclusivity in lawmaking, petroleum-rich states may better attract and
262
retain IOCs while simultaneously generating rents, despite fluctuations in oil prices.
Barma et al (2012:11) reach a similar conclusion, considering the credibility of
intertemporal agreements to be key in hindering IOCs obsolescent bargains with
governments. Furthermore, by allowing IOCs a voice in the decision-making process,
petroleum-rich states may stave off strife in a transparent manner. Given the disturbing
results from the qualitative analysis of Hypothesis 1, this dissertation considers repaying
debt with petroleum to be sub-optimal at best. Selling a commodity whose price is
consistently changing to repay foreign debt is simply unwise, especially if petro-states
follow in Venezuela’s footsteps and repay debt with poorer quality petroleum than what
was previously agreed.
The fourth policy recommendation this work promotes is nothing new to resource
curse literature, but seems to be the most difficult to pass through political and economic
filters—diversify the national economy by using oil rents to support other industries.
Purposeful diversification can help alleviate Dutch Disease and spur economic
development in the agricultural and manufacturing sectors. This allows states to have a
buffer should oil prices drop. Notice a subtle distinction in this policy recommendation—
it suggests oil rents be used in other industries, not social service programs, as in
Venezuela. Investing in social services may help certain groups for a time, but they do
not create meaningful employment for people. More importantly, these types of
investments help populations only if oil prices remain high and the government does not
run out of petroleum; yet the fact remains that prices fluctuate and oil is a finite resource.
Since every petroleum-rich resource curse state in this dataset has a nationalized
oil industry, the next policy recommendation assumes the existence of a national oil
263
company. Rents generated from petroleum ought to be decentralized and split between
the national, provincial, and local governments. This policy recommendation solves two
problems. First, it would stop the NOC from acting as a potentially unscrupulous arm of
the government as petroleum rents would be sent to more than one party. By dividing
rents, governments can use this revenue in different manners, thereby creating a
diversification of programs and projects. Second, by allowing provincial and local
governments a ‘piece of the pie,’ states may stave off criticisms from local communities
that the resource extracted from their properties benefits some far-away capital. This is
especially true in Cabinda, Angola’s oil-rich enclave, which remains one of the poorest
provinces in Angola.
Hypothesis 4 noted how oil states tend to enjoy better property rights than
diamond states. One of the surest ways to safeguard against weakening property rights
enforcements is to encourage the spillover effect from the extraction industry. By
regulating property rights, petroleum states can not only guarantee foreign investments
will not be expropriated, they can create a modus operandi for the enforcement of
property rights in other industries.
As Hypothesis 6 suggests, petroleum-rich resource curse states were the only ones
to experience international violence. Hedging against foreign invasions is difficult and
risky work. However, when looking at the economic and industrial unions in post-WWII
Europe, such as the European Coal and Steel Community—the precursor to what would
become the European Union—analysts note that combining and sharing industry
knowledge and experience may halt aggressive advances by foreign powers. By sharing
petroleum engineering resources, information, knowledge, and even labor, oil-rich states
264
may hedge against possible invasions by regional troublemakers, especially in the Middle
East.
The final policy recommendation for oil states refers to their borders. Sovereignty
issues are taken very seriously in international courts, but petroleum-rich states may
guard against border disputes by preemptively seeking resolutions before conflicts arise.
Border scrimmages are alarmingly frequent in the Middle East, with the most notable
cases being the Shatt al-Arab and Saddam Hussein’s invasion of Kuwait. However, a
border conflict between Saudi Arabia and Qatar from 1992 to 1994 in the al-Hasa
Province left two Qatari soldiers dead and created a tense environment between the two
states (Powers 2009:97). Doha accused Riyadh of attempting to annex a southern part of
its territory, marking the inception of a long train of future disputes between both states.
Border disputes in the following years eventually resulted in Qatar boycotting the Gulf
Cooperation Council (GCC) in 1994.80 As previously noted, Bahrain and Qatar also had a
border dispute, which was solved with a literal bridge between the two states. While it is
understood that borders in the Persian Gulf were left ambiguous and unguarded before
the oil era, demarcating frontiers and settling disputes preemptively ought to guard
against regional strongmen seeking more territory while claiming historical ties to the
region à la Hussein.
Most resource curse literature seeks to determine whether or not states experience
a curse because of the resources they possess. This dissertation has largely stayed away
from such ontological questions, instead focusing on how different resources may
80 According to some scholars, the relationship between the states in the GCC is that of Saudi Arabia as the master, and the other emirates as its vassals (da Lage 2005; Cordesman 1997).
265
contribute to different curses. By testing pathways and outcomes stemming from
resources before causal arrows flow in every direction, this work seeks to establish the
theory of resource curses as a viable avenue for future study and scholarship. Instead of
adopting a multi-pronged approach to resource curse outcomes, this theory considers
diamond- and petroleum-rich states to experience fundamentally different curses
contingent upon their resource. Finally, by offering policy recommendations, this work
seeks to offer a way out of the resource curse for states susceptible to these types of
economic, political, and violent plagues.
266
BIBLIOGRAPHY
2B1st Consulting. (2012). Oman Oil Company (OOC) in Brief. accessed 8 January 2018. https://www.2b1stconsulting.com/oman-oil-company-ooc-in-brief/
Abdon, A., & Felipe, J. (2011). The Product Space: What Does It Say About the Opportunities for Growth and Structural Transformation of Sub-Saharan Africa? (Economics Working Paper Archive No. wp_670). Levy Economics Institute. https://ideas.repec.org/p/lev/wrkpap/wp_670.html
Acemoglu, D., Aghion, P., & Violante, G. L. (2001). Deunionization, Technical Change and Inequality (SSRN Scholarly Paper No. ID 267264). Rochester, NY: Social Science Research Network. http://papers.ssrn.com/abstract=267264
Acemoglu, Daron, Johnson, Simon, & Robinson, James A. (2002). Reversal of Fortune: Geography and Institutions in the Making of the Modern World Income Distribution. The Quarterly Journal of Economics, 117(4), 1231–1294.
(2001). Colonial Origins of Comparative Development: An Empirical Investigation. American Economic Review, 91, 1369–1401.
Acosta, Pablo, A., Lartey, Emmanuel K., & Mandelman, Federico. S. (2009). Remittances and the Dutch disease. Journal of International Economics, 79(1), 102-116.
ADNOC. (2017). Exploration and Production. Abu Dhabi National Oil Company. accessed 19 January 2018. https://www.adnoc.ae/en/our-business/exploration-and-production
Aïssaoui, Ali. (2001). The Political Economy of Oil and Gas. Oxford: Oxford University Press for the Oxford Institute for Energy Studies.
Al Jazeera. (2010). Profile: Cabinda Separatists. Al Jazeera. accessed 13 March 2018. https://www.aljazeera.com/news/africa/2010/01/2010194414660644.html
(2011). Background: Sudan’s Oil Industry. accessed 20 January 2018. http://www.aljazeera.com/indepth/spotlight/southsudanindependence/2011/07/20117216441419555.html
al-Khalil, Samir. (1989) Republic of Fear: The Politics of Modern Iraq. University of California Press.
Alexander, Robin. (2010). Pemex Attempts to Force Leader of UNTyPP to Resign. UE
267
International. accessed 25 June 2018. http://www.ueinternational.org/MLNA/mlna_articles.php?id=177#1207
Alrosa. (2018). Key Facts About Alrosa. Alrosa. accessed 10 January 2018. http://eng.alrosa.ru/operations/key-facts-about-alrosa/
Alston, Lee, Harris, Edwyna, & Mueller, Benardo. (2012). The development of property rights on frontiers: endowments, norms, and politics. The Journal of Economic History, 72(3), 741-770.
Alvarez, Julio & Fiorito, James. (2005). Venezuelan Oil Unifying Latin America. Stanford University. ENG-297. Ethics of Development in a Global Environment.
Ananthalakshmi, A. (2016). UPDATE 1-Malaysia's Petronas to cut 2017 oil output by up to 20,000 bpd. (eds.) Christian Schmollinger and Kenneth Maxwell. Reuters. accessed 19 January 2018. https://af.reuters.com/article/commoditiesNews/idAFL4N1EG1K3
Andersen, Jørgen & Aslaksen, Silje. (2013). Oil and political survival. Journal of Developmental Economics, 100(1), 89–106.
Angrist, J. D., & Kugler, A. D. (2008). Rural windfall or a new resource curse? Coca, income, and civil conflict in Colombia. The Review of Economics and Statistics, 90(2), 191–215.
Antunes, Freire J. (1991). Kennedy e Salazar: o Leao e a Raposa.
Antwerp World Diamond Council—AWDC. (2013). AWDC and Alrosa reinforce ties in new Cooperation Agreement. Antwerp World Diamond Council Press Release. accessed 10 January 2018. https://www.awdc.be/sites/awdc/files/press/AWDC%20and%20Alrosa%20reinforce%20ties%20in%20new%20Cooperation%20Agreement.pdf
Aramco. (2018). Who We Are. Saudi Aramco. http://www.saudiaramco.com/en/home/about/who-we-are.html
Askari, Hossein, Cummings, John Thomas. & Glover, Michael. (1982). Taxation and Tax Policies in the Middle East. Butterworth Scientific: London.
Auty, Richard M. (1993). Sustaining Development in the Mineral Economies: The Resource Curse Thesis. London: Routledge.
(2001a). Introduction. Resource Abundance and Economic Development. New York: Oxford University Press.
(2001b). A Growth Collapse with High Rent Point Resources: Saudi Arabia, in (eds.) Richard M. Auty, Resource Abundance and Economic Development. New York: Oxford University Press.
268
Bank of Tanzania. (2013). Economic bulletin for the quarter ended March 2013: Dar es Salaam.
Barboza, Gustavo & Jose Cordero. (2001). Reforming a Small Resource-Rich Developing Market Economy: Costa Rica, in (eds.) Richard M. Auty, Resource Abundance and Economic Development. New York: Oxford University Press.
Barma, Naazneen H., Kaiser, Kai, Minh Le, Tuan, & Viñuela, Lorena. (2012). Rents To Riches? The Political Economy of Natural Resource-Led Development, Washington, DC: The World Bank.
Barrera, Priscila. (2017). Kimberlite Pipes: What They Are and How They’re Formed, Investing News Network. accessed 1 April 2018. https://investingnews.com/daily/resource-investing/gem-investing/diamond-investing/kimberlite-pipes-south-africa-australia-borneo-brazil-russia/
Basedau, M., & Lay, J. (2009). Resource curse or rentier peace? The ambiguous effects of oil wealth and oil dependence on violent conflict. Journal of Peace Research, 46(6), 757-776.
Bate, Roger. (2006). The Destruction of Property Rights and Resulting Wildlife Catastrophe in Zimbabwe. American Enterprise Institute. accessed 21 February 2018. http://www.aei.org/publication/the-destruction-of-property-rights-and-resulting-wildlife-catastrophe-in-zimbabwe/print/
Bayart, Jean François, Ellis, Stephen, & Hibou, Beatrice. (2009). The Criminalization of the State of Africa. African Issues.
Bazzi, Samuel & Blattman, Christopher. (2013). Economic shocks and conflict: The evidence from commodity prices. American Economic Journal: Macroeconomics, 6(4), 1–38.
BBC Africa. (2000). Mugabe Hits the Jackpot. BBC Africa. accessed 14 June 2018. http://news.bbc.co.uk/2/hi/africa/621895.stm
Bellows, J., & Miguel, E. (2009). War and local collective action in Sierra Leone. Journal of Public Economics, 93, 1144–1157.
Bender, Gerald. (1978) Kissinger in Angola. Anatomy of Failure.
Bengio, Ofra & Dann, Uriel. (1978-1979) Iraq, Middle East Contemporary Survey, 3
Bermúdez-Lugo, Omayra. (2012). The Mineral Industry of Côte d'Ivoire, in Minerals Yearbook – Area Reports: International 2012, Volume II. US Department of the Interior & US Geological Survey.
Besley, Timothy, & Ghatak, Maitreesh. (2010). Property rights and economic development. In Handbook of development economics (Vol. 5, pp. 4525-4595).
269
Elsevier.
Birdsall, Nancy, Pinckney, Thomas, & Sabot, Richard. (2001). Natural Resources, Human Capital, and Growth, in (eds.) Richard M. Auty, Resource Abundance and Economic Development. New York: Oxford University Press.
Bjorvatn, K., Farzanegan, M. R., & Schneider, F. (2012). Resource curse and power balance: Evidence from oil-rich countries. World Development, 40(7), 1308-1316.
Borges, Jorge Luis. (1960) Del rigor en las ciencias, in El Hacedor, Madrid: Alianza Editorial.
Boschini, Anne, D., Pettersson, Jan, & Roine, Jesper (2005) Resource Curse or Not: a question of Appropriability. Working Paper.
(2007). Resource curse or not: A question of appropriability. The Scandinavian Journal of Economics, 109(3), 593-617.
Bourguignon, F. (2004). The Poverty-growth-inequality triangle (Indian Council for Research on International Economic Relations, New Delhi Working Paper No. 125). Indian Council for Research on International Economic Relations, New Delhi, India. https://ideas.repec.org/p/ind/icrier/125.html
Bräutigam, Deborah. (2008). Introduction: Taxation and state-building in developing countries, in (eds.) D. Bräutigam, O. Fjelstad & M. Moore, Taxation and State-Building in Developing Countries. Cambridge: Cambridge University Press.
Bridgland, Fred. (1986). Jonas Savimbi: A Key to Africa, The Story Behind the Battle for Angola. Paragon House.
British Petroleum—BP. (2017). BP Statistical Review of World Energy, June 2017. 66th Edition.
(2018). Basra Light: Mideast Crudes, crude oil and refined products. accessed 21 April 2018, https://www.bp.com/en/global/trading/crude-oil-and-refined-products/crudes/middle-east/basra-light.html
Bronstein, Scott & Griffin, Drew. (2014). Self-funded and deep-rooted: how ISIS makes its millions. accessed 8 March 2018. https://www.cnn.com/2014/10/06/world/meast/isis-funding/index.html
Brooke, James. (1987). Cuba’s Strange Mission in Angola. The New York Times. accessed 14 March 2018. https://www.nytimes.com/1987/02/01/magazine/cuba-s-strange-mission-in-angola.html
Brooks, Sarah M. & Kurtz, Marcus J. (2016). Oil and Democracy: Endogenous Natural Resources and the Political “Resource Curse.” International Organization,70, 279-311.
270
Brückner, Markcus, & Ciccone, Antonio. (2010). International commodity prices, growth and the outbreak of civil war in sub-Saharan Africa. The Economic Journal, 120, 519–534.
Brunei Shell Petroleum. (2018). Overview of our Business. accessed 29 January 2018. https://www.bsp.com.bn/main/about-bsp/overview-of-our-business
Bryane, Michael. (2014). What Does Brunei Teach Us About Using Human Development Index Rankings as a Policy Tool? (February 13, 2014). accessed 5 October 2017. available at SSRN: https://ssrn.com/abstract=2395661 or http://dx.doi.org/10.2139/ssrn.2395661
Bryceson, Deborah Fahy, & Jønsson Jesper Bosse. (2013). Mineralizing Africa and artisanal mining’s democratizing influence. Mining and Social Transformation in Africa. Routledge: London.
Buonanno, Paolo, Durante, Ruben, Prarolo, Giovanni, & Vanin, Paolo. (2012). Poor institutions, rich mines: Resource curse and the origins of the Sicilian Mafia
Bustos, S., Gomez, C., Hausmann, R., & Hidalgo, C. A. (2012). The Dynamics of nestedness predicts the evolution of industrial ecosystems. PLOS One, 7(11), e49393. http://doi.org/10.1371/journal.pone.0049393
Butler, Paula. (2004). Tanzania: Liberalisation of investment and the mining sector analysis of the content and certain implications of the Tanzanian 1998 Mining Act, in (ed.) Bonnie Campbell. Regulating Mining in Africa: For Whose Benefits? Uppsala: Nordic Africa Institute. 67-80.
Butter, David. (2014). Fueling Conflict: Syria’s War for Oil & Gas. Carnegie Middle East Center. accessed 8 January 2018. http://carnegie-mec.org/diwan/55195?lang=en
Caldarelli, G., Cristelli, M., Gabrielli, A., Pietronero, L., Scala, A., & Tacchella, A. (2012). A Network Analysis of Countries’ Export Flows: Firm Grounds for the Building Blocks of the Economy. PLOS ONE, 7(10), e47278. http://doi.org/10.1371/journal.pone.0047278
Caselli, Francesco & Tesei, Andrea. (2016). Resource Windfalls, Political Regimes, and Political Stability. The Review of Economics and Statistics, 98(3), 573-590.
CASM. (2008). Communities and artisanal & small-scale mining: a global partnership for action. Communities and Small-Scale Mining.
CEIC. (2016). Yemen Crude Oil: Production. accessed 8 January 2018. https://www.ceicdata.com/en/indicator/yemen/crude-oil-production
(2018a). View Malaysia's Crude Oil: Production from 1995 to 2016 in the chart.
271
CEIC. https://www.ceicdata.com/en/indicator/malaysia/crude-oil-production
(2018b). Qatar Crude Oil: Production. accessed 19 January 2018. https://www.ceicdata.com/en/indicator/qatar/crude-oil-production
Center for Systemic Peace. (2016). INSCR Data Page. accessed 12 October 2017. 426 Center St. N, Vienna, VA 22180. http://www.systemicpeace.org/inscrdata.html
Central Bank of Iran. (2008). Online Data Base.
Central Intelligence Agency—CIA. (1977). Soviet and Cuban Intervention in the Angolan Civil War. Directorate of Intelligence. Intelligence Memorandum. Approved for release February 2001.
(2017). The World Factbook: Library. Central Intelligence Agency. accessed 4 October 2017. https://www.cia.gov/library/publications/the-world-factbook/
Chachage, C.S.L. (1995). The meek shall inherit the earth but not the mining rights: Mining and accumulation in Tanzania. in (ed.) Gibbon, P. Liberalised Development in Tanzania. Uppsala: Nordic Africa Institute, 37–108.
Chaïbi, Karim. (2018). Cartes historiques et thématiques sur l'Algérie, le Sahara et plus. Atlas Algerie. accessed 11 April 2018. https://www.atlasalgerie.com/karim-chaïbi/
Chikhi, Lamine. (2016). UPDATE 1-Algeria oil and gas output on the rise – Sonatrach. Reuters. accessed 17 January 2018. https://www.reuters.com/article/algeria-energy/update-1-algeria-oil-and-gas-output-on-the-rise-sonatrach-idUSL8N19I0EM
Chubin, S. & Tripp, C. (1989). Iran and Iraq at War. London: I.B. Tauris & Co. Ltd Publishers.
Clinch, Matt. (2013). Iran Puts Welcome Mat For Big Oil. CNBC. accessed 17 January 2018. https://www.cnbc.com/2013/12/04/iran-puts-out-the-welcome-mat-for-big-oil.html?view=story&%24DEVICE%24=native-android-tablet
Coker, Christopher & Helen, Tyson. (1985). NATO, the Warsaw Pact and Africa. Palgrave.
Colgan, Jeff. (2012). The Emperor Has No Clothes: the limits of OPEC in the global oil market. Heidelberg University. accessed 27 April 2018. http://www.uni-heidelberg.de/md/awi/peio/colgan_13.09.2012.pdf
Collier, Paul & Hoeffler, Anke. (1998). On economic causes of civil war. Oxford Economic Papers, 50, 563–573.
Collier, Paul. (2010a). The Plundered Planet: why we must—and how we can—manage nature for global prosperity. Oxford: Oxford University Press.
272
(2010b). The Political Economy of Natural Resources. Social Research, 77(4), 1105-1131.
Coppedge, Michael. (2002). Venezuela: popular sovereignty versus liberal democracy. Working Paper #294.
Corden W. M. & J. P. Neary. (1982). Booming Sector and De-industrialisation in a Small Open Economy. The Economic Journal 92, 829-831.
Corden, M. W. (1984). Booming Sector and Dutch Disease Economics: Survey and Consolidation, Oxford Economic Papers 36, 359-380.
Cordesman, Anthony H. (1990) Phase Four: Stalemate and War of Attrition on the Land and Escalation of the War in the Gulf: April 1984 to 1986. Center for Strategic and International Studies.
(1997). Bahrain, Oman, Qatar, and the UAE: Challenges of Security (Boulder, CO: Westview Press).
(2002). A Tragedy of Arms: Military and Security Developments in the Maghreb. London: Praeger.
Corkin, Lucy. (2017). After the Boom: Angola’s Recurring Oil Challenges in a New Context. Oxford Institute for Energy Studies. OIES Paper WPM 72.
Coroado, Herculano, & Strydom, T.J.. (2016). Angolan Rebels Claim More Casualties in Oil-Rich Cabinda. (ed.) Ed Cropley. Reuters. accessed 13 March 2018. https://www.reuters.com/article/us-angola-war-cabinda/angolan-rebels-claim-more-casualties-in-oil-rich-cabinda-idUSKCN10C2AN
Coronil, Fernando. (1997). The Magical State: Nature, Money, and Modernity in Venezuela. Chicago: University of Chicago Press.
Cristelli, M., Gabrielli, A., Tacchella, A., Caldarelli, G., & Pietronero, L. (2013). Measuring the Intangibles: A Metrics for the Economic Complexity of Countries and Products. PLOS ONE, 8(8), e70726. http://doi.org/10.1371/journal.pone.0070726
Cristelli, M., Tacchella, A., & Pietronero, L. (2015). The heterogeneous dynamics of economic complexity. PLOS ONE, 10(2), e0117174. http://doi.org/10.1371/journal.pone.0117174
Crooks, Ed. (2017). Foreign Oil Companies in Venezuela Feel the Strain. Financial Times. accessed 28 March 2018. https://www.ft.com/content/3264b33e-d680-11e7-a303-9060cb1e5f44
Cropley, Ed. (2016). Rebels alive and kicking in Angola’s petro-province, oil workers say. Reuters. accessed 13 March 2018. https://www.reuters.com/article/angola-
273
oil-security/rebels-alive-and-kicking-in-angolan-petro-province-oil-workers-say-idUSL8N1952C9
Cuaresma, Jesus Crespo, Oberhofer, Harald, & Raschky, Paul. (2010). Oil and the duration of dictatorships. Public Choice, 148(3–4), 505–530.
Da Lage, Olivier. (2005). Saudi Arabia and the Smaller Gulf States: The Vassals Take their Revenge. (Radio France Internationale: Paris)
Dahl, Carol A. (2015). International Energy Markets: Understanding Prices, Policies, and Profits. 2nd Edition. Tulsa, OK: PennWell Corporation.
Dal Bó, E, & Dal Bó, P. (2011). Workers, warriors, and criminals: social conflict in general equilibrium. Journal of European Economic Association, 9(4), 646–677.
Dauderstädt, Michael & Schildberg, Arne. (2006). Dead Ends of Transition. in (eds.) Rentier Economies and Protectorates. Frankfurt: Campus Verlag.
Davies, Rob. (2017). Petra Diamonds Market Value Falls After Tanzania Seizes $15m Shipment. The Guardian. accessed 5 April 2018. https://www.theguardian.com/business/2017/sep/11/petra-diamonds-market-value-falls-tanzania-seizes-shipment
de Boeck, Filip. (2001). Garimpeiro worlds: Digging, dying & ‘hunting’ for diamonds in Angola. Review of African Political Economy, 28(90), 549-562.
de la Vega Navarro, Ángel. (2008). The Energy Exception. Russia in Foreign Affairs. accessed 24 March 2018. http://eng.globalaffairs.ru/number/n_11283
de Leon, Daniel. (1886). The Conference at Berlin on the West-African Question. Political Science Quarterly, 1(1), 103-139.
de Soysa, Indra. (2000). The resource curse: Are civil wars driven by rapacity or paucity? in (eds.) Mats Berdal & David Malone, Greed and Grievance: Economic Agendas in Civil War. Boulder, CO: Lynne Rienner.
Dean, F. Musah. (2004). NOCAL 2004 Offshore Bid Announcement, Business Wire. accessed 10 January 2018. https://www.businesswire.com/news/home/20040202005192/en/NOCAL-2004-Liberia-Offshore-Bid-Announcement
Deibert, Michael. (2007). TRADE: Blood Diamonds No Longer Congo-Brazzaville’s Best Friend. International Press Service. accessed 16 January 2018. http://www.ipsnews.net/2007/11/trade-blood-diamonds-no-longer-congo-brazzavillersquos-best-friend/
Demsetz, Harold. (1967). Toward a Theory of Property Rights. The American Economic Review, 57(2), 347-359.
274
Di John, Jonathan. (2011). Is there really a resource curse? A critical survey of theory and evidence, Global Governance, 11, 167-184.
Diamond Intelligence Brief—DIB. (2011). Endiama Produced 8.55 Million Carats in 2010. Diamond Intelligence Brief. accessed 8 January 2018. http://www.diamondintelligence.com/magazine/magazine.aspx?id=9399
Dietrich, Christian. (18 June, 2001). Have African-based Diamond Monopolies Been Effective? Central Africa Minerals and Arms Research Bulletin. 2nd Edition.
Dillman, Bradford. (2000). State and private sector in Algeria: the politics of rent-seeking and failed development. Boulder, CO & Oxford: Westview.
Dos Santos, Daniel. (1983). Cabinda: the politics of oil in Angola’s enclave. African Islands and Enclaves, 7, 101-117.
Downey, Morgan. (2009). Oil 101. New York: Wooden Table Press, LLC.
Dreschler, Bernd. (2001). Small Scale Mining and Sustainable Development within the SADC Region. London: International Institute for Economic Development & World Business Council for Sustainable Development.
Dube, O., & Vargas, J. F. (2013). Commodity price shocks and civil conflict: Evidence from Colombia. The Review of Economic Studies, 80(4), 1384–1421.
Dutta, Sumit. (2013a). Top 10 Oil & Gas Companies: National Iranian Oil Co (NIOC), Oil & Gas IQ. accessed 17 January 2018. https://www.oilandgasiq.com/strategy-management-and-information/articles/top-10-oil-gas-companies-number-3-national-iranian
(2013b). Top 10 Oil & Gas Companies: Kuwait Petroleum Corporation (KPC). Oil & Gas IQ. accessed 17 January 2018. https://www.oilandgasiq.com/strategy-management-and-information/articles/top-10-oil-gas-companies-kuwait-petroleum
El Katiri, Laura, Fattouh, Bassam, & Segal, Paul. (2011). Anatomy of an oil-based welfare state: Rent distribution in Kuwait. London School of Economics.
El Wardany, Salma & Sarrar, Saleh. (2017). Libya Oil Output Drops to 5-Month Low on Biggest Field Halt. Bloomberg. accessed 8 January 2018. https://www.rigzone.com/news/oil_gas/a/151922/libya_oil_output_drops_to_5month_low_on_biggest_field_halt/
Emel, J. & Huber, M.T. (2008). A risky business: Mining, rent and the neoliberalization of ‘risk.’ Geoforum, 39(3), 1393-1407.
Enerdata. (2016). Gabon’s National Oil Company Signs First Oil Production Contract. Enerdata Intelligence & Consulting. accessed 8 January 2018.
275
https://www.enerdata.net/publications/daily-energy-news/gabons-national-oil-company-signs-first-oil-production-contract.html
Energy Information Administration—EIA. (2014). Country Analysis Brief: Sudan and South Sudan. accessed 8 January 2018. http://www.eisourcebook.org/cms/February%202016/sudan-south%20sudan%20authorities%20mgt%20ch6.pdf
(2015). Iraq was second-leading contributor to global oil supply growth during 2014. US Energy Information Administration. accessed 19 January 2018. https://www.eia.gov/todayinenergy/detail.php?id=19911
(2017). Country Analysis Brief: Kazakhstan. US Energy Information Administration. accessed 19 January 2018. http://www.ieee.es/en/Galerias/fichero/OtrasPublicaciones/Internacional/2017/EIA_Country_Aanlysis_Kazakhstan_10may2017.pdf
(2018a). Petroleum & Other Liquids. accessed 20 January 2018. https://www.eia.gov/dnav/pet/hist/LeafHandler.ashx?n=pet&s=rbrte&f=m
(2018b). Short Term Energy Outlook. accessed 20 January 2018. https://www.eia.gov/outlooks/steo/report/prices.php
Engerman, Stanley & Sokoloff, Kenneth. (1997). Factor Endowments, Institutions, and Differential Paths of Growth Among New World Economies: A View from Economic Historians of the United States, in (ed.) Stephen Haber. How Latin America Fell Behind. Stanford: Stanford University Press.
Engineering & Mining Journal. (2012). The support and service sector. Engineering & Mining Journal, 213(12),10–13.
Enterprise Surveys. (2016). Cameroon. accessed 21 February 2018. http://www.enterprisesurveys.org
Escalante, Fabián. (2006). Executive Action: 634 Ways to Kill Fidel Castro. Melbourne, Australia: Ocean Publishing.
Escobar, M, Valera C. & Pérez, R. (1997). A Large Heavy Oil Reservoir in Lake Maracaibo Basin: Cyclic Steam Injection Experiences. Society of Petroleum Engineers.
Euro-Pétrole. (2016). Qatar Petroleum Reduces Oil Production Levels. accessed 19 January 2018. https://www.euro-petrole.com/qatar-petroleum-reduces-oil-production-levels-n-i-14045
Farah, Douglas. (2 November, 2001). Al Qaeda Cash Tied to Diamond Trade, Sale of Gems from Sierra Leone Rebels Raised Millions, Sources Say.’ Washington Post.
276
Farhang, Mansour. (1985). The Iran-Iraq War: The feud, the tragedy, the spoils. World Policy Journal, 2(4), 659-680.
Farzanegan, Mohammed Reza, & Markwardt, Gunther. (2009). The effects of oil price shocks on the Iranian economy. Energy Economics, 31(1), 134-151.
Fearon, James & Laiton, David. (2006). Random Narrative: Algeria. Stanford University Working Paper. accessed 11 April 2018. https://web.stanford.edu/group/ethnic/Random%20Narratives/AlgeriaRN2.4.pdf
Felipe, J. (2009). Inclusive Growth, Full Employment and Structural Change: Implications and Policies for Developing Asia. London: Anthem Press.
Financial Times. (3 May, 1996). Angola Peace Monitor, 9(3).
Fisher, Eleanor, Mwaipopo, Rosemarie, Mutagwaba, Wilson, Nyange, David, & Yaron, Gil. (2009). The ladder that sends us to wealth: Artisanal mining and poverty reduction in Tanzania. Resources Policy 34(1-2), 32-38.
Forbes. (2015). World’s Biggest Oil Companies. Forbes Magazine. accessed 19 January 2018. https://www.forbes.com/pictures/eilh45ehhim/18-iraq-ministry-of-oil/#b0489c510209
Forero, Juan. (2001). Venezuela’s New Oil Law is Seen as a Risk to Growth. The New York Times. accessed 27 March 2018. https://www.nytimes.com/2001/12/04/world/venezuela-s-new-oil-law-is-seen-as-a-risk-to-growth.html
Forstater, Maya & Readhead, Alexandra. (2017). A Brutal Lesson for Multinationals: Golden Tax Deals Can Come Back and Bite You. The Guardian. accessed 5 April 2018. https://www.theguardian.com/global-development-professionals-network/2017/jul/06/a-brutal-lesson-for-multinationals-golden-tax-deals-can-come-back-and-bite-you
Frankel, Jeffrey. (2010). The Natural Resource Curse: A Survey. HKS Faculty Research Working Paper Series, RWP10-005. John F. Kennedy School of Government. Cambridge, MA: Harvard University.
Gaitonde, Aruna. (2013). India Diamond Cutting and Polishing Sector. Rough Polished. accessed 1 June 2018. http://www.rough-polished.com/en/analytics/77889.html
Galbraith, John K. (1984). New York Review of Books, in John Stockwell (1978) In Search of Enemies: A CIA Story. New York: W. W. Norton.
GAN Integrity Solutions. (2017). Cameroon Corruption Report. accessed 21 February 2018. https://www.business-anti-corruption.com/country-profiles/cameroon
277
Gates, Robert. (1983). Angola: Impact of the Clark Amendment. Note to Tom Cormak. Executive Secretary. Central Intelligence Agency. Declassified July 2010. accessed 15 March 2018. https://www.cia.gov/library/readingroom/docs/CIA-RDP85T00287R000400320001-4.pdf
Gause III, Gregory F. (2011). Saudi Arabia in the New Middle East. Council on Foreign Relations. Center for Preventive Action.
Gazprom. (2017). Shares. Gazprom. accessed 6 July 2018. http://www.gazprom.com/investors/stock/
Gberie, Lansana. (2002). War and peace in Sierra Leone: Diamonds, corruption and the Lebanese connection. The Diamonds and Human Security Project.
General Electric. (2017). Bahrain Petroleum Company (Bapco) Refinery Uses GE’s Mobile Water Solutions. accessed 8 January 2018. http://www.genewsroom.com/press-releases/bahrain-petroleum-company-bapco-refinery-uses-ge’s-mobile-water-solutions-283981
Gleditsch, Nils Petter, Wallensteen, Peter, Eriksson, Mikael, Sollenberg, Margareta, & Strand, Håvard. (2002). Armed Conflict 1946–2001: A New Dataset. Journal of Peace Research, 39(5), 615–637.
Global Security. (2018). OPLAN 1002 Defense of the Arabian Peninsula. accessed 25 May 2018. https://www.globalsecurity.org/military/ops/oplan-1002.htm
Goldman, Haley Blaire. (2014). Between A ROC and a Hard Place: the Republic of Congo’s illicit trade in diamonds and efforts to break the cycle of corruption. University of Pennsylvania Journal of International Law, (30)1, 359-397.
Gomes Porto, João. (2003). Cabinda Notes on a Soon-to-be-Forgotten War. Institute for Security Studies. Paper 77.
Goodley, Simon. (2010). Court documents allege 'corrupt' Kazakhstan regime's link to FTSE firms. The Guardian. accessed 25 June 2018. https://www.theguardian.com/business/2010/dec/02/kazakhstan-regime-link-to-ftse-firms
GRAE-FNLA. (1962). Glimpses of the Angolan Nationalist Organizations. GRAE (FNLA) Press Release. Leopoldville: Reproduced in R H Chilcote.
Guimarães, Fernando A. (2016). The Origins of the Angolan Civil War: Foreign Intervention and Domestic Political Conflict, 1961-76. Springer.
Gustafsson, B., & Johansson, M. (1999). In Search of Smoking Guns: What Makes Income Inequality Vary over Time in Different Countries? American Sociological Review, 64(4), 585–605. http://doi.org/10.2307/2657258
278
Guzman, Daniela. (2017). PDVSA Credit Rating Cut to C By Fitch. Bloomberg News. accessed 29 March 2018. https://www.bloomberg.com/news/articles/2017-11-07/pdvsa-credit-rating-cut-to-c-by-fitch-as-default-imminent
Gylfason, Thorvaldur. (2001). Natural resources, education, and economic development. European Economic Review, 45, 847-859.
Haber, Stephen, & Menaldo, Victor (2011). Do Natural Resources Fuel Authoritarianism? A Reappraisal of the Resource Curse. American Political Science Review, 105(1), 1-26.
Hamilton, Kirk. (2001) The Sustainability of Extractive Economies, in (eds.) Richard M. Auty, Resource Abundance and Economic Development. New York: Oxford University Press.
Hardy, Roger. (2005). The Iran-Iraq War: 25 Years On. BBC Network. accessed 25 May 2018. http://news.bbc.co.uk/2/hi/middle_east/4260420.stm
Hargreaves, Steven. (2011). Libya Oil Eyes By Western Companies. CNN Money. accessed 19 January 2018. http://money.cnn.com/2011/10/25/news/international/libya_oil/index.htm
Hartmann, Dominick, Jara Figueroa, Cristian Ignacio, Guevara, Miguel & Hidalgo, Cesar. (2015). Linking Economic Complexity, Institutions, and Income Inequality. World Development, 2-14.
Hausmann, R., Hidalgo, C. A., Bustos, S., Coscia, M., Simoes, A., & Yildirim, M. A. (2014). The Atlas of Economic Complexity: Mapping Paths to Prosperity. MIT Press.
Hausmann, R., Hwang, J., & Rodrik, D. (2006). What you export matters. Journal of Economic Growth, 12(1), 1–25.
Hayes, Mark. (2004). Algerian Gas to Europe: The Transmed Pipeline and Early Spanish Gas Import Projects. Working Paper #27.
Hays, Kristen & Otis, John. (2007). Two Oil Giants Defy Chavez: ConocoPhillips to Leave Projects in Venezuela; ExxonMobil Refuses to Sign. Houston Chronicle. accessed 25 March 2018. https://www.chron.com/business/energy/article/ConocoPhillips-Exxon-Mobil-tell-Venezuela-no-deal-1549403.php
Henry, Clement M. (2004). Algeria's Agonies: Oil rent effects in a bunker state. The Journal of North African Studies, 9(2), 68-81.
Heritage Foundation. (2018). Economic Freedom: Property Rights. accessed 21 February 2018. https://www.heritage.org/index/property-rights
279
Hidalgo, C. A., & Hausmann, R. (2009). The building blocks of economic complexity. Proceedings of the National Academy of Sciences, 106(26), 10570–10575. http://doi.org/10.1073/pnas.0900943106
Hidalgo, C. A., Klinger, B., Barabási, A.L., & Hausmann, R. (2007). The product space conditions the development of nations. Science, 317(5837), 482–487.
Hiro, Dilip & Salameh, Ghassan. (July - September 1984) ‘Chronicle of the Gulf War,' and, `Checkmate in the Gulf War,' MERIP Reports, 14:6/7
Hirschman, Albert O. (1958). The Strategy of Economic Development (Vol. 10). New Haven: Yale University Press.
Hiss, Tony. (1990). The Experience of Place. New York: Vintage Books.
Hodges, Tony. (2001). Angola from Afro-Stalinism to Petro-Diamond Capitalism. Oxford: James Currey/Bloomington; Indiana: Indiana University Press.
Hodler, Rodler. (2006). The curse of natural resources in fractionalized countries. European Economic Review, 50(6), 1367-1386.
Human Rights Watch—HRW. (2004). Angola: Between War and Peace in Cabinda A Human Rights Watch Briefing Paper. Human Rights Watch.
Hume, Neil & Megaw, Nicholas. (2017). Petra Diamonds Suspends Operations at its Tanzania Mine. Financial Times. accessed 5 April 2018. https://www.ft.com/content/ac009f60-96e2-11e7-b83c-9588e51488a0
Hummon, D. M. (1992). Community attachment: local sentiment and sense of place, in (eds.) Low and Altman, Place Attachment. New York: Plenum Press.
Humphreys, Macartan, & Weinstein, J. M. (2008). Who fights? The determinants of participation in civil war. American Journal of Political Science, 52, 436–455.
Humphreys, Macartan, Sachs, Jeffrey D. & Stiglitz, Joseph E. (2007). Escaping the Resource Curse. New York: Columbia University Press.
Humphreys, Macartan. (2005). Natural resources, conflict, and conflict resolution: Uncovering the mechanisms. Journal of conflict resolution, 49(4), 508-537.
Ikelegbe, Agustine. (2005). The economy of conflict in the oil rich Niger Delta region of Nigeria. Nordic Journal of African Studies, 14(2), 208-234.
IndexMundi. (2017). GINI index (World Bank estimate) - Country Ranking. accessed 4 October 2017. https://www.indexmundi.com/facts/indicators/SI.POV.GINI/rankings
280
(2018). Kuwait Crude Oil Production by Year. accessed 19 January 2018. https://www.indexmundi.com/energy/?country=kw&product=oil&graph=production
International Business Publications—IBP. (2011). Qatar: Foreign Policy and Government Guide. Strategic Information and Developments, Vol. 1.
International Crisis Group—ICG. (2004). Islamism, violence and reform in Algeria: Turning the page. ICG Middle East Report No. 29. Cairo/Brussels: International Crisis Group.
International Monetary Fund—IMF. (2014). Brunei Darussalam: Statistical Appendix. accessed 6 January 2018. https://www.imf.org/external/pubs/ft/scr/2014/cr14191.pdf
(2018). General government net debt, general government, in percent of GDP. accessed 3 February 2018. http://data.imf.org/?sk=4CC54C86-F659-4B16-ABF5-FAB77D52D2E6&sId=1393552803658
Ismail, Kareem. (2010). The Structural Manifestation of the “Dutch Disease:” The Case of Oil Exporting Countries. International Monetary Fund. IMF Working Paper WP10/103.
Israeli Diamond Institute—IDI. (2018). Williamson Diamond Mine. accessed 31 March 2018. https://en.israelidiamond.co.il/wikidiamond/diamond-mining-mines/williamson-diamond-mine/
Jablonski, Ryan S. (2015). The price of piracy in Somalia. Africa at LSE.
Jackson, Allison. (2016b). The Lowest Oil Prices Since 2003: Explained. Public Radio International. accessed 25 March 2018. https://www.pri.org/stories/2016-01-13/lowest-oil-prices-2003-explained
Jackson, Patrick Thaddeus. (2016a). The Conduct of Inquiry in International Relations: Philosophy of Science and its Implications for the Study of World Politics. London & New York: Routledge Press.
Jamasmie, Cecilia. (2016). Cameroon involved in Central African 'conflict diamonds' trade — report. Mining. accessed 23 April 2018. http://www.mining.com/cameroon-involved-in-central-african-conflict-diamonds-trade-report/
Jones, Luis (2004) Preventing the export of conflict diamonds in the Democratic Republic of the Congo. Stanford University. E297.
Juhasz, Antonia. (2013). Why the War in Iraq was Fought for Big Oil. CNN. accessed 20 June 2018. https://www.cnn.com/2013/03/19/opinion/iraq-war-oil-juhasz/index.html
281
Kabbah, Ahmed Tejan. (2001). Kabbah on Diamond War. New Vision (Freetown), quoting from the President’s convocation speech at the Southern Connecticut State University, after the University conferred on him an honorary doctorate in 2001.
Kabukuru, Wanjohi. (2013). East Africa sets tough new regulations. African Business, 394, 48–49.
Kabuya Kalala, François & Matata Ponyo, Mapon. (1997). L'espace monetaire kasaien, Crise de légitimité et de souveraineté monétaire en période d'hyperinflation au Congo (1993-1997). Paris: Institut Africain-CEDAF/ L'Harmattan.
Karl, Terry Lynn. (1997). The Paradox of Plenty: Oil Booms and Petro-States. Berkeley, CA: University of California Press.
Karombo, Tawanda. (2017). Production Up in Zim’s Coal and Diamond Mining. Business Report. accessed 16 January 2018. https://www.iol.co.za/business-report/markets/commodities/production-up-in-zims-coal-and-diamond-mining-10437688
Karsh, Efraim. (1987) The Iran- Iraq War: A Military Analysis, Adelphi Papers, 220. London: International Institute for Strategic Studies.
(1990). Geopolitical determinism: The origins of the Iran-Iraq war. Middle East Journal, 44(2), 256-268.
Kaufmann, Robert K., Dees, Stephan, Karadeloglou, Pavlos, & Sánchez, Marcelo. (2004). Does OPEC Matter? An Econometric Analysis of Oil Prices. The Energy Journal, 25(4), 67-90.
Kavanaugh, Michael. (2016). Anhui Construction, Congo Plan to Take Diamond Company Public. accessed 10 January 2018. http://www.miningnewsmagazine.org/?p=468
Kazeem, Yomi. (2017) Tanzania has seized a UK miner’s diamond shipment and spooked the global mining world—again. Quartz. accessed 2 April 2018. https://qz.com/1074700/tanzania-has-seized-15-million-of-diamonds-from-petra-diamonds/
KazMunayGas. (2016). JSC NC "KAZMUNAYGAS" ANNUAL REPORT 2016. accessed 8 January 2018. http://www.kmg.kz/uploads/documents/reports/2016/eng/AnnualReport2016FinalEng2.pdf
Keen, David. (1998). The economic functions of violence in civil wars. Adelphi Paper, 320. Oxford: Oxford University Press.
282
(2005). Conflict and Collusion in Sierra Leone. London: James Currey; New York: Palgrave.
Kimberley Process. (2015). Annual Global Summary: 2015 Production, Imports, Exports and KPC Counts
(2018). About. accessed 23 April 2018. https://www.kimberleyprocess.com/en/about
Kirchgaessner, Stephanie. (2005). US Shareholders Sue Over Yukos. Financial Times. accessed 14 June 2018. https://www.ft.com/content/9055a6be-44da-11da-a5f0-00000e2511c8
Klinghoffer, Arthur J. (1980). The Soviet Union and Angola. Army War College: Strategic Studies Institute, Carlisle Barracks, PA.
Koning, Tako. (2012). Milestones in Angola’s Oil History GeoExpro, 9(3). accessed 13 March 2018, http://www.geoexpro.com/articles/2012/10/milestones-in-angola-s-oil-history
(2014). Angola's Oil Industry - A Century of Progress in Exploration and Production. Presentation at the AAPG International Conference & Exhibition: Istanbul, Turkey. September 14-17.
Kottasová, Ivana. (2017). Diamond Miner’s Shares Crash as Tanzania Seizes Exports. CNN Money. accessed 5 April 2018. http://money.cnn.com/2017/09/11/investing/petra-diamonds-tanzania/index.html
KPMG. (2002). Compilation from International Oil Companies and Ministry of Finance records in Current Assessment of the Angolan Petroleum Sector: Inception Report by KPMG for the Ministry of Finance. Government of Angola.
Kuruvilla, Carol. (2013). Was this hottie deported from Saudi Arabia for being ‘too handsome’? Daily News. accessed 1 June 2018. http://www.nydailynews.com/news/world/hottie-deported-saudi-arabia-handsome-article-1.1327759
Laherrère, Jean. (2010). OPEC Quotas and Crude Oil Production. ASPO France: Association pour l'étude des pics de production de pétrole et de gaz naturel, 1-10.
Lau, Andrea. (2013). Omar Borkan Al Gala, ‘Deported’ For Being Too Handsome, Reveals Truth. Huffington Post. accessed 1 June 2018. https://www.huffingtonpost.ca/2015/01/16/omar-borkan-al-gala-deported_n_6488782.html
Le Billon, Philippe. (2001a). Angola’s Political Economy of War: the role of oil and diamonds (1975-2002). African Affairs,100, 55-80.
283
(2001b). The political ecology of war: natural resources and armed conflicts Political Geography, 20(5), 561-584.
Leahy, Kevin, et al. (2001). New Exploration Opportunities in Equatorial Guinea. Republic of Equatorial Guinea.
Lemelle, S.J. (1986). Capital, State and Labor: A History of the Gold Mining Industry in Colonial Tanganyika 1890-1942. PhD thesis. Los Angeles: University of California.
Libecap, Gary & Smith, James. (2002). The Economic Evolution of Petroleum Property Rights in the United States. The Journal of Legal Studies, 31(S2), The Evolution of Property Rights: A Conference Sponsored by the Searle Fund and Northwestern University School of Law, S589-S608.
Lifsher, Marc. (2001). Hydrocarbons Law Puts Private Investment In Venezuelan Petroleum Industry in Danger. The Wall Street Journal. accessed 26 March 2018. https://www.wsj.com/articles/SB1005775721799339000
Lujala, Päivi, Gleditsch, N.P., Gilmore, E. (2005). A diamond curse? Civil war and a lootable resource. Journal of Conflict Resolution (49)4, 538-562.
Lujala, Päivi. (2010). The Spoils of Nature: armed civil conflict and rebel access to natural resources. Journal of Peace Research, 47(1), 15-28.
Luxner, Larry. (2004). Enormous investments planned for Angolan oil industry. The Washington Diplomat. accessed 13 March 2018. http://www.luxner.com/cgi-bin/view_article.cgi?articleID=1281
Mahdavy, Hussein. (1970). The Patterns and Problems of Economic Development in Rentier States: The Case of Iran, in (ed.) M. A. Cook, Studies in the Economic History of the Middle East. London: Oxford University Press.
Mamdani, Mahmood. (2002). Good Muslim, bad Muslim: A political perspective on culture and terrorism. American anthropologist, 104(3), 766-775.
Maniruzzaman, A. F. M. (2009). The issue of resource nationalism: risk engineering and dispute management in the oil and gas industry. Texas Journal of Oil, Gas, & Energy Law, 5(79), 79-108.
Marshall, Monty & Jaggers, Keith. (2008). Polity IV Project: Political Regime Characteristics and Transitions, 1800–2006. Unpublished manuscript: University of Maryland.
Martinez, Ian. (2001). Student Article: Sierra Leone's "Conflict Diamonds": The Legacy of Imperial Mining Laws and Policy. University of Miami International and Comparative Law Review, 215, 217-239.
284
Materu, Beatrice. (2017). Tanzania to Repossess Petra Diamond’s Mine. The East African. accessed 5 April 2018. http://www.theeastafrican.co.ke/business/Tanzania-to-repossess-Petra-Diamond-mine-/2560-4089104-iht9hk/index.html
McCormick, Shawn. (1992). Angola in Transition: the Cabinda Factor, in CSIS Africa Notes. Washington, DC: Center for Strategic and International Studies.
McGreal, C. (2 July, 1999). ‘Profiteers’ War that Goes on Forever. Mail & Guardian.
McMahon, Tim. (2017). Historical Crude Oil Prices (Table) 1946-Present, Inflation Data. accessed 26 March 2018. https://inflationdata.com/Inflation/Inflation_Rate/Historical_Oil_Prices_Table.asp
McPhillips, Deidre. (2017). Countries that Produce the Most Diamonds. US News and World Report. accessed 5 October 2017. https://www.usnews.com/news/best-countries/articles/2017-01-13/10-countries-that-produce-the-most-diamond-gemstones
Medina, Juan Pablo & Soto, Claudio. (2007). Copper price, fiscal policy and business cycle in Chile. Banco Central de Chile.
Mehlum, Halvor, Moene, Karl & Torvik, Ragnar. (2006). Institutions and the resource curse. The Economic Journal, 116(508), 1-20.
(2002). Institutions and the resource curse, Mimeo.
Menaldo, Victor. (2016). The Institutions Curse: Natural Resources, Politics, and Development. Cambridge: Cambridge University Press.
Milanovic, B. L. (2013). All the Ginis Dataset. accessed 15 August 2018. http://data.worldbank.org/data-catalog/all-the-ginis
Miller Llana, Sarah. (2008). Exxon fights Chávez' Venezuela for compensation in courts. The Christian Science Monitor. accessed 26 March 2018. https://www.csmonitor.com/World/Americas/2008/0211/p04s01-woam.html
Mining Technology. (2018a). Catoca Diamond Mine. accessed 11 April 2018. https://www.mining-technology.com/projects/catoca-diamond-mine/
(2018b). Williamson Mine, Shinyanga Province. accessed 2 April 2018. https://www.mining-technology.com/projects/williamson-mine-shinyanga-province/
Minter, William. (1994). Apartheid’s Contras: An Inquiry into the Roots of War in Angola and Mozambique. London: Zed Publishing.
285
Misser, François & Vallée, Olivier. (1997). Les gemmocraties : l'économie politique du diamant africain. Paris: Desclée de Brouwer.
Mitchell, Timothy. (2013). Carbon Democracy: Political Power in the Age of Oil. London: Verso Publishing.
Mitton, Kieran. (2008). Engaging disengagement: The political reintegration of Sierra Leone's Revolutionary United Front: Analysis. Conflict, Security & Development, 8(2), 193-222.
Molchanov, Pavel. (2003). A Statistical Analysis of OPEC Quota Violations. Durham, NC: Duke University.
Monaldi, Francisco. (2018). The Death Spiral of Venezuela’s Oil Sector And What Can Be Done About It. Forbes. accessed 29 March 2018. https://www.forbes.com/sites/thebakersinstitute/2018/01/24/the-death-spiral-of-venezuelas-oil-sector-what-if-anything-can-be-done-about-it/#77cbeb8f7e60
Montenegro, Javier. (2018). La compra de autos públicos se disparó en la era de Correa. Expreso Ecuador. accessed 25 June 2018. http://www.expreso.ec/actualidad/corrupcion-rafaelcorrea-vehiculos-contraloria-petroecuador-JJ2209487
Morris, Roger. (1976). The Proxy War in Angola: the Pathology of a Blunder. The New Republic.
Morrison, Kevin M. (2013). Whither the Resource Curse? American Political Science Association, 11(4), 1117-1125.
Moss, Todd J. (2011). Oil to cash: Fighting the resource curse through cash transfers, Center for Global Development. Working Paper 237.
Murshed, Mansoob. (2001). Short-Run Models of Contrasting Natural Resource Endowments, in (eds.) Richard M. Auty, Resource Abundance and Economic Development. New York: Oxford University Press.
Myers Jaffe, Amy. (2018). How Much Worse can it get for Venezuela’s State Oil Firm PDVSA? Council on Foreign Relations. accessed 28 March 2018. https://www.cfr.org/blog/how-much-worse-can-it-get-venezuelas-state-oil-firm-pdvsa
Naff, Thomas. (1985). Gulf Security and the Iran-Iraq War. The National Defense University Press & The Middle East Research Institute.
Nash, Nathaniel C. (1987). Cuba is Mired in Angola, Top Defector Says. The New York Times. accessed 11 April 2018. https://www.nytimes.com/1987/07/01/world/cuba-is-mired-in-angola-top-defector-says.html
286
Ng’wanakilala, Fumbuka. (2017). Tanzania says to nationalize diamond consignment seized from Petra Diamonds. Reuters. accessed 4 April 2017. https://www.reuters.com/article/us-tanzania-mining/tanzania-says-to-nationalize-diamond-consignment-seized-from-petra-diamonds-idUSKCN1BK0T2
NNPC. (2018). About NNPC. Nigerian National Petroleum Corporation. accessed 19 January 2018. http://nnpcgroup.com/AboutNNPC/CorporateInfo.aspx
Noble, Kenneth. (1992). Cabinda Journal: Oil-Rich yet so Poor – Angolan Outpost is Restless. New York Times. accessed 13 March 2018. https://www.nytimes.com/1992/03/24/world/cabinda-journal-oil-rich-yet-so-poor-angolan-outpost-is-restless.html
Nolan, Michael, Baldwin, Teddy, & Tweed Hadley, Milbank. (2012). Minimising Risk in the Face of Government Action. Project Finance International, 47-49.
Nugent, Jeffrey &. Robinson, James A (2010). Are Factor Endowments Fate? Revista de Historia Económica, Journal of Iberian and Latin American Economic History (Second Series), Vol. 28.
Nyerere, Julius K. (1972). Tanzania ten years after independence. The African Review: A Journal of African Politics, Development and International Affairs, 2(1), 1-54.
Obiang Lima, Gabrial Mbaga, Eworo Milam, Mercedes, & NDong Ondo, Juan Antonia. (2015). The Oil and Gas Year: The Who’s Who of the Global Energy Industry. accessed 19 January 2018. http://www.theoilandgasyear.com/content/uploads/2015/10/TOGY_Equatorial-Guinea-2015.pdf
Observatory of Economic Complexity—OEC. (2018a). Algeria: Exports. Observatory of Economic Complexity. accessed 10 March 2018. https://atlas.media.mit.edu/en/profile/country/dza/
(2018b). Tanzania (TZA) Exports, Imports, and Trade Partners. Observatory of Economic Complexity. accessed 4 April 2018. https://atlas.media.mit.edu/en/profile/country/tza/
(2018c). Venezuela (VEN) Exports, Imports, and Trade Partners. Observatory of Economic Complexity. accessed 27 March 2018. https://atlas.media.mit.edu/en/profile/country/ven/
Oduniyi, Michael. (2003). Crude Oil Theft: Bunkerers get more daring, (May). accessed 8 March 2018. http://www.legaloil.com/NewsItem.asp?DocumentIDX=1056729417&Category=news
Office of Investment Affairs—OIA. (2016a). Guyana – Protection of Property Rights. US Department of State. accessed 21 February 2018.
287
https://www.export.gov/article?id=Guyana-Protection-of-Property-Rights
(2016b). Tanzania – Protection of Property Rights. US Department of State. accessed 21 February 2018. https://www.export.gov/article?id=Tanzania-Protection-of-Property-Rights
Oil & Gas Year. (2013). Bahrain Overview. accessed 20 January 2018. http://www.theoilandgasyear.com/market/bahrain/
Olsson, O., & Fors, H. C. (2004). Congo: The prize of predation. Journal of Peace Research, 41(3), 321–336.
Olstrom, Elinor & Schlager, Edella. (1992). Property-Rights Regimes and Natural Resources: A Conceptual Analysis. Land Economics, 68(3), 249-262.
Omgba, Luc Désiré. (2009). On the duration of political power in Africa: the role of oil rents. Comparative Political Studies, 42(3), 416-436.
OPEC. (2018). Member States. Organization of Petroleum Exporting Countries. accessed 4 May 2018. http://www.opec.org/opec_web/en/about_us/25.htm
Ovid. (2004). Metamorphoses. W.W. New York: Norton & Company.
Paget, Dan. (2017). Tanzanian president Magufuli’s record mining fine is a warning to the global extractive industry. Quartz. accessed 5 April 2018. https://qz.com/1040731/tanzanias-president-magufulis-fine-for-barrick-gold-owned-acacia-marks-a-new-day/
Paraskova, Tsvetana. (2018). Russia Boosts 2017 Crude Oil Production To 30-Year High. The Oil Price. accessed 19 January 2018. https://oilprice.com/Energy/Crude-Oil/Russia-Boosts-2017-Crude-Oil-Production-To-30-Year-High.html
Park, William. (2016). The Tragic Tale of Saddam Hussein’s ‘Supergun’. BBC. accessed 31 May 2018. http://www.bbc.com/future/story/20160317-the-man-who-tried-to-make-a-supergun-for-saddam-hussein
Parraga, Marianna, & El Gamal, Rania. (2017). As Venezuela pumps below OPEC target, oil rivals begin filling gap. Reuters. accessed 20 January 2018. https://www.reuters.com/article/us-opec-venezuela-quotas/as-venezuela-pumps-below-opec-target-oil-rivals-begin-filling-gap-idUSKBN1DK0CH
Persson, Torsten. (2005). Forms of Democracy, Policy and Economic Development. NBER Working Paper No. 11171.
Peters, Krijn, & Richards, Paul. (1998). ‘Why we fight:’ Voices of youth combatants in Sierra Leone," Africa, 68(2), 183-210.
288
Peterson, J.E. (2006). Qatar and the World: Branding for a Micro-State. Middle East Journal, 60(4).
Petra Diamonds. (2018). Investors. accessed 5 April 2018. https://www.petradiamonds.com/investors/
Petroecuador. (2016) Informe Estadístico 2016. accessed 6 January 2018. http://www.eppetroecuador.ec/wp-content/uploads/downloads/2017/06/INFORME-ESTADiSTICO-2016.pdf
Petróleos Mexicanos. (2017). Monthly Petroleum Statistics: Liquid Hydrocarbons Production. PEMEX. accessed 19 January 2018. http://www.pemex.com/en/investors/publications/Indicadores%20Petroleros%20Archivos/eprohidro_ing.pdf
Pham, Sherisse. (2017). China sues Venezuela’s Oil Company over Unpaid Bills. CNN Money. accessed 14 June 2018. http://money.cnn.com/2017/12/07/news/sinopec-sues-pdvsa-venezuela-china/index.html
Piketty, Thomas, Alvaredo, Facundo, Chancel, Lucas, Saez, Emmanuel, Zucman, Gabriel (2015) World Inequality Database (WID).
Powers, S. (2009). The Geopolitics of the News: The Case of the Al-Jazeera Network. Dissertation for the Faculty of the University of South California Graduate School in Partial Fulfillment for the Requirements for the Degree DOCTOR OF PHILOSOPHY (Communications).
Powlick, K.M. (2005). Natural Resources and Conflict: Diamonds in Sierra Leone. UMass/New School Joint Workshop. accessed 21 February 2018. https://www.peri.umass.edu/fileadmin/pdf/UM-NS_Workshop/MaevePowlick.pdf
Prensa Latina. (2016). Angola Closes 2016 Leading Oil Production In Africa. Further Africa – taken from Prensa Latina. accessed 19 January 2018. https://furtherafrica.com/2016/12/28/angola-closes-2016-leading-oil-production-in-africa/
Qatar Petroleum—QP. (2018). Crude Oil. Qatar Petroleum. accessed 19 January 2018. https://www.qp.com.qa/en/marketing/Pages/RP_CrudeOil.aspx
Quiñones, John. (2003). Sierra Leone Amputees. ABC News with David Muir. accessed 19 March 2018. http://abcnews.go.com/WNT/t/story?id=131404
Ravallion, M. (2004). Pro-Poor Growth: A Primer (Policy Research Working Paper No. ID 610283). World Bank.
Read, Madlen. (2008). Oil Sets New Trading Record Above $147 a Barrel. USA TODAY. accessed 24 March 2018. http://www.usatoday.com/money/economy/2008-07-11-3815204975_x.htm
289
Redvers, Louise. (2012). Oil-Rich Cabinda the Poorer for it. Mail & Guardian. accessed 13 March 2018. https://mg.co.za/article/2012-09-28-00-oil-rich-cabinda-the-poorer-for-it
Reich, Otto et al. (1999). Venezuela’s 1998 Presidential, Legislative, and Gubernatorial Elections: Elections Observations Report.
Reilly, Jill. (2013). I'm too sexy for Saudi Arabia: Actor Omar ordered out of country because his good looks would drive women to distraction. Daily Mail. accessed 1 June 2018. http://www.dailymail.co.uk/news/article-2315154/Omar-Borkan-Al-Gala-ordered-Saudi-Arabia-good-looks-drive-women-distraction.html
Reuters. (1987). Thatcher Government to Sell 31.5% BP Stake in Biggest-Ever Stock Offer, Reuters. accessed 5 July 2018. http://articles.latimes.com/1987-08-21/business/fi-2366_1_stock-offering
Robinson, James A., Torvik, Ragnar, & Verdier, Thierry. (2002). Political foundations of the resource curse. CEPR Discussion Paper 3422.
Rodrik, Dani. (2006). What’s so special about China’s exports? China & World Economy, 14(5), 1–19.
Rogers, James. (2006). Judicial Review Standards in Unicameral Legislative Systems: A Positive Theoretical and Historical Analysis. Creighton Law Review, 33(1), 65-120.
Rosen, Armin. (2016). How One Man’s Illness may have Changed the Course of Middle Eastern History. Business Insider. accessed 31 May 2018. http://www.businessinsider.com/how-the-shahs-cancer-may-have-changed-history-2014-10
Rosenstein-Rodan, P. N. (1943). Problems of industrialisation of eastern and southeastern Europe. The Economic Journal, 53(210/211), http://doi.org/10.2307/2226317
Rosneft. (2018). Rosneft at a Glance. Rosneft. accessed 19 January 2018. https://www.rosneft.com/about/Rosneft_today/
Ross, Michael & Mahdavi, Paasha. (2015). HarvardDataverse. http://dx.doi.org/10.7910/DVN/ZTPW0Y doi/10.7910/DVN/ZTPW0Y.
Ross, Michael L. (1999). The Political Economy of the Resource Curse. World Politics, 53(2), 297-322.
(2003). Oil, drugs, and diamonds: How do natural resources vary in their impact on civil war. Beyond greed and grievance: The political economy of armed conflict, 47-70.
(2004). What Do We Know about Natural Resources and Civil War? Journal of
290
Peace Research, 41(3), 337-356.
(2012). The Oil Curse: How Petroleum Wealth Shapes the Development of Nations. Princeton: Princeton University Press.
(2015). What Have We Learned From the Resource Curse?. Annual Review of Political Science, 18, 239-259.
Rukmangadhan, Radhika & Shabalala, Zandi. (2017). Petra Diamonds restarts Tanzania mine, sticks to output target. Reuters. accessed 5 April 2018. https://www.reuters.com/article/us-petra-diamonds-results/petra-diamonds-restarts-tanzania-mine-sticks-to-output-target-idUSKCN1BT1AD
Salih, Khaled. (1995). Anfal: The Kurdish Genocide in Iraq. Digest of Middle East Studies, 4(2), 24-39.
Sanderson, Henry. (2017). Petra Threatens to Cut Tanzania Investment After Diamonds Seizure. Financial Times. accessed 5 April 2017. https://www.ft.com/content/2bab9c3e-9c64-11e7-8cd4-932067fbf946
Sansal, Boualem. (2010). The First Great Novel about Islamism, The German Mujahid, in (ed.) Fouad Ajami. The Furrows of Algeria. (trans.) Frank Wynne. Europa Editions.
Savoye, J. (1997). Le pétrole et le guerre de Angola. Revue Internationale de Stratégie, 29.
Schlesinger, Arthur. (2002). Robert Kennedy and His Times: Volume II. Houghton Mifflin Harcourt.
Schofield, Richard N. (1986). Evolution of the Shatt al-'Arab boundary dispute. Middle East & North African Studies Press.
Schwarz, Rolf. (2004). State Formation Processes in Rentier States: The Middle Eastern Case, Graduate Institute of International Studies. Geneva, Switzerland.
Shabafrouz, Miriam. (2010). Oil and the eruption of the Algerian Civil War: A context-sensitive analysis of the ambivalent impact of resource abundance. GIGA working papers, No. 118.
Shamoo, Adil, E., Bricker, Bonnie, & Leaver, Erik. (2007). The Costs of War for Oil. Foreign Policy in Focus. accessed 20 June 2018. https://fpif.org/the_costs_of_war_for_oil/
Shand, Mike & International Crisis Group—ICG. (2016). Algeria’s South: Trouble’s Bellwether. International Crisis Group. accessed 11 April 2018. https://www.crisisgroup.org/middle-east-north-africa/north-africa/algeria/algeria-s-south-trouble-s-bellwether
291
Sheikhzadegan, Amir. (2003). Der Griff des politischen Islam zur Macht. Iran und Algerien im Vergleich. Europäische Hochschulschriften. Bern: Peter Lang.
Singer, H. W. (1950). The distribution of gains between investing and borrowing countries. The American Economic Review, 40(2), 473–485.
Skocpol, Theda. (1982). Rentier state and Shi'a Islam in the Iranian revolution. Theory and Society, 11(3), 265-283.
Smillie, Ian, Gberie, Lansana, & Hazleton, Ralph. (2000). The Heart of the Matter: Sierra Leone, Diamonds & Human Security: Complete Report. Diane Publishing.
Smillie, Ian. (2002). The Kimberley Process: The Case for Proper Monitoring. Ottawa: Partnership Africa Canada.
Smith, Benjamin. (2004) Oil wealth and regime survival in the developing world, 1960–99. American Journal of Political Science, 48(2), 232–246.
Smith, James, L. (2008). Organization of Petroleum Exporting Countries (OPEC), in (eds.) Steven N. Durlauf & Lawrence E. Blume, The New Palgrave Dictionary of Economics: Second Edition. Palgrave Macmillan.
Snyder, Richard & Bhavnani, Ravi. (2005). Diamonds, Blood, and Taxes: A Revenue-Centered Framework for Explaining Political Order. Journal of Conflict Resolution, 49(4), 563-597.
Sonangol. (2017). Gráfico Histórico de Produção. accessed 6 January 2018. http://www.sonangol.co.ao/English/AreasOfActivity/Upstream/Pages/Production-Map.aspx
(2018). Upstream. Sonangol. accessed 19 January 2018. http://www.sonangol.co.ao/English/AreasOfActivity/Upstream/Pages/Upstream.aspx
St. John, Peter. (1996). Insurgency, Legitimacy, and Intervention in Algeria. Canadian Security Intelligence Service. Commentary No. 65.
Stamico. (2018). About US: Corporate Profile. accessed 2 April 2018. http://www.stamico.co.tz/corporate-profile/
Stigler, George J. (1964). A theory of oligopoly. Journal of Political Economy, 72(1), 44–61.
Stockwell, John. (1978). In Search of Enemies: A CIA Story. New York: W. W. Norton.
Stora, Benjamin. (1995). Conflits et champs politiques en Algérie. Politique étrangère, 329-342.
292
Strange, Susan. (1999). States and Markets: Second Edition. London & New York: Pinter Publishing.
Summit Communications. (2006). National Oil Company Looks Toward the Future. accessed 20 January 2018. http://www.summitreports.com/sudan/sudapet.htm
Sustainable Race. (2018). Iran Country Analysis Oil, Source: EIA. accessed 25 May 2018. https://sustainablerace.com/iran-country-analysis-oil-source-eia/
Tanzania Invest. (2018). Diamonds. accessed 2 April 2018. https://www.tanzaniainvest.com/diamonds
Teorell, Jan, Dahlberg, Stefan, Holmberg, Sören, Rothstein, Bo, Khomenko, Anna & Svensson, Richard. (2017). The Quality of Government Standard Dataset. version Jan17. University of Gothenburg: The Quality of Government Institute. accessed 14 March 2017. http://www.qog.pol.gu.se doi:10.18157/QoGStdJan17.
Tetra Tech. (2018). Property Rights and Artisanal Diamond Development: Africa. accessed 31 January 2018. http://www.tetratech.com/en/projects/property-rights-and-artisanal-diamond-development-africa
The Economist. (2012). Venezuela’s Oil Industry Spilling Over. accessed 18 September 2017. http://www.economist.com/node/21547829
The New York Times (10 January 1988) p. E3. (From Lloyd’s Shipping Intelligence Unit for 1981 through 1986, and Center for Defense Information for 1986 and 1987.
The Washington Post (13 October 1987) p. A12.
Toolis, Kevin. (1990). The Man Behind Iraq’s Supergun. New York Times. accessed 31 May 2018. https://www.nytimes.com/1990/08/26/magazine/the-man-behind-iraq-s-supergun.html
Total. (2008). Venezuela: Sincor Officially Transformed into a Mixed Company. Total. accessed 26 March 2018. https://www.total.com/en/media/news/press-releases/venezuela-transformation-officielle-de-sincor-en-entreprise-mixte
Treble, Patricia. (2012). One of the Queen’s Favourite Brooches has Canadian Roots. Maclean’s. accessed 1 April 2018. http://www.macleans.ca/news/canada/one-of-the-queens-favourite-brooches-has-canadian-roots/#more-261604
Tuan, Yi-Fu. (1974). Topophilia: a study of environmental perception, attitudes, and values. New York: Columbia University Press.
Ulmer, Alexandra & Ellsworth, Brian. (2017). Exclusive: Venezuela's PDVSA sees 2017 oil output stuck near historic lows – document. Reuters. accessed 19 January 2018. https://www.reuters.com/article/us-venezuela-pdvsa/exclusive-venezuelas-
293
pdvsa-sees-2017-oil-output-stuck-near-historic-lows-document-idUSKBN14X0GW
United Nations Security Council. (1987). United Nations Security Council document S/16877 of 31 December 1984, with Addendum 1 of 22 January 1985, Addendum 2 of 31 December 1985, Addendum 3 of 31 December 1986, Addendum 4 of 22 January 1987, Correction 1 to Addendum 3 of 10 February 1987, and Addendum 5 of 31 December 1987.
United Nations. (2000). Report of the Panel of Experts appointed pursuant to the Security Council Resolution 1306 (2000), paragraph 19, in relation to Sierra Leone. United Nations. (December).
US Department of Justice. (2007). Armed Conflicts Report: Angola-Cabinda (1994 – First Combat Deaths). accessed 12 March 2018. https://www.justice.gov/sites/default/files/pages/attachments/2015/09/15/armed-conflict-report_angola-cabinda.pdf
US Department of State, Central Intelligence Agency, & Defense Intelligence Agency. (1975). The Implications of the Iran-Iraq Agreement. Approved for release August, 2004.
US Department of State. (2016). Investment Climate Statement: 2016. accessed 21 February 2018. https://www.state.gov/e/eb/rls/othr/ics/investmentclimatestatements/index.htm#wrapper
(2018). The Iran Hostage Crisis. Office of the Historian. accessed 31 May 2018. https://history.state.gov/departmenthistory/short-history/iraniancrises
USAID. (2011). Property Rights and Artisanal Diamond Development (PRADD) – Liberia: A review of the legal, regulatory and policy framework governing artisanal diamond mining in Liberia. accessed 31 January 2017. https://usaidlandtenure.net/wp-content/uploads/2016/09/USAID_Land_Tenure_PRADD_Liberia_Anlysis_of_Legal_Framework_2011.pdf
van der Ploeg, Frederick & Poelhekke, Steven. (2010). The pungent smell of “red herrings”: subsoil assets, rents, volatility, and the resource curse. Journal of Environmental and Economic Management, 60, 44–55.
van der Ploeg, Frederick. (2011). Natural resources: curse or blessing?. Journal of Economic Literature 49(2), 366–420.
van Wijenbergen, Sweder. (1984). Inflation, Employment, and the Dutch Disease in Oil-Exporting Countries: A short-run Disequilibrium Analysis. Quarterly Journal of Economics 99, 233-250.
294
Vassiliev, Alexei. (1998). The History of Saudi Arabia. London: Saqi Books.
Vatansever, Adnan & Gillies, Alexandra. (2009). The Political Economy of Natural Resource Management for Development: A Framework for Operational Research. Unpublished manuscript. Washington, DC: World Bank.
Verma, Nidhi. (2017). Venezuela’s PDVSA Misses Debt Payments to India’s Top Oil Producer. Reuters. accessed 28 March 2018. https://www.reuters.com/article/us-venezuela-india-oil-exclusive/exclusive-venezuelas-pdvsa-misses-debt-payments-to-indias-top-oil-producer-idUSKBN1D90L4
Vicente, Pedro. C. (2010). Does oil corrupt? Evidence from a natural experiment in West Africa. Journal of Development Economics, 92(1), 28-38.
Vidiani. (2018). Detailed Administrative Map of Angola with Cities and Airports. Vidiani. accessed 12 March 2018. http://www.vidiani.com/detailed-administrative-map-of-angola-with-cities-and-airports/
Vines, Alex. (2016). Why Fidel Castro’s Legacy in Africa is in Angola. Newsweek. accessed 14 March 2018. http://www.newsweek.com/fidel-castro-greatest-legacy-africa-angola-526321
Vlassenroot, Koen, & Van Bockstael, Steven. (2008). Artisanal diamond mining. Perspectives and challenges. Egmont. Gent: academia Press.
Voors, Maarten, Bulte, E., Papaioannou, K. J., & van der Windt, P. (2017). Resources and governance in Sierra Leone’s civil war. The Journal of Development Studies, 53(2), 278-294.
Vriens, Lauren. (2009). Armed Islamic Group (Algeria, Islamists). Council on Foreign Relations. accessed 11 April 2018. https://www.cfr.org/backgrounder/armed-islamic-group-algeria-islamists
Waltz, Kenneth N. (1979). Theory of International Politics. Long Grove, IL: Waveland Press Inc.
Watts, Michael. (2004). Resource curse? Governmentality, oil and power in the Niger Delta, Nigeria. Geopolitics, 9(1), 50-80.
Weber, Max. (1992). The Protestant Ethic and the Spirit of Capitalism. (transl.) Talcott Parsons. London & New York: Routledge.
Weissenstein, Michael, & Rodriguez, Olga. (2013). 25 Dead, 101 Injured in Mexico Oil Company Blast. San Francisco Chronicle. accessed 25 June 2018. https://web.archive.org/web/20130201071934/http://www.sfgate.com/business/article/Government-Death-toll-in-Mexico-oil-company-4240844.php#ixzz2Jcad9Yh2
295
Wenar, Leif. (2008). Property rights and the resource curse. Philosophy & public affairs, 36(1), 2-32.
Werenfels, Isabelle. (2005). Between Integration and Repression: Government response to Islamism in the Maghreb. SWP Research Paper. Berlin: SWP.
Wernau, Julie. (2018). ConocoPhillips Wins $2 Billion Ruling Against Venezuelan Oil Company. Wall Street Journal. accessed 14 June 2018. https://www.wsj.com/articles/conocophillips-wins-2-billion-ruling-against-venezuelan-oil-company-1524686895
Wick, Katharina & Bulte, Erwin. (2009). The curse of natural resources. Annual Review of Resource Economics, 1(1), 139–56.
Wigglesworth, Robin. (2017). Goldman Sachs Asset Arm Faces Large Paper Loss on Venezuelan Bond. Financial Times. accessed 28 March 2018. https://www.ft.com/content/94a6cbc0-c101-11e7-b8a3-38a6e068f464
Wilpert, Gregory. (2003). The Economics, Culture, and Politics of Oil in Venezuela. Venezuela Analysis. accessed 27 March 2018. https://venezuelanalysis.com/analysis/74
Workman, Thom. (1991). The social origins of the Iran-Iraq War.
World Bank. (2017). GDP Constant USD 2010. accessed 18 October 2017. https://data.worldbank.org/indicator/NY.GDP.MKTP.KD
(2018). Oil Rents (As % Of GDP). accessed 19 January 2018. https://data.worldbank.org/indicator/NY.GDP.PETR.RT.ZS
Wyss, Jim. (2017). Venezuela has a bread shortage. The government has decided bakers are the problem. Miami Herald. accessed 1 June 2018. http://www.miamiherald.com/news/nation-world/world/americas/venezuela/article138964428.html
Yager, Thomas R. (2012). The Mineral Industry of Tanzania. US Geological Survey: 2012 Minerals Yearbook.
Yergin, Daniel. (1992). The Prize: The Epic Quest for Oil, Money, and Power. New York: Touchstone Publishing.
(2012). The Quest: Energy, Security, and the Remaking of the Modern World. London: Penguin Books.
Zerrouky, Hassane. (2002). La nébuleuse islamiste en France et en Algérie. Paris: Éditions 1.
Zimnisky, Paul. (2017). 2017 Global Natural Diamond Production Forecasted at 142M
296
Carats Worth $15.6B. Paul Zimnisky Diamond Analytics. accessed 5 October 2017. http://www.paulzimnisky.com/2017-global-natural-diamond-production-forecasted-at-142m-carats-worth-15-6b
297
Appendices
Appendix A (Testing Hypothesis 2) The data and methods presented in Appendix 1 contains valuable information
regarding the collection of information for Hypothesis 2, which analyzes the strength of
the resource class in diamond- and petroleum-rich states. In obtaining the data to test this
hypothesis, this work used the CIA World Factbook for country populations (CIA World
Factbook), the Qualities of Governance dataset that incorporated Ross and Mahdavy’s
(2015) information on the value of oil production per state in 2014 dollars (Teorell et al
2017; Ross 2015). To determine the values of diamond production, this dissertation
reviewed the Kimberley Process Annual Global Summary, tabulating diamond
production, exports, and imports by carats and value (Kimberley Process 2015). World
Bank data is useful for determining the Gini coefficient of many states, though
oftentimes, the scores are relatively dated (i.e., before the 2008 financial market
downturn). For example, the World Bank offers Gini coefficients for Liberia from 2007,
Venezuela from 2006, Gabon and Ghana from 2005, and Tanzania from 2000.
Additionally, the CIA World Factbook displays Gini coefficients from Algeria in 1995,
Cameroon in 2001, Guyana in 2007, and Zimbabwe in 2006. Yet even between the CIA
World Factbook and the World Bank, the data is still incomplete. IndexMundi exhibits
Syria’s Gini coefficient from 2004, citing the World Bank (IndexMundi 2017).
Furthermore, and most frustrating, is that the Gini coefficients for many Gulf states are
298
different for citizens than for the masses of low-wage immigrant workers they receive
from Bangladesh, Pakistan, and India. For these states, this dissertation delved into
estimates by other scholars. Information on Kuwait is found at El-Katiri et al (2011); data
on Bahrain, Oman, and UAE is available at Figini & Holger (2006:20). Obtaining Gini
coefficients on Libya is even older and sketchier, but found in Askari et al (1982:211).
Equatorial Guinea’s Gini coefficient shows up in Dahl (2015:567). Brayne (2014:18) has
data on Brunei’s Gini coefficient.
An integral assumption in denoting Gini coefficients for resource curse states in
the post-Cold War period is that Gini coefficients are slow moving and do not drastically
change from year to year. Due to this, this work is comfortable using slightly dated
information, especially from a reputable source, such as the World Bank. Additionally,
because of the relatively sparse dataset, different sources were used to conduct this
research. The CIA World Factbook again proves useful in this endeavor, providing Gini
coefficients along with the date of inspection. Additionally, because measures, such as
Gini coefficients, are so popular, this dissertation trusts that the World Bank and the CIA
are using similar methodologies. Along this vein, the World Bank seems to possess more
recent information while the CIA dataset is more complete, yet dated.
For the time series analysis, annual population data was taken from the World
Bank. Only tiny Kuwait has three years missing from 1992 to 1995, right after the Iraqi
invasion. In this case, this dissertation calculated the geometric mean between the years
and plugged them into the missing cells. Oil production data was taken from Ross and
Mahdavy (2015), who masterfully created a dataset of all oil and gas production,
separated by state and year. They use many different determinants, but for the purposes
299
of this dissertation, the key variable is (oil_value_2014), which measures the annual
value of oil production per state in constant 2014 US dollars. Naturally, Ross and
Mahdavy (2015) do not have data on the years 2016 or 2017. While many scholars may
not find this too troubling, the price of all energy commodities, such as oil, gas, and coal,
have dropped in value by about half since 2014. This not only coincided with the latter
part of the Arab Spring, which affects many states in this analysis, it also has sent other
petro-state economies in a downward spiral (e.g., Venezuela). With 96% of their exports
stemming from petroleum, a halving of their main revenue source has left the Venezuelan
economy in shambles, combined and perhaps correlated with an increasingly autocratic
leader. Amazingly enough, while Ross and Mahdavy (2015) disaggregated petroleum
production by state and by year, they have no data on the world level, so this work added
all of the state’s oil production together to obtain a world petroleum production number
necessary for measuring RCAcp values in Hypothesis 2.
Ross and Mahdavy (2015) use constant 2014 dollars in their dataset, so for
continuity’s sake, this dissertation will use a similar measure for calculating state GDPs.
The nearest estimate comes from the World Bank, which measures GDP in terms of
purchasing power parity (PPP) in constant US dollars without “making deductions for
depreciation of fabricated assets or for depletion and degradation of natural resources”
(World Bank 2017).81 There exists another measure that makes these deductions for the
81 The full description of this variable reads, “GDP at purchaser's prices is the sum of gross value added by all resident producers in the economy plus any product taxes and minus any subsidies not included in the value of the products. It is calculated without making deductions for depreciation of fabricated assets or for depletion and degradation of natural resources. Data are in constant 2010 U.S. dollars. Dollar figures for GDP are converted from domestic currencies using 2010 official exchange rates. For a few countries where the official exchange rate does not reflect the rate effectively applied to
300
depletion of natural resources. However, the World Bank dataset for these states begins
in 1990 and there are many years missing for states such as Brunei, Kuwait, and UAE.
Yet even with using the most complete data, there are still plenty of years unaccounted
for in the 1980s (e.g., Gulf States, Libya, etc.). Still, as it’s the most complete information
available, and measured in similar dollars as Ross and Mahdavy’s (2015) dataset, then it
becomes the most convenient data for these purposes. For these missing years—and this
will be important later—this work took the difference between the last two years of data,
and subtracted that number for every previous year.82 The assumption is that GDP growth
is more or less linear. Naturally, this is not the case. However, as this dissertation needs
complete data for the equations in Hypothesis 2 to be relevant, it is somewhat
comfortable with such extrapolation, cognizant of reality’s complexity. The original
dataset would have 1370 observations, but due to incomplete data, there are only 930
total observations, with most of the missing data coming from diamond states.
In the oil realm, an interesting development occurred. For some states, the value
of oil produced was more than the state’s GDP. For Libya (1980, 1981, 1982, 2012, and
2013), Qatar (1980-1985), Iraq (1980), Kuwait (1980), and Saudi Arabia (1980), oil
production exceeded state GDP. For other states like Angola (2012), Libya (1983), Oman
(1980), and Saudi Arabia (1981), the percentage of oil production exceeded 90% of the
actual foreign exchange transactions, an alternative conversion factor is used” (World Bank 2017). 82 For example, let’s imagine that Saudi Arabia’s GDP in 1985 was $10 million and $11 million in 1986. This work took the difference between the two years ($1 million), and subtracted that from 1985, leaving Saudi Arabia with $9 million in 1984, $8 million in 1983, and so on.
301
state GDP, which also seems suspicious. To be sure, all of these datapoints will be
eliminated from the regression analyses, but it is important to clarify these discrepancies.
There are a number of reasons why this may have occurred. The original
suspicion was that the World Bank data was measured in nominal dollars rather than
current US dollars, but according to their description, that was not the case. Additionally,
if it were the case, we would observe a discrepancy between years in the 1980s, and not
Libya in 2013 or Angola in 2012. Naturally, the fact that many of these discrepancies
show up in the early 1980s is still suggestive, but there is another reason for that, which
we will explore in a bit. Other possibilities could be ruled out, such as FDI not being
taken into account for petroleum extraction, as many of these states have largely
nationalized their petro-industries. Furthermore, one dataset is set in 2014 dollars while
the other is in 2010 dollars, but the US dollar did not inflate much during those four
years. Another cause of the discrepancy is that some states, namely the Gulf states, had
incomplete GDP data, so in extrapolating their GDP by implementing an admittedly
rudimentary and ham-fisted approach, their information was skewed. Yet, that still does
not explain more recent discrepancies or states outside of the Gulf, even if complete data
were available.
The World Bank dataset that accounts for GDP in terms of PPP while taking
account resource depletion ought to explain the discrepancy, especially since their
numbers for a state’s GDP are higher than the ones used in this analysis. The problem
still remains that their dataset begins in 1990 and there is missing information for many
resource curse states. Another plausible possibility explaining the discrepancy is debt. If
petroleum-rich states are borrowing money at rates close to their GDPs, their resulting
302
GDP would be significantly lower than the total production of the state due to high rates
of borrowing. There is another possibility explaining the discrepancy in the data.
First, this work hesitates to conclude that either the World Bank or Ross and
Mahdavy (2015) are simply wrong, though it is more tempted to believe that states may
lie about their petro-production. If this is the case, then we have nothing to work with.
However, we may take state data at face value, while assuming that there may be a lag in
reporting their data. This would explain why the value of oil production exceeded GDP
during tumultuous years, especially with the inflated oil prices in Angola and Libya in
2012 and 2013, respectively. As was previously suggested, inflated prices corresponded
with huge crashes in commodity prices in 2014. If there were a lag in reporting, this
would appear in the analysis. Aside from these two relatively recent cases in Angola and
Libya, there are a few years in the 1980s where oil production and GDP do not match,
and below is the second part that may explain this discrepancy.
While less known than its predecessor in 1973, the Oil Embargo of 1979 hit
Western and Arab OPEC states very hard, in both consumption and production
capacities, respectively. Below are three charts depicting production in terms of barrels
per day from Kuwait, Qatar, and United Arab Emirates. As can be seen from the
petroleum output of these three Gulf states below, there was a sudden drop in production
during the early 1980s as part of the Oil Embargo in the previous year, leaving these
states with comparably less petroleum revenue.
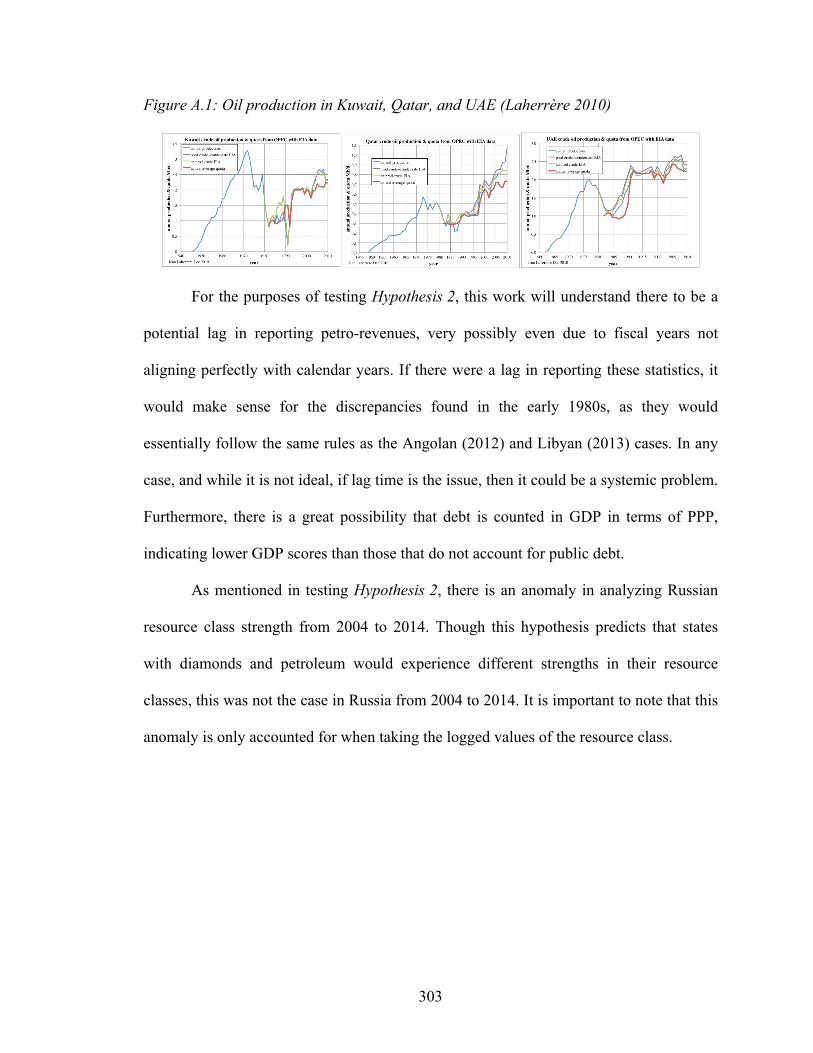
303
Figure A.1: Oil production in Kuwait, Qatar, and UAE (Laherrère 2010)
For the purposes of testing Hypothesis 2, this work will understand there to be a
potential lag in reporting petro-revenues, very possibly even due to fiscal years not
aligning perfectly with calendar years. If there were a lag in reporting these statistics, it
would make sense for the discrepancies found in the early 1980s, as they would
essentially follow the same rules as the Angolan (2012) and Libyan (2013) cases. In any
case, and while it is not ideal, if lag time is the issue, then it could be a systemic problem.
Furthermore, there is a great possibility that debt is counted in GDP in terms of PPP,
indicating lower GDP scores than those that do not account for public debt.
As mentioned in testing Hypothesis 2, there is an anomaly in analyzing Russian
resource class strength from 2004 to 2014. Though this hypothesis predicts that states
with diamonds and petroleum would experience different strengths in their resource
classes, this was not the case in Russia from 2004 to 2014. It is important to note that this
anomaly is only accounted for when taking the logged values of the resource class.
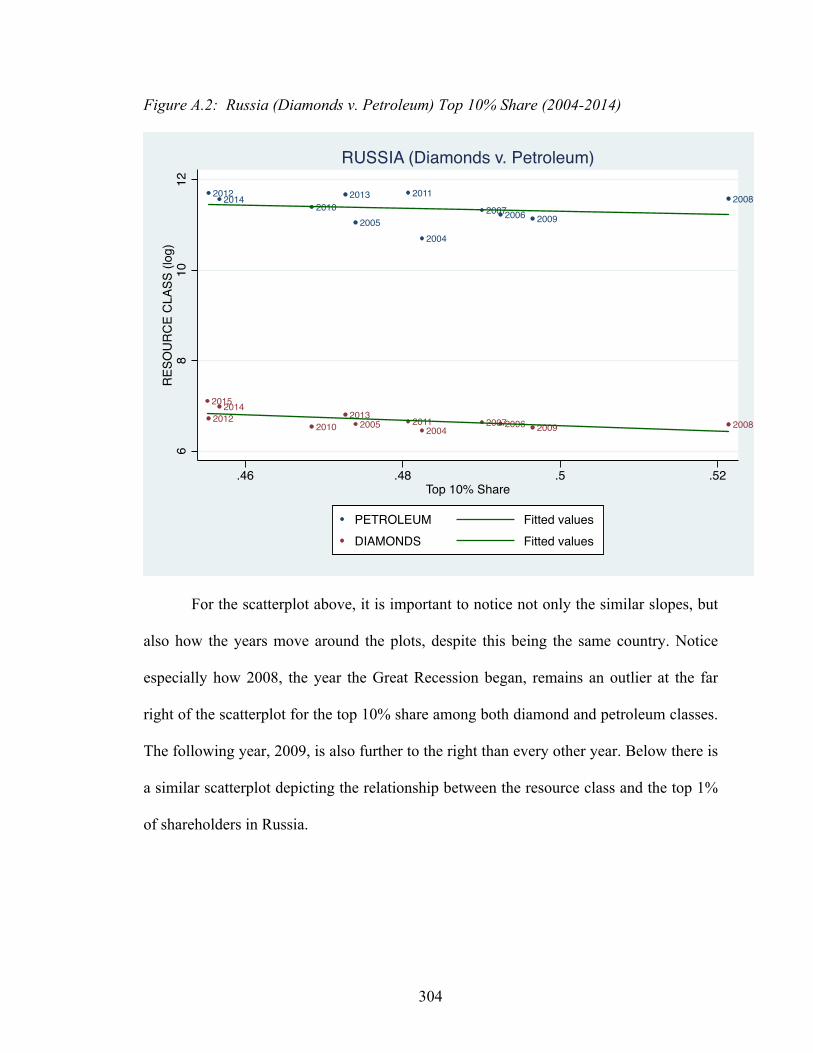
304
Figure A.2: Russia (Diamonds v. Petroleum) Top 10% Share (2004-2014)
For the scatterplot above, it is important to notice not only the similar slopes, but
also how the years move around the plots, despite this being the same country. Notice
especially how 2008, the year the Great Recession began, remains an outlier at the far
right of the scatterplot for the top 10% share among both diamond and petroleum classes.
The following year, 2009, is also further to the right than every other year. Below there is
a similar scatterplot depicting the relationship between the resource class and the top 1%
of shareholders in Russia.
201220142010
2013
2005
2011
2004
20072006 2009
2008
2015
20122014
20102013
2005 20112004
20072006 2009 2008
68
1012
RESO
URCE
CLA
SS (l
og)
.46 .48 .5 .52Top 10% Share
PETROLEUM Fitted valuesDIAMONDS Fitted values
RUSSIA (Diamonds v. Petroleum)

305
Figure A.3: Russia (Diamonds v. Petroleum) Top 1% Share (2004-2014)
As the reader will note, these two scatterplots are very similar. There is an
important distinction, outside of the slopes depicted in these scatterplots. Despite taking
the log of the resource class for Russian shareholders in the top 10% and 1% of society,
the petroleum resource class is consistently stronger than the diamond resource class.
Appendix B (Testing Hypothesis 3)
Testing Hypothesis 3 requires collecting data from many sources on nationalized
industries in diamond- and petroleum-rich resource curse states. The data must then be
synthesized into readable and testable formats. Below is the list of all of the collected
20122010
2014 2013
2009
2011
20042005
20082006 2007
20122010
201520142013
200920112004 20052008 2006 2007
68
1012
RESO
URCE
CLA
SS (l
og)
.2 .22 .24 .26 .28Top 1% Share
PETROLEUM Fitted valuesDIAMONDS Fitted values
RUSSIA (Diamonds v. Petroleum)
306
data for each industry, categorized in alphabetical order, first for petroleum states, and
second for diamond states.
Petroleum States
Algeria’s nationalized oil company, Sonatrach, produces 67 million metric tons of
petroleum, which is around 478 million barrels83 per year (Chikhi 2016). This figure will
be compared with the total Algerian petroleum production, taken from OPEC (2018)
statistical data available on their website.
Angola’s NOC, Sonangol, offers a chart describing their 2016 real oil production
(Sonangol 2017). Their total production hovered at 1.7 million barrels per day (b/d) in
2016 (Prensa Latina 2016). Sonangol also offers an interesting case because it produces
more petroleum than Angola’s total output. According to their website, Sonangol is the
exclusive oil lease grantor in Angola and as “part of its worldwide expansion strategy,
Sonangol has an oil exploration partnership in the Republic of Gabon Kiarsseny Marin
block - an area of about 5,442 km2. For this venture Sonangol is a shareholder with 10%
of the profits” (Sonangol 2018). Consequently, the ratio between Sonangol and Angola is
1.00125, meaning that Sonangol produces slightly more petroleum than its host state,
though this would attribute part this ratio to round-off error, as it is often difficult to
pinpoint when an NOC’s data was taken in comparison to the average oil price for the
year.84
83 There are 7.1475121 barrels of crude oil per metric ton. 84 Because petroleum production greatly varies from day to day, there remains the possibility that the snapshot of the NOC is incongruent with that of total oil production in a state.
307
As mentioned in Chapter 4, the microstate of Bahrain will not be accounted for in
this analysis. Because Bahrain is a quite a small island nation in the Gulf, their
nationalized oil company, Bahrain Petroleum Company (BAPCO), is more dedicated to
refining petroleum rather than producing it, as Bahrain has very few reserves compared to
its larger neighbors. Bahrain refines around 230,000 b/d of crude oil (General Electric
2017), which is five times the production of the tiny microstate. According to The Oil &
Gas Year, “the [Bahraini] government still relies on oil and gas for roughly 86% of its
revenues. Of these revenues, roughly 80% come from the 300,000 [b/d] Abu Safa
offshore oil field, which is owned and operated by Saudi Aramco but from which 50% of
the revenues are transferred to Bahrain. The remaining 20% comes from Bahrain’s only
oil field, Awali, which reached record production levels in June 2015, producing some
56,000 bopd [sic]” (Oil & Gas Year 2013).
Brunei will also be eliminated. While the official NOC of Brunei is
PetroleumBRUNEI, the Brunei Shell Petroleum Company is also partially owned by the
Sultan, and supplies Asian states with 350,000 b/d of petroleum (BSP 2018), far
outstripping total Brunei production, which can be found through the IMF database (IMF
2014:11). For its part, PetroleumBRUNEI extracts crude petroleum outside of Brunei
from oil blocks in Myanmar, Malaysia (partnered with Petronas), and Canada. Its
partnership with Shell skews the data so that it appears that these NOCs produce well
over the total production of the Nation of Brunei.
In Ecuador, Petroecuador produces 132 million barrels of petroleum per year.
These statistics are public information, found in their website (Petroecuador Informe
308
Estadístico 2016:10), while total Ecuadorian oil production of just over 200 million
barrels per year can be found through OPEC’s (2018) official statistics.
Equatorial Guinea’s NOC, GE Petrol, along with the Ministry of Mines, Industry,
and Energy oversees almost 90% of Equatorial Guinea’s total oil production (Obiang
Lima et al 2015:3; Leahy et al 2001:22). While the stated figures are not exact, this works
is considering this number to be approximately 89% of total production. Equatorial
Guinea’s total production is 91 million barrels per year, taken from IndexMundi, which
bases its data off the EIA (IndexMundi 2018). 89% of 91 million is 81 million barrels per
year, which is reflected in the Hypothesis 3 dataset.
Enerdata has information on Gabon’s NOC, the Gabon Oil Company (Enerdata
2016), which produces slightly over 80 million barrels per year. Total Gabonese oil
production can be found through OPEC’s (2018) official statistics, reflecting a very
similar amount of oil production as their NOC.
The National Iranian Oil Company (NIOC) is “overseen by Iran’s Ministry of
Petroleum, is exclusively responsible for Iran’s crude oil and gas exploration and
production operations, as well as research projects leading to the development of new oil
fields” (Dutta 2013a). For this reason, this work will equate Iranian total crude oil
production with NIOC production although recently, Iran has opened its doors to Total,
Shell, ExxonMobil, Conoco, Statoil, and BP (e.g., Clinch 2013). This dissertation prefers
to not use Forbes to calculate production totals for many NOCs because their productions
were often quoted as higher than national averages; yet, some NOCs, such as the Iranian
one, have very little public information about them. Given the information above, Iran’s
production ratio (VN / VP) will be 1:1, although this has the potential to decrease given
309
Iran’s partnerships with many MNCs over the past year. Total Iranian production values
were 1,108,166,515 barrels per year in 2013, meaning that NIOC had similar production.
The Iraqi National Oil Company (INOC) is another NOC with very hidden
production values. Because of this, this dissertation will resort to using the Forbes data,
taken from Wood Mackenzie’s 2014 analysis (Forbes 2015). This work additionally
hesitates to incorporate any 2014 data because production levels were much greater than
normal throughout the year, potentially misrepresenting NOC and total state production.
However, for certain NOCs, such as the Iraqi one, there is no viable alternative. Total
Iraqi petroleum production held at 3.4 million b/d in 2014, meaning that INOC comprised
of 58% of total production (EIA 2015).
The Kazakh NOC, KazMunayGas measures crude oil production in tons, but the
data is also transferable into barrels per year (KazMunayGas 2016:22). Kazakh
production is also available through the EIA, with KazMunayGas generating around
25.5% of total production (EIA 2017).
The Kuwait Petroleum Company (KPC) poses another interesting dilemma for the
analyst—its petroleum production consistently surpasses Kuwait’s total oil production.85
KPC’s oil production does not seem limited to just Kuwait. They have many subsidiaries
that extract, refine, and sell petroleum across the Middle East and in Europe (e.g., KPC’s
subsidiary, Q8 pronounced ‘Kuwait’). KPC is in fact richer than its host state, possibly
due to the State of Kuwait’s accumulated debt, which accounts for over 10% of their
85 Calculating petroleum production is a tricky venture. Not only does petroleum production constantly change depending upon the market, international affairs, and supply-side challenges, the price of oil is also constantly changing, partially contingent upon supply. This dissertation is therefore forced to use Ross & Mahdavy’s (2015) analysis of petroleum production and attempt to pin NOC production and prices to their model, cognizant of the shortcomings of this data manipulation.
310
GDP. Kuwaiti information is taken from Oil and Gas IQ (Dutta 2013b), and total Kuwaiti
production data is taken from IndexMundi, basing it off the EIA (IndexMundi 2018).
Libya’s oil production is notoriously unreliable, with armed groups often
targeting the El Sharara oil field and halting production (El Wardany & Sarrar 2017).
Due to the post-Gaddhafi civil unrest in Libya, this work incorporated OPEC’s more
recent statistic of Libya’s oil production (OPEC 2018). This information was combined
with data suggesting that Libya’s NOC accounts for 68.75% of Libya’s total production
(1.1 million b/d out of 1.6 million b/d) during the Arab Spring (Hargreaves 2011) to
determine Libya’s nationalization ratio.
In Malaysia, Petronas produces around 648,000 b/d (Ananthalakshmi 2016).
Because of the large slump in Malaysian oil production, followed by a spike, this work
cannot use the data provided by Ross & Mahdavy (2015). Information on total Malaysian
production is available through the CEIC charts (CEIC 2018a).
Mexico is another large petroleum producing state. Pemex, the nationalized oil
company of Mexico, publishes monthly petroleum output on their Petroleum Statistics
page (Pemex 2017), accounting for about 90% of total Mexican production.
Nigeria offers an interesting case as well. The Nigerian National Petroleum
Corporation (NNPC) operates in partnership with other multinational oil corporations and
locally-owned and operated businesses through Joint Operations Agreements (JOA) and
Production Sharing Contracts (PSC). These maneuvers allow the Nigerian government to
collect a share of the profits generated by MNCs without having to invest much capital.
Although the Nigerian government collects rents and has a powerful (and rumored to be
corrupt) body overseeing all oil production—the NNPC—this dissertation would
311
consider this to be the only petroleum state without a de jure NOC. That said, according
to their website, the “Nigerian National Petroleum Corporation (NNPC) is the state oil
corporation which was established on April 1, 1977” (NNPC 2018). Since its inception,
“in 1988, the NNPC was commercialized into 12 strategic business units, covering the
entire spectrum of oil industry operations: exploration and production, gas development,
refining, distribution, petrochemicals, engineering, and commercial investments” (NNPC
2018). The World Bank has data suggesting that the percentage of GDP stemming from
oil rents in Nigeria was hovering at around 3%, and since the NNPC oversees all petro-
activity in the country, then it is safe to assume that much, if not all, of these rents are
funneled through the NNPC (World Bank 2018).
Turning to Oman, this sultanate also has a strong nationalized oil company. The
Oman Oil Company statistics can be found at 2B1st Consulting page (2B1st Consulting
2012). Total Omani production data is taken from IndexMundi, with its nationalized oil
company accounting for 99% of total production (IndexMundi 2018).
According to Euro-Pétrole, Qatar Petroleum is responsible for all phases of the oil
and gas industry in Qatar (Euro-Pétrole 2016). Qatar Petroleum extracts oil from major
oil fields producing four different types of petroleum—Al-Shaheen Crude, Qatar Land
Crude, Qatar Marine Crude, and Al-Rayyan Crude—totaling 885,000 b/d (QP 2018).
That said, by all accounts, the Qatari national oil production is far lower than Qatar
Petroleum’s overall production. While in the past, Qatar may have peaked at 865,000 b/d,
it does not appear the country is producing at that volume any more (i.e., CEIC 2018b).
Note that Qatar Petroleum’s peak is less than its NOC’s reported crude oil production by
312
20,000 barrels per day, suggesting that Qatar Petroleum also extract petroleum from
outside its borders.
Rosneft, the Russian NOC, is 50% owned by the Government of Russia and
produced 210 million metric tons of petroleum in 2016 (Rosneft 2017). However, and
this may be deceiving—they also have operations in Venezuela, Brazil, Canada, US,
China, Iraq, and Indonesia thereby increasing their total production in comparison to
Russian total production. This becomes problematic if this work attempts to create a ratio
between NOC production and national production, as the NOC’s jurisdiction far outstrips
Russian boundaries. However, because Russia’s two petro-giants, Gazprom and Lukoil,
are privatized, Rosneft’s oil production does not supersede Russian total production.
Russia is producing 10.98 million barrels of petroleum per day (Paraskova 2018), while
Rosneft only accounts for 18.7% of that production though a percentage of that
production may be due to overseas projects.
Perhaps the state most well known for its petroleum is Saudi Arabia, and
predictably, the Kingdom has its own powerful NOC—Saudi ARAMCO. Originally a
joint venture between the US and Saudi Arabia, ARAMCO is short for Arabian American
Oil Company. By the 1970s, Saudi Arabia began buying shares of ARAMCO, up until it
owned the entire enterprise—just in time to embargo the West (Vassiliev 1998:390).
Current Saudi ARAMCO information can be found at their website (Aramco 2018), and
total Saudi production is taken from OPEC’s (2018) official statistics.
Sudapet in Sudan offers an interesting case as well. According to Summit
Communications, Sudapet controls between 5 and 20 percent of every oil producing
block in Sudan (Summit 2006). Due to the large spread, this dissertation is adopting the
313
information taken from the largest oil blocks in Sudan. From here, Sudapet seems to
control around 8% of these largest oil fields, so this work is calculating this percentage as
the average for Sudan.86 However, when South Sudan separated from Sudan, the majority
of Sudanese oil fields were suddenly in a different country. Yet, because South Sudan is a
landlocked country, the main way of exporting petroleum is through a national pipeline
running through Sudan and into the Red Sea. For the purposes of this dissertation, it will
use statistics from the Sudan that existed until 2011. Information on Sudapet, the
Sudanese NOC, was tabulated by the EIA in their country analysis brief (EIA 2014:7).
Meanwhile, Sudanese total oil output in 2011 before the split hovered at 490,000 b/d (Al
Jazeera 2011).
Moving along to Syria, the Syrian Petroleum Company produces around 55% of
Syria’s total petroleum output, around 200,000 b/d since the Arab Spring (Butter 2014).
However, due to the current war in Syria, reliable data has become quite scarce.
The United Arab Emirates is another oil-rich Emirate in the Gulf, with its own
NOC. The Abu Dhabi National Oil Company produces 3 million b/d (ADNOC 2017)
accounting for 97% of total figures taken from OPEC.
Venezuela is the state with the largest oil reserves in the world. Venezuela’s
disadvantage is that, unlike the ‘Arabian light’ oil found in the Gulf, its oil is comparably
denser and sourer. This tar sand-like oil is mostly found in the Orinoco Belt. Higher
quality petroleum has been discovered offshore and near Lake Maracaibo (e.g., BCF-17).
86 According to Summit Communications, “The biggest project it is currently involved in is the development of Blocks 3 and 7 in southeastern Sudan, where a major oil field has been discovered. Sudapet has an 8 percent stake in the controlling Petrodar consortium, partnering the China National Petroleum Corporation (41 percent), Petronas (40 percent), Gulf Oil Petroleum (6 percent), and the Al Thani Corporation (5 percent)” (Summit 2006).
314
In 2017, the nationalized oil company of Venezuela, Petróleos de Venezuela, Sociedad
Autónoma (PDVSA), produced 2.501 million b/d (Ulmer & Ellsworth 2017). However,
official Venezuelan output is lower than publicized output by PDVSA. These
discrepancies don’t go unnoticed by the media (e.g., Parraga & El Gamal 2017), but as
they are the most official figures available, this work is incorporating them into the
dataset.
Yemen has multiple companies conducting oil exploration and production, most
of them under the umbrella NOC, Yemen Oil and Gas Corporation. Yemeni crude oil
production has been incredibly unstable, ranging from 456,000 b/d in 2001 to 24,200 b/d
in 2016. While this work would like to use the average production of crude oil, 348,500
b/d from 1995 to 2016 (CEIC 2016), it has been unable to find reliable information
regarding the output of the Yemen Oil and Gas Corporation.
For continuity’s sake, this dissertation attempted to adopt Ross and Mahdavy’s
(2015) crude oil price taken from BP’s Statistical Review. The world benchmark, Brent
Crude, was at $98.95 in 2015. Yet, this is slightly unfortunate because prices
precipitously dropped in 2016 and 2017 right after Ross and Mahdavy’s (2015) analysis.
Currently, Brent Crude trades at $69.50 per barrel rather than the nearly $100 depicted in
Ross and Mahdavy’s (2015) dataset and a far cry away from the $140 barrel the world
saw in 2008. In order to account for the most realistic picture of oil production, this
dissertation adopted each state’s total crude oil production for the year that there is
available NOC data. Both numbers will be multiplied by the price Brent Crude during
said year. The EIA has data on 2016 and 2017 Brent Crude Prices (EIA 2018a), along
with previous years (EIA 2018b). Some years, such as 2014, saw swings from $111 per
315
barrel in July drop to $62 per barrel in December, so the totals will be averaged.
However, in these averages, there will be some round off error, meaning that this work
will take the most realistic picture of the comparative power of the NOC when analyzing
the petroleum dataset. Simultaneously, this analysis will be incorporating the GDP data
taken from Hypothesis 2, which measures GDP in terms of PPP in constant US dollars
without “making deductions for depreciation of fabricated assets or for depletion and
degradation of natural resources” (World Bank 2017).
Diamond States
The nationalized diamond company of Angola is Endiama, and they produced
8.55 million carats of diamonds, worth $956 million, at a value of around $111 per carat
(Diamond Intelligence Brief 2011).
Russia partially owns one of the largest diamond companies in the world—
Alrosa, which produces 37.4 million carats of diamonds each year (Alrosa 2018). Yet, the
Russian Federation only owns 43.9% of Alrosa, the Republic of Sakha, commonly
known as Yakutia, owns another 25%, and eight municipal districts within Yakutia own a
percent each of Alrosa. Other legal entities and individuals own the 23.07% rest of the
company (Antwerp World Diamond Council 2013:3). Because the Sakha Republic along
with the municipalities earning rents from Alrosa are all under the umbrella of the
Russian Federation, this analysis is accounting for 76.93% of the profits to be state-
owned, cognizant of such a simplification of reality.
Ghana has no nationalized diamond company, though it has a ministry dedicated
to ensuring that diamonds are extracted in a humane and legal matter.
316
Guinea offers diamond, bauxite, gold, and aluminum concession rights to dozens
of companies, but does not have a nationalized industry.
The Democratic Republic of the Congo and China partnered to form the Anhui
Foreign Economic Construction Group of China and the Democratic Republic of the
Congo, which is a 50/50 venture between Anhui (a Chinese mining company) and the
DRC in the eastern Kasai province (Kavanaugh 2016). While the data is not yet available,
this joint venture is expected to produce 6 million carats of diamonds per year, of which
the DRC would keep half since it’s a 50/50 venture (Kavanaugh 2016).
Tanzania has its own nationalized mining company, STAMICO, but diamond
production data is unreliable. As mentioned in Hypothesis 1 Tanzania owns 25% of the
Williamson Diamond Mine, but there is little data on any other diamond mines controlled
by STAMICO. Furthermore, as previously mentioned STAMICO is not only a diamond
company, but also mines for gold and coal.
In Ivory Coast, the Société d'Etat pour le Developpment Minier de la Côte
d'Ivoire, National Society for the Development of Mining of Ivory Coast (SODEMI),
overseas all mineral exploration and holds shares in other international mining companies
(Bermúdez-Lugo 2012:12.1). While not explicitly stated, it seem that the Ivoirian
government receives rents from international mining companies for drilling in their
territory, but amounts are not specified.
Sierra Leone owned a nationalized diamond mining company, National Diamond
Mining Company (Diminco), which was powerful throughout the 1970s and 1980s, but
the company was dissolved in 1993 after a series of corruption scandals (Martinez
2001:232).
317
The Zimbabwe Consolidated Diamond Company reported 1.1 million carats in
the first half of 2017 along with 690,000 carats in the latter half of 2016 for a total of 1.79
million carats (Karombo 2017).
Appendix C (Testing Hypothesis 4)
The full description of the coding of colonized states for Hypothesis 4 is added as
part of this appendix. The states that will not be considered former colonies are Ecuador,
Iran, Iraq, Kazakhstan, Liberia, Libya, Mexico, Oman, Russia, Saudi Arabia, Syria,
Venezuela, and Yemen. In the 19th century, Ecuador, Mexico, and Venezuela won their
independence from Spain. Others gained their independence from colonial powers before
World War II, such as Syria (1930 from France) and Iraq (1932 from the United
Kingdom). Libya’s independence from Italy occurred during World War II in 1943, so
the short-lived Italian occupation will not be considered. Iran, Saudi Arabia, and Oman
were not directly controlled by European powers, and the Ottoman Empire allowed them
various degrees of freedom. Due to this history, this work is not considering them to have
experienced direct colonial rule à la Scramble for Africa. By a slightly different token,
this dissertation is not considering Russia or Kazakhstan as colonies because Russia was
the founding member of the Soviet Union, while Kazakhstan was annexed, rather than
being colonized by it. Liberia was never colonized, and was founded by freed American
slaves. Modern-day Yemen was formerly two states, North Yemen (in the west) and
South Yemen (in the east). North Yemen, long known as the Mutawakkilite Kingdom of
Yemen and backed by the US, has exercised sovereignty over its territory since 1918. On
the other hand, South Yemen was a protectorate of the British Crown known as the
318
Colony of Aden, which, after granted independence from Great Britain, turned itself into
the People’s Republic of South Yemen and allied itself with the Soviet Union until it was
merged with North Yemen in 1990 (and then fought a separatist war against them). Due
to the irregular status of Yemen’s colonial past, this dissertation is not including a control
variable for Great Britain’s property rights scores.
States considered being colonies at the denouement of World War II are Algeria,
Angola, Bahrain, Brunei, Cameroon, Republic of the Congo, Democratic Republic of the
Congo, Equatorial Guinea, Gabon, Ghana, Guinea, Guyana, Ivory Coast, Kuwait,
Malaysia, Nigeria, Qatar, Sierra Leone, Zimbabwe, Sudan, United Arab Emirates, and
Tanzania. Because of the inherent racially-inspired colonization of Algeria by the French,
combined with their war for independence from 1954 to 1962, this dissertation will
consider Algeria a colony, though the French government technically considered it a
département of France. Some states, such as Kuwait, Bahrain, and Qatar were granted de
facto semi-independence as early as 1913, but remained as British protectorates until the
1960s and 1970s. However, because British control over these microstates was
significant, this work is including their colonial past in the testing of Hypothesis 4.
Finally, most African states gained their independence after World War II, meaning that
this analysis will account for property rights enforcement and composite economic
freedom scores for France in the case of Algeria, Cameroon, Republic of Congo, Gabon,
Guinea, and Ivory Coast. British scores will be accounted for in the cases of Bahrain,
Brunei, Ghana, Guyana, Kuwait, Malaysia, Nigeria, Qatar, Sierra Leone, Zimbabwe,
Sudan, United Arab Emirates, and Tanzania. The scores for Portugal will be controlled
for in Angola, Spanish scores will be accounted for in Equatorial Guinea, and Belgian
319
scores will be counted in the Democratic Republic of the Congo. As previously
mentioned, the colonizers’ scores are their current property rights and economic freedom
enforcement scores. While they should play a role in the assessment of Hypothesis 4, they
are not considered the primary variable in this analysis.
Appendix D (Testing Hypothesis 5)
This appendix details why a qualitative analysis was incorporated to test
Hypothesis 5 though quantitative measures were also taken. Valuable data found in the
UCDP/PRIO Armed Conflict Dataset (Gleditsch et al 2002) from the Uppsala Conflict
Data Program (UCDP) at Uppsala University and the Centre for the Study of Civil
War at the Peace Research Institute Oslo (PRIO) provides quantitative analyses of violent
conflict. The dataset is extensive and thorough, but for the purposes of this research, it
holds a few limitations. First, while the list of armed conflict dates back to the end of
World War II, the data ends in 2008. The Arab Spring, Boko Haram, conflicts in Syria,
Russian occupation of Crimea and Georgia, ISIS, and the overthrow of Gaddhafi are
unfortunately not accounted for in the UCDP/PRIO Armed Conflict Dataset.
Furthermore, because Kimberley Process data on diamonds extends from 2004 to 2016,
and UCDP/PRIO data ends in 2008, there is little overlap between the datasets for
accurate assessment.
The second weakness of the UCDP/PRIO dataset is that while there are four types
of violence measured, only two types of violence apply to Hypothesis 5. UCDP/PRIO
measures violence as extrasystemic armed conflict, interstate armed conflict, internal
armed conflict, and internationalized internal armed conflict. Extrasystemic armed
320
conflict is a conflict between a state and a non-state actor outside of the territory of the
state (e.g., US fighting al-Qaeda in Afghanistan) and is coded as ‘1’ in the UCDP/PRIO
dataset. Interstate armed conflict occurs between two or more states and is coded as ‘2.’
These first two types of armed conflict in the dataset do not apply to Hypothesis 5, as
they are not forms of internal rebellion. However, the internal armed conflict (coded as
‘3’ in UCDP/PRIO), defined as conflict “between the government of a state and one or
more internal opposition group(s) without intervention from other states” (Gleditsch et al
2002) is a type of rebellion. The second type of rebellion, internationalized internal
armed conflict (coded as ‘4’ in UCDP/PRIO) is characterized as conflict between “the
government of a state and one or more internal opposition group(s) with intervention
from other states on one or both sides” (Gleditsch et al 2002). Violence is further broken
down by intensity, where minor conflicts—coded as ‘1’—range from 25 to 999 battle-
related deaths, and major conflicts with more than 1,000 battle-related deaths are coded
as ‘2,’ perhaps too simplistically. Multi-year conflicts could be coded by year, type, and
intensity.
The extant data poses multiple challenges to testing the present hypothesis. First,
the analyst would have to conduct two quantitative assessments: one measuring instances
of internal rebellions in each state against all of the years in this analysis (1980-2016),
and another measuring internal rebellions as a percentage of total violence. Second, there
are instances where conflict between two states is only coded once (because it was one
conflict). The Iran-Iraq War (1980-1988) for instance, though only one war, is only coded
for Iran. In a quantitative analysis, even though Iraq lost nearly a million civilians during
this war, it would seem as if the war only influenced Iran. In essence, the data measures
321
instances and intensity of violence, rather than general violence per se. Petroleum-
petroleum state conflicts in this analysis will have to be counted only once, as will
diamond-diamond states conflicts. With the available data, only two wars included two
petro-states in this dissertation (Iran-Iraq War and Iraqi invasion of Kuwait).87 No
diamond states in this analysis fought each other from 1980 to 2016. The logic also holds
for resource curse states that waged war against other states that are not in this analysis.
For example, Gaddhafi in Libya tried to annex part of Chad, known as the Aouzou Strip88
in 1987. Since Chad is not in this analysis, such a conflict could only be counted once—
as a Libyan conflict—though two states were involved. However, what if a petro-state in
this work has a conflict with a diamond-state, also in this analysis? Then the analyst
would be forced to code such a scenario for both states. Luckily, from 1980 to 2008,
there was only one instance when this took place. Nigeria, a petroleum-rich state, and
Cameroon, a diamond-rich state, have had a territorial dispute over the Bakassi Peninsula
in the Gulf of Guinea since 1975, with escalating violence in 1996. Fortunately, this
minor conflict is the only instance in which two resource curse states in this analysis
appear with different resource codes. Finally, how should we code a resource curse state
being a party of a larger alliance, such as the minor role Mobuto Sese Seko’s DRC played
in the Angolan Civil War? Aggravatingly, there are also some states, such as Angola,
87 The Iran-Iraq War (1980-1988) could be coded under Iran, since Iraqi forces conducted the initial invasion in the Khuzestan Province of Iran. Additionally, since Saddam Hussein’s army invaded Kuwait (1990-1991), this work could count the Iraqi invasion as a Kuwaiti problem since it largely occurred in Kuwaiti soil. Both of these conflicts ended up spilling over into Iraq, but since initial invasions occurred in Iran and Kuwait, they could be coded accordingly. 88 The Aouzou Strip, named after a small town in the region, is a 100 km wide strip of the Chadian Sahara claimed to be rich in uranium.
322
which faced more than one internal rebellion per year, meaning that they could be coded
two or three times for the same year, depending on the number of conflicts.
This lengthy litany of issues renders the quantitative measure of violence with
many empirical and theoretical holes. Not only do binary lists of numbers not encompass
the agony and nightmares brought on by civil wars, they do not provide insights into
incentives and cost-benefit analyses that drive rebels to capture resources. For such
reasons, this hypothesis was tested in a qualitative fashion.