The Microsoft HoloLens 2 Provides Accurate Measures of Gait ...
12
Citation: Miller Koop, M.; Rosenfeldt, A.B.; Owen, K.; Penko, A.L.; Streicher, M.C.; Albright, A.; Alberts, J.L. The Microsoft HoloLens 2 Provides Accurate Measures of Gait, Turning, and Functional Mobility in Healthy Adults. Sensors 2022, 22, 2009. https://doi.org/10.3390/s22052009 Academic Editor: Roozbeh Ghaffari Received: 24 January 2022 Accepted: 25 February 2022 Published: 4 March 2022 Publisher’s Note: MDPI stays neutral with regard to jurisdictional claims in published maps and institutional affil- iations. Copyright: © 2022 by the authors. Licensee MDPI, Basel, Switzerland. This article is an open access article distributed under the terms and conditions of the Creative Commons Attribution (CC BY) license (https:// creativecommons.org/licenses/by/ 4.0/). sensors Article The Microsoft HoloLens 2 Provides Accurate Measures of Gait, Turning, and Functional Mobility in Healthy Adults Mandy Miller Koop 1 , Anson B. Rosenfeldt 1 , Kelsey Owen 1 , Amanda L. Penko 1 , Matthew C. Streicher 1 , Alec Albright 1 and Jay L. Alberts 1,2, * 1 Department of Biomedical Engineering, Cleveland Clinic, 9500 Euclid Ave., Cleveland, OH 44195, USA; [email protected] (M.M.K.); [email protected] (A.B.R.); [email protected] (K.O.); [email protected] (A.L.P.); [email protected] (M.C.S.); [email protected] (A.A.) 2 Center for Neurological Restoration, Cleveland Clinic, 9500 Euclid Ave., Cleveland, OH 44195, USA * Correspondence: [email protected]; Tel.: +1-216-445-3222 Abstract: Augmented-reality (AR) headsets, such as the Microsoft HoloLens 2 (HL2), have the potential to be the next generation of wearable technology as they provide interactive digital stimuli in the context of ecologically-valid daily activities while containing inertial measurement units (IMUs) to objectively quantify the movements of the user. A necessary precursor to the widespread utilization of the HL2 in the fields of movement science and rehabilitation is the rigorous validation of its capacity to generate biomechanical outcomes comparable to gold standard outcomes. This project sought to determine equivalency of kinematic outcomes characterizing lower-extremity function derived from the HL2 and three-dimensional (3D) motion capture systems (MoCap). Sixty-six healthy adults completed two lower-extremity tasks while kinematic data were collected from the HL2 and MoCap: (1) continuous walking and (2) timed up-and-go (TUG). For all the continuous walking metrics (cumulative distance, time, number of steps, step and stride length, and velocity), equivalence testing indicated that the HL2 and MoCap were statistically equivalent (error ≤ 5%). The TUG metrics, including turn duration and turn velocity, were also statistically equivalent between the two systems. The accurate quantification of gait and turning using a wearable such as the HL2 provides initial evidence for its use as a platform for the development and delivery of gait and mobility assessments, including the in-person and remote delivery of highly salient digital movement assessments and rehabilitation protocols. Keywords: augmented reality; HoloLens 2; validation; gait; turning; timed up-and-go 1. Introduction Identifying individuals at risk of falling remains a critical unmet need across neurolog- ical populations and older adults [1,2]. Gait speed has been proposed to be the “the sixth vital sign” [3], as it has been shown to predict hospitalizations, rehabilitation destinations, and falls [4–7]. Similarly, the Timed Up and Go Test (TUG) is one of the most widely used clinical tests of functional mobility in neurological and geriatric populations [8], and provides an assessment of walking, turning, and postural transitions, including stand- ing and sitting [9,10]. Similar to gait speed, the TUG is a reliable and valid measure of fall prediction in older adults [11]. While there is an abundance of data characterizing gait and TUG metrics in older populations and in those with neurological disease, the assessment of gait speed and functional mobility in a clinical setting is inconsistent. The fields of rehabilitation and neurology continue to identify a solution to provide a user- friendly, objective assessment of functional mobility that can be integrated into busy clinical workflows [12–14]. Augmented reality (AR) may be a technology solution for the routine delivery and assessment of gait and functional mobility metrics in clinical settings. Head-mounted Sensors 2022, 22, 2009. https://doi.org/10.3390/s22052009 https://www.mdpi.com/journal/sensors
-
Upload
khangminh22 -
Category
Documents
-
view
1 -
download
0
Transcript of The Microsoft HoloLens 2 Provides Accurate Measures of Gait ...
�����������������
Citation: Miller Koop, M.; Rosenfeldt,
A.B.; Owen, K.; Penko, A.L.; Streicher,
M.C.; Albright, A.; Alberts, J.L. The
Microsoft HoloLens 2 Provides
Accurate Measures of Gait, Turning,
and Functional Mobility in Healthy
Adults. Sensors 2022, 22, 2009.
https://doi.org/10.3390/s22052009
Academic Editor: Roozbeh Ghaffari
Received: 24 January 2022
Accepted: 25 February 2022
Published: 4 March 2022
Publisher’s Note: MDPI stays neutral
with regard to jurisdictional claims in
published maps and institutional affil-
iations.
Copyright: © 2022 by the authors.
Licensee MDPI, Basel, Switzerland.
This article is an open access article
distributed under the terms and
conditions of the Creative Commons
Attribution (CC BY) license (https://
creativecommons.org/licenses/by/
4.0/).
sensors
Article
The Microsoft HoloLens 2 Provides Accurate Measures of Gait,Turning, and Functional Mobility in Healthy AdultsMandy Miller Koop 1, Anson B. Rosenfeldt 1, Kelsey Owen 1, Amanda L. Penko 1, Matthew C. Streicher 1,Alec Albright 1 and Jay L. Alberts 1,2,*
1 Department of Biomedical Engineering, Cleveland Clinic, 9500 Euclid Ave., Cleveland, OH 44195, USA;[email protected] (M.M.K.); [email protected] (A.B.R.); [email protected] (K.O.); [email protected] (A.L.P.);[email protected] (M.C.S.); [email protected] (A.A.)
2 Center for Neurological Restoration, Cleveland Clinic, 9500 Euclid Ave., Cleveland, OH 44195, USA* Correspondence: [email protected]; Tel.: +1-216-445-3222
Abstract: Augmented-reality (AR) headsets, such as the Microsoft HoloLens 2 (HL2), have thepotential to be the next generation of wearable technology as they provide interactive digital stimuliin the context of ecologically-valid daily activities while containing inertial measurement units (IMUs)to objectively quantify the movements of the user. A necessary precursor to the widespread utilizationof the HL2 in the fields of movement science and rehabilitation is the rigorous validation of its capacityto generate biomechanical outcomes comparable to gold standard outcomes. This project soughtto determine equivalency of kinematic outcomes characterizing lower-extremity function derivedfrom the HL2 and three-dimensional (3D) motion capture systems (MoCap). Sixty-six healthy adultscompleted two lower-extremity tasks while kinematic data were collected from the HL2 and MoCap:(1) continuous walking and (2) timed up-and-go (TUG). For all the continuous walking metrics(cumulative distance, time, number of steps, step and stride length, and velocity), equivalence testingindicated that the HL2 and MoCap were statistically equivalent (error ≤ 5%). The TUG metrics,including turn duration and turn velocity, were also statistically equivalent between the two systems.The accurate quantification of gait and turning using a wearable such as the HL2 provides initialevidence for its use as a platform for the development and delivery of gait and mobility assessments,including the in-person and remote delivery of highly salient digital movement assessments andrehabilitation protocols.
Keywords: augmented reality; HoloLens 2; validation; gait; turning; timed up-and-go
1. Introduction
Identifying individuals at risk of falling remains a critical unmet need across neurolog-ical populations and older adults [1,2]. Gait speed has been proposed to be the “the sixthvital sign” [3], as it has been shown to predict hospitalizations, rehabilitation destinations,and falls [4–7]. Similarly, the Timed Up and Go Test (TUG) is one of the most widelyused clinical tests of functional mobility in neurological and geriatric populations [8], andprovides an assessment of walking, turning, and postural transitions, including stand-ing and sitting [9,10]. Similar to gait speed, the TUG is a reliable and valid measure offall prediction in older adults [11]. While there is an abundance of data characterizinggait and TUG metrics in older populations and in those with neurological disease, theassessment of gait speed and functional mobility in a clinical setting is inconsistent. Thefields of rehabilitation and neurology continue to identify a solution to provide a user-friendly, objective assessment of functional mobility that can be integrated into busy clinicalworkflows [12–14].
Augmented reality (AR) may be a technology solution for the routine delivery andassessment of gait and functional mobility metrics in clinical settings. Head-mounted
Sensors 2022, 22, 2009. https://doi.org/10.3390/s22052009 https://www.mdpi.com/journal/sensors
Sensors 2022, 22, 2009 2 of 12
AR systems deliver an interactive experience to the user by placing digital objects in theuser’s real-world environment [15]. Notably, AR systems are untethered wearables withan embedded inertial measurement unit (IMU) and a depth sensor that can capture kine-matic data to quantify the user’s activities (e.g., sitting, standing, walking, and turning).Because AR systems have the potential to deliver movement cues and objectively quantifymovement, they are candidates for integration into clinical workflows for the deliveryof movement assessments. However, AR motion sensors must be rigorously vetted toestablish the validity and reliability of the data prior to clinical integration. Recently, thefirst generation of head-mounted AR system, HoloLens 1 (HL1) (Microsoft Corporation,Redmond, CA) was validated for the assessment of gait and physical mobility [16,17].Overall, the studies revealed good agreement between the HL1 outcomes for measuresof accuracy in step detection and overall task time. However, other key metrics for char-acterizing locomotion were not evaluated for accuracy due to significant errors in thereference motion sensors [16], and known-group validity analyses provide inconsistentresults [16,17].
We recently completed a validation study of the HL1 motion sensors to characterizegait compared to a 3-dimensional (3D) motion capture (MoCap) system [18]. The resultsindicated that the 3D position and orientation data from the HL1 resulted in the accurateand reliable calculation of spatiotemporal gait variables (≤5% error) during straight-linewalking compared to a MoCap system across multiple walking speeds [18]. The preliminaryresults were very promising. Since the initial validation study, Microsoft Corporationreleased the HL2 to address the hardware and software limitations of the HL1, includingits restricted field of view, limited battery life, and relatively heavy headset, which limitedits wear time.
The subsequent HL2, with an enhanced field of view (52 degrees), reduced weight(566 g), and improved battery life (3 h), was released in November 2019 and is commerciallyavailable. The systematic validation of the HL2 motion sensors is a necessary precursorto using metrics derived from the HL2 in clinical applications or in the study of gaitdeficiencies in neurological populations. The primary aim of this project was to determinewhether the data derived from the HL2 characterizing lower extremity function duringcontinuous walking and the TUG were equivalent to the outcomes derived using the goldstandard MoCap system. Based on positive pilot studies using the HL1 [16–19], it washypothesized that the biomechanical outcomes of gait, turning, and functional mobilityfrom the two systems would be equivalent.
2. Methods2.1. Participants
Sixty-six participants were recruited with flyers from the Cleveland metropolitan areaand participated in this validation study from May 2020 to June 2020. All participantscompleted the informed consent process approved by the Cleveland Clinic IRB. Inclusioncriteria were as follows: age 18–45 years and the self-reported ability to ambulate 20 mincontinuously. Exclusion criteria included: cardiovascular, musculoskeletal, metabolic, orneurological disease that impairs one’s ability to ambulate unassisted, history of concussionin the previous six months, or a history of concussion at any time with residual physicalor cognitive symptoms, and the use of an assistive device during standing or ambulation.The age group was selected due to the relative homogeneity in gait speed, variability, andspatiotemporal variables among the men and women [20,21].
2.2. Procedures
Participants completed a single data collection session within the Biomechanics Labo-ratory at the Cleveland Clinic. During the visit, participants performed two experimentaltasks while kinematics data were collected concurrently with the MoCap and HL2 systems:(I) 60 s of continuous walking along an oval path (7 × 2 m walkway) at their preferredspeed, and (II) TUG. An oval path was selected for the walking assessments to allow a con-
Sensors 2022, 22, 2009 3 of 12
tinuous walking trial, which has been shown to produce gait speeds that more accuratelyrepresent normal walking speed compared to discrete walking trials [22]. A straight-linesegment (4 × 2 m) of the oval path (7 × 2 m walkway) was positioned within the MoCapcapture volume (4 × 2 m). Following instruction, the participants first verified that theyunderstood the tasks and that the equipment did not impede their normal movements;they then completed a single trial for each task. Trials were initiated by an audible 5 scountdown delivered to the participant through the HL2 headset. After the completionof each trial, the testing administrator performed visual assessments of the data to ensuredata were recorded and files were named appropriately.
2.3. Equipment, Processing, and Data Analysis
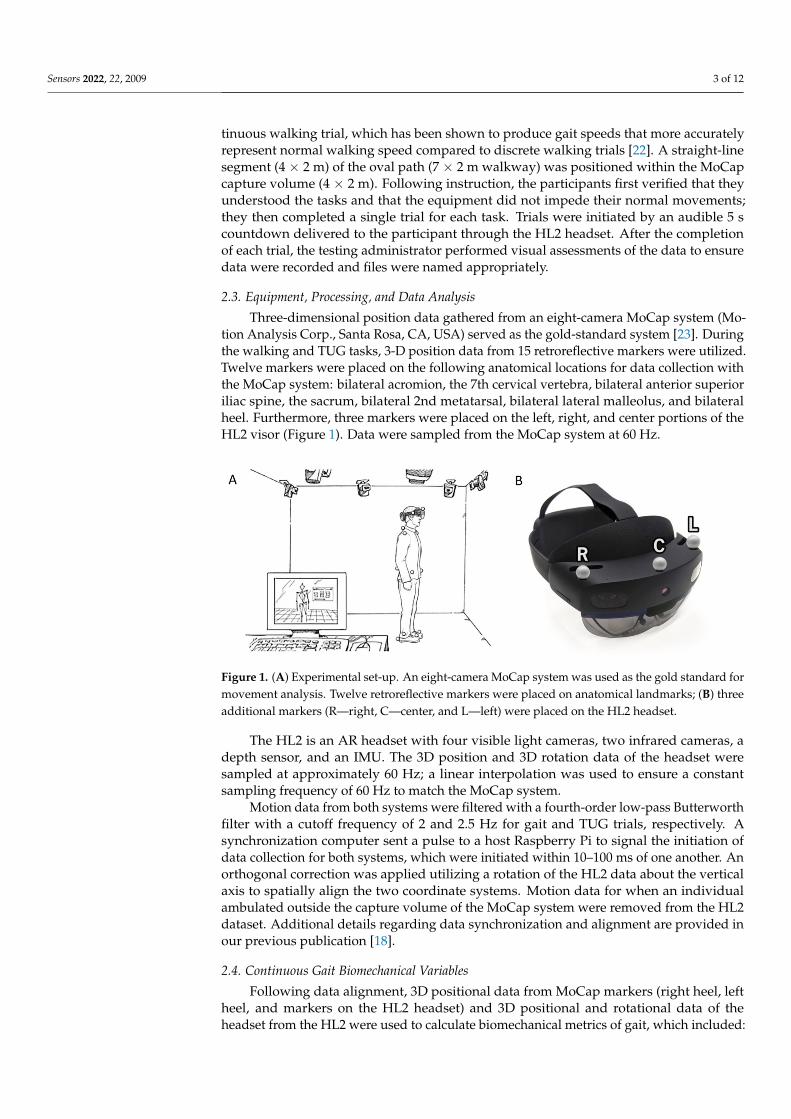
Three-dimensional position data gathered from an eight-camera MoCap system (Mo-tion Analysis Corp., Santa Rosa, CA, USA) served as the gold-standard system [23]. Duringthe walking and TUG tasks, 3-D position data from 15 retroreflective markers were utilized.Twelve markers were placed on the following anatomical locations for data collection withthe MoCap system: bilateral acromion, the 7th cervical vertebra, bilateral anterior superioriliac spine, the sacrum, bilateral 2nd metatarsal, bilateral lateral malleolus, and bilateralheel. Furthermore, three markers were placed on the left, right, and center portions of theHL2 visor (Figure 1). Data were sampled from the MoCap system at 60 Hz.
Sensors 2022, 22, x FOR PEER REVIEW 3 of 13
allow a continuous walking trial, which has been shown to produce gait speeds that more accurately represent normal walking speed compared to discrete walking trials [22]. A straight-line segment (4 × 2 m) of the oval path (7 × 2 m walkway) was positioned within the MoCap capture volume (4 × 2 m). Following instruction, the participants first verified that they understood the tasks and that the equipment did not impede their normal move-ments; they then completed a single trial for each task. Trials were initiated by an audible 5 s countdown delivered to the participant through the HL2 headset. After the completion of each trial, the testing administrator performed visual assessments of the data to ensure data were recorded and files were named appropriately.
2.3. Equipment, Processing, and Data Analysis Three-dimensional position data gathered from an eight-camera MoCap system (Mo-
tion Analysis Corp., Santa Rosa, CA, USA) served as the gold-standard system [23]. Dur-ing the walking and TUG tasks, 3-D position data from 15 retroreflective markers were utilized. Twelve markers were placed on the following anatomical locations for data col-lection with the MoCap system: bilateral acromion, the 7th cervical vertebra, bilateral an-terior superior iliac spine, the sacrum, bilateral 2nd metatarsal, bilateral lateral malleolus, and bilateral heel. Furthermore, three markers were placed on the left, right, and center portions of the HL2 visor (Figure 1). Data were sampled from the MoCap system at 60 Hz.
Figure 1. (A) Experimental set-up. An eight-camera MoCap system was used as the gold standard for movement analysis. Twelve retroreflective markers were placed on anatomical landmarks; (B) three additional markers (R—right, C—center, and L—left) were placed on the HL2 headset.
The HL2 is an AR headset with four visible light cameras, two infrared cameras, a depth sensor, and an IMU. The 3D position and 3D rotation data of the headset were sam-pled at approximately 60 Hz; a linear interpolation was used to ensure a constant sam-pling frequency of 60 Hz to match the MoCap system.
Motion data from both systems were filtered with a fourth-order low-pass Butter-worth filter with a cutoff frequency of 2 and 2.5 Hz for gait and TUG trials, respectively. A synchronization computer sent a pulse to a host Raspberry Pi to signal the initiation of data collection for both systems, which were initiated within 10–100 ms of one another. An orthogonal correction was applied utilizing a rotation of the HL2 data about the ver-tical axis to spatially align the two coordinate systems. Motion data for when an individ-ual ambulated outside the capture volume of the MoCap system were removed from the HL2 dataset. Additional details regarding data synchronization and alignment are pro-vided in our previous publication [18].
Figure 1. (A) Experimental set-up. An eight-camera MoCap system was used as the gold standard formovement analysis. Twelve retroreflective markers were placed on anatomical landmarks; (B) threeadditional markers (R—right, C—center, and L—left) were placed on the HL2 headset.
The HL2 is an AR headset with four visible light cameras, two infrared cameras, adepth sensor, and an IMU. The 3D position and 3D rotation data of the headset weresampled at approximately 60 Hz; a linear interpolation was used to ensure a constantsampling frequency of 60 Hz to match the MoCap system.
Motion data from both systems were filtered with a fourth-order low-pass Butterworthfilter with a cutoff frequency of 2 and 2.5 Hz for gait and TUG trials, respectively. Asynchronization computer sent a pulse to a host Raspberry Pi to signal the initiation ofdata collection for both systems, which were initiated within 10–100 ms of one another. Anorthogonal correction was applied utilizing a rotation of the HL2 data about the verticalaxis to spatially align the two coordinate systems. Motion data for when an individualambulated outside the capture volume of the MoCap system were removed from the HL2dataset. Additional details regarding data synchronization and alignment are provided inour previous publication [18].
2.4. Continuous Gait Biomechanical Variables
Following data alignment, 3D positional data from MoCap markers (right heel, leftheel, and markers on the HL2 headset) and 3D positional and rotational data of theheadset from the HL2 were used to calculate biomechanical metrics of gait, which included:
Sensors 2022, 22, 2009 4 of 12
cumulative distance, number of steps, step and stride length, total time, and gait velocity.Details of the mathematical calculations have been published previously [18].
2.5. Timed Up-and-Go Biomechanical Variables
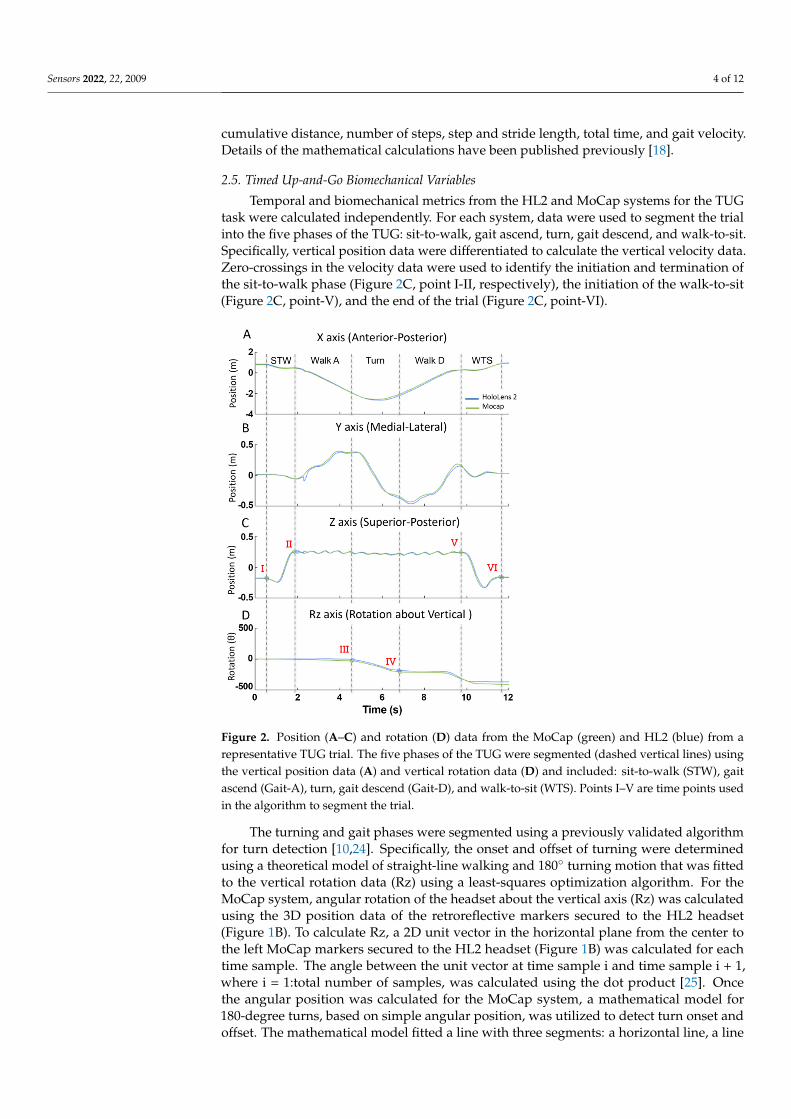
Temporal and biomechanical metrics from the HL2 and MoCap systems for the TUGtask were calculated independently. For each system, data were used to segment the trialinto the five phases of the TUG: sit-to-walk, gait ascend, turn, gait descend, and walk-to-sit.Specifically, vertical position data were differentiated to calculate the vertical velocity data.Zero-crossings in the velocity data were used to identify the initiation and termination ofthe sit-to-walk phase (Figure 2C, point I-II, respectively), the initiation of the walk-to-sit(Figure 2C, point-V), and the end of the trial (Figure 2C, point-VI).
Sensors 2022, 22, x FOR PEER REVIEW 4 of 13
2.4. Continuous Gait Biomechanical Variables Following data alignment, 3D positional data from MoCap markers (right heel, left
heel, and markers on the HL2 headset) and 3D positional and rotational data of the head-set from the HL2 were used to calculate biomechanical metrics of gait, which included: cumulative distance, number of steps, step and stride length, total time, and gait velocity. Details of the mathematical calculations have been published previously [18].
2.5. Timed Up-and-Go Biomechanical Variables Temporal and biomechanical metrics from the HL2 and MoCap systems for the TUG
task were calculated independently. For each system, data were used to segment the trial into the five phases of the TUG: sit-to-walk, gait ascend, turn, gait descend, and walk-to-sit. Specifically, vertical position data were differentiated to calculate the vertical velocity data. Zero-crossings in the velocity data were used to identify the initiation and termina-tion of the sit-to-walk phase (Figure 2C, point I-II, respectively), the initiation of the walk-to-sit (Figure 2C, point-V), and the end of the trial (Figure 2C, point-VI).
Figure 2. Position (A–C) and rotation (D) data from the MoCap (green) and HL2 (blue) from a rep-resentative TUG trial. The five phases of the TUG were segmented (dashed vertical lines) using the vertical position data (A) and vertical rotation data (D) and included: sit-to-walk (STW), gait ascend (Gait-A), turn, gait descend (Gait-D), and walk-to-sit (WTS). Points I–V are time points used in the algorithm to segment the trial.
The turning and gait phases were segmented using a previously validated algorithm for turn detection [10,24]. Specifically, the onset and offset of turning were determined using a theoretical model of straight-line walking and 180° turning motion that was fitted to the vertical rotation data (Rz) using a least-squares optimization algorithm. For the MoCap system, angular rotation of the headset about the vertical axis (Rz) was calculated using the 3D position data of the retroreflective markers secured to the HL2 headset (Fig-ure 1B). To calculate Rz, a 2D unit vector in the horizontal plane from the center to the left
Figure 2. Position (A–C) and rotation (D) data from the MoCap (green) and HL2 (blue) from arepresentative TUG trial. The five phases of the TUG were segmented (dashed vertical lines) usingthe vertical position data (A) and vertical rotation data (D) and included: sit-to-walk (STW), gaitascend (Gait-A), turn, gait descend (Gait-D), and walk-to-sit (WTS). Points I–V are time points usedin the algorithm to segment the trial.
The turning and gait phases were segmented using a previously validated algorithmfor turn detection [10,24]. Specifically, the onset and offset of turning were determinedusing a theoretical model of straight-line walking and 180◦ turning motion that was fittedto the vertical rotation data (Rz) using a least-squares optimization algorithm. For theMoCap system, angular rotation of the headset about the vertical axis (Rz) was calculatedusing the 3D position data of the retroreflective markers secured to the HL2 headset(Figure 1B). To calculate Rz, a 2D unit vector in the horizontal plane from the center tothe left MoCap markers secured to the HL2 headset (Figure 1B) was calculated for eachtime sample. The angle between the unit vector at time sample i and time sample i + 1,where i = 1:total number of samples, was calculated using the dot product [25]. Oncethe angular position was calculated for the MoCap system, a mathematical model for180-degree turns, based on simple angular position, was utilized to detect turn onset andoffset. The mathematical model fitted a line with three segments: a horizontal line, a line
Sensors 2022, 22, 2009 5 of 12
segment with constant slope, and a second horizontal line [24]. The transition points fromzero slope to constant slope marked the onset (Figure 2D, point III) and offset (Figure 2D,point IV) of the turns [24]. Turn duration (s) was calculated using the turn onset and offsettime points. Gait ascend and descend duration phases (s) were segmented automaticallythrough the aforementioned analyses, and metrics from these two phases were combinedto create one set of gait metrics per trial. Gait duration (s) was the total time spent walkingand Gait velocity (m/s) was calculated as the total distance traveled in the horizontal plane(m) divided by the Gait duration (s). The number of steps (count) and step length (m) weredefined using the same algorithm from the continuous walking data, and calculated duringthe gait and turning phases, respectively. Turn velocity (deg/s) was calculated as therotational displacement about the vertical axis measured during the turning phase dividedby the Turn duration. Peak turn velocity (deg/s) was calculated as the maximum rotationaldisplacement between successive samples and the time increment between two samples.
For the HL2 metrics, the same algorithm was applied for segmenting the TUG trialinto the five phases. Unlike the MoCap system, the angular rotation (Rz) of the headsetabout the vertical axis was a direct output from the HL2 system and, therefore, did notrequire calculation.
2.6. Statistical Analysis
Criterion validity for the biomechanical outcome metrics calculated using raw datafrom the HL2 system and the MoCap system was determined by Bland–Altman (BA)analyses and two one-sided paired-t-tests for equivalence testing (TOST) [26,27]. For eachmetric, the a priori equivalence margin for the TOST tests was set to +/−5% of the meanMoCap measurement [28–30]. The reliability of the HL2 metrics was evaluated using theintra-class correlation coefficients (ICC(2,1)) based on two-way random effects modelsfor single-rater consistency with 95% confidence intervals. ICC values were classifiedaccording to the following guidelines: values <0.5 indicated poor reliability, values between0.5 and 0.75 indicated moderate reliability, 0.75–0.9 indicated good reliability, and greaterthan 0.90 indicated excellent reliability [31].
The RMS errors were calculated in the x, y, and z axes, as well as the angular rotationabout the vertical axis (Rz) in the TUG tasks in order to assess alignment in the time seriesdata between the HL2 and MoCap.
3. Results3.1. Participant Demographics
Sixty-six participants completed the continuous walking and TUG tasks. MoCap datafrom two participants were missing due to marker occlusion. Therefore, all the outcomeswere calculated from the remaining data from 64 participants (Table 1).
3.2. Time-Series Data Demonstrate Excellent Agreement for Continuous Walking
The alignment of the time series position data between the MoCap and HL2 systemswas calculated using the root-mean-squared-error (RMS error) for each axis (X, Y, and Z).The time series data of the HL2 showed excellent agreement with the MoCap data basedon RMS error values of 8.5 cm, 2.1 cm, and 0.8 cm in the X, Y, and Z axes, respectively.
3.3. Biomechanical Outcomes across Systems Are Equivalent during Continuous Walking
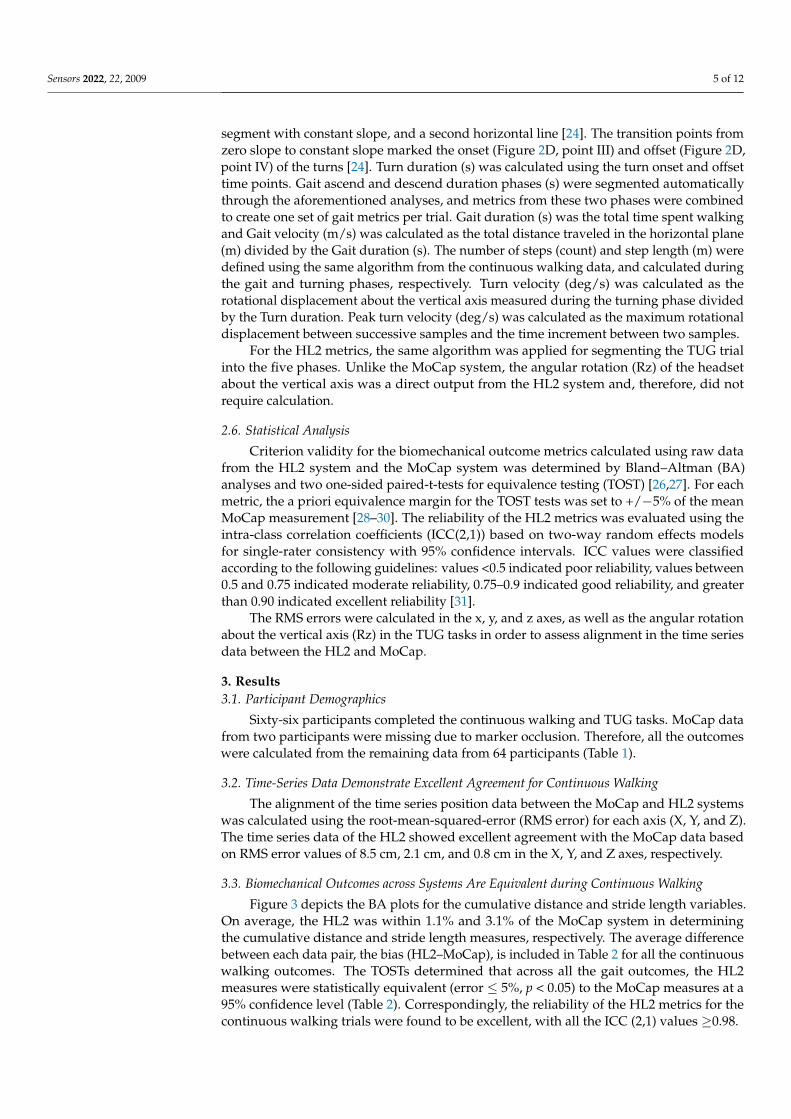
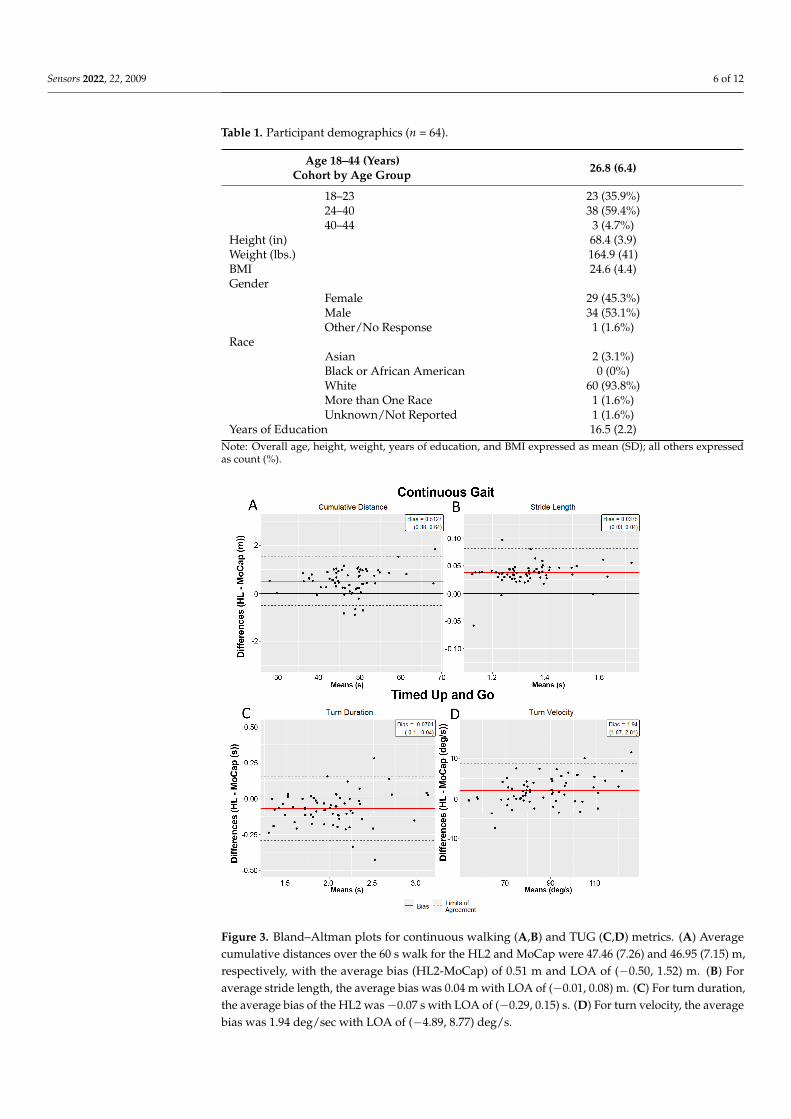
Figure 3 depicts the BA plots for the cumulative distance and stride length variables.On average, the HL2 was within 1.1% and 3.1% of the MoCap system in determiningthe cumulative distance and stride length measures, respectively. The average differencebetween each data pair, the bias (HL2–MoCap), is included in Table 2 for all the continuouswalking outcomes. The TOSTs determined that across all the gait outcomes, the HL2measures were statistically equivalent (error ≤ 5%, p < 0.05) to the MoCap measures at a95% confidence level (Table 2). Correspondingly, the reliability of the HL2 metrics for thecontinuous walking trials were found to be excellent, with all the ICC (2,1) values ≥0.98.
Sensors 2022, 22, 2009 6 of 12
Table 1. Participant demographics (n = 64).
Age 18–44 (Years)Cohort by Age Group 26.8 (6.4)
18–23 23 (35.9%)24–40 38 (59.4%)40–44 3 (4.7%)
Height (in) 68.4 (3.9)Weight (lbs.) 164.9 (41)BMI 24.6 (4.4)Gender
Female 29 (45.3%)Male 34 (53.1%)Other/No Response 1 (1.6%)
RaceAsian 2 (3.1%)Black or African American 0 (0%)White 60 (93.8%)More than One Race 1 (1.6%)Unknown/Not Reported 1 (1.6%)
Years of Education 16.5 (2.2)Note: Overall age, height, weight, years of education, and BMI expressed as mean (SD); all others expressedas count (%).
1
Figure 3. Bland–Altman plots for continuous walking (A,B) and TUG (C,D) metrics. (A) Averagecumulative distances over the 60 s walk for the HL2 and MoCap were 47.46 (7.26) and 46.95 (7.15) m,respectively, with the average bias (HL2-MoCap) of 0.51 m and LOA of (−0.50, 1.52) m. (B) Foraverage stride length, the average bias was 0.04 m with LOA of (−0.01, 0.08) m. (C) For turn duration,the average bias of the HL2 was −0.07 s with LOA of (−0.29, 0.15) s. (D) For turn velocity, the averagebias was 1.94 deg/sec with LOA of (−4.89, 8.77) deg/s.
Sensors 2022, 22, 2009 7 of 12
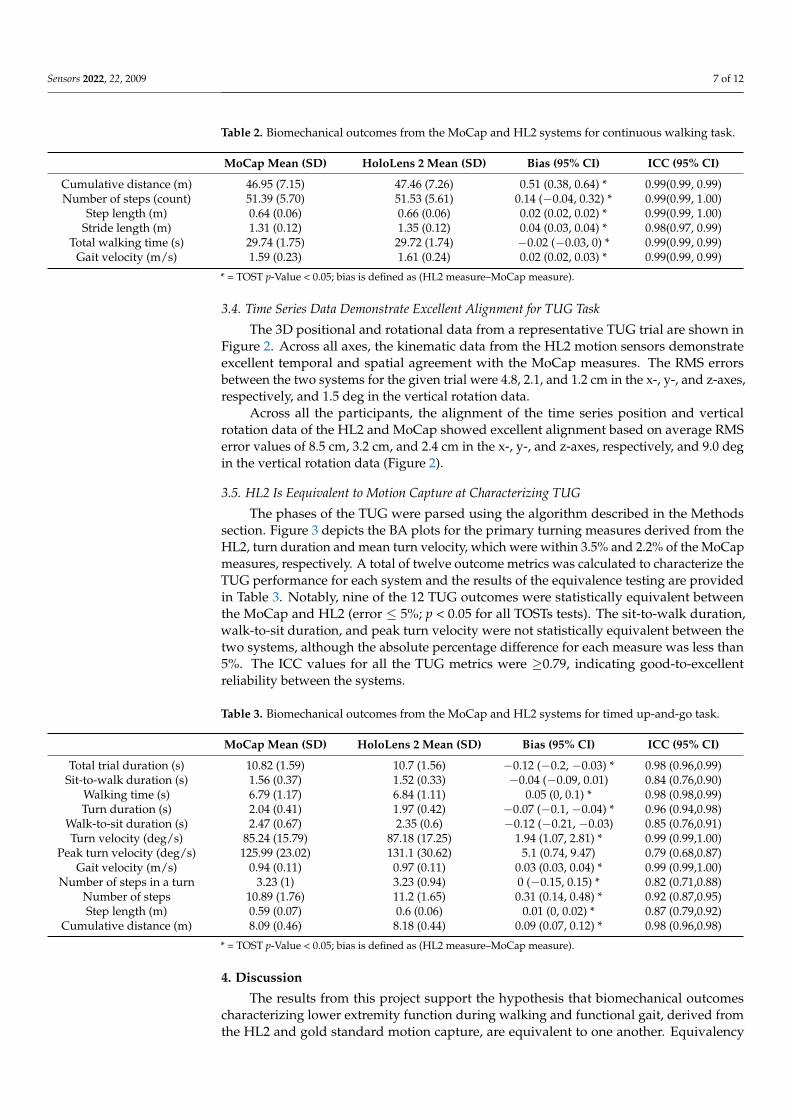
Table 2. Biomechanical outcomes from the MoCap and HL2 systems for continuous walking task.
MoCap Mean (SD) HoloLens 2 Mean (SD) Bias (95% CI) ICC (95% CI)
Cumulative distance (m) 46.95 (7.15) 47.46 (7.26) 0.51 (0.38, 0.64) * 0.99(0.99, 0.99)Number of steps (count) 51.39 (5.70) 51.53 (5.61) 0.14 (−0.04, 0.32) * 0.99(0.99, 1.00)
Step length (m) 0.64 (0.06) 0.66 (0.06) 0.02 (0.02, 0.02) * 0.99(0.99, 1.00)Stride length (m) 1.31 (0.12) 1.35 (0.12) 0.04 (0.03, 0.04) * 0.98(0.97, 0.99)
Total walking time (s) 29.74 (1.75) 29.72 (1.74) −0.02 (−0.03, 0) * 0.99(0.99, 0.99)Gait velocity (m/s) 1.59 (0.23) 1.61 (0.24) 0.02 (0.02, 0.03) * 0.99(0.99, 0.99)
* = TOST p-Value < 0.05; bias is defined as (HL2 measure–MoCap measure).
3.4. Time Series Data Demonstrate Excellent Alignment for TUG Task
The 3D positional and rotational data from a representative TUG trial are shown inFigure 2. Across all axes, the kinematic data from the HL2 motion sensors demonstrateexcellent temporal and spatial agreement with the MoCap measures. The RMS errorsbetween the two systems for the given trial were 4.8, 2.1, and 1.2 cm in the x-, y-, and z-axes,respectively, and 1.5 deg in the vertical rotation data.
Across all the participants, the alignment of the time series position and verticalrotation data of the HL2 and MoCap showed excellent alignment based on average RMSerror values of 8.5 cm, 3.2 cm, and 2.4 cm in the x-, y-, and z-axes, respectively, and 9.0 degin the vertical rotation data (Figure 2).
3.5. HL2 Is Eequivalent to Motion Capture at Characterizing TUG
The phases of the TUG were parsed using the algorithm described in the Methodssection. Figure 3 depicts the BA plots for the primary turning measures derived from theHL2, turn duration and mean turn velocity, which were within 3.5% and 2.2% of the MoCapmeasures, respectively. A total of twelve outcome metrics was calculated to characterize theTUG performance for each system and the results of the equivalence testing are providedin Table 3. Notably, nine of the 12 TUG outcomes were statistically equivalent betweenthe MoCap and HL2 (error ≤ 5%; p < 0.05 for all TOSTs tests). The sit-to-walk duration,walk-to-sit duration, and peak turn velocity were not statistically equivalent between thetwo systems, although the absolute percentage difference for each measure was less than5%. The ICC values for all the TUG metrics were ≥0.79, indicating good-to-excellentreliability between the systems.
Table 3. Biomechanical outcomes from the MoCap and HL2 systems for timed up-and-go task.
MoCap Mean (SD) HoloLens 2 Mean (SD) Bias (95% CI) ICC (95% CI)
Total trial duration (s) 10.82 (1.59) 10.7 (1.56) −0.12 (−0.2, −0.03) * 0.98 (0.96,0.99)Sit-to-walk duration (s) 1.56 (0.37) 1.52 (0.33) −0.04 (−0.09, 0.01) 0.84 (0.76,0.90)
Walking time (s) 6.79 (1.17) 6.84 (1.11) 0.05 (0, 0.1) * 0.98 (0.98,0.99)Turn duration (s) 2.04 (0.41) 1.97 (0.42) −0.07 (−0.1, −0.04) * 0.96 (0.94,0.98)
Walk-to-sit duration (s) 2.47 (0.67) 2.35 (0.6) −0.12 (−0.21, −0.03) 0.85 (0.76,0.91)Turn velocity (deg/s) 85.24 (15.79) 87.18 (17.25) 1.94 (1.07, 2.81) * 0.99 (0.99,1.00)
Peak turn velocity (deg/s) 125.99 (23.02) 131.1 (30.62) 5.1 (0.74, 9.47) 0.79 (0.68,0.87)Gait velocity (m/s) 0.94 (0.11) 0.97 (0.11) 0.03 (0.03, 0.04) * 0.99 (0.99,1.00)
Number of steps in a turn 3.23 (1) 3.23 (0.94) 0 (−0.15, 0.15) * 0.82 (0.71,0.88)Number of steps 10.89 (1.76) 11.2 (1.65) 0.31 (0.14, 0.48) * 0.92 (0.87,0.95)Step length (m) 0.59 (0.07) 0.6 (0.06) 0.01 (0, 0.02) * 0.87 (0.79,0.92)
Cumulative distance (m) 8.09 (0.46) 8.18 (0.44) 0.09 (0.07, 0.12) * 0.98 (0.96,0.98)
* = TOST p-Value < 0.05; bias is defined as (HL2 measure–MoCap measure).
4. Discussion
The results from this project support the hypothesis that biomechanical outcomescharacterizing lower extremity function during walking and functional gait, derived fromthe HL2 and gold standard motion capture, are equivalent to one another. Equivalency
Sensors 2022, 22, 2009 8 of 12
between systems support and expand our earlier work, indicating that first-generationHL1 data could be used to evaluate walking patterns [18]. Notably, the participants inthe current study walked a substantially greater distance compared to our earlier project(47 m versus 3 m). Evaluating the accuracy of the HL2 at characterizing gait over a greaterdistance was a critical unanswered question, as one of the appealing features of an ARsystem is that it is untethered, thereby allowing the precise quantification of unconstrained,potentially “real-world” movement. The equivalence across the systems in terms of walkingdistance indicates the HL2 measurements and data collection hardware are relatively stableand reliable; there was negligible drift between the two systems, as the participants walkednearly 50 m. Further, the biomechanical outcomes such as step length, stride length, andwalking velocity were equivalent between the systems. The ability to accurately quantifybiomechanical measures of gait over relatively long distances expands the potential touse AR technology in populations living with different neurological diseases, such asParkinson’s disease (PD) and multiple sclerosis, whose gait patterns may worsen withincreasing distance [32,33].
The results of this study demonstrate that the HL2 can be used to objectively and reli-ably quantify functional gait assessments, such as the TUG, which provides the cornerstonefor potential clinical use. Importantly, the data from the HL2 provided sufficient resolutionto parse the TUG into meaningful components by providing granular biomechanical mea-sures of movement patterns compared to the traditional, somewhat generic, total time tocomplete. Providing a user with detailed biomechanical outcomes that precisely character-ize functional mobility has the potential to facilitate integration into clinical use. Typically,the TUG has been used to assess overall mobility in geriatric and patient populations [11].A recent normative study of healthy adults (20–60 yrs.), reported differences in total trialtime for older adults (50–60 yrs.) compared to those in their 20 s, 30 s, and 40 s, but notbetween the younger age groups [34]. Significant differences in TUG times were related toreduced socioeconomic status, increased body mass index, and comorbidities. These resultsprovide insight into the contributing factors that reduce performance for older adults, butfurther work is required to identify the specific impairments that result in longer trial times,and whether significant differences in biomechanical measures exist between younger agegroups. Given the demonstrated accuracy of the HL2, future normative studies of healthyadults utilizing the HL2 device could evaluate biomechanical measures (e.g., gait or turningvelocity) to determine specific impairments and identify physical therapy interventionstailored to improve movement performance as it deteriorates with age.
The identification and quantification of turning using the HL2 address importantand meaningful gaps in the assessment of functional mobility in neurological patientpopulations. Turning is a complex motor task that is frequently associated with fall risk inhealthy older adults [35] and individuals with PD [36]. Difficulties in turning, such as lowturning velocity and increased step frequency, are particularly problematic in individualswith PD and can lead to the freezing of gait and falls [37]. Previous studies have shownthat falls that occur while turning led to an eight-fold increase in hip fractures compared tostraight-path falls [38–40], and medical costs more than tripled when a person sustaineda broken hip from a fall [41]. The importance of treating lower-extremity dysfunction inPD, such as the freezing of gait, is well recognized. However, triggering these symptomsduring a clinical examination or physical therapy sessions remains challenging [42,43],partly due to the difficulty in replicating real-world environments in a clinical setting thatare known to trigger FOG. AR systems, like the HL2, contain the necessary functionality tobridge the gap in clinical assessments of fall risk by providing a platform that can deliveran interactive digital environment to replicate the context in which instrumental dailyactivities that represent a fall risk are completed, while simultaneously providing valid andprecise outcome measures.
The HL system has been examined as a rehabilitation tool in the clinical arena andutilized to provide digital content to individuals with PD, with the aim of improvingspatio-temporal measures of gait, turning, and improvements in balance stability [44–47].
Sensors 2022, 22, 2009 9 of 12
These studies demonstrate the feasibility of using AR systems, such as the HL2, to deliver atherapeutic intervention in patient populations; however, the researchers did not utilizethe HL motion sensors to measure performance. Rather, they relied on an external motioncapture system or clinical scales to quantify performance. The validation of the derivedbiomechanical measures of gait, turning, and functional mobility from the HL2 motionsensors, as demonstrated in the current study, suggests that systems external to the HL2may not be necessary as it provides data that are sufficiently accurate to characterizecommon aspects of lower-extremity function. Subsequent studies involving AR technology,such as the HL2, can now be performed utilizing the full capability of the systems to deliverdigital content that the user can interact with, such as stepping over a digital curb, whileproviding trusted validated measures of lower-extremity function.
Taken together, the results of this project demonstrate that the HL2 provides stan-dardized and accurate data for the determination of objective measures of functional gaitthat could improve clinical decision-making and the care of patients with lower extremitydeficits. The concept of integrating wearable sensors to evaluate human movement usingnovel approaches is gaining momentum [48]. Tetherless AR technology has the poten-tial to differentiate itself from other portable, inexpensive IMU-based systems, as theycan enhance users’ environment with holographic images to add cognitive and physicalcomplexity, which can reliably provoke symptoms and produce biomechanical measuresof movement performance through the device’s embedded motion sensors. The barriersassociated with the use of the AR systems for quantitative measures of functional gait inthe clinical context are relatively limited as it is a stand-alone system that includes a singlecomponent (AR headset) compared to multiple IMUs or a multi-marker, multi-camera,motion analysis system. Consistent with the adoption of any new technology in medicine,clinician time and willingness to adapt are likely barriers to its integration into clinicalworkflows. However, we have demonstrated that the integration of technology into clinicalworkflows, when properly developed and validated, can improve outcomes and reducecost [49], as well as decreasing the time physicians spend documenting in the electronichealth record [50]. While this project focused on the validation of the HL2 device, otherhead-mounted AR systems are available. Alternative systems, such as the Magic Leap Oneand Magic Leap Two, vary slightly in hardware design and user interface, provide a slightlylarger field of view, and are marginally less expensive, at $2.5K/unit for Magic Leap Oneand $3.5K/unit for HL2. However, to our knowledge, no other commercially availableAR system has undergone the rigorous validation process of the HL2. The validation ofother AR systems is necessary, as each contains a different IMU package, with varyingmeasurement resolutions.
There are limitations to this project. The participants were healthy and young-to-middle-aged. Given the well-documented changes in gait that are part of the normal agingprocess, validation on a group of older adults is warranted. Furthermore, validation shouldalso be considered in individuals with atypical gait patterns. A recent study validated thespatiotemporal gait parameters calculated from the HoloLens 1 with a non-gold-standardmotion system (interactive walkway) in a group of individuals with PD and young healthyadults [17]. The results demonstrated a significant difference between young and PDand excellent test–retest reliability and between-systems agreement (intraclass correlationcoefficient >0.80) for gait metrics (gait speed, step length, and cadence). These preliminaryresults in a PD patient group are promising; however, the disease severity of the patientcohort, Hohen and Yahr stage 2.2, typically involves minimal gait impairments [51]. Thus,further research is required to determine whether the HL2 can provide biomechanicalmeasures of functional gait, including step count and turning, for patient groups withimpaired movements, such as shuffle-gait and the freezing of gait, which is often seen inmoderate–advanced-stage PD. Finally, since the postural transfers (sit-to-walk and walk-to-sit) in our dataset did not reach statistical significance, further work validating the HL2with movements in the vertical axis, such as squatting or kneeling, is necessary.
Sensors 2022, 22, 2009 10 of 12
As AR technology continues to evolve, applications that involve the delivery ofinteractive mobility evaluation and treatment protocols with simultaneous movementassessment should be evaluated. Specifically, our team is pursuing the utilization ofAR technology to deliver a dual-task intervention to treat postural and gait deficits inindividuals with PD and to assess mild traumatic brain injury. The systematic and rigorousevaluation of the measurement capabilities of AR technology is the prerequisite for clinicalintegration; the results from this project suggest AR technology is viable to provide valuein the evaluation of neurological patients.
5. Conclusions
The biomechanical outcomes characterizing lower-extremity function during walkingand functional gait, derived from the HL2 and gold standard motion capture, were statisti-cally equivalent to one another for the majority of outcomes. The accurate quantification ofgait and turning using the HL2 provides initial evidence for its use as a platform for thedevelopment and delivery of gait and mobility assessments, including the in-person andremote delivery of rehabilitation protocols.
Author Contributions: Conceptualization: M.M.K., A.B.R., M.C.S. and J.L.A.; data curation, A.L.P.,M.C.S. and A.B.R.; formal analysis, M.M.K., K.O., M.C.S. and A.A., funding acquisition, J.L.A.;project administration, A.B.R., A.L.P. and J.L.A.; resources, J.L.A.; software, M.M.K., K.O. and A.A.;supervision, J.L.A.; validation, M.M.K., K.O., M.C.S. and A.B.R.; writing—original draft preparation,M.M.K. and A.B.R.; writing—review and editing, M.M.K., A.B.R., A.L.P. and J.L.A. All authors haveread and agreed to the published version of the manuscript.
Funding: This work was supported by the Department of Defense (grant number: W81XWH-19-1-0685) and the Edward and Barbara Bell Family Chair.
Institutional Review Board Statement: The study was conducted according to the guidelines of theDeclaration of Helsinki and was approved by the Institutional Review Board of the Cleveland Clinic(Protocol 19-1440 approved, 17 November 2019).
Informed Consent Statement: Informed consent was obtained from all participants involved inthe study.
Data Availability Statement: The data presented in this study are available on request from thecorresponding author.
Acknowledgments: The authors would like to acknowledge Joshua D. Johnston for his assistancewith data analysis.
Conflicts of Interest: The authors declare no conflict of interest.
References1. Bloem, B.R.; Grimbergen, Y.A.; Cramer, M.; Willemsen, M.; Zwinderman, A.H. Prospective Assessment of Falls in Parkinson’s
Disease. J. Neurol. 2001, 248, 950–958. [CrossRef] [PubMed]2. Allen, N.E.; Schwarzel, A.K.; Canning, C.G. Recurrent Falls in Parkinson’s Disease: A Systematic Review. Parkinsons Dis. 2013,
2013, 906274. [CrossRef] [PubMed]3. Fritz, S.; Lusardi, M. White Paper: “Walking Speed: The Sixth Vital Sign”. J. Geriatr. Phys. Ther. 2009, 32, 46–49. [CrossRef]
[PubMed]4. Bohannon, R.W.; Ahlquist, M. Documentation of Prestroke Ambulation. Int. J. Rehabil. Res. 2003, 26, 71–72. [CrossRef]5. Purser, J.L.; Weinberger, M.; Cohen, H.J.; Pieper, C.F.; Morey, M.C.; Li, T.; Williams, G.R.; Lapuerta, P. Walking Speed Predicts
Health Status and Hospital Costs for Frail Elderly Male Veterans. J. Rehabil. Res. Dev. 2005, 42, 535–546. [CrossRef]6. Goldie, P.A.; Matyas, T.A.; Evans, O.M. Deficit and Change in Gait Velocity during Rehabilitation after Stroke. Arch. Phys.
Med. Rehabil. 1996, 77, 1074–1082. [CrossRef]7. Bohannon, R.W. Measurement of Gait Speed of Older Adults is Feasible and Informative in a Home-Care Setting. J. Geriatr.
Phys. Ther. 2009, 32, 22–23. [CrossRef]8. Horak, F.B.; Mancini, M. Objective Biomarkers of Balance and Gait for Parkinson’s Disease Using Body-Worn Sensors. Mov. Disord.
2013, 28, 1544–1551. [CrossRef]9. Mathias, S.; Nayak, U.S.; Isaacs, B. Balance in Elderly Patients: The “Get-Up and Go” Test. Arch. Phys. Med. Rehabil. 1986, 67,
387–389.
Sensors 2022, 22, 2009 11 of 12
10. Miller Koop, M.; Ozinga, S.J.; Rosenfeldt, A.B.; Alberts, J.L. Quantifying Turning Behavior and Gait in Parkinson’s Disease UsingMobile Technology. IBRO Rep. 2018, 5, 10–16. [CrossRef]
11. Shumway-Cook, A.; Brauer, S.; Woollacott, M. Predicting the Probability for Falls in Community-Dwelling Older Adults Usingthe Timed Up & Go Test. Phys. Ther. 2000, 80, 896–903. [PubMed]
12. Sun, R.; Sosnoff, J.J. Novel Sensing Technology in Fall Risk Assessment in Older Adults: A Systematic Review. BMC Geriatr. 2018,18, 14. [CrossRef] [PubMed]
13. Espay, A.J.; Bonato, P.; Nahab, F.B.; Maetzler, W.; Dean, J.M.; Klucken, J.; Eskofier, B.M.; Merola, A.; Horak, F.; Lang, A.E.; et al.Technology in Parkinson’s Disease: Challenges and Opportunities. Mov. Disord. 2016, 31, 1272–1282. [CrossRef] [PubMed]
14. Sangarapillai, K.; Norman, B.M.; Almeida, Q.J. Rehabilitation of Falls in Parkinson’s Disease: Self-Perception vs. ObjectiveMeasures of Fall Risk. Brain Sci. 2021, 11, 320. [CrossRef]
15. Miller, M.R.; Jun, H.; Herrera, F.; Yu Villa, J.; Welch, G.; Bailenson, J.N. Social Interaction in Augmented Reality. PLoS ONE 2019,14, e0216290. [CrossRef]
16. Sun, R.; Aldunate, R.G.; Sosnoff, J.J. The Validity of a Mixed Reality-Based Automated Functional Mobility Assessment. Sensors2019, 19, 2183. [CrossRef]
17. Geerse, D.J.; Coolen, B.; Roerdink, M. Quantifying Spatiotemporal Gait Parameters with HoloLens in Healthy Adults and Peoplewith Parkinson’s Disease: Test-Retest Reliability, Concurrent Validity, and Face Validity. Sensors 2020, 20, 3216. [CrossRef]
18. Koop, M.M.; Rosenfeldt, A.B.; Johnston, J.D.; Streicher, M.C.; Qu, J.; Alberts, J.L. The HoloLens Augmented Reality SystemProvides Valid Measures of Gait Performance in Healthy Adults. IEEE Trans. Hum. Mach. Syst. 2020, 50, 584–592. [CrossRef]
19. Guinet, A.L.; Bouyer, G.; Otmane, S.; Desailly, E. Validity of Hololens Augmented Reality Head Mounted Display for MeasuringGait Parameters in Healthy Adults and Children with Cerebral Palsy. Sensors 2021, 21, 2697. [CrossRef]
20. Bohannon, R.W.; Wang, Y.C. Four-Meter Gait Speed: Normative Values and Reliability Determined for Adults Participating in theNIH Toolbox Study. Arch. Phys. Med. Rehabil. 2019, 100, 509–513. [CrossRef]
21. Herssens, N.; Verbecque, E.; Hallemans, A.; Vereeck, L.; Van Rompaey, V.; Saeys, W. Do Spatiotemporal Parameters and GaitVariability Differ across the Lifespan of Healthy Adults? A Systematic Review. Gait Posture 2018, 64, 181–190. [CrossRef]
22. Brown, M.J.; Hutchinson, L.A.; Rainbow, M.J.; Deluzio, K.J.; De Asha, A.R. A Comparison of Self-Selected Walking Speedsand Walking Speed Variability When Data Are Collected During Repeated Discrete Trials and During Continuous Walking.J. Appl. Biomech. 2017, 33, 384–387. [CrossRef] [PubMed]
23. Schurr, S.A.; Marshall, A.N.; Resch, J.E.; Saliba, S.A. Two-Dimensional Video Analysis Is Comparable to 3d Motion Capture inLower Extremity Movement Assessment. Int. J. Sports Phys. Ther. 2017, 12, 163–172. [PubMed]
24. Salarian, A.; Horak, F.B.; Zampieri, C.; Carlson-Kuhta, P.; Nutt, J.G.; Aminian, K. iTUG, a sensitive and reliable measure ofmobility. IEEE Trans. Neural Syst Rehabil Eng. 2010, 18, 303–310. [CrossRef] [PubMed]
25. Strang, E.J.H.G. Calculus, OpenStax; Rice University: Houston, TX, USA, 2016.26. Bland, J.M.; Altman, D.G. Measuring Agreement in Method Comparison Studies. Stat. Methods Med. Res. 1999, 8, 135–160.
[CrossRef]27. Lakens, D. Equivalence Tests: A Practical Primer for t Tests, Correlations, and Meta-Analyses. Soc. Psychol. Personal. Sci. 2017, 8,
355–362. [CrossRef]28. Fusca, M.; Perego, P.; Andreoni, G. Method for Wearable Kinematic Gait Analysis Using a Harmonic Oscillator Applied to the
Center of Mass. J. Sens. 2018, 2018, 4548396. [CrossRef]29. Renaudin, V.; Susi, M.; Lachapelle, G. Step Length Estimation Using Handheld Inertial Sensors. Sensors 2012, 12, 8507–8525.
[CrossRef]30. Shin, S.H.; Park, C.G. Adaptive Step Length Estimation Algorithm Using Optimal Parameters and Movement Status Awareness.
Med. Eng. Phys. 2011, 33, 1064–1071. [CrossRef]31. McGraw, K.O.; Wong, S.P. Forming Inferences about Some Intraclass Correlation Coefficients. Psychol. Methods 1996, 1, 30–46.
[CrossRef]32. Santos, P.C.; Gobbi, L.T.; Orcioli-Silva, D.; Simieli, L.; van Dieen, J.H.; Barbieri, F.A. Effects of Leg Muscle Fatigue on Gait in
Patients with Parkinson’s Disease and Controls with High and Low Levels of Daily Physical Activity. Gait Posture 2016, 47, 86–91.[CrossRef] [PubMed]
33. Sehle, A.; Mundermann, A.; Starrost, K.; Sailer, S.; Becher, I.; Dettmers, C.; Vieten, M. Objective assessment of motor fatigue inMultiple Sclerosis using kinematic gait analysis: A pilot study. J. Neuroeng. Rehabil. 2011, 8, 59. [CrossRef] [PubMed]
34. Kear, B.M.; Guck, T.P.; McGaha, A.L. Timed Up and Go (TUG) Test: Normative Reference Values for Ages 20 to 59 Years andRelationships with Physical and Mental Health Risk Factors. J. Prim. Care Community Health 2017, 8, 9–13. [CrossRef] [PubMed]
35. Leach, J.M.; Mellone, S.; Palumbo, P.; Bandinelli, S.; Chiari, L. Natural Turn Measures Predict Recurrent Falls in Community-Dwelling Older Adults: A Longitudinal Cohort Study. Sci. Rep. 2018, 8, 4316. [CrossRef] [PubMed]
36. Cheng, F.Y.; Yang, Y.R.; Wang, C.J.; Wu, Y.R.; Cheng, S.J.; Wang, H.C.; Wang, R.Y. Factors Influencing Turning and Its Relationshipwith Falls in Individuals with Parkinson’s Disease. PLoS ONE 2014, 9, e93572. [CrossRef]
37. Spildooren, J.; Vinken, C.; Van Baekel, L.; Nieuwboer, A. Turning Problems and Freezing of Gait in Parkinson’s Disease:A Systematic Review and Meta-Analysis. Disabil. Rehabil. 2019, 41, 2994–3004. [CrossRef]
38. Cummings, S.R.; Nevitt, M.C. Non-Skeletal Determinants of Fractures: The Potential Importance of the Mechanics of Falls. Studyof Osteoporotic Fractures Research Group. Osteoporos. Int. 1994, 4 (Suppl. 1), 67–70. [CrossRef]
Sensors 2022, 22, 2009 12 of 12
39. Cummings, S.R.; Nevitt, M.C. Falls. N. Engl. J. Med. 1994, 331, 872–873. [CrossRef]40. Nevitt, M.C.; Cummings, S.R. Type of Fall and Risk of Hip and Wrist Fractures: The Study of Osteoporotic Fractures. J. Am.
Geriatr. Soc. 1994, 42, 909. [CrossRef]41. Cotter, P.E.; Timmons, S.; O’Connor, M.; Twomey, C.; O’Mahony, D. The Financial Implications of Falls in Older People for an
Acute Hospital. Ir. J. Med. Sci. 2006, 175, 11–13. [CrossRef]42. Bloem, B.R.; Hausdorff, J.M.; Visser, J.E.; Giladi, N. Falls and Freezing of Gait in Parkinson’s Disease: A Review of Two
Interconnected, Episodic Phenomena. Mov. Disord. 2004, 19, 871–884. [CrossRef] [PubMed]43. Okuma, Y.; Silva de Lima, A.L.; Fukae, J.; Bloem, B.R.; Snijders, A.H. A Prospective study of Falls in Relation to Freezing of Gait
and Response Fluctuations in Parkinson’s Disease. Parkinsonism Relat. Disord. 2018, 46, 30–35. [CrossRef]44. Held, J.P.O.; Yu, K.; Pyles, C.; Veerbeek, J.M.; Bork, F.; Heining, S.M.; Navab, N.; Luft, A.R. Augmented Reality-Based Rehabilita-
tion of Gait Impairments: Case Report. JMIR mHealth uHealth 2020, 8, e17804. [CrossRef] [PubMed]45. Blomqvist, S.; Seipel, S.; Engstrom, M. Using Augmented Reality Technology for Balance Training in the Older Adults:
A Feasibility Pilot Study. BMC Geriatr. 2021, 21, 144. [CrossRef] [PubMed]46. Janssen, S.; de Ruyter van Steveninck, J.; Salim, H.S.; Cockx, H.M.; Bloem, B.R.; Heida, T.; van Wezel, R.J.A. The Effects of
Augmented Reality Visual Cues on Turning in Place in Parkinson’s Disease Patients with Freezing of Gait. Front. Neurol. 2020, 11,185. [CrossRef]
47. Karatsidis, A.; Richards, R.E.; Konrath, J.M.; van den Noort, J.C.; Schepers, H.M.; Bellusci, G.; Harlaar, J.; Veltink, P.H. Validationof Wearable Visual Feedback for Retraining Foot Progression Angle Using Inertial Sensors and an Augmented Reality Headset.J. Neuroeng. Rehabil. 2018, 15, 78. [CrossRef]
48. Gao, B.; He, Z.; He, B.; Gu, Z. Wearable eye health monitoring sensors based on peacock tail-inspired inverse opal carbon.Sens. Actuators B Chem. 2019, 288, 734–741. [CrossRef]
49. Alberts, J.L.; Modic, M.T.; Udeh, B.L.; Zimmerman, N.; Cherian, K.; Lu, X.; Gray, R.; Figler, R.; Russman, A.; Linder, S.M.A Technology-Enabled Concussion Care Pathway Reduces Costs and Enhances Care. Phys. Ther. 2020, 100, 136–148. [CrossRef]
50. Macaron, G.; Moss, B.P.; Li, H.; Baldassari, L.E.; Rao, S.M.; Schindler, D.; Alberts, J.L.; Weber, M.; Ayers, M.; Bethoux, F.; et al.Technology-Enabled Assessments to Enhance Multiple Sclerosis Clinical Care and Research. Neurol. Clin. Pract. 2020, 10, 222–231.[CrossRef]
51. Goetz, C.G.; Poewe, W.; Rascol, O.; Sampaio, C.; Stebbins, G.T.; Counsell, C.; Giladi, N.; Holloway, R.G.; Moore, C.G.; Wenning,G.K.; et al. Movement Disorder Society Task Force report on the Hoehn and Yahr staging scale: Status and recommendations.Mov. Disord. 2004, 19, 1020–1028. [CrossRef]