The mechanism of rare earth incorporation in solution doping process
12
The mechanism of rare earth incorporation in solution doping process Anirban Dhar 1 , Atasi Pal 1 , Mukul Ch. Paul a , P. Ray 2 , Himadri S. Maiti 1 , Ranjan Sen 1* 1 Fiber Optics Laboratory, Central Glass & Ceramic Research Institute, 196, Raja S.C. Mullick Road, Kolkata-32, India. 2 Chemical Engineering Department, University of Calcutta, 92, A.P. C Road, Kolkata-9, India Corresponding author: [email protected] Abstract: The mechanism involved during solution doping process has been systematically investigated by correlating the soot characteristics and solution parameters with the amount of rare earth (RE) incorporated in the core of optical fiber. Experiments show that the amount of RE incorporation may be controlled with better precision by adjusting Al ion concentration in the soaking solution. A model has been developed on the basis of cooperative adsorption mechanism correlating different parameters in the overall process. Theoretical estimation shows good agreement with the experimental results and can be used to predict the extent of RE incorporation for any composition if the soot layer characteristics are known. ©2008 Optical Society of America OCIS codes: (060.2280) Fiber design and fabrication; (060.2410) Fibers, erbium; (999.9999) solution doping technique; (999.9999) adsorption-pore retention; (999.9999) porous soot layer. References and links 1. P. C. Becker, N. A. Olsson, and J. R. Simpson, Erbium doped fiber amplifiers-Fundamentals and technology, (Academic Press, 1999) pp. 13-30. 2. J. E. Townsend, “The development of optical fibers doped with rare earth ions,” Ph.D Thesis, University of Southampton (1990). 3. K. Aria, H. Namikawa, K. Kumata, and T. Honda, “Aluminum or phosphorus co-doping effects on the fluorescence and structural properties of neodymium-doped silica glass,” J. Appl. Phys. 59, 3430-3436 (1986). 4. T. Ohtsuki, S. Honkanen, S. I. Najafi, and N. Peyghambarian, “Cooperative upconversion effects on the performance of Er 3+ doped phosphate glass waveguide amplifiers,” J. Opt. Soc. Am. 14, 1838-1845 (1997). 5. J. F. MacDowell and G. H. Beall, “Immiscibility and crystallization in Al 2 O 3 -SiO 2 glasses,” J. Am. Ceram. Soc. 52, 17-25 (1969). 6. V. H. Khopin, A. A. Umnikov, A. N. Gur’yanov, M. M. Bubnov, A. K. Senatorov, and E. M. Dianov, “Doping of optical fiber preforms via porous silica layer infiltration with salt solutions,” Inorg. Mater. (Engl. Transl) 41, 363-368 (2005). 7. Y. H. Kim, U. C. Paek, and W. T. Han, “Effect of soaking temperature on concentrations of rare-earth ions in optical fiber core in solution doping process,” Proc. SPIE 4282, 123-132 (2001). 8. F. Z. Tang, P. McNamara, G. W. Barton, and S. Ringer, “Microscale inhomogeneities in Aluminium Solution-doping of silica-based optical fibers,” J. Am. Ceram. Soc. 90, 23-28 (2007). 9. A. Dhar, M. Ch. Paul, M. Pal, A. Kr. Mondal, S. Sen, H. S. Maiti, and R. Sen, “Characterization of porous core layer for controlling the rare earth incorporation in optical fiber,” Opt. Express 14, 9006-9015 (2006). 10. A. Dhar, M. C. Paul, M. Pal, S. K. Bhadra, H. S. Maiti, and R. Sen, “An improved method of controlling rare earth incorporation in optical fiber,” Opt. Commun. 277, 329-334 (2007). 1. Introduction Optical fibers doped with rare earth (RE) ions are finding increasing applications for the development of optical amplifier, fiber laser and temperature sensing devices. The performance of a fiber for a specific application is very much dependent on the fiber #98157 - $15.00 USD Received 1 Jul 2008; revised 29 Jul 2008; accepted 4 Aug 2008; published 8 Aug 2008 (C) 2008 OSA 18 August 2008 / Vol. 16, No. 17 / OPTICS EXPRESS 12835
Transcript of The mechanism of rare earth incorporation in solution doping process

The mechanism of rare earth incorporation in solution doping process
Anirban Dhar1, Atasi Pal1, Mukul Ch. Paula, P. Ray2, Himadri S. Maiti1, Ranjan Sen1* 1Fiber Optics Laboratory, Central Glass & Ceramic Research Institute,
196, Raja S.C. Mullick Road, Kolkata-32, India. 2Chemical Engineering Department, University of Calcutta, 92, A.P. C Road, Kolkata-9, India
Corresponding author: [email protected]
Abstract: The mechanism involved during solution doping process has been systematically investigated by correlating the soot characteristics and solution parameters with the amount of rare earth (RE) incorporated in the core of optical fiber. Experiments show that the amount of RE incorporation may be controlled with better precision by adjusting Al ion concentration in the soaking solution. A model has been developed on the basis of cooperative adsorption mechanism correlating different parameters in the overall process. Theoretical estimation shows good agreement with the experimental results and can be used to predict the extent of RE incorporation for any composition if the soot layer characteristics are known. ©2008 Optical Society of America
OCIS codes: (060.2280) Fiber design and fabrication; (060.2410) Fibers, erbium; (999.9999) solution doping technique; (999.9999) adsorption-pore retention; (999.9999) porous soot layer.
References and links
1. P. C. Becker, N. A. Olsson, and J. R. Simpson, Erbium doped fiber amplifiers-Fundamentals and technology, (Academic Press, 1999) pp. 13-30.
2. J. E. Townsend, “The development of optical fibers doped with rare earth ions,” Ph.D Thesis, University of Southampton (1990).
3. K. Aria, H. Namikawa, K. Kumata, and T. Honda, “Aluminum or phosphorus co-doping effects on the fluorescence and structural properties of neodymium-doped silica glass,” J. Appl. Phys. 59, 3430-3436 (1986).
4. T. Ohtsuki, S. Honkanen, S. I. Najafi, and N. Peyghambarian, “Cooperative upconversion effects on the performance of Er3+ doped phosphate glass waveguide amplifiers,” J. Opt. Soc. Am. 14, 1838-1845 (1997).
5. J. F. MacDowell and G. H. Beall, “Immiscibility and crystallization in Al2O3-SiO2 glasses,” J. Am. Ceram. Soc. 52, 17-25 (1969).
6. V. H. Khopin, A. A. Umnikov, A. N. Gur’yanov, M. M. Bubnov, A. K. Senatorov, and E. M. Dianov, “Doping of optical fiber preforms via porous silica layer infiltration with salt solutions,” Inorg. Mater. (Engl. Transl) 41, 363-368 (2005).
7. Y. H. Kim, U. C. Paek, and W. T. Han, “Effect of soaking temperature on concentrations of rare-earth ions in optical fiber core in solution doping process,” Proc. SPIE 4282, 123-132 (2001).
8. F. Z. Tang, P. McNamara, G. W. Barton, and S. Ringer, “Microscale inhomogeneities in Aluminium Solution-doping of silica-based optical fibers,” J. Am. Ceram. Soc. 90, 23-28 (2007).
9. A. Dhar, M. Ch. Paul, M. Pal, A. Kr. Mondal, S. Sen, H. S. Maiti, and R. Sen, “Characterization of porous core layer for controlling the rare earth incorporation in optical fiber,” Opt. Express 14, 9006-9015 (2006).
10. A. Dhar, M. C. Paul, M. Pal, S. K. Bhadra, H. S. Maiti, and R. Sen, “An improved method of controlling rare earth incorporation in optical fiber,” Opt. Commun. 277, 329-334 (2007).
1. Introduction
Optical fibers doped with rare earth (RE) ions are finding increasing applications for the development of optical amplifier, fiber laser and temperature sensing devices. The performance of a fiber for a specific application is very much dependent on the fiber
#98157 - $15.00 USD Received 1 Jul 2008; revised 29 Jul 2008; accepted 4 Aug 2008; published 8 Aug 2008
(C) 2008 OSA 18 August 2008 / Vol. 16, No. 17 / OPTICS EXPRESS 12835

characteristics and the doping level. Consequently the REs to be doped, their concentrations as well as the overall host glass composition are judiciously selected depending on the area of application and the wavelength ranges. The stringent requirement deserves a rigid control over the fabrication conditions and an in-depth understanding of the influence of the various process parameters on the fiber properties.
In order to fabricate RE doped fibers, MCVD [1] coupled with solution doping [1,2] technique is mostly accepted, since different REs can be doped easily with variation in concentrations by changing a few fabrication parameters. The process consists of deposition of porous core layer of appropriate thickness and composition over the cladding layer followed by soaking with an aqueous/alcoholic solution of suitable composition for a fixed time span. Subsequent to solution doping, the soaked layer is dried and sintered for transformation to clear glass. The tube is finally collapsed to a solid rod known as preform. Fiber of standard dimension is drawn from the preform using a fiber drawing tower.
Doping of high concentration of RE in pure silica is restricted because of a rigid network structure in silica. As a result, the RE ions form clusters when doped above a critical concentration leading to degradation in fiber performances. This happens due to unwanted scattering loss, rapid fluorescent decay and quenching of laser emission [3]. Co-doping of suitable elements like Al or P is known to enhance the RE solubility and enables to achieve the desired RE concentration for practical application [4]. Aluminium is preferred since besides alleviation of clustering problem, Al addition broadens the RE emission spectra, controls radial doping profile and reduces the central dip effectively. This improved characteristics by addition of Al is believed to be due to modification of silica network structure either as “network former” or “network modifiers” based on the structural unit of Al in silica glass [5], which depends on Al concentration.
RE concentration in fiber can be controlled by suitable choice of soot composition, deposition temperature (to control porosity) or by increasing the RE concentration directly in the soaking solution. While change in soot composition is associated with change in RI profile, controlling deposition temperature is difficult and often leads to non-uniformity in RE distribution. Similarly increasing RE concentration directly in soaking solution is associated with problem of RE clustering if proper RE to Al ratio is not maintained. Consequently proper selection of Al ion concentration is one of the prime requirements for getting good fiber properties.
Although some literatures are available regarding the role of Al on RE solubility, very few deal with the actual incorporation mechanism of dopant ions in soot structure during solution doping. A qualitative model was proposed by Townsend et.al [2] without any mathematical formulation. Similarly Khopin, et. al [6], Kim, et. al [7] and Tang, et. al [8] investigated different factors related to control of dopant incorporation and proposed some theoretical concept, but no quantitative relationship was presented to correlate the fabrication conditions with the amount of RE incorporated.
The present study is based upon the above background. In order to understand the actual mechanism of solution doping and the role of Al, correlation of soot characteristics and solution properties with the incorporated dopant amount is important. The authors of this paper earlier investigated different parameters controlling soot characteristics with their effect on final fiber [9]. Similarly correlation between different solution properties and their influence on final fiber performance was also reported [10]. In the present work, the correlation of different process parameters with the incorporated RE amount is presented. The influence of Al on RE incorporation has been systematically investigated. Experiment was designed to study RE incorporation with variation in Al/RE ratio for fixed RE concentration in soaking solution and a simple model has been developed based on adsorption-pore retention factors to explain the observed result. Validity of the model has been examined by predicting the RE incorporation for different solution compositions and comparing the result
#98157 - $15.00 USD Received 1 Jul 2008; revised 29 Jul 2008; accepted 4 Aug 2008; published 8 Aug 2008
(C) 2008 OSA 18 August 2008 / Vol. 16, No. 17 / OPTICS EXPRESS 12836
with experimental data. According to our knowledge this is the first quantitative approach to correlate different process parameters and incorporated RE amount in fiber.
2. Experimental
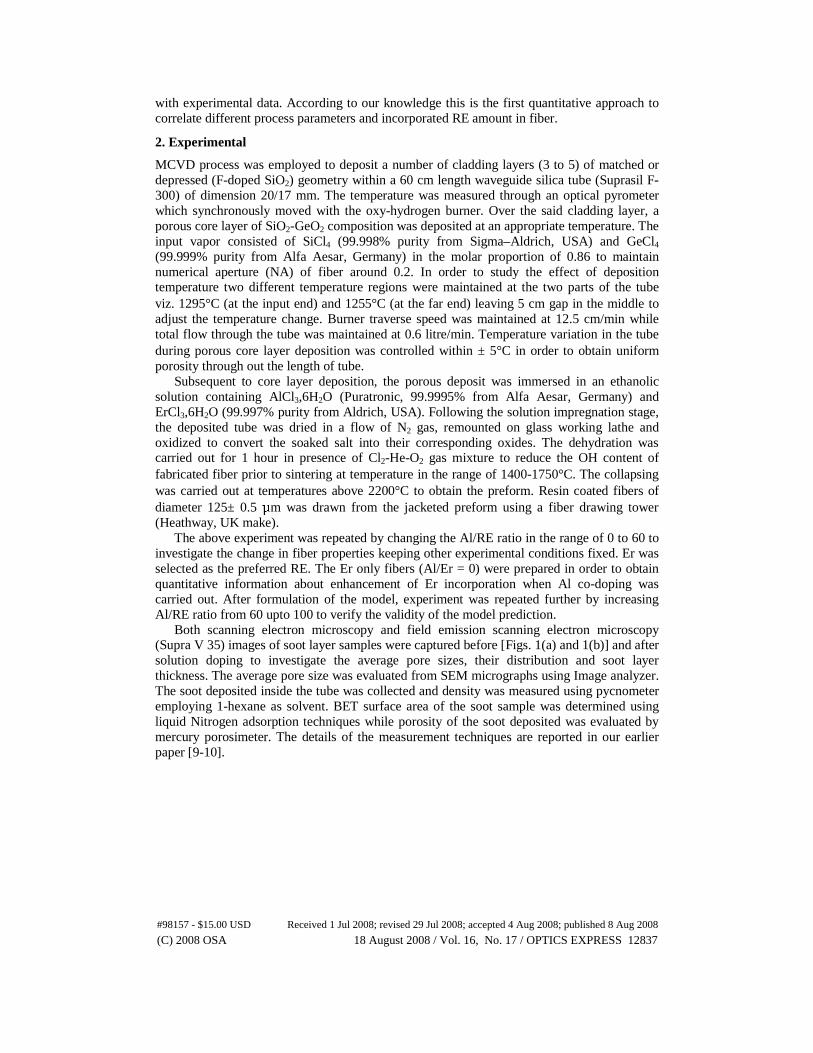
MCVD process was employed to deposit a number of cladding layers (3 to 5) of matched or depressed (F-doped SiO2) geometry within a 60 cm length waveguide silica tube (Suprasil F-300) of dimension 20/17 mm. The temperature was measured through an optical pyrometer which synchronously moved with the oxy-hydrogen burner. Over the said cladding layer, a porous core layer of SiO2-GeO2 composition was deposited at an appropriate temperature. The input vapor consisted of SiCl4 (99.998% purity from Sigma–Aldrich, USA) and GeCl4 (99.999% purity from Alfa Aesar, Germany) in the molar proportion of 0.86 to maintain numerical aperture (NA) of fiber around 0.2. In order to study the effect of deposition temperature two different temperature regions were maintained at the two parts of the tube viz. 1295°C (at the input end) and 1255°C (at the far end) leaving 5 cm gap in the middle to adjust the temperature change. Burner traverse speed was maintained at 12.5 cm/min while total flow through the tube was maintained at 0.6 litre/min. Temperature variation in the tube during porous core layer deposition was controlled within ± 5°C in order to obtain uniform porosity through out the length of tube.
Subsequent to core layer deposition, the porous deposit was immersed in an ethanolic solution containing AlCl3,6H2O (Puratronic, 99.9995% from Alfa Aesar, Germany) and ErCl3,6H2O (99.997% purity from Aldrich, USA). Following the solution impregnation stage, the deposited tube was dried in a flow of N2 gas, remounted on glass working lathe and oxidized to convert the soaked salt into their corresponding oxides. The dehydration was carried out for 1 hour in presence of Cl2-He-O2 gas mixture to reduce the OH content of fabricated fiber prior to sintering at temperature in the range of 1400-1750°C. The collapsing was carried out at temperatures above 2200°C to obtain the preform. Resin coated fibers of diameter 125± 0.5 μm was drawn from the jacketed preform using a fiber drawing tower (Heathway, UK make).
The above experiment was repeated by changing the Al/RE ratio in the range of 0 to 60 to investigate the change in fiber properties keeping other experimental conditions fixed. Er was selected as the preferred RE. The Er only fibers (Al/Er = 0) were prepared in order to obtain quantitative information about enhancement of Er incorporation when Al co-doping was carried out. After formulation of the model, experiment was repeated further by increasing Al/RE ratio from 60 upto 100 to verify the validity of the model prediction.
Both scanning electron microscopy and field emission scanning electron microscopy (Supra V 35) images of soot layer samples were captured before [Figs. 1(a) and 1(b)] and after solution doping to investigate the average pore sizes, their distribution and soot layer thickness. The average pore size was evaluated from SEM micrographs using Image analyzer. The soot deposited inside the tube was collected and density was measured using pycnometer employing 1-hexane as solvent. BET surface area of the soot sample was determined using liquid Nitrogen adsorption techniques while porosity of the soot deposited was evaluated by mercury porosimeter. The details of the measurement techniques are reported in our earlier paper [9-10].
#98157 - $15.00 USD Received 1 Jul 2008; revised 29 Jul 2008; accepted 4 Aug 2008; published 8 Aug 2008
(C) 2008 OSA 18 August 2008 / Vol. 16, No. 17 / OPTICS EXPRESS 12837

(a) (b)
Fig. 1. SiO2-GeO2 doped soot deposited at 1255°C (a) SEM micrograph, (b) FESEM micrograph.
The optical and geometrical parameters of preform were measured using Preform Analyzer PK-2600 (Photon Kinetics, USA). The fiber geometry and its RI profile were evaluated using Fiber Analyzer NR-20 (EXFO, Canada). The attenuation in the range of 800 to 1650 nm was measured using attenuation measurement setup (Bentham, UK made) based on cut-back technique. The average Er ion concentration in the core of the preform was determined from the peak at 980 nm in attenuation curve. The quantitative values of Al and Er content were also measured via Electron Probe Micro Analysis (EPMA) (carried out from University of Minnesota, Mexico). For EPMA analysis, preform sample of thickness 1.5 mm with both sides polished was prepared and measurement was carried out along the core in a step of 0.5 μm in order to have detailed information about the elemental distribution.
3. Result
Different soot parameters namely density, pore sizes, porosity, surface area and soot layer thickness have been evaluated with change in deposition temperature and presented in Table 1 for two different temperature regions namely 1255° and 1295°C. The soot density was found to be 2.286 gm/cc while the porosity at 1255° and 1295°C was 75% and 69% respectively. The reason behind the decrease in porosity at higher temperature is a consequence of partial sintering. The measured surface area of soot deposited at 1295°C was found to be less than that of soot deposited at 1255°C.
Table 1. Different soot parameters with change in deposition temperature
For deposition Soot Parameters at 1255°C at 1295°C
Density 2.286 gm/cc Average pore size 1.5-2 μm
Porosity 75% 69% Thickness 7.5 μm 5.25 μm
Surface area 10.13 m2/gm 7.6 m2/gm
The fiber characteristics obtained from different preform runs are summarized in Table 2. The result shows that for fixed Er concentration of 0.01 (M), variation in Al ion concentration leads to changes in incorporated Er amount appreciably for soot deposited either at 1255°C or at 1295°C. The elemental distribution of Al in fabricated preform, evaluated through EPMA, shows gradual increase in Al content with increase in its concentration in the soaking solution (Fig. 2). The Er ion concentration obtained from EPMA is found to differ slightly with the Er ion concentration evaluated from attenuation curve of the corresponding fibers. Such variation is expected since cutback method provides more accurate result compared to EPMA if concentration levels lies in ppm order [7].
10 μm
1μm
#98157 - $15.00 USD Received 1 Jul 2008; revised 29 Jul 2008; accepted 4 Aug 2008; published 8 Aug 2008
(C) 2008 OSA 18 August 2008 / Vol. 16, No. 17 / OPTICS EXPRESS 12838

0
0.1
0.2
0.3
0.4
0.5
0.6
0.7
0.8
0.9
0 200 400 600 800
Distance (micron)
Al 2O
3 w
t%
0.6 (M) 0.3 (M)
Table 2. Result of different preform runs
Soot deposited at 1255°C Soot deposited at 1295°C Composition of
soaking solution:
AlCl3 concentration
(in presence of
0.01(M) ErCl3 in
ethanol)
Er concentration
(mole ppm)
NA Core
dimension
μm
Er concentration
(mole ppm)
NA Core
dimension
μm
0 (M) 478 0.21 7.6 363 0.23 7.5
0.3 (M) 693 0.20 7.5 503 0.22 7.6
0.45 (M) 788 0.22 7.6 563 0.24 7.6
0.6 (M) 838 0.21 7.9 655 0.22 8.0
0.75 (M) 778 0.19 8.1 666 0.20 8.25
1.0 (M) 722 0.23 8.3 633 0.24 8.3
The tabulated results clearly indicate the possibility of controlling the RE incorporation by manipulating Al/Er proportion in soaking solution instead of increasing RE concentration directly in the solution and thus reducing probability of unwanted RE distribution non-uniformity and clustering problem. With increase in Al concentration in solution from 0.3 (M) to 0.6 (M), the Er concentration in the core increases (corresponding to 0.01 (M) Er ion concentration in solution) by about 30% at 1295°C. The incorporation efficiency thereby increases making the process more efficient. This trend is found to continue up to AlCl3 concentration of 0.6 (M) for deposition at 1255°C and 0.75 (M) for soot deposited at 1295°C after which the Er incorporation decreases. This result is quite interesting and has been explained on the basis of the model developed. It has been further observed that the process provides better control and good uniformity along the preform/fiber length compared to the conventional techniques.
Fig. 2. Comparison of Al incorporation in case of preform sample using 0.3 and 0.6 (M) AlCl3 solution where core deposited at 1255°C.
4. The model
The variation in Er ion incorporation with changing Al/RE proportion can be explained on the basis of co-operative phenomena shown by adsorbed Al species on the soot surface. It appears that during solution doping some amount Al and Er ions get adsorbed instantly on the exposed soot surface and simultaneously pores are filled by the soaking solution containing Al/Er species. The overall amount of Al and Er ions incorporated is sum of adsorbed species on soot surface and the amount retained within the pores. With time, the adsorbed amount of Al and Er species enhances since adsorbed Al ions attract more and more Er and Al ion towards soot
#98157 - $15.00 USD Received 1 Jul 2008; revised 29 Jul 2008; accepted 4 Aug 2008; published 8 Aug 2008
(C) 2008 OSA 18 August 2008 / Vol. 16, No. 17 / OPTICS EXPRESS 12839

surface. But this adsorption factor is non-linear and decreases after a certain Al/Er ratio in soaking solution depending upon selected deposition temperature (60 for 1255°C and 75 for 1295°C). Due to relatively large excess of Al ion in soaking solution compared to Er at higher Al/Er proportion, Al assisted Er adsorption reduces. The overall increase in incorporated Er ion at lower temperature is a consequence of greater “surface to volume ratio” which helps to retain more soaking solution compared to soot deposited at higher temperature (1295°C), detail explanation is given in our earlier paper [9].
Since increasing Al concentration in soaking solution increases Er ion incorporation, we assumed that adsorption of Er on Al incorporated surface is a “co-operative phenomenon”, i.e. adsorbed Al species helps additional Al and Er adsorption. The total amount of Al and Er in the final fiber will be the sum of the two factors namely i) the adsorbed Al and Er species on the soot surface (adsorption factor) and ii) the solute present in the solution retained within the pores after draining out the solution (pore retention factor). This concept is schematically presented in Fig. 3.
(a) (b) (c)
Fig. 3. Schematic of theoretical model. Porous soot layer (a) before soaking, (b) at intermediate stage, (c) after completion of soaking.
Deduction of working formula: It is assumed that apart from direct adsorption from the solution phase, whose rate will be proportional to the concentration in the solution and also to the fraction of uncovered surface, there is also a parallel cooperative adsorption, in which an adsorbed Al particle helps additional adsorption of dopant ions. Rate of this cooperative adsorption will be proportional to the above factors, namely concentration of Al in solution, fraction of uncovered surface and also to the fraction of surface covered with Al species. Desorption rate will be proportional to the fraction of surface covered by Al species.
The normal adsorption term can be expressed by ( )ErAlAlAl Ck θθ −−11 , while the co-
operative term can be represented by ( ) Alm
ErAlAlAl Ck θθθ −−11 . Now considering adsorption-
desorption equilibrium between adsorbed ions with that of ions present in bulk solution the following equations was obtained for Al species on soot surface.
( ) ( ) AlAlAlm
ErAlAlAlErAlAlAl kCkkCk θθθθθθ 21111 4 =−−+−−
The above form can also be written as follows
( ) ( )( ) AlAlm
ErAlErAlAlAl kCK θθθθθθ =−−+−− −14 111 (1)
where Al
AlAl k
kK
2
1=
Bulk Solution
Tube surface
Unsintered soot layer deposited on surface
Soot layer adsorbed with dopant at intermediate time
Adsorbed soot layer after adsorption-desorption equilibrium is reached
δ Soot layer thickness
δ δ δ
#98157 - $15.00 USD Received 1 Jul 2008; revised 29 Jul 2008; accepted 4 Aug 2008; published 8 Aug 2008
(C) 2008 OSA 18 August 2008 / Vol. 16, No. 17 / OPTICS EXPRESS 12840

The first term in the last multiplier in left hand side of Eq. (1) represents the normal adsorption rate and the second term represents the cooperative phenomenon for Al species. Similarly for adsorbed Er species on soot surface we can write,
( ) ( ) ErErAln
ErAlErErErAlErEr kCkkCk θθθθθθ 21111 3 =−−+−−
( )( ) ErAln
ErAlErAlErEr kCK θθθθθθ =−−+−− −13 11)1( (2)
where Er
ErEr k
kK
2
1=
In Eq. (2) the first term in the last multiplier represents the normal adsorption rate and the second term represents the adsorption of Er species due to adsorbed Al species.
CAl and CEr are the concentration of Al and Er ion in soaking solution, θAl and θEr are the surface coverage by Al and Er species. KAl, KEr, k3 and k4 are the constant terms. Power m and n will have values depending on the number of free sites available in the process. The KAl and KEr was the ratio of adsorption to desorption rate constant of Al and Er species.
The values of 43 ,,, kkKK ErAl were evaluated numerically using MATLAB software. The smallest values of m and n which give good matching with our experimental result are
1 and 2. Though these values may suggest that for cooperative adsorption of Er, two adsorbed Al atoms are needed and for cooperative adsorption of Al a single adsorbed Al is sufficient, these values are to be considered as strictly empirical.
Solving Eqs. (1) and (2) numerically, produce the variation of Alθ and Erθ with change in Al concentration. The amount of Al or Er retained by adsorption will be proportional to the surface coverage Alθ and Erθ respectively.
Now the amount of solute retained by the pores (PR) are proportional to soot thickness (δ ), porosity of soot ( ε ) and solution concentration (Cx). If the surface area/unit wt of soot
is denoted by A, soot density by ρ and molar adsorptivity/unit surface area be β , then amount of species retained within the pores per unit mass of soot will be given by
βρδεθ )1( −Ax Thus total amount of Al species per unit mass of soot will be given by
βθρε
εA
CAl
Al +−
=)1(
(3)
Total amount of Er species per unit mass of soot will be given by
βθρε
εA
CEr
Er +−
=)1(
(4)
Finally to convert the amount of Al and Er in porous deposit obtained from the theoretical model (in moles per unit mass of soot) into the corresponding ppm in final fiber, two factors X and Y for Al and Er are required which are independent of other parameters.
On multiplication with the above two factors, Eqs. (3) and (4) are changed to Eqs. (5) and (6) as shown below.
Thus total amount of Al species in fiber is given by
= XAC
AlAl
⎥⎦
⎤⎢⎣
⎡+
−βθ
ερε
)1( (5)
Thus total amount of Er species in fiber is given by
= YAC
ErEr
⎥⎦
⎤⎢⎣
⎡+
−βθ
ερε
)1( (6)
#98157 - $15.00 USD Received 1 Jul 2008; revised 29 Jul 2008; accepted 4 Aug 2008; published 8 Aug 2008
(C) 2008 OSA 18 August 2008 / Vol. 16, No. 17 / OPTICS EXPRESS 12841

The above two equations can predict the amount of Al and Er incorporated in final fiber in terms of ppm.
Using the above two final relationship, pore retention amount can also be calculated at any temperature from known soot parameters and any soaking solution composition.
The different physical parameters of the soot deposited at two different temperatures viz. 1255° and 1295°C required for this model computation have been presented in Table 1 and were obtained experimentally. The molar adsoptivity is the amount of dopant adsorbed per unit superficial area of the soot and has been determined on the basis of monolayer formation on the exposed soot surface. The change in adsorptivity value with change in temperature is due to variation in surface area and porosity of the soot layer. The values are 0.7x10⁻⁹ mole/cm2 and 1.3x10⁻⁹ mole/cm2 at 1255° and 1295°C respectively.
Alθ and Erθ are surface covered by Al or Er species, evaluated by numerically solving Eqs. (3) and (4) simultaneously in two successive stages. In 1st Stage: initial optimization of different unknown parameters was carried out using a direct search method. While in 2nd stage optimization of the different parameters was carried out using a sequential root square minimization method. The second step was continued until the error dropped below 1.5x10⁻⁵.
It is evident that total number of moles of dopant present per unit mass of soot, in the soot layer will be proportional to the concentration obtained in the final fiber expressed in mole%. The proportionality factors were found to be 3550 for Er and 1030 for Al. The ratio of these two factors 3.45 is quite close to 3.75 the ratio of the molecular weight of the corresponding oxides. In order to determine the concentration in ppm, the value in mole% was multiplied by a factor of 104.
5. Discussion
The predicted values of Er and Al from model when compared with experimental data shows good matching and reveal some interesting facts about the solution doping process not reported previously.
The amounts of incorporated Er determined from loss measurement are found to be in good agreement with predicted values for soot deposited either at 1255° or 1295°C. Amount of adsorbed amount (AD) in soot surface as well as amount retained within the pore (PR) was evaluated theoretically and the calculated value indicates that the latter factor is predominant over former one. The ratio of AD/PR amount for Er species in soot deposited at 1255°C is found to increase from 0.52 to 0.74 when Al concentration changes from 0.3(M) to 0.6(M) but falls to 0.56 for Al concentration of 1.0(M) in soaking solution. Actual Er concentration measured in fiber follows similar trend, i.e, increases with increase of Al concentration in soaking solution from 0.3(M) to 0.6(M), but falls with further increase in Al concentration up to 1.0(M) and beyond for fixed Er concentration of 0.01(M) in soaking solution. Table 3 shows the comparison.
#98157 - $15.00 USD Received 1 Jul 2008; revised 29 Jul 2008; accepted 4 Aug 2008; published 8 Aug 2008
(C) 2008 OSA 18 August 2008 / Vol. 16, No. 17 / OPTICS EXPRESS 12842

Table 3. Comparison of experimental and theoretical results for Er incorporation
The AD/PR ratio for Er species in case of soot deposited at 1295°C is also in agreement
with the final Er concentration obtained in fiber from loss measurement technique. However, the adsorbed amount at this temperature (i.e., at 1295°C) has been found to be less compared to the amount at 1255°C (Table 4), inspite of the fact that the calculated molar adsorptivity/ unit surface area is slightly higher for soot deposited at 1295°C. This may be explained on the basis of enhancement in partial sintering which reduces the amount of available soot surface and thereby adsorbed Er/Al species during solution impregnation. The consequence of lower specific surface of soot formed at 1295°C is that, the amount of Er adsorbed is small compared to the amount of Er retained in entrapped solution. This in turn will imply less pronounced maximum in final Er concentration as a function of Al concentration at 1295°C compared to 1255°C. This behaviour is verified from the experimental data given in Table 4 and presented in Fig. 4. Since the pore retention is considered as a fixed quantity for a specified soot structure and fixed solution composition, the change in Er ion incorporation, for fixed Er concentration in soaking solution but with increase in Al concentration is a result of co-operative adsorption exhibited by the adsorbed Al-species.
Table 4. Pore retention and adsorption factors for Er species obtained from model
Deposition temperature 1255°C Deposition temperature 1295°C Composition of
soaking
solution:
AlCl3
concentration
(in presence of
0.01(M) ErCl3
in ethanol)
PR
amount
(mole/
gm of
soot)
AD
amount
(mole/
gm of
soot)
Ratio
of
AD/PR
Er in
fiber
(mole
ppm)
PR
amount
(mole/
gm of
soot)
AD
amount
(mole/
gm of
soot)
Ratio
of
AD/PR
Er in
fiber
(mole
ppm)
0.3 (M) 1.31x10⁻⁵ 0.686x10⁻⁵ 0.523 693 0.973x10⁻⁵ 0.425x10⁻⁵ 0.436 503
0.6 (M) 1.31x10⁻⁵ 0.974x10⁻⁵ 0.743 838 0.973x10⁻⁵ 0.809x10⁻⁵ 0.831 655
1.0 (M) 1.31x10⁻⁵ 0.736x10⁻⁵ 0.561 722 0.973x10⁻⁵ 0.801x10⁻⁵ 0.823 633
Incorporated Al concentration measured from EPMA for soot deposited at 1255°C and at
1295°C shows good matching except a little deviation in case of 1.0(M) AlCl3 solution where
Er ion concentration (mole ppm)
Deposition temperature 1255°C Deposition temperature 1295°C
Composition of soaking
solution:
AlCl3 concentration
(in presence of 0.01(M)
ErCl3 in ethanol)
Experimental
result
Predicted
result
Experimental
result
Predicted
result
0 (M)
0.3 (M)
0.45 (M)
0.6 (M)
0.75(M)
1.0 (M)
478
693
788
838
778
722
478
707
791
812
790
726
363
503
563
655
666
633
356
496
575
632
653
630
#98157 - $15.00 USD Received 1 Jul 2008; revised 29 Jul 2008; accepted 4 Aug 2008; published 8 Aug 2008
(C) 2008 OSA 18 August 2008 / Vol. 16, No. 17 / OPTICS EXPRESS 12843

the calculated value is higher than the experimental data. The comparison is presented in Fig. 5. The AD/PR ratio (Table 5a & 5b) determined from model for Al species (both at 1255°C and at 1295°C) indicates smaller fractional increment and points out that the self enhancement of Al due to cooperative adsorption is relatively smaller with respect to the Al induced enhancement of Er. This is borne out experimentally and can be explained as follows. Since the Er concentration in soaking solution is less compared to Al concentration, direct adsorption of Er is small; hence relative enhancement by cooperative phenomena is higher. On the contrary due to considerably higher Al concentration in soaking solution relative amount of self-enhancement is small.
Fig. 4. Predicted and experimentally obtained Erbium ion incorporation with change in AlCl3
concentration in soaking solution. Experimental value at 1255°C, Experimental value at
1295°C, Theoretically predicted result.
Fig. 5. Predicted and experimentally obtained Aluminium ion incorporation with change in
AlCl3 concentration in soaking solution. Experimental value at 1255°C, Experimental
value at 1295°C, Theoretically predicted result.
0
3000
6000
9000
12000
15000
18000
0 0.2 0.4 0.6 0.8 1 1.2AlCl3 concentration (M)
Al i
on
co
nce
ntr
atio
n (
pp
m)
275
425
575
725
875
0 0.2 0.4 0.6 0.8 1 1.2AlCl3 concentration (M)
Er-
ion
co
nce
ntr
atio
n (
pp
m)
#98157 - $15.00 USD Received 1 Jul 2008; revised 29 Jul 2008; accepted 4 Aug 2008; published 8 Aug 2008
(C) 2008 OSA 18 August 2008 / Vol. 16, No. 17 / OPTICS EXPRESS 12844

Table 5a. Experimental and theoretical values with pore retention and adsorption factors for Al species at 1255°C
Deposition temperature 1255°C Composition of soaking
solution:
AlCl3 concentration
(in presence of 0.01(M)
ErCl3 in ethanol)
PR amount
(mole/gm
of soot)
AD amount
(mole/gm
of soot)
Ratio of
AD/PR
Experimental
Al
ion
concentration
(mole ppm)
Predicted
Al
ion
concentration
(mole ppm)
0.3 (M) 0.3922x10⁻³ 0.0895 x10⁻³ 0.2281 4845 4977
0.45(M) 0.5905 x10⁻³ 0.1612 x10⁻³ 0.2729 7616 7743
0.6(M) 0.7874 x10⁻³ 0.2361 x10⁻³ 0.2998 10485 10542
1.0(M) 1.2073 x10⁻³ 0.3839 x10⁻³ 0.3179 16585 17468
Table 5b. Experimental and theoretical values with pore retention and adsorption factors for Al species at 1295°C
Deposition temperature 1295°C Composition of soaking
solution:
AlCl3 concentration
(in presence of 0.01(M)
ErCl3 in ethanol)
PR amount
(mole/gm
of soot)
AD amount
(mole/gm
of soot)
Ratio of
AD/PR
Experimental
Al
ion
concentration
(mole ppm)
Predicted
Al
ion
concentration
(mole ppm)
0.45(M) 0.4381 x10⁻³ 0.0942 x10⁻³ 0.2150 5417 5596
0.6(M) 0.5842 x10⁻³ 0.1475 x10⁻³ 0.2524 7429 7592
1.0(M) 0.9746 x10⁻³ 0.2838 x10⁻³ 0.2911 12740 12110
6. Conclusion
The mechanism of RE incorporation during solution doping process has been systematically investigated by correlating the soot characteristics and solution properties with the amount of RE incorporated in the fiber. The influence of Al on RE solubility has also been studied experimentally. The results indicate that Er concentration in the fiber can be controlled by controlling the Al concentration only, keeping the Er amount fixed in the solution. The RE incorporation has been explained on the basis of cooperative adsorption phenomena. A model based on adsorption-pore retention factor is proposed and predicted result shows good agreement with the experimental data. The model can be used to predict quantitatively the final RE incorporation on the basis of known soot parameters like average pore size, thickness, porosity, and solution properties, especially the Al/RE proportion. This is the first approach to correlate quantitatively the different process parameters with the incorporated RE amount in fiber.
Acknowledgments
The authors are thankful to the Director, CG&CRI for his constant encouragement in carrying out the investigation. They also like to thank the colleagues of Fiber Optics Laboratory, particularly to Mr. M. Pal, Dr. S. K. Bhadra and Mr. K. Dasgupta, for their valuable help and suggestions during the experimental work. Thanks are also due to SEM-ESCA laboratory, especially to Dr. Mrs. S. Sen, for their constant support in SEM/FESEM analyses of the porous deposit samples. We also thank Dr. E. Fharm of University of Minnesota, Mexico for
#98157 - $15.00 USD Received 1 Jul 2008; revised 29 Jul 2008; accepted 4 Aug 2008; published 8 Aug 2008
(C) 2008 OSA 18 August 2008 / Vol. 16, No. 17 / OPTICS EXPRESS 12845

his kind support to carry out EPMA analyses of preform samples. One of the authors Anirban Dhar is thankful to CSIR, India for providing Senior Research Fellowship (SRF).
#98157 - $15.00 USD Received 1 Jul 2008; revised 29 Jul 2008; accepted 4 Aug 2008; published 8 Aug 2008
(C) 2008 OSA 18 August 2008 / Vol. 16, No. 17 / OPTICS EXPRESS 12846