Magnetic and magneto optic properties of substituted polythiophenes
Upload
khangminh22Category
view
4download
0
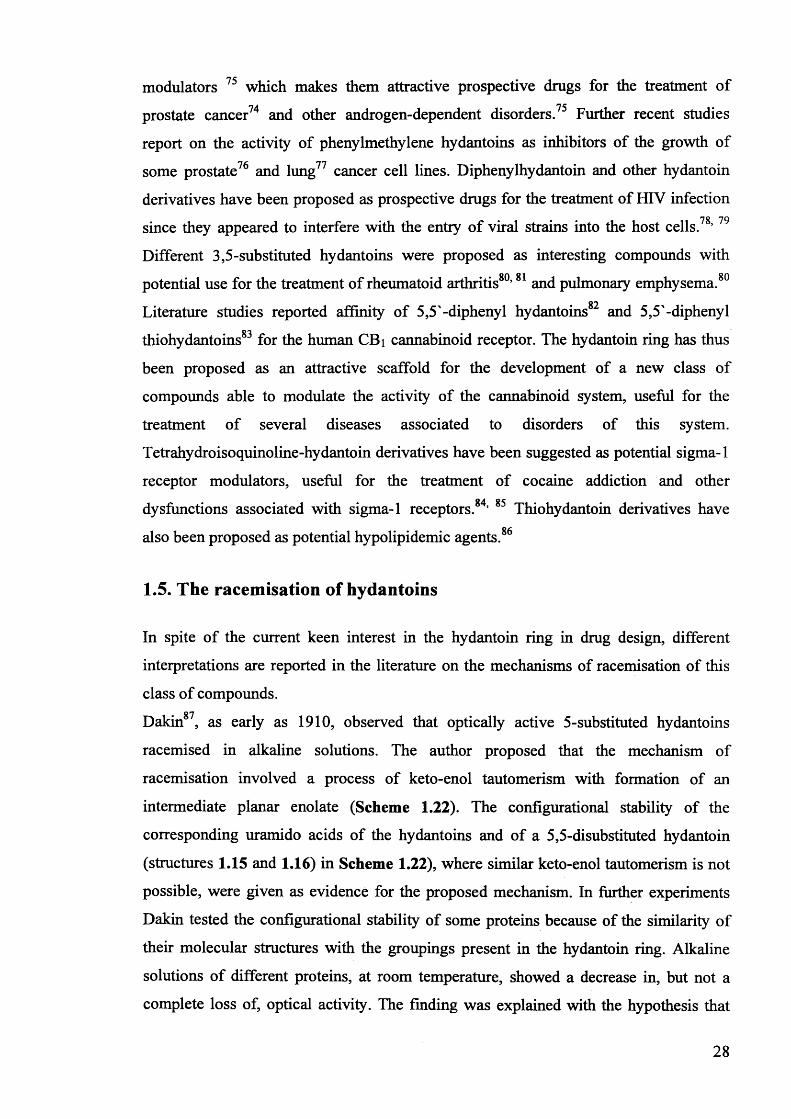
The mechanism of racemisation of 5-substituted hydantoins in aqueous solution
Stefania Narduolo
A thesis submitted for Degree of Doctor of PhilosophySchool of Chemistry Cardiff University
December 2011
UMI Number: U585521
All rights reserved
INFORMATION TO ALL USERS The quality of this reproduction is dependent upon the quality of the copy submitted.
In the unlikely event that the author did not send a com plete manuscript and there are missing pages, th ese will be noted. Also, if material had to be removed,
a note will indicate the deletion.
Dissertation Publishing
UMI U585521Published by ProQuest LLC 2013. Copyright in the Dissertation held by the Author.
Microform Edition © ProQuest LLC.All rights reserved. This work is protected against
unauthorized copying under Title 17, United States Code.
ProQuest LLC 789 East Eisenhower Parkway
P.O. Box 1346 Ann Arbor, Ml 48106-1346

IO O
DECLARATION
This work has not been submitted in substance for any other degree or award at this or any
other university or place of learning, nor is being submitted concurrently in candidature for
any degree or other award.
Signed . . ...............................(candidate) Date .. 0 %. I. ? .P ). P.
STATEMENT 1
This thesis is being submitted in partial fulfillment of the requirements for the degree PhD.
Signed ... (candidate) Date . /.P P. / .P-.P.'. P ..
STATEMENT 2
This thesis is the result of my own independent work/investigation, except where otherwise
stated.
Other sources are acknowledged by explicit references.
Signed (candidate) Date ... P. P P ./ P.PPP
STATEMENT 3
I hereby give consent for my thesis, if accepted, to be available for photocopying and for
inter-library loan, and for the title and summary to be made available to outside organisations.
Signed ®TLr. . .............................. (candidate) Date ... P. Q. P . / . & P . /

To my parents
Summary
This thesis describes our studies of the racemisation of substituted hydantoins and is
divided in six chapters.
Chapter 1 presents the concepts of chirality and racemisation and its implications in
drug development. The literature on the stereolability of 5-substituted hydantoins is
summarised. Chapter 2 describes detailed kinetic and mechanistic studies of the
racemisation of (5)-5-benzylhydantoin and (S)-3-iV-methyl-5-benzylhydantoin, aimed at
establishing the mechanistic aspects of racemisation of these molecules. Kinetics of
H/D exchange and racemisation, kinetic isotope effects, and solvent kinetic isotope
effects all favour the SeI mechanism of racemisation as opposed to the Se2 process
proposed by others.
Chapter 3 discusses the effects of structural modifications on the stereolability of a
series of model 5-substituted hydantoins with improved water solubility as compared to
(<S)-5-ben2ylhydantoin and (S)-3-V-methyl-5-benzylhydantoin. Hydantoins containing a
protonated amino or an ammonium group showed increased stereolability. This finding
was attributed to intramolecular facilitation of racemisation by the positive charge. The
primary and solvent kinetic isotope effects on the racemisation of two model 5-
substituted hydantoins were determined and again supported an SeI mechanism of
racemisation.
Chapter 4 deals with solvent effects on racemisation and H/D exchange of a series of
5-benzylhydantoins. DMSO added to phosphate buffers showed a marked rate-
increasing effect for all of the substrates under study. Co-added 2-propanol and dioxane
showed a rate-decreasing effect on neutral hydantoins and a rate-increasing effect on a
cationic hydantoin. Solvent effects on the basicity of anionic catalysts and phenomena
of preferential solvation were proposed as important factors affecting the rate constants
in mixed media.
Chapter 5 reports the preliminaiy results of exploratory experiments aimed at assessing
potentials and limitations of VCD and IR spectroscopy for kinetic and mechanistic
studies of racemisation.
Finally, Chapter 6 summarises our findings and presents recommendation for future
work.
Acknowledgments
First and foremost I thank my supervisor, Dr Niek Buurma, to whom I am especially
grateful for giving me the opportunity to work on this project, for his expertise and
invaluable and enthusiastic guidance and support throughout this PhD. Thanks for the
time patiently spent in very useful conversation, which helped overcome the difficulties
encountered in this research and writing-up.
I thank Prof. Barry Carpenter and Dr Anne Marie O’Donoghue for accepting to read
this thesis. Prof. Carpenter and Dr O’Donoghue, as well as Prof. Lloyd-Jones, are also
gratefully acknowledged for very helpful comments and suggestions during group-
meetings and/or during the “UK POC group meetings”.
I would like to thank my mentor Dr Nick Tomkinson and examiners Prof. Keith Smith
and Dr Ian Fallis for contributing to this research with useful questions and comments
during the viva-voce examinations.
I thank Dr Andrew Leach, Dr Simone Tomasi and Dr Nabil Asaad from AstraZeneca,
for help and suggestions and for hospitality at AstraZeneca.
I gratefully thank Dr Robert Richardson for invaluable help in the lab, discussions and
support, Dr Lavinia Onel for her kind help with data analyses, friendship, and very
appreciated practical help, Dr G. S. M. Sundaram and, last in chronological time of
joining the POC group, but not at all least, Dr Julia Rehbein.
Thanks to my past, present and “temporary” colleagues in the POC Centre: Larry,
Mihaela, Mazin, Ismail, Andy, Alicja, Zuzka, Josie, Jamie, Azzedine, Ed and Daniela,
for being a fantastic lab-company, always ready to help...and laugh and to Dr Eric
Tipmann.
Thank you to the library and technical staff of Cardiff University for very kind
helpfulness.
I am grateful to Linda and Malcolm for warm hospitality, help, encouragement and
patience in particular in the last period of my stay in Cardiff and for fantastic dinners
and pleasant chats.
Finally I would like to thank all those not mentioned but remembered people who, in
many different ways, helped me during these years of PhD.
I thank Cardiff University and AstraZeneca for hospitality and support.
II
Very special thanks are for my family, for their constant helpful presence, extensive and
invaluable support, encouragement and patience.
A note on stereochemical representations
In this thesis solid and broken wedges have been used to represent absolute
configuration at chiral centres. Plain bonds have been used to depict mixtures of
enantiomers or diastereoisomers or when the stereochemistry was unknown or not
defined. Wavy bonds have been used in some schemes to place special emphasis on the
racemic nature of chiral molecules, especially as a consequence of phenomena of
racemisation.
List of abbreviations
v Volume
ml Millilitre
t Time
min Minutes
s Seconds
rt Room temperature
°C Degree Celsius
K Kelvin
g Gram
mg Milligram
nm Nanometre
mm Millimetre
cm Centimetre
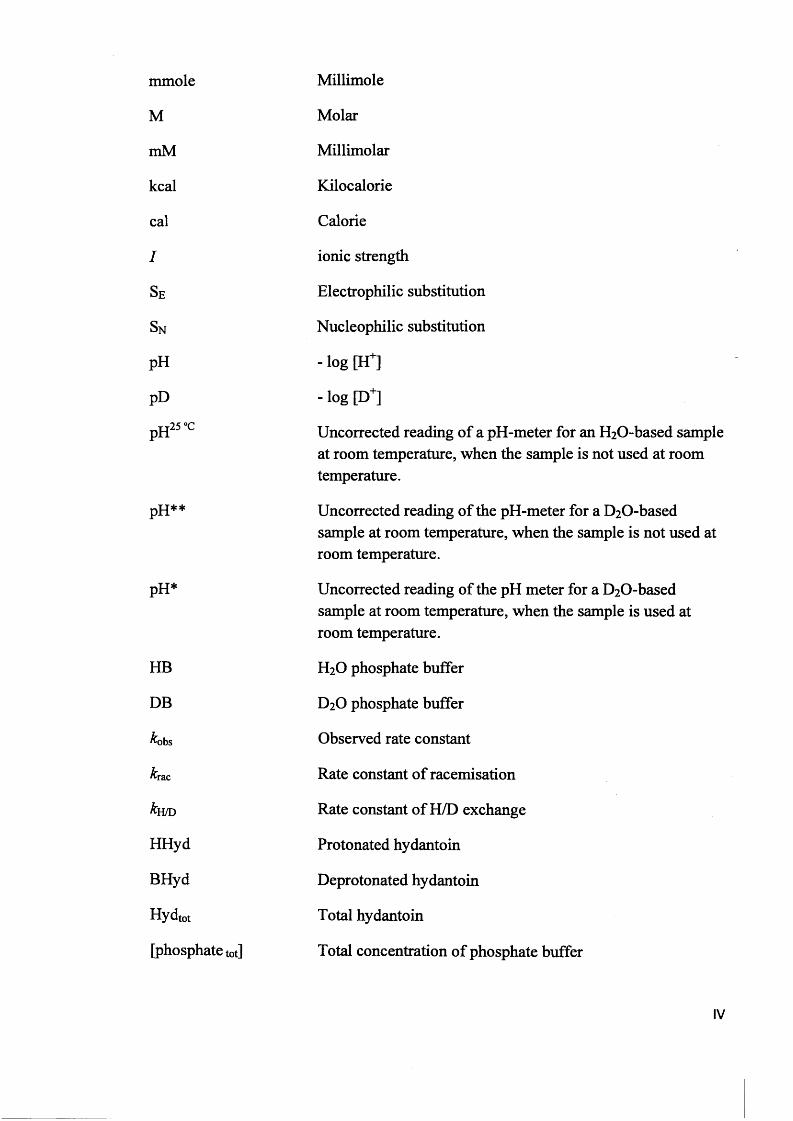
mmole
M
mM
kcal
cal
/
SE
Sn
pH
pD
pH25 °c
pH**
pH*
HB
DB
obs
rac
kuiD
HHyd
BHyd
Hydtot
[phosphate tot]
Millimole
Molar
Millimolar
Kilocalorie
Calorie
ionic strength
Electrophilic substitution
Nucleophilic substitution
- log [Hf]
- log [D+]
Uncorrected reading of a pH-meter for an H20 -based sample at room temperature, when the sample is not used at room temperature.
Uncorrected reading of the pH-meter for a D20 -based sample at room temperature, when the sample is not used at room temperature.
Uncorrected reading of the pH meter for a D20 -based sample at room temperature, when the sample is used at room temperature.
H2O phosphate buffer
D2O phosphate buffer
Observed rate constant
Rate constant of racemisation
Rate constant of H/D exchange
Protonated hydantoin
Deprotonated hydantoin
Total hydantoin
Total concentration of phosphate buffer
IV
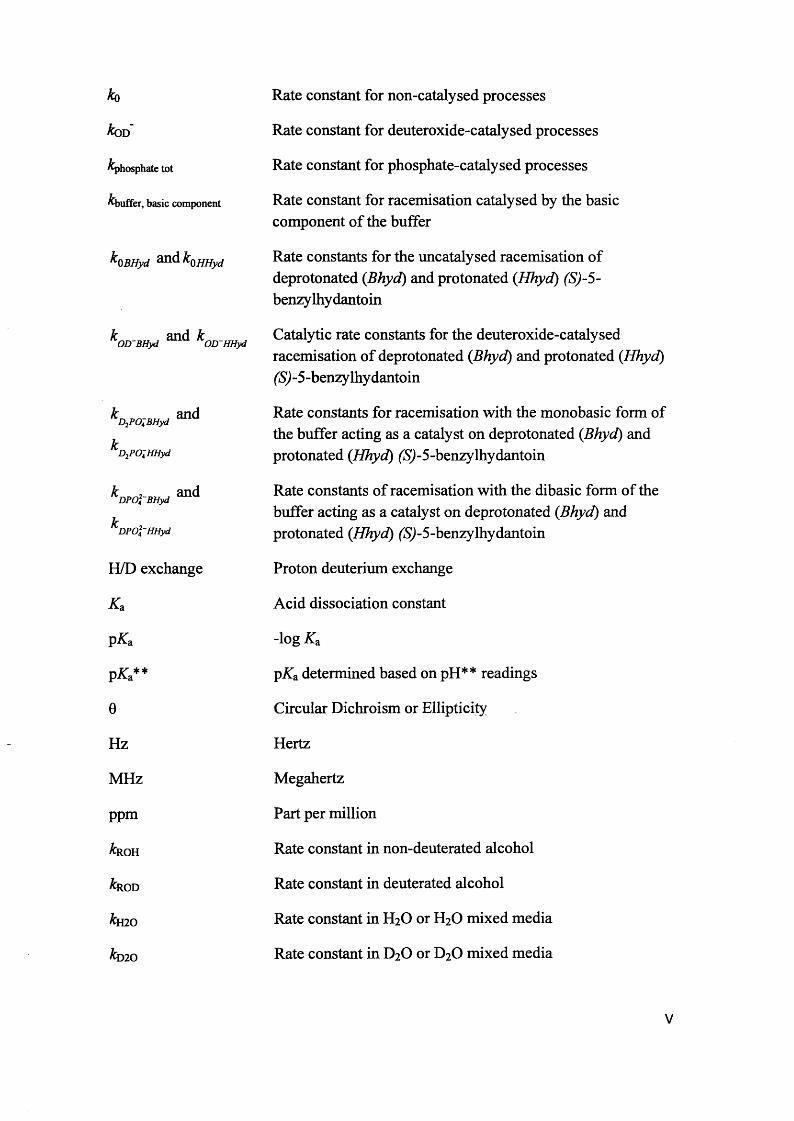
ko
koD
^phosphate tot
^buffer, basic component
k()BHyd koHHyd
k and kOD~BHyd OD~HHyd
kn J andD2POa BHyd
D2PO;HHyd
£ , andDPOi BHyd
DPOfHHyd
H/D exchange
Ka
pKa
pK**
0
Hz
MHz
ppm
&ROH
ROD
kmo
kmo
Rate constant for non-catalysed processes
Rate constant for deuteroxide-catalysed processes
Rate constant for phosphate-catalysed processes
Rate constant for racemisation catalysed by the basic component of the buffer
Rate constants for the uncatalysed racemisation of deprotonated (Bhyd) and protonated (Hhyd) (S)-5- benzylhydantoin
Catalytic rate constants for the deuteroxide-catalysed racemisation of deprotonated (Bhyd) and protonated (Hhyd) (S^-5-benzylhydantoin
Rate constants for racemisation with the monobasic form of the buffer acting as a catalyst on deprotonated (Bhyd) and protonated (Hhyd) (S^-5-benzylhydantoin
Rate constants of racemisation with the dibasic form of the buffer acting as a catalyst on deprotonated (Bhyd) and protonated (Hhyd) (5>)-5-benzylhydantoin
Proton deuterium exchange
Acid dissociation constant
"log Ka
pKa determined based on pH** readings
Circular Dichroism or Ellipticity
Hertz
Megahertz
Part per million
Rate constant in non-deuterated alcohol
Rate constant in deuterated alcohol
Rate constant in H2O or H2O mixed media
Rate constant in D2O or D2Q mixed media
V
kii Rate constant of reaction of a non-deuterium-labelledsubstrate
&D Rate constant of reaction of a deuterium-labelled substrate
HRMS High resolution mass spectrum
GC-MS Gas chromatography-mass spectrometry
El Electron impact (ionization)
APCI Atmospheric pressure chemical ionization
ESI Electrospray ionization
X Wavelength
v Wave number
M.p. Melting point
CDI Carbonyldiimidazole
Pd/C Palladium on carbon
THF Tetrahydrofuran
TFE Trifluoroethanol
DIOX Dioxane
IP 2-propanol
DMSO Dimethyl sulfoxide
TRIS tris(hydroxymethyl)aminomethane
PPTS pyridinium p-toluenesulfonate
THP Tetrahydropyranyl
Me Methyl
Et Ethyl
Ph Phenyl
Ar Aromatic
NMR Nuclear magnetic resonance
VI
J Coupling constant
8 Chemical shift
ppm Parts per million
A l f Enthalpy of activation
AS^ Entropy of activation
e.u. Entropic units (cal K '^m of1)
HPLC High-performance (pressure) liquid chromatography
FT-IR Fourier Transform Infra Red
UV-Vis Ultra Violet -Visible
VCD Vibrational Circular Dichroism
CD or ECD Electronic Circular Dichroism
8 Dielectric constant or extinction coefficient
p. Dipole moment
Ej (30) Transition energy at 25°C for the long-wavelengthabsorption band of Reichardt’s pyridinium-V-phenoxide betaine dye1
71* Kamlet and Taft's solvatochromic parameter of solventdipolarity / polarizability
a Kamlet and Taft's solvatochromic parameter of solventhydrogen-bond-donor acidity
P Kamlet and Taft's solvatochromic parameter of solventhydrogen-bond-acceptor basicity or Bronsted parameter
Specific rotation, given with temperature, expressed in °C and wavelength (D). D refers to the D line of the emission spectrum of sodium (A,=589 nm).4
DFT Density Functional Theory
MM Molecular Mechanics
FF Force Field
VII
MMFF94
B3PW91
B3LYP
Merck Molecular Force Field5
Becke three-parameter and Perdew-Wang functionals6
Becke three-parameter and Lee-Yang-Parr functionals6
List of contents
Chapter 1
Enantiomers and racemisation
1.1. Chirality: some definitions and historical background.................................. 1
1.2. The problem of racemisation in drug development....................................... 5
1.2.1. Some studies on the racemisation of drugs under various conditions 6
1.3. Structure and stereolability................................................................................... 15
1.3.1. Chiral centres potentially liable to racemise.................................................... 15
1.3.2. Stereolability and carbon acid acidity.............................................................. 16
1.3.3. Quantitative studies on carbon acid acidity................................................. 19
1.4. The hydantoins ring in drug development....................................................... 27
1.5. The racemisation of hydantoins....................................................................... 28
1.6 . Solvent effects on reactions of racemisation and H/D exchange.................. 39
1.6.1. Solvents and solvent properties........................................................................ 39
1.6.2. The effect of the medium on racemisation and H/D exchange: examples
reported in the published literature............................................................................. 39
1.6.3. The effect of the medium on equilibria............................................................ 45
VIII
1.7. Aim of the thesis........................................................................................... 46
References............................................................................................................. 47
Chapter 2
The kinetics and mechanism of racemisation of (*S)-5-
benzylhydantoin and (*S)-3-7V-methyl-5-benzylhydantoin.
2.1. Introduction.................................................................................................... 56
2.2. Syntheses......................................................................................................... 58
2.3. Kinetic studies................................................................................................ 61
2.3.1. Racemisation of (S) 5-benzylhydantoin in phosphate buffers................... 61
2.3.2. The effect of pH** on the rate constants of racemisation.......................... 63
2.3.3. Racemisation of (iS)-3-/V-methyl-5-benzylhydantoin in phosphate buffers 67
2.3.4. H/D exchange of (S)-5-benzylhydantoin.................................................... 73
2.4. Mechanistic aspects....................................................................................... 76
2.4.1. The comparison of the rate constants of racemisation and H/D exchange
of (S)-5-benzylhydantoin in phosphate buffers ..................................... 76
2.4.2. The H/D exchange of deuterium-labelled 5-benzylhydantoins 2.1a and
2.2a......................................................................................................................... 77
2.4.3. Bronsted correlation for base-catalysed racemisation of
5-benzylhydantoins................................................................................................ 79
2.4.4. Kinetic isotope effects for racemisation of 2.1 and 2.2.............................. 81
2.4.4.1. The solvent kinetic isotope effect.......................................................... 81
IX
2.4A.2. The primary kinetic isotope effect 83
2.4.5. Kinetic consequences of racemisation of (S)-5-benzylhydantoins 2.1 and
2.2 by the SeI and Se2 mechanisms....................................................................... 84
2.5. Conclusions...................................................................................................... 88
2.6. Experimental Part 1......................................................................................... 89
2.7. Experimental Part 2 ......................................................................................... 101
Acknowledgments.................................................................................................. 104
References............................................................................................................... 105
Chapter 3
The effect of structural modifications on the kinetics and mechanism
of racemisation of 5-substituted hydantoins.
3.1. Introduction...................................................................................................... I l l
3.2. Structural modifications in position 3 ............................................................. 112
3.2.1. Syntheses....................................................................................................... 112
3.2.2. Kinetic studies............................................................................................... 115
3.2.3. Activation parameters for racemisation of 3.2, 3.3 and 3.5...................... 122
3.2.4. Mechanistic considerations.............................................................. 125
3.2.4.1. The possible mechanisms of intramolecular participation of the125
cationic groups in the racemisation of 3.4 and 3.5...............................................
3.2.4.2. The slight rate depressing effect of alkyl groups.................................... 132
3.3. Structural modifications in position 5........................................................... 134
X
3.3.1. Syntheses..................................................................................................... 135
3.3.2. Kinetic studies............................................................................................. 137
3.4. Conclusions.................................................................................................... 142
3.5. Experimental Part 1....................................................................................... 144
3.6. Experimental Part 2 ........................................................................................ 162
Acknowledgments................................................................................................. 165
References............................................................................................................. 165
Chapter 4
The effect of cosolvents on the racemisation of substituted hydantoins
in aqueous solutions
4.1. Introduction................................................................................................. 171
4.2. DMSO, 2-propanol, trifluoroethanol, and dioxane as co-solvents: a few ^72
characteristics........................................................................................................
4.3. Kinetic studies................................................................................................ 174
4.3.1. The effect of d6-DMSO and dg-2-propanol on the kinetics of H/D174
exchange and racemisation of (£)-5-benzylhydantoins........................................
4.3.1.1. Kinetic studies in the presence of 33% added co-solvent...................... 174
4.3.1.2. Kinetic studies in the presence of 25% added co-solvent...................... 179
4.3.2. Solvent kinetic isotope effects in mixed media......................................... 182
4.3.3. The effect of added co-solvents on p£a.................................................... 183
XI
4.3.4. Medium effects and the stereochemical course of H/D exchange of (S)-
5-benzy lhydantoin 4.1............................................................................................. 184
4.4. Discussion...................................................................................................... 186
4.4.1. The effect of co-solvents on the rate constants of racemisation and H/D
exchange of neutral benzy lhy dantoins.................................................................. 187
4.4.2. The effect of co-solvents on the rate constants of racemisation and H/D
exchange of the cationic hydantoin 4.4.................................................................. 189
4.4.3. The solvent kinetic isotope effect for racemisation and the comparison
of the rate constants of racemisation and H/D exchange in mixed media:
mechanistic implications......................................................................................... 189
4.5. Conclusions.................................... 190
4.6. Experimental..................................................................................................... 191
References................................................................................................................ ^
Chapter 5
Exploring the use of IR and VCD spectroscopy for the study of
reaction mechanisms involving stereogenic centres.
5.1. The potentials of Vibrational Circular Dichroism (VCD) spectroscopy... 199
5.1.1. The VCD technique..................................................................................... 199
5.1.2. Calculated VCD spectra.............................................................................. 200
5.1.2.1. Prediction of VCD spectra of model chiral molecules........................ 200
5.1.2.2. Testing the performance of the method for the prediction of VCD208
spectra......................................................................................................................
XII
5.1.2.3. Calculation of VCD spectra - Conclusions............................................. 210
5.1.3. The use of VCD spectroscopy for kinetic and mechanistic studies of
racemisation of 5-substituted hydantoins............................................................. 212
5.1.3.1. Kinetic considerations regarding expected signals.................................. 212
5.1.3.2. Calculated IR and VCD spectra for 5-benzylhydantoin.......................... 214
5.1.3.3. Experimental IR spectra for 5-benzylhydantoin and 3-V-methyl-5-
benzy lhydantoin.................................................................................................... 217
5.1.3.4. Recording VCD spectra: the VCD spectrum of the standard compound
(+)-camphor........................................................................................................... 219
5.1.3.5. Conclusions for section 5.1.3................................................................... 222
99*35.2. Structure-acidity correlations by IR Spectroscopy......................................
9 9 0
5.2.1. Literature correlation analyses using infrared spectral data......................
9 95.2.2. Correlation analysis for 5-benzylhydantoins.............................................
5.3. Conclusion...................................................................................................... 230
5.4. Experimental................................................................................................. 230
233Acknowledgments.................................................................................................
References............................................................................................................. 233
Chapter 6
Epilogue
6.1. Conclusions................................................................................................... 236
6.2. Future work.................................................................................................... 237
XIII
References 238
Appendix 1............................................................................................................... 240
Appendix 2 ............................................................................................................... 269
Appendix 3............................................................................................................... 287
Appendix 4 ............................................................................................................... 311
References
1. Reichardt, C., Solvents and Solvent Effects in Organic Chemistry. Third ed.;
WILEY VCH: Weinheim, 2003; p 416.
2. Reichardt, C., Solvents and Solvent Effects in Organic Chemistry. Third ed.;
WILEY VCH: Weinheim, 2003; p 431.
3. Maskill, H., The Physical Basis o f Organic Chemistry. Oxford University Press:
Oxford New York, 1985; p 420.
4. Vollhardt, P., Chimica Organica. Zanichelli Editore S.p.A.: Bologna, 1998; p
153.
5. Halgren, T. A., Journal o f Computational Chemistry 1996,17 (5-6), 490-519.
6 . Jensen, F., Introduction to Computational Chemistry. John Wiley & Sons:
Chichester New York Weinheim Brisbane Singapore Toronto, 1999; p 177-194.
XIV
Chapter 1
Enantiomers and racemisation
1.1. Chirality: some definitions and historical background
“It's the same thing....only different!” is the title of an interesting review by Silas
Smith1 on the links between toxicity and chirality in different common chemical
compounds. A pair of enantiomers are, in a way, “the same thing” since they share the
same molecular and structural formula but they are “different” with respect to their
spatial arrangement.
In particular, enantiomers are two mirror image molecules which are not
superimposable. Objects of which the mirror images are not superimposable are also
called chiral, from the Greek term “xsip”2 which means “hand”. The differences
between enantiomers become apparent when they interact with polarized light; all chiral
compounds exhibit optical activity. The observation that chiral molecules interact with
polarised light led, in the 19th century, to the first intuitions about molecular asymmetry.
In 1832 Biot observed that solutions of (2R, 3R) tartaric acid (Scheme 1.1), naturally
occurring in acidulous fruit juices, were able to rotate the plane of the polarised light.
By contrast, solutions of racemic tartaric acid, initially called “racemic acid”, were
optically inactive. “Racemic acid”4 had been accidentally prepared by Kestner during
the preparation of tartaric acid, “with which it is associated in the juice of the grape”.5
Later, in 1848, Pasteur was able to rationalise the observation made by Biot. He noticed
that recrystallisation of the racemic sodium ammonium salt of tartaric acid gave two
different crystals with mirror image shapes. The two crystals, dissolved in water, gave
solutions that rotated the polarised light in opposite directions. Pasteur called the two
“species” of tartrates dextro (+) and levo (-) based on their effects on polarised light.6n
The structures of dextro and levo tartaric acids are reported in Scheme 1.1.
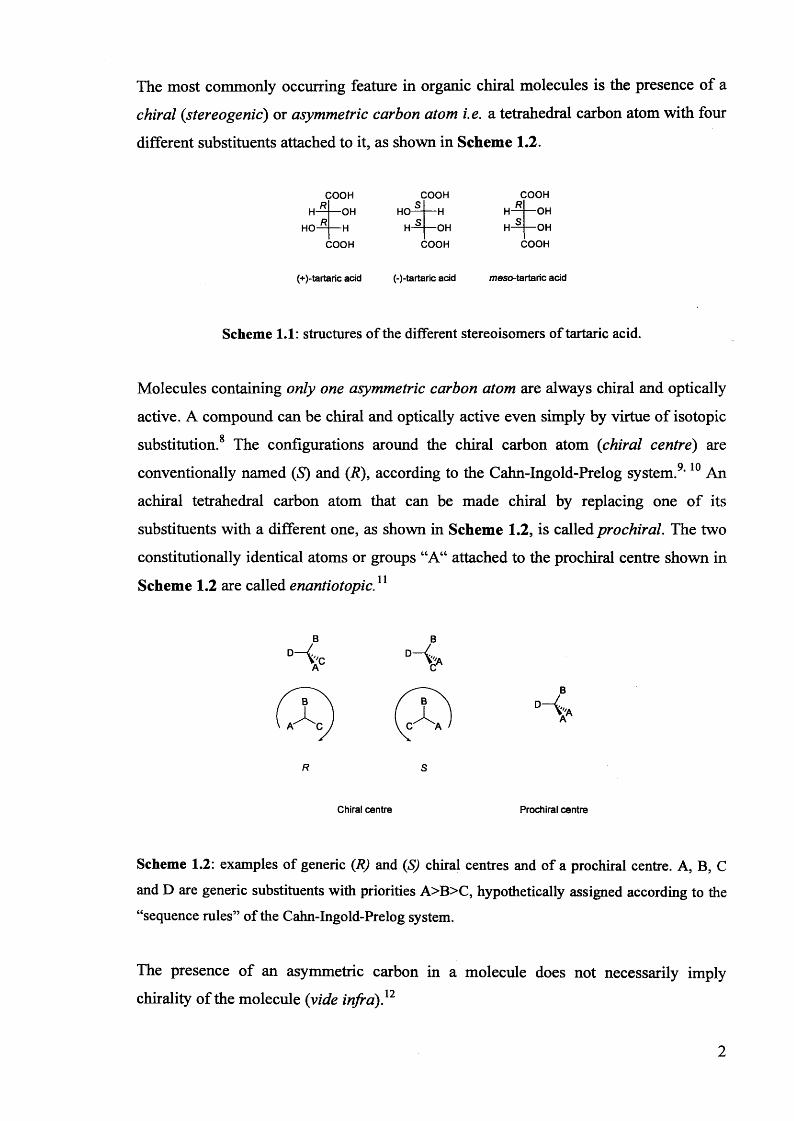
The most commonly occurring feature in organic chiral molecules is the presence of a
chiral (stereogenic) or asymmetric carbon atom i.e. a tetrahedral carbon atom with four
different substituents attached to it, as shown in Scheme 1.2.
HHO
COOH OH
H
COOH
RR
HO-
COOH
-H -OH
COOH
-OH -OH
Rs
(+)-tartaric acid
COOH
(-)-tartaric acid
H H
COOH
meso-tartaric acid
Scheme 1.1: structures of the different stereoisomers of tartaric acid.
Molecules containing only one asymmetric carbon atom are always chiral and optically
active. A compound can be chiral and optically active even simply by virtue of isotopic• • 8 •substitution. The configurations around the chiral carbon atom {chiral centre) are
conventionally named (S) and (R), according to the Cahn-Ingold-Prelog system.9,10 An
achiral tetrahedral carbon atom that can be made chiral by replacing one of its
substituents with a different one, as shown in Scheme 1.2, is called prochiral. The two
constitutionally identical atoms or groups “A“ attached to the prochiral centre shown in
Scheme 1.2 are called enantiotopic.11
Prochiral centreChiral centre
Scheme 1.2: examples of generic (R) and (S) chiral centres and of a prochiral centre. A, B, C
and D are generic substituents with priorities A>B>C, hypothetically assigned according to the
“sequence rules” of the Cahn-Ingold-Prelog system.
The presence of an asymmetric carbon in a molecule does not necessarily imply
chirality of the molecule {vide infra)}2
2
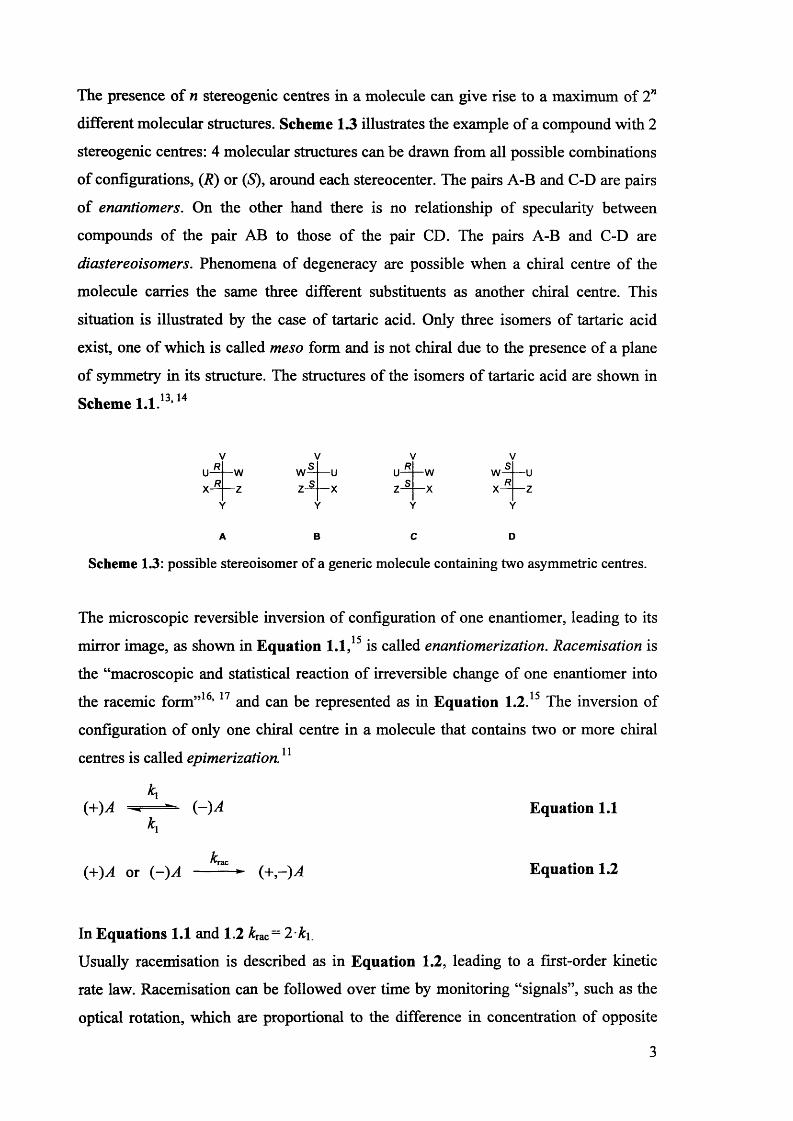
The presence of n stereogenic centres in a molecule can give rise to a maximum of 2”
different molecular structures. Scheme 1.3 illustrates the example of a compound with 2
stereogenic centres: 4 molecular structures can be drawn from all possible combinations
of configurations, (R) or (S), around each stereocenter. The pairs A-B and C-D are pairs
of enantiomers. On the other hand there is no relationship of specularity between
compounds of the pair AB to those of the pair CD. The pairs A-B and C-D are
diastereoisomers. Phenomena of degeneracy are possible when a chiral centre of the
molecule carries the same three different substituents as another chiral centre. This
situation is illustrated by the case of tartaric acid. Only three isomers of tartaric acid
exist, one of which is called meso form and is not chiral due to the presence of a plane
of symmetry in its structure. The structures of the isomers of tartaric acid are shown in
Scheme 1.1.13> 14
—w ws7 S
— u7 S
—w w*l x K&
A B C D
Scheme 1.3: possible stereoisomer of a generic molecule containing two asymmetric centres.
The microscopic reversible inversion of configuration of one enantiomer, leading to its
mirror image, as shown in Equation 1.1,15 is called enantiomerization. Racemisation is
the “macroscopic and statistical reaction of irreversible change of one enantiomer into
the racemic form”16, 17 and can be represented as in Equation 1.2.15 The inversion of
configuration of only one chiral centre in a molecule that contains two or more chiral
centres is called epimerization.11
K(+)A w (-)A Equation 1.1
K
k(+)A or ( - )A ---- (+,—)v4 Equation 1.2
In Equations 1.1 and 1.2 £rac= 2&i.
Usually racemisation is described as in Equation 1.2, leading to a first-order kinetic
rate law. Racemisation can be followed over time by monitoring “signals”, such as the
optical rotation, which are proportional to the difference in concentration of opposite
enantiomers. The link between k\ and kmc can be understood in two ways. First, every
enantiomerisation event “racemises two molecules”. Alternatively, kinetic analysis of
the simple process of uncatalysed enantiomerisation, as shown in Equation 1.1, allows
a straightforward derivation. Enantiomerisation is a reversible first-order reaction with
equal rate constants for the forward and the reverse processes, leading to a rate
expression described by Equation 1.3,
T ^ 4 " l = ~2V Equation 1.3
where [(+M]o is the concentration of (+)A at time t=0, [(+^4]e is concentration of (+)A
at equilibrium and [(+)z4]/ is the concentration of (+)A at time t.
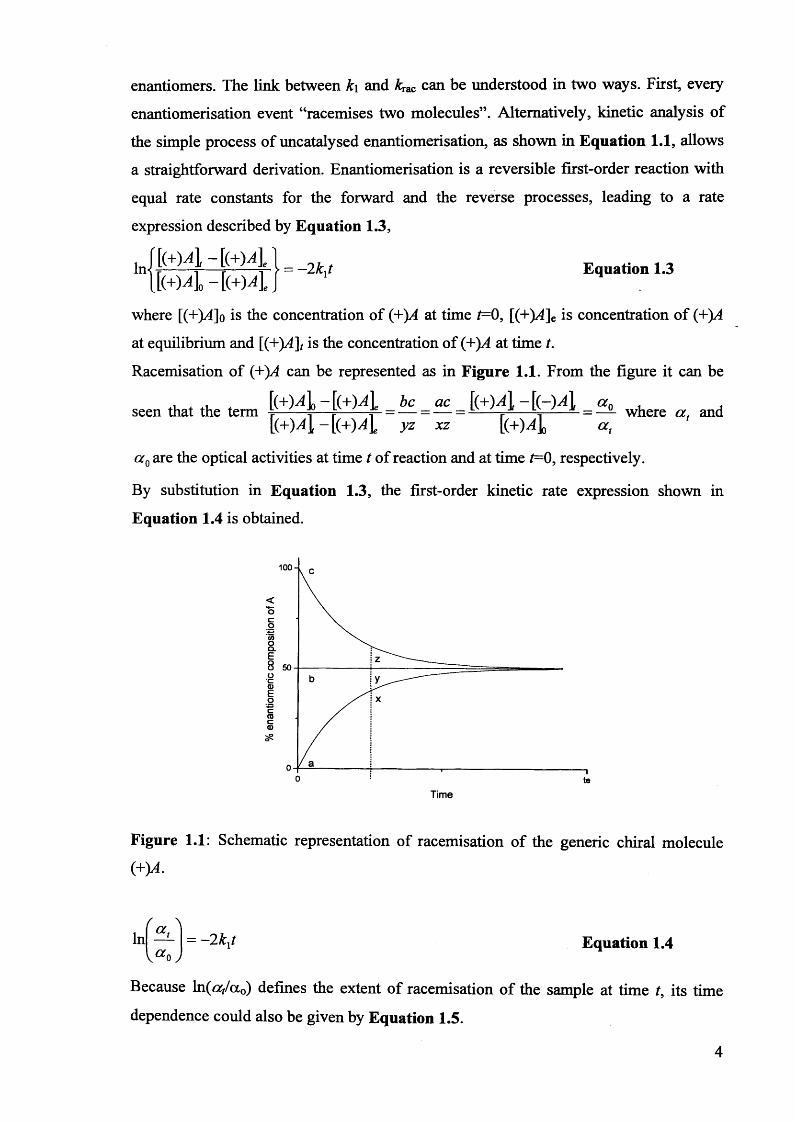
Racemisation of (+)4 can be represented as in Figure 1.1. From the figure it can be
seen that the term ~ K+> 4 = jg. = f £ = ~ l H 4 = go. where a, and[(+)4~[(+)4 yz xz [(+)4 a ,
a 0 are the optical activities at time t of reaction and at time t= 0, respectively.
By substitution in Equation 1.3, the first-order kinetic rate expression shown in
Equation 1.4 is obtained.
1 00 -
<ocoCOoQ.E8o■C(UEo
Time
Figure 1.1: Schematic representation of racemisation of the generic chiral molecule
(+M-
In - - 2 kxt Equation 1.4
Because ln (^ /a 0) defines the extent of racemisation of the sample at time t, its time
dependence could also be given by Equation 1.5.
Inf \a
\ a *J-kmct Equation 1.5
Comparison of Equations 1.4 and 1.5 shows that kTaLC equals 2 k \n
1.2. The problem of racemisation in drug development.
The development of new drugs with increased structural complexity not only implies
more complex synthetic routes but leads to a parallel increased complexity in their
reactivity, stability, and fate in the human body. The presence of a chiral center in a
pharmaceutically active molecule is an aspect that deserves particular attention.
Asymmetry is ubiquitous in nature and in biological systems. Biological
macromolecules are rich in chiral centres of set configurations such as L-amino acids
and Z)-sugars. In the complex “chiral” biological system, enantiomers may therefore
experience phenomena of selective binding, absorption, enzyme or receptor interactions,
leading to different biological responses.1, 19 Several optically active enantiomers of a
variety of drugs have been found to racemise in the human body and frequently only
one of the two enantiomers is active while the other may be inactive or even toxic. The
case of thalidomide is a tragically famous example. Racemic thalidomide, used as a
sedative and anti-nausea drug, was withdrawn from the market in 1961 due to its
teratogenic effects. It was later recognised that the molecule was configurationally not
stable {vide infra), and the S (-)-enantiomer of the drug was proposed as being
responsible for the teratogenic effects.21’24 In 1992 the US Food and Drug
Administration set forth precise guidelines regulating the marketing of new chiral drugs,
accounting for the possibility of phenomena of racemisation and potential differences in
the biological activity between opposite enantiomers. It is therefore very important to
know not only the pharmaceutical properties of both forms of chiral drugs but also the
kinetics and mechanisms by which they may interconvert. The problem of racemisation
of chiral drugs has been reviewed16, 22, 26 and its implications in drug development
discussed, leading to the “enantiomer versus racemate debate”, examining advantages
and disadvantages in the marketing of either of the two “forms” of a chiral drug. Testa
et al. in particular discussed the relevance of the problem of racemisation in drug
development with respect to the time scale of the process, distinguishing between
pharmaceutical and pharmacological relevance. If the half life of a molecule, under
physiological conditions (37 °C, pH=7.4), is of the order of minutes or hours, i.e. lower
than the time of residence of the drug in the body, the process has pharmaceutical
relevance. Half lives of racemisation or epimerisation of the order of months or years
are relevant from the pharmacological point of view, due to the implications in the
process of manufacturing and storage of the drug. ’ Preliminary kinetic studies
assessing the stereolability of potential drug candidates, under all relevant conditions,
can therefore help orient medicinal chemists' decisions when dealing with the
development of chiral drugs. The important implications of racemisation in drug design
prompted many studies aiming at assessing the stereolability of different chiral drugs.
The results of studies on the configurational stabilities of a few important biologically
active chiral compounds are briefly described in the following paragraphs.
1.2.1. Some studies on the racemisation of drugs under various conditions
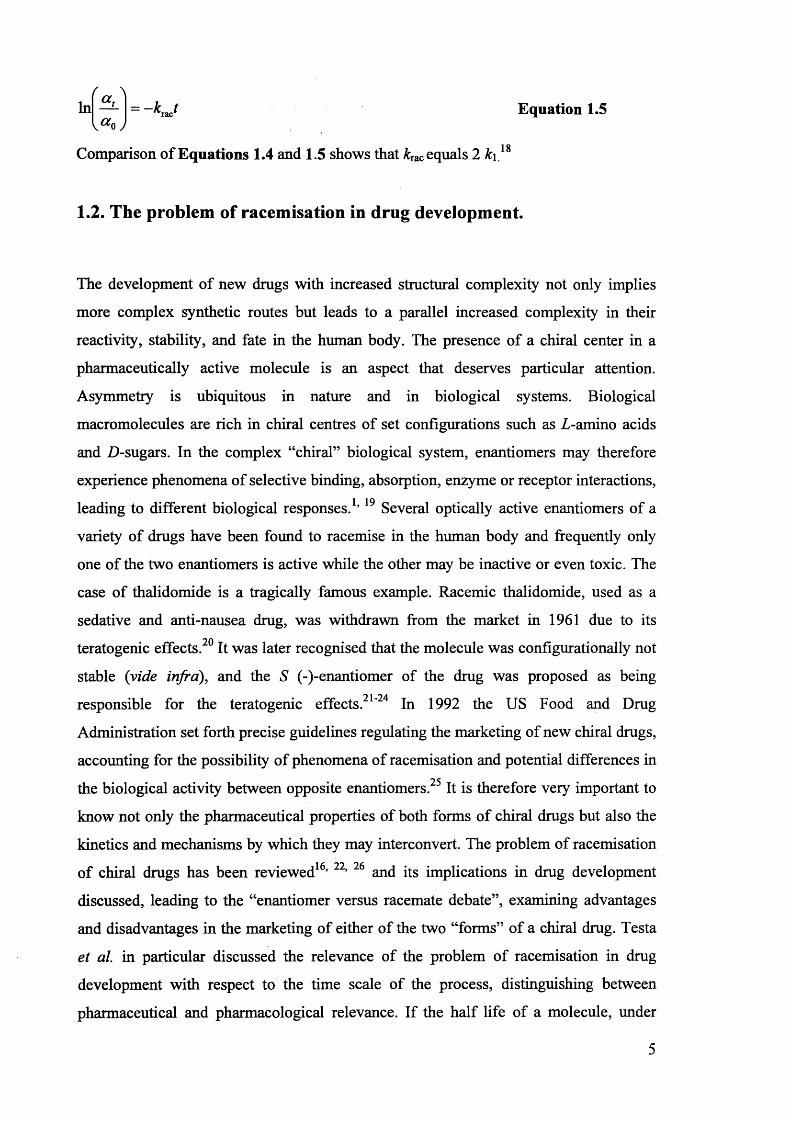
Knoche and Blaschke24 reported the fast racemisation of thalidomide (structure 1.1 in
Scheme 1.4) enantiomers in phosphate buffer 0.067 M, pH=7.4 at 37°C (approximate
ti/f= 270 minutes) The reaction is accelerated by the addition of human serum albumin.
Reist et al.23 also studied the racemisation of thalidomide in phosphate buffers under
various experimental conditions. The chiral inversion was found to be catalysed by
hydroxyl ions, phosphate, albumin and amino acids. The pseudo-first-order rate
constants of enantiomerisation, in buffered solutions at pH 7.4 and 37 °C, were found to
increase linearly with phosphate buffer concentration and with the concentration of co
added fatty-acid free human serum albumin. Rate constants of enantiomerisation were
close to zero in 0.1 M phosphate buffers at pH 2 and 3 and increased with buffer pH.
Based on the experimental results, the authors proposed that chiral inversion occurred
through a mechanism of electrophilic substitution of the asymmetric proton, catalysed
by bases. The catalytic effect of human serum albumin was proposed to reside in the
basic arginine and lysine residues of human serum albumin rather than in a single
catalytic site of the protein.
6
o
o o
o
1.1
Scheme 1.4: structure of thalidomide.
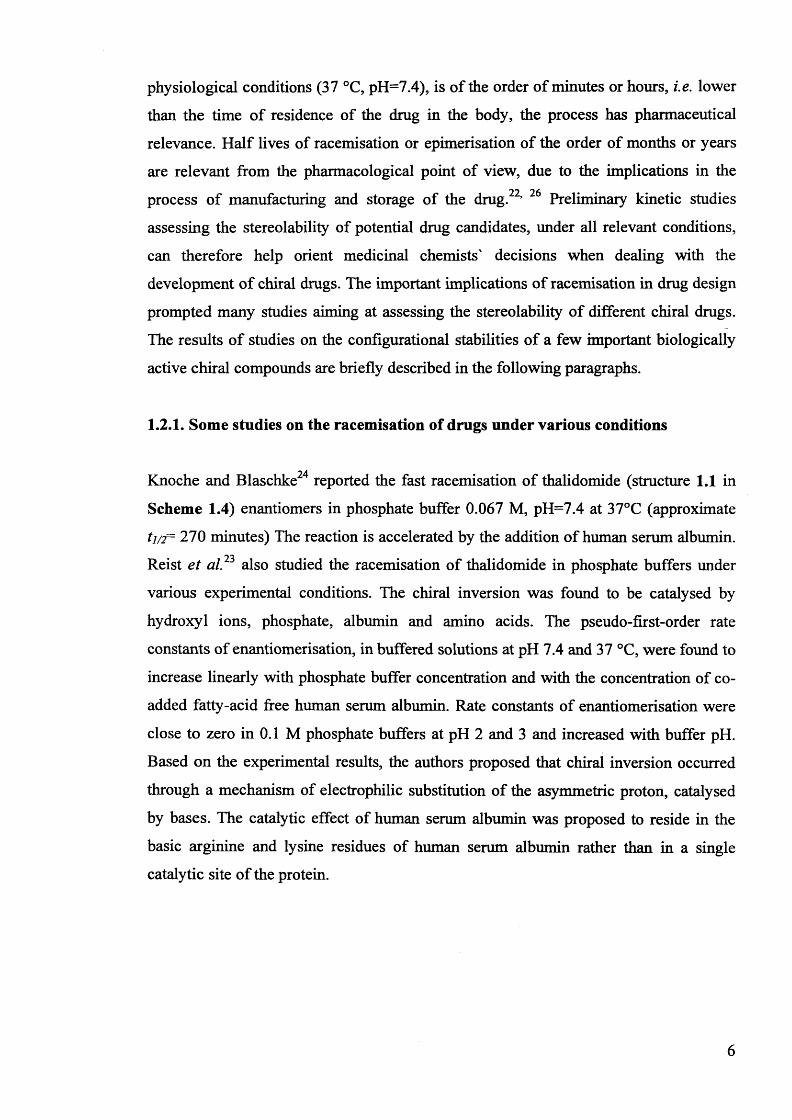
Oxazepam (structure 1.2 a) in Scheme 1.5) is a drug which has been used as a sedative in
the pH range between 0.5 and 13.3. The authors reported that no general-acid or
general-base catalysis was observed for racemisation of 1.2 a) in the pH range under
study. pH-rate profiles showed the independence of the rates of racemisation on pH, in
the neutral pH region (a “flat” region of the pH-rate profile was found between
approximately pH=3 and 9). Rate constants increased with pH above pH=10, reaching a
plateau value at pH=13. Slow racemisation was observed in the acidic pH range. Three
different protonation states o f oxazepam at different pH were reported in the paper, the
proposed sites of protonation and deprotonation being the nitrogen in position 4 and the
hydroxyl oxygen, respectively, according to previous studies (Scheme 1.5).
In the pH range under investigation racemisation of oxazepam was attributed to
“spontaneous reaction of neutral oxazepam species in the neutral pH region” and
hydroxide-catalysed or spontaneous racemisation of the deprotonated form of the
molecule in the basic pH range. The kinetics of base-catalysed racemisation and
hydrolysis of enantiomers of Oxazepam 3-acetate (structure 1.2b in Scheme 1.5) were
studied in buffers and in sodium hydroxide solutions, in the pH range 7.5-14, by Yang
and Bao.28 Kinetic traces were fitted to a first-order kinetics rate law. A half life of
97its racemic form. Testa reported an estimated half-life of 10±5 minutes at room
temperature and neutral pH for racemisation of oxazepam.26 The kinetics of97racemisation of oxazepam were studied by Aso et al. in aqueous buffered solutions in
x a) Oxazepam: X=H, Y=H, R=Hb) Oxazepam acetate: X=H, Y=H, R=CH3COc) Lorazepam: X=H, Y=CI, R=Hd) Temazepam : X=CH3, Y=H, R=He) Lormetazepam: X=CH3l Y=CI, R=HCl
Scheme 1.5: structure of oxazepam and related compounds.
7
racemisation of 62.0 minutes, determined at 55 °C in a mixture of isopropanol and
Robinson-Britton buffer 29 at pH 9.5 in the proportion 1:10 (v:v) was reported.
Racemisation under similar conditions but with a Robinson-Britton buffer with a pH of
7.5 was observed but it appeared to be very slow (an estimated half life >1000 min was
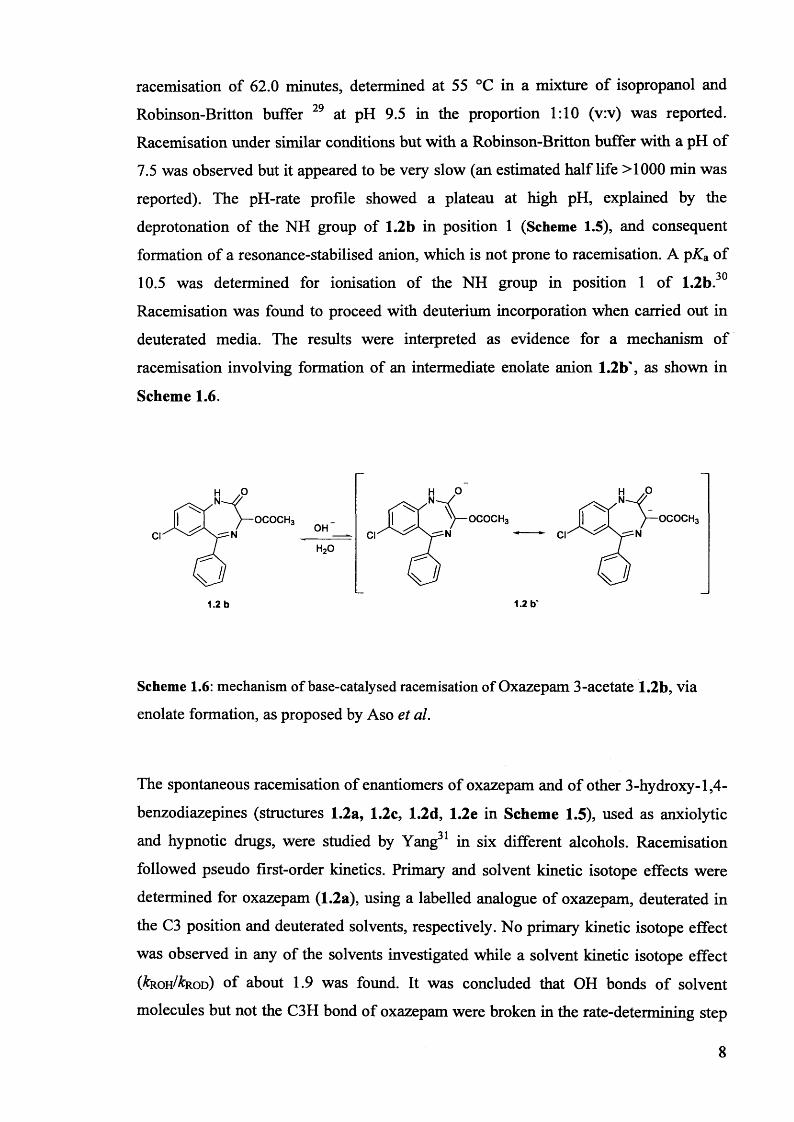
reported). The pH-rate profile showed a plateau at high pH, explained by the
deprotonation of the NH group of 1.2b in position 1 (Scheme 1.5), and consequent
formation of a resonance-stabilised anion, which is not prone to racemisation. A pKa of• • 3010.5 was determined for ionisation of the NH group in position 1 of 1.2b.
Racemisation was found to proceed with deuterium incorporation when carried out in
deuterated media. The results were interpreted as evidence for a mechanism of
racemisation involving formation of an intermediate enolate anion 1.2b ', as shown in
Scheme 1.6.
ci
1.2 b
V -O COCH,OH
H20Cl
OCOCH3 OCOCH;
Cl
1.2 b*
Scheme 1.6: mechanism of base-catalysed racemisation of Oxazepam 3-acetate 1.2b, via
enolate formation, as proposed by Aso et al.
The spontaneous racemisation of enantiomers of oxazepam and of other 3-hydroxy-1,4-
benzodiazepines (structures 1.2a, 1.2c, 1.2d, 1.2e in Scheme 1.5), used as anxiolytic
and hypnotic drugs, were studied by Yang31 in six different alcohols. Racemisation
followed pseudo first-order kinetics. Primary and solvent kinetic isotope effects were
determined for oxazepam (1.2a), using a labelled analogue of oxazepam, deuterated in
the C3 position and deuterated solvents, respectively. No primary kinetic isotope effect
was observed in any of the solvents investigated while a solvent kinetic isotope effect
(&r o h /& r o d ) of about 1.9 was found. It was concluded that OH bonds of solvent
molecules but not the C3H bond of oxazepam were broken in the rate-determining step
of the reaction. Small negative entropies of activation were reported for the
racemisation of oxazepam in methanol, ethanol and 2-propanol. Based on the reported
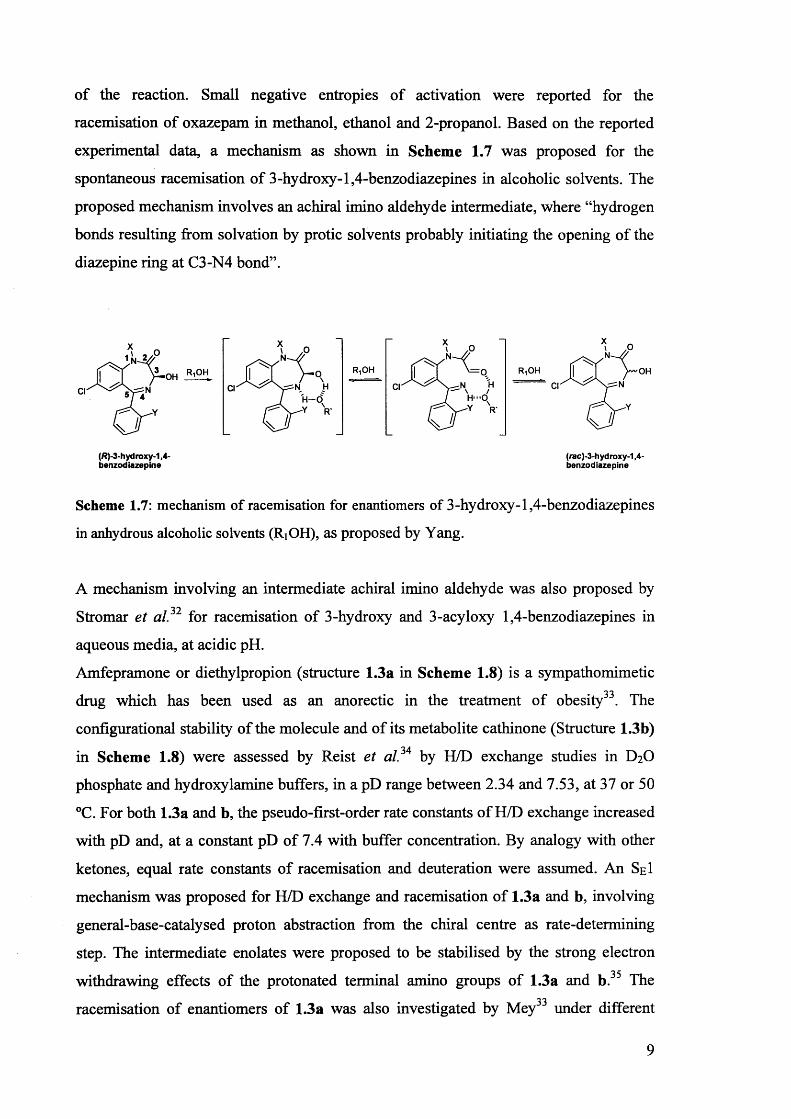
experimental data, a mechanism as shown in Scheme 1.7 was proposed for the
spontaneous racemisation of 3-hydroxy-1,4-benzodiazepines in alcoholic solvents. The
proposed mechanism involves an achiral imino aldehyde intermediate, where “hydrogen
bonds resulting from solvation by protic solvents probably initiating the opening of the
diazepine ring at C3-N4 bond”.
ci H-d
(R)-3-hydroxy-1,4- benzodiazepine
OH—OCl
(rac)-3-hydroxy-1,4- benzodiazepine
Scheme 1.7: mechanism of racemisation for enantiomers of 3-hydroxy-1,4-benzodiazepines
in anhydrous alcoholic solvents (RiOH), as proposed by Yang.
A mechanism involving an intermediate achiral imino aldehyde was also proposed by
Stromar et al.32 for racemisation of 3-hydroxy and 3-acyloxy 1,4-benzodiazepines in
aqueous media, at acidic pH.
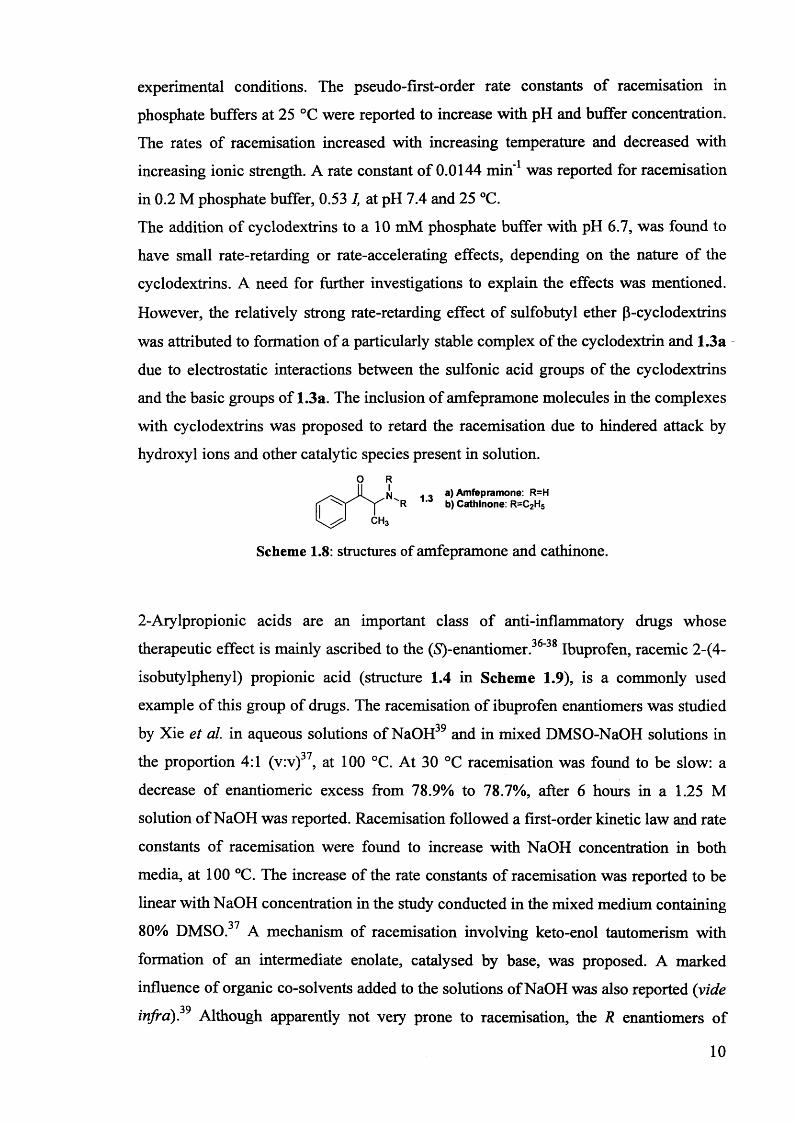
Amfepramone or diethylpropion (structure 1.3a in Scheme 1.8) is a sympathomimetic
drug which has been used as an anorectic in the treatment of obesity33. The
configurational stability of the molecule and of its metabolite cathinone (Structure 1.3b)
in Scheme 1.8) were assessed by Reist et a l3A by H/D exchange studies in D2O
phosphate and hydroxylamine buffers, in a pD range between 2.34 and 7.53, at 37 or 50
°C. For both 1.3a and b, the pseudo-first-order rate constants of H/D exchange increased
with pD and, at a constant pD of 7.4 with buffer concentration. By analogy with other
ketones, equal rate constants of racemisation and deuteration were assumed. An SeI
mechanism was proposed for H/D exchange and racemisation of 1.3a and b, involving
general-base-catalysed proton abstraction from the chiral centre as rate-determining
step. The intermediate enolates were proposed to be stabilised by the strong electron
withdrawing effects of the protonated terminal amino groups of 1.3a and b.35 The
racemisation of enantiomers of 1.3a was also investigated by Mey under different
9
experimental conditions. The pseudo-first-order rate constants of racemisation in
phosphate buffers at 25 °C were reported to increase with pH and buffer concentration.
The rates of racemisation increased with increasing temperature and decreased with
increasing ionic strength. A rate constant of 0.0144 m in1 was reported for racemisation
in 0.2 M phosphate buffer, 0.53 I, at pH 7.4 and 25 °C.
The addition of cyclodextrins to a 10 mM phosphate buffer with pH 6.7, was found to
have small rate-retarding or rate-accelerating effects, depending on the nature of the
cyclodextrins. A need for further investigations to explain the effects was mentioned.
However, the relatively strong rate-retarding effect of sulfobutyl ether p-cyclodextrins
was attributed to formation of a particularly stable complex of the cyclodextrin and 1.3a
due to electrostatic interactions between the sulfonic acid groups of the cyclodextrins
and the basic groups of 1.3a. The inclusion of amfepramone molecules in the complexes
with cyclodextrins was proposed to retard the racemisation due to hindered attack by
hydroxyl ions and other catalytic species present in solution.o R
N . . a) Amfepramone: R=H ^R b) Cathinone: R=C2H5
3
Scheme 1.8: structures of amfepramone and cathinone.
2-Arylpropionic acids are an important class of anti-inflammatory drugs whose
therapeutic effect is mainly ascribed to the (S)-enantiomer.36'38 Ibuprofen, racemic 2-(4-
isobutylphenyl) propionic acid (structure 1.4 in Scheme 1.9), is a commonly used
example of this group of drugs. The racemisation of ibuprofen enantiomers was studied
by Xie et al. in aqueous solutions of NaOH39 and in mixed DMSO-NaOH solutions in
the proportion 4:1 (v:v)37, at 100 °C. At 30 °C racemisation was found to be slow: a
decrease of enantiomeric excess from 78.9% to 78.7%, after 6 hours in a 1.25 M
solution of NaOH was reported. Racemisation followed a first-order kinetic law and rate
constants of racemisation were found to increase with NaOH concentration in both
media, at 100 °C. The increase of the rate constants of racemisation was reported to be
linear with NaOH concentration in the study conducted in the mixed medium containing3780% DMSO. A mechanism of racemisation involving keto-enol tautomerism with
formation of an intermediate enolate, catalysed by base, was proposed. A marked
influence of organic co-solvents added to the solutions of NaOH was also reported (vide39infra). Although apparently not very prone to racemisation, the R enantiomers of
10
ibuprofen and, in general, o f 2-arylpropionic acids are known to undergo chiral
aromatic substituents on the chiral carbon (structures 1.5a-f in Scheme 1.10), in
followed first-order kinetics and interconversion rate constants increased linearly with
trioctylamine concentration. The effect of different aryl substituents attached to the
chiral carbon on the rates of racemisation was studied. A Hammett plot correlating the
second-order rate constants of enantiomerisation with the <j values of the different aiyl
groups gave a Hammett p value of 3.58, suggesting build up of negative charge in the
transition state. A mechanism of racemisation was proposed involving rate-
determining proton abstraction of the asymmetric proton by the base, with formation of
an enolate intermediate forming a contact ion-pair with the protonated base, as in
Scheme 1.11.
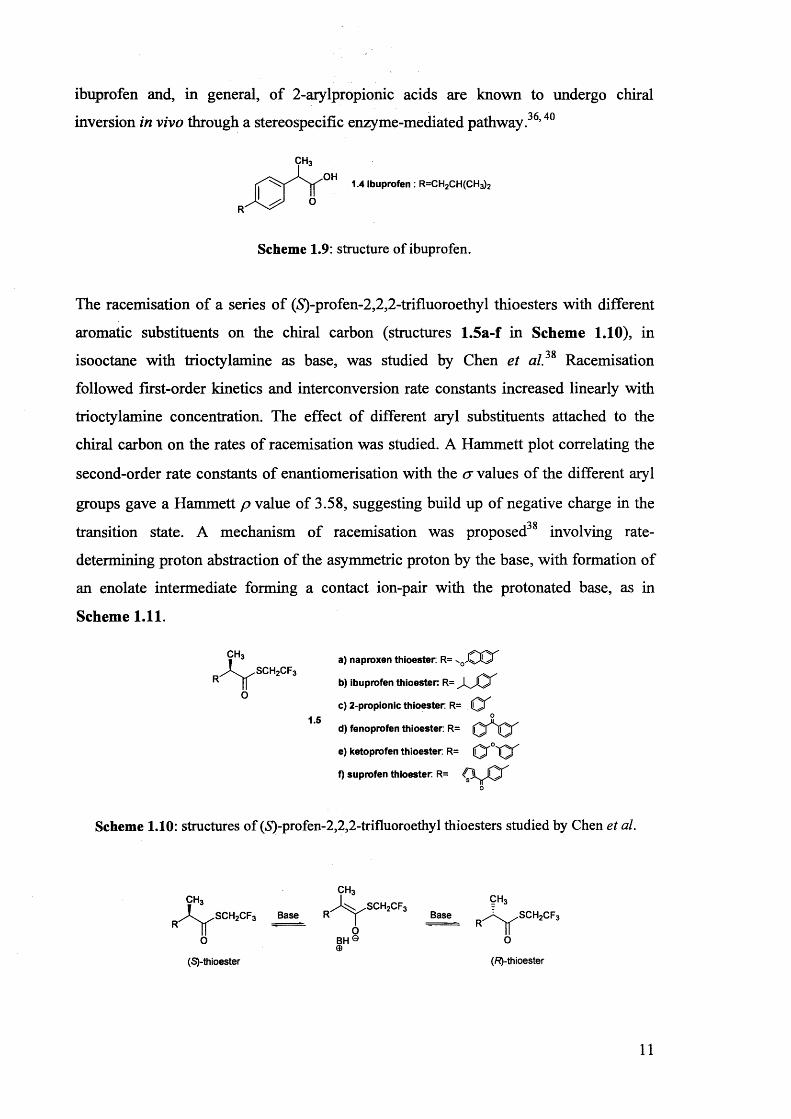
Scheme 1.10: structures of (5)-profen-2,2,2-trifluoroethyl thioesters studied by Chen et al.
inversion in vivo through a stereospecific enzyme-mediated pathway.36,40
1.4 Ibuprofen : R=CH2CH(CH3)2
Scheme 1.9: structure of ibuprofen.
The racemisation of a series of (5)-profen-2,2,2-trifluoroethyl thioesters with different
isooctane with trioctylamine as base, was studied by Chen et a/.38 Racemisation
o
a) naproxen thioester: R= - oJ 0 O ^
b) ibuprofen thioester: R=
c) 2-propionic thioester R= (0 T1.5 O
d) fenoprofen thioester R=
e) ketoprofen thioester R= 0 ^ ° T ^
f) suprofen thioester R=0
R
ch3J^ .sc h 2cf3
0BHeO O
(S)-thioester (R)-thioester
11
Scheme 1.11: mechanism of racemisation of (S)-profen 2,2,2- trifluoroethyl thioesters catalysed
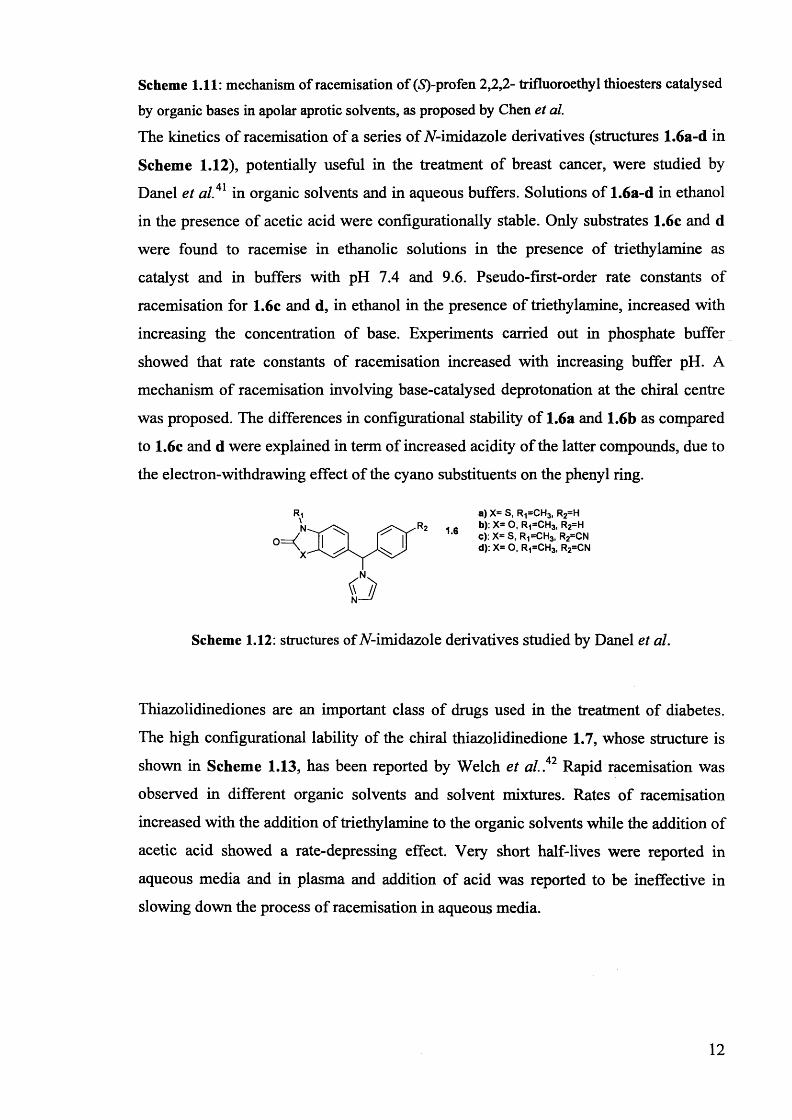
by organic bases in apolar aprotic solvents, as proposed by Chen et al.The kinetics of racemisation of a series of A-imidazole derivatives (structures 1.6a-d in
Scheme 1.12), potentially useful in the treatment of breast cancer, were studied by
Danel et al. 41 in organic solvents and in aqueous buffers. Solutions of 1.6a-d in ethanol
in the presence of acetic acid were configurationally stable. Only substrates 1.6c and d
were found to racemise in ethanolic solutions in the presence of triethylamine as
catalyst and in buffers with pH 7.4 and 9.6. Pseudo-first-order rate constants of
racemisation for 1.6c and d, in ethanol in the presence of triethylamine, increased with
increasing the concentration of base. Experiments carried out in phosphate buffer
showed that rate constants of racemisation increased with increasing buffer pH. A
mechanism of racemisation involving base-catalysed deprotonation at the chiral centre
was proposed. The differences in configurational stability of 1.6a and 1.6b as compared
to 1.6c and d were explained in term of increased acidity of the latter compounds, due to
the electron-withdrawing effect of the cyano substituents on the phenyl ring.
a) X= S, R^CH* R2=H R2 b): X= O, R^CH* R2=H
-b c): X= S, RPCH3, R2=CNd): X= O, Ri=CH3l R2=CN
Scheme 1.12: structures of A-imidazole derivatives studied by Danel et al.
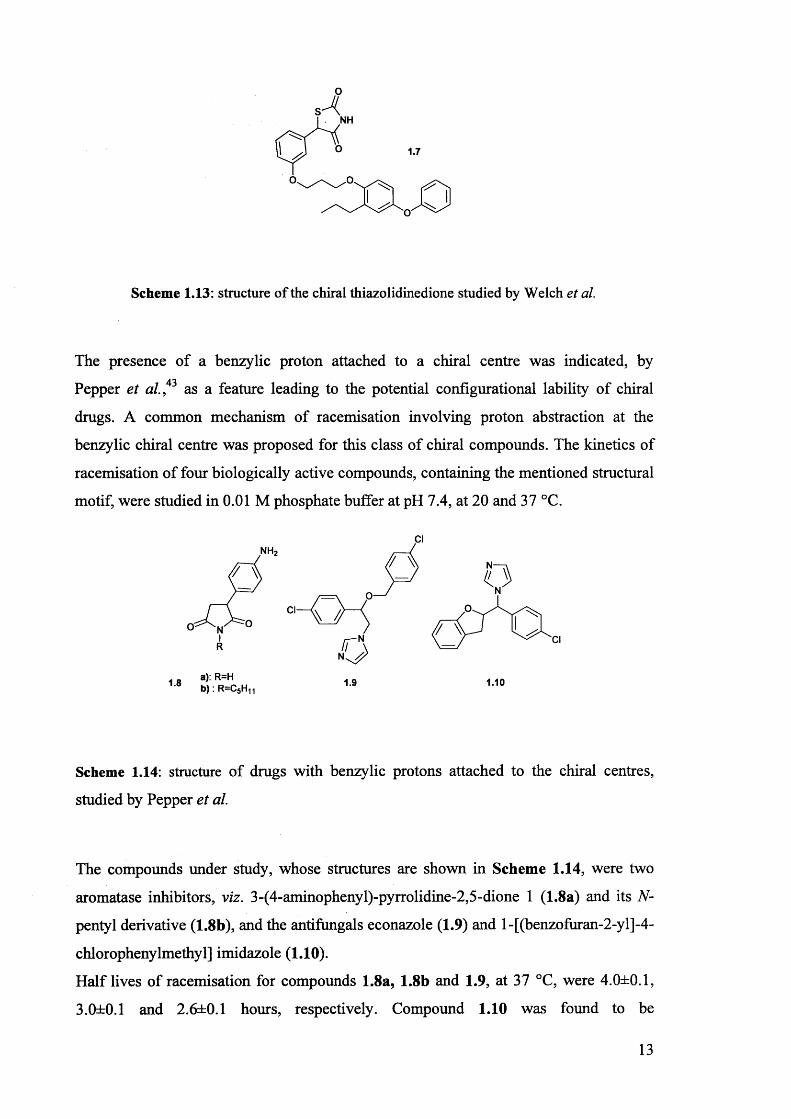
Thiazolidinediones are an important class of drugs used in the treatment of diabetes.
The high configurational lability of the chiral thiazolidinedione 1.7, whose structure is
shown in Scheme 1.13, has been reported by Welch et al. . 42 Rapid racemisation was
observed in different organic solvents and solvent mixtures. Rates of racemisation
increased with the addition of triethylamine to the organic solvents while the addition of
acetic acid showed a rate-depressing effect. Very short half-lives were reported in
aqueous media and in plasma and addition of acid was reported to be ineffective in
slowing down the process of racemisation in aqueous media.
12
NH
1.7
Scheme 1.13: structure of the chiral thiazolidinedione studied by Welch et al.
The presence of a benzylic proton attached to a chiral centre was indicated, by
Pepper et al. , 43 as a feature leading to the potential configurational lability of chiral
drugs. A common mechanism of racemisation involving proton abstraction at the
benzylic chiral centre was proposed for this class of chiral compounds. The kinetics of
racemisation of four biologically active compounds, containing the mentioned structural
motif, were studied in 0.01 M phosphate buffer at pH 7.4, at 20 and 37 °C.
nh2
1.8
R
a): R=Hb ): R=CSHU 1.9 1.10
Scheme 1.14: structure of drugs with benzylic protons attached to the chiral centres,
studied by Pepper et al.
The compounds under study, whose structures are shown in Scheme 1.14, were two
aromatase inhibitors, viz. 3-(4-aminophenyl)-pyrrolidine-2,5-dione 1 (1.8a) and its N-
pentyl derivative (1.8b), and the antifungals econazole (1.9) and l-[(benzofuran-2-yl]-4-
chlorophenylmethyl] imidazole (1.10).
Half lives of racemisation for compounds 1.8a, 1.8b and 1.9, at 37 °C, were 4.0±0.1,
3.0±0.1 and 2.6±0.1 hours, respectively. Compound 1.10 was found to be
13
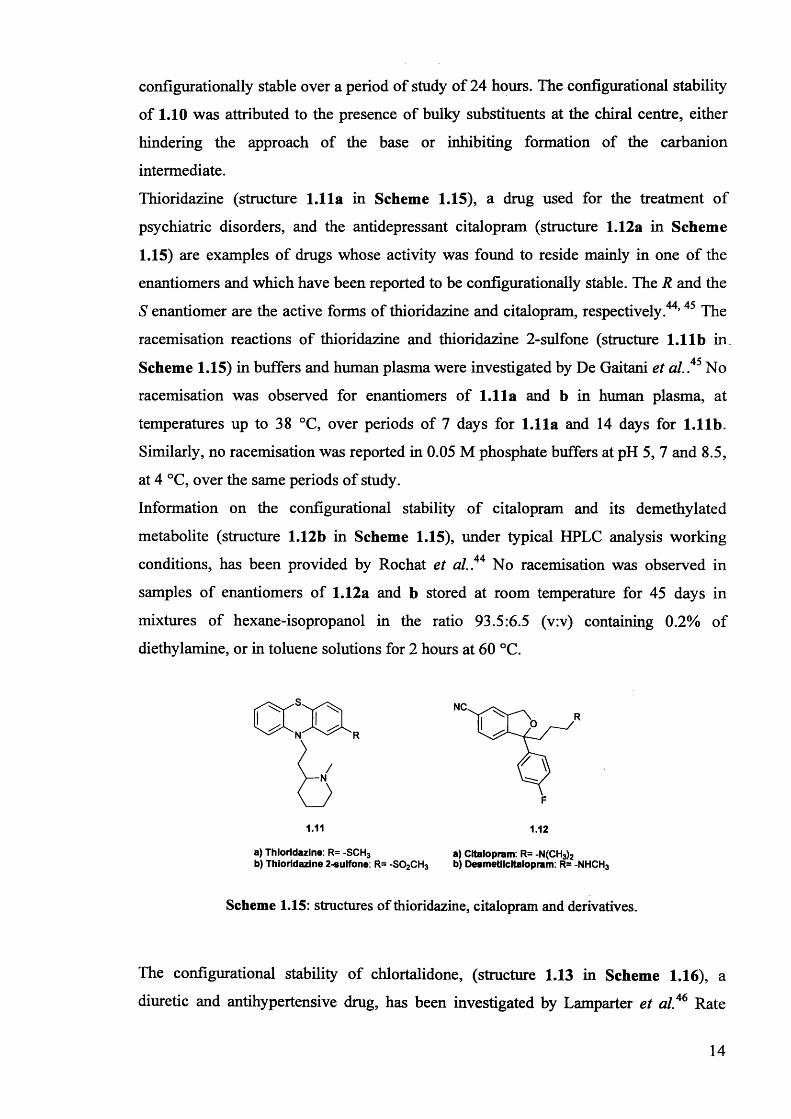
configurationally stable over a period of study of 24 hours. The configurational stability
of 1.10 was attributed to the presence of bulky substituents at the chiral centre, either
hindering the approach of the base or inhibiting formation of the carbanion
intermediate.
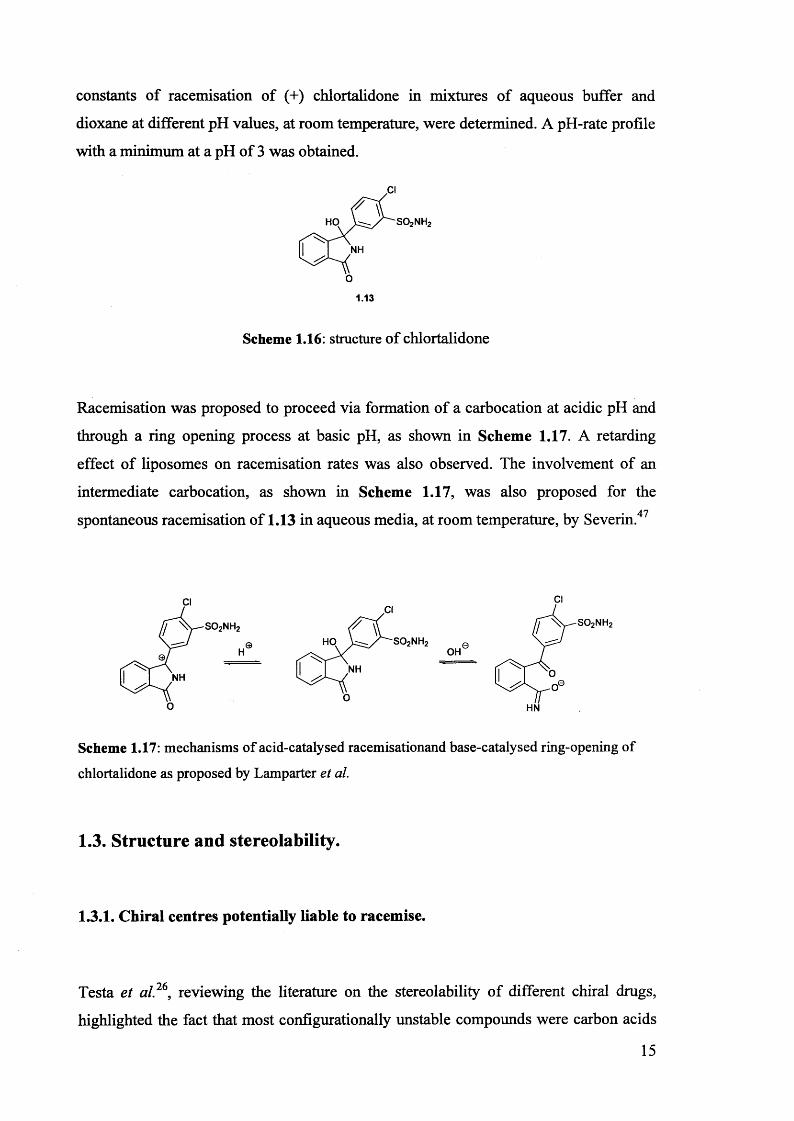
Thioridazine (structure 1.11a in Scheme 1.15), a drug used for the treatment of
psychiatric disorders, and the antidepressant citalopram (structure 1.12a in Scheme
1.15) are examples of drugs whose activity was found to reside mainly in one of the
enantiomers and which have been reported to be configurationally stable. The R and the
S enantiomer are the active forms of thioridazine and citalopram, respectively.44,45 The
racemisation reactions of thioridazine and thioridazine 2-sulfone (structure 1.11b in
Scheme 1.15) in buffers and human plasma were investigated by De Gaitani et al. . 45 No
racemisation was observed for enantiomers of 1.11a and b in human plasma, at
temperatures up to 38 °C, over periods of 7 days for 1.11a and 14 days for 1.11b.
Similarly, no racemisation was reported in 0.05 M phosphate buffers at pH 5, 7 and 8.5,
at 4 °C, over the same periods of study.
Information on the configurational stability of citalopram and its demethylated
metabolite (structure 1.12b in Scheme 1.15), under typical HPLC analysis working
conditions, has been provided by Rochat et al. 44 No racemisation was observed in
samples of enantiomers of 1.12a and b stored at room temperature for 45 days in
mixtures of hexane-isopropanol in the ratio 93.5:6.5 (v:v) containing 0.2% of
diethylamine, or in toluene solutions for 2 hours at 60 °C.
NC.
1.11 1.12
a) Thioridazine: R= -SCH3 a) Citalopram: R= -N(CH3)2b) Thioridazine 2-sulfone: R= -S02CH3 b) Desmetilcitalopram: R= -NHCH3
Scheme 1.15: structures of thioridazine, citalopram and derivatives.
The configurational stability of chlortalidone, (structure 1.13 in Scheme 1.16), a
diuretic and antihypertensive drug, has been investigated by Lamparter et a l 46 Rate
14
constants of racemisation of (+) chlortalidone in mixtures of aqueous buffer and
dioxane at different pH values, at room temperature, were determined. A pH-rate profile
with a minimum at a pH of 3 was obtained.
HO
NH
1.13
Scheme 1.16: structure of chlortalidone
Racemisation was proposed to proceed via formation of a carbocation at acidic pH and
through a ring opening process at basic pH, as shown in Scheme 1.17. A retarding
effect of liposomes on racemisation rates was also observed. The involvement of an
intermediate carbocation, as shown in Scheme 1.17, was also proposed for the
spontaneous racemisation of 1.13 in aqueous media, at room temperature, by Severin.47
,eOH
HN
NH
HO
NH
Scheme 1.17: mechanisms of acid-catalysed racemisationand base-catalysed ring-opening of chlortalidone as proposed by Lamparter et al.
1.3. Structure and stereolability.
1.3.1. Chiral centres potentially liable to racemise.
Testa et a l26, reviewing the literature on the stereolability of different chiral drugs,
highlighted the fact that most configurationally unstable compounds were carbon acids
15
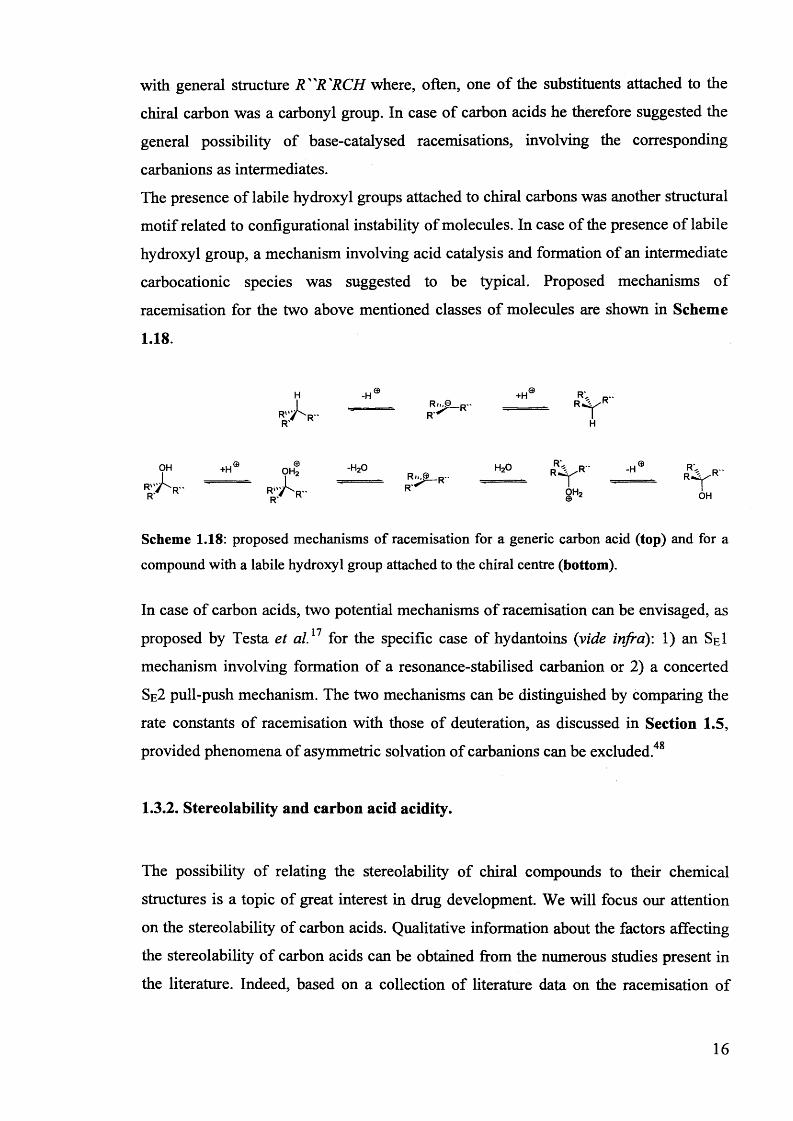
with general structure R"R'RCH where, often, one of the substituents attached to the
chiral carbon was a carbonyl group. In case of carbon acids he therefore suggested the
general possibility of base-catalysed racemisations, involving the corresponding
carbanions as intermediates.
The presence of labile hydroxyl groups attached to chiral carbons was another structural
motif related to configurational instability of molecules. In case of the presence of labile
hydroxyl group, a mechanism involving acid catalysis and formation of an intermediate
carbocationic species was suggested to be typical. Proposed mechanisms of
racemisation for the two above mentioned classes of molecules are shown in Scheme
1.18.
n -HR-n©_R
+HFT TH
OH w > r- H ,R " -H - R , r ..
RRr v - R' ^ Th
Scheme 1.18: proposed mechanisms of racemisation for a generic carbon acid (top) and for a
compound with a labile hydroxyl group attached to the chiral centre (bottom).
In case of carbon acids, two potential mechanisms of racemisation can be envisaged, as
proposed by Testa et a l 11 for the specific case of hydantoins (vide infra): 1) an Sgl
mechanism involving formation of a resonance-stabilised carbanion or 2) a concerted
Se2 pull-push mechanism. The two mechanisms can be distinguished by comparing the
rate constants of racemisation with those of deuteration, as discussed in Section 1.5,
provided phenomena of asymmetric solvation of carbanions can be excluded.48
1.3.2. Stereolability and carbon acid acidity.
The possibility of relating the stereolability of chiral compounds to their chemical
structures is a topic of great interest in drug development. We will focus our attention
on the stereolability of carbon acids. Qualitative information about the factors affecting
the stereolability of carbon acids can be obtained from the numerous studies present in
the literature. Indeed, based on a collection of literature data on the racemisation of
16
several chiral drugs, Testa et al.22,26 provided some guidelines for the prediction of the
configurational stability of carbon acids with general structure R"R 'RCH.
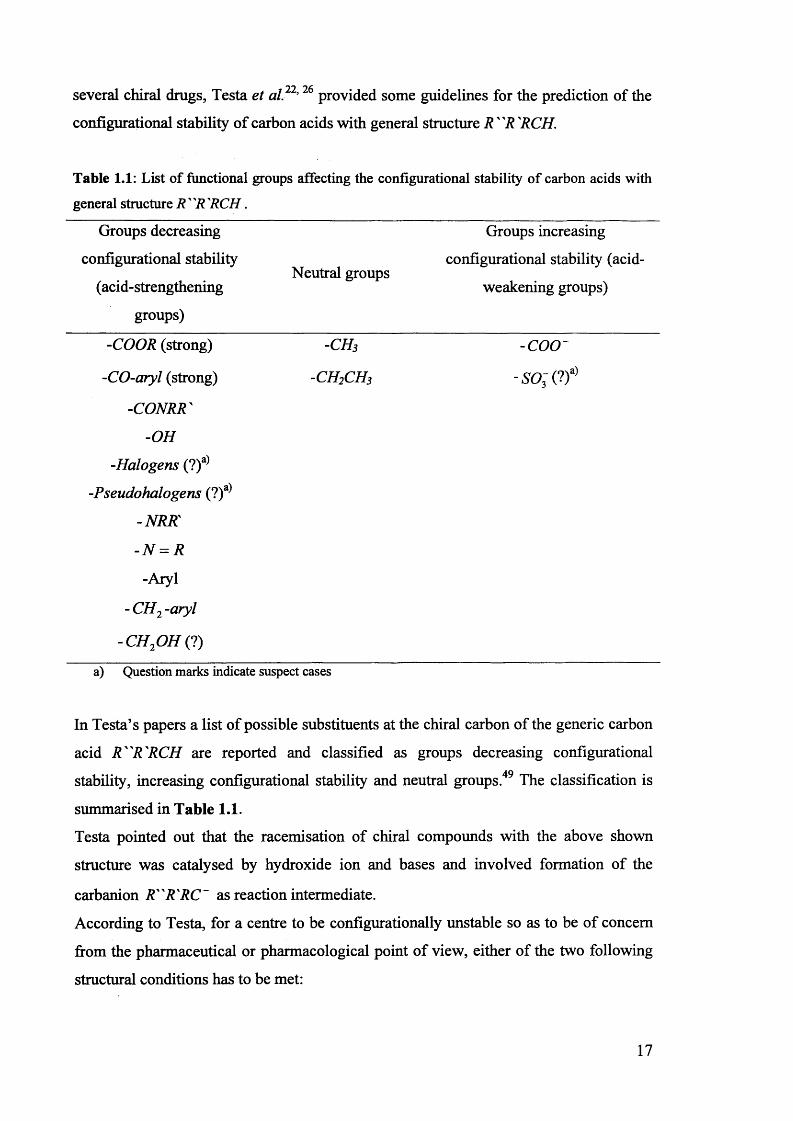
Table 1.1: List of functional groups affecting the configurational stability of carbon acids with
general structure R " R 'R C H .
Groups decreasing
configurational stability
(acid-strengthening
groups)
Neutral groups
Groups increasing
configurational stability (acid-
weakening groups)
-COOR (strong) - c h 3 - COO'
-CO-aryl (strong) -CH2CH3 - s o - (?)a)
-CONRR'
-OH
-Halogens (?)a)
-Pseudohalogens (?)a
-N R R
-N = R
-Aryl
- CH2 -aryl
-CH2OH (?)
a) Question marks indicate suspect cases
In Testa’s papers a list of possible substituents at the chiral carbon of the generic carbon
acid R"R'RCH are reported and classified as groups decreasing configurational
stability, increasing configurational stability and neutral groups.49 The classification is
summarised in Table 1.1.
Testa pointed out that the racemisation of chiral compounds with the above shown
structure was catalysed by hydroxide ion and bases and involved formation of the
carbanion R"R'RC~ as reaction intermediate.
According to Testa, for a centre to be configurationally unstable so as to be of concern
from the pharmaceutical or pharmacological point of view, either of the two following
structural conditions has to be met:
17
1) the presence of three carbanion-stabilizing groups directly attached to the chiral
centre
2) the presence of two carbanion-stabilizing groups (of which one has to be
strongly carbanion stabilising) and a neutral group directly attached to the chiral
centre.
Wilson reviewed50 experimental data from previous studies to help understand the effect
of substituents on the stereolability of compounds of the form R 'RCHX where X = -
COR, -CN or -NO2 The aim of the review was to give experimental evidence for the
hypothesis of the equivalence of the processes of racemisation and tautomerisation for
carbon acids with the mentioned structure. The author reported a classification of
groups X, in order of increasing ability at inducing tautomeric change: -COO~< -
CONH2< -COOH< -COOR< -COCl < -COR < -CN. Wilson compared the ranking
above with literature data from racemisation studies, and highlighted a parallel in the
ability of the groups at promoting tautomeric change and racemisation. Wilson
highlighted the unanimous opinion of several authors about the stabilising effect of the
carboxylate group, the first substituent in the series. For example a study by Alhberg51
was mentioned, who found that neutralization of optically active a,a'-sulpho-di-«-
butyric acid (H0 0 CCH(C2Hs)S0 2 CH(C2Hs)C0 0 H)), to form the corresponding
dicarboxylate, almost completely suppressed its racemisation. As far as substituents R'
and R (in Wilson’s notation) are concerned, if either of the two is an electron-
withdrawing group, the stereolability of the molecule is invariably enhanced. Examples
are reported illustrating the particularly strong destabilising effects of cyano and
ammonium groups. Weaker effects were reported for halogens and the hydroxy group,
for which the order -Cl > -Br » -OH, in terms of ability at favouring racemisation,
was deduced based on studies of the stereolability of phenyl halogenoacetic esters. The
effect of alkyl groups on the base-catalysed racemisation of acids with structure
S0 2 (CHRC0 0 H) 2 was also discussed by Wilson, citing a study by Ahlberg,51
suggesting the order -CH3 > -C2H5 > -CH(CH3)2 for facilitation of racemisation.
Finally the case of aryl groups, strong activating groups in prototropy, was treated.
Wilson reported several studies demonstrating the ability of aryl groups at promoting
racemisation. For example, Me Kenzie and Wren observed that esters of the form
RCH(OH)COOR' were not generally prone to racemisation under basic conditions,
unless R was a phenyl group.52 On the other hand, the phenyl group had to be directly
18
attached to a so-called “racemisable system” such as -CH(OH)COOR' 52 or -
CH(OH)NHR '53, for a compound to be configurationally unstable. This observation is in
line with the above-mentioned empirical “rules” reported by Testa et a l 2 1 , 26 for chiral
stability. McKenzie et al. also observed particularly low configurational stability of
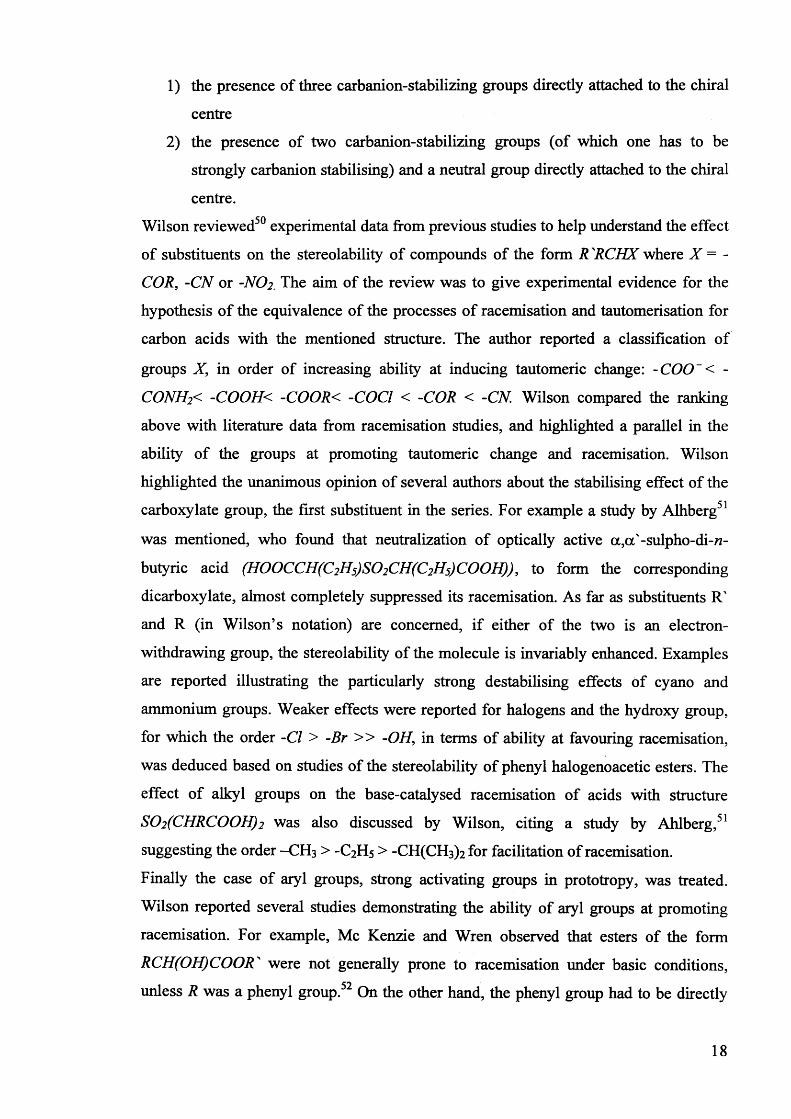
optically active derivatives of phenyl-p-tolylacetic acid, whose structures are shown in
Scheme 1.19, under the catalytic action of alkali.53,54
R
R= -OH, -OR', -NH2
Scheme 1.19: general structure of the derivatives of pheny 1-p-tolylacetic acid studied by
McKenzie and co-workers.
As mention earlier, the potential stereolability of chiral compounds bearing a benzylic
proton at the chiral centre was also predicted by Pepper et al. 43
Further examples of the effects of substituents at a chiral centre on its configurational
stability are given in the study by Testa on the chiral inversion of 5-substitutedi nhydantoins (vide infra).
The ability of substituents at stabilising carbanions, i.e. increasing the acidity of carbon
acids is therefore recognised as an important feature to take into consideration, when
dealing with the racemisation of this class of compounds.
1.3.3. Quantitative studies on carbon acid acidity.
It has recently been proposed55 that the stereolability of chiral a-substituted ketones
could be predicted using the pKa of these carbon acids. The pKa themselves can be
modulated by means of structural modifications. This hypothesis was successfully
tested using two biologically active ketones.
The acidity of a carbon acid has both thermodynamic and kinetic implications and the
kinetic acidity, measured by the rate at which a carbon acid donates protons to a base,
can be correlated to its thermodynamic acidity.56 Quantitative studies on the carbon
acidities of several a-carbonyl carbon acids, in aqueous solution, were carried out by
Richard et al.. The measurement of the rate constants of deprotonation by bases of
19
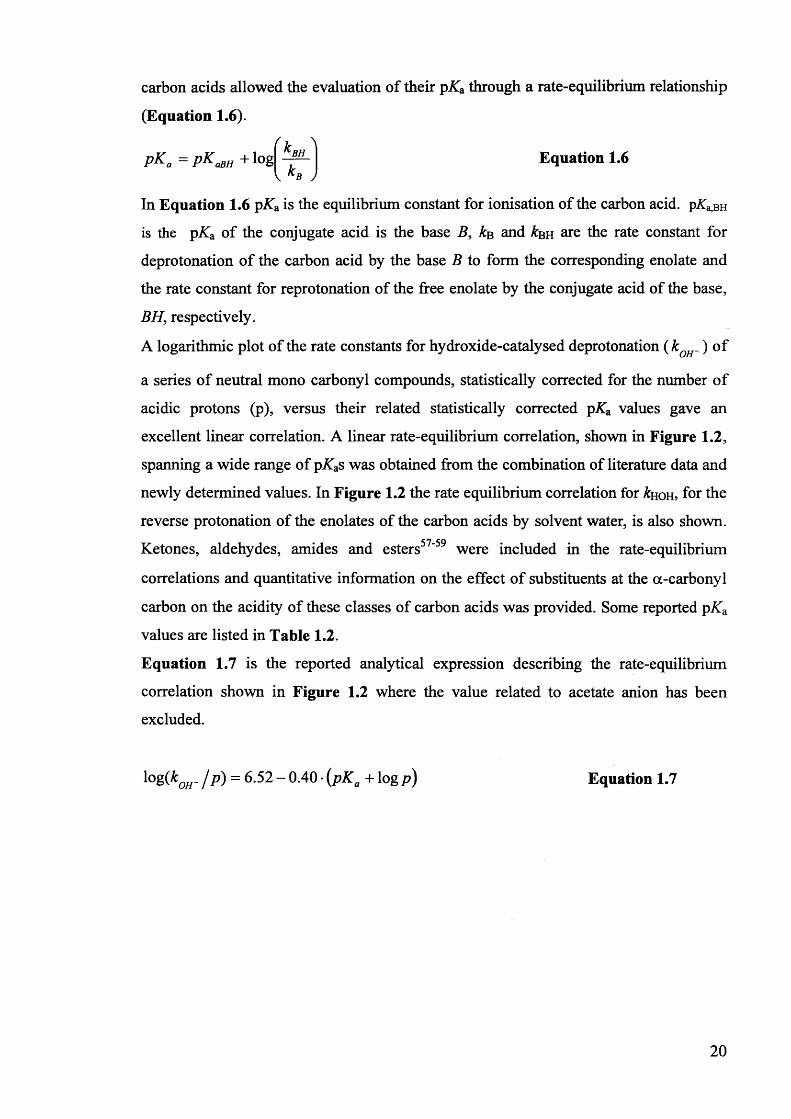
carbon acids allowed the evaluation of their pKa through a rate-equilibrium relationship
(Equation 1.6).
is the pKa of the conjugate acid is the base B, &b and £bh are the rate constant for
the rate constant for reprotonation of the free enolate by the conjugate acid of the base,
BH, respectively.
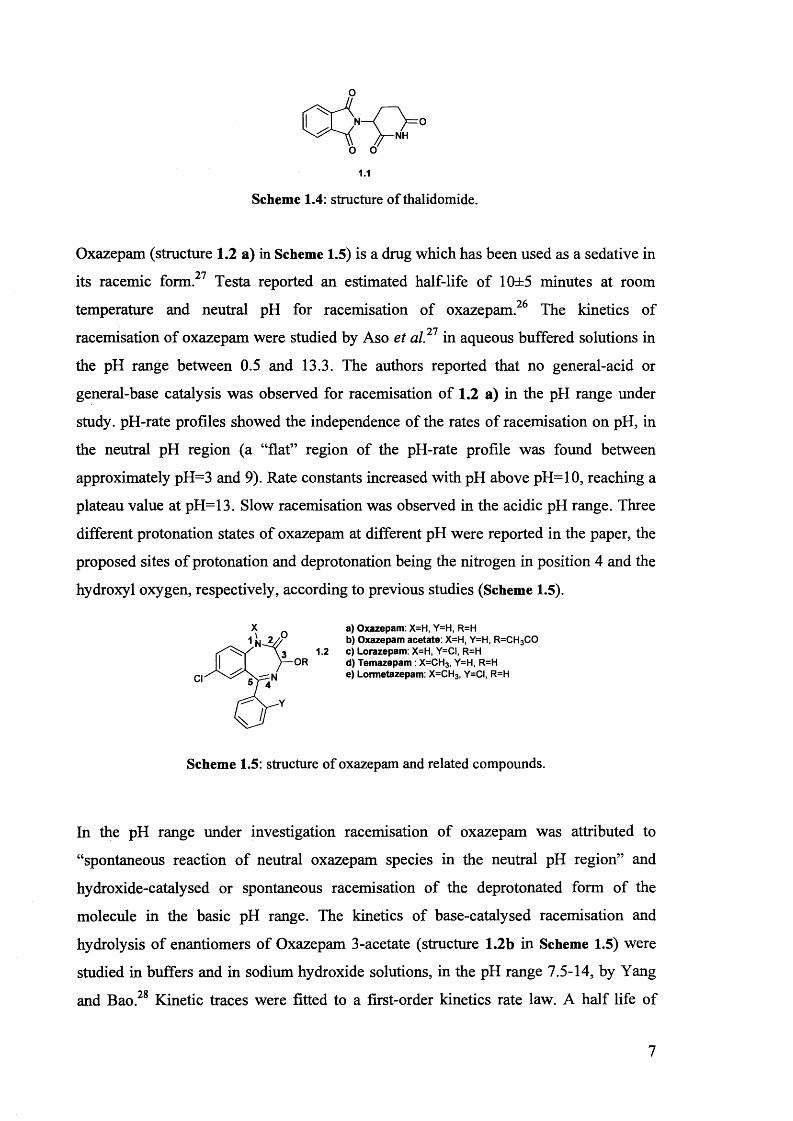
A logarithmic plot of the rate constants for hydroxide-catalysed deprotonation ( kQR_) of
a series of neutral mono carbonyl compounds, statistically corrected for the number of
acidic protons (p), versus their related statistically corrected pKa values gave an
excellent linear correlation. A linear rate-equilibrium correlation, shown in Figure 1.2,
spanning a wide range of pATas was obtained from the combination of literature data and
newly determined values. In Figure 1.2 the rate equilibrium correlation for &h o h , for the
reverse protonation of the enolates of the carbon acids by solvent water, is also shown.
Ketones, aldehydes, amides and esters57'59 were included in the rate-equilibrium
correlations and quantitative information on the effect of substituents at the a-carbonyl
carbon on the acidity of these classes of carbon acids was provided. Some reported pKa
values are listed in Table 1.2.
Equation 1.7 is the reported analytical expression describing the rate-equilibrium
correlation shown in Figure 1.2 where the value related to acetate anion has been
Equation 1.6
In Equation 1.6 pKa is the equilibrium constant for ionisation of the carbon acid. pA^bh
deprotonation of the carbon acid by the base B to form the corresponding enolate and
excluded.
log (k0H- /p ) = 6.52 - 0.40 • (pKa + logp) Equation 1.7
20
15
•r* 10
-10
35 4030251510 20
p £ a + log/>
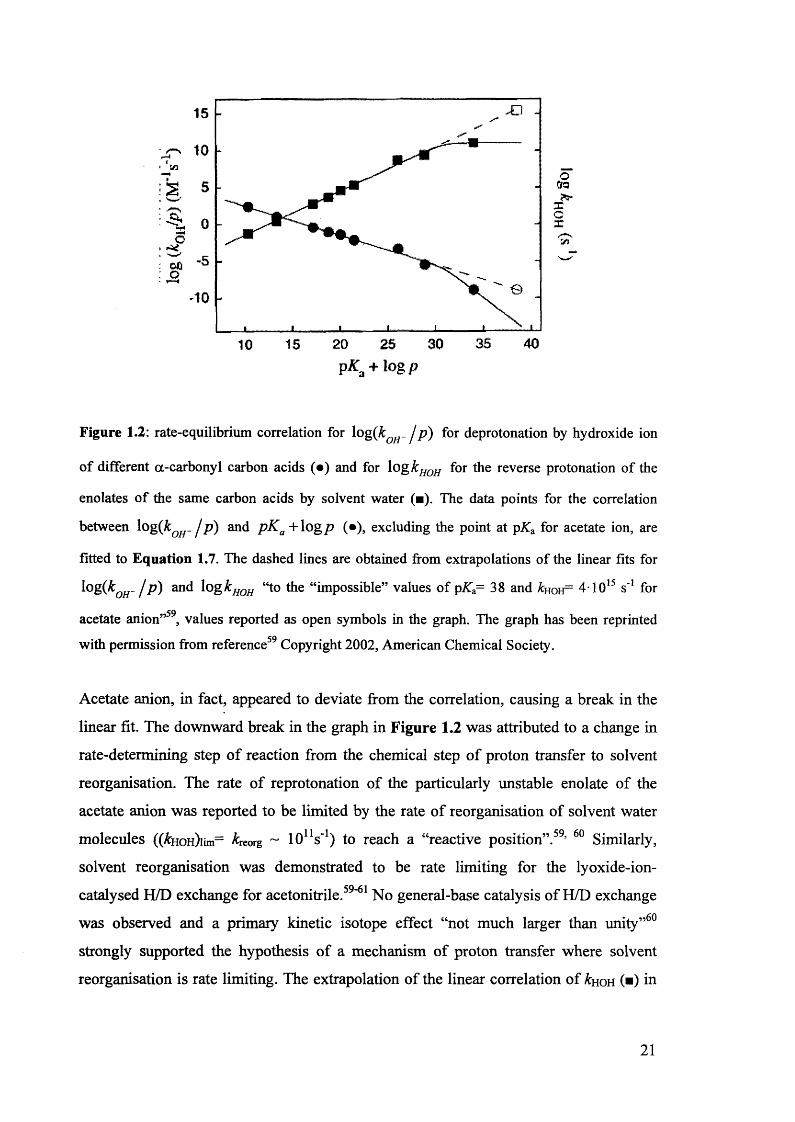
Figure 1.2: rate-equilibrium correlation for log{k QH- / p) for deprotonation by hydroxide ion
of different a-carbonyl carbon acids (•) and for log k HOH for the reverse protonation of the
enolates of the same carbon acids by solvent water (■). The data points for the correlation
between log{kQH_jp) and p K a + log p (•), excluding the point at pKz for acetate ion, are
fitted to Equation 1.7. The dashed lines are obtained from extrapolations of the linear fits for
log(&0/r j p ) and logkH0H “to the “impossible” values of pK &= 38 and ^hokt" 41015 s'1 for
acetate anion”59, values reported as open symbols in the graph. The graph has been reprinted
with permission from reference59 Copyright 2002, American Chemical Society.
Acetate anion, in fact, appeared to deviate from the correlation, causing a break in the
linear fit. The downward break in the graph in Figure 1.2 was attributed to a change in
rate-determining step of reaction from the chemical step of proton transfer to solvent
reorganisation. The rate of reprotonation of the particularly unstable enolate of the
acetate anion was reported to be limited by the rate of reorganisation of solvent water
molecules ((&HOH)iim= kK0Tg ~ lO1 "1) to reach a “reactive position”.59, 60 Similarly,
solvent reorganisation was demonstrated to be rate limiting for the lyoxide-ion-
catalysed H/D exchange for acetonitrile.59"61 No general-base catalysis of H/D exchange
was observed and a primary kinetic isotope effect “not much larger than unity”60
strongly supported the hypothesis of a mechanism of proton transfer where solvent
reorganisation is rate limiting. The extrapolation of the linear correlation of kuon (■) in
21
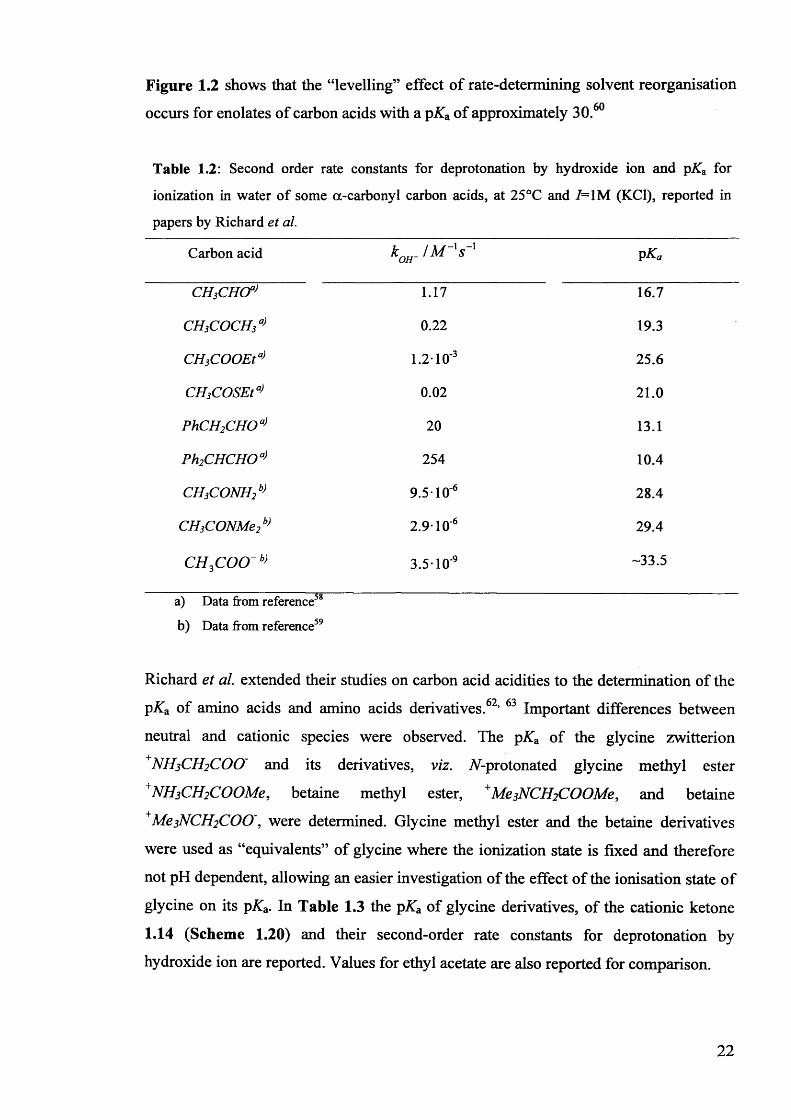
Figure 1.2 shows that the “levelling” effect of rate-determining solvent reorganisation
occurs for enolates of carbon acids with a pKa of approximately 30.60
Table 1.2: Second order rate constants for deprotonation by hydroxide ion and pK a for
ionization in water of some a-carbonyl carbon acids, at 25°C and 7=1 M (KC1), reported in
papers by Richard e t al.
Carbon acid pKa
CH3CHCrJ 1.17 16.7
CH3COCH 3a) 0.22 19.3
CH3C O O E ta) 1.2-10'3 25.6
CH3C O SE ta) 0.02 21.0
PhCH 2C H O a) 20 13.1
Ph2C H C H O a) 254 10.4
CH3CONH2b) 9.5-1 O'6 28.4
CH3CONM e2b) 2.9-10‘6 29.4
CH3C O O b)
\ r-____58
3.5-10'9 -33.5
a) Data from reference^b) Data from reference59
Richard et al. extended their studies on carbon acid acidities to the determination of the
pKa of amino acids and amino acids derivatives.62, 63 Important differences between
neutral and cationic species were observed. The pKa of the glycine zwitterion
+NH3 CH2 COO' and its derivatives, viz. TV-protonated glycine methyl ester
NH3CH2 COOMe, betaine methyl ester, + Me 3NCH2COOMe, and betaine
* MesNCfyCOO', were determined. Glycine methyl ester and the betaine derivatives
were used as “equivalents” of glycine where the ionization state is fixed and therefore
not pH dependent, allowing an easier investigation of the effect of the ionisation state of
glycine on its pKa. In Table 1.3 the pKa of glycine derivatives, of the cationic ketone
1.14 (Scheme 1.20) and their second-order rate constants for deprotonation by
hydroxide ion are reported. Values for ethyl acetate are also reported for comparison.
22
Scheme 1.20: structure of the cationic ketone 1.14 included in the rate-equilibrium correlation
shown in Figure 1.3, reported by Richard et al
Table 1.3: Second order rate constants for deprotonation by hydroxide ion and pK a for
ionization in water of ethyl acetate and glycine derivatives and 1.14, at 25°C and 7=TM (KC1),
determined by Richard e t al.
Carbon acid kOH- / M - ' s " P K a
CH2COOEt 1.2-10‘3 25.6
+NH3CH2COOM e 4.1 21.0±1.0
+M e3NCH2COOM e 390 18.0±1.0
+n h 3c h 2c o o - 4.5-1 O'5 28.8±0.5
+M e 3NCH2COO' 3.3-10-4 27.3±1.2
1.14 1.8-1 O'5 10.9
From the data in Table 1.3 the acidifying effect of the a-NR3+ (R=H, Me) groups is
evident. The lower acidifying effect of the oc-NH3+ group as compared to the a- NMe3+
was found to be in line with the polar effects of the groups as quantified by the
inductive substituent constants c?i64, which have been reported to be ai= 0.92 and 0.60
for a- NMe3+ and a-NH3+, respectively .62’65 It was highlighted59 that the same 4.6 units
in pKa difference between ethyl acetate and A^-protonated glycine methyl ester is
reflected in the pATa difference between acetate anion (value reported in Table 1.2) and
glycine zwitterions.
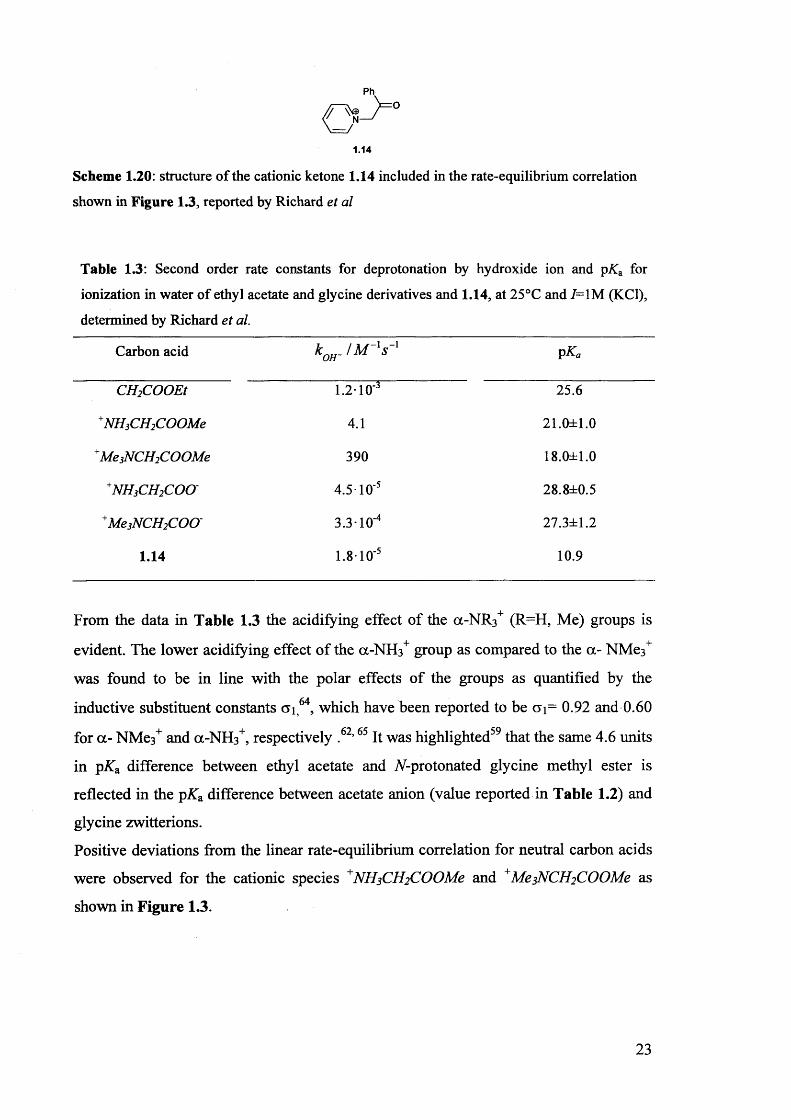
Positive deviations from the linear rate-equilibrium correlation for neutral carbon acids
were observed for the cationic species ^NH^CfyCOOMe and +MesNCH2 COOMe as
shown in Figure 1.3.
12
8
4
8
10 15 20 25 30 35
12
8 _#2Ore
4 a?** O
o ^
h4 w "
-8
pK + log p
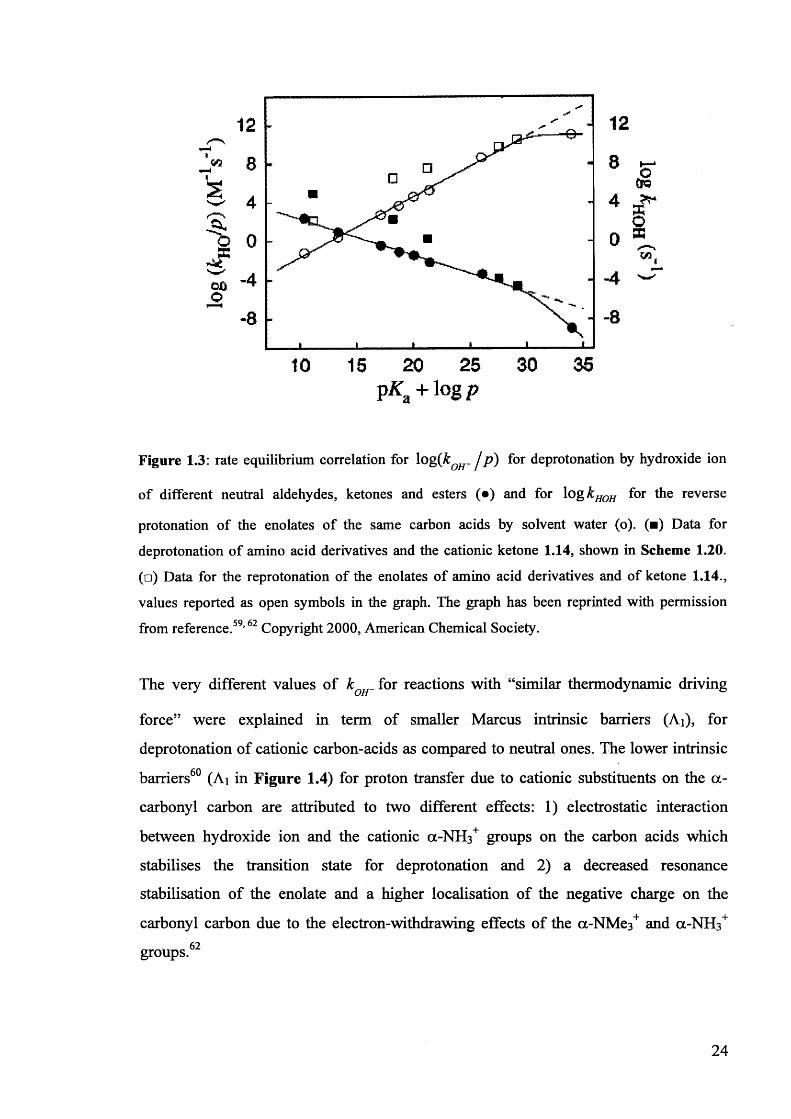
Figure 1.3: rate equilibrium correlation for log{kOH- / P) f°r deprotonation by hydroxide ion
of different neutral aldehydes, ketones and esters (•) and for log kHOH for the reverse
protonation of the enolates of the same carbon acids by solvent water (o). (■) Data for
deprotonation of amino acid derivatives and the cationic ketone 1.14, shown in Scheme 1.20. (□) Data for the reprotonation of the enolates of amino acid derivatives and of ketone 1.14., values reported as open symbols in the graph. The graph has been reprinted with permission
from reference.59,62 Copyright 2000, American Chemical Society.
The very different values of k „ . for reactions with “similar thermodynamic drivingOH
force” were explained in term of smaller Marcus intrinsic barriers (Ai), for
deprotonation of cationic carbon-acids as compared to neutral ones. The lower intrinsic
barriers60 (Ai in Figure 1.4) for proton transfer due to cationic substituents on the a-
carbonyl carbon are attributed to two different effects: 1) electrostatic interaction
between hydroxide ion and the cationic a-NH3+ groups on the carbon acids which
stabilises the transition state for deprotonation and 2) a decreased resonance
stabilisation of the enolate and a higher localisation of the negative charge on the
carbonyl carbon due to the electron-withdrawing effects of the a-NMe3+ and a-NH3+ 62groups.
24
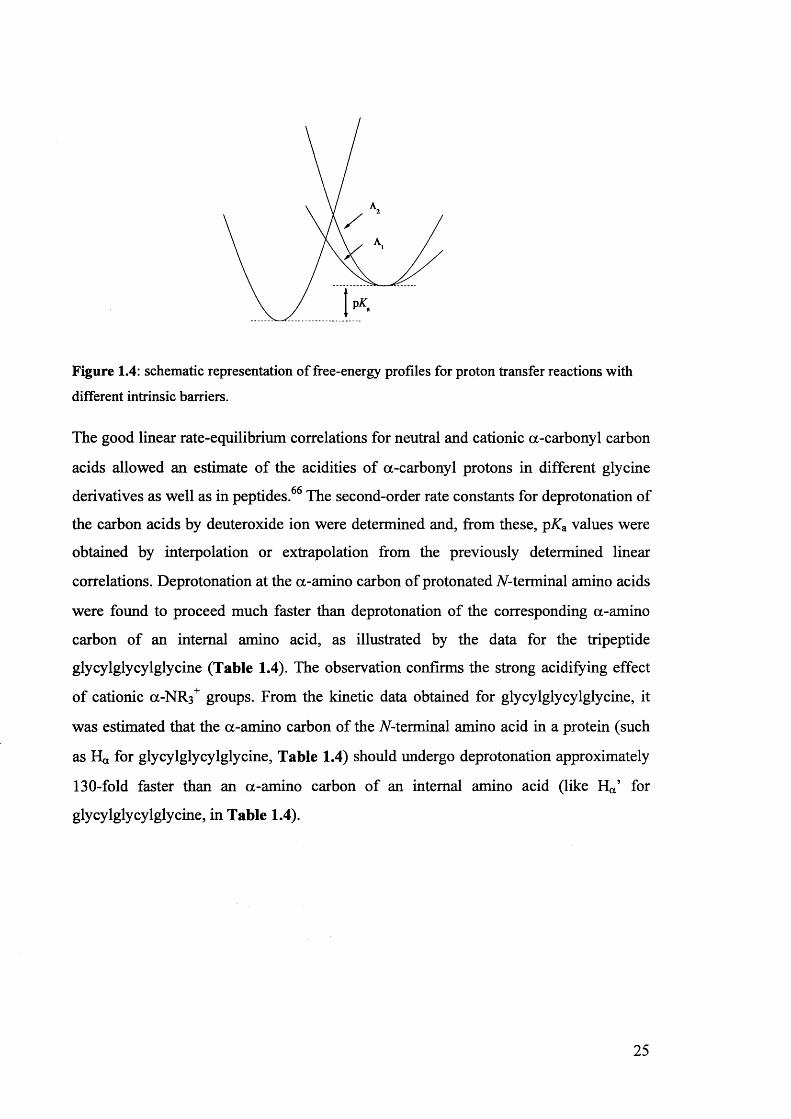
Figure 1.4: schematic representation of free-energy profiles for proton transfer reactions with different intrinsic barriers.
The good linear rate-equilibrium correlations for neutral and cationic a-carbonyl carbon
acids allowed an estimate of the acidities of a-carbonyl protons in different glycine
derivatives as well as in peptides.66 The second-order rate constants for deprotonation of
the carbon acids by deuteroxide ion were determined and, from these, pKa values were
obtained by interpolation or extrapolation from the previously determined linear
correlations. Deprotonation at the a-amino carbon of protonated TV-terminal amino acids
were found to proceed much faster than deprotonation of the corresponding a-amino
carbon of an internal amino acid, as illustrated by the data for the tripeptide
glycylglycylglycine (Table 1.4). The observation confirms the strong acidifying effect
of cationic a-NR.3+ groups. From the kinetic data obtained for glycylglycylglycine, it
was estimated that the a-amino carbon of the TV-terminal amino acid in a protein (such
as H« for glycylglycylglycine, Table 1.4) should undergo deprotonation approximately
130-fold faster than an a-amino carbon of an internal amino acid (like Ha’ for
glycylglycylglycine, in Table 1.4).
25
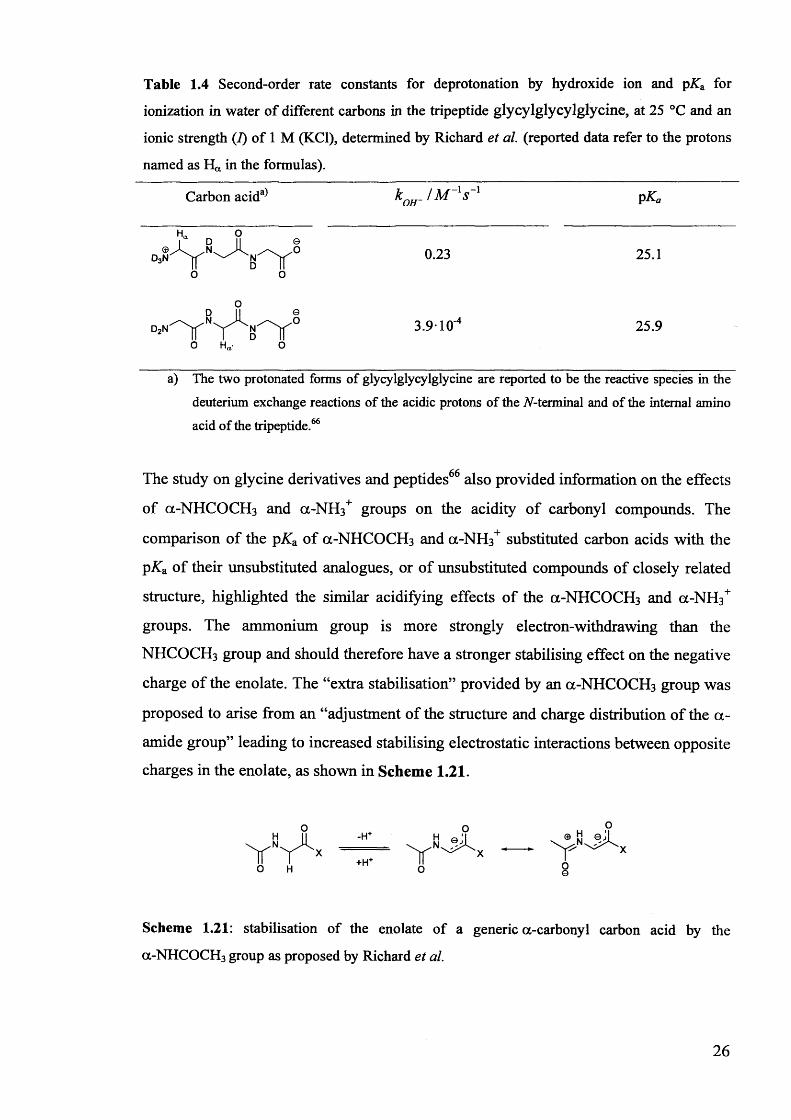
Table 1.4 Second-order rate constants for deprotonation by hydroxide ion and pK& for
ionization in water of different carbons in the tripeptide glycylglycylglycine, at 25 °C and an
ionic strength (i) of 1 M (KC1), determined by Richard et al. (reported data refer to the protons
named as Ha in the formulas).
Carbon acida) PK a
Hoc 0
0 0
0.23 25.1
0 Ha- 0
3.9-1C4 25.9
a) The two protonated forms of glycylglycylglycine are reported to be the reactive species in thedeuterium exchange reactions of the acidic protons of the TV-terminal and of the internal amino acid of the tripeptide.66
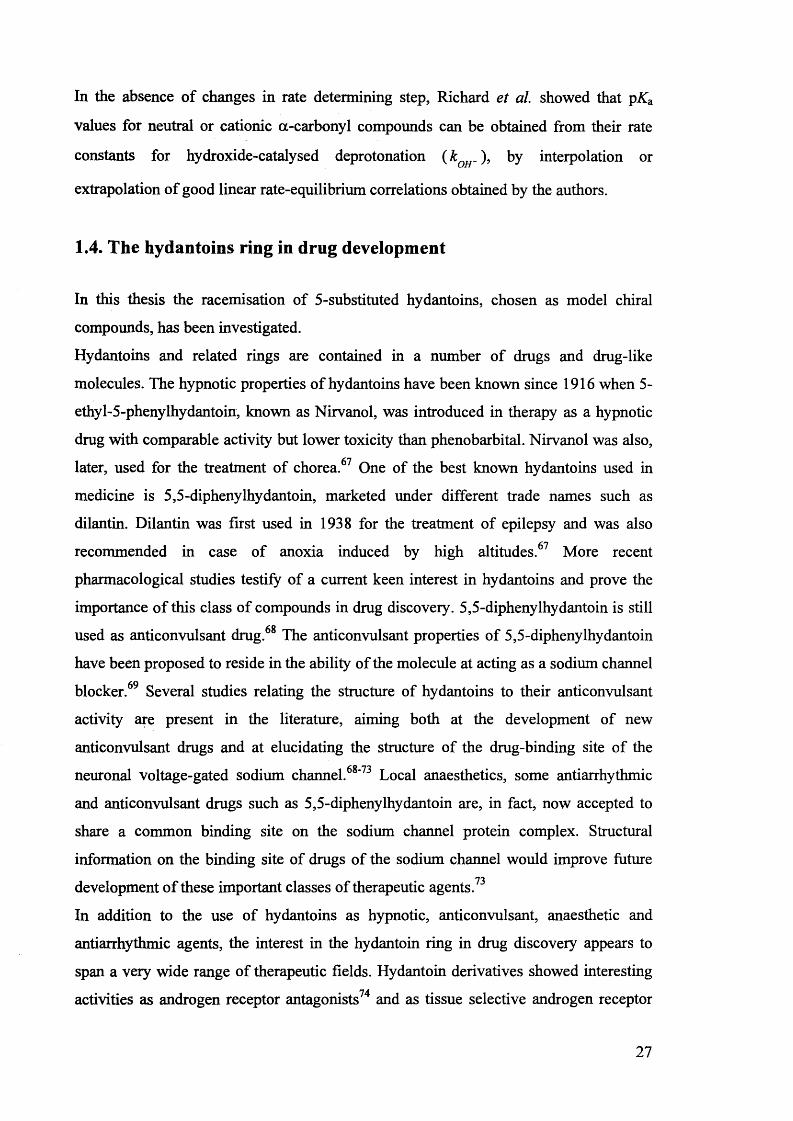
The study on glycine derivatives and peptides66 also provided information on the effects
of a-NHCOCH3 and a-NH3+ groups on the acidity of carbonyl compounds. The
comparison of the pKa of 0C-NHCOCH3 and a-NH3+ substituted carbon acids with the
pKa of their unsubstituted analogues, or of unsubstituted compounds of closely related
structure, highlighted the similar acidifying effects of the CX-NHCOCH3 and a-NH3+
groups. The ammonium group is more strongly electron-withdrawing than the
NHCOCH3 group and should therefore have a stronger stabilising effect on the negative
charge of the enolate. The “extra stabilisation” provided by an (X-NHCOCH3 group was
proposed to arise from an “adjustment of the structure and charge distribution of the a-
amide group” leading to increased stabilising electrostatic interactions between opposite
charges in the enolate, as shown in Scheme 1.21.
Scheme 1.21: stabilisation of the enolate of a generic a-carbonyl carbon acid by the
a-NHCOCH3 group as proposed by Richard et al.
26
In the absence of changes in rate determining step, Richard et al. showed that pKa
values for neutral or cationic a-carbonyl compounds can be obtained from their rate
constants for hydroxide-catalysed deprotonation (k ) 9 by interpolation or
extrapolation of good linear rate-equilibrium correlations obtained by the authors.
1.4. The hydantoins ring in drug development
In this thesis the racemisation of 5-substituted hydantoins, chosen as model chiral
compounds, has been investigated.
Hydantoins and related rings are contained in a number of drugs and drug-like
molecules. The hypnotic properties of hydantoins have been known since 1916 when 5-
ethyl-5-phenylhydantoin, known as Nirvanol, was introduced in therapy as a hypnotic
drug with comparable activity but lower toxicity than phenobarbital. Nirvanol was also,
later, used for the treatment of chorea.67 One of the best known hydantoins used in
medicine is 5,5-diphenylhydantoin, marketed under different trade names such as
dilantin. Dilantin was first used in 1938 for the treatment of epilepsy and was also• • • ftTJrecommended in case of anoxia induced by high altitudes. More recent
pharmacological studies testify of a current keen interest in hydantoins and prove the
importance of this class of compounds in drug discovery. 5,5-diphenylhydantoin is still
used as anticonvulsant drug.68 The anticonvulsant properties of 5,5-diphenylhydantoin
have been proposed to reside in the ability of the molecule at acting as a sodium channel
blocker.69 Several studies relating the structure of hydantoins to their anticonvulsant
activity are present in the literature, aiming both at the development of new
anticonvulsant drugs and at elucidating the structure of the drug-binding site of the
neuronal voltage-gated sodium channel.68*73 Local anaesthetics, some antiarrhythmic
and anticonvulsant drugs such as 5,5-diphenylhydantoin are, in fact, now accepted to
share a common binding site on the sodium channel protein complex. Structural
information on the binding site of drugs of the sodium channel would improve future
development of these important classes of therapeutic agents.
In addition to the use of hydantoins as hypnotic, anticonvulsant, anaesthetic and
antiarrhythmic agents, the interest in the hydantoin ring in drug discovery appears to
span a very wide range of therapeutic fields. Hydantoin derivatives showed interesting
activities as androgen receptor antagonists74 and as tissue selective androgen receptor
27
modulators 75 which makes them attractive prospective drugs for the treatment of
prostate cancer74 and other androgen-dependent disorders.75 Further recent studies
report on the activity of phenylmethylene hydantoins as inhibitors of the growth of
some prostate76 and lung77 cancer cell lines. Diphenylhydantoin and other hydantoin
derivatives have been proposed as prospective drugs for the treatment of HIV infection• • • • TO HQsince they appeared to interfere with the entry of viral strains into the host cells. ’
Different 3,5-substituted hydantoins were proposed as interesting compounds withfin fii finpotential use for the treatment of rheumatoid arthritis 5 and pulmonary emphysema.
• • S')Literature studies reported affinity of 5,5'-diphenyl hydantoins and 5,5'-diphenyl
thiohydantoins83 for the human CBi cannabinoid receptor. The hydantoin ring has thus
been proposed as an attractive scaffold for the development of a new class of
compounds able to modulate the activity of the cannabinoid system, useful for the
treatment of several diseases associated to disorders of this system.
Tetrahydroisoquinoline-hydantoin derivatives have been suggested as potential sigma-1
receptor modulators, useful for the treatment of cocaine addiction and other
dysfunctions associated with sigma-1 receptors.84, 85 Thiohydantoin derivatives have
also been proposed as potential hypolipidemic agents.
1.5. The racemisation of hydantoins
In spite of the current keen interest in the hydantoin ring in drug design, different
interpretations are reported in the literature on the mechanisms of racemisation of this
class of compounds.fi n
Dakin , as early as 1910, observed that optically active 5-substituted hydantoins
racemised in alkaline solutions. The author proposed that the mechanism of
racemisation involved a process of keto-enol tautomerism with formation of an
intermediate planar enolate (Scheme 1.22). The configurational stability of the
corresponding uramido acids of the hydantoins and of a 5,5-disubstituted hydantoin
(structures 1.15 and 1.16) in Scheme 1.22), where similar keto-enol tautomerism is not
possible, were given as evidence for the proposed mechanism. In further experiments
Dakin tested the configurational stability of some proteins because of the similarity of
their molecular structures with the groupings present in the hydantoin ring. Alkaline
solutions of different proteins, at room temperature, showed a decrease in, but not a
complete loss of, optical activity. The finding was explained with the hypothesis that
28
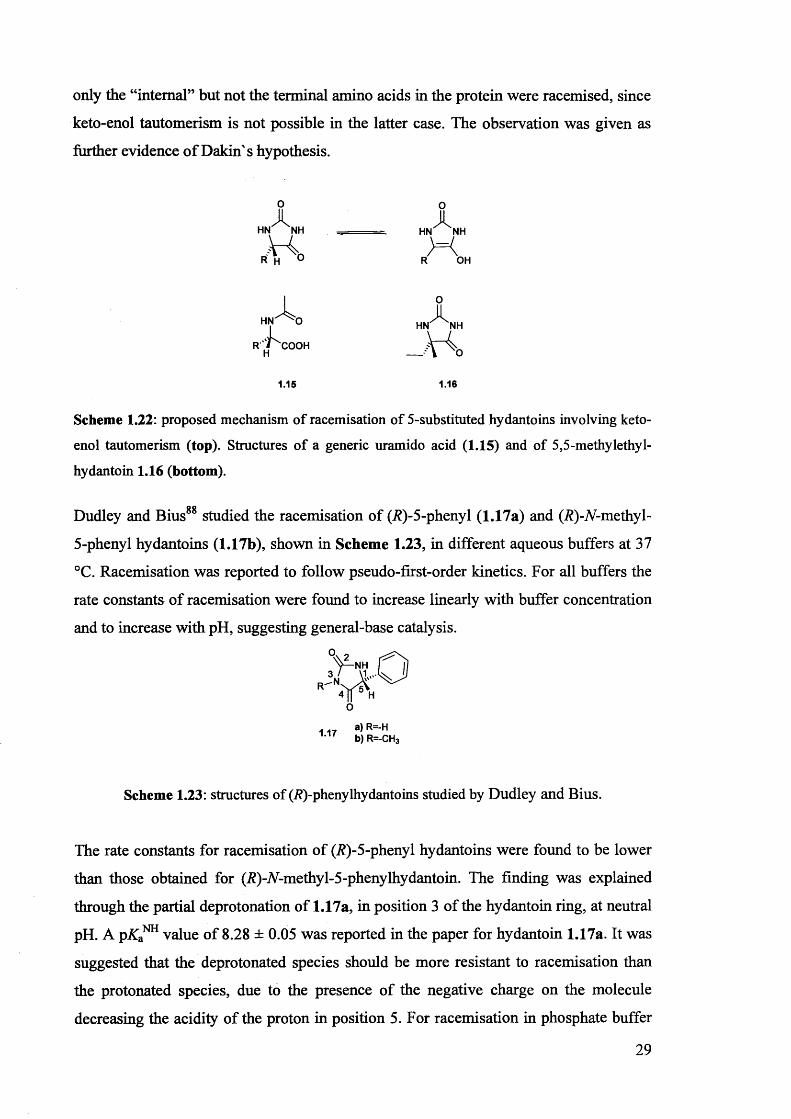
only the “internal” but not the terminal amino acids in the protein were racemised, since
keto-enol tautomerism is not possible in the latter case. The observation was given as
further evidence of Dakin's hypothesis.
o oA 1
HN NH . ■ . HN NH
V A AAR H ° R OH
I oHJ 0 h » A m i
r ' A cooh _ ' V ^ (
1.15 1.16
Scheme 1.22: proposed mechanism of racemisation of 5-substituted hydantoins involving keto-
enol tautomerism (top). Structures of a generic uramido acid (1.15) and of 5,5-methylethyl-
hydantoin 1.16 (bottom).
Dudley and Bius88 studied the racemisation of (i?)-5-phenyl (1.17a) and (i?)-7V-methyl-
5-phenyl hydantoins (1.17b), shown in Scheme 1.23, in different aqueous buffers at 37
°C. Racemisation was reported to follow pseudo-first-order kinetics. For all buffers the
rate constants of racemisation were found to increase linearly with buffer concentration
and to increase with pH, suggesting general-base catalysis.
■V*o
11 7 a)R=‘H 1,1' b)R=-CH3
Scheme 1.23: structures of (i?)-phenylhydantoins studied by Dudley and Bius.
The rate constants for racemisation of (i?)-5-phenyl hydantoins were found to be lower
than those obtained for (R)-A-methyl-5-phenylhydantoin. The finding was explained
through the partial deprotonation of 1.17a, in position 3 of the hydantoin ring, at neutral
pH. A pATa n value of 8.28 ± 0.05 was reported in the paper for hydantoin 1.17a. It was
suggested that the deprotonated species should be more resistant to racemisation than
the protonated species, due to the presence of the negative charge on the molecule
decreasing the acidity of the proton in position 5. For racemisation in phosphate buffer
29

the authors proposed a mechanism as shown in Scheme 1.24, involving rate-
determining proton abstraction by the dibasic form of the buffer. The mechanism
involves a concerted exchange of protons between the divalent phosphate and the
hydantoin, leading to a neutral enol as intermediate. The donation of the proton by
water molecules, instead of by phosphate, is however not excluded. The reason for
proposing a concerted mechanism is that the presence of an intermediate carbanion was
considered unlikely by the authors since it should involve formation of a basic species
in a medium where efficient proton donors such as water and phosphate molecules are
present.
0 = \ \ j H O—P—o ■ ° = \ II P— o ■ 0 = \ V 0 ~ P —O3R' R' R'
R= C6H5
R'= CH3 or H
Scheme 1.24: proposed mechanism of phosphate catalysed racemisation of (i?)-5-phenyl-
hydantoins.
Lazarus89 studied the racemisation of (S)-5-benzylhydantoin 1.18a and (iS)-A-methyl-5-
benzylhydantoin 1.18b, shown in Scheme 1.25, in aqueous buffers in a pH range
between 6 and 14, at 37 °C. Racemisation was reported to be hydroxide- and buffer-
catalysed. The kinetics of racemisation of (S)-5-benzylhydantoin were found to be
complicated by the acidity of the proton in position 3 of the hydantoin ring. A pKa of
8.65±0.10 was reported for 5-benzylhydantoin. To distinguish between the kinetically
equivalent processes of general-base catalysis acting on the protonated form of 1.18a
and general-acid catalysis acting on the deprotonated form, the kinetics of racemisation
of (S^-A-methyl-5-benzylhydantoin 1.18b were investigated. (<S)-jV-methyl-5
benzylhydantoin can be seen as an “equivalent” of the protonated form of (S)-5-
benzylhydantoin. Evidence for hydroxide catalysis on protonated and deprotonated
forms of 1.18a was provided and these pathways come in addition to catalysis by
phosphate, tris and carbonate buffers. The racemisation of 1.18b was also found to be
catalysed by hydroxide and buffers. Bronsted plots for racemisation of 1.18a and 1.18b
gave values of ft of 0.59 and 0.51, respectively. Based on the experimental data, a
30
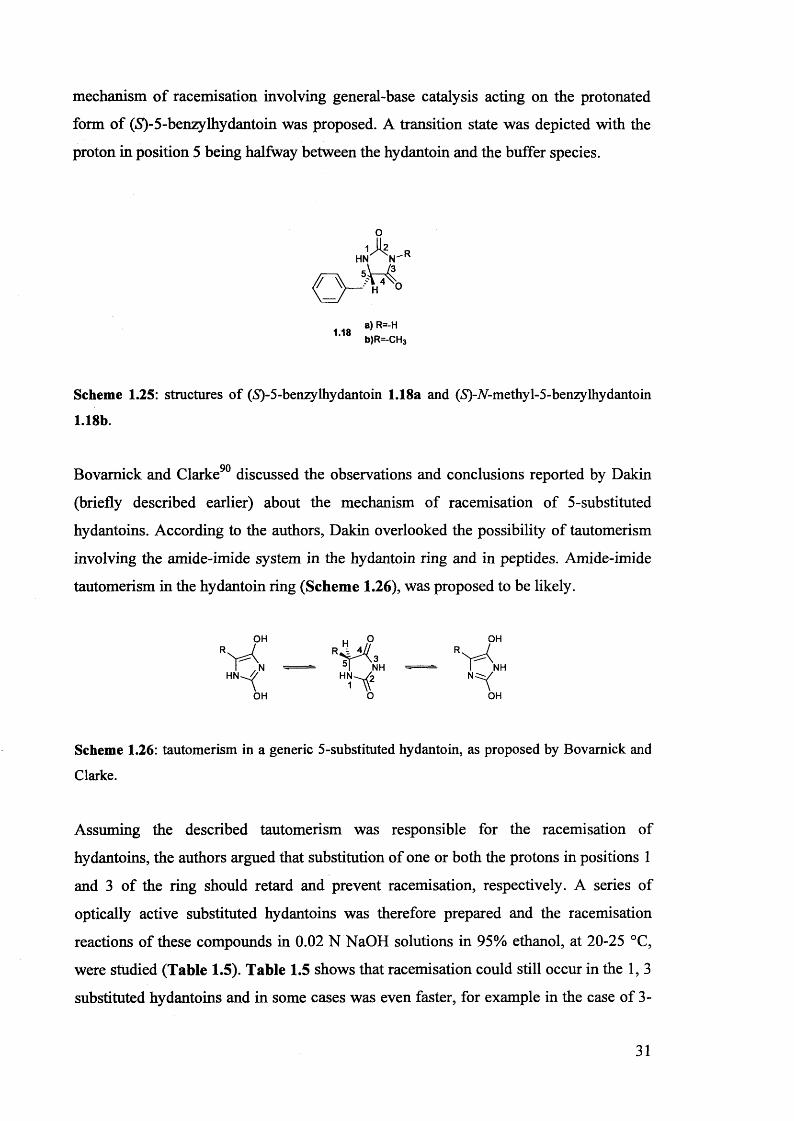
mechanism of racemisation involving general-base catalysis acting on the protonated
form of (*S)-5-benzylhydantoin was proposed. A transition state was depicted with the
proton in position 5 being halfway between the hydantoin and the buffer species.
oR
Scheme 1.25: structures of (iS)-5-benzylhydantoin 1.18a and (5)-Af-methyl-5-benzylhydantoin
hydantoins. According to the authors, Dakin overlooked the possibility of tautomerism
Scheme 1.26: tautomerism in a generic 5-substituted hydantoin, as proposed by Bovamick and
Clarke.
Assuming the described tautomerism was responsible for the racemisation of
hydantoins, the authors argued that substitution of one or both the protons in positions 1
and 3 of the ring should retard and prevent racemisation, respectively. A series of
optically active substituted hydantoins was therefore prepared and the racemisation
reactions of these compounds in 0.02 N NaOH solutions in 95% ethanol, at 20-25 °C,
were studied (Table 1.5). Table 1.5 shows that racemisation could still occur in the 1,3
substituted hydantoins and in some cases was even faster, for example in the case of 3-
1.18b.
Bovamick and Clarke90 discussed the observations and conclusions reported by Dakin
(briefly described earlier) about the mechanism of racemisation of 5-substituted
involving the amide-imide system in the hydantoin ring and in peptides. Amide-imide
tautomerism in the hydantoin ring (Scheme 1.26), was proposed to be likely.
OH O OH
31
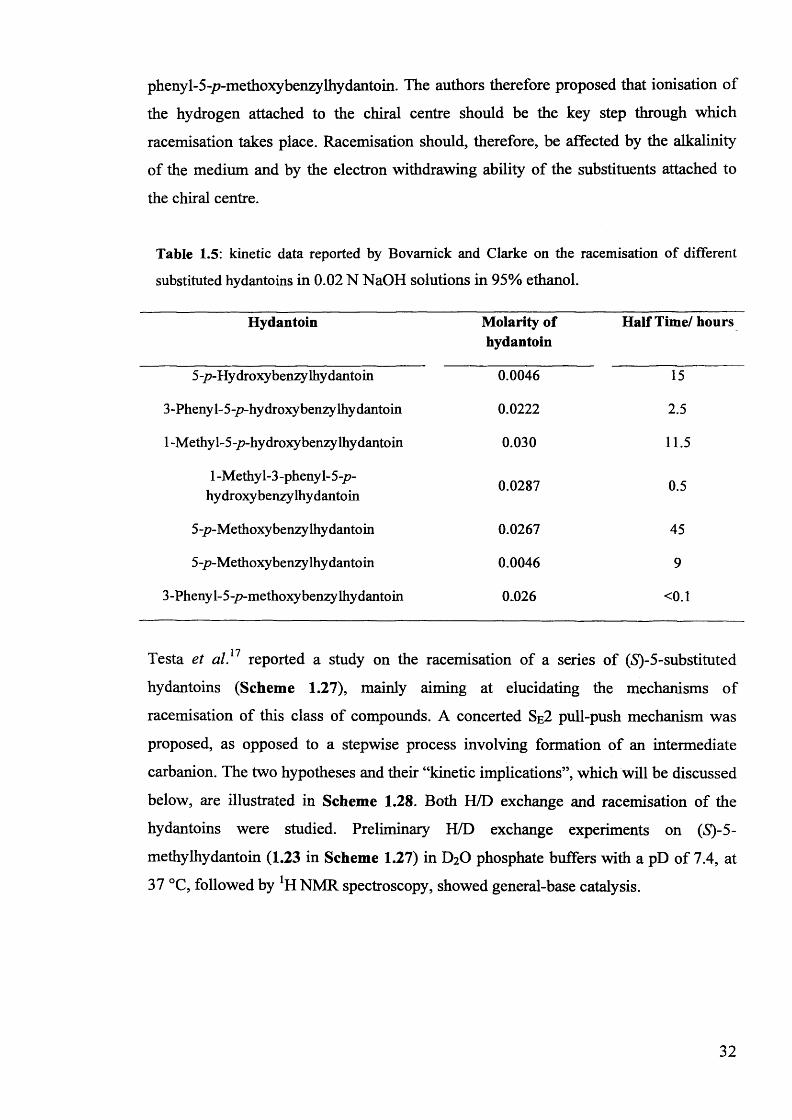
phenyl-5-p-methoxybenzy lhydantoin. The authors therefore proposed that ionisation of
the hydrogen attached to the chiral centre should be the key step through which
racemisation takes place. Racemisation should, therefore, be affected by the alkalinity
of the medium and by the electron withdrawing ability of the substituents attached to
the chiral centre.
Table 1.5: kinetic data reported by Bovamick and Clarke on the racemisation of different
substituted hydantoins in 0.02 N NaOH solutions in 95% ethanol.
Hydantoin Molarity of hydantoin
Half Time/ hours
5-p-Hydroxybenzy lhydantoin 0.0046 15
3-Phenyl-5-p-hydroxybenzy lhydantoin 0.0222 2.5
1 -Methyl-5-p-hydroxybenzy lhydantoin 0.030 11.5
1 -Methyl-3-phenyl-5-p- hydroxybenzy lhydantoin
0.0287 0.5
5-p-Methoxybenzy lhydantoin 0.0267 45
5-p-Methoxybenzy lhydantoin 0.0046 9
3 -Pheny 1- 5 -p-methoxy benzy lhydantoin 0.026 <0.1
17Testa et al. reported a study on the racemisation of a series of (S)-5-substituted
hydantoins (Scheme 1.27), mainly aiming at elucidating the mechanisms of
racemisation of this class of compounds. A concerted Se2 pull-push mechanism was
proposed, as opposed to a stepwise process involving formation of an intermediate
carbanion. The two hypotheses and their “kinetic implications”, which will be discussed
below, are illustrated in Scheme 1.28. Both H/D exchange and racemisation of the
hydantoins were studied. Preliminary H/D exchange experiments on (S)-5-
methylhydantoin (1.23 in Scheme 1.27) in D2O phosphate buffers with a pD of 7.4, at
37 °C, followed by NMR spectroscopy, showed general-base catalysis.
32
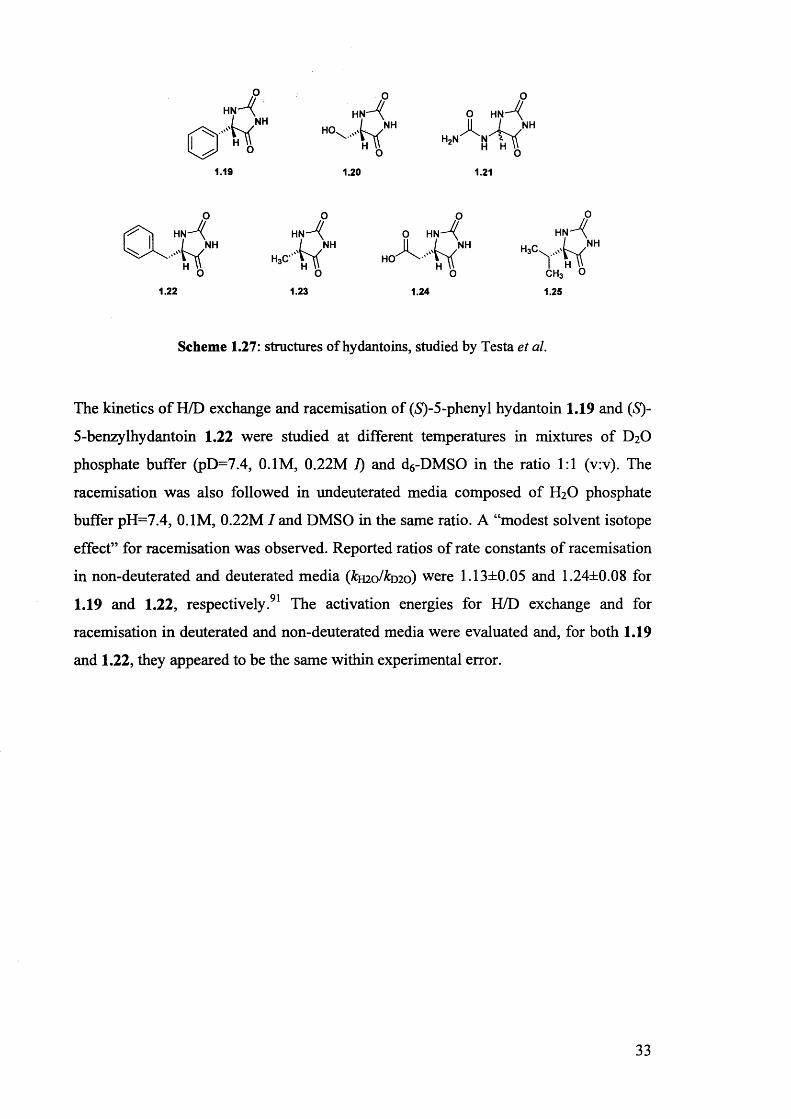
Scheme 1.27: structures of hydantoins, studied by Testa et al.
The kinetics of H/D exchange and racemisation of (5)-5-phenyl hydantoin 1.19 and (S)-
5-benzylhydantoin 1.22 were studied at different temperatures in mixtures of D2O
phosphate buffer (pD=7.4, 0.1M, 0.22M 7) and d6-DMSO in the ratio 1:1 (v:v). The
racemisation was also followed in undeuterated media composed of H2O phosphate
buffer pH=7.4, 0.1M, 0.22M / and DMSO in the same ratio. A “modest solvent isotope
effect” for racemisation was observed. Reported ratios of rate constants of racemisation
in non-deuterated and deuterated media (kmo/kmo) were 1.13±0.05 and 1.24±0.08 for
1.19 and 1.22, respectively.91 The activation energies for H/D exchange and for
racemisation in deuterated and non-deuterated media were evaluated and, for both 1.19
and 1.22, they appeared to be the same within experimental error.
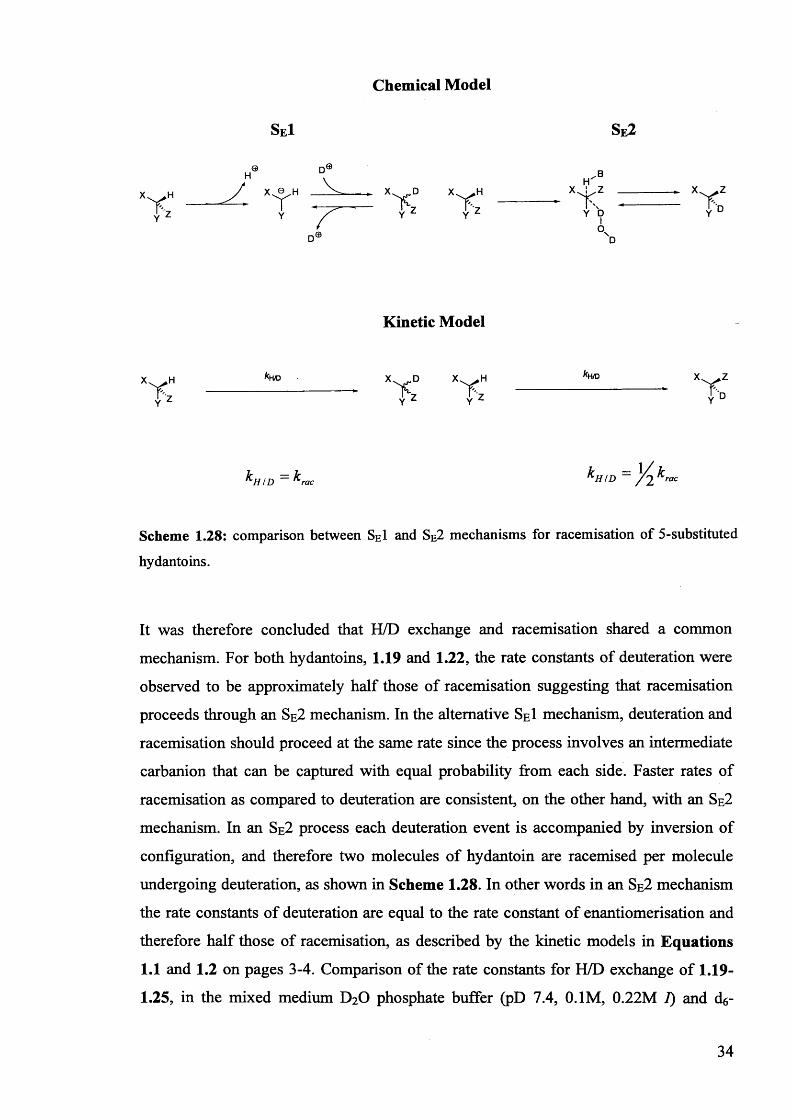
Chemical Model
SE1 Se2
'X
h' b
y b To
Kinetic Model
X^H *h® X\ ^ D X H X ZJ z f z f z ^ Y D
k H I D = K a c k H / D ~ ^ rac
Scheme 1.28: comparison between SeI and Se2 mechanisms for racemisation of 5-substituted
hydantoins.
It was therefore concluded that H/D exchange and racemisation shared a common
mechanism. For both hydantoins, 1.19 and 1.22, the rate constants of deuteration were
observed to be approximately half those of racemisation suggesting that racemisation
proceeds through an Sg2 mechanism. In the alternative SeI mechanism, deuteration and
racemisation should proceed at the same rate since the process involves an intermediate
carbanion that can be captured with equal probability from each side. Faster rates of
racemisation as compared to deuteration are consistent, on the other hand, with an Sr2
mechanism. In an Se2 process each deuteration event is accompanied by inversion of
configuration, and therefore two molecules of hydantoin are racemised per molecule
undergoing deuteration, as shown in Scheme 1.28. In other words in an Se2 mechanism
the rate constants of deuteration are equal to the rate constant of enantiomerisation and
therefore half those of racemisation, as described by the kinetic models in Equations
1.1 and 1.2 on pages 3-4. Comparison of the rate constants for H/D exchange of 1.19-
1.25, in the mixed medium D2O phosphate buffer (pD 7.4, 0.1M, 0.22M I) and d6-
34
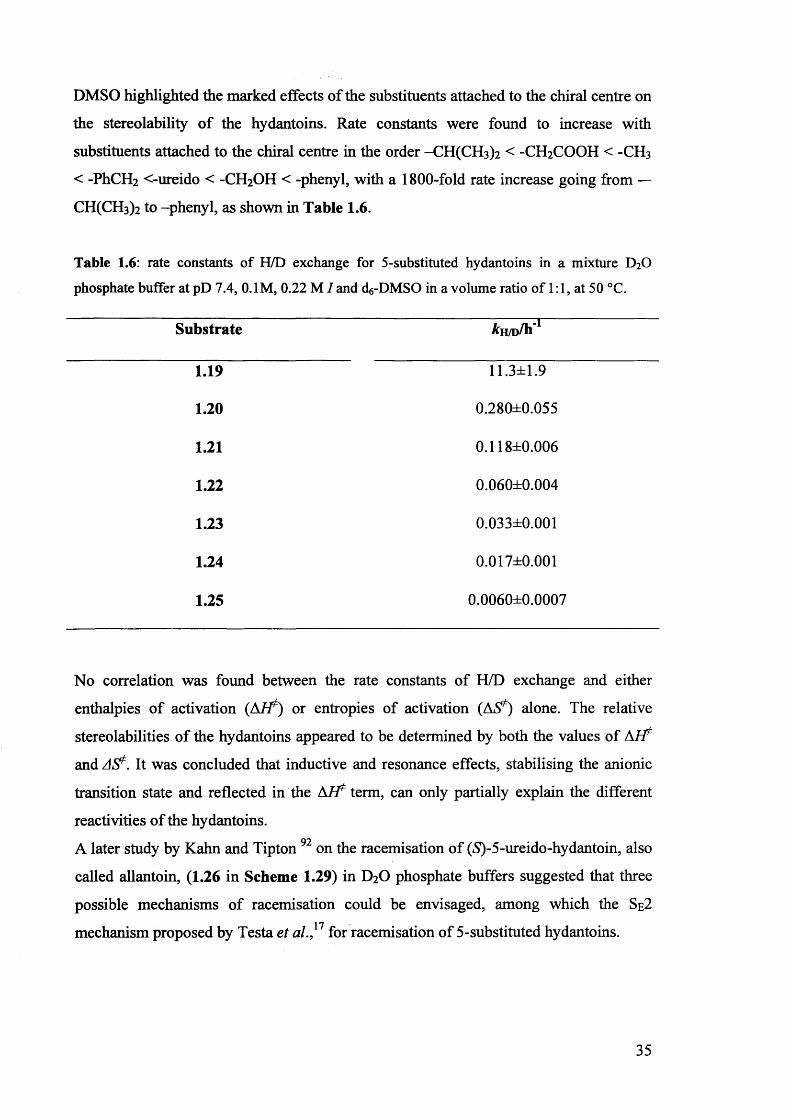
DMSO highlighted the marked effects of the substituents attached to the chiral centre on
the stereolability of the hydantoins. Rate constants were found to increase with
substituents attached to the chiral centre in the order -CH(CH3)2 < -CH2COOH < -CH3
< -PI1CH2 <-ureido < -CH2OH < -phenyl, with a 1800-fold rate increase going from —
CH(CH3)2 to -phenyl, as shown in Table 1.6.
Table 1.6: rate constants of H/D exchange for 5-substituted hydantoins in a mixture D20
phosphate buffer at pD 7.4, 0.1M, 0.22 M / and ck-DMSO in a volume ratio of 1:1, at 50 °C.
Substrate kH /o /h1
1.19 11.3±1.9
1.20 0.280±0.055
1.21 0.118±0.006
1.22 0.060±0.004
1.23 0.033±0.001
1.24 0.017±0.001
1.25 0.0060±0.0007
No correlation was found between the rate constants of H/D exchange and either
enthalpies of activation (Ai f ) or entropies of activation (AS^) alone. The relative
stereolabilities of the hydantoins appeared to be determined by both the values of AF t
and AS?. It was concluded that inductive and resonance effects, stabilising the anionic
transition state and reflected in the Ai f term, can only partially explain the different
reactivities of the hydantoins.
A later study by Kahn and Tipton on the racemisation of (*S)-5-ureido-hydantoin, also
called allantoin, (1.26 in Scheme 1.29) in D2O phosphate buffers suggested that three
possible mechanisms of racemisation could be envisaged, among which the Se2
mechanism proposed by Testa et al.}1 for racemisation of 5-substituted hydantoins.
35
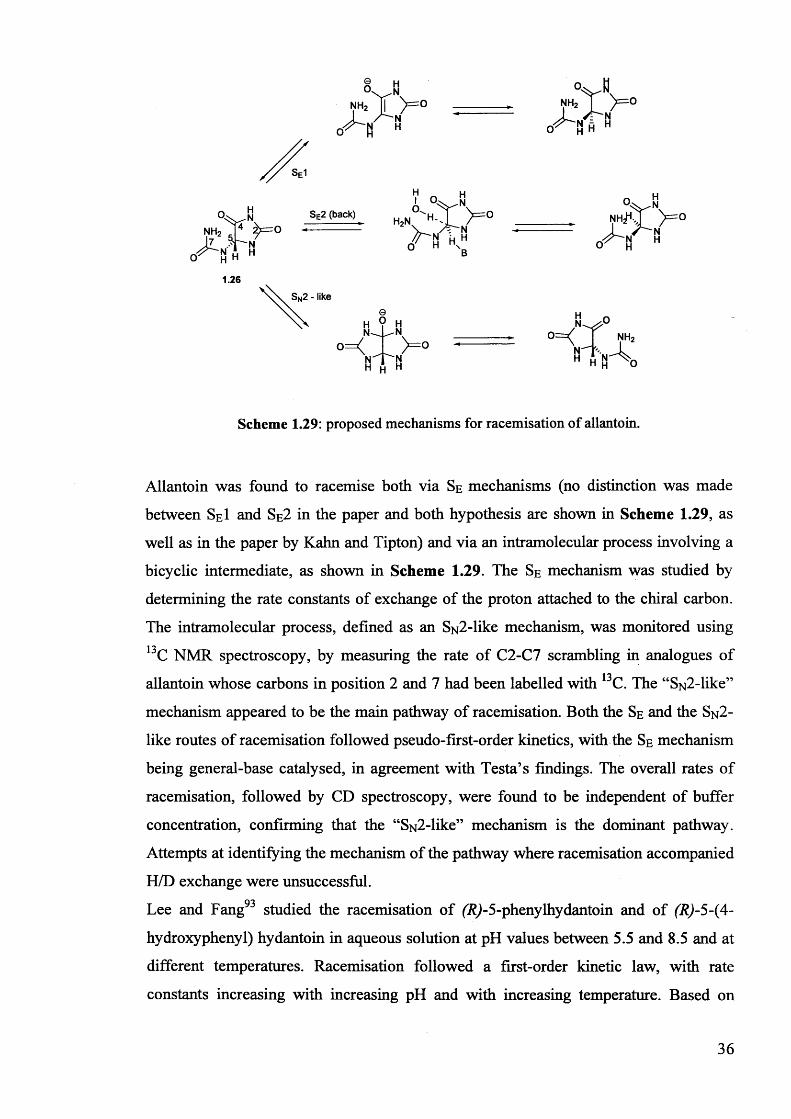
n HNH,
0< ^ N H O H
Y > = °/^N
SE1
5
1.26
I^=0
Se2 (back)H2N
V n H
-°YV<
nh° Y V °
J r v °h
O ' H
o=k nY ° <*H H P| X 0
Scheme 1.29: proposed mechanisms for racemisation of allantoin.
Allantoin was found to racemise both via Se mechanisms (no distinction was made
between SeI and Se2 in the paper and both hypothesis are shown in Scheme 1.29, as
well as in the paper by Kahn and Tipton) and via an intramolecular process involving a
bicyclic intermediate, as shown in Scheme 1.29. The Se mechanism was studied by
determining the rate constants of exchange of the proton attached to the chiral carbon.
The intramolecular process, defined as an S^-like mechanism, was monitored using
13C NMR spectroscopy, by measuring the rate of C2-C7 scrambling in analogues of1 allantoin whose carbons in position 2 and 7 had been labelled with C. The “S^-like”
mechanism appeared to be the main pathway of racemisation. Both the Se and the S n 2 -
like routes of racemisation followed pseudo-first-order kinetics, with the Se mechanism
being general-base catalysed, in agreement with Testa’s findings. The overall rates of
racemisation, followed by CD spectroscopy, were found to be independent of buffer
concentration, confirming that the “SN2-like” mechanism is the dominant pathway.
Attempts at identifying the mechanism of the pathway where racemisation accompanied
H/D exchange were unsuccessful.QO
Lee and Fang studied the racemisation of (R)-5-phenylhydantoin and of (R)-5-(4-
hydroxyphenyl) hydantoin in aqueous solution at pH values between 5.5 and 8.5 and at
different temperatures. Racemisation followed a first-order kinetic law, with rate
constants increasing with increasing pH and with increasing temperature. Based on
36
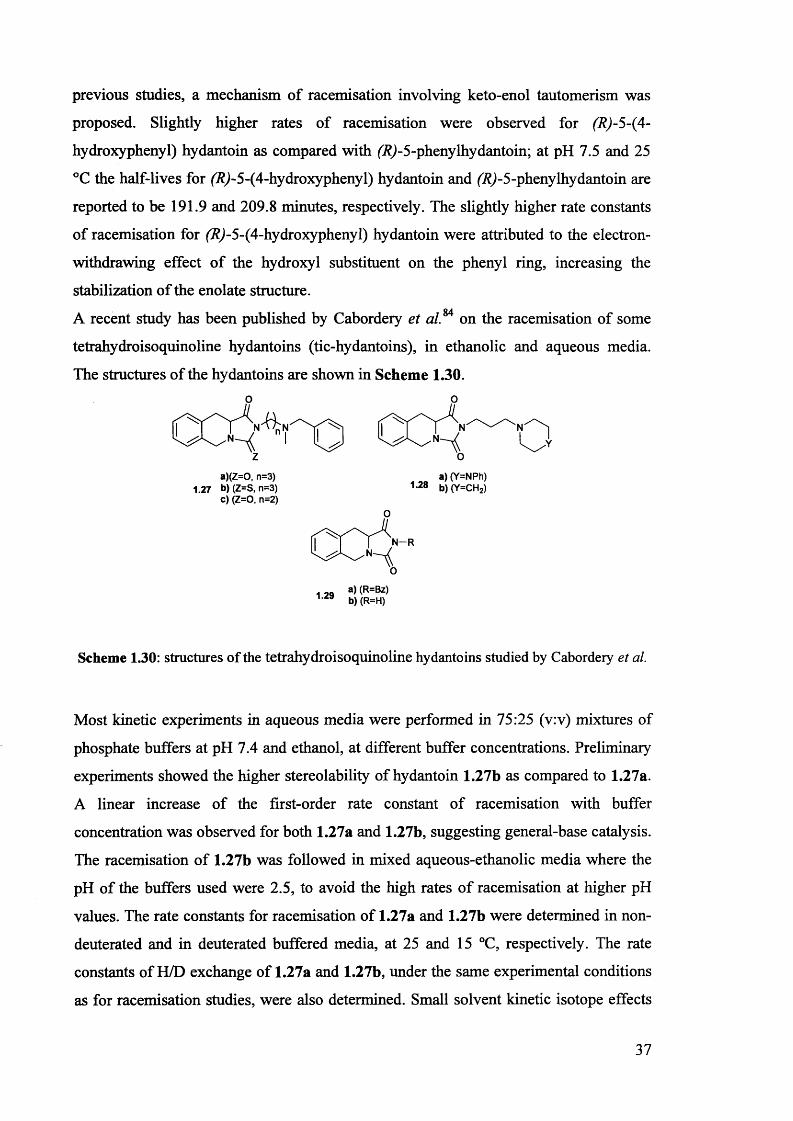
previous studies, a mechanism of racemisation involving keto-enol tautomerism was
proposed. Slightly higher rates of racemisation were observed for (R)-5-(4-
hydroxyphenyl) hydantoin as compared with (R)-S-phenylhydantoin; at pH 7.5 and 25
°C the half-lives for (7?J-5-(4-hydroxyphenyl) hydantoin and (R)-5-pheny lhy dantoin are
reported to be 191.9 and 209.8 minutes, respectively. The slightly higher rate constants
of racemisation for fJ?J-5-(4-hydroxyphenyl) hydantoin were attributed to the electron-
withdrawing effect of the hydroxyl substituent on the phenyl ring, increasing the
stabilization of the enolate structure.
A recent study has been published by Cabordery et a lu on the racemisation of some
tetrahydroisoquinoline hydantoins (tic-hydantoins), in ethanolic and aqueous media.
The structures of the hydantoins are shown in Scheme 1.30.
G O ^ n o
a)(Z=0, n=3) a) (Y=NPh)1.27 b)(Z=S,n=3) b)(Y=CH2)
c) (Z=0, n=2)
N -R
oa) (R=Bz)b) (R=H)
Scheme 1.30: structures of the tetrahydroisoquinoline hydantoins studied by Cabordery et al.
Most kinetic experiments in aqueous media were performed in 75:25 (v:v) mixtures of
phosphate buffers at pH 7.4 and ethanol, at different buffer concentrations. Preliminary
experiments showed the higher stereolability of hydantoin 1.27b as compared to 1.27a.
A linear increase of the first-order rate constant of racemisation with buffer
concentration was observed for both 1.27a and 1.27b, suggesting general-base catalysis.
The racemisation of 1.27b was followed in mixed aqueous-ethanolic media where the
pH of the buffers used were 2.5, to avoid the high rates of racemisation at higher pH
values. The rate constants for racemisation of 1.27a and 1.27b were determined in non-
deuterated and in deuterated buffered media, at 25 and 15 °C, respectively. The rate
constants of H/D exchange of 1.27a and 1.27b, under the same experimental conditions
as for racemisation studies, were also determined. Small solvent kinetic isotope effects
37
of approximately 1.5 were found for both hydantoins 1.27a and 1.27b, in accordance | n
with results reported by Testa et al. in their study on 5-substituted hydantoins {vide
supra). Almost equal rate constants for racemisation and deuteration were obtained for
hydantoin 1.27a. An SeI mechanism for racemisation of 1.27a was therefore proposed,
involving formation of a planar carbanion which is then non-stereospecifically
reprotonated. On the contrary, for hydantoin 1.27b, at pD=7.3, the rate constant of
deuteration was found to be half that of racemisation suggesting that deuteration1 7occurred with inversion of configuration. An Se2 mechanism, as proposed by Testa , is
therefore proposed for hydantoin 1.27b.94 The rate constants for racemisation of
hydantoins 1.27c, 1.28a, b and 1.29a, determined in a 75:25 (v:v) mixture of phosphate
buffers 0.33 mM with pH 7.4 and ethanol, at 25 °C, were found to be similar to those of
1.27a (the reported half life is 28.8 hours), under identical conditions. Reported half
lives for 1.27c, 1.28a, b and 1.29a, were variable between 30 and 46 hours, suggesting a
small influence of the nature of the side chain on the rate constants of racemisation. A
slightly smaller rate constant of racemisation was reported for compound 1.29b (half-
life of 62 hours), with no substituent on the nitrogen in position 3 of the hydantoin ring.
The authors highlight the analogy with results published by Bovamick and Clarke90
{vide supra) who reported an higher stereolability of 3-phenyl-5-p-
methoxybenzylhydantoin as compared to 5-p-methoxybenzylhydantoin (Table 1.5).
From the results of the studies on the racemisation of 5-substituted hydantoins, briefly
described in this section, it appears that the mechanism of racemisation of this class of
compounds is still under discussion. An SeI mechanism is, in general, recognised for• 1 7 O C 0 * 7
racemisation and H/D exchange of ketones. * ' We will mention here the kinetic
studies by Wilson et al. on the model ketone 2-o-carboxybenzyl-l-indanone.95’ 98
Bromination and racemisation of 2-o-carboxybenzyl-l-indanone were reported to
proceed at the same rate with ionisation being the rate determining step of both
processes 95 A primary kinetic isotope effect £h/&d of 3.0 at 45 °C was observed for
base-catalysed bromination of the ketone.98 A stepwise mechanism involving a short
lived enolate intermediate has also been proposed by Richard et al. for base-catalysed
deuterium incorporation into a wide range of a-carbonyl carbon acids {vide supra).51,58,62 66 Se2 mechanisms are however proposed, in the literature, for racemisation of
hydantoin derivatives, along with SeI pathways {vide supra).
38
1.6. Solvent effects on reactions of racemisation and H/D exchange.
1.6.1 Solvents and solvent properties
The crucial role of the solvent in chemical reactions has been noticed since the very
early stages of chemical investigations but many aspects of “solvent effects” still remain
beyond our quantitative understanding. Hence, correlations between solvent effects on
reactions and physical properties of the solvents are, usually, not straightforward.
A comprehensive classification of solvents is not easy due to the diversity of physical
and chemical properties within the wide range of organic and inorganic solvents."
However, extending a classification made by Parker,100 solvents can be conveniently
divided in three main groups.101,102
a) Protic: this class include solvents that posess hydrogen atoms bound to
electronegative atoms (OH, NH, etc.). Protic solvents usually have high
dielectric constants (c > 15), are hydrogen-bond donors and are, therefore, good
anion solvators. Water and alcohols belong to this class.
b) Dipolar-aprotic: solvents of this class have no acidic protons but posses large
dielectric constants (s > 15), and large dipole moments (p > 8.3-1 O'30 Cm)101.
Dipolar-aprotic solvents are good electron-pair donors (EPD solvents) and
therefore, good cation solvators through their lone pair of electrons. On the other
hand their ability at solvating anions is poor (vide infra). Acetone, acetonitrile,
DMSO are examples of dipolar aprotic solvents.
c) Non-polar aprotic: this class is characterised by low dielectric constants (s < 15)
and low dipole moments (p < 8.3 • 10'30 Cm)101. Solvents of this class do not have
acidic protons and donor/acceptor properties and therefore show only weak
interaction with the solute. Hydrocarbons, halocarbons and ethers are typical
solvents of this class.
1.6.2. The effect of the medium on racemisation and H/D exchange reactions:
examples from the published literature
Several literature studies testify to the effects that the reaction medium can have on the
rate constants of racemisation and H/D exchange reactions of different chiral substrates.■IQ
For example, in their study of the racemisation of ibuprofen (vide supra) Xie et al.
39
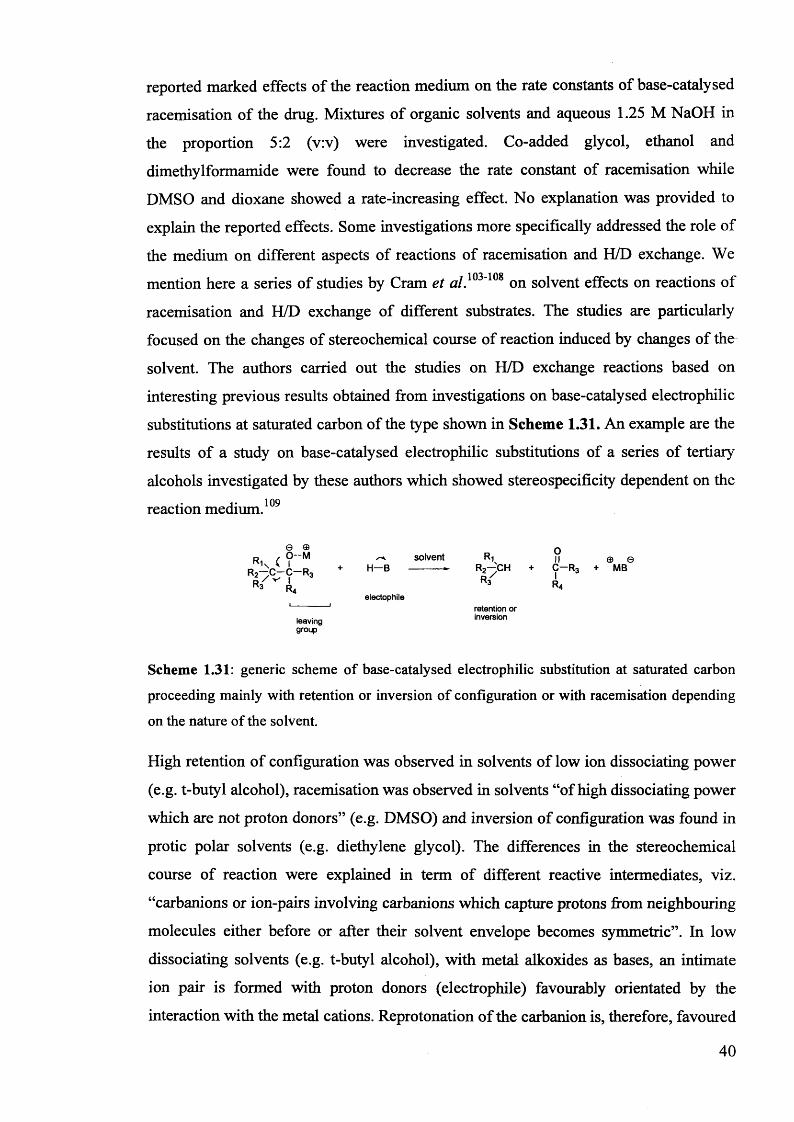
reported marked effects of the reaction medium on the rate constants of base-catalysed
racemisation of the drug. Mixtures of organic solvents and aqueous 1.25 M NaOH in
the proportion 5:2 (v:v) were investigated. Co-added glycol, ethanol and
dimethylformamide were found to decrease the rate constant of racemisation while
DMSO and dioxane showed a rate-increasing effect. No explanation was provided to
explain the reported effects. Some investigations more specifically addressed the role of
the medium on different aspects of reactions of racemisation and H/D exchange. We
mention here a series of studies by Cram et a/.103'108 on solvent effects on reactions of
racemisation and H/D exchange of different substrates. The studies are particularly
focused on the changes of stereochemical course of reaction induced by changes of the
solvent. The authors carried out the studies on H/D exchange reactions based on
interesting previous results obtained from investigations on base-catalysed electrophilic
substitutions at saturated carbon of the type shown in Scheme 1.31. An example are the
results of a study on base-catalysed electrophilic substitutions of a series of tertiary
alcohols investigated by these authors which showed stereospecificity dependent on the
reaction medium.109
solvent Ri n © ©H—B --------------- R2-^CH + C—R3 + MB
R* R ,electophile
retention or inversion
Scheme 1.31: generic scheme of base-catalysed electrophilic substitution at saturated carbon proceeding mainly with retention or inversion of configuration or with racemisation depending on the nature of the solvent.
High retention of configuration was observed in solvents of low ion dissociating power
(e.g. t-butyl alcohol), racemisation was observed in solvents “of high dissociating power
which are not proton donors” (e.g. DMSO) and inversion of configuration was found in
protic polar solvents (e.g. diethylene glycol). The differences in the stereochemical
course of reaction were explained in term of different reactive intermediates, viz.
“carbanions or ion-pairs involving carbanions which capture protons from neighbouring
molecules either before or after their solvent envelope becomes symmetric”. In low
dissociating solvents (e.g. t-butyl alcohol), with metal alkoxides as bases, an intimate
ion pair is formed with proton donors (electrophile) favourably orientated by the
interaction with the metal cations. Reprotonation of the carbanion is, therefore, favoured
40
© ©R , 0--M R\ ( I +
r 2- c - c - r 3 +r / v ' I R3 R4
leavinggroup
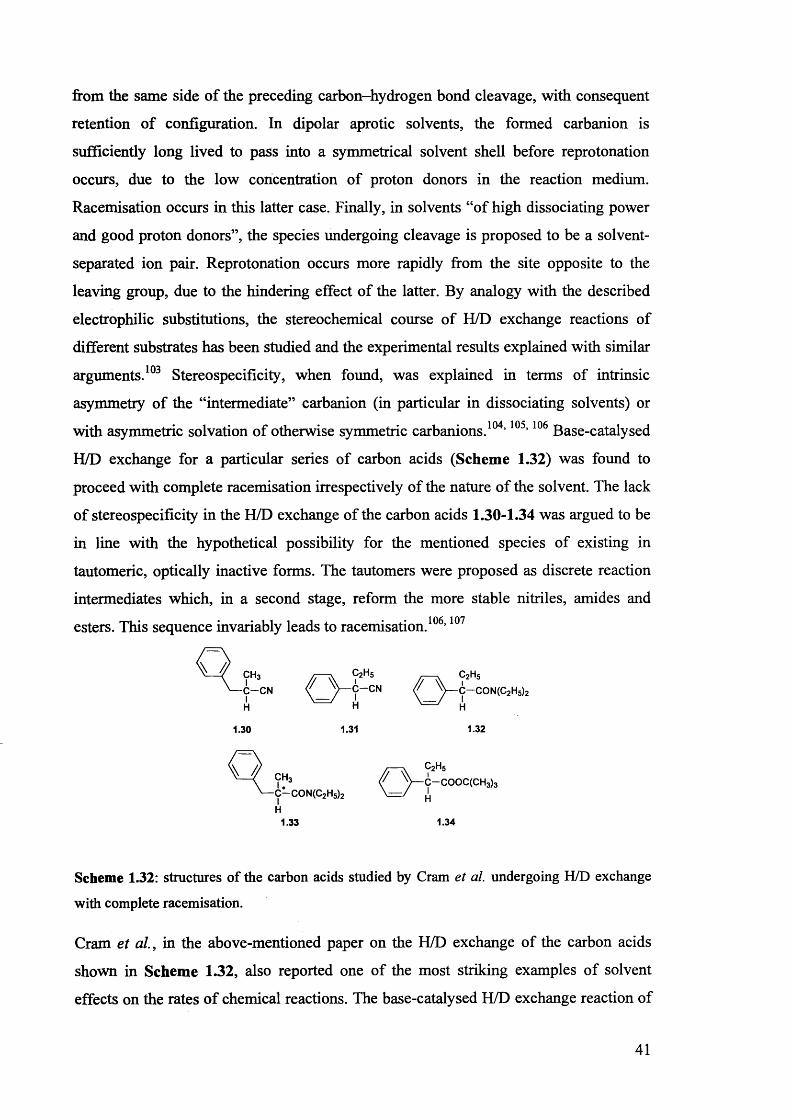
from the same side of the preceding carbon-hydrogen bond cleavage, with consequent
retention of configuration. In dipolar aprotic solvents, the formed carbanion is
sufficiently long lived to pass into a symmetrical solvent shell before reprotonation
occurs, due to the low concentration of proton donors in the reaction medium.
Racemisation occurs in this latter case. Finally, in solvents “of high dissociating power
and good proton donors”, the species undergoing cleavage is proposed to be a solvent-
separated ion pair. Reprotonation occurs more rapidly from the site opposite to the
leaving group, due to the hindering effect of the latter. By analogy with the described
electrophilic substitutions, the stereochemical course of H/D exchange reactions of
different substrates has been studied and the experimental results explained with similar
arguments.103 Stereospecificity, when found, was explained in terms of intrinsic
asymmetry of the “intermediate” carbanion (in particular in dissociating solvents) or
with asymmetric solvation of otherwise symmetric carbanions.104,105,106 Base-catalysed
H/D exchange for a particular series of carbon acids (Scheme 1.32) was found to
proceed with complete racemisation irrespectively of the nature of the solvent. The lack
of stereospecificity in the H/D exchange of the carbon acids 1.30-1.34 was argued to be
in line with the hypothetical possibility for the mentioned species of existing in
tautomeric, optically inactive forms. The tautomers were proposed as discrete reaction
intermediates which, in a second stage, reform the more stable nitriles, amides and
esters. This sequence invariably leads to racemisation.106,107
c 2h5C-CON(C2H5)2
c h 3C-CON(C2H5)2
C-COOC(CH3)3
1.33 1.34
Scheme 1.32: structures of the carbon acids studied by Cram et al. undergoing H/D exchange
with complete racemisation.
Cram et al., in the above-mentioned paper on the H/D exchange of the carbon acids
shown in Scheme 1.32, also reported one of the most striking examples of solvent
effects on the rates of chemical reactions. The base-catalysed H/D exchange reaction of
41
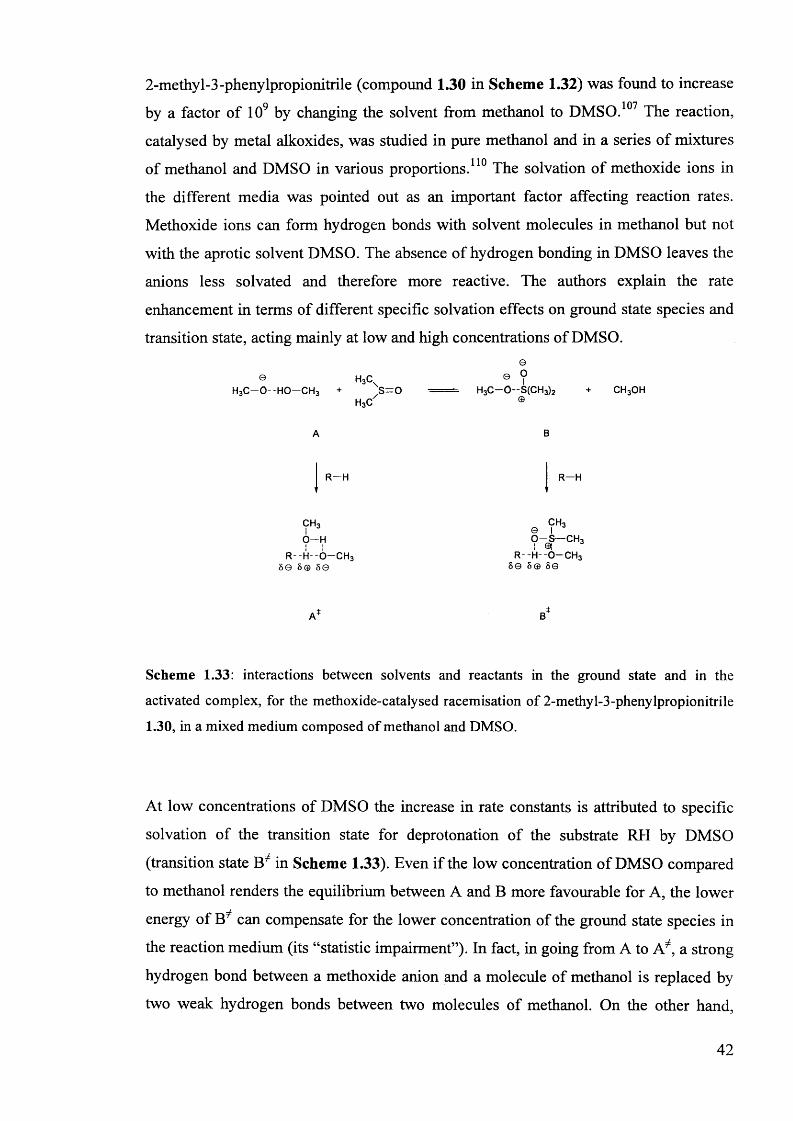
2-methy 1-3 -phenylpropionitrile (compound 1.30 in Scheme 1.32) was found to increase
by a factor of 109 by changing the solvent from methanol to DMSO.107 The reaction,
catalysed by metal alkoxides, was studied in pure methanol and in a series of mixtures
of methanol and DMSO in various proportions.110 The solvation of methoxide ions in
the different media was pointed out as an important factor affecting reaction rates.
Methoxide ions can form hydrogen bonds with solvent molecules in methanol but not
with the aprotic solvent DMSO. The absence of hydrogen bonding in DMSO leaves the
anions less solvated and therefore more reactive. The authors explain the rate
enhancement in terms of different specific solvation effects on ground state species and
transition state, acting mainly at low and high concentrations of DMSO.
h3cH3C - 0 --H0 -C H 3 + s=o
h3c
0 0 0
H3C -0 ~ S (C H 3)2©
CH30H
R—H R -H
CH3 ?—H
R--H--6-CH35© 5© 5©
CH3© Io —s — c h 3! ®l 3
R--H--O-CH38© 8© 8©
Scheme 1.33: interactions between solvents and reactants in the ground state and in the
activated complex, for the methoxide-catalysed racemisation of 2-methyl-3-phenylpropionitrile
1.30, in a mixed medium composed of methanol and DMSO.
At low concentrations of DMSO the increase in rate constants is attributed to specific
solvation of the transition state for deprotonation of the substrate RH by DMSO
(transition state in Scheme 1.33). Even if the low concentration of DMSO compared
to methanol renders the equilibrium between A and B more favourable for A, the lower
energy of B can compensate for the lower concentration of the ground state species in
the reaction medium (its “statistic impairment”). In fact, in going from A to A*, a strong
hydrogen bond between a methoxide anion and a molecule of methanol is replaced by
two weak hydrogen bonds between two molecules of methanol. On the other hand,
42
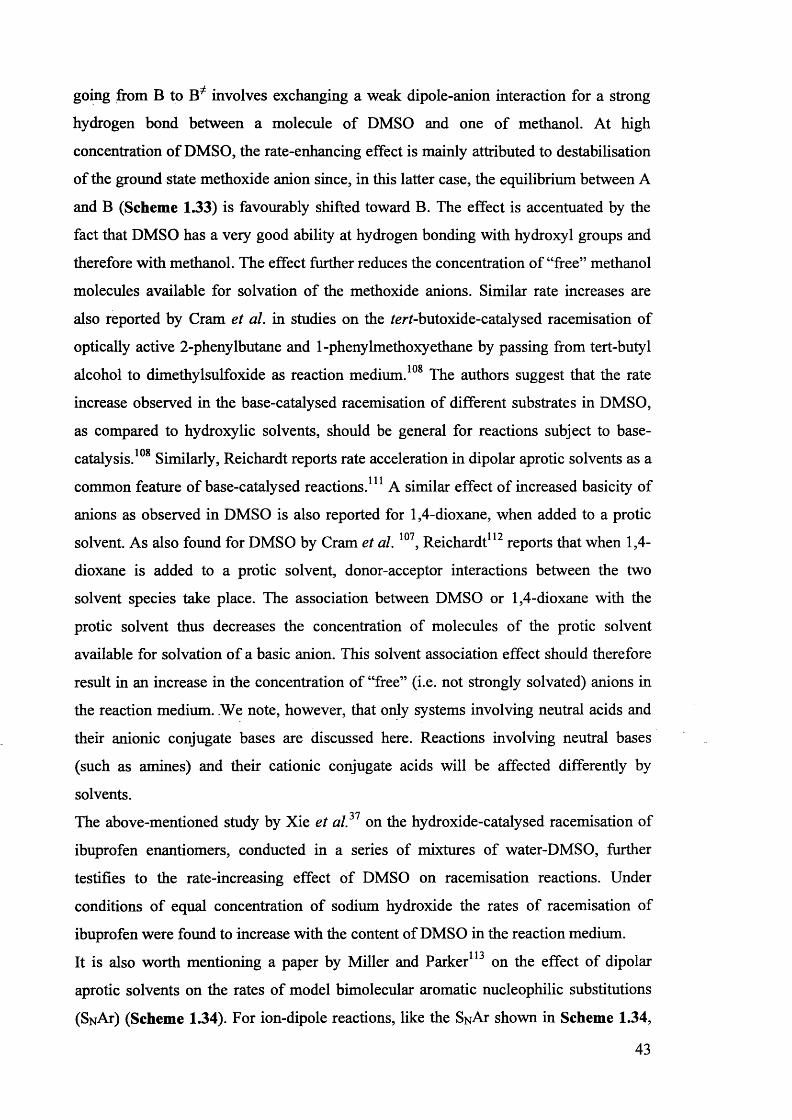
going from B to involves exchanging a weak dipole-anion interaction for a strong
hydrogen bond between a molecule of DMSO and one of methanol. At high
concentration of DMSO, the rate-enhancing effect is mainly attributed to destabilisation
of the ground state methoxide anion since, in this latter case, the equilibrium between A
and B (Scheme 1.33) is favourably shifted toward B. The effect is accentuated by the
fact that DMSO has a very good ability at hydrogen bonding with hydroxyl groups and
therefore with methanol. The effect further reduces the concentration of “free” methanol
molecules available for solvation of the methoxide anions. Similar rate increases are
also reported by Cram et al. in studies on the /ert-butoxide-catalysed racemisation of
optically active 2-phenylbutane and 1-phenylmethoxyethane by passing from tert-butyli nsalcohol to dimethylsulfoxide as reaction medium. The authors suggest that the rate
increase observed in the base-catalysed racemisation of different substrates in DMSO,
as compared to hydroxy lie solvents, should be general for reactions subject to base-
catalysis.108 Similarly, Reichardt reports rate acceleration in dipolar aprotic solvents as a
common feature of base-catalysed reactions.111 A similar effect of increased basicity of
anions as observed in DMSO is also reported for 1,4-dioxane, when added to a protic
solvent. As also found for DMSO by Cram et al. 107, Reichardt112 reports that when 1,4-
dioxane is added to a protic solvent, donor-acceptor interactions between the two
solvent species take place. The association between DMSO or 1,4-dioxane with the
protic solvent thus decreases the concentration of molecules of the protic solvent
available for solvation of a basic anion. This solvent association effect should therefore
result in an increase in the concentration of “free” (i.e. not strongly solvated) anions in
the reaction medium. .We note, however, that only systems involving neutral acids and
their anionic conjugate bases are discussed here. Reactions involving neutral bases
(such as amines) and their cationic conjugate acids will be affected differently by
solvents.
The above-mentioned study by Xie et al? 1 on the hydroxide-catalysed racemisation of
ibuprofen enantiomers, conducted in a series of mixtures of water-DMSO, further
testifies to the rate-increasing effect of DMSO on racemisation reactions. Under
conditions of equal concentration of sodium hydroxide the rates of racemisation of
ibuprofen were found to increase with the content of DMSO in the reaction medium.• 113 •It is also worth mentioning a paper by Miller and Parker on the effect of dipolar
aprotic solvents on the rates of model bimolecular aromatic nucleophilic substitutions
(SnA t) (Scheme 1.34). For ion-dipole reactions, like the SnA t shown in Scheme 1.34,
43
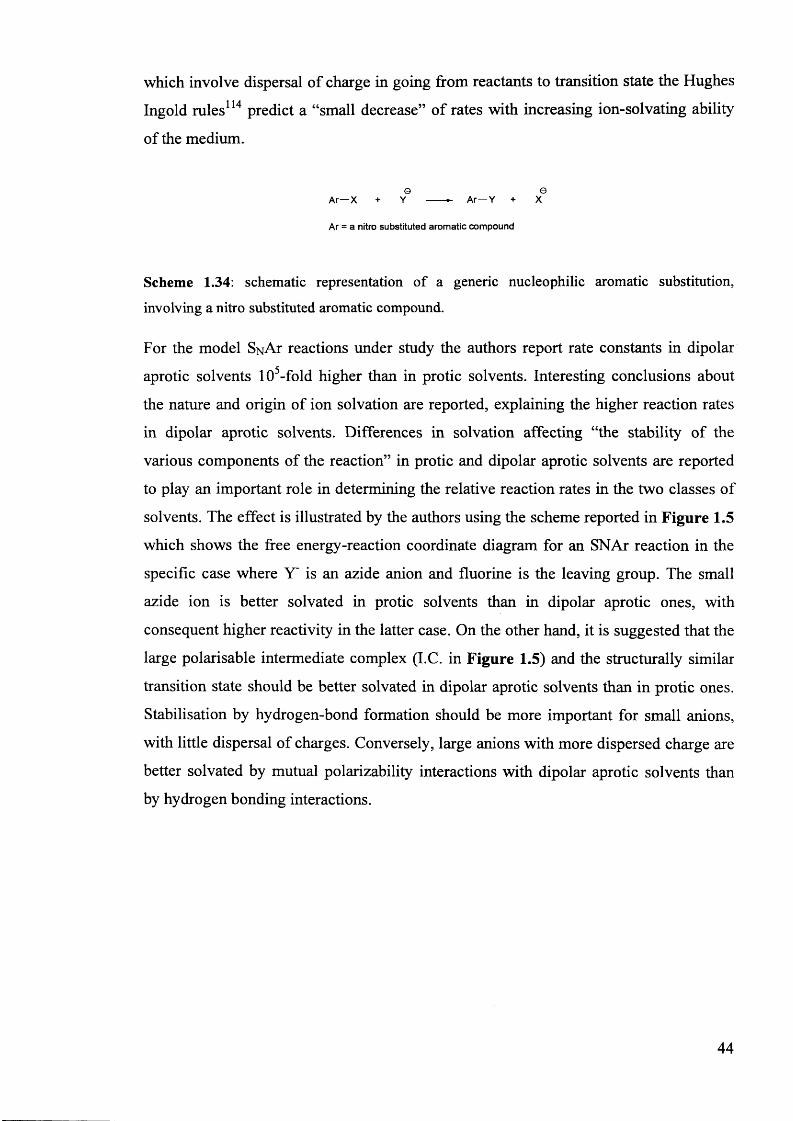
which involve dispersal of charge in going from reactants to transition state the Hughes
Ingold rules114 predict a “small decrease” of rates with increasing ion-solvating ability
of the medium.
© ©Ar—X + Y ------► Ar—Y + X
Ar = a nitro substituted aromatic compound
Scheme 1.34: schematic representation of a generic nucleophilic aromatic substitution, involving a nitro substituted aromatic compound.
For the model SnA t reactions under study the authors report rate constants in dipolar
aprotic solvents 105-fold higher than in protic solvents. Interesting conclusions about
the nature and origin of ion solvation are reported, explaining the higher reaction rates
in dipolar aprotic solvents. Differences in solvation affecting “the stability of the
various components of the reaction” in protic and dipolar aprotic solvents are reported
to play an important role in determining the relative reaction rates in the two classes of
solvents. The effect is illustrated by the authors using the scheme reported in Figure 1.5
which shows the free energy-reaction coordinate diagram for an SNAr reaction in the
specific case where Y' is an azide anion and fluorine is the leaving group. The small
azide ion is better solvated in protic solvents than in dipolar aprotic ones, with
consequent higher reactivity in the latter case. On the other hand, it is suggested that the
large polarisable intermediate complex (I.C. in Figure 1.5) and the structurally similar
transition state should be better solvated in dipolar aprotic solvents than in protic ones.
Stabilisation by hydrogen-bond formation should be more important for small anions,
with little dispersal of charges. Conversely, large anions with more dispersed charge are
better solvated by mutual polarizability interactions with dipolar aprotic solvents than
by hydrogen bonding interactions.
44
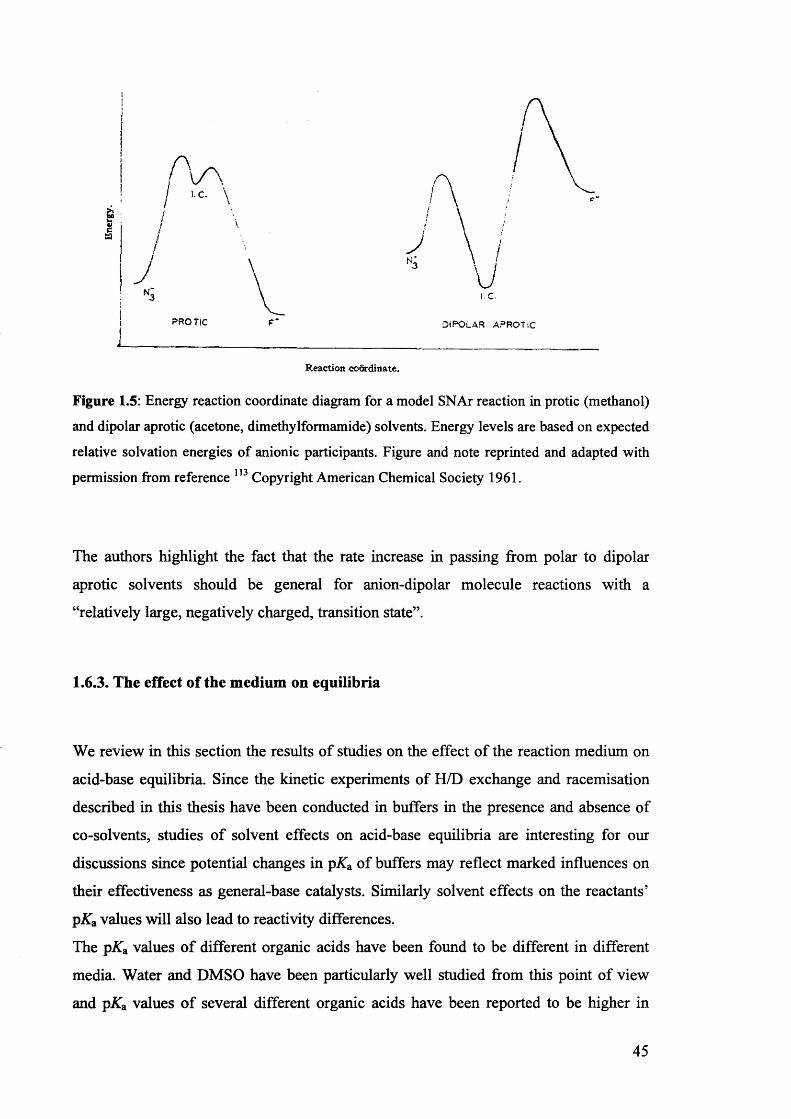
j P R O T IC fr’ D IPO L A R A P R O T iC
i __________________________________ _____________ ________Reaction coordinate.
Figure 1.5: Energy reaction coordinate diagram for a model SNAr reaction in protic (methanol) and dipolar aprotic (acetone, dimethylformamide) solvents. Energy levels are based on expected relative solvation energies of anionic participants. Figure and note reprinted and adapted with permission from reference 113 Copyright American Chemical Society 1961.
The authors highlight the fact that the rate increase in passing from polar to dipolar
aprotic solvents should be general for anion-dipolar molecule reactions with a
“relatively large, negatively charged, transition state”.
1.6.3. The effect of the medium on equilibria
We review in this section the results of studies on the effect of the reaction medium on
acid-base equilibria. Since the kinetic experiments of H/D exchange and racemisation
described in this thesis have been conducted in buffers in the presence and absence of
co-solvents, studies of solvent effects on acid-base equilibria are interesting for our
discussions since potential changes in pKa of buffers may reflect marked influences on
their effectiveness as general-base catalysts. Similarly solvent effects on the reactants’
pKa values will also lead to reactivity differences.
The pKa values of different organic acids have been found to be different in different
media. Water and DMSO have been particularly well studied from this point of view
and pKa values of several different organic acids have been reported to be higher in
DMSO as compared to the values determined in water.115, 116 Studies in the literature
also report pKa values of some organic acids in mixed aqueous media containing
different amounts of DMSO117’120 or d6-DMS0120 122 co-added. Some of the studies121,
122 report very small values of ApKa (approximately 0.2 units)123 for acetic acid and
propionic acid derivatives in mixtures of d6-DMSO and water containing up to 64
volume-% of d6-DMSO. Other studies, however, report larger ApKa values (for example
Baughman and Kreevoy report values of ApKa for a series of organic acids ranging from
2 to 3 units between H2O and a mixture of H2O with 80 volume- % DMSO) and a
linear117,120 or almost linear118 increase of pKa with increasing mole fraction of DMSO
in the binary mixture H2O-DMSO. Nevertheless, Ballash et al. suggested that there is
no simple correlation between the two quantities based on their imperfect linear• - 117correlation between pKa values and mole fraction of DMSO. Similarly, Mukerjee
highlighted the fact that ApKa values for different acids can be very different and
therefore a simple model to predict the pKa of different structures is not realistic. Higher
pKa values, as compared to those determined in pure water, are also reported for some
acetic acid derivatives in binary mixtures water-ethanol124 and for different acids in pure
ethanol125 and in methanol.126 Increased pKa values for acetic acid, as compared to the127values in pure water, are also reported in binary mixtures water-dioxane.
As far as buffers are concerned, an interesting study by Mukerjee and Ostrow reports a
linear increase in the measured pH values of phosphate buffer solutions in water with
the amount of DMSO co-added.117
1.7. Aim of the thesis
The first part of the work described in this thesis has addressed the kinetics of
racemisation of 5-substituted hydantoins in the attempt of shedding light on the
controversial mechanistic aspects of the racemisation of this class of compounds. Some
results reported in the literature have been confirmed, others refuted, and new data have
been obtained. The second part of the work described in this thesis was focused on the
development of suitable model compounds allowing relevant information by means of
different analytical techniques to be obtained.
46
References
1. Smith, S. W., Toxicological Sciences 2009,110 (1), 4-30.
2. Vollhardt, P., Chimica Organica. Zanichelli Editore S.p.A.: Bologna, 1998; p
149.
3. Smith, M. B.; March, J., March's Advanced Organic Chemistry. Sixth ed.;
WILEY-INTERSCIENCE: Hoboken, New Jersey, 2007; p 136-138.
4. From the latin term “racemus”, which means “bunch of grapes”.
5. Turner, E., Elements o f Chemistry. Fifth ed.; Desilver, Thomas & Co.:
Philadelphia, 1835; p 511-512.
6. Flack, H. D., Acta Crystallographica Section A 2009, 65, 371-389.
7. Vollhardt, P., Chimica Organica. Zanichelli Editore S.p.A.: Bologna, 1990; p
168.
8. Streitwieser, A.; Schaeffer, W. D., Journal o f the American Chemical Society
1956, 75(21), 5597-5599.
9. Cahn, R. S.; Ingold, C. K.; Prelog, V., Experientia 1956,12 (3), 81-94.
10. The old D/L system introduced by Rosanoff is still used for amino acids. The
system is based on the convention of assigning the configuration of chiral centres, by
analogy with an arbitrarily chosen configuration of (+)-glyceraldehyde, used as a
standard.
11. Moss, G. P., Pure and Applied Chemistry 1996, 6 8 (12), 2193-2222.
12. On the contrary, some compounds are chiral and therefore exhibit optical
activity even if they do not contain any asymmetric carbon atom. Most common
examples are compounds where restricted rotation gives rise to perpendicular
dissymmetric planes such as asymmetrical substituted biphenyl with prevented or
restricted rotation around the single bond or some asymmetrically substituted
cumulenes. Compounds can be chiral also by virtue of their helical structure.
13. Smith, M. B.; March, J., March's Advanced Organic Chemistry. Sixth ed.;
WILEY-INTERSCIENCE: Hoboken, New Jersey, 2007; p 164-165.
14. Vollhardt, P., Chimica Organica. Zanichelli Editore S.p.A.: Bologna, 1998; p
163-170.
15. Maskill, H., The Physical Basis of Organic Chemistry. Oxford University Press:
Oxford New York, 1990.
47
16. Ali, I.; Gupta, V. K.; Aboul-Enein, H. Y.; Singh, P.; Sharma, B., Chirality 2007,
19(6), 453-463.
17. Reist, M.; Carrupt, P. A.; Testa, B.; Lehmann, S.; Hansen, J. J., Helvetica
Chimica Acta 1996, 79 (3), 767-778.
18. Maskill, H., The physical Basis o f Organic Chemistry. Oxford University Press:
Oxford New York, 1990; p 278-282.
19. Caldwell, J., Journal o f Chromatography A 1996, 719 (1), 3-13.
20. Therapontos, C.; Erskine, L.; Gardner, E. R.; Figg, W. D.; Vargesson, N.,
Proceedings o f the National Academy o f Sciences o f the United States o f America 2009,
106 (21), 8573-8578.
21. The enantioselectivity of the teratogenic properties of thalidomide is, however,
controversial.
22. Testa, B.; Carrupt, P. A.; Gal, J., Chirality 1993, 5 (3), 105-111.
23. Reist, M.; Carrupt, P. A.; Francotte, E.; Testa, B., Chemical Research in
Toxicology 1998,11 (12), 1521-1528.
24. Knoche, B.; Blaschke, G., Journal o f Chromatography A 1994, 6 6 6 (1-2), 235-
240.
25. U. S. Food and Drug Administration. Development of New Stereoisomeric
Drugs(1992) .http ://www.fda. gov/Drugs/GuidanceComplianceRegulatorylnformation/G
uidances/ucml22883.htm (accessed July 11 2011).
26. Reist, M.; Testa, B.; Carrupt, P. A., Enantiomer 1997, 2 (3-4), 147-155.
27. Aso, Y.; Yoshioka, S.; Shibazaki, T.; Uchiyama, M., Chemical &
Pharmaceutical Bulletin 1988, 36 (5), 1834-1840.
28. Yang, S. K.; Bao, Z. P., Chirality 1994, 6 (4), 321-328.
29. A mixed buffer containing borate, citrate, acetate and phosphate species.
30. Value determined by spectrophotometric titration in a mixture acetonitrile-buffer
in the ratio 1:10 (v:v) at 23 °C.
31. Yang, S. K., Enantiomer 1998, 3 (6), 485-490.
32. Stromar, M.; Sunjic, V.; Kovac, T.; Klasinc, L.; Kajfez, F., Croatica Chemica
Acta 1974, 46 (4), 265-274.
33. Mey, B.; Paulus, H.; Lamparter, E.; Blaschke, G., Chirality 1998, 10 (4), 307-
315.
34. Reist, M.; Christiansen, L. H.; Christoffersen, P.; Carrupt, P. A.; Testa, B.,
Chirality 1995, 7 (6), 469-473.
35. pKa values of 8.79±0.017 and 8.37±0.023 were reported forl.3a and 1.3b,
respectively.
36. Caldwell, J.; Hutt, A. J.; Foumelgigleux, S., Biochemical Pharmacology 1988,
37(1), 105-114.
37. Xie, Y. C.; Liu, H. Z.; Chen, J. Y., International Journal o f Pharmaceutics
2000,196 (1), 21-26.
38. Chen, C. Y.; Chang, Y. S.; Lin, S. A.; Wen, H. I.; Cheng, Y. C.; Tsai, S. W.,
Journal o f Organic Chemistry 2002, 67 (10), 3323-3326.
39. Xie, Y. C.; Liu, H. Z.; Chen, J. Y., Biotechnology Letters 1998,20 (5), 455-458.
40. Knihinicki, R. D.; Williams, K. M.; Day, R. O., Biochemical Pharmacology
1989,38 (24), 4389-4395.
41. Danel, C.; Foulon, C.; Goossens, J.-F.; Bonte, J.-P.; Vaccher, C., Tetrahedron-
Asymmetry 2006, 77(16), 2317-2321.
42. Welch, C. J.; Kress, M. H.; Beconi, M.; Mathre, D. J., Chirality 2003, 15 (2),
143-147.
43. Pepper, C.; Smith, H. J.; Barrell, K. J.; Nicholls, P. J.; Hewlins, M. J. E.,
Chirality 1994, 6 (5), 400-404.
44. Rochat, B.; Amey, M.; Vangelderen, H.; Testa, B.; Baumann, P., Chirality 1995,
7 (6), 389-395.
45. de Gaitani, C. M.; Martinez, A. S.; Bonato, P. S., Chirality 2003, 15 (6), 479-
485.
46. Lamparter, E.; Blaschke, G.; Schluter, J., Chirality 1993, 5 (5), 370-374.
47. Severin, G., Chirality 1992,4 (4), 222-226.
48. Cram, D. J., Fundamentals o f Carbanion Chemistry. Academic Press: New York
and London, 1965; Vol. 4, p 85-105.
49. Gu, L.; Strickley, R. G., Pharmaceutical Research 1987, 4 (5), 392-397.
50. Wilson, C. L., Journal o f the Chemical Society 1934, 98-99.
51. Ahlberg, R., Berichte Der Deutschen Chemischen Gesellschaft 1928, 61, 811-
817.
52. McKenzie, A.; Wren, H., Journal o f the Chemical Society 1920, 777, 680-690.
53. McKenzie, A.; Smith, I. A., Journal o f the Chemical Society 1922, 121, 1348-
1361.
54. McKenzie, A.; Widdows, S. T., Journal o f the Chemical Society 1915,107, 702-
715.
49
55. Cirilli, R.; Costi, R.; Gasparrini, F.; La Torre, F.; Pierini, M.; Siani, G., Chirality
2009, 21 (1), 24-34.
56. Cram, D. J., Fundamentals o f Carbanion Chemistry. Academic Press: New York
and London, 1965; Vol. 4, p 1-20.
57. Amyes, T. L.; Richard, J. P., Journal o f the American Chemical Society 1992,
114 (26), 10297-10302.
58. Amyes, T. L.; Richard, J. P., Journal o f the American Chemical Society 1996,
118 (13), 3129-3141.
59. Richard, J. P.; Williams, G.; O'Donoghue, A. C.; Amyes, T. L., Journal o f the
American Chemical Society 2002,124 (12), 2957-2968.
60. Richard, J. P.; Amyes, T. L.; Toteva, M. M., Accounts o f Chemical Research
2001, 34 (12), 981-988.
61. Richard, J. P.; Williams, G.; Gao, J. L., Journal o f the American Chemical
Society 1999,121 (4), 715-726.
62. Rios, A.; Amyes, T. L.; Richard, J. P., Journal o f the American Chemical
Society 2000,122 (39), 9373-9385.
63. Williams, G.; Maziarz, E. P.; Amyes, T. L.; Wood, T. D.; Richard, J. P.,
Biochemistry 2003, 42 (21), 8354-8361.
64. Hine, J., Structural Effects on Equilibria in Organic Chemistry. Wiley-
Interscience: New York London Sydney Toronto, 1975; p 97-99.
65. Hine, J., Structural Effects on Equilibria in Organic Chemistry. Wiley -
Interscience: New York London Sydney Toronto, 1975; p 98.
66. Rios, A.; Richard, J. P.; Amyes, T. L., Journal o f the American Chemical
Society 2002,124 (28), 8251-8259.
67. Ware, E., Chemical Reviews 1950, 46 (3), 403-470.
68. Thenmozhiyal, J. C.; Wong, P. T. H.; Chui, W. K., Journal o f Medicinal
Chemistry 2004, 47 (6), 1527-1535.
69. Brouillette, W. J.; Jestkov, V. P.; Brown, M. L.; Akhtar, M. S.; Delorey, T. M.;
Brown, G. B., Journal o f Medicinal Chemistry 1994, 37 (20), 3289-3293.
70. Cortes, S.; Liao, Z. K.; Watson, D.; Kohn, H., Journal o f Medicinal Chemistry
1985, 28 (5), 601-606.
71. Brown, M. L.; Brown, G. B.; Brouillette, W. J., Journal o f Medicinal Chemistry
1997, 40 (4), 602-607.
50
72. Mehta, N. B.; Diuguid, C. A. R.; Soroko, F. E., Journal o f Medicinal Chemistry
1981,24 (4), 465-468.
73. Zha, C. X.; Brown, G. B.; Brouillette, W. J., Journal o f Medicinal Chemistry
2004, 47 (26), 6519-6528.
74. Balog, A.; Salvati, M. E.; Shan, W. F.; Mathur, A.; Leith, L. W.; Wei, D. D.;
Attar, R. M.; Geng, J. P.; Rizzo, C. A.; Wang, C. H.; Kiystek, S. R.; Tokarski, J. S.;
Hunt, J. T.; Gottardis, M.; Weinmann, R., Bioorganic & Medicinal Chemistry Letters
2004,14 (24), 6107-6111.
75. Zhang, D.; Xing, X. C.; Cuny, G. D., Journal o f Organic Chemistry 2006, 71
(4), 1750-1753.
76. Mudit, M.; Khanfar, M.; Muralidharan, A.; Thomas, S.; Shah, G. V.; van Soest,
R. W. M.; El Sayed, K. A., Bioorganic & Medicinal Chemistry 2009,17 (4), 1731-
1738.
77. Zuliani, V.; Carmi, C.; Rivara, M.; Fantini, M.; Lodola, A.; Vacondio, F.; Bordi,
F.; Plazzi, P. V.; Cavazzoni, A.; Galetti, M.; Alfieri, R. R.; Petronini, P. G.; Mora, M.,
European Journal o f Medicinal Chemistry 2009, 44 (9), 3471-3479.
78. Kim, D.; Wang, L. P.; Caldwell, C. G.; Chen, P.; Finke, P. E.; Oates, B.;
MacCoss, M.; Mills, S. G.; Malkowitz, L.; Gould, S. L.; DeMartino, J. A.; Springer, M.
S.; Hazuda, D.; Miller, M.; Kessler, J.; Danzeisen, R.; Carver, G.; Carella, A.; Holmes,
K.; Lineberger, J.; Schleif, W. A.; Emini, E. A., Bioorganic & Medicinal Chemistry
Letters 2001,11 (24), 3099-3102.
79. Comber, R. N.; Reynolds, R. C.; Friedrich, J. D.; Manguikian, R. A.; Buckheit,
R. W.; Truss, J. W.; Shannon, W, M.; Secrist, J. A., Journal o f Medicinal Chemistry
1992,35 (19), 3567-3572.
80. Groutas, W. C.; Stanga, M. A.; Castrisos, J. C.; Schatz, E. J., Journal o f enzyme
inhibition 1990, 3 (3), 237-243.
81. deLaszlo, S. E.; Allen, E. E.; Li, B.; Ondeyka, D.; Rivero, R.; Malkowitz, L.;
Molineaux, C.; Siciliano, S. J.; Springer, M. S.; Greenlee, W. J.; Mantlo, N., Bioorganic
& Medicinal Chemistry Letters 1997, 7 (2), 213-218.
82. Kanyonyo, M.; Govaerts, S. J.; Hermans, E.; Poupaert, J. H.; Lambert, D. M.,
Bioorganic & Medicinal Chemistry Letters 1999, 9 (15), 2233-2236.
83. Muccioli, G. G.; Martin, D.; Scriba, G. K. E.; Poppitz, W.; Poupaert, J. H.;
Wouters, J.; Lambert, D. M., Journal o f Medicinal Chemistry 2005, 48 (7), 2509-2517.
51
84. Cabordery, A.-C.; Toussaint, M.; Azaroual, N.; Bonte, J.-P.; Melnyk, P.;
Vaccher, C.; Foulon, C., Tetrahedron-Asymmetry’ 2011, 22 (2), 125-133.
85. Toussaint, M.; Mousset, D.; Foulon, C.; Jacquemard, U.; Vaccher, C.; Melnyk,
P., European Journal o f Medicinal Chemistry 2010, 45 (1), 256-263.
86. Tompkins, J. E., Journal o f Medicinal Chemistry 1986, 29 (5), 855-859.
87. Dakin, H. D., American Chemical Journal 1910, 44, 48.
88. Dudley, K. H.; Bius, D. L., Drug Metabolism and Disposition 1976, 4 (4), 340-
348.
89. Lazarus, R. A., Journal o f Organic Chemistry 1990, 55 (15), 4755-4757.
90. Bovamick, M.; Clarke, H. T., Journal o f the American Chemical Society 1938,
60, 2426-2430.
91. The authors suggest that the small solvent kinetic isotope effect should support
an Se2 mechanism. However a comparison appears to be made with literature data
reporting values of primary kinetic isotope effects.
92. Kahn, K.; Tipton, P. A., Bioorganic Chemistry 2000, 28 (2), 62-72.
93. Lee, C. K.; Fan, C. H., Enzyme and Microbial Technology 1999, 24 (10), 659-
666.
94. The hypothesis however does not seem to be in line with the small reported
solvent kinetic isotope effect of 1.27b.
95. Hsu, S. K.; Wilson, C. L., Journal o f the Chemical Society 1936, 623-625.
96. Hsu, S. K.; Ingold, C. K.; Wilson, C. L., Journal o f the Chemical Society 1938,
78-81.
97. The equivalence of rates of bromination, racemisation and H/D exchange
observed for ketones, lead to the conclusion that, for this class of compounds, ionisation
should be the common rate determining step for all the three processes.
98. Wilson, C. L., Journal o f the Chemical Society 1936, 1550-1553.
99. Reichardt, C., Solvents and Solvent Effects in Organic Chemistry. Third ed.;
WILEY VCH: Weinheim, 2003; p 57.
100. Parker, A. J., Chemical Reviews 1969, 69 (1), 1-32.
101. Reichardt, C., Solvents and Solvent Effects in Organic Chemistry. Third ed.;
WILEY VCH: Weinheim, 2003; p 82-84.
102. Isaacs, N. S., Physical Organic Chemistry. Pearson Education Limited: Harlow,
UK, 1995; p 194.
52
103. Cram, D. J.; Kingsbury, C. C.; Rickbom, B., Journal o f the American Chemical
Society 1959,81 (21), 5835-5835.
104. Roitman, J. N.; Cram, D. J., Journal o f the American Chemical Society 1971, 93
(9), 2225-2231.
105. Cram, D. J.; Rickbom, B.; Kingsbury, C. A., Journal o f the American Chemical
Society 1961,83 (17), 3688-&.
106. Cram, D. J.; Nielsen, W. D.; Rickbom, B., Journal o f the American Chemical
Society 1960,82 (24), 6415-6416.
107. Cram, D. J.; Kingsbury, C. A.; Haberfie.P; Rickbom, B., Journal o f the
American Chemical Society 1961,83 (17), 3678-3687.
108. Cram, D. J.; Rickbom, B.; Knox, G. R., Journal o f the American Chemical
Society 1960,82 (24), 6412-6413.
109. Cram, D. J.; Mateos, J. L.; Hauck, F.; Langemann, A.; Kopecky, K. R.; Nielsen,
W. D.; Allinger, J., Journal o f the American Chemical Society 1959, 81 (21), 5774-
5784.
110. The authors exclude phenomena of ion pairing at the low concentrations of base
employed and the metal alkoxides are considered fully dissociated in all the reaction
mixtures under investigation.
111. Reichardt, C., Solvents and Solvent Effects in Organic Chemistry. Third ed.;
WILEY VCH: Weinheim, 2003; p 259-262.
112. Reichardt, C., Solvents and Solvent Effects in Organic Chemistry. Third ed.;
WILEY VCH: Weinheim, 2003; p 241-242.
113. Miller, J.; Parker, A. J., Journal o f the American Chemical Society 1961, 83 (1),
117-123.
114. Hughes, E. D.; Ingold, C. K., Journal o f the Chemical Society 1935, 244-255.
115. http://www.chem.wisc.edu/areas/reich/pkatable.
116. pXa Data Compiled by R. Williams http://research.chem.psu.edu/brpgroup/pKa
compilation.pdf.
117. Mukerjee, P.; Ostrow, J. D., Tetrahedron Letters 1998, 39 (5-6), 423-426.
118. Ballash, N. M.; Robertso.Eb; Sokolows.Md, Transactions o f the Faraday
Society 1970, 6 6 (574), 2622-2628.
119. Baughman, E. H.; Kreevoy, M. M., Journal o f Physical Chemistry 1974, 75 (4),
421-423.
53
120. Vesala, A.; Saloma, E., Acta Chemica Scandinavica Series a-Physical and
Inorganic Chemistry 1976,30 (4), 277-280.
121. Holmes, D. L.; Lightner, D. A., Tetrahedron 1995, 51 (6), 1607-1622.
122. Holmes, D. L.; Lightner, D. A., Tetrahedron 1996, 52 (15), 5319-5338.
123. ApATa is defined as the difference of pKa in the presence of d6-DMSO or DMSO
co-added and the pKa. value in water alone.
124. Frohlige.Jo; Gartska, R. A.; Irwin, H. W.; Steward, O. W., Analytical Chemistry
1968, 40 (10), 1408-1411.
125. Reichardt, C., Solvents and Solvent Effects in Organic Chemistry. Third ed.;
WILEY VCH: Weinheim, 2003; p 95.
126. Clare, B. W.; Cook, D.; Ko, E. C. F.; Mac, Y. C.; Parker, A. J., Journal o f the
American Chemical Society 1966, 8 8 (9), 1911-1916.
127. Bates, R. G.; Pawlak, Z., Journal o f Solution Chemistry 1976, 5 (3), 213-222.
54
Chapter 2
The kinetics and mechanism of racemisation of (>S)-5-benzylhydantoin and (^-3-A^-methyl-5- benzy lhydantoin.
Abstract
The kinetics and mechanism of racemisation and H/D exchange of (S)-5-
benzy lhy dantoin 2.1 and of (*S)-3-A-methy 1-5-benzylhydantoin 2.2 have been studied in
D2O- and H20-based buffers. Both processes are general-base catalysed. The kinetics of
racemisation of (*S)-5-benzy lhy dantoin is complicated by the acidity of the proton in
position 3 of the hydantoin ring (Scheme 2.3). A method is presented allowing the
analysis of the complex kinetics where the rate of racemisation depends on the
protonation state of the molecule. A Bronsted plot for racemisation (S)-3 -TV-methy 1-5-
benzylhydantoin in aqueous buffers gave a value of P of approximately 0.6, suggesting
a transition state of the rate-determining step of racemisation with the exchangeable
proton being halfway between the asymmetric carbon and the base. No solvent kinetic
isotope effect was detected for racemisation of the benzylhydantoins in phosphate
buffers, while a primary kinetic isotope effect of approximately 3.5 for racemisation of
(iS)-5-benzylhydantoin was observed. Deuterium-labelled 5-benzylhydantoins have been
synthesised which allowed us to obtain further stereochemical and mechanistic
information on H/D exchange of the molecules in D2O phosphate buffer. A
mathematical expression describing the racemisation of a generic chiral molecule in a
deuterated medium, following an Se2 mechanism has been developed and experimental
data have been fitted to the mentioned model. The expected ECD signal for a generic
55
kinetic trace for the mentioned model was also numerically simulated and compared to
experimental kinetic traces.
Mathematical analyses, numerical simulations, comparison of rate constants of
racemisation and H/D exchange, experimental kinetic isotope effects, and kinetic
experiments carried out with deuterium labelled benzylhydantoins all consistently
support the SeI mechanism of racemisation and not the previously proposed Se2
mechanism.
2.1. Introduction
Despite the keen interest in the hydantoin ring in drug design1'19 and several studies in
the literature on the racemisation of 5-substitued hydantoins ’ " and closely related
structures, 27,28 the mechanism of interconversion of opposite enantiomers of this class
of compounds has not been unequivocally elucidated (see Chapter 1, Sections 1.4 and
1.5). The studies described in this Chapter aim to shed more light on the mechanism of
racemisation of 5-substituted hydantoins, under experimental conditions mimicking
physiological ones.
5-Benzylhydantoin and 3-A-methyl-5-benzy lhydantoin were chosen as model
compounds for our studies of the kinetics and mechanism of racemisation of 5-
substituted hydantoins. This choice was based on the consideration that
benzylhydantoins allow for significant structural variation (also see Chapter 3), show
convenient rates of racemisation and because of the presence of suitable UV-active
functional groups in their structures, enabling easy detection by UV and ECD7Q(electronic circular dichroism) spectroscopy.
23As proposed by Testa et al and briefly discussed in Chapter 1, two maun mechanistic
pathways can be envisaged for the racemisation of 5-substituted hydantoins: the SeI and
the Se2 pathways, shown in Scheme 2.1.
Testa et a l, in the above mentioned paper, suggested a general-base catalysed Se2
mechanism for racemisation of 5-substituted hydantoins. (£)-5-benzylhydantoin and (S)-
5-pheny lhy dantoin were used as model compounds. The kinetic experiments described
in the paper were carried out in a mixed medium composed by 50% DMSO and 50%
phosphate buffer. Both deuterated and non-deuterated solvents were used. A key
56
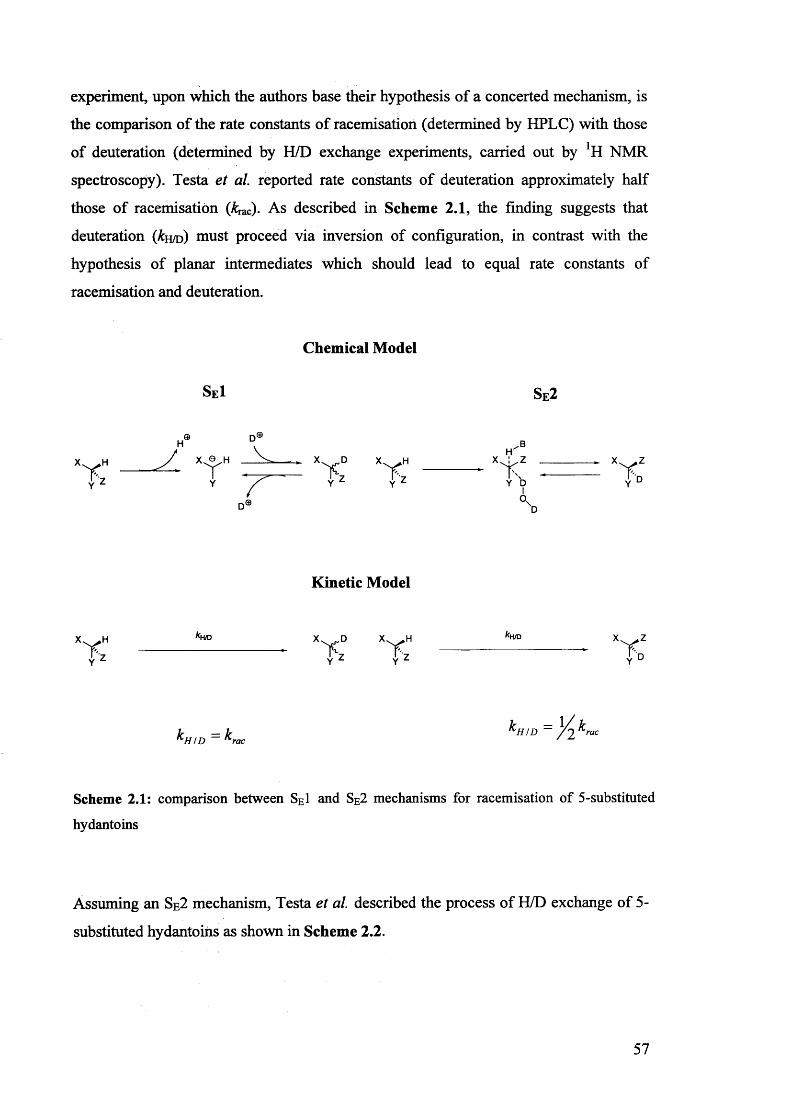
experiment, upon which the authors base their hypothesis of a concerted mechanism, is
the comparison of the rate constants of racemisation (determined by HPLC) with those
of deuteration (determined by H/D exchange experiments, carried out by NMR
spectroscopy). Testa et al. reported rate constants of deuteration approximately half
those of racemisation (kTac). As described in Scheme 2.1, the finding suggests that
deuteration (&h /d ) must proceed via inversion of configuration, in contrast with the
hypothesis of planar intermediates which should lead to equal rate constants of
racemisation and deuteration.
Chemical Model
SE1 Se2
x h X^H,BH
xi < zY DI
C>
I D
Kinetic Model
X^HN
X D IS ^zY Y
H/D X^ZY d
I f — I f* H /D rac
I f — \ / I fH ID ~ / 2 r
Scheme 2.1: comparison between SE1 and SE2 mechanisms for racemisation of 5-substituted
hydantoins
Assuming an Se2 mechanism, Testa et al. described the process of H/D exchange of 5-
substituted hydantoins as shown in Scheme 2.2.
57
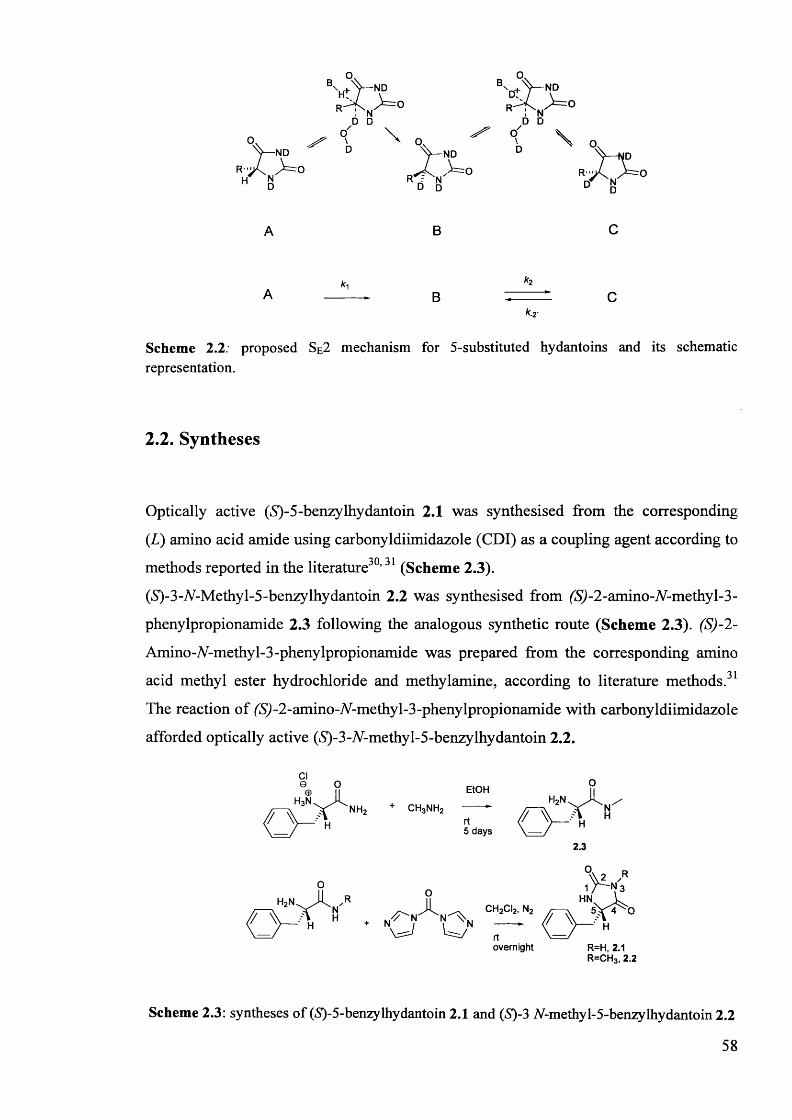
Scheme 2.2: proposed SE2 mechanism for 5-substituted hydantoins and its schematic representation.
2.2. Syntheses
Optically active (£)-5-benzylhydantoin 2.1 was synthesised from the corresponding
(.L) amino acid amide using carbonyldiimidazole (CDI) as a coupling agent according to
methods reported in the literature ’ (Scheme 2.3).
(iS)-3-A^-Methyl-5-benzylhydantoin 2.2 was synthesised from (5)-2-amino-Ar-methyl-3-
phenylpropionamide 2.3 following the analogous synthetic route (Scheme 2.3). (S)-2-
Amino-A7-methyl-3-phenylpropionamide was prepared from the corresponding amino
acid methyl ester hydrochloride and methylamine, according to literature methods.31
The reaction of (S) -2-amino-2/-methy 1-3 -phenylpropionamide with carbonyldiimidazole
afforded optically active (5)-3-A/-methyl-5-benzylhydantoin 2.2.
EtOH
2.3
c h 2ci2, n2
overnight R=H, 2.1 R=CH3, 2.2
Scheme 2.3: syntheses of (iS)-5-benzylhydantoin 2.1 and (S)-3 A^-methyl-5-benzylhydantoin 2.2
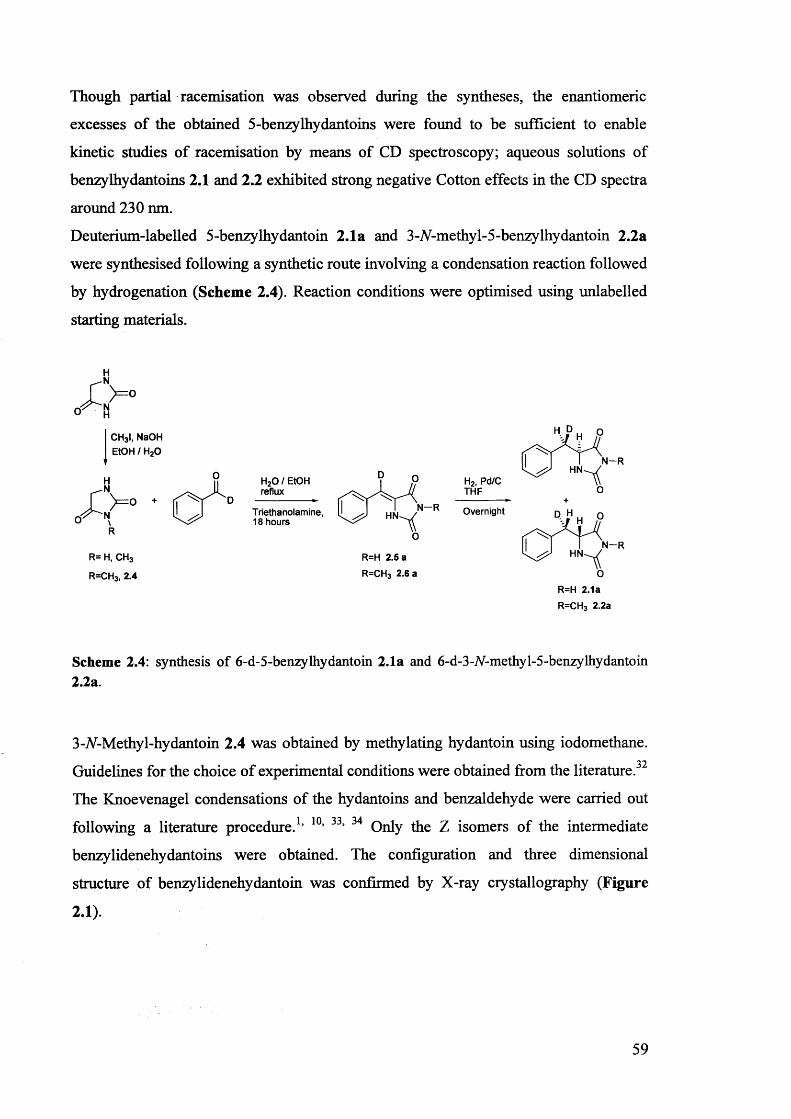
Though partial racemisation was observed during the syntheses, the enantiomeric
excesses of the obtained 5-benzylhydantoins were found to be sufficient to enable
kinetic studies of racemisation by means of CD spectroscopy; aqueous solutions of
benzylhydantoins 2.1 and 2.2 exhibited strong negative Cotton effects in the CD spectra
around 230 nm.
Deuterium-labelled 5-benzylhydantoin 2.1a and 3-N-methy 1-5-benzylhydantoin 2.2a
were synthesised following a synthetic route involving a condensation reaction followed
by hydrogenation (Scheme 2.4). Reaction conditions were optimised using unlabelled
starting materials.
CH3I, NaOH EtOH / H20
R= H, CH3
R=CH3i 2.4
H20 / EtOH reflux
Triethanolamine, 18 hours
R=H 2.5 a R=CH3 2.6 a
H2, Pd/C THF
Overnight
H P
N -R
N -RHN
R=H 2.1aR=CH3 2.2a
Scheme 2.4: synthesis of 6-d-5-benzylhydantoin 2.1a and 6-d-3-7V-methyl-5-benzylhydantoin 2.2a.
3-jV-Methy 1-hy dantoin 2.4 was obtained by methylating hydantoin using iodomethane.32Guidelines for the choice of experimental conditions were obtained from the literature.
The Knoevenagel condensations of the hydantoins and benzaldehyde were carried out1 1 A ' I *2 'J / I
following a literature procedure. ’ 5 ’ Only the Z isomers of the intermediate
benzylidenehydantoins were obtained. The configuration and three dimensional
structure of benzylidenehydantoin was confirmed by X-ray crystallography (Figure
2.1).
59
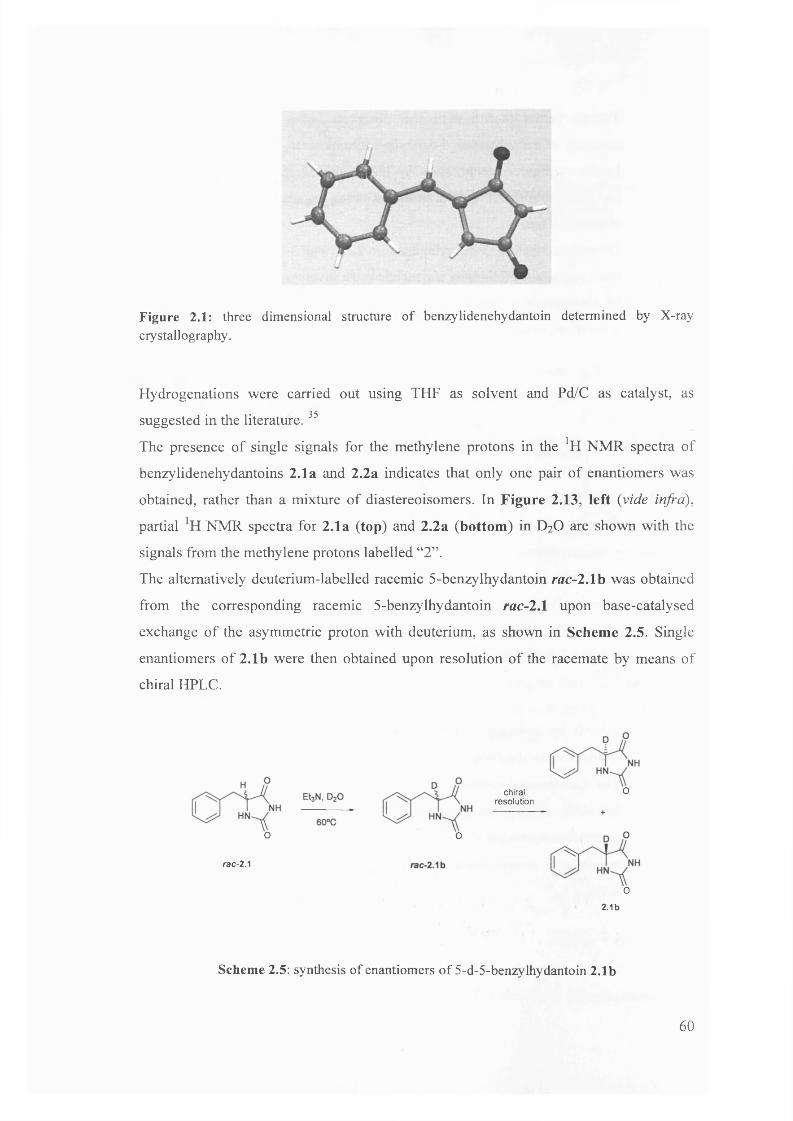
Figure 2.1: three dimensional structure of benzylidenehydantoin determined by X-ray crystallography.
Hydrogenations were carried out using THF as solvent and Pd/C as catalyst, as
benzylidenehydantoins 2.1a and 2.2a indicates that only one pair of enantiomers was
obtained, rather than a mixture of diastereoisomers. In Figure 2.13, left (vide infra),
signals from the methylene protons labelled “2”.
The alternatively deuterium-labelled racemic 5-benzylhydantoin rac-2.1b was obtained
from the corresponding racemic 5-benzylhydantoin rac-2.1 upon base-catalysed
exchange of the asymmetric proton with deuterium, as shown in Scheme 2.5. Single
enantiomers of 2.1b were then obtained upon resolution of the racemate by means of
chiral HPLC.
suggested in the literature.35
The presence of single signals for the methylene protons in the [H NMR spectra of
partial NMR spectra for 2.1a (top) and 2.2a (bottom) in D2O are shown with the
chiralresolution
O+
O O
rac-2.1
O2.1b
Scheme 2.5: synthesis of enantiomers of 5-d-5-benzylhydantoin 2.1b
60
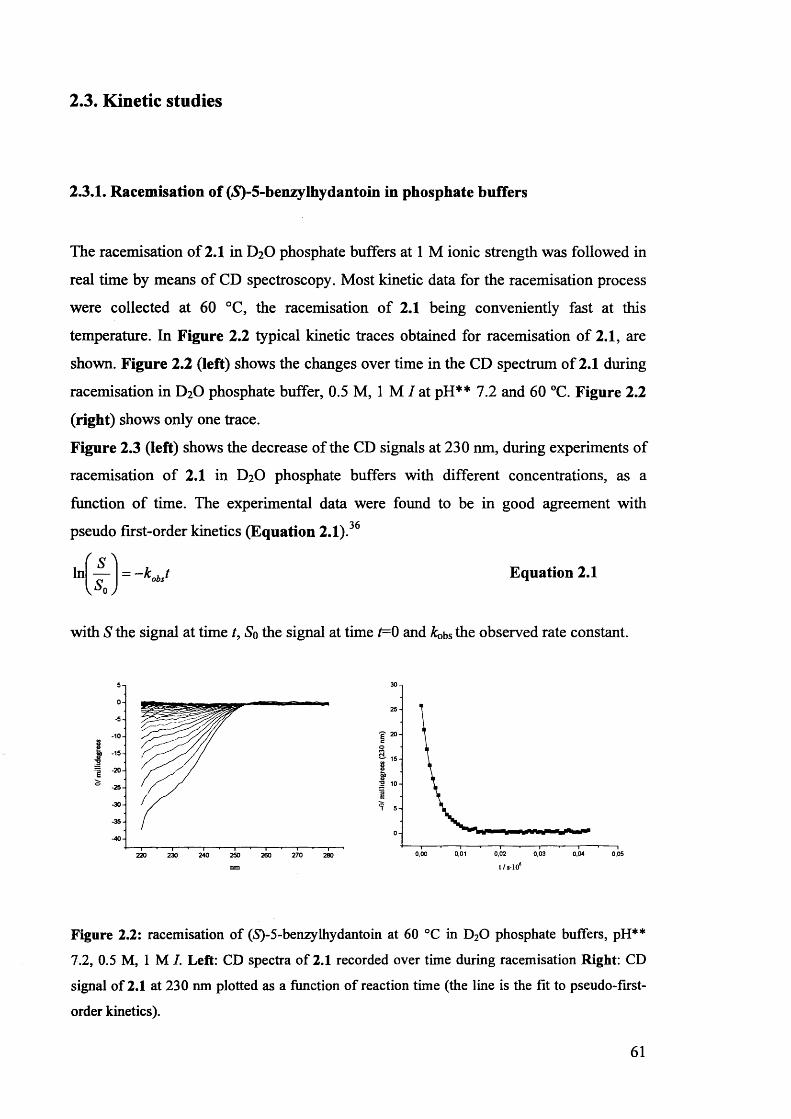
2.3. Kinetic studies
2.3.1. Racemisation of (5)-5-benzylhydantoin in phosphate buffers
The racemisation of 2.1 in D2O phosphate buffers at 1 M ionic strength was followed in
real time by means of CD spectroscopy. Most kinetic data for the racemisation process
were collected at 60 °C, the racemisation of 2.1 being conveniently fast at this
temperature. In Figure 2.2 typical kinetic traces obtained for racemisation of 2.1, are
shown. Figure 2.2 (left) shows the changes over time in the CD spectrum of 2.1 during
racemisation in D2O phosphate buffer, 0.5 M, 1 M I at pH** 7.2 and 60 °C. Figure 2.2
(right) shows only one trace.
Figure 2.3 (left) shows the decrease of the CD signals at 230 run, during experiments of
racemisation of 2.1 in D2O phosphate buffers with different concentrations, as a
function of time. The experimental data were found to be in good agreement withHZ'
pseudo first-order kinetics (Equation 2.1).
In = ~koJ Equation 2.1
with S the signal at time t, So the signal at time t= 0 and kobs the observed rate constant.
50-5
-10
-15-20
-25-30-35-40
240 250 270220 230 260 280
30
25
-g 20
ofqio
15
00,040,00 0,01 0,02 0,03 0,05
t/s-10
Figure 2.2: racemisation of (*S)-5-benzylhydantoin at 60 °C in D20 phosphate buffers, pH**
7.2, 0.5 M, 1 M /. Left: CD spectra of 2.1 recorded over time during racemisation Right: CD
signal of 2.1 at 230 nm plotted as a function of reaction time (the line is the fit to pseudo-first-
order kinetics).
61
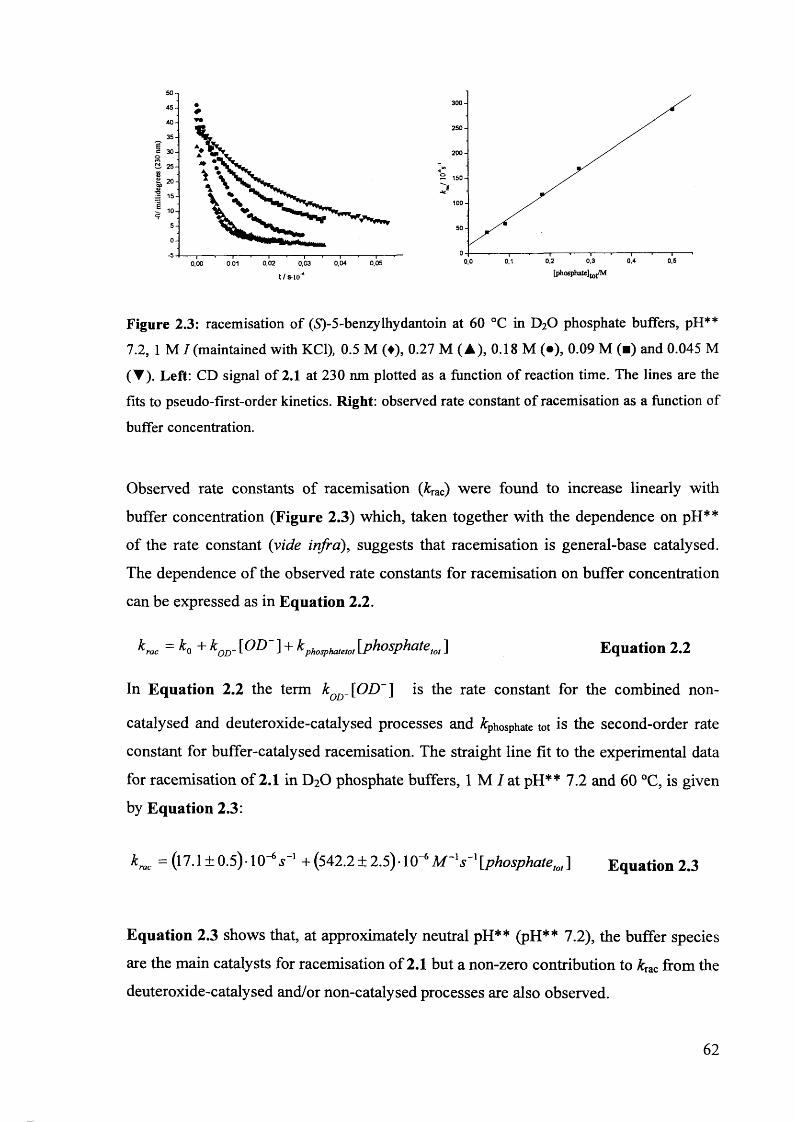
300
250
200
o 150
100
50
0 0,50,3 0.40,20,0
[phosphate]tot/M0,04 0,050,02 0,030,00 001
Figure 2.3: racemisation of (£)-5-benzylhydantoin at 60 °C in D20 phosphate buffers, pH**
7.2, 1 M / (maintained with KC1), 0.5 M (♦), 0.27 M (A), 0.18 M (•), 0.09 M (■) and 0.045 M
(T). Left: CD signal of 2.1 at 230 nm plotted as a function of reaction time. The lines are the
fits to pseudo-first-order kinetics. Right: observed rate constant of racemisation as a function of
buffer concentration.
Observed rate constants of racemisation (kTac) were found to increase linearly with
buffer concentration (Figure 2.3) which, taken together with the dependence on pH**
of the rate constant (vide infra), suggests that racemisation is general-base catalysed.
The dependence of the observed rate constants for racemisation on buffer concentration
can be expressed as in Equation 2.2.
K a C = h + k OD- [ O D " \ ^phosphatetot [phosphatetot ] Equation 2.2
In Equation 2.2 the term kQD_ [OD~ ] is the rate constant for the combined non
catalysed and deuteroxide-catalysed processes and phosphate tot is the second-order rate
constant for buffer-catalysed racemisation. The straight line fit to the experimental data
for racemisation of 2.1 in D2O phosphate buffers, 1 M I at pH** 7.2 and 60 °C, is given
by Equation 2.3:
=(17.1 ±0.5)-10-V* + (542.2 ± 2.5) • 10^ s'[phosphate m ] Equation 2.3
Equation 2.3 shows that, at approximately neutral pH** (pH** 7.2), the buffer species
are the main catalysts for racemisation of 2.1 but a non-zero contribution to kmc from the
deuteroxide-catalysed and/or non-catalysed processes are also observed.
62
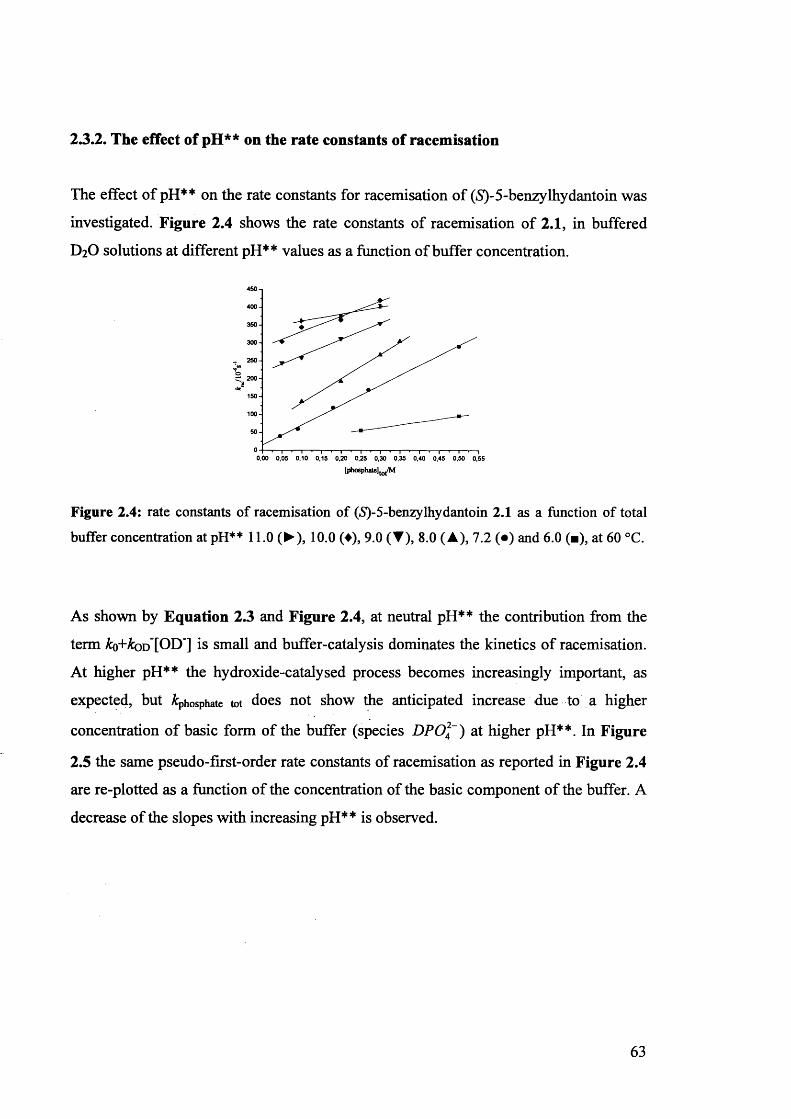
2.3.2. The effect of pH** on the rate constants of racemisation
The effect of pH** on the rate constants for racemisation of (S)-5-benzylhydantoin was
investigated. Figure 2.4 shows the rate constants of racemisation of 2.1, in buffered
D2O solutions at different pH** values as a function of buffer concentration.
450400350300250
oC 200 *8150
100
5000,00 0.05 0.10 0.15 0.20 0.25 0,30 0,35 0.40 0,45 0.50 0,55
[phosphate] tot/M
Figure 2.4: rate constants of racemisation of (S)-5-benzylhydantoin 2.1 as a function of total
buffer concentration at pH** 11.0 (►), 10.0 (♦), 9.0 (▼), 8.0 (A), 7.2 (•) and 6.0 (■), at 60 °C.
As shown by Equation 2.3 and Figure 2.4, at neutral pH** the contribution from the
term Ao+&od [OD‘] is small and buffer-catalysis dominates the kinetics of racemisation.
At higher pH** the hydroxide-catalysed process becomes increasingly important, as
expected, but phosphate tot does not show the anticipated increase due to a higher
concentration of basic form of the buffer (species DPO]~) at higher pH**. In Figure
2.5 the same pseudo-first-order rate constants of racemisation as reported in Figure 2.4
are re-plotted as a function of the concentration of the basic component of the buffer. A
decrease of the slopes with increasing pH** is observed.
63
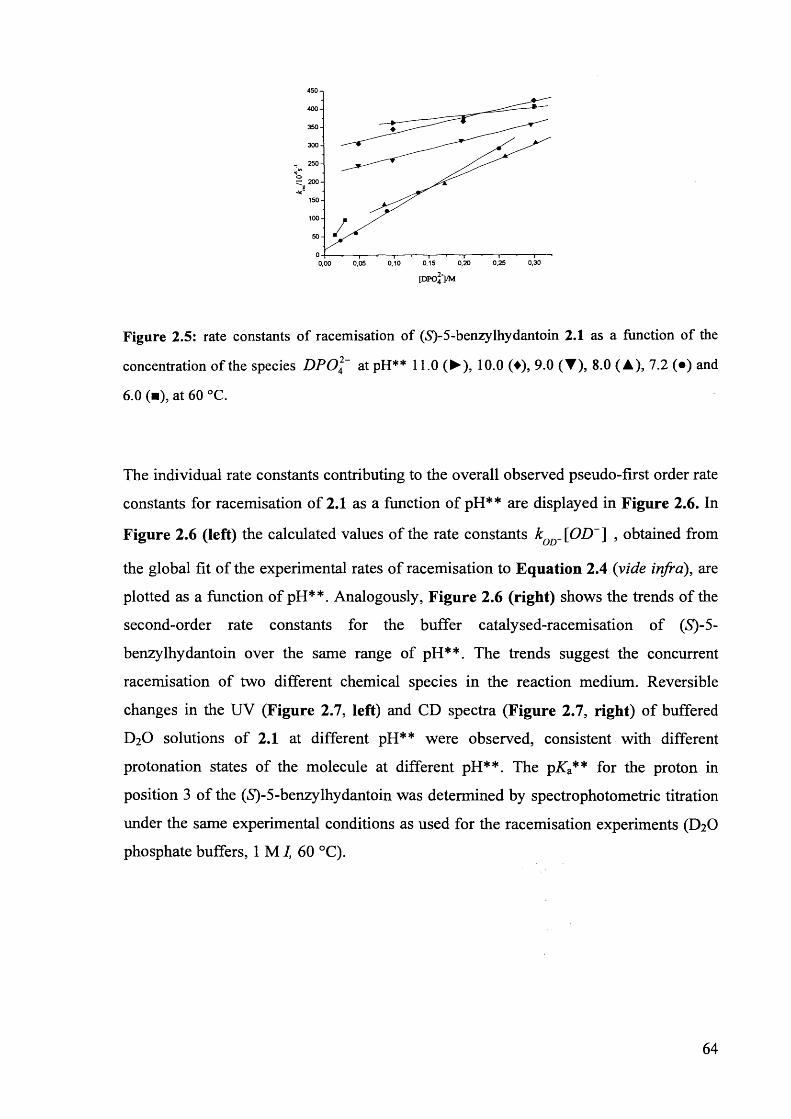
o
0,25 0,300,15 0,200,05 0,100,00
[DPO^J/M
Figure 2.5: rate constants of racemisation of (5)-5-benzylhydantoin 2.1 as a function of the
concentration of the species D P O at pH** 11.0 (►), 10.0 (♦), 9.0 (T ), 8.0 (A), 7.2 (•) and
6.0 (■), at 60 °C.
The individual rate constants contributing to the overall observed pseudo-first order rate
constants for racemisation of 2.1 as a function of pH** are displayed in Figure 2.6. In
Figure 2.6 (left) the calculated values of the rate constants kQD_[OD~] , obtained from
the global fit of the experimental rates of racemisation to Equation 2.4 (vide infra), are
plotted as a function of pH**. Analogously, Figure 2.6 (right) shows the trends of the
second-order rate constants for the buffer catalysed-racemisation of (5)-5-
benzylhydantoin over the same range of pH**. The trends suggest the concurrent
racemisation of two different chemical species in the reaction medium. Reversible
changes in the UV (Figure 2.7, left) and CD spectra (Figure 2.7, right) of buffered
D20 solutions of 2.1 at different pH** were observed, consistent with different
protonation states of the molecule at different pH**. The pKa** for the proton in
position 3 of the (S)-5-benzylhydantoin was determined by spectrophotometric titration
under the same experimental conditions as used for the racemisation experiments (D20
phosphate buffers, 1 M /, 60 °C).
64
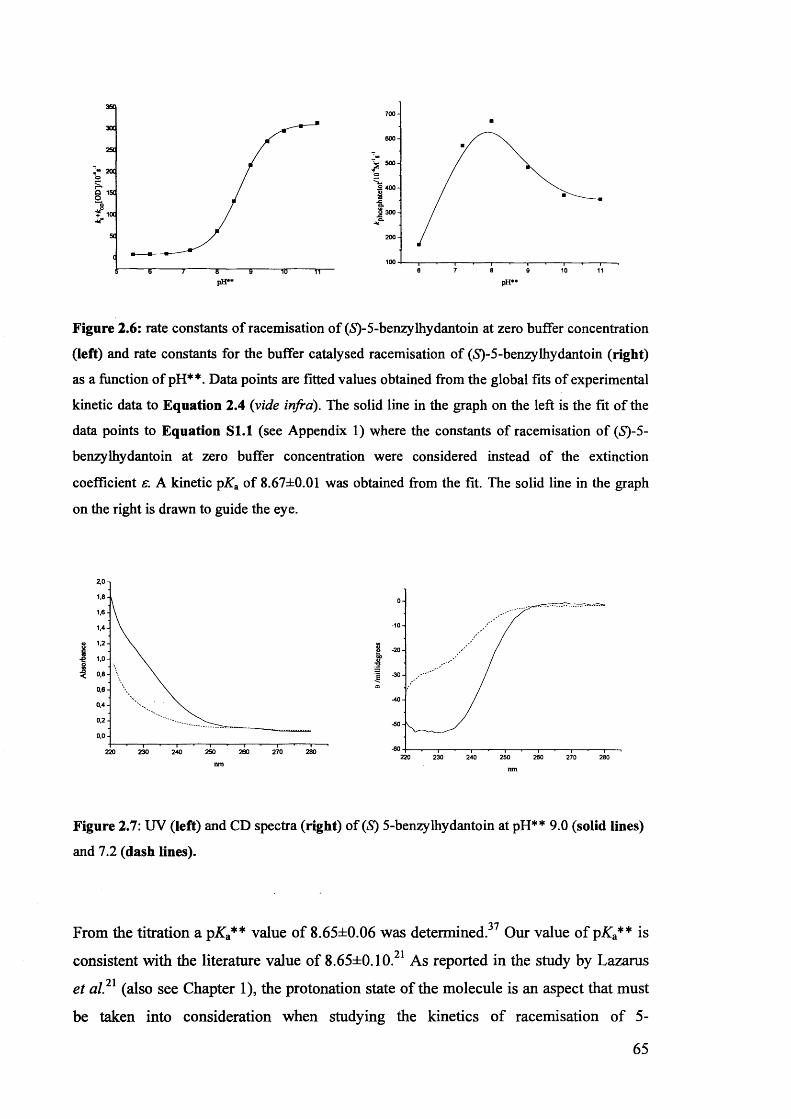
------ 6------ 7------ B------ S------ TO------ITpH**
6 7 8 9 10 11pH**
Figure 2.6: rate constants of racemisation of (5)-5-benzylhydantoin at zero buffer concentration
(left) and rate constants for the buffer catalysed racemisation of (S')- 5 -benzy lhydantoin (right)
as a function of pH**. Data points are fitted values obtained from the global fits of experimental
kinetic data to Equation 2.4 (vide infra). The solid line in the graph on the left is the fit of the
data points to Equation S l.l (see Appendix 1) where the constants of racemisation of {S)~5-
benzylhydantoin at zero buffer concentration were considered instead of the extinction
coefficient e. A kinetic pK a of 8.67±0.01 was obtained from the fit. The solid line in the graph
on the right is drawn to guide the eye.
2,° -i
1,6 -
1,4-1,2 -I•e 1,0 -
0,6 -
0,4-0,2 -
0,0 -
280220 230 240 250 260 270
0-10
-20
-3C
-40
-60220 230 240 250 260 270 280nm nm
Figure 2.7: UV (left) and CD spectra (right) of (S) 5-benzylhydantoin at pH** 9.0 (solid lines)
and 7.2 (dash lines).
From the titration a pKa** value of 8.65±0.06 was determined.37 Our value of pKa** is21consistent with the literature value of 8.65±0.10. As reported in the study by Lazarus
et al. 21 (also see Chapter 1), the protonation state of the molecule is an aspect that must
be taken into consideration when studying the kinetics of racemisation of 5-
65
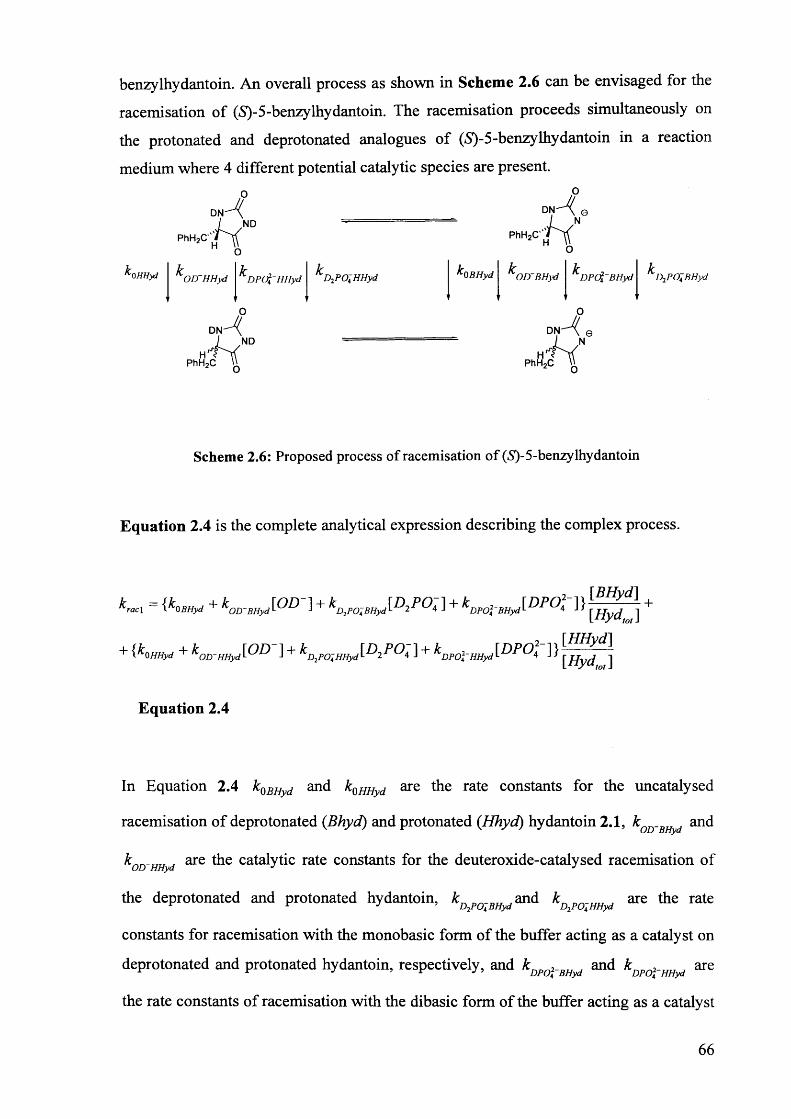
benzylhydantoin. An overall process as shown in Scheme 2.6 can be envisaged for the
racemisation of (5)-5-benzylhydantoin. The racemisation proceeds simultaneously on
the protonated and deprotonated analogues o f (5)-5-benzylhydantoin in a reaction
medium where 4 different potential catalytic species are present.
,o
, L s NDPhH2C' i It
H IPhH
OHHyd OITHHyd DP(J$~HHyd D2PO;HHyd C0BHyd OITBHyd D P Q tB H yd D2PO^BHyd
I NDH
PhH2C PhH2C
Scheme 2.6: Proposed process of racemisation of (S)-5-benzylhydantoin
Equation 2.4 is the complete analytical expression describing the complex process.
kracl = iK B H y d + ^OD B H y d ^ ^ ^ + ^ D2POABHyd^ ^ ^ 4 ^ + ^ DPO^BHyd^ ^ ^ 4 ] } [ H y d ] +
+ ( ^ 0 HHyd + k OD-HH y d [ O D ] + ^ D 2P O ; H H y d ^ 2 ^ A ] + ^ DPO}~ HHyd ] ) j J
Equation 2.4
In Equation 2.4 k0BHyd and k0HHyd are the rate constants for the uncatalysed
racemisation of deprotonated (.B hyd) and protonated (H h yd ) hydantoin 2.1, kQD_BHyd and
k(jD~HHyd are l^e catalytic rate constants for the deuteroxide-catalysed racemisation of
the deprotonated and protonated hydantoin, k D PO-BHyd and kD PO-HHyd are the rate
constants for racemisation with the monobasic form of the buffer acting as a catalyst on
deprotonated and protonated hydantoin, respectively, and k DpQ2_BHyd and k DpQ2_HHyd are
the rate constants of racemisation with the dibasic form of the buffer acting as a catalyst
66
on deprotonated and protonated hydantoin, respectively. Finally [BHyd]
[HHyd][HydM]
are the fractions of the deprotonated and the protonated form of 2.1 present in
the reaction mixture at a given pH**.
The use of Equation 2.4 for data analysis is not straightforward; many variables are
involved and several of the individual contributions to the overall observed rate constant
are kinetically equivalent.
2.3.3. Racemisation of (»S)-3-7V-methyl-5-benzylhydantom in phosphate buffers
To overcome the problem of deprotonation of 2.1 and simplify the kinetic system, the
3-jV-methyl analogue of (5)-5-benzylhydantoin (compound 2.2 in Scheme 2.3) was
synthesised and its racemisation studied under the same experimental conditions as for
2.1. Kinetic experiments were carried out in D20 phosphate buffers at pH** 6.0, 7.2,
8.0, 9.0 and 10.0. However the kinetic experiments carried out at pH** 10.0 appeared to
be irreproducible (Appendix 1) and were not included in the fits described in the
following sections. The reason of the poor reproducibility of the data is unclear. UV
spectra of 2.2 during racemisation experiments did not show evident changes and there
is therefore no clear support for the hypothesis of structural modification, such as
hydrolysis of 2.2, over time but neither can the possibility be unambiguously excluded.
The results of the kinetic experiments of racemisation of 2.2 are summarised in Figure
2.8 (left) where the observed rate constants for racemisation of 2.2 are plotted as a
function of buffer concentration. Similarly, Figure 2.8 (right) shows the rate constants
for racemisation of 2.1 plotted as a function of buffer concentration.
67
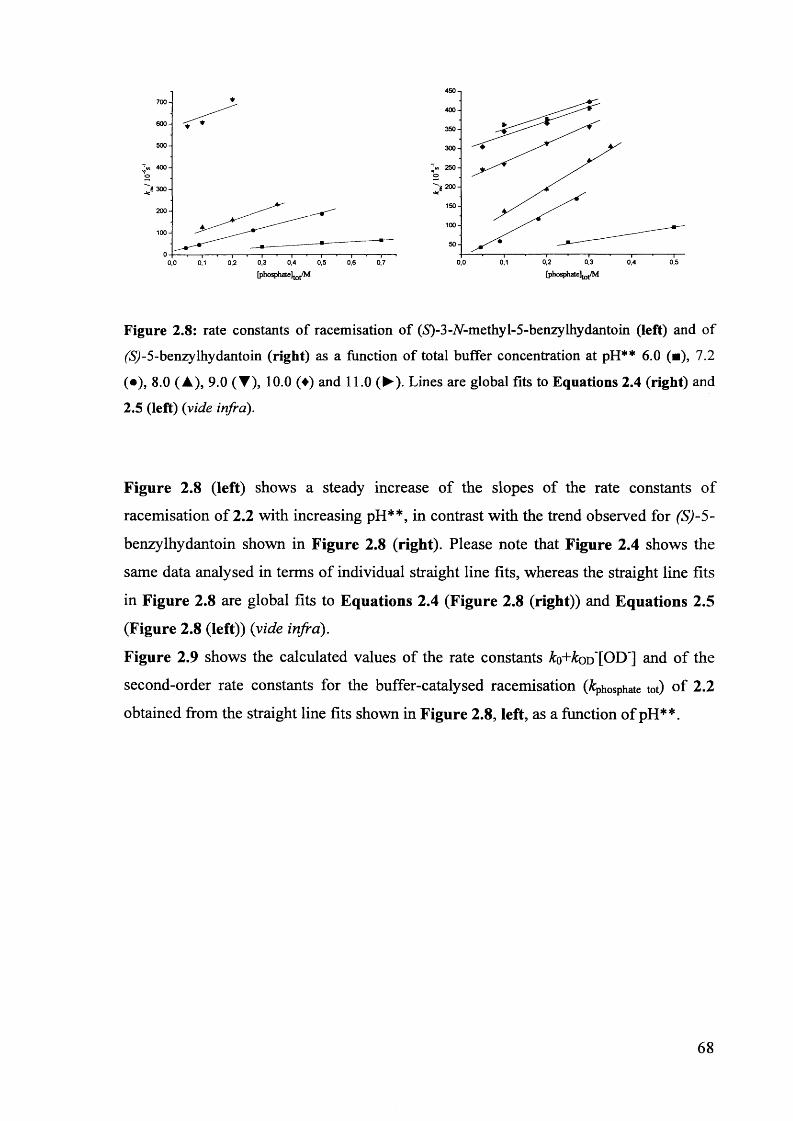
•g 200
0,2 0,3 0,4 0,50,0
> 300 -
0,4 0,5 0,60,3 0,70,0 0,2
[phosphate J^j/M [phosphate j/M
Figure 2.8: rate constants of racemisation of (iS^-S-N-methyl-S-benzylhydantoin (left) and of
(S)-5-benzylhydantoin (right) as a function of total buffer concentration at pH** 6.0 (■), 7.2
(•), 8.0 (A), 9.0 (Y), 10.0 (♦) and 11.0 (►). Lines are global fits to Equations 2.4 (right) and
2.5 (left) (vide infra).
Figure 2.8 (left) shows a steady increase of the slopes of the rate constants of
racemisation of 2.2 with increasing pH**, in contrast with the trend observed for (S)-5-
benzylhydantoin shown in Figure 2.8 (right). Please note that Figure 2.4 shows the
same data analysed in terms of individual straight line fits, whereas the straight line fits
in Figure 2.8 are global fits to Equations 2.4 (Figure 2.8 (right)) and Equations 2.5
(Figure 2.8 (left)) (vide infra).
Figure 2.9 shows the calculated values of the rate constants & o+& od [OD'] and of the
second-order rate constants for the buffer-catalysed racemisation (phosphate tot) of 2.2
obtained from the straight line fits shown in Figure 2.8, left, as a function of pH**.
68
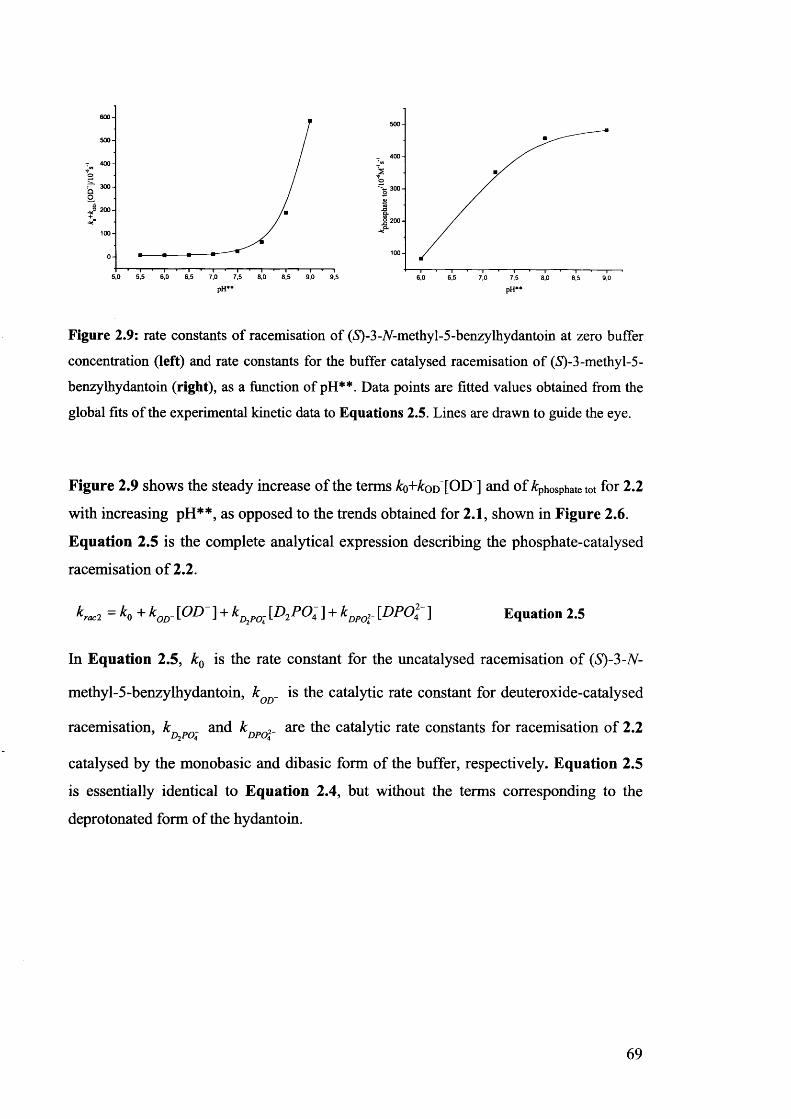
600500400
oh 300oo
200
100
05.0 6.55,5 7.0 7.5 9.0
500
4002o 300ojaa.2 200
100
6.5 7,57.0 9,0pH** pH**
Figure 2.9: rate constants of racemisation of (S^-N-methyl-S-benzylhydantoin at zero buffer concentration (left) and rate constants for the buffer catalysed racemisation of (iS)-3-methyl-5- benzylhydantoin (right), as a function of pH**. Data points are fitted values obtained from the global fits of the experimental kinetic data to Equations 2.5. Lines are drawn to guide the eye.
Figure 2.9 shows the steady increase of the terms ko+kon[OD] and of phosphate tot for 2.2
with increasing pH**, as opposed to the trends obtained for 2.1, shown in Figure 2.6.
Equation 2.5 is the complete analytical expression describing the phosphate-catalysed
racemisation of 2.2 .
kraci = K + kOD- \QD ] + kD2Po; [D2p O~A ] + k DpQ]_ \DPO42~ ] Equation 2.5
In Equation 2.5, k0 is the rate constant for the uncatalysed racemisation of (S)-3-N-
methyl-5-benzylhydantoin, k is the catalytic rate constant for deuteroxide-catalysed
racemisation, k n and k ^ , are the catalytic rate constants for racemisation of 2.2D2POa DPOl J
catalysed by the monobasic and dibasic form of the buffer, respectively. Equation 2.5
is essentially identical to Equation 2.4, but without the terms corresponding to the
deprotonated form of the hydantoin.
69
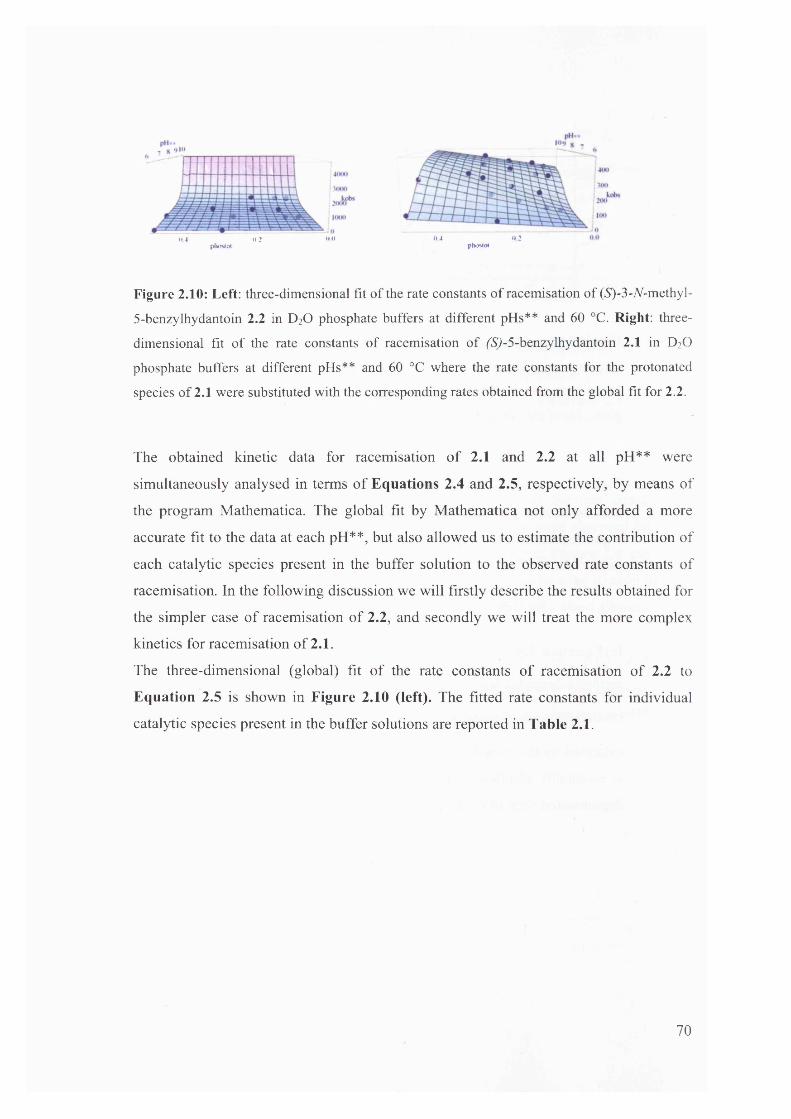
0.4 0.2phostot
0.0 0.4 0.2phosKH
Figure 2.10: Left: three-dimensional fit of the rate constants of racemisation of (^-B-Af-methyl-
5-benzylhydantoin 2.2 in D20 phosphate buffers at different pHs** and 60 °C. Right: three-
dimensional fit of the rate constants of racemisation of ^S)-5-benzylhydantoin 2.1 in D20
phosphate buffers at different pHs** and 60 °C where the rate constants for the protonated
species of 2.1 were substituted with the corresponding rates obtained from the global fit for 2.2.
The obtained kinetic data for racemisation of 2.1 and 2.2 at all pH** were
simultaneously analysed in terms of Equations 2.4 and 2.5, respectively, by means of
the program Mathematica. The global fit by Mathematica not only afforded a more
accurate fit to the data at each pH**, but also allowed us to estimate the contribution of
each catalytic species present in the buffer solution to the observed rate constants of
racemisation. In the following discussion we will firstly describe the results obtained for
the simpler case of racemisation of 2.2, and secondly we will treat the more complex
kinetics for racemisation of 2.1.
The three-dimensional (global) fit of the rate constants of racemisation of 2.2 to
Equation 2.5 is shown in Figure 2.10 (left). The fitted rate constants for individual
catalytic species present in the buffer solutions are reported in Table 2.1.
70
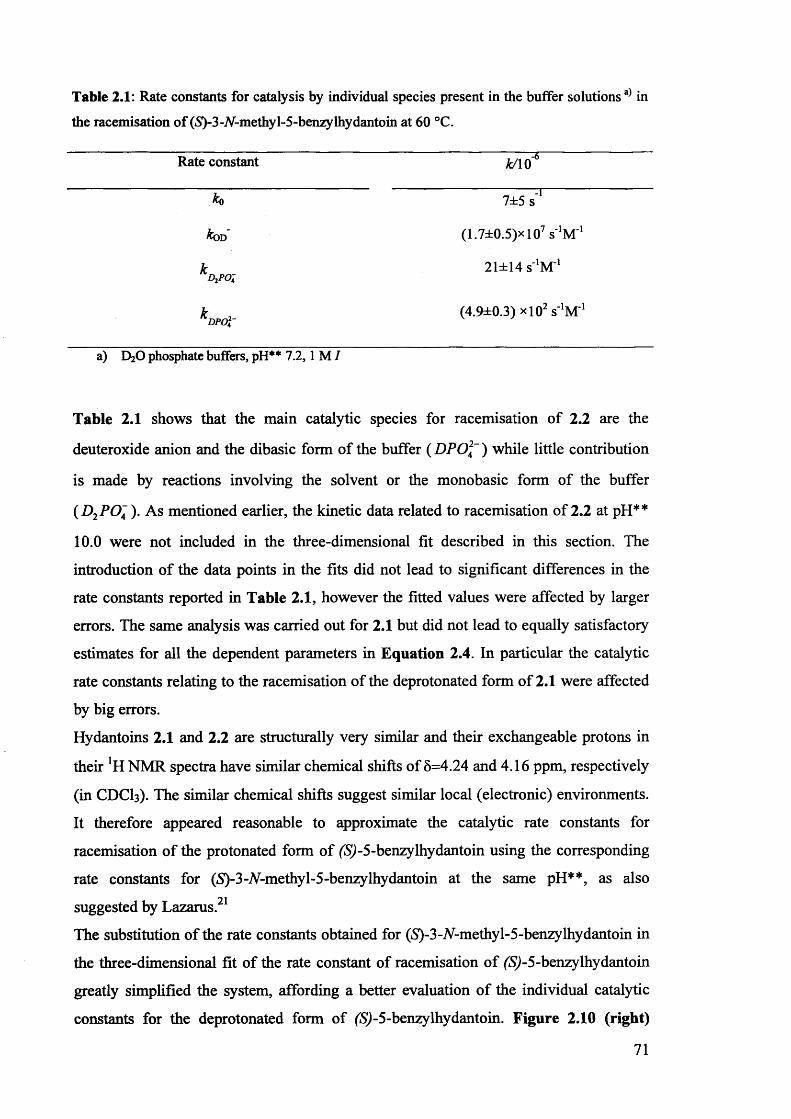
Table 2.1: Rate constants for catalysis by individual species present in the buffer solutionsa) in
the racemisation of (S)-3-jV-methyl-5-benzylhydantoin at 60 °C.
Rate constant k /106
*0 7±5 s'1
koD (1.7±0.5)xl07 s lM A
kD2PO~21±14 s^M'1
^DPOl' (4.9±0.3)*102 s^M'1
a) D20 phosphate buffers, pH** 7.2,1 M /
Table 2.1 shows that the main catalytic species for racemisation of 2.2 are the
deuteroxide anion and the dibasic form of the buffer ( DPO\~ ) while little contribution
is made by reactions involving the solvent or the monobasic form of the buffer
(D2PO\ ). As mentioned earlier, the kinetic data related to racemisation of 2.2 at pH**
10.0 were not included in the three-dimensional fit described in this section. The
introduction of the data points in the fits did not lead to significant differences in the
rate constants reported in Table 2.1, however the fitted values were affected by larger
errors. The same analysis was carried out for 2.1 but did not lead to equally satisfactory
estimates for all the dependent parameters in Equation 2.4. In particular the catalytic
rate constants relating to the racemisation of the deprotonated form of 2.1 were affected
by big errors.
Hydantoins 2.1 and 2.2 are structurally very similar and their exchangeable protons in
their *H NMR spectra have similar chemical shifts of 5=4.24 and 4.16 ppm, respectively
(in CDCI3). The similar chemical shifts suggest similar local (electronic) environments.
It therefore appeared reasonable to approximate the catalytic rate constants for
racemisation of the protonated form of (S)-5-benzylhydantoin using the corresponding
rate constants for (S)-3-A-methy 1-5-benzylhydantoin at the same pH**, as also1
suggested by Lazarus.
The substitution of the rate constants obtained for (S)-3-A-methyl-5-benzylhydantoin in
the three-dimensional fit of the rate constant of racemisation of (^ -5-benzylhydantoin
greatly simplified the system, affording a better evaluation of the individual catalytic
constants for the deprotonated form of (Sj-5-benzylhydantoin. Figure 2.10 (right)
71
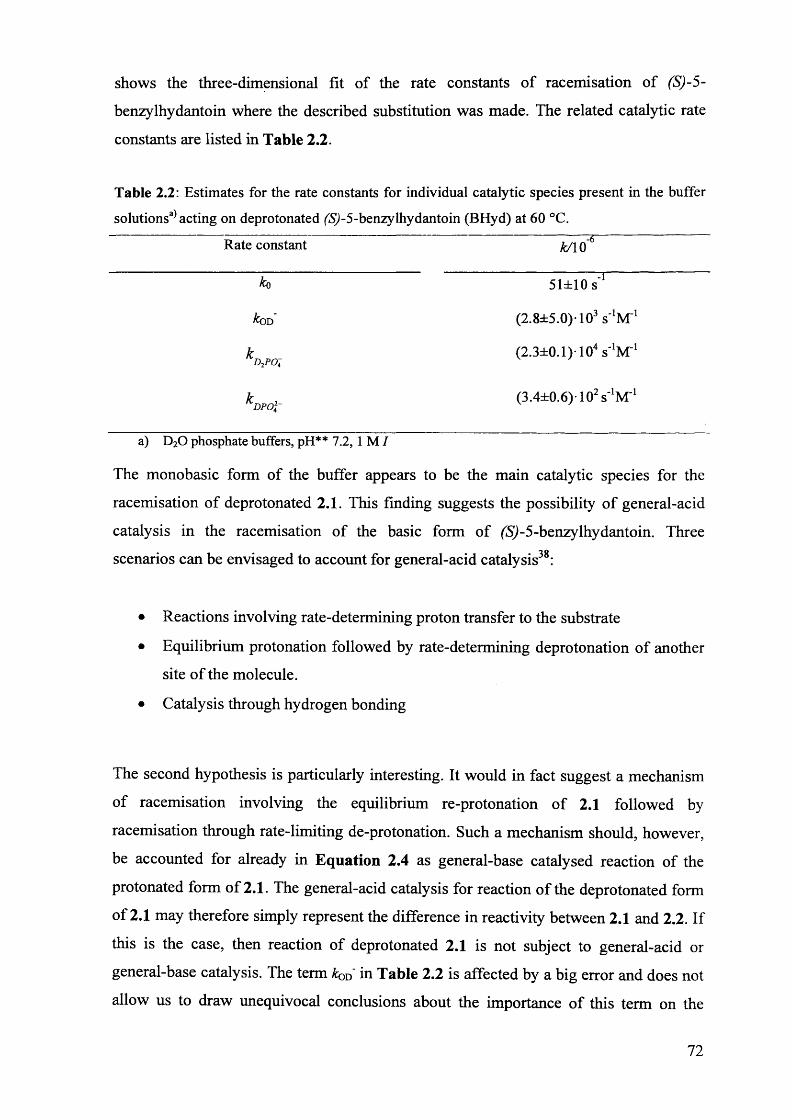
shows the three-dimensional fit of the rate constants of racemisation of (S)-5-
benzylhydantoin where the described substitution was made. The related catalytic rate
constants are listed in Table 2.2.
Table 2.2: Estimates for the rate constants for individual catalytic species present in the buffer
solutionsa) acting on deprotonated -5-benzylhydantoin (BHyd) at 60 °C.
Rate constant A/10'6
k0 51±10 s 1
koD (2.8±5.0)103 s^M'1
*DiPOa(2.3±0.1)-104s‘1M‘1
^DPO\~(S /liO ^-loV M *1
a) D20 phosphate buffers, pH** 7.2, 1 M /
The monobasic form of the buffer appears to be the main catalytic species for the
racemisation of deprotonated 2.1. This finding suggests the possibility of general-acid
catalysis in the racemisation of the basic form of (S^-5-benzylhydantoin. Three
scenarios can be envisaged to account for general-acid catalysis38:
• Reactions involving rate-determining proton transfer to the substrate
• Equilibrium protonation followed by rate-determining deprotonation of another
site of the molecule.
• Catalysis through hydrogen bonding
The second hypothesis is particularly interesting. It would in fact suggest a mechanism
of racemisation involving the equilibrium re-protonation of 2.1 followed by
racemisation through rate-limiting de-protonation. Such a mechanism should, however,
be accounted for already in Equation 2.4 as general-base catalysed reaction of the
protonated form of 2.1. The general-acid catalysis for reaction of the deprotonated form
of 2.1 may therefore simply represent the difference in reactivity between 2.1 and 2.2. If
this is the case, then reaction of deprotonated 2.1 is not subject to general-acid or
general-base catalysis. The term Aod in Table 2.2 is affected by a big error and does not
allow us to draw unequivocal conclusions about the importance of this term on the
72
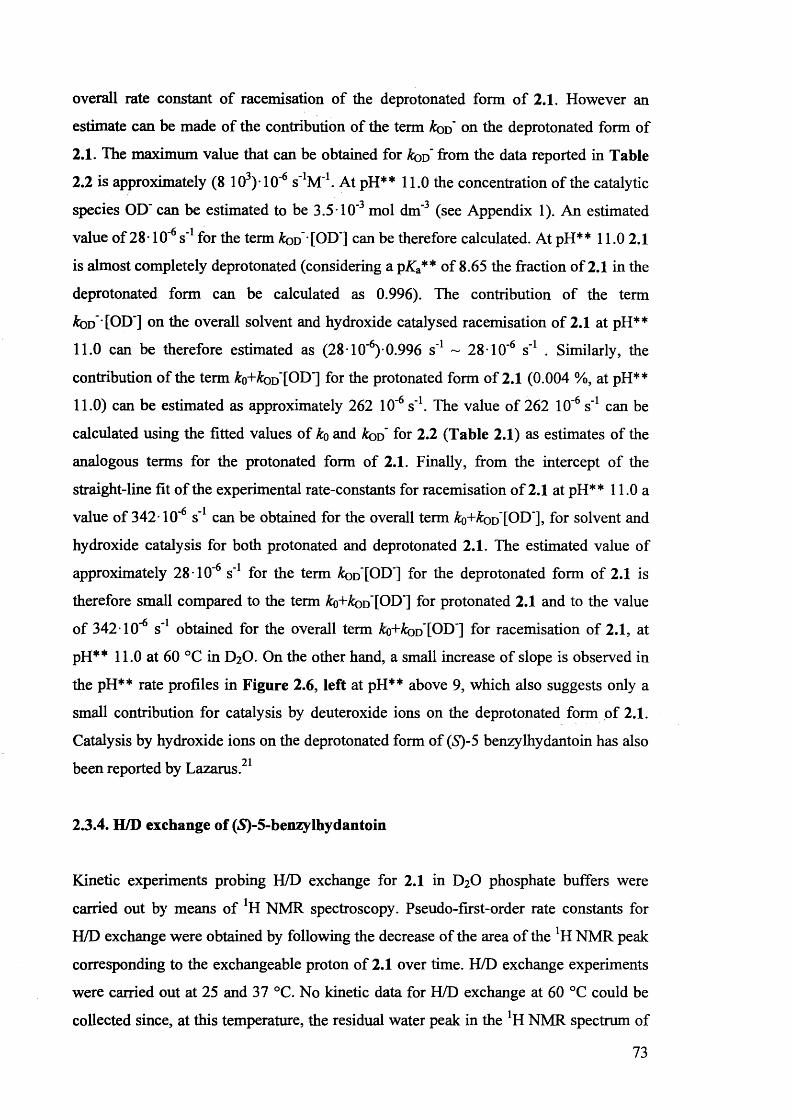
overall rate constant of racemisation of the deprotonated form of 2.1. However an
estimate can be made of the contribution of the term kou on the deprotonated form of
2.1. The maximum value that can be obtained for kou from the data reported in Table
2.2 is approximately (8 103)■ 10-6 s^M"1. At pH** 11.0 the concentration of the catalytic
species OD" can be estimated to be 3.5-10‘3 mol dm'3 (see Appendix 1). An estimated
value of 28-10'6 s'1 for the term kou '[OD‘] can be therefore calculated. At pH** 11.0 2.1
is almost completely deprotonated (considering a pKa** of 8.65 the fraction of 2.1 in the
deprotonated form can be calculated as 0.996). The contribution of the term
^od [OD'] on the overall solvent and hydroxide catalysed racemisation of 2.1 at pH**
11.0 can be therefore estimated as (28-1 O'6) 0.996 s'1 ~ 28-1 O'6 s'1 . Similarly, the
contribution of the term £o+&od [OD'] for the protonated form of 2.1 (0.004 % , at pH**
11.0) can be estimated as approximately 262 10'6 s'1. The value of 262 10'6 s'1 can be
calculated using the fitted values of ko and &od for 2.2 (Table 2.1) as estimates of the
analogous terms for the protonated form of 2.1. Finally, from the intercept of the
straight-line fit of the experimental rate-constants for racemisation of 2.1 at pH** 11.0 a
value of 342-10'6 s'1 can be obtained for the overall term ^o+^od [OD'], for solvent and
hydroxide catalysis for both protonated and deprotonated 2.1. The estimated value of
approximately 28-1 O'6 s'1 for the term &od [OD'] for the deprotonated form of 2.1 is
therefore small compared to the term Ao+&od [OD"] for protonated 2.1 and to the value
of 342-1 O’6 s'1 obtained for the overall term ko+kou'[OD"] for racemisation of 2.1, at
pH** 11.0 at 60 °C in D2O. On the other hand, a small increase of slope is observed in
the pH** rate profiles in Figure 2.6, left at pH** above 9, which also suggests only a
small contribution for catalysis by deuteroxide ions on the deprotonated form of 2.1.
Catalysis by hydroxide ions on the deprotonated form of (S)-5 benzylhydantoin has also 1
been reported by Lazarus.
2.3.4. H/D exchange of (S)-5-benzylhydantoin
Kinetic experiments probing H/D exchange for 2.1 in D2O phosphate buffers were
carried out by means of !H NMR spectroscopy. Pseudo-first-order rate constants for
H/D exchange were obtained by following the decrease of the area of the JH NMR peak
corresponding to the exchangeable proton of 2.1 over time. H/D exchange experiments
were carried out at 25 and 37 °C. No kinetic data for H/D exchange at 60 °C could be
collected since, at this temperature, the residual water peak in the *H NMR spectrum of
73
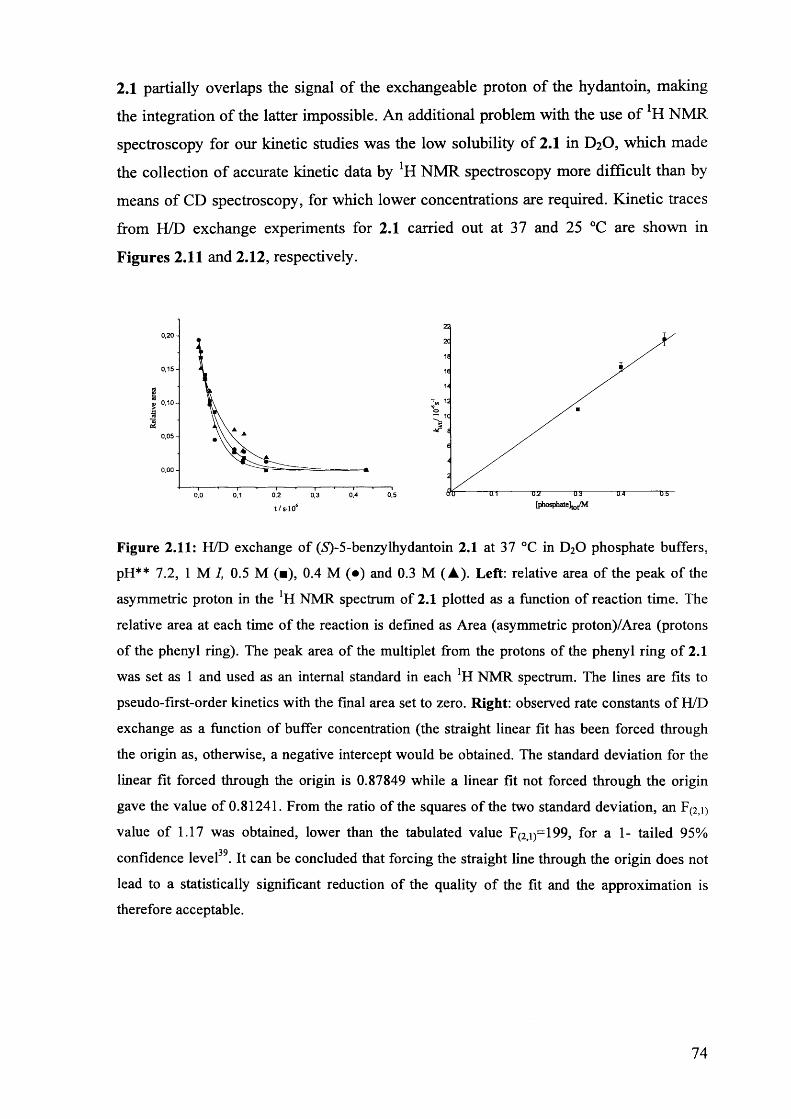
2.1 partially overlaps the signal of the exchangeable proton of the hydantoin, making
the integration of the latter impossible. An additional problem with the use of *H NMR
spectroscopy for our kinetic studies was the low solubility of 2.1 in D2O, which made
the collection of accurate kinetic data by *H NMR spectroscopy more difficult than by
means of CD spectroscopy, for which lower concentrations are required. Kinetic traces
from H/D exchange experiments for 2.1 carried out at 37 and 25 °C are shown in
Figures 2.11 and 2.12, respectively.
0 ,2 0 -
0,15-
0,50,2 0,40,0 0,1 0,3
o5
Figure 2.11: H/D exchange of (5)-5-benzylhydantoin 2.1 at 37 °C in D20 phosphate buffers,
pH** 7.2, 1 M I, 0.5 M (■), 0.4 M (•) and 0.3 M (A). Left: relative area of the peak of the
asymmetric proton in the !H NMR spectrum of 2.1 plotted as a function of reaction time. The
relative area at each time of the reaction is defined as Area (asymmetric proton)/Area (protons
of the phenyl ring). The peak area of the multiplet from the protons of the phenyl ring of 2.1
was set as 1 and used as an internal standard in each *H NMR spectrum. The lines are fits to
pseudo-first-order kinetics with the final area set to zero. Right: observed rate constants of H/D
exchange as a function of buffer concentration (the straight linear fit has been forced through
the origin as, otherwise, a negative intercept would be obtained. The standard deviation for the
linear fit forced through the origin is 0.87849 while a linear fit not forced through the origin
gave the value of 0.81241. From the ratio of the squares of the two standard deviation, an F(2>i)
value of 1.17 was obtained, lower than the tabulated value F(2>i)=199, for a 1- tailed 95%
confidence level39. It can be concluded that forcing the straight line through the origin does not
lead to a statistically significant reduction of the quality of the fit and the approximation is
therefore acceptable.
74
6
5
4
oO JJ 2
1
00,0 0,1 0,50,2 0,3 0,4
0,16-0,14-0,1 2 -
0 ,1 0 -
0,06-3 0,06-
0,0 2 -
0,0 0 -
•0,020,0-0,2 0,4 0,6 0.8 1.2 1.41.0
t/s-106 [phosphate]tot/M
Figure 2.12: H/D exchange of (5)-5-benzylhydantoin 2.1 at 25 °C in D20 phosphate buffers,
pH* 7.2, 1 M I, 0.5 M (A), 0.3 M (•) and 0.1 M (■). Left: relative area of the peak of the
asymmetric proton in the *H NMR spectrum of 2.1 plotted as a function of reaction time. The
relative area at each time of the reaction is defined as Area (asymmetric proton)/Area (protons
of the phenyl ring). The peak area of the multiplet from the protons of the phenyl ring of 2.1
was set as 1 and used as an internal standard in each JH NMR spectrum.The lines are fits to
pseudo -first-order kinetics with the final area set to zero. Right: observed rate constant of H/D
exchange as a function of buffer concentration.
As shown in Figures 2.11 (right) and 2.12 (right), general-base catalysis, observed for
racemisation of 2.1, was confirmed in H/D exchange experiments.
Table 2.3 shows the second-order rate constants for buffer-catalysed H/D exchange of
2.1 in D2O phosphate buffers of 1 M / at pH** 7.2, at 37 and 25 °C and the
corresponding rate constants for the combined uncatalysed and deuteroxide-catalysed
H/D exchange reactions.
Table 2.3: rate constants for buffer-catalysed and for the combined uncatalysed and
deuteroxide-catalysed H/D exchange of 2.1 in D20 phosphate buffers, 1 M /, pH ** 7.2, at 37
and 25 °C.
Temperature / °C ^phosphate tot / 10 S M ko + ^0D [OD'] / 10'6 s'1
37 38.5±20.6a) ob)
25 11.4±0.7a) -0.1 ±0.1a)
a) Standard errors from linear fitting performed by means of the program Origin.b) The straight line fit has been forced through the origin.
75
2.4. Mechanistic aspects
2.4.1. The comparison of the rate constants of racemisation and H/D exchange of
(iS)-5-benzylhydantoin in phosphate buffers
As mentioned in the introduction of this Chapter, the comparison of the rate constants of
racemisation with rate constants of H/D exchange allows stereochemical and
mechanistic information to be obtained. Rate constants for racemisation of (S)-5-
benzylhydantoin were compared with rate constants for H/D exchange in D2O
phosphate buffers, at 25 °C, under several conditions (Table 2.4).
Table 2.4: comparison of rate constants for racemisation and H/D exchange of
(iS)-5-benzylhydantoin 2.1 in D2O phosphate buffers, 1 M 7, at 25 °C.
[phosphate] / M pH* k a c /lo V ku/ol 10 6 s rac ! H/D
0.5 7.2 6.28 ± 0.08 ■> 5.42 ± 0.41 ■> 1.2 ± 0 .1c)
0.1 7.2 1.30 ± 0.02 *)b) 1.03 ± 0.05 *> 1.3 ± 0.1c)
0.3 9.0 8.79 ± 0.25 ■> 6.69±0.29*> 1.3 ± 0.1c)a) Errors from nonlinear least squares fitting performed by means of the program Origin based on
the Levenberg-Marquardt (LM) algorithm, b) Rate constant determined in H20 phosphate buffer 0.1 M, 1 M I. c) Errors calculated as uncertainties on functions of several variables.40
The differences between rate constants for H/D exchange and racemisation are small,
viz. up to a factor of 1.3. Testa et al.23 reported values for &rac/&H/D varying from 1.4 to
1.7 for 5-benzylhydantoin, although these values are for experiments under different
experimental conditions (D2O phosphate buffer, pD 7.4, 0.1 M, 0.22 M I, in a mixture
with d6-DMSO in the proportion 1:1 (v:v), at a series of temperatures between 50 and
80 °C).
Our ratios of krac/kwD are close to unity, supporting an SeI rather than an Se2
mechanism. Our experimental values krdLJkw ) are similar to those reported by17 • •Cabordery for racemisation of a model tetrahydroisoquinoline hydantoin, as
mentioned in Chapter 1.
76
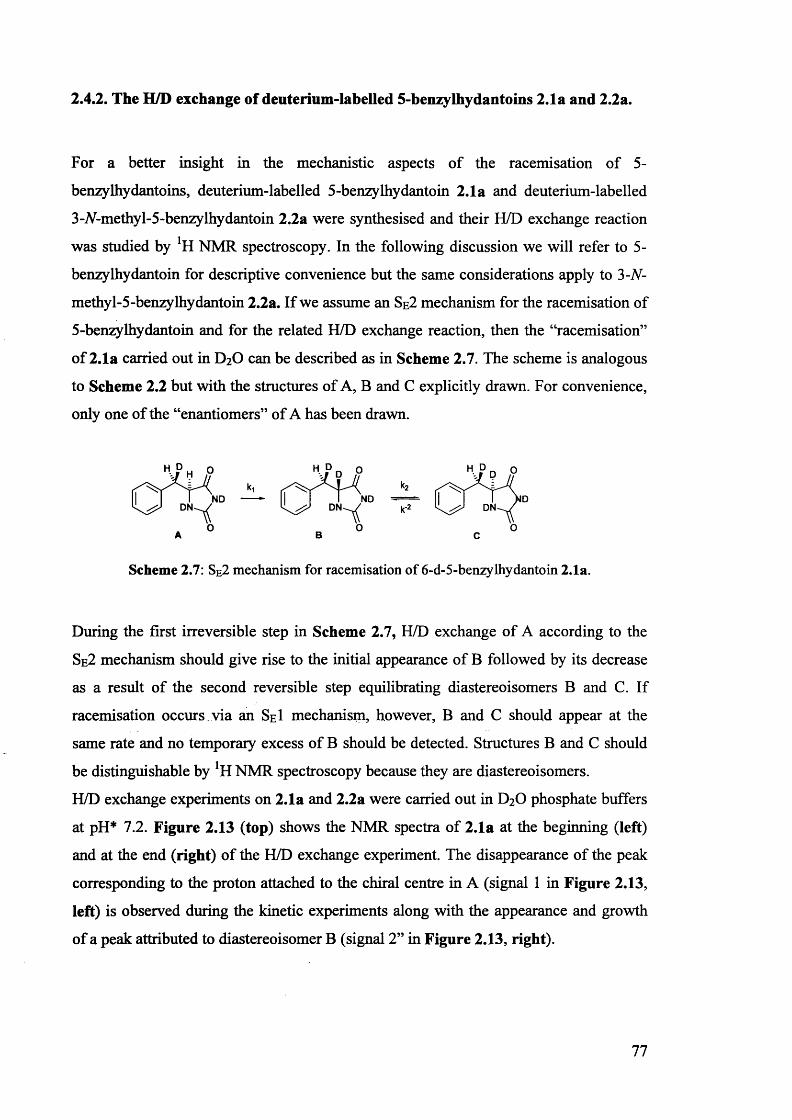
2.4.2. The H/D exchange of deuterium-labelled 5-benzylhydantoins 2.1a and 2.2a.
For a better insight in the mechanistic aspects of the racemisation of 5-
benzylhydantoins, deuterium-labelled 5-benzylhydantoin 2.1a and deuterium-labelled
3-A-methy 1-5 -benzy lhy dantoin 2.2a were synthesised and their H/D exchange reaction
was studied by lH NMR spectroscopy. In the following discussion we will refer to 5-
benzylhydantoin for descriptive convenience but the same considerations apply to 3 -N-
methyl-5-benzylhydantoin 2.2a. If we assume an Se2 mechanism for the racemisation of
5-benzylhydantoin and for the related H/D exchange reaction, then the “racemisation”
of 2.1a carried out in D2O can be described as in Scheme 2.7. The scheme is analogous
to Scheme 2.2 but with the structures of A, B and C explicitly drawn. For convenience,
only one of the “enantiomers” of A has been drawn.
NDDN
NDDN DN
Scheme 2.7: SE2 mechanism for racemisation of 6-d-5-benzylhydantoin 2.1a.
During the first irreversible step in Scheme 2.7, H/D exchange of A according to the
Se2 mechanism should give rise to the initial appearance of B followed by its decrease
as a result of the second reversible step equilibrating diastereoisomers B and C. If
racemisation occurs via an SeI mechanism, however, B and C should appear at the
same rate and no temporary excess of B should be detected. Structures B and C should
be distinguishable by !H NMR spectroscopy because they are diastereoisomers.
H/D exchange experiments on 2.1a and 2.2a were carried out in D20 phosphate buffers
at pH* 7.2. Figure 2.13 (top) shows the NMR spectra of 2.1a at the beginning (left)
and at the end (right) of the H/D exchange experiment. The disappearance of the peak
corresponding to the proton attached to the chiral centre in A (signal 1 in Figure 2.13,
left) is observed during the kinetic experiments along with the appearance and growth
of a peak attributed to diastereoisomer B (signal 2” in Figure 2.13, right).
77
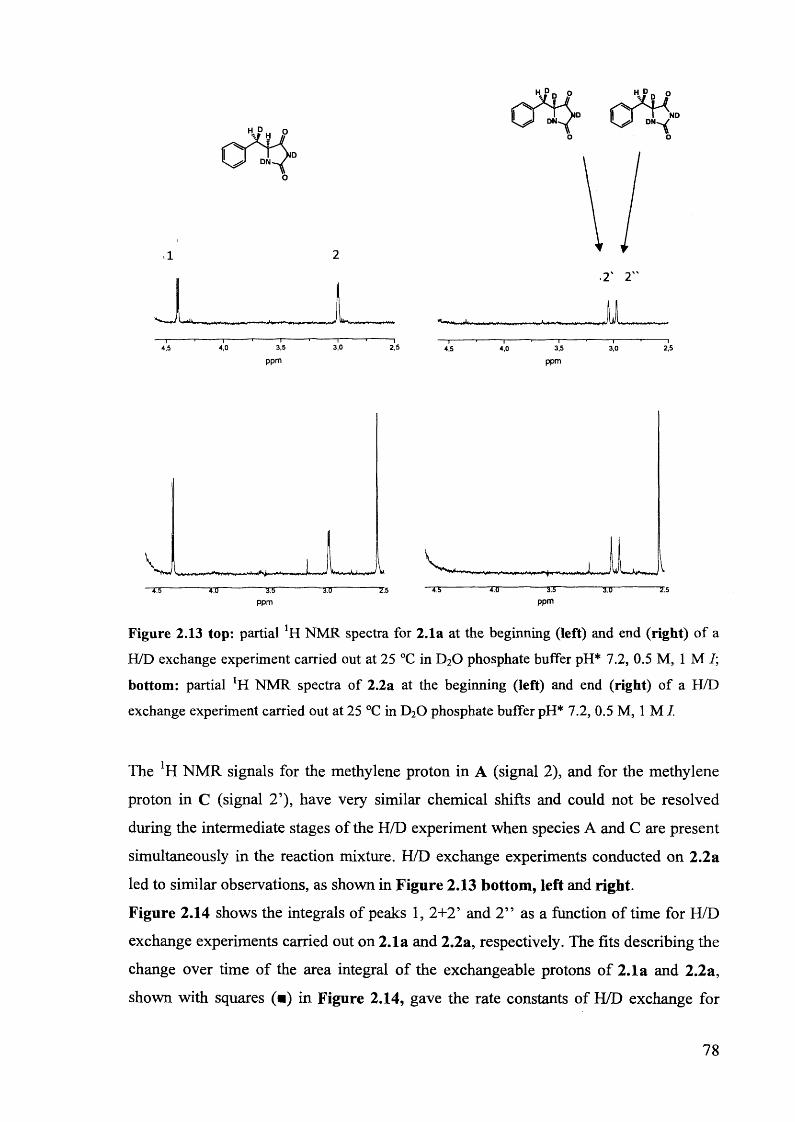
n li ■ I til I ■ iI T T I T I T
ppm ppm
Figure 2.13 top: partial 1H NMR spectra for 2.1a at the beginning (left) and end (right) of a
H/D exchange experiment carried out at 25 °C in D20 phosphate buffer pH* 7.2, 0.5 M, 1 M I; bottom: partial *H NMR spectra of 2.2a at the beginning (left) and end (right) of a H/D
exchange experiment carried out at 25 °C in D2Q phosphate buffer pH* 7.2, 0.5 M, 1 M I.
The !H NMR signals for the methylene proton in A (signal 2), and for the methylene
proton in C (signal 2’), have very similar chemical shifts and could not be resolved
during the intermediate stages of the H/D experiment when species A and C are present
simultaneously in the reaction mixture. H/D exchange experiments conducted on 2.2a
led to similar observations, as shown in Figure 2.13 bottom, left and right.
Figure 2.14 shows the integrals of peaks 1, 2+2’ and 2” as a function of time for H/D
exchange experiments carried out on 2.1a and 2.2a, respectively. The fits describing the
change over time of the area integral of the exchangeable protons of 2.1a and 2.2a,
shown with squares (■) in Figure 2.14, gave the rate constants of H/D exchange for
78
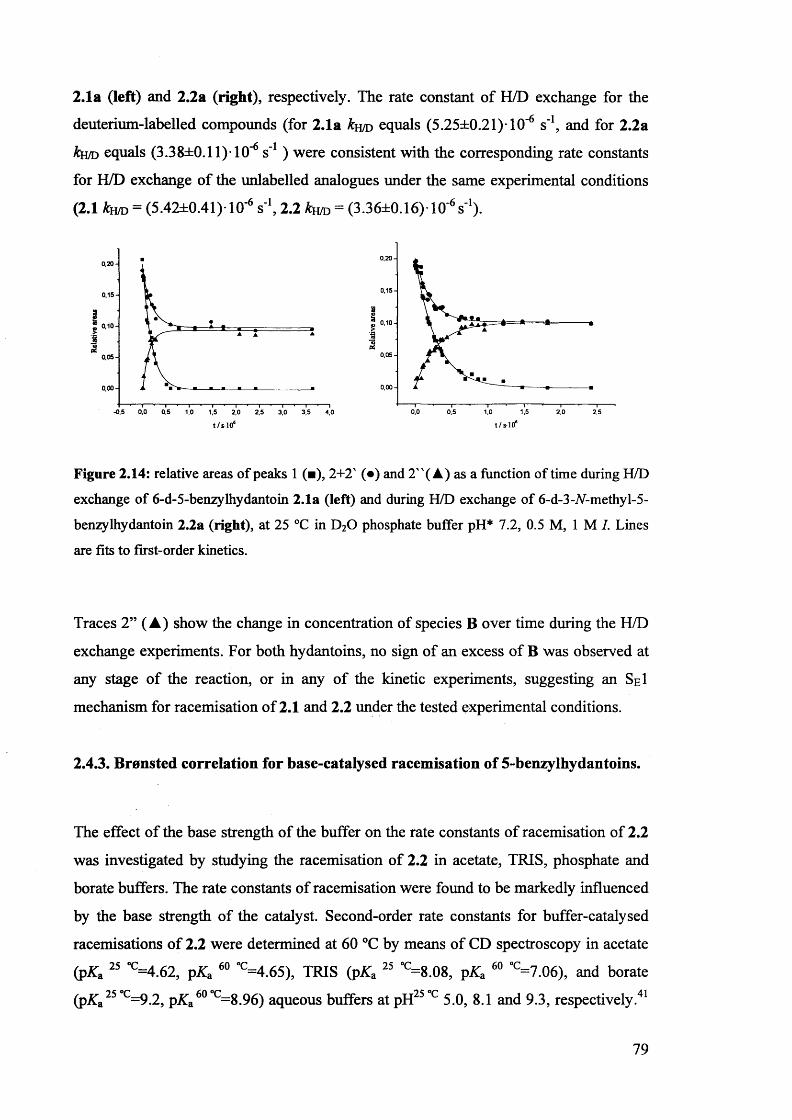
2.1a (left) and 2.2a (right), respectively. The rate constant of H/D exchange for the
deuterium-labelled compounds (for 2.1a & h/d equals (5.25+0.21)1 O'6 s'1, and for 2.2a
& h/d equals (3.38+0.11)10'6 s'1 ) were consistent with the corresponding rate constants
for H/D exchange of the unlabelled analogues under the same experimental conditions
(2.1 ku/D = (5.42±0.41) 10"6 s'1, 2.2 kao = (3.36+0.16)-1 O'6 s'1).
0,2 0 -
0,15-
i5 0,10 - >I
0,05-
0,0 0 -
0,0 1,50,5 1,0 2,0 2,5
0 ,2 0 -
0,15-
1g 0,10-
1 i 0,05-
0,00 -
-0,5 0,0 0,5 1,0 1,5 2,0 2,5 3,0 3,5 4,0t/s-10‘ t/s 10*
Figure 2.14: relative areas of peaks 1 (■), 2+2' (•) and 2"( A) as a function of time during H/D
exchange of 6-d-5-benzylhydantoin 2.1a (left) and during H/D exchange of 6-d-3-TV-methy 1-5-
benzylhydantoin 2.2a (right), at 25 °C in D20 phosphate buffer pH* 7.2, 0.5 M, 1 M I. Lines
are fits to first-order kinetics.
Traces 2” (A ) show the change in concentration of species B over time during the H/D
exchange experiments. For both hydantoins, no sign of an excess of B was observed at
any stage of the reaction, or in any of the kinetic experiments, suggesting an SeI
mechanism for racemisation of 2.1 and 2.2 under the tested experimental conditions.
2.4.3. Brensted correlation for base-catalysed racemisation of 5-benzylhydantoins.
The effect of the base strength of the buffer on the rate constants of racemisation of 2.2
was investigated by studying the racemisation of 2.2 in acetate, TRIS, phosphate and
borate buffers. The rate constants of racemisation were found to be markedly influenced
by the base strength of the catalyst. Second-order rate constants for buffer-catalysed
racemisations of 2.2 were determined at 60 °C by means of CD spectroscopy in acetate
(jpKa 25 °c=4.62, pKa 60 °c=4.65), TRIS (pKa 25 °c=8.08, pKa 60 °c=7.06), and borate
(pKa25 °c=9.2, pATa60°c=8.96) aqueous buffers at pH25°c 5.0, 8.1 and 9.3, respectively.41
79
The second-order rate constants for buffer-catalysed racemisation of 2.2 in the different
buffers are listed in Table 2.5.
Table 2.5: Second-order rate constants for buffer catalysed racemisation (£ buffer, basic component) o f
2.2 in aqueous buffers with 1 M I, at 60 °C, pH25 C 5.0 (acetate buffer), 8.1 (TRIS buffer), 9.3
(borate buffer) and pH** 7.2 (phosphate buffer) b).
Buffer ^ buffer, basic component ! S ' ’ 10
Acetate 10.3±1.8a)c)
Phosphate b) 479.0±9.6a)c)
Tris 910.5±6.2a)c)
Borate 4382±107a)c)
a) Errors from non-linear least squares fitting performed by means of the program Origin using theLevenberg-Marquardt (LM) algorithm.
b) Data related to D20 phosphate buffers, see note 41.c) Rate constants are corrected for the fraction of the buffer in the basic form, considering pKa
values for the buffers, at 25 °C.
A Bronsted plot for racemisation of 2.2 at 60 °C was constructed (Figure 2.15). Two
fits are reported in Figure 2.15, obtained by using literature values of pKa of the buffers
determined at either 25 or 60 °C.42-45 The values of p obtained from linear fits of the
two sets of data are 0.57 ± 0.08 when pKa values at 25 °C are used, and 0.59 ± 0.08
when pKa values at 60 °C are considered. A small difference is obtained and the two
values are within error margins. The /? value of approximately 0.6 confirms general-
base catalysis and reveals a transition state where the exchangeable proton in position 5
of (*S)-3-A-methyl-5-benzylhydantoin is approximately halfway between the base (basic
form of the buffers) and the chiral carbon of the hydantoin, as was also proposed by
Lazarus 21 The experimental value of p is consistent with the literature21 value of 0.51.
The strong similarities between 2.1 and 2.2, as apparent from the previous experiments
(vide supra), suggest that a similar conclusion can safely be drawn for 2.1. Very similar
P values for racemisation of 2.1 and 2.2 are also reported in the literature for catalysis
by phosphate, TRIS, carbonate and hydroxide.21
80
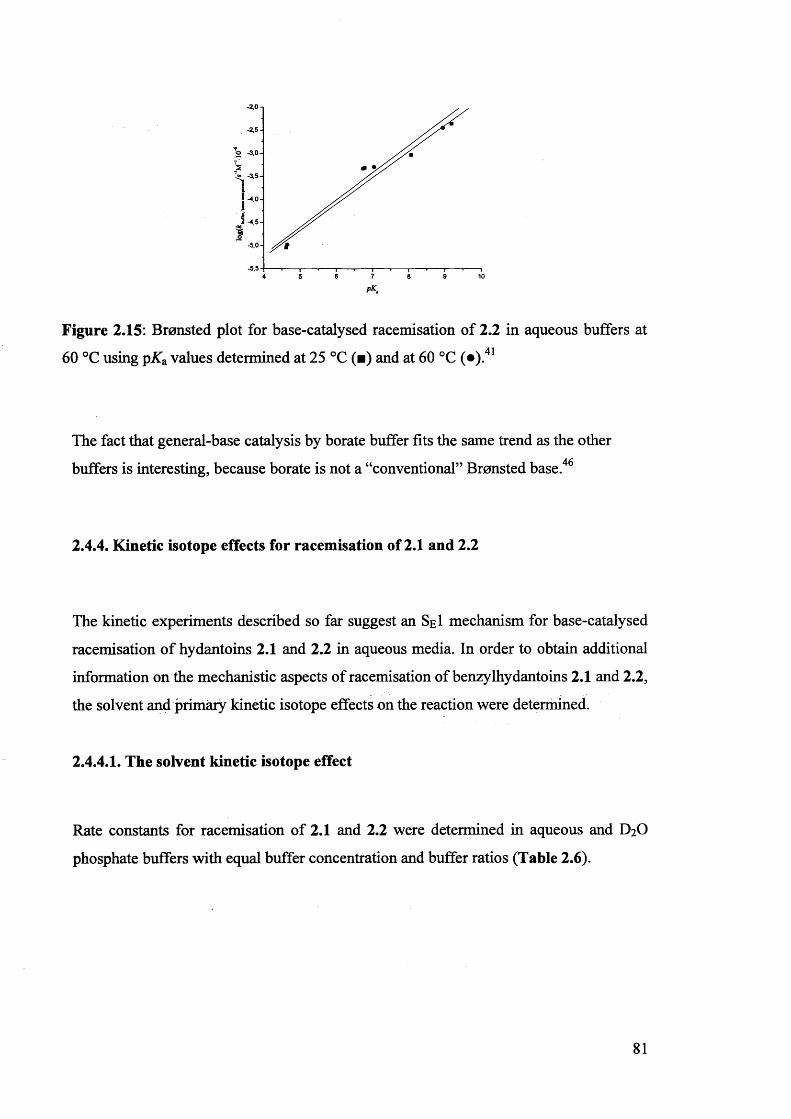
-2,5-
© -3,0-
!« -3,5-
-4.0-
-4,5-
-5,0-
-5,5 74 5 6 9 108
PK.
Figure 2.15: Bronsted plot for base-catalysed racemisation of 2.2 in aqueous buffers at
60 °C using pKa values determined at 25 °C (■) and at 60 °C («).41
The fact that general-base catalysis by borate buffer fits the same trend as the other
buffers is interesting, because borate is not a “conventional” Bronsted base.46
2.4.4. Kinetic isotope effects for racemisation of 2.1 and 2.2
The kinetic experiments described so far suggest an Sgl mechanism for base-catalysed
racemisation of hydantoins 2.1 and 2.2 in aqueous media. In order to obtain additional
information on the mechanistic aspects of racemisation of benzylhydantoins 2.1 and 2 .2 ,
the solvent and primary kinetic isotope effects on the reaction were determined.
2.4.4.1. The solvent kinetic isotope effect
Rate constants for racemisation of 2.1 and 2.2 were determined in aqueous and D2O
phosphate buffers with equal buffer concentration and buffer ratios (Table 2.6).
81
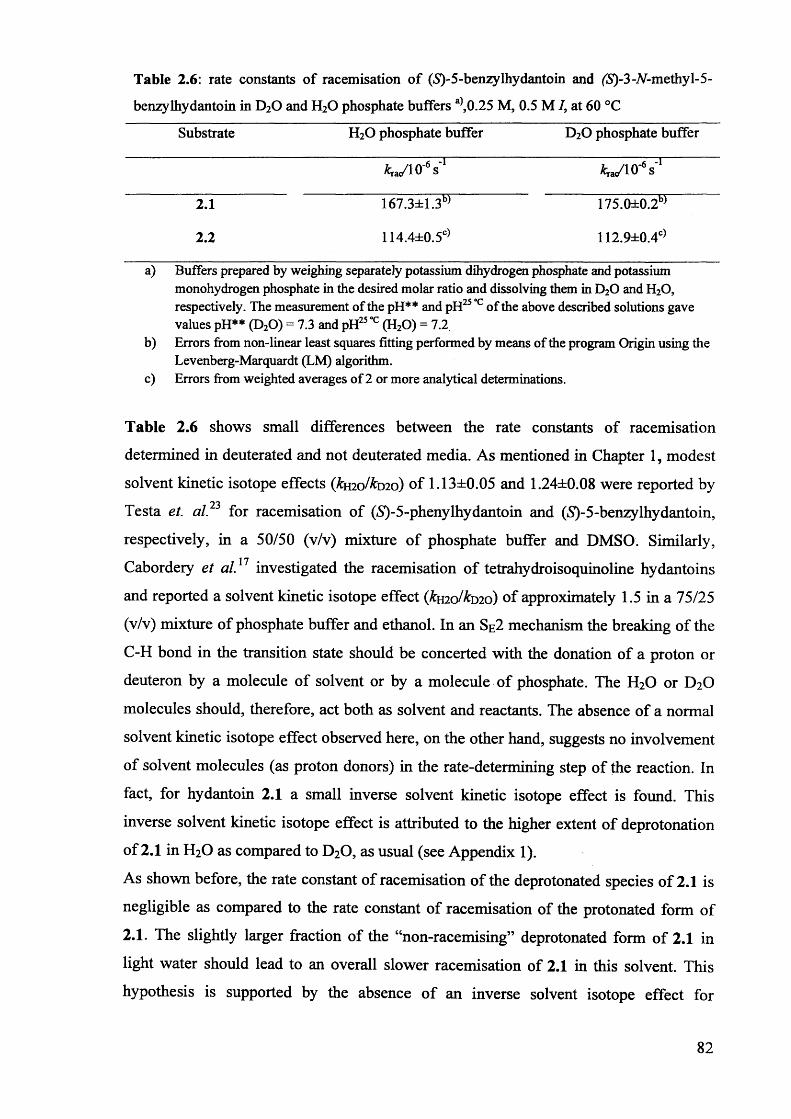
Table 2.6: rate constants of racemisation of (5)-5-benzylhydantoin and (S)-3-A^methy 1-5-
benzylhydantoin in D20 and H20 phosphate buffers a),0.25 M, 0.5 M /, at 60 °C
Substrate H20 phosphate buffer D20 phosphate buffer
&rao/l O'6 S 1 W i o V
2.1 167.3±1.3b) 175.0±0.2b)
2.2 114.4±0.5c) 112.9±0.4C)
a) Buffers prepared by weighing separately potassium dihydrogen phosphate and potassium monohydrogen phosphate in the desired molar ratio and dissolving them in D20 and H20, respectively. The measurement of the pH** and pH25 °c of the above described solutions gave values pH** (D20) = 7.3 and pH25 °c (H20) = 7.2.
b) Errors from non-linear least squares fitting performed by means of the program Origin using the Levenberg-Marquardt (LM) algorithm.
c) Errors from weighted averages of 2 or more analytical determinations.
Table 2.6 shows small differences between the rate constants of racemisation
determined in deuterated and not deuterated media. As mentioned in Chapter 1, modest
solvent kinetic isotope effects (kmo/koio) of 1.13±0.05 and 1.24±0.08 were reported by
Testa et. al. for racemisation of (S)-5-phenylhydantoin and (S)-5-benzylhydantoin,
respectively, in a 50/50 (v/v) mixture of phosphate buffer and DMSO. Similarly,
Cabordery et a l}1 investigated the racemisation of tetrahydroisoquinoline hydantoins
and reported a solvent kinetic isotope effect {kmo/kmo) of approximately 1.5 in a 75/25
(v/v) mixture of phosphate buffer and ethanol. In an Se2 mechanism the breaking of the
C-H bond in the transition state should be concerted with the donation of a proton or
deuteron by a molecule of solvent or by a molecule of phosphate. The H20 or D20
molecules should, therefore, act both as solvent and reactants. The absence of a normal
solvent kinetic isotope effect observed here, on the other hand, suggests no involvement
of solvent molecules (as proton donors) in the rate-determining step of the reaction. In
fact, for hydantoin 2.1 a small inverse solvent kinetic isotope effect is found. This
inverse solvent kinetic isotope effect is attributed to the higher extent of deprotonation
of 2.1 in H20 as compared to D20 , as usual (see Appendix 1).
As shown before, the rate constant of racemisation of the deprotonated species of 2.1 is
negligible as compared to the rate constant of racemisation of the protonated form of
2.1. The slightly larger fraction of the “non-racemising” deprotonated form of 2.1 in
light water should lead to an overall slower racemisation of 2.1 in this solvent. This
hypothesis is supported by the absence of an inverse solvent isotope effect for
82
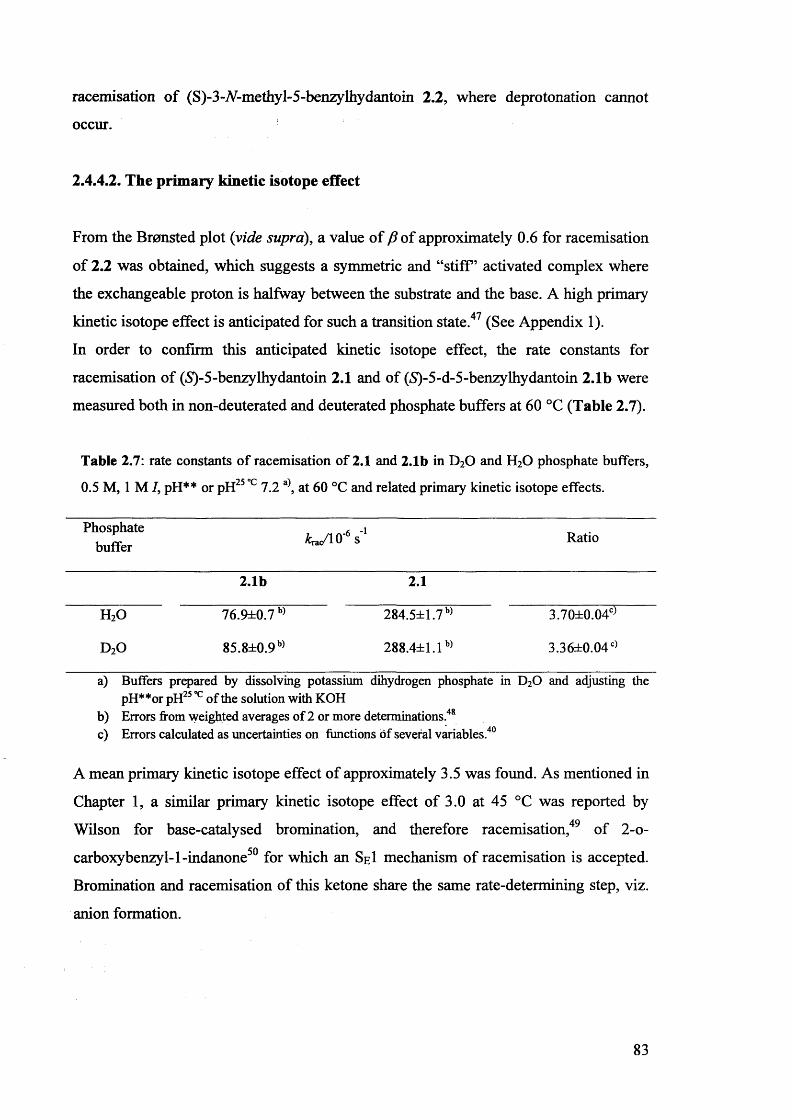
racemisation of (S)-3-A7-methyl-5-benzylhydantoin 2.2, where deprotonation cannot
occur.
2.4.4.2. The primary kinetic isotope effect
From the Bronsted plot (vide supra), a value of p of approximately 0.6 for racemisation
of 2.2 was obtained, which suggests a symmetric and “stiff’ activated complex where
the exchangeable proton is halfway between the substrate and the base. A high primary
kinetic isotope effect is anticipated for such a transition state.47 (See Appendix 1).
In order to confirm this anticipated kinetic isotope effect, the rate constants for
racemisation of (5)-5-benzylhydantoin 2.1 and of (S)-5-d-5-benzylhydantoin 2.1b were
measured both in non-deuterated and deuterated phosphate buffers at 60 °C (Table 2.7).
Table 2.7: rate constants of racemisation of 2.1 and 2.1b in D20 and H20 phosphate buffers,
0.5 M, 1 M I, pH** or pH25 °c 7.2a), at 60 °C and related primary kinetic isotope effects.
Phosphatebuffer W 1 0 '6 s'1 Ratio
2.1b 2.1
h 2o 76.9±0.7b) 284.5±1.7b) 3.70±0.04c)
d 2o 85.8±0.9b) 288.4±1.1b) 3.36±0.04c)
a) Buffers prepared by dissolving potassium dihydrogen phosphate in D20 and adjusting thepH**or pH25 °c of the solution with KOH
b) Errors from weighted averages of 2 or more determinations.48c) Errors calculated as uncertainties on functions of several variables 40
A mean primary kinetic isotope effect of approximately 3.5 was found. As mentioned in
Chapter 1, a similar primary kinetic isotope effect of 3.0 at 45 °C was reported by
Wilson for base-catalysed bromination, and therefore racemisation,49 of 2-o-
carboxybenzyl-l-indanone50 for which an SeI mechanism of racemisation is accepted.
Bromination and racemisation of this ketone share the same rate-determining step, viz.
anion formation.
83
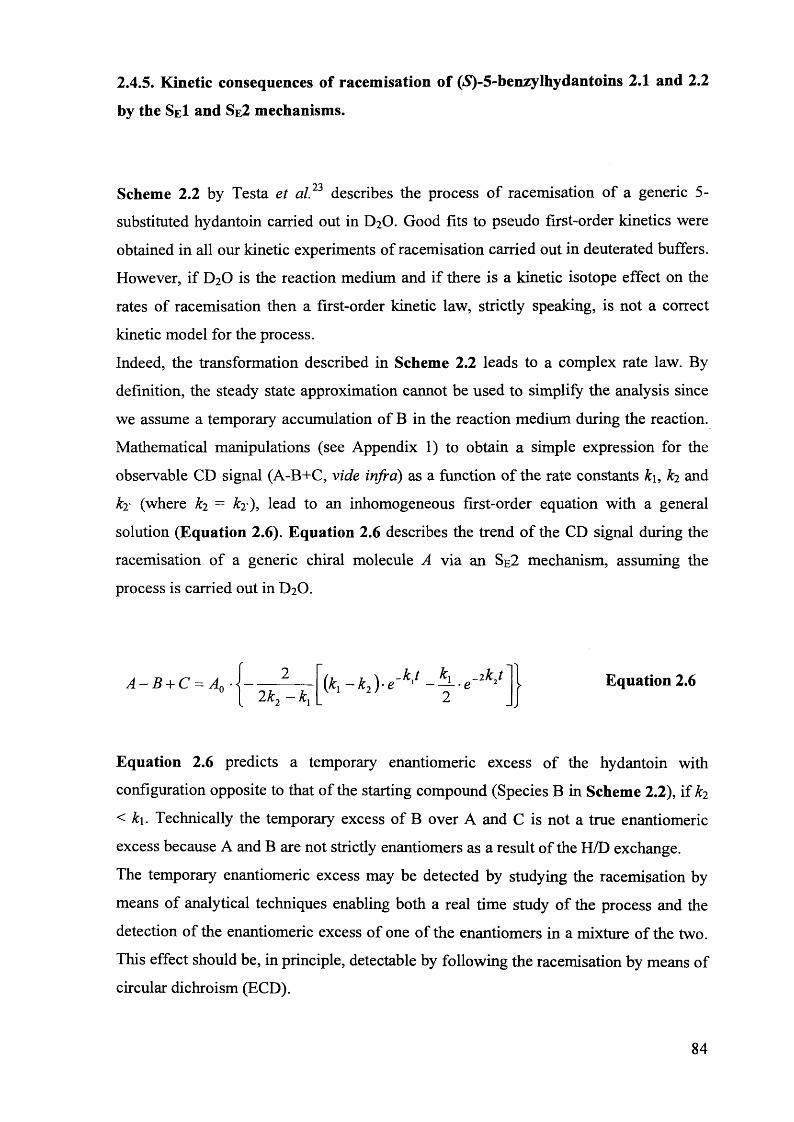
2.4.5. Kinetic consequences of racemisation of (S)-5-benzylhydantoins 2.1 and 2.2
by the SeI and Se2 mechanisms.
Scheme 2.2 by Testa et a l23 describes the process of racemisation of a generic 5-
substituted hydantoin carried out in D2O. Good fits to pseudo first-order kinetics were
obtained in all our kinetic experiments of racemisation carried out in deuterated buffers.
However, if D2O is the reaction medium and if there is a kinetic isotope effect on the
rates of racemisation then a first-order kinetic law, strictly speaking, is not a correct
kinetic model for the process.
Indeed, the transformation described in Scheme 2.2 leads to a complex rate law. By
definition, the steady state approximation cannot be used to simplify the analysis since
we assume a temporary accumulation of B in the reaction medium during the reaction.
Mathematical manipulations (see Appendix 1) to obtain a simple expression for the
observable CD signal (A-B+C, vide infra) as a function of the rate constants k\, kj and
k? (where &2 = &2O, lead to an inhomogeneous first-order equation with a general
solution (Equation 2.6). Equation 2.6 describes the trend of the CD signal during the
racemisation of a generic chiral molecule A via an Se2 mechanism, assuming the
process is carried out in D2O.
Equation 2.6 predicts a temporary enantiomeric excess of the hydantoin with
configuration opposite to that of the starting compound (Species B in Scheme 2.2), if &2
< k\. Technically the temporary excess of B over A and C is not a true enantiomeric
excess because A and B are not strictly enantiomers as a result of the H/D exchange.
The temporary enantiomeric excess may be detected by studying the racemisation by
means of analytical techniques enabling both a real time study of the process and the
detection of the enantiomeric excess of one of the enantiomers in a mixture of the two.
This effect should be, in principle, detectable by following the racemisation by means of
circular dichroism (ECD).
Equation 2.6
84
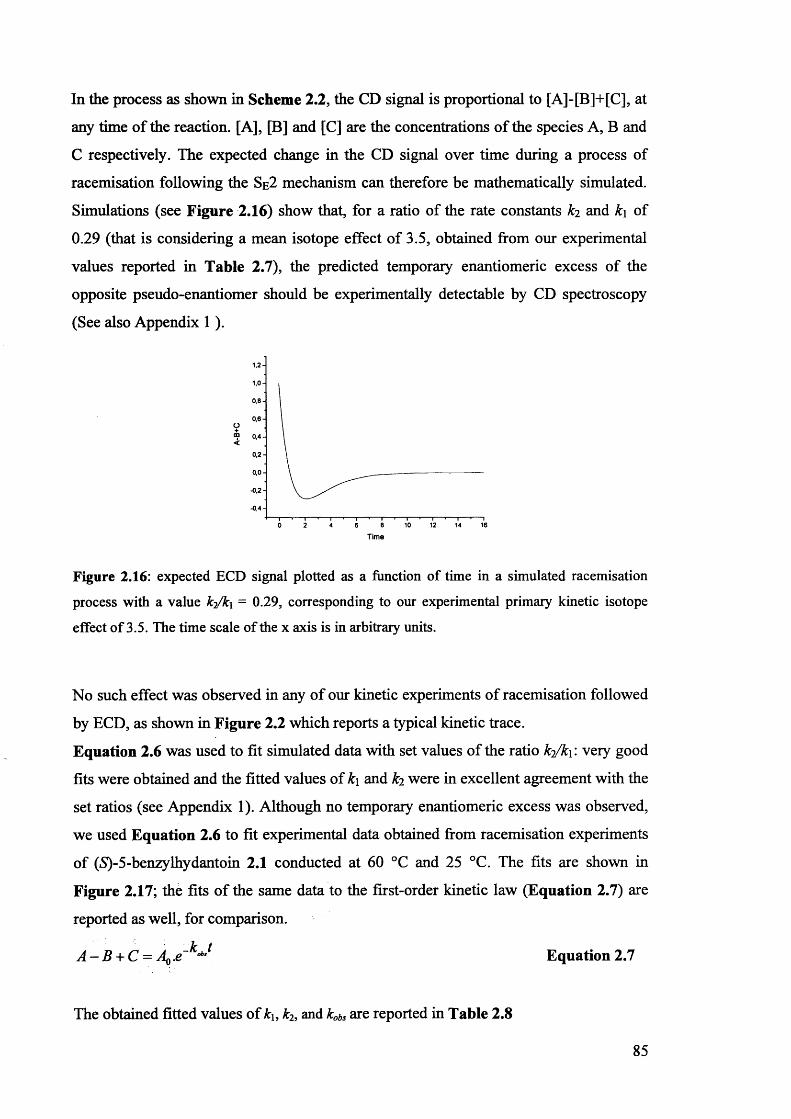
In the process as shown in Scheme 2.2, the CD signal is proportional to [A]-[B]+[C], at
any time of the reaction. [A], [B] and [C] are the concentrations of the species A, B and
C respectively. The expected change in the CD signal over time during a process of
racemisation following the Se2 mechanism can therefore be mathematically simulated.
Simulations (see Figure 2.16) show that, for a ratio of the rate constants k2 and k\ of
0.29 (that is considering a mean isotope effect of 3.5, obtained from our experimental
values reported in Table 2.7), the predicted temporary enantiomeric excess of the
opposite pseudo-enantiomer should be experimentally detectable by CD spectroscopy
(See also Appendix 1 ).
0,8
0,6O+°P 0,4 <
0,2 -
0,0 -
-0,2 -
-0,4-0 2 8 10 12 14 164 6
Figure 2.16: expected ECD signal plotted as a function of time in a simulated racemisation
process with a value k2/k\ = 0.29, corresponding to our experimental primary kinetic isotope
effect of 3.5. The time scale of the x axis is in arbitrary units.
No such effect was observed in any of our kinetic experiments of racemisation followed
by ECD, as shown in Figure 2.2 which reports a typical kinetic trace.
Equation 2.6 was used to fit simulated data with set values of the ratio k2/k \: very good
fits were obtained and the fitted values of k\ and k2 were in excellent agreement with the
set ratios (see Appendix 1). Although no temporary enantiomeric excess was observed,
we used Equation 2.6 to fit experimental data obtained from racemisation experiments
of (5)-5-benzylhydantoin 2.1 conducted at 60 °C and 25 °C. The fits are shown in
Figure 2.17; the fits of the same data to the first-order kinetic law (Equation 2.7) are
reported as well, for comparison.
A - B + C = Aq Equation 2.7
The obtained fitted values of ku k2, and kobs are reported in Table 2.8
85
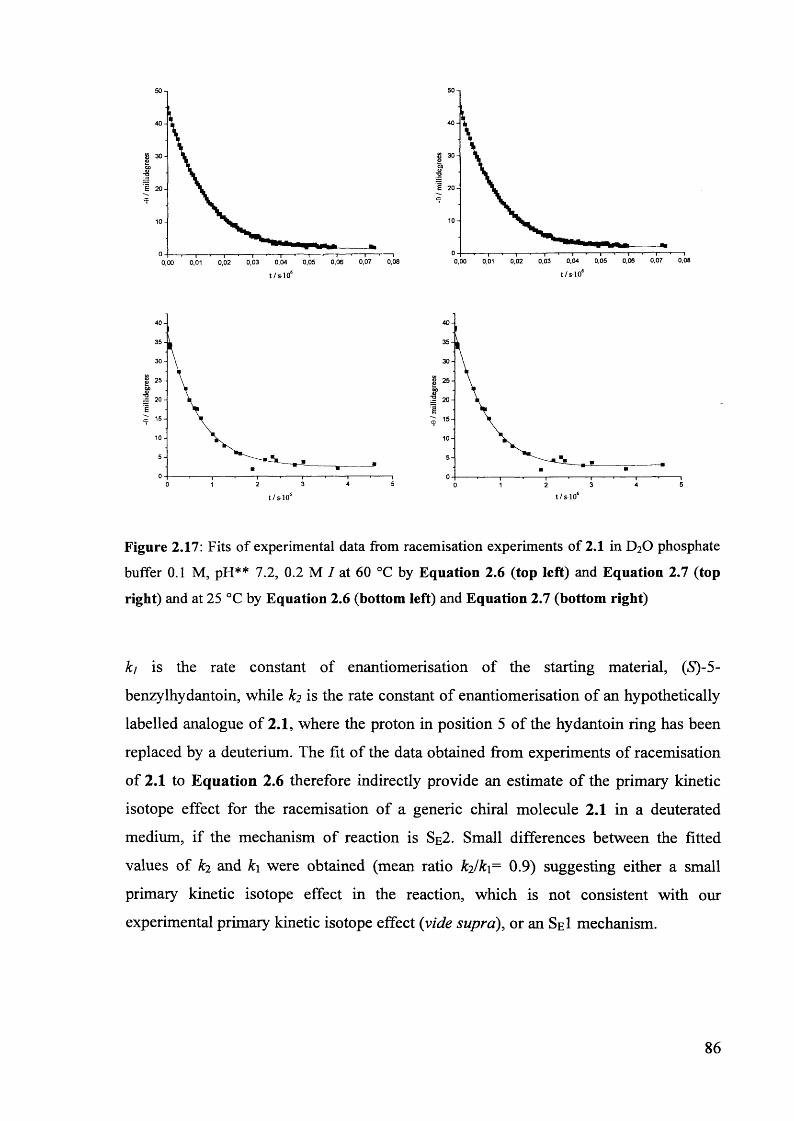
40
30
6 20
10
0 0,07 0,080,060,02 0,03 0,04 0,050,00 0,01
40
i 30T3
<£
10
0 0,080,070,05 0,060,03 0,040,00 0,01 0,02
40353025
oo20
£S 15
10
50 53 420 1
25-Q0M 2 0 -
530 1 2 4
Figure 2.17: Fits of experimental data from racemisation experiments of 2.1 in D20 phosphate
buffer 0.1 M, pH** 7.2, 0.2 M I at 60 °C by Equation 2.6 (top left) and Equation 2.7 (top
right) and at 25 °C by Equation 2.6 (bottom left) and Equation 2.7 (bottom right)
k] is the rate constant of enantiomerisation of the starting material, (S)-5-
benzylhydantoin, while is the rate constant of enantiomerisation of an hypothetically
labelled analogue of 2.1, where the proton in position 5 of the hydantoin ring has been
replaced by a deuterium. The fit of the data obtained from experiments of racemisation
of 2.1 to Equation 2.6 therefore indirectly provide an estimate of the primary kinetic
isotope effect for the racemisation of a generic chiral molecule 2.1 in a deuterated
medium, if the mechanism of reaction is Se2. Small differences between the fitted
values of ki and k\ were obtained (mean ratio ki/k\= 0.9) suggesting either a small
primary kinetic isotope effect in the reaction, which is not consistent with our
experimental primary kinetic isotope effect (vide supra), or an SeI mechanism.
86
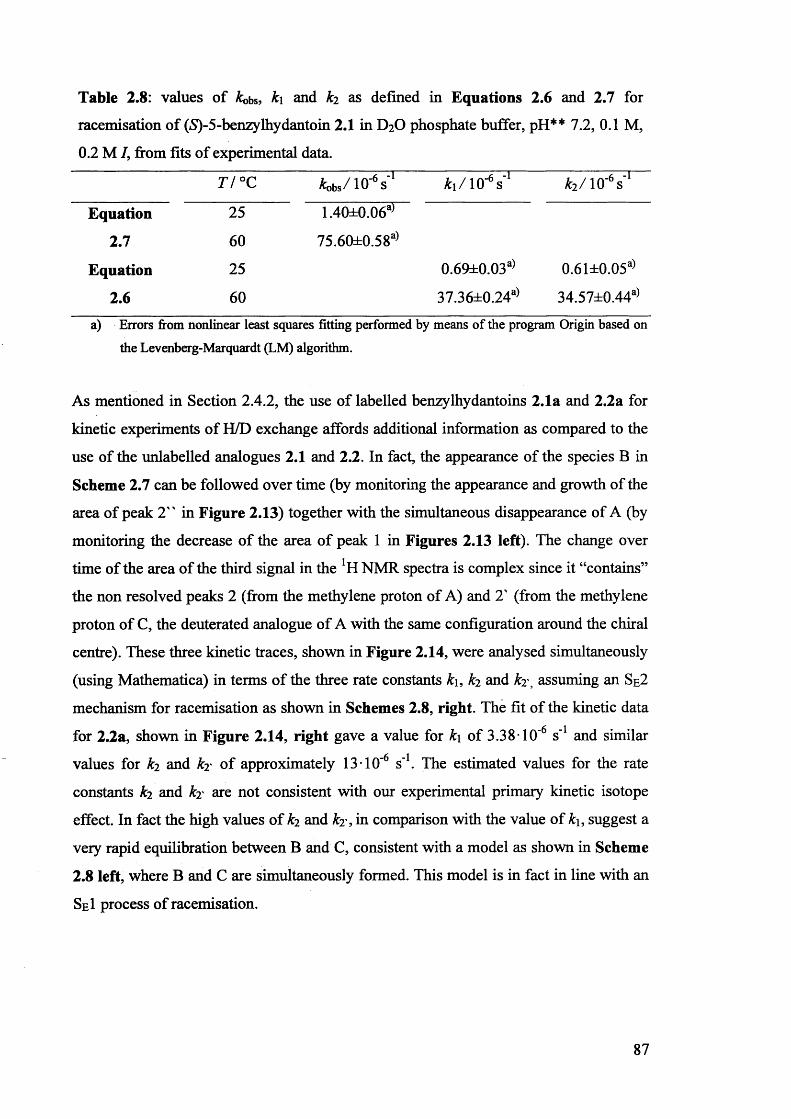
Table 2.8: values of &obs, k\ and k2 as defined in Equations 2.6 and 2.7 for
racemisation of (S)-5-benzylhydantoin 2.1 in D2O phosphate buffer, pH** 7.2, 0.1 M,
0.2 M /, from fits of experimental data.
77 °C W io -V Jti/icrV1 k i/ 10'6s 1
Equation 25 1.40±0.06a)
2.7 60 75.60±0.58a)
Equation 25 0.69±0.03a) 0.61±0.05a)
2.6 60 37.36±0.24a) 34.57±0.44a)
a) Errors from nonlinear least squares fitting performed by means of the program Origin based onthe Levenberg-Marquardt (LM) algorithm.
As mentioned in Section 2.4.2, the use of labelled benzylhydantoins 2.1a and 2.2a for
kinetic experiments of H/D exchange affords additional information as compared to the
use of the unlabelled analogues 2.1 and 2.2. In fact, the appearance of the species B in
Scheme 2.7 can be followed over time (by monitoring the appearance and growth of the
area of peak 2" in Figure 2.13) together with the simultaneous disappearance of A (by
monitoring the decrease of the area of peak 1 in Figures 2.13 left). The change over
time of the area of the third signal in the !H NMR spectra is complex since it “contains”
the non resolved peaks 2 (from the methylene proton of A) and T (from the methylene
proton of C, the deuterated analogue of A with the same configuration around the chiral
centre). These three kinetic traces, shown in Figure 2.14, were analysed simultaneously
(using Mathematica) in terms of the three rate constants k\, k2 and k?, assuming an Se2
mechanism for racemisation as shown in Schemes 2.8, right. The fit of the kinetic data
for 2.2a, shown in Figure 2.14, right gave a value for k\ of 3.38-10"6 s'1 and similar
values for £2 and kx of approximately 13-10”6 s'1. The estimated values for the rate
constants k2 and kx are not consistent with our experimental primary kinetic isotope
effect. In fact the high values of k2 and kx, in comparison with the value of k\, suggest a
very rapid equilibration between B and C, consistent with a model as shown in Scheme
2.8 left, where B and C are simultaneously formed. This model is in fact in line with an
SeI process of racemisation.
87
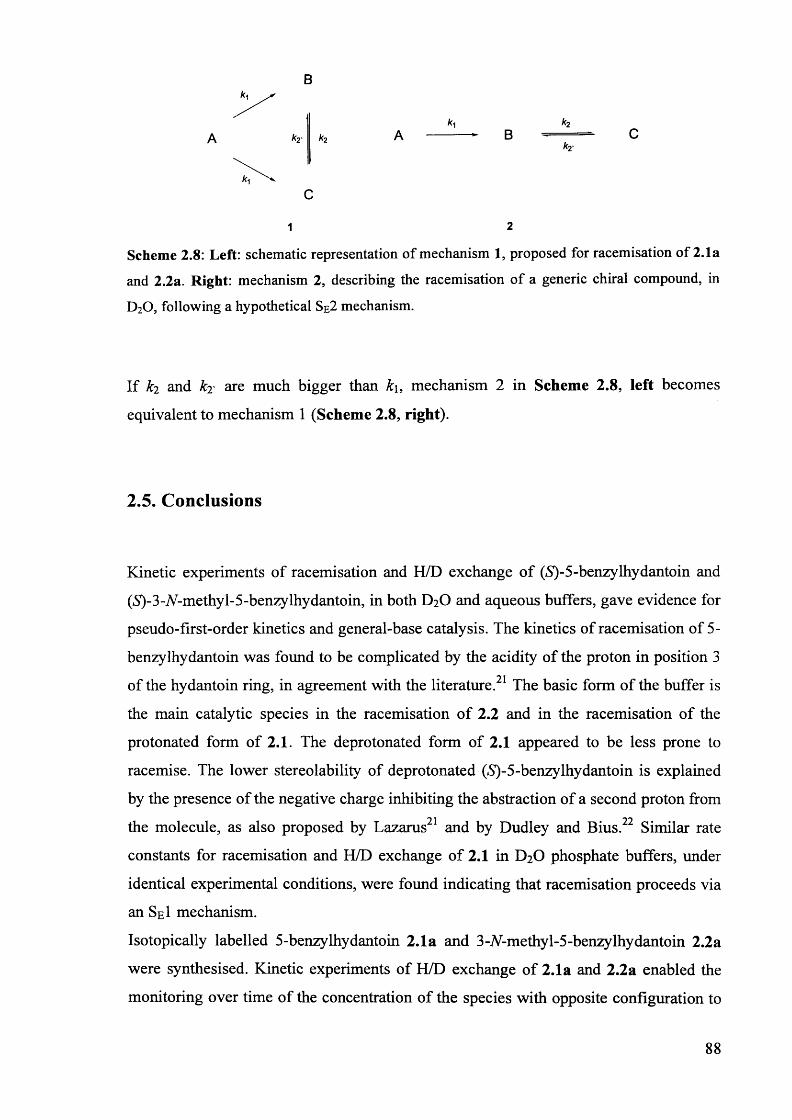
Scheme 2.8: Left: schematic representation of mechanism 1, proposed for racemisation of 2.1a and 2.2a. Right: mechanism 2, describing the racemisation of a generic chiral compound, in
D20, following a hypothetical Se2 mechanism.
If and kx are much bigger than k\, mechanism 2 in Scheme 2.8, left becomes
equivalent to mechanism 1 (Scheme 2.8, right).
2.5. Conclusions
Kinetic experiments of racemisation and H/D exchange of (S)-5-benzylhydantoin and
(£)-3 -7V-methy 1-5-benzylhydantoin, in both D2O and aqueous buffers, gave evidence for
pseudo-first-order kinetics and general-base catalysis. The kinetics of racemisation of 5-
benzylhydantoin was found to be complicated by the acidity of the proton in position 391of the hydantoin ring, in agreement with the literature. The basic form of the buffer is
the main catalytic species in the racemisation of 2.2 and in the racemisation of the
protonated form of 2.1. The deprotonated form of 2.1 appeared to be less prone to
racemise. The lower stereolability of deprotonated (S)-5-benzy lhy dantoin is explained
by the presence of the negative charge inhibiting the abstraction of a second proton from
the molecule, as also proposed by Lazarus21 and by Dudley and Bius.22 Similar rate
constants for racemisation and H/D exchange of 2.1 in D2O phosphate buffers, under
identical experimental conditions, were found indicating that racemisation proceeds via
an SeI mechanism.
Isotopically labelled 5-benzy lhy dantoin 2.1a and 3-N-methy 1-5-benzy lhy dantoin 2.2a
were synthesised. Kinetic experiments of H/D exchange of 2.1a and 2.2a enabled the
monitoring over time of the concentration of the species with opposite configuration to
the starting material, species B in Scheme 2.7, during H/D exchange experiments. No
temporary excess of the above mentioned species was detected at any stage of the H/D
exchange experiments. A /? value of 0.6 was obtained for racemisation of 2.2,
confirming general-base catalysis and revealing a symmetric activated complex for
racemisation with the exchangeable proton halfway between the base and the molecule
of hydantoin. Solvent and primary kinetic isotope effects for racemisation of 2.1 were
determined. No normal solvent kinetic isotope effect was detected while the reaction
revealed a mean primary kinetic isotope effect of 3.5. All experimental findings suggest
a stepwise mechanism (SeI) as the most likely mechanistic route for base catalysed
racemisation of benzylhydantoins 2.1 and 2.2, in purely aqueous media. Finally, a
mathematical model for a generic Se2 process of racemisation in D2O was developed
and experimental data of racemisation have been analysed in terms of this equation. No
primary isotope effect was predicted by the fits of experimental data to the mentioned
rate law. The finding confirms that the racemisation of 2.1 and 2.2 proceeds via an SeI
mechanism.
2.6. E x p e rim e n ta l P a r t 1
Materials
All solvents, drying agents, inorganic acids and bases were Laboratory Reagent Grade
and were purchased from Fisher Scientific. All dry solvents were dried using an MB
SPS-800 solvent purification system. All materials were used without further
purification. (5)-2-amino-3 -pheny lpropanamide, fS^-methy 1-2-ami no-3-
phenylpropanoate hydrochloride, methylamine (33% dry solution in ethanol),
iodomethane, triethanolamine, ld-benzaldehyde and palladium on activated carbon (5
weight %), were from Sigma-Aldrich. Carbonyldiimidazole (CDI), hydantoin, and
benzaldehyde, were from Alfa-Aesar.
89
Chromathography
Filtrations were carried out on medium fast speed filter paper or on celite kieselgur,
white (general purpose grade). Celite was from Fisher Scientific. Separations by HPLC
were carried out on an Agilent HPLC system 1200 series equipped with a 1200 Series
quaternary pump, a 1200 Series diode array detector, a 1200 Series vacuum degasser
and a 1200 Series preparative autosampler. HPLC grade solvents were purchased from
Fisher Scientific.
NMR Spectroscopy
*H NMR spectra were recorded on a Bruker AVANCE 400 or a Bruker AVANCE 500
spectrometer at 400 or 500 MHz, respectively. 13C NMR spectra were recorded on the1 13same instruments as H NMR spectra, at C resonance frequencies of 101 MHz (Bruker
AVANCE 400) and 126 MHz (Bruker AVANCE 500). Coupling constants are reported
in hertz (Hz). Chemical shifts are reported in parts per million (5) and are referenced to
the residual *H and 13C signal of the NMR solvent used in *H NMR and 13C NMR
spectra, respectively. Dimethylsulfoxide-d6, acetone-d6, chloroform-d or D2O were used
as reported in the individual sections. Dimethylsulfoxide-d6 (D 99.9%) was purchased
from Cambridge Isotope Laboratories, Inc, chloroform-d (H2O<0 .01%, 99.80 %D) was
from EURISO-TOP, deuterium oxide (99.9%) was obtained from Fluorochem.
Mass spectrometry
Molecular masses were determined from high resolution mass spectra (HRMS). The
spectra were recorded on a Waters GCT Premier XE GCMS spectrometer. El (electron
impact) was used as ionisation method.
IR spectroscopy
IR spectra were recorded on a Varian Excalibur Spectrometer (FTS 7000) equipped
with a SensIR ATR accessory (attenuated total reflectance Fourier transform infrared
(ATR FT-IR) spectra) and a Deuterated Tri-Glycine Sulfate (DTGS) detector.
90
Melting points
Melting points were recorded on a Stuart Melting point SMP11. Thermometers were
Brannan LO-tox with a temperature range 0-300 °C and divisions of 1 °C.
Polarimetry
Specific optical activities were determined by means of an Optical Activity Ltd. AA-
1000 polarimeter in a 5.00 cm path length glass cell. D refers to the D line of the
emission spectrum of sodium (A,=589 nm). Approximate optical purities were calculated
based on literature values of specific optical activities of enantiopure compounds, when
available. Solvent and concentration (expressed in g/100 ml) of the solutions used for
the measurements are reported in the individual sections.
Methods
Two general methods were used to prepare more than one compound.
Method 2.1: synthesis of (Z)-5-benzylideneimidazolidine-2,4-diones 2.5, 2.6, 2.5a,
2.6a: (Z)-5-benzylideneimidazolidine-2,4-diones, precursor of the unlabelled racemic
benzylhydantoins rac-2.1, rac-2.2, and of deuterium-labelled benzylhydantoins la and
2a were prepared by condensation of hydantoin or TV-methylhy dantoin with unlabelled
or deuterium-labelled benzaldehyde. Hydantoin or A-methylhydantoin was dissolved in
water (10 ml per gram of hydantoin) in a round bottom flask at 70 °C with stirring. The
PH was adjusted to 7 with few drops of a saturated solution of NaHC03 .
Triethanolamine was added to the solution of hydantoin. A solution of aldehyde in
ethanol (3 ml per gram of aldehyde), was then added dropwise and the temperature rose
to reflux. The reaction mixture was kept under reflux for approximately 24 hours. The
mixture was then allowed to cool down and the products were recovered by filtration.
The solid products were washed with a mixture of ethanol and water (1:5) and
recrystallised from ethanol.
91
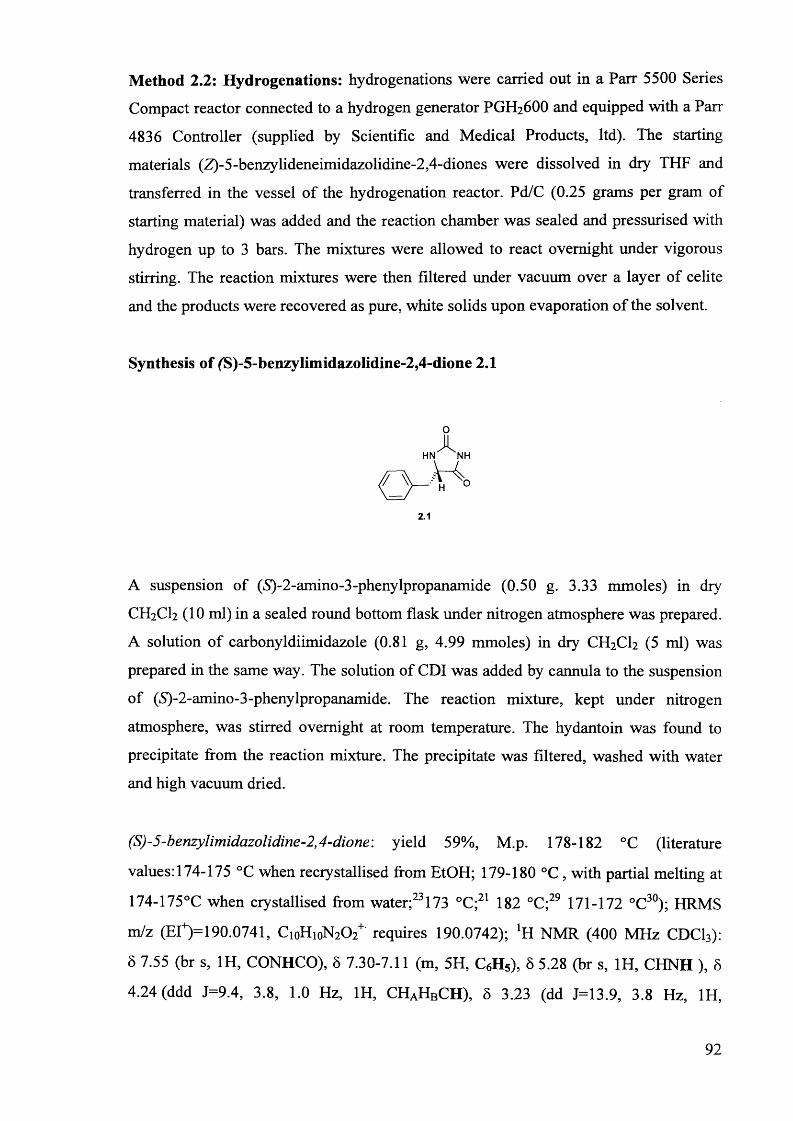
Method 2.2: Hydrogenations: hydrogenations were carried out in a Parr 5500 Series
Compact reactor connected to a hydrogen generator PGH26OO and equipped with a Parr
4836 Controller (supplied by Scientific and Medical Products, ltd). The starting
materials (Z)-5-benzylideneimidazolidine-2,4-diones were dissolved in dry THF and
transferred in the vessel of the hydrogenation reactor. Pd/C (0.25 grams per gram of
starting material) was added and the reaction chamber was sealed and pressurised with
hydrogen up to 3 bars. The mixtures were allowed to react overnight under vigorous
stirring. The reaction mixtures were then filtered under vacuum over a layer of celite
and the products were recovered as pure, white solids upon evaporation of the solvent.
Synthesis of (S)-5-benzylimidazolidme-2,4-dione 2.1
A suspension of (£)-2-amino-3-phenylpropanamide (0.50 g. 3.33 mmoles) in dry
CH2CI2 (10 ml) in a sealed round bottom flask under nitrogen atmosphere was prepared.
A solution of carbonyldiimidazole (0.81 g, 4.99 mmoles) in dry CH2CI2 (5 ml) was
prepared in the same way. The solution of CDI was added by cannula to the suspension
of (iS)-2-amino-3-phenylpropanamide. The reaction mixture, kept under nitrogen
atmosphere, was stirred overnight at room temperature. The hydantoin was found to
precipitate from the reaction mixture. The precipitate was filtered, washed with water
and high vacuum dried.
(S)-5-benzylimidazolidine-2,4-dione: yield 59%, M.p. 178-182 °C (literature
values: 174-175 °C when recrystallised from EtOH; 179-180 °C , with partial melting at
174-175°C when crystallised from water;23173 °C;21 182 °C;29 171-172 °C30); HRMS
m/z (EI+)=190.0741, Ci0HioN202+ requires 190.0742); *H NMR (400 MHz CDCI3):
oHN NHA.
2.1
6 7.55 (br s, 1H, CONHCO), 5 7.30-7.11 (m, 5H, C6H5), 5 5.28 (br s, 1H, CHNH ), 8
4.24 (ddd J=9.4, 3.8, 1.0 Hz, 1H, CHAHBCH), S 3.23 (dd J=13.9, 3.8 Hz, 1H,
92
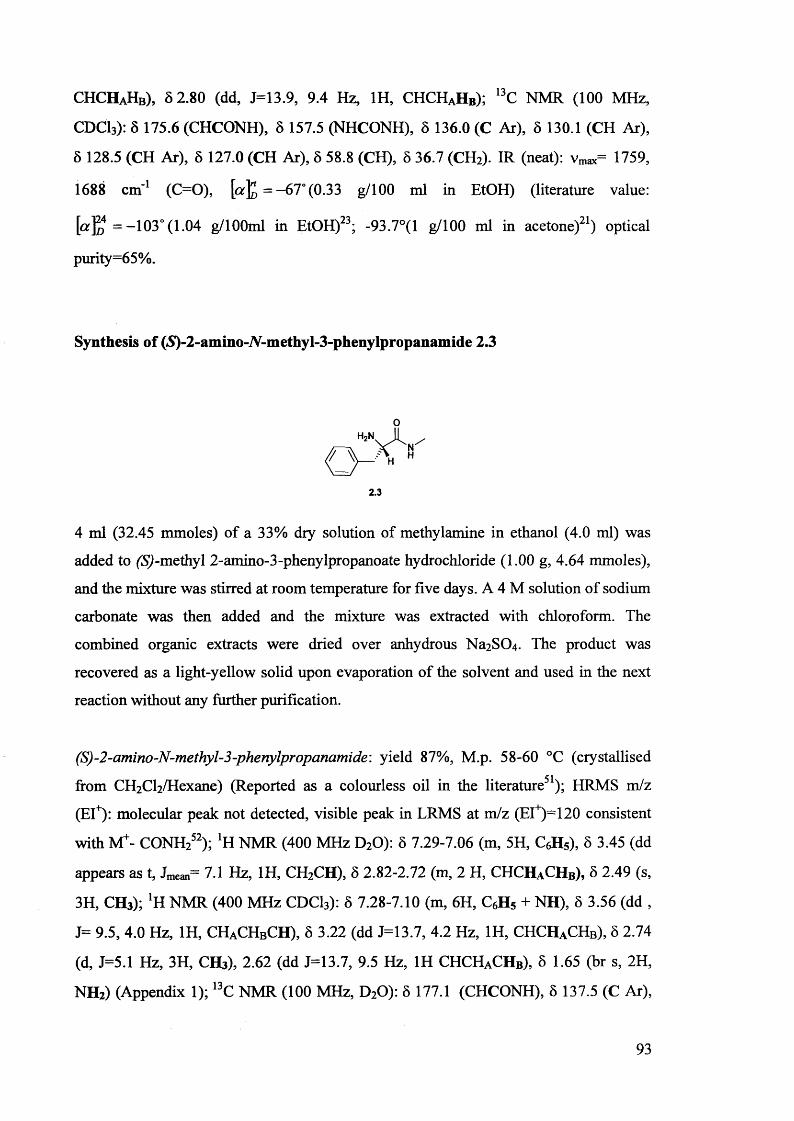
CHCHaHb), 5 2.80 (dd, J=13.9, 9.4 Hz, 1H, CHCHAHB); 13C NMR (100 MHz,
CDCI3): 5 175.6 (CHCONH), 5 157.5 (NHCONH), 5 136.0 (C Ar), 5 130.1 (CH Ar),
8 128.5 (CH Ar), 6 127.0 (CH Ar), 6 58.8 (CH), 5 36.7 (CH2). IR (neat): vmax= 1759,
1688 cm"1 (C=0), ]pc% = -67° (0.33 g/100 ml in EtOH) (literature value:
\ccYq =-103° (1.04 g/lOOml in EtOH)23; -93.7°(1 g/100 ml in acetone)21) optical
purity=65%.
Synthesis of (£)-2-ammo-7V-methyl-3-phenylpropanamide 2.3
0
V t h
2.3
4 ml (32.45 mmoles) of a 33% dry solution of methylamine in ethanol (4.0 ml) was
added to (5)-methyl 2-amino-3-phenylpropanoate hydrochloride (1.00 g, 4.64 mmoles),
and the mixture was stirred at room temperature for five days. A 4 M solution of sodium
carbonate was then added and the mixture was extracted with chloroform. The
combined organic extracts were dried over anhydrous Na2S04 . The product was
recovered as a light-yellow solid upon evaporation of the solvent and used in the next
reaction without any further purification.
(S)-2-amino-N-methyl-3-phenylpropanamide: yield 87%, M.p. 58-60 °C (crystallised
from CH2C12/Hexane) (Reported as a colourless oil in the literature51); HRMS m/z
(El*): molecular peak not detected, visible peak in LRMS at m/z (EI+)=T20 consistent
with M*- CONH252); NMR (400 MHz D20): 5 7.29-7.06 (m, 5H, C6H5), 5 3.45 (dd
appears as t, Jmem= 7.1 Hz, 1H, CH2CH), 5 2.82-2.72 (m, 2 H, CHCHACHB), 5 2.49 (s,
3H, CH3); lH NMR (400 MHz CDC13): 5 7.28-7.10 (m, 6H, C6H5 + NH), 5 3.56 (dd ,
J= 9.5, 4.0 Hz, 1H, CHaCHbCH), 5 3.22 (dd J=13.7, 4.2 Hz, 1H, CHCHACHB), 5 2.74
(d, J=5.1 Hz, 3H, CH3), 2.62 (dd J=13.7, 9.5 Hz, 1H CHCHACHB), 5 1.65 (br s, 2H,
NH2) (Appendix 1); 13C NMR (100 MHz, D20): 5 177.1 (CHCONH), 5 137.5 (C Ar),
93
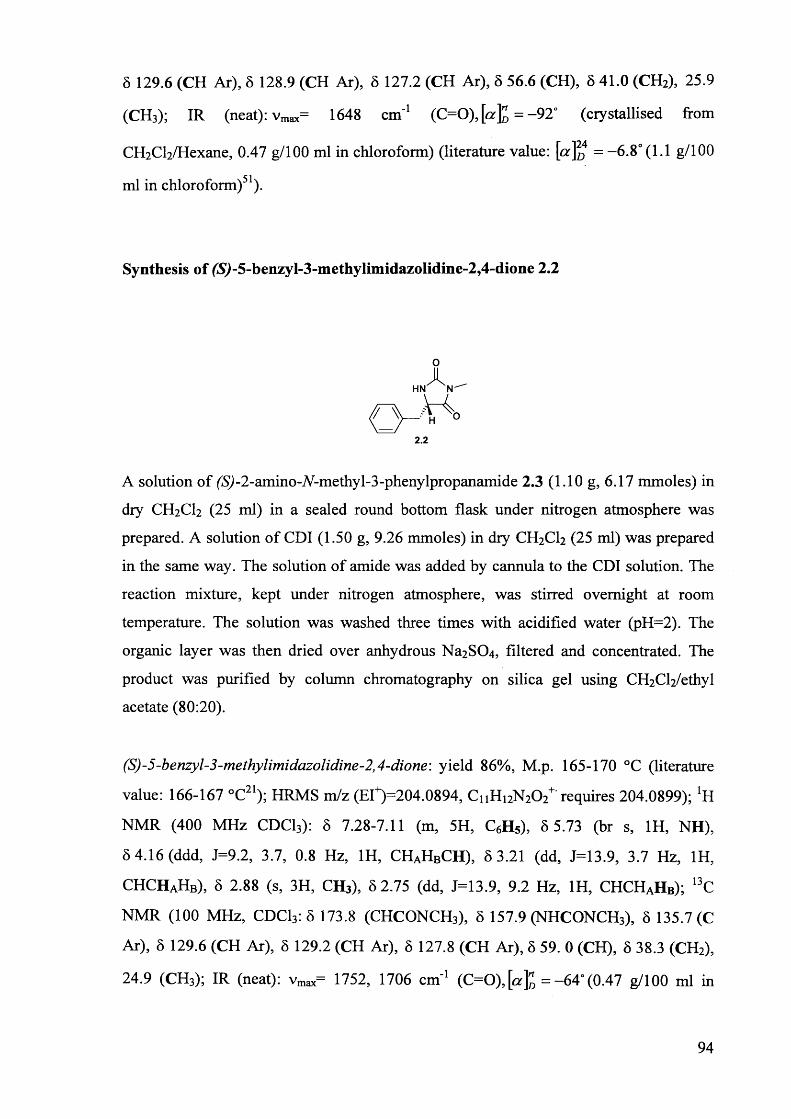
5 129.6 (CH Ar), 5 128.9 (CH Ar), 6 127.2 (CH Ar), 5 56.6 (CH), 6 41.0 (CH2), 25.9
(CH3); IR (neat): vmax= 1648 cm'1 (C=0), [a% = -92° (crystallised from
CH2Cl2/Hexane, 0.47 g/100 ml in chloroform) (literature value: [a]2 = - 6 .8° (1.1 g/100
ml in chloroform)51).
Synthesis of (5)-5-benzyl-3-methyIimidazoIidine-2,4-dione 2.2
o
2.2
A solution of (5)-2-amino-A-methy 1-3-phenylpropanamide 2.3 (1.10 g, 6.17 mmoles) in
dry CH2CI2 (25 ml) in a sealed round bottom flask under nitrogen atmosphere was
prepared. A solution of CDI (1.50 g, 9.26 mmoles) in dry CH2CI2 (25 ml) was prepared
in the same way. The solution of amide was added by cannula to the CDI solution. The
reaction mixture, kept under nitrogen atmosphere, was stirred overnight at room
temperature. The solution was washed three times with acidified water (pH=2). The
organic layer was then dried over anhydrous Na2S04 , filtered and concentrated. The
product was purified by column chromatography on silica gel using C ^C V ethyl
acetate (80:20).
(S)-5-benzyl-3-methylimidazolidine-2,4-dione: yield 86%, M.p. 165-170 °C (literature
value: 166-167 °C21); HRMS m/z ( E I +) = 2 0 4 . 0 8 9 4 , C nH nN jC ^ requires 204.0899); ‘H
NMR (400 MHz CDC13): 8 7.28-7.11 (m, 5H, C6H5), 5 5.73 (br s, 1H, NH),
5 4.16 (ddd, J=9.2, 3.7, 0.8 Hz, 1H, CHAHBCH), 8 3.21 (dd, J=13.9, 3.7 Hz, 1H,
CHCHaHb), 8 2.88 (s, 3H, CH3), 5 2.75 (dd, J=13.9, 9.2 Hz, 1H, CHCHAHB); 13C
NMR (100 MHz, CDCI3: 5 173.8 (CHCONCH3), 8 157.9 (NHCONCH3), 5 135.7 (C
Ar), 5 129.6 (CH Ar), 5 129.2 (CH Ar), 5 127.8 (CH Ar), 5 59. 0 (CH), 8 38.3 (CH2),
24.9 (CH3); IR (neat): vmax= 1752, 1706 cm'1 (C=Q), [«]" =-64 '(0 .47 g/100 ml in
94
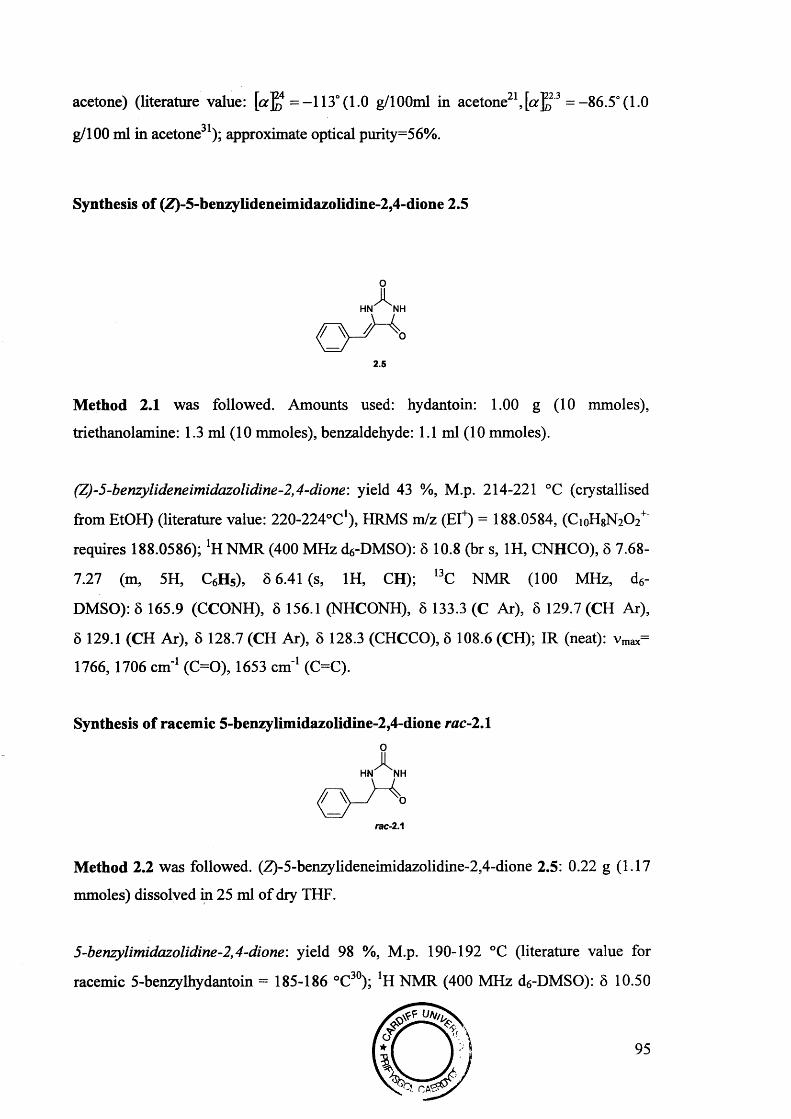
acetone) (literature value: [or£4 =-113° (1.0 g/lOOml in acetone21, \ a ^ 3 = -86.5° (1.0
g/100 ml in acetone31); approximate optical purity=56%.
Synthesis of (Z)-5-benzylideneimidazolidine-2,4-dione 2.5
oHN NHA.
o
2.5
Method 2.1 was followed. Amounts used: hydantoin: 1.00 g (10 mmoles),
triethanolamine: 1.3 ml (10 mmoles), benzaldehyde: 1.1 ml (10 mmoles).
(Z)-5-benzylideneimidazolidine-2,4-dione: yield 43 %, M.p. 214-221 °C (crystallised
from EtOH) (literature value: 220-224°C1), HRMS m/z (EI+) = 188.0584, (CioH8N20 2+
requires 188.0586); !H NMR (400 MHz d6-DMSO): 8 10.8 (br s, 1H, CNHCO), 8 7.68-
7.27 (m, 5H, C6H5), 8 6.41 (s, 1H, CH); 13C NMR (100 MHz, d6-
DMSO): 8 165.9 (CCONH), 8 156.1 (NHCONH), 8 133.3 (C Ar), 8 129.7 (CH Ar),
8 129.1 (CH Ar), 8 128.7 (CH Ar), 8 128.3 (CHCCO), 8 108.6 (CH); IR (neat): vmax=
1766, 1706 cm'1 (C=0), 1653 cm'1 (C=C).
Synthesis of racemic 5-benzylimidazolidine-2,4-dione rac-2.1
Method 2.2 was followed. (Z)-5-benzylideneimidazolidine-2,4-dione 2.5: 0.22 g (1.17
mmoles) dissolved in 25 ml of dry THF.
oHN NHA.
5-benzylimidazolidine-2,4-dione: yield 98 %, M.p. 190-192 °C (literature value for
racemic 5-benzylhydantoin = 185-186 °C30); *H NMR (400 MHz d6-DMSO): 5 10.50
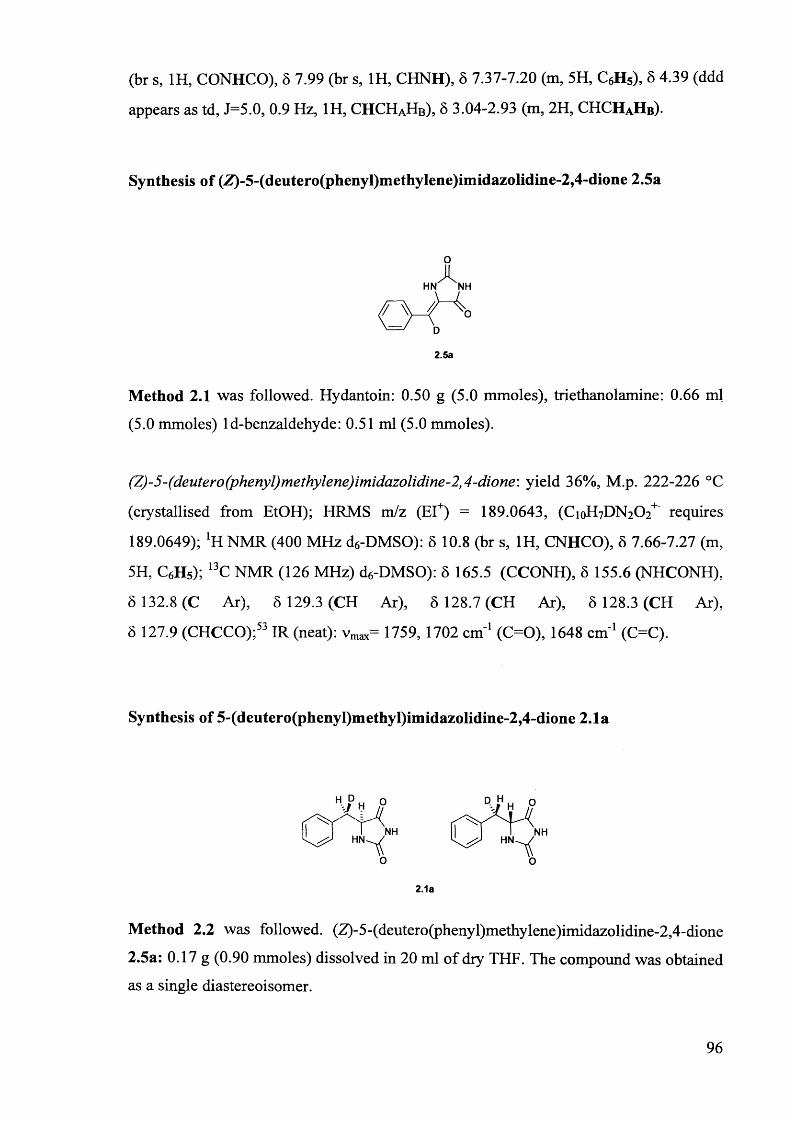
(br s, 1H, CONHCO), 5 7.99 (br s, 1H, CHNH), 5 7.37-7.20 (m, 5H, C6H5), 8 4.39 (ddd
appears as td, J=5.0, 0.9 Hz, 1H, CHCHAHB), 8 3.04-2.93 (m, 2H, CHCHaH b).
Synthesis of (Z)-5-(deutero(phenyl)methylene)imidazolidine-2,4-dione 2.5a
o
HN NH
2.5a
Method 2.1 was followed. Hydantoin: 0.50 g (5.0 mmoles), triethanolamine: 0.66 ml
(5.0 mmoles) ld-benzaldehyde: 0.51 ml (5.0 mmoles).
(Z)-5-(deutero(phenyl)methylene)imidazolidine-2,4-dione: yield 36%, M.p. 222-226 °C
(crystallised from EtOH); HRMS m/z (EI+) = 189.0643, (CioH7DN202+ requires
189.0649); lH NMR (400 MHz d6-DMSO): 8 10.8 (br s, 1H, CNHCO), 8 7.66-7.27 (m,
5H, C6H5); 13C NMR (126 MHz) d6-DMSO): 8 165.5 (CCONH), 8 155.6 (NHCONH),
8 132.8 (C Ar), 8 129.3 (CH Ar), 8 128.7 (CH Ar), 8 128.3 (CH Ar),
8 127.9 (CHCCO);53 IR (neat): vmax= 1759, 1702 cm'1 (C=0), 1648 cm'1 (C=C).
Synthesis of 5-(deutero(phenyl)methyl)imidazolidine-2,4-dione 2.1a
2.1a
Method 2.2 was followed. (Z)-5-(deutero(phenyl)methylene)imidazolidine-2,4-dione
2.5a: 0.17 g (0.90 mmoles) dissolved in 20 ml of dry THF. The compound was obtained
as a single diastereoisomer.
96
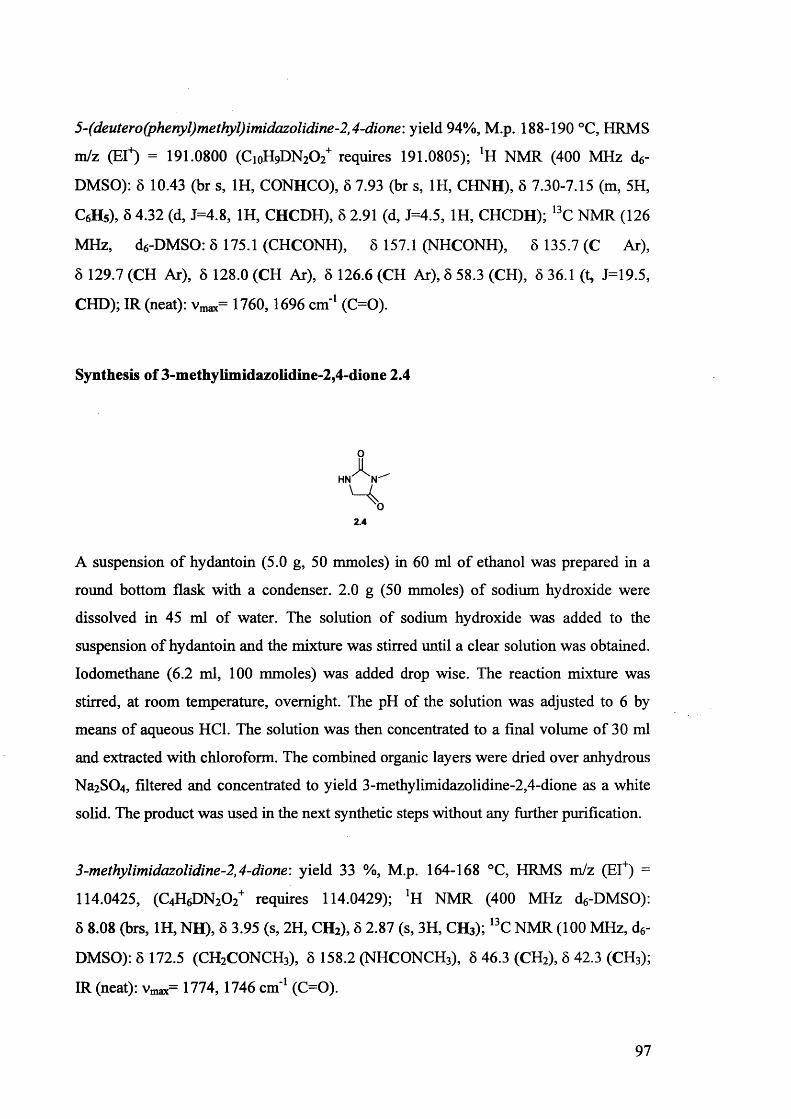
5-(deutero(phenyl)methyl)imidazolidine-2,4-dione: yield 94%, M.p. 188-190 °C, HRMS
m/z (El4) = 191.0800 (C!oH9DN20 2+ requires 191.0805); *H NMR (400 MHz d6-
DMSO): 5 10.43 (br s, 1H, CONHCO), 5 7.93 (br s, 1H, CHNH), 5 7.30-7.15 (m, 5H,
CeHs), 8 4.32 (d, J=4.8, 1H, CHCDH), 8 2.91 (d, J=4.5, 1H, CHCDH); 13C NMR (126
MHz, de-DMSO: 8 175.1 (CHCONH), 8 157.1 (NHCONH), 8 135.7 (C Ar),
8 129.7 (CH Ar), 8 128.0 (CH Ar), 8 126.6 (CH Ar), 8 58.3 (CH), 8 36.1 (t, J=19.5,
CHD); IR (neat): vmax= 1760,1696 cm 1 (C=0).
Synthesis of 3-methylimidazolidine-2,4-dione 2.4
ox
HN
2.4
A suspension of hydantoin (5.0 g, 50 mmoles) in 60 ml of ethanol was prepared in a
round bottom flask with a condenser. 2.0 g (50 mmoles) of sodium hydroxide were
dissolved in 45 ml of water. The solution of sodium hydroxide was added to the
suspension of hydantoin and the mixture was stirred until a clear solution was obtained.
Iodomethane (6.2 ml, 100 mmoles) was added drop wise. The reaction mixture was
stirred, at room temperature, overnight. The pH of the solution was adjusted to 6 by
means of aqueous HC1. The solution was then concentrated to a final volume of 30 ml
and extracted with chloroform. The combined organic layers were dried over anhydrous
Na2SC>4, filtered and concentrated to yield 3-methylimidazolidine-2,4-dione as a white
solid. The product was used in the next synthetic steps without any further purification.
3-methylimidazolidine-2,4-dione: yield 33 %, M.p. 164-168 °C, HRMS m/z (EI+) =
114.0425, (C^sDNjCb4 requires 114.0429); ‘H NMR (400 MHz d6-DMSO):
8 8.08 (brs, 1H, NH), 8 3.95 (s, 2H, CH2), 8 2.87 (s, 3H, CH3); 13C NMR (100 MHz, d6-
DMSO): 8 172.5 (CH2CONCH3), 8 158.2 (NHCONCH3), 8 46.3 (CH2), 8 42.3 (CH3);
IR (neat): vmax= 1774,1746 cm'1 (C=Q).
97
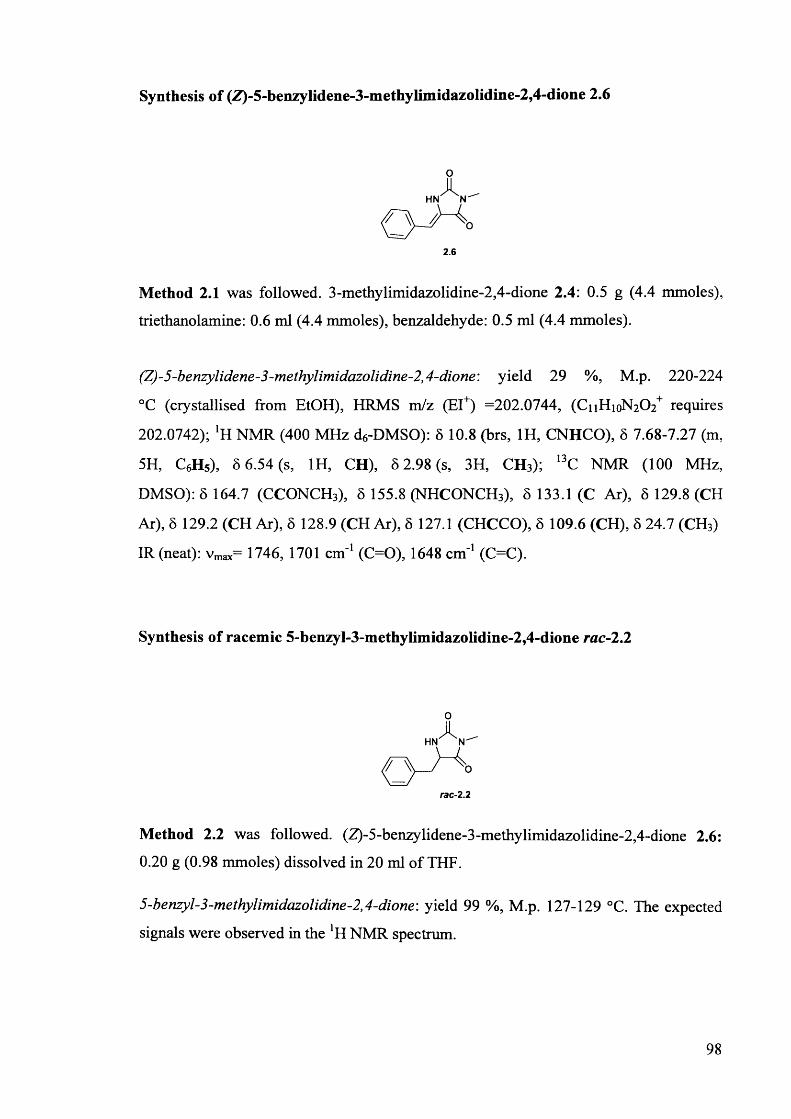
Synthesis of (Z)-5-benzylidene-3-methylimidazolidine-2,4-dione 2.6
o
2.6
Method 2.1 was followed. 3-methylimidazolidine-2,4-dione 2.4: 0.5 g (4.4 mmoles),
triethanolamine: 0.6 ml (4.4 mmoles), benzaldehyde: 0.5 ml (4.4 mmoles).
(Z)-5-benzylidene-3-methylimidazolidine-2,4-dione: yield 29 %, M.p. 220-224
°C (crystallised from EtOH), HRMS m/z (EI+) =202.0744, (CiiHioN20 2+ requires
202.0742); [H NMR (400 MHz d6-DMSO): 5 10.8 (brs, 1H, CNHCO), 5 7.68-7.27 (m,
5H, C6H5), 5 6.54 ( s , 1H, CH), 8 2.98 (s, 3H, CH3); 13C NMR (100 MHz,
DMSO): 8 164.7 (CCONCH3), 8 155.8 (NHCONCH3), 8 133.1 (C Ar), 8 129.8 (CH
Ar), 8 129.2 (CH Ar), 8 128.9 (CH Ar), 8 127.1 (CHCCO), 8 109.6 (CH), 8 24.7 (CH3)
IR (neat): vmax= 1746, 1701 cm'1 (C=0), 1648 cm'1 (C=C).
Synthesis of racemic 5-benzyl-3-methylimidazolidine-2,4-dione rac-2.2
0
rac- 2.2
Method 2.2 was followed. (Z)-5-benzylidene-3-methylimidazolidine-2,4-dione 2.6:
0.20 g (0.98 mmoles) dissolved in 20 ml of THF.
5-benzyl-3-methylimidazolidine-2,4-dione: yield 99 %, M.p. 127-129 °C. The expected
signals were observed in the !H NMR spectrum.
98
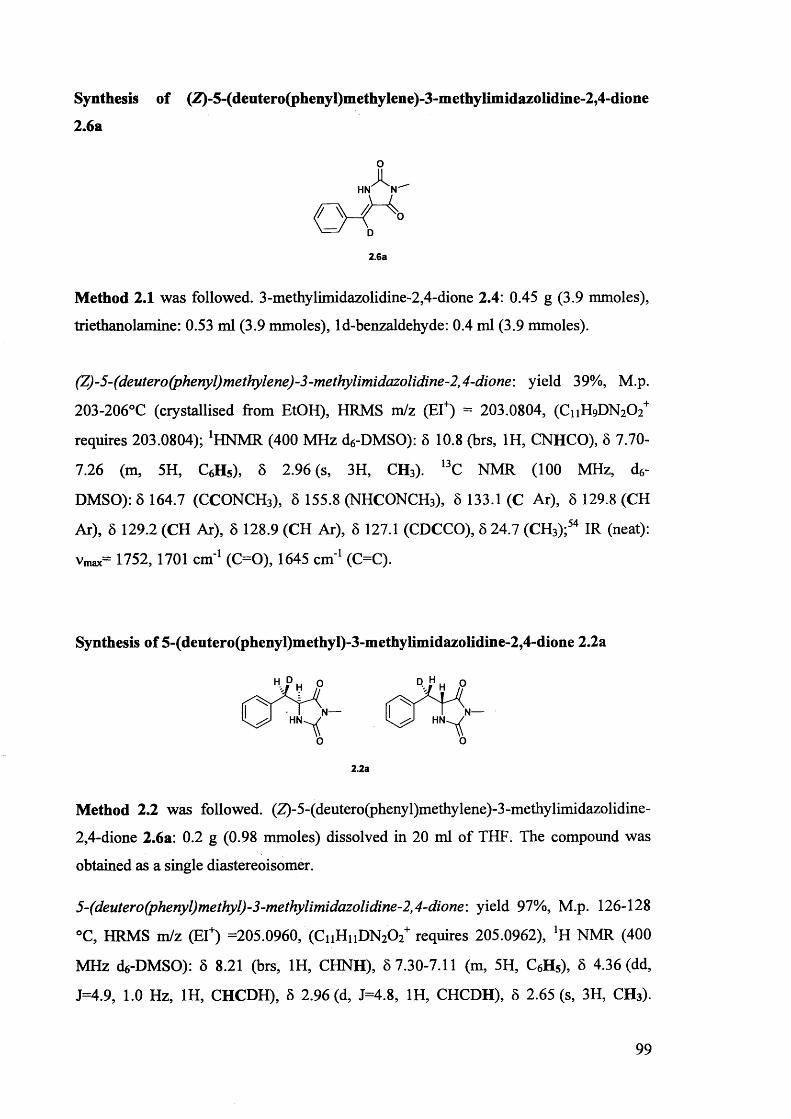
Synthesis of (Z)-5-(deutero(phenyl)methylene)-3-methylimidazolidine-2,4-dione
2.6a
o
2.6a
Method 2.1 was followed. 3-methylimidazolidine-2,4-dione 2.4: 0.45 g (3.9 mmoles),
triethanolamine: 0.53 ml (3.9 mmoles), ld-benzaldehyde: 0.4 ml (3.9 mmoles).
(Z)-5-(deutero(phenyl)methylene)-3-methylimidazolidine-2,4-dione: yield 39%, M.p.
203-206°C (crystallised fiom EtOH), HRMS m/z (El") = 203.0804, (C11H9DN2O2"
requires 203.0804); ‘HNMR (400 MHz d«-DMSO): 5 10.8 (brs, 1H, CNHCO), 8 7.70-
7.26 (m, 5H, QHs), 8 2.96 (s, 3H, CH3). 13C NMR (100 MHz, d6-
DMSO): 8 164.7 (CCONCH3), 8 155.8 (NHCONCH3), 8 133.1 (C Ar), 8 129.8 (CH
Ar), 8 129.2 (CH Ar), 8 128.9 (CH Ar), 8 127.1 (CDCCO), 8 24.7 (CH3);54 IR (neat):
Vmax= 1752, 1701 cm'1 (C=0), 1645 cm'1 (C=C).
Synthesis of 5-(deutero(phenyl)methyl)-3-methylimidazolidine-2,4-dione 2.2a
N—HN
N—HN
2.2a
Method 2.2 was followed. (Z)-5-(deutero(phenyl)methylene)-3-methylimidazolidine-
2,4-dione 2.6a: 0.2 g (0.98 mmoles) dissolved in 20 ml of THF. The compound was
obtained as a single diastereoisomer.
5-(deutero(phenyl)methyl)-3-methyIimidazolidine-2,4-dione: yield 97%, M.p. 126-128
°C, HRMS m/z (El") =205.0960, (CnHnDNjtV requires 205.0962), ‘H NMR (400
MHz d«-DMSO): 8 8.21 (brs, 1H, CHNH), 8 7.30-7.11 (m, 5H, C6H5), 8 4.36 (dd,
J=4.9, 1.0 Hz, 1H, CHCDH), 8 2.96 (d, J=4.8, 1H, CHCDH), 8 2.65 (s, 3H, CH3).
99
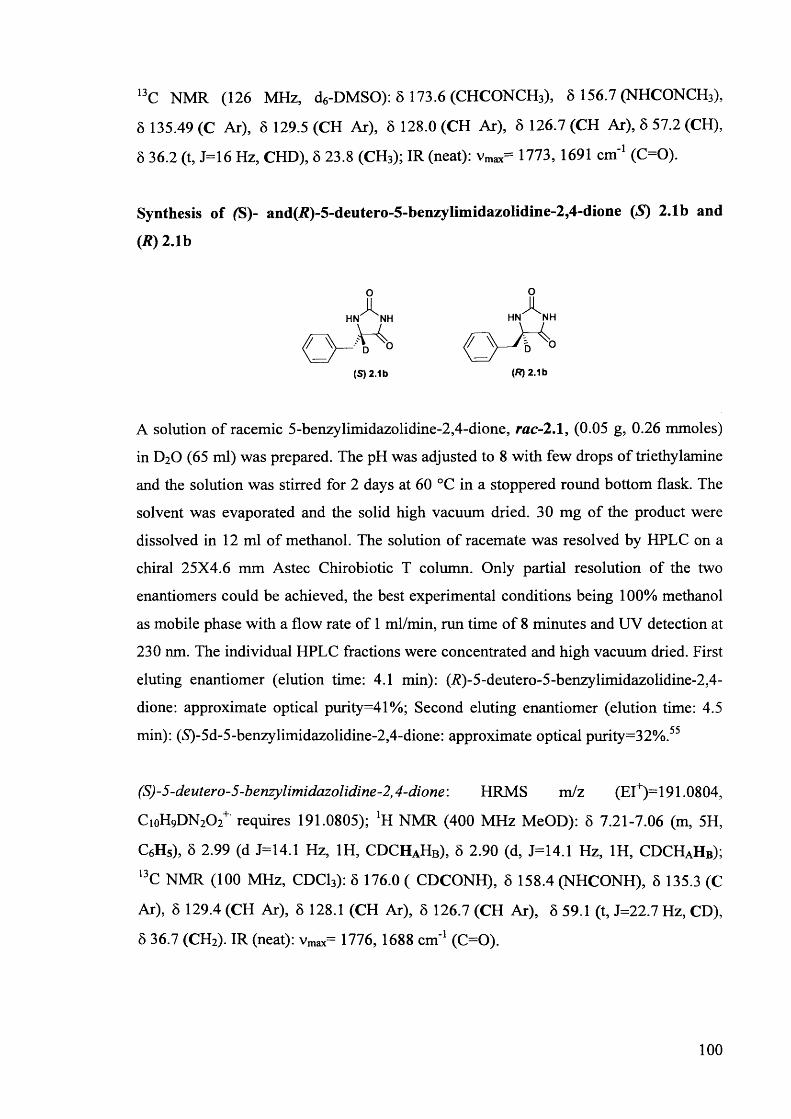
13C NMR (126 MHz, d6-DMSO): 6 173.6 (CHCONCH3), 5 156.7 (NHCONCH3),
6 135.49 (C Ar), 6 129.5 (CH Ar), 5 128.0 (CH Ar), 5 126.7 (CH Ar), 5 57.2 (CH),
5 36.2 (t, J=16 Hz, CHD), 6 23.8 (CH3); IR (neat): vmax= 1773, 1691 cm'1 (C=0).
Synthesis of (S)- and(/?)-5-deutero-5-benzylimidazolidine-2,4-dione (5) 2.1b and
(R) 2.1b
ox
HN NH
(S) 2.1b
A solution of racemic 5-benzylimidazolidine-2,4-dione, rac-2.1, (0.05 g, 0.26 mmoles)
in D2O (65 ml) was prepared. The pH was adjusted to 8 with few drops of triethylamine
and the solution was stirred for 2 days at 60 °C in a stoppered round bottom flask. The
solvent was evaporated and the solid high vacuum dried. 30 mg of the product were
dissolved in 12 ml of methanol. The solution of racemate was resolved by HPLC on a
chiral 25X4.6 mm Astec Chirobiotic T column. Only partial resolution of the two
enantiomers could be achieved, the best experimental conditions being 100% methanol
as mobile phase with a flow rate of 1 ml/min, run time of 8 minutes and UV detection at
230 nm. The individual HPLC fractions were concentrated and high vacuum dried. First
eluting enantiomer (elution time: 4.1 min): (i?)-5-deutero-5-benzylimidazolidine-2,4-
dione: approximate optical purity=41%; Second eluting enantiomer (elution time: 4.5
min): (5)-5d-5-benzylimidazolidine-2,4-dione: approximate optical purity=32%.55
(S)-5-deutero-5-benzylimidazolidine-2,4-dione: HRMS m/z (EI+)= 191.0804,
CioH9DN202+ requires 191.0805); ‘H NMR (400 MHz MeOD): 5 7.21-7.06 (m, 5H,
C6H5), 5 2.99 (d J=14.1 Hz, 1H, CDCHAHB), 6 2.90 (d, J=14.1 Hz, 1H, CDCHAHB);
13C NMR (100 MHz, CDC13): 8 176.0 ( CDCONH), 8 158.4 (NHCONH), 5 135.3 (C
Ar), 8 129.4 (CH Ar), 8 128.1 (CH Ar), 8 126.7 (CH Ar), 8 59.1 (t, J=22.7 Hz, CD),
8 36.7 (CH2). IR (neat): vm„= 1776,1688 cm-1 (C=Q).
100
2.7. Experimental Part 2
Materials
Potassium chloride (analytical grade) and acetic acid (analytical grade) were from
Fluka. Potassium hydroxide (analytical grade) was from Fisher Scientific. Potassium
dihydrogen phosphate (crystallised) was from VWR. Dipotassium hydrogen phosphate
anhydrous was from Fisher Scientific. Deuterium oxide (99.9%) was purchased from
Fluorochem. Potassium tetraborate tetrahydrate (99.5%) was from Alfa Aesar.
Potassium acetate (99+%) was from Aldrich. Tris-(hydroxymethyl)-aminomethane
(molecular biology grade, >99.9%) was purchased from Melford. The water used for the
preparation of solutions was demineralised by means of a water purification system
Purelab Option from Elga.
Apparatus
Materials were weighed on an analytical balance Fisher Brand PS-100 (Max 100 g,
d=0.1 mg). Volumes of solutions were measured by means of Gilson or Eppendorf
Research micropipettes. pH measurements were carried out, at room temperature, using
a HANNA INSTRUMENTS pH 210 pH meter. The pH meter was calibrated before
each measurement with certified traceable to NIST buffers at pH 7.00+0.01 (at 25 °C)
(from Fisher), pH 10.01+0.02 (at 25 °C) (from Fisher) and pH 4.00+0.01 (at 25 °C)
(from Reagecon). Reported values are uncorrected. Values are reported as pH**
indicating the reading of the pH meter. Thermostatic water baths Subaqua 12
(temperature stability ±0.2 °C) or Julabo MB-5 Heating Circulator (temperature stability
±0.2 °C) were used to control the temperature of solutions in kinetic experiments with
timescales longer than three days. Kinetic experiments of racemisation were carried out
on a Chirascan CD spectrometer equipped with a temperature-controlled sample holder
for circular dichroism (temperature stability: ± 0.02 °C), in 1.00 cm path length quartz
cuvettes, unless otherwise stated. Kinetic experiments of H/D exchange were carried out
on a Bruker AVANCE 400 spectrometer at 400 MHz. Pulse interval (Dl): 1 s, pulse
width (pw): 10.75 ps, acquisition time (at): 3.42 s.
101
Preparation of solutions
D2O phosphate buffers pH** 6.0, 7.2, 8.0, 9.0, 10.0, 11.0, 2 M / and H2O phosphate
buffer pH** 7.2, 1 M, 2 M I were prepared by dissolving dihydrogen phosphate in D20
and H2O, respectively, and by adjusting the pH to the desired value with KOH. D2O and
H20 phosphate buffers 0.5 M, 1 M 7, were prepared by weighing separately potassium
dihydrogen phosphate and potassium monohydrogen phosphate in the desired molar
ratio and dissolving them in D2O and H2O, respectively.56 The measurement of the
pH** of the above described solutions gave values pH** (D2O) = 7.33 and pH25 c
(H2O) = 7.24. For D2O phosphate buffers, after preparation of the solutions, as
described above, the solvent was evaporated and replenished 3 times with fresh D2O, to
guarantee the exchange with deuterons and removal of the protons from the non-
deuterated inorganic materials used to prepare the solutions. D2O phosphate solutions at
pH** 9.0, 10.0 and 11.0 are, technically, not phosphate buffers since the pH is more
than 1 units higher than the pKa of the conjugate acid-base pair KH2POA / K2HPOA.
However, no significant change of pH** was detected during kinetic experiments even
in the presence of reduced buffer capacity. D2O phosphate solutions at pH** 9.0, 10.0
and 11.0 should be, more correctly, regarded as solutions of catalyst of racemisation.9 ° rWater acetate buffers pH 5.0, 2 M 1 were prepared by mixing acetic acid and
potassium acetate in the desired molar ratio and by adding water to the final desired
total buffer concentrations. Water borate buffers pH25 c 9.3, 2 M / were prepared by
dissolving the desired amount of potassium tetraborate tetrahydrate in water. No pH
adjustment was made. Water TRIS buffers pH25 °c 8.1, 2 M /: water solutions of Tris-
(hydroxymethyl)-aminomethane were prepared and the pH was adjusted to the desired
value with HC1. Potassium chloride was used to adjust the ionic strength of all buffer
solutions.
Stock solutions of hydantoins were prepared by dissolving the solid hydantoins in D2O
or H2O for the use in kinetic experiments carried out in deuterated and non-deuterated
media, respectively. The solutions were prepared in plastic eppendorfs which were kept,
overnight, under continuous rotation at a speed of 20 rpm by means of a Stuart Tube
rotator SB2. The solutions were then centrifuged for 8 minutes at 13.3 rpm on a
Jencons-pls Spectrafuge 24.D centrifuge. The clear supernatant was transferred in a new
eppendorf and an amount of fresh solvent, equivalent to 1/10 of the total volume of
solution, was added to the solutions, to avoid precipitation.
102
Kinetic studies
The reaction media for the CD experiments were prepared by mixing buffer solutions,
D2O, and the stock solutions of hydantoins in suitable proportions to obtain f in a l
solutions with the desired ionic strength, and concentrations of buffer and of hydantoin.
Typical final concentrations of hydantoins were 0.4 mmolar for hydantoins 2.1 and
2.1b, 0.9 mmolar for hydantoin 2.2. Kinetic experiment of racemisation of 2.1 in D20
0.5 M phosphate buffer at 1 M ionic strength at different concentrations of the
hydantoin showed the independence, within experimental errors, of the rate constants of
racemisation on the concentration of hydantoin (See Appendix 1).
Solvents and stock solutions were mixed immediately before the start of the kinetic
experiments, to minimise the time lag between the beginning of the reaction and the
acquisition of the kinetic data. CD experiments at 60 °C were carried out in 1 cm quartz
cuvettes housed in the thermostated sample holder of the spectrometer, unless otherwise
stated. CD spectra were automatically recorded at set time intervals which were chosen
based on the timescale of the reaction. In the kinetic experiments at 25 °C, the
temperature was controlled by housing the solutions in thermostatic water baths. CD
spectra were recorded at set time intervals. The decreases of the CD signals at 230 nm
(for hydantoins 2.1 and 2.1b) or 240 nm (for hydantoin 2.2) were followed over time.
Kinetic experiments of racemisation for (S) 5-benzy lhy dantoin 2.1, at different
concentrations of substrate were carried out by mixing stock solution of buffer and
stock solution of hydantoin in different proportion to give the desired final
concentrations of buffer and hydantoin. The experiment at 100% volume (S)-5-
benzylhydantoin, was carried out by dissolving the hydantoin directly in the buffer
mixture. Experiments were carried out in 1 cm path length (5 and 10% volume of
substrate) or 1 mm path length (50 and 100% volume of substrate), quartz cuvettes.
The reaction media for the kinetic experiments of H/D exchange were prepared by
mixing equal volumes of stock solutions of buffers and stock solutions of hydantoins, to
give the desired final concentrations of buffer and ionic strength. The choice of the final
concentrations of hydantoins was limited by their solubilities in D20 . Typical final
concentrations were 2 mM for hydantoins 2.1, 2.1a and 2.1b and 5 mM for hydantoins
2.2 and 2.2a. Solvents and stock solutions were mixed immediately before the start of
the kinetic experiments. Reaction mixtures were transferred in NMR tubes which were
103
housed in thermostatic water baths. !H NMR spectra were taken at set time intervals
chosen depending on the time scale of the H/D exchange reaction. The NMR tubes were
not thermostated during the time of acquisition of the NMR spectra.
Rate constants of H/D exchange were obtained by following the decrease of the relative
area integral of the exchangeable protons of the hydantoins, over time. In all
experiments, the 'H NMR signal from the phenyl ring of the benzylhydantoins, was
used as internal standard to evaluate the integrals of the [H NMR peaks of the
exchangeable protons of 2.1 and 2.2 and of the exchangeable protons and methylene
protons of 2.1a and 2.2a. Spectral processing and integrations of *H NMR signals were
carried out by means of the program SpinWorks 2.5.5.
The rate constants for all kinetic experiments were obtained by fitting experimental
data-points to first-order kinetics or to the kinetic model described by Equation 2.6, by
means of the computer program Origin. The three-dimensional fits of the experimental
rate constants for racemisation of 2.1 and 2.2, at different pH** and buffer
concentrations were carried out by means of the program “Mathematica”. The data
analysis for the H/D exchange experiments of compounds 2.2a, described in Section
2.4.5 was also carried out by means of the program “Mathematica”.
p/fa measurements of 2.1
The UV spectra of 2.1 were recorded in D2O phosphate buffers at different pH**, at
60 °C, in 1 cm quartz cuvettes, using a Jasco UV-VIS V-650 Spectrometer. Four
titrations were performed using buffered solutions of 2.1 with concentrations of the
hydantoin variable between 0.2 and 0.5 mM. The extinction coefficients (e) of 2.1 at
230 nm were plotted as a function of pH**. The pKa** was obtained from the fit of the
data points to a sigmoidal curve.
Acknowledgments
I thank Dr Lavinia Onel for deriving Equation 2.6, which is the analytical solution of
the kinetic model describing a hypothetical process of racemisation following an Se2
mechanism and for the data analysis for hydantoins 2.1a and 2.2a. Dr Rob Richardson
104
is gratefully acknowledged for help in the synthesis lab, in particular with the use of the
hydrogenation reactor and useful discussions. I thank Prof. Guy Lloyd-Jones for
suggesting the use of deuterium-labelled 2.1a and 2.2a. Dr Benson Kariuki is
acknowledged for the determination of the X-ray structure of 2.5. Dave Walker and
Robin Hicks are acknowledged for recording high resolution mass spectra.
References
1. Thenmozhiyal, J. C.; Wong, P. T. H.; Chui, W. K., Journal o f Medicinal
Chemistry 2004, 47 (6), 1527-1535.
2. Brouillette, W. J.; Jestkov, V. P.; Brown, M. L.; Akhtar, M. S.; Delorey, T. M.;
Brown, G. B., Journal o f Medicinal Chemistry 1994,37 (20), 3289-3293.
3. Cortes, S.; Liao, Z. K.; Watson, D.; Kohn, H., Journal o f Medicinal Chemistry
1985,28 (5), 601-606.
4. Brown, M. L.; Brown, G. B.; Brouillette, W. J., Journal o f Medicinal Chemistry
1997, 40 (4), 602-607.
5. Mehta, N. B.; Diuguid, C. A. R.; Soroko, F. E., Journal o f Medicinal Chemistry
1981,24 (4), 465-468.
6. Zha, C. X.; Brown, G. B.; Brouillette, W. J., Journal o f Medicinal Chemistry
2004, 47 (26), 6519-6528.
7. Balog, A.; Salvati, M. E.; Shan, W. F.; Mathur, A.; Leith, L. W.; Wei, D. D.;
Attar, R. M.; Geng, J. P.; Rizzo, C. A.; Wang, C. H.; Krystek, S. R.; Tokarski, J. S.;
Hunt, J. T.; Gottardis, M.; Weinmann, R., Bioorganic & Medicinal Chemistry Letters
2004,14 (24), 6107-6111.
8. Zhang, X.; Allan, G. F.; Sbriscia, T.; Linton, O.; Lundeen, S. G.; Sui, Z.,
Bioorganic & Medicinal Chemistry Letters 2006,16 (22), 5763-5766.
9. Mudit, M.; Khanfar, M.; Muralidharan, A.; Thomas, S.; Shah, G. V.; van Soest,
R. W. M.; El Sayed, K. A., Bioorganic & Medicinal Chemistry 2009,17 (8), 3216-
3217.
10. Zuliani, V.; Carmi, C.; Rivara, M.; Fantini, M.; Lodola, A.; Vacondio, F.; Bordi,
F.; Plazzi, P. V.; Cavazzoni, A.; Galetti, M.; Alfieri, R. R.; Petronini, P. G.; Mora, M.,
European Journal o f Medicinal Chemistry 2009, 44 (9), 3471-3479.
105
11. Kim, D.; Wang, L. P.; Caldwell, C. G.; Chen, P.; Finke, P. E.; Oates, B.;
MacCoss, M.; Mills, S. G.; Malkowitz, L.; Gould, S. L.; DeMartino, J. A.; Springer, M.
S.; Hazuda, D.; Miller, M.; Kessler, J.; Danzeisen, R.; Carver, G.; Carella, A.; Holmes,
K.; Lineberger, J.; Schleif, W. A.; Emini, E. A., Bioorganic & Medicinal Chemistry
Letters 2001,11 (24), 3099-3102.
12. Comber, R. N.; Reynolds, R. C.; Friedrich, J. D.; Manguikian, R. A.; Buckheit,
R. W.; Truss, J. W.; Shannon, W. M.; Secrist, J. A., Journal o f Medicinal Chemistry
1992, 35(19), 3567-3572.
13. Groutas, W. C.; Stanga, M. A.; Castrisos, J. C.; Schatz, E. J., Journal o f enzyme
inhibition 1990, 3 (3), 237-43.
14. deLaszlo, S. E.; Allen, E. E.; Li, B.; Ondeyka, D.; Rivero, R.; Malkowitz, L.;
Molineaux, C.; Siciliano, S. J.; Springer, M. S.; Greenlee, W. J.; Mantlo, N., Bioorganic
& Medicinal Chemistry Letters 1997, 7 (2), 213-218.
15. Kanyonyo, M.; Govaerts, S. J.; Hermans, E.; Poupaert, J. H.; Lambert, D. M.,
Bioorganic & Medicinal Chemistry Letters 1999, 9 (15), 2233-2236.
16. Muccioli, G. G.; Martin, D.; Scriba, G. K. E.; Poppitz, W.; Poupaert, J. H.;
Wouters, J.; Lambert, D. M., Journal o f Medicinal Chemistry 2005, 48 (7), 2509-2517.
17. Cabordery, A.-C.; Toussaint, M.; Azaroual, N.; Bonte, J.-P.; Melnyk, P.;
Vaccher, C.; Foulon, C., Tetrahedron-Asymmetry 2011, 22 (2), 125-133.
18. Toussaint, M.; Mousset, D.; Foulon, C.; Jacquemard, U.; Vaccher, C.; Melnyk,
P., European Journal o f Medicinal Chemistry 2010, 45 (1), 256-263.
19. Tompkins, J. E., Journal o f Medicinal Chemistry 1986, 29 (5), 855-859.
20. Bovamick, M.; Clarke, H. T., Journal o f the American Chemical Society 1938,
60, 2426-2430.
21. Lazarus, R. A., Journal o f Organic Chemistry 1990, 55 (15), 4755-4757.
22. Dudley, K. H.; Bius, D. L., Drug Metabolism and Disposition 1976, 4 (4), 340-
348.
23. Reist, M.; Carrupt, P. A.; Testa, B.; Lehmann, S.; Hansen, J. J., Helvetica
Chimica Acta 1996, 79 (3), 767-778.
24. Kahn, K.; Tipton, P. A., Bioorganic Chemistry 2000, 28 (2), 62-72.
25. Dakin, H. D., American Chemical Journal 1910, 44, 48.
26. Lee, C. K.; Fan, C. H., Enzyme and Microbial Technology 1999, 24 (10), 659-666.
106
27. Pepper, C.; Smith, H. J.; Barrell, K. J.; Nicholls, P. J.; Hewlins, M. J. E.,
Chirality 1994, 6 (5), 400-404.
28. Welch, C. J.; Kress, M. H.; Beconi, M.; Mathre, D. J., Chirality 2003, 15 (2),
143-147.
29. Suzuki, T.; Igarashi, K.; Hase, K.; Tuzimura, K., Agricultural and Biological
Chemistry 1973,37 (2), 411-416.
30. Yamaguchi, J.; Harada, M.; Kondo, T.; Noda, T.; Suyama, T., Chemistry Letters
2003,32 (4), 372-373.
31. Zhang, D.; Xing, X. C.; Cuny, G. D., Journal o f Organic Chemistry 2006, 71
(4), 1750-1753.
32. Akeng'a, T. O.; Read, R. W., South African Journal o f Chemistry-Suid-
Afrikaanse TydskrifVir Chemie 2007, 60, 11-16.
33. Mudit, M.; Khanfar, M.; Muralidharan, A.; Thomas, S.; Shah, G. V.; van Soest,
R. W. M.; El Sayed, K. A., Bioorganic & Medicinal Chemistry 2009, 17 (4), 1731-
1738.
34. Mudit, M.; Khanfar, M.; Muralidharan, A.; Thomas, S.; Shah, G. V.; van Soest,
R. W. M.; El Sayed, K. A., Bioorganic & Medicinal Chemistry 2009, 17 (8), 3216-
3217.
35. From SciFinder search: Takuma, Y.; Watanabe, N., (Mitsubishi Chemical.
Corp., Japan). Jpn. Kokai Tokkyo Koho (2001), 5pp. CODEN: JKXXAF JP
2001158775 A 20010612 Patent written in Japanese. Application JP 2000-149256
20000522.
36. Maskill, H., The physical Basis o f Organic Chemistry. Oxford University . Press:
Oxford New York, 1990; p 278-282.
37. The pH values used in the titration was the conventional pH** defined as
described in the experimental section, which was routinely used in all the experiments
described in this thesis.
38. Maskill, H., The Physical Basis o f Organic Chemistry. Oxford University Press:
Oxford New York, 1990; p 327-335.
39. http://instruct.uwo.ca/geog/500/f test.htm. (accessed 14 April 1012).
40. Taylor, J., An introduction to error analysis The study o f uncertainties in
physical measurements. Second ed.; University Science Books: Sausalito, California,
1997; p 73-77.
107
41. The value for the second-order rate constants for buffer catalysed racemisations
of 2.2 in D20 phosphate buffer has also been included. Considering the small solvent
kinetic isotope effect observed for racemisation of (iS)-5-benzylhydantoins 2.1 and 2.2,
the approximation was considered appropriate.
42. Fukada, H.; Takahashi, K., Proteins-Structure Function and Genetics 1998, 33
(2), 159-166.
43. Ramette, R. W.; Culberson, C. H.; Bates, R. G., Analytical Chemistry 1977, 49
(6), 867-870.
44. Good, N. E.; Winget, G. D.; Winter, W.; Connolly, T. N.; Izawa, S.; Singh, R.
M. M., Biochemistry 1965, 5 ((2)), 467-477.
45. Bates, R. G., Journal o f Research o f the National Bureau o f Standards Section
a-Physics and Chemistry 1962, 66 (2), 179-&.
46. Silvestroni, P., Fondamenti di Chimica. 10th ed.; Masson Editoriale Veschi:
Milano, 1996; p 711.
47. Anslyn, E. V.; Dougherty, D. A., Modern Physical Organic Chemistry.
University Science Books: Sausalito, California, 2006; p 421.
48. Taylor, J. R., An introduction to Error Analysis The study o f uncertainties in
physical measurements. Second ed.; University Science Books: Sausalito, California,
1997; p 174-177.
49. Hsu, S. K.; Wilson, C. L., Journal o f the Chemical Society 1936, 623-625.
50. Wilson, C. L., Journal o f the Chemical Society 1936, 1550-1553.
51. Ojima, I.; Chen, H. J. C.; Qiu, X. G., Tetrahedron 1988, 44 (17), 5307-5318.
52. Kasai, T.; Furukawa, K.; Sakamura, S., Journal o f the Faculty o f Agriculture
Hokkaido University 1979, 59 (3), 279-283.
53. The 13C NMR signal (CD ), corresponding to the peak at d 108.6 (CH), in the13C NMR spectrum of the unlabelled analogue, 2.5, appears to be very week and not
clearly distinguishable from noise.
54. The 13C NMR signal (CD ), corresponding to the peak at d 109.6 (CH), in the13C-NMR spectrum of the unlabelled analogue, 2.6, appears to be very week and not
clearly distinguishable from noise.
55. Absolute configurations and approximate optical purity of enantioenriched
samples of (S) and (.R) 5d-5-benzylimidazolidine-2,4-dione were 2.1b obtained by
comparing their respective CD spectra to CD spectra of (S) 5-benzylimidazolidine-2,4-
108
dione 2.1, used as a reference. It was assumed that CD and UV spectra were unaffected
by the isotopic substitution.
56. The buffers prepared by weighing separately the basic and acidic forms of
phosphate were used in the experiments for the determination of solvent kinetic isotope
effects, to obtain the same buffer ratios in H2O and D2O. Unless otherwise stated, the
other experiments were carried out in buffers prepared by dissolving potassium
dihydrogen phosphate in D2O and adjusting the pH* to the desired value with KOH.
109
Chapter 3
The effect of structural modifications on the kinetics and mechanism of racemisation of 5-substituted hydantoins.
Abstract
A series of hydantoins with different substituents in positions 3 and 5 has been
synthesised and their configurational stability has been assessed by means of H/D
exchange and racemisation experiments in phosphate buffers. H/D exchange and
racemisation follow pseudo-first-order kinetics. General-base catalysis was observed for
racemisation of the compounds obtained in optically active forms. Structural
modifications in both positions 5 and 3 affect the rate constants of H/D exchange and
racemisation. A mechanism involving intramolecular facilitation of racemisation by
cationic functional groups is proposed for two 3-substituted hydantoins, one containing
an alkyl chain with terminal protonated amino group and the other carrying an
ammonium group as substituent. The possibility of intramolecular base-catalysis for
racemisation of a model hydantoin containing a pyridyl group in its structure was also
explored but no evidence was found supporting such catalysis. The solvent and primary
kinetic isotope effects were determined for racemisation of (5)-5-substituted hydantoins
carrying a pyridyl group and an jV-methyl-pyrrolyl group. The significant primary
kinetic isotope effects along with the absence of solvent kinetic isotope effects support
an SeI mechanism for racemisation of the two hydantoins, as was also proposed in
Chapter 2 for racemisation of (5)-5-benzylhydantoin.
110
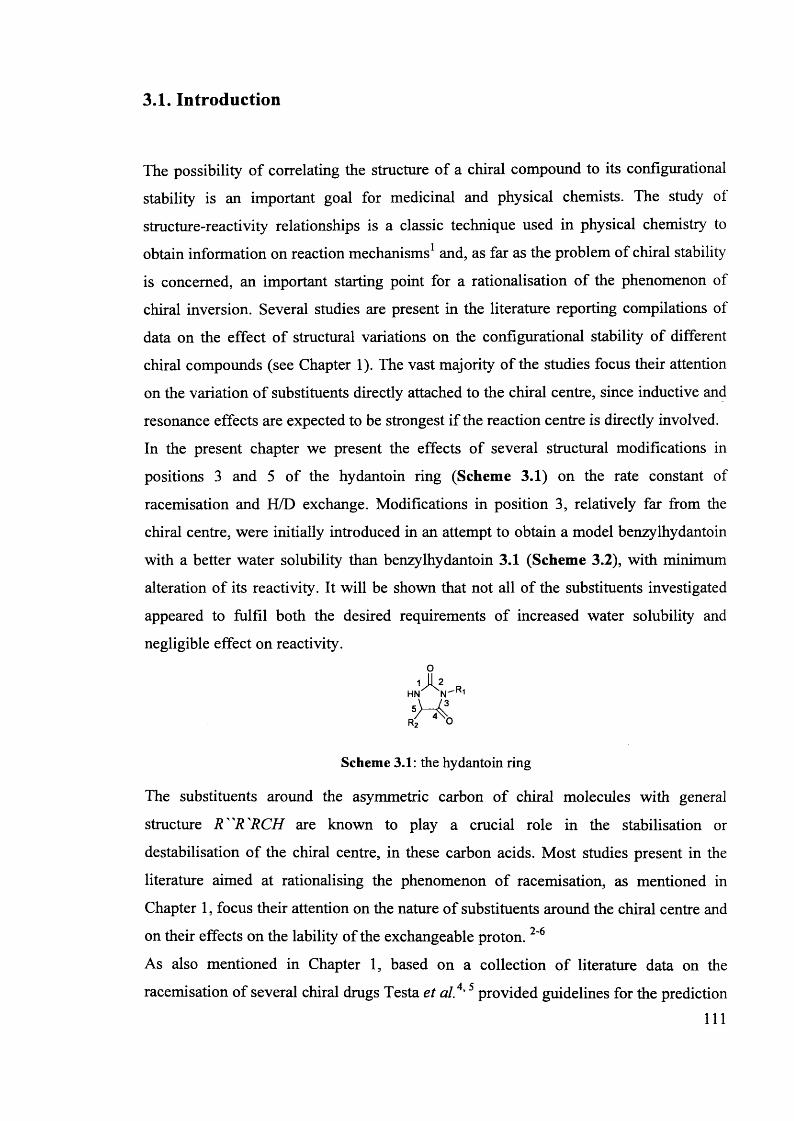
3.1. Introduction
The possibility of correlating the structure of a chiral compound to its configurational
stability is an important goal for medicinal and physical chemists. The study of
structure-reactivity relationships is a classic technique used in physical chemistry to
obtain information on reaction mechanisms1 and, as far as the problem of chiral stability
is concerned, an important starting point for a rationalisation of the phenomenon of
chiral inversion. Several studies are present in the literature reporting compilations of
data on the effect of structural variations on the configurational stability of different
chiral compounds (see Chapter 1). The vast majority of the studies focus their attention
on the variation of substituents directly attached to the chiral centre, since inductive and
resonance effects are expected to be strongest if the reaction centre is directly involved.
In the present chapter we present the effects of several structural modifications in
positions 3 and 5 of the hydantoin ring (Scheme 3.1) on the rate constant of
racemisation and H/D exchange. Modifications in position 3, relatively far from the
chiral centre, were initially introduced in an attempt to obtain a model benzylhydantoin
with a better water solubility than benzylhydantoin 3.1 (Scheme 3.2), with minimum
alteration of its reactivity. It will be shown that not all of the substituents investigated
appeared to fulfil both the desired requirements of increased water solubility and
negligible effect on reactivity.o
Scheme 3.1: the hydantoin ring
The substituents around the asymmetric carbon of chiral molecules with general
structure R ' 'R 'RCH are known to play a crucial role in the stabilisation or
destabilisation of the chiral centre, in these carbon acids. Most studies present in the
literature aimed at rationalising the phenomenon of racemisation, as mentioned in
Chapter 1, focus their attention on the nature of substituents around the chiral centre and
on their effects on the lability of the exchangeable proton. 2-6
As also mentioned in Chapter 1, based on a collection of literature data on the
racemisation of several chiral drugs Testa et a l4,5 provided guidelines for the prediction
111
of the configurational stability of carbon acids with general structure R"R'RCH. In
Testa's papers configurational stability is linked to the nature of substituents, classified
as groups decreasing or increasing configurational stability and neutral groups, in the
generic carbon acid R"R'RCH. A similar approach was adopted by Wilson3 in a study
aimed at establishing links between structure and configurational stability of
compounds of the form R'RCHX where X = -COR, -CN or N 02 (Chapter 1). The
importance of the ability of substituents at stabilising carbanions, i.e. increasing the
acidity of carbon acids, has been highlighted in the literature as an important factor
affecting the configurational stability of carbon acids. In Chapter 1 studies have been
mentioned reporting on correlations between pATa and rate constants of deprotonation by
bases of a wide range of a-carbonyl carbon acids.6'11
3.2. Structural modifications in position 3
3.2.1. Syntheses
The introduction of polar groups in position 3 of the hydantoin ring appeared to be a
convenient structural modification to obtain model (»S)-5-benzylhydantoins with
increased solubility in water. Scheme 3.2 shows the structures of the (S)-3-N-
substituted-5-benzyl hydantoins 3.3-3.5 that we have synthesised. In hydantoins 3.3-3.5
the substituents are not directly attached to the chiral centre, hence little change in the
rate constants of racemisation was expected compared to benzylhydantoins 3.1 and 3.2,
whose structures are also shown in Scheme 3.2. As for compound 3.2, the substitution
of the hydrogen in position 3 with an alkyl group allowed to circumvent complications
of the kinetics of racemisation arising from the presence of an acidic proton in the
substrate (see Chapter 2). Compound 3.4 was initially synthesised simply as a reaction
intermediate to prepare compound 3.5 but its racemisation and H/D exchange were
investigated anyway.
112
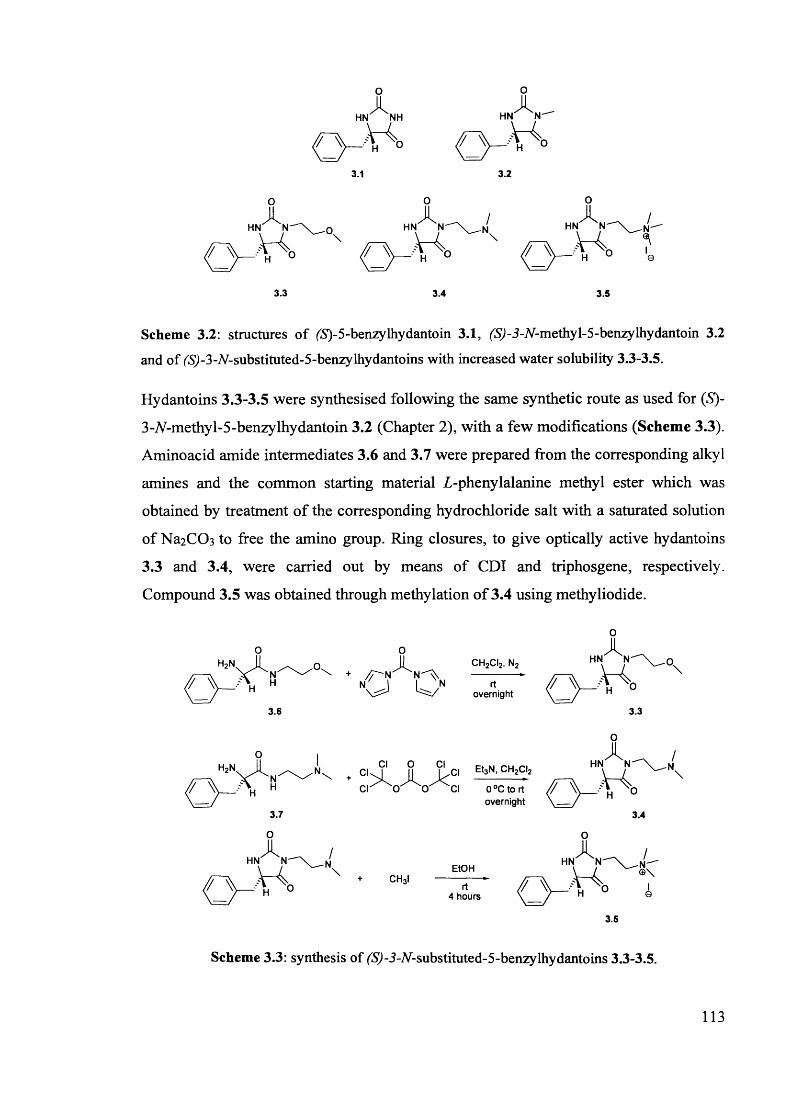
o o
3.3 3.4 3.5
Scheme 3.2: structures of fS)-5-benzylhydantoin 3.1, (^-3-jV-methyl-5-benzylhydantoin 3.2
and of (5)-3-7V-substituted-5-benzylhydantoins with increased water solubility 3.3-3.5.
Hydantoins 3.3-3.5 were synthesised following the same synthetic route as used for (S)-
3-N-methy 1-5-benzylhydantoin 3.2 (Chapter 2), with a few modifications (Scheme 3.3).
Aminoacid amide intermediates 3.6 and 3.7 were prepared from the corresponding alkyl
amines and the common starting material Z-phenylalanine methyl ester which was
obtained by treatment of the corresponding hydrochloride salt with a saturated solution
of Na2CC>3 to free the amino group. Ring closures, to give optically active hydantoins
3.3 and 3.4, were carried out by means of CDI and triphosgene, respectively.
Compound 3.5 was obtained through methylation of 3.4 using methyliodide.
o
c h 2ci2, n2
overnight
Y ci Et3N, CH2CI2
0 °C to rt overnight
4 hours
3.5
Scheme 3.3: synthesis of (5)-3-7V-substituted-5-benzylhydantoins 3.3-3.5.
113
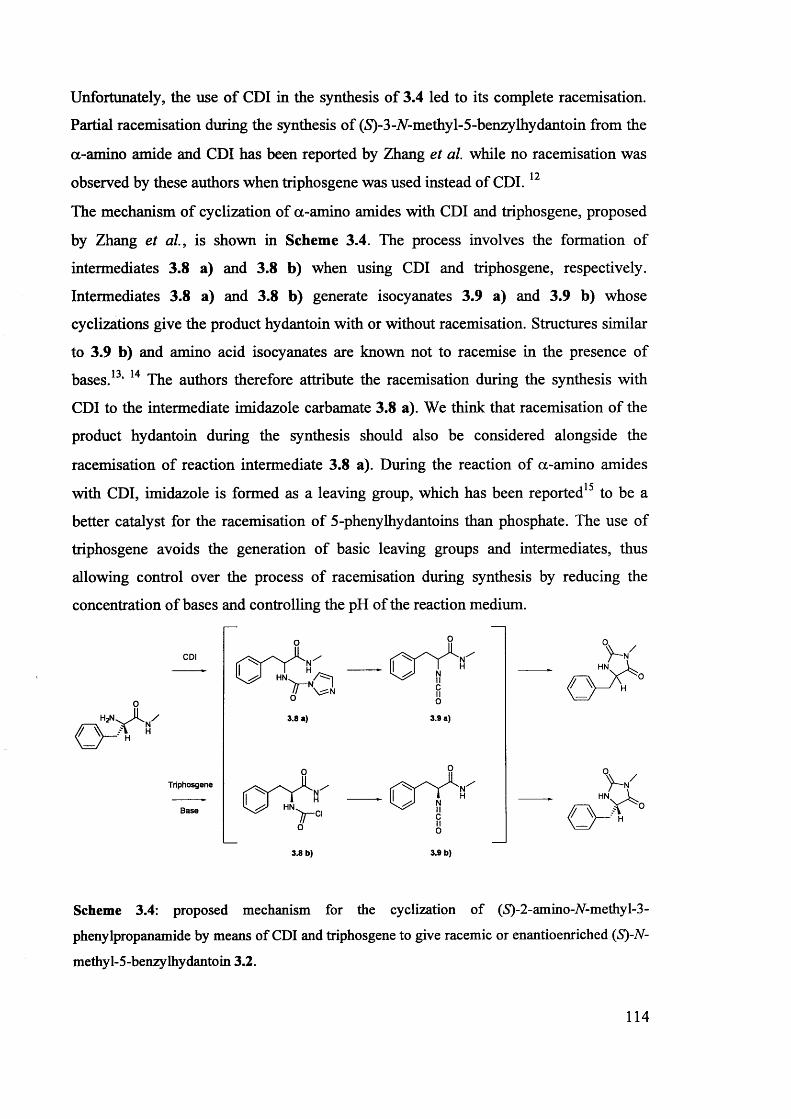
Unfortunately, the use of CDI in the synthesis of 3.4 led to its complete racemisation.
Partial racemisation during the synthesis of (S)-3-iV-methyl-5-benzylhydantoin from the
a-amino amide and CDI has been reported by Zhang et al. while no racemisation was12observed by these authors when triphosgene was used instead of CDI.
The mechanism of cyclization of a-amino amides with CDI and triphosgene, proposed
by Zhang et al., is shown in Scheme 3.4. The process involves the formation of
intermediates 3.8 a) and 3.8 b) when using CDI and triphosgene, respectively.
Intermediates 3.8 a) and 3.8 b) generate isocyanates 3.9 a) and 3.9 b) whose
cyclizations give the product hydantoin with or without racemisation. Structures similar
to 3.9 b) and amino acid isocyanates are known not to racemise in the presence of
bases.13, 14 The authors therefore attribute the racemisation during the synthesis with
CDI to the intermediate imidazole carbamate 3.8 a). We think that racemisation of the
product hydantoin during the synthesis should also be considered alongside the
racemisation of reaction intermediate 3.8 a). During the reaction of a-amino amides
with CDI, imidazole is formed as a leaving group, which has been reported15 to be a
better catalyst for the racemisation of 5-phenylhydantoins than phosphate. The use of
triphosgene avoids the generation of basic leaving groups and intermediates, thus
allowing control over the process of racemisation during synthesis by reducing the
concentration of bases and controlling the pH of the reaction medium.
h2nv A /
CDI
HN.
3.8 a)
Triphosgene
HN.Base
3.8 b)
NIICIIo
3.9 a)
3.9 b)
HN
Scheme 3.4: proposed mechanism for the cyclization of (iS)-2-amino-JV-methyl-3-
phenylpropanamide by means of CDI and triphosgene to give racemic or enantioenriched (S)-N-
methyl-5-benzylhydantoin 3.2.
114
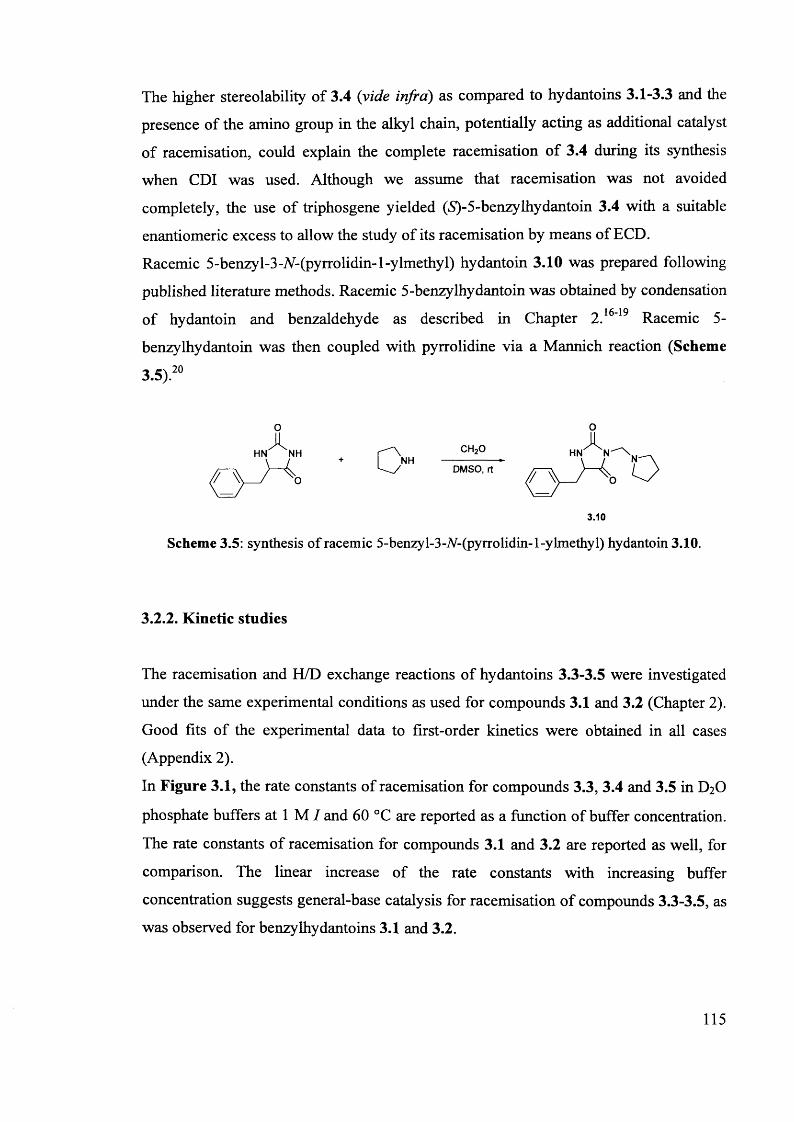
The higher stereolability of 3.4 {vide infra) as compared to hydantoins 3.1-3.3 and the
presence of the amino group in the alkyl chain, potentially acting as additional catalyst
of racemisation, could explain the complete racemisation of 3.4 during its synthesis
when CDI was used. Although we assume that racemisation was not avoided
completely, the use of triphosgene yielded (5)-5-benzylhydantoin 3.4 with a suitable
enantiomeric excess to allow the study of its racemisation by means of ECD.
Racemic 5-benzyl-3-A-(pyrrolidin-l-ylmethyl) hydantoin 3.10 was prepared following
published literature methods. Racemic 5-benzylhydantoin was obtained by condensation
of hydantoin and benzaldehyde as described in Chapter 2.16-19 Racemic 5-
benzylhydantoin was then coupled with pyrrolidine via a Mannich reaction (Scheme
3.5).20
DMSO, rt
3.10
Scheme 3.5: synthesis of racemic 5-benzyl-3-A-(pyrrolidin-l-ylmethyl) hydantoin 3.10.
3.2.2. Kinetic studies
The racemisation and H/D exchange reactions of hydantoins 3.3-3.5 were investigated
under the same experimental conditions as used for compounds 3.1 and 3.2 (Chapter 2).
Good fits of the experimental data to first-order kinetics were obtained in all cases
(Appendix 2).
In Figure 3.1, the rate constants of racemisation for compounds 3.3, 3.4 and 3.5 in D2O
phosphate buffers at 1 M / and 60 °C are reported as a function of buffer concentration.
The rate constants of racemisation for compounds 3.1 and 3.2 are reported as well, for
comparison. The linear increase of the rate constants with increasing buffer
concentration suggests general-base catalysis for racemisation of compounds 3.3-3.5, as
was observed for benzylhydantoins 3.1 and 3.2.
115
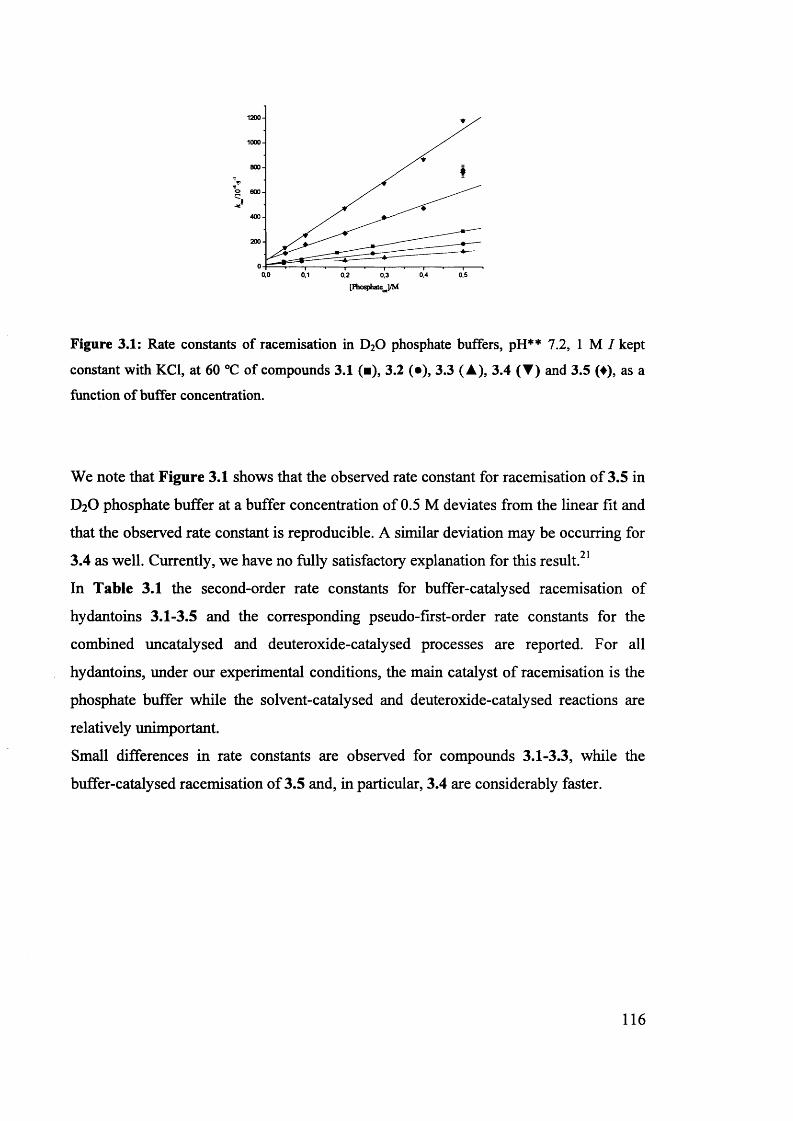
o
0.0 0.4 0,50.2 0.3[PliosphateJ/M
Figure 3.1: Rate constants of racemisation in D20 phosphate buffers, pH** 7.2, 1 M I kept
constant with KC1, at 60 °C of compounds 3.1 (■), 3.2 (•), 3.3 (A), 3.4 (▼) and 3.5 (♦), as a
function of buffer concentration.
We note that Figure 3.1 shows that the observed rate constant for racemisation of 3.5 in
D2O phosphate buffer at a buffer concentration of 0.5 M deviates from the linear fit and
that the observed rate constant is reproducible. A similar deviation may be occurring for
3.4 as well. Currently, we have no fully satisfactory explanation for this result.21
In Table 3.1 the second-order rate constants for buffer-catalysed racemisation of
hydantoins 3.1-3.5 and the corresponding pseudo-first-order rate constants for the
combined uncatalysed and deuteroxide-catalysed processes are reported. For all
hydantoins, under our experimental conditions, the main catalyst of racemisation is the
phosphate buffer while the solvent-catalysed and deuteroxide-catalysed reactions are
relatively unimportant.
Small differences in rate constants are observed for compounds 3.1-3.3, while the
buffer-catalysed racemisation of 3.5 and, in particular, 3.4 are considerably faster.
116
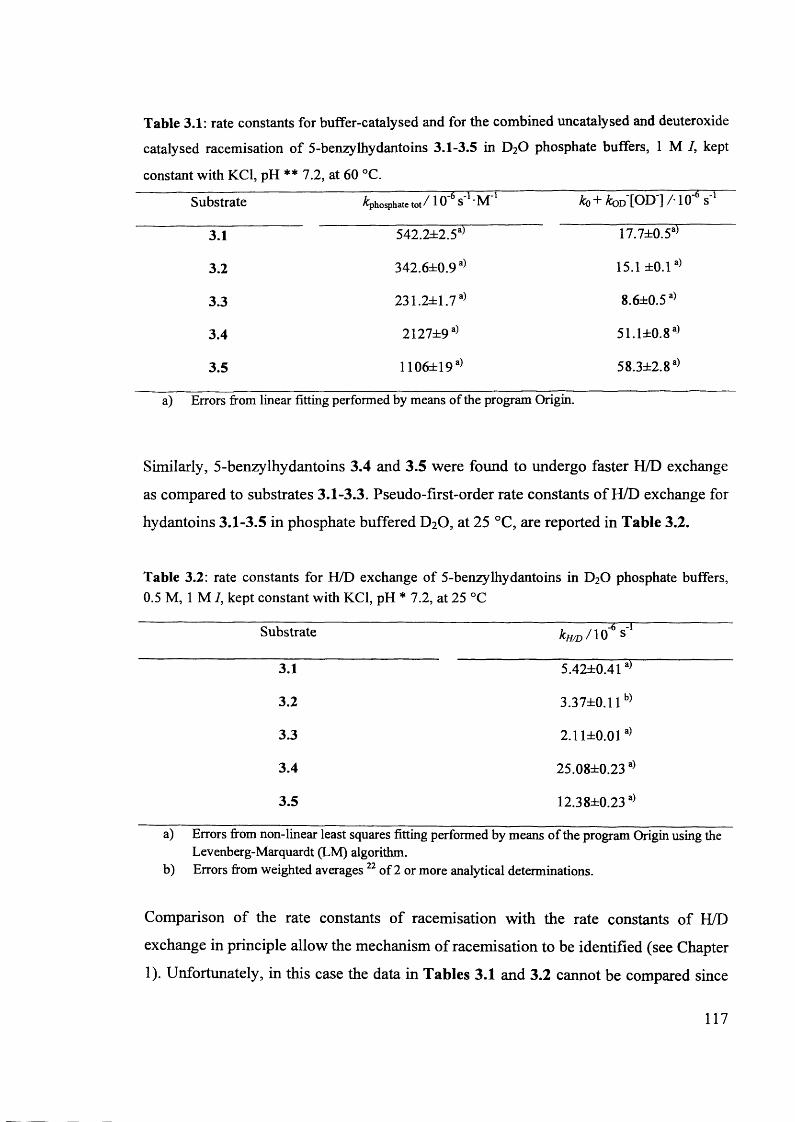
Table 3.1: rate constants for buffer-catalysed and for the combined uncatalysed and deuteroxide
catalysed racemisation of 5-benzylhydantoins 3.1-3.5 in D20 phosphate buffers, 1 M 7, kept
constant with KC1, pH ** 7.2, at 60 °C.
Substrate ^phosphate tot / 1 0 S M jfcb+W O D 'l/ lO-* s’1
3.1 542.2±2.5a) 17.7±0.5a)
3.2 342.6±0.9a) 15.1 ±0.1a)
3.3 231.2±1.7a) 8.6±0.5a)
3.4 2127±9a) 51.1±0.8a)
3.5 1106±19a) 58.3±2.8a)
a) Errors from linear fitting performed by means of the program Origin.
Similarly, 5-benzylhydantoins 3.4 and 3.5 were found to undergo faster H/D exchange
as compared to substrates 3.1-3.3. Pseudo-first-order rate constants of H/D exchange for
hydantoins 3.1-3.5 in phosphate buffered D2O, at 25 °C, are reported in Table 3.2.
Table 3.2: rate constants for H/D exchange of 5-benzylhydantoins in D20 phosphate buffers, 0.5 M, 1 M 7, kept constant with KC1, pH * 7.2, at 25 °C
Substrate kii/D f 10 s
3.1 5.42±0.41a)
3.2 3.37±0.11b)
3.3 2.11±0.01a)
3.4 25.08±0.23a)
3.5 12.38±0.23a)
a) Errors from non-linear least squares fitting performed by means of the program Origin using theLevenberg-Marquardt (LM) algorithm,
b) Errors from weighted averages 22 of 2 or more analytical determinations.
Comparison of the rate constants of racemisation with the rate constants of H/D
exchange in principle allow the mechanism of racemisation to be identified (see Chapter
1). Unfortunately, in this case the data in Tables 3.1 and 3.2 cannot be compared since
117
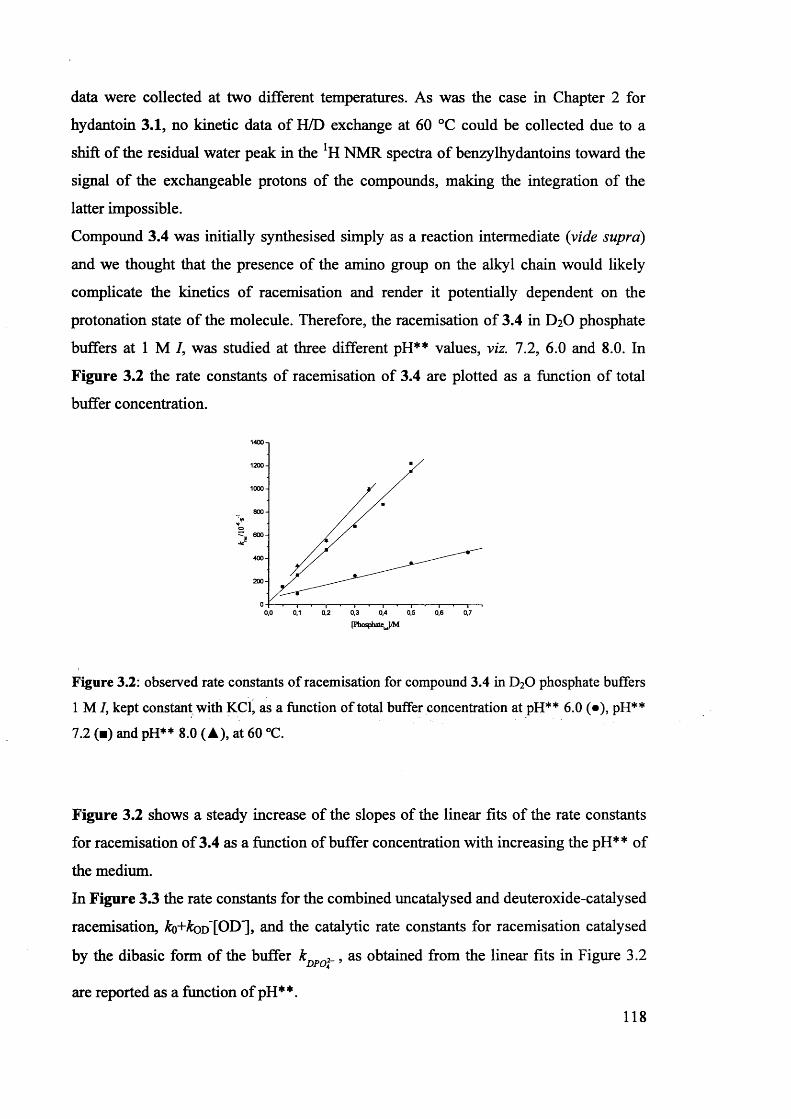
data were collected at two different temperatures. As was the case in Chapter 2 for
hydantoin 3.1, no kinetic data of H/D exchange at 60 °C could be collected due to a
shift of the residual water peak in the NMR spectra of benzylhydantoins toward the
signal of the exchangeable protons of the compounds, making the integration of the
latter impossible.
Compound 3.4 was initially synthesised simply as a reaction intermediate {vide supra)
and we thought that the presence of the amino group on the alkyl chain would likely
complicate the kinetics of racemisation and render it potentially dependent on the
protonation state of the molecule. Therefore, the racemisation of 3.4 in D2O phosphate
buffers at 1 M I, was studied at three different pH** values, viz. 7.2, 6.0 and 8.0. In
Figure 3.2 the rate constants of racemisation of 3.4 are plotted as a function of total
buffer concentration.
1400
1200
1000
800
600
400
200
00,1 0,3 0,5 0.6 0,70,0 0,2 0,4
[PhosphaleJ/M
Figure 3.2: observed rate constants of racemisation for compound 3.4 in D20 phosphate buffers 1 M /, kept constant with KC1, as a function of total buffer concentration at pH** 6.0 (•), pH** 7.2 (■) and pH** 8.0 (A), at 60 °C.
Figure 3.2 shows a steady increase of the slopes of the linear fits of the rate constants
for racemisation of 3.4 as a function of buffer concentration with increasing the pH** of
the medium.
In Figure 3.3 the rate constants for the combined uncatalysed and deuteroxide-catalysed
racemisation, & o+ & o d [OD'], and the catalytic rate constants for racemisation catalysed
by the dibasic form of the buffer £ , as obtained from the linear fits in Figure 3.2l / r t / 4
are reported as a function of pH**.118
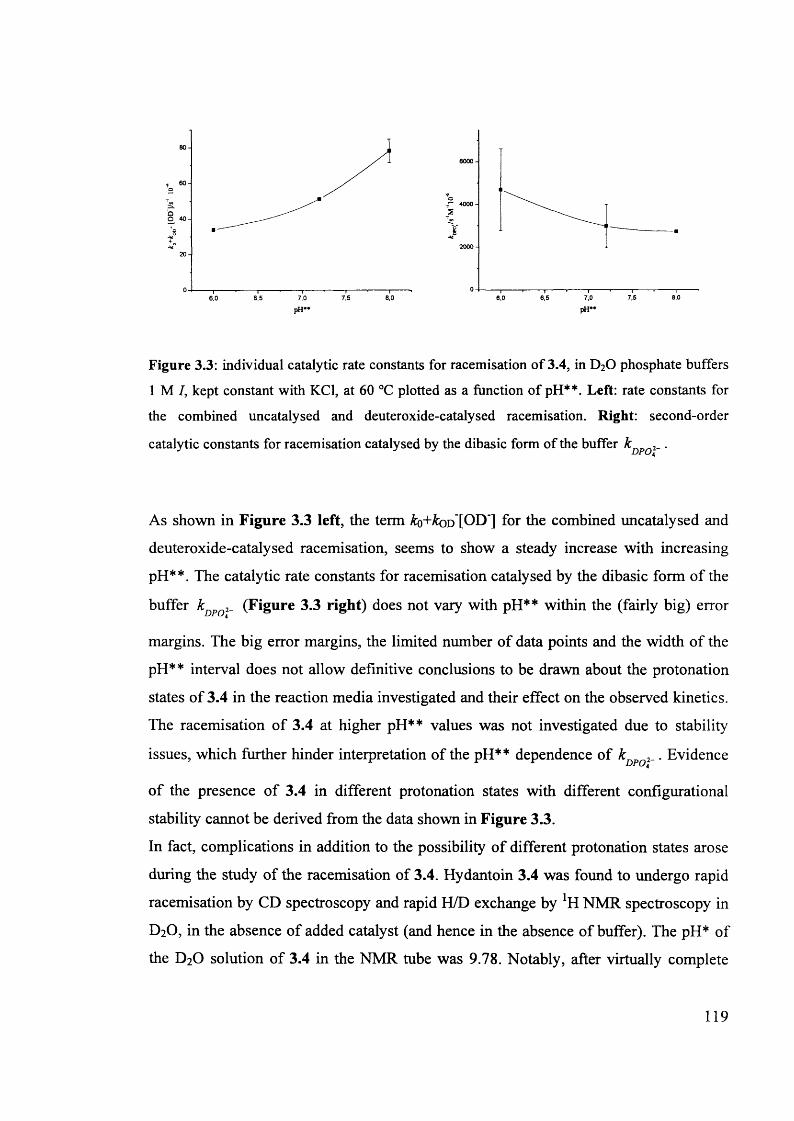
6000
4000
2000
0 7,0 7,5 8,06,56,0
O 40-
7,5 8,06,5 7,06,0
pH** pH**
Figure 3.3: individual catalytic rate constants for racemisation of 3.4, in D20 phosphate buffers
1 M /, kept constant with KC1, at 60 °C plotted as a function of pH**. Left: rate constants for
the combined uncatalysed and deuteroxide-catalysed racemisation. Right: second-order
catalytic constants for racemisation catalysed by the dibasic form of the buffer ^DPOi- •
As shown in Figure 3.3 left, the term ko+kov[OD] for the combined uncatalysed and
deuteroxide-catalysed racemisation, seems to show a steady increase with increasing
pH**. The catalytic rate constants for racemisation catalysed by the dibasic form of the
buffer W (Figure 3.3 right) does not vary with pH** within the (fairly big) error
margins. The big error margins, the limited number of data points and the width of the
pH** interval does not allow definitive conclusions to be drawn about the protonation
states of 3.4 in the reaction media investigated and their effect on the observed kinetics.
The racemisation of 3.4 at higher pH** values was not investigated due to stability
issues, which further hinder interpretation of the pH** dependence of kDpQ. Evidence
of the presence of 3.4 in different protonation states with different configurational
stability cannot be derived from the data shown in Figure 3.3.
In fact, complications in addition to the possibility of different protonation states arose
during the study of the racemisation of 3.4. Hydantoin 3.4 was found to undergo rapid
racemisation by CD spectroscopy and rapid H/D exchange by [H NMR spectroscopy in
D2O, in the absence of added catalyst (and hence in the absence of buffer). The pH* of
the D20 solution of 3.4 in the NMR tube was 9.78. Notably, after virtually complete
119
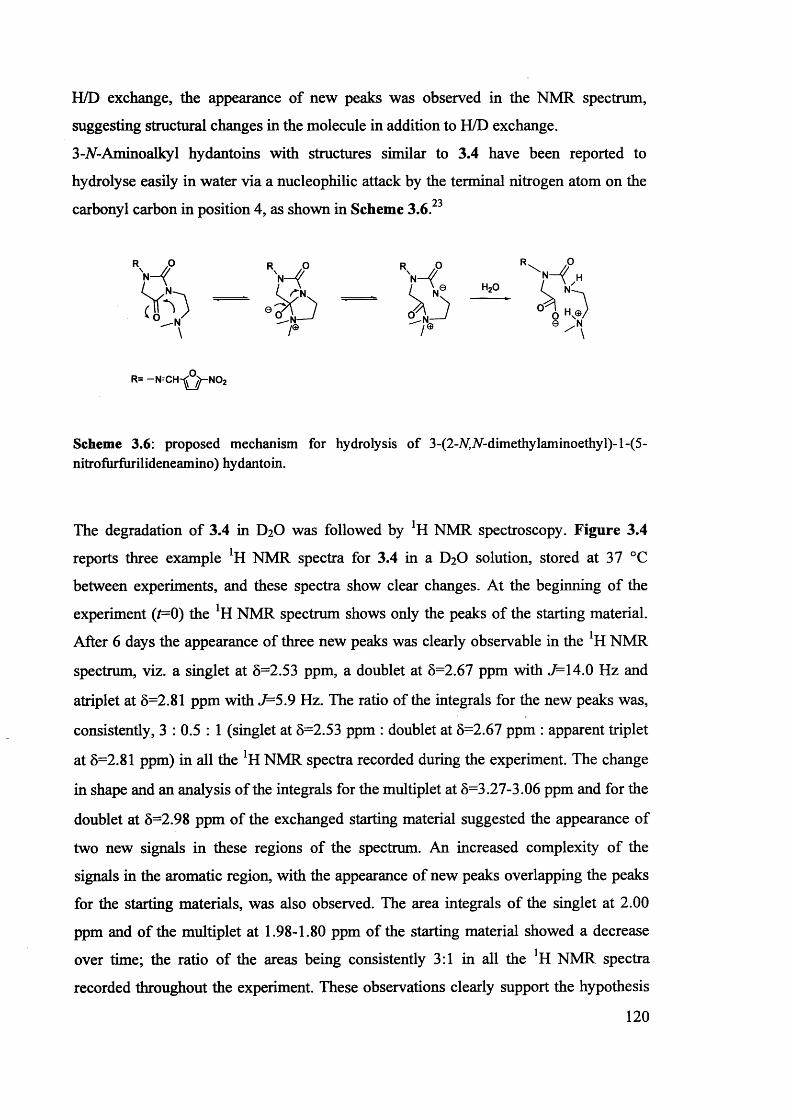
H/D exchange, the appearance of new peaks was observed in the NMR spectrum,
suggesting structural changes in the molecule in addition to H/D exchange.
3 -A-Aminoalky 1 hydantoins with structures similar to 3.4 have been reported to
hydrolyse easily in water via a nucleophilic attack by the terminal nitrogen atom on the93carbonyl carbon in position 4, as shown in Scheme 3.6.
R= -N = C H ^ °^-N 02
Scheme 3.6: proposed mechanism for hydrolysis of 3-(2-A,A-dimethylaminoethyl)-l-(5- nitrofurfurilideneamino) hydantoin.
The degradation of 3.4 in D2O was followed by *H NMR spectroscopy. Figure 3.4
reports three example *H NMR spectra for 3.4 in a D2O solution, stored at 37 °C
between experiments, and these spectra show clear changes. At the beginning of the
experiment (/=0) the *H NMR spectrum shows only the peaks of the starting material.
After 6 days the appearance of three new peaks was clearly observable in the *H NMR
spectrum, viz. a singlet at 8=2.53 ppm, a doublet at 8=2.67 ppm with J=14.0 Hz and
atriplet at 8=2.81 ppm with J= 5.9 Hz. The ratio of the integrals for the new peaks was,
consistently, 3 : 0.5 : 1 (singlet at 8=2.53 ppm : doublet at 8=2.67 ppm : apparent triplet
at 8=2.81 ppm) in all the *H NMR spectra recorded during the experiment. The change
in shape and an analysis of the integrals for the multiplet at 8=3.27-3.06 ppm and for the
doublet at 8=2.98 ppm of the exchanged starting material suggested the appearance of
two new signals in these regions of the spectrum. An increased complexity of the
signals in the aromatic region, with the appearance of new peaks overlapping the peaks
for the starting materials, was also observed. The area integrals of the singlet at 2.00
ppm and of the multiplet at 1.98-1.80 ppm of the starting material showed a decrease
over time; the ratio of the areas being consistently 3:1 in all the *H NMR spectra
recorded throughout the experiment. These observations clearly support the hypothesis
120
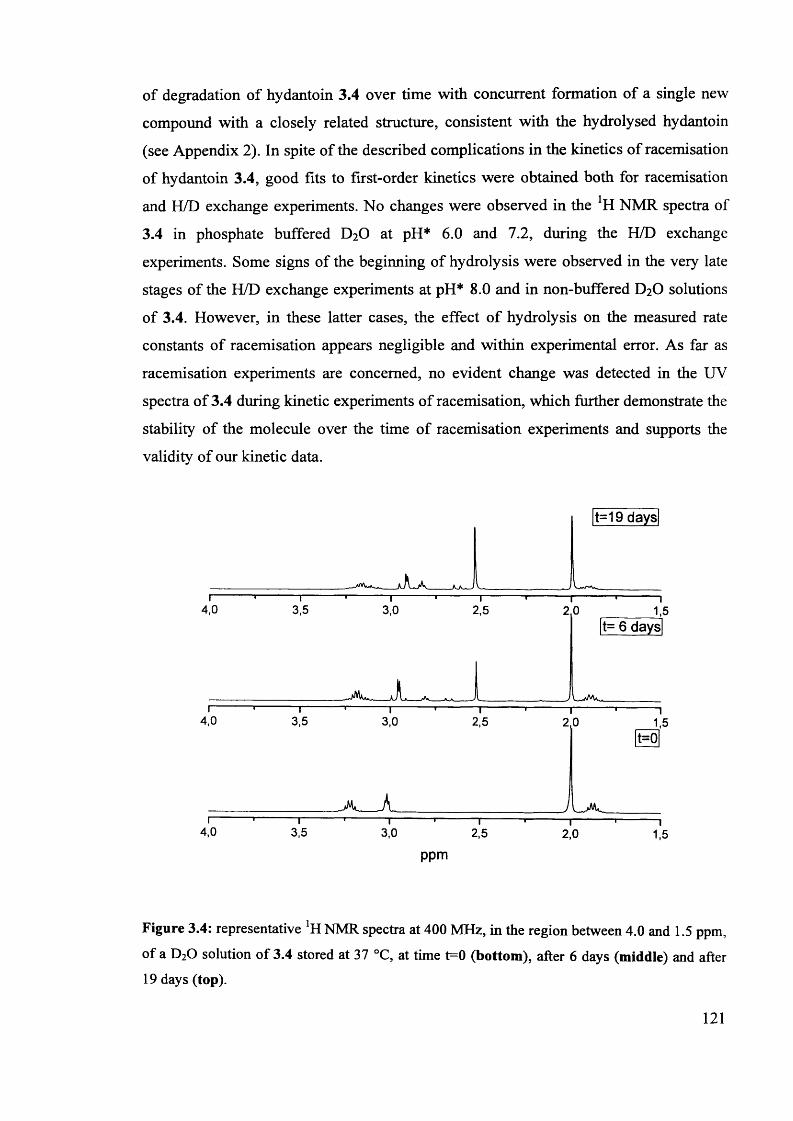
of degradation of hydantoin 3.4 over time with concurrent formation of a single new
compound with a closely related structure, consistent with the hydrolysed hydantoin
(see Appendix 2). In spite of the described complications in the kinetics of racemisation
of hydantoin 3.4, good fits to first-order kinetics were obtained both for racemisation
and H/D exchange experiments. No changes were observed in the !H NMR spectra of
3.4 in phosphate buffered D20 at pH* 6.0 and 7.2, during the H/D exchange
experiments. Some signs of the beginning of hydrolysis were observed in the very late
stages of the H/D exchange experiments at pH* 8.0 and in non-buffered D20 solutions
of 3.4. However, in these latter cases, the effect of hydrolysis on the measured rate
constants of racemisation appears negligible and within experimental error. As far as
racemisation experiments are concerned, no evident change was detected in the UV
spectra of 3.4 during kinetic experiments of racemisation, which further demonstrate the
stability of the molecule over the time of racemisation experiments and supports the
validity of our kinetic data.
t=19 days
t= 6 days
t=0
4,0 3,5~T~3,0 2,5 2,0 1,5
ppm
Figure 3.4: representative *H NMR spectra at 400 MHz, in the region between 4.0 and 1.5 ppm,
of a D20 solution of 3.4 stored at 37 °C, at time t=0 (bottom), after 6 days (middle) and after 19 days (top).
121
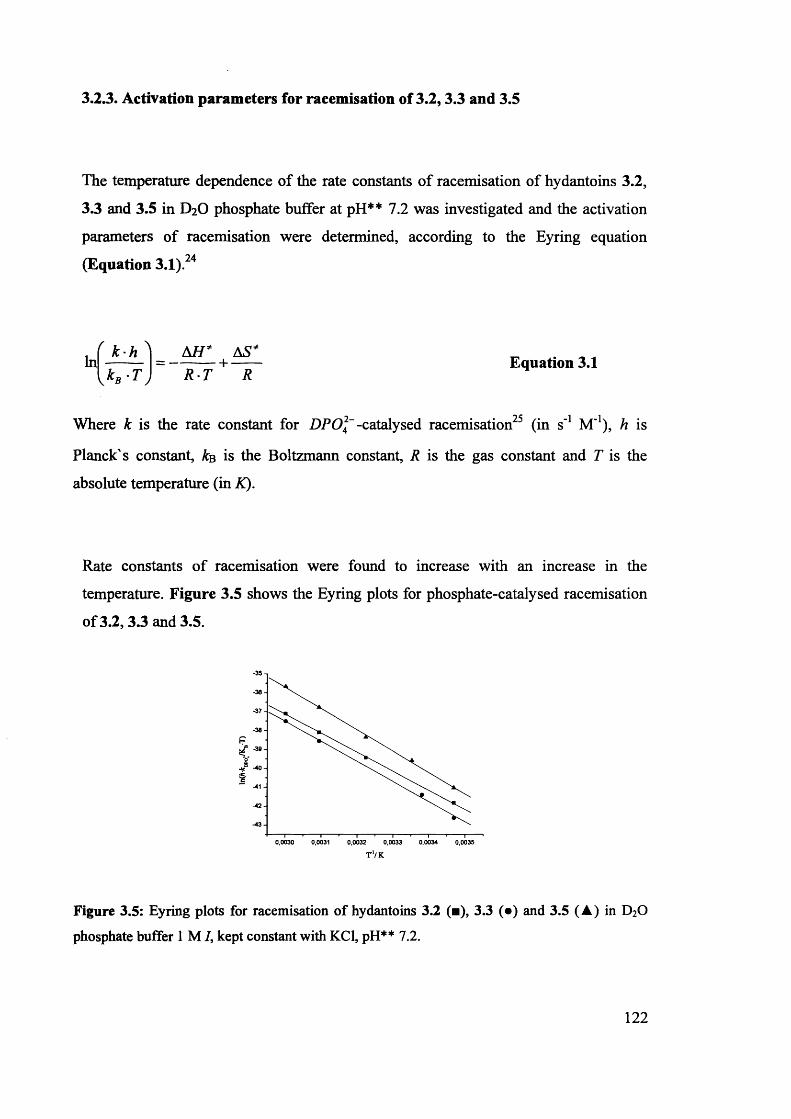
3.2.3. Activation parameters for racemisation of 3.2,3.3 and 3.5
The temperature dependence of the rate constants of racemisation of hydantoins 3.2,
3.3 and 3.5 in D2O phosphate buffer at pH** 7.2 was investigated and the activation
parameters of racemisation were determined, according to the Eyring equation
(Equation 3.1).24
Where k is the rate constant for DPO] -catalysed racemisation25 (in s'1 M \ h is
Planck's constant, kb is the Boltzmann constant, R is the gas constant and T is the
absolute temperature (in K).
AH AS* h Equation 3.1R T R
Rate constants of racemisation were found to increase with an increase in the
temperature. Figure 3.5 shows the Eyring plots for phosphate-catalysed racemisation
of 3.2, 3.3 and 3.5.
-35-36-37-36
P^ 39
i -40-41-42-43
0,0030 0,0031 0,0032 0,0033 0,0034 0,0035t Vk
Figure 3.5: Eyring plots for racemisation of hydantoins 3.2 (■), 3.3 (•) and 3.5 (A) in D20
phosphate buffer 1 M /, kept constant with KC1, pH** 7.2.
122
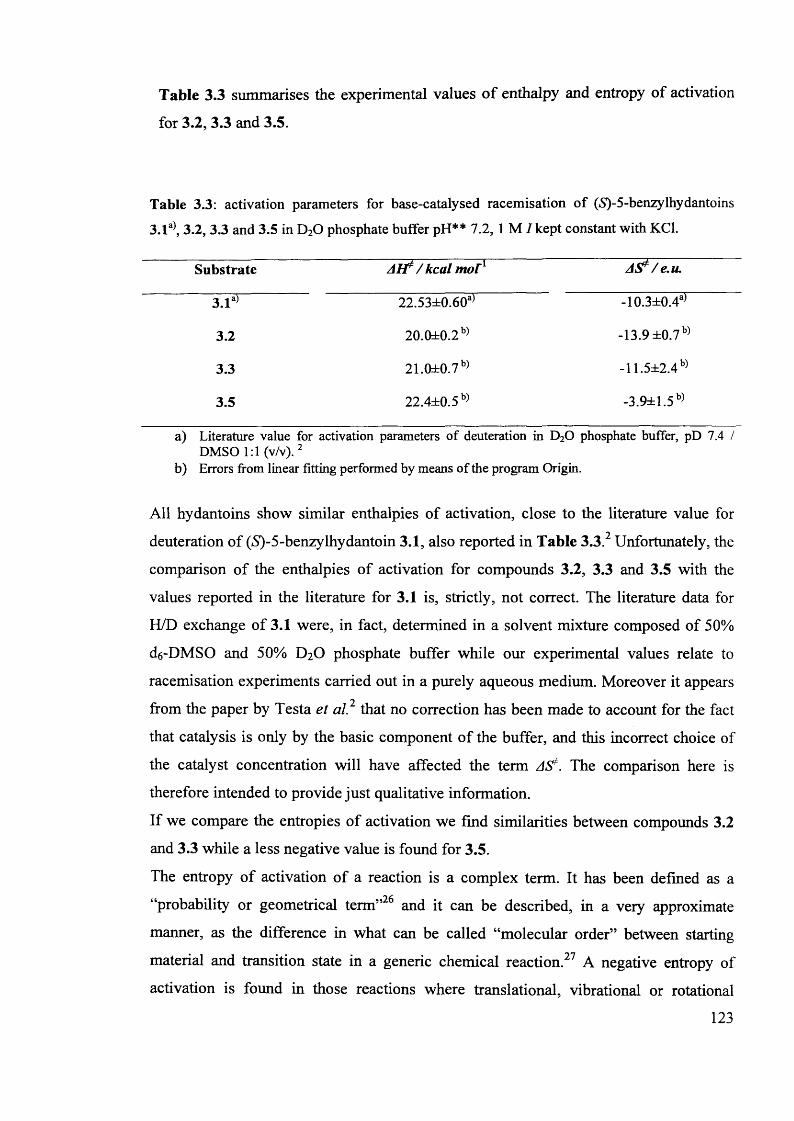
Table 3.3 summarises the experimental values of enthalpy and entropy of activation
for 3.2, 3.3 and 3.5.
Table 3.3: activation parameters for base-catalysed racemisation of (5)-5-benzylhydantoins
3.1a), 3.2, 3.3 and 3.5 in D20 phosphate buffer pH** 7.2, 1 M / kept constant with KC1.
Substrate AH*/kcal mol1 A£>/e.u.
3.1a) 22.53±0.60a) -10.3±0.4a)
3.2 20.0±0.2b) -13.9 ±0.7b)
3.3 21.0±0.7b) -11.5±2.4b)
3.5 22.4±0.5b) -3.9±1.5b)
a) Literature value for activation parameters of deuteration in D20 phosphate buffer, pD 7.4 / DMSO 1:1 (v/v). 2
b) Errors from linear fitting performed by means of the program Origin.
All hydantoins show similar enthalpies of activation, close to the literature value for
deuteration of (S)-5-benzylhydantoin 3.1, also reported in Table 3.3.2 Unfortunately, the
comparison of the enthalpies of activation for compounds 3.2, 3.3 and 3.5 with the
values reported in the literature for 3.1 is, strictly, not correct. The literature data for
H/D exchange of 3.1 were, in fact, determined in a solvent mixture composed of 50%
d6-DMSO and 50% D2O phosphate buffer while our experimental values relate to
racemisation experiments carried out in a purely aqueous medium. Moreover it appears
from the paper by Testa et a l2 that no correction has been made to account for the fact
that catalysis is only by the basic component of the buffer, and this incorrect choice of
the catalyst concentration will have affected the term AS*. The comparison here is
therefore intended to provide just qualitative information.
If we compare the entropies of activation we find similarities between compounds 3.2
and 3.3 while a less negative value is found for 3.5.
The entropy of activation of a reaction is a complex term. It has been defined as a
“probability or geometrical term”26 and it can be described, in a very approximate
manner, as the difference in what can be called “molecular order” between starting
material and transition state in a generic chemical reaction.27 A negative entropy of
activation is found in those reactions where translational, vibrational or rotational
123
degrees of freedom are lost when passing from starting material to activated complex.
Solvation is also an important factor which can significantly affect the value of AS^. The
complex nature of AS^ of a reaction makes its interpretation difficult; however
comparison of values of AS? appears to be reasonable within the context of the same, or
strongly related, chemical reaction. 26,27
In a simple model of phosphate-catalysed racemisation of hydantoins, the chemical
species potentially involved in the rate-determining step of reaction are a molecule of
hydantoin, the catalyst (here dibasic phosphate) and molecules of D2O. Catalyst and
solvent are the same in all racemisation reactions compared here. We can therefore
exclude any contribution from these species alone to the differences in the reaction
profile of the investigated hydantoins. Any difference in the activation parameters of
racemisation should therefore be attributed to differences in the structures of the
hydantoins.
During the process of racemisation a CH bond is partially broken in the transition state
with consequent formation of a partial negative charge on the carbon atom upon going
from reactant to activated complex. In case of the racemisation of neutral hydantoins
3.1-3.3, this corresponds to a net build up of charge upon going from reactants to
activated complexes. In the case of the positively charged compound 3.5, the
developing negative charge is formed in the presence of the cationic substituent. The
positive charge can be imagined to contribute intramolecularly to stabilisation of the
formation of the partial negative charge in 3.5, while for the neutral molecules, this role
can only be played by the solvent water. Solvation will be accompanied by an “entropic
penalty” due to the creation of a local shell of “structured” water molecules, oriented by
the developing negative charge of the activated complex. In the case of compound 3.5,
an ammonium salt, solvation effects are already important in the reactants due to the
positive charge of the ammonium group. Therefore, in the case of 3.5, the “movement”
along the reaction profile from reactants to activated complex involves passing from a
charged species to a formally neutral one. This explanation could be worded
alternatively by stating that the positive charge on the ammonium group could compete
with the solvent at stabilising the developing negative charge in the transition state.
Therefore, in the racemisation of 3.5, contrary to substrates 3.1-3.3, solvation effects
should be more important in the reactant than in the activated complex, with a
consequent smaller entropic loss while going from the reactant state to the transition
124
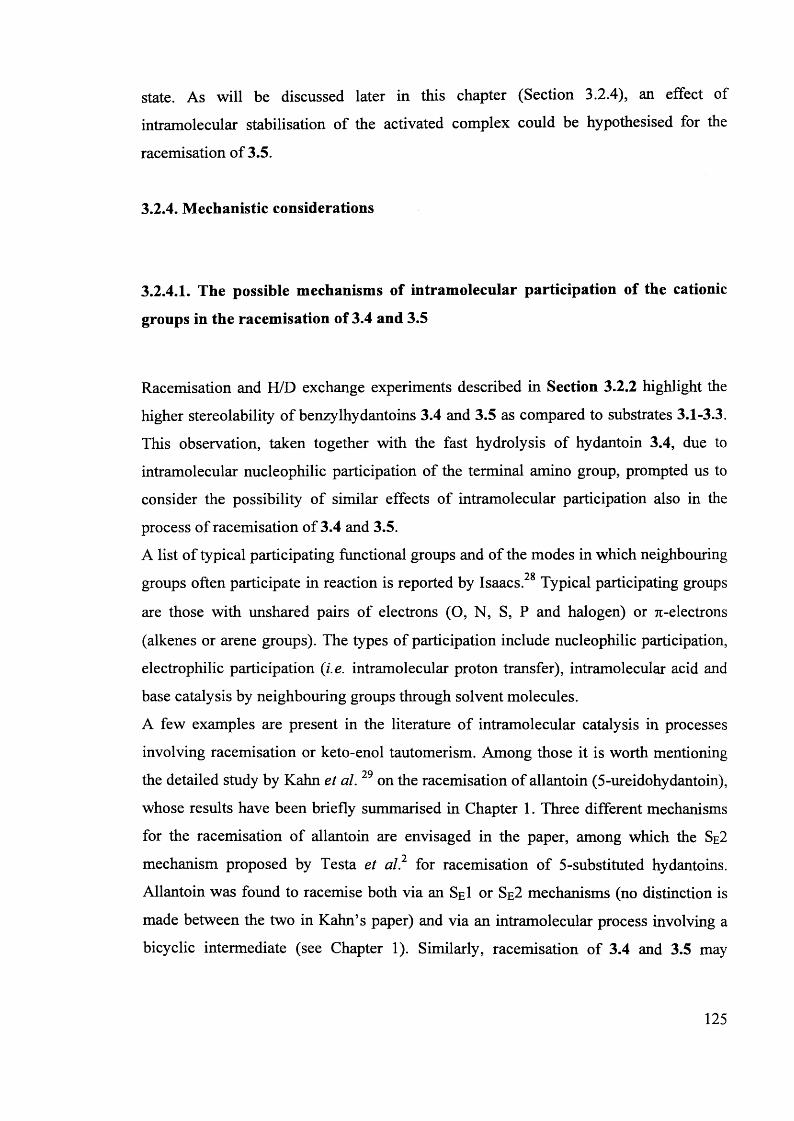
state. As will be discussed later in this chapter (Section 3.2.4), an effect of
intramolecular stabilisation of the activated complex could be hypothesised for the
racemisation of 3.5.
3.2.4. Mechanistic considerations
3.2.4.I. The possible mechanisms of intramolecular participation of the cationic
groups in the racemisation of 3.4 and 3.5
Racemisation and H/D exchange experiments described in Section 3.2.2 highlight the
higher stereolability of benzylhydantoins 3.4 and 3.5 as compared to substrates 3.1-3.3.
This observation, taken together with the fast hydrolysis of hydantoin 3.4, due to
intramolecular nucleophilic participation of the terminal amino group, prompted us to
consider the possibility of similar effects of intramolecular participation also in the
process of racemisation of 3.4 and 3.5.
A list of typical participating functional groups and of the modes in which neighbouring28 • •groups often participate in reaction is reported by Isaacs. Typical participating groups
are those with unshared pairs of electrons (O, N, S, P and halogen) or 71-electrons
(alkenes or arene groups). The types of participation include nucleophilic participation,
electrophilic participation (i.e. intramolecular proton transfer), intramolecular acid and
base catalysis by neighbouring groups through solvent molecules.
A few examples are present in the literature of intramolecular catalysis in processes
involving racemisation or keto-enol tautomerism. Among those it is worth mentioning
the detailed study by Kahn et al. 29 on the racemisation of allantoin (5-ureidohydantoin),
whose results have been briefly summarised in Chapter 1. Three different mechanisms
for the racemisation of allantoin are envisaged in the paper, among which the Se2
mechanism proposed by Testa et al? for racemisation of 5-substituted hydantoins.
Allantoin was found to racemise both via an SeI or Se2 mechanisms (no distinction is
made between the two in Kahn’s paper) and via an intramolecular process involving a
bicyclic intermediate (see Chapter 1). Similarly, racemisation of 3.4 and 3.5 may
125
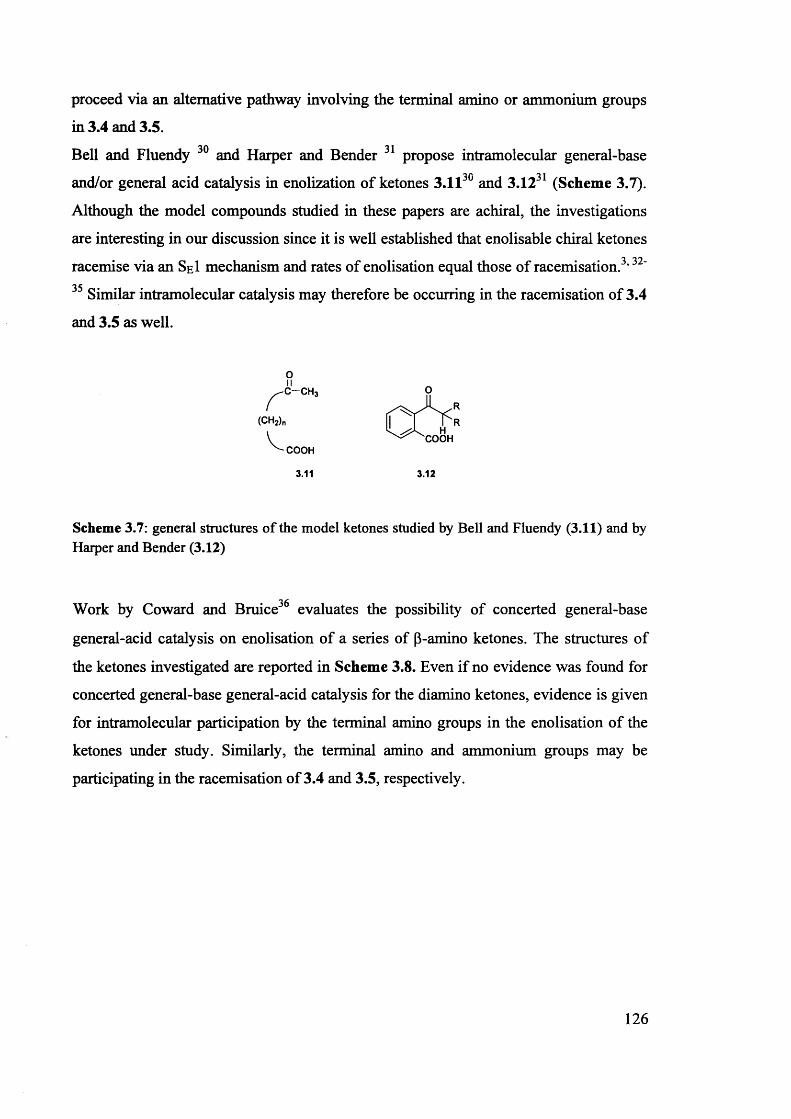
proceed via an alternative pathway involving the terminal amino or ammonium groups
in 3.4 and 3.5.
Bell and Fluendy 30 and Harper and Bender 31 propose intramolecular general-base
and/or general acid catalysis in enolization of ketones 3.1130 and 3.1231 (Scheme 3.7).
Although the model compounds studied in these papers are achiral, the investigations
are interesting in our discussion since it is well established that enolisable chiral ketones
racemise via an SeI mechanism and rates of enolisation equal those of racemisation.3,32'35 * • *Similar intramolecular catalysis may therefore be occurring in the racemisation of 3.4
and 3.5 as well.
o
COOHCOOH
3.11 3.12
Scheme 3.7: general structures of the model ketones studied by Bell and Fluendy (3.11) and by Harper and Bender (3.12)
Work by Coward and Bruice evaluates the possibility of concerted general-base
general-acid catalysis on enolisation of a series of p-amino ketones. The structures of
the ketones investigated are reported in Scheme 3.8. Even if no evidence was found for
concerted general-base general-acid catalysis for the diamino ketones, evidence is given
for intramolecular participation by the terminal amino groups in the enolisation of the
ketones under study. Similarly, the terminal amino and ammonium groups may be
participating in the racemisation of 3.4 and 3.5, respectively.
126
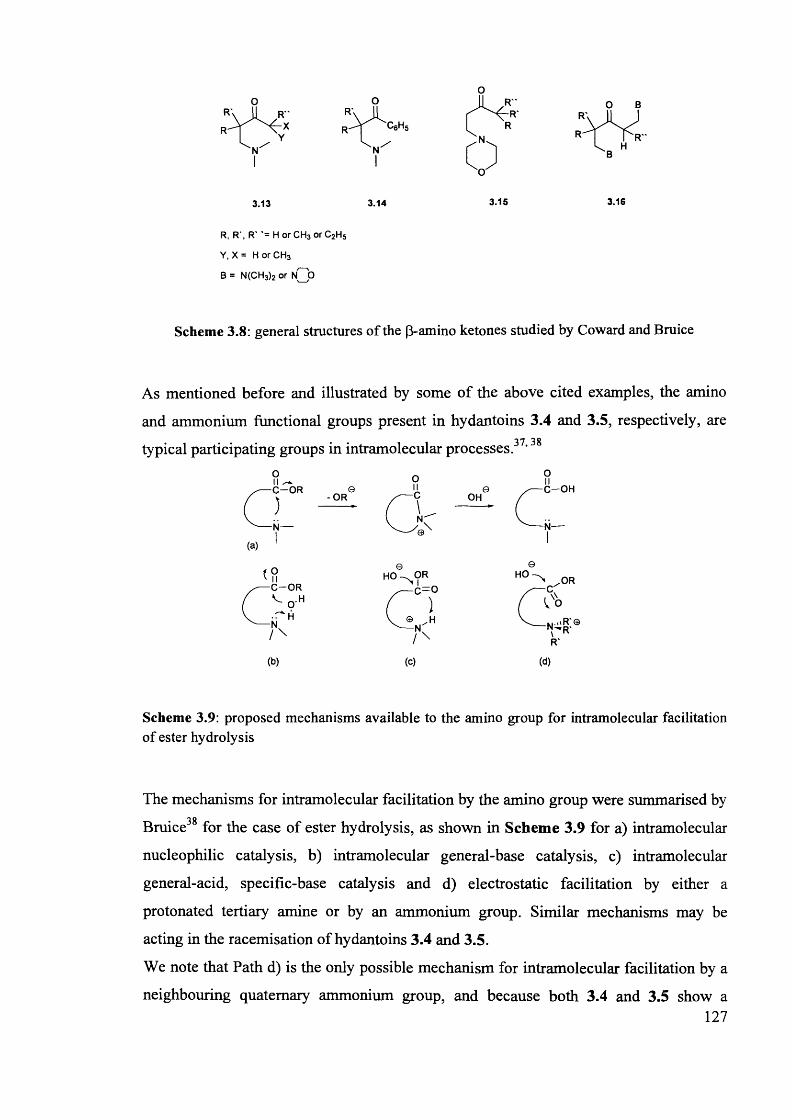
o
3.13 3.14 3.15 3.16
R, R \ R' '= H or CH3 orC2H5
Y, X = H or CH3
B = N(CH3)2 or nH d
Scheme 3.8: general structures of the (3-amino ketones studied by Coward and Bruice
As mentioned before and illustrated by some of the above cited examples, the amino
and ammonium functional groups present in hydantoins 3.4 and 3.5, respectively, are37 38typical participating groups in intramolecular processes. ’
(b) (c) (d)
Scheme 3.9: proposed mechanisms available to the amino group for intramolecular facilitation of ester hydrolysis
The mechanisms for intramolecular facilitation by the amino group were summarised by
Bruice for the case of ester hydrolysis, as shown in Scheme 3.9 for a) intramolecular
nucleophilic catalysis, b) intramolecular general-base catalysis, c) intramolecular
general-acid, specific-base catalysis and d) electrostatic facilitation by either a
protonated tertiary amine or by an ammonium group. Similar mechanisms may be
acting in the racemisation of hydantoins 3.4 and 3.5.
We note that Path d) is the only possible mechanism for intramolecular facilitation by a
neighbouring quaternary ammonium group, and because both 3.4 and 3.5 show a127
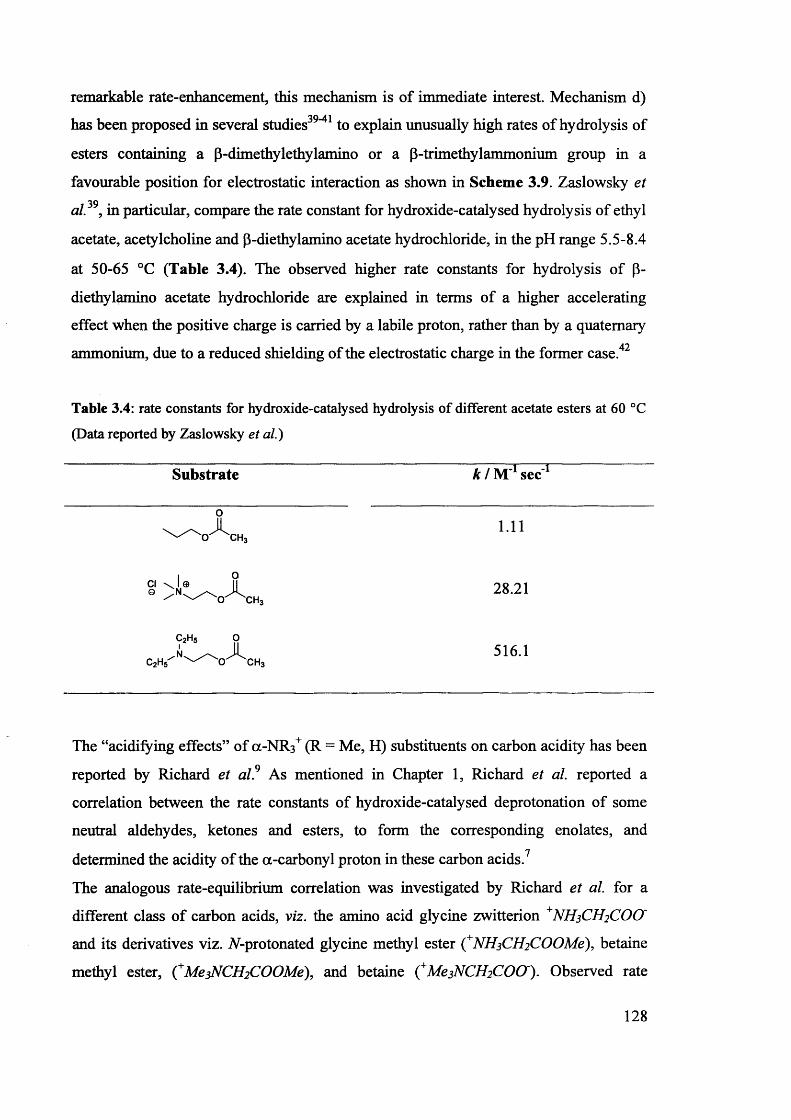
remarkable rate-enhancement, this mechanism is of immediate interest. Mechanism d)
has been proposed in several studies39 1 to explain unusually high rates of hydrolysis of
esters containing a p-dimethylethylamino or a p-trimethylammonium group in a
favourable position for electrostatic interaction as shown in Scheme 3.9. Zaslowsky et
al. , in particular, compare the rate constant for hydroxide-catalysed hydrolysis of ethyl
acetate, acetylcholine and p-diethylamino acetate hydrochloride, in the pH range 5.5-8.4
at 50-65 °C (Table 3.4). The observed higher rate constants for hydrolysis of p-
diethylamino acetate hydrochloride are explained in terms of a higher accelerating
effect when the positive charge is carried by a labile proton, rather than by a quaternary
ammonium, due to a reduced shielding of the electrostatic charge in the former case.42
Table 3.4: rate constants for hydroxide-catalysed hydrolysis of different acetate esters at 60 °C
(Data reported by Zaslowsky et al.)
Substrate k I M' sec'
0xO CH3 1.11
Cl \l@0
0^ Xo c h 3 28.21
c2H51C2H.T ^
0^ XO CH3 516.1
The “acidifying effects” of a-NR3+ (R = Me, H) substituents on carbon acidity has been
reported by Richard et al.9 As mentioned in Chapter 1, Richard et al. reported a
correlation between the rate constants of hydroxide-catalysed deprotonation of some
neutral aldehydes, ketones and esters, to form the corresponding enolates, andn
determined the acidity of the a-carbonyl proton in these carbon acids.
The analogous rate-equilibrium correlation was investigated by Richard et al. for a
different class of carbon acids, viz. the amino acid glycine zwitterion +NH3CH2COO~
and its derivatives viz. JV-protonated glycine methyl ester CNHsCfyCOOMe), betaine
methyl ester, (4MesNCfyCOOMe), and betaine ( Me3NCH2COO). Observed rate
128
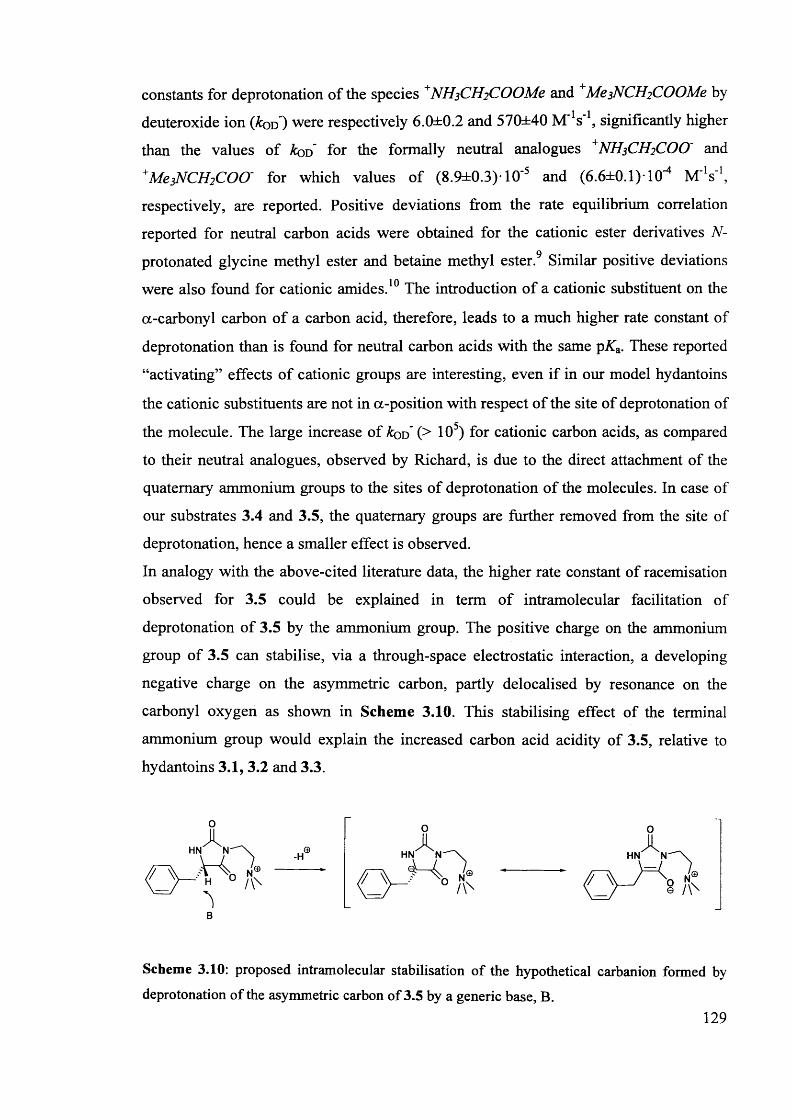
constants for deprotonation of the species N H 3 C H 2 C OOMe and 4MeiNCfyCOOMe by
deuteroxide ion (&od ) were respectively 6.0±0.2 and 570±40 M *s l, significantly higher
than the values of koD for the formally neutral analogues N H 3 C H 2C O O and
+Me3NCH2 COO~ for which values of (8.9±0.3)-10'5 and (h.hiO.lJ lO-4 M 'V 1,
respectively, are reported. Positive deviations from the rate equilibrium correlation
reported for neutral carbon acids were obtained for the cationic ester derivatives N-
protonated glycine methyl ester and betaine methyl ester.9 Similar positive deviations
were also found for cationic amides.10 The introduction of a cationic substituent on the
a-carbonyl carbon of a carbon acid, therefore, leads to a much higher rate constant of
deprotonation than is found for neutral carbon acids with the same pKa. These reported
“activating” effects of cationic groups are interesting, even if in our model hydantoins
the cationic substituents are not in a-position with respect of the site of deprotonation of
the molecule. The large increase of &od (> 105) for cationic carbon acids, as compared
to their neutral analogues, observed by Richard, is due to the direct attachment of the
quaternary ammonium groups to the sites of deprotonation of the molecules. In case of
our substrates 3.4 and 3.5, the quaternary groups are further removed from the site of
deprotonation, hence a smaller effect is observed.
In analogy with the above-cited literature data, the higher rate constant of racemisation
observed for 3.5 could be explained in term of intramolecular facilitation of
deprotonation of 3.5 by the ammonium group. The positive charge on the ammonium
group of 3.5 can stabilise, via a through-space electrostatic interaction, a developing
negative charge on the asymmetric carbon, partly delocalised by resonance on the
carbonyl oxygen as shown in Scheme 3.10. This stabilising effect of the terminal
ammonium group would explain the increased carbon acid acidity of 3.5, relative to
hydantoins 3.1, 3.2 and 3.3.
B
Scheme 3.10: proposed intramolecular stabilisation of the hypothetical carbanion formed by deprotonation of the asymmetric carbon of 3.5 by a generic base, B.
129
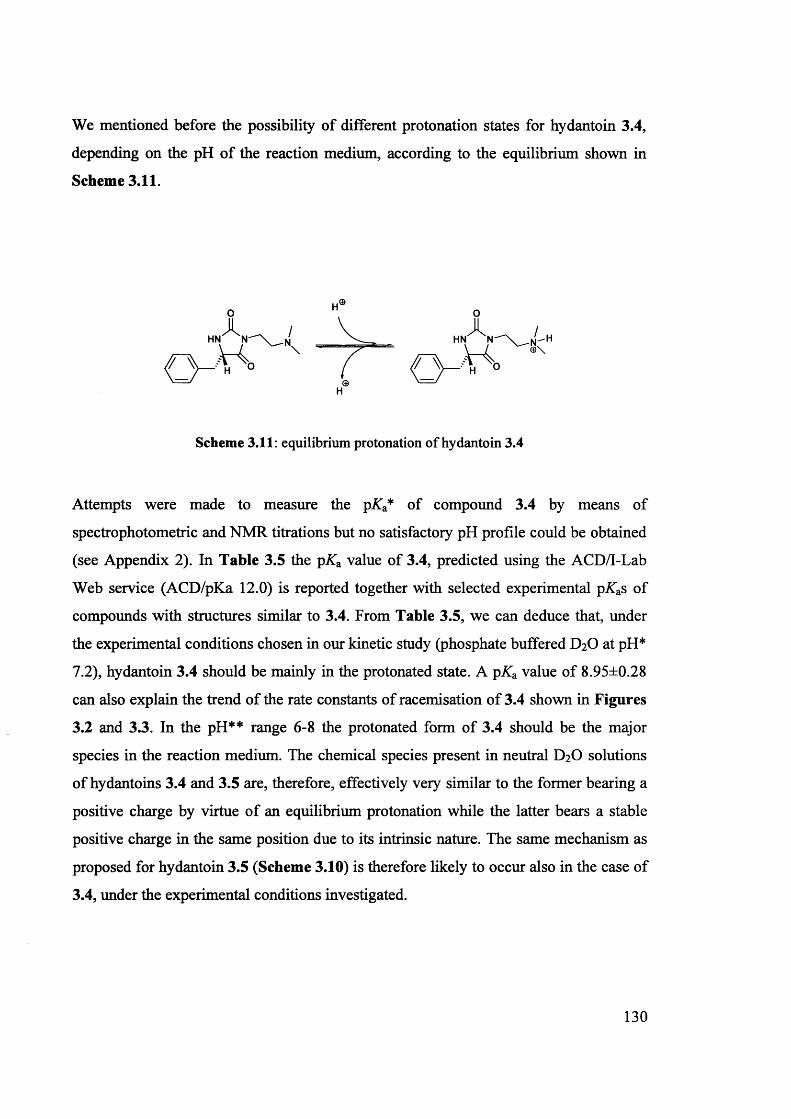
We mentioned before the possibility of different protonation states for hydantoin 3.4,
depending on the pH of the reaction medium, according to the equilibrium shown in
Scheme 3.11.
o
H
Scheme 3.11: equilibrium protonation of hydantoin 3.4
Attempts were made to measure the pKa* of compound 3.4 by means of
spectrophotometric and NMR titrations but no satisfactory pH profile could be obtained
(see Appendix 2). In Table 3.5 the pKa value of 3.4, predicted using the ACD/I-Lab
Web service (ACD/pKa 12.0) is reported together with selected experimental p^as of
compounds with structures similar to 3.4. From Table 3.5, we can deduce that, under
the experimental conditions chosen in our kinetic study (phosphate buffered D2O at pH*
7.2), hydantoin 3.4 should be mainly in the protonated state. A pKa value of 8.95±0.28
can also explain the trend of the rate constants of racemisation of 3.4 shown in Figures
3.2 and 3.3. In the pH** range 6-8 the protonated form of 3.4 should be the major
species in the reaction medium. The chemical species present in neutral D2O solutions
of hydantoins 3.4 and 3.5 are, therefore, effectively very similar to the former bearing a
positive charge by virtue of an equilibrium protonation while the latter bears a stable
positive charge in the same position due to its intrinsic nature. The same mechanism as
proposed for hydantoin 3.5 (Scheme 3.10) is therefore likely to occur also in the case of
3.4, under the experimental conditions investigated.
130
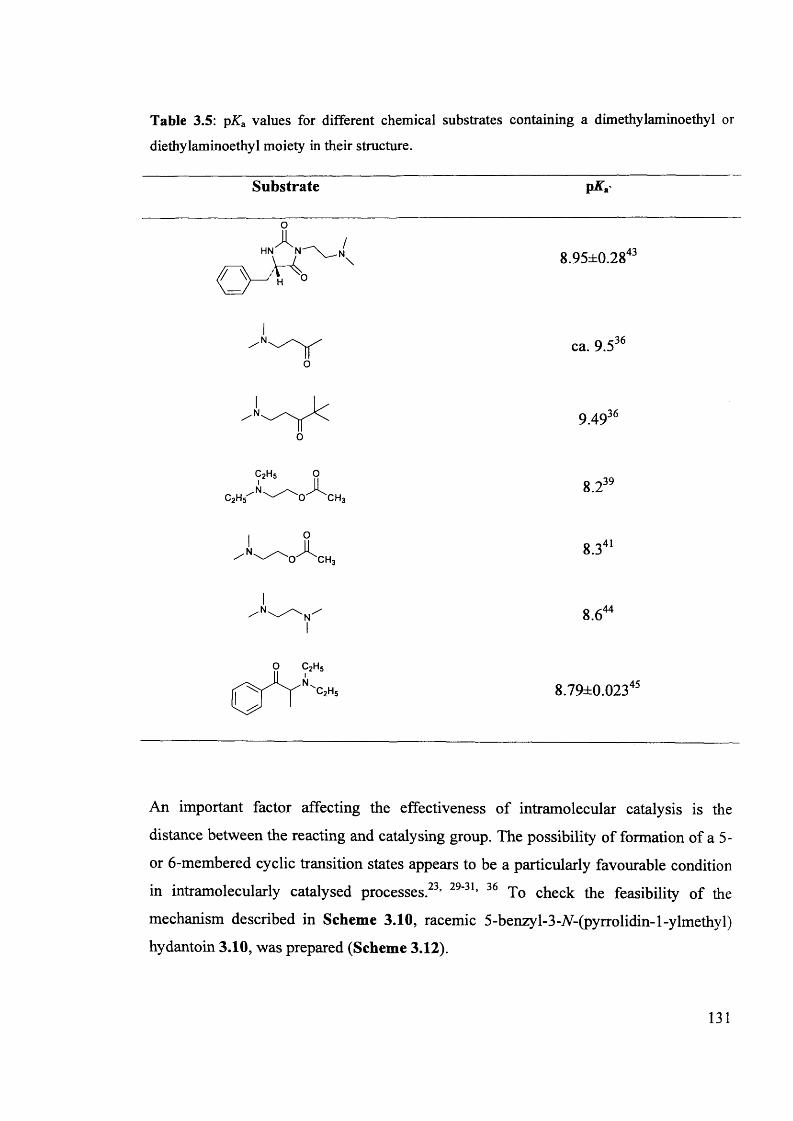
Table 3.5: pKa values for different chemical substrates containing a dimethylaminoethyl or
diethylaminoethyl moiety in their structure.
Substrate pK*
oA.
HN N
/V A\ 8.95±0.2843
ca. 9.536
9.4936
C2H5 O
Ac 2h 5 o c h 3
8.239
I 0O CH3
8.341
8.644
O C2H5 iN.
C,H, 8.79±0.02345
An important factor affecting the effectiveness of intramolecular catalysis is the
distance between the reacting and catalysing group. The possibility of formation of a 5-
or 6-membered cyclic transition states appears to be a particularly favourable condition
in intramolecularly catalysed processes.23, 29'31, 36 To check the feasibility of the
mechanism described in Scheme 3.10, racemic 5-benzyl-3-A-(pyrrolidin-l-ylmethyl)
hydantoin 3.10, was prepared (Scheme 3.12).
131
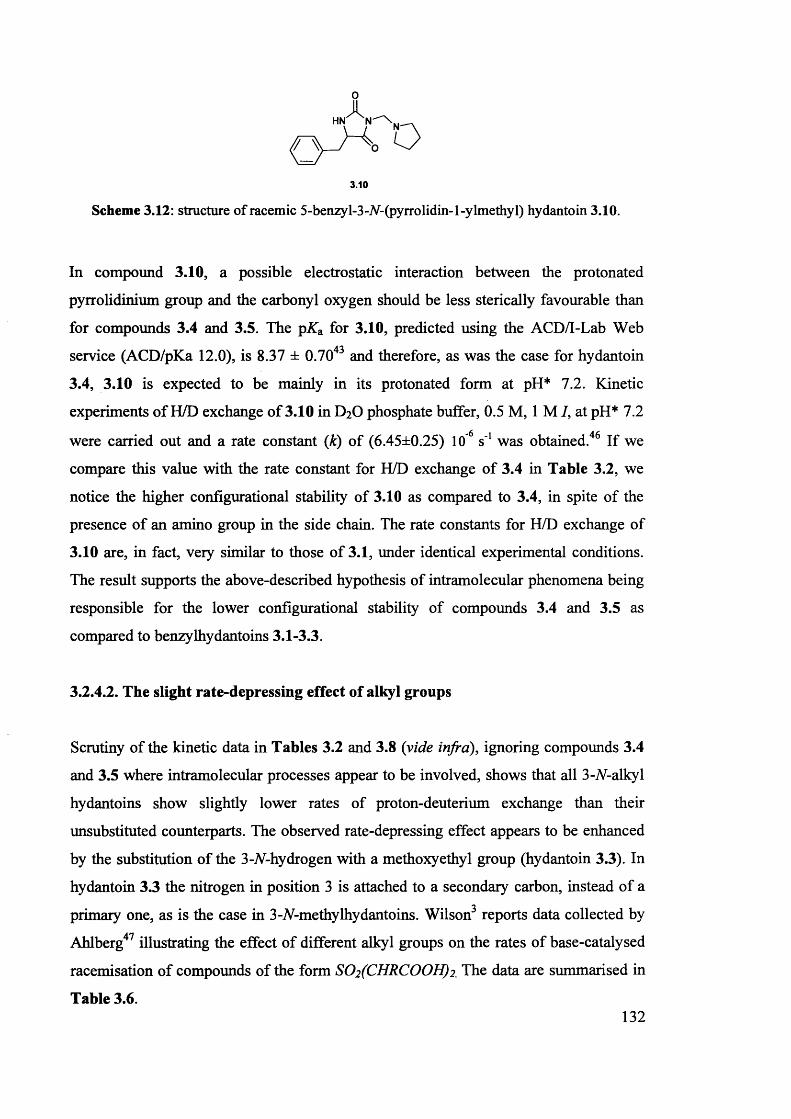
0
3.10
Scheme 3.12: structure of racemic 5-benzy 1-3-7V-(pyrrolidin-1 -ylmethy 1) hydantoin 3.10.
In compound 3.10, a possible electrostatic interaction between the protonated
pyrrolidinium group and the carbonyl oxygen should be less sterically favourable than
for compounds 3.4 and 3.5. The pKa for 3.10, predicted using the ACD/I-Lab Web
service (ACD/pKa 12.0), is 8.37 ± 0.7043 and therefore, as was the case for hydantoin
3.4, 3.10 is expected to be mainly in its protonated form at pH* 7.2. Kinetic
experiments of H/D exchange of 3.10 in D2O phosphate buffer, 0.5 M, 1 M /, at pH* 7.2
were carried out and a rate constant (k) of (6.45±0.25) 106 s 1 was obtained.46 If we
compare this value with the rate constant for H/D exchange of 3.4 in Table 3.2, we
notice the higher configurational stability of 3.10 as compared to 3.4, in spite of the
presence of an amino group in the side chain. The rate constants for H/D exchange of
3.10 are, in fact, very similar to those of 3.1, under identical experimental conditions.
The result supports the above-described hypothesis of intramolecular phenomena being
responsible for the lower configurational stability of compounds 3.4 and 3.5 as
compared to benzylhydantoins 3.1-3.3.
3.2.4.2. The slight rate-depressing effect of alkyl groups
Scrutiny of the kinetic data in Tables 3.2 and 3.8 (vide infra), ignoring compounds 3.4
and 3.5 where intramolecular processes appear to be involved, shows that all 3-A-alkyl
hydantoins show slightly lower rates of proton-deuterium exchange than their
unsubstituted counterparts. The observed rate-depressing effect appears to be enhanced
by the substitution of the 3-A-hydrogen with a methoxyethyl group (hydantoin 3.3). In
hydantoin 3.3 the nitrogen in position 3 is attached to a secondary carbon, instead of a
primary one, as is the case in 3 -TV-methylhydantoins. Wilson3 reports data collected by
Ahlberg47 illustrating the effect of different alkyl groups on the rates of base-catalysed
racemisation of compounds of the form S0 2 (CHRC0 0 H)2. The data are summarised in
Table 3.6.132
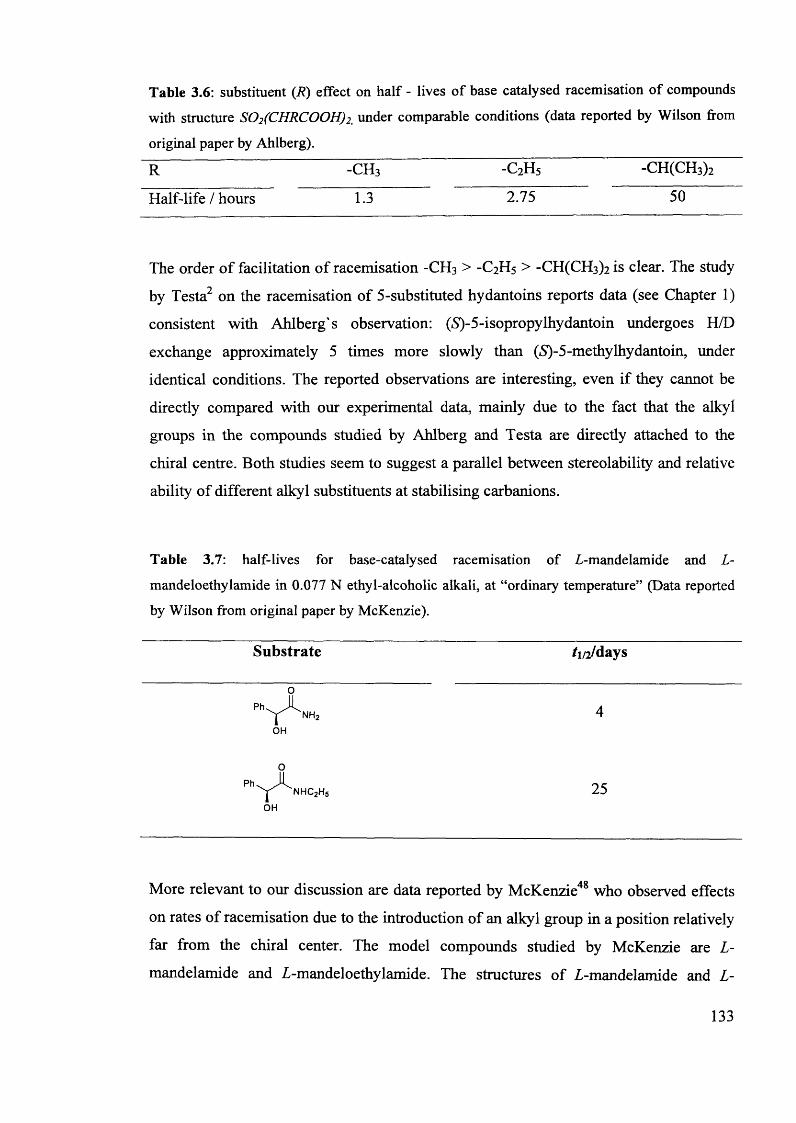
Table 3.6: substituent (R) effect on half - lives of base catalysed racemisation of compounds
with structure S02(CHRC00H)2, under comparable conditions (data reported by Wilson from
original paper by Ahlberg).
R - c h 3 - C 2 H 5 -CH(CH3)2
Half-life / hours 1.3 2.75 50
The order of facilitation of racemisation -CH3 > -C2H5 > -CH(CH3)2 is clear. The study
by Testa2 on the racemisation of 5-substituted hydantoins reports data (see Chapter 1)
consistent with Ahlberg's observation: (5)-5-isopropylhydantoin undergoes H/D
exchange approximately 5 times more slowly than (5)-5-methylhydantoin, under
identical conditions. The reported observations are interesting, even if they cannot be
directly compared with our experimental data, mainly due to the fact that the alkyl
groups in the compounds studied by Ahlberg and Testa are directly attached to the
chiral centre. Both studies seem to suggest a parallel between stereolability and relative
ability of different alkyl substituents at stabilising carbanions.
Table 3.7: half-lives for base-catalysed racemisation of T-mandelamide and L-
mandeloethylamide in 0.077 N ethyl-alcoholic alkali, at “ordinary temperature” (Data reported
by Wilson from original paper by McKenzie).
Substrate /1/2/days
n h c 2h5OH
More relevant to our discussion are data reported by McKenzie48 who observed effects
on rates of racemisation due to the introduction of an alkyl group in a position relatively
far from the chiral center. The model compounds studied by McKenzie are L-
mandelamide and L-mandeloethylamide. The structures of Z-mandelamide and L-
133
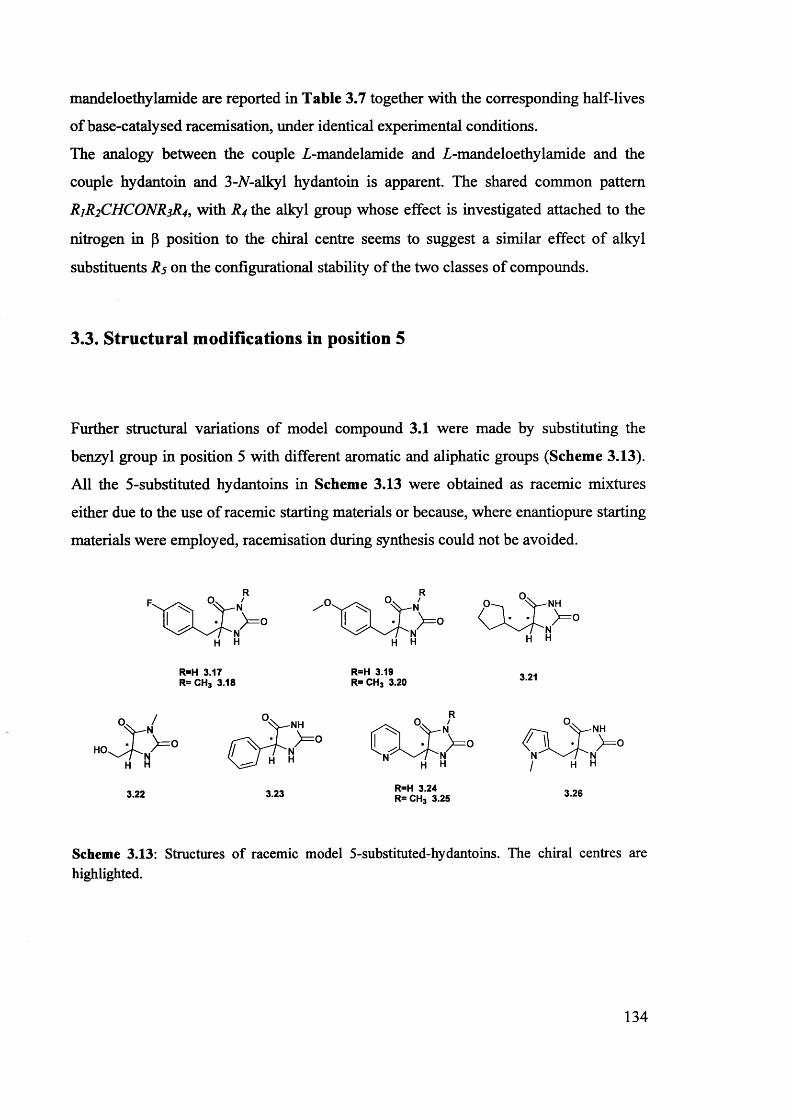
mandeloethylamide are reported in Table 3.7 together with the corresponding half-lives
of base-catalysed racemisation, under identical experimental conditions.
The analogy between the couple Z-mandelamide and Z-mandeloethylamide and the
couple hydantoin and 3-JV-alkyl hydantoin is apparent. The shared common pattern
R1R2CHCONR3R4, with R4 the alkyl group whose effect is investigated attached to the
nitrogen in p position to the chiral centre seems to suggest a similar effect of alkyl
substituents R5 on the configurational stability of the two classes of compounds.
3.3. Structural modifications in position 5
Further structural variations of model compound 3.1 were made by substituting the
benzyl group in position 5 with different aromatic and aliphatic groups (Scheme 3.13).
All the 5-substituted hydantoins in Scheme 3.13 were obtained as racemic mixtures
either due to the use of racemic starting materials or because, where enantiopure starting
materials were employed, racemisation during synthesis could not be avoided.
'V'NH
c Q > °H H
R=H 3.17 R= CH3 3.18
R=H 3.19 R= CH3 3.20 3.21
Scheme 3.13: Structures of racemic model 5-substituted-hydantoins. The chiral centres are highlighted.
134
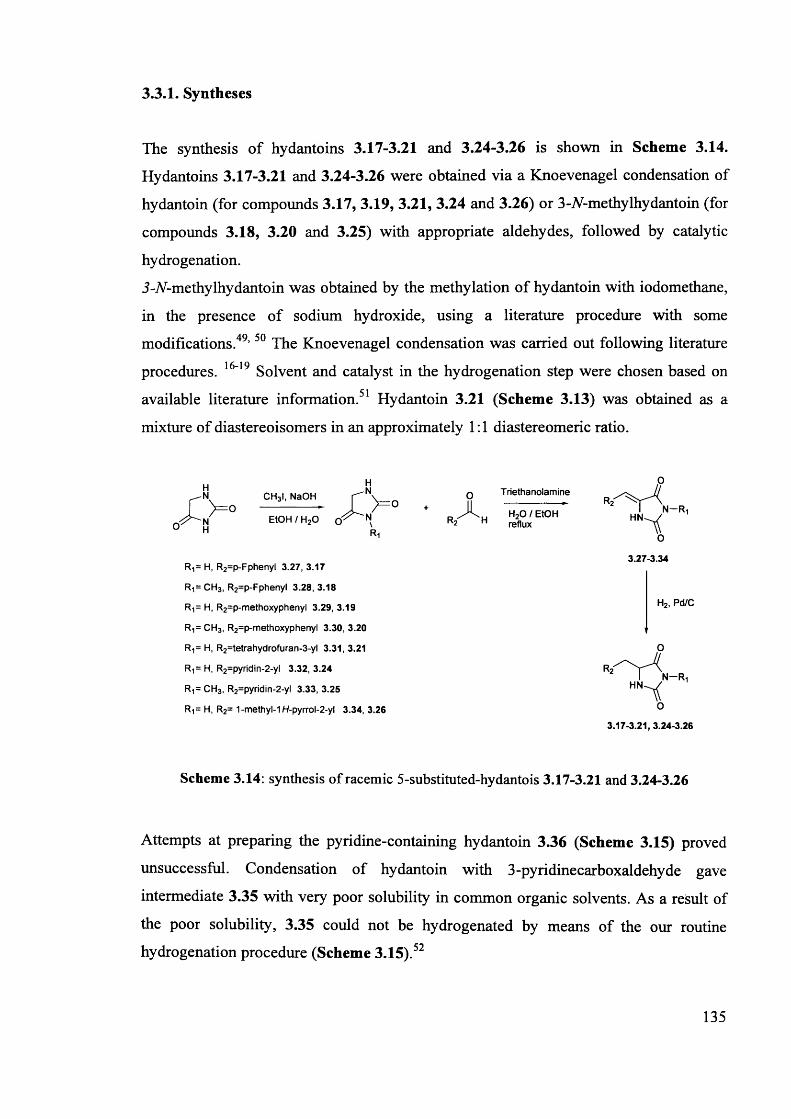
3.3.1. Syntheses
The synthesis of hydantoins 3.17-3.21 and 3.24-3.26 is shown in Scheme 3.14.
Hydantoins 3.17-3.21 and 3.24-3.26 were obtained via a Knoevenagel condensation of
hydantoin (for compounds 3.17, 3.19, 3.21, 3.24 and 3.26) or 3-A-methylliydantoin (for
compounds 3.18, 3.20 and 3.25) with appropriate aldehydes, followed by catalytic
hydrogenation.
i-TV-methylhydantoin was obtained by the methylation of hydantoin with iodomethane,
in the presence of sodium hydroxide, using a literature procedure with some
modifications.49,50 The Knoevenagel condensation was carried out following literature
procedures. 16-19 Solvent and catalyst in the hydrogenation step were chosen based on
available literature information.51 Hydantoin 3.21 (Scheme 3.13) was obtained as a
mixture of diastereoisomers in an approximately 1:1 diastereomeric ratio.
0X N 0° H
CH3I, NaOH
EtOH / H20 o' \Ri
R,= H, R2=p-Fphenyl 3.27, 3.17
Ri= CH3, R2=p-Fphenyl 3.28, 3.18
Ri= H, R2=p-methoxyphenyl 3.29, 3.19
Ri= CH3, R2=p-methoxyphenyl 3.30, 3.20
Rt= H, R2=tetrahydrofuran-3-yl 3.31, 3.21
R,= H, R2=pyridin-2-yl 3.32, 3.24
Rt= CH3i R2=pyridin-2-yl 3.33, 3.25
Ri= H, R2= 1-methyl-1/-/-pyrrol-2-yl 3.34, 3.26
OA,
Triethanolamine
H20 / EtOH reflux
N-R .HN
3.27-3.34
H2, Pd/C
N-R-HN
3.17-3.21, 3.24-3.26
Scheme 3.14: synthesis of racemic 5-substituted-hydantois 3.17-3.21 and 3.24-3.26
Attempts at preparing the pyridine-containing hydantoin 3.36 (Scheme 3.15) proved
unsuccessful. Condensation of hydantoin with 3-pyridinecarboxaldehyde gave
intermediate 3.35 with very poor solubility in common organic solvents. As a result of
the poor solubility, 3.35 could not be hydrogenated by means of the our routine
hydrogenation procedure (Scheme 3.15).52
135
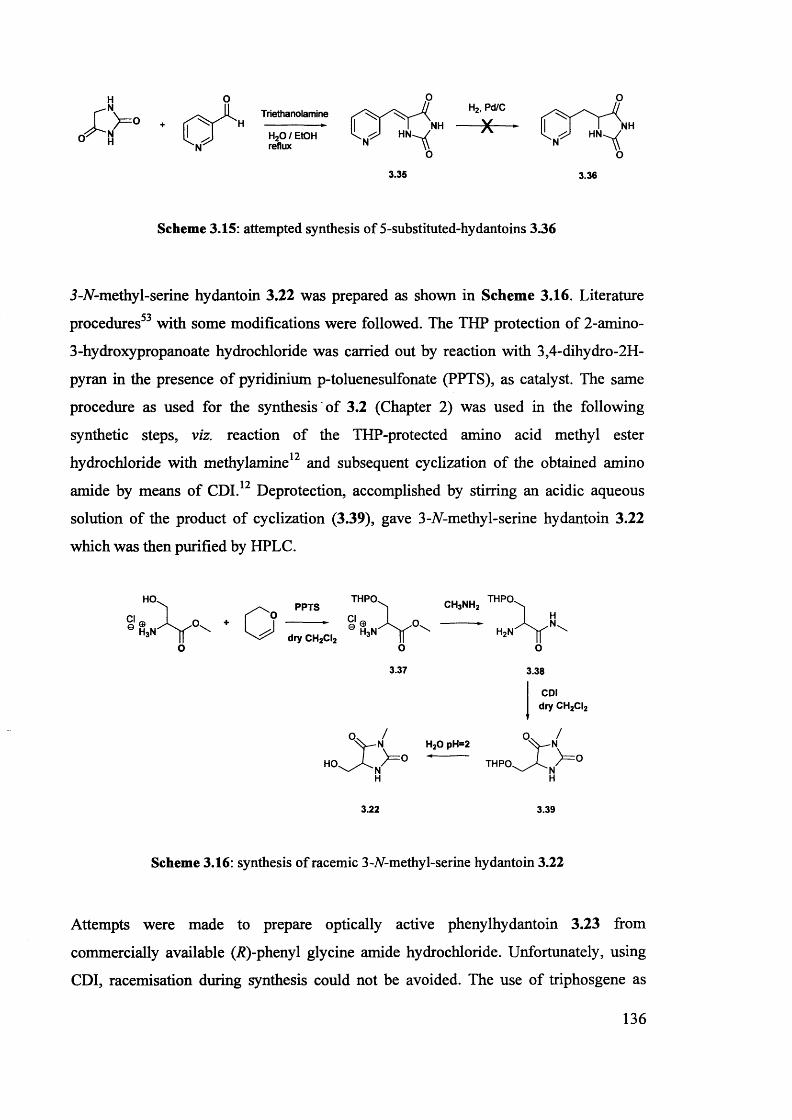
H
0X X °0 H
Triethanolamine
H20 / EtOH reflux
NHHN
3.35
H2, Pd/C
NHHN
3.36
Scheme 3.15: attempted synthesis of 5-substituted-hydantoins 3.36
3-A-methy 1-serine hydantoin 3.22 was prepared as shown in Scheme 3.16. Literature
procedures53 with some modifications were followed. The THP protection of 2-amino-
3-hydroxypropanoate hydrochloride was carried out by reaction with 3,4-dihydro-2H-
pyran in the presence of pyridinium p-toluenesulfonate (PPTS), as catalyst. The same
procedure as used for the synthesis of 3.2 (Chapter 2) was used in the following
synthetic steps, viz. reaction of the THP-protected amino acid methyl ester• 12 • • • hydrochloride with methylamine and subsequent cyclization of the obtained amino
1 ?amide by means of CDI. Deprotection, accomplished by stirring an acidic aqueous
solution of the product of cyclization (3.39), gave 3 -A-methy 1-serine hydantoin 3.22
which was then purified by HPLC.
HO.
h3n
PPTS
dry CH2CI2
THPO
H,N
ch3nh2 THPO
O3.37
HO.
3.22
H20 pH=2
h2n ^ Yo
3.38
CDIdry CH2CI2
°v /V% 0
H
3.39
Scheme 3.16: synthesis of racemic 3-A-methy 1-serine hydantoin 3.22
Attempts were made to prepare optically active phenylhydantoin 3.23 from
commercially available (i?)-phenyl glycine amide hydrochloride. Unfortunately, using
CDI, racemisation during synthesis could not be avoided. The use of triphosgene as
136
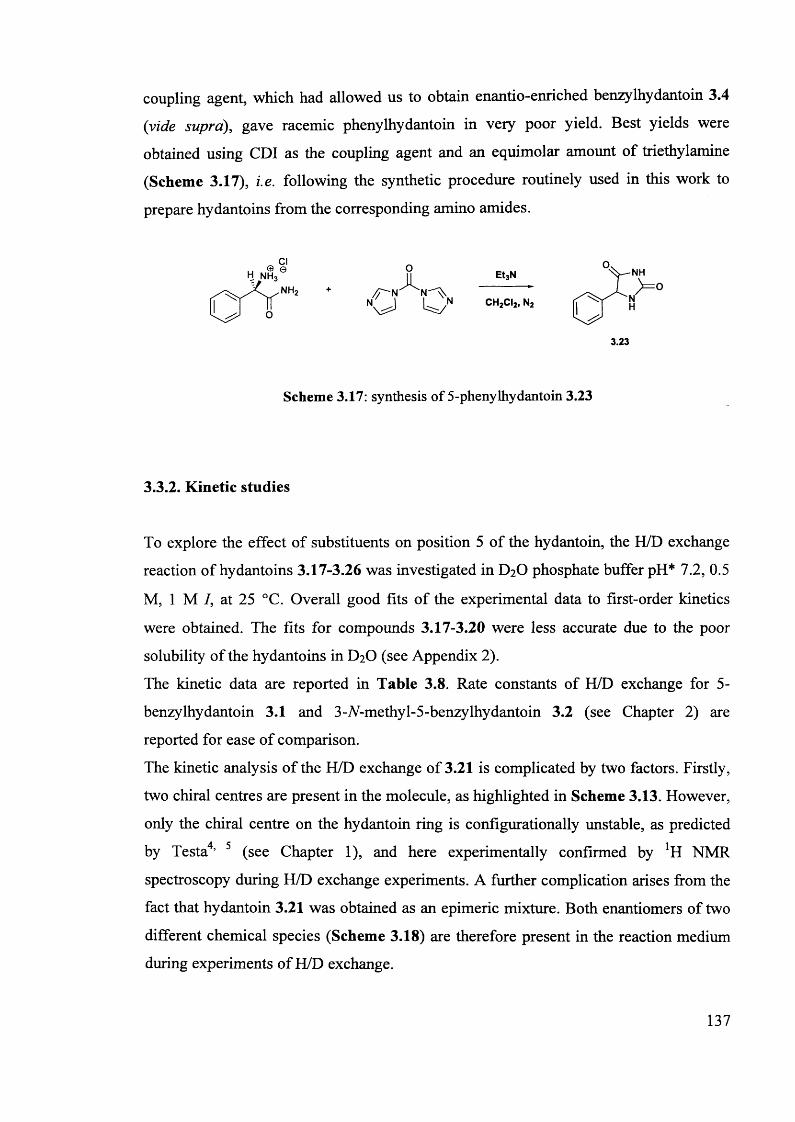
coupling agent, which had allowed us to obtain enantio-ennched benzylhydantoin 3.4
(vide supra), gave racemic phenylhydantoin in very poor yield. Best yields were
obtained using CDI as the coupling agent and an equimolar amount of triethylamine
(Scheme 3.17), i.e. following the synthetic procedure routinely used in this work to
prepare hydantoins from the corresponding amino amides.
Et3N ° V - nh
L ^ N CH2CI2l N2 ( j ^ f "
3.23
Scheme 3.17: synthesis of 5-phenylhydantoin 3.23
3.3.2. Kinetic studies
To explore the effect of substituents on position 5 of the hydantoin, the H/D exchange
reaction of hydantoins 3.17-3.26 was investigated in D2O phosphate buffer pH* 7.2, 0.5
M, 1 M 7, at 25 °C. Overall good fits of the experimental data to first-order kinetics
were obtained. The fits for compounds 3.17-3.20 were less accurate due to the poor
solubility of the hydantoins in D2O (see Appendix 2).
The kinetic data are reported in Table 3.8. Rate constants of H/D exchange for 5-
benzylhydantoin 3.1 and 3-/V-methyl-5-benzylhydantoin 3.2 (see Chapter 2) are
reported for ease of comparison.
The kinetic analysis of the H/D exchange of 3.21 is complicated by two factors. Firstly,
two chiral centres are present in the molecule, as highlighted in Scheme 3.13. However,
only the chiral centre on the hydantoin ring is configurationally unstable, as predicted
by Testa4, 5 (see Chapter 1), and here experimentally confirmed by *H NMR
spectroscopy during H/D exchange experiments. A further complication arises from the
fact that hydantoin 3.21 was obtained as an epimeric mixture. Both enantiomers of two
different chemical species (Scheme 3.18) are therefore present in the reaction medium
during experiments of H/D exchange.
137
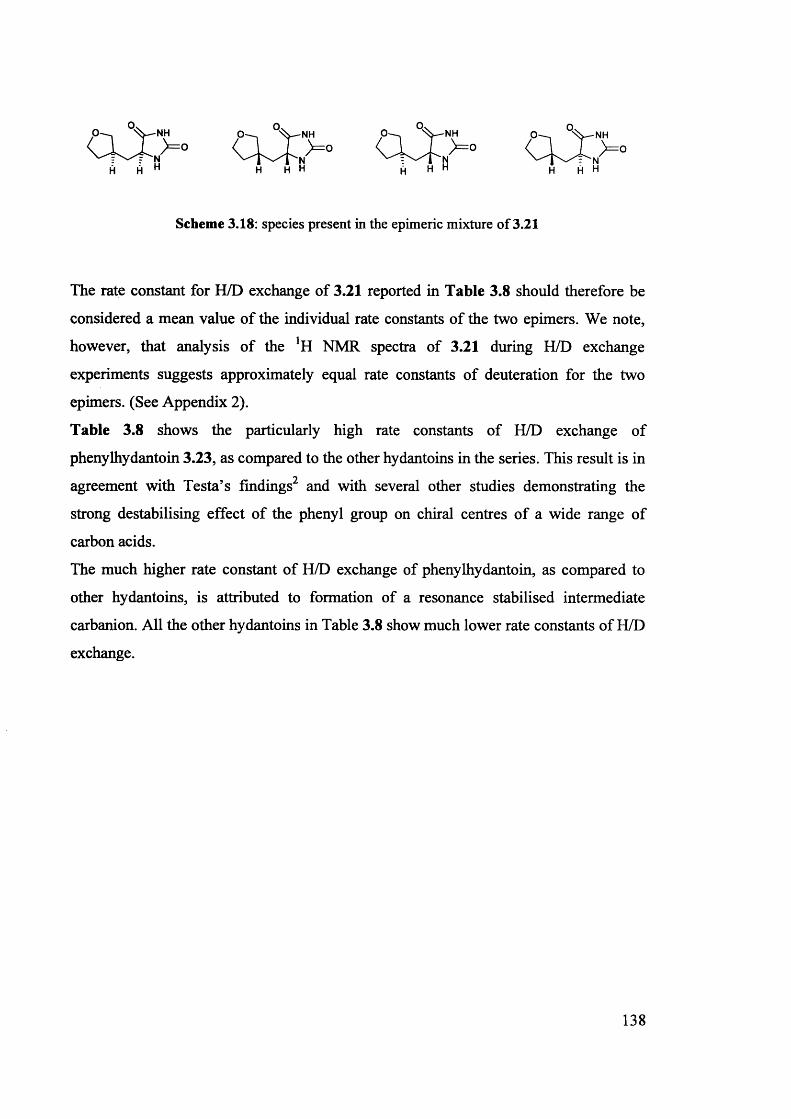
Scheme 3.18: species present in the epimeric mixture of 3.21
The rate constant for H/D exchange of 3.21 reported in Table 3.8 should therefore be
considered a mean value of the individual rate constants of the two epimers. We note,
however, that analysis of the *H NMR spectra of 3.21 during H/D exchange
experiments suggests approximately equal rate constants of deuteration for the two
epimers. (See Appendix 2).
Table 3.8 shows the particularly high rate constants of H/D exchange of
phenylhydantoin 3.23, as compared to the other hydantoins in the series. This result is in
agreement with Testa’s findings2 and with several other studies demonstrating the
strong destabilising effect of the phenyl group on chiral centres of a wide range of
carbon acids.
The much higher rate constant of H/D exchange of phenylhydantoin, as compared to
other hydantoins, is attributed to formation of a resonance stabilised intermediate
carbanion. All the other hydantoins in Table 3.8 show much lower rate constants of H/D
exchange.
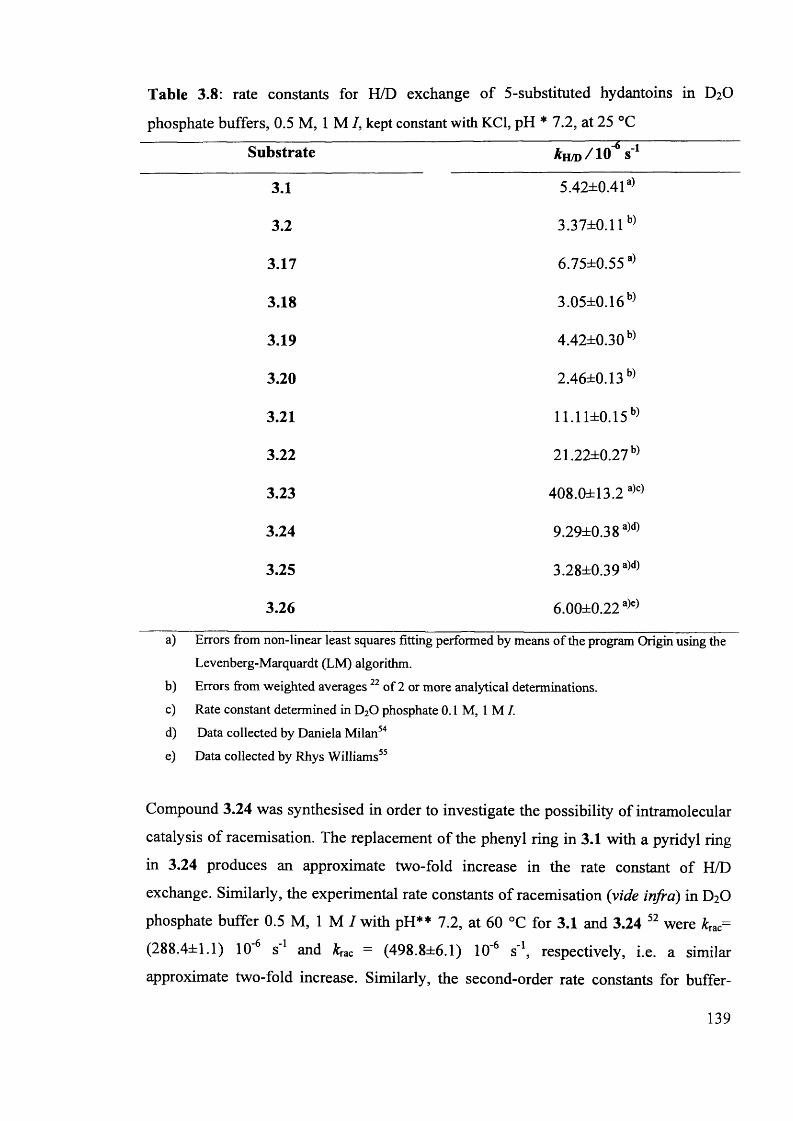
Table 3.8: rate constants for H/D exchange of 5-substituted hydantoins in D20
phosphate buffers, 0.5 M, 1 M I, kept constant with KC1, pH * 7.2, at 25 °C
Substrate kn/D /1 0 s 1
3.1 5.42±0.41a)
3.2 3.37±0.11b)
3.17 6.75±0.55a)
3.18 3.05±0.16b)
3.19 4.42±0.30b)
3.20 2.46±0.13b)
3.21 11.11±0.15b)
3.22 21.22±0.27b)
3.23 408.0±13.2a)c)
3.24 9.29±0.38a)d)
3.25 3.28±0.39a)d)
3.26 6.00±0 .2 2 a)e)
a) Errors from non-linear least squares fitting performed by means of the program Origin using theLevenberg-Marquardt (LM) algorithm.
b) Errors from weighted averages 22 of 2 or more analytical determinations.c) Rate constant determined in D20 phosphate 0.1 M, 1 M I.d) Data collected by Daniela Milan54e) Data collected by Rhys Williams55
Compound 3.24 was synthesised in order to investigate the possibility of intramolecular
catalysis of racemisation. The replacement of the phenyl ring in 3.1 with a pyridyl ring
in 3.24 produces an approximate two-fold increase in the rate constant of H/D
exchange. Similarly, the experimental rate constants of racemisation (vide infra) in D20
phosphate buffer 0.5 M, 1 M / with pH** 7.2, at 60 °C for 3.1 and 3.24 52 were kTac=
(288.4±1.1) 106 s 1 and kTac = (498.8±6.1) 10"6 s'1, respectively, i.e. a similar
approximate two-fold increase. Similarly, the second-order rate constants for buffer-
139
catalysed racemisation (phosphate tot) in D2O phosphate buffers at 1 M I at pH** 7.2 and
60 °C were phosphate tot = (542.2±2.5)10"6 s'1 M'1 and phosphate tot = (906.4±22.7)10'6
s"1 M’1 for 3.1 and 3.24 52, respectively. A pKa value of 5.97 is reported in the literature56
for 2-methyl and 2-ethyl pyridine. We therefore assume a similar pKa value for
protonation of the pyridine ring in hydantoin 3.24. Under the experimental conditions
chosen in our kinetic studies (buffered D2O with pH** 7.2) the pyridine ring in 3.24 is
therefore expected to be mainly deprotonated. The pyridine ring could therefore, at least
in principle, act as an additional catalyst for racemisation acting via an intramolecular
pathway. Considering the Bronsted p value of 0.59 for racemisation of (S)-5-cn
benzylhydantoin (see Chapter 2 and reference ) a local effective concentration ofCO
catalytic pyridyl groups of 10 M, and a pKa value of 5.97 for protonation of the
pyridyl group of 3.24, a rate constant for intramolecular catalysis of racemisation by the
pyridyl group of 960 1 O’6 s'1 was estimated. The linear fit of the experimental rate
constants of racemisation of 3.24 in D2O phosphate buffers at 60 °C plotted as a
function of buffer concentration gave a rate constant for the reaction not catalysed by
buffer of (41.1±6.6)10‘6 s’1. This value should include the contributions to racemisation
from all catalytic species present in solution, apart from the buffer, and therefore also
the contribution for hypothetical intramolecular catalysis by the pyridyl substituent. The
comparison of the experimental value of (41.1±6.6)10’6 s’1 with the estimated value of
960 1 O’6 s’1 for catalysis via hypothetical intramolecular catalysis of racemisation by the
pyridyl groups appears to exclude this hypothesis, or at least highlights that
intramolecular catalysis is not efficient.
A very small difference in configurational stability is observed when the phenyl ring of
3.1 is replaced with an A-methyl-pyrrolyl group (compound 3.26). The observed rate
constants for racemisation of 3.2655 in D2O 0.5 M phosphate buffer, 1 M I at pH** 7.2 ,
at 60 °C (&rac) and the second-order rate constant for buffer catalysed racemisation
(^phosphate tot) in D20 phosphate buffers were &rac= ( 3 0 3 .5 ± l . l ) 1 0 ’6 s'1 and phosphate tot =
(5 7 9 .1 ± 5 0 .1 )1 0 _6 s’1 M’1, respectively. These rate constants are similar in value to the
corresponding values found for 3.1 (vide supra and Table 3.9). Hydantoin 3.26 contains
an TV-methyl pyrrole in its structure. A pKa of ca. -10 is reported in the literature59 for
protonation of pyrrole at nitrogen. The very weak basicity of pyrrole indicates the
impossibility of the JV-methyl pyrrolyl moiety in 3.26 to act as an efficient
140
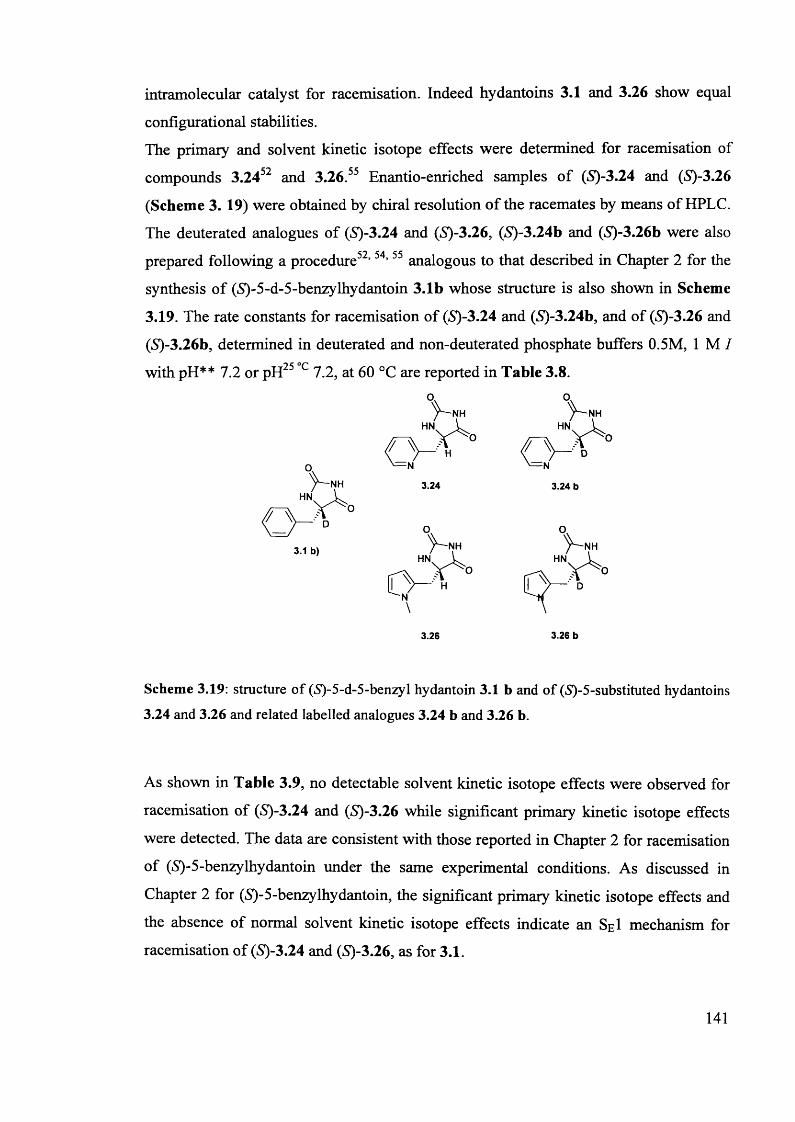
intramolecular catalyst for racemisation. Indeed hydantoins 3.1 and 3.26 show equal
configurational stabilities.
The primary and solvent kinetic isotope effects were determined for racemisation of
compounds 3.2452 and 3.26.55 Enantio-enriched samples of (S)-3.24 and (S)-3.26
(Scheme 3. 19) were obtained by chiral resolution of the racemates by means of HPLC.
The deuterated analogues of (iS)-3.24 and (£)-3.26, («S)-3.24b and (S)-3.26b were also
prepared following a procedure52,54,55 analogous to that described in Chapter 2 for the
synthesis of (S)-5-d-5-benzylhydantoin 3.1b whose structure is also shown in Scheme
3.19. The rate constants for racemisation of (S)-3.24 and (5)-3.24b, and of (S)-3.26 and
(S)-3.26b, determined in deuterated and non-deuterated phosphate buffers 0.5M, 1 M I
with pH** 7.2 or pH25 c 7.2, at 60 °C are reported in Table 3.8.o oy —NH NH
HN. L HN.
'/ V _ /v °H V V DO V = N \ = N
3.24 3.24 bHN
/ / \v _ . D
3.1 b)
O
\ \ y —NH y n h
HN. k HN.
H'N
\
3.26 3.26 b
Scheme 3.19: stmcture of (5)-5-d-5-benzyl hydantoin 3.1 b and of (S)-5-substituted hydantoins 3.24 and 3.26 and related labelled analogues 3.24 b and 3.26 b.
As shown in Table 3.9, no detectable solvent kinetic isotope effects were observed for
racemisation of (S)-3.24 and (S)-3.26 while significant primary kinetic isotope effects
were detected. The data are consistent with those reported in Chapter 2 for racemisation
of (S)-5-benzylhydantoin under the same experimental conditions. As discussed in
Chapter 2 for (S)-5-benzylhydantoin, the significant primary kinetic isotope effects and
the absence of normal solvent kinetic isotope effects indicate an SeI mechanism for
racemisation of (S>3.24 and (S)-3.26, as for 3.1.
141
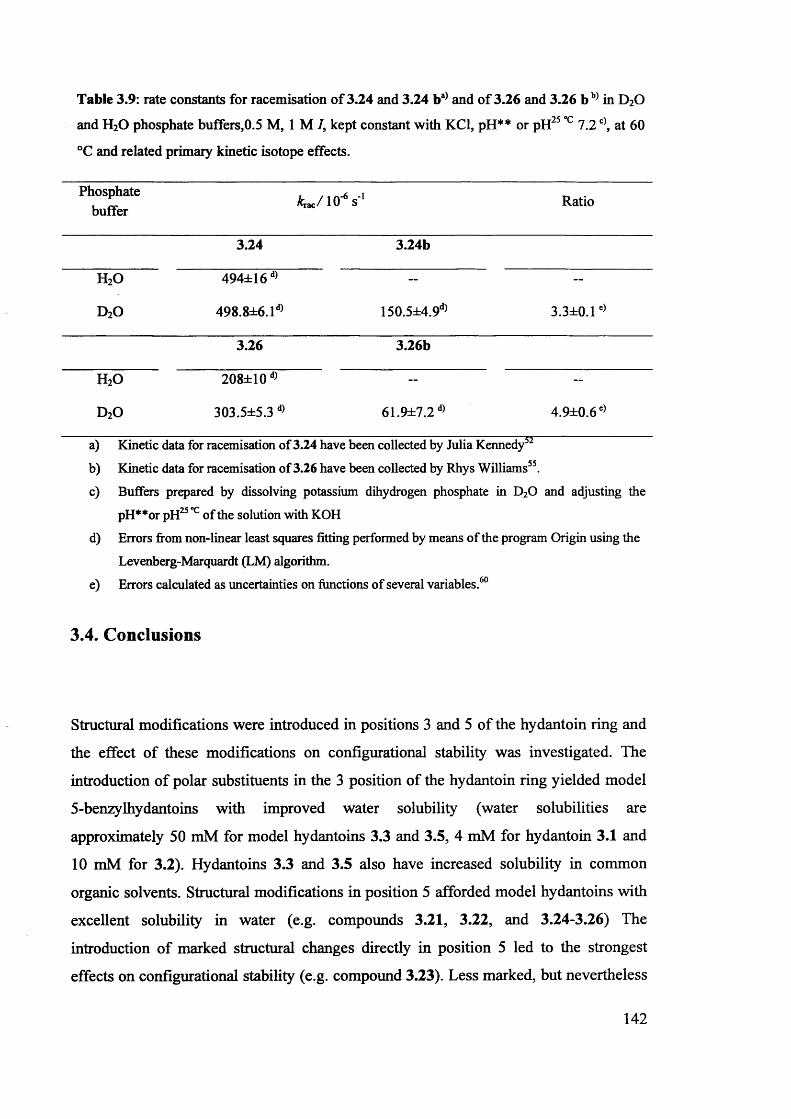
Table 3.9: rate constants for racemisation of 3.24 and 3.24 ba) and of 3.26 and 3.26 b b) in D20
and H20 phosphate buffers,0.5 M, 1 M 7, kept constant with KC1, pH** or pH25 °c 7.2c), at 60
°C and related primary kinetic isotope effects.
Phosphatebuffer fcrac/10-6 s*1 Ratio
3.24 3.24b
h2o 494±16d) — -
d 2o 498.8±6.1d) 150.5±4.9d) 3.3±0.1e)
3.26 3.26b
h 2o 208±10d) - -
d 2o 303.5±5.3 d) 61.9±7.2d)
S_____________T .r_________________________________________1 .51
4.9±0.6e)....... - . . . . . . ■. .i ■ ... . . . .
a) Kinetic data for racemisation of 3.24 have been collected by Julia Kennedyb) Kinetic data for racemisation of 3.26 have been collected by Rhys Williams55.c) Buffers prepared by dissolving potassium dihydrogen phosphate in D20 and adjusting the
pH**or pH25 °c of the solution with KOHd) Errors from non-linear least squares fitting performed by means of the program Origin using the
Levenberg-Marquardt (LM) algorithm.e) Errors calculated as uncertainties on functions of several variables.60
3.4. Conclusions
Structural modifications were introduced in positions 3 and 5 of the hydantoin ring and
the effect of these modifications on configurational stability was investigated. The
introduction of polar substituents in the 3 position of the hydantoin ring yielded model
5-benzylhydantoins with improved water solubility (water solubilities are
approximately 50 mM for model hydantoins 3.3 and 3.5, 4 mM for hydantoin 3.1 and
10 mM for 3.2). Hydantoins 3.3 and 3.5 also have increased solubility in common
organic solvents. Structural modifications in position 5 afforded model hydantoins with
excellent solubility in water (e.g. compounds 3.21, 3.22, and 3.24-3.26) The
introduction of marked structural changes directly in position 5 led to the strongest
effects on configurational stability (e.g. compound 3.23). Less marked, but nevertheless
142
evident effects were observed when structural modification was introduced in position (3
with respect to the chiral centre (e.g. compounds 3.21, 3.22, 3.24, 3.25). Small
differences in the rate constants of H/D in further positions (e.g. compounds 3.17-3.20)
or upon replacement of the phenyl ring in 3.1 with an N-methyl-pyrrolyl group (e.g.
compound 3.26) were observed.
Some of the structural modifications in position 3 of the hydantoin ring led to
remarkably big changes in the rate constants of racemisation, even if the site of
differentiation involved positions far from the chiral centre. The hypothesis of
intramolecular facilitation has been proposed to explain unusually high rates of
racemisation and H/D exchange of 3 substituted benzylhydantoins 3.4 and 3.5,
containing amino and ammonium groups. The positive charges on the ammonium group
of 3.5 and on the protonated amino group of 3.4 could stabilise, via through-space
electrostatic interactions, the developing negative charges on the asymmetric carbons of
3.5 and 3.4, respectively. Literature and experimental data supporting the hypothesis of
intramolecular facilitation of H/D exchange for 3.4 and 3.5 are reported. The possibility
of intramolecular base-catalysis of racemisation has been investigated by comparing the
configurational stability of the model compound 3.26, containing a pyridyl substituent
in its structure, with that of («S)-5-benzylhydantoin 3.1. The small value of the intercept
of the straight line fit obtained by plotting the rate constants of racemisation of 3.26
against the concentration of the buffer excludes the hypothesis of efficient
intramolecular general-base catalysis in this compound. Marked primary kinetic isotope
effects and the absence of solvent kinetic isotope effects were observed for racemisation
of hydantoins 3.24 and 3.26, as for hydantoin 3.1. The finding indicates an SeI
mechanism for racemisation of the two compounds, as was also found for racemisation
of hydantoin 3.1 (Chapter2).
143
3.5. Experimental Part 1
Materials
All solvents, drying agents, inorganic acids and bases were Laboratory Reagent Grade
and were purchased from Fisher Scientific unless otherwise stated. All dry solvents
were dried using an MB SPS-800 solvent purification system. All materials were used
without further purification. (S) -methy l-2-amino-3 -pheny lpropanoate, 3-
methoxypropan-1-amine, A^^-dimethylethane- 1,2-diamine, triethylamine,
iodomethane, triethanolamine, palladium on activated carbon (5 weight %), 3,4-
dihydro-2H-pyran, tetrahydrofuran-3-carboxaldehyde, formaldehyde (37% solution in
water) and (i?)-2-amino-2-phenyl acetamide hydrochloride were from Sigma-Aldrich.
Carbonyldiimidazole, hydantoin, 4-methoxy-benzaldehyde, 4-fluoro-benzaldehyde,
(DZ)-Serine methyl ester hydrochloride and pyrrolidine were from Alfa-Aesar.
Triphosgene and pyridinium 4-toluenesulfonate were from Acros Organics.
Chromatography
Column chromatography purifications were carried out on Silica 60 A, particle size 35-
70 micron or Florosil, 60-100 mesh. Filtrations were carried out on medium fast speed
filter paper or on celite kieselgur, white (general purpose grade), unless otherwise
stated. Silica and celite were from Fisher Scientific. Florosil was obtained from Alfa
Aesar. Separations by HPLC were carried out on an Agilent HPLC system 1200 series
equipped with a 1200 Series quaternary pump, a 1200 Series diode array detector, a
1200 Series vacuum degasser and a 1200 Series preparative autosampler. HPLC grade
solvents were purchased from Fisher Scientific.
NMR Spectroscopy
*H NMR spectra were recorded on a Bruker AVANCE 400 or a Bruker AVANCE 5001 spectrometers at 400 or 500 MHz respectively. C NMR spectra were recorded on the
same instruments as !H NMR spectra, at 13C resonance frequencies of 101 MHz (Bruker144
AVANCE 400) and 126 MHz (Bruker AVANCE 500). Coupling constants are reported
in hertz (Hz). Chemical shifts are reported in parts per million (8) and are referenced to
the residual *H and 13C signal of the NMR solvent used in !H NMR and 13C NMR
spectra, respectively. Dimethylsulfoxide-d6 (D 99.9%) was purchased from Cambridge
Isotope Laboratories, inc, chloroform-d (H2O<0.01%, 99.80 %D), acetone-d6
(H2O+D2O <0.02%, 99.80 %D) and methanol-d* (HOD+D2CXO.O3 %) were from
EURISO-TOP, Deuterium oxide (99.9%) was obtained from Fluorochem.
Mass spectrometry
Molecular masses were determined from high resolution mass spectra (HRMS). The
spectra were recorded on a Waters GCT Premier XE GCMS spectrometer. El (electron
impact) was used as ionisation method, unless otherwise stated. Molecular masses could
not be determined for molecules where fragmentations could not be avoided. Fragment
masses of particular diagnostic relevance are reported instead, when they were detected.
IR spectroscopy
IR spectra were recorded on a Varian Excalibur Spectrometer (FTS 7000) equipped
with a SensIR ATR accessory (attenuated total reflectance Fourier transform infrared
(ATR FT-IR) spectra), a Deuterated Tri-Glycine Sulfate (DTGS) detector and a liquid
nitrogen cooled Cryogenic Mercury Cadmium Telluride (MCT) detector. A CaF2 cell,
100 pm path length, was used for spectra in D20 solution.
Melting points
Melting points were recorded on a Stuart Melting point SMP11. Thermometers were
Brannan LO-tox with temperature range 0-300 °C, division 1 °C.
145
Polarimetry
Specific optical activities [or£ were determined by means of an Optical Activity Ltd.
AA-1000 polarimeter in a 5.00 cm path length glass cell. D refers to the D line of the
emission spectrum of sodium (>-=589 nm). Approximate optical purities were calculated
based on literature values of specific optical activities of enantiopure compounds, when
available. Solvent and concentration (expressed in g/100 ml) of the solutions used for
the measurements are reported in the individual sections.
Methods
General methods were used to prepare more than one compound.
Method 3.1: synthesis of a-amino amides 3.6 and 3.7: (S)-methyl-2-amino-3-
phenylpropanoate hydrochloride was stirred for five minutes with a 4 M solution of
sodium carbonate in a round bottom flask. The mixture was extracted with chloroform,
the combined organic extracts were dried over anhydrous Na2SC>4 and the solvent
evaporated. (S)-methyl-2-amino-3-phenylpropanoate was recovered as yellow oil (yield:
95%). Dry methanol and the alkylamines were added to (S)-methyl-2-amino-3-
phenylpropanoate and the reaction mixtures were stirred at room temperature for five
days. Solvent and residual amines were then evaporated.
Method 3.2: Synthesis of (Z)-5-benzylideneimidazolidine-2,4-diones 3.27-3.30 and
(Z)-5-((tetrahydrofuran-3-yl) methylene) imidazolidine-2,4-dione 3.31: hydantoin
(compounds 3.27, 3.29, 3.31) or A-methylhydantoin (compounds 3.28 and 3.30) was
dissolved in water (10 ml per gram of hydantoin) in a round bottom flask at 70 °C with
stirring. The pH was adjusted to 7 with few drops of a saturated solution of NaHCCL.
Triethanolamine was added to the solution of hydantoin. A solution of aldehyde in
ethanol (3 ml per gram of aldehyde), was then added dropwise and the temperature
raised to reflux. The reaction mixture was kept under reflux for approximately 24 hours.
The mixture was then allowed to cool down and the product recovered by filtration or
146
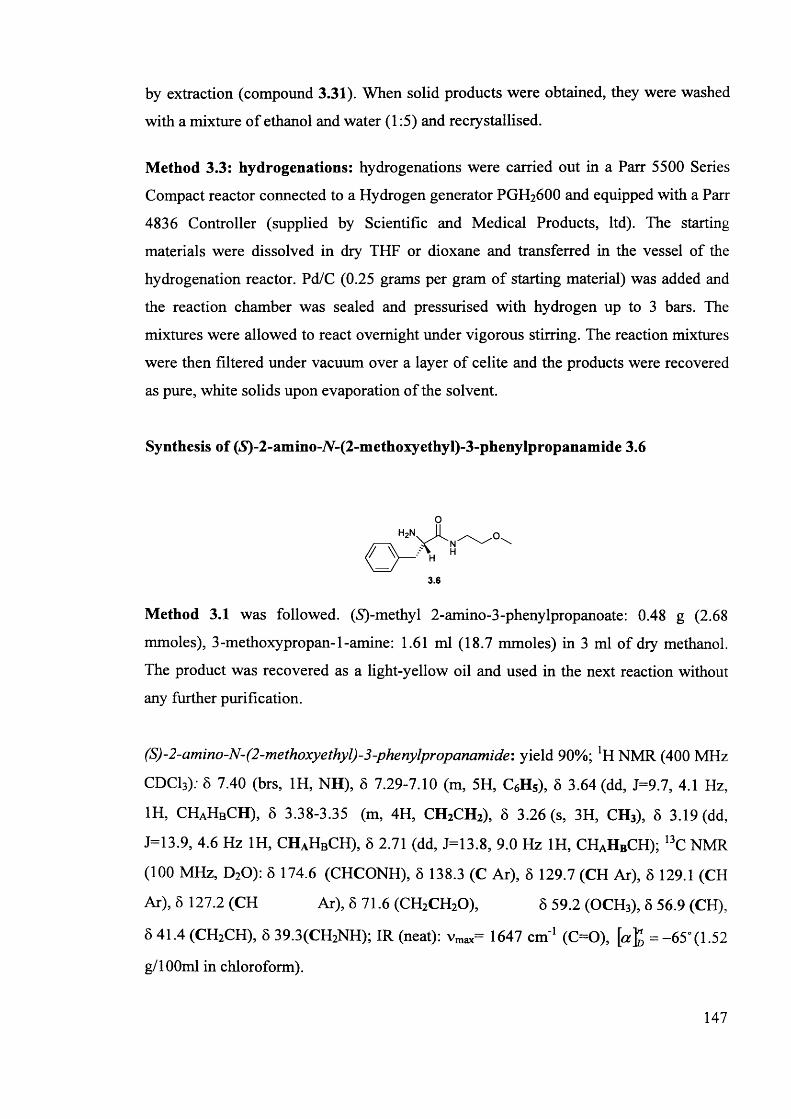
by extraction (compound 3.31). When solid products were obtained, they were washed
with a mixture of ethanol and water (1:5) and recrystallised.
Method 3.3: hydrogenations: hydrogenations were carried out in a Parr 5500 Series
Compact reactor connected to a Hydrogen generator PGH26OO and equipped with a Pan-
4836 Controller (supplied by Scientific and Medical Products, ltd). The starting
materials were dissolved in dry THF or dioxane and transferred in the vessel of the
hydrogenation reactor. Pd/C (0.25 grams per gram of starting material) was added and
the reaction chamber was sealed and pressurised with hydrogen up to 3 bars. The
mixtures were allowed to react overnight under vigorous stirring. The reaction mixtures
were then filtered under vacuum over a layer of celite and the products were recovered
as pure, white solids upon evaporation of the solvent.
Synthesis of (£)-2-ammo-7V-(2-methoxyethyl)-3-phenylpropanamide 3.6
H H
3.6
Method 3.1 was followed. (S)-methyl 2-amino-3-phenylpropanoate: 0.48 g (2.68
mmoles), 3-methoxypropan-l-amine: 1.61 ml (18.7 mmoles) in 3 ml of dry methanol.
The product was recovered as a light-yellow oil and used in the next reaction without
any further purification.
(S)-2-amino-N-(2-methoxyethyI)-3-phenylpropanamide: yield 90%; [H NMR (400 MHz
CDCI3): 5 7.40 (brs, 1H, NH), 6 7.29-7.10 (m, 5H, C6H5), 6 3.64 (dd, J=9.7, 4.1 Hz,
1H, CHaHbCH), 5 3.38-3.35 (m, 4H, CH2CH2), 5 3.26 (s, 3H, CH3), 5 3.19 (dd,
J=13.9, 4.6 Hz 1H, CHaHbCH), 6 2.71 (dd, J=13.8, 9.0 Hz 1H, CHAHBCH); 13C NMR
(100 MHz, D20): 5 174.6 (CHCONH), 6 138.3 (C Ar), 6 129.7 (CH Ar), 6 129.1 (CH
Ar), 5 127.2 (CH Ar), 6 71.6 (CH2CH20), 6 59.2 (OCH3), 5 56.9 (CH),
6 41.4 (CH2CH), 8 39.3(CH2NH); IR (neat): vmax= 1647 cm'1 (C=0), [<2 ]J =-65° (1.52
g/lOOml in chloroform).
147
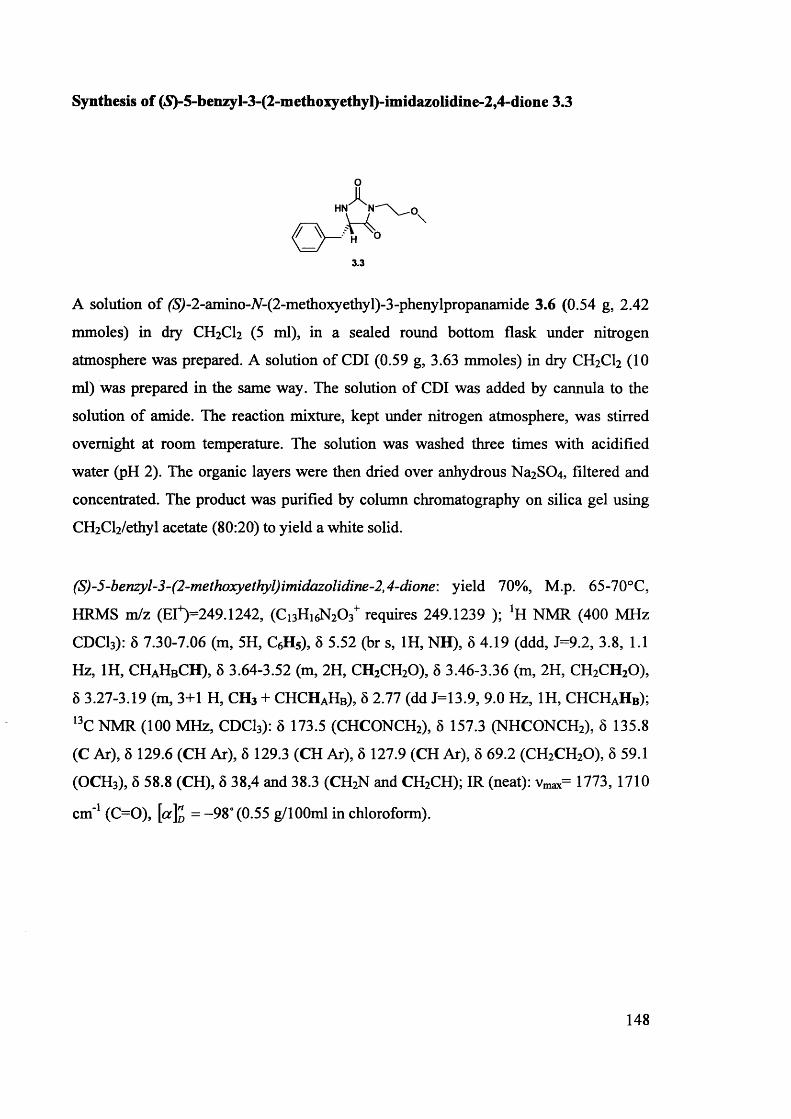
Synthesis of (S)-5-benzyl-3-(2-methoxyethyl)-imidazolidine-2,4-dione 3.3
o
3.3
A solution of f5^-2-amino-AL(2-methoxyethyl)-3-phenylpropanamide 3.6 (0.54 g, 2.42
mmoles) in dry CH2CI2 (5 ml), in a sealed round bottom flask under nitrogen
atmosphere was prepared. A solution of CDI (0.59 g, 3.63 mmoles) in dry CH2CI2 (10
ml) was prepared in the same way. The solution of CDI was added by cannula to the
solution of amide. The reaction mixture, kept under nitrogen atmosphere, was stirred
overnight at room temperature. The solution was washed three times with acidified
water (pH 2). The organic layers were then dried over anhydrous Na2SC>4, filtered and
concentrated. The product was purified by column chromatography on silica gel using
CH2Cl2/ethyl acetate (80:20) to yield a white solid.
(S)-5-benzyl-3-(2-methoxyethyl)imidazolidine-2,4-dione: yield 70%, M.p. 65-70°C,
HRMS m/z (E IV 249.1242, ( c 13Hi6N203+ requires 249.1239 ); !H NMR (400 MHz
CDCI3): 5 7.30-7.06 (m, 5H, C6H5), 5 5.52 (br s, 1H, NH), 5 4.19 (ddd, J=9.2, 3.8, 1.1
Hz, 1H, CHaHbCH), 5 3.64-3.52 (m, 2H, CH2CH20), 5 3.46-3.36 (m, 2H, CH2CH20),
5 3.27-3.19 (m, 3+1 H, CH3 + CHCHAHB), 5 2.77 (dd J=13.9, 9.0 Hz, 1H, CHCHAHB);
13C NMR (100 MHz, CDC13): 5 173.5 (CHCONCH2), 5 157.3 (NHCONCH2), 5 135.8
(C Ar), 5 129.6 (CH Ar), 5 129.3 (CH Ar), 5 127.9 (CH Ar), 5 69.2 (CH2CH20), 5 59.1
(OCH3), 5 58.8 (CH), 6 38,4 and 38.3 (CH2N and CH2CH); IR (neat): vmax= 1773, 1710
cm'1 (C=0), [a]^ = -98° (0.55 g/lOOml in chloroform).
148
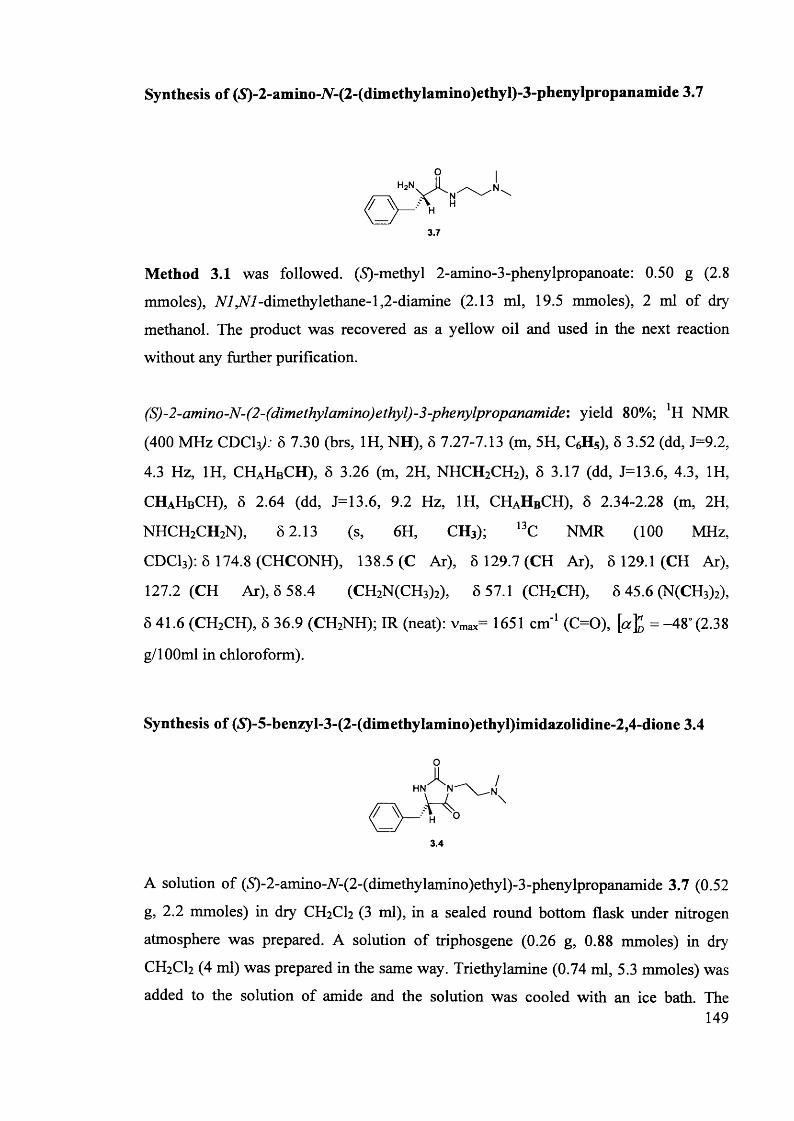
Synthesis of (S)-2-amino-A-(2-(diniethylamino)ethyl)-3-phenylpropanamide 3.7
3.7
Method 3.1 was followed. (S)-methyl 2-amino-3-phenylpropanoate: 0.50 g (2.8
mmoles), N1 JSll-dimethylethane- 1,2-diamine (2.13 ml, 19.5 mmoles), 2 ml of dry
methanol. The product was recovered as a yellow oil and used in the next reaction
without any further purification.
(S)-2-amino-N-(2-(dimethylamino)ethyl)-3-phenylpropanamide: yield 80%; lH NMR
(400 MHz CDC13;.‘ 8 7.30 (brs, 1H, NH), 5 7.27-7.13 (m, 5H, C6H5), 5 3.52 (dd, J=9.2,
4.3 Hz, 1H, CHaHbCH), 5 3.26 (m, 2H, NHCH2CH2), 8 3.17 (dd, J=13.6, 4.3, 1H,
CHaHbCH), 8 2.64 (dd, J=13.6, 9.2 Hz, 1H, CHAHBCH), 8 2.34-2.28 (m, 2H,
NHCH2CH2N), 8 2.13 (s, 6H, CH3); 13C NMR (100 MHz,
CDC13): 8 174.8 (CHCONH), 138.5 (C Ar), 8 129.7 (CH Ar), 8 129.1 (CH Ar),
127.2 (CH Ar), 8 58.4 (CH2N(CH3)2), 5 57.1 (CH2CH), 5 45.6 (N(CH3)2),
5 41.6 (CH2CH), 5 36.9 (CH2NH); IR (neat): vmax= 1651 cm'1 (C=0), [a £ = -48° (2.38
g/100ml in chloroform).
Synthesis of (5r)-5-benzyl-3-(2-(dimethyIamino)ethyl)imidazolidine-2,4-dione 3.4
o
3.4
A solution of (iS)-2-amino-7V-(2-(dimethylamino)ethyl)-3-phenylpropanamide 3.7 (0.52
g, 2.2 mmoles) in dry CH2C12 (3 ml), in a sealed round bottom flask under nitrogen
atmosphere was prepared. A solution of triphosgene (0.26 g, 0.88 mmoles) in dry
CH2C12 (4 ml) was prepared in the same way. Triethylamine (0.74 ml, 5.3 mmoles) was
added to the solution of amide and the solution was cooled with an ice bath. The149
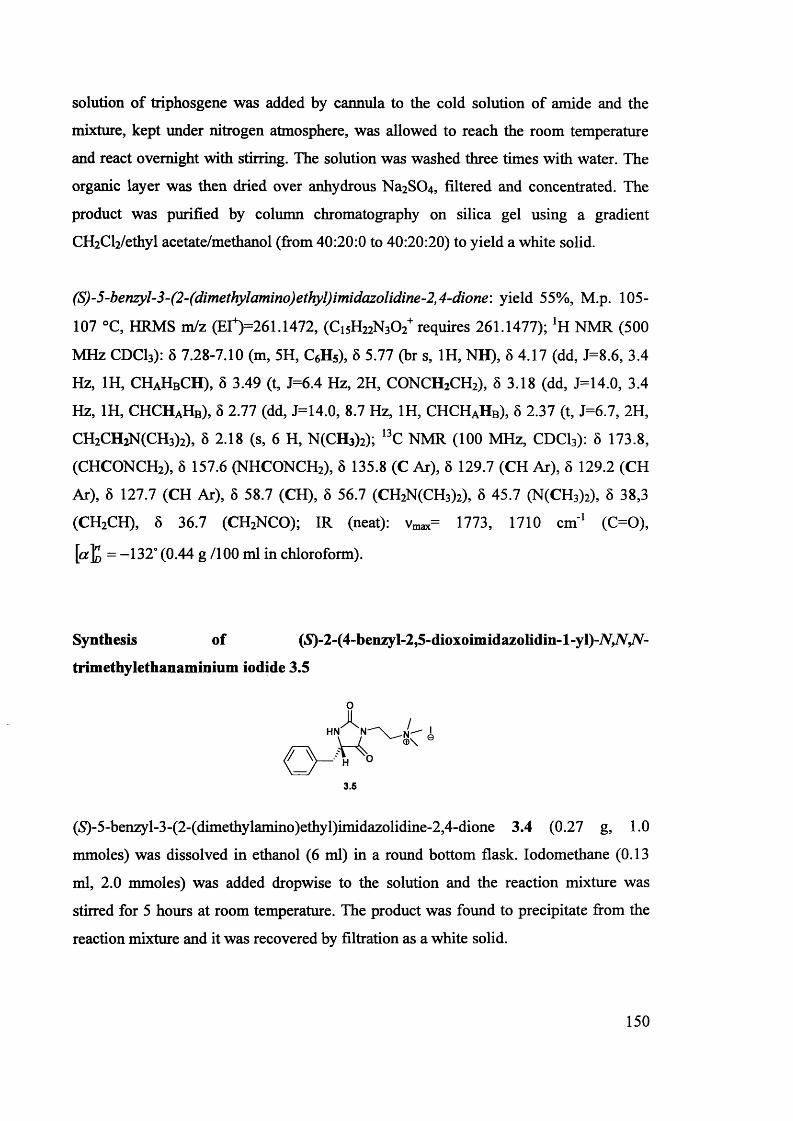
solution of triphosgene was added by cannula to the cold solution of amide and the
mixture, kept under nitrogen atmosphere, was allowed to reach the room temperature
and react overnight with stirring. The solution was washed three times with water. The
organic layer was then dried over anhydrous Na2S04 , filtered and concentrated. The
product was purified by column chromatography on silica gel using a gradient
CH2Cl2/ethyl acetate/methanol (from 40:20:0 to 40:20:20) to yield a white solid.
(S)-5-benzyl-3-(2-(dimethylamino)ethyl)imidazolidine-2)4-dione\ yield 55%, M.p. 105-
107 °C, HRMS m/z (EIV261.1472, (Ci5H22N30 2+ requires 261.1477); *H NMR (500
MHz CDC13): 8 7.28-7.10 (m, 5H, C6H5), 5 5.77 (br s, 1H, NH), 5 4.17 (dd, J=8.6, 3.4
Hz, 1H, CHaHbCH), 8 3.49 (t, J=6.4 Hz, 2H, CONCH2CH2), 8 3.18 (dd, J=14.0, 3.4
Hz, 1H, CHCHaHb), 8 2.77 (dd, J=14.0, 8.7 Hz, 1H, CHCHAHB), 8 2.37 (t, J=6.7, 2H,
CH2CH2N(CH3)2), 8 2.18 (s, 6 H, N(CH3)2); l3C NMR (100 MHz, CDC13): 8 173.8,
(CHCONCH2), 8 157.6 (NHCONCH2), 8 135.8 (C Ar), 8 129.7 (CH Ar), 8 129.2 (CH
Ar), 8 127.7 (CH Ar), 8 58.7 (CH), 8 56.7 (CH2N(CH3)2), 8 45.7 (N(CH3)2), 8 38,3
(CH2CH), 8 36.7 (CH2NCO); IR (neat): vmax= 1773, 1710 cm'1 (C=0),
[a lo = ” 132° (0.44 g /100 ml in chloroform).
Synthesis of («S)-2-(4-benzy 1-2,5-dioxoim idazolidin-l-y l)-AyvyV"
trimethylethanaminium iodide 3.5
A ,HN N " " \ 1® \
3.5
(iS)-5-benzyl-3-(2-(dimethylamino)ethyl)imidazolidine-2,4-dione 3.4 (0.27 g, 1.0
mmoles) was dissolved in ethanol (6 ml) in a round bottom flask. Iodomethane (0.13
ml, 2.0 mmoles) was added dropwise to the solution and the reaction mixture was
stirred for 5 hours at room temperature. The product was found to precipitate from the
reaction mixture and it was recovered by filtration as a white solid.
150
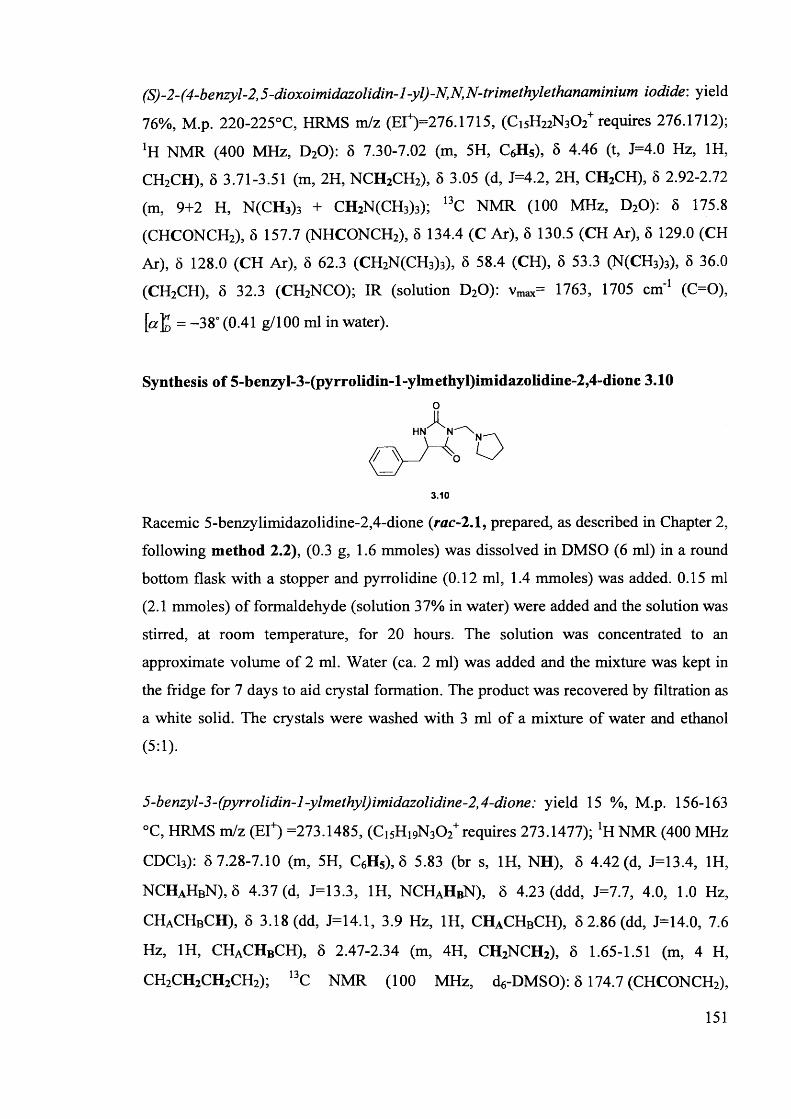
(S)-2-(4-benzyl-2,5-dioxoimidazolidin-l-yl)-N,N,N-trimethylethanaminium iodide: yield
76%, M.p. 220-225°C, HRMS m/z (Efl)=276.1715, (Ci5H22N3C>2+ requires 276.1712);
'H NMR (400 MHz, D20): 8 7.30-7.02 (m, 5H, C6H5), 8 4.46 (t, J=4.0 Hz, 1H,
CH2CH), 8 3.71-3.51 (m, 2H, NCH2CH2), 8 3.05 (d, J=4.2, 2H, CH2CH), 8 2.92-2.72
(m, 9+2 H, N(CH3)3 + CH2N(CH3)3); 13C NMR (100 MHz, D20): 8 175.8
(CHCONCH2), 8 157.7 (NHCONCH2), 8 134.4 (C Ar), 8 130.5 (CH Ar), 8 129.0 (CH
Ar), 8 128.0 (CH Ar), 8 62.3 (CH2N(CH3)3), 8 58.4 (CH), 8 53.3 (N(CH3)3), 8 36.0
(CH2CH), 8 32.3 (CH2NCO); IR (solution D20); vmax= 1763, 1705 cm-1 (C=0),
[«]J = -38° (0.41 g/100 ml in water).
Synthesis of 5-benzyl-3-(pyrroIidin-l-ylmethyl)imidazolidine-2,4-dione 3.10o
3.10
Racemic 5-benzylimidazolidine-2,4-dione (rac-2.1, prepared, as described in Chapter 2,
following method 2.2), (0.3 g, 1.6 mmoles) was dissolved in DMSO (6 ml) in a round
bottom flask with a stopper and pyrrolidine (0.12 ml, 1.4 mmoles) was added. 0.15 ml
(2.1 mmoles) of formaldehyde (solution 37% in water) were added and the solution was
stirred, at room temperature, for 20 hours. The solution was concentrated to an
approximate volume of 2 ml. Water (ca. 2 ml) was added and the mixture was kept in
the fridge for 7 days to aid crystal formation. The product was recovered by filtration as
a white solid. The crystals were washed with 3 ml of a mixture of water and ethanol
(5:1).
5-benzyl-3-(pyrrolidin-l-ylmethyl)imidazolidine-2,4-dione: yield 15 %, M.p. 156-163
°C, HRMS m/z (EI+) =273.1485, (Ci5Hi9N30 2+requires 273.1477); 'H NMR (400 MHz
CDC13): 8 7.28-7.10 (m, 5H, C6HS), 5 5.83 (br s, 1H, NH), 8 4.42 (d, J=13.4, 1H,
NCHAHBN), 8 4.37 (d, J=13.3, 1H, NCHaHbN), 8 4.23 (ddd, J=7.7, 4.0, 1.0 Hz,
CHaCHbCH), 8 3.18 (dd, J=14.1, 3.9 Hz, 1H, CHACHBCH), 8 2.86(dd, J=14.0, 7.6
Hz, 1H, CHaCHbCH), 8 2.47-2.34 (m, 4H, CHjNCHj), 8 1.65-1.51 (m, 4 H,
CH2CH2CH2CH2); 13C NMR (100 MHz, d6-DMSO): 8 174.7 (CHCONCH2),
151
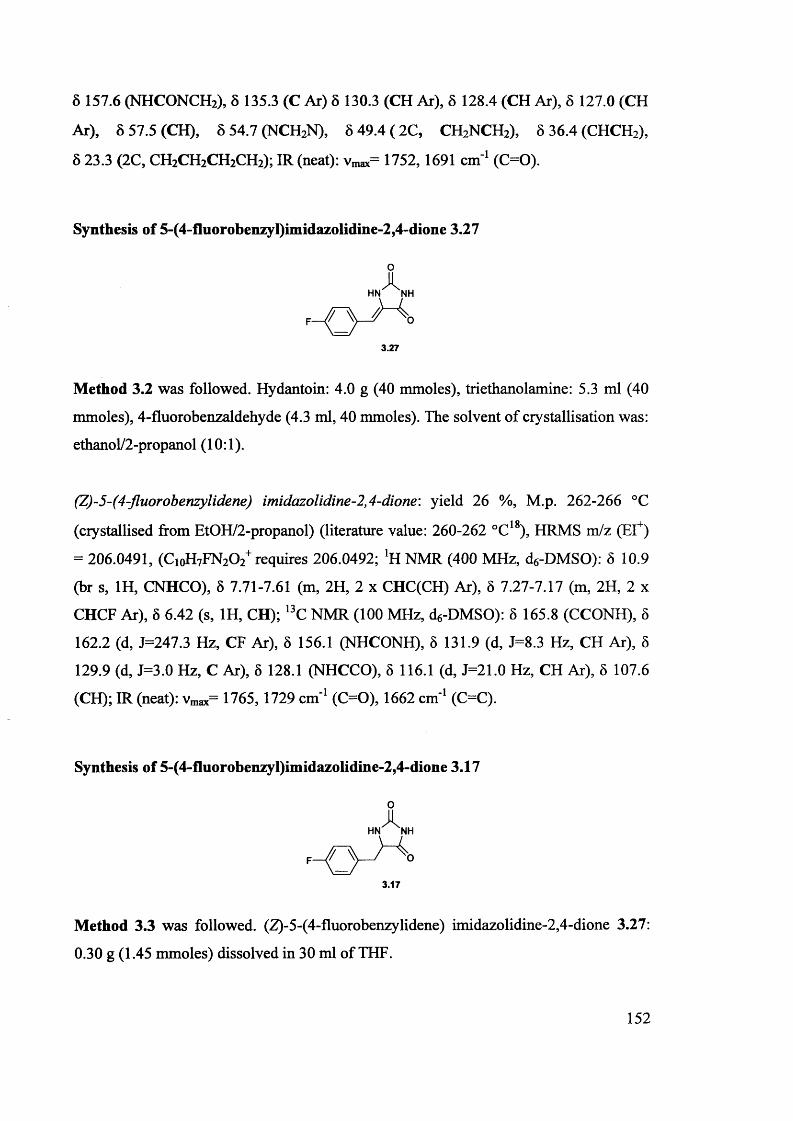
8 157.6 (NHCONCH2), 8 135.3 (C Ar) 8 130.3 (CH Ar), 8 128.4 (CH Ar), 8 127.0 (CH
Ar), 8 57.5 (CH), 8 54.7 (NCH2N), S49.4(2C, CH2NCH2), 8 36.4 (CHCH2),
8 23.3 (2C, CH2CH2CH2CH2); IR (neat): vmax= 1752,1691 cm 1 (C=0).
Synthesis of 5-(4-fluorobenzyl)imidazolidine-2,4-dione 3.27
oxHN NH
3.27
Method 3.2 was followed. Hydantoin: 4.0 g (40 mmoles), triethanolamine: 5.3 ml (40
mmoles), 4-fluorobenzaldehyde (4.3 ml, 40 mmoles). The solvent of crystallisation was:
ethanol/2-propanol (10:1).
(Z)-5-(4-fluorobenzylidene) imidazolidine-2,4-dione: yield 26 %, M.p. 262-266 °C
(crystallised from EtOH/2-propanol) (literature value: 260-262 °C18), HRMS m/z (EI+)
= 206.0491, (CioH7FN202+requires 206.0492; 'H NMR (400 MHz, d6-DMSO): 6 10.9
(br s, 1H, CNHCO), 5 7.71-7.61 (m, 2H, 2 x CHC(CH) Ar), 5 7.27-7.17 (m, 2H, 2 x
CHCF Ar), 8 6.42 (s, 1H, CH); 13C NMR (100 MHz, d6-DMSO): 5 165.8 (CCONH), 8
162.2 (d, J=247.3 Hz, CF Ar), 8 156.1 (NHCONH), 8 131.9 (d, J=8.3 Hz, CH Ar), 8
129.9 (d, J=3.0 Hz, C Ar), 8 128.1 (NHCCO), 8 116.1 (d, J=21.0 Hz, CH Ar), 8 107.6
(CH); IR (neat): vmax= 1765,1729 cm'1 (C=0), 1662 cm'1 (C=C).
Synthesis of 5-(4-fluorobenzyl)imidazolidine-2,4-dione 3.17
ox
HN NH
3.17
Method 3.3 was followed. (Z)-5-(4-fluorobenzylidene) imidazolidine-2,4-dione 3.27:
0.30 g (1.45 mmoles) dissolved in 30 ml of THE.
152
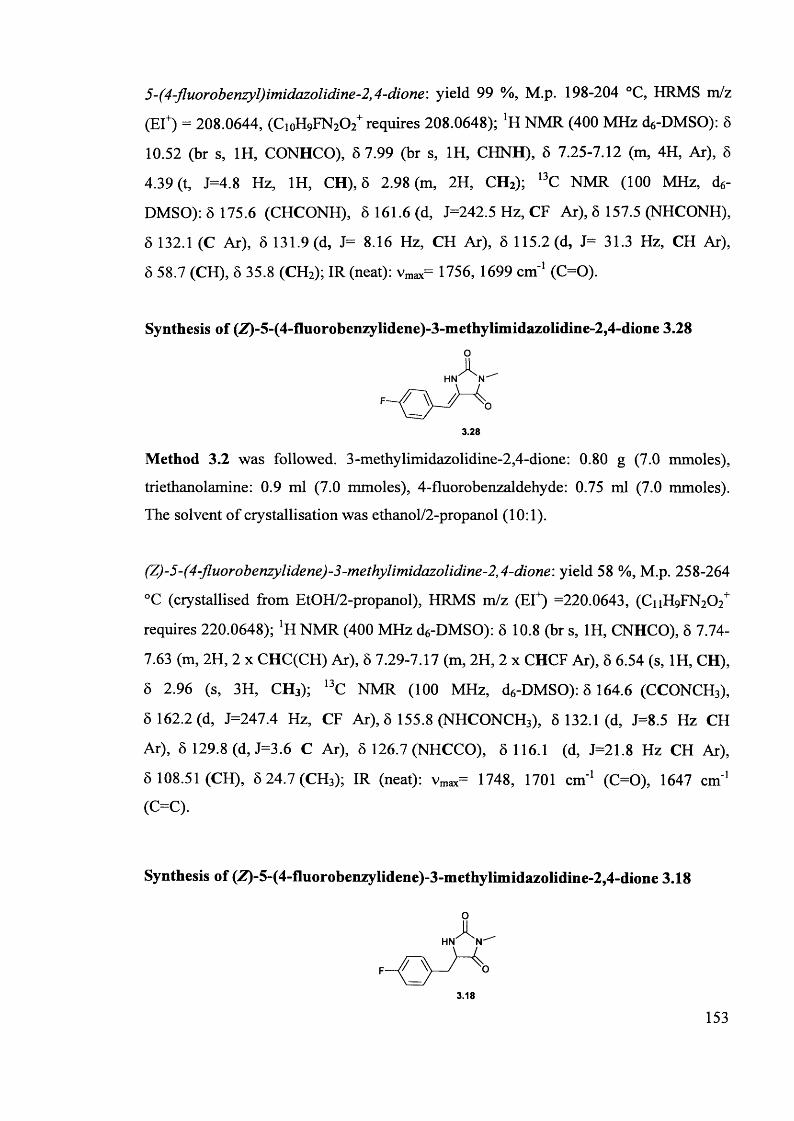
5-(4-fluorobenzyl)imidazolidine-2,4-dione: yield 99 %, M.p. 198-204 °C, HRMS m/z
(El4) = 208.0644, (CioH9FN202+ requires 208.0648); ‘H NMR (400 MHz dc-DMSO): 5
10.52 (br s, 1H, CONHCO), 5 7.99 (br s, 1H, CHNH), S 7.25-7.12 (m, 4H, Ar), 5
4.39 (t, J=4.8 Hz, 1H, CH), 5 2.98 (m, 2H, CH2); 13C NMR (100 MHz, d6-
DMSO): 5 175.6 (CHCONH), 8 161.6 (d, J=242.5 Hz, CF Ar), 5 157.5 (NHCONH),
5 132.1 (C Ar), 8 131.9 (d, J= 8.16 Hz, CH Ar), 5 115.2(d, J= 31.3 Hz, CH Ar),
8 58.7 (CH), 5 35.8 (CH2); IR(neat): vmax= 1756, 1699 cm'1 (C=0).
Synthesis of (Z)-5-(4-fluorobenzylidene)-3-methylimidazolidme-2,4-dione 3.28o
xHN N""
3.28
Method 3.2 was followed. 3-methylimidazolidine-2,4-dione: 0.80 g (7.0 mmoles),
triethanolamine: 0.9 ml (7.0 mmoles), 4-fluorobenzaldehyde: 0.75 ml (7.0 mmoles).
The solvent of crystallisation was ethanol/2-propanol (10:1).
(Z)-5-(4-fluorobenzylidene)-3-methylimidazolidine-2,4-dione: yield 58 %, M.p. 258-264
°C (crystallised from EtOH/2-propanol), HRMS m/z (El*) =220.0643, (CnHgF^C^*
requires 220.0648); 'H NMR (400 MHz d6-DMSO): 8 10.8 (br s, 1H, CNHCO), 5 7.74-
7.63 (m, 2H, 2 x CHC(CH) Ar), 5 7.29-7.17 (m, 2H, 2 x CHCF Ar), 8 6.54 (s, 1H, CH),
5 2.96 (s, 3H, CH3); 13C NMR (100 MHz, d6-DMSO): 8164.6 (CCONCH3),
5 162.2 (d, J=247.4 Hz, CF Ar), 8 155.8 (NHCONCH3), 8 132.1 (d, J=8.5 Hz CH
Ar), 5 129.8 (d, J=3.6 C Ar), 6 126.7 (NHCCO), 5 116.1 (d, J=21.8 Hz CH Ar),
5 108.51 (CH), 5 24.7 (CH3); IR (neat): vmax= 1748, 1701 cm'1 (C=0), 1647 cm'1
(C=C).
Synthesis of (£)-5-(4-fluorobenzylidene)-3-methylimidazolidine-2,4-dione 3.18
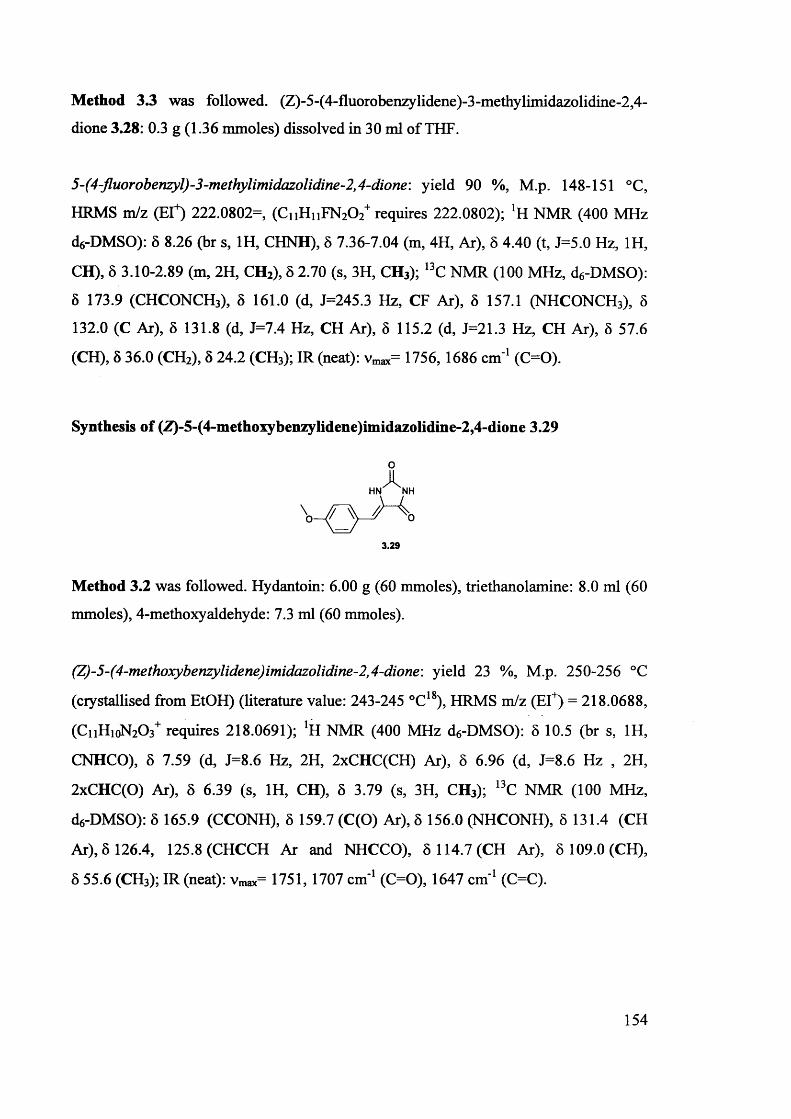
Method 3.3 was followed. (Z)-5-(4-fhiorobenzylidene)-3-methylimidazolidine-2,4-
dione 3.28: 0.3 g (1.36 mmoles) dissolved in 30 ml of THF.
5-(4-fluorobenzyl)-3-methylimidazolidine-2,4-dione\ yield 90 %, M.p. 148-151 °C,
HRMS m/z (El4) 222.0802=, (CiiHnFN202+ requires 222.0802); 'H NMR (400 MHz
ds-DMSO): 8 8.26 (br s, 1H, CHNH), 8 7.36-7.04 (m, 4H, Ar), 8 4.40 (t, J=5.0 Hz, 1H,
CH), 8 3.10-2.89 (m, 2H, CH2), 8 2.70 (s, 3H, CH3); 13C NMR (100 MHz, d6-DMSO):
8 173.9 (CHCONCH3), 8 161.0 (d, J=245.3 Hz, CF Ar), 8 157.1 (NHCONCH3), 8
132.0 (C Ar), 8 131.8 (d, J=7.4 Hz, CH Ar), 8 115.2 (d, J=21.3 Hz, CH Ar), 8 57.6
(CH), 8 36.0 (CH2), 8 24.2 (CH3); IR (neat): Vmax= 1756,1686 cm'1 (C=0).
Synthesis of (Z)-5-(4-methoxybenzylidene)imidazolidine-2,4-dione 3.29
oHN NH
3.29
Method 3.2 was followed. Hydantoin: 6.00 g (60 mmoles), triethanolamine: 8.0 ml (60
mmoles), 4-methoxyaldehyde: 7.3 ml (60 mmoles).
(Z)-5-(4-methoxybenzylidene)imidazolidine-2,4-dione: yield 23 %, M.p. 250-256 °C
(crystallised from EtOH) (literature value: 243-245 °C18), HRMS m/z (EI+) = 218.0688,
(CiiHioN20 3+ requires 218.0691); lU NMR (400 MHz d6-DMSO): 5 10.5 (br s, 1H,
CNHCO), 5 7.59 (d, J=8.6 Hz, 2H, 2xCHC(CH) Ar), 8 6.96 (d, J=8.6 Hz , 2H,
2xCHC(0) Ar), 5 6.39 (s, 1H, CH), 5 3.79 (s, 3H, CH3); 13C NMR (100 MHz,
de-DMSO): 5 165.9 (CCONH), 8 159.7 (C(O) Ar), 8 156.0 (NHCONH), 8 131.4 (CH
Ar), 8 126.4, 125.8 (CHCCH Ar and NHCCO), 8 114.7 (CH Ar), 8 109.0 (CH),
8 55.6 (CH3); IR(neat): vmax= 1751, 1707 cm'1 (C=0), 1647 cm'1 (O C ).
154
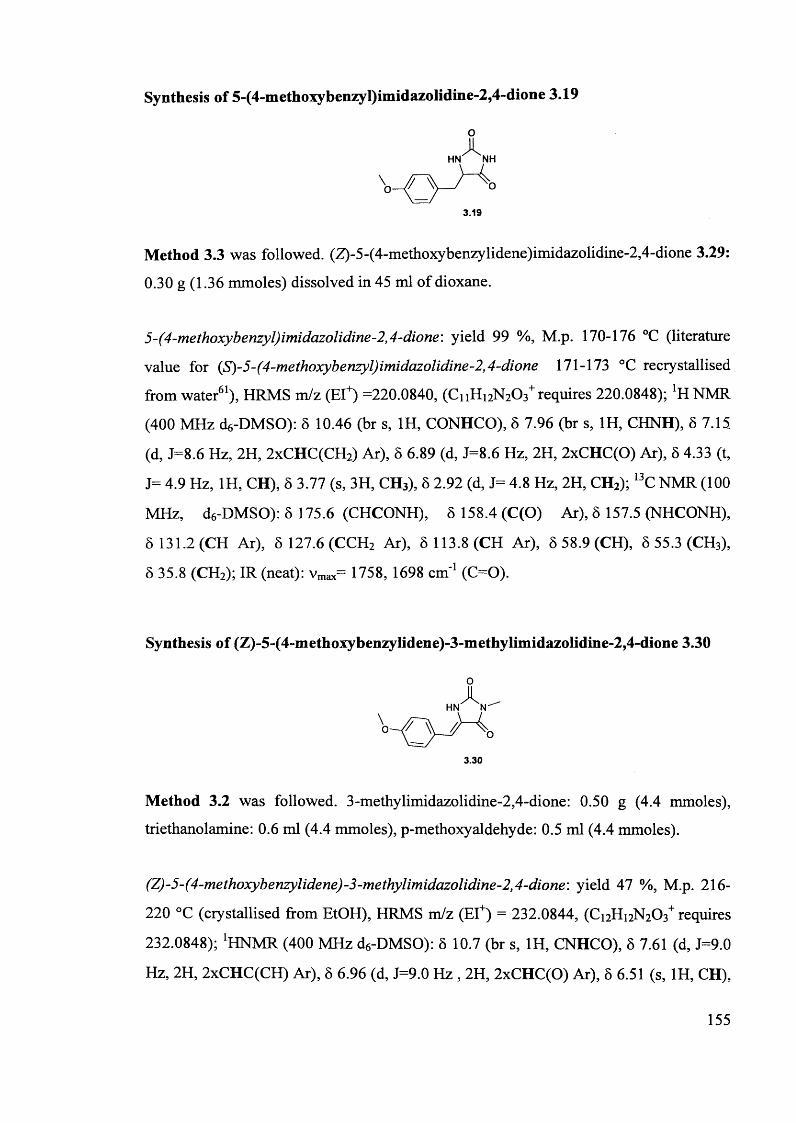
Synthesis of 5-(4-methoxybenzyl)imidazolidine-2,4-dione 3.19
oHN NHA.
o
3.19
Method 3.3 was followed. (Z)-5-(4-methoxybenzylidene)imidazolidine-2,4-dione 3.29:
0.30 g (1.36 mmoles) dissolved in 45 ml of dioxane.
5-(4-methoxybenzyl)imidazolidine-2,4-dione: yield 99 %, M.p. 170-176 °C (literature
value for (<S)-5-(4-methoxybenzyl)imidazolidine-2,4-dione 171-173 °C recrystallised
from water61), HRMS m/z (El4) =220.0840, (CiiH12N203+ requires 220.0848); ‘H NMR
(400 MHz d«-DMSO): 5 10.46 (br s, 1H, CONHCO), 8 7.96 (br s, 1H, CHNH), 8 7.15
(d, J=8.6 Hz, 2H, 2xCHC(CH2) Ar), 8 6.89 (d, J=8.6 Hz, 2H, 2xCHC(0) Ar), 8 4.33 (t,
J= 4.9 Hz, 1H, CH), 8 3.77 (s, 3H, CH3), 8 2.92 (d, J= 4.8 Hz, 2H, CH2); 13C NMR (100
MHz, d6-DMSO): 8 175.6 (CHCONH), 8 158.4(C(0) Ar), 8 157.5 (NHCONH),
8 131.2 (CH Ar), 8 127.6(CCH2 Ar), 8 113.8 (CH Ar), 8 58.9 (CH), 8 55.3 (CH3),
8 35.8 (CH2); IR(neat): vmax= 1758, 1698 cm'1 (C=0).
Synthesis of (Z)-5-(4-methoxybenzylidene)-3-methylimidazolidine-2,4-dione 3.30
Method 3.2 was followed. 3-methylimidazolidine-2,4-dione: 0.50 g (4.4 mmoles),
triethanolamine: 0.6 ml (4.4 mmoles), p-methoxyaldehyde: 0.5 ml (4.4 mmoles).
(Z)-5-(4-methoxybenzylidene)-3-methylimidazolidine-2,4-dione: yield 47 %, M.p. 216-
220 °C (crystallised from EtOH), HRMS m/z (EI+) = 232.0844, (Ci2Hi2N203+ requires
232.0848); 1HNMR (400 MHz d6-DMSO): 8 10.7 (br s, 1H, CNHCO), 8 7.61 (d, J=9.0
Hz, 2H, 2xCHC(CH) Ar), 8 6.96 (d, J=9.0 Hz , 2H, 2xCHC(0) Ar), 8 6.51 (s, 1H, CH),
oHN
3.30
155
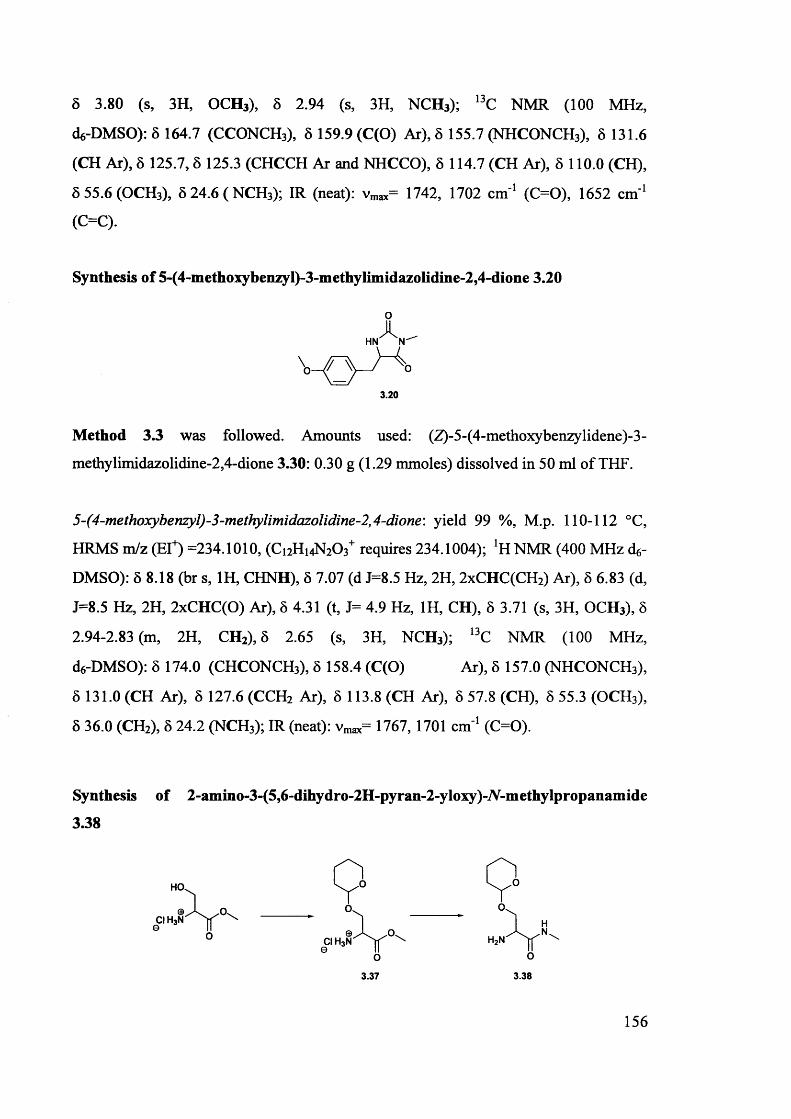
8 3.80 (s, 3H, OCH3), 8 2.94 (s, 3H, NCHj); 13C NMR (100 MHz,
d«-DMSO): 8 164.7 (CCONCH3), 8 159.9 (C(O) Ar), 8 155.7 (NHCONCH3), 8 131.6
(CH Ar), 8 125.7,8 125.3 (CHCCH Ar and NHCCO), 8 114.7 (CH Ar), 8 110.0 (CH),
8 55.6 (OCH3), 8 24.6 ( NCH3); IR (neat): vmax= 1742, 1702 cm'1 (C=0), 1652 cm'1
(C=C).
Synthesis of 5-(4-methoxybenzyl)-3-methylimidazolidine-2,4-dione 3.20
o
3.20
Method 3.3 was followed. Amounts used: (Z)-5-(4-methoxybenzylidene)-3-
methylimidazolidine-2,4-dione 3.30: 0.30 g (1.29 mmoles) dissolved in 50 ml of THF.
5-(4-methoxybenzyl)-3-methylimidazolidine-2,4-dione: yield 99 %, M.p. 110-112 °C,
HRMS m/z (El*) =234.1010, (Ci2Hi4N20 3+ requires 234.1004); 'H NMR (400 MHz d6-
DMSO): 8 8.18 (br s, 1H, CHNH), 8 7.07 (d J=8.5 Hz, 2H, 2xCHC(CH2) Ar), 8 6.83 (d,
J=8.5 Hz, 2H, 2xCHC(0) Ar), 8 4.31 (t, J= 4.9 Hz, 1H, CH), 8 3.71 (s, 3H, OCH3), 8
2.94-2.83 (m, 2H, CH2) ,8 2.65 (s, 3H, NCH3); 13C NMR (100 MHz,
ds-DMSO): 8 174.0 (CHCONCH3), 8 158.4 (C(O) Ar), 8 157.0 (NHCONCH3),
8 131.0 (CH Ar), 8 127.6 (CCH2 Ar), 8 113.8 (CH Ar), 8 57.8 (CH), 8 55.3 (OCH3),
8 36.0 (CH2), 8 24.2 (NCH3); IR (neat): vmax= 1767, 1701 cm'1 (C=0).
Synthesis of 2-amino-3-(5,6-dihydro-2H-pyran-2-yloxy)-7V-methylpropanamide
3.38
3.37 3.38
156
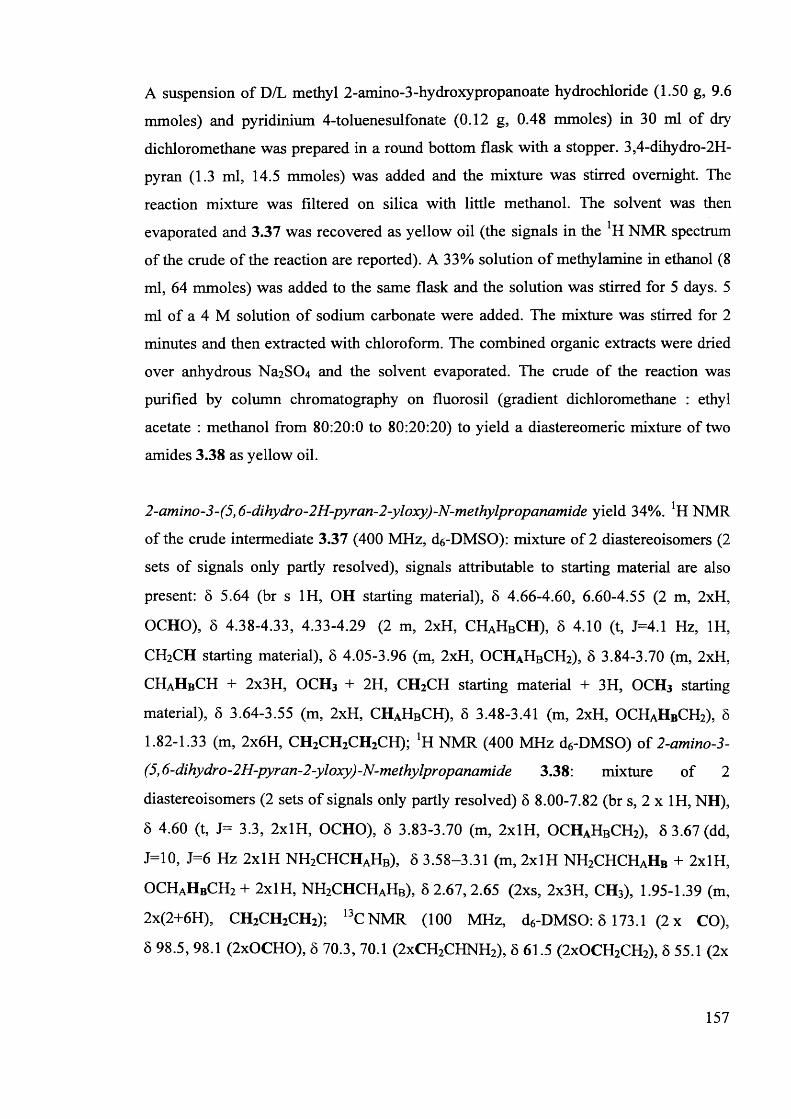
A suspension of D/L methyl 2-amino-3-hydroxypropanoate hydrochloride (1.50 g, 9.6
mmoles) and pyridinium 4-toluenesulfonate (0.12 g, 0.48 mmoles) in 30 ml of dry
dichloromethane was prepared in a round bottom flask with a stopper. 3,4-dihydro-2H-
pyran (1.3 ml, 14.5 mmoles) was added and the mixture was stirred overnight. The
reaction mixture was filtered on silica with little methanol. The solvent was then
evaporated and 3.37 was recovered as yellow oil (the signals in the *H NMR spectrum
of the crude of the reaction are reported). A 33% solution of methylamine in ethanol (8
ml, 64 mmoles) was added to the same flask and the solution was stirred for 5 days. 5
ml of a 4 M solution of sodium carbonate were added. The mixture was stirred for 2
minutes and then extracted with chloroform. The combined organic extracts were dried
over anhydrous Na2S04 and the solvent evaporated. The crude of the reaction was
purified by column chromatography on fluorosil (gradient dichloromethane : ethyl
acetate : methanol from 80:20:0 to 80:20:20) to yield a diastereomeric mixture of two
amides 3.38 as yellow oil.
2-amino-3-(5,6-dihydro-2H-pyran-2-yloxy)-N-methylpropanamide yield 34%. !H NMR
of the crude intermediate 3.37 (400 MHz, d6-DMSO): mixture of 2 diastereoisomers (2
sets of signals only partly resolved), signals attributable to starting material are also
present: 5 5.64 (br s 1H, OH starting material), 5 4.66-4.60, 6.60-4.55 (2 m, 2xH,
OCHO), 6 4.38-4.33, 4.33-4.29 (2 m, 2xH, CHAHBCH), 5 4.10 (t, J=4.1 Hz, 1H,
CH2CH starting material), 5 4.05-3.96 (m, 2xH, OCHAHBCH2), 6 3.84-3.70 (m, 2xH,
CHaHbCH + 2x3H, OCH3 + 2H, CH2CH starting material + 3H, OCH3 starting
material), 5 3.64-3.55 (m, 2xH, CHaHbCH), 8 3.48-3.41 (m, 2xH, OCHAHBCH2), 8
1.82-1.33 (m, 2x6H, CH2CH2CH2CH); 'H NMR (400 MHz d6-DMSO) of 2-amino-3-
(5,6-dihydro-2H-pyran-2-yloxy)-N-methylpropanamide 3.38: mixture of 2
diastereoisomers (2 sets of signals only partly resolved) 8 8.00-7.82 (br s, 2 x 1H, NH),
8 4.60 (t, J= 3.3, 2xlH, OCHO), 8 3.83-3.70 (m, 2xlH, OCHAHBCH2), 8 3.67 (dd,
J=10, J=6 Hz 2xlH NH2CHCHaHb), 8 3.58-3.31 (m, 2xlH NH2CHCHAHB + 2xlH,
OCHaHbCH2 + 2xlH, NH2CHCHaHb), 8 2.67,2.65 (2xs, 2x3H, CH3), 1.95-1.39 (m,
2x(2+6H), CH2CH2CH2); l3CNMR (100 MHz, d6-DMSO: 8173.1 (2 x CO),
8 98.5, 98.1 (2xOCHO), 8 70.3, 70.1 (2xCH2CHNH2), 8 61.5 (2xOCH2CH2), 8 55.1 (2x
157
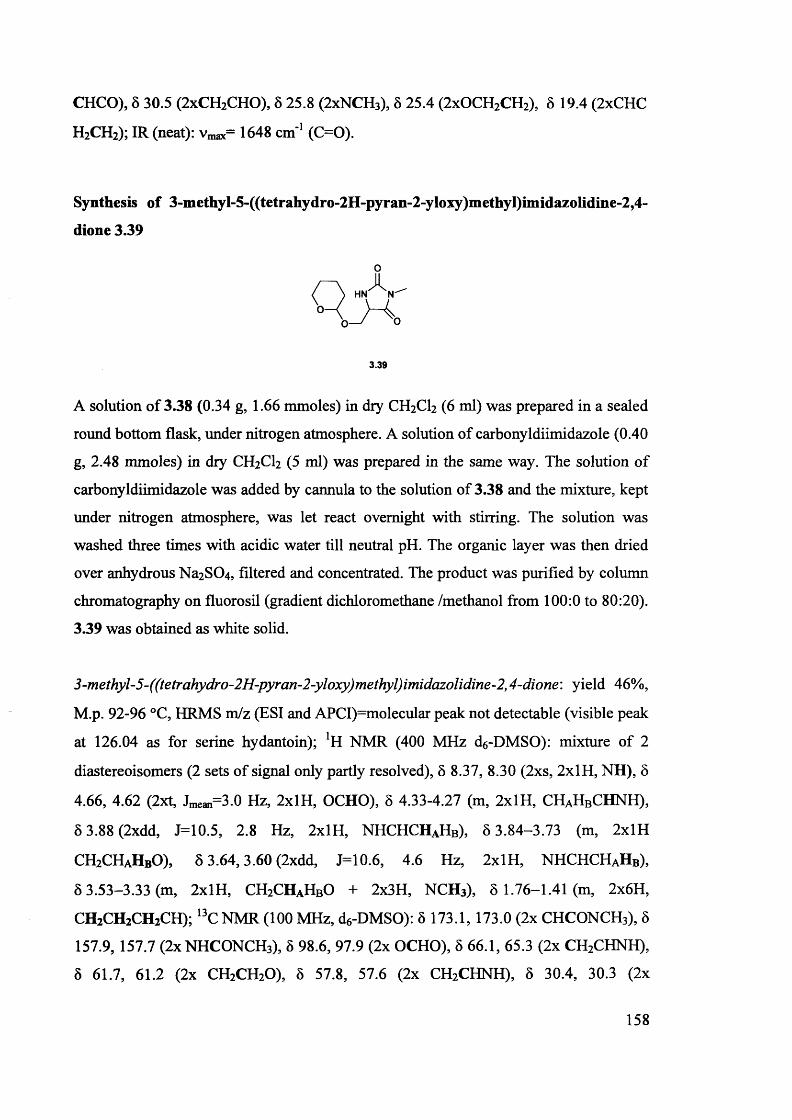
CHCO), 8 30.5 (2xCH2CHO), 8 25.8 (2xNCH3), 8 25.4 (2xOCH2CH2), 8 19.4 (2xCHC
H2CH2); IR (neat): vmax= 1648 cm'1 (C=0).
Synthesis of 3-methyl-5-((tetrahydro-2H-pyran-2-yloxy)methyl)imidazolidine-2,4-
dione 3.39
o
3.39
A solution of 3.38 (0.34 g, 1.66 mmoles) in dry CH2CI2 (6 ml) was prepared in a sealed
round bottom flask, under nitrogen atmosphere. A solution of carbonyldiimidazole (0.40
g, 2.48 mmoles) in dry CH2CI2 (5 ml) was prepared in the same way. The solution of
carbonyldiimidazole was added by cannula to the solution of 3.38 and the mixture, kept
under nitrogen atmosphere, was let react overnight with stirring. The solution was
washed three times with acidic water till neutral pH. The organic layer was then dried
over anhydrous Na2SC>4, filtered and concentrated. The product was purified by column
chromatography on fluorosil (gradient dichloromethane /methanol from 100:0 to 80:20).
3.39 was obtained as white solid.
3-methyl-5-((tetrahydro-2H-pyran-2-yloxy)methyl)imidazolidine-2,4-dione: yield 46%,
M.p. 92-96 °C, HRMS m/z (ESI and APCI)=molecular peak not detectable (visible peak
at 126.04 as for serine hydantoin); *H NMR (400 MHz d6-DMSO): mixture of 2
diastereoisomers (2 sets of signal only partly resolved), 8 8.37, 8.30 (2xs, 2xlH, NH), 8
4.66, 4.62 (2xt, Jmean=3.0 Hz, 2xlH, OCHO), 8 4.33-4.27 (m, 2x1 H, CHAHBCHNH),
8 3.88 (2xdd, J=10.5, 2.8 Hz, 2xlH, NHCHCHAHB), 8 3.84-3.73 (m, 2xlH
CH2CHaHbO), 8 3.64,3.60 (2xdd, J=10.6, 4.6 Hz, 2xlH, NHCHCHAHB),
8 3.53-3.33 (m, 2xlH, CH2CHaHbO + 2x3H, NCH3), 8 1.76-1.41 (m, 2x6H,
CH2CH2CH2CH); 13C NMR (100 MHz, ds-DMSO): 8 173.1, 173.0 (2x CHCONCH3), 8
157.9, 157.7 (2x NHCONCH3), 8 98.6, 97.9 (2x OCHO), 8 66.1, 65.3 (2x CH2CHNH),
8 61.7, 61.2 (2x CH2CH20), 8 57.8, 57.6 (2x CH2CHNH), 8 30.4, 30.3 (2x
158
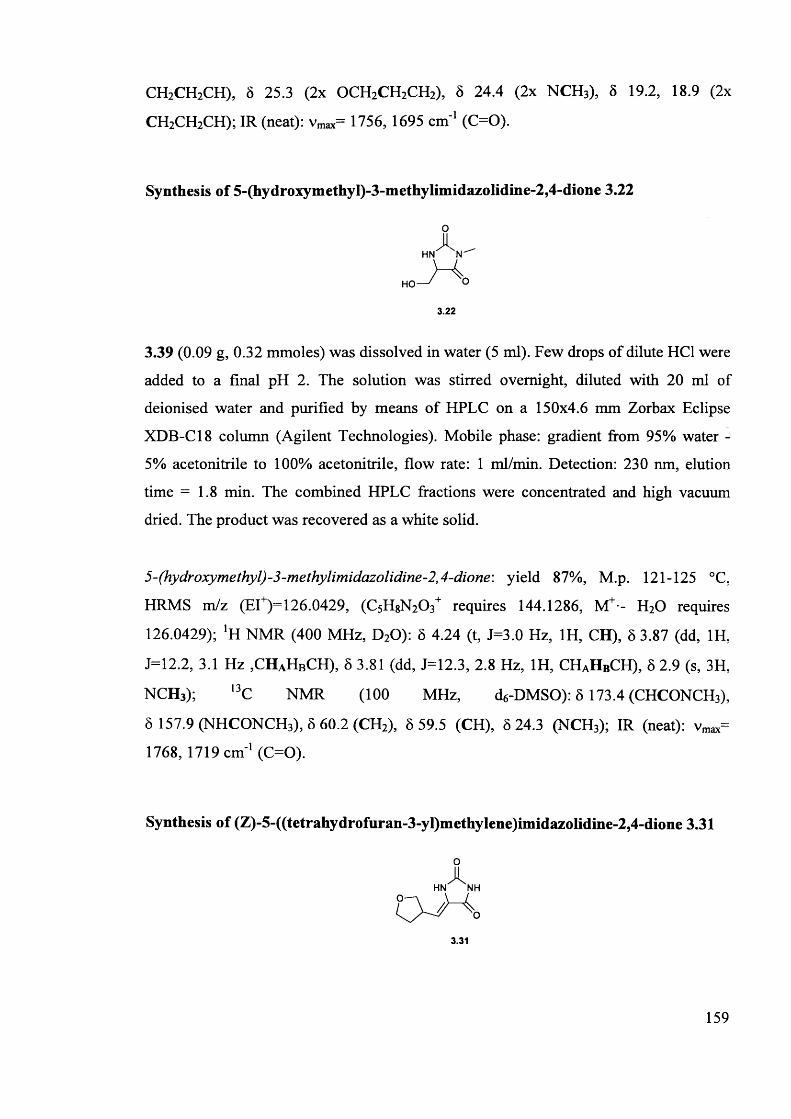
CH2CH2CH), 8 25.3 (2x OCH2CH2CH2), 5 24.4 (2x NCH3), 8 19.2, 18.9 (2x
CH2CH2CH); IR (neat): vmax= 1756, 1695 cm'1 (C=0).
Synthesis of 5-(hydroxymethyI)-3-methylimidazolidine-2,4-dione 3.22
o
3.22
3.39 (0.09 g, 0.32 mmoles) was dissolved in water (5 ml). Few drops of dilute HC1 were
added to a final pH 2. The solution was stirred overnight, diluted with 20 ml of
deionised water and purified by means of HPLC on a 150x4.6 mm Zorbax Eclipse
XDB-C18 column (Agilent Technologies). Mobile phase: gradient from 95% water -
5% acetonitrile to 100% acetonitrile, flow rate: 1 ml/min. Detection: 230 nm, elution
time = 1.8 min. The combined HPLC fractions were concentrated and high vacuum
dried. The product was recovered as a white solid.
5-(hydroxymethyl)-3-methylimidazolidine-2,4-dione: yield 87%, M.p. 121-125 °C,
HRMS m/z (EI+)=126.0429, (CsH8N203+ requires 144.1286, M+ - H20 requires
126.0429); 'H NMR (400 MHz, D20): 8 4.24 (t, J=3.0 Hz, 1H, CH), 8 3.87 (dd, 1H,
J=12.2, 3.1 Hz ,CHaHbCH), 8 3.81 (dd, J=12.3, 2.8 Hz, 1H, CHAHBCH), 8 2.9 (s, 3H,
NCH3); 13C NMR (100 MHz, d6-DMSO): 8173.4 (CHCONCH3),
8 157.9 (NHCONCH3), 8 60.2 (CH2), 8 59.5 (CH), 8 24.3 (NCH3); IR (neat): vmax=
1768, 1719 cm'1 (C=0).
Synthesis of (Z)-5-((tetrahydrofuran-3-yl)methylene)imidazolidine-2,4-dione 3.31
o
3.31
159
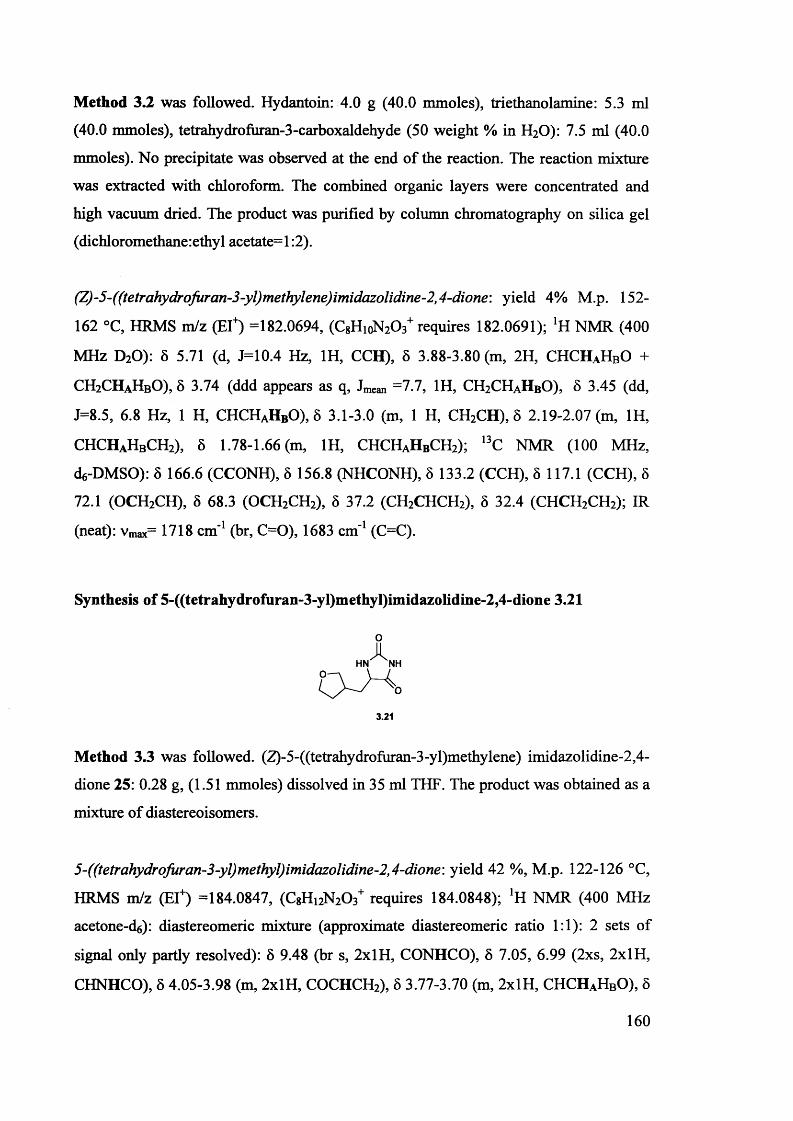
Method 3.2 was followed. Hydantoin: 4.0 g (40.0 mmoles), triethanolamine: 5.3 ml
(40.0 mmoles), tetrahydrofuran-3-carboxaldehyde (50 weight % in H2O): 7.5 ml (40.0
mmoles). No precipitate was observed at the end of the reaction. The reaction mixture
was extracted with chloroform. The combined organic layers were concentrated and
high vacuum dried. The product was purified by column chromatography on silica gel
(dichloromethane: ethyl acetate=l:2).
(Z)-5-((tetrahydrofuran-3-yl)methylene)imidazolidine-2,4-dione: yield 4% M.p. 152-
162 °C, HRMS m/z (El*) =182.0694, (C8HioN203+ requires 182.0691); lH NMR (400
MHz D20): 8 5.71 (d, J=10.4 Hz, 1H, CCH), 8 3.88-3.80 (m, 2H, CHCHaHbO +
CH2CHaHbO), 8 3.74 (ddd appears as q, Jmean =7.7, 1H, CH2CHaHbO), 8 3.45 (dd,
J=8.5, 6.8 Hz, 1 H, CHCHaHbO), 8 3.1-3.0 (m, 1 H, CH2CH), 5 2.19-2.07 (m, 1H,
CHCHaHbCH2), 8 1.78-1.66 (m, 1H, CHCHAHBCH2); 13C NMR (100 MHz,
de-DMSO): 8 166.6 (CCONH), 8 156.8 (NHCONH), 8 133.2 (CCH), 8 117.1 (CCH), 8
72.1 (OCH2CH), 8 68.3 (OCH2CH2), 8 37.2 (CH2CHCH2), 8 32.4 (CHCH2CH2); IR
(neat): vmax= 1718 cm'1 (br, C=0), 1683 cm'1 (C=C).
Synthesis of 5-((tetrahydrofuran-3-yl)methyl)imidazolidine-2,4-dione 3.21
o
3.21
Method 3.3 was followed. (Z)-5-((tetrahydrofuran-3-yl)methylene) imidazolidine-2,4-
dione 25: 0.28 g, (1.51 mmoles) dissolved in 35 ml THF. The product was obtained as a
mixture of diastereoisomers.
5-((tetrahydrofuran-3-yl)methyl)imidazolidine-2,4-dione\ yield 42 %, M.p. 122-126 °C,
HRMS m/z (El4) =184.0847, ( C g H ^ /V requires 184.0848); 'H NMR (400 MHz
acetone-d6): diastereomeric mixture (approximate diastereomeric ratio 1:1): 2 sets of
signal only partly resolved): 8 9.48 (br s, 2xlH, CONHCO), 8 7.05, 6.99 (2xs, 2xlH,
CHNHCO), 8 4.05-3.98 (m, 2xlH, COCHCH2), 8 3.77-3.70 (m, 2xlH, CHCHaHbO), 8
160
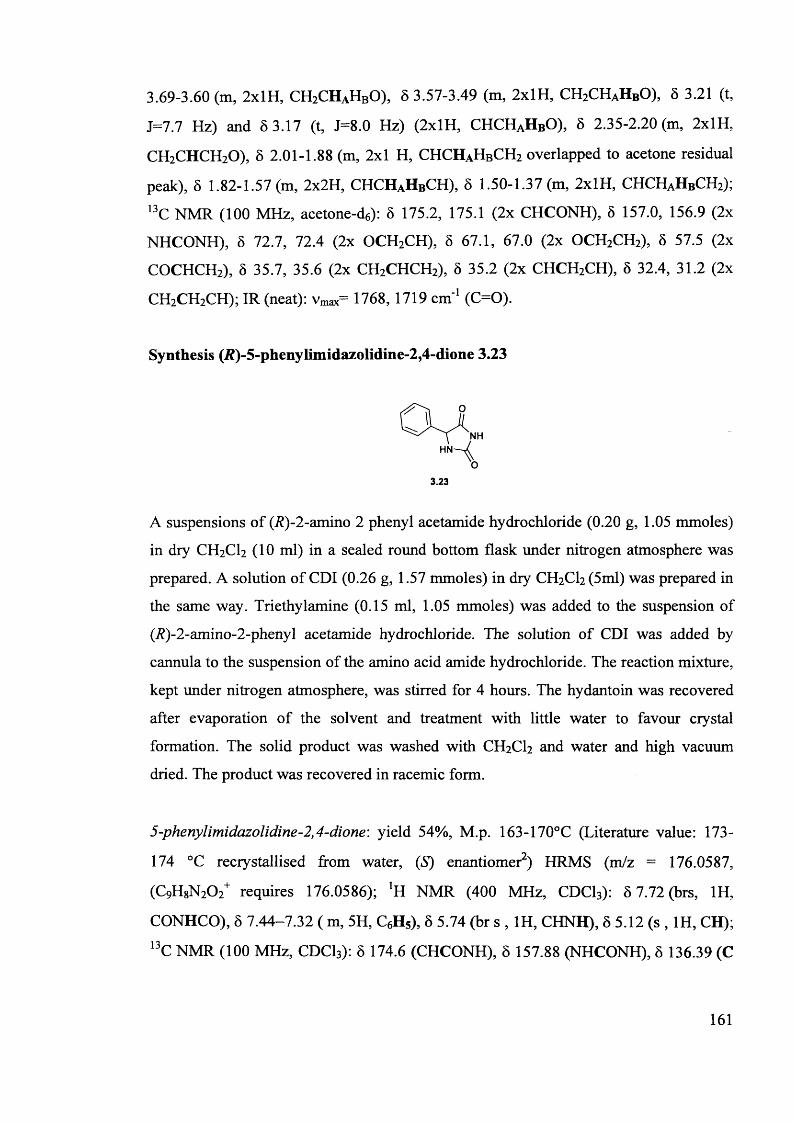
3.69-3.60 (m, 2xlH, CH2CHaHbO), 5 3.57-3.49 (m, 2xlH, CH2CHaHbO), 5 3.21 (t,
J=7.7 Hz) and 8 3.17 (t, J=8.0 Hz) (2xlH, CHCHaHbO), 6 2.35-2.20 (m, 2xlH,
CH2CHCH20), 8 2.01-1.88 (m, 2x1 H, CHCHAHBCH2 overlapped to acetone residual
peak), 8 1.82-1.57 (m, 2x2H, CHCHAHBCH), 8 1.50-1.37 (m, 2xlH, CHCHAHBCH2);
13C NMR (100 MHz, acetone-d^): 8 175.2, 175.1 (2x CHCONH), 8 157.0, 156.9 (2x
NHCONH), 8 72.7, 72.4 (2x OCH2CH), 5 67.1, 67.0 (2x OCH2CH2), 8 57.5 (2x
COCHCH2), 8 35.7, 35.6 (2x CH2CHCH2), 8 35.2 (2x CHCH2CH), 8 32.4, 31.2 (2x
CH2CH2CH); IR (neat): vmax= 1768, 1719 cm'1 (C=0).
Synthesis (/?)-5-phenylimidazolidine-2,4-dione 3.23
3.23
A suspensions of (7?)-2-amino 2 phenyl acetamide hydrochloride (0.20 g, 1.05 mmoles)
in dry CH2CI2 (10 ml) in a sealed round bottom flask under nitrogen atmosphere was
prepared. A solution of CDI (0.26 g, 1.57 mmoles) in dry CH2CI2 (5ml) was prepared in
the same way. Triethylamine (0.15 ml, 1.05 mmoles) was added to the suspension of
(7?)-2-amino-2-phenyl acetamide hydrochloride. The solution of CDI was added by
cannula to the suspension of the amino acid amide hydrochloride. The reaction mixture,
kept under nitrogen atmosphere, was stirred for 4 hours. The hydantoin was recovered
after evaporation of the solvent and treatment with little water to favour crystal
formation. The solid product was washed with CH2CI2 and water and high vacuum
dried. The product was recovered in racemic form.
5-phenylimidazoIidine-2,4-dione: yield 54%, M.p. 163-170°C (Literature value: 173-
174 °C reciystallised from water, (S) enantiomer2) HRMS (m/z = 176.0587,
(C9H8N20 2+ requires 176.0586); *H NMR (400 MHz, CDCI3): 8 7.72(brs, 1H,
CONHCO), 8 7.44-7.32 ( m, 5H, C6H5), 8 5.74 (br s , 1H, CHNH), 8 5.12 ( s , 1H, CH);
13C NMR (100 MHz, CDCI3): 8 174.6 (CHCONH), 8 157.88 (NHCONH), 8 136.39 (C
161
Ar), 8 129.03 (CH Ar) 8 128.62 (CH Ar) 8 127.06 (CH Ar) 8 61.54 (CH); IR (neat):
Vmax= 1774, 1718 cm 1 (C =0).[a£ = O’(0.45 g/lOOml in EtOH).
3.6. Experimental Part 2
Materials
Potassium chloride (analytical grade) was from Fluka. Potassium hydroxide (analytical
grade) was from Fisher Scientific. Potassium dihydrogen phosphate (crystallised) was
from VWR. Deuterium oxide (99.9%) was purchased from Fluorochem.
Apparatus
Materials were weighed on an analytical balance Fisher Brand PS-100 (Max 100 g,
d=0.1mg). Volumes of solutions were measured by means of Gilson or Eppendorf
Research micropipettes. pH measurements were carried out, at room temperature, using
a HANNA INSTRUMENTS pH 210 pH meter. The pH meter was calibrated before
each measurement with certified traceable to NIST buffers at pH 7.00±0.01 (at 25 °C)
(from Fisher), pH 10.01±0.02 (at 25 °C) (from Fisher) and pH 4.00±0.01 (at 25 °C)
(from Reagecon). Reported values are uncorrected. Values are reported as pH**
indicating the reading of the pH meter at room temperature. Thermostatic water baths
Subaqua 12 (temperature stability ±0.2 °C) or Julabo MB-5 Heating Circulator
(temperature stability ±0.2 °C) were used to control the temperature of solutions in
kinetic experiments with timescales longer than three days. Kinetic experiments of
racemisation were carried out on a Chirascan CD spectrometer equipped with a
Temperature-Controlled Sample Holder for circular dichroism (temperature stability: ±
0.02 °C), in 1.00 cm path length quartz cuvettes. Kinetic experiments of H/D exchange
were carried out on a Bruker AVANCE 400 or a Bruker AVANCE 500 spectrometers at
400 (pulse interval (Dl): 1 s , , pulse width (pw): 10.75 ps, acquisition time (at): 3.42 s)
or 500 MHz(pulse interval (Dl): 1 s , , pulse width (pw): 12.00 ps, acquisition time (at):
5.45 s), respectively.
162
Preparation of solutions
Stock solutions of D20 phosphate buffers were prepared by dissolving potassium
dihydrogen phosphate in D20 and adjusting the pH** of the solution with KOH, to give
final buffers with the desired concentrations and pH**. Potassium chloride was used to
adjust the ionic strength of the buffer solutions. After preparation of the buffers, as
described above, the solvent was evaporated and replenished 3 times with fresh D20 , to
guarantee the exchange with deuterons and removal of the protons from the non
deuterated inorganic materials used to prepare the solutions.
Stock solutions of hydantoins were prepared by dissolving the solid hydantoins in D20.
In all cases except for hydantoins, 3.4, 3.21 and 3.22, the solutions were prepared in
plastic eppendorfs which were kept, overnight, under continuous rotation at a speed of
20 rpm by means of a Stuart Tube rotator SB2. The solutions were then centrifuged for
8 minutes at 13.3 rpm on a Jencons-pls Spectrafuge 24.D centrifuge. The clear
supernatant was transferred in a new eppendorf and an amount of fresh solvent,
equivalent to approximately 1/10 of the total volume of solution, was added to the
saturated solution, to avoid precipitation. Solution of hydantoins 3.4, 3.21 and 3.22 were
obtained by dissolving the desired amounts of hydantoins with stirring for 10 minutes.
Kinetic experiments
The reaction media for the CD experiments were prepared by mixing buffer solutions,
D20 , and the stock solutions of hydantoins in suitable proportions to obtain final
solutions with the desired ionic strength, concentration of buffer and concentration of
hydantoin. Typical final concentrations of hydantoins were 0.7 mM for hydantoin 3.3,
0.3 mM for hydantoin 3.4 and 0.1 mM for hydantoin 3.5. Solvents and stock solutions
were mixed immediately before the start of the kinetic experiments, to minimise the
time lag between the beginning of the reaction and the acquisition of the kinetic data.
CD experiments at 60 °C, 50 °C and some experiments at 37 °C, with a timescale lower
than three days, were carried out in the quartz cuvettes housed in the thermostated
sample holder of the spectrometer. CD spectra were automatically recorded at set time
intervals which were chosen based on the timescale of the reaction. In the kinetic
163
experiments at 15, 25 and 37 °C, whose timescale was ranging from a week to three
months, the temperature was controlled by housing the solutions in thermostatic water
baths and CD spectra were recorded at set time intervals. The decreases of the CD
signals, typically at 235 or 240 nm, were followed over time.
The reaction media for the kinetic experiments of H/D exchange were prepared by
mixing equal volumes of stock solutions of buffers and stock solutions of hydantoins, to
give the desired final concentrations of buffer and ionic strength. The choice of the final
concentrations of hydantoins was limited by their solubilities in D20 . Typical final
concentrations were variable between 2 and 5 mM for hydantoins 3.1, 3.2, 3.10, 3.17-
3.20 and 3.23, from 25 to 27 mM for hydantoins 3.3, 3.4 and 3.5 and 60 mM for
hydantoins 3.21 and 3.22. Solvents and stock solutions were mixed immediately before
the start of the kinetic experiments. Reaction mixtures were transferred in NMR tubes
which were housed in thermostatic water baths. *H NMR spectra were taken at set time
intervals chosen depending on the time scale of the H/D exchange reaction. Except for
the kinetic experiments for 5-phenylhydantoin (carried out on a Bruker AVANCE 500
spectrometer), whose H/D exchange was particularly fast, the NMR tubes were not
thermostated during the time of acquisition of the !H NMR spectra. H/D exchange
experiments for phenylhydantoin 3.23 at 25 °C were carried out on a Bruker AVANCE
500 spectrometer at 500 MHz. The temperature was controlled by a Bruker BVT 3000
digital controller (temperature stability ±0.2 °C). Spectra were taken every 5 minutes.
Pseudo first-order rate constants of H/D exchange were obtained by following over time
the decrease of the relative area integrals of the exchangeable protons of the hydantoins.
The !H NMR signal from the phenyl ring (compounds 3.1-3.5, 3.10, 3.23 and 3.17-3.20)
or from stable alkyl groups of the hydantoins (compounds 3.21 and 3.22) were used as
internal standards to evaluate the integrals of the NMR peaks of exchangeable protons.
Spectral processing and integrations of NMR signals were carried out by means of the
program SpinWorks 2.5.5.
Rate constants for all kinetic experiments were obtained by fitting experimental data
points to first-order kinetics, by means of the computer program Origin.
164
Solubility tests
The solubilities of hydantoins were determined gravimetrically. The water was
evaporated from exactly measured volumes of saturated solutions of hydantoins, and the
residue was weighed on an analytical balance.
Acknowledgments
I would like to acknowledge Prof. Barry Carpenter for his useful group-meeting
comments leading to the discussion reported in Section 3.2.3. Dr Robert Richardson is
gratefully acknowledged for kind help and discussions on spectral analyses reported in
this Chapter. I thank Daniela Milan, Julia Kennedy and Rhys Williams for their work on
this project leading to the synthesis of hydantoins 3.24-3.26 and 3.24b, 3.26b and
related kinetic experiments. I would also like to thank Dr Rob Jenkins for technical
support with the NMR experiments of H/D exchange for compound 3.23 and Dave
Walker and Robin Hicks for recording high resolution mass spectra.
References
1. Anslyn, E. V.; Dougherty, D. A., M odern P hysica l O rganic Chem istry.
University Science Books: Sausalito, California, 2006; p 441-445.
2. Reist, M.; Carrupt, P. A.; Testa, B.; Lehmann, S.; Hansen, J. J., H elvetica
C h im ic a A c ta 1996, 79 (3), 161- i n .
3. Wilson, C. L., Journa l o f the C hem ica l S o c ie ty 1934, 98-99.
4. Reist, M.; Testa, B.; Carrupt, P. A., E nan tiom er 1997, 2 (3-4), 147-155.
5. Testa, B.; Carrupt, P. A.; Gal, J., C hira lity 1993, 5 (3), 105-111.
165
6. Cirilli, R.; Costi, R.; Gasparrini, F.; La Torre, F.; Pierini, M.; Siani, G., Chirality
2009,21 (1), 24-34.
7. Amyes, T. L.; Richard, J. P., Journal o f the American Chemical Society 1996,
118 (13), 3129-3141.
8. Richard, J. P.; Williams, G.; O'Donoghue, A. C.; Amyes, T. L., Journal o f the
American Chemical Society 2002,124 (12), 2957-2968.
9. Rios, A.; Amyes, T. L.; Richard, J. P., Journal o f the American Chemical
Society 2000,122 (39), 9373-9385.
10. Rios, A.; Richard, J. P.; Amyes, T. L., Journal o f the American Chemical
Society 2002,124 (28), 8251-8259.
11. Williams, G.; Maziarz, E. P.; Amyes, T. L.; Wood, T. D.; Richard, J. P.,
Biochemistry 2003, 42 (27), 8354-8361.
12. Zhang, D.; Xing, X. C.; Cuny, G. D., Journal o f Organic Chemistry 2006, 71
(4), 1750-1753.
13. Nowick, J. S.; Powell, N. A.; Nguyen, T. M.; Noronha, G., Journal o f Organic
Chemistry 1992, 57 (26), 7364-7366.
14. Nowick, J. S.; Holmes, D. L.; Noronha, G.; Smith, E. M.; Nguyen, T. M.;
Huang, S. L., Journal o f Organic Chemistry 1996, 61 (11), 3929-3934.
15. Dudley, K. H.; Bius, D. L., Drug Metabolism and Disposition 1976, 4 (4), 340-
348.
16. Mudit, M.; Khanfar, M.; Muralidharan, A.; Thomas, S.; Shah, G. V.; van Soest,
R. W. M.; El Sayed, K. A., Bioorganic & Medicinal Chemistry 2009,17 (4), 1731-
1738.
17. Mudit, M.; Khanfar, M.; Muralidharan, A.; Thomas, S.; Shah, G. V.; van Soest,
R. W. M.; El Sayed, K. A., Bioorganic & Medicinal Chemistry 2009,17 (8), 3216-
3217.
18. Thenmozhiyal, J. C.; Wong, P. T. H.; Chui, W. K., Journal o f Medicinal
Chemistry 2004, 47 (6), 1527-1535.
19. Zuliani, V.; Carmi, C.; Rivara, M.; Fantini, M.; Lodola, A.; Vacondio, F.; Bordi,
F.; Plazzi, P. V.; Cavazzoni, A.; Galetti, M.; Alfieri, R. R.; Petronini, P. G.; Mora, M.,
European Journal o f Medicinal Chemistry 2009, 44 (9), 3471-3479.
20. Zha, C. X.; Brown, G. B.; Brouillette, W. J., Journal o f Medicinal Chemistry
2004,47(26), 6519-6528.
166
21. Instrumental imprecision arising from the high rates of racemisation together
with a smaller CD signal of compound 3.5 as compared to compounds 3.1-3.4 could be
hypothesised. The weaker CD signals of 3.5 can be due to its smaller enantiomeric
excess as compared to hydantoins 3.1-3.4, leading to a smaller signal to noise ratio. The
ease of racemisation of 3.5 and, most importantly, of its precursor 3.4 strongly supports
further partial racemisation of 3.5 during the last step of its synthesis, involving the
methylation of 3.4. The instrumental limit is, however, only an hypothesis for the odd
experimental result. The possibility for the reaction being second order in phosphate
could also be envisaged. However further investigations are needed to confirm the
hypothesis.
22. Taylor, J. R., An introduction to Error Analysis The study o f uncertainties in
physical measurements. Second ed.; University Science Books: Sausalito, California,
1997; p 174-177.
23. Spencer, C. F., Journal o f Heterocyclic Chemistry 1973,10 (4), 455-457.
24. Maskill, H., The Physical Basis o f Organic Chemistry. Oxford University Press:
Oxford New York, 1990; p 247.
25. Under the experimental conditions (buffer 0.5 M, pH** 7.2), the basic form of
the buffer was found to be the main catalyst for the racemisation of benzylhydantoins
3.1 and 3.2 (see Chapter 2) and the approximation &0bs ~ &hpo42 ' [HPO42’] could be made.
By analogy and considering that, at neutral pH the racemisation of hydantoins 3.1-3.5 is
in practice completely catalysed by phosphate buffer, the same approximation appeared
to be reasonable for hydantoins 3.3 and 3.5.
26. Maskill, H., The Physical Basis o f Organic Chemistry. Oxford University Press:
Oxford New York, 1990; p 253-260.
27. Anslyn, E. V.; Dougherty, D. A., Modern Physical Organic Chemistry.
University Science Books: Sausalito, California, 2006; p 372.
28. Isaacs, N. S., Physical Organic Chemistry. Longman Scientific & Technical:
1995; p 643-667.
29. Kahn, K.; Tipton, P. A., Bioorganic Chemistry 2000, 28 (2), 62-72.
30. Bell, R. P.; Fluendy, M. A. D., Transactions o f the Faraday Society 1963, 59
(487), 1623-1630.
31. Harper, E. T.; Bender, M. L., Journal o f the American Chemical Society 1965,
87 (24), 5625-5632.
167
32. Ingold, C. K.; Wilson, C. L., Journal o f the Chemical Society 1934, 93-97.
33. Ingold, C. K.; Wilson, C. L., Journal o f the Chemical Society 1934, 773-777.
34. Hsu, S. K.; Wilson, C. L., Journal o f the Chemical Society 1936, 623-625.
35. Hsu, S. K.; Ingold, C. K.; Wilson, C. L., Journal o f the Chemical Society 1938,
78-81.
36. Coward, J. K.; Bruice, T. C., Journal o f the American Chemical Society 1969,
91 (19), 5339-5345.
37. Isaacs, N., Physical Organic Chemistry. Longman Scientific & Technical: 1995;
p 647.
38. Bruice, T. C.; Benkovic, S. J., Bioorganic Mechanisms. First ed.; W. A.
Benjamin, Inc: New York Amsterdam, 1966; Vol. I, p 134-145.
39. Zaslowsky, J. A.; Fisher, E., Journal o f Physical Chemistry 1963, 67 (5), 959-
961.
40. Holland, G. F.; Durant, R. C.; Friess, S. L.; Witkop, B., Journal o f the American
Chemical Society 1958,80 (22), 6031-6035.
41. Davis, W.; Ross, W. C. J., Journal o f the Chemical Society 1950, (NOV), 3056-
3062.
42. In spite of the ability of quaternary ammonium groups at facilitating ester
hydrolysis, solutions of 3.5 in D2O and in D2O phosphate buffers with pH* 7.2 were
found to be stable.
43. The predicted value of pKa was obtained using the ACD/I-Lab Web service
(ACD/pKa 12.0).
44. Dahlen, A.; Hilmersson, G., Journal o f the American Chemical Society 2005,
727(23), 8340-8347.
45. Mey, B.; Paulus, H.; Lamparter, E.; Blaschke, G., Chirality 1998, 10 (4), 307-
315.
46. Error from weighted average of 3 analytical determinations.
47. Ahlberg, R., Berichte Der Deutschen Chemischen Gesellschaft 1928, 61, 811-
817.
48. McKenzie, A.; Smith, I. A., Journal o f the Chemical Society 1922, 121, 1348-
1361.
49. Khan, A.; Marson, C. M.; Porter, R. A., Synthetic Communications 2001, 31
(11), 1753-1764.
168
50. Akeng'a, T. O.; Read, R. W., South African Journal o f Chemistry-Suid-
Afrikaanse TydskrifVir Chemie 2007, 60, 11-16.
51. From SciFinder search: Takuma, Y.; Watanabe, N., (Mitsubishi Chemical.
Corp., Japan). Jpn. Kokai Tokkyo Koho (2001), 5pp. CODEN: JKXXAF JP
2001158775 A 20010612 Patent written in Japanese. Application JP 2000-149256
20000522.
52. Kennedy, J., CD spectroscopy as analytical means for the study of mechanisms
of racemisation of hydantoins. Cardiff University: Cardiff, 2011.
53. Asahina, Y.; Takei, M.; Kimura, T.; Fukuda, Y., Journal o f Medicinal
Chemistry 2008, 51 (11), 3238-3249.
54. Milan, D., Kinetics and computational studies of the mechanism of racemisation
and H/D exchange of subsituted hydantoins in aqueous, mixed-aqueous and non-
aqueous solvents. Cardiff University: Cardiff, 2011.
55. Williams, R., Kinetics of racemisation of a substituted hydantoin pyrrole.
Cardiff University: Cardiff, 2011.
56. pKa Data Compiled by R. Williams http://research.chem.psu.edu/brpgroup/pKa
compilation.pdf.
57. Lazarus, R. A., Journal o f Organic Chemistry 1990, 55 (15), 4755-4757.
58. Misuraca, M. C.; Grecu, T.; Freixa, Z.; Garavini, V.; Hunter, C. A.; van
Leeuwen, P. W. N. M.; Dolores Segarra-Maset, M.; Turegat, S. M., Journal o f Organic
Chemistry 2011, 76 (8), 2723-2732.
59. Katritzky, A. R., Handbook o f Heterocyclic Chemistry. Pergamon Press: Oxford
New York Toronto Sydney Frankfurt, 1985; p 250.
60. Taylor, J., An introduction to error analysis. University Science Books:
Sausalito, California, 1997; p 73-77.
61. Bovamick, M.; Clarke, H. T., Journal o f the American Chemical Society 1938,
60, 2426-2430.
169
Chapter 4
The effect of cosolvents on the racemisation of substituted hydantoins in aqueous solutions
Abstract
We report on the effect of added co-solvents on the phosphate-catalysed racemisation
and H/D exchange reactions of a series of 5-benzylhydantoins (Scheme 4.1). The
effects of added dimethyl sulfoxide (DMSO), 2-propanol, trifluoroethanol, and dioxane
were investigated. The rate constants for racemisation and H/D exchange of neutral
hydantoins 4.1-4.3 were found to increase in the presence of increasing amounts of
added DMSO. Added trifluoroethanol similarly increased the rate constants for
racemisation and H/D exchange, but to a lesser extent than DMSO. 2-Propanol and
dioxane showed a rate-depressing effect. The rate constants for racemisation and H/D
exchange of cationic hydantoin 4.4 were found to be increased by the addition of all of
the co-solvents under investigation, with dioxane showing the strongest rate-
accelerating effect. The absence of significant solvent kinetic isotope effects for the
racemisation of all hydantoins in the presence and in the absence of added co-solvents
supports an SeI mechanism for racemisation of all model hydantoins in all the mixed
media investigated. No evidence was found for changes in the stereochemical course of
the H/D exchange of 4.1 in mixed media containing d6-DMSO and d8-2-propanol as co
solvent, as compared to H/D exchange in pure D2O phosphate buffers. In the mixed
media, as in pure buffers (Chapter 2), approximately equal rate constants for
racemisation (krac) and H/D exchange (&h /d ) were observed.
170
4.1. Introduction
As mentioned in Chapter 3, a major practical problem in the study of (*S)-5-
benzylhydantoin 4.1 and, to a lesser extent, (S>3-A-methyl-5-benzylhydantoin 4.2
(Scheme 4.1) as model compounds for kinetic studies of racemisation is their poor
solubility in water. Although the poor water solubility is not a problem when UV and
CD spectroscopy are used, detection limits become important in less sensitive
techniques such as NMR or IR spectroscopy, where higher concentrations are required.
The addition of a co-solvent can help address the solubility problem and this strategy
has been used in previous studies. For example, all kinetic experiments described in the
paper on the racemisation of hydantoins by Testa et al.1, often cited in this thesis, were
conducted in mixed media composed of 50 volume-% phosphate buffers and 50
volume-% DMSO. In light of the difference between our mechanistic conclusions in
aqueous solutions and Testa's conclusions in water-DMSO mixtures, we decided to
conduct kinetic studies in the presence of DMSO to both improve the solubility of
hydantoins 4.1 and 4.2 and to investigate possible changes in the process of
racemisation and H/D exchange of our model hydantoins, induced by changes in the
reaction medium.
Marked effects on the rate constants of H/D exchange of 4.1 and 4.2, due to the addition
of DMSO, were found. This observation prompted us to extend our studies to further
co-solvents and to the racemisation and H/D exchange of hydantoins 4.1, 4.2, 4.3 and
4.4 (Scheme 4.1).
Co-solvents could not be added in every proportion to the buffer solutions because of
mixing problems and, eventually, precipitation of buffer components. Under the
experimental conditions typically used in the kinetic experiments described in this thesis
(phosphate buffers with 1 M I), 25 % was the maximum volume of co-solvent that
could be added to the buffer. Kinetic experiments at higher concentrations of co
solvents were possible only in the presence of lower buffer concentrations and ionic
strengths. The kinetic experiments described in this thesis were typically conducted in
buffers at 1 M ionic strength while mixtures containing 50 volume-% DMSO and 50
volume-% phosphate buffers at 0.2 M ionic strength were the typical reaction media in
the experiments carried out by Testa.1
171
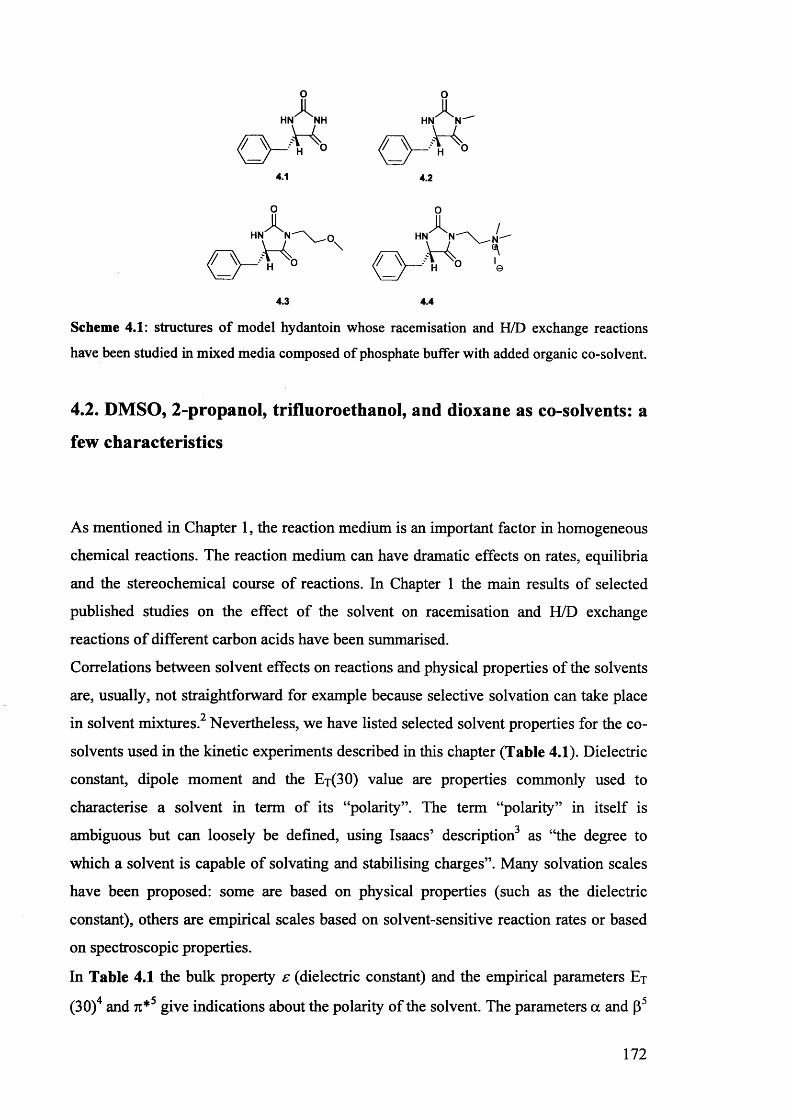
o oX XHN NH HN
// vJX ° f \ - ^ S4.1 4.2
O OX X /HN\ HNv
f fV ^ o I4.3 4.4
Scheme 4.1: structures of model hydantoin whose racemisation and H/D exchange reactions
have been studied in mixed media composed of phosphate buffer with added organic co-solvent.
4.2. DMSO, 2-propanol, trifluoroethanol, and dioxane as co-solvents: a
few characteristics
As mentioned in Chapter 1, the reaction medium is an important factor in homogeneous
chemical reactions. The reaction medium can have dramatic effects on rates, equilibria
and the stereochemical course of reactions. In Chapter 1 the main results of selected
published studies on the effect of the solvent on racemisation and H/D exchange
reactions of different carbon acids have been summarised.
Correlations between solvent effects on reactions and physical properties of the solvents
are, usually, not straightforward for example because selective solvation can take place
in solvent mixtures. Nevertheless, we have listed selected solvent properties for the co
solvents used in the kinetic experiments described in this chapter (Table 4.1). Dielectric
constant, dipole moment and the E t(3 0 ) value are properties commonly used to
characterise a solvent in term of its “polarity”. The term “polarity” in itself is
ambiguous but can loosely be defined, using Isaacs’ description as “the degree to
which a solvent is capable of solvating and stabilising charges”. Many solvation scales
have been proposed: some are based on physical properties (such as the dielectric
constant), others are empirical scales based on solvent-sensitive reaction rates or based
on spectroscopic properties.
In Table 4.1 the bulk property s (dielectric constant) and the empirical parameters Et
(30)4 and n*5 give indications about the polarity of the solvent. The parameters a and (35
172
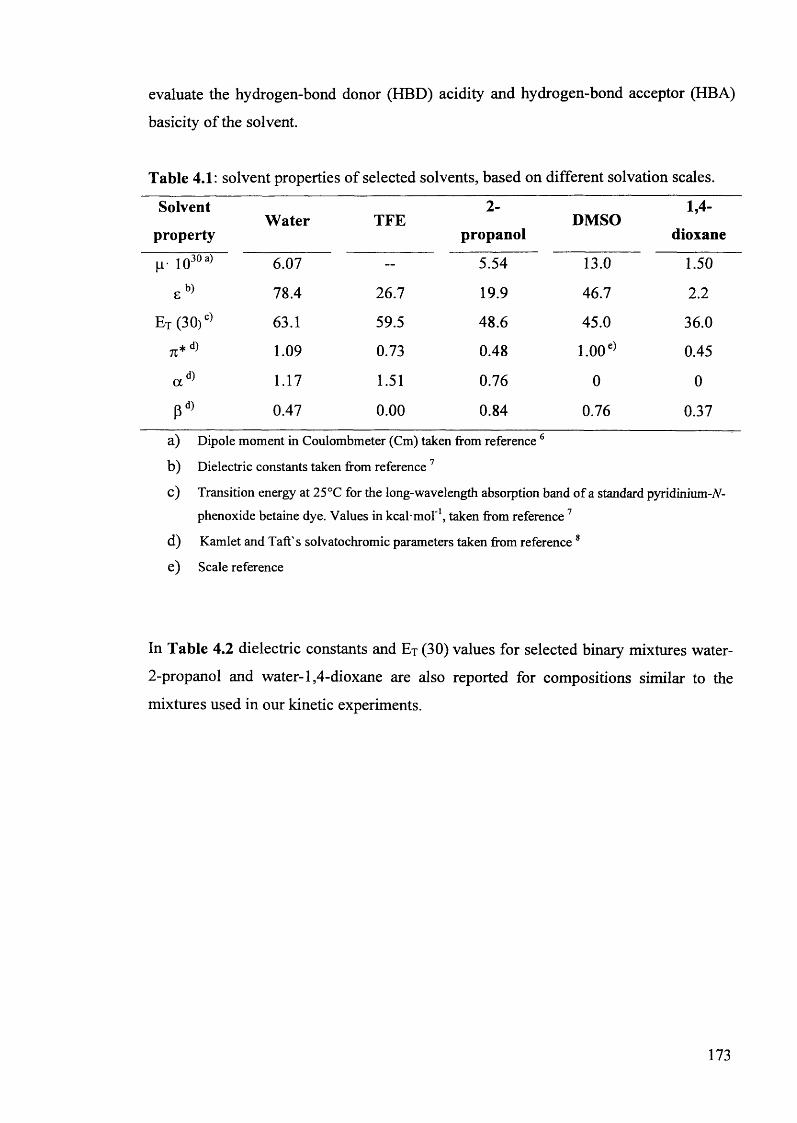
evaluate the hydrogen-bond donor (HBD) acidity and hydrogen-bond acceptor (HBA)
basicity of the solvent.
Table 4.1: solvent properties of selected solvents, based on different solvation scales.
Solvent
propertyWater TFE
2-
propanolDMSO
1,4-
dioxane
|i- 1030a) 6.07 — 5.54 13.0 1.50
£ b> 78.4 26.7 19.9 46.7 2.2
Et (30) c) 63.1 59.5 48.6 45.0 36.0
1.09 0.73 0.48 1.00c) 0.45
a d) 1.17 1.51 0.76 0 0p d) 0.47 0.00 0.84 0.76 0.37
a) Dipole moment in Coulombmeter (Cm) taken from reference6
b) Dielectric constants taken from reference7
c) Transition energy at 25°C for the long-wavelength absorption band of a standard pyridinium-A -phenoxide betaine dye. Values in kcal mol'1, taken from reference7
d) Kamlet and Taft's solvatochromic parameters taken from reference 8
e) Scale reference
In Table 4.2 dielectric constants and Ex (30) values for selected binary mixtures water-
2-propanol and water-1,4-dioxane are also reported for compositions similar to the
mixtures used in our kinetic experiments.
173
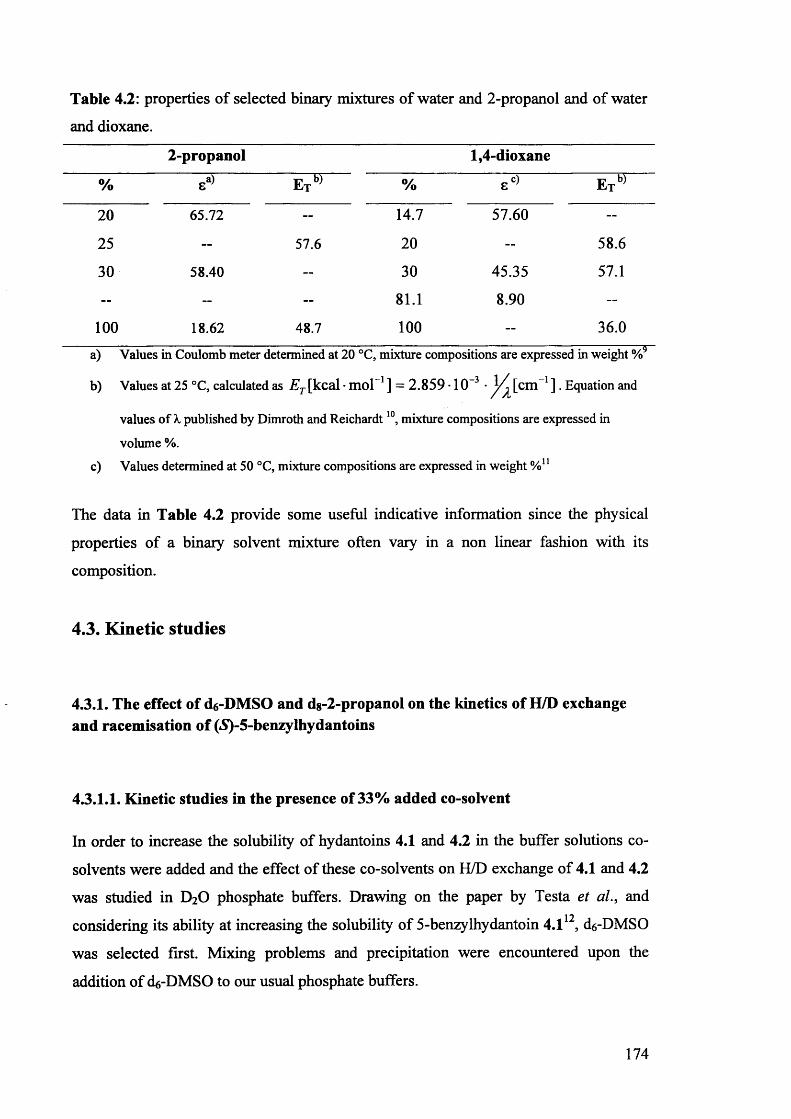
Table 4.2: properties of selected binary mixtures of water and 2-propanol and of water
and dioxane.
2-propanol 1,4-dioxane
% 8a) ETb) % s c) ETb)
20 65.72 — 14.7 57.60 —
25 — 57.6 20 — 58.6
30 58.40 — 30 45.35 57.1
— — — 81.1 8.90 —
100 18.62 48.7 100 — 36.0
a) Values in Coulomb meter determined at 20 °C, mixture compositions are expressed in weight %
b) Values at 25 °C, calculated as ET [kcal • mol 1 ] = 2.859 • 10 3 • [cm 1 ]. Equation and
values of X published by Dimroth and Reichardt10, mixture compositions are expressed in
volume %.c) Values determined at 50 °C, mixture compositions are expressed in weight %u
The data in Table 4.2 provide some useful indicative information since the physical
properties of a binary solvent mixture often vary in a non linear fashion with its
composition.
4.3. Kinetic studies
4.3.1. The effect of d6-DMSO and dg-2-propanol on the kinetics of H/D exchange and racemisation of (5)-5-benzylhydantoins
43.1.1. Kinetic studies in the presence of 33% added co-solvent
In order to increase the solubility of hydantoins 4.1 and 4.2 in the buffer solutions co
solvents were added and the effect of these co-solvents on H/D exchange of 4.1 and 4.2
was studied in D20 phosphate buffers. Drawing on the paper by Testa et al., and• • • 12 considering its ability at increasing the solubility of 5-benzylhydantoin 4.1 , d6-DMSO
was selected first. Mixing problems and precipitation were encountered upon the
addition of cU-DMSO to our usual phosphate buffers.
174
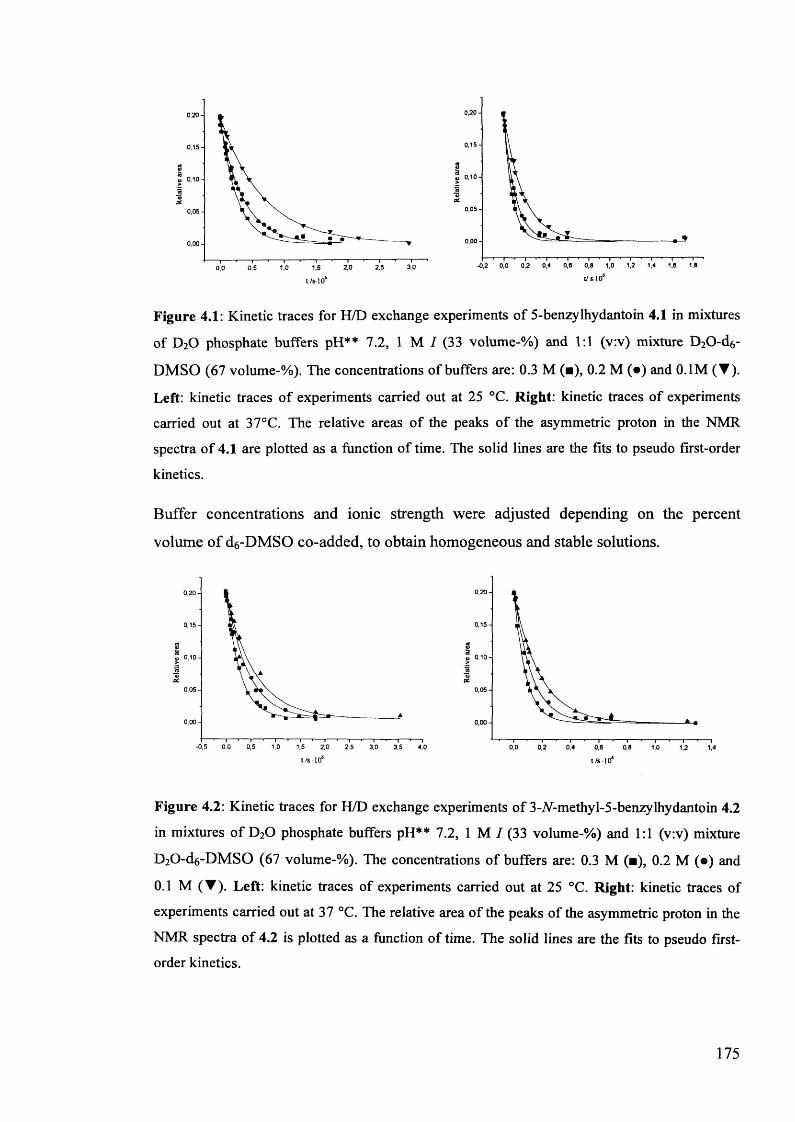
0 ,2 0 -
0,15-
0 ,1 0 -
(Q
0,05-
0 ,0 0 -
1,2 1,4 1,6 1.6-0,2 0,0 0,2 0,4 0,6 0.8 1,0
0 ,2 0 -
0,15-aa
0 ,1 0 ->
£0,05-
0,0 0 -
3.02.0 2.50.5 1.0 1.50.0
t/s-106 1/5106
Figure 4.1: Kinetic traces for H/D exchange experiments of 5-benzylhydantoin 4.1 in mixtures
of D20 phosphate buffers pH** 7.2, 1 M I (33 volume-%) and 1:1 (v:v) mixture D20-d6-
DMSO (67 volume-%). The concentrations of buffers are: 0.3 M (■), 0.2 M (•) and 0.1M (▼).
Left: kinetic traces of experiments carried out at 25 °C. Right: kinetic traces of experiments
carried out at 37°C. The relative areas of the peaks of the asymmetric proton in the NMR
spectra of 4.1 are plotted as a function of time. The solid lines are the fits to pseudo first-order
kinetics.
Buffer concentrations and ionic strength were adjusted depending on the percent
volume of d6-DMSO co-added, to obtain homogeneous and stable solutions.
0,2 0 -
0,15-*0>
0,05-
0 ,0 0 -
0.0 0,2 0,4 0,80.6 1.0 1.2
0,15-
£ti
0,05-
0,0 0 -
-0.5 0,5 1.0 1.50.0 2.0 2,5 3,0 3,5t/s-10* t/s-106
Figure 4.2: Kinetic traces for H/D exchange experiments of 3-/V-methyl-5-benzylhydantoin 4.2
in mixtures of D20 phosphate buffers pH** 7.2, 1 M / (33 volume-%) and 1:1 (v:v) mixture
D20-d6-DMS0 (67 volume-%). The concentrations of buffers are: 0.3 M (■), 0.2 M (•) and
0.1 M (T ). Left: kinetic traces of experiments carried out at 25 °C. Right: kinetic traces of
experiments carried out at 37 °C. The relative area of the peaks of the asymmetric proton in the
NMR spectra of 4.2 is plotted as a function of time. The solid lines are the fits to pseudo first- order kinetics.
175
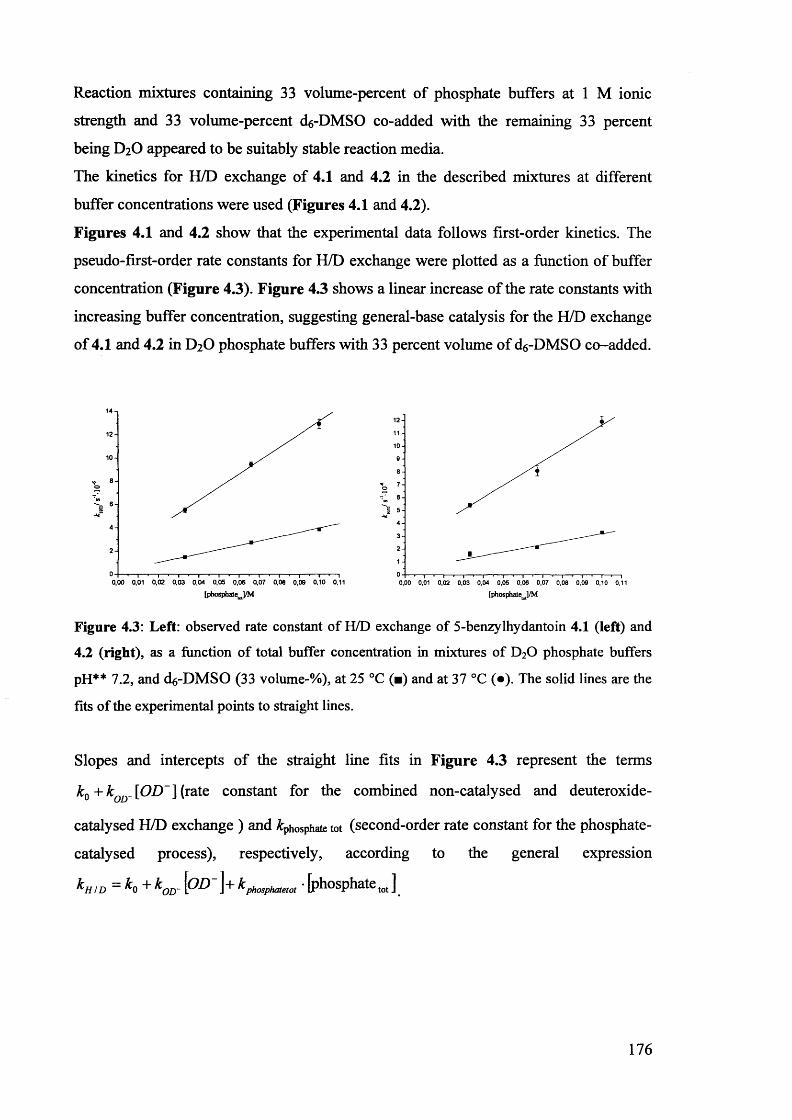
Reaction mixtures containing 33 volume-percent of phosphate buffers at 1 M ionic
strength and 33 volume-percent cU-DMSO co-added with the remaining 33 percent
being D2O appeared to be suitably stable reaction media.
The kinetics for H/D exchange of 4.1 and 4.2 in the described mixtures at different
buffer concentrations were used (Figures 4.1 and 4.2).
Figures 4.1 and 4.2 show that the experimental data follows first-order kinetics. The
pseudo-first-order rate constants for H/D exchange were plotted as a function of buffer
concentration (Figure 4.3). Figure 4.3 shows a linear increase of the rate constants with
increasing buffer concentration, suggesting general-base catalysis for the H/D exchange
of 4.1 and 4.2 in D2O phosphate buffers with 33 percent volume of d6-DMSO co-added.
14
1210
8*©
642
00,00 0,01 0,02 0.03 0,04 0,05 0,06 0,07 0,06 0,09 0,10 0,11
1211
10
98
7o6
5432
1
00,00 0,01 0,02 0,03 0,04 0,05 0,06 0,07 0,08 0,09 0,10 0,11[phosphateJ/M [phosphateJ/M
Figure 4.3: Left: observed rate constant of H/D exchange of 5-benzylhydantoin 4.1 (left) and
4.2 (right), as a function of total buffer concentration in mixtures of D20 phosphate buffers
pH** 7.2, and d6-DMSO (33 volume-%), at 25 °C (■) and at 37 °C (•). The solid lines are the
fits of the experimental points to straight lines.
Slopes and intercepts of the straight line fits in Figure 4.3 represent the terms
k0+kOD-[OD~]{rate constant for the combined non-catalysed and deuteroxide-
catalysed H/D exchange ) and phosphate tot (second-order rate constant for the phosphate-
catalysed process), respectively, according to the general expression
kHio = ko + koD~[0Z)"]+ kpho,pHaU„ ,' [phosphateM]
176
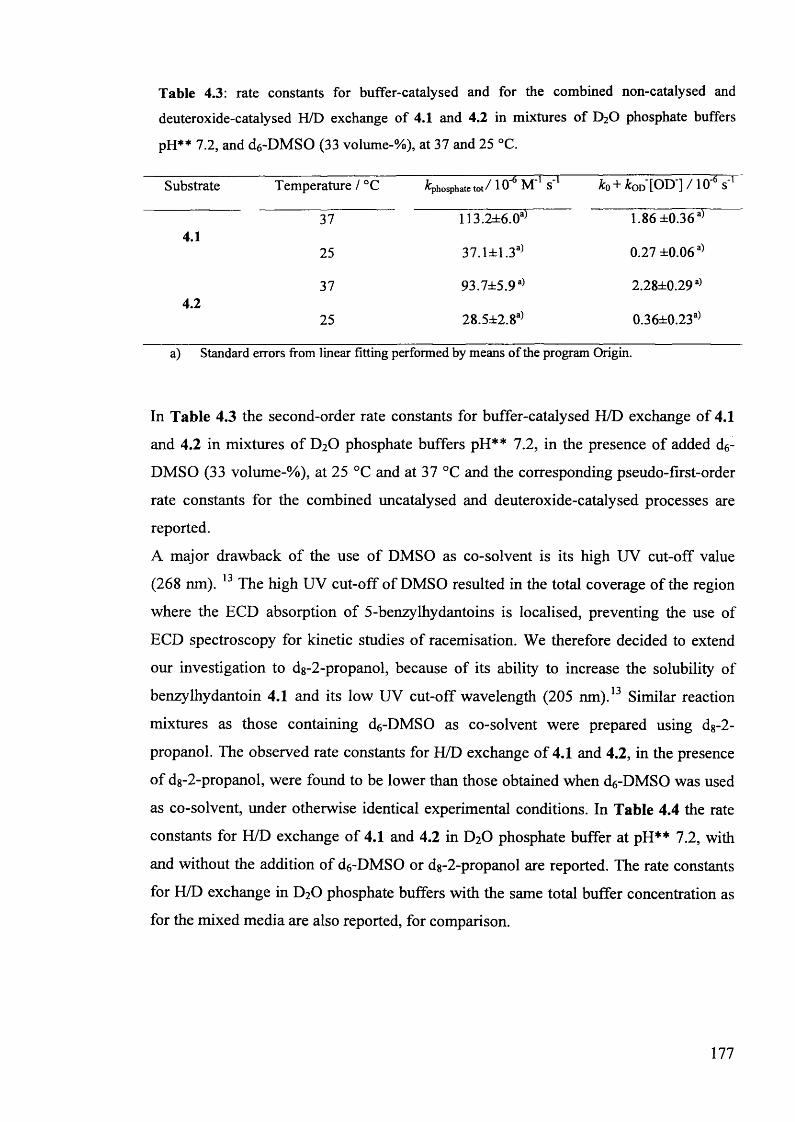
Table 4.3: rate constants for buffer-catalysed and for the combined non-catalysed and
deuteroxide-catalysed H/D exchange of 4.1 and 4.2 in mixtures of D20 phosphate buffers
pH** 7.2, and d6-DMSO (33 volume-%), at 37 and 25 °C.
Substrate Temperature / °C ^phosphate to t / 10*6 M 1 S 1 ko + &od [OD‘] /1 O'6 s 1
37 113.2±6.0a) 1.86 ±0.36a)4.1
37.1±1.3a) 0.27 ±0.06a)25
37 93.7±5.9a) 2.28±0.29a)4.2
28.5±2.8a) 0.36±0.23a)25
a) Standard errors from linear fitting performed by means of the program Origin.
In Table 4.3 the second-order rate constants for buffer-catalysed H/D exchange of 4.1
and 4.2 in mixtures of D20 phosphate buffers pH** 7.2, in the presence of added d.6-
DMSO (33 volume-%), at 25 °C and at 37 °C and the corresponding pseudo-first-order
rate constants for the combined uncatalysed and deuteroxide-catalysed processes are
reported.
A major drawback of the use of DMSO as co-solvent is its high UV cut-off value
(268 nm). 13 The high UV cut-off of DMSO resulted in the total coverage of the region
where the ECD absorption of 5-benzylhydantoins is localised, preventing the use of
ECD spectroscopy for kinetic studies of racemisation. We therefore decided to extend
our investigation to dg-2-propanol, because of its ability to increase the solubility of
benzylhydantoin 4.1 and its low UV cut-off wavelength (205 nm).13 Similar reaction
mixtures as those containing dg-DMSO as co-solvent were prepared using dg-2-
propanol. The observed rate constants for H/D exchange of 4.1 and 4.2, in the presence
of dg-2-propanol, were found to be lower than those obtained when d6-DMSO was used
as co-solvent, under otherwise identical experimental conditions. In Table 4.4 the rate
constants for H/D exchange of 4.1 and 4.2 in D20 phosphate buffer at pH** 7.2, with
and without the addition of d6-DMSO or dg-2-propanol are reported. The rate constants
for H/D exchange in D20 phosphate buffers with the same total buffer concentration as
for the mixed media are also reported, for comparison.
177
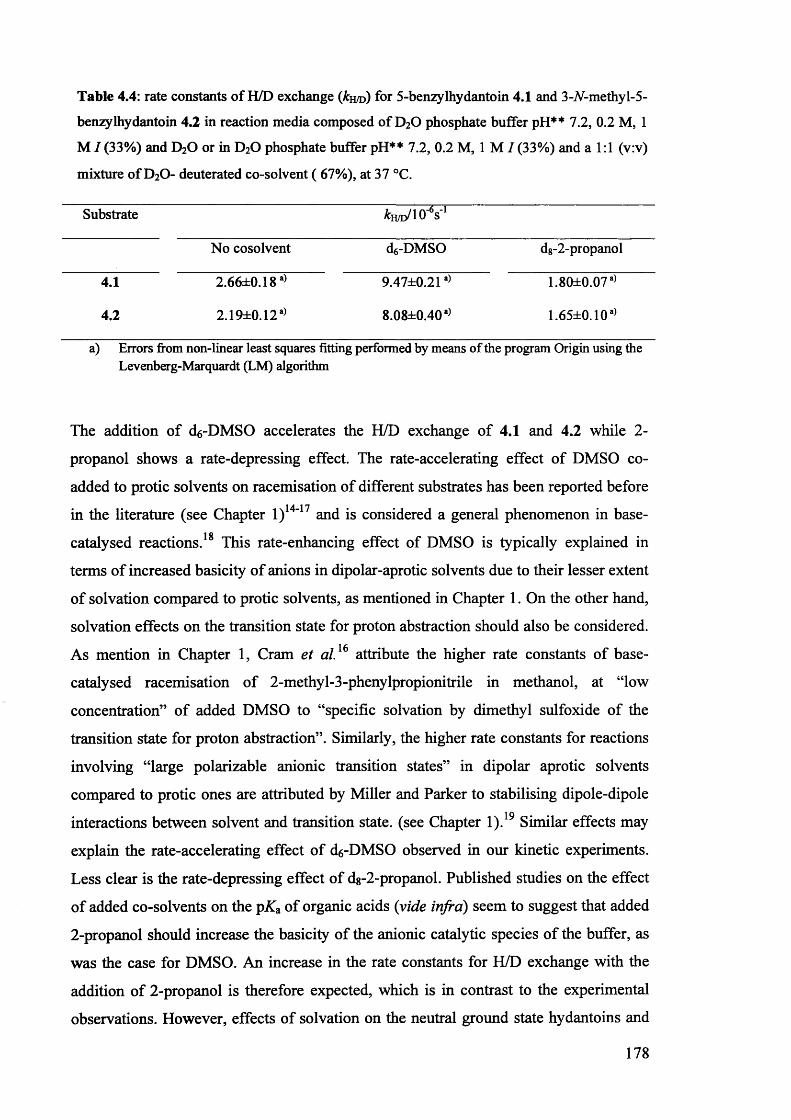
Table 4.4: rate constants of H/D exchange (&h /d) for 5-benzylhydantoin 4.1 and 3-iV-methyl-5-
benzylhydantoin 4.2 in reaction media composed of D20 phosphate buffer pH** 7.2, 0.2 M, 1
M / (33%) and D20 or in D20 phosphate buffer pH** 7.2, 0.2 M, 1 M / (33%) and a 1:1 (v:v)
mixture of D20- deuterated co-solvent ( 67%), at 37 °C.
Substrate ^h/d/IO^s 1
No cosolvent d6-DMSO dg-2 -propanol
4.1 2.66±0.18a) 9.47±0.21a) 1.80±0.07a)
4.2 2.19±0.12a) 8.08±0.40a) 1.65±0.10a)
a) Errors from non-linear least squares fitting performed by means of the program Origin using theLevenberg-Marquardt (LM) algorithm
The addition of c^-DMSO accelerates the H/D exchange of 4.1 and 4.2 while 2-
propanol shows a rate-depressing effect. The rate-accelerating effect of DMSO co
added to protic solvents on racemisation of different substrates has been reported before
in the literature (see Chapter l)14'17 and is considered a general phenomenon in base-152catalysed reactions. This rate-enhancing effect of DMSO is typically explained in
terms of increased basicity of anions in dipolar-aprotic solvents due to their lesser extent
of solvation compared to protic solvents, as mentioned in Chapter 1. On the other hand,
solvation effects on the transition state for proton abstraction should also be considered.
As mention in Chapter 1, Cram et al,16 attribute the higher rate constants of base-
catalysed racemisation of 2-methyl-3-phenylpropionitrile in methanol, at “low
concentration” of added DMSO to “specific solvation by dimethyl sulfoxide of the
transition state for proton abstraction”. Similarly, the higher rate constants for reactions
involving “large polarizable anionic transition states” in dipolar aprotic solvents
compared to protic ones are attributed by Miller and Parker to stabilising dipole-dipole
interactions between solvent and transition state, (see Chapter l) .19 Similar effects may
explain the rate-accelerating effect of d6-DMSO observed in our kinetic experiments.
Less clear is the rate-depressing effect of ds-2-propanol. Published studies on the effect
of added co-solvents on the pKa of organic acids (vide infra) seem to suggest that added
2-propanol should increase the basicity of the anionic catalytic species of the buffer, as
was the case for DMSO. An increase in the rate constants for H/D exchange with the
addition of 2-propanol is therefore expected, which is in contrast to the experimental
observations. However, effects of solvation on the neutral ground state hydantoins and
178
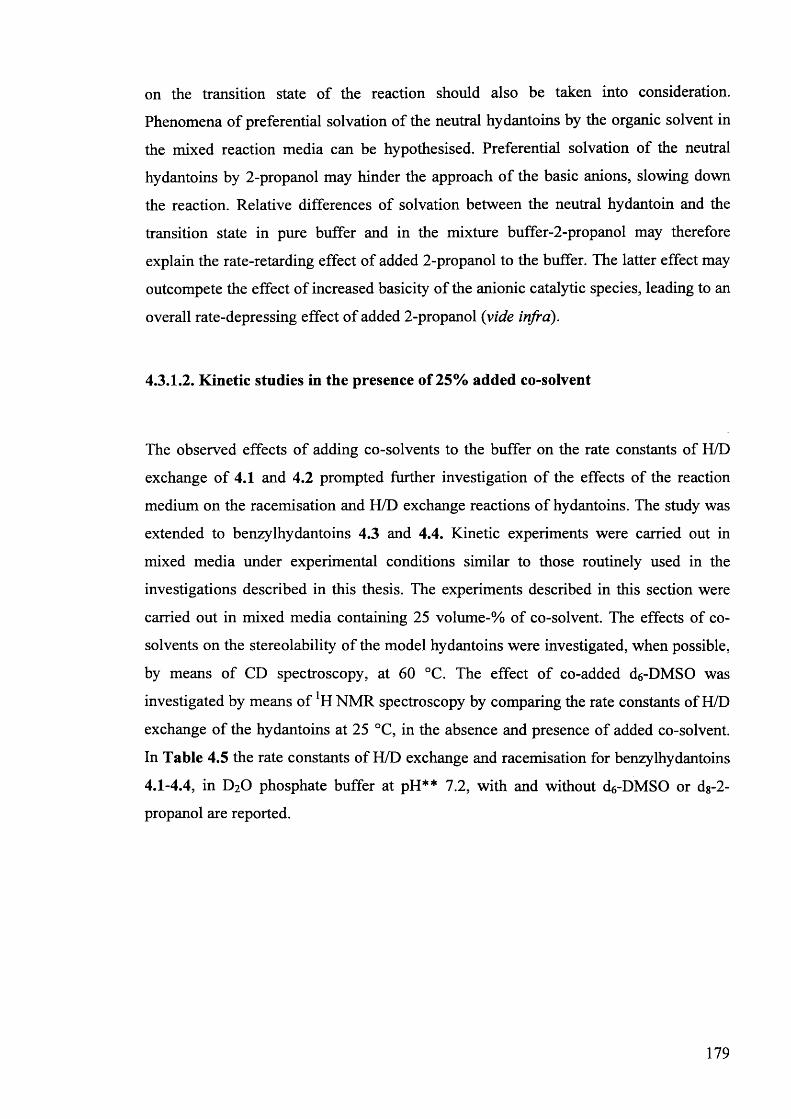
on the transition state of the reaction should also be taken into consideration.
Phenomena of preferential solvation of the neutral hydantoins by the organic solvent in
the mixed reaction media can be hypothesised. Preferential solvation of the neutral
hydantoins by 2-propanol may hinder the approach of the basic anions, slowing down
the reaction. Relative differences of solvation between the neutral hydantoin and the
transition state in pure buffer and in the mixture buffer-2-propanol may therefore
explain the rate-retarding effect of added 2-propanol to the buffer. The latter effect may
outcompete the effect of increased basicity of the anionic catalytic species, leading to an
overall rate-depressing effect of added 2-propanol (vide infra).
4.3.I.2. Kinetic studies in the presence of 25% added co-solvent
The observed effects of adding co-solvents to the buffer on the rate constants of H/D
exchange of 4.1 and 4.2 prompted further investigation of the effects of the reaction
medium on the racemisation and H/D exchange reactions of hydantoins. The study was
extended to benzylhydantoins 4.3 and 4.4. Kinetic experiments were carried out in
mixed media under experimental conditions similar to those routinely used in the
investigations described in this thesis. The experiments described in this section were
carried out in mixed media containing 25 volume-% of co-solvent. The effects of co
solvents on the stereolability of the model hydantoins were investigated, when possible,
by means of CD spectroscopy, at 60 °C. The effect of co-added d6-DMSO was
investigated by means of *H NMR spectroscopy by comparing the rate constants of H/D
exchange of the hydantoins at 25 °C, in the absence and presence of added co-solvent.
In Table 4.5 the rate constants of H/D exchange and racemisation for benzylhydantoins
4.1-4.4, in D2O phosphate buffer at pH** 7.2, with and without d6-DMSO or dg-2-
propanol are reported.
179
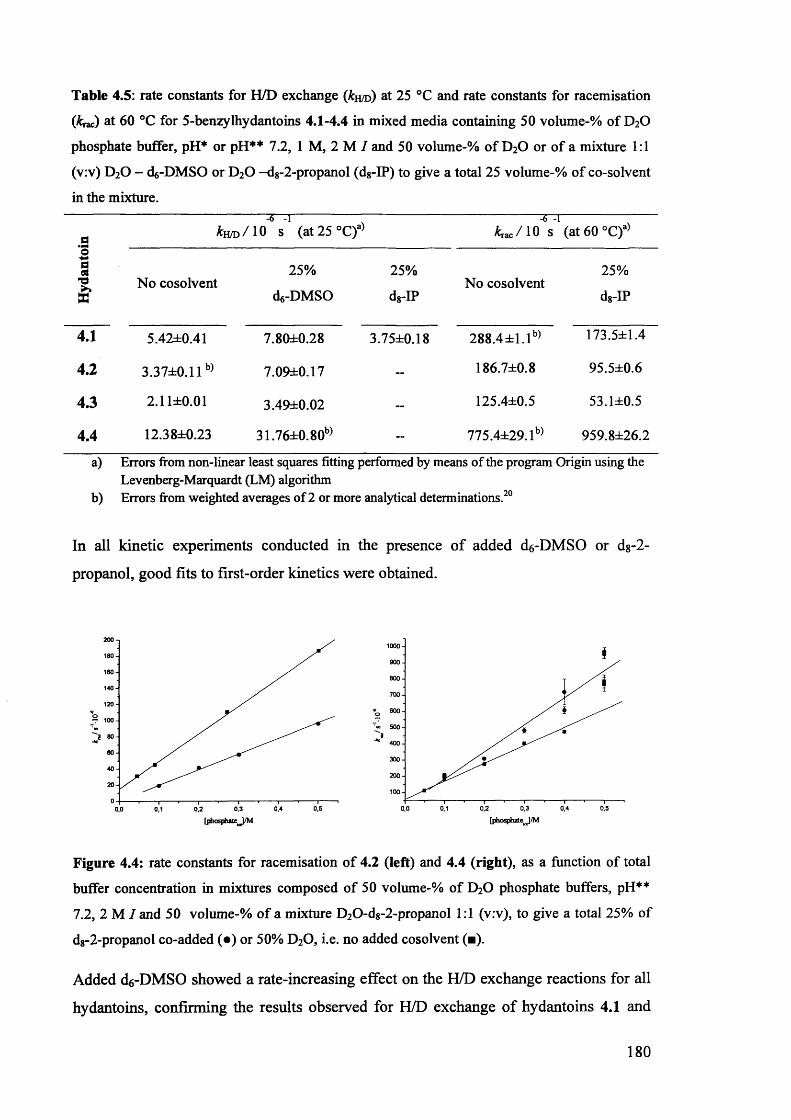
Table 4.5: rate constants for H/D exchange (&h/d) at 25 °C and rate constants for racemisation
(£rac) at 60 °C for 5-benzylhydantoins 4.1-4.4 in mixed media containing 50 volume-% of D2O
phosphate buffer, pH* or pH** 7.2, 1 M, 2 M I and 50 volume-% of D20 or of a mixture 1:1
(v:v) D20 - d6-DMSO or D20 -dg-2-propanol (dg-IP) to give a total 25 volume-% of co-solvent
in the mixture.
fl
-6 -1k w o /1 0 s (at 25 °C)a)
■ — ■ -6 -1 &rac/1 0 S (at 60 °C)a)
0a08 25% 25% 25%
No cosolvent No cosolventX d^-DMSO dg-IP dg-IP
4.1 5.42±0.41 7.80±0.28 3.75±0.18 288.4 ± l.lb) 173.5±1.4
4.2 3.37±0.11b) 7.09±0.17 -- 186.7±0.8 95.5±0.6
4.3 2 .1 1 ±0 .0 1 3.49±0.02 - 125.4±0.5 53.1±0.5
4.4 12.38±0.23 31.76±0.80b) - 775.4±29.1b) 959.8±26.2
a) Errors from non-linear least squares fitting performed by means of the program Origin using the Levenberg-Marquardt (LM) algorithm
b) Errors from weighted averages of 2 or more analytical determinations.20
In all kinetic experiments conducted in the presence of added d6-DMSO or d%-2-
propanol, good fits to first-order kinetics were obtained.
200
180160140120
100
‘g 60
6040200 0,50.40,2 0,30,0 0,1
700-600-o
'i
300-2 00 -
0,30.1 0,2 0,4 0,50,0
[phosphateJ/M [phosphateJM
Figure 4.4: rate constants for racemisation of 4.2 (left) and 4.4 (right), as a function of total
buffer concentration in mixtures composed of 50 volume-% of D20 phosphate buffers, pH**
7.2, 2 M I and 50 volume-% of a mixture D20-dg-2-propanol 1:1 (v:v), to give a total 25% of
dg-2-propanol co-added (•) or 50% D20, i.e. no added cosolvent (■).
Added d^-DMSO showed a rate-increasing effect on the H/D exchange reactions for all
hydantoins, confirming the results observed for H/D exchange of hydantoins 4.1 and
180
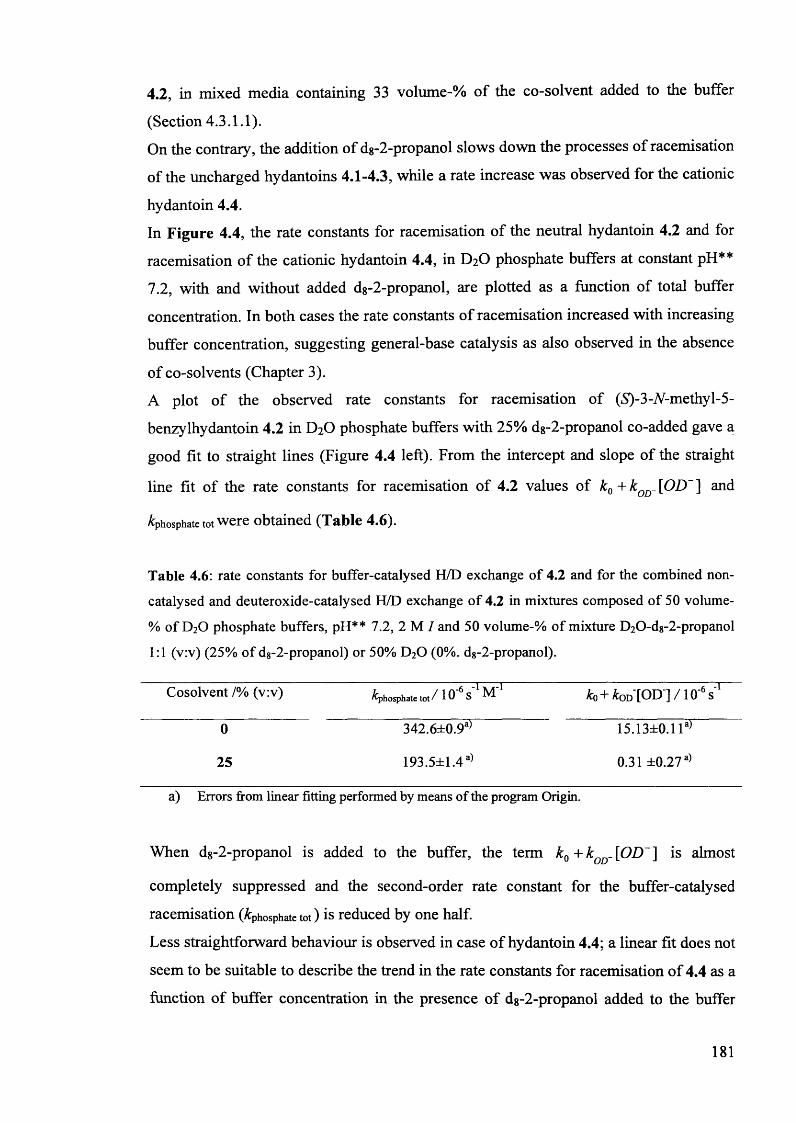
4.2, in mixed media containing 33 volume-% of the co-solvent added to the buffer
(Section 4.3.1.1).On the contrary, the addition of dg-2-propanol slows down the processes of racemisation
of the uncharged hydantoins 4.1-4.3, while a rate increase was observed for the cationic
hydantoin 4.4.
In Figure 4.4, the rate constants for racemisation of the neutral hydantoin 4.2 and for
racemisation of the cationic hydantoin 4.4, in D20 phosphate buffers at constant pH**
7.2, with and without added d8-2-propanol, are plotted as a function of total buffer
concentration. In both cases the rate constants of racemisation increased with increasing
buffer concentration, suggesting general-base catalysis as also observed in the absence
of co-solvents (Chapter 3).
A plot of the observed rate constants for racemisation of (S)-3-/V-methyl-5-
benzylhydantoin 4.2 in D20 phosphate buffers with 25% dg-2-propanol co-added gave a
good fit to straight lines (Figure 4.4 left). From the intercept and slope of the straight
line fit of the rate constants for racemisation of 4.2 values of kQ + kQD_ [OD~ ] and
phosphate tot were obtained (Table 4.6).
Table 4.6: rate constants for buffer-catalysed H/D exchange of 4.2 and for the combined non
catalysed and deuteroxide-catalysed H/D exchange of 4.2 in mixtures composed of 50 volume-
% of D20 phosphate buffers, pH** 7.2, 2 M I and 50 volume-% of mixture D20-dg-2-propanol
1:1 (v:v) (25% of dg-2-propanol) or 50% D20 (0%. dg-2-propanol).
Cosolvent /% (v:v) phosphate tot/ Id S ^4 £0 + £Od [O D ]/1 0 V
0 342.6±0.9a) 15.13±0.11a)
25 193.5±1.4a) 0.31 ±0.27a)
a) Errors from linear fitting performed by means of the program Origin.
When dg-2-propanol is added to the buffer, the term k0 + kQD. [OD ] is almost
completely suppressed and the second-order rate constant for the buffer-catalysed
racemisation (phosphate tot) is reduced by one half.
Less straightforward behaviour is observed in case of hydantoin 4.4; a linear fit does not
seem to be suitable to describe the trend in the rate constants for racemisation of 4.4 as a
function of buffer concentration in the presence of dg-2-propanol added to the buffer
181
(Figure 4.4 - right). Similarly, in the absence of any co-solvent the point at the highest
buffer concentration (0.5 M) was found to deviate from the linear fit (Chapter 3). A
polynomial fit appeared to better reproduce the variation in &rac with increasing buffer
concentration. However, the origin of the observed increase in Arrac at higher buffer
concentration is currently unclear (see Appendix 3). Nevertheless, even if the
dependence of the rate constants of racemisation of 4.4 on buffer concentration is not
simple, the rate enhancing effect of added 2-propanol is clear.
4.3.2. Solvent kinetic isotope effects in mixed media
In Chapter 2 we reported very small differences between the rate constants of
racemisation of 4.1 and 4.2 in kinetic experiments conducted in deuterated and non-
deuterated buffers. This observation suggested no direct involvement of the solvent in
the rate-determining step of the reaction, in agreement with the conclusion that
racemisation and H/D exchange occur via the SeI mechanism. To explore whether the
mechanism of racemisation and H/D exchange remain the same in the presence of
added co-solvents, kinetic experiments of racemisation were carried out in the presence
of 25% co-solvent added to the buffer, in deuterated and non-deuterated media.
Considering the opposite effects of d6-DMSO and dg-2-propanol on the rate constants
for H/D exchange of 4.1-4.4, the effects of two additional co-solvents, viz. dioxane and
trifluoroethanol, were also tested. The kinetic data have been summarised in Table 4.7.
Table 4.7 illustrates the effect of added 1,4-dioxane and trifluoroethanol on the rate
constants for racemisation of hydantoins 4.1-4.4. The rate constant of racemisation in
the absence of any co-solvent added to the buffer are also reported, for comparison. As
observed in the case of 2-propanol, the addition of 1,4-dioxane also has a rate-
depressing effect on racemisation of hydantoins 4.1-4.3 while a marked rate-increasing
effect was found for hydantoin 4.4. Trifluoroethanol has a slight accelerating effect on
the racemisation of all hydantoins, however the effect seems to be small and further data
are needed to allow interpretation of the results.
182
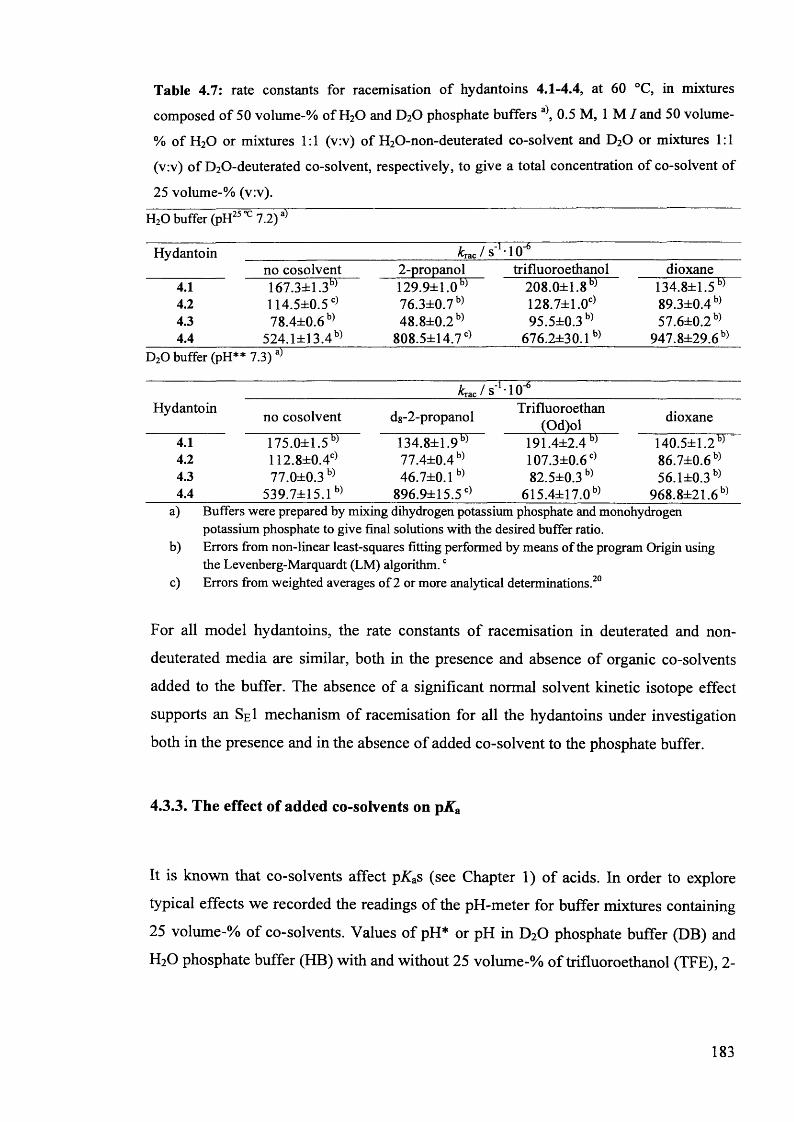
Table 4.7: rate constants for racemisation of hydantoins 4.1-4.4, at 60 °C, in mixtures
composed of 50 volume-% of H2O and D2O phosphate buffers 0.5 M, 1 M / and 50 volume-
% of H2O or mixtures 1:1 (v:v) of I^O-non-deuterated co-solvent and D2O or mixtures 1:1
(v:v) of D2 0 -deuterated co-solvent, respectively, to give a total concentration of co-solvent of
25 volume-% (v:v).
H20 buffer (pH25 7.2)a)
Hydantoin Ic'vrac/ s'1 -1 O'6
no cosolvent 2 -propanol trifluoroethanol dioxane4.1 167.3±1.3b) 129.9±1.0b) 208.0±1.8b) 134.8±1.5b)4.2 114.5±0.5C) 76.3±0.7b) 128.7±1.0c) 89.3±0.4b)4.3 78.4±0.6b) 48.8±0.2b) 95.5±0.3b) 57.6±0.2b)4.4 524.1±13.4b) 808.5±14.7c) 676.2±30.1b) 947.8±29.6b)
D20 buffer (pH*:* 7.3) a)
krzc / s’MO'6
Hydantoin no cosolvent dg-2 -propanol Trifluoroethan(Od)ol dioxane
4.1 175.0±1.5b) 134.8±1.9b) 191.4±2.4b) 140.5±1.2b)4.2 112.8±0.4c) 77.4±0.4b) 107.3±0.6c) 86.7±0.6b)4.3 77.0±0.3 b) 46.7±0.1b) 82.5±0.3b) 56.1±0.3b)4.4 539.7±15.1b) 896.9±15.5c) 615.4±17.0b) 968.8±21.6b)
a) Buffers were prepared by mixing dihydrogen potassium phosphate and monohydrogenpotassium phosphate to give final solutions with the desired buffer ratio.
b) Errors from non-linear least-squares fitting performed by means of the program Origin using the Levenberg-Marquardt (LM) algorithm. 0
c) Errors from weighted averages of 2 or more analytical determinations.20
For all model hydantoins, the rate constants of racemisation in deuterated and non-
deuterated media are similar, both in the presence and absence of organic co-solvents
added to the buffer. The absence of a significant normal solvent kinetic isotope effect
supports an SeI mechanism of racemisation for all the hydantoins under investigation
both in the presence and in the absence of added co-solvent to the phosphate buffer.
4.3.3. The effect of added co-solvents on pKa
It is known that co-solvents affect pKas (see Chapter 1) of acids. In order to explore
typical effects we recorded the readings of the pH-meter for buffer mixtures containing
25 volume-% of co-solvents. Values of pH* or pH in D20 phosphate buffer (DB) and
H20 phosphate buffer (HB) with and without 25 volume-% of trifluoroethanol (TFE), 2-
183
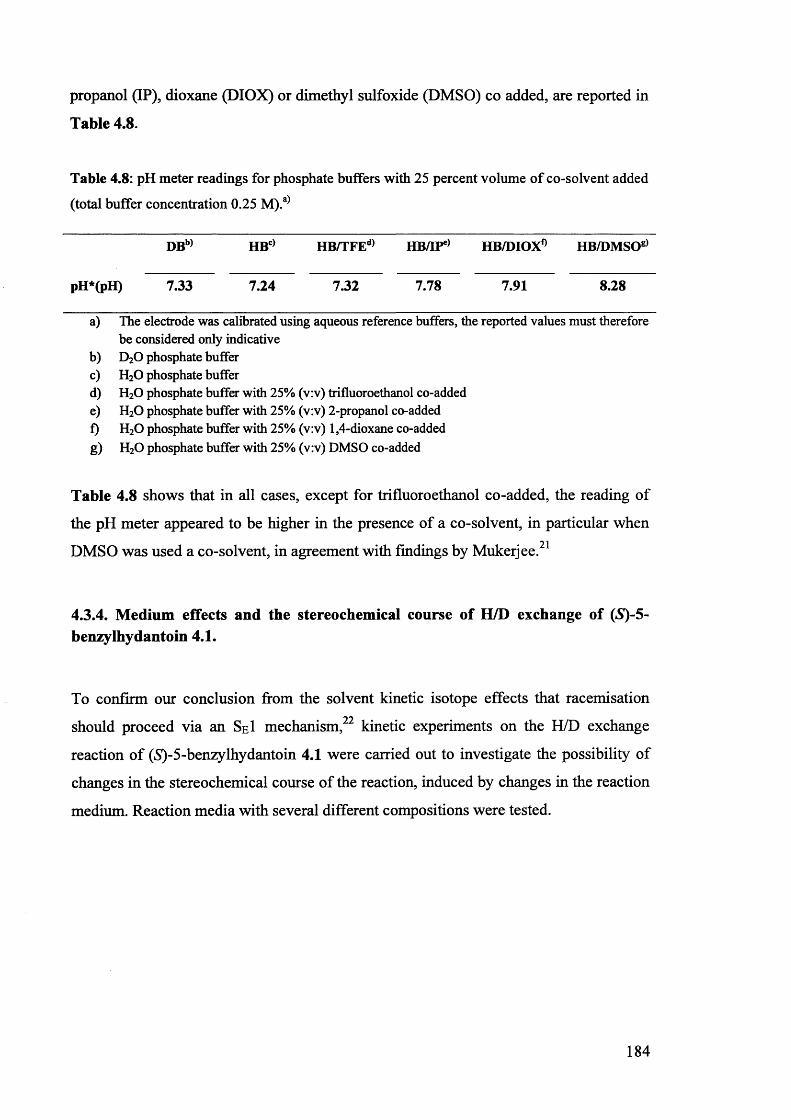
propanol (IP), dioxane (DIOX) or dimethyl sulfoxide (DMSO) co added, are reported in
Table 4.8.
Table 4.8: pH meter readings for phosphate buffers with 25 percent volume of co-solvent added
(total buffer concentration 0.25 M).a)
DBb) HBC) HB/TFEd) HB/IPe) HB/DIOX0 HB/DMSOg)
pH*(pH) 7.33 7.24 7.32 7.78 7.91 8.28
a) The electrode was calibrated using aqueous reference buffers, the reported values must therefore be considered only indicative
b) D20 phosphate bufferc) H20 phosphate bufferd) H20 phosphate buffer with 25% (v:v) trifluoroethanol co-addede) H20 phosphate buffer with 25% (v:v) 2-propanol co-addedf) H20 phosphate buffer with 25% (v:v) 1,4-dioxane co-addedg) H20 phosphate buffer with 25% (v:v) DMSO co-added
Table 4.8 shows that in all cases, except for trifluoroethanol co-added, the reading of
the pH meter appeared to be higher in the presence of a co-solvent, in particular when
DMSO was used a co-solvent, in agreement with findings by Mukerjee.21
4.3.4. Medium effects and the stereochemical course of H/D exchange of (S)-5- benzylhydantoin 4.1.
To confirm our conclusion from the solvent kinetic isotope effects that racemisation
should proceed via an SeI mechanism,22 kinetic experiments on the H/D exchange
reaction of (S)-5-benzylhydantoin 4.1 were carried out to investigate the possibility of
changes in the stereochemical course of the reaction, induced by changes in the reaction
medium. Reaction media with several different compositions were tested.
184
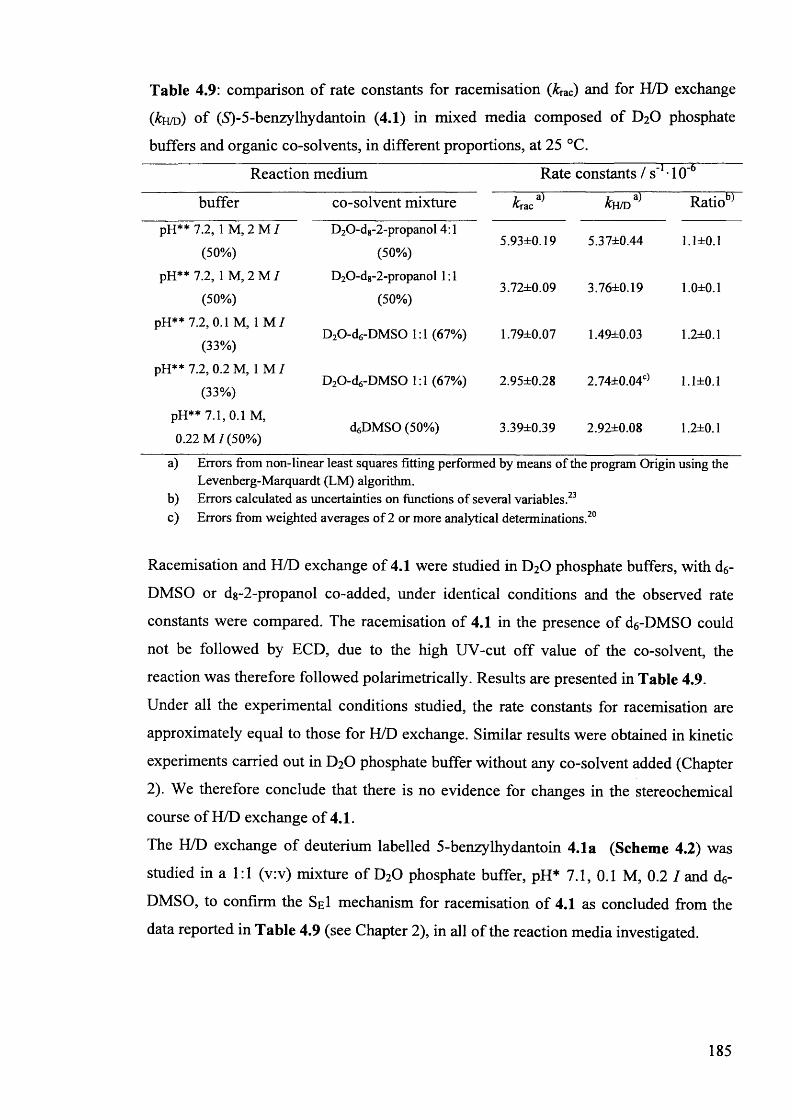
Table 4.9: comparison of rate constants for racemisation (&rac) and for H/D exchange
(&h/d) of (S)-5-benzylhydantoin (4.1) in mixed media composed of D2O phosphate
buffers and organic co-solvents, in different proportions, at 25 °C.
Reaction medium Rate constants / s"1 10’6
buffer co-solvent mixture k a)rt-rac kwD^ Ratiob
pH** 7.2, 1 M,2M7 (50%)
D20-d8-2-propanol 4:1 (50%)
5.93±0.19 5.37±0.44 1.1±0.1
pH** 7.2, 1 M, 2 M I (50%)
D20-d8-2-propanol 1:1 (50%)
3.72±0.09 3.76±0.19 1.0±0.1
pH** 7.2, 0.1 M, 1 MI (33%)
D20-cU-DMSO 1:1 (67%) 1.79±0.07 1.49±0.03 1.2±0.1
pH** 7.2, 0.2 M, 1 MI (33%)
D20-d<5-DMS0 1:1 (67%) 2.95±0.28 2.74±0.04c) 1.1±0.1
pH** 7.1, 0.1 M, 0.22 M 7(50%)
dJDMSO (50%) 3.39±0.39 2.92±0.08 1.2±0.1
a) Errors from non-linear least squares fitting performed by means of the program Origin using theLevenberg-Marquardt (LM) algorithm.
b) Errors calculated as uncertainties on functions of several variables.23c) Errors from weighted averages of 2 or more analytical determinations.20
Racemisation and H/D exchange of 4.1 were studied in D2O phosphate buffers, with d6-
DMSO or dg-2-propanol co-added, under identical conditions and the observed rate
constants were compared. The racemisation of 4.1 in the presence of d6-DMSO could
not be followed by ECD, due to the high UV-cut off value of the co-solvent, the
reaction was therefore followed polarimetrically. Results are presented in Table 4.9.
Under all the experimental conditions studied, the rate constants for racemisation are
approximately equal to those for H/D exchange. Similar results were obtained in kinetic
experiments carried out in D20 phosphate buffer without any co-solvent added (Chapter
2). We therefore conclude that there is no evidence for changes in the stereochemical
course of H/D exchange of 4.1.
The H/D exchange of deuterium labelled 5-benzylhydantoin 4.1a (Scheme 4.2) was
studied in a 1:1 (v:v) mixture of D20 phosphate buffer, pH* 7.1, 0.1 M, 0.2 / and d6-
DMSO, to confirm the SeI mechanism for racemisation of 4.1 as concluded from the
data reported in Table 4.9 (see Chapter 2), in all of the reaction media investigated.
185
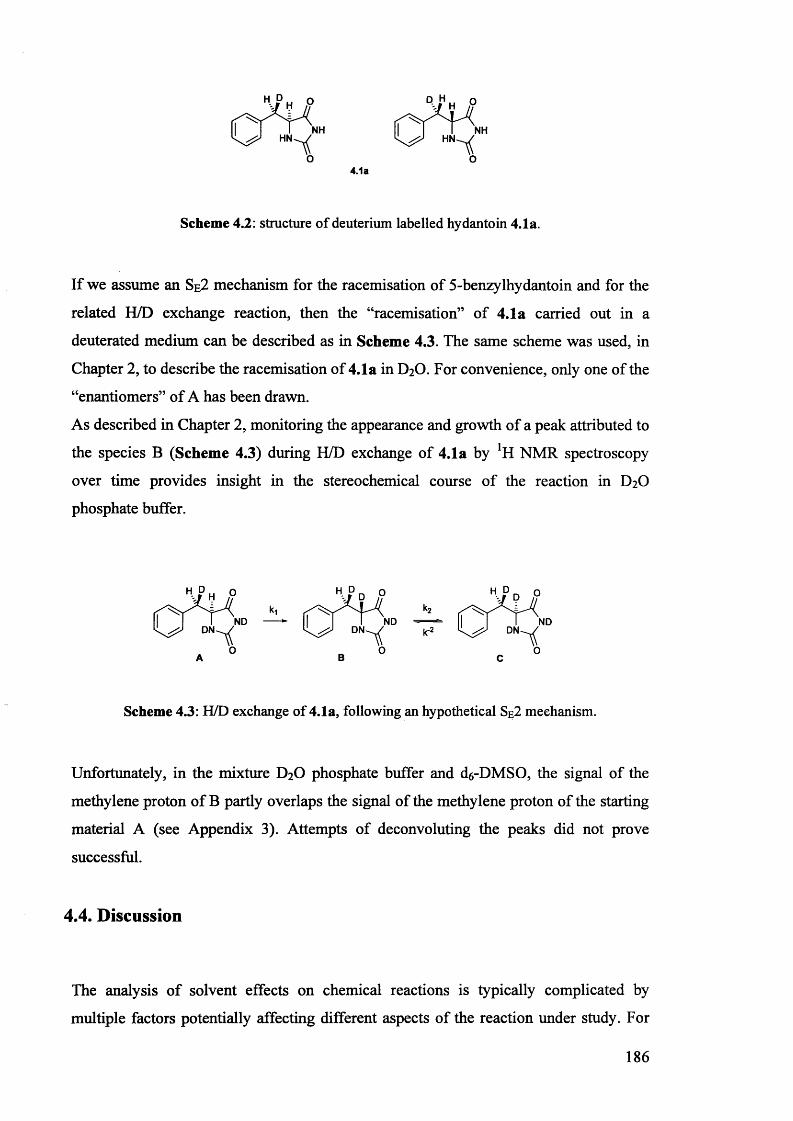
NHHN
NHHN
4.1a
Scheme 4.2: structure of deuterium labelled hydantoin 4.1a.
If we assume an Se2 mechanism for the racemisation of 5-benzylhydantoin and for the
related H/D exchange reaction, then the “racemisation” of 4.1a carried out in a
deuterated medium can be described as in Scheme 4.3. The same scheme was used, in
Chapter 2, to describe the racemisation of 4.1a in D2O. For convenience, only one of the
“enantiomers” of A has been drawn.
As described in Chapter 2, monitoring the appearance and growth of a peak attributed to
the species B (Scheme 4.3) during H/D exchange of 4.1a by *H NMR spectroscopy
over time provides insight in the stereochemical course of the reaction in D2O
phosphate buffer.
ND ND NDDN DN DN
Scheme 4.3: H/D exchange of 4.1a, following an hypothetical Se2 mechanism.
Unfortunately, in the mixture D2O phosphate buffer and d6-DMSO, the signal of the
methylene proton of B partly overlaps the signal of the methylene proton of the starting
material A (see Appendix 3). Attempts of deconvoluting the peaks did not prove
successful.
4.4. Discussion
The analysis of solvent effects on chemical reactions is typically complicated by
multiple factors potentially affecting different aspects of the reaction under study. For
186
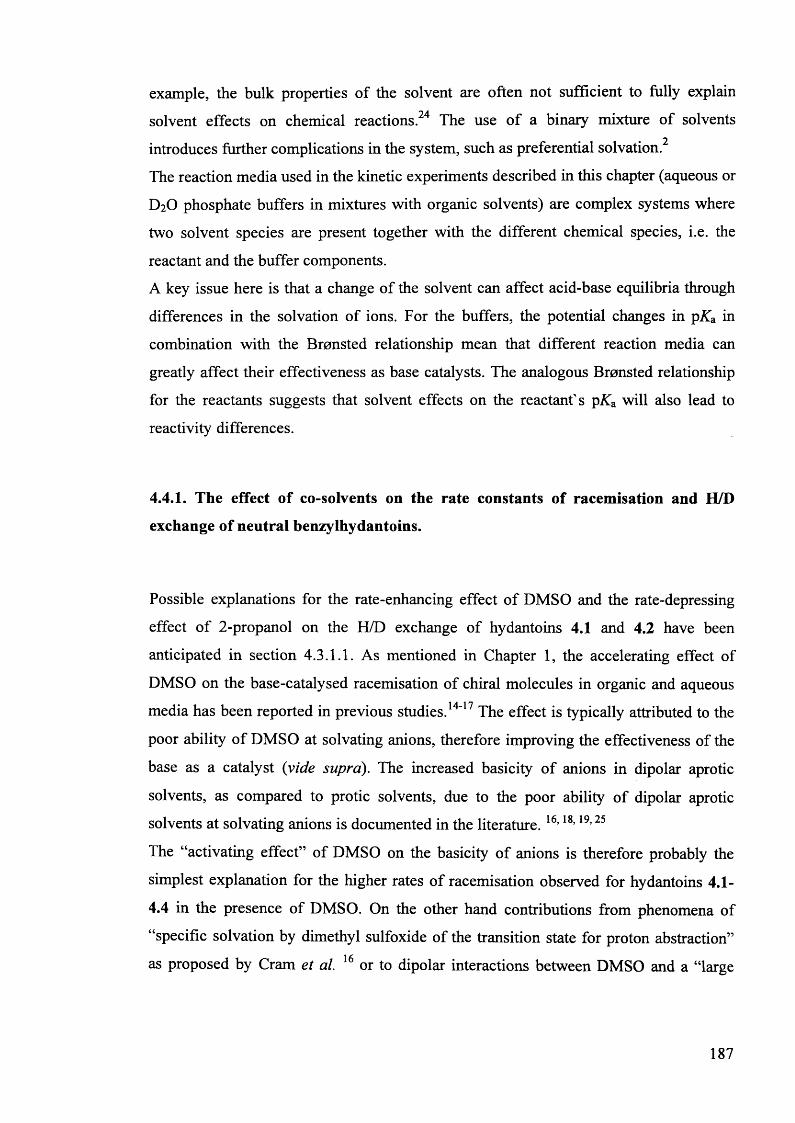
example, the bulk properties of the solvent are often not sufficient to fully explain
solvent effects on chemical reactions.24 The use of a binary mixture of solvents* 2introduces further complications in the system, such as preferential solvation.
The reaction media used in the kinetic experiments described in this chapter (aqueous or
D20 phosphate buffers in mixtures with organic solvents) are complex systems where
two solvent species are present together with the different chemical species, i.e. the
reactant and the buffer components.
A key issue here is that a change of the solvent can affect acid-base equilibria through
differences in the solvation of ions. For the buffers, the potential changes in pKa in
combination with the Bronsted relationship mean that different reaction media can
greatly affect their effectiveness as base catalysts. The analogous Bronsted relationship
for the reactants suggests that solvent effects on the reactant's pKa will also lead to
reactivity differences.
4.4.1. The effect of co-solvents on the rate constants of racemisation and H/D
exchange of neutral benzylhydantoins.
Possible explanations for the rate-enhancing effect of DMSO and the rate-depressing
effect of 2-propanol on the H/D exchange of hydantoins 4.1 and 4.2 have been
anticipated in section 4.3.1.1. As mentioned in Chapter 1, the accelerating effect of
DMSO on the base-catalysed racemisation of chiral molecules in organic and aqueous
media has been reported in previous studies.14'17 The effect is typically attributed to the
poor ability of DMSO at solvating anions, therefore improving the effectiveness of the
base as a catalyst (vide supra). The increased basicity of anions in dipolar aprotic
solvents, as compared to protic solvents, due to the poor ability of dipolar aprotic
solvents at solvating anions is documented in the literature. 16,18,19,25
The “activating effect” of DMSO on the basicity of anions is therefore probably the
simplest explanation for the higher rates of racemisation observed for hydantoins 4.1-
4.4 in the presence of DMSO. On the other hand contributions from phenomena of
“specific solvation by dimethyl sulfoxide of the transition state for proton abstraction”
as proposed by Cram et al. 16 or to dipolar interactions between DMSO and a “large
187
polarizable anionic transition state”, as described by Miller and Parker (see Chapter l )19
may also play a role in the observed rate-enhancing effect.
Less clear is the origin of the rate-retarding effect of dioxane and 2-propanol on the
racemisation of neutral hydantoins 4.1-4.3. As mentioned in Chapter 4, not just DMSO
but also other solvents, such as ethanol and dioxane, tend to increase the pKa of organicO 1 T /C O '}
acids and a similar effect may be envisaged for phosphate in our buffer mixtures. ’
Therefore, an increased basicity of anions with consequent increased rate constants of
base-catalysed racemisation may also be expected when 2-propanol and dioxane are
added to the buffer. In the specific case of dioxane, an activating effect on basic anions
similar to, although weaker than, that of DMSO is reported in the literature (Chapter
l).34 In reality, the rate constants of racemisation and H/D exchange of neutral
hydantoins are lower in the mixed media containing dioxane and 2-propanol than in
pure buffers. The lower dielectric constant of 2-propanol and, in particular, dioxane as
compared to water would also support the hypothesis of ion-pair formation, which couldn C
explain the lower rate constants in the presence of the co-solvents. However the
dielectric constants of binary mixtures water/dioxane and water/2-propanol with
contents of co-solvent similar to the buffer mixtures used in our experiments are still
higher than 40 (see Table 4.2) which, according to Reichardt, is not sufficient for
extensive ion pair formation. The observed decreased rate constants of racemisation
therefore suggests that such anion-solvation effects are counterbalanced by other, more
important, effects involving differences in solvation of the reactant hydantoins or the
transition state of reaction in mixed media as compared to pure buffers. Phenomena of
preferential solvation of the hydantoins by the organic co-solvents, hindering the
approach of the phosphate molecules and, therefore, slowing down the process of
racemisation can be envisaged, as mentioned earlier for the case of 2-propanol.
The good ability of 2-propanol and dioxane at solubilising the hydantoins, taken
together with the low polarity of the solvents support the hypothesis. Similar to 2-
propanol and dioxane, DMSO shows a good ability at solubilising the hydantoins,
however it is more polar than 2-propanol and dioxane. In addition, as mentioned in
Chapter 1, when DMSO is added to a protic solvent, donor-acceptor interactions
between the two solvent species can take place. The mentioned effects seem to render
the hypothesis of phenomena of preferential solvation of the hydantoins in mixed media
containing DMSO less likely than in mixtures buffer-dioxane or buffer-2-propanol.
Finally while DMSO should have a good stabilising effect on the transition state for
188
proton abstraction (vide supra), the lower polarities of 2-propanol and 1,4 dioxane
should render them less “good” at solvating “large polarizable anionic transition states”.
A relative lower stabilization of the transition state of reaction, as compared to the
neutral ground state hydantoins in the mixed media containing 2-propanol or dioxane
than in pure buffers, could therefore explain the rate depressing effects of the two co
solvents.
4.4.2. The effect of co-solvents on the rate constants of racemisation and H/D
exchange of the cationic hydantoin 4.4.
In case of the cationic hydantoin 4.4, the rate constants of racemisation are increased by
the addition of all of the organic co-solvents investigated. In case of DMSO, the
increased effectiveness of phosphate anions as basic catalyst could play a role in the rate
increase, as it did for the neutral hydantoins 4.1-4.3. In Chapter 3 we proposed that the
higher rate constants of racemisation and H/D exchange of hydantoin 4.4, as compared
to hydantoins 4.1-4.3, could be due to intramolecular facilitation of deprotonation of 4.4
by the ammonium group. It was proposed that the positive charge on the ammonium
group of 4.4 could stabilise, via a through-space electrostatic interaction, a developing
negative charge on the asymmetric carbon. The binary mixtures containing 2-propanol
and 1,4-dioxane have a lower dielectric constants than pure water and should be less
effective at solvating charged species in solution. A lower dielectric constant and a
lesser extent of solvation of the ammonium group in the binary mixtures could be
responsible for more favourable intramolecular electrostatic interactions in the mixed
media, leading to an increase in the observed rate constant of racemisation.
4.4.3. The solvent kinetic isotope effect for racemisation and the comparison of the
rate constants of racemisation and H/D exchange in mixed media: mechanistic
implications.
Kinetic experiments of racemisation of hydantoins 4.1-4.4, conducted in deuterated and
non-deuterated media, in the presence of co-solvents as well as in pure buffer, gave
similar rate constants of racemisation. This absence of a solvent kinetic isotope effect
suggests no direct participation of the solvent as a reactant in the rate-determining step
of the process of racemisation in all cases, supporting the hypothesis of an SeI
189
mechanism as proposed in Chapter 2 for the racemisation of 4.1 and 4.2 in purely
aqueous media. Similarly, the ratios of the rate constants of racemisation and H/D
exchange for 4.1 in several different binary mixtures containing dg-2-propanol and d6-
DMSO where found to be approximately 1. This finding also supports the hypothesis of
an SeI mechanism for racemisation of 4.1 under all experimental conditions
investigated.
4.5. Conclusions
Kinetic studies of H/D exchange and racemisation for hydantoins 4.1-4.4 in binary
mixtures of phosphate buffer with added organic co-solvents were carried out. The rate
constants were found to be affected by the addition of co-solvents. DMSO has an
accelerating effect on the racemisation and H/D exchange of all of the model
hydantoins. This result is in line with literature data reporting increased rate constants of
racemisation for different chiral compounds in the presence of DMSO as co-solvent.
The effect is attributed to the poor ability of DMSO at solvating basic anions, rendering
them more effective general-base catalysts. The addition of 1,4-dioxane and 2-propanol
to the buffer was found to have a rate-depressing effect on racemisation of neutral
hydantoins 4.1-4.3. Different hypotheses have been proposed to explain the finding,
however no definitive explanation can be given at this stage. Contrary to the neutral
hydantoins 4.1-4.3, for cationic hydantoin 4.4 the addition of 2-propanol or dioxane to
the buffer led to an increase of the rate constants of racemisation. Notably, the biggest
rate increase was observed for the addition of the apolar cosolvent 1,4-dioxane. This
finding is tentatively interpreted as support for the hypothesis of a mechanism of
racemisation for 4.4 involving intramolecular facilitation by the ammonium group (see
Chapter 3).
The rate constants for racemisation and H/D exchange of (S)-5-benzylhydantoin 4.1
were compared for selected different reaction media containing dg-2-propanol and d6-
DMSO as co-solvents. Racemisation and H/D exchange were found to proceed
approximately at the same rates, as observed in pure aqueous media. Kinetic
experiments of racemisation for hydantoins 4.1-4.4 were also carried out in binary
deuterated and non-deuterated media. The rates were found to be approximately the
same, i.e. there is no solvent kinetic isotope effect as was also observed in the absence
190
of any added organic cosolvent. These findings support an SeI mechanism of
racemisation for the model hydantoins in the binary mixtures investigated, as proposed
for the racemisation of 4.1 and 4.2 in purely aqueous buffers in Chapter 2 and of
hydantoins 3.24 and 3.26 (Chapter 3).37"39
4.6. Experimental
Materials
Potassium chloride (analytical grade) was from Fluka. Potassium hydroxide (analytical
grade) was from Fisher Scientific. Potassium dihydrogen phosphate (crystallised) was
from VWR. Dipotassium hydrogen phosphate (anhydrous) was from Fisher Scientific.
Deuterium oxide (99.9%) was purchased from Fluorochem. 2-Propanol (HPLC grade)
was purchased from Fisher Scientific. 2-Propanol-dg (99% isotopic), 2,2,2-trifluoro
ethanol (NMR grade, >99.5%) and 1,4 dioxane (99+%) were from Alfa Aesar. 2,2,2-
Trifluoroethan(ol-d) (99 atom % D) was from Aldrich. Methyl sulfoxide (99.85%, extra
pure) was from Acros Organics. Dimethylsulfoxide-d6 (D 99.9%) was purchased from
Cambridge Isotope Laboratories, Inc. The water used for the preparation of H2O
phosphate buffers was demineralised by means of a water purification system Purelab
Option from Elga. Hydantoins 4.1-4.4 and 4.1a were synthesised as described in
Chapters 2 and 3.
Apparatus
Materials were weighed on an analytical balance Fisher Brand PS-100 (Max 100 gr,
d=0.1mg). Where needed, accurate volumes of aqueous and D2O solutions were
delivered by means of Gilson or Eppendorf Research micropipettes. Volumes of organic
co-solvent, except for dimethylsulfoxide and dimethylsulfoxide-d6, were dispensed by
means of microsyringes. pH measurements were carried out, at room temperature, using
a HANNA INSTRUMENTS pH 210 pH meter. The pH meter was calibrated before
each measurement with certified buffers traceable to NIST standards at pH 7.00+0.01
(at 25 °C) (from Fisher), pH 10.01+0.02 (at 25 °C) (from Fisher) and pH 4.00+0.01 (at
25 °C) (from Reagecon). Reported pH values are uncorrected. Values reported as pH**
191
represent the reading of the pH meter for a DiO-based solution not used at 25 °C.
Thermostatic water baths Subaqua 12 (temperature stability ±0.2°C) or Julabo MB-5
Heating Circulator (temperature stability ±0.2°C) were used to control the temperature
of solutions in kinetic experiments with timescales longer than three days. Kinetic
experiments of racemisation, except when d6-DMSO was used as a co-solvent, were
carried out on a Chirascan CD spectrometer equipped with a temperature-controlled
sample holder (temperature stability: ± 0.02°C), in 1.00 cm or 0.5 cm path length quartz
cuvettes. Kinetic experiments of racemisation in the presence of d6-DMSO were carried
out by means of an Optical Activity Ltd. AA-1000 polarimeter in a 5.00 cm path length
glass cell. Kinetic experiments of H/D exchange were carried out on a Bruker
AVANCE 400 spectrometer at 400 MHz (for 1H). Pulse interval (Dl): 1 s, pulse width
(pw):10.75 ps, acquisition time (at): 3.42 s.
Preparation of solutions
Unless otherwise stated, stock solutions of D2O phosphate buffers were prepared by
dissolving potassium dihydrogen phosphate in D2O and adjusting the pH** of the
solution using KOH to give final buffers at the desired concentrations and pH**. D2O
and H2O phosphate buffers at 0.5 M and 1 M ionic strength were prepared by weighing
separately potassium dihydrogen phosphate and potassium monohydrogen phosphate in
the desired molar ratio and dissolving them in D2O and H2O, respectively.40 The
measurement of the pH25 c or pH** of the above described solutions gave values pH*
(D2O) = 7.33 and pH25 °c (H2O) = 7.24. For D2O phosphate buffers, after preparation of
the solutions as described above, the solvent was evaporated and replenished 3 times
with fresh D2O, to guarantee the full exchange with deuterons and removal of the
protons from the non-deuterated inorganic materials used to prepare the solutions.
Potassium chloride was used to adjust the ionic strength of all buffer solutions.
Stock solutions of hydantoins for racemisation experiments carried out by CD
spectroscopy were prepared in plastic eppendorfs which were kept, overnight, under
continuous rotation at a speed of 20 rpm by means of a Stuart Tube rotator SB2. The
solutions were then centrifuged for 8 minutes at 13.3 rpm on a Jencons-pls Spectrafuge
24.D centrifuge. The clear supernatant was transferred to a new eppendorf and an
amount of fresh solvent, equivalent to 1/10* of the total volume of solution, was added
192
to the solutions to ensure concentrations below the solubility limits of the hydantoins to
avoid precipitation. Unless otherwise stated, stock solutions of hydantoins for H/D
exchange experiments carried out by NMR spectroscopy and solutions for
racemisation experiments followed polarimetrically were prepared by dissolving the
solid hydantoins directly in mixtures of D2O and deuterated co-solvents in the desired
volumetric ratios.
Kinetic studies
The reaction media for the CD experiments in mixed deuterated media were prepared
by mixing D2O phosphate buffers, deuterated co-solvents, D2O, and stock solutions of
hydantoins in D20 to give desired final concentrations of buffer, hydantoin and the
required volume of co-solvent. The same procedure was followed for CD experiments
carried out in non-deuterated media where H20 , H2O buffers, non-deuterated co
solvents and solutions of hydantoins in H2O were used. Typical final concentrations of
hydantoins were the same as for kinetic experiments performed in purely aqueous
media, described in Chapters 2 and 3, viz. 0.4 mM for hydantoin 4.1, 0.9 mM for
hydantoin 4.2, 0.7 mM for hydantoin 4.3, and 0.1 mM for hydantoin 4.4. Solvents and
stock solutions were mixed immediately before the start of the kinetic experiments to
minimise the time lag between the beginning of the reaction and the acquisition of the
kinetic data. CD experiments at 60 °C were carried out in quartz cuvettes housed in the
thermostated sample holder of the spectrometer. CD spectra were automatically
recorded at set time intervals which were chosen based on the timescale of the reaction.
For longer experiments at 25 °C, the temperature of the cuvettes between recording CD
spectra was controlled by storing the solutions in thermostatic water baths and recording
CD spectra at set time intervals. For all cases, the decreases of the CD signals at 230,
235 or 240 nm were followed over time.
The reaction media for the kinetic experiments of H/D exchange were prepared by
mixing the desired volumes of stock solutions of D2O phosphate buffers with stock
solutions of the hydantoins in mixed deuterated media to give the desired final
concentrations of buffer and the desired volume percentage of co-solvent. For the
kinetic experiments for 4.1, carried out in mixtures of D2O phosphate buffers and d6-
DMSO in a 1:1 volumetric ratio, the solid hydantoin was dissolved directly in the
reaction mixture. In the H/D exchange experiments for hydantoins 4.1 and 4.2 in the
193
presence of cU-DMSO (50 volume-% and 33 volume-%) typical concentrations of
hydantoins 4.1 and 4.2 were approximately 25 mM. For the H/D exchange experiments
for hydantoins 4.1-4.4 in the presence of 25% co-solvent, typical final, total
concentrations of hydantoins in the reaction medium were 10 mM for hydantoins 4.1
and 4.2 and 30 mM for hydantoins 4.3 and 4.4. The required stock solutions were mixed
immediately before the start of the kinetic experiments. Reaction mixtures were
transferred to NMR tubes which were stored in thermostatic water baths during the time
of the kinetic experiments. *H NMR spectra were recorded at set time intervals chosen
depending on the time scale of the H/D exchange reaction. The NMR tubes were not
thermostated during the time of acquisition of the *H NMR spectra. H/D exchange was
monitored by following the decrease of the area integral of the exchangeable protons of
the hydantoins over time. In all experiments, the !H NMR signal from the phenyl ring of
the benzylhydantoins was used as internal standard to evaluate the integrals of the !H
NMR peaks of exchangeable protons. Spectral processing and integrations of NMR
signals were carried out by means of the program SpinWorks 2.5.5.
The reaction media for kinetic experiments of racemisation of 4.1 in the presence of
DMSO, which was followed polarimetrically, were the same as those used for H/D
exchange experiments followed by !H NMR spectroscopy. Solutions were stored at
constant temperature by means of thermostated water baths. Aliquots of the solutions
were taken at set time intervals and the optical rotation (a) of the solution was
measured.
Rate constants for all kinetic experiments were obtained by fitting experimental data
points to a first-order kinetics rate law, by means of the computer program Origin.
Solubility tests
Solubilities of hydantoins were determined gravimetrically. The solvent was evaporated
from exactly measured volumes of saturated solutions of hydantoins in the mixed
media. The residue was then weighed on an analytical balance.
194
References
1. Reist, M.; Carrupt, P. A.; Testa, B.; Lehmann, S.; Hansen, J. J., Helvetica
Chimica Acta 1996, 79 (3), 767-778.
2. Reichardt, C., Solvents and Solvent Effects in Organic Chemistry. Third ed.;
WILEY VCH: Weinheim, 2003; p 38-42.
3. Isaacs, N. S., Physical Organic Chemistry. 1995; p 199.
4. Reichardt, C., Solvents and Solvent Effects in Organic Chemistry. Third ed.;
WILEY VCH: Weinheim, 2003; p 416.
5. Reichardt, C., Solvents and Solvent Effects in Organic Chemistry. Third ed.;
WILEY VCH: Weinheim, 2003; p 431.
6. Reichardt, C., Solvents and Solvent Effects in Organic Chemistry. Third ed.;
WILEY VCH: Weinheim, 2003; p 472-475.
7. Isaacs, N. S., Physical Organic Chemistry. Pearson Education Limited: Harlow,
UK, 1995; p 203-204.
8. Reichardt, C., Solvents and Solvent Effects in Organic Chemistry. Third ed.;
WILEY VCH: Weinheim, 2003; p 433.
9. Akerlof, G., Journal o f the American Chemical Society 1932, 54, 4125-4139.
10. Dimroth, K.; Reichard.C, Zeitschrift Fur Analytische Chemie Fresenius 1966,
215 (5), 344-350.
11. Leong, T. H.; Dunn, L. A., Journal o f Physical Chemistry 1972, 76 (16), 2294-
2298.
12. Solubility tests of 4.1 in a 1:1 (v:v) mixture of H2O-DMSO, at room
temperature, gave a mean value of 107 mM. Solubility tests of 4.1 in H2O with the
addition of 33% (v:v) and 25% (v:v) DMSO or 2-propanol gave approximate values of
50 and 30 mM, respectively.
13. Jackson, B. http://macro.lsu.edu/HowTo/solvents/UV%20Cutoff.htm.
14. Xie, Y. C.; Liu, H. Z.; Chen, J. Y., Biotechnology Letters 1998, 20 (5), 455-458.
15. Xie, Y. C.; Liu, H. Z.; Chen, J. Y., International Journal o f Pharmaceutics
2000,196 (1), 21-26.
16. Cram, D. J.; Kingsbury, C. A.; Haberfie.P; Rickbom, B., Journal o f the
American Chemical Society 1961, 83 (17), 3678-3687.
195
17. Cram, D. J.; Rickbom, B.; Knox, G. R., Journal o f the American Chemical
Society 1960,82 (24), 6412-6413.
18. Reichardt, C., Solvents and Solvent Effects in Organic Chemistry. Third ed.;
WILEY VCH: Weinheim, 2003; p 259-262.
19. Miller, J.; Parker, A. J., Journal o f the American Chemical Society 1961, 83 (1),
117-123.
20. Taylor, J. R., An introduction to Error Analysis The study o f uncertainties in
physical measurements. Second ed.; University Science Books: Sausalito, California,
1997; p 174-177.
21. Mukerjee, P.; Ostrow, J. D., Tetrahedron Letters 1998, 39 (5-6), 423-426.
22. The comparison of the rate constants of H/D exchange and racemisation can
provide mechanistic information, in the absence of phenomena of preferential solvation.
23. Taylor, J., An introduction to error analysis The study o f uncertainties in
physical measurements. Second ed.; University Science Books: Sausalito, California,
1997; p 73-77.
24. Reichardt, C., Solvents and Solvent Effects in Organic Chemistry. Third ed.;
Wiley VCH Weinheim, 2003; p 218.
25. Parker, A. J., Chemical Reviews 1969, 69 (1), 1-32.
26. Ballash, N. M.; Robertso.Eb; Sokolows.Md, Transactions o f the Faraday
Society 1970, 66 (574), 2622-2628.
27. Baughman, E. H.; Kreevoy, M. M., Journal o f Physical Chemistry 1974, 75 (4),
421-423.
28. Vesala, A.; Saloma, E., Acta Chemica Scandinavica Series a-Physical and
Inorganic Chemistry 1976,30 (4), 277-280.
29. Holmes, D. L.; Lightner, D. A., Tetrahedron 1995, 51 (6), 1607-1622.
30. Holmes, D. L.; Lightner, D. A., Tetrahedron 1996, 52 (15), 5319-5338.
31. Reichardt, C., Solvents and Solvent Effects in Organic Chemistry. Third ed.;
WILEY VCH: Weinheim, 2003; p 97.
32. Clare, B. W.; Cook, D.; Ko, E. C. F.; Mac, Y. C.; Parker, A. J., Journal o f the
American Chemical Society 1966,88 (9), 1911-1916.
33. Bates, R. G.; Pawlak, Z., Journal o f Solution Chemistry 1976,5 (3), 213-222.
34. Reichardt, C., Solvents and Solvent Effects in Organic Chemistry. Third ed.;
WILEY VCH: Weinheim, 2003; p 241-242.
196
35. Reichardt, C., Solvents and Solvent Effects in Organic Chemistry. Third ed.;
WILEY VCH: Weinheim, 2003; p 262-263.
36. Reichardt, C., Solvents and Solvent Effects in Organic Chemistry. Third ed.;
WILEY VCH: Weinheim, 2003; p 48.
37. Milan, D., Kinetics and computational studies of the mechanism of racemisation
and H/D exchange of subsituted hydantoins in aqueous, mixed-aqueous and non-
aqueous solvents. Cardiff University: Cardiff, 2011.
38. Kennedy, J., CD spectroscopy as analytical means for the study of mechanisms
of racemisation of hydantoins. Cardiff University: Cardiff, 2011.
39. Williams, R., Kinetics of racemisation of a substituted hydantoin pyrrole.
Cardiff University: Cardiff, 2011.
40. The buffers prepared by weighing separately the basic and acidic forms of
phosphate were used in the experiments for the determination of solvent kinetic isotope
effects, to obtain the same buffer ratios in H2O and D2O. All the other experiments were
carried out in buffers prepared by dissolving potassium dihydrogen phosphate in D2O
and adjusting the pH* to the desired value with KOH.
197
Chapter 5
Exploring the use of IR and VCD spectroscopy for the study of reaction mechanisms involving stereogenic centres.
Abstract
We present the results of exploratory studies aimed at evaluating potential and
limitations of vibrational circular dichroism (VCD) and infrared (IR) spectroscopy for
kinetic and mechanistic studies of reactions involving chiral compounds. The first
section of the chapter describes calculation approaches for VCD spectra of a selection
of small, relatively flexible, chiral molecules including our model compound 5-
benzylhydantoin. A general method for predicting VCD spectra of flexible chiral
molecules is described. The VCD spectra of selected synthetic intermediates of interest
to AstraZeneca containing two chiral centres, one of which created by isotopic
substitution, were also calculated. Couples of diastereoisomers differing only by the
configuration at the chiral centre generated by isotopic labelling showed different
calculated VCD spectra, even though these spectra are not mirror images. The findings
suggest the possibility of discriminating between all members of a family of
diastereoisomers using VCD spectroscopy by comparing the calculated with the
experimental VCD spectra. The second part of the chapter addresses the practical
aspects of recording IR and VCD spectra in aqueous solutions for mechanistic studies of
racemisation of 5-substituted hydantoins. Our preliminary experiments did not prove
successful. Instrumentation difficulties were encountered in recording experimental
VCD spectra and in the detection of the CD bands in the IR spectra of deuterium
labelled 5-benzylhydantoin and 3-V-methyl-5-benzylhydantoin as predicted by DFT
198
calculations. The final section of the chapter reports the IR spectra of 5 model 5-
benzylhydantoins recorded in D2O solution. In spite of the strong absorption of the
solvent, the IR bands for the stretching modes of the carbonyl groups of the molecules
could be detected. An attempted correlation between vibrational frequencies of the
carbonyl stretching modes and the stereolability of the model hydantoins did not lead to
satisfactory results.
5.1. The potentials of Vibrational Circular Dichroism (VCD) spectroscopy
5.1.1. The VCD technique
Vibrational Circular Dichroism (VCD) spectroscopy is a relatively recently developed
spectroscopic technique useful for the study of chirality. The first commercial dedicated
FTIR VCD spectrometer was marketed in 1997 by the company Bio Tools, in Illinois.1
VCD spectroscopy can be seen as an extension of ECD (Electronic Circular Dichroism)
spectroscopy from the UV-visible region, where electronic transitions occur, into the
mid-IR or near-IR regions where vibrational transitions occur. VCD spectroscopy is
therefore a potentially powerful means for detection of chirality, able to give access to
information not available by means of any other analytical technique.1'4 Indeed, VCD
allows the assignment of absolute configuration of chiral molecules in solution by
comparison of the experimental spectrum with the spectra predicted by means of ab
initio quantum chemical calculations (vide infra). For flexible molecules in solution,
experimental VCD spectra reflect the conformational populations over the various
conformations. Calculated VCD spectra can similarly be constructed as Boltzmann-
population-weighted composites of the calculated spectra of all lowest energy
conformers of the molecule. Comparison between predicted and experimental spectra
therefore allows conformational analysis. VCD spectroscopy can, in fact, resolve
conformers that exist for as little as picoseconds, since typical vibrational periods are
shorter than 1 picosecond.2 VCD spectroscopy has been successfully used to study
supramolecular structures of perfluorinated carbon chains,5 proteins6 and protein-
oligosaccharide complexes7.
199
5.1.2 Calculated VCD spectra
5.I.2.I. Prediction of VCD spectra of model chiral molecules.
VCD spectra of chiral molecules can be predicted by means of quantum mechanicalQ 1
calculations carried out by dedicated software such as Gaussian. ' Comparison of
calculated and experimental VCD spectra is a useful tool enabling the determination of
absolute configuration of chiral molecules in solution. The VCD technique can,
therefore, be potentially useful for the establishment of the stereochemical course and
the mechanism of chemical reactions involving chiral centres. The technique can be
extended because, as mentioned in Chapter 1, a molecule can be chiral simply by virtue
of isotopic substitution. Isotopic labelling is, therefore, a very useful tool enabling the
creation of “new” chiral centres in strategic positions of molecules and, as a
consequence, allowing the widening of the potential applications of the VCD technique.
Of particular interest here is the possibility of monitoring the stereochemical course of
reactions by creating a chiral centre by means of isotopic labelling, for example using
structures such as shown in Scheme 5.1. Structures 5.1-5.3 contain two chiral centres,
one of which has been created by means of isotopic labelling.
The VCD spectra of several molecules of interest to AstraZeneca (Scheme 5.1)11 were
calculated by DFT methods to investigate the possibility of using VCD to discriminate
between compounds 5.1 a) and 5.1 b), between 5.2 a) and 5.2 b) and between 5.3 a) and
5.3 b. Being able to distinguish between these structures is important for the elucidation
of the mechanism of a synthetic step in the preparation of bicalutamide, an important
drug used in the treatment of hormone-dependent cancer.
200
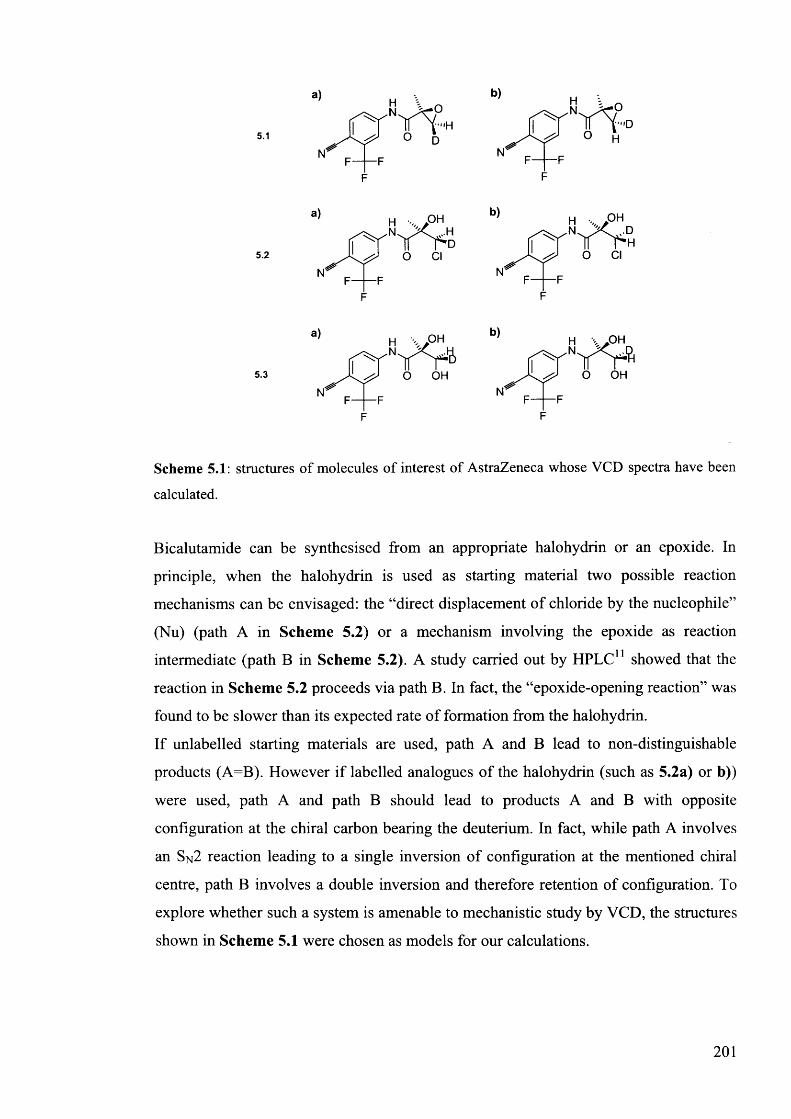
F F
Scheme 5.1: structures of molecules of interest of AstraZeneca whose VCD spectra have been
calculated.
Bicalutamide can be synthesised from an appropriate halohydrin or an epoxide. In
principle, when the halohydrin is used as starting material two possible reaction
mechanisms can be envisaged: the “direct displacement of chloride by the nucleophile”
(Nu) (path A in Scheme 5.2) or a mechanism involving the epoxide as reaction
intermediate (path B in Scheme 5.2). A study carried out by HPLC11 showed that the
reaction in Scheme 5.2 proceeds via path B. In fact, the “epoxide-opening reaction” was
found to be slower than its expected rate of formation from the halohydrin.
If unlabelled starting materials are used, path A and B lead to non-distinguishable
products (A=B). However if labelled analogues of the halohydrin (such as 5.2a) or b))
were used, path A and path B should lead to products A and B with opposite
configuration at the chiral carbon bearing the deuterium. In fact, while path A involves
an Sn2 reaction leading to a single inversion of configuration at the mentioned chiral
centre, path B involves a double inversion and therefore retention of configuration. To
explore whether such a system is amenable to mechanistic study by VCD, the structures
shown in Scheme 5.1 were chosen as models for our calculations.
201
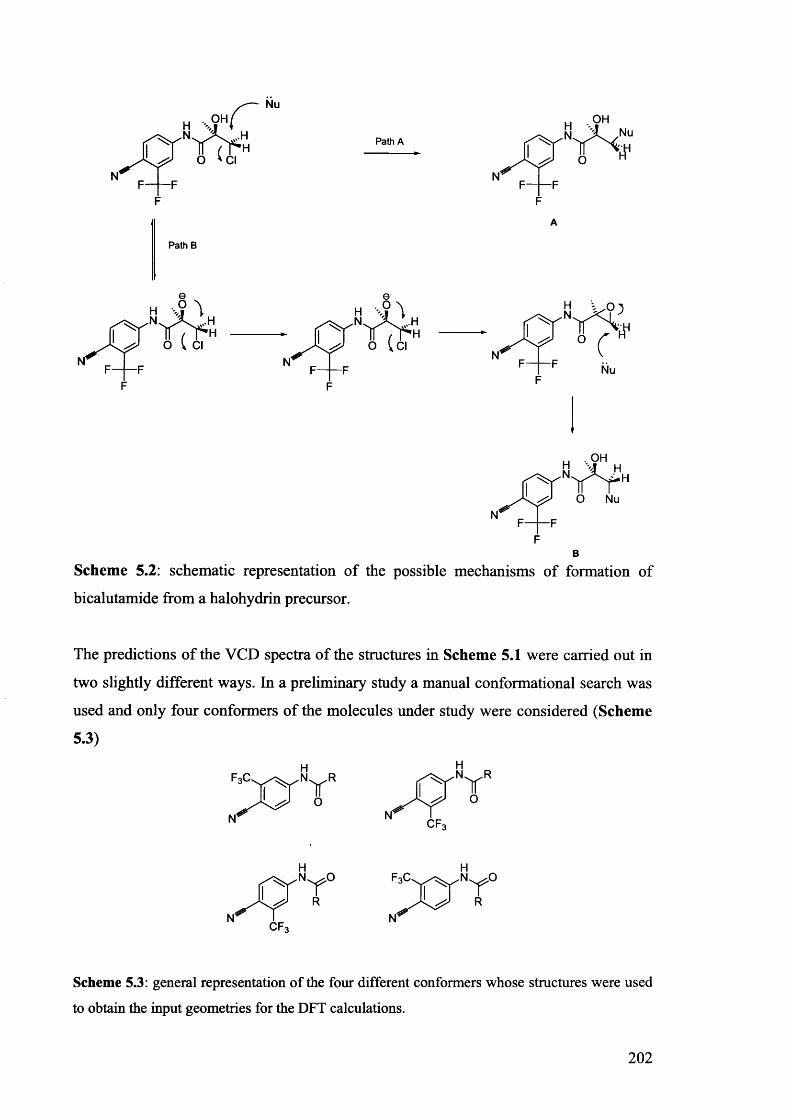
Nu. OHi
n ( p HO *C I
Path AH T ►
o
Nu
if
Path B
N
F
h -.jh”y V "»O v Cl ° C
i f fNu
FB
Scheme 5.2: schematic representation of the possible mechanisms of formation of
bicalutamide from a halohydrin precursor.
The predictions of the VCD spectra of the structures in Scheme 5.1 were carried out in
two slightly different ways. In a preliminary study a manual conformational search was
used and only four conformers of the molecules under study were considered (Scheme
5.3)
Scheme 5.3: general representation of the four different conformers whose structures were used
to obtain the input geometries for the DFT calculations.
202
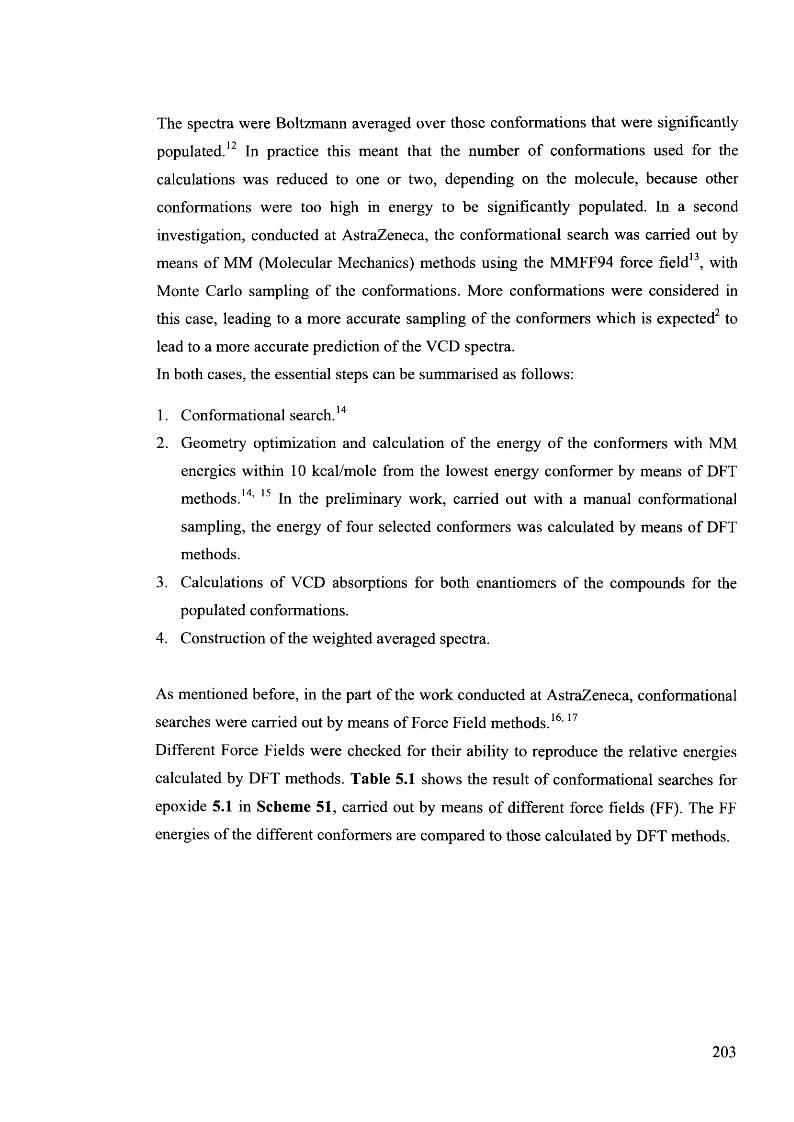
The spectra were Boltzmann averaged over those conformations that were significantly
populated.12 In practice this meant that the number of conformations used for the
calculations was reduced to one or two, depending on the molecule, because other
conformations were too high in energy to be significantly populated. In a second
investigation, conducted at AstraZeneca, the conformational search was carried out by
means of MM (Molecular Mechanics) methods using the MMFF94 force field13, with
Monte Carlo sampling of the conformations. More conformations were considered in
this case, leading to a more accurate sampling of the conformers which is expected to
lead to a more accurate prediction of the VCD spectra.
In both cases, the essential steps can be summarised as follows:
1. Conformational search.14
2. Geometry optimization and calculation of the energy of the conformers with MM
energies within 10 kcal/mole from the lowest energy conformer by means of DFT
methods.14, 15 In the preliminary work, carried out with a manual conformational
sampling, the energy of four selected conformers was calculated by means of DFT
methods.
3. Calculations of VCD absorptions for both enantiomers of the compounds for the
populated conformations.
4. Construction of the weighted averaged spectra.
As mentioned before, in the part of the work conducted at AstraZeneca, conformational
searches were carried out by means of Force Field methods.16,17
Different Force Fields were checked for their ability to reproduce the relative energies
calculated by DFT methods. Table 5.1 shows the result of conformational searches for
epoxide 5.1 in Scheme 51, carried out by means of different force fields (FF). The FF
energies of the different conformers are compared to those calculated by DFT methods.
203
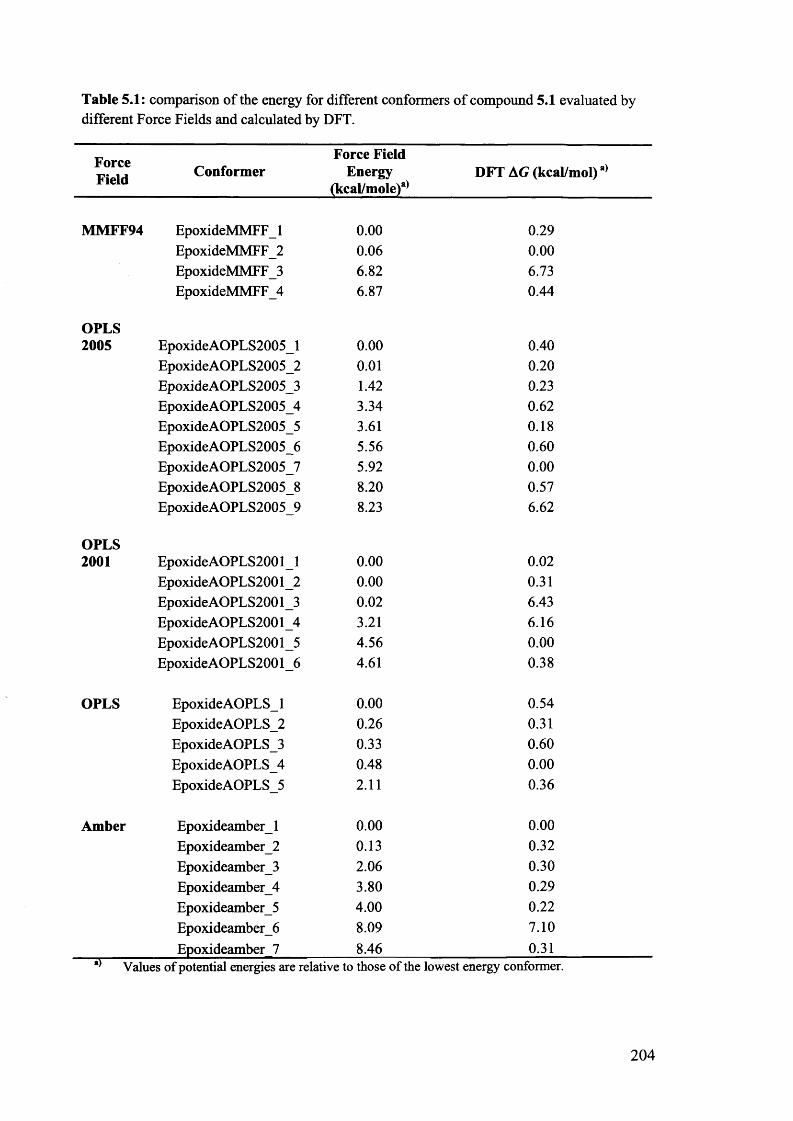
Table 5.1: comparison of the energy for different conformers of compound 5.1 evaluated by different Force Fields and calculated by DFT.
ForceField Conformer
Force Field Energy
(kcal/mole)a)DFT AG (kcal/mol)a)
MMFF94 EpoxideMMFF_ 1 0.00 0.29EpoxideMMFF_2 0.06 0.00EpoxideMMFF_3 6.82 6.73EpoxideMMFF_4 6.87 0.44
OPLS2005 EpoxideAOPLS2005_l 0.00 0.40
EpoxideAOPLS2005_2 0.01 0.20EpoxideAOPLS2005_3 1.42 0.23EpoxideAOPLS2005_4 3.34 0.62EpoxideAOPLS2005_5 3.61 0.18EpoxideAOPLS2005_6 5.56 0.60EpoxideAOPLS2005_7 5.92 0.00EpoxideAOPLS2005_8 8.20 0.57EpoxideAOPLS2005_9 8.23 6.62
OPLS2001 Epoxide AOPLS2001 1 0.00 0.02
EpoxideAOPLS2001 2 0.00 0.31EpoxideAOPLS2001 3 0.02 6.43Epoxide AOPLS2001 4 3.21 6.16EpoxideAOPLS2001 5 4.56 0.00Epoxide AOPLS2001 6 4.61 0.38
OPLS Epoxide AOPLS_ 1 0.00 0.54EpoxideAOPLS_2 0.26 0.31EpoxideAOPLS_3 0.33 0.60EpoxideAOPLS_4 0.48 0.00EpoxideAOPLS_5 2.11 0.36
Amber Epoxideamberl 0.00 0.00Epoxideamber_2 0.13 0.32Epoxideamber_3 2.06 0.30Epoxideamber_4 3.80 0.29Epoxideamber_5 4.00 0.22Epoxideamber_6 8.09 7.10Epoxideamber 7 8.46 0.31
Values of potential energies are relative to those of the lowest energy conformer.
204
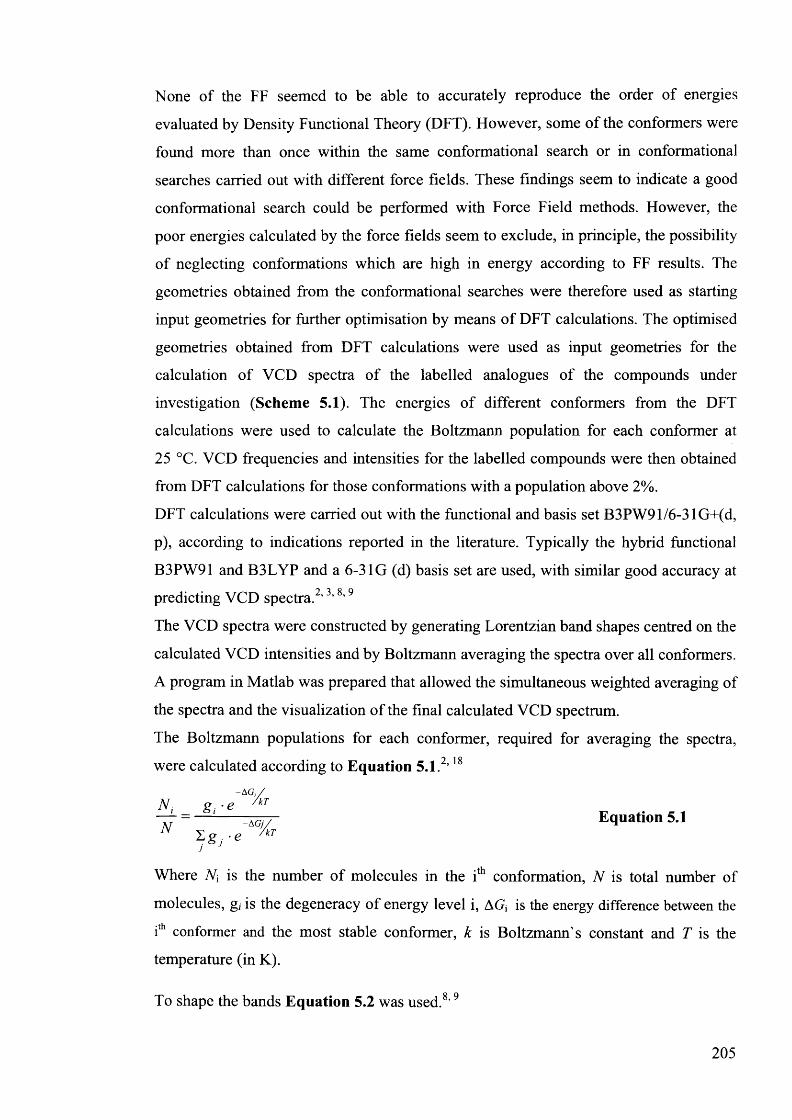
None of the FF seemed to be able to accurately reproduce the order of energies
evaluated by Density Functional Theory (DFT). However, some of the conformers were
found more than once within the same conformational search or in conformational
searches carried out with different force fields. These findings seem to indicate a good
conformational search could be performed with Force Field methods. However, the
poor energies calculated by the force fields seem to exclude, in principle, the possibility
of neglecting conformations which are high in energy according to FF results. The
geometries obtained from the conformational searches were therefore used as starting
input geometries for further optimisation by means of DFT calculations. The optimised
geometries obtained from DFT calculations were used as input geometries for the
calculation of VCD spectra of the labelled analogues of the compounds under
investigation (Scheme 5.1). The energies of different conformers from the DFT
calculations were used to calculate the Boltzmann population for each conformer at
25 °C. VCD frequencies and intensities for the labelled compounds were then obtained
from DFT calculations for those conformations with a population above 2%.
DFT calculations were carried out with the functional and basis set B3PW91/6-31G+(d,
p), according to indications reported in the literature. Typically the hybrid functional
B3PW91 and B3LYP and a 6-31G (d) basis set are used, with similar good accuracy at
predicting VCD spectra.2,3’8’9
The VCD spectra were constructed by generating Lorentzian band shapes centred on the
calculated VCD intensities and by Boltzmann averaging the spectra over all conformers.
A program in Matlab was prepared that allowed the simultaneous weighted averaging of
the spectra and the visualization of the final calculated VCD spectrum.
The Boltzmann populations for each conformer, required for averaging the spectra,
were calculated according to Equation 5.1.2,18
molecules, gj is the degeneracy of energy level i, AGj is the energy difference between the
ith conformer and the most stable conformer, k is Boltzmann's constant and T is the
temperature (in K).
To shape the bands Equation 5.2 was used.8,9
Equation 5.1
Where N\ is the number of molecules in the ith conformation, N is total number of
205
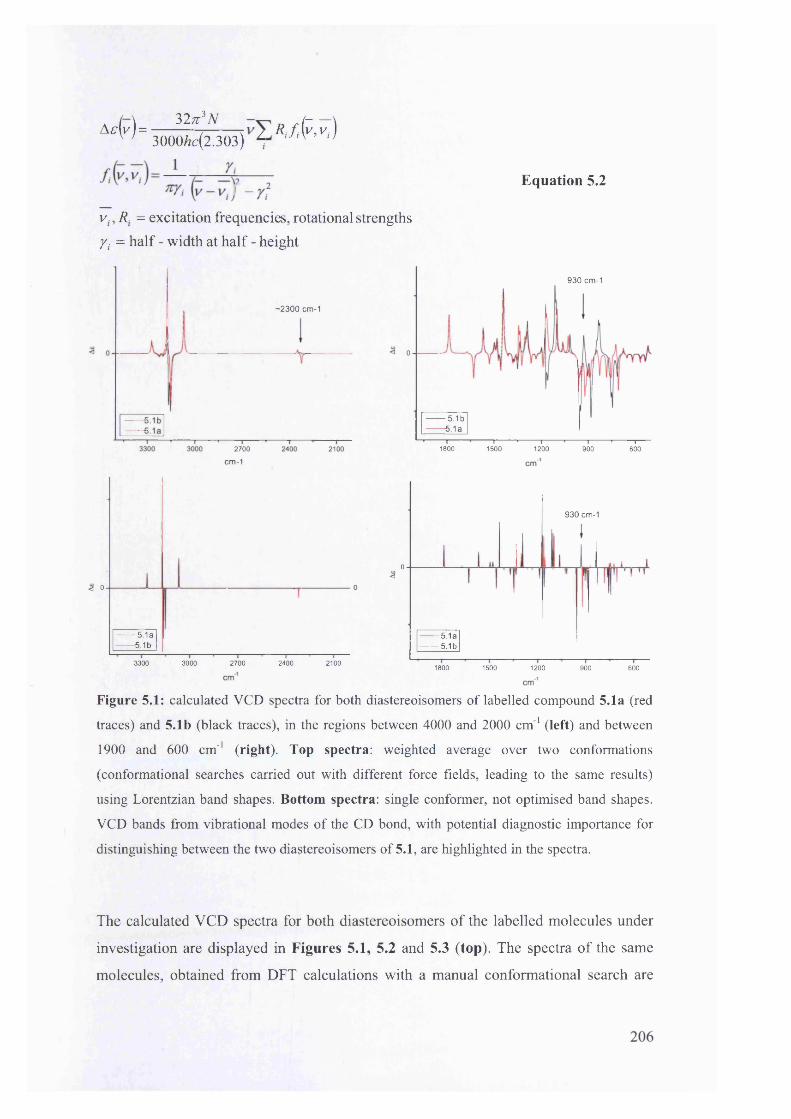
A£(v) = 32;r3AfR . / M3000Ac(2.303) z
V , [ y - v j - r ,1/ , R. = excitation frequencies, rotational strengths yi = half - width at half - height
Equation 5.2
-2300 cm-1
2700
cm-1
930 cm-1
0
5.1b 5.1a
1800 1500 1200 900 600
< 0
5.1a 5.1b
3300 3000 2700 2400 2100
930 cm-1
0<
-5 .1 a 5.1b
1800 1500 1200 900 600
Figure 5.1: calculated VCD spectra for both diastereoisomers of labelled compound 5.1a (red
traces) and 5.1b (black traces), in the regions between 4000 and 2000 cm'1 (left) and between
1900 and 600 cm'1 (right). Top spectra: weighted average over two conformations
(conformational searches carried out with different force fields, leading to the same results)
using Lorentzian band shapes. Bottom spectra: single conformer, not optimised band shapes.
VCD bands from vibrational modes of the CD bond, with potential diagnostic importance for
distinguishing between the two diastereoisomers of 5.1, are highlighted in the spectra.
The calculated VCD spectra for both diastereoisomers of the labelled molecules under
investigation are displayed in Figures 5.1, 5.2 and 5.3 (top). The spectra of the same
molecules, obtained from DFT calculations with a manual conformational search are
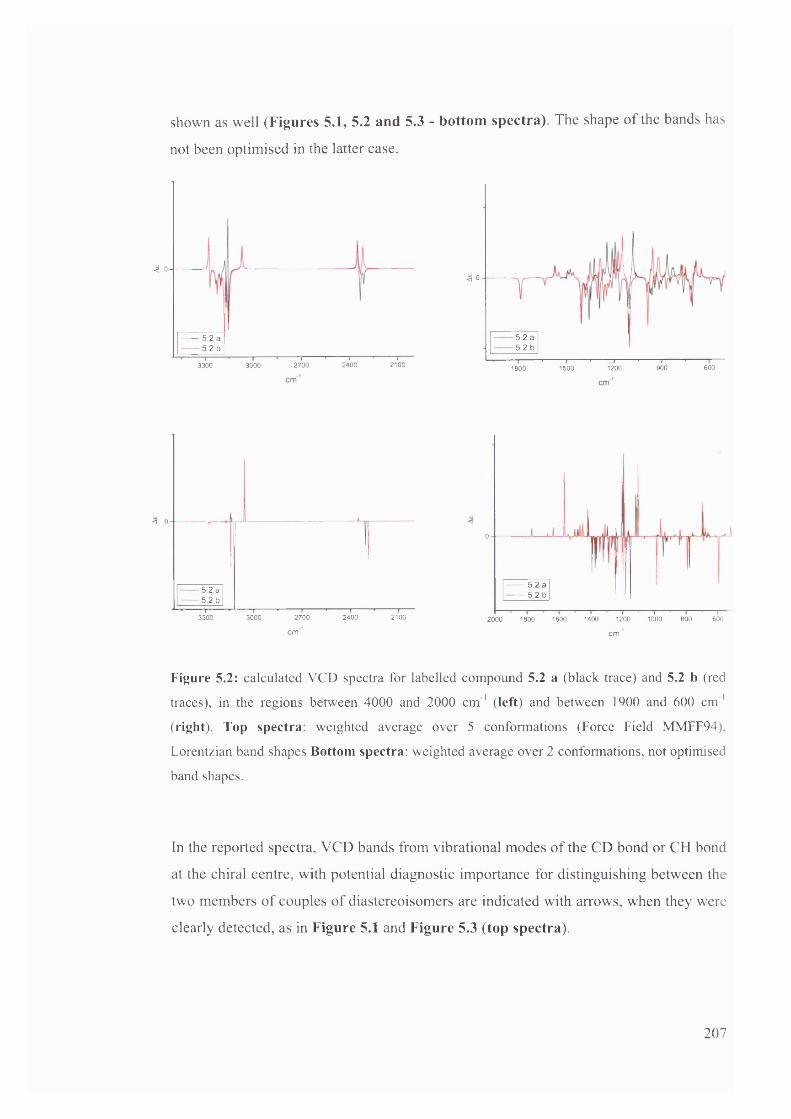
shown as well (Figures 5.1, 5.2 and 5.3 - bottom spectra). The shape of the bands has
not been optimised in the latter case.
< 0
5.2 a— 5.2 b
2400 21003000 27003300
< 0
5.2 a5.2 b
1200 900 6001800 1500
< 0 . -
5.2 a5.2 b
3300 3000 2700 2400 2100
0
5.2 a— 5.2 b
1600 1400 1200 1000 800 6002000 1800
cm 1 cm-1
Figure 5.2: calculated VCD spectra for labelled compound 5.2 a (black trace) and 5.2 b (red
traces), in the regions between 4000 and 2000 cm'1 (left) and between 1900 and 600 cm'1
(right). Top spectra: weighted average over 5 conformations (Force Field MMFF94),
Lorentzian band shapes Bottom spectra: weighted average over 2 conformations, not optimised
band shapes.
In the reported spectra, VCD bands from vibrational modes of the CD bond or CH bond
at the chiral centre, with potential diagnostic importance for distinguishing between the
two members of couples of diastereoisomers are indicated with arrows, when they were
clearly detected, as in Figure 5.1 and Figure 5.3 (top spectra).
207
-2290
5.3 b5.3 a
3300 3000 2700 2400 2100
< 0
HDHHHD
1800 1500 1200 900 600
cm'1 cm'1
o
<
5.3 b5.3 a
3000 2700 2400 21003300
<
05.3 b
1800 1500 1200 900 600
cm'1
Figure 5.3: calculated VCD spectra for labelled compound 5.3 a (red traces) and 5.3 b (black
traces), in the regions between 4000 and 2000 cm'1 (left) and between 1900 and 600 cm'1
(right). Top spectra: weighted average over 14 conformations (Force Field MMFF94) using
Lorentzian band shapes. Bottom spectra: weighted average over 2 conformations, not
optimised band shapes.
5.I.2.2. Testing the performance of the method for the prediction of VCD spectra.
To test our method for predicting VCD spectra, the VCD spectrum of a simple model
compound, (i?)-3-methyl-cyclohexanone (Scheme 5.4) was calculated19 and the
calculated spectrum was compared with experimental and calculated spectra reported in
the literature.3
208
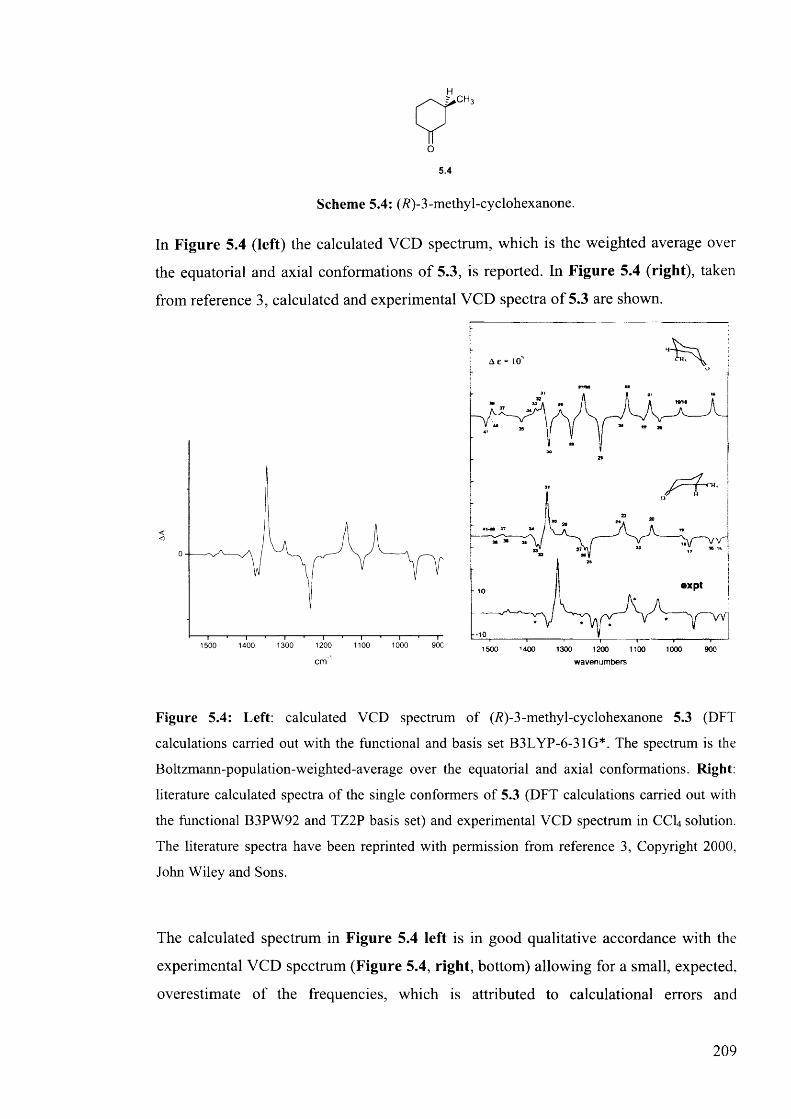
o5.4
Scheme 5.4: (/?)-3-methyl-cyclohexanone.
In Figure 5.4 (left) the calculated VCD spectrum, which is the weighted average over
the equatorial and axial conformations of 5.3, is reported. In Figure 5.4 (right), taken
from reference 3, calculated and experimental VCD spectra of 5.3 are shown.
a e * i<r
0
expt-10
--10
90C1300 1200 1100 10001500 1400 1300 1200 1100 1000 9001500
c m 1 wavenumbers
Figure 5.4: Left: calculated VCD spectmm of (i?)-3-methyl-cyclohexanone 5.3 (DFT
calculations carried out with the functional and basis set B3LYP-6-31G*. The spectmm is the
Boltzmann-population-weighted-average over the equatorial and axial conformations. Right:
literature calculated spectra of the single conformers of 5.3 (DFT calculations carried out with
the functional B3PW92 and TZ2P basis set) and experimental VCD spectmm in CCI4 solution.
The literature spectra have been reprinted with permission from reference 3, Copyright 2000,
John Wiley and Sons.
The calculated spectrum in Figure 5.4 left is in good qualitative accordance with the
experimental VCD spectrum (Figure 5.4, right, bottom) allowing for a small, expected,
overestimate of the frequencies, which is attributed to calculational errors and
209
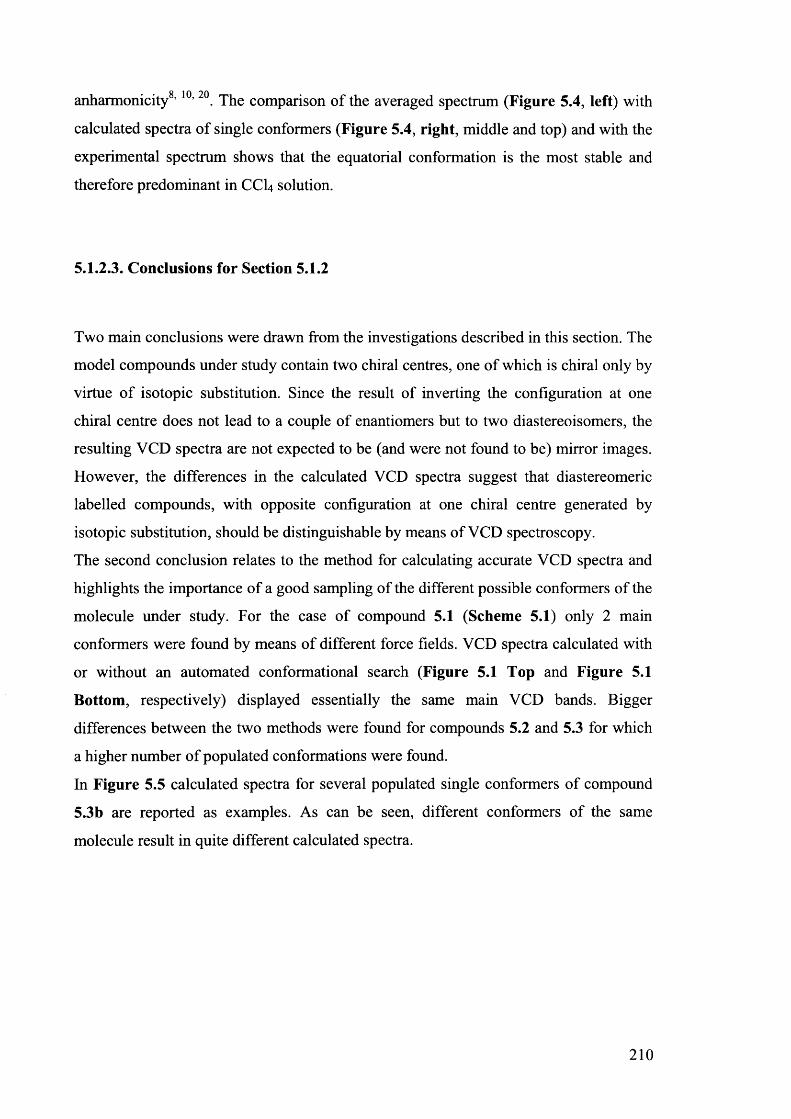
8 10 20anharmonicity ’ ’ . The comparison of the averaged spectrum (Figure 5.4, left) with
calculated spectra of single conformers (Figure 5.4, right, middle and top) and with the
experimental spectrum shows that the equatorial conformation is the most stable and
therefore predominant in CCI4 solution.
5.1.2.3. Conclusions for Section 5.1.2
Two main conclusions were drawn from the investigations described in this section. The
model compounds under study contain two chiral centres, one of which is chiral only by
virtue of isotopic substitution. Since the result of inverting the configuration at one
chiral centre does not lead to a couple of enantiomers but to two diastereoisomers, the
resulting VCD spectra are not expected to be (and were not found to be) mirror images.
However, the differences in the calculated VCD spectra suggest that diastereomeric
labelled compounds, with opposite configuration at one chiral centre generated by
isotopic substitution, should be distinguishable by means of VCD spectroscopy.
The second conclusion relates to the method for calculating accurate VCD spectra and
highlights the importance of a good sampling of the different possible conformers of the
molecule under study. For the case of compound 5.1 (Scheme 5.1) only 2 main
conformers were found by means of different force fields. VCD spectra calculated with
or without an automated conformational search (Figure 5.1 Top and Figure 5.1
Bottom, respectively) displayed essentially the same main VCD bands. Bigger
differences between the two methods were found for compounds 5.2 and 5.3 for which
a higher number of populated conformations were found.
In Figure 5.5 calculated spectra for several populated single conformers of compound
5.3b are reported as examples. As can be seen, different conformers of the same
molecule result in quite different calculated spectra.
210
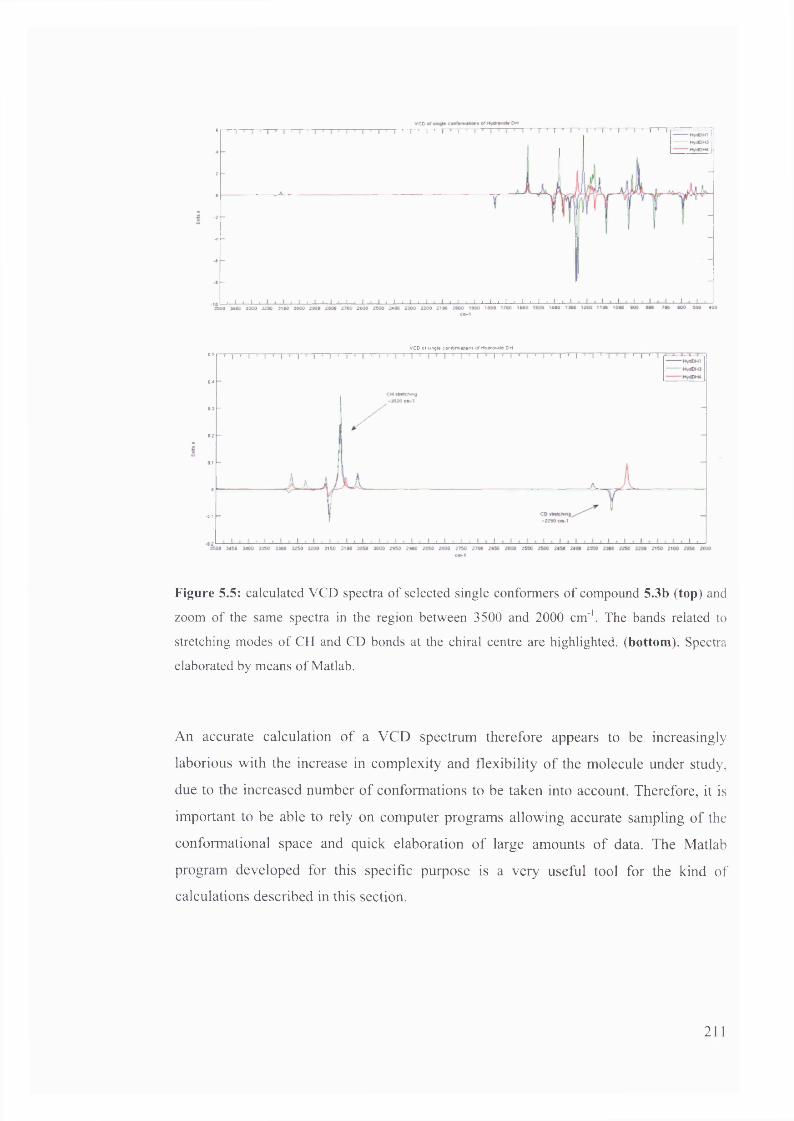
t
z
-4 I
6
VCD or single conft>r*i«#on* of Hv<*o*e»e DHI v
04
01
0
U 1
Figure 5.5: calculated VCD spectra of selected single conformers of compound 5.3b (top) and
zoom of the same spectra in the region between 3500 and 2000 cm'1. The bands related to
stretching modes of CH and CD bonds at the chiral centre are highlighted, (bottom). Spectra
elaborated by means of Matlab.
An accurate calculation of a VCD spectrum therefore appears to be increasingly
laborious with the increase in complexity and flexibility of the molecule under study,
due to the increased number of conformations to be taken into account. Therefore, it is
important to be able to rely on computer programs allowing accurate sampling of the
conformational space and quick elaboration of large amounts of data. The Matlab
program developed for this specific purpose is a very useful tool for the kind of
calculations described in this section.
211
5.1.3. The use of VCD spectroscopy for kinetic and mechanistic studies of racemisation of 5-substituted hydantoins
5.1.3.1 Kinetic considerations regarding expected signals
In Chapter 2 the possibility of an Se2 mechanism for racemisation of 5-substituted01hydantoins, as proposed in the literature , was discussed. A schematic representation of
the base-catalysed racemisation of 5-substituted hydantoins in D2O, if the racemisation
were to occur via the Se2 mechanism, was reported in Chapter 2 and is repeated below
(Scheme 5.5) for convenience.
A B C
k-z
Scheme 5.5: proposed SE2 mechanism for 5-substituted hydantoins and its schematic representation.
Mathematical simulations showed that, for small differences between the rate constants
&2 and k\ (See Scheme 5.5) the temporary enantiomeric excess of species B over the
combination of species A and C is expected to be small and, therefore, experimentally
hardly detectable by ECD. On the other hand, the temporary enantiomeric excess of the
species B over species C should be sufficiently high to be detectable by VCD
spectroscopy. The reaction, if proceeding via the Se2 mechanism, could therefore be
followed effectively by monitoring the appearance and subsequent disappearance of the
VCD signals arising from vibrational modes of the C-D bonds of the hydantoins
undergoing racemisation and concomitant H/D exchange. Calculations of VCD spectra
212
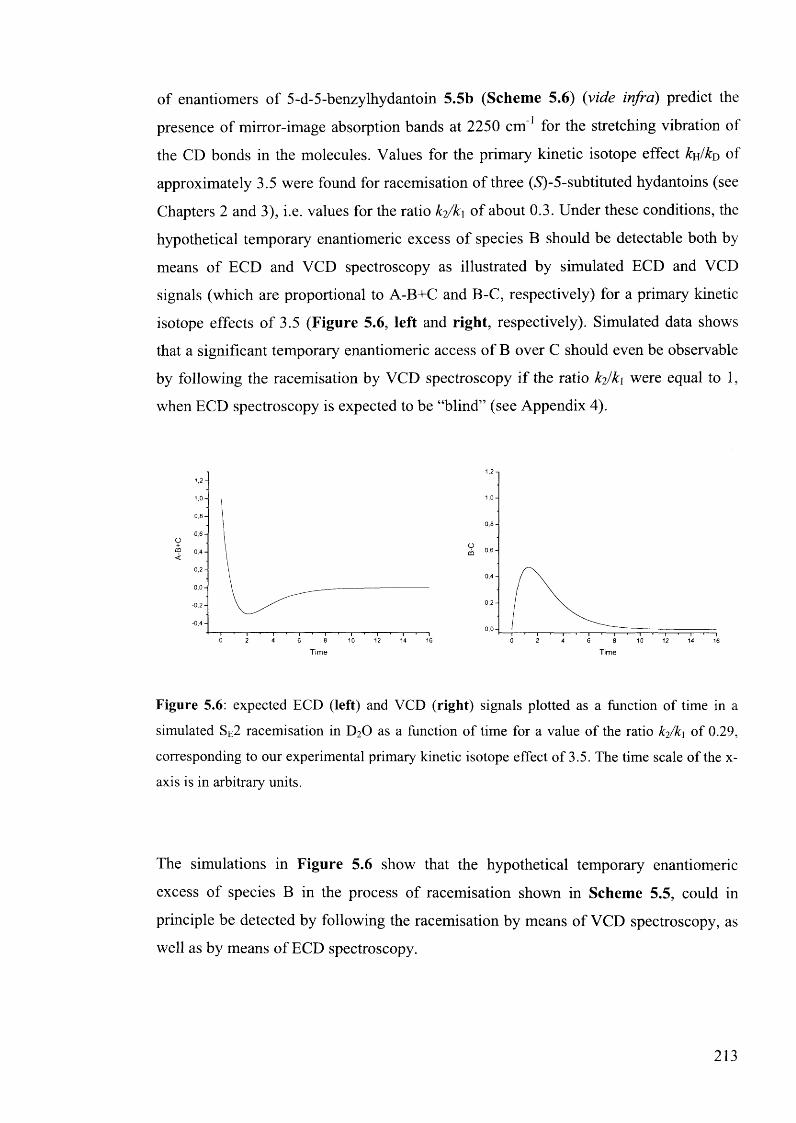
of enantiomers of 5-d-5-benzylhydantoin 5.5b (Scheme 5.6) {v id e infra) predict the
presence of mirror-image absorption bands at 2250 cm’1 for the stretching vibration of
the CD bonds in the molecules. Values for the primary kinetic isotope effect ku/ko of
approximately 3.5 were found for racemisation of three (5)-5-subtituted hydantoins (see
Chapters 2 and 3), i.e. values for the ratio k2/k \ of about 0.3. Under these conditions, the
hypothetical temporary enantiomeric excess of species B should be detectable both by
means of ECD and VCD spectroscopy as illustrated by simulated ECD and VCD
signals (which are proportional to A-B+C and B-C, respectively) for a primary kinetic
isotope effects of 3.5 (Figure 5.6, left and right, respectively). Simulated data shows
that a significant temporary enantiomeric access of B over C should even be observable
by following the racemisation by VCD spectroscopy if the ratio k f k i were equal to 1,
when ECD spectroscopy is expected to be “blind” (see Appendix 4).
O
0,4 -
0 ,0 -
2 60 4 8 10 12 14 16
1,2 -
0,6 -O+CO<
0 ,2 -
0 ,0 -
-0 .2 -
0 2 4 8 10 12 166 14
Figure 5.6: expected ECD (left) and VCD (right) signals plotted as a function of time in a
simulated SE2 racemisation in D20 as a function of time for a value of the ratio k2/k\ of 0.29,
corresponding to our experimental primary kinetic isotope effect of 3.5. The time scale of the x-
axis is in arbitrary units.
The simulations in Figure 5.6 show that the hypothetical temporary enantiomeric
excess of species B in the process of racemisation shown in Scheme 5.5, could in
principle be detected by following the racemisation by means of VCD spectroscopy, as
well as by means of ECD spectroscopy.
213
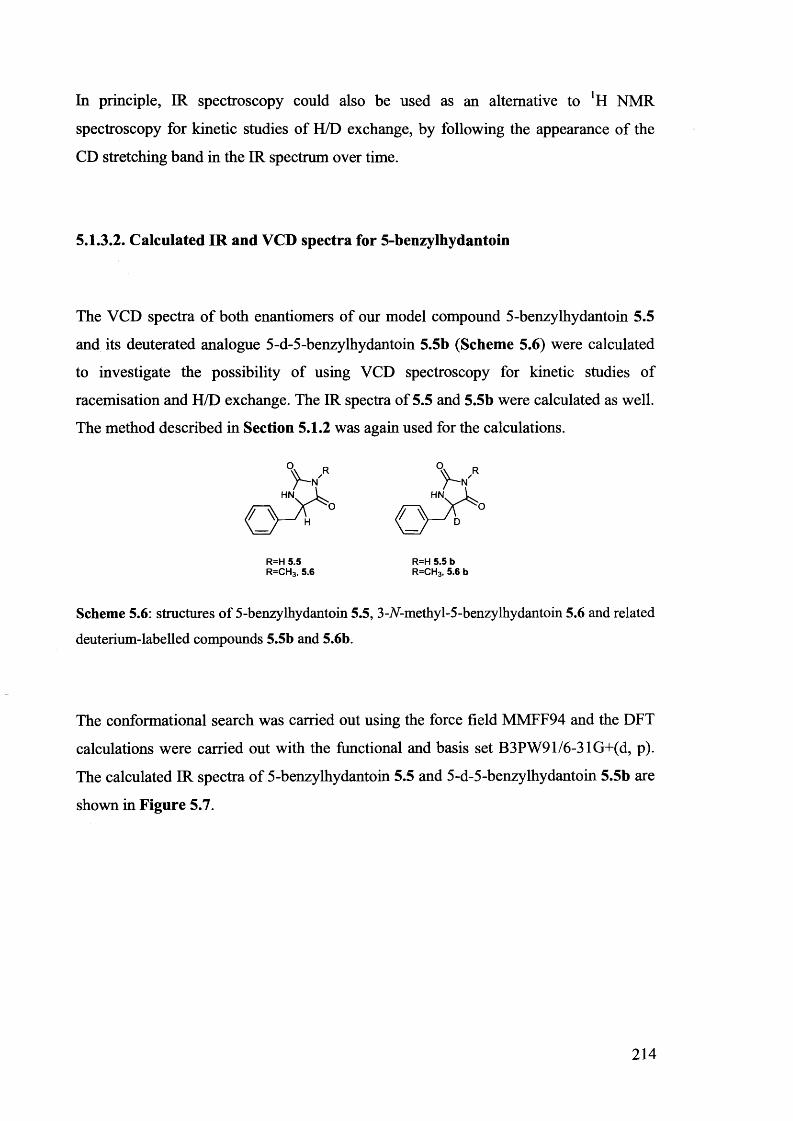
In principle, IR spectroscopy could also be used as an alternative to !H NMR
spectroscopy for kinetic studies of H/D exchange, by following the appearance of the
CD stretching band in the IR spectrum over time.
5.1.3.2. Calculated IR and VCD spectra for 5-benzylhydantoin
The VCD spectra of both enantiomers of our model compound 5-benzylhydantoin 5.5
and its deuterated analogue 5-d-5-benzylhydantoin 5.5b (Scheme 5.6) were calculated
to investigate the possibility of using VCD spectroscopy for kinetic studies of
racemisation and H/D exchange. The IR spectra of 5.5 and 5.5b were calculated as well.
The method described in Section 5.1.2 was again used for the calculations.
Scheme 5.6: structures of 5-benzylhydantoin 5.5, 3-V-methyl-5-benzylhydantoin 5.6 and related
deuterium-labelled compounds 5.5b and 5.6b.
The conformational search was carried out using the force field MMFF94 and the DFT
calculations were carried out with the functional and basis set B3PW91/6-3 lG+(d, p).
The calculated IR spectra of 5-benzylhydantoin 5.5 and 5-d-5-benzylhydantoin 5.5b are
shown in Figure 5.7.
R=H 5.5 R=CH3, 5.6
R=H 5.5 b R=CH3, 5.6 b
214
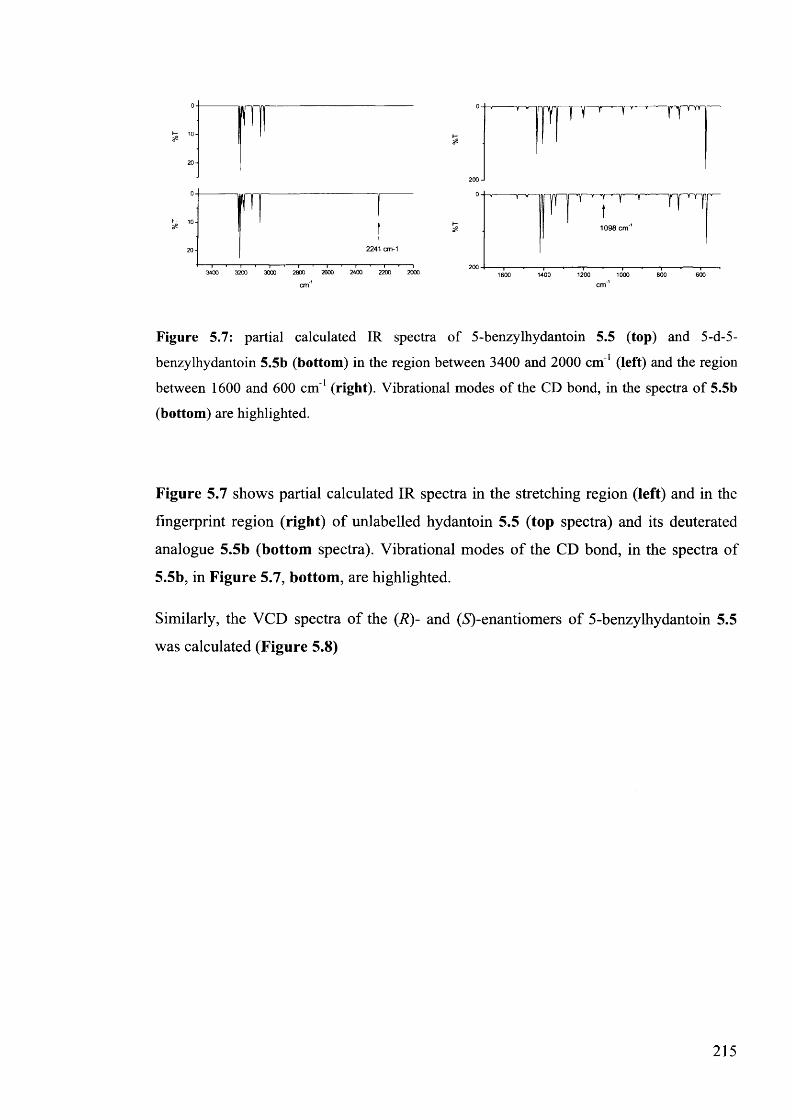
1600
cm'1 cm'
Figure 5.7: partial calculated IR spectra of 5-benzylhydantoin 5.5 (top) and 5-d-5-
benzylhydantoin 5.5b (bottom) in the region between 3400 and 2000 cm'1 (left) and the region
between 1600 and 600 cm 1 (right). Vibrational modes of the CD bond, in the spectra of 5.5b
(bottom) are highlighted.
Figure 5.7 shows partial calculated IR spectra in the stretching region (left) and in the
fingerprint region (right) of unlabelled hydantoin 5.5 (top spectra) and its deuterated
analogue 5.5b (bottom spectra). Vibrational modes of the CD bond, in the spectra of
5.5b, in Figure 5.7, bottom, are highlighted.
Similarly, the VCD spectra of the (R )- and (V)-enantiomers of 5-benzylhydantoin 5.5
was calculated (Figure 5.8)
215
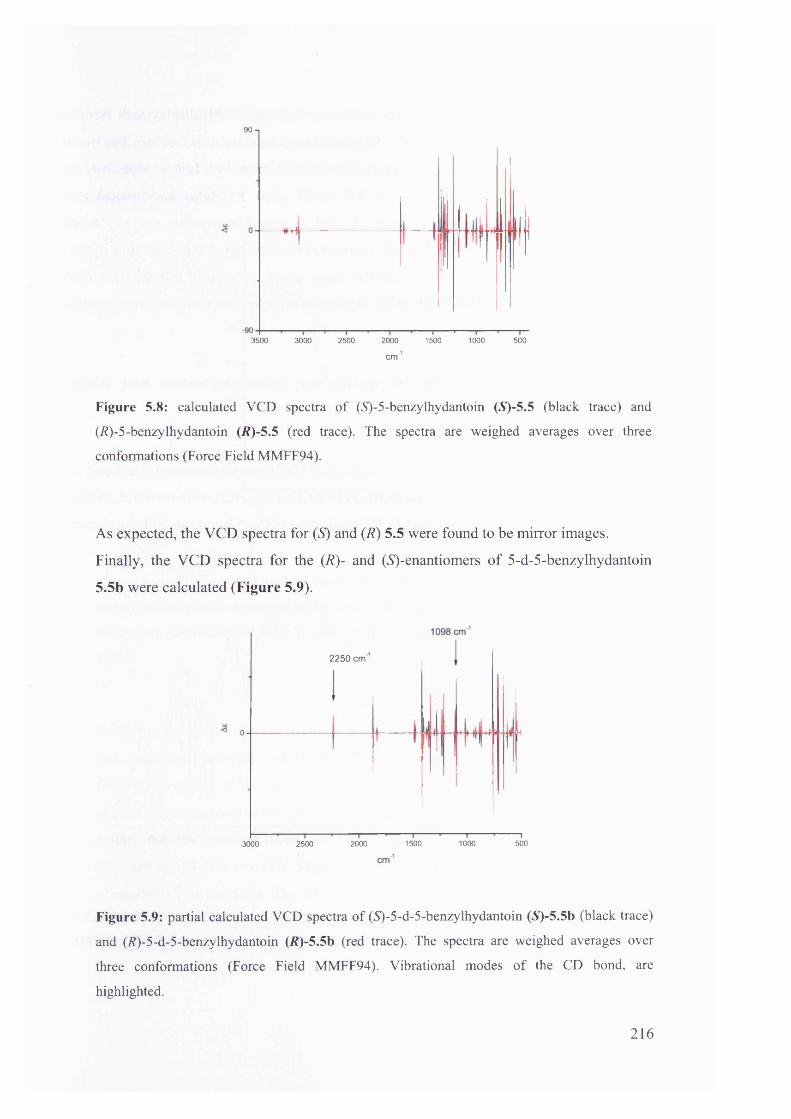
90-,
3500 3000 2500 2000 1500 1000 500
cm'1
Figure 5.8: calculated VCD spectra of (S')-5-benzylhydantoin (S)-5.5 (black trace) and
(R)-5 -benzylhydantoin (R)-5.5 (red trace). The spectra are weighed averages over three
conformations (Force Field MMFF94).
As expected, the VCD spectra for (S) and (R ) 5.5 were found to be mirror images.
Finally, the VCD spectra for the (R)- and (S)-enantiomers of 5-d-5-benzylhydantoin
5.5b were calculated (Figure 5.9).
2250 cm
0
2000 1500 1000 5003000 2500
Figure 5.9: partial calculated VCD spectra of (S)-5-d-5-benzylhydantoin (5)-5.5b (black trace)
and (i?)-5-d-5-benzylhydantoin (R)-5.5b (red trace). The spectra are weighed averages over
three conformations (Force Field MMFF94). Vibrational modes of the CD bond, are
highlighted.
2 1 6
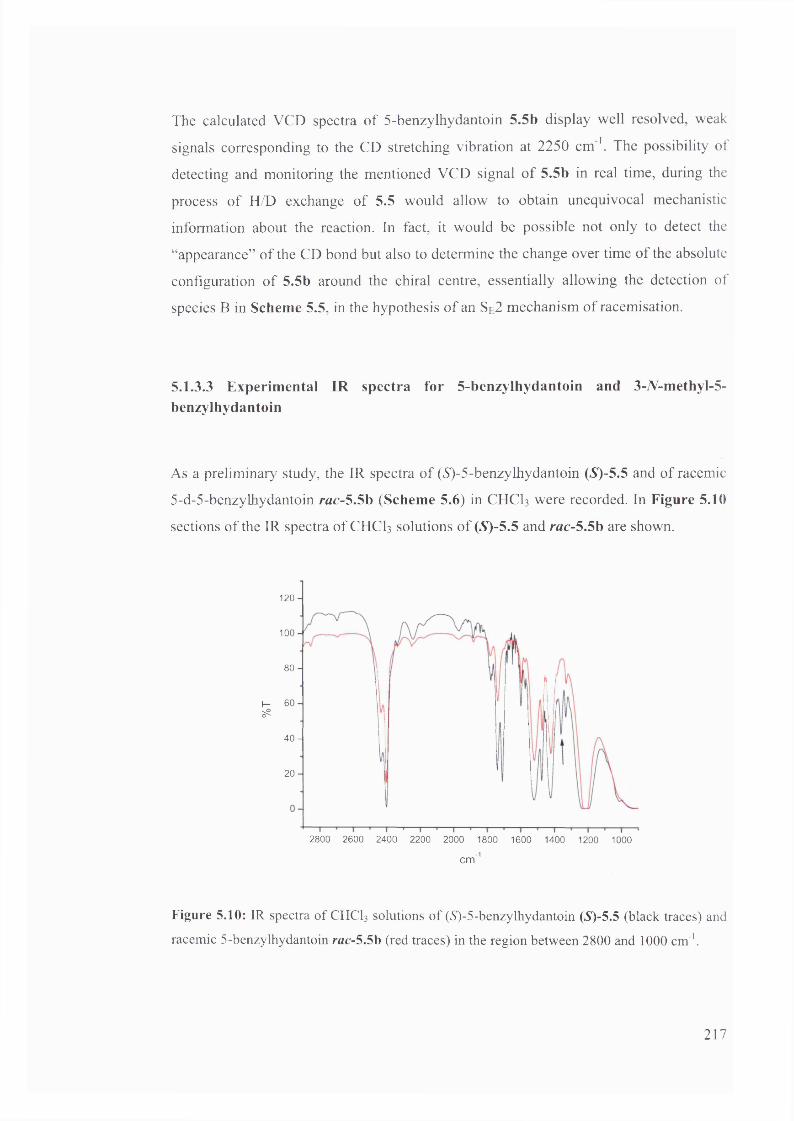
The calculated VCD spectra of 5 -benzylhydantoin 5.5b display well resolved, weak
signals corresponding to the CD stretching vibration at 2250 cm '. The possibility of
detecting and monitoring the mentioned VCD signal of 5.5b in real time, during the
process of H/D exchange of 5.5 would allow to obtain unequivocal mechanistic
information about the reaction. In fact, it would be possible not only to detect the
“appearance” of the CD bond but also to determine the change over time of the absolute
configuration of 5.5b around the chiral centre, essentially allowing the detection of
species B in Scheme 5.5, in the hypothesis of an Se2 mechanism of racemisation.
5.1.3.3 Experimental IR spectra for 5-benzylhydantoin and 3-7V-methyl-5- benzylhydantoin
As a preliminary study, the IR spectra of (5)-5-benzylhydantoin (S)-5.5 and of racemic
5-d-5-benzylhydantoin rao5.5b (Scheme 5.6) in CHCI3 were recorded. In Figure 5.10
sections of the IR spectra of CHCI3 solutions of (S)-5.5 and rac-5.5b are shown.
1 2 0 -
1 0 0 -
8 0 -
6 0 -I-vPo'4 0 -
2 0 -
2800 2600 2400 2200 2000 1800 1600 1400 1200 1000
cm1
Figure 5.10: IR spectra of CHC13 solutions of (S)-5-benzy lhydantoin (*S)-5.5 (black traces) and
racemic 5-benzylhydantoin rac-5.5b (red traces) in the region between 2800 and 1000 cm'1.
217
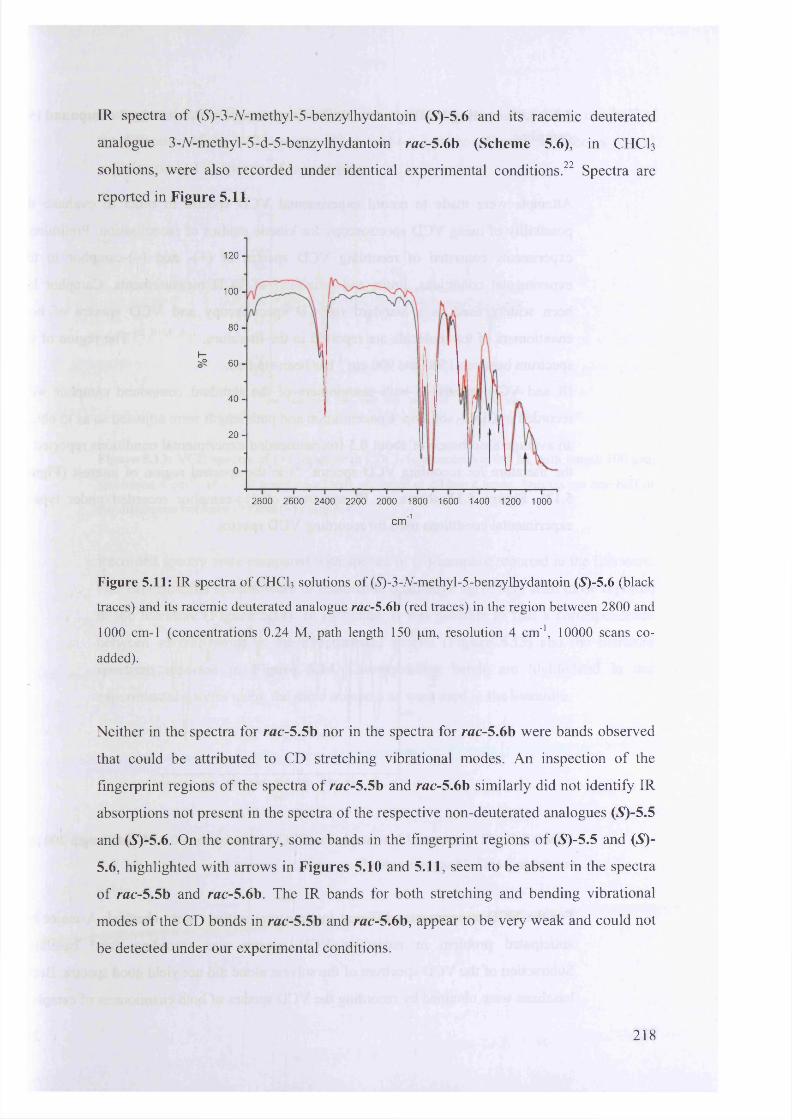
IR spectra of (S)-3-//-methyl-5-benzylhydantoin (S)-5.6 and its racemic deuterated
analogue 3-ALmethyl-5-d-5-benzylhydantoin rac-5.6b (Scheme 5.6), in CHCI3
solutions, were also recorded under identical experimental conditions. 2 2 Spectra are
reported in Figure 5.11.
12 0 -
1 0 0 -
8 0 -
I-sP 6 0 -
4 0 -
2 0 -
2800 2600 2400 2200 2000 1800 1600 1400 1200 1000
cm"1
Figure 5.11: IR spectra of CHC13 solutions of (S)-3-7V-methy 1-5-benzy lhydantoin (5)-5.6 (black
traces) and its racemic deuterated analogue rac-5.6b (red traces) in the region between 2800 and
1000 cm-1 (concentrations 0.24 M, path length 150 pm, resolution 4 cm'1, 10000 scans co
added).
Neither in the spectra for rac-5.5b nor in the spectra for rac-5.6b were bands observed
that could be attributed to CD stretching vibrational modes. An inspection of the
fingerprint regions of the spectra of /-ao5.5b and rac-5.6b similarly did not identify IR
absorptions not present in the spectra of the respective non-deuterated analogues (S)-5.5
and (S)-5.6. On the contrary, some bands in the fingerprint regions of (S)-5.5 and (5)-
5.6, highlighted with arrows in Figures 5.10 and 5.11, seem to be absent in the spectra
of rac-5.5b and rac-5.6b. The IR bands for both stretching and bending vibrational
modes of the CD bonds in rac-5.5b and rac-5.6b, appear to be very weak and could not
be detected under our experimental conditions.
2 1 8
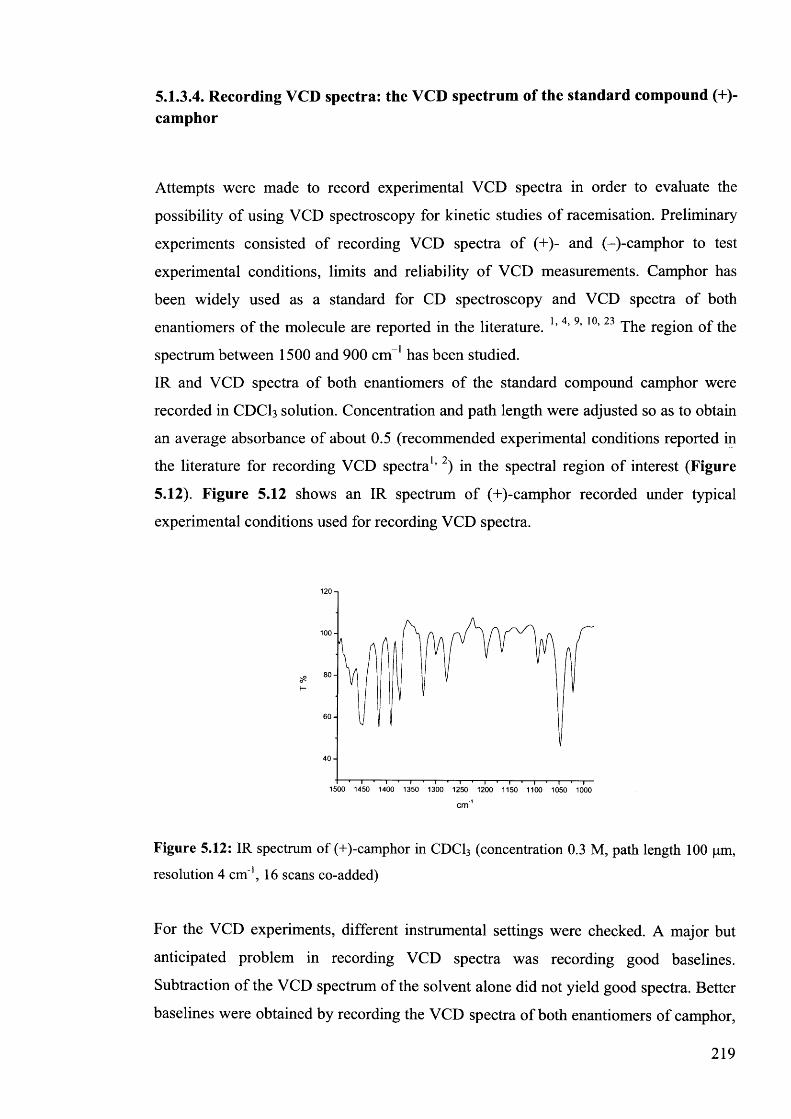
5.I.3.4. Recording VCD spectra: the VCD spectrum of the standard compound (+)- camphor
Attempts were made to record experimental VCD spectra in order to evaluate the
possibility of using VCD spectroscopy for kinetic studies of racemisation. Preliminary
experiments consisted of recording VCD spectra of (+)- and (-)-camphor to test
experimental conditions, limits and reliability of VCD measurements. Camphor has
been widely used as a standard for CD spectroscopy and VCD spectra of both
enantiomers of the molecule are reported in the literature. l’4’9’ 10, 23 The region of the
spectrum between 1500 and 900 cm-1 has been studied.
IR and VCD spectra of both enantiomers of the standard compound camphor were
recorded in CDCI3 solution. Concentration and path length were adjusted so as to obtain
an average absorbance of about 0.5 (recommended experimental conditions reported in1 9the literature for recording VCD spectra ’ ) in the spectral region of interest (Figure
5.12). Figure 5.12 shows an IR spectrum of (+)-camphor recorded under typical
experimental conditions used for recording VCD spectra.
120-1
100-
8 0 -
6 0 -
4 0 -
1500 1450 1400 1350 1300 1250 1200 1150 1100 1050 1000
Figure 5.12: IR spectrum of (+)-camphor in CDC13 (concentration 0.3 M, path length 100 pm, resolution 4 cm'1, 16 scans co-added)
For the VCD experiments, different instrumental settings were checked. A major but
anticipated problem in recording VCD spectra was recording good baselines.
Subtraction of the VCD spectrum of the solvent alone did not yield good spectra. Better
baselines were obtained by recording the VCD spectra of both enantiomers of camphor,
219
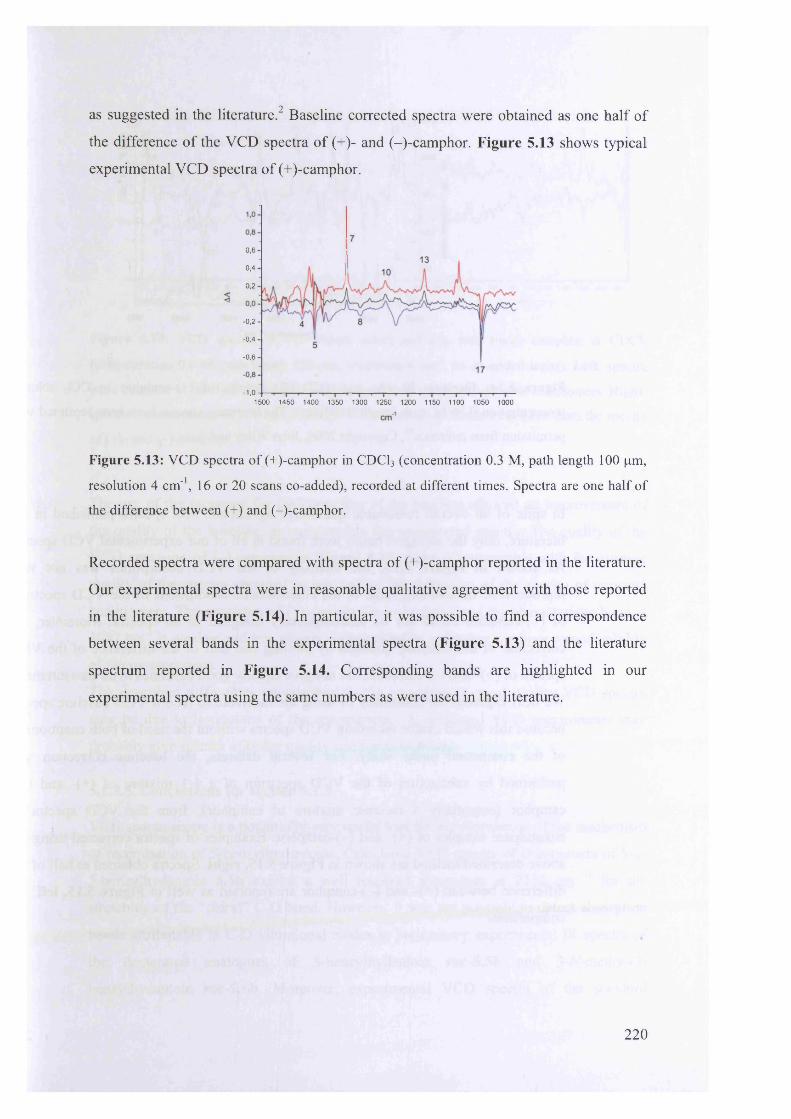
as suggested in the literature.2 Baseline corrected spectra were obtained as one half of
the difference of the VCD spectra of (+)- and (-)-camphor. Figure 5.13 shows typical
experimental VCD spectra of (+)-camphor.
0.6
0.4
0,2
-0.2
-0.4
-0.6
- 1.01500 1450 1400 1350 1300 1250 1200 1150 1100 1050 1000
Figure 5.13: VCD spectra of (+)-camphor in CDC13 (concentration 0.3 M, path length 100 pm,
resolution 4 cm'1, 16 or 20 scans co-added), recorded at different times. Spectra are one half of
the difference between (+) and (-)-camphor.
Recorded spectra were compared with spectra of (+)-camphor reported in the literature.
Our experimental spectra were in reasonable qualitative agreement with those reported
in the literature (Figure 5.14). In particular, it was possible to find a correspondence
between several bands in the experimental spectra (Figure 5.13) and the literature
spectrum reported in Figure 5.14. Corresponding bands are highlighted in our
experimental spectra using the same numbers as were used in the literature.
2 2 0
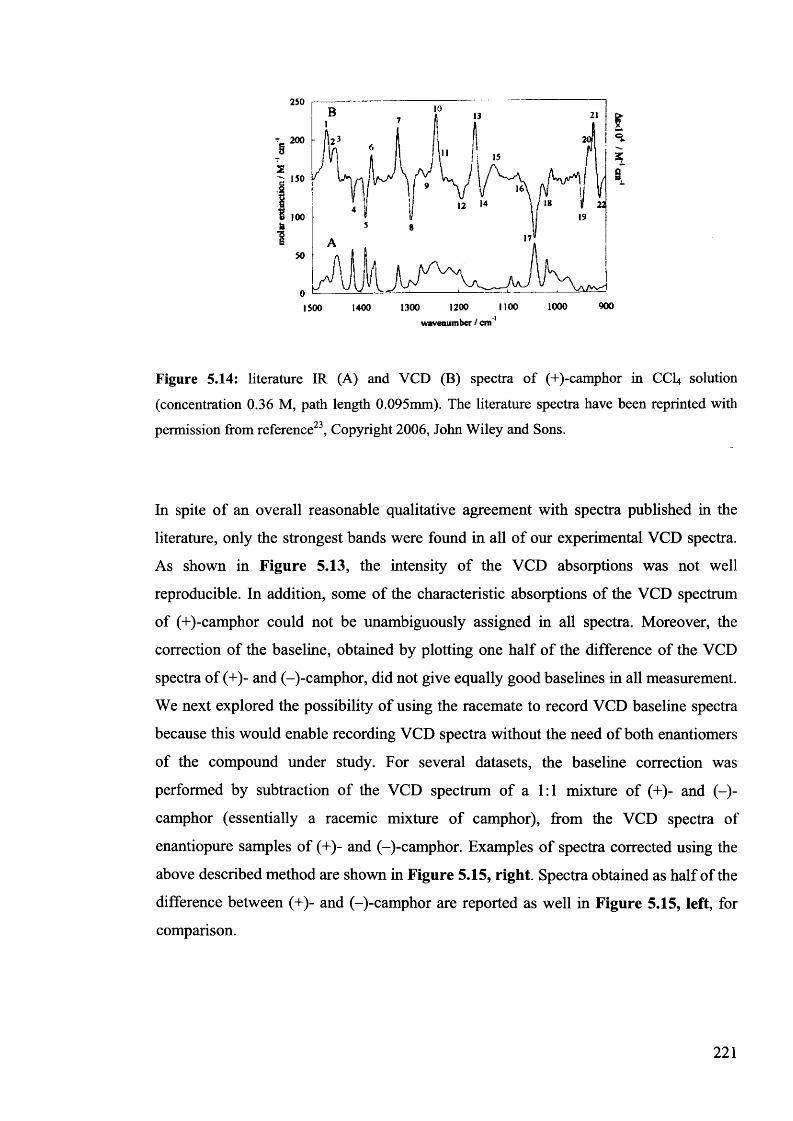
250
a•3E
M \ aJ W \ A50
01500 1400 1300 1200 1100 1000 900
waven umber / cm1
Figure 5.14: literature IR (A) and VCD (B) spectra of (+)-camphor in CCI4 solution
(concentration 0.36 M, path length 0.095mm). The literature spectra have been reprinted with
permission from reference23, Copyright 2006, John Wiley and Sons.
In spite of an overall reasonable qualitative agreement with spectra published in the
literature, only the strongest bands were found in all of our experimental VCD spectra.
As shown in Figure 5.13, the intensity of the VCD absorptions was not well
reproducible. In addition, some of the characteristic absorptions of the VCD spectrum
of (+)-camphor could not be unambiguously assigned in all spectra. Moreover, the
correction of the baseline, obtained by plotting one half of the difference of the VCD
spectra of (+)- and (-)-camphor, did not give equally good baselines in all measurement.
We next explored the possibility of using the racemate to record VCD baseline spectra
because this would enable recording VCD spectra without the need of both enantiomers
of the compound under study. For several datasets, the baseline correction was
performed by subtraction of the VCD spectrum of a 1:1 mixture of (+)- and (-)-
camphor (essentially a racemic mixture of camphor), from the VCD spectra of
enantiopure samples of (+)- and (-)-camphor. Examples of spectra corrected using the
above described method are shown in Figure 5.15, right. Spectra obtained as half of the
difference between (+)- and (-)-camphor are reported as well in Figure 5.15, left, for
comparison.
221
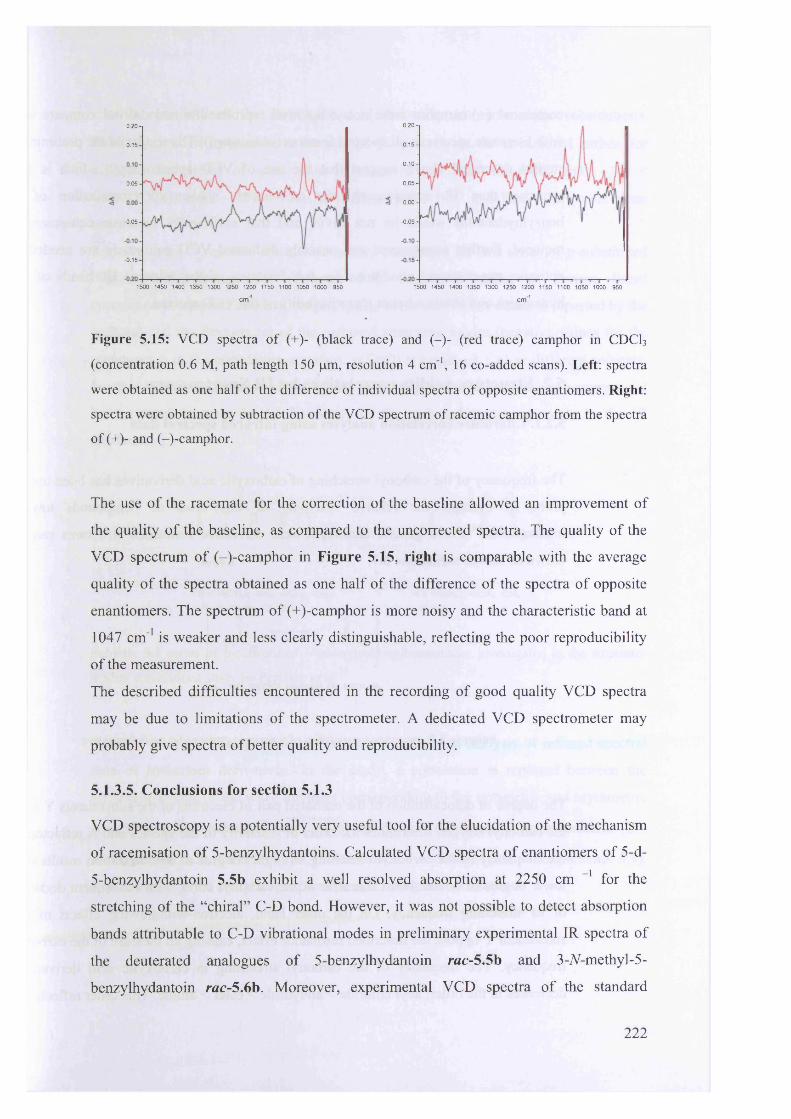
0.20
0.15
0.10
0.05
0.00
-0.05
1500 1450 1400 1350 1300 1250 1200 1150 1100 1050 1000 950
0.20
0.15
0.05
-0.05
-0.15
1500 1450 1400 1350 1300 1250 1200 1150 1100 1050 1000 950
cm’ cm'
Figure 5.15: VCD spectra of (+)- (black trace) and (-)- (red trace) camphor in CDC13
(concentration 0.6 M, path length 150 pm, resolution 4 cm 1, 16 co-added scans). Left: spectra
were obtained as one half of the difference of individual spectra of opposite enantiomers. Right: spectra were obtained by subtraction of the VCD spectrum of racemic camphor from the spectra
of (+)- and (-)-camphor.
The use of the racemate for the correction of the baseline allowed an improvement of
the quality of the baseline, as compared to the uncorrected spectra. The quality of the
VCD spectrum of (-)-camphor in Figure 5.15, right is comparable with the average
quality of the spectra obtained as one half of the difference of the spectra of opposite
enantiomers. The spectrum of (+)-camphor is more noisy and the characteristic band at
1047 cm'1 is weaker and less clearly distinguishable, reflecting the poor reproducibility
of the measurement.
The described difficulties encountered in the recording of good quality VCD spectra
may be due to limitations of the spectrometer. A dedicated VCD spectrometer may
probably give spectra of better quality and reproducibility.
5.I.3.5. Conclusions for section 5.1.3
VCD spectroscopy is a potentially very useful tool for the elucidation of the mechanism
of racemisation of 5-benzylhydantoins. Calculated VCD spectra of enantiomers of 5-d-
5-benzylhydantoin 5.5b exhibit a well resolved absorption at 2250 cm 1 for the
stretching of the “chiral” C-D bond. However, it was not possible to detect absorption
bands attributable to C-D vibrational modes in preliminary experimental IR spectra of
the deuterated analogues of 5-benzylhydantoin rac-5.5b and 3-V-methyl-5-
benzylhydantoin rac-5.6b. Moreover, experimental VCD spectra of the standard
2 2 2
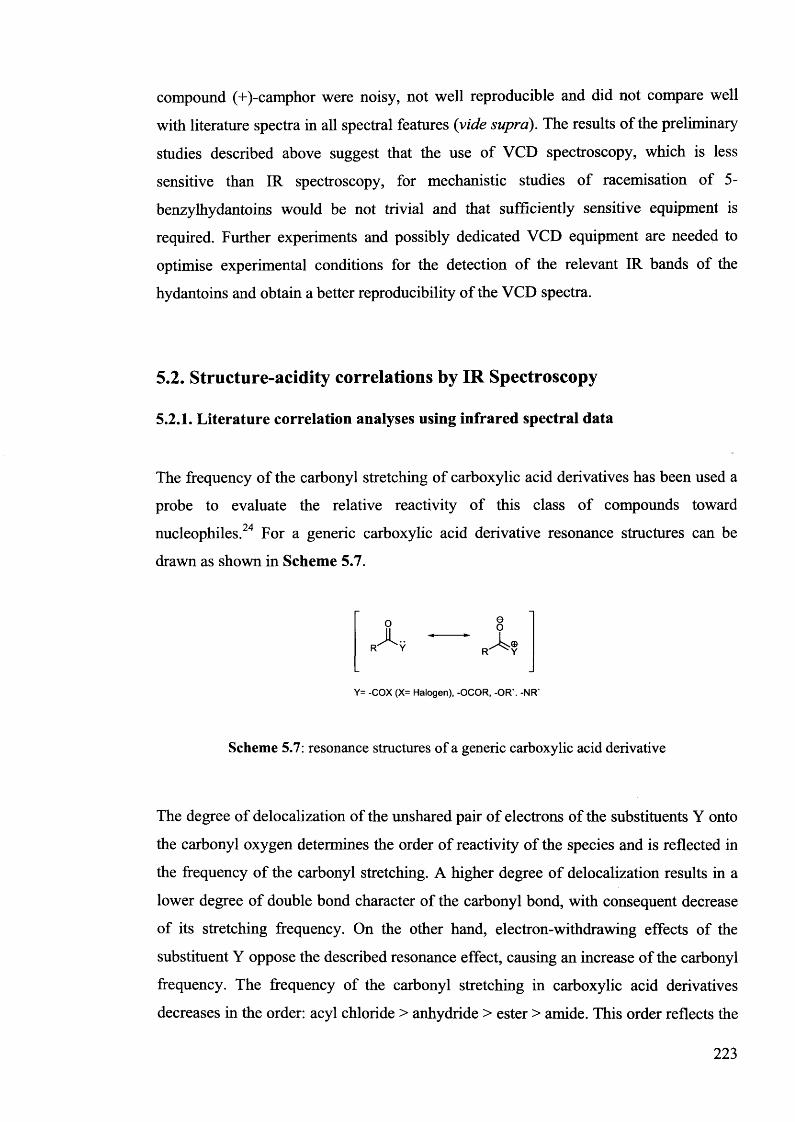
compound (+)-camphor were noisy, not well reproducible and did not compare well
with literature spectra in all spectral features (vide supra). The results of the preliminary
studies described above suggest that the use of VCD spectroscopy, which is less
sensitive than IR spectroscopy, for mechanistic studies of racemisation of 5-
benzylhydantoins would be not trivial and that sufficiently sensitive equipment is
required. Further experiments and possibly dedicated VCD equipment are needed to
optimise experimental conditions for the detection of the relevant IR bands of the
hydantoins and obtain a better reproducibility of the VCD spectra.
5.2. Structure-acidity correlations by IR Spectroscopy
5.2.1. Literature correlation analyses using infrared spectral data
The frequency of the carbonyl stretching of carboxylic acid derivatives has been used a
probe to evaluate the relative reactivity of this class of compounds toward
nucleophiles.24 For a generic carboxylic acid derivative resonance structures can be
drawn as shown in Scheme 5.7.
o oA — XR Y
Y= -COX (X= Halogen), -OCOR, -OR'. -NR'
Scheme 5.7: resonance structures of a generic carboxylic acid derivative
The degree of delocalization of the unshared pair of electrons of the substituents Y onto
the carbonyl oxygen determines the order of reactivity of the species and is reflected in
the frequency of the carbonyl stretching. A higher degree of delocalization results in a
lower degree of double bond character of the carbonyl bond, with consequent decrease
of its stretching frequency. On the other hand, electron-withdrawing effects of the
substituent Y oppose the described resonance effect, causing an increase of the carbonyl
frequency. The frequency of the carbonyl stretching in carboxylic acid derivatives
decreases in the order: acyl chloride > anhydride > ester > amide. This order reflects the
223
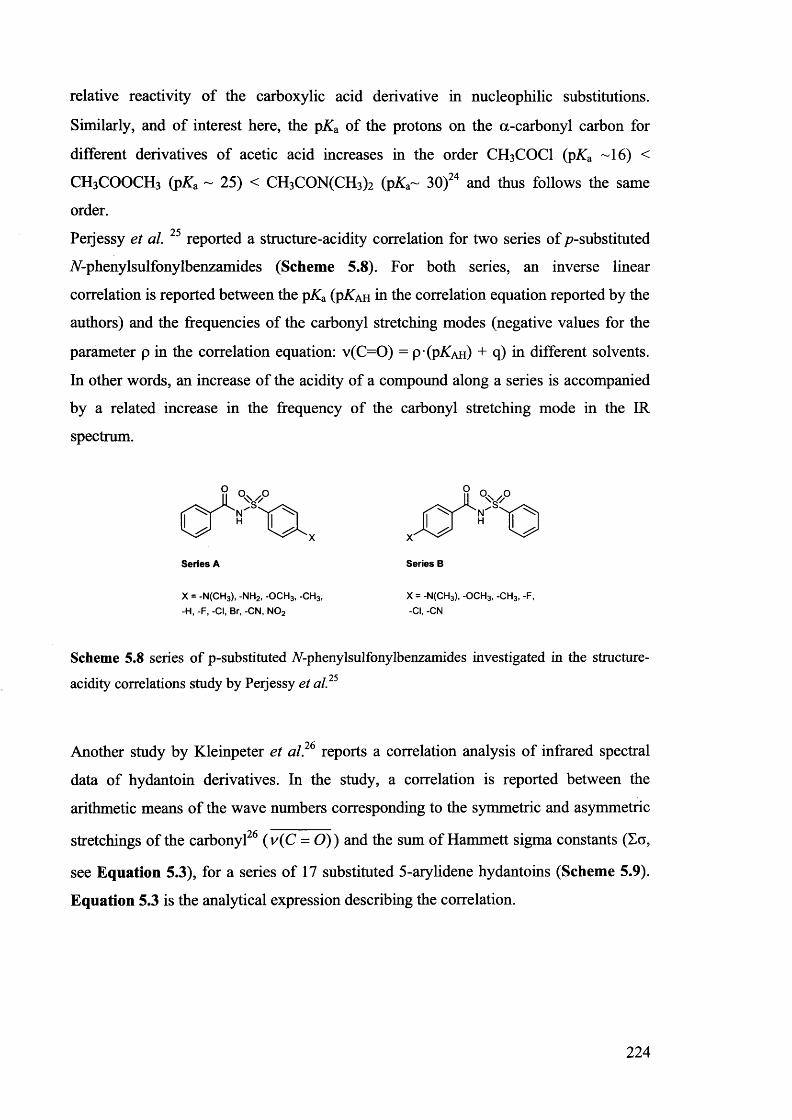
relative reactivity of the carboxylic acid derivative in nucleophilic substitutions.
Similarly, and of interest here, the pKa of the protons on the a-carbonyl carbon for
different derivatives of acetic acid increases in the order CH3 COCI (pKa -16) <
CH3 COOCH3 (ptfa ~ 25) < CH3CON(CH3 ) 2 (p^a~ 30)24 and thus follows the same
order.
Peijessy et al. reported a structure-acidity correlation for two series of -substituted
iV-phenylsulfonylbenzamides (Scheme 5.8). For both series, an inverse linear
correlation is reported between the pK& (p^ah hi the correlation equation reported by the
authors) and the frequencies of the carbonyl stretching modes (negative values for the
parameter p in the correlation equation: v(C=0) = p(pAah) + q) in different solvents.
In other words, an increase of the acidity of a compound along a series is accompanied
by a related increase in the frequency of the carbonyl stretching mode in the IR
spectrum.
Series A Series B
X = -N(CH3), -NH2i -0 CH3, -CH3, X = -N(CH3), -o c h 3, -c h 3, -f,-H, -F, -Cl, Br, -CN, N02 -Cl, -CN
Scheme 5.8 series of p-substituted iV-phenylsulfonylbenzamides investigated in the structure- acidity correlations study by Peijessy et al. 25
Another study by Kleinpeter et al? 6 reports a correlation analysis of infrared spectral
data of hydantoin derivatives. In the study, a correlation is reported between the
arithmetic means of the wave numbers corresponding to the symmetric and asymmetric
stretchings of the carbonyl26 (v{C = O)) and the sum of Hammett sigma constants (So,
see Equation 5.3), for a series of 17 substituted 5-arylidene hydantoins (Scheme 5.9).
Equation 5.3 is the analytical expression describing the correlation.
224
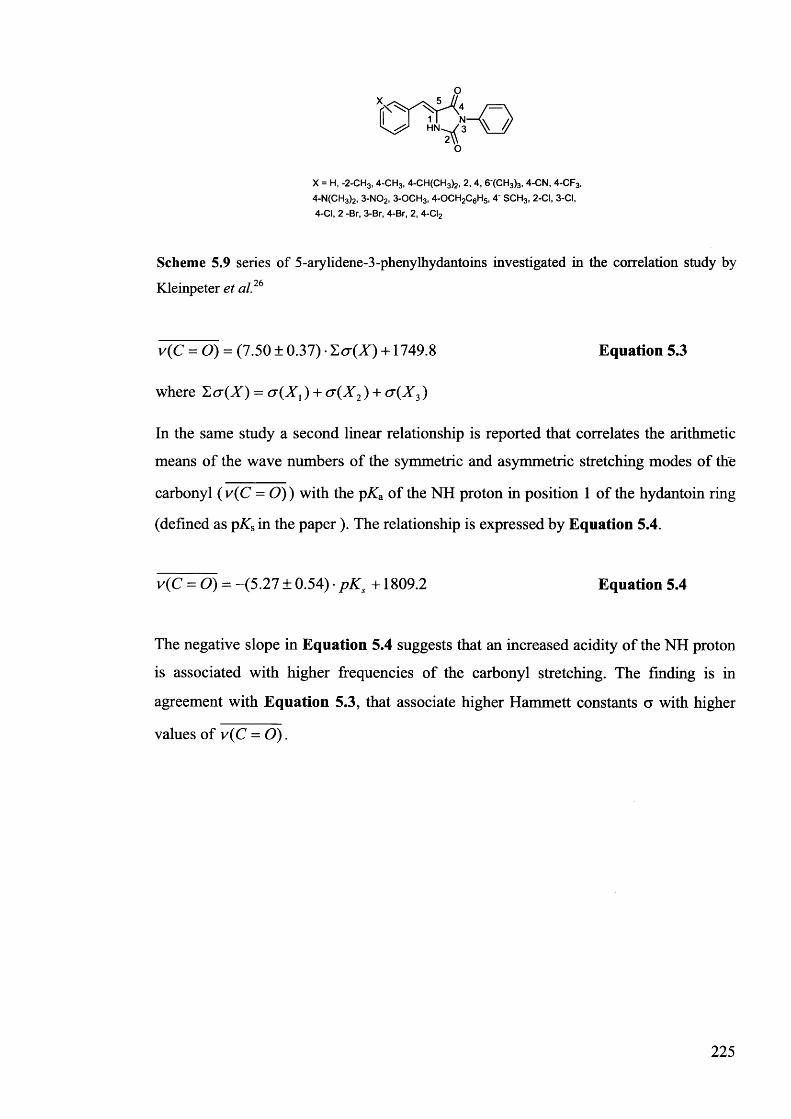
X = H, -2 -CH3, 4 -CH3, 4-CH(CH3)2, 2, 4, 6 '(CH3)3, 4-CN, 4-CF3, 4-N(CH3)2, 3-N02i 3 -OCH3, 4-OCH2C6H5, 4‘ SCH3, 2-CI, 3-CI, 4-CI, 2 -Br, 3-Br, 4-Br, 2, 4-CI2
Scheme 5.9 series of 5-arylidene-3-phenylhydantoins investigated in the correlation study by Kleinpeter et al,26
v(C = O) = (7 .5 0 ± 0 .3 7 ) • Xcr(X) + 1749.8 Equation 5.3
where £<r(X) = cr(X1) + <r(X2) + cr(X3)
In the same study a second linear relationship is reported that correlates the arithmetic
means of the wave numbers of the symmetric and asymmetric stretching modes of the
carbonyl ( v(C = O) ) with the pKa of the NH proton in position 1 of the hydantoin ring
(defined as p^s in the paper). The relationship is expressed by Equation 5.4.
v(C = 0 ) = -(5.27 ± 0.54) • pK s +1809.2 Equation 5.4
The negative slope in Equation 5.4 suggests that an increased acidity of the NH proton
is associated with higher frequencies of the carbonyl stretching. The finding is in
agreement with Equation 5.3, that associate higher Hammett constants a with higher
values of v(C = O) .
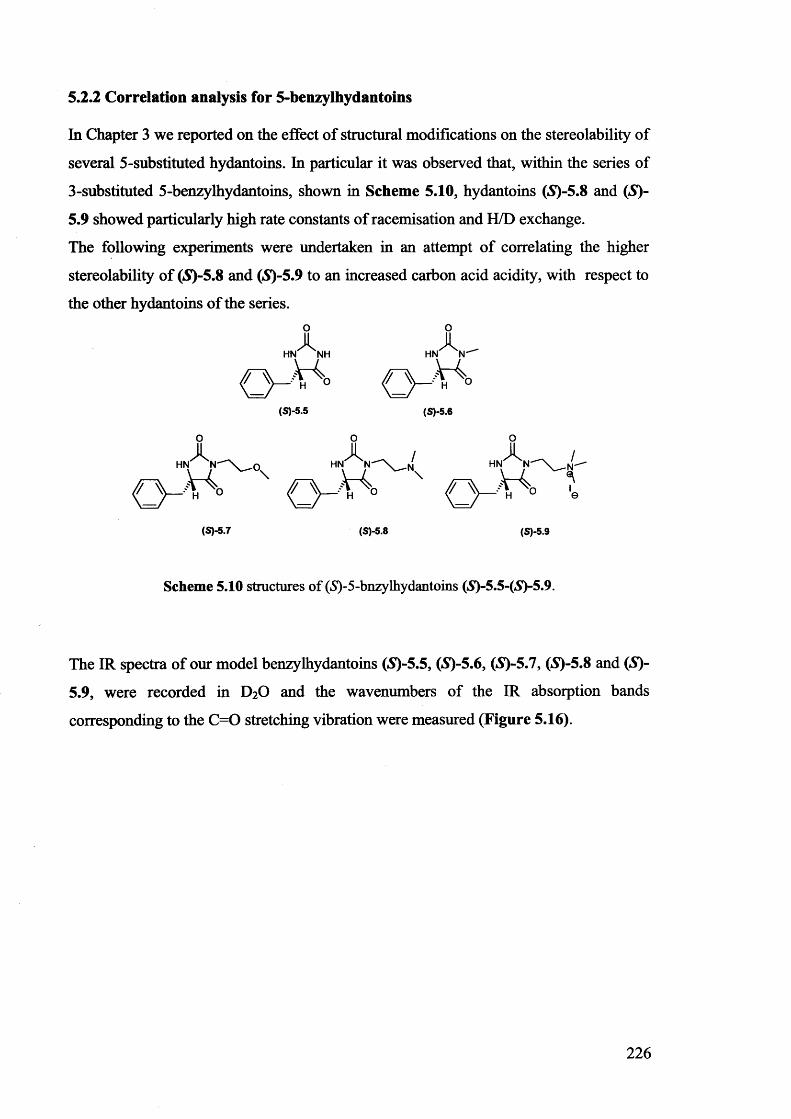
5.2.2 Correlation analysis for 5-benzylhydantoins
In Chapter 3 we reported on the effect of structural modifications on the stereolability of
several 5-substituted hydantoins. In particular it was observed that, within the series of
3-substituted 5-benzylhydantoins, shown in Scheme 5.10, hydantoins (£)-5.8 and (5)-
5.9 showed particularly high rate constants of racemisation and H/D exchange.
The following experiments were undertaken in an attempt of correlating the higher
stereolability of (5)-5.8 and (S)-5.9 to an increased carbon acid acidity, with respect to
the other hydantoins of the series.
(S)-5.5 (S)-5.6
O O O
(S)-5.7 (S)-5.8 (S)-5.9
Scheme 5.10 structures of (S)-5-bnzylhydantoins (S)-5.5-(S)-5.9.
The IR spectra of our model benzylhydantoins (5)-5.5, (5)-5.6, (£)-5.7, (*S)-5.8 and (£)-
5.9, were recorded in D2O and the wavenumbers of the IR absorption bands
corresponding to the C=0 stretching vibration were measured (Figure 5.16).
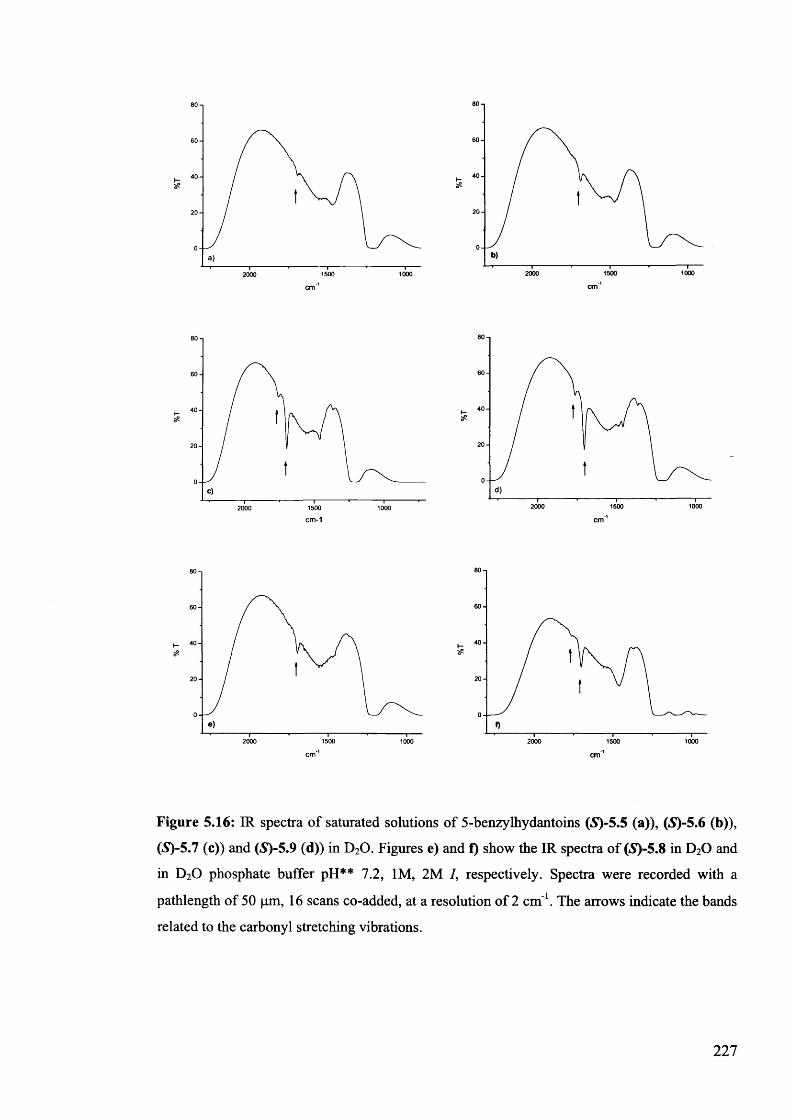
80
60
40
20
0
100015002000
80
60
40
20
01500 10002000
cm'1 cm1
80
60
40
20
015002000 1000
80
60
40
20
010002000 1500
cm*1
60
40
20
0
2000 1500 1000
80
60
40
20
0
2000 1500 1000
cm'1 cm’1
Figure 5.16: IR spectra of saturated solutions of 5-benzylhydantoins (S)-5.5 (a)), (S)-5.6 (b)), (S)-5J (c)) and (S)-5.9 (d)) in D20. Figures e) and f) show the IR spectra of (S)-5.8 in D20 and in D20 phosphate buffer pH** 7.2, 1M, 2M I, respectively. Spectra were recorded with a
pathlength of 50 pm, 16 scans co-added, at a resolution of 2 cm'1. The arrows indicate the bands related to the carbonyl stretching vibrations.
227
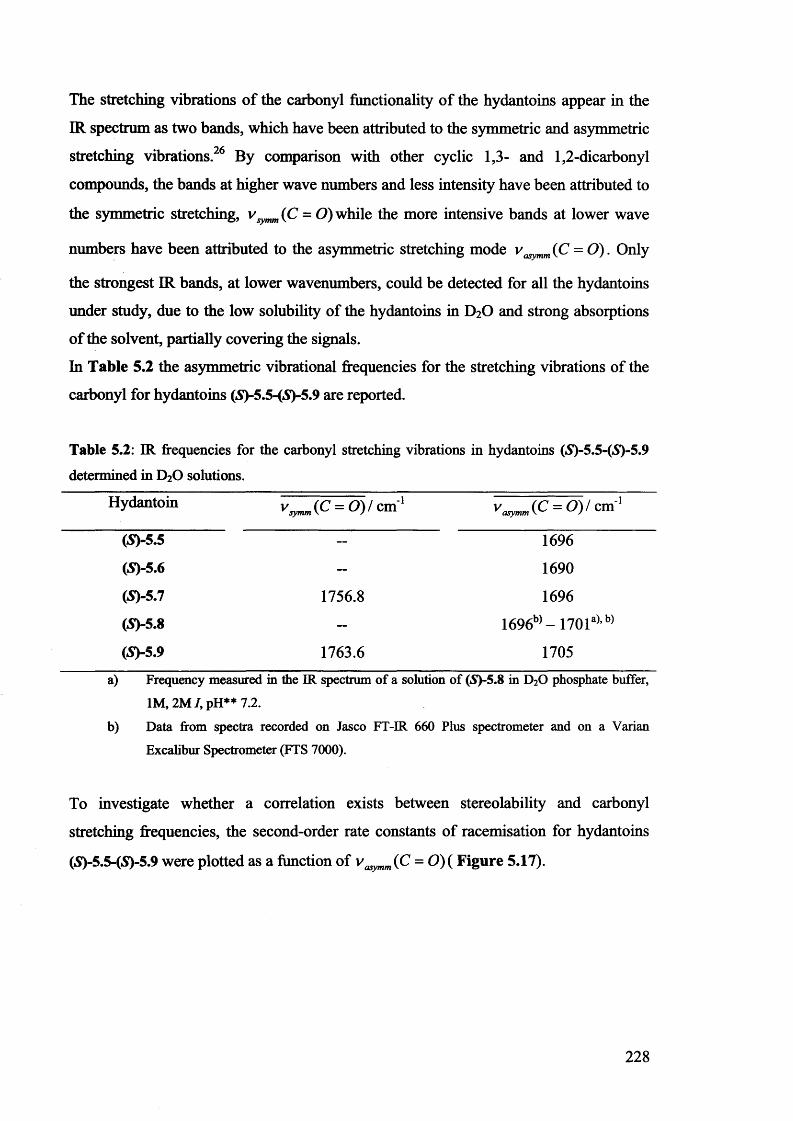
The stretching vibrations of the carbonyl functionality of the hydantoins appear in the
ER spectrum as two bands, which have been attributed to the symmetric and asymmetric
stretching vibrations.26 By comparison with other cyclic 1,3- and 1,2-dicarbonyl
compounds, the bands at higher wave numbers and less intensity have been attributed to
the symmetric stretching, vsymm (C = O) while the more intensive bands at lower wave
numbers have been attributed to the asymmetric stretching mode vaS3wm(C = O). Only
the strongest IR bands, at lower wavenumbers, could be detected for all the hydantoins
under study, due to the low solubility of the hydantoins in D2O and strong absorptions
of the solvent, partially covering the signals.
In Table 5.2 the asymmetric vibrational frequencies for the stretching vibrations of the
carbonyl for hydantoins (S)-5.5-(5)-5.9 are reported.
Table 5.2: IR frequencies for the carbonyl stretching vibrations in hydantoins (S)-5.5-(S)-5.9 determined in D20 solutions.
Hydantoin »V»(C = 0 ) / cm'1 VcsymJC = O)/
(5)-5.5 — 1696
(*S)-5.6 — 1690
(iS)-5.7 1756.8 1696
(S)-5.8 — 1696b)- 1701a),b)
(*S)-5.9 1763.6 1705
a) Frequency measured in the IR spectrum of a solution of (5)-5.8 in D20 phosphate buffer, lM,2M/,pH**7.2.
b) Data from spectra recorded on Jasco FT-IR 660 Plus spectrometer and on a Varian Excahbur Spectrometer (FTS 7000).
To investigate whether a correlation exists between stereolability and carbonyl
stretching frequencies, the second-order rate constants of racemisation for hydantoins
(»S)-5.5-(5)-5.9 were plotted as a function of v asymm{C = 0 ) ( Figure 5.17).
228
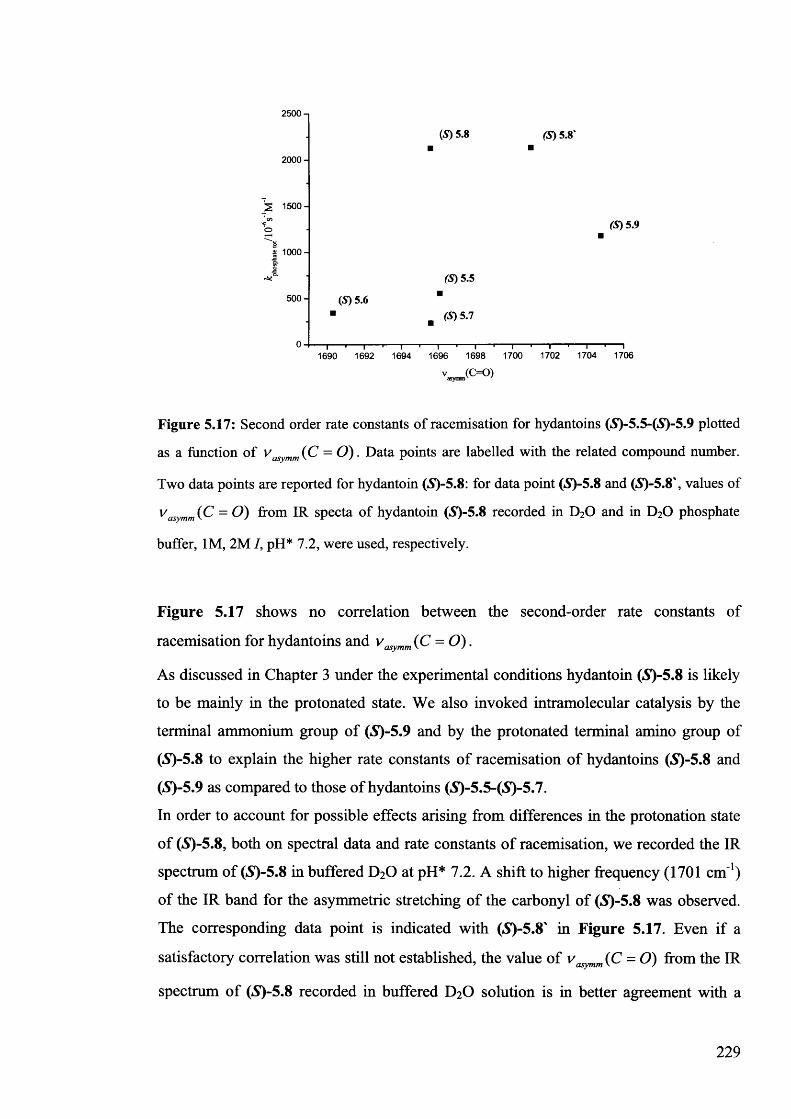
2500
2000 -
(5 )5 .8 (S) 5.8'
^ 1500-
§ 1000 -
500- (5 )5 .6
(S) 5.5i(5 )5 .7
(5) 5.9
— i------ ■------1----------- ■-1------------'-1----------- >-1------------>-1----------- 1-1---------- 1--1------ 11690 1692 1694 1696 1698 1700 1702 1704 1706
v (O O )asymm '
Figure 5.17: Second order rate constants of racemisation for hydantoins (*S)-5.5-(<S)-5.9 plotted
as a function of vasymm (C = 0 ) . Data points are labelled with the related compound number.
Two data points are reported for hydantoin (*S)-5.8: for data point (£)-5.8 and (<S)-5.8', values of
vasymm (C = O ) from IR specta of hydantoin (5)-5.8 recorded in D20 and in D20 phosphate
buffer, 1M, 2M I, pH* 7.2, were used, respectively.
Figure 5.17 shows no correlation between the second-order rate constants of
racemisation for hydantoins and vasymm (C = 0 ) .
As discussed in Chapter 3 under the experimental conditions hydantoin (S)-5.8 is likely
to be mainly in the protonated state. We also invoked intramolecular catalysis by the
terminal ammonium group of (5)-5.9 and by the protonated terminal amino group of
(5)-5.8 to explain the higher rate constants of racemisation of hydantoins (*S)-5.8 and
(5)-5.9 as compared to those of hydantoins (S)-5.5-(S)-5.7.
In order to account for possible effects arising from differences in the protonation state
of (S)-5.8, both on spectral data and rate constants of racemisation, we recorded the IR
spectrum of (5)-5.8 in buffered D2O at pH* 7.2. A shift to higher frequency (1701 cm 1)
of the IR band for the asymmetric stretching of the carbonyl of (<S)-5.8 was observed.
The corresponding data point is indicated with (»S)-5.8' in Figure 5.17. Even if a
satisfactory correlation was still not established, the value of vasymm(C = O) from the IR
spectrum of (5)-5.8 recorded in buffered D2O solution is in better agreement with a
229
qualitative trend of the data that seems to associate higher values of vasymm (C = O) to
higher rate constants of racemisation. This trend also conforms to correlation studies on
hydantoin derivatives reported in the literature (See Section 5.2.1).
5.3 Conclusion
In this chapter we reported preliminary experiments aimed at evaluating the potentials
of VCD and IR spectroscopy in the study of the mechanism of reactions involving
stereogenic centres. A method has been presented which allows the prediction of the
VCD spectra of “flexible” chiral molecule for which the possibility of different
conformations should be considered. Preliminary experiments have been presented
aimed at finding suitable experimental conditions for the recording of experimental
VCD spectra. Enantiomers of the model compound camphor has been used. The
recorded spectra, although in overall qualitative agreement with literature spectra were
noisy and not well reproducible. IR spectra of 5-benzylhydantoin 5.5, 3-V-methyl-5-
benzylhydantoin 5.6 and their deuterated analogues 5.5b and 5.6b were recorded.
Unfortunately, it was not possible to detect the IR bands from vibrational modes of CD
bonds in the deuterated hydantoins, potentially important in view of mechanistic
studies of racemisation and H/D exchange. Further experiments and possibly dedicated
VCD equipment are needed for the use of IR and VCD spectroscopy for mechanistic
studies as envisaged in this chapter. Finally preliminary experiments aimed at searching
a correlation between stereolability and vibrational frequencies of the carbonyl
stretching modes of model hydantoins has been described. Satisfactory results were not
obtained.
5.4. Experimental
Calculations of VCD and IR spectra
Conformational searches were carried out by means of the program MacroModel. The
force field MMFF 94 was mainly used. Conformational searches were carried out
within 10 kcal/mole with Monte Carlo sampling of the conformations, 100 steps per
230
rotatable bond. The DFT calculations were carried out by means of the Gaussian03
program, using the functional and basis set B3PW91/6-31G + (d, p). Elaborations of the
VCD spectra with Lorentzian band shapes were carried out by means of the program
MATLAB.
Experimental IR and VCD spectra
Apparatus
VCD and some of the IR spectra were recorded on a Varian Excalibur Spectrometer
(FTS 7000) equipped with a liquid nitrogen cooled Cryogenic Mercury Cadmium
Telluride (MCT) detector and a single modulation setup. The IR spectra described in
Section 5.2.2 were recorded on a Jasco FT-IR 660 Plus spectrometer, unless otherwise
stated. For VCD spectra and IR spectra in CDCI3 and CHCI3 solution, a liquid sample
cell with variable path length and KBr windows was used. A liquid cell with CaF2
windows, with Teflon spacers to define the optical path length, was used to record
spectra in D2O solutions.
Materials
Dimethylsulfoxide-ds (D 99.9%) was purchased from Cambridge Isotope Laboratories,
inc, chloroform-d (H2O<0.01%, 99.80 %D) was from EURISO-TOP, deuterium oxide
(99.9%) was obtained from Fluorochem, CHCI3 was from Fisher Scientific. (+)-
Camphor, kindly provided by Dr. I. Fallis, and (-)-camphor were from Aldrich.
Hydantoins (5)-5-benzylimidazolidine-2,4-dione (£)-5.5, (S)-5-benzyl-3-
methylimidazolidine-2,4-dione (S)-5.6, (S)-5-benzyl-3-(2-methoxyethyl)-imidazolidine-
2,4-dione (5)-5.7, (*S)-5-benzyl-3-(2-(dimethylamino)ethyl)imidazolidine-2,4-dione (S)-
5.8 and (*S)-2-(4-benzyl-2,5 dioxoimidazolidin-1 -yl)-V, V,A-trimethylethanaminiurn
iodide (S)-5.9 were prepared as described in Chapters 2 and 3. Deuterium-labeled
hydantoins rac-5.5b and rac-5.6b were recovered from solutions in D2O phosphate
buffers used in H/D exchange kinetic experiments , after complete deuteration of the
231
substrates. The procedure used for recovery of rac-5.5b was as follow: the solution of
rac-5.5b in D2O phosphate buffer was concentrated and the deuterated hydantoin was
recovered by filtration. The solid was washed three times with D2O and high vacuum
dried. In case of hydantoin rac-5.6b, the solution in D2O phosphate buffer was
concentrated to a small volume and quickly extracted with chloroform. The combined
organic extracts were concentrated. The solid obtained was washed with a little D2O,
filtered and high vacuum dried. Structures were confirmed by NMR spectroscopy.
VCD and IR spectra
VCD spectra and the IR spectra described in section 5.1.3.3 and 5.1.3.4 were recorded
on a Varian Excalibur Spectrometer (FTS 7000) equipped with a liquid nitrogen cooled
Cryogenic MCT detector. The sample chamber was purged with nitrogen for 5 to 10
minutes after placing the cell in the sample holder and during spectral acquisitions. A
TGS region filter (< 2000 cm 1) was used for the recording of VCD spectra of (+)- and
(-)- camphor. IR spectra of the solution samples were recorded before the acquisition of
VCD spectra and concentration and path length were adjusted in order to obtain IR
spectra with an average transmission of approximately 30% in the spectral window of
interest. Typical concentrations were 0.3 or 0.6 M, and optimal path lengths were found
between 100 and 150 pm. Resolutions of 4 or 8 cm'1 were used for most experiments.
VCD spectra of individual enantiomers were obtained from 16 to 25 co-added spectra.
Baseline-corrected VCD spectra were obtained as one half of the difference between the
VCD spectra of individual enantiomers or by subtracting the VCD spectrum of a
racemic mixture of the compound under study from the spectrum of a single
enantiomer. The IR spectra described in section 5.2.2. were recorded on a Jasco FT-IR
spectrometer in a cell with a pathlength of 50 pm, at a resolution of 2 cm'1 with 16 scans
co-added. The IR spectrum of (5)-5.8 in D2O solution, recorded on the Jasco FT-IR
spectrometer, was also recorded on the Varian FTIR Spectrometer, giving the same
value for the frequency of the carbonyl stretching of (£)-5.8 as found in the previous
experiment.
232
Acknowledgments
I thank Dr Andrew Leach, Dr Simone Tomasi, Dr Martin Packer (all at AstraZeneca)
for their kind and valuable help with the development of the method for calculating
VCD spectra described in Section 5.1. and Dr Nabil Asaad who inspired the work. I
would also like to thank Dr Larry Goldman and Dr Robert Richardson, from Cardiff
University, for precious help with the calculations carried out at Cardiff University. I
aknowledge AstraZeneca and Cardiff University for making available computational
facilities and time.
References
1. Nafie, L. A., Business Briefing:Pharma Outsourcing 2004, 1-4.
2. Freedman, T. B.; Cao, X. L.; Dukor, R. K.; Nafie, L. A., Chirality 2003, 15 (9),
743-758.
3. Stephens, P. J.; Davlin, F. J., Chirality 2000,12 (4), 172-179.
4. Kellenbach, E. R.; Dukor, R. K.; Nafie, L. A., Spectroscopy Europe 2007, 19
(4), 15-18.
5. Monde, K.; Miura, N.; Hashimoto, M.; Taniguchi, T.; Inabe, T., Journal o f the
American Chemical Society 2006,128 (18), 6000-6001.
6. Keiderling, T. A., Current Opinion in Chemical Biology 2002, 6 (5), 682-688.
7. Rudd, T. R.; Nichols, R. J.; Yates, E. A., Journal o f the American Chemical
Society 2008,130 (7), 2138-+.
8. Devlin, F. J.; Stephens, P. J.; Cheeseman, J. R.; Frisch, M. J., Journal o f
Physical Chemistry A 1997,101 (51), 9912-9924.
9. Devlin, F. J.; Stephens, P. J.; Cheeseman, J. R.; Frisch, M. J., Journal o f
Physical Chemistry A 1997,101 (35), 6322-6333.
10. Devlin, F. J.; Stephens, P. J.; Cheeseman, J. R.; Frisch, M. J., Journal o f the
American Chemical Society 1996,118 (26), 6327-6328.
11. Asaad, N.; Fillery, S., Organic & Biomolecular Chemistry 2009, 7 (4), 678-686.
233
12. Only one (for compound 5.1) or two (for compounds 5.2 and 5.3) conformers
were found to be populated with the population of the other conformers being below
0.001%..
13. Halgren, T. A., Journal o f Computational Chemistry 1996,17 (5-6), 490-519.
14. Conformational searches, geometry optimisations and calculations of the
energies, by means of DFT methods, for different conformers were carried out on non
labelled analogues of the structures shown in Scheme 5.1.
15. Jensen, F., Introduction to Computational Chemistry. John Wiley & Sons:
Chichester New York Weinheim Brisbane Singapore Toronto, 1999; p 177-194.
16. Jensen, F., Introduction to Computational Chemistry. John Wiley & Sons:
Chichester New York Weinheim Brisbane Singapore Toronto, 1999; p 6-52.
17. The foundation of Force Field Methods or Molecular Mechanics (MM) is the
observation that molecules tend to be composed of units (called “atom types”) which
are structurally similar. MM methods can be seen as a generalisation and improvement
of the usual ball and stick models of molecules, using the “atom types” as building
blocks. FF methods bypass the solution of the Schrodinger equation by writing the
energy as a parametric function of the internal coordinates of the molecule. They
therefore enable a quick construction of the potential energy surface corresponding to
different conformations of the molecule and a first rough evaluation of energy minima
corresponding to stable conformers. The basis of Density Functional Theory (DFT), on
the contrary, relies on the fact that the ground-state electronic energy of a set molecular
structure can be correlated to the electron density, through appropriate functional.
18. Chiorboli, P., Fondamenti di Chimica. Second ed.; Unione Tipografico-Editrice
Torinese: Torino, 1991; p 519.
19. The calculations were carried out by Dr Simone Tomasi from AstraZeneca.
20. Finley, J. W.; Stephens, P. J., Theochem-Journal o f Molecular Structure 1995,
357(3), 225-235.
21. Reist, M.; Carrupt, P. A.; Testa, B.; Lehmann, S.; Hansen, J. J., Helvetica
Chimica Acta 1996, 79 (3), 767-778.
22. The better solubility of 5.6 and 5.6b in CHCI3 as compared to 5.5 and 5.5b
makes the formers more suitable for studies by means of analytical techniques, such as
IR or VCD spectroscopy, where relatively high concentrations are needed.
23. Morita, H. E.; Kodama, T. S.; Tanaka, T., Chirality 2006,18 (10), 783-789.
234
24. Vollhardt, P., Chimica Organica. Zanichelli Editore S.p.A.: Bologna, 1998; p
790-794.
25. Peijessy, A.; Fabian, W. M. F.; Parik, P.; Ludwig, M.; Loos, D.; Sustekova, Z.,
Molecules 2004, 9 (4), 213-222.
26. Kleinpeter, E.; Klod, S.; Peijessy, A.; Samalikova, M.; Synderlata, K.;
Sustekova, Z., Journal o f Molecular Structure 2003, 645 (1), 17-27.
235
Chapter 6
Epilogue
6.1. Conclusions
This thesis describes studies on the processes of racemisation and H/D exchange of 5-
substituted hydantoins, carried out mainly by means of CD and NMR spectroscopy.
Studies in the literature report controversial conclusions about the mechanism of1 ftracemisation of 5-substituted hydantoins " and both SeI and Se2 mechanisms have
been proposed.
We focused on two model compounds, viz. (S)-5-benzylhydantoin and (S)-3-iV-methyl-
5-benzylhydantoin. Detailed kinetic studies of racemisation and H/D exchange of these
two model hydantoins provided a coherent set of findings. First, reactions were found to
follow pseudo-first-order kinetics and were general-base catalysed. Second, the ratio of
the rate constants of racemisation and H/D exchange of (*S)-5-benzylhydantoin are
consistently equal under the experimental conditions where both rate constants were
evaluated. Third, primary kinetic isotope effects are significant, while solvent kinetic
isotope effects are negligible. Fourth, deuterium labelled hydantoins for which the
process of H/D exchange and racemisation leads to the formation of diastereoisomers
indicated immediate racemisation rather than inversion upon H/D exchange. Fifth,
mathematical analyses and numerical simulations show that the observed first-order
kinetics cannot be in agreement with a mechanism in which the first deuteration step
also leads to inversion of the chiral centre. All these observations support the SeI
236
mechanism for the racemisation of substituted hydantoins and most are incompatible
with the Se2 mechanism.
A series of 5-substituted hydantoins was also synthesised, addressing the low water
solubility of (S)-5-benzylhydantoin and (S)-3 - V-methy 1-5 -benzy lhydantoin, therefore
allowing kinetic studies by means of analytical techniques less sensitive than CD
spectroscopy, such as IR or VCD spectroscopy. Some of the structural modifications
gave rise to unexpected differences in the stereolability of the substrates. In particular
hydantoins containing a protonated amino or an ammonium group showed increased
stereolability. This finding was attributed to intramolecular facilitation of racemisation
by the positive charge. For two 5-substituted hydantoins the primary and solvent kinetic
isotope effects on racemisation were also determined with results again supporting an
SeI mechanism of racemisation.
The experiments described in Chapter 4 of this thesis focused on the effect of the
solvent on racemisation and H/D exchange of a series of 5-benzylhydantoins. DMSO
added to phosphate buffers showed a marked rate-increasing effect for all of the
substrates under study. Co-added 2-propanol and dioxane showed rate-decreasing
effects on the racemisation and H/D exchange of neutral hydantoins and a rate-
increasing effect on racemisation and H/D exchange of a cationic hydantoin. Solvent
effects on the basicity of anionic catalysts and phenomena of preferential solvation were
proposed as important factors affecting the rate constants in mixed media.
Finally, in Chapter 5, we have described preliminary experiments aimed at assessing
potentials and limitations of VCD and IR spectroscopy for kinetic and mechanistic
studies of racemisation.
6.2. Future work
A recent paper by Cabordery reports an SeI mechanism of racemisation for a series of
substituted hydantoins while an Se2 mechanism is proposed for substituted 2-
thiohydantoins. The finding is interesting because it suggests that the introduction of a
thioamide has a significant effect on the racemisation reaction. Future work could
therefore aim to confirm this finding. A Knoevenagel condensation of
2-thiohydantoin with appropriate aldehydes followed by a catalytic hydrogenation, as
described in this thesis for preparing some of our model hydantoins (see Chapters 2 and237
3) may be used to prepare the required substrates. The determination of primary and
solvent kinetic isotope effects, together with studies of H/D exchange using suitable
deuterium-labelled substrates (see Chapter 2) might help shed light on the mechanism
of racemisation of these thiohydantoins.
Regarding the effects of co-solvents on racemisation reactions, further experiments are
needed for a better insight into these. In particular further investigations should be
addressing the question of the non-linear dependence of the rate constants of
racemisation of a model cationic hydantoin in mixed media with the concentration of
co-added 2-propanol (see Chapter 4).
It would be interesting to obtain information about the carbon acid acidity of 5-
substituted hydantoins as described by Richardt et al. for several classes of different
carbon acids (see Chapter l).9'14
Further work may also be focussed on finding suitable experimental conditions allowing
the use of VCD and IR spectroscopy for kinetic studies of racemisation of 5-substituted
hydantoins. Substituted hydantoins with increased water solubility and not too high rate
constants of racemisation, such as hydantoins 3.24 and 3.25, described in Chapter 3 of
this thesis, may be used as model compounds for this purpose.
References
1. Reist, M.; Carrupt, P. A.; Testa, B.; Lehmann, S.; Hansen, J. J., Helvetica
Chimica Acta 1996, 79 (3), 767-778.
2. Cabordery, A.-C.; Toussaint, M.; Azaroual, N.; Bonte, J.-P.; Melnyk, P.;
Vaccher, C.; Foulon, C., Tetrahedron-Asymmetry 2011,22 (2), 125-133.
3. Lazarus, R. A., Journal o f Organic Chemistry 1990,55 (15), 4755-4757.
4. Kahn, K.; Tipton, P. A., Bioorganic Chemistry 2000,28 (2), 62-72.
5. Dudley, K. H.; Bius, D. L., Drug Metabolism and Disposition 1976, 4 (4), 340-
348.
6. Bovamick, M.; Clarke, H. T., Journal o f the American Chemical Society 1938,
60,2426-2430.
7. Dakin, H. D., American Chemical Journal 1910, 44, 48.
8. Lee, C. K.; Fan, C. H., Enzyme and Microbial Technology 1999, 24 (10), 659-
666.238
9. Amyes, T. L.; Richard, J. P., Journal o f the American Chemical Society 1992,
114 (26), 10297-10302.
10. Amyes, T. L.; Richard, J. P., Journal o f the American Chemical Society 1996,
118 (13), 3129-3141.
11. Richard, J. P.; Williams, G.; O'Donoghue, A. C.; Amyes, T. L., Journal o f the
American Chemical Society 2002,124 (12), 2957-2968.
12. Rios, A.; Amyes, T. L.; Richard, J. P., Journal o f the American Chemical
Society 2000,122 (39), 9373-9385.
13. Williams, G.; Maziarz, E. P.; Amyes, T. L.; Wood, T. D.; Richard, J. P.,
Biochemistry 2003, 42 (27), 8354-8361.
14. Rios, A.; Richard, J. P.; Amyes, T. L., Journal o f the American Chemical
Society 2002,124 (28), 8251-8259.
239
Appendices
for
The mechanism of racemisation of 5-substituted hydantoins in aqueous solution
Stefania Narduolo
A thesis submitted for Degree o f Doctor o f PhilosophySchool o f Chemistry Cardiff University
December 2011
Appendix 1
This Appendix is for Chapter 2
The kinetics and mechanism of racemisation of (A)-5- benzylhydantoin and (5)-3-A-methyl-5-
benzylhydantoin
240
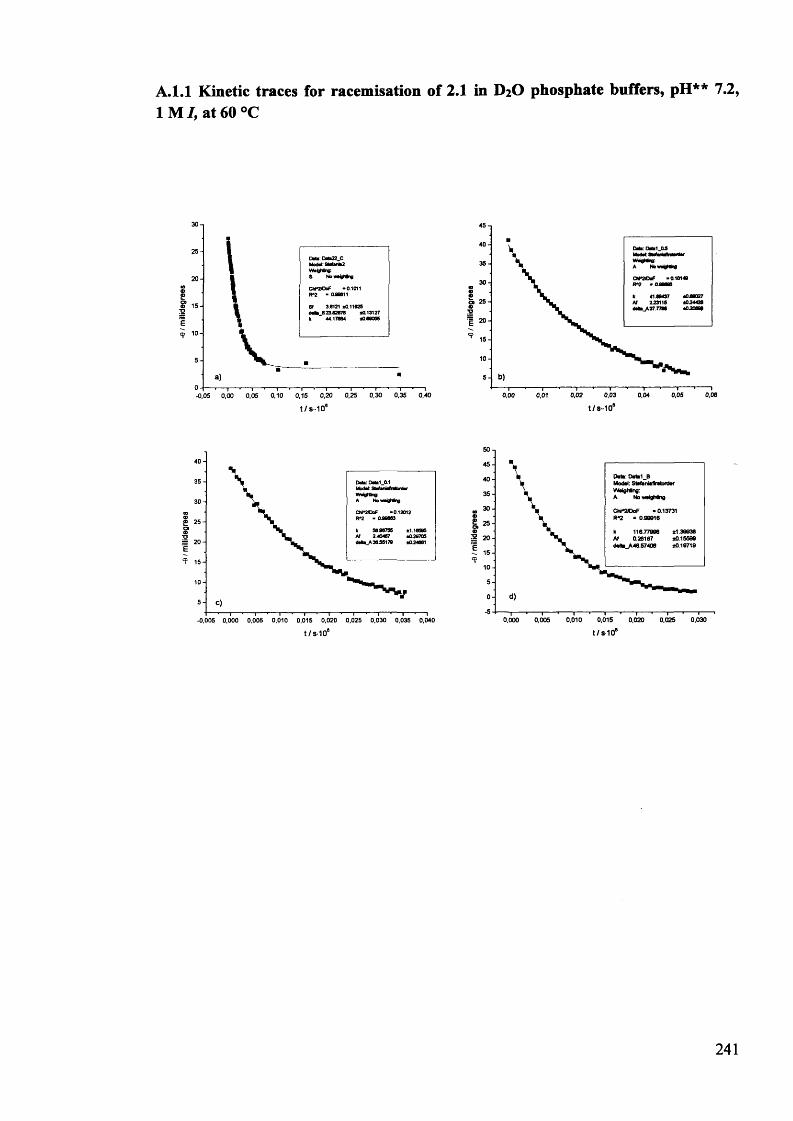
-e / m
illide
gree
s 'e
/ mill
ideg
rees
A. 1.1 Kinetic traces for racemisation of 2.1 in D2 O phosphate buffers, pH** 7.2,1 M /, at 60 °C
■
-0,05 0,00 0,05 0,10 0,15 0,20t/s-10*
0,25 0,30 0,35 0,40
a 25
D)1T T
0,02 0,03t/s-10*
-0,005 0,000 0,005 0,010 0,015 0,020 0,025 0,030 0,035 0,040t/S-10*
50454035302520
1510
50-5 0,000 0,005 0,010 0,015 0,020 0,025 0,030
241
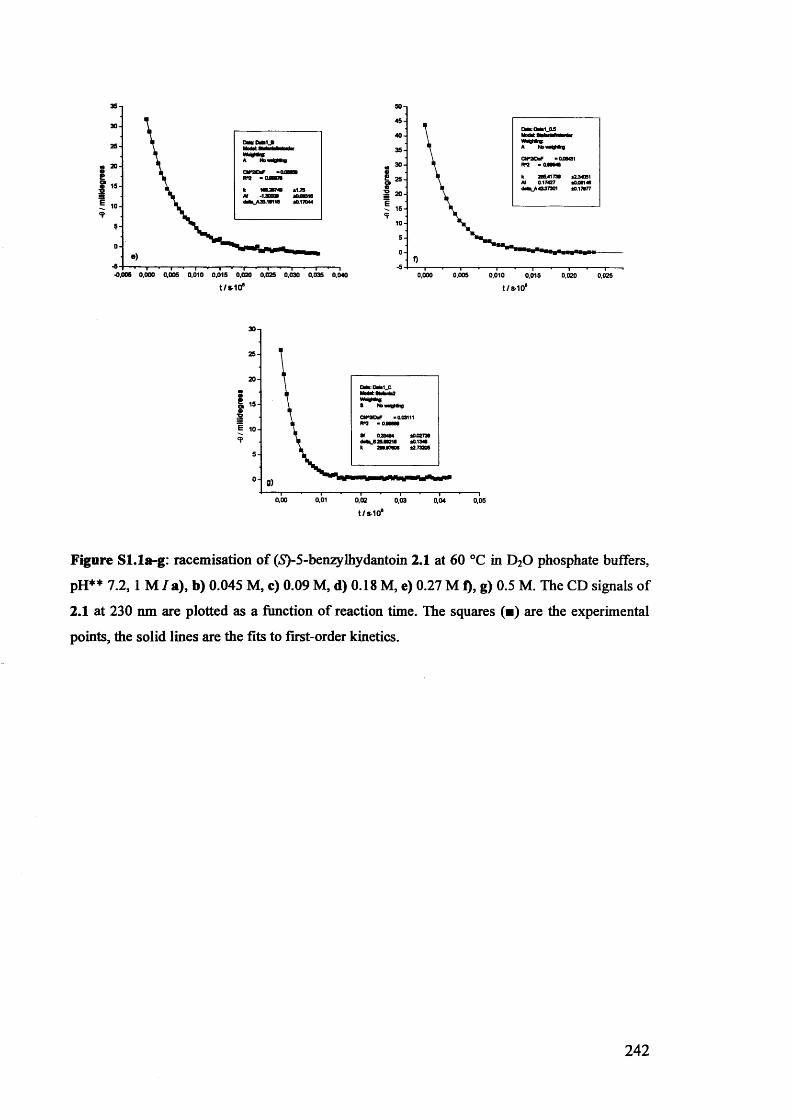
m 20? IS
-0,005 0,000 0,005 0,010 0,015 0,020 0,025 0,030 0,035 0,040
«se&a■T>E
0,0050,000 0,010 0,0200,015 0,025t/s-10* t/s-10*
25-
mI?sE
0,00 0,01 o,oe 0,03 0,04 0,05t/s-10*
Figure Sl.la-g: racemisation of («S)-5-benzylhydantoin 2.1 at 60 °C in D20 phosphate buffers,
pH** 7.2, 1 M /a), b) 0.045 M, c) 0.09 M, d) 0.18 M, e) 0.27 M f), g) 0.5 M. The CD signals of
2.1 at 230 nm are plotted as a function of reaction time. The squares (■) are the experimental
points, the solid lines are the fits to first-order kinetics.
242
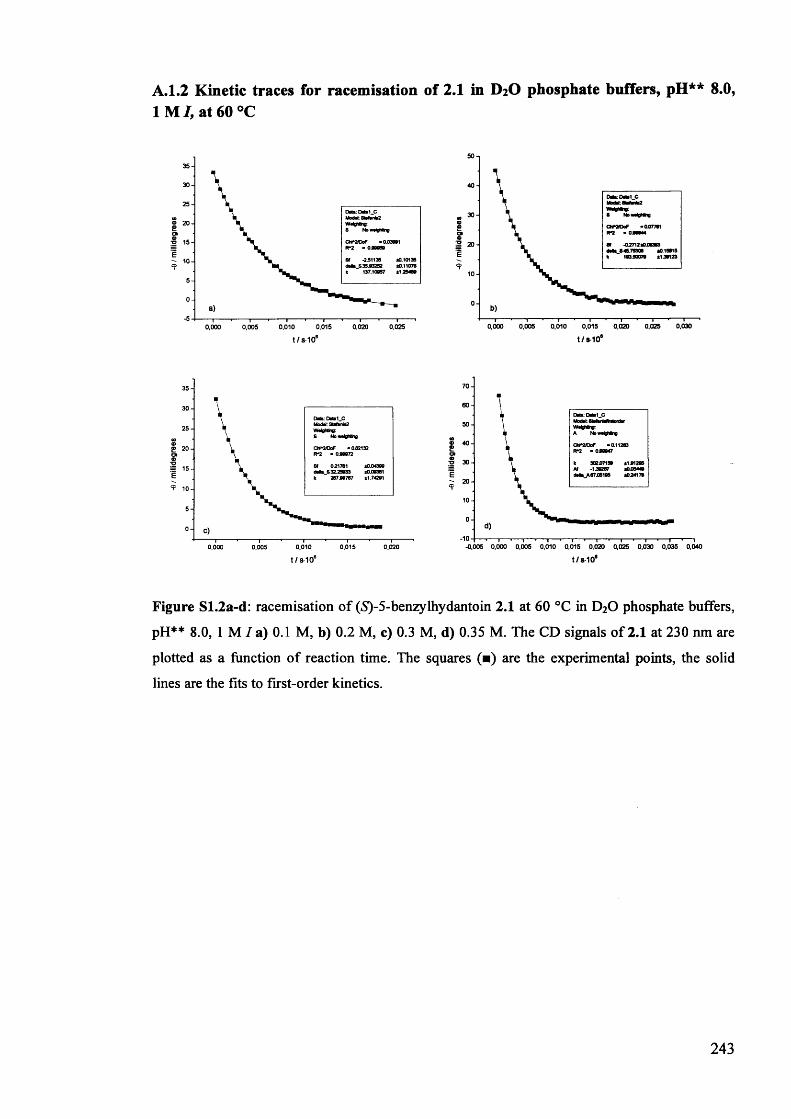
A. 1.2 Kinetic traces for racemisation of 2.1 in D2 O phosphate buffers, pH** 8.0,1 M I , at 60 °C
0.0300.000 0,005 0,010 0,015 0,020 0,025
353025
2 20 £ o 0S 15E
50-5
0,010 0,015 0,020 0,0250,000 0,005t/S-10* t/S-108
7060504030
E 20100
•10 -J 1---,--- .-1---- .-1---- .-1---- .-1---- 1-1---- .-1---- 1-1--1--1-0,005 0,000 0,005 0,010 0,015 0,020 0,025 0,030 0,035 0,040
353025
9£ 20 o>9■o= 15 E
50
0,0150,000 0,005 0,010 0,020t/iH O 8 t/s-108
Figure S1.2a-d: racemisation of (5)-5-benzylhydantoin 2.1 at 60 °C in D20 phosphate buffers,
pH** 8.0, 1 M / a) 0.1 M, b) 0.2 M, c) 0.3 M, d) 0.35 M. The CD signals of 2.1 at 230 nm are
plotted as a function of reaction time. The squares (■) are the experimental points, the solid
lines are the fits to first-order kinetics.
243
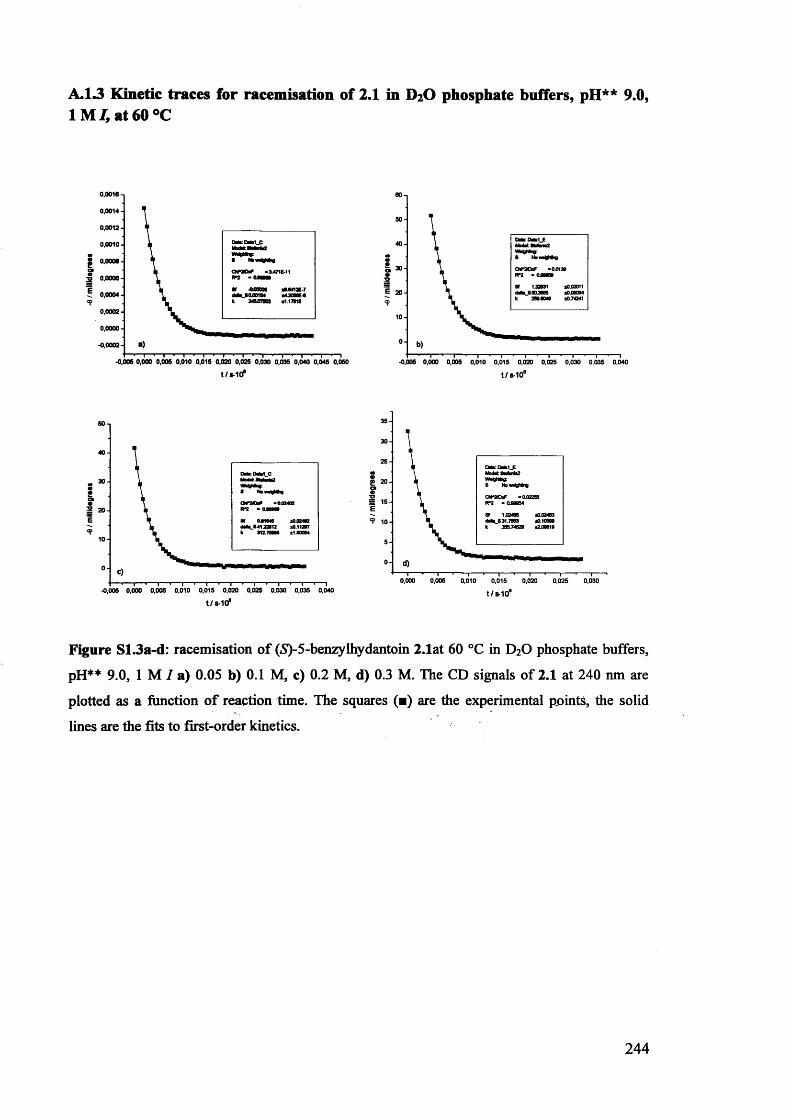
A.13 Kinetic traces for racemisation of 2.1 in D2O phosphate buffers, pH** 9.0,1 M /, at 60 °C
0.0018-,0,00140,0012
0,0010
0,00080,00080,00040,0002
0,0000-0,0002- ■)
£ 30-I S E 20- ?
10-1
-0,006 0,000 0,006 0,010 0,015 0,020 0,025 0,030 0,035 0,040 0,045 0,050t /8 - l t f
-0,005 0,000 0,005 0,010 0,015 0,020 0,025 0,030 0,035 0,040t/S-10*
C)TT 0,000 0,005 0,010 0,020 0,0300,015 0,025
-0,005 0,000 0,005 0,010 0,015 0,020 0,025 0.030 0,035 0,040t/s-108
Figure S1.3a-d: racemisation of (£)-5-benzylhydantoin 2.1at 60 °C in D2O phosphate buffers, pH** 9.0, 1 M I a) 0.05 b) 0.1 M, c) 0.2 M, d) 0.3 M. The CD signals of 2.1 at 240 nm are plotted as a function of reaction time. The squares (■) are the experimental points, the solid lines are the fits to first-order kinetics.
244
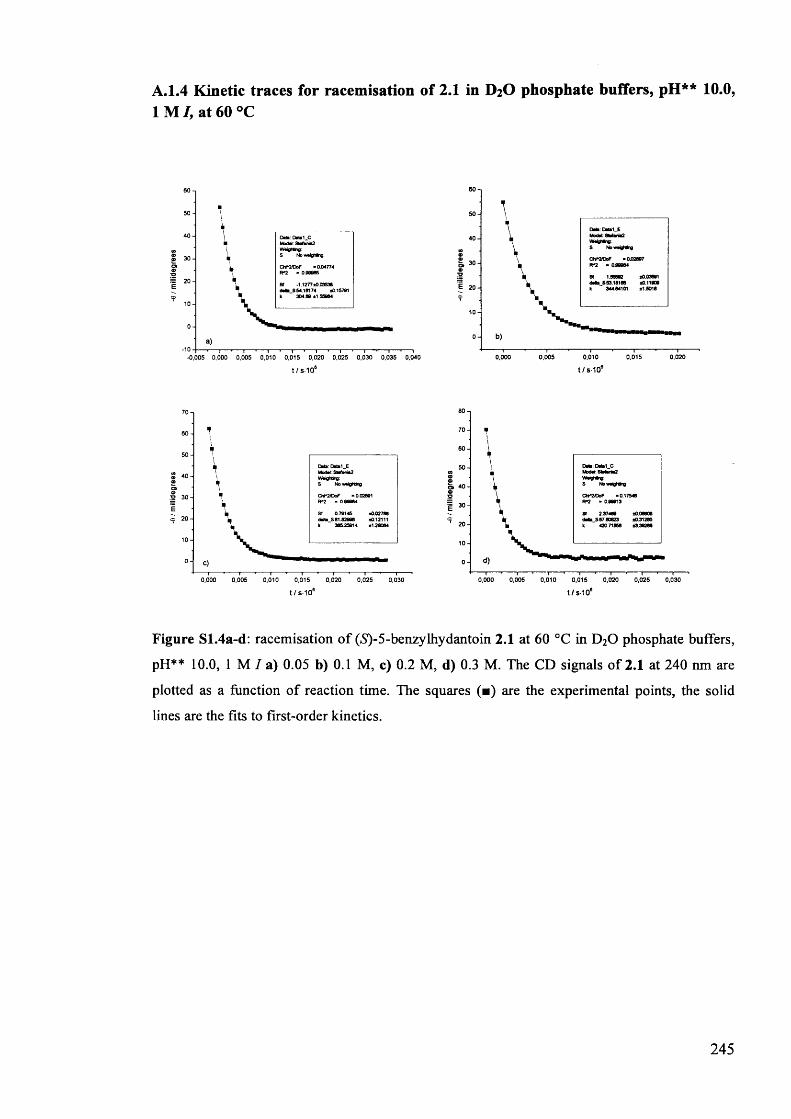
A. 1.4 Kinetic traces for racemisation of 2.1 in D2O phosphate buffers, pH** 10.0,1 M /, at 60 °C
-0,005 0,000 0,005 0,010 0,015 0,020 0,025t /S -106
0,030 0,035 0,040
60
50
40
30
2010
00,005 0,010 0,015 0,0200,000
70605040302010
0
0,000 0,005 0,010 0,015 0,020 0,025 0,030 0,000 0,005 0,015t/s-108
0,020 0,025
Figure S1.4a-d: racemisation of (5)-5-benzylhydantoin 2.1 at 60 °C in D20 phosphate buffers,
pH** 10.0, 1 M I a) 0.05 b) 0.1 M, c) 0.2 M, d) 0.3 M. The CD signals of 2.1 at 240 nm are
plotted as a function of reaction time. The squares (■) are the experimental points, the solid
lines are the fits to first-order kinetics.
245
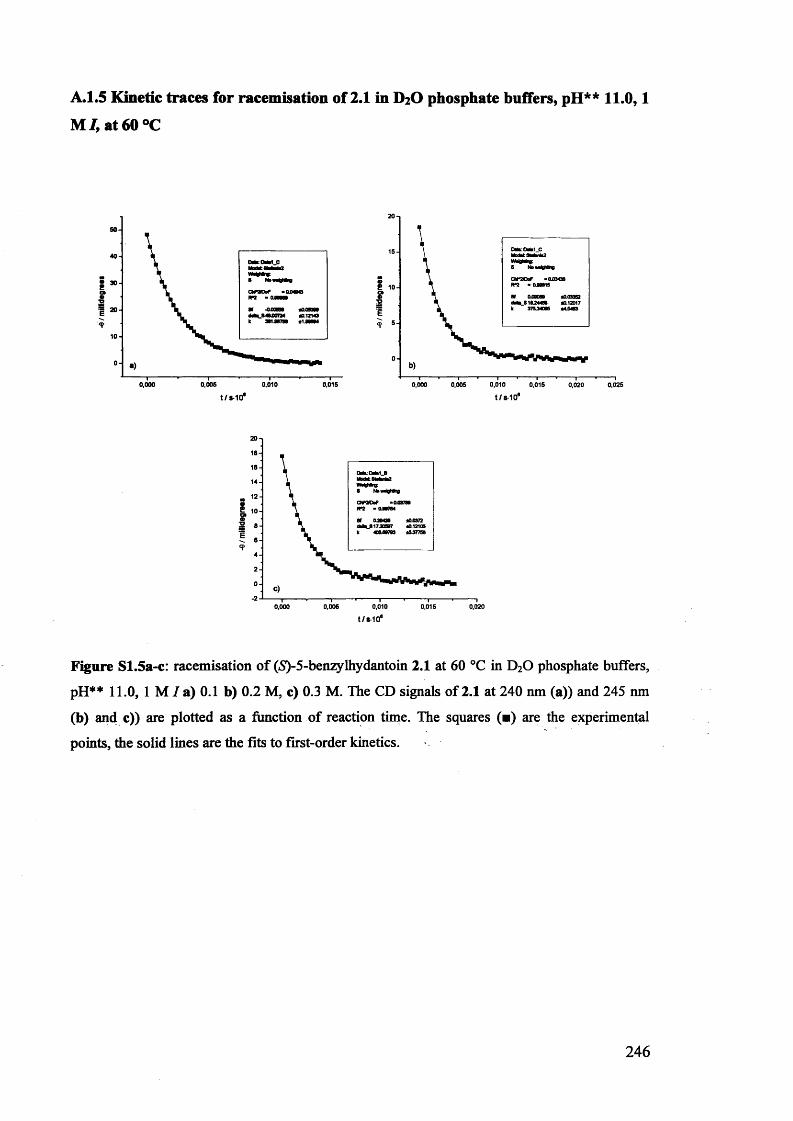
A.1.5 Kinetic traces for racemisation of 2.1 in D2O phosphate buffers, pH** 11.0,1
M I, at 60 °C
m9e?3
E
0,000 0,0100,005 0,015 0,0250,020
1 20-
0,000 0,005 0,010 0,015t/S-10* t/S-10*
2018161412«•
9I 109
I 8 S 6420-2 0,0100,005 0,015 0,0200,000
t/S-10®
Figure S1.5a-c: racemisation of (S)-5-benzylhydantoin 2.1 at 60 °C in D20 phosphate buffers, pH** 11.0, 1 M / a) 0.1 b) 0.2 M, c) 0.3 M. The CD signals of 2.1 at 240 nm (a)) and 245 nm (b) and c)) are plotted as a function of reaction time. The squares (■) are the experimental points, the solid lines are the fits to first-order kinetics.
246
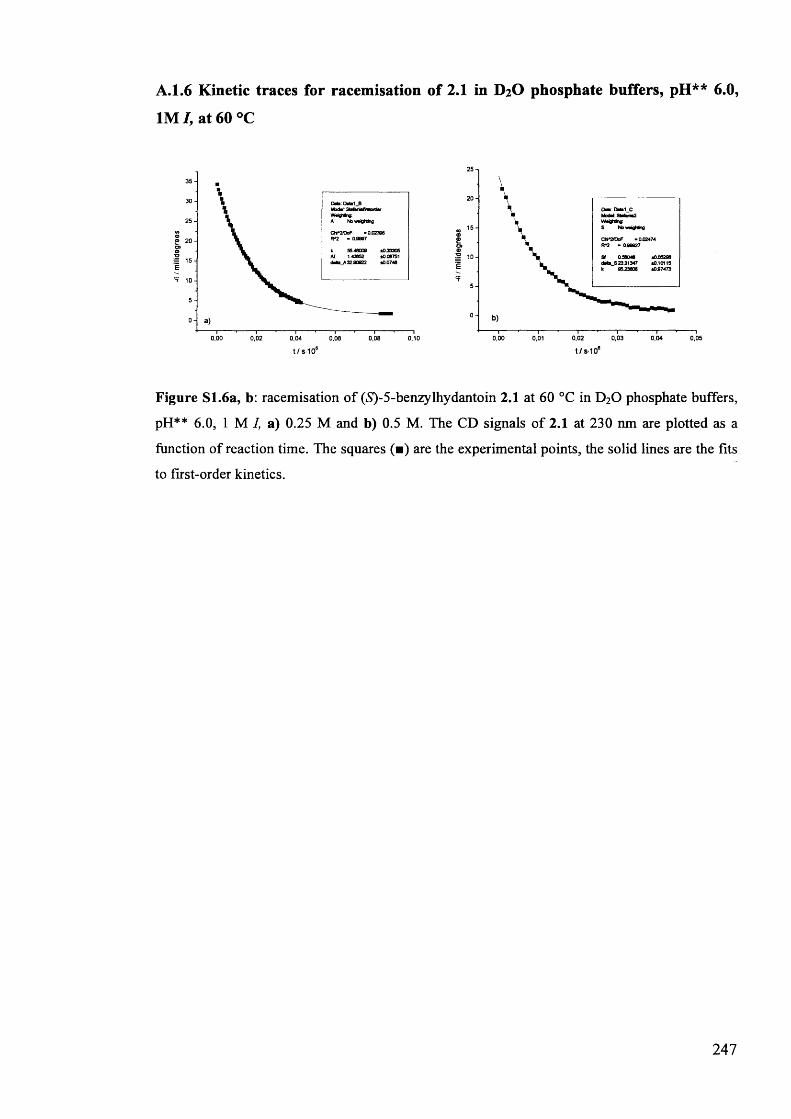
A. 1.6 Kinetic traces for racemisation of 2.1 in D2 O phosphate buffers, pH** 6.0,
1M /, at 60 °C
25
20
15s9o»©■o 10E
5
00,02 0,030,00 0,01 0,04 0,05
353025
©9 20C2>9X3 15E
T 1050
0,00 0,02 0,04 0,06 0,08 0,10t/s-106 t/s-108
Figure S1.6a, b: racemisation of (5)-5-benzylhydantoin 2.1 at 60 °C in D20 phosphate buffers,
pH** 6.0, 1 M /, a) 0.25 M and b) 0.5 M. The CD signals of 2.1 at 230 nm are plotted as a
function of reaction time. The squares (■) are the experimental points, the solid lines are the fits
to first-order kinetics.
247
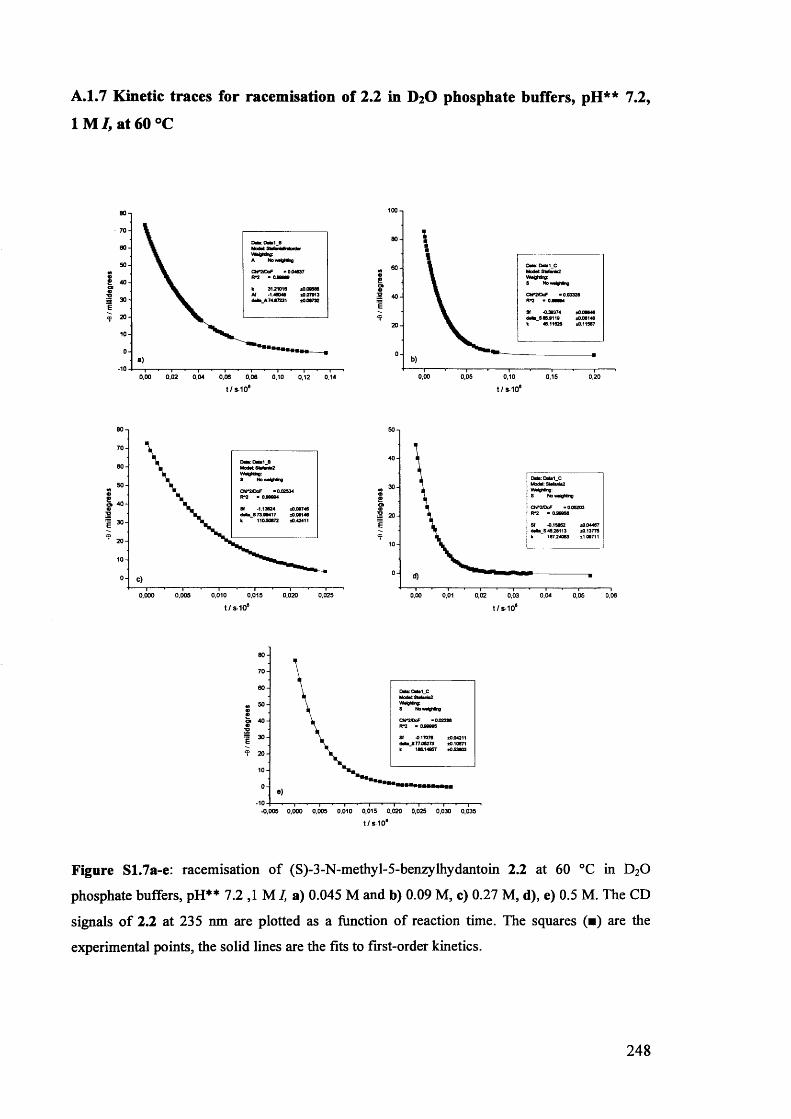
A.1.7 Kinetic traces for racemisation of 2.2 in D2 O phosphate buffers, pH** 7.2,
1 M /, at 60 °C
£ 40S 30 E
a)0,06 0,06
t/S -108
§ 40E
0,10t/s-108
30-20-10-
0,010 0,015t/S -108
50
40
30
20
10
00.00 0,01 0,02 0,03 0,04 0,05 0,06
t /s -1 0 8
-0,005 0,000 0,005 0,010 0,015 0,020 0,025 0,030 0,035t /s -1 0 8
Figure S1.7a-e: racemisation of (S)-3-N-methyl-5-benzylhydantoin 2.2 at 60 °C in D20
phosphate buffers, pH** 7.2 ,1 M /, a) 0.045 M and b) 0.09 M, c) 0.27 M, d), e) 0.5 M. The CD
signals of 2.2 at 235 nm are plotted as a function of reaction time. The squares (■) are the
experimental points, the solid lines are the fits to first-order kinetics.
248
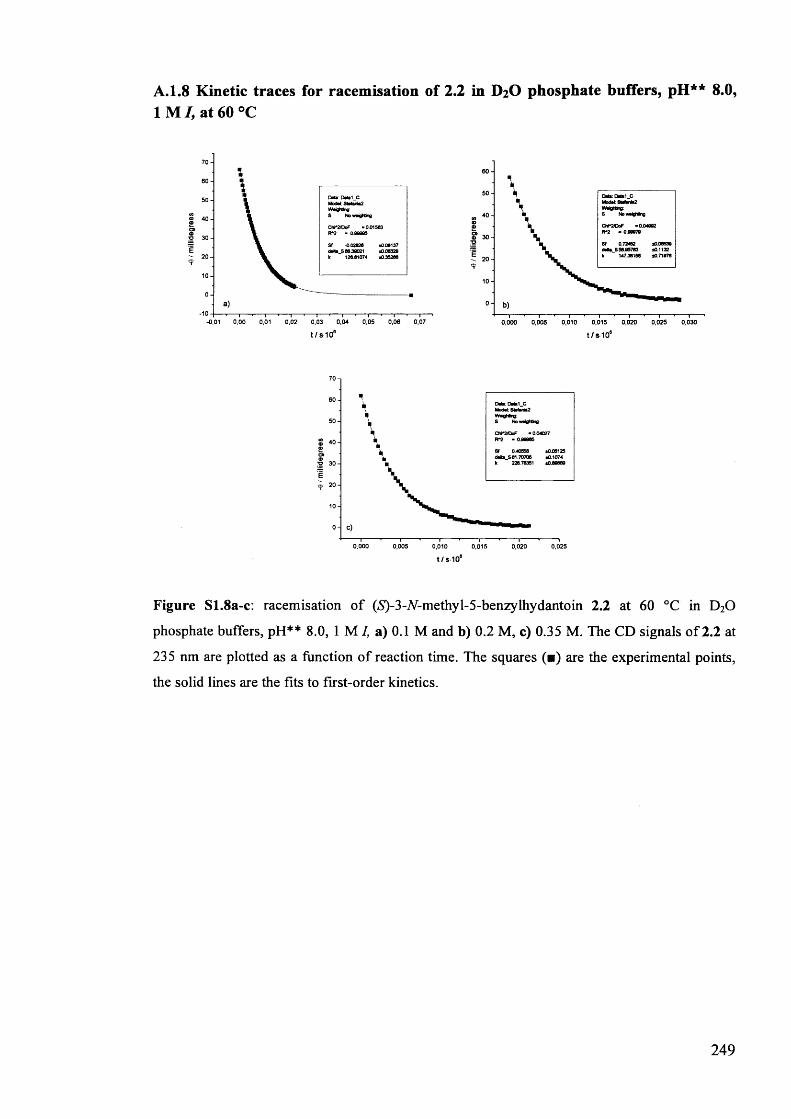
A. 1.8 Kinetic traces for racemisation of 2.2 in D2 O phosphate buffers, pH** 8.0,1 M /, at 60 °C
706050
©© 4009©S 30'E 209
100
•10-0,01 0,00 0,01 0,02 0,03 0,04 0,05 0,06 0,07
6050
40©©© 30 ;o1 209
100
0,010 0,015 0,020 0,025 0,0300,000 0,005t/s106 t/s-106
706050
«©0940
E 2010
00,000 0,005 0,010 0,015 0,020 0,025
t/s-106
Figure S1.8a-c: racemisation of (*S)-3-7V-methyl-5-benzylhydantoin 2.2 at 60 °C in D20
phosphate buffers, pH** 8.0, 1 M /, a) 0.1 M and b) 0.2 M, c) 0.35 M. The CD signals of 2.2 at
235 nm are plotted as a function of reaction time. The squares (■) are the experimental points,
the solid lines are the fits to first-order kinetics.
249
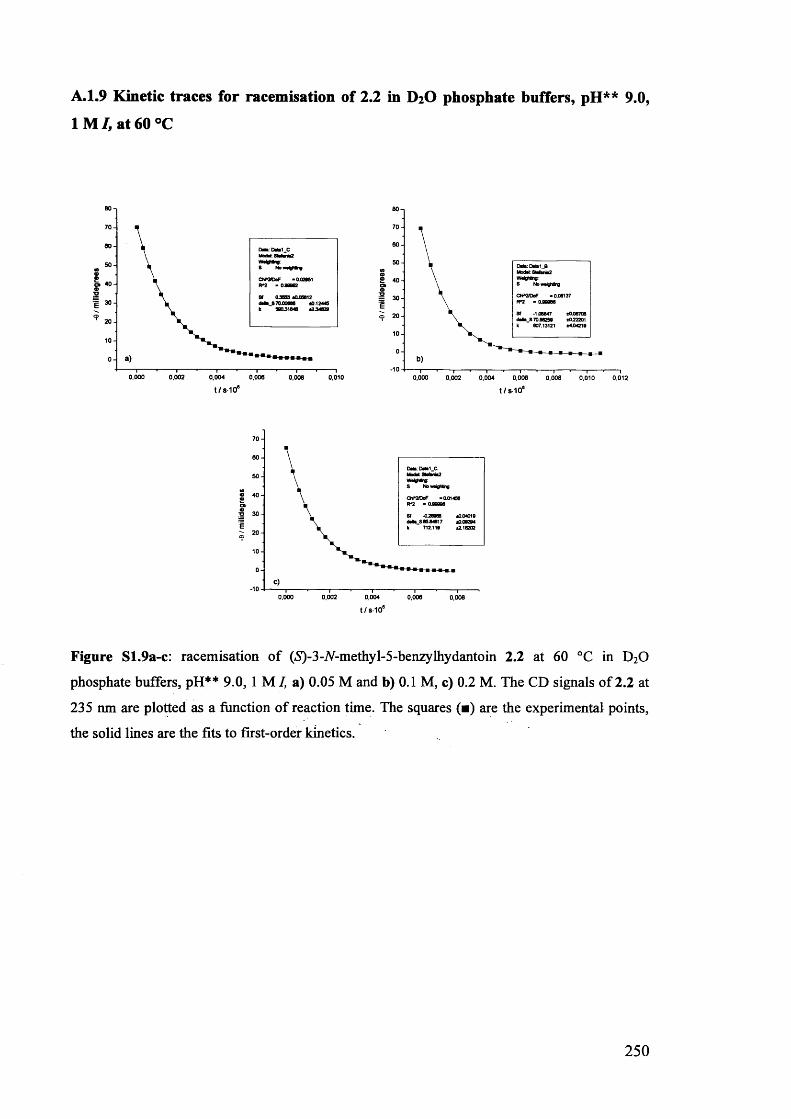
A. 1.9 Kinetic traces for racemisation of 2.2 in D2 O phosphate buffers, pH** 9.0,
lM / ,a t 60 °C
C» 40
0,000 0,002 0,004 0,006 0,006 0,010
80706050co0£ 4030e
10
0-10
0,000 0,002 0,004 0,006 0,008 0,010 0,012t / 3*10* t/s-108
706050
M00GB0*04030
E 20o100
-10 0,0020,000 0,004 0,006 0,008t/s-108
Figure S1.9a-c: racemisation of (5)-3-iV-methyl-5-benzylhydantoin 2.2 at 60 °C in D20
phosphate buffers, pH** 9.0, 1 M I, a) 0.05 M and b) 0.1 M, c) 0.2 M. The CD signals of 2.2 at
235 nm are plotted as a function of reaction time. The squares (■) are the experimental points,
the solid lines are the fits to first-order kinetics.
250
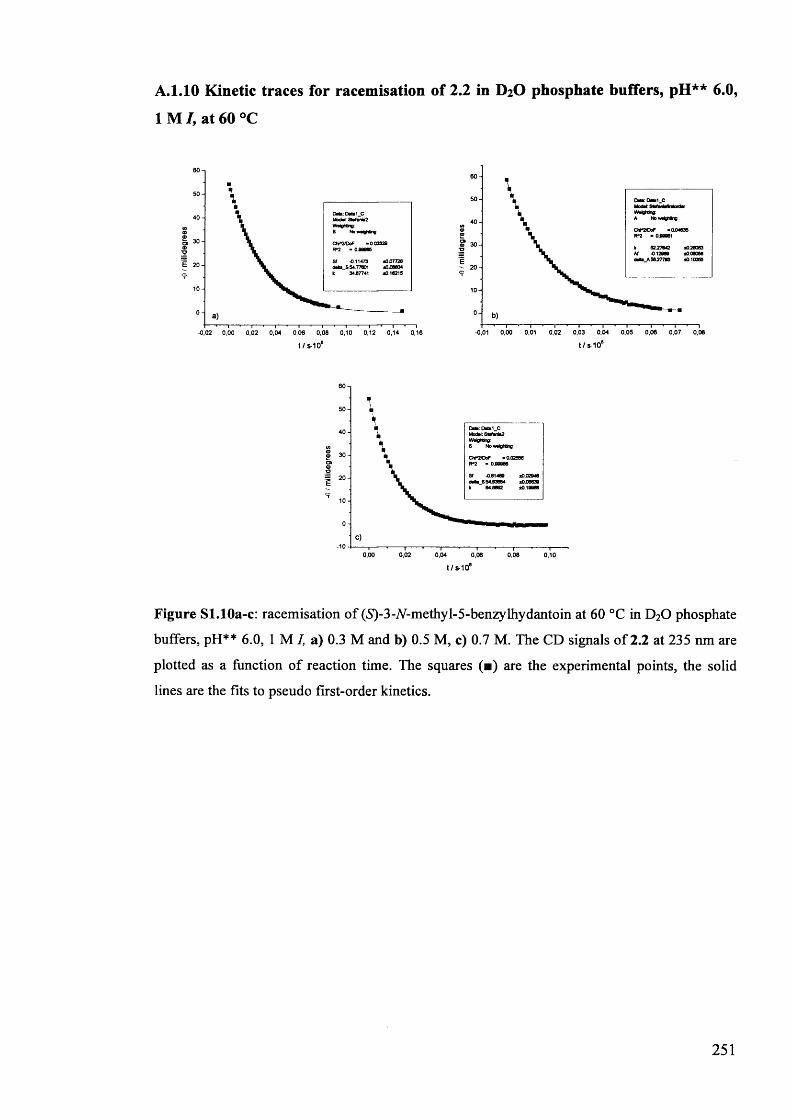
A. 1.10 Kinetic traces for racemisation of 2.2 in D2 O phosphate buffers, pH** 6.0,
1 M /, at 60 °C
-0,02 0,00 0,02 0,04 0,06 0,06 t/s-106
0,10 0,12 0,14
0 30- ;o1
-0,01 0,00 0,01 0,02 0,03 0,04 0,05t/s1 0 6
0,06 0,07 0,06
60
50
40s<D30c»<0-o 206■t 10
0-10 0,00 0,02 0,04 0,06 0,08 0,10
t/s-106
Figure Sl.lOa-c: racemisation of (S)-3-JV-methyl-5-benzylhydantoin at 60 °C in D20 phosphate
buffers, pH** 6.0, 1 M I, a) 0.3 M and b) 0.5 M, c) 0.7 M. The CD signals of 2.2 at 235 nm are
plotted as a function of reaction time. The squares (■) are the experimental points, the solid
lines are the fits to pseudo first-order kinetics.
251
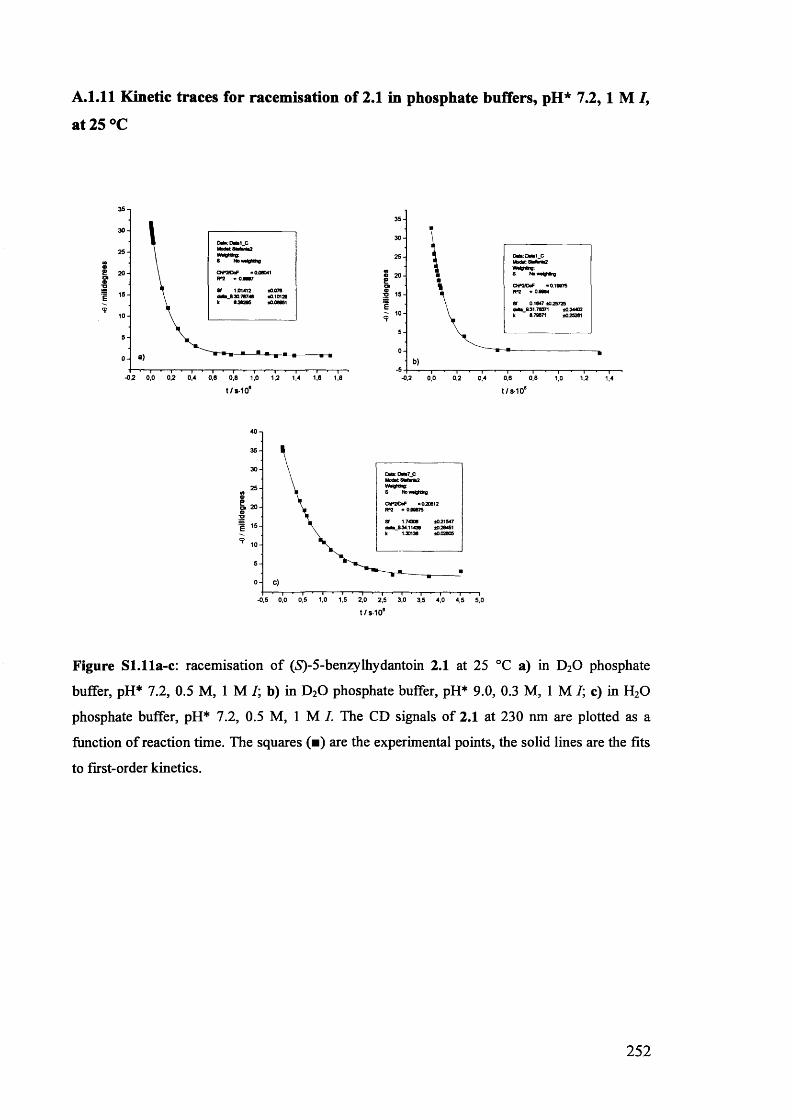
A.I.11 Kinetic traces for racemisation of 2.1 in phosphate buffers, pH* 7.2,1 M /,
at 25 °C
353025201510
50-0,2 0,0 0,2 0.4 0,6 0,6 1,0 1,2 1.61.4 1.6
353025
«Q© 20 SOi©S 15I 10
50-5 0.80,0 0,2 0.4 0.6 1.21.0 1.4
t/s-106 t/s-106
-0,5 0,0 0,5 1,0 1,5 2,0 2,5 3,0 3,5 4,0 4,5 5,0t /S -1 0 '
Figure Sl.lla-c: racemisation of (5)-5-benzylhydantoin 2.1 at 25 °C a) in D20 phosphate
buffer, pH* 7.2, 0.5 M, 1 M /; b) in D20 phosphate buffer, pH* 9.0, 0.3 M, 1 M /; c) in H20
phosphate buffer, pH* 7.2, 0.5 M, 1 M /. The CD signals of 2.1 at 230 nm are plotted as a
function of reaction time. The squares (■) are the experimental points, the solid lines are the fits
to first-order kinetics.
252
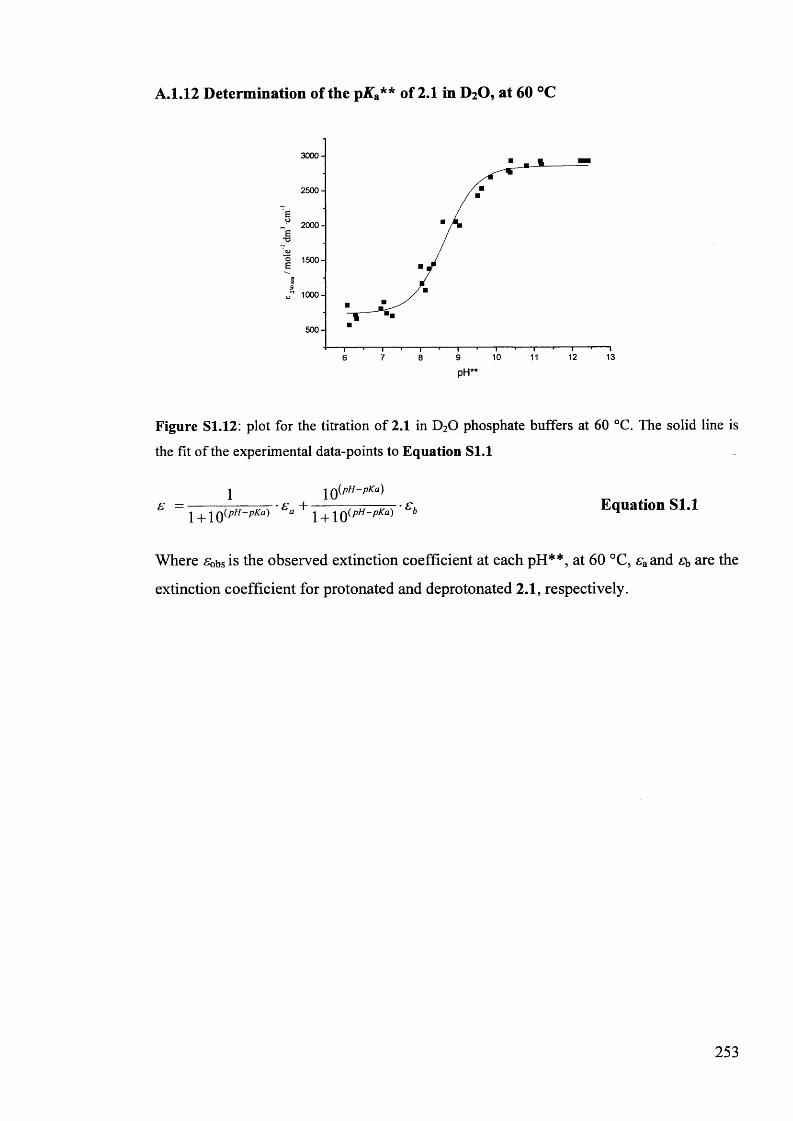
A.1.12 Determination of the pK&** of 2.1 in D2O, at 60 °C
3000-
2500-
Eu 2000-'s•p
| 1500-
!1000-U
500-
1310 11 127 96 8pH*
Figure SI.12: plot for the titration of 2.1 in D20 phosphate buffers at 60 °C. The solid line is
the fit of the experimental data-points to Equation Sl.l
£ =1 1 ()(pH~pKa)
1 + 1 $ pH~pKa>> 8(1 + 1 +1 $ pH~pKa>) £b Equation S l.l
Where £bbs is the observed extinction coefficient at each pH**, at 60 °C, s^and £b are the
extinction coefficient for protonated and deprotonated 2.1, respectively.
253
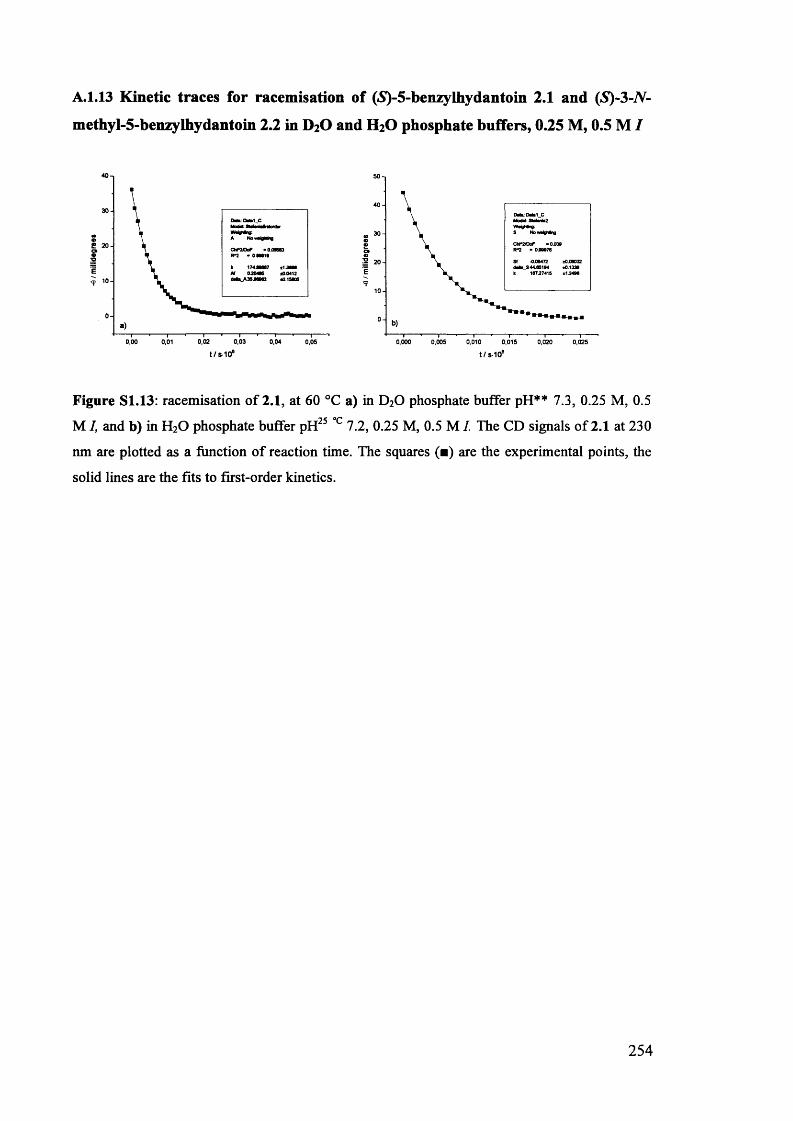
A.1.13 Kinetic traces for racemisation of (5)-5-benzylhydantoin 2.1 and (S )-3 -N -
methyl-5-benzylhydantoin 2.2 in D2O and H2O phosphate buffers, 0.25 M, 0.5 M I
e 2 0-
0,02 0,03 0,040,00 0,01 0,05
M•&o»m■oE
9
0,000 0,005 0,010 0,015 0,020 0,025t/S-10® t/S-10®
Figure SI.13: racemisation of 2.1, at 60 °C a) in D20 phosphate buffer pH** 7.3, 0.25 M, 0.5
M I, and b) in H20 phosphate buffer pH25 c 7.2, 0.25 M, 0.5 M I. The CD signals of 2.1 at 230
nm are plotted as a function of reaction time. The squares (■) are the experimental points, the
solid lines are the fits to first-order kinetics.
254
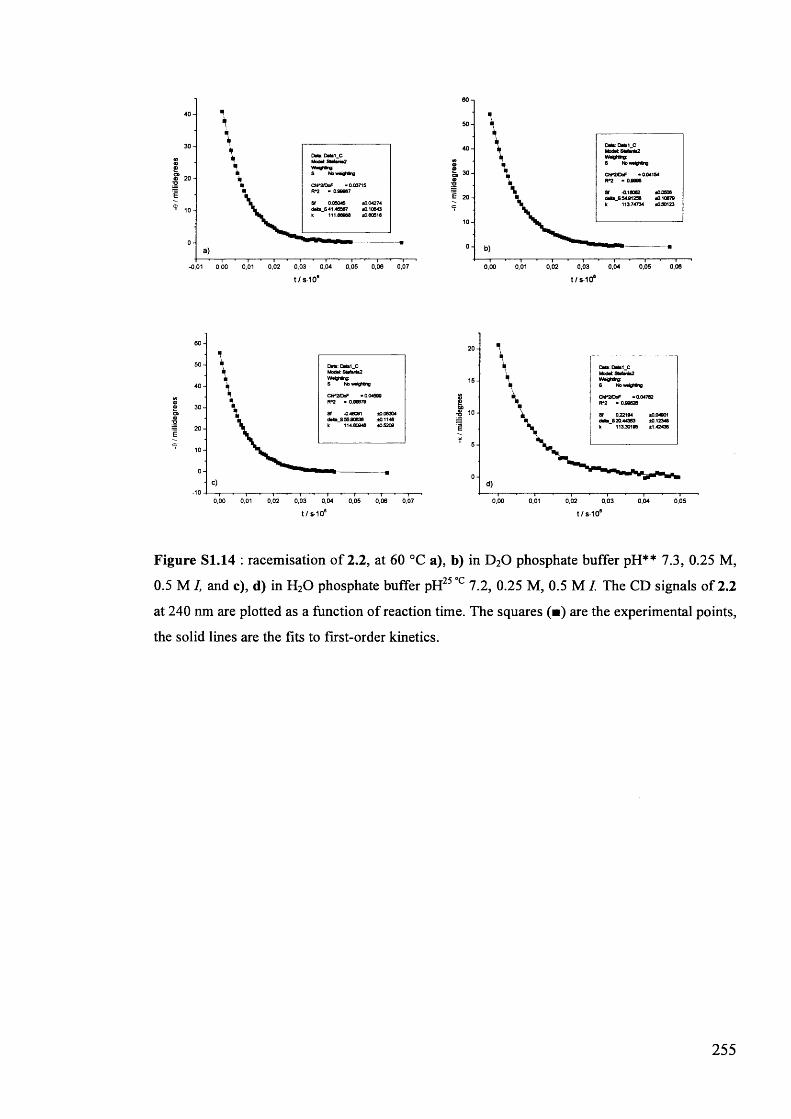
6 0 -i
0,03 0,04t / s 10°
0,05 0,06 0,07
50
40
30
20100
0,04 0,05 0,060,00 0,01 0,02 0,03
>0.04762Sf 0.22194data 820.44363 k 11330195
Figure SI.14 : racemisation of 2.2, at 60 °C a), b) in D20 phosphate buffer pH** 7.3, 0.25 M,
0.5 M I, and c), d) in H20 phosphate buffer pH25 °c 7.2, 0.25 M, 0.5 M I. The CD signals of 2.2
at 240 nm are plotted as a function of reaction time. The squares (■) are the experimental points,
the solid lines are the fits to first-order kinetics.
255
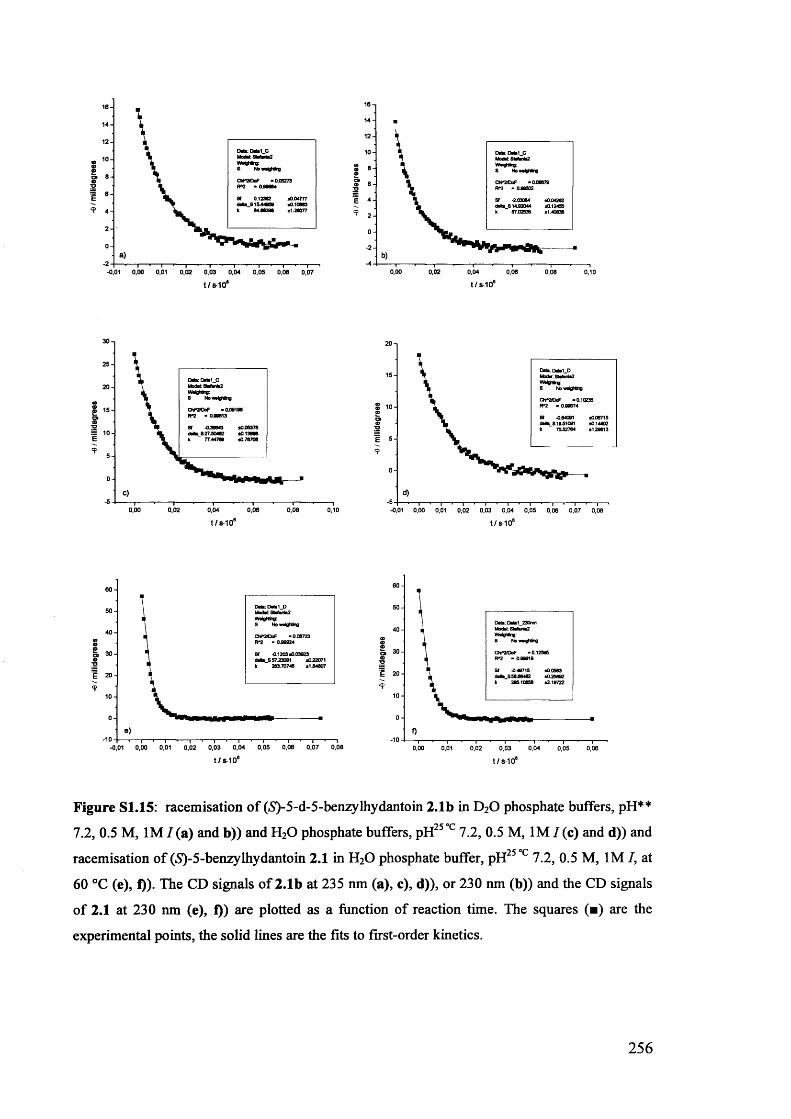
E
? 4-1
-0,01 0,00 0,01 0,02 0,03 0,04t/S-10*
0,05 0,06 0,07
Oft«•o»9'O
E
0,00 0,02 0,04 0,06 0,08 0,10
3025
2015
10 Z7J0482
5
0
-5 0,02 0,080,00 0,04 0,06 0,10
I S
-0,01 0,00 0,01 0,02 0,03 0,04 0,05 0,06 0,07 0,08t/S-10®
E 20$
),01 0,00 0,01 0,02 0,03 0,04 0,05 0,06 0,07 0,08t/s-106
0,03t/s-106
Figure S1.15: racemisation of (S)-5-d-5-benzylhydantoin 2.1b in D20 phosphate buffers, pH**
7.2, 0.5 M, 1M / (a) and b)) and H20 phosphate buffers, pH25 c 7.2, 0.5 M, 1M / (c) and d)) and
racemisation of (5)-5-benzylhydantoin 2.1 in H20 phosphate buffer, pH25 c 7.2, 0.5 M, 1M /, at
60 °C (e), f)). The CD signals of 2.1b at 235 nm (a), c), d)), or 230 nm (b)) and the CD signals
of 2.1 at 230 nm (e), f)) are plotted as a function of reaction time. The squares (■) are the
experimental points, the solid lines are the fits to first-order kinetics.
256
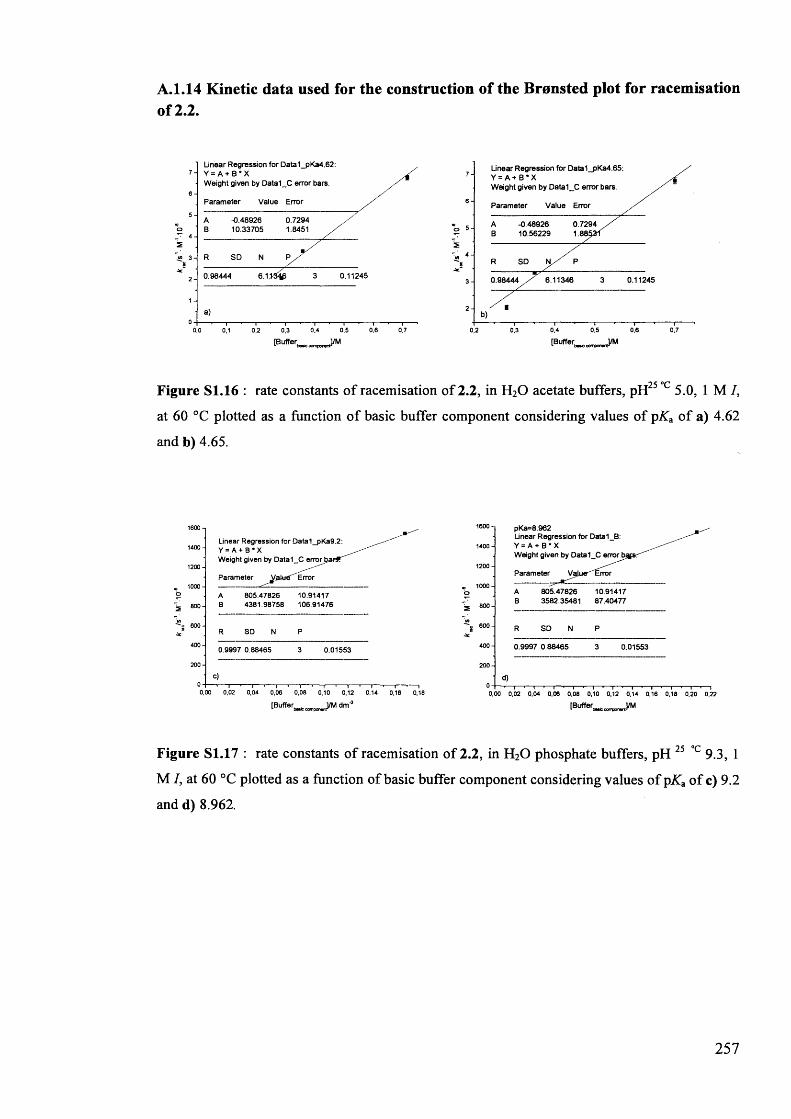
A.1.14 Kinetic data used for the construction of the Bronsted plot for racemisation of 2.2.
Linear R egression for Data1_pKa4.65: Y = A + B * XW eight given by D ata1_C error bars.
7
6Value ErrorParam eter
0.72941.8853-
-0.4892610.56229
o 5
SD
0.112450.98444 i.113463
20,4 0,5 0,6 0,70,2 0,3
Linear R egression for Data1_pKa4.62: Y = A + B * XW eight given by Data1_C error bars.
76
P aram eter Value Error
50.72941.8451
-0.4892610.33705o
4
SDm 30.112450.984442
10 0,60,0 0,2 0.4 0,5 0,70,1 0,3
Figure SI.16 : rate constants of racemisation of 2.2, in H20 acetate buffers, pH25 c 5.0, 1 M /,
at 60 °C plotted as a function of basic buffer component considering values of pK a of a) 4.62
and b) 4.65.
1600 n
1400
1200 -
1000 -
g 800-
600-c400
200-
Linear Regression for Data1_pKa9.2: Y = A + B * XWeight given by Data1_C error fc
Param eter Error
A 805.47826 10.91417B 4381.98758 106.91476
R SD N P
0.9997 0.88465 3 0.01553
0,00 0,02 0,04 0,06 0,08 0,10 0,12 0,14 0,16 0,18
[B u ffe r^ componJ /M dm-3
1600 pKa=8.962Linear Regression for Data1_B:
1400- Y = A + B * XWeight given by Data1_C error
1200-Param eter Vailue-' Error
o1000-
A 805.47826 10.91417
ip 800- B 3582.35481 87.40477
~~s 600- R SD N P
400- 0.9997 0.88465 3 0.01553
200-
0,00 0,02 0,04 0,06 0,08 0,10 0,12 0,14 0,16 0,18 0,20 0,22[B u ffe r^
Figure SI.17 : rate constants of racemisation of 2.2, in H20 phosphate buffers, pH 25 °c 9.3, 1
M I, at 60 °C plotted as a function of basic buffer component considering values of pK A of c) 9.2
and d) 8.962.
257
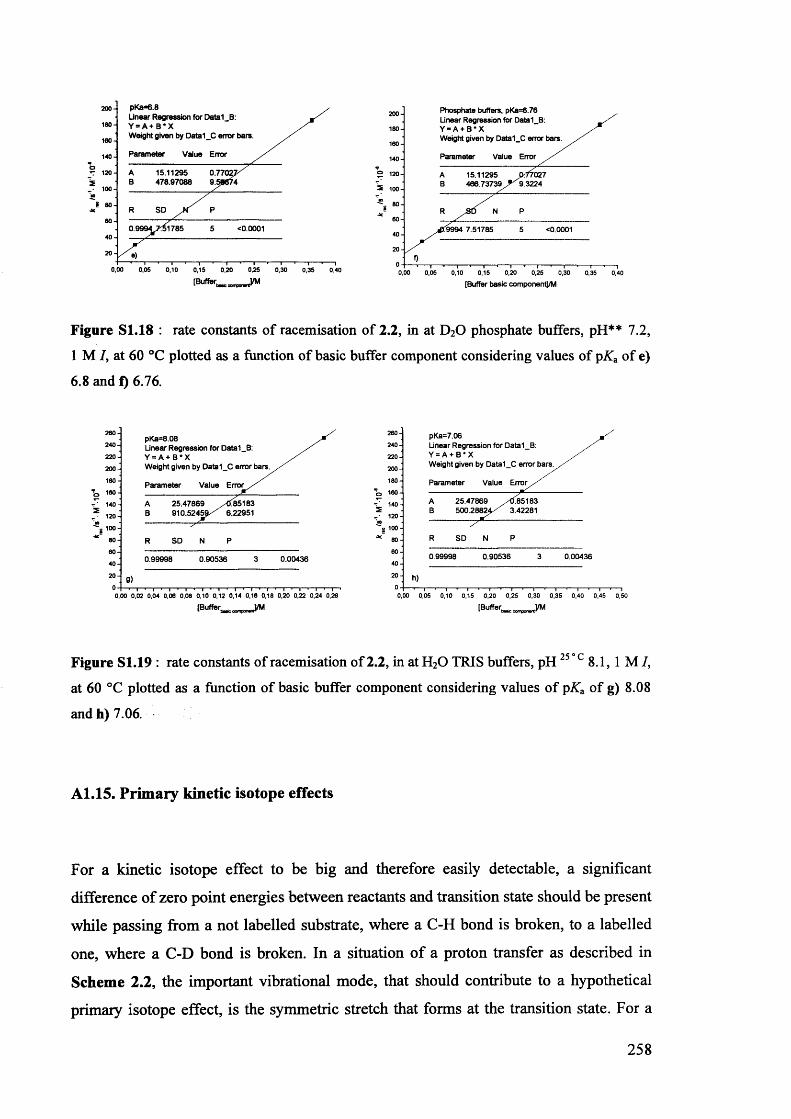
200-180-160-140-
*3 120-3= 100-CO
80-60-40-20-
pKa=6.8Linear Regression for D atal B: Y = A + B * XW eight given by Data1_C e n w bare.
Param eter Value Error
15.11295 0478.97088 9
a.77027888674
8 1 7 8 5 < 0.0001
0,15 0,20 0,25 0,30 0,35[Buffer oonvx)J/M
Phosphate buffers, pKa=6.76 Linear Regression for Data1_B:Y = A + B* X Weight given by Data1_C error bars.
Param eter
15.11295466.73739
Value Error
0rT7027 9.3224
IT9994 7.51785
0,10 0,15 0,20 0,25 0,30[Buffer basic componentJ/M
Figure SI.18 : rate constants of racemisation of 2.2, in at D20 phosphate buffers, pH** 7.2, 1 M 7, at 60 °C plotted as a function of basic buffer component considering values of pKa of e) 6.8 and f) 6.76.
260-pKa=8.08 J *Linear Regression for Data 1_B: 240' Y = A + B * X 220- W eight given by Data1_C error bars. 200 -P aram eter Value Error 180 ‘
pKa=7.06Linear R egression for D atal B:Y = A + B * X - / W eight given by Data1_C error b a r s . /
/P aram eter Value E r ro r ^ /
A 25.47869 ^<5^85183 -T 140- B 9 1 0 .5 2 4 5 9 / 6.22951 5 120.
A 25.47869 /<£85183 B 5 0 0 .2 8 8 2 4 / 3.42281----------------------------------
^ 100-
R SD N P ■* 80-/
R SD N P----------------------------------- 60-0.99996 0.90536 3 0.00436 ^ 0.99998 0.90536 3 0.00436
0,00 0,02 0,04 0,06 0,08 0,10 0,12 0,14 0,18 0,18 0,20 0,22 0,24 0,26 0,05 0,10 0,15 0,20 0,25 0,30 0,35 0,40 0,45 0,50[Buffer
Figure S1.19 : rate constants of racemisation of 2.2, in at H20 TRIS buffers, pH25 °c 8.1, 1 M 7, at 60 °C plotted as a function of basic buffer component considering values of pKa of g) 8.08 and h) 7.06.
A1.15. Primary kinetic isotope effects
For a kinetic isotope effect to be big and therefore easily detectable, a significant
difference of zero point energies between reactants and transition state should be present
while passing from a not labelled substrate, where a C-H bond is broken, to a labelled
one, where a C-D bond is broken. In a situation of a proton transfer as described in
Scheme 2.2, the important vibrational mode, that should contribute to a hypothetical
primary isotope effect, is the symmetric stretch that forms at the transition state. For a
258
reaction such as racemisation of benzylhydantoins, with a transition state where the
proton is halfway between the base and the hydantoin, the frequencies of the symmetric
stretch in the activated complex, centred around the exchangeable proton, should
display very little dependence upon the nature of the isotope. On the other end a
significant difference in vibrational frequencies of stretching between deuterated and
not deuterated reactants are expected. In practice, the molecule should “travel” along the
reaction coordinate, from a “steep” to a “shallow” potential energy well on the energy
surface. Significant primary kinetic isotope effects are expected in the described
situation.1
A1.16. Conversion factors for pH and pK* in H2O and D2O
Typically the concentration of deuterons in a D2O solution (pD) is correlated to the
more familiar pH through the simple relation shown in Equation S1.2.2’3
p D = p H + 0.4 Equation S 1.2
The p£a value of phosphate in D2O is, similarly, shifted by a factor of 0.5 as compared
to the value in H2O. The traditional conversion from pKa (D) to pKa (H) is shown in
Equation SI.3.4
p K a (D ) = p K a ( H ) + 0.5 Equation S 1.3
The two corrections described above essentially cancel out. On the other end, the molar
ratio between protonated and deprotonated forms of 2.1 in solution are similarly
affected by the shift in pKa of 2.1 in D2O as compared to H2O. This pKa shift turns into
a slightly higher concentration of deprotonated form of 2.1 in H2O as compared to D2O.
259
A.I.17. Derivation of Equation 2.6
dAdt
dB
- k xA
= ^ • 6 ^ - k 2B + k2C
A = Aq£ ^
1
- k t
dt
Ao=A+B+C C = Aq- A - B = Aq- A q - B
By substituting 2 in 1
dB k t k t— = kxA e 1 - k2B + k2A$ -AQ -k2-e 1 - k2B dt
dBdt
dB
= Aqfa - k2)• e ^ - (k2 +k2)-B + k2A^
-^- + {k2 + k2)-B = A0 (kl - k 2\ e ^ +k2AQ
dBdt
+(k2 +&2)- B - ^ 2 ' ^0 k2 +k2
- A^(kx- k 2\ e - k t
This equation has the form of the inhomogeneous Equation SI.4
dy . \ . /, . r \ - k t— ■ + (k2 + k2 )• y = (fe, + k2 )• e' Equation SI.4
where = andk2 + k2 dt dt
General solution of Equation S 1.4 is
y - a ■ + ft • e~ ^ 2 + where a, P are constants
A .
k2 +k2 - kx
At t = 0 B0 = 0
_ ^2*4) _ Aq(kx fc2) -k t ■ o c-{k2 +k^)-t 0 k2 +k2 k2 +k2- kx
For t = 0
260
y 0k2 ' Aq _ A ^ - k ^ ) k2 + k2 k2+ k2 - kx + P
P = ~ A"'2 1 2
k2 + k 2 k 2 + k 2 — kxor P = - A c
kxk 2
[k2 + k 2)• (k2 + k 2 ~ k x)
B k i - A* A f a - k i ) £-k,ik 2 + k 2 k 2 + k2 - kx
A0kx k 7(k2 + k 2)• [k2 + k 2 - k x) k2 + k2
Aq = A + B + C so A + C = Aq - B , by subtracting B from each term and by
substitution, the analytical expression of A + C - B , proportional to the CD signal, is
obtained:
A + C - B = A0 - B - B = A q -2 B =
= Aq-1 - 2 . k i - k 2 e _k,t kxk 2_______ t . e-(*2 + * 2 ) - ' + k2 ' Ao_k2 + k 2 - k t ( i2 + k2 Jk2 + k 2 - k 2) k2 + k2
Since k2 = k 2 we can simplify the expression to
A - B + C = An •< —2 k 2 — k x
(kl - k 2 y e + ‘ - ^ - e - + ‘ Equation 2.6
261
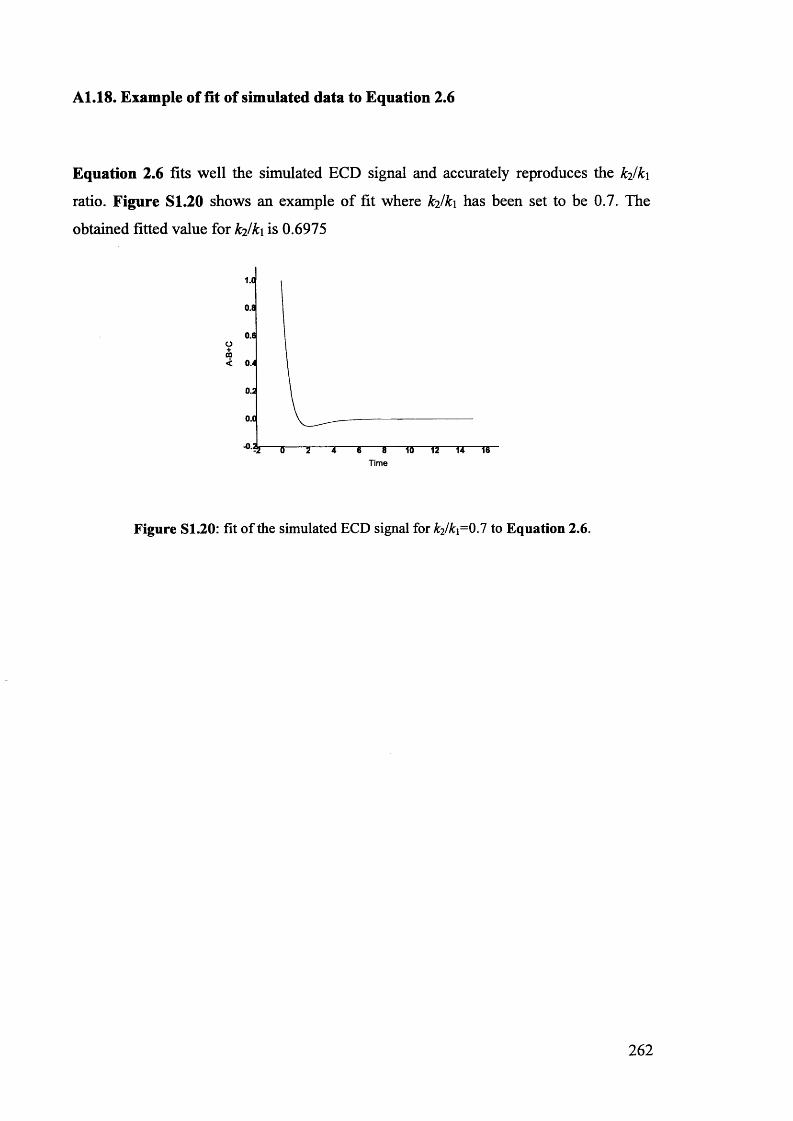
A1.18. Example of fit of simulated data to Equation 2.6
Equation 2.6 fits well the simulated ECD signal and accurately reproduces the ki/k\
ratio. Figure S1.20 shows an example of fit where ki/ki has been set to be 0.7. The
obtained fitted value for is 0.6975
1.C
0.8
0.8o+m
0.2
0.C
Time
Figure S1.20: fit of the simulated ECD signal for kj/k^OJ to Equation 2.6.
262
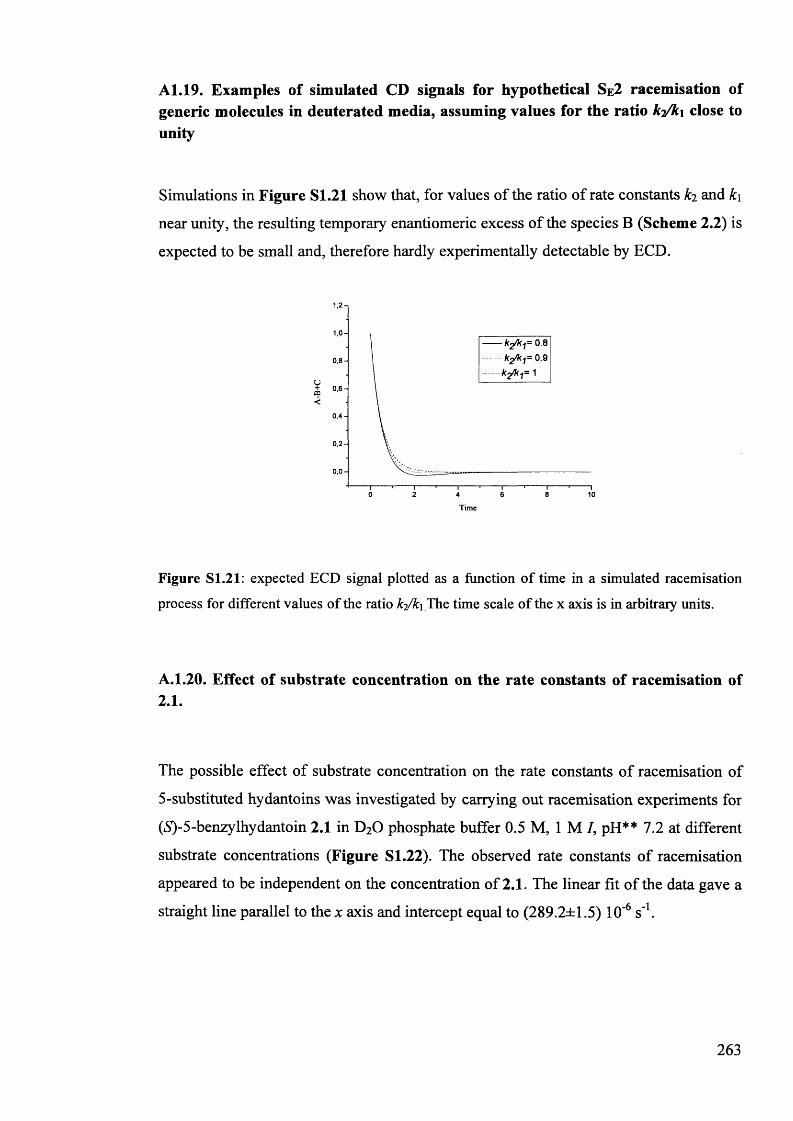
A1.19. Examples of simulated CD signals for hypothetical Se2 racemisation of generic molecules in deuterated media, assuming values for the ratio close to unity
Simulations in Figure S1.21 show that, for values of the ratio of rate constants ki and k\
near unity, the resulting temporary enantiomeric excess of the species B (Scheme 2.2) is
expected to be small and, therefore hardly experimentally detectable by ECD.
1'2i
0,8-
m °'6“ 03<0,4 -
0,2-
0,0-
2 8 100 4 6
Figure S1.21: expected ECD signal plotted as a function of time in a simulated racemisation
process for different values of the ratio k2/ki The time scale of the x axis is in arbitrary units.
A. 1.20. Effect of substrate concentration on the rate constants of racemisation of 2.1.
The possible effect of substrate concentration on the rate constants of racemisation of
5-substituted hydantoins was investigated by carrying out racemisation experiments for
(5)-5-benzylhydantoin 2.1 in D20 phosphate buffer 0.5 M, 1 M /, pH** 7.2 at different
substrate concentrations (Figure S1.22). The observed rate constants of racemisation
appeared to be independent on the concentration of 2.1. The linear fit of the data gave a
straight line parallel to the x axis and intercept equal to (289.2±1.5) 10’6 s'1.
263
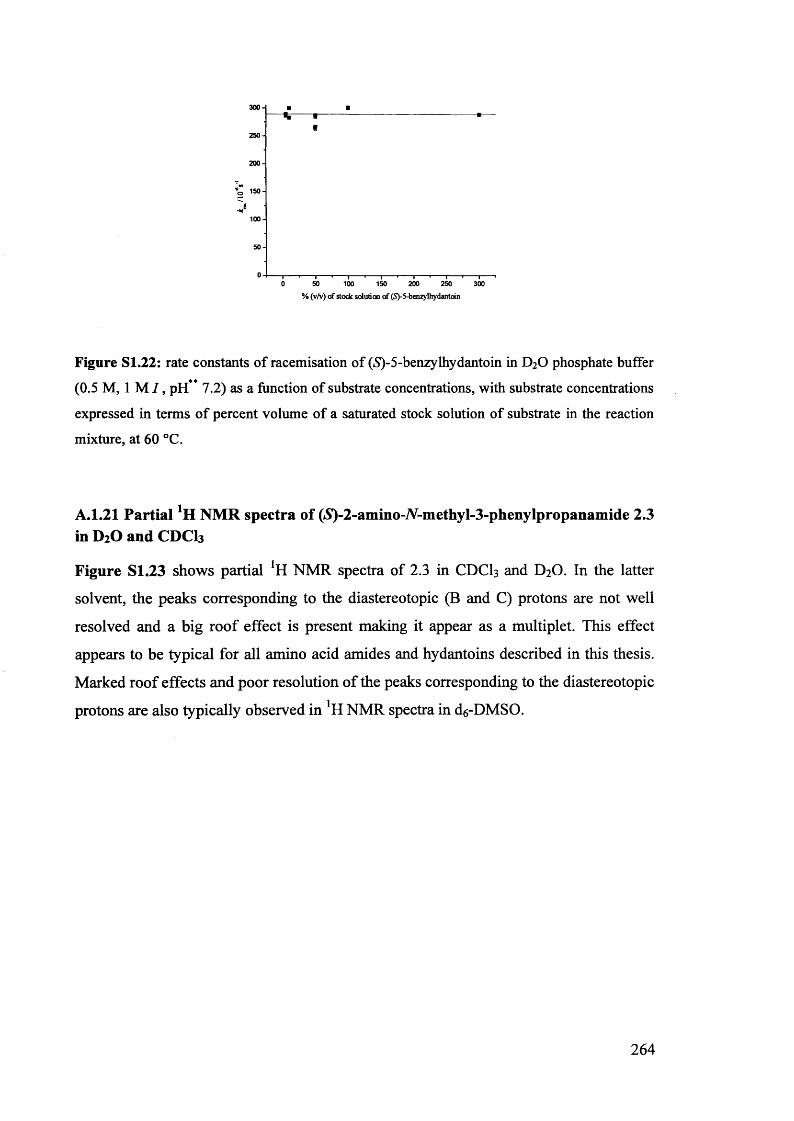
1 '--1 '-1 ■ 1 ■ 1 1--1 ■ 1 ■0 50 100 150 200 250 300
% (v/v) of stock solution of (5)-5-benzylhydantoin
Figure S1.22: rate constants of racemisation of (S)-5-benzylhydantoin in D20 phosphate buffer (0.5 M, 1 M I , pH** 7.2) as a function of substrate concentrations, with substrate concentrationsexpressed in terms of percent volume of a saturated stock solution of substrate in the reactionmixture, at 60 °C.
A. 1.21 Partial NMR spectra of (5)-2-ammo-A-methyl-3-phenylpropanamide 2.3 in D2O and CDCI3
Figure S1.23 shows partial *H NMR spectra of 2.3 in CDCI3 and D2O. In the latter
solvent, the peaks corresponding to the diastereotopic (B and C) protons are not well
resolved and a big roof effect is present making it appear as a multiplet. This effect
appears to be typical for all amino acid amides and hydantoins described in this thesis.
Marked roof effects and poor resolution of the peaks corresponding to the diastereotopic
protons are also typically observed in *H NMR spectra in d6-DMSO.
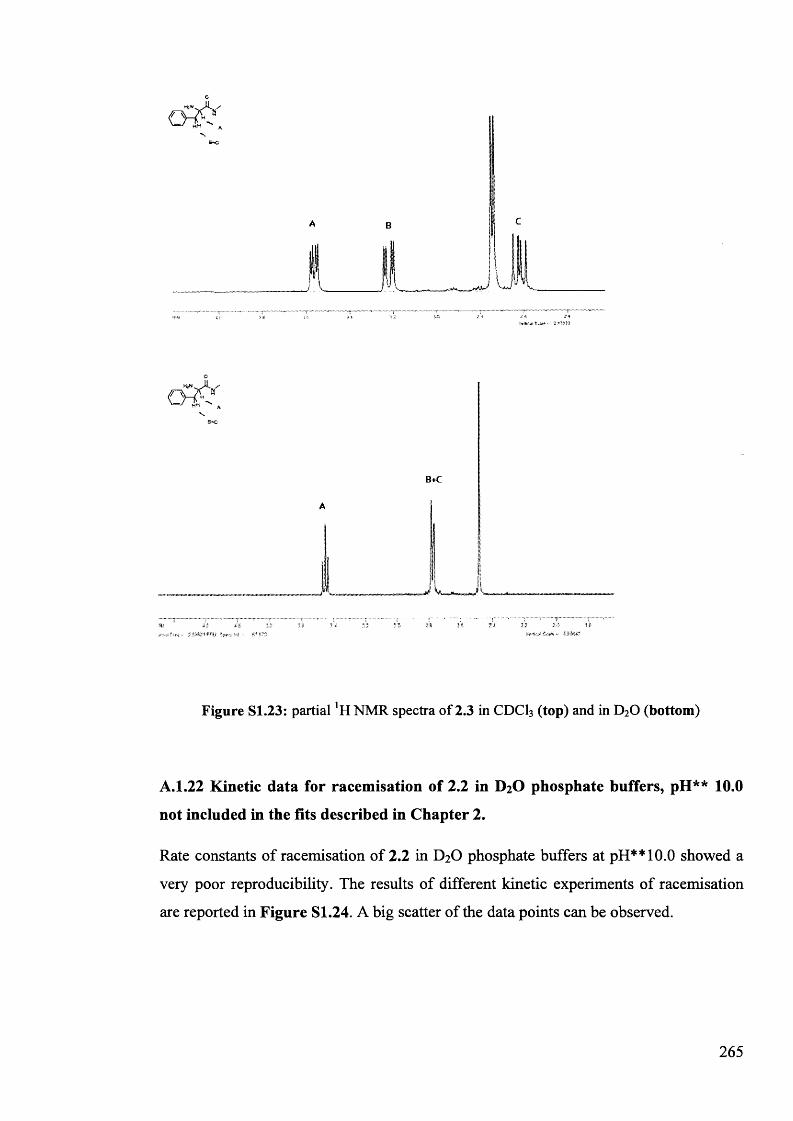
G
■„,y----- ~y
O
Figure S1.23: partial *H NMR spectra of 2.3 in CDC13 (top) and in D20 (bottom)
A. 1.22 Kinetic data for racemisation of 2.2 in D2O phosphate buffers, pH** 10.0
not included in the fits described in Chapter 2.
Rate constants of racemisation of 2.2 in D2O phosphate buffers at pH* *10.0 showed a
very poor reproducibility. The results of different kinetic experiments of racemisation
are reported in Figure S1.24. A big scatter of the data points can be observed.
265
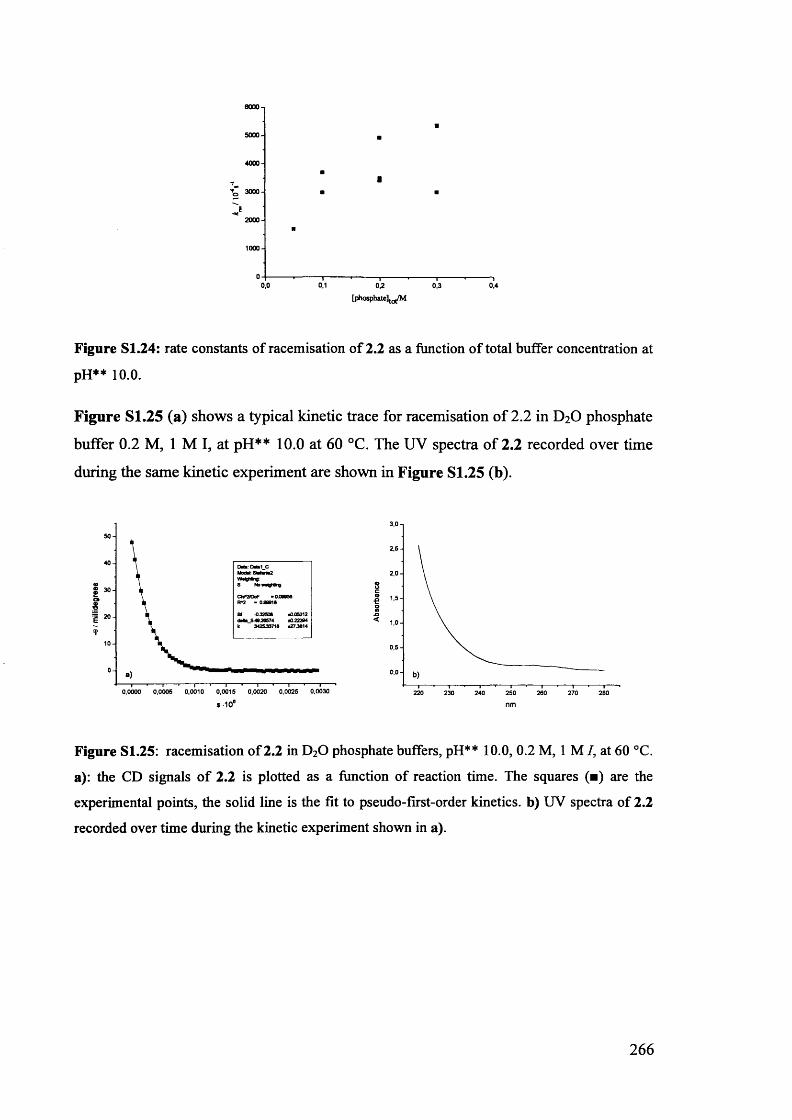
[phosphate]tot/M
Figure S1.24: rate constants of racemisation of 2.2 as a function of total buffer concentration at
pH** 10.0.
Figure S1.25 (a) shows a typical kinetic trace for racemisation of 2.2 in D2O phosphate
buffer 0.2 M, 1 M I, at pH** 10.0 at 60 °C. The UV spectra of 2.2 recorded over time
during the same kinetic experiment are shown in Figure SI.25 (b).
3 ,0 -i
2 ,5 -
2,0-8cto€oCO.O<
0 ,5 -
0,0-220 230 250 260 270 280240
50
40
M©&a»©“O30
1 20 10
00,0000 0,0005 0,0010 0,0015 0,0020 0,0025 0,0030
s-106 nm
Figure S1.25: racemisation of 2.2 in D20 phosphate buffers, pH** 10.0, 0.2 M, 1 M 7, at 60 °C.
a): the CD signals of 2.2 is plotted as a function of reaction time. The squares (■) are the
experimental points, the solid line is the fit to pseudo-first-order kinetics, b) UV spectra of 2.2
recorded over time during the kinetic experiment shown in a).
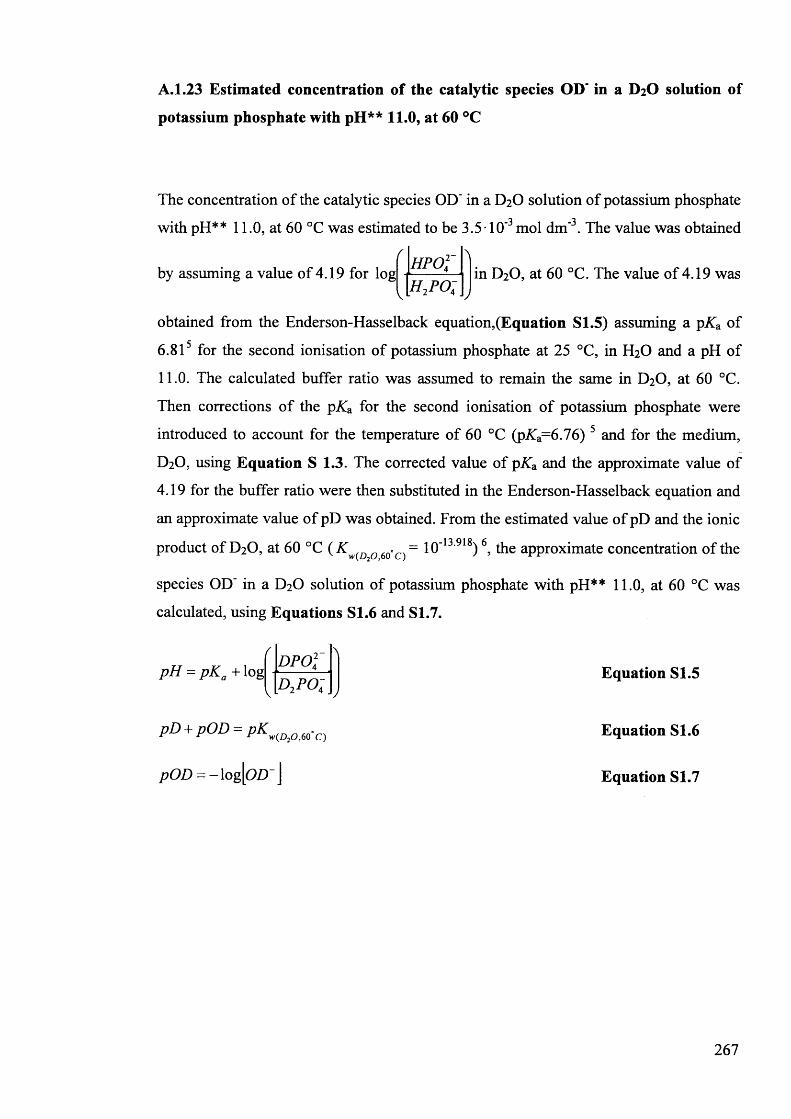
A. 1.23 Estimated concentration of the catalytic species OD~ in a D2O solution of
potassium phosphate with pH** 11.0, at 60 °C
The concentration of the catalytic species OD’ in a D2O solution of potassium phosphate
with pH** 11.0, at 60 °C was estimated to be 3.5-1 O'3 mol dm'3. The value was obtained
by assuming a value of 4.19 for logf \
H p o y
Vh 2p o ; )
in D2O, at 60 °C. The value of 4.19 was
obtained from the Enderson-Hasselback equation,(Equation SI.5) assuming a pKa of
6.815 for the second ionisation of potassium phosphate at 25 °C, in H2O and a pH of
11.0. The calculated buffer ratio was assumed to remain the same in D2O, at 60 °C.
Then corrections of the pKa for the second ionisation of potassium phosphate were
introduced to account for the temperature of 60 °C (pKa=6.76) 5 and for the medium,
D2O, using Equation S 1.3. The corrected value of pKa and the approximate value of
4.19 for the buffer ratio were then substituted in the Enderson-Hasselback equation and
an approximate value of pD was obtained. From the estimated value of pD and the ionic
product of D2O, at 60 °C ( K w(D Q 6Q. = 10'13 918) 6, the approximate concentration of the
species OD' in a D2O solution of potassium phosphate with pH** 11.0, at 60 °C was
calculated, using Equations S1.6 and S1.7.
d p o ;pH = pK a + logD2PO\
pD + pOD = pKw(Dom.c)
pOD = -log[o£T j
Equation S1.5
Equation SI.6
Equation S1.7
267
References
1. Anslyn, E. V.; Dougherty, D. A., Modern Physical Organic Chemistry.
University Science Books: Sausalito, California, 2006; p 421.
2. Glasoe, P. K.; Long, F. A., Journal o f Physical Chemistry 1960, 64 (1), 188-190.
3. Li, N. C.; Tang, P.; Mathur, R., Journal o f Physical Chemistry 1961, 65 (6),
1074-1076.
4. Glasoe, P. K.; Eberson, L., Journal o f Physical Chemistry 1964, 68 (6), 1560-
1562.
5 p£aS for phosphate from Fukada, H.; Takahashi, K., Proteins-Structure Function
and Genetics 1998, 33 (2), 159-166
6 Xw for D2O at 60 °C from "Handbook of Chemistry and Physics", 74th edition,
1993 1994, CRC Press, David R. Lide Editor-in-Chief, p.8-48
268
Appendix 2
This Appendix is for Chapter 3
The effect of structural modifications on the kinetics and mechanism of racemisation of 5-substituted
hydantoins.
269
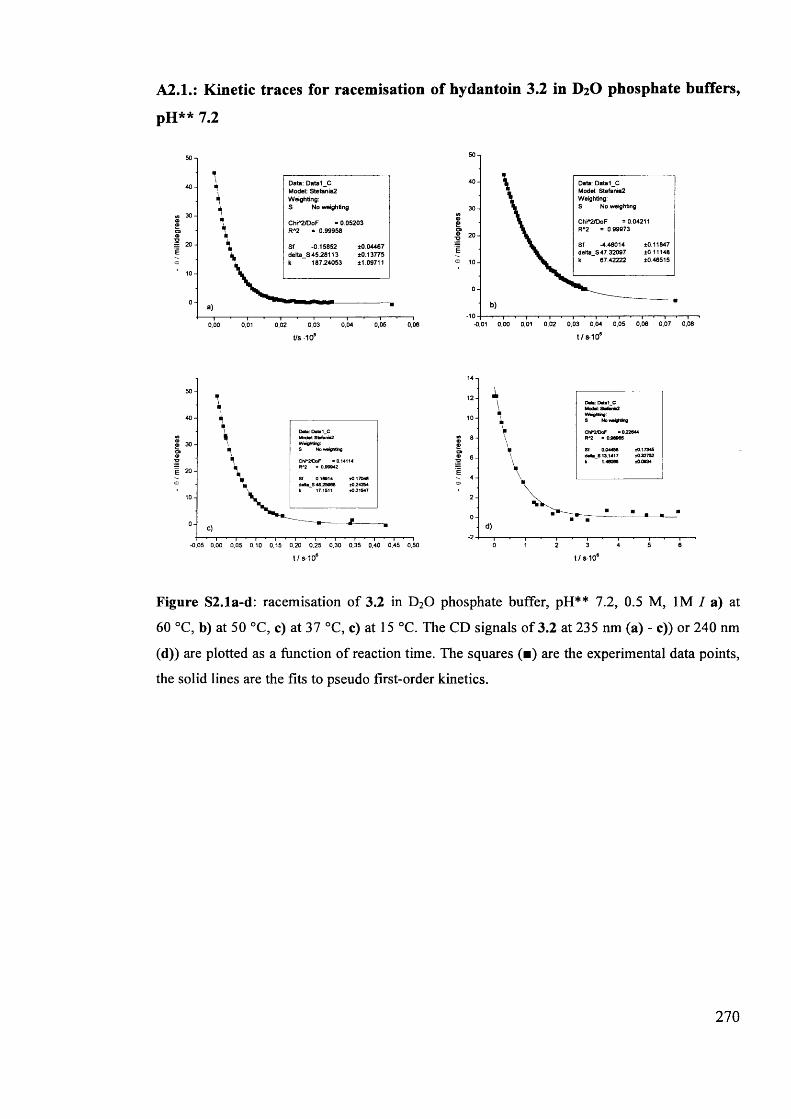
A2.1.: Kinetic traces for racemisation of hydantoin 3.2 in D2 O phosphate buffers,
pH** 7.2
50
40
Weighting:
30
©£o»| 20
£<= 10
0
-10-0,01 0,00 0,01 0,02 0,03 0,04 0,05 0,06 0,07 0,08
50
40
W eighting:No weighting
m 30©0)©;g
20 ±0.04467±0.13775E10
00,05 0,060,00 0,01 0,02 0,03 0,04
t/s-105 t/s-105
14
12
10
8©©
© ;g 6
E2
0-2
50 1 2 3 4 6
50
40
© 30 a t©■3
10
0-0,05 0,00 0,05 0,10 0,15 0,20 0,25 0,30 0,35 0,40 0,45 0,50
t/s-106 t/s-10e
Figure S2.1a-d: racemisation of 3.2 in D20 phosphate buffer, pH** 7.2, 0.5 M, 1M / a) at
60 °C, b) at 50 °C, c) at 37 °C, c) at 15 °C. The CD signals of 3.2 at 235 nm (a) - c)) or 240 nm
(d)) are plotted as a function of reaction time. The squares (■) are the experimental data points,
the solid lines are the fits to pseudo first-order kinetics.
270
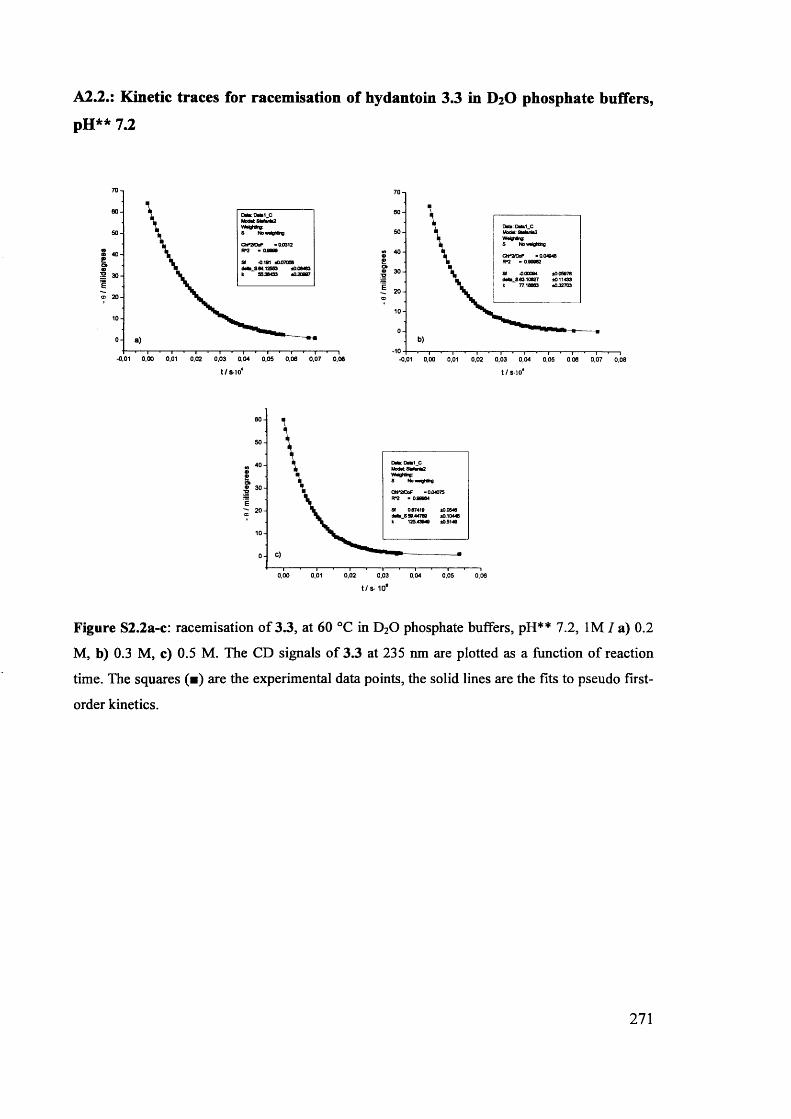
A2.2.: Kinetic traces for racemisation of hydantoin 3.3 in D2 O phosphate buffers,
pH** 7.2
706050
S 40ec»9S 30E
100-0,01 0,00 0,01 0,02 0,03 0,04 0.05 0,06 0,07 0,06
706050
m 40 oso»| 30
E 20100
•10-0,01 0,00 0,01 0,02 0,03 0,04 0,05 0,06 0,07 0,08t /s - io 4 t / s - 104
60
50
4099o»9 302E 20
100
0,00 0,01 0,02 0,03 0,04 0,05 0,06t / s - 1 0 6
Figure S2.2a-c: racemisation of 3.3, at 60 °C in D20 phosphate buffers, pH** 7.2, 1MI a) 0.2
M, b) 0.3 M, c) 0.5 M. The CD signals of 3.3 at 235 nm are plotted as a function of reaction
time. The squares (■) are the experimental data points, the solid lines are the fits to pseudo first-
order kinetics.
271
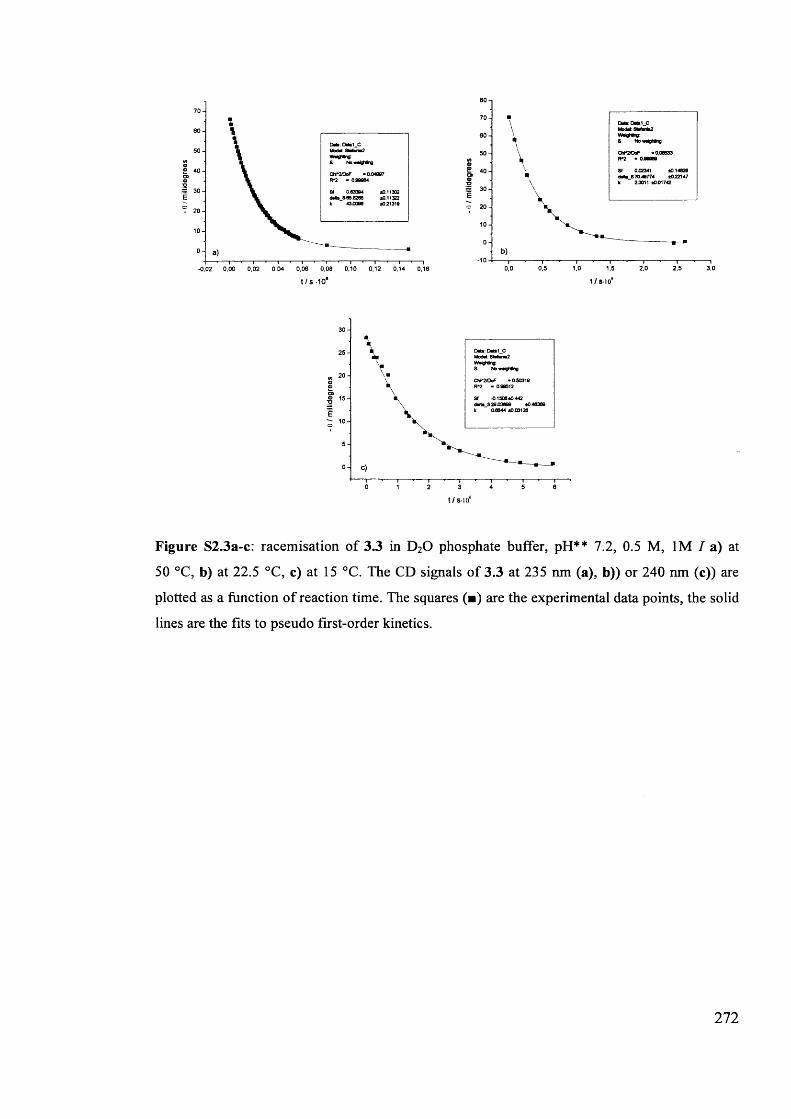
80-.
706050
©ab 40 ©•o= 30E« 20
100
•10 0,5 1,0 1,5 2,0 2,5 3,00,0
6050
©® 40at©a 30E
*7 2010
0-0,02 0,00 0,02 0,04 0,06 0,08 0,10 0,12 0,14 0,16
t/s-106 t / s io 6
30
25
20at© 15E10o
5
00 2 3 4 5 61
t/s-io6
Figure S2.3a-c: racemisation of 3.3 in D20 phosphate buffer, pH** 7.2, 0.5 M, 1M / a) at
50 °C, b) at 22.5 °C, c) at 15 °C. The CD signals of 3.3 at 235 nm (a), b)) or 240 nm (c)) are
plotted as a function of reaction time. The squares (■) are the experimental data points, the solid
lines are the fits to pseudo first-order kinetics.
272
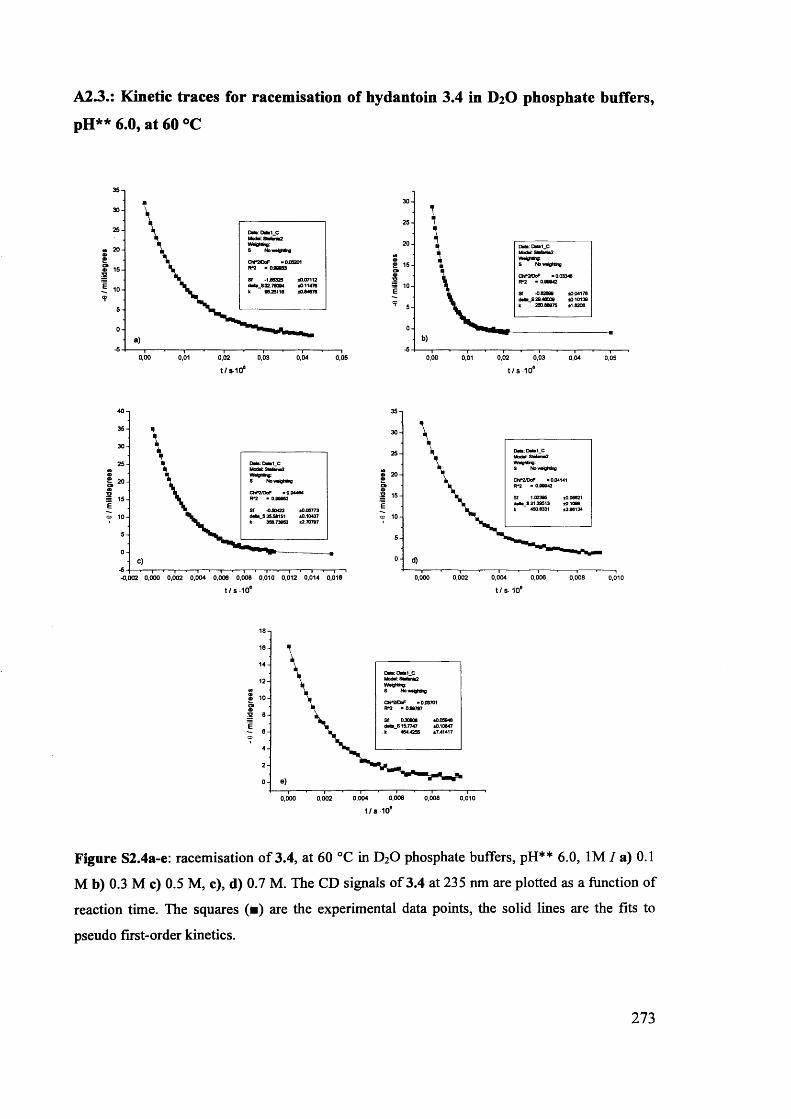
A2.3.: Kinetic traces for racemisation of hydantoin 3.4 in D2 O phosphate buffers,
pH** 6.0, at 60 °C
35
3025
m 20 9S9 15 tj 10
CD
50
-5 0,00 0.02 0.03 0.04 0,050,01
30
25
20
(A9©Oft 15
9-9 10E
0-5
0,02 0,030,00 0,01 0,04 0,05
t/s-106 t /s 106
40
35
30
25M9&O9T3
20
15Eo 10
5
0-5-|--.--1--- 1---1-1---- «-1--- i---•-1---- 1-1---- 1-1--1--1—-0,002 0,000 0,002 0,004 0,006 0,008 0,010 0,012 0,014 0,016
35
30
25
S 209o»©S 15
ECD 10
50
0,000 0,002 0,004 0,006 0,008 0,010
t/s-108 t/s-106
18
16
14
12
©;o 0
E6
420
0,006 0,0080,004 0,0100,000 0,002
t/s-106
Figure S2.4a-e: racemisation of 3.4, at 60 °C in D20 phosphate buffers, pH** 6.0, 1MI a) 0.1
M b) 0.3 M c) 0.5 M, c), d) 0.7 M. The CD signals of 3.4 at 235 nm are plotted as a function of reaction time. The squares (■) are the experimental data points, the solid lines are the fits to
pseudo first-order kinetics.
273
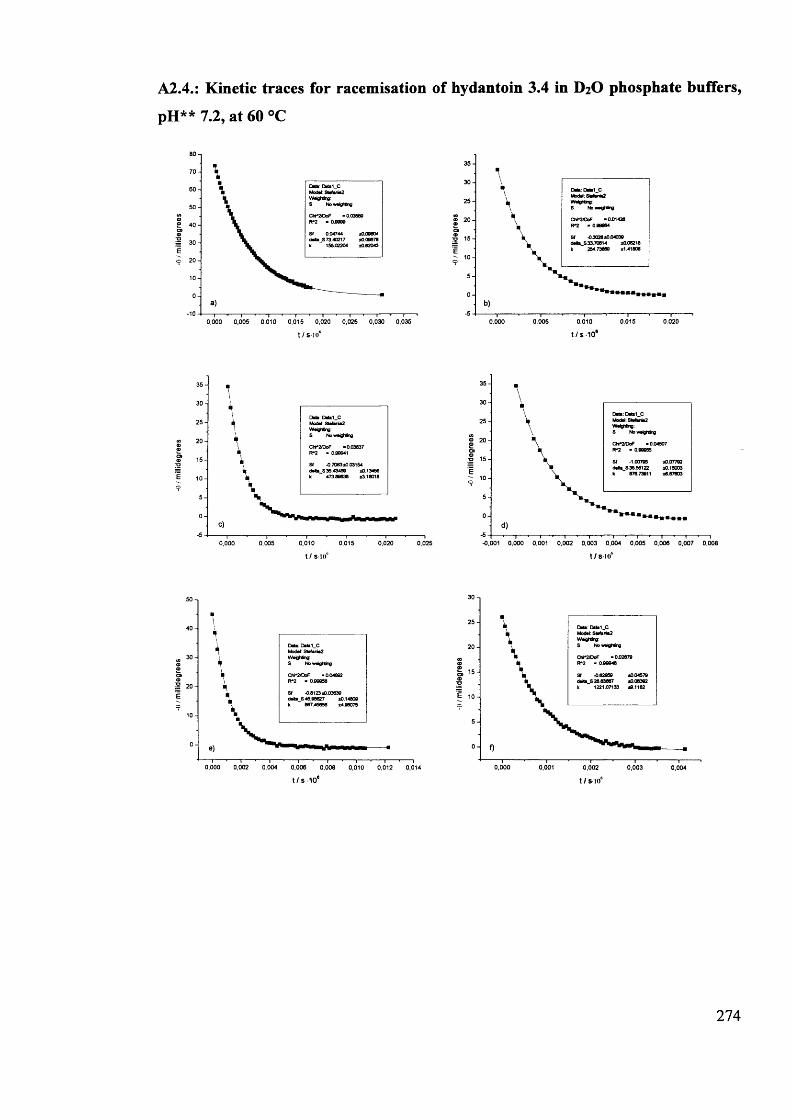
-o /m
illid
egre
es
-o / m
illid
egre
es
-n/m
illid
egre
es
A2A.'. Kinetic traces for racemisation of hydantoin 3.4 in D2 O phosphate buffers,
pH** 7.2, at 60 °C
•0.01426
Sf 0.04744(Mb S 73.40217 k 15502204
2 0 -
15-
0.010
t / S 10°
15-I
*0.001 0.000 0.001 0,002 0,003 0,004 0,005 0,006 0,007 0,006t/s-106
30
25
20
15
10
5
00,000 0,001 0,002 0,003 0,004
50
40
30
20
10
00,000 0,002 0,004 0,006 0,008 0,010 0,012 0,014
t / s 10e t / s - 106
274
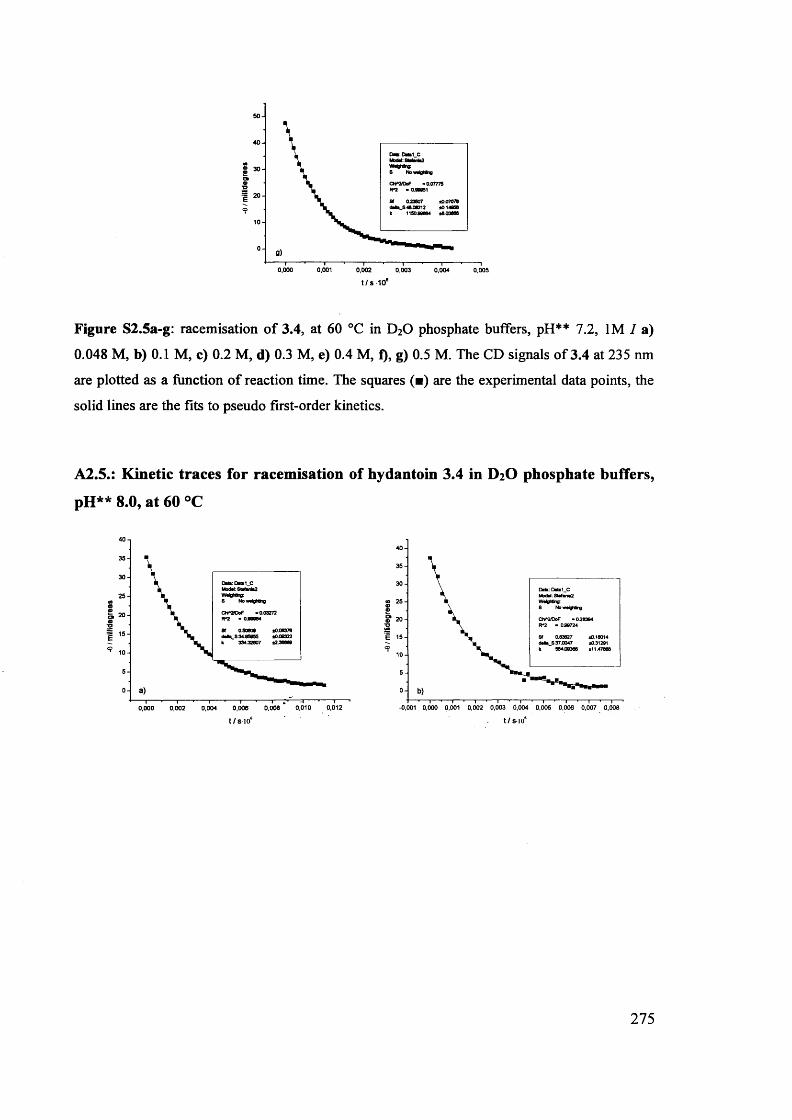
0,0010,000 0,002 0,003 0,004 0,005t/S-10®
Figure S2.5a-g: racemisation of 3.4, at 60 °C in D20 phosphate buffers, pH** 7.2, 1M / a) 0.048 M, b) 0.1 M, c) 0.2 M, d) 0.3 M, e) 0.4 M, f), g) 0.5 M. The CD signals of 3.4 at 235 nm are plotted as a function of reaction time. The squares (■) are the experimental data points, the solid lines are the fits to pseudo first-order kinetics.
A2.5.: Kinetic traces for racemisation of hydantoin 3.4 in D2O phosphate buffers,
pH** 8.0, at 60 °C
40353025
«aAAat 20A•O15CD
10
50
0,010 0,0120,0080,0060,000 0,002 0,004
40353025
<x>1050-0,001 0,000 0,001 0,002 0,003 0,004 0,005 0,006 0,007 0,006
t/s-io6 t/s*io6
275
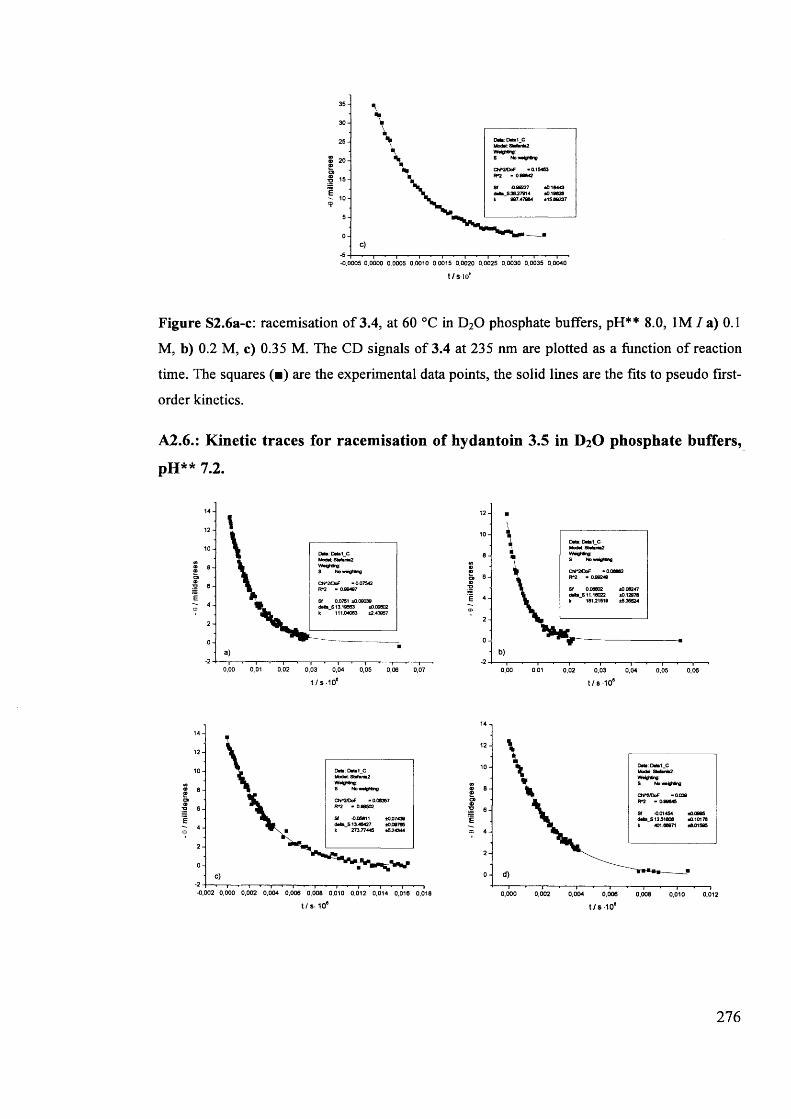
353025
©CD
20
Oft
2 15E
50-5 -|--.--1--.--,--.--,--.--,--1--,--.--,--.--,--.--1--- \->0,0005 0,0000 0,0005 0,0010 0,0015 0,0020 0,0025 0,0030 0,0035 0,0040
t/s-io6
Figure S2.6a-c: racemisation of 3.4, at 60 °C in D20 phosphate buffers, pH** 8.0, 1M 7 a) 0.1
M, b) 0.2 M, c) 0.35 M. The CD signals of 3.4 at 235 nm are plotted as a function of reaction
time. The squares (■) are the experimental data points, the solid lines are the fits to pseudo first-
order kinetics.
A2.6.: Kinetic traces for racemisation of hydantoin 3.5 in D2O phosphate buffers,
pH** 7.2.
1412
10
©<D 8o»
6
E 4G
2
0-2
0,00 0,01 0,02 0,03 0,04 0,05 0,06 0,07
12106
o» 6«;o
2
0-2 0,00 0,01 0,03 0,040,02 0,05 0,06
t/s-106 t/s-106
141210
s©
8
Eo 4
2
00,000 0,002 0,004 0,006 0,008 0,010 0.012
1412
10
© 8©O©;0 6
E 42
0-2 -| ,-, ,-----, ,-, , ,---- , ,--, ,-, , , ,-0,002 0,000 0,002 0,004 0,006 0,008 0,010 0,012 0,014 0,016 0,018
t /s -1 0 * t /s -1 0 *
276
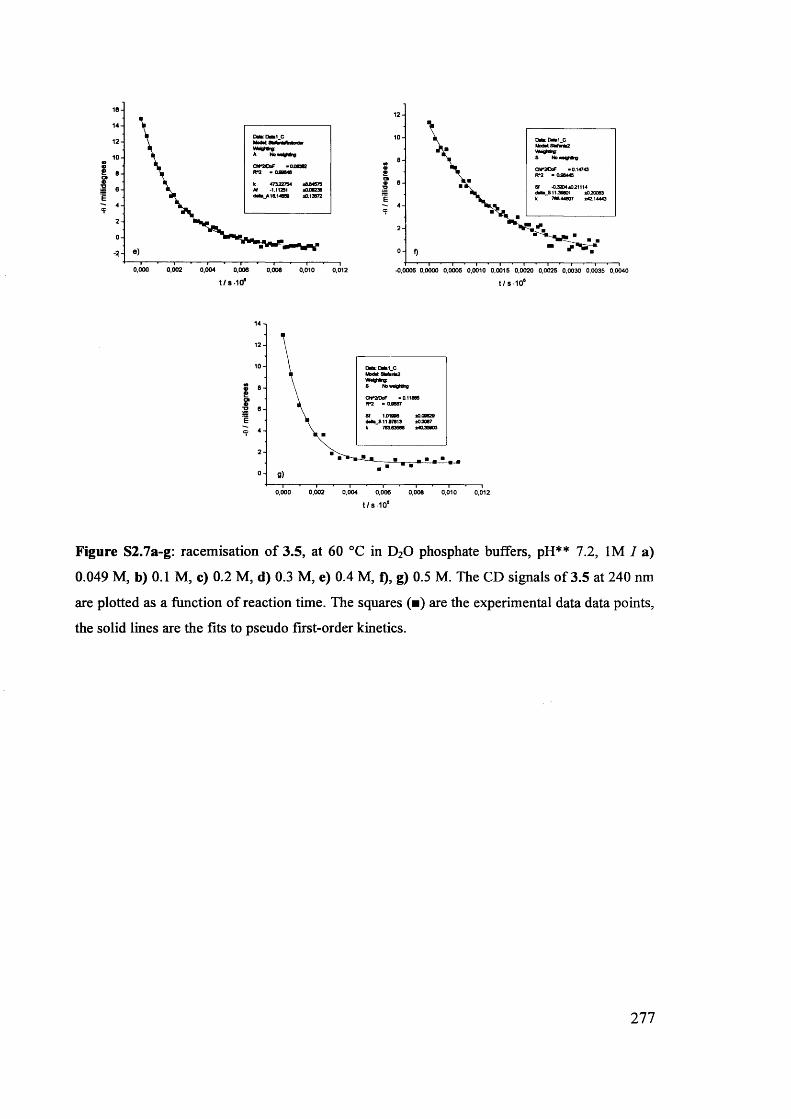
16141210•B
£ 8a t®*o 6E 4
20-2
0,000 0,002 0,004 0,006 0,008 0,010 0,012
12106«»
sa t• 62E 4
20<0,0005 0.0000 0,0005 0,0010 0,0015 0,0020 0,0025 0,0030 0,0035 0,0040
t/ s -1 0 6 t /s -1 0 6
1412108
20
0,0020,000 0,004 0,006 0,008 0,010 0,012t/S-10®
Figure S2.7a-g: racemisation of 3.5, at 60 °C in D20 phosphate buffers, pH** 7.2, 1M I a)
0.049 M, b) 0.1 M, c) 0.2 M, d) 0.3 M, e) 0.4 M, I), g) 0.5 M. The CD signals of 3.5 at 240 nm
are plotted as a function of reaction time. The squares (■) are the experimental data data points,
the solid lines are the fits to pseudo first-order kinetics.
277
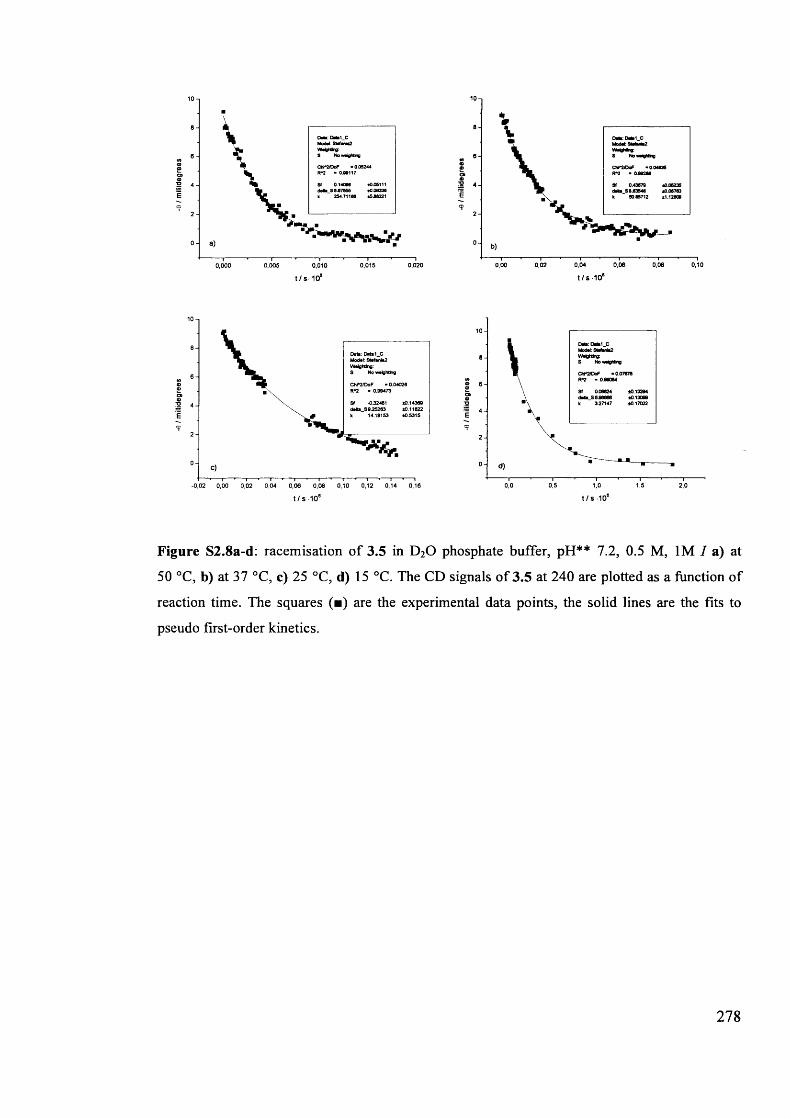
10-. 10-.
I 4E
\MxW-. StfnU ling; Noweghbng
Sf 0.14096 ±005111<Mta_S 807956 ±006336k 254.71166 ±506221
0,010
t/S- 10®
8
6©«CBa■a 4E© 2
00,04 0,06 0,08 0,100,00 0,02t/S 10®
10
6
6©a>o>©•u AE
2
0-0,02 0,00 0,02 0,04 0,06 0,08 0,10 0,12 0,14 0,16
10
8
6CB©■o 4E
2
00,5 1.0 1,50,0 2,0
Figure S2.8a-d: racemisation of 3.5 in D20 phosphate buffer, pH** 7.2, 0.5 M, 1M I a) at
50 °C, b) at 37 °C, c) 25 °C, d) 15 °C. The CD signals of 3.5 at 240 are plotted as a function of
reaction time. The squares (■) are the experimental data points, the solid lines are the fits to
pseudo first-order kinetics.
278
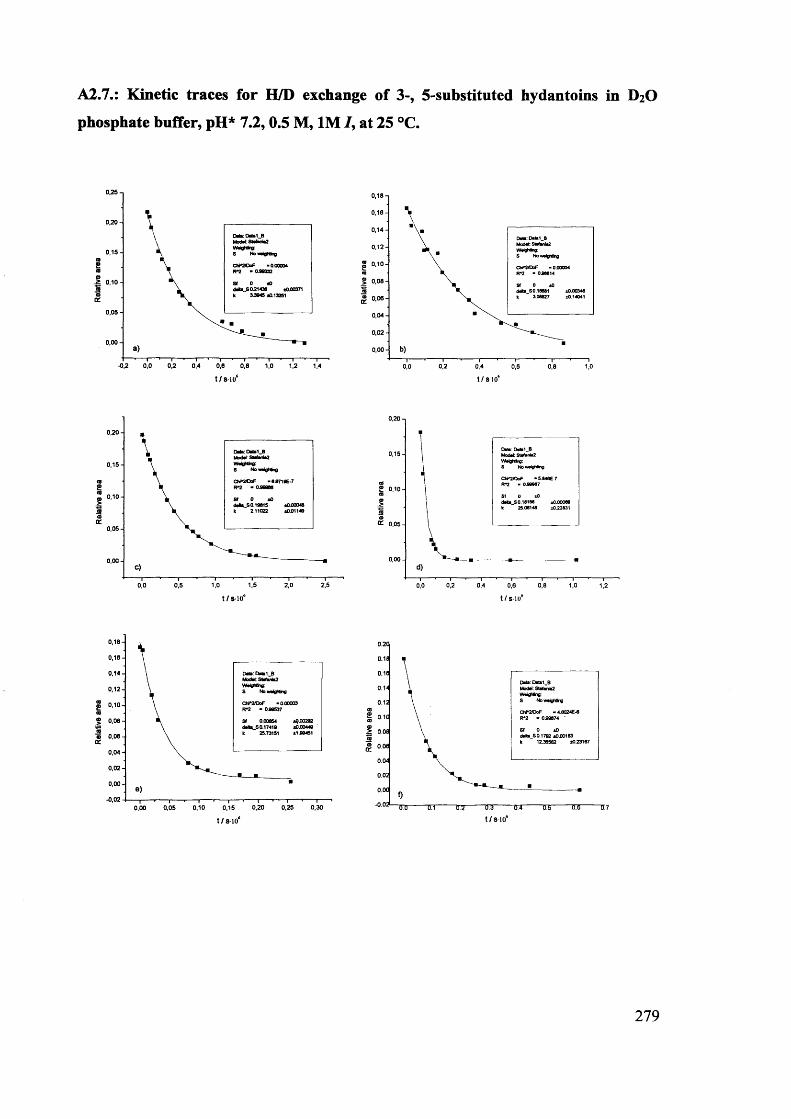
Rela
tive
area
Re
lativ
e ar
ea
Rela
tive
area
A2.7.: Kinetic traces for H/D exchange of 3-, 5-substituted hydantoins in D2O
phosphate buffer, pH* 7.2, 0.5 M, 1M /, at 25 °C.
(M l S 0.19615 k 2.11022
NowtighUngST 0.00854<Mta_S0.17419 k 25.73151
*023167
279
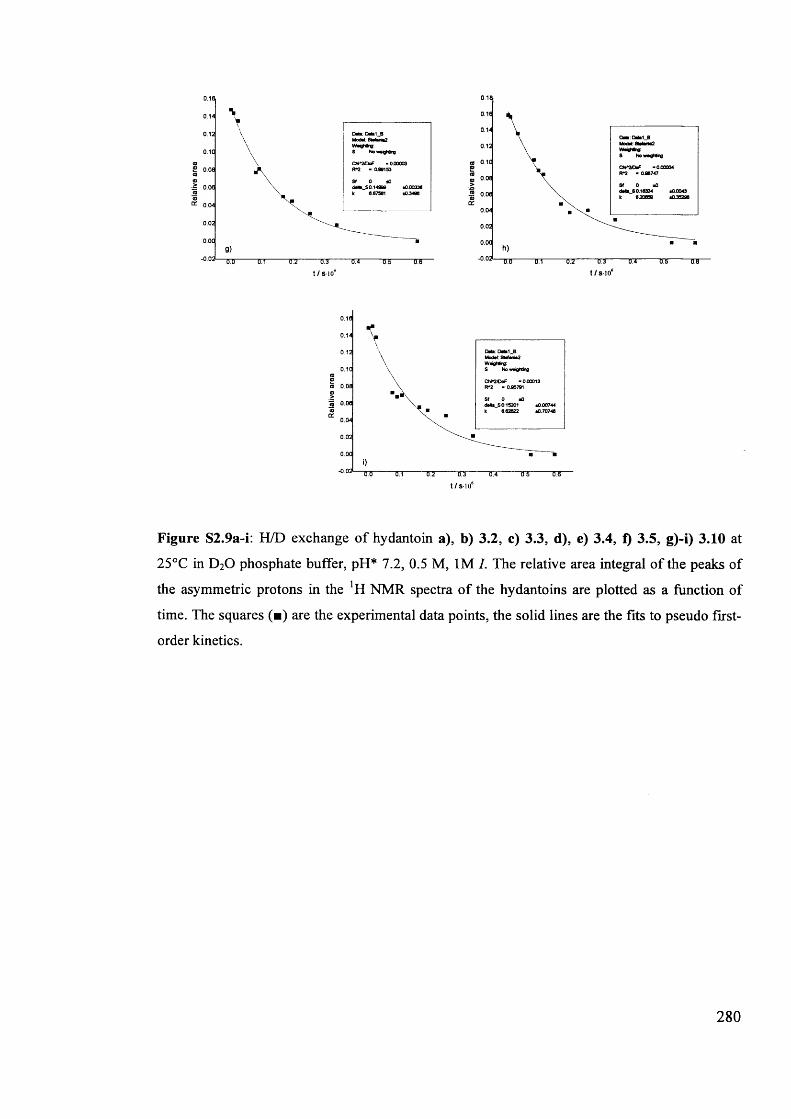
to 0.10
—ITS— t / s io 6
CN*2>DoF -0.00013 R*2 - 055791
±050744±0.70748
Figure S2.9a-i: H/D exchange of hydantoin a), b) 3.2, c) 3.3, d), e) 3.4, f) 3.5, g)-i) 3.10 at
25°C in D20 phosphate buffer, pH* 7.2, 0.5 M, 1M I. The relative area integral of the peaks of
the asymmetric protons in the !H NMR spectra of the hydantoins are plotted as a function of
time. The squares (■) are the experimental data points, the solid lines are the fits to pseudo first-
order kinetics.
280
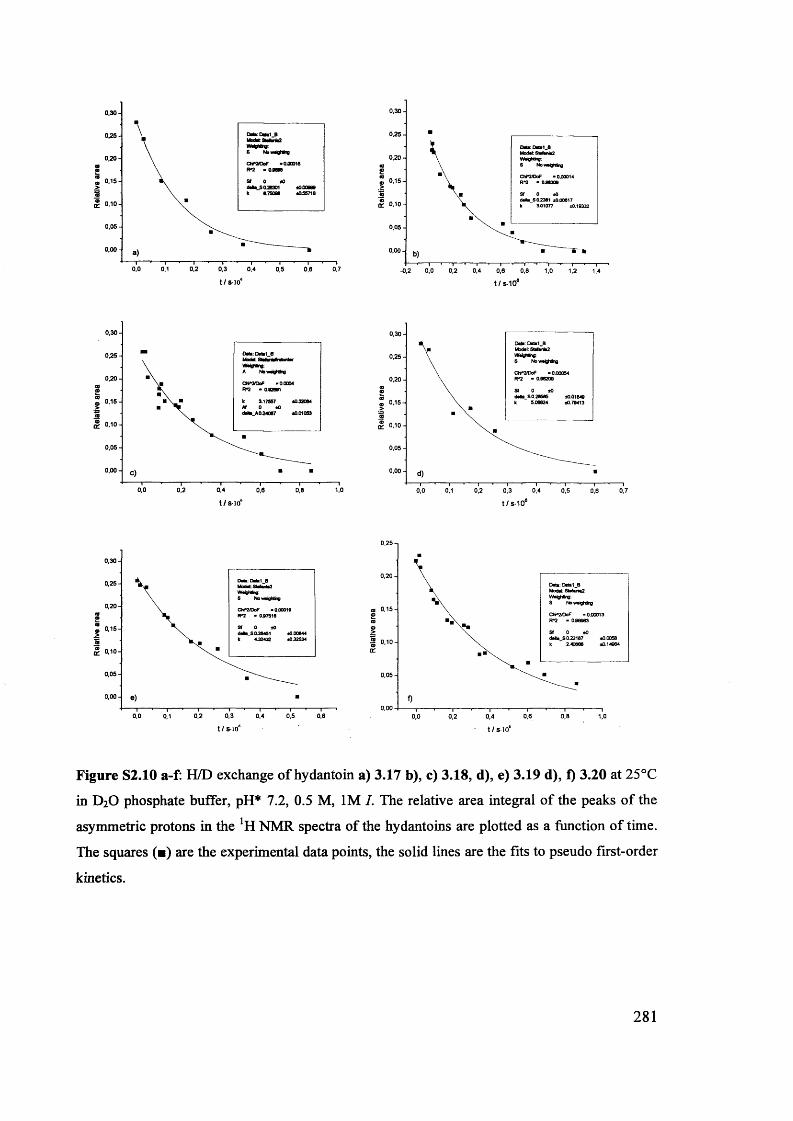
0,30-
0,25 -
0,20-
0,15-
0,05-
0,00--0,2 0,0 0.2 0,4 0,6 0,6 1,0 1,2 1,4
0,30-
0,20-
0,15-
0,05-
0,0 0,2 0,3 0,70,1 0,4 0,5 0,6t /S - 106 t /s -1 0 6
0,30-
0,25-
0,20-
0,15-
0,05-
0,0 0,2 0,4 0,6 1.00,8
0,30-
0,25-
0,20-
0,15-
0,05-
0,00-0,1 0,3 0,4 0,50,0 0,2 0,70,6
t / s - 106 t /s -1 0 6
0,25-,
0,20-
0,15-£CO©©rc.
0,10-
0,00 0,6 0,8 1,00,0 0,2 0,4
0,30-
0,25-
0,20-
0,15-
0,05-
0,00-0,2 0,3 0,5 0,60,0 0,40,1
t/S-IO6 - t/S-106
Figure S2.10 a-f: H/D exchange of hydantoin a) 3.17 b), c) 3.18, d), e) 3.19 d), f) 3.20 at 25°C in D2O phosphate buffer, pH* 7.2, 0.5 M, 1M I. The relative area integral of the peaks of the asymmetric protons in the JH NMR spectra of the hydantoins are plotted as a function of time. The squares (■) are the experimental data points, the solid lines are the fits to pseudo first-order
kinetics.
281
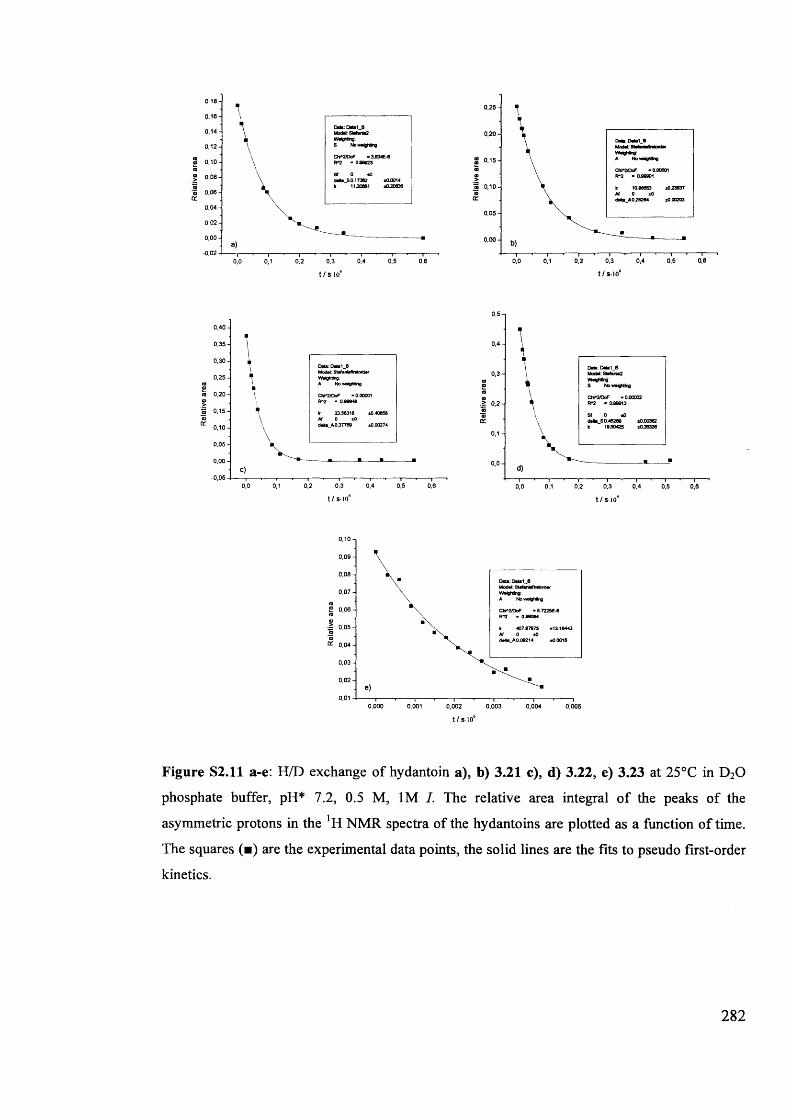
0,18-0,16-0,14-0,12-
© o,io- (05 0,08 - "S3© 0,06 -
0,04-0,02-0,00--0,02-
0,25-
0,20-
« 0.10-
0,05-
0,00-0.60,2 0,3 0,4 0,50,0 0,1
0,40-0,35-0,30-0,25-(0a>
a 0 ,20 - ©S 0,15-
0,10- 0,05- 0,00- -0,05-
0,5-,
0,4-
0.3-<0©(0a>0,2-
0,0-
0,2 0.3 0,4 0,5 0,60,0 0,1
0,10-|0,09-
0,07-0,06-
0 0,04 -0,03-0,02- e)0,01 0,000 0,001 0,002 0,003 0,004 0,005
t / s io 6
Figure S2.ll a-e: H/D exchange of hydantoin a), b) 3.21 c), d) 3.22, e) 3.23 at 25°C in D20
phosphate buffer, pH* 7.2, 0.5 M, 1M I. The relative area integral of the peaks of the
asymmetric protons in the NMR spectra of the hydantoins are plotted as a function of time.
The squares (■) are the experimental data points, the solid lines are the fits to pseudo first-order
kinetics.
282
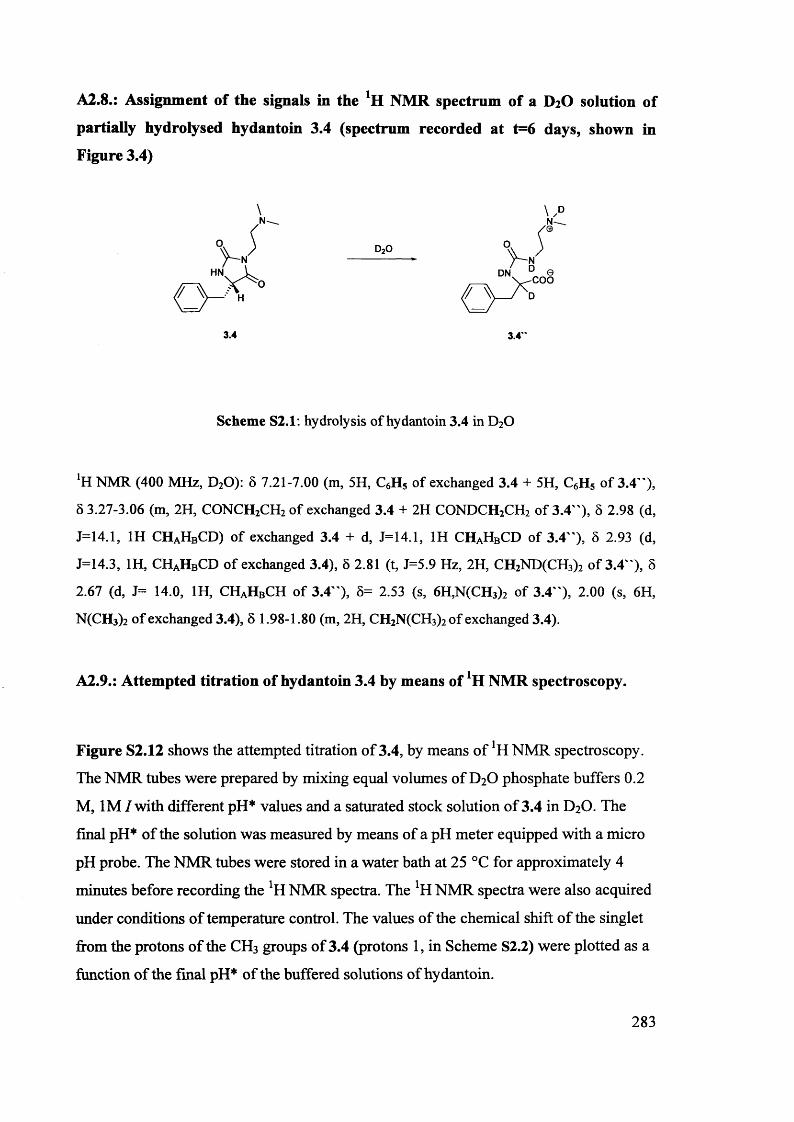
A2.8.: Assignment of the signals in the NMR spectrum of a D2O solution of
partially hydrolysed hydantoin 3.4 (spectrum recorded at t=6 days, shown in
Figure 3.4)
HN.
D20
DN.COO
3.4 3.4'
Scheme S2.1: hydrolysis of hydantoin 3.4 in D20
*H NMR (400 MHz, D20): 5 7.21-7.00 (m, 5H, C6H5 of exchanged 3.4 + 5H, C6H5 of 3.4"),
5 3.27-3.06 (m, 2H, CONCH2CH2 of exchanged 3.4 + 2H CONDCH2CH2 of 3.4"), 5 2.98 (d,
J=14.1, 1H CHaHbCD) of exchanged 3.4 + d, J=14.1, 1H CHAHBCD of 3.4"), 5 2.93 (d,
J=14.3, 1H, CHaHbCD of exchanged 3.4), 5 2.81 (t, J=5.9 Hz, 2H, CH2ND(CH3) 2 of 3.4"), 5
2.67 (d, J= 14.0, 1H, CHaHbCH of 3.4"), 5= 2.53 (s, 6 H,N(CH3) 2 of 3.4"), 2.00 (s, 6 H,
N(CH3) 2 of exchanged 3.4), 5 1.98-1.80 (m, 2 H, CH2N(CH3) 2 of exchanged 3.4).
A2.9.: Attempted titration of hydantoin 3.4 by means of NMR spectroscopy.
Figure S2.12 shows the attempted titration of 3.4, by means of *H NMR spectroscopy.
The NMR tubes were prepared by mixing equal volumes of D2O phosphate buffers 0.2
M, 1M / with different pH* values and a saturated stock solution of 3.4 in D2O. The
final pH* of the solution was measured by means of a pH meter equipped with a micro
pH probe. The NMR tubes were stored in a water bath at 25 °C for approximately 4
minutes before recording the *H NMR spectra. The *H NMR spectra were also acquired
under conditions of temperature control. The values of the chemical shift of the singlet
from the protons of the CH3 groups of 3.4 (protons 1, in Scheme S2.2) were plotted as a
function of the final pH* of the buffered solutions of hydantoin.
283
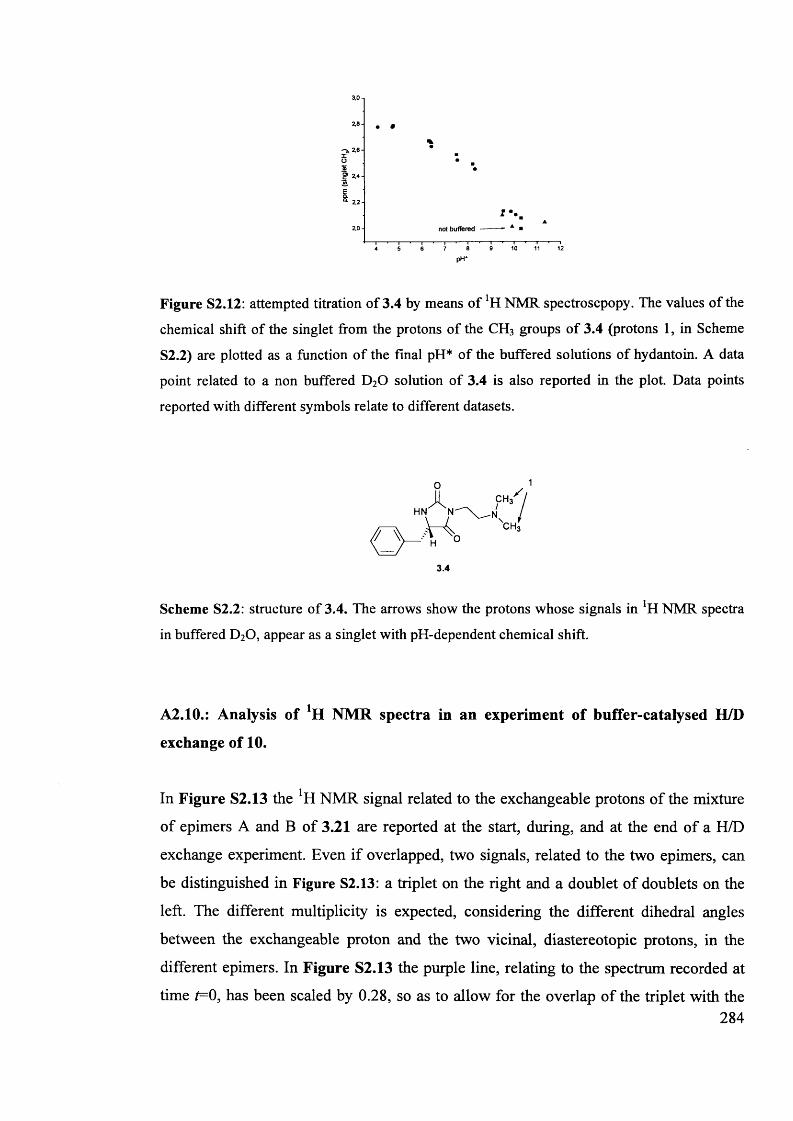
Figure S2.12: attempted titration of 3.4 by means of ]H NMR spectroscpopy. The values of the
chemical shift of the singlet from the protons of the CH3 groups of 3.4 (protons 1, in Scheme
S2.2) are plotted as a function of the final pH* of the buffered solutions of hydantoin. A data
point related to a non buffered D20 solution of 3.4 is also reported in the plot. Data points
reported with different symbols relate to different datasets.
oHN N"
3.4
Scheme S2.2: structure of 3.4. The arrows show the protons whose signals in *H NMR spectra
in buffered D20, appear as a singlet with pH-dependent chemical shift.
A2.10.: Analysis of XH NMR spectra in an experiment of buffer-catalysed H/D
exchange of 10.
In Figure S2.13 the *H NMR signal related to the exchangeable protons of the mixture
of epimers A and B of 3.21 are reported at the start, during, and at the end of a H/D
exchange experiment. Even if overlapped, two signals, related to the two epimers, can
be distinguished in Figure S2.13: a triplet on the right and a doublet of doublets on the
left. The different multiplicity is expected, considering the different dihedral angles
between the exchangeable proton and the two vicinal, diastereotopic protons, in the
different epimers. In Figure S2.13 the purple line, relating to the spectrum recorded at
time t=0, has been scaled by 0.28, so as to allow for the overlap of the triplet with the284
c h 3
CH
✓
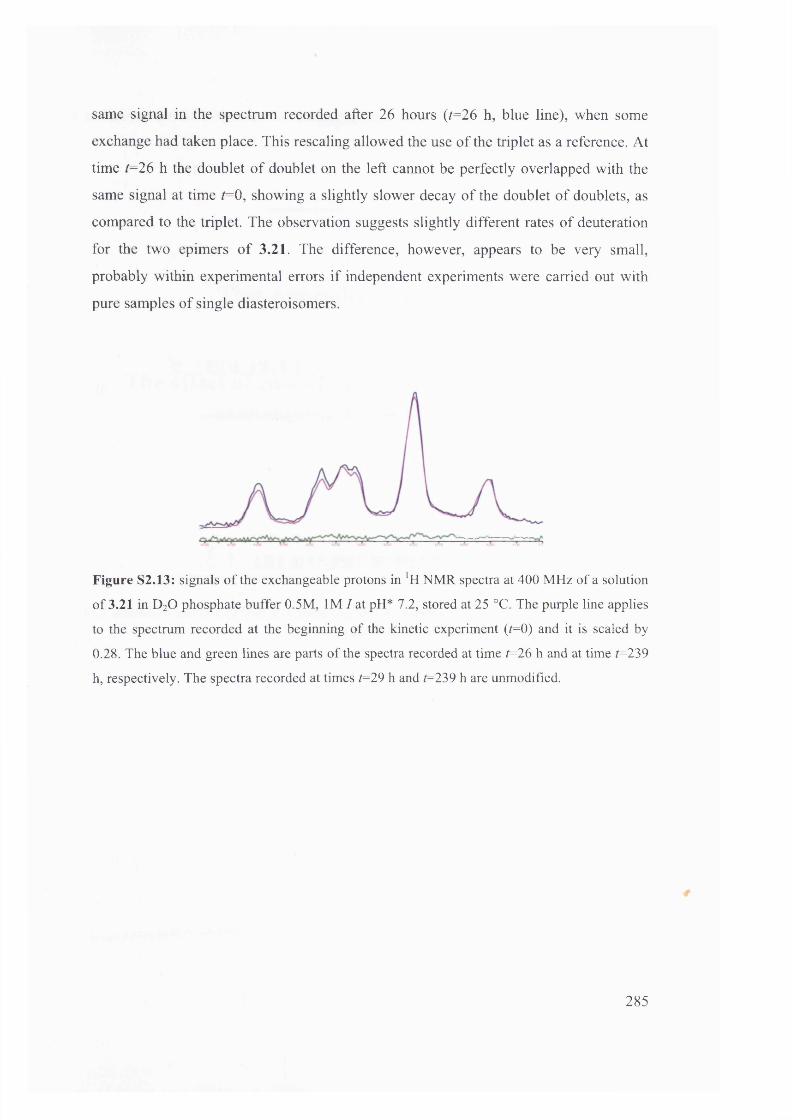
same signal in the spectrum recorded after 26 hours (t=26 h, blue line), when some
exchange had taken place. This rescaling allowed the use of the triplet as a reference. At
time t= 26 h the doublet of doublet on the left cannot be perfectly overlapped with the
same signal at time t= 0 , showing a slightly slower decay of the doublet of doublets, as
compared to the triplet. The observation suggests slightly different rates of deuteration
for the two epimers of 3.21. The difference, however, appears to be very small,
probably within experimental errors if independent experiments were carried out with
pure samples of single diasteroisomers.
Figure S2.13: signals of the exchangeable protons in ‘H NMR spectra at 400 MHz of a solution
of 3.21 in D20 phosphate buffer 0.5M, 1MI at pH* 7.2, stored at 25 °C. The purple line applies
to the spectrum recorded at the beginning of the kinetic experiment (/=0) and it is scaled by
0.28. The blue and green lines are parts of the spectra recorded at time t=26 h and at time t=239
h, respectively. The spectra recorded at times t=29 h and t=239 h are unmodified.
285
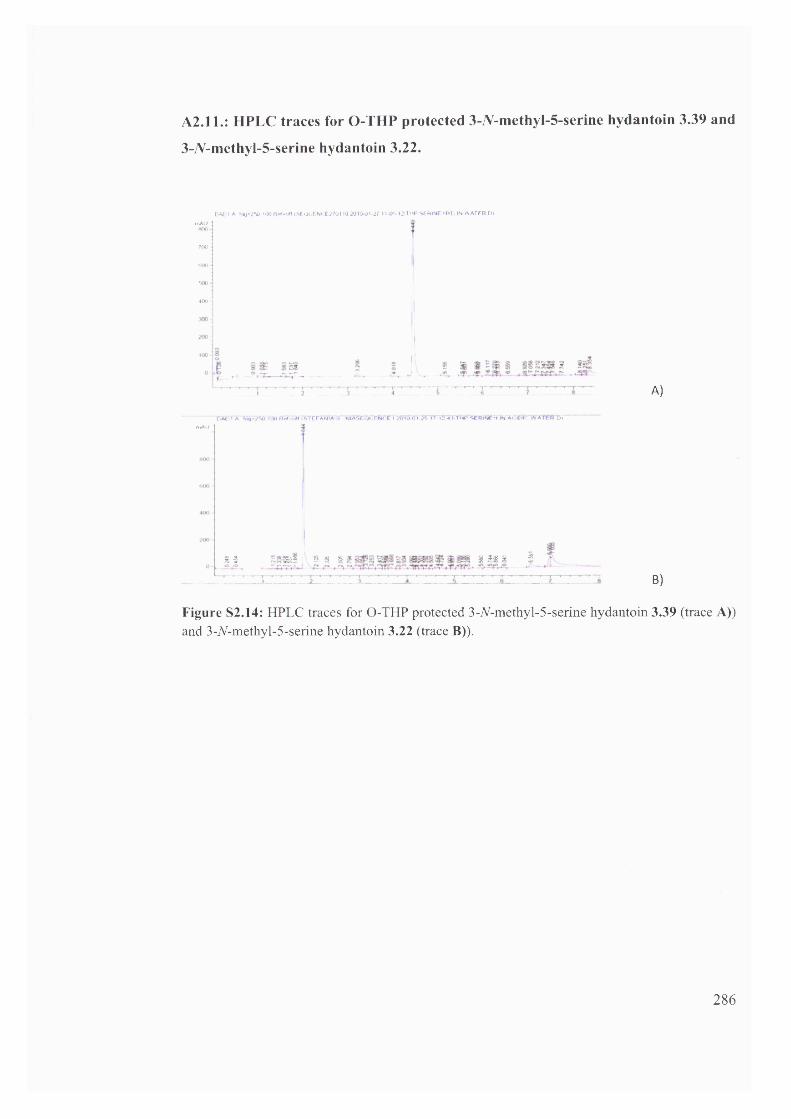
A 2.ll.: HPLC traces for O-THP protected 3-Ar-methyl-5-serine hydantoin 3.39 and
3-./V-methyl-5-serine hydantoin 3.22.
DAOt A S«q=25G 100 R«rf=off < SEQUENCE 270110 2010-01-27 11*06-12 7 HP SERINE HYD IN WAfERD)mAU*00
700 -
aoo 500- 400
— —
C)At1 > * SiQ-?®~ian>*f;i3risirErANnr5 miaseoterte i'S5T6oc» i7 i? j i rttt' serimertn'aciEht wa t tsrmAU
S 3 S * 3 5 ? § 8 § § 3 $ i 2 f
___________I______ 2_
A)
B)
Figure S2.14: HPLC traces for O-THP protected 3-jV-methy 1-5-serine hydantoin 3.39 (trace A)) and 3-A-methy 1-5-serine hydantoin 3.22 (trace B)).
286

Appendix 3
This Appendix is for Chapter 4
The effect of co-solvents on racemisation and H/D exchange of 5-benzylhydantoins
287
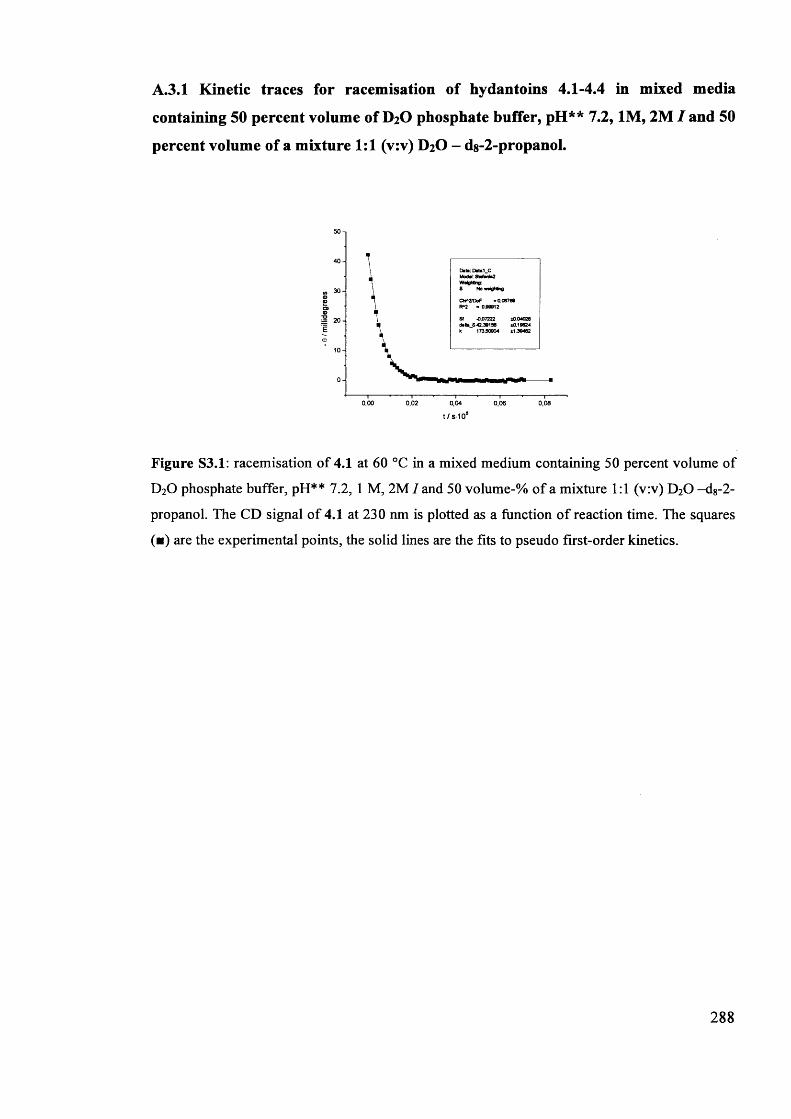
A.3.1 Kinetic traces for racemisation of hydantoins 4.1-4.4 in mixed media
containing 50 percent volume of D2 O phosphate buffer, pH** 7 .2 ,1M, 2M / and 50
percent volume of a mixture 1:1 (v:v) D2O - d8-2-propanol.
50
40
30s£09©■Q20E©
10
00,00 0,02 0,04 0,080,06
t /s -1 0 6
Figure S3.1: racemisation of 4.1 at 60 °C in a mixed medium containing 50 percent volume of
D20 phosphate buffer, pH** 7.2, 1 M, 2M I and 50 volume-% of a mixture 1:1 (v:v) D20 -d 8-2-
propanol. The CD signal of 4.1 at 230 nm is plotted as a function of reaction time. The squares
(■) are the experimental points, the solid lines are the fits to pseudo first-order kinetics.
288
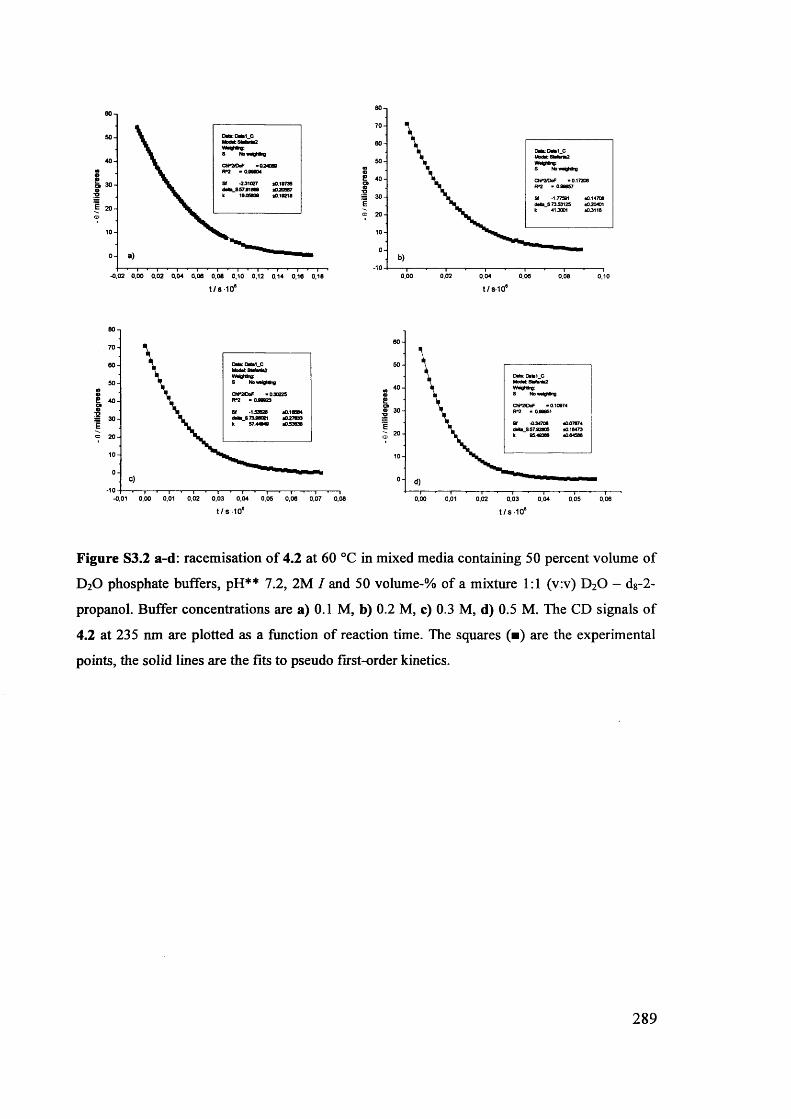
OI 30-
-0,02 0,00 0,02 0,04 0,06 0,08 0,10 0,12 0,14 0,16 0,16t /8 -1 0 *
80706050403020100
•10-0,01 0,00 0,01 0,02 0,03 0,04 0,05 0,06 0,07 0,08t / s - 1 0 6
b)—i--- ■ r »■----1----'----1----'----1----•----10,00 0,02 0,04 0,06 0,08 0,10
t /s -1 0 9
60
50
40
30
20100
0,00 0,01 0,02 0,03 0,04 0,05 0,06t /S - 1 0 6
Figure S3.2 a-d: racemisation of 4.2 at 60 °C in mixed media containing 50 percent volume of
D2O phosphate buffers, pH** 7.2, 2M I and 50 volume-% of a mixture 1:1 (v:v) D20 - d8-2-
propanol. Buffer concentrations are a) 0.1 M, b) 0.2 M, c) 0.3 M, d) 0.5 M. The CD signals of
4.2 at 235 nm are plotted as a function of reaction time. The squares (■) are the experimental
points, the solid lines are the fits to pseudo first-order kinetics.
289
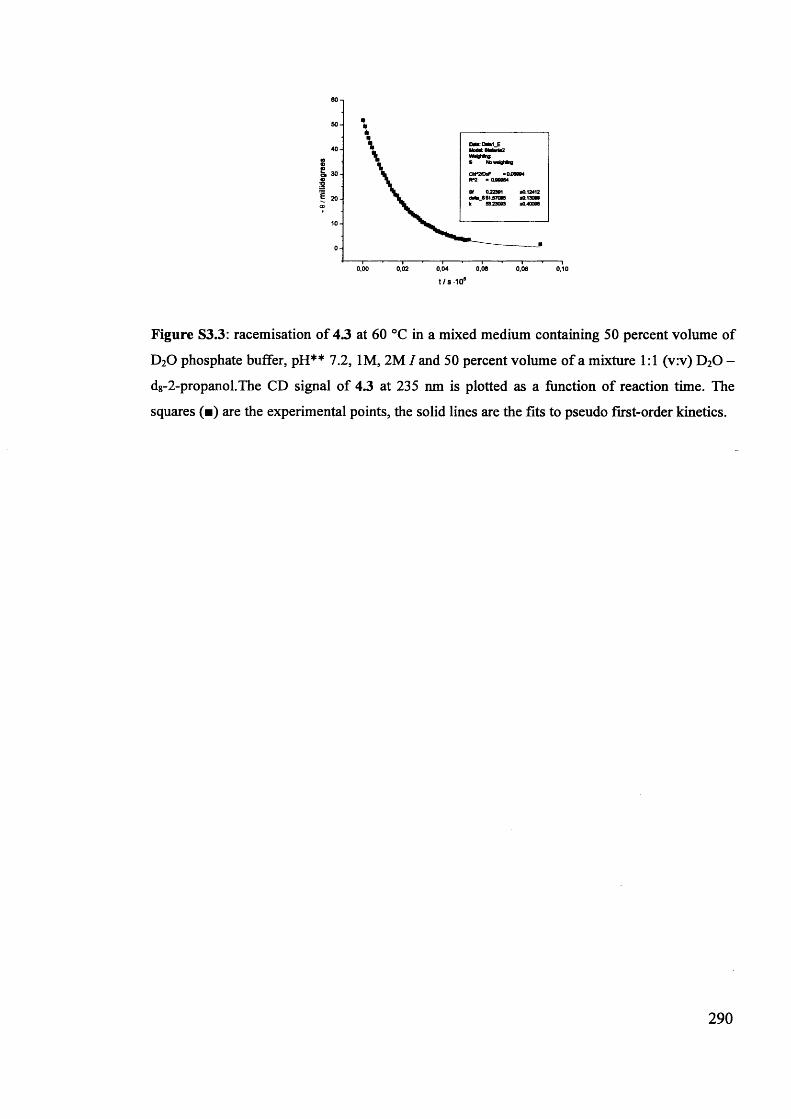
6 0-|50
40m0<D01■o
30
f 20100
0,00 0,02 0,04 0,06 0,08 0,10t/S-106
Figure S3.3: racemisation of 4.3 at 60 °C in a mixed medium containing 50 percent volume of
D20 phosphate buffer, pH** 7.2, 1M, 2M / and 50 percent volume of a mixture 1:1 (v:v) D20 -
dg-2-propanol.The CD signal of 4.3 at 235 nm is plotted as a function of reaction time. The
squares (■) are the experimental points, the solid lines are the fits to pseudo first-order kinetics.
290
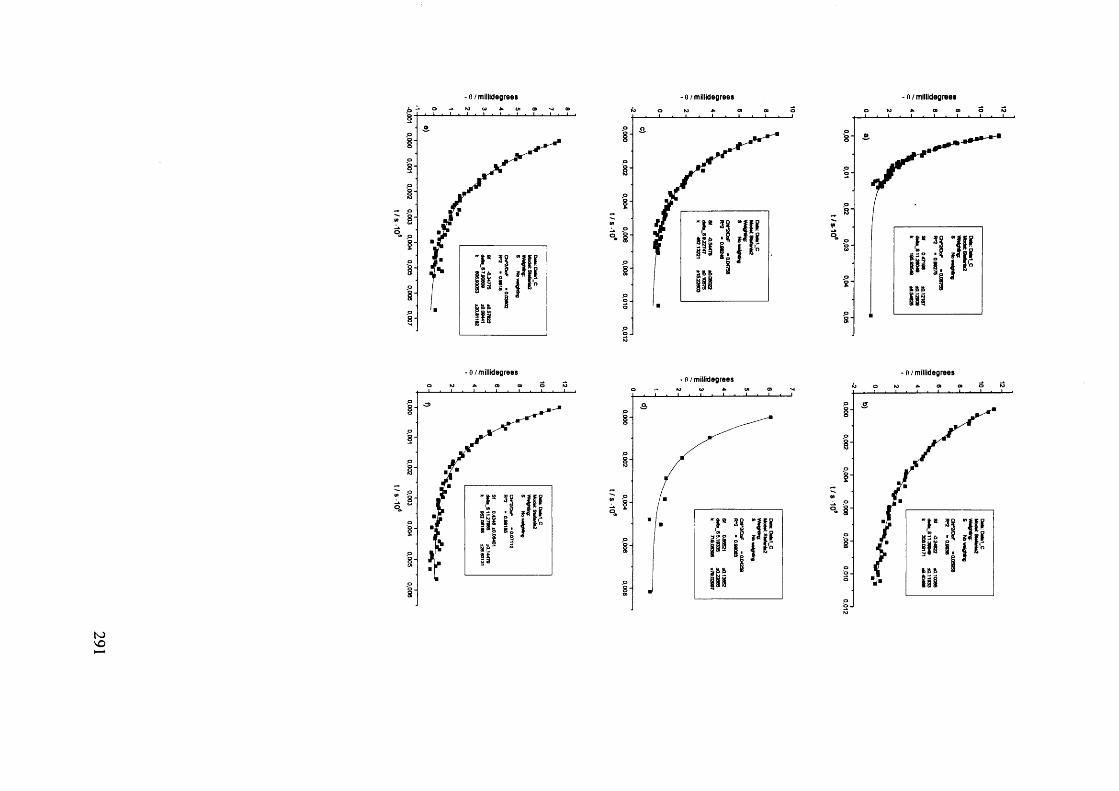
- 0 / millidegrees
8 -
o /millidegrees
vo
- e / millidegrees - fi / millidegrees
m ^ a cd o o io ^ a a> o roi ■ i - » » » » » • » . > . i . i . i . i ■ i . i
•£*
2s*>i |
0 / millidegrees
O foa> CDOO
O
OIO
O
Ooo
o
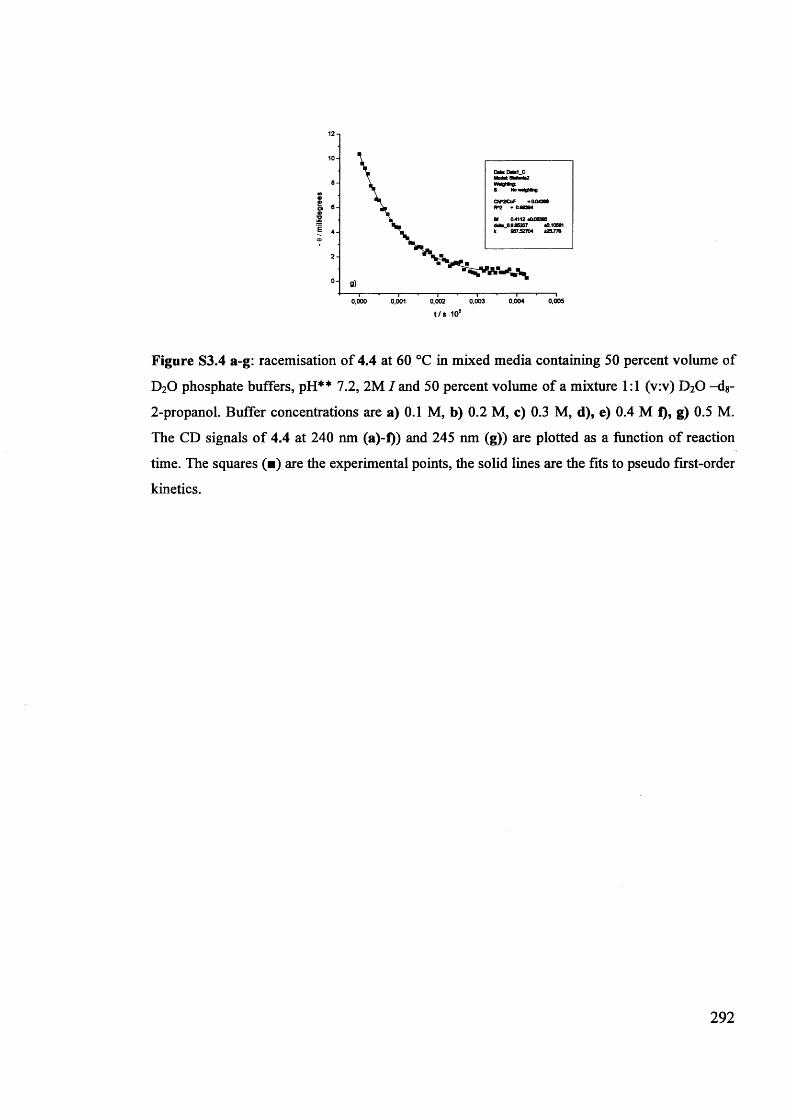
8MOo 6
20
0,003 0,004 0.0050,000 0,001 0,002
t/S 10*
Figure S3.4 a-g: racemisation of 4.4 at 60 °C in mixed media containing 50 percent volume of
D20 phosphate buffers, pH** 7.2, 2M / and 50 percent volume of a mixture 1:1 (v:v) D20 -d8-
2-propanol. Buffer concentrations are a) 0.1 M, b) 0.2 M, c) 0.3 M, d), e) 0.4 M f), g) 0.5 M.
The CD signals of 4.4 at 240 nm (a)-f)) and 245 nm (g)) are plotted as a function of reaction
time. The squares (■) are the experimental points, the solid lines are the fits to pseudo first-order
kinetics.
292
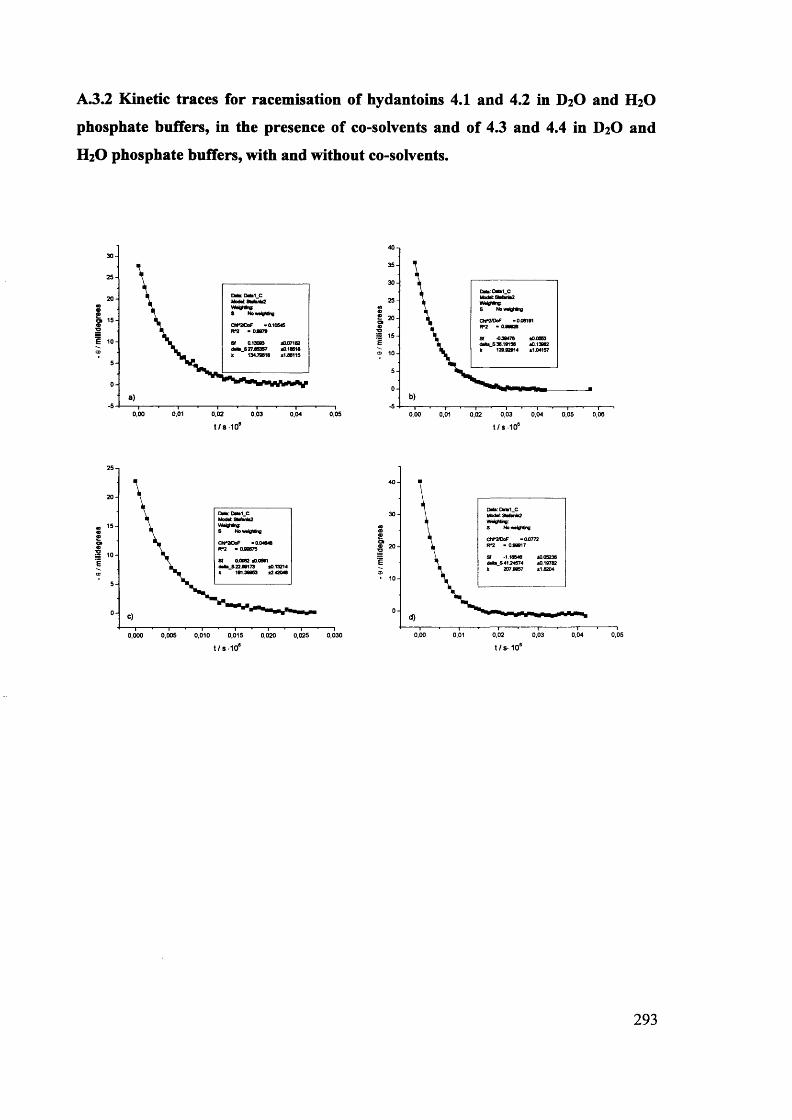
- r /
mill
ideg
rees
- e
/ mill
ideg
rees
A.3.2 Kinetic traces for racemisation of hydantoins 4.1 and 4.2 in D2O and H2O
phosphate buffers, in the presence of co-solvents and of 4.3 and 4.4 in D2O and
H2O phosphate buffers, with and without co-solvents.
' 0.0772
*0.05236*0.19782*18204
Sf 0.0082 *08991drt* 82289173 *0.13214k 191JS983 ±2.42046
293
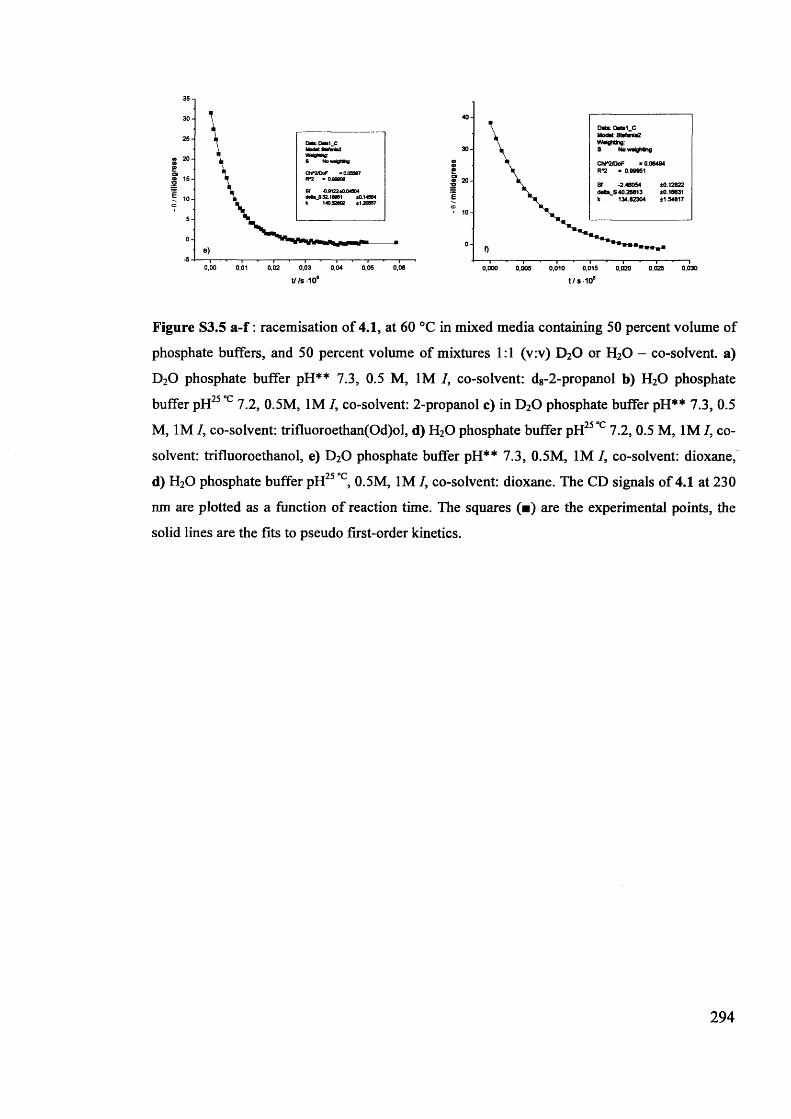
35-,
40l D«t»1_C
30to«£o«■o 20£<E • 10
00,005 0,010 0,015 0,025 0,0300,000 0,020
3025
to 20 ©£OB© 15
50-5 0,01 0,03 0,060,00 0,02 0,04 0,05
t / / s 10® t / s - 1 0 6
Figure S3.5 a - f : racemisation of 4.1, at 60 °C in mixed media containing 50 percent volume of
phosphate buffers, and 50 percent volume of mixtures 1:1 (v:v) D20 or H20 - co-solvent, a)
D20 phosphate buffer pH** 7.3, 0.5 M, 1M /, co-solvent: dg-2-propanol b) H20 phosphate
buffer pH25 c 7.2, 0.5M, 1M /, co-solvent: 2-propanol c) in D20 phosphate buffer pH** 7.3, 0.5
M, 1M /, co-solvent: trifluoroethan(Od)ol, d) H20 phosphate buffer pH25 °c 7.2, 0.5 M, 1M /, co
solvent: trifluoroethanol, e) D20 phosphate buffer pH** 7.3, 0.5M, 1M /, co-solvent: dioxane,
d) H20 phosphate buffer pH25 c, 0.5M, 1M /, co-solvent: dioxane. The CD signals of 4.1 at 230
nm are plotted as a function of reaction time. The squares (■) are the experimental points, the
solid lines are the fits to pseudo first-order kinetics.
294
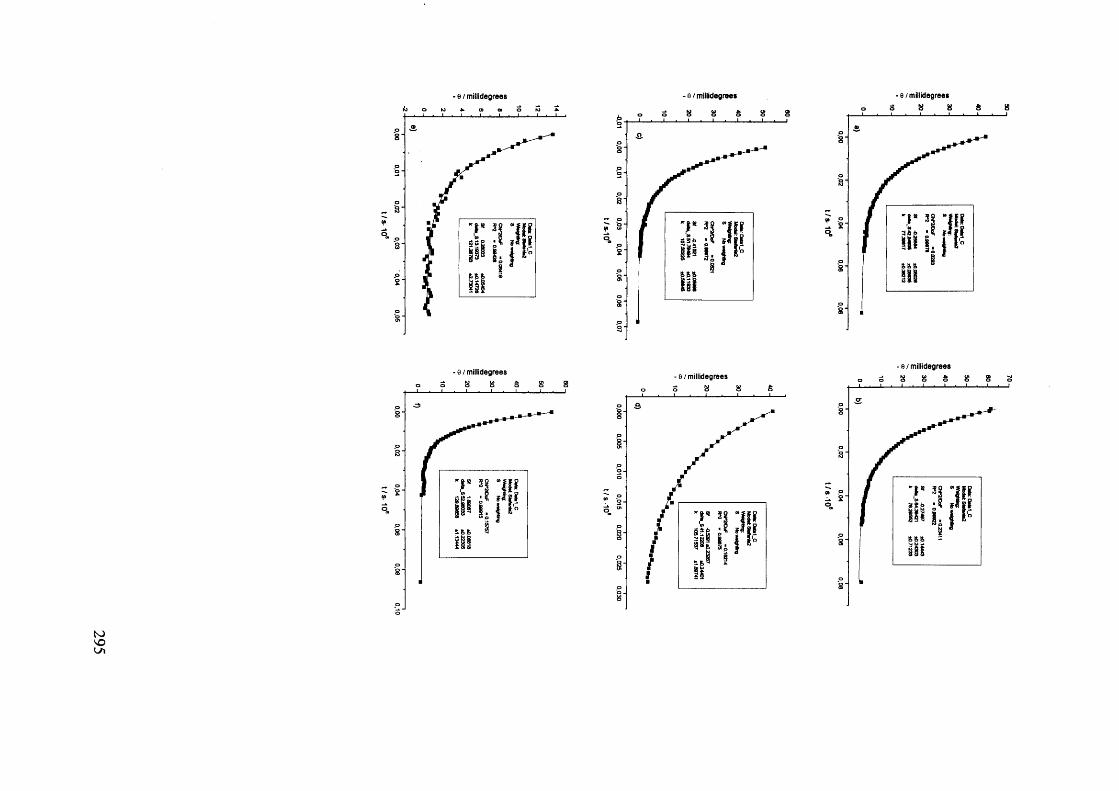
295
- e / millidegrees
I I * i » » ■ ■ ■ » ■__L
- e / millidegrees
8 8—i » t . i . i . i
t/s-10
9 t/s-10*
- f) / millidegrees
8 8 S 8 8__i i i i i i_j i i,o
- e / millidegrees
S8Oo
o
p
oooo*o
p
§oo8
- e / millidegrees
5 8 8 6 8
- fi / millidegrees
8 8 8 8 8-I 1__ 1__ 1__ L.
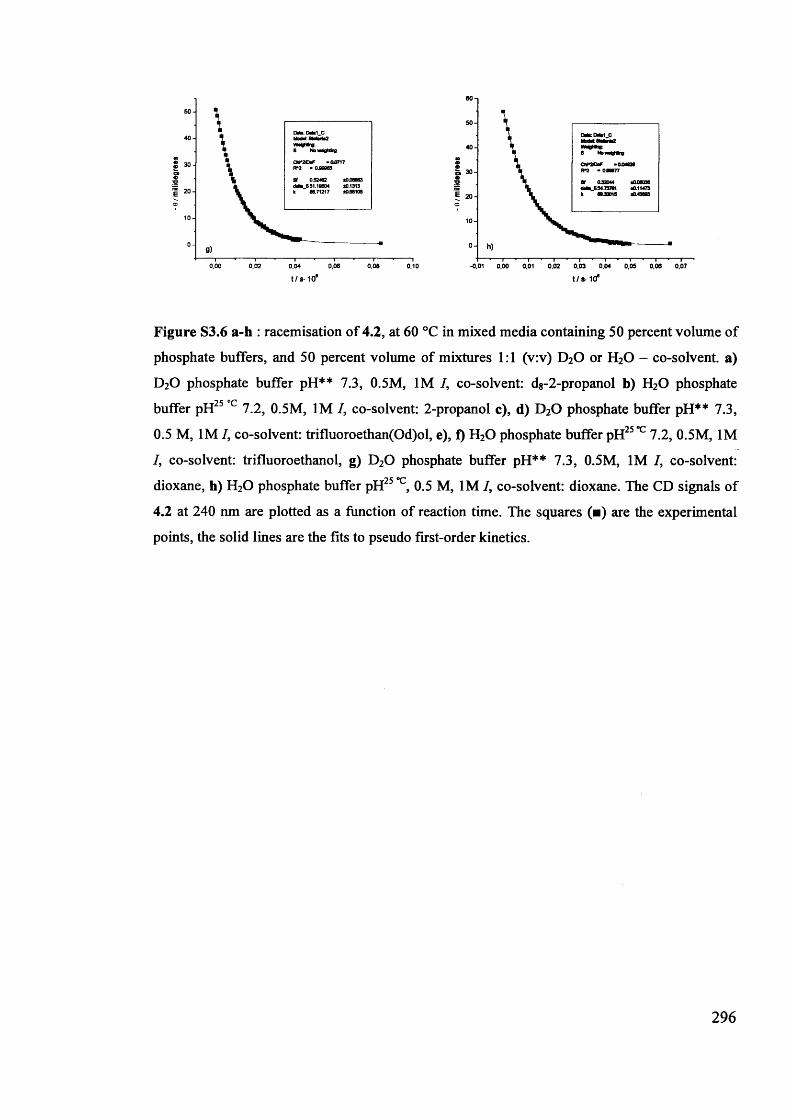
0,04 0,06t / s - 10fl
M•Sa0T3
E
-0,01 0,00 0,01 0,02 0,03 0,04 0,05 0,06 0,07t/S - 10*
Figure S3.6 a-h : racemisation of 4.2, at 60 °C in mixed media containing 50 percent volume of
phosphate buffers, and 50 percent volume of mixtures 1:1 (v:v) D20 or H20 - co-solvent, a)
D20 phosphate buffer pH** 7.3, 0.5M, 1M /, co-solvent: dg-2-propanol b) H20 phosphate
buffer pH25 c 7.2, 0.5M, 1M I, co-solvent: 2-propanol c), d) D20 phosphate buffer pH** 7.3,
0.5 M, 1M /, co-solvent: trifluoroethan(Od)ol, e), f) H20 phosphate buffer pH25C 7.2, 0.5M, 1M
1, co-solvent: trifluoroethanol, g) D20 phosphate buffer pH** 7.3, 0.5M, 1M I, co-solvent:
dioxane, h) H20 phosphate buffer pH25 C, 0.5 M, 1M /, co-solvent: dioxane. The CD signals of
4.2 at 240 nm are plotted as a function of reaction time. The squares (■) are the experimental
points, the solid lines are the fits to pseudo first-order kinetics.
296
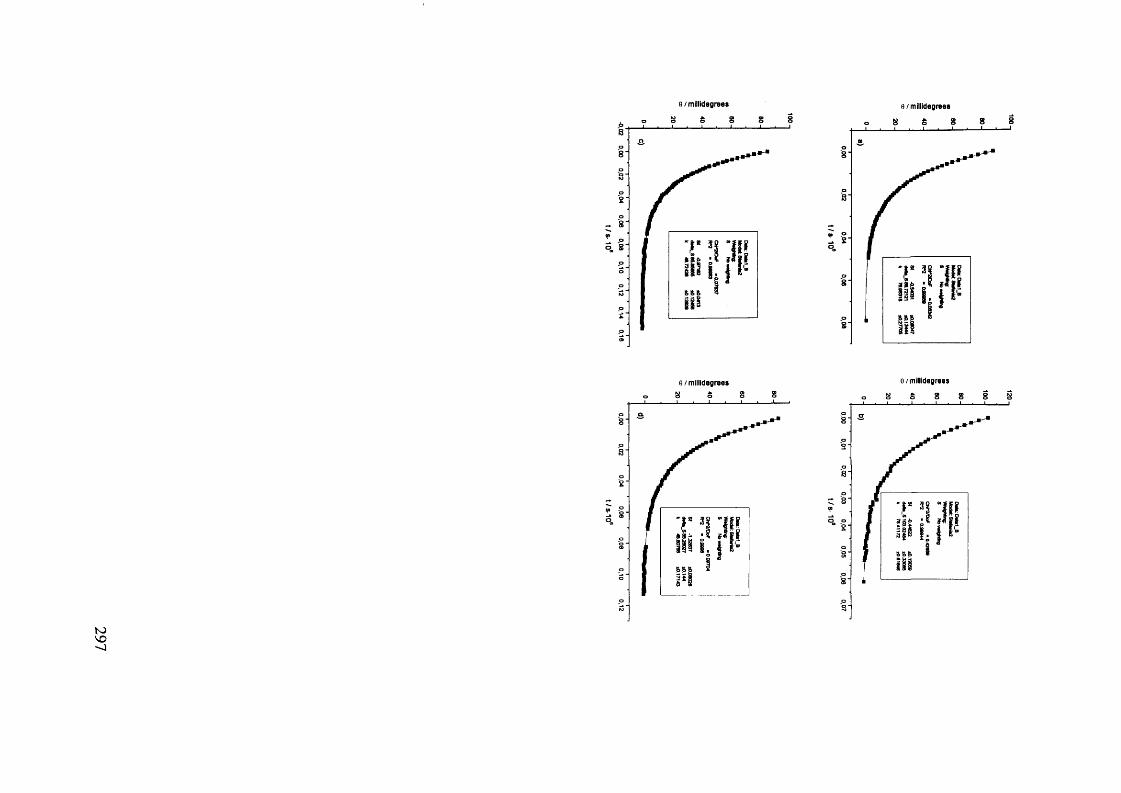
to'Oo
0 / millidegrees fl / millidegrees
e /millidegreese / millidegrees
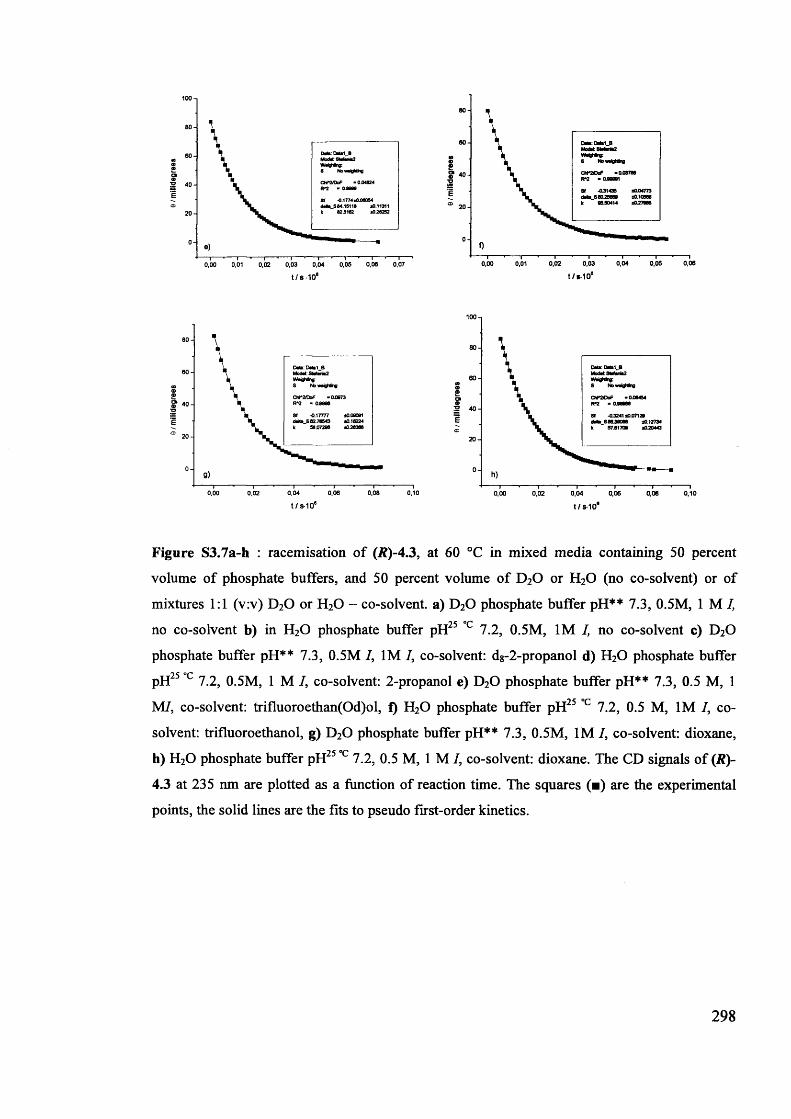
e)—i—•—i—«—i—■—i—■—i—■—i—■—i—*—i—0,00 0,01 0,02 0,03 0,04 0,05 0,06 0,07
t/S-10*
—j--- .---- ,----.----,---- .----I----.----1----.----,0,00 0,02 0,04 0,06 0,08 0,10t /s - 1 0 6
80
60
40
20
00,04 0,05 0,060,02 0,030,00 0,01
t/s-106
100
h)TT T T0,00 0,02 0,04 0,06 0,08 0,10
t/s-1 0 e
Figure S3.7a-h : racemisation of (R)-4.3, at 60 °C in mixed media containing 50 percent
volume of phosphate buffers, and 50 percent volume of D20 or H20 (no co-solvent) or of
mixtures 1:1 (v:v) D20 or H20 - co-solvent, a) D20 phosphate buffer pH** 7.3, 0.5M, 1 M I,
no co-solvent b) in H20 phosphate buffer pH25 c 7.2, 0.5M, 1M 7, no co-solvent c) D20
phosphate buffer pH** 7.3, 0.5M 7, 1M 7, co-solvent: dg-2-propanol d) H20 phosphate buffer
pH25 c 7.2, 0.5M, 1 M 7, co-solvent: 2-propanol e) D20 phosphate buffer pH** 7.3, 0.5 M, 1
M7, co-solvent: trifluoroethan(Od)ol, f) H20 phosphate buffer pH25 °c 7.2, 0.5 M, 1M 7, co
solvent: trifluoroethanol, g) D20 phosphate buffer pH** 7.3, 0.5M, 1M 7, co-solvent: dioxane,
h) H20 phosphate buffer pH25 °c 7.2, 0.5 M, 1 M 7, co-solvent: dioxane. The CD signals of (R)-
4.3 at 235 nm are plotted as a function of reaction time. The squares (■) are the experimental
points, the solid lines are the fits to pseudo first-order kinetics.
298
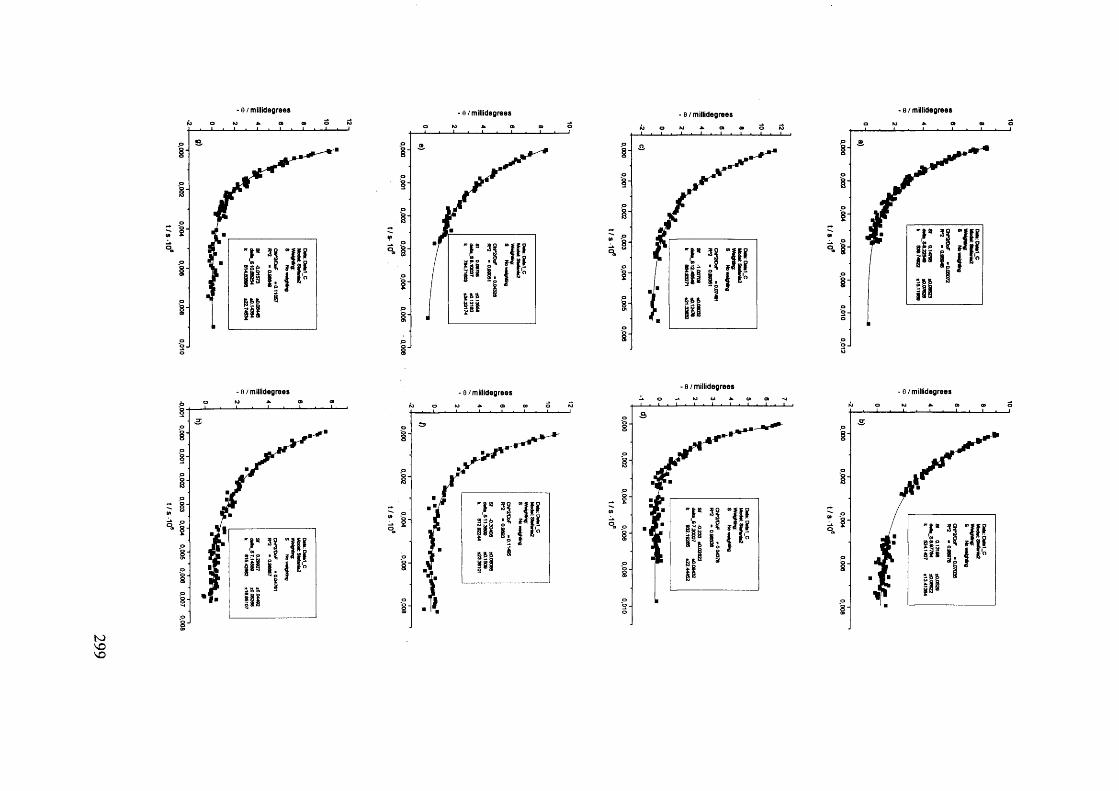
299
■ fi / m illidegrees ■A /m illidegreesO M
o, 8
- A / millidegrees - A/millidegreesh ° M8'
8 -
8 -
8 --4
O8
o> oo
t/s-10
6 t/s-1
0'
- e /m illidegrees - e / m illidegrees
OM a» ODo
o
o"8©
O§O
O
OI
- e / millidegrees- A / millidegrees
i . I L.
■
8 -
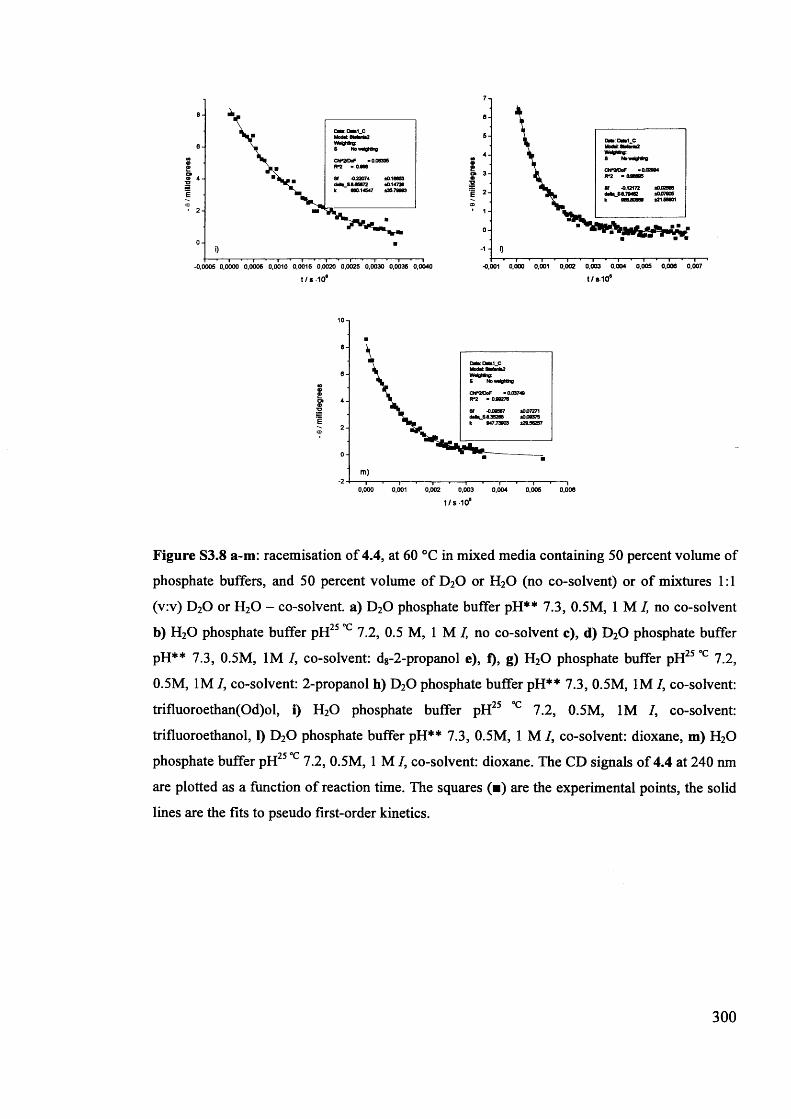
7n6
543
' 10-1-0,001 0,000 0,001 0,002 0,003 0,004 0,005 0,006 0,007
6
6M®©O# 1 4E<x ■ 2
0-0,0005 0,0000 0,0005 0,0010 0,0015 0,0020 0,0025 0,0030 0,0035 0,0040
t /s -1 0 * t/s-10*
10
8
6
4
2
0
-2 0,000 0,001 0,002 0,003 0,004 0,005 0,006t/S-10*
Figure S3.8 a-m: racemisation of 4.4, at 60 °C in mixed media containing 50 percent volume of
phosphate buffers, and 50 percent volume of D20 or H20 (no co-solvent) or of mixtures 1:1
(v:v) D20 or H20 - co-solvent, a) D20 phosphate buffer pH** 7.3, 0.5M, 1 M /, no co-solvent
b) H20 phosphate buffer pH25 c 7.2, 0.5 M, 1 M /, no co-solvent c), d) D20 phosphate buffer
pH** 7.3, 0.5M, 1M /, co-solvent: dg-2-propanol e), f), g) H20 phosphate buffer pH25 °c 7.2,
0.5M, 1M /, co-solvent: 2-propanol h) D20 phosphate buffer pH** 7.3, 0.5M, 1M /, co-solvent:
trifluoroethan(Od)ol, i) H20 phosphate buffer pH25 °c 7.2, 0.5M, 1M /, co-solvent:
trifluoroethanol, 1) D20 phosphate buffer pH** 7.3, 0.5M, 1 M /, co-solvent: dioxane, m) H20
phosphate buffer pH25 c 7.2, 0.5M, 1 M /, co-solvent: dioxane. The CD signals of 4.4 at 240 nm
are plotted as a function of reaction time. The squares (■) are the experimental points, the solid
lines are the fits to pseudo first-order kinetics.
300
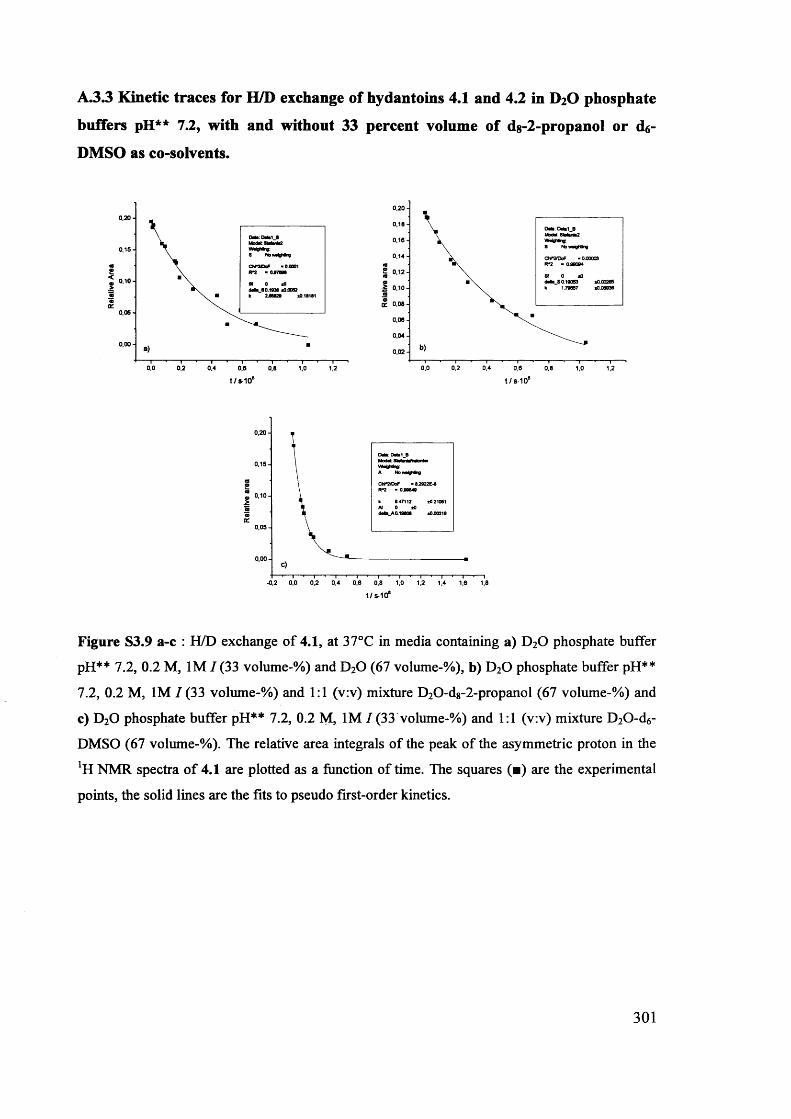
A.3.3 Kinetic traces for H/D exchange of hydantoins 4.1 and 4.2 in D2O phosphate
buffers pH** 7.2, with and without 33 percent volume of ds-2-propanol or d6-
DMSO as co-solvents.
■a)
0,0 0,2 0,6
t/s-108
0.2 0 -
0,18-0,16-0,14-0 ,1 2 -
•jS 0,10-fc 0,08-
0,060,04-
0.0 0,2 0,4 0,6 1,20,8 1,0
0,2 0 -
0,15-(DO<5* 0,1 0 - _>
0,05-
0,0 0 -
-0,2 0.0 0,2 0,4 0,6 0,8 1,0 1.2 1,81,4 1,6
t/s-108
Figure S3.9 a-c : H/D exchange of 4.1, at 37°C in media containing a) D20 phosphate buffer
pH** 7.2, 0.2 M, 1M 7(33 volume-%) and D20 (67 volume-%), b) D20 phosphate buffer pH**
7.2, 0.2 M, 1M 7(33 volume-%) and 1:1 (v:v) mixture D2 0-d 8-2-propanol (67 volume-%) and
c) D20 phosphate buffer pH** 7.2, 0.2 M, 1M 7(33 volume-%) and 1:1 (v:v) mixture D2 0-d6-
DMSO (67 volume-%). The relative area integrals of the peak of the asymmetric proton in the
!H NMR spectra of 4.1 are plotted as a function of time. The squares (■) are the experimental
points, the solid lines are the fits to pseudo first-order kinetics.
301
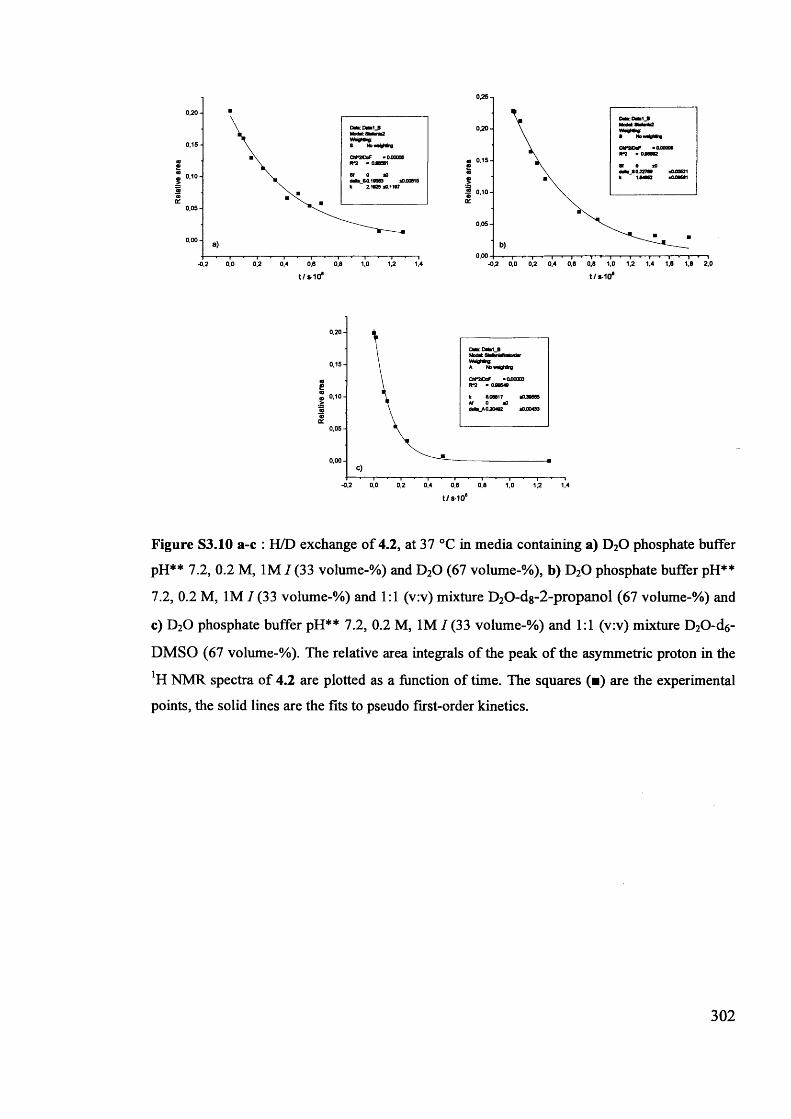
9 0,15-
5 0,10 -
0,00-0,2 0,0 0.2 0,4 0,6 0,8 1,0 1,2 1,4 1,6 1.8 2,0
0,2 0 -
0,15-9sg 0,10-
0,05-
0,0 0 -
0,0 0.2 0.6 0.8 1.0 1,2 1,4-0,2 0,4t / s 10® t/s-10*
0,20-
0,15-9eo 0,10- >
0,05-
0,0 0 -
-0,2 0,0 0,2 0.4 0,6 0,8 1,0 1,2 1,4t /s -1 0 6
Figure S3.10 a-c : H/D exchange of 4.2, at 37 °C in media containing a) D20 phosphate buffer pH** 7.2, 0.2 M, 1MI (33 volume-%) and D20 (67 volume-%), b) D20 phosphate buffer pH**
7.2, 0.2 M, 1MI (33 volume-%) and 1:1 (v:v) mixture D20-dg-2-propanol (67 volume-%) and
c) D20 phosphate buffer pH** 7.2, 0.2 M, 1M 7(33 volume-%) and 1:1 (v:v) mixture D20-d6-
DMSO (67 volume-%). The relative area integrals of the peak of the asymmetric proton in the
!H NMR spectra of 4.2 are plotted as a function of time. The squares (■) are the experimental points, the solid lines are the fits to pseudo first-order kinetics.
302
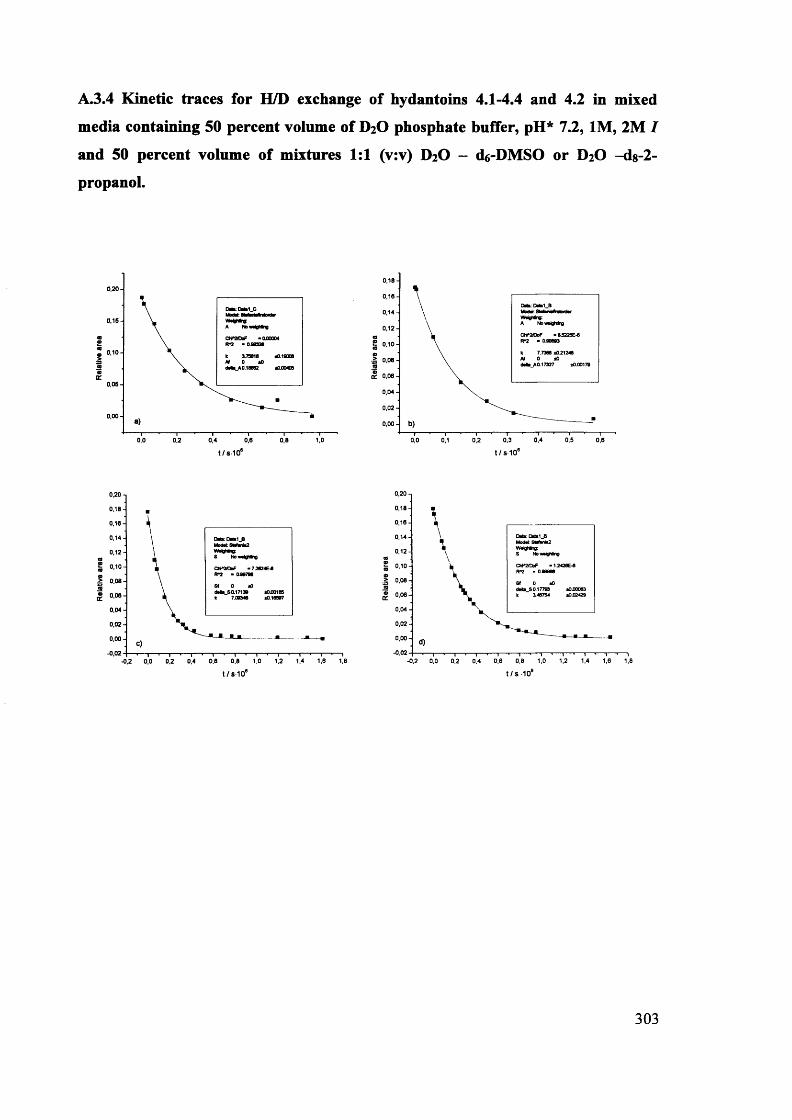
A.3.4 Kinetic traces for H/D exchange of hydantoins 4.1-4.4 and 4.2 in mixed
media containing 50 percent volume of D2O phosphate buffer, pH* 7.2, 1M, 2M I
and 50 percent volume of mixtures 1:1 (v:v) D2O - d6-DMSO or D2O -ds-2-
propanol.
(Bsm
0 ,1 0 -
0,05-
0,00 -
0,0 0,4 0.6 0,8 1,00.2t/S-10*
0,180,160,140,12
0,10
0,080C 0,06
0,040,02
0.3 0,4 0.50,0 0,1 0,2 0,6
0,20-i0,18-0,16-0,14-0,12-0,10-0,08-0,06-0,04-0 ,0 2 -
0,00--0,0 2 - 1,4 1,8
0,20-,0,18-0,16-0,14-0 ,1 2 -co1 °.1°
i 0,08 •I °.06
0,040,02
0 ,0 0 -
-0 ,0 2 - 0,4 0,6 1,0 1.2 1,4 1,6
303
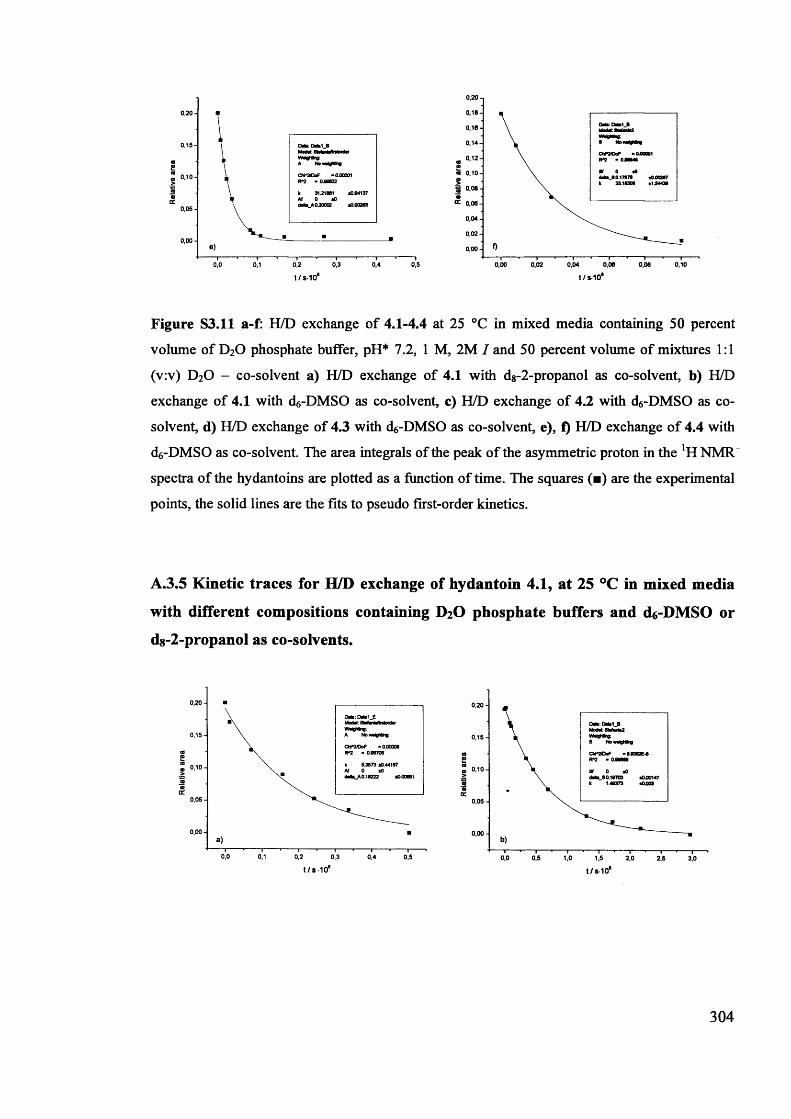
0,20-.
0,180.160,140.12
<° 0.105 0,08 ^ 0,06
0,02
0,0 0 -
0,06 0,060,00 0,02 0,04
0 ,2 0 -
0,15-(0Scs
0 ,1 0 -9>a9a: 0,05-
0 ,0 0 -
0,5o.o 0,1 0,2 0,3 0,4t/s-108 t/s-108
Figure S3.ll a-f: H/D exchange of 4.1-4.4 at 25 °C in mixed media containing 50 percent
volume of D20 phosphate buffer, pH* 7.2, 1 M, 2M I and 50 percent volume of mixtures 1:1
(v:v) D20 - co-solvent a) H/D exchange of 4.1 with dg-2 -propanol as co-solvent, b) H/D
exchange of 4.1 with d6-DMSO as co-solvent, c) H/D exchange of 4.2 with d6-DMSO as co
solvent, d) H/D exchange of 4.3 with d6-DMSO as co-solvent, e), f) H/D exchange of 4.4 with
d6-DMSO as co-solvent. The area integrals of the peak of the asymmetric proton in the ]H NMR
spectra of the hydantoins are plotted as a function of time. The squares (■) are the experimental
points, the solid lines are the fits to pseudo first-order kinetics.
A.3.5 Kinetic traces for H/D exchange of hydantoin 4.1, at 25 °C in mixed media
with different compositions containing D2O phosphate buffers and d6-DMSO or
ds-2-propanol as co-solvents.
0,20-
0,15-<sSCD 0,10-9>99tr 0,05-
0,0 0-
0,0 0.2 0,3 0,4 0,5
0,20 -
0,15-a>
« 0,10- >99a' 0,05-
0,0 0,5 1.0 1.5 2,0 2,5 3,0t/ s -1 0 e t/s-10*
304
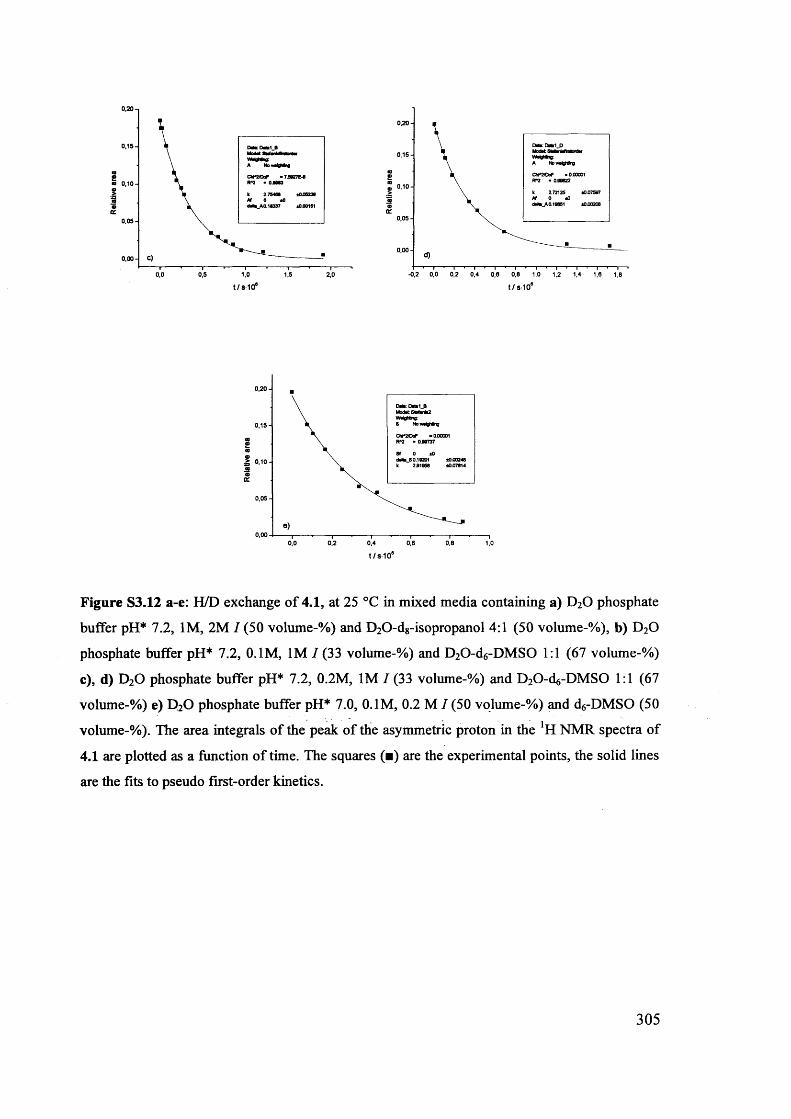
0,20-1
0,15-
m 0 ,1 0 -
0,05-
0,5 1.0 1.5 2,00,0
0,20-
0,15-si
t 0,1 0 - t> s0)O' 0,05-
0,00-
-0,2 0,0 0,2 0,4 0,6 0,8 1,0 1,2 1,4 1,6 1,8t/s-108 t/s-108
0,20-
0,15-
0.10-
0,05-
0,00 0.40.0 0,2 0,6 0,6 1.0t/S 108
Figure S3.12 a-e: H/D exchange of 4.1, at 25 °C in mixed media containing a) D20 phosphate
buffer pH* 7.2, 1M, 2M I (50 volume-%) and D20-d8-isopropanol 4:1 (50 volume-%), b) D20
phosphate buffer pH* 7.2, 0.1M, 1M 7(33 volume-%) and D20-d6-DMS0 1:1 (67 volume-%)
c), d) D20 phosphate buffer pH* 7.2, 0.2M, 1M I (33 volume-%) and D^-d^-DMSO 1:1 (67
volume-%) e) D20 phosphate buffer pH* 7.0, 0.1M, 0.2 M I (50 volume-%) and c^-DMSO (50
volume-%). The area integrals of the peak of the asymmetric proton in the ]H NMR spectra of
4.1 are plotted as a function of time. The squares (■) are the experimental points, the solid lines
are the fits to pseudo first-order kinetics.
305
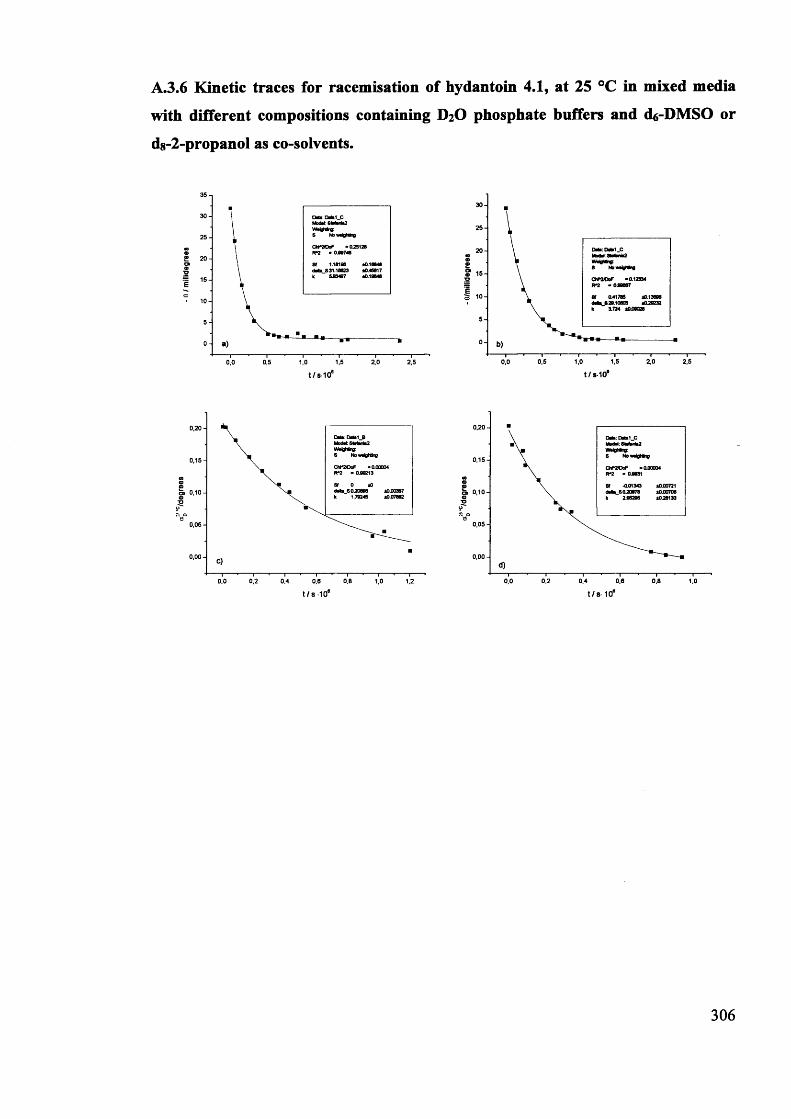
- a /
mill
ideg
rees
A.3.6 Kinetic traces for racemisation of hydantoin 4.1, at 25 °C in mixed media
with different compositions containing D2 O phosphate buffers and d6-DMSO or
d8-2-propanol as co-solvents.
35302520151050
1,5 2,0 2,50,0 0,5 1,0T
t/s-108 t/s-10*
0,20-
0,15-
o» 0,10-
0,05-
0,00-
0,0 0,2 0,4 0,8 1,00,6 1,2t / 8- 10“
306
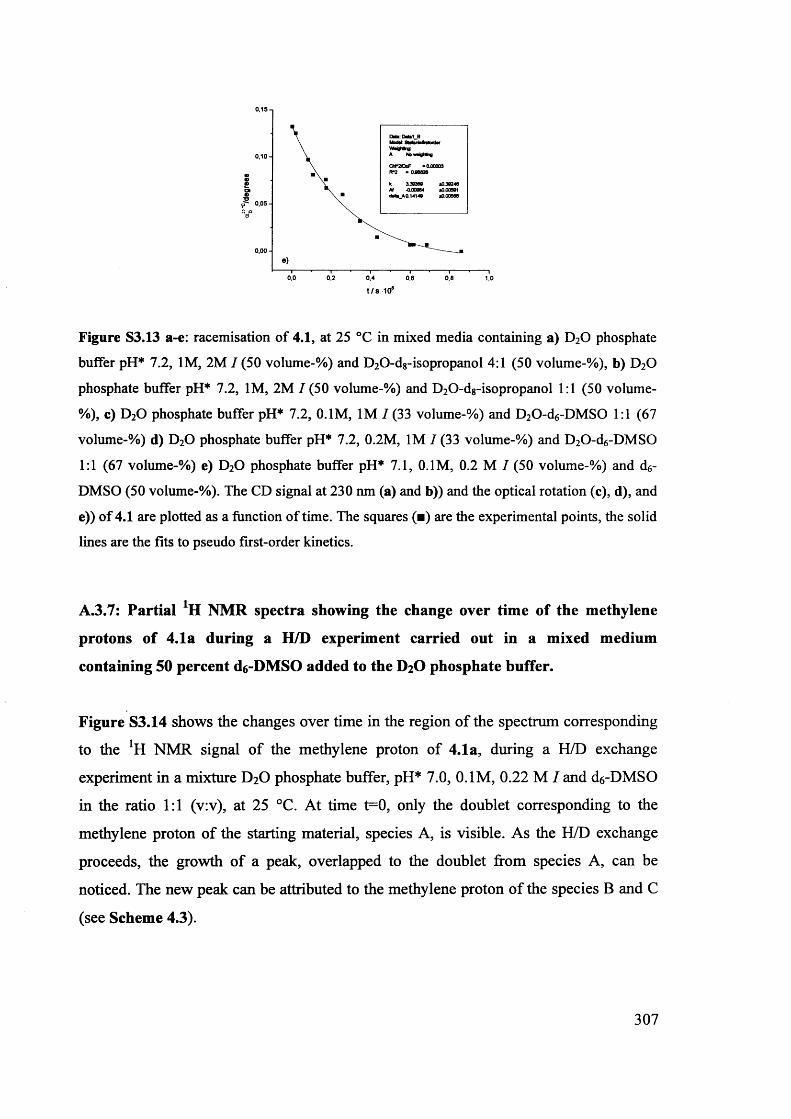
0,15-.
0,10-«0 E01oT3 0,05-V> a 8
0,00-
0.0 0,2 0,4 0.6 0.8 1,0
t / s 10‘
Figure S3.13 a-e: racemisation of 4.1, at 25 °C in mixed media containing a) D20 phosphate
buffer pH* 7.2, 1M, 2M / (50 volume-%) and D20-d8-isopropanol 4:1 (50 volume-%), b) D20
phosphate buffer pH* 7.2, 1M, 2M / (50 volume-%) and D20-d8-isopropanol 1:1 (50 volume-
%), c) D20 phosphate buffer pH* 7.2, 0.1M, 1M I (33 volume-%) and D20-d6-DMS0 1:1 (67
volume-%) d) D20 phosphate buffer pH* 7.2, 0.2M, 1M / (33 volume-%) and D20-d6-DMS0
1:1 (67 volume-%) e) D20 phosphate buffer pH* 7.1, 0.1M, 0.2 M / (50 volume-%) and d6-
DMSO (50 volume-%). The CD signal at 230 nm (a) and b)) and the optical rotation (c), d), and
e)) of 4.1 are plotted as a function of time. The squares (■) are the experimental points, the solid
lines are the fits to pseudo first-order kinetics.
A.3.7: Partial 1H NMR spectra showing the change over time of the methylene
protons of 4.1a during a H/D experiment carried out in a mixed medium
containing 50 percent d6-DMSO added to the D2O phosphate buffer.
Figure S3.14 shows the changes over time in the region of the spectrum corresponding
to the !H NMR signal of the methylene proton of 4.1a, during a H/D exchange
experiment in a mixture D2O phosphate buffer, pH* 7.0, 0.1M, 0.22 M I and d6-DMSO
in the ratio 1:1 (v:v), at 25 °C. At time t=0, only the doublet corresponding to the
methylene proton of the starting material, species A, is visible. As the H/D exchange
proceeds, the growth of a peak, overlapped to the doublet from species A, can be
noticed. The new peak can be attributed to the methylene proton of the species B and C
(see Scheme 4.3).
307
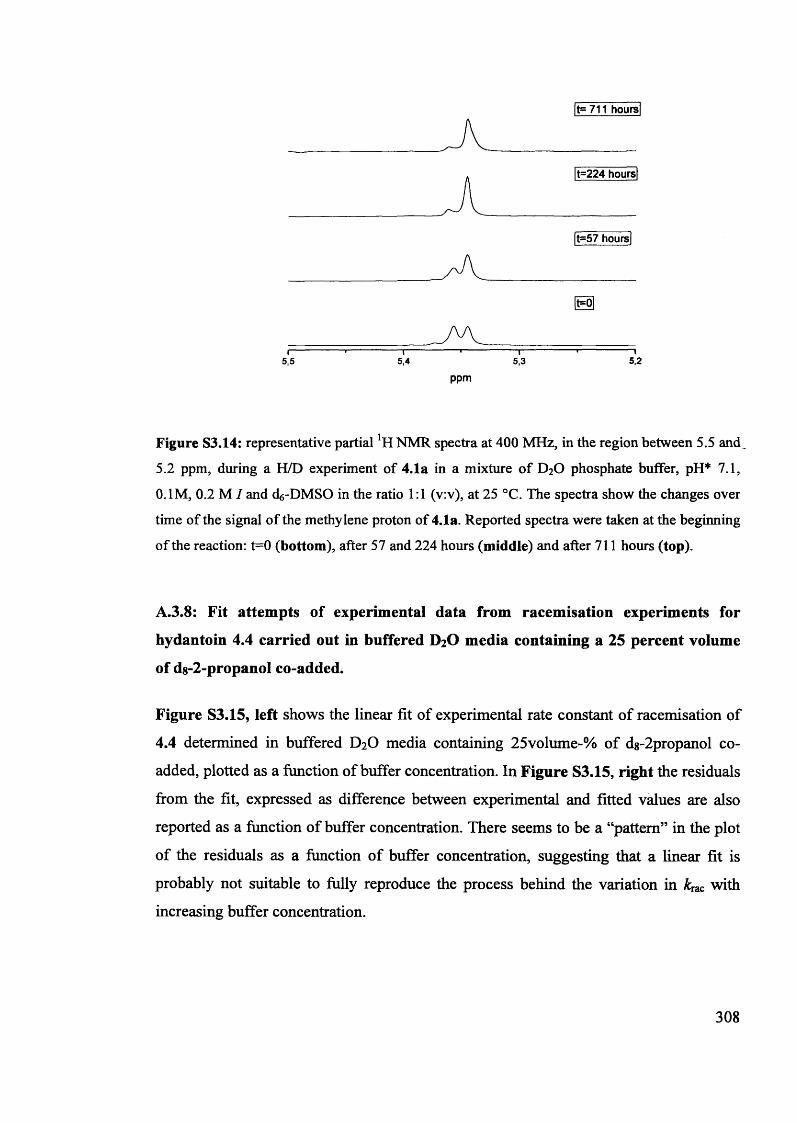
|t= 711 hoursl
|t=224 houTsj
|t=57 hoursl
___________________/ A . ___________________
H
_______________________i---------- '---------- 1---------- '---------- 1---------- ■---------- 15,5 5,4 5,3 5,2
ppm
Figure S3.14: representative partial *H NMR spectra at 400 MHz, in the region between 5.5 and
5.2 ppm, during a H/D experiment of 4.1a in a mixture of D20 phosphate buffer, pH* 7.1,
0.1M, 0.2 M I and d^-DMSO in the ratio 1:1 (v:v), at 25 °C. The spectra show the changes over
time of the signal of the methylene proton of 4.1a. Reported spectra were taken at the beginning
of the reaction: t=0 (bottom), after 57 and 224 hours (middle) and after 711 hours (top).
A.3.8: Fit attempts of experimental data from racemisation experiments for
hydantoin 4.4 carried out in buffered D2O media containing a 25 percent volume
of dg-2-propanol co-added.
Figure S3.15, left shows the linear fit of experimental rate constant of racemisation of
4.4 determined in buffered D2O media containing 25volume-% of dg-2propanol co
added, plotted as a function of buffer concentration. In Figure S3.15, right the residuals
from the fit, expressed as difference between experimental and fitted values are also
reported as a function of buffer concentration. There seems to be a “pattern” in the plot
of the residuals as a function of buffer concentration, suggesting that a linear fit is
probably not suitable to fully reproduce the process behind the variation in kiac with
increasing buffer concentration.
308
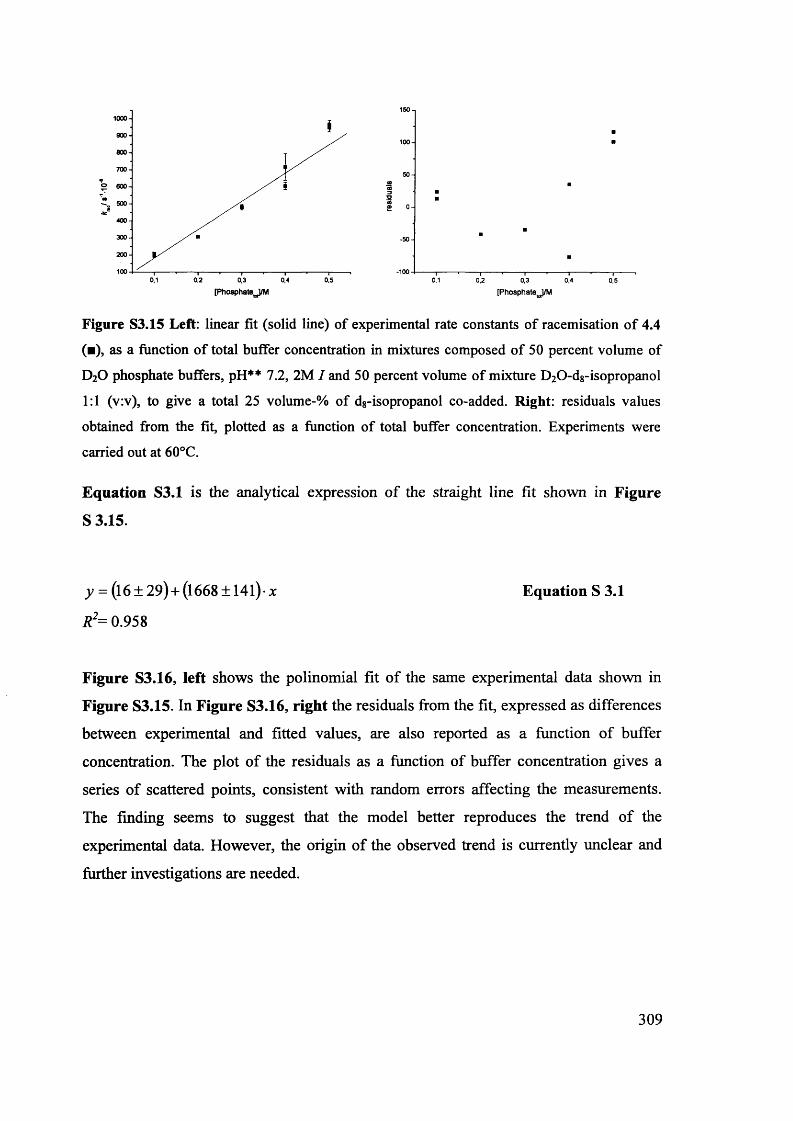
-1000,1 0,2 0,3
[Phosphate^J/M0,4 0.5 0.1 0,2 0,3
[Phosphate^J/M
0,4 0,5
Figure S3.15 Left: linear fit (solid line) of experimental rate constants of racemisation of 4.4 (■), as a function of total buffer concentration in mixtures composed of 50 percent volume of D20 phosphate buffers, pH** 7.2, 2M / and 50 percent volume of mixture D20-d8-isopropanol 1:1 (v:v), to give a total 25 volume-% of d8-isopropanol co-added. Right: residuals values obtained from the fit, plotted as a function of total buffer concentration. Experiments were carried out at 60°C.
Equation S3.1 is the analytical expression of the straight line fit shown in Figure
Figure S3.16, left shows the polinomial fit of the same experimental data shown in
Figure S3.15. In Figure S3.16, right the residuals from the fit, expressed as differences
between experimental and fitted values, are also reported as a function of buffer
concentration. The plot of the residuals as a function of buffer concentration gives a
series of scattered points, consistent with random errors affecting the measurements.
The finding seems to suggest that the model better reproduces the trend of the
experimental data. However, the origin of the observed trend is currently unclear and
further investigations are needed.
S 3.15.
y = (16 ±29)+(1668 ± 141)-x
R2= 0.958
Equation S 3.1
309
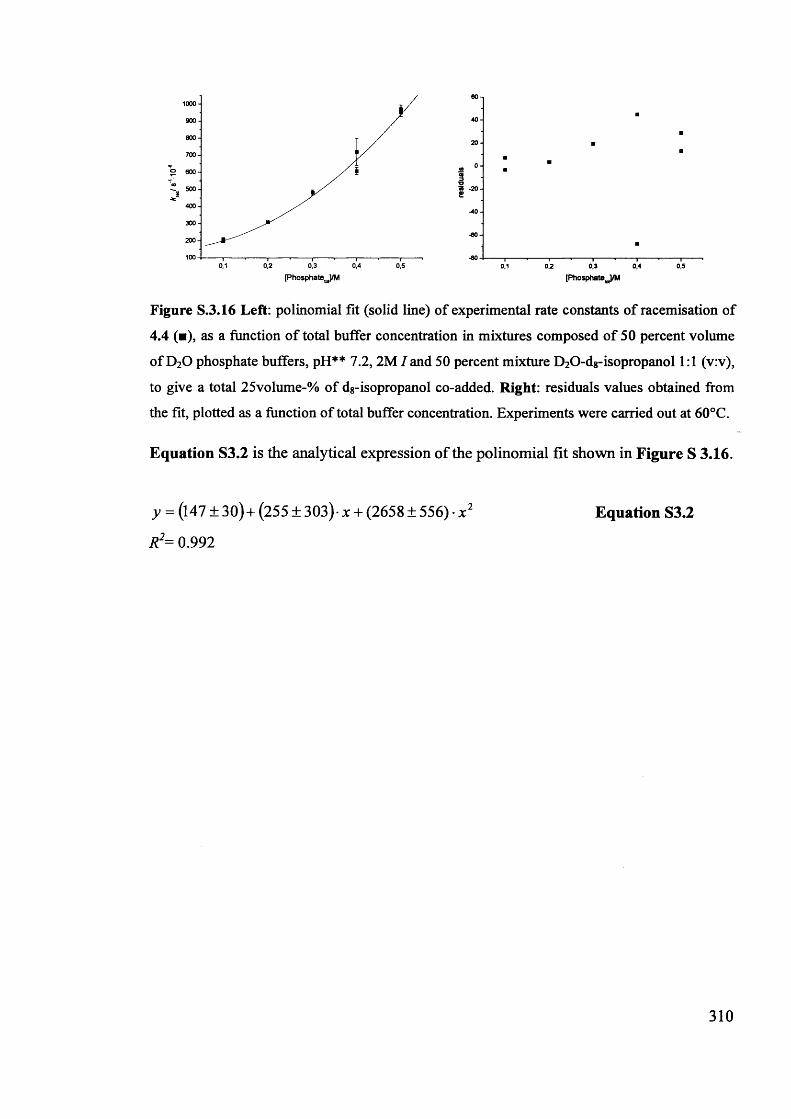
60 -i
■4 0 -
■20 - ■
■■0- ■
-2 0 -
-4 0 -
-6 0 -■
-80-1----- ,---,---1 1 '---- I--- '----- 1--- 10,1 0,2 0,3 0,4 0,5
[Phosphate J /M
Figure S.3.16 Left: polinomial fit (solid line) of experimental rate constants of racemisation of4.4 (■), as a function of total buffer concentration in mixtures composed of 50 percent volume of D20 phosphate buffers, pH** 7.2, 2M / and 50 percent mixture D20-d8-isopropanol 1:1 (v:v), to give a total 25volume-% of dg-isopropanol co-added. Right: residuals values obtained from the fit, plotted as a function of total buffer concentration. Experiments were carried out at 60°C.
Equation S3.2 is the analytical expression of the polinomial fit shown in Figure S 3.16.
y = (147 ± 30)+ (255 ± 303)- x + (2658 ± 556) • x 2 Equation S3.2
R2= 0.992
600500400300200
1000,2 0,3 0,4 0,5
[Phosphate J /M
310
Appendix 4
This Appendix is for Chapter 5
Exploring the use of IR and VCD spectroscopy for the study of reaction mechanisms involving stereogenic
centres.
311
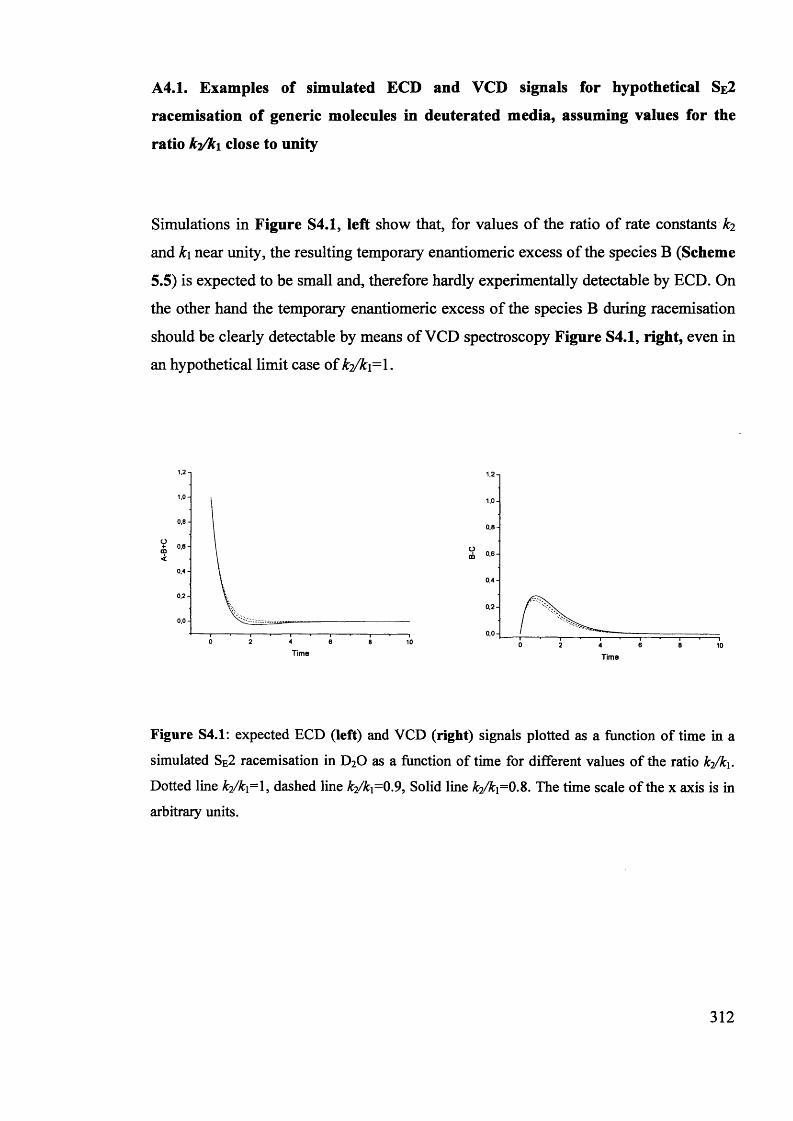
A4.1. Examples of simulated ECD and VCD signals for hypothetical Se2
racemisation of generic molecules in deuterated media, assuming values for the
ratio k i/k i close to unity
Simulations in Figure S4.1, left show that, for values of the ratio of rate constants
and k\ near unity, the resulting temporary enantiomeric excess of the species B (Scheme
5.5) is expected to be small and, therefore hardly experimentally detectable by ECD. On
the other hand the temporary enantiomeric excess of the species B during racemisation
should be clearly detectable by means of VCD spectroscopy Figure S4.1, right, even in
an hypothetical limit case of k?/k\=\.
1,0 -
O+ 0 ,6 - m<
0,4-
0 ,2 -
0 ,0 -
0 2 4 6 8 10
1,2-i
1,0 -
0,8 -
Oob0,4-
0.2 -
0,0 -0 2 64 8 104 6
Time
Figure S4.1: expected ECD (left) and VCD (right) signals plotted as a function of time in a simulated SE2 racemisation in D20 as a function of time for different values of the ratio ki/k\. Dotted line k2/k\=\, dashed line kj/ki=0.9, Solid line ki/k\=0.%. The time scale of the x axis is in arbitrary units.
312
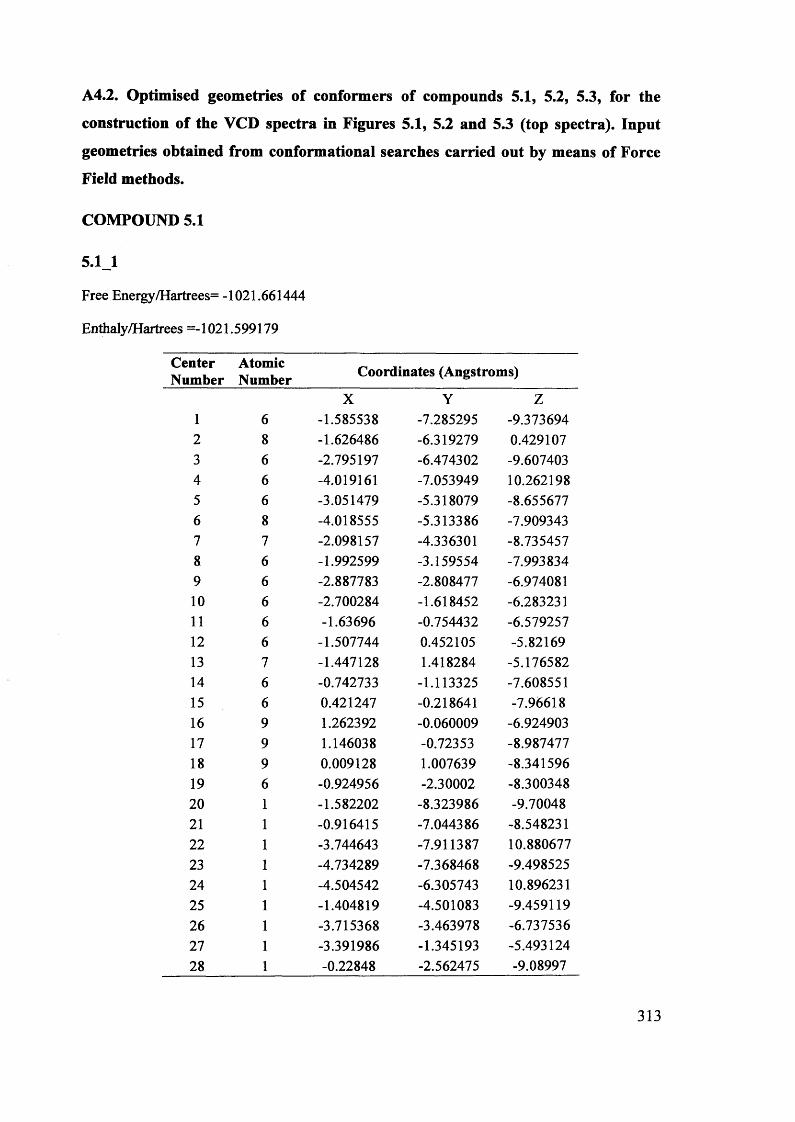
A4.2. Optimised geometries of conformers of compounds 5.1, 5.2, 5.3, for the
construction of the VCD spectra in Figures 5.1, 5.2 and 5.3 (top spectra). Input
geometries obtained from conformational searches carried out by means of Force
Field methods.
COMPOUND 5.1
5.1_1
Free Energy/Hartrees= -1021.661444
Enthaly/Hartrees =-1021.599179
CenterNumber
AtomicNumber Coordinates (Angstroms)
X Y Z1 6 -1.585538 -7.285295 -9.3736942 8 -1.626486 -6.319279 0.4291073 6 -2.795197 -6.474302 -9.6074034 6 -4.019161 -7.053949 10.2621985 6 -3.051479 -5.318079 -8.6556776 8 -4.018555 -5.313386 -7.9093437 7 -2.098157 -4.336301 -8.7354578 6 -1.992599 -3.159554 -7.9938349 6 -2.887783 -2.808477 -6.9740811 0 6 -2.700284 -1.618452 -6.28323111 6 -1.63696 -0.754432 -6.5792571 2 6 -1.507744 0.452105 -5.8216913 7 -1.447128 1.418284 -5.17658214 6 -0.742733 -1.113325 -7.60855115 6 0.421247 -0.218641 -7.9661816 9 1.262392 -0.060009 -6.92490317 9 1.146038 -0.72353 -8.98747718 9 0.009128 1.007639 -8.34159619 6 -0.924956 -2.30002 -8.3003482 0 1 -1.582202 -8.323986 -9.700482 1 1 -0.916415 -7.044386 -8.5482312 2 1 -3.744643 -7.911387 10.88067723 1 -4.734289 -7.368468 -9.49852524 1 -4.504542 -6.305743 10.89623125 1 -1.404819 -4.501083 -9.45911926 1 -3.715368 -3.463978 -6.73753627 1 -3.391986 -1.345193 -5.49312428 1 -0.22848 -2.562475 -9.08997
313
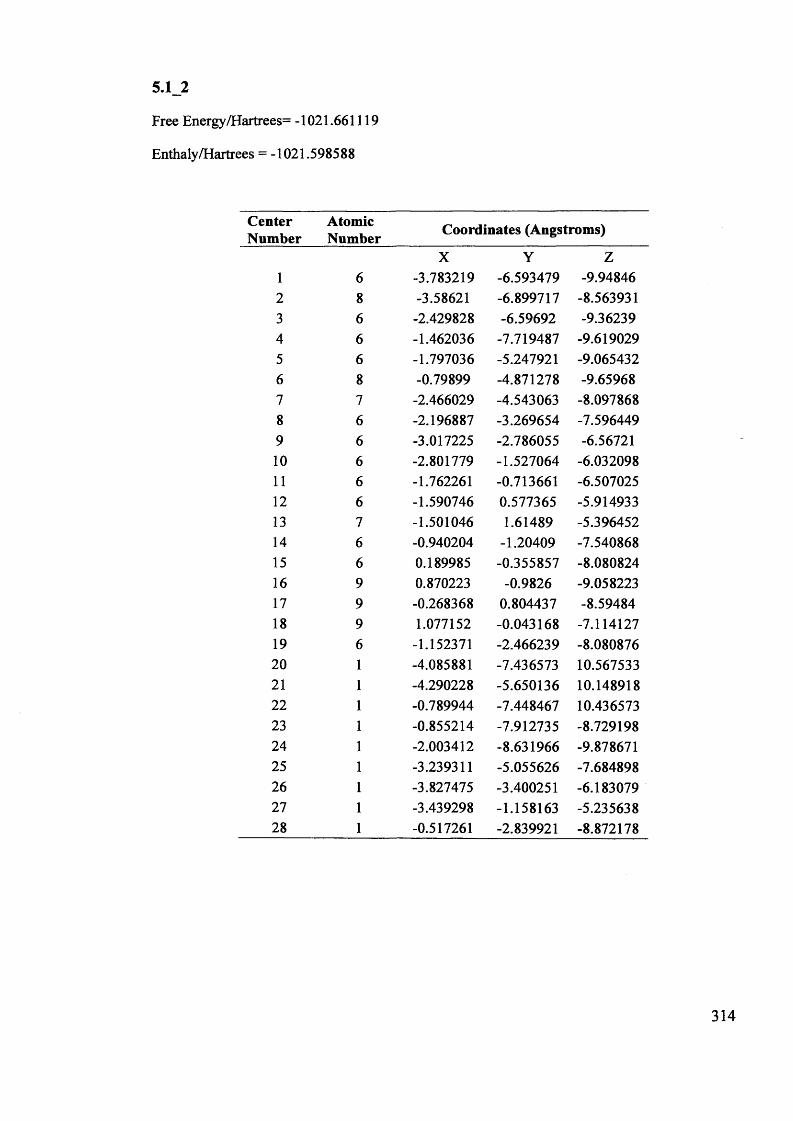
5.1_2
Free Energy/Hartrees= -1021.661119
Enthaly/Hartrees = -1021.598588
CenterNumber
AtomicNumber Coordinates (Angstroms)
X Y Z1 6 -3.783219 -6.593479 -9.948462 8 -3.58621 -6.899717 -8.5639313 6 -2.429828 -6.59692 -9.362394 6 -1.462036 -7.719487 -9.6190295 6 -1.797036 -5.247921 -9.0654326 8 -0.79899 -4.871278 -9.659687 7 -2.466029 -4.543063 -8.0978688 6 -2.196887 -3.269654 -7.5964499 6 -3.017225 -2.786055 -6.5672110 6 -2.801779 -1.527064 -6.03209811 6 -1.762261 -0.713661 -6.50702512 6 -1.590746 0.577365 -5.91493313 7 -1.501046 1.61489 -5.39645214 6 -0.940204 -1.20409 -7.54086815 6 0.189985 -0.355857 -8.08082416 9 0.870223 -0.9826 -9.05822317 9 -0.268368 0.804437 -8.5948418 9 1.077152 -0.043168 -7.11412719 6 -1.152371 -2.466239 -8.08087620 1 -4.085881 -7.436573 10.56753321 1 -4.290228 -5.650136 10.14891822 1 -0.789944 -7.448467 10.43657323 1 -0.855214 -7.912735 -8.72919824 1 -2.003412 -8.631966 -9.87867125 1 -3.239311 -5.055626 -7.68489826 1 -3.827475 -3.400251 -6.18307927 1 -3.439298 -1.158163 -5.23563828 1 -0.517261 -2.839921 -8.872178
314
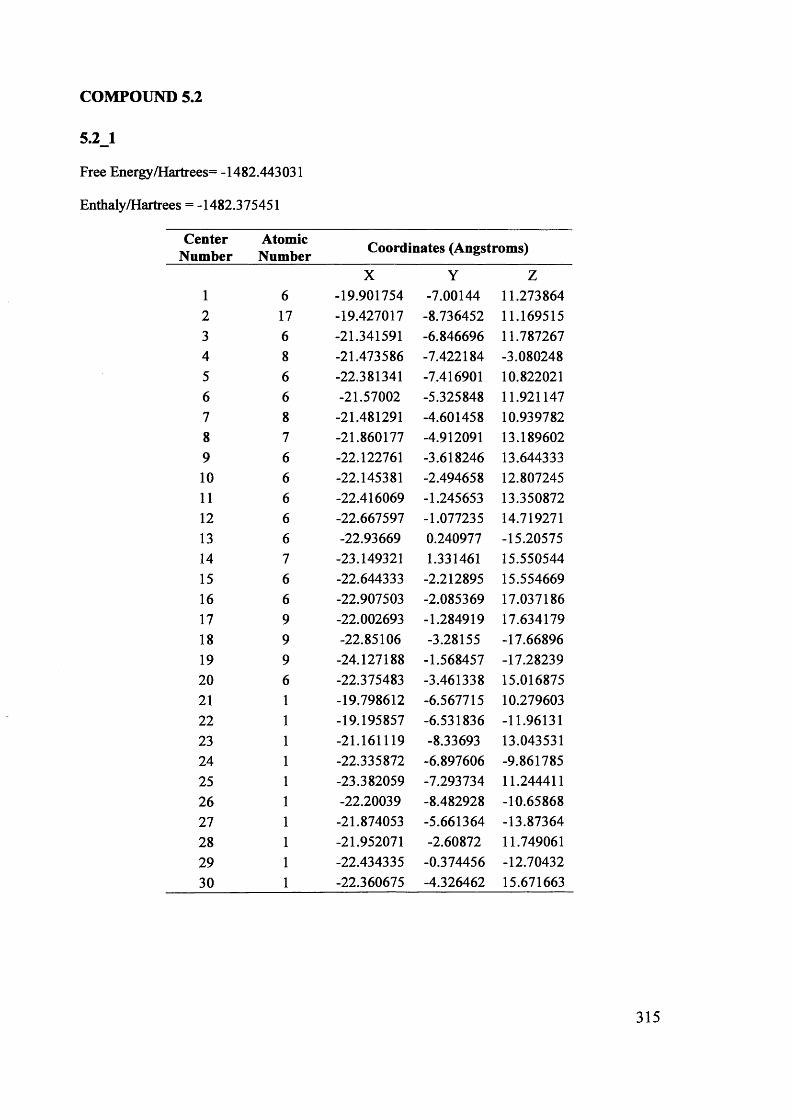
COMPOUND 5.2
5.2_1
Free Energy/Hartrees= -1482.443031
Enthaly/Hartrees = -1482.375451
CenterNumber
AtomicNumber Coordinates (Angstroms)
X Y Z1 6 -19.901754 -7.00144 11.2738642 17 -19.427017 -8.736452 11.1695153 6 -21.341591 -6.846696 11.7872674 8 -21.473586 -7.422184 -3.0802485 6 -22.381341 -7.416901 10.8220216 6 -21.57002 -5.325848 11.9211477 8 -21.481291 -4.601458 10.9397828 7 -21.860177 -4.912091 13.1896029 6 -22.122761 -3.618246 13.64433310 6 -22.145381 -2.494658 12.80724511 6 -22.416069 -1.245653 13.35087212 6 -22.667597 -1.077235 14.71927113 6 -22.93669 0.240977 -15.2057514 7 -23.149321 1.331461 15.55054415 6 -22.644333 -2.212895 15.55466916 6 -22.907503 -2.085369 17.03718617 9 -22.002693 -1.284919 17.63417918 9 -22.85106 -3.28155 -17.6689619 9 -24.127188 -1.568457 -17.2823920 6 -22.375483 -3.461338 15.01687521 1 -19.798612 -6.567715 10.27960322 1 -19.195857 -6.531836 -11.9613123 1 -21.161119 -8.33693 13.04353124 1 -22.335872 -6.897606 -9.86178525 1 -23.382059 -7.293734 11.24441126 1 -22.20039 -8.482928 -10.6586827 1 -21.874053 -5.661364 -13.8736428 1 -21.952071 -2.60872 11.74906129 1 -22.434335 -0.374456 -12.7043230 1 -22.360675 -4.326462 15.671663
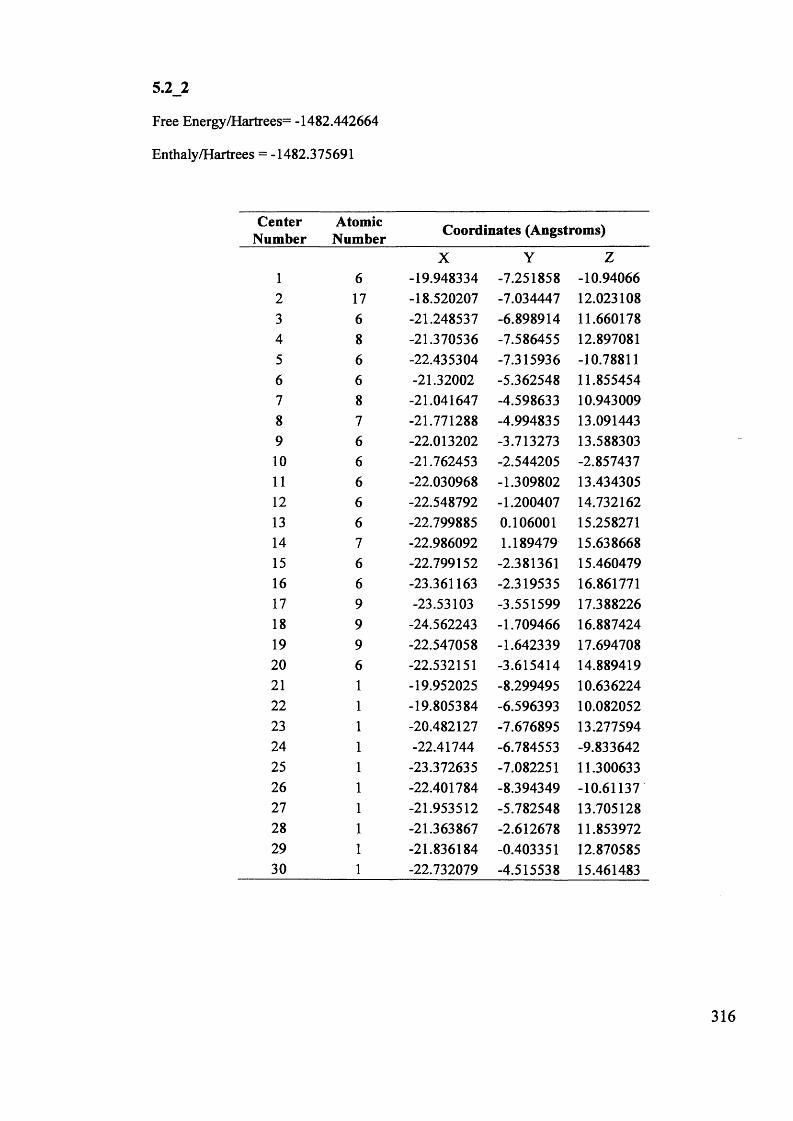
5.2_2
Free Energy/Hartrees= -1482.442664
Enthaly/Hartrees = -1482.375691
CenterNumber
AtomicNumber Coordinates (Angstroms)
X Y Z1 6 -19.948334 -7.251858 -10.940662 17 -18.520207 -7.034447 12.0231083 6 -21.248537 -6.898914 11.6601784 8 -21.370536 -7.586455 12.8970815 6 -22.435304 -7.315936 -10.788116 6 -21.32002 -5.362548 11.8554547 8 -21.041647 -4.598633 10.9430098 7 -21.771288 -4.994835 13.0914439 6 -22.013202 -3.713273 13.5883031 0 6 -21.762453 -2.544205 -2.85743711 6 -22.030968 -1.309802 13.4343051 2 6 -22.548792 -1.200407 14.73216213 6 -22.799885 0.106001 15.25827114 7 -22.986092 1.189479 15.63866815 6 -22.799152 -2.381361 15.46047916 6 -23.361163 -2.319535 16.86177117 9 -23.53103 -3.551599 17.38822618 9 -24.562243 -1.709466 16.88742419 9 -22.547058 -1.642339 17.6947082 0 6 -22.532151 -3.615414 14.8894192 1 1 -19.952025 -8.299495 10.6362242 2 1 -19.805384 -6.596393 10.08205223 1 -20.482127 -7.676895 13.27759424 1 -22.41744 -6.784553 -9.83364225 1 -23.372635 -7.082251 11.30063326 1 -22.401784 -8.394349 -10.6113727 1 -21.953512 -5.782548 13.70512828 1 -21.363867 -2.612678 11.85397229 1 -21.836184 -0.403351 12.87058530 1 -22.732079 -4.515538 15.461483
316
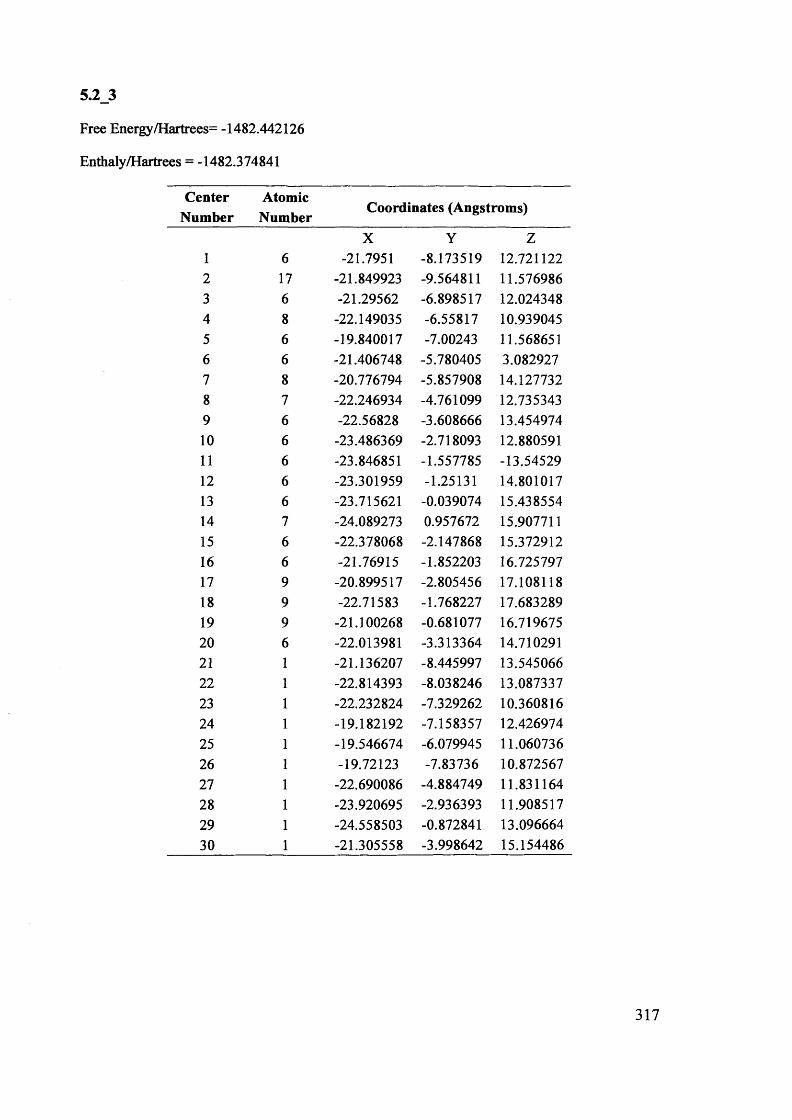
5.2_3
Free Energy/Hartrees= -1482.442126
Enthaly/Hartrees = -1482.374841
CenterNumber
AtomicNumber Coordinates (Angstroms)
X Y Z1 6 -21.7951 -8.173519 12.7211222 17 -21.849923 -9.564811 11.5769863 6 -21.29562 -6.898517 12.0243484 8 -22.149035 -6.55817 10.9390455 6 -19.840017 -7.00243 11.5686516 6 -21.406748 -5.780405 3.0829277 8 -20.776794 -5.857908 14.1277328 7 -22.246934 -4.761099 12.7353439 6 -22.56828 -3.608666 13.45497410 6 -23.486369 -2.718093 12.88059111 6 -23.846851 -1.557785 -13.5452912 6 -23.301959 -1.25131 14.80101713 6 -23.715621 -0.039074 15.43855414 7 -24.089273 0.957672 15.90771115 6 -22.378068 -2.147868 15.37291216 6 -21.76915 -1.852203 16.72579717 9 -20.899517 -2.805456 17.10811818 9 -22.71583 -1.768227 17.68328919 9 -21.100268 -0.681077 16.71967520 6 -22.013981 -3.313364 14.71029121 1 -21.136207 -8.445997 13.54506622 1 -22.814393 -8.038246 13.08733723 1 -22.232824 -7.329262 10.36081624 1 -19.182192 -7.158357 12.42697425 1 -19.546674 -6.079945 11.06073626 1 -19.72123 -7.83736 10.87256727 1 -22.690086 -4.884749 11.83116428 1 -23.920695 -2.936393 11.90851729 1 -24.558503 -0.872841 13.09666430 1 -21.305558 -3.998642 15.154486
317
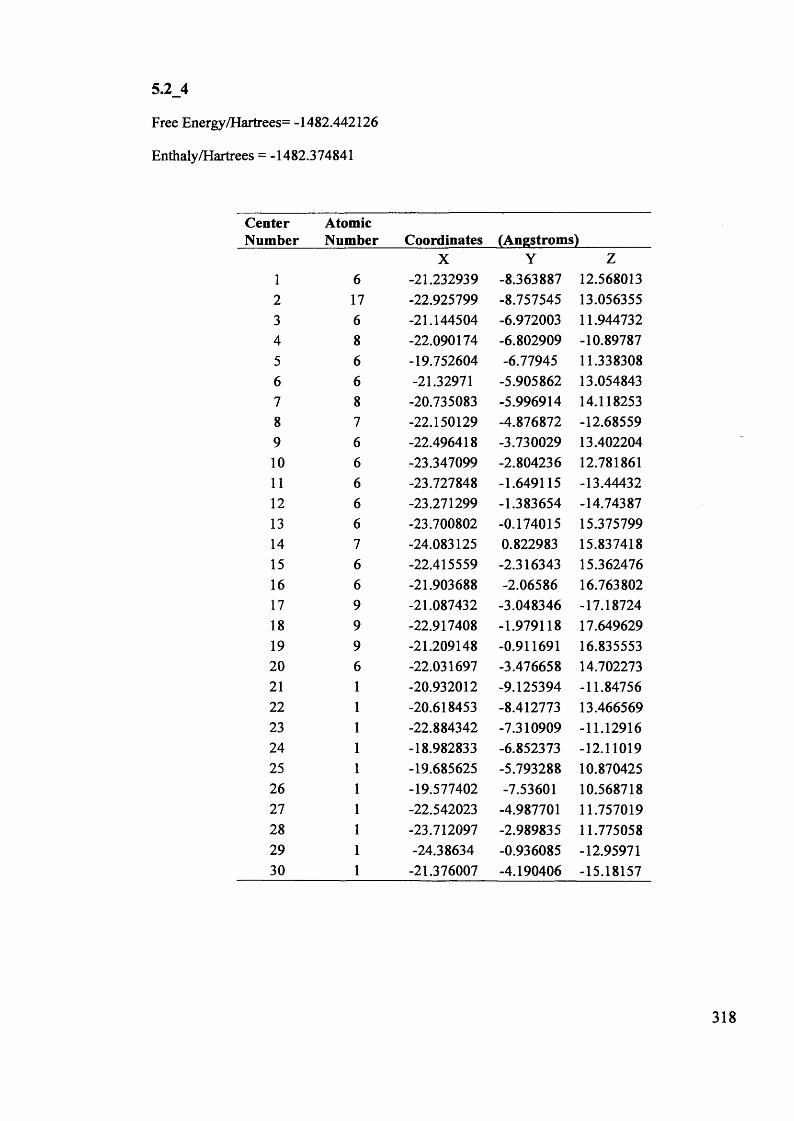
5.2_4
Free Energy/Hartrees= -1482.442126
Enthaly/Hartrees = -1482.374841
CenterNumber
AtomicNumber Coordinates (Angstroms)
X Y Z1 6 -21.232939 -8.363887 12.5680132 17 -22.925799 -8.757545 13.0563553 6 -21.144504 -6.972003 11.9447324 8 -22.090174 -6.802909 -10.897875 6 -19.752604 -6.77945 11.3383086 6 -21.32971 -5.905862 13.0548437 8 -20.735083 -5.996914 14.1182538 7 -22.150129 -4.876872 -12.685599 6 -22.496418 -3.730029 13.40220410 6 -23.347099 -2.804236 12.78186111 6 -23.727848 -1.649115 -13.4443212 6 -23.271299 -1.383654 -14.7438713 6 -23.700802 -0.174015 15.37579914 7 -24.083125 0.822983 15.83741815 6 -22.415559 -2.316343 15.36247616 6 -21.903688 -2.06586 16.76380217 9 -21.087432 -3.048346 -17.1872418 9 -22.917408 -1.979118 17.64962919 9 -21.209148 -0.911691 16.83555320 6 -22.031697 -3.476658 14.70227321 1 -20.932012 -9.125394 -11.8475622 1 -20.618453 -8.412773 13.46656923 1 -22.884342 -7.310909 -11.1291624 1 -18.982833 -6.852373 -12.1101925 1 -19.685625 -5.793288 10.87042526 1 -19.577402 -7.53601 10.56871827 1 -22.542023 -4.987701 11.75701928 1 -23.712097 -2.989835 11.77505829 1 -24.38634 -0.936085 -12.9597130 1 -21.376007 -4.190406 -15.18157
318
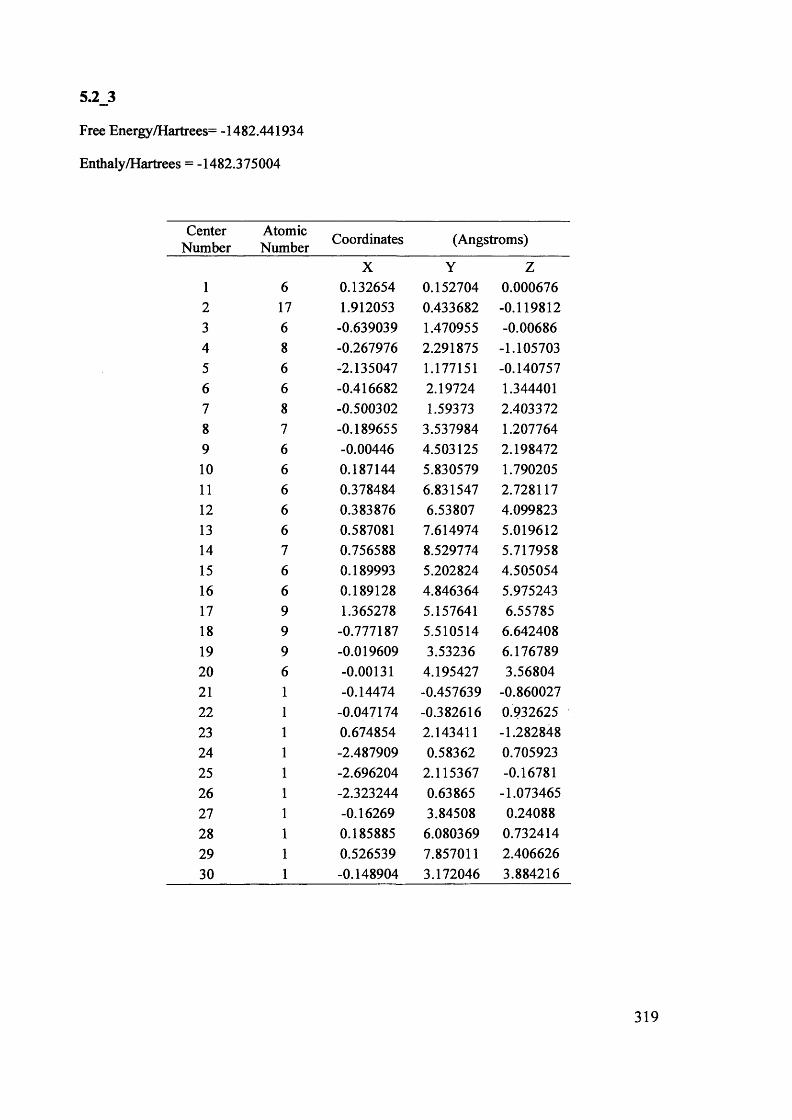
5.2_3
Free Energy/Hartrees= -1482.441934
Enthaly/Hartrees = -1482.375004
CenterNumber
AtomicNumber Coordinates (Angstroms)
X Y Z1 6 0.132654 0.152704 0.0006762 17 1.912053 0.433682 -0.1198123 6 -0.639039 1.470955 -0.006864 8 -0.267976 2.291875 -1.1057035 6 -2.135047 1.177151 -0.1407576 6 -0.416682 2.19724 1.3444017 8 -0.500302 1.59373 2.4033728 7 -0.189655 3.537984 1.2077649 6 -0.00446 4.503125 2.1984721 0 6 0.187144 5.830579 1.79020511 6 0.378484 6.831547 2.7281171 2 6 0.383876 6.53807 4.09982313 6 0.587081 7.614974 5.01961214 7 0.756588 8.529774 5.71795815 6 0.189993 5.202824 4.50505416 6 0.189128 4.846364 5.97524317 9 1.365278 5.157641 6.5578518 9 -0.777187 5.510514 6.64240819 9 -0.019609 3.53236 6.1767892 0 6 -0.00131 4.195427 3.568042 1 1 -0.14474 -0.457639 -0.8600272 2 1 -0.047174 -0.382616 0.93262523 1 0.674854 2.143411 -1.28284824 -2.487909 0.58362 0.70592325 1 -2.696204 2.115367 -0.1678126 1 -2.323244 0.63865 -1.07346527 1 -0.16269 3.84508 0.2408828 1 0.185885 6.080369 0.73241429 1 0.526539 7.857011 2.40662630 1 -0.148904 3.172046 3.884216
319
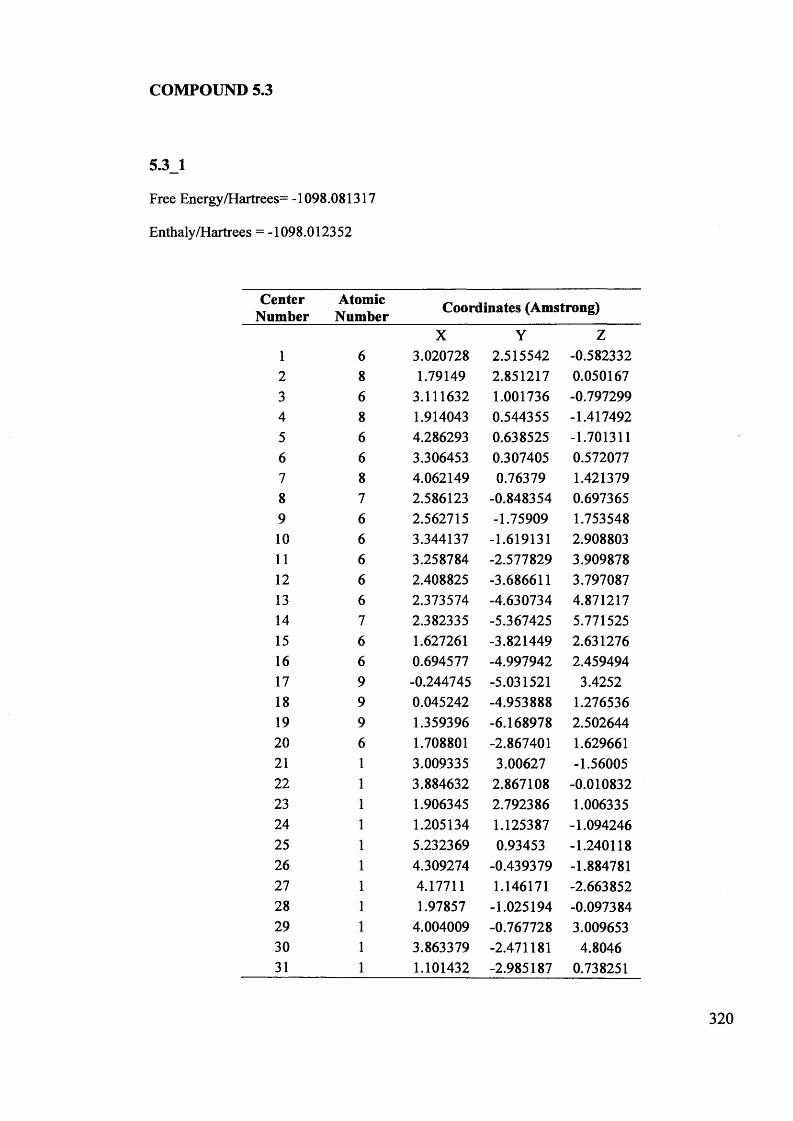
COMPOUND 5.3
Free Energy/Hartrees= -1098.081317
Enthaly/Hartrees = -1098.012352
CenterNumber
AtomicNumber Coordinates (Amstrong)
X Y Z1 6 3.020728 2.515542 -0.5823322 8 1.79149 2.851217 0.0501673 6 3.111632 1.001736 -0.7972994 8 1.914043 0.544355 -1.4174925 6 4.286293 0.638525 -1.7013116 6 3.306453 0.307405 0.5720777 8 4.062149 0.76379 1.4213798 7 2.586123 -0.848354 0.6973659 6 2.562715 -1.75909 1.753548
1 0 6 3.344137 -1.619131 2.90880311 6 3.258784 -2.577829 3.9098781 2 6 2.408825 -3.686611 3.79708713 6 2.373574 -4.630734 4.87121714 7 2.382335 -5.367425 5.77152515 6 1.627261 -3.821449 2.63127616 6 0.694577 -4.997942 2.45949417 9 -0.244745 -5.031521 3.425218 9 0.045242 -4.953888 1.27653619 9 1.359396 -6.168978 2.5026442 0 6 1.708801 -2.867401 1.6296612 1 1 3.009335 3.00627 -1.560052 2 1 3.884632 2.867108 -0.01083223 1 1.906345 2.792386 1.00633524 1 1.205134 1.125387 -1.09424625 1 5.232369 0.93453 -1.24011826 1 4.309274 -0.439379 -1.88478127 1 4.17711 1.146171 -2.66385228 1 1.97857 -1.025194 -0.09738429 1 4.004009 -0.767728 3.00965330 1 3.863379 -2.471181 4.804631 1 1.101432 -2.985187 0.738251
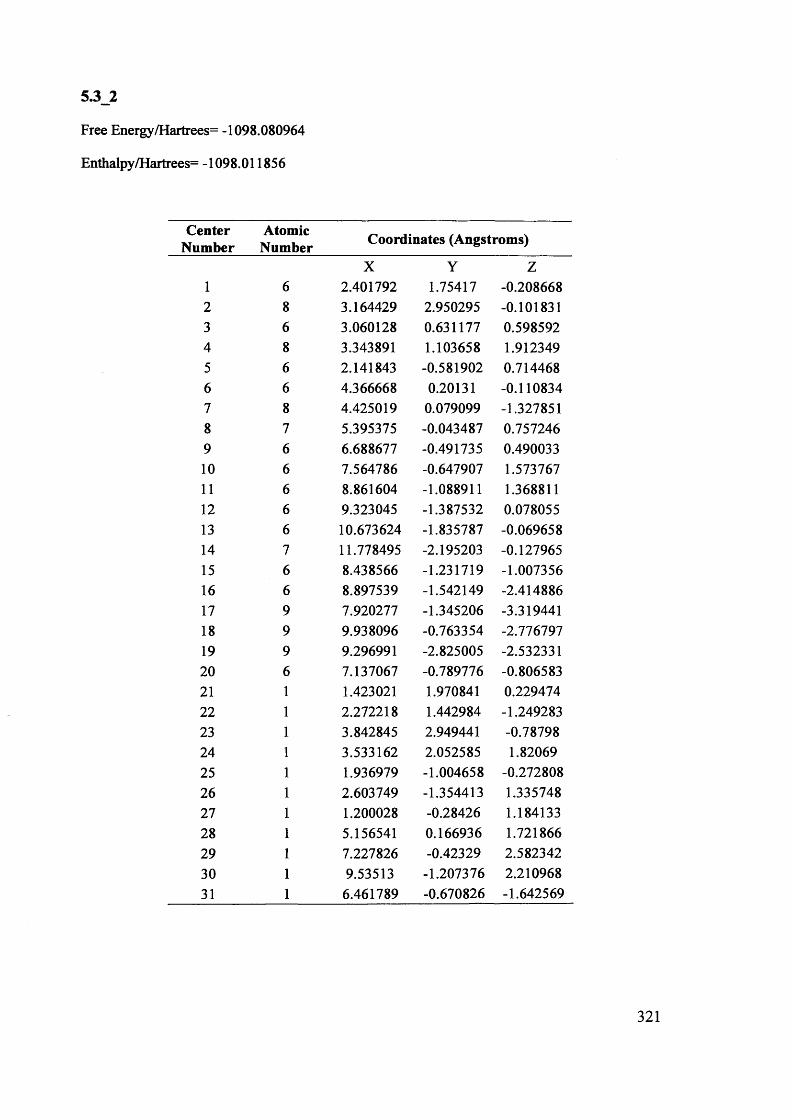
5.3_2
Free Energy/Hartrees= -1098.080964
Enthalpy/Hartrees= -1098.011856
CenterNumber
AtomicNumber Coordinates (Angstroms)
X Y Z1 6 2.401792 1.75417 -0.2086682 8 3.164429 2.950295 -0.1018313 6 3.060128 0.631177 0.5985924 8 3.343891 1.103658 1.9123495 6 2.141843 -0.581902 0.7144686 6 4.366668 0.20131 -0.1108347 8 4.425019 0.079099 -1.3278518 7 5.395375 -0.043487 0.7572469 6 6.688677 -0.491735 0.49003310 6 7.564786 -0.647907 1.57376711 6 8.861604 -1.088911 1.36881112 6 9.323045 -1.387532 0.07805513 6 10.673624 -1.835787 -0.06965814 7 11.778495 -2.195203 -0.12796515 6 8.438566 -1.231719 -1.00735616 6 8.897539 -1.542149 -2.41488617 9 7.920277 -1.345206 -3.31944118 9 9.938096 -0.763354 -2.77679719 9 9.296991 -2.825005 -2.53233120 6 7.137067 -0.789776 -0.80658321 1 1.423021 1.970841 0.22947422 1 2.272218 1.442984 -1.24928323 1 3.842845 2.949441 -0.7879824 1 3.533162 2.052585 1.8206925 1 1.936979 -1.004658 -0.27280826 1 2.603749 -1.354413 1.33574827 1 1.200028 -0.28426 1.18413328 1 5.156541 0.166936 1.72186629 1 7.227826 -0.42329 2.58234230 1 9.53513 -1.207376 2.21096831 1 6.461789 -0.670826 -1.642569
321
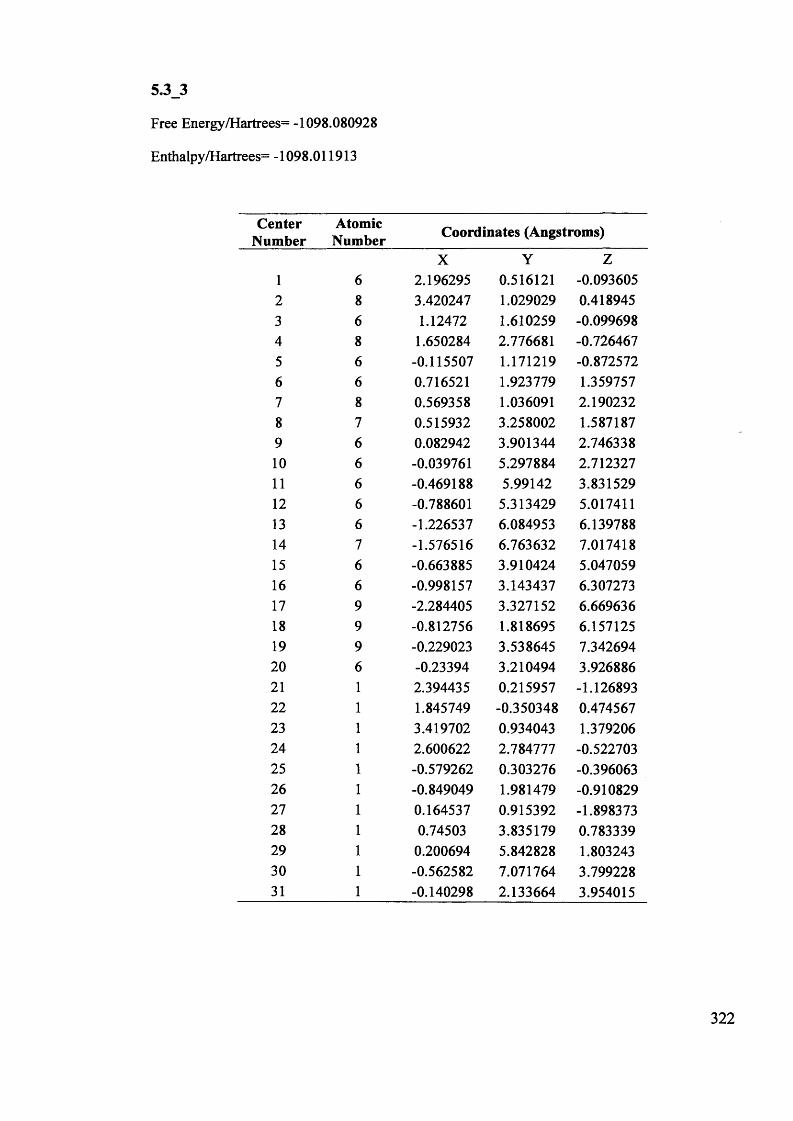
5.3_3
Free Energy/Hartrees= -1098.080928
Enthalpy/Hartrees= -1098.011913
CenterNumber
AtomicNumber Coordinates (Angstroms)
X Y Z1 6 2.196295 0.516121 -0.0936052 8 3.420247 1.029029 0.4189453 6 1.12472 1.610259 -0.0996984 8 1.650284 2.776681 -0.7264675 6 -0.115507 1.171219 -0.8725726 6 0.716521 1.923779 1.3597577 8 0.569358 1.036091 2.1902328 7 0.515932 3.258002 1.5871879 6 0.082942 3.901344 2.7463381 0 6 -0.039761 5.297884 2.71232711 6 -0.469188 5.99142 3.8315291 2 6 -0.788601 5.313429 5.01741113 6 -1.226537 6.084953 6.13978814 7 -1.576516 6.763632 7.01741815 6 -0.663885 3.910424 5.04705916 6 -0.998157 3.143437 6.30727317 9 -2.284405 3.327152 6.66963618 9 -0.812756 1.818695 6.15712519 9 -0.229023 3.538645 7.3426942 0 6 -0.23394 3.210494 3.9268862 1 1 2.394435 0.215957 -1.1268932 2 1 1.845749 -0.350348 0.47456723 1 3.419702 0.934043 1.37920624 1 2.600622 2.784777 -0.52270325 1 -0.579262 0.303276 -0.39606326 1 -0.849049 1.981479 -0.91082927 1 0.164537 0.915392 -1.89837328 1 0.74503 3.835179 0.78333929 1 0.200694 5.842828 1.80324330 1 -0.562582 7.071764 3.79922831 1 -0.140298 2.133664 3.954015
322
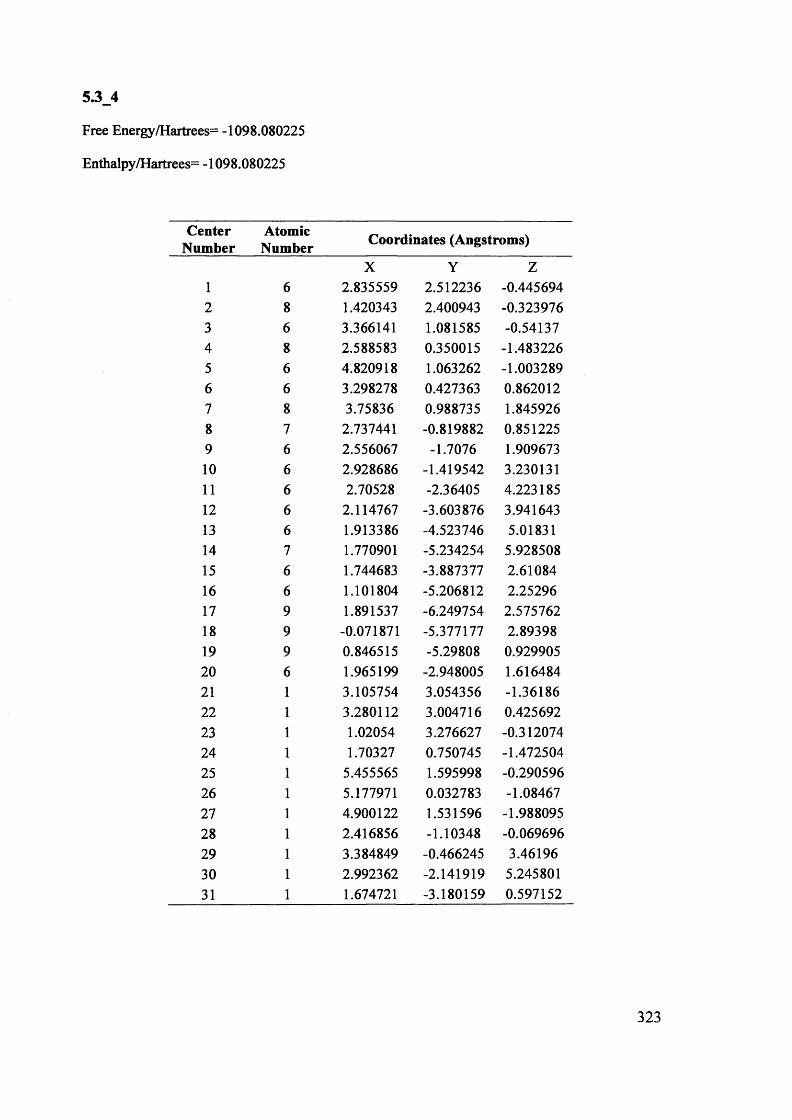
53_4
Free Energy/Hartrees= -1098.080225
Enthalpy/Hartrees= -1098.080225
CenterNumber
AtomicNumber Coordinates (Angstroms)
X Y Z1 6 2.835559 2.512236 -0.4456942 8 1.420343 2.400943 -0.3239763 6 3.366141 1.081585 -0.541374 8 2.588583 0.350015 -1.4832265 6 4.820918 1.063262 -1.0032896 6 3.298278 0.427363 0.8620127 8 3.75836 0.988735 1.8459268 7 2.737441 -0.819882 0.8512259 6 2.556067 -1.7076 1.90967310 6 2.928686 -1.419542 3.23013111 6 2.70528 -2.36405 4.22318512 6 2.114767 -3.603876 3.94164313 6 1.913386 -4.523746 5.0183114 7 1.770901 -5.234254 5.92850815 6 1.744683 -3.887377 2.6108416 6 1.101804 -5.206812 2.2529617 9 1.891537 -6.249754 2.57576218 9 -0.071871 -5.377177 2.8939819 9 0.846515 -5.29808 0.92990520 6 1.965199 -2.948005 1.61648421 1 3.105754 3.054356 -1.3618622 1 3.280112 3.004716 0.42569223 1 1.02054 3.276627 -0.31207424 1 1.70327 0.750745 -1.47250425 1 5.455565 1.595998 -0.29059626 1 5.177971 0.032783 -1.0846727 1 4.900122 1.531596 -1.98809528 1 2.416856 -1.10348 -0.06969629 1 3.384849 -0.466245 3.4619630 1 2.992362 -2.141919 5.24580131 1 1.674721 -3.180159 0.597152
323
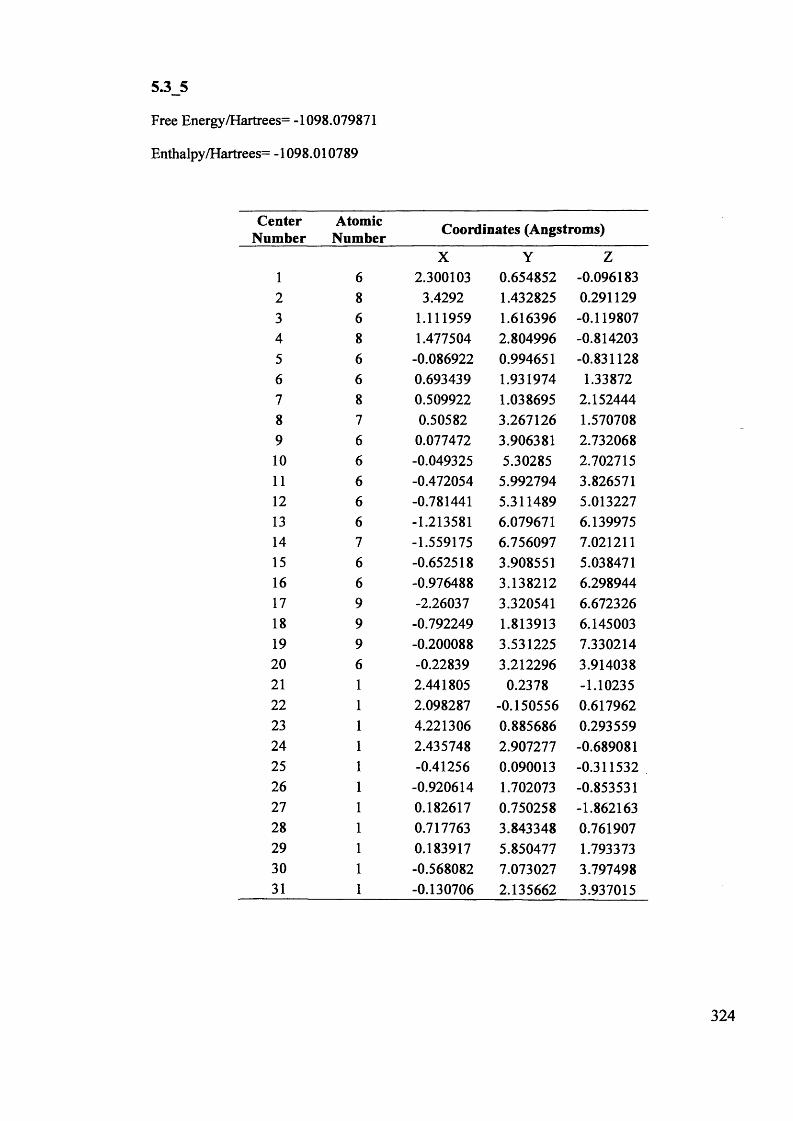
5.3_5
Free Energy/Hartrees= -1098.079871
Enthalpy/Hartrees= -1098.010789
CenterNumber
AtomicNumber Coordinates (Angstroms)
X Y Z1 6 2.300103 0.654852 -0.0961832 8 3.4292 1.432825 0.2911293 6 1.111959 1.616396 -0.1198074 8 1.477504 2.804996 -0.8142035 6 -0.086922 0.994651 -0.8311286 6 0.693439 1.931974 1.338727 8 0.509922 1.038695 2.1524448 7 0.50582 3.267126 1.5707089 6 0.077472 3.906381 2.7320681 0 6 -0.049325 5.30285 2.70271511 6 -0.472054 5.992794 3.8265711 2 6 -0.781441 5.311489 5.01322713 6 -1.213581 6.079671 6.13997514 7 -1.559175 6.756097 7.02121115 6 -0.652518 3.908551 5.03847116 6 -0.976488 3.138212 6.29894417 9 -2.26037 3.320541 6.67232618 9 -0.792249 1.813913 6.14500319 9 -0.200088 3.531225 7.3302142 0 6 -0.22839 3.212296 3.9140382 1 1 2.441805 0.2378 -1.102352 2 1 2.098287 -0.150556 0.61796223 1 4.221306 0.885686 0.29355924 1 2.435748 2.907277 -0.68908125 1 -0.41256 0.090013 -0.31153226 1 -0.920614 1.702073 -0.85353127 1 0.182617 0.750258 -1.86216328 1 0.717763 3.843348 0.76190729 1 0.183917 5.850477 1.79337330 1 -0.568082 7.073027 3.79749831 1 -0.130706 2.135662 3.937015
324
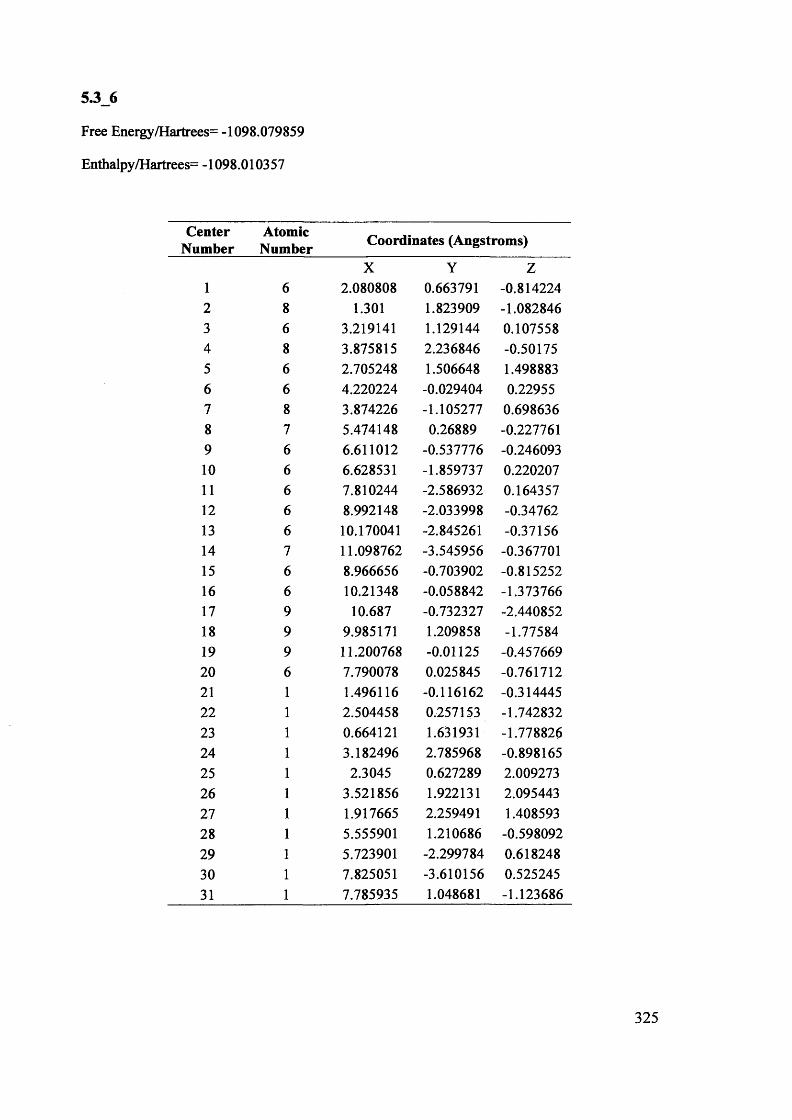
5.3_6
Free Energy/Hartrees= -1098.079859
Enthalpy/Hartrees= -1098.010357
CenterNumber
AtomicNumber Coordinates (Angstroms)
X Y Z1 6 2.080808 0.663791 -0.8142242 8 1.301 1.823909 -1.0828463 6 3.219141 1.129144 0.1075584 8 3.875815 2.236846 -0.501755 6 2.705248 1.506648 1.4988836 6 4.220224 -0.029404 0.229557 8 3.874226 -1.105277 0.6986368 7 5.474148 0.26889 -0.2277619 6 6.611012 -0.537776 -0.24609310 6 6.628531 -1.859737 0.22020711 6 7.810244 -2.586932 0.16435712 6 8.992148 -2.033998 -0.3476213 6 10.170041 -2.845261 -0.3715614 7 11.098762 -3.545956 -0.36770115 6 8.966656 -0.703902 -0.81525216 6 10.21348 -0.058842 -1.37376617 9 10.687 -0.732327 -2.44085218 9 9.985171 1.209858 -1.7758419 9 11.200768 -0.01125 -0.45766920 6 7.790078 0.025845 -0.76171221 1 1.496116 -0.116162 -0.31444522 1 2.504458 0.257153 -1.74283223 1 0.664121 1.631931 -1.77882624 1 3.182496 2.785968 -0.89816525 1 2.3045 0.627289 2.00927326 1 3.521856 1.922131 2.09544327 1 1.917665 2.259491 1.40859328 1 5.555901 1.210686 -0.59809229 1 5.723901 -2.299784 0.61824830 1 7.825051 -3.610156 0.52524531 1 7.785935 1.048681 -1.123686
325
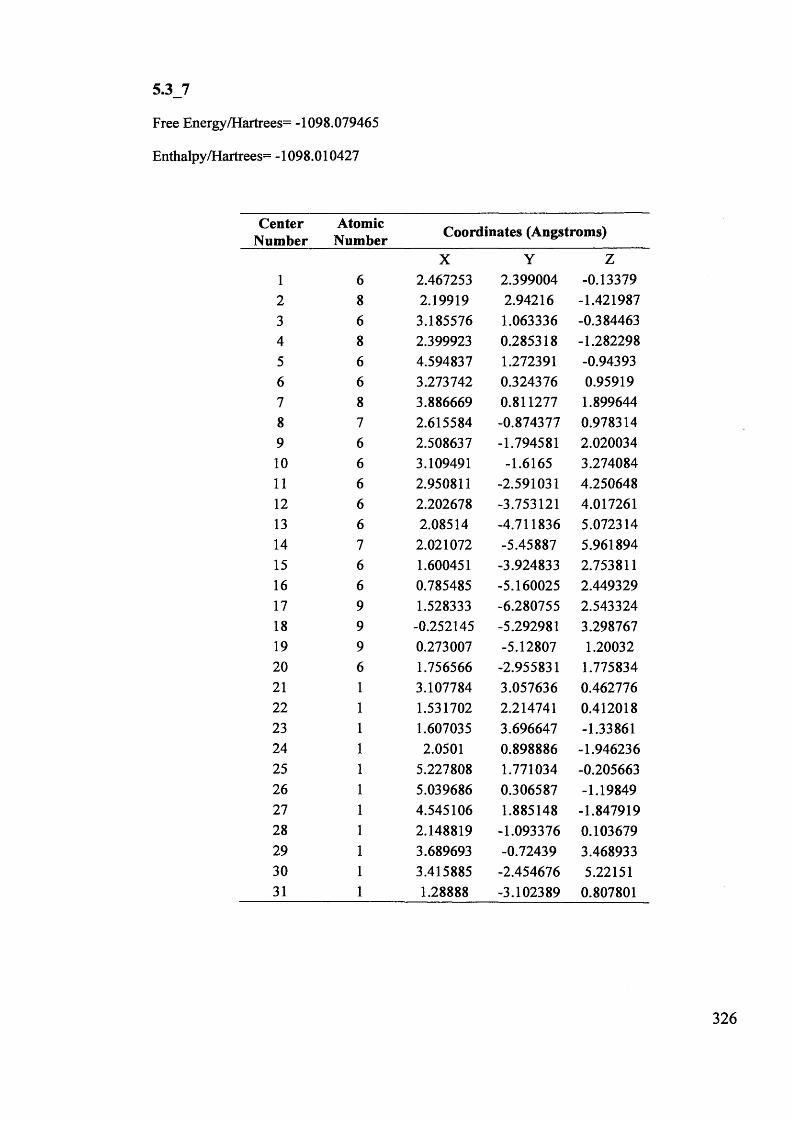
5.3_7
Free Energy/Hartrees= -1098.079465
Enthalpy/Hartrees= -1098.010427
CenterNumber
AtomicNumber Coordinates (Angstroms)
X Y Z1 6 2.467253 2.399004 -0.133792 8 2.19919 2.94216 -1.4219873 6 3.185576 1.063336 -0.3844634 8 2.399923 0.285318 -1.2822985 6 4.594837 1.272391 -0.943936 6 3.273742 0.324376 0.959197 8 3.886669 0.811277 1.8996448 7 2.615584 -0.874377 0.9783149 6 2.508637 -1.794581 2.02003410 6 3.109491 -1.6165 3.27408411 6 2.950811 -2.591031 4.25064812 6 2.202678 -3.753121 4.01726113 6 2.08514 -4.711836 5.07231414 7 2.021072 -5.45887 5.96189415 6 1.600451 -3.924833 2.75381116 6 0.785485 -5.160025 2.44932917 9 1.528333 -6.280755 2.54332418 9 -0.252145 -5.292981 3.29876719 9 0.273007 -5.12807 1.2003220 6 1.756566 -2.955831 1.77583421 1 3.107784 3.057636 0.46277622 1 1.531702 2.214741 0.41201823 1 1.607035 3.696647 -1.3386124 1 2.0501 0.898886 -1.94623625 1 5.227808 1.771034 -0.20566326 1 5.039686 0.306587 -1.1984927 1 4.545106 1.885148 -1.84791928 1 2.148819 -1.093376 0.10367929 1 3.689693 -0.72439 3.46893330 1 3.415885 -2.454676 5.2215131 1 1.28888 -3.102389 0.807801
326

53_8
Free Energy/Hartrees= -1098.079448
Enthalpy/Hartrees= -1098.006954
CenterNumber
AtomicNumber Coordinates (Angstroms)
X Y Z1 6 2.132908 0.588399 -0.9186812 8 1.337001 1.659783 -1.4076653 6 3.220388 1.130934 0.0359844 8 3.862318 2.230243 -0.6007845 6 2.64477 1.558461 1.3870756 6 4.244003 0.008122 0.2531327 8 3.922979 -1.023008 0.8294148 7 5.479779 0.274421 -0.267669 6 6.624833 -0.521248 -0.2499381 0 6 6.673136 -1.791899 0.3400811 6 7.86062 -2.511365 0.3135041 2 6 9.017807 -2.000575 -0.29034913 6 10.203937 -2.800022 -0.27599914 7 11.140588 -3.488883 -0.23575715 6 8.960829 -0.722641 -0.8837516 6 10.180055 -0.125705 -1.54707117 9 10.632017 -0.90466 -2.5493618 9 9.919624 1.089118 -2.07595619 9 11.193104 0.032792 -0.6723212 0 6 7.778561 -0.000496 -0.859232 1 1 1.536554 -0.180416 -0.4174332 2 1 2.60773 0.143416 -1.79831723 1 0.62336 1.843474 -0.78660324 1 3.180095 2.682908 -1.12186925 1 2.23808 0.697571 1.92363926 1 3.426476 2.01817 1.99754427 1 1.855949 2.304555 1.24336428 1 5.540759 1.184879 -0.71325729 1 5.787728 -2.199006 0.80989830 1 7.899724 -3.494664 0.77068431 1 7.749786 0.981741 -1.319319
327
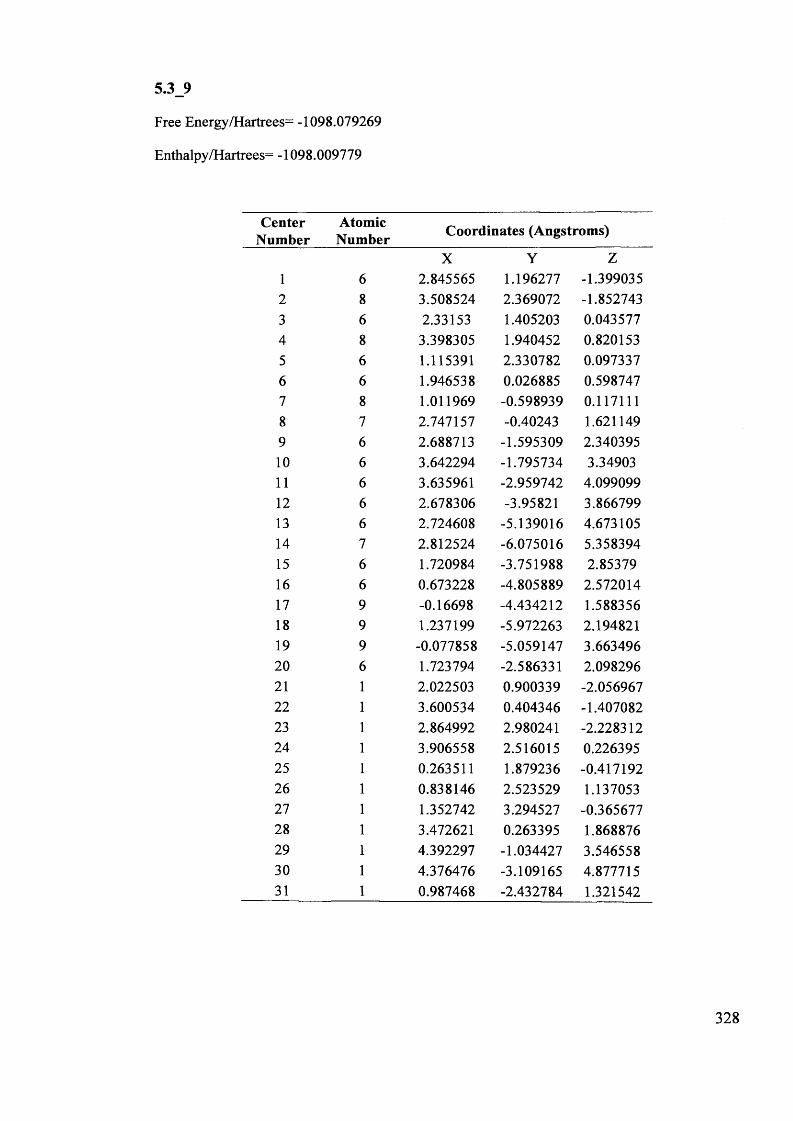
5.3_9
Free Energy/Hartrees= -1098.079269
Enthalpy/Hartrees= -1098.009779
CenterNumber
AtomicNumber Coordinates (Angstroms)
X Y Z1 6 2.845565 1.196277 -1.3990352 8 3.508524 2.369072 -1.8527433 6 2.33153 1.405203 0.0435774 8 3.398305 1.940452 0.8201535 6 1.115391 2.330782 0.0973376 6 1.946538 0.026885 0.5987477 8 1.011969 -0.598939 0.1171118 7 2.747157 -0.40243 1.6211499 6 2.688713 -1.595309 2.3403951 0 6 3.642294 -1.795734 3.3490311 6 3.635961 -2.959742 4.0990991 2 6 2.678306 -3.95821 3.86679913 6 2.724608 -5.139016 4.67310514 7 2.812524 -6.075016 5.35839415 6 1.720984 -3.751988 2.8537916 6 0.673228 -4.805889 2.57201417 9 -0.16698 -4.434212 1.58835618 9 1.237199 -5.972263 2.19482119 9 -0.077858 -5.059147 3.6634962 0 6 1.723794 -2.586331 2.0982962 1 1 2.022503 0.900339 -2.0569672 2 1 3.600534 0.404346 -1.40708223 1 2.864992 2.980241 -2.22831224 1 3.906558 2.516015 0.22639525 1 0.263511 1.879236 -0.41719226 1 0.838146 2.523529 1.13705327 1 1.352742 3.294527 -0.36567728 1 3.472621 0.263395 1.86887629 1 4.392297 -1.034427 3.54655830 1 4.376476 -3.109165 4.87771531 1 0.987468 -2.432784 1.321542
328
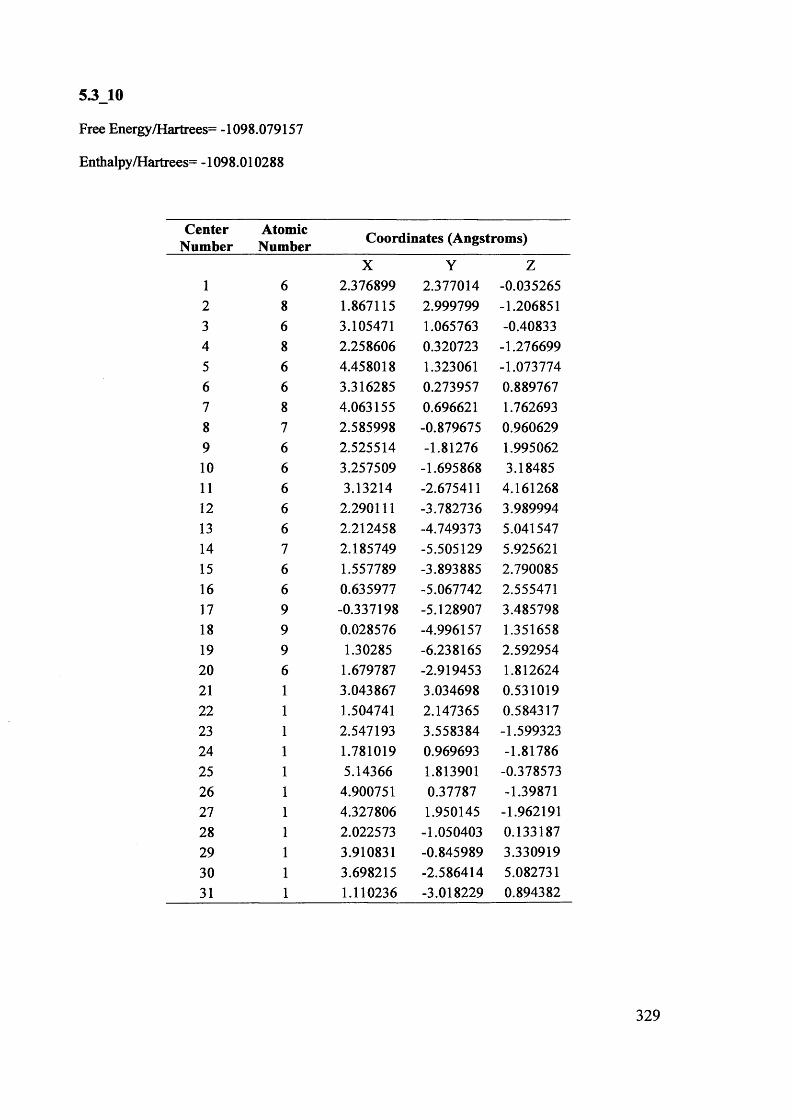
53_10
Free Energy/Hartrees= -1098.079157
Enthalpy/Hartrees= -1098.010288
CenterNumber
AtomicNumber Coordinates (Angstroms)
X Y Z1 6 2.376899 2.377014 -0.0352652 8 1.867115 2.999799 -1.2068513 6 3.105471 1.065763 -0.408334 8 2.258606 0.320723 -1.2766995 6 4.458018 1.323061 -1.0737746 6 3.316285 0.273957 0.8897677 8 4.063155 0.696621 1.7626938 7 2.585998 -0.879675 0.9606299 6 2.525514 -1.81276 1.99506210 6 3.257509 -1.695868 3.1848511 6 3.13214 -2.675411 4.16126812 6 2.290111 -3.782736 3.98999413 6 2.212458 -4.749373 5.04154714 7 2.185749 -5.505129 5.92562115 6 1.557789 -3.893885 2.79008516 6 0.635977 -5.067742 2.55547117 9 -0.337198 -5.128907 3.48579818 9 0.028576 -4.996157 1.35165819 9 1.30285 -6.238165 2.59295420 6 1.679787 -2.919453 1.81262421 1 3.043867 3.034698 0.53101922 1 1.504741 2.147365 0.58431723 1 2.547193 3.558384 -1.59932324 1 1.781019 0.969693 -1.8178625 1 5.14366 1.813901 -0.37857326 1 4.900751 0.37787 -1.3987127 1 4.327806 1.950145 -1.96219128 1 2.022573 -1.050403 0.13318729 1 3.910831 -0.845989 3.33091930 1 3.698215 -2.586414 5.08273131 1 1.110236 -3.018229 0.894382
329
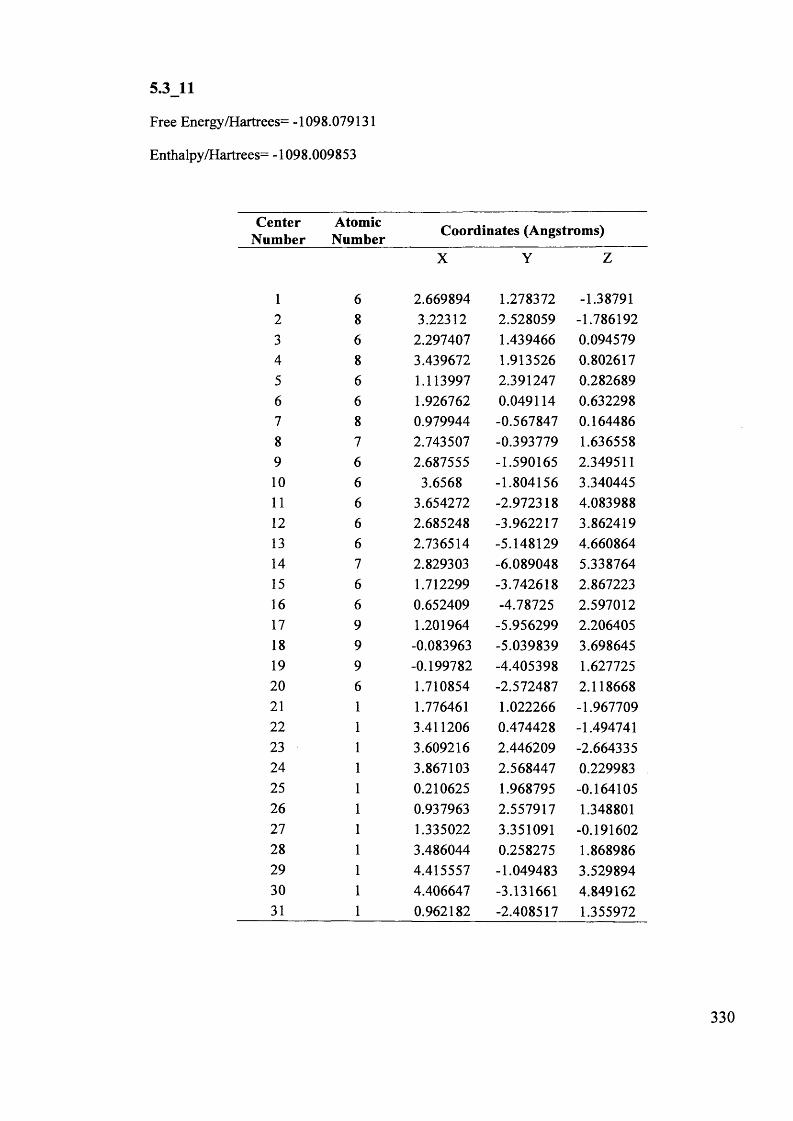
5.3_11
Free Energy/Hartrees= -1098.079131
Enthalpy/Hartrees= -1098.009853
CenterNumber
AtomicNumber Coordinates (Angstroms)
X Y Z
1 6 2.669894 1.278372 -1.387912 8 3.22312 2.528059 -1.7861923 6 2.297407 1.439466 0.0945794 8 3.439672 1.913526 0.8026175 6 1.113997 2.391247 0.2826896 6 1.926762 0.049114 0.6322987 8 0.979944 -0.567847 0.1644868 7 2.743507 -0.393779 1.6365589 6 2.687555 -1.590165 2.34951110 6 3.6568 -1.804156 3.34044511 6 3.654272 -2.972318 4.08398812 6 2.685248 -3.962217 3.86241913 6 2.736514 -5.148129 4.66086414 7 2.829303 -6.089048 5.33876415 6 1.712299 -3.742618 2.86722316 6 0.652409 -4.78725 2.59701217 9 1.201964 -5.956299 2.20640518 9 -0.083963 -5.039839 3.69864519 9 -0.199782 -4.405398 1.62772520 6 1.710854 -2.572487 2.11866821 1 1.776461 1.022266 -1.96770922 1 3.411206 0.474428 -1.49474123 1 3.609216 2.446209 -2.66433524 1 3.867103 2.568447 0.22998325 1 0.210625 1.968795 -0.16410526 1 0.937963 2.557917 1.34880127 1 1.335022 3.351091 -0.19160228 1 3.486044 0.258275 1.86898629 1 4.415557 -1.049483 3.52989430 1 4.406647 -3.131661 4.84916231 1 0.962182 -2.408517 1.355972
330
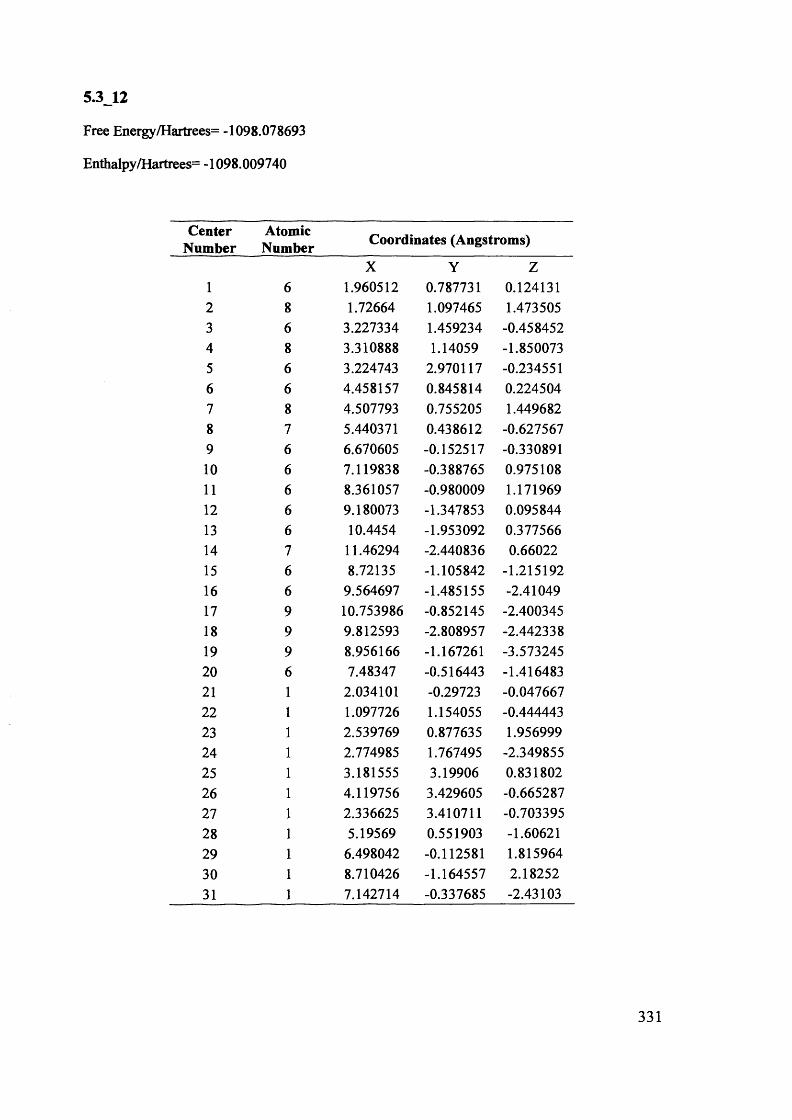
5.3_12
Free Energy/Hartrees= -1098.078693
Enthalpy/Hartrees= -1098.009740
CenterNumber
AtomicNumber Coordinates (Angstroms)
X Y Z1 6 1.960512 0.787731 0.1241312 8 1.72664 1.097465 1.4735053 6 3.227334 1.459234 -0.4584524 8 3.310888 1.14059 -1.8500735 6 3.224743 2.970117 -0.2345516 6 4.458157 0.845814 0.2245047 8 4.507793 0.755205 1.4496828 7 5.440371 0.438612 -0.6275679 6 6.670605 -0.152517 -0.33089110 6 7.119838 -0.388765 0.97510811 6 8.361057 -0.980009 1.17196912 6 9.180073 -1.347853 0.09584413 6 10.4454 -1.953092 0.37756614 7 11.46294 -2.440836 0.6602215 6 8.72135 -1.105842 -1.21519216 6 9.564697 -1.485155 -2.4104917 9 10.753986 -0.852145 -2.40034518 9 9.812593 -2.808957 -2.44233819 9 8.956166 -1.167261 -3.57324520 6 7.48347 -0.516443 -1.41648321 1 2.034101 -0.29723 -0.04766722 1 1.097726 1.154055 -0.44444323 1 2.539769 0.877635 1.95699924 1 2.774985 1.767495 -2.34985525 1 3.181555 3.19906 0.83180226 1 4.119756 3.429605 -0.66528727 1 2.336625 3.410711 -0.70339528 1 5.19569 0.551903 -1.6062129 1 6.498042 -0.112581 1.81596430 1 8.710426 -1.164557 2.1825231 1 7.142714 -0.337685 -2.43103
331
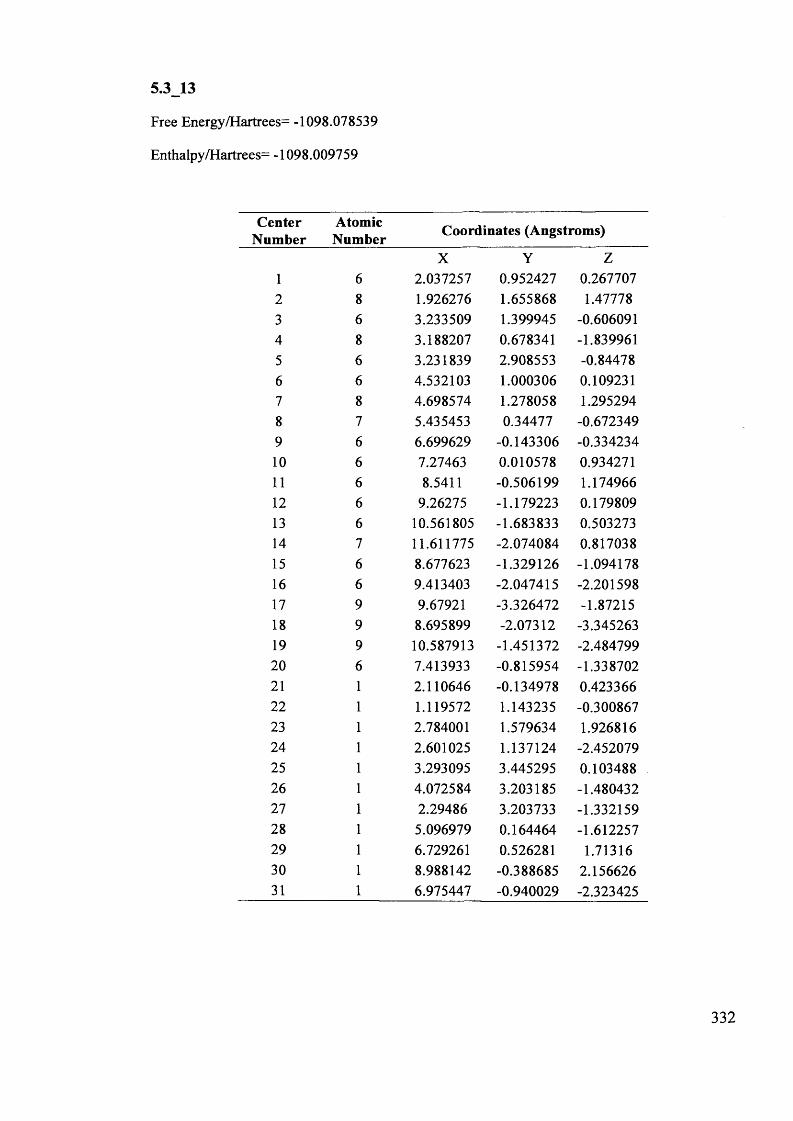
5.3_13
Free Energy/Hartrees= -1098.078539
Enthalpy /Hartrees= -1098.009759
CenterNumber
AtomicNumber Coordinates (Angstroms)
X Y Z1 6 2.037257 0.952427 0.2677072 8 1.926276 1.655868 1.477783 6 3.233509 1.399945 -0.6060914 8 3.188207 0.678341 -1.8399615 6 3.231839 2.908553 -0.844786 6 4.532103 1.000306 0.1092317 8 4.698574 1.278058 1.2952948 7 5.435453 0.34477 -0.6723499 6 6.699629 -0.143306 -0.33423410 6 7.27463 0.010578 0.93427111 6 8.5411 -0.506199 1.17496612 6 9.26275 -1.179223 0.17980913 6 10.561805 -1.683833 0.50327314 7 11.611775 -2.074084 0.81703815 6 8.677623 -1.329126 -1.09417816 6 9.413403 -2.047415 -2.20159817 9 9.67921 -3.326472 -1.8721518 9 8.695899 -2.07312 -3.34526319 9 10.587913 -1.451372 -2.48479920 6 7.413933 -0.815954 -1.33870221 1 2.110646 -0.134978 0.42336622 1 1.119572 1.143235 -0.30086723 1 2.784001 1.579634 1.92681624 1 2.601025 1.137124 -2.45207925 1 3.293095 3.445295 0.10348826 1 4.072584 3.203185 -1.48043227 1 2.29486 3.203733 -1.33215928 1 5.096979 0.164464 -1.61225729 1 6.729261 0.526281 1.7131630 1 8.988142 -0.388685 2.15662631 1 6.975447 -0.940029 -2.323425
332
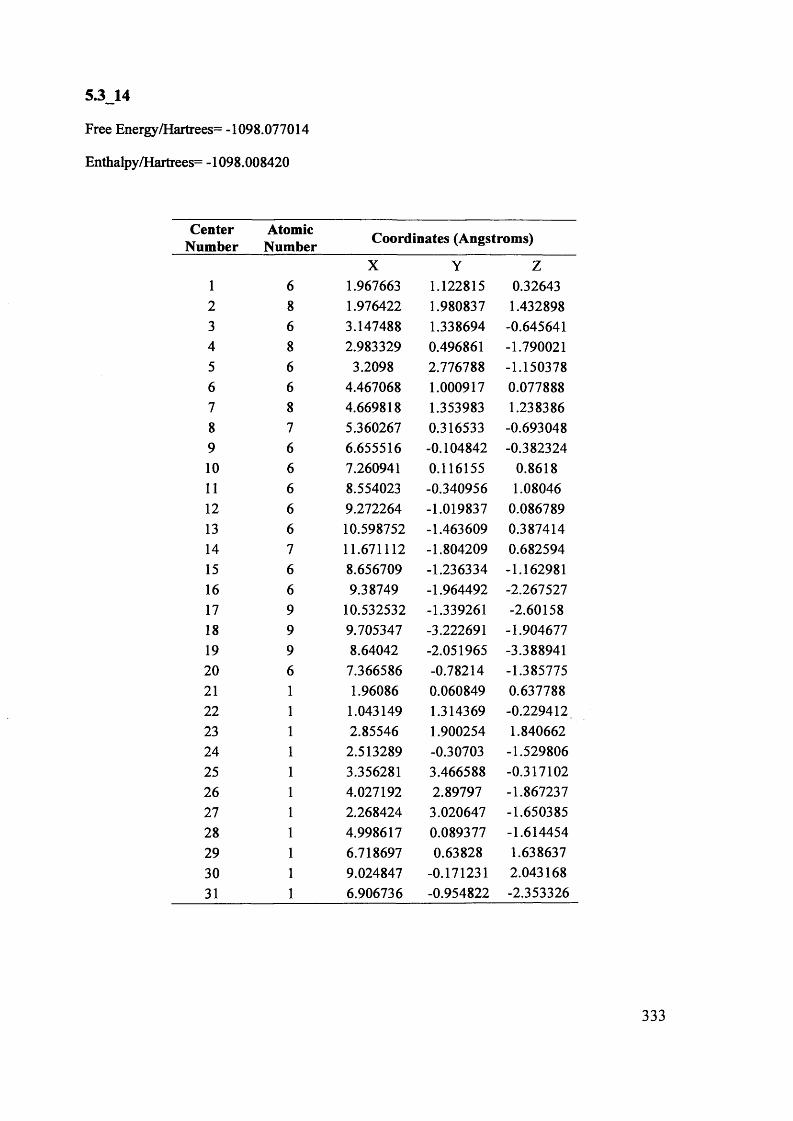
5.3_14
Free Energy/Hartrees= -1098.077014
Enthalpy/Hartrees= -1098.008420
CenterNumber
AtomicNumber Coordinates (Angstroms)
X Y Z1 6 1.967663 1.122815 0.326432 8 1.976422 1.980837 1.4328983 6 3.147488 1.338694 -0.6456414 8 2.983329 0.496861 -1.7900215 6 3.2098 2.776788 -1.1503786 6 4.467068 1.000917 0.0778887 8 4.669818 1.353983 1.2383868 7 5.360267 0.316533 -0.6930489 6 6.655516 -0.104842 -0.38232410 6 7.260941 0.116155 0.861811 6 8.554023 -0.340956 1.0804612 6 9.272264 -1.019837 0.08678913 6 10.598752 -1.463609 0.38741414 7 11.671112 -1.804209 0.68259415 6 8.656709 -1.236334 -1.16298116 6 9.38749 -1.964492 -2.26752717 9 10.532532 -1.339261 -2.6015818 9 9.705347 -3.222691 -1.90467719 9 8.64042 -2.051965 -3.38894120 6 7.366586 -0.78214 -1.38577521 1 1.96086 0.060849 0.63778822 1 1.043149 1.314369 -0.22941223 1 2.85546 1.900254 1.84066224 1 2.513289 -0.30703 -1.52980625 1 3.356281 3.466588 -0.31710226 1 4.027192 2.89797 -1.86723727 1 2.268424 3.020647 -1.65038528 1 4.998617 0.089377 -1.61445429 1 6.718697 0.63828 1.63863730 1 9.024847 -0.171231 2.04316831 1 6.906736 -0.954822 -2.353326
333
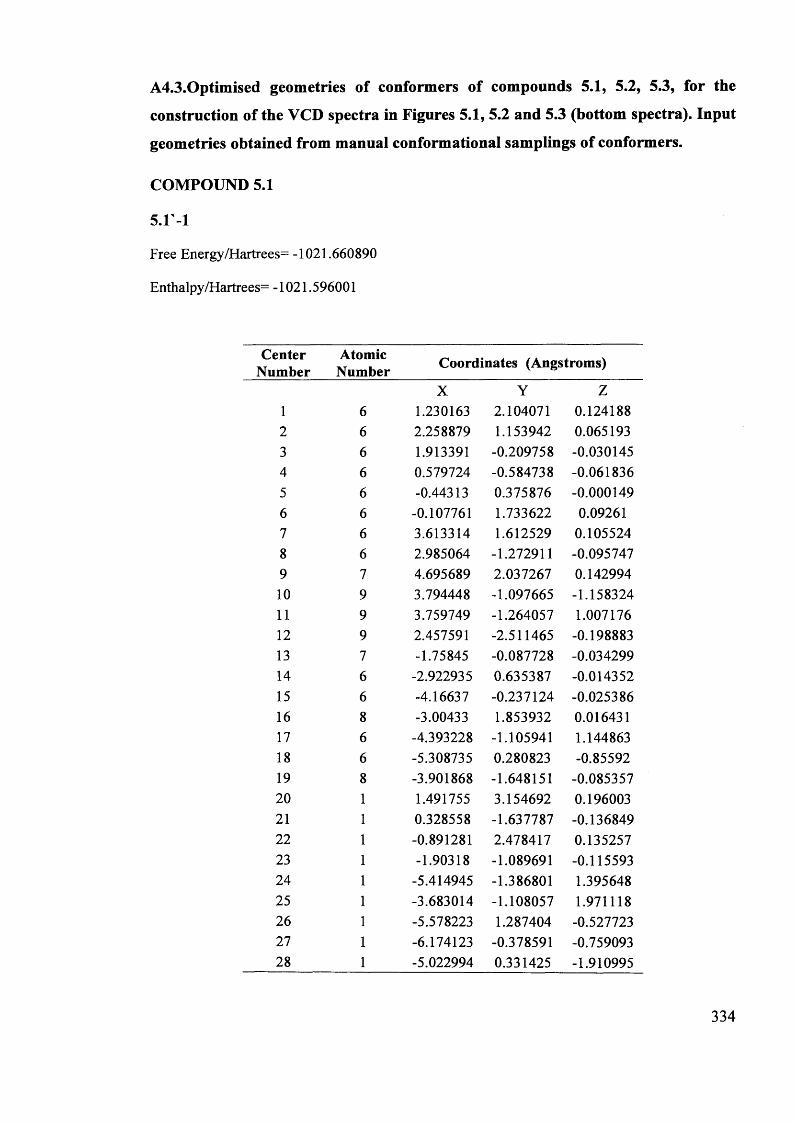
A4.3.0ptimised geometries of conformers of compounds 5.1, 5.2, 5.3, for the
construction of the VCD spectra in Figures 5.1, 5.2 and 5.3 (bottom spectra). Input
geometries obtained from manual conformational samplings of conformers.
COMPOUND 5.1
5.1-1
Free Energy/Hartrees= -1021.660890
Enthalpy/Hartrees= -1021.596001
CenterNumber
AtomicNumber Coordinates (Angstroms)
X Y Z1 6 1.230163 2.104071 0.1241882 6 2.258879 1.153942 0.0651933 6 1.913391 -0.209758 -0.0301454 6 0.579724 -0.584738 -0.0618365 6 -0.44313 0.375876 -0.0001496 6 -0.107761 1.733622 0.092617 6 3.613314 1.612529 0.1055248 6 2.985064 -1.272911 -0.0957479 7 4.695689 2.037267 0.14299410 9 3.794448 -1.097665 -1.15832411 9 3.759749 -1.264057 1.00717612 9 2.457591 -2.511465 -0.19888313 7 -1.75845 -0.087728 -0.03429914 6 -2.922935 0.635387 -0.01435215 6 -4.16637 -0.237124 -0.02538616 8 -3.00433 1.853932 0.01643117 6 -4.393228 -1.105941 1.14486318 6 -5.308735 0.280823 -0.8559219 8 -3.901868 -1.648151 -0.08535720 1 1.491755 3.154692 0.19600321 1 0.328558 -1.637787 -0.13684922 1 -0.891281 2.478417 0.13525723 1 -1.90318 -1.089691 -0.11559324 1 -5.414945 -1.386801 1.39564825 1 -3.683014 -1.108057 1.97111826 1 -5.578223 1.287404 -0.52772327 1 -6.174123 -0.378591 -0.75909328 1 -5.022994 0.331425 -1.910995
334
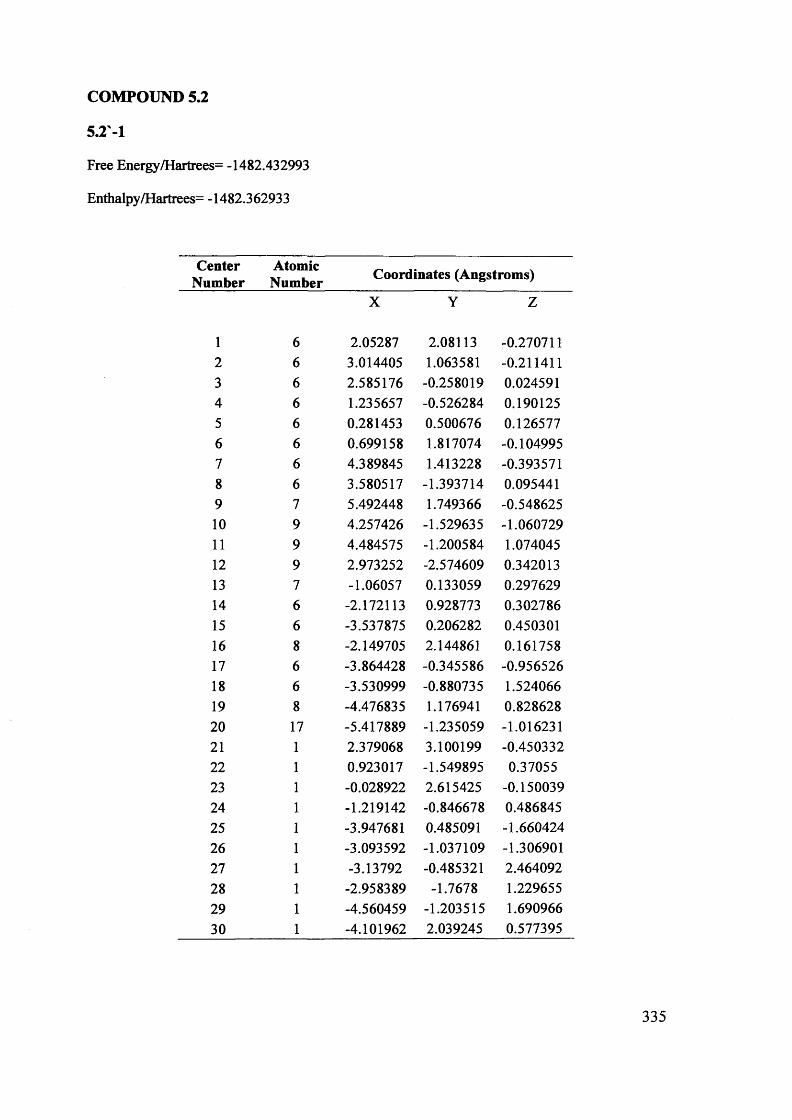
COMPOUND 5.2
5.2-1
Free Energy/Hartrees= -1482.432993
Enthalpy/Hartrees= -1482.362933
CenterNumber
AtomicNumber Coordinates (Angstroms)
X Y Z
1 6 2.05287 2.08113 -0.2707112 6 3.014405 1.063581 -0.2114113 6 2.585176 -0.258019 0.0245914 6 1.235657 -0.526284 0.1901255 6 0.281453 0.500676 0.1265776 6 0.699158 1.817074 -0.1049957 6 4.389845 1.413228 -0.3935718 6 3.580517 -1.393714 0.0954419 7 5.492448 1.749366 -0.54862510 9 4.257426 -1.529635 -1.06072911 9 4.484575 -1.200584 1.07404512 9 2.973252 -2.574609 0.34201313 7 -1.06057 0.133059 0.29762914 6 -2.172113 0.928773 0.30278615 6 -3.537875 0.206282 0.45030116 8 -2.149705 2.144861 0.16175817 6 -3.864428 -0.345586 -0.95652618 6 -3.530999 -0.880735 1.52406619 8 -4.476835 1.176941 0.82862820 17 -5.417889 -1.235059 -1.01623121 1 2.379068 3.100199 -0.45033222 1 0.923017 -1.549895 0.3705523 1 -0.028922 2.615425 -0.15003924 1 -1.219142 -0.846678 0.48684525 1 -3.947681 0.485091 -1.66042426 1 -3.093592 -1.037109 -1.30690127 1 -3.13792 -0.485321 2.46409228 1 -2.958389 -1.7678 1.22965529 1 -4.560459 -1.203515 1.69096630 1 -4.101962 2.039245 0.577395
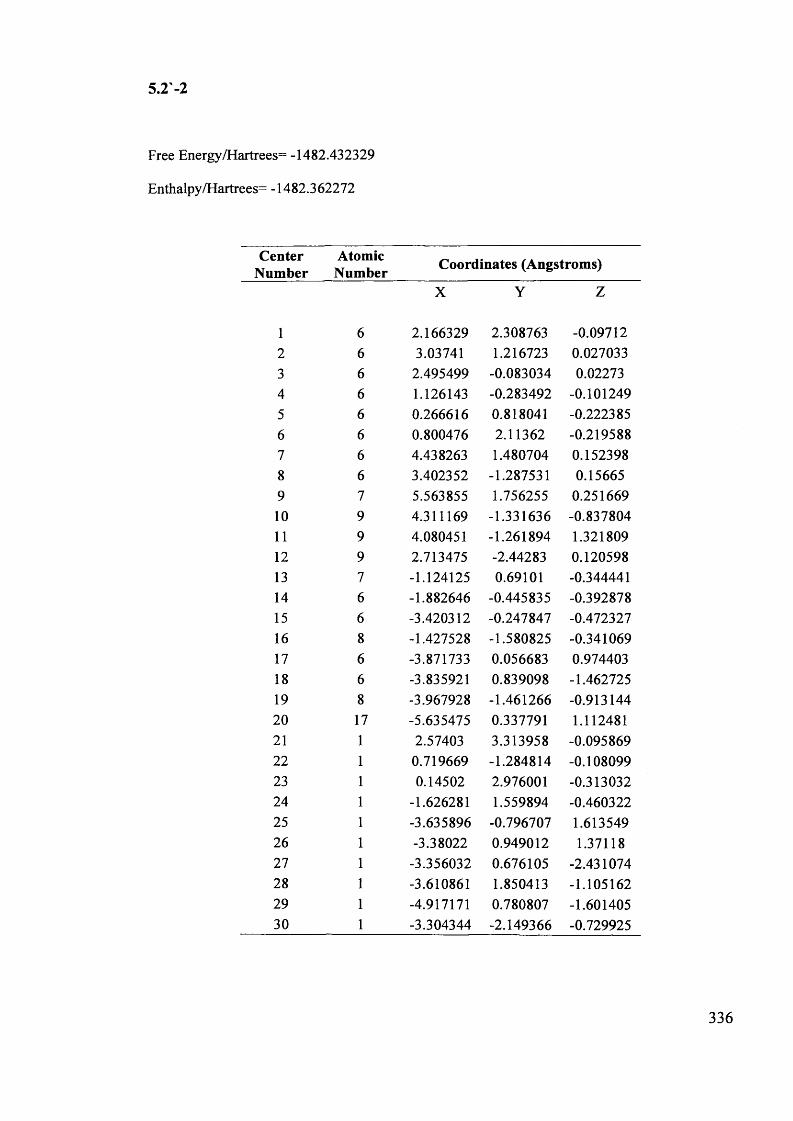
5.2'-2
Free Energy/Hartrees= -1482.432329
Enthalpy/Hartrees= -1482.362272
CenterNumber
AtomicNumber Coordinates (Angstroms)
X Y Z
1 6 2.166329 2.308763 -0.097122 6 3.03741 1.216723 0.0270333 6 2.495499 -0.083034 0.022734 6 1.126143 -0.283492 -0.1012495 6 0.266616 0.818041 -0.2223856 6 0.800476 2.11362 -0.2195887 6 4.438263 1.480704 0.1523988 6 3.402352 -1.287531 0.156659 7 5.563855 1.756255 0.25166910 9 4.311169 -1.331636 -0.83780411 9 4.080451 -1.261894 1.32180912 9 2.713475 -2.44283 0.12059813 7 -1.124125 0.69101 -0.34444114 6 -1.882646 -0.445835 -0.39287815 6 -3.420312 -0.247847 -0.47232716 8 -1.427528 -1.580825 -0.34106917 6 -3.871733 0.056683 0.97440318 6 -3.835921 0.839098 -1.46272519 8 -3.967928 -1.461266 -0.91314420 17 -5.635475 0.337791 1.11248121 1 2.57403 3.313958 -0.09586922 1 0.719669 -1.284814 -0.10809923 1 0.14502 2.976001 -0.31303224 1 -1.626281 1.559894 -0.46032225 1 -3.635896 -0.796707 1.61354926 1 -3.38022 0.949012 1.3711827 1 -3.356032 0.676105 -2.43107428 1 -3.610861 1.850413 -1.10516229 1 -4.917171 0.780807 -1.60140530 1 -3.304344 -2.149366 -0.729925
336
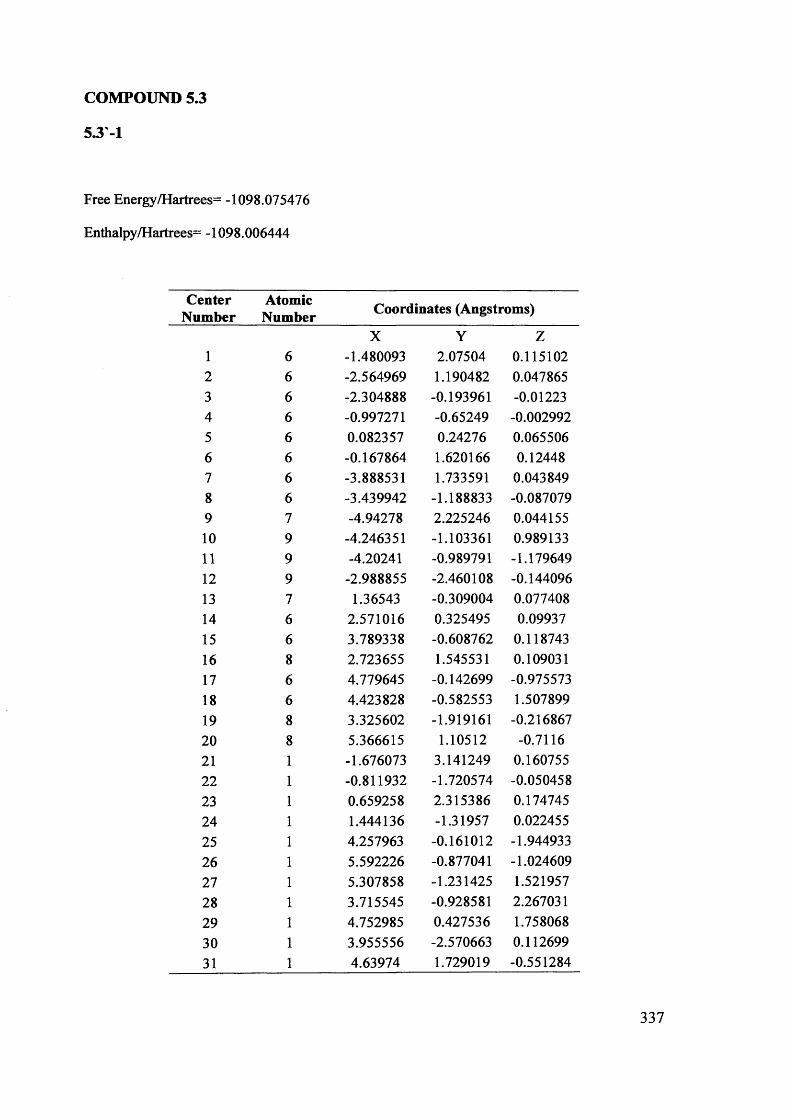
COMPOUND 5.3
5.3-1
Free Energy/Hartrees= -1098.075476
Enthalpy/Hartrees= -1098.006444
CenterNumber
AtomicNumber Coordinates (Angstroms)
X Y Z1 6 -1.480093 2.07504 0.1151022 6 -2.564969 1.190482 0.0478653 6 -2.304888 -0.193961 -0.012234 6 -0.997271 -0.65249 -0.0029925 6 0.082357 0.24276 0.0655066 6 -0.167864 1.620166 0.124487 6 -3.888531 1.733591 0.0438498 6 -3.439942 -1.188833 -0.0870799 7 -4.94278 2.225246 0.04415510 9 -4.246351 -1.103361 0.98913311 9 -4.20241 -0.989791 -1.17964912 9 -2.988855 -2.460108 -0.14409613 7 1.36543 -0.309004 0.07740814 6 2.571016 0.325495 0.0993715 6 3.789338 -0.608762 0.11874316 8 2.723655 1.545531 0.10903117 6 4.779645 -0.142699 -0.97557318 6 4.423828 -0.582553 1.50789919 8 3.325602 -1.919161 -0.21686720 8 5.366615 1.10512 -0.711621 1 -1.676073 3.141249 0.16075522 1 -0.811932 -1.720574 -0.05045823 1 0.659258 2.315386 0.17474524 1 1.444136 -1.31957 0.02245525 1 4.257963 -0.161012 -1.94493326 1 5.592226 -0.877041 -1.02460927 1 5.307858 -1.231425 1.52195728 1 3.715545 -0.928581 2.26703129 1 4.752985 0.427536 1.75806830 1 3.955556 -2.570663 0.11269931 1 4.63974 1.729019 -0.551284
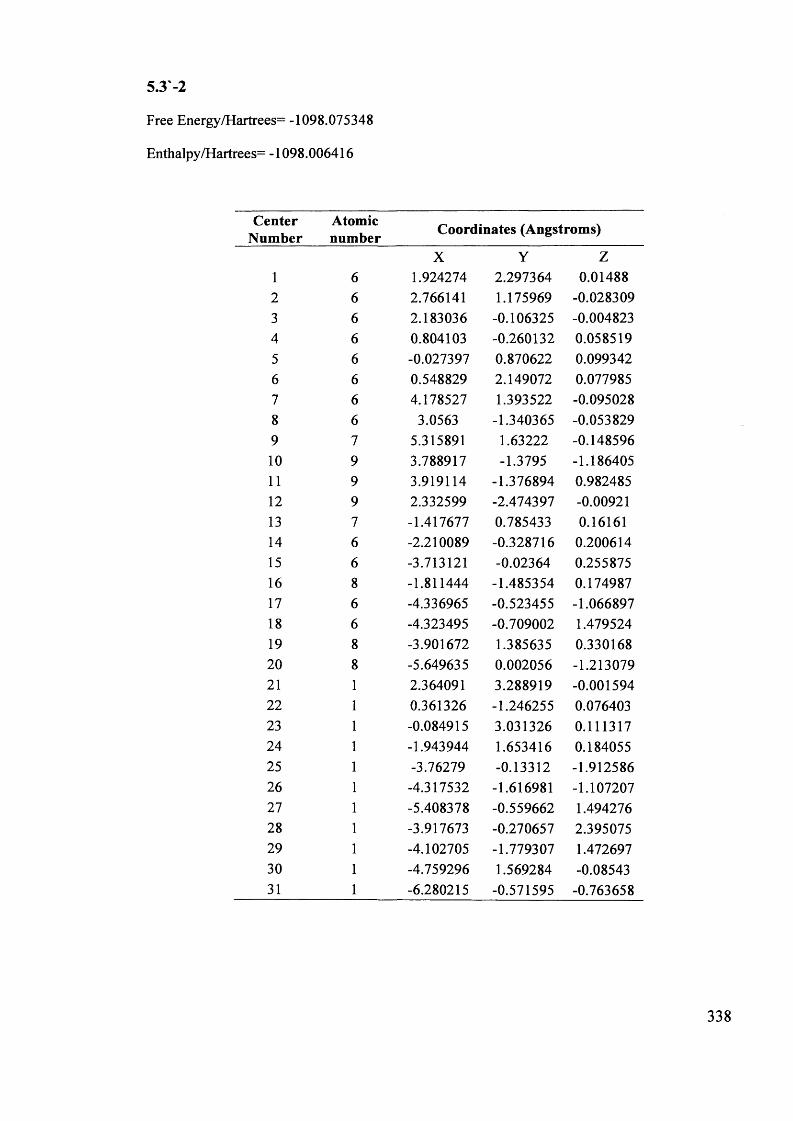
5.3'-2
Free Energy/Hartrees= -1098.075348
Enthalpy/Hartrees= -1098.006416
CenterNumber
Atomicnumber Coordinates (Angstroms)
X Y Z1 6 1.924274 2.297364 0.014882 6 2.766141 1.175969 -0.0283093 6 2.183036 -0.106325 -0.0048234 6 0.804103 -0.260132 0.0585195 6 -0.027397 0.870622 0.0993426 6 0.548829 2.149072 0.0779857 6 4.178527 1.393522 -0.0950288 6 3.0563 -1.340365 -0.0538299 7 5.315891 1.63222 -0.14859610 9 3.788917 -1.3795 -1.18640511 9 3.919114 -1.376894 0.98248512 9 2.332599 -2.474397 -0.0092113 7 -1.417677 0.785433 0.1616114 6 -2.210089 -0.328716 0.20061415 6 -3.713121 -0.02364 0.25587516 8 -1.811444 -1.485354 0.17498717 6 -4.336965 -0.523455 -1.06689718 6 -4.323495 -0.709002 1.47952419 8 -3.901672 1.385635 0.33016820 8 -5.649635 0.002056 -1.21307921 1 2.364091 3.288919 -0.00159422 1 0.361326 -1.246255 0.07640323 1 -0.084915 3.031326 0.11131724 1 -1.943944 1.653416 0.18405525 1 -3.76279 -0.13312 -1.91258626 1 -4.317532 -1.616981 -1.10720727 1 -5.408378 -0.559662 1.49427628 1 -3.917673 -0.270657 2.39507529 1 -4.102705 -1.779307 1.47269730 1 -4.759296 1.569284 -0.0854331 1 -6.280215 -0.571595 -0.763658
338
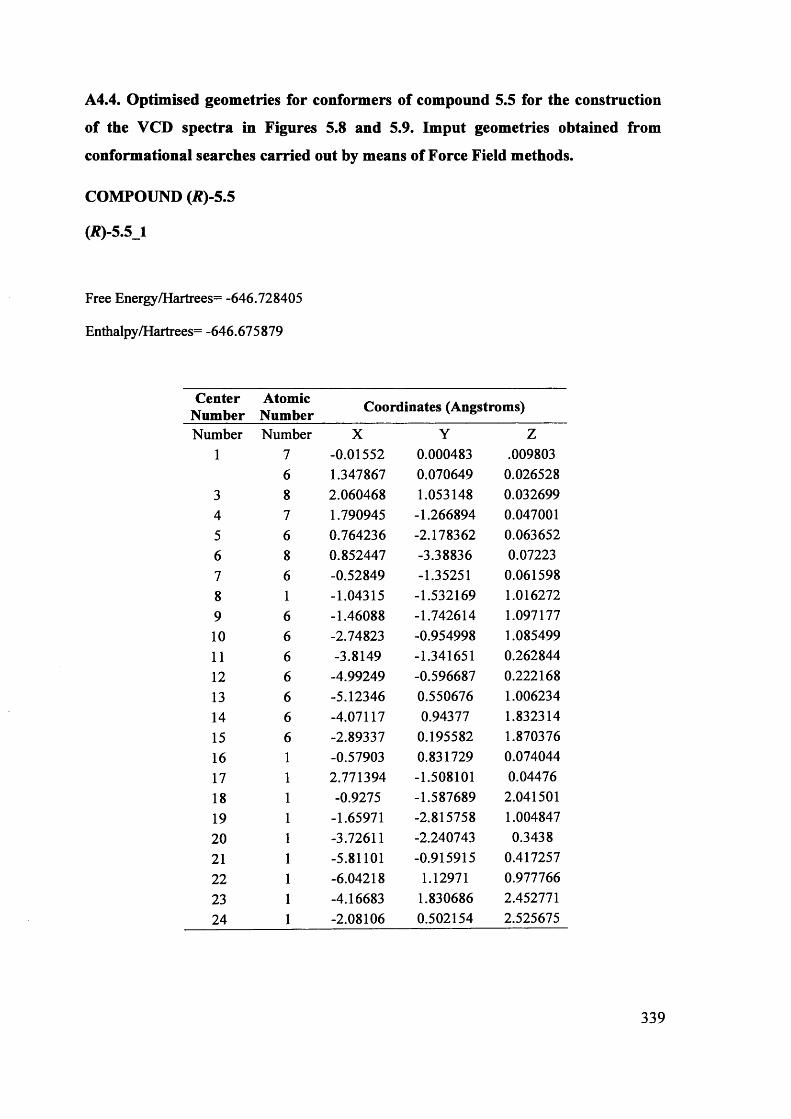
A4.4. Optimised geometries for conformers of compound 5.5 for the construction
of the VCD spectra in Figures 5.8 and 5.9. Imput geometries obtained from
conformational searches carried out by means of Force Field methods.
COMPOUND (I?)-5.5
(J?)-5.5_l
Free Energy/Hartrees= -646.728405
Enthalpy/Hartrees= -646.675879
CenterNumber
AtomicNumber Coordinates (Angstroms)
Number Number X Y Z1 7 -0.01552 0.000483 .009803
6 1.347867 0.070649 0.0265283 8 2.060468 1.053148 0.0326994 7 1.790945 -1.266894 0.0470015 6 0.764236 -2.178362 0.0636526 8 0.852447 -3.38836 0.072237 6 -0.52849 -1.35251 0.0615988 1 -1.04315 -1.532169 1.0162729 6 -1.46088 -1.742614 1.09717710 6 -2.74823 -0.954998 1.08549911 6 -3.8149 -1.341651 0.26284412 6 -4.99249 -0.596687 0.22216813 6 -5.12346 0.550676 1.00623414 6 -4.07117 0.94377 1.83231415 6 -2.89337 0.195582 1.87037616 1 -0.57903 0.831729 0.07404417 1 2.771394 -1.508101 0.0447618 1 -0.9275 -1.587689 2.04150119 1 -1.65971 -2.815758 1.00484720 1 -3.72611 -2.240743 0.343821 1 -5.81101 -0.915915 0.41725722 1 -6.04218 1.12971 0.97776623 1 -4.16683 1.830686 2.45277124 1 -2.08106 0.502154 2.525675
339
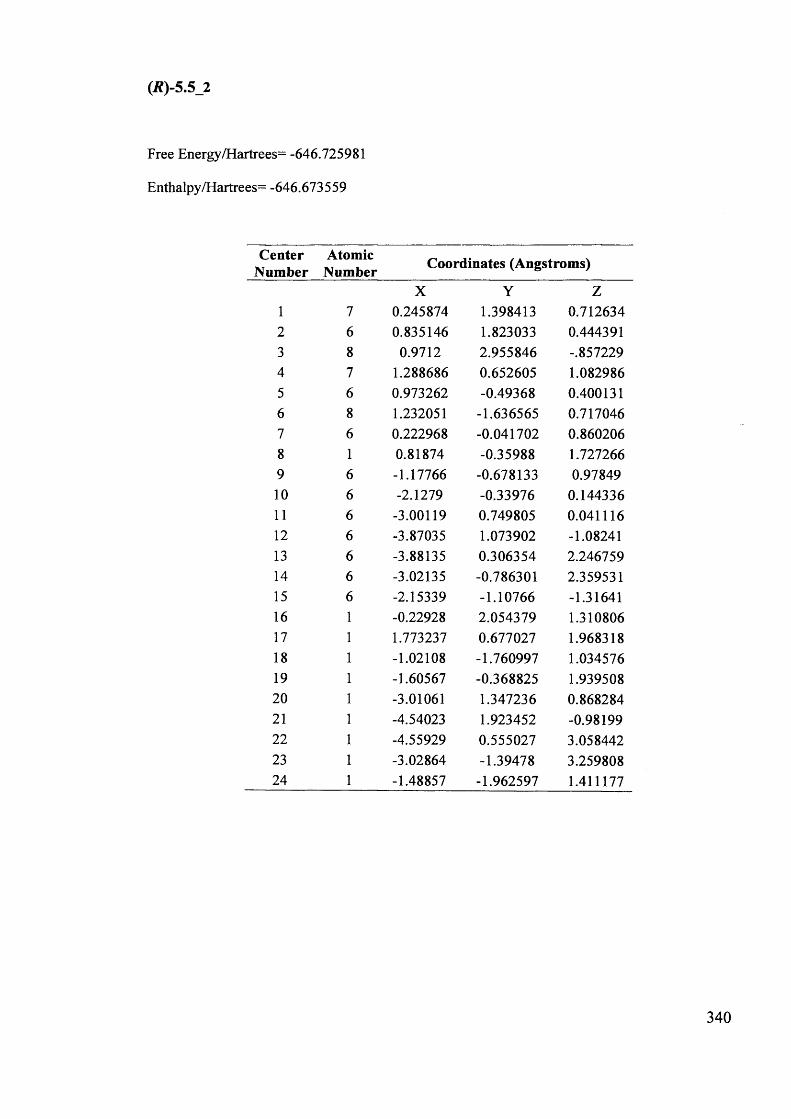
(l?)-5.5_2
Free Energy/Hartrees^ -646.725981
Enthalpy/Hartrees= -646.673559
CenterNumber
AtomicNumber Coordinates (Angstroms)
X Y Z1 7 0.245874 1.398413 0.7126342 6 0.835146 1.823033 0.4443913 8 0.9712 2.955846 -.8572294 7 1.288686 0.652605 1.0829865 6 0.973262 -0.49368 0.4001316 8 1.232051 -1.636565 0.7170467 6 0.222968 -0.041702 0.8602068 1 0.81874 -0.35988 1.7272669 6 -1.17766 -0.678133 0.9784910 6 -2.1279 -0.33976 0.14433611 6 -3.00119 0.749805 0.04111612 6 -3.87035 1.073902 -1.0824113 6 -3.88135 0.306354 2.24675914 6 -3.02135 -0.786301 2.35953115 6 -2.15339 -1.10766 -1.3164116 1 -0.22928 2.054379 1.31080617 1 1.773237 0.677027 1.96831818 1 -1.02108 -1.760997 1.03457619 1 -1.60567 -0.368825 1.93950820 1 -3.01061 1.347236 0.86828421 1 -4.54023 1.923452 -0.9819922 1 -4.55929 0.555027 3.05844223 1 -3.02864 -1.39478 3.25980824 1 -1.48857 -1.962597 1.411177
340
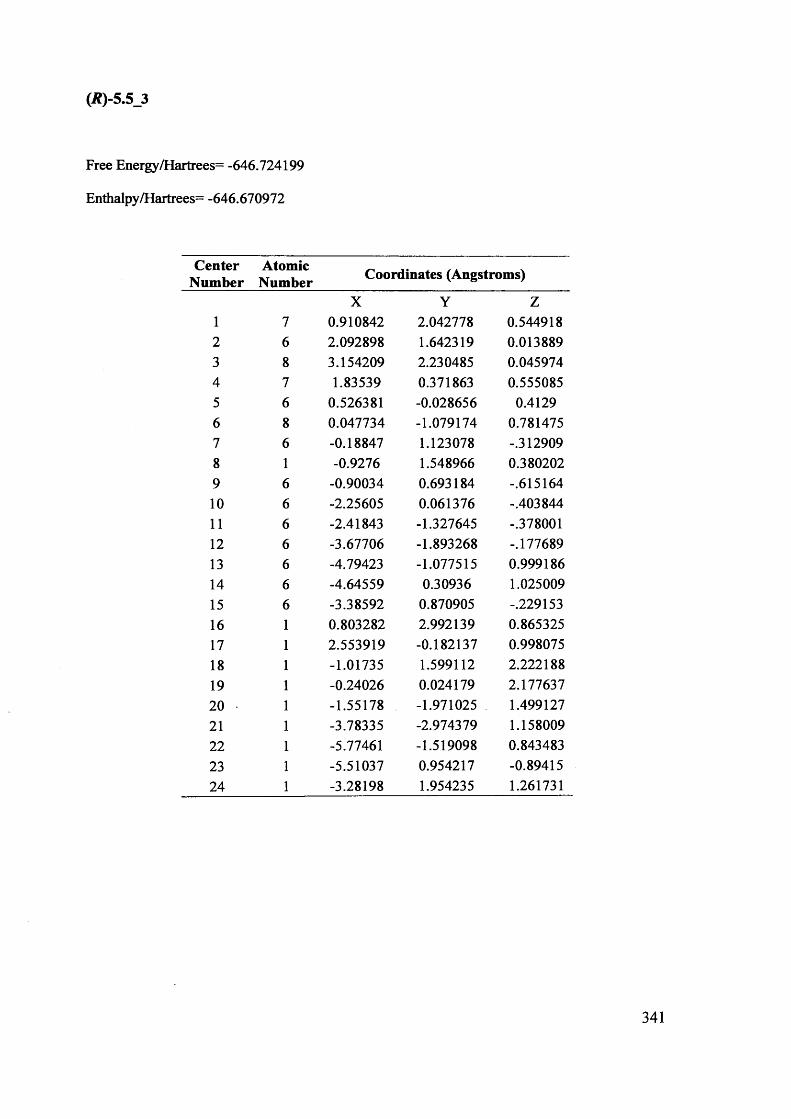
(tf)-5.5_3
Free Energy/Hartrees= -646.724199
Enthalpy/Hartrees= -646.670972
CenterNumber
AtomicNumber Coordinates (Angstroms)
X Y Z1 7 0.910842 2.042778 0.5449182 6 2.092898 1.642319 0.0138893 8 3.154209 2.230485 0.0459744 7 1.83539 0.371863 0.5550855 6 0.526381 -0.028656 0.41296 8 0.047734 -1.079174 0.7814757 6 -0.18847 1.123078 -.3129098 1 -0.9276 1.548966 0.3802029 6 -0.90034 0.693184 -.61516410 6 -2.25605 0.061376 -.40384411 6 -2.41843 -1.327645 -.37800112 6 -3.67706 -1.893268 -.17768913 6 -4.79423 -1.077515 0.99918614 6 -4.64559 0.30936 1.02500915 6 -3.38592 0.870905 -.22915316 1 0.803282 2.992139 0.86532517 1 2.553919 -0.182137 0.99807518 1 -1.01735 1.599112 2.22218819 1 -0.24026 0.024179 2.17763720 1 -1.55178 -1.971025 1.49912721 1 -3.78335 -2.974379 1.15800922 1 -5.77461 -1.519098 0.84348323 1 -5.51037 0.954217 -0.8941524 1 -3.28198 1.954235 1.261731
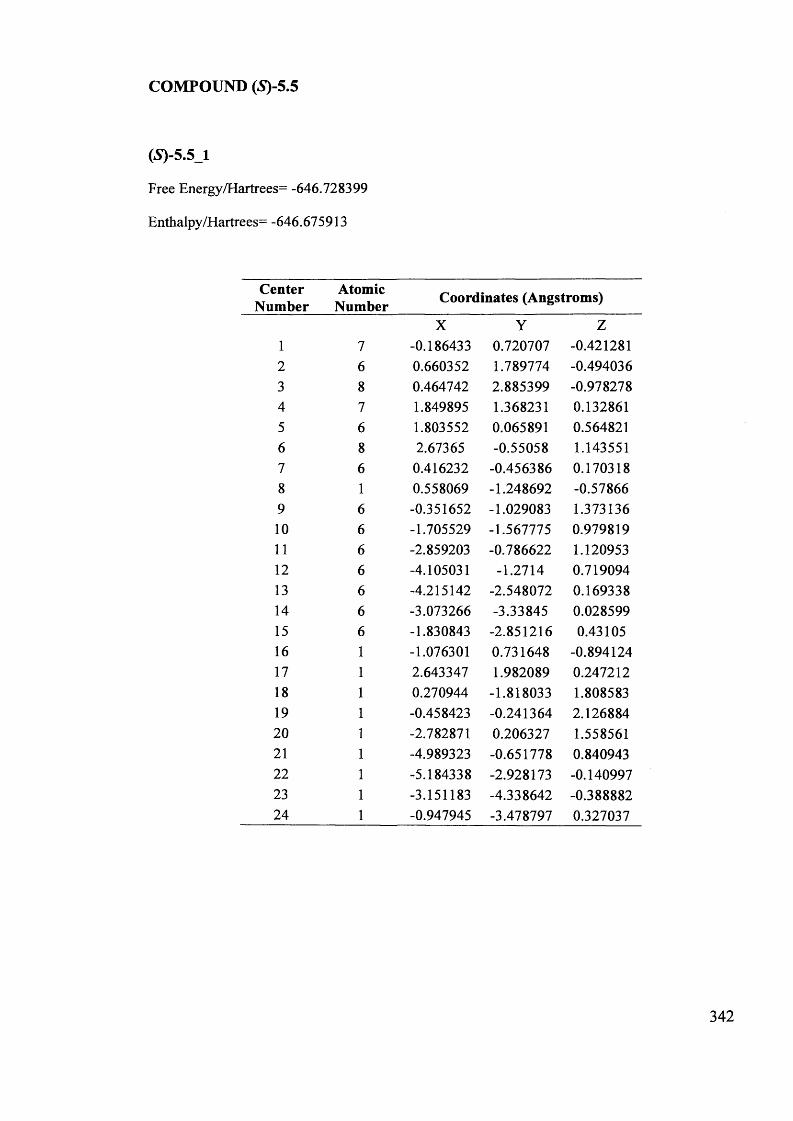
COMPOUND (S)-5.5
(S )-5.5_1
Free Energy/Hartrees= -646.728399
Enthalpy/Hartrees= -646.675913
CenterNumber
AtomicNumber Coordinates (Angstroms)
X Y Z1 7 -0.186433 0.720707 -0.4212812 6 0.660352 1.789774 -0.4940363 8 0.464742 2.885399 -0.9782784 7 1.849895 1.368231 0.1328615 6 1.803552 0.065891 0.5648216 8 2.67365 -0.55058 1.1435517 6 0.416232 -0.456386 0.1703188 1 0.558069 -1.248692 -0.578669 6 -0.351652 -1.029083 1.37313610 6 -1.705529 -1.567775 0.97981911 6 -2.859203 -0.786622 1.12095312 6 -4.105031 -1.2714 0.71909413 6 -4.215142 -2.548072 0.16933814 6 -3.073266 -3.33845 0.02859915 6 -1.830843 -2.851216 0.4310516 1 -1.076301 0.731648 -0.89412417 1 2.643347 1.982089 0.24721218 1 0.270944 -1.818033 1.80858319 1 -0.458423 -0.241364 2.12688420 1 -2.782871 0.206327 1.55856121 1 -4.989323 -0.651778 0.84094322 1 -5.184338 -2.928173 -0.14099723 1 -3.151183 -4.338642 -0.38888224 1 -0.947945 -3.478797 0.327037
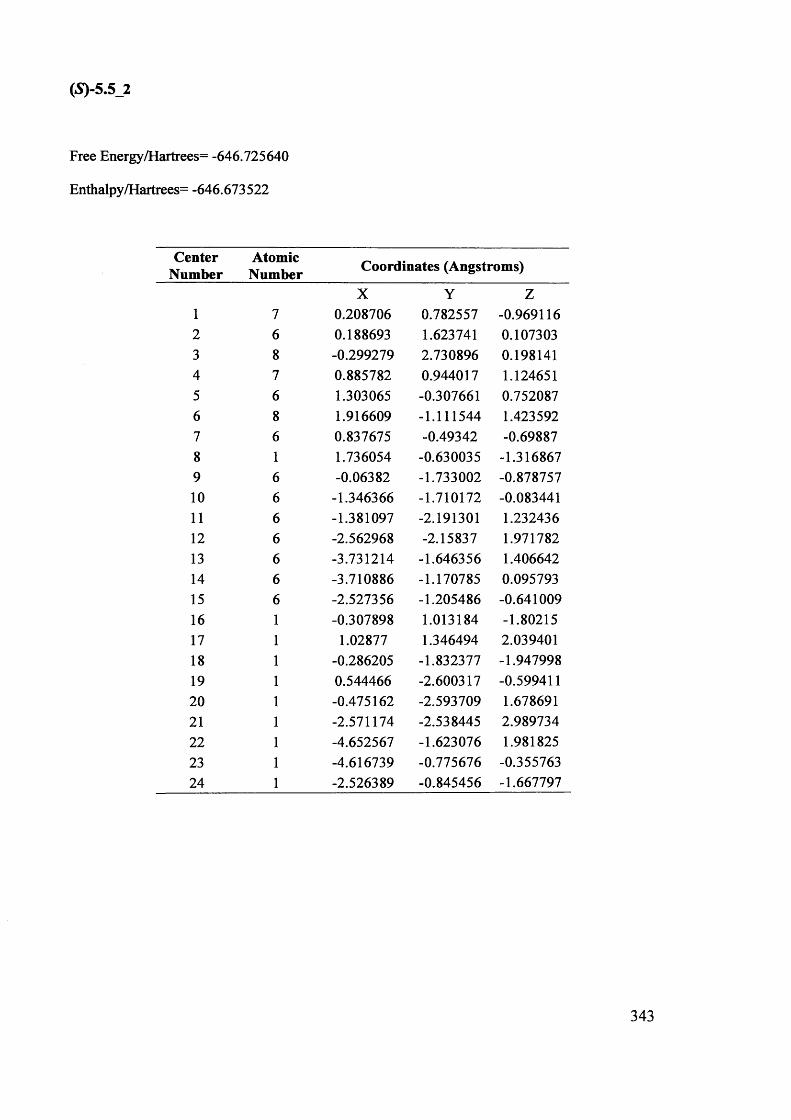
(S)-5.5_2
Free Energy/Hartrees= -646.725640
Enthalpy/Hartrees= -646.673522
CenterNumber
AtomicNumber Coordinates (Angstroms)
X Y Z1 7 0.208706 0.782557 -0.9691162 6 0.188693 1.623741 0.1073033 8 -0.299279 2.730896 0.1981414 7 0.885782 0.944017 1.1246515 6 1.303065 -0.307661 0.7520876 8 1.916609 -1.111544 1.4235927 6 0.837675 -0.49342 -0.698878 1 1.736054 -0.630035 -1.3168679 6 -0.06382 -1.733002 -0.87875710 6 -1.346366 -1.710172 -0.08344111 6 -1.381097 -2.191301 1.23243612 6 -2.562968 -2.15837 1.97178213 6 -3.731214 -1.646356 1.40664214 6 -3.710886 -1.170785 0.09579315 6 -2.527356 -1.205486 -0.64100916 1 -0.307898 1.013184 -1.8021517 1 1.02877 1.346494 2.03940118 1 -0.286205 -1.832377 -1.94799819 1 0.544466 -2.600317 -0.59941120 1 -0.475162 -2.593709 1.67869121 1 -2.571174 -2.538445 2.98973422 1 -4.652567 -1.623076 1.98182523 1 -4.616739 -0.775676 -0.35576324 1 -2.526389 -0.845456 -1.667797
343
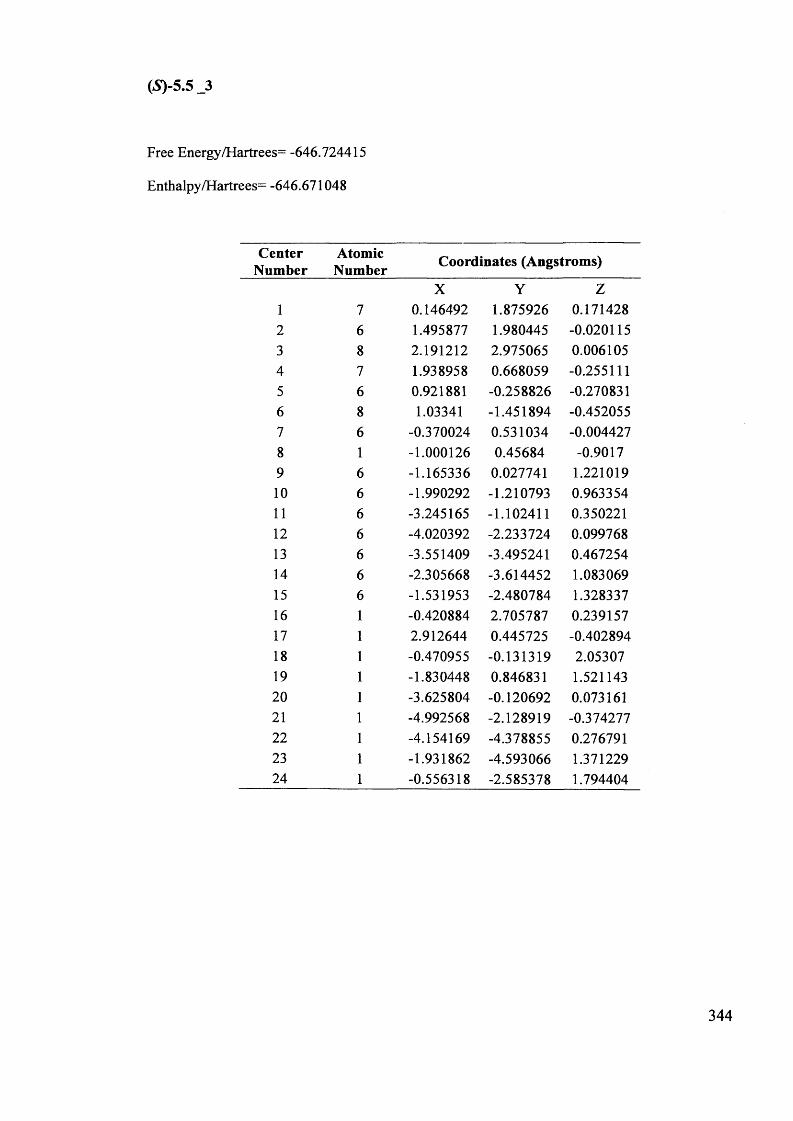
(*S)-5.5 _3
Free Energy/Hartrees= -646.724415
Enthalpy/Hartrees= -646.671048
CenterNumber
AtomicNumber Coordinates (Angstroms)
X Y Z1 7 0.146492 1.875926 0.1714282 6 1.495877 1.980445 -0.0201153 8 2.191212 2.975065 0.0061054 7 1.938958 0.668059 -0.2551115 6 0.921881 -0.258826 -0.2708316 8 1.03341 -1.451894 -0.4520557 6 -0.370024 0.531034 -0.0044278 1 -1.000126 0.45684 -0.90179 6 -1.165336 0.027741 1.22101910 6 -1.990292 -1.210793 0.96335411 6 -3.245165 -1.102411 0.35022112 6 -4.020392 -2.233724 0.09976813 6 -3.551409 -3.495241 0.46725414 6 -2.305668 -3.614452 1.08306915 6 -1.531953 -2.480784 1.32833716 1 -0.420884 2.705787 0.23915717 1 2.912644 0.445725 -0.40289418 1 -0.470955 -0.131319 2.0530719 1 -1.830448 0.846831 1.52114320 1 -3.625804 -0.120692 0.07316121 1 -4.992568 -2.128919 -0.37427722 1 -4.154169 -4.378855 0.27679123 1 -1.931862 -4.593066 1.37122924 1 -0.556318 -2.585378 1.794404
344
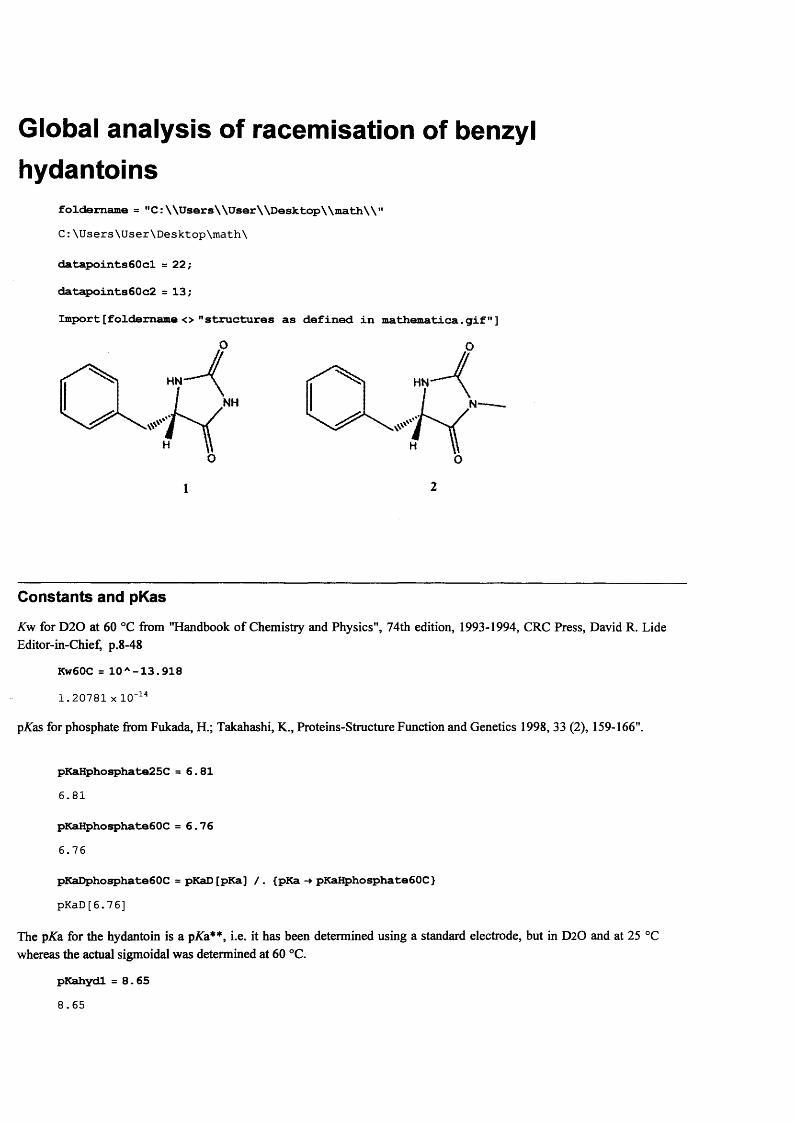
Global analysis of racemisation of benzyl hydantoins
foldername = "CrWUsersWUserWDesktopWmathW"C:\Users\User\Desktop\math\
datapoints60cl = 22; datapoints60c2 = 13;
Import [foldemame <> "structures as defined in mathematica.gif"]
HN
NH
1
HN
O
Constants and pKas
Kvf for D 2 0 at 60 °C from "Handbook o f Chemistry and Physics", 74th edition, 1993-1994, CRC Press, David R. Lide Editor-in-Chief, p.8-48
Kw60C = 10 A -13. 918
1.20781 x 10'14
pA as for phosphate from Fukada, H.; Takahashi, K., Proteins-Structure Function and Genetics 1998, 33 (2), 159-166".
pKaHphosphate25C =6.816.81
pKaHphosphate60C = 6.766.76
pKaDphosphate60C = pKaD [pKa] / . {pKa -> pKaHphosphate60C }pKaD[6.76]
The pKa. for the hydantoin is a pKa**, i.e. it has been determined using a standard electrode, but in D 20 and at 25 °C whereas the actual sigmoidal was determined at 60 °C.
pKahydl = 8.658 . 6 5
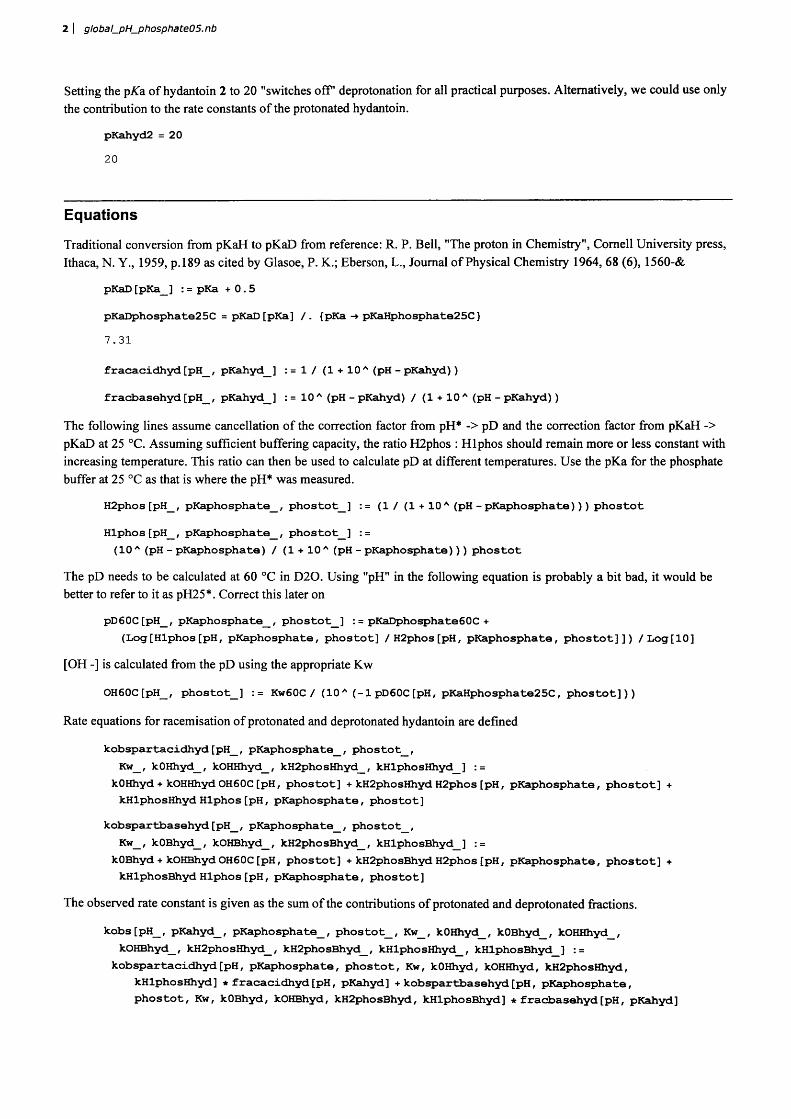
2 | global_pH_phosphate05.nb
Setting the pKa. o f hydantoin 2 to 20 "switches off' deprotonation for all practical purposes. Alternatively, we could use only the contribution to the rate constants o f the protonated hydantoin.
pKahyd2 =2020
Equations
Traditional conversion from pKaH to pKaD from reference: R. P. Bell, "The proton in Chemistry", Cornell University press, Ithaca, N. Y., 1959, p .189 as cited by Glasoe, P. K.; Eberson, L., Journal o f Physical Chemistry 1964, 68 (6), 1560-&
pKaD [pKa_] : = pKa +0.5
pKaDphosphate25C = pKaD [pKa] / . {pKa -* pKaHphosphate25C}7.31
fracacidhyd [pH_, pKahyd_] :=1/(1 + 10A (pH - pKahyd))
fracbasehyd [pH_, pKahyd_] : = 10 A (pH - pKahyd) / (1 + 10 A (pH - pKahyd))
The following lines assume cancellation o f the correction factor from pH* -> pD and the correction factor from pKaH -> pKaD at 25 °C. Assuming sufficient buffering capacity, the ratio H2phos : Hlphos should remain more or less constant with increasing temperature. This ratio can then be used to calculate pD at different temperatures. Use the pKa for the phosphate buffer at 25 °C as that is where the pH* was measured.
H2phos [pH_, pKaphosphate_, phostot_] := (1 / (1 + 10 A (pH - pKaphosphate))) phostot
Hlphos[pH_, pKaphosphate_, phostot_] :=(10 A (pH - pKaphosphate) / (1 + 10 A (pH - pKaphosphate))) phostot
The pD needs to be calculated at 60 °C in D 20. Using "pH" in the following equation is probably a bit bad, it would be better to refer to it as pH25*. Correct this later on
pD60C[pH_, pKaphosphate_, phostot_] : = pKaDphosphate60C +(Log [Hlphos [pH, pKaphosphate, phostot] /H2phos[pH, pKaphosphate, phostot]]) /Log[10]
[OH -] is calculated from the pD using the appropriate Kw
OH60C[pH_, phostot_] := Kw60C / (10A (-lpD60C[pH, pKaHphosphate25C, phostot]))
Rate equations for racemisation o f protonated and deprotonated hydantoin are defined
kobspartacidhyd[pH_, pKaphosphate_, phostot_,Kw_, k0Hhyd_, kOHHhyd_, kH2phosHhyd_, kHlphosHhyd_] : =
kOHhyd + kOHHhyd OH60C [pH, phostot] + kH2phosHhyd H2phos [pH, pKaphosphate, phostot] + kHlphosHhyd Hlphos [pH, pKaphosphate, phostot]
kobspartbasehyd [pH_, pKaphosphate_, phostot_,Kw_, k0Bhyd_, kOHBhyd_, kH2phosBhyd_, kHlphosBhyd_] :=
kOBhyd + kOHBhyd OH60C [pH, phostot] + kH2phosBhyd H2phos [pH, pKaphosphate, phostot] + kHlphosBhyd Hlphos [pH, pKaphosphate, phostot]
The observed rate constant is given as the sum o f the contributions o f protonated and deprotonated fractions.
kobs[pH_, pKahyd_, pKaphosphate_, phostot_, Kw_, k0Hhyd_, k0Bhyd_, kOHHhyd_, kOHBhyd_, kH2phosHhyd_, kH2phosBhyd_, kHlphosHhyd_, kHlphosBhyd_] :=
kobspartacidhyd[pH, pKaphosphate, phostot, Kw, kOHhyd, kOHHhyd, kH2phosHhyd, kHlphosHhyd] * fracacidhyd[pH, pKahyd] + kobspartbasehyd[pH, pKaphosphate, phostot, Kw, kOBhyd, kOHBhyd, kH2phosBhyd, kHlphosBhyd] * fracbasehyd[pH, pKahyd]
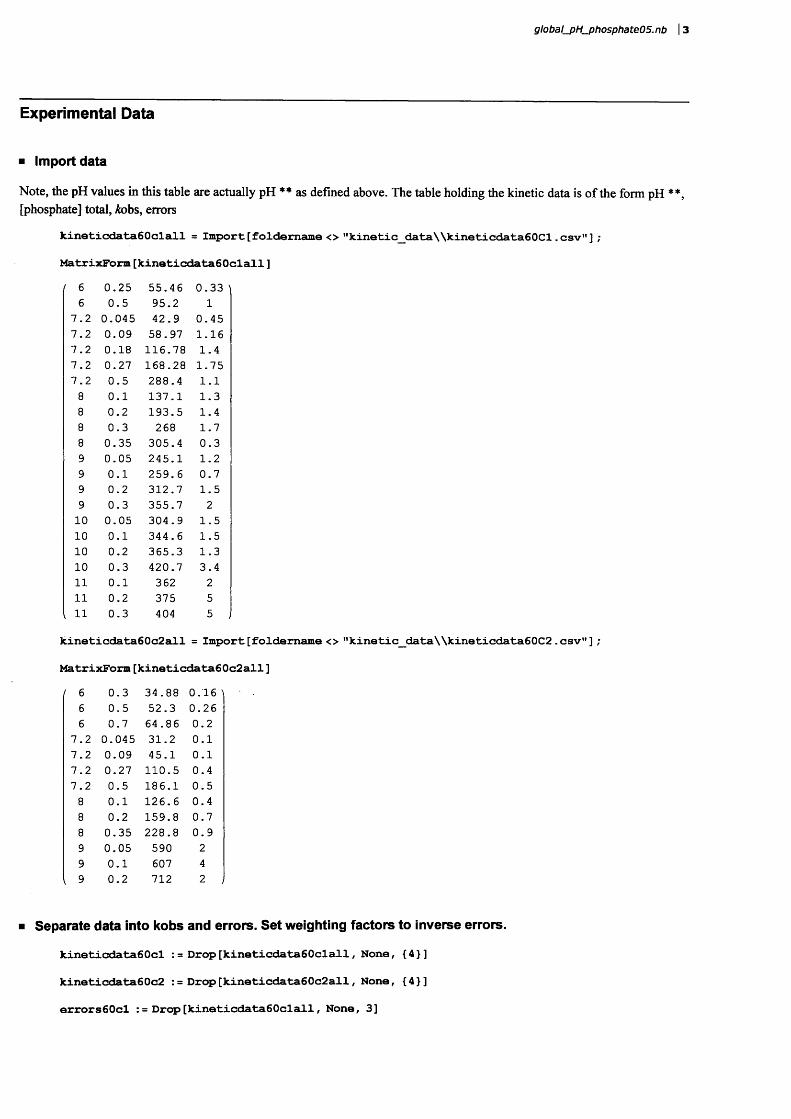
global_pH_phosphate05.nb | 3
Experimental Data
■ Import data
Note, the pH values in this table are actually pH ** as defined above. The table holding the kinetic data is o f the form pH **, [phosphate] total, fobs, errors
k±neticdata60clall = Import [foldemame <> "kinetic_data\\kineticdata60Cl. csv" ] ;
MatrixForm[kineticdata60clall]
6 0.25 55.46 0.336 0.5 95.2 1
7.2 0.045 42.9 0.457.2 0.09 58.97 1.167.2 0.18 116.78 1.47.2 0.27 168.28 1.757.2 0.5 288.4 1.18 0.1 137.1 1.38 0.2 193.5 1.48 0.3 268 1.78 0.35 305.4 0.39 0.05 245.1 1.29 0.1 259. 6 0.79 0.2 312.7 1.59 0.3 355.7 210 0.05 304.9 1.510 0.1 344.6 1.510 0.2 365.3 1.310 0.3 420.7 3.411 0.1 362 211 0.2 375 5
, 11 0.3 404 5
kineticdata60c2all = Import [foldemame <> "kinetic_data\\kineticdata60C2 . csv" ] ;
MatrixForm[kinet±cdata60c2all]6 0.3 34.88 0.166 0.5 52.3 0.266 0.7 64.86 0.2
7.2 0.045 31.2 0.17.2 0.09 45.1 0.17.2 0.27 110.5 0.47.2 0.5 186.1 0.58 0.1 126.6 0.48 0.2 159.8 0.78 0.35 228.8 0.99 0.05 590 29 0.1 607 4
, 9 0.2 712 2 ,
■ Separate data into kobs and errors. Set weighting factors to inverse errors.
kineticdata60cl := Drop[kineticdata60clall, None, {4}]
kineticdata60c2 := Drop[kineticdata60c2all, None, {4}]
errors60cl : = Drop[kineticdata60clall, None, 3]
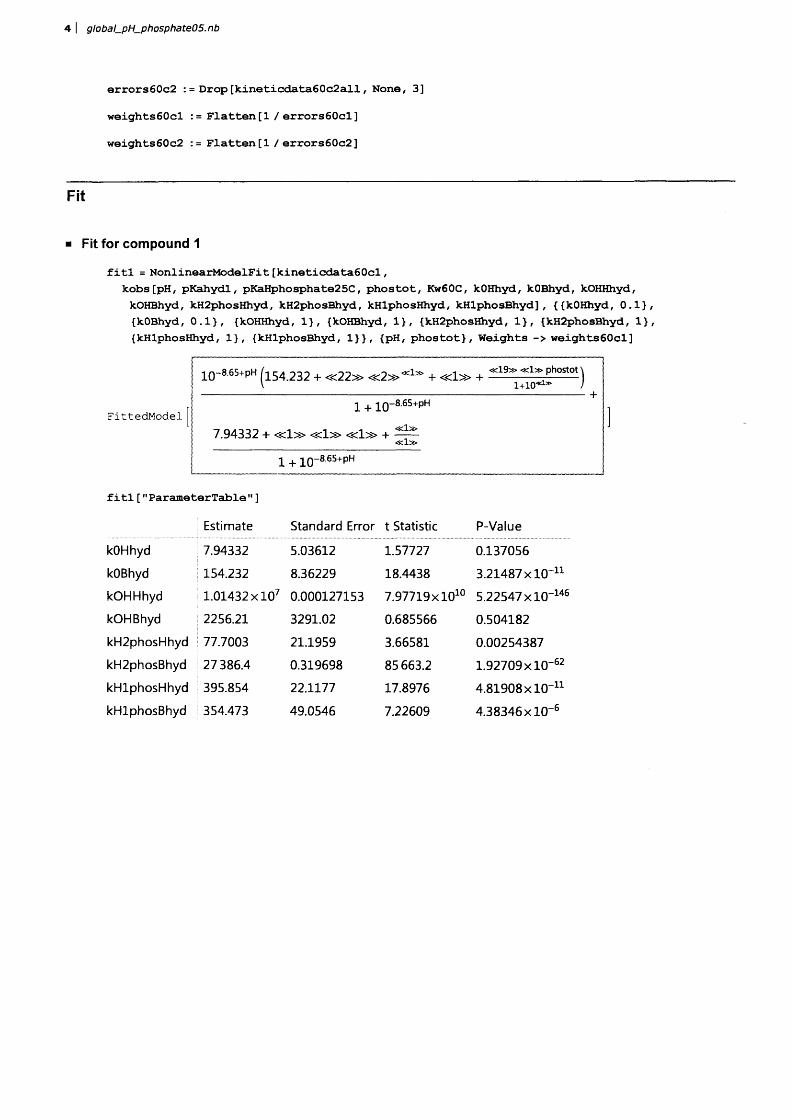
4 | global_pH_phosphate05.nb
errors60c2 : = Drop[kineticdata60c2all, None, 3] weights60cl := Flatten[1 / errors60cl]
weights60c2 := Flatten [1 /errors60c2]
Fit
■ Fit for compound 1
fitl = NonlinearModelFit[kineticdata60cl,kobs[pH, pKahydl, pKaHphosphate25C, phostot, Kw60C, kOHhyd, kOBhyd, kOHHhyd, kOHBhyd, kH2phosHhyd, kH2phosBhyd, kHlphosHhyd, kHlphosBhyd], {{kOHhyd, 0.1}, {kOBhyd, 0.1}, {kOHHhyd, 1}, {kOHBhyd, 1}, {kH2phosHhyd, 1}, {kH2phosBhyd, 1}, {kHlphosHhyd, 1}, {kHlphosBhyd, 1}}, {pH, phostot}, Weights -> weights60cl]
|1 0 - ^ P H fl54.232 + « 2 2 » + « 1 » +I V l+ io ^ )| 1 + 1 0 -8.65+pH +
FittedModel7.94332 + <scl;s> <sd.:» « :1» +
I 1 + 10“8-65+ph
fitl["ParameterTable"]
Estimate Standard Error t Statistic P-Value
kOHhyd 7.94332 5.03612 1.57727 0.137056
kOBhyd 154.232 8.36229 18.4438 3.21487 x lO -11
kOHHhyd 1.01432 x lO 7 0.000127153 7.97719xl010 5.22547 x l0 ~ 146
kOHBhyd 2256.21 3291.02 0.685566 0.504182
kH2phosHhyd 77.7003 21.1959 3.66581 0.00254387
kH2phosBhyd 27386.4 0.319698 85 663.2 1.92709 x lO "62
kHlphosHhyd 395.854 22.1177 17.8976 4.81908 x lO -11
kHlphosBhyd 354.473 49.0546 7.22609 4.38346 x l0 ~ 6
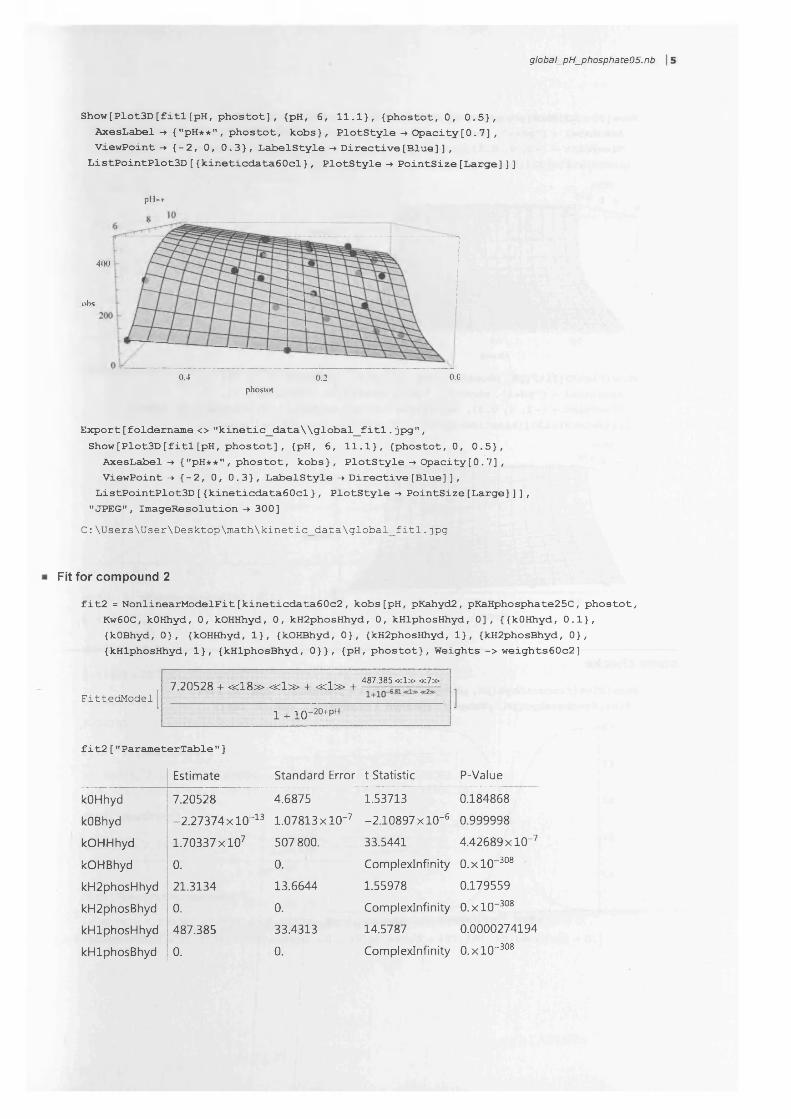
global_pH_phosphate05. nb
Show[Plot3D[fitl[pH, phostot], {pH, 6, 11.1}, (phostot, 0, 0.5}, AxesLabel - * {"pH**", phostot, kobs}, Plotstyle -» Opacity[0.7] , Viewpoint -» {-2, 0, 0.3}, LabelStyle -» Directive [Blue] ] ,
ListPointPlot3D [ {kineticdata60cl} , PlotStyle -» PointSize [Large] ] ]
pH**
400
4>bs
0.4 0.2 0.Cphostot
Export [foldemame <> "kinetic_data\\global_fitl. jpg" ,Show[Plot3D[fitl[pH, phostot], {pH, 6, 11.1}, {phostot, 0, 0.5},
AxesLabel->{ "pH**" , phostot, kobs}, PlotStyle -* Opacity [0 . 7] , ViewPoint-» {-2, 0, 0.3}, LabelStyle -» Directive [Blue] ] ,
ListPointPlot3D [ {kineticdata60cl} , PlotStyle -» PointSize [Large] ] ] , "JPEG", ImageResolution -* 300]
C :\Users\User\Desktop\math\kinetic_data\global_fitl.jpg
Fit for compound 2
fit2 = NonlinearModelFit[kineticdata60c2, kobs[pH, pKahyd2, pKaHphosphate25C, phostot, Kw60C, kOHhyd, 0, kOHHhyd, 0, kH2phosHhyd, 0, kHlphosHhyd, 0], {{kOHhyd, 0.1}, {kOBhyd, 0}, {kOHHhyd, 1}, {kOHBhyd, 0}, {kH2phosHhyd, 1}, {kH2phosBhyd, 0}, {kHlphosHhyd, 1}, {kHlphosBhyd, 0}}, {pH, phostot}, Weights -> weights60c2]
FittedModel[
fit2["ParameterTable"]
Estimate Standard Error t Statistic P-Value
kOHhyd 7.20528 4.6875 1.53713 0.184868
kOBhyd -2.27374 xlO "13 1.07813 xlO"7 -2.10897 xlO"6 0.999998
kOHHhyd 1.70337 xlO 7 507800. 33.5441 4.42689 xlO"7
kOHBhyd 0. 0. Complexlnfinity O.xlO"308
kH2phosHhyd 21.3134 13.6644 1.55978 0.179559
kH2phosBhyd 0. 0. Complexlnfinity O.xlO"308
kHlphosHhyd 487.385 33.4313 14.5787 0.0000274194
kHlphosBhyd 0. 0. Complexlnfinity O.xlO"308
_ - 487.385 « 1 » <k7 »7.20528 + « 1 8 » « 1 » + « 1 » +
1 + io -20+pH
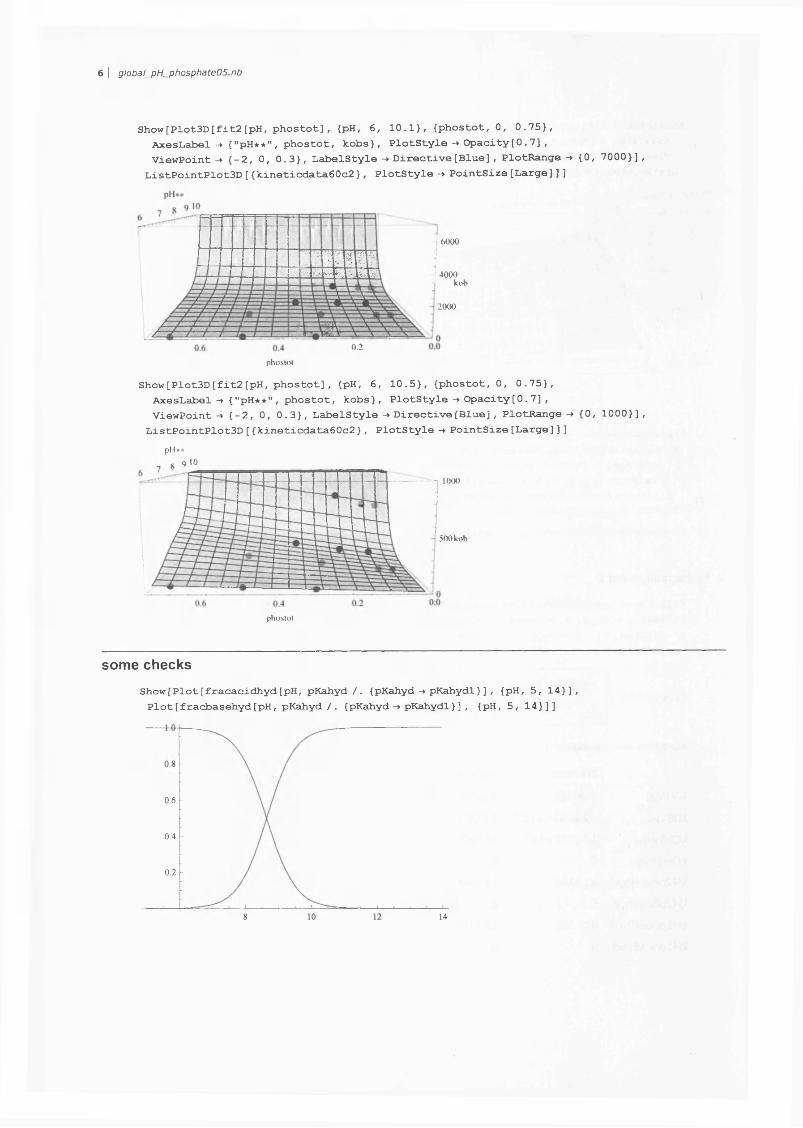
6 | global_pH_phosphate05.nb
Show[Plot3D[fit2[pH, phostot], {pH, 6, 10.1}, {phostot, 0, 0.75),AxesLabel -> {"pH**", phostot, kobs}, PlotStyle -* Opacity[0.7] ,Viewpoint -* {-2, 0, 0.3}, LabelStyle -» Directive [Blue] , PlotRange -> {0, 7000}] ,
ListPointPlot3D [ {kineticdata60c2 } , PlotStyle -» PointSize [Large] ] ]
phostot
HS1IBI «
6000
4000kob
mwmmmmmm ■— i— mm war it o w im i
2000
0.2
Show[Plot3D[fit2[pH, phostot], {pH, 6, 10.5}, {phostot, 0, 0.75},AxesLabel - * {"pH**" , phostot, kobs}, PlotStyle-» Opacity [0. 7] ,Viewpoint -» {-2, 0, 0.3}, LabelStyle -» Directive [Blue] , PlotRange -» {0, 1000}] ,
ListPointPlot3D [ {kineticdata60c2} , PlotStyle -» PointSize [Large] ] ]pH»*
8 9 01000
500 kob
pbo^ol
so m e ch eck s
Show [ Plot [fracacidhyd [pH, pKahyd/. {pKahyd -» pKahydl}] , {pH, 5, 14}], Plot [fracbasehyd [pH, pKahyd/. {pKahyd -» pKahydl} ] , {pH, 5, 14}]]
0.6
0.4
0.2
148
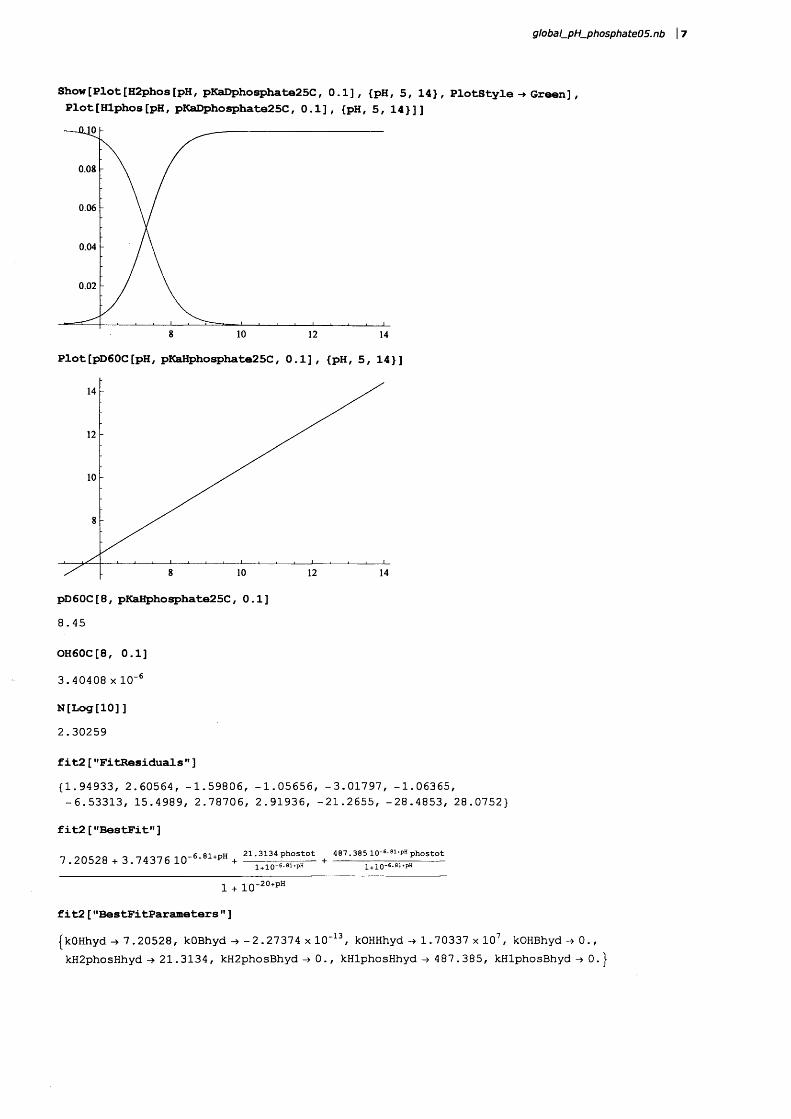
global_pH_phosphate05.nb | 7
Show[Plot[H2phos [pH, pKaDphosphate25C, 0.1], (pH, 5, 14}, PlotStyle-» Green] , Plot [ Hlphos [pH, pKaDpho spha te2 5C, 0.1], (pH, 5, 14}]]
0.08
0.06
0.04
0.02
8 10 12 14
Plot[pD60C[pH, pKaHphosphate25C, 0.1], {pH, 5, 14}]
pD60C[8, pKaHphosphate25C, 0.1]8.45
OH60C[8, 0.1]
3.40408 x 10'6
N[Log[10]]2.30259
fit2["FitResiduals"]{1.94933, 2.60564, -1.59806, -1.05656, -3.01797, -1.06365, -6.53313, 15.4989, 2.78706, 2.91936, -21.2655, -28.4853, 28.0752}
fit2["BestFit"]
7.20528 + 3.7437 6 icr6-81+pH + 21.3134 phostot 487.385 lO-0-01tPH phostot1 + 10~6-B1*PH 1 + 1O-0*0^4ph
1 + io-20+pH
fit2["BestFitParameters"]
{kOHhyd 7 .20528, k O B h y d 2 .27374 x 10'13, kOHHhyd 1.70337 x 10⁷, kOHBhyd->0., kH2phosHhyd 21. 3134 , kH2phosBhyd-> 0., kHlphosHhyd-> 487 . 385, k H l p h o s B h y d 0. }
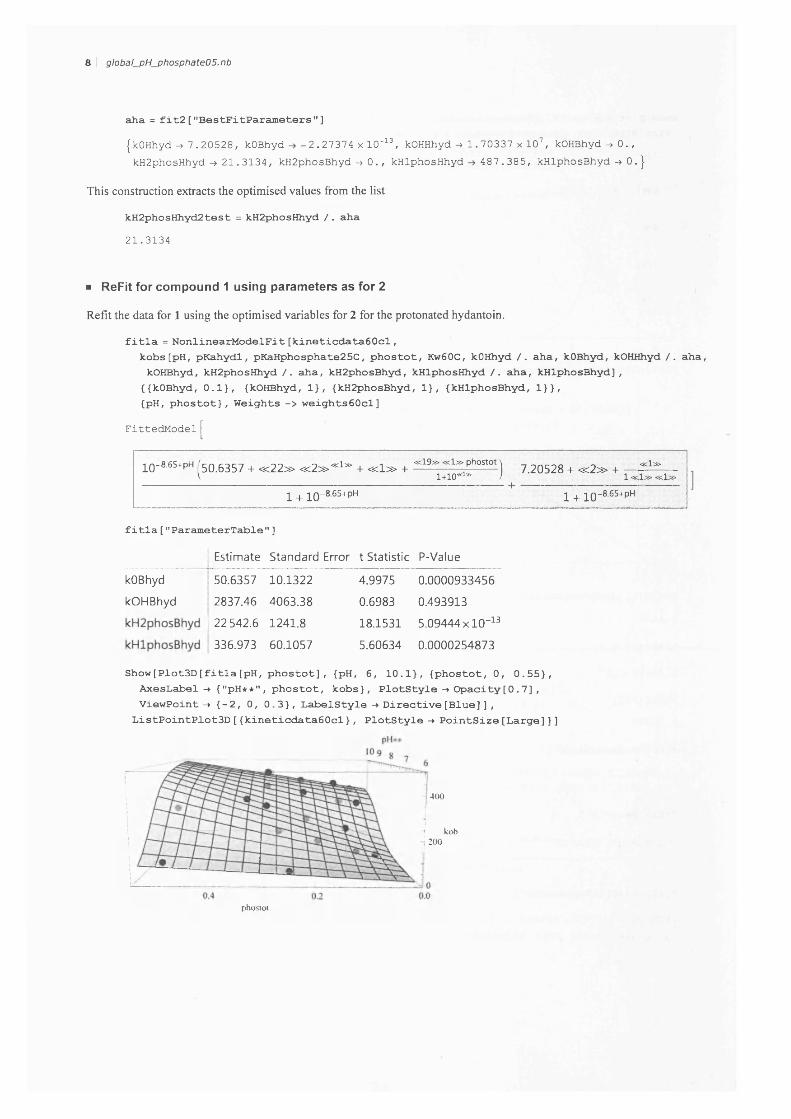
8 | global_pH_phosphate05.nb
aha = fit2["BestFitParameters"]{kOHhyd -» 7.20528, k O B h y d 2 .27374 x 10'13, kOHHhyd -> 1.70337 x 10⁷, kOHBhyd->0., kH2phosHhyd-» 21. 3134, kH2phosBhyd -» 0., kHlphosHhyd 487 . 385, kHlphosBhyd -» 0. j
This construction extracts the optimised values from the list
kH2phosHhyd2test = kH2phosHhyd / . aha21.3134
■ ReFit for compound 1 using parameters as for 2
Refit the data for 1 using the optimised variables for 2 for the protonated hydantoin.
fitla = NonlinearModelFit[kineticdata60cl,kobs[pH, pKahydl, pKaHphosphate25C, phostot, Kw60C, kOHhyd /. aha, kOBhyd, kOHHhyd /. aha, kOHBhyd, kH2phosHhyd /. aha, kH2phosBhyd, kHlphosHhyd /. aha, kHlphosBhyd],{{kOBhyd, 0.1), {kOHBhyd, 1}, {kH2phosBhyd, 1}, {kHlphosBhyd, 1}},{pH, phostot}, Weights -> weights60cl]
FittedModelf
lQ-8-65+pH j[50.6357 + « 2 2 » « 2 » « 1» + « 1 » + ^ ^ “ “ 1 K 1+10^ J| 7.20528 + « 2 » + , ^1 «1» «1»|
1 + i o -8-65+ph 1 + io ~8-65+ph
f i 11a ["ParameterTable"]
I Estimate Standard Error t Statistic P-Value
50.6357 10.1322 4.9975 0.0000933456
2837.46 4063.38 0.6983 0.493913
[ 22 542.6 1241.8 18.1531 5.09444 xlO "13
336.973 60.1057 5.60634 0.0000254873
kOBhyd
kOHBhyd
Show[Plot3D[fitla[pH, phostot], {pH, 6, 10.1}, {phostot, 0, 0.55}, AxesLabel -* {"pH**", phostot, kobs}, PlotStyle -*■ Opacity[0.7] , Viewpoint -» {-2, 0, 0.3}, LabelStyle -*■ Directive [Blue] ] ,
ListPointPlot3D[{kineticdata60cl}, PlotStyle -» PointSize[Large]]]
400
kob200
phostot
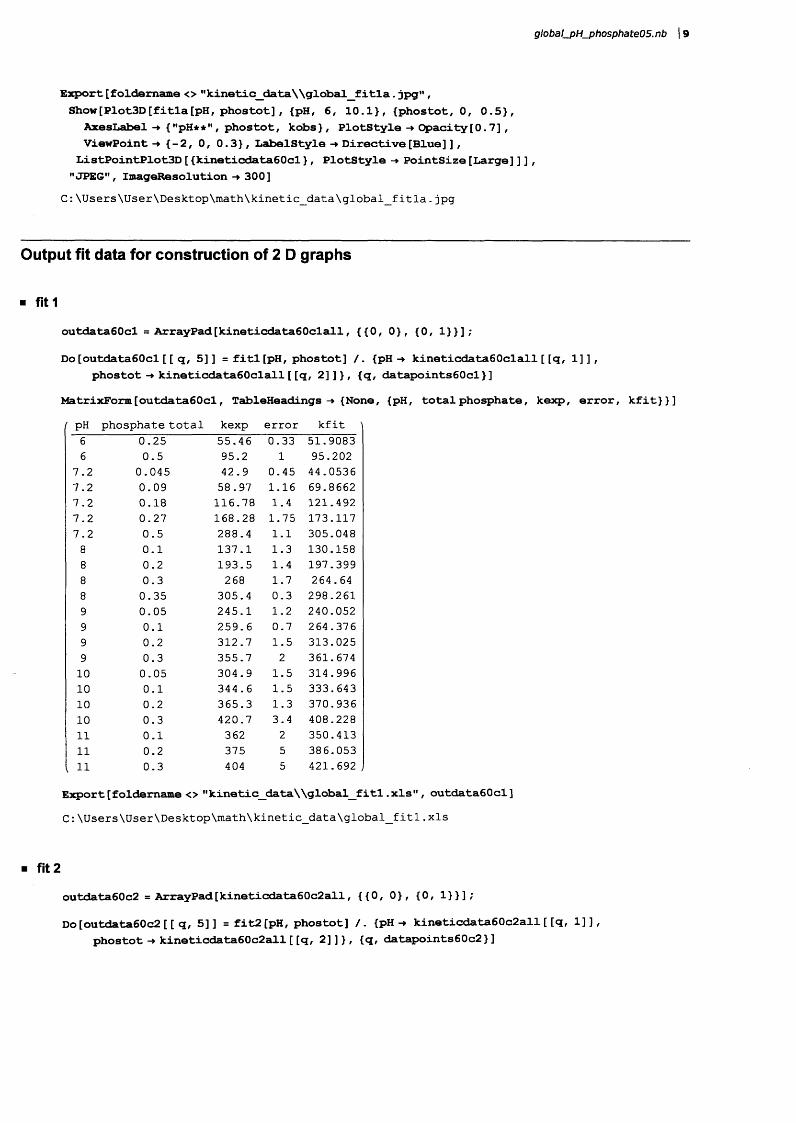
global_pH_phosphate05.nb 19
Export [foldemame <> "kinetic_dataWglobal_fitla.jpg" ,Show[Plot3D[fitla[pH, phostot], {pH, 6, 10.1}, {phostot, 0, 0.5),
AxesLabel -» {"pH**", phostot, kobs}, PlotStyle -» Opacity[0.7] , Viewpoint -» {-2, 0, 0.3}, LabelStyle -» Directive [Blue] ] ,
ListPointPlot3D [ {kineticdata60cl} , PlotStyle -» PointSize [Large] ] ] , "JPEG", ImageResolution -» 300]
C:\Users\User\Desktop\math\kinetic_data\global_fitla.jpg
Output fit data for construction of 2 D graphs
■ fit 1
outdatafiOcl = Array Pad [kineticdata6 Ocl all, {{0, 0}, {0, 1}}];
Do[outdata60cl [ [ q, 5] ] = fitl[pH, phostot] /. {pH -» kineticdata60clall[[q, 1] ] , phostot -» kineticdata60clall [ [q, 2] ] } , {q, datapoints60cl} ]
MatrixForm [outdata60cl, TableHeadings -» {None, {pH, total phosphate, kexp, error, kfit}}]pH phosphate total kexp error kfit6 0.25 55.46 0.33 51.90836 0.5 95.2 1 95.202
7.2 0.045 42.9 0.45 44.05367.2 0.09 58.97 1.16 69.86627.2 0.18 116.78 1.4 121.4927.2 0.27 168.28 1.75 173.1177.2 0.5 288.4 1.1 305.0488 0.1 137.1 1.3 130.1588 0.2 193.5 1.4 197.3998 0.3 268 1.7 264.648 0.35 305.4 0.3 298.2619 0.05 245.1 1.2 240.0529 0.1 259. 6 0.7 264.3769 0.2 312.7 1.5 313.0259 0.3 355.7 2 361.67410 0.05 304.9 1.5 314.99610 0.1 344.6 1.5 333.64310 0.2 365.3 1.3 370.93610 0.3 420.7 3.4 408.22811 0.1 362 2 350.41311 0.2 375 5 386.053
, 11 0.3 404 5 421.692 ,
Export [foldemame <> "kinetic_data\\global_fitl .xls" , outdata60cl]C:\Users\User\Desktop\math\kinetic_data\global_fitl.xls
■ fit 2
outdata60c2 = ArrayPad[kineticdata60c2all, {{0, 0}, {0, 1}}];
Do[outdata60c2[[ q, 5]] = fit2[pH, phostot] /. {pH - * kineticdata60c2all[[q, 1]], phostot -» kineticdata60c2all [ [q, 2]]}, {q, datapoints60c2 } ]
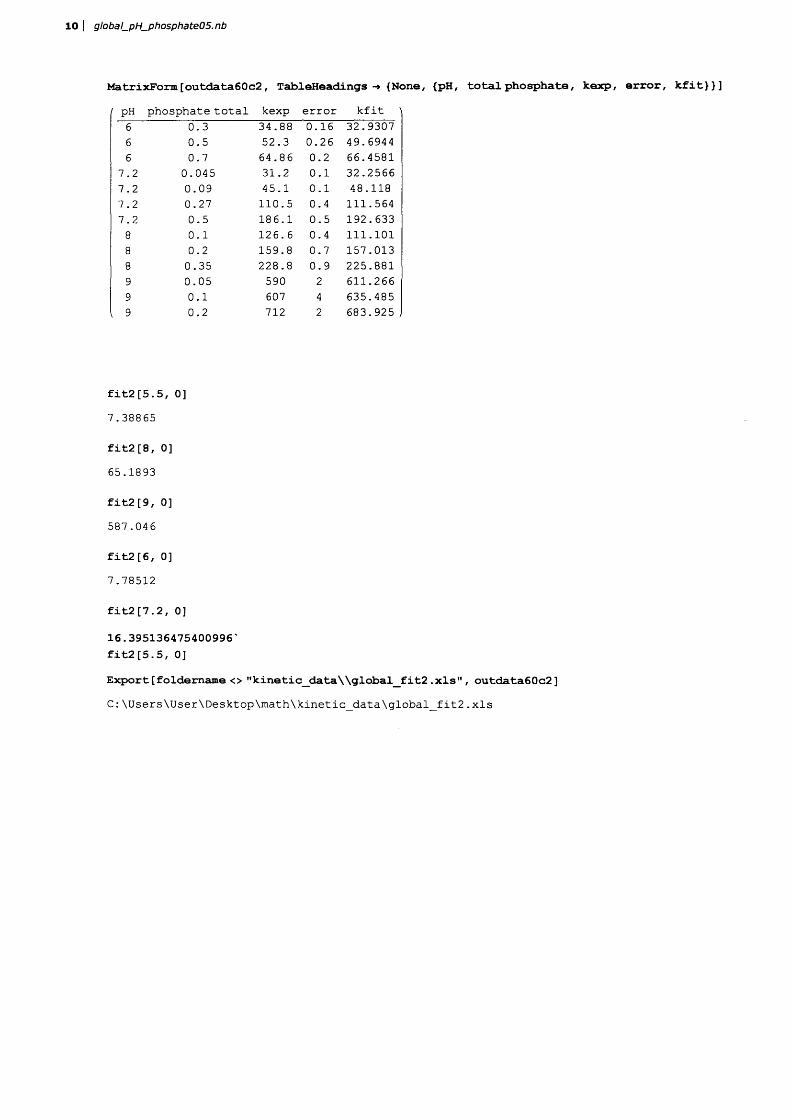
10 | global_pH_phosphate05.nb
MatrixForm[outdata60c2, TableHeadings -» {None, {pH, total phosphate, kexp, error, kfit}}]' pH phosphate total kexp error kfit '
6 0.3 34.88 0.16 32.93076 0.5 52.3 0.26 49.69446 0.7 64.86 0.2 66.4581
7.2 0.045 31.2 0.1 32.25667.2 0.09 45.1 0.1 48.1187.2 0.27 110.5 0.4 111.5647.2 0.5 186.1 0.5 192.6338 0.1 126. 6 0.4 111.1018 0.2 159.8 0.7 157.0138 0.35 228.8 0.9 225.8819 0.05 590 2 611.2669 0.1 607 4 635.4859 0.2 712 2 683.925
fit2[5.5, 0]7.38865
fit2[8, 0]65.1893
fit2[9, 0]587 .046
fit2[6, 0]7.78512
fit2[7.2, 0]
16.395136475400996' fit2[5.5, 0]
Export [foldemame <> "kinetic_dataWglobal_fit2.xls", outdata60c2]C:\Users\User\Desktop\math\kinetic_data\global_fit2.xls
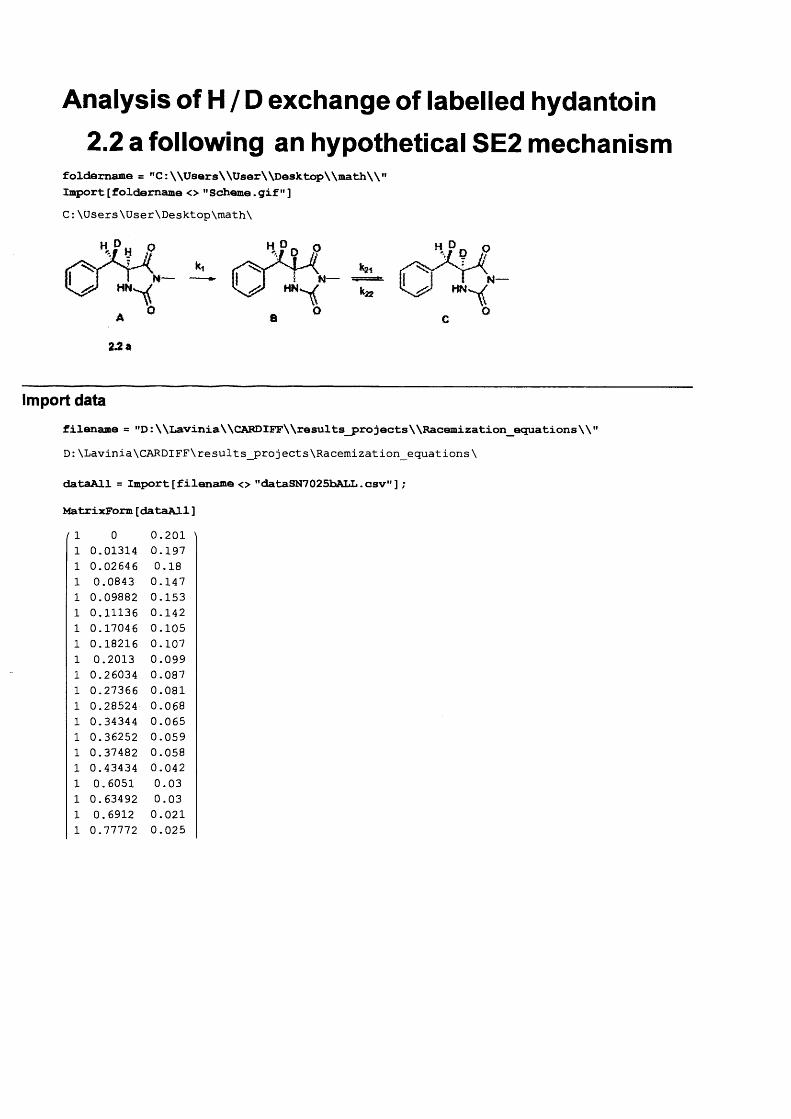
Analysis of H / D exchange of labelled hydantoin2.2 a following an hypothetical SE2 mechanism
foldemame = "C:\\Users\\User\\Desktop\\math\\"Import [foldemame <> "Scheme. gif" ]C:\Users\User\Desktop\math\
HN
2.2 a
N—HN
Import datafilename = "D: \\Lavinia\\CARDIFF\\results_projects\\Racemization_equations\\"D: \Lavinia\CARDIFF\results_projects\Racemization_equations\
dataAll = Import [filename <> "dataSN7025hALL. csv" ] ;
MatrixForm[dataAll]1 0 0.2011 0.01314 0.1971 0.02646 0.181 0.0843 0.1471 0.09882 0.1531 0.11136 0.1421 0.17046 0.1051 0.18216 0.1071 0.2013 0.0991 0.26034 0.0871 0.27366 0.0811 0.28524- 0.0681 0.34344 0.0651 0.36252 0.0591 0.37482 0.0581 0.43434 0.0421 0.6051 0.031 0.63492 0.031 0.6912 0.0211 0.77772 0.025
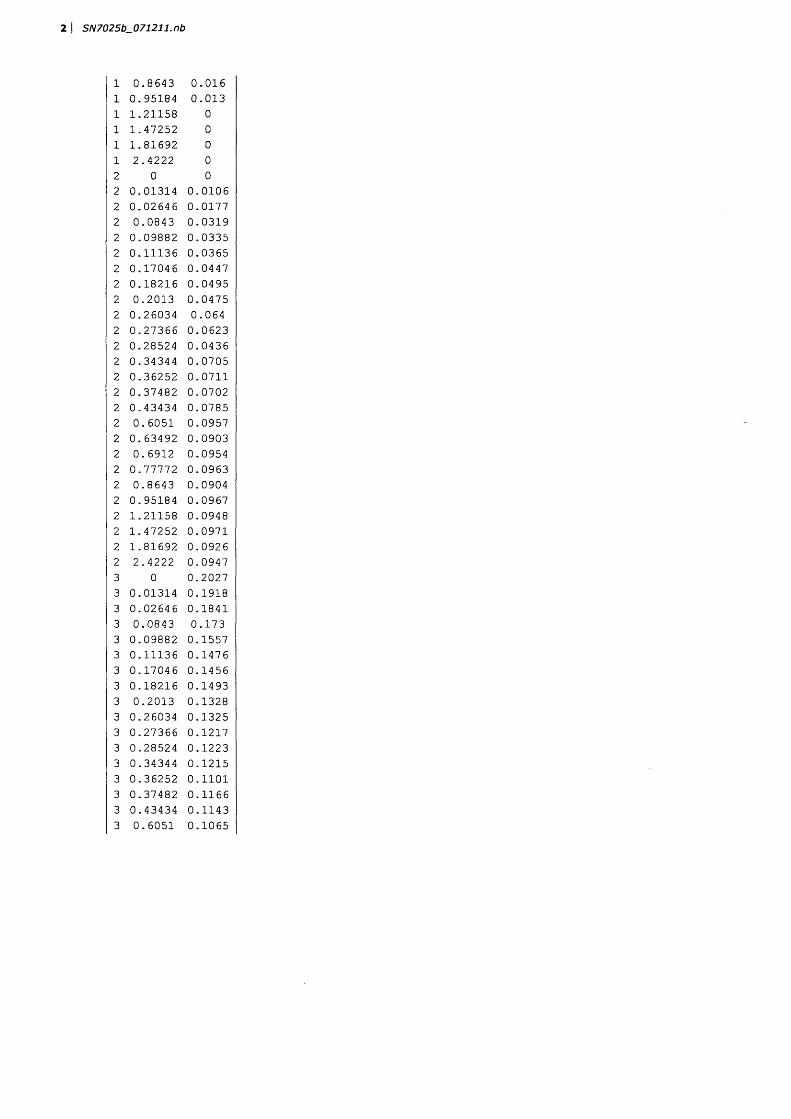
2 | SN7025b_071211.nb
1 0.8643 0.0161 0.95184 0.0131 1.21158 01 1.47252 01 1.81692 01 2.4222 02 0 02 0.01314 0.01062 0.02646 0.01772 0.0843 0.03192 0.09882 0.03352 0.11136 0.03652 0.17046 0.04472 0.18216 0.04952 0.2013 0.04752 0.26034 0.0642 0.27366 0.06232 0.28524 0.04362 0.34344 0.07052 0.36252 0.07112 0.37482 0.07022 0.43434 0.07852 0.6051 0.09572 0.63492 0.09032 0.6912 0.09542 0.77772 0.09632 0.8643 0.09042 0.95184 0.09672 1.21158 0.09482 1.47252 0.09712 1.81692 0.09262 2.4222 0.09473 0 0.20273 0.01314 0.19183 0.02646 0.18413 0.0843 0.1733 0.09882 0.15573 0.11136 0.14763 0.17046 0.14563 0.18216 0.14933 0.2013 0.13283 0.26034 0.13253 0.27366 0.12173 0.28524 0.12233 0.34344 0.12153 0.36252 0.11013 0.37482 0.11663 0.43434 0.11433 0.6051 0.1065
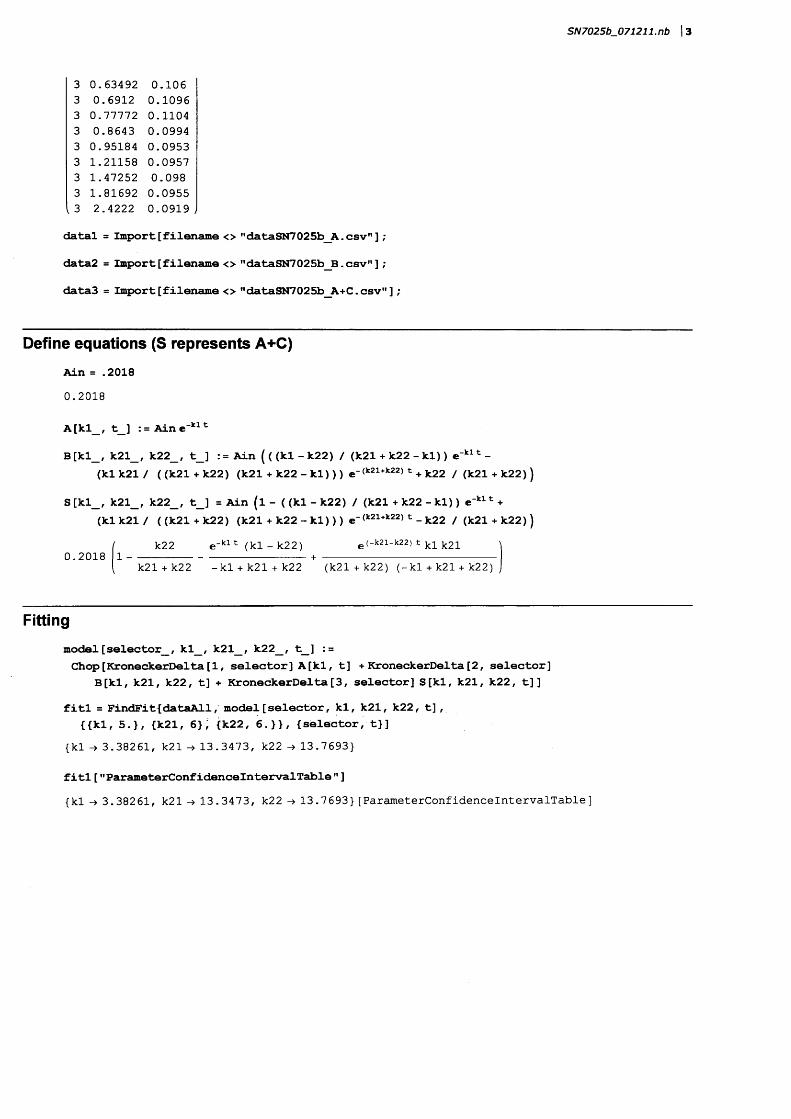
SN7025b_07121 l.nb | 3
3 0.63492 0.1063 0.6912 0.10963 0.77772 0.11043 0.8643 0.09943 0.95184 0.09533 1.21158 0.09573 1.47252 0.0983 1.81692 0.0955. 3 2.4222 0.0919
datal = Import [filename <> "dataSN7025b_A.csv"] ;
data2 = Import[filename <> "dataSN7025b_B.csv"];
data3 = Import [filename <> "dataSN7025b_A+C.csv"] ;
Define equations (S represents A+C)Ain = .20180.2018
A[kl_, t_] : = Ain e
B [kl_, k21_, k22_, t_] : = Ain ( ( (kl - k22) / (k21 + k22 - kl)) e-kl -(kl k21 / ((k21 + k22) (k21 + k22 - kl)) ) e-(k21+k22) + k22 / (k21 + k22))
S [kl_, k21_, k22_, t_] = Ain (l - ( (kl - k22) / (k21 + k22 - kl)) e"klt +(kl k21 / ((k21 + k22) (k21 + k22 - kl))) e"(k21+k22) - k22 / (k21 + k22))
0.2018k22
1 -
(kl - k22) (-k21-k22) t k l k 2 1
k21 + k22 - kl + k21 + k22 (k21 + k22) (-kl + k21 + k22)
Fittingmodel [selector_, kl_, k21_, k22_, t_] : =Chop[KroneckerDelta [1, selector] A [kl, t] + KroneckerDelta [2, selector]
B[kl, k21, k22, t] + KroneckerDelta[3, selector] S[kl, k21, k22, t] ]fitl = FindFit[dataAll, model[selector, kl, k21, k22, t] ,
{{kl, 5.}, {k21, 6>; {k22, 6.}}, {selector, t}]{kl ^ 3.38261, k21 13.3473, k22 ^ 13.7693}
fitl [ "ParameterConfidencelntervalTable " ]{kl 3.38261, k21 13.3473, k22 ^ 13.7693} [ParameterConfidencelntervalTable ]
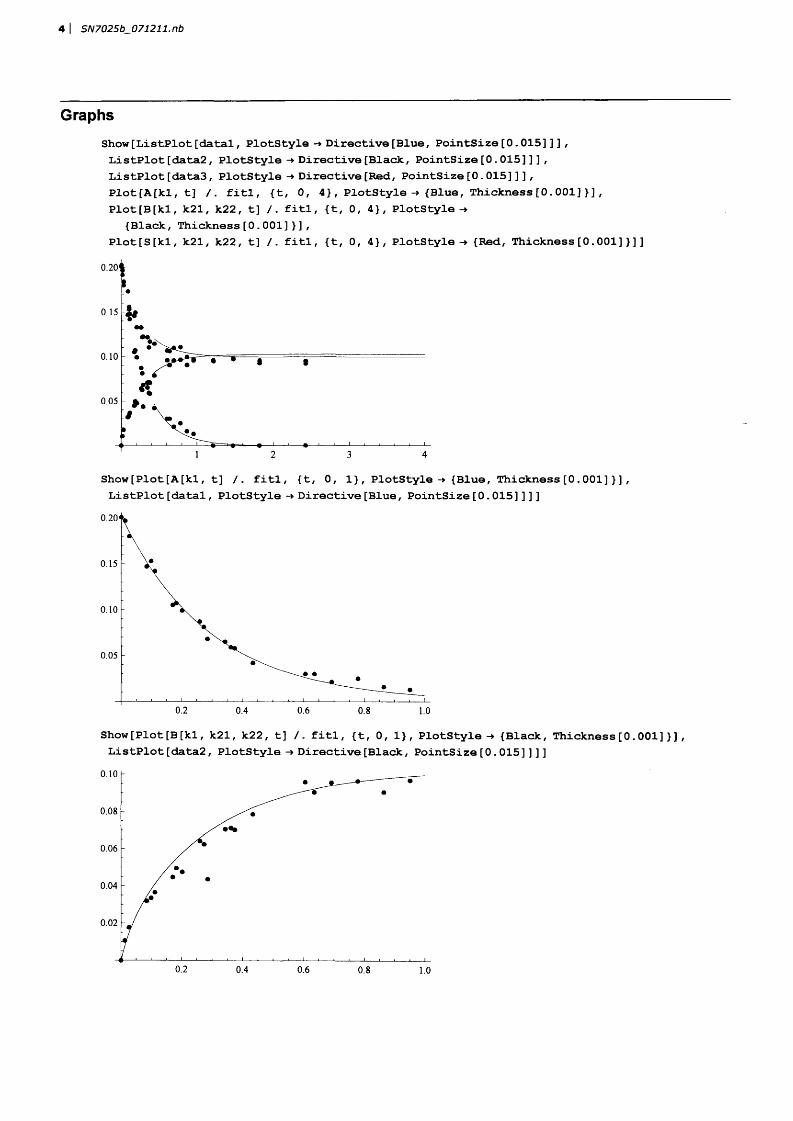
4 | SN7025b_071211.nb
GraphsShow [ListPlot [datal, PlotStyle -* Directive [Blue, PointSize [0. 015] ] ] ,ListPlot [data2, PlotStyle -» Directive [Black, PointSize [0. 015] ] ] ,ListPlot [data3, PlotStyle -» Directive [Red, PointSize [0. 015] ] ] ,Plot[A[kl, t] /. fitl, {t, 0, 4} , PlotStyle -♦ {Blue, Thickness[0.001]}] ,Plot[B[kl, k21, k22, t] /. fitl, {t, 0, 4}, PlotStyle-»
(Black, Thickness[0.001]}] ,Plot[S[kl, k21, k22, t] /. fitl, (t, 0, 4}, PlotStyle -» (Red, Thickness[0.001]}]]
0 .20 '
0.15
0.10
0.05
Show [Plot [A [kl, t] /. fitl, (t, 0, 1}, PlotStyle-* (Blue, Thickness [0. 001] }] , ListPlot[datal, PlotStyle -»Directive[Blue, PointSize[0.015]]]]
0 . 20 '
0.15
0.10
0.05
0.2 0.60.4 0.8 1.0
Show [Plot [B[kl, k21, k22, t] /. fitl, (t, 0, 1}, PlotStyle-* (Black, Thickness [0.001] }] , ListPlot [data2 , PlotStyle -» Directive [Black, PointSize [0. 015] ] ] ]
0.10
0.08
0.06
0.04
0.02
0.2 0.4 0.6 0.8 1.0
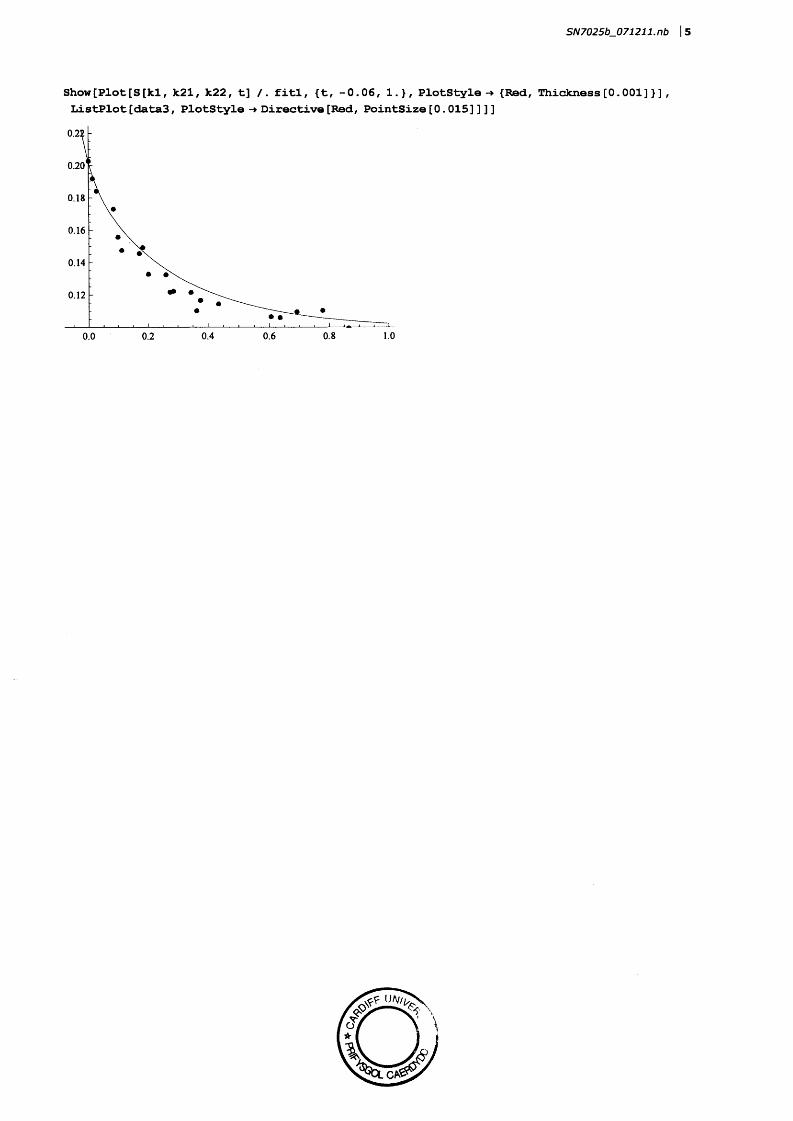
SN7025b_07121 l.nb | 5
Show [Plot [S[kl, k21, k22, t] /. fitl, {t, -0.06, 1.}, PlotStyle-* {Red, Thickness [0.001] }] , ListPlot [data3, PlotStyle -* Directive [Red, PointSize [0. 015] ] ] ]
0.2:
0.20
0.18
0.16
0.14
0.12
• •
0.4 0.6 0.8 1.00.20.0
Copyright © 2022 FDOKUMEN


![5-Substituted [1]pyrindine derivatives with antiproliferative activity](https://static.fdokumen.com/doc/165x107/63444c49f474639c9b044f5e/5-substituted-1pyrindine-derivatives-with-antiproliferative-activity.jpg)