The Meaning of Motor Activity: Emotion, Temperament, Mood ...
328
The Meaning of Motor Activity: Emotion, Temperament, Mood, and Laterality Nancy A. McKeen University of Manitoba A Dissertation submitted to the Faculty of Graduate Studies in partial f'ulfillment of the requiremsnts for the degree of Doctor of Philosophy Depariment of Psychology University of Manitoba Winnipeg, Manitoba (c) Apnl, 2000
-
Upload
khangminh22 -
Category
Documents
-
view
3 -
download
0
Transcript of The Meaning of Motor Activity: Emotion, Temperament, Mood ...

The Meaning of Motor Activity:
Emotion, Temperament, Mood, and Laterality
Nancy A. McKeen
University of Manitoba
A Dissertation submitted to the Faculty of Graduate Studies in partial f'ulfillment of the requiremsnts for the degree of
Doctor of Philosophy
Depariment of Psychology University of Manitoba Winnipeg, Manitoba
(c) Apnl, 2000

National Library Bibliothèque nationale du Canada
Acquisitions and Acquisitions et Bibliographie Senrices services bibliographiques
385 Wellington Street 395, nw, Wellington CMawaON KlAOCJll OllawaON K1AOW canada Cenada
The author has granted a non- exclusive licence allowing the National Library of Canada to reproduce, loan, distribute or sell copies of Ùiis thesis in rnicrofonn, paper or electronic formats.
The author retains ownership of the copyright in this thesis. Neither the thesis nor substantial extracts 60rn it may be printed or otherwise reproduced without the author's permission.
L'auteur a accordé une licence non exclusive permettant à la Bibliothèque nationale du Canada de reproduire, prêter, distribuer ou vendre des copies de cette thèse sous la forme de microfiche/fiim, de reproduction sur papier ou sur format électronique.
L'auteur conserve la propriété du droit d'auteur qui protège cette thèse. Ni la thèse ni des extraits substantiels de celle-ci ne doivent être imprimés ou autrement reproduits sans son autorisation.

TKE UNIVERSITY OF MANITOBA
FACULW OF GRADUATE STUDIES *.JI+**
COPYRICET PERMISSION PAGE
The Meaning of Motor Activity: Emotion, Temperament, Mood, and Laterality
Nancy A. McKccn
A Thesis/Practicum submitted to the Faculty of Graduate Studies of The University
of Manitoba in parthl fulflllment of the requiremenn of the degree
of
Doetor of Philosopby
NANCY A. MCKEEN @ 2000
Permission ha8 bcta gnnted to the Libriry of The University of Manitoba to Iend or sell copicr of tbir thcridpracticum, to the National Libnry of Cana& to microtllm thh thesir/practicum and to Itnd or seU copies of the lilm, and to Diuertations Abstricts Interardonrl to pubush an abstract of this theridpricticum.
The ruthor resemr other pubkadon rightr, and aeither tbh thcddpncîîcum nor extensive estrads f o m it may be printed or othemise reproduced witbout the author's written permisrion.


Motor Activity
Concepts in Laterality Research . . . . . . . . . . . . . . . . . . . . . . . . . . . . . . . . . . . . . . . 35 Hemisphenc Specialization and Lateralization . . . . . . . . . . . . . . . 37
Dichotic listening . . . . . . . . . . . . . . . . . . . . . . . . . . . . . . . . 40 Development of Asymmetries in Motor Function . . . . . . . . . . . - 4 1 Motor Control and Asymmetries in the CNS . . . . . . . . . . . . . . . . 42 Motor Coritrol and Asymrnetxies in the PNS . . . . . . . . . . . . . . . . 44
. . . . . . . . . . . . . . . . . . . . . . . . . . . . . . . Asymmetries of Limb Size 46 . . . . . . . . . . . . . . . . . . . Lateral Asymmetries Related to Motor Activity - 4 7
. . . . . . . . . . . . . . . . . . . . . . . . . . . . . . . . . . . . . . . . . . . Handedness 48 Handedness and Hemisphenc Speciahtion . . . . . . . . . . . . . . . . 50
. . . . . . . . . . . . . . . . . . . . . . . . . . . . . . . . . . . . . . . . . . . . Footedness 51 . . . . . . . . . . . . . . . . . . . . . . . . . . . . . . . . . . . . . . . . . . . . . E yedness 53 . . . . . . . . . . . . . . . . . . . . . . . . . . . . . . . . . . . . . . . . . . . . . Earedness 54
Motor Activity and Lateral Behavioural Preferences . . . . . . . . . . 55 . . . . . . . . . . . . . . . . . . . . . . . . . . . . . . . . . . . . . . . . . . . . Lateralization of Emotion 58
Asyrnmctries in Approach and Withdrawd . . . . . . . . . . . . . . . . . 61 . . . . . . . . . . . . . . . . . . . .4sym metries in Activation and Arousal -66
. . . . . . . . . . . . . . . . . . . . . . . . . Motor Asymmeûies and Emotion ri9
. . . . . . . . . . . . . . . . . . . . . . . . . . . . . . . . . . . . . . . . . . . . . . . . . . . . . . . . . . . . . . . . SWDY 1 72 Overd Activity . . . . . . . . . . . . . . . . . . . . . . . . . . . . . . . . . . . . . . . . . . . . . . . . . . . . . 73
The Actometer . . . . . . . . . . . . . . . . . . . . . . . . . . . . . . . . . . . . . . . . . . . . . . . 74 . . . . . . . . . . . . . . . . . . . . . . . . . Actometer standudization 74
Validity of the Actometers in the Laboratory . . . . . . . . . . . . . . . . 75 Reliability of the Actometers in the Laboratory . . . . . . . . . . . . . . 75 Reliability of the Actometers in the Field . . . . . . . . . . . . . . . . . . . 76 Validity of the Actometers in the Field . . . . . . . . . . . . . . . . . . . . . 77 Stability of Actometer-Measured Arm Movements . . . . . . . . . . . 78
. . . . . . . . . . . . . . . . . . . . . . . . . . . . . . . . . . . . . . . . . . . . The Accelerometer 78 Accelerometer standardization of measurement . . . . . . . . 79
. . . . . . . . . . . . . . . . . . . . . . . . . . . . . . . . . Accelerometer Validity -80 . . . . . . . . . . . . . . . . . . . . . . . . . . . . . . . . Accelerometer Reliability 82
. . . . . . . . . . . . . . . . . . . Accelerometer Stability in tlie Laboratory 82 . . . . . . . . . . . . . . . . . . . . . . . . Accelerometer Stability in the Field 83
. . . . . . . . . . . . . . . . . . . . . . . . . . . . . . . . . . . . . . . . . . . . The Activity Diary 84 . . . . . . . . . . . . . . . . . . . . . . . . Hypotheses About Ove& Activity 86
. . . . . . . . . . . . . . . . . . . . . . . . . . . . . . . . . . . . . . . . . . . . . . . . . . . . . Lateral Activity 86 . . . . . . . . . . . . . . . . . . . . . . . . . . . . . . . . . . . . Lateral Preference Inventory 87
. . . . . . . . . . . . . . . . . . . Reliability and validity of the LP I 88 . . . . . . . . . . . . . . . . . . . . . . . . Hypotheses About Lateral Activity 89
. . . . . . . . . . . . . . . . . . . . . . . . . . . . . . . . . . . Anthropometrics and Demographics 89 . . . . . . . . . . . . . . . . . . . . . . . . . . . . . . . . . . . . . . . . . . . . Physical Measures 90

Motor Activity
. . . . . . . . . . . . . . . . . . . . . . . . . . . . . Height and Weight Measures 90 . . . . . . . . . . . . . . . . . . . . . . . . Height and weight reliability 90
. . . . . . . . . . . . . . . . . . . . . . . . . . . . . . . . . . Limb Length Measures 91 . . . . . . . . . . . . . . . . . . . . . . . . . . . . . . . . . . . . . . . . . . . . . Affect intensity Measure 91
Age effects in the AiM . . . . . . . . . . . . . . . . . . . . . . . . . . . . 94 Gender effects in the AIM . . . . . . . . . . . . . . . . . . . . . . . . . 34 The validity of the AIM . . . . . . . . . . . . . . . . . . . . . . . . . . . 94 The reliabiiity of the AIM . . . . . . . . . . . . . . . . . . . . . . . . . . 95
The Devêlopmênt of AIM Factors . . . . . . . . . . . . . . . . . . . . . . . . . 95 Hypotheses about the AlM . . . . . . . . . . . . . . . . . . . . . . . . . . . . . . . 97
METHOD STUDY 1 . . . . . . . . . . . . . . . . . . . . . . . . . . . . . . . . . . . . . . . . . . . . . . . . . . . . . . . 38 . . . . . . . . . . . . . . . . . . . . . . . . . . . . . . . . . . . . . . . . . . . . Participants 98
. . . . . . . . . . . . . . . . . . . . . . . . . . . . . . . . . . Surnmary of Procedure 98 . . . . . . . . . . . . . . . . . . . . . . . . . . Overd Activity Level Variables 100
. . . . . . . . . . . . . . . . . . . . . . . . . . . . . Movements per hour 100 . . . . . . . . . . . . . . . Acceleromder quarter-hour variables 101
. . . . . . . . . . . . . . . . . . . Accelerorneter 24-hour variables 101 . . . . . . . . . . . . . . . . . . . . Accelerorneter count estimates 101
. . . . . . . . . . . . . . . . . . . . . . . . . . . . . . . . . . . . . The Activity Diary 102 Activity Diary variables used in Study 1 . . . . . . . . . . . . . 102
. . . . . . . . . . . . . . . . . . . . . . . . . . . . . . . Lateral Activity Variables 103 Actometer dextrality rneasure . . . . . . . . . . . . . . . . . . . . . 103 Accelerornetrr dextrality masure . . . . . . . . . . . . . . . . . . 103
. . . . . . . . . . . . . . . . . . . . . . . . . . . . . Lateral Preference Inventory 104 . . . . . . . . . . . . . . . . . . . . . LPI measures used in Study 1 104
. . . . . . . . . . . . . . . . . . . . . . . . . . . . . . Anthroporneûic Measures 104 . . . . . . . . . . . . . . . . . . . . . . . . . . . . . . . . . . . . . . . . Height 104 . . . . . . . . . . . . . . . . . . . . . . . . . . . . . . . . . . . . . . . . Weight 105
. . . . . . . . . . . . . . . . . . . . . . . . . . . . Limb length masures 105 . . . . . . . . . . . . . . . . . . . . . . . . . Shoulder to elbow length 105 . . . . . . . . . . . . . . . . . . . . . . . . Shoulder-elbow reliabiiity 106
. . . . . . . . . . . . . . . . . . . . . . . . . . . . . . Elbow-wrist length 106 . . . . . . . . . . . . . . . . . . . . . . . . . . Elbow to wrist reliability 106
. . . . . . . . . . . . . . . . . . . . . . . . . . . . . . . . . . . . Hand length 106 . . . . . . . . . . . . . . . . . . . . . . . . . . . Hand-length reliability 107
. . . . . . . . . . . . . . . . . . . . . . . . . . . . . . . . . . . Wrist breadth 107 . . . . . . . . . . . . . . . . . . . . . . . . . . Wrist-breadth reliability 107
. . . . . . . . . . . . . . . . . . . . . . . . . . . . The Affect intensity Measure 108 . . . . . . . . . . . . . . . . . . . . . AIM variables used in Stuây I 108
. . . . . . . . . . . . . . . . . . . . . . . . . . . . . . . . . . . . . . . . . . . . . . . . . . . . . . RESüLTS STUDY 1 108 . . . . . . . . . . . . . . . . . . . . . . . . . . . . Preliminary Data Assessrnent 108

Motor Activity v
Data Standardization and Aggregation . . . . . . . . . . . . . . . . . . . . 1 10 Actometers . . . . . . . . . . . . . . . . . . . . . . . . . . . . . . . . . . . . 1 10 Actometer intraclass correlation . . . . . . . . . . . . . . . . . . . . 110 Accelerometers: quarter-hou data . . . . . . . . . . . . . . . . . . 111 Acceleromcters: per individual data . . . . . . . . . . . . . . . . . 112 Accelerometer intraclass correlation . . . . . . . . . . . . . . . . 112 Physical measurernents . . . . . . . . . . . . . . . . . . . . . . . . . . 112
Descriptive Statistics for Overall Activity . . . . . . . . . . . . . . . . . . 113 Demographics . . . . . . . . . . . . . . . . . . . . . . . . . . . . . . . . . . 113 Activity measures . . . . . . . . . . . . . . . . . . . . . . . . . . . . . . . 115 -4ctivity Diary . . . . . . . . . . . . . . . . . . . . . . . . . . . . . . . . . . 115
Dextrality Vanables . . . . . . . . . . . . . . . . . . . . . . . . . . . . . . . . . . . . 115 Actometer-based dextrahty . . . . . . . . . . . . . . . . . . . . . . . 116 Accelerometer-based dextrality . . . . . . . . . . . . . . . . . . . . 116
Descriptive Stahstics for the Dextrality and Laterality Data . . . . 116 Dextral activity . . . . . . . . . . . . . . . . . . . . . . . . . . . . . . . . . 117 Lateral preference . . . . . . . . . . . . . . . . . . . . . . . . . . . . . . . 118 Gender ciifferences on the AiM . . . . . . . . . . . . . . . . . . . . 118 Demographics . . . . . . . . . . . . . . . . . . . . . . . . . . . . . . . . . . 119 Lim b lengths . . . . . . . . . . . . . . . . . . . . . . . . . . . . . . . . . . . 119 The AIM . . . . . . . . . . . . . . . . . . . . . . . . . . . . . . . . . . . . . . 113 Convergence among activity measures . . . . . . . . . . . . . . 121
Results of Preàictions with Dextnlity Variables . . . . . . . . . . . . . 121 Demographics and physical measures . . . . . . . . . . . . . . . 121 Laterality prefrrences . . . . . . . . . . . . . . . . . . . . . . . . . . . . 122
Overd and Dextrd Activity Intercorrelations . . . . . . . . . . . . . . . 122 . . . . . . . . . . . . . . . . . . . . . . . . . . . . . . . . . . . . . . . . . . . . . The AIM 122
Activity and AIM correlations . . . . . . . . . . . . . . . . . . . . . 123
DISCUSSION STUDY 1 . . . . . . . . . . . . . . . . . . . . . . . . . . .
. . . . . . . . . . . . . . . . . . . . . . . . . . . . . . . . . . . . . . . . . . . . . . . . . . . . . . . . . . . . . . . S'KDY 2 128 . . . . . . . . . . . . . . . . . . . . . . . O v e d activity and arousal 128
Lateralized activity and emotional expenence . . . . . . . . 128 Lateraiized activity and emotional perception . . . . . . . . . 128
. . . . . . . . . . . . . . . . . . . . . . . . . . . . . . . . . . . . . . . . . . . . . . . . . . . . . . Instruments 129 Pavlovian Temperament Swey . . . . . . . . . . . . . . . . . . . . . . . . . . . . . . . . 129
. . . . . . . . . . . . . . . . . . . . . . . . . . . . . . . . . . . . Vdidity of the PTS 130 . . . . . . . . . . . . . . . . . . . . . . . Reliabdity and Stability of the PTS 132
Hypotheses about the Ir15 . . . . . . . . . . . . . . . . . . . . . . . . . . . . . . 133 . . . . . . . . . . . . . . . . . . . . . . . . . . . . . . . . . . . . . . . . . . The BISBAS Scales 133
. . . . . . . . . . . . . . . . . . . . . . . . . . . . . . . . . Vàlidity of the BISBAS 135 Reliability and Stability of the BISBAS . . . . . . . . . . . . . . . . . . . . 135

. . . . . . . . . . . . . . . . . . . . . . . . . . Hypotheses about the BISBAS 136 . . . . . . . . . . . . . . . . . . . . . . . . . . . . . . . . . . . . . . . . . . The PANAS Scales 137
. . . . . . . . . . . . . . . . . . . . . . . . . . . . . . . . . Validity of Uie PANAS 138 . . . . . . . . . . . . . . . . . . . . Reliability and Stability of the PANAS 139
. . . . . . . . . . . . . . . . . . . . . . . . . . . Hypotheses about the PANAS 140 . . . . . . . . . . . . . . . . . . . . . . . . . . . . . . . . . . . . . . . Dichotic Listening Task 141
. . . . . . . . . . . . . . . Validity of the Dichotic Listening Technique 142 . . . . . . . . . . . . . . . . . . . . Reiiability of Dichotic Listening Tasks 145
. . . . . . . . . . . . . . . . . . . . . . . . . . . . Sex differences in DL 137 . . . . . . . . . . . . . . . . . . . . . . Lateralization of Affect in DL Tasks 147
. . . . . . . . . . . . . . . . . . . . . . . . . . Hypotheses about the DL Task 149 . . . . . . . . . . . . . . . . . . . . . . . . . . . . . . . Sumrnary of Hypotheses 150
. . . . . . . . . . . . . . . . . . . . . . . . . . . . . . . . . . . . . . . . . . . . . . . . . . . . . . METHOD STUDY 2 153 . . . . . . . . . . . . . . . . . . . . . . . . . . . . . . . . . . . . . . . . . . . . Procedure 153
. . . . . . . . . . . . . . . . . . . . . . . . Sample size determination 154
. . . . . . . . . . . . . . . . . . . . . . . . . . . . . . RESULTS STUDY 2
. . . . . . . . . . . . . . . . . . . . . . . . . . . . . Actometers: Overall 155 . . . . . . . . . . . . . . . . . . . . . . . . . . Prehinary assessrnent 155
. . . . . . . . . . . . . . . . . . . . . . . . . . . . . . Actometer nieasure 159 . . . . . . . . . . . . . . . . . . . . . . . . . . . . . Descriptive statistics 156
Mean actometer and dernographics correlations . . . . . . 158 . . . . . . . . . . . . . . . . . . . . . . . . . . Accelerometers (CSA): Overall 159
. . . . . . . . . . . . . . . . . . . . Prehinary data management 159 . . . . . . . . . . . . . . . . . . . . . . . . . . Prehinary assessment 159 . . . . . . . . . . . . . . . . . . . . . . . . . . Accelerorneter rneasure 159
. . . . . . . . . . . . . . . . . . . . . . . . . . . . . Descriptive statistics lé0 . . . . . . . . . . . . . . . Mean acceleration and demographics 160
. . . . . . . . . . . . . . . . . . . . . . . . . . . . . . Actometers: Dexûd Index 161 . . . . . . . . . . . . . . . . . . . . The dextral actometer measure 161
. . . . . . . . . . . . . . . . . . . . . . . . . . . . . Descriptive statistics 162 Dextral actometer index and demographics correlations
. . . . . . . . . . . . . . . . . . . . . . . . . . . . . . . . . . . . . . . . 162 . . . . . . . . . . . . . . . . . . . . . Accelerometers (CSA): De- Index 163
. . . . . . . . . . . . . . . . . . . nie dextmi accelerometer index 163 . . . . . . . . . . . . . . . . . . . . . . . . . . . . . Descriptive statistics 163
. . . . . . . Dextral accelerometerindex and demographics 164 . . . . . . . . . . . Relation between Actometers and Accelerornetea 164
. . . . . . . . . . . . Overall activity-measure intercorrelations 164
. . . . . . . . . . . . Dextral activity-rneasure interconelations 165 . . . . . . . . . . . . . . . . . instrument Merences in dextrality 166

Instrument differences in categoncal asymmetry . . . . . . 166 Actomrter categorical asymmetry by gender . . . . . . . . . 166 Accelerometer asymmetry by gender . . . . . . . . . . . . . . . 167
. . . . . . . . . . . . . . . . . . . . . . . . . . . . . . . . . . . . . . . . . . . . . The AIM 167 . . . . . . . . . . . . . . . . . . . . . . . . . . . . . . The AIM measures 107
. . . . . . . . . . . . . . . . . . . . . . . . . . . Initial data assessment 168 . . . . . . . . . . . . . . . . . . . . . . . . . AIM Descriptive statistics 168
. . . . . . . . . . . . . . . . . . . . . . . . . . . . AIM Intercorrelations 170 AIM VIKI dsmogmpl~cs comlations . . . . . . . . . . . . . . . . 171 M M and mean activity correlations . . . . . . . . . . . . . . . . . 174 AIM and mean activity correlations by sex . . . . . . . . . . . 174
. . . . . . . . . . . . . . . . . . . . Shidy 1 and Study 2 combined 175 AIM and dextral activity correlations . . . . . . . . . . . . . . . 177 AIM and dextral activity correlations by sex . . . . . . . . . 177 Study 1 and Study 2 combined . . . . . . . . . . . . . . . . . . . . 177
. . . . . . . . . . . . . . . . . . . . . . . . . . . . . . . . . . . . . . . . . . . . . The PTS 178 . . . . . . . . . . . . . . . . . . . . . . . . . . . . . . . The PTS measures 178
. . . . . . . . . . . . . . . . . . . . . . . . . . . Initial data assessrnent 178 . . . . . . . . . . . . . . . . . . . . . . . . . PTS descriptive statistics 178
. . . . . . . . . . . . . . . . . . . . . . . . . . . . PTS Intercorrelations 179 PTS measures and demographics comlations . . . . . . . 180
. . . . . . . . . . . . . . . . . PTS and mean activity correlations 181 PTS and mean activity correlations by sex . . . . . . . . . . . 181
. . . . . . . . . . . . . . . . PTS and dextral activity correlations 182 PTS and dextral activity correlations by sex . . . . . . . . . . 182
. . . . . . . . . . . . . . . . . . . . . . . . . . . . . . . . . . . . . . . . . The BISBAS 183 . . . . . . . . . . . . . . . . . . . . . . . . . . . The BISBAS measures 183 . . . . . . . . . . . . . . . . . . . . . . . . . . . Initial data assessment 184
. . . . . . . . . . . . . . . . . . . . . . BISBAS descriptive statistics 184 . . . . . . . . . . . . . . . . . . . . . . . . . BISBAS intercorrelations 185
. . . . . . . . . . . . . BISBAS and demographics correlations 186
. . . . . . . . . . . . . BISBAS and mean activity correlations 187 BISBAS and mean activity correlations by sex . . . . . . . 187
. . . . . . . . . . . . . . . . . . BISBAS scales with age partialled 188 BISBAS and dextral activity correlations . . . . . . . . . . . . 188 BISBAS and dextral activity correlations by sex . . . . . . 190
. . . . . . . . . . . . . . . . . . . . . . . . . . . . . . . . . . . . . . . . . . nie PANAS 190 . . . . . . . . . . . . . . . . . . . . . . . . . . . The PANAS measures 191 . . . . . . . . . . . . . . . . . . . . . . . . . . . initial data assessrnent 191
. . . . . . . . . . . . . PANAS descriptive statistics by interval 192 . . . . . . . . . . . . . . . . . Mean PANAS descriptive statistics 192
. . . . . . . . . . . . . . . . . . . . . . . . . PANAS intercorrelations 194 PANAS and demopphcs correlations . . . . . . . . . . . . . 194

Motor Activity viii
PANAS intervals and mean activity correlations . . . . . . 196 Mean PANAS and meui activity correlations . . . . . . . . 197 PANAS intervals and dextral activity correlations . . . . . 198 Mean PANAS and dextral activity correlations . . . . . . . 199 . . . . . . . . . . . . . . . . . . . . . . . . . . . . . . . . . . . . . . . . . . . . . . The LPI 199
. . . . . . . . . . . . . . . . . . . . . . . . . . . . . . . The LPI measures 199 . . . . . . . . . . . . . . . . . . . . . . . . . . . Initial data assessrnent 199 . . . . . . . . . . . . . . . . . . . . . . . . . . LPI descriptive statistics 200
. . . . . . . . . . . . . . . . . . . . . . . . . . . . . LPI iritcrcorrz~ao 202 . . . . . . . . . . . . . . . . . LPI and demographics correlations 202
. . . . . . . . . . . . . . . . . . . . . . . . . . . . LPI and mean activity 203 . . . . . . . . . . . . . . . . LPI and dextral activity correlations 203
. . . . . . . . . . . . . . . . . . . . . . . . The Dichotic Listening (DL) Task 105 . . . . . . . . . . . . . . . . . . . . . . . . . . . . . . . The DL measures 205
. . . . . . . . . . . . . . . . . . . . . . . . . . . Initial data assessrnent 206 . . . . . . . . . . . . . . . . . . DL Accuracy descriptive statistics 206
Lateral DL descriptive statistics . . . . . . . . . . . . . . . . . . . . 207 . . . . . . . . . . . . . . . . . . . . . . . . . . . . . DL Intercorrelations 208
DL measures and demographcs col~elations . . . . . . . . . 209 DL scales and mean activity correlations . . . . . . . . . . . . 210
. . . . . . . . . . . DL scales and dextral activity correlations 211 Factor Anaiysis of PTS. BISBAS. AIM. and PANAS Subscales
. . . . . . . . . . . . . . . . . . . . . . . . . . . . . . . . . . . . . . . . . . . . . . 213 Exploratory factor analysis plan . . . . . . . . . . . . . . . . . . . 214 Preparatory evaluation of data for factor analysis . . . . . . 215
. . . . . . . . . . . . . . . . . . . . . . . . . . . . Initial analysis by sex 217 . . . . . . . . . . . . . . . . . . . . . . . . . . FA on the whole sample 217
Criteria used to evaiuate the factor andysis . . . . . . . . . . 217 FA factors and demographcs correlations . . . . . . . . . . . 219 FA factors and mean activity correlations . . . . . . . . . . . -220
. . . . . . . . . . . . . . . . . . . . . FA factors and dextral activity 221
. . . . . . . . . . . . . . . . . . . . . . . . . . . . . . . . . . . . . . . . . . . . . . . . . . DISCUSSION SïüDY 2 222 Gender Differences in Arousai, Mood. and Perception . . . . . . . 223
. . . . . . . . . . . . . . . . . . Gender DEerences in Overall Movement 228 Overail Activity and Factor Analysis of Questio~aire Data . . . 230
. . . . . . . . . . . . . . . . . . . . . . . . . . . . . . . . . . . . Lateralized Activity 231 . . . . . . . . . . . . . . . Gender Dflerencss in Lateralized Movement 233
Lateralwd Activity and Factor Analysis of Questionnaire Data . . . . . . . . . . . . . . . . . . . . . . . . . . . . . . . . . . . . . . . . . . . . . -233
. . . . . . . . . . . . . . . . . . . . . . . . . . . . . . . . . . . . . . . . . . . . . . . . . GENERAL, DISCUSSION 235 . . . . . . . . . . . . . . . . . . . . . . . . . . . . . . . . . . . . . Activity Measures 235

Motor Activity
. . . . . . . . . . . . . . . . . . . . . . . . . . . . . . . . . . Overail Mean Activity 236 Potential Applications of this Measurement Approach . . . . . . . 237
. . . . . . . . . . . . . . . . . . . . . . . Psychological Meaning of Activity 239 . . . . . . . . . . . . . . . . . . . . . . . . . . . . . . . . . . . . Lateralized Activity 242
. . . . . . . . . . . . . . . . . . . . Limitations of the Dissertation Studies 246 . . . . . . . . . . . . . . . . . . . . . . . . . . . . . . . . . . . . . . Future Directions 249
. . . . . . . . . . . . . . . . . . . . . . . . . . . . . . . . . . . . . . . . . . . . . . . . . . . . . . . . . . REFERENCES 252
. . . . . . . . . . . . . . . . . . . . . . . . . . . . . . . . . . . . . . . . . . . . . . . . . . . . . . . . . . . . . Appendk A 279

Motor Activity x
Study 1 Tables
. . . . . . . . . . . . . . . . . . . . . . . . . . . . . . Table 1 . Descriptive Statistics ofStudy I Sumple 114 . . . . . . . . . . . . . . . . . Table 2 . Descriptive Summary of h i a b l e s Related to Laterolity 117
. . . . . . . . . . . . . . . . . . . . Table 3 . Summary ofHypothesized Relationships in Study I 120 . . . . . . . . . . . . . . . . . . . . . . . . . Table 4 . Overall and Dextral Activity Intercorrelations 122
. . . . . . . . . . . . . . . . . . . . . . . . . . . . . . . . . . . . . . . . . Table 5 ALCl lntercorrelationMorrix 123 . . . . . . . . . . . . . . . . . . . . . . . . . . . . . . . . . . . . . Table 6 Strmmary ofpredicted relations 152

Motor Activity
Shidy 2 Tables
Table 7 . Dernogrophic and Descriptive lnfomation . . . . . . . . . . . . . . . . . . . . . . . . . . . 155 Table 8 . AL Measure Descriptive Statistics. Whole Sample and by Sex . . . . . . . . . . . . 157 Table 9 . Intercorrelation Motrix forrhe Actometers . . . . . . . . . . . . . . . . . . . . . . . . . . . 158 Table 10 . Intercorrelation Matrix for the CSA Accelerometers . . . . . . . . . . . . . . . . . . . 161 Table 1 1 . Actometer and Accelerometer.4divity Meusure Correlations . . . . . . . . . . . 165 Table 12 . AIM Descriptive Statisticsfor Study 2 . . . . . . . . . . . . . . . . . . . . . . . . . . . . . . 170 Table 1 3 . ALti In tercowelation .! futrix . . . . . . . . . . . . . . . . . . . . . . . . . . . . . . . . . . . . . . 171 Table 14 . AIM Zntercorrelation Matrix by Sex . . . . . . . . . . . . . . . . . . . . . . . . . . . . . . . . . 171 Table 15 . Summary oj'Predicted Relationships with Movement Measures . . . . . . . . . 173 Table 16 . Motor Acttvity and Other Meumres. Correlations by Sex . . . . . . . . . . . . . . . 175 Table 17 . PTS Descriptive Statistics . . . . . . . . . . . . . . . . . . . . . . . . . . . . . . . . . . . . . . . . . 180 Table 18 . PTS Intercorrelation Matrix . . . . . . . . . . . . . . . . . . . . . . . . . . . . . . . . . . . . . . . 181 Table 19 . AL Measures und PTS Correlations. Whole Sumple and by Sex . . . . . . . . . . 183 Table 20 . B Z S W Scale Descriptive Statistics . . . . . . . . . . . . . . . . . . . . . . . . . . . . . . . . 185 Table 2 1 . BISR4S Subscales Intercorrelation Matrix . . . . . . . . . . . . . . . . . . . . . . . . . . . 188 Table 22 . BISBcLS a n d A Meusure Correlutions. Whole Somple and by Sex . . . . . . . . 189 Table 23 . PAMAS Descriptive Slatistics &y Time of Day . . . . . . . . . . . . . . . . . . . . . . . . 193 Table 24 . P.4ALAAS Descriptive Statistics . . . . . . . . . . . . . . . . . . . . . . . . . . . . . . . . . . . . . . 194 Table 25 . PANAS ZntercorrelationMa~rix . . . . . . . . . . . . . . . . . . . . . . . . . . . . . . . . . . . . 195 Table 26 . Pm4S and CS4 Activity Pearson Correkutions by Time of Day. Whole Sample
. . . . . . . . . . . . . . . . . . . . . . . . . . . . . . . . . . . . . . . . . . . . . . . . . . . . . . . . and by Sex 196 Table 27 . RLLiVAAS and AL Meusure Correlations. Whole Sample and by Sex . . . . . . . . 1% Table 28 . Nztmber ofParticiparits Grouped by Side ofLateral Preference . . . . . . . . . . 200
. . . . . . . . . . . . . . . . . . . . . . . . . . . . . . . . . . . . . . . . . Table 29 . LPI Descriptive Stutistics 202 Table 30 . P I Strbscales Intercorrelution Mutrix . . . . . . . . . . . . . . . . . . . . . . . . . . . . . . 203 Table 3 1 . LPl and AL Meusure Correlations. Whole Sampie and l y Sex . . . . . . . . . . . 204 Table 32 . DL Meusures Mem Percent by Task for both Ears . . . . . . . . . . . . . . . . . . . . 207 Table 33 . DL Tusk. Percent ofPurticipants Grouped by Side of Greater Number of
. . . . . . . . . . . . . . . . . . . . . . . . . . . . . . . . . . . . . . . . . . . . . . . . . . . . . Correct Trials 208 Table 34 . DL Task lntercowelations, Percent Accuracy. Both Eurs . . . . . . . . . . . . . . . 209 Table 35 . DL Task lntercorrelutions, R-L Percent Correct, Both Eurs . . . . . . . . . . . . . 210 Table 36 . DL Acnrracy Correlations wtth AL by Sex . . . . . . . . . . . . . . . . . . . . . . . . . . . 211 Table 37 . Intercorrelation Motrix forFactorAnak'ysis. 13x 13 . . . . . . . . . . . . . . . . . . 216 Table 38 . Principal Components Factor Anolysis, Whofe SampIe. Vartmar Rotation
. . . . . . . . . . . . . . . . . . . . . . . . . . . . . . . . . . . . . . . . . . . . . . . . . . . . . . . . . . . . . . . . . 220 Table 39 . Activity and FA Factors Correlations. Whole Sumple and by Sex . . . . . . . . . 222

Motor Activity
Acknowledgments
1 would k e to acknowledge the tremendous support given generously by D
xii
en
Cmpbell and my advisor, Warren Eaton. 1 would particularly Wre to thank Warren Eaton
for aiways being there for al1 of the years it has taken, accepting my occasional outburst
of dismay, and dowing me the fieedom to develop my intellechai wings from a soiid
base. 1 thank Darren for his absolutely steadfast wi l l ingr~ss to delve into any issue and ûy
to grasp its essential tmth. Thank you, as weii, for so cornpetently pitching in and dohg
what needed to be done during my illness in the midst of data collection. 1 also thank
Pascal Gautroii, who prepared the packets for data collection, and to Gen Mitsutake for
helping to enter data. 1 reaily appreciated your timely assistance. 1 also thank my patient
cornmittee, Dr. Jane Bow, Dr. E. Schludemann, and Dr. John Whiteley for their
encouragement, their expertise, and their hard work on my behalf

Motor Ac tivity .uiii
Abstract
individuais exhibit unique differences in the amount of motor activity that they
exhibit as they go about their dady activities (Eaton, 1994). Theoreticaiiy, motor activity is
salient to the emotional and arousd mechanisms thought to underlie temperament
(Rothbart & Ahadi, 1994; Strelau, 1993, 1994, 1996). To test the theory empirically, two
studies were conducted.
In Study 1, motor activity was assessed over a 24-hour peiiod in 2 1 university
students. Analysis of demographc and anthropometric variables showed that gender, limb
length, and body size were not correlated with motor activity. Two objective measures of
activity showed convergent validity, and both showed cxternal validity with an Activity
Diary. In Study 2, arousal, emotion, and mood correlates of motor activity were assessrd in
a sample of 84 university students. A factor analysis revealed a gender ciifference whch
showed that Negative Arousal was significmtly negatively conelated with overall activity in
females, but not in males.
h second focus of the dssertation was to examine the emotional and amusal
correlates of within-individual laterai differences in limb movement. Emotion is
asyrnmetrically processed with the nght cerebrai hemisphere specialized for negative
emotional valence, and the lefi for processing positive valence (Davidson, 1995; Heller,
1993). h movement, controîled by the contralateral hernisphere (Carlson, 199 l), was
hypothesized to correlate with emotion; specificdy, a lefi-arm bias in movement wodd
relate to positive emotion, and a nght bias would relate to negative emotion. Correlations
revealed a gender Merence, showing that in males, but not in females, greater n@t-ami
activity was associated with the Positive Arousal factor. nius, emotional arousal is
associated with daiiy activity, but may be expressed Merently by males and females.

Motor Activity 1
The Meaning of Motor Activity: Exnotion, Temperament, Mood, and Laterality
INTRODUCTION
Just as we take it for granted that people have different personalities, so too do we
assume that they demcnstrate difirent amounts of general motor activity in theû
everyday lives. In fact, when we are trying to describe the unique characteristics of others,
we often comment on differences arnong people in theû typical levels of motor activity.
Consider the case of two friends. One prefers to be "on the go" for most of the day.
Typicdy, her physical activity takes the fonn of bking to and fiom work, going for a
waik at lunch tune, and taking part in an aerobiç work-out in the evening. The other fhend
usudy dnves her car to and fiom work, sits in the lounge at lunch, and spends her
evenings in quiet activities, such as watching television. Each woman considers herseif a
fhendly, sociable person, who enjoys the Company of other people. However, their
typicd levels of physical ac tivity remain rather différent. This unique variation in the
customary motor activity level displayed by individuals is easily recognized by others and
commonly used in everyday parlance to describe chamcter.
The ornnipresence of motor activity rnakes it obsewable in d ages, from fetal life
to old age. In fact, it is the very cornmonplace presence of general motor activity that
makes it somewhat of a double-edged sword in terms of research. Yes, it is present and
observable in ai i living beings. Yet, because of this very familiu presence, it tends to be
ignored as a dimension of behaviour, unworthy of our notice. An individual engaged in
motor activity may be doing any number of activities for any number of reasons. How
cm we derive meaning fkom something that occurs at al1 ages and in everyone to a greater

Motor Ac tivity 2
or lesser degree?
The question is, psychologically s p e h g , to what do the d d y unique, but typicaî,
individual levds of motor activity relate? Motor activity involves behavioural, affective,
and cognitive components (Wankel, 1997). Bzhaviouraiiy, motor activity is considered a
dimensicm cf temperament (Denyberry & Rothbart, 1988; Rnthbarî, 1986a; Strelau,
1983). It includes all of the rnovements we make, whether they are skiiled and planned or
unskilled and unplanned (Eaton & Enns, 1986). As a cognitive rnechanism, we use our
movement as a means with which to explore and interact with our environment
(Campbell, Eaton, & McKeen, 2000). Emotion ako plays a role in motor activity. We
jurnp for joy. We sûke out in anger. We fieeze in fear.
Movrmznt in general is a multifaceted behaviour, an important indicator of
adûptability, sociabiiity, and mental health (Bouchard, 1997; Chodzko-Zajko, 1997;
Cs~kszentmihalyi, 1997). It is the behavioural and rmotional components of motor
activity that wili be the focus of this dissertation. In it, 1 will address three aspects of
motor activity. First, in a theoretical literahire review, 1 will address the notion of motor
activity and its relation to emotion and temperament. What are the ernotionai and
temperarnentai correlates of individual differences in motor activity level? Secondly, 1 wdi
examine intra-individual differences in motor activity. Are there differences in how much
individuals typically move their right- and lefi- m s ? What might asymrneûic movements
indicate about how individuals dif!Cer fiom one another in their tempement and in their
experience and perception of emotion? Thirdly, 1 wili address measurement issues in the
study of motor activity, comparing the characteristics of two types of instruments
designed to measure activity. To acknowledge the importance of ecologically valid

Motor Activity 3
samples of data, 1 wiîi measure the motor activity of individuals çarrying out their usual
activities throughout a typical day.
Concepts of Motor Activity
There are several different theoretical perspectives on motor activity avaùabls in
the psychological literature. Although some of these are not central tn the research
proposed in this dissertation, they provide some insight into the importance and nature of
motor activity in a variety of contexts. The literahire described next characterizes the
influence of motor activity on health and the quality of our psychic and social life.
Physical Rctivily, Fifness, and Health
The relationship of physical activity to fitness and health is an area of research
Linking motor activity to haalth outcornes associated with longevity. The health issues
include weight control, bone density, blood pressure, blood fat levels, glucose
metabolism, immune function, and the prevention of vascular disease. Fitness and health
aspects of' motor activity become particularly salient to the elderly, since projections are
that about 15 percent of the population will be 65 pars of age by the year 2000
(Bouchard, 1997). The percentage of elderly will grow to about 40 per cent of the addt
population by the year 2075 Fumer, 1995). Researchers on one longitudinal study of
FUullsh men concluded that the physicaîiy active subjects lived about two years longer
than their more inactive cohorts, even afier accounting for age, smoking, blood pressure,
serurn cholesterol and body mass index (Pekkanen, Nissinen, Marti, Tuornilehto, Punsar,
& Karvonen, 1987). Researchers have estimated that three to four hours of exercise a
week adds about 1.5 years to Me (Paffenbarger, Hyde, & Wing, 1990). Thus, physical
activity continues to be important to the quality of life over the lifespan (Bouchard, 1997).

Motor Activity 4
Physical Activity, Psychic Energy, und Flow
Another approach to the study of activity addresses the spintual aspects of
physical activity (Csikszentmihalyi, 1997). The research is based on the idea that the
activities one chooses shapes both the person who engages in them as weil as the
commimity at large. From this perspective, activity refers to any patterned, voluntary
investment of attention. The investment of attention allows people to act, to thmk, and to
have feelings about what they do. People select fiom a wide variety of possible activities.
The study of these activities enables us to understand the pattern of choices that shape the
physical and mental lives of hdwiduals. Those activities in which people invest attention
or psychic energy determine the content of individual lives, as weli as the parameters of
culture and social institutions (Csikszentmihalyi, 199 7).
n i e average Amencan worker spends about 42 percent of b or her wakuig life on
the job (about 40 hours per week), but only about two thirds of this tune is spent actually
workmg. The other thûd is spcnt socialuing, daydreaming, snacking, or on other
nonproductive activities. Anothrr 40 percent of time is spent in activities in the home.
These activities include housework (about 8 percent), watching television (about 7
percent), resting (4 percent), hobbies (about 4 percent), reading (3 percent), eating and
groorning (6 percent), and talbg (2 percent). Other activities outside the home (18
percent of the tirne) include leisure activities such as sports, movies and restaurants (9
percent), shopping (3 percent), and ûansportation (6 percent) (Csikszentmihalyi 1997).
Examination of the affective valence of various activities indicates that people
report being happiest when they are involved wiüi other people. They report being least
happy when they take a nap, watch television, read, or do housework. Both work

Motor Activity 5
activities and leisure activities can promotr personal growth for an individual, as long as
the activity is psychologicaiiy complex and provides what Csikszentmihaly (1 997) c d s
"flow." Byflow he means the feeling of being so involved or absorbed in an activity that
wr no longer worry about irrelevant issues, and we forget ourselves to the task at hand.
The flow experience cm QGGUI when challenges are high and personal sMls are used to
the utmost. The awareness of time disappears, and "the experience resembles a smooth,
alrnost automatic movement toward an inrvitable outcome @. 75)." This experience is so
enjoyable that the individual wants to repeat whatever activity has produced it. Flow tends
to occur rither wMe at work or during active leisure activities.
The opposite offlow is psychic entropy. Psychc entropy manifests itself as an
inability to use energy effectively because of ignorance, lack of motivation, or conflictutg
emotions, such as fear, rage, or depression. Csikszentmihalyi (1997) might suggest that
those who watch much television should be amcted with psychic entropy, or atrophy of
motivation. Watclung television is an activity that is universally reported as involving no
challenges, requiring no s u , and providing the least flow-like enjoyment. Yet people
spend hours doing it every week. Csikszentmihalyfs explmation is that people seek to
balance the psychic energy they must expend with the anticipated benefits. Television
viewing provides little enjoymerit, but it also requires little effort. Playing the piano or
riding a bicycle are much more enjoyable, but require greater expenditures of energy.
When children are completely absorbed in their play, they spontaneously enjoy
Jow. However, in societies where there are few opportunities for flow expenences,
Csikszentrnlhaiyi (1 997) suggests there is a progressive atrophy of the desire for complex
activities. Children can lose their desire to explore new possibilities, become used to

Motor Activity O
passive entertainment, and no longer perceive the opportunities for action, if they are not
exposed to complex activities when they are young.
The idea here is that habitua1 physical activity is an intrinsically psychologicdy
rewarduig experience, or at least has potential as a rewarding experience, if wr begin at a
Young age and continue to be active throughout our lives. Csikszentmihalyi (1 9 9 3 also
irnplies that exposure to increased doses of physical activity will generate positive feelings
offlow, whch wdl in tum encourage us to be more active stiSl. The emphasis is on the
psychological benefits of physical activity and 'being all one can be' through active living.
Social and Communal Perspectives of Physical Act ivity
The Canadian govemment has initiated a program encouragmg what they refer to
as "active Living." Active living is de fuied as a way of life in which physical activity
experiences are valued and integrated into dady living (Fitness Canada, 1988, cited in
Wankel, 1997). From this perspective, physical actiblty involves a socictai or cultural
dimension because it involves the collective valuing of being physically active and
establishing noms for being active. It is the intention of the Canadian govemment to
make regular physical activity a valued "cuihrral trademark" (Fitness Canada, 1986, cited
in Wankel 1997, p. 94) because it has recognized that active living is desirable for the
wel-being of individuaîs, as weii as for the community at large.
Active living involves behaviourai, cognitive, and affective components. The
behaviourai component is the engagement of individu& in regular physical activity. The
cognitive component pertains to one's knowledge of how to be active and how to make
activity an integral part of one's life. The affective component involves the positive
vduing of physical activity and the positive feelings associated with being active (Wankel,

Motor Activity 7
1997).
From this social perspective, the psychological aspects of physical activity involve
the understanding of how to get people motivated to become involved, and how best to
get them to stay involved in exercise and physical activity. Researchers have found, for
example, that invdvement in physical activity is positively assciciated with incarne,
education, and occupational level, and negatively associated with age. Adults who are
more likely to be physically active tend to perceive the health benefits of activity, are self-
motivated, have the support of their spouses, and believe they have both time and access
to facilities. Factors negatively affecting physical activity include behg a smoker, being
ovenveight, working in a blue-colla, job, and experiencing mood disturbance.
Environmental variables include disruptions in routine and the perceived discorn fort of
the physical activity (Dishman, Sallis, L Orenstein? 1985). Males and fernales are similar
in their rate of participation in leisure-tune physical activity, but males tend to participate
at higher intensity levels than females (Stephens & Craig, 1990).
The above research areas linking physical activity to areas of social concem
providr û social context to understand the importance of motor activity. It is evident that
the physical activity of the population at large has Car-reaching consequences for long-
terni weil-being. Especially noteworthy for my research topic is that involvement in
regular physical activity is associated with desirable psychological outcornes. People
report that they feel healthier, have reduced anxiety and depression, and have an
enhanced sense of self-esteem, enjoyment, and satisfaction in lifr (Wankei, 1997).
Psychological maladies, such as depression, anxiety, and psychosocial stress are three
areas of particular interest to researchers studying the relation between physical activity

Motor Activity 8
and mental health (Spirduso & Mackie, 1995). Therefore, the concept of an active, healthy
lifestyle has irn port ant implications for understanding emotional and psychosocial
function. Importantly for the dissertation, however, is that ihere is a lack of evidence to
indicate how physical activity mediates emotional function or psychosocial stressors
Cwankel 199T).
My research focuses on the role that motor activity plays in individual
psychological characteristics, more than on the physical or social consequences of
activity. Individuals show distinct differences in the amount of motor activity that they
exhibit while going about their daily routines. One important aspect of psychological
research into motor activity is to identify possible reasons for these individuai differences
of preference or uicluiûtion for activity. For instance, individual differences in the
inclination to be active may be due in part to the arousal or pleasure associated with being
physicdy active. It is h s focus which is central to the studies presented in th&
dissertation.
In examining the psychological meaning of motor activity, 1 argue that the
ernotional charactenstics of an individual's typical interaction in his or her day-to-day
living will reflect differences in motor activity. 1 also assume that fiom early in life
individuals use their motor activity or movemcnt to optimize or regulate their emotional
comfort levels in their interactions with othen and by themselves. Operationally, 1 do not
focus on the maintenance hinctions of motor activity, which presumably are similar in ail
people. Instead, 1 am focusing on the aspects of motor activity that show individual
differences. Specificaily, 1 I examine individual differences in motor activity and its
emotionai and temprramental correlates

Motor Activity 9
Emotions and motor activity may becorne integrated with each other early in life.
The first basic component of sensorimotor action includes movement, perception, and
feeling, and there is no sharp distinction beîween action and feeling (Fischer, Shaver, &
Carnochan, 1990). m s integration of action and emotion rnay continue into adulthood,
so that rnotor activity continues to reflect ari individual's emotional state. Since emotions
provide a motivational basis for more stable temperarnental differences among
individuals, it is worthwhile reviewing theories of both emotion and temperarnent, and
how they might relate, at least in thcory, to motor activity.
Theones of Emotion
The cornmon-sense view a hundred years ago was that emotional experiences
produce bodily expressions of emotion. In contrast to that view, William James (1 884;
cited in LeDoux, 1989) thought that the perception of an event @y the sensory cortex)
produces b o d y changes (through the motor cortex). Perceptions of bodily changes then
give nse to an emotion about the event. James's theory was criticized by Cannon (1927,
193 1 ; cited in LeDow, 1989) who argued that bodily changes were too non-specific and
too slow to account for emotional expenence. He thought that the brain possessed a
special emotionai s ystem, of which the hypothalamus was the integrative structure. Papez
(1937; cited in LeDow, 1989) discovered such a functional circuit in the brain (the Papez
circuit) which involved the relay of sensory input through the hypothalamus, anterior
thalamus, cingulate cortex, hippocampus, and back to the hypothalamus. The flow of
information through this loop Papez thought essential to nonnal emotional function.
MacLean (1949, 1952; cited in LeDow, 1989) postulated the existence of a visceral brah
or h b i c system. The limbic system consisted of phylogeneticaiiy old structures located

Motor Activity 10
around the medial walls of the cerebral hemispheres as weii as associated subcorticai
nuclei. The çore of this ernotional systrm is a mechanism for determinhg the affective
sigruficance of stimuli. in essence, research of the biological substrates of emotion has
focused on autonornic changes that accompany emotion in humans and on the
subcortical h b i c system circuits that mediate ern~t imal behaviours in animals
(Davidson, 1 995).
Fiinctions ojemotions
Emotions function in several usefid ways. First, thry provide sunival value by
preparing an organism to fight or flee dangerous situations by provohg the release of
autonornic and endocrine responses in the body. Secondly, emotions are motivahg If a
reinforcer is positive, the organism will work to obtain it. If the reinforcer is ncgativc, the
organism will work to avoid it or wiU reduce the response on which it is made contingent.
Novelty, for example, may be positively reinforcing encouragmg curiosity and the desirr
to explore the environment. Thirciiy, emotions prornote social bonding by motivating
anirnals and humans to communicate with each other. For example, emotions are an
integral part of the ability of an infant to develop a bond of attachment to his or her
mother. They also serve a cognitive îùnction, by providing a mechanism for a current
ernotional state to facilitate the storage and recall of memones. For example, happy
memoRes are more likely to be recded when the individual is currently in a happy mood.
This occurs because of the increasing strength of active synapses in associative neuronal
networks. It is likely that some of the input wons fiom an expenenced event carry
information about the current emotional state, as well as about the event itself. The happy
event will be recaiied best when the memory closely resembles the pattern of rnodined

synapses (Rous, 1990).
Panhepp 's Theory of Emoiion
Panksepp's (1982) theory of emotion set out four primary emotive neural circuits
in the brain in animals. In the mmmalian brain, these four subcortical circuits pass
between rnidbrain, h b i c systm, and basal ganglia, and they elicit well-organizrd
behavioural sequences that Panksepp labels the expectuncy, rage, fear, and panic
circuits. AU four circuits show reciprocal Uihibitory relations. in other words, the action of
one inhibits the action ofthe other. The expectancy circuit mediates anticipatory
exploratory or approach behaviour and is responsiblc for producing motor arousal that
leads to movement. The rage circuit generates an 'affective' attack involving growhg and
biting whsn the animal is restrained or Mtatcd. The fear circuit elicits escape or fieezing
behaviours in response to environmental threats. The panic circuit mediates distress
vocalizations and agitated behaviour in situations that would encourage increased social
co hesion and caregiving behaviour (Panksep p, 1 982).
In latrr work, Panksepp (1 989) brought in the notion of hierarchical control of
motions in which he emphasized the robust influence of the subcortical processes over
cortical processes in humans. He makes the point that our personality structures may be
rnolded by the nature and vigour of our emotional circuits and by the habitua1 arousal of
an emotional system during the early phases of development. He also suggests that in
humans the laterality of various basic processes in the animal brain may be the source of
emotional specialization of the two hemispheres of the brain. Asymmetries in emotional
control may emerge îiom the manner in which the relatively symmetRc subcortical
processes are elaborated by the two sides of the brain (Panksepp, 1989).

Motor Activity 12
With modem methoûs avdable, recent research on emotion has focused on how
the subcorticai and cortical areas of the brain are functionaiiy intrgrated (LeDoux, 1989).
Much work has been done on the means of expression of emotions and on the role that
various cortical regions play in the regdation of emotion (e.g., Borod, 1993a, 1993b;
Davidson. 1992b. 1992~. 1993a 1995; Davidson, Ekman, Saron, Senulis, & Friesen, 1990;
Fischer et al., 1990; Fox, 1994; Heller, 1993; LeDoux, 1989; LeDoux, 1995). In particular,
the focus is on the antenor and fkontal cortical areas, which have extensive anatomic
reciprocity with both subcorticd areas and the posterior cortex, aii implicated in
emotional behaviour. These areas are also hked to motor function (Fuster, 1989).
Asyrnmetnes of the antenor cortex have been implicated in different foms of emotional
behaviour (Davidson, 1995). In this dissertation 1 intend to examine asymmetries of
motor activity dong with vanous emotional behaviours.
Approach- Witlrdrawaf
One of the recent key concepts in emotion theory is the behavioural consequences
of the emotional expenence. The decision to approach or withdraw is the most
fundamental adaptive decision made by any organism, and individuals M e r in their
tendency to approach or withdraw liom new situations (Davidson, 1992a). Responses are
accompanied by changes in motor tension and the cardiovascular system, probably
produced by the lunbic system. There are also individual ciifferences in the threshold at
which approach and withdrawal behaviour occun. For example, some individuals requise
high levels of fear stimuli to initiate withdrawal behaviour. Others start to withdraw at
lower levels of intensity (Strelau, 1994).

Motor Activity 13
Emotions und Motor Activity
How does a i l of this relate to rnotor activity? Leventhal's (1979) percephial-motor
theory of emotions helps make the connection between emotions and motor activity. He
maintains that the centrai nervous system (CNS) uses the peripheral motor system to
constmct emotional reactions. He suggests that activation of the autonomie nervous
system (ANS) and an increased level of arousal of the CNS are concomitant with the
production of the expressive motor reactions controlied by a centrai motor mrchanism
(Gainoîti, 1989). In infancy, innate motor programs express cmotion in an iruiate reflex-
iike r n m r r . With age, and more cornplex and variable expenences, extemal stimuli are
associated with interna1 representations and memories of past emotional experiences.
Gradually, emotionally expressive motor programs are incorporated into the individual's
set of communicative skiils and interpersonal interactions (Gainotti, 1989). Gainotti
suggests that these expressive movements can include facial expressions and vocal
activity. 1 suggest that motor activity might aiso be one of those expressive movements
reflecting individual merences in emotional expression.
Support for this suggestion comes fkom several theoretical and empincai sources.
The theoty of Henri Walion (1879-1962; cited in Van Der Veer, 1996) lends some support
for this hypothesis. W d o n believed that children go through different stages of emotional
development, similar to Piaget's stages of cognitive development. It was his view that
muscle tone or muscle tension is a prime factor in emotional behaviour, and protides an
accurate idea of the affective state of the infant. Wallon saw both laughing and crying as
resolutions to a gradua1 build-up of hypertonia. For example, laughmg releases tension
through spasms of the skeletal muscles (Van der Veer, 1996). This notion of the close

Motor Activity 14
connection between affect or emotion and motor activity has received some support from
an empirical study (McKeen, 1995) and is a tenet or assumption of most emotion and
temperament theones (e.g., Gainotti, 1989; Gray; 199 1 a; Strelau, 1983).
Theones of Temperament
Whde individual differences in emntion is a key issue ofmany studies of
temperament, it is ofien not çasy to shidy empirically. The concepts are either vaguely
defhed or too specific to animai research to be usefùl with humans. Temperament
providrs a more 'user fiiendly' way to examine emotion in that it is a higher-level
constnict and ofien relies on self-reports of typical responses to ernotional situations
found in daily Life. In the foUowing discussion, 1 detine temperament, and further describe
various theoretical perspectives related to individual differences in temprrarnent and
motor activity.
Temperamentfiom a Neo-Povlovian Perspective
The neo-Pavlovians emphasize the physiological basis of temperament. From
Pavlov's initiai work on conditioned responses in dogs, he and others of the school based
the notion of temperament on the dynamics of excitatory and Uihibitory newous
processes thought to underlie observable individual differences in humans. As de finrd by
Strelau (1 993), tempement
refers to basic, relatively stable personality traits which apply
m d y to the fomal aspects of reactions and behavior (energetic
level and temporal characteristics). These traits are present since
early chilcihood and they occur in man and animals. Being
primariiy determined by inbom phy siological mechanisms,

Motor Activity 15
ternperament is subject to changes caused by maturation and by
some environmental factors @ 1 17).
By stability, Strelau means that temperament is relatively stable over time, but that
changes can and do occur. These are mainly due to developmental and lifespan
maturaticnal changes in the physiological rnechanisms that underlie ternperament. B y
formal traits, Strelau means those characteristics that rnay be descnbed in tems of energy
and tempo (Strelau, 1996). He is thus emphasiang that any behaviour may be descnbed
in tems of its intensity or magnitude, as weil as by its speed or duration. According to the
neo-Pavlovians, the main fundamental features of the nervous system type are defuied as
the strength, mobility, and equilibrium of the nervous system processes (Mangan dé
Paisr y, 1983; Strelau, 1983).
Sirength ofthe nervous Tvstem. The strength of the nervous system is determined
by the reactivity of the individual's excitatory response system. A strong nexvous system
is the resdt of low reactivity or sensitivity . A weak system is a consequence of high
reactivity or sensitivity (Mangan & Paisey, 1983). Two neo-Pavlovians, Teplov and
Nebylitsyn, considered the strength of the nervous system as a bipolar aait that can be
designated either as endurance (or rfficiency) at one extremc or sensitivity at the other,
the correlation between the two being about 0.7 (Strelau, 1983). Nebylitsyn (1972; cited in
Mangan & Paisey, 1983) also interpreted electroencephalographic (EEG) evidence as
indicating that there are two physiological facton iduencing the strength of the nervous
system. One factor is responsible for sensory reactivity. The other is an independent
factor responsible for motor activity. The implication of this hâing is that the strength
characteristics of the nervous system may be related to individuai ciifferences in both

Motor Activity 16
sensory reactivity and motor activity (Mangan & Paisey, 1983).
Mobility ofthe nervous system. nie capacity of the biological system to react
quickly to changes in the environment, the neo-Pavlovians c d the mobility of the
nervous system. Adaptiveness, or functional speed of the nervous system is central to ths
idea of mobility. Speed is also closely related to the idea oflability and dynarnism of
nervous system processes. Although mobility may be a more important concept for
lraming and intelligence than for temperament (Strelau, 1983), rnobility also may relate to
motor activity. Individuals who are highly mobile are likely to be Uivolved with more than
one activity at a tirne, and enjoy the hustle and bustle of daily Living and of novel
occasions. Therefore they are Likely to be more physicdy active.
Equilibrium. Equilibrium of both excitatory and inhibitory processes involves the
balance of nervous processes (Mangan & Paisey, 1983). Accordhg to Strelau (1 983),
Nebylitsyn hypothesized that the balance of excitation and inhibition is a h c t i o n of both
the activahg influence of the reticular structures of the subcortex and the idubitoiy
influence of the cortex. Strelau hirnself(1972) has defined it as the ratio between strength
of excitation and inhibition.
These fundamental neo-Pavlovian concepts involving neivous system processes
are very much related to basic physiological processes (Strelau, 1983). The work done by
these researchers was experimental in nature and involved physical response measures
such as galvanic skin responses (GSR), EEG responses, as well as visual, auditory, and
other sensory, and reaction time responses. Many of the theoretical physiological
concepts derived fiom the neo-Pavlovian studies in the 1950's and 1960's still hold today,
thei. meanings perhaps taking on new emphases in the process. For example, the concept

Motor Activity 17
of the strength of the nervous system is typicaily referred to in the Westem iiterahire as
the arousal or activation of the newous system. Although these Westem concepts are not
solely related to neo-Pavlovian theory, they are important to the theory and are discussed
more M y here. Various components of arousal have been put forth. I will describe
several of these and their relation to emotion and motor actisity next.
Arotrsal
Immanud Kant (1 724- 1804) developed the idea that temperarnent can be
charactzrized as 'iife energy' (LebensbojQ. According to him, our life energy ranges
barn excitability to drowsiness (Kant, 19 12). Later in the cenhiry, Pavlov introduced the
concept of strength of excitation in the cortex and subcortex, which he thought underlies
the notion of arousai. He thought that individual differznces in the intensity of these
excitatory processes could explain individuai ciifferencas in arousabiiity (Pavlov, 195 1,
1952; as cited in Strelay 1994). Duffy (1 951, 1957; as cited in Strelau, 1994) considered
arousal or activation as an undifferentiated intensity dimension undrrlymg temperarnent.
Individuals differ in the level of arousal and responsiveness to stimulation. Arousal she
dehed as the release of potential energy for use in activity or response, whch is
determined by physiological factors. Energy release can takz various foms, such as EEG
activity, skeletal muscle tension, electrodemal activity (EDA), or activity of the ANS
(Sirelau, 1 994).
Hrbb (1955; as cited in Strelau, 1994) disthguished two main roles that
stimulation plays in temperament. One function is as a cue, guiding the direction of
behaviour. The other is an arousal or vigilance hction, referred to the energetic
background of behaviour. Hebb suggested that arousal is synonymous with 'general dive

Motor Activity 18
state,' which he conceptualized as an energizer. He descnbed arousal as an engine that is
ninning, but whch has no steering wheel. Habb also related performance to the concept
of the inverted-U-shaped curve relation that occurs between intensity of stimuli and the
speed of leaming (Yerkes & Dodson, 1908). At low levels of arousal, an increase in drive
intensity may be rewxding, whereas ût high levels, m incremr in intemit). may De
distressing. An increase of arousal to the optimal level is accornpanied by positive
emotions (and high levels of performance), but beyond that, arousal is a source of
negative emotions (and reduced levels of performance).
Since the discovery of the reticular activûting system (RAS), arousal is also
considered a neurophysiological construct. Whcn the RAS was initialiy described
(Moruzzi 8r Magoun, 1949), it was assumed to serve as a generalized arousal mechanism,
which responded to sensory input and energized behaviour. It also activated EEG waves
and the sympathetic nervous system. Since that tune several researchcrs (e.g., Lacey,
1967; Pribram 8t McGuinness, 1975; Routtenberg, 1968) have postulated that there are
two arousal systems in the brain, the RAS and the limbic system. The function of the two
systems is reciprocal. That is, each suppresses the activity of the other, and organisms
regulate their behaviour by maintainhg a balance of activity between the two systems
(Routtenberg, 1968).
The RAS functions to regulate arousal, which is designated as a phasic, short-lived
response to stimuli. It reflects an individual's responsiveness to specific stimuli. The
limbic system is an activation system, which maintains a tonic readiness to respond with
action (McGuinness & Pnbmm, 1980; Tucker & Williamson, 1984). This tonic readiness
can be considered as the individual's typical baseline or set-point of arousal.

Motor Activiîy 19
By mrans of the arousal system, facilitated by the posterior cortex, the brain
orients to novel input. The arousal system is thought to be a reward systern, important in
the integration of response mrchanisrns necessary for reinforcement. Approach responses
(and expansive cognition) are positively reinforcing Withdrawal responses (and
cmstncted cognition) are negatively reinforcing (Routtenbeo, 1968). Thus. through its
reinforcing of reward, arousal is thought important to emotion (McGuinness & Pribrarn,
1980). Arousal is augmented with increasing novzlty or complesity of stimuli, but
repetitive stimuli soon produce habituation. The neurotransmitter substrates of arousal are
the norepinephruie and serotonin pathways that proceed nom the brainstem to innervate
widespreûd areas of the brain. These substances regulate the sleep/wake cycle. They also
sensitize the individual to novel environmental stirnuh, and perhaps füter out inelevant
stimuli. Thus, arousd is responsible for wakefulness, sleepiness, alertness, and the typical
level of responsivity to sensory percephial input (Carlson, 199 1; Tuckzr 6r Williamson,
1984). It is a concept closely comectcd to both emotional behaviour and motor activity.
Activatiort
Activation is a second concept closely related to the notion of arousal. Activation
refers to a state of tonic excitation regulated prirnarily by the basal gangha of the
extrapyramidal system. Activation is integrai to motor operations, supporting postural
readiness and motivationdy directed action. As such, it is associated with vegetative
activities (Routtenberg, 1968) and with intentional movement (Heilrnan & Watson, 1989).
Activation directs the individual's attention inwardly, a characteristic more of wariness
than of outward orienting to novelty Vucker & Williamson, 1984). Activation is also
important in providing a motivation to act (McGuinness & Pnbram, 1980).

Motor Actiwty 20
The dopamine pathways fiom the brainstem substantia nigra combine with
cholinrrgic neurochemical influences on the basal gangha and facilitation h m the
dorsolateral fiontal cortex, to regulate activation (McGuinness & Pribram, 1980).
Dopamine activation is implicated in the augmentation of motor control. Spontaneous
locomotion depends upon an intact dopamine network. and research incîicates that
spontaneous motor activity comlates more closely with changes in dopamine levels than
with norepinephnne. Dopamine causes an active, vigilant attentional mode, which is
essentiai for avoidance behaviour and tied to motor readiness, However, rather than a
simple, positive correlation with motor activity, dopamine regulation paradoxically
facilitates a tight control of behaviour. In animals, high levels of dopamine restrict the
range of behaviour, producing repetitive, highly stereotyped motor responses. Low lrvels
of dopamine impair the ordered, sequential organizatiori of behaviour. Individuals with
clinicdy low leveb of dopamine are unable to move their h b s normaliy, and have
particular trouble in initiating motor activity (Tucker & Williamson, 1984).
Of course, in a normal, adaptive environment individu& maintain a balance of
control in both extemal arousal and intemal activation. Too rnuch arcusal would produce
a behavioural response to every stimulus, resulting in behaviour that is randorn,
distracted, and disorganized. An optimal amount of vousal may encourage curiosity and
interest in one's smoundings. Too much activation would produce behaviour that is
repetitive and redundant. An optimal arnount of activation would provide a regulatory
substrate for motivation facilitating habit formation gucker & Williamson, 1984).
A key point here is that, in theory, levels of arousal and activation should relate to
both emotional state and to motor activity. Arousal should be related to emotional

Motor Activity 2 1
feelings and to observable motor responses in new situations. Activation should be related
to the individual's typical level of motor activity and to an intemal motivation to move.
The neo-Pavlovian approach to temperament and the concepts of arousal and
activation focus on very general underlying physiological processes that can be applied to
any number of behaviours, including motor activity . It is useful to examine how this
approach makes specific reference to activity lçvel.
-4 neo-Pavlovian Accouni of Motor Aciivity.
Sirelau's theory (1 983; 19853; l985b; 19863; l986b; 1987; 1989; 1994; 1996)
contauis several concepts that relate to motor activity. Strelau (1 989) maintains that
individuals have a tendency to react to situations with characteristic rnergy and tempo.
Individual differences in the energy level of behaviour are the result of the two basic
dimensions of biologicaiiy-based temperament, reactivity and activity. Strelau's reactivity
closely resernbles the neo-Pavlovian concept of strength of the nervous system. Because
most behaviours involve an emotional context, the emotional state accompanpg an
action comprises the excitation-inducing factor or reactivity (Strelau, 1989). Tempo or
briskness is the tendency to react quickly, or to keep up a high tempo of activity. It also
refers to the ease with which an individual shih behavioural responses according to
changes in the environment (Strelau, 1996).
Strelau (1983; 1993) discusses activity in tems of its fùnction. It is conceptualized
as the tendency of an individual to undertake behaviour of high stimulative value, and
therefore it is the way in which an individual typicaliy controls and maintains a personal
optimum level of shuiation or of activation. The amount of stimulation needed for an
optimal level of activation ciiffers according to the reactivity of the individual. Motor

Motor Activity 22
activity can, in effect, "organize" the sources of stimulation into stimulation-seeking and
stimulation-avoiding activities, depending on whether the individual is a 'low-reactive' or a
'high reactive.' For example, 'low-reactive' individuals tend to prefer highly stimulating
activities to maintain an optirnal level of arousal (Strelau, 1985b; 1989). 'High reactive'
individuals prefer less stimulating activities to maintain their optimal level of arousal.
According to Strelau then, individuals will show a preference for a typical level of
activity, which functions for them to maintain an optimal level of arousal. The individual's
activity will be the result of efforts to either avoid or engage in a more or less stimulative
environment. Emotional arousal or affect participates in the regdation of the individual's
optimal level of arousal by providing motivation to act.
Many of the empirical temperament data corne from correlational studies, in
which researchers use questionnaire methods and ask about the occurrence of spwific
behaviours. A questionnaire has been developed (Newbeny, et al., 1997a) which
integrates neo-Pavlovian concepts of arousal with Western psychobiologicai views on
temperment. 1 briefly descnbe this scale, called the Pavlovian Temperament S w e y
(PTS), a sel'report measure used in Study 2 of the dissertation.
The PTS (formerly called the Strelau Temperament Inventory-Revised) contains
three subscales reflecting the three dehtional facets of the temperament dimensions. The
subscales are named the Strength of Excitation (SE), Strength of hhibition (SI), and
Mobility of Nervous Processes (MO). nie SE facet includes questions about emotional
composure, perseverence in the face of danger, susceptibility to distractions when
working, and resistance to fàtigue. nie SI facet includes questions about the ability to
delay speaking, tolemnce of delay in beginning projects, self-control for the benefit of

Motor Activity 23
others, and the abdity to suppress expression of feelings. The MO facet includes
questions related to the ability to adapt to changes in working conditions, the speed with
which emotions change, tolerance for the unfamiliar or unexpecteà, and the l h g for
being involved in multiple activities.
There is another theory of temperament developed by Gray 11 99 la). whch
appears to be salient to both emotional temperiment and motor activity. This theory, and
its implication for motor activity are descnbed next.
Temperament Rom an Activatiodnhibition Perspective
Gray' s theory of brain function and behaviour has been particularly influentid in
the area of temperament and personality research. He maintains that any psychological
funchon depends upon the activity of the brain, so that if there exists a psychology of
temperarnent, then there is also a neuropsychology of temperament (Gray, 199 1 a). He
assumes that temperament is what remains of individual ciifferences once the effects of
general intelligence, visuospatiai, verbal ability, or other cognitive hc t ions have been
removed (Gonzalez, Hynd, & Martin, 1994). Hence, his neuropsychological model of
temperarnent concems the neural substrates of emotional behaviour. Emotions are states
of the CNS elicited by reinforcing evmts.
Gray (1 99 1 b) assumes that clifFerences among individuais in temperament reflect
differences in their predispositions towarâs different kinds of amotional responses to
reinforcing events (Gonzalez, et al., 1994). Gray's model describes three emotional
subsystems which respond to three fiindamental emotion systems of the cortex and
subcortex. The three emo tional sy stems are re ferred to as the behavioral inhibition sys tem
(BIS), the behavioural approach or activation system (BAS), and the fi@fli%t system

Motor Activity 24
(FFS) (Gray, 1991b).
Behaviourul inhibition system (BIS). Activity in the BIS is elicited by conditioned
stimuli that are associated with punishment, termination of reward, or novel stimuli. The
stimuli activating the BIS cause an intemption, or uihibition of ongoing behaviour, and
an increase in arousal and attention. By increasing arousal and attcntion the system
modulates exploratory behaviour. The BIS inhibits behaviour that rnay lead to negative or
painful outcomrs. The subjective state that accompanies activity in the BIS is anxiety
(Gray, 199 1 a). Thaefore, BIS activation exhibited as anxiety may be responsible for
feelings of fear, anxiety, hstration, or sadness. The BIS is thought to involve neurai
activity in the septo-hippocampal system, a part of the limbic system.The links between
the septo-hippocarnpai system and both the basal ganglia and crrebeiium provide a
means for the lirnbic systcm to communicate with the motor system, and thus a means
for generating overt bchaviours associated with emotions. The prefiontal cortex also
modulates motor behaviour (SteinmeQ 1994).
Behaviourol aciivation system (BAS). The BAS is a positive feedback system
activated by stimuli and associated with reward, or with the termination or omission of
punishment. It is an approach system that îùnctions to increase the spatiotemporal
proximity of stimuli, and is therefore considered a motor programming system (Gonzalez
et al., 1994). The key components ofthis motor system are the basai ganglia, the
dopaminergic fibres that ascend fkom the mesencephalon to the basal ganglia, the
thalarnic nuclei linked to the basal gangha, and neocorticai areas linked to the basal
gangha. These components fom two interrelated subsystems. The b t is the caudate
motor system, a non-limbic cohco-shiato-pallido-thalamic-midbrain circuit. This system

M o tor Activity 25
seems to be important in regdatirtg the inhibition of motor activity. The second is the
accumbens motor system, which is a iimbic cortico-striato-pallido-thalamic-midbrain
circuit. This system switches between steps in a motor program, interacting with the
septo-hippocampal system, and monitoring the routine operation of a motor program.
Gray p~stulates that the BAS underlies pleasurable states, siich as anticipation or
happiness ( G o d e z et al., 1994).
Fighr orjlighf system (FFS). The t h d emotionai system, the FFS, is specialized
to respond to 4 t h unconditioned punishg stimuli or the temination or omission of
reward (Gray, 199 1 b). With an activated FFS, the individual responds to aversive stimuli
with defensive aggression or escape behaviour. The anatomical structures that appear to
function in support of this system include the arnygdala, which uihibits the media1
hypothalamus, whch in him inhibits the final common pathway in the central gray of the
midbrain. The system may be influenced by input fiom the BIS, probably by way of the
septo-hippocampai system. No direct links to a corresponding human emotion has been
found as yet with the FFS, although anger and terror are possibilities (Gray, 199 la).
It is the balance or interactions among these emotional systems that Gray
hypothesizes resdts in human temperament or personality differences. Gray (1 99 1 b)
suggests that his biological approach serrves as a basis for other concepts of temperment
and personality. He makes the case that theories of personality (e.g., Eysenck, 1967;
Eysenck & Eysenck, M., 1985; Eysenck & Eysenck, S., 1969) and mood structure (e.g.,
Teliegen, 1985) are compatible with the BISIBASIFFS theory of temperment. hdividuals
will demonsûate different patterns of emotionaiity with different combinations of positive
and negative affect. Thus, individu& who possess a more reactive septohippocampal BIS

Motor Activity 26
are susceptible to threats of punishment and non-reward. They are anxious and
introverted, more fearful and hstrated. Individuals who possess a more reactive media1
forebrain bundle approach system (BAS) are susceptible to signals of reward or
nonpunishrnent. They are extraverted, impulsive, and more susceptible to emotions such
as relief and hope (Denybcny 8r Rothbut, 1988).
Within the BISIBAS system, temperament reflects individual differences in
predispositions towards particular kinds of emotions. How might the behavioiiral
Inhibition and activation systems produce i~dividual differences in motor activity?
Moior Aciivity Ni an InhibitiodActivation @ I S / W ) System.
Gray's theoty of the approach and withdrawal mechanisms of the BIS/BAS have
implications for motor activity. Because the BAS is an emotional system that has êvolvcd
to motivate a pleasurable engagement with the environment, it involves fonvard
locomotion and search behaviour (Nelson, 1994). Individuals with a highly activated BAS
would be more inched to approach new situations, and want to be in the centre of
whatever is happening. Therefore, motor activity would be higher generaiiy in individuals
with sensitive approach systems. On the other hand, individuals who have very active BIS
systems tend to present more negative affect and withdraw fiom novel situations. housal
of the BIS would inhibit rather than energize motor behaviour (Fowles, 1980).
niere is some support in the literature for the idea that the BIS/BAS relates to
motor activity. In studying children, Quay (1988, 1993) has used the BISIBAS theory to
suggest the underlylng causes of behaviour disorders. He argues that an overactive BAS
may be responsible for causing extreme responses to reward signals resulting in conduct
disorders. An underactive BIS might be the cause of impaired inhibition in the fàce of

Motor Activity 27
threatened punishrnent, resulting in attention deficit hyperactivity.
There are other factor analytic approaches to theories of temperament that aîmost
exclusively make use of self-report questionnaires and include activity specifically as a
dimension of temperament. Several of these are discussed next. Rzcent hdings h m
biology, behavioiu genetics, and personality theory c o n h the prominence of rnotor
activity as a dimension of temperarnent (e.g., G o d e z , Hynd, & Martin, 1994; Gray,
1991a; Saudino & Eaton, 1991).
Rothbart 's Theory of Temperument
There are other concepts and ways to define temperarnent. Rothbart is a key
rcsearcher and theorist in the area of temperarnent. She presents a psychobiological
approach to personality developrnent, maintamhg that the "study of temperarnent is
located at a level of analysis with physiology on one side and social interaction on the
other" (Rothbart 6t Ahadi, 1994, p. 56). She and her colleagues d e h e temperarnent as the
"constitutiondy based individual âEerences in reactivity and self-regdation" @. 55).
Over tirne, reactivity and self-regulation are influenced by heredity, maturation, and
experience. The concepts of reactivity and self-regulation are important in the behavioural
consequences of temperarnent.
Reactivity
Reactivity refers to the intensity and temporal aspects of psychobiological
functioning of the somatic, endocrine, autonornic and centrai nemous systems (Rothbart,
1986b). It is defined more generally as the excitabtlity, responsivity, or arousability of an
individual's physiological and behavioural systems (Rothbart & Denybeny, 198 1).
Reactivity is also described as the anatornical and physiological mechanism responsible

Mo tor Activity 28
for the release of stored energy. There are individual differences in the arousal
mechanisrns that detexmine reactivity. In high-reactive individuals, these mechanisms
enhance or augment stimulation. In low-reactive individuals, the mechanisms reduce or
suppress stimulation.
In its empincal measurement, reactivity has been operatinnalized into centml and
peripheral forms. Cortical reactivity is assessed by examiting extemal sensory sensitivity
(tg., noticing room temperature), intemal percephiai sensitivity (e-g ., noticing stomach
growling), and cognitive reactivity (e.g., ease of angaging in daydreaming, problem-
solving, and visuai images). Penpheral reactivity is assessed by examining individual
differences in autonomie reactivity (e.g., sweating paims), motor tension ( e g , tension in
shouider muscles), and motor activation (e.g., feet tapping whde reading) (Denybeny &
Rothbart, 1988).
Self-regulution
Self-regulation refers to the individuai's ability to actively control arousal and
emotional responses. It is a process that serves to moddate the individual's reactivity,
through cognitive orientation, attention, approach, and avoidance behaviours (Rothbart,
1986b). Behaviourdy, it oAen refea to self-control, as is the case when one inhibits
attending to irrelevant stimuli. It also refea to more subtle behaviour, as occurs when an
individuai can attend to one particular stimulus and ignore others. The result is that
individu& can shift their attention toward a positive stimulus and away fiom a negative
sîimulus. In this way, they c m attenuate or regdate their arousal and emotion (Ahadi &
Rothbart, 1994; Denyberry & Rothbart, 1988).

Motor Activity 29
Rothbart f Theory and Motor Activity
Rothbart (1986a; 1986b) includes activity as a central dimension of temperament.
She presurnes that motor activity is an underlying constitutional tendency of the
individual to react in a typical manner or style across a variety of situations and to regulate
his or her own responses. The developrnent of ternperarnent involves the addition of
increasing regdatory control over initial patterns of reactivity or activation (Rothbart &
Posner, 1985). Rothbart d e h e s activity level in chiidren as the level of the child's gross
motor activity, including movement of anns and legs, and rate and extent of locomotor
activity (Ahadi & Rothbart, 1994). Her recent temperament inventory, the Early
Adolescence Temperament Questionnaire (EATQ; Capaldi & Rothbart, 1997) includes
staternents fiom the Activity subscale such as, I hardly everfidget o r sqzrirm around
and, When I get excited I ojlenfeel like moving oround.
There are other ways to d e h e temperament, but the examples above provide a
flavour for the major concepts involvrd in defining temperament in the literature. The
general concepts and definitions of temperament above emphasize the constitutional and
biological bases of temperament. Rothbvt is one of several researchers who sprcifically
includes motor activity as a dimension of temperament. 1 will briefly discuss three other
theories of temperament that also include the concept of motor activity as a dimension of
temperament. These theones may provide clues about our individual differences in motor
activity and what they reveal about our temperament.
Theories using Motor Activity as a Temperament Dimension
Through the New York Longitudinal Study, Thomas and Chess (1977) studied the
social, motionai, and attentional characteristics of children, and determined those that

Motor Activity 30
were predictive of later problems. niey devdoped nine dimensions of cMdhood
temperament, of which activity level was one. Thomas, Chess, and Birch (1968) d e h e
activity level as the mount of spontaneous movement in the child's behaviour and the
dady proportion of active to inactive periods. They fotmulated dimensions of
temperament based on the underlying acceptance of the notion that Uidividiials differ in
the way they behave. They maintain that temperament deals with how a response is made
(fast or slow, mild or intense), rather than what the response is (affection, aggression etc.)
(Strelau, 1983).
Buss and Plomin (1984) drhe activity in tems of fiequency or rate, t h e spent in
high-energy activities and persistence in conhnuing with such acclvity, the amplitude or
vigour of the activity, the choice or preference for hgh-energy games or work, and the
reaction to enforced idleness. For example, their EAS (Emotionality, Activity, and
Sociability) Temperament S w e y asks parents of chddren to rate statements such as,
child is always on the go and child is very energetic, to obtain an overaii masure of how
active the chiid is. Buss (199 1) dehed it sirnilady as the expenâiture of physicd energy.
He specificaliy excludes any cognitive effort (sucti as thinking, hagining, planning) and
any arousal that accornpanies emotional behûviour. For adults, he ernphasizes the tempo
or pace of action, vigour or intensity, and endurance of active individu&.
Eaton (1994) defines activity level sirnply as the individuai's customary level of
energy expendiîure through movement. This definition captures the essence of the
theoretical dennitions without restricting it to any one particulas theoretical approach. This
definition also Links motor activity to the notion of energy expenditwe used in biology
and medicine. niere is no requirement for activity to be goal-directed for example, nor are

Motor Activity 31
causal antecedents implied. Energy can be expended to maintain body temperature and to
grow, but the notion of activity level is restricted to movement-based calorie costs. Such
an approach ailows for practical measurement, but is broad enough to encompass the
more theoreticdly-based definitions.
Theoretical manen of importance when ûymg to operationalize or develop
hypotheses about motor activity revolve around psychobiological and temperamental
issues of individual style of behaviour. Although we understand many fûcts about the
way the motor systzm is organized physicdy, motor activity level as a psychological
concept is not weU understood. When 1 refer to activity level here, 1 am refening to
Eaton's (1994) defuiition, which 1 wiil be using for the purposes of this dissertation. This
conceptualization of motor activity as a dimension of temperament focuses on the way
that individuals typically act or interact with their environment. The defirution dors not
refer exclusively to skilled motor activity, but it does include it. It also includes unsMled
motor activity. From this perspective, motor activity is an ecologicdy based
psychological concept, that describes individual differences in susceptibility to stimuli and
initiation of behaviour.
Theoy ofMwd
Although not shidied fiom a biological perspective, mood is nonetheless a
psychological constnict involved in concepts of emotion and arousal. nie followuig
theory of mood is interesting because it includes a consideration of energy as it relates to
positive and negative emotion and physical activity.
Thayer (1989) argues that there exist two mood systems which work to arouse
feelings of mood. The energetic arousal system is recognizeble by subjective sensations of

Motor Activity 32
energy, vigour, or peppiness. If the mood is one of energetic arousal, the individual is
predisposed to move and be physicdy active. Deches in the energetic mood system
incline an individual to fecl tired, and to rest or be physicdy inactive. The second mood
system is the tense arousal system. It is associated with feelings of tension, anxiety, or
fearfulnzss. With activation of the tense arousal system, a preparation for action is
present, but also restraint or inhibition to act.
The two mood systems interact together to produce vanous moods. High energy
and low tension are associated with feelings of cahness, optimism, happiness, and
pleasurable feeling, which is called a good mood. Low energy and high tension produce
an unpleasant feeling, often labelled as a bad mood mayer, 1989). Anythmg thût
increasrs feelings of energy and decreases feelings of tension (e.g., caffeine, cocaine,
tranquilizers, exercise, sleep) encourages positive feelings and puts an individuai in a good
affective state or mood. The addictive attraction of attaining a positive mood is a key
motivation in the use of various psychoactive drugs. The often imrnrdirte positive effects
of exercise, Thayer (1989) attributes to the effects of energetic arousal on mood.
Relations among Emotion, Temperument, and Mood
Although the concepts of ernotion, temperament, and mood corne nom different
theoretical backgrounds, it is useful to discuss how they relate to each other. One way to
explain the relationship among emotion, temperament, and mood is to apply them dong a
temporal dimension. Temperament lasts longer than mood and is the most stable or
consistent (Strelau, 1986b). Mood lasts longer than emotion. Emotions are ofien
described as transient feeiing states. Moods are usually d e h e d in terms of states of mind
or attitude predisposing the individuai to some action. Moods and emotions can
Motor Activity 33
contribute to temperament if they are consistent enough over time mayer, 1989).
People usually dascnbe moods as subjective, background feelings that last for a
tirne and may or rnay not have an identifiable cause. Mood is sometimes seen as an
assumed tendency or inclination to act under certain circumstances (Thayer, 1989).
Hciwever, it is dso considered a biopsychological concept in which affect is not so rnuch
the response to biochemicd, psychophysiological, or cognitive b o d y processes, but an
interaction process mayer , 1989). In this way, thoughts, subjective feelings, life events,
and biological processes are ail necessvy for moods to occur.
Another way to explain the relationship between emotion, temperament, and
mood is in tenns of their lustoical o n p . Emotion cornes fiom the experimentai animal
Literahue, and thus, empincally, oflen its concepts deal with basic neurobiological
processes of emotion atûibuted to animais. Emotional concepts therefore corne fiom the
bottom up. Temperament and mood are considered top down approaches, coming as they
do fiom the sel'report methodology of the adult personality literature. As weil, emotions
tend to be more intense than mood mayer, 1989).
1 dweii on the concepts of temperament, mood, and emotion for two reasons.
First, emotion theorists use neurobiological or psychobiological approaches on which to
base their theones. These lower-level theones are then used to explain the biological basis
of higher-level concepts or theories of temperament, or mood, which I will be assessing in
this dissertation. Secondly, I s h d be examining the literature on the hemisphenc
l a t e rh t ion of emotion. This literahire consistentiy re fers to the concept of emotion,
rather than to the concepts of mood, presumably because of the stronger biological
advances made in the name of emotion. I therefore want to include both in the general
theoretical discussion.
Sumnary
The neo-Pavlovian concepts of arousal, excitation, and inhibition are not
inconsistent with Gray's (1 99 1 a, 199 1 b) notion of the approach-oriented activation
system, and the withdrawal-oriented inhibition system. Both systems are thought to
underlie the expenance of behaviour and emotion. The excitation and inhibition systems
can be assessed rmpirically using the BISBAS scale developed by Carver and White
(1 994). Neo-Pavlovian concepts of arousal can be assessed wing the Pavlovian
Temperament Survey (PTS; Newbeny et al., 1997a). Mood can be assessed using a brief
self-report measure (PANAS; Watson, Clark, & Tellegen, 1988). In addition, the Affect
Intensity Measure (AIM; Larsen & Diener, 1987) can be used to measure both arousal
and affective valence charactenstics. These instruments describe the tendency and tom
with which individuals interact with others and the world around. It should be the case
empincdy, that arousal is related to an individual's typical level of motor activity. In this
dissertation, I am using these self-report instruments to examine the temperamental and
emotional correlates of motor activity.
The underlying assumption of the research discussed above is that moior activity
is a unified entity present to a greater or lesser degree in all living animais. However,
another way to explore the meaning of motor activity is as a laterai phenomenon.
Corballis (1989) speculates that asymmetries in humans make efficient use of neural
space and are evolutionarily advantageous. Further, Davidson (1 W a ) suggests that the
decision to approach or withdraw speedily is adaptive when it cornes to fleeing danger,
for example. In any life or death situation, one would want to be able to move decisively

Motor Activity 35
away from, rather than toward an enemy! He argues that at the point of taking action, we
must choose whether to go left or right. Davidson (1992a) also suggests that it might be
evolutionarily advantageous if these lateral movements were associated with OUI
motions, providing motivation to move. nius, the possibility exists that asymmetric
motor activity relates to the emotions.
in the next section, 1 discuss the iiterature on lateral asymmetries and how t h g
relate to eniotions. Further, 1 wdl attempt to draw together the Gterature on hemispheric
lateralization to make the case that lateral biases in movement should relate to motional
rxperiencrs or perceptions.
Concepts in Laterality Research
In the psychological literature, lateral asyrnrneûies in behaviour are esplained
fiom a neuropsychological perspective. This tradition developed out of the clinicd
literahire, whch emphasizes the importance of asymmctries in the function of the CNS.
Although the initial impetus for mucli of the neuropsychological hctional and
physiologicai laterality research has been based on clinical pathology, there is now an
extensive base of data and rnethods on which to draw for research of a non-clinical
nature. In fact, various neuropsychological rnethods, behavioural responses, and
observations provide options for collecting relatively ecological data outside of the
laboratory setting. One of the goals of this dissertation is to collect an ecological sarnple of
motor activity to explore its relation to individual differences in the domains of
temperament, emotion, and other lateral mo tor asymmetries, such as handedness, fiom a
neuropsychological perspective. In order to understand this perspective, 1 will describe
next several key theoretical issues in laterality research and how they relate to motor

Motor Activity 36
asymmetries.
An examination of the neuropsychological literature on lateral asymmetries
reveals many right-left differences in behaviour. These asymmetries are important
because they are thought to represent underlying asymmetric processes in brain funchon
in bct!h adults (Bradshaw & Nettletcn, 108 1 ; Galaburda, Rosen, & Sherman, 1 ??O;
Geschwind, 1979; Geschwind & Gaiaburda, l985a, l985b; Helhge, 1 993; Iaccino, 1993;
Kinsboume & Hiscock, 1983; Zaidel, 1983) and in children (Best, 1988; Koenig, 1990;
Kolb & Fantie, 1989; Levy, 198 1 ; O'Leaiy, 1990; Witelson, 1977; Young, 1 99Oa).
Lateralization in neural control involving either motor performance or motor prefcrence is
evident in various functional perceptuai and cognitive abilities. For example, lateral
asymmetrics are evident in preferences involving motor function, such as handedness
(Annett, 1992; Gottfried & Bathurst, 1983; Provins, Milner, & Kerr, 1982; Young, 1990b)
and footedness (Levy & Levy, 1978; Peters, 1988). There are other abilities and
preferences in the area of kinesthetics (Pipe, 1991), touch (Flaneiy & B W g , 1979;
Moreau & Milner, 198 1 ; Rose, 1984), evedness (Bryden, Free, Gagne, & Groff, 199 1 ;
Dûvidson 6t Hugdahl, 1996), and eyedness (Bourassa, McManus, & Bryden, 1996).
Cognitive h c tions such as visual perception (Hellige, et al., 1 994), spatial func tion,
thinking, and language (Bates, O'Conneli, Vaid, Sledge, & Oakes, 1986; Goldberg &
Costa, 1981 ; GottGned & Bathurst, 1983; Levy & Reid, 1978; Shucard & Shucard, 1990;
Witelson, 1977), also show lateralized differences. However, the pdcular focus in this
dissertation is on the lateralization of emotions and the relationship of emotional
expression to lateml asymmetries in motor activity. Both emotional expression and
emotional understanding have been shown to be lateralized in normal individuals

Motor Activity 37
(Davidson, 1993a, 1995; Borod, 1993a; Heller, 1993; Kinsboume & Bemporad, 1984;
Tucker & Frederick, 1989) .
Aithough many of these lateral behaviours involve motor activity, what we do not
know is the relationship between spontaneous rnotor activity and other lateralized
behavic?urs. Among the multitude of studies on v ~ o u s laterdked behaviours, none has
explored motor activity as a lateralized behaviour. Insights into the relationship bebvean
behaviour and brain function have been reveaied through shidies on lateral asyrnmehies
in coption and emotional function. Could it also be the case that lateral asymmrtnes in
motor activity and emotional function reflect a relationship between behaviour and brain
function? Ths gap in the literature wdl be addressed in this dissertation. I will examine
how asymmehies of motor activity relate to an individual's emotional behavioun,
temperament, and other lateral preferences
Many asymmstnes are fairly casy to observe in normal individuals. There are
several key concepts that offer explmations for why we see asymmetncal behaviours.
These concepts include the notion of hemisphenc speciaiization, and hemisphenc
lateralization. Both hemispheric lateralization and hemispheric specialization are tems
that often are used interchangeably in the psychological Merahire, and both are of
particular relevance to understanding the theoretical basis of the proposed study. These
terms and the issues they engender are therefore described in more detail below.
Hemispheric Speciulization and Lateralization
Hemisphenc specialization refers to a theoretical concept involving the functional
organization of higher mental functions (e.g., verbal, visuo-spatial, emotional
understanding and expression) in the brain. The term refers to the locaiization or focushg
Motor Activity 38
of crucial component processes in one hemisphere of the brain, resuiting in what is
referred to as lateralization (to the le ft or nght hernisphere) of the function. In the
literature, both hemispheric specialization and lateraikation are used with siightly different
meanings, dependhg upon the context. Either term may refer to the specificity of the task
of one hernisphere's rde in mediating cognition, to the cornpetence of the hemisphere in
processing a particuiar task, or fhaily, to the hemisphere that is relatively more involved
in processhg a specific task (Witelson, 1987). Ofien the assumption is that for any
particuiar function, the hemisphere that is relatively more involved will also be the more
competent.
The term lateralization or laterality, usually describes the behavioural evidence or
observable asymrneûies predicted by the notion of hemisphenc specialization or
hemisphenc lateralizab'on, which is a theoretical consûuct (Kinsbourne & Hiscock, 1983).
Thus, although they are oRen used interchangeably, hemispheric specialization refers to
the competency or specificity of a cognitive task on one side of the brah, while
lateralization describes the involvement or degree of asymmetry without respect to the
direction of the asymmetty (Collins, cited in McManus, 1991).
Each hemisphere is thought to be specialized or uniquely suited to carry out some
functions or tasks better than others. nie specialiration of the two hernispheres has oRen
been descnbed in tenns of dichotomies, with the lefi side said to be best at verbal,
analyûc, serial, focal tasks, and the right hemisphere best at nonverbai, holistic,
associative, and diaise tasks (Kinsbourne & Hiscock, 1983). More specincally, the left
hemisphere is thought to be speciaiized for tasks involving the-dependent and sequential
functions, such as speaking and the fhely tuned, discrete movements involved in e t ing .

Motor Activity 39
The right hemisphere is thought to be specialized for tasks that involve spatial
relationships and the recognition and production of emotional communication. For
example, the more holistic process of synthesizing individual features involved in face
recognition is considered a right hemisphere task, as are the manipuio-spatial tasks
involved Ui map-reading and understanding braille (Bradshaw & Nettleton, 198 1).
Mthough it may appear that the tasks performed best or conîrolied by each hernisphere
are clearly dehrd , the literature on the topic is fa1 fiom complete.
It is very much a matter of tradition and supposition how the cognitive processes
or functions ascribed to the two hemispheres are labelled and described. We develop
psychological constnicts to try to descnbe cognitive functions, but they rnay be
inadequately defined (Bradshaw & Nettleton, 1981). To go beyond description and try to
understand why the two hemispheres are rnost competent at different types of tasks,
researchers are tryuig to idenhfy more precisely the underlying cognitive mechanisrns
used to cany out each of the tasks. For example, the basic mrchanism underlying the
exquisite timing and sequrntial motor functions ascribed to the lefi hemisphere are
variously identified as an ability to inhibit behaviour, der to carry out intentional
action, ancUor maintain vigdance (Pribrarn & McGuinness, 1975; Tucker, Vannana, &
Rothlind, 1990; Tucker & Williamson, 1984), or to support motor readiness for the ' fight
or flight' msponse Vucker and Denybeny, 1992). The cognitive mechanisms amibuted to
the right hemisphere are identified as a tendency to impulsive action and/or attentional
activity (Bradshaw & Nettleton, 198 1 ; Verfaellie & Heilman, 1 !NO), especially orienthg to
novel events Vucker, 1989), and being particdarly skilled in the comprehension and
perception of visuospatial and tactile experiences (Deutsch, Bourbon, Papanicolaou, &

Motor Activity 40
Eisenberg, 1988; Witelson, 1976).
Semmes (1968) and Gur et al. (1980) suggest that each hemisphcre is uniquely
suited for different functions because there is more grey matter in the left hemisphere and
more white matter in the nght hemisphere. Grey matîer is composed of nerve ce& and
unrnyelinated fibres suited to short-distance inha-hernisphere function, while white matter
is composed primanly of myehated neive fibres suitable for cross-region inter-
hemisphere transfer. On the basis of such asymmetncal neuroanatomical organization,
Goldberg and Costa (1981) suggest that the right hemisphere has a grrater capiicity to deal
with complex, multi-modal diffise information, gathering and integrating information
tiom different areas of the brain. The left hemisphere has a greater capacity to deal with
unirnodal focally represented information, such as is necessary for discriminating fine
differences in language and m a h g fine oral movements in speech.
Dichoric listening. One technique for behaviourdy asszssing hemisphenc
asymmetries is to adrninister a dichotic listening (DL) task (Kimura, 1967). In this
procedure individuals listen to two competing messages delivered to rach rar by
strreophonic hcadphones. The key to this task is to present information to both ears at the
same tirne, and to provide more elements for processing at any one moment than the
brain is capable of proctssing (Hugdahl, 1995). This simultaneous exposure to each ear,
of more stimulus components than can be consciously analyzed, in effect, ensures that
information is presented to each hemisphere separately. Greater accuracy in reporting
stimuli presented to one ear is interpreted as reflecting the specialiliition of the
contralateral hemisphere for the task (Kinsboume & Hiscock, 1983). A right-ear
advantage (REA) has been associated with a left-hemisphere specialization for idenhfylng

Motor Activity 41
language (digits, words, and consonant-vowel s yllables'). A le fi-ear advantage (LE A) has
been associated with a nght hernisphere superiofity for the reporting of musical notes,
emotional stimuli, and environmental sounds (Hahn, 1987; Koenig, 1990). In this
dissertation, I am assessing hemispheric specialization for language and emotional
perception by means ofa DL task. 1 expect that most individuals wdl show a REA for
language, and a LEA for emotional stimuli, but how the ear advantage will relate to
lateralized motor activity, 1 cannot predict.
Thus, the current level of understanding and knowledge about how the brain
functions is developing into more than just a descriptive list. However, Linking brain
function to sprcific, observable behaviours is a difficuit task. The existence of intra-
individual variations may account for some of the inconsistencies or contradictions in the
finduigs in the empincal literature on lateralities (Gur & Reivich, 1980; Nestor & Safer,
1990). Newrthzkss, much is known about typical asymmetries in motor control and the
nervous system. Thesr functions and processes are discussed next.
De velopment of.4.rymmetrie.s Ni Maor Funclion
Peters (1 983) and others (Govind, 1989; Guth & Yelh, 197 1, cited in Peters, 1983)
make several points of interest to a discussion of the development of hemispheric
function and motor activity. They have suggested specdcdy that an increase of activity
on one side will produce a differentiation of the muscle fibres into the slow type on that
side. Peters (1983) also speculates that any early bias in the amount of movement in an
arm or leg is liable to result in different rates of differentiation. Therefore, even an initial,
rnild but consistent bias in activity c m result in a strong asymmetry later on. If a mild
movement bias eariy in life amplifies later structural changes involving modifications in

Motor Activity 42
both form and function, the results are relevant to a developmental view of hemispheric
specialization and lateralities. Early diEerentia1 right-le fi motor activity shouid influence
later lateral motor activity, and consistency of lateralized practice should promote more
precise motor control. Thus, an early bias in lateral behaviour might lead evenhially to
later right-lefl differences in manual skill andor hand preference (Peters, 1983).
Ilforor Control aondAsymmetries in the CNS
For nomai motor functioning, both cortical and subcortical structures are
important. In the cerebrai cortex, the parietal and fiontal cortex, and their interconnections
are considered key in motor coritrol processes (Haaland & Harrington, 1990). The
subcortical sites that most dûectly Uiflmnce movement are the basal ganglia, the heaiamic
relays and the cerebellum. The complete rnotor circuit consists of the supplernentruy
motor am (SMA), primary motor, and somatosensory areas in the cortex, and the
putarnen, globus palhdus, and thalamus in the subcortex (Haaland & H d g t o n , 1990).
The SMA participates in the planning of motor routines. The premotor area participates in
non-routine, voluntary movements, dependent upon sensory information. The primary
motor area controls voluntary motor hctions. Subcortical areas participate in the
planning and execution of voluntary movements (Roland, 1984).
Physiologicaliy, Geschwind and Galaburda (1985a) hypothesize that there are two
motor pathway systems and that these systems control the ability or ease with which an
individual leam Merent types of motor rnovements. n i e first system is the pyramidal
or corticospinal pathway Uiat controls complex sequences of îine motor movements and
independent motor control of the fhgers. The second system is the extr~pyramida~ or
axial pathway controhg the abdity to coordinate whole limbs and proximal body

Motor Activity 43
movements, such as those involved in posture and large motor movements.
Peters (1983) suggests that the two motor systems, the pyramidal and axial
systems, are functionally intenelated. For example, he speculates that in executing a
skdied movement, the guidance of the movement is controlled by the axial systeni, but
that the formation of the intention to move and the initiation of mevernent is c;trried eut
by both systems, providing a p a t e r resolution of precise movements. Of particular
interest here is that asymmetries in motor activity are a function of the system that
initiates and teminates rnovements rather than in the guidance of a skdied movement.
Most, but not al individuais have distinct matornical brain asymmetries. In about
65 per cent of the population, the areas of the brain thought to be important in language
hc t ion are larger on the left side. In about 24 per cent of the population these areas are
about equal in size, and in the remaihg 1 1 per cent, the right hemisphere appears larger
(Geschwind & Levitsky, 1968). Similar biases in the same proportions have been reported
for the brains of both chddren and adults (Geschwind & Galaburda, 1985a) with normal
language development .
The empiricd ûnding of lefi hemisphere superiority for language appears to be in
fact, a lefi hemisphere superiority for learning sequences of movements, including
sequences of articulatory movements of the mouth and tonguc and h b posture (Kimura,
1977; Kolb & m e r , 1981, cited in Heliige, 1993). Thus, lefi hemisphere superiorities
derive fiom an asymmeûy of left-hemisphere superiority for motor control (Heliige,
1 993).
Although much of the theoretical and empirical literature de& with the
lateralization of various cognitive functions, less is said about the lateralkation of general

Motor Activity 44
motor activity, especidy spontaneous, unskilied motor activity and limb movemsnt.
Behavioural evidence of motor asymmeûies is varied in nature. The asymmetnes may
include facial expressions (Kinsboume & Bemporad, 1984), limb preferences in the form
of handedness (Mnett, 1972; Henninger, 1992; McManus & Biyden, 1992; Steenhuis &
Bryden, 19S9), footedness (Peters, 1988), and rotational and tuming biases (Glick, 1993).
Eye preference (Bourassa et al., 1996) and earedness (Davidson & Hugdahl, 1996;
Kimura, 196 1 a), whde not predominantly motor in nature, are conceptudy related. For
example, it is conceivable that the hemisphere dominant for language rnay be related to
motor asymrnetnes through attentionai or perceptual asymmetnes.
As far as having a direct effect on h b movement, it is iikely that asymmeûies of
the peripheral nervous system (PNS) would be involved. Some of the key asymrnetries of
the PNS are described next.
Mot or Control and hymmetries in the PNS
Two main motor nerve pathways connect the cortical areas of the brain to the
subcortex and the muscles of the skeletal system. The direct corticospinal (pyramidal)
tract onginates in the precentral gyrus of the cortex and passes down through the intemal
capsule. The pyramidal tract contains fast conducting neurons (Martinez, Lamas, &
Canedo, 1995) and is critical for the development of fine manuai skills, such as those
involved in precise individual h g e r movement (Hofkten, 1989). About 90 percent of the
nerve fibres cross to the opposite side (decussate) at the level of the medulia and
terminate in the spinal cord to form the lateral corticospinal tract. Avons of this laterai
tract originate in the region of the primaiy motor cortex controiling the motor newons
which control the distal limbs, those that move the arms, han& and hgen. The

Motor Activity 45
remainder of the fibres descend through the ipsilateral spinal cord forming the ventrai
corticospinal tract (Carlson, 199 1). Decussation of the neive fibres rneans that the ight
motor cortex exercises control over the left side of the body, and the lefi motor cortex
exercises control over the right side of the body (Bigler, 1988).
The extrapyramidal tract passes f h m the brain to the spinal cord. It includes the
basal ganglia (the caudate nucleus, globus paiiidus, putamen, nucleus accumbens septi,
and olfactory tubercle) and an m y of brains tem nuclei (subthalarnic nucleus, substan tia
nigra, red nucleus, reticular formation, and various cerebellar nuclei). The caudate and
putamen fonn the shiatum (also cailed the neostriatum) (Afifi, 1994a, 1994b). The
sûiatum of the extrapyramidal ûact interconnects with the dopamine-nch centres of the
nigroshiatal systern to arouse the motor system and control background movement, such
as posture. In general, the extrapyramidal system controls the muscles of the tmnk and
pro?ùmal lirnbs, and is involvrd in controlling activities such as waiking. Parts of the
sûianim are connected to the limbic system, so physiologically, an association can be
made between the cortex, motor, and rmotional systems.
Anatomicdy, the contralateral neuronal pathways between the cortical
hemispheres and the hands are larger than the ipsilateral ones, and those linhg the left
hemisphere with the right hand are the largest. Asyrnmeûks exist in the number of
pyramidal fibres that cross f?om one side to the other at the level of the meduiia in about
40 per cent of human newous systems studied. The decussation is more complete for the
pyramidal path arîsing fiom the left hemisphere than it is for the one arising from the nght
(Geschwind & Galaburda, 198%). The implication of this anatornical arrangement is that
in most people the motor connections between the left hemisphere and nght hand are

Motor Activity 46
dominant over those of the right hemisphere and the 1zA hand and over the ipsilateral
pathways. Functionaiiy, however, the left hemisphere in particultir, is thought to be
dominant in the control of motor processes (Bnnkman & Kuypers, 1973; Peters, 1983).
In terms of motor control asymmetries, various researchers (e.g., Haaland 8r
Harringtcm, 1990) have proposed that the lefi hemisphere is dominant for controlling what
they cd open-bop movements. These movements are rapid, ballistic type movements
that are performed with littie modification by sensory input. No evidence has been found
for hemispheric asymmetry in controlied, closed-loop movements, whch are slowzr and
modified fiom moment to moment by sensory feedback. However, right-hemisphere
injuries have produced impairments in initiahg a closed-loop movement toward a visual
target, and left-hemisphere injuries have produced impaimients in the final stages of
guduig movements to a target (Heîîige, 1993). Thus, each hemisphere may have specific
roles in the speed ofmotor control.
Individual finger movements are controlled contralaterdy, as are whole am and
leg movements (proximal and distal). Proximal movements (e.g., rnovement of the arm at
the shoulder) of the limbs are controlled ipsilateraily (Brinlanan & Kuypers, 1973; Ma&,
Gonzalez, Rothi, & Heilrnan, 1993). Thus, for most motor activities involving oniy one
side of the body, the lefl hemisphere controls the h b movements of the right side of the
body, and the right hemisphere controls movements of the lefi side.
Agmmetries oflimb Sire
In addition to asymmetries in various areas of the CNS and PNS, there are
physical asymrneûies in the limbs. For example, anatomical asymmetnes have been
found in both upper and lower h b s . Ln one study of adult righthandea, 85 per cent had

Motor Activity 47
longer and heavier left legs, but longer right arms (von Bonin, 1962). However, between
the ages of six and 20 years, both right arms and right legs were longer. In another study,
Ingelmark (1947) found that lefianders between ages six and 20 aii had longer left arms.
Since it is conceivable that asymrnetries in the lirnb size could influence lateralized
differences in metor activity, I am assessing the relation in this dissertation. ln the next
section, I bzgin a discussion on asyrnmetries thought related to motor behaviours.
L a t e d Asymmetries Reluted to Motor Activity
Theoreticaliy and empirically, it is the case that individual variation in brain
asymmetry shows behavioural manifestations. A lateral asymmetry expressed in a
sensorhotor activity is considered to be a behaviourai expression of hemisphenc
specisliziition for the task. In motor behaviour, an asymmetry in the differential use or
preference for one iimb over the other for any number of tasks is considered the
behavioural expression of lateralization or hemispheric specializûtion (Hellige, 1993;
Henninger, 1992; Kinsboume & Hiscock, 1 983). A manual response that consistently
favours either the right or left hand is defined as a laterrility of hand preference. Laterality
of hand preference is irnplicated in the hypothesized relationship between hemispheric
h c t i o n and manual control. For example, in the most common case, the asymmatricd
use of the right hand for writing is thought to relate to a specialization for handebiess in
the contralaterai leA hemisphere. Sknilarly, a pedal asymrnetry (or footedness) is the
differential use of preference for one foot or leg over another in ta& that require
differential roles for the two lirnbs (Peters, 1988). These functional asyrnmetries are
evident across the Mespan. Some of the common functional lateralities are closely
associated with movement either directly or indirectîy (Hebge, 1993).

Motor Activity 48
Handedness
There is no single accepted view on how to define handedness, nor on which
motor behaviours can be considered key to the concept of handedness. For adults, Kolb
and Wishaw (1 990) define handedness as a consistent preference for the use of one hand
in a variety cf manipulations @. 403).
McManus et al. (1988) distinguish between direction or preference and degree or
skiil in descnbing handedness. Direction of handedness refers to the lefl-right categoncal
assigrnent of manual laterahty preference. Direction or preference re flects the fact that a
right-handed individual will tend to use the nght hand for a varizty of different tasks.
However, a hand preference doas not necessaniy imply greater relative to the non-
preferred hand (Annett, 1972; Flowers, 1975). McManus et al. (1 988) and othars (e.g.,
Annett, 1972) suggest that a genetic factor might be responsible for the preference. A
directional preference begins to develop between 5 and 8 months of age (Ramsay, 1984),
but does not appear to be consistent until between age three to age five for both nght- and
lefi-handers (McManus et al., 1988).
Degree of handedness refers to the extent to which each hand is used consistently
for particular tasks. It is a measure of the relative use of both hands, and it is a continuous
variable. Because it involves practice in manual skills (i.e., in that one hand is used
consistentiy for particular tasks), degree of handedness Mplies a relatively better dexterity
in speed or accuracy of fine hand and h g e r movements for one hand over the other.
There is no familial trend in degree of handedness, and it appears to be iduenced by the
individual's usage and cognitive strategies of motor control. Degree of handedness
continues to develop untii age seven (McManus et al., 1988).

Motor Activity 49
Steenhuis and Biyden (1989) focus on the skiil level required to execute a task, but
also consider the influence of other factors. The analysis of their questionnaire shows that
salient fàctors of handedness include the skili required to carry out a manual activity, the
size of the object manipulated, the strength required to use the object, and whether the
activity is a one-handed or WC-handed activity. The f3st factor incliided questions on
drawing, witing, hamrnering, erasing, sewing, the use of a toothbmsh, and cutting bread
with a kmfe. About 70 percent of right-handers and 63 percent of lefi-handers always use
their prefrmd hand for these activities. The second factor involved picking up objects,
such as paper clips, marblrs, pieces of paper, and pins. These activities tend to be lrss
lateralized. In their shidy of 2000 individuals, only 19 percent of right-handers and 18
percent of lefl -handen indicate that they use one particular hand exclusively for these
activities. The thtrd factor involved the use of a bat and an axe. Ten percent of right-
handers and 26 percent of lefi-lianders use their lefl side for these activities. The fourth
factor was a strength riement, involving carrpg heavy objects, and suitcases. For both
right- and lefi- handers, these activities are performed about equally by both hanch
(Steenhius & Bryden, 1989).
Oldfield (1971) simply defines handedness as a preference for use of one hand in a
set of habitua1 everyday acts. His widzly-used Edinburgh Inventory is a questionnaire
which assesses handedness based on the individual's preference for famihar one-handed
and two-handed tasks such as writing, drawing, throwing a ball, brushing teeth, using a
broom, dealing cards, and threading a needle (Oldfieleld, 197 1). For the two-handed tasks,
the hand used to manipulate rather than hold the object is the one considered to be the
prefèrred hand. For example, when opening a jar with two hands, it is the hand that huns

Motor Activity 50
the lid that is considered as the preferred hand rather than the hand that holds the jar
(Oldfield, 1971).
Handedness and Hemispheric Speciolizut ion
In the most general way, handedness is considered a reflection of the greater
capacity of one side of the brain tu acquire the programs for particular skills (Liepmann,
1908; cited in Geschwind & Galaburda, 1985a). For example, hemisphenc specialization
in the lefi hemisphere for language has bern iinked to right-handedness (Witelson, 1987).
One might be inclined to thuik then, that left-handedness must be M e d to the right
hemisphrre for language. However, studies examining the occurrence of manual
interference when adult subjects are given concurrent verbal and manual tasks indicate
that manual activity is often controiled to some extent at least by the left hemisphere for
both nght- and lefi-huided tasks for both right- and lefl-handed people (Simon Br
Sussman, 1 387).
In fact, in over 95 percent of the right-handed population and 70 percent of the
left-handed population, both motor control and language are controlied by the lefi-
hemisphere (Kinsbourne & Hiscock, 1983). Although the specific proportions Vary
according to the study, various researchers have concluded that in about 15 percent of
lefbhanders, language and handedness are dissociated, typically with language controllad
by the right hemisphere and motor control in the lefl hemisphere. A M e r 15 percent of
lefi-handers have the functions bihemispherically controlled (Simon & Sussman, 1987).
That is, they show no observable l a t e rh t ion ofTects in tasks that usually show evidence
of such. Therefore, about 30 percent of left-handers have a non-standard cerebral
dominance for language and/or motor control. However, on average, a hemisphenc

Motor Activity 51
asyrnmetxy for a group of lefi-handers can be expected to be in the same direction as
right-handen, but with a smaiier magnitude for the left-handers (Hellige, 1993).
Although it is a commonly assessed neuropsychological variable, t h e is not
much in the psychological literature on the relationship between handedness and rnotor
activity. The results of one recent shiciy do show that handedness was not si_oiificantly
related to either motor activity or lateralized motor activity. in ths study, both right- aiid
lefi- handers were more active on the left (Eaton et al., 1998). Similady, in this dissertation
study, 1 do not expect to find a relationship between handedness and lateralized motor
activity. However, a check of handedness is in order. 1 will assess handedness with a brie€
4-item questionnaire (Coren, 1993a).
Footedness
Strucmally and physiologically, the functioning of leg and foot movements are
the same as for the hands. However, footedness does differ h m handedness somrwhat
because relative to the hands, the activities of the feet are less complex and less
overlearned. Furthemore, there are more unimanual activities in day-to-day living than
there are uni-footed activities (Gabbard & Hart, 1996). Most of the usual movements of
the feet, such as walking and standings involve both limbs. Peters (1988) suggests that the
lateral bias in role differentiation in the lower limbs is not as compelling as it is for the
hands because of these difTerences. Therefore, it may be that foot activity is functionally
more bilateraily controlled than are hand movements (Aglioti, Dd'Agnola, GireUi, &
Mami, 199 1). Footedness is stiii important though, as a lateralized behaviour, because it
has been found to be a better predictor of direction and strength of language lateralization
than is handedness (Seuleman, 1980).

Motor Activity 52
Peters (1 988) defines footedness by emphasizing the role differentiation of the feet
(andfor legs). The foot that is selected to manipulate objects or to lead off first is d e h e d
as the prefened or dominant foot. The foot used for support and power functions is
d e b d as the non-preferred or non-dominant foot. in righthanders, the lefi foot (or leg) is
most offen used for support and power functions, and the right f ~ o t (or kg) is iised ta
manipulatc objects. Lefthanders as a goup do not show a clear preference for either foot,
although they show more lefi footedness than do nghthanders.
Typicai îindings in several studies show that about 95 pcr cent or more of right-
handed children use their right feet to kick a bal, while only between 50 and 84 prr cent
of lefianders used their left feet (Annett & Turner, 1974; Peters & Durding, 1979; Peters,
1988). Lefi-handed children were almost as hkely to be right footed as left footed,
indicating that the leJ3handrrs manifest less latemlized foot preference than nght-handers.
In one study, researchea found that 94 percent of right-handers were also right-footed,
but only 41 percent of lefi-handers were also lefbfooted (Chapman, Chaprnan, & Allen,
1987).
The assessrnent of footedness is somewhat complicated by the interactions
between hands and feet, such as those that occur in athletic performances, dancing,
playing musical instniments, and in operathg rnachinery. However, both preference and
performance of foot and leg activities cm be used in determinhg footedness. Kicking a
bali, picking up pebbles with the toes, and stepping up ont0 a chair are tasks used to
distinguish foot preferences. Foot performance measures include tapping speed, and
tapping rhythm, tests of leg strength, and picking up and releasing small objects with the
toes (Peten, 1988).

Motor Activity 53
Although 1 do not expect a relationship between motor activity and footedness,
footedness is a commonly measured laterality. 1 wiU assess footedness with the brief
Coren (1 993) questionnaire.
Eyedness
lust as handedness and footedness are manifestations of lateral domhance or
sidedness, so too is therc a dominant sighting eye. Although its functional significance is
not hilly understood (Bourassa et al., 1996; Porac, 1997), the dominant eye reflects a
behavioural selection or preference for viewing when oniy one eye can be used. Sensory
dominance occurs when monocdar views are discrepant and must bz coordinattd, and
acuity dominance refers to the eye that performs with better vision, but sighting
dominance is most analogous to handedness or footedness (Porac & Coren, 1976).
Ninety-seven percent of the population consistently uses the same eyr for various
one-eyed sighting tasks, whde about three percent show no consistent preference. Eye
preference appeus to be independent of age, sex, or cultural differences (Bourassa et al.,
1996). However, there is an age effect apparent when the concordance between age and
handedness is examined. Older people have à greater hand-eye association than young
people by a ratio of 1.4 h e s per decade (Bourassa et al., 1996). In their recent meta-
analysis of eye dominance and hand preference in over 50,000 people fiom 43
populations, Bourassa et al. (1 996) found that a right-eyed sighting dominance occurs in
about 64 percent, and a left-eyed preference occurs in about 36 percent of the population.
Tlurty- four percent of right-handers and 57 percent of le fi-handers are left-eyed. The
overd incidence of left-eyedness in lefi-handen is 2.5 greater than that in nght-handers.
T'us, there is a smali, but consistent association between handedness and eyedness.

Motor Activity 54
This association between handedness and eyedness was c o n h e d in a later study
of eye preference in a Canadian population that ranged in age fiom 18 to 94 years. Both
nght- and lefl-handers were more likely than not to display congrnent eye preference. In
the 18 to age 30 group, the odds ratio indicates that the occurrence of left eye preference
increases by a factor of 4 if one is left-handed. In the age 55 to 74 goup, the odds ratio is
raised to a factor of 16, and in the 75 to 94 year age group, it is a factor of 18. Similar
hdings result fiom predicting eye pre ference fiom foot preference. Being le fi- footed
increases the likelihood that an individual between ages 18 and 30 will be left-eyed by a
factor of 6. That number is increased to a factor of 25 for the 55 to 74 age group and by a
factor of 8 in the oldest group (Porac, 1997).
The association between eye and handedness is siightly greater when
questionnaire methods are used (Bourassa et al., 1996). However, it is possible that the
association is shaped over time by hand-eye practice effects. In this study, the assessrnent
of eyedness is not a major feahire. Therefore, assessing eyedness using a short
questionnaire (Coren, 1993a) should be sufficient.
Earedness
Earedness is not exactly a motor asymmetry, but it is a commonly measured
laterality. It is thought to represent more than just a preference for using one ear over the
other for listering on the telephone. Asymmetries of perception in listening are
considered evidence of underlying hemispheric speciaiization, hyp~thesized to relate to
lateralized cognitive, emotionaî, or perceptual processes in cerebral hemisphere function
(Heiiige et al., 1994; Hugdahl, 1995).
In normal individuals, auditory infornation is transmitted fiom each ear to both

Motor Activity 55
contralateral and ipsilateral cortical areas, particularly the areas responsible for language
understanding and speech. Auditory stimuli travel fiom the cochlear nucleus in the ear
(fiom the vestibulocochlear nerve) to reach the prirnary auditory cortex in the temporal
lobe for language processing. Although signals f?om both ears reach the auditory cortex
in both temporal lobes, the contralateral patliways are dominant and preponderant,
probably due to the fact that they contain a greater number of fibres and transmit
information faster (Hugdahl, 1995; Iaccino, 1 993).
Earedness is a commonly measured lateral preference, and although I do not
expect a relationship with laterailzed motor activity, 1 will assess it briefly in the proposrd
shidy. Earedness as a preference for listening will be assessed in tlus dissertation study by
m e m of the Coren (1993) questionriaire. 1 will also assess verbal and emotional
perception using a dichotic tape task whch 1 wiii discuss later (Bulman-Fleming &
Bryden, 1994).
Motor Activjty und Lateral Behoviouruf Prefirences
Of the above functional asymmetries of preference, handedness and footedness
are most Wrely to relate to motor activity. Eyedness and earedness do not so obviously
involve penpheral limb movements. However, any hypothesized relation betwren a
cornmon lateral preference and motor activity must take into consideration the possibility
that either perceptual habits or attentional biases may make any interaction complex in
everyday activity. The typical right-hander's left-hemisphere bias for speech for example,
might ifluence the amount of motor activity expressed by the right- or left- arms while
an individuai is speaking. Right-am movement might be diminished during speech
because the conüaiateral left hemisphere is absorbed with the cognitive task. On the other

Motor Activity 56
hand, perhaps speech enhances right-arm (or lefi-am) movement by conûibuting
emphasis and rneaning to the words. W e 1 am not examining the effects of speech or
other specific motor task on motor activity in this dissertation, these behaviours are no
doubt an influence on the daily motor activity expressed by an individual.
Empixically, ihere is little research relating motor activity assessed in everyday
context to lateral preferences or skills. In one such study, archival h s of persons living
in pre-literate cultures were examined for hand use (Marchant, McGrew, & Eibl-
Eibesfeldt, 1995). The researchers concluded that hand use in the natural environment of
the three cultures studied was consistently, but weakly, right-sided. Tool use however,
was strongly right lateralized when a precision grip was involved.
In a longitudinal study of twins carried out in our laboratory (Saudino & Eaton,
199 l), wz have found that patterns of spontaneous movement changes with age. .4s
measured with rnechanicai instruments over a two-day period, at the age of 6 rnonths
about 60 percent of the infants showed more lefi-armed motor activity. By the age of 3
years, about 96 percent of the same children showed more lefi-armed motor activity. By
age 6, about 70 percent of the children showed more lefi-amed motor activity (McKeen,
1997). Because of the huge developrnental trends evident at 3 years of age, when alrnost
aü of the children were more active with theû left ams, we found no correlations with
individual differences characteIistics, such as handedness or motor skill level.
In another study camied out in our laboratory, we also examined arm movement
in a nahird setting. We used an insüumented measure of the fiequency of am
movements of 70 univenity students over typical two-&y periods. We used the 32-item
Waterloo Handedness Inventory (Steenhuis & Bryden, 1989) to assess hand preference

Motor Activity 57
on a vGety of unimanual activities in right- and left-handers. We found that the
participants' leil arrns made approximately 80 more movements per hour than did their
right m s . This asymmeûy retlected r generalized lehard shift in the distribution in the
arm-movçment fiequzncy. It was not due to a few extreme individuals. However, to our
surprise, the obsenped sinistral bias \vas not related to direction or degree of hand
preference. Seventy-two percent of right-handers were lefi-biased in movement
frequency, whereas 59% of lefi-handers were left-biased, a non-significant difference
(Eaton et al., 1998). These percentages in the adult sample are very sirnilar to those we
found in the 6-year-old sunple, in which 70 percent showed more left-med activity.
Other ernpitical evidence relatmg asyrnmetnc motor activity to lateral prrferences
is Mrtually non-existent in the literature. Because we (Eaton et al., 1998) unexpectedly
found no relationship between handedness and lateralized motor activity, 1 do not expect
a relationship to emerge in this study . However, if the lateral asymmetry of motor activity
emerges, 1 shaîi assess it in relation to the other customary lateraiities. Thus, in the
dissertation studies, 1 am assessing hmdedness, footedness, raredness, and eyedness, and
their relation to latcral differences in motor activity.
It is one thing to find ernpiricai evidence of lateral differences in motor activity. It
is another thing to discover to what they relate. It is conceivable that they are rneaningless,
simply evolir~ionaryjunk lefi over fiom our primordial past. More optimistically,
asymmetries in motor activity may provide a link between brai. and observable
behaviour, as intriguing as the link between handedness and lateralkation. While many of
the hand activities that we accomplish are bimanual to a greater or lesser degree, the few
empiricd results we have seem to indicate a consistent lefi-biased motor activity in

Motor Activity 58
everyday activities. As discussed above, this activity bias does not seem to relate to
handedness in either children or adults. To what might the asymmetry relate? 1 suggest
that lateral differences in motor activity among individuah relate to ditrerences in their
ternperament, emotion, or mood. In the next section, I discuss the recent empirical
evidence for the lateralizatim of ernotim and its possible relation ta motor activity.
Lateralization of Emotion
Earliest evidzncr of emotionai lateralization cornes fiom reports of the affective
consequences of brain damage. Negative affect and catastroptuc reactions were reportcd
in patients with lefi-hemisphere damage. Patients with damage to the left frontal regions
of the cortex tend to be apathetic, experience a loss of interest and pleasure in Life, and
have difficulty initiating vol un ta^^ action, al symptoms we describe as reflecting
depression and sadness (Davidson, 1995). In patients with right-hemisphere damage,
indifference, joking, or euphoria predominate (Davidson & Fox, 1988). Similarly, in
epileptic patients, pathologtcal cryuig occurs more eequently with lefbsided lesions.
Pathological laughter occurs more fiequently with right-hemisphere lesions (Sackeirn,
Greenberg, Weirnan, Gur, Hungerbuhler, & Geshwind, 1982).
in a nomal population, researchers have used facial expression and
rlectrophysiologîcal procedures to make inferences about patterns of activation. For
example, stuâies using EEG data have found greater right-sided anterior activation (in the
fion ta1 and an terior temporal areas) during facial expressions of disgust than during happy
facial expressions in adults (Davidson, 1992b). Facial signs of disgust related to the taste
of ciûic acid were also present in newborns and also associated with greater nght-sided
fiontal activation. From studies such as these, researchers conclude that an early

Motor Activity 59
differential anterior lateralkation for emotion is present fiom birth (Davidson, 1992b).
Researchers (e.g., Lee, Loring, Dahi, & Meador, 1993; Sackhehn et al., 1982) have
suggested an inhibition-disinhibition brain mechanism to account for the rather contrary
findmgs between the clinical and nomal populations. They hypothesize that under
normal circumstances, each intact hernisphere inhibits the emotional tendency of the
contralateral one, creating a balance of emotionai expression. Thus, the activation of the
right hernisphere during negative motions that occurs in normal individuals is inhibited
somewhat by the effect of the lefl hemisphere control. In those with left hernisphere
lesions, that inhibition no longer occurs. The idea is that damage to the Izfl hernisphere
interfères with its normal ability to inhibit the nahird tendency of the right hemisphere to
produce negative emotions. Negative emotions occur more fiequently in those wiîh left
hemisphere clinical conditions. The resuit is a production of excessive negative affect in
those with lefl hemisphere lesions. The resuits of the Lee et al. (1993) study support the
conclusion that the intruisic emotional tone of the left hemisphere is positive (produchg
euphoria, elation, and laughter), and the intrinsic ernotional tone of the right hemisphere is
nrgative (produchg sûdness, depression, and crying).
In tems of individual differences in temperament, behaviourdy inhibited children
show significantly less lefi-sided fiontai activation compared to their age-peers (FOX,
1989). Inhibited chddren are described as shy, fearful or introverted. They also appear
more anxious and more distressed by mildly stressful events. The pattern of lefi fiontal
EEG hypoactivation displayed by the tnhibited chilchen is similar to that observed in
aduits who are depressed (Davidson, 1992b). 'The point here is that there are individual
differences in emotional reactivity, expression, and lateralization in normal children ûnd

Motor Activity 90
infants. These differences in laterality and emotionality may represent individual
differences in the thresholds for affective responsivity and thus to individual differences in
temperament (Davidson, 1995; Davidson & Tomarken, 1989) that occur early in life.
One important aspect of the research on emotional lateralization and affect in
infants is that they have not yet lemed to regcilate their emotional expressions and
reactivity to emotion-producing stimuli (Davidson, 1992a). It is thus easier to rxarriinz the
production of cmotion in infants. One such study demonstrates some of the lateral
asyrnmetries in emotional reactivity as shown by changes in facial expressions. Facial
expressions, it should be mentioned, are essentiaiiy motor responses of emotion. Fox and
Davidson (1 988) found thst among normal 10-month-old infants, those who cried in
response to a one minute separation fiom theû mothers had greater right-sided fiontal
activity during a pior baseiine measure. None of the infants appeared to differ in facial
expression during the baseiine assessment. When the mothers rehuned and approached
their infants, those infants who exhibited joyN expressions showed greater activation in
the lef€ fkontal hemisphere. During the study procedures, infants who exhibitrd sad facial
expressions showed greater right hemisphere activation, if they later cried. They showed
greater leil hemisphere activation if they appeared sad, but did not cry. Anger with crymg
was associated with significantly more right fiontal activation, but anger in the absence of
crying was associated with lefl fiontal activation (Fox & Davidson, 1988).
In the study above (Fox & Davidson, 1988), individual differences in baseline
measures of fiontal asymmetry were related to the intensity of both positive and negative
affective responses to shidy procedures. That is, rather than indexing some kind of
generaiized emotional reactivity, the anterior asymmeûy was valence specific. It prirnarily

Motor Activity 61
indexes the individual's relative balance of positive and negative affective response
tendencies (Davidson & Tomarken, 1989).
However, Fox and Davidson (1988) further intelpretrd the asymrnetries in frontal
activation to reflect the engagement of systems mediating either an approach (lefi) or
withdrawal (right) system. Davidson (1992a) a y e s that approach and withdrawai are two
basic dimensions dong which emotions differ. His theoiy and its relation to the
lateralization of emotion is discussed next.
hymmetries in Approach and IVi~hdrawal
Davidson (1992a) maintains that decisions to approach or to withdraw are
fundamental adaptive choices that are basic because of their phylogenetic primacy.
Organisms at every level of phylogeny approach or withdraw frorn situations in order to
suivive. Davidson (l992a) suggests that in primitive organisms, nidllnentary foms of
approach and withdrawal emerged prior to the appearance of ernotion and occur in its
absence. However, in humans, over the course of evolution, approach and withdrawal
actions have emerged in the context of emotion. In more complex organisms, as
coordination among the percephial, cognitive, and action systems became necessary,
motions evolved dong with already established approach and withdrawal action
systems. They form convergence zones in the brain, which integrate information fiom
vanous neural networks to code valence of emotion, fornulate action plans, and generate
autonomie supports Oavidson, 1 Wa, 1 993a). The orbital prefkontal cortical areas are the
likely sites of an emotion convergence zone. These areas have the most significant input
from subcortical sites in which emotional processing is known to occur. They also
interconnect the more posterior dorsolateral and medial parietal cortical areas (Davidson,

Motor ActiVity 62
1993a).
Davidson (1993a) suggests that one effective way in which cornpetitive
interactions between the approach and withdrawal response systems can be minirnized is
to separate them geographicaiiy in the brain. He suggests that hernispheric speciaiization
for the appmach and withdrawal response systems is the most effective separation
achieved in vertebrate nervous system evolution. Davidson (1 993a) argues that the
empirical evidence shows that the lefl fiontai region mediates approach-related behaviour,
and that the right fiontal region mediates withdrawal-related behaviour.
The infant studies mentioned above (Fox, 1989; Fox & Davidson, 1988) are
compatible with such an interpretation. Infants who watched their mothers waîk towards
them showed greater left-fiontal (approach) activation, as did those whose facial
expressions appeared joyfbl during a garne of peek-a-boo. Other less complete smiling
was not associated with lefi lateraikation of EEG data. Facial expressions of anger and
sadness in the absence of crying also were associated with left fiontal activation, while
those that included the act of ciying were associated with right fiontai activation.
However, in infancy, crying also can be considered an approach function, acting as an
effort to obtain help or to communicate unhappiness or discornfort. Smiling expressions
c m represent tnie happiness associated with approach behaviour, or sirnply
contentedness or politeness, not related to approach behaviours. Thus, depending on the
context, expressions of anger, or sadness, or happiness can be considered expressions of
either approach or withdrawal mechanisms (Fox & Daviâson, 1988).
Although eliciting genuine emotions in a laboratory setting is somewhat more
difiicult in adults, studies using an association between facial expression and EEG data

Motor Activity 63
have been carried out. In one study (Davidson, Ekman, Saron, Senulis, & Friesen, 1990),
nght-handed adults were ppresented with brief silent film clips designed to elicit either
happiness (e.g., a puppy playing with flowers) or disgust (e.g., a training film designed to
show nurses how to care for burn victims). These two emotions were considered most
kely to be associated with approach and ~ithdrawal~ respectively. The subjects' facial
expressions were unobtrusively videotaped while they watched the f ihs . Subjects
reportrd that the films did indeed elicit the desûed emotions, and they reported very
similu ratings of intensity for the different clips. As expected, disgust was associated with
more activation in the nght frontal area, F(1,9) = 3 2 . 1 0 , ~ c .0005, when compared to the
happy condition. AU of the subjects showed more nght-sided fiontal activation relative to
the lefl during disgust versus happiness.
In the above sîudy (Davidson et al., 1990), it was only ahen facial expressions
were used to venfy and flag the presence of particular emotional states did the films show
an asymrnetry cffect. Thus, the right-left hemispheric asymmehies occurred ody when
there was concurrent motor system involvement in the fonn of facial expressions.
The reliability of these emotion inducing EEG shidies is good. Different measwes
of anterior asymmetry show that test-retest correlations range between 0.66 and 0.73.
Coefficient alphas (based on eight separate 1-minute trials) show levels of intemal
reiiability in the 0.85 range. Interestingly, in this study md othea using a similar method,
there are pronounced individual differences in the absolute magnitude of the asymmetry
scores. Between-conditions differences (positive and negative film clips) are
superimposed on wideiy ciifferhg individual ditferences in basal levels of asymmetry
(Davidson, 1995; Davdison & Tomarken, 1 989).

Motor Activity 64
Based on the results of these studies, Davidson (1995) suggests that a subject's
overall EEG asymmetry d u h g a task is highly correlated with his or her resting baselinc.
Greater relative left-sided fiontal activation at rest is associated with increased intensity of
reports of positive affect in response to füm clips designed to elicit happiness or
musement. Subjects with greater right fiontal activation at rest report more intense
negative affect to the nIm clips. hterior asymmetries during baselines are stable over
time, and are predictive of an individual's affective style or emotionai characteristics of
emotiond reactivity, mood, and temperament (Davidson, 1995).
Another study using the EEG wiih the film clips method frornarken, Davidson,
Wheeler, & Doss, 1992) supports the idea that there are stable individual differences in
reactivity of emotional states. In this study, subjects were required to report their
subjective mood using the Positive and Negative Affect Scale (PANAS; Watson et al.,
1988). With this self-rating scale, subjects who showed extreme and stable lefl fiontal
EEG activation reported more positive affect and less negative affect than thair nght
fiontdy activated peen.
In the above cited study (Tomarken et ai., 1992), the researchers found no relation
between overall level of reported atrect and fiontal asymmetry. Davidson (1995) suggests
that this finding indicates that cortical asymmetry is specific to a particular emotional
valence rather than to an overall level of arousal or affect Uitensity. He suggests that
individuals with increased right-sided anterior activation will show an increased
vulnerabiliîy or lower threshold for emotions, psychopath010gy, and moods associated
with withdrawal. They should be more Milnerable to the emotions of fear and disgust,
show more negative affect, and be more vulnerable to d e t y disorders associated with a

Motor Activity 65
withdrawai component, such as phobias about social interaction. Individuals with
decreased activation in the left anterior region shouid be more minerable to emotional
states and traits such as depression that are associated with deficits in approach. These
would include psychomotor retardation, and loss of interest and pleasure in the world
around. Davidson (l993a) maintains that the most pronounced difference between normal
individu& and those who are depressed is not an increase of negative affect, but a
drcrease in positive affect in this group.
In a more recent study Sutton and Davidson (1997) used EEG measures of
prefiontal asymrnetry and two self-report measures to examine individual differencas in
emotionai reactivity. They measured EEG activation in 46 right-handcrs and had them
complete the PANAS (Watson et al., 1988) and the BIS/BAS (Carver & White, 1994) self-
report instruments. They retested the subjects about five months later on the BISIBAS
and about six and one half months later on the PANAS. The results showed quite hgh
test-retest stability for the BISIBAS measure. The intra-class correlation was .72 for the
BAS and .68 for the BIS subscales after 5 months. It was somewhat lower for Positive
Afkct (ICC = .45) and Negative Affect (ICC = S7) subscales of the PANAS after 6.5
months. They found that subjects with higher lefi-sided EEG fiontal asymmetry had
higher BAS scores, r = .do, p < .O 1. Those with greater right-sided fiontal asymrneûy had
higher BIS scores, r = -.41,p < .01. Although in this study the PANAS subscales were not
related sigmficantly to EEG activation, the correlation between the BAS-BIS difference
score and EEG asyrnmeûy was sigruficant, r = .53 p c .O0 1. The results of this study are
of particdar import because they indicate that EEG activation is associated with longer
term individual diBirences in emotional reactivity. These longer terni Merences are also

Motor Activity 66
lateralized and are associated with mood and temperament.
Although other researchers are in agreement that there are different cortical
mrchanisms involved in emotional func tion, O thcr conceptualizations of the lateralization
of ernotion have been proposed. For example, Tucker and h s colleagues (Tucker &
Frederick, 1989; Tucker, Vannatta, 8. RotNin4 1990: Tucker & Williamson. 1984) and
Hriler (1 993, 1990) suggest a different theoretical account of emotion and brain
laterahzation rclated to the function of arousal. Theû conceptuakation is discussed next.
Asymmetries in Activation und .-lrousaf
Tucker and 'lNiiiimson (1984) ernphasize the asyrnmeûic function of elementvy
activation and arousal processes as reflected by two neurotransmittrr systems, the
noradrenargic and dopamincrgic pathways. The dopaminergc path is integral to activation
or motor readiness. However, in animals, each increase in dopamine level restricts the
animal's range of behaviour, und motor actions become stereotyped caricatures of their
normal appearance. Tucker and Wdliamson (1984) proposed that this tonic activation
system applies a redundancy bias to neural oporations. This bias has the effect of
restricting or focusing attention, which facilitates the ability of the lefl hemisphere in
perceptual orientation and ai& its expertise in the sequential control of cognitive and
motor operations. The resdting intemal orientation is consistent with the introvert's
sensitivity to overstimdation. The focal attentional mode is produced by a preponderance
of what Tucker et al. (1990) c d tonic activation. The affective bias associated with the
redundancy bias of the tonic activation system is descnbed as a dimension of calrnness-
anxiety (or serenity-hostility).
The noradrenergic pathways form the neurophysiologic substrate of the arousal

Motor Activity 67
system to apply a habituation bias to information processing. This habituation bias leads
the brain to respond only to novel events. The fact that noradrenergic pathways are right
lateralized means that habituation serves as the underlying expansive attentional
mechanism for the right hemisphere emotional self-regulation systern. Thus, the
extravert's extemal orientation is thought to reflect a primary process mode of orienting
to the social environment. The expansive scope of attentional control is produced by a
prepondrrance of phasic arousal, which is a right parietal hemispheric function. The
affective bias associated with an expansive orientation and high levels of phasic arousal is
describcd as a dimension of valence, happy-depressed (or positive-negative) (Helier, 1990,
1993; Tucker & Frederick, 1989; Tucker et al, 1990).
Helier (1993) has extended Tucker's pucker & Williamson, 1984; Tucker &
Frederick, 1989) theory about laterahtion of emotions, postulathg that different patterns
of brain activity will be involved in the expression of different emotions. She suggasts that
there are two independent dimensions underlying emotiond expenence. One dimension
is involved in the modulation of emotional valence and is located in the fiontal lobes.
Higher left than right fiontal activity is associated with pleasant valence, and higher right
than le fi fiontal activity is associated with unpleasant valence. The other dimension is
involved in the modulation of autonomic arousal and is located in the parietotemporal
area. Higher activity in the nght parietotemporal area of the brah is associated with higher
levels of arousai, and lower activity in the right parietotemporal m a is associated with
lower levels of arousal.
Developmental tendencies and individual ciifferences in emotion and arousal are
the result of an interaction between the two emotional systems. Happiness is

Motor Activiîy 68
characterized by pleasant valence (relatively high left frontal activation) and relatively high
arousal (relatively high ~ight parietotemporai arousal). Sadness or depression is
characterized by unpleasant valence and relatively low arousai. The interactions contribute
to the production of unique and stable patterns of traits and emotional characteristics
(Hzller, 1093).
Both the approach-withdrawal and activation-arousal accounts recognize that
emotion, mood, or temperament apprar to be !ateralized. Heiler (1993) suggests that there
is a dynamic interaction that occurs between fiontai and parietotemporal regions. She
suggests that because fiontal cortex has inhibitory influences over paxietotemporal cortex
(Brodal, 1981 ; cited in Heiler, 1993), a tendency towards high right fiontal activation
might combine with reduced right parietotemporal activation to establish individual
differences in mood or personahty organization. Discrepancies cm occur when
researchers focus on a one dimensional right- or kfi- hemisphere function, rather than on
a two dimensional right-left and anterior-posterior functioning.
One Limitation of many of the studies that examine emotionai lateralkation is that
they use the EEG method, whch cannot hande motor movement. in EEG studies
examining emotional facial expression, all rnotor activity must be Uiterpreted as an artifact
and all movement-related activation must be excluded fiorn analysis. This is, ironically, in
spite of the finding that only when motor responses in the form of facial expressions are
used to identify appropriate emotional epochs, do the EEGs show the expected laterality
(Davidson, 1995). From the perspective of understanding the meaning of motor activity,
what is needed is a way to assess both emotion and motor activity at the same time.
There are other conceptual and methodologicai problems in studies on

Motor Activiîy 69
lateralkation of emotions. For example, some researchers fail to distinguish between the
perception and the production of emotion when they interpret laterality data (Davidson,
1993a). It may make a difference if an individual is asked to report a perceived emotion
rather than experience the emotion directly. Perception rnay be lateralized differently than
experience. Likewise, as in the case of facial expressions, the relative mount of right- or
left- hemisphere activation may differ if an emotional behaviour is expressed
spontanrously rather than elicited in a controkd setting. Although the de tds are yet to
be fully understood, these problems do not negate the finding that there do appear to br
differences in the way positive and negative emotions, or approach-withdrawal functions,
and arousal are lateralized.
Another point that 1 would like to emphasize is that the evidence indicates that
lateral brain asymmetries and facial motor expressions are related to emotion and
individual diffirences in temperament. It is possible that h b motor asymmetries also are
related to emotion and individual differences in temperament. lhere are several studies in
which the production of asymmetrical motor expressions are related to emotion.
Motor hymmetries and Emotion
One ecological study was carried out by obseiving people in restaurants or during
conversations in the laboratory (Moscovitch & Olds, 1982). In this situation, the
researchea found that most facial actions were bilateral. However, about 20% of the thne,
the lefl side moved more vivaciously than the right. In another study, electromyelogram
(EMG) responses were recorded from different facial muscles during positive and
negative emotional expressions. The left hemifàce (nght hemisphere) was more mobile in
expressing negative emotions and the nght hemiface (lefi hemisphere) was more mobile

Motor Activity 70
for movements related to smiles (Schwartz, Ahem, & Brown, 1979).
In another study (Brockmeier & Ulrich, 1993), 24 male subjects were videotaped
for facial asymrnetnes whde being in t r~ewed. The in te~ewer induced positive, neutral,
and negative moods in each the subjects. To induce a positive mood, the subjects were
asked to define the wmd happiness, and recall the mnst recent episode of happiness and
to describe three more similar life events. The negative mood induction was similar, but
the subjects were reked to remember and visualize honifying or fhghtening events. For
rach of five minutes of conversation, the videotape was exarnined fiiame by kame for
evidrnce of mood. The point at which the Facial expression peaked was p ~ t e d on paper,
and asymmetries of the corners of the mouth were measured. The researchea found that
during positive ITIOO~, 20 out of 24 subjects showed a right-lateralized lifting of the
corners of the mouth when compared to the neutral condition. During negative mood, 2 1
out of 24 subjects showed a left-lateralized lowering of the corners of the mouth. Both of
these studies are compatible with the EEG-facial expression perception studies, in that
right lûteralized behaviour was associated with positive mood and left lateral behaviour
was associated with negative mood.
A third study ( S c M & Lamon, 1989) is interesting in that the researchers asksd
subjects to maintain voluntary contractions of their facial muscles for about a minute.
AAer each contraction, they asked the subjects to indicate how they were feeling. Ten of
the twelve subjects reported hawig emotional expenences. Following right face
contractions, the subjects reported feelings such as, sarcastic, cocky, up, good, and m g .
Following lefi face contractions, subjects reported feeling sud or depressed. Although
other attempts to induce emotion by motor response have Med (cg., Kop, Merckelbach,

Motor Activity 71
& Muris, 1993), the study does attempt to acknowledge the potential role that motor
systems play in the experience of emotion.
Summary
To surnmarize the literature, there is evidence to suggest that an individual's
~eneral level of motor activity relates to temperamental aspects of arousal and reactivity. Y
As well, some theoretical and ernpincal evidence points to a comection between
asymmetric movement and specific emotional valence (positive or negative), irrespective
of overd arousal or reactivity.
To assess these generd predictions, 1 present the resdts oftwo correlational
studies. n i e fbst study was designed to ded with some of the measurernent issues in
assessing motor activity and provide an indication of the direction that the second study
should take. The second study assessed the relationslup arnong overall motor activity,
lateralized motor activity, temperment, emotion, and mood in a larger samplr.

Motor Activity 72
STLJDY 1
Study 1 focused on the assrssment of two types of motion-sensitive instruments
used to measure motor activity. It served as a reliability and validity shidy, testing the
consistency ofdifferent mechanical devices, and how they correspond to behavioural and
self-report measures of activity. Although concephiaiiy both instruments measure motor
activity, there are no empirical studies directly comparing actometers and accelerometers.
It was therefore uiiportant to validate the instruments to determine how accurately the
instruments reflect Memnt types of motor bchaviour, and to determine the relationship
between the instruments. The first purpose for Study 1 then, was to compare the
accelerometers to the actometers and to an extemal source of validity (an Activity Diary).
A second purpose for Shidy 1 was to compare the lateral differencss in rach of
the instruments by examining differences in activity between the right and left m s . In
previous studies using actomders, we have found a consistent lefi bias in arm movement
Bequçncy, whether the sarnple under study was infants, children, or adults (e.g., Eaton &
McKeen, 1992; Eaton et al., 1998; McKeen, 1995, 1997). The question is, does this lateral
bias exist using the accelerometen? That is, does the lateralization effect generaiize
beyond the one type of instrument.
A third purpose of Study 1 was to examine vaRous anthropometric and
demographic vaiables that would detemine the generalizability of the motor activity
measures. Therefore, 1 evaluated potential correlates of the instrument-measured motor
activity, such as gender, height, weight, age, arm length. I also asked participants a
question on the habitual arm they use for carrying a knapsack. This question was asked in
order to assess the possibility that the typical carrying habits of the students Mght be a

Motor Activity 73
correlate of arm rnovement. 1 beliwed that these variables were useful in helping me
determine the sample size necessaiy for Study 2 to detect an effect, should one exist.
The fourth purpose of Study 1 was to begin an exploration into the temperamental
and emotiond correlates of both overall movement and the lateral bias in movement.
Larsen and Diener (1987) suggest that affect intensity dows individuals to self-regulate
their levels of arousal, consistent with Strelau's theory of temperament (1 983, 1996) in
which reactivity and activity play a role in regdahg the stimulative value of an
individual's surroundings. If affect intensity is rrlated to an individual's reactivity, and
reactivity is related to physicai activity level, then it cm be argued that affect intensity also
should be related to physical activity. Shidy 1, therefore, includes a self-report measure of
affect intensity (AIM; Larsen & Diener, 1987). The AIM &O assesses the specific positive
or negative emotional valence of affect intensity (Weinfurt, Bryant, & Yamold, 1994).
Thus, an assessment of the co~ec t ion between asymmetric movement and emotional
valence cm be made.
Overd Activity
Assessing the movements of participants as they go about their daily activities has
two clear benefits. The data are more ecologically valid than studies based on laboratory
assessments of movement. As well, the data represent a relatively large sarnpling of the
individuals' rnotor activities. 'lhis last attribute is important because it d o w s for the
aggregation of behaviour drawn from many situations. Aggregation (Epstein, 1980; 1984)
cancels out uncontrollable and incidental factors, and contributes to the reliability,
replicability, and generality of the resultant measurement. Thus, in Study 1, participants
wore instruments m e a s h g their motor activity over a 24-hour period while they went

about their daily routines.
The Actometer
The Kaulins and Willis Mode1 10 1 Motion Recorder, or actometer, was used in
both Study 1 and Study 2. This actometer is a modified woman's mechanical analog
~vristlv3tch wivith a watchcase diameter of 25 mm, and weight of 10 g, excluding band. In
these instruments the movement recorded is proportional to the number of tirnes the
watch is tilted or oscillated. Movement is not indicated in real tirne and only a summation
of movement over the data-collection penod is recorded (see Eaton, McKeen, & Saudino,
1996 for details on the mechanism; see also Tryon, 1991). The actometer is not responsive
to intensity of movement but does provide a fiequency measure of h b movement.
Given their smdl size and appeuance, actometers can b wom for several days in
nahualistic settings with minimal monitoring by the investigator and without disturbing
the routines of the participant's daily life. Thus, it is possible to obtain samples of
behaviour over prolonged time periods fiom individuals in their typical enwonments.
Over the past decade many studies have been canied out successfully using actorneters
on infants as young as five weeks, on preschoolers, school-aged children, adolescents,
and on adults (see Eaton et al., 1996). The basic measurement paradigrn was adapted for
the research population in this study.
Actometer standardization. One actometer unit (AU) is debed as the kinetic
energy required to advance the 'second hand by a one-second interval marking on the
face of the dial (Eaton et al, 1996). Because of variabdity in the total length of time each
participant wears the instruments, the readings are converted to a rate measure of
movements per h w .

Motor Activity 75
Vufidity of the Actometers in the Luboratory
The vahdity and reliability of the actometers c m be assessed using a chemical
shaker bath (Eaton, McKeen, & Lam, 1988). In this procedure, the actometers are
strapped to the racks of the shaker bath and osciilated at a uniform rate. It is possible to
Vary both the leneth of t h e of the mcwement session as well as the rate of rack
oscillation. Using this shaker bath technique Eaton et al. (1988) oscdlated 27 actometers a
distance of 2.5 cm at a rate of approximately 245 cycles per minute for three independent
trials of 5, 10, and 15 min. in length. Analysis of variance (Trials(3) x Actometer(2~)
showed that the Trials effect was very strong, F (2,52) = 28,544.9, p < .O00 1, with means
on the three trials of 48 1,949, and 1 567 AUs, respectivsly. The longer the actometers were
osciilated, the higher the mean AU recorded.
In another similar study (Eaton et al., 1996), 19 actometers were exposed to trials
in which t h e (4- or 8- min) and/or rate of oscillation (170 or 200 cycles per min) were
varied. In a 3-way analysis of variance (Actometers (19) x Time (2) x Rate (2)),
significant effects emerged for both time and rate, but not for actomcters, and there were
no interaction effects. Longer oscillation sessions produced higher recorded movemcnt
scores. The 8-min session presented twîce as many recorded movements as did the 4-min
session. In addition this study also showed that the 1 15% higher oscillation rate (200/170)
presented 1 18% more rnovements than did the lower rate. This result again confirmed that
the actometers arc valid and sensitive to movement.
Reliability of the Actorneters in the Laborutory
To measure the reliability of the actometers, an intraclass conelation coefficient
(ICC) was used to estimate the degree of concordance among the readings of the

Motor Activity 76
actometers (Shrout & Fleiss, 1979). In the two shaker-bath shidies described above, the
Actometer effect was non-significant, and the ICCs were -99 (Eaton et al., 1998) and 9 8
(Eaton et al., 1996), resprctively. These results and other similar studies (e.g., Tryon,
1984a) provide strong evidence for the reliabiiity of the actometers, and one can infer that
the actorneters are interchangeable.
Reliabiiity of the Actornerers in the Field
Reliability can not be divorced from the measurement context, and the reliabilities
of actometer studes in the field are better estimates of the fùnctionai reliability of
actometers in measuruig human h b movements than is the reliability of data based on
shaker b a h (Eaton et al., 1996) or measuring sticks Vryon, 1984a). The measurement
situation is less certain outside of the laboratory setting. Humans move sornewhat
differently fiom day to day, and behaviour is subject to the vagaries of the everyday
context. Several studies have assessed the reliability ofthe actometers in the field setting
(Eaton, 1983; Eaton & Dureski, 1986; Eaton et al., 1988; Eaton et al., 1996).
For adults, Eaton et al. (1996) estimated that a single actometer worn on one wrist
for a 24-hour period had a generalizability coefficient of .37. This estimate of reiiability
rose to .43 if the actometers were wom on both m s for a 24-hou period. Lower
reliabilities result when the actometers are wom for a shorter penod of thne and are based
on fewer limbs (Eaton et al., 1996), consistent with behavioural sampling reliability
estimates more generally (Epstein, 1980). The large repertoire of addt activities and varied
everyday contexts they expenence increase the chance of recording unrepresentative
momentary activities. Such occurrences Wrely reduce &y-to-day reliability estimates of
movement. in comparing the level of agreement arnong actometers for measuring shaker-

Motor Activity 77
bath movements to studies on humans, the rriiability estimates are somewhat lower, but
are stiU substantial.
Validity of the Acfometers in the Field
Validity has aiso been examined in empirical field studies with children. Buss,
Block, and Block (1980) used actorneters on 129 children (65 boys and 64 guls) ages three
to six yeus, for a longitudinal study of ego and cognitive development. They found
sigruficant comlations between actometers and teacher judges at ages three, four, and
seven for girls, r = .42, p < .O1 and at ages three and four for boys, r = S7,p < .001.
Stevens et ai. (1978) compared actometer rneasures of activity to c h c a l observers and
mothers' ratings of a group of 13 boys, nine to thirteen yean of age, who were attending a
day hospital program for various behaviour disorden and leaming disabhties. AU six
clinical staff raters made assessments of classroom activity that were significantly
correlated with actometer scores, r = .49, p < .O5 to r = .73, p < .O 1, but not with a
measure of overail activîty measured in a variety of settings. The mothers' ratings
correlated sigmficantly with their sons' overail activity, r = .65, p < .05, although not with
classroom activity. Ullman, Barkley, and Brown (1978) used actorneters and an
observation of motor activity in children aged 5 to 12. In their control group of normal
boys, actometer-measured wrist activity correlated with the number of quadrant changes
made by the boys in the room, r = .83,p < ,0001. nius, in some studies subjective ratings
correspond to objective measures. However, inconsistencies in the hdings indicate that
other factors must be involved when ratings are used. These may include the social
appropnateness of the behaviour of the chiidren.

Motor Activity 78
Stability ofActometer-hfeasuredArm Movements
One recent study (Eaton et al., 1998) shows the stability of the actometer activity
measure. The study was carried out using actometers on right- and lefi-handers engaged
in their customary activities over a two-day period. Seventy young adults participated (2 1
lefi-handed fernales, 13 kA-handed males, 17 right-handed fernales, and 19 nght-handed
males). Because m movement data were obtained for each of the two days of data
collection, individual differences in movement could be e m i n e d for continuity or
stabiiity over t h e . First day variation among participants in amount of ami activity (total
movements per hour) predicted their second day activity, r = .26,p c . O 5 As well, the
degree of movement asyrnmetry (% of right am movements) on the îirst day was
strongly predictive of second day asymmetry, r = SO, p < .O00 1. Handedness was not
significarit in this study, F(1,66) < 1.00, p > .OS, nor was gender.
Furthcr rvidence for the stability of rneasured activity cornes fiom a study of 33
coiiege students (Tryon, 1984b). The students wore actometers on both wnsts and ankles
24 hours a day for 14 days. The co~~dational analysis showed that the mean walang
activity for al of the subjects for Week 1 was nearly equivaient to that of Week 2 (25.9
AU/rnin for Week 1 and 25.8 for Week 2). The correlations between Week 1 and Week 2
for the le fi wrist, r = 49, p < .O 1, for the right wrist, r = .73, p < ,000 1. Thus, this extensive
sarnphg of sîudent behaviour shows that movement fiequency is stable fiom one week
to the next.
The Accelerometer
The accelaometer is a new instrument developed to measure motor activity in
field settings (Mode1 7164, available fkom Cornputer Science and Applications (CSA), 2

Motor Activity 79
Clifford Drive, Shalimar, FL 32579, U.S.A.; emd : [email protected]). It is designed to
detect acceleration and deceleration or intensity of human movement (Jan% 1994; Tryon
& WiHiarns, 1996). The instrument rneasures 5.1 X 4.1 X 1.5 cm, weighs 70 g, and is
powered by a 0.5 volt A . Lithium coin battery. It is housed in a plastic case that cm be
sbapped tc a limb much Me a normal wristwatch cm be. nie instruments use integrated
circuitry and a memory store to provide a continuous recording of minute-by-minute
movement counts in real tirne. Their memory store of data can be downloaded duectly
onto a cornputer disk or hard drive (Janz, 1994; Janz, Witt, & Mahoney, 1995; Melanson
& Freedson, 1995).
Researchers can select the time epoch over which acceleration is averaged. The
length of time the instrument can record movement depends upon the duration of the
epoch chosen. For example, if a one-minute epoch is chosen at initialization, the CSA
monitor wdi have a nin time of 22.75 days. In Study 1 , I used a 10-second epoch, so the
instrument was capable of recording data for three days.
Accelerometer standardisation of meusurement. The standard unit of rneasure of'
acceleration is the rate at which bodies fieely f d due to gravity. This standard is based on
the G force at sea level at 45 degrees latitude. One G = 9.80616 m per sec2 at sea level
flryon, 1991). This naturai metric was used to rneasure acceleration of movement in a
lirnb or other area of the body. To rneasure human activity, the accelerometer has a
threshold of 0.033 gravitational force (G force) of acceleration and is calibrated to respond
to an acceleration magnitude fiom 0.05 G to 2.13 G within a specified fkquency range.
Only acceleration within the hquency range of O. 1 O and 3.60 Hz are detectable, with
maximal sensitivity to accelerations at 0.75 Hz. The 0.10- to 3.60-Hz filter is used to

Motor Activiîy 80
discriminate human movement fiom vibration and other artifacts. The signal is sampled at
10 times per second (10 Hz), and the resulting values cm be summed each minute,
providing a iiequency count of acceleration and a &al measurement unit of Gkounts.
Thus, the rate of acceleration is a function of amplitude of movement, moddated by the
Hertz value or speed of the movement.
Accelerometer Volidity
Janz (1994) carried out a shidy with thirty-one 7- to 15-year-olds in their homes.
She measured physical activity with the CSA accelerometer and a heart rate monitor
concurrently for three 12-hour-day trials. The children completed a d d y activity diary.
Using the accelerometer, physical activity was defïned as the mean number of movement
counts per day and vigorous activity as the number of minutes spent at movement counts
greater than or equal to 256 per minute per day. The 256 counts per minute value was the
80" percentile of movernent counts for the entire group. The Pearson product-moment
correlations between the average movement count £tom the CSA accelerometer and the
average hem rate over the 3 days averaged r = .57, p < . O 5 For vigorous activity (above
or equal to 256 accelerometer counts per min), the colrelations with an estirnate of
vigorous heart activity (the number of minutes equal to or greater than 60% of the heart
rate reserve (HRR)) also were examined. The correlation between vigorous activity and
the HRR over the 3 days was r = S7,p < . O 5
In a study of 28 young adults (mean age of 2 1 years) designed to validate two
types of accelerometers, Melanson and Freedson (1 995) had adults perfonn an exercise
protocol on the treadmdl, using dflerent speech (walking, fast walkîng and jogging) and
different grades (O%, 3% and 6%). They found that the correlation between the CSA

hlotor Activity 81
accelerometer wrist counts and the heart rate was significant, r = .73, p < .O 1, and that the
correlation between the accelerometer and the speed of walking or jogging was
significant, r = 37, p < .O 1. They also found that Caltrac accelerometers, another
commercidy available motion recorder, and CSA accelerometers were significantly
cmelated, r = .8?, but that there was no relatimship behveen the acceler~meters and the
treadrniii grade, r = .02,p > .05. The correlation between CSA wrist-activity counts and
energy expenditure (measured in kcal per min) was significant, r = .8 1, p < .O 1.
There are several issues to note about the two above studies. First, they show that
several of the criteria that one would expect to relate to motor activity (heart rate, vigour
of exercise, and speed of walkmg) do relate to motor activity, as measured by various
types of accelerometers. Secondly, the shidy was done in a laboratory setting, where
vigour, speed, and grade a i i cm be controlled. Even so, the lack of a correlation between
the acceleration and grade of the treadrniii(O% to 6%) may be because the speed o l the
movements may not have increased as the grade became steeper. Thus, the type of
movements that individuals carry out will be iniportant in rxamining the relationshps
involved. Finally, although not examined in this study, the accelerometers are quite
sensitive to s m d movements. Janz, Witt, and Mahoney (1 995) considered CSA
accelerometer activity below 25 movement counts per minute as sedentary activity and
excluded it from their shidy to minimize the impact of body fidgeting on the activity
measure. They also defined movement counts per min above 250 as moderate activity,
and above 500 as vigorous activity.
1 did not group accelerometer data uito categories because 1 did not want to
artificially resûict the initial cornparisons between the actometen and accelerometers. It

Motor Activity 82
could be that the actometers are less sensitive to srnall movements than the
accelerometers, and some differences in the activity estimates of the two instruments
could result.
Accelerometer Reliabifity
Reliability refers to the consistency of measurement of a single measure or
alternative forms of a measure (Brown, 1983). In this case, the more reliable the
acceterometers are, the more they will measure the same activity in the same way from
one ûial to the next. Tryon and Williams (1996) give a detailed description of the CSA
accelerometer reliability characteristics. Using a pendulum and a spùuiing device, they
examined the consistency of the CSAS both over repeated ûials and across instruments.
For the pendulum-swing trials, the maximum difference was 30 counts out of 1,208
counts, or 2.5 per cent. S o m of the differences were due to differences in the rate of the
pendulum swing decay across the three trials. Consistency esûmates with the spinning
device produced similarlÿ high reliability data, with a SD of 0.007 around a mean of 1 .O25
over 5 ûials. Thus, the reliability of the within-instrument test was hi&. In another test of
reliability, Tryon and Williams (1996) used 40 difEerent CSA Mode1 7164 instruments and
submitted each to the spinner test. Between-unit variability produced similarly low levels
of measurement variability.
Accelerome fer Stability in the Labora tory
Stability estirnates are correlations between two administrations of the same test,
separated in time (Brown, 1983). There are two types of stability. The k t type relates to
how similarly an Uistnunent records the same measure on two different occasions. Using
a test-retest design, Melanson and Freedson (1994) required adults to repeat the sarne

Motor Activity 83
activity protocol (treadmili walking and running) on two different occasions. They
reported a high reliability for the CSA accelerometer, r = .93 to .99. In another shidy,
ushg a similar accelerometer, Patterson et al. (1 993; cited in Tryon & Williams, 1996),
obtained wrist-activity measurements kom instruments wom by 1 5 healthy adults
replicating various physical activities on two separate occasions. The activity measure for
the hvo occasions comelated highly, r = .98, p < ,000 1 .Thus, the accelerometers provide a
very stable measurernent of movement, at least in the laboratory setting.
Accelerometer Stability in the Field
It is more difficult to measure stability outside the laboratory, because wiability
of the instrument is to some extent due to differences or Uiconsistencies, not in the
instrument, but in the individual wearing it. The behaviour of the individual is not
completely consistent fkom one day to the next, for example. Behavioural consistency, or
how sirnilady an individual scores on the same test or instrument on different occasions
describes a second type of stability. In one shidy (Janz et ai., 199 S), thirty 7- to 15-year-
old children (M = 1 1.2 years, 15 males) wore the CSA accelerometer at their waists for
12.2 hours per day over two 3-day prriods (Monday through Saturday). Stability for the
accelerometer-measured activity was moderate, r = .42 to .47, using one day of
monitoring of typical activity. Ushg the full 6 monitored days, the stability was greater,
r = .81 to 34. 'Ihe data indicated that 4 days of monitoring were needed to reflect the
children's typical leveis of activity. Using movement counts during t h e spent at or above
moderate activity, the CSA accelerometer showed a between-day stabiiity range fiom
r = .23 to .43 (Janz, 1994).
The ciifference in the magnitude of the correhtions between the labonitoiy and

Mot or Ac tivity 84
field studies can be explained by severai factors. First, the instments may be measuring
a true lack of consistency in individuals' daily activity patterns (Janz et al., 1995).
Secondly, the types of movement that occur in everyday life rnay not be well-rneasured.
Janz et al. (1995), for example, suggest that with the accekrometers wom at the waist,
they can not detect torso movement and movernents in the non-vertical plane. In contrast-
the movements rneasured in controiied settings are oflen activities such as w a h g and
ninnuig, which may be more accurately measured by the accrlerometers.
Day-to-day stability of the instments was not tested in Study 1. The participants
wore the instruments for one day only. However, the 24hour period does provide a
reasonable samphg of the participant's typical behaviour. With 5 instments available,
and each phcipant wearing two, 1 decided to sacrifice the lrngth of t h e of data
collection for a larger sample size.
The Aciivity Diary
A key part of the rationale for Study 1 was to assess the validity of the actometers
and t h accelerometers. 1 wanted some extemal empirical evidence that the instruments
reflected some measure of the individual's activity. It is possible, for example, that over
the course of the day an individual could make many more small tilts or twists of the
wrists, whch would be recorded by the actometers, but not by the accelerometers. Thus,
particularly if the instruments were only weakiy correlated, it would be important to know
which instrument reflects the individuai's ?rue' level of activity.
To assess the extemal validity of the instniments, the participants of Study 1 were
asked to complete an Activity Diary covering the same 24-hou penod dwing which the
activity instruments were being wom. The content of the Activity Diary was based on that

Motor Activity 85
developed by Salk et al. (1985) and Paffenbarger, Blair, Lee and Hyde (1993). Sallis et al.
(1 985) iisted examples of activities in three categories: Moderate, Hard, and Veiy Hard
ac tivities . Within each category, he O ffered exarnples in three domains: Sports Activities,
Household Tasks, and Occupational Tasks. Exarnples of moderate activities in each of the
three domains are brisk walking, mowing the lawn with a power mower, making
deliveries, and lifting and carrymg Light objects (for sports, household and occupational
categones, respectively). Hard activities include, doubles tennis, scrubbing floors, and
construction work. Very hard activities include, jogging, swimrning, diggmg a garden, and
caft~ulg heavy loads.
1 made one change to the content of the Activity D i q for Study 1. Sallis et al.
(1 985) obtained a measure of light activity by subtracting total diary tirne fiorn time spent
in more vigorous activities, rather than having participants estirnate tirna spent in light
activity directly. Because 1 knew that the participants would be spendmg some part of
their day in light or very light activities, such as sitting in class and studying, 1 thought it
would br less conking if they marked down ali of their activities. 1 therefore extended
the diary by adding a 'Sleep' category, a 'Light,' and a 'Very Light' activities categories. 1
supplied examples for iight activities as suggested by Paffenbarger et al. (1993), and
provided examples of activities for each level that included the three categones: leisure or
sports, household tasks, and occupational tasks.
The students' Activity Diaries were based on a combination of the format used
successfÛily by others (Bm, Krarner, Boisjoly, McVey-White, at Pless, 1988; McKeen,
1988). The diary was laid out something like a musical scale. T h e was indicated across
the bottom fiom lefi to right, with each hour divided into four sections representing

Motor Activity 86
quarter hours. The lowest level on the scale indicated the lowest level ofactivity, sleep.
Each higher level on the scale represmted a M e r level of activity. The range was fiom I
(sleep) to 6 (very hard activity) (see Activity Diary in Appendk A).
Hypotheses Abou! Overall Acfivi~y
I have described three activity measurernent approaches, actornetrrs,
accelerometers, and an activity diary. While both instruments measure motor activity, the
relationship between actometers and accelerometers is not known. It is possible for
example, that Uidividuals rnight cany out some activity in which they repratedly twist
thrir wrists (movements that would repster on the actometer), but so slowly that
acceieration was minimal (movements that might not register on the accelerometer).
However, when data are aggregated over the 24-hour period, 1 am predicting that the two
activity measures will show a positive correlation.
The Activity Diary was included in Study 1 to provide a measure of extemal
validity for the activity-measuring instruments. The instrument measures of activity level
should show a relation to the participants' dias, reports of activity. Therefore the
prediction is that the mean diary activity levels wdî correlate positively with the mean
overall activity measures fiom both the actometers and the accelerometers.
Lateral Activity
Rather than aggregating rnovement across limbs, motor activity can also be
examined for between-limb diflerences. For example, in one recent study descnbed
earlier, Eaton et al. (1998) found a leA lateral bias in arm movement in 70 young addts.
The lateral difference measure of per cent of right-ami movement over total ami
movement had a mean of 46% (SD = 1 1%)). Individuals moved their lefi amis about 80

Motor Activity 87
times per hour more ofien than their right amis (Eaton et al., 1998). When this lateral
difference was examined categorically, 66 per cent (72% of right-handers and 59% of left-
handen) of the participants showed more movement in their iefi arms than their right
m s . In fact, a consistent lefi bias in motor activity has been found, whether the sample
iinder study was infants, children, or adults (Eaton & McKeen, 1992; E a t m et ai., 1998;
McKeen, 1995, 1997).
As in the studies above, lateral asymmetries in arm rnovement will be descnbed in
two ways. A conhnuous measure of dextrality will be calculated and d e h e d as Per cent
of R i g h i - h Movemenf/Total A m Movement. As well, a categorical measure of laterahty
wdi classi@ individuals as either right- or lefi- biased in the fiequency and acceleration of
their movements.
Potential correlates of asymmetric movernent are other laterd preferences.
'Iherefore, in addtion to describing and comparing the lateral movement aspimetries as
measured by the actometers and accelerometers, several other lateral preferences WIU be
examined as potential correlates.
Luterai Pmjèrence Invenfory
Past research with the actometers indicates that spontaneous motor actiGty is not
related to handedness (Eaton et al., 1998). However, 1 had neither empirical data nor
reports in the laterality literahire indicating whether or not a relation exists among the
other lateral preferences and either the actometen or the accelerometers. On the one hand,
it seems inniitively reasonable to hypothesize that more right-sided movement wdl reflect
a right-sided preference for doing things. However, to the extent that lateral preference
inventories usuaily assess only skilled motor activities, while the actometers and

Motor Activity 88
accelerometers measure a i l types of skilied and unskilled activities, a strong relationship is
not anticipated.
Coren's (1993a) Lateral Preference Inventory (LPI) was administered to the
participants at the end of data coliection. Coren's self-report questionnaire is brief and
covew four differrnt common lateral preferences. (t is a l6-item questionnaire containhg
four items each on eyedness, footedness, earedness, as well as handedness. The eyedness
questions inquire about the eye used to look through a telescope and a d e sight, look
into a dark bottle and through a keyhola. The footedness questions refer to preferences for
kickmg a bail, picking up pebbles with the toes, stepping on a bug, and stepping up onto a
chair. The earedness questions inquire about which ear is used to listen at a closed door,
to an earphone, to someone's heartbeat, and to a faint clock. The handedness questions
ask about with which hand an individual draws, throws a bail, uses an eraser, and deals a
card. Each item requires a response of lefi, right, or either.
Reliability and valàdity of the LPI. The LPI was nomed on a sarnple of 3307
volunteers, ranghg in age fiom 17 to 35 years of age, recmited fiom the campus of the
University of British Columbia. Coren (1 993a) found differences between males and
females. In his sarnple, 91% of femaies and 88% of males were nght-handed, p < .05,89%
of females and 84% of males were right-footed, p < .O0 1,67% of females and 6 1 % of
males were right-eared, p < .O0 1. There were no sex Merences Ui eye preference (70%
for females and 71% for males). Experiments between self-reports on the LPI and direct
observation of lateral performance have demonsûated a 92% concordance (Porac, Coren,
& Duncan, 1980). The handedness subscale shows the highest concordance rate at 97%.
Test-retest reliability over a one-year period averages 98% (Coren & Porac, 1978).

Motor Activity 89
Hypotheses About Laterol Activity
As with earlier studies, 1 expect to find a left bias in actometer-measured arm
activity. Because the reason for the greater lefi-am actometer-measured activity is
unla1own, however, it is unclear whether or not the accelerometers wdl show the same
pattern as the actometers. The accelerorneters may be more sensitive and record smaller:
fher movements than the actometers. If that is the case, and the dominant (usudy right)
side makes more s m d movements than the non-dominant side, then the lefl-greater
movement (that has been found with the actometers) may not occur with the
accelerometers. The prediction though, is that the accelerometers wdl foilow the samr
lateral pattern as the actometers and show greater left-side activity.
Anthroporneûics and Demographics
If sex differences in activity are fouiid to exkt ui studies, usudy males are found
to be the more active. In children, males are generdy more active than fernales by about
one-half standard deviation (Eaton & Enns, 1986). There are very few adult field studies
of objectively measured activity which contain gender data. In an actometer study with
young adults, no srx Merences in activity were found (Eaton et al., 1998). In another
study of78 men and women activity was rneasured using Caltrac accelerometers and
various self-report scales (lacobs, Ainsworth, Hartman, & Leon, 1993). In this study
mean levels of motion were recorded for an average of 14 two-&y sessions spaced over a
one-year period. Females were slightly more active than males by 30 activity units per
day, resulting in a small ES (d = 0.20).
However, in this study and another (Matthews & Freedson, 1995) the objective
activity data (based on Caltrac and Tritrac accelerometers) were converted into Metabolic

Motor Activity 90
Equivalencz units (METs). These units were designed to measure energy expenditure and
took into account sex, height, weight, and age in their cdculation. Using MET estimates of
energy expendihire, males were esîhated to be more active than females by f d y
substantiai amounts, ES = 1.6 (Jacobs et al., 1993), and ES = 2.6 SD (Matthsws &
Freedson, 1995). The METs however, do not allow a direct and objective cornparison of
activity between men and women. Thus, there is no clear consensus in the literature on
whether or not adults show sex clifferences in motor activity. Sex differences in activity
wdi be examined in both dissertation studies, but none are expectcd.
Physical Measures
Becûuse the instruments measuring activity may be hflurnced by an individual's
size, each parhcipant had his or her height, weignt, arm length, hand length, and wrist
breadth rneasured, while wearing surnmer clothing. For reiiability puiposes, two separate
measures of each were taken, and the mean values used as the true values. Because 1
examined differences in lateral activity, and it is possible that values obtained Born the
dominant side will &Ber fiom those of the non-dominant side (Martorell et al., 1988), limb
lengths were meûsured on both the right and left sides.
Heighr and Wezght Measures
In infants and children, activity level measured by means of actometen increases
with age and size (Eaton et ai., 1996). However, in an actorneter study of young adults
(Eaton, et al., 1998) activity was not related to size. Thus, although it is possible that age
or size may contribute to motor activity level, 1 am not predicting that age or size are
siuficant correlates of activity in adulthood.
Height and weighr reliobility. Height and wesght are easily taken measurements

Motor Activity 91
and so common that reliability figures are often not reported. in one study, two
consecutive height and weight measures of children showed the same high Speannan-
Brown reliabhty coefficient of .99 (Campbell, 1995). Height and weight differences
between rneasurers in the Fels Longituduial Shidy were minimal with the largest mean
memurernent discrepancy of 2.4 mm (SD = 2.1 mm) for height and 1.7 g (SD = 3.8 g) for
weight (Chu~nlea & Roche, 1979). These s m d discrzpancies in inter-measmer
consistency for both weight and height indicate that the reliabdity of these measures taken
at any one time is v e ~ y good.
Limb Length hleanrres
Previous studies have not found evidence of a relationship between Limb length
and actomrter-measured activity (Eaton et al., 1998). However, as Study 1 is an
exploratory one, designed to examine the characteristics and correlates of the CSA
accelerorneters, 1 took m, wrist, and hand measures of the participants. Although 1 am
not predicting that iim b length will influence the ac tivity measures, it is conceivablr that
long m s ( k e a long pendulm swinging) could influence the activity or acceleration
recorded by the instruments.
Affect lntensity Measure
The Affect intensity Measure (AIM; Larsen & Diener, 1987) is a 40-item
questionnaire that assesses the magnitude or intensity with which an individual typicdly
expenences his or her emotions. It is rated on a 6-point Likert-type scale, in which
participants indicate to what degree their intensity varies in reaction to the emotional
events of daily Me (see Appendix A). The original intention of the questionnaire was to
assess emotional intensity without regard for the picular emotion that the individuai

Motor Activity 92
experienced. Affect intensity is a psychological constmct that emphasizes that regardless
of the specdc emotional content or hedonic tom, individuals who chamcterifticaily
experience their positive emotions quite strongly, will also tend to experience their
negative smotions more strongly. Affect intensity wdi be manifest in a variety of ways,
including bodily responses or cogmtive changes (e.g., a pounding heart, or feelings of
energy or arousal, and behavioural consequences like difficulty concentrating or inability
to mhibit motor actions) to specifïc common every-day situations.
Larsen and Dirner (1987) suggest that affect intensity is a dimension of
temperament. They make a distinction between personality and temprrament,
maintainhg that personality refess to the 'what' or the content of behaviour.
Temperarnent, including affect intensity, refers to the 'how' or the style of behaviour.
Thus, to satisQ a gregarious, social nature, the content of an individual's behaviours may
consist of many social interactions. However, the content of behaviours cm be
differentiated fiom the style of behaviour. in the style of behaviour, it is not so much what
one does, but how one does it. For example, some individuals will achieve their goals by
working methodicaîly, slowly, and persistentiy. Others wdl work more energetically,
fiantically, and sporadicdy to achieve the same goals.
Affect htensity as a dimension of temperament has several characteristics (Larsen
& Diener, 1987). First, it cuts across specific responses and refea to a generalized style of
emotional experience and response. Secondly, it appears early in lifi (Le., has an
unlearned component to it), and thirdly, it is stable over a long period of tirne. These
characteristics are three central components of temperament (Goldsmith & Rieser-
Damer, 1986; Rothbar?, 1986b; StreIau, 1996). They refer to a style of emotional

Motor Activity 93
experience and an individual' s response tendency .
Larsen and Diener (1987) found that affect intensity was significantly related to
four major dimensions of temperament. It correlated significantly with each of the
dimensions on the Buss and Plomin (1984) temperament questionnaire: Emotionality
(r = 33, Acti~ity (r = .41), Sociability (r = .16), and Arousability or Reactivity (r = 39).
'T'hus, empiricdy, it is not an orthogonal or independent temperament dimension, but
rather a component of various dimensions. It also loadcd on two factors in a factor
analysis of personality and temperament traits. The fist was a positive loading on a Social
Afnliation factor which included measures of empathy, nurturancr, social recognition,
dependency, and (negatively) strength of excitation. The second factor, perhaps best
characterized as Adaptability, was associated negatively with affect intensity. It included
traits of non-neuroticism, non-impulsiveness, and non-aggression, dong with strength of
inhibition, and mobility of the nervous processes (Sirelau & Zawadzki, 1995).
Although they do not speciQ the exact rnechanisrn, Larsen and Diener (1987)
suggest that emotional response intensity functions to regulate internai stimulation level
or CNS arousal level. Individuals have different levels of optimum arousal and will seek to
alter their level of arousal in order to maintain or modulate it. They will regulate their
arousal level by reguiating their behaviours, typicdy either responding to sensory
stimulation or dampening iis effects. When individuals are presented with the same
emotion-provolong stimuh, those who score high on affect intensity respond more
intensely than do individuab who score low on affect intensity. It is not that the high
scorers objectively lead more stimulating lives. They simply respond to every-day events
with more intensity or arousal (Larsen & Diener, 1987).

Motor Activity 94
Age effects in the A M . Age and gender effects were examineci in a study of 242
hdividuals ranging in age from 16 to 68 years (Diener, Sandvik, & Larsen, 1985). There
were decreases in affect intensity as age increased, r = -.26, p < .O 1. When they divided
the participants up into 4 age-groups, the researchen found that the most pronounced
&op occuned between the ynung adult and middle-aged grmiips. Diener et ai. (1985)
suggest that the change may reflect either biological changes or environmental effects that
could occur with age. The younger individuals may lead more stirnuiating (and shessful)
lives, wMe the older individuals may have adapted to their emotional activities.
Gender effects in the AIM. Women score higher than men at each age category on
the AIM (Diener et al., 1985). This gender issue is not simple, however. Bryant, Yarnold,
and Grimm (1996) did not h d significant gender differences in one study of 2 18
university students (1 50 females), but did find them in another of 1304 students (803
females). The mean differences are s m d but consistent, with females reporîing higher
scores than males. The discrepancy between the studies may be due to dserences in
statistical power. Bryant et al. (1996) discuss the matter of gender differences in affect
expression, and they suggest that a distinction should be drawn between inner exnotionai
expenence and outward expression of emotion. They interpret their pattern of resdts to
Uidicate that women rnay be more aware of negative emotional shmuli and be more
willing or able to express them, relative to men (Bryant et al., 1996).
The validity of the ALM. The AIM has been used in snidies of daily reports of
affect intensity. Larsen and Diener (1987) report the results of three sepamte studies in
which individu& report their daily moods and Me events. The AIM correlated
sigruficantly with average daily emotional events in all three studies, with r' s ranging fiom

Motor Activity 95
.49 to .6 1. The AIM relates significantly and positively to mood scaies that measured
feeiings of physical activity, amusai, tenseness, productivity, energy, and sociability
(Larsen at Diener, 1987). These moods relate to the arousal or energy level that an
individual feels, but are non-valenced in that they could accompany either positive or
negative ernotional states. They provide a pichire of the dady state of the high affect
intensity person who is usually on the go, keyed up, and vigorous. Larsen and Diener
(1987) again report that in one study of 74 college studmts, the AIM correlated with both
positive affect, r = .4 1, p < .O 1, and negative affect, r = .39, p < .O 1 .
The reliability of the AIM. The AIM obtained a coefficient a (Cronbach, 1951) in
the range of .90 to .94 across four separate sarnples. The test-retest reliabilities for the
AIM at 1 -, 20, and Imonth intervals were .80, .8 1, and .8 1 respectively. For one group of
41 individuals (out of a total 76) who had been given the AIM two years previously, the
correlation for test stability was significant, r = .75, p c .O 1 (Larsen & Diener, 1987). In
another study, 48 undergraduates (25 fernales) participated in a self-report reliability study
in which the N M was given (Hjelle & Bernard, 1994). Test-retest reliability across a 10-
week tirne penod was good, r = .7 1, p < .O 1. The evidence consistently shows that the
AIM has good psychometric properties, with good internai consistency and stability.
The Development ofMM Factors
The AIM scale was developed oripinaîly as a putative unidimensional constmct
measuring affect intensity irrespective of emotional valence. Several resrarchers have
investigated the validity of the unidimensional interpretation (cg., Bryant, Yamold, &
Grimm, 1996; Weinfurt, Bxyanf & Yamold, 1994). Using factor andysis, WeinfÙrt et al.
(1 994) evaluated the fit of several models, includhg Larsen and Diener ' s (1 987) single

Motor Activity 96
factor model. As a result, they recommended a four-factor mode1 which contains two
positive affect dimensions and two negative affect dimensions. The model was derived
using principal components analysis (PCA), and fit both male and female samples
reasonably weli. These factors were used in Study 1 to examine the relation of both
positive and negative airect to mesures ~fmc' tor activity, both overd activity and
lateralized.
The 6rst factor (Positive AEect) consists of 1 7 items that reflect feelings of
happiness, elation, exuberance, euphoria, enthusiasm, excitement, and joy. Eight of the
items tap positive reactivity or the degree to which the individuals typicdy react to
pleasurable events with positive emotion. For example, When I accompfish something
diflculr Ifeel delighed or elated is an item included on the Positive Affect factor. The
second factor (Negative Intensity) contains 10 items that tap a wide range of negative
affective responses, including d e t y , tension, negative viscerd reactions and general
negative emotional intensity. My emotions tend to be more intense thon ihose o f io s t
people, is an item included in this factor. The third factor (Serenity) consists of seven
items describing positive affect as calm, content, relôued, quiet, peaceful and untroubled.
An examplc item is, I would charucierize my happy moods as closer io contentment
thon to joy. The Serenity factor is negatively related to both Positive Affect and Negative
Iniensity and unrelated to the fourth factor, Negative Reactivity. Weinfurt et al. (1994)
suggest that these relations may indicate in part that the experience of positive affect as
tranquil contentment reflects for some individu& their rejection of intense affective
expenence. The fourth factor (Negative Reactivity) is composed of six items assessing
negative affective reactions to environmental stimuli or events. An example item is, The

Motor Activity 97
sight of someone who is hurt bu& afleets me strongij. Negative Reactivity is
conceptudy and empiricaily distinct fiom Negative Intensity. For exarnple, one may be
very disturbed by an undesirable event (Negative Reactivity), but then dampen the
negative reaction with coping measures that produce a low Negative Intensity. This
reactivity-intensity distinction did nct emerge for Positive -4tTect. It rnay be that people do
not typicdy control theû positive rmotional reactions to events to the same extent that
they control their negative reactions (Wehfurt et al., 1994).
Hypotheses about the AIM
In terms of overall motor activity, severai hypotheses c m be drawn about the
relationship with the AIM factors. Overd rnovement (as measured by both the
actometers and the accelerometers) should relate positively to high levels of arousai as
refiected in Negative Reactivity, Negative Intensity, and the Positive Affect factors. The
Serenity factor, if it represents low arousai, should relate negatively to overd activity
level.
So too, can hypotheses be made about the lateralized activity measures of activity
(dextrality), as descnbed radier in the general introduction. In an infant study, negative
affectivity (crying) was associated with nght leg movement, as measured by the
actometers (McKeen, 1995). Contenteâness and happiness were associated with lefl ami
movement. Assurning that the above-mentioned relationship between lateralized motor
activity and affect holds for older people, dextrality (relatively greater nght-sidrd activity)
should be related positively to Negative Reactivity andlor Negative htensity but related
negatively to Positive Affect. If the Serenity Eactor retlects positive affect, then it should
be related negatively to dextrality.

Motor Activity 98
Age has been found in the past to correlate negatively with affect intensity, and
females have been found to report more intense negative reactivity (Weinfùrt et al., 1994).
Since both age and gender ditferences have been found with the AIM, 1 am assessing
these in Study 1.
METHOD STUDY 1
Participan~s
The participants were recmited fiom a Spring session Introductory Psychology
class at the University of Manitoba. For their participation, students received three credits
towards their final grade. There were no restrictions for sign-up. One female student failed
to arrive for her scheduled appointment. One additional female student was recruited
fiom among the Psychology Graduate Students. The 6nal number of student participants
was 23 (12 males and 1 1 fernales).
Sumnrary of Procedure
Before the data were coliected for this study, 48 actometers were checked for
sensitivity using the chernical shaker-bath method, identical to the method described
earlier (Eaton et al., 1996). Four of those actometen with valid readings, showing a very
high level of agreement, were used in Study 1.1 counterbalanced both instruments by
systematicaily reversing the hand on which each instrument was to be worn.
When students anived at the research room for their scheduled appointment, 1
gave them a brief description of the study, including a general description of what would
be required of them during the 24-hour data collection period. They then signed a consent
fom informing them that they were under no obligation to participate and were fiee to
withdraw fiom the study at any tirne. 1 agreed to keep confidenfial any information they

Motor Activity 99
provided me.
1 took several physical measurements, including height, weight, arm length, wrist
breadth, and hand length. 1 then described, demonsbated, and attached two activity-
measuring instments to aach of their wrists. Specifically, one actometer and one
nccelerorneter, ivere anached to each shident's nght- and left- wrists rvith sports-type
wristbands.
1 provided oach student with a folder whch contained information and
instructions for recording data over the next 24-hour period, and which the students took
home. Each folder held five data-collection foms (see Appendix A), and each of the
forms was shown and explained to the students. The first form provided instructions on
the Wear and care of the inshuments and instructions on how to record any period of time
over the data-collection day that the instniments were removed. On the second form, the
students recorded their bedtirne and rnoming wake tune, dong with the cment readings
on one of the instruments, the actometer. The third and fourth foms were, respectively,
an Activity D i q and a sample example of how to record their daily activities on the
diary. The last form was a list of examples of various physical activities to help the
students classi@ the physical elements of their occupational, household, and leisure tasks
canied out over the data-collection day. Finally, students were asked to complete an affect
intensity questionnaire (the AIM) before they left.
About 24 hours later, the students rehimed for a second and final appointment.
The instruments were removed, the h a 1 readings recorded (for the actometer) or data
downloaded (for the accelerometer), and the Activity Diary was reviewed briefly to check
for completeness. During these activities, the students completed the LPI (Coren, 1 993).

Motor Activity 100
1 then provided each student with verbal and wxitten feedback (Appendix A),
describing the extemal validity aspects of the study (comparing relations among the
actometer md accelerometer and the Activity Diary), the reliability aspects ( w e h g
instruments on both wrists to compare within individual instruments), and briefly
describing hdings fiom previous activity studies with infants and childrzn. Findy, 1
thanked the students for participating in the study and told them where and when 1 would
display the final results of the study.
To restate briefly, the 6rst purpose of Study 1 was an exploratory one to
compare the actometers to the accelerometers, and relate both types of instruments to an
extemal source of validity (an Activity Diary). A second purpose was to evaluate the
lateral differences on both instruments by examining differences between the right and
left wrists. The third purpose for the shidy was to examine various anthropornetric and
demographc variables that might affect either of the activity-rneasuring instruments. The
fourth purpose was to examine individual differences in affective experience as a correlate
of overd and lateral differences in motor activity. Beginning with a description of the
mechanical device measures, I will descnbe each measure used in Study 1.
Overall Act ivàv Level Variables
Movements per hour. Eaton et al. (1996) sstimated that an actometer registers 1
AU for evely five changes in direction. One AU appean as 1 s on the actometer face.
Using this information, the number of arm movements equals the nurnber of elapsed
actometer seconds multiplied by 5. This number is then converted into a measure of total
movementsper hour by dividing by the number of hours the actometer had been worn
(less those times the actometer had been removed for bathing, etc.). For example. a

Motor Activity 101
participant whose actometer showed an elapsed time of 64 min (3840 sec) over 24.0
recording hours would generate a total movementsper hour estunate of 800
(800 = 5 x 3840 1 24). 1 used this movementsper hour measure rather than raw AUs as a
summary dependent variable because it is more easily envisaged and comprehended.
Acceleromeier quarrer-hour voriobles. 1 initialized the accelerometers to record
the average acceleration on each h b for every ten-second epoch. This setting resulted in
approximatsly 8640 data points recorded by each accelerometer (24 hr x 60 min x 60 sec
11 0 sec= 8640) over the twenty-fours hours. Because the participants kept an Activity
Diary based on activity notations for every 1 Srninute period throughout the data-
collection period, the acceleration data were summarized and expressed as three va~iables
based on the mran acceleration for each limb over each quarter hour (Meon right and
Mean lep).
Accelerometer 24-hour variables. Similarly, for each individual, 1 summarized the
data over a 24-hour period and expressed it as a mean acceleration value for each m.
The mean value for both m s represents the o v e d measure of the individual's meon
Wcount over the 24 hours.
Acceleromeier count estirnutes. Because the study is in part designed to compare
the two types of activity-measuring instruments, 1 created fiom the accelerometer data,
estimates of âequency of movement that might mimic the way the actometers measure
movement. Because the actometers are not sensitive to small movements, 1 decidrd to
exclude any acceleration below 50 Gfcounts fiom the data. These Gkounts of
accelerometer data were caiculated in the same manner as the acceleration variables
(Mean cmnt le# am, Mean count right am, and ûverall mean count for each quarter

Motor Activity 102
h o u and each individual over 24 hours).
The Activity Diury
The Activity Diary consistd of a one-page 24-hour log with the start and finish
times and each hour indicated. Participants estimated and recorded their average level of
activity for every quarter hour of the day on which they were wearing the motion-
recording instrun~ents. They did this by drawing a line through the diary at the appropriate
level for the appropriate quarter hour. A sample diary demonstrated the reporting method
for a hypothetical individual's day and contained a page Lishg examples of activity level
intensity for various common daily activities in which they might be engaged. They were
not required to fil in the diaiy 3t 15-minute intervals. They were simply asked to keep
track of their activity levels throughout the day as accurately as they were able and to
record the activity level in the ciiary when it was convenient for them to do so. An effort
was made at the end of the data collection to check the diaries for rnissing tirnes and to
inquise if there were any activity in whch the participants had engaged, but were unsure
of how to categorize it. Copies of the diary, sample, and examples are included in
Appendk A.
Activity Diary variables used in S ~ d y 1. Because the participants kept their
diaries for 24 hours, there were approximately 96 data points recorded for each individual
(24 hr x 4 quarters per hr = 96). These quarter-hou epochs were matched by time and
correlated with the quarter-hour epochs for the accelerometers. ui addition, 1 used each
individuai's mean 24-hour uctivity level, as reported by the Activity Diary, as the
dependent variable to correlate with the mean actometer-measured activity.

Motor Activity 103
Lateral Activity Variables
Actometer dextrulity measure. Using the total movements per hou fiom the left
and right arms, Eaton et al. (1996) calculated for each individual a percent right arm
movements (%RA moves) score. This score was the percentage of ail movements, right or
l e 4 that were nght-arm movements (100 x right am movements ! total m movements).
This same dextral index in this study is the continuous laterality measure. Thus, a
participant whose arm movement fkequencies were perfectly symmetrical would generate
a 96 RA moves score of 50. A right-biased participant would generate a score over 50, and
a left-biased person, a score under 50. A categorical latitrrality variable also was created
with participants classified as either left biased, % RA less than 50, or as nght biased, %
RA equal to or greater than 50.
Accelerometer dextrality measure. To examine lateral differences in acceleration
counts between the right- and lefi- arrns, 1 created a separate dextrality index variable
(IOOxTotal Right A m Acceleration) / (Total Right A m Acceleration + Total Leji A m
Acceleration). With the denominator based on the total acceleration for each individual, 1
calculated differences in individual's laterd acceleration wMe taking into consideration
their overall acceleration. The laterd measure is expressed in t e n s of right-sided
acceleration. For greater accuracy 1 calculated the lateral summary variables (dextrality
based on quarter-hours and 24 hours) fiom the original IO-second-epoch data. This
method of calculation means that a nght-greater or lefbgreater between-lirnb
determination was based on the relative düferences between right- and lefi- limbs for
every 10 s, rather than over the quarter-hour or 24-hour periods.

Motor Activity 1 04
Lateral P@rence Inventory
Participants completed the LPI so that the possibility could be evaluated that a
lateral preferences is related to the measures of asyrnmetric activity. Because lateralized
actometer-measured activity was uncorrelated to handedness in a previous study (Eaton
et al., 1998), 1 did not anticipate that the measures wouid be related in Shidy 1 . 1 decided
to use a quick 12-question laterality self-report, which would assess four commonly
measured lateral preferences (Coren, 1993, in Appendix A).
LPI m e a w e s used in Study 1. Data are scored for each four-item subscale as the
sum of the 4 items. Lefr responses were given a score of - 1. Either responses were aven a
score of O. Right responses were given a score of + l . Each of the four subscales can range
in value fiom -4 to +4. Four indicated consistent lefi prefrrence, and +4 indicated
consistent right preference. A score of O hdicated arnbidextrality. Combined, the four
scale values can range fkom -16 to +16, with mean LPI scores ranging fiom -4 to +4.
An thropome tric Meusures
Heighi. Height is an indicator of stature and was measured in crnheters with an
anthropometer, according to the method set out by Gordon, Chumlea, and Roche (1988).
The anthropometer consists of a graduated vertical rod on a stand, with a moveable rod
k e d to the vertical rod at nght angles. The moveable rod is positioned so that it touches
the vertex of the subject's head. To have their height measured, participants stood in
stocking feet on a flat floor. Their body weight was distributed evedy on both f e g and
they were asked to face forward so that their eyes were l o o h g at a spot on the opposite
wd at eye level. Amis hung d o m fieely at the sides of the ûunk, wiîh the palms fàchg
the thighs. Heels were placed together with the backs of the heels touching the base of the

Motor Activity 105
anthropometer. The angle between the media1 part of the two feet was about 60 degrees,
cornfortable for maintainhg balance. The participants were asked to inhale deeply and
maintain a M y erect position during the measurement procedure. Height was measured
twice and recorded to the nearest O. 1 cm. The mean value was used as the final rneasure.
Weighr. Weight was measured twice using a portable scale placed on the
holeurn-covered Boor. The participants distnbuted their body weight avenly with both
feet over the centre of the scde. They wore iight-weight indoor dothmg, without shoes
and sweaters. 1 recorded their weight to the nearest half pound.
Limb Iength meonrros. Because the G/count measure of the acczlerometer is a
function of both amplitude and speed, it is possible that h b length influences the
measure. As there are no reports in the iiterature, 1 decided to measure h b length in
Study 1 .1 measured arm length in segments (Lohman, Roche, & Martord, 1988). Each
ami segment was measured twice per side, and 1 used the mean of the two masures as
the final value.
Shoulder to elbow length. This measurement allows for the measure of the
shoulder to elbow length with minimal effect of adipose and muscular tissue (Martin,
Carter, Hendy, & Malina, 1988). It is made using an anthropometer configured as a
sliding-beam caliper, which has a metric mie rod with a îked blade at 90 degrees to the
rod at one end and a sliding blade parailel at the other. The participants wore light indoor
clothing for ease of m e a s h g and stood erect on the holeurn fioor with their weight
distnbuted evenly on both feet. The beam of the anthropometer was positioned
lengthwise behind the m. The k e d blade of the anthropometer was in contact with the
acromion process (the highest point of the lateml edge of the acromial spine or outer poht

Motor Activity 1 06
of the shoulder), as determined by palpation. 1 moved the sliding blade of the
anthropometer to the posterior surface of the olecranon process of the ulna (at the elbow).
That distance, m e a s h g the longitudinal axis of the upper am, was recorded to the
nearest 0.1 cm. Two measures of the shoulder to elbow length were taken on each m.
The mean was used as the final measure.
Shoulder-elbow reliability. A 1985 s w e y of 530 Canadian Forces aircrew
produced an intra-rneasurer variance of 2.7 mm and an inter-measuser variance of8.4 mm
(Stewart, 1985).
E l b o w - ~ s t length. Elbow to wrist length was also measured with the actometrr
configured as a sliding caliper. The participant stood erect on the floor with feet together,
weight equally distributed between both feet, shoulders drawn back, and the head
positioned with eyes gazing straight ahead. The subjects let their arms hang by their sides,
then flexed their elbows at 90 degrees, with their palms facing medidy and the fingers
extended. 1 positioned the fxed ami of the caliper with the m a t postenor point overlying
the olecranon (at the elbow). 1 aligned the sliduig arrn of the caliper with the most distal
palpable point of the styloid process of the radius (at the wist). Duxing the measurement,
the amis of the caliper were held perpendicular to the long a i s of the f o r e m . This
measure was recorded to the nearest 0.1 cm (Martin et al., 1988). Two measures of each
elbow to wrist length were taken on each ami. The mean was used as the b a l measure.
Elbow to wrist reliabiltty. Test-retest data fiom an anthropomehic s w e y of 530
Canadian Forces aircrew produced an inter-measuter variance of 2.9 mm and an inter-
measurer variance of 9.8 mm (Stewart, 1985).
Hand length. This measurement was made with the anthropometer configued as

Motor Activity 1 07
a caliper. Participants stood with their amis hanging relaxed and their f o r e m s extended
horizontaiiy. Their hand and fïngers were extended @ut not hyperextended), p h up. 1
held the central bar of the sliding caliper pardel to the longitudinal axis of the hand. 1
aligned the h e d cross-arm of the caliper with the most distal palpable point of the styloid
proccss of the ndius (at the ivrist). 1 placed the sliding cross-arm of the caliper at the tip of
the third (middle) hger. That measurement was recorded to the nearest 0.1 cm (Martin, et
al., 1988). Two rneasures of each hand were taken. The mean length was used as the h a 1
measure.
Hand-length reliability. Data are not avaiiable in the literaturc (Martin, Carter,
Hendy, & Malina, 1988).
Wrist breadth. Wrist breadth is used as an index of skeletal mass and kame size.
In the Brussels Cadaver Stucly, wrist breadth was the skeletal measuse most hghly
correlated with skeletal mass, r = .88 (Clarys, Martin, & Drinkwater, 1984). 1 used a
sliding caliper to measure the distance between two bony prominences on the wrist, the
uinar and radial styloids. The participants stood facing me, flexing their f o r e m s to 90
degrees at the elbow and close to the chest. They presented the dorsum of each hand to
be measured. 1 palpated the most medial aspect of the uhar styloid with the middle 6nger
of my right hand, and slid the tip of the caiiper onto this landmark. 1 located the most
lateral aspect of the radial styloid with the rniddle h g e r of my left hand, and moved the
other end of the caliper to this position. 1 appiied firm pressure and recorded the breadth
to the nearest 0.1 cm (Wilmore et al., 1988). This measure was taken twice, and the mean
was used as the h a 1 breadth.
Wrist-breadth reliability. According to Wilmore et al. (1988) the wrist breadth is a

Motor Activity 1 08
highly reliable measure, showing an inûa-measurer reliabrlity of r = -99. One study
showed a test-mtest correlation of .96 betwern measurements taken on the same day on
coilege-aged males ( W h o r e & Behnke, 1969).
The Affect Intensity Measure
1 administered the Anéct lntensity Measure (.MM) tc? the participants for two
rrasons. First, it seemed relevant to the measurement of motor activity and to theoretical
notions such as arousai, reactivity, and self-regdation. Secondly, 1 was interested in
£inding correlates of lateralized activity that are relaied to measures of positive and
negative affect.
rlUi variables used in Sfudy 1. I used the four positive and negative AIM factors
(Weinfùrt et al., 1994; Lsted in Bryant, et al., 1996) in the analysis of Study 1 because they
provide an opportuniîy to examine the relationship between both affective valence and
arousal for both overaü and lateraked measures of motor activity.
RESULTS STUDY 1
Preliminary Dota Assessrnent
1 conducted ail of the statistical analyses with SAS-pc software for Windows95,
version 6.12 (SAS Institute, 1996; SAS Campus Drive, Cary, North Carolina, USA
2751 3). AU major variables were examined for possible outliers and skewed values using
the SAS Univariate and Frequency procedures.
The original sample consisted of 23 individuais, 11 fernales and 12 males.
However, I decided to drop two right-handed male participants after examining their
activity &ta. For one of the males, an accelerometer appeared to malfùnction. The
accelerometer on this individual's left wxist output approxhately double the data points

Motor Activity 1 09
t h t it was set to output (1 7,000 data points instead of 8,5OO), rendering this left-arm data
unreliable. Because the cornparison between the right and lefi arms was an important part
of Study 1,I decided to drop this individual fiom the sample. The second male was
identified as both a univariate and a bivariate outher. When his mean right-arm
accelerometer value was pbtted against hs mean right-am actornetrr vaiiie, it was
evident that his data were unusual. His mean right-ami accelerometer value was the
lowest of di of the values for the sample (at 75 counts, about 3 SD below the mean of
183.6). At the same tirne, his mean r ight-m actometer value was 2.4 SD's above the
mean (at 1 180 movements /heur, M = 60 1 movements/hr, SD = 245). His mean lefl
accelerometer value was also the lowest of the sample (at 83.9 counts, M = 182.7 counts,
SD = 62.9), while b mcan left actometer value was at 1594 (A4 = 864 movementshr,
SD = 451).
To test the influence of the second participant's data on the regression
coefficients, 1 ran the SAS Regression procedure, using the right- and lefb acceleration
values as dependent variables and the actometer values as the regressors. 1 included the
Influence Diagnostics option (Cook's Distance). Cook's D statistic is a measure of the
influence of an obsewation and determines how much the regression coefficients are
changed by deleting any particulas obsewation. A Cook's D result greater than one
deserves closer scnitiny as an outlier (Kleinbaurn, Kupper & Muller, 1988). My
questionable data had Cook's D values of 6.2 (right acceierometer), 5.4 (le fi
accelerometer), and 1.2 (right actometer). T h g into account that 2 1 tests were done (a D
statistic for each participant), the cntical value for the upper 2.5% of the distribution is
F(i, 18) = 5.98. One of this individual's Uuee questionable data points lay outside this

Motor Activity 110
value. This participant was a left-handed individual who, 1 had noted, wrote with his hand
in a hooked position. His Activity Diary did not indicate any information that might help
explain the unusual pattern. 1 decided to &op this individual fiom the sample. No other
participant's Cook's D was statktically significant.
One other male reported that he stayed up studying fcr an exam and did not sleep
the night of data collection. 1 was therefore unable to examine his wake-sleep data.
Because the examination of the wake-sleep data was only a smaii part of Study 1,1 kept
this individual in the sample, except for analyses involving sleep or wake times. Thus, the
linal sample consisted of 21 indwiduals, 10 males and 1 1 fernales.
Dota Standardization und Aggregotion
Actometers. The cowlation between the right- and left- ami actometer scores was
significant, r = -86, p c -000 1. Therefore, I used the mean fiom the two limbs as the overd
activity variable.
Actometer intraclass correlution. I used four actometers in Study 1 and divided
hem into 2 sets of 2 actometers each. 1 counterbalanced the order of th& use so that each
participant wore the instments on the h b s opposite to the person before. Thus, about
half of the participants used each set of instruments, and within each set, each actometer
was used on the right or left ami for about half the t h e . 1 estirnated the reliability of the
instruments by using an intraclass correlation coefficient (ICC). The ICC is an estimate of
the degree of concordance between the readings of each actometer in a set. It was
caiculated fiom a 2-way analysis of variance (ANOVA) ui which k judges (actometers)
assess n targets (individuais) (Shrout & Fleiss, 1979). 1 used the mean squares output for
targets, judges, and residual error to obtain the ICC. The ICC was .62 and .41, for the first

Motor Activity 11 1
and second set of actometers, respectively. This result is sirnilar to the reliability
coef?ïcient of .43, obtained when adults wore the instruments on both arms for 24-hours
(Eaton et al., 1996). The ANOVA main-order effect for Uidividuals was significant,
indicaihg that there were significant individual differences in activity levei, but the
actoometer eEect was non-signrficant. This finding indicates that the there is a high degree
of agreement between instruments, and that the instruments are therefore reliably
interchangeable.
Accelerometers: quarter-hour data. The accelerometer data were based on the
average acceleration of the h b calculated every 10 s throughout the wearing time. This
epoch length for the 2 1 participants over the 24-hour penod rrsulted in a data set
containhg approximatcly 200,000 observations. Data reduction invoived combining these
IO-s epochs into acceleration values based on longer epochs of tirne. For Study 1, it was
most useful to combine the data into quarter-hour epochs, as this epoch was the unit of
tirne on whch the Activity Diaries were based. 1 reduced the 10-s data to quarter-hour
data by using the Summary procedure in SAS. In the analysis of the accelerometer data,
the initial starhg tirnes and h a 1 ending times of the data collection were Linked to the
starting and ending times of the Activity Diaries. The participants had started and ended
their diaries on the quarter hour (e.g., 10:00, 10: 1 5, 1 MO). Thus, some of the
accelerometer data at the very beginning and end of the data collection were eliminated, if
it was obtained either before the Diay started or after the Diary finished. In order to
ensure that each quarter hour contained a good sampling of accelerometer data, 1 kept
only quarter-hour penods which contained nt least 80% of the data (at least 72/90 data
points). This procedure caused a drop of four percent in the number of observations

Motor Activity 112
(fiom 2098 to 2012). Thus, the h a 1 aggregation of the IO-s data into quater-hour epochs
resulted in a dataset that contained about 2000 observations (about 90 observations for
each of the 2 1 participants).
Accelerometers: per individual data. The accelerometer data were M e r
reduced tci produce a mean acceleration cnunt per individual. The SAS Summary
procedure was used to create a mean variable for each person, resulting in a data set
containing 2 1 observations. The correlation between the right- and lefi- accelerometer
scores was significant, r = -96, p < ,000 1.1 used the mean of the right- and lefi- am
accelerorneter data to calculate an overall accelerometer count for each participant.
Accelerometer intraclms correlution. Two sets of 2 accelerometers were created
for Study 1. The same counterbalancing procedure as for the actometers was canied out,
so that each set of instniments was worn by approxirnately half of the participants, half
on one ann and half on the other. The ICC for the accelerometers was calculated in the
samr way as for the actometer sets and was 0.92 and 0.98. The ICC value is a minimum
value estirnate, because it includes the extraneous effects of having one instrument worn
on the right and one wom on the hft.
Physicul meusurements. Each of the physical measurements were taken twice and
means were calculated for weight, height, am length, hand length, and wrist breadth. The
correlations between the first and second measurements ranged fiom r = .98 to r = .99.I
used the mean values of each measure as the best estimate of the true values. Correlations
between the right- and lefi- h b s ranged fiom r = .94 (for right- and lefi- wrists) to r = .98
(for right- and lefi- ami and hand lengths). Taking the means of the 4 h b measurements
(first and second measures, left and right limbs) produced the ha1 limb length values.

Motor Activity 113
Descriptive Sta fis! ics for fieral] Adivity
A summary of the descriptive statistics for the Study 1 sample foiiows in Table 1 .
Deinogruphics. As expected, the females were on average smaiier than the males
in height, weight, and h b lengths. Males were on average about one year younger (about
21 years of ape) than the females (about 22 years), with more variability in the ages of the
females.

Mo tor Ac tivi ty 114
Table 1. Descriptive Staristics of Study I SampIe.
Males Fernaies
Mean SD Mean SD
Dernographies
Age Ws) Height (cm)
Weight Ob)
Limb Lengths
A r m s cm (R)
cm (LI Wrists cm (R)
cm (LI Hand Length cm (R)
cm (LI Actlvlty Monltors
Actometer Mv/Hr (R)
MvIHr (L)
Accelerorneter g (R)
g (LI Acâivlty Diary Mean (M/6)
AIM
Mean (M/6)
Positive Mect
Negative Intensity
Sereniîy
Negative Reactivity 3.8 1.3
N: Males = 10 Females = 1 1

Motor Activity 115
Activity meosures. There was no statisticaiiy sigdicant difference between the
males and femalcs in overall actometer-measured activity (765 movements per hr for
males, SD = 384, versus 702 for females, SD = 301), F(9,lO) = 1 . 6 3 , ~ < .46. Nor were
there sex differences in accelerometer-measured activity (males 188 g/counts, SD = 73.4,
versus fernales 179 gkounts, SD = 50.2, F(9,l O)= 2.52, p < 1 7 . When the data h m the
males and fernales were combined, the mean accsleration force was about 184 gkounts.
on the right and 183 gkounts on the left. For the actometers with males and fmales
combined, the mean right value was 601 movements per hou, and the mean lefl value
was 866 movements per hour.
Activity Diary. The reports of activity by the participants in their Activity Dianes
gable 1) indicated that the males were sigmficantly more active than the females,
F(9,lO) = 3.87, p < .M. This finding is somewhat surprising, bccause aU participants were
given the same instructions for keeping the diary, and both objective measures of activity
indicate that there were no statisticaiiy significant differences in activity between the
sexes. The correlations of mean diary activity with activity measures were higher for the
rnales, r = .XI, p < -08, and r = .74, p < .02, than for females, r = .4O, p < .22, and r = .38,
p < .25, for actometers and accelerometers, respectively. The test of significance between
two non-independent correlations (Appelbaum & McCall, 1983, p. 444, showed that the
Merence between the male-female correlations was statisticdy sigmlicant for both
actometers, z = 2.64, p < .004, and accelerometen, r = 8.80, p < ,000 1 .
Dextrality Variables
With one actometer and one accelerometer attached to each individual's ri@ and
lefi- wrists, rneasures of activity were available for bot, the right- and leA- amis. 1
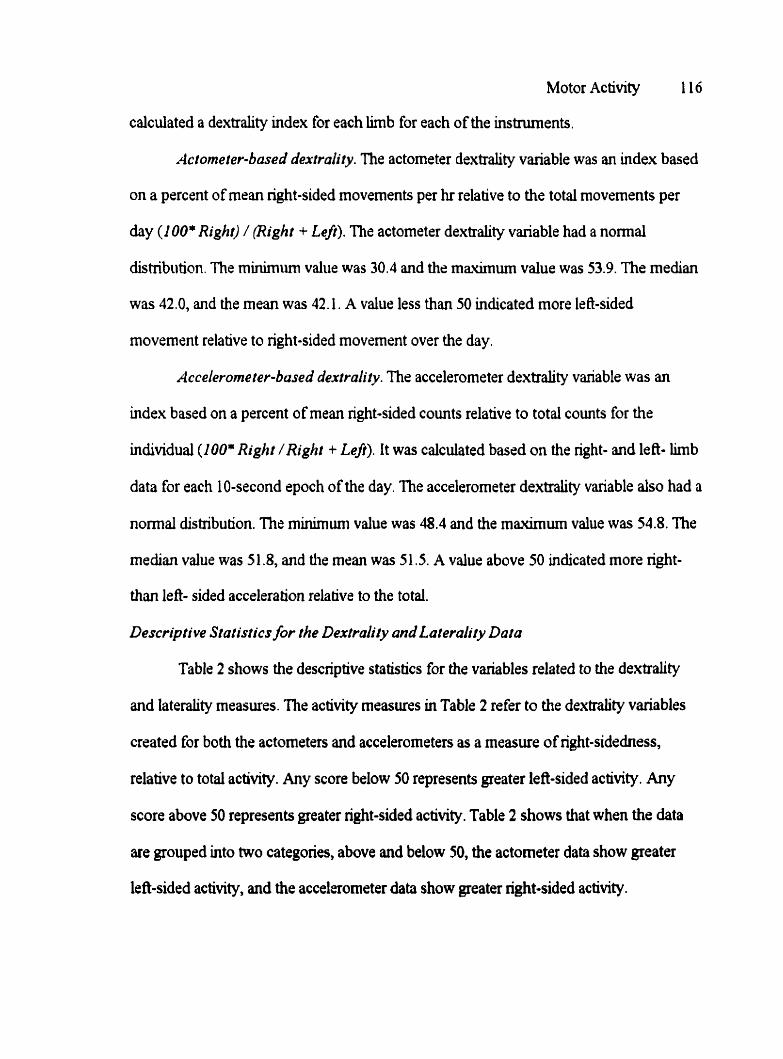
Motor Activity 116
caîculated a dextrahty index for each limb for each of the instruments.
Actometer-based dextrality. The actometer dextrality variable was an index based
on a percent of rnean right-sided rnovements per hr relative io the total movements per
day (1 00' Right) / (Righi + Lefi). The actometer dextrality variable had a normal
distnbiiticin. The m i n h u m value was 30.4 and the mâuimum value was 53.9. The rnedian
was 42.0, and the mean was 42.1. A value less than 50 indicated more lefl-sided
movernent relative to right-sided movement over the day.
Accelerometer-based dextrality . The accelerometer dextrality vaxiable was an
index based on a percent of mean right-sided counts relative to total counts for the
individual (100' Right /Right + Le#). It was calcuiated based on the right- and left- h b
data for each IO-second epoch of the day. The accelerometer dextrality variable dso had a
nomal distribution. The minimum value was 48.4 and the maximum value was 54.8. The
median value was 51.8, and the mmran was 5 1 S. A value above 50 indicated more right-
than lefb sided acceleration relative to the total.
Descriptive Statistics fur the Dextrali ?y und Laterality Dora
Table 2 shows the descriptive statistics for the variables related to the dextrality
and laterality rneasures. nie activity masures in Table 2 refer to the dextrality variables
created for both the actometers and accelerometea as a measure of nght-sidedness,
relative to total activity. Any score below 50 represents greater lefi-sided activity. Any
score above 50 represents greater right-sided activity. Table 2 shows that when the data
are grouped into two categories, above and below 50, the actometer data show greater
left-sided activity, and the accelerorneter data show greater right-sided activity.

Table 2. Descriptive Sunmary of Variables Related to Laterality.
Males Females
Activity (lOO*R/R+L)
Actometer 40.8 5.1 43.2 5.9
Accelerometer 51.0 1.7 51.9 1.4
LPI (% of right-biased participants)
Hand 95.0 15.8 97.7 5.3
Foot 86.7 20.1 91.7 11.8
E Y ~ 90.0 20.7 73.5 29.5
Ear 74.2 20.5 78.0 23
Nore. Activity monitor values c 50 = greater mean left-sided activity.
Dextral activity. The actometer data resuits shown in Table 2 replicate the Eaton
et al. (1 998) results. A repeated measures ANOVA (with ami as the within- and gender as
the between- factor) found a significant arm effect, F(l, 19) = 19.3, p < .0003. The
actorneters again recorded greater lefi-sided activity than right-sided activity. Only two
participants had mean nght actometer data greater than 50%. Males made an average of
307 more movements per hr on the le& and females made an average of 222 more
movernents per lu on the le fi. in contrast, the accelerorneter data showed no lateral b i s ,
F(1,19) = 0.03,~ < .86. Neither the actometer nor accelerometer dextrality measures
showed statisticdy sigdcant Merences between males and females, Actometer:
i(19) = 0 .97 ,~ > .33; Accelerometer: t(19) = - 1 . 2 , ~ > .23. When the data were combined
for the males and the females, the mean dextrality value for the actometen was 42.07%,

Motor Activity 118
SD = 5.56, and for the accelerometzrs was 51.49%, SD = 1.58.
Lateralpre&rence. Each LPI raw score ranged fiom -4 (extremely lefi-handed) to
+4 (extremely right-handed). The scores were converted to a mean percent value for the
sarnple. With extreme right-handedness at 100%, the mean handedness value for both
males and fernales combined was 96.44%. None of the lateral preferenca measures (eyr.
ear, foot, or hand) showed statisticdy sigruficant differences between the males and
femaies, except for handedness. The gender difference in handedness is probably
explained by the fact that one male in Study 1 was lefbhanded. All the other participants
reported that they were right-handed.
Gender dtflerences on the AIM. There was some discussion in the literahire
(Larsen & Diener, 1987; Weinfurt et al., 1994) about the differences between males and
females in the intensity of theû reported affect intensity, and whether the differences are
due to the females awareness of negative emotional reactions and theû willingness to
express thern, relative to males. Therefore, the data were exarnined separately by gender
for the AIM. Larsen and Diener (1 987) found that females scored higher than males on
the overd mean AIM for ages ranging fiom 16 to 68 years. Bryant et al. (1996) found that
females scored higher than males on the Negative Reactivity scaie in one study, but found
no differences in the pattern for males and females in another. One of the advantages in
using Weinfurt et al.'s (1994) factors in Study 1 is that the mode1 was developed to fit
both male and fernale data. In this study, there were no statisticdy significant differences
between males and females on any of the AIM factors (Positive Aaect, F(9,lO)- 1.26,
p < .73, Negative Intensity, F(9,lO) = 1.02, p < .98, Serenity, F(9,lO) = 1.13, p < .87, and
Negative Reactivity, F (9,lO) = 3.23, p < .09). Table 3 is a summary of the predicted

Motor Activity 119
relationships between the activity measures and the other variables cokcted in the study.
Results of Predictions with OveraflAcfivity
Demogruphics. As expected therc were no significant differences between males
and females in activity level. However, contrary to the hypothesis, there were age effects
in the data. The mean age cf the sample was 2 1.4 years of age (SD = 3.2 yean). The
negative correlation between age and the overall actometer score (Table 3) indicates, at a
trend level of significance, that older individuals move less fiequently than younger
inâividuals. The relationship with weight foilows a similar pattern, although not significant
in this sample. Height is not significantly related to movement activity.
Limb lengths. Limb lengths (Table 3) did not show significant correlations with
either the actometer or accelerometer measures of activity. The correlation between arm
length and height was statistically significant, r = .90,p < .0001. In Study 2, height wiU be
used as a proxy for limb length and limb length wiU not be measured.
The AIM. The AIM questionnaire factors show some interesting relations with the
activity measures ('ïable 3). The prediction that overd activity would be positively related
to Positive Affect, Negative Intensity, and Negative Reactivity was not c o n h e d . In fact,
o v e d actometer-measured activity was unrelated to both Positive Affect and Negative
Intensity, and significantly negatively correlatrd with Negative Reactivity, r = -34. The
correlation of activity with Serenity was significant (negative), as predicted. None of the
predicted correlations between the AIM factors and overd accelerometer-measured
activity were found. However, given the smaü sample size, the correlation between
acceleration and Negative Reactivity looked promising.

Motor Activity 120
Table 3. Summary of Hypothesized Relationships in Study I .
Other Variables Activitv Measures
Overail Activity (AL) Dextr ali ty
Actometer Accelerometer Actometer Accelerometer
Deniognp hics
Age (ns) - . /O* (n~) 0.24 (7) .34 (7) .36
Height (ns) -.lO (ns) -.20 (ns) 0.14 (ns) .O2
Weight (ns) -.28 (ns) -.26 (ns) .31 (ns) .22
Limb Lengths
A m Length (ns) -.O8 (ns) 0.26 (ns) -.O6 (ns) .O2
HandLength (ns) -.O5 (ns) -.IO (1x5) -.20 (ns) .O1
Wrist Breadth (ns) .O4 (m) -.O5 (ns) -.26 (ns) -.14
Lateral Preferences
Handedness (ns) .13 (ns) .16 (7) -.12 (?) .18
Footedness (ns) .O0 (ns) .O6 (7) -.O0 (1) .20
E yedness (ns) -.O4 (ns) .12 (7) .10 (7) .O0
Earedness (ns) .O2 (ns) .12 (7) -.18 (?) .O5
AIM
Positive Affect @os) -.O4 @os) -.O5 (neg) .O0 (neg)--22
Neg Intensity @os) -23 @os) .O3 @os) -.O2 @os) -.O6
Sereniîy (neg) -.62*** (neg) .22 (neg) -.36 (neg) .36
Neg Reactivity @os) -.54** @os) .26 @os) -.27 @os) .10*
Activity Dlary
Mean @OS) AS** @os) .58* * * (ns) 0.14 (ns) -.35
Note. n=2 1 . Predicted directions of correlations are in brackets. Bolded items c o n f h hypotheses. Italicized items are opposite to hypotheses. Gender C o h g : Males=l. Females=2. Predictions: ns = non-signincant; pos = positive; neg = negative; 3 = unknown. *p < 10. **p < . O 5 ***p < .001.

Motor Activity 121
Convergence among activity meclsures. The correlation between the overall
actometer and the overd accelerometer scores was significant, showing evidence of
convergent validity (see Table 4). Thus, although the actometers and accelerometers
measure different aspects of activity, they appear to be measuring some aspect that is
common to both instruments. nie significant correlations between the mean Activity
Diary score and overaii activity, as measured by both the actometers and the
accelerometers provides further convergent validity among the instruments. The Activity
Diary also provided svidence for external validity for both the actometers and the
accelerometers (see Table 3).
Resulrs of Prediclions with Dextrali ty Variables
The analysis presentrd some intsresting, if uncxpected, finduigs. Actometers
showed the predicted lefl-sided bias in rnovement. Accelerometers, however, did not
show such a sinistrai bias. A similar inconsistency was evident when participants were
classified into either a greater nght- or greater lefl- arm movement category. According to
the actorneter-recording, 2012 1 people in the study were more active on the left, whde
according to the accelerometea, 18/2 1 were more active on the nght. Nonetheless, the
dextral measures between these two instruments were correiated significantly with each
other rable 4).
Demogruphics und physical measures. None of the demographic variables
reached statistical signifcance in the correlations with the dextrality measures (Table 3).
As expected, limb lengths were not conelated with either measure of dextrality Fable 3).
It is not expected that these measaues would be sipiicant conelates of dextrai activity,
and they will not be measured in Study 2.

Motor Activity 122
Lateralityprefirences. There was no relation between handedness and dexûality
for either actometer- or accelerometer-measured activity (Table 3). However, with only
one lefi-hander in the Study 1 sample, no conclusions c m be drawn about the
relationship between lateraiized activity and lateral hand preference.
01vrafi and De-rird Aciivify Intercornehiions
Because two different dependent variables were created fiom the same instrument
measures, it is useful to show the comelations arnong them. Table 4 shows the
correlations among the overd activity measures (M of both m s ) and the dextrality
measures for both actometers and accelerometers.
Table 4. Overall and DextraIActivity Inlercorrelations.
Pearson Correlations
Ove rail Overail Dextrality Actometer Accelerorneter Actometer
- - - -
Overd Actometer
Overd Accelerorneter .52***
Dextrality Actometer -.42* -. 15
Dextrality Accelerorneter ..69*** * 9.36 .51**
The A IM
Table 5 shows the AIM fiictor intercorrelations. Although Negative Intensity is
conceptuaily distinct fiom Negative Reactivity, a significant relation emerged between the
two. As well, a significant relation emerged between Positive Affect and Negative
Reac tivity, but none between Positive Affect and Negative intensity . niere fore, it does

Motor Activity 123
not appear that intensity of affect occurs irrespective of emotional valence.
Table 5. AM Intercorrelation Matrix.
Pearson Correlations - -- --
Positive M e c t Negative Int ensity Serenity
Positive Affect
Negative Intensity -06
Srrenity .O6 0.19
Negative Reactivity .46** .45**
Note. n = 21. * p < .10. **p .p< .OS. ***p < .01.
Activity undAIM correiotions. The prediction was that dextrality would relate to
the affective mesure (AIM) factors. Specificaily, there would be a positive correlation
between dextrality and Negative Reactivity and Negative Intensity, and a negative
correlation between dextrality and Positive Affect and Serenity. The results show some
evidence in those directions gable 3), although not significantly so in this s m d simple of
2 1 individuals. For example, dextral acceleration is negatively correlated with Positive
Affect and positively conelated with Negative Reactivity .
DISCUSSION STUDY 1
Shidy 1 was an exploratory one, designed to assess two types of activity monitors
and initiate an examination of the correlates of overd and asymmetric motor activity .
One of the main purposes of the shidy was to examine the relationship between the
actometers and the accelerometers, and to show some evidence of extemal validity for the
instruments. In this, the study was successfùi. 1 found a signincant relationship between
the actometer and the accelerometer measures. 1 also was able to find evidence of

Motor Activity 124
convergent validity for the concept of activity level with a positive relation between the
instruments and the Activity Diary. Self-rathgs of activity correlated sigdicantly with the
instmented measures.
The msuit of the correlation between sex and the mean Activity Dia.ry level raises
a question. Ushg the instruments to estimate overall activity level? sex differences were
not significant. However, d i q reports of physical activity did show significant sex
diffirences. Males reportçd lugher mean activity levels on their diaries than did the
females. Are the males inflating their activity levels or are the females underestimating
theû activity levels? The higher correlations between the instruments and diary activity for
the males suggests that it is the fernales who are underestimating their activity levels,
rather han the males who are lntlating theirs.
Why might males be more accurate than fernales in reporting theû activiv One
possibility lies with the sensitivity of the instruments. The males may be m a h g larger
movements and more high acceleration movements, which are picked up by the
instruments, particularly the accelerornetea. Another possibility is that the Activity Diary
categories less adequately describe the physical activities of fernales. I provided the
participants with examples of physicai activities (sec Appendiv A). Light activity
examples included shopping, s t rohg, and looking for books in the libraiy. Moderate
activities included brisk walking, and household tasks, such as sweeping, dusting, doing
the laundry, and gardening. If females are doing more of these types of activities than
males, and if these activities are redy more active than expected, then the Activity Diary
could be underestimating the physicai activities of females. Shopping may be more of a
moderate activity than a light activity, and housework may be more hard than moderate.

Motor Activity 125
The data should be more carefully evaluated for placement in an activity category.
Perhaps some of these physical activities could be promoted to the next higher level in the
diary. At the very least, we could promote a healthier level of physical activity in fernales,
somethuig a h to weightlifting s m d weights, by encouraging them to do more shopping.
Demogaphic vaiables, such as age, heighf weight, or limb lena& were nc?t
predicted to act as moderator variables for the activity measures. For the most part, the
hclmgs were as expected. Neither ami, or hand length, nor wrist size were sigrdcant
correlates of instrument-measured activity. Because the lunb length masures were not
implicated as correlates of activity, either overd or asymrnetnc, h b length was not
measured in Study 2. Chronological age was the oniy demographic variable significantly
related to activity. Even though the participants in this study were withui a veiy limited
age-range, it appears to be the case that the older individu& were not as physicdy active
as were the younger ones. Although age effects are not being exarnined as a main focus in
Study 2, this surprising outcorne needs further attention in future shidies.
The negative relationship between overd actometer-rneasured activity and
Negative Reactivity Fable 3) was surprising, as a positive relation was predicted. The
question items making up this scale (Appendix A) ask about respondent reactions to
unpleasant, sad, or guilt-inducing situations. These questions perhaps reflect more anviety
or withdrawal-induchg situations, which may be expressed by a reduction of activity . On
the other hand, the relation between Negative Reactivity and accelerometer-measured
activity did not show a similar relation to that of the actometer mesure Vabie 3). It is
therefore, chflicult to make a conclusive statement regarding the relation of Negative
Recctivity with activity. Reports of low leveb of Serenity or calmness were associated

Motor Activity 126
with higher levels of overd actorneter-measured activity, as predicted. In Shidy 2,1 will
furtha examine this intxiguing data by collecting more activity data and relating it to other
measures of both arousd and emotion.
In terms of the dextrality, as was found with the actometers, handedness and other
rneasures oflaterd preference were nc?t related to asymmetric activity. This finding
replicates that of Eaton et al. (1998) in an independent sample. However, it stiU does not
clear up the mystery as to what this asymmetry is related, and to what its purpose.
In discussing the literature and developing my hypotheses, one of the working
assumptions involvcs the putative brain-behaviour relationship. 1 have been making the
assumption that greatér neural activation or arousal is related to or even squivalent to
greater physical arousal in the Tom of motor activity. In Shidy 1, overd actometer-
measured motor activity was negatively related to the Serenity or calmness arousd
subscale of the AIM. Thus, in this case, motor activity was related to a dimension of
arousal in the assumed manner. in the valence-motor activity hypotheses, one also might
assume that hemisphenc arousal of valence will be related to contralateral rnotor
activation. The left hemisphere mainly activates the right limbs, and the right hemisphere
activates the lefi iimbs. The difficulty is fhat the theoretical literanire on hemispheric
valence consistently reports a lefl hemisphere-positive emotion connection and a right
hemisphere- negative emotion connection. This situation shouid result in a nght-ami
movement-left hernisphere-positive emotion connection and a left ami movement-right-
hemisphere-nega tive emotion connection. However, the empirical data relating valence of
affect to lateral motor activity (McKeen, 1995; McKeen, Eaton, Cynpbeil, & Saudino,
1998; and Study 1 above) have shown that right-ami movement is related to negative

Motor Activity 127
emotion. How can this counter-intuitive result o c c ~ ?
Let me refer to the results of Shidy 1. If the Serenity subscale of the AiM
represents positive emotion and low arousal and Negative Reactivity represents negative
emotion and hgh arousal, the relation with motor activity mjght not be as simple as it first
appears. Both subscales are negatively related to motor activity. It seerns that neither
valence nor arousal offers a satisfactory explanation. One possibility is that arousal and
valence are independent dimensions (Helier, 1993), and there need not be the same
pattern of arousai for both constnicts.
Another possibility is that the assumption is wrong that greater lateralwd neural
activation leads to greater limb activity. Instead ofactivating a contralateral lirnb, arousal
of one hemisphere may inhibit motor activity of the contralateral h b . Thus, one could
explain the right-arm rnovement-negative emotion relation by suggesting that the aroused
right hernisphere is Uihibiting rnovement in the lefi m. This explanation works for the
positive and negative emotions and dextrd motor activity found thus far.
It would be premature at this point to attempt to explain the apparent
inconsistencies in the brain-behaviour relationship. Study I was lunited in that it was
based on a s m d sample size, and the results should be considered preliminary. in Study
2,1 more systernaticaily assessed arousal and valence of emotion and theu relation to
motor activity in a larger sample.

Motor Activity 128
STUDY 2
In a second shidy with a larger sample, both overail motor activity and lateralized
motor activity level were exarnined, as they related to temperament, mood, and affect
intensity. For theoretical reasons, lateral preferences were also assessed, including an
additional measure of laterality: the dichotic listenina (DL) task.
Overall activity und arousol. In keeping with the results of Study 1, it was
hypothesized that overail activity would relate to measures of general arousal. In&viduals
with relatively higher levels of arousal, either negative or positive in tone, would show
higher levels of activity. As with the other lateral preferences, I did not hypothesize a
relation between overail activity and the DL masure.
Lateralized uctiviîy und emotional experience. Lateralized activity (the dextrality
measures) should relaie more specificaiiy to the nature of the affect expenenced by the
individual. Consistent with previous empirical iïndings (Study 1 and McKeen, 1995)' it
was hypothesized that individuals with relatively greater right-sided activity (more drxtral)
also would experience more negative affect. As well, it was hypothesized that Uidividuals
with relatively l e s right-sided activity (less dextrd) would experience more positive
affect.
Lateralized activity and emotional perception. Based on Davidson and
Hugdahl' s (1 996) hdings relating DL to EEG measures (lefi fiontal activation-less REA,
right fiontal activation-greater REA) and the left-positive, nght-negative association
between EEG and emotion (Davidson, 1995), 1 am hypothesizing a positive relationship
between REA for negative emotion perception (angry and sud conditions on the DL tape)
and negative affect on the self-report rneasures and &O a positive relationship between

Motor Activity 129
REA for negative affect and dextral activity . Those who describe themselves as more
positive in affect should show less of an REA for negative tone (angry or sad on the DL
tape) and a negative association with dextral activity.
In the foiiowing section, 1 review the measures of temperamental arousal,
emotional valence, mood, and affective perception used in Study 2. .As rnentionzd above,
a dichotic Iistening tape (as used by Bryden et ai., 199 1 ; Bryden & MacRae, 1989; and
Bulrnan-Fleming & Bryden, 1994) is used to assess emotional perception. Measures of
emotionai experience are obtauied using two self-report scales, the Positive Affect-
Negative Affect Scaie (PANAS; Watson et al., 1988) and the Affect Intensity Measure
(AIM; Larsen & Diener, 1987). The AIM assesses arousal, as weii as positive, and
negative affect. n i e Bzhavioral Inhibition tBehaviora1 Activation Scale (BISBAS; Carver
Br White, 1994) and the Pavlovian Temperament Scale (PTS; Newbeny et al., 1997) assess
aspects of temperamental aroiisal. In reviewing the validity and reliability of these
instruments, 1 highlight the empiricai nature of each concept and outhe the hypothesized
relations between motor activity and the emotional concepts. Copies of the instruments
used in Study 2 are in Appendix B.
Instments
Puvlovt an Temperament Survey
The Pavlovian Temperament Survey (PTS-Amencan English Version) is a 66-item
self-report questionnaire developed to assess Pavlov's conception of the constitutional
characteristics of the neivous system (Newbeny et al., 1997a). It contains three subscales,
reflecting three defirutional fàcets of the temperament dimensions. The subscales are
named the Strength of Excitation (SE), Strength of Inhibition (SI), and Mobility of

Motor Activity 130
Nelvous Processes (MO), drscribed earlier. Each contains 22 items answered in a 4-point
Likert-type scale (sirongly ugrce, agree, djsagree, and strongly disagree).
Vulidity of ihe PTS
In validating the questionnaire, researchers have compared it to results obtained
with other temperament or personality questinnnaires also refening tn the concept of
arousal. These include inventories measuring extraversion, nruroticism, psychoticism,
sensation seekmg, impulsivity, and affect intensity (Ruch, Angleitner, & Strelau, 199 1).
For example, the results of one study of 159 parûcipanb showed that SE was correlated
with the subscales of Zuckerman's (1979) sensation seeking questionnaire. These
subscales included M and Advenhue Seekmg, r = .45, p < .O0 1, Expenence Seehg,
r = .46, p < .O0 1, Boredom Susceptibility, r = .3 1, p < .O0 1, and Disdibition, r = .36,
p < ,001. Strength of Inhibition was correlated negatively with the sensation seeking
subscales of Expenence Seeking, r = 9-35, p < .O0 1, and Disinhibition, r = 9.35, p < .O0 1.
Mobility was mos t h i a y correlated with Thdl and Adventure Seekmg, r = .36, p < .O0 1
and Expenence Seekmg, r = .43, p < .O0 1.
In that same study (Ruch et al., 1991) SE was related to ImpSivity , r = .27,
p < .O0 1, Venturesomeness, r = 34, p < -00 1, and negatively with Empathy, r = 0.29,
p < .O0 1 on an Impuisivity scale (Eysenck, Pearson, Easting, and Allsopp, 1985). Strength
of Inhibition was related negatively to impulsivity , r = -.42,p < .001, and
Venturesomeness, r = -.22,p < .01, and to Affect Intensity on the AIM (Larsen & Diener,
1 987), t = -.48, p < .O0 1. Thus, the arousal subscales of the PTS are consistent with other
s&report instruments designed to assess levels of arousal.
The PTS subscales are also related to various personality dimensions, as evident in

Motor Activity 131
a senes of validity studies described below (see Ruch et al., 199 1). n i e participants in
these studies came fiom three independent samples. The fhst consisted of 159
participants, aged 18 to 67 years (M = 33.6, SD = 12.8). The second consisted of 102
subjects, aged 19 to 70 years (M = 32.1, SD = 12.0). The third consisted of 74 subjects,
aged 17 to 68. Approximately halfwere fernale. Strength oPExcitation cornelates with
gender, r = -.29, p < .01, and SI correlates with agr, r = .27,p < .O 1. This fincihg is
compatible with the idea that males wiii show a greater desire for sensation seeking and
assertiveness. It is aiso plausible that the ability or willingness to inhibit action should
increase with age (Newberry et al., 1997a).
On Eysenck's Personality Questionnaire (EPQ-R; Eysenck, Eysenck, & Barrett,
1985a) SE was related positively to Extraversion, r = .39, p < .O0 1 and Psychoticism,
r = .23, p < .O 1, and negatively to Neuroticism, r = 0.42, p < .O0 1. The SI was related
negatively to Extraversion, r = 9-37, p < .O0 1, Psychoticism, r = -.36, p < .O 1, and
Neuroticism, r = -.38, p < .001. Mobility related positively to Eautraversion, r = .46,
p < .001, and negatively to Neuroticism, r = -.34, p < .001. Thus, it is evident that SE and
SI differ most in their relationshp to Extraversion. It is not clear to what extent SE and SI
predict Neuroticism indapendently or whether the two facets are redundant to some
extent. More analyses examinhg demographic variables and the influence of gender
needs to be done (Clark & Newbeny, 1995).
On the NE0 Personrility Inventory (NEO-PI; Costa & McCrae, 1985), SE was
most highly related to Neuroticism, r = -.57, p < .O0 1, and Extraversion, r = .47, p < .O0 1.
Strength of Inhibition was also related to Neuroticism, r = 9.26, p < .O 1, and
Agreeableness r = .29, p < .O0 1. Mobility was also related to Neuroticism, r = 0.53,

Motor Activity 132
p < .O0 1, and Extraversion, r = .53, p < .O0 1. The patterns of correlations among the PTS
scales and two personality scales are similar, although there appears to be some empincal
overlap with the concept of Neuroticisrn (or rather non-neurotic emotiorial stability).
In the temperament domain on the Emotionality-Activity-Sociability-
Irnpulsiveness inventory (EASI; Buss & Plcrnin, 1984), SE was again cmelated
negatively with Emotionality (negative emotionality), r = -.42, p < .O0 1, and positively
with Activity, r = .43, p < .O0 1. Strength of Inhibition was correlated negatively with
Emotionality, r = -.39, p < ,001, and Impulsivity, v = 4 6 , p < .O0 1, and positively with
Activity, r = .26, p < .O 1. Sirnilarly, MO was comlated negatively with Ernotionality, r = - .46, p < .O0 1, and positively with Activity, r = .42, p < .O0 1, and Sociability, r = .33,
p < .01. It is noteworthy that the EASI Activity subscale is associated with the SE, SI, and
the MO. The main differences among the scales involved their relations with Emotionality
for SE, ImpSiMty for SI, and Sociability for the MO subscale.
The SE, SI, and MO subscales are conceptudy independent, but not ernpincally
so. The intercorrelations mong the three scales are statisticdy significant, the SE-SI
relation, r = .22, p c .O 1, the SE-MO relation, t = .43, p c .O 1, and the SI-MO relation,
r = .16, p < .O 1. The SE-MO relation is based mamly on the high correlations between
questions deaiing with demanding, intensive activities (on the SE) and questions dealing
with the ability to change fiom one activity to another (on the MO). From the pattern of
correlations, Clark and Newberry (1995) maintain that each contributes something that
the other does not.
Reliability and Stability of the PTS
On a shidy sample of 554 individuals, the items making up the SE, SI, and MO

Motor Activity 133
subscales of the PTS (Newbeny et al., 1997a) produced Cronbach's (1951) alpha
coefficients of .83, .75, and .83, respectively (Clark & Newbeny, 1995). Test-retest
reliabilities for the PTS were assessed on a sample of 375 individuais. The intesvals
between test-taking varied between one and 56 days, with a median interval of 27 days.
Cordations between the first and second times were .?2, .?O, and .?O for the SE, SI, and
MO subscales. Both reliability and stability are quite acceptable.
Hpotheses abotrt the PTS
1 am hypothasizing that the SE and MO subscales of the PTS wdl relate to arousal
and thus, to overall motor activity. The SI should be related iiegatively to overali activity.
In contrast to an expected relation between arousal and overail activity, 1 do not expect to
find a significant relationship between the PTS subscales and lateralized activity. On the
whole, the question items on the PTS are not related to specific positive or negative
emotional valence, but reflect the intent of the scale to measure the individuai's general
arousaî level.
The BISRAS Scales
The Brhavioural Inhibition/Behavioural Activation Scale (BISBAS) 1s a 20-item
questionnaire dcsigned to assess Gray's theory (1 972) of behaviouml inhibition and
activation. Gray's theory attributes approach behaviour and positive affect to a sensitivity
to signals of reward (BAS activity) and inhibition of behaviour and the creation of
negative affect to sensitivity to signals of punishment (BIS activity). BIS fictioning is
related to a proneness to anxiety and the BAS is related to impulsive or antisocial
tendencies (Carver & White, 1994).
Aithough there well may be a sigmficant correlation with d e t y , the BISBAS

Motor Activity 134
scale is not the sarne as one measuring trait anxiety or irnpulsiveness. The reason is that
although a person with a highly sensitive BIS may be vulnerable to states of anxiety or
other negative affects, the individual may be quite adept at arranguig his or her life to
avoid threatening situations that would cause anxiety. The BISBAS is designed to
measure the sensitivity of the system rather than the individiial's typicnl experiences in
day-to-day life (Carver & White, 1994).
The BIS and BAS physiological systems should be independent of each other,
although empiricdy, the degree of independence varies across subscales. In Carver and
White's (1 994) study (N = 732), the BIS scale correlated r = -. 12 with BAS Drive, r = .28
with BAS Reward Responsiveness, and r = -.O8 with BAS Fun Seeking. In Sutton and
Davidson's (1997) study, the correlation between the BIS and BAS scores was not
significant, r = 4 7 , p > .26.
The answers to the BISBAS scale questions follow a Likert-type format.
Responses are made on a 4-point response scale with 1 indicating strong agreement and
4 indicating strong disagreement. There is one BIS scde and three BAS-related subscales
in the BISBAS. This scale was denved onginally fhm a factor andysis study of 732
college students. Items assessing the BIS reference potentidy punishing events. These
include staternents such as, 1 worry about making mistakes, and If1 think something
unpleusant i s going to huppen I usuuUy gel pretty 'worked up.' Items assessing the BAS
reference potentidy rewarding events. These include statements such as, When I get
something I want, Ijèel excited and energized, and When I t doing well al someihing, I
love to keep ar it (Carver & White, 1994).

Motor Activity 135
Vulidity of the BISRAS
Carver and White (1994) administered several other scales to assess the
convergent and discriminant validity of the BISBAS scale. As expected, the BAS scales
were related to extraversion. On a sample of 38 1 people, researchers found that
extraversion was conelated with BAS Drive, r = .41.p < .001. BAS Reward. r = .39.
p < .001, and BAS Fun Seeking, r = .59, p < .001, but was uncorrelated with the BIS,
r = -. 14, p > .OS (Eysenck & Eysenck, 198%). The BIS scale was related negatively to the
Optirnism scale on the Life Orientation Test (LOT; Scheier & Caner, 1985), r = -.22,
p < .001.
The BISBAS shows good discriminant validity for the affective component of the
scale. Tested on a sample of 498 adults (Caiver & White, 1994), the BIS score was related
to Negative Affectivity on the PANAS scale (Watson et al., 1988), r = .42, p < .O0 1, but
Negative Affectivity was uncorrelated with the BAS subscales, Drive, r = -.07, p > .05,
Reward, r = .OS,p > .05, and Fun Seeking, r = 4 5 , p > . O 5 Positive Affectivity was
correlated with the BAS scales, Drive, r = .31, p < .O0 1, Reward, r = 28, p < .O0 1, and Fun
Seekirig, r = .19,p < .O0 1, but was uncorrelated with the BIS scale, r = 9.06 ,~ > .05. This
evidence of both convergent and discriminant validity will d o w me to examine the
hypothesized relations among motor activity, emotion, and arousal.
Reliubil i~ and Stabiliv of the BISBAS
Internai reliabiîity for each of the subscale items was asscssed in a study of 732
individuals (Carver & White, 1994). The alpha coefficient (Cronbach, 195 1) for the BIS
scale was -74, M = 19.99, SD = 3.79. The alpha coefficient for the BAS subscales were .73,
M = 17.59, SD = 2.14 for BAS Rewarû Responsiveness, -76 for BAS Drive, M = 12.05,

Motor Activity 136
SD = 2.36, and .66 for BAS Fun Seeking, M = 1 2.43, SD = 2.26. A gender Merence in
mean BISBAS ratings was also found (Cmer & White, 1994). BIS scores were lower
among men, M = 18.84 than among women, M = 2 1.09. BAS Reward Responsiveness
(the h s t BAS subscale) scores were also lower arnong men, M = 17.27, than among
women, M = 17.90. In another study, Sutton and DaMdson (1997) found average alpha
coefficienl of .75 for the BIS items and .85 for the BAS items.
To assess rzliability across h e , a simple of 1 13 subjects were retested about
eight weeks afler the initial testing. Test-retest correlations were .66 for the BIS scale, .59
for BAS Reward Rrsponsiveness, .66 for BAS Drive, and .69 for the BAS Fun Seeking
subscale (Cawer & White, 1994). Sutton and Davidson (1 997) adrninistered the BISBAS
scale twice, about five months apart, to a group of forty-six 1 8- to 22- year olds. The
intraclass correlation as a measure of test-retest stability was .68 for the BIS scale, .72 for
the BAS, and .8 1 for the ciifference (of r scores) between the BIS and BAS scores.
Hypotheses about the BISRAS
It was hypothesized that the BISBAS scale, as a measure of arousal, would
correlate positively with overail activity. Those whose BAS scores were higher would be
more highly aroused, and their overd activity would correlate positively with theû BAS
score. The BIS score represents essentiaily an inhibition of arousal, so it was hypothesized
that the BIS score would be negatively correlated with overall activity. Additionally, if the
BIS score also represents a negative ernotional tone (anxiety), then dextral activity should
correlate positively (greater @t-arm activity) with BIS scores.

Motor Activity 137
The PANAS Scales
in studies of the structure of affect in which researches investigate facial
expressions or mood, two dominant dimensions emerge. The two are usuaily described as
a dimension of pleasantness-unpleasantness or positive-negative affect and a dimension
of xousal. A41though the t e m s positive aEect and negative affect might siiggest that these
two mood factors are opposites and thereforr highly negatively correlated, they have
emerged as two distinct rnood dimensions. In factor analytic studies of affect, they are
rneanuigfully represented as orthogonal dimensions. M e n individuals rate their moods
d d y using the PANAS, within-subject analysis indicates that the Positive and Negative
Affect scores share only about 12% of the variance (Watson & Clark, 1997).
Positive Affect (PA) re flects an individual's enthusiasm, activity, and alertness.
High PA involves high energy, full concentration, and pleasurable engagement. Negative
Affect (NA) reflects a dimension of subjective distress, aversive mood states, including
anger, contempt, disgust, guilt, fear, and anxiety. Low NA involves a state of calrnness
and serenity. Trait dimensions of positive and negative emotionality roughly correspond
to the dominant personality factors of'exûaversion and anxiety-neuroticism, respectively
(Watson et al., 1988).
The PANAS scale (Positive and Negative Affect Schedule; Watson, Clark, Br
Teîlegen, 1988) is a 20-item self-report scale. The scale contains 10 emotion descnptoa
which assess Negative Affect and 10 which assess Positive Affect. To complete the scale,
individuals indicate whether they have experienced a particulas mood state duMg a
specified time fhme. lndividuais rate their moods on a 5-point Likert-type scale, labeiied
very slightiy or no! ut au, o little, moderatel), quite a bit, and very much (Watson et al.,

Motor Activiîy 138
1 988).
The PANAS differs fiom the BISBAS scales in that the PANAS asks respondents
to indicate to what extent they experience each affect in day to day life. The BISBAS
aùns to assess a vufnerobility to a particular arousal expenences. The PANAS also taps a
range of specific positive and neeative emotions (Carver & White, 1994).
Vaiidity of t l~e PM&
The PANAS correlates with other measures of affective state. The Beck
Depression Inventory (BDI; Beck et al., 196 1) is a selfireport questionnaire assessing miid
to moderate levels of depression. Wîîh a sample size of 880, the NA scaie correlated .56
with the BDI and -.35 with the PA scale of the PANAS. These results suggest that
depression involves both the lack of plmurable expenence (low PA) in addition to anger,
apprehension, Nt, and distress (hi& NA). The A-State subscale h m the State-Trait
Anviety Scale (STAI; Spielberger, Gorsuch, & Lushene, 1970) is a scale designed to
assess negative responses to a variety of stressa and aversive events. With a sample of
203 individu&, the PANAS NA scale correlated .5 1 with the A-State and the PANAS PA
correlated -.35 with the A-State. Many of the items on the A-State tap moods traditiondy
associated with anxiety, such as feeling tense, upset, womed, anuious, nentous, and
jitteiy. Others reflect pleasant, high PA states, such as, feeling joyful, pleasant, self-
confident, and rested. The advantage of the PANAS over both of these instruments is that
it assesses both positive and negative affective states separately (Watson, et al., 1988).
When the PANAS was used to assess intraindividual mood fluctuations, it was
sensitive to changing circumstances. In two studies, Watson (1988) had subjects complete
the PANAS eidier each evening for 5- to 7- weeks or every three wakhg hours for a week.

Motor Acîivity 139
At cach assessment, the individuals also rated their social activity and the level of stress
that they had expenenced over the previous appropriate time epoch. As expected, in both
studies the withui-subject variations in perceived stress were strongly correlated with NA,
but not PA. Social activity was more highly related to PA than to NA. Positive Affectivity
rose in the moming, remained steady during the rest of the day, and declined during the
evening. Negative Affectivity did not exhibit a diumal pattern.
In a study examining EEG activation, the PANAS (Watson et al., 1988), and the
AIM (Larsen & Diener, 1987) were administered to 90 undergraduate women.
Researchers found that greater relative left fiontal activation was associated with increased
PA and decreased activation with NA. Among those who completed the PANAS at the
same time as th& EEG was assessed, the correlation between fiontal asymmetry and the
PA-NA differences score was significant, r = .3 1 , p < . O 5 Among the women whose
anterior temporal asymmetry was stable over time, mean EEG asymmetry predicted
subsequent PA scores obtained between 6 and 15 rnonths after EEG recordings were
made, r = .49, p < .O05 (Tomarken et al., 1 992).
Reliability und Stobility of the PANAS
Normative and reliability data were developed using largely independent samples
and seven different temporal instructions. A total of over 4000 coiiege students and 164
university employees rated how they felt either riglit now, today, during the past few
duys, during the past week, during the past few weekr, during the past yeur, or, in
generul (Watson et al., 1988). No large or consistent sex ciifferences were found. Subjects
reported more PA than NA over d of the tirne h e s .
Assessments of interna1 consistency showed that Cronbach's alpha ranged from

Motor Activity 1 40
.86 to .90 for PA and fiom -84 to .87 for NA. The reliabdity of the scales was unaffected
by the tirne instructions used. The correlation between the PA and NA scales was low.
They shared between 1 % (for mood today) and 5% (for mood in the past year) of their
variance. In a factor analysis of the scale items, two dominant factors emerged.
Correlations dern~nstrating convergent validity within a factor ranged f h n 89 to 95,
whereas discriminant correlations between factors were low, ranging fiom -.O2 to -. 18.
Test-retest reliability, based on 101 students who completed ratings for each of the
seven tirne m e s on two different occasions, eight weeks apart showed no significant
differences. But, the retest stability tended to increase as the t h e fiame lengthened
because ratings over the longer time penods were irnplicit aggregations (Watson et al.,
1988).
The PA and NA scales also showed long-tenn stability. Students, who were tested
during college and retested six to seven years later showed significant rank-order stability
in the PA and NA experienced. The correlation between Negative Affect at the two times
was r = -43, p < .O 1. The correlation between Positive Affect at the two times was r = .36,
p < .O 1. The researchers suggested that PANAS measures of Positive and Negative mect
showed substantial stability as trait measures across time (Watson & Walker, 1996).
Hjpotheses about the PANAS
1 am hypothesking that the PANAS scale will correlate positively with overall
activity. Individuals with either high PA or high NA will be aroused and therefore wdl also
show high levels of motor activity. As well, those with low levels of PA and NA WU be
the least aroused and show the least motor activity.
Based on the research hdings that show greater left activity was associated with

Mo tor Activity 141
contrnteàness or happiness in infants and greater right activity was associated with
fusshg and crymg (McKeen, 1995), 1 am hypothesinng that self-reported PA will
coirelate negatively with dextral activity (k, greater le fl activity), while NA wdi correlate
positively with dextral activity (greater right activity). I am also hypothesizing that if
relatively more happiness is related to greater lefi-sided activity, then the PA-NA
Merence score will relate negatively to the dextral activity measure.
Dichotic Listening Task
The DL task was initially developed to simulate the attentional problem that air
trafic controllers face when they are required to listen to Eght information from more
than one aircraA at the same tirne. Kimura (1 96 1 a, 196 1b) showed that subjects with nght-
hemisphere language representation were more accurate recalling items fiom the lefl eu,
while those with lefi-hemisphere language were more accurate in recahg items from the
right ear. Kimura's data showed that in normal people, regardless of handedness, the
majority show a REA for language. Her initiai studies were foliowed by others whch
showed that most people display a LEA for melody, environmental sounds and emotional
stimuli (Bryden, 1988a; Koenig, 1990).
There are two general views as to why laterality effects are observed in the DL
task. The classic explanation is an argument based on biological stmcture. The argument
is that the contralateral pathways are larger and huictionally stronger than ipsilateral
pathways. Moreover, language-based information that reaches the right hemisphere has to
be transfened across the corpus callosum to the lefi-hemisphere for processing. This
indirect tmnsfer makes for a less efficient process than the direct contralateral path
(Hugdahl, 1995). In addition, newous activation in contralateral pathways may block or

Motor Activity 142
inhibit activation in ipsilateral ones (Kimura, 1967). Individual ciifferences are thought to
occur because the degree of laterabation depends upon a given task and differences in
prior expenence or biological tendencies for responding to the task.
The second view is the argument that the anticipation of a verbal stimulus primes
the left hemisphere, which increases arousal in the (ieft) language-specialized hemisphere
and causes an individual to attend to the contralateral stimulus. nius, a listening
asymmetry in normal people may be a manifestation of a tendency to shift attention to
the side contraiateral to the more higNy activated hemisphere (Kinsboume & Hiscock,
1983). Individual differences are thought to arise fiom the relative degrre to whch a
specific task activates eiîher one hemisphere or the other.
According to Bryden (1988a), the current evidence indicates that neither view is
completely correct. One problem for the attentional mechanism theory is that it does not
predict the empiRcal occurrence of both right- and lefi-hemisphere activation at the same
time for non-verbal and verbal material, respectively. On the other hanci, attentional
factors do appear to be a component in producing dichotic laterality effects. When either
adults or chilâren are asked to attend to what they hear in one ear, they are more accurate
in the ear that is attended, although the dominant ear score is more resistant to attentional
manipulation (Asbjomsen & Hugdau 1995; Harper & Kraft, 1986).
Val~dity of the Dichotic Listening Technique
One of the most reliable ways of validating verbal tasks in DL performance is to
compare DL results on a verbal task of ianguage b c t i o n after the administration of
amobarbital sodium (Sodium Amytal) to one hemisphere (Hugdahl, 1995). Sodium
Amytai is a barbiturate which suppresses function in the hemisphere that receives the


Motor Activity 1 44
lefi-hemisphere language dominance than did the Wada test.
Besides the Wada mathod, there are other means used to validate the DL
technique. In terms of biological structural differences, verbal DL measures show that
those people with a REA (lefi-hernisphere language dominance) are more likely to have a
lasger lefl posterior sylvian region, which is associated with language processing. Those
with a LEA (right-hemisphere speech dominance) are more Wrely to have a larger right
posterior sylviûn region. A LEA (right-hemisphere speech) is also associated with a
corpus callosum larger by about 25% when compared with patients who have either lefl
hemisphere or bilaterai speech dominance (Strauss, 1988).
Finally, Davidson and Hugdahl(1996) report that asymmeûies in EEG activity
predict DL performance. Participants perfonned the DL task 4 months after the EEG
testing. The pattern of data indicated that individuais with a larger REA on a verbal task
showed more left-sided activation in the temporal-parietal region. A largrr REA was also
associated with decreased EEG activation in the left-prefiontal region and increased
activation in the nght pre fiontal area. Davidson and Hugdahl(1996) suggest that auditory
lateralization is probably not related to a single mechanism, so they were not surprised
that there were low correlations arnong measures in other perceptuai modalities that
putatively reflect hemispheric specialization. They also noted that asymmeâries almg the
rostral-caudal plane may be of as much relevance as the right-left dimension. This last
study (Davidson & Hugdahl, 1996) is exciting because it is among a L w to h d a
significant relation between a physiological measure and a behaviourai rneasure.

Motor Activity 145
Reliabiliry of Dichotic Listenittg Tmks
Dichotic listening techniques have included a range of stimuli that require the
perception of nonsense syllables, digits, and lists of words (which tend to produce a REA
in most individuals), and environmental sounds, music, synthesized sounds and
emotiond tone recognition (which tend to produce a LE.4 in most Vidividuals). Respmse
procedures include reporting orally or on paper, either &e recd or matching a set of
choices, directing attention to one ear or the other, reporthg whether or not a word
belongs to a particular semantic category, or indicating when a particulas target word is
heard (Segalowitz, 1986).
Bryden (1988a) maintains that the REA is a very robust effect, no matter what
variations have been introciuced in methodology. The original procedure involved the
presentation of lists of words or digits. Subjects were told to recall as many of the stimuli
as possible in any order, and the strategy of attending to and reporthg was left to the
preference of the subject. Therefore, if the subject reports items fiom the nght ear &st,
the individual must retain those items h m the left ear in memory for a longer penod of
time. Thus, hemispheric lateraiization may not be the ody tactor affecting the magnitude
of the REA. There may be a memory component as weli. Bvden (1988a) maintains that
with standard DL procedures, speech lateralization is correctly assessed 85% of the tirne.
Hugdahl(1995) reported that 28 of 32 subject. (87.5%) maintained a REA using a
consonant-vowel (CV) task when retested afier one year. Other researchers suggest that
the DL technique is not that reliable. in their review of eight studies fiom the seventies
and early eighties, Hiscock and Decter (1988) estimate that even over a short test-retest
interval in adults, the reiiability is no greater than about 0.70. Teng (198 1) reported test-

Motor Activity 146
retest conelations that ranged f?om -. 1 1 to +.60 in an adult study that spanned an interval
of one to six rnonths. On the othzr hana Biyden (1988a) reports that much hgher
reliabilities have been found. For example, McKeever, Nolan, Diehl and Seitz (1984)
showed a DL task reliability of 0.88. and Speaks, Niccum and Carney (1982) one of 0.90.
Several rnethodolngical diflkrences may account for the discrepancies in rrported
reliabilities. Modem sound equipment provides better control over the quality, loudness,
and timing of stimulus presentations. A second change is that, rather than being lrft fiee
to choose their own strategy for attenduig to one ear or the other, subjects now are ofien
asked to attend to one particular side or to one particular target sound or ernotional tone.
These changes have resuited in reduced between-participant variance and better reiiability
(Bryden, 1988a).
The REA for verbal DL tasks continues to be a consistent and robust finding
(Bryden, 1988a). The DL task used in Zatorre's (1989) study is considered more reiiable
than the original one used by Kunura (1 96 1 a) (Strauss, 1988). Zatorre (1 989) and others
(Wexler & Halwes, 1983) used a verbal DL task made up of consonant-vowel-consonant
(CVC) monosyllables that rhyme (e.g., cow-pow). This type of verbal DL task is cded a
fùsed rhymed words test (Wexler & Halwes, 1983).The Kimura-type DL task consists of
different one-syllable words (e.g., rot-mop). A second methodological change invoives
having the subjrct deliberately attend to one ear or the other and report ody those items
presented to that ear. Bryden, Munhail and Mard (1983) found that this procedural
change, cailed a directeci attention procedure, gives the same REA as the fiee recall
method. However, it also results in a reduced between-subject variance, thus Mproving
reliabrlity . A third methodological change involves monitoring a target word (e.g. dog)


Motor Activity 149
sample of 72 nght-handed chiidren in Grades One, Three, and Five. The children were
instmcted to listen for a target word (bower or tower) or a target emotion (happy, ungry,
sad, or neutru0 for 72 tnals each. n i e results showed a Task by Ear interaction,
F(1,58) = 49.17, p < .O0 1. Similar to the aduits, when words were the target, subjects were
more accurate on the ri@ than on the lefi. When emotions were the target, siibjects wcre
more accurate on the left than on the right car. Emotional stimuli were easier to process
than word stimuli for the children, F(1,58) = 4.72, p < .04. Sud was reportrd more
accurately than happy, F(1,52) = 26.92, p < .O0 1.
Although the studies have demonstrated a left hemisphere advantage for words
and a right hemisphere advantage for emotion, they have not typicaily found a valence by
car interaction etkct. However, the technique of using simultaneous emotion and verbal
tasks is new, and it may be the case that valence etTects can be demonstrated with the new
DL method. In this dissertation, a copy of the same DL tape that Bulman-Fleming and
Bryden (1994) and Obrzut et al. (1 997) used in their shidies wdi be used. Both verbal and
emotional DL function will be examined to get a measure of laterai ear advantage for both
words and emotions.
Hypotheses about the DL Tusk
According to the iiterature, a REA has been found for the perception of verbai
material and a LEA has been found for the perception of emotional matenai (Bryden,
1 988a). 1 predict the same resuits in Study 2. The finding of a lateral difference in the
particular valence of emotions has been more elusive to find with the DL method
(Bryden, 1988b; Obmt et ai., 1997). 1 predict, albeit optimisticdy, that the data wiu show
a laterality for valence. Happy will show a REA and that sud and angry will show a LEA.

Motor Activity 150
There are no hypotheses for the relation between the DL task and overaii activity.
However, 1 am hypotheskhg a relation between the DL data and lateralized activity. If
there is a REA for happy, and dextral activity also is negatively associated with happy,
then there should be a significant negative relation between the REA and dextral activity.
Similuly, if there is a LE.4 for rad, and angry, dextral activity also is pccitively ass~ciated
with sud, then there should be a significant positive relation between the LEA and dextral
activity .
Summary oiHypotheses
The hypothesized relations arnong activity, arousal, and émotion described above
are outluied in Table 6. To summarize, overd activity wili relate to measures of general
arousal. Higher lrvels of activity wdl be associated with higher levels of arousal (as
reflected by Positive Affect, Negative Intensity and Negative Reactivity on the AIM, the
Behavioural Activation scale on the BISBAS, SE and MO on the PTS, and both PA and
NA on the PANAS). Lower levels of activity will be associated with lower levels of
arousal (SI on the PTS, the BIS scale on the BISBAS, and Serenity scale on the AIM). 1
do not expect any relation between overd activity and any of the lateral preferences,
includuig the DL measure.
Lateralwd activity (the dextrality measures) will relate more specifically to the
nature of the affect experienced by the individual. 1 expect that there will br a right-lefi
movement difference related to affect. Specifically, movement in the contralateral lefl am
WLU relate to negative emotional Uûormation processed in the right hemisphere.
Movement in the right ami VIAU relate to positive affect processed in the left hemisphere.
What is less obvious is whether one might expect greater or lesser movement as a result

Motor Activity 151
of the activated contralateral hemispheres. Based on empirical results fiom previous
shidies (e.g., McKeen, 1995), I have assumed that the emotiondy activated hemisphere
inhibits contralaterai ami movement. Thus, 1 am hypothesizing that relatively greater
nght-sided ami activity (more dextral) wiU be positively correlated with negativr affect, as
defined by Negative intemity or Negative Reactivity on the AIM, Negative Affect on the
PANAS, and BIS on the BISBAS. Conversely, 1 am hypothesizing that relatively less
right-sided activity (less dextrality) will be negatively correlated with positive affect, as
defined by Positive Atrect on the N M , Positive Affect on the PANAS, and as BAS on the
BISBAS. With respect to emotional perception, 1 am hypothesizing a positive relation
between dextral activity and a REA for negative emotional perception (angry and sud
conditions on the DL task). Conversely, 1 am expectuig a negative relation between
dextral activity and a REA for positive emotional perception (happy on the DL task).

Table 6. Sttmmary ofpredictedrelations.
Other Measures Artlvity Measures Overail AL DexîraI AL
CSA CSA
Demogrrphlcs
Sex
Age
PANAS
PA
NA
PA-NA
Lateml Preferences
DL Words
Happy Sad/ Angry
AIM
Positive Affect
Negative Intensity
Serenity Negative Reactivity
PTS SE
SI
MO
SEISI
BISfBM
BIS BAS
*%
pos
neg
J'eg pos
neg
PO s
n'% pos
BAS-BIS DOS DOS ne^ nesz pos = positive correlations predicted. neg = negative correlations predicted.

Motor Activity 153
METHOD STüDY 2
Procedures
The procedures in Study 2 were similar in format to that of Study 1 , except that
participants did not have their limbs measured nor did they complete an Activity Diary.
To assess motor activity, participants wore one actometer and one accelerometer on each
wrist, the same as in Study 1. They provided demographic information, participated in a
dichotic listening (DL) task, and completed various questiomaires in the laboratory. To
assess temperarnental arousal and emotional traits, students completed the PTS
(Newberry et al., 1997a), the BISBAS (Carver & White, 1994), and the AIM (Larsen &
Diener, 1987). To assess emotional state or mood, participants completed the PANAS
(Watson et al., 1988). To assess laterai preferences, participants completed the LPI
(Coren, 1993). To assess verbal and emotional perception, participants carried out a
dichotic htening task (Bulman- Fleming & B yden, 1 994).
The participants aîîended an initiai appoinhnent during which they cornpleted
most of the questionnaires. Duhg a second appointment, the activity monitors were
strapped to each wrist to measure the participants' motor activity for the next 24-hou
period. At that time, participants also were given instructions on the care of the
instruments, had their weight and height taken, and were asked for demographic
information. Participants were also given instructions on completing three mood
(PANAS) inventories while they were wearing the instruments. Twenty-four hours later,
participants retumed for a third appointment, at which tirne they rehuned the activity
monitors, and cornpleted one hal PANAS mood inventory and the LPI.

Motor Activity 154
Sample size detemination. 1 estimated that the etyect sizes of the correlations 1
would be testing were moderate in size (r = .30). Based on the results of Study 1 and the
literature in the area, 1 did not expect sigdicant sex Merences in activity level, self-
report temperament, mood scales, the lateral preference inventory, nor in the dichotic
listening task. Using statistical pcwer analyses (Cohen, 1969), aven a correlation of 30,
an alpha of .05, and two-tded testing procedures, a sample size of 80 was needed in order
to have an 80% or higher chance of identifyuig the hypothesized correlations.
Participants. The participants for Study 2 were recruited fiom the Introductory
Psychology classes of the 1998 University of Manitoba Spring and Summer sessions. A
total of 85 undergraduate university students participatcd in Study 2,45 fernales and 40
males. For their participation, they received credits towards their Introductory Psychology
course grade muk. One male completed only part of the requirements for the study, and
was dropped 60m further analysis, resulting in a final sarnple of 84,45 femaies and 39
males.
RESULTS STUDY 2
The mean age of the participants was 22 years (SD = 5.8), although the age range was
fiom 16 to 49 years. Table 7 shows the basic descriptive characteristics of the sample.

Motor Activity 155
Table 7. Demographic and Descriptive Infunnation.
Mean SD SE Min Max
Whole Sample (n = 84)
Age (Years) 22.33 5.80 0.63 16.89 49.60
Height (cm) 170.3 1 10.35 1.13 148.10 190.60
Weight (Kg) 71.69 15.15 1 .O5 48.20 113.45
Ponderal Index 1 .46 0.30 0.03 1.01 2.74
Sleep (Hrs) 7.58 1.34 O. 15 4.00 1 1 .O0
Males (n = 39)
Age (Years) 21.01 4.32 0.69 17.87 39.12
Height (cm) 178.36 6.60 1 .O6 166.00 190.60
Weight (Kg) 77.67 12.48 2.00 56.55 105.60
Ponderal Index 1.37 0.18 0.03 1 .O8 1.80
Sleep (Hrs) 7.78 1.31 0.2 1 5.00 1 1 .O0
Fernales (n = 45)
Age (Years) 23.47 6.67 0.99 16.89 49.60
Height (cm) 163.34 7.56 1.13 148.10 181.40
Wright (Kg) 66.5 1 15.47 2.3 1 48.20 1 13.45
Ponderal Index 1.53 0.37 0.05 1.01 2.74
Sleep (Hrs) 7.40 1.35 0.20 4,OO 10.00
Note. Min = Minimum; Max = Maximum; Ponderal Index = 100000 * Weight/ Height'; Sleep = Self-reported hours of sleep.
Actometers: Overall
Preliniinary assesment. Two females produced very high ight-arm movement
scores, 3.8 and 3.1 SD above the mean. They both indicated verbdy that they were very

Motor Activity 156
active. One had been bicycling for 1.5 hours and the other had been at work in a daycare
centre. There fore, their measured ac tivity corresponded with their highly active lifestyle.
AAer the overd mean movement of both limbs was calculated, only the daycare worker's
movement score remained above 3 SD (3.4). Given the context of her d d y activity, 1 did
not alter her data.
Actometer meusure. As in Study 1,1 calculated a movements per hour rate
measure for each h b . This rate rneasure includes the time the individuals spent sleeping,
as weU as the time they spent canying on their evexyday activities. The correlation
between the le fi and right m s was sipficant, r = .66, p < .O00 1. Therefore, 1 used the
mean fiom the two h b s as the overd activity variable. This mean rate measure is the
k s i of the two key outcome variables for the actometer measure.
Descriptive statistics. Participants produced an average of 8 1 O movements per
hour. However, individual differences in movement levels were evident. Table 8 shows
the descriptive statistics for the actometer data. Ample variability in mean actometar
activity scores is apparent. The intercorrelation matrix for the actometer measures shows
that these individual differences are consistent across LMbs (sce Table 9).

Motor Activity 157
Table 8. AL, Measure Descriptive Storisrics, mole Sample and by Sex.
Actometers Accelerometers
Descriptives AU L R Dex AU L R Dex
Mole Sample (n = 84)
Mn 810 891 729 44.1 999 971 1042 51.3
SC> 344 363 332 9.9 317 3 4 382 3.3
SE 38 40 43 1.1 35 37 42 0.4
Minimm 263 297 143 14.8 471 444 446 40.3
Maximum 1989 2018 2201 67.2 2003 2358 2348 59.1
Males (n = 39)
Minimum 263 350 143 14.8 471 444 446 40.3
Mavimum 1483 1864 1420 58.8 1591 1538 1644 56.8
Maximum 1989 2018 2201 67.2 2003 2358 2346 59.1 - - - - . -- - - -
Nole. Actorneter measure is in movements per hr; Acceleration measure is in CSA accelemtion units per min. Ai = 84 = AU; Dex = Dextraiity ratio, 1 OOxR/R+L, the asyrnmetxy rneasure; L = Lefi-ami measure; R = Right-arm measure.

Motor Activity 158
Table 9. Intercorrelulion Mutrix for the Actometers.
Activity Measures Mn RA LA Dex -
Whole Sample (n = 84) -
Mean AL (Mn) -O-
Right Ami (RA) . 9 2 * * ~ ~ * ---
Lefi Arm (LA) .go***** .66*"*** --O
Dextrality (Dex) .22** ,56***** -. 18" O--
Males (n = 39)
Mean AL (Mn) --- Right Arm (RA) ,94u+*** -O-
Left Arm (LA) ,g2+**+r .76**UL* .--
Dextrality (Dex) .18 .46*** -. 18 O--
Mean actometer and demographics correlut ions. Overd ac tivity was signdicantly
correlated with participants' reports of having participated in a sports activity, r = -43,
p < .O00 1. However, activity was not significantly correiated with age, r = .02,p < 3 5 ,
weight, r = -.18,p < J O , or height, r= -.14,p < .22, nor number ofhours ofsleep, r = 0.1 1,
p < .3 1. For this sample, females showed a non-signiticant trend of being more active than
males, i(82) = - 1.67, p < .IO.

Motor Activity 159
Acceierome i ers (CU) : Overd
Pdiminary dura munagemeni. The mean acceleration for each individual's ight and
lefi amis was calculated for every minute the parûcipants wore the instruments. This
resulted in a data set containhg 1 15,432 observations based on the 1-min recordings of 84
individu&. Using the S m a r y Procedure in S.AS, this smple sizr was reduced h r n
1 15,432 to 84 observations, one for each participant, by calculating a mean acceleration
score based on each 1-min sarnple for each m.
Preliminary assessrneni. In assessing the CSA data for Study 2,1 found four
instances of aberrant or missing data, two instances of faulty right-am data, and two
instances of faulty lefl-am data. In each of the four cases, 1 used rnean proporlional
substitutions to estimate the aberrant limb data. For the two participants with aberrant
lefi-arm CSA data, I estimated a mean lefi-arm value that was 0.9394 (the mean
proportional diaerence) of their right-am data. For the two with aberrant right-am data, 1
estimated a right-am CSA value of 1 .O645 times their leR-arm values. For all four
individuah, the overd mean CSA values were cdcdated as the mean of the estimated
lunb score on one am and the actual limb score on the other m. The same two
individuals who had exhibited the highest activity scores on the actometer data were
outiiers on the CSA data. In these cases, 1 moved their mean CSA values in toward the
mean by 1 SD, so that they still maintained their ranking within the data set, but were not
as extreme. This procedure moved one individual tiom a mean CSA value of 2 196
g/counts to 1843 gkounts and the other fiom 2352 gkounts to 2003 glcounts.
Acceleromeier mearure. The correlation between the lefb and right-ami CSA
measures was significant for the whole sample, r = .83, p c ,0001. Therefore, a mean

Motor Activity 160
overd lunb score was calculated, based on the mean of participants' mean right- and lefl-
arm acceleration scores. Thus, the overall CSA value is based on a mean of mean
accelerations per min. 'This rate measure includes the time the individuals spent sleeping,
as well as the time they spent canying on their every-day activities. This overd mean
CSA value is used as one of the twa key CSA outcorne variables.
Descriptive stutistics. Table 8 shows the descriptive statistics for the CSA measure.
Unexpectediy, the mean acceleration rate for females is significantly higher than for
males, t(82) = - 3 . 2 5 , ~ < .O 1. Because the distributions of the data by gender for mean
acceleration were quite normal, a mean difference provides a fair cornparison of the data.
Using an arcsine transformation for proportional data (Cohen, 1969), the proporûonal
mean diaérence ES e s h a t e (h) between the males and females was calculated to be
h = 0.16 (Cohen, 1969, p. 176- 1 79). Cohen (1 969) describes this estimate as a sniall
difference between proportions or a s m d ES. As with the actometer measure, there was
considerable variability in acceleration among individuals in the whole sample and within
gender (see Table 8). Table 10 shows the intercorrelations among the CSA variables.
Mean accelerarion und demographics correlations. Overail acceleration was not
signincantly comelated with age, r = -17, p < .13, but was correlated with sports
participation, r = A?, p < .O00 1, and the number of hours of sleep reported, r = 0.22,
p < .O5 Weight was not correlated with overall acceleration, r = -. 16, p < .14, but height
was, r = 0.34, p < .O 1. However, when the influence of gender was partialled fkom the
correlation between acceleration and height, the correlation became non-significant,
r = 0.17,~ < .13.

Motor Activity 161
Table 10. Intercorrelation Matrix for the C U Acceîerometers.
CSA Measures Mean CSA Right Arm Left Ami Dexralty
Mole Sample (n = 84)
Mean CSA --- Right h m *96**1*L --O
Lefl Am -93'**** .83***** --- Dextrality .O9 .26** -. 14 ---
Males (n = 38 - 39)
Note. Dextrality = Dextral C SA index, 1 003 RigWRight + Lee. *p < .IO, **p < -05, ***p < .Ol, ****p c ,001, *****p < .0001.
Actometers: Dextral Index
The dextrul octometer meusure. As in Sîudy 1, I cdculated a lateral index of
dextrality based on the difference between the activity the right and left m s , 100*Right-
Am Activity/(Right-Am Activity + Left-Am Activity). A value less than M indicates
greater lefi-arm activity, a value greater than 50 indicates greatsr right-arm activity, and a
value of 50 indicates symmetry of movement. In generai, positive correlations involving


Motor Activiîy 163
participants, r = .18, p < .10, and those with less sleep, r = -.20, p < .07, showed a trend
towards exhibiting relatively greater nght-ami movement. The dextral actometer index
was not significantly correlated with self-reported participation in a sports activity, r = - . IO, p < .34. None of these demographic variables were significant when exarnined by
gender.
Acceleromeiers (CU): D e x t d lndex
The dextral accelerometer index. The dextral index created with the CSA data is the
same as that created with the actometer data, 100'Mean Right-Ami Acceleration per
min/(Mean Right-Am Acceleration per min+ Mèan Lefi-hm Acceleration per min). As
with the actometer dextrality index a value less than 50 indicates greater lefi-arm
acceleration, a value greater than 50 indicates greater right-ami acceleration, and a value of
50 indicates symmeûy of acceleration. in general, positive correlations involving this
laterai index usually referred to greater right-am acceleration, negative conelations to
greater lefi-arm acceleration.
Descriptive staiisiics. Unlike the actometer index, acceleration was greater on the
right arm with an overd mean dextrahty index of 5 1.29. The repeated measurrs ANOVA
(arm by gender) showed a significant lateml e ffect, F(l J8) = 8 -3, p < .O 1 . 'lhe lateral (lefi-
right) by gender interaction was not significant, F(l J8) = 0 . 0 7 , ~ < -80, so both males and
females showed a similar right b i s in arm acceleration. Table 8 shows the descriptive
statistics for the C SA dextrality index. Table 10 shows the intercorrelations among the
CSA msasures. The overail rnean CSA measure was uncorrelated with the CSA dextral
index., r = .lO,p < .38.

Motor Activity 164
Dextral acceferometer index and dernographies correlations. Age and nurnber of
hours of slrep correlated with dextrd acceleration scores, but these relations varieci by
gender. The dextral CSA index did show a trend significance level with age, r = .18,
p < .IO. This trend was mainly due to the correlation between dextral CSA scores and age
for males, r = .33,p < .M. Older males dernonstrateci relatively more riglit-sidzd CSA
ûctivity. Females did not show a significant relation between CSA asymrnetry and agr,
r = .02, p c 36. Dextral C SA activity also was correlated with the num ber of hours of
sleep, r = -.3 1, p < .O 1 for the whole sample. However, the relation with duration of sloep
was due mauily to the fernales, r = -.40, p < .01, rather than to males, r = -.22,p < .17. For
fernales, greater right-sided CSA activity was related to having fewer hours of sleep.
Dextral CSA activity was not significantly correlated with self-reported participation in a
sports activity, r = -. 10, p < .40, weight, r = œ.04, p < .76, or height, r = -. 1 2, p < .3 1 .
Relation between Actometers andAccelerometers
Actometers and accelerometers each measure different aspects of activity . Ac tometers
measure fiequency of movement and accelerorneters measure acceleration. One of the
benefits of having the participants wear both types of activity measuring instruments
(actometers and CSA accelerometers) was to be able to examine the relationship between
the two types of instruments. I expscted that the two measures would be sigdicantly
correlated, both for the mean levels of movement and for the right-lefi-indices. Table 1 1
shows the correlations between the actometer variables and the CSA variables.
O v e r d activizy-measure intercorrelutions. The correlation between the mean CSA
and mean actometer variables was statisticaiiy sigmiïcant, r = .70,p < .0001, indicating

Motor Activity 165
that although the two instruments are maasuMg different aspects of movement, mean
fiequency of movement was related to mean acceleration of movement. The conelations
were similar for both males and females (see Table 1 1).
Table 1 1 . Actomefer und Accelerometer Actavify Measure Correlations. . . .
Acceierorneters
Mean CSA Right Arm Left Arm Dextrality
Actometers Whole Sample (n = 80-84)
Note. Bolded items are correlations between counterpart measures. *p < .IO, **p < .05, ***p < .01, ****p < .OOL, *****p < .0001.
Dextral activity-measure intercomlations. A somewhat dinerent picture emerged
for the dextmlity measures. Table 1 1 shows that for the whole sample, the actometerKSA

Motor Activity 166
dextrai indices were significantly correlated, r = .28, p < .05. The correlations between the
two instruments were significantly lower between the dextral indices than between the
mean values, r = .28 vs r = .70, z = 3.70, p < ,000 1. This rather low correlation between the
actometer and accelerometer lateral indices was not expected.
Instrument differences in dexfrafity. The mean values (see Table 8) show that
fiequency of movement (actometer measure) was higher on the lefi ami than the right,
wMe acceleration was lower on the lefl arm than the right m. Thus, a lefi-arm bias was
present for the actometer measure, while a nght-am bias was present for the
accelerorneter measure. Handedncss, as reported on the LPI, was not significantly related
to the actometer dextrality measure, r = -.06, p < .55, but was related at the trend level to
the accelerometer measure of daxtrality, r = .1Y, p < .09.
Instrument diflerences l n categorical asymmetry. As in SSiudy 1, a categorical lefl
bias in fiequency of movement was present in Shidy 2. Seventy-five per cent of the
participants showed a sigmficant sinistral asymmetry, ~ ' (1 , n=80) = 22.1, p c .O0 1. In
contrast, 70 per cent of participants showed a sigmlicant dextral asymmetry in
acceleration, ~ ' ( 1 , n=80) = 12.8, p < .001. There was no significant interaction between the
two asymmetry classifications, x2(1, n=80) = 0.95, p < 34 . In other words, a categorical
bias in movement frequency was unrelated to a categorical bias in acceleration.
Actometer cotegorical asymmetry by gender. As with the continuous dextrd index,
when ac tometer-measured activity was categorized into those with either greater right- or
greater lefl- activity, signincant gender ditFerences emerged. Males were more strongly left
lateralized than fernales. For the whole sample, 89 per cent of males and 63 per cent of

Motor Activiîy 167
females showed greater left-axm movement. For the 80 right-handers (37 males, 43
females), a two (male, femaie) by two (greater lefi movement, greater right movement) chi
square test was significant, ~ ' ( 1 , n=80) = 7.39, p < .O 1. Only five per cent of right-handed
males showed greater nght-ami movement, while 20 per cent of right-handed femaies
showed greater right-arm movement, as measured by actometers.
Acceleromeier asymmeiry by gender. Table 8 shows that the continuous
accelerometer dextrality index did not differ for males, M = 50.7 and females, M = 5 1.8,
r(82) = - 1.4 1, p < .16. When participants were classified into dxhotomous categories
according to whether they showed a greater lefi- or greater nght- acceleration bias, males
and females showed no differences in their lateral classification. Males (68 per cent) and
females (70 per cent) showed similar percentages of relatively greater right-med CSA
movement. A two by two chi square test (gender by arm of greater movement) was not
found to be statistically significant, x2(1, n=80) = 0.05, p c 34.
As described earlier, several Merent questionnaires were used to assess the
psychological concepts of arousai and emotional expenence. These included the PTS, the
BISBAS, the AIM, and the PANAS. 1 will describe the results of each of these scales in
tum, and report on the relation of the scalrs to motor activity.
The A M
The AIM meumres. The AIM is a 40-item questionnaire designed to assess the typical
intensity with which individuals expenence their emotions. It will be recailed that
participants rate th& emotionality on a 6-point scale, with answer choice ranging fbm
never to uhvays. 1 used the same AIM four-factor subscales as 1 did in Snidy 1, derived

Motor Activity 188
and interpreted by Weinfurt et al. (1994). These include Positive Affect, Negative
Intensity, Serenity, und Negative Reactivity. 1 also included a Total AIM score as part of
the descriptive statistics for the questionnaire. Positive Mect consists of 17 items,
Negative Intensity consists of 10 items, Serenity consists of 7 items, and Negative
Reactiviiy conskts of 6 itsrns.
h i f i a l data assessment. The Four AIM subscales and Total AIM scores were
normdiy disttibuted. There were no outhers apparent for any of the scales. In the bivariate
relations with the movement variables, no oiitliers appeared. However, four individuals
(three fimales and one male) were missing instnimented activity data on one of their
lirnbs. Although I used a weighted mean in estimahg their h b asyrnmetry, I did not
want to include their laterd data in the correlations with the other psychological masures.
Thzrefore, For the tables descnbing the relations between dexûal movement and the AIM
subscaies, 1 used a reduced sample, N = 80.
AIM Descriptive statistics. The AIM's basic descriptive statistics appsar reasonable
(see Table 12). Cronbach's (1951) coefficient for each of the subscales ranged on^ 0.73
for Negative Intensity to 0.93 for Positive Affect, indicating acceptable reliability. The
items with the highest correlation with the total for Positive Affect were, When I ' m happy
I feel làke bursting with joy, r = 30, My happy moods ore so strong that Ijèel like I 'm
"in heaven," r = -78, and When sornething good huppens, Z am usually mirch more
jubilant thon others, r = .75. The items wiîh the highest correlation with the total for
Negative Intensity were, Myfiiends wouldprobably suy I ' m a iense or "high stmng "
person, r = S2, My emotions tend to be more intense than those of mostpeople, r = -51,

Motor Activity 169
and ' C d m und cool' could eosily describe me (reflected), r = S0. The items with the
highest correlation with the total for Serenity were, I w m l d characterire my happy
moods as closer to contentment thon to joy, r = .7O, When I am happy the feeling is
more like contentmeni und inner cairn thon one ofexhilarution and excitement, r = .69,
and When Ifleel happiness, i t is a quiet type of conteniment, r = .00. The items with the
highest correlation with the total for Negative Reactivity were, When I feei guiity, this
emofion is p i t e strong, r = -66, When 1 do soniething wrong I have strong feelings of
shume and guilt, r = .60, and Sad movies deeply touch me, r = .59. Unexpected gender
differences were present in two of the AIM subscales (see Table 12). Negative Reactivity
showcd a significant sex difference, t(82) = -3.63, p < .O0 1, and Positive Affrct showed a
trend sex difference, t(82) = - 1.95, p < .06. In both cases, the females reported highèr
scores than the males, with females reporting higher Positive Affect and Negative
Reactivity than males. These sex differences were similar to the results of Weinfurt et al.
(1 994).

Motor Activity 1 70
Table 12. AIMDescriptive Statistics for Study 2.
AIM & AIM Subscales M SD Min Max Rellabiliîy
Tohl Sampk
Positive Affect
Negativc Intensity
Serenity
Negative Reactivity
Total AIM Score
Males
Positive Affect
Nqative lntensity
Serenity
Negative Reactivity
Total AIM Score
Females
Positive Affect
Negative Intensity
Serenity
Negative Reac tivity
Total AIM Score
Note. Maximum score possible is 6 on each subscaie. Min= Minimum. Max=Maximurn. Reliability = Cronbach's alpha, a measure of intemal consistency. The 4 M M subscales are based on Weinfiut et a1.(1994) factors. Total Sample N = 84. Males n = 39. Femaies n = 45.
AUI Inrercorrelutions. Table 13 shows the intercorrelation mahi< for the AIM
subscales for the whole sample. Significantly positive correlations among Positive AfEect,

Motor Activity 171
Negative Intensity, and Negative Reactivity indicate that those who were intense in their
ernotionality were intense, irrespective of the valence of the emotion. Serenity was the
oniy subscale that showed a different relation to the other subscales, as might be expected
for a calmness factor. The intercorrelation matrix by sex shows that the patterns of
co~elations were similar for both males and temales (see Table 14).
Table 13. AI34 Intercorrelation Matrix.
Positive Affect Negative Intensity Serenity
Negative Intensity .29***
Serenity -.21* 4 0
Negative Reactivity *44***** .38* * * *
Note. N'84.
*p < -10, **p < .05, *'*p < .01, ****p < ,001, ***** p < ,0001.
Table 1 4. .UM Intercowe!ation hiatrix by Sex.
Positive M e c t Negative Serenity Negative Intensity Reac tivity
POS A f k t .o.. -24 9.20 .48****
Neg Intensity .30* .... 0.23 .30**
Serenity -.30* -.O2 ..-O -.O2
Neg Reac tivity .29* .4OW* .22 .--O
- -. --
Note. Males (n = 39) are below the diagonal; Females (n = 45) above.
*p < .IO, **p < .05, ***p < .01, ****p < .001, *****p < .0001.
HM and dernographics correlations. Several signdicant correlations among the AI M
subscales and demographic variables emerged, most of which were gender specific.
Positive Affect was positively related to the number of hours of sleep for males at the

Motor Activity 172
trend level, r = .32, p < .06, but showed a non-significant negative relation to sleep for
females, r = -.24, p < .13. Ponderal Index, a measure of weight relative to height, was
negatively related to Positive AfEect for males at the trend level, r = -.28, p < .IO, but
showed a non-sjgnificant positive relation for females, r = 24,p < .12. Thus, in this
sample, slight males reported iess Positive Affect than heirvier males. Wogative Iritaisity
and Serenity showed no significant demographic correlates, except that Age was
conelated with Serenity for fernales, r = .M,p < .05. Thus, older females reported more
calmness than younger females, but there were no significant relations between age and
calmness for males, r = -.OS, p < .76. Negative Reactivity was negatively related to height
for fernales, r = -.34,p < -03, but not for males, r = 0 . 2 4 , ~ < . lS . Thus, shorter females
reported greater Negative Reactivity. &O, for fernales, Negative Reactivity was positively
related to participation in sports events, r = .30, p < .05, but the relation did not hold for
males, r = -.2 1, p c .2 1. Although many of these male - fernale correlations are of sirnilar
magnitude they are in the opposite direction, and statisticaiiy they do not differ from each
0 t h . The lack of sigru6cant difference could be due to a lack of statistical power.
Altemately, they could be due to sample specific fhdings or Type 1 enor that may not
replicate. It is surprising that females who pcarîicipate in sports reported greater Negative
Reactivity. These results may suggest that physical activity represents psychologicaUy
different meanings for males and females.

Mo tor Ac tivity 173
Table 15. Summan, ofPredictedRelationships with Movement Measures. Overali AL Dertral AL
Actometer CSA Actometer CSA
Other Measures P All P All P AU P Al1
Demogra phles
Sex
*%Y AIM (n=80)
Positive Affect
Neg Intensity
Serenity
Neg Reactivity
PTS
SE
S 1
MO
SWSI
BISBAS ( ~ 8 0 )
BIS
BAS
BAS-BIS
PANAS
PA
NA
P A-NA
Dlchotlc Ustenlag
Words
Happy Angry ~ 3 9 - 4 2
.lS" --
.OS --
.18 ~ O S
- .O1 pos
-.lga neg
.O8 pos
-.13 POS
.O2 neg
-.O6 POS
O POS
-.18 neg
.12 pos
2 pus
-22" pos
-.O1 pos
.14 --
.L4 --
.O6 .O
0.12 -0
-- .18*
neg -.O3
POS -.O7
neg .15
pos .O8
1- -.os -- -. 12
-- -. 10 -- .O3
POS - . l 8
neg -.O2
neg .O7
neg .20*
pos -.O2
neg .14
- -.O9
neg 0.12
pos .36..
Sad n=4142 -. 12 -O -. 18 pos -.14 pos 0.21
Note. P=Predicted. Bolded entnss an significant in pndicted direction. AL = Activity Level.
N = W. except where indicated othemise. *p < .IO, **p < -05, '**@p < .O0 1. *+***p < .O00 1.

Motor Activity 174
A l 4 and meun activity correlations. I predicted that overd rnovement should be
positively correlated with higher levels of arousd, as defhed by the AIM Positive AfFect,
Negative Intensity, and Negative Reactivity subscales. A negative correlation should exist
between overd movement and Serenity. Table 15 shows these predictioiis and the
resultmg correlations between the movement measures and the MM for the whole
sarnple. Ody two of eight possible correlations (two instruments each with four
subscales) were sigmficant in the predicted direction. In support of the arousal-movernent
prediction, Serenity was negatively correlated with actometer-measured movement at the
trend level, r = -. 19, p < .10, and Negative Reactivity was positively correlated with overall
acceleration, r = 2 8 , p < .05. The remaining non-sigmficant results may have bean due to
some gender discrepancies among the relations between movement and the AIM
subscales.
A M and mean activity correlations by sex. Four of the eight predictions
involving the AIM subscales and overaii movement showed non-significant relations,
perhaps due to opposite AIM-Activity Level relations for males and females. Table 16
shows the correlations between the AIM subscales and movement by sex. For females,
Positive Affect showed a positive trend relation to overali actometer-measured movement,
r = .26, p < .IO, but not for males, r = .O 1, p < .94. For males, Negative Reactivity showed
a positive relation to overall CSA acceleration, r = .33,p < .04, but not for fernales, r = .00,
p c: .77. However, when these male-fernale correlations were compareà, neither the
Positive Affect gender difference, z = 0.30, p < .77, two-taileà, nor the Negative Reactivity
cornparison, z = 0.34, p < .73, two-tailed were sigruficantly Werent. If these correlational

Motor Activiîy 175
trends held with a larger sample size, these gender differences wodd probably be
significant. Alternatively, the differences could be due to sample specific iduences or
Type 1 error. Nonetheless, collapshg across gender would interfere with the identification
of wih-gender relations.
Study 1 und Smdy 2 combined. in Snidy 1 no signdicant sex differencrs emerged
when movement and AIM subscales were correlated. However, in Study 2, sex
ciifferences figure prominently and produced results that appear far fiom conclusive.
Because the participants in Study 1 had completed the same AIM questionnaire and
provided the sarne movement data as in Study 2, I combined the two data sets and
correlated the movement measures with the AiM subscales (N = 105, males n = 49,
females n = 56). Several changes in the relations occurred as a result. For overd activity,
only the actometer mesure showed a non-significant trend with Srrenity, r = -. 18,
p < .06. This result was due mauûy to the relation between actometer-measured activity
and Serenity in males, r = -.34,p < .02, rather than in fernales, r = 0.08, p < 3. Overd
accelerorneter-measured activity did not relate to any of the AIM subscales.

Motor Activity 1 76
Table 16. Muor Actt v e e r -es. CorrelpUMs . . bu Sex
Other Activity Mearures Measures vergUBL
s CSA
6
Demograp hicl PI
Age AIM Positive AfEect Nrg Intensity Serenity Neg Reactivity PTS SE SI
MO SEISI
BISBAS BIS BAS BAS-BIS
PANAS PA
NA
PA-NA
Dlchotic Llstening
Words .O8
Happy -. 12 AQW .25 Sad - - O
Note. M=Maies, ~ 3 7 - 3 9 . F=Femaies, ~ 4 2 - 4 5 , except for Sad and Angxy DL tasks where Males n=19-20, Females n=22-23. DL tasks (Accuracy), have Task Order and Earphone statisticaliy partiaued. *p < .IO, **p < .OS, ** *p < .O 1.

Motor Activity 177
AIM and dextral activity correlations. Based on the hypothesis that greater
dextral movement would reflect more negative affect, 1 predicted that dextral movement
would relate posi tively to Negative Intensity or Negative Reactivity, but negativel y to
Positive Affect and possibly Serenity (reflecting more le fi-side movement). These
hypotheses were lefi largeiy u n c o n h e d in Study 2 (Table 15).
AIM and dextrul activity correlations by sex. Examination of the dextral
movernent-AIM relations by sex were not much more informative (see Table 16). The
only predicted result was that between Positive Affect and dextrai acceleraiion in males,
r = - .34,p < .OS. In males, greater lefi-an accrleration was related to positive emotional
experiences. For females, movement asymmetry showed Little relation to any of the AIM
subscdes.
Srudy I and Sntdy 2 combined. For the whole sample, the dextral accelerometer
mesure was significantly positively related to both Serenity, r = .20,p < .05, and to
Negative Reactivity, r = .23,p < .03. 1 had expectrd that dextral movement would relate
positively only to the negative AIM subscdes. The actometer dextral score was &O
positively related to Negative Reactivity, r = .20, p < .05, confhning the accelerometrr
result. The accelerometer results for the whole sample were due primarily to the relation
with the AIM subscales for males, r = .28,p < .05, for bath Serenity and for Negative
Reactivity, r = .25, p < .09. Alî of the correlations between dextral activity and the AIM
subscales were close to zero for females.

Motor Activity 178
The PTS
The PTS measures. The PTS was constnicted so that 22 items make up each of
three subscales, Strength of Excitation ( S E ) , Strength of Inhibition (SI), and Mobility of
Nervous (MO) processes subscales. The dependent measures for this study included
lhrsz threz subscdzs, as waii as a ratio of SE to SI.
Initial data assessment. The univariate distributions for the PTS subscales and the
ratio score are all normaiiy disûibuted. Bivariate plots with the key activity variables were
examined for outlizrs. Two individuals who showed both high activity levels and low to
moderate PTS subscale values were possible outhers. However, no Cook's d statistic was
greater than 0.24, indicating that none of the individuais were troublesome bivariate
outlien (Kleinbaum, et ai., 1988).
PTS descriptive statistics. Table 17 describes the basic statistics for each of the
PTS subscales, SE, SI, MO processes, as wel as the Ratio score. Cronbach's alpha
coefficient of reliability for each of the three subscales was adequate, ranging fiom 0.77 to
0.88. The items with the highest correlation with total for the SE subscale included,
Sudden danger does no# discourage me, r = .58, Myperformance mffers in an
environment with a lot of distractions (negative), r = S6,1 can 't work if I 'm mwounded
by hustle and bustle (negative), r = 3, and I keep cool if1 'm under a lot of time
pressure, r = 32. High scores on the SE subscale represent individuals who are not easily
flustered, distracted, or fatigued, and who can concentrate in spite of noise or
conversation going on around them. The items with the highest correlation with the total
in the SI subscale included, It 's hard for me io suppress ny annoyance, even when it 's

Motor Activity 1 79
necessary (negative), r = .53, I t 's difinrl, for me to intemcpt something I m doing even
ifsomeone askr me to (negative), r = .43, and I t is hard for me to control my curiosity
when I have the chance to look at sorneone else f things or notes (negative), r = -41.
High scores on the SI subscale represent individuals who can control their feelings of
annoyame, impatience, and curiosity with or about other people. The items with the
highest correlation with the total for the MO subscale hcluded, I don 't have any trouble
chunging quickiyfiom one activity to another, r = .68,1 quickly gel used to new
working conditions, r = .66, and d e n my job changes, I m quick fo adust, r = .58. High
scores on the MO subscale represent indwiduals who quickly adapt to change or
unexpected events in their daily lives with littie stress, and who do not find it difficuit to
shake off a bad mood.
PTS Intercorrelotions. Theoreticdly, the subscales are orthogonal, but
empiricaüy, they show some dependencies. Table 18 shows the intercorrelation ma& for
the PTS subscales. Strength of Inhibition and SE were not significantly correlated, nor
were SI and MO. Howevcr, SE and MO were correlated. These results are sirnilar to
Newbeny et al.3 (1997) hdings which show a correlation of 0.59 between SE and MO,
although they also found a significant but smder correlation of 0.22 between SE and SI.

Motor Activity 180
Table 17. PTS Descri~tive Statistics.
PTS Subscales M SD Min Max Relia bility
Whole Sample (n = 84)
Excitement (SE) 2 63 0.37 1.68 3.55 0.83
Inhibition (SI) 2.48 0.33 1.45 3.32 0.77
Mobhty (MO) 2.24 0.34 1.45 3.23 0.86
Males (n = 39)
Excitement (SE) 2.61 0.3 1 2.00 3.36 O. 72
Inhibition (SI) 2.52 0.30 1.73 3.32 0.74
Mobility (MO) 2.26 0.28 1.64 2.95 0.80
Fernales (n = 45)
Excitement (SE) 2.65 0.4 1 1.68 3.55 0.87
Inhibition (SI) 2.44 0.36 1.46 3.18 0.80
Mobility (MO) 2.22 0.38 L .46 3.23 0.89
Note. Môxinum score possible is 4. Min= Minimum; Max=Maximum. Reiiabiliîy = Cronbach's alpha, a rneasure of intemal consistency for items comprising each subscale.
PTS m e a w e s and demogruphics correlations. Older participants reported lower
SI subscale scores than younger participants, both with the outliers removed, r = -.32,
p < .O 1, and without outlkrs removed, r = - -33, p < .O 1. However, there were no other
significant correlations between any of the PTS subscales and height, weight, h o m of
sleep, or self-reported participation in a sports activity. 'Ihere were no sigdicant gender
relations in any of the PTS subscales in this study, although in other Merature, gender
diaérences have been observed (males higher on the SE, Newbeny et al., 1997).

Motor Activity 181
Table 18. PTS Intercorrelation Matrix.
PTS Subscales Excitation Inhibition Mobility
Mole Sample (n = 84)
Excitement (SE)
Inhibition (SI)
Mobiliîy (MO)
-.-- .10 ---- .OO'""" -. 03
Males (n = 39) -
Excitement (SE) -O-*
Inhibition (SI) .O8
Mobility (MO) .56**" .22
Females (n = 45)
Excitement (SE) O---
Inhibition (SI) .12 ---- Mobility (MO) ,64**** * -. 18 --O-
**p < .05, ***p < -01, ****p < ,001, *****p C .0001.
PTS and mean activity cowelations. Activity was predicted to be positively
correlated with both SE and MO, and negatively with SI. These predictions and the
resdting correlations between activity and PTS variables are presented in Table 15. No
support was found for any of these predictions, using either actometer- or accelerometer-
measured ac tivity .
PTS and mean activity correlations by sex. Interesting PTS-Activity relations did
emerge when examined by gender. Table 19 shows the correlations brtween the PTS
subscales and the overd activity measures by gender. Mobility in males was correlated
with overd acceleration rate, as predicted. However, conûary to the prediction, SI was

Motor Activity 182
positively correlated at the trend level with actometer-measured fiequency of movement
m o n g males. in females, none of the PTS subscales were sigruficantly related to overall
actometer-measured movernent or acceleration rates.
PTS and dextral activity correlations. No predictions were made regardmg the
relation of dextrd movement to the PTS scies. Tdbk 19 shows tliz çiln~1atioi1s betwzen
the PTS scales and the dextral actometer and accelerometer measures. No sigruficant
dextral relations emerged.
PT$ and dextrol activity correlations by sex. An examination by gender revealcd
an interesthg relation. Inhibition was negatively related to dextral acceleration in femalrs
(see Table 19). This trend indicated that greater Inhibition was related to greater lefi-am
acceleration in females, but not in males.

Motor Activity 183
Table 19. AL Measures andPTS Correfations, W h l e Sumde and b y Sex. - -. -- - -- - --
Overall AL Dextral AL
PTS subscdes Actometers CSA Actometer CSA
Whole Sarnple
Excitement (SE) -. 13 -.O4 .O2 -.O8
inhibition (SI) .O2 -. 10 .O8 -.12
Mobility (MO) -.O6 -.O2 -.O8 -. 10
Mean (66 items) -.O8 -.O8 .O 1 -.14
Males -- -- -- - - -
Excitement (SE) 0.1 1 .26 .O4 -. 15
Inhibition (SI) .28* .16 .18 .12
Mobhty (MO)
Mean (66 items)
Females
Excitement (SE) -. 16 0.23 -,O4 -.O4
Inhibition (SI) -.O7 -.20 .12 -.36**
Mobility (MO) -. 16 -. 16 -. 10 -.O4
Mean (66 items) -.19 -.28* - .O2 0.20
Note. AL is Activity Level. CSA refers to the Accelerometer measure of AL. = 84; Males, n = 38-39. Females, n = 42-45. *P < .IO, +*p < .05, ***p c .01,****~ < .ooi, ***** p < ,0001.
The BISRAS
The B I S W rneasures. The BISBAS is a 20-item questionnaire consisting of two
subscales, the Behavioirrol Inhibition Scde (BIS) and the BehoviouralActivation Scde
(BAS). The BAS scale itself has three subscales, &4S Rewurd Responsiveness, BAS
Drive, and &eS Fun Seeking. individuals high in behavioural inhibition are vulnerable to

Mo tor Ac tivity L 84
states of negative affect and are sensitive to social signais of punishment. Those high in
behavioural activation are typicaily extraverts who show positive affect and are
parb'cularly sensitive to social signals of reward. To anaiyze additional hypotheses, a
standardized difference score was created by subtracting the z-transformed BIS scale
score Born the z-tram formed BAS scale score. Positive BAS-BI S difference scores re flec t
relatively greater BAS activity .
Initial data assessment. The SAS univariate procedure showed that the BISBAS
subscales and Difference scores were normally distxibuted. There were no univariate
outliers or bivariate outliers with activity apparent for any of the scales.
BISRAS descriptive statistics. Table 20 describes the basic statistics for each of
the BISBAS subscales. The mean BIS score was 2.95, and the mean BAS score was 3.04
(Range 1 - 4). Cronbach's (195 1) alpha coefficient for each of the subscales was adequate
for the two key subscales for the BIS (7 items) and for the BAS (13 items), see Table 20.
The BAS subscales varied in their reliabiiity, adrquate except perhaps for the BAS
Reward subscale, r = 3 5 . The three BAS subscales consisted of 4 or 5 items each. The
items with the highest correlation with the total for the BIS subscale included, I fedpretty
worried or upset when I think or kiow somebody is angry at me, r = .66, VI think
something unpleasant 1s going to happen, I usually get pretty 'worked up, ' r = 3, and
Criticim or scolding hurts me quite a bit, r = .49. The items with the highest correlation
with the total for the complete BAS subscale included, I go out of my way to get things I
want, r = .60,1 crave excitement md new sensations, r = .56, and When I wan!
something, I u ~ u u l ' go 011-out to gel it, r = .54. For the BAS Responsivity to Reward

Motor Activity 185
subscale, the best item was, It would excite me to win a contest, r = .42. For the BAS
Drive subscaie, the best item was, When I want something, Z usuolly go all-out to get it,
r = .74. For the BAS Fun-seeking subscale, the best item was, I will ofren do thingsfor
no reason other thon they might Le f in , r = .55.
Table 20. BISBflS Scole Descriptive Statistics.
BISBAS Subscales M SD Min Max Reliabillîy --
BIS 2.95 0.49 1.86 4.00 0.77
BAS 3.04 0.39 2.25 4.00 0.80
BAS Reward 3.30 0.35 2.40 4.00 0.55
BAS Drive 2.85 0.61 1 .50 4.00 0.83
BAS Fun Seekmg 2.99 0.52 2.00 4.00 0.72
Difference Score (BAS-BIS) 0.09 0.6 1 - 1.36 1.54 ---- Note. N = 84. Maximum score possible is 4. Min= Minimum; Max=MaxMurn. Reliability = Cronbach's alpha, a rneasure of internai consistency.
BISBAS intercorrelations. The intercorrelations among the BISBAS subscales
(see Table 2 1) are similar to those of Cawer and White (1994) and Sutton and Davidson
(1997). The BIS subscale was not significantiy correlated to the overall BAS subscale,
r = .OS,p < .64, indicating that the concepts are independent. However, the BIS was
sigmficantly related to one of the BAS subscales, Responsivity to Reward, r = .30,
p < .O1. This means that the individuals in this shidy were sensitive to both BIS
characteristics, such as novelty and punishment, as weli as to BAS characteristics, such as
signals of reward and nonpunishment.

Motor Activiiy 186
Table 2 1 . B I S M Subscales Intercorrelation Matrix.
BIS BAS Reward Drive Fun Diff
Note. N = 84.
**p < .OS, ***p < -01, ****p < .001, ***+*p < .0001.
BISRAS and demogmphics correlations. 'There were no significant correlations
among any of the BISBAS subscaies and height, weight, hours of sleep, nor self-reported
participation in a sports activiiy. Although there were gender differences (BIS and BAS
Reward Responsiveness scores higher among fernales) in the original developrnent of' the
BISBAS scale (Carver & White, 1994), there were rio gender differences among any of
the subscales in this study. Age was significantly negatively correlated with overd BAS,
r = 0.34, p < .01, and its subscales, BAS Reward, r = -.28, p < .05, BAS Drive, r = -.23,
p < .O4 and Fun Seeking, r = 4 0 , p < .O1. Although 75 per cent of this sample were
between the ages of 18 and 22, and only nine individuais were older than 31 years of age,
an age relation stili emerged. Younger participants tended to engage in goal-directed
efforts and attend to the cues of reward more so than older participants.

Motor Activity 187
BISBAS and meun activzty correlations. 1 had hypothesized that higher BAS
scores would represent higher arousd, which would relate positively to movement.
Higher BIS scores would represent lower arousal and relate to lower movement levels.
Table 15 shows the predictions and the resulting correlations between the BISBAS scales
iuid actiVity. Across ihè wliolz sàriiple, only the BAS Drive and the Diffirznce scor3
showed trend level support in the predicted direction Cor overall actometer-measured
movement only (see Table 22). More specificdy, relatively greater BAS than BIS scores
(BAS-BIS Difference score), and responsiveness to rewards and achievement behaviours
(BAS Drive) predicted more fiequent h b movements. None of the BAS subscales
showed sigmficant correlations with the CSA-rneasured acceleration.
BISBAS and mean activity correlations by sex. The relations between the
BISBAS subscales and overall movement did show some distinct differences when
analyzed by sex. For example, the BIS subscale showed little relationship with overall
movement for males for either actometer-measured rnovement, or for overali acceleration
(see Table 22). However, for femaies, the BIS was sigmficantly negatively related to
overall acceleration as predicted and to overali actometer-measured movernent at a trend
level. These maldfernale correlations were not statistically diEerent in the case of
actometer-measured movement, z = 1 . 2 2 , ~ < .23, two-taiied, but did show a trend level
difference in the correlation between BIS and accelerorneter-measured activiîy, z = 1.74,
p < .O& two-tailed. For males, the BAS Drive d e was significantly related to overall
actometer-measured movement, r = .44,p < 41, but not for fernales, t = .04,p < .79.
However, this gender difference was not statistically significant, z = 0.30, p < 7 5 , two-

Motor Activity 188
taded. The relations between BAS Dnve and acclerometer-measured activity showed a
similu pattern but did not reach sigdicance for either males or females.
B I S M scales with age partialled. Because age was unexpectedly sigmficantly
related to the BAS subscales, 1 examined the BAS-activity correlations partjahg age for
the whok sam plr and b y sex. The pattern of resuits wu aiinilar. Witli aga partialled, the
BIS was sidl significant for females for both overall actometer-measured movement,
r = -.32, p < .05, and for CSA-measured acceleration, r = -.37, p < -02. With age partiaiied,
for males, the BAS Dnve subscale (with items pertainuig to the persistent pursuit of
desired goals) was positively related to overail actorneter-measured movement, r = .38,
p c -02. Drive was not related to actometer-measured movement for females, r = -.Ol,
p < .98. In sum, for females, the BIS (considered a punislunent sensitivity scale) was
salient to both the overd fiequency and acceleration of movrment. For males, the BAS
seemed more salient to movement than the BIS.
BISBAS and dextral octivify correlations. For the overall sarnple, most of the
predicted hypotheses between dextral movement and the BISBAS scales were not
supported. Table 22 shows the correlations among the BISBAS scores and the dextral
movement measures. There was one significant negative correlation between BAS Fun
Seekhg and dextral acceleration, indicating that Fun Seeking was associated with more
leftsided acceleration, as predicted.

Table 22. BISMS u n d a Meusure Correlations, Whole Somple and by Sex.
OveraU AL Dextral AL
BISBAS subscales Actometers CSA Actometers CSA
Whole Sample
BIS -. 17 -. 10 .O4 -.14
BAS . l i -.O2 .IO -.OS
BAS Reward -.O2 -.O8 . O0 -. 16
BAS Drive .18* .O0 .14 .12
BAS Fun Seelhg .O4 - .O2 .O8 . 72** - Difference (BAS-BIS) .21* .O6 .O4 .O7
Mean BISBAS -.O6 -. 10 .10 -. 16
Males
BIS -.O4 .18 .O0 1.2 1
BAS .31* .18 .26 -.O6
BAS Reward -.O4 ,O8 .O 1 -. 18
BAS Drive .44*** .24 .34** .26
BAS Fun Seekmg .12 .O3 .12 -.31 *
Difference (BAS-BIS) 2 2 -.O3 ,15 .12
Mean BISBAS .16 .26 .16 -.20
Females
BIS 0 . 2 8 ~ -.34** .O 1 0.12
BAS .O 1 -. 14 .O2 -. 10
BAS Reward -.O0 -. 18 .O0 0.14
BAS Drive .O4 -. 14 .O2 -.O4
BAS Fun Seekmg -.O 1 -.O6 .O 1 -.O8
Di fference (BAS- BIS) .24 .19 .O0 .O4
Mean BISBAS -.20 -.34* * .O2 -.15
Note. AL = Activity Level. N = 80-84; Males, n = 38-39; Females, n = 42-45. *p < .IO, **p < .05, ***p < -01, ****p < ,001, *****p < .0001.

Motor Activity 190
BISBRT und dextrul uctivity correlations by sex. 1 examined the BAS-dextral
activity correlations by sex, as wel as partialhg age. This more fine-grained anaiysis
revealed some male-specific ccorrelates. For males, the overall BAS was significantly
correlated with actometer-measured movement, r = .42, p < .O 1, as 1 had predicted. This
inay liave bèzn due to one puticular BAS subscale, the BAS Drive, ~vhich kvas positively
correlated to both actometer-measured dextral movement, r = 47, p < .O 1, and to dextral
acceleration, r = .38,p < .02. For fernales, the correlations between BAS subscales and
dextral movement with age partiailed remained resolutely close to zero. Because there
were no significant sex differences in the univariate distributions for either the BISBAS
scales or the CSA dextral measure, 1 can attibute the sex ciifference found here to
differences in the asyrnrnetric movement of' males and fernales in their response to arousal
(or diflerences in arousal leading to different asymmrûic movement responses).
The PANAS
The PANAS is a self-report scale that consists of 20 adjectives describing the
individual' s mood. Study participants rated themselves on 1 0 nega tive mood descriptors
and 10 positive mood descriptors using a 5-point scale, ranging fiom very slighily or not
ai all to very m c h . Each participant completed a total of five assessments over the 24-
hours that they were wearing the activity monitors; these included a baseline assessrnent
at the start of the &ta collection, foiiowed by three more assessments completed around
meal times and bedtime d u h g activity-data collection, and a bal assessrnent at the end
of the &ta collection.

Motor Activity 191
The PANAS measirres. M e r discarding the initial PANAS baseline mrasure,
which had no time-luiked activity data, the final four assessment tmes were used to create
four PANAS intervals for each individual. For each individuai, each of these four intervais
was based on the penod of time between the previous assessment and the curent one. In
caicdating Lime intervais, I inciudzd a PAYAS assessrnent for any given interval if it ivas
done withui a particular five-hou window of tirne. Thus, a PANAS assessment was
included in Interval 1 if it was completed between 06:29 am and 1 1 :2Y am (moming).
Interval 2 was between 1 1 :29:O1 am and 16:29 pm (afternoon), Interval 3 between
l6:D:O 1 pm and 2 1 :29 pm (evening), and Interval 4 was between 2 1 : D : O 1 pm and O2:3 1
am (night). The measures created for each individual included a Negative Affect (NA)
score, a Positive Affect (PA) score, and a Difference score tased on the ditrerence
between the standardwd means (PA-NA) for each interval. Findy, the means for each
interval were combined to create one overall mean PA, NA, and Difference score for each
individual for the whole 24-hour penod.
Initial data assessment . The mean Positive Affect and Difference scores were
approximately nomal in their distribution; however, the mean Negative Affect score was
not normdy distributed. It was quite positively skewed, indicating that most individuals
rated negative mood descriptors as very slighdy or not ut all, M = 1.39, SD = .34,
Median = 1.27.1 exarnined the stem and leaf distribution of the NA scores after re-
expressing the data using several niathematical îransformation rnethods (e.g., logarithms,
square mots, reciprocai square root, square root of the refiected scores, as per Tukey,
1977). However, the distribution was not visibly Mproved, so 1 decided to keep the raw

Motor Activity 192
NA scores. There were no univariate outlien apparent for any of the PANAS scores, and
no outliers appeared in o b s e h g the bivariate plots between the overall movement
variables and the PANAS scores.
PANAS descriptive staristics by interval. The descriptive statistics for the PANAS
for each time interval separately are presented in Table 23. The reiiability of these interval
scores was vexy good, with Cronbach's (1951) alphas ranging fiom 0.77 to 0.92.
Interestingly, the mean PA mood scores changed throughout the day. Positive Affect was
highest in the aftemoon and lowest in the late evening. AAemoon PA ratings were
significantly higher than moming and late evening PA ratings, r(l,3 19) = 3.65, p < .OS,
using Tukey ' s H SD test to control for experimentwise error. Early evening PA ratings
also were significantly higher than the late evening ratings. Although an intnguing result,
subsequent interval analyses were restricted to mood-activity relations, the focus of this
study .
Mean P M descriptive statistics. Descriptive statistics of the mean PANAS
scores coiiapsing across ai l intervals are presented in Table 24. Cronbach's (1 95 1) alpha
for PA and NA was 0.90 for the whole sample, showing that the correlation with total was
very good. For the whole sarnple, the items with the iughest correlation with the total for
Positive AfSect were enthusiastic, r = .78, attentive, r = .76, and determined, r = .74. The
items with the highest correlation with the total for Negative Affect were scured, r = .84,
ufiuid, r = . 74 and nemous, r = .72.

Table 23. PANAS Descriptive Statistics by Time of Day.
PANAS Subscales M SD Mln Max Rellabillty
Whole Sam~le
Interval 1 (Moming: 6:30 am - 1 1 :30 am) (n = 82)
Positive Affect (PA) 2.32 0.77 1 .O0 3.80 0.88
Negative Affect (NA) 1.36 0.44 1 .O0 3.00 0.82
Difference (PA-NA) 0.96 0.83 -1.10 2.60 ---- Interval 2 (Afiemoon: 1 1 :30 am to 4:30 pm) (n = 74)
Positive Affect (PA) 2.70 0.78 1 .O0 4.80 0.88
Negative m e c t (NA) 1.44 0.58 1 .O0 4.10 0.87
Diffaence (PA-NA) 1.26 1.00 -1.50 3.80 o.*-
Interval 3 (Early Evening: 4:30 pm - 9:30 pm) (n = 82) - - -- - - -
Positive Mect (PA) 2.57 0.82 1 .O0 4.90 0.90
Negative Affect (NA) 1.46 0.60 1 .O0 4.10 0.88
Difference (PA-NA) 1.10 1.04 -1.90 3.50 0-0-
Interval 4 (Late Evening: 9:30 pm - 2:30 am) (n = 80)
Positive Affect (PA) 2.07 0.88 1 .O0 4.60 0.92
Negative Affect (NA) 1.32 0.38 1 .O0 2.90 O. 77
Difference (PA-NA) 0.76 0.92 -0.80 3.00 ---- -- - - -
Note. Maximum score possible is 5. Min= Minimum; Max=Maximum. Reliability =
Cronbach's alpha, a measure of intemal consistent y.

Table 24. PANRS Descriptive Stutistics.
PANAS Subscales M SD Min Max Reliabllity - -
Mole Sample (n = 84) --
Positive Affect (PA) 2.53 0.56 1 .O2 4.30 O .90
Negative Affect (NA) 1.39 0.34 1 .O0 2.58 0.90
Difference (PA-NA) 1.14 0.63 -0.64 2.89 --O-
Males (n = 39) - -- - - - - - - -- - - - - -
Positive Affect (PA) 2.51 0.47 1.64 3.54 0.88
Negative Affect (NA) 1.47 0.39 1 .O2 2.58 0.9 1
Difference (PA-NA) 1 .O4 0.60 -0.36 2.48 ---O
Females (n = 45) . - .- - - - - - - . . -. . -.
Positive Affect (PA) 2.55 0.63 1 .O2 4.30 0.92
Negative Affect (NA) 1.32 0.28 1 .O0 2.24 0.86
Difference (PA-NA) 1.23 0.65 -0.64 2.89 ----
.Vote. Maximum score possible is 5. Min- Minunum; Max=Mauimum. Reliability =
Cronbach's alpha, a measure of intemal consistency.
PANAS intercorrelations. Because the PANAS NA distribution was veIy
positively skeweà, 1 used Speman rank order correlations for al of the PANAS analysis.
Table 25 shows the intercorrelations among the three mean PANAS subscales. in theory,
PA and NA subscales are orthogonal, and this was the case in Study 2.
PANAS and demographics con=elutions. There were no signincant conelations
among any of the mean PANAS subscales and gender, height, weight, hours of sleep, nor
self-reported participation in a sports activity. For males, however, age was associated
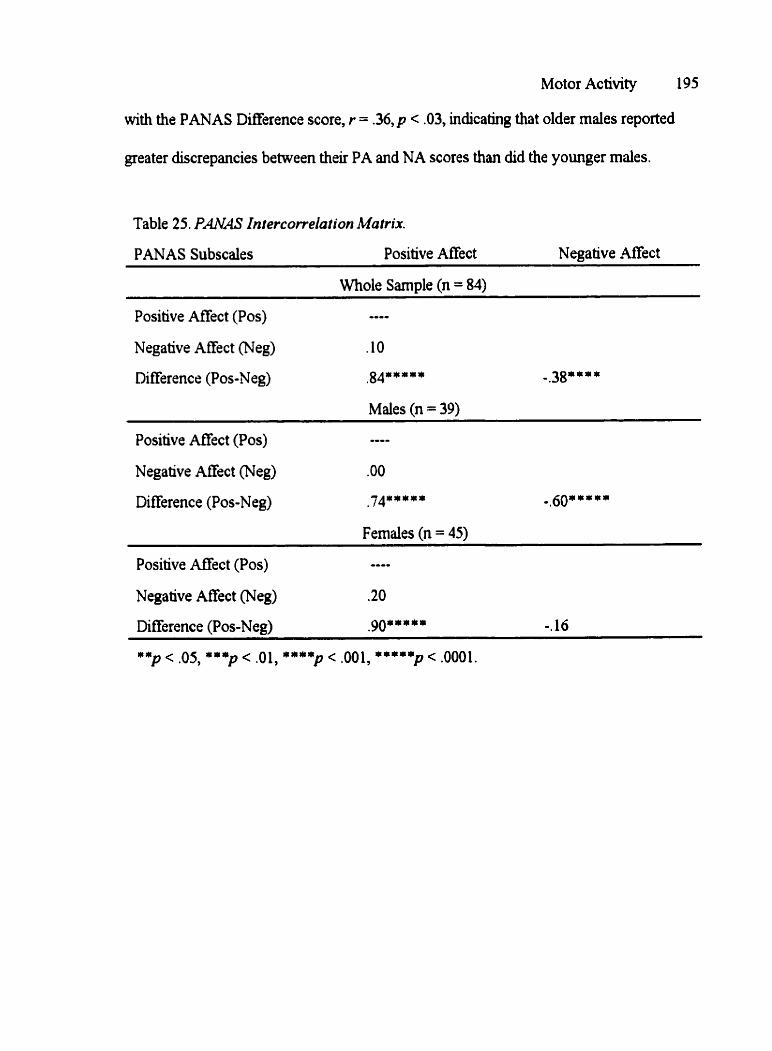
Motor Activity 195
with the PANAS Difference score, r = .36, p < .03, indicating that older males reported
greater discrepancies between their PA and NA scores than did the younger males.
Table 25. Pm& Intercowelation Ma trix.
PANAS Subscales Positive Affect Negative * . e c t
Whole Sample (n = 84)
Positive Affect (Pos) ---- Negative Affect (Neg) .10
Males (n = 39)
Positive Affect (Pos) ---- Negative Affect (Neg) .O0
Difference (Pos-Neg) ,74***** .,60*****
Females (n = 45)
Positive AfEect (Pos) ---. Negative Affect (Neg) .20
Difference (Pos-Neg) .go*"*** -. 16
**p < -05, ***p < .01, ****p < .001, *****JI < .0001.

Motor Activity 196
Table 26. P M und CSA Activity Pearson Correlations by Time of Day, Whole Sumpie and by Sex.
PANA!! Males Females Whde Sample Subscales
AL Dex AL Dex AL Dex
Interval 1 (Moming) (n = 38-39 males, 40-43 females, 78-82 whole sample)
Positive Afiect .20 .31* -.O0 .O3 .10 .16
Negative Affect .O9 -. 18 -.36** .2 1 -. 18 .O2
Difference .12 .33** .10 .O0 .12 -16
Intervai 2 (Aftemoon) (n = 37 males, 34-37 females, 70-74 whole sample)
Positive Affect -.O0 -. 18 .28* .11 .16 .O3
Negative Atrect 9.12 .O2 .O6 -16 - .O6 .O8
Difference .O6 - A S .28* .O0 .20* -.O0
Interval 3 (Early Evening) (n = 36-37 males, 42-45 fernales, 78-82 whole) - - - -- -
Positive AfTect .23 .25 .O2 -.O8 .14 .O8
Negative Affect .24 -.O3 .10 .10 .l I -.O0
Difference .O2 .16 -.O4 -. 18 .O5 .O2
Interval 4 (Late Evening) (n = 37-38 males, 40-42 fernaies, 77-80 whole) -- pp - -
Positive Affect -.O4 .37** .20 .O2 .O8 .20*
Negative Affect .40** .O6 -. 16 -. 10 .13 .O0
Difference 0.28' .28* .26+ .O0 .O0 .16
Note. AL=CSA acceleration activity . Dex= CSA Dexttality Index
*p < .10, **p < .OS, ***p < .Ol.
P M intervah and meun octiv~ty correkations. 1 predicted that overd
movement should be positively correlated with both positive and negative affect, as
defined by the PA and NA subscales. 1 first examined the activity-measure correlations

Motor Activity 197
with the PANAS subscales by interval as weli as by gender. Table 26 shows these
correlations for the whole sample and by sex for each interval. When correlations were
examined separately by gender, NA in females was negatively related to overali
movement, but during the moming hours ody. Arnong males, NA was sifificantly
positively correlated with overd CSA activity in the late evenuig. However, statisticdy
significant male-fernale differences in the PANAS-AL correlation patterns by inteivd
wsre minimal. Only the correlations in Interval 1 between overall CSA activity and NA for
males and females differed at the trend level, z = 1.73, p < .09, two-tailed.
Mean PANAS und meun activity correlations. Table 27 shows the rnean PANAS
subscales collapsed across intervals. 'lhis table shows that overd actometer-measurrd
movement was significantly correlated with PA but not with NA. However, overd CSA
acceleration was not significantly correlated with either PA, nor NA. Thus, when time of
day was ignored, the data indicated that only positive mood related to overall kquency
of movement, but not negative mood.
Although this hding of a signincant relation between actome ter-rneasured
activity and Positive Affect was Uitriguing, it was only one significant resuit in an
expected pattern of significant resuits. Therefore, it is quite Wrely the result of Type 1
error.

Mot or Ac tivity 198
Table 27. PANAS andAL Measure Correfations, Whole Sample and by Sex.
Overd AL Dextral AL
PANAS subscales Actometers CSA Actorneters CSA
Whole Sample
Positive Affect .22** .14 -.O6 .20*
Negative AEect -.O0 .O2 -.O4 -.O2
Difference (Pos-Neg) .14 .O8 -.O4 .14
Males
Positive Affect .23 . l l - .O9 .28*
Negative AfEect .14 .20 -. 14 .O0
Difference (Pos-Neg) .O8 -.O4 .O3 .10
Females
Positive Affect .22 .14 9.10 .18
Negative Affect 1.12 -.O8 .18 .O8
Difference (Pos-Neg) .18 .10 0.24 .12
Note. Correlations are Spearman coefficients. N = 80-84. Male n = 38-39. Female n = 42-45. *p .p .10, **p < .05, ***p < .Ol,****p c .001, ***** p < .0001.
PMRT intervals und dextraf octivity correlations. The prediction was that PA
would correlate with greater lefi-am acceleration (i.e., wodd show a negative correlation
with dextral activity), and that NA would conelate with greater nght-arm acceleration (i.e .,
would show a positive correlation with dextml activity). These predictions were not
supported by the data. Table 26 shows the correlations of the PANAS subscales with the
dexûaî CSA activity measures by interval for males and fernales and for the overd
sample. Females, in particular, showed no evidence of any pattern. Males showed a
pattern opposite to that predicted. In three of the four intervals, males showed positive

Motor Activity 199
correlations between PA and dextml CSA activity, at a trend level for Intervai 1,
significant for Interval 4, and in the s m e direction, but not significant for interval 3.
Mean PANAS and dextral activity correfations. Based on the hypothesis that
greater dextral movement would reflect more negative affect, 1 had predicted that dextral
movement wodd relate positively to NA. 1 also had predicted that dextral movement
would relate negatively (reflecting more lefi-side movement) to PA. These predictions
were not supported by the data. Table 27 shows the correlations between the dextral
movement variables and the mean PANAS subscaies for both the overail sample and by
sex aRer collapsing across intervals. At a trend level PA correlated positively with dextral
CSA activity, indicating that greater right-arm movement was associated with PA rather
than NA. For actometer-measured dexûaî activity, the data showed no significant
correlations with any of the PANAS scales.
The LPI
The LPI measures. The LPI is a 16-item selereport questionnaire designed to
reflrct an individual's hand, foot, eye, and ear preferences. Four items assess each of
these common lateral preferences, and scores range fiom -4 (completely lefl preferenced)
to +4 (completely right preferenced) (Coren, 1993a). Four lateral preference variables
were created frorn the 16 items, reflecting each of the four lateml preferences. For
descriptive piuposes, each of the four lateral preferences were classified into right-left
categories. Lee-side preference was classined as any score less than zero, and right-side
preference was any score greater than or equal to zero.
Initial data assesment. Ai of the preference subscales were negatively skewed,
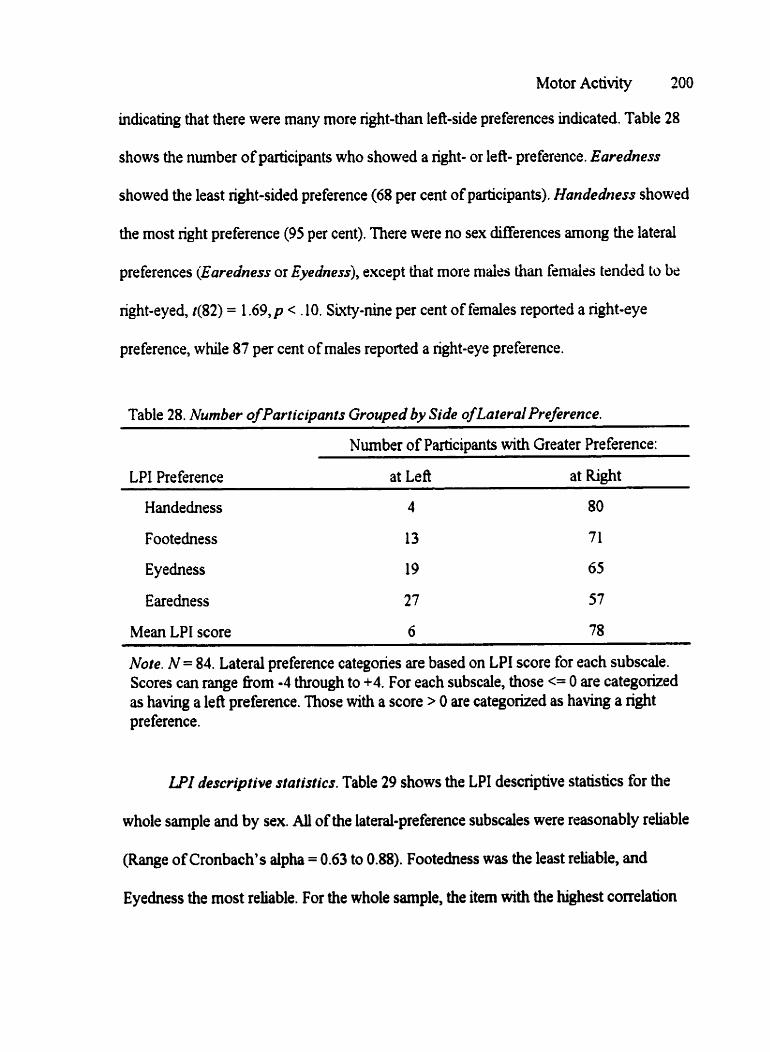
Motor Activity 200
indicating that there were many more nght-than lefi-side preferences indicated. Table 28
shows the number of participants who showed a right- or left- preference. Euredness
showed the les t nght-sided preference (68 per cent of participants). Handedness showed
the most right preference (95 per cent). There were no sex clifferences arnong the lateral
preferences (Ewedness or Eyedness), except that more mdes than fernales tznded to bz
right-eyed, t(82) = 1.69,~ < .10. Sixty-nine per cent of femdes reported a right-eye
preference, wlde 87 per cent of males reported a nght-eye preference.
Table 28. Number of Participants Grouped by Side of Lateral PreMence.
Number of Participants with Greater Pre ference:
LPI Preference at Left at Right
Handedness 4 80
Footedness 13 71
Eyedness 19 65
Earedness 27 57
Mean LPI score 6 78 - -- - -
Note. N = 84. Laterd preference categories are based on LPI score for each subscale. Scores can range fkom -4 through to +4. For each subscale, those <= O are categorized as having a leA preference. niose with a score > O are categorized as having a right pre ference.
LPI descriptive statistics. Table 29 shows the LPI descriptive statistics for the
whole sample and by sex. AU of the lateral-preference subscales were rrasonably reliable
(Range of Cronbach's aipha = 0.63 to 0.88). Footedness was the least reliable, and
Eyedness the most reliable. For the whole sample, the item with the highest correlation

Motor Activity 20 1
with the total for Handedness was, Which hand removes the top card when you are
dealingfiom a deck?, r = .80. The item with the highest correlation with the total for
Footechess was, Ifyou wanted to pick up a pebble wirh your toes, which foot would you
choose?, r = .62. For Eyedness, the item with the highest correlation with the total was,
W~ich eye would you use tu sight down a Me?, r = .80. For Earedness, the item witii the
highest correlation with the total was, Inio which enr warldyou place the eorphone qf a
transistor radio?, r = .76.

Motor Activity 202
Table 29. LPI Descriptive Statistics.
LPI Preference M SD Min Max Reliability
Whole Sample (n = 84)
Hand 3.3 1.4 -4 4 .O8
Foot
E Y ~
Ear
Males (n = 39) - - - . . - - - - - - - - - . -.
Hand 3.4 1.3 2 4 .82
Foot 2.5 1.5 - 1 4 .69
E Y ~ 2.5 2.5 4 4 .87
Ear 1.5 2.3 4 4 .72
Females (n = 45)
Hand 3.2 1.5 4 4 .72
Foot 2.3 1.6 2 4 .58
E Y ~
Ear
Note. Scores range fiom -4 to +4. Above O is considered a right preference. Min= Minimum; Max=Maxllnum. Reliability = Cronbach's alpha, a measure of interna1 consistency .
LPI intercorrelations. Table 30 shows the intercorrelations arnong the four LPI
subscales for the whole sample and by sex. Handedness was significantly conelated with
footedness and eyedness, but the other lateral preferences were not sipficantly related.
LPI and demogruphics codations. niere were no sigdicant cot~elations
among any of the subscales with gender, height, weight, hom of sleep, nor self-reported

Motor Activity 203
participation in a sports activity.
Table 30. LPI Subscales Intercorrelation Matrix.
LPI Subscales Hand Foot E Y ~ E ar
Whole Sample (n = 84)
Hmd
Foot
Eye
.38**** .25** .14
-..- .16 .10
-..O .18
Males (n = 39)
Hand
Foot
E Y ~
O--- .14 .24 -. 16
-m... .IO -.O8
--.O .O6
Females (n = 45)
Hand
Foot
E Y ~
---- .54**+*r .24 .37**
.... .18 .25*
.__O .28*
LPI and mean cctivity correlations. No particular relations between lateral
preference and movement were predicted. Table 31 shows the correlations between the
activity measures and the LPI subscales. There were no sigmfïcant correlations between
overaii actometer-measured movement and lateml preference.
LPI and dextral activity correlations. The LPI measure of laterd preference was
used in this study as a check to indicate how typical this sample was compared to the
lateral preference percentages found in the population. 1 did not offer any a priori
hypotheses regarchg rnovement and lateral prefermce. Table 3 1 shows that greater right-

earehess was related to greater fieguency of right-ami movement. Greater right-hand
preference was correlated at the trend level with greater right-arm acceleration.
Table 3 1. LPI and AL Measure Correlutions, Whole Sample and by Sex.
LPI subscales Actometers CSA Actometers CSA -
Whole Sam~le
Hand
Foot
E Y ~
Ear
.14 -.O0 -.O6 .19'
.O6 9-07 -.O2 - .O6
.O4 . i l .10 .13
.12 .10 .28*** -.O2
Males
Foot .26 .32* 0.12 0.14
Females
Hand .14 -.O0 .19 .11
F O O ~ -.O3 9.28" .12 .O8
Ear .O6 .O4 .20 .O2 - - - - - - - - -
Note. Positive values on the LPI indicate greater right-sided preference. Thus,
positive correlations refiect the relation of the activity measures wit right-sided
preferences. N = 80-84. Males n = 38-39. Females n = 42-45.
*p < .IO, **p < .os, =**p < .01.

Motor Activity 205
The Dichotic Listening PL) Task
The DL task was administered to mess participants' accuracy in perceiving
auditory stimuli presented to each ear simultaneously. AU participants were asked to
attend to 2 16 stimuli through stereo earphones. AL1 participants listened for verbal stimuli
(the word Dower, 72 tridsj and Happy sounding stimuli (any word, 72 stimuli).
Conceptually, both Anger and Sadness can be classified as representing negative affect
and therefore should show the same pattern of DL results. However, empirically, negative
affect has sometimes been represented by anger (Harrnon-Jones & Men, 1998) and
sorneûxnes by fear or disgust (Davidson, 1995) or sadness (Obrzut et al., 1997) . Becausê
of the exploratory nature of Study 2, it was decided that both angry and sad stimuli wouid
be used, with the expectation that results fiom the both stimuli could be combined in later
analysis. Consequently, half the participants attended to Angry soundmg words and hal f
to Sad sounding words (72 stimuli). mus, each individual listened for three of the four
possible stimuli. The order in whch participants attended to each of the three stimuli was
counterbalanced, as was the earphone placed on the participants' right rar.
The DL measures. From the four DL tasks, 1 created two sets of dependent
variables for each individual. The calculations were based on percentages because each
individual did not necessanly receive the same number of correct stimuli for each set of
trials. The f k t set consisted of Accuracy scores assessed fol each type of stimulus.
Accwacy was caiculated by subtracting the per cent of false positives (participant
wrongly indicated that he or she had heard the target stimuli) fiom the per cent of
conectly answered stimuli. Because the false positive enors could have occurred at either

Motor Activity 206
the left- or right- ear, no within-individual lateral score can be obtained for the Accuracy
variables. Thrrefore, Accuracy is an overd score that included both right and left
responses. A second set of dependent variables consisted of withm-individual lateral
difference scores, calculated by subtracbng the per cent of stimuli correct at the left ear
Boni the per cent correct at the right sa1 €01 ~ a ç h stimulus. Thu, each individual had a
lateral per cent correct score and an overd accuracy score for three stimuli (the word
Dower, the Happy voice, and either the Sad orAngry voice).
Initial data ussessment. AU of the mean per cent Accuracy variables and Lateral
DifEerence scores were reasonably normdy disûibuted. There were no extreme univariate
outliers apparent for any of the scores. None of the Accuracy nor Lateral Difference
scores showed significant sex différences (no t value > 1.16, nor p value < 0.26). None of
the Accuracy or Lateral DSerence scores were obvious outlien in bivariate plots with
both actometer and accelerometer measures of activity. 1 examined rar of presentation
side (Earphone) and stimulus order (Order) to assess the possibility that either of these
procedures influenced the DL scores. There were certain instances where the influence of
Earphone at right ear by Order was statistically significant. Accuracy scores showed an
Earphone by Order interaction for both the Sad, F(2,36) = 3.26, p < .05, and Angry tasks,
F(2,36) = 4.07, p < .03. The Lateral Difference scores also showed an Order by Earphone
between-subjects effect for the Happy and Word conditions, F(5,72) = 3 . 4 6 , ~ < .01.
Therefore, the correlations between activity measures and dichotic measures were
calculated afler statisticdy partialhg out the effects of earphone and order of stimuli.
DL Accurocy descriplive siatistics. Table 32 shows the mean percentages for

Motor Activiîy 207
each of the DL tasks. Among the participants who were given the Word, Happy, and Sud
tasks, Accuracy for the Happy task was sigdcantly worse than for the Word task,
F(1,72) = 5.63, p < .03. Accumcy in the Huppy task &O was significantly worse than
Accuracy for the Sad task, F(1,41) = 1 1.28, p < .01. Accuracy for the Word and Sad tasks
did not differ significantiy, F(1,41) = O.41,p < .53. Among th* participants Fvho werc
given the Word, Happy, and Angry tasks, Accuracy did not differ significantly by task.
Table 32. DL Meusures Mean Percent by Taskjor both Eurs.
Mean Percent for DL Measures
Correct False Pos Accurac y R - L
Word 84 76 14 8 9 68 15 17 28
Happy 84 67 20 6 10 62 22 - 14 28
Sad 42 78 18 8 12 71 24 4 2 2 1
an gr^ 42 72 18 8 11 62 22 -16 27
Note. Correct- Mn % Correct, False Pos= Mn % False Positive, Accuracy=Mn %
Correct-Mn % False Positive, R-L= Asyrnmeûic Mn % Correct (Right-Lefi). For the
R-L measure, a negative value indicates a lefi ear advantage. A positive value indicates
a greater right ear advantage.
Loteral DL descriptive statistics. The Word stimulus showed a right e u
advantage (REA), and d of the emotional stimuli (Huppy, Sad, andhgry) showed a lefi-
ear advantage (LEA). The REA for the word stimulus is consistent with the literature on
DL tasks, and is thought to indicate that verbal stimuli are better processed by the left
hemisphere in most individuais. The îiterahue is somewhat less consistent on DL

Motor Activity 208
emotional stimuli. It could be that all emotional stimuli show a LEA (are better processed
in the right hemisphere). It could also be that only negative stimuli show a LEA, in which
case, negative stimuli would be better processed in the nght hemisphere and positive
stimuli in the lefl hemisphere. Table 33 shows that in this study ail of the emotional
stimuli showed a LEA, irrespective of valence.
Table 33. DL Tusk, Percent of Participants Grouped by Side of Greuter N m b e r of Correct Trials.
Percent of Participants with More Correct Trials
DL Task N at Left Ear at Right Ear
Word 'Dower' 84 18 82
Happy Voice 84 67
Sad Voice 42 62 38
Angry Voice 42 71 29
Note. Participants are grouped by the ear at which they showed the greater number of
correct responses.
DL Intercorrehtions. Table 34 shows the intercorrelations among the DL
Accuracy scores for the whole simple. Individuals who accurately perceived the Happy
voice also accurately perceived the Sad voice. Otherwise task Accuracy scores were
relatively independent among the sbulus types. The lateral clifference scores were not so
independent. Table 35 shows the intercorrelations among the Lateral Difference scores.
This table shows that without regard for right-left direction, those individuais who made
more correct responses on one emotionai listening task tended also to make conect
responses on the other emotional tasks.

DL meosures and dernogrophies correlations. There were no signincant
conelations (before or after partialling out the effects of Earphone and Order) among
either Accuracy or Lateral Merence scores and gender, height, weight, nor selEreported
participation in a sports activity. Partialling out the effects of Earphone side and Order of
tasks, the number of hours of sleep reportrd by participants was nzgativzly correlated
with the Anger Accuracy score, r = -.33,p < .O5 and positively correlated with the Sad
Accuracy score, r = .36,p < .03. That is, the less sleep pacipants had on the night that
they were wearing the instruments, the more accurate they were at recogni9ng the Angry
tone, and the less accurate they were at recogniPng the Sad tone. No other significant
correlations were found among the other Accuracy scores or any of the DL Lateral
Difference variables and demographic vaiables.
Table 34. DL Task Intercorrelations, Percent Accurocy, Both Ears.
Percent Accuracy Both Ears
DL Task Word Happy Sad mw Word ..-. .211 .O2 .O0
Happy
Sad -p. .- - -
Note. Percent Accuracy = Mn% Correct-Mn% False Positives, irrespective of ear of
stimulus at each trial. AU participants were given the Word and Happy tasks, N = 84;
n = 42 for correlations involving Sad or Angy.
t Participants were given either a Sad task or an Angry task, not both.
* P . , < 10 *****p < .0001.

Table 35. DL Task Intercorrelutions, R-L Percent Correct, Both Ears.
--
DL Task Word Happy Sad ~ V W
Word .14 .27* .43***
Sad -00- t
Noie. Laterai Difference = % R correct - % L correct. N = 84 for Happy and Word
conditions; n = 42 for Sad or Angry condition.
t Participants were given either a Sad task or an Angry task, but aU participants were
given the Word and Happy tasks.
DL scules und mean activity correlutions. 1 had offered no predictions in the
relation bztween overail activity and the DL subscaies. The conelations between the
activity measures and DL Accuracy measures are presented in Table 15. None of the
correlations with overail activity (actometer- or accelerometer-measured) were statisticdy
significant at p < .OS. An examination of the correlations by sex was no more rewarding .
None of the correlations by sex between overall activity and Accuracy or Lateral
Difference scores was signtncant. None of the correlations between males and fernales
were siguficantly different fiom each other. Table 36 shows the correlations by sex
between the activity measures and the DL variables, both Accuracy and Lateral
DEerence measures.

Motor Activity 21 1
Table 36. Dt Accuracy Correlations with AL by Sex.
Activlfy Measures Dichotic Overall AL extra1 AL
DL Accuracy Words .O8
Happy -.12
AWY .25 Sad -.40
DL Lateral Difference Words .25
Happy -. 12
AQW .O8 Sad 10 - 09 -,48* * 44** 501s 11
Note. AL = Activity Level. CSA = Accelerometer measure of activity. M=Males F=Females. Males N=37-39. Females N=42-45, except for the Sad and Angry DL tasks where males n=19-20, females n=22-23. Accuracy = Total % Correct - % False Positives for both eus. Lateral Difference = % Correct at Right Ear - % Correct at Lefi
ear. *p < .IO, **p < .05, ***p < .01.
DL scales and dertral activity correlations. 1 predicted that ernotional DL
perception would be related to lateralized motor activity. If happiness is betîer analyzed in
the lefi hemisphere, then the nght arm should be differentialiy active (either more or less
than the left-am). Similady, if negative emotion is better processed in the right
hemisphere, and if, as I proposed, lateralùed ami movement is linked to lateralized brain
activation, then lateralized arm activity should be evident in the relation of activity to
either the emotional (Sad or Angryl voices. In the whole sample, there was very linle

MotorActivity 212
evidence that DL performance was related to lateraiized movement (see Table 15). Only
CSA-measured dextral activity was related to the Accuracy ofAngry perception, r = .36,
p < .03. This result is perhaps clarified in Table 36 with the results shown by sex. Using an
r-to-z transformation, males and females did not differ significantly, z = 0.42, p < .67, two-
tailrd, with respect to the reiation between CSA-measurzd lataal activity diffwnces and
the Accuracy o f h g r y . However, the males probably accounted for most of the
relationslup in the overall sample betwern dextral activity and the Accuracy perception of
Angry in the predicted direction. Wiîh respect to actometer-rneasured dextral activity,
Table 36 also shows a trend différence in the correlation between males and femdes in
their DL perception of Sad, r-to-z transformation, z = 1 . 9 2 , ~ < .06, NO-tailed.
The majority of participants (62%) were more fiequently correct for the lefi-ear
DL stimulus, regardless of gender. For the typical female participant, the more often they
were correct when Sad was at their lefl ear, the more ofien they moved their left amis. For
males, the opposite was me. The more ofien the males were correct when Sad was at
their left ear, the more ofien they moved theû right amis. 'lhis significant sex difference in
perception of Sad and the non-sigdicant difference evident for males in the correlations
between dexûai actometer-measured activity and bothhgry, and Sad, z = - 1.86, p < .07,
two-tailed, r-to-z transformation, indicates that Sad and Angry can not be sirnply
combined in to one negative emotion variable. 1 should note that the sample sizes were
quite s m d for the Angry and Sad DL conditions and therefore even large correlations
were not sigukantly Merent from each other.

Motor Activity 213
Factor Anaiysis oPTS, BISRAS, MM, und P N B Subscufes
Although the questionnaires used in Study 2 are based on several different
theoretical constructs (i.e., affect intensity in the AIM, biological reactivity in the PTS,
activation and inhibition in the BISBAS, mood in the PANAS), all can be subsumed
undzr two basic independent constnicts that ddeacribè motion. ? h ~ first construct
describes emotional valence, as identified by the positive and negative nature of the
emotion (e.g., Positive M e c t and Negative Reactivity or Negative Intensity in the AIM,
Negative and Positive Affect in the PANAS). The second descnbes the arousal level of the
emotion (e.g., Strength of Excitation/Inhbition and Mobility in the PTS, Serenity in the
AIM). It is unclear, however, whether some of the measures are best described as
belonging to either a valence or an arousal constnict. For example, the BISBAS subscalrs
might be subsumed under arousal if activation or reactivity were key, but under valence if
the affective tone were kry to their understanding. A similar situation occurs with the
Strength of Inhibition and Excitation subscales in the PTS, and the Negative Reactivity
and Negative intensity subscales of the AIM. Empirically, these scales might describe
either arousal or valence.
Theoreticaliy, emotion and affect are typically described in tems of their valence
and/or their arousal (e.g., Heller, 1993; Russel & Barrett, 1999; Watson, Wiese, Vaidya, &
Tellegen, 1999). These two theoretical consîructs are usually extracted as independent
entities in the empirical data. In Study 2, few of the hypothesized relationships among the
individual affect and arousal measures and motor activity were c o h e d . By themselves,
the questionnaire subscales did not provide convincing evidence of the hypothesked

Motor Activity 2 14
pattern of association, with either overall movement or lateralized movernent. It may be
the case that if the individual variables were combined in some way, the data might be
more informative, wifh respect to the relationship between emotion or arousal and motor
activity. For exarnple, the linear combination of variables into a few coherent factors
might provide a more effective means by whch to examine the relationship between
emotion and movement. Two questions ûrise. Does the data fit the 2-factor solution
typicdy found in studies of emotion, or is it possible that a factorial solution extracts four
separate factors, two for valence (negative and positive) and two for arousal (hgh and
low). The second question is, do the factors denved relate to overall or lateralized motor
ac tivity ?
To address these issues, 1 carried out an exploratory factor analysis (FA).
Specificdy, the FA was an attempt to identiQ coherent factors that might reflect at least
two underlying processes, arousal and valence, and to provide an indication of how thry
interact with each other. The FA also dowed me to rrduce the larger nurnber of observed
variables to a smaiier number of derived factors in order to improve the reliability of the
mesures. By themselves, the questio~aire subscaies did not provide convincing
evidence of the hypothesized pattem of association, with either overall movement or
lateralized movement. The linear combination of variables into a few coherent factors
might provide a more effective means by which to examine the relationship between
emotion and movement.
Eqdoratory factor analysisplan. In the FA conducted, I included all of the
subscales of the questionnaires used in Study 2 [PTS (3 subscales), BISBAS (4

Motor Activity 2 15
subscales), AIM (4 subscales), and PANAS (2 subscales)] as variables, with the aim of
deriving two to four interpretable factors. 1 then correlated the derived factors with the
movement variables. According to the theoretical literature, 1 expected that the FA would
yield at least two factors, an arousal and a valence factor, and possibly four factors,
reflecting low arousal, high arousal, positive valence, and negative valence.
Preporatory evaluation of datafor factor analysis. 1 f k t examined the data for
evidence of multicohearity by examining the interconelation matrix of the 13 subscales
(Table 37). None of the 13 subscales were highiy intercorrelated. Strength of Excitement
(PTS) with b o t . Behavioural Inhibition (BIS), r = S9,p < .0001, and Mobility (PTS),
r = .60, p < .0001, were the highest coi~elations of the matrix. AU of the subscales except
for Negative Affect on the PANAS were normaily disûibuted, and no data were missing.
A sampling of 22 bivariate plots between various questionnaire subscales showed no
obvious outliers or problems of curvilineanty. However, two of the 13 subscales, Negative
Affect fiom the PANAS and Serenity fiom the AIM, did not correlate significantly @ad
no r values > .22, norp values c .05) with any of the other variables in the set. Therefore,
these two variables were dropped £kom the subsequent factor analysis. The final set of
intercorrelations consisted of a 11 x 1 1 variable matrix.

Motor Activity
Table 37. Intercowelation Motrix for Factor Analysis, 13 x 13
1 AIM Positive Affect
2 AiM Neg intensity
3 AiM Sereniîy
4 AIM Neg Reactivity
5 BISBAS BIS
6 BISBAS Reward
7 BISBAS Drive
8 BISBAS Fun
9 PANAS Positive
10 PANAS Negative
1 f PTS SE
12 PTS SI
13 PTS Mobility -- --
Note. N = 84. Correlations above .2 1 are statistically significant at p < -05, above .28 at p < .O 1, above .35 (italicized) at p < .OOl,
above .38 (bold4d und iralicized) at p < .O00 1 .

Motor Activity 2 17
Initial analysis by sex. An initial FA was conducted to determine if the factor
analysis could be based on the combined sample of males and females. Because there
were only 39 males and 45 females in the sample, an analysis separately by gender was
likely to be minimdy reliable. However, because some of the observed variables
originally showed gender differences, it nias important to examine the FA separately by
sex initidy. Whether two or four factors were denved, for both males and females, the
factor structures were sirnilar. The main diffrrence between the male and female pattern
of factors was that for males, the first factor was a Negative Arousal factor, folowed by
the Positive Arousal factor. For the females, the loadings were reversed. The &st factor
was a Positive Arousd factor, followed by a Negative Arousal factor. Because the content
of the factors for the males and fernales were similar, 1 decided to combine the male and
female groups and conduct the FA on the whole group.
FA on the whole sample. Table 38 shows rhe results of the FA based on the whole
sample, N = 84. Principal components extraction using the SAS Factor procedure was
used initiaily to estimate the number of viable factors from eigenvdues and the Scree plot.
Four factors met this initial criteria. Two-, three-, and four-factor extractions then were
examinecl for the best solution, using both a principal components with varimax rotation.
Squared multiple correlations (SMC's) were used on the diagonal matrix for the
communality estimates.
Criteria used to evahtate thefactor analysis. Apart fiom examining the Scree
plot and having al1 factor eigenvdues greater than 1, there wcre three other cnteria used to
determine the best Eactor solution. The first critenon is a factor analysis rule of thumb

Motor Activity 2 18
used by Thurstoiie (E. Schludemann, personal communication, Feb 2000) that the nth
factor should contain n raw variables. The four-factor solution did noi meet this cnterion,
as Factor 4 of the rotated solution contained only two sigruficantly loaded variables. The
second rule of rhumb is based on the notion that ail of the variables together entered into
the factor andysis should tiuoretidy account for 100 O/o of the varima, that each
variable should account for Unth per cent of that variance, that each factor derived should
have at least two vanables loaded ont0 it to make it a lepitiniate factorial consûuct, and
that therefore each factor should account for at least Un variables per cent of the variance.
The first rule of thumb is combined with the second nde ofthumb, in this case indicating
that the fourth factor should account for 4/n % of the variance. This criterion [LOO/ 1 1
variables = Y. 1% each x 4 (4 variables should make up the fourth factor) = 36.4%] was not
met in the four-factor solution (which accounted for only 19% of the variance). The h a 1
criterion is that the variables loading on each factor should be unique to that factor.
Complex loadhgs, in which a variable loads sigmficantly on more than one factor are to
be avoided. Although the three-factor solution met the first two criteria (Scree plot and
eigenvalue > I), and the fkst two d e s of thumb, it did not meet the final critenon.
Negative Reactivity loaded complexly on both on both Factor 1 and Factor 3. Another
dificulty was that the three-factor solution was not obviously interpretable. First, the thûd
factor spiit Factor 2 variables. Factor 3 was comprised of variables that showed correlation
linkages to both Factor 1 and Factor 2. Secondly, the variables comprishg Factor 3 did
not themselves correlate with each other. Therefore, it was thought k e l y that this solution
was an artifact unique to this sample. Thus, the two-factor model, derived with varimax

Motor Activity 219
rotation, was chosen as the h a 1 solution. The two factors accounted for aii 11 variables. It
met most of the criteria, including interpretability, except that Mobihty (PTS) loaded
sigdicantly on both Factor 1 and Factor 2 (see Table 38). Together, the two factors
accounted for 40.8% of the variance. Factor 1 can be described as a Positive Arousal
factor and Factor 2 can be descnbed as a Negative Arousai factor (see Table 38).
FA factors und demographics correlotions. The two factors derived from the FA
were first examined for significant correlations with the demographic variables to check
for potential confounds. Age was significantly related to Factor 1, r = -.27,p < .05. Older
participants reported higher Positive housal scores. As weîi, heavier uidividuals (heavier
relative to their height) reported greater Positive Arousal, r = .26, p < . O 5

Motor Activity 220
Table 38. Principal Components Factor Analysis, Whole Sumple, Vorim~r Rotation
Scale Subscale Factor 1 Factor 2
BISBAS
BISBAS
AIM
BISBAS
PANAS
PTS
BISBAS
PTS
PTS
AIM
AIM
BAS Drive
BAS Fun
Positive Affect
BAS Reward
Positive AGect
Strength of Inhibition
BIS Inlubition
Strength of Excitement
Mo bility
Negative Reactivity
Negative Intensity
Percent Variance Explained 43 40 - --
Note. Italicized, bolded entries are the ones interpreted for each factor. N = 84.
FA jactors and mean activity correlations. Table 39 shows the correlations
between activity and the two factors derived fiom the FA on the whole simple. The
variance due to both age and hand preference were statistically pda l ied fiom ail of the
correlations. None of these whole-sample correlations showed a significant association
with overd activity. However, there were some gender differences. For fernales, Factor 2
(Negative Arousal) was correlated negatively with overall activity, for both actometer-

Motor Activity 22 1
measured activity, r = -.X, p < .04, and accelerometer-measured activity, r = -.38,p c .02.
Therefore, for females Negative Arousal was associated with reduced motor activity. For
males, Negative Arousal showed a trend opposite to that of the females. Factor 2
(Negative Arousal) was positively correlated, but only at a trend level, with overd
acceleromrtrr-measured activity, r = .31,p < .O6, but Factor 2 was not correlated with
overali actometer-measured activity, r = .OO,p < .98. However, the difference between the
male and fernale comelations (r = 9.38 vs r = +.31) was statisticaliy signifcant, z = 2.09,
p < -05, NO-tded).
FA factors and dextral activity correlaiions. As with the overall activity
correlations, the variances due to both age and hand preference were statisticdy partiailed
fiom the correlations. For dextrai activity in the whole sample, no significant correlations
ernerged for either instrument. Correlations by sex showed some interesthg diRaences,
particdarly with respect to dextrai activity (see Table 39). For males, greater nght-ami
actometer-measured activity was associated with Factor 1 (Positive Arousal). For females,
neither of the factors showed a significant relation with dextral activity.

Motor Activity 222
Table 39. Activitv and FA Factors Cowelations. Whole Sample and b y Sex.
Overail Activity Dextral Activity
Two FA Factors Actometers CSA Actometers CSA
Whole Sample
1 . Positive Arousal .O8 .O4 .19* .O8
2. Negative Arousal -.16 -.O4 .O6 -. 10
Males - - - - - - - - --
1. Positive Arousal .14 .14 .SI*** .OS
2. Negative Arousal -.O0 .31* .O4 -. 14
Females - - - - - -- - -- -- --- - -
1. Positive Arousd .O0 -.O8 .O3 .O2
2. Negative Arousal -.32" -.38" -. 10 -.O9
Note. FA = Factor Analysis. CSA = accelerometer measure of activity. Both Age and Hand preferencr have bean partialleci fkom ail correlations. Whole sample N = 80. Malesn = 38. Femalesn = 42. *p < .IO, **p < .05, ***p < .01.
DISCUSSION STUDY 2
In Study 2, I exarnined the relationshp among motor activity, émotion, and
arousal. Two objective measures of motor activity were used. Each used different
technologies to measue the movement of individu& as they went about their daily
routines. Over a 24-hou prrioâ, the actometers rneasured fiequency, and the CSA
accelerometers rneasured acceleration of spontaneous arm movement. Participants also
completed several questionnaire measures designed to assess their curent emotional
states and longer terni traits of arousal. The study attempted to examine whether
individual differences in movement relate to individuel differences in emotional and
temperamental charac teristics of arousai.

Motor Activity 223
1 had hypothesized that mean arm movement would show a pattern of positive
correlations with temperament and mood measures of arousal, irrespective of emotional
valence. That is, the greater the levels of arousal or emotional intensity experienced by the
participants, the greater the levels of overail movement they would demonstrate. 1 also
had hypothesized that laterai differences in movctniziit wodd relie tc, eiwtiond
mrasures, showing an effect related to emotiond valence, the positive or negative
disposition of the emotion. That is, greater relative right-arm movement would relate to
higher levels of negative affect, and greater relative le fi-am movernent wouid relate to
higher levels of positive affect. Although there were instances in whch the hypotheses
were supported (see Table 151, in general, the results did not confkm the hypothesized
patterns for either mean activity or lateralized activity.
Gender Differences in Avousal, Mood, and Perception
Because gender differences were apparent in Study 2, at least with respect to their
relation to activity, some discussion of gender ditferences in the self-report msasures and
the activity measures is useful. Gender differences in the self-report measures are
discussed first.
Overall, the gender Merence was very h i t e d in the univariate situation. Only the
AIM questionnaire showed some gender differences on two of its subscales. Femalas
acknowledged greater Xegative Reactivity than males, with a mean standardized
difference (Cohen's d) of 0.74. Females &O acknowledged greater Positive Affect than
males at the trend level resulting in mean standardized difference (Cohen's d) of 0.42.
These findings are consistent with previous studies (eg., Weinfurt et al., 1994), which

Motor Activity 224
have s h o w that females declare a greater breadth of emotional sxperience than do males,
irrespective of the emotional valence, positive or negative.
In Study 2, there were no univariate gender Merences found arnong the
questionnaire subscales on the PTS, BISBAS, PANAS, or DL tasks. In the literature,
some gsndcr diffsrsnces have bren found, although they are not necessdy consistent.
Newberry et al. (1997) found that in their study of 452 cokge students, the males rated
themselves sigruficantly higher on the PTS SE (Excitation) subscale, but not on the SI
(Inhibition) or MO (Mobility) subscales. The SE scale includes items on emotional
composure under threat or pressure, perseverence in the face of danger or risk, and
susceptibility to distractions while working. Carver and White (1994) found that in thair
sarnple of 732 coiiege students, fernales had higher BIS (Inhibition) and BAS (Reward
Responsiveness) scores than males. Their fkding indicates that females rate themselves as
more sensitive to anxiety-provoking stimuli and also more sensitive to signals of reward.
In the PANAS, as in Study 2, no consistent sex differences in mood ratings have been
found (Watson, Clark, & Teliegen, 1988). In the DL task, sex differences have been
reported, with males typically more lateralized for language than females (Bryden, 1988b).
Bulman-Fleming and Bryden (1 994) however, did not h d gender ditrerences in either the
verbal or emotional DL tasks in their study of 128 young adults. Generdy, mdes and
females show a lefi-ear advantage for verbal mateiial and a right-ear advantage for
emotional material, as was found in Study 2. niose studies hdùig gender &Terences
seem to have relatively large sample sizes. A likely interpretation is that the gender
ciifferences in the questionnaires used in Study 2 are relatively smali in magnitude.

Motor Activity 225
In Study 2, the lack of gender differences on the PTS and BISBAS scales by
themselves indicates that both males and females are rankùig their arousal levels in a
similar manner. Moreover, a lack of gender differences on the PANAS mood rankings
indicates that over the 24-hour data collection period, males and femdes did not differ in
their positive or negative mood rankuigs. Thus, it does not appear that the females in
general Uiflated (or males deflated) theu ratings. 'The similarity of scoring on the arousal
scales and mood ranhgs, coupled with the differences on the AIM responses to positive
and negative anèct traits, indicates that females may be more aware of their emotional
traits or are d y more emotiondy intense than males.
Surprisingly, the generai hypothesis, that arousal, as represented by the PTS (SE,
SI, and MO), the AiM (Positive Affect, Negative Intrnsity, Negative Reactivity, and
serenity), the PANAS (PA and NA), and the BlSBAS (BAS: Reward, Dnve and Fun-
seekmg, and BIS subscales) scaies wouid be related to motor activity, was not found in
Study 2. Only two subscdes supported the general prediction. On the PTS, only the MO
subscale was significmtly related to overall movement (only for the accelerometers) and
only for the males. In other words, for males, MO (the ability to adjust quickly to new
activities, w o r b g conditions, or jobs) is related positively to CSA-rated movement. Male
actometer-rneasured activity was also co~~elated with the BAS scale, especially the BAS
Drive subscale. Given the number of correlational analyses conducted on the data, it is
possible that the sigruficant results are the result of'ïype 1 enor. It is also possible that
greater levels of BAS Dnve (e.g., going "4-out" to get something desired) are associated
with greater movement in males. Female movement may be reflected more by the level of

Motor Activity 226
BIS in the BISBAS. Both activity measures show that BIS (e.g., getthg upset or worried
when somrone is angxy at me) is negatively reiated to movernent in females (see Table
22). For females, the greater the SI (Strength of Inhibition), the less overd movement.
An inbiguing aspect of the data is that in emotion/arousal and activity level, the
male-fimale differences appear only with respect to their relation with activity. There were
no significant univariate gender differences in either the BISBAS or PTS scales. The
occurrence of this sex difference only in the bivariate case is of importance because it
indicates that although the underlying biological systems may be similar, the resulting
behavioural reactions may not be. That is, although there may not be gender differences
in temperament and typical leveis of arousal and emotional responses, males and females
may be cued to respond to ciiffersnt aspects of theû environment. In this study, the
salience of male movement is reflected in the PTS Mobility and BISBAS Drive scales.
These scales re flect the approach mechanisms, such as engaging in goal-direc ted
behaviour, 3 sensitivity to the possibiiity of aaaining reward, being able to react to
unexpected environmental changes, and positive feelings, such as h o p , elation, and
happiness. For females, movement was salient only with respect to a sensitivity to BIS.
Behaviourai Inhibition is a withdrawal mechanism responsive to punishment cues and
more negative emotional cues, such as anxiety, fear, htrat ion, and sadness.
To some extent, the data fiom this study reflect a stereotype of what a typical
male or fernale might do when they are emotiondy aroused and upset. Pichire a
negatively aroused male pounding away with a hammer and nails or a punching bag and a
fernaie sitting quietly at home in fiont of the television with a box of ice cream. Why

Motor Activity 227
males and females would have different correlates of movement is a matter of
speculation.
The results are consistent with recent evolutionary-based theones of gender
differences, that sex differences in pattern of emotional responses are related to the
different reproductive strategies and motives of men and wornzii (Bjorklund & Gpp,
1996; Geaiy, 1998). Females may have benefitted fiom an adapted abdity to inhibit
impulsive behaviour and control their emotional expressiveness and arousal as a way to
negotiate their social environment. Geary (1998), for example, suggests evolutionaiy
adaptability has enabled females to show somewhat grzater skiil at strategically managing
the expression of social cues and the subtleties of social dynamics than males. Thus,
females could better manage relationships with physicdy iarger and potentidy more
aggressive males in order to encourage a secure chdd-rearing environment and maintain
social stability arnong fiiends and kin. For example, it may have been the case in the
evolutionary past, that during episodes of negative arousal, such as would occur during
situations of threat to a woman or her offsprhg, suNival depended upon her remaining
still and quiet. For males, survival might have depended upon an active approach to the
negative arousal situation (e.g., tighting or tleeing). Thus, different behavioural responses
for males and females rnight have emerged h m sunilar emotional or arousal responses.
The point to be emphasized is that the results of Study 2 show that although the
males and femaies did not differ in their levels of arousal and emotional valence, they did
appear to respond differently in terms of their rnotor activity. Many researchers have not
found significant gender differences in ernotional responsiveness or behavioural inhibition

Motor Activity 228
(Bjorklund & Kipp, 1996). nierefore, it codd be the case that males and females do not
differ to any great degree in their underlylng physiological or biological makeup, but have
adapted differentially in their behaviouml responses, specificdy their motor activity
responses, to emotion and arousal.
'Ille data cannot sprtak to dirrtïtio~i of causotion, so tlut dtliougli ws might balieve
that emotional arousal causes us to change our activity level, that is not necessanly the
case. If emotions are generally adaptive (Nesse, 1998), then it couid be that motor ûctivity
helps us io regulate, express, or maintain our emotiond arousai. The intuitive common-
sensr view is that we respond to emotional arousal with movement. Emotion or arousal
precedes the bodily response to it. However, it might also be the case that movement
hrlps us to regulûte, evoke, or maintain our mood or arousal levels to help us adapt. In
othrr words, in a Jamesian way, amotionai arousal may be a consequence of our actions
(James, 1950).
Gender Differences in Over<ill Movemerrt
In terms of motor activity, there were no sex differences in actometer-measured
fiequency of movement in either Study 1 or Study 2. In fact, when the two study sarnpla
were combined, mean actometer-rneasured activity showed no sigdicant sex differences,
t(1,103) = - 1.3, p < .20, N = 105. This finding is consistent with a previous actorneter field
study (Eaton et al., 1998) of 79 ad& in which no sigdcant sex ciifferences were found.
In Study 2, females did show greater CSA-rated accelemtion than males, resulting
in an ES of 0.67 SDs. The sigdcant sex Merence in accelemtion is sufprising, given that
there were no sigdicant differences in the numbers of males and females who indicated

Motor Activity 229
that they had participated in sports during the time that they were wearing the
instruments, r = .08,p < .45. Thirty per cent of the males and 36 per cent of the females
had participated in a sporting activity. In addition, when Study 1 and Shidy 2 data were
combined, a significant sex difference in acceleration stïU was present with females
showing more acceleration than males, r i 1,103) = -2.1, p < .O5 This sex difference in
CSA-measured acceleration resulted in an ES of 0.40 SDs. An ES of 0.40 means that 65.5
per cent of the female values excezd 50 percent of the male acceleration values in this
sample, a smail to medium effect (Cohen, 1969, p. 20, p. 179).
This unexpected sex difference in CSA-rated acceleration is interesthg though,
because the 6nding of greater movement in females is unusual in the literature. One
possible reason for the significant sex Merences found in this study is that the femalrs
had more active lifestyles. They were older on average by two years, and the age range
was larger for females than males. Participants were given an opportunity to describe
some of their d d y activities when they were s h o w a graph of the^ days' activity on a
cornputer screen at the end of data coliection. Anecdotally, it seemed the case that in this
sample, many more of the females had part-time or fbll-time work in addition to their
shidies. For example, the two individuais who showed the highest acceleration in Shidy 2
were both fernales. One was the mother ofthree children who canied out her normal
housework during the period in whicli she wore the instruments. The other worked in a
daycare and went about her usual activities the &y that shr wore the instruments. The
third highest female worked as a cleaner in the residences on campus. The two most
active males participated in sports duMg &ta collection, one who roller-bladed home and

Motor Activity 230
another who was involved in wrestling. Many more of the males however, did not
mention having been at work during the t h e that they were wearing the ac tivity monitors.
Those who did, mentioned work in sales or on cornputers. Typicdy, the males went
home after class to watch television, read, or sleep. Their activity may have been more
deliberate (e .g., playmg sports), but less consistent than the females in the study .
Overall.4ctivity and Factor llnalysis of Questionnaire Data
The exploratory factor analysis was an attempt to combine individual
questioiuiaire subscales into fewer coherent factors, which might provide a clearer picture
of the relation between movement and emotion/arousal. For the sample as a whok,
neither of the two interpreted factors derived in the factor analysis were significantly
related to overall movement, as measured by either actometers or accelerometers (see
Table 39). However, when correlations between the two factors and movement variables
were cmied out separately for males and females, some interesthg relations emerged
between activity and Factor 2.
Factor 2 is a Negative Arousal factor, composed of subscales fiom the BISBAS
(BIS), the PTS (SE and MO), and the AIM (Negative Intensity and Negative Reactivity).
To individu&, ths factor reflects the salience of anxiety and worry (BISBAS Inhibition),
a susceptibility to feeling guilty, nervous, and highly strurag, (AIM Negative Intensity),
and being easily aroused emotionally (AIM Reactivity); yet, they enjoy sensation-seehg
activities, thrive in the hustle and bustie of daily lire (PTS SE), and adapt easily to new
situations or activities (PTS MO).
For females, Factor 2 (Negative Arousal) was significantly negatively correlated

Motor Activity 231
with overail movement. Both actometers and accelerometers showed the same results (see
Table 38). For males, the results were not as clear. Males showed a positive trend
correlation between actometer-measured activity and Negative Arousai. Thus, it appears
that males and fernales may have different behavioural responses to Negative Arousai.
it is also intereshg that the negative vdericz oCthz factor focuszs on amie@ and
wony more than on anger. This result makes sense given the 24-hour snapshot of
emotional mood obtained in Study 2. Participants indicated very low levels of negative
mood (with a positively skrwed distribution) on the PANAS Negative emotion subscalr.
However, the PTS and BISBAS scales that reflect longer term feelings, including worry
and anxiety, were normally distxibuted. Thus, individu& were more Likely to admit to
more general feelings of anxiety or worry than they were to admit currently experiencing
any particular negative mood, such as distress, hostility, irritability, shame, or fear. One
implication is that immediate ratings of ernotions, particularly negative emotions, even
rated over the course of 24-hours, rnay be quite unreliable. It may bc important to obtain
ratings over more than a single day to obtain an adequately disûibuted sampling of
ernotions. It might ais0 be worthwhde to use an experimental emotion induction
procedure to obtain a range of emotions, rather than depend upon the randomnrss of the
field situation.
Laterahed Activity
Lateralized activity was calculated as a dextrality index, a h c t i o n of right-axm
movement relative to left-am movement (Right-arm movementl (Right-arm rnovement +
Lefi-am movement). This dextrality index is a quantitative, continuous variable,

Motor Activity 232
reflecting the relative amount of right-armed activity. For ease of interpretation, the
variable was calculated such that a score of 50 represents symrnetry of movement in both
arms. A score of less than 50 represents a left-amed bias, and a score of greater than 50
represents a right-med bias. The Pearson product-moment correlations calculated in the
studirs were based on this continuous variable, and in grnerd, negativz cornlations
Uivolving the lateralized activity variables represent greater lefi-arrned movernent, and
positive correlations represent greater right-med rnovement.
As in Study 1, one purpose of Study 2 was to replicate previous hduigs of a lefl-
lateral bias in actomrter-measured movement, as found by Eaton et al. (1998). As the
resuits show, students once again producrd a left-rnovement bias in actometer-measured
movement fiequency. No defirutive assessment can be made on the lateral movement
bias among lefi-handers. ïliere were only four individuals (two males and two fimales) in
Study 2 who were classified as left-handen on the LPI questionnaire. For these lefi-
handers, as assessed by the actometers, one male and one female showed greater lefi-arm
activity, and one male and one fernale showed greater right-arm activity. With this latest
replication, a left bias in actometer-measured movement has been found in three separate
studies (Eaton et al., 1998; Study 1 ; Study 2), infants (McICeen, 1995), preschoolers
(McKeen, 1997), and school-aged children and adolescents (McKeen, Eaton, Carnpbeil,
& Mitsutake, 1999).
A second purpose of both Shidy I and Study 2 was to assess the lateral bias as
measured by the accelerometers and compare the two instruments. Despite the
consistency of a s i n i s a bias in actometer-measured movement, the acceleration showed

Motor Activity 233
a dextml or right-sided bias. 1 will discuss this finding and comment on possible
interpretations of it later in the General Discussion.
Gender Differences in Ln~erulized Movement
in Study 2, the ac tometer rneasure of movement showed that categorically more
males were lefi biased than females, and that males were also more strongly lateralized
than fernales. The size of this proportional mean difference, however, is srnaii (Cohen,
1969). Therefore, although statistically significant, this result may be somewhat sample-
specific. Eaton et al. (1998) did not find that males and females differed in the magnitude
of this movement asymmetry.
Lateralized Activiîy and Factor Analysis ofQuestionnu~re Data
1 had hypothesized that lateral ciifferences in movement would relate to emotional
arousal measures. More specijïcally, 1 had predicted that lateral differences in arm
movement wodd show contrasûng effects related to emotiond valence, the positive or
negative disposition of the emotion. That is, greater relative right-am movement would
relate to higher levels of negative affect, and greater relative lefi-arm movement would
relate to higher levels of positive affect. Measures of general arousal without an emotional
context (e.g., the PTS subscales) would not be related to lateralized movement. Those
measures which tap both emotional and arousai aspects of temperament, such as the AIM
and the BISBAS were predicted to be related to lateralized activity according to the
emotional valence inherent in the particular subscale. For exarnple, the BAS subscaie of
the BISBAS should relate to lateral movement in the same way that a positive emotion
subscale would do, and the BIS should relate to lateral movement the way that a negative

Motor Activity 234
motion subscale would. Table 15 shows the specific hypothesized relationships between
dextrai activity and the emotiod arousal variables and the correlational results. There was
only one instance in whch the hypotheses were confhed . Accuracy on hearing the
Angry tone of voice on the DL task was positively correlated with right-arm movement,
as measured by the CSA accelzrornetzrs, r = .36,p < .03. Howevzr, in gmeral, the results
did not c o n h the hypothesized patterns for lateralized activity.
An examination of lateralized movement with statistically derived factors
produced few results. For the sample as a whole, their were no significant results between
éither factor and eithrr of the lateraiized measures of activity. For males, asymmetric
acceleration was positively related to Factor 1, indicating that greater right-axm movemrnt
was related to the linear combination of variables making up the Positive Arousal factor.
Ncithçr factor related sigm6cantly to lateraiized movement in females. Factor 2 (Negative
Arousal) related to overall activity in females, but not to lateralized activity.
How do these results fit with other stuciîes of emotion, arousai, and laterai
âifferences? Generaüy, right-hernisphere activation has been associated with negative
emotion and lefi-hemisphere activation with positive emotion (Davidson, 1995). In terms
of iimb movement, one could expect that contralaterai right-arm movement would be
associated with positive emotion and lefi-am movement with negative emotion. Two
recent experirnental studies involving facial movement provide motor examples. in one
study, unilateral nght-sided fàcial contractions were related to persistence in solving
insolvable puzzles. The researchers hypothesized that persistence represents positive
emotion and suggested that right-sided hcial contractions activated the contralateral lefl

Motor Activity 235
hemisphere associated with positive emotion (Schiff, et al., 1998) and approach
behaviours (Schiff & Bassel 1996). in Study 2 of the dissertation, the female results show
no relationship with lateralized activity, whde male results appear consistent with tindings
relating hemisphere differences and emotion.
G E K E W DISCUSSION
Study 1 was a pilot study designed to examine the measurement issues involved
in the use of two activity-rneasuring instruments. The results showed that gender, size of
limb, height, or weight were not significant correlates of motor activity. An Activity Diary
provided convergent validity that the instruments were measuring motor activity. Shidy 1
&O showed some initial support for the notion that emotional temperament was related
to laterd asymmetnes in movement. Shidy 2 extended the hdings of Study 1 with a
larger sample, and more comprehensive ratings of emotion, temperament, and mood. In
Study 2, a gender difference in acceieration was found, with females being more active
than males in overd movement and also more right-biased han males. More important
was the hdùig that males and females appeared to differ in how movement relates to
their emotional characteristics. A discussion of the more salient study results follows,
dong with a discussion of the limitations of the dissertation studies, future directions to
take the research, and the usefulness of the activity monitors as research tools.
Acti vity Measures
One of the purposes of using both actomcters and accelerometen to measure
movement in both studies was to assess motor activity simultaneously fiom two different
perspectives, kquency and acceleration. Because the two types of activity monitors were

Motor Activity 236
used at the same tirne at the same site, it was possible to compare the two instruments,
both as they measure overd activity and lateralized activity. In order to examine issues of
extemal validity, both shidies also included other measures of activity, such as an Activity
Diary. The measurement issues related to overd activity wiil be discussed k s t and then
the issues related to lateraiized activity.
Overull Mean Activity
In terms of overd mean activity, the actometers and accelerometers show a véry
seong positive relationship. The correlation between mean actometer-measured activity
and mean accelerometer-measured activity was quite high in Study 2 (r = .70, p < .O00 1 in
Table 1 1), and is quite sirnilar in magnitude when Study 1 and Study 2 data were
cornbined, r = .65, p < ,000 1. Thus, individuals who ranked highly in their fiequency of
movement, also tended to rank highly in their movement acceleration. As well, the
distributions between actometea and accelerometers showed quite remarkable sirnilarities
in shape (negative skews), and range of mean activity scores over the 24-hour period. It
c m be concluded that while the two instruments assess motor activity in different ways,
over a 24-hou period there is a hi& correspondence between mean fiequency of
movement and mean acceleration of movement generally.
Other measures of activity show consistent support for activity as an entity or
construct that describes how much people move generally. in Study 1, the Activity Diary
aiiowed participants to track theu various activities over the day. Participants indicated
when they were sleeping and rated their walOng activities from very light to v e v hurd.
The results showed a sigdcant positive relationship between both fiequency of

Motor Activity 237
movement (actometers), movement acceleration (accelerometers), and the mean diary
activity score (see Table 3). In Study 2, ayes-no responsr to a question about
participation in a sports activity resulted in a positive correlation with mean activity as
measured by both instruments. Those who had participated in a sports activity moved
more kequently and with greater acceleration over the &y than thosr who had not
participated. Moreover, the greater the number of hours of sleep at night, the less the
mean acceleration score. Frequency of movement, although in the same direction, was
not significantly related to the amount of sleep individuals experienced. Thus, based on
threr separate sources of information about the nature of dady activity, the Activity Diary,
reports of participation in a sports activity, and the arnount of sleep reported, the activity
monitors do provide a good means by wiuch to measure motor actiblty.
Potentiel Applications of h i s Meusurement Approach
The CSA accelerometers appear to have great potential in objectively measuring
the movement of individuais in that thy associate movement with time and provide
flexible measures of movement. The dady ebb and flow of activity could be examined
(Kerkhof 1985). For example, the circadian rhythm of movement patterns could be
assessed (Hu, Bouchad, & Lykken, 1998). This information would be of particular
import to individu& who must change their wake-sleep habits in the course of work-
related shft changes (Reinberg, et al., 1988).
Along similar lines, the accelerometers would make ideal instniments to assess
individuah who are having sleep problems. in the dissertation studies, it was usually
evident fbrorn the visuai plot of activity by tune, when the participants feu asleep. Even

Motor Activity 238
reading in bed could be distinguished from the 'flat line' pattern of sleep. Knowing the
exact nature of the sleep problem being expenenced would aliow physicians to
understand the problem without having to have their patients corne in to a hospital
environment for diagnosis. The elderly, for example, oAen develop difficulties with their
sleep habits (Mason, 1992). If they were to Wear iiie aççelrrorneters for a fcw nights, a
quite precise estirnate of their slerp intemptions would be evident.
Both the accelerometers and actometers are ideal instruments for assessing the
typical levels of activity in individuais of any age, fiom the very young to the vrry old.
Greater activity levels are associated with longevity and the maintenance of independent
functioning (Sallis & Owen, 1999). A means to measure motor activity across the lifespan
is of great value to those who are identifjmg the relations of activity to chronic diseases,
life satisfaction, and longevity (DuRant, niornpson, Johnson, & Baranowsla, 1996;
Kahma~zyk, Malina, Song, & Bouchard, 1998; Puhl, 1989; Saris, 1986).
The value ofphysical activity in health and fibiess is currently a topic of prime
interest in the research literahire. While questionnaire methods comprise the major means
of assessing e sha te s of physical activity (PaaFenbarger et al., 1993), some studies find
only low levels of variance in physical fitness is explained by physical activity variables
(Katpnarzyk et al., 1998). Objective instruments would prove to be useM because they
measure al l of the motor activity produceâ, and not just that produced in specinc exercise
workouts. It may be that long-tem fitness depends more upon a consistent level of
energy expenditure across al activities, rather than on more sporadic, but intense exercise

Motor Ac tivity 239
n i e instruments may also be useful in determining gender differences in activity.
Fernales have been found to be quite unreliable in reporting their leisure activity and their
strenuous activity (Weller & Corey, 1998). Thk underestimation of motor ûctivity could
be related to the items on questionnaires, which emphasize male-dominated leisure
octivities, or a reluciance on tliz part of the ferrides to adroit tiiiit they a2 U~volved hl
strenuous activities. in Study 1, the Activity Diary showed a gender difference in mean
activity, but the instruments did not. The conclusion was that fimales had under-reported
their activity level in Study 1. hecdotaiiy, some of the most active femdes in Study 1
had becn shopping, rather than involved in sports. Shopping was classified on their diary
as oniy a moderate energy-expenditure activity. It rnay be that some non-sport actitities
may be just as strenuous as sports games, but that questionnaires do not reflect that
reality .
P sychological Meuning ofActivity
More difficult to answer is the question, "do actometer-rneasured movement and
accelerometer-measured movement mean the same thing, psychologically speaking?" My
attempt to answer that question, based on a predicted pattem of relations among activity
and the emotion- and arousal-based questionnaire scales, ultimately was unsuccessful.
There were too few statistically signincant relations between activity and ernotional
arousal subscales to substantiate the predicted pattern of correlatiom.
One of the key factors in many of the null results was low statistical power. There
were a relatively large number of unexpected, but statistically significant bivariate
relations between gender and the various questio~aire subscales. If there was a pattern of

Motor Activiw 240
results present in the data, it was that many of the questionnaire subscale correlations
were in the opposite direction for males and females. However, because the sarnple
consisted of 45 females and 39 males, many of these correlations were not sipficant
when exarnined separately by gender; nor, in many cases were they significantly different
h m each other.
The pattern of nuii relations between overd activity and emotional or arousal
correlates was broken only on two occasions. Male activity was positively related to BAS
positive arousal, and female activity was negatively related to BIS anxiety (see Table 16).
This hdmg was confhmed by the results of the factor analysis whch showed that Factor
2 (Negative Arousal) was negatively related to female movement. In other words, maks
tend to be more active in response to positive arousai, and females tend to be less active in
response to negative arousal.
The best generaiization that can be made is that there are subtls indications that
the movement of males and femaies may difKer in response to either arousal or emotional
feelings, or al tematively, that arousal or emotions rnay produce diffeiing movement
responses in males and females. Why a behavioural inhibition system might be salient for
females and a behavioural activation system for males is not known. It is certainly
plausible that movement is associated with emotional arousal. One can speculate that in
our evolutionary past, the ability of females and their cfüldren to survive was related to
their ability to inhibit their behavioural responses, a withdrawal bias. Males might have
been better served by a motor responsiveness to arousal, an approach bias, which w d d
be associated with an inciination to explore new situations.

Motor Activity 241
As it happens, in Study 1 and Shidy 2, the sample size was too s m d to make any
reliable statement about how arousal and emotion relates to overail movement. If the ES
for the relation between emotional and arousal correlates is approxirnately 0.20 (based on
a p e u a l of the co~~elations between the questionnaire results and activity measures), and
the h m o n i c mean sample size is 42 (2 * n i * n2 i ni + riz), tlizii thz powzr to detzct a
ûue statisticdy significant result is 25 per cent (Cohen, 1969, p. 89). With this ES, md
ushg a one-tailed cnterion alpha at .Os, it would be necessary to have a sample size of 1 17
males and 11 7 females to have a 70 per cent chance of finding a statistical significance
(Cohen, 1969, p. 98). Using the same criteria, but with the originally predicted ES of 0.30,
the numbrr necessary to detect a m e effect would have been 102 (51 mdes and 5 1
females). Of course, without significant gender Merences, the number necessary to
attain a power of 70 per cent would be cut in haif Thus, the lack of conespondenca
between males and femaies, although often not statisticdy significant, resulted in a
picîure of the data that did not c o n h the predicted relationships.
In both Study 1 and Study 2, participants wore two activity monitors, one on each
wrist. Thus, it is possible to assess within-individual lateral asymmetries in movement
with each type of instrument. The resulting lateral measures of rnovement showed
relationships with arousal and ernotion variables that did not simply mirror the
relationships found with the overall measure of activity. There are a couple of key
measurement issues involvhg the asymmetiy of arm movement. These are discussed
next.

Motor Activity 242
Lateralireci Activity
The dextrality index was based on the Merence between the activity of the right
and lefi m s , relative to total arm movement. Thus, the index is a continuous measure of
nght-arm movement relative to total movement. For analyses involving a right-left
categoricai dichotomy, a continuous vaiue aquai or greater than 50 was cliissified as nghr-
and a value less than 50 was classified as le#-biased.
Descnptively, in Study 2 the distributions of the dextral measures of the
actometers and accelerometers were not as simila. as are the overail mem activity
distributions. The median value of the actometers was 45 per cent, wMe the median value
for the accelerometers was 51.6 per cent. The disûibution range was 52 percentage points
for the actomrter index, but ody 19 percentage points for the accelerorneter index. To
generalize, it appears that the actometer index is more variable and crntred below 50 per
cent, indicating a le£t bias in fiequency of movement. The accelerometer index is less
variable and centred slightly above 50 per cent, indicating a slight right bias in accelrration
of movement.
In comparing the actometers and accelerometers on the dextrality indices, two
striking features emerge. The h t is that, while significantly correlated, the correlation is
still only modest (see Table 1 1) and significantly less than the correlations between the
overaii mean values of the monitors. When Study 1 and Study 2 are combined (N = 101),
the correlation between the two dextral indices is quite modest, r = .30,p < .003. The
implication is that, for the correlational analyses between the psychological measures and
the dextrality indices, the pattern of results can be expected to diverge for the two

Motor Activity 243
measures of lateral movement. The relatively low correlation between the two dextral
measures, particularly for the Cemales, could indicate that dextral movement may
represent different psychological meanings for the two sexes. From the data it is difncult
to detemine Xthis implication is empirically the case. Many of the expected predictions
of rdationships betwzen laterd movement iirid the arousd and ertiotiord subscdzs did
not emerge for either instrument.
The second stnking feature is that the actorneters show hgher fiequency of
movement on the left ann, and the accelerometers show a higher acceleration of
movement on the right m. The finding desentes comment. In Study 2, as assessed by
accelerometers, 69 per cent of aii right-handed individuals showed greater right-arm
movement, and 3 1 per cent showed greater left-am movement, the reverse of what the
actometer data showed. However, this reversal in asymmetric movement patterns does
not reflect a simple shift or cross categorization between the two instruments. The chi
square test for an interaction between the instruments by side of greatest movernent was
not significant, and therefore those who moved more on the left by actometer recording
were not those who necessanly moved more on the right by accelerometer recordmg. The
resdt is surprising. What might account for such instrument differences?
One explanation is that the movements may be qualitatively Merent. If
movement fiequency is greater on the le& yet at the same tirne, acceleration is greater on
the right, it could be the case that the 1efi-m movements are slower or of smaiier
amplitude. Right-arm accelerations, although they might occur less fiequently, could be
of greater amplitude. The implication is that, for the conelational analyses between the

Motor Activity 244
psychological measures and the dextrality indices, the pattern of results can be expected
to diverge for the two measures of lateral movernent.
A second possible explanation is that the two instmments measure rnovement at
different levels of sensitivity. Actometen may be more accurate at measuring larger limb
movements than srnall ones. They move one -second' or one activity unit for
approximately every five changes of direction (Eaton et al., 1996). S m d movements,
such as those involved in fine motor tasks are not necessanly recorded as motor activity.
Thus, actometers may provide an ' o v e ~ e w ' rneasure of movement fiequency.
Accekrometers provide a measure of average acceleration per minute, and are probably
more sensitive to srnaUer rnovements.
In the natural srtting of both studies, the instruments were measuring a.D lands of
rvery-day movements that included both skiiled and unslalled activities. Thus, the
movement biases recorded were not closely related to the handedness reported by the
participants. However, the slight right-sided bias of movement acceleration recorded by
the accelerometers is consistent with Marchant et a i .3 (1995) hding that hand-use in
naturai settings is consistently, but weakly right-sided in various cultures.
The left bias in fiequency of movement as recorded by the actometers may in part
be due to a combination of missing the smaller fine motor movements, such as might be
involved in writing or typing, and the possibility that we use our iight- and lefi- limbs for
different hinctions. If, as Guiard (1987) suggests, we use our nght han& to hold onto
objects and our le ft hands to detine %e spatial reference vital to the elaboration of
motion of the right hand" (Guiard, 1987, p. 502), then many of our bimanual movements

Motor Activity 245
may include differentiated manual gestures. As happens when we write with our skilled
hand, we usuaily orient the paper on which we are writing with the Iesser skilled hand.
OU writing hand makes smder scale movements at the same time that our non-w~iting
hand is makuig larger scale movements. These larger, usuaüy le fi-biased movements
would be recorded by the actorneters, and wodd account [or a lefi-bias in fiequency of
movement. The lefi movement bias is not simply a hinction of skilled hand movemrnts,
however. Other processes may account for if as demonstratrd by the fact that the left-
arm bias is also present in infants and preschoolen. These populations are not typicdy
engaged in the many skiîied activities of the adult.
In tems of measurement issues, it is important to note that the accelerometer
variable calcdation was based on the relative difference per minute in acceleration
between the left- and right-ms. By using the ratio of right-lefi movement based on mean
accelerations per minute, the acceleration in the right arm was yoked to accelrration in the
left m every minute. Cdculating the dextral ratio over other lengths of time (e.g., 30
min., 1 hr, or the entire 24-hr penod to mention a few) can produce different outcornes.
For example, a separate analysis of Study 1 data involved calcdating two dextral ratios.
One was based on per cent nght-ami movement for each 10-sec intervai, and the other
was based on per cent right-arm movement for each quarter-hour interval. These two
methods of calculating a dextral index produced different categorical resdts. The 10-sec
method resulted in 3 of 22 participants showing a le fi-greater than right movement bias.
The quarter-hou method resulted in 10 of 22 participants showing a greater le fi-than-nght
b i s . Therefore, the issue of data aggregation is pdcuiariy important to the mean

Motor Activity 246
acceleration measure. In Study 1 and 2, the difference per minute calculation was used
because it was available and seemed like the most conservative measure to use. The
question remains though. What is the most appropriate unit of aggregation to use in
shidying the psychological meaning of lateralized movernent?
T'kir: instruments have bzen ooniriiacidy avdabk iit reasonablè picès only
recently, and 1 am unaware of any literatwe using accelerometers to create a lateral index.
Therefore, it is not known whch intentai of time might be best able to capture lateral
differences in movement whch are also psychologically meaningful. It could be, for
example, that lateral movement differences are best aggregated over a longer period of
time in order to capture movement differences related to mood, arousd, or other
emotions. In ths case, individual a m movements would be summed over longer periods
of t h e before creating an index of dextrality. Thus, fiom both a mzasurement perspective
and a psychological perspective, it wiU be important in hiture studies to investigate
methodically the properûes of each way of definhg the lateral index.
Limitations of the Disser~ution Studies
These dissertation field studies were designcd to examine the rncaning of the
eveyîay movement of individu& with respect to their levels of amusal and emotional
characteristics. Generai hypotheses consisted ofpredictions regarding the relationship of
overaii mean activity to arousal characteristics and of emotional valence to latemlized
activity. Sipifkant hdings are sparse, and it is evident that there are certain limitations to
the studies canied out and describcd above.
One limitation is a problem typicdy found in field studies, and that is that there is

Motor Activity 247
no experimental control over either the activities canied out by participants or in the
moods and other emotional characteristics experirnced by the participants over the 24-
h o u data-collection period. in the case of the PANAS Negahve Affect, for example, very
few individuals expressed even moderate levels of negative mood over the time period of
the study. Thus, the data analysis of negative mood in Study 2 is qute unreliable.
Similarly, the movement of the participants was dictated by the day-to-day routines of the
individuals in the shidies, and these routmes varied greatly. It is probably the case that
individual differznces in both overall movement and laterwed movement depend not so
much on the common activities typicaiiy canied out by everyone in the study, but by the
activities carrieci out during fiee time. In Study 2 particularly, some individu& were
working full tirne and had almost no fiee time, whde others had almost ail of their day
fiire. It might have hrlped the outcome of the studies if the participants generally hrd
sirnilar opportunities to engage in fiee time and pursue theû natural emotional behavioural
ac tivities.
A second limitation of the studies is the low power to detect a tnic underlying
effect. Sample size was determined on the expectation that there would not br significant
gender differences in either movement or in the reporting of arousal and emotional
experience. in fact, gender differences rarely occurred in the univariate situation. It was
only in the bivariate cases, in the relationships of arousal and emotion with movement,
that the surprishg gender ciifferences appeared. Thus, the non-significant relations that
emerged in the studies may be due to low power. To attain sufficient power to detect
significant relationships with activity, the sample sizes would have to be at least doubled.

Motor Activity 248
A third limitation of the studies is the reliance on young adult participants. It may
bey for exarnple, that many first-year University students are not very knowledgeable or
are in a state of flux regarding self-reports of their temperament or emotional feelings.
Older individuals might provide a more mature, or at least consistent, picture of their
emononal Me. It could also be that those whose activity declines greatly with age are
those who are at greater risk for developing emotional or hcalth problems. It would be in
this older population that an objective activity measure might be of rnost benefit.
A related issue involves the reliability of the questio~aires administered to the
participants in the shidies. Although the data on the whole showed normal distributions in
these studies and good intemal reliability of items on the questionnaires, self-reports are
not necessarily the best means to mess behaviour. Quasi-experimentd behavioural tasks
might provide a better way to assess responses to emotional arousal (e.g., laboratory
manipulations and asscssments of mood and limb movement patterns).
One M e r limitation of the dissertation studies was that a ckar empirical
distinction between emotion and arousal was not achieved. The theoretical distinction in
the literature d e h g emotion in terms of valence, orthogonal fiom arousal and activation
(Heller, 1993; Watson et al., 1999), was not found. in Study 2, for example, the BISBAS
and PTS scales, designed to assess physiological arousal, and the PANAS and AIM
scales, which focus on emotional characteristics, were ail included in each s i m c a n t
factor denved fiom the factor analysis.
\ M e these limitations are important, the great advantage of the studies is that
they were able to assess individu&' typical levels of movement over a 24-hou period

Motor Activity 249
without resûiction. Individuals were able to cany on their usual activities, as the
instruments were unobtnisive and not inconvenient for most participants.
Shuitaneously, two types of activity data were collecte4 fiequency and accebration of
movement, so a cornparison of the data was possible. The assessment of the limitations
and benefits of the activity studies provide a basis on whch to explore idera for îuturl:
directions in the study of movement. To these 1 turn next.
Fu fure Directions
With smaiier than anticipated rffect sizes, and in anticipation of sex differences in
the relation between emotion and movement, a simple option for a fiiîure study would be
to double the sample size. In addition, havhg participants Wear the instniments for a two-
or h e e - day period would provide some benefits. Reliabdity of the instruments fiom day
to day could be estimated, and a broader sample range of mood estimations could be
obtained. A M e r refinemcnt relates to the temperament or personality variables that
might influence overail movement. in transitioning fiom childhood to adulthood, activity
changes kom a prirnary dimension of temperament to a facet of extraversion in adult
personality (Eaton, 1994). Extraverts, therefore, may be more active than introverts.
Therefore, a measure of personality would make a beneficial addition to a study protocol.
What rnight be even more effective than a replication study however, is to use an
experimental approach to the study of arousal and emotion. For example, instead of
relying upon individu& to report a normal distribution of mood scores, it might be more
effective to use experimental mood induction procedures, or tasks that can be
manipulated for failure or success, to produce positive or negative moods. Movement

Motor Activity 250
could then be examined within the context of emotional valence.
The original experimentai studies by Kimura (1973% 1973b) would constitute a
good mode1 on which to devzlop such a study. Kunura assessed laterai movements in the
context of a conversation. If a mood induction procedure was given pnor to a
conversation occuing, it wodd be possibk to test the hypothèsis that mood influences
movement. The accelerometers would be ideal instruments to use for restricted tirne
intervals, because they associate movement with real tirne on a minute-to-minute basis.
Thus, right- and lefi- hand movements can be yoked by tirne, and lateral differences
assessed easily. Although handedness did not have a sigruficant influence on the current
studies, experimental studies could use more homogenous handedness groups.
The above study would address the effects of ernotion on movement, but to somr
extent, it assumes a directional effect. It could be that movement influences emotion or
arousal rathrr than emotion influencing movement. niere is evidence, for example, that
movement or exercise can improve an individual's mood (Hays, 1999; McCaulcy, Talbot,
& Martinez, 1999). However, lateral differences in rnovement codd be tested more
precisely. One way to iissess the influence of movernent on emotion is to prescribe the
movement and let the emotion Vary. For example, Schitr and Larnon (1 989) asked
participants to contract one side of their facial muscles for one minute and then asked
participants to indicate how they were feeling. A sirnilar procedure could be canied out by
using an asymrnehic limb movement procedure and assessing mood aftemrards.
Another less experimental method wodd be to assess movement in c h c d
populations. Depressed individuals or bipolar mood disorder individuais might provide a

MotorActivity 251
sample group who show extreme affective States. The hypothesis is that individuals
would show changes in their laterai movement patterns depending on their emotional
state. With the accelerometer, changes in movement couid be tracked conbnuously over
weeks, days, or hours. Circadian rhythm patterns of movement could be examined, dong
with measures of emotion, arousal, and cognitive-task performance.
In summary, in the dissertation studies, I have measured individuals' typical levels
of activity in a fiee-living field situation, and have examined the possibility that movement
is rnraningful and plays an important role in the expression or regulation of emotion and
arousal. Although the results are far fiom conclusive, 1 am not yet ready to abandon the
throry. The hypothesis that limb movement would in any way be related to temperament
and emotion was a risky one, and for the results to provide even nominal success is
somewhat surprising. With the knowledge that males and females differ in their
behavioural responses to emotional experience, it may be possible to fhd that meanhg in
motor activity.

REFERENCES
Afifi, A. K. (1 994a). Basal Ganglia: Functional anatomy and physiology. Part 1 . Journal of Child Nnrrology, 9,249-260.
Afifi, A. K. (1 994b). Basal ganglia: Functional anatomy and physiology . Part 2. Journal oJChild Neurologv, 9,352-36 1 .
Aglioû, S., Dall'Agnola, R., Gireh, M., & Mani, C. A. (199 1). Bilateral hemispheric control of foot distal movements: Evidence ~ o m normal subjects. Cor~ex, 27, 571-581.
Ahadi, S. A., & Rothbart, M. K. (1994). Temperatnent, development and the big five. In C. F. Halverson, G. A. Kohnstamm, & R. P. Martin (Eds.), The developing structure oftemperament andpersonalityfiom infuncy to adulthood. Hilisdale, N . J . : Erlbaurn.
hnett , M. (1972). The distribution of manual asymmetry. British Journal of Psychology, 63,343-358.
Annett, M. (1 992). Paraiiels between asymmeüies of Planum Temporale and of hmd skill. Neuropsychologia, 30,95 1-962.
hnet t , M., & Turner, A. (1974). Laterality and the growth of intellectual abiiities. British Journal of Educational Psychology, 44,37-46.
Applebaum, M. I., & McCall, R. B. (1 983). Design and analysis in developmental psychology. In P. H. Mussen (Series Ed.) & W. Kessen (Vol. Ed.), Handbook of Child Psychology: Vol. 1. History, Theory, and Methodr (4' ed., pp. 41 5 - 476). New York: Wiley .
Asbjomsen, A. E., & Hugdahi, K. (1 995). Attentional efficts in dichotic listening. Braira and Lunguage, 49,189-20 1 .
Barr, R. G., Kramer, M. S., Boisjoly, C., McVey-White, L., & Pless, 1. B. (1988). Parental diary of infant cry and fuss behaviour. Archives of Diseuse in Childhood, 63, 380-387.
Bates, E., O'Connel, B., Vaid, J., Sledge, P., & Oakes, L. (1986). Language and hand pre ference in early development. Developmentul Neuropsychologv, 2.1 - 1 5.
Beck, A. T., Ward, C. H., Mendelson, M., Mock, J., & Erbaugh, J. (1961). An inventory for measuing depression. Archives of Generul PJychiatry, 4,56 1-57 1 .

Best, C. T. (1988). The emergence of cerebral asymmeûies in early human development: A literahire review and neuroembryological model. In D. L. Molfese & S. J. Segalo witz (Eds .), Lateraïization in children. Develupmental tmplicotions. N. Y. : Guddford Press.
Bigler, E . D . (1 988). OveMew of func tional neuroanatom y. Diagnostic clinical neuropsychologv (revised ed., pp. 1-30). Ausûn, Texas: University of Texas Press.
Bjorklund, D. F., L Iupp, K. (1 9903. Parental investn~rrit theory md gzndzr Merences in the evolution of inhibition mechanisms. Psychological Bulletin, 120, 163- 188.
Borod, J. C. (1 993a). Emotion and the brain-anatomy and theory: An introduction to the special section. Nerrropsvchofo~, 7,427-432.
Borod, J. C. (1993b). Cerebral mechanisms underlying facial, prosodie, and lexical emotional expression: A review of neuropsychological studies and methodological issues. Neuropsychology, 7,445-463.
Bouchard, C. (1 997). Biological aspects of the active h g concept. In J. E. Curtis, & S. J. Russell (Eds.), Physical activity in humun experience: Interdtsctplinary perspectives @p. 7-58). Windsor, Ont: Human Kinetics.
Bourassa, D. C., M c M ~ u s , 1. C., & Bryden, M. P. (1996). Handedness and eye- dominance: A meta-analysis of their relationship. Lateruïity, 1,5034.
Bradshaw, J. L., & Nettleton, N. C. (198 1). The nature of hernispheric specialization in man. The Behaviorul and Brain Sciences, 4, 5 1-9 1.
Brinkman, J., & Kuypers, H. G. J. M. (1973). Cerebral control of contralaterai and ipsilateral ami, hand and hger movements in the split-brain rhesus monkey. Brain, 96, 653-674.
Brockmeier, B., & Ulrich, G. (1993). Asymmeûies of expressive facial rnovernents during experimentaily induced Positive vs. Negative mood states: A video-analyûcal study. Cognition and Emotion, 7,393-405.
Brown, F. G. (1983). Principies of educotionul andpsychological testing. (3d ed, pp. 74-97). New York: Holt, Rinehart and Winston.
Bryant, F. B., Yamold, P. R., & Grimm, L. G. (1996). Toward a measurement model of the AfYect Intensity Measure: A three-factor structure. Journul ofResearch in Persona Iity, 30,223-247.

Bryden, M. P. (1988a). An o v e ~ e w of the dichotic listening procedure and its relation to cerebral organization. In K. Hugdahl (Ed.), Handbook of dichotic listening: Theory, methods und reseurch @p. 1-43). Toronto: John Wiley.
Bryden, M. P. (1 988b). Dichotic studies of the lateralization of affect in normal subjects. In K. Hugdahl (Ed.), Handbook ofdichotic listening: Theory, methods and research @p. 359-374). Toronto: John Wiley.
Bryden, M . P., Free, T., Gagne, S., & GrofS P. (199 i j. Handedness cffects in the detection of dichotically-presented words and emotions. Cortex, 2 7,290235.
Bryden, M. P., & MacRae, L. (1989). Dichotic laterality effects obtained with emotional words. Neuropsychiatry, Neuropsychologv, and Behavioral Neurology, 1, 171-176.
Bryden, M. P., Munhali, K., & Allard, F. (1 983). Attentional biases and the right- aar effect in dichotic lirtening. Bruin and lariguage, 18,236-248.
Bulman-Fleming, M. B., & Bryden, M. P. (1 994). Simultaneous verbal and affective laterality effects. Neuropsychologia, 32,787-797.
BUSS, A., Er Plomin, R. (1984). Temperament Early developingpersonality traits. Hillsdalr, N .J. :Erlbaum Associates.
Buss, D., Block, J., & Block, 1. (1 980). Preschool activity level: Personality cowlates and devclopmental implications. Child Development, 51,40 1-408.
Campbell, D. W. (1995). The developenî ofcognitive inhibition and motor activity level in yotrng children. Unpublished master's thesis, University of Manitoba, Winnipeg, Manitoba, Canada.
Campbell, D. W., Eaton, W. O., & McKeen, N. A. (2000). Motor activity and behavioral control in young chiidren. Manuscript under revision.
Cannon, W. B. (1927). The James-Lange theory of emotions: A critical examination and an alternative theory. American Journal ofPychology, 39, 106- 124.
Cannon, W. B. (1 93 1). Again the James-Lange and the thalamic theories of emotion. The Psychological Review, 38,28 1-295.
Capaldi, D. M., & Rothbart, M. K. (1997). Early adolescent temperament questionnaire. Parent version. Unpublished manuscript.

Carlson, N. R. (199 1). Physiology of behavior. Toronto: AUyn and Bacon.
Carver, C. S., & White, T. L. (1994). Behavioral inhibition, behavioral activation, and affective responses to impending reward and punishrnent: The BIS/BAS scales. Journal of Personulity and Social Psychology, 67,3 19-333.
Chapman, J. P., Chapman, L. I., & Ailen, J. J. (1987). The measurement of foot preference. Neuropsychologia. 25,579-584.
Chodzko-Zaj ko, W. J. (1 997). The World Health Organization issues guideluies for promoting physical ûctivity arnong older persons. Journal ofAgirag and Physical Activity, 5, 1-8.
Chumlea, W. C., & Roche, A. F. (1979). Unpublished data, Wright State University School of Medicine, Department of Pediaûics, Yeliow Springs, OH.
Clark, W. B., gt Newberry, B. H. (1 995, My). Temperament and thejive-joctor personality formulation: Some initialfindings. Paper presented at the VIIth Meeting of the International Society for the Shidy of Individual Differences, Wmaw, Poland.
Clarys, J. P., M a t h , A. D., & Drinkwater, D. (1984). Gross tissue weights in the human body by cadaver dissection. Hman Biology, 56,459-473.
Cohen, 1. (1969). Statisticalpower analysis for the behavioral sciences. New York, NY: Academic Press.
Corballis, M. C. (1 989). Laterality and human evolution Psychological Review, 96,492-505.
Coren, S. (1993a). The laterai preference inventory for measurement of handedness, footedness, eyedness, and earedness: Noms for young adults. Bulletin of the Psychonornic Society, 31, 1-3.
Coren, S. (1 993b). The lefiander syndrone. The couses and conseguences of lefi-handedness. New York: Vintage.
Coren, S., and Porac, C. (1978). The validity and reliability of self-report items for the measurement of lateral pre ference. British Journal of Psychology, 69,207-2 1 1 .
Costa, P. T., & McCrae, R. R. (1985). The NE0 Peaonality fnventory manual. Odessa, FL: Psychological Assessrnent Resources.

Motor Activity 256
Cronbach, L. 1. (1951). Coefficient alpha and the intemal structure of tests. Psychometrika, 16,297-334.
Csikszentmihalyi, M. (1 997). Ac tivity, experience, and personal growth. In J . E. Curtis, & S. J. Russell (Eds.), Physical octivity in human experience: Interdisciplinary perspectives @p. 59-88). Windsor, Ont: Human Kinetics.
Davidson, R. J. (1992a). Prolegomenon to the structure of motion: Gleanings tiom neuropsychology. Cognition and Emotiori, 6,245-268.
Davidson, R. J. (1 992b). Emotion and affective style: Hernispheric substrates. Psychological Science, 3,39943.
Davidson, R. J. (1992~). Anterior cerebral asymmetry and the nature of emotion. Bruin and Cognition, 20, 125- 15 1.
Davidson, R. J. (1 993a). Parsing affective space. Perspectives fiom neuropsychology and psychophysiology. Neuropsychology, 7,464-475.
Davidson, R. 1. (1 993b). Cerebral asyrnmetry and emotion: Conceptuai and rncthodological conundrurns. Cognition and Enrotton, 7, 1 1 5- 138.
Davidson, R. J. (1995). Cerebral asymmetry, emotion, and affective style. In R. J. Davidson, & K. Hugdahl (Eds.), Brnin asynimetry @p 361-387). Cambridge, MA: MIT.
Davidson, R. J., Ekman, P., Saron, C. D., Senulis, I. A., & Friesen, W. V. (1990). Approach-withdrawai and cerebral asyrnmeûy: Emotiond expression and brain physiology 1. Journal of Personality and Social Psychology, 58,330-34 1.
Davidson, R. J., & Fox, N. A. (1988). Cerebral asyrnmeûy and emotion: Deveiopmental and individual dBerences. In D. L. Molfese & S. J. Segalowitz (Eds.), Bruin lateralimiion in children: Developmentd implications @p. 19 1-206). New York: Guildford Press.
Davidson, R. I., & Hugdahl, K. (1996). Baseline asymmetries in brai. elecûical ac tivity predic t dichotic listening performance. Neuropsychologv, 1 U, 2 4 1 -246.
Davidson, R. J., & Tornarken, A. J. (1 989). Laterality and emotion: an electrophysiological approach. In F. Boiler & 3. Grahan (Eds.), Hondbook of neuropsychology, Vol. 3 @p. 4 1 9-44 1). Amsterdam: Elsevier Science Pubhhers.

Motor Activity 257
Denybeny, D., & Rothbart, M. K. (1988). Arousal, affect, and attention as components of temperament. Journul ofPersonulity and Social Psychology, 55,958- 966.
Deutsch, Ge, Bourbon, W. T., Papanicolaou, A. C., & Eisenberg, H. M. (1988). Visuospatial tasks compared via activation of regional cerebral blood flow. hreuropsychologiu, 26,445-452.
Diener, E., Sand\& E., t Larsen, R. J. (1985). Age and sex cffects for affect intensity . De velopmental Psychology, 2 1,542-546.
Dishman, R. K., Sallis, I. F., & Orenstein, D. R. (1985). The determinants of physical activity and exercisr . Public Health Reports, 100, 1 58- 1 7 1.
DU@, E. (1951). The concept of energy mobdizatioii. Psychological Review, 58, 30-40.
Du@, E. (1957). The psychologicd significancz of the concept of Arousal or Activation. Psychologicul Review, 64,265-275.
DuRant, R. H., Thompson, W. O., Johnson, M., & Baranowsla, T. (1996). The relationship among television watching, physicai activity, and body composition of 5- or 6-year old chddren. Pediabic Exerctse Science, 8, 15-26.
Duysens, J. (1982). Does control of limb movement equal control of limb muscies? Behavioral and Brain Sciences, 5,544.
Eaton, W. 0. (1983). Measuring activity level with actometers: Reliability, validity, and arm length. Child Development, 54,720-726.
Eaton, W. 0. (1994). Temperament, development, and the five-factor model: Lessons fiom activity level. In C. F. Halverson, Sr., G. A. Kohnstamrn, & R. P. Martin (Eds.), The developing structure of temperament andpersonalityfiom infancy to adulthood @p. 173- 187). Hillsdak, N. J.: Erlbaum.
Eaton, W. O., & hue& C. (1986). Parent and actometer mesures of motor activity level in the young infant. In fnt Behavior andDevelopmeni, 9,383-393.
Eaton, W. O, & Enns, L. R. (1986). Sex differences in human motor activity level. Psycho&ogicoî BuIIetin, 1 Oû, 1 9-28.

Mo tor Activity 258
Eaton, W. O., & McKeen, N. A. (1992). Developmental differences in irfani moior activity: h s , legs and octometers. Poster presented at the 8th Biennial International Conference on Infant Shidies, Miami, Fla., May 6- 10, 1992.
Eaton, W. O., McKeen, N. A., & Lam, C-S. (1988). Instnunented motor activity measurement of the young infant in the home: Validity and reliability. Infant Behavior and Development, 11,375-378.
Eolori, W. O., LIcKcen, N. A., & Saudino, K. J. (1996)). M e a s h g human individual differences in general motor activity with actometers. In K.-P. Ossenkopp, M. Kavalien, and P. R. Sanberg (Eds.). Meamring Movement and locomotion: From Invertebrotes to Humans. New York: Springer.
Eaton, W. O., Rothman B., McKeen, N. A., 8 Campbell, D. W. (1998). Something sinistral happening? Asyrnmetry in ami movement fiequency. Lateraliiy, 3, 31 1-322.
Epstein S. (1 984). The stability of behavior across time and situations. In R. Zucker, J. Aronoff, & A. 1. Rabin, (Eds.), Personality and the prediction ofbehavior @p 209-268). San Diego: Academic Press.
Epstein, S. (1 980). The stability of behavior: II. Implications for psychological research. American Psychologisi, 35,790-806.
Eysenck H. J. (1 967). The structure of humun personality. London: Methuen.
Eysenck, H. J., & Eysenck, M. W. (1985). Personality and individtral difirences --A natural science approach. New York: Plenum.
Eysenck, H. J., & Eysenck, S. B. G. (1 969). Personality structure und measurement. London: Routledge & Kegan Paul.
Eyscnck, H. J e , Eysenck, S. B. G., & Bmett, P. (1985). A revised version of the P scale. Personality and Individual Differences, 6,2 1-29,
Fischer, K. W., Shaver, P. R., & Carnochan, P. (1990). How emotions develop and how they organize development. Cognition und Emotion, 4 8 1 - 127.
Flanery, R. C., & Balling, J. D. (1979). Developmental changes in hemisphenc specislization for tacrile spatiaî ability. Developmen!ul Psychology, 15,364-372.
Flowers, K. (1975). Handedness and controlled movement British Journai of Psychology, 66,39052.

Motor Activity 259
Fowles, D. C. (1980). The three arousal model: implications of Gray's two-factor l e h g theory for heart rate, electroderrnal activity, and psychopathy. Psychophysiologv, 17,87-104.
Fox, N. A. (Ed.). (1994). The development of emotion regulation. Biological and behaviorai consideratiom. Monographs of the Society for R e s e w h in Child Development, 59 (2-3, Serial No. 240). Chicago: University of Chicago Press.
Fox, N. A. (1989). Psychophysiological correlates of emotional reactivity during the first year of life. Developmental Psychologv, 25,364-372.
Fox, N. A., & Davidson, R. J. (1988). Patterns ofbrain electrical activity during facial signs of emotion in ten-month-old infants. Developmental Psychologv, 21,230-236.
Fry, W. F. (1 994). The biology of humor. Humor, 7, 1 1 1 - 126.
Funk Br Wagnell's Canadian College Dictionq. (1 989). Markham, Ont.: Fitzhenry & Whiteside.
Fuster, J. M. (1989). The prefiontal cortex: Rnatomy, physiology, and the neuropsychologv ofthe fiontal lobe. New York: NY: Raven Press.
Gabbard, C., & Hart, S. (1996). A question of foot dominance. The Jourxal of General Psychology, 123,289-296.
Gainoni, G. (1989). Features of ernotional behavior relevant to neurobiology and theorics of emotion. In G. Gamotti & C. Cdtagirone (Eds.), Emofions und the dual b a i n Vol. 18. Experimental Brain Reseurch Series @p. 9-27). New York: Springer-Vrrlag.
Galaburda, A. M., Rosen, G. D., & Sherman, G. F. (1990). individual variabiliîy in cortical organization: It's relationship to brain laterality and implications to function. Neuropsychologia, 28,529-546.
Geary, D. C. (1 998). Male, fenae: The evolution of human sex dtferences. Washington: APA.
Ge ffen, G., & Caudrey, D. (1 98 1). Reliability and validity of the dichotic monitoring test for language laterality . Neuropsychologia, 19,4 1 3-423.
Geschwind, N . (1979). Speciakations of the human brain. Scientific American, 241, 180- 199.

Geschwinâ, N., & Galaburda, A. M. (1 985a). Cerebral lateralkation. Biological mechanisms, associations, and pathology: 1. A hypothesis and a program for a research. Archives ofNeurology, 42,428-459.
Geschwind, N., & Galaburda, A. M. (1 .)8Sb). Cerebral lateralization. Biological mechanisms, associations, and pathology: II. A hypothesis and a program for a research. Archives of NeuroIogy, 42,52 1-552.
Geschwind, N., & Levitsky, W. (1968j. LeNnght asymmetries in teniporal speech region. Science, 161, 186- 1 87.
Gainom G. (1 989). Disorden of emotions and affect in patients with undateral brain damage. In F. Boller, & J. Grahan (Eds.), Handbook of neuropsychologv, Vol. 3 @p. 345-361). North-Holland: Elsevier Science.
Glick, S. D. (1 993). Rotational behavior in children and adults. In J. P Ward, & W. D. Hopkins (Eds.). Primote Laterdry. Cuwent behaviorol evidence ofprimate asymmetries. New York: Sp~ger-Verlag .
Goldberg, E ., & Costa, L. D. (1 98 1). Hemisphere clifferences in the acquisition and use of descriptive systems. Brain and Lanpage, 14,144-173.
Goldsmith, H. & Reiser-Danner (1986). Vanation among temperament theories and validation studies of temperament assessment. In G. A. Kohnstamm (Ed.), Temperament Discussed. Lisse, The Netherlands: Swets & Zeitlinger.
G o d e z , J. J., Hynd, G. W., & Martin, R. P. (1 994). Neuropsychology of temperarnent. In P. A. Vernon (Ed.), The neuropsychologv ofindividual differences. New York: Academic.
Gordon, C. C., Chumlea, W. C., & Roche, A. F. (1988). Stature, recumbent length, and weight. In T. G. Lohman, A. F., Roche, & R. Martorell (Eds.). Anthropometric standardization rejèrence mumal. Champaign, IL: Human Kinetic Books.
Gottfhed, A., gt Bathurst, K. (1 983). Hand preference across time is related to intelligence in young girls, not boys. Science, 221,1074- 1 076.
GoWid, C. K. (1 989). Asymmetiy in lobster claws. h e r i c a n Scientist, 7 7,468- 474.

Gray, J. A. (1972). The psychophysiological basis of introversion-extraversion: A modification of E ysenck's theory. In V. D. Nebylitsyn & J. A. Gray (Eds.), The biological bases of individual behaviour @p. 182-205). San Diego, CA: Academic Press.
Gray, J . A. (1 99 1 a). The neuropsychology of tempement. In S. Strelau, & A. Angleiîner (Eds .), Explorotioris in temperamen t. International perspectives on theory and meanrremen~ @p. 105- 128). New York: Plenum.
Gray, J. A. (1991b). Neural systems, emotion and personality. In J. Mdden IV (Ed.), Neirrobiologv of learning, emotion and affect. New York: Raven.
Guiard, Y. (1987). Asymmetric division of laborin human skdled bimanual action: The bernatic chah as a model. Journal ofA4otor Behavior, 19,486-5 17.
Gu., R. C., & Reivich, M. (1980). Cognitive task rffects on hemispheric blood flow in humans: Evidence for individual differences in hernispheric activation. Broin und Langit age, 9, 78-92.
Gur, R., Packer, I., Hungerbuhier, J., Reivich, M., Obrist, W., Amamet, W., & Sackheim, H. (1 980). Differences in the distribution of gray and white matter in human cerebral hemispheres. Science, 207, 1226- 1228.
Haaland, K. Y., & Harrington, D. L. (1990). Complex movement behavior: Toward understandmg cortical and subcortical interactions in regulating control processes. In G. E. Stehach & P. A. Vroon (Series Ed.), G. E. Hammond (Vol. Ed.), Advances in psychology, Vol. 70. Cerebral control of speech and timb movements @p. 169-200). North-Holland: Elsevier Science.
Hahn, W. K. (1987). Cerebral lateralization of function: From infancy through childhood. Psychological Bulletin, 1 O 1,376-392.
Hannon-Jones, E ., & Allen, J. B.(1998). Anger and f?ontal brain activity: EEG as ymmeîzy consistent with approach m O tivation des pite negative affective valence. Journal of Personality and Social Psychology, 5,13 10- 13 16.
Harper, L. V., & Kraft, R. H. (1986). Lateralization of receptive language in preschoolers: Test-retest reliability in a dichotic listening task Developmental Psychologv, 22,553-556.
Hays, K. F. (1 999). Working if out: Using exercise in psychotherapy. Washington, DC: Amencan Psychological Association.

Motor Activity 262
Hebb, D. 0. (1 955). Drives and the C.N.S. (concephial nervous system). Psychologicol Review, 62,243-254.
Heilman, K. M., 8r Watson, R. T. (1989). Arousd and emotions. In F. Boler, & J. Grafinan (Eds.), Handbook of neuropsychology, Vol. 3 @p. 403-4 17). North-Holand: Elsevier Science.
Heller, W. (1993). Neuropsychological mechanisms of individual clifferences in emo tion, personality, and arousai. rhropsychology, 7 , 3 7 6 4 9 .
Heller, W. (1990). The neuropsychology of emotion: Developmental patterns and implications for psychopathology. In N. L. Stein, B. Leventhal, & T. Trabasso (Eds.), Psychological and biologicol approaches to emotion @p. 167-21 1). Hilisdale, NJ: Lawrence Erlbawn.
Hellige, J . B. (1 993). Hemispheric asymmetry: What 'r right and what 's le f . Cambridge: Haivard University Press.
Heliige, J. B., Bloch, M. I., Cowin, E. L., Eng, T. L., Eviatar, Z., & Sergent, V. (1 994). Individual variation in hemisphenc asymmetry: Multitask study of effects related to handedness and sex. Journal of Experimentul Psychologv: General, 123,235256.
Henninger, P. (1992). Handedness and lateraikation. In A. E. Puente & R. J. McCafliey (Eds.), Handbook ofneuropsychological assessrnent A biopsychosocial perspective @p. 1 4 1 - 1 79). New York: Plenum Press.
Hiscock, M . , & Decter, M. H. (1988). In K . Hugdahl (Ed.), Hundbook of dichotic listening: Theory. methods and reseorch. Toronto: John Wiley.
Hjeile, L. A., & Bernard, M. (1994). Private self-consciousness and the retest reiiability of self-reports. Journal of Research in Personulity, 28,52067.
Hofsten, von, C. (1989). Motor development as the development of systems: Comments on the special section. Developmental Psychologv, 25,950-953.
Hugdahl, K. (1995). Dichotic listening: Probing temporal lobe huictionai integrity. In R. J . Davidson & K . Hugdahl (Eds.), BrainRPynmetry. Cambridge, Massachusetts: MIT Press.
Hur, FM., Bouchard, T. J., & Lykken, D. T. (1998). Genetic and environmental influence on morningness-eveningness. Personality and Indivldual Differences, 25,9 1 7- 925.

Iaccino, J. F. (1 993). Lefi brain - right brain diflerences: Inquiries, evidence, and new approaches. Wsdale, N . J . : Lawrence Erlbaum Associates.
Jacobs. D. R., Ainsworth, B. E., Harûnan, T. J., & Leon, A. S. (1993). A simultaneous evaiuation of 10 comrnonly used physical activity questionnaires. Medicine and Science in Sports and Exercise, 25,8 1-9 1.
James, W. (1884). What is motion? Mind, 9, 188-205.
James, W. (1950). The principles ofpsychologv, Vol. 1, New York: Dover.
J w K. F. (1994). Validation of the CSA accelerometer for assessing children's physical activity. Medicine and Science in Sports und Exercise, 2 4 369-375.
Jang K. F. , Witt, J., L Mahoney, L. T. (1995). The stability of children's physical activity as measured by accelerometry and self-report. Medicine and Science in Sports and Exercise, 2 7, 1326- 1332.
Kant, 1. (1 9 1 2). Anthropologie in pragrnatischer hhsicht. Leipkg: Meiner (original work published in 1798).
Katzmarryk, P. T., Malina, R. M., Song, T. M. K. , & Bouchard, C. (1998). Physical activity and health-related fitness in youth: a mdtivariate andysis. Medicine & Science in Sports & Exercise, 30,709-71 4 .
Kerkhof, G. A. (1985). Inter-individual clifferences in the hurnan circadian system: A review. Biological Psychology, 20,83- 1 12.
b u r a , D. (1961a). Cerebral dominance and the perception of verbal stimuli. Cunodian Journal of Psychology, 15,166- 1 7 1.
Kimura, D. (1961b). Some effects of temporal-lobe damage on auditov perception. Canadian Journal of Psyhology, 15, 156- 165.
Kimura, D. (1 967). Functional asymmetry of the brain in dichotic listening. Cortex, 3, 163- 168.
Kirnura, D. (1973a). Manual activity duMg speaking- 1. Right-handers. Neuropsychologia, 11,45-50.
Kimura, D. (1973b). Manual activity during speaking- II. Left-handen. Neuropsychologie, 11,51-55.

Kunura, D. (1977). Acquisition of a motor ski11 after left-hemisphere damage. Brain, 100,527-542.
Kinsboume, M. and Hiscock, M. (1983). 'Ihe normal and deviant development of functional lateralmîtion of the brain. In P. H. Mussen (Ed.), Handbook of child psychology. Vol. II Infmcy and developmentdpsychobiology, (4th ed., pp. 1 57-280). New York: J. Wiley & Sons.
hsbourne, M.,& Bemporad, B. (1 983). Lateraiization of motion: A modd and the evidence. In N. A. Fox & R. J. Davidson (Eds.). Thepsychobiology of aflective development @p. 259-291). Hilisdale, N. J.: Lawrence Erlbaum.
Kleinbaum, D. G., Kupper, L. L., & Muller, K. E. (1988).&plied Regremion ha lys i s and Other Mulrivuriable Methods (Zn* Edition). Boston: PWS-KENT.
Koenig, 0. ( 1990). Child neuropsychological development : lateralkation of function - hemispheric speciabtion. In C -A. Hauert (Ed.), Developmentalp~ychologv~ cognitive, perceptual-motor, and neuropsychological perspectives. (Advances in Psychology, #64, pp. 357-388). North-Hoiland: Elsevier Science Publishers.
Kolb, B, & Fmtie, B. (1 989). Development of the child's brain and behavior. In C. R. Reynolds Br E. Fletcher-Janzen (Eds.), Handbook of clinicul nnrropsychology, (Chapter 2, pp. 17-39). New York: Plenum.
Kolb, B., & Whishaw, 1. Q. (1 990). Variations in cerebral asymmetry. In Fundamentais of humun neuropsyehologv @p. 383-41 1). NY: WH Freeman.
Kop, W. J., Merckelbach, H., & Muris, P. (1 993). Unilateral contraction and induction of emotion: A reply to Schitrand Lamon. Cortex, 29,553-554.
Lacey, J. 1. (1967). Somatic response patteming and stress: Some revisions of activation theoiy. In M. H. Appley & R. Tnunbull (Eds.), Psychologicui stress: Issues in research @p. 14-44). New York: Appleton-Century-Crofts.
Larsen, R. J., and Diener, E. (1 987). Affect intenstty as an individual difference characteristic: A review. Jounial of Reseurch in Personality, 2 1,l-39.
LeDow, J . E . (1 989). Cognitive-emotional interactions in the brain. Cognition und Emotion, 3,267-289.
LeDow, I. E. (1995). Emotion: Clues fiom the brain AnmtalReview of Psychology, 46,220-235.

Lee, G. P., Loring. D. W., Dahl, I. L., & Meador, K. J. (1993). Hemispheric s p e c i ~ t i o n for emotional expression. Neuropsychioiry, Neuropsychologv, and Behaviord Neurology, 6, 143- 148.
Leventhal, H. (1979). A perceptual-motor processing mode1 of emotion. In P. Pliner, K. Blankenstein, & 1. M. Spigel (Eds.), Perception ofemotion in selfand others @p 1-46). New York: Plenum.
Levy, J. (1981). La terh t ion and its implications for variation in development. In E. S. G o h (Ed.), Developmental plmticiiy. Beliaviorol and biological aspects of variations in development. (Chapter 6, pp. 175-228). New York: Academic Press.
Levy, J., & Levy, J. (1978). Human lateralization fiom head to foot: Sex-related factors. Science, 204 129 1 - 1292.
Levy, J., & Reid, M. (1978). Variations in cerebrai organization as a function of handedness, hand posture in writing, and sex. Journal of Experimental Psychology: General, 1 0 7, 1 1 9- 1 44.
Lewandowski, L., & Kohlbremer, R. (1985). Lateralization in gified children. Developmental Neuropsychologv, 1,277-282.
Lohman, T . G., Roche, A. F., Martorell, R. (1988). Anthropometric sfandardization refrence mamol. Champaign, IL: Human Kinetic Books.
Mack, L., Gonzalez Rothi, L. J., & Heilman, K. M . (1 993). Hemispheric spec ih t ion for handwfiting in righthanders. Brain and Cognition, 21,80436.
MacKay, W. A. (1982). The motor system controls what it senses. Behavioral and Brain Sciences, 5,557.
MacLean, P. D. (1949). Psychosomatic disease and the visceral bmin. Recent developments bearing on the Papez theory of emotion. Psychosomatic Medicine, 1 I , 338-353.
MacLean, P. D. (1 952). Some psychiatrie implications of physiological studies on fionto-tempoml portion of iimbic system (Wceral braul). Electroencepholography and Clinical Neurophysiology, 4,407-4 18.
Mangan, G. L., & Paisey, T. J. H. (1983). Current perspectives in neo-Pavlovian temperament theory and research: A review. Austra!hz Journal ofPsychoiogy, 35,3 19- 347.

Motor Activity 266
Marchant, L. F., McGrew, W. C., & Eibl-Eibesfeldt, 1. (1995). 1s human handedness universal? Ethological analyses fiom three traditional cultures. Erhofogv, 10 1, 239-258.
Marhn, A. D., Carter, J. E. L., Hendy, K. C., & Malina, R. M. (1988). Segment lengths. in T. G. Lohan, A. F., Roche, & R. Martoreli (Eds.). Anthropometric stundurdization refirence mumal. Champaign, IL: Human Kmetic Books.
Martinez, L., Lamas, J. A., & Canedo, A. (1 995). Pyramidal tract and corticospinal neurons with branchmg axons to the doaal column nuclei of the cat. Neuroscience, 68, 1 95-2 06.
Martoreii, R., Mendoza, F., Mueiler, W. H., & Pawson, 1. G. (1 988). Which side to measure: right or hfl? In T. G. Lohman, A. F. Roche, & R. Martorell (Eds.). Anthropometric standardization refience manuaf. Champaign, IL: Human Kirtetic Books.
Mason, D. J. (1992). Measuring circadian rhythms. Actigraph versus activation checklist. Western Journal of Nursing Research, 14,358-379.
Matthews, C. E., & Frecdson, P. S. (1995). Field trial of a three-dimensional activity monitor: cornparison with self report. Medicine and Science in Sports and Exercise, 2 7, 1 O7 1 - 1078.
McAuley, E., Talbot, H. M., & Martinez, S. (1 999). Manipulaûng self-efficacy in the exercise environment in women: Influences on affective responses. Heolth Psychology, 18,288-294.
McGuinness, D., & Pribram, K. (1980). The neuropsychology of attention: Emotional and motivationai controls. In M. C. Wittrock (Ed.), The brain andpsychologv. New York: Academic.
McKeen, N. A. (1988). Znfrint motor activity: Tempe~~ment and woke-sleep bel~cviout. Unpublished Master' s thesis, University of Manitoba.
McKeen, N. A. (1995, March). Afect andAsymrnetric Limb Activity in Infants. Poster presented at the 6 1" Biennial Conference of The Society for Research in Child Development, Indianapolis, M.
McKeen, N. A. (1997, April). Laterd asymrnetries and developmental change in spontaneous rnotor. Poster presented at the 6Zd Biennial Conference of The Society for Research in Child Developrnent, Washmgton, DC.

Motor Activity 267
McKeen, N. A., Eaton, W. O., Campbell, D. W., & Mitsutake, G. (1999, April). Sinistral Movement Bias in 7- to 14-Year O&: Another Brick in the Wall. Poster presented at the 63rd Biennial Conference of The Society for Research in Child Developmrnt, Albuquerque, NM.
McKeen, N. A.., Eaton, W. O., Campbell, D. W. & Saudino, K. 3 . (1998, May). Movement Asymrnetries ut Age 3 Predict Behaviour Problems ai flge 6. Poster presented at the 10" Biennial University of Waterloo Conference on Child Development, Waterloo, Ont.
McKeever, W. F., Nolan, D. R., Diehi, J. A., & Seitz, K. S. (1984). Handedness and language laterlaity: Discrimination of handedness gxoups on the âichotic consonant- vowel task. Cortex, 20,509-523.
McManus, 1. C., & Bryden, M. P. (1992). The genetics ofhandrdness, cerebral dominance and lateralization. in F. Boler & J. Grahan (Series Eds.) & 1. Rapin & S. J. Segalowitz (Vol. Eds.), Handbook of Neuropsychology, Vol. 6: Chilii Neuropsychologv @p. 1 1 5- 1 44). Amsterdam: Elsevier.
McManus, 1. C., Sik, G., Cole, D. R., MeUon, A. F., Wong, I., & Kloss, 1. (1988). The development of handedness in children. British Journal of Developmentai Psychology, 6,257-273.
Melanson, E. L., & Freedson, P. S. (1994). Vahdity and reliability of a 3- dimensional accelerometer in estimating energy expenditure (abstract) . Medicine and Science in Sports and Exercise, 26, S42.
Melûnson, E. L., & Freedson, P. S. (1995). Validity of the Computer Science and Applications, Inc. (CSA) activity monitor. Medicine and Science in Sports and Exercise, 27,934-940.
Moreau T., & Milner, P. (1981). Lateral ditferences in the detection of touched body parts in young children. Developmental Psychology, 17,351-356.
Moruzzi, G., & Magoun, H. W. (1949). Brain stem reticular formation and activation of the EEG. Electroencephalogruphy and Clinicat Neurophysiolqy, 1,455- 473.
Moscovitch, M., & Olds, 1. (1982). Asymmeîries in spontaneous facial expressions and their possible relation to hemispheric spec~alization. Nerrropsych~logia~ 20,71-81.

Nelson, C. A. (1994). Neural bases of infant temperamed. in J. E. Bates & T. D. Wachs (Eds.), tempe rumen^. Individual differences ut the intefice of biology and behavior @p. 47-82). Washington, DC: Amencan Psychological Association.
Nesse, R. (1 998). Emo tional disorders in evolutionary perspective. British Journal of Medical Psychology, 7 71,397-4 1 5.
Nestor, P. G., & Safer, M. A. (1990). a multi-method investigation of individual ciifferences ki hemisphericity . Cortex, $6,409-42 1.
Newbeny, B. H., Clark, W. B., Crawford, R. L., Strelau, J., Angleitner, A., Jones, J. H., & Eliasz, A. (1997a). An American English version of the Pavlovian Temperament Survey. Personality and Individual Differences, 22, 105- 1 14.
Newberry, B. H., Clark, W. B., Crawford, R. L., Strelau, J., Angleitner, A., Jones, 1. H., & Eliasz, A. (1 997b). Supplementary material for An American English version of the Pavlovian Temperament Survey. Unpublished manuscript, Kent State University, Kent OH.
OtBoyle, M. W., Benbow, C. P., & Alexander, J. E. (1995). Sex differences, hamisphenc laterality, and associated brain activity in the intellectualiy gifted. Developmentul Neuropsychology, 11,4 15-443.
O b m f J. E., Blyden, M. P., Lange, P., & Bulman-Fleming, B. (1997). Concurrent left-hemisphere-verbal and right-hemisphere-emotional processing in children: Dichotic laterality effects. Journal of the International Neuropsychology Society, 3,50.
Oldfield, R. C. (1971). The assessrnent and analysis of handedness: The E dinburgh Inventory . ,Veuropsychologiq 9,97- 1 1 3.
O'Leary, D. S. (1990). Neuropsychological development in the child and the adolescent: Functional maturation of the central nervous system. In GA. Hauert (Ed.), Developnreniolpsychology. Cogniiive, percephtul-motor, and neuropsychological perspectives. Advances in Psychology, 64. @p. 339-355). Amsterdam: Elsevier Science Publishers.
Paffenbarger, R., Hyde, R. T., & Wing, A. L. (1 990). Physical activity and physical fitness as deteminants of heath and longevity. in C. Boucharcl, R. J. Shephard, T. Stephens, J. R. Sutton, & B. D. McPherson (Eds.), Exercise ,ptness and healih: A consensus of current knowledge @p. 33-48). Champaign, IL: Human Kinetics.
PafTenbarger, R. S., Jr., Blair, S. N., Lee, 1.-M., & Hyde, R. T. (1993). Measurernent of physical activity to assess health effects in fiee-living populations. Medicine and Science in Sports ond Exercise, 25,60-70.

Motor Activity 269
Panksepp, J. (1982). Toward a general psychobiological theory of emotions. The Behuvioral and Bratn sciences, 5,407-467.
Panksepp, J. (1989). The psychobiology of emotions: the animal side of human feelings. In G. Gainotti 6r C. Caltagirone (Eds.), Emotions and the dual brain: Vol. 18. Experimental Brain Research Series @p. 3 1-55). New York: Springer-Verlag.
Papez, J. W. (1937). A proposed mechanisrn of emotion Archives of Nezîrologv und Psychiatr), ?9,2 17-224.
Pavlov, 1. P. (1 95 1/ 1952). Complete works (2nd ed.). Moscow: SSSR Academy of Sciences (in Russian).
Pekkanen, J., Nissinen, A., Marti, B., Tuomilehto, J., Punsar, S., & Kamonen, M. J . (1987). Reduction of prernature mortality by high physical activity: a 20-year follow-up of middle-aged Finnish men. Lancet, i, 1473- 1477.
Peters, M. (1 983). Differentiation and lateral specialization in motor development. In G. Young, S. J. Segalowitz, C. M. Corter, & S. E. Trehub (Eds.), Manual speciaIization and the developing brain @p. 141 - 1 59). New York: Academic.
Peters, M. (1988). Footedness: Asymmehies in foot preference and skdl and neuropsychological assessrnent of foot movement. Psychologica~ Wdletin, 103, 1 79- 192.
Peters, M., & Durding, B. M. (1 979). Footedness of le fi- and right-handers. American Journal of Psychology, 92, 133- 142.
Pipe, M-E. (1 99 1). Developmental changes in h g e r localization. Narropsychologia, 29,339-342.
Pkamiglio, L., Caltagirone, C., & Zoccolomi, P. (1989). Facial expression of emotion. In F. Boller, & J. Grahan (Eds.), Hundbook of neuropsychology, Vol. 3 @p. 383-40 1). Amsterdam: Elsevier Science Publishers (Biomedical Division).
Porac, C. (1997). Eye preference patterns among lefi-handed adults. Laterulity, 2, 305-3 16.
Porac, C., & Coren, S. (1976). The dominant eye. Psychological Bulletin, 83,880- 897.
Porac, C., Coren, S., & Duncan, P. (1980). Life-span age trends in laterality. Journal of Gerontology, 35,715-72 1.
Pribram, K. H., & McGuinnness, D. (1975). Arousal, activation, and effort in the control of attention, Psychological Review, 82,116- 1 49.

Provins, K. A., Mher, A. D., & Kerr, P. (1982). Asymmeûy of manual preference and performance. Percepual and Motor Skills, 54,179- 194.
Puid, J. L. (1989). Energy expenditure among children: Implications for chitdhood obesity. 1: Resting and dietary energy expenditure. Pediairic Exercise Science, 1 , 2 12- 229.
Quay, H. C. (1 988). The behavioral reward and inhibition system in chilàhood behavior disorden. In L. M. Bloomingdale (Ed.), Attention deficit disorder (Vol. 3, pp. 1 76- 186). Elmsford, NY: Pergamon Press.
Quay, H . C . (1 993). The psychobiology of undersocialized aggressive conduct disorder: A theoretical perspective. Development and Psychopathology, 5,165- 180.
Ramsay, D. S. (1984). Onset of duplicated syliable babbhg and unimanual handebiess in infancy: Evidence for developmental change in hcmispheric spzciahtion? Developmental Psychologv, 2 0,640 7 1.
Rasmussen, T., & Milner, B. (1977). The role of early lefi-brain injuy in determinhg lateraiization of cerebral speech function. h n a l s ofthe New YorkAcodemy of Sciences, 229,355-369.
Reinberg, A., Motohashi, Y., Bourdeleau, P., Andlauer, P., Levi, F., & Bicakova- Rocher, A. (1 988). Alteration of period and amplitude of circadian rhythm in shifi workrrs. European Journal ofApplied md Occupational Physioiogy, 5 7,15025.
Roland, P. E. (1 984). Organitation of motor control by the nomal human brain. Humun Neurobiology, 2, 205-2 16.
Roils, E. T. (1990). A theory of emotion, and its application to understanding the neural basis of emotion. Cognition and Emotion, 4,16 1- 190.
Rose, S. A. (1 984). Developmental changes in hemispheric speciaiization for tactual processing in very young chiidren: Evidence from cross-modal ûans fer. De velopmental Psychology, 20,568-574.
Rothbart, M. K. (L986a). Longitudinal observation of infant temperament. Developmental Psychologv, 22,356-365.
Rothbarî, M. K. (1 986b). A psychobiofogical approach to the study of temperament . In G. A. Kohnstarnm (Ed.),Temperament disnrssed. Temperament and development in infancy and childhood @p. 63-72). Lisse, Hoiiand: Swets & Zeitlinger.

Rothbart, M. K., & Ahach, S. A. (1994). Temperament and the development of personaliîy . Journal ofAbnonnul Psychology, lO3,55-66.
Rotbbart, M. K., & Denyberry, D. (1 98 1). Development of individual differences in temperament In M. E. Lamb & A. L. Brown (Eds.), Advances in developrnental psychology (Vol. 1). Wsdale, N. J.: Erlbaum.
Rothbart, M. K., & Posner, M. 1. (1985). Temperament and the development of self-wgulation. In L. C. Hartlage 6t C. F. TelPow (Eds.), The nezrrops):chofogy of individual differences @p. 93- 123). New York: Plenum.
Routtenberg, A. (1 968). The two-arousal hypothesis: Reticular formation and h b i c system. Psychologicul Review, 75,5 1-80.
Ruch, W. (1992). Pavlov's types of newous system, Eysenck's typology and the Hippocrates-Galen ternperaments: An empirical examination of the asserted correspondence of three temperament Typologies. Personality und Individual D~ferences, 13, 1259- 1271.
Ruch, W ., Angleitner, A., & Strela y J. (1 99 1). The Strelau Temperament Inventory - Revised (STI-R) : Validity studies. European J o m a l of Personality, 5,287- 308.
Rueckert, L. M., & Levy, J. (1995). Cerebral asymmetry and selective attention in mathernaticaîiy gifted adolescents. Developmental NeuropJychology, 1 1,4 1 -52.
Russell, J . A., & Bmett, L. F. (1999). Core affect, prototypical emotional episodes, and other h n g s cded Emotion: Dissecting the elephant. Journal of Personality and Social Psychology, 76,805-819.
Sackeim, H., Greenberg, M., Weirnan, A., Gur, R., Hungerbuhler, J., & Géschwhd, N. (1982). Hemisphenc asymmetxy in the expression of positive and negative emotions. Archives of Neurology, 39,2 10-2 18.
Sallis, J. F., Haskell, W. L., Wood, P. D e y Fortmann, S. P., Rogers, T., Blair, S. N., & Paffenbargrr, R. S., Jr. (1 985). Physical activity assessrnent methodology in the five- city project. dmerican Journal of Epik io logy , I21,9 1 - 106.
Sallis, J . F., & Owen, N . (1 999). Physical uctivity and behaviorai medicine. Thousand Oaks, CA: Sage Publications.
Saris, W. H. M. (1 986). Habituai physicd activity in children: Methodology and findings in health and disease. Medicine and Science in Sports and Exercise, 18,253- 263.

SAS Institute (1 985b). SAS user's guide: Statistics (Version 5 Edition). Carey, NC: SAS Institute.
Saudino, K. J., & Eaton, W. 0. (1991). Infant temperament and genetics: An objective twin study of activity level, Child Development, 62,1167- 1 1 74.
Scheier, M. F., & Carver, C. S. (1985). Optirnism, coping, and health: Assessment and implications of generalized outcorne expectancies. Heulih Psychology, 4,219-247.
Sch$ B. B., & Bassel C. (1996). Effects of asymmetrical hemispheric activation on approach and withdrawal responses. Neuropsychologv, 10,557-564.
Schiff, B. B., Guirguis, M., Kenwood, C., & Herman, C. P. (1998). Asymmetrical hemispheric activation and behavioral persistence: Effects of unilateral muscle contractions. Neuropsychologv, 12,526-532.
Schff, B. B., & Lamon, M. (1989). Inducing emotion by unilateral contraction of facial muscles: A new look at hemisphenc specialization and the experience of emotion. Neuropsvchologia~ 2 7,923-935.
Schwartz, G. E., Ahern, G.L., & Brown, S. L. (1979). Lateralized facial muscle response to positive and negative emotional stimuii. Psychophysiologv, 16,56 1-57 1.
Searleman, A. (1 980). Subject variables and cerebral organization. Cortex, 16, 239-254.
Segalowitz, S. (1 986). Validity and reliability of noninvasive lateralization measures. In J . E. O b m t & G. W. Hynd (Eh.), Child neuropsychologv: Theory and research, Vol 1 @p. 191-208). Orlando, FL: Academic.
Semmes, 1. (1 968). Hemisphere specialization: a possible clue to mechanism. Neuropsychologia, 6, 1 1 -26.
Shannahoff-Khalsa, D. (199 1). Lateraked rhythm of the central and autonomic nervous sys tems. Intemotionol Journal of Psychophysiology, 1 I,22 5-25 1.
Shrout, P. E., & Fleiss, J. L. (1979). Intraclass correlations: Uses in assessing rater reliability. Psychological Buletin, 86,420-428.
Shucard, J. L., & Shucard, D. W. (1 990). Auditory evoked potzntials and hand preference in 6-monthsld infants: Possible gender-related differences in cerebral organization. Developmental Psychologv, 26,923-930.
Simon, T. J., & Sussman, H. M. (1987). The dual task paradigm: Speech dominance or manual dominance? Nwopsychologio, 25,559-569.

Motor Activity 273
Sonner, 1. L. (Ed.) (1 992). Hemisphericity us a key zo understanding individual dlffennces. Springfield, IL: Charles C . Thomas.
Speaks, C., Niccum, N., & Carney, E. (1 982). Statisticai properties of responses to dichotic listening with CV nonsense syllables. Journal oftlte Acoustical Society of Americu, 72, 1 185- 1 194.
Spielberger, C. D., Gorsuch, R. L., L Lushene, R. E. (1970). Manual for the State- Trait &ety Inventory. Pdo M o , CA: Consulting Psychologists Press.
Spirduso, W. W., & Macke, K. S. (1995). Health, exercise, and emotional function. In W. W. Spirduso, Physicul dimensions of oging @p. 279-302). Champaign, IL: Hurnan Ktnetics.
Springer, S. P., & Deutsch, G. (1 989). Lefr brain, right brain (3rd ed.). New York: W. H. Freeman.
Steenhuis, R. E., & Bryden, M. P. (1989). DifFerent dimensions of hand preference that relate to skilied and unskilied activities. Cortex, 25,289-304.
Stephens, T., & Craig, C . (1990). The well-being ofCanudians: Highlights of the 1988 Campbell's survey. Ottawa: Canadian Fitness and Lifestyle Research Institute.
Stevens, T., Kupst, M., Suran, B., & Schulman, J. (1 978). Activity level: A cornparison brîween actometer scores and observer rarings. Journal ofAbnormal Child Psychology, 6, 1 63- 1 73.
Stewart, L. E. (1985). Anthropontetric survey ofCunodian forces aircrew (tech Rep. No. 85-12-01). Toronto: Human Elements Incorporated.
Strauss, E. (1986). Han4 foot, eye and ear preferences and performance on a dichotic listening test. Cortex, 22,475-482.
Strauss, E. (1988). Dichotic Listening and Sodium Amytal: Functional and morphological aspects of hemispheric asyrnrneûy. In K. Hugdahl (Ed.), Hundbook of dichotic listening: Theory, rnethods and reseurch. Toronto: John Wiley.
Steinmee J. E. (1994). Brain substrates of emotion and temperament. In J. E. Bates dé T. D. Wachs (Eds.), Temperament. Individual differences ut the interjiuce of biologv und behavior @p. 1 7-48). Washington, DC : Amencan Psychological Association.
Strelau, 1. (1972). A diagnosis of temperament by nonexperirnental techniques. Polish Psychological Bulletin, 3(2), 97- 1 05.

Strelau, J. (1974). Temperament as an expression of energy level and temporal features of behavior. Polish Psychological Bulletin, 5, 1 19- 127.
Strelau, J. (1983). Temperument, personality, activity. New York: Academic.
Strelay J. (1985a). Introduction. In J. Strelau (Ed.), Temperamentul buses of behavior: Warsaw studies on individual differences @p. 1-6). Lisse, Holland: Swets & Zeitllliger.
Strelau, J. (1 98Sb). Pavlov's typology and the Regulative Theory of Temperament . In J . S trelau (E d.), Temperumental bases cf behavior: Warsaw shtdies on indi vidual dl ffeerenres @p. 7-40). Lisse, Holland: Swets & Zeitlinger.
Strelau, J. (1 986a). Do biological mechanisms determine the specificity of temperarnent? In G. A. Kohnstamm (Ed.),Temperament discussed. Temperameni and development in jnfancy und childhood @p. 73-82). Lisse, Holand: Swets & Zeitlinger.
Strelau, J. (1986b). Stability does not mean stability. In G. A. Kohnstamm (Ed.),Temperument discussed. Temperament and development in infuncy und childhood @p. 59-62). Lisse, Holland: Swets & Zeitlinger.
Strelau, J. (1 987). Emotion as a key concept in temperament research. Journal of Research in Personulity, 2 4 5 10-528.
Strelau, J. (1989). The regulative theory of temperament as a result of East-West influences. In G. A. Kohnstunm, J. E. Bates, & M. K. Rothbart (Eds.), Temperameni in childhood @p. 35-48). New York: Wiley.
Strelay J. (1 99 1). ' Renaissance in research on temperament: Where to?' . In J. Strelau, & A. Angleitner (Eds.), Eip/orations in temperament. Infernotional perspectives on theories and rneasurement. NY: Plenum Press.
Strelau, S. (1 993). The location of the Regulative Theory of Temperament (RIT) among other temperament theories. in J . Hettema, & 1. J. Deary (Eds.), Farndations of personulity @p. 1 13- 132). Dordrecht, Netherlands: Kluwer.
Strela y 1. (1 994). The concepts of arousal and arousabiliîy as used in temperarnent studies. In J. E. Bates & T. D. Wachs (Eds.), Temperument. Individual diferences ut the interface of biology und behavior @p. 1 17-142). Washmgîon, DC: Amencan Psychological Association.
Strelau, J. (1 996). The regulative theory of temperament : Cment stahis. Persondity and hdividuol Diferences, 2413 1 - 142.

Strelau, J., & Zawadrla, B. (1993). The fomal characteristics of behaviour - temperament inventory (FCB-TI): theoretical assurnptions and scde construction. European Journal of Personality, 7,3 13-336.
Strelau, J . & Zawadzla, B. (1 995). The Formal Characteristics of Behaviour- Temperament hventory (FCB-TI): validity studies. European Journal ofPersonulity, 9, 207-229.
Sutton, S. K., & Dûrldson, R. J . (1997). Prefrontal brain asymmetry: -4 biol~gical substrate of the behavioral approach and inhibition systems. Psychological Science, 8, 204-2 1 O.
Tellegen, A. (1 985). Structures of mood and personality and their relevance to iissessing anxiety, with an ernphasis on self-report. In A. H. Tuma, & J. D. Maser (Eds.), Anxiety and ~ h e anxiety disorders @p. 681-706). Hillsdale, NJ: Erlbaum.
Teng, E . L. (1 98 1). Dichotic ear difference is a poor index for the functionai asymrneûy between the cerebral hemispheres. Neuropsychologia, 19,235-240.
Thayer, R. E. (1989). The biopsychology ofmood and arousul. New York: Oxford University.
Thomas, A., & Chess, S. (1977). Temperament and developmen~. New York: Brunner/Mazel.
Thomas, A., Chrss, S., & Birch, H . ( 1 968). Temperament and behavior disorders ~n children. New York: New York University Press.
Tomarken, A. J., Davidson, R. J., Wheeler, R. W., & Doss, R. (1992). Individual dif'ferences in anterior brain asymmetiy and fiiridamental dimensions of emotion. Jorcmal oflersonality and Social Psychology, 62,676-687.
Tryon, W. W. (1984a). Principles and methob of rnechanically measuring motor activity. ~ e h o v i o r d h s e s s m e ~ , 6, 129-139.
Tryon, W. W. (1 984b). MeasuMg activity using actometers: A methodological shidy. Journal qfBehavioralAssessment, 6,147- 153.
TVOK W. W. (1 99 1). Activity meamremen! in psychology and medicine. In A. S . Beiîack and M. Hersen (Series Eds.) Applied Clinicai Psychology. New York: Plenum Press.
Tryon, W. W., & Williams, R. (1996). Fdy proportional actigraphy: A new instrument. Behavior Research Methods, Instmments, & Cornputers, 28,392-403.

Tucker, D. M. (1 989). Neural substrates of thought and affective disorders. In G. Gainotti & C. Caltagirone (Eds.), Emotions and the duul brain. Experimental Brain Research, Series 18. Heidelberg: Springer-Verlag.
Tucker, D. M., & Derryberry, D. (1992). Motivated attention: Anviety and the frontal executive functions. Neicropsychiatry, Neuropsychology, und Behavioral Neurology, 5,233-252.
Tucker, D. M., & Frederick, S. L. (1989). Emotion and brain lateralkation. In H. Wagner & A. Manstead (Eds.), Handbook of social psychophysioiogy @p. 27-70). Toronto: J. Wiley & Sons.
Tucker, D. M., & Wiuiamson, P. A. (1984). Asymmetric neural control systems in human self-regdation. Psychological Review, 91, 185-2 1 5.
Tucker, D. M., Vannatta, K., & Rothlind, J. (1990). Arousal and activation systems and primitive adaptive controls on cognitive priming. In N. L. Stein, B. Leventhal, & T. Trabasso (Eds.), Psychological and biological approuches to emotion . Hdisdale, N . J . : Lawrence Erlbaun.
Tukey I. W. (1977). Exploratory data analysis. Reading, MA: Addison-Wesley.
Tumer, G. (1995). I O I S Aîer the boom. How toprosper throzcgh the coming retirement crisis. Toronto: Key Porter Books.
üilxnan, D. G., BarMey, R. A., & Brown, H. W. (1978). The behavioral syrnptoms of hyperhetic children who successfuly responded to stimulant drug treahnent. ilmericm Journal of Orthopgchiutry, 48, 425-437.
Van der Veer, R. (1996). H ~ M Wallon's theory of edy child developrnent: The role of emotions. DevelopmentalReview, 16,364-390.
Verfaellie, M., & Heilrnan, K. M. (1990). Hemispheric asymmeûies in attentional con&ol: Implications for hand preference in sensorhotor tasks. Bruin und Cognition, 14, 70-80.
Von Bonin, F. (1962). Anatomid asymmeûîes of the cerebral hemispheres. In V. B. Mountcastle (Ed.), Interhemispheric relations and cerebral doniinance. Baltimore, MD: Johns H o p h University Press.
Wada, J., & Rasmussen, T. (1 960). Intracarotid injection of sodium amytal for the lateraiization of cerebral speech dominance. Experirnental and clinical observations. Journul of Neurology, 17,266-282.

Motor Activity 277
Wankel L. M. (1997). The social psychology ofphysical activity. In J. E. Curtis, & S. J . Russell (Eds.), Physical acti vity in human eaperience: Interdisciplinor y perspectives @p. 89- 1%). Windsor, Ont: Human Kinetics.
Watson, D. (1988). Intraindividual and interindividual analyses of Positive and Negative Affect: Their relation to health complaints, perceived stress, and daily activities. Journal of Personuiity and Social Psychology, 54, 1020- 1030.
Watson, D., & Clark, L. A. (199;). Wasur~rnént and misrneasurêrnent of mood: recurrent and emergent issues. Journal of Personality hsessment, 68,267-296.
Watson, D., Clark, L. A., & Teilegen, A. (1988). Development and validation of brief measures of positive and negative affect: The PANAS scales. Journal ofPersonaiity and Social Psychoiogy, 54,1063- 1 070.
Watson, D., & Tellegen, A. (1 985). Toward a consensual structure of mood. Psychological Bulletin, 98,2 19-235.
Watson, D., & Walker, L. M. (1996). The long-term stability and predictive validity of trait rneasures of affect. Jolrrnal ojPersonality and SociaiPsychoiogv, 70, 567-577.
Watson, D., Wiese, D., Vaidya, J., & Teilegen, A. (1999). The two general activation systems of affect: Structural îindings, rvolutionary considerations, and psychobiological evidence. Journal of Persor,ulity and Social Psychologv. 76,820-838.
Weinfurt, K. P., Bryant, F. B., & Yamold, P. R. (1994). The factor structure of the Affect Intensity Measure: In search of a measurement model. Journal ofResearch in Personality, 28,3 1 4-3 1 .
Weller, 1. M. R., & Corey, P. N. (1998). A study of the reliability of the Canada Fitness S w e y questionnaire. Medicine & Science in Sports & Exercise, 3 9 1530-1 536.
Wexler, B. E ., & Halwes, T. (1 983). hcreasing the power of dichotic methods: the fused rhyrned words test. Néwopsychologio, 21,59-66.
Wilmore, J. H., Br Behnke, A. R. (1969). An anthropomeûic estimation of body density and lem body weight in young men. J m a l ofApplied Physiology, 27,25-3 1.
Wilmore, J. H., Frisancho, R. A., Gordon, C. C., Himes, J. H., Martin, A. D., Martoreii, R., & Seefeldt, V. D. (1988). Body breadth equipment and measurement techniques. In T. G. Lohman, A. F. Roche, & R Maartoreu (Eds.), Anthropometric stundardizution rewnce munual @p. 27-38). Champaign, IL: Human Kine tic Books.

Motor Activity 278
Witelson, S. F. (1976). Sex and the single hemisphere: Specialization of the right hemisphere for spatial processing. Science, 193,425-427.
Witelson, S. F. (1977). Early hemisphcre speciaiization and interhernisphere plasticity : An empincal and theoretical review . In S. J. Segalowitz & F. A. Gruber (Eds.), Language development and neurological theory (Chapter 16, pp. 2 13-287). New York: Academic Press.
'&%&on, S. F. (1985). the brain comêction: The corpus cdosum is hrger in kft- handers. Science, 229,665-668.
Witelson, S. F. (1987). Neurobiological aspects of laquage in cluldren. Child Development, 58,653-688.
Yerkes, R. M., & Dodson, 1. D. (1908). The relation of strength of stimulus to rapidity of habit formation. Journal of Comparative Neuroiogy and Psychologv, 18,459- 582.
Young, G. (1 99Oa). Early neuropsychologicai development : Laterb t ion of functions - hemisphenc specialization. In C-A. Hauert (Ed.), Developmentalpsychologv. Cognitive, perceptual-motor, and neuropsychologicalperspectives (Advances in psychology, #37, pp. 1 13- 18 1). North-Holland: Elsevier Science Publishers.
Young, G. (1 990b). The development of hernispheric and manual specialization. In G. E. Harnrnond (Ed.), Cerebral control of speech and limb movements (Advances in Psychology, #70, pp. 79- 139). North-Hollmd: Elsevier Science Publishers.
Zaidel, E . (1 983). Advances and retreats in laterality research. The Behaviorul and Brain Sciences, 6,523-528.
Zatorre, R. 1. (1989). Perceptual asymmeûy on the dichotic fused words test and cerebral speech lateraikation determined by the carotid Sodium Amytd test. Neuropsychologia, 2 7, 1207- 12 19.
Zuckennan, M. (1 979). Sensot ion seeking: Beyond the optimal level of urousal. Hillsdale, N J : Erlbaum .

Appendix A
Study 1 : Instruments and Foms
Recruitrnent
Consent fonn
Monitor and Anthropornetnc fom
Activity Monitor Instructions
Activity Diary
Activity Examples
Activity Diary Example
Affect uitensity Measure (AIM)
AIM reference and Weinhirt's scoring
Lateral Pre ference Inventory (LPI)
LPI reference and scoring
Feedback fonn

RECRUITMENT OF PARTICIPANTS
People move spontaneously al1 the time, both day and night, and they often show a level of movement that is uniquely typical for them. I am beginning a series of studies on the significance of an individual's typical level of motor activity for their mood and temperament.
If you participate in this study. you will Wear Activity Monitors on each wrist for 24 hours. These monitors measure your activity as you go about your normal day. You will also complete several personality, temperament, and mood questionnaires before, during, and after you Wear the activity monitors.
You must corne for three appointments. Usually. at the first appointment, you will complete several personality and temperament questionnaires. At the second appointment, you will be fitted with the activity monitors. and I will give you instructions on how to care for thern. I will also take a few physical measures - your height, and weight, and ask you a few questions. You will also do a dichotic listening task, in which you will be asked to listen for particular words and emotional tones of voice, and a pegboard task to assess your manual dexterity .
At the final appointment, 24 hours later, you will return the activity monitors and finish the questionnaires. I will show you a cornputer graph of your activity as it was record& by the monitor over the pmvious day.
It is not hard, but it requires that you Wear the instruments for one day and keep track of your moods. I have only enough instruments for four people per day to participate, so it ts vety important that you be able to return for your final appointment exactly 24 hours alter the second one. Otherwise the next person scheduled will be unable to take part in the study.
The first two appointments should take about f hour &. The third will take about 30 minutes.

Consent Form
1 , agree to participate in a research study of
motor activity conducted by Nancy McKeen, Department of Psychology,
University of Manitoba (474-9338). 1 understand that I am under no obligation to
participate, and that I may withdraw from the study at any time. I understand that
any information I provide for the study will be kept confidential to protect my
privacy.
Date: Signature:
Telephone: Home: Work:
Name of a Contact Person:
(Contact penon who might get a message to you)
Relationship to you: (e.g., patent, mate, friend)
Telephone Num ber of Contact Person:

Name: Birthdate; (DDMMMYY) ID-
START DATE: (DDMMMYY: hh:mm) , : - -,
ENDDATE:(DDMMMYY:hh:mm) : :
Acceleromete~: Epoch (hh: mm: ss) : :
CSA Right # CSA Lefi#
Actometer Readings: Acto Set - Right Acto # Lefi Acto #
ACTO START READING: (hh:mm:ss)
Right am: : - - : - - le fia^:--:-:- -
ACTO FINAL READING: (hh:mm:ss)
Right a m : : _:_ - : - - Lefiam:--:--:--
BEGIN TlME (Acto & CSA): (DDMMMYY:hh:rnm)
Kyht: - - - - - - - : -- -- Lefi: - - - A - - - : -- : -- END TlME:(Acto & CSA) (DDMMMYY:hh:mm)
------- : - - : - - Lefi: -- - --- - - - - : - - Height (cm): Heiyht l Height3
Weight (Ibs): Weight 1 WeiyhtZ
Arm Length: Shoulder to elbow (cm): Right 1 Right 2
Lefi I Left 2
Elbow to Wrist (cm): Right 1 Right 2
Lefi I Lee 2
Hand Length (cm.): Right 1 Right 3
Lefi 1 Lefi 2
Wrist Breadth (cm.): Right 1 Right 1
Lefl 1 Lefi 2
Shoulder brg? (L= 1 Both=2 R=3 ):
'Morning' or ' Eveaing' Penoa? (in energy level, easiness in rising)
(am=l ?=Z pm=3)

Activity Instrument Instructions
So.. . you're wearing motion recorders.. .
1 . Make sure the instruments fit snugly, enough so that the! your wrist.
y do not flop around on
2. Wear them as much as possible, including when you sleep. We want to get as complete a measure of your overall activity as possible.
3 . Do not wind the watches.
4. The instruments are not waterproof', so ... if you must bathe or swim or wash your dishes . . . t h them uflbuth wrists. They arc! not delicate, but they should not be hit hard. lf you are doing something like playing volleyball, please remove them. With these few exceptions, we urge you to continue your normal activities while weariny the instruments.
5 . Put each instrument back on the same wrist îrom which it was removed. Eacli instrument i s labeled as "Right" or "LeA" If they are removed, return each to the appropriate wrist .
6. If you have a problem or a question, cal1 Nancy McKeen at 474-6955
Summary of Procedure
1 . Get on with your Iife.
'I . Record any occasions when the instruments are not wom (for showers, etc.)
Reason for removal
I
--
L
D ~ Y
1
r
1
r
Real Time (HH:MM a d p m )
OR On
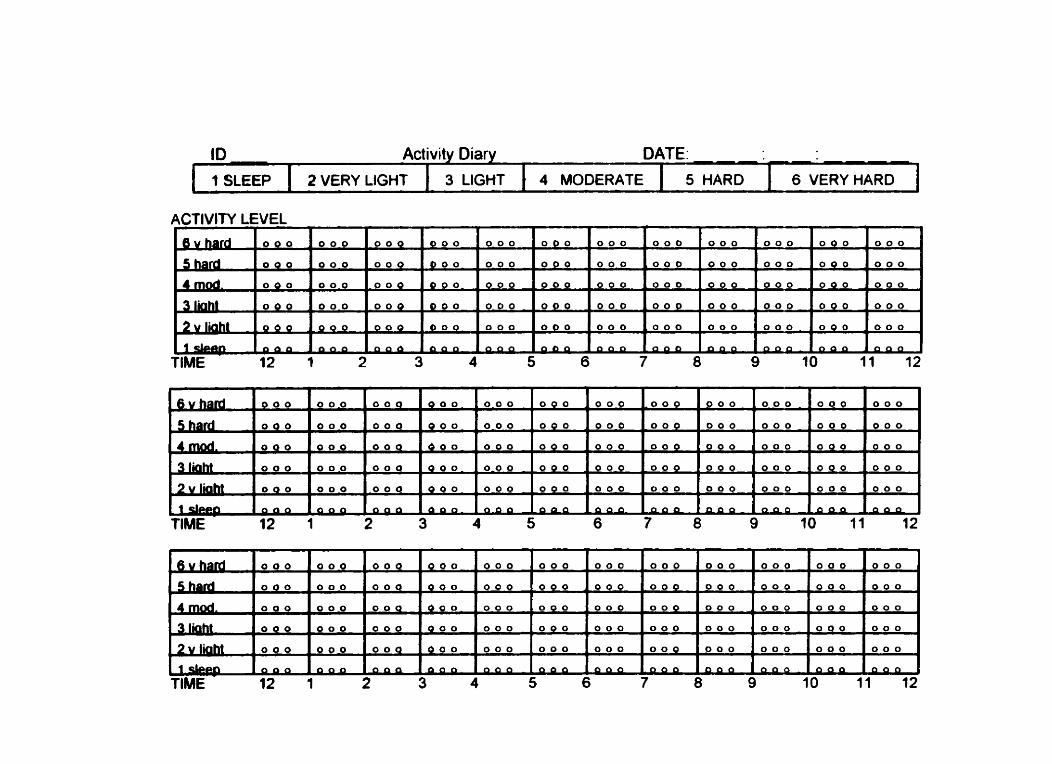
ACTlVlTY LEVEL
TlME 12 1 2 3 4 5 6 7 9 10 11 12
ID - Activity Diary DATE:
B v ~ . o o o o o o o o ~ 0 0 0 0 0 0 0 0 0 0 0 0 0 0 0 o o o o o o o o o L
5 hard O Q O 0 0 0 O O Q Q O O - 0 0 0 0 0 0 . 0 0 0 0 0 0 . 0 0 0 0 0 0 0 0 0 0 0 0
O 0 0 O 0 0 0 0 0 0 0 0
TlME 12 1 2 3 4 5 6 7 8 9 10 11 12
? SLEEP 4 MODERATE 2 VERY LIGHT 3 LIGHT 5 HARD 6 VERY HARD
TlME 12 1 2 3 4 5 6 7 8 9 10 11 12
, 0 0 0
00.0
0 0 0
0 0 0
0 0 ~ 0
f i
G V ~ k
_
3 liaht I
~ v W r
1-n
0 - 0 0
0 . 0 0 .
0 0 0
0 - 0 0
. . O 0 0
Q O ~
,000
- 0 0 0
0 0 0
0 0 0
0 0 0
0 4 0
0 0 0
O Q O
O Q O
0 0 0
0 0 0
P P Q
T
O Q O
O 0 0 ,
O Q O
0 0 0 .
0 0 0
a 0 0
0 0 - 0
0 0 0
0 0 O
00.0
O 0 0
P O P
o o o
O 0 0
0 0 0
0 0 0
O 0 0
a 0 0
o o o
0 0 0
0 0 0
0 0 0
O 0 0
O O Q
0 0 0
O O Q
0 0 0
O O Q
Q O O .
O 0 0
4 0 0 .
0 0 0 .
0 0 0
a 0 0
o o o -
0 0 0 .
0 0 0
0 0 0 -
O 0 0
O
P
o o o
O 0 0
O Q O
0 0 0
O 0 0
0 0 0

Activity Examples
Occupational tasks:
Household tasks:
Sports or leisure:
Occupational tasks:
Household tasks:
VERY HARB ACTIMTIES (6) Very hard physical labour - Digging or Choppiny with heavy tools. Carryiny heavy loads, such as bricks or lumber or sandbays, Fanniny
Digginy or hoeins a garden. Carrying loads uphill or upstairs
Jogging or Running. Singles Tennis, Badminton. Racquetball or Squash. Soccer. Wrestling, Step Aerobics or Aerobic Dancing. Skipping, Rowing, Basketball, Skiing, Skatiny, Tobogganhg
HARDAC~VITIES (5) Physical labour: Heavy carpentry. Construction work
Heavy housework: Scrubbiny tloors. Unloading goceries. Window washing (removing windows), Lifting boxes or Moving fumiture, Vacuuminy. Rakiny the lawn. Snow shoveling (few inches)
Sports or leisure activities: Doubles tennis. Cycliny (fast), Dancing (e.y. folk, square, line dancing). Wei yhtlifliny (heavier weights)
Occupational tasks:
Household tasks:
Spons or leisure:
Occupat ional tasks:
MODEM I E Acn WT/ES (4) Mail Delivery. Patrolman, Waitiny tables, Housepainter. Wallpaperiny. Truck driMng (making deliveries and lifting and canying liyht objects)
Sweepiny, Dustiny, Moppiny, Doiny Laundry. Making beds. Cleaning the refigerator. Weeding the yarden, Mowing the lawn. Washiny the car
Brisk walking ( 12- 13 mins per Km), Bowliny. Volleyball, Piny pong, Shooting baskets, Bicycling moderately on level ground. Weiçhtlifiinç (small weiyhts), Calisthenic exercises, Playing catch. Baseball
I,I(~HT ACTIMTI ES (3) Photocopying. Goiny for coflèe, Looking for books in the library
Household activities: Getting dressed. Tidying up, Washing dishes, Cooking. Shopping
Sports or leisure activities: Strolling
VERY LJGHT ACT~MTIES (2) Occupational tasks: Writing, Reading, Typing at cornputer, Talking on phone, Sitting in class
Household activities: Eating, Knitting, Driving a car
Spons or leisure activities: Chess, Playing cards, Painting pictures, Listening to music, TV

ID - Activity Diary Exarnple Date
ACTlVlTY LEVEL
TlME 2 3 4 5 6 7 8 9 10 11 12
ACTlVlfV LEVEL
TlME 12 1 2 3 4 5 6 7 8 9 10 11 12
v
5 HARO
1 SCEEP
Each column of the table represents one hour of time. Each of the srnall circles within a square represents 15 minutes. To the best of your ability, indicate your level d a d ~ t y for each quarter hour of thé day by drawing a line to join each successive circie al the appropriate level of activfly. To estimate the correct activity level, use as guidelines the examples supplied. If you are not sure, make a note of the activity, and we can discuss it when you return for your second visit.
3 LlGHT
6 VERY HARD
2 VERY LIGHT
In the above example, I started my diary at 12 pm on the first day I went to the Iibrary to read for 2 hours, walked to my car, drove home, made dinner, watched TV for an hour, d r m to the gyrn for a workout I then drove home, got ready for bed and read l slept from 11 30 pm to 7 15 am The next morning, I got dressed, made a lunch, gathered my books together, drove !O school, sat in class for 2 hours. went to lunch, and walked to rny lab At 12 pm noon, I finished keeping the diary
4 MODERATE

Affect lntensity Measure (AIM) The followiny statements refer to the emotional reactions to typical life-events. Please
indicate how YOU react to these events by circling the appropnate number for each statement from the foollowiny scale. Please base your answers on how YOLr react, not on how you think others react or how a person should react.
1 . When 1 accomplish something dificult I feel delighted or elated. 1 2 3 4 5 6
NEVER I
3 . When 1 feel happy it is a strony type of exuberance. 1 2 3 4 5 6
3 . 1 enjoy beiny with other people very much.
4. I feel pretty bad when 1 tell a lie.
L
ALMOST NEVER
2
C . . When 1 solve a small personal problern. I feel euphorie. 1 , 3 4 5 6
6 . My emotions tend to be more intense than those of most people. 1 2 3 4 5 6
OCCASIONALLY 3
7. My happy moods are so strony that 1 feel like l'm "in heûven." 1 2 3 4 5 6
8. 1 get overly enthusiastic. 1 2 3 4 5 6
USUALLY 4
9. If l complete a task 1 thought was impossible. 1 am ecstatic. 1 2 3 4 5 6
10. My hean races at the anticipation of some exciting event. 1 2 3 4 5 6
ALMOST ALWAYS
5
1 1 . Sad movies deeply touch me. 1 2 3 4 5 6
ALWAYS 6
12. When Pm happy it's a feeling of being untroubled and content
rather than beiny zestfùl and aroused. 1 2 3 4 2 6
13. When I talk in front of a group for the first time
my voice sets shaky and my heart races. 1 2 3 4 5 6
14. When something good happens, 1 am usually much more jubilant
than others. 1 2 3 4 5 6
15. My tiiends might Say r m emotional. 1 2 3 4 5 6
1 6. The mernories I like the most are of t hose of times when I felt
content and peaceful rather than zesthl and enthusiastic. 1 2 3 4 5 6
1 7. The sight of someone who is hun badly affects me strongly. 1 2 3 4 5 6
18. When Fm feeling weli it's easy for me to go from being
in a good m d to king really joyfbl. 1 2 3 4 5 6

19. "Calm and cool" could easily describe me. 1 2 3 4 5 6
10. When i'm happy 1 feet like l'm burstinp with joy. 1 2 3 4 5 6
2 1 . Seeins a picture of some violent car accident in a newspaper
makes me feel si& to my stomach. 1 2 3 4 5 6
22. When "l'm happy 1 feel very eneryetic. 1 2 3 4 5 6
NEVER
23. When 1 receM an award I becorne overjoyed. 1 2 3 4 5 6
24. When 1 succeed at something, my reaction is calm contentment. 1 2 3 4 5 6
ALMOST NEVER
25. When I do something wons ? have strong feclings of shame and guilt. l 2 3 4 5 6
26. 1 cm remain calm even on the most tryiny days. 1 2 3 4 5 6
27. When things are going good t feet "on top of the world. " 1 2 3 4 5 6
j
28. When I get angry it's easy for me to still be rational and not overreact. 1 2 3 4 5 6
29. When 1 know 1 have done something very wett, 1 feel rela~ed and cornent
rather than excited and elated. 1 2 3 4 5 6
30. When 1 do feel anxiety it is nomidty very strong. 1 2 3 4 5 6
3 1 . My negative moods are mild in intensity. 1 2 3 4 5 6
32. Whcn t am csciicd ovcr something 1 ami to sham my fcclings with mcryonc. 1 2 3 4 5 6
33. When 1 feel happiness, it is a quiet type of contentment. 1 2 3 4 5 6
I OCCASIONALLY
34. My fnmds would probably say I'm a tense or "high-anmg" p a o n . 1 2 3 4 5 6
35. When I'm happy 1 bubble over with energy. 1 2 3 4 5 6
36. When t feet Quihy, this motion is quite arong. 1 2 3 4 5 6
37. 1 would characterize my happy m d s as closer to contentment dian to joy. 1 2 3 4 5 6
38. When someone complimcms me, t gct so happy 1 could "burst." 1 2 3 4 5 6
39. When 1 am nervous 1 get shaky al1 over. 1 2 3 4 5 6
40. Whm 1 am happy the f i is more like contentment and im cahn
than one of exhilaration and excitement. 1 2 3 4 3 6
2 USUALLY
3
ALMOST ' ALWAYS ALWAYS
4 5 1 6

ref: Weinfurt, K. P., Bryant, F. B., & Yamold, P. R. (1994). The factor structure of the Affect lntensity Measure: In search of a measurement model. Journal of Research in Personality, 28, 31 4-31 .
Larsen, R. J., and Diener, E. (1 987). Affect intensity as an individual difference characteristic: A review. Journal of Research in Personality, 2 1, 1 -39.
'Affect lntensity Measure - AIM Scuring
40 items, score 1-6 from never. almost never. occasionally, usually, almost always, always
= items reflected for Weinfurt's factors
Positive Affectivtty 4factor Weinfurt': AIMI-AIM3 AIM5 AIM7-AIMI0 AIM14 AIM18 AIM20 AIM22 AIM23 AIM27 AIM32 AIM35 AIM38
Negative lntensity 4factor Weinfurt': AIM6 AlMl3 AlMl5 AlMl9* AIM26* AIM28* AIM30 AIM31 AIM34 AM39
Serenity Weinfurt' : VAR AIMl2 AIMI6 AIM24 AIM29 AIM33 AIM37 AIM40
Negative Reactivity 4factor Weinfurt': AIM4 AlM11 AIM17 AIM21 AIM25 AIM36
Overall AIM score': AtM1 -AIM40

The Laterai Preference lnventory
Simply read each of the questions below. Decide which hand, foot, etc. you use for each activity and then circle the answer that describes you the best. If you are unsure of any answer, try to act out the action.
1. With which hand do you draw?
2. Which hand would you use to throw a bal1 to hit a target?
Left
Left
7. Which foot would you use to step on a bug?
8. If you had to step up ont0 a chair, which foot would you place on the chair first?
9. Which eye would you use to look through a telescooe?
3. In which hand would you use an eraser on paper?
4. Which hand removes the top card when you are dealing frorn a deck?
5. With which foot would you kick a bal1 to hit a target?
Left
. Left
Left
Left
- Left
6. If you wanted to pick up a pebble with your taes, Left which foot would you use?
i 10. If you had to look into a dark bottle to see how full it was, which eye would you use?
l
11. Which eye would you use to peep through a keyhole?
12. Which eye would you use to sight down a rifle?
13. If you wanted to listen in on a conversation going on behind a closed door, which ear would you place against the door?
14. lnto which ear would you place the earphone of a transistor radio?
1 5. If you wanted to hear someone's heartbeat which ear would you place against their chest?
16. Imagine a small box resting on a table. This box contains a srnatl dock. Which ear would you press against the box to find out if the dock was tickina?
Left - Left -
Left - Left
- Left -
Left I
teft
Ri ht Either
Right Either -t Ri ht Either
Right Either -t RightFEit her
Right Either I Ri ht Either
Right Either -t Right Either 1 Right Either 1
l - -
Right Either
Right Either I Right Either I Right Either

Reference for Coren's lateral preference inventory:
Coren, S. (1 993). The lateral preference inventory for measurement of handedness, footedness, eyedness, and earedness: Norms for young adults. Bulletin of the Psychonomie Society, 31, 1-3.
Scoring Instructions: Items 1-4 are handedness, 5-8 are footedness, 9-1 2 are eyedness, and 13-16 are earedness. For each Citem subscale, compute (R-L), where R is the number of "right" responses and L is the number of "left" responses.

Feedback on the Activity Study
This shidy is an example of both correlational and quasi-experimental studies. 1 wili cornelate the movement data fiom the two different instruments, expecting that there is a high positive correlation between the two types of instruments. The correlational study is important because, in addition to canying out experiments, it is important to coliect ecologically valid data in every-day situations.
I need reliability data for my activity measures to understand how accurately and consistently each of the instruments measures activity. If my instruments are inconsistent or inaccurate, the data that 1 collect also will be inconsistent and inaccurate, making it M c u i t for me to understand and interpret my results or confixm my hypotheses. (Garbage in equals garbage out!)
The diary should provide extemal validity for the instruments. The diary wdl help me to determine if the instruments measure what 1 think they are measuring.
In anaiyang the participants' data, 1 cm determine the vaiance in activity that c m be accounted for by the instruments themselves, by the individual who is wearing the instrument, and by measurement error. This information informs me about how much power 1 have to detect individuai ditferences, and so helps to give me an idea about how many participants 1 wiii need for rny dissertation activity study.

Motor Activity 293
Appendix B
Study 2: Instruments and forms:
Consent form
Ac tivity monitors and demographic information fom
Pavlovian Temperament S w e y (WS)
PTS scoring key
Behavioral Inhibition/Behaviorai Activation (BISBAS):
subscales and reference
BISBAS scale
BISBAS scoring
PANAS - current
PANAS - since the last tirne
PANAS scoring and reference
Dichotic Listening Task (DL) instructions and re ference
DL correct stimulus trials at nght- and lefi- ears, as recorded on tape

ACTlVlTY STUDY, NANCY McKEEN, University of Manitoba
This study is being conducted by Nancy McKeen from the Department of Psychology at the University of Manitoba. The goal of the project is to examine motor activity and its emotional correlates. Each participating peson's motor activity level will be measured with two small watch- like motion recorders worn on each wrist for 24 hours. I will measure other characteristics, such as temperament traits, personality, and mood. I will also rneasure language, emotional perception, and dexterity. I want to see if such characteristics are related to activity level. This study has been approved by the Human Ethical Review Committee of the Psychology Department.
In signing this consent form, I understand that:
my participation in the project is entirely voluntary;
I can withdraw from the study at any time and for any reason;
my participation involves cornpleting some questionnaires about my personality and c haracteristic behaviour;
my participation involves wearing motion recorden, answering dernographic questions, being rneasured for physical sire (e.g., height and weight), completing a test of motor dexterity and ear perception; and being asked for my hand, eye, foot, and ear preferences;
information about me will be kept confidential and the data will be kept in locked locations;
scientific reports about the results of the research may be prepared if findings warrant, but my name (or specific details that might identify me) will not be used in such reports without my permission;
I have been given a copy of this form; and
I can contact the Chair, Hurnan Ethical Review Committee, Department of Psychology (474-9338), with any corn plaints about this research. If you have any other questions, cal1 Nancy McKeen or Dr. Warren O. Eaton at 474-6955.
Thank you for your time and valuable participation.
Name:
Telephone: Home: Work:
Name of a Contact Peson:
Date:
(a person who might get a message to you)

Activity Monitors & Demographic information
Name: ID-
Actometers: Acto Set: Lefi Acto # Right Acto #
ACT0 START DATE: (DDMMMYY:hh:mm) - : :
ACT0 ST.4RT READING: (hh:mm:ss)
Lefi a m : - - : - - : - , Right am: : : - - ACTO END DATE: (DDMMMYY:hh:mm) - : :
ACTO FlNAL READCNG: (hh:mm:ss)
Lefi a m : __: : Right am: : : - -
Accelerometen: Epoch (hh: mm: ss) : :
CS.4 Right #: CSA Lefi #:
CSA BEGIN TIME: (DDM.MMYY:hh:rnin)
Lefi: -- L- Righi: - - - - - - - : - - : - - CS.4 END TIME: (DDh4MMYY:hh:mrn)
Lefi: ------- : - - : - - Right: ------- : -- : - - - --
How typical a dry was this for you? For activity? ( I = N O ~ , 7=Fairly. 3=Very):
For fiequency of interactiny wit h others?
For quality of interactions with others?
Did you participate in any athletic activities while you were weariny the monitors?
In which spoits did you participate?
Gendcr: ( t =M, ?=F):
Birthdrte: (DDMMMYY)
Height (cm): Height:
Weight (lbs): Weightl: Weight2:
Shoulder bal? (L= l Both=2 R=3 ):
<Moming' or Evening' Penon? (in energy level, easiness in rising)
(am=l ?=2 pm=3)

ID Pavlovian Temperament Survey
The items in this inventory refer to various aspects of temperament - the ways
people react to everyday events. There are no right or wrong answers; every
type of temperament has its advantages.
Your answers to these questions will be used only for research purposes. It is
very important that you answer the questions truthfully.
Please respond to the items without looking back at your answers to earlier
items. Try to describe yourself honestly: in terms of what you have been like in
the part year, not what or how you would like to be. You may find it easier to
respond to the items if you compare yourself with other people of the same sex
and roughly the same age.
Naturally, your behaviour and views change from situation to situation, but
please try to describe yourself as you usually are - in general on the average.
Please respond to the items below by circling the number following the
statement that best describes your view of each statement.
1. Sudden danger would prevent me from carrying on with 1 2 3 4
something I am doing.
2. When someone hurts me, I try to get back at them, "tit for tat." 1 2 3 4
3. 1 don? mind if I suddenly have to work with people I don? 1 2 3 4
know.
4. 1 find it unpleasant when I've made up my mind to do 1 2 3 4
something, and for some reason I can't begin on it.

I can feel at home very quickly in strange places.
I avoid noise when I am reading.
I can switch quickly frorn one job to another.
I gladly accept the challenges of risky projects.
When it becomes necessary, it is easy for me to stop watching
TV or listening to the radio.
I get flustered easily when I am under a lot of pressure.
When I am angry and I meet friends who are in high spirits, I
can easily forget my anger and enjoy their Company.
During a conversation. I sometimes have trouble waiting for
rny turn to speak.
I like it when I can do several things at the same tirne.
It is hard for me to suppress my annoyance, even when it is
necessary .
My efficiency declines when there is a lot going on around me.
It is hard for me to give up sornething that I am enjoying (eg.,
watching TV) even when others ask me to.
Even when I am working very hard. I feel fresh.
Unexpected events are stressful for me.
I don't have to open a present right away just to see what it is.
It takes me quite a while to get used to a new place.
I would be unable to function if I learned about the death of
someone very close to me.
I can easily do many different things one after another.
My performance suffers in an environment with a lot of
distractions.

it is difficult for me to interrupt something I am doing, even if
someone asks me to.
If carrying out a plan becomes dangerous, that is a good
reason for me to stop.
If I am in a bad mood, even things that I usually enjoy can't get
me out of it.
It is diffwlt for me to let other people finish what they are
saying .
I don? care if my hobby inconveniences other people.
I can control myself when a nasty comment is on the tip of my
tongue.
I like working when there is a lot going on around me.
When my job changes, I am quick to adust.
I am reluctant to take major risks.
I adapt quickly to changes in the way my work is organized.
I keep cool if I am under a lot of time pressure.
At festive occasions I can hardly wait for the formalities to be
over.
It is easy for me to shift back and forth between very different
activities.
I can't work if I am surrounded by hustle and bustle.
When someone has hurt my feelings, I can regain rny
composure if I have to.
I usually answer questions immediately, even when it is
advisable to wait.
I can easily adapt to sudden changes in my work schedule.

It is easy for people ta notice my disappointment, even if I
would like to hide it.
Fatigue often causes me to make mistakes.
If need be, 1 c m refrain from expressing my opinion, even if i
know I am right.
If I am staying in a new place, I get used to it quickly.
I cantt defend myself very well when I am attacked in public.
I don? have any trouble changing quickly from one activity to
another.
Sudden danger does not discourage me.
I don't like it al1 when I cannot begin something I have planned
to do.
I don? like to speak in public.
I get impatient when I can't begin a meal because I'm waiting
for others.
I need a lot of time before I c m go from being sad to being
happy.
My face is like an open book which everyone can read.
I don? like to make decisions that can have wide-ranging
consequences.
I gel unsettled by unexpected changes in my daily routine.
I gel rattled when I work under noisy conditions.
It is hard for me to control my curiosity when I have the chance
to look at someone else's things or notes.
I quiMy gel used to new working conditions.
I get impatient easily when I am explaining something.

I need a while to "warrn up" when I'm starting something new. 1 2 3 4
Loud conversations nearby do not affect how well I get things 1 2 3 4
done.
I can't change from one emotion to another. 1 2 3 4
When I really feel like enjoying myself, I am too impatient to 1 2 3 4
wait for others who want to corne.
I get tired quickly when I have to work longer than usual. 1 2 3 4
When I have asked someone to do a job, it is hard for me to 1 2 3 4
wait until it is finished.
I love talking to several people at the same time. 1 2 3 4
I would panic if I were the victim of a theft. 1 2 3 4

SCORlNC KEY: PTS-AmE (66-im)
This key allows scoring of Strength of Excitation (SE), Stmigth of inhibition (SI), Md Mobility of Nervous Processes (MO). For each scale, some of items are reverse-worded.
The key is based upon assigning a numerical score of 1 to " strongly agre, ' d v o u ~ h 4 for "strongly disagree. ' so that coding cm proceed in a natural direction - that is with highcr numbers npresenting respondents' marks fbrther to the right in the set of response boxes for ePch item. Bccuisc "swngly agrœ' is then represented by the lowest number. scores in which higher numerical values reprisent greater arnounts of the trait must be obtaineâ by reverse coding of positive& wordcd ù ~ - ù ~ &ose wording refects the trait in question. Such items are indicateâ by a ( 0 ) in the key.
strengtb of ExdtoÉioii (SE) 1 6 8 (-1 10 15 17 (-1 21 23 25 30 (-1 32 34 ( 0 )
37 42 45 47 (-1 49 53 55 60 (9 63 66
Strcngth of Inbibitioll (SI) 2 4 9 (-1 12 14 16 19 (-1 24 27 28 29 (-1 35 39 41 43 (-1 48 50 52 56 58 62 64

BISIBAS Scale Items Ref: Carver. C. S, & White, T. L. (1994). Behaviorat tnhiûttioo, behavroral activation, and affective responses to impending reward and punishment: The BlSlBAS Scales. Journal d Personelty and Soael Psychobgy, 667, 31 9-333.
BIS a. If I think something unpleasant is going to happen, t usualty get
pretty "worked up." b. I worry about making mistakes. c. Criticisrn or scolding hurts me quite a bit. ci. I feel pretty wwried or upset when 1 thtnk or know somebody is
angry at me. e. Even if something bad is about fo happen to me, I rarely
expenence fear or newousness. (reverse code) f. I feel worried when 1 think I have done poorty at sornething. g. I have few fean compared to my friends. (Reverse code)
2. BAS Reward Responstveness a. When I get something I want, I feel excited and energized. b. When I'rn doing well at somethtng, t love to keep at it. c. When good things happen to me, it affects me strongly. d. It would excite me to win a contest. e. When I see an opportunity for something I like, I get excited right
away.
3. BAS Drive a. When l want something, t usuaHy go att-out to get it. b. I go out of my way to get things I want. c. If I see a chance to get something 1 want, I move on it rigM away. d. When I go after something, I use a "no holds barred" approach.
4. BAS Fun Seeking a. I will often do things for no other reason than that they might be
fun. b. I crave excitement and new sensations. c. I'm always willing to try something new if I think it will be fun. d. I often ad on the spur of the moment.

Strongly Disagree
1 Disagree
2 Agree
3
Strongl y Agree
4
1. If I think something unpleasant ts going to happen, 1 $ 2 3 4 usually get pretty "worked up."
2. When I get something I want, t feel excited and energized. 1 2 3 4
3. When I want something, I usually go all-out to get it. 1 2 3 4
4. 1wiiloftendothingsfornootherreasonthanthatthey 1 2 3 4 might be fun.
5. I worry about making rnistakes. 1 2 3 4
6. When I'm doing well at something, I love to keep at it. 1 2 3 4
7. 1 go out of my way to get thtngs 1 want. 1 2 3 4
8. I crave excitement and new sensations. 1 2 3 4
9. Criticism or scolding hurts me quite a bit. 1 2 3 4
10. When good things happen to me, it affects me strongly. 1 2 3 4
11. If I see a chance to get something I want, I move on A $ 2 3 4 right away.
12. 1 feel pretty worried or upset when I think or know 1 2 3 4 somebody is angry at me.
13. Even if something bad is about to happen to me, t rarely 1 2 3 4 experience fear or nervousness.
14. It would excite me to win a contest. 1 2 3 4
15. I'm always willing to try something new if I think it will be 1 2 3 4 fun.
16. 1 feel worried when I think I have dom, poorly at 1 2 3 4 something .
17. 1 have few fears cornpared to rny friends. 1 2 3 4
18. When I see an opportunity for something I like, I get 1 2 3 4 excited right away.
19. When I go Mer sornething I use a "no holds baned" 1 2 3 4 approach.
20. 1 often a d on the spur of the moment. 1 2 3 4

BISBAS Scoring
BIS: Mean of items: 1 5 9 12 13" 16 17'
BAS Drive: Mean of items: 3 7 11 19
BAS Reward: Mean of items: 2 6 10 14 18
8AS Fun: Mean of items: 4 8 15 20
Mean BAS: Mean of Drive, Reward, and Fun subscales
+ = reverse score item
Likert type scale: 1 =Strongly disagree, 2=Disagree. 3=Agree, 4=Strongly agree

PANAS
This scale consists of a number of words that descnbe different feelings and emotions. Read each item and then mark the appropriate answer in the space next to that word. lndicate to what extent you feel this way r ikt now, that is, at the present moment. Use the following scale to record your answers:
interested guilty irritable determined - distressed scared alert attentive
excited hostile ashamed jittery upset ent husiastic - inspired active st rong - proud nervous afiaid
3
moderately
4
quite a bit
. 1
1
very slightly or not at al1
5
extremely
I 7
a little
A
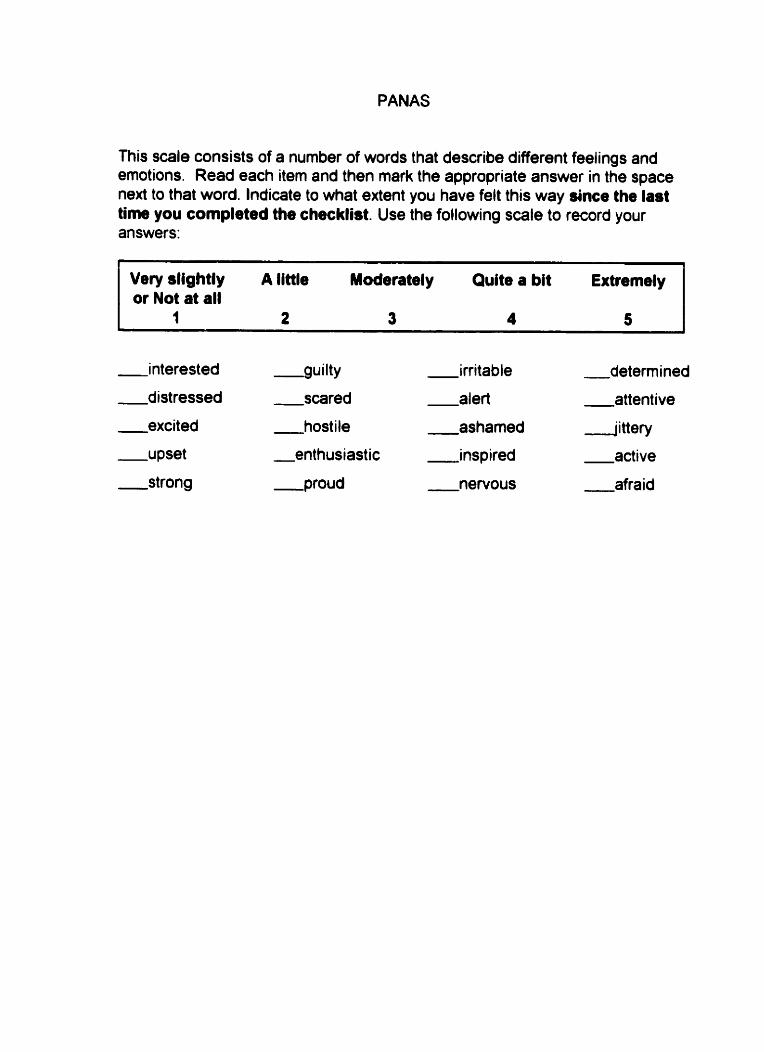
PANAS
This scale consists of a number of words that describe different feelings and emotions. Read each item and then mark the appropriate answer in the space next to that word. lndicate to what extent you have felt this way rince the last time you compkted the checklist. Use the following scale to record your answers:
Very sllghtly A little Moderately Quite a bit Extremely or Not at all
1 2 3 4 5
interested guilty irritable determined
distressed scared alert attentive
excited - hostile - ashamed iittery
upset enthusiastic - inspired active
strong proud nervous - afra i d

PANAS Scoring
Watson, D., Clark, L. A., 8 Tellegen. A. (1 988). Development and validation of brief measures of positive and negative affect: The PANAS scales. Journal of Personality and Social Psychology, 54, 1063-1 070.
20 items, 2 subscales - PA (1 Oitems), NA (1 0 items);
No reflections on the PANAS scores need reverse scoring.;
P-PA = MEAN (OF P l P3 P5 P9 Pl0 Pl2 Pi4 Pl6 Pl7 P19); PJA= MEAN (OF P2 P4 P6 P7 P8 Pl1 Pl3 Pl5 Pl8 P20);
P-PA = 'PANAS Positive Affect' P-NA = 'PANAS Negative Affect'

ID#: Date (ddMONyy):
~ H O ~ C EMoTIoNAL W o ~ o s TASK (WATERLOO TAPE)
Instructions: Check that both channels are equal in volume using the calibration tone. "The tone should sound like it is coming from the centre of your head." Explain the dichotic procedure a. i.e., hear two different words at same time - one in each ear. Demonstrate the dichotic procedure: a. one male voice & one fernale voice b. CV's: PA, DA, GA, KA, PA, TA c. ask participant to repeat what male or female voice says d. 8 trials Explain the experiment. a. one male voice b. 4 words: BOWER. DOWER, POWER, TOWER c. 4 tones of voice: HAPPY, SAD, ANGRY, NEUTRA1 d. 16 stimuli in total e. Listen for target 'X' (eg, "the word, BOWER" or "a Happy tone of
voice" f. Play al1 16 stimuli binaurally - subject should identify one example
of target 'X." If not, play the stimuli again. Repeat: a. Listen for 'X' b. "If you hear 'X' in either ear - tell me (citcle) 'YES' " c. "If you do not hear 'X' in either ear - tell me (circle) 'NO' " There are 144 trials, divided into 8 sets of 18 trials. Afier each set of 18, t h e is a 10 second break. A tone will indicate when the next set is about to begin. Ask participant if there are any questions. Play Block One. Response sheet (2 pages) should be photocopied single sheet, double- sided. Tape 8 Instructions distributed for M. P. Bryden by Dr. B. Bulman- Fleming, Depanment of Psychology , University of Waterloo, Waterloo, ON N2L 3G1 phone: S I 9-888-4567 ~3043; FAX: S I 9-7466631 email: bflerning@watarts. uwaterloo.ca

Tokens are 500 milliseconds, presented with a 4500 millisecond SOA. There is a 10 second break every 18 trials. A tone marks the start of another set of 18 trials.
ichotic Demonstraun Trial(L (3 second ISI) - Presented once at beginning of tape. - Ask subject to repeat what the male (or female) voice says.
1. 'Ready' signal 2. f-BA - m-KA 3. f-PA - m-GA 4. m-BA - f-KA 5. m-GA - 1-PA 6. m-PA - f -GA 7. f-KA - m-BA 8. m-KA - f-BA 9. f-GA - m-PA
inaural Demonstration of Stimuli ( 3 second SOA) - Presented twice; once before BLOCK 1 and once before BLOCK 2. - Ask subject to report the occurence of their target word andlor emotion. - If subject does not reporl at least once, rewind and repeat demo trials.
Tone Sad Power Angry Power Sad Tower Neutral Bower Sad Bower Angry Dower Sad Dower Angry Bower Happy Power Happy Tower Angiy Tower Neutral Dower Neutral Power Happy Dower Neutral Tower Happy Bower
There are' two blocks of 144 experimental trials, divided into sets of 18 trials as described below. Each of the 2 blocks is divided into Pait A and Pait B. In each Part, the 72 nonsimilar pairs of stimuli are presented once.

RESPONSE SHEET (p. 1 of 2)
HAND PROGRAM ORDER
YES NO
YES NO
YES NO
YES NO
YES NO
YES NO
YES NO
YES NO
YES NO
YES NO
YES NO
YES NO
YES NO
YES NO
YES NO
YES NO
YES NO
YES NO
YES NO
YES NO
YES NO
YES NO
YES NO
YES NO
YES NO
VES NO
YES NO
YES NO
YES NO
YES NO
YES NO
YES NO
YES NO
YES NO
YES NO
YES NO
SUBJECT # SEX
YES NO
YES NO
YES NO
YES NO
YES NO
YES NO
YES NO
YES NO
YES NO
VES NO
YES NO
YES NO
YES NO
YES NO
YES NO
YES NO
VES NO
YES NO
YES NO
YES NO
YES NO
YES NO
YES NO
YES NO
YES NO
YES NO
YES NO
YES NO
YES NO
YES NO
YES NO
YES NO
YES NO
YES NO
YES NO
YES NO

RESPONSE SHEET (p. 2 of 2)
YES NO
YES NO
YES NO
YES NO
YES NO
YES NO
YES NO
YES NO
YES NO
YES NO
YES NO
YES NO
YES NO
YES NO
YES NO
YES NO
YES NO
YES NO
YES NO
YES NO
YES NO
YES NO
YES NO
YES NO
YES NO
YES NO
YES NO
YES NO
YES NO
YES NO
YES NO
YES NO
YES NO
YES NO
YES NO
VES NO
SUBJECT #
YES NO
YES NO
YES NO
YES NO
YES NO
YES NO
YES NO
YES NO
YES NO
YES NO
YES NO
YES NO
YES NO
YES NO_
YES NO
YES NO
YES NO
YES NO
YES NO
E S NO
YES NO
YES NO
YES NO
YES NO
YES NO
YES NO
YES NO
YES NO
YES NO
YES NO
YES NO
YES NO
YES NO
YES NO
YES NO
YES NO

MBLA
1. NP-Hl 2. NT-AP 3. HP-AD 4. AD-NB 5. SP-AD 6. AD-NP 7. SD-HP 8. AD-HB 9. SB-AT
10. HT-SB 11. NP-AB 12. S0-NB 13. SO-NT 14. AD-NT 15. HP-AB 16. HP-NT 17. NT-AB 18. ST-HB
WEIB
73. HT-SP 74. HP-SD 75. AB-NP 76. NB-HP 77. NP-HD 78. AD-HT 79. AT-SB 80. NP-ST 81. ND-AP 82. HD-ST 83. NB-AD 84. ST-HP 85. HB-AP 86. AT-ND 87. SD-HB 88. AB-HP 89. HB-AD 90. AP-NB
(Left ear - Right ear)
HP-ST ST-AD NB-AT Nô-HO AT-HP ST-NO HB-AT AP-ST SB-NP SB-HP NT-SB HO-S? AP-ND HO-NP HB-SD NB-ST SB-AP HT-NB
AB-HT ST-NP ND46 AP-HT HT-ND AD-SB SP-HT NB-AP HO-AP HP-NB SO-HT SP-AT HBND A?-HB AB-HD ND-AT SP-NT AT-HO
(Left ear - Right ear)
HP-SB HB-NT AT-HB NT-AD NP-SB Nt-HP HT-AB ST-NB HP-AT AB-NT HB-ST ND-HT HT-SD HT-NP SD-AB NP-AT HO-NT AD-SP
HT-AP SP-ND NB-HT AP-SB SD-NP AP-SD HD-NB NT-SD AP-HO NB-SD SPA8 SB-NT NP-AD SP-NB ST-AB ND-HP HO-AT AD-ST
55. HT-AD 56. HB-SP 57. AB-SP 58. NP-H6 59. AT-SD 60. ND-SP 61. HP-ND 62. SD-AP 63. NB-SP 64. HD-SB 65. NT-HD 66. NP-SD 67. AB-ST 68. AT-NP 69. ST-HD 70. NT-HB 71. ND-AB 72. AB-SD
127. SB-ND 128. ST-AP 129. HB-NP 130. AP-NT 131. SB-HO 132. NT-SP 133. AD-HP 134, AT-NB 135. SP-HD 136. SB-AD 137. ND-HB 138. SD-AT 139. ND-ST 140. AT-SP 141. AB-ND 142. HO-AB 143. SB-HT 144. SP-HB

e A B u l (Left ear - Right ear)
(Left ear - Right ear) . i
AP-HT HB-AD NT-HU SB-AT HT-NB AB-NP SP-NO AT-HP ST-NB SB-NP AP-ND SP-AT NT-SD AP-HO ST-AB HP-SB ND-HB NT-AP
QI. NB-AD' 92. HD-SB 93. HB-NP 94. HP-AD 95. HT-NP 96. HB-AT 97. ND-SB 98. SD-AB 99. AD-NT
100. ST-HP 101. NT-HP 102. AB-SP 103. HO-AT 104. SD-HP 105. APISD 106. HP-NB 107. AD-SP 108. SB-HT
109. HB-NT' 110. SD-Hf Il 1. SB-AD 112. AB-Hf 113. NO-HP 114. SD-NB I l S . HT-AD 116. NP-AD 117. NT-SP 118. AP-NB 119. AP-SB 120. HO-NB 121. AT-ND 122. AT-SD 123. NO-ST 124. NP-SD 125. HP-AB 126. HT-SP
127. NP-AT 128. ST-HB 129. NB-SP 130. HO-ST 131. ND-Hl 132. AB-ND 133; HD-NP 134. AB-HD 135. SD-HB 136. NP-ST 137. HB-AP 138. NB-AT 139. NT-SB 140. AD-ST 141. SP-HB 142. AB-NT 143. ST-AP 144. SP-HD