The Meaning and Determinants of Skills Shortages
23
OXFORD BULLETIN OF ECONOMICS AND STATISTICS, 60, 2 (1998) 0305-9049 THE MEANING AND DETERMINANTS OF SKILLS SHORTAGES† Francis Green, Stephen Machin and David Wilkinson I. INTRODUCTION What do employers mean when they say that they face a ‘skill shortage’ at their establishment(s)? How employers conceive of skill shortages matters because they are the prime, often the only, source of information allowing judgments to be made about skills disequilibria. What employers say therefore affects general perceptions about the adequacy, or otherwise, of skills supplies. In Britain’s employer-led system of training this is likely to have a strong bearing on policy formation. Moreover, some economic analysts have attributed significant constraints on British economic growth to skill shortage indicators derived from employer surveys. 1 The problem to be addressed in this paper is that there remains substantial ambiguity about what a skill shortage amounts to. The British Government’s Training Agency defined a ‘skills shortage’ as existing ‘when there are not enough people available with the skills needed to do the jobs which need to be done’ (Training Agency, 1990, page 29). On the one hand, it is said, there may be a difficulty in recruiting workers with the right skills. On the other hand, there may be a ‘skills gap’ when ‘firms’ existing staff do not have the skills they need to do their job effectively’ (ibid.). This notion of a skills shortage can be useful because of its broad perspective, but it may well not correspond to employers’ own interpreta- tions. Moreover, previous research has pointed to ambiguities over both the notion of ‘skills’ and the notion of ‘shortage’. It is often held that the ‘skills’ being referred to are essentially technical, defined by the ability to perform given tasks or to master various techniques, whether manual † Part of this paper draws on a report produced for the Department for Education and Employment entitled ‘An Analysis of Workplace Training and Skill Shortages’, published in the DfEE Research Studies Series No. RS7. We are very grateful to the Department for Education and Employment for financial support. We would also like to thank Jonathan Haskel and an anonymous referee for some useful comments and suggestions and Steve Woodland for help with the EMSPS and WIRS data. 1 See, among others, Haskel and Martin (1993a). 165 © Blackwell Publishers Ltd, 1998. Published by Blackwell Publishers, 108 Cowley Road, Oxford OX4 1JF, UK & 350 Main Street, Malden, MA 02148, USA.
Transcript of The Meaning and Determinants of Skills Shortages

OXFORD BULLETIN OF ECONOMICS AND STATISTICS, 60, 2 (1998)0305-9049
THE MEANING AND DETERMINANTS OF SKILLS SHORTAGES†
Francis Green, Stephen Machin and David Wilkinson
I. INTRODUCTION
What do employers mean when they say that they face a ‘skill shortage’at their establishment(s)?
How employers conceive of skill shortages matters because they are theprime, often the only, source of information allowing judgments to bemade about skills disequilibria. What employers say therefore affectsgeneral perceptions about the adequacy, or otherwise, of skills supplies.In Britain’s employer-led system of training this is likely to have a strongbearing on policy formation. Moreover, some economic analysts haveattributed significant constraints on British economic growth to skillshortage indicators derived from employer surveys.1
The problem to be addressed in this paper is that there remainssubstantial ambiguity about what a skill shortage amounts to. The BritishGovernment’s Training Agency defined a ‘skills shortage’ as existing‘when there are not enough people available with the skills needed to dothe jobs which need to be done’ (Training Agency, 1990, page 29). On theone hand, it is said, there may be a difficulty in recruiting workers withthe right skills. On the other hand, there may be a ‘skills gap’ when ‘firms’existing staff do not have the skills they need to do their job effectively’(ibid.).
This notion of a skills shortage can be useful because of its broadperspective, but it may well not correspond to employers’ own interpreta-tions. Moreover, previous research has pointed to ambiguities over boththe notion of ‘skills’ and the notion of ‘shortage’. It is often held that the‘skills’ being referred to are essentially technical, defined by the ability toperform given tasks or to master various techniques, whether manual
†Part of this paper draws on a report produced for the Department for Education andEmployment entitled ‘An Analysis of Workplace Training and Skill Shortages’, published inthe DfEE Research Studies Series No. RS7. We are very grateful to the Department forEducation and Employment for financial support. We would also like to thank JonathanHaskel and an anonymous referee for some useful comments and suggestions and SteveWoodland for help with the EMSPS and WIRS data.
1 See, among others, Haskel and Martin (1993a).
165© Blackwell Publishers Ltd, 1998. Published by Blackwell Publishers, 108 Cowley Road, OxfordOX4 1JF, UK & 350 Main Street, Malden, MA 02148, USA.
dexterity or cognitive skills. Yet it has been shown, for example by Oliverand Turton (1982), that what employers mean by skills (when they referto skills shortages) encompasses also a range of behavioural attributessuch as reliability, ability to work without supervision, and stability ofemployment. Research now generally recognizes that both behaviouralattributes and technical skills are included in the potential list of qualitiesthat employers are looking for (Bosworth, Dutton and Lewis, 1992).
‘Shortage’ can also be an ambiguous term because it begs the questionof shortage in relation to what. A shortage could be in relation to whatemployers currently demand. On the other hand, a shortage could be inrelation to some suitable defined optimal level of skills, which perhapsmight be more aptly referred to as a ‘skills deficiency’ (Green andAshton, 1992). This optimal level of skills might be that which is derivablefrom economic theory, though even then there is need for clarificationabout what is the most appropriate definition of optimal employment forcontrasting with actual employment (Green and Ashton, 1992; Bosworth,1993). The two notions of skills shortage are quite different, even thoughthey are frequently conflated in practice. Such a confusion can lead to afundamental misperception of any problems with underlying skills in theworkforce (Senker, 1992). For example, if in some situation there arefound to be no skills shortages, as defined in the former sense thatemployers are able to find all the employees they currently demand, thiscannot be taken to imply that there are no skills deficiencies (that is, skillsshortages in the second sense) which might be usefully addressed withpublic policies.2
In empirical work, shortages have always in practice been interpreted,or even defined directly, in terms of difficulties in filling vacancies. To ourknowledge, none of the studies hitherto have considered skills shortagesin practice as encompassing problems with the skills or qualities of firms’existing employees. For example, Haskel and Martin (1993a) treat theCBI skills shortage indicator as a proxy for the average duration ofvacancies of skilled labour, and Stevens (1994) uses the same indicator asa proxy for the marginal cost of recruiting skilled labour. Jones and Goss(1991), Haskel and Martin (1993b) and Bosworth (1993) measure skillsshortage in various ways directly as a hard-to-fill vacancy.
But, given the broader notion contained in the above-quoted definitionby the Training Agency, and given also the wider currency of the term ingeneral usage, to equate ‘skill shortage’ with ‘hard-to-fill vacancy’ may bea very risky assumption which, if falsely made, could lead to unsafeconclusions. One problem that has been identified with this approach isthat not all recruitment difficulties are due to problems with a lack ofworkers. Other reasons are regularly cited for recruitment difficulties. It
2 Most (but not all) research work uses the notion of ‘skills shortage’ in the first sense, andfrom here on we shall limit our discussion to that sense only.
© Blackwell Publishers 1998
166 BULLETIN
has been argued that a skills shortage carried with it the presumption that‘reasonable’ recruitment efforts have been made, and ‘reasonable’ wagesand training prospects offered (Green, A. and Owen, 1992), and someresearchers have preferred to reserve the notion of a skills shortage forthose recruitment difficulties that are said by the employers to arise fromlack of skilled workers available to the firm, for example due to lowunemployment in the area (Campbell and Baldwin, 1993).
Clarifying the meaning of skills shortages as perceived by employersshould prove of value, both in terms of helping to evaluate the validity ofthe various interpretations in the existing literature, and as an aid toforming appropriate policy responses to important employer survey indi-cators such as the CBI skills shortage indicator. In this paper, we aim tocontribute to an increased understanding of employers’ perceptions ofskills shortages using a simple statistical method and a rich new establish-ment-based data source, the Employer Manpower and Skills PracticesSurvey (EMSPS). The value of this data source for present purposes isfirst that employers were asked in entirely separate questions about (a)their experience of ‘skills shortages’, (b) their experience in filling vacan-cies and (c) their experience of deficiencies in the ‘qualities’ of theirexisting workforce. By matching up their responses to these separatequestions we are able to gain valuable insights as to employers’ percep-tions of skills shortage. We also examine the factors underlying thesethree experiences in order to throw further light on their similarities anddifferences. The survey also allows respondents to report their ownperceptions of why they experienced skill shortages or difficulties inrecruitment. By examining these reported perceptions, and the extent ofconsistency between responses to the different questions, we aim tocomplement in-depth case-studies of small numbers of establishmentssuch as that by Oliver and Turton (1982).
Our findings show that the experience of a skill shortage overlaps onlypartially with either the experience of a hard-to-fill vacancy of the experi-ence of a deficiency in the quality of the workforce (see also Robinson,1996, who makes similar points, but from a more macroeconomic pers-pective). We also estimate some simple descriptive econometric modelswhich (along with our more descriptive initial analysis) lead us toconclude that, in a substantial number of cases, the term ‘skills shortage’appears, from this data, to mean for employers something wider ordifferent from ‘hard-to-fill vacancy’. Our analysis seems to suggest thatemployers appear not to have any problem for themselves in interpretingquestions on ‘skills shortages’, but they are not being perceived in auniform way by all employers. Indeed, many employers stress that,amongst both their existing workforce and job applicants, that thereappear to be important shortfalls in motivational and attitudinal skills,leading us to believe that social skills are an important part of the skillssaid to be in shortage. This clearly has rather different meaning than the
© Blackwell Publishers 1998
167THE MEANING AND DETERMINANTS OF SKILLS SHORTAGES
commonly used hard-to-fill vacancy data utilized by some researchers tomeasure skills shortages.
We proceed as follows. Section II briefly describes the data and therelevant questions. Section III presents the main findings from comparingresponses to the three questions. In Section IV we examine the determi-nants of skill shortages and of hard-to-fill vacancies. Section V concludes.
II. SUMMARY DETAILS ABOUT EMSPS
The Employers’ Manpower and Skills Practices Survey (EMSPS) was setup to examine aspects of employers’ skill formation, including their skillneeds, recruitment practices and training. It was a large-scale survey ofestablishments aimed in part as a follow-up to the earlier Training inBritain study (Deloitte, Haskins and Sells, 1989), but also prompted bygrowing concern about skill shortages at the end of the 1980s emanatingfrom the upward trend in the Confederation of British Industry’s skillshortage indicator.3 It was conducted as a follow up to the 1990 Work-place Industrial Relations Survey (WIRS3) which is a nationally repre-sentative survey of 2061 British establishments with 25 or more employeesin all sectors except agriculture, forestry and fishing and coal mining. AllWIRS3 main management respondents who said they did not mind beingrecontacted were asked to participate in EMSPS. Once unproductive andout of scope responses were taken into account the EMSPS sample wasleft at 1693 establishments, corresponding to a response rate of 89percent. Face-to-face interviews were then conducted by experiencedinterviewers employed by Social and Community Planning Research(SCPR) between November 1990 and October 1991 using a structuredquestionnaire. Initial analysis of the EMSPS dataset was carried out in aseries of Employment Department Working Papers (Dench 1993a, 1993band 1993c) concerned with types of employer providing training, traininginfrastructure and aspects of continuous training.4
III. SKILL SHORTAGES, HARD-TO-FILL VACANCIES AND QUALITY OFAN ESTABLISHMENT’S WORKFORCE
In this section, we deploy two methods to explore what employers meanby skill shortages and hard-to-fill vacancies. These are: the matching ofresponses to separate questions, and a classification and examination ofthe perceived indicators are reported by respondents.
3 The CBI Industrial Trends samples around 1500 manufacturing firms and reports thepercentage of firms indicating that skilled labour is ‘a factor which (is) likely to limit (their)output over the next four months’.
4 See also Green, Machin and Wilkinson (1995) for further details of the data set.
© Blackwell Publishers 1998
168 BULLETIN
Response Matching
Following our introductory remarks, we compare responses to three ques-tions in the survey (the precise questions are reproduced in theAppendix). First, there is the reported presence or absence of a skillshortage in the previous 12 months. Second, there is whether employerswho had needed to fill vacancies in the previous 12 months had difficultydoing so. The third variable records whether employers thought that theiremployees lacked any of a list of qualities that they ‘would (ideally) likethem to have’. The aim is to establish how closely these variables arerelated.
In all but two establishments in EMSPS, respondents were able to givea definite response, when asked whether they had experienced a skillshortage in the previous year. Some 35.2 percent answered in the affirma-tive. Employers were also asked whether, in each occupational group,they had filled any job vacancies in the previous 12 months, either inter-nally or externally. If so, they were asked to estimate on a 5-point scalehow easy it was to recruit. We classify a ‘hard-to-fill vacancy’ as one thatwas ‘fairly difficult’ or ‘very difficult’ to fill, and 41.2 percent reported yesto this experience.
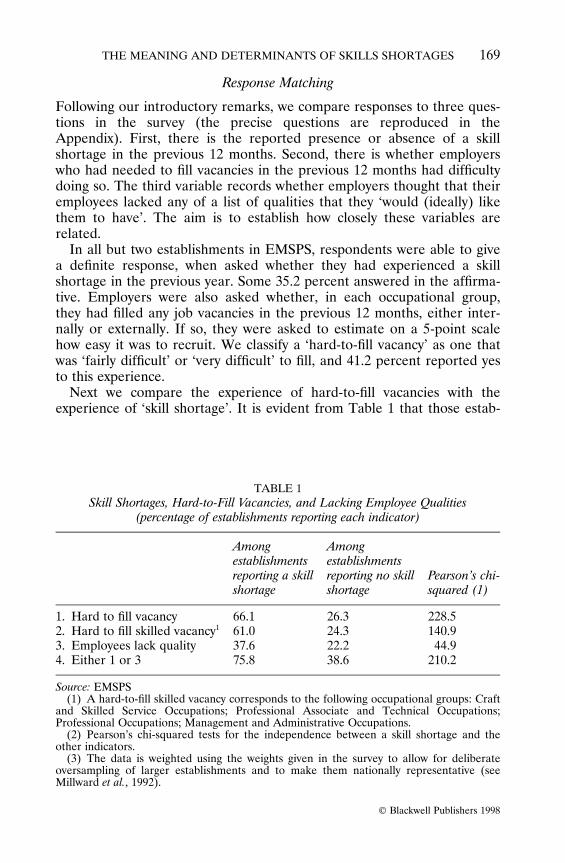
Next we compare the experience of hard-to-fill vacancies with theexperience of ‘skill shortage’. It is evident from Table 1 that those estab-
TABLE 1Skill Shortages, Hard-to-Fill Vacancies, and Lacking Employee Qualities
(percentage of establishments reporting each indicator)
Among Amongestablishments establishmentsreporting a skill reporting no skill Pearson’s chi-shortage shortage squared (1)
1. Hard to fill vacancy2. Hard to fill skilled vacancy1
3. Employees lack quality4. Either 1 or 3
66.161.037.675.8
26.324.322.238.6
228.5140.9
44.9210.2
Source: EMSPS(1) A hard-to-fill skilled vacancy corresponds to the following occupational groups: Craft
and Skilled Service Occupations; Professional Associate and Technical Occupations;Professional Occupations; Management and Administrative Occupations.
(2) Pearson’s chi-squared tests for the independence between a skill shortage and theother indicators.
(3) The data is weighted using the weights given in the survey to allow for deliberateoversampling of larger establishments and to make them nationally representative (seeMillward et al., 1992).
© Blackwell Publishers 1998
169THE MEANING AND DETERMINANTS OF SKILLS SHORTAGES
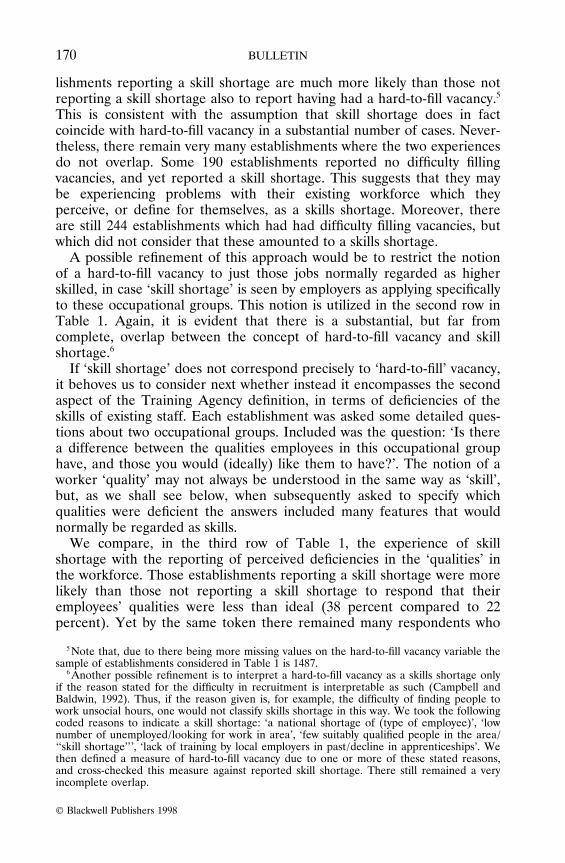
lishments reporting a skill shortage are much more likely than those notreporting a skill shortage also to report having had a hard-to-fill vacancy.5
This is consistent with the assumption that skill shortage does in factcoincide with hard-to-fill vacancy in a substantial number of cases. Never-theless, there remain very many establishments where the two experiencesdo not overlap. Some 190 establishments reported no difficulty fillingvacancies, and yet reported a skill shortage. This suggests that they maybe experiencing problems with their existing workforce which theyperceive, or define for themselves, as a skills shortage. Moreover, thereare still 244 establishments which had had difficulty filling vacancies, butwhich did not consider that these amounted to a skills shortage.
A possible refinement of this approach would be to restrict the notionof a hard-to-fill vacancy to just those jobs normally regarded as higherskilled, in case ‘skill shortage’ is seen by employers as applying specificallyto these occupational groups. This notion is utilized in the second row inTable 1. Again, it is evident that there is a substantial, but far fromcomplete, overlap between the concept of hard-to-fill vacancy and skillshortage.6
If ‘skill shortage’ does not correspond precisely to ‘hard-to-fill’ vacancy,it behoves us to consider next whether instead it encompasses the secondaspect of the Training Agency definition, in terms of deficiencies of theskills of existing staff. Each establishment was asked some detailed ques-tions about two occupational groups. Included was the question: ‘Is therea difference between the qualities employees in this occupational grouphave, and those you would (ideally) like them to have?’. The notion of aworker ‘quality’ may not always be understood in the same way as ‘skill’,but, as we shall see below, when subsequently asked to specify whichqualities were deficient the answers included many features that wouldnormally be regarded as skills.
We compare, in the third row of Table 1, the experience of skillshortage with the reporting of perceived deficiencies in the ‘qualities’ inthe workforce. Those establishments reporting a skill shortage were morelikely than those not reporting a skill shortage to respond that theiremployees’ qualities were less than ideal (38 percent compared to 22percent). Yet by the same token there remained many respondents who
5 Note that, due to there being more missing values on the hard-to-fill vacancy variable thesample of establishments considered in Table 1 is 1487.
6 Another possible refinement is to interpret a hard-to-fill vacancy as a skills shortage onlyif the reason stated for the difficulty in recruitment is interpretable as such (Campbell andBaldwin, 1992). Thus, if the reason given is, for example, the difficulty of finding people towork unsocial hours, one would not classify skills shortage in this way. We took the followingcoded reasons to indicate a skill shortage: ‘a national shortage of (type of employee)’, ‘lownumber of unemployed/looking for work in area’, ‘few suitably qualified people in the area/‘‘skill shortage’’’, ‘lack of training by local employers in past/decline in apprenticeships’. Wethen defined a measure of hard-to-fill vacancy due to one or more of these stated reasons,and cross-checked this measure against reported skill shortage. There still remained a veryincomplete overlap.
© Blackwell Publishers 1998
170 BULLETIN
complained of employee’s qualities but did not report a shortage of skills.Below we take a look in greater detail at the range of these complaints.
On the supposition, instead, that employers may have a wider notion ofskills shortage, one that encompasses both internal skills problems anddifficulties with filling vacancies, we combined these two types of indices.The measure in the fourth row of Table 1 picks up whether establish-ments report either a hard-to-fill vacancy in any group or any problemwith employees lacking any qualities, or both. Again, there is an incom-plete overlap between the combined measure and the reporting of a skillshortage.
Although it is clear from the above that problems with the ‘qualities’ ofthe existing workforce can only at best be part of what is understood byskill shortages, it is possible to develop understanding of skills problemsfacing establishments by taking a closer look at the sorts of qualities thatare deemed to be lacking. The aim next, therefore, is to investigatefurther whether any particular qualities are associated with skillsshortage, and at the same time to examine how far various perceiveddeficiencies are associated with specific occupational groups. Respondentsto the survey were asked to tick up to nine types of worker ‘quality’ whichthey might see as lacking in their employees. There is obviously someelasticity in the possible interpretations given to worker ‘quality’. Some ofthose listed in the first column of Table 2 can easily be termed as skills,such as, for example, manual dexterity or numeracy. Others, such as‘living locally’, or ‘willingness to work unsocial hours’, might be an advan-tage but would not normally be regarded as a skill. A third group falls inbetween. Consider, for example, the ‘ability to cover for absences’, whichis also linked with ‘versatility’. While this may be related to the concept ofmulti-skilling, respondents to the survey might view this ability throughthe perspective of the prevailing employee relations norms in the estab-lishment, and see the problem as workers being unwilling to do jobsoutside their normal job description or expectations. Unfortunately, thelist of qualities does not correspond precisely to the types of skills thatare often claimed to be at a premium, such as ability to work withcomputers, or the ability to solve problems.
Economic theory suggests at least two possible interpretations of aquality deficiency. One is that employers knowingly employ workers withless than ideal qualities simply because they can hire them more easily ormore cheaply than other workers who might be more productive for thefirm, and that because of their lower wages this is a profit-maximizingstrategy. In this case, the reported deficiencies might be expected toreflect long-standing characteristics of the workforce as perceived byemployers. One particular strand of thinking places emphasis on thebehavioural and motivational characteristics of workers, suggesting that itis deficiencies in these areas that most closely reflect the Britishemployers’ notion of skills shortage (Oliver and Turton, 1982). Another
© Blackwell Publishers 1998
171THE MEANING AND DETERMINANTS OF SKILLS SHORTAGES

TABLE 2Skills Shortages and Qualities Lacking in Employees
Operatives Personal and Craft and Clerical Professional ManagementRoutine and protective skilled and associate and Profes- andunskilled assembly services service Sales secretarial technical sional administrative
Number of establishments* 510 308 216 341 206 440 138 266 204Number lacking qualities** 116 79 74 73 62 64 20 29 33Percentage lacking qualities*** 22.8 25.5 34.1 21.6 30.1 14.5 14.5 10.8 16.1
Percentwitha skillshortage3 Percent of establishments reporting quality lacking
Ability to read and write/ 51.0 10.1 11.7 6.2 7.0 11.6 9.0 2.2 0.0 6.2numeracy
Good references from 64.6 3.3 0.0 9.2 0.2 1.0 1.7 0.0 0.0 0.0employer/school
Experience of similar work/ 55.6 7.9 9.8 4.6 8.9 5.3 1.9 18.7 18.8 0.1work environment
Record of stable employment 58.5 17.5 8.0 13.8 3.1 6.9 1.2 0.0 0.3 0.0Manual dexterity/good 50.6 1.8 10.7 0.0 5.1 0.0 0.0 0.0 0.0 0.0
hand–eye coordinationPhysical fitness/strength 42.1 6.0 9.0 4.6 1.1 0.0 0.0 3.9 14.0 10.3Toleration of repetitive work 63.8 12.9 4.5 5.0 5.5 7.3 6.7 0.1 0.0 0.0Versatility/ability to 41.8 6.9 9.6 10.7 22.9 11.1 15.8 2.3 14.7 20.8
cover for absencesInterpersonal skills/ 40.1 16.5 14.3 44.9 33.4 26.8 44.0 20.1 52.4 48.8
communication skillsCommercial and business 47.8 6.7 20.8 16.5 17.6 33.7 7.0 55.1 14.8 41.1
awarenessCreativity/originality 41.5 10.6 4.6 7.6 12.8 1.7 19.6 39.0 23.5 25.3Honesty/integrity 51.9 3.7 15.6 6.3 1.5 1.3 0.0 0.0 0.0 10.3
© B
lackwell Publishers 1998
172B
UL
LE
TIN

TABLE 2 — contd
Operatives Personal and Craft and Clerical Professional ManagementRoutine and protective skilled and associate and Profes- andunskilled assembly services service Sales secretarial technical sional administrative
Number of establishments* 510 308 216 341 206 440 138 266 204Number lacking qualities** 116 79 74 73 62 64 20 29 33Percentage lacking qualities*** 22.8 25.5 34.1 21.6 30.1 14.5 14.5 10.8 16.1
Percentwitha skillshortage3 Percent of establishments reporting quality lacking
Reliability/motivation to work/ 43.7 36.2 42.3 25.2 25.3 23.6 18.7 3.2 4.1 13.5can rely on to attend
Ability to work with little 49.7 49.5 18.3 36.9 19.7 30.3 22.5 17.7 9.6 7.6supervision
Ability to get on with others 56.2 18.3 5.7 22.3 25.5 9.7 18.7 19.1 24.7 33.5in a team/fitting in
Good self representation/ 64.3 14.5 5.2 25.4 28.5 22.4 19.4 0.5 33.2 11.6having something about them
Living locally 51.5 1.3 0.0 1.9 7.0 0.0 0.0 8.4 3.8 0.0Willingness to work 44.1 8.7 13.4 2.9 0.9 29.1 2.5 0.4 0.0 4.3
unsocial hoursOther 54.4 4.8 10.9 3.3 13.6 14.1 7.1 0.4 2.6 5.9
Notes:(1) Respondents could indicate up to 9 qualities in respect of each occupation. In each establishment two occupations were randomly chosen (one from each of
two groups) for questions on this issue, but if there were less than 5 employees in any occupation the questions were not asked.(2) * This is the number of establishments that were asked about the employees in each group.
** This is the number of establishments that were asked about the employees in each group and which indicated that those employees lacked any qualitites.***This is the percentage of establishments indicating that those employees lacked a quality, i.e. 100 multiplied by ** divided by *.
(3) For each group of establishments reporting a quality deficiency, the percentage of establishments reporting a skill shortage.(4) The data is weighted using the weights given in the survey to allow for deliberate oversampling of larger establishments and to make them nationally
representative (see Millward et al., 1992).
© B
lackwell Publishers 1998
173T
HE
ME
AN
ING
AN
D D
ET
ER
MIN
AN
TS O
F SK
ILL
S SHO
RT
AG
ES
interpretation of a quality deficiency comes from the hypothesis thatemployers have a changing demand for skills, and existing workforceschange only slowly through the gradual processes of labour turnover andthrough continuing training programmes; this lag implies a state ofdisequilibrium. The latter interpretation is most in line with widespreadcommentary that we are in an age of rapidly changing skill demands.Adopting that, we might expect to find perceived deficiencies lie mostly inthe area where skill demands are thought to be expanding.7 In particular,reference is commonly made to the increased need for problem-solvingskills, for communication skills, for team-working or cooperative skills,and for the ability to take on a wider range of tasks (i.e. multi-skilling).
The following points emerge from Table 2:
(i) The first column extends part of the analysis of Table 1 by examin-ing whether any particular named quality deficiency closely matchesemployers’ reporting of skill shortage. Taking as its base, the number ofestablishments reporting each deficiency, it gives the percentage of thoseestablishments that also reported a skill shortage. The percentage of allestablishments reporting a skills shortage was 35.2. In the case of everyquality, the percentage of those reporting a deficiency who also reporteda skill shortage was above 35.2. The qualities that matched more closelythan the rest were: good references, toleration of repetitive work, goodself representation and record of stable employment. But, in the case ofevery quality or skill, there remain many establishments where the defi-ciency is not coupled with the reportage of skill shortage. For example, itis somewhat remarkable that, among 45 establishments reporting literaryor numeracy problems in any occupational group, 23 did not report askills shortage.
(ii) As can be seen from the third row of the table, the reportage oflacking qualities is higher in respect of manual workers than of non-manual workers, with the exception of sales workers. The group with thehighest percent of establishments experiencing quality differences isPersonal and Protective Services. Reportage of lacking qualities is lowerthan average amongst craft and skilled service workers. Despite therelative expansion of non-manual and decline of manual occupations,therefore, there is no evidence here that such changes in demand arereflected in lagging deficient skills of non-manuals.
(iii) For all groups, lack of interpersonal/communication skills are awidespread problem amongst establishments; amongst non-manualemployees this is one of the most widely quoted deficiencies; in particu-
7 On the other hand, firms facing skill shortages often find ways of adapting, includingmanaging to reduce the demands they make of the skills of their existing workforce, throughappropriate choice of technologies and working methods. To that extent, employers’ demandsfor higher skills are suppressed and deficiencies in the existing workforce may not berecorded (Green and Ashton, 1992).
© Blackwell Publishers 1998
174 BULLETIN

lar, amongst professional and management or administrative workers onein two establishments which registered complaints reported this problem.
(iv) Versatility/ability to cover for absences was not seen, in mostcases, as a major deficiency. An exception is Craft and skilled serviceworkers, the group that corresponds most closely to the ‘intermediate-skilled’ worker that is said to be in national shortage (Ryan, 1991;Steedman, Mason and Wagner, 1991); 73 out of 341 establishmentsreported some quality deficiencies for this group, and out of this 73, 17(or 22.9 percent) named versatility/ability to cover for absences asdeficient.
(v) For lower-skilled manual workers, substantial numbers of establish-ments reported perceived deficiencies in relation to the ideal in terms ofbehaviour, motivation and reliability: the category ‘reliability/motivationto work/can rely on them to attend’ scored highest for operative andassembly workers. ‘Ability to work with little supervision’ was also seen asa problem by many establishments, particularly for routine unskilledemployees, with half of establishments identifying a deficiency amongthese employees reporting this problem. This category corresponds mostclosely with the notion of ‘autonomy’: where workers have a degree ofautonomy in the control of their work tasks, this is an indication of botha certain skill and a certain responsibility. Also of some importance forthese groups were ‘toleration of repetitive work’ and ‘record of stableemployment’.
In sum, there is mixed support in this data for the hypothesis that skillsdeficiencies are more likely to occur in the case of those skills for whichthere is said to be an expanding demand. The strongest instance of this isthe prominence of the perceived deficiencies in communication and inter-personal skills for all groups. Against that, however, is the finding thatnon-manual workers whose skills are typically to be in increasing demand,have comparatively less perceived skill deficiencies. There is also strongconfirmation that amongst the lower-status occupational groups it is thebehavioural and social skills that are seen as the main problem, consistentwith the hypothesis of Oliver and Turton (1982). The problem here canhardly be interpreted as one of skill formation lagging behind techno-logically-induced bias in the demand for skills. The behavioural and socialskills issue in part reflects the ongoing state of employee relations, andthe notion of ‘quality’ as interpreted by the respondents to the question-naire has here to be understood only loosely. If employees lack the‘quality’ of, for example, tolerating repetitive work, or are seen as notwell-motivated to work hard, this might be a problem as much of thework environment as of the worker. Finally, this detailed look at theresponses on quality deficiencies re-confirms that there is at best a weakconnection between the notion, in the eyes of employers, that there is a
© Blackwell Publishers 1998
175THE MEANING AND DETERMINANTS OF SKILLS SHORTAGES
‘skills shortage’ and the notion that employees lack certain qualities, evenin the case of those qualities which are most easily identified as skills.
Employers’ Perceptions
If the match between ‘skill shortage’ and ‘hard-to-fill vacancy’ is incom-plete, what interpretations can be put upon those cases where the estab-lishment’s responses to the two questions do not match? We investigatedthe meaning of these terms further by analysing responses to follow-upquestions in which respondents were asked to report their own percep-tions of indicators of each concept.
Three possibilities suggest themselves in cases where a skill shortagebut no hard-to-fill vacancy is reported. First, it could simply be a matterof inconsistency. Second, skill shortage might have a longer term meaningfor respondents, who could report a skill shortage even though they havenot attempted to recruit in the last year. Third, skill shortage could referto problems other than recruitment, such as problems with the existingworkforce.
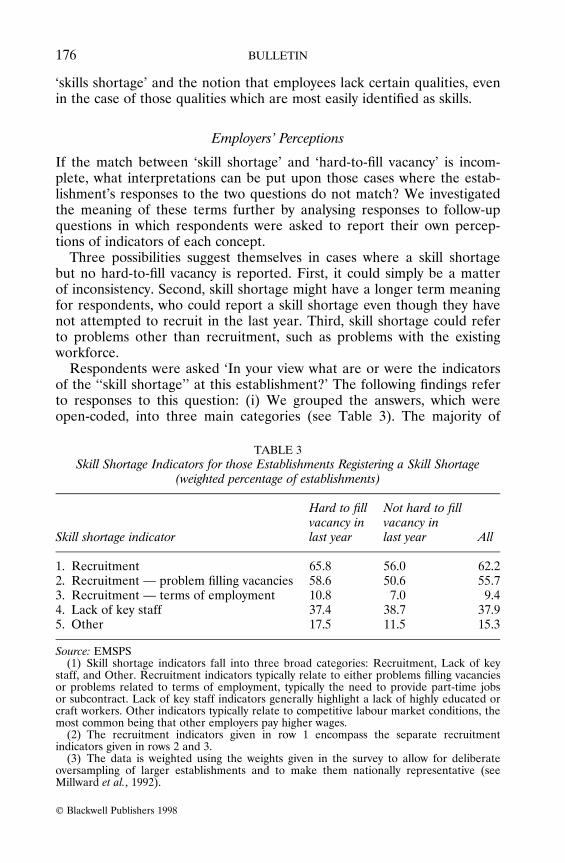
Respondents were asked ‘In your view what are or were the indicatorsof the ‘‘skill shortage’’ at this establishment?’ The following findings referto responses to this question: (i) We grouped the answers, which wereopen-coded, into three main categories (see Table 3). The majority of
TABLE 3Skill Shortage Indicators for those Establishments Registering a Skill Shortage
(weighted percentage of establishments)
Hard to fill Not hard to fill
Skill shortage indicatorvacancy inlast year
vacancy inlast year All
1. Recruitment2. Recruitment — problem filling vacancies3. Recruitment — terms of employment4. Lack of key staff5. Other
65.858.610.837.417.5
56.050.6
7.038.711.5
62.255.7
9.437.915.3
Source: EMSPS(1) Skill shortage indicators fall into three broad categories: Recruitment, Lack of key
staff, and Other. Recruitment indicators typically relate to either problems filling vacanciesor problems related to terms of employment, typically the need to provide part-time jobsor subcontract. Lack of key staff indicators generally highlight a lack of highly educated orcraft workers. Other indicators typically relate to competitive labour market conditions, themost common being that other employers pay higher wages.
(2) The recruitment indicators given in row 1 encompass the separate recruitmentindicators given in rows 2 and 3.
(3) The data is weighted using the weights given in the survey to allow for deliberateoversampling of larger establishments and to make them nationally representative (seeMillward et al., 1992).
© Blackwell Publishers 1998
176 BULLETIN
answers directly concerned recruitment problems: 62 percent of establish-ments gave one or more of these as an indicator of skill shortage. Withinthis group, some indicators were simply reported as difficulties of recruit-ment, while others (about 9 percent of establishments) said they had hadto change the terms of employment in order to recruit (e.g. part-timeinstead of full-time). The second category of responses concerned reportsof ‘lack of key staff’, which mainly meant a lack of craft workers or ofgraduates. While the reason for this lack is not spelled out, presumablythis also related to lack of recruitment of such staff. The third (small)category of responses, labelled ‘Other’, included responses concerningcauses or consequences of skill shortage.
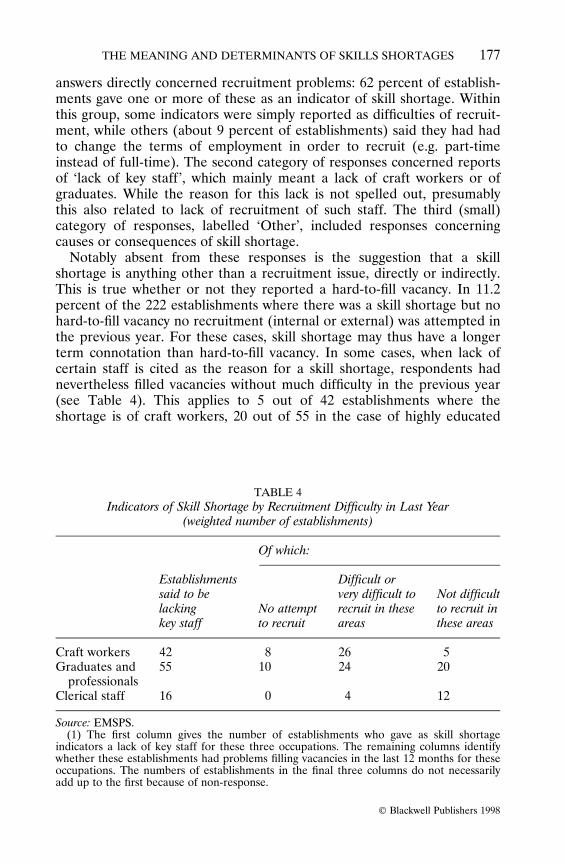
Notably absent from these responses is the suggestion that a skillshortage is anything other than a recruitment issue, directly or indirectly.This is true whether or not they reported a hard-to-fill vacancy. In 11.2percent of the 222 establishments where there was a skill shortage but nohard-to-fill vacancy no recruitment (internal or external) was attempted inthe previous year. For these cases, skill shortage may thus have a longerterm connotation than hard-to-fill vacancy. In some cases, when lack ofcertain staff is cited as the reason for a skill shortage, respondents hadnevertheless filled vacancies without much difficulty in the previous year(see Table 4). This applies to 5 out of 42 establishments where theshortage is of craft workers, 20 out of 55 in the case of highly educated
TABLE 4Indicators of Skill Shortage by Recruitment Difficulty in Last Year
(weighted number of establishments)
Of which:
Establishments Difficult orsaid to be very difficult to Not difficultlacking No attempt recruit in these to recruit inkey staff to recruit areas these areas
Craft workers 42 8 26 5Graduates and 55 10 24 20
professionalsClerical staff 16 0 4 12
Source: EMSPS.(1) The first column gives the number of establishments who gave as skill shortage
indicators a lack of key staff for these three occupations. The remaining columns identifywhether these establishments had problems filling vacancies in the last 12 months for theseoccupations. The numbers of establishments in the final three columns do not necessarilyadd up to the first because of non-response.
© Blackwell Publishers 1998
177THE MEANING AND DETERMINANTS OF SKILLS SHORTAGES
workers and 12 out of 16 in the case of clerical staff. These instancessuggest that the responses may be inconsistent.8
Consider now those establishments which reported a hard-to-fillvacancy but no skill shortage. A possible reason for this group is thatthere may be certain reasons for a hard-to-fill vacancy, those reasonsmost closely identified with skills, which are regarded as a skills shortage,while other types are not so perceived. Alternatively the responses may,again simply be inconsistent.
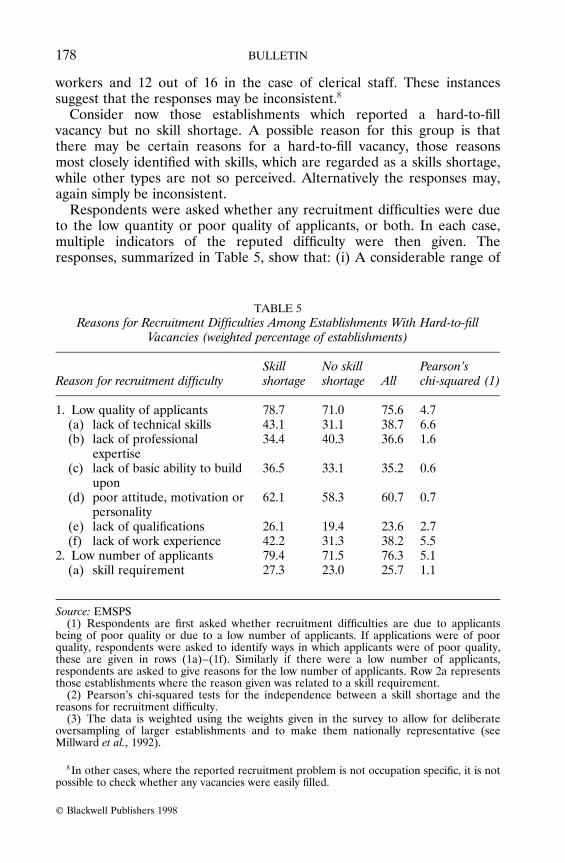
Respondents were asked whether any recruitment difficulties were dueto the low quantity or poor quality of applicants, or both. In each case,multiple indicators of the reputed difficulty were then given. Theresponses, summarized in Table 5, show that: (i) A considerable range of
8 In other cases, where the reported recruitment problem is not occupation specific, it is notpossible to check whether any vacancies were easily filled.
TABLE 5Reasons for Recruitment Difficulties Among Establishments With Hard-to-fill
Vacancies (weighted percentage of establishments)
Skill No skill Pearson’sReason for recruitment difficulty shortage shortage All chi-squared (1)
1. Low quality of applicants(a) lack of technical skills(b) lack of professional
expertise(c) lack of basic ability to build
upon(d) poor attitude, motivation or
personality(e) lack of qualifications(f) lack of work experience
2. Low number of applicants(a) skill requirement
78.743.134.4
36.5
62.1
26.142.279.427.3
71.031.140.3
33.1
58.3
19.431.371.523.0
75.638.736.6
35.2
60.7
23.638.276.325.7
4.76.61.6
0.6
0.7
2.75.55.11.1
Source: EMSPS(1) Respondents are first asked whether recruitment difficulties are due to applicants
being of poor quality or due to a low number of applicants. If applications were of poorquality, respondents were asked to identify ways in which applicants were of poor quality,these are given in rows (1a)–(1f). Similarly if there were a low number of applicants,respondents are asked to give reasons for the low number of applicants. Row 2a representsthose establishments where the reason given was related to a skill requirement.
(2) Pearson’s chi-squared tests for the independence between a skill shortage and thereasons for recruitment difficulty.
(3) The data is weighted using the weights given in the survey to allow for deliberateoversampling of larger establishments and to make them nationally representative (seeMillward et al., 1992).
© Blackwell Publishers 1998
178 BULLETIN
indicators are given for the poor quality of applicants. Of note is thatnearly one in two establishments cited poor attitudes, motivation orpersonality: this finding is consistent with our earlier finding of defi-ciencies reported in social skills of the existing workforce. Also of note isthat insufficient work experience is cited in half of the establishments, andseems of wider importance than qualifications, cited in only a third ofestablishments. (ii) Where the problem is a low number of applicants, thereason is thought to be a skill requirement of the job in only a quarter ofestablishments. In other cases the most widely cited reasons werecompetition from other high paying employers, the image of the employeror industry, low unemployment or the location of the establishment. (iii)There is however, relatively little difference between the reasons given bythose establishments reporting a skill shortage and those not. Establish-ments reporting a lack of technical skills, or a lack of work experience,were more abundant amongst those reporting skill shortages (chi-squaredtests indicated these differences are significant at the 5 percent level).Generally, however, establishments reported the full range of reasonswhether or not they had a skill shortage.
We conclude that the hypothesis, above that skill shortages arereported only or primarily in cases where hard-to-fill vacancies are experi-enced for particular skill-related reasons, is rejected. Therefore, either therecruitment difficulty associated with hard-to-fill vacancies is not seen assufficiently important to count as a skill shortage or, on a more pessi-mistic note, respondents are being inconsistent.
IV. THE DETERMINANTS OF SKILLS SHORTAGES AND HARD-TO-FILLVACANCIES
The survey data described in Section III seems to depict a lack of acomplete match between reported skills shortage and either hard-to-fillvacancy or quality deficiencies in the workforce. It might nevertheless beargued that whatever their differences their correlates are similar andthat therefore the differences may be of little importance either foranalysis of the effects of skill shortages or in terms of the implications forpolicy. For this reason, and also because understanding more about thecorrelates of skill shortages is useful in its own right, we next investigateand compare the determinants of skill shortage and of hard-to-fillvacancies.9
We consider the determinants of managers reporting having skill short-ages and/or hard-to-fill vacancies using a simple binomial probit model.
9 Since the questions on quality deficiencies were asked only for some occupational groups(different groups for different establishments), it would be invalid to compare the statisticaldeterminants of quality deficiency with the statistical determinants of skill shortage, the latterbeing a question applied to the whole workforce.
© Blackwell Publishers 1998
179THE MEANING AND DETERMINANTS OF SKILLS SHORTAGES

This framework models two binary choice outcomes, allowing their errorterms to be correlated (with conditional error correlation coefficient r).Allowing for a non-zero error correlation seems a natural thing to do inthis case as there is clearly an overlap between reporting skills shortagesand hard-to-fill vacancies. This will improve efficiency of the estimates butalso allow us to examine the correlation after conditioning on the inde-pendent variables of interest.
We consider a range of determinants of the skill shortage and hard-to-fill vacancies variables and those included in our econometric model aresimilar to those utilized in other studies focusing on hard-to-fill vacancies(e.g. Haskel and Martin, 1993b; Bosworth, 1993). Variable definitions anddescriptive statistics on these variables are given in Table A1 and in theAppendix. These results are presented in Table 6. We report probitcoefficient estimates (and standard errors), together with appropriatemarginal effects, which make the coefficient estimates comparable acrossthe groups of interest by giving the proportionate impact of a givenvariable on the probability of an outcome (these are in square bracketsbeneath the coefficient estimates).
There are a number of interesting results that emerge. First of all, r isestimated to be 0.562 (and strongly significant) suggesting a need toestimate the bivariate probit allowing for the errors to be correlated ascompared to separate single equation models. It also suggests that, afterconditioning on the independent variables, skill shortages and hard-to-fillvacancies are likely to coexist in a given workplace. There is, however, aless than perfect match as the estimate of r is significantly less than one.
In terms of the independent variables, it is reassuring that the skilledshare of employment variable is a significant determinant of bothoutcomes. It is, however, noticeable that the positive impact of thisvariable is much stronger in the skills shortage equation than in the hard-to-fill vacancy equation (the marginal effect being almost twice as large at0.048 as compared to 0.026).
There are also some other differences. The union recognition variableattracts a significant negative coefficient in the hard-to-fill vacanciesequation, whilst it is an insignificant determinant of skill shortages. Asecond notable difference is the impact of the expanding market variablewhich has a (positive) significant association with skills shortages, and norelationship with hard-to-fill vacancies. A third difference is the impact oflocal labour market unemployment, which is negative and significant inthe hard-to-fill vacancies probit. Fourthly, a larger share of part-timeworkers has a strong negative association with the presence of hard-to-fillvacancies, but an insignificant relation with skills shortages.
These differences make it clear that skill shortages and hard-to-fillvacancies can mean different things in different establishments. However,despite these different patterns, some variables impact on the incidenceof skill shortages and hard-to-fill vacancies in a similar way. The clearest
© Blackwell Publishers 1998
180 BULLETIN
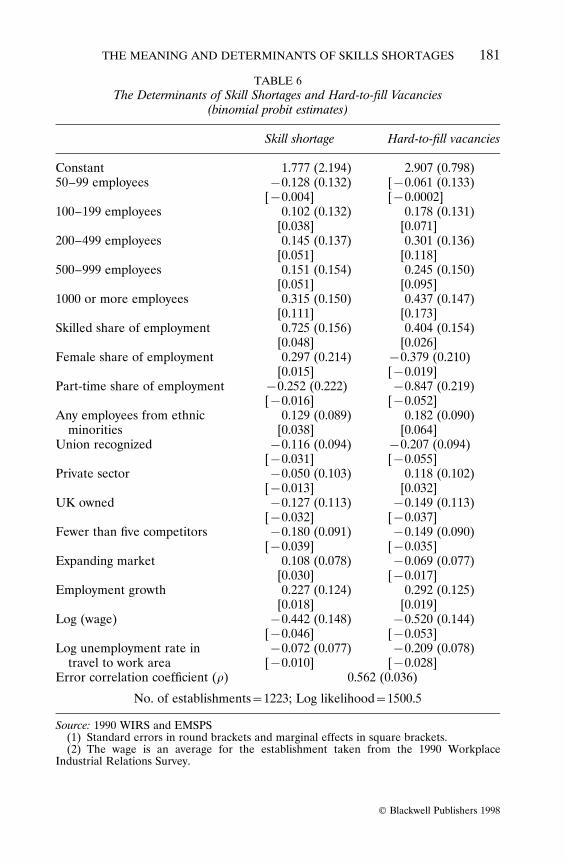
TABLE 6The Determinants of Skill Shortages and Hard-to-fill Vacancies
(binomial probit estimates)
Skill shortage Hard-to-fill vacancies
Constant 1.777 (2.194) 2.907 (0.798)50–99 employees µ0.128 (0.132) [µ0.061 (0.133)
[µ0.004] [µ0.0002]100–199 employees 0.102 (0.132) 0.178 (0.131)
[0.038] [0.071]200–499 employees 0.145 (0.137) 0.301 (0.136)
[0.051] [0.118]500–999 employees 0.151 (0.154) 0.245 (0.150)
[0.051] [0.095]1000 or more employees 0.315 (0.150) 0.437 (0.147)
[0.111] [0.173]Skilled share of employment 0.725 (0.156) 0.404 (0.154)
[0.048] [0.026]Female share of employment 0.297 (0.214) µ0.379 (0.210)
[0.015] [µ0.019]Part-time share of employment µ0.252 (0.222) µ0.847 (0.219)
[µ0.016] [µ0.052]Any employees from ethnic 0.129 (0.089) 0.182 (0.090)
minorities [0.038] [0.064]Union recognized µ0.116 (0.094) µ0.207 (0.094)
[µ0.031] [µ0.055]Private sector µ0.050 (0.103) 0.118 (0.102)
[µ0.013] [0.032]UK owned µ0.127 (0.113) µ0.149 (0.113)
[µ0.032] [µ0.037]Fewer than five competitors µ0.180 (0.091) µ0.149 (0.090)
[µ0.039] [µ0.035]Expanding market 0.108 (0.078) µ0.069 (0.077)
[0.030] [µ0.017]Employment growth 0.227 (0.124) 0.292 (0.125)
[0.018] [0.019]Log (wage) µ0.442 (0.148) µ0.520 (0.144)
[µ0.046] [µ0.053]Log unemployment rate in µ0.072 (0.077) µ0.209 (0.078)
travel to work area [µ0.010] [µ0.028]Error correlation coefficient (r) 0.562 (0.036)
No. of establishments\1223; Log likelihood\1500.5
Source: 1990 WIRS and EMSPS(1) Standard errors in round brackets and marginal effects in square brackets.(2) The wage is an average for the establishment taken from the 1990 Workplace
Industrial Relations Survey.
© Blackwell Publishers 1998
181THE MEANING AND DETERMINANTS OF SKILLS SHORTAGES

example is the establishment wage variable.10 In higher wage establish-ments there is a reduced probability of having skill shortages or hard-to-fill vacancies. This is presumably because establishments that pay higherwages will attract both more job applicants and better quality applicants.Hence, they will be less likely to have problems filling vacancies and beless likely to face skill shortages. Similarly, size of establishment has apositive impact on both outcomes (though the marginal effects are quan-titatively different across the two equations). Other variables includedmainly had insignificant impacts on both equations.
V. CONCLUSIONS
This paper has explored the notion of a ‘skills shortage’ as interpreted bythe respondents to a large scale survey of establishments, the EmployerManpower Skills Practices Survey. It has had the objective of trying to pindown the nature of the problem to which employers are referring, usinga simple method of comparing responses to different questions inseparate parts of the questionnaire. Whilst most existing research andpolicy discussions tend to equate the notion of a skills shortage with thatof a hard-to-fill vacancy of one kind or another, we have found thatcannot be all there is to it. Although there is a considerable overlapbetween those establishments with a skill shortage and those with a hard-to-fill vacancy, there are also a substantial number of establishmentswhich fit into one or other category but not both.
Moreover, while there are some common factors determining theexperience of skill shortages and/or the experience of a hard-to-fillvacancy (e.g. average wages), there are also notable differences betweenthe processes determining the outcomes: lack of union recognition, estab-lishment size, having a higher share of skilled workers in employment andwhether the market for the establishment’s product(s) is expanding allhave differential impacts on the probability that an establishment hasskills shortages or hard-to-fill vacancies.
There is also, evidently, some overlap between the establishmentsreporting a skills shortage and those reporting some deficiencies in the‘qualities’ of their existing employees. Though the degree of this overlapis not so strong as that between skill shortages and hard-to-fill vacancies,those with quality deficiencies were more likely than average to report askill shortage. Yet many establishments that reported deficiencies in thequalities of the workforce did not, apparently, count these deficiencies as
10 This is an average wage computed from WIRS. Inclusion of the skilled wage in place ofthe average wage (on a sub-sample of 686 establishments containing skilled wage data)produced similar results: in the skills shortage equation the estimated coefficient (standarderror) on the log (skilled wage) was µ0.441 (0.243) as compared to µ0.604 (0.231) in thehard-to-fill vacancy equation.
© Blackwell Publishers 1998
182 BULLETIN
skill shortages, even when the quality deficiency is in something as basicas literacy or numeracy. Moreover, employers’ own perceived indicatorsof skill shortages tend to refer directly or indirectly to concern withrecruitment problems rather than short-comings of their existing work-force. More notable is that, both for the existing workforce, and amongjob applicants, employers referred to motivational and attitudinalproblems in a large number of cases: evidently, social skills are an import-ant part of the skill said to be in shortage.
These findings suggest that while employers appear not to have anyproblem for themselves in interpreting questions on ‘skills shortages’ (ifonly because they showed no reluctance to answer the question) wecannot rely on them being perceived in a uniform and consistent way byall employers. While, for many employers, skills shortages may be directlyinterpreted as hard-to-fill vacancies, there are also some employers whosee the problem in wider terms, perhaps taking a longer term view thanjust their recent recruitment actvity. In addition, a number of employersappear to give inconsistent responses.
Our findings point to two main conclusions for future research. First,studies that investigate the causes and effects of ‘skill shortages’ need topay serious attention to their measurement. If one is not certain of whatis being measured, one can hardly be absolutely confident in the findings.Another practical conclusion is that in future research on establishmentsand their skill formation practices, further steps could be taken to gainclarification either directly or indirectly from respondents as to theexperiences they choose to classify as a skills shortage.
Leeds University Business SchoolUniversity College London and CEP, London School of Economics
Date of Receipt of Final Manuscript: November 1997
REFERENCES
Booth, A. (1991). ‘Job-Related Formal Training: Who Receives It and What Is ItWorth?’, BULLETIN, Vol. 53, pp. 281–94.
Bosworth, D. (1993). ‘Skill Shortages In Britain’, Scottish Journal of PoliticalEconomy, Vol. 40, pp. 241–71.
Bosworth, D., Dutton, P. and Lewis, J. (1992). ‘Introduction’ in Bosworth, D.,Dutton, P. and Lewis, J. (eds.), Skill Shortages: Causes and Consequences,Avebury, Aldershot.
Campbell, M. and Baldwin, S. (1993). ‘Recruitment Difficulties and SkillShortages: An Analysis of Labour-Market Information in Yorkshire andHumberside’, Regional Studies, Vol. 27, pp. 271–80.
Deloitte Haskins and Sells (1989). Training in Britain. A Study of Funding, Activityand Attitudes. Employers’ Activities. London, Her Majestry’s Stationery Office.
© Blackwell Publishers 1998
183THE MEANING AND DETERMINANTS OF SKILLS SHORTAGES

Dench, S. (1993a). ‘What Types of Employer Train?’, Employment Department.Social Science Research Branch Working Paper No. 3.
Dench, S. (1993b). ‘Employers’ Training: Its Infrastructure and Organisation’,Employment Department. Social Science Research Branch Working PaperNo. 4.
Dench, S. (1993c). ‘Employers’ Provision of Continuous Training’, EmploymentDepartment. Social Science Research Branch Working Paper No. 6.
Green, A. and Owen, D. (1992). ‘Skill Shortages: The Local Dimension’, inBosworth, D., Dutton, P. and Lewis, J. (eds.), op. cit.
Green, F. (1993a). ‘The Determinants of Training of Male and FemaleEmployees in Britain’, BULLETIN, Vol. 55, pp. 103–22.
Green, F. (1993b). ‘The Impact of Trade Union Membership on Training inBritain’, Applied Economics, Vol. 25, pp. 1033–43.
Green, F. and Ashton, D. (1992). ‘Skill Shortage and Skill Deficiency: ACritique’, Work, Employment and Society, Vol. 6, pp. 287–301.
Green, F., Machin, S. and Wilkinson, D. (1995). ‘Unions and Training: AnAnalysis of Training Practices in Unionised and Non-Unionised Workplaces’,University of Leeds, School of Business and Economic Studies, DiscussionPaper No. E95/08.
Haskel, J. and Martin, C. (1993a). ‘Do Skill Shortages Reduce Productivity? —Theory and Evidence From the United Kingdom’, Economic Journal, Vol. 103,pp. 386–94.
Haskel, J. and Martin, C. (1993b). ‘The Causes Of Skill Shortages In Britain’,Oxford Economic Papers, Vol. 45, pp. 573–88.
Jones, R. and Goss, D. (1991). ‘The Role of Training Strategy in Reducing SkillsShortages: Some Evidence From a Survey of Small Firms’, Personnel Review,Vol. 20, pp. 24–30.
Kennedy, S., Drago, R., Sloan, J. and Wooden, M. (1994). ‘The Effect of TradeUnions on the Provision of Training: Australian Evidence’, British Journal ofIndustrial Relations, Vol. 32, pp. 565–80.
Millward, N., Stevens, M., Smart, D. and Hawes, W. (1992). Workplace IndustrialRelations in Transition: the ED/ESRC/PSI/ACAS Surveys, Dartmouth,Aldershot.
Oliver, J. and Turton, J. (1982). ‘Is There a Shortage of Skilled Labour?’, BritishJournal of Industrial Relations, Vol. 20, pp. 195–200.
Robinson, P. (1996). ‘Skill Shortages and Full Employment: How Serious aConstraint?’, in Michie, J. and Grieve-Smith, J. (eds.), Creating IndustrialCapacity: Towards Full Employment, Oxford University Prss.
Ryan, P. (1991). International Comparisons of Vocational Education and Trainingfor Intermediate Skills, Falmer Press, London.
Senker, P. (1992). ‘Skill Shortages and Britain’s International Competitiveness’, inBosworth, D., Dutton, P. and Lewis, J. (eds.), op cit.
Steedman, H., Mason, G. and Wagner, K. (1991). ‘Intermediate Skills in theWorkplace: Deployment, Standards and Supply in Britain, France andGermany, National Institute Economic Review, No. 136, pp. 60–76.
Stevens, M. (1994). ‘An Investment Model for the Supply of Training byEmployers’, Economic Journal, Vol. 104, pp. 556–70.
© Blackwell Publishers 1998
184 BULLETIN
Training Agency (1990). ‘Labour Market and Skill Trends 1991/1992’,Employment Department.
APPENDIX
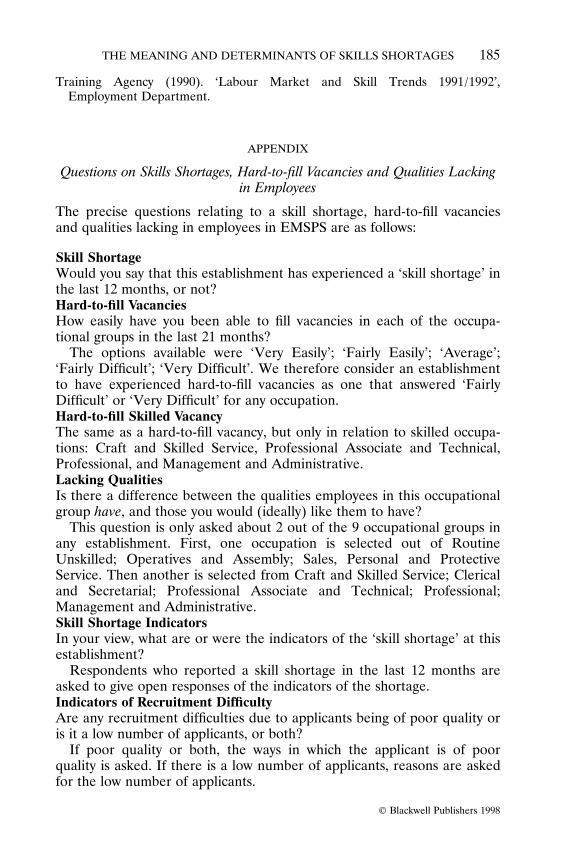
Questions on Skills Shortages, Hard-to-fill Vacancies and Qualities Lackingin Employees
The precise questions relating to a skill shortage, hard-to-fill vacanciesand qualities lacking in employees in EMSPS are as follows:
Skill ShortageWould you say that this establishment has experienced a ‘skill shortage’ inthe last 12 months, or not?Hard-to-fill VacanciesHow easily have you been able to fill vacancies in each of the occupa-tional groups in the last 21 months?
The options available were ‘Very Easily’; ‘Fairly Easily’; ‘Average’;‘Fairly Difficult’; ‘Very Difficult’. We therefore consider an establishmentto have experienced hard-to-fill vacancies as one that answered ‘FairlyDifficult’ or ‘Very Difficult’ for any occupation.Hard-to-fill Skilled VacancyThe same as a hard-to-fill vacancy, but only in relation to skilled occupa-tions: Craft and Skilled Service, Professional Associate and Technical,Professional, and Management and Administrative.Lacking QualitiesIs there a difference between the qualities employees in this occupationalgroup have, and those you would (ideally) like them to have?
This question is only asked about 2 out of the 9 occupational groups inany establishment. First, one occupation is selected out of RoutineUnskilled; Operatives and Assembly; Sales, Personal and ProtectiveService. Then another is selected from Craft and Skilled Service; Clericaland Secretarial; Professional Associate and Technical; Professional;Management and Administrative.Skill Shortage IndicatorsIn your view, what are or were the indicators of the ‘skill shortage’ at thisestablishment?
Respondents who reported a skill shortage in the last 12 months areasked to give open responses of the indicators of the shortage.Indicators of Recruitment DifficultyAre any recruitment difficulties due to applicants being of poor quality oris it a low number of applicants, or both?
If poor quality or both, the ways in which the applicant is of poorquality is asked. If there is a low number of applicants, reasons are askedfor the low number of applicants.
© Blackwell Publishers 1998
185THE MEANING AND DETERMINANTS OF SKILLS SHORTAGES
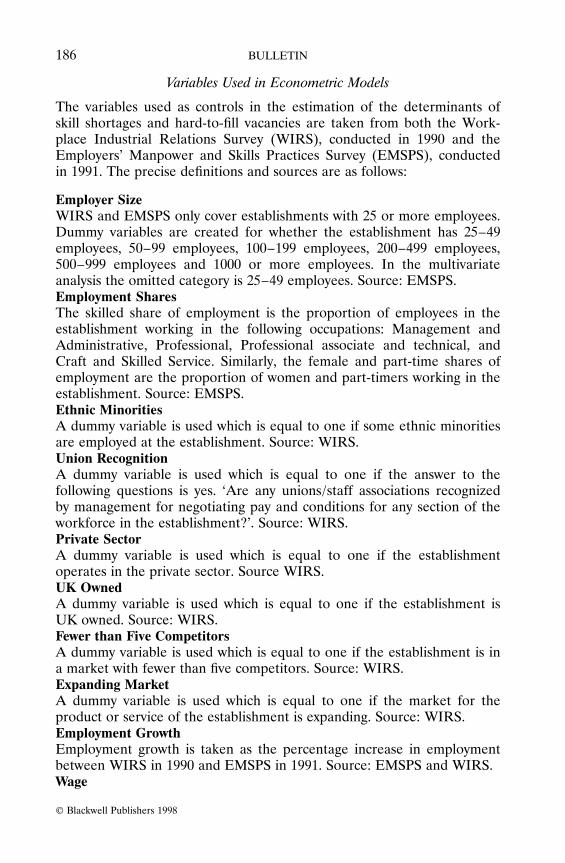
Variables Used in Econometric Models
The variables used as controls in the estimation of the determinants ofskill shortages and hard-to-fill vacancies are taken from both the Work-place Industrial Relations Survey (WIRS), conducted in 1990 and theEmployers’ Manpower and Skills Practices Survey (EMSPS), conductedin 1991. The precise definitions and sources are as follows:
Employer SizeWIRS and EMSPS only cover establishments with 25 or more employees.Dummy variables are created for whether the establishment has 25–49employees, 50–99 employees, 100–199 employees, 200–499 employees,500–999 employees and 1000 or more employees. In the multivariateanalysis the omitted category is 25–49 employees. Source: EMSPS.Employment SharesThe skilled share of employment is the proportion of employees in theestablishment working in the following occupations: Management andAdministrative, Professional, Professional associate and technical, andCraft and Skilled Service. Similarly, the female and part-time shares ofemployment are the proportion of women and part-timers working in theestablishment. Source: EMSPS.Ethnic MinoritiesA dummy variable is used which is equal to one if some ethnic minoritiesare employed at the establishment. Source: WIRS.Union RecognitionA dummy variable is used which is equal to one if the answer to thefollowing questions is yes. ‘Are any unions/staff associations recognizedby management for negotiating pay and conditions for any section of theworkforce in the establishment?’. Source: WIRS.Private SectorA dummy variable is used which is equal to one if the establishmentoperates in the private sector. Source WIRS.UK OwnedA dummy variable is used which is equal to one if the establishment isUK owned. Source: WIRS.Fewer than Five CompetitorsA dummy variable is used which is equal to one if the establishment is ina market with fewer than five competitors. Source: WIRS.Expanding MarketA dummy variable is used which is equal to one if the market for theproduct or service of the establishment is expanding. Source: WIRS.Employment GrowthEmployment growth is taken as the percentage increase in employmentbetween WIRS in 1990 and EMSPS in 1991. Source: EMSPS and WIRS.Wage
© Blackwell Publishers 1998
186 BULLETIN
The wage used is an employment weighted sum of the wage in each offive occupation categories. Source: WIRS.Unemployment in Travel-to-Work-AreaThe unemployment rate by travel to work areas is merged in to theoriginal WIRS dataset.
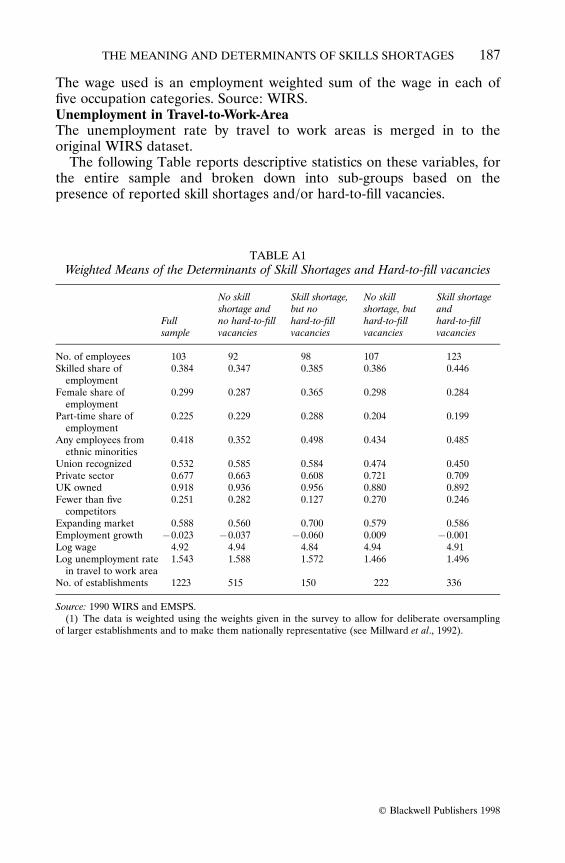
The following Table reports descriptive statistics on these variables, forthe entire sample and broken down into sub-groups based on thepresence of reported skill shortages and/or hard-to-fill vacancies.
TABLE A1Weighted Means of the Determinants of Skill Shortages and Hard-to-fill vacancies
Fullsample
No skillshortage andno hard-to-fillvacancies
Skill shortage,but nohard-to-fillvacancies
No skillshortage, buthard-to-fillvacancies
Skill shortageandhard-to-fillvacancies
No. of employees 103 92 98 107 123Skilled share of 0.384 0.347 0.385 0.386 0.446
employmentFemale share of 0.299 0.287 0.365 0.298 0.284
employmentPart-time share of 0.225 0.229 0.288 0.204 0.199
employmentAny employees from 0.418 0.352 0.498 0.434 0.485
ethnic minoritiesUnion recognized 0.532 0.585 0.584 0.474 0.450Private sector 0.677 0.663 0.608 0.721 0.709UK owned 0.918 0.936 0.956 0.880 0.892Fewer than five 0.251 0.282 0.127 0.270 0.246
competitorsExpanding market 0.588 0.560 0.700 0.579 0.586Employment growth µ0.023 µ0.037 µ0.060 0.009 µ0.001Log wage 4.92 4.94 4.84 4.94 4.91Log unemployment rate 1.543 1.588 1.572 1.466 1.496
in travel to work areaNo. of establishments 1223 515 150 222 336
Source: 1990 WIRS and EMSPS.(1) The data is weighted using the weights given in the survey to allow for deliberate oversampling
of larger establishments and to make them nationally representative (see Millward et al., 1992).
© Blackwell Publishers 1998
187THE MEANING AND DETERMINANTS OF SKILLS SHORTAGES