The main objective of national accounts is to provide ... - IIOA!
21
Use of the supply and use tables in the process of constant prices estimation: Czech experience Marek ROJICEK Czech Statistical Office Na padesatem 81, Prague Czech Republic [email protected] Jaroslav SIXTA Czech Statistical Office Na padesatem 81, Prague Czech Republic [email protected] Introduction The main objective of national accounts is to provide comprehensive data, which can be used for analysis and evaluation of the performance of an economy, mainly about the major economic flows such as production, household consumption and capital formation. Contrary to data at current prices, data at constant prices cannot be directly observed. Decomposition of value changes into price changes and volume changes is an important aspect of the compilation of national accounts. Supply and use tables 1
-
Upload
khangminh22 -
Category
Documents
-
view
0 -
download
0
Transcript of The main objective of national accounts is to provide ... - IIOA!

Use of the supply and use tables in the process ofconstant prices estimation: Czech experience
Marek ROJICEK
Czech Statistical Office
Na padesatem 81, Prague
Czech Republic
Jaroslav SIXTA
Czech Statistical Office
Na padesatem 81, Prague
Czech Republic
Introduction
The main objective of national accounts is to provide
comprehensive data, which can be used for analysis and
evaluation of the performance of an economy, mainly about
the major economic flows such as production, household
consumption and capital formation. Contrary to data at
current prices, data at constant prices cannot be directly
observed. Decomposition of value changes into price
changes and volume changes is an important aspect of the
compilation of national accounts. Supply and use tables
1
(SUT) provide an excellent compilation framework for
constant price estimates. The keystone of the deflation of
the national accounts aggregates is using as detailed
commodity breakdown as possible. Then it is necessary to
decompose the use side into the individual matrices
according to different price indices (domestics, imports,
trade and transport margins, taxes, etc.). These tasks
necessarily make demands on using a strong software tool,
which is able to process huge amount of data in acceptable
time period. The Czech Statistical Office (CZSO) adopted
Norwegian software SNA-NT for current and constant prices
SUT compilation in 2005. At present the CZSO has
experience with compilation of 4 year time series. The
paper describes the state of work in this field and brings
our view on the positive and negative aspects of SNA-NT
system application in practice.
1.SUT and deflation of NA in the CZSO
In the Czech Republic, the Czech Statistical Office
(CZSO) is responsible for the national accounts in current
and constant prices compilation. Until the year 2003, the
constant prices data were calculated only for the
2
quarterly GDP estimates. They were not based on the supply
and use tables and were related to the fixed year base.
Since 2004 the CZSO has started with the annual supply and
use tables compilation in current and constant prices.
Within approximately 8 months the time series of 1995 –
2002 supply and use tables was compiled.
For this purpose only minimal level of aggregation
according to EUROSTAT rule was used (60 commodities). This
level of aggregation was used for balancing supply and use
tables. For price indices (CPI and PPI) weighting the more
detailed level was used (3 to 4 digit level of CPA). The
CZSO also put into practice the annual chaining. As a base
year the previous year’s prices were used and the volume
indices were thus chained. As a reference year the 1995
was used. An important rule, which is also followed by the
CZSO, is consistency of valuation. It means that valuation
of the price indices should be the same as valuation of
deflated data. Practically, production price indices (PPI)
have to be applied for the basic prices data and consumer
price indices (CPI) should be applied for the purchaser´s
prices data. To ensure this, the valuation matrices (trade
3

and transport margins, taxes and subsidies) should be
calculated.
The principle of consistency of deflation requires that
the same data both on the source and use side are deflated
by the same price indices. It is necessary to decompose
the use side into the individual vectors and matrices
according to different price indices (domestics, imports,
trade and transport margins, taxes, subsidies etc.). After
applying the correct price indices for the decomposed SUT,
backward aggregation of the deflated figures is carried
out. By dividing the current and constant prices data we
acquire the volume and price indices at any level of
aggregation. The process of constant prices estimation
should be sometimes repeated, because some inconsistencies
and errors are revealed. Then data in current prices are
corrected and the process of deflation is performed again.
Below a simplified structure of the supply and use tables
used for the constant prices estimates is shown.
4
2.Process of implementation of SNA-NT
The cooperation with Statistics Norway relative to supply
and use tables compilation started in November 2002 when
the first meeting in Statistics Norway took part. CZSO
experts met with Norwegian colleagues and discussed about
various aspects of SUT methodology and practical
compilation. Norwegian partners introduced their software
for current and constant prices compilation called SNA-NT.
Then two other meetings in the CZSO followed. They were
focused on practical implementation and training of SNA-NT
in Czech conditions. In June 2004 the last session took
place. The process of implementation has to be delayed
because of enormous volume of work connected with the
national accounts revision before EU entry. The Department
of Annual National Accounts continued in this project in
the beginning of 2005 within the project PHARE 2002
"Constant prices estimates". The constant prices
compilation was emphasized in this phase of the project in
contrary to existing work focused only on the current
prices SUT compilation.
5

A significant amount of time within the project (SNA-NT
implementation) was dedicated to the explanation and
discussion of the requirements concerning metadata and
statistical data and the work involved to prepare the data
in the format required as input into the SNA-NT software.
An important part of the SUT project involved customising
the SNA-NT classifications to meet the needs of the Czech
Republic. Significant effort went into establishing the
level of classification necessary for analysis of
industries, types of final use and products.
Steps of implementation (in the end of 2004 and at the
beginning of 2005):
Preparation of source data for current prices
compilation (accounts for 2001 and 2002)
Creation of the tools for transferring data into ASCII
files and transfer of them
Balancing SUT of 2001 in current prices and updating to
accounts of 2002
Preparation of price indices at detailed level (for
2002 and 2001 accounts)
6
Creation of the code lists for products and users
Constant prices calculation
Data check and analysis
During 2005 the experimental work on SNA-NT project was
finished. In 2006 the new system was used for “real
compilation” of the SUT for 2003 and 2004 and in the
second half of the year also for 2005 (preliminary version
of NA) compilation. CZSO then evaluated the results and
decided that for preliminary version of NA simplified
system of Excel sheets will be used. For final version of
NA (t + 18 months) the results were satisfactory and it
was decided to continue in using software SNA-NT.
3.Czech experience with SNA-NT
Implementation of SNA-NT into Czech national accounts
brought new possibilities of supply and use tables
compilation. The previous system based on spreadsheet
tables was quite sophisticated but very slow. The CZSO
tried to compile tables in extent of 3-digit CPA x 3-digit
NACE but because of the extent of data, tables were
compiled in extent of 2-digit CPA x 2-digit NACE. Current
7
application of SNA-NT comprises 128 industries and about
250 basic commodities that are furthermore split into 5
categories (see below).
3.1 Description of the system
The SNA-NT system is based on ORACLE database and it
means that there are not any data stored in local
computers (except backups). Therefore, the core of the
system is an application installed on local computer that
processes the data stored on server. The system of data
comprises several tables - classifications, aggregations,
indices etc. The most important tables are T1 (for supply
side) and T2 (for use side) that form the core of the data
system. The structure of both tables is the same (see
annex).
Data are stored in table T1 or T2 according to their
nature, T1 is designed for supply side and T2 for use
side. All indicators are broken down by products and type
of user or supplier (industries, type of export, type of
margin etc.). On the supply side we distinguish following
types of supplies:
8

Market output (code 23) broken down by industries and
products
Other non-market output broken down by industries and
products, separately for S.1311+S.1314 (code 24),
S.1313 (code 25) and S.15 (code 26)
Import of goods, services and purchases of residents
abroad (code 52)
Transport and sale margins (code 29 and columns
VERDI_14T and VERDI_14R)
Taxes and subsidies on products (columns VERDI_11 and
VERDI_13)
Value added tax (VERDI_17)
Similar structure is used for the use:
Intermediate consumption corresponding to the supply
side, for market (code 23) and other non-market
producers (codes 24,25 and 26) broken down by
industries
Gross fixed capital formation (code 28) broken down
by type of asset
9

Final household consumption (code 61) broken down by
COICOP
Final consumption of government institution for
S.1311+S.1314 (code 64), S.1313 (code 65)
Final consumption of non-profit institutions serving
households (code 66).
Export of goods and services and consumption of non-
residents in domestic economy.
Inventories and residue (code 87).
Columns LEVERANDOER and MOTTAKER represent the type of
supply (in T1 table) and the type of use (in T2 table).
Columns VERDI represent valuation,
VERDI_10….basic prices
VERDI_11….taxes on products
VERDI_12….subsidies on products
VERDI_13….producers’ prices (VERDI_10 + VERDI_11 +
VERDI_12)
VERDI_14R......sales margins
VERDI_14T....transport margins
10

VERDI_17….value added tax
VERDI_19….purchasers’ prices
Other columns are not used in the Czech system.
So, the first example in table 1 (T1 table) shows market
output (23) in industry 010 (23010), product 011 (code
011000) of 39455 mil. CZK in basic prices. Taxes less
subsidies are 127 – 1525 = -1398, the value of producer’s
prices in industry 010 is 38057 mil. CZK.
Second example shows intermediate consumption of commodity
011 (code 011000) in market industry 010 (code 23010) of
7006 Mil. (see table 2). CZK in basic prices. Also taxes
on products, VAT (VERDI_17 = 20 Mil.CZK), transport
margins (VERDI_14T = 222 Mil.CZK), and sale margins
(VERDI_14R = 1009 Mil.CZK), are shown. Only the last
column is distinct from T1, VERDI_19, the values in
purchaser’ prices (7978 Mil. CZK).
The SNA-NT system also include T3 table that is designed
for third quadrant (income approach to value added) but
this is currently not used by the CZSO.
11
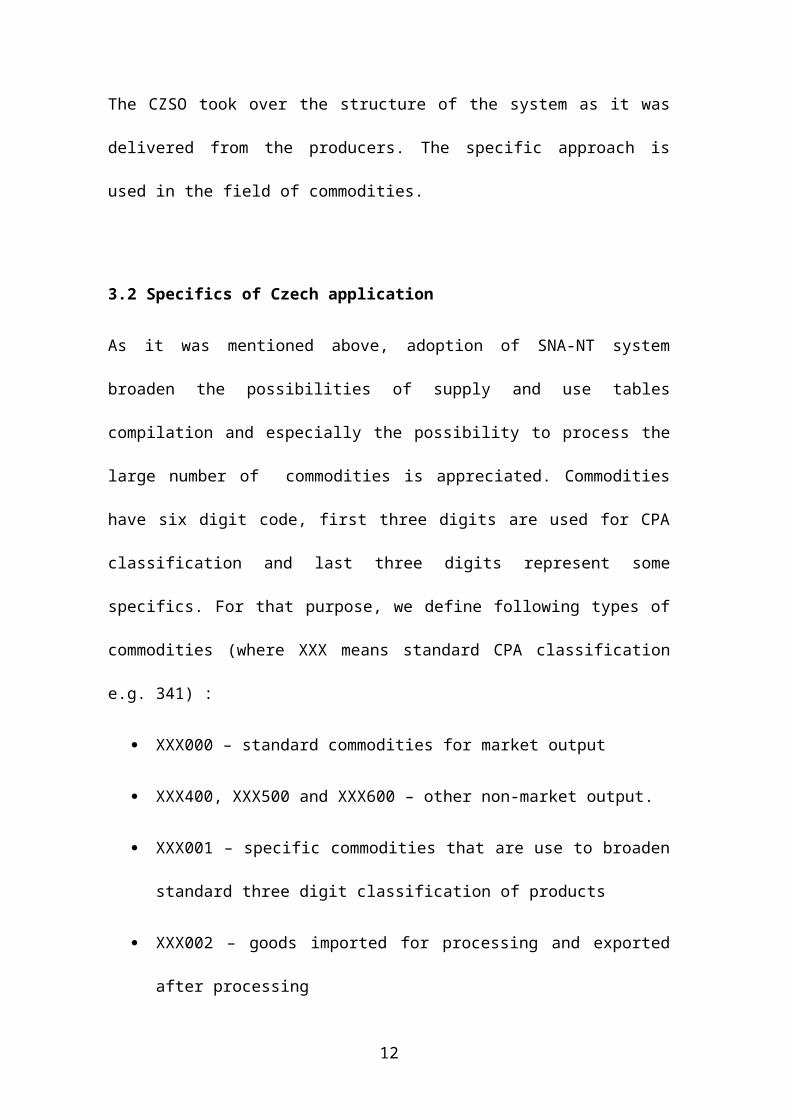
The CZSO took over the structure of the system as it was
delivered from the producers. The specific approach is
used in the field of commodities.
3.2 Specifics of Czech application
As it was mentioned above, adoption of SNA-NT system
broaden the possibilities of supply and use tables
compilation and especially the possibility to process the
large number of commodities is appreciated. Commodities
have six digit code, first three digits are used for CPA
classification and last three digits represent some
specifics. For that purpose, we define following types of
commodities (where XXX means standard CPA classification
e.g. 341) :
XXX000 – standard commodities for market output
XXX400, XXX500 and XXX600 – other non-market output.
XXX001 – specific commodities that are use to broaden
standard three digit classification of products
XXX002 – goods imported for processing and exported
after processing
12

XXX003 – goods exported for processing and imported
after processing
The reason for specific commodities lies mainly in the
nature of transaction. For example, other non-market
output is automatically balanced transaction and
therefore it does not influence the total discrepancy
between source and use side. Similarly the processing is
balanced transaction. The CZSO collect data from companies
without the value of material imported for processing. It
means that the value added by processing is surveyed by
SBS and the data on value of goods being processed are
collected by foreign trade statistics. The value of
processing is significant (about 4.5% of GDP in 2005) and
it is considered as a correction that influence both
intermediate consumption and output. Analogous approach is
used for imputed rent and individual housing construction.
The construction of specific commodities helps the CZSO
with balancing of discrepancy, i.e. to exclude balanced
commodities and consider mainly on the market producers.
3.3 Positive and negative features of the system
13
At first, it is necessary to mention that evaluation of
the SNA-NT is purely subjective. It comes out from our
experience with SNA-NT system and other users may have
different feelings. The most important positives are
obvious:
1. The major advantage of SNA-NT is its ability to
process huge amount of data (database oriented
software).
2. Consistency and linkage check. It means that the
adjustment made on one side is automatically
transposed to the opposite side and all valuation
matrices are automatically recalculated (all
commodities are automatically balanced in all
valuation levels).
3. Fast and consistent constant prices estimates.
The whole philosophy of SNA-NT is well projected and it is
clear that positives are much more significant than
possible negatives. It must be said that no crucial
objection against SNA-NT were discovered by the CZSO.
14
Generally, no negative impression of SNA-NT was
discovered. Actually, it means that there are some areas
that may have to be changed or better that would offer
alternative solutions. Following problems were discovered
during using SNA-NT as an integral part of Czech national
accounts:
VAT calculation
Margins
Supply and use for/from abroad
VAT is an important part of taxes on products and it
is strongly positive that SNA-NT allows to measure it
separately. VAT is estimated (in SNA-NT) from the use side
by multiplying tax rates by tax bases broken down by type
of user. From the theoretical point of view it is
absolutely correct. But practically the most important
problem is that the known sum of VAT (in the Czech
Republic data are from the Ministry of Finance) does not
equal the theoretical VAT estimated in SNA-NT. One of the
reasons is underestimation of the figure from MoF but the
difference can also be caused by incorrect estimation of
the individual aggregates (esp. household consumption).
15

According to the transmission program, detailed
calculation of theoretical VAT is supposed to be
transmitted in later period and during SUT calculation
there is not enough time for it. It means that the final
adjustment for VAT must be done in the end in spread
sheet. It would be very useful to have some procedure that
would allow to split the residual VAT into some
commodities where is the share of VAT payers and non-
payers not known.
The similar situation is in the field of margins.
Margins are estimated from the use side by multiplying
rates by bases. The phenomenon is also clear but SNA-NT
could offer some alternative approaches. Sales and
transport margins are not surveyed and therefore not known
in the Czech Republic. For these purposes, the CZSO
estimated rates but there is no way to asses the quality
of such estimates. Moreover, the rates are needed before
the compilation of supply and use tables. The first
problematic issue relates to principle. The SNA-NT should
offer some procedure that would help to solve problematic
discrepancies between supply and use side and should be
16

caused by margins or to allow adjustment of margins
directly in the process of balancing. The second problem
consists in the technical solution. The change of rate
during balancing (when one is under the time strait)
should be more user friendly and should be offered
directly from user menu. In our opinion, the second issue
is the most important problem of SNA-NT.
Supplies from abroad (imports for intermediate
consumption) and use for abroad (output designed to
export) are in SNA-NT solved proportionally to the
commodities. It means that the same share for all
industries is used for one product. Practically, there
should arise the problem within some industries that may
have different share of imported and domestically produced
supplies. This issue is not so crucial and it could be
solved by creating special commodities for import and
export. This issue was deeply discussed with Norwegian
experts and it does not need any special solution.
Moreover, the Czech economy is going to be stronger and
more and more linked with the EU and the difference
17
between price indices for import and domestic output
should decrease.
Only one remark to reports in SNA-NT. It is not clear
why basic aggregates are missing. For example, SNA-NT does
not offer Account of goods and services that is
standardised in ESA 1995. It would be very useful to have
such information directly in menu because it took some
time to download data from ORACLE to spreadsheet to
compile goods and services account. Maybe one remark
should also mention the preferences of used spreadsheets
(MS Excel), some tools that would download data from
ORACLE would be suitable.
As it was mentioned, the CZSO is generally satisfied
with the SNA-NT. Only some problematic issues were
discovered and they are not very significant.
Conclusion
Implementation of SNA-NT represented significant progress
of supply and use tables both in current and constant
prices compilation. Although there are some minor
problematic issues, the CZSO has been successfully using
18

SNA-NT for two years. Accounts for 2002, 2003, 2004 and
2005 were prepared in SNA-NT. The CZSO has developped its
own tables and presentations in spreadsheet for
downloading data from SNA-NT. The most important for
balancing are aggregated indicators in CPA (3 digit level)
and overall view of goods and services account. The CZSO
has also developped its own RAS method (in spreadsheet)
linked to SNA-NT.
References
[1] CZSO, EU Candidate countries: Project on estimation ofNational Accounts at constant prices. Final report. Czech Statistical Office 2003
[2] EC, The ESA 95 Input-Output Manual: Compilation and Analysis. Eurostat 2002
[3] EC, Handbook on price and volume measures in national accounts. Eurostat 2002
[4] EC, Commission Decision 98/715/EC[5] EC, Commission Decision 2002/990/EC[6] UN, Handbook of Input-Output Table Compilation and
Analysis. New York, United Nations 1999
19

Annex
Table 1: Structure of T1 Table
PRODUKT LEVERANDOER VERDI_10
VERDI_1
1 VERDI_12VERDI_13 VERDI_14R VERDI_14T VERDI_15 VERDI_16
VERDI_1
7
VERDI_1
8
011000 23010 39455 127 -1525 38057
….. ….. ….. ….. ….. ….. ….. ….. ….. ….. ….. …..
….. ….. ….. ….. ….. ….. ….. ….. ….. ….. ….. …..
Table 2: Structure of T2 Table
PRODUKT MOTTAKER
VERDI_1
0
VERDI_1
1
VERDI_1
2
VERDI_1
3
VERDI_14
R
VERDI_14
T
VERDI_1
5
VERDI_1
6
VERDI_1
7
VERDI_1
8
VERDI_1
9
011000 23010 7006 29 -308 6727 1009 222 0 0 20 0 7978
20

….. ….. ….. ….. ….. ….. ….. ….. ….. ….. ….. …..
….. ….. ….. ….. ….. ….. ….. ….. ….. ….. ….. …..
21