LiCl induces TNF-α and FasL production, thereby stimulating apoptosis in cancer cells
Upload
independentCategory
view
1download
0
The low frequency phonons dynamics in supercooled LiCl, 6H2OM. E. Gallina,1,2 L. Bove,2 C. Dreyfus,2 A. Polian,2 B. Bonello,3 R. Cucini,4 A. Taschin,4
R. Torre,4 and R. M. Pick2,a�
1Dipartimento di Chimica, Università di Perugia, I-06100 Perugia, Italy2IMPMC, Université P. et M. Curie, CNRS-UMR 7590, F-75015 Paris, France3INSP, Université P. et M. Curie, CNRS-UMR 7588, F-75015 Paris, France4LENS and Dip. di Fisica, Università di Firenze, I-50019 Sesto Fiorentino, Italy
�Received 30 April 2009; accepted 17 July 2009; published online 24 September 2009�
We report the results of a series of ultrasound, Brillouin scattering, and optical heterodyne detectedtransient grating experiments performed on a LiCl, 6H2O solution from room temperature down tothe vicinity of its liquid-glass transition, Tg�138 K. Down to T�215 K, the supercooled liquidhas a behavior similar to what is expected for supercooled water: its zero frequency sound velocity,C0, continuously decreases while the corresponding infinite frequency velocity, C�, sharplyincreases, reflecting the increasing importance of H bonding when temperature is lowered. Below215 K, specific aspects of the solution, presumably related to the role of the Li+ and Cl− ions, modifythe thermal behavior of C0, while a � relaxation process also appears and couples to the soundpropagation. The origin of those two effects is briefly discussed. © 2009 American Institute ofPhysics. �doi:10.1063/1.3197851�
I. INTRODUCTION
Most liquids, when cooled, e.g., at constant pressure,exhibit a first-order transition at a freezing temperature Tf atwhich they transform into a crystal. Yet, glass former liquidsmiss this transition and remain, upon further cooling, in themetastable supercooled state. The most spectacular manifes-tation of this state is the constant and dramatic increase in theliquid shear viscosity with decreasing temperature. This vis-cosity variation is due to the corresponding increase, uponcooling, of a time scale loosely defined as the “structural”relaxation time whose corresponding relaxation process cancouple to a large number of dynamical variables. The liquid-glass transition takes place at the arbitrarily defined tempera-ture Tg at which this relaxation time is of the order of 1 h.
Many other liquids may be brought, by slow cooling, toa supercooled state for some limited range of temperaturebelow Tf but abruptly crystallize before reaching Tg. In sucha case, a fast quench of the liquid generally leads to an amor-phous state, which is the corresponding glass. Vice versa,this glass may be heated above Tg, leading to a supercooledliquid with very high viscosity, but, upon further heating, thelatter again inevitably abruptly crystallizes, leaving a more orless extended temperature range in which the supercooledliquid cannot be obtained either by cooling or by heating.
Water is, in this respect, a rather exceptional liquid: Itcan be supercooled below Tf =273 K but inevitably crystal-lizes before reaching 247 K.1 In this small temperature do-main, the variation of its relaxation time has been deter-mined, e.g., by Brillouin scattering in the immediate vicinityof 247 K �Ref. 1� or in a larger temperature domain�256 K�T�320 K� by optical Kerr effect �OKE�.2 In thistemperature range, the OKE relaxation time follows the
mode coupling theory �MCT� prediction3 ���T−Tc�−� withTc=220 K. This MCT law usually characterizes a fragileglass former,4 and, following the MCT thumb rule Tg
�0.8Tc, one would predict a liquid-glass transition at a tem-perature in the vicinity of 170 K. Unfortunately, a simplequench of bulk water does not lead to the glass state but tothe crystalline Ih form of ice. Bulk samples of amorphous icecan be obtained only through a simultaneous pressure andthermal treatment of Ih ice performed below 130 K. Pressur-ization, e.g., above 0.4 GPa at 130 K, brings such a crystalinto a high density amorphous �HDA� phase.5 In the sametemperature range, depressurization of HDA brings itthrough a first-order transition into a low density amorphous�LDA� phase and this LDA-HDA transformation is thenreversible.5 Nevertheless, heating bulk LDA does not lead tothe supercooled liquid but to its recrystallization in Ih ice.LDA can also be obtained by hyperquenching of micrometricsamples of water.6 The heating of such microsamples thenfollows the scenario described in the preceding paragraph,yielding Tg�138 K. This complex behavior is somewhat inagreement with the hypothesis6 of a critical point in thephase diagram of water, located around T=220 K and P=0.1 GPa. At lower temperatures, water would separate ei-ther in low density water �LDW�, the phase obtained by heat-ing the LDA films, or in high density water. Further coolingwould transform those supercooled waters into the respectiveglasses, LDA or HDA. Nevertheless, this critical point hasnot been experimentally identified up to now.
Water, ice, and the LHA or LDA ices are particularlysurprising as far as their low frequency sound propagation isconcerned. At ambient pressure, the speed of sound, C0, de-creases below 343 K,7 i.e., far above Tf, instead of increasingas in most liquids, and this variation is not related to achange in density as the C0�T� curve monotonically de-creases down to 247 K though the water density has its maxi-a�Electronic mail: [email protected].
THE JOURNAL OF CHEMICAL PHYSICS 131, 124504 �2009�
0021-9606/2009/131�12�/124504/10/$25.00 © 2009 American Institute of Physics131, 124504-1
Downloaded 02 Oct 2009 to 150.217.156.84. Redistribution subject to AIP license or copyright; see http://jcp.aip.org/jcp/copyright.jsp

mum four degrees above Tf. This decrease is large ��25% inthis 100 K range� and leads to the low value of C0�247 K�=1225 ms−1.1 Conversely, the sound velocity of ice is large,8
around 3300 ms−1 at 273 K, and one obtains similar values9
for the LDA and HDA ices at 60 K. As the thermal variationof the sound velocity is generally small in a glass, one ex-pects a very similar value at the LDA-LDW transition tem-perature. In the corresponding supercooled liquid, this valuewould represent the sound velocity, C�, at frequencies muchlarger than the inverse of the relaxation time. C� /C0 wouldthus be much larger than 2, which is generally the signatureof a strong glass former.4 Such glass formers have a Tg muchlower than what could be anticipated from their high tem-perature properties, as is the case for LDA. The vicinity ofthe critical point at ambient pressure, i.e., the T�200 Kregion, could represent the transition region between thefragile glass former behavior observed at high temperature5
and the strong glass former behavior suggested, e.g., by thevery high value of the sound velocity in LDA.
The evolution of the relaxation process/processes whichcouples/couple to the low frequency speed of sound is animportant tool to have access to mechanisms at the origin ofthe supercooled state. Because of the very limited tempera-ture range where this state exists in water, such a study is notfeasible. Solutions of LiCl, RH2O with R�4 may appear asan indirect route to bypass this difficulty. Their equilibriumphase diagram10 shows that they can form only three crystal-line hydrates, for R=2, 3, and 5, and that it exists an eutecticpoint at Te=199 K for R�7 where the liquid separates intomicrocrystals of ice and of the R=5 hydrate. The nonequi-librium aspect of this diagram was first studied by Vuillardand Kessis in 1960.11 It revealed the existence of a glasstransition for all the R�3 solutions, always located in thevicinity of 140 K, i.e., close to the Tg value of pure water.Furthermore, in the vicinity of R=6, no additional thermalanomaly was observed above the glass transition, indicatingthat the supercooled liquid �below Te� was stable down to Tg.
Those solutions, in particular their supercooled phase,started to be very actively studied at the beginning of the1990s. On the one hand, a series of experiments was per-formed by light scattering techniques. Tao and Lindsay12 de-tected a central peak in low frequency, depolarized, measure-ments performed above room temperature. They interpretedthis peak as the slow part of the reorientation process of thewater molecules located on the first hydratation shell. Thecorresponding relaxation time varied with R and tempera-ture, being, e.g., of the order of 10 ps at room temperaturefor R=4. The polarized spectrum of those solutions was laterstudied by Tao et al.13 in the same frequency range, fromroom temperature down to 90 K �provided that crystalliza-tion would not occur before�, for similar values of R. Theyshowed that a structural relaxation process whose character-istic time strongly increases upon cooling couples with thelongitudinal phonons. In particular, for R=6.7, they mea-sured the apparent sound velocity, ratio of the frequency ofthe Brillouin peak maximum to the scattering vector, in thewhole supercooled phase. This velocity has, qualitatively, thebehavior that one could anticipate for the hypothetical super-cooled water and for the LDA glass: it remains approxi-
mately constant down to 250 K then increases sharply belowthat temperature down to Tg where its value is approximatelytwice as large as at room temperature. Finally, Halalay andNelson14 performed a transient grating �TG� experiment witha homodyne detection on three solutions with R=4, 5.7, and6.7. For R=6.7, in the small temperature range common toRefs. 13 and 14, the relaxation times deduced from those twoexperiments were rather similar. Let us also point out that,for R=6.7, Halalay and Nelson also found evidence of twoother relaxation processes that had thermal behaviors differ-ent from the first one, relaxation times 10–50 times shorterand a totally unknown origin.
On the other hand, an important series of different ex-periments was performed over a more-than-ten-years periodby Elarby-Aouizerat et al. These authors first improved15
over the nonequilibrium phase diagram of Ref. 11 and madeclear by a structural analysis of the liquid phase that, for R�6, it was possible to supercool the solution down to Tg
without the occurrence of any microcrystallization. Many oftheir results were obtained by �coherent or incoherent, elasticor inelastic� neutron scattering. They also measured, intera-lia, the thermal expansion coefficient of the solutions, andthey performed NMR and muon spectroscopy experiments.In particular, through those two last techniques and quasi-elastic neutron scattering measurements, Maurin et al.16 evi-denced, in the supercooled regime, for some values of R, therotational motion of the molecules already identified aboveroom temperature by Tao and Lindsay12 for other R values.In analogy with the usual Johari–Goldstein17 terminology,they named it a � process because its relaxation time reallyseparated, e.g., around 200 K for R=6, from that of the struc-tural, or �, process measured in the same experiment: belowthat temperature, this � relaxation time increased onlyslowly. The value of the � relaxation time varied by factorsas large as 15 depending on the technique used to measure it,but its temperature evolution turned out to be approximatelythe same in their different experiments.16�c�
We present here the results of a set of experiments, de-signed for studying the low frequency dynamics of one suchsolution, LiCl, 6H2O, associating for the first time ultra-sound, light scattering, and TG techniques, from 300 K downto the vicinity of Tg. The last series of experiments was per-formed on the heterodyne detected HD-TG instrument ofLENS.18 They were analyzed with the help of the parametersobtained from the two first experiments using methods19,20
that introduce, at each temperature, quantities directly enter-ing into the equations of motion of a supercooled liquid �seeSec. II�. Our analysis shows that LiCl, 6H2O exhibits twotypes of behavior. Above 210 K, the experiments can beanalyzed as for any other glass forming liquid, i.e., introduc-ing a unique � relaxation process the characteristic time ofwhich increases with decreasing temperature. Conversely,below that temperature, the TG experiments cannot be un-derstood without the introduction of an anomaly in C0�T�with respect to the extrapolation of the ultrasonic measure-ments, and of a � relaxation process analogous to that ofMaurin et al. In other words, down to T�215 K, our resultsparallel the possible behavior of the sound propagation in thehypothetical supercooled water phase. On the contrary, at
124504-2 Gallina et al. J. Chem. Phys. 131, 124504 �2009�
Downloaded 02 Oct 2009 to 150.217.156.84. Redistribution subject to AIP license or copyright; see http://jcp.aip.org/jcp/copyright.jsp

lower temperatures, they are certainly largely influenced bythe presence of LiCl in the supercooled solution.
In order to show those points, this paper is organized asfollows. Section II summarizes the theoretical backgroundwhich underlies the analysis of our experiments. In Sec. III,after describing the preparation of the sample, we presentand analyze the ultrasonic and Brillouin measurements. Thewhole Sec. IV is devoted to the analysis of the HD-TG ex-periments whose methods are presented successively for the300–215 K interval and for the 200–166 K and for the 210–200 K domains. The results are then discussed in the wholetemperature range. Finally Sec. V summarizes our findingsand shortly discusses different perspectives opened by thepresent work.
II. THEORETICAL CONSIDERATIONS:A BRIEF SUMMARY
A. General theoretical framework
The three types of experiments performed on our systemand analyzed in the present paper are based on the use of alongitudinal phonon propagator, PL�q� ,��, written under theform
PL−1�q� ,�� = �2 − q2C2��� , �2.1�
where C2��� is the square of a frequency dependent soundvelocity that is written as
C2��� = C02 + �
j
j2�gj��� j� + i�� , �2.2�
all the quantities appearing in the right hand side of Eq. �2.2�being temperature dependent. In this expression, j is thestrength of a relaxation process with relaxation time � j,gj��� j� is the Laplace transform of the corresponding relax-ation process �in the present paper, we shall use for simplic-ity a Cole–Davidson form for the derivative of such a pro-cess, namely,
�gj��� j� = 1 − 1
1 + i�� j�j
, �2.3�
where � j is the corresponding stretching coefficient �� j =1yields a Debye relaxation process��, � is the residual phononlinewidth, and C0 is clearly equal to �C2��=0�, whichmeans that it is the zero frequency sound velocity. Similarly,ignoring the residual phonon linewidth, one obtains
C2�� → �� = C02 + �
j
j2 � C�
2 , �2.4�
an equation that defines the infinite frequency sound velocityC�.
B. Ultrasonic and light scattering experiments
In an ultrasonic experiment, one imposes the frequencyof the source, �US, here equal to 7 MHz, and one measuresthe time necessary for a short pulse of such a frequency to
travel a fixed distance. One thus measures Re��C2��US�� andobtains the C0 value when all the �US� j are much smallerthan unity �high temperature case� or C� when they are much
larger than unity �low temperature case�. Between those twoextreme cases, except in their immediate vicinity, no signalcan be detected due to its very large attenuation over the longdistance traveled by the pulse.
In a Brillouin experiment, one measures directly a signalI��� for a given wave vector q� fixed by the geometry of thescattering experiment. I��� is related to PL�q� ,�� by
I��� = Ibg +I0
�Im�PL�q� ,��� , �2.5�
where Ibg is a background intensity and I0 the intensity of thephonon under study.
C. The heterodyne detected transient grating signal
The same longitudinal phonon propagator, PL�q� ,��, en-ters into the expression of the optical HD-TG signal, S�t�.The signal, measured in this pump-probe, time-resolved ex-periment, has a rather complex origin,18,19,21 that needs to bebriefly summarized. In this experiment, a very high intensity,instantaneous pulse is divided into two coherent beams �thepumps� of equal amplitudes and propagating in quasiparalleldirections which interfere in the liquid and generate, in fine,two density gratings of wave vector q� .
The first one has an electrostrictive origin. The modu-lated electrostrictive force, created by the interaction of theinterference electric field of the two pumps with the liquid,generates two longitudinal phonons. Those phonons haveequal amplitude, wave vectors q� and −q� , and a period of afew nanoseconds. Their interference creates a density gratingcalled the instantaneous stimulated Brillouin scattering�ISBS� grating.
The second grating has a thermal origin, namely, an in-stantaneous spatial modulation of the local temperature ofthe liquid created by a weak absorption of the same interfer-ence field. This thermal grating induces, on the one hand, apressure grating which, in turn, generates phonons identicalto the first ones. On the other hand, the thermal modulationdecreases, by heat diffusion, with a lifetime, �h, which, in thegeometry used here, is always in the 104 ns range. The localdensity tends to adjust to this local temperature, thus creatinga second, static density grating whose amplitude increases onthe � relaxation time scale. In this second instantaneousstimulated thermal scattering �ISTS� grating, there is thus acompetition between the roles of �� and �h.19,21
The time evolution of the sum of those two gratings ismonitored by the amplitude, S�t�, of a probe beam diffractedby these gratings and heterodynely detected, the change inindex of refraction, n, of the liquid being proportional to itschange in density, �. In those HD-TG experiments, ignoringadditional effects of no importance here,22 there is thus �seenevertheless Sec. IV� only one detection mechanism, namely,�n /��.
Our HD-TG experiments were analyzed by the numeri-cal techniques and with the help of the formula given in Ref.20. Neglecting the frequency dependences of the specificheat and of the thermal pressure coefficients, the amplitude
124504-3 Phonons dynamics in supercooled LiCl, 6H2O J. Chem. Phys. 131, 124504 �2009�
Downloaded 02 Oct 2009 to 150.217.156.84. Redistribution subject to AIP license or copyright; see http://jcp.aip.org/jcp/copyright.jsp
of the detected beam is proportional to the convolution prod-uct of the response function of the instrument by the inverseLaplace transform of
S���� = iPL�q� ,�� 1
1 + i��h�q�− aq2� . �2.6�
In Eq. �2.6�, we have replaced �h, the thermal diffusion re-laxation time, by �h�q� in order to make explicit its q depen-dence,
�h�q� =CV
�q2 , �2.7�
where CV is the specific heat at constant volume per unitmass and � the heat diffusion coefficient. The first term ofthe bracket in Eq. �2.6� is the ISTS contribution to S����while the second is the relative weight of the ISBS contribu-tion to the same quantity. Note that, contrary to Ref. 20, wehave also made explicit the q dependence of this secondterm, a being in principle a material constant only weaklydependent on temperature, as well as CV and �.
III. EXPERIMENTAL RESULTS
A. Experimental aspects
The LiCl, 6H2O solution was prepared from Sigma an-hydrous LiCl �99.98%� dissolved in de-ionized distilled wa-ter under an Ar atmosphere. Its concentration was checkedby the Service Central d’Analyse du CNRS �SR-59�. Thesolution was filtered through a 0.2 m nanoporous filter,loaded into cylindrical glass tubes with 1 cm diameter, andflame sealed. The tubes were kept in liquid nitrogen duringthe sealing in order to avoid water evaporation. The solutionswere clear and dust-free. For the ultrasonic experiments, thesample consisted of a 16 mm long tube, filled at room tem-perature with the LiCl, 6H2O solution. For the Brillouinones, the sample tube was fitted into a cylindrical copperblock with two windows for incoming and scattered lights.The copper block was attached to the cold finger of a home-made cryostat. The temperature was controlled by a LakeShore controller. In both experimental setups, a silicium di-ode was mounted close to the sample to ensure a minimumdifference between the recorded and the sample tempera-tures.
B. The ultrasonic results
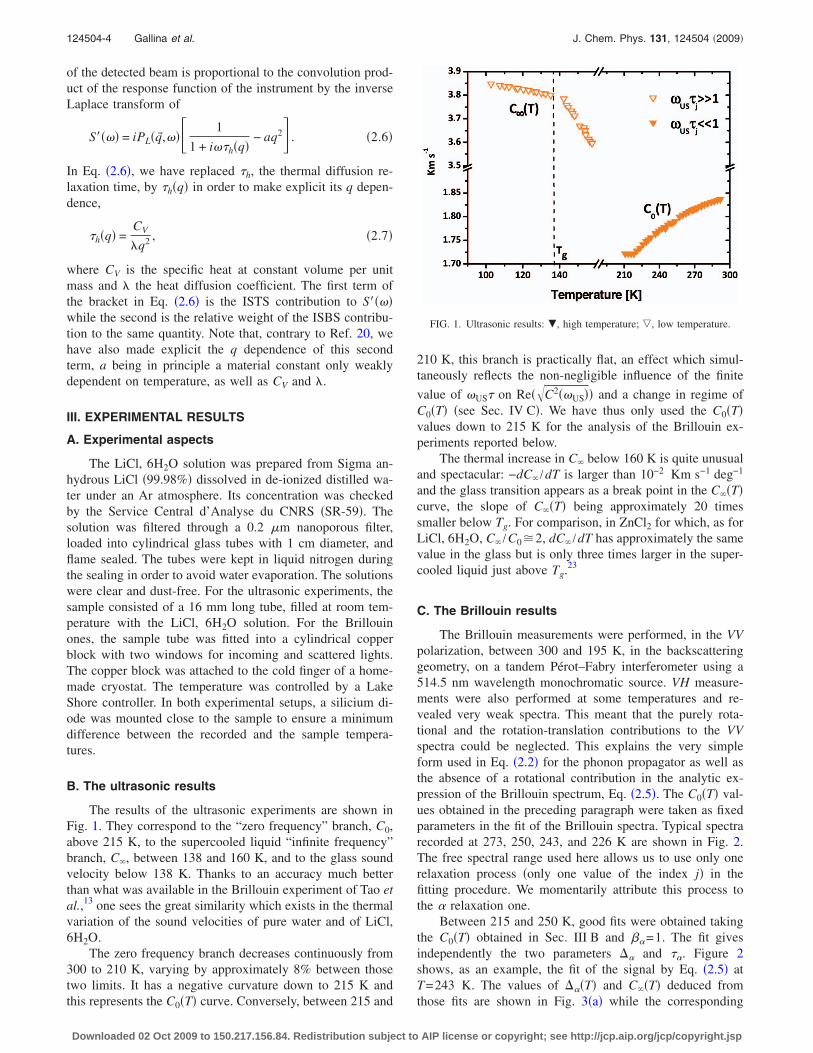
The results of the ultrasonic experiments are shown inFig. 1. They correspond to the “zero frequency” branch, C0,above 215 K, to the supercooled liquid “infinite frequency”branch, C�, between 138 and 160 K, and to the glass soundvelocity below 138 K. Thanks to an accuracy much betterthan what was available in the Brillouin experiment of Tao etal.,13 one sees the great similarity which exists in the thermalvariation of the sound velocities of pure water and of LiCl,6H2O.
The zero frequency branch decreases continuously from300 to 210 K, varying by approximately 8% between thosetwo limits. It has a negative curvature down to 215 K andthis represents the C0�T� curve. Conversely, between 215 and
210 K, this branch is practically flat, an effect which simul-taneously reflects the non-negligible influence of the finite
value of �US� on Re��C2��US�� and a change in regime ofC0�T� �see Sec. IV C�. We have thus only used the C0�T�values down to 215 K for the analysis of the Brillouin ex-periments reported below.
The thermal increase in C� below 160 K is quite unusualand spectacular: −dC� /dT is larger than 10−2 Km s−1 deg−1
and the glass transition appears as a break point in the C��T�curve, the slope of C��T� being approximately 20 timessmaller below Tg. For comparison, in ZnCl2 for which, as forLiCl, 6H2O, C� /C0�2, dC� /dT has approximately the samevalue in the glass but is only three times larger in the super-cooled liquid just above Tg.23
C. The Brillouin results
The Brillouin measurements were performed, in the VVpolarization, between 300 and 195 K, in the backscatteringgeometry, on a tandem Pérot–Fabry interferometer using a514.5 nm wavelength monochromatic source. VH measure-ments were also performed at some temperatures and re-vealed very weak spectra. This meant that the purely rota-tional and the rotation-translation contributions to the VVspectra could be neglected. This explains the very simpleform used in Eq. �2.2� for the phonon propagator as well asthe absence of a rotational contribution in the analytic ex-pression of the Brillouin spectrum, Eq. �2.5�. The C0�T� val-ues obtained in the preceding paragraph were taken as fixedparameters in the fit of the Brillouin spectra. Typical spectrarecorded at 273, 250, 243, and 226 K are shown in Fig. 2.The free spectral range used here allows us to use only onerelaxation process �only one value of the index j� in thefitting procedure. We momentarily attribute this process tothe � relaxation one.
Between 215 and 250 K, good fits were obtained takingthe C0�T� obtained in Sec. III B and ��=1. The fit givesindependently the two parameters � and ��. Figure 2shows, as an example, the fit of the signal by Eq. �2.5� atT=243 K. The values of ��T� and C��T� deduced fromthose fits are shown in Fig. 3�a� while the corresponding
FIG. 1. Ultrasonic results: �, high temperature; �, low temperature.
124504-4 Gallina et al. J. Chem. Phys. 131, 124504 �2009�
Downloaded 02 Oct 2009 to 150.217.156.84. Redistribution subject to AIP license or copyright; see http://jcp.aip.org/jcp/copyright.jsp

values of �� versus 1000 /T are shown in Fig. 3�b�. Figure3�a� shows that the C��T� curve linearly extrapolates to thevalues obtained in the ultrasonic experiment below 160 K.
Conversely, at high �T�250 K� and low �T�215 K�temperatures, the line width of the spectra is too narrow toanalyze its shape with any appreciable accuracy. In particu-lar, at high temperature, the imaginary part of the � relax-ation process can be represented by
�2 1 − 1
1 + i������ � i��
2����, �3.1�
and it is only the product appearing in the right hand side ofEq. �3.1� that can be determined. In those two temperaturedomains, we have only used the experimental spectra tocheck that their analysis leads to results consistent with thosededuced from the ultrasonic and HD-TG data.
IV. THE TRANSIENT GRATING RESULTS
The experiments were performed with a grating of wavevector q=0.63 m−1. Typical signals obtained between 300and 166 K are shown in Fig. 4. At first sight, they appearvery similar to signals obtained on molecular glass formingliquids such as OTP18 or m-toluidine.20 At high temperature,long lived longitudinal phonons decay with a time constantthat decreases with decreasing temperature while, after theirdecay, the ISTS signal remains constant up to the time whenthe density grating decays with its �h lifetime. The longitu-dinal phonons have their maximum attenuation at 200 K. Atlower temperatures, the phonon lifetime increases again but,when �� becomes longer than this lifetime, the ISTS signalrises for a few �� before reaching its maximum �see, e.g., the172 K signal�. Finally, at 166 K �not shown in Fig. 4� ��
becomes of the same order of magnitude as �h and the finaldecay of the signal is slower than above thattemperature.
A. T>215 K
Between 300 and 215 K, where the phonon dampingincreases upon cooling, we used the same phonon propagatorand the same values of C0�T� as for the analysis of the Bril-louin corresponding spectra. The relaxation process had to beapproximated by Eq. �3.1� down to 240 K. Below that tem-perature and down to 215 K, the results of the fits wereconsistent with those obtained in the Brillouin experiment.As in m-toluidine,20 the ISBS contribution to the total signalis never larger than 30% in the short time �st� region wherethis signal has not yet decreased to zero. The coefficient a,Eq. �2.6�, has a weak and linear variation with temperature,da /adT=2�10−3.
B. T<200 K, the extra signal
A close look, for instance, at the 187 K signal shows, asshown by the arrow, in the 0.1–5 s region a small decreasebefore reaching the normal thermal decay, that has not beenseen in any other supercooled liquid. Such an extra decay isseen at all the temperatures between 195 and 172 K. It is, infact, the precursor of the much larger decay seen by Halalayand Nelson14 for the concentration R=6.7, under conditionsthat did not allow its proper study. As will be shown in aforthcoming paper,24 this surprising feature can be analyzedas the signature of an additional detection mechanism, notincluded in the discussion performed in Sec. II, generated bythe very intense electric field of the pumps. In this tempera-ture range, the pumps pulses slightly modify directly thestructure of the supercooled solution, whence its refractiveindex, opening, for the signal S�t�, a new detection channel
�
��
�
� � � � � ��
�
�
�
�
�
�
�
�
�
�
�
�
� �
� �
� � �
�
�
� �
� �� �
� �
� �
�
�
�
�
�
�
!
�
"
#
$
%
&
%
'
!"
#
FIG. 2. Brillouin spectra at some temperatures: �, T=273 K;�, T=250 K; �, T=243 K; �, T=226 K; ---- fit of the T=243 K spec-trum by Eq. �2.5�.
FIG. 3. Results of the fit of the Brillouin spectra. �a� �, �; �, C�; ___,linear extrapolation of C�. �b� ˝, ��, with its error estimate, I.
124504-5 Phonons dynamics in supercooled LiCl, 6H2O J. Chem. Phys. 131, 124504 �2009�
Downloaded 02 Oct 2009 to 150.217.156.84. Redistribution subject to AIP license or copyright; see http://jcp.aip.org/jcp/copyright.jsp

whose importance decays on a time scale of the order of ��.We have tested that, at each temperature, the correspondingsignal has an amplitude that increases with R−6, R�6, butwith a shape that is R independent.24 We have thus subtractedthe R=6 signal from one measured with an R=7.15 solution,determined which small portion of this extra signal is presentin the R=6 original signal, and subtracted from it this smallportion. It is this cleaned signal that has been analyzed be-low. Note24 that this effect appears only below 200 K, itsimportance decreasing upon cooling to become negligible at181 K.
C. T<200 K, necessity of a new fit strategy
Above 210 K, the � relaxation process seen by Tao andLindsay12 and by Maurin et al.16 did not show up in theBrillouin signal and we could similarly analyze the TG sig-nal totally ignoring it. Conversely, below 200 K, we need tointroduce it in the fitting procedure. Without this extra relax-ation process, one can obtain a �� value which reproducesthe increase in the signal in the 10–100 ns range, but thecorresponding relaxation time is too long for the acousticphonons to completely decay in this time range. This doesnot agree with the experimental results, e.g., at 184 K. Viceversa, one can determine a much shorter �� for which thephonons have properly decayed but, in this case, the increasein the signal after the phonon decay cannot be reproduced,again in disagreement with the experimental results.
From another point of view, because of Eqs. �2.2�–�2.4�,C0 and C� play a symmetrical role, the knowledge of the setof j and of one sound velocity yielding the value of theother. The ultrasonic results below 160 K and the C��T�values obtained from the analysis of the Brillouin and TGexperiments from 260 to 215 K can be linearly interpolatedto yield C��T� between 210 and 166 K, and we checked thatthis interpolation agreed with the values that could be de-duced from the Brillouin spectra at 205 and 195 K. Never-theless, these values are not consistent with the extrapolationof C0�T� below 215 K: they cannot reproduce the shape ofthe TG signals in this temperature domain. This is clearlyvisible, for instance, at 184 K where this shape is rathersimilar to what is obtained in the same temperature regimefor, e.g., m-toluidine:20 the maximum of the signal, around200 ns, is approximately equal to its mean value in the fewnanosecond region. We show in the Appendix that the shorttime mean value of the ISTS signal, i.e., for instance, themean value between its first minimum and the next maxi-mum, is proportional to
Ist =1
�B2�h
, �4.1a�
where �B=2� /TB, TB being the phonon period measured inthis time range. At 184 K, �B�C�q as can be deduced fromFigs. 3�a� and 4; the ISBS contribution does not change theresult of Eq. �4.1a� because this second term oscillates with
FIG. 4. HD-TG signals at some temperatures.
124504-6 Gallina et al. J. Chem. Phys. 131, 124504 �2009�
Downloaded 02 Oct 2009 to 150.217.156.84. Redistribution subject to AIP license or copyright; see http://jcp.aip.org/jcp/copyright.jsp

the same period as the ISTS one but with a zero mean value.The Appendix also gives the expression of the amplitude ofthe signal for times such that ��� t��h for the case of asingle relaxation channel and for a phonon decay time muchshorter than ��. This amplitude is proportional, with the sameproportionality factor as in Eq. �4.1a�, to
Ilt =1
�C0q�2�h. �4.1b�
The extrapolation of C0�T�, Fig. 1, down to 184 K leads to
Ilt/Ist � C�
C02
= 3.4
1.62
= 4.5 �4.2�
while the experimental ratio is hardly larger than unity. Theintroduction of the two relaxation channels, � and �, hardlychanges the result, as appears on the three curves of Fig. 5:the shape of the curves computed imposing simultaneouslyC0 and C� with either one �b� or two �c� relaxation channelsis completely different from the signal �a� recorded at thattemperature.
In view of the linear variation of C��T� discussed above,we have decided for the following fitting strategy. We haveused these C��T� values as well as a linear extrapolation ofthe values obtained for a�T� above 210 K as known quanti-ties at each temperature. The stretching coefficient �� wasfound by a trial and error process to be of the order of 0.4and was kept to this constant value over the whole tempera-ture range while �� was left as a fit parameter. This lead to afive parameter fit,25 and fitting constraints were later appliedto obtain a smooth thermal variation of the physically mean-ingful parameters, ��T�, ��T�, C0�T�, ���T�, and ���T�.
Let us finally note that, for T=210, 205, and 200 K, thesignals could be fitted with the same technique as for highertemperatures using for C0�T� the extrapolation of the ultra-sonic results between 300 and 215 K. Nevertheless, this tech-nique lead to values of C��T� significantly larger than pre-dicted by the linear interpolation mentioned above. We have
thus repeated those fits using the same strategy as for T�200 K. The results for the parameters C0�T�, j, and � j
were found to be consistent both with their higher and theirlower temperature values. However, the accuracy of the fitsdid not allow us to discriminate between a one relaxation anda two relaxations origin of the signal, both hypotheses givingequally satisfactory results. We shall report here the resultsobtained with the two relaxations model.
D. Results of the fit in the whole temperature rangeand discussion
The results for ��T�, ��T�, and C0�T� between 210and 166 K are shown in Fig. 6. We have also represented onthe same figure the C0�T� and �T����T� curves for T�215 K, as well as the value of C��T� for all the tempera-tures. Finally, ����T�� and ����T�� for T�215 K, where�� j�=� j� j and the unique ��T�����T� for T�215 K appearin Fig. 7.
FIG. 7. TG relaxation times: ˝, �, high temperature; , ����, low tempera-ture; � , ����, low temperature. The Vogel–Fulcher approximation for � and���� as well as the Arrhenius approximation for � and ���� are also shown.
FIG. 5. The signal at T=184 K: �a� �——–� Original signal; �b� �----------�signal calculated with C0 extrapolated from high temperature and with onerelaxation time; �c� �……..� same as �b� but calculated with two relaxationtimes.
90 120 150 180 210 240 270 300
0.6
1.2
1.8
2.4
3.0
3.6
88
C (T) (US)C0(T) (US)
C (T) (HD-TG)C0(T) (HD-TG)
∆ (T>210 K)∆
α(T<210 K)
∆β(T<210 K)
Temperature [K]
Km
s-1
FIG. 6. TG parameters.����, C�, all temperatures;☺☺☺☺, C0, all temperatures; �,�, high temperature; �, ��, low temperature; � , ��, low temperature. Forcompleteness, are added on this figure: �, C�, ultrasonic results; �, C0,ultrasonic results.
124504-7 Phonons dynamics in supercooled LiCl, 6H2O J. Chem. Phys. 131, 124504 �2009�
Downloaded 02 Oct 2009 to 150.217.156.84. Redistribution subject to AIP license or copyright; see http://jcp.aip.org/jcp/copyright.jsp

The thermal variations of ��T� and ��T��T�215 K� are a priori surprising when compared to the�T� curve for T�215 K. Indeed we obtain a smooth varia-tion of all the parameters when satisfying the conditions��T���T� and ��T����T� for T�210 K; conversely,no consistent thermal evolutions of ��T� and ��T�could be obtained assuming the opposite constraints:��T���T� and ��T����T� in the vicinity of thattemperature.
Figure 6 shows that both �T� and ��T� increase withdecreasing temperature while ��T� has the opposite behav-ior.
• The ��T���T� finding in the vicinity of 210 K sug-gests that, above that temperature, �T� represents theamplitude of a “process” in which the � and � contri-butions appear as mixed in a light scattering experi-ment. Conversely, at lower temperatures, the local pro-cess decouples from the structural relaxation; it has thusa less and less important weight in an experiment whichdetects a collective, q�0, dynamics, whence a decreasein � upon cooling.
• The thermal evolution of ��T� has presumably quite adifferent origin. In all the glass formers studied so far,d��T� /dT is also negative. Nevertheless, usually, �
does not vary much in the Tg−1.5Tg range: in fragileglass forming liquids, such as m-toluidine20 or OTP,18
for instance, where � /C0 is never larger than unity, �
hardly changes by more than 30%. One finds a changeof the same order of magnitude in the much strongerglass former ZnCl2,26 which keeps a tetrahedral coordi-nation of the Zn2+ ion with four Cl− ions in the wholesupercooled phase and in which one finds a � /C0 ratioof the order of 1.5. One should thus rather attribute thelarge values of −d�T� /dT and of −d��T� /dT at lowertemperatures to the strengthening of the interaction of ahydrogen atom located on a water molecule with theother water molecules or with the Cl− ions, an effectwhich is specific to water and water solutions. Thestrong increase in �T� above 210 K totally explains theincrease in C��T� in this temperature range; conversely,this increase is only partly due to the large change in��T� below 210 K, another contribution coming forthe change in the thermal evolution of C0.
C0�T� is obtained from the values of C��T�, ��T�, and��T� through Eq. �2.4�. As it is apparent in Fig. 6, C0�T�clearly and strongly increases with decreasing temperaturebelow 215 K, contrary to its T�210 K behavior. A verytempting explanation of this totally unexpected change inregime is to draw a comparison between the pure water caseand the R=6 solution, relating this anomaly to the watercritical point.6 In LiCl, RH2O with R�6, this point couldstill be around 200–210 K but at a lower pressure than inwater so that the change in behavior of C0�T� around thattemperature would be a strong, though indirect, indication ofthe existence of this critical point. Unfortunately, the thermalevolution of the density does not favor this explanation. Thisdensity has been measured for various values of R ranging
from R=3.8 to R=7.6 and from 150 K to more than 330 Kby El Hachadi.27 In particular, the R=5.95 measurementsshow a weak negative thermal expansion, �=−1.4�10−4 K−1 which is absolutely constant from 150 to above280 K. Due to this very low value, it is quite unlikely that thestructural modifications induced by passing in the vicinity ofthis critical point would affect the isothermal compressibilitywithout also changing the value of �. One should rather sug-gest that below 210 K, a new relaxation channel appears,with a very long lifetime, possibly in the range of 1 s.28
C0�T� would then not be any more the zero frequency soundvelocity but the sound velocity above the corresponding fre-quency range, the real C0�T� being reachable only throughquasistatic sound velocity measurements.29 We suspect thisextra relaxation channel to be a consequence of the presenceof the LiCl solvent and not of the water itself.
The results for ����T�� and ����T�� are shown in Fig. 7,as well as the values of � obtained between 200 and 250 K�see Fig. 3�b��. As for the results of Maurin et al.,16 oneobtains the “decoupling” of the two relaxation processesaround 200–215 K, the � and ���� values exhibiting a posi-tive curvature when plotted versus 1000 /T from 250 K downto 166 K. Conversely � and ���� have an Arrhenius behaviorin the same temperature range. The thermal behavior of �and ���� are consistent with those of Maurin et al.16 when ascaling factor of 3 is applied to our results, the low tempera-ture saturation of this second relaxation process at very lowtemperature16 not appearing in the small temperature intervalconsidered here.
Let us finally note that the analysis of the TG resultsbelow 200 K has turned out to be uneasy. The subtractionprocedure necessary to remove the small part of the extrasignal discussed in Sec. IV B may still lead to a 1%–1.5%error in some of its parts, in particular, in the short time one.Due to the interplay between the different parameters, thismay lead to much larger errors in the values of the two j
and �� j�. We have estimated that the uncertainties in �
and/or � can be as large as 300 ms−1 for their lowest val-ues, leading to errors of the same order of magnitude for C0.This may also result in relative errors �� j� / �� j� as large as30%.
V. SUMMARY AND FINAL COMMENTS
The present study has been undertaken in order to lookat possible similarities in the behavior of the sound velocitiesof two systems. One is supercooled water, which can bestudied only in a small portion of its supercooled regime, andLDA ice around 60 K. The second is the solution LiCl,6H2O, which can be supercooled down to Tg. The similarityof the already known results between those two systems sug-gested that an extended study of the second could shed somelight on the thermal behavior of the first one and on themechanisms which underlie it.
Our series of experiments on LiCl, 6H2O has providedus with a very simple result relative to the infinite frequencysound velocity, C��T�. This velocity has a perfectly linear
124504-8 Gallina et al. J. Chem. Phys. 131, 124504 �2009�
Downloaded 02 Oct 2009 to 150.217.156.84. Redistribution subject to AIP license or copyright; see http://jcp.aip.org/jcp/copyright.jsp

thermal dependence between 160 and 250 K. Its variation isunusually large, typically three to four times larger than inother supercooled liquids.
This important increase in C��T� upon cooling is due tothe large corresponding increase in the coupling coefficientbetween the zero frequency sound velocity and the � relax-ation process. This increase is quite important both aboveand below the T�210 K region. It is presumably related tothe increasing importance of the bonding of a H atom be-longing to one water molecule to the other water moleculesand to the Cl− ions. Our experiments provide the first quan-tification of the effect on the vibrational dynamics.
Nevertheless, our TG results below 215 K exhibit a ther-mal behavior different from what is observed above that tem-perature:
• First, the zero frequency sound velocity is not the ana-lytical continuation of C0�T� at higher temperatures.The apparent zero frequency velocity has a negativeslope, Fig. 6, in this temperature range. We have arguedthat this may be due to the appearance, below 215 K, ofa new, extremely slow, relaxation process not detectablewith our experimental setup. The true C0�T� could stillbe the analytical continuation of the high temperaturecurve while the quantity determined in our experimentwould be an intermediary velocity originating from thecoupling of the longitudinal phonons to this process.
• Second, we have obtained direct evidence of the cou-pling of the longitudinal phonons, in this temperaturerange, to an additional relaxation process. This processis a “� relaxation” process, i.e., which separates around210 K from the main relaxation one, and it has beendescribed, in earlier experiments12,16,30 as due to the re-orientation of the water molecules.
The existence of this extra coupling is, in fact, surpris-ing. In a simple molecular supercooled liquid, this reorienta-tional dynamics directly appears19 as the “OKE part” of theHD-TG signal, a signal which takes place at so short a time�t�1 ns� that it cannot be studied with the LENS setup usedfor the present experiment. Conversely, at longer times, thisdynamics simply renormalizes the shear viscosity,31 thus ap-pearing indirectly in the longitudinal viscosity but not as aprocess that directly couples to the longitudinal phonons, Eq.�2.1�. We thus suggest that the � process detected here par-allels the reorientational motion of the water molecules but isdifferent from it.
In conclusion, the present study of a LiCl, 6H2O solutionfulfills only partly its initial objective:
• Between 300 and 215 K, our results validate the sce-nario anticipated for supercooled water: C0�T� continu-ously decreases with decreasing temperature while�T�, the coupling constant with the relaxation process,increases so much that the infinite frequency sound ve-locity, C��T�, also increases sharply.
• Conversely, the change in regime around 210 K is pre-sumably not related to the vicinity of a hypotheticalcritical point similar to that of supercooled water. It
originates more likely from a specific interaction be-tween the solute, LiCl, and the water solvent. The con-sequences appear both in the thermal behavior of C0�T�,as measured in the present experiment, and in the exis-tence of a � relaxation which couples to the longitudi-nal phonons.
The study of those two effects requires experimentaltechniques and/or theoretical efforts that are beyond thescope of the present paper. Another approach is to try modi-fying their importance or, possibly, their appearance byslightly changing the solute. Replacing Cl− by Br− has beenshown32 to produce a solution that can be also supercooleddown to its Tg�140 K for the same R value. This is a routethat we expect to explore shortly.
ACKNOWLEDGMENTS
We wish to thank B. Canny, J. C. Chervin, and P.Munsch, from IMPMC, for their constant collaboration dur-ing the Brillouin experiment. All the HD-TG measurementshave been performed on the LENS instrument through theLENS 1459 contract, and we are grateful to P. Bartolini forhis frequent help during those experiments. Some of us wishalso to acknowledge different interesting discussions on theLiCl, 6H2O problem with D. Fioretto. Last but not least, weare grateful to J. Canny, from UPMC, who has largely as-sisted one of us �L.B.� in the careful preparation of thesamples.
APPENDIX: THE HD-TG SIGNALAT LOW TEMPERATURE
We discuss here some aspects of the ISTS signal fortemperatures at which the longitudinal phonons are longlived ��, damping constant, much smaller than the phononapparent frequency, �B /2�� but with a lifetime much shorterthan that of the thermal grating, �h. We focus on two timeregimes, t�1 /�B and 1 /�B� t��h, and we note, to startwith, that the ISTS contribution to the signal �see Eq. �2.6��is proportional to
− PL�t� �1
�hexp�− t/�h� , �A.1�
where � stands for a convolution product while PL�t� and�1 /�h�exp�−t /�h� are, respectively, the inverse Laplace trans-forms of the phonon propagator PL��� and of �1+ i��h�−1.
1. The tÈ1/�B, short time regime
In this time range, PL�t� corresponds to a highly under-damped phonon with frequency �B /2� for which
PL��� �1
�2 − ��B2 + 2i���
�A.2�
or, with ���B,
PL�t� �− 1
�Bsin �Bt exp�− �t� . �A.3�
A straightforward calculation leads to
124504-9 Phonons dynamics in supercooled LiCl, 6H2O J. Chem. Phys. 131, 124504 �2009�
Downloaded 02 Oct 2009 to 150.217.156.84. Redistribution subject to AIP license or copyright; see http://jcp.aip.org/jcp/copyright.jsp

ISTS�t�st =1
�B�h
1
�B2 + � −
1
�h2
��B�exp�− t/�h� − cos �Bt�
+ � −1
�h�sin �Bt . �A.4a�
For t�1 /�B�1 /���h, one obtains
ISTS�t�st =1
�b2�h
�1 − cos �Bt� . �A.4b�
The ISTS signal has a mean value equal to 1 /�B2�h plus an
oscillation with the same amplitude, ISTS�t=0� being equalto zero.
2. The 1/�™ t<�h, long time regime
We consider only those temperatures for which, on topof the previous conditions on the parameters, one has ��� t,i.e., a temperature-time domain where the structural relax-ation does not contribute anymore to the signal. This timerange corresponds to a frequency domain where � is sosmall with respect to �0=qC0 and to all the � j
−1 �where the � j
are the relaxation times which appear in Eq. �2.2�� that onecan approximate PL��� by −�0
−2. Equation �A.4� immedi-ately leads to
ISTS�t�lt =1
�02�h
. �A.5�
Equation �A.5� gives the value of the maximum of the ISTSsignal in this time domain, and this also represents the valueof the broad maximum of the total signal as the ISBS con-tribution is, by hypothesis, equal to zero at such times.
1 S. Magazu, G. Maisano, D. Majolino, F. Mallamace, P. Migliardo, F.Aliotta, and C. Vasi, J. Phys. Chem. 93, 942 �1989�.
2 R. Torre, P. Bartolini, and R. Righini, Nature �London� 428, 296 �2004�.3 See, for a review, W. Götze and L. Sjogren, Rep. Prog. Phys. 55, 241�1992�.
4 C. A. Angell, in Relaxations in Complex Systems, edited by K. L. Ngaiand G. B. Wright �NRL, Washington, DC, 1984�, p. 3.
5 R. J. Nelmes, J. S. Loveday, Th. Strässle, C. L. Bull, M. Gutherie, G.Hamel, and S. Klotz, Nat. Phys. 2, 414 �2006�.
6 See, for a review, O. Mishima and H. E. Stanley, Nature �London� 396,329 �1998�.
7 C. L. O’Connor and J. P. Schlupf, J. Chem. Phys. 47, 31 �1967�.8 Usual ice is a polycrystal, while ice crystallizes in the hexagonal system.9 H. Schober, M. M. Koza, A. Tölle, C. Masciovecchio, F. Sette, and F.Fujara, Phys. Rev. Lett. 85, 4100 �2000�.
10 H. E. Moran Jr., J. Phys. Chem. 60, 1666 �1956�.11 G. Vuillard and J. J. Kessis, Bull. Soc. Chem. Fr. 336, 2063 �1960�.12 N. J. Tao and S. M. Lindsay, J. Phys.: Condens. Matter 1, 8709 �1989�.13 N. J. Tao, G. Li, and H. Z. Cummins, Phys. Rev. B 43, 5815 �1991�.14 I. C. Halalay and K. A. Nelson, J. Chem. Phys. 97, 3557 �1992�.15 A. Elarby-Aouizerat, J. F. Jal, P. Chieux, L. M. Letoffé, P. Claudy, and J.
Dupuy, J. Non-Cryst. Solids 104, 203 �1988�.16 �a� P. O. Maurin, J. Dupuy-Philon, J. F. Jal, N. Asahi, J. Kawamura, T.
Kamiyama, and Y. Nakamura, Prog. Theor. Phys. Suppl. 126, 141�1997�; �b� P. O. Maurin, Ph.D. thesis, University of Lyon, 1998; �c� J.Chem. Phys. 109, 10939 �1998�.
17 G. P. Johari and M. Goldstein, J. Chem. Phys. 53, 2372 �1970�.18 �a� R. Torre, A. Taschin, and M. Sampoli, Phys. Rev. E 64, 061504
�2001�; �b� A. Taschin, P. Bartolini, R. Eramo, and R. Torre, ibid. 74,031502 �2006�.
19 R. M. Pick, C. Dreyfus, A. Azzimani, R. Gupta, R. Torre, A. Taschin, andT. Franosch, Eur. Phys. J. B 39, 169 �2004�.
20 A. Azzimani, C. Dreyfus, R. M. Pick, P. Bartolini, A. Taschin, and R.Torre, Phys. Rev. E 76, 011510 �2007�.
21 Y. Yang and K. A. Nelson, J. Chem. Phys. 104, 5429 �1996�.22 The possible role of the dielectric anisotropy of the molecules forming
the liquid is described in Ref. 19.23 M. Soltwisch, J. Sukmanowski, and D. Quitmann, J. Chem. Phys. 86,
3207 �1987�.24 L. Bove, C. Dreyfus, and R. M. Pick �in preparation�.25 �h�q� plays a role only in the t�1 s time regime, where the intensity of
the signal and �h�q� are the only relevant parameters. Both are thus ac-curately determined from this time domain. Their values do not interferewith the determination of the other parameters and �h�q� is found to beconstant in the whole temperature range that will be discussed here.
26 C. Dreyfus, M. J. Lebon, F. Vivicorsi, A. Aouadi, and R. M. Pick, Phys.Rev. E 63, 041509 �2001�.
27 A. El Hachadi, Ph.D. thesis, Université Claude Bernard, Lyon, 1991.28 Such a very long relaxation time is suggested by the photon correlation
spectroscopy measurements of Gomez �unpublished� on LiCl, 6H2O so-lutions in the Tg−Tg+10 K range which do not reveal more than onerelaxation process in the 10−6−1 s range.
29 Note that the thermal behavior of other quantities also changes in thevicinity of 200–210 K. This is the case for the shear viscosity of an R=5.75 solution �Ref. 33� which was reanalyzed by Prével et al. �Ref. 34�.The same paper reports a discontinuity in the spin echo signal of a LiCl,6D2O solution in the vicinity of that temperature. Prével et al. proposedthat those effects would be related to the temperature Tp=207 K at whichthe crystallized hydrate LiCl, 5H2O transforms into a supercooled liquidwith R�5 and a mixture of other R�5 crystals �Ref. 15�. Another struc-tural effect takes place at the eutectic temperature Te=199 K, namely,the crystallization of the stable R�7 solution under the form of ice andother hydrate microcrystals. The relationship between any of those struc-tural modifications and the change in the thermal behaviors discussedhere has not been worked out up to now.
30 F. Aliotta, C. Vasi, G. Maisano, D. Majolino, F. Mallamace, and P.Migliardo, J. Chem. Phys. 84, 4731 �1986�.
31 R. M. Pick, T. Franosch, A. Latz, and C. Dreyfus, Eur. Phys. J. B 31, 217�2003�.
32 J. J. Kessis, Bull. Soc. Chem. Fr. 7, 48 �1965�.33 C. T. Moynihan, R. D. Dressel, and C. A. Angell, J. Chem. Phys. 55,
3013 �1971�.34 B. Prével, J. Dupuy-Phillon, J. F. Jal, J. F. Legrand, and P. Chieux, J.
Phys.: Condens. Matter 6, 1279 �1994�.
124504-10 Gallina et al. J. Chem. Phys. 131, 124504 �2009�
Downloaded 02 Oct 2009 to 150.217.156.84. Redistribution subject to AIP license or copyright; see http://jcp.aip.org/jcp/copyright.jsp
Copyright © 2022 FDOKUMEN