The limits of resilience: Distress following chronic political violence among Palestinians
23
The Limits of Resilience: Distress Following Chronic Political Violence among Palestinians Stevan E. Hobfoll, Rush Medical College Anthony D. Mancini, Pace University Brian J. Hall, Rush Medical College and Kent State University Daphna Canetti, and University of Haifa George A. Bonanno Teachers College Columbia University Abstract We examined posttraumatic stress disorder (PTSD) and depression symptom trajectories during ongoing exposure to political violence, seeking to identify psychologically resilient individuals and the factors that predict resilience. Face-to-face interviews were conducted with a random sample of 1196 Palestinian adult residents of the West Bank, Gaza, and East Jerusalem across three occasions, six months apart (September, 2007–November,2008). Latent growth mixture modeling identified PTSD, and depression symptom trajectories. Results identified three PTSD trajectories: moderate-improving (73% moderate symptoms at baseline, improving over time), severe-chronic (23.2% severe and elevated symptoms over the entire year); and severe-improving (3.5% severe symptoms at baseline and marked improvement over time). Depression trajectories were moderate-improving (61.5%); severe-chronic (24.4%); severe-improving (14.4%). Predictors of relatively less severe initial symptom severity, and improvement over time for PTSD were less political violence exposure and less resource loss; and for depression were younger age, less political violence exposure, lower resource loss, and greater social support. Loss of psychosocial and material resources was associated with the level of distress experienced by participants at each time period, suggesting that resource-based interventions that target personal, social and financial resources could benefit people exposed to chronic trauma. Keywords Palestinian; war; mass casualty; political violence; PTSD; depression; resilience; resistance; West Bank; Gaza © 2011 Elsevier Ltd. All rights reserved. Correspondence should be sent to Stevan E. Hobfoll, Ph.D. Department of Behavioral Sciences, Rush University Medical Center, 1645 W. Jackson Blvd., Chicago, Illinois, 60612, U.S.A. [email protected]. Publisher's Disclaimer: This is a PDF file of an unedited manuscript that has been accepted for publication. As a service to our customers we are providing this early version of the manuscript. The manuscript will undergo copyediting, typesetting, and review of the resulting proof before it is published in its final citable form. Please note that during the production process errors may be discovered which could affect the content, and all legal disclaimers that apply to the journal pertain. NIH Public Access Author Manuscript Soc Sci Med. Author manuscript; available in PMC 2012 April 1. Published in final edited form as: Soc Sci Med. 2011 April ; 72(8): 1400–1408. doi:10.1016/j.socscimed.2011.02.022. NIH-PA Author Manuscript NIH-PA Author Manuscript NIH-PA Author Manuscript
Transcript of The limits of resilience: Distress following chronic political violence among Palestinians

The Limits of Resilience: Distress Following Chronic PoliticalViolence among Palestinians
Stevan E. Hobfoll,Rush Medical College
Anthony D. Mancini,Pace University
Brian J. Hall,Rush Medical College and Kent State University
Daphna Canetti, andUniversity of Haifa
George A. BonannoTeachers College Columbia University
AbstractWe examined posttraumatic stress disorder (PTSD) and depression symptom trajectories duringongoing exposure to political violence, seeking to identify psychologically resilient individualsand the factors that predict resilience. Face-to-face interviews were conducted with a randomsample of 1196 Palestinian adult residents of the West Bank, Gaza, and East Jerusalem acrossthree occasions, six months apart (September, 2007–November,2008). Latent growth mixturemodeling identified PTSD, and depression symptom trajectories. Results identified three PTSDtrajectories: moderate-improving (73% moderate symptoms at baseline, improving over time),severe-chronic (23.2% severe and elevated symptoms over the entire year); and severe-improving(3.5% severe symptoms at baseline and marked improvement over time). Depression trajectorieswere moderate-improving (61.5%); severe-chronic (24.4%); severe-improving (14.4%). Predictorsof relatively less severe initial symptom severity, and improvement over time for PTSD were lesspolitical violence exposure and less resource loss; and for depression were younger age, lesspolitical violence exposure, lower resource loss, and greater social support. Loss of psychosocialand material resources was associated with the level of distress experienced by participants at eachtime period, suggesting that resource-based interventions that target personal, social and financialresources could benefit people exposed to chronic trauma.
KeywordsPalestinian; war; mass casualty; political violence; PTSD; depression; resilience; resistance; WestBank; Gaza
© 2011 Elsevier Ltd. All rights reserved.Correspondence should be sent to Stevan E. Hobfoll, Ph.D. Department of Behavioral Sciences, Rush University Medical Center,1645 W. Jackson Blvd., Chicago, Illinois, 60612, U.S.A. [email protected]'s Disclaimer: This is a PDF file of an unedited manuscript that has been accepted for publication. As a service to ourcustomers we are providing this early version of the manuscript. The manuscript will undergo copyediting, typesetting, and review ofthe resulting proof before it is published in its final citable form. Please note that during the production process errors may bediscovered which could affect the content, and all legal disclaimers that apply to the journal pertain.
NIH Public AccessAuthor ManuscriptSoc Sci Med. Author manuscript; available in PMC 2012 April 1.
Published in final edited form as:Soc Sci Med. 2011 April ; 72(8): 1400–1408. doi:10.1016/j.socscimed.2011.02.022.
NIH
-PA Author Manuscript
NIH
-PA Author Manuscript
NIH
-PA Author Manuscript

Research on mass casualty events, including political violence, has overwhelmingly focusedon pathological responding in the face of traumatic stress (Galea et al., 2002; de Jong,Komproe, Van Ommeren, El Masri, Araya, Khaled et al., 2001; Punamaki, Komproe, Qouta,Elmasri, & de Jong, 2005). However, a contrasting viewpoint suggests that a majority ofthose exposed to trauma evidence a relatively stable trajectory of healthy functioning, orquick recovery, indicative of psychological resilience (Bonanno, 2004; Bonanno, Galea,Bucciarelli, & Vlahov, 2007). The complete absence of a stress response, called stressresistance has also been observed, although less commonly than resilient outcomes ((Layne,Warren, Shalev, & Watson, 2007).
The bulk of research on resilience and resistance has examined responses to isolated, time-limited stressor events, or personal crises (Bonanno, Westphal, & Mancini, 2011). Incontrast, the single prior study of resilience and resistance in the face of chronic masscasualty, focusing on actually doing well, or at least being relatively symptom-free, foundthat a majority of the population in Israel did not display resilience or resistance patterns(Hobfoll, Palmieri, Johnson, Canetti-Nisim, Hall, & Galea, 2009). This study suggesting thepossibility that individual level traumas are not directly comparable to chronic mass casualtycircumstances, even in the relatively high resource nation of Israel. Further, this study foundthat the predictors of resilience and resistance mirror the predictors of psychopathologyunder chronic mass casualty conditions, which is a critical finding, as it would suggest thatefforts to strengthen the population would positively impact both the vulnerable andgenerally resilient segments of the population.
Studies have increasingly examined the impact of war and political turmoil in low-incomecountries as well as the predictors of PTSD and depression in such contexts (Bayer, Klasen,& Adam, 2007; Cardozo et al., 2000; de Jong et al., 2001; Eggerman & Panter-Brick, 2010;Panter-Bricker, 2010; Vinck, Pham, Stover, & Weinstein, 2007). The region of thePalestinian Authority is one such region where chronic, severe stress circumstances havepredominated during recent years due to the social, economic, and violent repercussions ofIsraeli military occupation, Palestinian militant resistance to that occupation, and Palestinianfactional infighting. Studies of adult Palestinians have found marked levels of PTSD,depression, and physical health problems (Ai, Peterson, & Ubelhor, 2002; Cardozo, Vergara,Agani, & Gotway, 2000; de Jong et al., 2001). This includes our own prior work on thesame sample under study here (Canetti, Galea, Hall, Johnson, Palmieri, & Hobfoll, 2010;Hobfoll, Hall, & Canetti, in press).
Our aim in the current investigation was to further explore variations in adjustmentfollowing mass casualty by empirically modeling the prevalence of different symptomtrajectories in a population-based study of Palestinians living in Gaza, the West Bank, andEast Jerusalem. We were particularly interested in the prevalence of the resilience andrecovery trajectories in this population as well as the predictors of those trajectories. Suchtrajectory analysis allows for revealing of positive, or healthy trajectories that prior methodsdo not uncover. As such, this methodological advance also constitutes as major difference inhow resilience and resistance can be explored. Further, although we based our study on aPalestinian population because of their exposure to chronic adversity, our interest was in thebroader context of chronic events as they occur in many regions of the world.
Among the variables associated with more favorable outcomes following trauma exposureare demographic factors, such as higher education, being male, and higher income (Bonannoet al., 2007; Hobfoll et al., 2009; Norris et al., 2002). These indicators are thought to berelated to more favorable outcomes, in part, because they reflect having greater access toother psychosocial resources, status, and financial resources (Bonanno et al., 2007; Hatch &Dohrenwend, 2007; Hobfoll, 1989). Religiosity has also been indicated in some research to
Hobfoll et al. Page 2
Soc Sci Med. Author manuscript; available in PMC 2012 April 1.
NIH
-PA Author Manuscript
NIH
-PA Author Manuscript
NIH
-PA Author Manuscript
be a resiliency resource, but other studies have found religiosity to be related to poorercoping in the face of trauma (Chen & Koenig, 2006; Hobfoll, et al., 2008). This treatment ofdemographic variables as resources is consistent with the foundational work of Hollingsheadand Redlich (1958), and a long-term sociological tradition, which indicated that thesedemographic factors were social structures associated with privilege, lifestyle, andpossessing desired (and undesirable) status roles (Hatch & Dohrenwend, 1997).
Examining mass casualty events, studies have found that possessing psychosocial resources(e.g., self-efficacy, social support) and sustaining them (i.e., not losing resources) is alsorelated to more favorable outcomes (Bleich, Gelkopf, Melamed, & Solomon, 2006; Bonannoet al., 2010; Eggerman & Panter-Brick, 2010; Galea et al; 2002; Hobfoll et al., 2009). Suchfindings are consistent with Hobfoll’s (1989; 1998) conservation of resources (COR) theorythat posits that people’s psychosocial resources create a protective web that enables them toreceive emotional and task support, sustain everyday life tasks and the special demands thataccompany trauma, and provides an objective basis that supports the belief that they will beable to do reasonably well in the face of trauma. This is particularly important during timesof sustained trauma, such as Palestinians have experienced, as resources are challenged andmay be overwhelmed with chronic demand and because loss cycles during suchcircumstances oftentimes are of both great impact and move quickly (de Jong, 2002;Palmieri, Canetti-Nisim, Galea, Johnson, & Hobfoll, 2008), and in ways that are notexplained by the trauma exposure alone (Miller & Rasmussen, 2010).
In a prospective 3-wave study of a national sample of Palestinians, we framed ourhypotheses in the context of repeated or chronic traumatic circumstances. This study goesbeyond our prior studies on this sample by searching for resilience and resistancetrajectories, whereas our and other’s prior work has focused entirely on levels of PTSD anddepression symptoms or diagnosis. Trajectory analyses allow for an uncovering of the fullrange of outcomes, which is not possible in analyses of distress levels where thoseexperiencing low, or virtually no distress are lumped together with those under mid-distressand compared to those under high distress. We examined the following hypotheses, whichhad not been tested in our earlier studies on this sample:
1. We expected to find several trajectories that have been noted in prior research in regionsexperiencing political violence. Specifically, we anticipated:
A chronically distressed trajectory, as indicated by moderate to high symptomatologysustained across the duration of our study. Given the plight of Palestinians, we predicted thatthis would be a common trajectory.
A recovery trajectory, as indicated by initially high symptom levels that gradually decreaseacross time. We believed that this might be the most common trajectory, as during our studythe intensity of the Intifada was declining, violence was easing, the economy wasimproving, and freedom of mobility was improving, even if all these stressors were stillconsiderable.
A delayed distress trajectory, as indicated by initially moderate levels of psychologicaldistress that increase across time. This trajectory has generally been found to be of limitedsize, but notable nonetheless, and is an indication of people who are initially experiencingsub-threshold pathology but gradually succumb to the pressures in their environment.
A relatively resilient trajectory, indicated by relatively consistently low levels of symptomsacross the duration of our study. Although prior studies have found this to be the mostcommon trajectory, we expected it to be rarer given the omnipresent violence and other
Hobfoll et al. Page 3
Soc Sci Med. Author manuscript; available in PMC 2012 April 1.
NIH
-PA Author Manuscript
NIH
-PA Author Manuscript
NIH
-PA Author Manuscript
chronic stressors Palestinians encountered during this period, but still not an uncommontrajectory.
Given the degree of trauma exposure, we predicted that there would be no resistancetrajectory in the current sample, as Conservation of Resources theory would predict thatsuch chronic distress would have exhausted individual and community resources to too greata degree.
2. We hypothesized that predictors of these trajectories would be evidenced as follows:
Persons exhibiting the resilience and recovery trajectories would have greater economic andmaterial resources (e.g., males, and people having higher income and education levels)compared to the persons exhibiting the chronic distress and delayed distress trajectories.
Persons exhibiting the resilience and recovery trajectories would have greater social support,less political violence exposure, and less psychosocial and material resource loss comparedto persons exhibiting the chronic distress and delayed distress trajectories.
Based on prior research, we did not expect differences between the chronic and delayeddistress trajectories.
MethodsFace-to-face interviews were conducted across three measurement occasions (Baselineinterview from September 17th to October 16th, 2007; 6-month follow-up from October 15,2008 to November 1, 2008; 12-month follow-up from May 29, 2009 to June 10, 2009) withan initial sample of 1196 people over the age of 18 in the West Bank, Gaza Strip, and EastJerusalem. Interviewers were Palestinians from the local population who were trained ininterviewing techniques and supervised by experienced interview supervisors. Most wereprofessionals in the areas of social work and teaching. For the purpose of achieving a marginof error of 3%, the sample size was set to be around 1200 participants. The sampling wasconducted using a stratified 3-stage cluster random sampling strategy. First, 60 clusters wereselected with populations of 1,000 or more individuals (after stratification by district andtype of community – urban, rural, and refugee camp) with probabilities proportional to size,using the most currently available census information. Next, 20 households in each of thechosen clusters were selected. The third stage involved selecting one individual in eachhousehold using Kish Tables. We visited each sampled household at least 3 times tocomplete the interview. Once the identified individual was identified, the study waspresented as confidential and part of an international study of the stress on Palestinians.Participants provided verbal informed consent and were paid the equivalent of about $5(U.S.D.).
The study was approved by the institutional review boards of Rush University MedicalCenter, The University of Haifa, and Kent State University.
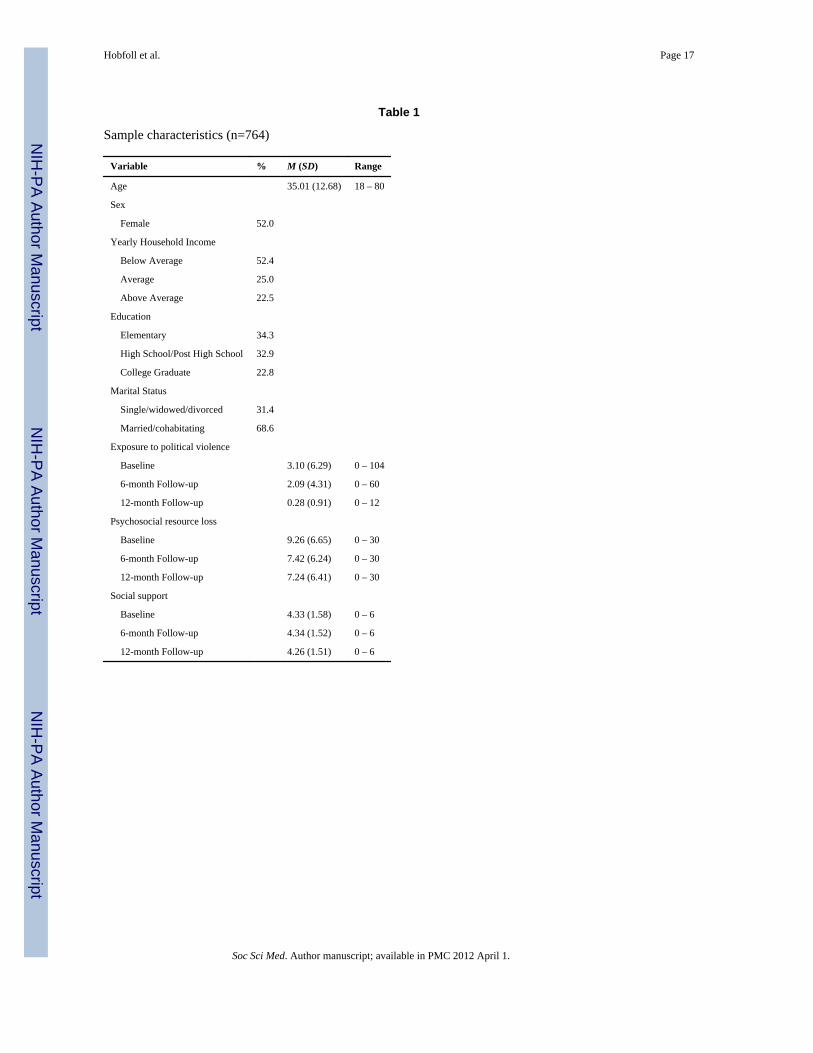
ParticipantsParticipants were 764 Palestinian adults living in the West Bank, Gaza Strip, and EastJerusalem who completed interviews at all three measurement occasions. This samplecomprised 64.0% of the 1,196 people who completed the baseline interview and 86% of the889 who participated at the 12-month study follow-up. The overall rate of attrition was 36%,which is deemed acceptable (Vinck et al., 2007) and the retained sample paralleled theknown Palestinian population demographics in age, economic status, and sex, (ICBS, 2007;Vinck et al., 2007) (see Table 1). When comparing rates of attrition across the three regions,
Hobfoll et al. Page 4
Soc Sci Med. Author manuscript; available in PMC 2012 April 1.
NIH
-PA Author Manuscript
NIH
-PA Author Manuscript
NIH
-PA Author Manuscript
it was noted that East Jerusalem represented the largest proportion of attrition (35%compared to 30.5% West Bank and 32% for Gaza, χ2 = 2, 100.51, p < .001).
To assess possible differences between the analyzed and the attrition sample, chi-squaretests and independent samples t-tests were conducted on all independent variables atbaseline assessment. Only income differed, with drop-outs reporting higher householdincomes (M = 1.82, SD = .85) than those retained (M = 1.64, SD = .79), t(1160) = −3.66, p< .001.
Study Instruments and VariablesAll interview measures were translated and back-translated into Arabic. In previous studies,these measures were found to have sound psychometric properties in this population(Hobfoll, Hall & Canetti, in press; Canetti et al., in press). Each interview lastedapproximately 45 to 60 minutes. Participants reported their sex, marital status single/divorced/separated/widowed, married), age, education (less than high school, high schoolgraduate, some college, college graduate) and income within three categories ranging fromless than average to more than average.
Region of residence was coded as East Jerusalem, Gaza, and the West Bank, as these arethree distinct geo-political regions with quite different circumstances. East Jerusalem is mostcontiguous and interactive with Israel, and essentially borderless with Israel. It is also thearea most in contention in any future settlement. Gaza is most economically deprived,isolated, and governed by Hamas. The West Bank is economically challenged, under clearmilitary occupation, and under the governance of the more moderate Fatah political party.
Exposure to political violence was assessed by three items that were summed. Participantsself-reported the total number of times they had experienced any of the following as a directresult of the Intifada or political violence: 1) a death of a family member or a friend, 2) aninjury to a family member, friend, or to themselves, or whether they 3) witnessed politicalviolence. At the first measurement wave, participants provided information about whetherthese events occurred during the past year, or within the past three months. At eachsubsequent measurement wave, participants answered these questions about eventsoccurring since the previous interview.
Loss of psychosocial and material resources related to exposure to political violence wasassessed using a 10-item scale from the Conservation of Resources Evaluation (COR-E;Hobfoll & Lilly, 1993). Participants were asked “To what extent have you lost any of thefollowing things in the past year as a result of violence among factions?” Items include:“feeling that you are successful,” “feeling that you are of great value to other people,”“stability of your family,” “intimacy with at least one friend,” “hope, “sense of control inyour life,”, “the feeling that life has meaning and purpose,” “Faith in the ability ofgovernment to protect you and your family,” “economic loss,” and “loss of employment orbusiness.” Participants indicated the degree they lost these resources on a 4-point scale withitem responses ranging from 0 (did not lose at all) to 3 (lost very much). All items weresummed to represent a total loss score, with higher numbers indicating greater resource loss.
Social support satisfaction was measured rated from 0 (not at all satisfied) to 3 (verysatisfied). “How satisfied are you with the social support you receive from your… 1)“family,” 2) “friends.”
PTSD symptoms occurring within the past month owing to exposure to political violencewere assessed with the well-validated 17-item PTSD Symptom Scale Interview (PSS-I; Foa,Riggs, Dancu, & Rothbaum, 1993), which has been shown to be reliable and valid among in
Hobfoll et al. Page 5
Soc Sci Med. Author manuscript; available in PMC 2012 April 1.
NIH
-PA Author Manuscript
NIH
-PA Author Manuscript
NIH
-PA Author Manuscript

non-Western, low-income regions (Hobfoll et al., 2008; Palmieri et al., 2008). Items (0 (notat all) to 3 (very much)) were summed to create a total score. Alpha was .86,- .89 acrosswaves).
Symptoms of depression were assessed using the 9-item Patient Health Questionnaire-9, awell-validated, highly sensitive instrument for identifying depression symptom severity(Kroenke, Spitzer, & Williams, 2001), used in Israeli Palestinian populations (Hobfoll et al.,2009). Responses were based on a 4-point rating scale with 0 (not at all), 1 (several days), 2(more than half the days), and 3 (nearly every day) (alpha= .85–.90 across waves).
Statistical AnalysisWe used a latent growth mixture model (LGMM) framework to group participants intodifferent patterns of change in depression and PTSD across time (Muthé, 2004).1 In effect,LGMM tests whether the population under study is composed of a mixture ofsubpopulations that display these distinct trajectories of change across time. The trajectoriesare determined through growth parameters (latent continuous variables) that can be definedin different ways. Typically, an intercept, linear, and quadratic model is tested, thoughgrowth can also be defined in terms of cubic change or can be freely estimated based on thedata themselves. The degree of heterogeneity in these patterns determines whether multipletrajectories of response are characteristic of the data, and the groupings are defined bycategorical latent variables, similar to a factor structure in factor analysis.
We used Mplus 5.1 to identify latent trajectories. Mplus employs a robust full-informationmaximum-likelihood (FIML) estimation procedure for handling missing data. FIMLassumes missing data are unrelated to the outcome variable (missing at random). Ouranalyses consisted of three steps. First, we identified a univariate single-class growth modelwithout covariates to facilitate model specification for the LGMM. Second, we comparedone- to five-class unconditional LGMMs (no covariates), assessing relative fit withconventional indices, including the Bayesian, sample-size adjusted Bayesian, and Aikaikeinformation criterion indices, entropy values, the Lo-Mendell-Rubin likelihood test (LRT:Lo, Mendell, & Rubin, 2001), and the bootstrap likelihood ratio test (BLRT: Nylund,Asparouhov, & Muthén, 2007). We sought a model with lower values for the criterionindices, higher entropy values, and significant p values for both the LRT and the BLRT. Wealso used theory regarding prototypical trajectories to inform our model selection.
ResultsSimple Growth Models
For both PTSD and depression symptoms, we began by estimating a simple growth model.Using the likelihood ratio chi-square test to determine fit, we examined models with anintercept parameter (no growth), and intercept and slope parameters (linear growth). Thelinear model provided a significant improvement in fit over the intercept only model for
1LGMM is one of a group of latent variable techniques that identifies meaningful subpopulations within a larger population ofindividuals based on heterogeneous patterns of growth in an outcome across time. Related techniques, such as latent class growthanalysis (Jung & Wickrama, 2008) and group-based modeling (Nagin, 1999), also seek to group individuals into meaningfulsubpopulations based on longitudinal growth patterns. In the present study, we employed LGMM based on the considerableheterogeneity evidenced in previous work on acute stressors (Bonanno, 2004), which suggested that a similar degree of inter-individual variability would be present in responses to a chronic stressor. LGMM is widely acknowledged as the most powerfulmethod of diagnosing this population heterogeneity (Muthen, 2004). LGMM is distinguished from other approaches by its capacitynot only to use latent continuous (intercept, slope) and categorical variables (trajectory class) but also to model the variances for thesevariables within each class. This allows for greater flexibility in characterizing growth, a particularly important consideration when agreater degree of heterogeneity is present.
Hobfoll et al. Page 6
Soc Sci Med. Author manuscript; available in PMC 2012 April 1.
NIH
-PA Author Manuscript
NIH
-PA Author Manuscript
NIH
-PA Author Manuscript

both depression and PTSD symptoms, indicating an overall pattern of change in depressionand PTSD symptoms across time.
Before testing different class solutions, we varied model parameters to ensure modelconvergence and inspected modification indices to obtain the best fit. Log likelihood-ratiochi-square testing of multi-class models indicated that allowing intercept parameter to varyfreely across classes (random effect) while fixing the variance of the slopes across classes(fixed effect) provided the best fitting model for both PTSD and depression symptoms.
Data were collapsed for the three regions (West Bank, Gaza, and East Jerusalem), as priorstudy of the full sample found no differences by region for PTSD or depression (χ2(2, N =1106) = 1.00, p=.606; χ2(2, N = 1106) = .367, p=.832, respectively) (Canetti, et al., 2010),and preliminary trajectory analysis also rejected region as a covariate, indicating that it didnot predict beyond what was predicted by the exposure or loss variables.
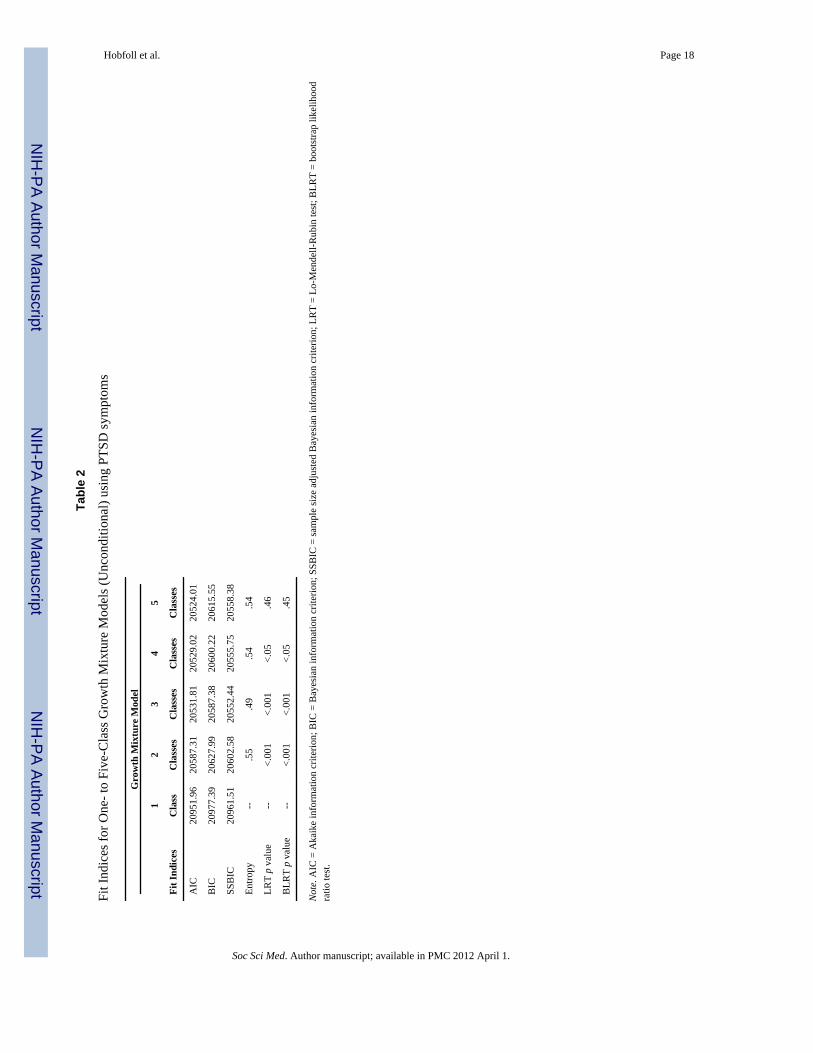
Trajectory Class Solutions for Symptoms of PTSD and DepressionPTSD Trajectories—As shown in Table 2, the information criterion indices showeddecreasing Aikaike Information Criterion (AIC) values for each additional class going from2 to 5 classes; Bayesian Information Criterion (BIC) decreased from 1 to 3 classes and thenbegan to increase. Entropy was similar across class solutions. However, the guidance offeredby Lo-Mendell-Rubin test (Lo, Mendell, and Rubin, 2001) suggested that either a 3- or 4-class solution represented the best fit to the data. Both the 3- and 4-class solutions describedsimilar patterns. The 3- class solution revealed groups with conceptually interpretablesymptoms (Bonanno, 2004): one group had initially moderate PTSD symptoms that grewworse over time, another group had initially moderate PTSD symptoms that improved overtime, and a third group had elevated PTSD symptoms but showed marked improvement overtime. The 4-class solution was similar to the 3-class solution but split the improved groupinto two. Based on the fit statistics and conceptual interpretability, then, we selected the 3-class solution as optimal (Curran & Hussong, 2003; Nylund, Asparouhov, and Muthén,2007).
The next step was to include relevant baseline covariates in a conditional model. Inclusionof six covariates improved model fit: age, income, social support, exposure to violence,recent trauma exposure, and resource loss. In the final model, class assignment and theintercept parameter were regressed on the covariates. Table 3 shows growth parameterestimates for the three-class conditional model and Figure 1 depicts the trajectories ofestimated mean PTSD symptom scores for each class across time. By far the most commontrajectory was characterized by a moderate level of PTSD symptoms at T1 and a slight butsignificant decline in PTSD symptoms across time. This trajectory, which we labeledmoderate-improving, was assigned to 73.3% of the sample. The next most commontrajectory was characterized by a severe level of PTSD symptoms at T1 that remainedelevated across time. We labeled this trajectory, severe-chronic, and it was assigned to23.2% of the sample. The remaining class was characterized by a severe level of PTSDsymptoms at T1 and marked decrease in PTSD symptoms across time. This trajectory,which we labeled severe-improving accounted for 3.5% of the sample. No delayed distresstrajectory was noted.
Covariate prediction of PTSD intercept and class membership—To assess therole of baseline covariates in the LGMM, we examined predictors of the class intercepts.Within each class, resource loss was a significant predictor of a higher intercept. To examineprediction of class membership, we conducted a series of logistic regression analyses. Theseanalyses revealed the following group differences. Baseline resource loss was greater in thesevere-improving group compared to all other groups: severe-improving (B = −6.34, SE =
Hobfoll et al. Page 7
Soc Sci Med. Author manuscript; available in PMC 2012 April 1.
NIH
-PA Author Manuscript
NIH
-PA Author Manuscript
NIH
-PA Author Manuscript

1.51, p < .001), moderate-improving (B = −3.48, SE = .96, p < .001), and severe-chronic (B= −5.09, SE = 1.16, p < .001). The moderate-improving group also had significantly greaterbaseline resource loss than the severe-chronic group (B = −1.61, SE = .45, p < .001) and thesevere-improving group (B = −2.85, SE = 1.12, p < .01). Baseline exposure to violence wassignificantly greater in the severe chronic group than the moderate-improving group (B = −.91, SE = .029, p < .001) and the severe-improving group (B = −0.37, SE = .019, p =.05). Thesevere-improving group also had greater baseline exposure to political violence than themoderate-improving group (B = −.85, SE = .034, p <.05). Recent trauma exposure in the 3months prior to T1 was greater in the moderate-improving group than the severe-improvinggroup (B = 2.34, SE = 1.20, p =.05). Baseline income did not differentiate the groups.
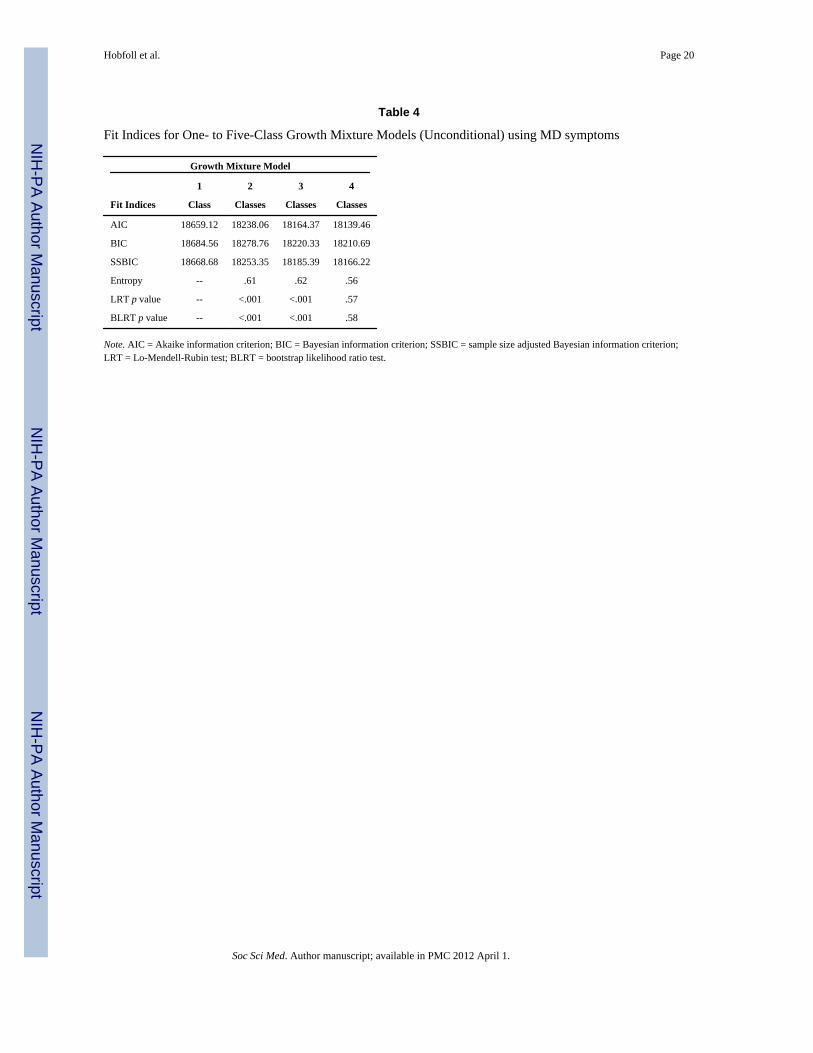
Depression trajectories—We next applied the approach described above to depressionsymptoms. As shown in Table 4, the information criterion indices showed decreasing AICand BIC values for each additional class going from 2 to 4 classes. However, both the Lo-Mendell-Rubin tests and entropy values clearly suggested that a 3-class solution representedthe best fit to the data. Therefore, we selected the 3-class solution as optimal for depressionsymptoms.
As in the previous analyses, the next step was to include relevant baseline covariates in aconditional model for symptoms of depression. Inclusion of five covariates improved modelfit: recent exposure to political violence, age, income, resource loss, and social support. Inthe final model, class assignment and the intercept parameters were regressed on thecovariates. Table 5 shows growth parameter estimates for the three-class conditional modeland Figure 2 shows the mean depression scores for each class across time. Similar to theanalysis for PTSD symptoms, the most common trajectory was characterized by a moderatelevel of depression symptoms at T1 and a slight but significant decline in depressionsymptoms across time. This trajectory, which we labeled moderate-improving, was assignedto 61.5% of the sample. The next most common trajectory was characterized by a moresevere level of depression at T1 and then steadily worsening depression symptoms acrosstime. We labeled this trajectory, severe-chronic, and it was assigned to 24.4% of the sample.The remaining trajectory captured was characterized by severe depression at T1 and then amarked decline in symptoms over time. We labeled this trajectory severe-improving. Itcaptured 14.1% of the sample. Again, no delayed distress group was found.
Covariate prediction of depression class membership—The role of baselinecovariates in the LGMM were again examined in a series of logistic regression analyses.These analyses revealed the following group differences. Baseline resource loss was greaterin the severe-improving group compared to the two other groups: severe-chronic (B = −3.10,SE = 1.29, p < .001), moderate-improving (B = −3.81, SE = .90, p < .001). The severe-chronic distress group had significantly greater recent trauma exposure than the moderate-improving group (B = −.35, SE = .13, p < .01). The severe-chronic distress group also hadsignificantly lower baseline social support than the moderate-improving group (B = .91, SE= .37, p < .05). The severe-chronic distress group was older in age at baseline than both themoderate-improving group (B = −.038, SE = .015, p < .05) and the severe-improving group(B = −.049, SE = .024, p =.05). Baseline income again failed to differentiate the groups.
Predictors of Class MembershipIn order to more fully examine predictors of the latent class trajectories, we conductedmultinomial logistic regression analyses. Included variables were participant sex, age,income, education, marital status, exposure to political violence at T1, T2, and T3, resourceloss at T1, T2 and T3, and social support at T1, T2 and T3.
Hobfoll et al. Page 8
Soc Sci Med. Author manuscript; available in PMC 2012 April 1.
NIH
-PA Author Manuscript
NIH
-PA Author Manuscript
NIH
-PA Author Manuscript
Predictors of PTSD classes—For the first model, we compared the likelihood of beingin Class 3 (severe-chronic distress) to Class 1 (moderate-improving) and Class 2 (severe-improving) by specifying Class 3 as the reference group in the models. See Table 6 forcomplete results. For model 2, we specified Class 1 (moderate-improving) as the referencecategory in order to compare Class 1 and Class 2.
Results of Model 1 indicated that being a member of the moderate-improving group asopposed to the severe-chronic distress group was predicted by being male (OR = .61, p = .04), being younger (OR = .96, p < .001), having less exposure to political violence at T1(OR = .91, p < .001), greater resource loss at T1 (OR = 1.38, p < .001), and greater socialsupport at T1 (OR = 1.38, p < .001). Being a member of the moderate-improving group asopposed to the severe-chronic distress group was predicted by less resource loss at T2 (OR= .88, p < .001), and by less resource at T3 (OR = .89, p < .001).
Being a member of the severe-improving group as opposed to the severe-chronic distressgroup was predicted by having less exposure to political violence at T1 (OR = .93, p = .004),greater resource loss at T1 (OR = 2.59, p < .001), less resource loss at T2 (OR = .85, p = .005), greater exposure to political violence at T3 (OR = 2.30, P = .004) , and less resourceloss at T3 (OR = .65, p < .001).
Results of Model 2 indicated that being a member of the severe-improving group comparedto the moderate-improving group was predicted by greater resource loss at T1 (OR = 1.88, p< .001), and less social support at T1 (OR = .58, p = .005) and by greater exposure topolitical violence (OR = 2.78, p < .001) and less resource loss at T3 (OR = .74, p < .001).
Predictors of Depression Classes—For the first model, we compared the likelihood ofbeing in Class 3 (severe-chronic) to Class 2 (moderate-improving) and Class 1 (severe-improving) by specifying Class 3 as the reference group in the models. For model 2, wespecified Class 2 as the reference category in order to compare Class 1 and Class 2. SeeTable 7 for complete results.
Results of Mode1 indicated that being a member of the moderate-improving group asopposed to the severe-chronic group was predicted by being younger (OR = .94, p < .001),having less resource loss at T2 (OR = .90, p < .001) and at T3 (OR = .86, p < .001), andhaving greater social support at T1 (OR = 1.56, p < .001).
Being a member of the severe-improving as opposed to the severe-chronic group was bybeing male (OR = .38, p < .05), being younger (OR = .92, p < .001), having greater resourceloss at T1 (OR = 2.22, p < .001), less resource loss at T3 (OR = .70, p < .001), and lesssocial support at T1 (OR = .65, p = .006).
Results of Model 2 indicated that being a member of the severe-improving group comparedto the moderate-improving group was predicted by greater resource loss at T1 (OR = 2.19, p< .001), less social support at T1 (OR = .42, p < .001), greater resource loss at T2 (OR =1.08, p = .04) and less resource loss at T3 (OR = .81, p < .001)
DiscussionOur most striking finding is the generally higher prevalence of PTSD and depression,combined with the relative absence of truly resilient, resistant, or full recovery trajectoriescompared to prior studies of these patterns. Indeed, as predicted, a healthy resilient/resistanttrajectory was not identified in any analyses. Although this may appear obvious given thelevel of environmental threat and loss in the region, prior studies of even severe communitytrauma in many regions of the world (Bonanno, Brewin, Kaniasty, & LaGreca, 2010;
Hobfoll et al. Page 9
Soc Sci Med. Author manuscript; available in PMC 2012 April 1.
NIH
-PA Author Manuscript
NIH
-PA Author Manuscript
NIH
-PA Author Manuscript

Hobfoll et al., 2009) and personal health trauma (Bonanno et al., 2011) revealed asubstantive relatively unscathed subgroup and a more fully recovered group. This suggests anecessary addendum to Bonanno’s view of resilience and recovery when it is applied torepetitive or chronic severe trauma circumstances. Consistent with Conservation ofResources (COR) theory (1998), and our own prior study of resistance and resilience in ahigher income population exposed to chronic political violence (Hobfoll et al., 2009), overtime resiliency resources can be overburdened and a much more sizable percent of thepopulation may becomes symptomatic. This does not mean that recovery does not occur, butrather that it may take more time for the recovery process to be enacted, and that fewindividuals will be resistant to stress.
Differences between our current and prior study of resilience and resistance among IsraeliJews and Palestinians are notable (Hobfoll et al., 2009). In that study, exposure to terrorismand war was not statistically significant, whereas psychosocial and resource loss was.Further, that study, while focusing on a high distress population, still revealed a smallpercent of resilient and resistant individuals. This suggests that the much greater levels ofchronic, repeated trauma and the much poorer resources among Palestinians in this regionmay contribute to these differences. As such, although Israelis have experienced majortrauma and traumatic threat, Israelis reside a one of the wealthier nations in the world, andhave a manifold lower level of exposure to political violence, even during the worst periodof the Second Intifada.
The failure to find differences by region (i.e., Gaza, the West Bank, and East Jerusalem) isnotable. The lack of differences on PTSD and depression, even initially when the Intifadaand Israeli military reaction was at its height may indicate that exposure and resiliencevariables are balancing these sociopolitical and economic differences. Further, region didnot influence the trajectory modeling. These findings support Conservation of Resourcestheory’s primary principle, that it is the degree of resource loss that is most significant, andthat exposure to trauma itself mainly manifests its influence through psychosocial andmaterial resource lack and loss (see also Miller & Rasmussen, 2010).
In general, men and younger individuals had more favorable trajectories than women andolder individuals. Likewise, being exposed to less political violence and having greatersocial support were associated with being in the relatively more favorable or improvingtrajectories. Initial high levels of distress were predicted by greater psychosocial andmaterial resource loss during this highly tumultuous period. However, a recovery patternwas predicted by experiencing lower levels of psychosocial and material resource loss insubsequent assessments as the political climate surrounding political violence decreased andthe situation relatively stabilized. That social support remains salient given intensechallenges to family functioning is a critical finding here and in other reports of Palestinians(Qouta, Punamki, & El Sarraj, 2008).
It is also of interest that for PTSD the severe-improving group, compared to the chronicdistress group was predicted by greater exposure to political violence. This may suggest thatbeing in the chronic distress group is more likely to be characterological, whereas membersof the other trajectories may have intense reactions that they are better able to recover from.Also, depression trajectories were not well-identified by trauma exposure, suggesting thatPTSD is more traumatogenic. These and other inconsistencies with the trauma literatureunderscore the importance of considering chronic traumatic circumstances in their socio-ecological perspective, whereby the overall chronicity of adversity becomes a majorsignature of the circumstances and therefore people’s reactions (Miller & Rasmussen, 2010;Miller & Rosco, 2004).
Hobfoll et al. Page 10
Soc Sci Med. Author manuscript; available in PMC 2012 April 1.
NIH
-PA Author Manuscript
NIH
-PA Author Manuscript
NIH
-PA Author Manuscript

Limitations and Strengths of the StudyWe do not know who declined study, and if some individuals were sheltered from ourinterviewers for personal, social, or political reasons. Overall, our cooperation rates weresimilar or better than similar studies (Scholte et al., 2004; Vinck et al., 2007) and manystudies of war’s impact in low income regions did not use random sampling (Basoglu et al.,2005; Bayer et al., 2007), but not knowing who declined or even avoided our interviewersremains a concern. The application of trauma-related diagnostic constructs in non-Westerncultures has also been questioned (Nicholl & Thompson, 2004). We and others havedocumented cross-cultural applicability and quite similar findings as those found in the Westin our own and others’ research (Cardozo et al., 2000; Hobfoll et al., 2008; Scholte et al.,2004), however similarity should not be assumed to mean equivalence. It is also importantto underscore that naturalistic studies can be used to imply causality, but such implicationsmust be viewed cautiously.
Also, although we can assume that the high levels of distress and low levels of resiliency areattributable to chronic conditions of mass casualty and extreme adverse conditions, we onlymeasured recent resource loss and recent trauma exposure. Future study might examinepersonal exposure to these conditions versus just living in a region where exposure iswidespread in order to examine how these two related, but different, aspects of thisexperience contributes to resilience and distress. Finally, although only income predictedattrition, income itself is a complex variable which may be related to degree of involvementin political process, political attitudes, and availability of personal, social, and materialresources in ways that we did not measure but are potentially meaningful.
ConclusionsA major finding of this study is that in the context of repeated or chronic traumaticcircumstances, resilience and resistance are relative terms, and cannot be construed to meanthat a majority, or even a substantive percentage of the population are symptom free, or haveonly a few symptoms of distress as previous work has argued (Bonanno et al., 2011). Theshape of these patterns in our study was similar to that observed in previous trauma studies,only the floor levels of low symptoms were markedly higher. Indeed, the adjustment in thefloor level of responding was dramatic, and has major theoretical, as well as practicalmeaning. These findings suggest, for example, that the normal adaptive mechanisms thatdrive high levels of resilience and resistance to psychological distress in the face of aversiveevents can be overwhelmed when mass casualties are ongoing and occur in an economicallydepressed region. Psychosocial and material resource loss during each period was the keypredictor of the shape of the trajectories across periods consistent with recent theoreticalwork that, like Conservation of Resources theory, emphasizes that trauma exposure and thecontext of daily events must both be considered in mass casualty situations (Miller &Rasmussen, 2010). Loss of psychosocial and material resources was associated with thelevel of distress experienced by participants at each time period, suggesting that resource-based interventions could benefit people exposed to chronic trauma. Such intervention couldfocus on all levels of resources, including personal resources (e.g., self-efficacy, job skills),social resources (e.g., social support, family relationships), material resources (e.g., housing,transportation), and condition resources (e.g., job availability, fair access to work, openborders). Although any meaningful intervention is complex, such a resource model leads totargeted goals that are potentially achievable.
AcknowledgmentsThis study was made possible, in part, by grants from NIMH (R01 MH073687) to the first author.
Hobfoll et al. Page 11
Soc Sci Med. Author manuscript; available in PMC 2012 April 1.
NIH
-PA Author Manuscript
NIH
-PA Author Manuscript
NIH
-PA Author Manuscript

ReferencesICBS. Israeli Central Bureau of Statistics. Statistical abstract of Israel 2007 - no. 58 subject 2 table no.
7: Localities (1) and population, by district, sub-district, religion and population group. fromhttp://www.cbs.gov.il/reader/
Ai AL, Peterson C, Ubelhor D. War-related trauma and symptoms of posttraumatic stress disorderamong adult Kosovar refugees. Journal of Traumatic Stress. 2002; 15:157–160. [PubMed:12013067]
Basoglu M, Livanou M, Crnobaric C, Franciskovic T, Suljic E, Duric D, et al. Psychiatric andCognitive Effects of War in Former Yugoslavia: Association of Lack of Redress for Trauma andPosttraumatic Stress Reactions. JAMA: Journal of the American Medical Association. 2005;294:580–590.
Bayer CP, Klasen F, Hubertus A. Association of Trauma and PTSD Symptoms with Openness toReconciliation and Feelings of Revenge Among Former Ugandan and Congolese Child Soldiers.JAMA: Journal of the American Medical Association. 2007; 298:555–559.
Bleich A, Gelkopf M, Melamed Y, Solomon Z. Mental health and resiliency following 44 months ofterrorism: a survey of an Israeli national representative sample. BMC Medicine. 2006; 4:21.[PubMed: 16934160]
Bonanno GA. Loss, trauma, and human resilience: Have we underestimated the human capacity tothrive after extremely aversive events? American Psychologist. 2004; 59:20–28. [PubMed:14736317]
Bonanno GA, Brewin CR, Kaniasty K, La Greca AM. The parameters of disaster: Consequences,risks, and resilience in individuals, families, communities, and society. Psychological Science in thePublic Interest. 2010; 11:1–49.
Bonanno GA, Galea S, Bucciarelli A, Vlahov D. What predicts psychological resilience after disaster?The role of demographics, resources, and life stress. Journal of Consulting and Clinical Psychology.2007; 75:671–682. [PubMed: 17907849]
Bonanno GA, Westphal M, Mancini AD. Resilience to loss and potential trauma. Annual Review ofClinical Psychology. 2011; 7 xxx-xxx. (due to publication in March).
Canetti D, Galea S, Hall BJ, Johnson RJ, Palmieri PA, Hobfoll SE. Exposure to prolonged socio-political conflict and the risk of PTSD and depression among Palestinians. Psychiatry: Biologicaland Interpersonal Issues. 2010; 73:219–232.
Cardozo BL, Vergara A, Agani F, Gotway CA. Mental health, social functioning, and attitudes ofKosovar Albanians following the war in Kosovo. JAMA: Journal of the American MedicalAssociation. 2000; 284:569–577.
Chen Y, Koenig H. Do People Turn to Religion in Times of Stress?: An Examination of Change inReligiousness Among Elderly, Medically Ill Patients. Journal of Nervous & Mental Disease. 2006;194:114–120. [PubMed: 16477189]
Curran PJ, Hussong AM. The use of latent trajectory models in psychopathology research. Journal ofAbnormal Psychology. 2003; 112:526–544. [PubMed: 14674867]
de Jong, JTVM., editor. Trauma, war, and violence: Public mental health in socio-cultural context.New York: Plennum-Kluwer; 2002.
de Jong JTVM, Komproe IH, Van Ommeren M, El Masri M, Araya M, Khaled N, et al. Lifetimeevents and posttraumatic stress disorder in 4 postconflict settings. JAMA: Journal of the AmericanMedical Association. 2001; 286(5):555–562.
Eggerman M, Paner-Brick C. Suffering, hope, and entrapment: Resilience and cultural values inAfghanistan. Social Science and Medicine. 2010; 71:71–83. [PubMed: 20452111]
Enders CK. The performance of the full information maximum likelihood estimator in multipleregression models with missing data. Educational and Psychological Measurement. 2001; 61:713–740.
Foa EB, Riggs DS, Dancu CV, Rothbaum BO. Reliability and validity of a brief instrument forassessing post-traumatic stress disorder. Journal of Traumatic Stress. 1993; 6:459–473.
Hobfoll et al. Page 12
Soc Sci Med. Author manuscript; available in PMC 2012 April 1.
NIH
-PA Author Manuscript
NIH
-PA Author Manuscript
NIH
-PA Author Manuscript

Galea S, Ahern J, Resnick H, Kilpatrick D, Bucuvalas M, Gold J, et al. Psychological sequelae of theSeptember 11 terrorist attacks in New York City. New England Journal of Medicine. 2002;346:982–987. [PubMed: 11919308]
Hatch SL, Dohrenwend BP. Distribution of traumatic and other stressful life events by race/ethnicity,gender, SES and age: A review of the research. American Journal of Community Psychology.2007; 40:313–332. [PubMed: 17906927]
Hobfoll SE. Conservation of resources: A new attempt at conceptualizing stress. AmericanPsychologist. 1989; 44:513–524. [PubMed: 2648906]
Hobfoll, SE. Stress, culture, and community: The psychology and philosophy of stress. New York:Plenum Press; 1998.
Hobfoll SE, Canetti-Nisim D, Johnson RJ, Palmieri PA, Varley JD, Galea S. The association ofexposure, risk, and resiliency factors with PTSD among Jews and Arabs exposed to repeated actsof terrorism in Israel. Journal of Traumatic Stress. 2008; 21:9–21. [PubMed: 18302179]
Hobfoll SE, Hall BJ, Canetti D. Political violence, psychological distress, and perceived health: Alongitudinal investigation in the Palestinian Authority. Psychological Trauma: Theory, Research,Practice, Policy. (in press).
Hobfoll SE, Lilly RS. Resource conservation as a strategy for community psychology. Journal ofCommunity Psychology. 1993; 21:128–148.
Hobfoll SE, Palmieri PA, Johnson RJ, Canetti-Nisim D, Hall BJ, Galea S. Trajectories of Resilience,Resistance and Distress during Ongoing Terrorism: The Case of Jews and Arabs in Israel. Journalof Consulting and Clinical Psychology. 2009; 77:138–148. [PubMed: 19170460]
Hollingshead, AB.; Redlich, FC. Social class and mental illness: A community study. New York, N.Y.: John Wiley & Sons; 1958.
Jung T, Wickrama KAS. An introduction to latent class growth analysis and growth mixture modeling.Social and Personality Psychology Compass. 2008; 2:302–317.
Kroenke K, Spitzer RL, Williams JBW. The PHQ-9: Validity of a brief depression severity measure.Journal of General Internal Medicine. 2001; 16:606–613. [PubMed: 11556941]
Layne, CM.; Warren, JS.; Watson, PJ.; Shalev, AY. Risk, vulnerability, resistance, and resilience:Toward an integrative conceptualization of posttraumatic adaptation. In: Friedman, MJ.; Keane,TM.; Resick, PA., editors. Handbook of PTSD: Science and practice. 2007. p. 497-520.
Lo Y, Mendell N, Rubin D. Testing the number of components in a normal mixture. Biometrika. 2001;88:767–778.
Miller KE, Rasmussen A. War exposure, daily stressors, and mental health in conflict and post-conflictsettings: Bridging the divide between trauma-focused and psychosocial frameworks. SocialScience & Medicine. 2010; 70:7–16. [PubMed: 19854552]
Muthén, B. Latent variable analysis: Growth mixture modeling and related techniques for longitudinaldata. In: Kaplan, D., editor. Handbook of quantitative methodology for the social sciences.Newbury Park, CA: Sage Publications; 2004. p. 345-368.
Nagin DS. Analyzing developmental trajectories: A semiparametric, group-based approach.Psychological Methods. 1999; 4:139–157.
Nicholl C, Thompson A. The psychological treatment of Post Traumatic Stress Disorder (PTSD) inadult refugees: A review of the current state of psychological therapies. Journal of Mental Health.2004; 13:351–362.
Norris FH, Stevens SP. Community resilience and the principles of mass trauma Intervention.Psychiatry: Interpersonal and Biological Processes. 2007; 70:320–328.
Norris FH, Friedman MJ, Watson PJ, Byrne CM, Diaz E, Kaniasty K. 60,000 disaster victims speak:Part I. An empirical review of the empirical literature, 1981–2001. Psychiatry: Interpersonal andBiological Processes. 2002; 65:207–239.
Nylund KL, Asparouhov T, Muthén B. Deciding on the number of classes in latent class analysis andgrowth mixture modeling. A Monte Carlo simulation study. Structural Equation Modeling. 2007;14:535–569.
Palmieri PA, Canetti-Nisim D, Galea S, Johnson RJ, Hobfoll SE. The psychological impact of theIsrael-Hezbollah war on Jews and Arabs in Israel: The impact of risk and resilience factors. SocialScience & Medicine. 2008; 67:1208–1216. [PubMed: 18667263]
Hobfoll et al. Page 13
Soc Sci Med. Author manuscript; available in PMC 2012 April 1.
NIH
-PA Author Manuscript
NIH
-PA Author Manuscript
NIH
-PA Author Manuscript
Panter-Brick C. Conflict, violence, and health: Setting a new interdisciplinary agenda. Social Scienceand Medicine. 2010; 70:1–6. [PubMed: 19931960]
Punamäki R-L, Komproe IH, Qouta S, Elmasri M, de Jong JVM. The role of peritraumatic dissociationand gender in the association between trauma and mental health in a Palestinian communitysample. American Journal of Psychiatry. 2005; 162:545–551. [PubMed: 15741472]
Qouta S, Punamäki RL, El Sarraj E. Child development and family mental health in war and militaryviolence: The Palestinian experience. International Journal of Behavioral Development. 2008;32:310–321.
Scholte WF, Olff M, Ventevogel P, de Vries GJ, Jansveld E, Cardozo BL, et al. Mental healthsymptoms following war and repression in eastern Afghanistan. JAMA: Journal of the AmericanMedical Association. 2004; 294:585–593.
Vinck P, Pham P, Stover E, Weinstein H. Exposure to War Crimes and Implications for PeaceBuilding in Northern Uganda. JAMA: Journal of the American Medical Association. 2007;298:543–554.
Hobfoll et al. Page 14
Soc Sci Med. Author manuscript; available in PMC 2012 April 1.
NIH
-PA Author Manuscript
NIH
-PA Author Manuscript
NIH
-PA Author Manuscript

Figure 1.PTSD symptom trajectory classes for the conditional model (with covariates).Note. On the X-axis, 1 = baseline, 2 = six-month follow-up, and 3 = 12-month follow-up. Y-axis refers to PTSD symptom severity.
Hobfoll et al. Page 15
Soc Sci Med. Author manuscript; available in PMC 2012 April 1.
NIH
-PA Author Manuscript
NIH
-PA Author Manuscript
NIH
-PA Author Manuscript

Figure 2.MD symptom trajectory classes for the conditional model (with covariates).Note. On the X-axis, 1 = baseline, 2 = six-month follow-up, and 3 = 12-month follow-up. Y-axis refers to MD symptom severity.
Hobfoll et al. Page 16
Soc Sci Med. Author manuscript; available in PMC 2012 April 1.
NIH
-PA Author Manuscript
NIH
-PA Author Manuscript
NIH
-PA Author Manuscript
NIH
-PA Author Manuscript
NIH
-PA Author Manuscript
NIH
-PA Author Manuscript
Hobfoll et al. Page 17
Table 1
Sample characteristics (n=764)
Variable % M (SD) Range
Age 35.01 (12.68) 18 – 80
Sex
Female 52.0
Yearly Household Income
Below Average 52.4
Average 25.0
Above Average 22.5
Education
Elementary 34.3
High School/Post High School 32.9
College Graduate 22.8
Marital Status
Single/widowed/divorced 31.4
Married/cohabitating 68.6
Exposure to political violence
Baseline 3.10 (6.29) 0 – 104
6-month Follow-up 2.09 (4.31) 0 – 60
12-month Follow-up 0.28 (0.91) 0 – 12
Psychosocial resource loss
Baseline 9.26 (6.65) 0 – 30
6-month Follow-up 7.42 (6.24) 0 – 30
12-month Follow-up 7.24 (6.41) 0 – 30
Social support
Baseline 4.33 (1.58) 0 – 6
6-month Follow-up 4.34 (1.52) 0 – 6
12-month Follow-up 4.26 (1.51) 0 – 6
Soc Sci Med. Author manuscript; available in PMC 2012 April 1.
NIH
-PA Author Manuscript
NIH
-PA Author Manuscript
NIH
-PA Author Manuscript
Hobfoll et al. Page 18
Tabl
e 2
Fit I
ndic
es fo
r One
- to
Five
-Cla
ss G
row
th M
ixtu
re M
odel
s (U
ncon
ditio
nal)
usin
g PT
SD sy
mpt
oms
Gro
wth
Mix
ture
Mod
el
12
34
5
Fit I
ndic
esC
lass
Cla
sses
Cla
sses
Cla
sses
Cla
sses
AIC
2095
1.96
2058
7.31
2053
1.81
2052
9.02
2052
4.01
BIC
2097
7.39
2062
7.99
2058
7.38
2060
0.22
2061
5.55
SSB
IC20
961.
5120
602.
5820
552.
4420
555.
7520
558.
38
Entro
py--
.55
.49
.54
.54
LRT
p va
lue
--<.
001
<.00
1<.
05.4
6
BLR
T p
valu
e--
<.00
1<.
001
<.05
.45
Not
e. A
IC =
Aka
ike
info
rmat
ion
crite
rion;
BIC
= B
ayes
ian
info
rmat
ion
crite
rion;
SSB
IC =
sam
ple
size
adj
uste
d B
ayes
ian
info
rmat
ion
crite
rion;
LR
T =
Lo-M
ende
ll-R
ubin
test
; BLR
T =
boot
stra
p lik
elih
ood
ratio
test
.
Soc Sci Med. Author manuscript; available in PMC 2012 April 1.

NIH
-PA Author Manuscript
NIH
-PA Author Manuscript
NIH
-PA Author Manuscript
Hobfoll et al. Page 19
Table 3
Growth Factor Parameter Estimates for 3-Class Conditional Model using PTSD Symptoms
InterceptMean (SD)
SlopeMean (SD)
Severe-improving 31.69 (3.71)*** −14.94 (0.00)***
Severe-chronic 28.68 (5.25)** 1.33 (0.00)
Moderate-improving 20.43 (5.42)*** −4.27 (0.00)***
Note. SD = Standard deviation.
*p < .05;
**p < .01;
***p < .001 (two-tailed)
Soc Sci Med. Author manuscript; available in PMC 2012 April 1.
NIH
-PA Author Manuscript
NIH
-PA Author Manuscript
NIH
-PA Author Manuscript
Hobfoll et al. Page 20
Table 4
Fit Indices for One- to Five-Class Growth Mixture Models (Unconditional) using MD symptoms
Growth Mixture Model
1 2 3 4
Fit Indices Class Classes Classes Classes
AIC 18659.12 18238.06 18164.37 18139.46
BIC 18684.56 18278.76 18220.33 18210.69
SSBIC 18668.68 18253.35 18185.39 18166.22
Entropy -- .61 .62 .56
LRT p value -- <.001 <.001 .57
BLRT p value -- <.001 <.001 .58
Note. AIC = Akaike information criterion; BIC = Bayesian information criterion; SSBIC = sample size adjusted Bayesian information criterion;LRT = Lo-Mendell-Rubin test; BLRT = bootstrap likelihood ratio test.
Soc Sci Med. Author manuscript; available in PMC 2012 April 1.

NIH
-PA Author Manuscript
NIH
-PA Author Manuscript
NIH
-PA Author Manuscript
Hobfoll et al. Page 21
Table 5
Growth Factor Parameter Estimates for 3-Class Conditional Model using MD symptoms
Intercept Mean (SE) Slope Mean (SE)
Severe-improving 15.13 (2.47)*** −7.48 (0.00)***
Severe-chronic 12.95 (2.46)*** −2.71 (0.00)*
Moderate-improving 8.67 (2.21)*** 3.16 (0.00)***
Note. SD = Standard deviation.
*p < .05;
**p < .01;
***p < .001 (two-tailed)
Soc Sci Med. Author manuscript; available in PMC 2012 April 1.

NIH
-PA Author Manuscript
NIH
-PA Author Manuscript
NIH
-PA Author Manuscript
Hobfoll et al. Page 22
Tabl
e 6
Res
ults
of M
ultin
omia
l Log
istic
Reg
ress
ions
Pre
dict
ing
PTSD
Lat
ent C
lass
Mem
bers
hip
Var
iabl
e−
2 lo
glik
elih
ood
χ2(2
)
Cla
ss 1
: Mod
erat
e-im
prov
ing
Cla
ss 2
: Sev
ere-
impr
ovin
g
Cla
ss 3
:Se
vere
Chr
onic
ME
xp(B
)
95%
conf
iden
cein
terv
al fo
rE
xp(B
)M
Exp
(B)
95%
Con
fiden
cein
terv
al fo
rE
xp(B
)
Ref
eren
ceC
ateg
ory
M
Inte
rcep
t58
7.99
24.1
2**
B: 0
.11
B: -1
3.61
Sex:
wom
en56
8.40
4.52
52.6
0.61
*0.
38,
0.99
33.0
0.98
0.22
,4.
3752
.4
Age
579.
7215
.84*
*33
.90.
96**
0.95
,0.
9841
.30.
990.
93,
1.07
38.9
Inco
me
566.
993.
111.
81.
320.
96,
1.82
1.6
1.07
0.43
,2.
651.
5
Educ
atio
n56
8.66
4.78
2.3
1.25
0.99
,1.
582.
21.
810.
85,
3.87
1.9
Mar
ried
565.
151.
2767
.01.
020.
61,
1.73
81.0
3.50
0.35
,35
.474
.0
Expo
sure
to p
oliti
cal v
iole
nce
(T1)
584.
1520
.28*
*2.
30.
91**
0.86
,0.
967.
60.
93**
0.89
,0.
986.
3
Expo
sure
to p
oliti
cal v
iole
nce
(T2)
565.
581.
711.
60.
960.
89,
1.02
2.3
0.97
0.80
,1.
174.
5
Expo
sure
to p
oliti
cal v
iole
nce
(T3)
579.
5015
.62*
*0.
20.
83*
0.68
,1.
000.
72.
30**
1.31
,4.
020.
7
Psyc
hoso
cial
reso
urce
loss
(T1)
828.
1926
4.31
**9.
41.
38**
1.29
,1.
4722
.92.
59**
1.97
,3.
406.
4
Psyc
hoso
cial
reso
urce
loss
(T2)
599.
1935
.31*
*6.
60.
88**
0.84
,0.
927.
00.
85**
0.76
,0.
9510
.1
Psyc
hoso
cial
reso
urce
loss
(T3)
614.
4650
.59*
*6.
40.
89**
0.85
,0.
936.
90.
65**
0.55
,0.
789.
8
Soci
al su
ppor
t (T1
)59
0.88
26.9
9**
4.5
1.38
**1.
19,
1.60
3.2
0.80
0.53
,1.
203.
7
Soci
al su
ppor
t (T2
)56
5.14
1.27
4.4
1.01
0.87
,1.
184.
40.
780.
49,
1.26
4.0
Soci
al su
ppor
t (T3
)56
6.47
2.59
4.4
1.13
0.97
,1.
324.
31.
060.
66,
1.69
3.9
Not
e. T
he χ
2 in
dica
tes t
he d
iffer
ence
bet
wee
n th
e −
2 lo
g lik
elih
oods
of t
he fu
ll m
odel
and
the
mod
el is
this
inde
pend
ent v
aria
ble
was
om
itted
. Exp
(B) i
ndic
ates
that
the
odds
ratio
of b
eing
in th
e cl
ass a
sop
pose
d to
the
refe
renc
e ca
tego
ry a
s a fu
nctio
n of
a o
ne-u
nit i
ncre
ase
of th
e in
depe
nden
t var
iabl
e. M
eans
are
repo
rted
for a
ll va
riabl
es sa
ve fo
r sex
, and
mar
ried,
whi
ch a
re e
xpre
ssed
in p
erce
ntag
es.
* p <
.05.
**p
< .0
01.
Soc Sci Med. Author manuscript; available in PMC 2012 April 1.

NIH
-PA Author Manuscript
NIH
-PA Author Manuscript
NIH
-PA Author Manuscript
Hobfoll et al. Page 23
Tabl
e 7
Res
ults
of M
ultin
omia
l Log
istic
Reg
ress
ions
Pre
dict
ing
Dep
ress
ion
Late
nt C
lass
Mem
bers
hip
Var
iabl
e−
2 lo
glik
elih
ood
χ2(2
)
Cla
ss 1
: Sev
ere-
impr
ovin
gC
lass
2: M
oder
ate-
impr
ovin
g
Cla
ss 3
:Se
vere
Chr
onic
ME
xp(B
)
95%
conf
iden
cein
terv
al fo
rE
xp(B
)M
Exp
(B)
95%
Con
fiden
cein
terv
al fo
rE
xp(B
)
Ref
eren
ceC
ateg
ory
M
Inte
rcep
t69
4.20
25.8
4**
B: -3
.70*
B: 2
.64*
*
Sex:
wom
en67
3.38
5.02
45.4
0.38
*0.
14,
0.99
52.8
0.70
0.44
,1.
0954
.0
Age
715.
5347
.17*
*36
.60.
92**
0.87
,0.
9632
.90.
94**
0.93
,0.
9640
.5
Inco
me
671.
112.
741.
80.
590.
31,
1.11
1.7
0.90
0.68
,1.
211.
7
Educ
atio
n66
9.81
1.45
2.1
1.21
0.78
,1.
852.
30.
950.
77,
1.17
2.0
Mar
ried
671.
463.
1073
.01.
670.
53,
5.25
67.3
1.55
0.94
,2.
5570
.0
Expo
sure
to p
oliti
cal v
iole
nce
(T1)
672.
464.
092.
90.
960.
92,
1.00
2.5
0.96
0.92
,1.
014.
5
Expo
sure
to p
oliti
cal v
iole
nce
(T2)
668.
830.
471.
30.
960.
83,
1.11
1.7
1.01
0.96
,1.
063.
6
Expo
sure
to p
oliti
cal v
iole
nce
(T3)
670.
261.
890.
11.
080.
74,
1.58
0.2
0.90
**0.
75,
1.07
0.6
Psyc
hoso
cial
reso
urce
loss
(T1)
1034
.10
365.
73**
11.3
2.22
**1.
84,
2.69
7.0
1.02
**0.
97,
1.07
9.5
Psyc
hoso
cial
reso
urce
loss
(T2)
694.
1525
.79*
*9.
40.
970.
90,
1.04
5.7
0.90
**0.
87,
0.94
10.9
Psyc
hoso
cial
reso
urce
loss
(T3)
762.
1793
.80*
*9.
60.
70**
0.63
,0.
785.
30.
86**
0.83
,0.
9011
.7
Soci
al su
ppor
t (T1
)73
3.78
65.4
2**
4.2
0.65
**0.
47,
0.89
4.7
1.56
**1.
34,
1.80
3.5
Soci
al su
ppor
t (T2
)66
9.44
1.07
3.8
0.97
0.71
,1.
324.
61.
070.
92,
1.25
3.9
Soci
al su
ppor
t (T3
)66
9.14
0.78
3.9
0.88
0.65
,1.
194.
51.
010.
87,
1.17
3.9
Not
e. T
he χ
2 in
dica
tes t
he d
iffer
ence
bet
wee
n th
e −
2 lo
g lik
elih
oods
of t
he fu
ll m
odel
and
the
mod
el is
this
inde
pend
ent v
aria
ble
was
om
itted
. Exp
(B) i
ndic
ates
that
the
odds
ratio
of b
eing
in th
e cl
ass a
sop
pose
d to
the
refe
renc
e ca
tego
ry a
s a fu
nctio
n of
a o
ne-u
nit i
ncre
ase
of th
e in
depe
nden
t var
iabl
e. M
eans
are
repo
rted
for a
ll va
riabl
es sa
ve fo
r sex
, and
mar
ried,
whi
ch a
re e
xpre
ssed
in p
erce
ntag
es.
* p <
.05.
**p
< .0
01.
Soc Sci Med. Author manuscript; available in PMC 2012 April 1.