The Limits of Discipline: Ownership and Hard Budget Constraints in the Transition Economies
39
ECONOMIC RESEARCH REPORTS C.V. Starr Center for Applied Economics Department of Economics Faculty of Arts and Science New York University 269 Mercer Street, 3 rd Floor New York, New York 10003-6687 The Limits of Discipline: Ownership and Hard Budget Constraints in the Transition Economies by Roman Frydman, Cheryl Gray, Marek Hessel, & Andrzej Rapaczynski RR#: 2000-02 January 2000
Transcript of The Limits of Discipline: Ownership and Hard Budget Constraints in the Transition Economies
ECONOMIC RESEARCH REPORTS
C.V. Starr Center for Applied Economics
Department of Economics
Faculty of Arts and Science
New York University
269 Mercer Street, 3rd Floor
New York, New York 10003-6687
The Limits of Discipline: Ownership and HardBudget Constraints in the Transition Economies
by
Roman Frydman,Cheryl Gray,Marek Hessel,
&Andrzej Rapaczynski
RR#: 2000-02 January 2000
The authors would like to thank Joel Turkewitz for his contributions to the design and implementation of the1
survey instrument, and Mihaela Popescu for her extraordinary assistance in the analysis of the data. The authors alsothank Sarbajit Sinha for computer support in the initial stages of research. Helpful conversations with, and commentsfrom, Marvin Chirelstein, William Green, Glenn Hubbard, and Mark Roe are also gratefully acknowledged.
The authors are grateful to the CEU Foundation, the Open Society Institute and the World Bank for supportingresearch on this paper. CV Starr Center for Applied Economics at New York University has provided additional supportfor Roman Frydman's research. None of these institutions are responsible for the opinions expressed in this paper.
THE LIMITS OF DISCIPLINE:OWNERSHIP AND HARD BUDGET CONSTRAINTS
IN THE TRANSITION ECONOMIES ,1
Roman Frydman, Department of Economics, New York University, and Privatization ProjectCheryl Gray, The World BankMarek Hessel, Graduate School of Business, Fordham University, and Privatization ProjectAndrzej Rapaczynski, Columbia University School of Law, and Privatization Project
January 2000
AbstractThis paper argues that the imposition of financial discipline is not sufficient to remedy ownershipand governance-related deficiencies of corporate performance. Using evidence from thepostcommunist transition economies, the paper shows that a policy of hard budget constraintsfalters when state firms, because of inferior revenue performance and lesser willingness to meetpayment obligations, continue to pose higher credit risk than privatized firms. The brunt of statefirms’ lower creditworthiness falls on state creditors. But the “softness” of these creditors isunavoidable if it prevents a demise of firms that are in principle capable of successfulrestructuring through ownership changes.
JEL Classification: G32, P17, P27, P31. Keywords: ownership; financial discipline;performance; transition.
REMEMBER TO GENERATE CROSS-REFERENCES BEFORE EVERY PRINTING
I. Introduction
Financial discipline is often viewed as the most important prerequisite of efficient
corporate performance, and indeed of the health of the economy as a whole. “Soft budget
constraints” have long been seen as a primary source of inefficiency of communist firms and as
responsible for the ultimate failure of the socialist regimes (Gomulka, 1985; Kornai, 1993). In
those postcommunist countries that pursued rapid privatization, the dependence of firms on the
state budget has been much reduced or eliminated (Schaffer, 1998), and reforms of the banking
sector have hardened budget constraints faced by firms. The effects of those changes on
enterprise and bank performance in various transition economies have been analyzed by, among
others, Corricelli and Thorne (1993), Coricelli and Djankov (1998), Bonin and Schaffer (1995),
Bergloff and Roland (1997, 1998), Bai and Wang (1998), Djankov (1999), and Perotti (1998).
Outside of postcommunist transition, soft budget constraints have played a part in
analyses of financial system structure (Dewatripont and Maskin, 1995) and federalism (Qian and
Roland, 1998). More recently financial crises around the world have been attributed to lax
financial practices on governmental, bank and firm levels (Mitchell, 1999a, 1999b). Not
surprisingly, therefore, the various “rescue packages” have stressed the need for greater financial
discipline and made it into the most important condition of economic assistance.
Without denying that financial discipline plays a very important role in corporate
performance, this paper argues, using empirical evidence from the postcommunist transition
economies, that there are clear limits, deriving from the governance and ownership structure of
firms, to what financial discipline can accomplish. Although financial constraints restrict waste
and force better cost management, the prospects of a firm’s ultimate success (and the vibrancy of
the economy as a whole) depend in large measure on the degree of inventiveness, creativity, and
readiness to accept risk on the part of persons responsible for corporate decisions. These
characteristics, often embraced in the general concept of entrepreneurship, have only an indirect
relation to financial discipline, and there are reasons to believe that financial discipline is not a
3
The question is of more than theoretical importance: several transition countries (Albania, Armenia, Bulgaria,1
Kazakstan, the Kyrgyz Republic, Macedonia, and Romania) have recently implemented isolation programs whichcombine features of reorganization under bankruptcy with severance payments for employees and labor deploymentassistance in large loss-making state-owned enterprises. (Djankov and Ilayperuma, 1997) The programs aim at alleviatingthe risks of continued soft budget constraints through direct subsidies by the government, the use of tax arrears, and loansfrom state-owned banks. Djankow (1998) analysis of the isolation program for financially distressed firms in Romaniaconcludes that firms included in the program still faced softer budget constraints than their counterparts outside theprogram, and that the program did not produce any tangible improvements in their operational performance.
sufficient condition for their promotion and development.
Indeed, the main thrust of the arguments in this paper is that the very attempts to impose
truly “hard” budget constraints through reforms of the financial sector and stringent
macroeconomic measures, although in themselves desirable, may not be feasible without control
changes on the level of the firms. In other words, the question is not so much whether a regime of
hard budget constraints should be established, but whether it can be effectively established
without adequate governance and ownership reforms. 1
Our evidence comes from a study of small and medium-sized firms in the three most
advanced transition economies of Central Europe, the Czech Republic, Hungary and Poland. In
all three countries, trade and bank creditors are imposing harder constraints on loss-making firms
(Schaffer, 1998). There is also considerable support for the proposition that a hardening of
budget constraints forces not only private but also state firms to economize on available financial
resources (Pinto, Belka and Krajewski, 1993). Similarly, Balcerowicz, Gray, and Hashi (1998)
document extensive employment changes among the largest state firms in Central Europe, which
were presumably in large part prompted by the tightening of budget constraints. The
streamlining of the cost side of the state enterprises’ operations in response to external discipline
is in fact quite effective: unless the state is active in company decisions, the restructuring of state
enterprises in the transition environment of Central Europe tends to lower costs by margins
similar to those achieved in privatized firms (Frydman et al., 1999; Frydman, Hessel, and
Rapaczynski, 1998).
What ultimately matters in credit markets, however, is a firm’s ability to pay, and even
the strictest financial discipline will not allow firms to keep covering their obligations if they
cannot generate sufficient revenues. We have shown elsewhere (Frydman et al., 1999) that the
ability to generate revenue, especially during periods of rapid economic change, is inherently tied
4
to firm ownership, and that firms privatized to certain types of private owners enjoy a significant
performance advantage in this respect over their state counterparts. In this paper, we show that
state firms’ inability to match the revenue performance of privatized firms makes them a higher
credit risk. We further show that state firms are not only less able to pay their creditors but also
that they are also less willing to do so than privatized firms with a similar ability to pay.
As long as a firm generates enough revenues to repay some (or all) of its obligations,
which ones (or whether) it will chose to pay depends on a number of factors, including the
relative urgency of various obligations, the expectations of different creditors, the nature of the
legal environment, and the existence of alternative investment opportunities. One of such factors,
which is likely to play a role in state firms’ willingness or propensity to repay, is the
politicization of repayment decisions, especially if repayment forces layoffs and other politically
difficult decisions (Claessens and Djankov, 1998). Thus, state firms will be seen to represent
significantly higher credit risks than their privatized or private counterparts, both because of their
inferior revenue performance and the nature of their repayment decisions.
Our findings also shed some light on the behavior of creditors in the early stages of
postcommunist transition. In well-functioning credit markets, differences in creditworthiness of
firms should be reflected in the allocation of credit. One would therefore expect that the higher
credit riskiness of state firms would result in a stricter rationing of credit to those firms. Our data
suggest this is indeed the case for trade credit. However, banks (and tax authorities) appear
significantly “softer” in imposing financial discipline on state firms than on their privatized and
private counterparts. Inasmuch as virtually all of those banks were state-owned at the time of the
survey, we attribute this behavior in part to the likely politicization of credit decisions by state
creditors.
But the softness of the budget constraints this introduces may not be just a matter of a
“weakness of will” on the part of the relevant (state) actors. To be sure, the fact that state
creditors continue to impose laxer discipline on state firms effectively amounts to a new subsidy.
But this subsidy need not result from a merely undesirable kind of politicization of credit
decisions that a better implementation of a tough credit policy would perhaps be able to avoid.
Unless one is willing to accept a likely demise of a large number of state firms that cannot
5
A firm was classified as private if it was never a state-owned enterprise. A previously state-owned firm was2
considered privatized if the combined holdings of private parties gave them a blocking power over major companydecisions. In the absence of such power, the firm was classified, depending on its legal form, as a noncorporatized orcorporatized state enterprise.
generate sufficient cash flows to survive, “rock hard” budget constraints might simply be
unrealistic, and the subsidy provided by state creditors might, to some extent, be rational,
especially if the firms in question are capable of successful revenue restructuring through
ownership transformations (as may very well be the case in light of Frydman et al. (1999) and
other studies cited therein). The conclusion we draw from this is not that the policy of hard
budget constraints should be relaxed or abandoned, but that it cannot be made truly effective
unless accompanied by speedy and effective privatization.
The paper is organized as follows: Section II describes the sample on which the study is
based. In Section III we explain the assumptions about credit behavior that underlie our analysis.
In Section IV we evaluate the different risks that firms with different ownership types represent
to their short-term creditors and in Section V we examine the creditors’ responses to those risks.
Section VI examines the behavior of the firms in our sample with respect to the repayment of
their long-term debts. We conclude in Section VII.
II. Ownership, performance, and credit arrears: an overview
The analysis presented here is based on a survey of mid-sized manufacturing firms in the
Czech Republic, Hungary and Poland conducted in 1994-95. The firms were classified into
private, privatized, and state firms, the latter further divided into noncorporatized and
corporatized entities. The subsample of firms used in this paper consists of 216 firms, 70 of2
which were in the Czech Republic, 90 in Hungary, and 56 in Poland. 31 percent of sample firms
were held by the state (17 percent as corporatized entities), 43 percent were privatized, and 26
percent were private firms. At the time of the survey, state and privatized firms were quite
similar in terms of their size, with the average employment of about 580 full-time employees
and the annual sales just above US$ 12.5 million; private firms were smaller, with the average
employment of about 200 employees and sales of about US$ 7 million. (Additional sample
description will be found in Appendix A.)
6
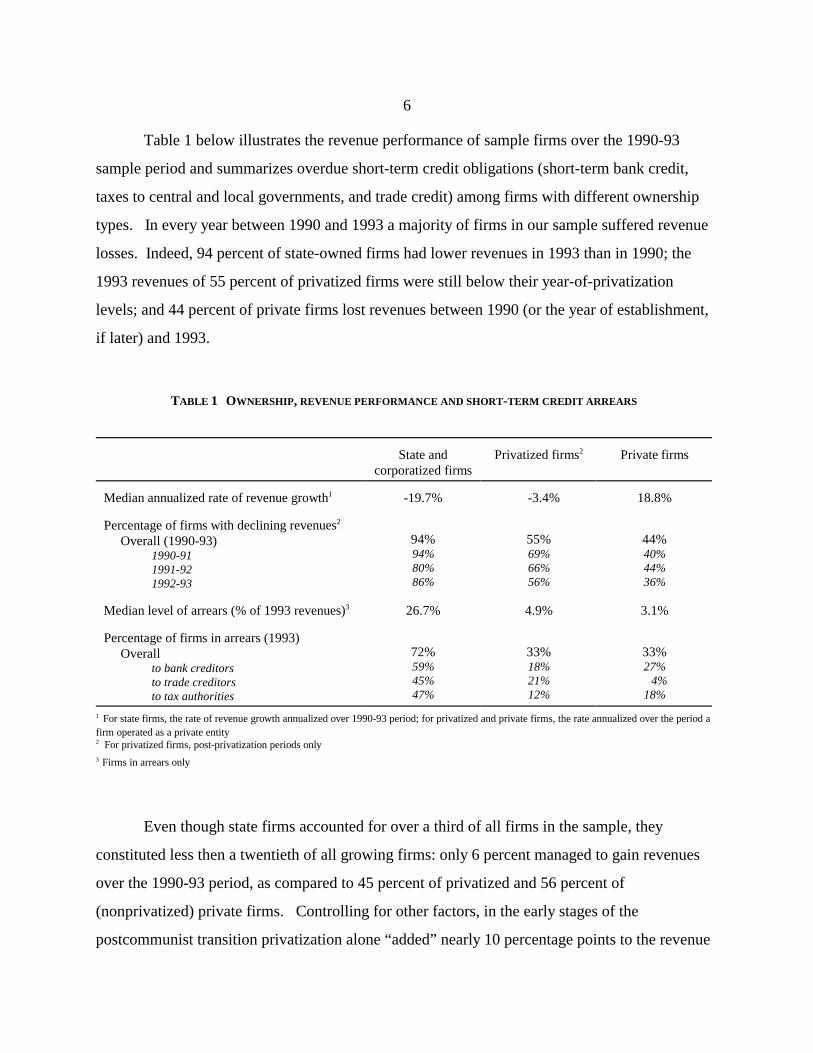
Table 1 below illustrates the revenue performance of sample firms over the 1990-93
sample period and summarizes overdue short-term credit obligations (short-term bank credit,
taxes to central and local governments, and trade credit) among firms with different ownership
types. In every year between 1990 and 1993 a majority of firms in our sample suffered revenue
losses. Indeed, 94 percent of state-owned firms had lower revenues in 1993 than in 1990; the
1993 revenues of 55 percent of privatized firms were still below their year-of-privatization
levels; and 44 percent of private firms lost revenues between 1990 (or the year of establishment,
if later) and 1993.
TABLE 1 OWNERSHIP, REVENUE PERFORMANCE AND SHORT-TERM CREDIT ARREARS
State and Privatized firms Private firmscorporatized firms
2
Median annualized rate of revenue growth -19.7% -3.4% 18.8%1
Percentage of firms with declining revenues2
Overall (1990-93)1990-911991-921992-93
94% 55% 44%94% 69% 40%80% 66% 44%86% 56% 36%
Median level of arrears (% of 1993 revenues) 26.7% 4.9% 3.1%3
Percentage of firms in arrears (1993) Overall
to bank creditorsto trade creditorsto tax authorities
72% 33% 33%59% 18% 27%45% 21% 4%47% 12% 18%
For state firms, the rate of revenue growth annualized over 1990-93 period; for privatized and private firms, the rate annualized over the period a1
firm operated as a private entity For privatized firms, post-privatization periods only2
Firms in arrears only3
Even though state firms accounted for over a third of all firms in the sample, they
constituted less then a twentieth of all growing firms: only 6 percent managed to gain revenues
over the 1990-93 period, as compared to 45 percent of privatized and 56 percent of
(nonprivatized) private firms. Controlling for other factors, in the early stages of the
postcommunist transition privatization alone “added” nearly 10 percentage points to the revenue
7
In evaluating credit performance, we considered a firm to be in bank credit or tax arrears if any of its payments3
were past due. For trade credit, we defined overdue payments as those late by 60 or more days. This extension of theusual repayment period was necessary because delays in repaying trade credit within 30 days were quite common duringthe early stages of transition, particularly in the Czech Republic and Poland. In both of these countries, one out of everytwo firms failed to repay its suppliers within 30 days, the ratio dropping to one in three past 60 days (in Hungary, the ratiostood at one in four irrespective of the time period.) Moreover, the widespread incidence of “short” (under 60 days)delays overshadowed any systematic ownership differences, which surfaced only with the incidence of more persistentdelays.
growth rate of a firm privatized to owners not employed by the firm (Frydman et al., 1999).
The decline of revenues in the early years of transition was bound to put many firms in
financial difficulties. Overall, 45 percent of the firms in our sample were in arrears to one or
more of their short-term creditors. Not surprisingly, the percentage was markedly higher among3
firms with declining revenues: 57 percent of such firms were in arrears to one or more of their
creditors, as compared to 24 percent of those with growing sales (the difference significant at p <
0.01); such performance-induced differences affected all three types of creditors.
State firms dwarfed privatized and private firms in every credit category: proportionally
at least twice as many state-owned firms as their privately-owned counterparts were late in
meeting their obligations to all types of creditors. Nearly 3 out of every 4 state and corporatized
firms were in arrears to one or more of their short-term creditors, as compared to 1 out of 3
privatized and 1 out of 7 private firms (both differences significant at p < 0.01). Moreover,
among the firms in arrears, the median level of combined arrears in state firms, amounting to
nearly 27 percent of annual revenues, was considerably higher than among the privatized (4.9
percent) and private (3.1 percent) firms.
III. Measurement and evaluation of debtors’ and creditors’ behavior
We assess the creditworthiness of a firm with certain characteristics (such as cost and
revenue performance, ownership type, etc.) by estimating the probability that a firm with these
characteristics would have defaulted on any of its outstanding short-term credit obligations to any
of its creditors during the 1990-1993 period. The higher the probability that a firm would have
been late in meeting its obligations to one of its creditors, the lower the firm’s overall
creditworthiness (and the higher the credit risk it represents).
In addition to a firm’s overall creditworthiness, we also evaluate the likelihood of its
8
having been being late on payments to particular types of creditors. In a well functioning market,
and in the absence of any distinctive seniority structure of outstanding short-term obligations,
those likelihoods should match the “overall” creditworthiness of the firm. Although we have no
information on the terms of credit granted by different types of creditors, we see no prior reason
for any short-term debts of any firms to be subordinated to other short-term debts in a systematic
fashion. We therefore assume that, in principle, all short-term credit obligations are to be met
pari passu and we interpret systematic differences in the likelihoods of arrears to different types
of creditors as evidence that some firms give and/or receive preferential treatment to or from
some types of creditors. (Of particular interest here is the behavior of state firms vis-a-vis state
creditors.)
We break down the concept of a firm’s creditworthiness into two components. The first
is the firm’s ability to pay. Although numerous factors affect this ability (including the firm’s
cash flow, the excess of its sales over costs, and the degree of leverage), we use the firm’s rate of
revenue growth as a proxy for its ability to repay. One reason is that information concerning the
other factors, such as cash flow, cost of capital, and profitability, was notoriously unreliable in
the early stages of the postcommunist transition. We have only limited data on those factors, and
cannot recreate a complete evaluation that a lender may have made before extending credit.
Moreover, we doubt that creditors were able to rely on them to any significant extent.
But there is another, more important, reason why we believe that a firm’s ability to
service its debt obligations in the environment of the early postcommunist transition was
primarily a function of its ability to generate sufficient revenues. Where firms differed most in
the transition environment of the early 1990s, especially firms with different ownership types,
was not in their ability to control costs but in their capacity to restructure their products and find
new markets, so as to achieve a level of sales capable of assuring the firm’s future viability
(Frydman et al., 1999. Once a firm’s revenues were growing, costs could be kept in check,
increasing the chances of being able to meet payment obligations. When revenues were falling
fast, however, even the most stringent cost cutting measures were unlikely to provide sufficient
savings to enable the firm to service debts. Indeed, while we found a close relation between the
ability to generate revenues and creditworthiness (as discussed below), we could discern no
9
This way of gauging the differences in the willingness or propensity to pay depends, of course, on the4
closeness of “fit” between revenue growth and the ability to pay. To the extent that revenue growth may not be a perfectproxy, and thus may not capture certain aspects of a firm’s ability to pay, those aspects may be “picked up” by othervariables in our equations, especially those pertaining to ownership type. The most important potential candidate for suchleakage would be the state firms’ inferior cost performance. We have explained already that there is no statisticallysignificant relation between cost performance and creditworthiness in our sample. We also know from Frydman et al.(1999) that state firms do not, as a matter fact, perform worse on costs than privatized companies. We do not believe,therefore, that the possibility of this kind of “leakage” is serious enough to vitiate our assumption that the significance ofthe coefficients of the ownership-type dummies in our equations reflects mostly differences in the willingness orpropensity, and not the ability, to repay.
statistically significant relation between a firm’s cost performance and its ability to repay its
obligations.
A firm’s decision to repay any individual obligation, however, depends on more than its
ability to come up with the cash; it involves a decision whether to allocate any available cash to
this or another purpose. This decision reflects the component of the firm’s creditworthiness that
goes beyond the ability to repay, and involves the firm’s willingness (or propensity) to repay.
We gauge a firm’s willingness to meet its credit obligations by the differential likelihood of its
defaulting on its debt payments, as compared to other (types of) firms with a similar ability to
pay. If the state firms in our sample, for example, were more likely to default on their payments
than private ones, even after differences in ability to pay (as measured by revenue growth) were
controlled for, we take this to be a reflection of these firms’ lesser willingness or propensity to
pay. 4
While a firm’s ability to pay is a function of firm-specific characteristics (in our model,
essentially its ability to generate sufficient revenues to meet its payment obligations), its
willingness or propensity to pay is a function of three different types of factors: (1) system-
specific characteristics of the legal and economic environment, such as the extent of the credit
market development, the nature and effectiveness of bankruptcy laws, etc.; (2) firm-specific
characteristics, corresponding to how the firm values its relation with a given creditor relative
both to other claimants (including its labor force and any political constituencies that might
support the priority of some claimants over others) and other available investment opportunities;
(3) creditor-specific characteristics, related to how stringently the creditor will react to
nonpayment or even a possibility of default.
We assume that decisions to repay creditors are economic in nature, i.e., that they reflect
10
This is not uncommon even in well-functioning markets (Stiglitz and Weiss, 1981), and it is unlikely that5
interest rate variations played a significant role in credit allocation in the early years of postcommunist transition. Inflation premia on loans were so high as to dwarf most firm-specific interest-rate adjustments. Also, with practically nocredit history of firms under the conditions of a market economy, most creditors(especially banks) had limited ability tomake fine differentiations in the degree of risk represented by particular borrowers. Most credit allocation, therefore, was
likely to have been done through yes-or-no decisions on particular credit applications. (Although we do not have data onshort-term interest rates in our survey, the data on long-term rates faced by the firms in our sample confirms this view,showing that interests rates did not vary in relation to creditworthiness. In fact, there was no statistically significantdifference between the interest rates faced by state and privatized firms in our sample. New private firms faced anestimated 3% surcharge.)
the perceived balance between the costs of delaying payments to some or all creditors and the
costs of foregone opportunities that timely payment involves. If, for example, state firms
manifest lesser willingness or propensity to repay than privatized firms, this may be related in
part to some internal pressures and preferences of state actors (such as those related to a
politicization of repayment decisions) and in part to a relaxation of the budget constraints
resulting from some “softness” with which state firms may be treated by all or certain types of
creditors.
We attempt to gauge the separate effect of these factors, in particular the contribution that
the creditors’ behavior might have made to the creditworthiness of a particular type of firms, in
two ways. First, we assess the willingness or propensity of debtor firms to repay different types
of creditors: a differential willingness of debtors to repay might be indicative of a differential
willingness (or ability) of creditors to collect. Second, we test the creditors’ potential
contribution to the likelihood of default by looking into the levels of arrears that certain types of
firms were permitted to run up. We assume that closing credit lines (rather than raising interest
rates) was the primary method by which creditors were likely to ration credit in the early stages
of postcommunist transition. If a particular type of debtor, therefore, presented a known higher5
risk to a given creditor, the creditor would ration credit more strictly to this type of debtor (by
requiring better revenue performance, for example), and would cut off credit once the arrears
reached a certain level. (We assume that credit lines to defaulting borrowers could be shut off
rather easily because short-term bank and trade credit were revolving in nature.)
Thus, if the various factors affecting risk differentials among different types of firms were
properly taken into account in the initial decision to extend credit, the same factors should have
11
We also tested for the impact of any sectoral differences among firms by including two-digit industry dummies6
as well as combinations of such dummies (capturing the difference between consumer and industrial goods sectors)among the variables in our model. We found that all such sectoral effects lacked significance and their inclusion left theestimates of other variables virtually intact.
See Appendix B for the description of the annualization method.7
no impact on the relative levels of arrears among the same types of firms. We took the evidence
of the contrary phenomenon – i.e. the fact that the same factors account for both the incidence
and the levels of overdue payments by some type of firms to certain types of creditors – as an
indication that the creditors involved were either unaware of these factors’ role in determining
creditworthiness or, more likely, ignored them and pursued “soft” credit policies with respect to
firms with the characteristics in question. If state ownership, for example, turned out to be an
explanatory factor with respect to both a firm’s creditworthiness and the size of the arrears the
firm may run up to state banks, we considered this an evidence that state banks were “soft” in
extending credit to state firms. This way of gauging the impact of creditors’ behavior on the
creditworthiness of their debtors will become important in disentangling the relationship between
the policy of hard budget constraints and firm creditworthiness in the environment of the
postcommunist transition.
IV. Ownership, revenue performance, and creditworthiness
In this section, we examine the likelihood of a firm’s default on its short-term obligations
as a function of the firm’s revenue performance, ownership type, and the country in which the
firm is located. We use the annualized rate of revenue growth to measure the firm’s revenue6
performance. Since falling revenues are apt to affect the likelihood of default differently from7
the rising ones, we split the revenue growth into two corresponding variables. We estimate
separately likelihoods of defaults on obligations to the following types of short-term creditors:
(1) any creditors (2) bank creditors, (3) tax authorities, (4) any state creditors (banks or tax
authorities), and (5) trade creditors. (Throughout, state firms in the Czech Republic serve as the
reference group). The resulting estimates appear in Table 2.

12
Rate of growth of revenues for firms Rate of growth of revenues for firms with Privatized firm Private (non-privatized) firmwith decreasing revenues increasing revenues1 1
4
-0.013* -0.35* -0.38*(0.004) (0.15) (0.16
0.000(0.001
13
While the negative sign of the “corporatization” contrast suggests that corporatized firms may also have been8
lower credit risks than noncorporatized state firms, the difference lacks statistical significance.
Obligations to all short-term creditors
Two features of the estimates of the likelihood of a firm’s defaulting on any of its short-
term obligations, reported in column (1) of Table 2, deserve note. The first is the relationship
between creditworthiness and the rate of revenue growth. The second is the impact of ownership
on the willingness or propensity to repay.
We have conjectured that declining revenues are a proxy for a firm’s decreasing ability to
repay its obligations, and the coefficient of this variable (-0.013) is highly significant, consistent
with the conjecture. For firms with growing revenues, however, the likelihood of default is not
related to the rate of revenue growth. This is not unexpected if growing revenues generally
indicate sufficiently high ability to pay – as seems reasonable to assume in most instances. Once
a firm’s revenues are growing, its decision to repay (or not repay) depends mostly on other
factors, and the rate of growth itself is not predictive of the likelihood of arrears.
In the early years of transition, state firms lost revenues much faster than firms that had
either never been state-owned or had been privatized (see Table 1 and the accompanying text):
indeed, all but three state and corporatized firms in our sample had declining revenues over the
sample period. Thus, to the extent that declines meant a lesser ability to pay and a higher
likelihood of default, state firms were by this fact alone generally less creditworthy and were hit
much harder by any consistent policy of hard budget constraints.
But in addition to their lower ability to pay, state firms also showed less willingness or
propensity to repay. Even when revenue performance is controlled for, the ownership contrasts
for privatized and private firms (-0.36 and -0.38, respectively) are both significant, indicating that
those firms were significantly less likely than their state counterparts to fall behind in their short-
term obligations. Thus, even as between state and privatized or private firms with the same8
ability to pay, state firms represented a higher risk to their short-term creditors. (Interestingly,
privatized and private firms are statistically indistinguishable from each other insofar as their
willingness or propensity to repay is concerned.) These differences in creditworthiness between
state-owned and privately-owned firms were independent of the firms’ domicile: once the
14
revenue performance and ownership of a firm are accounted for, country effects are insignificant
in predicting the likelihood of a firm’s running late in meeting some of its payment obligations.
(As we shall see, however, which of its obligations the firm was more likely to default on is not
independent of the country in which the firm was located.)
The lower willingness or propensity of state firms to repay their short-term obligations
may have been in part a function of the way they were treated by their creditors. If the creditors
imposed “softer” budget constraints on state firms than on other firms, this lowered the cost of
nonpayment and -- if the opportunity costs of payment did not change -- reduced the state firms’
propensity to repay. We will inquire later whether there is reason to believe that at least some
creditors were indeed softer on state firms. But there may also have been other reasons why the
state firms’ willingness or propensity to repay was lower than that of their privately-owned
counterparts, and these reasons may have been specific to the state firms themselves. The most
likely candidate would be a politicization of repayment decisions: paying one’s debts may have
introduced cash constraints that would force layoffs or wage restrictions, or other cost-cutting
measures that would impinge on the firm’s politically powerful constituencies. If state firms
were more subject to political pressure by these constituencies, their opportunity cost of
repayment would be higher and would raise the risk they represented to their creditors.
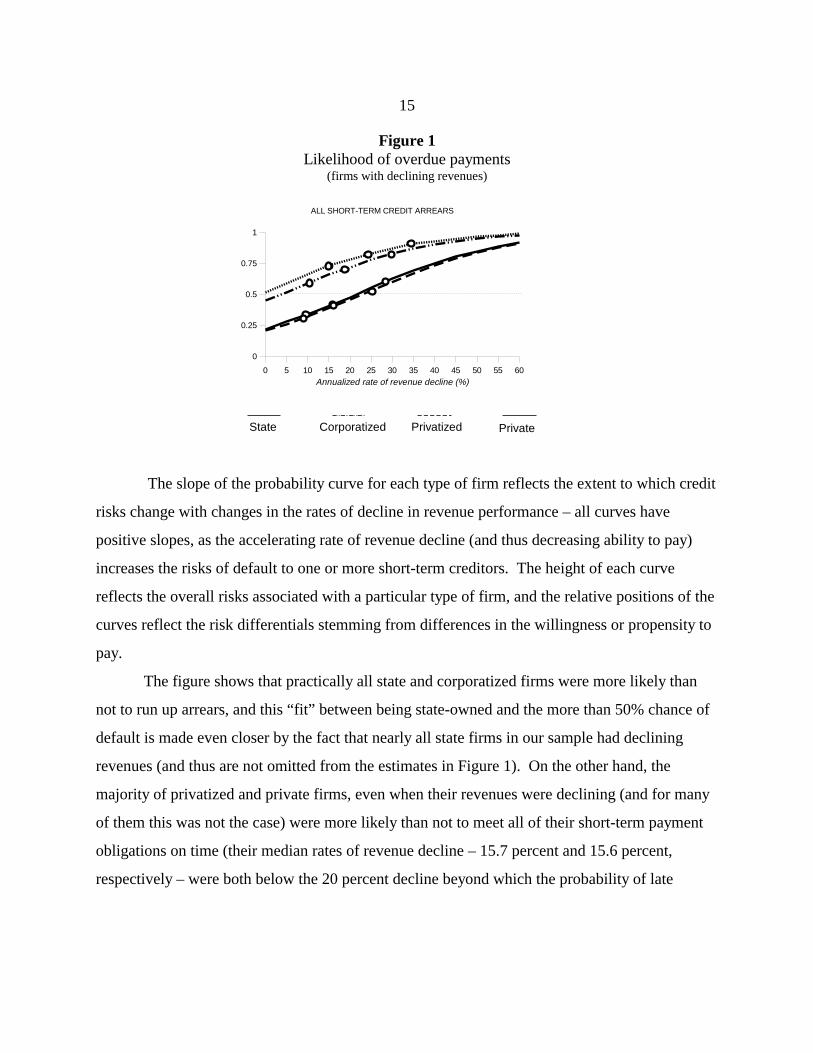
The estimates reported in Table 2 are the marginal effects evaluated at the mean values of
explanatory variables, and comparisons of the creditworthiness of firms with different types of
ownership might be facilitated by the probability curves generated by these estimates. Figure 1
shows these curves; to increase the clarity of graphic presentation, the probabilities were re-
estimated without country variables, which had lacked significance in the original equation.
Since few state firms had growing revenues, the graph compares only firms with declining
revenues. The three marks on each probability curve identify the positions of the first, second,
and third quartile firms in terms of the rate of revenue decline. The dotted horizontal line
identifies the point of equal odds of meeting financial obligations on time.
Annualized rate of revenue decline (%)0 5 10 15 20 25 30 35 40 45 50 55 60
0
0.25
0.5
0.75
1
ALL SHORT-TERM CREDIT ARREARS
State Corporatized Privatized Private
15
Figure 1Likelihood of overdue payments
(firms with declining revenues)
The slope of the probability curve for each type of firm reflects the extent to which credit
risks change with changes in the rates of decline in revenue performance – all curves have
positive slopes, as the accelerating rate of revenue decline (and thus decreasing ability to pay)
increases the risks of default to one or more short-term creditors. The height of each curve
reflects the overall risks associated with a particular type of firm, and the relative positions of the
curves reflect the risk differentials stemming from differences in the willingness or propensity to
pay.
The figure shows that practically all state and corporatized firms were more likely than
not to run up arrears, and this “fit” between being state-owned and the more than 50% chance of
default is made even closer by the fact that nearly all state firms in our sample had declining
revenues (and thus are not omitted from the estimates in Figure 1). On the other hand, the
majority of privatized and private firms, even when their revenues were declining (and for many
of them this was not the case) were more likely than not to meet all of their short-term payment
obligations on time (their median rates of revenue decline – 15.7 percent and 15.6 percent,
respectively – were both below the 20 percent decline beyond which the probability of late
16
Note also that the position of the third quartile privatized firm suggests about even odds (1:1) of default, while9
for a state firm with the identical rate of revenue decline the odds are higher than 4:1.
As we explain later, however, some of the state firms’ lower propensity to repay was itself attributable to the10
softness of their (state) creditors.
payments for these firms exceeded 0.5). 9
Another measure of the difference in the propensity to repay is the horizontal distance
separating the probability curves in Figure 1. This distance suggests that a state firm would have
to have about 20 percentage points higher revenue growth to be as creditworthy as a privatized
firm with otherwise similar characteristics, a very severe handicap on state ownership. If short-
term creditors had applied strictly nondiscriminatory lending criteria, the lower overall
creditworthiness of state firms, reflecting both their lower ability and lower propensity to pay,
might have resulted in a virtual credit cutoff to the state-owned sector.10
Bank, tax , and trade credit
Overall incidence of nonpayment to creditors was only a part of the story of the
developing standards of creditworthiness in the transition economies. Debtors not only dealt
with the financial ups and downs during this difficult period by occasionally defaulting on their
obligations; they also juggled their obligations to different types of creditors. Which creditors
they tended to pay first and which they tended to skip when money was short tells quite a lot
about the effectiveness of financial market reforms.
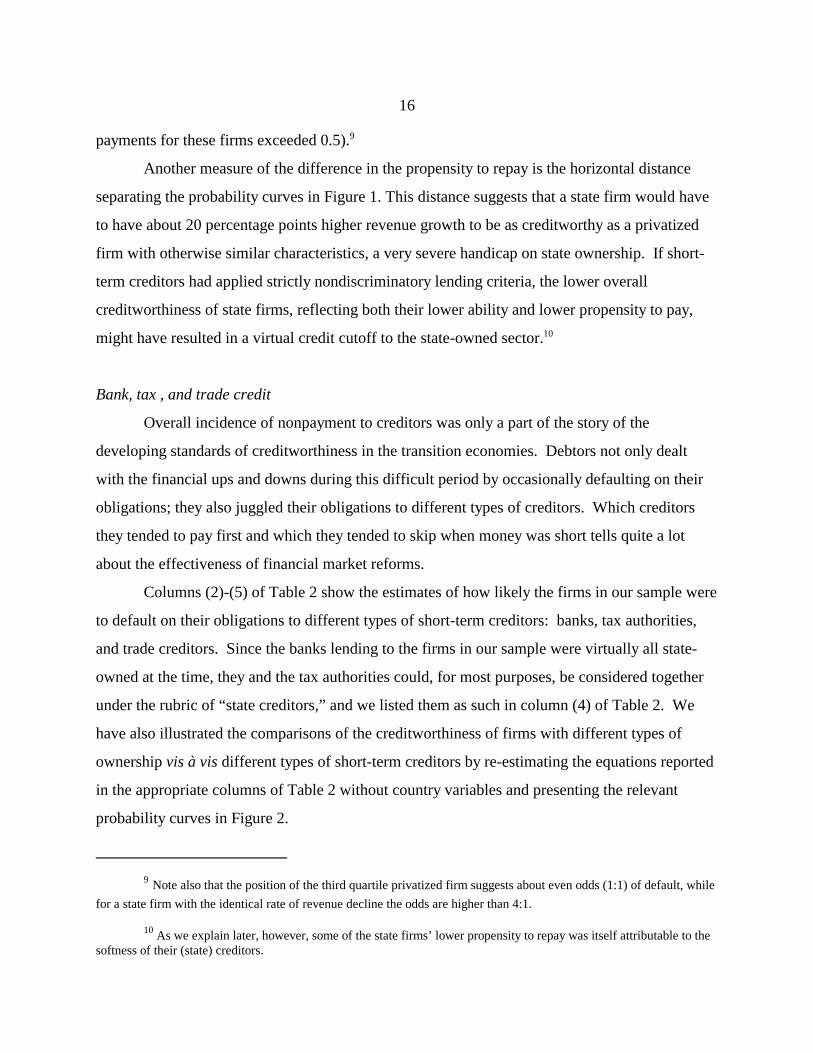
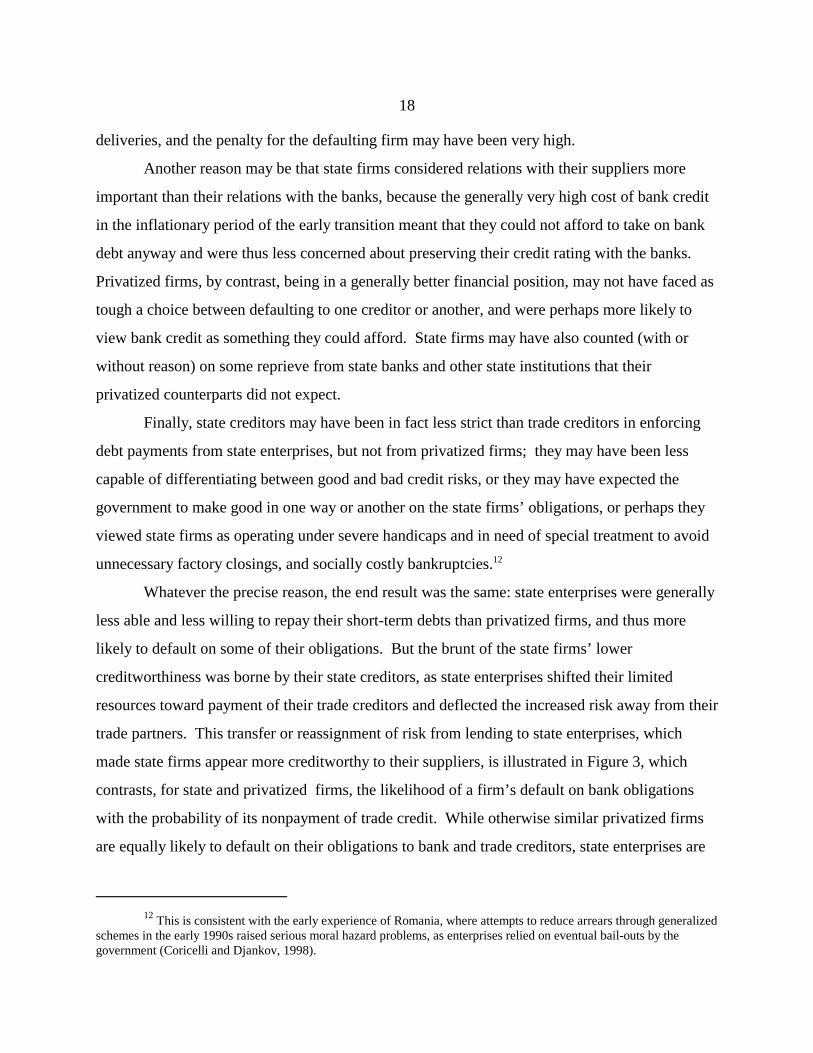
Columns (2)-(5) of Table 2 show the estimates of how likely the firms in our sample were
to default on their obligations to different types of short-term creditors: banks, tax authorities,
and trade creditors. Since the banks lending to the firms in our sample were virtually all state-
owned at the time, they and the tax authorities could, for most purposes, be considered together
under the rubric of “state creditors,” and we listed them as such in column (4) of Table 2. We
have also illustrated the comparisons of the creditworthiness of firms with different types of
ownership vis à vis different types of short-term creditors by re-estimating the equations reported
in the appropriate columns of Table 2 without country variables and presenting the relevant
probability curves in Figure 2.
Annualized rate of revenue decline (%)0 5 10 15 20 25 30 35 40 45 50
0
0.25
0.5
0.75
1
TAXES
Annualized rate of revenue decline (%)0 5 10 15 20 25 30 35 40 45 50
0
0.25
0.5
0.75
1
BANK CREDIT
State Corporatized Privatized Private
Annualized rate of revenue decline (%)0 5 10 15 20 25 30 35 40 45 50
0
0.25
0.5
0.75
1
TRADE CREDIT
17
But see the caveat in note 3 above.11
Figure 2Likelihood of default on obligations to banks, tax authorities, and trade creditors
(for firms with declining revenues)
The significance of the rate of a firm’s declining revenues for the likelihood of default
persists throughout all the equations reported in Table 2. Given our assumption that revenue
growth is a good proxy for the ability to pay, the remaining differences in the creditworthiness of
firms with different ownership types were most likely due to differences in the willingness or
propensity to repay. Perhaps the most interesting of these is the difference between the11
payment behavior of privatized firms and that of noncorporatized state-owned enterprises vis à
vis state and trade creditors. The ownership contrasts for privatized firms in both bank and tax
credit equations (-0.46 and -0.37, respectively) are significant, indicating that state and privatized
enterprises differed significantly in their propensity to repay their short-term obligations to state
creditors . The corresponding contrast in the trade credit equation (-0.09), however, lacks
significance, suggesting that after differences in revenue growth (the ability to pay) are controlled
for, the remaining differences in the likelihood of default on obligations to trade creditors were
no longer significant.
The fact that state firms appear as “resolved” as their privatized counterparts to pay their
trade creditors on time may be due to several factors. One possible reason is that trade creditors
may have found it easier to enforce their payment schedules than banks or tax authorities: if a
firm was very dependent on its suppliers, it may have been easy for a supplier to cut off
18
This is consistent with the early experience of Romania, where attempts to reduce arrears through generalized12
schemes in the early 1990s raised serious moral hazard problems, as enterprises relied on eventual bail-outs by thegovernment (Coricelli and Djankov, 1998).
deliveries, and the penalty for the defaulting firm may have been very high.
Another reason may be that state firms considered relations with their suppliers more
important than their relations with the banks, because the generally very high cost of bank credit
in the inflationary period of the early transition meant that they could not afford to take on bank
debt anyway and were thus less concerned about preserving their credit rating with the banks.
Privatized firms, by contrast, being in a generally better financial position, may not have faced as
tough a choice between defaulting to one creditor or another, and were perhaps more likely to
view bank credit as something they could afford. State firms may have also counted (with or
without reason) on some reprieve from state banks and other state institutions that their
privatized counterparts did not expect.
Finally, state creditors may have been in fact less strict than trade creditors in enforcing
debt payments from state enterprises, but not from privatized firms; they may have been less
capable of differentiating between good and bad credit risks, or they may have expected the
government to make good in one way or another on the state firms’ obligations, or perhaps they
viewed state firms as operating under severe handicaps and in need of special treatment to avoid
unnecessary factory closings, and socially costly bankruptcies.12
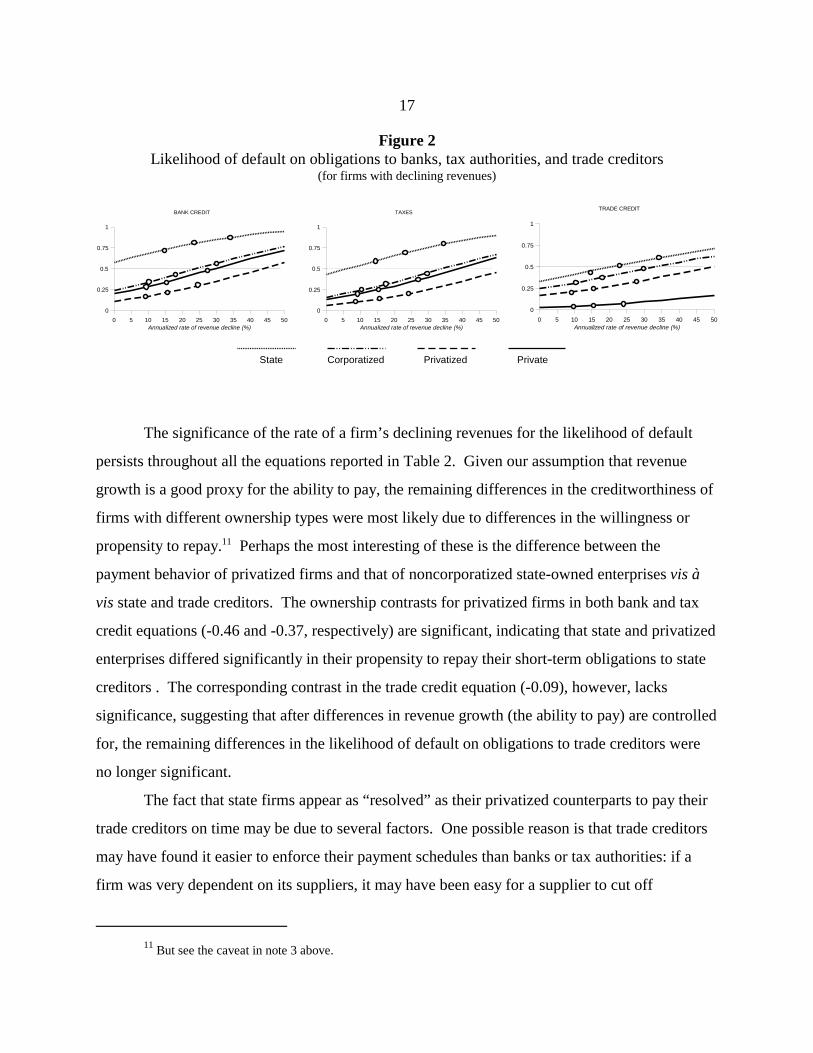
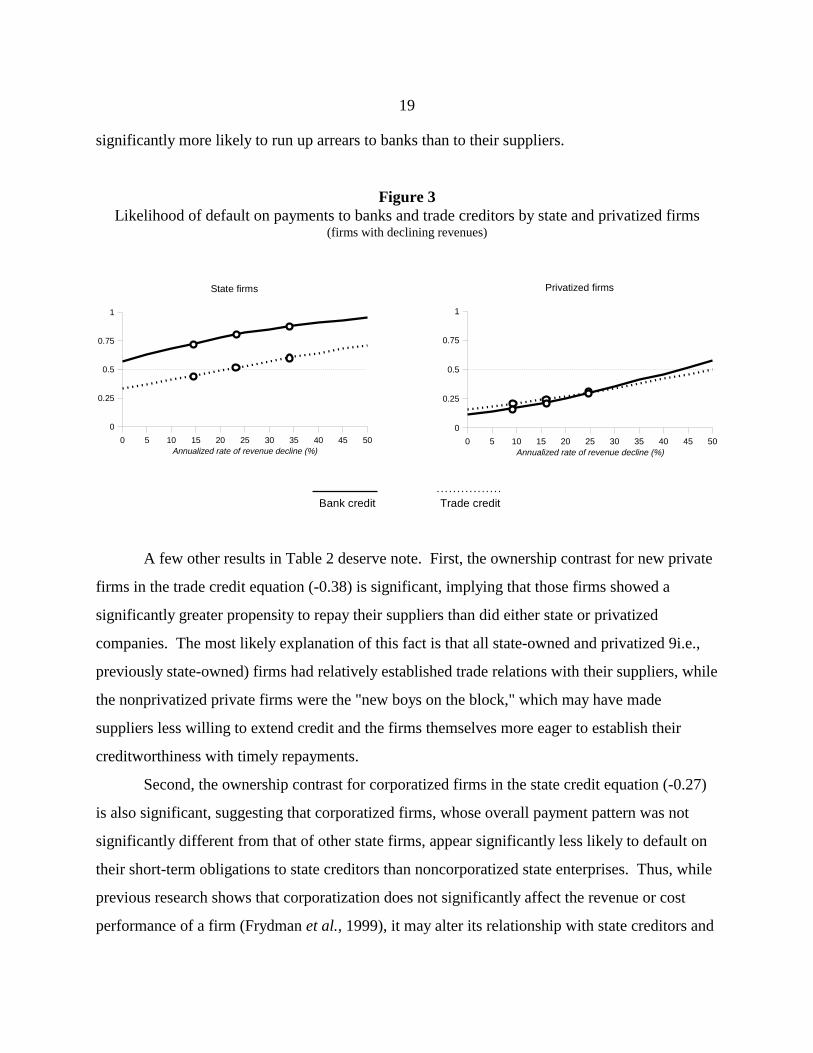
Whatever the precise reason, the end result was the same: state enterprises were generally
less able and less willing to repay their short-term debts than privatized firms, and thus more
likely to default on some of their obligations. But the brunt of the state firms’ lower
creditworthiness was borne by their state creditors, as state enterprises shifted their limited
resources toward payment of their trade creditors and deflected the increased risk away from their
trade partners. This transfer or reassignment of risk from lending to state enterprises, which
made state firms appear more creditworthy to their suppliers, is illustrated in Figure 3, which
contrasts, for state and privatized firms, the likelihood of a firm’s default on bank obligations
with the probability of its nonpayment of trade credit. While otherwise similar privatized firms
are equally likely to default on their obligations to bank and trade creditors, state enterprises are
Annualized rate of revenue decline (%)0 5 10 15 20 25 30 35 40 45 50
0
0.25
0.5
0.75
1
State firms
Annualized rate of revenue decline (%)0 5 10 15 20 25 30 35 40 45 50
0
0.25
0.5
0.75
1
Privatized firms
Bank credit Trade credit
19
significantly more likely to run up arrears to banks than to their suppliers.
Figure 3Likelihood of default on payments to banks and trade creditors by state and privatized firms
(firms with declining revenues)
A few other results in Table 2 deserve note. First, the ownership contrast for new private
firms in the trade credit equation (-0.38) is significant, implying that those firms showed a
significantly greater propensity to repay their suppliers than did either state or privatized
companies. The most likely explanation of this fact is that all state-owned and privatized 9i.e.,
previously state-owned) firms had relatively established trade relations with their suppliers, while
the nonprivatized private firms were the "new boys on the block," which may have made
suppliers less willing to extend credit and the firms themselves more eager to establish their
creditworthiness with timely repayments.
Second, the ownership contrast for corporatized firms in the state credit equation (-0.27)
is also significant, suggesting that corporatized firms, whose overall payment pattern was not
significantly different from that of other state firms, appear significantly less likely to default on
their short-term obligations to state creditors than noncorporatized state enterprises. Thus, while
previous research shows that corporatization does not significantly affect the revenue or cost
performance of a firm (Frydman et al., 1999), it may alter its relationship with state creditors and
20
To test this hypothesis, we re-estimated our overall default and bank-credit default equations (columns 1 and13
2 in Table 1) separating the firms owned by Czech privatization funds from all other privatized firms. In the overalldefault equation, the firms owned by the Czech funds were not significantly more likely to default than other privatizedcompanies. But when only the default on bank credit was examined, the firms owned by the Czech privatization fundswere significantly more likely to default than other privatized firms, and their payment behavior was in fact notsignificantly different from that of state firms.
harden the budget constraint. Whether this is due to a greater resolve of the firm itself or that of
its state creditors, the greater expectation of privatization that often accompanies the process of
corporatization – and thus perhaps the lower likelihood of state bailout – may have played a role.
Finally, some country differences, determining the “environmental” background of
creditworthiness, should be noted. Trade creditors seem more likely to have collected their
payments on time in Hungary than in either the Czech Republic or Poland, perhaps a
consequence of the stricter bankruptcy laws in Hungary at the time of our survey. Also, on
average, firms in the Czech Republic tended to default less often to state creditors than those in
either Hungary and Poland: the Czech government may have been more effective in imposing
financial discipline on state and non-state firms alike (this was certainly true about tax
payments), but also, according to some reports, Czech banks may have been more willing to
capitalize overdue payments. This may have been particularly true in the case of the relation
between the firms owned by Czech investment funds and the banks controlling the same funds.13
IV. Creditor behavior and developing credit markets in postcommunist transition
We have seen that state-owned firms represented a higher credit risk to short-term
creditors than privately-owned firms, both because of their lesser ability to pay and their lower
willingness or propensity to repay. State firms were particularly sluggish in repaying their short-
term obligations to state creditors, while showing greater propensity to satisfy their trade
creditors. In this section we examine the extent to which different creditors recognized the
differences in the creditworthiness of different types of firms, and in particular, the extent to
which their own behavior may have been a factor in determining the likelihood of nonrepayment.
As explained in section III above, we assume that direct rationing of short-term credit
(rather than interest rate differentials) was likely to have been the main method by which
creditors in the transition environment react to perceived excessive credit riskiness of individual
21
If being state-owned, for example, is a property that partially explains both the likelihood of a firm’s default14
on bank debt and the level of its overdue bank debts, then we conclude that banks, to begin with, did not properly takestate ownership as an indication of an increased probability of default and were “soft” in extending credit to state firms.
Another methodological point is relevant as well: A direct estimation of the determinants of the levels of15
overdue payments among firms in arrears would produce biased results, because a firm with arrears cannot be treated asrandomly selected from the population of all firms in the sample. In estimating, for example, the role that ownershipplayed in determining the level arrears run up by a firm, the fact that state firms were more likely to run up arrears thanprivatized firms in the first place might skew the impact of ownership on the level of arrears. To correct this problem, weused Heckman’s two step estimation procedure (Heckman, 1979; Greene, 1981).
borrowers. To the extent that credit allocation in the early years of transition mirrored the
borrowers’ creditworthiness, it was likely to be reflected in the amount of borrowing (degree of
leverage) that particular firms might be allowed by their creditors.
But if risk differentials – whether related to ownership, performance, or any other factor
affecting credit riskiness – were properly accounted for in determining the allowable degree of
leverage, they should not account for any differences in the levels of overdue credit. In other
words, if a variable significant in explaining the variation in the incidence of arrears among
certain types of firms were to remain significant in explaining the variation in the levels of their
arrears as well, the persistence would imply that creditors did not properly take this variable into
account in the first place, when they were assessing the creditworthiness of the firms in
question. 14
To examine the determinants of the size of the arrears a firm was allowed to run up by a
given type of creditor, we estimated the average size of a firm’s arrears as a function of its
revenue performance (separating revenue growth into two variables, one for firms with growing,
the other with falling revenues), ownership type, and the country in which the firm was located.
Because not all firms had arrears, the number of firms in the sample became too low to obtain
consistently significant results if the firms were split into too many categories. Consequently, we
combined into one category of “state-owned firms” both the corporatized and the non-
corporatized state firms, which were not statistically significantly different from each other.
Similarly, we combined the privatized and new (nonprivatized) private firms, the coefficients of
which were virtually identical, into one category of “privately-owned firms.”15
We again estimated separately the arrears run up on short-term obligations to (1) any
22
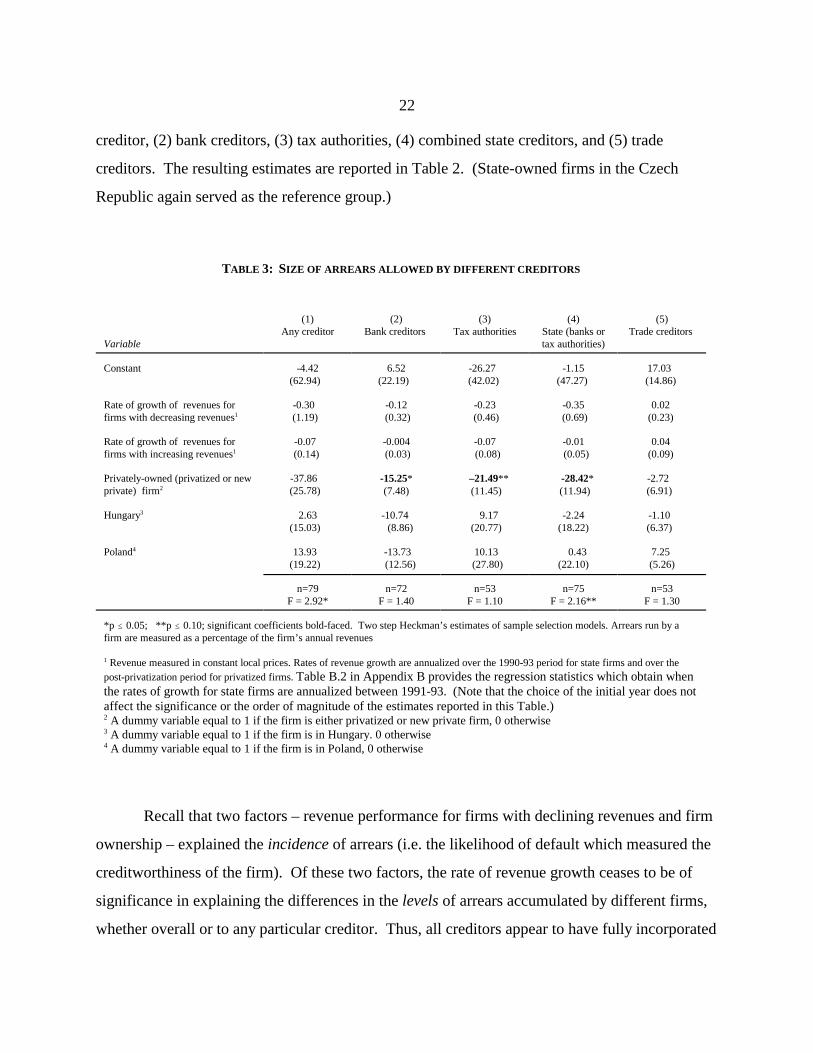
creditor, (2) bank creditors, (3) tax authorities, (4) combined state creditors, and (5) trade
creditors. The resulting estimates are reported in Table 2. (State-owned firms in the Czech
Republic again served as the reference group.)
TABLE 3: SIZE OF ARREARS ALLOWED BY DIFFERENT CREDITORS
Variable tax authorities)
(1) (2) (3) (4) (5)Any creditor Bank creditors Tax authorities State (banks or Trade creditors
Constant -4.42 6.52 -26.27 -1.15 17.03 (62.94) (22.19) (42.02) (47.27) (14.86)
Rate of growth of revenues for -0.30 -0.12 -0.23 -0.35 0.02 firms with decreasing revenues (1.19) (0.32) (0.46) (0.69) (0.23) 1
Rate of growth of revenues for -0.07 -0.004 -0.07 -0.01 0.04 firms with increasing revenues (0.14) (0.03) (0.08) (0.05) (0.09) 1
Privately-owned (privatized or new -37.86 -2.72 private) firm (25.78) (6.91) 2
-15.25* –21.49** -28.42* (7.48) (11.45) (11.94)
Hungary 2.63 -10.74 9.17 -2.24 -1.10 3
(15.03) (8.86) (20.77) (18.22) (6.37)
Poland 13.93 -13.73 10.13 0.43 7.25 4
(19.22) (12.56) (27.80) (22.10) (5.26)
n=79 n=72 n=53 n=75 n=53F = 2.92* F = 1.40 F = 1.10 F = 2.16** F = 1.30
*p � 0.05; **p � 0.10; significant coefficients bold-faced. Two step Heckman’s estimates of sample selection models. Arrears run by afirm are measured as a percentage of the firm’s annual revenues
Revenue measured in constant local prices. Rates of revenue growth are annualized over the 1990-93 period for state firms and over the1
post-privatization period for privatized firms. Table B.2 in Appendix B provides the regression statistics which obtain whenthe rates of growth for state firms are annualized between 1991-93. (Note that the choice of the initial year does notaffect the significance or the order of magnitude of the estimates reported in this Table.) A dummy variable equal to 1 if the firm is either privatized or new private firm, 0 otherwise2
A dummy variable equal to 1 if the firm is in Hungary. 0 otherwise3
A dummy variable equal to 1 if the firm is in Poland, 0 otherwise4
Recall that two factors – revenue performance for firms with declining revenues and firm
ownership – explained the incidence of arrears (i.e. the likelihood of default which measured the
creditworthiness of the firm). Of these two factors, the rate of revenue growth ceases to be of
significance in explaining the differences in the levels of arrears accumulated by different firms,
whether overall or to any particular creditor. Thus, all creditors appear to have fully incorporated
23
The ex post bailout of deficient firms through “soft budget constraints” is often blamed for the persistent16
inefficiency of state firms (Kornai, 1993; Gomulka, 1995).
the revenue performance component of a firm’s creditworthiness in determining the credit line
open to the firm. However, the ownership contrasts continue to remain significant in explaining
the levels of overdue payments some firms were allowed to amass. In particular, the ownership
contrast for private firms in the state credit equation (-28.42) is significant while that in the trade
credit equation (-2.72) is not: state, but not trade, creditors seem to have allowed state-owned
firms to run up higher arrears than the privately-owned firms.
We may only conjecture about the exact reason for the “softness” of state creditors on
state-owned firms. It is unlikely that this effect is due to purely informational problems, such as
not being able to assess properly the degree of credit risk that state-owned firms represented.
Even if non-trade creditors, with their less close ties to borrowing firms, had somewhat worse
access to information, what we are dealing here looks too much like a systematic slant in favor of
state firms to be explained in this way.
A more likely reason is that state creditors intentionally favored state-owned firms, either
because of a politicization of credit decisions or because of the “old boy” connections between
state lenders and state-owned firms in financial difficulty. Under this view, the differential
treatment of state firms by state creditors followed from a correct assessment of these firms’
inability to meet their financial obligations, and the extension of credit was consciously meant as
a subsidy to state firms that could not generate sufficient revenues to survive. Moreover,
although this kind of policy might have had many adverse consequences and went against the
convictions of most committed reformers in the postcommunist countries, the subsidies in16
question may have not been entirely irrational. For if privatization was likely to lead to quick
improvement in the state firms’ performance (as research to date indicates), state firms may have
been legitimately seen as having had some turnaround potential, and letting them die by financial
strangulation may not have appeared to be the right policy to the state lenders with long relations
to these firms.
But the subsidy was more likely a result not of any conscious policy on the part of the
lenders, but rather of their refusal to follow a credit policy that would explicitly discriminate

24
against state firms. State-owned firms were less creditworthy in part because of their lesser
ability to pay. Yet the insignificance of revenue performance as a determinant of the size of
arrears for these firms means that state creditors seem to have had no difficulty in making the
ability to pay (perhaps explicitly measured by sales performance) into one of the lending criteria,
even if this adversely affected the state firms’ ability to obtain credit.
But the second element of the state firms’ lower creditworthiness – their lesser
willingness or propensity to pay – may have been more difficult to handle. To some extent, of
course, this component of the credit risk posed by state firms was probably induced by the
creditors themselves: if they were softer toward state firms in their credit policies, the state-
owned firms, taking advantage of this softness, would show themselves less creditworthy. But
this was very likely a chicken-and-egg problem, and we have argued already that, to some extent
at least, the state-firms’ lower propensity to repay their short-term obligations was probably due
to firm-specific (and not creditor specific) factors, such as the high opportunity cost of repayment
for state firms that may have faced political pressure not to lay off workers or engage in other
painful cost-cutting restructuring.
To the extent such firm-specific reasons for state firms’ lower propensity to repay were
present, it may have been very difficult to find a proxy for their existence, other than the very
fact of state ownership. If creditors wanted to allocate credit according to the real credit risks
represented by the borrowing firms, therefore, it might have been be necessary to adopt a policy
of explicit discrimination on the basis of state ownership. And while trade creditors (many of
whom were private entities) may have been doing just that in not allowing state-owned firms to
run up unduly high arrears, state lenders may have found it much more difficult to do so, much as
an American government-regulated insurer might find it difficult to take gender into account in
its pricing decisions, even if it is known that gender is a good proxy for such things as life
expectancy or child-birth-related medical expenses. Faced with this peculiar “cognitive
constraint,” state lenders in the postcommunist countries may have been forced to ignore the
most reliable lending criteria and attempt to follow a “facially neutral,” nondiscriminatory policy,
which in fact amounted to granting subsidies to the state-owned firms in their portfolios.
Once such a policy is followed, of course, it has the further effect of softening the budget
25
For state and private firms, we score rescheduling at any time between 1991 and 1993; for privatized firms,17
we take into account only post-privatization rescheduling. This can bias our results, if privatized firms might have hadtheir debts rescheduled prior to privatization. Our data and other information suggest, however, that this is not likely tohave been the case. First, in contradistinction to other countries, privatization in the postcommunist transition wasgenerally not preceded by an infusion of new funds to the firms to be privatized. Second, debt rescheduling in our sampleappears to have begun in 1993 only: of the 35 state and corporatized firms which reported rescheduling of their debtsbetween 1990 and 1993, 28 had the first instance of rescheduling in 1993 or 1994 and only 1 reported a 1991rescheduling. Still, the very possibility of bias warrants some caution in interpreting the results reported in this section.
constraint faced by state-owned firms and contributes further to their lower creditworthiness.
This is hardly surprising: although some aspects of creditworthiness may be originally firm-
specific and others creditor-specific, it invariably “takes two to tango.” On the debtor side, the
deficiencies of state ownership make state-owned firms a higher credit risk, both because of their
lesser ability to pay and their lower propensity to do so. Moreover, both of these characteristics
are intrinsic to state ownership: the former because of the constraints state ownership imposes on
a firm’s ability to generate revenues, the latter because of the politicization of the firm’s
repayment decisions. On the creditor side, state ownership produces an equally pronounced and
ownership-specific effect, as state creditors are forced to ignore, and perhaps willing to bear the
burden of, the higher credit risks represented by state firms, effectively allowing them to extract a
significant “risk rent” from the state. The two sides reinforce each other and make the hard
budget constraint policy, so dear to most reformers, to some extent unrealistic.
V. Long-term debt
The information in our survey concerning long-term debt is less detailed than that
concerning short-term obligations. Still, we were able to estimate the long-term debt counterpart
of the probability of default equation reported in Table 2. It would be surprising if the
differences among firms with different ownership types observed in connection with the
likelihood of default on short-term obligations did not carry over to long-term debts – and they
do.
We again identify the risk in extending long-term loans with the likelihood of default and
measure it by looking at the incidence of debt rescheduling. We relate this likelihood to the rate17
of growth of a firm’s revenues prior to rescheduling, again using separate variables for firms
with negative and positive revenue growth, the firm’s ownership type, and the country in which it
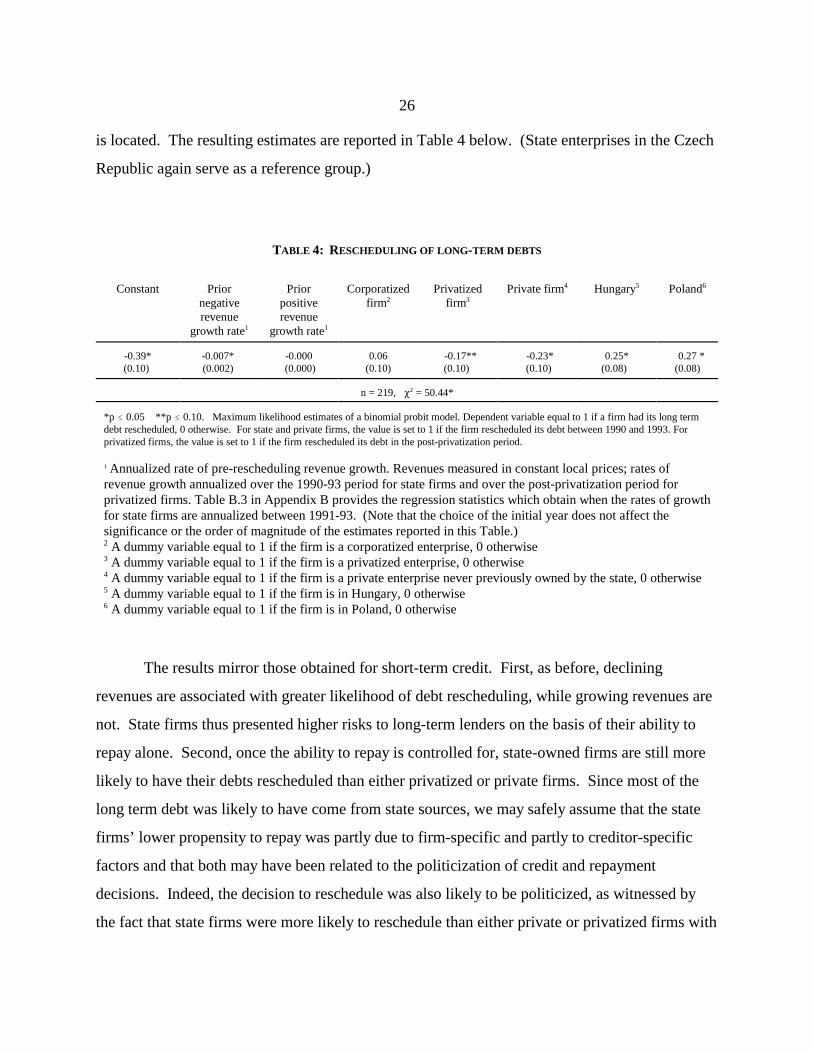
26
is located. The resulting estimates are reported in Table 4 below. (State enterprises in the Czech
Republic again serve as a reference group.)
TABLE 4: RESCHEDULING OF LONG -TERM DEBTS
Constant Prior Prior Corporatized Privatized Private firm Hungary Polandnegative positive firm firmrevenue revenue
growth rate growth rate1 1
2 3
4 5 6
-0.39* -0.007* -0.000 0.06 -0.17** -0.23* 0.25* 0.27 *(0.10) (0.002) (0.000) (0.10) (0.10) (0.10) (0.08) (0.08)
n = 219, � = 50.44*2
*p � 0.05 **p � 0.10. Maximum likelihood estimates of a binomial probit model. Dependent variable equal to 1 if a firm had its long termdebt rescheduled, 0 otherwise. For state and private firms, the value is set to 1 if the firm rescheduled its debt between 1990 and 1993. Forprivatized firms, the value is set to 1 if the firm rescheduled its debt in the post-privatization period.
Annualized rate of pre-rescheduling revenue growth. Revenues measured in constant local prices; rates of1
revenue growth annualized over the 1990-93 period for state firms and over the post-privatization period forprivatized firms. Table B.3 in Appendix B provides the regression statistics which obtain when the rates of growthfor state firms are annualized between 1991-93. (Note that the choice of the initial year does not affect thesignificance or the order of magnitude of the estimates reported in this Table.) A dummy variable equal to 1 if the firm is a corporatized enterprise, 0 otherwise2
A dummy variable equal to 1 if the firm is a privatized enterprise, 0 otherwise3
A dummy variable equal to 1 if the firm is a private enterprise never previously owned by the state, 0 otherwise4
A dummy variable equal to 1 if the firm is in Hungary, 0 otherwise5
A dummy variable equal to 1 if the firm is in Poland, 0 otherwise6
The results mirror those obtained for short-term credit. First, as before, declining
revenues are associated with greater likelihood of debt rescheduling, while growing revenues are
not. State firms thus presented higher risks to long-term lenders on the basis of their ability to
repay alone. Second, once the ability to repay is controlled for, state-owned firms are still more
likely to have their debts rescheduled than either privatized or private firms. Since most of the
long term debt was likely to have come from state sources, we may safely assume that the state
firms’ lower propensity to repay was partly due to firm-specific and partly to creditor-specific
factors and that both may have been related to the politicization of credit and repayment
decisions. Indeed, the decision to reschedule was also likely to be politicized, as witnessed by
the fact that state firms were more likely to reschedule than either private or privatized firms with
27
the same revenue history.
Finally, the environmental factors determining the likelihood of rescheduling are
measured by the coefficients on the country dummies. Note in this connection that Czech firms
were significantly less likely to reschedule than either their Polish or Hungarian counterparts,
which in turn were not significantly different from each other. We were unable to determine
whether these differences were due to more difficult formal rescheduling or easier informal roll-
overs in the Czech Republic.
VI. Conclusions
The choice of policies for emerging economies in times of economic crisis depends on
the extent to which financial discipline can improve firm performance. This paper shows that the
there are clear limits to what financial discipline can accomplish in the absence of firm-level
restructuring.
Previous research has established that the introduction of financial discipline on state
firms in the postcommunist transition environment was quite effective in forcing them to
restructure the costs of their operations, even if a degree of politicization of such things as
employment reductions continued to hamper their performance. Hard budget constraints were
largely ineffective, however, in improving the revenue performance of state-owned firms, as the
markets for their goods continued to shrink and their restructuring efforts did not produce the
desired results.
But the ability to generate revenues, more than any other factor, determines a firm’s
ability to repay its obligations in the economic upheavals following the fall of the communism.
As a result, the policy of hard budget constraints can be only partially successful unless
accompanied by privatization. As state firms lose their markets, they encounter increasing
difficulties with servicing their debt obligations, and they tend to put pressure on their creditors
to allow them some slack in repayment discipline. While the mostly private trade creditors seem
to resist these pressures and penalize state firms for their lesser willingness or propensity to
repay, state creditors are more receptive. Whether as a conscious policy or because of their
reluctance to engage in explicit discrimination against state firms that a market-based credit

28
allocation would require, the state creditors respond to the state firms’ desperate situation.
Moreover, because many state firms could be turned around by privatization, state
creditors’ might find it particularly difficult to let them perish by cutting off the supply of credit.
But extending credit on softer terms to state firms than to their privatized and new private
counterparts is also dangerous and breeds a cycle of deteriorating financial discipline. Our
conclusion, therefore, is not that the hard budget constraints of the postcommunist reform
policies should be relaxed. It is rather that these policies are not realistic unless accompanied by
speedy privatization: firm-level restructuring is necessary complement to financial discipline if
the transition from communist to a well-functioning market economy is to be successful.
29
REFERENCES
Bai, Chong-en and Yijang Wang, 1998. Bureaucratic Control and the Soft Budget Constraint.Journal of Comparative Economics 26 (1): 41-61.
Balcerowicz, Leszek, Cheryl W. Gray, and I. Hashi, 1998. Exit Processes in TransitionEconomies: Downsizing, Workouts, and Liquidation. Central European University Press,Budapest.
Bergloff, Erik and Gerard Roland, 1998. Soft Budget Constraints and Banking in TransitionEconomies, Journal of Comparative Economics 26 (1): 18-40.
Bergloff, Erik and Gerard Roland, 1997. Soft Budget Constraints and Banking in TransitionEconomies, European Economic Review 41: 807-817.
Bonin, John and Mark Schaffer, 1995. Banks, Firms, Bad Debts, and Bankruptcy, CEPRDiscussion Paper 234.
Claessens, Stijn and Simeon Djankov, 1998. Politicians and Firms in Seven Central and EasternEuropean Countries, World Bank Policy Research Working Paper 1954.
Coffee, John C.,1996. Institutional Investors in Transitional Economies, in Roman Frydman,Cheryl W. Gray, and Andrzej Rapaczynski, eds., Corporate Governance in CentralEurope and Russia. Volume 1: Banks, Funds, and Foreign Investors. Central EuropeanUniversity Press, Budapest.
Corricelli, Fabrizio and Simeon Djankov, 1998. Soft Budget Constraints and EnterpriseRestructuring in Romania. World Bank, mimeo.
Corricelli, Fabrizio and Alfredo Thorne, 1993. Dealing with Enterprises’ Bad Loans. Economicsof Transition 1 (1): 112-115.
Devatripont, Mathias and Eric Maskin, 1995. Credit and Efficiency in Centralized andDecentralized Economies. Review of Economic Studies 62 (4): 541-555.
Djankov, Simeon, 1999. The Enterprise Isolation Program in Romania. World Bank, mimeo. Djankov, Simeon and Kosali Ilayperuma, 1997. The Failure of Government-Led Reorganizations
of Financially Distressed Firms in Transition Economies. World Bank, mimeo. Frydman, R., C.W. Gray, M. Hessel, and A. Rapaczynski, 1999. When Does Privatization
Work? The Impact of Private Ownership on Corporate Performance in the TransitionEconomies. Quarterly Journal of Economics (forthcoming ).
Frydman, Roman, Marek Hessel, and Andrzej Rapaczynski, 1997. Why Ownership Matters?Politicization and Entrepreneurship in the Restructuring of Enterprises in Central Europe.C.V. Starr Center for Applied Economics, New York University.
Gomulka, Stanislaw, 1985. Kornai’s Soft Budget Constraint and the Shortage Phenomenon: ACriticism and a Restatement. Economics of Planning 19 (1): 1-11.
Greene, William, 1981. Sample Selection Bias as a Specification Error: Comment,Econometrica
Heckman, J., 1979. Sample Selection Bias as a Specification Error, EconometricaKornai, Janos, 1993. The Evolution of Financial Discipline under the Postsocialist System,
Kyklos 46 (3): 315-336Kornai, Janos, 1990. The Road to a Free Economy. Shifting from a Socialist System: The
Example of Hungary. W.W. Norton, New York.
30
Mitchell, Janet, 1999a. Banks’ Bad Debts: Policies, Creditor Passivity, and Soft BudgetConstraints, in A. Meyendorf and A. Thakor, eds. Financial Sector Development inEconomies in Transition, MIT Press, Cambridge, MA. (forthcoming).
Mitchell, Janet, 1999b. Theories of Soft Budget Constraints and the Analysis of banking Crises.Mimeo.
Perotti, Enrico, 1998. Inertial Credit and Opportunistic Arrears in Transition. EuropeanEconomic Review 42 (9): 1703-1726.
Pinto, B., Marek Belka, and S. Krajewski, 1993. Transforming State Enterprises in Poland:Evidence on Adjustment By Manufacturing Firms, Brookings Papers on EconomicActivity, 1: 213-269.
Schaffer, Mark E., 1998. Do Firms in Transition Economies Have Soft Budget Constraints? AReconsideration of Concepts and Evidence. Journal of Comparative Economics 26 (1):80-103.
Stiglitz, George and A.Weiss, 1981. Credit Rationing in Markets with Imperfect Information.American Economic Review 71: 393-410.
Qian, Yingyi and Gerard Roland, 1998. Federalism and the Soft Budget Constraint. AmericanEconomic Review 88(5): 1143-1162.
31
By a privatized firm we mean an enterprise (partially or totally) privatized through a privatization of a prede-18
cessor state-owned company (or its part) in which the combined holdings of private parties give them a blocking power. We consider private parties to have blocking power if they control the percentage of votes formally sufficient to blockmajor decisions at the general shareholder meeting. Note that this means that in some (15%) of the firms classified asprivatized in this paper, the state remains a majority shareholder. But the high concentration of holdings in our samplemakes the difference between blocking and majority power of little significance.
We have no reason to believe that the incompleteness of data for certain firms introduces any systematic bias19
“in favor” or “against” any group of firms. The most common reason for incompleteness was lack availability or anobvious misunderstanding of the meaning of certain questions, such as those concerning the initial period for which datawere to have been provided.
APPENDIX A: SAMPLE DESCRIPTION
The study is based on a survey of 506 mid-size firms conducted in the fall of 1994 in theCzech Republic, Hungary, and Poland. The sample was drawn from firms employing between100 and 1,500 persons. The procedure used was to draw randomly from the list of firms providedby the Central Statistical Office in each country, but when a maximum of firms with a certaintype of owners was reached, further firms with the same ownership type were not included in thesurvey. (No such adjustments were necessary in Hungary.) Separate interviews (using differentclose-ended questionnaires) were conducted in each firm with the chief executive officer, thechief financial officer, and the chief production officer, each of whom was asked about matters inhis or her particular area of expertise. An additional questionnaire, requesting time series data onrevenues, labor and material costs, employment, and taxes, was filled out at each firm by theaccounting department.
The present study is based on a subsample of the original 506 firms. First, we excludedfrom the subsample 86 firms whose ownership structure was unclear. Second, to allow for theanalysis of post-privatization performance, we further limited the subsample of privatized firms18
to those privatized in 1990, 1991, and 1992 (thus excluding 87 privatized in 1993 or 1994, forwhich no post-privatization data were available). Beyond these exclusions, some firms did notprovide complete data on all aspects of their performance. The number of firms actually used19
in the analysis thus varies with the particular aspect of performance under examination, but thetotal number of firms in the largest subsample used here was 216 firms (see Table A.2).
Both state-owned and privatized firms in the sample were generally larger than the newprivate firms. The initial (1990 for state firms, year of privatization for privatized firms) meanannual sales of state-owned and privatized firms were US$ 16.4 million and US$ 13.9 million,respectively, with the corresponding mean initial employment levels of 743 and 661 full-timeemployees, while the respective initial (1990 or year of establishment, if later) values for the newprivate firms were US$ 5.05 and 164 employees (see Table A.1). These firms operated both inconsumer goods (food and beverages, clothing, and furniture) and in industrial goods sectors(non-ferrous minerals, chemicals, textiles and leather), with roughly 56% of privatized firms,64% of state firms, 45 % of corporatized firms, and 71% of new private firms in consumer goodssectors. (See Table A.3.)
All privatized firms in the sample had highly concentrated ownership: except for
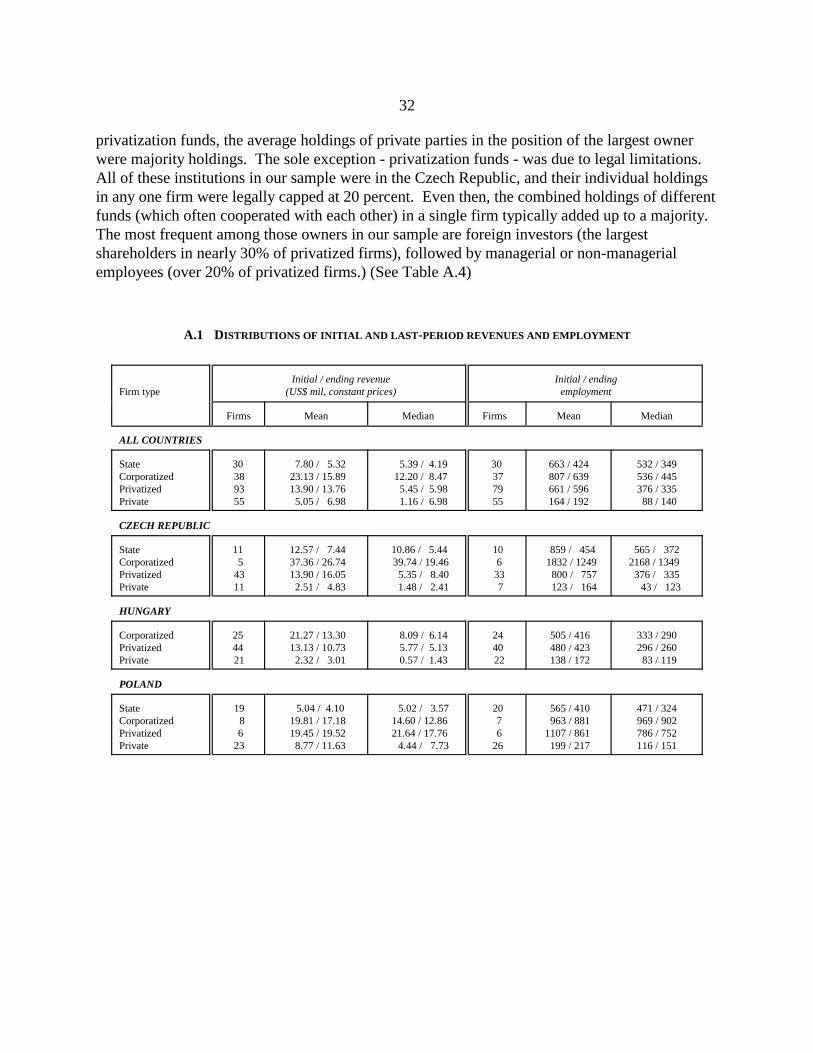
32
privatization funds, the average holdings of private parties in the position of the largest ownerwere majority holdings. The sole exception - privatization funds - was due to legal limitations. All of these institutions in our sample were in the Czech Republic, and their individual holdingsin any one firm were legally capped at 20 percent. Even then, the combined holdings of differentfunds (which often cooperated with each other) in a single firm typically added up to a majority. The most frequent among those owners in our sample are foreign investors (the largestshareholders in nearly 30% of privatized firms), followed by managerial or non-managerialemployees (over 20% of privatized firms.) (See Table A.4)
A.1 DISTRIBUTIONS OF INITIAL AND LAST -PERIOD REVENUES AND EMPLOYMENT
Firm type (US$ mil, constant prices) employmentInitial / ending revenue Initial / ending
Firms Mean Median Firms Mean Median
ALL COUNTRIES
State 30 7.80 / 5.32 5.39 / 4.19 30 663 / 424 532 / 349Corporatized 38 23.13 / 15.89 12.20 / 8.47 37 807 / 639 536 / 445 Privatized 93 13.90 / 13.76 5.45 / 5.98 79 661 / 596 376 / 335Private 55 5.05 / 6.98 1.16 / 6.98 55 164 / 192 88 / 140
CZECH REPUBLIC
State 11 12.57 / 7.44 10.86 / 5.44 10 859 / 454 565 / 372Corporatized 5 37.36 / 26.74 39.74 / 19.46 6 1832 / 1249 2168 / 1349 Privatized 43 13.90 / 16.05 5.35 / 8.40 33 800 / 757 376 / 335Private 11 2.51 / 4.83 1.48 / 2.41 7 123 / 164 43 / 123
HUNGARY
Corporatized 25 21.27 / 13.30 8.09 / 6.14 24 505 / 416 333 / 290Privatized 44 13.13 / 10.73 5.77 / 5.13 40 480 / 423 296 / 260Private 21 2.32 / 3.01 0.57 / 1.43 22 138 / 172 83 / 119
POLAND
State 19 5.04 / 4.10 5.02 / 3.57 20 565 / 410 471 / 324Corporatized 8 19.81 / 17.18 14.60 / 12.86 7 963 / 881 969 / 902Privatized 6 19.45 / 19.52 21.64 / 17.76 6 1107 / 861 786 / 752Private 23 8.77 / 11.63 4.44 / 7.73 26 199 / 217 116 / 151
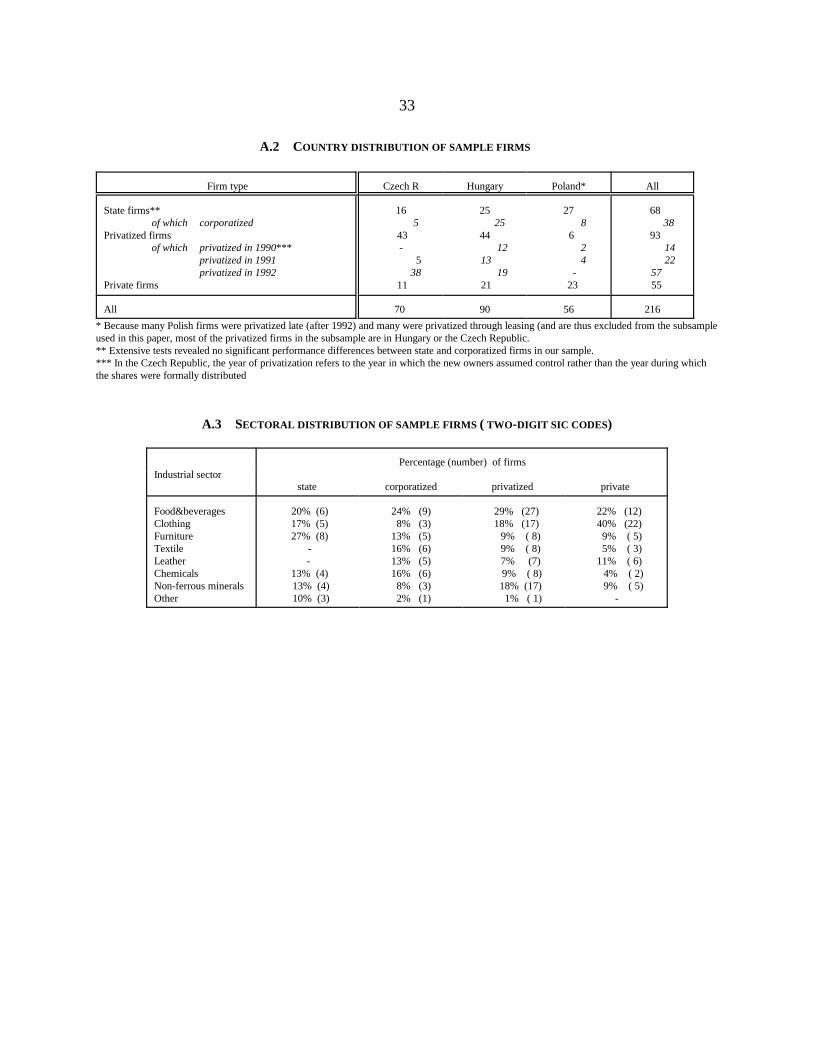
33
A.2 COUNTRY DISTRIBUTION OF SAMPLE FIRMS
Firm type Czech R Hungary Poland* All
State firms** 16 25 27 68of which corporatized 5 25 8 38
Privatized firms 43 44 6 93of which privatized in 1990*** - 12 2 14
privatized in 1991 5 13 4 22 privatized in 1992 38 19 - 57
Private firms 11 21 23 55
All 70 90 56 216
* Because many Polish firms were privatized late (after 1992) and many were privatized through leasing (and are thus excluded from the subsampleused in this paper, most of the privatized firms in the subsample are in Hungary or the Czech Republic.** Extensive tests revealed no significant performance differences between state and corporatized firms in our sample.*** In the Czech Republic, the year of privatization refers to the year in which the new owners assumed control rather than the year during whichthe shares were formally distributed
A.3 SECTORAL DISTRIBUTION OF SAMPLE FIRMS ( TWO-DIGIT SIC CODES)
Industrial sectorPercentage (number) of firms
state corporatized privatized private
Food&beverages 20% (6) 24% (9) 29% (27) 22% (12)Clothing 17% (5) 8% (3) 18% (17) 40% (22)Furniture 27% (8) 13% (5) 9% ( 8) 9% ( 5) Textile - 16% (6) 9% ( 8) 5% ( 3) Leather - 13% (5) 7% (7) 11% ( 6) Chemicals 13% (4) 16% (6) 9% ( 8) 4% ( 2)Non-ferrous minerals 13% (4) 8% (3) 18% (17) 9% ( 5)Other 10% (3) 2% (1) 1% ( 1) -
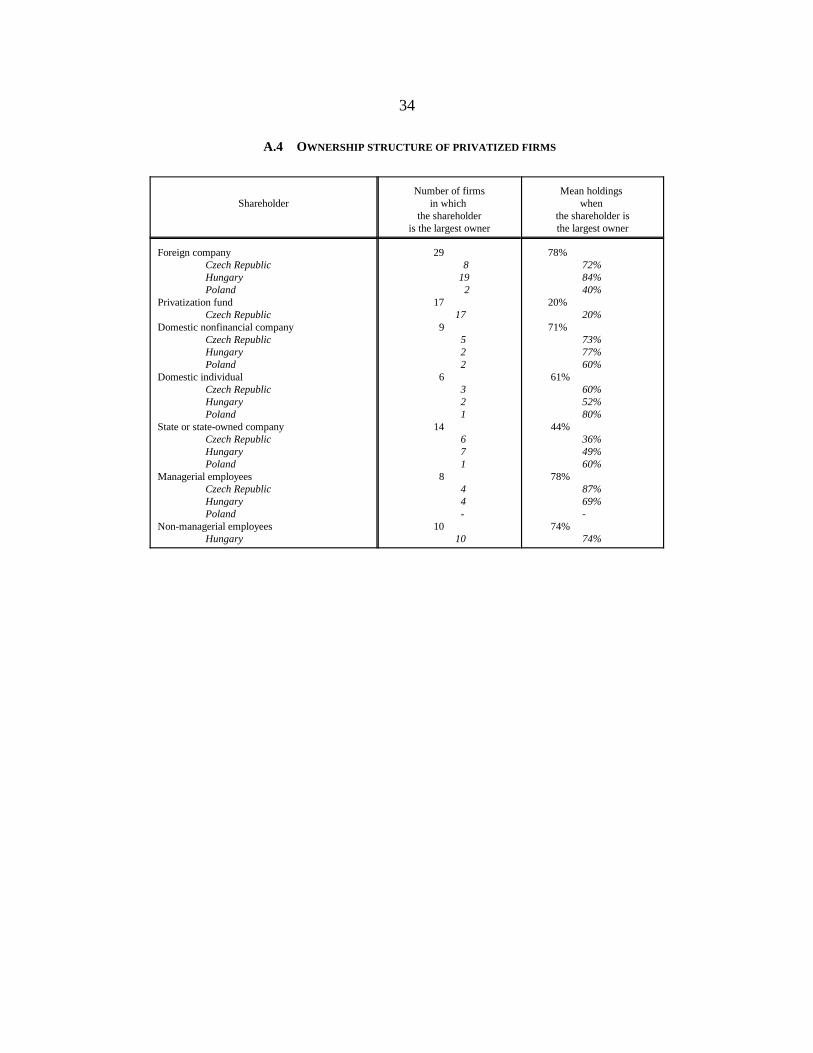
34
A.4 OWNERSHIP STRUCTURE OF PRIVATIZED FIRMS
Shareholder in which when Number of firms Mean holdings
the shareholder the shareholder isis the largest owner the largest owner
Foreign company 29 78%Czech Republic 8 72%Hungary 19 84%Poland 2 40%
Privatization fund 17 20%Czech Republic 17 20%
Domestic nonfinancial company 9 71%Czech Republic 5 73%Hungary 2 77%Poland 2 60%
Domestic individual 6 61%Czech Republic 3 60%Hungary 2 52%Poland 1 80%
State or state-owned company 14 44%Czech Republic 6 36%Hungary 7 49%Poland 1 60%
Managerial employees 8 78%Czech Republic 4 87%Hungary 4 69%Poland - -
Non-managerial employees 10 74%Hungary 10 74%
35
APPENDIX B: REGRESSION ESTIMATES WITH THE REVENUE PERFORMANCE OF STATE FIRMS EVALUATED OVER 1991-93.
In order to smooth year-to-year variations, the revenue performance of the firms in thesample is usually annualized over a number of years according to the following formula: if Rt
denotes a firm’s performance level in year t, the annualized rate of revenue growth, r, is animputed rate which satisfies P /P = (1 + r ) over the appropriate time interval (T - t), T > t. T t
(T - t )
In the regressions reported in this paper the revenue performance of privatized firms isgenerally measured between the time of privatization and 1993 (which is the last year for whichwe have annual data in our sample). Since different firms were privatized at different times(1990, 1991, 1992), attempting to keep the time interval the same for state and privatized firmswould necessitate three different sets of comparisons, each of which would compare a relativelysmall number of firms privatized in a given year to the same set of state firms. We thereforedecided to group all privatized firms together.
This raises the question of the period over which the revenue performance of state firmsshould be measured. Any particular choice could, in principle, bias the results. For example, if1990 was a bad recessionary year for all firms and if there were only a handful of firms privatizedin 1990, a comparison of the growth rates of state firms annualized over the 1990-1993 periodwith the growth rates of the privatized firms annualized over the 1991-1993 or 1992-1993periods could make the performance of state firms look artificially weak. To avoid this problem, we estimated the performance of state firms over two different time periods, 1990-93 and 1991-93 (a one year period, 1992-93, was unnecessarily short to be included). The estimates obtainedusing the longer period, 1990-93, are presented in the paper, while those obtained for 1991-93are presented in this Appendix. Note, however, that the results are essentially invariant withrespect to the time period used: the estimates retain their signs and significance across both sets,indicating that different macroeconomic conditions in different years do not affect our results.
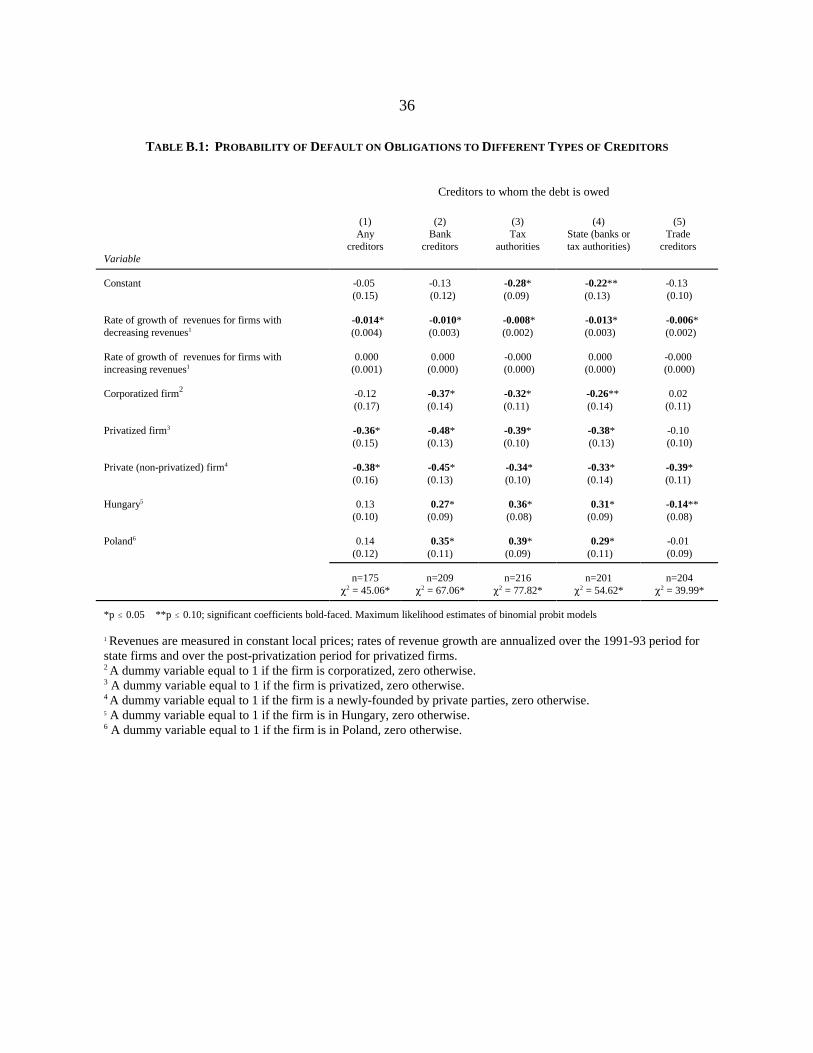
36
TABLE B.1: PROBABILITY OF DEFAULT ON OBLIGATIONS TO DIFFERENT TYPES OF CREDITORS
Creditors to whom the debt is owed
Variable
(1) (2) (3) (4) (5)Any Bank Tax State (banks or Trade
creditors creditors authorities tax authorities) creditors
Constant -0.05 -0.13 -0.13 (0.15) (0.12) (0.10)
-0.28* -0.22**(0.09) (0.13)
Rate of growth of revenues for firms withdecreasing revenues1
-0.014* -0.010* -0.008* -0.013* -0.006* (0.004) (0.003) (0.002) (0.003) (0.002)
Rate of growth of revenues for firms with 0.000 0.000 -0.000 0.000 -0.000 increasing revenues (0.001) (0.000) (0.000) (0.000) (0.000)1
Corporatized firm -0.12 0.02 2
(0.17) (0.11) -0.37* -0.32* -0.26** (0.14) (0.11) (0.14)
Privatized firm -0.10 3 -0.36* -0.48* -0.39* -0.38*(0.15) (0.13) (0.10) (0.13) (0.10)
Private (non-privatized) firm4 -0.38* -0.45* -0.34* -0.33* -0.39*(0.16) (0.13) (0.10) (0.14) (0.11)
Hungary 0.135
(0.10) 0.27* 0.36* 0.31* -0.14**(0.09) (0.08) (0.09) (0.08)
Poland 0.14 -0.01 6
(0.12) (0.09) 0.35* 0.39* 0.29*(0.11) (0.09) (0.11)
n=175 n=209 n=216 n=201 n=204� = 45.06* � = 67.06* � = 77.82* � = 54.62* � = 39.99*2 2 2 2 2
*p � 0.05 **p � 0.10; significant coefficients bold-faced. Maximum likelihood estimates of binomial probit models
Revenues are measured in constant local prices; rates of revenue growth are annualized over the 1991-93 period for1
state firms and over the post-privatization period for privatized firms.A dummy variable equal to 1 if the firm is corporatized, zero otherwise.2
A dummy variable equal to 1 if the firm is privatized, zero otherwise.3
A dummy variable equal to 1 if the firm is a newly-founded by private parties, zero otherwise.4
A dummy variable equal to 1 if the firm is in Hungary, zero otherwise.5
A dummy variable equal to 1 if the firm is in Poland, zero otherwise.6
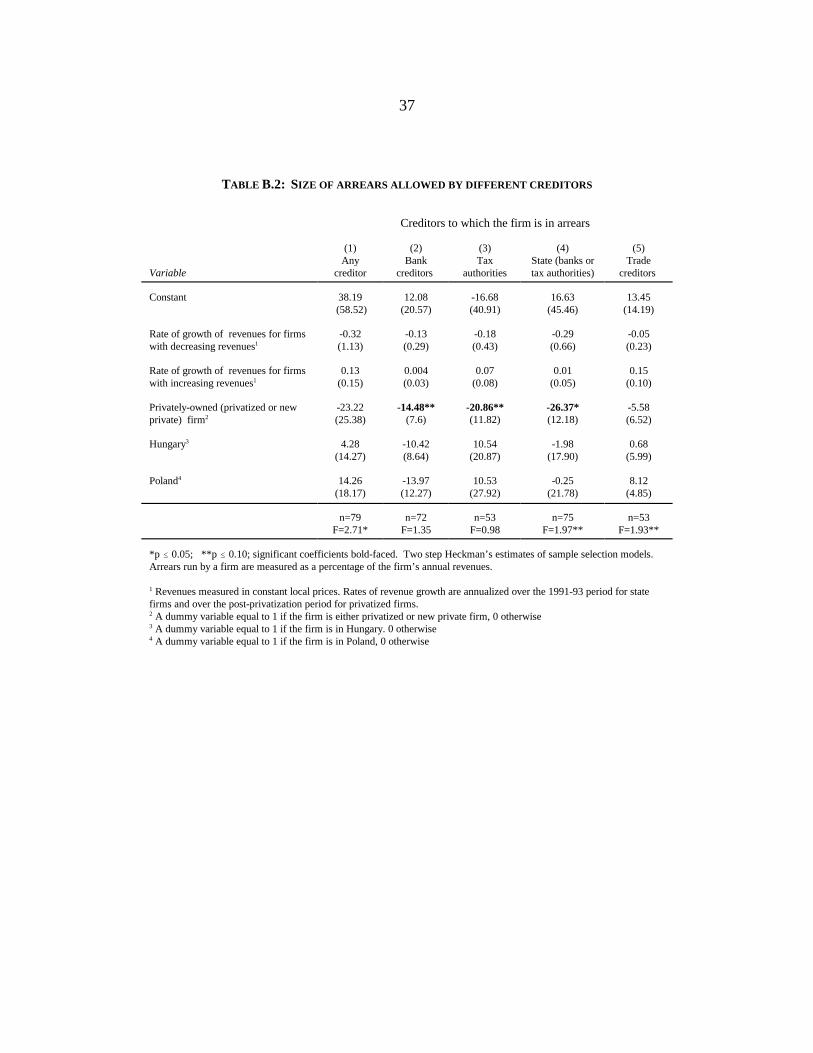
37
TABLE B.2: SIZE OF ARREARS ALLOWED BY DIFFERENT CREDITORS
Creditors to which the firm is in arrears
Variable creditor creditors authorities tax authorities) creditors
(1) (2) (3) (4) (5)Any Bank Tax State (banks or Trade
Constant 38.19 12.08 -16.68 16.63 13.45 (58.52) (20.57) (40.91) (45.46) (14.19)
Rate of growth of revenues for firms -0.32 -0.13 -0.18 -0.29 -0.05with decreasing revenues (1.13) (0.29) (0.43) (0.66) (0.23)1
Rate of growth of revenues for firms 0.13 0.004 0.07 0.01 0.15with increasing revenues (0.15) (0.03) (0.08) (0.05) (0.10)1
Privately-owned (privatized or new -23.22 -5.58private) firm (25.38) (6.52)2
-14.48** -20.86** -26.37*(7.6) (11.82) (12.18)
Hungary 4.28 -10.42 10.54 -1.98 0.683
(14.27) (8.64) (20.87) (17.90) (5.99)
Poland 14.26 -13.97 10.53 -0.25 8.124
(18.17) (12.27) (27.92) (21.78) (4.85)
n=79 n=72 n=53 n=75 n=53F=2.71* F=1.35 F=0.98 F=1.97** F=1.93**
*p � 0.05; **p � 0.10; significant coefficients bold-faced. Two step Heckman’s estimates of sample selection models.Arrears run by a firm are measured as a percentage of the firm’s annual revenues.
Revenues measured in constant local prices. Rates of revenue growth are annualized over the 1991-93 period for state1
firms and over the post-privatization period for privatized firms. A dummy variable equal to 1 if the firm is either privatized or new private firm, 0 otherwise2
A dummy variable equal to 1 if the firm is in Hungary. 0 otherwise3
A dummy variable equal to 1 if the firm is in Poland, 0 otherwise4
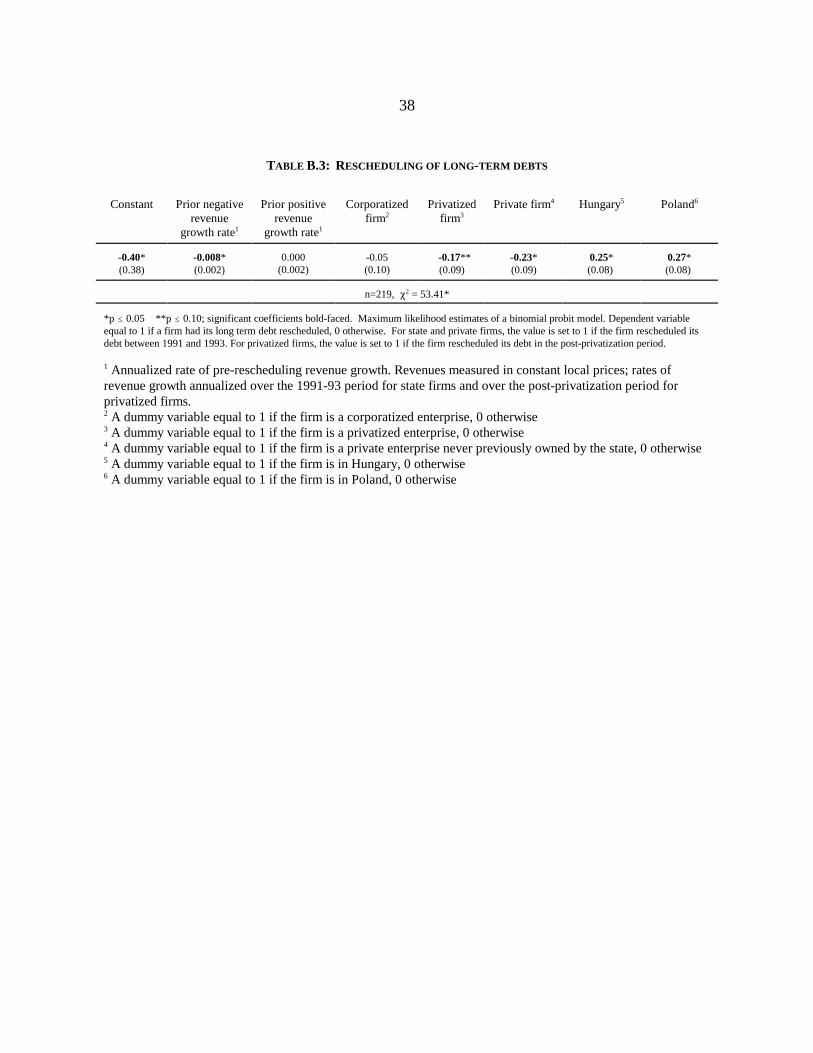
38
TABLE B.3: RESCHEDULING OF LONG -TERM DEBTS
Constant Prior negative Prior positive Corporatized Privatized Private firm Hungary Polandrevenue revenue firm firm
growth rate growth rate1 1
2 3
4 5 6
-0.40* -0.008* -0.17** -0.23* 0.25* 0.27*(0.38) (0.002) (0.09) (0.09) (0.08) (0.08)
0.000 -0.05(0.002) (0.10)
n=219, � = 53.41*2
*p � 0.05 **p � 0.10; significant coefficients bold-faced. Maximum likelihood estimates of a binomial probit model. Dependent variableequal to 1 if a firm had its long term debt rescheduled, 0 otherwise. For state and private firms, the value is set to 1 if the firm rescheduled itsdebt between 1991 and 1993. For privatized firms, the value is set to 1 if the firm rescheduled its debt in the post-privatization period.
Annualized rate of pre-rescheduling revenue growth. Revenues measured in constant local prices; rates of1
revenue growth annualized over the 1991-93 period for state firms and over the post-privatization period forprivatized firms. A dummy variable equal to 1 if the firm is a corporatized enterprise, 0 otherwise2
A dummy variable equal to 1 if the firm is a privatized enterprise, 0 otherwise3
A dummy variable equal to 1 if the firm is a private enterprise never previously owned by the state, 0 otherwise4
A dummy variable equal to 1 if the firm is in Hungary, 0 otherwise5
A dummy variable equal to 1 if the firm is in Poland, 0 otherwise6