The Ligamp TP53 Assay for Detection of Minimal Residual Disease in Head and Neck Squamous Cell...
20
THE LIGAMP TP53 ASSAY FOR DETECTION OF MINIMAL RESIDUAL DISEASE IN HNSCC SURGICAL MARGINS M. Luana Poeta 1,8 , Judith Manola 2 , David Goldenberg 3 , Arlene Forastiere 1 , Joseph A. Califano 1 , John A. Ridge 4 , Jarrard Goodwin 5 , Daniel Kenady 6 , John Saunders 7 , William Westra 1 , David Sidransky 1 , and Wayne M. Koch 1,* 1 Johns Hopkins University, Baltimore, MD 2 Dana-Farber Cancer Institute, Boston, MA 3 Pennsylvania State Hershey Medical Center, Hershey, PA. 4 Fox Chase Cancer Center, Philadelphia, PA 5 University of Miami/Sylvester Comprehensive Cancer Center, Miami, FL 6 University of Kentucky, Lexington, KY 7 Greater Baltimore Medical Center, Baltimore, MD 8 CIR, Laboratory of Molecular Medicine and Biotechnology, University Campus Bio-Medico of Rome, Italy. Abstract Purpose—Detect tumor-related DNA using LigAmp in histologically clear margins and associate results with clinical outcome. Experimental Design—Patients with head and neck cancer were registered for molecular analysis of surgical margins. Adequacy of resection was ensured using histologic margin analysis. Further margins were then harvested and DNA extracted. TP53 mutations in tumor were determined using Affymetrix p53 GeneChip. Margins were analyzed by Ligamp in comparison with standard curves for quantification of mutant DNA. Ligation employed 2 oligonucleotides to isolate DNA targeting the mutation. Ligated DNA was amplified using real-time PCR. The quantity of mutation in the margin was determined as percent of mutant species relative to plasmid (MRP) and relative to tumor (MRT). Cutpoints were identified and defined groups evaluated for local failure-free, cancer-specific, and overall survival. Study margins were examined for presence of tumor by light microscopy. Results—Tissue from 95 patients with common mutations was analyzed. Fifteen experienced local recurrence. Cutpoints of 0.15% for MRP and 0.5% for MRT were chosen as most selective of recurrent cases. LigAmp had slightly better area under the ROC curve (p=0.09) than light microscopy correctly predicting 9 of 15 recurrent tumors. There were 6 false negative cases and 26 false positive results. No statistically significant distinctions were observed in cancer-specific or overall survival in this limited cohort. Conclusions—Ligamp provides quantifiable, sensitive detection of mutant DNA in histologically normal margins. Detection of mutant species in margins may identify patients at risk of local recurrence. *Corresponding author: 601 N. Caroline Street, Baltimore, MD 21287. (to which reprint requests should be sent) Telephone: 410-955-4906; FAX 410-955-0035, [email protected]. NIH Public Access Author Manuscript Clin Cancer Res. Author manuscript; available in PMC 2010 December 15. Published in final edited form as: Clin Cancer Res. 2009 December 15; 15(24): 7658–7665. doi:10.1158/1078-0432.CCR-09-1433. NIH-PA Author Manuscript NIH-PA Author Manuscript NIH-PA Author Manuscript
Transcript of The Ligamp TP53 Assay for Detection of Minimal Residual Disease in Head and Neck Squamous Cell...
THE LIGAMP TP53 ASSAY FOR DETECTION OF MINIMALRESIDUAL DISEASE IN HNSCC SURGICAL MARGINS
M. Luana Poeta1,8, Judith Manola2, David Goldenberg3, Arlene Forastiere1, Joseph A.Califano1, John A. Ridge4, Jarrard Goodwin5, Daniel Kenady6, John Saunders7, WilliamWestra1, David Sidransky1, and Wayne M. Koch1,*1Johns Hopkins University, Baltimore, MD2Dana-Farber Cancer Institute, Boston, MA3Pennsylvania State Hershey Medical Center, Hershey, PA.4Fox Chase Cancer Center, Philadelphia, PA5University of Miami/Sylvester Comprehensive Cancer Center, Miami, FL6University of Kentucky, Lexington, KY7Greater Baltimore Medical Center, Baltimore, MD8CIR, Laboratory of Molecular Medicine and Biotechnology, University Campus Bio-Medico ofRome, Italy.
AbstractPurpose—Detect tumor-related DNA using LigAmp in histologically clear margins and associateresults with clinical outcome.
Experimental Design—Patients with head and neck cancer were registered for molecular analysisof surgical margins. Adequacy of resection was ensured using histologic margin analysis. Furthermargins were then harvested and DNA extracted. TP53 mutations in tumor were determined usingAffymetrix p53 GeneChip. Margins were analyzed by Ligamp in comparison with standard curvesfor quantification of mutant DNA. Ligation employed 2 oligonucleotides to isolate DNA targetingthe mutation. Ligated DNA was amplified using real-time PCR. The quantity of mutation in themargin was determined as percent of mutant species relative to plasmid (MRP) and relative to tumor(MRT). Cutpoints were identified and defined groups evaluated for local failure-free, cancer-specific,and overall survival. Study margins were examined for presence of tumor by light microscopy.
Results—Tissue from 95 patients with common mutations was analyzed. Fifteen experienced localrecurrence. Cutpoints of 0.15% for MRP and 0.5% for MRT were chosen as most selective ofrecurrent cases. LigAmp had slightly better area under the ROC curve (p=0.09) than light microscopycorrectly predicting 9 of 15 recurrent tumors. There were 6 false negative cases and 26 false positiveresults. No statistically significant distinctions were observed in cancer-specific or overall survivalin this limited cohort.
Conclusions—Ligamp provides quantifiable, sensitive detection of mutant DNA in histologicallynormal margins. Detection of mutant species in margins may identify patients at risk of localrecurrence.
*Corresponding author: 601 N. Caroline Street, Baltimore, MD 21287. (to which reprint requests should be sent) Telephone:410-955-4906; FAX 410-955-0035, [email protected].
NIH Public AccessAuthor ManuscriptClin Cancer Res. Author manuscript; available in PMC 2010 December 15.
Published in final edited form as:Clin Cancer Res. 2009 December 15; 15(24): 7658–7665. doi:10.1158/1078-0432.CCR-09-1433.
NIH
-PA Author Manuscript
NIH
-PA Author Manuscript
NIH
-PA Author Manuscript

INTRODUCTIONDespite significant improvement in loco-regional control by multimodal therapy, includingsurgery, radiotherapy and chemotherapy, only a modest change has been attained in the 5-yearsurvival rates of head and neck squamous cell carcinoma (HNSCC) patients over recentdecades. It is well established that during surgical treatment, clear margins represent one ofthe most important indicators of clinical outcome. However, even when surgical margins havebeen read as clear, the local recurrence rate is still 10–30% (1,2). This observation suggeststhat occult tumor cells undetected by conventional histologic evaluation may be presentsurrounding resection margins, leading to treatment failure (3,4). The detection of occultdisease in margin tissue may be predictive of local recurrence and potentially serve as anindicator for consideration of further surgery and/or adjuvant chemo-radiotherapy (5).
Targets for molecular detectionVarious targets have been proposed as detection markers of occult HNSCC (6,7). Idealcandidates should have tumor specificity, high prevalence, and should be retained during tumorprogression and metastasis. DNA molecular markers are robust due to the higher stability ofDNA in tissue samples, rendering the possibility of using archived paraffin embeddedmaterials. According to these criteria, TP53 mutations appear to be suitable markers forminimal residual disease detection in HNSCC (8). Numerous studies have attempted to assessthe presence of cells with TP53 mutation by immunohistochemistry (IHC). However, IHC hassubstantial limitations as a surrogate for DNA sequence probing to detect TP53 mutations (9,10). Not all mutations result in the production of a stable protein amenable to staining. Mis-sense mutations that introduce a “stop” sequence, for example, will result in no proteinproduction. On the other hand, there are reasons other than gene mutation that may accountfor accumulation of p53 protein within a cell that is detected by IHC staining, such as bindingto other cellular proteins (MDM2). Other problems include the use of different antibodies andunmasking techniques as well as an arbitrary threshold definition of “over-expression” indifferent reports.
Molecular detection methodologyMethods for detection of altered DNA include restriction fragment length polymorphism(RFLP) (11), allele-specific PCR (12), and oligonucleotide ligation (13,14) Each of theseassays has disadvantages, such as insufficient detection limits (0.1% - mutant/WT ratio of1:1000) and labor-intensive procedures.
Our previous work has shown a sensitive and specific approach for molecular assessment ofTP53 mutations in HNSCC margins using oligomer probe binding and radionucleotidedetection (15). However, limitations of that method are the extensive time required and theneed for radiolabelled probes. Recently a PCR-based method, called LigAmp (16) wasdescribed to assess single nucleotide genetic variants in the k-RAS gene and for HIVgenotyping. This assay is able to detect 1 mutant species in the presence of 10,000 wild-typemolecules (0.01%). LigAmp results are quantitative, allowing investigators to explore thethreshold (percentage) of tumor species present associated with clinical outcome.
The aim of this study is to demonstrate the feasibility to detect and measure the presence oftumor-related DNA using LigAmp in histologically clear surgical resection margins and tocompare results with clinical outcome, particularly local disease recurrence. The hypothesis isthat submicroscopic levels of remaining malignant cells contribute to local treatment failureof HNSCC patients. Molecular assessment of risk of recurrence may help in the identificationof patients who could benefit from additional surgery or chemo-radiotherapy, while avoiding
Poeta et al. Page 2
Clin Cancer Res. Author manuscript; available in PMC 2010 December 15.
NIH
-PA Author Manuscript
NIH
-PA Author Manuscript
NIH
-PA Author Manuscript
inappropriate treatment of those subjects for which molecular assessment indicate the adequacyof surgical treatment.
MATERIALS AND METHODSStudy protocol
Between 1997 and 2002, 560 patients were accrued to a cooperative group study (ECOG 4393and RTOG 9614). Eligible patients were diagnosed with HNSCC and planned for surgery withcurative intent. Patients were identified at over 18 participating institutions and signedinformed consent approved by the cooperative groups and each institutional investigationalreview board. Demographic patient information was submitted to the cooperative group datacenters preoperatively. On the day of surgery, samples of tumor were harvested for studypurposes. Tumor extirpation proceeded following standard surgical practice. Margin tissue wassubmitted to the institutional surgical pathology service for intra-operative frozen sectionanalysis to confirm the adequacy of resection. Once adequate extirpation had been confirmedin this manner, further margin samples were taken from the presumed normal tissue at theperimeter of the surgical resection site for study purposes. All specimens were shipped on dryice by overnight courier to the Johns Hopkins Head and Neck Cancer Research Laboratory.
Tumor and margin sample collectionTumor and margin samples were rapidly frozen at −80°C. A series of 5-micron sections werecut from the primary tumor and margin specimens for hematoxylin-eosin staining to inspectfor the presence of HNSCC or dysplasia. Additional 12-micron sections were cut and placedin 1% SDS and proteinase K at 48°C overnight followed by DNA extraction with phenol/chloroform and ethanol precipitation.
Tumor samples with at least 70% cancer cells were eligible for molecular studies. Tumors withlow neoplastic cellularity (<70%) were microdissected to enrich the malignant cells. DNA wasextracted from all margins samples and submitted for analysis. Margin tissue was processedin toto without microdissection. For margin processing, serial sectioning was performed,making thin section slides at the beginning, middle and end of the cut through the sample.These slides were stained with hematoxylin and eosin for light microscopic analysis by thestudy pathologist (WHW). Fifty sections of 12 microns thickness were harvested from eachmargin sample for DNA extraction.
TP53 exon amplificationA second generation p53 GeneChip assay (Affymetrix, Santa Clara, CA) was used to screenTP53 mutations in exons 2–11 in Head and Neck primary tumors (17). The presence ofmutation in primary tumor was confirmed by sequencing. For tumor and margins, each exonharboring a mutation was amplified in a single polymerase chain reaction (PCR). Reactionswere carried out in a volume of 25 µl using 200 ng of template, 2mM of each primer (Invitrogen,CA), 5 units of Platinum Taq polymerase (Invitrogen, CA), 1.5 mM each dATP, dCTP, dGTP,dTTP, 16.6 mM ammonium sulfate; 67 mM Trizma; 6.7 mM magnesium chloride; 10 mMmercaptoethanol; 0.1% DMSO; PCR was performed using the following conditions: 95°C for2 min, followed by 35 cycles at 95°C for 30 s, Melting Temperature specific for each exon for1 minute, 72°C for 90 s, extension at 72°C for 2 min. After each gel run, PCR product waspurified using a QIAquick Gel Extraction Kit (Qiagen), and the concentration was determinedusing a Nanodrop (ND-1000 Spectrophotometer, NanoDrop Technologies, Inc.).
Poeta et al. Page 3
Clin Cancer Res. Author manuscript; available in PMC 2010 December 15.
NIH
-PA Author Manuscript
NIH
-PA Author Manuscript
NIH
-PA Author Manuscript
TP53 mutant plasmidsA subset of common TP53 mutations that occurred in more than one tumor within thepopulation were selected for Ligamp margin analysis. Plasmids containing the TP53 mutatedsequences were manufactured to provide a source of positive control DNA for mutant speciesquantification. Site-direct mutagenesis was performed from Top Gene Technologies (Quebec,Canada) using pcDNA 3.1 p53 vector to obtain mutant TP53 plasmids for the followingmutated codons: 157.1T, 179.1G, 192.1T, 193.2T, 193.2G, 196.1T. 205.2G, 206.2A, 213.1T,238.2A, 272.1T, 272.1A, 273.2T, 278.1T, 280.2A, 282.1T, 298.1T, 342.1T. pCR259 plasmids(a gift from Dr. C. Ishioka) have been used as mutant plasmids for other TP53 mutations:175.2A, 220.2G, 232.1T, 245.1A, 248.1T, 248.2A, 273.1T, 273.2A (Fig. 1 Supplementary).Each plasmid was amplified for the exon containing the mutation (primer sequences areavailable on request). Concentration was determined using a Nanodrop (ND-1000Spectrophotometer, NanoDrop Technologies, Inc.). 1010 copies of PCR product were seriallydiluted to generate standard curves. Tumor, normal and margin samples have been analyzedin comparison with the standard curve in order to get an accurate quantification of mutantDNA.
TP53 LigAmpAfter DNA amplification, dilutions of each PCR product were made to give 1010 ampliconcopies/5 µl calculated from the size of the amplicon for each exon and assuming 1 bp of ddDNA= 660pg/pmol and 1 pmol = 6.02 × 10¹¹ copies. According to this calculation the LigAmpassay was performed in two steps (Fig 2 Supplementary). First, the Ligation Step was conductedusing two different oligonucleotides (upstream and downstream) designed to specificallymatch the mutation (Ligation primer sequences are available on request). DNA was incubatedin a final volume of 25 µl with 1 pmol of mutant oligonucleotide, 0.5 pmol of downstreamoligonucleotide, 4 U of Pfu DNA ligase in 1X Pfu ligase buffer (Stratagene). Ligationconditions were the following: 95°C for 3 min, 90 cycles at 95°C for 30 sec. and 64°C for 4min. In the presence of mutation the two oligonucleotides are ligated to one other. Each containsa region specific to target the mutation and a tail (M13F and M13R) that permit amplificationof the ligated product in a subsequent Q-PCR (Quantitative PCR) reaction. In order to increasethe specificity of the assay, a mismatch has been inserted 2 base pairs upstream from the mutantbase. For all TP53 mutant upstream oligonucleotides, we tested all possible mismatches andthen we chose the one with best performance (r2 values ranging from 0.95 to 0.98). Theupstream oligonucleotide also contains a region of unique foreign DNA (16rSDNA) that servesas the binding region for a probe in the Q-PCR reaction. The second step, the Q-PCRamplification, was performed using the 7500 Real-Time PCR System (Applied Biosystem).The ligated DNA was amplified using 5 pmol of upstream (5’-ACTGTAAAACGACGGCCAGTG-3 ’) and downstream M13 primers (5 ’-TGCAGGAAACAGCTATGACCA-3 ’), and 2.5 pmol of a probe (16rSDNA FAM-5’-CGTATTACCGCGGCTGCTGGCAC-3’-TAMRA), 12.5 µl of Taqman Universal PCRMaster Mix (Applied Biosystems) in a final volume of 25 µl. The M13 primers hybridize tothe M13 tails and the probe hybridizes to the 16rSDNA sequence. This step is independent ofthe specific mutation targeted in the ligation step.
The binding of the probe requires ligation of the two oligonucleotides and subsequentpolymerization of the complementary strand of DNA in the Q-PCR step. The Q-PCR probebinds to the bottom strand of the amplified DNA. Extension from the M13 forward primerallows the probe to be cleaved and the released fluorophore to be detected by 7500 SDSsoftware. If no ligation occurs in the first step because of mispairing, there is no template foramplification in the Q-PCR step. The quantity of mutations in margins has been expressed astwo ratios: the percent of mutant species in margins relative to plasmid (MRP, absolutequantity) and the percent of mutant species relative to tumor (MRT, relative quantity).
Poeta et al. Page 4
Clin Cancer Res. Author manuscript; available in PMC 2010 December 15.
NIH
-PA Author Manuscript
NIH
-PA Author Manuscript
NIH
-PA Author Manuscript
Statistical methodsLocal failure events (local tumor recurrence) were documented during follow-up at treatinginstitutions by physical examination and/or radiographic imaging confirmed with biopsy whenpossible. Patients who died of other causes or who are still alive were censored as of the datelast known alive. Cause-specific survival was estimated by considering death from disease tobe an event and censoring patients who died of other or unknown causes and those still aliveat the date of last reported follow-up . Overall survival was counted from the date of surgeryto the date of death or last date known alive. Mutations were classified as disruptive if theywere nonconservative mutations located inside the key DNA-binding domain (L2–L3 region),or if they were stop codons in any region (17).
Descriptive statistics were used to characterize patients and clinical features. Fisher’s exacttest (18) and the Wilcoxon rank sum test (19) were used to compare characteristics betweenpatients with and without positive margins and with and without local recurrence. Recursivepartitioning was used to explore possible cutpoints (20). ROC curves were used to comparethe relative utility of microscopy and molecular margin status. The logrank test was used toestimate one-year local failure-free survival, cause-specific survival, and overall survival rates(21). Gray’s method was also used to examine competing causes of failure, considering localfailure, regional/distant failure, and death without recurrence as the types of failure (22).
RESULTSDemographic, clinical and histopathologic features of the population
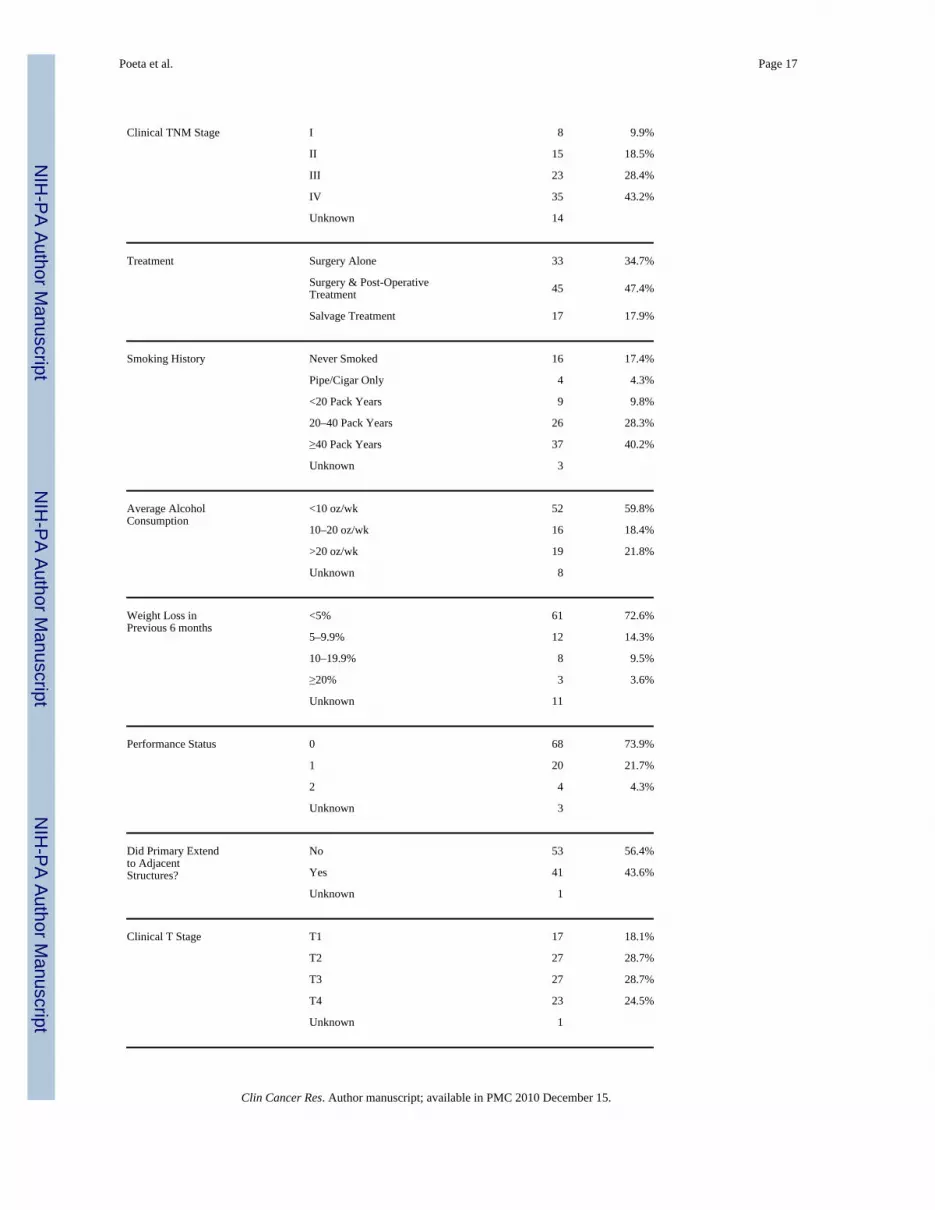
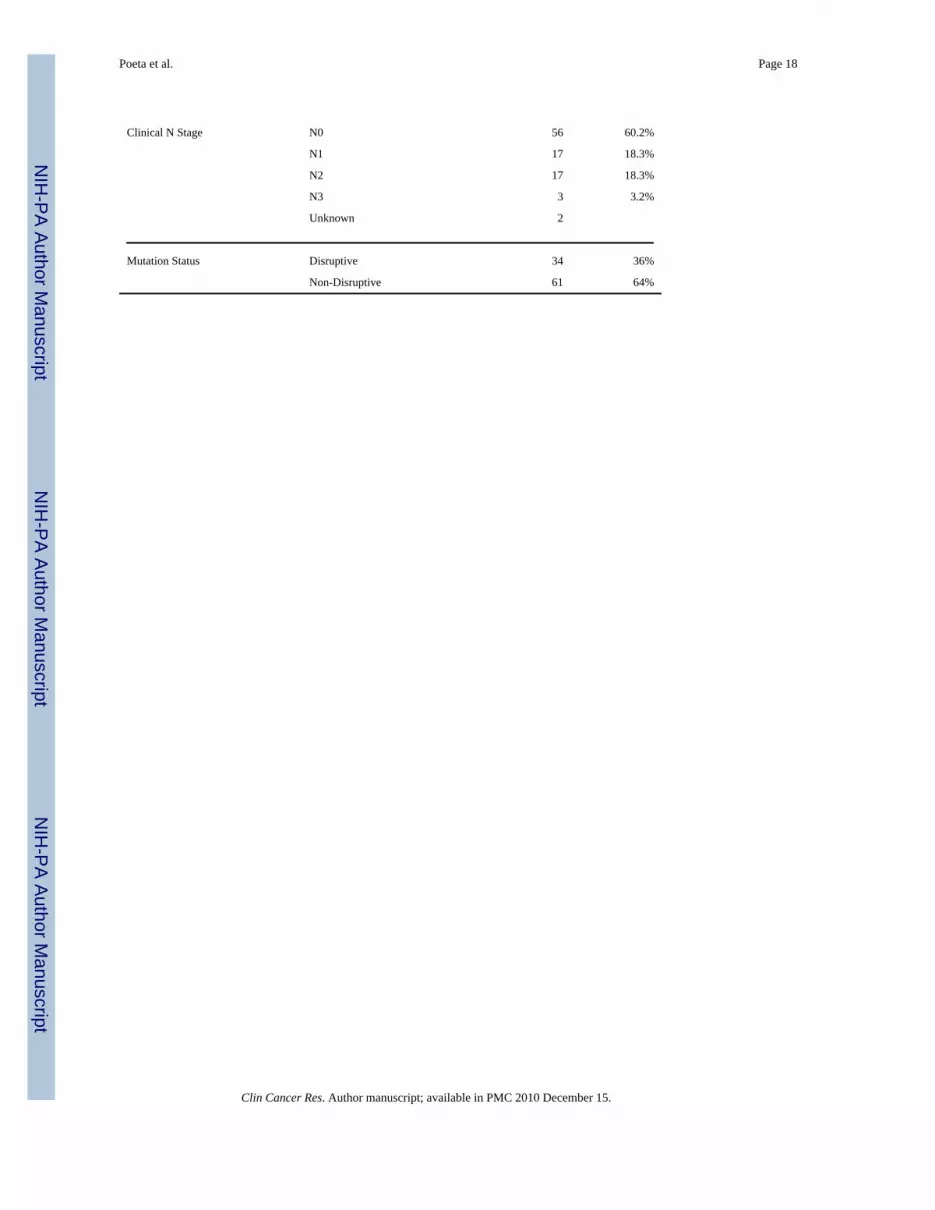
A cohort of 560 cases was enrolled in over 18 member institutions of ECOG and RTOG. Asshown in Figure 1, 140 cases were eliminated for a variety of reasons (no tumor tissue available(n=88), DNA could not be amplified (n=36), ineligible per protocol (n=16)). TP53 mutationstatus was determined in the remaining 420 cases. 224 (53.3%) had mutation of TP53 and thuswere potentially available for molecular margin analysis. We selected cases for developmentof the LigAmp approach that had a specific missense point mutation also found in at least oneother case so as to maximize the utility of each plasmid control that was manufactured (Fig. 1Supplementary). A total of 26 different TP53 mutations shared in at least two of 95 subjectshave been analyzed and form the study cohort. 34 of these cases have a disruptive mutationresulting in amino acid substitution predicted to disrupt DNA binding (17). The remaining 61subjects were found to have a non-disruptive (conservative) TP53 genetic alteration.Characteristics of the selected patients are shown in Table 1. The histologic status of submittedstudy margin tissue (harvested after clinical margins were judged to be free of tumor) wasevaluated centrally (WHW) by light microscopy. Among 95 patients, there were 10 with tumor(severe dysplasia or invasive carcinoma) visible in at least one margin sample and 85 patientsfor whom all margin specimens were negative. The distribution of the number of slides/samplesevaluated did not differ between these two groups (p=0.76) indicating that there was noimprovement in detection by supplemental light microscopy with more margin samplesavailable.
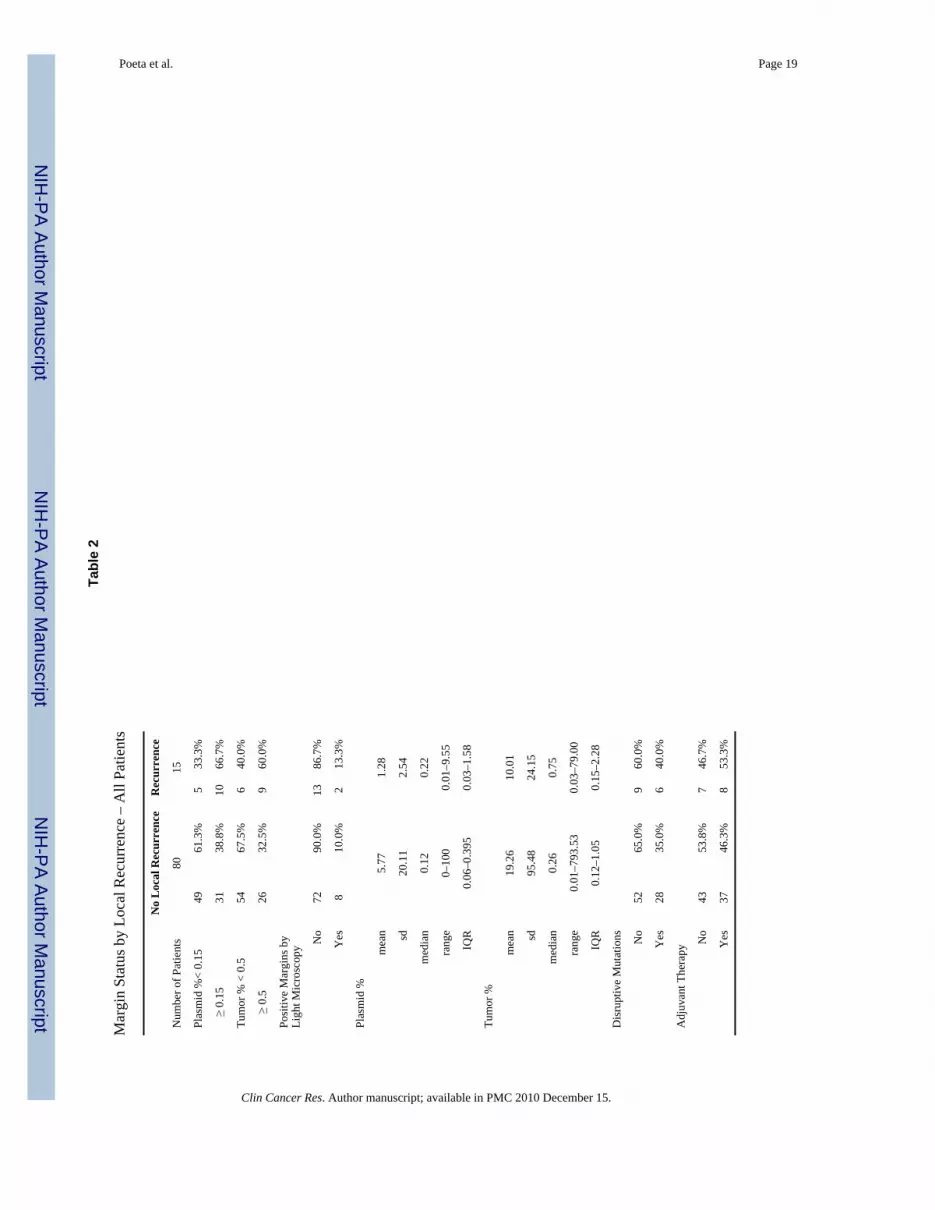
Table 2 shows mean proportions of TP53 mutant species in the margins, analyzed both asabsolute levels (MRP) and relative to tumor concentration (MRT), among patients with andwithout local recurrence.
Evaluation of an optimal threshold for margin analysisWe used recursive partitioning to explore possible cutpoints for distinguishing patients withand without local recurrence, using both ratios described above. A survival model was usedfor the partitioning, with local failure as the endpoint of interest. Figure 2 shows the mainpartitions for the two ratios. Since the MRT was the model with the best discriminant power
Poeta et al. Page 5
Clin Cancer Res. Author manuscript; available in PMC 2010 December 15.
NIH
-PA Author Manuscript
NIH
-PA Author Manuscript
NIH
-PA Author Manuscript
at the first split, this was selected for further exploration. A mutation threshold of 0.5%characterized this split. A mutation threshold of 0.15% was the optimal cutpoint for MRP.
Figure 3 shows the receiver operator characteristic (ROC) curves for light microscopy of studymargins and the LigAmp metric assessed at the 0.5% MRT cutpoint as predictors of localrecurrence status. There is some evidence in this limited sample for the LigAmp evaluation tohave greater area under the ROC curve than supplemental light microscopy (p=0.09).
Relationships among histopathological margin status, molecular assessment and clinicaloutcome
Among the 95 patients analyzed by LigAmp, 15 experienced local recurrence. Table 2 showsthe distribution of the metrics, the proportion of patients above and below each LigAmpcutpoint, the proportion with and without positive margins, and the proportion with and withoutdisruptive mutations among patients who did and did not experience local recurrence. Therewas no association between margin status or mutation category and local recurrence.
Nine of 15 (60%) cases with documented local recurrence had MRT above the 0.5% threshold.These are cases in which molecular margin analysis was “true positive” indicating likelydisease recurrence despite clear margins as judged by standard histopathologic evaluation atthe treating institution. In two of these cases, tumor was also detected by light microscopicevaluation of the study (supplemental) margins submitted for molecular evaluation. Using thesame threshold criteria, 26 of 80 cases that have not demonstrated disease recurrence werefound to contain tumor cells by molecular analysis (32.5% false positive rate), and six caseshave recurred in which LigAmp did not demonstrate molecular evidence of tumor cells (falsenegatives). Light microscopy evaluation of supplemental margins also found no evidence oftumor in any of these 6 cases.
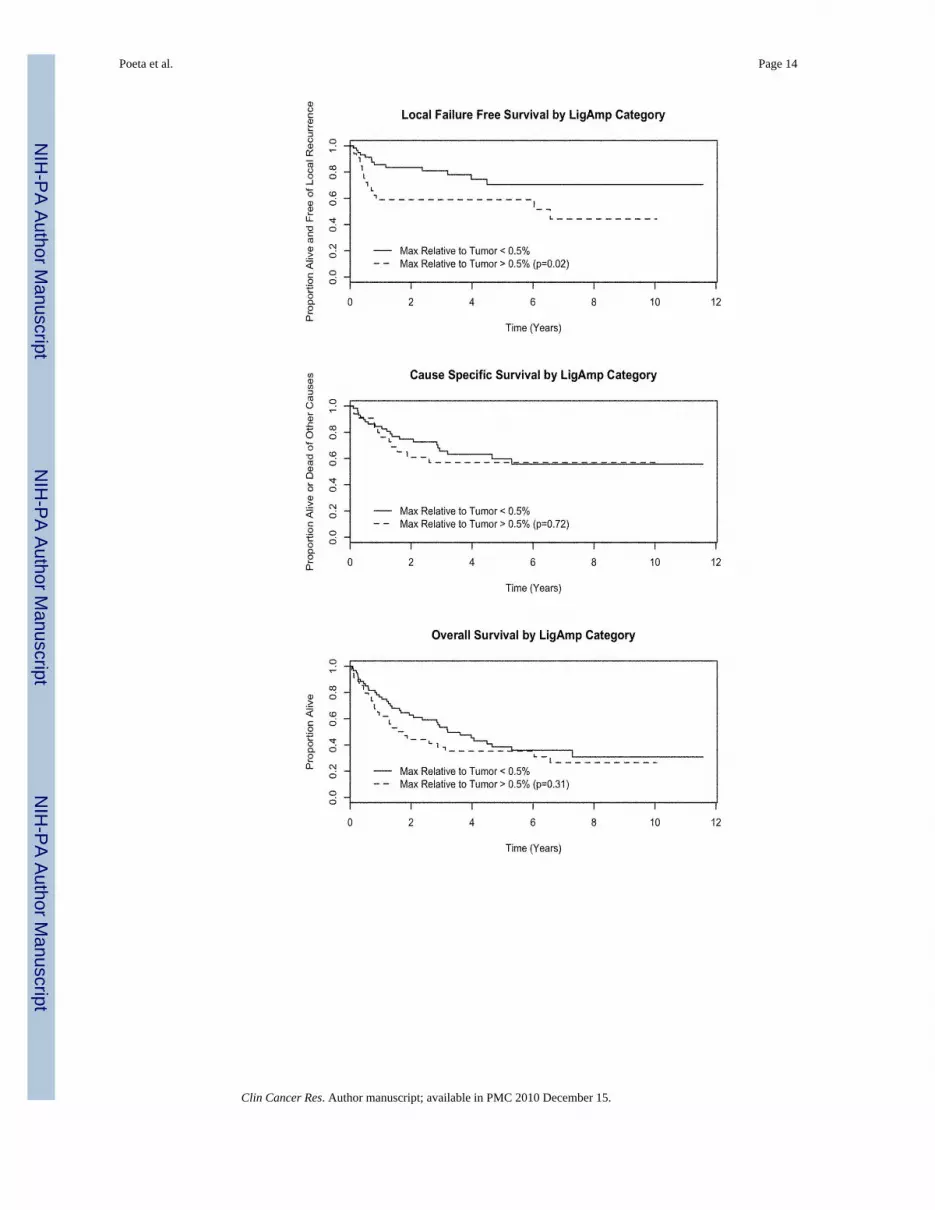
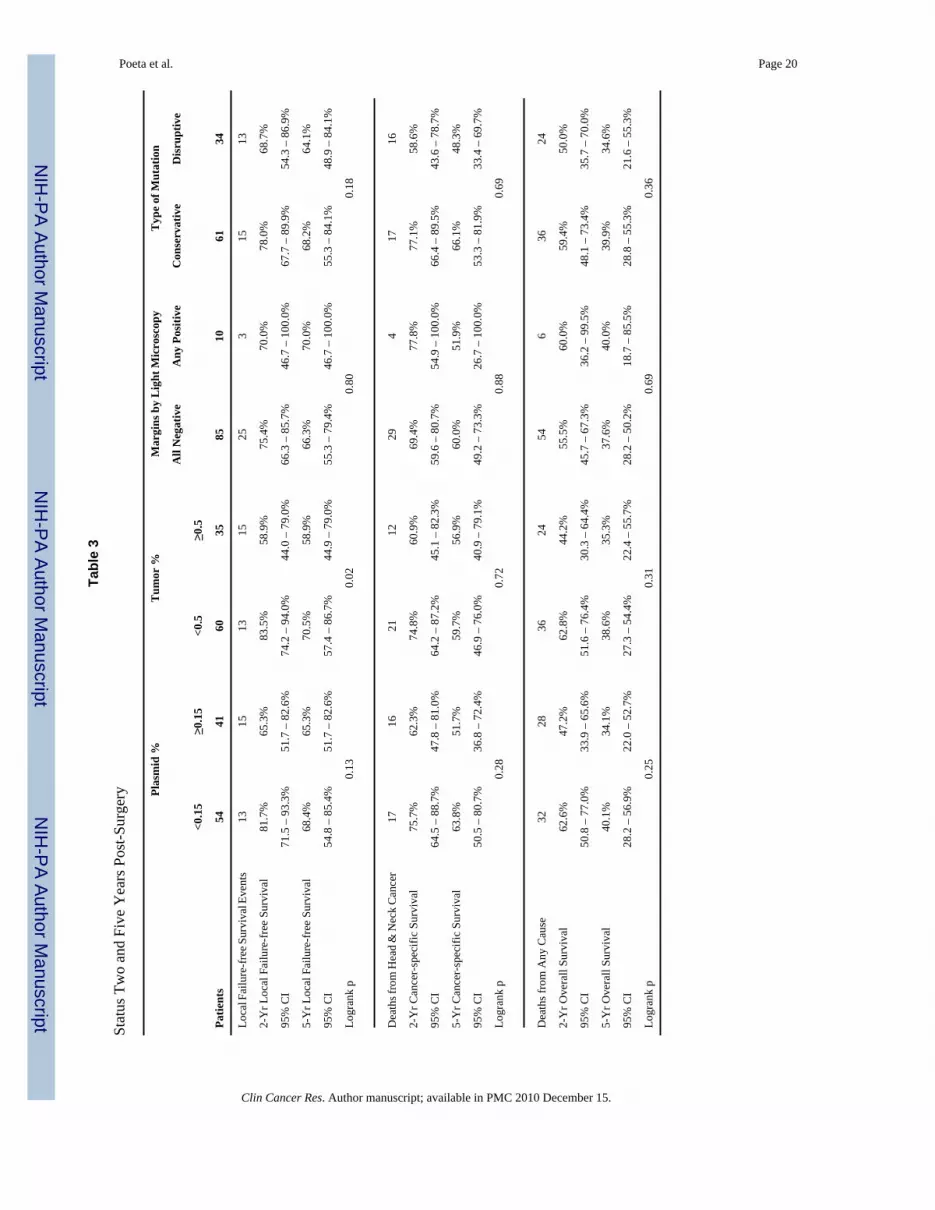
Median follow-up among patients still alive is 6.7 years. Table 3 provides estimates of two-year and five-year local failure-free survival (FFS), cause-specific survival (CSS), and overallsurvival (OS) by each of the predictive metrics. There was a statistically significantprolongation in local FFS for patients below the MRT cutoff compared to those above thecutoff (p=0.02). Since the cutpoints were optimized based on the presence of local recurrence,the local FFS metrics would be expected to perform well. While the p-value provides anestimate of the relative value of each metric, it does not represent the true Type I error for thetest and should be interpreted with caution. No other statistically significant associations wereidentified. The analysis of competing causes of death and failure yielded no statisticallysignificant differences by either light microscopy or LigAmp metrics (data not shown). Itshould be noted that these are exploratory analyses and statistical power is extremely limited.
DISCUSSIONHistopathological evaluation of surgical margins is the standard approach to assess theadequacy of surgical treatment. In light of a significant recurrence rate despite clear margins(1), several groups have investigated alternative approaches to detect occult tumor cells insurgical margins of HNSCC (14,15).
Typically, a limited number of samples are submitted during surgery in order to evaluateresection margin status, both for immediate (frozen section) evaluation and for permanent(fixed tissue) histologic evaluation. The surgeon and pathologist select how many margins willbe analyzed and from what locations based on the physical features of the tumor and resectionsite. In most HNSCC cases, 0–10 frozen section specimens are submitted, and 6–10 fixed tissueslides evaluated. In this study, all cases had been determined to have clear margins using thesestandard clinical procedures before additional margins were taken for molecular analysis. The
Poeta et al. Page 6
Clin Cancer Res. Author manuscript; available in PMC 2010 December 15.
NIH
-PA Author Manuscript
NIH
-PA Author Manuscript
NIH
-PA Author Manuscript
process of margin evaluation by surgical pathology is limited both by the economy of sampling(number of slides evaluated), the skill and experience of the pathologist, and the sensitivity oflight microscopy.
No method to detect TP53 alterations has proven to be amenable to wide-spread clinical use.Markers of high quality for molecular detection must be specific to fully transformed cancercells and not merely indicative of a field effect of precancerous potential. As we have alreadysuggested, immunohistochemical analysis of p53 expression in surgical margins (6) is limitedin its ability to detect the presence of minimal residual cancer cells. Furthermore, IHC, likestandard histopathologic evaluation of thin sections taken from margin samples analyzes onlya small portion of the total perimeter around a tumor. So laboratory assays have been developedto explore other methods to detect the presence of tumor-specific molecular alterations (13,14,15,23) indicative of occult cancer cells in surgical margins of HNSCC. Submission of theentire margin sample for DNA extraction allows for a rigorous evaluation of the entire marginvolume.
The TP53 plaque assay used in our earliest study is a laborious method requiring 3 days andusing radio-labelled oligonucleotides. Alternative PCR-based approaches have been described,with a similar detection limit of around 0.1% of mutant/wild-type species. However, in someof these studies, quantification of mutant cells has been performed using tumor DNA togenerate the standard curve, leading to an inaccurate assessment of the mutant fraction presentin the margin (tumor samples are not comprised of 100% cancer cells). In this study, we soughtto overcome the limitations and disadvantages of these assays. The LigAmp assay (16) hasbeen shown to be a reliable method for detecting single nucleotide variants in cancer. By usingTP53 mutant plasmids to generate the standard curve we were able to derive an absolutequantification of mutant DNA in tumor and margins. Accurate quantification of mutation inprimary tumors allows exclusion of cases with subclinical passenger mutations.
The aim of this study was to demonstrate the usefulness of LigAmp for the evaluation of TP53mutation in surgical margins. To that end, we selected a subset of 95 of the 224 cases withmutation in order to maximize utility of effort to create plasmids for quantification control andoptimize conditions for assaying each mutation. This subset was reflective of the entire cohortand the entire mutation group in all demographic and tumor-related parameters (supplementaltable 2). Cases with TP53 mutation are more common in tumors of the oral cavity and lesscommon in the oropharynx where HPV is an etiologic factor. Furthermore, this cohort allowedfor the exploration of threshold cutpoints of clinically relevant mutant species detection settingthe stage for a full scale evaluation of the entire cohort.
We evaluated all study margins by light microscopy to explore the relative sensitivity ofmolecular analysis to supplemental focused histologic evaluation. Light microscopy alsoserved as a means of internal verification of molecular findings. Of note, the light microscopywas performed by an expert pathologist who was cognizant of the goal of identifying minuteclusters of suspicious cells in these samples taken after the local institutional pathologicdiagnosis had already deemed margins to be clear. The molecular approach performed betterthan supplemental histopatological evaluation in identifying cases with subclinical positivemargins. LigAmp thresholds correctly identified 60% of all cases that went on to recur locally(9 of 15), while light microscopy confirmed the presence of visible tumor cells in only two ofthese cases. Both methods failed to predict recurrence in the other six local failure cases.
The rate of false positive and false negative molecular analyses was somewhat disappointing- particularly the latter, for which increased concern for recurrence and potential need forsupplemental therapy would not have been predicted. There are several possible reasons thatthe LigAmp assay may have underestimated recurrence risk. The sample size is modest (n=95),
Poeta et al. Page 7
Clin Cancer Res. Author manuscript; available in PMC 2010 December 15.
NIH
-PA Author Manuscript
NIH
-PA Author Manuscript
NIH
-PA Author Manuscript
yet three times larger than in our pilot study. The number of events (local recurrences) is low(n=15), perhaps due to improvement in loco-regional disease control with modern adjuvanttherapy or rigorous surgical management in this prospective trial focused on adequacy of tumorextirpation. It is also possible that the sampling of margins failed to include critical deep tissuewhich, if positive, would have predicted some of the local recurrences. Finally, the thresholdof 0.5% may be too high to include some true positive cases with tumor cells in margins.
A recent report from analysis of TP53 mutations in this cohort revealed a decrement in overallsurvival among patients whose tumor contained TP53 alterations predicted to disrupt DNAbinding. Analysis of clinical endpoints in this subset of 95 patients failed to demonstrate anyassociation between clinical outcome and type of p53 mutation. Use of post-operative adjuvantradiation also did not affect the rate of survival. Among those patients who did not have tumorrecurrence, 46% had received postoperative radiation compared with 53% of those whosetumor recurred (Table 2).
Given the limited number of recurrence events and the availability of a TP53 mutationamenable to Ligamp in less than half of all cases, alternate markers must be utilized for theexpanded evaluation of this cohort. Furthermore, LigAmp still requires several hours oflaboratory work to evaluate a margin sample even when the tumor has been analyzed formutation previously and a pertinent plasmid is on hand. Optimally, molecular evaluation ofmargins should be completed during the time frame of surgical resection and reconstructionin order to permit further resection of identified positive margins. Tumor-specific promoterhypermethylation has shown promise as a marker of rare tumor cells (24) and results applyingthis approach to molecular detection in our margin cohort are forthcoming. Data from thecurrent study provides the first accurate quantification of tumor cells in recurrent cases, andthis cohort of tumors and margins for which TP53 results are known will permit comparisonof results using novel markers with that of TP53 analysis.
We conclude that TP53 LigAmp analysis represents a rapid, quantitative and reproduciblemethod to investigate the clinical significance of detecting occult tumor cells in margins ofHNSCC. Accurate prediction of recurrent cases may lead to an improvement in early detectionof residual cancer and overall management of HNSCC patients.
STATEMENT OF TRANSLATIONAL RELEVANCE
Clear surgical resection margins represent one of the most important prognostic indicatorsfor patients with squamous cell carcinoma of the head and neck (HNSCC). However, thelocal recurrence rate is still 10% to 30% among patients with microscopically clear margins,suggesting that occult tumor cells may be present surrounding resection boundaries. Betterdetection and subsequent removal or other treatment of occult disease in adjacent tissuemay result in improved outcomes.
Supplementary MaterialRefer to Web version on PubMed Central for supplementary material.
AcknowledgmentsSupported by NIH/NIDCR R01 DE013152
This study was coordinated by the Eastern Cooperative Oncology Group (Robert L. Comis, M.D., Chair) and supportedin part by Public Health Service Grants CA23318, CA66636, CA21115, CA16116, CA27525 and from the NationalCancer Institute, National Institutes of Health and the Department of Health and Human Services. Its contents aresolely the responsibility of the authors and do not necessarily represent the official views of the National CancerInstitute.
Poeta et al. Page 8
Clin Cancer Res. Author manuscript; available in PMC 2010 December 15.
NIH
-PA Author Manuscript
NIH
-PA Author Manuscript
NIH
-PA Author Manuscript

REFERENCES1. van Houten VM, Leemans CR, Kummer JA, Dijkstra J, Kuik DJ, van den Brekel MW, Snow GB,
Brakenhoff RH. Molecular diagnosis of surgical margins and local recurrence in head and neck cancerpatients: a prospective study. Clin Cancer Res 2004 Jun 1;10(11):3614–3620. [PubMed: 15173067]
2. Leemans CR, Tiwari R, Nauta JJ, van der Waal I, Snow GB. Recurrence at the primary site in headand neck cancer and the significance of neck lymph node metastases as a prognostic factor. Cancer(Phila) 1994;73:187–190. [PubMed: 8275423]
3. Partridge M, Li SR, Pateromichelakis S, Francis R, Phillips E, Huang XH, Tesfa-Selase F, LangdonJD. Detection of minimal residual cancer to investigate why oral tumors recur despite seeminglyadequate treatment. Clin Cancer Res 2000 Jul;6(7):2718–2725. [PubMed: 10914716]
4. Haque R, Contreras R, McNicoll MP, Eckberg EC, Petitti DB. Surgical margins and survival afterhead and neck cancer surgery. BMC Ear Nose Throat Disord 2006 Feb 17;6:2
5. Bradley PJ, MacLennan K, Brakenhoff RH, Leemans CR. Status of primary tumour surgical marginsin squamous head and neck cancer: prognostic implications. Curr Opin Otolaryngol Head Neck Surg2007 Apr;15(2):74–81. [PubMed: 17413406]
6. van Houten VM, Tabor MP, van den Brekel MW, Kummer JA, Denkers F, Dijkstra J, Leemans R, vander Waal I, Snow GB, Brakenhoff RH. Mutated p53 as a molecular marker for the diagnosis of headand neck cancer. J Pathol 2002 Dec;198(4):476–486. [PubMed: 12434417]
7. Tunca B, Erisen L, Coskun H, Cecener G, Ozuysal S, Egeli U. P53 gene mutations in surgical marginsand primary tumor tissues of patients with squamous cell carcinoma of the head and neck. Tumori2007 Mar–Apr;93(2):182–188. [PubMed: 17557566]
8. van Houten VM, Tabor MP, van den Brekel MW, Denkers F, Wishaupt RG, Kummer JA, Snow GB,Brakenhoff RH. Molecular assays for the diagnosis of minimal residual head-and-neck cancer:methods, reliability, pitfalls, and solutions. Clin Cancer Res 2000 Oct;6(10):3803–3816. Review.[PubMed: 11051222]
9. Taylor D, Koch WM, Zahurak M, Shah K, Sidransky D, Westra WH. Immunohistochemical detectionof p53 protein accumulation in head and neck cancer: correlation with p53 gene alterations. HumPathol 1999 Oct;30(10):1221–1225. [PubMed: 10534171]
10. Sjögren S, Inganäs M, Norberg T, Lindgren A, Nordgren H, Holmberg L, Bergh J. The p53 gene inbreast cancer: prognostic value of complementary DNA sequencing versus immunohistochemistry.J Natl Cancer Inst 1996 Feb 21;88(3–4):173–182. [PubMed: 8632491]
11. Whetsell LH, Ringer DP, Schaefer FV. Molecular approach to rapid assessment of p53 tumorsuppressor mutations in esophageal tumors from stained histological slides. Diagn Mol Pathol 1994Jun;3(2):132–141. [PubMed: 7520333]
12. Vary CP, Carmody M, LeBlanc R, Hayes T, Rundell C, Keilson L. Allele-specific hybridization oflipoprotein lipase and factor-V Leiden missense mutations with direct label alkaline phosphatase-conjugated oligonucleotide probes. Genet Anal 1996 Sep;13(3):59–65. [PubMed: 8931992]
13. Harden SV, Thomas DC, Benoit N, Minhas K, Westra WH, Califano JA, Koch W, Sidransky D. Real-time gap ligase chain reaction: a rapid semiquantitative assay for detecting p53 mutation at low levelsin surgical margins and lymph nodes from resected lung and head and neck tumors. Clin Cancer Res2004 Apr 1;10(7):2379–2385. [PubMed: 15073114]
14. Huang X, Pateromichelakis S, Hills A, Sherriff M, Lyons A, Langdon J, Odell E, Morgan P, HarrisonJ, Partridge M. p53 mutations in deep tissues are more strongly associated with recurrence thanmutation-positive mucosal margins. Clin Cancer Res 2007 Oct 15;13(20):6099–6106. [PubMed:17947474]
15. Brennan JA, Mao L, Hruban RH, Boyle JO, Eby YJ, Koch WM, Goodman SN, Sidransky D.Molecular assessment of histopathological staging in squamous-cell carcinoma of the head and neck.N Engl J Med 1995 Feb 16;332(7):429–435. [PubMed: 7619114]
16. Shi C, Eshleman SH, Jones D, Fukushima N, Hua L, Parker AR, Yeo CJ, Hruban RH, Goggins MG,Eshleman JR. LigAmp for sensitive detection of single-nucleotide differences. at Methods 2004 Nov;1(2):141–147. Epub 2004 Oct 21.
17. Poeta ML, Manola J, Goldwasser MA, Forastiere A, Benoit N, Califano JA, Ridge JA, Goodwin J,Kenady D, Saunders J, Westra W, Sidransky D, Koch WM. TP53 mutations and survival in
Poeta et al. Page 9
Clin Cancer Res. Author manuscript; available in PMC 2010 December 15.
NIH
-PA Author Manuscript
NIH
-PA Author Manuscript
NIH
-PA Author Manuscript

squamous-cell carcinoma of the head and neck. N Engl J Med 2007 Dec 20;357(25):2552–2561.[PubMed: 18094376]
18. Cox, DR. Analysis of Binary Data. London, England: Methuen & Co, Ltd; 1970.19. Wilcoxon F. Individual comparisons by ranking methods. Biometrics 1945;1:80–83.20. Breiman, L.; Friedman, J.; Stone, CJ.; Olshen, RA. Classification and Regression Trees. Pacific
Grove, California: Wadsworth, Inc.; 1984.21. Peto R, Peto J. Asymptotically efficient rank invariant test procedures. J R Stat Soc Ser A 1972;135
(2):185–206.22. Gray RJ. A class of k-sample tests for comparing the cumulative incidence of a competing risk. Ann
Stat 1988;16(3):1141–1154.23. Zhou S, Kachhap S, Sun W, Wu G, Chuang A, Poeta L, Grumbine L, Mithani SK, Chatterjee A, Koch
W, Westra WH, Maitra A, Glazer C, Carducci M, Sidransky D, McFate T, Verma A, Califano JA.Frequency and phenotypic implications of mitochondrial DNA mutations in human squamous cellcancers of the head and neck. Proc Natl Acad Sci U S A 2007 May 1;104(18):7540–7545. Epub 2007Apr 24. [PubMed: 17456604]
24. Carvalho AL, Jeronimo C, Kim MM, Henrique R, Zhang Z, Hoque MO, Chang S, Brait M, NayakCS, Jiang WW, Claybourne Q, Tokumaru Y, Lee J, Goldenberg D, Garrett-Mayer E, Goodman S,Moon CS, Koch W, Westra WH, Sidransky D, Califano JA. Evaluation of promoter hypermethylationdetection in body fluids as a screening/diagnosis tool for head and neck squamous cell carcinoma.Clin Cancer Res 2008 January;14(1):97–107. [PubMed: 18172258]
Poeta et al. Page 10
Clin Cancer Res. Author manuscript; available in PMC 2010 December 15.
NIH
-PA Author Manuscript
NIH
-PA Author Manuscript
NIH
-PA Author Manuscript
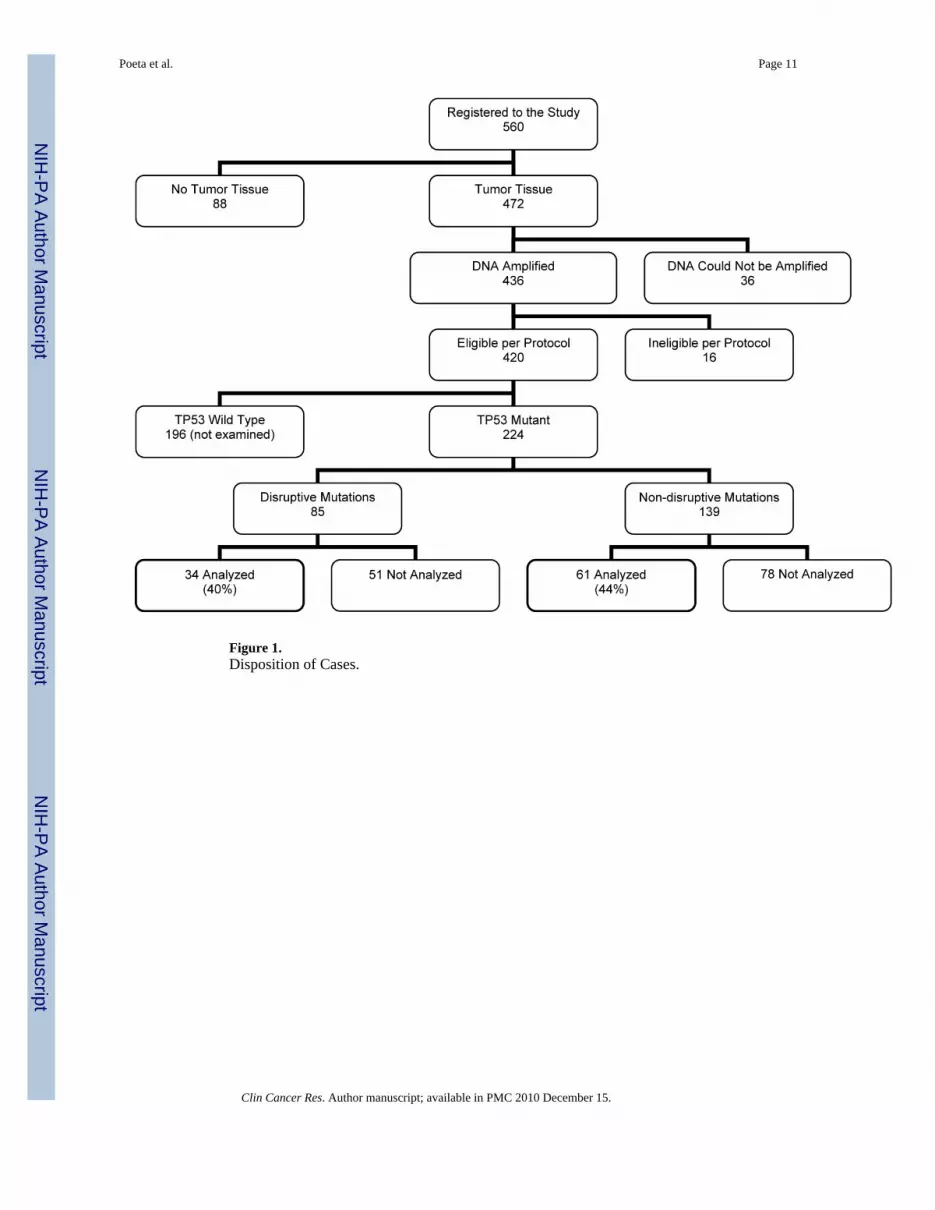
Figure 1.Disposition of Cases.
Poeta et al. Page 11
Clin Cancer Res. Author manuscript; available in PMC 2010 December 15.
NIH
-PA Author Manuscript
NIH
-PA Author Manuscript
NIH
-PA Author Manuscript

Figure 2.Recursive partitioning trees to determine optimal cutpoint for percentage of margin cellsrelative to tumor (left) and relative to plasmid (right). The height of the vertical lines isproportional to the error in the fit.
Poeta et al. Page 12
Clin Cancer Res. Author manuscript; available in PMC 2010 December 15.
NIH
-PA Author Manuscript
NIH
-PA Author Manuscript
NIH
-PA Author Manuscript
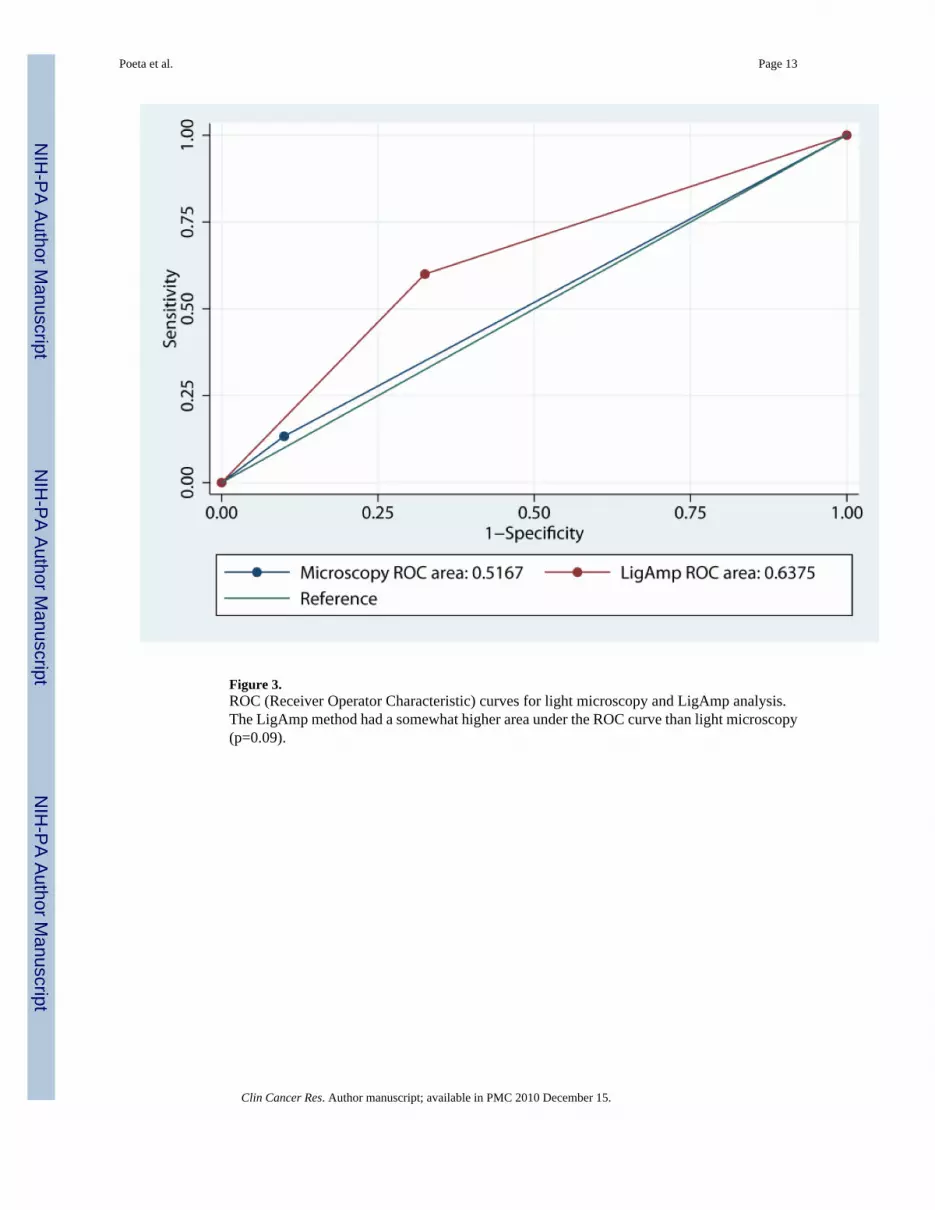
Figure 3.ROC (Receiver Operator Characteristic) curves for light microscopy and LigAmp analysis.The LigAmp method had a somewhat higher area under the ROC curve than light microscopy(p=0.09).
Poeta et al. Page 13
Clin Cancer Res. Author manuscript; available in PMC 2010 December 15.
NIH
-PA Author Manuscript
NIH
-PA Author Manuscript
NIH
-PA Author Manuscript
Poeta et al. Page 14
Clin Cancer Res. Author manuscript; available in PMC 2010 December 15.
NIH
-PA Author Manuscript
NIH
-PA Author Manuscript
NIH
-PA Author Manuscript

Figure 4.Kaplan-Meier plots of local failure-free survival, cancer specific survival, and overall survivalby optimal cutpoint of LigAmp percentage of mutant species relative to tumor. Logrank p-values for differences in local failure-free, cancer specific and overall survival by cutpointcategory are 0.02, 0.72, and 0.31, respectively. Because the cutpoint was selected on the basisof local failure, the p-value for local failure-free survival does not represent the probability ofobserving the results by chance alone and thus should be interpreted with caution.
Poeta et al. Page 15
Clin Cancer Res. Author manuscript; available in PMC 2010 December 15.
NIH
-PA Author Manuscript
NIH
-PA Author Manuscript
NIH
-PA Author Manuscript

NIH
-PA Author Manuscript
NIH
-PA Author Manuscript
NIH
-PA Author Manuscript
Poeta et al. Page 16
Table 1
Demographic and Clinical Characteristics
Sex Male 65 68.4%
Female 30 31.6%
Race White 81 85.3%
Hispanic 6 6.3%
African-American 8 8.4%
Age <55 29 30.5%
55–64 27 28.4%
>64 39 41.1%
Cell Differentiation Well differentiated 20 22.2%
Moderately differentiated 54 60.0%
Poorly differentiated 16 17.8%
Undifferentiated - -
Unknown 5
Primary Tumor Site Oral Cavity 56 58.9%
Oropharynx 12 12.6%
Hypopharynx 8 8.4%
Larynx 13 13.7%
Other 5 5.3%
>1 Primary 1 1.1%
Pathologic T Stage pT1 24 25.5%
pT2 32 34.0%
pT3 15 16.0%
pT4 22 23.4%
pTx/is 1 1.1%
missing 1 1.1%
Pathologic N Stage pNo/Nx 46 48.9%
pN+ 48 51.1%
missing 1
Status of PrimaryTumor
Eradicated but LocalRecurrence 9 9.7%
Residual Disease AfterPrimary Surgery 14 15.1%
Untreated 70 75.3%
Unknown 2
Clin Cancer Res. Author manuscript; available in PMC 2010 December 15.
NIH
-PA Author Manuscript
NIH
-PA Author Manuscript
NIH
-PA Author Manuscript
Poeta et al. Page 17
Clinical TNM Stage I 8 9.9%
II 15 18.5%
III 23 28.4%
IV 35 43.2%
Unknown 14
Treatment Surgery Alone 33 34.7%
Surgery & Post-OperativeTreatment 45 47.4%
Salvage Treatment 17 17.9%
Smoking History Never Smoked 16 17.4%
Pipe/Cigar Only 4 4.3%
<20 Pack Years 9 9.8%
20–40 Pack Years 26 28.3%
≥40 Pack Years 37 40.2%
Unknown 3
Average AlcoholConsumption
<10 oz/wk 52 59.8%
10–20 oz/wk 16 18.4%
>20 oz/wk 19 21.8%
Unknown 8
Weight Loss inPrevious 6 months
<5% 61 72.6%
5–9.9% 12 14.3%
10–19.9% 8 9.5%
≥20% 3 3.6%
Unknown 11
Performance Status 0 68 73.9%
1 20 21.7%
2 4 4.3%
Unknown 3
Did Primary Extendto AdjacentStructures?
No 53 56.4%
Yes 41 43.6%
Unknown 1
Clinical T Stage T1 17 18.1%
T2 27 28.7%
T3 27 28.7%
T4 23 24.5%
Unknown 1
Clin Cancer Res. Author manuscript; available in PMC 2010 December 15.
NIH
-PA Author Manuscript
NIH
-PA Author Manuscript
NIH
-PA Author Manuscript
Poeta et al. Page 18
Clinical N Stage N0 56 60.2%
N1 17 18.3%
N2 17 18.3%
N3 3 3.2%
Unknown 2
Mutation Status Disruptive 34 36%
Non-Disruptive 61 64%
Clin Cancer Res. Author manuscript; available in PMC 2010 December 15.
NIH
-PA Author Manuscript
NIH
-PA Author Manuscript
NIH
-PA Author Manuscript
Poeta et al. Page 19
Tabl
e 2
Mar
gin
Stat
us b
y Lo
cal R
ecur
renc
e –
All
Patie
nts
No
Loc
al R
ecur
renc
eR
ecur
renc
e
Num
ber o
f Pat
ient
s80
15
Plas
mid
%<
0.15
4961
.3%
533
.3%
≥
0.15
3138
.8%
1066
.7%
Tum
or %
< 0
.554
67.5
%6
40.0
%
≥
0.5
2632
.5%
960
.0%
Posi
tive
Mar
gins
by
Ligh
t Mic
rosc
opy N
o72
90.0
%13
86.7
%
Yes
810
.0%
213
.3%
Plas
mid
%
mea
n5.
771.
28
sd20
.11
2.54
med
ian
0.12
0.22
rang
e0–
100
0.01
–9.5
5
IQR
0.06
–0.3
950.
03–1
.58
Tum
or %
mea
n19
.26
10.0
1
sd95
.48
24.1
5
med
ian
0.26
0.75
rang
e0.
01–7
93.5
30.
03–7
9.00
IQR
0.12
–1.0
50.
15–2
.28
Dis
rupt
ive
Mut
atio
ns No
5265
.0%
960
.0%
Yes
2835
.0%
640
.0%
Adj
uvan
t The
rapy
No
4353
.8%
746
.7%
Yes
3746
.3%
853
.3%
Clin Cancer Res. Author manuscript; available in PMC 2010 December 15.
NIH
-PA Author Manuscript
NIH
-PA Author Manuscript
NIH
-PA Author Manuscript
Poeta et al. Page 20
Tabl
e 3
Stat
us T
wo
and
Five
Yea
rs P
ost-S
urge
ry Plas
mid
%T
umor
%M
argi
ns b
y L
ight
Mic
rosc
opy
Typ
e of
Mut
atio
n
All
Neg
ativ
eA
ny P
ositi
veC
onse
rvat
ive
Dis
rupt
ive
<0.1
5≥0
.15
<0.5
≥0.5
Patie
nts
5441
6035
8510
6134
Loca
l Fai
lure
-fre
e Sur
viva
l Eve
nts
1315
1315
253
1513
2-Y
r Loc
al F
ailu
re-f
ree
Surv
ival
81.7
%65
.3%
83.5
%58
.9%
75.4
%70
.0%
78.0
%68
.7%
95%
CI
71.5
– 9
3.3%
51.7
– 8
2.6%
74.2
– 9
4.0%
44.0
– 7
9.0%
66.3
– 8
5.7%
46.7
– 1
00.0
%67
.7 –
89.
9%54
.3 –
86.
9%
5-Y
r Loc
al F
ailu
re-f
ree
Surv
ival
68.4
%65
.3%
70.5
%58
.9%
66.3
%70
.0%
68.2
%64
.1%
95%
CI
54.8
– 8
5.4%
51.7
– 8
2.6%
57.4
– 8
6.7%
44.9
– 7
9.0%
55.3
– 7
9.4%
46.7
– 1
00.0
%55
.3 –
84.
1%48
.9 –
84.
1%
Logr
ank
p0.
130.
020.
800.
18
Dea
ths f
rom
Hea
d &
Nec
k C
ance
r17
1621
1229
417
16
2-Y
r Can
cer-
spec
ific
Surv
ival
75.7
%62
.3%
74.8
%60
.9%
69.4
%77
.8%
77.1
%58
.6%
95%
CI
64.5
– 8
8.7%
47.8
– 8
1.0%
64.2
– 8
7.2%
45.1
– 8
2.3%
59.6
– 8
0.7%
54.9
– 1
00.0
%66
.4 –
89.
5%43
.6 –
78.
7%
5-Y
r Can
cer-
spec
ific
Surv
ival
63.8
%51
.7%
59.7
%56
.9%
60.0
%51
.9%
66.1
%48
.3%
95%
CI
50.5
– 8
0.7%
36.8
– 7
2.4%
46.9
– 7
6.0%
40.9
– 7
9.1%
49.2
– 7
3.3%
26.7
– 1
00.0
%53
.3 –
81.
9%33
.4 –
69.
7%
Logr
ank
p0.
280.
720.
880.
69
Dea
ths f
rom
Any
Cau
se32
2836
2454
636
24
2-Y
r Ove
rall
Surv
ival
62.6
%47
.2%
62.8
%44
.2%
55.5
%60
.0%
59.4
%50
.0%
95%
CI
50.8
– 7
7.0%
33.9
– 6
5.6%
51.6
– 7
6.4%
30.3
– 6
4.4%
45.7
– 6
7.3%
36.2
– 9
9.5%
48.1
– 7
3.4%
35.7
– 7
0.0%
5-Y
r Ove
rall
Surv
ival
40.1
%34
.1%
38.6
%35
.3%
37.6
%40
.0%
39.9
%34
.6%
95%
CI
28.2
– 5
6.9%
22.0
– 5
2.7%
27.3
– 5
4.4%
22.4
– 5
5.7%
28.2
– 5
0.2%
18.7
– 8
5.5%
28.8
– 5
5.3%
21.6
– 5
5.3%
Logr
ank
p0.
250.
310.
690.
36
Clin Cancer Res. Author manuscript; available in PMC 2010 December 15.