Communication Studies & English - The University of Liverpool
Upload
nottinghamCategory
view
0download
0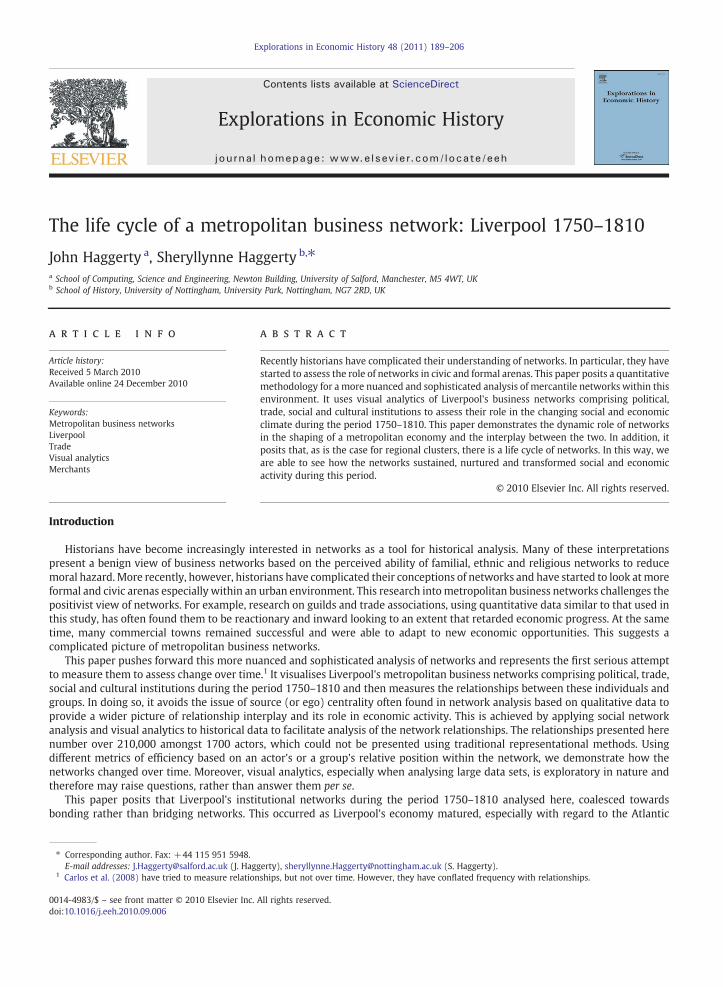
Explorations in Economic History 48 (2011) 189–206
Contents lists available at ScienceDirect
Explorations in Economic History
j ourna l homepage: www.e lsev ie r.com/ locate /eeh
The life cycle of a metropolitan business network: Liverpool 1750–1810
John Haggerty a, Sheryllynne Haggerty b,⁎a School of Computing, Science and Engineering, Newton Building, University of Salford, Manchester, M5 4WT, UKb School of History, University of Nottingham, University Park, Nottingham, NG7 2RD, UK
a r t i c l e i n f o
⁎ Corresponding author. Fax: +44 115 951 5948.E-mail addresses: [email protected] (J. Hagg
1 Carlos et al. (2008) have tried to measure relation
0014-4983/$ – see front matter © 2010 Elsevier Inc.doi:10.1016/j.eeh.2010.09.006
a b s t r a c t
Article history:Received 5 March 2010Available online 24 December 2010
Recently historians have complicated their understanding of networks. In particular, they havestarted to assess the role of networks in civic and formal arenas. This paper posits a quantitativemethodology for amore nuanced and sophisticated analysis of mercantile networks within thisenvironment. It uses visual analytics of Liverpool's business networks comprising political,trade, social and cultural institutions to assess their role in the changing social and economicclimate during the period 1750–1810. This paper demonstrates the dynamic role of networksin the shaping of a metropolitan economy and the interplay between the two. In addition, itposits that, as is the case for regional clusters, there is a life cycle of networks. In this way, weare able to see how the networks sustained, nurtured and transformed social and economicactivity during this period.
© 2010 Elsevier Inc. All rights reserved.
Keywords:Metropolitan business networksLiverpoolTradeVisual analyticsMerchants
Introduction
Historians have become increasingly interested in networks as a tool for historical analysis. Many of these interpretationspresent a benign view of business networks based on the perceived ability of familial, ethnic and religious networks to reducemoral hazard.More recently, however, historians have complicated their conceptions of networks and have started to look atmoreformal and civic arenas especially within an urban environment. This research intometropolitan business networks challenges thepositivist view of networks. For example, research on guilds and trade associations, using quantitative data similar to that used inthis study, has often found them to be reactionary and inward looking to an extent that retarded economic progress. At the sametime, many commercial towns remained successful and were able to adapt to new economic opportunities. This suggests acomplicated picture of metropolitan business networks.
This paper pushes forward this more nuanced and sophisticated analysis of networks and represents the first serious attemptto measure them to assess change over time.1 It visualises Liverpool's metropolitan business networks comprising political, trade,social and cultural institutions during the period 1750–1810 and then measures the relationships between these individuals andgroups. In doing so, it avoids the issue of source (or ego) centrality often found in network analysis based on qualitative data toprovide a wider picture of relationship interplay and its role in economic activity. This is achieved by applying social networkanalysis and visual analytics to historical data to facilitate analysis of the network relationships. The relationships presented herenumber over 210,000 amongst 1700 actors, which could not be presented using traditional representational methods. Usingdifferent metrics of efficiency based on an actor's or a group's relative position within the network, we demonstrate how thenetworks changed over time. Moreover, visual analytics, especially when analysing large data sets, is exploratory in nature andtherefore may raise questions, rather than answer them per se.
This paper posits that Liverpool's institutional networks during the period 1750–1810 analysed here, coalesced towardsbonding rather than bridging networks. This occurred as Liverpool's economy matured, especially with regard to the Atlantic
erty), [email protected] (S. Haggerty).ships, but not over time. However, they have conflated frequency with relationships.
All rights reserved.
190 J. Haggerty, S. Haggerty / Explorations in Economic History 48 (2011) 189–206
trade, and the slave trade in particular. However, this study also argues that networks are dynamic, fluctuate over time andhave a life cycle. We therefore find that various networks were in operation at the same time. This means that, as with regionalclusters, some will eventually wither, but this facilitates the emergence of new and more dynamic networks in turn.
This paper first outlines the major themes in the related literature on networks and places our contribution in context. It thenoutlines the methodology and the eighteenth-century Liverpool case study. This is followed by a discussion on the rise and fall of asection of Liverpool's Metropolitan Business Networks. Finally, we draw our conclusions.
Networks in history
Historians have been using networks as an analytical tool for some time. This is a worthwhile exercise becausecontemporaries also realised the value of networks, even if they called their contacts ‘friends’ or ‘correspondents’ (Hancock,2005). In particular, business networks are intended to produce various outcomes such as the rapid transfer and synthesis ofknowledge or understanding, the conferment of status and legitimacy, lower information and transaction costs, and the abilityto adapt to environmental changes (Podolny and Page, 1998). Historians often accept that such networks always performedthese positive functions and were easily constructed and maintained (Davidoff and Hall, 1987; Prior and Kirby, 1993; Walvin,1997; Hamilton, 2005). This may be because much stress has been placed on the ‘implicit contract of family’ (Ben-Porath, 1980)and ethnic and religious ties, assuming that they reduced moral hazard (Mathias, 2000). It is true that such ties providedreputational mechanisms and specific cultural market information, but ethnic ties could also be inward looking and provideextra obligations (Greif, 1989; Mentz, 2004; Rauch, 2001; Haggerty, 2006). Furthermore, whilst Quakers were perceived to havea highly moralistic business culture, they, like Jews, also faced ostracism (Doerflinger, 1987; Tolles, 1963; Trivellato, 2009).Indeed, Rauch (2001) has argued that the importance of ethnic networks has been exaggerated due to their observability ratherthan their importance.
If family, ethnic and religious ties are insufficient to explain business networks, we need to look to more civic ways ofnetworking. Hancock (1996) has shown how merchants came together in order to share skills and capital and has demonstratedthat many networks included people who had never met, especially useful considering the distances covered by trade in thisperiod. Clearly then, strong and weak ties worked together in a dynamic way in order for businessmen to conduct their trade.Furthermore, merchants usually belonged to a number of networks at any one time, depending on their fluctuating businessinterests, and their power or importance within each varied. For example, a merchant might use the tavern or drinking clubs tofoster trust relationships for credit, acquire the latest gossip at the coffee house and ‘change’, but might further career and politicalinterests via a trade association and the town council. Such ‘Metropolitan Business Networks’ are the ‘intangible infrastructure of aregion’; consisting wholly or partly of business people, they are significant because their members meet face-to-face, regularly,and are usually efficient because these members are busy men (Casson, 2003). Often articulated as institutions such as guilds ortrade associations in the eighteenth century, these more formalised networks frequently provided a social context for a rationalbusiness activity. Interestingly thesemore institutionalised networks existed as a separate entity, withmembers coming and goingand power relationships shifting over time. This should have allowed them to be flexible and to adapt quickly to a changingenvironment. Working together on the same issues to defend certain aspects of trade also promoted trust and solidarity andmanypeople became attached to the micro social order of the institutions themselves, as well as to their fellow members (Baldassarriand Diani, 2007; Lawler et al., 2008). This is not to say that such institutions were without their problems. They often becamevictims of their own success and protected vested interests. For example, Ogilvie (2004) argues that guilds in German proto-industry inhibited progress and produced friction rather than promoted economic development, and Rosenband (1999) foundmuch the same in his analysis of the early industrial revolution. Crumplin (2007) has also shown that dense metropolitannetworks can easily become opaque, which allows cliques to get out of control. Business networks, therefore, are not alwaysefficient.
However, the fact that Liverpool, and indeed many other British metropolitan areas were so successful in this period, suggeststhat business networks mostly fulfilled their purpose. For example, Pearson and Richardson (2001) argue that Liverpool'spermeable networks grew through in-migration in this period, meaning that the trading community was receptive and open, andGreefs (2008) found the same for Antwerp. In this way, international trade was promoted by alleviating problems of contractenforcement and asymmetrical information, and by providing information about new trading opportunities. However, it is alsoclear that individuals weremembers of various institutionswhich linkedwith various networks, and that all of thesewere active atthe same time. Therefore, whilst one network might have been successful, another one may have been in decline, and still otherson the rise at the same time. Therefore, institutionalised networks, like those of individuals, were constantly changing andreforming, as power relationships within them adjusted accordingly. This suggests that, as Swann (1998) found for regionalclusters, networks have a life cycle. It is with this dynamism, power relationships and life cycle of such problematic metropolitanbusiness networks that this article is concerned.
Whilst historians and, indeed, social scientists have recently complicated their understandings of networks, they haveyet to measure these networks to quantify their dynamics as an aid to analysing actors’ or groups’ influence in, and reactionsto, the wider economic environment. This paper therefore uses visual analytics and graph theory to analyse Liverpoolmercantile networks in 1750–1810. Importantly this methodology allows us to visualise and measure the relationships forvast data sets (such as the c. 210,000 analysed here), not possible under ‘traditional’ representative methods such as graphsor tables.
191J. Haggerty, S. Haggerty / Explorations in Economic History 48 (2011) 189–206
Case study and methodology
Liverpool 1750–1810 provides an excellent case study for many reasons. Liverpool benefitted greatly from Britain's Atlantictrade and was hailed as the second city of the realm during this period (Montefiore, 1804). Liverpool was the leader in the slavetrade after 1750, traded with Nova Scotia, throughout the thirteen colonies/states, and had excellent connections with the BritishWest Indies as well as a vibrant coastal trade. It was the largest outport in this period with tonnage through the port increasing(Hyde, 1971; Marriner, 1982). Port development also played an important part in helping the city economically, the first wet dockbeing opened in 1715 (Power, 1997). This success encouraged in-migration and Liverpool's population grew in consequence. In1708, the population of Liverpool was around 6500 (Lawton, 1953). By the time of the first census in 1801 it was 77,653 (BritishParliamentary Papers, 1801). This rapid rise in population was mirrored by an increase in trade. Imports entering the portamounted to only 14,600 tons in 1709, but had grown to 450,000 tons by 1800 (Marriner, 1982). It also had a variety of formal andinformal institutions as befitted its status (Stobart, 2000) providing networking opportunities. It is their records of membershipthat will allow us to analyse and measure its metropolitan business networks.
The problemwith local and confidential networking is that much of it is not recorded in official records. We do not knowwhatwas said after the official meetings, in the Exchange, customs house or tavern for example.We therefore do not always understandthe interplay between formal and informal structures and friendship cliques. Institutional records can, however, provide us withthe names of individuals involved and therefore the basis for network analysis.We use four of these institutions. Our choice wasshaped by the desire to use a range of institutions which would cover merchants in different spheres, various stages of theircareers, and also by the longevity of extant data in order to be able to measure change over time.
Town Council (Liverpool Town Books)
Arguably the most formal and civic of the institutions. It was a ‘close’ (self-electing) corporation and was dominated by elitemercantile men (Power, 1997). It was an Anglican institution very active in protecting and promoting the trade of the town. Therecords cover the whole period under study.
Committee of the African Merchants Trading from Liverpool (hereafter African Committee) (Committee Book of the African Company ofMerchants trading from Liverpool)
This was a formal trade associationwith links to similar societies in London and Bristol. Run bymerchants, this represented oneof the important trades of the town. Whilst it was dominated by slave traders, membership was not exclusive to those in thattrade. For example, Edgar Corrie was on the Committee but was against the slave trade. Its records cover the whole period of thisstudy.
Library/Lyceum (Liverpool Lyceum)
First founded in 1758 as the Library, it was later renamed the Lyceum (and is referred to as such throughout this paper). It wasan informal cultural institution representative of many of its type in the period. Set up as an elite library, the membership fee wasfive guineas (£5 5 s) (Wallace, 1795) and among its members weremany of the leading liberals and abolitionists of the town, suchas William Roscoe and William Rathbone. Its records run from 1769 and continue throughout our period.
Drinking clubs
These were informal institutions with a wide membership of men at varying stages of their careers, mercantile and otherwise.We use two. The Ugly Face Club records (Ugly Face Club) run from 1743 to 1757. Membership of the club included manymerchants and ships’ captains as well as doctors, a draper and an architect. The Mock Corporation of Sephton (Sephton MockCorporation) (hereafter Mock Corporation) records run from 1753 to 1796. However, the records are sporadic between 1786 and1796, with membership recorded only for 1789, 1790 and 1796. Membership was muchmore diverse than the Ugly Face Club andincludedmerchants andmariners as well as those frommany walks of Liverpool life such as potters, corn factors, coopers, grocers,a slater and plasterer, glaziers, and pedlars.
A hundred percent sample was taken of all four institutions for the years for which their records are extant. Fig. 1 illustrates thetotal number of individual actors recorded across all institutions (removing double counts for multiple institutional membership).As can be seen, the number of actors involved in the clubs in this study rose until the 1770s and then declined despite theintroduction of the Lyceum data. However, data available for the Mock Corporation of Sephton is sporadic during the 1780s and1790s and not available for the 1800s, which affects the total individual actors recorded. This is not to say that actors were notinvolved in this club, only that data of active participation described above is not extant.
We have also cross referenced institutional data with other sources to provide further information about slave tradeinvestment groups, such as the Trans Atlantic Slave Trade Database (Eltis et al., 2010), trade directories and other qualitativesources such as merchants’ letterbooks to illustrate our arguments where appropriate.
Because total actors recorded here number between 200 and 375 at any one time, in a port where the population wasapproaching 80,000 at the turn of the nineteenth century, this case study is far from being representative of the whole population.
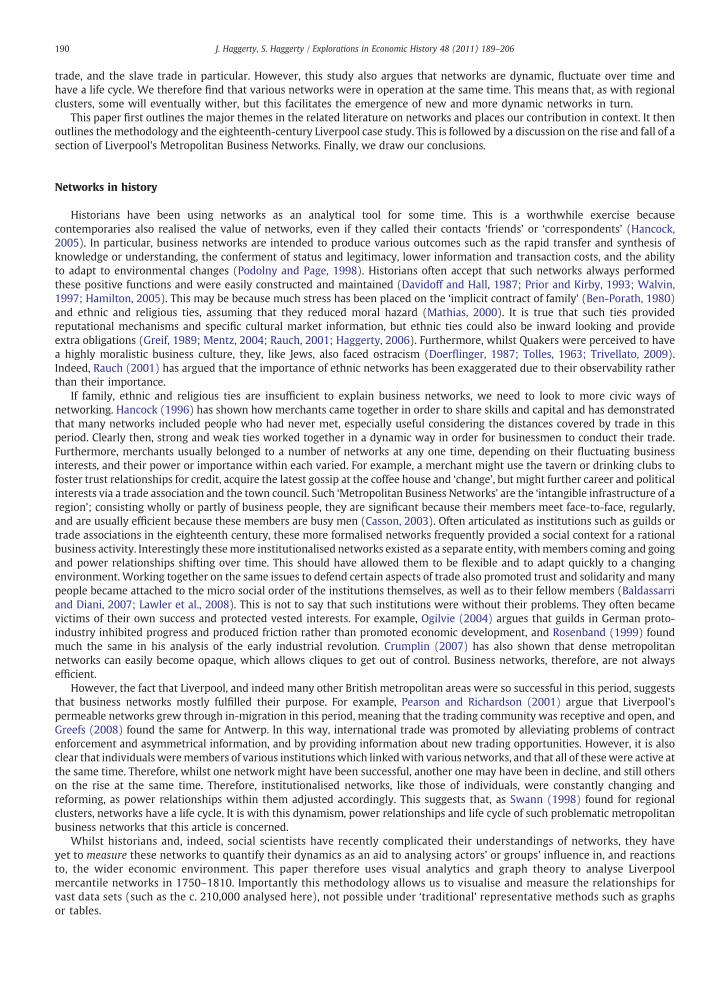
Fig. 2. Number of actors by institution.
Fig. 1. Total individual actors in all institutions.
192 J. Haggerty, S. Haggerty / Explorations in Economic History 48 (2011) 189–206
Indeed, a study of this periodwhich used a very wide definition of the trading community (including factors, shopkeepers, grocers,etc.) found that community to account for only 2.5% to 3.5% of the whole Liverpool population (Haggerty, 2006). Moreover,differing assessments by historians and contemporaries as to the precise definition of a merchant (or indeed Hyde et al.'s (1951)merchant of ‘substance’) makes calculating the representativeness of this sample problematic. However, comparing the numbersof the Town Council and the African Committee which comprised only merchants (see Fig. 2) against numbers of merchants listedin the trade directories (Haggerty, 2006) demonstrates that for the 1760s, 1770s and 1780s, between 42% and 63% of all merchantsare represented here. If we include those belonging to the Lyceum and drinking clubs the number is even higher. The high
193J. Haggerty, S. Haggerty / Explorations in Economic History 48 (2011) 189–206
numbers of merchants listed in the trade directories in the 1790s and 1800s mean that this percentage is reduced to between12.5% and 22.5%. However, given that we are interested in the elite metropolitan business networks, it is likely that we haveincluded most of the significant actors.
All membership records of the Town Council, the African Committee and the Ugly Face Club were recorded. The MockCorporation had a wide membership but not all were active members. Therefore, only those actors who were recorded as inattendance at meetings or were elected to the council were noted. The Lyceum also had an extremely wide membership, but onlythose attending committee meetings were recorded. Therefore, active rather than passive participants in these institutions areanalysed. In order to make this data manageable we have had to assume that all members listed within one decademet each otherand were part of an institutional peer group. This provides the basis for the relationships presented in the analysis below which istherefore grouped by decade. Cross-decade relationships are not analysed here, although we recognise that peer grouprelationships would not be restricted by our temporal groupings.
Fig. 2 also demonstrates that institutional membership and participation changed throughout the period on an institution-by-institution basis. The number of individual actors belonging to the Town Council (TC), after a brief rise in the 1760s, declinedduring the period. The number of actors belonging to the African Committee (AC) rose to a high of 107 during the 1780s beforedeclining over the following twenty years. This decline took place during a period characterised by war, credit crises and theabolition of the slave trade in 1807. The Mock Corporation (MC) enjoyed a healthy participation by members until a decline in the1780s and 1790s (thoughmuch of this is due to the lack of extant data). The number of actors actively participating in the Lyceum's(L) committee remained constant throughout the period due to its policy of replacing 50% of the committee's members each year.However, actors who served on the committee could leave and then rejoin the committee at the next available opportunity.Interestingly the rise and decline in institutional membership demonstrated in Figs. 1 and 2 does not fit neatly with measures ofgroup density, as shown in Table 1. Network density is a widely used measure of group cohesion, measured between 0 and 1,where 0 is an inefficient network and 1 a highly efficient network (Wasserman and Faust, 1994). Usually, as group sizes increase,the density decreases if the numbers of actor degrees remain unchanged, i.e. the group gets too big for everyone to know eachother. However, the network in this study does not follow this expected trend precisely. Between 1750 and 1769, group cohesionas identified by network density rises along with the number of actors. However, this trend is reversed during the next twodecades where the number of actors and group cohesion declines. A comparison of the 1790s with the 1800s shows where thenumber of actors and group cohesion decline. As will be demonstrated below, this supports our argument that Liverpool'smetropolitan business networks, as represented here, were more permeable with a bridging quality (Burt, 2004) at the beginningof our period, but coalesced towards more bonding or closed networks towards the end.
In order to further our analysis of these fluctuating networks, we need first to understand exactly how networks are measured.A network is an interconnected group or system and the relations, both logical and physical, between the actors. There is atendency to assume that just because actors are linked they must form a cohesive social network. However, this is not necessarilythe case and the relationships between network members must be explored to fully understand how these networks functioned.In order to analyse complex changes in relationships and behaviour, we analyse an actor's and group's positionwithin the network(or networks) in order to understand and quantify their role, behaviour or potential power through relational information withinthe wider network(s). We achieve this by using mathematical modelling through graph theory.
It is worthwhile providing a brief overview of graph theory terminology relevant to the analysis. It is not the intention of thispaper to present a detailed overview of the field of graph theory. However, it is necessary to explain the methodology used in thisstudy (for detailed explanations see (Wasserman and Faust, 1994; Haggerty and Haggerty, 2010; Freeman, 1978/79)). A graphcomprises a set of points (or vertices) which are connected to other points through edges (or arcs). Two points that are directlyconnected by an edge are said to be adjacent. The number of other points to which any given point is adjacent is called the degree ofthat point. The distance between points is calculated by the number of edges in a path. The shortest paths linking pairs of points arecalled geodesics. Points falling on the geodesics between a given pair of points stand between these points. Fig. 3 provides anexample of a small graph.
In Fig. 3, points in the graph are numbered P1 to P4. P1 is adjacent to P2 and P3, but is not adjacent to P4. Points P1and P2 havedegrees of two and P3 has a degree of three. However, due to P4's position on the periphery of the graph, it has a degree of onlyone. There are two paths from P1 to P4; the first through two other points, P2 and P3, the second directly via P3. The distance isequal to the number of edges in a path. Thus, using the first path P1 has a distance of three to P4 and via the second path, a distanceof two. As the second path is shorter than the first, this is the geodesic. As Fig. 3 illustrates, not all actors are equal. P3 has access to
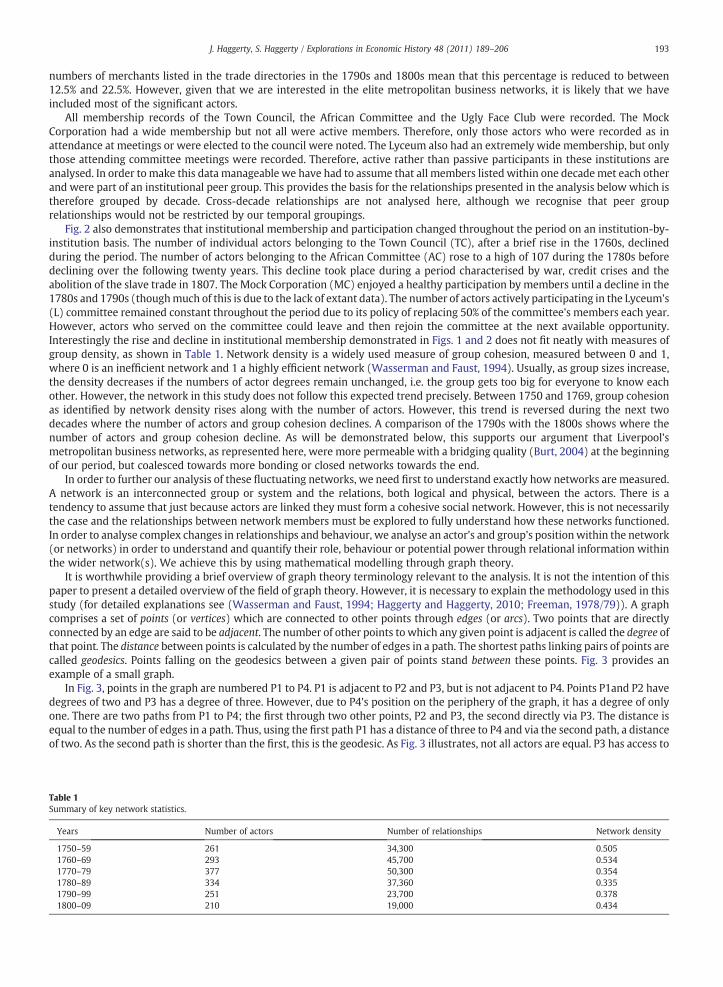
Table 1Summary of key network statistics.
Years Number of actors Number of relationships Network density
1750–59 261 34,300 0.5051760–69 293 45,700 0.5341770–79 377 50,300 0.3541780–89 334 37,360 0.3351790–99 251 23,700 0.3781800–09 210 19,000 0.434

Fig. 3. A graph with four points and four edges.
194 J. Haggerty, S. Haggerty / Explorations in Economic History 48 (2011) 189–206
P1, P2 and P4. In contrast both P2 and P1 have access to two other actors (each other and P3), whilst P4 has access to only one otheractor, P3. P3 therefore has the best access or ‘centrality’ having access to all three of the other actors.
Within this paper, we use the following terminology.Network refers to all institutions and actors within the study as well as therelationships therein. An institution (and therefore institutional membership) refers to each of the four associations or clubs. Asubnet is a cluster of actors that belonged to two or more institutions and therefore formed their own small groupings throughtheir cross-institutional membership. An actor is an individual member.
We use threemeasures of centrality to provide an analysis of the network dynamicswithin our case study. It is not the focus of thisanalysis to suggestwhich is themost “correct”measure of a graph.However, a combination of variousmeasures provides anoverviewof the dynamics of the network fromdifferent viewpoints and an appreciation of the actors’ or groups’ roles therein. Allmeasures usedin this paper are those detailed in Wasserman and Faust (1994). These measures are built into the application, SocNetV (Kalamaras,2009), which has been used to provide the results and visualisations in this paper. The measures of the network are:
Out-degree centrality
This measure analyses the expansiveness, or number of actors that a particular actor possesses or accesses. It thereforemeasures which institutions or subnets provided the most potential connections within the network. In Fig. 3, this would be P3.Out-degree centrality in this study uses the Actor Out-Degree Centralization (AODC) measure. An AODC value of zero indicatesthat all actors within the group are equal, as would occur in a regular lattice network. An AODC value of one indicates that a singleactor dominates all other actors within the network, as in a star network.
Betweeness centrality
This network measure identifies potential points of control within the network. Those that act as chokepoints (are the mostbetween others) may be centres of power, control and influence because they can choose to retain or share that information.Again, this would be P3 in Fig. 3. Betweeness recognises that communication flow within a given network often does not rely onadjacent actors but moves along geodesics. Because they are focal points of communications within the group and subgroups,certain actors facilitate contact and communications within the network and can therefore be seen as major channels of influence.An Actor Betweeness Centrality (ABC) value falls between zero, indicating that all actors have exactly the same betweeness withinthe network, and one, when a single actor falls on all geodesics between all the other actors (indicative of a star network).
Closeness centrality
This measure analyses how close an actor is to other actors within the network. Closeness centrality identifies the relativeaccess to information that each actor possessed. Those closer to other actors in the networkmay be less reliant on a chain of othersfor their decision-making process and may be more independent. In Fig. 3, P4 is the most dependent. Actors that belong togroupings with a high closeness centrality are likely to have access to the latest information and to be able to make well-judged,timely decisions. The Actor Closeness Centrality (ACC) is measured between zero, as would be indicated by a circular networkvisualisation, and one, which would be indicated by a star network.
Once the networks are measured, the results are represented using visual analytic tools and techniques. Visual analytics hasbecome important as a field in applied computing and is defined as the science of analytical reasoning facilitated by interactivevisual interfaces (Chabot, 2009). Visual analytics facilitates the representation and understanding of large and complex data sets.Visual analytic applications incorporate both visualisation and statistical elements that, combined, provide the researcher with amore nuanced and sophisticated view of their data. Moreover, this area of human–computer interaction is designed to beexploratory (Perer and Schneiderman, 2009). This is particularly important in the study of the networks identified within thisstudy which analyses and measures approximately 210,000 relationships involving 1700 actors. This large and complexinformation cannot be represented meaningfully in more traditional ways, such as tables. Indeed, specific computer programshave been developed by the authors to analyse and prepare the relationship data used in this study for input into SocNetV as thiscould not be achieved manually. Thus, visual analytics is ideally suited to this study as it not only enables the representation of anetwork (and its subnets), but also measures their complicated and interrelated nature over time.
195J. Haggerty, S. Haggerty / Explorations in Economic History 48 (2011) 189–206
In order to demonstrate, measure and quantify relational changes in the networks over the period under study, the networkanalysis of institutional membership is broken down into three groups of two decades: 1750–1769, 1770–1789 and 1790–1809.We then use four methods to visualise andmeasure the relationships between these actors within these two-decade periods usingthe SocNetV social network application. First, a cluster analysis provides a high-level view of membership by and acrossinstitutions and visualises the potential communications flow available to members through relational connections (representedby lines) between actors. In addition, it highlights key bridges between the institutions through identification of subnets, i.e. thoseactors that belong to more than one institution. Second, this paper uses the three centrality measurements outlined above toassess relationships afforded by institutional membership. In the resulting visualisations of the networks, the closer an actor is tothe centre of the diagram, the more central they are in the network by that measure, i.e. the nearer they are to a measure of 1.
To further demonstrate how the networks facilitated business during this period, we have used the Trans-Atlantic Slave TradeDatabase (Eltis et al., 2010) to follow investment trends in this trade by actors in our networks. Whilst we recognise that this tradewas only one of many interests that these actors will have had during this period, this source provides evidence as to howLiverpool's merchants used their institutional membership networks to engage in economic activity. In addition, it supports ourargument that, far from being static, networks and the way that actors used them was dynamic.
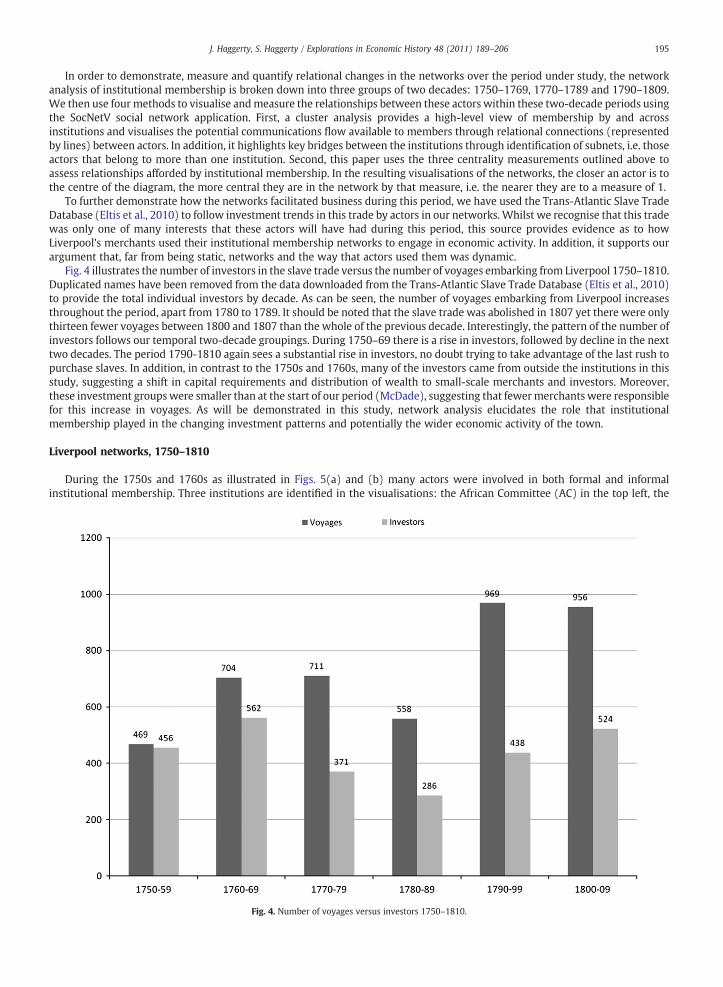
Fig. 4 illustrates the number of investors in the slave trade versus the number of voyages embarking from Liverpool 1750–1810.Duplicated names have been removed from the data downloaded from the Trans-Atlantic Slave Trade Database (Eltis et al., 2010)to provide the total individual investors by decade. As can be seen, the number of voyages embarking from Liverpool increasesthroughout the period, apart from 1780 to 1789. It should be noted that the slave trade was abolished in 1807 yet there were onlythirteen fewer voyages between 1800 and 1807 than the whole of the previous decade. Interestingly, the pattern of the number ofinvestors follows our temporal two-decade groupings. During 1750–69 there is a rise in investors, followed by decline in the nexttwo decades. The period 1790-1810 again sees a substantial rise in investors, no doubt trying to take advantage of the last rush topurchase slaves. In addition, in contrast to the 1750s and 1760s, many of the investors came from outside the institutions in thisstudy, suggesting a shift in capital requirements and distribution of wealth to small-scale merchants and investors. Moreover,these investment groupswere smaller than at the start of our period (McDade), suggesting that fewermerchants were responsiblefor this increase in voyages. As will be demonstrated in this study, network analysis elucidates the role that institutionalmembership played in the changing investment patterns and potentially the wider economic activity of the town.
Liverpool networks, 1750–1810
During the 1750s and 1760s as illustrated in Figs. 5(a) and (b) many actors were involved in both formal and informalinstitutional membership. Three institutions are identified in the visualisations: the African Committee (AC) in the top left, the
Fig. 4. Number of voyages versus investors 1750–1810.
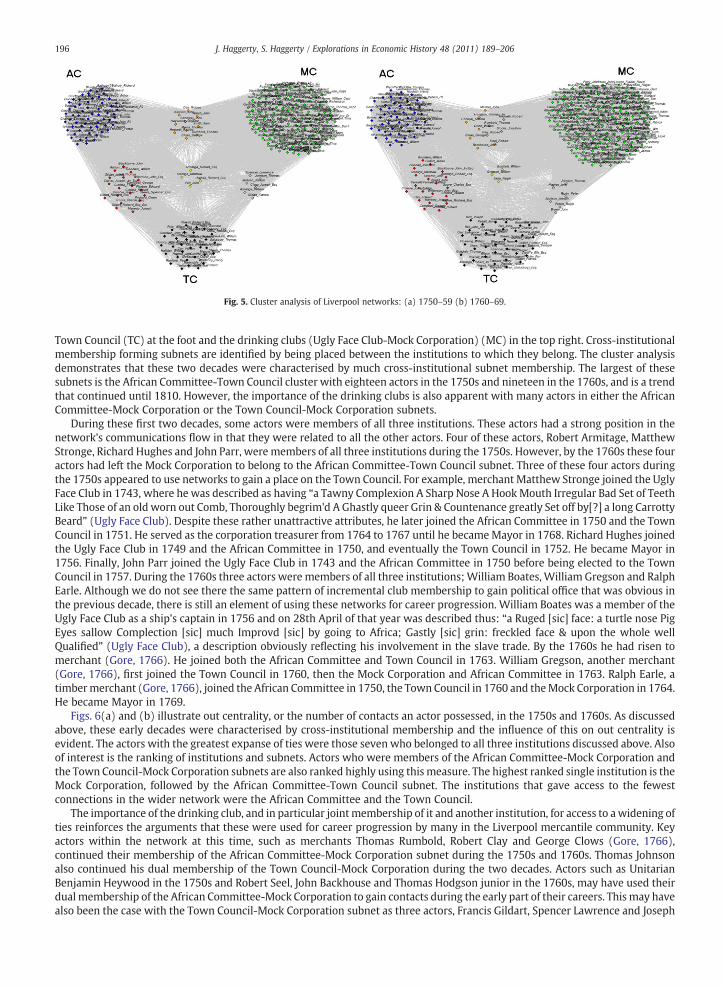
Fig. 5. Cluster analysis of Liverpool networks: (a) 1750–59 (b) 1760–69.
196 J. Haggerty, S. Haggerty / Explorations in Economic History 48 (2011) 189–206
Town Council (TC) at the foot and the drinking clubs (Ugly Face Club-Mock Corporation) (MC) in the top right. Cross-institutionalmembership forming subnets are identified by being placed between the institutions to which they belong. The cluster analysisdemonstrates that these two decades were characterised by much cross-institutional subnet membership. The largest of thesesubnets is the African Committee-Town Council cluster with eighteen actors in the 1750s and nineteen in the 1760s, and is a trendthat continued until 1810. However, the importance of the drinking clubs is also apparent with many actors in either the AfricanCommittee-Mock Corporation or the Town Council-Mock Corporation subnets.
During these first two decades, some actors were members of all three institutions. These actors had a strong position in thenetwork's communications flow in that they were related to all the other actors. Four of these actors, Robert Armitage, MatthewStronge, Richard Hughes and John Parr, were members of all three institutions during the 1750s. However, by the 1760s these fouractors had left the Mock Corporation to belong to the African Committee-Town Council subnet. Three of these four actors duringthe 1750s appeared to use networks to gain a place on the Town Council. For example, merchant Matthew Stronge joined the UglyFace Club in 1743, where he was described as having “a Tawny Complexion A Sharp Nose A HookMouth Irregular Bad Set of TeethLike Those of an old worn out Comb, Thoroughly begrim'd A Ghastly queer Grin & Countenance greatly Set off by[?] a long CarrottyBeard” (Ugly Face Club). Despite these rather unattractive attributes, he later joined the African Committee in 1750 and the TownCouncil in 1751. He served as the corporation treasurer from 1764 to 1767 until he becameMayor in 1768. Richard Hughes joinedthe Ugly Face Club in 1749 and the African Committee in 1750, and eventually the Town Council in 1752. He became Mayor in1756. Finally, John Parr joined the Ugly Face Club in 1743 and the African Committee in 1750 before being elected to the TownCouncil in 1757. During the 1760s three actors were members of all three institutions;William Boates, William Gregson and RalphEarle. Although we do not see there the same pattern of incremental club membership to gain political office that was obvious inthe previous decade, there is still an element of using these networks for career progression. William Boates was a member of theUgly Face Club as a ship's captain in 1756 and on 28th April of that year was described thus: “a Ruged [sic] face: a turtle nose PigEyes sallow Complection [sic] much Improvd [sic] by going to Africa; Gastly [sic] grin: freckled face & upon the whole wellQualified” (Ugly Face Club), a description obviously reflecting his involvement in the slave trade. By the 1760s he had risen tomerchant (Gore, 1766). He joined both the African Committee and Town Council in 1763. William Gregson, another merchant(Gore, 1766), first joined the Town Council in 1760, then the Mock Corporation and African Committee in 1763. Ralph Earle, atimbermerchant (Gore, 1766), joined the African Committee in 1750, the Town Council in 1760 and theMock Corporation in 1764.He became Mayor in 1769.
Figs. 6(a) and (b) illustrate out centrality, or the number of contacts an actor possessed, in the 1750s and 1760s. As discussedabove, these early decades were characterised by cross-institutional membership and the influence of this on out centrality isevident. The actors with the greatest expanse of ties were those seven who belonged to all three institutions discussed above. Alsoof interest is the ranking of institutions and subnets. Actors who were members of the African Committee-Mock Corporation andthe Town Council-Mock Corporation subnets are also ranked highly using this measure. The highest ranked single institution is theMock Corporation, followed by the African Committee-Town Council subnet. The institutions that gave access to the fewestconnections in the wider network were the African Committee and the Town Council.
The importance of the drinking club, and in particular jointmembership of it and another institution, for access to awidening ofties reinforces the arguments that these were used for career progression by many in the Liverpool mercantile community. Keyactors within the network at this time, such as merchants Thomas Rumbold, Robert Clay and George Clows (Gore, 1766),continued their membership of the African Committee-Mock Corporation subnet during the 1750s and 1760s. Thomas Johnsonalso continued his dual membership of the Town Council-Mock Corporation during the two decades. Actors such as UnitarianBenjamin Heywood in the 1750s and Robert Seel, John Backhouse and Thomas Hodgson junior in the 1760s, may have used theirdual membership of the African Committee-Mock Corporation to gain contacts during the early part of their careers. Thismay havealso been the case with the Town Council-Mock Corporation subnet as three actors, Francis Gildart, Spencer Lawrence and Joseph
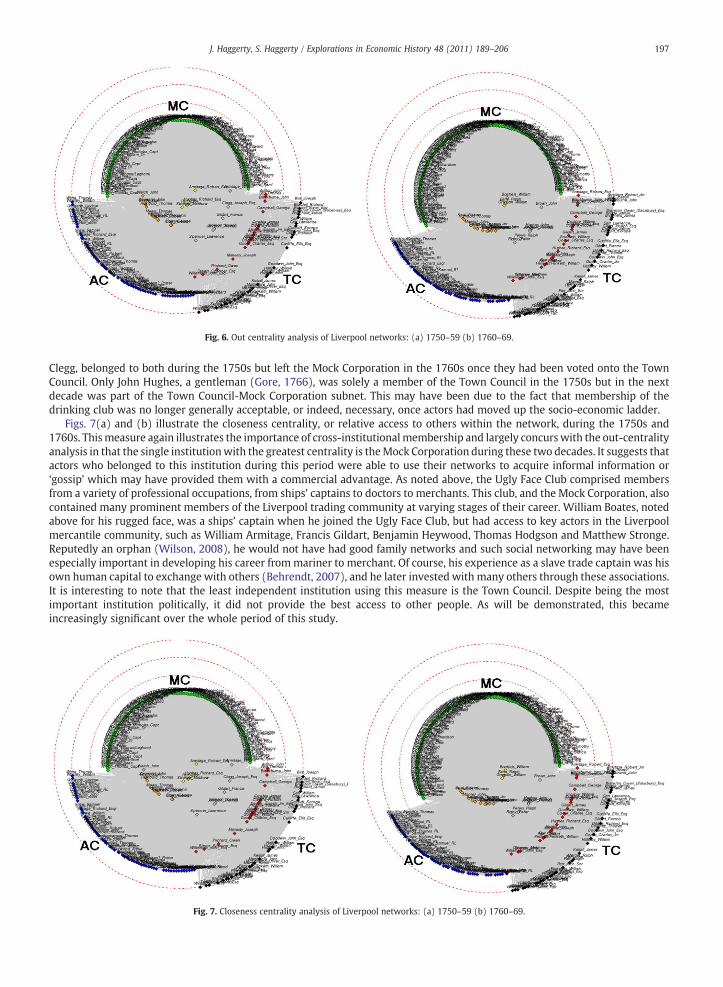
Fig. 7. Closeness centrality analysis of Liverpool networks: (a) 1750–59 (b) 1760–69.
Fig. 6. Out centrality analysis of Liverpool networks: (a) 1750–59 (b) 1760–69.
197J. Haggerty, S. Haggerty / Explorations in Economic History 48 (2011) 189–206
Clegg, belonged to both during the 1750s but left the Mock Corporation in the 1760s once they had been voted onto the TownCouncil. Only John Hughes, a gentleman (Gore, 1766), was solely a member of the Town Council in the 1750s but in the nextdecade was part of the Town Council-Mock Corporation subnet. This may have been due to the fact that membership of thedrinking club was no longer generally acceptable, or indeed, necessary, once actors had moved up the socio-economic ladder.
Figs. 7(a) and (b) illustrate the closeness centrality, or relative access to others within the network, during the 1750s and1760s. Thismeasure again illustrates the importance of cross-institutional membership and largely concurswith the out-centralityanalysis in that the single institutionwith the greatest centrality is theMock Corporation during these two decades. It suggests thatactors who belonged to this institution during this period were able to use their networks to acquire informal information or‘gossip’ which may have provided them with a commercial advantage. As noted above, the Ugly Face Club comprised membersfrom a variety of professional occupations, from ships’ captains to doctors to merchants. This club, and the Mock Corporation, alsocontained many prominent members of the Liverpool trading community at varying stages of their career. William Boates, notedabove for his rugged face, was a ships’ captain when he joined the Ugly Face Club, but had access to key actors in the Liverpoolmercantile community, such as William Armitage, Francis Gildart, Benjamin Heywood, Thomas Hodgson and Matthew Stronge.Reputedly an orphan (Wilson, 2008), he would not have had good family networks and such social networking may have beenespecially important in developing his career frommariner to merchant. Of course, his experience as a slave trade captain was hisown human capital to exchange with others (Behrendt, 2007), and he later invested with many others through these associations.It is interesting to note that the least independent institution using this measure is the Town Council. Despite being the mostimportant institution politically, it did not provide the best access to other people. As will be demonstrated, this becameincreasingly significant over the whole period of this study.
198 J. Haggerty, S. Haggerty / Explorations in Economic History 48 (2011) 189–206
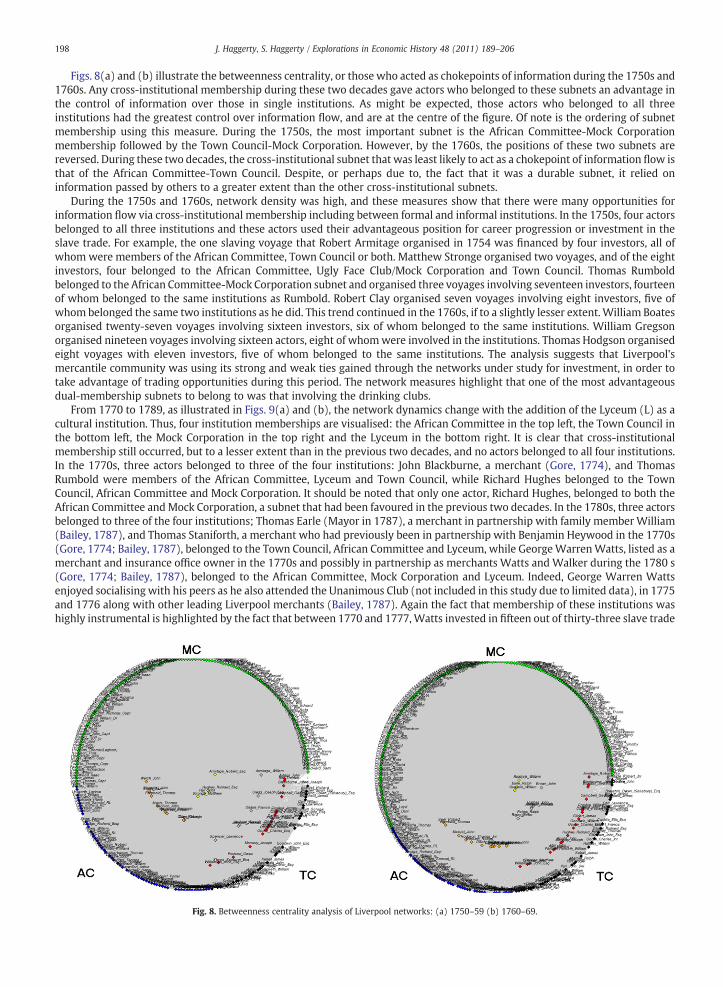
Figs. 8(a) and (b) illustrate the betweenness centrality, or those who acted as chokepoints of information during the 1750s and1760s. Any cross-institutional membership during these two decades gave actors who belonged to these subnets an advantage inthe control of information over those in single institutions. As might be expected, those actors who belonged to all threeinstitutions had the greatest control over information flow, and are at the centre of the figure. Of note is the ordering of subnetmembership using this measure. During the 1750s, the most important subnet is the African Committee-Mock Corporationmembership followed by the Town Council-Mock Corporation. However, by the 1760s, the positions of these two subnets arereversed. During these two decades, the cross-institutional subnet that was least likely to act as a chokepoint of information flow isthat of the African Committee-Town Council. Despite, or perhaps due to, the fact that it was a durable subnet, it relied oninformation passed by others to a greater extent than the other cross-institutional subnets.
During the 1750s and 1760s, network density was high, and these measures show that there were many opportunities forinformation flow via cross-institutional membership including between formal and informal institutions. In the 1750s, four actorsbelonged to all three institutions and these actors used their advantageous position for career progression or investment in theslave trade. For example, the one slaving voyage that Robert Armitage organised in 1754 was financed by four investors, all ofwhom were members of the African Committee, Town Council or both. Matthew Stronge organised two voyages, and of the eightinvestors, four belonged to the African Committee, Ugly Face Club/Mock Corporation and Town Council. Thomas Rumboldbelonged to the African Committee-Mock Corporation subnet and organised three voyages involving seventeen investors, fourteenof whom belonged to the same institutions as Rumbold. Robert Clay organised seven voyages involving eight investors, five ofwhom belonged the same two institutions as he did. This trend continued in the 1760s, if to a slightly lesser extent.William Boatesorganised twenty-seven voyages involving sixteen investors, six of whom belonged to the same institutions. William Gregsonorganised nineteen voyages involving sixteen actors, eight of whomwere involved in the institutions. Thomas Hodgson organisedeight voyages with eleven investors, five of whom belonged to the same institutions. The analysis suggests that Liverpool'smercantile community was using its strong and weak ties gained through the networks under study for investment, in order totake advantage of trading opportunities during this period. The network measures highlight that one of the most advantageousdual-membership subnets to belong to was that involving the drinking clubs.
From 1770 to 1789, as illustrated in Figs. 9(a) and (b), the network dynamics change with the addition of the Lyceum (L) as acultural institution. Thus, four institution memberships are visualised: the African Committee in the top left, the Town Council inthe bottom left, the Mock Corporation in the top right and the Lyceum in the bottom right. It is clear that cross-institutionalmembership still occurred, but to a lesser extent than in the previous two decades, and no actors belonged to all four institutions.In the 1770s, three actors belonged to three of the four institutions: John Blackburne, a merchant (Gore, 1774), and ThomasRumbold were members of the African Committee, Lyceum and Town Council, while Richard Hughes belonged to the TownCouncil, African Committee and Mock Corporation. It should be noted that only one actor, Richard Hughes, belonged to both theAfrican Committee andMock Corporation, a subnet that had been favoured in the previous two decades. In the 1780s, three actorsbelonged to three of the four institutions; Thomas Earle (Mayor in 1787), a merchant in partnership with family member William(Bailey, 1787), and Thomas Staniforth, a merchant who had previously been in partnership with Benjamin Heywood in the 1770s(Gore, 1774; Bailey, 1787), belonged to the Town Council, African Committee and Lyceum, while GeorgeWarrenWatts, listed as amerchant and insurance office owner in the 1770s and possibly in partnership as merchants Watts and Walker during the 1780 s(Gore, 1774; Bailey, 1787), belonged to the African Committee, Mock Corporation and Lyceum. Indeed, George Warren Wattsenjoyed socialising with his peers as he also attended the Unanimous Club (not included in this study due to limited data), in 1775and 1776 along with other leading Liverpool merchants (Bailey, 1787). Again the fact that membership of these institutions washighly instrumental is highlighted by the fact that between 1770 and 1777,Watts invested in fifteen out of thirty-three slave trade
Fig. 8. Betweenness centrality analysis of Liverpool networks: (a) 1750–59 (b) 1760–69.

Fig. 9. Cluster analysis of Liverpool networks: (a) 1770–79 (b) 1780–89.
199J. Haggerty, S. Haggerty / Explorations in Economic History 48 (2011) 189–206
voyages with the following members of the Unanimous Club: Joseph Brooks junior, William Crosbie, Alexander Nottingham,William Pole, Charles Pole and Clayton Case (Eltis et al., 2010). Excluding the Poles, all of these were members of the AfricanCommittee during this decade alongside Watts.
The 1770s marked a period of decline in use of the Mock Corporation by members of the African Committee. This suggests thatmerchantswere no longer using drinking clubs for access to other actors, and this trendmay have been encouraged by the fact thatthe conversation at the Mock Corporation tended to be social rather than commercial, as well as by a declining need for expandingnetworks amongst the more established merchants (Wilson, 2008). However, six actors joined the African Committee-Lyceumsubnet, including Benjamin Heywood who had previously used the informal drinking club and was a member of the Lyceumduring both decades. This may have as much to say about cultural aspirations as about mercantile ambitions. During 1780–89,newer members of the African Committee again straddle these two institutions. Of these five actors who described themselves asmerchants, three, Andrew Black, Cobham Richardson andWilliamWilson, were first active in the African Committee and then theMock Corporation. John Hodgson, a merchant in partnership with his brother Thomas (Bailey, 1787), and Ralph Fisher first becameactive in the Mock Corporation and then in the African Committee. In the previous decade, John Hodgson had belonged to theLyceum-Mock Corporation subnet. In the 1770s, eight actors were in the Mock Corporation-Lyceum subnet, suggesting that thissubnet still provided networking opportunities, but perhaps not trade-related ones. Indeed, membership of these institutions mayhave been associated with reputation and civic status rather than commerce. Once these actors are economically establishedwithin the wider community, they may have used their financial status for cultural purposes. This is particularly noted in theAfrican Committee-Lyceum subnet which included leading Liverpool merchants, such as Benjamin Heywood, Thomas Staniforth,John Stronge and Edgar Corrie (Gore, 1774; Bailey, 1787), which illustrates that slave traders and non-conformists were stillsocialising together. However, these subnets decline slightly in the 1780s despite still including leading merchants such asBenjamin Arthur Heywood and Thomas Hodgson. The strong relationship between the African Committee and Town Councilcontinued with a large number of actors in this subnet.
These second two decades were therefore characterised by a complexity of networks in flux during a transitional period. Cross-institutional membership continued to provide some opportunities for potential contacts within the network during the 1770sand 1780s as further illustrated in Figs. 10(a) and (b). During the 1770s, cross-institutional membership provided greateropportunities for contacts than belonging to a single institution. The exception was the Mock Corporation which was moreadvantageous for contacts than belonging to the African Committee-Town Council subnet. This position was reversed in the 1780swith actors in the African Committee again using the drinking club so that the African Committee-Mock Corporation subnet rankssecond in the network analysis. This may be due to a new generation of merchants entering the community. During both decades,one of the weaker-ranked subnets is that of the Lyceum-African Committee, although it still provided more opportunities forcontacts than the African Committee-Town Council subnet.
There is also a shift in single institution ranking whereby the African Committee fell below the Lyceum in the 1770s, but theposition was reversed in the 1780s. This is significant due to the rise of the abolitionist movement at this time. For example, somemembers of the Lyceum, including William Rathbone, William Roscoe, Daniel Daulby and James Currie, were members of theLondon based Society for the Abolition of the African Slave Trade in 1788 (Trepp, 1928). These actors may have had influencewithin the Lyceum itself, but the African Committee had greater potential influence in the wider network and therefore in theLiverpool mercantile community.
Closeness centrality (independence and access to timely information) as illustrated in Figs. 11(a) and (b) follows a similarpattern to out centrality in the 1770s. During this decade, the Mock Corporation provided the fastest opportunity for informationflow as a single institution, and in comparison to some cross-institutional groupings. This position changed during the 1780s whenit was more advantageous to belong to any cross-institutional subnet rather than to a single institution. It was also when, as notedabove, the African Committee provided the best access to information as a single institution. This may mean that it was becoming
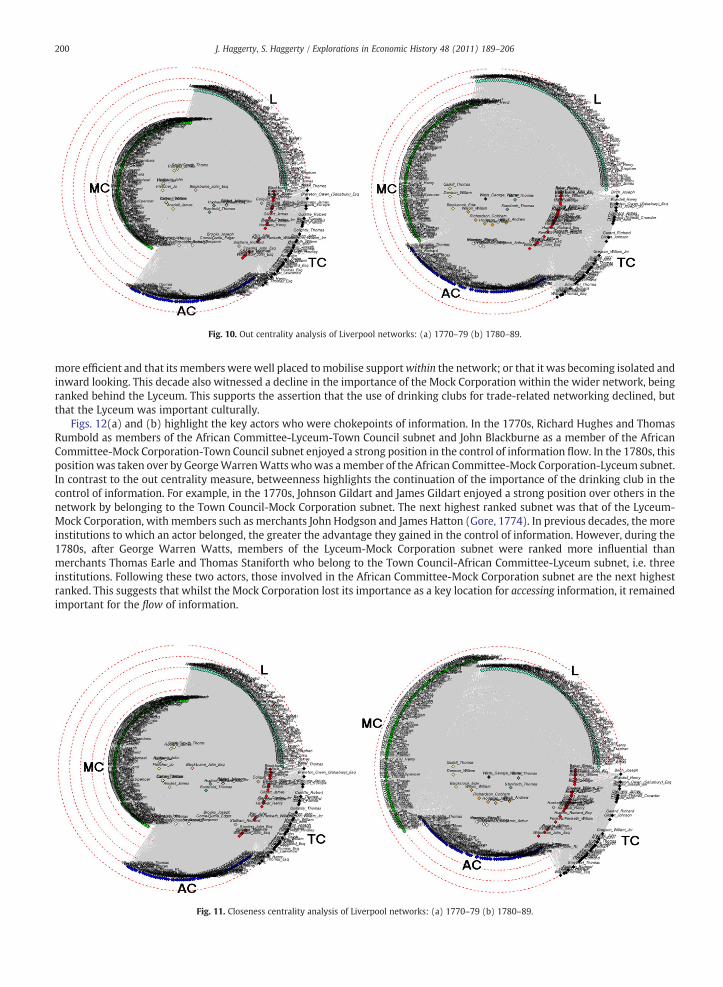
Fig. 11. Closeness centrality analysis of Liverpool networks: (a) 1770–79 (b) 1780–89.
Fig. 10. Out centrality analysis of Liverpool networks: (a) 1770–79 (b) 1780–89.
200 J. Haggerty, S. Haggerty / Explorations in Economic History 48 (2011) 189–206
more efficient and that its members werewell placed tomobilise supportwithin the network; or that it was becoming isolated andinward looking. This decade also witnessed a decline in the importance of the Mock Corporation within the wider network, beingranked behind the Lyceum. This supports the assertion that the use of drinking clubs for trade-related networking declined, butthat the Lyceum was important culturally.
Figs. 12(a) and (b) highlight the key actors who were chokepoints of information. In the 1770s, Richard Hughes and ThomasRumbold as members of the African Committee-Lyceum-Town Council subnet and John Blackburne as a member of the AfricanCommittee-Mock Corporation-Town Council subnet enjoyed a strong position in the control of information flow. In the 1780s, thispositionwas taken over by GeorgeWarrenWattswhowas amember of the African Committee-Mock Corporation-Lyceum subnet.In contrast to the out centrality measure, betweenness highlights the continuation of the importance of the drinking club in thecontrol of information. For example, in the 1770s, Johnson Gildart and James Gildart enjoyed a strong position over others in thenetwork by belonging to the Town Council-Mock Corporation subnet. The next highest ranked subnet was that of the Lyceum-Mock Corporation, with members such as merchants John Hodgson and James Hatton (Gore, 1774). In previous decades, the moreinstitutions to which an actor belonged, the greater the advantage they gained in the control of information. However, during the1780s, after George Warren Watts, members of the Lyceum-Mock Corporation subnet were ranked more influential thanmerchants Thomas Earle and Thomas Staniforth who belong to the Town Council-African Committee-Lyceum subnet, i.e. threeinstitutions. Following these two actors, those involved in the African Committee-Mock Corporation subnet are the next highestranked. This suggests that whilst the Mock Corporation lost its importance as a key location for accessing information, it remainedimportant for the flow of information.
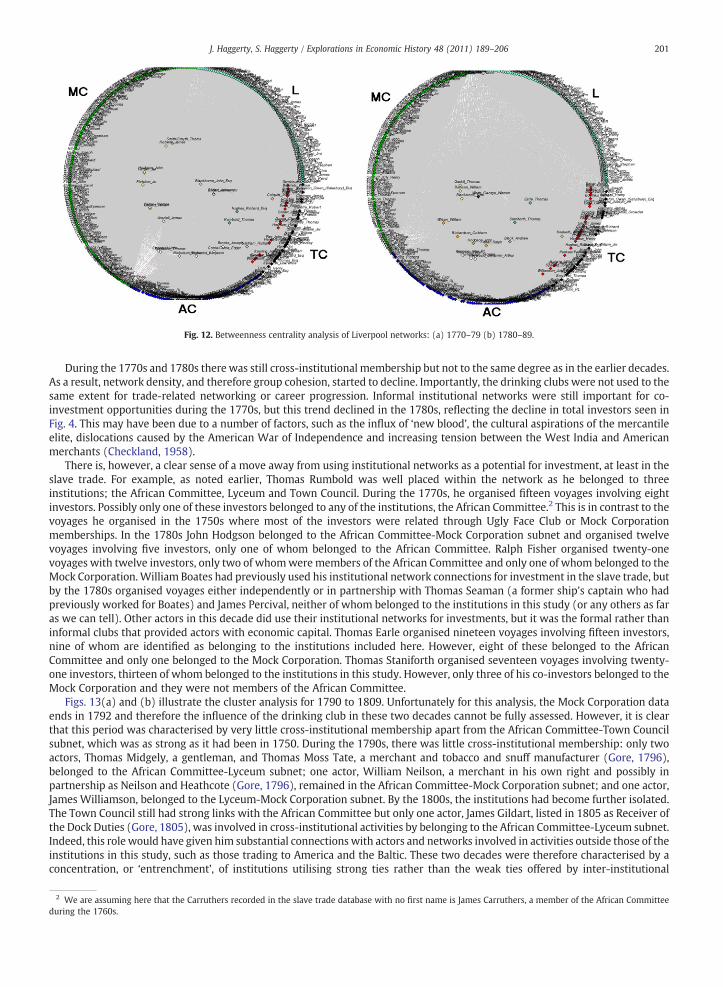
Fig. 12. Betweenness centrality analysis of Liverpool networks: (a) 1770–79 (b) 1780–89.
201J. Haggerty, S. Haggerty / Explorations in Economic History 48 (2011) 189–206
During the 1770s and 1780s there was still cross-institutional membership but not to the same degree as in the earlier decades.As a result, network density, and therefore group cohesion, started to decline. Importantly, the drinking clubs were not used to thesame extent for trade-related networking or career progression. Informal institutional networks were still important for co-investment opportunities during the 1770s, but this trend declined in the 1780s, reflecting the decline in total investors seen inFig. 4. This may have been due to a number of factors, such as the influx of ‘new blood’, the cultural aspirations of the mercantileelite, dislocations caused by the American War of Independence and increasing tension between the West India and Americanmerchants (Checkland, 1958).
There is, however, a clear sense of a move away from using institutional networks as a potential for investment, at least in theslave trade. For example, as noted earlier, Thomas Rumbold was well placed within the network as he belonged to threeinstitutions; the African Committee, Lyceum and Town Council. During the 1770s, he organised fifteen voyages involving eightinvestors. Possibly only one of these investors belonged to any of the institutions, the African Committee.2 This is in contrast to thevoyages he organised in the 1750s where most of the investors were related through Ugly Face Club or Mock Corporationmemberships. In the 1780s John Hodgson belonged to the African Committee-Mock Corporation subnet and organised twelvevoyages involving five investors, only one of whom belonged to the African Committee. Ralph Fisher organised twenty-onevoyages with twelve investors, only two of whomwere members of the African Committee and only one of whom belonged to theMock Corporation.William Boates had previously used his institutional network connections for investment in the slave trade, butby the 1780s organised voyages either independently or in partnership with Thomas Seaman (a former ship's captain who hadpreviously worked for Boates) and James Percival, neither of whom belonged to the institutions in this study (or any others as faras we can tell). Other actors in this decade did use their institutional networks for investments, but it was the formal rather thaninformal clubs that provided actors with economic capital. Thomas Earle organised nineteen voyages involving fifteen investors,nine of whom are identified as belonging to the institutions included here. However, eight of these belonged to the AfricanCommittee and only one belonged to the Mock Corporation. Thomas Staniforth organised seventeen voyages involving twenty-one investors, thirteen of whom belonged to the institutions in this study. However, only three of his co-investors belonged to theMock Corporation and they were not members of the African Committee.
Figs. 13(a) and (b) illustrate the cluster analysis for 1790 to 1809. Unfortunately for this analysis, the Mock Corporation dataends in 1792 and therefore the influence of the drinking club in these two decades cannot be fully assessed. However, it is clearthat this period was characterised by very little cross-institutional membership apart from the African Committee-Town Councilsubnet, which was as strong as it had been in 1750. During the 1790s, there was little cross-institutional membership: only twoactors, Thomas Midgely, a gentleman, and Thomas Moss Tate, a merchant and tobacco and snuff manufacturer (Gore, 1796),belonged to the African Committee-Lyceum subnet; one actor, William Neilson, a merchant in his own right and possibly inpartnership as Neilson and Heathcote (Gore, 1796), remained in the African Committee-Mock Corporation subnet; and one actor,James Williamson, belonged to the Lyceum-Mock Corporation subnet. By the 1800s, the institutions had become further isolated.The Town Council still had strong links with the African Committee but only one actor, James Gildart, listed in 1805 as Receiver ofthe Dock Duties (Gore, 1805), was involved in cross-institutional activities by belonging to the African Committee-Lyceum subnet.Indeed, this role would have given him substantial connections with actors and networks involved in activities outside those of theinstitutions in this study, such as those trading to America and the Baltic. These two decades were therefore characterised by aconcentration, or ‘entrenchment’, of institutions utilising strong ties rather than the weak ties offered by inter-institutional
2 We are assuming here that the Carruthers recorded in the slave trade database with no first name is James Carruthers, a member of the African Committeeduring the 1760s.
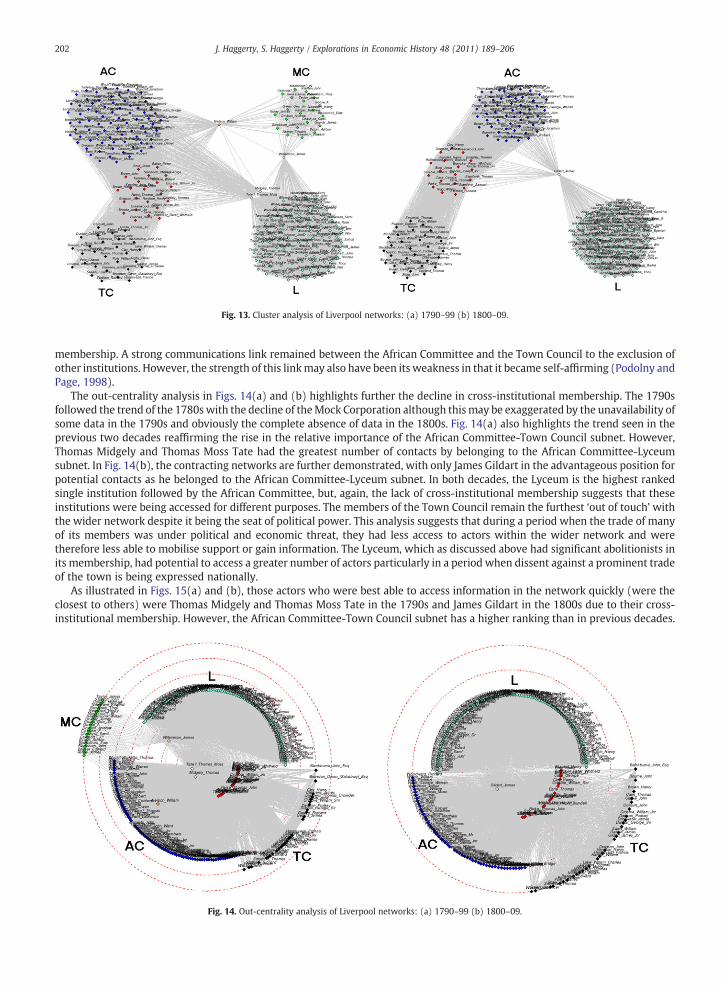
Fig. 14. Out-centrality analysis of Liverpool networks: (a) 1790–99 (b) 1800–09.
Fig. 13. Cluster analysis of Liverpool networks: (a) 1790–99 (b) 1800–09.
202 J. Haggerty, S. Haggerty / Explorations in Economic History 48 (2011) 189–206
membership. A strong communications link remained between the African Committee and the Town Council to the exclusion ofother institutions. However, the strength of this linkmay also have been its weakness in that it became self-affirming (Podolny andPage, 1998).
The out-centrality analysis in Figs. 14(a) and (b) highlights further the decline in cross-institutional membership. The 1790sfollowed the trend of the 1780swith the decline of theMock Corporation although thismay be exaggerated by the unavailability ofsome data in the 1790s and obviously the complete absence of data in the 1800s. Fig. 14(a) also highlights the trend seen in theprevious two decades reaffirming the rise in the relative importance of the African Committee-Town Council subnet. However,Thomas Midgely and Thomas Moss Tate had the greatest number of contacts by belonging to the African Committee-Lyceumsubnet. In Fig. 14(b), the contracting networks are further demonstrated, with only James Gildart in the advantageous position forpotential contacts as he belonged to the African Committee-Lyceum subnet. In both decades, the Lyceum is the highest rankedsingle institution followed by the African Committee, but, again, the lack of cross-institutional membership suggests that theseinstitutions were being accessed for different purposes. The members of the Town Council remain the furthest ‘out of touch’ withthe wider network despite it being the seat of political power. This analysis suggests that during a period when the trade of manyof its members was under political and economic threat, they had less access to actors within the wider network and weretherefore less able to mobilise support or gain information. The Lyceum, which as discussed above had significant abolitionists inits membership, had potential to access a greater number of actors particularly in a period when dissent against a prominent tradeof the town is being expressed nationally.
As illustrated in Figs. 15(a) and (b), those actors who were best able to access information in the network quickly (were theclosest to others) were Thomas Midgely and Thomas Moss Tate in the 1790s and James Gildart in the 1800s due to their cross-institutional membership. However, the African Committee-Town Council subnet has a higher ranking than in previous decades.

Fig. 15. Closeness centrality analysis of Liverpool networks: (a) 1790–99 (b) 1800–09.
Fig. 16. Betweenness centrality analysis of Liverpool networks: (a) 1790–99 (b) 1800–09.
203J. Haggerty, S. Haggerty / Explorations in Economic History 48 (2011) 189–206
In the 1790s, it took up an advantageous position above the two actors (James Williamson and William Neilson) belonging to theother two cross-institutional subnets. This subnet was able to pass information around faster than the two other subnets or soleinstitutions. However, whilst this subnet had closer ties within the wider network, a comparisonwith the cluster analysis suggeststhat although it was able to pass information around faster than other subnets, it was unable to access new information throughcross-institutional membership. The African Committee also had an advantageous position in the 1790s in that it had close ties.However, this position is lost to the Lyceum during the 1800s. It should also be noted that the poorest institution for closeness wasthe Town Council. Even in the 1790s, it was ranked lower than the Mock Corporation despite the fact that the drinking club hadfewer actors. The Town Council therefore was the least independent institution in terms of information and had less timely accessto that information compared to those actors involved in other institutions.
As seen in previous decades, cross-institutional membership provided actors with the opportunities to act as chokepoints ofinformation flow. However, as illustrated in Figs. 16(a) and (b), with little cross-institutional membership very few actors had anadvantageous betweenness position in the network. In the 1790s, the most influential chokepoints were those actors whobelonged to the African Committee-Lyceum subnet, the African Committee-Mock Corporation subnet and the Lyceum-MockCorporation subnet. During the 1790s and 1800s, the importance of the African Committee-Town Council subnet as a chokepointof information flow is evident. However, this was not because the subnet increased in importance as a chokepoint of informationcompared to other decades, but due to fewer actors engaging in cross-institutional activities as a whole in this period. Thisprovides more evidence that the African Committee-Town Council subnet failed to use its potentially advantageous networkposition.
204 J. Haggerty, S. Haggerty / Explorations in Economic History 48 (2011) 189–206
The networks between 1790 and 1810 were therefore characterised by very little cross-institutional membership with actorsfurther coalescing into interest groups. This could be due to actors leaving the networks in this study to join others that reflectednew economic trends within Liverpool. Despite the rise in investors in the slave trade during these two decades, seen in Fig. 4,there was a decline in the use of other members of the institutional networks for potential investment. For example, WilliamNielson, the only actor belonging to the African Committee-Mock Corporation subnet in the 1790s organised twenty-eight voyageswith only four investors, only one of whom was also in the African Committee. Thomas Staniforth, who belonged to the AfricanCommittee-Town Council subnet, organised seven voyages but used his relationships in the African Committee more. This may bedue to his employing business practices that he had used successfully since the 1770s. Of his thirteen investors, six also belonged tothe African Committee. Thomas Earle used his relationships within the institutions far less. He organised twenty-four voyagesinvolving seventeen investors. Yet only two also belonged to the African Committee with the others belonging to none of theinstitutions in this study. This reliance on investors outside the institutional networks continued into the 1800s. Thomas Earle wasin the African Committee-Town Council subnet in this next decade and organised five voyages with four investors, but none ofthem belonged to any of the institutions. George Case, also in the African Committee-Town Council subnet, organised thirty-fivevoyages with only seven investors, only two of whom also belonged to the African Committee.
Conclusion
Using visual analytics has facilitated the analysis of a large data set with over 210,000 relationships involving 1700 actors.Moreover, it has provided a nuanced and sophisticated view of theway in which institutional membership networks changed overtime, not only in the long term, but dynamically within the short term as well. This study confirms that using tools such as visualanalytics can be useful in raising both specific andwider issues from the quantitative data, especially where there is a lack of extantqualitative data. In addition, visual analytics is exploratory in nature, and therefore may raise questions, rather than answer themper se. The results of this research suggest some conclusions about Liverpool's metropolitan business networks, and also aboutnetworks more generally.
Despite being the leading British out port during the period 1750–1810, Liverpool's business networks, as represented by thedata here, coalesced towards bonding rather than bridging networks. This occurred as Liverpool's economy matured, especiallywith regard to the Atlantic trade, and the slave trade in particular. The fact that there was a decline in cross-institutionalmembership may also be a reflection of the increasing tension between the many non-conformists who traded with the thirteencontinental colonies and the Anglicans involved in the West India and slave trade. Even banking was split along these lines withthe West India men banking with Gregsons & Co. and then later Leyland & Bullins, and the American merchants with Clarke &Roscoe (Checkland, 1958). Indeed, it has been suggested that there were two identities in Liverpool by the late eighteenth century(Stobart, 2000). This tension is reflected in our network analysis.
Furthermore, as these institutional networks coalesced, so did investment groups – at least in the slave trade. Over timeinvestment groups in the slave trade got smaller and smaller (McDade) and relied less and less on institutional networks.However, the number of individuals investing in the slave trade during the 1790s and 1800s grew dramatically following a decline.Moreover, by the end of the period, a fewmen such as Thomas Case dominated the Council (Ascott et al., 2006). They had politicalpower and were rich men from well connected families. For example, Thomas Leyland may have been exceptional, having diedwith an estate worth somewhere under £600,000, but William Pole, mayor in 1778, died leaving around £80,000 and ThomasMolyneux, mayor in 1806, left just under £35,000 (Pope, 2007). Therefore, not only did these men not need the drinking clubs forcareer progression, but they no longer required the more formal institutions for co-investment either. However, their institutionalmemberships, and the networks and social capital the memberships afforded, meant that they were well placed to provideinvestment opportunities to the wider Liverpool business community. Indeed, the rise in investors and voyages during the 1790sand 1800s following the decline in the previous two decades suggests a change in capital requirements and distribution of wealthin Liverpool reflected in our network analysis with small-scale merchants and investors moving into this trade.
The increasing coalescence and dysfunctionality of these metropolitan networks may help to explain why Liverpool merchantswere not better able to defend against the movement to abolish the slave trade. They were slow to react to Dolben's Act in 1788(Sanderson, 1972) and did not fully participate in the London Society for Abolition (Ryden, 2009). It is certainly difficult to explainWilliam Roscoe's election as MP in 1806. True, Roscoe campaigned on an anti-East India Company ticket (Wilson, 2008), but itmust have been well known that he supported abolition. He was also nominated by his business partner in his bank, ThomasLeyland, and seconded by Thomas Earle, both prominent slave traders. This seemingly strange occurrence is, however, a reflectionof the fact that most Liverpool slave traders engaged in the slave trade as only part of a wider business portfolio (Haggerty, 2008),William Davenport being a lonely exception (Richardson, 1976). Furthermore, most merchants were involved in a variety ofpartnerships in order to bring together skills, capital and contacts. For example, Thomas Case was in partnership with NicholasSouthworth in the slave trade and in importing sugar and rum from Jamaica, ran a Manchester warehouse, exported dry goods toPhiladelphia, acted as an insurance broker in partnership with William Gregson, ran a colliery, and was a proprietor of a fire office(Haggerty, 2008). Therefore, whilst the Town Council was dominated by slave traders who did not engage in cross-institutionalmembership, its members were able to assess and cater for their needs through their wider trading interests. This is demonstratedby the impressive dock programme in the port throughout the eighteenth century, planned and supported by the town council(Power, 1997), which catered well for all the trades its wider community was engaged in.
Despite abolition of the slave trade, Liverpool's success continued into the nineteenth century. This is no doubt a reflection ofthe increasing importance of other sectors of the trading community, not included in the institutional membership analysed here.
205J. Haggerty, S. Haggerty / Explorations in Economic History 48 (2011) 189–206
Networking was clearly occurring in other spaces amongst the other groups. For example, there was a Chamber of Commerceestablished in 1774 and an American Chamber of Commerce in 1801. The members of the American Chamber of Commerce,despite including a few slave traders such as Thomas andWilliam Earle, were clearly another group from those on the Council andAfrican Committee, including the Quaker Rathbones. Indeed, as this group gained in importance, they gained in influence too. Forexample, American merchants such as William Rathbone, Thomas Martin, and James Cropper were called to give evidence to theHouse of Commons in 1808 regarding the increasing tensions with the United States (House of Commons Parliamentary, 1808).The first president of the Shipowners’ Association set up in 1810 was also a leading American trader, Samuel Holland (Tolley,1812). It is clear therefore that whilst the networks of the slave trade-dominated Council and African Committee were coalescing,other groups of merchants were on the rise.
Liverpool's experience in 1750–1810 has much to say about networks more generally. Increasingly bonding networks meanthat some metropolitan business networks are less able to respond to wider changes in national and international trade. AsGranovetter notes, the shape of the network environment determines a group's ability to mobilise in the face of external pressure(Granovetter, 1973). Moreover, it is clear that as a network matures, its members need institutions less and less for access toinformation and credit as well. Lastly, this case study of Liverpool suggests that, as is the case with clusters (Swann, 1998), there isa life cycle of networks. This means that some will eventually wither, but that this facilitates the emergence of new and moredynamic networks which eventually take over. Importantly, by looking at networks within institutions we can see that ‘far frombeing divorced from the study of political institutions and culture, networks are the constitutive elements that sustain, rupture,and transform social and economic institutions’ in turn (Smith-Doerr and Powell, 2005).
Acknowledgements
The authors would like to thank Bryce Campbell, James Walters, Paul Fergus, Andrew Popp and the two anonymous reviewersfor their comments on drafts of this paper. All errors are, of course, ours alone.
References
Ascott, D.E., Lewis, F., Power, M., 2006. Liverpool 1660–1750: People, Prosperity and Power. Liverpool University Press, Liverpool.Bailey, W. (Ed.), 1787. Liverpool Trade Directory for 1787, Printed for W. Bailey, Liverpool.Baldassarri, D., Diani, M., 2007. The integrative power of civic networks. The American Journal of Sociology 113 (3), 735–780.Behrendt, S.D., 2007. Human capital in the British slave trade. In: Richardson, D., Schwarz, S., Tibbles, A. (Eds.), Liverpool and Transatlantic Slavery. Liverpool
University Press, Liverpool, pp. 66–97.Ben-Porath, Y., Mar 1980. The F-connection: families, friends, and firms, and the organization of exchange. Population and Development Review 6 (1), 1–30.British Parliamentary Papers, 1968. Census Reports: Abstracts of the Answers and Returns, Enumeration (1801). Cass, London.Burt, R.D., 2004. Structural holes and good ideas. The American Journal of Sociology 10 (2), 349–399.Carlos, A.M., Maguire, K., Neal, L., 2008. ‘A Knavish People...’: London Jewry and the stock market during the South Sea bubble. Business History 50 (6), 728–748.Casson, M.C., 2003. An economic approach to regional business networks. In: Wilson, J.F., Popp, A. (Eds.), Industrial Clusters and Regional Business Networks in
England 1750–1970. Ashgate, Aldershot, pp. 19–43.Chabot, C., 2009. Demystifying visual analytics. IEEE Computer Graphics and Applications 84–87 March/April.Checkland, S.G., 1958. American versus West Indian Traders in Liverpool, 1793–1815. Journal of Economic History 18 (2), 141–160.Committee Book of the African Company of Merchants trading from Liverpool, Liverpool Record Office 352/MD1.Crumplin, T.E., 2007. Opaque networks: business and community in the Isle of Man, 1840–1900. Business History 49 (6), 780–801.Kalamaras, D.B., 2009. SocNetV, http://socnetv.sourceforge.net, accessed December 2009.Davidoff, L., Hall, C., 1987. Family Fortunes: Men and Women of the English Middle Class 1780–1850. Hutchinson Education, London.Doerflinger, T.M., 1987. A Vigorous Spirit of Enterprise: Merchants and Economic Development in Revolutionary Philadelphia. W. W. Norton & Co, New York and
London, pp. 218–223.Eltis, D., et al., 2010. Trans-Atlantic Slave Trade Database, available at http://www.slavevoyages.org, accessed August 2010.Freeman, L.C., 1978/79. Centrality in social networks conceptual clarification. Social Networks 1, 215–239.Gore, J. (Ed.), 1766. Liverpool Trade Directory for 1766, Liverpool: Printed by W. Nevett & Co. for J. Gore.Gore, J. (Ed.), 1774. Liverpool Trade Directory for 1774, Printed by J. Gore, Liverpool.Gore, J. (Ed.), 1796. Liverpool Trade Directory for 1796, Liverpool.Gore, J. (Ed.), 1805. Liverpool Trade Directory for 1805, Printed by J. Gore, Liverpool.Granovetter, M.S., 1973. The strength of weak ties. The American Journal of Sociology 78 (6), 1360–1380.Greefs, H., 2008. Exploiting international webs of relations: immigrants and the reopening of the harbour of Antwerp on the eve of the nineteenth century. In:
Jarvis, A., Lee, R. (Eds.), Trade, Migration and Urban Networks in Port Cities, c. 1640-1940, Research in Maritime History, No. 38. International MaritimeEconomic History Association, St John's, Newfoundland, pp. 81–108.
Greif, A., 1989. Reputation and coalitions in medieval trade: evidence on the Maghrabi traders. Journal of Economic History 49 (4), 857–882.Haggerty, S., 2006. The British-Atlantic Trading Community, 1760–1810: Men Women and the Distribution of Goods. Brill, Leiden.Haggerty, S., 2008. Liverpool, the slave trade and the British-Atlantic Empire, c. 1750–1775. In: Haggerty, S., Webster, A., White, N.J. (Eds.), The Empire in One City?
Liverpool's Inconvenient Imperial Past. Manchester University Press, Manchester, pp. 17–34.Haggerty, J., Haggerty, S., 2010. Visual analytics of an eighteenth-century business network. Enterprise and Society 11 (1), 1–25.Hamilton, D.J., 2005. Scotland, the Caribbean and the Atlantic World, 1750–1820. Manchester University Press, Manchester.Hancock, D., 1996. Citizens of the World: London Merchants and the Integration of the British Atlantic Community, 1735–1785. Cambridge University Press,
Cambridge. pp. 104–114.Hancock, D., 2005. The trouble with networks: managing the Scots’ Madeira Trade. Business History Review 79, 467–491.House of Commons Parliamentary Papers, Minutes of Evidence, p. 119.Hyde, F.E., 1971. Liverpool and the Mersey: an economic history of a port 1700–1970. David and Charles, Newton Abbott.Hyde, F.E., Parkinson, B.B., Marriner, S., 1951. The port of Liverpool and the crisis of 1793. Economica New Series 18 (72), 363–377.Lawler, E.J., Yoon, J., Thye, S.R., 2008. Social exchange and micro social order. American Sociological Review 73, 519–542.Lawton, R., 1953. Genesis of population. In: Smith,W. (Ed.), A Scientific Survey of Merseyside. For the British Association by University of Liverpool Press, Liverpool,
pp. 120–131.Liverpool Lyceum, Liverpool Record Office 027 OCM.

206 J. Haggerty, S. Haggerty / Explorations in Economic History 48 (2011) 189–206
Liverpool Town Books, Liverpool Record Office, 352 MIN COU IMarriner, S., 1982. The Economic and Social Development of Merseyside, 1750–1960. Croom Helm, London.Mathias, P., 2000. Risk, credit and kinship in early modern enterprise. In: McCusker, J.J., Morgan, K. (Eds.), The Early Modern Atlantic Economy. Cambridge
University Press, Cambridge, pp. 15–35.McDade, K. Bristol and Liverpool Merchants’ Slave Trade Networks (PhD in progress, University of Nottingham).Mentz, S., 2004. The commercial culture of the Armenian merchant: Diaspora and social behaviour. Itinerario 28 (1), 16–28.Montefiore, J., 1804. The trader's and manufacturer's compendium; containing the laws, customs and regulations, relative to trade, intended for the use of
wholesale and retail dealers, vol 2. printed for the Author, London.Ogilvie, S., 2004. Guilds, efficiency, and social capital: evidence from German proto-industry. Economic History Review 57 (2), 286–333.Pearson, R., Richardson, D., 2001. Networking in the industrial revolution. Economic History Review 54 (4), 657–679.Perer, A., Schneiderman, B., 2009. Integrating statistics and visualisation for exploratory power: from long-term case studies to design guidelines. IEEE Computer
Graphics and Applications 39–51 May/June.Podolny, J.M., Page, K.L., 1998. Network forms of organization. Annual Review of Sociology 24, 57–76.Pope, D., 2007. The wealth and social aspirations of Liverpool's slave merchant of the second half of the eighteenth century. In: Richardson, D., Schwarz, S., Tibbles,
A. (Eds.), Liverpool and Transatlantic Slavery. Liverpool University Press, Liverpool.Power, M.J., 1997. Councillors and commerce in Liverpool, 1650–1750. Urban History 24 (3), 301–323.Prior, A., Kirby, M., 1993. The Society of Friends and the family firm. Business History 35 (4), 66–85.Rauch, J.E., 2001. Business and social networks in international trade. Journal of Economic Literature 39, 1177–1203.Richardson, D., 1976. Profits in the Liverpool Slave Trade: the Accounts of William Davenport, 1757–1784. In: Anstey, R., Hair, P.E. (Eds.), Liverpool, the African
Slave Trade, and Abolition, Historic Society of Lancashire and Cheshire Occasional Series Vol. 2, Liverpool, pp. 60–90.Rosenband, L.N., 1999. Social capital in the early Industrial Revolution. Journal of Interdisciplinary History 29 (3), 435–457.Ryden, D.B., 2009. West Indian Slavery and British Abolition 1783–1807. Cambridge University Press, Cambridge.Sanderson, F.E., 1972. The Liverpool delegates and Sir William Dolben's bill. Transactions of the Historic Society of Lancashire and Cheshire 124, 57–84.Sephton Mock Corporation, Liverpool Record Office 367 SEF.Smith-Doerr, L., Powell, W.W., 2005. Networks and Economic Life, In: Smelser, N.J., Swedberg, R. (Eds.), The Handbook of Economic Sociology, 2nd ed. Princeton
University Press, Princeton and Oxford, pp. 379–402.Stobart, J., 2000. Culture versus commerce: societies and spaces for elites in eighteenth-century Liverpool. Journal of Historical Geography 28 (4), 471–485.Swann, G.M.P., 1998. Introduction. In: Swann, G.M.P., Prevezer, M., Stout, D. (Eds.), The Dynamics of Industrial Clustering: International Comparisons in Computing
and Biotechnology. Oxford University Press, Oxford.Tolles, F.N., 1963. Meeting house and counting house: the quaker merchants of colonial Philadelphia, 1682–1783, W.W. Norton & Co. New York, pp. 17–19, 24–27.Tolley, B.H., 1967. The American Trade of Liverpool in the Early Nineteenth century and the War of 1812, Unpublished PhD Thesis, University of Liverpool.Trepp, J., 1928. The Liverpool movement for the abolition of the English slave trade. Journal of Negro History 13 (3), 265–285.Trivellato, F., 2009. The Familiarity of Strangers: The Sephardic Diaspora, Livorno, and Cross-Cultural Trade in the Early Modern Period. Yale University Press, New
Haven and London.Ugly Face Club, Liverpool Record Office 367 UGL.Wallace, J., 1795. A General and Descriptive History of the Ancient and Present State of the Town of Liverpool, Printed for and Sold by R. Phillips, Castle Street,
Liverpool.Walvin, J., 1997. The Quakers. Money and Morals, John Murray, London.Wasserman, S., Faust, K., 1994. Social Network Analysis: Methods and Applications. Cambridge University Press, Cambridge.Wilson, A., 2008. William Roscoe: Commerce and Culture. Liverpool University Press, Liverpool.
Copyright © 2022 FDOKUMEN


![33rd year - Deeper Life Bible Church [Liverpool]](https://static.fdokumen.com/doc/165x107/6336f6eed63e7c790105970d/33rd-year-deeper-life-bible-church-liverpool.jpg)