The Latest Miocene–Early Pliocene biogenic bloom: a revised Indian Ocean perspective
17
Ž . Marine Geology 161 1999 75–91 www.elsevier.nlrlocatermargeo The Latest Miocene–Early Pliocene biogenic bloom: a revised Indian Ocean perspective Gerald R. Dickens a, ) , Robert M. Owen b a School of Earth Sciences, James Cook UniÕersity, TownsÕille, QLD 4811, Australia b Department of Geological Sciences, UniÕersity of Michigan, 2435 C.C. Little Bldg., Ann Arbor, MI 48109-1063, USA Received 7 May 1996; accepted 18 September 1998 Abstract Numerous investigations of Neogene sediment sequences from the Indian and Pacific Oceans have led to a paleoceano- graphic hypothesis that recently has been coined the ‘‘biogenic bloom’’. This hypothesis suggests that primary productivity increased substantially at Indo-Pacific upwelling zones during the Latest Miocene–Early Pliocene. Although it is clear that recognition of a widespread biogenic bloom provides a fundamental framework for understanding Late Neogene global change, it also is apparent that investigations of this phenomena require syntheses of a variety of information from time-correlated sediment sequences that span large oceanic regions. Late Neogene polarity chron boundaries and nannofossil Ž . events are placed on a common and current time scale for 12 Ocean Drilling Program ODP sediment sequences in order to Ž . construct a coherent description of the biogenic bloom in the Indian Ocean. Carbonate mass accumulation rates MARs were significantly higher than present-day in the north and west Indian Ocean between 9.0 and 3.5 Ma. Sediment deposited during this time interval also is dominated by planktic faunal assemblages that are indicative of high-productivity, and redox conditions that are explained by an increase in the supply of organic carbon. Further, sediment of this age contains benthic faunal assemblages and chemical characteristics that are consistent with low dissolved O in intermediate waters. These 2 observations collectively suggest that, between 9.0 and 3.5 Ma, productivity in the north and west Indian Ocean was Ž . significantly higher than present-day, and the intermediate water oxygen minimum zone OMZ was more extensive than present-day. This paleoceanographic condition was most intense between 6.0 and 5.0 Ma in the Indian Ocean. Comparison of the Indian Ocean sites with two locations in the Pacific Ocean suggests that the biogenic bloom was time-coincident in the Indian and Pacific Oceans. The biogenic bloom, therefore, implies an important change in global nutrient cycling occurred during the Latest Miocene–Early Pliocene, although a satisfactory explanation for the change remains elusive. q 1999 Elsevier Science B.V. All rights reserved. Keywords: Neogene; paleoceanography; geochemical cycles; nutrients; silica; phosphorous 1. Introduction A series of investigations over the past 2 decades has documented that sediment deposited during the ) Corresponding author. Tel.: q61-77-81-5008; fax: q61-7- 47251501; E-mail: [email protected] Latest Miocene–Early Pliocene and beneath up- welling zones of the Pacific Ocean exhibits pro- nounced anomalies relative to older and younger sediment. In particular, there are significant increases Ž . in the mass accumulation rate MAR of biogenic components, major changes in planktic and benthic fauna assemblages, and marked decreases in sedi- 0025-3227r99r$ - see front matter q 1999 Elsevier Science B.V. All rights reserved. Ž . PII: S0025-3227 99 00057-2
Transcript of The Latest Miocene–Early Pliocene biogenic bloom: a revised Indian Ocean perspective

Ž .Marine Geology 161 1999 75–91www.elsevier.nlrlocatermargeo
The Latest Miocene–Early Pliocene biogenic bloom: a revisedIndian Ocean perspective
Gerald R. Dickens a,), Robert M. Owen b
a School of Earth Sciences, James Cook UniÕersity, TownsÕille, QLD 4811, Australiab Department of Geological Sciences, UniÕersity of Michigan, 2435 C.C. Little Bldg., Ann Arbor, MI 48109-1063, USA
Received 7 May 1996; accepted 18 September 1998
Abstract
Numerous investigations of Neogene sediment sequences from the Indian and Pacific Oceans have led to a paleoceano-graphic hypothesis that recently has been coined the ‘‘biogenic bloom’’. This hypothesis suggests that primary productivityincreased substantially at Indo-Pacific upwelling zones during the Latest Miocene–Early Pliocene. Although it is clear thatrecognition of a widespread biogenic bloom provides a fundamental framework for understanding Late Neogene globalchange, it also is apparent that investigations of this phenomena require syntheses of a variety of information fromtime-correlated sediment sequences that span large oceanic regions. Late Neogene polarity chron boundaries and nannofossil
Ž .events are placed on a common and current time scale for 12 Ocean Drilling Program ODP sediment sequences in order toŽ .construct a coherent description of the biogenic bloom in the Indian Ocean. Carbonate mass accumulation rates MARs
were significantly higher than present-day in the north and west Indian Ocean between 9.0 and 3.5 Ma. Sediment depositedduring this time interval also is dominated by planktic faunal assemblages that are indicative of high-productivity, and redoxconditions that are explained by an increase in the supply of organic carbon. Further, sediment of this age contains benthicfaunal assemblages and chemical characteristics that are consistent with low dissolved O in intermediate waters. These2
observations collectively suggest that, between 9.0 and 3.5 Ma, productivity in the north and west Indian Ocean wasŽ .significantly higher than present-day, and the intermediate water oxygen minimum zone OMZ was more extensive than
present-day. This paleoceanographic condition was most intense between 6.0 and 5.0 Ma in the Indian Ocean. Comparisonof the Indian Ocean sites with two locations in the Pacific Ocean suggests that the biogenic bloom was time-coincident inthe Indian and Pacific Oceans. The biogenic bloom, therefore, implies an important change in global nutrient cyclingoccurred during the Latest Miocene–Early Pliocene, although a satisfactory explanation for the change remains elusive.q 1999 Elsevier Science B.V. All rights reserved.
Keywords: Neogene; paleoceanography; geochemical cycles; nutrients; silica; phosphorous
1. Introduction
A series of investigations over the past 2 decadeshas documented that sediment deposited during the
) Corresponding author. Tel.: q61-77-81-5008; fax: q61-7-47251501; E-mail: [email protected]
Latest Miocene–Early Pliocene and beneath up-welling zones of the Pacific Ocean exhibits pro-nounced anomalies relative to older and youngersediment. In particular, there are significant increases
Ž .in the mass accumulation rate MAR of biogeniccomponents, major changes in planktic and benthicfauna assemblages, and marked decreases in sedi-
0025-3227r99r$ - see front matter q 1999 Elsevier Science B.V. All rights reserved.Ž .PII: S0025-3227 99 00057-2
( )G.R. Dickens, R.M. OwenrMarine Geology 161 1999 75–9176

( )G.R. Dickens, R.M. OwenrMarine Geology 161 1999 75–91 77
Ž . X Ž .Fig. 2. a Bathymetric profile along transect A–A from Fig. 1 . The present locations of ODP sites 721, 722, 728, 731, 752, 754, and 757are shown on this profile as well as the present dimensions of the Indian Ocean OMZ at contours of 1.0 mlrl O and 2.0 mlrl dissolved O2 2Ž .from Wyrtki, 1971 . Note that the lateral dimensions of the Indian Ocean OMZ are much greater than the zone of high primary productivity
Ž .in the northwest Indian Ocean. b The biogenic bloom hypothesis in the Indian Ocean. During the Latest Miocene–Early Pliocene,productivity in the north and west Indian Ocean was significantly elevated, and the underlying OMZ was greatly expanded. Note that theOMZ dimensions in the lower figure are highly schematic.
Žmentary redox conditions e.g., Van Andel et al.,1975; Leinen, 1979; Theyer et al., 1985; Woodruff,1985; Kennett and Von der Borch, 1986; Berger etal., 1993; Delaney and Filippelli, 1994; Farrell et al.,
.1995a; Rea et al., 1995; Dickens and Owen, 1996 .Similar lithological, biological, and chemical vari-
ations have been identified in Latest Miocene–EarlyPliocene sediment deposited in the north and central
ŽIndian Ocean e.g., Peterson and Backman, 1990;
Peterson et al., 1992; Brummer and Van Eijden,1992; Hermelin, 1992; Dickens and Owen, 1994;
. ŽSeisser, 1995 . Thus, various authors Peterson et al.,1992; Berger et al., 1993; Delaney and Filippelli,1994; Dickens and Owen, 1994, 1996; Farrell et al.,
.1995a,b; Rea et al., 1995 have alluded to a paleo-ceanographic scenario that explains the collectiveobservations: productivity increased significantlywithin cores of Indo-Pacific divergence zones. The
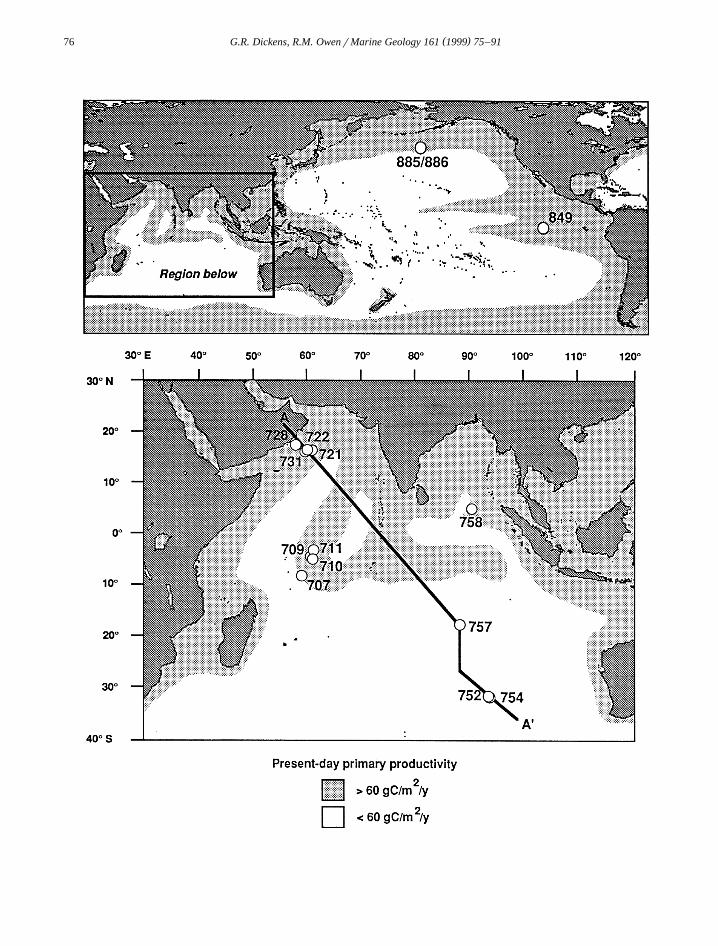
Ž .Fig. 1. Location map showing Ocean Drilling Program ODP sites discussed in this study as well as present-day primary productivityy2 y1 Ž .delineated by a contour of 60 g cm a from Berger, 1991 . Note that areas of high productivity in the present-day Indo-Pacific region
are predominantly zones of surface water divergence.

( )G.R. Dickens, R.M. OwenrMarine Geology 161 1999 75–9178
hypothesis has been called the ‘biogenic bloom’Ž .Farrell et al., 1995a .
Development of a better knowledge of the causesand consequences of this large-scale productivitychange is obviously important to global change in-vestigations of the Late Neogene. However, furtherwork aimed at examining the biogenic bloom hy-pothesis is inhibited by three key limitations: nostudy has described the hypothesis itself, differentstudies have used different time scales, and moststudies have been focused at a local to regional scale.
Ž .The purpose of this paper is fivefold: 1 to present aŽ .description of the Late Neogene biogenic bloom, 2
to synthesize supporting evidence for the hypothesisfrom multiple sediment sequences of the Indian
Ž .Ocean, 3 to provide a revised age and descriptionŽ .of the biogenic bloom in the Indian Ocean, 4 to
show that the biogenic bloom is broadly time-coinci-Ž .dent in the Indian and Pacific Oceans, and 5 to
discuss the significance of the hypothesis in terms ofglobal biogeochemical cycling.
2. The biogenic bloom hypothesis
Primary production in the present-day surface wa-ters of the Indian and Pacific Oceans is highly
Žheterogeneous ranging from relatively low 25–60 gy2 y1.cm a values in the large central areas of these
Ž y2 y1.oceans to relatively high 60–500 g cm aŽ .values Berger, 1991; Fig. 1 . Most of the latter
regions are characterized by surface water diver-gence, which leads to upward transport of nutrient-rich deep waters into the nutrient-poor euphotic zone.These Indo-Pacific ‘‘divergence zones’’ include the
Ž .northern and western Indian Ocean Fig. 1 .High rates of surface productivity at Indo-Pacific
divergence zones induce a significant downward fluxof organic carbon. Decomposition of this sinkingorganic matter within the water column causes pro-
Ž .nounced oxygen minimum zones OMZs that existat intermediate water depths beneath all present-day
ŽIndo-Pacific divergence zones Reid, 1965; Wyrtki,.1971 . The present-day intermediate-water OMZ of
Ž .the Indian Ocean O -2.0 mlrl exists as a2
wedge-shaped lens that extends approximately 5000Ž .km in a southeast direction Fig. 2a .
The biogenic bloom hypothesis suggests that pri-mary productivity within the cores of present-dayIndo-Pacific divergencerupwelling zones increasedsignificantly during the Latest Miocene–Early
ŽPliocene Van Andel et al., 1975; Peterson et al.,1992; Farrell et al., 1995a; Rea et al., 1995; Dickens
.and Owen, 1996 . Oceanographic models indicatethat increased surface productivity will intensify un-
Žderlying intermediate water OMZs Olson et al.,.1993 . Thus, a corollary to the hypothesis is that
intermediate water OMZs intensified and expandedŽduring the Latest Miocene–Early Pliocene Dickens
.and Owen, 1994 . The biogenic bloom hypothesisapplied to the Indian Ocean suggests that primaryproductivity in the north and west regions increasedduring the Latest Miocene–Early Pliocene, and theOMZ intensified and extended further than 5000 km
Ž .in a southeast direction Fig. 2b .
3. Time correlation and mass accumulation ratesin Late Neogene sediment
Time scales for the Neogene have been revised inŽrecent years Cande and Kent, 1992, 1995; Berggren
.et al., 1985; Shackleton et al., 1995 , and this seriesof revisions has significantly changed the age of timedatums in the Latest Miocene and Early Pliocene.For example, the age for top of the C3An.1n polarity
Ž .chron GilbertrChron 5 boundary was 5.35 MaŽ .according to the time scale of Berggren et al. 1985 ,
but is 5.89 Ma according to the latest time scale ofŽ . ŽCande and Kent 1995 and Shackleton et al. 1995,
.hereafter, referred to as the SHCK95 time scale .Previous literature concerning the biogenic bloom
Žin the Indian Ocean Peterson and Backman, 1990;Peterson et al., 1992; Brummer and Van Eijden,
.1992; Dickens and Owen, 1994 has applied the timeŽ .scale of Berggren et al. 1985 . The recent time scale
revision thus impacts the biogenic bloom scenario inthe Indian Ocean. First, the ages for various lines ofevidence to support the biogenic bloom need to bemodified. Second, MARs of sedimentary compo-nents that are used as evidence to support the bio-genic bloom need to be recalculated because the
Ž .linear sedimentation rates LSRs from which theyare derived depend on the age of selected time

( )G.R. Dickens, R.M. OwenrMarine Geology 161 1999 75–91 79
datums. A MAR for a given component, C, is calcu-Ž Ž ..lated as follows Eq. 1 :
MAR sW =LSR=DBD 1Ž .C C
where W is the weight percent of component C,C
LSR is the linear sedimentation rate, and DBD is thedry bulk density.
A revised description and timing of the biogenicbloom in the Indian Ocean requires placement ofmultiple Neogene sediment sequences on a commontime scale. Depths and revised ages for polaritychron boundaries and nannofossil events at 12 ODP
Ž .sites in the Indian Ocean Fig. 1; Table 1 are listedin Table 2. Depths of datums at these sites are those
Ž .reported in previous literature see Table 2 . Ages ofpolarity chron boundaries are from the SHCK95 timescale. Ages of nannofossil events are from the bios-
Ž .tratigraphic chart of Berggren et al. 1995a,b . How-Ž .ever, because Berggren et al. 1995a,b only have
revised ages of faunal events between 0 and 5.34Ma, older nannofossil datums need to be calibratedto the SHCK95 time scale. This has been doneŽ .Table 2 by determining the stratigraphic position ofthese events relative to polarity chron boundaries in
Žthe same core at ODP site 710 see Backman et al.,.1990 . It is assumed that these nannofossil events are
relatively isochronous across the Indian Ocean. The
Table 1ŽLocation and depth of ODP sites discussed in this study mbsls
.meters below sea level
Site Latitude Longitude Water depthŽ .mbsl
Indian OceanX X707 07833 S 59801 E 1552X X709 03855 S 60833 E 3041X X710 04819 S 60859 E 3824X X711 02845 S 61810 E 4430X X721 16841 N 59852 E 1955X X722 16837 N 59848 E 2028X X728 17841 N 57850 E 1428X X731 16828 N 59842 E 2366X X752 30853 S 93825 E 1086X X754 30856 S 93834 E 1075X X757 17801 S 88811 E 1661X X758 05823 N 90822 E 2924
Pacific OceanX X849 00811 N 110831 W 3839X X885r886 44841 N 168815 W 5709 to 5714
exceptions to this procedure are the first occurrenceof D. hamatus and the last occurrence of S. hetero-morphus which do not occur at site 710. The ages
Ž .for these events 10.39 and 13.57 Ma are fromrecent investigations of sediment in the eastern Equa-
Žtorial Pacific Raffi and Flores, 1995; Shackleton et.al., 1995 . It is assumed that these two nannofossil
events are relatively isochronous between the Indianand Pacific Oceans.
In addition to updating ages of sedimentary da-tums, a revised perspective of the biogenic bloom inthe Indian Ocean necessitates recalculation of MARs.For MARs discussed in Section 4, W and DBDC
Žmeasurements are from ODP site chapters Backman.et al., 1988; Pierce et al., 1989; Prell et al., 1989
Žand original sources Peterson and Backman, 1990;.Farrell and Janecek, 1991; Dickens and Owen, 1994 .
However, the age and mean depth of datums inTable 2 was used for determining the LSR.
4. Evidence of the biogenic bloom in the IndianOcean
Primary support for the biogenic bloom in theIndian Ocean is from MAR calculations of carbonatein Neogene sediment sequences that are shallowŽ .-3000 m and underlie regions of relatively high
Žpresent-day productivity Peterson and Backman,1990; Peterson et al., 1992; Farrell and Janecek,1991; Brummer and Van Eijden, 1992; Seisser,
.1995 . During the Latest Miocene–Early Pliocene,bulk carbonate MARs were 150 to 250% higher thanthose of present-day at ODP sites 707, 709, 710 on
Ž .the Mascarene Plateau Fig. 3 , at ODP sites 721,Ž .722 and 728 in the western Arabian Sea Fig. 4 , and
at site 758 on the northern end of Ninety-east RidgeŽ .Fig. 5 . Carbonate at these locations is composed
Ž . Žpredominantly )90% of planktic tests nannofos-.sils and foraminifera . Thus, the observed increase in
bulk carbonate MARs represents either greater sup-ply or, alternatively, less removal of biogenic car-bonate.
Two lines of evidence indicate that elevated car-bonate MARs in the Latest Miocene–Early Pliocenereflect enhanced supply via paleoproductivity rather
Žthan diminished dissolution Peterson and Backman,

( )G.R. Dickens, R.M. OwenrMarine Geology 161 1999 75–9180
Table 2Age and depth of Latest Miocene–Pleistocene datums for locations in this study
References 1 and 2 3 3 and 4 3 and 4 3 and 4 3 and 4 5 5
Datum Age 707A 709A 710A 710B 711A 721A 721BŽ . Ž . Ž . Ž . Ž . Ž . Ž . Ž .Ma mbsf mbsf mbsf mbsf mbsf mbsf mbsf
FO E. huxleyi 0.26 9.23"0.58LO P. lacunosa 0.46 16.20"0.75Base C1n 0.78 9.00 6.50 7.70r20.00† 6.00Top C1r.1n 0.99 7.70Base C1r.1n 1.07 39.30"0.75LO C. macintyrei 1.59 9.65"0.25 19.88"0.18 13.60"0.20Top C2n 1.77 15.40Base C2n 1.95 21.35LO D. brouweri 1.95 11.65"0.75 19.88"0.18 18.55"0.25 25.95"0.15 9.14"0.34 61.20"0.75LO D. triradiatus 2.18 11.65"0.75 19.88"0.18 18.55"0.25 25.95"0.15LO D. pentaradiatus 2.51 15.80"0.40 24.83"0.33 19.15"0.35 25.95"0.15 12.14"0.34 70.70"0.75LO D. surculus 2.57 17.10"0.45 19.80"0.30 25.95"0.15 76.95"2.50Top C2An.1n 2.58 26.05 20.10 79.76"0.20 85.70"0.65LO D. tamalis 2.78 17.85"0.75 22.19"0.32 25.95"0.15Base C2An.1n 3.04Top C2An.2n 3.11 26.00Base C2An.2n 3.22 30.55 26.20Top C2An.3n 3.33 31.65 26.70Base C2An.3n 3.58 33.25 28.30 117.05"0.40LO R. pseudoumbilica 3.75 26.85"0.75 34.90"0.40 26.30"2.80 29.90"0.20 115.38"0.58Top C3n.1n 4.18 32.00Base C3n.1n 4.29 29.90 33.10Top C3n.2n 4.48 33.30Base C3n.2n 4.62 34.20 18.40Top C3n.3n 4.80 35.90 36.20 18.70 151.31"0.36LO Amaurolithus 4.80primus
U ULO C. acutus 4.84 45.75"0.65 36.35"0.25 36.05"0.45Base C3n.3n 4.89 37.00 37.30 19.00Top C3n.4n 4.98 37.80 38.10 19.40FO C. rugosus 5.12 45.75"0.65 56.00"1.00 43.80"5.41 39.35"0.15Base C3n.4n 5.23 40.70 20.30 169.60"2.25FO C. acutus 5.34 59.18"0.43 43.80"5.41 41.75"0.45
U ULO D. quinqueramus 5.49 53.75"0.75 64.72"1.50 49.20 43.40"0.30 179.45"0.60Top C3An.1n 5.89 46.90 24.00 206.50"0.35Base C3An.1n 6.14 49.20 25.90Top C3An.2n 6.27 49.70 50.50 26.90Base C3An.2n 6.57 52.00 52.90 29.40Top C3Bn 6.94 57.10 31.60Base C3Bn 7.09 59.00 32.80
U U UFO Amaurolithus spp. 7.40 80.55"0.75 94.25"2.65 60.55"0.25 60.55"0.25 32.35"0.75Top C4n.1n 7.43 60.30 61.20 33.80Base C4n.1n 7.56 61.60 62.30Top C4n.2n 7.65 62.10 63.00Base C4r.1n 8.26 66.20
U UFO D. quinqueramus 8.32 66.6 261.41"0.76Top C4An 8.70 74.20Base C4An 9.03 76.80Top C4Ar.1n 9.23 77.30 77.50Base C4Ar.1n 9.31 78.10 78.50 41.00‡
U U ULO D. hamatus 9.40 104.85"0.75 110.48"0.43 78.70"0.30 78.75"0.75 285.27"3.74Top C4Ar.2n 9.58 79.30 79.80Base C4Ar.2n 9.64 79.70 80.30Top C5n.1n 9.74 80.00 80.60FO D. hamatus 10.39 ¶ 113.25"0.45 114.98"0.43 86.80"0.30 319.65"0.50LO S. heteromorphus 13.57 ¶ 122.65"0.65 93.75"0.25 48.90
Ž . Ž . Ž . Ž .Ages for polarity chron boundaries and first FO and last LO occurrences of nannofossil events are from 1 Cande and Kent 1995Ž . Ž . ŽU .and 2 Berggren et al. 1995a,b except where marked with asterisks. These latter ages were determined from extrapolation between
Ž . Ž . Žpolarity chron boundaries at Site 710, or ¶ taken from Raffi and Flores 1995 . Depths for datums in mbsfsmeters below seafloor or. Ž . Ž . Ž . Ž . Ž . Ž . Ž .mcdsmeters composite depth are from 3 Rio et al. 1990 , 4 Schneider and Kent 1990 , 5 Spaulding et al. 1991 , 6 Pierce et al.
Ž . Ž . Ž . Ž . Ž .1989 , 7 Raffi and Flores 1995 , and 8 Dickens et al. 1995 . Depth ranges reflect low sampling resolution and represent intervals overwhich the datum occurs. Depths have not been rounded to reflect significant figures. Depths in boldface italics are those that are used forage models in this study. The depth of the base of the C4Ar.1n polarity chron at Hole 711A is taken from Hole 711B with a q2 m
Ž . Ž .differential between the two holes ‡ . There is a lengthy repeated interval at Hole 710B † .

( )G.R. Dickens, R.M. OwenrMarine Geology 161 1999 75–91 81
5 5 5 6 6 6 6 7 8
722ArB 728A 731A 752A 754A 757B 758A 849 885r886Ž . Ž . Ž . Ž . Ž . Ž . Ž . Ž . Ž .mbsf mbsf mbsf mbsf mbsf mbsf mbsf mcd mcd
10.38"0.57 12.28"1.50 10.38"0.5727.13"0.57 19.69"0.59 18.88"0.43 3.05"0.75 6.75"0.75 13.3"0.45
36.08"0.38 10.90 4.8738.20"0.25 14.20 5.71
38.03"0.38 41.46"0.74 45.85"0.40 15.30 6.2046.50"0.75 53.18"1.50 66.48"0.52 9.75"0.75 44.05"0.30
9.5126.00 10.55
53.90"0.76 62.75"1.50 85.13"1.28 4.30 6.35"0.25 12.75"0.75 25.95"0.75 59.35"0.10
73.60"0.75 69.18"1.50 95.53"0.48 7.35"0.75 35.05"0.7571.00"0.75
82.85"0.40 72.95"0.75 34.20 14.5976.69"0.59 10.35"0.75 16.25"0.75 77.20"0.1579.18"0.38 39.50
40.5041.90
85.48"0.68 42.90104.65"0.70 93.28"0.38 23.70106.48"0.58 95.89"0.59 10.30 15.95"0.25 23.3"0.30 45.15"0.75 105.25"0.10
123.90"1.45131.78"0.38143.35"0.75 56.20154.72"1.09 58.70
142.45"0.40 167.44"0.35 61.50
177.12"0.37 63.05186.05"0.27 64.00
157.25"0.45153.90"1.50 208.27"0.43 66.70
19.10 24.00"1.30 38.95"0.75 174.30"0.45164.48"0.58 223.51"1.50 113.60"0.75 43.55"0.75 70.45"0.75 189.65"0.30185.50"4.41 76.40 35.47
80.50 37.1882.70 38.49
220.00"1.50 84.30 40.6190.2092.10
25.10 33.35"1.55 52.25"0.75 281.45"0.7545.99
280.45"4.85 164.38"0.68 62.90"0.70 103.15"0.7551.87
305.28"0.58 203.81"1.31 71.50"0.30 116.35"0.75 341.09"0.72
328.85"4.85 243.39"2.08 356.16"0.7658.10 77.00 83.75"0.75

( )G.R. Dickens, R.M. OwenrMarine Geology 161 1999 75–9182
Fig. 3. Calculated carbonate MARs, sedimentary redox conditions, and diatom presence with respect to age at ODP sites 707, 709, 710, andŽ .711 on the Mascarene Plateau. Carbonate percentages, DBD, and LSRs for carbonate MARs are from Backman et al. 1988 , Peterson and
Ž . Ž . Ž .Backman 1990 , and Table 2. Intervals of reduced facies are from Backman et al. 1988 and Robinson 1990 . Intervals with diatoms areŽ . Žfrom Mikkelsen 1990 . Depths of all parameters have been converted to the SHCK time scale Cande and Kent, 1995; Shackleton et al.,
.1995 via Table 2.
.1990; Peterson et al., 1992 . The overall abundanceof diatom tests, as well as the abundance of those
Ždiatoms associated with high-productivity e.g.,.Thlassionema spp. , is relatively high in sediment
deposited during the Latest Miocene and EarlyPliocene at sites 707, 709, 710, 721, 722, and 728Ž .Mikkelsen, 1990; Nigrini, 1991; Fig. 3 . Sedimentdeposited during the Latest Miocene–Early Pliocene
Žat sites 709 and 710 is green rather than pale brown.for other time intervals and has an abnormally low
Žwhole-core magnetic susceptibility Backman et al.,.1988; Robinson, 1990 . These intervals reflect reduc-
tion of Fe that likely occurred because of an increaseŽin the supply of organic carbon Backman et al.,
.1988; Robinson, 1990 . Evidence at site 758 alsoŽargues against decreased removal of carbonate be-
.low .ŽBecause elevated paleoproductivity and an in-
.crease in the flux of organic carbon should result inŽ .lysocline shoaling e.g., Broecker and Peng, 1982 ,
secondary support for the biogenic bloom comesfrom evidence for increased carbonate dissolution atthose locations at deep to intermediate water depthsŽ .Farrell and Janecek, 1991; Peterson et al., 1992 .
During the Latest Miocene–Early Pliocene, carbon-Žate MARs decreased at sites 711 and 731 Figs. 3
.and 4 which are at 4430 and 2366 m below seaŽ .level at present-day, respectively Table 1 . An in-
crease in the abundance of discoasterids in LatestMiocene–Early Pliocene sediment at site 711 sug-gests that the decrease in carbonate MAR represents
Ž .greater dissolution Rio et al., 1990 . The green colorof Latest Miocene–Early Pliocene sediment at this
Ž .location Fig. 3 further suggests that the dissolutionwas related to an increase in the supply of organic
Ž .carbon Peterson et al., 1992 . A decrease in theweight percent of coarse fraction carbonate also sug-gests greater dissolution at site 758 during the Early
Ž .Pliocene Farrell and Janecek, 1991 .Ancillary evidence for the biogenic bloom in the
Indian Ocean comes from sediment proxies for de-creased dissolved O in intermediate waters. The2
abundance of benthic foraminifera assemblages thatŽinhabit present-day OMZs e.g., those dominated by
.BoliÕina spp. and UÕigerina spp. increases in sedi-ment deposited during the Latest Miocene–Early
ŽPliocene at sites 721, 722, 731 and 754 Nomura,.1991; Hermelin, 1992; Figs. 3 and 5 . The carbon

( )G.R. Dickens, R.M. OwenrMarine Geology 161 1999 75–91 83
Fig. 4. Calculated carbonate MARs and the presence of a particu-lar benthic foraminifera assemblage with respect to age at ODPsites 721, 722, 728, and 731 on the Arabian Margin. Carbonatepercentages, DBDs, and LSRs for carbonate MARs are from Prell
Ž .et al. 1989 and Table 2. Intervals containing a benthicforaminifera assemblage that is associated with low dissolved O2
Ž .are from Hermelin 1992 . Depths of all parameters have beenŽconverted to the SHCK time scale Cande and Kent, 1995;
.Shackleton et al., 1995 via Table 2.
isotope ratio in benthic foraminifera and the MAR ofmanganese decrease in Latest Miocene and Early
ŽPliocene sediment at Sites 752, 754, and 757 Rea et.al., 1991; Dickens and Owen, 1994; Fig. 5 . The
observed decreases in calculated Mn fluxes are notan artifact of LSR problems at these locations be-cause they coincide with decreases in the MnrSc
Ž .ratio Dickens and Owen, 1994; Fig. 5 . These sitesare located on shallow ridges of the Indian Oceanthat are presently beyond the peripheries of the
Ž .intermediate water OMZ Fig. 2a . Because lowerdissolved O in intermediate waters should be asso-2
ciated with a decrease in the carbon isotope ratio ofdissolved CO as well as an decrease in sedimentary2
flux of Mn, the chemical changes have been inter-preted as representing intensification and expansion
Ž .of the OMZ Dickens and Owen, 1994; Fig. 2b .The above evidence for increased productivity or
decreased dissolved O at any particular location2
could be caused by past movement of a site to
beneath a zone of high productivity or into an OMZ.However, tectonic histories for most of the above
Žlocations preclude such scenarios Peterson et al.,.1992; Dickens and Owen, 1994 . Thus, a variety of
evidence indicates that productivity in the northernand western Indian Ocean increased during the Lat-
Ž .est Miocene–Early Pliocene Fig. 2b .Lithological and biological variations at other In-
dian Ocean locations likely support the biogenicbloom but are not stressed here for various reasons.The LSR significantly increases in sediment de-posited during the Latest Miocene–Early Pliocene at
Ž .Deep Sea Drilling Project DSDP sites 232, 235,Ž237 in the northwestern Indian Ocean Vincent,
.1974 . This observation probably indicates an in-crease in the biogenic accumulation rate at thesesites, although there is a paucity of biogenic carbon-ate or silica data to construct biogenic MAR curvesand support the inference. Relatively high abun-dances of benthic fauna associated with low dis-
Fig. 5. Calculated carbonate MARs with respect to age at ODPsites 752 and 754 on Broken Ridge, and ODP sites 757 and 758on Ninety-east Ridge. Carbonate percentages, DBDs, and LSRs
Ž .for carbonate MARs are from Pierce et al. 1989 and Table 2.Depths of all parameters have been converted to the SHCK time
Ž .scale Cande and Kent, 1995; Shackleton et al., 1995 via Table 2.Note that the upper 3.0 my of sediment at sites 752, 754, and 757are extensively winnowed, and that the entire sediment column at
Ž .these locations is winnowed to some degree House et al., 1991 .

( )G.R. Dickens, R.M. OwenrMarine Geology 161 1999 75–9184
solved O occur in Latest Miocene–Early Pliocene2
sediment at DSDP site 214 and ODP site 756 on theŽsouthern end of Ninety-east Ridge Gupta and
.Srinivasan, 1990, 1992; Nomura, 1991 . LatestMiocene–Early Pliocene sediment at site 756 is alsocharacterized by a significant decrease in bulk Mn
Žcontent and the MnrSc ratio Dickens, 1996, pp..157–159 that may signify an expanded OMZ. How-
ever, well-constrained age markers for sites 214 and756 are needed in order to incorporate this informa-tion into a regional synthesis.
A fundamental issue concerning the biogenicbloom in the Indian Ocean is whether productivityincreased in the central Indian Ocean. Peterson et al.Ž .1992 suggested that carbonate MARs increased at
Ž .sites 752, 754 and 757 Fig. 1 during the LatestMiocene–Early Pliocene. An opposite trend is ob-served at sites 752 and 754 when revised ages fornannofossil datums are used in the MAR calculationsŽ .Fig. 5 . This decrease in carbonate MARs at sites
Ž .752, 754 and perhaps 757 during the LatestMiocene–Early Pliocene would be more pronouncedif Late Pliocene–Pleistocene winnowing is consid-ered. The upper 3.0 Ma of sediment at sites on
Broken and southern Ninety-east Ridges have beenŽextensively winnowed Pierce et al., 1989; House et
.al., 1991 , and an effect of this winnowing is todecrease the LSRs at these sites. However, becauseother Neogene time intervals at these sites contain
Žshort hiatuses and winnowing Pierce et al., 1989;.Dickens and Owen, 1994 , a proxy that is indepen-
dent of LSR calculations needs to be examined atthese sites before a definitive conclusion regardingLatest Miocene–Early Pliocene productivity in thecentral Indian Ocean can be reached.
5. Timing of the biogenic bloom in the IndianOcean
All evidence indicates that increased productivityin the Indian Ocean during the Latest Miocene–EarlyPliocene occurred between 9.0 and 3.5 Ma with theexception of reduced facies at sites 709 and 711, andthe presence of diatoms at sites 709, 710, and 711Ž .Figs. 3–6 . However, various lines of evidence atdifferent locations suggest that, during these 5.5 Ma,high productivity spanned slightly different time in-
Fig. 6. The MnrSc ratio, the d13C of Cibicidoides benthic foraminifera, and the presence of two benthic foraminifera assemblages withrespect to age at ODP sites 752 and 754 on Broken Ridge, and ODP sites 757 on Ninety-east Ridge. Mn and Sc concentrations are from
Ž . 13 Ž .Dickens and Owen 1994 . The d C of Cibicidoides tests are from Rea et al. 1991 . Intervals dominated by UÕigerina sp. andŽ .Ehrenbergina sp. at site 754 are believed to be associated with low dissolved O Nomura, 1991 . Depths of all parameters have been2
Ž .converted to the SHCK time scale Cande and Kent, 1995; Shackleton et al., 1995 via Table 2.

( )G.R. Dickens, R.M. OwenrMarine Geology 161 1999 75–91 85
Ž .tervals Figs. 3–6 . For example, carbonate MARswere elevated between 7.5 and 3.5 at sites 707 and709, between 8.7 and 4.3 at site 710, between 6.0and 4.8 Ma at site 721, and between 6.5 and 5.0 Maat site 722. Likewise, the reduced facies occurredbetween 9.3 and 2.2 Ma at site 709, between 8.7 and2.8 Ma at site 711, and between 8.3 and 5.8 Ma atsite 710.
The stratigraphy at the 12 Indian Ocean sitesdiscussed here is moderately to well-constrained.Thus, age discrepancies for various proxy indicatorsat different locations are probably real. The biogenic
Žbloom, therefore, represents a time interval 9.0 to.3.5 Ma where productivity was high in the north
and west Indian Ocean, but may not have beenelevated for the entire 5.5 Ma at any given locationrelative to prior and subsequent time intervals.
A general explanation for some of the observedŽage discrepancies is that elevated productivity and
.the extent of the intermediate water OMZ wastransgressive with respect to time and space during
Žthe Latest Miocene–Early Pliocene Dickens and.Owen, 1994, 1996 . That is, primary productivity
was highest and the intermediate water OMZ wasŽ .most extensive Fig. 2b during a particular time
interval. For example, carbonate MARs at site 728Ž .decrease to present-day values at an age 3.5 Ma
Ž .younger than at site 721 4.8 Ma . Because present-day productivity at site 728 is higher than at site 721Ž .Berger, 1991 , and because site 728 is closer to theOman coast, the observation may signify gradualcontraction of a high productivity zone along theOman Margin. If this general explanation is correct,it is suggested that the biogenic bloom in the IndianOcean was most pronounced between 6.0 and 5.0Ma because all 12 locations in the Indian Oceanexamined here display evidence for increased pro-
Ž .ductivity or an intensified and expanded OMZŽduring this particular million-year time interval Figs.
.3–6 .
6. Indo-Pacific comparison of the biogenic bloom
Evidence for the biogenic bloom in the PacificOcean is similar to that offered for the Indian Ocean.
ŽCalculated MARs of biogenic components CaCO ,3.SiO , and P increase in sediment deposited during2
the Latest Miocene and Early Pliocene and beneathŽpresent-day divergence zones e.g., Van Andel et al.,
1975; Leinen, 1979; Theyer et al., 1985; Berger etal., 1993; Delaney and Filippelli, 1994; Farrell et al.,
.1995a; Rea and Snoeckx, 1995; Rea et al., 1995 .These MAR increases are associated with elevatedabundances of faunal tests associated with high sur-
Žface productivity Berger et al., 1993; Farrell et al.,.1995a , and evidence for Fe mobilization because of
Žhigher organic carbon fluxes Tarduno, 1994; Arnold.et al., 1995; Dickens and Owen, 1996 . Foraminifera
assemblages associated with low dissolved O also2
are prevalent in sediment deposited at intermediatewater depths of the Pacific Ocean during the Latest
ŽMiocene and Early Pliocene Woodruff and Douglas,.1981; Woodruff, 1985; Resig, 1993 . Two ODP sites
in the Pacific Ocean are discussed below to demon-strate that evidence for the biogenic bloom in PacificOcean is broadly time-coincident with that in theIndian Ocean.
Site 849 is located beneath the divergence zone ofŽ .the eastern Equatorial Pacific Fig. 1 . Using age
datums in Table 2, CaCO and DBD data from3Ž .Mayer et al. 1992 , calculated MARs of CaCO3
increase about 200–300% at this site between ap-Ž .proximately 9.0 and 3.5 Ma Fig. 7a .
Sites 885r886 are located beneath the southernŽedge of the North Pacific high productivity belt Fig.
.1 and contain a Late Neogene sediment sequenceŽ .Table 2 . Several lines of evidence at these sitesindicate that productivity increased between 8.1 and3.5 Ma, and reached a maximum between 6.0 and5.0 Ma. Sediment deposited prior to 8.1 Ma and after
Ž .3.5 Ma predominantly consists )50% of red clay.However, sediment deposited between 8.1 and 3.5
Ž .Ma predominantly consists 60–90% of diatomsŽ .Fig. 7b , and this prominent lithologic change repre-sents an increase in the flux of biogenic silicaŽ .Snoeckx et al., 1995 . The presence of hydrogenous
Ž .Fe–Mn nodules in sediment of 7.5 Ma age Fig. 7bsupports this interpretation because such nodules areburied at the onset of relatively high sedimentation
Ž .rates Usui and Takashi, 1994 . Between 6.0 and 5.0Ma, rock magnetic properties and downcore Fe con-centrations show that Fe was remobilized within thesediment column because a sedimentary redox
Žthreshold was surpassed Arnold et al., 1995; Dick-.ens and Owen, 1996 . An increase in barite deposi-

( )G.R. Dickens, R.M. OwenrMarine Geology 161 1999 75–9186
Ž .Fig. 7. a Calculated carbonate MARs with respect to age at ODPsite 849 in the eastern equatorial Pacific. Carbonate percentages,DBDs, and LSRs for carbonate MARs are from Mayer et al.Ž . Ž .1992 and Table 2. b The stratigraphic column at ODP sites885r886 in the North Pacific with respect to age. The strati-
Ž .graphic column is presented in Dickens et al., 1995 , and theŽ . Žreduced interval is described in Arnold et al., 1995 and Dickens
.and Owen, 1996 . Depths of all parameters at both sites have beenŽconverted to the SHCK time scale Cande and Kent, 1995;
.Shackleton et al., 1995 via Table 2.
tion suggests that the reduced facies was caused byŽan increase in the supply of organic carbon Dickens
.and Owen, 1996 .
7. Significance of the biogenic bloom
The significance of the Late Neogene biogenicbloom is that it necessitates a fundamental change innutrient cycling during the Latest Miocene and EarlyPliocene. Primary productivity in the oceans is lim-ited by the availability of nutrients, and the residence
Ž 3y ytime of nutrients in the ocean e.g., PO , NO ,4 3. Ž 5H SiO is relatively short -10 years, Delaney4 4
.and Filippelli, 1994; Treguer et al., 1995 . The bio-genic bloom lasted for approximately 5.5 Ma. Hence,increased productivity and burial of nutrients at mul-tiple locations in the Indian and Pacific Oceansbetween 9.0 and 3.5 Ma implies one of two general
Ž .scenarios: 1 there was an increase in the supply ofŽ .nutrients to the ocean, andror 2 there was a redis-
tribution of nutrients within the ocean. Both scenar-
ios have been invoked, although neither is an entirelysatisfactory explanation at present.
Rivers are the primary supply of nutrients to theŽocean. Thus, several authors Berger et al., 1993;
Berger and Stax, 1994; Delaney and Filippelli, 1994;.Farrell et al., 1995b have suggested that the bio-
genic bloom was caused by increased delivery ofnutrients to the ocean via enhanced continentalweathering. The primary implication of this scenariois that net supply and burial of nutrients in the entireocean increased between 9.0 and 3.5 Ma. Althoughno direct information has been offered to supportincreased productivity in the Atlantic Ocean or in theIndian and Pacific Oceans away from divergencezones during the Latest Miocene–Early Pliocene,variations in three parameters may support the abovescenario. The significant increase in seawater 87Srr86Sr during the Latest Miocene–Early Pliocene may
Žsignify elevated riverine fluxes to the oceans Farrell.et al., 1995b . The general increase in terrigenous
Ždeposition during the Late Neogene Rea, 1992;.Dobson et al., 1997 may indicate increased riverine
Žoutflow and hence, nutrient supply assuming physi-cal and chemical weathering are not completely de-
. 13coupled . The pronounced difference in d C ofbenthic foraminifera between the Atlantic and Pa-cific Oceans during the Latest Miocene–EarlyPliocene may represent higher mean nutrient levels
Ž .in the ocean Wright and Miller, 1996 . Note thatthere is a time problem with linking the first twochanges to the biogenic bloom. Rates of increase inseawater 87Srr86Sr and terrigenous deposition arehighest after termination of the biogenic bloom at 3.5
ŽMa see Rea, 1992; Farrell et al., 1995b; Dobson et.al., 1997 .
Redistribution of nutrients within the ocean mightbe expected with a change in oceanic circulation.Formation of deep water in the north Atlantic was
Žrelatively intense between 9.0 and 3.0 Ma Wright.and Miller, 1996 . High latitude locations also were
anomalously warm during the Gilbert polarity chronŽbetween approximately 6.0 and 5.0 Ma Hays and
.Opdyke, 1967; Koizumi, 1986 . General circulationmodels have coupled intensification of deep waterformation and high-latitude warming to an accelera-
Žtion of the deep water conveyor Rind and Chandler,.1991 . Simple box models also demonstrate that
enhanced deep water flow will increase productivity

( )G.R. Dickens, R.M. OwenrMarine Geology 161 1999 75–91 87
Ž .at divergence zones Lyle and Pisias, 1990 . Thus,Ž .Dickens and Owen 1996 have suggested that the
biogenic bloom was related to transfer of nutrientsŽfrom other regions e.g., the Atlantic Ocean, conti-
.nental margins, and central gyres to Indo-Pacificdivergence zones because of accelerated deep waterflow; that is, termini of the deep water conveyorŽ .Indo-Pacific divergence zones received increasednutrient fluxes at the expense of decreased nutrientdeposition along the deep water conveyor. A possi-ble implication of this scenario is that net supply andburial of nutrients in the entire ocean was constantduring the Late Neogene, and that primary productiv-ity was decreased at certain locations away fromIndo-Pacific divergence zones. Carbonate MARs de-crease in sediment deposited during the LatestMiocene–Early Pliocene at locations away from di-
Žvergence zones in the Pacific Van Andel et al.,.1975; Theyer et al., 1985; Farrell et al., 1995a .
However, it is unclear whether this observation re-flects a decrease in productivity, or alternatively,greater dissolution because of overall elevated Latest
ŽMiocene–Early Pliocene productivity Farrell et al.,.1995a . Moreover, it is unclear whether this general
explanation is plausible with advanced global circu-lation models.
Regardless of which driving mechanism is cor-rect, recognition of the biogenic bloom is relevant toinvestigations concerning the evolution of the Hi-malayas. Several authors have used evidence forincreased productivity in the north and west IndianOcean to support a general Himalayan tectonicmodel; i.e., uplift of the Himalayas passed a thresh-old altitude in the Latest Miocene–Early Pliocenethat initiated the Asian monsoon system and high
Žproductivity in the north and west Indian Ocean see.Molnar et al., 1993 . Although this combined tec-
tonic and paleoceanographic scenario may be cor-Ž .rect, the argument as presented is problematic be-
cause it neglects evidence for elevated productivityin the Pacific Ocean during the Latest Miocene–EarlyPliocene. All recent literature concerning the bio-
Žgenic bloom Peterson et al., 1992; Berger and Stax,1994; Berger et al., 1993; Delaney and Filippelli,1994; Dickens and Owen, 1994, 1996; Farrell et al.,
.1995a,b; Rea et al., 1995 agrees that increasedprimary productivity during Latest Miocene–EarlyPliocene at Indo-Pacific divergence zones was re-
lated to a global-scale driving mechanism. Whetherthis global-scale driving mechanism involved uplift
Žof the Himalayas e.g., via increased weathering and.delivery of nutrients to the oceans is an intriguing
question that might be addressed with future studies.
8. Summary
The biogenic bloom hypothesis suggests that pri-mary productivity at Indo-Pacific divergence andupwelling zones increased substantially during theLatest Miocene–Early Pliocene. The hypothesis issupported in the Indian Ocean with proxies for en-
Žhanced paleoproductivity carbonate MARs, silicapresence, planktic fauna assemblages, reduced fa-
.cies in north and west regions, and proxies for lowerŽdissolved O benthic fauna assemblages, carbon2
isotopes in benthic foraminifera, sedimentary man-.ganese fluxes at intermediate water depths. The
biogenic bloom in the Indian Ocean occurred be-tween 9.0 and 3.5 Ma, and is most intense between6.0 and 5.0 Ma. Thus, the biogenic bloom is broadlytime-coincident across the Indian and Pacific Oceans,and necessitates a fundamental change in globalnutrient cycling during the Latest Miocene–EarlyPliocene relative to present-day.
9. Addendum
Given the inordinate duration of time betweensubmission and publication, some portions of thismanuscript are now dated. This section briefly sum-marizes and discusses recent work relevant to topicsin the manuscript that were not included in oursubmitted version. The manuscript above has onlybeen changed from the original submitted version toaddress reviewer comments.
Age datums for Miocene nannofossil events havebeen revised such that they are consistent with the
Ž .SHCK95 time scale Berggren et al., 1995a,b . Re-vised ages for LO D. quinqueramus, FO A. primus,and LO D. hamatus, and LO S. heteromorphus are5.6, 7.2, 9.4, and 13.6 Ma, respectively. The esti-

( )G.R. Dickens, R.M. OwenrMarine Geology 161 1999 75–9188
mated age for FO D. hamatus is 10.7 to 11.2 Ma.Late Miocene ages and MARs used in the workpresented here should be updated to incorporate the
Ž .age revisions of Berggren et al. 1995a,b , althoughthe effect to the presentation and interpretation ofdata will be minimal.
Additional support for the biogenic bloom in theIndian Ocean has come from micropaleontological
Ž .and geochemical investigations. Nomura 1995 hasdocumented benthic foraminifera assemblage changesat site 757 that are consistent with a decrease indissolved oxygen in the Latest Miocene–Early
ŽPliocene. A. Gupta and E. Thomas personal com-.munication have noted similar changes at DSDP site
219 in the northeast Arabian Sea. Banakar et al.Ž .1997 have documented chemical variations in amanganese crust at intermediate water depth in thenorthern Indian Ocean that are consistent with anexpanded Latest Miocene–Early Pliocene OMZ.
Recent studies of sediment sequences in the Pa-cific Ocean contribute additional insight to the signa-ture and problems of the Late Neogene biogenic
Ž .bloom. Schroeder et al. 1997 document pronouncedincreases in the sedimentary flux of barium to theseafloor of the equatorial Pacific during the LateMiocene–Early Pliocene. This observation is similar
Ž .to that made by Dickens and Owen 1996 forsediment at Sites 885r886 in the North Pacific.Apparently, there may be a mass balance problemfor the barium geochemical cycle as previously hasbeen acknowledged for the global budgets of silica
Ž .and phosphorous. Dickens and Barron 1997 haveshown that the biogenic bloom in the North Pacificis marked by a pronounced increase in the depositionof pennate diatoms. Spectacular pennate diatom matsalso were deposited in the equatorial Pacific at the
Ž .same time Kemp and Baldauf, 1993 . Massive pen-nate diatom ‘‘dumps’’ appear to be a signature of thebiogenic bloom, and the origin of these remarkablesedimentary intervals may be a key component tounderstanding the biogenic bloom.
Ž .Murray and Peterson 1997 have presented thefirst compelling data to indicate elevated carbonateMARs in Latest Miocene–Early Pliocene sedimentfrom the Atlantic Ocean. These locations are atshallow depth beneath the equator at the Ceara Rise.These authors also observed an increase of dissolu-tion gradients similar to those observed in the Indian
Ž .Ocean as previously discussed . However, there re-mains no evidence for the biogenic bloom at loca-tions away from the Equator or distal from upwellingregions.
Ž .Filippelli 1997 has argued that the biogenicbloom is the result of a sequence of processes initi-ated by intensification of the Asian monsoon. Theonset of monsoon conditions leads to increasedweathering in the Himalayas and enhanced nutrientdelivery to the oceans. Although we do not dismiss
Ž .this hypothesis as previously discussed , we noteŽ .that Filippelli 1997 has not rigorously addressed
Žproblems with this hypothesis notably timing rela-.tionships or satisfactorily refuted the alternative ex-
planation involving a change in ocean circulation.Ž .Filippelli 1997 dismisses a driving mechanism in-
volving ocean circulation on grounds that the ob-served increase in equatorial Pacific phosphorus ac-cumulation is of sufficient magnitude to necessitatean increase in nutrient supply from continents. How-ever, this argument does not follow from its premisesbecause the proxy records for P accumulation liedirectly beneath the equator and are not necessarilyrepresentative of regional or global P accumulationŽ .Weber and Owen, 1997 .
Acknowledgements
We thank T.C. Moore, Jr. for numerous discus-sions concerning the biogenic bloom and two re-viewers for comments on the original manuscript.This work represents part of a partial fulfillment ofthe requirements for the degree of Doctor of Philoso-phy in The University of Michigan for G. Dickens.
References
Arnold, E., Leinen, M., King, J., 1995. Paleoenvironmental varia-tion based on the mineralogy and rock-magnetic properties ofsediment from sites 885 and 886. Proc. ODP, Sci. Results 145,231–245.
Backman, J., Duncan, R.A. et al., 1988. Proc. ODP, Initial Rep.115, 1085 pp.
Backman, J., Schneider, D.A., Rio, D., Okada, H., 1990. Neogenelow-latitude magnetostratigraphy from site 710 and revised

( )G.R. Dickens, R.M. OwenrMarine Geology 161 1999 75–91 89
age estimates of Miocene nannofossil datum events. Proc.ODP, Sci. Results 115, 271–276.
Banakar, V.R., Pattan, J.N., Mudholkar, 1997. Palaeoceano-graphic conditions during the formation of a ferromanganesecrust from the Afanasiy-Nikitin seamount, North Central In-dian Ocean: geochemical evidence. Mar. Geol. 136, 299–315.
Berger, W.H., 1991. Produktivitat des ozeans aus geologischer¨sicht: Denkmodelle und beispiele. Z. Dtsch. Geol. Ges. 142,149–178.
Berger, W.H., Stax, R., 1994. Neogene carbonate stratigraphy ofŽ .Ontong Java Plateau Western Equatorial Pacific : three unex-
pected findings. Terra Nova 6, 520–534.Berger, W.H., Leckie, R.M., Janecek, T.R., Stax, R., Takayama,
T., 1993. Neogene carbonate sedimentation on Ontong JavaPlateau: highlights and open questions. Proc. ODP, Sci. Re-sults 130, 711–744.
Berggren, W.A., Kent, D.V., Flynn, J.J., Van Couvering, J.A.,1985. Cenozoic geochronology. Geol. Soc. Am. Bull. 96,1407–1418.
Berggren, W.A., Hilgen, F.J., Langereis, C.G., Kent, D.V.,Obradovich, J.D., Raffi, I., Raymo, M.E., Shackleton, N.J.,1995a. Late Neogene chronology: new perspectives in high-resolution stratigraphy. Geol. Soc. Am. Bull. 107, 1272–1287.
Berggren, W.A., Kent, D.V., Flynn, J.J., Van Couvering, J.A.,1995b. A revised Cenozoic geochronology and chronostratig-raphy. Geochronology time scales and global stratigraphiccorrelation. SEPM Spec. Publ. 54, 129–212.
Broecker, W.S., Peng, T.-H., 1982. Tracers in the Sea. EldigioPress, Palisades, NY.
Brummer, G.J.A., Van Eijden, A.J.M., 1992. ‘‘Blue-ocean’’ pale-oproductivity estimates from pelagic carbonate mass accumu-lation rates. Mar. Micropaleontol. 19, 99–117.
Cande, S.C., Kent, D.V., 1992. A new geomagnetic polarity timescale for the Late Cretaceous and Cenozoic. J. Geophys. Res.97, 13917–13951.
Cande, S.C., Kent, D.V., 1995. Revised calibration of the geo-magnetic polarity time scale for the Late Cretaceous andCenozoic. J. Geophys. Res. 100, 6093–6095.
Delaney, M.L., Filippelli, G.M., 1994. An apparent contradictionin the role of phosphorus in Cenozoic chemical mass balancesfor the world ocean. Paleoceanography 9, 513–527.
Dickens, G.R., 1996. Geochemical links between paleoceanogra-phy and marine sediment-hosted ore deposits. PhD Thesis.University of Michigan, 229 pp.
Dickens, G.R., Barron, J.A., 1997. A rapidly deposited pennatediatom ooze in Upper Miocene–Lower Pliocene sedimentbeneath the North Pacific polar front. Marine Micropaleontol.31, 177–182.
Dickens, G.R., Owen, R.M., 1994. Late Miocene–Early Pliocenemanganese redirection in the central Indian Ocean: expansionof the intermediate water oxygen minimum zone. Paleo-ceanography 9, 169–181.
Dickens, G.R., Owen, R.M., 1996. Sediment geochemical evi-Ž .dence for an Early–Middle Gilbert Early Pliocene productiv-
ity peak in the North Pacific Red Clay Province. MarineMicropaleontol. 27, 107–120.
Dickens, G.R., Snoeckx, H., Arnold, E., Morley, J.J., Owen,
R.M., Rea, D.K., Ingram, L., 1995. Composite depth scale andstratigraphy for sites 885r886. Proc. ODP, Sci. Results 145,205–217.
Dobson, D.M., Dickens, G.R., Rea, D.K., 1997. Terrigenoussedimentation at Ceara Rise. Proc. ODP, Sci. Results 154,465–473.
Farrell, J.W., Janecek, T.R., 1991. Late Neogene paleoceanogra-Žphy and paleoclimatology of the northeast Indian Ocean site
.758 . Proc. ODP, Sci. Results 121, 297–355.Farrell, J.W., Raffi, I., Janecek, T.R., Murray, D.W., Levitan, M.,
Dadey, K.A., Emeis, K.-C., Lyle, M., Flores, J.-A., Hovan, S.,1995a. Late Neogene sedimentation patterns in the easternequatorial Pacific Ocean. Proc. ODP, Sci. Results 138, 717–756.
Farrell, J.W., Clemens, S.C., Gromet, L.P., 1995b. Improvedchronostratigraphic reference curve of late Neogene seawater87Srr86Sr. Geology 23, 403–406.
Filippelli, G.M., 1997. Intensification of the Asian monsoon and achemical weathering event in the Late Miocene–EarlyPliocene: implications for Late Neogene climate change. Geol-ogy 25, 27–30.
Gupta, A.K., Srinivasan, M.S., 1990. Northern Indian Oceandeep-sea benthic foraminifera. Mar. Micropaleontol. 16, 77–91.
Gupta, A.K., Srinivasan, M.S., 1992. UÕigerina proboscideaabundances and paleoceanography of the northern IndianOcean DSDP Site 214 during the Late Neogene. Mar. Mi-cropaleontol. 19, 355–367.
Hays, J.D., Opdyke, N.D., 1967. Antarctic radiolaria, magneticreversals and climate changes. Science 158, 1001–1011.
Hermelin, J.O.R., 1992. Variations in the benthic foraminiferalfauna of the Arabian Sea: a response to changes in upwellingintensity? In: Summerhayes, C.P., Prell, W.L., Emeis, K.-C.Ž .Eds. , Upwelling Systems: Evolution Since the Early Miocene.Geol. Soc. Spec. Publ., London, 64, 151–166.
House, M.A., Rea, D.K., Janecek, T.R., 1991. Grain-size recordof ocean current winnowing in Oligocene to Pleistocene ooze,Broken Ridge, southeastern Indian Ocean. Proc. ODP, Sci.Results 121, 211–218.
Kemp, A.E.S., Baldauf, J.G., 1993. Vast Neogene laminateddiatom mat deposits from the eastern equatorial Pacific Ocean.Nature 362, 141–144.
Kennett, J.P., Von der Borch, C.C., 1986. Southwest PacificCenozoic paleoceanography. Initial Rep., DSDP 90, 1493–1517.
Koizumi, I., 1986. Pliocene and Pleistocene diatom levels relatedwith paleoceanography in the Northwest Pacific. Mar. Mi-cropaleontol. 10, 309–325.
Leinen, M., 1979. Biogenic silica accumulation in the centralequatorial Pacific and its implications for Cenozoic paleo-ceanography. Geol. Soc. Am. Bull. 90, 1310–1376.
Lyle, M., Pisias, N., 1990. Ocean circulation and atmosphericCO changes: coupled use of models and paleoceanographic2
data. Paleoceanography 5, 15–41.Mayer, L., Pisias, N., Janecek, T. et al., 1992. Site 849. Proc.
ODP, Initial Rep. 138, 735–807, Pt. 2.Mikkelsen, N., 1990. Cenozoic diatom biostratigraphy and paleo-

( )G.R. Dickens, R.M. OwenrMarine Geology 161 1999 75–9190
ceanography of the western equatorial Indian Ocean. Proc.ODP, Sci. Results 115, 411–432.
Molnar, P., England, P., Martinod, J., 1993. Mantle dynamics,uplift of the Tibetan Plateau, and the Indian monsoon. Rev.Geophys. 31, 357–396.
Murray, D.W., Peterson, L.C., 1997. Biogenic carbonate produc-tion and preservation changes between 5 and 10 Ma from theCeara Rise, western equatorial Atlantic. Proc. ODP, Sci. Re-sults 154, 375–388.
Nigrini, C., 1991. Composition and biostratigraphy of radiolarianŽassemblages from an area of upwelling Northwestern Arabian
.Sea, Leg 117 . Proc. ODP, Sci. Results 117, 89–126.Nomura, R., 1991. Oligocene to Pleistocene benthic foraminiferal
assemblages at sites 754 and 756, eastern Indian Ocean. Proc.ODP, Sci. Results 121, 31–76.
Nomura, R., 1995. Paleogene to Neogene deep-sea paleoceanogra-phy in the eastern Indian Ocean: benthic foraminifera fromODP Sites 747, 757 and 758. Micropaleontology 41, 251–290.
Olson, D.B., Hitchcock, G.L., Fine, R.A., Warren, B.A., 1993.Maintenance of the low-oxygen layer in the central ArabianSea. Deep-Sea Res., Part II 40, 673–685.
Peterson, L.C., Backman, J., 1990. Late Cenozoic carbonate accu-mulation and the history of the carbonate compensation depthin the western equatorial Indian Ocean. Proc. ODP, Sci.Results 115, 467–507.
Peterson, L.C., Murray, D.W., Ehrmann, W.U., Hempel, P., 1992.Cenozoic carbonate accumulation and compensation depthchanges in the Indian Ocean. In: Duncan, R.A., Rea, D.K.,
Ž .Kidd, R.B., Von Rad, U., Weissel, J.K. Eds. , Synthesis ofResults From Scientific Drilling in the Indian Ocean. Am.Geophys. Union, Geophys. Monogr. 70, 311–333.
Pierce, J., Weissel, J. et al., 1989. Proc. ODP, Initial Rep. 121,1000 pp.
Prell, W.L., Niitsuma, N. et al., 1989. Proc. ODP, Initial Rep.117, 1236 pp.
Raffi, I., Flores, J.-A., 1995. Pleistocene through Miocene calcare-Žous nannofossils from eastern equatorial Pacific Ocean Leg
.138 . Proc. ODP, Sci. Results 138, 233–286.Rea, D.K., 1992. Delivery of Himalayan sediment to the Northern
Indian Ocean and its relation to global climate, sea level,uplift, and seawater strontium. In: Duncan, R.A., Rea, D.K.,
Ž .Kidd, R.B., Von Rad, U., Weissel, J.K. Eds. , Synthesis ofResults From Scientific Drilling in the Indian Ocean. Am.Geophys. Union, Geophys. Monogr. 70, 387–402.
Rea, D.K., Snoeckx, H., 1995. Sediment fluxes in the Gulf ofAlaska: paleoceanographic record from Site 887 on the Pat-ton–Murray Seamount Platform. Proc. ODP, Sci. Results 145,247–256.
Rea, D.K., Lohmann, K.C., MacLeod, N.D., House, M.A., Hovan,S.A., Martin, G.D., 1991. Oxygen and carbon isotopic recordsfrom the oozes of sites 752, 754, 756, and 757, eastern IndianOcean. Proc. ODP, Sci. Results 121, 219–228.
Rea, D.K., Basov, I.A., Krissek, L.A. et al., 1995. Scientificresults of drilling the North Pacific transect. Proc. ODP, Sci.Results 145, 577–596.
Reid, J.L., 1965. Intermediate waters of the Pacific Ocean. JohnsHopkins Oceanographic Studies No. 2, Baltimore, 85 pp.
Resig, J.M., 1993. Cenozoic stratigraphy and paleoceanography ofbiserial planktonic foraminfers, Ontong Java Plateau. Proc.ODP, Sci. Results 130, 231–244.
Rind, D., Chandler, M., 1991. Increased ocean heat transports andwarmer climate. J. Geophys. Res. 96, 7437–7461.
Rio, D., Fornaciari, E., Raffi, I., 1990. Late Oligocene throughEarly Pleistocene calcareous nannofossils from western equa-
Ž .torial Indian Ocean Leg 115 . Proc. ODP, Sci. Results 115,175–235.
Robinson, S.G., 1990. Applications for whole-core magnetic sus-ceptibility measurements of deep-sea sediments: Leg 115 re-sults. Proc. ODP, Sci. Results 115, 737–771.
Schneider, D.A., Kent, D.V., 1990. Paleomagnetism of Leg 115sediments: implications for Neogene magnetostratigraphy andpaleolatitude of the Reunion Hotspot. Proc. ODP, Sci. Results115, 717–736.
Schroeder, J.O., Murray, R.W., Leinen, M., Pflaum, R.C., Janecek,T.R., 1997. Barium in equatorial Pacific carbonate sediment:terrigenous, oxide, and biogenic associations. Paleoceanogra-phy 12, 125–146.
Seisser, W.G., 1995. Paleoproductivity of the Indian Ocean duringthe Tertiary Period. Global Planet. Change 11, 71–88.
Shackleton, N.J., Crowhurst, S., Hagelberg, T., Pisias, N., Schnei-der, D.A., 1995. A new Late Neogene timescale: applicationto ODP Leg 138 sites. Proc. ODP, Sci. Results 138, 73–101.
Snoeckx, H., Rea, D.K., Jones, C.E., Ingram, B.L., 1995. Eolianand silica deposition in the central North Pacific: results fromsites 885r886. Proc. ODP, Sci. Results 145, 219–230.
Spaulding, S.A., Bloemendal, J., Hayashida, A., Hermelin, J.O.R.,Kameo, K., Kroon, D., Nigrini, C.A., Sato, T., Steens, T.N.F.,Takayama, T., Troelstra, S.R., 1991. Magnetostratigraphic andbiostratigraphic synthesis, Leg 117, Arabian Sea. Proc. ODP,Sci. Results 117, 127–145.
Tarduno, J.A., 1994. Temporal trends of magnetic dissolution inthe pelagic realm: gauging paleoproductivity?. Earth Planet.Sci. Lett. 123, 39–48.
Theyer, F., Mayer, L.A., Barron, J.A., Thomas, E., 1985. Theequatorial Pacific high-productivity belt: elements for a syn-thesis of Deep Sea Drilling Project Leg 85 results. Initial Rep.,DSDP 85, 971–985.
Treguer, P., Nelson, D.M., Van Bennekom, A.J., DeMaster, D.J.,Leynaert, A., Queguiner, B., 1995. The silica balance in theworld ocean; a reestimate. Science 268, 375–379.
Usui, A., Takashi, I., 1994. Fossil manganese deposits buriedwithin DSDPrODP cores, Legs 1–126. Mar. Geol. 119, 111–136.
Van Andel, T.H., Heath, G.R., Moore Jr., T.C., 1975. Cenozoichistory and paleoceanography of the central equatorial PacificOcean: a regional synthesis of Deep Sea Drilling Project data.Geol. Soc. Am., Mem. 143, 143 pp.
Vincent, E., 1974. Cenozoic planktonic biostratigraphy and paleo-ceanography of the tropical western Indian Ocean. Initial Rep.,DSDP 26, 1111–1150.
Weber, E.T., Owen, R.M., 1997. The Late Miocene–EarlyPliocene biogenic bloom: an examination of phosphorous ac-cumulation in the central Indian Ocean. EOS, Trans. AGUŽ .Spring Meeting .

( )G.R. Dickens, R.M. OwenrMarine Geology 161 1999 75–91 91
Woodruff, F., 1985. Changes in Miocene deep-sea benthicforaminiferal distribution in the Pacific Ocean: relationship topaleoceanography. Geol. Soc. Am. Bull., Mem. 143, 131–175.
Woodruff, F., Douglas, R.G., 1981. Response of deep-sea benthicforaminifera to Miocene paleoclimatic events, DSDP site 289.Mar. Micropaleontol. 6, 617–632.
Wright, Miller, 1996. Control of North Atlantic Deep Watercirculation by the Greenland–Scotland Ridge. Paleoceanogra-phy 11, 157–170.
Wyrtki, K., 1971. Oceanographic Atlas of the International IndianOcean Expedition. National Science Foundation, Washington,DC, 351 pp.