The Journal of Polymer Science Part a General Papers 1965 ...
401
or £ JOURNAL OF POLYMER SCIENCE: PART A YOL. 3 (1965) EDITORIAL We are starting, in May, the publication of a separate monthly journal— Polymer Previews—which will preprint the Synopses of all the papers to be published in the Journal of Polymer Science, Part A (General Papers) and Part C (Symposia). The Synopses will be published as soon as possible after acceptance of the original articles by the Editorial Office of the Journal. They are identified by title, author, and production code number which will be repeated in the Journal for easy reference. The purposes of Polymer Previews are : To make available to the polymer scientist a survey of the important new contributions to research in the held ; To provide advance information on the essential contents of all papers to be published 3 to 4 months later in the Journal of Polymer Science. To obtain a subscription, please apply to the Publisher. Authors of future articles in the Journal should keep this new feature in mind when preparing their Synopses. Editors and Publishers 1249 mudWR mhiQ'mnrt'rám' h s.a
-
Upload
khangminh22 -
Category
Documents
-
view
0 -
download
0
Transcript of The Journal of Polymer Science Part a General Papers 1965 ...

o r £
JOURNAL OF POLYMER SCIENCE: PART A YOL. 3 (1965)
EDITORIAL
We are starting, in May, the publication of a separate monthly journal— Polymer Previews—which will preprint the Synopses of all the papers to be published in the Journal of Polymer Science, Part A (General Papers) and Part C (Symposia).
The Synopses will be published as soon as possible after acceptance of the original articles by the Editorial Office of the Journal. They are identified by title, author, and production code number which will be repeated in the Journal for easy reference.
The purposes of Polymer Previews are :
To make available to the polymer scientist a survey of the important new contributions to research in the held ;To provide advance information on the essential contents of all papers to be published 3 to 4 months later in the Journal of Polymer Science.
To obtain a subscription, please apply to the Publisher.Authors of future articles in the Journal should keep this new feature in
mind when preparing their Synopses.
Editors and Publishers
1249
mudWR mhiQ'mnrt'rám'
h s . a

JOURNAL OF POLYMER SCIENCE: PART A VOL. 3, PP. 1251-1265 (1965)
Crystalline State of Cellulose in Fresh and Dried Mature Cotton Fiber from Unopened Bolls
as Studied by X-Ray Diffraction*
A. N. J. HEYN,f Plant Fibers Pioneering Research Laboratory, Southern Utilization Research and Development Division, Argicultural Research
Service, U. S. Department of Agriculture, New Orleans-, Louisiana
Synopsis
The crystal inity of cellulose in the undried cotton fiber, fresh from the unopened but mature boll, was studied by x-ray diffractometer methods and compared with the crystallinity cf portions of fibers from the same samples either dried directly or from which the water has been removed in various “indirect” ways calculated to better preserve the original structure including: (a) Solvent exchange, (b) freeze-drying, (c) drying above the critical temperature of liquids and (d) drying after the cellulose of the wet fiber has beer, crosslinked. The difference in crystallinity observed between directly and indirectly dried fibers indicates that a crystallization process must take place during the direct drying of the water-wet fiber. This crystallization process is promoted by the presence of water and inhibited or prevented when the fiber is dried indirectly. An increase of the degree of crystallinity due to wetting can be explained by assuming that the crystallization, which had been suppressed in the indirectly dried fiber takes place subsequently upon drying of the rewetted fiber. That the indirect methods preserve entirely or partially, such amorphous structure as is originally present is confirmed by the lower density and higher dyestuff accessibility of such fibers.
INTRODUCTION
The molecular structure—crystalline, paracrystalline, or amorphous— in which cellulose occurs in cell walls is of importance for many problems. One of these is the molecular biology of cell elongation; another the explanation of the properties of fibers.
In connection with a theory of plastic surface growth of cell walls, Heyn,1 in 1934 studied the walls of young elongating cells of Avena coleoptiles by x-ray diffraction, in order to obtain information about the organization of the cellulose molecules during the growth of the wall. From the undried fresh sample, a diffuse, halolike pattern characteristic of water was obtained. After drying, a diffraction pattern characteristic of cellulose was obtained. Although this finding raised the question whether or not cellulose is present only in an amorphous form in the fresh wall, no conclusion
* Prepared while the author was a visiting scientist during the summer of 1963.t Present address: Department of Riology, Louisiana State University in New Or
leans, New Orleans, Louisiana.1251

1252 A. N. J. HEYN
was drawn because it appeared possible that the cellulose diagram might be “masked” by the water halo or that the diffracted radiation from crystalline cellulose might be dissipated, (e.g., by multiple scattering by the water in the undried sample).
With regard to the properties of fibers it has been a question of long standing in what form cellulose occurs in undried cotton fiber, what happens during the drying of the fiber and how the circumstances of drying might affect the properties of the resulting product by altering the molecular aggregation. In connection with this problem Berkley and Kerr2 investigated the structure o: the undried, fresh cotton fiber with x-rays, using photographic methods. They obtained diagrams which gave no indication at all of the expected cellulose diagram but only two diffuse halos characteristic of water. Upon drying, the halos disappeared and at the same time the diagram of cellulose appeared just as in the 1934 case cited above. If, before drying, the cotton had been stretched (or excessively handled) in the wet state, a faint cellulose diagram appeared besides the halos. If a dried bundle of cotton was rewetted, the cellulose diagram remained present, From these experiments Berkley and Kerr concluded that in the undried cotton fiber of the ages studied cellulose occurs only in an amorphous structure. Their model of undried cotton fiber contains sets of long-chain cellulose molecules which upon drying bundle up at regular intervals into a permanent crystalline structure, leaving unordered material between the crystalline domains.
Preston3 has already pointed out that this interpretation of amorphous cellulose “cannot in the least be regarded as final,” since the absence of an x-ray diagram does not necessarily imply the absence of crystalline regions (but only that these regions are small in size), and since the cellulose diagram of the fresh material may be “masked” by the water halos. It still remained to be explained then why in the rewetted fiber, the water halo does not mask the cellulose pattern.
Ranby and Katzmire,4 in a study of the cellulose during the development of the cotton fiber from the immature to the mature condition, using x-ray photographic methods, always found evidences of crystalline cellulose in the dried, mature cotton fiber, but could not be certain of its presence in the immature cotton fiber (20-25 days after flowering). They used fibers preserved in 50% alcohol which, after washing with distilled water, were dried in a vacuum over P20 5 or which were dried after solvent exchange from acetone to cyclohexane. They did not investigate never-dried material.
In small-angle x-ray studies of undried cotton fiber, Heyn5'6 found distinct evidence of the existence of regular discontinuities of a diameter of 50 A. which might, correspond either to micelles of (fully crystalline) crystallites of cellulose or to intermicellar interstices of the same dimensions. (From x-ray data alone it is not possible to decide between these two possibilities, although the first appeared the simplest.) Both cases would be in disagreement with a continuous amorphous structure and rather suggest that some crystalline structure exists in undried cotton fiber.

CRYSTALLINE STATE OF CELLULOSE 1253
The question about the state in which cellulose occurs in elongating young cell walls and in undried secondary walls and what changes occur in crystallinity during drying thus remained undecided, although an amorphous structure in fresh walls and the occurrence of crystallization upon drying has been suggested by some of the studies made.
The present paper reports the results of x-ray diffractometer studies concerned with these problems. It was hoped that information might be obtained about the original undisturbed state of the molecules without interference by the presence of water on the existing cellulose diffraction pattern by using the following techniques. Fresh undried fibers, just removed from the unopened but relatively mature bolls, were air-dried normally and hi special ways to preserve the original molecular organization as well as possible: Before drying, the water was replaced with nonpolar liquids or removed by freeze-drying or by drying the fiber after crosslinking the cellulose. In order to obtain information about the degree of dispersion, porosity, or collapse of the amorphous phase, measurements were also made of the density and accessibility of the fibers for dyestuffs. With these methods the effects of the condition of the amorphous phase of the various treatments could be followed to complement the x-ray data.
MATERIAL AND METHODS
After some initial experiments had been carried out with bolls grown by Mr. R. S. Orr of the Southern Regional Research Laboratory, cotton .bolls, harvested just before opening, were received from the Agricultural Experiment Station at, Mississippi State University.
The locks, collected from the fresh unopened bolls, were placed under water during the removal of the fiber from the seeds, or sampled in a moist chamber, to retain the normal moisture content. Care was taken not to exert the slightest tension on the fibers. A portion of the fibers from each boll was always dried directly in air to serve as a control.
Removal of Water
Liquid Exchange Method. In the liquid exchange the fibers were passed successively from the water-wet state of the boll through one of the following scries of liquids in each of which they remained for 2-12 hr.: (a) ethanol —► 100% etnanol — ethyl ether; (b) Cellosolve (2-ethoxyethanol) ethyl ether; (c) 100% methanol -► benzene; (d) 75% methanol -»■ 100% methanol —► «-pentane; and (e) 100% methanol — n-pentane.
The n-pentane, ethanol, and methanol were carefully dried. It was assumed that in this way the last traces of water were removed from the fiber. From the last liquid of each series the fibers were dried in air at room temperature or in a vacuum desiccator at 60°C.
By replacing the reactive water by inert, especially nonpolar liquids and by removing these liquids, rather than water, from the fiber, it was expected that the molecular organization would remain better preserved.

1254 A. N. J. IIEYN
The best results were obtained with benzene and pentane. It is important that, according to nitrogen adsorption methods, these substances are known to preserve the largest internal surface of the fiber. They would, therefore, cause a smaller collapse of the molecular structure when used for drying than would polar liquids, such as water.
Liquids Above Critical Temperature. Another method followed was the one used by Kisiler9 for the preparation of aerogels. The method consists in removing the final exchange liquid at a pressure greater than the critical vapor pressure and at a temperature above the critical temperature, so that the liquid is first transformed into a gas, and the liquid-gas interface is destroyed before the liquid is removed.
This precludes the action of a fluid-gas interface which, presumably, induces the collapse of the amorphous region during drying. n-Pentano, which has a critical temperature of 197°C. at a pressure of 33 atm., was used. It is interesting that after this high temperature treatment the cellulose was apparently undamaged. This can be understood because oxygen and water were absent. On the other hand, it has been shown10'11 that heat damage occurs between 260 and 300°C. and that the presence of oxygen and water greatly increases the effect.
Freeze-Drying. Freeze-drying has been found to be a useful method for retaining many fine structures of biological origin. The use of this technique to prepare amorphous sugars and other normally crystallizable substances is well known.12'13 The water-wet samples were placed in glass containers and were frozen in the wet state with standard equipment in a Dry Ice-acetone mixture at —70°C. or in liquid nitrogen; in the latter case w-pentane was used as an intermediary liquid to prevent formation of air insulating gas layer around the sample. After 24 hr. in a lyophilizer, the samples were dry.
CrosslinkingBy crosslinking the cellulose in the undried fiber before removal of the
water it was expected that the original state of the molecules would be reinforced and stabilized, and thus remain better preserved during the removal of the water.
The crosslinked material was prepared according to Goldthwait’s procedure14 as modified by Reeves et al.,18 a solution of 19.5% or 9.5% hydrochloric acid and 7.4% formaldehyde in water was used. The undried fibers remained in this solution for 15-60 min., after which time they were washed and dried in air. Control experiments were also prepared with standard dry fiber.
Diffractometer TracesThe x-ray traces were obtained with a standard Norelco diffractometer
with the use of nickel-filtered copper radiation and a pulse height analyzer for discrimination to provide a high degree of monochromatization. The incident x-ray radiation was carefully standardized by use of a brass stand
CRYSTALLINE STATE OF CELLULOSE 1255
ard. The same scaling multiplier and time factors (16-1-4) were used throughout this work. One unit of the graph is equivalent to 6 counts/ sec.
The dry diffractometer specimens were prepared according to the method of Segal16 and of Nelson and Schultz.17 The fibers were first passed through a Wiley mill and pressed at 25,000 psi into flat platelets of 1 X 2 cm. with a dry weight of 100 mg. A few drops of a 1% solution of cellulose acetate in amyl acetate were added to the pellet for better coherence, after which it was pressed again to remove excess liquid. After drying, the pellet was pressed once more before being placed in the diffractometer. This method was found to give very reproducible results. Experiments with whole fibers mounted parallel in special holders gave comparable results, but at a lower intensity and with larger variation.
Density Measurements
The density measurements were carried out with a density gradient tube according to the technique of Orr18 with carbon tetrachloride and hexane as gradient liquids. The method was modified by deliberately omitting the boiling with xylene, intended to remove the trapped air. I t was assumed thao the bulk density so measured would be an indicator for differences in the degree of dispersion or contraction of the amorphous phase. Hermans and Weidinger19 similarly endeavored to calculate the proportion of crystalline and amorphous cellulose from density measurements. Whatever the coi’rect explanation might be, the density measurements at least served as an indicator of changes in the noncrystalline portion of the fiber.
Differential Dye Test
This test was carried out according to the method of Goldthwait,20'21 as modified by Rebenfeld and Hong.22
RESULTS
X-Ray Data
In all 160 x-ray diffractogram traces were prepared; only a few representative traces are presented in the figures.
Undried Fiber. Figure la is a trace of pure water in the sample holder. The maximum at 26 21.3° is from the covering polyethylene film. Figure 16 is a trace of a mature fiber recovered under water from a boll harvested before opening. Figure lc is a trace of similar fiber collected from the boll in an atmosphere of 100% R. H., so as to maintain the same water content which existed in the living cell.
During the recording of the x-ray tracing, the original water content of these samples was maintained. The whole fibers were packed into a wet platelet of the standard size ( 1 X 2 cm.) in an aluminum sample holder, which, according to the method of Segal16 was subsequently closed off on the exposed side by a 0,5 mil polyethylene film,

1256 A. N. J. llE Y iï
The intensity of the 002, 101, and 101 peaks is lowest (10 units in Fig. 16, and 17 units in Fig. lc) in the wet samples. There is definite evidence of crystalline structure in spite of the almost complete absorption of diffraction by the large amount of water present. In parallel experiments it was shown that ground, highly crystalline cellulose, when saturated with water also gave diffractograms with similarly reduced intensities.23
Fig. 1. Diffractometer traces of: (a) pure water in the sample holder; (b ) water-wet fiber; (c) same fiber sampled at 100% R.H.; (cl) same fiber compressed in wet state at 25,000 psi; (e) same fiber dried overnight at room temperature and humidity; (/) same fiber passed and then dried at room temperature and humidity; (g ) a Deltapine control, dry.
Air-Dried Fiber. Figure Id is a trace of the first platelet (Fig. 16) after it had been pressed again with a pressure of 25,000 psi. Figure lc is a trace of the same platelet dried overnight in air, at room temperature; Figure I f is a trace of a commercial cotton, variety Deltapine, several years old, prepared in the standard way by passing the fibers through a Wiley mill and adding a slight amount of cement to the platelet for coherence.
The intensity of the 002, 101, and 101 peaks is highest in the commercial sample (71 units) and medium in the samples which were pressed (34 units in Fig. Id), or dried overnight (43 units in Fig. le) or pressed and dried
CRYSTALLINE STATE OF CELLULOSE 1257
Fig. 2. Diffractometer traces of: (a) filler dried from benzene; (b) same fiber, control,dried overnight from water.
(51 units in Fig. 1/). An increased definition and separation of the 101 and lOl peaks is also observed.
Whereas in the wet samples the main peak is located at 23°, in the dry samples it is located at 22.5°.
Figures 55 and 5c below also illustrate the distinct decrease in intensity of the 002 peaks of fibers dried only overnight at room conditions as compared with those of fibers stored for a longer period under room conditions (Deltapine standard).
Effect of Stretching of the Undried Fiber. Stretching of the fiber in water before drying was always found to result in slightly higher diffraction peaks in the dried samples as compared to unstretched samples, regardless of what the subsequent preparation has been.
Fiber Dried After Liquid Exchange. Fibers dried from ether after the water had been first exchanged by alcohol or Cellosolve, did not give a tracing greatly different from that of the directly air-dried fibers.
The diffractometer traces of fibers dried from benzene, (Fig. 2), however, differed in various ways from those dried from water. In the first place the 002 peak intensity was lower, and a less clear definition and separation of the 101, lOl peaks was observed. In the second place a much higher background was present between the 002 and 101 peaks. In the benzene- dried samples the intensity of the background at a position of 2d = 18-19° measured 14 units (Fig. 2a), against 10 units in a comparable sample dried overnight from the water wet state in air and which had a similar intensity of the 002 peak (Fig. 25).

1258 A. N. J . HEYN
Fiber Dried From Liquids Above Critical Temperature. Figure 3 shows diffractograms of amorphous cellulose and of fiber dried from pentane above the critical temperature (197°C.).
The maximum of the diffractogram of amorphous cellulose (ball-milled cotton) is located between 22 and 18°, at about 26 = 20°, just between the position of the 002 and 101 peaks of crystalline cellulose. This position corresponds with the location of greatest broadening (and resulting shift) of the 002 peak. The Deltapine control had an intensity of the 002 peak
DIFFRACTOMETER ANGLE 29, IN DEGREES
Fig. 3. Diffractometer traces of: (a) amorphous cellulose prepared by ball-milling; (b ) fiber dried above critical temperature from pentane; (c) same, after 30 hr. at room temperature and humidity; (d) same, dried from pentane in vacuum desiccator a t 33°C.; (e) Deltapine control.
of 65 and a background of 10 units (Fig. 3e). In the pentane-dried samples the background was 12 and 13 units, respectively, Fig. 35 and 3d). Lastly, in the pentane samples the 002 peak was broadened on the side toward the smaller angle. This broadening went hand in hand with a slight shift of the 002 peak toward a lower angle. This broadening will be explained in the discussion in relation to the following experimental data.
Freeze-Dried Fiber. The freeze-dried samples (Fig. 4o) show the same features as the pentane and benzene-dried samples. The 002 peak is still lower than those (about 50-55 units), if the pre-drying has taken place thoroughly by liquid nitrogen, The composite features indicate the lowest

CRYSTALLINE STATE OF CELLULOSE 1259
Fig. 4. Diffractometer traces of: (a) freeze-dried fiber, prefrozen in liquid nitrogen; (6) same, after 24 hr. a t room temperature and humidity; (c ) freeze-dried fiber, prefrozen in a Dry Ice-acetone mixture and thereafter kept for 24 hr. a t room temperature and humidity; (d) same fiber as in (a) but rewetted in water and dried at room temperature overnight.
degree of crystallinity of all samples studied (with the exception of the freeze-dried, crosslinked samples of Fig. 5a, to be discussed below).
After storing of the samples for 24 hr. the intensity of the 002 peak was increased to 62 units (Fig. 4c).
If a freeze-dried sample is rewetted in water and dried overnight at room temperature, a most striking effect is observed. The intensity of the 002 peak (Fig. 4d) increases to 80 units, which is even higher than that of the Deltapine standard. Also the 101 peak increases in intensity, and abetter separation occurs into 101 and 101 peaks; the background is greatly reduced. These component features indicate a high degree of crystallinity.
Crosslinked Fiber. The x-ray traces of crosslinked fiber (Fig. 5) show about the same features as those of the freeze-dried materials. A very high background intensity is observed, 15 units (Fig. 5a) against 11 units for the controls which had been dried directly during the same time, (Fig. 5b); all samples show the same intensity of the 002 peak.
Crosslinked, Freeze-Dried, and Benzene-Exchange, Freeze-Dried Fiber. The diffractograms of the fibers freeze-dried after crosslinking or liquid exchange into benzene are given in Figure 6.
In the crosslinked and freeze-dried sample (Fig. 6a), a very low 002 peak intensity of 51 is observed and a 101 peak height of 20 units against a

1260 A. N. J. IIEYN
F ig . 5. D iff ra c to m e te r tra c e s of: (a ) fib er cro sslin k ed w ith fo rm ol a n d d ried o v e rn ig h t a t ro o m te m p e ra tu re a n d h u m id ity ; l b ) n o n c ro ss lin k ed c o n tro l d ried o v e rn ig h t a t room te m p e ra tu re a n d h u m id ity ; (c) D e lta p in e con tro l.
background intensity of 14 units. Figure 6c is a diffractogram of a Deltapine control traced at the same intensity setting of the 002 peak but showing a background of only 8°. Figure 6b shows a noncrosslinked control dried overnight from water. The clear definition of peaks and the lower background in Figures 66 and 6c which are in strong contrast to the features of the crosslinked fiber indicate a lower crystallinity than in any of the other samples.
The benzene-exchanged, freeze-dried sample (Fig. 6d) shows the same features as that in Figure 6a, though to a smaller extent.
It was shown in parallel experiments that “cement-treated” samples gave almost identical curves, except at a slightly higher level.
Density Data
The results of the density measurements are given in Table I.The value (1.214) reported in the table for freeze-dried cotton is the
lowest ever reported for cotton. The subsequent increase of the density of the freeze-dried cotton can be explained by a steady penetration of the liquid into the amorphous portions of the fiber, probably replacing entrapped air (the amount of entrapped air might serve as a measure of the porosity). In the stretched fiber this penetration is apparently faster, perhaps as a result of ruptures in the outer and inner layers or of the forma-

CRYSTALLINE STATE OF CELLULOSE 1261
DIFFRACTOMETER ANGLE 26 IN DEGREESF ig . 6. D iff ra c to m e te r tra c e s of n o n c e m e n te d sam p les of: ( a ) fo rm o l-c ro ss lin k ed a n d
freeze-d ried fib er; (6) c o n tro l d ried o v e rn ig h t a t ro o m te m p e ra tu re a n d h u m id ity ; (c) D e lta p in e co n tro l, t r a c e d a t sam e in te n s i ty fo r 002 p e a k ; (d ) fiber freeze-d ried a f te r b e n ze n e liq u id exchange.
T A B L E ID e n s ity M e a su re m e n ts w ith C o tto n F ib e r fro m W h ic h W a te r H a s B een R e m o v e d in
V ario u s W a y s (M e a su re d a f te r 24 h r .)
F ib e r D e n s ity , g ./c c .N o rm a l, a ir-d rie d fro m w a te r 1 .5 5 0A m o rp h o u s, b a ll-m illed 1 .5 0 5B enzene, a ir-d ried 1 .5 1 0P e n ta n e -d r ie d , a b o v e c ritica l
te m p e ra tu re 1 .4 0 7F re e ze -d rie d 1 .2 1 4 -1 .2 4 0F re e ze -d rie d , a f te r 48 h r. 1 .2 8 2F re e ze -d rie d a f te r 7 d a y s 1 .5 0 4F re e ze -d rie d , s tre tc h e d 1 .5 0 4 -1 .5 2 9C ro ss lin k ed 1 .5 2 0
tion of irregular crevices in the amorphous portions during the collapse of the fiber.
The density value of the pentane “critically dried” fiber (1.407) is also a very low one. The density value of crosslinked fiber (1.520) corresponds very well with the one (1.525) reported by Reeves et al.15
1262 A. N. J. IIEYN
Differential Dye Results
The benzene- and pentane-dried samples after dyeing all showed a very high accessibility, as indicated by a brilliant green color, whereas the samples directly air-dried from the same bolls exhibited a red color, indicating a more compact structure.
DISCUSSION
From the above experiments, the following conclusions may be drawn regarding the state of cellulose in the fresh but mature, undried fiber and the extent of crystallization of cellulose during drying.
Since the diffractograms of the undried fiber always show some cellulose diffraction pattern, it must be concluded that crystalline cellulose does always occur in the mature fresh fiber. These observations do not support the hypothesis of Berkley and Kerr,2 according to whom cellulose would occur only in the amorphous form in the undried fiber. That these authors did not find any indication of a cellulose pattern in the diagram of undried cotton fiber (except after stretching) may probably be ascribed to their technique. Not only did they use the photographic recording method, but also they probably did not use monochromatized radiation. It is well known that the x-ray scattering effect by water is greatly increased when nonmonochromatized radiation is used. In the present study, a more highly monochromatized radiation was achieved than by the authors by use of the pulse height analyzer in addition to the nickel filter and the focusing effect, inherent to the diffractometer setup. The use of such discrimination and of a reflection technique should reduce the amorphous scattering of water.
In the experiments of Berkley and Kerr2 the much stronger water scattering may have easily “masked” or dissipated the diffraction effect by cellulose, particularly when the crystallinity was still low, as in the undried fiber. After the crystallinity had increased as a result of stretching, or as a result of direct drying (see conclusions below) the scattering by water was found no longer to mask the diffraction effect. The experimental observations of these authors may thus be explained without assuming an all- amorphous structure in the fresh fiber.
The reason for the use of indirect methods to remove the water in the present experiments has already been briefly mentioned in the introduction. Following modern views, the presence and removal of water would promote the crystallization of cellulose by enabling the formation of hydrogen bonds between hydroxyls between and within the cellulose molecules. The presence of a liquid-gas interface would moreover promote the “collapse” of the amorphous regions of the molecules into a denser arrangement, in- ducive to crystallization. In the absence of either water (pentane- and benzene-drying) or of an interface (freeze-drying and “critical temperature evaporation”), or after reinforcement of the molecules by crosslinking, the further collapse and crystallization would be inhibited and the original

CRYSTALLINE STATE OF CELLULOSE 1263
organization of the molecules in the fresh fiber might be expected to be maintained to a great extent. The density values and the differential dye tests show that a greater porosity and dyestuff accessibility results from these treatments, features which may be explained by a better preservation and a lower degree of collapse of the amorphous phase.
The experiments show that with samples from which the water has been removed in this indirect way, x-ray diffractograms with lower peak height, larger width, and higher background are obtained as compared to those from the directly dried samples. All of these features indicate that a lower degree of crystallinity exists in the indirectly dried than in the directly dried fibers. Since the indirect drying methods tend to preserve the amorphous structure better than the direct drying methods, it may be concluded that a greater extent of crystallization must occur during direct drying of the water-wet fiber than when the water is removed indirectly. This is in accordance with the modern views outlined above, according to which the presence of water and its gradual removal would induce crystallization and its absence suspend this process. The results with the rewetted, freeze-dried fiber are in agreement herewith. After rewetting the freeze-dried fiber and subsequently drying it from the water- wet state, the degree of crystallinity is found to be increased far above that of the freeze-dried material. I t appears as if after freeze drying the secondary crystallization process takes place only after rewetting of the fiber and subsequent direct drying from the water-wet state. In how far the indirect methods prevent any crystallization to take place at all cannot be decided from the data available. The fact that no completely amorphous structure was ever observed after indirect water removal is at least in agreement with the above findings concerning the presence of crystallinity in the undried fiber.
The results show that a further crystallization of cellulose, beyond the original crystallinity in the wet fiber, takes place during the drying from water and that this process, moreover, continues for some time afterwards; this is indicated by the still larger degree of crystallinity of old material which had been stored for some time.
An interesting observation is the unilateral broadening and slight shift of the 002 peak, described in the experimental part. This shift may be explained in the preset case by a superposition of an amorphous background above the ordinary diffraction pattern. The trace of amorphous cellulose has a maximum just between the two peaks (Fig. 4a). Its super position, therefore, will result indeed in a shift of the 002 peak toward a smaller angle. This shift has to be explained, therefore, by a decrease of crystallinity rather than by an increase of spacing in the microcrystallites.
I t should be emphasized, finally, that the present experiments were carried out with mature cell walls of cotton of which the major portion consists of secondary wall material. The question as to whether elongating primary walls (e. g\, coleoptiles) contain cellulose in a crystalline form is not answered by the present findings.

1264 A. N. J. IIEYN
T h e a u th o r w ishes, in th e firs t p lace , to th a n k D r. C a rl M . C o n ra d , C hief R e se a rc h C h em ist, P la n t F ib e rs P io n e erin g R e se a rc h L a b o ra to ry , fo r h a v in g m a d e th is re sea rch possib le d u r in g a m o s t in te re s t in g s ta y a t h is la b o ra to r ie s d u rin g th e su m m er of 1963, for th e m a n y v a lu a b le su g g estio n s a n d in sp ir in g d iscussions co n ce rn in g th is re sea rc h p ro je c t a n d fo r th e u n lim ite d u se of th e fac ilitie s o f h is lab o ra to rie s . H e expresses th a n k s to D r. L . N . W ise, D e a n of A g ric u ltu re , M iss issipp i S ta te U n iv e rs ity , a n d M r. R . A. ( I n for sam p les of c o tto n bo lls ; to M r. R . L . H o lm es fo r h e lp a n d use of th e fac ilitie s fo r e v a p o ra tin g p e n ta n e a t a te m p e ra tu re a n d p re ssu re a b o v e th e c ritic a l te m p e ra tu re ; to D r. Y. L. F r a m p to n fo r a ss is ta n ce a n d fac ilitie s fo r th e free z e-d ry in g e x p e rim e n ts ; to D r. M . L. N e lso n fo r fu rn ish in g th e d y e stu ff so lu tio n s ; a n d to M r. J . J . C reely a n d M r. W alte r D . K ing , for a ssis tan ce .
U se of a c o m p a n y a n d /o r p ro d u c t n a m e b y th e D e p a r tm e n t does n o t im p ly a p p ro v a l o r re co m m e n d a tio n to th e exclusion of o th e rs w h ich m a y also b e su itab le .
References1. H e y n , A. N . J . , P ro to pla sm a , 2 1 , 299 (1934).2. B e rk ley , E . E ., a n d T . K e rr , In d . E n g . ('h e m ., 38 , 304 (1946).3. P re s to n , R . 1)., T h e M o le c u la r A rch ite ctu re o f P la n t C e ll W a lls , W iley, N ew Y ork ,
1952, p . 176.4. R â n b v , B . (! . a n d J. L . K a tz m ire p a p e r p re se n te d a t F ir s t C e llu lose C onference,
C e llu lose R e se a rc h In s t i tu te , S y racuse , N . Y ., A p ril 24,1958.5. H e y n , A. N . J . , J . A p p l. P h y s., 26, 519 (1955).6. H e y n , A. N . J., J . A p p l. P h y s., 26 , 1113 (1955).7. H u n t, C. M ., R . L . B la ine , a n d J . W . R o w en , T e x t ile R es. J . , 20 , 43 ( 1950).8. M e rc h a n t, M . V ., T A P P I , 4 0 , 771 (1957).9 K is tle r , S. S., J . P h y s. ('h e m ., 36 , 52 (1932).
10. T a n g , W . K ., a n d W . K . N eill, A m . C hem . Soc. D iv . P o ly m e r C hem ., P re p rin t s , 4, N o . 2, 484 (1938).
11. W alte r , R . C ., K . C . B aas , a n d W . E . R o se v a ere , In d . E n g . C hem ., 40 , 158 (1948).12. M a n n , J . , P u r e A p p l. C hem ., 5 , 91 (1962).13. H igg ins, H . G ., C. M . S te w a rt, a n d K . J . H a rr in g to n , ./. P o ly m e r S c i. , 5 1, 59
(1961).14. G o ld th w a it, C. F ., T e x t i l e R e s 2 1 ,5 5 (1951).15. R eeves, W . A., R . M . P e rk in s , a n d L . H . C h an ce , T e x t ile R es. J . , 30 , 179 (1960).16. Segal, L ., T e x tile R e s. J . , 32, 702 (1962).17. N elson , M . L ., a n d E . F . S ch u ltz , J r . , T e x tile R es. J . , 3 3, 515 ( 1963).18. O rr, R . S., L . C. W eiss, H . B. M oore , a n d J . N . G ra n t, T e x tile R es. J ., 25, 592
(1955).19. H e rm an s , P. H ., a n d A. W eid in g er, J . A p p l. P h y s., 1 9 ,491 (1948).20. G o ld th w a it, C . F ., H . (). S m ith , a n d M . P . B a rn e t t , T e x tile W o rld , 97, (7 ) 105, 201
(1947).21. G o ld th w a it, C . F ., H . O. S m ith , a n d F . T . R o b e r ts , T e x tile R es. J . , 20 , 100 (1950).22. R e b en fe ld , L ., a n d H o n g W u , T e x tile R e s . 3 1 ,8 8 6 ( 1961 ).23. Segal, L ., p e rso n a l c o m m u n ica tio n .
RésuméO n a é tu d ié , p a r des m é th o d e s de d iffrac tio n a u x ra y o n s -X , la c r is ta llin ité d e la ce llu
lose d a n s la fib re d e c o to n n o n-sëchée , à p a r t i r d ire c te m e n t de la b a lle n o n o u v e r te m ais m û re e t les r é s u l ta ts o b te n u s o n t é té c o m p arés av ec la c r is ta llin ité de p o r t io n s de fib res o b te n u e s à p a r t i r d es m êm es é ch a n tillo n s séchés d ire c te m e n t ou b ien d o n t l ’e au a é té en lev ée d e d iffé re n te s m a n iè re s ‘in d ire c te s ’ d e façon à p ré se rv e r le m ieux p o ss ib le la s t r u c tu r e g én éra le . C es d iffé re n te s m an iè re s c o m p re n n e n t: (a ) éch an g e de so lvant., (6) ly o p h ilisa tio n , (c ) séchage a u d essu s d e la te m p é ra tu re c r itiq u e d es liq u id e s e t ( d ) séch ag e a p rè s q u e la cellu lose d e la fib re m ou illée so it p o n té e . L a d ifférence d e c ris ta l-

CRYSTALLINE STATE OF CELLULOSE 1265
Unité o b se rv ée e n tre les fib res séchées d ire c te m e n t e t in d ire c te m e n t in d iq u e q u ’u n p ro cessu s de c r is ta llis a tio n p e u t a v o ir lieu p e n d a n t le séchage d ire c t de la fib re m ou illée d ’e au . C e p ro cessu s d e c r is ta l lis a tio n e s t fa v o risé p a r la p ré sen ce d ’e au e t in h ib é ou em p ê ch é lo rsq u e la fib re e s t séchée in d ire c te m e n t. U n e a u g m e n ta tio n d u d eg ré de c ris ta l- l in ité d u e au m o u illag e p e u t ê tre ex p liq u é en a d m e t ta n t q u e la c ris ta llisa tio n , q u i a v a i t é té su p p rim é e d a n s la fib re séchée in d ire c te m e n t, a lieu u lté r ie u re m e n t p a r séch ag e d e la fibre rem ou illée . L e f a i t q u e les m é th o d e s in d ire c te s p ré se rv e n t e n tiè re m e n t ou p a r tie lle m e n t te lle s t r u c tu r e a m o rp h e p ré se n te o rig in e llem en t, e s t confirm é p a r la d e n s ité p lu s fa ib le e t p a r l ’a cc ess ib ilité p lu s é levée au x c o lo ra n ts d e te lles fibres.
ZusammenfassungD ie K r is ta l l in i tä t v o n Z ellu lose in d e r u n g e tro c k n e te n B au m w o llfa se r, frisch a u s d e r
u n g eö ffn e ten , a b e r re ifen K a p se l, w u rd e m it R ö n tg e n b e u g u n g sm e th o d e n u n te r s u c h t u n d m it d e r K r is ta l l in i tä t v o n T e ilen d e r F a se rn a u s d e r g leichen P ro b e v erg lich en , d ie e n t w ed er d irek c g e tro c k n e t w u rd e n o d e r a u s d e n e n d a s W asse r a u f v e rsch ied en en “ in d ire k te n ” W egen e n tf e rn t w o rd en w ar, d ie e ine besse re E rh a l tu n g d e r u rsp rü n g lic h e n S t ru k tu r g e w äh rle is te n so llten . D a z u g eh ö ren (a ) L ö su n g sm itte la u s ta u sc h , (6) G e frie r tro c k n u n g , (c ) T ro c k n u n g o b e rh a lb d e r k r itis c h e n T e m p e ra tu r v o n F lü ss ig k e ite n , (d ) T ro c k n u n g n a c h V e rn e tz u n g d e r fe u c h te n F a se r . D e r b e o b a c h te te U n te rsc h ie d in d e r K r is ta l l in i tä t zw ischen d irk e k t u n d in d ire k t g e tro c k n e te n F a se rn ze ig t, d a ss w ä h re n d d e r d ire k te n T ro c k n u n g d e r fe u c h te n F a se r e in K ris ta llisa tio n sp ro z e s s s ta t t f in d e n m uss. D iese r K ris ta llis a tio n sp ro z e s s w ird d u rc h d ie G e g e n w a rt v o n W asse r b e g ü n g s tig t u n d w ird bei in d ire k te r T ro c k n u n g d e r F a se r v e rh in d e r t. E in e Z u n ah m e des K r is ta ll in itä ts g ra d e s d u rc h B e fe u c h tu n g k a n n d u rc h d ie A n n a h m e e in e r K ris ta ll is a tio n , w elche in d e r in d ire k t g e tro c k n e te n F a se r u n te rd rü c k t w o rd en w ar, b e im d a rau ffo lg en d e n T ro c k n e n d e r w ied erb e fe u c h te te n F a se r e rk lä r t w erd en . D a ss d ie in d ire k te n M e th o d e n z u r G ä n ze o d e r zum T e il d ie u rsp rü n g lic h v o rh a n d e n e a m o rp h e S t r u k tu r e rh a lte n , w ird d u rc h d ie n ied rig ere D ic h te u n d d ie h ö h e re F a rb s to ffa u fn a h m e so lch er F a se rn b e s tä t ig t .
Received May 22, 1964 Revised September 4, 1964 (Prod. 4506A)
wÉuâwn nnjQYiinri'HSflT

JOURNAL OF POLYMER SCIENCE: PART A VOL, 3, PP. 1267-1278 (1965)
Heterogeneous Polymer Systems. I. Polymerie Oil-in-Oil Emulsions
GUNTHER E. MOLAU, Polymer and Chemicals Research Laboratory, The Dow Chemical Company, Midland, Michigan
SynopsisA n o v e l c lass o f em ulsions h a s b e en in tro d u c e d . E m u ls io n s o f th is c lass com prise
tw o im m isc ib le p o ly m e r so lu tio n s a n d a g ra f t co p o ly m er as a n em u ls ify in g a g e n t. T h e n a m e p o ly m e ric oil-in-o il em u lsio n s (P O O em u lsio n s) h a s b een su g g e ste d fo r th e new em ulsions. T h e c o n ce p t h as b e en v e rified w ith se v e ra l sy s te m s of p o ly m e r so lu tio n s . T h e p o ly m e rs u se d h e re a re p o ly (e th y l a c ry la te ) , p o ly (m e th y l m e th a c ry la te ) , p o ly s ty re n e , p o ly v in y lto lu e n e , p o ly -p -ie r/.-b u ty ls ty ren e , a n d a s ty re n e /a c ry lo n it r i le co p o lym er.
INTRODUCTIONA wide variety of definitions of the term emulsions exists in the literature.
According to Becher,1 “an emulsion is a heterogeneous system, consisting of at least one immiscible liquid intimately dispersed in another in the form of droplets, whose diameter, in general, exceeds 0.1 yu. Such systems possess a minimal stability, which may be accentuated by such additives as surface-active agents, finely divided solids, etc.”
Two types of emulsion are known: An emulsion of oil droplets in a continuous phase of water, and an emulsion of water droplets in a continuous phase of oil. The terms oil and water, as used in the literature, denote nonpolar and polar liquids in general. The question can be asked: Do these two emulsion types represent a limit, or are other emulsion types possible?
If “immiscible oils” or “immiscible waters” could be found, the possibility would arise that not one, but three classes of emulsions could be made, namely oil-oil (0/0) emulsions, oil-water (O/W) emulsions, and water-water (W/W) emulsions. Each of these three classes of emulsions would then consist of two emulsion types, depending on which phase is the continuous and which is the disperse phase (Fig. 1). Within each class, the two emulsion types should be invertible, as oil-in-water emulsions can be inverted into water-in-oil emulsions and vice versa.2
Of the three conceivable classes of emulsions, only the combination oil- in-water or, in more general terms, the combination nonpolar-polar, is described in the literature. The combination oil-oil or nonpolar-nonpolar and the combination water-water or polar-polar have been either not recognized or not seriously considered.
1267

1268 G. E. MOLAU
F ig u re 1.
The purpose of this paper is the verification of the existence of oil-in-oil emulsions. A mechanism of stabilization of oil-in-oil emulsions will be proposed in a subsequent paper, and water-in-water emulsions will be discussed in a future paper in this series.
RESULTS AND DISCUSSION
Principles of POO Emulsions
A general access to heterogeneous liquid systems consisting of two or more immiscible oils or waters is given when polymer solutions rather than low molecular weight materials are employed. Dobry and Boyer- Kawenoki3 have shown that solutions of two polymers in one solvent separate into two phases. Other authors4*'7 have confirmed the generality of the occurrence of phase separation of polymer solutions, and Scott8 has presented a thermodynamic treatment of the phenomenon. Systems with more than two phases can be obtained when more than two polymers are dissolved in one solvent.
Novel types of emulsions can be made with immiscible polymer solutions, namely oil-in-oil and water-in-water emulsions, if emulsifiers active in such systems can be found. It is conceivable that even a series of emulsions can be made which represents a gradual transition from entirely nonpolaroil-in-oil emulsions to very polar water-in-water emulsions. A series of this type would involve nonpolar polymers like polystyrene, polymers of medium polarity such as polyacrylates, polymethacrylates and polymeric alcohols like poly (vinyl alcohol), and highly polar polymers like polyelectrolytes. Indeed, the possibilities for making emulsions of this new type seem to be as wide as the field of polymer chemistry. Since the new emulsions are based on polymer solutions, the terms polymeric oil-in-oil emulsions (POO emulsions) and polymeric water-in-water emulsions (PWW emulsions) are proposed for these systems.
There are two major differences between polymeric emulsions and conventional emulsions: (1) the two phases of POO and PWW emulsions areof equal or similar polarity, while the phases of conventional emulsions are of opposite polarity; ($) the immiscibility of the two liquids employed in POO and PWW emulsions is a consequence of the incompatibility of the solutes, while the immiscibility of the liquids employed in conventional emulsions is a consequence of the incompatibility of the solvents (oil and

HETEROGENEOUS POLYMER SYSTEMS. I 1269
water). In POO emulsions, the solvent is the same in both phases, and the interface is comparable (for illustrative purposes) to a semipermeable membrane in osmosis: i.e., the solvent can pass freely between the phases; the solutes cannot.
One prerequisite for the preparation of oil-in-oil emulsions is fulfilled. Immiscible oils are now generally available because of the phenomenon of phase separation of polymers in solution. In order to prepare POO emulsions, another prerequisite must be fulfilled as well: emulsifiers must be found which are active in such systems. Since POO emulsions, by definition, consist of nonpolar, organic phases, a nonionic mechanism of stabilization has to be expected. This speculation suggests the use of polymeric materials which are similar to nonionic surfactants, i.e., materials which contain chains of different structure in the same molecule. Graft and block copolymers are polymeric materials which are formally similar to nonionic surfactants, and—without any implication as to their mechanism of stabilization—the idea to try graft and block copolymers as POO emulsifiers seems attractive, particularly since Bartl and von Bonin9 have successfully used a styrene-grafted polyethylene oxide) as an emulsifier in water- in-oil emulsions.
In Situ Generation of the Second PhaseConventional oil-water emulsions are made by agitating a mixture of oil,
water, and an emulsifier. Another possibility of making an emulsion exist in the case of POO-emulsions. There, an emulsion can cither be made by agitating a mixture of two immiscible polymer solutions with a POO emulsifier or by polymerizing a solution of a polymer in another monomer and thus ci eating the second phase in situ in a finely dispersed form. The latter method is particularly attractive, since formation of graft copolymer by chain transfer to the dissolved polymer occurs during the polymerization, if the chain transfer constant is of sufficient magnitude. A system should result in which the components of the graft copolymer are identical with the homopolymers in the two phases, thus assuring complete compatibility of each branch of the graft copolymer with the corresponding homopolymer. This compatibility aspect becomes important when the homopolymers are themselves random copolymers.
The partial polymerization of any solution of a polymer in another monomer should lead to the in situ formation of a polymeric oil-in-oil emulsion, provided that the dissolved polymer and the formed polymer are incompatible (which is usually the case) and that both polymers are soluble in the monomer which serves as the solvent. The emulsion stability would depend on the amount of graft copolymer formed during the polymerization.
The preparation of POO emulsions by in situ formation of the second phase and of the POO emulsifier will be illustrated here with the use of combinations of polystyrene with poly (methyl methacrylate), poly (ethyl acrylate), polyvinyltoluene, poly-p-ieri-butylstyrene, and a styrene/acrylonitrile copolymer as examples.

1270 G. E. MOLAU
The polymerization of a 6% solution of poly(ethyl acrylate) in styrene may serve as a typical example for the observations made during such a heterogeneous polymerization. The initial solution of poly(ethyl acrylate) is water-clear. It is homogeneous, i.e., it contains only one phase, since only one polymer is present. The system is still homogeneous after a minute amount of the styrene has been polymerized to polystyrene, since phase separation does not occur before a certain threshold value of composition which is called the “critical point.” After this point, two phases coexist which are solutions of both polymers, poly(ethyl acrylate) and polystyrene, in styrene. In one phase, which will be called the poly (el hyl acrylate) phase, poly(ethyl acrylate) prevails, and in the other phase, which will be called the polystyrene phase, polystyrene prevails. As the polymerization proceeds and more polystyrene is formed, the amount of polystyrene in the poly(ethyl acrylate) phase decreases, and the amount of polystyrene in the polystyrene phase increases. After a certain degree of conversion has been reached, there is practically only one polymer in each phase, so that the system consists then of a poly(et,hyl acrylate) solution in styrene and a polystyrene solution in styrene. More detailed information on phase equilibria of two polymers in one solvent can be found in the literature on phase separation cited above and in Tompa’s book on polymer solutions.10
Since the compositions of the two phases change as the polymerization proceeds, the refractive indices of the two phases also change, which behavior leads to a change in the appearance of the samples from water-clear to slightly hazy, turbid, and opaque. Occasionally, when the refractive indices of all constituents are practically identical, no haze or opacity can be observed. Such systems should not be mistaken for homogeneous systems, even if they look water-clear. A good phase contrast microscope often makes two phases visible in systems which appear entirely clear to the naked eye. Even if the phase separation cannot be made visible at all, the necessity of its occurrence can still be concluded from the bulk of experimental evidence, according to which polymers of sufficiently different structure are only very rarely compatible. The first occurrence of opacity in a polymerization does not necessarily indicate the critical point. However, the point of first opacity is often very near the critical point.
The first samples of a series taken during a polymerization occasionally separate into two liquid layers after a relatively short time because not enough graft copolymer has been formed after this polymerization time to give sufficient emulsion stability. In order to avoid confusion with the phenomenon of phase separation, this phenomenon of separation into two layers will be called here “demixing” (from the German enlmischen), since this term is commonly used in the German literature on emulsions (e.g., byE. Manegold).16 Demixing does not coincide with coagulation; it is a consequence of coagulation.
Another important phenomenon occurring during a heterogeneous polymerization is the change of the phase volume ratio as a function of the degree of conversion of the system. The phase volume ratio 'fr is defined

HETEROGENEOUS POLYMER SYSTEMS. I 1271
F ig . 2. P h a se v o lu m e ra tio a s a fu n c tio n of co n v ersio n fo r th e sy s te m 6 % p o ly (e th y l a c ry la te ) -p o ly s ty re n e -s ty re n e .
here as = A /B , where A is the volume of the phase of the polymer which was initially dissolved in the monomer and B is the volume of the polystyrene phase. The phase volume ratio could be measured as a function of degree of conversion, if the samples taken during the polymerization would readily demix. However, many POO emulsions are so stable that complete coagulation can be achieved only after long centrifugation times in an ultracentrifuge. A simpler way of obtaining a phase volume ratio curve is the preparation of a series of solutions, the compositions of which correspond to the compositions of samples taken during a polymerization, except that the graft copolymer, i.e., the POO emulsifier, has been omitted. Such solutions demix readily, since they are not emulsified, and an “approximate” phase volume ratio can be measured. The phase volume ratio obtained by this method is called approximate, because a certain error will be

1272 G . E . M O L A U
Fig . 3. 6 % P o ly (e th v l a c ry la te ) in s ty re n e , p o ly m e rize d to 6 .3 % c o n v ersio n : b e fo reth e invers ion p o in t.
F ig . 4. 6 % P o ly (e th y l a c ry la te ) in s ty re n e , p o ly m erized to 2 4 .4 % co n v ers io n : a f te r th ein v ers io n p o in t.
introduced by the omission of the graft copolymer. However, this error should be small, since the amount of graft copolymer formed during the polymerization is usually rather small.
The approximate phase volume ratio has been plotted in Figure 2 for the system poly(ethyl acrylate)—polystyrene-styrene as a function of the degree of conversion C. Before the critical point, the system is homogeneous, and no phase volume ratio exists. At the critical point, the polystyrene phase comes into existence. As the polymerization proceeds, the volume of the polystyrene phase increases and, consequently, the phase volume ratio decreases, because styrene (solvent) is transformed into polymer which, in turn, draws other solvent from the poly(ethyl acrylate) phase until the osmotic equilibrium is reached. This behavior has definite consequences with respect to the structure of the POO emulsion. Since

HETEROGENEOUS POLYMER SYSTEMS. I 1273
the polystyrene phase is, at first, very small, it is naturally the disperse phase of the POO emulsion. As the polymerization proceeds and the volume of the polystyrene phase increases at the expense of the volume of the poly (ethyl acrylate) phase (Fig. 2), a point is finally reached at which the polystyrene phase becomes too large to be disperse and the polyfethyi acrylate) phase becomes too small to be continuous. At this point, a phase inversion occurs. After the inversion point, the poly(ethyl acrylate) phase is disperse, and the polystyrene phase is continuous. During the polymerization of a 6% solution of polyethylacrylate in styrene, the phase inversion occurs at 10% conversion. Figure 3 shows the emulsion state before the inversion point, and Figure 4 shows the emulsion state after the inversion point. In both phase contrast photomicrographs, the poly- (ethyl acrylate) phase is white, and the polystyrene phase is black.
The occurrence of phase inversions in oil-water emulsions has been described at length in the literature,1’2 and a relation between the emulsion state and the phase volume ratio has been pointed out by several authors. A phase volume theory of the emulsion state based on purely stereometric grounds was proposed by Ostwald.11 Sherman12 has shown that the phase volume ratio at which inversion occurs can be a function of the emulsifier concentration. A dependency of the phase inversion point on the concentration of the POO emulsifier seems to exist also in POO emulsions. In several POO emulsion systems, a shifting of the inversion point to higher phase volume ratios (lower degrees of conversion) has been observed to occur when the concentration of the POO emulsifier is decreased.
In the polymerization of a 6% solution of poly(methyl methacrylate) in styrene, all samples before 13.5% conversion were water-clear, so that no phase contrast could be obtained under the microscope. The phase inversion must have occurred in this region, because the poly(methyl methacrylate) phase was the disperse phase after this region. The samples at conversions higher than 13.5% were opaque and looked very similar to the samples obtained during the polymerization of the poly(ethyl acrylate) solution. Since poly(methyl methacrylate) has no activated C—H bonds, it should have a lower chain transfer constant than poly (ethyl acrylate), which has C—H bonds activated by the ester carbonyls. Therefore, less grafting should occur ceteris 'paribus on the poly(methyl methacrylate) than on the poly(ethyl acrylate) and, consequently, the POO emulsion stability in the poly(methyl methacrylate) system should be lower than in the poly(ethyl acrylate) system, which is indeed the case. In the poly(methyl methacrylate) system, all samples taken during the polymerization demixed within three to four weeks, while the samples of the poly(ethyl acrylate) system were stable for at least half a year. The droplets in the former system were larger than the droplets in the latter system. The observation has usually been made that the average drop size in POO emulsions increases as the concentration of the POO emulsifier and the emulsion stability decrease.
Polymeric oil-in-oil emulsions are, by definition, emulsions of phases with similar polarity. The question arises: How similar can the polymers in the

12 7 4 G. E. MOLAU
Fig. 6. 10% Polystyrene in p-ierf-butylstyrene, polymerized to 7.8% conversion: atthe inversion point.
two phases be and still permit an emulsion to be made? In pursuit of this question, three POO emulsions have been prepared, the components of which have very similar structures.
The three systems are: polystyrene-poly-p-ier£-butylstyrene- p-tert-butylstyrene, polystyrene-polvvinyltoluene-vinyltoluene, and polystyrene- styrene/acrylonitrile copolymer-styrene/acrylonitrile. Phase separation occurs in each system. POO emulsions have been prepared by polymerization of 10% solutions of polystyrene in p-teri-butylstyrene, in vinyltoluene, and in a 75/25 styrene/acrylonitrile mixture. The same observations have been made in these systems as in the systems described above. All samples taken during the polymerization were opaque POO emulsions. Phase inversions took place during each polymerization. As typical examples, photomicrographs of samples taken during the polymerization of the solution of polystyrene in ¡»-ferf-bu*ylstyrene are shown here. Figure 5 shows

HETEROGENEOUS POLYMER SYSTEMS. I 1275
Fig. 7. 10% Polystyrene in p -te rt-b u tylstyrene, polymerized to 13.3% conversion:after the inversion point.
the system before the inversion point, Figure 6 shows the system at the inversion point, and Figure 7 shows the system after the inversion point. The polystyrene phase is black, and the poly-p-feri-butylstyrene phase is white in these pictures. Multiple emulsions can be observed in Figures 6 and 7 and also in Figure 4. The occurrence of multiple emulsions after the phase inversion point is a phenomenon generally observed in POO emulsions. The same phenomenon has been observed after phase inversions in oil-water emulsions.2’13 The phase inversion occurred at about 8% conversion in the system containing poly-p-feri-butylstyrene, at about 14% conversion in the system containing polyvinyltoluene, and at about 30% conversion in the system containing the styrene/acrylonitrile copolymer. The samples taken at less than 15% conversion demixed gradually over a period of half a year. The samples taken at conversions higher than 15% were stable for more than half a year. (Further polymerization of the solvent-monomers was inhibited with benzoquinone in all samples.)
Occurrence of POO Emulsions in the Literature
Although the existence of POO or PWW emulsions has hitherto apparently not been recognized, many authors have probably prepared materials which actually were POO emulsions but were not recognized as emulsions, since the true nature of such systems is revealed only when a phase contrast microscope is employed. The unusually high stability of many POO emulsions might often have disguised even the heterogeneous nature of the systems so effectively that they were mistaken for homogeneous systems. Occasionally, a so-called “compatibilization” of polymers by graft copolymers is mentioned in publications. In such publications, compatibilization apparently means making a heterogeneous two-polymer system homogeneous by blending in a graft copolymer, in the same manner as a heterogeneous system consisting of benzene and water is made homogeneous by adding methanol. However, the literature on phase separation

1276 G. E. MOLAU
and polymer incompatibility cited above and phase separation experiments which will be reported later suggest that a compatibilization of this type is not possible in heterogeneous polymer systems.
Recently, Hughes and Brown14 have studied the influence of styrene- grafted poly(ethyl acrylate) on the phase separation of poly(ethyl acrylate) and polystyrene in a common solvent. The authors grafted a poly(ethyl acrylate) latex with styrene and obtained a mixture of the graft copolymer with the two corresponding homopolymers. The graft copolymer was isolated from this mixture by a solvent extraction procedure. The authors obtained two distinct liquid layers when they dissolved pure poly(ethyl acrylate) and pure polystyrene in mutual solvents. When they dissolved their graft copolymer-homopolymer mixture in the same solvents, they no longer obtained two liquid layers, but solutions which they described as turbid. Then, the authors isolated the graft copolymer from their mixture and dissolved it together with pure poly(ethyl acrylate) and pure polystyrene in the same solvents. Again, the authors obtained turbid solutions which did not give two liquid layers. From these experiments, Hughes and Brown concluded that a property of the graft is its ability to “eompatibilize” poly(ethyl acrylate) and polystyrene in common solvents and that for the grafts and mixtures containing them, the two-phase separation could not be obtained.
Since Hughes and Brown had apparently prepared a POO emulsion rather than a homogeneous system, their experiments were repeated. The turbid solutions which Hughes and Brown had obtained, when graft copolymer was present in their system, were investigated with a phase contrast microscope. As expected, these turbid solutions were not homogeneous systems, but POO emulsions.
Observations which should be mentioned here were made by Bristow3 and Merrett.16 Bristow observed that “an interpolymer (prepared by mastication) caused a marked reduction in the speed of phase separation” in phase equilibrium studies in polymer-polymer-solvent systems. Merrett found that colloidal suspensions of solid polymer particles in organic solvents can be stabilized by graft copolymers, one component of which is identical with the polymer in this organic latex.
Direct Emulsification with Radiation Graft CopolymerPhase-separating solutions of two polymers in one solvent usually
demix within a few hours to give two liquid layers. POO emulsions can be prepared from such systems by adding small amounts of suitable graft copolymers. Such POO emulsions are stable for several days, weeks, or months, depending on the nature of the polymers involved. Preliminary experiments can be reported here, which were carried out in order to study the possibility of making POO emulsions with graft copolymers obtained by 7 -radiation grafting.
In order to prepare graft copolymers by this method, 20% solutions of polymers in monomers were irradiated in screw-cap bott les which were completely filled, thus excluding air almost entirely. The irradiations were

He t e r o g e n e o u s p o l y m e r s y s t e m s , i 1277
carried cut with a Co60 source at room temperature at a dose rate of 100 krad/hr., doses ranging from 0.25 to 4.00 Mrad being used. A linear dependency of the degree of conversion of the samples on the radiation dose was observed, and a phase inversion occurred after irradiation with 1.5 Mrad (20.6% conversion) during the irradiation of a 20% solution of poly(methyl methacrylate) in styrene.
While all samples of this series were still liquid after irradiation, all samples irradiated with doses higher than 0.75 Mrad were solid in a series of 20% solutions of polystyrene in methyl methacrylate. The POO emulsifier activity of the irradiated poly(methyl methacrylate) solutions in styrene was tested by adding 2% of these samples to a two-phase system obtained by dissolving 6% poly(methyl methacrylate) and 20% polystyrene in 74% benzene. (The 2% of emulsifier solution is based on the total two-phase mixture.) After agitating on a laboratory shaker, the samples were allowed to stand for observation. While the control sample with no emulsifier demixed within 8 hr., the samples with emulsifier demixed within a period of 75 hr., the demixing times depending on the radiation dose which the emulsifier solution had received.
The emulsifier activity of the samples obtained by irradiation of 20% solutions of polystyrene in methyl methacrylate was tested by adding 5% of these samples to two-phase ssytems obtained by dissolving 6% polystyrene and 20% poly(methyl methacrylate) in 74% benzene. The control sample with no emulsifier demixed within 6-7 hr. The samples with emulsifier demixed over a period of 5 to 6 weeks. The individual demixing times were again a function of the radiation dose which the emulsifier had received.
EXPERIMENTALPoly(ethyl acrylate) was prepared by emulsion polymerization according
to the method described by Hughes and Brown.14 Poly (methyl methacrylate) (du Pont Lucite) and polystyrene (Dow Styron 638) were molding grade production materials which were used without purification. The ieri-butylstyrene was the para isomer; the vinyltoluene was a mixture of isomers (60% meta + 40% para).
In order to prepare POO emulsions by in situ generation of the second phase, mass polymerizations of 6% or 10% solutions of polymers in monomers were carried out in a 3-liter resin flask equipped with stirrer, reflux condenser, and thermocouple. The polymerizations were carried out under nitrogen with a stirrer speed of 60 and 0.03% Bz20 2 as initiator. The temperature was 75°C. when acrylonitrile was present and 90°C. in all other cases. Samples were taken every 15 min. The solids contents of the samples were determined on a moisture balance. The conversion C was calculated from the solids contents S by the formula:
C = (S - P)/[ 1 - (P/100)]where P is the concentration of the dissolved polymer. S, P, and C are given in per cent, but the percentages of S and P are based on the entire system, while the conversion C is based on the monomer only.

1278 G E. MOLAU
The emulsion state of the samples was investigated by using a dark phase contrast microscope. In this type phase contrast microscope, the phase with the lower refractive index appears white. Refractive index measurements must accompany all investigations of POO emulsions in order to establish which is the disperse phase and which is the continuous phase. Refractive index measurements have also been used to confirm that the phase inversions observed are not optical illusions caused by a crossover point of the refractive index curves.
The author wishes to thank M r. H . L . Garrett for preparing the phase contrast photomicrographs, M r. P. A. T raylor for his general advice and assistance of the microscopic work, and D r. S. G. Turley for reading the manuscript. D r. T . Gillespie and D r. A. M . Schwartz (H arris Research Laboratories) contributed to this work by their combined interest and stim ulating discussions. Special thanks are due Dr. H . Kesk- kula for suggesting the field of research.
References1. Becher, P., E m u ls io n s , A C S Monograph No. 135, Reinhold, New York, 1057.2. Clayton, W., Theory o f E m u ls io n s , Blakiston, New York, 1954.3. Dobry, A., and F . Boyer-Kawenoki, J . P o lym er S r i . , 2, 90 ( 1947).4. Kern, R . I., and R . I. Slocombe, J . P o lym er S e i., 15, 183 (1955).5. Bristow, G. M ., J . A p p l. P o lym er S e i., 2, 120 (1959).6. Kern, R . I., J . P o lym er S e i., 21, 19 (1956).7. Voorn, M . J., Fortschr. H ochpolym er. Forsch., 1, 192 (1959).8. Scott, R . L., J . Chem . P h y s ., 17, 279 (1949).9. Bartl, H ., and W. von Bonin, M akrom ol. C hem ., 57, 74 (1962).
10. Tompa, H., P olym er So lu tio n s, Butterworths, London, 1956.11. Ostwald, W., K o llo id -Z ., 6 ,10 3 (1910); ib id ., 7 , 64 (1910).12. Sherman, P., Research (L o n d o n ), 8, 396 (1955).13. Seifritz, W., J . P h ys . C hem ., 29, 738 (1925).14. Hughes, L. J., and G. L. Brown, J . A p p l. P o lym er S e i., 7, 59 (1963).15. Merrett, F. M ., R icerca S e i., 25, 279 (1955).16. Manegold, E., E m u ls io n en , Strassenbau, Chemie und Technik Verlagsgesellschaft,
Heidelberg, 1952.
RésuméOn présente une nouvelle classe d ’émulsions. Les émulsions de cette classe sont
composées de deux solutions de polymères non-miscibles et d ’un copolymère greffé comme émulsifiant. Le nom Polymeric Oil-in-O il Em ulsion (POO-emulsions) a été suggéré pour les nouvelles émulsions. On a vérifié ce système avec plusieurs solutions de polymères. Les polymères employés ici sont le polyaerylate d’éthyle, le polyniéthacrylate de méthyle, le polystyrène, le polyvinyltoluène, le poly-p-feri-butylstyrène et un copolv- mère styrène/acrylonitrile.
ZusammenfassungEine neue Klasse von Emulsionen ist eingeführt worden. Emulsionen dieser Klasse
bestehen aus zwei nichtmischbaren Polymerenlösungen und einem Pfropfcopolymeren als Emulgator. Der Name Polymere Oel-in-Oel Emulsionen (POO-Em ulsionen) wird für die neuen Emulsionen vorgeschlagen. Das Konzept ist an mehreren Systemen von Polymerenlösungen verifiziert worden. Die hier benützten Polymeren sind Poly- äthylacrylat, Polymethylmethacrylat, Polystyrol, Polyvinyltoluol, PoIy-p-ieW-butyl- styrol und ein Copolymerisat von Styrol und A crylnitril.
Received July 10, 1964 (Prod. No. 4523A)

JOURNAL OF POLYMER SCIENCE: PART A VOL. 3, PP. 1279 1238 (1965)
Probabilistic Considerations of the Tactivity of Optically Active Polymers
TAIvAYUKI FUENO, RONALD A. SHELDEN,* and JL NJI FURUKAWA, Department of Synthetic Chemistry,
Kyoto University, Yoshida, Kyoto, Japan
Synopsis
The probability theory of M arkov chains used in the characterization of stereoregular polymers is extended to optically active high polymers. The degree of tacticity is expressed in terms of the transition probabilities for chain growth which is asymmetric with respect to selection of monomer unit configurations. The variation of the Bovey tacticities w ith the probability parameters is illustrated for the case of asymmetric, simple M arkov chains. The relations between tacticity and configurational asymmetry of optically active polymers are discussed.
I. INTRODUCTION
In a previous communication,1 we have dealt with the nonstationary process of linear copolymer chain growth on the basis of the Markov statistics and concluded that the copolymer composition tends to be anisometric with respect to the component monomers in its stationary limit, whenever the transition probabilities associated with the propagation step of copolymerization do not satisfy the stochastic reversibility. Thus for the occurrence of the so-called asymmetric polymerizations, whether asymmetric induction or selection, it is necessary only that in the chain propagation step the two conditional probabilities of persistence of the ultimate unit configurations, D and L, be unequal (DD ^ LL).
The above inequality for asymmetric polymerization can obtain when the selection of monomer unit configurations is governed by the statistics of either “asymmetric” Markov chains (LD ^ DD ^ LL ^ DL) 1 or Bernoulli trials (LD = DD 5 LL = DL).2 In the case of asymmetric-selection polymerization, the probability parameters can be evaluated from the reactivity ratios of the enantiomorphic monomers, which in turn are obtainable, at least in principle, by the usual copolymerization technique. On the other hand, in the case of asymmetric-induction polymerization, in which adding monomer has no asymmetric carbon, it is impossible to decide the statistical scheme only from the data for the degree of configurational asymmetry induced in the high polymers.
* National Science Foundation (U . S. A .) Regular Postdoctoral Fellow for 1963-64.
1279

1280 T. FUENO, 11. A. SHELDE1Y, .1. FURL'KAWA
In the present study, we consider quantitatively the relations between tacticity and configurational asymmetry of optically active high polymers in the stationary limit. Basically, the treatment is an extension of various statistical theories3-5 of polymer tacticity to cover the asymmetric Markov process, including the Bernoullian statistics as a special case. The relations obtained should be useful for discriminating between the two statistical schemes and for characterizing stereoregular asymmetric polymers.
II. GENERAL CONSIDERATIONS
We will be concerned with the polymer chain growth in which a chain- end sequence consisting of k monomer units selects a monomer unit configuration under the influence cf those k units, thereby forming a new monomer unit sequence of the length k in the chain end. We refer to these terminal sequences before and after the monomer addition as the states i and j, respectively. Each step of monomer addition is subject to the competition of the two possible elementary reactions, e.g.,
,----- * -wLDD—T)LT) + M —
I----- *■ — LDLState i (k = 3) States j ( k = 3)
If the conditional probability, ptj, of the transition from the state i to the state j is independent of the extent of polymerization, then the chain growth can be described by the statistics of the Markov type with a 2‘ X 2* stochastic matrix P, whose fth column and j th row elements are pij.i The transition probabilities are expressible in terms of the rates of the competing elementary reactions and are subject to the restriction:
mE Pa = 1
3 = 1
f = 1,2, . . . , mm = 2* (1)
Consider an interior sequence of k monomer units in a linear polymer molecule, the molecular weight of which is so great that the effect of initiation is negligibly small. We denote by Fi,i) the probability that the interior sequence be in the state i. The Markov process of chain growth is then represented by a set of simultaneous linear equations:
mE PvFP = FjW
i = 1
.7=1,2, . . . , m (2)
The probability Ft(i} is given by a nonvanishing root of eqs. (2), which is normalized in such a way that
E = i (3)

OPTICALLY ACTIVE POLYMERS 1281
The mathematical procedure for obtaining the above probability is formally identical with that used for calculating the fraction of a given monomer in a copolymer formed from 2k component monomers under the influence of the terminal unit alone. The result is1'4
= h / Z Pi (4)3 = 1
Here is the ith component of the unnormalized eigenvector corresponding to the unit eigenvalue of P, and is obtainable1 as the minor determinant of the fth column and fth row element in the singular determinant (5):
D = P u — 1 P 21
Pl i J»22— 1
P\n,
Pm 1 Pm 2
(5)
P2n, Pmm 1
Replacing and \j/j with the corresponding diagonal minors Dtt and Djjt we can rewrite eq. (4) as
= Dtl/ Z D„ (6)y=i
That is, the distribution of sequence states in a polymer chain is equal to the fractional distribution of the diagonal minors derived from the singular determinam (5).
Finally, the polymer tacticity can be expressed in terms of pertinent sequence distributions and, eventually, as the function of the transition probabilities alone. In the next section, the tacticity and configurational asymmetry of a polymer chain will be calculated for the cases of asymmetric Markov chains with k = 1 and 2. The cases in which k is greater than 2 will not be treated because they are of little practical significance.
III. RELATIONS BETWEEN TACTICITY AND ASYMMETRY
A. Simple Markov Chains ( k = 1)
In a simple Markov chain, only the terminal unit of the chain is responsible for the transition probability. We denote by pDd and pDl the conditional probabilities that in the propagation step a growing polymer carrying a terminal unit D selects the D and L configurations, respectively. Similar transition probabilities corresponding to persistence and alternation of the terminal unit L on propagation will be respectively denoted by pLl and pld- The fractions, FD(I), and F L(1), of D and L configurations existing in a high polymer are calculated from eq. (6), giving

1282 T. FUENO, R. A. SI1ELDEN, J. FURUKAWA
Fd(1) = (1 — Pll) / (2 — phi — Poo) = Pho/(pho + Pdl) (7 a)
7’l(1> = (1 — Pdd)/(2 — p ll — Pdd) = po l/ (¡Old + Pol) (7b)
The degree of configurational asymmetry, «d, which may be defined as the excessive fraction of D configurations in a high polymer chain, is expressed as
wo = 7 d<1) — Fl (1) = (pld — Pdl)/(pi.d + Pol) (8)
In eqs. (7) and (8), pld and Pol cannot both be zero.The degrees of polymer tacticity have been defined in two ways. One
is the Natta tacticity,6 which is defined as the fractions of the two adjacent monomer configurations (dyad ) that are isotactically bonded (DD or LL) or syndiotactically bonded (DL or LD) in a chain. The other class of tac- ticities, proposed by Bovey and Tiers,7 is concerned with the sequences of three consecutive monomer configurations (triad). These triads are said to be isotactic if they are in the DDD or LLL configuration, syndiotactic if they are in the DLD or LDL configuration, and heterotactic if they consist of one isotactic bond and one syndiotactic bond, i.e., DDL, DLL, LDD, or LLD.
In conformity with the definitions stated above, N atta’s isotacticity 70 and syndiotacticity *S0 of asymmetric polymers may be formulated as
h = Td<j Pdd + Fhmphh
= 1 — Zphopoij {poo + Pol) (9)
So = Fd(1)Pdl + Fhmphh,
= 2pldPdl/(Pld + Pot) (10)
In a similar fashion, Bovey’s isotacticity 7, syndiotacticity S, and hetero-tacticity H are calculated, giving
7 = F ^ p W + Fl^P ll1
= 1 + PloPol — 4joldPdl/(Pld + Pdi.) (11)
S = 7’D(1)pDr.pLD + 7',!,(I)pmPDr,
= PldPdi. (12)
77 = 7’d(1)(PddPdl + Pdi.Pll) + + Pi.dPdd)
= 4p LdPdl/(Pld + Pdl) — 2pldPdl (13)
These five tacticities are not mutually independent. First, it is apparent that 7 + S + 77 = 1 and 70 + *So = 1. Second, from eqs. (9)—(13), it can readily be verified that
70 = 7 + 77/2
So - S + 77/2 (14)

OPTICALLY ACTIVE POLYMERS 1283
1.0
0.8
0.6
RLD0.4
0.2
00 1.0
PrDL
Fig. 1. Contour diagram of the degrees of isotaetieity I (curves) and configurational asymmetry o>d (straight lines) as functions of the alternation probabilities for a polymer formed by the simple Markov mechanism.
Therefore, any two of the Bovey tacticities define the third as well as / 0 and S0. Further, those two Bovey tacticities just suffice to make possible the evaluation of the two independent probability parameters, pLD and pDL, which completely characterize the polymer molecules formed by the asymmetric, simple Markov mechanism. The Bernoullian case needs no separate consideration, since it is no more than a special case of Markov chains, in which pld + Pdl = 1 •
It is worthwhile to note here that the Bovey tacticities of an asymmetric polymer can be related with its Natta tacticities and the (degree of) configurational asymmetry by
The second terms in the right-hand sides of eqs. (15)-(17) represent the departure of the Bovey tacticities from the one-parameter theory7 in which the statistics of selection of tactic bonds is assumed to be Bernoullian.
In Figure 1 the (degree of) isotaetieity I calculated from eq. (11) is illustrated in the form of a contour diagram with pLd and pdl as variables. A family of straight lines radiating from the origin shows the dependence of the configurational asymmetry cop upon the two parameters.
On the basis of Figure 1 several points can clearly be stated, although some of them may have been obvious qualitatively. In the first place, the isotaetieity of a polymer tends to become large when either one of the two alternation probabilities is sufficiently small. In other words, when one
I = Io1 + Pi,dPdlu>d2
S = So2 + PldPdl“d2
H = 2I0So — 2pldPdlwd!
(15)(16)
(17)

1284 T. FUENO, R. A. SHELDEN, J. FURUKAWA
persistence probability (either pDD or jjll) is large, the other probability has little effect on the isotacticity.
Second, a set of p0L and pLD may be determined uniquely from known values of I and u>D of high polymers. This may serve as a resolution of the statistics governing asymmetric polymerization.
Third, although the isotacticity of a polymer must be large if the polymer has an appreciably high configurational asymmetry, the converse is not necessarily true. For instance, when / is as great as 0.9, uD can take on any value (including zero) between 0.932 and —0.932, depending on the asymmetry of the mode of chain propagation. Nonetheless, large configurational asymmetry is possible only for highly isotactic polymers since the greater the / value, the greater is the maximum possible value of |cod|. These mutual relations between I and cod are quantitatively represented by the inequalities:
2con2/ (1 + M ) < I < 1 (18)
or rather
0 < |coD| < (/ + v 7 :! -i S/)/-l (19)
which can be derived from eqs. (8) and (11) under the restriction that 0 < pld + Pdl N 2.
Figures 2 and 3, respectively, demonstrate the dependences of syndio- and heterotacticities of polymers on the probability parameters. Either may provide a check on the parameters obtained from the experimental values of / and coD with the aid of Figure 1 and on the applicability of the case k = 1.
Fig. 2. Contour diagram of the degrees of syndiotacticityS (curves) and configurational asymmetry wD (straight lines) as functions of the alternation probabilities for a polymer formed by the simple Markov mechanism.

OPTICALLY ACTIVE POLYMERS 1285
Fig. 3. Contour diagram of the degree of heterotacticity i f as a function of the alternation probabilities for a polymer formed by the simple Markov mechanism.
I t can be seen from Figure 2 that high syndiotacticity will be imparted to a polymer only when both alternation probabilities are so large that the polymer has no appreciable asymmetry. The degree of heterotacticity attains a maximum value 0.5 when pDD = pm, = pm = Pll = 1/2, as can be seen in Figure 3.
In principle, comparisons of the above theoretical results with observations may be attempted for polymers, for which the configurational asymmetry can be measured. Although the tacticity measurements by the NMR technique have been reported for polymers of methyl methacrylate,7 «-methylstyrene,8 styrene,9 propene,14 and methyl vinyl ether,10 no tacticity data are available as yet for those polymers having optical activity.
B. Markov Chains with Penultimate Effects Included ( k = 2)
When the configuration of the penultimate monomer unit also affects the selection of the configuration of adding monomer, there are eight possible elementary reactions of the type :
—XY + M — •~vYZ
with instantaneous probabilities of transition pxyz, where X, Y, and Z stand for either D or L. Since these eight parameters are subject to the four stochastic restrictions
P X Y D + P X Y L = 1 (20)
only four of them are independent. Here we will choose P d d d , P l l l , P d l d ,
and pldl as the independent parameters.The fractions, Fxy<2), of the dyads XY existing in a polymer are equal to

1286 T. FUENO, R. A. SHELDEN, J. F U RU K A WA
the relative magnitudes (normalized to unity) of the diagonal minors of the 4 X 4 determinant
D = ¡ P d d d — 1 o 1 — P l d l o
1 — P d d d — 1 P l d l 0
0 PdIjD “ 1 1 ~ Pu.l| 0 1 — Pdld 0 Plll — 1
(21)
where the dyads DD, DL, LD, and LL correspond to the rows from the top to the bottom, respectively. The results are
Fdd(2> = (1 ~ Plll)(1 — Pldl)A4. (22a)
Fll(2) = (1 — Pddd)(1 — P d l d ) / A (22b)
F n l <2) = / ' W 2 > = (1 — Plll)(1 — P d d d ) / A (22c)
where
A = (1 — Plll)(1 — P j.dl) +
(1 — Pddd)(1 — P d l d ) + 2(1 — Plll)(1 — P d d d ) (23)The expressions (22) are identical with those given by Miller3 and by Price.4
The fractional distributions, FD(2) and Fl(2), of the D and L configurations are given by
Pd<2) = F d d ® + P l d (2 ) (24a)
P i . (2 ) = P l l <2) + P d l (2 ) (24b)respectively. The configurational asymmetry of a polymer is then expressed as
0 )D = Fn(2> — FL(2) = Fd»(2) — F l l <2) (25)
which does not vanish unless the following relation holds:
(1 — Plll)/(1 — P d d d ) = (1 — Pdld)/(1 — p l d i J (20)Obviously, the Natta tacticities are
h = / 'W 2) + Fhlp (27)
-So = f W 2) + F ld(2) = 1 - h (28)while the tacticities consistent with Bovey’s definition arc
I = Fdd(2,Pddd + Fll(2)Plll (29)
S = Fdl(2)Pdld + F ld(2)Pldl (30)
H — Fdd(2>Pddl + Fdl(2)Pdll + Fld(2,Pldd + Fll(2)Plld
= 1 - I - S (31)
Again, the relations (14) hold, whether the Markov process under consideration is symmetric or not.

OPTICALLY ACTIVE POLYMERS 1287
Thus we have only three independent physical quantities, coD, /, and S, related to four unknown parameters. In order to characterize the polymer, therefore, at least one more independent piece of experimental information is required
IV. DISCUSSIONSo far, considerations have been confined to the characterization of an
asymmetric polymer which is formed at a single type of catalytic site. The situation becomes a bit more complex when one considers the possibility that a catalyst provides more than one type of active site participating in the propagation reaction, thus giving mixtures of polymer chains of various stereospecific properties. For instance, the fact that the formation of stereoregular polymer is often accompanied by the formation of a certain amount of amorphous polymer emphasizes the importance of this possibility. In the case where there are only two types of catalyst present, one giving amorphous and the other giving crystalline polymer, separation of the two polymer fractions permits the application of the theory to each fraction separately.
In discussing the mechanism of stereoregular polymerization by heterogeneous catalysts, Schuerch12 first suggested the possibility that in some cases of catalysis giving isotactic polymer the propagation reaction at a particular catalytic site conforms to asymmetric statistics favoring either D or L configuration and that the entire sample of catalyst contains equal numbers of left- and right-handed sites. In the polymerization of racemic monomers, then, a “quasi-racemic” mixture of optically active polymer chains would be formed. If the quasi-racemic polymer formed could be optically resolved, it would be possible to characterize each of the quasi- enantiomorphic polymers by the present theory. Probably, the argument can be extended to include the situation that a catalyst may carry equal numbers of left- and right-handed sites with various abilities of stereoregulation.
In considering the possibility of Schuerch’s “dual-site” mechanism, the experimental results of the copolymerization between D- and L-propylene oxides conducted recently by Tsuruta et al.13 are interesting. The enantiomeric monomer mixtures were copolymerized at various feed ratios by use of an optically inactive, yet stereospecific, catalyst (ZnEt2—ROH). Optical activity of the gross polymer obtained was found to be proportional to that of the monomer feed, and the unreacted monomer mixture had the same optical activity as did the feed mixture. These results indicate that the apparent monomer reactivity ratios are rD = rL = 1 and, hence, that the chain growth as a whole obeys the Bernoullian statistics. Further, the polymer was fractionated with a solvent into crystalline and amorphous parts, which respectively showed higher and lower optical activities than would be expected from the observed mode of monomer consumption, i.e., the overall polymerization behavior obeying the Bernoullian statistics. These observations seem to be explainable only by assuming the presence

1288 T. FUENO, R. A. S1IELDEN, J. FURUKAWA
of equal numbers of D- and L-catalyst sites, each biased to select one configuration. Perhaps, the tacticity-asymmetry relations can be analyzed by the present theory when tacticity data become available.
Conceivably, there are some cases of asymmetric polymerization where the Markovian statistics breaks down. For example, the statistics is non- Markovian when a given catalytic site exists in more than one reactive state in dynamic equilibrium during the growth of a chain as in the mechanism proposed by Coleman and Fox14 for homogeneous anionic polymerization. The results of the present asymmetry considerations are, of course, not applicable to such non-Markovian processes.
References1. Fueno, T., and J. Furukawa, J , Polymer Sei., A2, 3681 (1964).2. Frisch, H. L., C. Schuerch, and M. Szwarc, J . Polymer Sei., 11, 559 (1953).3. Miller, R. L., and L. E. Nielsen, J . Polymer Sei., 46, 303 (1960); R. L. Miller,
ibid., 56, 375 (1962).4. Price, F. P., J . Chem. P hys., 36, 209 (1962).5. Johnsen, U., K olloid-Z., 178, 161 (1961).6 . Natta, G., J. Polym er Sei., 16, 143 (1955); ibid., 20, 251 (1956).7. Bovey, F. A., and G. V. D. Tiers, ./. Polymer Sei., 44, 173 (1960); R. A. Bovey,
ibid., 46, 59 (1960).8 . Brownstein, S., S. Bywater, and D. J. Worsfold, M akromol. Chem., 48, 127 (1961).9. Brownstein, S., S. Bywater, and D. J. Worsfold, J . P hys. Chem., 6 6 , 2067 (1962).
10. Stehling, F. C., J . Polymer Sei., A2, 1815 (1964).11. Brownstein, S., and D. M. Wiles, J . Polymer Sei., A2, 1901 (1964).1 2 . Schuerch, C., J . Polym er Sei., 40, 533 (1959).13. Yoshida, N., M. Yokota, S. Inoue, and T. Tsuruta, papers presented at the 17th
Annual Meeting of the Japan Chemical Society, Tokyo, April 1964.14. Coleman, B. D., and T. G Fox, J . Chem. Phys., 38, 1065 (1963).
RésuméOn étend la théorie des probabilités des chaînes de Markov, utilisée pour la carac
térisation des polymères stéréoréguliers, aux hauts polymères optiquement actifs. On exprime le degré de tacticité en fonction de la probabilité de transition d'une chaîne en croissance assymétrique, en tenant compte du choix de la configuration de l’unité monomérique. La variation de tacticité selon Bovey avec les paramètres de probabilité, est illustrée par des chaînes de Markov simples et. assymétriques. On discute les relations entre la tacticité et l’assymétrie configurationnelle des polymères optiquement actifs.
ZusammenfassungDie zur Charakterisierung von stereoregulären Polymeren angewendete Wahrschein
lichkeitstheorie von Markov-Ketten wird auf optisch aktive Hochpolymere ausgedehnt. Der Taktizit.ätsgrad wird durch die Übergangswahrscheinlichkeit für das Kettenwachstum, welche in Bezug auf die Auswahl der Monomerbausteinskonfiguration unsymmetrisch ist, ausgedrückt. Die Abhängigkeit der Taktizität nach Bovey von den Wahrscheinlichkeitsparametern wird für den Fall von asymmetrischen, einfachen Markov-Ketten gezeigt. Die Beziehungen zwischen Taktizität und Konfigurationsasymmetrie von optisch aktiven Polymeren werden diskutiert.
Received July 22, 1964 (Prod. No. 4516A)

JOURNAL OF POLYMER SCIENCE: PART A VOL. 3, PP. 1289-1302 (1965)
B ranch ing in Poly (butadiene-co-sty ren e ) . I. B ranch ing D eterm ined by V iscom etry
and U ltracen trifuga tion
J. BLACHFORD and R. F. ROBERTSON, Department of Chemistry, McGill University, Montreal, Quebec, Canada
SynopsisA sample of poly(butadiene-co-styrene), SBR, was divided into twelve fractious by
precipitation from a dilute benzene solution. The intrinsic viscosities [ j? ] and weights of all the fractions were measured, and the sedimentation coefficients so were determined for the nine fractions of highest molecular weight. From the values of [i;] and s» the number of crosslinks per molecule m, was calculated for each fraction. The results indicated that only the four fractions of highest molecular weight contained crosslinked molecules. The number of crosslinks per weight-average primary (prior to cross- linking) molecule for the entire sample, So, was obtained from the weights of the fractions and the values of m. By use of various theories, values of So of 0.78, 0.56, and 0.38 were obtained. From the values obtained for [tj] and s0 and the pycnometric partial specific volume of the polymer in benzene, the molecular weights M of the nine fractions of highest [77] were calculated. The molecular weights of the remaining fractions were calculated from the relation between M and [77] obtained by others. A molecular weight distribution curve was established and used to obtain So <0.36.
INTRODUCTIONIf poly (butadiene-co-styrene), SBR, is polymerized at a high temperature
or to a high conversion, some of the polymer molecules will be branched. The occurrence of branching is revealed by the formation of an insoluble gel under certain polymerization conditions. Branching may involve either trifunctional or tetrafunctional units. Tetrafunctional branching is generally called crosslinking. According to the experimental results of Morton,1 almost all the branching in SBR arises from crosslinking. Cragg and co-workers2’3 have examined the relative amounts of crosslinking in SBR polymerized under various conditions, and concluded that the Huggins’ constant4 increases with the extent of crosslinking.
In the present paper a quantitative determination is made of the degree of crosslinking and the distribution of the crosslinks in a sample of SBR. Similar studies have been made by Thurmond and Zimm6 on polystyrene, by Guillet6 on polyethylene, and by Sent! et al.7 on dextran.
To determine the number of crosslinks per molecule it is necessary to know the ratio of the intrinsic viscosity of the molecule to that of a linear molecule of the same molecular weight. In the present work, a relation
1289

1290 J . B L A C H F O R D A N D R . F . R O B E R T S O N
between the intrinsic viscosity and the sedimentation coefficient is proposed to obtain this ratio. This method, in conjunction with several theories, can be used to estimate the degree of crosslinking in fractions of a sample of SBR. By using the weights of the fractions together with the degree of crosslinking in each fraction, the amount of crosslinking in the unfractionated sample can be calculated. From the experimentally determined molecular weight distribution another estimate can be made of the amount of crosslinking in the unfractionated sample. The results of these two methods have been compared with those obtained from a study of the radiolysis of SBR reported in another paper.8
THEORETICAL
The sedimentation coefficient s0 is related to the molecular weight M and the molecular frictional coefficient/0, by the Svedberg equation:9
So = M(1 — v0po)/Nfo (1)
In this equation p0 is the density of the solvent and v0 is the polymer partial specific volume. Flory has derived the relation10
h = voP'(s?yA (2)where vo is the solvent viscosity, P' is a “universal” constant, and (So2) is the mean-square radius of gyration at the theta temperature. Another relation from the treatment of Flory* is
M = 4>'[iS?)/M}3/>Ml/' (3)where 4>' is also a “universal” constant. The ratio (S02)/M is also a constant for a given polymer-solvent system.
The ratio of the mean-square radius of gyration of a branched molecule to that of a linear molecule of the same molecular weight is denoted by g, where g has been related13 to rn, the number of cross-links per molecule.
It has frequently been assumed6'10 that eqs. (2) and (3) may be written for branched molecules in the form
C/o) br = VO P '(S?y/2g‘A (4)Mbr = 4>[(V )/M ]i/!M V ’ (5)
Equation (5) indicates thatMbr/Mlin = ga/l (6)
Stockmayer and Fixman14 suggested that the effective hydrodynamicradius of a polymer molecule is less sensitive to branching than is the radius of gyration. They derived the relation
(/o)br = P'vo(S?yAh (7)* The treatment of Flory is not entirely correct. Krigbaum and Carpenter,11 for
instance, found that <t>’, decreases as the “goodness” of the solvent increases. Several theories12 maintain that the chief reason for the discrepancy between Flory’s theory and experiment is due to his assumption that the polymer segment density is Gaussian at all temperatures. Despite these objections Flory’s theory is used here.

B R A N C H I N G I N P O L Y ( B U T A D I E N E - c o - S T Y R E N E ). I 1291
where h is the ratio of the effective hydrodynamic radius of a branched molecule to that of a linear molecule of the same molecular weight. They related h to g, and found that h is less sensitive to branching than is gl/\ In view of the general experimental validity of eqs. (2) and (3) for linear polymers, they assumed that the ratio of effective hydrodynamic radii of branched to linear polymers obtained for the friction coefficient could also be used to discuss viscosity. This assumption leads to
b k = 4>'{(S?)/M]^M^h3 (8)and
Mbr/Miin = h3 (9)Zimm and Kilb15 have recently derived the relation
Mbr/M.in = g h (10)Equations analogous to eqs. (4) and (5) can be written
( / o ) b r = ^ P ' b r O V V V 8 ( 1 1 )
M b r = * ' b : r K W M f ’M ' V * ( 1 2 )
where P \ r and 4>'ht might vary. The theories of Bueche16 and of Kotliar and Podgor17 are in good agreement with the last relation. Furthermore, the results of two investigations18,19 on monodisperse polystyrene support the Zimm and Kilb theory.
On combining eqs. (1), (2), and (3) for linear polymers one obtains
(So).inMnnVYM2/3 = (tfOun^POlin-Kl - VoPo)/voN (13)
where the subscript (lin) has been added to denote linearity. The term (0/)iin,//3(jP')iin—1 has been found experimentally to have the value 2.5 X 10⁶ for linear flexible chain molecules.
For branched molecules, each of the three sets of eqs. (1), (4), and (5);(1), (7), and (8); and (1), (11), and (12) leads to
(so)„rMbr'/3Al/2/i = (« ¿ W O b r-K l - voPo)/voN (14)According to the theories of Flory and of Stockmayer and Fixman
( 4 ) b r = ( 4 ) l i n
and( P I b r = ( P ' ) l i n
Experiments with branched and linear dextrans7 indicate that the product (<t>')'/‘(P ')_1 is unaffected by branching. This finding leads to the assumption that
(^»Olin^POlm-1 = (^Obr^Obr-1when interpreting results by using the Zimm and Kilb theory. If the value of M is the same in eqs. (13) and (14), then
Vs(So) l in lt7 ] l in (S o )b r [ ? /]b r (15)

1292 J. BLACKFORD AND R. F. ROBERTSON
At temperature greater than the theta temperature, eqs. (2) and (3) for linear molecules become10
fo = ho ] P W ) ,/!a (16)and
h] = 4>'[(S?)/M]‘hM lhaz = KMa (17)
where a is the excluded volume factor and K and a are constants. On combining eqs. (1), (15), and (17), the excluded volume factor a cancels out and eq. (13) results. It can be assumed that a also cancels out in the case of branched molecules. Equations (6), (9), and (10) are strictly valid at the theta temperature only, but experimental evidence6,19 indicates that the use of temperatures above the theta temperature leads to negligible errors.
Eliminating M between eqs. (13) and (17) leads to
(so)nn = Ash],in7 (18)
where Ks and y are constants andy = (2 — a)/‘¿a
Schumaker19 has derived a similar equation. Substituting eqs. (18) into eqs. (15) gives
K s h £ ' ' + 1 ) /3 = ( S o ) b r h ] b r ‘/3 ( 1 9 )
If y, K s, (so)br and hW are known, the value of h]n„ can be obtained from this equation. From the ratio h]br/h]iin a value of g can be calculated by using eqs. (6), (9), or (10). From g the number of crosslinks per molecule, m, can be obtained by using the Zimm and Stockmayer relation.13 The weight-average number of crosslinks per molecule, mw, for the entire sample can be calculated from the weights of the fractions and the values of in for each fraction. The number of crosslinked units per weight-average primary molecule 50 is related5,14'15 to mw by
m* = S0/ (1 - S„) (20)There are several advantages to this method of finding g over that
employing the molecular weight. In a sample containing highly cross- linked molecules there is likely to be some microgel. Even a very small amount of microgel will have a major effect on the accuracy of light- scattering experiments,21 but will have an insignificant effect in ultracentrifugation. Equation (4), (7), or (11) in conjunction with eq. (1) indicates that (so)br is greater than (s0)im while h]br is less than h]nn. Therefore, the effect of branching is more pronounced when the quantities [17] and s0 are employed rather than [97 ] and ilf.
EXPERIMENTAL
The SBR sample, obtained from the Polymer Corporation, Sarnia, Ontario, was prepared by emulsion polymerization and contained im

BRANCHING IN POLY(BUTADlENE-co-STYRENE). I 1293
purities of fatty acid soap, fatty acid, and Polygard antioxidant. The conversion was 70 ± 2%. The manufacturers estimated that the styrene content was 28.7% and that 20% of the polybutadiene portion was vinyl- 1,2, 7% was as-1,4, and 73% was trans-1,4. According to Binder22 these values indicate that the polymerization temperature was about 5°C.
Reagent grade benzene and methanol obtained from Fisher Scientific Company were used as received. The antioxidant A-phenyl-d-naphthyl- amine, was obtained from Eastman Organic Chemicals.
FractionationThe fractionation technique employed was almost identical to that de
veloped by Cragg.23 A solution of 15 g. of SBR in 1500 ml. of benzene was prepared in a 3-liter stoppered separatory funnel maintained at 25 °C. in a constant temperature bath. A precipitant of 50% methanol in benzene was added to the solution with vigorous stirring until the solution became so turbid that the stirrer shaft was not visible in the illumination of a 100-w. light bulb held behind the bath. The temperature of the bath was increased very slowly with stirring, until the cloudiness just disappeared. At this point heating was stopped, and the bath was allowed to cool to 25°C. Stirring was then stopped, and the polymer phase allowed to precipitate for 24 hi-. At the end of this period the precipitate was drawn off into a stoppered 100-ml. flask. A small amount of antioxidant was added and the volume made up to 100 ml. by the addition of benzene. The weight of each fraction was obtained by a freeze-drying technique. Twelve fractions were obtained in this manner.
ViscosityA modified Ubbelohde viscometer, designed by Craig and Henderson24
for a negligible kinetic energy correction, was used to measure the intrinsic viscosity of each fraction at 25 ± 0.05°C. Dust was removed from the solvent, benzene, and from the solution by filtration through sintered glass. The validity of the method of dilution was established by the determination of the solids content after the final dilution.
To detect any dependence of viscosity on shear rate a four-bulb viscometer was also employed. This viscometer was a modified form of the suspended-level dilution capillary viscometer of Schurz and Immergut.25
Partial Specific VolumeFourteen density determinations were made over the concentration
range 35.9-2.60 g./l. in a 25-ml. pycnometer, and the partial specific volume was calculated by Kraemer’s formula.9
UltracentrifugationSedimentation velocity measurements were made in a Spinco Model E
ultracentrifuge equipped with Schlieren optics employing a Wolter phase plate as the opaque element. Throughout the experiments the rotor

1294 J. BLACITFORD AND R. F. ROBERTSON
temperature was maintained at 25 ± 0.5°C., the rotor speed was 59,000 rpm, and the phase plate angle was either 50° or 60°. Standard double- sector cells were used with solvent in one channel and solution in the other.In each sedimentation study about 12 photographs were taken at 16-min. intervals starting at some suitable time after the rotor had attained the desired angular velocity. Each fraction was examined at several concentrations between 0.7 and 0.1 g./lOO ml. of solution. However, a few experiments were made at higher concentrations.
RESULTS
Fractionation
The weight of polymer in each fraction is given in Table I. These fractions are numbered according to the order in which they were precipitated. The sum of the weights is 11.76 g. After the withdrawal of the last fraction a small amount of polymer and impurities having a total weight of 1.47 g. remained in solution. Approximately 88% of the original 15 g. of sample can thus be accounted for. The amount of impurities in the starting material was determined by the standard method26 and accounts for 6.73% of the sample. Therefore about 3% of the polymer remains in solution. Since the moisture content of the SBR was negligible, the loss in material must be related to adsorption of some of the polymer on the sides of the separatory funnel, and to errors in the pipet deliveries arising from the high viscosity of the polymer solution.
From the weights and intrinsic viscosities of the fractions the intrinsic viscosity of the unfractionated polymer was calculated to be 2.55. This value is slightly greater than 2.31 found by the direct measurement of the [77] of the unfractionated polymer. This discrepancy indicates a loss of low molecular weight material during fractionation.
Viscosity
Linear plots of the reducec viscosity, Vsp/c, against concentration c were used to determine the intrinsic viscosity [77] of the fractions. No shear rate effect was found, even for the fractions of highest [77]. The results of Table I show that [77] steadily decreases from fractions 1 to 12.
Values of the Huggins’ constant, fc', given in Table I, were calculated from the slopes of the 7?sp/c versus c plots by using the equation
W c = M + fc'M2c (21)An accurate value of fc' could not be calculated for fraction 12 because of major scatter in the plot of t)sv/ c versus c. For fractions with high intrinsic viscosities fc' tends to increase with [77].
Another method of calculating [77] employs a plot of In i)r/c versus c, where rjT is the relative viscosity. Values of [rj] obtained by this method were in good agreement with those obtained from plots of 77sv/c versus c for fractions with fc' < 0.30. For fractions with higher fc' values, plots of

BRANCHING IN POLY(BUTADIENE-co-STYRENE). I 1295
TABLE ISolution Properties and Molecular Weights of the Fractions
FractionWeight,
g- fob dl./g. k', g./dl.So X 1013,
sec. h /M M X 10~3
1 0.477 5.38 0.742 4.63 2.24 1,1682 1.120 5.13 0.593 4.41 2.29 1,0583 0.777 4.30 0.414 3.39 2.15 6564 0.765 3.65 0.341 2.85 2.06 4645 0.862 3.18 0.333 1.91 1.28 2386 1.310 2.59 0.274 1.65 1.47 1747 1.254 2.19 0.248 1.44 1.50 1288 1.294 1.81 0.244 1.29 1.69 99.29 1.360 1.48 0.289 1.21 1.97 81.9
10 1.385 1.10 0.267 57.711 0.980 0.786 0.237 36.912 0.190 0.632 27.6
In rir/c versus c were nonlinear and on extrapolation to zero concentration gave higher values of [17] than those obtained by the first method. Mac- Farlane and McLeod27 have explained this disagreement, and have shown that plots of Vsp/c versus c give the correct values of [ti].
Ultracentrifugation
Single symmetrical peaks were obtained for all the fractions. Unfortunately, peak movement could not be accurately measured for fractions 10, 11, and 12 because the peaks were too small and blurred. The maximum-ordinate sedimentation coefficient s was obtained from linear plots of log X m versus time, where X n is the distance of the maximum ordinate from the center of the rotor.28
Since the density and viscosity of benzene are sensitive to pressure, the value of the sedimentation coefficient will depend on pressure. A correction for this effect has been proposed by Oth and Desreux29 in the equation
s, = s(l - nP) (22)
where sv is the sedimentation coefficient uncorrected for pressure, s is the value at one atmosphere pressure, P is the pressure at that point in the cell at which sp was measured, and ^ is a factor which depends on the sensitivity of the solvent viscosity and density to pressure. The value of ¡x was calculated from the data of Baldwin and Van Holde.80 It was found that (1 — nP) = 1.04 ± 0.01.
Plots of 1/s versus concentration c gave straight lines, as is illustrated in Figure 1 for fraction 4. The sedimentation coefficient at zero concentration s0 was obtained by extrapolation, and ks was calculated by using the equation
1 / s = ( 1 / s o ) ( 1 + k sc) ( 2 3 )

1296 J. BLACHFORD AND R. F. ROBERTSON
O 0-2 0-4 0-6 0-8C (g. cLl~')
Fig. 1. Dependenee of the sédimentation coefficient on concentration for fraction 4.
Values of s0 and k j [17] are given in Table I. The value of s0 steadily increases with intrinsic viscosity, whereas lcs/[ri] increases in an irregular manner,
Because the peaks were somewhat blurred, only Gralen’s method31 could be used to estimate the polydispersity of each of the fractions. The ratio of the area under the sedimentation curve to the maximum ordinate, X m, was plotted against X m for a particular concentration to give a straight line. Extrapolation of a plot of the slopes of these lines versus concentration gave the slope at zero concentration. This slope has been related to the ratio of the weight-average molecular weight M w to the number- average molecular weight M„. For all the fractions Mw/M n was found to be 1.03 ± 0.01. This represents an unexpectedly low degree of polydispersity considering that only twelve fractions were obtained.
Molecular Weight
The molecular weights of the first nine fractions were calculated by using eq. (13) or (14). As eq. (15) indicates, both equations give the same value of M. The results are presented in Table I. The partial specific volume Vo was found to be 0.995 ± 0.005 at 25°C. The viscosity of the solvent i)o was 6.024 mpoises and its density p0 was 0.8735 g./ml., both at 25°C. These values together with = 2.5 X 10⁶ wereused in calculating M .
Values of M for the last three fractions were calculated from
M = 2.95 X 10-W 0-71 (24)
This equation was determined32 for fractions of “cold” SBR. In a following section it is shown that the molecules of the last three fractions are linear; therefore, eq. (24) can be used to calculate their molecular weight. If the molecules were branched, M determined by using eq. (24) would be less than the true value.

B R A N C H IN G IN P 0 L Y (B U T A D 1 E N E -c o -S T Y R E N E ). I 1297
Fig. 2. Theoretical and experimental molecular weight distribution curves.
From the values of M and the weights of the fractions, the molecular weight distribution curve given in Figure 2 was established. For comparison, Ivilb’s33 theoretical distribution curves are shown for several values of 5D, the number of crosslinked units per weight average primary molecule. Neither of the theoretical distributions agree with the experimentally determined distribution: they indicate less low molecular weight and less high molecular weight material than is found experimentally.
A value cf the ratio Mw/M n = 2.84 was calculated from the expression
Mw = Z (dWc/dM )M E {dW Jdm /M M n E (,iW jd M y
where Wc is the cumulative weight.
Degree of Crosslinking
Figure 3 shows the plot of log s0 versus log fo] for the nine fractions of highest molecular weight. The results for five of these fractions can be fitted to a straight line described by the equation
so = 0.944 [t?]11-61 (26)
Therefore, in eq. (18), K s = 0.944 and y = 0.61. By using these values in eq. (19) together with the appropriate values of s0 and [j? |, the ratios hlbr/hlun for each of the four fractions of highest molecular weight were obtained. Values of g were calculated according to the three theories represented by eqs. (6), (9), and (10). The three series of to values given in Table II were then obtained by using the Zimm and Stockmayer theory.13

1298 J. BLACHFORD AND R. F. ROBERTSON
Fig. 3. The dependence of the sedimentation coefficient at zero concentration, so, on [ij].
From the results given in Table II it is evident that the branching frequency, represented by the ratio m/M, increases with molecular weight as predicted by theory.33 Three values of the weight-average number of crosslinks per molecule, mw, were calculated by using the appropriate values of to and the weights of the fractions. The value of mw calculated by the Zimm-Kilb theory, eq. (10), is about six times greater than that based on Flory’s theory, eq. (6), and about three times greater than that based on the Stockmayer-Fixman theory, eq. (9). Finally, three values of So, given in Table II, were obtained by substituting rnw into eq. (20).
TABLE IIDegree of Crosslinking in Each Fraction
Fraction Mbr/Mlin
m
Zimm-Kilb Stockmayer-Fixman Flory
1 0.544 21.3 6.4 2.72 0.558 19.0 5.9 2.53 0.661 8.4 3.8 1.74 0.712 5.4 2.9 1.35 1.000 0 0 0
mw 3.58 1.26 0.55h 0.78 0.56 0.38
Another value of So was calculated from the relation33
Mw/M n = [2 - (So/2) ]/(l - So) (2 7 )
From the experimentally determined result of Mw/M n = 2 .8 4 , the value 50 = 0.36 was obtained. This method of calculating S0 is valid only if the primary molecular weight distribution is the “most probable.” If it is broader, 50 will be overestimated.

BRANCHING IN POLY(BUTADIENE-co-STYRENE). I 1299
DISCUSSIONOne of the most frequently used branching parameters is Huggins’
constant, k'. There is, however, considerable doubt as to whether an increase in k' does actually indicate the occurrence of branching and not simply an increase in polydispersity34 or in molecular orientation.36 In the present study a change in shear rate had no effect on k ', and therefore the latter possibility can be excluded. According to Cleverdon,36 the degree of polydispersity of the fractions increases with the relative molecular weight, and so the increase in k' that we observe might result from a change in polydispersity. However, the value of k' for the unfractionated polymer is 0.42 which is less than for the four fractions of highest molecular weight. In this particular study, therefore, the increase in k' can be attributed to branching. The corresponding increase in m, the number of crosslinks per molecule, supports this conclusion.
Others18,13 have also found that k ' increases with branching; however, experiments have been reported37-38 in which k' is independent of branching. lVIanson and Cragg37 have suggested that only certain types of branching- affect k' and that branching which has only a small influence on the segment density distribution of the molecule will have no effect on k'. Apparently the type of branching which occurs in SBR has a large influence on the segment density distribution.
Wales and Van Holde40 have used the theories of Burgers39 and of Flory10 to derive the relation
ks/[y] = 1.66
From the derivation this relation should be valid for both linear and branched molecules; however, its validity, even for linear molecules, is in doubt.41 Wales and Van Holde40 claim that ks is characteristic of the low molecular weight components of a sample. Therefore, considering that [??] is characteristic of the high molecular weight components, ks/\rj] should decrease with increasing polydispersity. The high molecular weight fractions are expected to be more polydisperse than the low molecular weight fractions, and so the increase in ks/[q] with molecular weight cannot be due to polydispersity. Although the effect of branching on ks has not been examined theoretically, the results of Moore et al.42 indicate that ks is less for a branched molecule than for a linear molecule of the same molecular weight. The large values of fcs/[rj] found in the present work suggest that branching decreases [77 ] to a greater extent than it does ks.
A quantitative estimate of the degree of branching in a particular sample of SBR is the main concern of this investigation. To make this estimate the following four assumptions had to be made: (1) molecular nonlinearity is the result of crosslinking, not trifunctional branching;(2) if the crosslinks were destroyed a “most probable” molecular weight distribution would result; (3) the crosslinks occur at random; and (4) the fractions are monodisperse. As previously mentioned, Morton’s results indicate that crosslinking is the chief cause of molecular nonlinearity.

1300 J. BLACIIFORD AND R. F. ROBERTSON
The analysis of Booth and Beason43 shows that the primary molecular weight distribution of SBR is only slightly broader than the “most probable” type. Flory10 claims that a small amount of nonrandom cross- linking might occur, but only to a significant extent at conversions greater than that used in preparing the present sample.
The fourth assumption, that the fractions are monodisperse, is definitely not valid. Both theoretically and experimentally it has been shown that the degree of polydispersity increases with the relative molecular weight of the fractions.86 I t is not known whether branched molecules differ in solubility from linear molecules of the same molecular weight. If there is a solubility difference the polydispersity of the high molecular weight fractions might be greater than that occurring in the fractionation of linear molecules.
From Gralen’s method the degree of polydispersity in the fractions is found to be very low; 'Mw/M n ~ 1.03. There are several reasons for regarding these results sceptically. One of the assumptions in this method is that no diffusion occurs; but Eriksson44 has shown that, a correction must be made for diffusion. The extent of such a correction for the present system is unknown. According to several experiments45 on other polymers, the dependence on concentration of the slope of (area/Xm) versus X m increases with decreasing concentration. Therefore, by the failure to use sufficiently low concentrations the value of the slope at zero concentration would be too small. This underestimation would give a value of Mw/M n which is less than the true value.
The effect of polydispersity on the experimentally determined molecular weight distribution and the values of m and 50 will depend on the molecular weight distribution of the fractions, on how the molecular weight distribution changes with the molecular weight of the fractions, and on how the branched molecules are distributed in the fractions.* Without this information it is impossible to estimate the nature of the errors in either the molecular weight distribution or in the values of m and So- The large discrepancy between the theoretical and the experimental molecular weight distribution curves shown in Figure 2 is probably due to polydispersity of the fractions. Apparently, this polydispersity causes the experimentally determined molecular weight distribution to overestimate the amount of low and high molecular weight material. If another method, light scattering, for example, was used to measure the molecular weight, the nature of the errors in the molecular weight distribution might be radically different. Even if the molecular weight distribution is subject to a very large error, the values of m or <50 might be subject to a very much smaller error.
A following paper8 describes the changes in solubility and swelling
* The results of Thurmond and Zimm5 for crosslinked polystyrene have been used to test the validity of several theories.5'1416 Unfortunately, only nine fractions were collected and therefore the importance of polydispersity is greater than in the present case.

BRANCHING IN POLY(BUTADIENE-co-STYRENE). I 1301
resulting from the exposure of SBR to 7 -radiation. The results strongly indicate that 60 — 0.9. If this is the correct value, it can be concluded that 50 based on the experimentally determined molecular weight distribution is too low, and that the three theories represented by eqs. (6), (9), and (10) overestimate the effect of branching on intrinsic viscosity. Of the three theories that of Zimm and Kilb gives the most accurate value of 50; however, because the effect of polydispersity of the fractions is unknown the validity of even this theory is not definitely established.
References1. Morton, M., Ann. N. Y . Acad. Sci., 57, 432 (1953).2. Cragg, L. H., and G. R. H. Fern, J. Polymer Sci., 10, 185 (1953).3. Manson, J. H., and L. H. Cragg, Can. J. Chem., 30, 482 (1952).4. Huggins, M. L., J. Am. Chem. Soc., 64, 2716 (1942).5. Thurmond, C. D., and B. H. Zimm, J. Polymer Sci., 8, 477 (1952).6. Guillet, J. E., J. Polymer Sci., Al, 2869 (1963).7. Senti, 7. R., N. N. Heilman, H. H. Ludwig, G. E. Babcock, R. Tobin, C. A.
Glass, and B. L. Lamberts, J. Polymer Sci., 17, 527 (1955).8. Blachfcrd, J., and R. F. Robertson, J. Polymer Sci., A3, 1311 (1965).9. Svedberg, T., and K. O. Pedersen, The Ultracentrifuge, Oxford Univ. Press, 1940.
10. Flory, ? . J., Principles of Polymer Chemistry, Cornell Univ. Press, Ithaca, N. Y., 1953.
11. Krigbaum, W. R., and D. K. Carpenter, J. Phys. Chem., 59, 1166 (1955).12. Stoekmayer, W. H., and M. Kurata, Fortschr. Hochpolymer-Forsch., 3, 196
(1963).13. Zimm, B. H., and W. H. Stoekmayer, J. Chem. Phys., 17, 1301 (1949).14. Stoekmayer, W. H., and M. Fixman, Ann. N. Y. Acad. Sci., 57, 334 (1953).15. Zimm, B. H., and R. W. Kilb, J. Polymer Sci., 37,19 (1959).16. Bueche F., J. Polymer Sci., 41, 549 (1959).17. Kotliar A. M., and S. Podgor, J. Polymer Sci., 55, 423 (1961).18. Morton, M., T. E. Helminiak, S. D. Gadkary, and F. Bueche, J. Polymer Sci.,
57, 471 (1962).19. Orofino, T. A., and F. Wenger, J. Phys. Chem., 67, 566 (1963).20. Schumaker, V. N., J. Polymer Sci., 38, 343 (1959).21. Cooper, W., D. E. Eaves, and G. Vaughan, J. Polymer Sci., 59, 241 (1962).22. Binder, J. L., Ind. Eng. Chem., 46, 1727 (1954).23. Cragg, L. H., and D. F. Switzer, Can. J . Chem., 31, 868 (1953).24. Craig, A. W., and D. A. Henderson, J. Polymer Sci., 19, 215 (1956).25. Schurz, J., and E. H. Immergut, J. Polymer Sci., 9, 279 (1952).26. Kolthoff, I. M., C. W. Carr, and B. J. Carr, J. Polymer Sci., 2, 637 (1947).27. MacFarlane, R. B., and L. A. McLeod, Proc. Rubber Technol. Conf., 3rd Conf.
{London), 1954, 214.28. Schachman, H. K., TJUracentrifugation in Biochemistry, Academic Press, New
York, 1959.29. Oth, J., and V. Desreux, Bull. Soc. Chim. Belg., 63, 133 (1954).30. Baldwin, R. L., and K. E. Van Holde, Fortschr. Hochpolymer Forsch., 1, 451
(1958).31. Gralen, N., Dissertation. University of Uppsala, 1944,32. Novikov, A. S., M. B. Khaikina, T. V. Dorokhina, and M. J. Arkhangelskaya,
Colloid J., (USSR), 15, 51 (1953).33. Kilb, IL W., J. Polymer Sci., 38 , 403 (1959).34. Tompa, H., Polymer Solutions, Academic Press, New York, 1956.35. Jones, M. H., Con. J. Chem., 34, 1027 (1956).

1302 J. BLACHFORD AND R. F. ROBERTSON
36. Cleverdon, D., and D. Laker, J. Appl. Chem., 1, 6 (1951).37. Manson, J. A., and L. H. Cragg, Can. J . Chem., 36, 858 (1958).38. Pollock, D. J., L. J. Elyash, and T. W. DeWitt, J. Polymer Sri., 15, 335 (1955).39. Burgers, J. M., Proc. Acad. Sri., Amsterdam, 45, 9 (1942).40. Wales, M., and K. E. Yan Halde, J. Polymer Sri., 14, 81 (1954).41. Cheng, P. Y., and H. K. Schachman, J. Polymer Sri., 16, 19 (1955).42. Moore, L. D., Jr., G. R. Greear, and J. O. Sharp, J. Polymer Sri., 59, 339 (1962).43. Booth, C., and L. R. Beason, J. Polymer Sri., 42, 81, 93 (1960).44. Eriksson, A. F. V., Acta Chem. Scand., 7, 623 (1953).45. Kinell, P. O., and B. G. Rânby, Advan. Colloid Sri., 3, 161 (1950).
RésuméUn échantillon de poly(butadiène-co-styrène), SBR, a été divisé en douze fractions par
précipitation à partir d ’une solution benzénique diluée. Les viscosités intrinsèques, h] et les poids de toutes les fractions ont été mesurés, et les coefficients de sédimentation, s„, ont été déterminés pour les neuf fractions possédant les poids moléculaires les plus élevés. A partir des valeurs de h] et de sot le nombre de ramifications par molécule, ni, a été calculé pour chaque fraction. Les résultats indiquent qu’il n’y a que les quatre fractions de poids moléculaires les plus élevés qui contiennent des molécules ramifiées. Le nombre de ramifications par molécule primaire de poids moyen (avant la ramification) pour l’échantillon entier, d0, a été obtenu à partir des poids des fractions et des valeurs de m. En utilisant diverses théories, on a obtenu des valeurs de d„ de 0.78, 0.56 et 0.38. A partir des valeurs obtenues pour [y] et s0 e t du volume spécifique partiel pycnométrique du polymère dans le benzène, on a calculé les poids moléculaires, M, des neuf fractions possédant une h] le plus élevé. On a calculé les poids moléculaires des fractions restantes par la relation entre M et [y] obtenue par d’autres méthodes. On a dressé une courbe de distribution du poids moléculaire et on l’a utilisée pour obtenir d„ < 0.36.
ZusammenfassungEine Poly(butadien-co-styrol)-Probe, SBR, wurde durch Fällung aus einer verdünnten
Benzollösung in zwölf Fraktionen zerlegt. Die Yiskositätszahl, [77] , und das Gewicht aller Fraktionen wurden gemessen und für die neun Fraktionen mit dem höchsten Molekulargewicht der Sedimentationskoeffizient so bestimmt. Aus den Werten von [77] und So wurden für jede Fraktion die Zahl der Vernetzungsstellen pro Molekül, m, berechnet. Die Versuchsergebnisse zeigen, dass nur die vier Fraktionen mit dem höchsten Molekulargewicht vernetzte Moleküle enthalten. Die Zahl der Vernetzungsstellen pro Gewichtsmittel des primären (vor der Vernetzung) Moleküls diir die gesamte Probe, 50, wurde aus den Fraktionsgewichten und den »i-Werten erhalten. Nach verschiedenen theoretischen Ansätzen wurden 60-Werte von 0,78, 0,56, und 0,38 erhalten. Aus den erhaltenen [^j-und So-Werten sowie dem pyknometrischen, partiellen spezifischen Volumen des Polymeren in Benzol wurden die Molekulargewichte, M, der neun Fraktionen mit dem höchsten [77] berechnet. Die Molekulargewichte der übrigen Fraktionen wurden aus der bekannten [i?]-Af-Beziehung erhalten. Eine Molekulargewichtsverteilungskurve wurde aufgestellt und damit 50 < 0,36 erhalten.
Received June 1, 1964 Revised September 11, 1964 (Prod. No, 4519A)

JOURNAL OF POLYMER SCIENCE: PART A VOL. 3, PP. 1303-1311 (1965)
Branching in Poly(butadiene-co-styrene). II. Radiation-Induced Branching Examined
by Viscometry
J. BLACHFORD and R. F. ROBERTSON, Department of Chemistry, McGill University, Montreal, Quebec, Canada
SynopsisThe dependence of intrinsic viscosity on radiation dose has been examined for poly-
(butadiene-co-styrene) irradiated in vacuo and for mixtures of this polymer and N- phenyl-/3-naphthylamine irradiated in air and in vacuo. If no correction is made for crosslinking in the unirradiated polymer, theories examined appear to overestimate the increase in intrinsic viscosity. However, if it is assumed that in the unirradiated polymer the number of crosslinked units per weight-average primary molecule So is 0.65, the results agree with the theory of Spiro which uses the Stockmayer-Fixman relation between intrinsic viscosity and branching. The dose required for incipient gelation, R g, was determined for the various samples. These results were used together with the number-average molecular weight of the unirradiated polymer and with assumed values of So to calculated values of Gx, the number of crosslinks formed per 100 e.v. of radiation energy absorbed by the sample. Good agreement with solubility and swelling results, reported elsewhere, was obtained if S0 = 0.9.
INTRODUCTIONAny one or any combination of the following reactions might occur
on irradiating a polymer: degradation, crosslinking, cyclization, endlinking, and crosslinking by a chain reaction. The composition and environment of the polymer determine which of these reactions will occur. The nature of the changes in solution properties produced by irradiation aids in distinguishing between these possible reactions. In a forthcoming paper1 the radiation-induced changes in solubility and swelling of SBR are examined, and it is concluded that at doses several times greater than the dose for incipient gelation Rg, only crosslinking or endlinking occurs. On studying the molecular weight changes caused by irradiating polystyrene of various molecular weight distributions Spiro has concluded that no endlinking occurs.2 In the present work it is assumed that this conclusion is applicable to SBR.
This paper deals with the radiation-induced changes in the intrinsic viscosity of pure poly(butadiene-co-styrene) and the same polymer containing various amounts of N-phenyF/J-naphthylamine. The viscosity results are compared to those predicted by Katsuura,3 Kilb,4 Kotliar,6 and Spiro.6
1303

1304 J. BLAC1IFORD AND R. F. ROBERTSON
In interpreting the results it was necessary to consider that the unirradiated polymer contained crosslinked molecules. The extent of this cross- linking has been investigated elsewhere.1'7
EXPERIMENTAL
Materials
The SBR sample was obtained from Polymer Corporation, Sarnia, Ontario. It was prepared by emulsion polymerization at approximately 5°C. and contained impurities of fatty acid soap, fatty acid, and Polygard antioxidant. The molecular weight distribution and extent of crosslinking of this same sample were investigated in a previous paper.7
Reagent grade benzene and methanol (Fisher) were used in all the experiments. The antioxidant A7-phenyl-/3-naphthylamine was obtained from Eastman Organic Chemicals and will be denoted by B.
Sample Preparation
The impurit ies in the SBR were separated from the poly (butadiene-costyrene) by precipitating the polymer with methanol from a dilute solution of SBR in benzene. The concentration of methanol needed for complete precipitation of the polymer was sufficiently low that all the impurities remained soluble. To avoid oxidation the entire purification was accomplished in a nitrogen atmosphere. Upon precipitating the polymer, the supernatant liquid was withdrawn and the polymer redissolved in benzene. Following reprecipitation and removal of the supernatant liquid, the polymer was washed with methanol. The purified polymer was dissolved in benzene and a known quantity of antioxidant, B, added. The solution was frozen, placed in a vacuum desiccator and freeze-dried. From the weight of dry polymer plus B and the known weight of B the percentage of B in the polymer was calculated. The samples were stored at 0°C. in a vacuum and in the dark.
Irradiation Technique
Samples were placed in Pyrex tubes and evacuated at 1 u for at least two days to ensure the removal of all the benzene. At a pressure of 0.1 n the tubes were sealed and irradiated in a Co60 gamma-cell manufactured by Atomic Energy of Canada Limited. The electron densities and electron fractions of the polymer and antioxidant were used in calculating the dose received by the samples. In making these calculations the value of w for air was taken as 34 e.v. The dose rate varied from 6.0 to 5.2 Mrad/hr. during the period of experimentation. The pure polymer was irradiated in vacuo, and the polymer containing antioxidant, B, was irradiated both in vacuo and in air.

BRANCHING IN POLY(BUTADIENE-co-STYRENE). II 1305
Determination of R g and [1 7 ]
The dose for incipient gelation Rg was determined by noting the dose required to cause a benzene solution of the irradiated polymer to block a sintered glass filter. This method was subject to several possible sources of error. A small quantity of gel might block such a small fraction of the area of the sintered glass that its presence might not be detected. Furthermore, if a small amount of gel is present in the form of small aggregates it might pass through the pores of the filter. At doses only slightly less than Rs the intrinsic viscosity of some of the molecules is very high; therefore, slow filtration might be caused by this high viscosity rather than by the presence of gel. Because of these possible sources of error the accuracy of Rg is probably only about 10% and the precision 5%.
The intrinsic viscosities of samples were determined as previously described.7
RESULTS
Dose for Incipitant Gelation, R „
The values of Rs obtained by the filtration technique are given in TableI. They refer to the dose adsorbed by the entire sample, not simply by the pure polymer. A discussion of the effect of antioxidant and of air on Re will be given in a future paper.8
Gx is defined as the number of crosslinks formed per 100 e.v. of radiation energy absorbed by the sample. This quantity is related to Rg and the weight-average molecular weight of the unirradiated polymer, Mw, by9
Gx = 0.48 X 10VRgMw (1)
The number-average molecular weight of the unirradiated polymer, M n, is related to Mw by9
Mw/M n = [2 - (50/2 )]/(l - So) (2)
where 50 is the number of crosslinked units per weight-average primary molecule. (Two crosslinked units are equivalent to a crosslink, and primary molecules result from t he breaking of the crosslinks.) By osmometry* it was found that M„ = 89,900. However, the correct value of 50 is in doubt.
In a previous investigation7 the molecular weight distribution of the polymer was determined, and from this distribution it was estimated that 5o = 0.36. In the same investigation, values of 50 were calculated from the solution properties and weights of the fractions in conjunction with several theories. 1 lory's theory19 gave <50 = 0.38, the theory of Stockmayer and Fixman11 gave 50 = 0.56, and the theory of Zimm and Kilb12 gave 50 = 0.78. A study1 of the effect of radiation on the solubility of the polymer
* The osmotic pressure data were supplied by the Pulp and Paper Research Instituteof Canada.

1306 J. BLACIIFORD AND R. F. ROBERTSON
indicated that S0 = 0.9. Three of these possible values of S0 have been used in eq. (2) to give values of Mw which in turn have been substituted into eq. (1) with the various values of R„ to give three series of Gx values. The complete results are presented in Table I. As 50 increases Gx decreases: for the pure polymer Gx = 9.41 if 50 = 0.0, but Gx = 1.72 if So = 0.9.
TABLE IDependence of R g, Gx, and M w on 5o and Content of Antioxidant B
B, % R„, Mrad
Gfi, crosslinks/100 e.v. absorbed
S0 = 0.00,Ma = 3.0 X
So = 0.78, 105 Mw = 2.4 X
50 = 0.90,105 M w = 4.7 X 10s
0 0.20 9.41 3.33 1.720.5 0.54 3.49 1.24 0.64
COioOI 0.69 2.73 0.96 0.507.1, 11.3 0.69 2.73 0.96 0.5060.0 1.00 1.88 0.67 0.350» 1.69 3.18 1.13 0.592.7» 0.53 1.00 0.36 0.18
“ Irradiated in air.
If Mw is determined experimentally it is not necessary to know So to calculate Gx because the product R„MW is independent of 50. However, the determination of Mw by light scattering is often unreliable,13 particularly for branched polymers.14
Intrinsic Viscosity
An investigation was made of the possible errors in [??] arising from microgel, oxidation, and filtration. Samples irradiated to doses near but less than R„ were analyzed for microgel by shaking the solutions with finely
Fig. 1. Plot of log of the slope of vsp/c versus c as a function of fifi.

BRANCHING IN POLY(BUTADIENE-co-ST YRENE). II 1307
Fig. 2. The dependence of M u/M o on R/Iig.
Fig. o. A comparison between the theoretical and experimental dependence ofM r/M o on R /R g.
divided calcium sulfate.15 No microgel was detected. To remove small particles of dust, the solutions were filtered through sintered glass prior to viscosity measurements. Even for samples irradiated to doses close to R„ the intrinsic viscosity vras unaffected by filtration. Although SBR is readily oxidized, an increase in the oxygen content of the polymer (determined by Alfred Bernhardt, Max Planck Institute) from 0.12% to 0.46% had no effect on the change in [77] caused by irradiation. One week of exposure to air at room temperature was required to increase the oxygen content of the pure polymer to 0.46%. The pure polymer samples studied for radiation effects were never exposed to air for longer than ten minutes.

1308 J. BLACIIFORD AND R. F. ROBERTSON
Values of [17 ] were obtained from linear plots of i}sp/c versus concentration c, as has previously been described.7 In Figure 1 the log of the slopes of the plots of i]sp/c versus c are plotted against the corresponding [77]
values for all the samples examined. The straight line obtained can be fitted to the equation
V s v / c = h i + k ' i v Y c (3)
where
k' = 0.223 [77 ]°-76 (4)
The Huggins’ constant,16 k ’ has generally been found to be independent of [17] for linear polymers.
Figure 2 shows the effect of irradiation on the intrinsic viscosity for doses up to R,j. The intrinsic viscosity of the unirradiated polymer is denoted by [ 1 7 ]0 and that of the irradiated polymer by [1 7 ]B. The scatter of the points is probably the result of errors in Rs, rather than of errors in [1 7 ] or R. Figure 3 compares the results with theory for three assumed values of S0. When 80 is zero, all four theories predict much higher values of [??]«/b]o than are obtained experimentally. This same discrepancy exists for three of the theories when 80 = 0.65 or 0.80; but the theory of Spiro6 is in good agreement with experiment at do = 0.65 and even underestimates [77 ]«/ [77 ]0 at 50= 0.80.
All theories have been applied assuming the exponent in the Mark- Houwink relation is 0.68. This value is close to that of 0.71 determined17 for “cold” SBR. According to the theories differences of this magnitude are insignificant. A further assumption is that crosslinking alone occurs on irradiation.
DISCUSSION
Huggins’ constant k' is one of the most frequently reported but least understood parameters in the treatment of the solution properties of polymers. Among the factors attributed to an increase in k’ are an increase in molecular orientation,18 in branching,19 and in polydispersity.10 For certain polymers an increase in one of these variables definitely causes an increase in k', but for other polymers no such relation is observed. In a previous investigation7 it was concluded that branching in SBR increases k'. Therefore, the increase in k' found in the present work and expressed by eq. (4) can be assumed to reflect branching and possibly other factors.
The applicability of eqs. (1) and (2) and of the four theories represented in Figure 3 involves several assumptions concerning the effect of the radiation on the polymer and the properties of the unirradiated polymer. One of these assumptions is that, branching in the unirradiated polymer must be caused by crosslinking imposed randomly upon a “most probable” molecular weight distribution. According to Morton,21 almost all the branching in SBR is caused by crosslinking. Booth and Beason22 have

B R A N C H I N G I N P O L Y ( B U T A D lE N E - e o - S T Y R B N E ) . I I 1 3 0 9
shown that the primary molecular weight distribution in SBR is only slightly broader than the “most probable” type. The occurrence of a small amount of nonrandom crosslinking in SBR has been suggested by Flory,10 but it is only significant at conversions greater than that used for the present polymer sample.
The validity of assuming that only crosslinking occurs on irradiation has already been discussed. The absence of degradation has been established for high dcses; however degradation might occur at low doses. In the present paper it is assumed that degradation is absent at all doses. Solubility results1 have indicated that SBR irradiated in air undergoes a small amount of degradation with a ratio of scissions to crosslinks of 0.25. Figure 2 shows that, within experimental error, this amount of degradation does not affect the shape of the plot of ble/fo]o versus R /R g. This insensitivity is consistent with theory and has been thoroughly investigated byKilb.23
The final assumption, that the crosslinking caused by the irradiation occurs at random, is valid for polystyrene and for polybutadiene, and since styrene units in SBR are distributed at random it is likely that crosslinking will occur at- random.10 Witt's solubility24 results support the occurrence of random crosslinking, since the shape of his plots of sol fraction versus dose are independent of the styrene content of SBR.
Witt24 also found Gx = 1.70 for SBR containing 28% styrene and Gx = 1.15 for 38% styrene. He obtained M w by light scattering and therefore did not need <50 to calculate Gx. However, light scattering generally gives a value of Mw which is high; therefore, Witt’s Gx values are probably low. The present sample contained 28.7% styrene, and on the basis of Witt’s results Gx should be slightly less than 1.70. Table I gives Gx = 1.72 for 5o = 0.90 and Gx =3.33 for 80 =0.56. Assuming Witt’s results are correct it can be concluded that 50 = 0.90. This is the same result as obtained from solubility data.1
The theories which predict the dependence of intrinsic viscosity on dose are very complicated. Any such theory must consider the following problems.
(1) For the relation between the number of crosslinks per molecule m and the ratio of the radius of gyration of a crosslinked molecule to that of a linear molecule of the same molecular weight, denoted by g, theories have been proposed by Kataoka25 and by Zimm and Stockmayer.26 For a given value of g, Kataoka predicts a higher value of to.
(2) For the relation between g and the ratio of the intrinsic viscosity of a crosslinked molecule to that of a linear molecule of the same molecule weight, frW bhin, four main theories have been proposed. Those of Flory,10 Katsuura,3 Zimm and Kilb,12 and Stockmayer and Fixman11 are represented by eqs. (5), (6), (7), and (8), respectively,
hlbr/hLin = g'h[v ]br/ \.V ]lin = g2~a
(5)
(6)

1310 .1. BLACHFORD AND R. F. ROBERTSON
h l b r / h l l i n = gl/* ( 7 )
\ v ] b r / \ y ll in ' ^ ( 8 )
where a is the exponent in the Mark Houwinlc equation and h is a function of g.
(3) Theories treating the problem of the effect of crosslinking on the molecular weight distribution have been proposed by Kotliar,8 Kilb,4 Schultz,27 Zimm and Stockmayer,26 Katsuura,3 and Spiro.6
Considering that one theory from each of the three groups must be used in calculating the dependence of b]«/fa]o on R /R g there are forty-eight possible combinations and therefore this number of possible theories relating these two ratios. The four combinations considered in the present work have been derived in detail and have received some experimental support. Of these four only that derived by Katsuura uses the relation between g and in proposed by Ivataoka. To relate g to |/? l-'b. I?7 lun Katsuura used eq. (6), Kotliar used a relation similar to eq. (7), Kilb used eq.(7), and Spiro used eq. (8). The four combinations involve different theories for relating crosslinking to changes in molecular weight distribution; however, the theories employed by Kilb and Spiro are almost identical.
As Figure 3 shows, only Spiro’s theory agrees with the present experimental results. The major difference between this theory and the others is that it involves the Stockmayer-Fixman relation, eq. (8). The use of this relation leads to the prediction that the ratio b ]«/[??]o is almost independent of dose when the extent of crosslinking is great. The other relations lead to the prediction that [y)R/ [r/]o increases approximately exponentially with extent of crosslinking. The results of the present work suggest that the Stockmayer-Fixman relation is correct. Furthermore, the result 50 = 0.65 agrees well with 80 = 0.56 calculated from the solution properties of the fractions7 as interpreted by the Stockmayer-Fixman relation. On the other hand, solubility results1 strongly support 50 = 0.9; this is close to the value 0.78 obtained using the Zimm-Kilb relation to interpret the fraction data. The Stockmayer-Fixman relation might be correct only at high extents of crosslinking, and another relation such as that proposed by Zimm and Kilb might be correct at lower values.
References1. Blachford, J., and R. F. Robertson, J. Polymer Sci., A3, 13)3 (1965).2. Spiro, J. G., and C. A. Winkler, J. Appl. Polymer Sci., 8, 1709 (1964).3. Katsuura, K., J. Phys. Soc. Japan, 15, 2310 (1960).4. Kilb, R. W., J. Polymer Sci., 38, 403 (1959).5. Kotliar, A. M., J. Polymer Sci., 55, 71 (1961).6. Spiro, J. G., D. A. I. Goring, and C. A. Winkler, J. Phys. Chem., 68, 323 (1964).7. Blachford, J., and R. F. Robertson, J. Polymer Sci., A3, 1289 (1965).8. Blachford, J., and R. F. Robertson, J. Polymer Sci., A3, 1325 (1965).9. Charlesby, A., Atomic Radiation and Polymers, Pergamon Press, London, 1959.
10. Flory, P. J., Principles of Polymer Chemistry, Cornell Univ. Press, Ithaca, N. Y., 1953.
11. Stockmayer, W. H., and M. Fixman, Ann. N. Y. Acad. Sci., 57, 334 (1953).
BRANCHING IN POLY(BUTADIENE-co-STYRENE). II 1311
12. Zimm, B. H., and R. W. Kilb, J. Polymer Sei., 37, 19 (1959).13. Lebel, R. G., D. A. I. Goring, and T. E. Timell, J. Polymer Sei., C2, 9 (1963).14. Cooper, W., D. E. Eaves, and G. Vaughan, J. Polymer Sei., 59, 241 (1962).15. Freeman, R., Proc. Rubber Technol. Conf. 3rd Conf. London, 1954, 3 (1954).16. Huggins, M. L., J. Am. Chem. Soc., 64, 2716 (1942).17. Novikov, A. S., M. B. Khaikinar, T. V. Dorokliina, and M. J. Arkhangelskaya,
Colloid J. ( U SSR), 15, 51 (1953).18. Jones, M. H., Can. J. Chem., 34, 1027 (1956).19. Orofino, T. A., and F. Wenger, J. Phys. Chem., 67, 566 (1963).20. Tompa, H., Polymer Solutions, Academie Press, New York, 1956.21. Morton, M., Ann. N. Y. Acad. Sei., 57, 432 (1953).22. Booth, C., and L. R. Beason, J. Polymer Sei., 42, 93 (1960).23. Kilb, R. W., J. Phys. Chem., 63, 1838 (1959).24. Witt, E., J. Polymer Sei., 41, 507 (1959).25. Kataoka, S., Busseironkenkyu, 66, 102 (1953); quoted in ref. 3.26. Zimm, B. H., and W. H. Stoekmayer, J. Chem. Phys., 17, 1301 (1949).27. Schultz, A. R., P. I. Roth, and G. B. Rathmann, J. Polymer Sei., 22, 495 (1956).
RésuméOn a examiné la dépendance de la viscosité intrinsèque vis-à-vis de la dose de radiation
pour le poly(butadiène-co-styrène) irradié sous vide et pour des mélanges de ce polymère et de iV-phényl-0-naphthylamine irradiés à l’air et sous vide. Si aucune correction n ’est faite pour le pontage dans le polymère non-irradié, les théories examinées paraissent surestimer l’augmentation de la viscosité intrinsèque. Cependant si on admet que dans le polymère non-irradié, le nombre d’unités pontées par molécule primaire de poids moyen, S„, est 0.65, les résultats concordent avec la théorie de Spiro qui utilise la relation de Stoekmayer-Fixman entre la viscosité intrinsèque et la ramification. La dose requise pour le début de gélification, R„ a été déterminée pour divers échantillons. Ces résultats ont été utilisés en combinaison avec le poids moléculaire moyen en nombre du polymère non-irradié et avec les valeurs admises de S0 pour calculer les valeurs de Gx, le nombre de ramifications formées par 100 e.v. d’énergie de radiation absorbée par l’échantillon. Une bonne concordance avec les résultats, relatés ailleurs, de solubilité et de gonflement, rapportés ailleurs, a été obtenue si S0 = 0.9.
ZusammenfassungDie Abhängigkeit der Viskositätszahl von der Strahlungsdosis wurde an Poly(Buta-
dien-co-Styrol) bei Bestrahlung im Vakuum und an Mischungen dieser Polymeren mit Ar-Phenyl-/3-naphthylamin bei Bestrahlung in Luft und im Vakuum untersucht. Ohne Anbringung einer Korrektur für die Vernetzung im unbestrahlten Polymeren scheinen die überprüften Theorien eine zu grosse Zunahme der Viskositätszahl zu liefern. Bei Annahme einer Vernetzungszahl pro Gewichtsmittel des Primärmoleküls, S0, im nich bestrahlten PoRmeren von 0,65 stimmen die Ergebnisse jedoch mit der Theorie von Spiro überein, welche die Beziehung von Stoekmayer-Fixman zwischen Viskositätszahi und Verzweigung benützt. Die zum Eintritt der Gelbildung erforderliche Dosis, Ra, wurde an den veschiedenen Proben bestimmt, zusammen mit dem Zahlenmittel des Molekulargewichts des nicht bestrahlten Polymeren und mit angenommenen Werten für S0 wurden diese Ergebnisse zur Berechnung von GRWerten, der Zahl der pro lOOeV in der Probe absorbierten Strahlungsenergie gebildeten Vernetzungsstellen benützt. Mit S0 = 0,9 wurde gute Übereinstimmung mit an anderer Stelle mitgeteilten Löslich- keits- und Quellungsergebnissen erhalten.
Received June 1, 1964 Revised September 11, 1964 (Prod. No. 4520A)

JOURNAL OF POLYMER SCIENCE: PART A VOL. 3, PP. 1313-1324 (1965)
B ranch ing in P o ly (butadiene-co-styre n e ) . III. R ad ia tion-Induced B ranch ing E xam ined
by Solubility and Swelling
J. BLACHFORD and R. F. ROBERTSON, Department of Chemistry, McGill University, Montreal, Quebec, Canada
Synopsis
The dependence of solubility and swelling on radiation dose has been examined for pure polymer and polymer containing varying amounts of the antioxidant .Y-phenyl- /3-naphthylamine. Degradation did not occur when samples were irradiated in vacuo but in the presence of air degradation was initiated and crosslinking was retarded. During irradiation in vacuo the antioxidant interacted with the polymer and prevented the formation of a large number of crosslinks. An analysis of the solubility data indicated that there were 0.9 crosslinked units per weight-average primary molecule in the unirradiated polymer, and that 1.59 crosslinks were formed in the pure polymer on the absorption of 100 e.v. of radiation energy (i.e., Gx = 1.59). These values are consistent with the swelling data but not with the experimentally determined molecular weight distribution.
INTRODUCTION
Solubility and swelling determinations have frequently been used to study the effect of radiation on polymers. Witt1 examined the dependence of solubility on dose for SBR samples containing different percentages of styrene. For a sample of the same composition as that used in the present work, Witt found Gx, the number of crosslinks formed per 100 e.v. absorbed, to have a value of 1.71. In the present paper values of Gx are determined by methods different from those used by Witt. The present techniques and their results are compared and evaluated.
In studies of the solubility and swelling changes produced by irradiation, the effect of crosslinking in the unirradiated polymer is frequently ignored. In the present work the importance of preirradiation crosslinking is examined, and estimates are made of the number of crosslinked units per weight-average primary molecule 50 in the unirradiated polymer. The values found for 60 are compared with those obtained by other methods.2’3
In the present investigation the effects of air and of the presence of the additive N-phenyl-d-naphthylamine on the polymer irradiation process have been examined by solubility and swelling techniques.
1313

1314 J. BLACKFORD AND R. F. ROBERTSON
EXPERIMENTALThe materials, the purification methods, and the irradiation techniques
employed have previously been described.2'3
SolubilityThe determination of the percentage of irradiated polymer soluble in
benzene was simple and accurate. A known weight of small pieces of irradiated polymer, generally about 0.3 g., was placed in 25 ml. of benzene for 24 hr. The solution was then decanted into a 100-ml. volumetric flask. The procedure was repeated three times, the gel washed with small amounts of benzene, and the final solution made up to 100 ml. A dilute solution of the antioxidant IV-phenyl-jS-naphthy lamine (denoted by B) was used in the extraction of the pure polymer. The solids content of 25 or 50 ml. of the final benzene solution was found by freeze-drying. In calculating the percentage of soluble polymer a correction was made for the presence of the antioxidant, B. This technique could be applied with satisfactory reproducibility if more than 50% of the sample were gel. Below 50% the gel tended to break into small pieces which passed over into the solution during decantation, even when a copper 100 mesh filter was employed. Consequently, only the results for gel contents greater than 50% are reported.
Baskett’s4 method was used to determine the minimum value of the ratio of the number of scissions to the number of crosslinks, po/qo. A sample was irradiated to a high dose, extracted, and the gel divided into several portions. Each portion was irradiated to a different dose and the gel content measured.
SwellingUpon separating the gel from the sol the degree to which the gel swelled
in benzene was determined. The benzene not incorporated into the gel was decanted off, and the pai tides of swollen gel were rolled on a paper towel for about 1 min. to remove any surface benzene. The particles were then quickly transferred to a weighed stoppered bottle and their weight determined. Because the weight of dry gel was known from solubility experiments, the benzene associated with the gel could be found.
This very practical technique was subject to two obvious sources of error. If the drying process were too prolonged some of the benzene contributing to the swelling might be lost during the drying of the gel, and if too rapid, some excess benzene would remain in the gel. To determine the importance of these possible errors in the drying technique, the method of Flory5 for the determination of the extent of swelling in a saturated benzene atmosphere was applied to several samples of widely differing degrees of swelling. This rather complex method gave results within 2% of the paper towel method.
In preliminary experiments it was found that the degree of subdivision of the sample and the time of extraction, beyond 24 hr., had no effect on

BRANCHING IN POLY(BUTADIENE-co-STYRRNE). I ll 1315
the extent of swelling. Bardwell6 made a thorough study of these effects and reached the same conclusion. In the light of his results no further study was deemed necessary.
RESULTS
Solubility
Figure 1 shows the dependence of S + y /S on l/R , where S is the sol fraction and R the dose. According to Charlesby,7 if the initial molecular weight distribution is of the “most probable” type and if the unirradiated polymer consists of only linear molecules, the data should fit the equation
S + V S = (po/qo) + (0.48 X 10⁷G, MmR) (1)
In this equation po/qo is the ratio of the number of scissions to the number of crosslinks, R is the dose in megarads, M n, is the number-average molecular weight of the unirradiated linear polymer, and Gx is the number of crosslinks formed per 100 e.v. of energy absorbed. The plots of Figure 1 do not obey this equation since, as previous investigations2 showed, the unirradiated polymer contains crosslinked molecules. The extent of this crosslinking may be expressed as the number of crosslinked units per weight-average primary (prior to crosslinking) molecule, denoted by the symbol 50. This degree of crosslinking may also be expressed as an equivalent specific dose of radiation, R0. If the experimentally determined dose for incipient gelation is R0 and if po/qo = 0, then
5o — R o / (Ro + R g) (2 )
The solubility data will obey eq. (1) if a specific value of R0 is added to R. At high values of R this correction will have a very small effect. Therefore the intercept with the ordinate will be unaffected by R0, and it may be concluded that for samples irradiated in vacuo po/qo = 0. For samples irradiated in air, however, po/qo is greater than zero.
-+
0 5 10 15i/ r (m e g a r a d s -1 X I02)
Fig. I. Dependence of S + V S on 1 ¡R\ (O) 0% B; ( • ) 0.5% B; (□) 2.1, 5.3, 7.1, and 11.3% B; (■) 60.0% B; (A) 0% B, irradiated in the presence of air; (A) 2.7% B, irradiated in the presence of air.

1316 J. BLACHFORD AND R. F. ROBERTSON
TABLE ISolubility Following Second Irradiation (Initial Solubility was 5.20%)
R, Mrad s, % s + v s25.2 0.28 0.008142.2 0.315 0.0087
122.0 0.568 0.0132
Table I shows the data used in estimating po/qo by Baskett’s method. Unfortunately, the doses employed were not sufficiently high to give a constant value of S + y/S . It can be concluded, however, that po/q» is greater than 0.01. The actual value of po/qo cannot be much greater than this; otherwise the plots of S + \/.S' versus 1/R would not extrapolate to an approximately zero intercept.
From the slopes of the plots of Figure 1 measured at high doses, values of Gx were calculated from eq. (1). As the results of Table II show, the value of Gx calculated in this manner is almost independent of 80. To correct for crosslinks in the unirradiated polymer it was necessary to add R0 to the dose, and to calculate Mno by using eq. (3) J
Mn = M J { 1 - So/4) (3)In this equation M n is the number-average molecular weight of the cross- linked unirradiated polymer. A value of M n = 89,900 was obtained by osmometry. Table II also gives the values of Gx previously calculated3 from R„, M n, and assumed values of S0. In contrast to Gx calculated by using eq. (1), Gx calculated by this method is highly dependent on Sn. The two methods give approximately the same results for irradiation in vacuo when 50 = 0.9.
Figure 2 gives plots of sol fraction versus R /R s for samples irradiated in vacuo. Except for the case of 0.52% antioxidant content, all the data fit one curve. A comparison of this curve with theoretical curves indicates that ¿>o = 0.9. The theoretical curves were obtained using Charlesby’s theoretical curve7 of sol fraction versus R/R„ for 50 = 0.
TABLE IIDependence of Gx on % B and on the Method of Calculation
Gx calculated from 5», M n and the plot of S + \/<S
Gx calculated from So, M„ and R a versus 1 /R
B, % So = 0 So = 0.8 So = 0.9 So = 0 So = 0.8
0 9.41 3.33 1.72 1.62 1.590.5 3.49 1.24 0.64 0.97 0.942.1, 5.3 2.73 0.96 0.50 0.59 0.567.1, 11.3 2.73 0.96 0.50 0.59 0.5660.0 1.88 0.67 0.35 0.46 0.430“ 3.18 1.13 0.59 1.16 1.102 .7a 1.00 0.36 0.18 0.41 0.39
“ Irradiated in air.

BRANCHING IN POLY(BUTADIENE-co-STYRENE). I l l 1317
Fig. 2. Comparison between theoretical and experimental dependence of S on R /R g: (O) 0, 2.1, 5.3, 7.1, and 11.3% B; ( • ) 0.5% B.
10 3 0 5 0R (MEGARADS)
Fig. 3. Plot of log S vs. R for samples containing 2.1, 5.3, 7.1, and 11.3% B.
Values of sol fraction from his curve were plotted against [(R/Rg) — 50]/(l — 50) , where R /R g is also from the Charlesby curve.
Pearson8 has suggested that chain reaction crosslinking occurs when butadiene polymers are irradiated. The method of Charlesby for the detection of this type of reaction has been applied to the present results. Figure 3 shows the required plot of log S versus dose for samples containing 2.1, 5.3, 7.1, and 11.3% antioxidant. A similar plot is obtained for pure polymer. The average slope between S = 0.2 and S = 0.8 was determined anc together with the previously determined values of Rg substituted into eq. (4).
i = [d(log S)/dR] R g (M J M n) (4)

1318 J. BLACKFORD AND 11. F. ROBERTSON
Fig. 4. Dependence of S on I/»2: (O) 0% B; ( • ) 0.5% B; (□) 2.1, 5.3, 7.1, and 11.3% B; ( ■ ) 60.0% B; (A) 0%, B, irradiated in the presence of air; (A) 2.7% B, irradiated in the presence of air.
The average number of links formed per chain reaction is equal to (1 — i)/i. If So = 0, then Mw/M n = 2. Substitution into eq. (4) leads to t =0.5, and therefore a chain reaction does not occur. If a correction is made for ¿¡o values greater than zero, the likelihood of a chain reaction is reduced since i increases. This increase occurs because Mm is less than Mn, while the slope is unaffected by R0, and RaMw = {Rg + R0)Mm.
Swelling
Figure 4 shows the dependence of the volume fraction of polymer v2 in the swollen gel on the sol fraction, S. The dependence is identical for all the samples with one exception; pure polymer irradiated in air gives higher v2 values.
According to Flory10 the average molecular weight between crosslinks, M c„, is related to v2 by the expression
________ M eg _ _ _ — P y V l (%/3 — 2 Vi/fn)(1 - _ + In (1 - v2) + v, [0)
In this equation pp is the density of the polymer, Vi is the molar volume of the solvent, x is the interaction coefficient between the polymer and the solvent, f n is the functionality of the branching (in the present case f n = 4), and M n„a is the primary number-average molecular weight of the molecules in the gel. This equation includes the correction for “free ends” given by Flory.10 The value of Mmg is calculated from eqs. (3) and(6) as:
M mg = Mm (1 + V S ) (6)
Equation (5) has been found to underestimate the value of Meg.11,12 This discrepancy has been attributed, in part, to chain entanglements which result in physical crosslinks, to si eric hindrance, and to changes in

BRANCHING IN POLY(BUTADlENE-co-STYRENE). I l l 1319
X■ Blanchard and Wooton13 have proposed that the first two factors may be corrected for by the expression
Mcg = Ws + yiF (1 - 2 M J M nJ (7)
In this equation 71 is an entanglement factor and ws a steric hindrance factor. Furthermore,
71 = 1 + crMcg (8)
where a is a constant for a given polymer-solvent system. Using Mullins’ results12 for natural rubber in m-decane, Blanchard and Wooton13 found ws = 0 and <7 = 0.414 X 10 ~i. In the present work these results have been assumed to be valid for SBR in benzene.
Kraus14 has studied the dependence of x, the interaction coefficient, on v2 for polybutadiene in n-heptane. He found that
X = 0.37 + 0.52«2 (9)
It has been assumed that this equation is also valid for the present system. To find the importance of the correction, calculations have been made using x = 0.38 for all values of v2. This is the average of the values 0.38 and 0.40 ootained by French and Ewart15 and by Bristow,16 respectively. These two values support the validity of eq. (9), since x = 0.36 was found for completely soluble polymer and x = 0.40 for v2 = 0.181.
Upon obtaining Mm the crosslinking density for the gel, qg, and for the entire sample, q, was calculated. The crosslinking density is defined as the proportion of main chain units crosslinked. Flory10 gives the relation
Mcg = 10/ (qg + w/M nJ (10)
where w is the average weight of the monomer units in the polymer, 68.6 in the present work. Combining eq. (10) with the relation7
q. = 3(1 + S i (11)gives
q = [(1 - M cg/M mg)io]/[(l + S )M J (12)
To calculate the values of q given in Table III, seven widely distributed values of v% and S from the main curve of Figure 4 were used. Figure 5 shows the dependence of q on dose for samples containing 2.1, 5.3, 7.1, and11.3% B. For pure polymer the dependence would be identical but the doses would be lower by a constant factor. In correcting for 50, eq. (3) was used, and R0 was added to the dose. The result of Figure 5 shows that this correction has only a small effect. However, on correcting for the dependence of x on v2 it is found that q is reduced by approximately 30%. A similar reduction in q is obtained on correcting for chain entanglements.
Values of q may also be calculated from the relation7q = flG>/0.48 X 106 (13)

1320 J. BLACKFORD AND R. F. ROBERTSON
TABLE IIIDependence of the Crosslinking Density q on Dose, and the Effect
of Correcting for Chain Entanglements and Changes in x
Crosslinking density q X 104
R, Mrad (So = 0)
R T Rot Mrad
(S0 = 0.8) l/«2 8, %
X
<r
= 0 = 0.38
= 0
6o = 0.8 <$ox = 0.38 x
(7 = 0 <7
= 0.8 = 0.37 +
0.52»2 = 0
5o — 0.8 X = 0.37 +
0.52»2 <r = 4.14 X
10“5
4.6 7.36 52 48.0 4.0 4.80 4.80 3.086.4 9.16 36 38.0 5.5 6.38 6.38 3.76
10.7 13.46 22 24.0 10.0 10.2 9.28 4.8222.5 25.26 12 10.0 25.5 26.9 22.9 10.742.0 44.76 8 4.0 53.5 56.2 39.0 19.650.0 52.76 7.2 3.0 65.0 66.4 45.9 24.262.0 64.76 6.5 2.0 81.5 84.2 53.8 24.9
The plots in Figure 5 show that q calculated by using Gx = 0.50 or 0.96 is in better agreement with q from swelling data than if Gx = 2.73 is used. As Table II shows, Gx = 2.73 was calculated for 50 = 0.0, while Gx = 0.96 and 0.50 were calculated for So = 0.8 and 0.9, respectively. If the corrections for chain entanglement and changes in x are valid, the swelling results indicate that Gx is less than 0.50 and 50 is greater than 0.9.
Fig. 5. Crosslinking density q as a function of R: ( • ) uncorrected; (O) corrected for 6p; (A) corrected for 50 and x; (□) corrected for 60, x, and chain entanglements.

BRANCHING IN POLY(BUTADIENE-co-STYRENE). Ill 1321
DISCUSSION
There are several assumptions implicit in the analysis of the solubility and swelling results given here. It is assumed that any branching present in the unirradiated polymer is caused by randomly occurring crosslinking imposed on a molecular weight distribution which is approximately of the “most probable” type. It has previously been shown2 that these conditions are fulfilled for the SBR system studied. It is further assumed that the radiation causes neither endlinking nor cyclization. Spiro17 has developed a method, based on changes in molecular weight distribution, to distinguish between endlinking and crosslinking. An application of this method to polystyrene revealed that no endlinking occurred. The results of Spiro and the general improbability of an endlinking reaction support the assumption that endlinking is absent in the present case. Saito18 has considered the effect that cyclization would have on the dependence of sol fraction on dose. According to his analysis, cyclization in the absence of degradation but in the presence of crosslinking would result in a plot of log S versus log (R /Rg) which would be convex to the R /R 0 axis. However, if 80 is greater than zero, the resulting concavity might mask the effect of cyclization. However, since the importance of cyclization increases with dose, an inflection point in the plots of log S versus log (R /Rrj) might be expected. These plots are given in Figure 2 and show no points of inflection. This does not prove that cyclization is absent; but when the lack of evidence for cyclization in any polymer system is also considered, the assumption that cyclization is absent seems justified.
Figure 1 indicates that degradation occurs only when the polymer is irradiated in air. Even though the method of Baskett4 indicates that po/qo = 0.01 for irradiation in vacuo, the true value might be zero because of the possibility of degradation by oxidation. The solubility results of Witt1 also indicate that no degradation occurs. Contrary to this, Anderson19 found po/qo to be considerably greater than zero; however, the stress relaxation technique used by Anderson to detect scission measures instantaneous scissions in addition to permanent scissions.
In a previous paper3 it was shown that the presence of air during irradiation increases Rg. This increase must be caused partly by the occurrence of scissions, and might also be caused by a reduction in cross- linking. If the subscript a denotes degradation, then according to Schultz et al.20
RJR„a = (q«a ~ Poa/2)/qo (14)
If it is assumed that q0a = qo then for qaJpoa values obtained from Figure 1, a value of Rg/R ga = 0.90 is obtained for the 2.7% B sample and 0.95 for the pure polymer. However, the experimental ratio Rg/R ga is 0.41 for the 2.7% B sample and 0.37 for the pure polymer. Therefore, on irradiating the polymer in air, not only is degradation initiated, but crosslinking is retarded,

1322 J. BLACIIFORD AND II. F. ROBERTSON
The plots of Figure 4 show the degree of swelling of pure polymer irradiated in air to be much less than for polymer irradiated in vacuo or for polymer containing B irradiated in air. Apparently, the pure polymer is oxidized to such an extent that it no longer swells as much as unoxidized material. Oxidation probably changes both x and the polymer density. In a following paper21 the amount of oxidation is examined by infrared spectroscopy, and it is shown that a polymer containing B is only slightly oxidized. This explains why swelling behavior is unaffected by the air if B is present.
The results of Table II indicate that a large reduction in Gx is produced by the addition of a small amount of B. The number of crosslinks prevented by B can be calculated at any dose and for any composition. Figure 2 shows that the plots of sol fraction versus I t f i t , , for samples containing 2.1, 5.3, 7.1, and 11.3% B coincide with the plot for the pure polymer, provided irradiation is in vacuo. If the effect of B in retarding crosslinking were not constant, the plots would not coincide. For example, the sol fraction for samples containing 0.52% B tends to decrease more rapidly with R /R g than for the other samples. This must occur because the protective effect of B is decreasing with increasing dose and therefore Rg is also decreasing. The effective or instantaneous value of Rg will be that which makes R /R e at a given sol fraction equal to R /R g for pure polymer at the same sol fraction (or for polymer containing more than 2% B). At a sol fraction of 0.01, which corresponds to a dose of 50 Mrad, the effective value of Rg for a polymer containing 0.52% B is 0.454. This is considerably lower than the value of 0.54 found for Rg by filtration technique.2 For Rg = 0.454 and an assumed value of 80, the number of crosslinked units per weight-average primary molecule, 5, may be calculated for R = 50 Mrad from eqs. (2) and (15).
ft (R '• Ro)/(Rg + Ro) (15)Thus for a polymer containing 0.52% B, a value of ft = 22.9 is found if fto = 0.8. For pure polymer, Rs = 0.20, and for the same values of 50 and R, 5 is found to be 50.8. On correcting for dilution in a sample containing 0.52% B the value of S should be 50.8 X 0.9948 = 50.6, provided there is no interaction between B and polymer. These results indicate that B prevents the formation of 50.5 — 22.9 = 27.7 crosslinked units. On the other hand, if S0 = 0.9, the number of crosslinked units prevented is 14.0. In a following paper21 these results are compared to the amount of B destroyed at R = 50 Mrad.
Values of S0 and Gx have been estimated in this report and also in two previous reports2'3 by several different methods. A summary and evaluation of these methods and their results will now be given. Four methods have been used to calculate S0.
(,1) The unirradiated polymer was divided into twelve fractions, and the weights, intrinsic viscosities, and sedimentation coefficients of these

BRANCHING IN P O L Y ( B U T AD1E N E -c o -S T Y Kl i NE ). I ll 1323
fractions were measured. The data were interpreted by several theories,22'23 and the two most reliable theories gave S0 = 0.56 and 0.78.
(2) Using the same data mentioned above the molecular weight distribution of the unirradiated polymer was established. This distribution indicated tliat Mw/M n = 2.84 and 50 = 0.36.
(8) According to the theory24 of Spiro, the manner in which the intrinsic viscosity increases with dose indicates that 50 = 0.65 in the present system.
(4) From the log-log plot of sol fraction versus R /R a it was estimated that (S0 = C.9. This is considered the most reliable value of S0 because it is based on well established theory and the experimental technique is the simplest and most accurate.
Two methods have been used to calculate Gx.(1) From the R„ value, the number-average molecular weight of the
unirradiated polymer, and the experimentally determined ratio Mw/M n, it was estimated3 that Gx = 9.41 for the pure polymer irradiated in vacuo.
(2) From the plot of S + \^ S versus l /R and the number-average molecular weight of the unirradiated polymer it was estimated that for 50 = 0.0 and 0.8 the respective values of Gx would be 1.62 and 1.59. These values are in good agreement with Gz = 1.71 obtained by Witt.1 They are probably more reliable than Gx = 9.41 because sol fraction and M n are more accurately determined than Rg and Mw/M n.
If the experimentally determined molecular weight distribution is narrower than the true distribution, and if M w/M n = 15.5, rather than 2.86, a value of 50 = 0.9 is obtained. If this value of 50 is now combined with Rg and M„, a value of Gx = 1.72 is found. The agreement of these values with S0 and Gx calculated by the most reliable methods strongly suggests that the experimentally determined molecular weight distribution is, indeed, much narrower than the true one. The theories used to interpret the solution properties of the fractions appear to overestimate the effect of crosslinking on intrinsic viscosity; however, the polydis- persity of the fractions might be the cause of this discrepancy. As previously noted,3 three of the chief theories which relate intrinsic viscosity to R/Rg appear to overestimate the increase in fo], whereas the theory of Spiro24 underestimates this increase.
The swelling results are difficult to interpret because the validity of the corrections for chain entanglements and for changes in x with v2 are not well established. Furthermore, no correction is made for the excluded volume effect which might be important.26 Swelling results for other polymers nave generally been found to overestimate Gx if none of these corrections is made. Therefore, the results presented in Figure 5 indicate thai, Gx for samples containing 2.1-11.3% B is less than 0.96. The corresponding value of Gx for the pure polymer is 3.33. These values were calculated from <5(| assumed to be 0.8 and Rg and M Therefore, the swelling results indicate that 50 is greater than 0.8. These limiting values of fip and are consistent with So = 0.9 and Gx = 1.59,

1324 J. BLACHFORD AND R. F. ROBERTSON
References1. Witt, E., J. Polymer Sei., 41, 507 (1959).2. Blachford, J., and R. F. Robertson, J. Polymer Sei., A3, 1287 (1965).3. Blachford, J., and R. F. Robertson, J. Polymer Sei., A3, 1301 (1965).4. Baskett, A. C., Ricerca Sei. (Suppl.), 25A, 379 (1955).5. Flory, P. J., N. Rabjohn, and M. C. Shaffer, J. Polymer Sei., 4, 225 (1949).6. Bardwell, J. A. E., Ph.D. Thesis, McGill University, Montreal, Que., 1948.7. Charlesby, A., Atomic Radiation and Polymers, Pergamon Press, London, 1959.8. Pearson, R. W., J. Polymer Sei., 25, 189 (1957).9. Charlesby, A., Proc. Roy. Soc. (London), A241, 495 (1957).
10. Flory, P. J., Principles of Polymer Chemistry, Cornell Univ. Press, Ithaca, N. Y., 1953.
11. Hwa, J. C. 11., J. Polymer Sei., 58, 715 (1962).12. Mullins, L., J. Polymer Sei., 19, 225 (1956).13. Blanchard, A. F., and P. M. Wooton, J. Polymer Sei., 34, 627 (1957).14. Kraus, G., Rubber World, 135, 67, 254 (1956).15. French, O. M., and R. H. Ewart, Ind. Eng. Chem., Anal. Ed., 19, 165 (1947).16. Bristow, G. M., J. Polymer Sei., 36, 526 (1959).17. Spiro, J. G., and C. A. Winkler, J. Appl. Polymer Sei., 8, 1709 (1964).18. Saito, O., J. Phys. Son. Japan, 13, 198, 1451 (1958).19. Anderson, H. R., ./. Appl. Polymer Sei., 3, 316 (1960).20. Schultz, A. R., P. I. Roth, and G. B. Rathman, J. Polymer Sei., 22, 495 (1956).21. Blachford, J., and R. F. Robertson, J. Polymer Sei., A3, 1325 (1965).22. Zimm, B. H., and R. W. Kilb, J. Polymer Sei., 37, 19 (1959).23. Stockmayer, W. H., and M. Fixman, Ann. N. Y. Acad. Sei., 57, 334 (1953).24. Spiro, J. G., D. A. I. Goring, and C. A. Winkler, J. Phys. Chem., 68, 323 (1964).25. Hermans, J. J., J. Polymer Sei., 59, 191 (1962).
RésuméOn a étudié la dépendance de la solubilité et du gonflement vis-à-vis de la dose de
radiation dans le cas d’un polymère pur et un polymère contenant différentes quantités d’un antioxydant, la A'-phényl-d-napMhylnmiio. Aucune dégradation n’a lieu lorsque les échantillons sont irradiés sous vide, mais en présence d’air, la dégradation est initiée et le pontage est retardé. Pendant l’irradiation sous vide, l’antioxydant, réagit avec le polymère et empêche ainsi la formation d’un grand nombre de pontages. Une analyse des résultats de solubilité montre qu’il y a 0.9 unités pontées par rapport au poids moyen des molécules primaires dans le polymère non-irradié, et que 1.59 ponts sont formés dans le polymère pur par absorption d’une énergie de radiation de 100 e.v. (c.a.d. Gx = 1.59). Ces valeurs concordent avec les résultats obtenus à partir des études du gonflement, mais non avec la distribution du poids moléculaire déterminé expérimentalement.
ZusammenfassungDie Abhängigkeit der Löslichkeit und Quellung von der Strahlungsdosis wurde an
reinem Polymeren und an solchem mit wechselndem Gehalt an W-Phenyl-/3-Naphthyl- amin als Antioxydans untersucht. Bei Bestrahlung der Proben in Vakuum trat kein Abbau auf, in Gegenwart von Luft jedoch wurde der Abbau initiiert und die Vernetzung verzögert. Während der Bestrahlung in Vakuum reagierte das Antioxydans mit dem Polymeren und verhinderte die Bildung einer grossen Zahl von Vernetzungsstellen. Eine Analyse der Löslichkeitsdaten zeigte, dass im unbestrahlten Polymeren 0,9 vernetzte Bausteine pro Gewichtsmittel des Primärmoleküls vorhanden waren und dass im reinen Polymeren bei der Absorption von lOOeV Strahlungsenergie 1,59 Vernetzungsstellen gebildet werden (d.h. G* = 1,59). Diese Werte sind mit den Quellungsdaten konsistent, nicht aber mit der experimentell bestimmten Molekulargewichtsverteilung.
Received June 1, 1964 Revised September 11, 1964 (Prod. No. 4521A)

JOURNAL OF POLYMER SCIENCE: PART A VOL. 3, PP. 1325-1335 (1965)
Branching in Poly (butadiene-co-styrene). IV. Retardation of Radiation-Induced Branching
J. BLACHFORD and R. F. ROBERTSON, Department oj Chemistry, McGill University, Montreal, Quebec, Canada
Synopsis
The composition and yield of the evolved gas and the resulting changes in infrared and ultraviolet spectra have been examined for the irradiation of poly (butadiene-costyrene). Apart from crosslinking, the major changes which occurred during the reaction were the evolution of hydrogen and the destruction of vinyl groups. For every 100 e.v. of radiation energy absorbed 0.45 molecules of hydrogen were evolved, G(H2) = 0.45, and 6.1 vinyl groups were destroyed, G(-vinyl) = 6.1. These results have been compared with the yield of crosslinks, Gx = 1.60. Addition of A-phenyl-/?-naphthyl- amine to the polymer reduced the gas yield to a greater extent than predicted by the “mixture law’’ (which states that the yield of a product from component X is directly proportional to the electron fraction of X). Over the additive concentration range of 2-11%, the gas yield was constant. This behavior is identical to that found previously for the crosslink yield. An explanation of these results has been given which involves the occurrence of processes which exhibit a negative deviation from the mixture law together with processes which exhibit a positive deviation. The destruction of the additive during the irradiation of a sample containing initially 0.52% additive has been determined. The results indicate that the additive protects the polymer mainly by charge transfer or excitation energy transfer.
INTRODUCTION
I t has frequently been observed that the yields of some of the products resulting from irradiation of hydrocarbon mixtures are less than would be expected if the absorption of energy by each component were directly proportional to its electron fraction.1'2 This discrepancy has been attributed to interactions between the components. In solutions of alkanes the interaction appears to be mainly physical in nature, i.e., chemical bonds are neither formed nor broken.2 In other systems, such as the vapor-phase radiolysis of mixtures of cyclohexane and benzene, the interaction is mainly chemical in nature. In this paper a study is made of the interaction between a low molecular weight compound, N-phenyl-/3-naphthylamine, denoted B, and a polymer, poly (butadiene-co-styrene).
In a previous paper4 it was found that for a concentration of the low molecular weight compound, B, of 2% the yield of crosslinks is much less than would be expected on the basis of electron fraction. Over the range2-11% B, however, the yield of crosslinks is constant. In the present in-
1325

1326 J. BLACIIFORD AND R. F. ROBERTSON
vestigation the dependence of total gas yield on concentration of B has been examined, and compared with the dependence of crosslink yield.
Dyne and Denhartog2’5 have studied the nature of the interaction between liquid hydrocarbons by determining the isotopic composition of the hydrogen yield, and Charlesby and Lloyd6 have studied the nature of the interaction between anthracene and silicone by following the reduction in anthracene concentration on irradiation. It is essentially this latter technique which has been employed for the present system.
The changes in the degree of unsaturation resulting from irradiation have frequently been studied for both hydrocarbons and polymers. In the present work changes in unsaturation have been examined by infrared and ultraviolet spectroscopy and by mass spectrometry. These changes have been compared with the corresponding amount of crosslinking.
EXPERIMENTAL
The methods employed in the preparation and irradiation of samples have been described elsewhere.4 Reagent grade toluene was obtained from Fisher Scientific and the anhydrous ethanol from Consolidated Alcohols.
Gas Analysis
The total amount of gas evolved on irradiation was measured in a calibrated manifold containing a McLeod gauge. Gas yields were measured for samples containing various amounts of B and for doses up to 45 Mrad. The composition of the gas evolved from the pure polymer was determined by mass spectrometry.
Infrared and Ultraviolet Spectroscopy
A solution technique could not be used to obtain the infrared spectrum of irradiated polymer because of the insolubility of the polymer. Consequently, a thin film of unirradiated polymer was formed between two sodium chloride plates, and its spectrum was measured on a Perkin-Elmer Model 21 spectrophotometer before and after irradiation in vacuo.
The high sensitivity of sodium chloride to moisture made it necessary to employ a different technique7 for samples irradiated in air. A concentrated solution of polymer in benzene was placed in a glass ring floating on mercury. On evaporation of the benzene a thin circular film of polymer remained attached to the sides of the ring. This same technique was used to prepare films for ultraviolet spectroscopy.
Destruction of Additive
The concentration of the additive B was obtained by extracting a sample with a solvent which dissolves B, but not polymer, and determining the concentration of B in the solvent by ultraviolet spectroscopy. The effect of irradiation was studied for doses up to 50 Mrad.

BRANCHING IN POLY(BUTADIENE-co-STYRENR). IV 1327
A 1.8-g. sample of polymer containing 0.52% B was cut into 1 mm. cubes and refluxed in 50 ml. of ethanol-toluene azeotrope, (ETA) containing 7 parts of ethanol to 3 parts of toluene. After 4 hr. of refluxing the solution was cooled and the supernatant decanted into a volumetric flask. This extraction was repeated four times. The volume of the combined supernatants was made up to 250 ml. by washing the extracted polymer with ETA. Aliquots of this solution were diluted to give a concentration suitable for ultraviolet spectra measurements. A Beckman Model DK-1 spectrophotometer was used and the peak at .308 mu was attributed to A-phenyl-/3-naphthylamine, B. This technique is essentially the same as the standard method8 for the determination of the antioxidant content of SBR.
RESULTS
Gas Analysis
Figure 1 shows the dependence of gas yield Y on dose R. For samples containing 50% B there is a nonlinear relation between Y and R, but for all other B concentrations this relation is linear. The number of molecules of gas evolved per 100 e.v. of energy absorbed by the sample, Gg, was calculated from these results. Table I and Figure 2 show the dependence of Gg on B concentration. The number of crosslinks formed per 100 e.v. of energy absorbed, Gx, which was determined previously,4 is also given in Table I and Figure 2. The value of G„ for the sample containing 60% B is not shown in the figure because of its extreme dependence on dose. It appears that G„ and Gx are independent of additive concentration over the range 2.1-11.3% B.
The dashed line in Figure 2 represents the “mixture law” 2 which states that the yield of a radiolytic product which arises from a particular compound is directly proportional to the electron fraction of the compound. Lamborn and Swallow9 claim that in certain systems energy absorption is
Fig. 1. Gas yield as a function of dose and additive concentration.

1328 J. BLACIIFORD AND R. F. ROBERTSON
Fig. 2. Dependence of Gg and Gx on percentage B.
not directly proportional to electron fraction. However, recent experimental evidence supports the premise of direct proportionality.10 In the present system the electron density of the polymer is approximately equal to that of the additive, and therefore the mixture law may be expressed in terms of weight fraction rather than electron fraction. Figure 2 shows that Gx and G„ are less than predicted by the mixture law. The extent of this negative deviation reaches a maximum at 2% B. The value of G„ = 1.8, which was obtained at low doses for the polymer containing 60% B, represents a large positive deviation.
The composition of the gas formed on irradiation of the pure polymer to a dose of 31 Mrad was 87.1% hydrogen, 4.7% ethylene, and 8.2% high mass number constituents. Therefore, since G„ = 0.52 for pure polymer, G(H2) = 0.452, G(C2H4) = 0.0244, and (7(higher mass number) = 0.0427.
Changes in the Spectra
The infrared spectrum of pure polymer was measured before and after irradiation in vacuo to a dose of 150 Mrad. The only change was a decrease in the peak associated with vinyl groups11 at 912 cm.-1. The absorbance of this peak decreased from 0.561 at 72 = 0 to 0.357 at R = 150 .Mrad. According to the composition of the polymer determined by the manufacturers, the vinyl content of the unirradiated polymer is 15.5%. From this value and the change in absorbance it is calculated by Beer’s law that after a dose of 150 Mrad, 36.3% of the vinyl groups initially present have been destroyed. This suggests that G( — vinyl) is 6.1.
Infrared spectral measurements showed that after a dose of only 10 Mrad the pure polymer irradiated in air is greatly oxidized. Pure polymer exposed to air alone for the same period as required for a dose of 100 Mrad was only slightly oxidized. When samples containing 2.7% B were ir

BRANCHING IN POLY(BUTADIENE-eo-STYRENE). IV 1329
radiated in air, however, the extent of oxidation was only slightly greater than that in the absence of radiation.
Irradiation of the pure polymer in vacuo to a dose of 100 Mrad produced a large increase in the ultraviolet absorption of the polymer. An even larger increase was noted when air was present during irradiation.
Destruction of BFigure 3 shows the dependence on dose of the weight fraction Q of soluble
B in samples which contained 0.52% B before irradiation. From the plot it is seen that at doses above 5 Mrad, Q decreases linearly with dose, while below 5 Mrad the rate of decrease is greater the lower the dose.
Fig. 3. Weight fraction of soluble additive as a function of dose for samples containing 0.52% soluble additive prior to irradiation.
The material balance for the irradiation of a mixture of polymer, P, and additive, B, is
Po + Po — Br + Bn + Bog + P r + P dg (1)In this equation B0 and P0 are the respective weights of additive and polymer in the unirradiated sample. All the symbols of the right-hand side of this equation represent weights in the irradiated sample. Bn is the weight of soluble additive, Bn is the weight of additive attached to the polymer, and -Bdg the weight of additive decomposed to gas or to fragments which do not absorb in the same ultraviolet region as the pure antioxidant. P R and P dg are the weights of polymer extracted and decomposed to gas, respectively. The number of molecules of additive which are destroyed or become attached to the polymer per weight-average primary (prior to crosslinking) molecule is
D = [(PD + P dg) (iV/217) ]{M J P0N) (2)where 217 is the molecular weight of the antioxidant, N is Avogadro’s number, and M m is the weight-average molecular weight of the primary molecules. Before irradiation
Qo — Po/ (Po + Po) (3)

1330 J. BLACHFORD AND R, F. ROBERTSON
and after irradiation
Qr — Br/ (B r + Pr + Bo) (4)
Substituting the relation
Bo + Bog = B0 — Br (5)
and eqs. (3) and (4) into eq. (2) leads to
D = ( A / W 2 1 7 ) ' [Qof (1 — Q o)] — [Q r (-Br + P r + B D)/Po]\ (6 )
If it is assumed that P r = P 0 and Bo = 0, then eq. (6) becomes
D = (MWJ217) { [Qa/(1 - Qo)] - [Qr / ( 1 - O r ) ] } (7)
Because of the assumptions, D calculated by eq. (7) will be slightly greater than the true value.
The value of Mm must first be obtained before D can be calculated. The primary molecular weight distribution of the unirradiated polymer is only slightly broader than the “most probable” type; therefore, Mm is approximately twice as large as the number-average molecular weight of the primary molecules, Mm.12 The number of crosslinked units per weight- average primary molecule, S0, is related to M m by the expression13
M n = M J ( 1 - So/4) (8)
where Mn is the number-average molecular weight of the crosslinked molecules. By osmometry it was found that Mn = 89,900, and previous investigations4 indicate that <50 is between 0.8 and 0.9. Substitution of these values into eq. (8) gives two values of Mm which in turn lead to two values of Mm. Using these values in eq. (7) together with Q values obtained from Figure 3 gives D = 1.32 for a dose of 50 Mrad and for 80 = 0.8, and D = 1.27 for the same dose but wi*h 80 = 0.9.
DISCUSSION
The relative amounts of crosslink formation, gas evolution, and vinyl group destruction which occur on irradiating the pure polymer suggest what groups of the polymer chain are affected and how they are affected. In SBR only the butadiene units need be considered because they are much more sensitive to radiation than are the styrene units since Gx = 3.2 for polybutadiene14 and Gx — 0.345 for polystyrene.16 The G value for gas other than hydrogen is only 0.067. The processes which produce this gas are relatively unimportant compared to those which lead to crosslink formation, hydrogen evolution, and vinyl group destruction, since Gz = 1.60, <?(H2) = 0.,45 and (7(- vinyl) = 1.25.
These three major processes are closely related to each other. I t was previously shown that only crosslinking occurs on irradiation and that this

BRANCHING IN POLY(BUTADIENE-co-STYRENE). IV 1331
TABLE IDependence of Gx and G„ on Additive Concentration
E, %
G„, molecules of gas/100 e.v.
absorbed by sampleGx, crosslinks/100
e.v. absorbed by sample
0 0.52 1.590.5 0.48 0.942.1 0.38 0.565.3 0.38 0.567.1 0.38 0.56
11.3 0.38 0.5600.3 1.8” 0.43
0.25>> —
100.0 0.04« 0.000.02d
a For R = 0. h For R = 40 Mrad. - For R = 6 Mrad. d For R = 54 Mrad.
crosslinking does not involve a chain reaction.4 Therefore, the two basic processes involving polymer molecules P are
P + P PP
P + P ----* PP + H2
There may be several intermediate steps possibly involving ions, radicals, and excited molecules. Since (?(H2) = 0.45 and Gx = 1.60, the ratio of the yields of the first process to the second process is 2.55. Depending on the specific reactions involved, the first process may result in the destruction of one or two vinyl groups, and the second process may result in the destruction of two vinyl groups, or, no destruction may occur. These qualifications are based on the consideration that the destruction of a vinyl group represents the formation of two new single bonds. The high value of G{ vinyl) relative to Gx and (?(H2) might be caused by a reaction between adjacent vinyl groups on the same molecule. Considering that G(H2) m 0.45 this reaction must lead to very little hydrogen evolution.
Kuz’minskii et al.16 found that the unsaturation in SBR had been reduced by 80% after a dose of 150 Mrad. Turner17 claims that the chemical method used by them to measure the degree of unsaturation overestimates the amount of destruction. The results of the present work tend to support Turner’s criticism, since infrared analysis indicates that only 36% of the unsaturation is destroyed after 150 Mrad.
On exposing natural rubber to y-radiation, Evans et al.7 observed considerable diene formation. The increase in the ultraviolet absorption obtained in the present work might also be due to diene formation. If two vinyl groups react with each other to give a crosslink and hydrogen, a diene would be formed.

1332 J. BLACKFORD AND R. F. ROBERTSON
Fig. 4. Theoretical dependence of Gx on additive concentration.
The changes in the infrared spectrum of the polymer when irradiated in air are similar to those observed by others in the absence of radiation. Apparently the radiation accelerates the rate of oxidation but does not introduce new oxidation reactions. Dole et al.18 have suggested a large number of complicated reactions which probably occur during radiation- induced oxidation. Solubility results previously reported4 for irradiation in air indicate that the ratio of scissions to crosslinks is 0.10 for pure polymer and 0.25 for polymer containing 2.7% B, but because thick samples were used the true values of these ratios is probably considerably greater. The solubility results also indicated that the presence of air not only initiates scission but retards crosslinking as well. Infrared analyses show that B is very efficient in protecting the polymer from radiation-induced oxidation. Bauman and Born19 have suggested the reactions responsible for this protection. In contrast to the present results, Field et al.20 found that when the polymer was exposed in air to ultraviolet radiation the presence of B increased the amount of oxidation.
The results of Figure 2 indicate that B and the polymer interact so that both Gx and Gg are less than predicted by the mixture law. In a previous investigation4 it was found that after a sample containing initially 0.52% B was irradiated to 50 Mrad, B had prevented the formation of 27.9 cross- linked units per weight-average primary molecule if S0 = 0.8 and 14 if 50 = 0.9. In the present investigation it is found that after the same sample has received the same dose of 50 Mrad, 1.32 molecules of B have become attached to the polymer or have decomposed per weight-average primary molecule if 80 = 0.8, and 1.27 if 50 = 0.9. Therefore, the ratio of crosslinked units prevented to molecules of B attached to the polymer or decomposed is 21.3 for 50 = 0.8 and 10.6 for ¿>0 = 0.9. There are several reasons for the probably overestimation of the extent of attachment and decomposition of

BRANCHING IN POLY(BUTADIENE-co-STYRENE). IV 1333
B and therefore for the probable underestimation of this ratio. Incomplete evacuation or a post-irradiation reaction would result in the attachment of B to the polymer. If some of the polymer dissolves in the azeotrope underestimation will result. The assumptions involved in calculating eq. (7) will lead to an underestimation of this ratio.
The large number of crosslinked units prevented for each molecule of B destroyed is incompatible with a radical scavenging mechanism. If it is assumed that each crosslinked unit corresponds to a radical, a molecule of B must scavenge at least 10.6 radicals: this is highly unlikely. A small amount of radical scavenging probably does occur; but most of the protection must be due to charge transfer or excitation energy transfer.
The effect of B on Gx and G„ over the entire concentration range is given in Figure 2. Values of G0 for the sample containing 60% B are not shown in this figure but are given in Table I. At a concentration of 60% B the solubility limit of B in the polymer is definitely exceeded. The very high Gg values for this sample and the dose dependence of Gg is probably related to this and to secondary reactions involving the scavenging of hydrogen; however, no definite explanation can be given. Over the range 2-11% B the values of Gs and Gx are constant. It might be suggested that only one process is responsible for the formation of crosslinks and gas, and that Gg and Gx are the same at 11% as at 2% B since the solubility limit of B in the polymer is 2%. However, the results of Angert and Kuz’minskii indicate that the solubility limit is in excess of 10% B. Furthermore, even if the solubility limit were 2% B, the value of Gs would decrease by 0.03 units and that of Gx by 0.05 units over the range 2-11% B because of the dilution of the polymer by B. This argument refutes other explanations involving the occurrence of only one process.
For simplicity we can assume that there are two processes involved, although there might be more. The large deviation from the mixture law produced by 2% B indicates that one of these processes is reduced by B. Even if this process were completely retarded by a concentration of 2% B and the other process were unaffected by B, there would still be a reduction in Gx and Gg over the range 2-11% B since the concentration of polymer is being reduced. The independence of Gg and Gx over the range 2-11% B indicates that the second process exhibits a positive deviation from the mixture law. Figure 4 shows one possible manner in which two such processes could be affected by B to give a plot similar to that of Figure 2.
The twc processes could involve ions exclusively or excited molecules exclusively. However, because radiation produces both ions and excited molecules and because B affects the processes differently, it is likely that one mechanism involves ions and the other excited molecules. Since B is a secondary amine and therefore a good electron donor, it would prevent the ionic process by replacing electrons lost by polymer molecules. This implies that the reaction which exhibits a negative deviation from the mixture law is ionic. The other process which involves excited molecules exhibits a positive deviation from the mixture law because of the transfer of excita-
JOURNAL OF POLYMER SCIENCE: PART A VOL. 3, PP. 1337-1357 (1965)
Kinetics of Styrene Polymerization Catalyzed by Rhenium Pentachloride
MIKIHARU KA .MAUI 11 and HAJIME MIYAMA, Basic Research Laboratories, Toyo Rayon Company, Ltd., Kamakura, Japan
SynopsisPolystyrene of high molecular weight was obtained in a good yield by the polymeriza
tion of styrene catalyzed by rhenium pentachloride in benzene or benzene-ethylene dichloride solution. The mechanism of this polymerization reaction was studied by kinetic and spectroscopic measurements. Experimental results were well explained by assuming that a jr-complex between rhenium pentachloride and monomer initiates the cationic polymerization in the case of benzene solution and that +CH2CH2C1 initiates the cationic polymerization in the presence of ethylene dichloride.
INTRODUCTION
It has been reported that rhenium halides act as Lewis acids1 and are effective as polymerization catalysts.2'3 In the present study, styrene was polymerized by using rhenium pentachloride, and polystyrene of high molecular weight was obtained in a good yield. The mechanism of this polymerization reaction was studied under various experimental conditions by using kinetic and spectroscopic measurements.
EXPERIMENTAL
Sample
Commercial styrene was washed twice with 20% aqueous sodium hydroxide, washed twice with 20% aqueous sodium bisulfite, washed thoroughly with water, then dried over calcium chloride and distilled at reduced pressure. A distillate boiling at 39°C./10.5 mm. Hg was used for the experiment. Commercial ethyl monochloroacetate was completely dried over calcium chloride and distilled at reduced pressure. A distillate boiling at 44°C./13 mm. Hg was used for the experiment. Commercial benzene was washed twice with concentrated sulfuric acid and then washed thoroughly with water, allowed to stand for 24 hr. over calcium chloride, and distilled over sodium metal. A distillate boiling at 80°C./760 mm. Hg was used. Commercial ethylene dicldoride was dried completely over calcium chloride and distilled. A distillate boiling at 83.7°C./760 mm. Hg was used. Commercial rhenium pentachloride was completely purified by
1337

1338 M. KAMACIII AND IT. MIYAMA
repeated sublimation at a high vacuum. All of these samples were purified or distilled again immediately before each run.
Procedure
A lOO-ml. three-necked flask with a mercury-seal stirrer was used. Into this flask, desired quantities of solvent and monomer were introduced under an atmosphere of purified nitrogen gas. The mixture was kept at a constant temperature (±0.05°C.) in a thermostat. A solution of rhenium pentachloride in ethyl monochloroacetate was added rapidly under the nitrogen atmosphere. At definite time intervals after the addition of the catalyst, aliquots of the reaction mixture were removed with a syringe previously filled with nitrogen and were poured into methanol to precipitate polymer. The obtained polymer was dissolved in toluene, precipitated twice with methanol, washed completely with methanol, and dried at reduced pressure.
The molecular weight of the polymer was determined by using an Ost- wald viscometer at 30°C. for toluene solutions and also by using a vapor pressure osmometer (Mechro.ab, Model 30-1 A) at ‘20°C. for benzene solution. Molecular weight was calculated from the viscosity measurement, by using the equation:4
to] = 1.2 X 10 4J / n-7
Visible and ultraviolet absorption spectra for the reaction system were measured by a Cary 14 spectrometer.
RESULTS
Rate of Polymerization
Except in special cases, all measurements were conducted by dissolving a desired quantity of rhenium pentachloride in 5 ml. cf ethyl monochloroacetate and adding this solution to the polymerization system to give a total volume of 50 ml.
The variations of yield with time at various concentrations of catalyst are shown in Figures 1-3, benzene being used as a solvent and the initial concentration of monomer being kept constant. The variations of yield with time at various concentrations of monomer with benzene as a solvent and a constant initial concentration of catalyst are shown in Figures 4-6.
Each of the rates of polymerization obtained from the curves in Figures 1-6 reaches a stationary value with time. An example is shown in Figure 7. It is obvious from the figure that the rate of polymerization increases with polymerization time and that it becomes stationary at the time t . A s shown in Figure 8, the stationary rates Rs obtained from Figures 1-6 satisfy the relationship:
JR, = fc[C]„[M]s« ( 1 )

KINETICS OF STYRENE POLYMERIZATION 1339
T I M E ( h r . )
Fig. 1. Time-conversion curves of polymerization at various catalyst concentrations: (O) 3.300 mmole/l.; (A) 2.200 mmole/1.; ( • ) 1.100 mmole/1. Reaction temperature: 0°C., styrene concentration: 5.228 mole/1.
Fig. 2. Time-conversion curves of polymerization a t various catalyst concentrations: (O) 1.100 mmole/1.; (A) 0.550 mmole/1.; ( • ) 0.275 mmole/1. Reaction temperature: 10°C., styrene concentration: 5.228 mole/1.
Here, [M]s is stationary concentration of monomer and [C]0 is initial concentration of catalyst which is used as an approximate value of the stationary state concentration of catalyst. Values of the rate constant k obtained from the straight lines of Figure 8 are plotted against l /T as shown in Figure 9. From this plot, an activation energy of 29.1 kcal./mole is obtained. Also, as shown in Figure 10, values of r obtained from Figures 1-6 satisfy the relationship:
1/r = k T[C ],[MV-8 (2)

1340 M. KAMACHI AND II. MIYAMA
Fig. 3. Time-conversion curves of polymerization at various catalyst concentrations: (O) 0.330 mmole/I.; ( A ) 0.220 mmole/1.; ( • ) 0.165 mmole/1.; (A.) 0.110 mmole/]. Reaction temperature: 20°C., styrene concentration: 5.228 mole/1.
Fig. 4. Time-conversion curves of polymerization at various monomer (styrene) concentrations: (O) 5.228 mole/1.; ( A ) 3.485 mole/1.; ( • ) 2.614 mole/1. Reaction temperature: 0°C., catalyst concentration: 3.300 mmole/1.
An Arrhenius plot of kT is shown in Figure 11 and an activation energy of 28.7 kcal./mole is obtained.
Degree of Polymerization
The variation of the degree of polymerization P with time is shown in Figure 12, where the change of yield with time is shown for comparison. I t is obvious that the degree of polymerization attains a constant value at the stationary state. The relation between the degree of polymerization

KINETICS OF STYRENE POLYMERIZATION 1341
TIME (hr. )
Fig. 5. Time-conversion curves of polymerization at various monomer (styrene) concentrations: (C) 6.099 mole/L; (O) 5.228 mole/1.; (») 4.357 mole/1.; (A) 3.485mole/1.; (A) 2.614 mole/1. Reaction temperature: 10°C., catalyst concentration:0.550 mmole/1.
Fig. 6. Time-conversion curves of polymerization at various monomer (styrene) concentrations: (O) 5.228 mole/1.; (A) 3.485 mole/1.; (A) 2.614 mole/1. Reaction temperature: 20 °C., catalyst concentration: 0.220 mmole/1.
and the initial concentration of monomer is shown in Figure 13, where the concentration of catalyst was kept constant. These measurements were conducted for system of styrene-benzene-ethyl monochloroacetate-catalyst where 5 ml. of ethyl monochloroacetate was used for the total volume of 50 ml. In order to determine the effect of ethyl monochloroacetate on the degree of polymerization, various quantities of ethyl monochloroacetate were

1342 M. KAMACHI AND H. M1YAMA
Fig. 7. Polymerization rate dependence on the reaction time. Reaction temperature: 0°C., catalyst concentration: 2.200 mmole, 1., monomer concentration: 5.228 mole/1.
Fig. 8. Changes of polymerization rate with [C]0[M]B2-8 a t various temperatures: ( • )0°C.; (€) 10°C.; (O) 20°C.
used for 45 ml. of styrene without benzene and the concentration of catalyst was kept constant; results are shown in Figure 14.
Spectroscopic Measurements
Since color of the polymerization system changed from dark green to yellow brown during the polymerization, spectroscopic measurements were conducted at 20 °C. to examine the change of visible and ultraviolet absorption during the polymerization. Also, spectra of the catalyst-benzene

KINETICS OF STYRENE POLYMERIZATION 1343
, 31 /TxlO
Fig. 9. Arrhenius plot of log k vs. 1 /T .
Fig. 10. Change of 1/ t with [C]0[M]o2.
and catalyst-ethyl monochloroacetate-benzene systems were examined as shown in Figures 15 and 16. In the catalyst-benzene system, the first absorption occurs at 3120 A. and the second absorption at 3550 A. By adding ethyl monochloroacetate, the first absorption shifts to 3220 A. and the second to 3600 A. As shown in Figure 17a, immediately after addition of styrene to the mixture of catalyst, ethyl monochloroacetate, and benzene, the first absorption moves to 3250 A. but the second does not change. Also, new peaks appear at 3050 and 2999 A. After 30 min. of mixing, as shown in Figure 175, intensities of these new peaks increase, and those of absorptions at 3250 and 3600 A. decrease. Two hours after mixing, when

1344 M. KAMACIII AND H. MIYAMA
l/T x 1 0 3
Fig. 11. Arrhenius plot of log kr vs. 1JT.
Fig. 12. Changes of intrinsic viscosity and conversion with polymerization time: ('——) conversion and ( • ) viscosity with polymerization at temperature of 10°C., monomer concentration of 5.228 mole/1., catalyst concentration of 0.550 mmole/1.; (—) conversion and (O ) viscosity with polymerization at temperature of 0°C., monomer concentration of 3.485 mole/1., catalyst concentration of 3.300 mmole/1.
the polymerization is supposed to be almost over, the new peaks at 2999 and 3050 A. disappear, as shown in Figure 17c.
In order to check whether the shift of the absorption spectra caused by the addition of ethyl monochloroacetate is due to the formation of a new bond, NMR and infrared spectra of a solution of rhenium pentachloride in ethyl monochloroacetate were measured. No evidence for the formation of a new bond was obtained.

KINETICS OF STYRENE POLYMERIZATION 1345
Fig. 13. Dependence of 1 /p on the initial monomer concentrations: (€•) 0°C., catalyst concentration: 3.300 mmole/1.; ( • ) 10°C., catalyst concentration of 0.550 mmole/!.; (O) 20°C., and catalyst concentration of 0.220 mmole/1.
3 . 0
2. 0
0. 12
1 /IM1
0 . 1 3
Fig. 14. Dependence of 1 /p on the initial monomer concentration in the system without benzene. Reaction temperature: 10°C., catalyst concentration: 0.550 mmole/1.
Elementary Analysis
Results of elementary analysis of the polymer obtained are shown in Table I. Here, the molecular weight of the polymer calculated on the basis of the assumption that one polymer molecule contains one chlorine atom is compared with that obtained by vapor pressure osmometry.
The osmometric results are in sufficiently close agreement with the calculated molecular weights to indicate that each polymer molecule contains one chlorine atom.
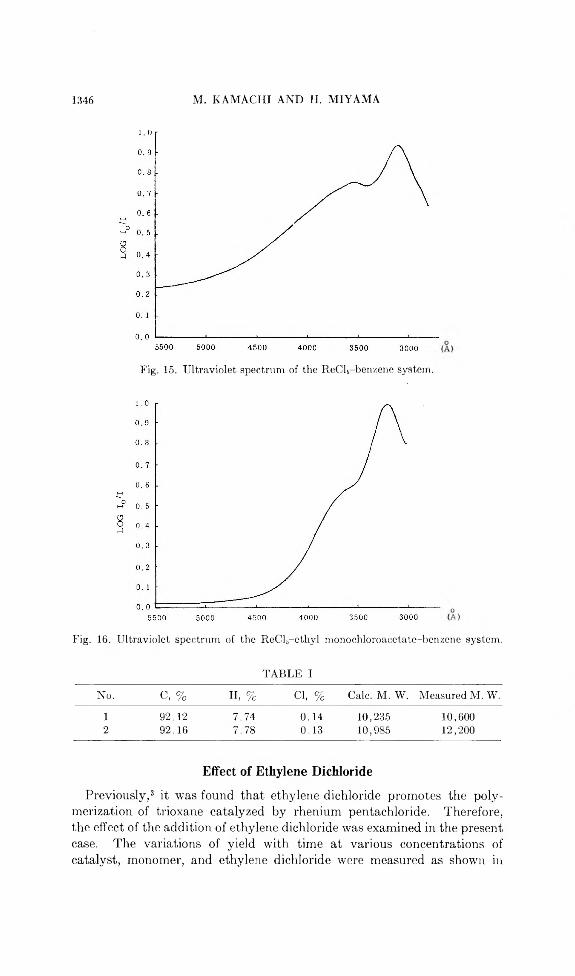
1846 M . K A M A C H I A N D Fl. M I Y A M A
Fig. 15. Ultraviolet spectrum of the ReCL-benzene system.
Fig. 16. Ultraviolet spectrum of the ReCl5-ethyl monochloroacetate-benzene system.
TABLE I
No. c , % H, % Cl, % Calc. M. W. Measured M. W.
1 92.12 7.74 0.14 10,235 10,6002 92.16 7.78 0.13 10,985 12,200
Effect of Ethylene Dichloride
Previously,3 it was found that ethylene dichloride promotes the polymerization of trioxane catalyzed by rhenium pentachloride. Therefore, the effect of the addition of ethylene dichloride was examined in the present case. The variations of yield with time at various concentrations of catalyst, monomer, and ethylene dichloride were measured as shown in

KINETICS OF STYRENE POLYMERIZATION 1 3 4 7
Fig. 17. Ultraviolet spectra of the ReCL-ethyl monochloroacetate-benzene-styrene system: (a) immediately after mixing; (6) 30 min. after mixing; (c) 2 hr. after mixing.

1348 M . K A M A C H l A N D I I . M I Y A M A
Fig. 18. Time-conversion curves of polymerization at 0°C. at various catalyst concentrations: (©) 1.146 mmole/1.; (©) 2.292 mmole/1.; (O) 4.584 mmole/l. Ethylene dichloride concentration: 4.234 mole/1., monomer concentration: 2.16 mole.. I.
Fig. 19. Time-conversion curves of polymerization at 10°C. at various catalyst concentrations: ( • ) 1.146 mmole/1.; (©) 2.292 mmole/1.; (O) 4.584 mmole/1. Ethylene dichloride concentration: 4.234 mole/1., monomer concentration: 2.16 mole/1.
Figures 18-23. As shown in Figure 24, the stationary rate of polymerization R, obtained from these figures is found to satisfy the eq. (3):
Rs = fc'[E]o®-s[CJ„0-ffEM].M (3)
where, [E]0 is the initial concentration of ethylene dichloride. The Arrhenius plot of k' is given in Figure 25, from which an activation energy of13.6 fccal./mole is obtained. Also, the absorption spectrum of the ethylene dichloride-catalyst system is shown in Figure 26. Obviously, there

KINETICS OF STYRENE POLYMERIZATION 1349
Fig. 20. Time-conversion curves of polymerization at 20°C. at various catalyst concentrations: ( • ) 0.145 mmole/1.; (C) 0.229 mmole/1.; (O) 0.342 mmole/1. Ethylene dichloride concentration: 4.234 mole/1., monomer concentration: 2.16 mole/I.
Fig. 21. Time-conversion curves of polymerization at various monomer concentrations: (©) 1.57 mole/1.; ( • ) 2.16 mole/1.; (©) 2.67 mole/1.; (O) 3.46 mole/1. Ethylene dichloride concentration: 4.234 mole/1., reaction temperature: 10°C., catalyst concentration: 1.146 mmole/1.
is a new absorption at 3060 A. which was not observed in the systems not containing ethylene dichloride.
DISCUSSION
In order to explain the obtained results, the mechanism shown in eqs.(4)-(10) is proposed.

1350 M. KAMACH1 AND H. MIYAMA
Fig. 22. Time-conversion curves of polymerization a t various monomer concentrations: ( • ) 0.77 mole/1.; (C) 1.08 mole/l.; (O) 1.57 mole/l. Ethylene dichloride concentration: 4.234 mole/1., reaction temperature: 10°C., catalyst concentration: 1.46 mmole /l.
T IM E (hr. )
Fig. 23. Time-conversion curves of polymerization at various ethylene dichloride concentrations: (A) 2.17 mole/1.; ( • ) 4.234 mole/1.; (O) 6.351 mole/1. Reaction temperature: 10°C., catalyst concentration: 1.15 mmole/1., monomer concentration: 2.16 mole/1.
Complex formation:k
M + C (4 )
Initiation:

KINETICS OF STYRENE POLYMERIZATION 1351
Fig. 24. Change of polymerization rate with [E]o°-5[C]o0,6[M]a1-8 at various temperatures: ( • ) 0°C.; (C) 10°C.; (O) 20°C.
Fig. 25. Arrhenius plot of log k ' vs. 1 / T .
Propagation:

1352 M. KAMAC1II AND II. MIYAMA
Fig. 26. Ultraviolet spectra of the systems (a) R.eCl5-ethylene dichloride; (6) ReCh-ethylene dichloride-styrene.
XM,+ -* XM„ (7)Transfer:
XM„+ + 9 XM , + 8 + (8)k l r s '
XM,+ - S' -* XM„ + S'+ (9)
XM„+ + M ^ X M , + M+ (10)
Here, M is monomer, C catalyst, X complex between C and M, XM„ + growing cation, XM, polymer, S benzene, and S' ethyl monochloroacetate.
For reaction (4), the following equilibrium equation is considered.
K = [X]/[M][C] (11)

KINETICS OF STYRENE POLYMERIZATION 1353
In the stationary state, the total concentration of growing cations£ [XM„+] is considered to be a constant. Therefore,
£ [X M n+)/dt = fc,[M],[X], - *r [XM,+], = 0 (12)
Thus
E[X M ,+]s = (&</&r)[M]l [X]I (13)
kT — kt + fcfrs[S] + fcirs'tS'] (14)
From eq. (11) and (13),
E[X M ,+] = (W W [ M L ![C], (15)On the other hand, the stationary rate of polymerization Rs is given by
R, = M M ]S£[XM „+]S (16)
By substituting eq. (15) into equation (16) we obtain
R. = (KkJc,/kT)[C].1M]S (17)
If [C]s is equal to [C]o, this equation is very similar to eq. (1). Also, an experimental activation energy of 29.1 kcal./mole is considered to be thatof Kkikp/ k T.
Next, the nonstationary state during the period r will be considered. The rate of formation of growing cations is given by
dZ\XM,+]/dt = *,[X][M] - MXM„+] (18)
By integrating, we have
£ [X M B+] = ( k J k J lM U X U l - e-kn) (19)
The rate of polymerization is given by
-d[M]/dt = fcp[M]£[XM„+] (20)
On integrating this, we have
In [M]0/[M ], = kv f £ [XM, + ]di (21)J 0
» Substituting this into eq. (19) yields
In [M]„[M], = ( iM r)[M ]o [X ]0 f (1 - e~kTt)dtJ o
= ( W * r ) [ M ] o [ X ] o r + (M i/* r .) [M ]o [X ]o (e -* rr - D (22)
Here, the magnitude of kT in the typical cationic polymerization of styrene is ca. 10-2 sec.6 and r in the present experiment is 103—104 sec. Since the term, e~kTT is far smaller than unity, this can be neglected. Thus,
In [M ]0/ [ M ] , = ( W M [ M ] o [ X ] 0[r - (1 / k T) ] (23)

1354 M. KAMACHI AND II. MIYAMA
Also, 1/7,-j. may be neglected when compared with r. Therefore,
In [M]0/[M ], = (kpkt/ k T) [M]0[X]0r (24)
By substituting eq. (11) into this and rearranging, we have
1 /r = (Kkpkt/kT)[C]o[MVln [M]S/[M]„ (25)
In the present experimental conditions, In [M]S/[M ]0 is almost constant. Therefore, the following relationship is obtained.
1/r cc {Kkpkt/ k T)[C]0[MV (26)
This almost agrees with eq. (2). Thus, the experimental activation energy of 28.7 kcal./mole for fcr of the eq. (2) is considered to be equivalent to Kkpkjkrp. In the discussion of eq. (17), a value of 29.1 kcal./mole was proposed for the activation energy of Kkpkf/kT. Therefore, the mechanism above described is considered reasonable from the measurements of both the stationary polymerization rate and the time r.
Then, the average degree of polymerization is given by eq. (27) :6
i / P = ( w y + C M S 1 /M M ] }+ (% /[S 'l/*aM ]) + (kt/ k p[ M]) (27)
When the total volume of the polymerization system is kept constant and only the ratio of styrene to benzene is changed, this equation becomes:7
Here,
1/P [(klrm — bktrs + aktTS + ks')/kp] 1/[M ]
k,' = kt + k trs’[S'] - fcirs[S]
a = 1000ds/ i r s,
b = dsWm/dmWs
(28)
and
C = dsWs’/ds'Ws
where ds, ds' , and dm are densities and Ws, W /, and W J are molecular weights of benzene, ethyl monochloroacetate, and styrene, respectively. From the slopes and intercepts of Figure 13, values of aktrs/k p + ks' /kp and ktrm/kp — bktrs/k p are obtained. Also, from Figure 14, it is obvious that aktrs/k p + k / / k p becomes zero for the system without benzene. In this system, bktrs/ k p may be ignored. Therefore, ktrm/k v can be calculated from
TABLE II
Temperature, °C. ktrm/kp ktrs/kp
0 2.13 X 10“3 2.00 X 10-410 2.00 X 10“3 0.95 X 10"420 2.47 X 10“3 0.79 X 10“4 •

KINETICS OF STYRENE POLYMERIZATION 1355
the intercept of Figure 16. By substituting the value of ktrm/k„ into the value of ktTm/kp — bktrs/k P, ktTS/kP can be calculated as shown in Table II. These values of k trm/k p and ktrs/kp are about one tenth of those obtained for the polymerization of styrene in benzene catalyzed by BF3-OEt2, SnCh, and TiCh-7 This suggests that rhenium pentachloride is a stronger Lewis acid than these catalysts.6*5
When ethyl monochloroacetate was added to the benzene-catalyst system, the absorption peaks moved toward the longer wavelength. This shift might be due to the polar effect of ethyl monochloroacetate as usually observed in the addition of polar solvent.8 Also, the shift of the second peak observed when styrene was added is considered to be due to the formation of a 7r-complex9 between styrene and rhenium pentachloride. Moreover, new peaks observed at 2999 A. and 3050 A. during the polymerization are considered to be due to the growing cation. Jordan et al.10 observed a new absorption at 4100-4200 A. in the polymerization of styrene catalyzed by SnCL and A1CL and claimed that this is an absorption by growing cation. However, Higashimura11 observed an absorption at 4100 A. even in the system of polystyrene-SnCL-HCl and also found a new absorption at 3090 A. in the polymerization system. Thus, Higashimura proposed that the absorption at 3090 A. must be due to the existence of growing cation. The present results support bis proposition. Taking into account these results, a more detailed mechanism is considered. Since the coordination number of rhenium is 6- 8, 7r-complex formation between rhenium pentachloride and styrene is equally possible as in the case of SnCl4 and styrene.12 This process corresponds to the process of complex formation. Then, this complex forms a new x-bonding with another styrene monomer molecule and at the same time loses one chlorine atom. Thus, a carbonium ion and a chloride ion are formed. In this initiation process, the formation of new x-bond and the cleavage of Re-Cl occur and it requires a rather large activation energy. Therefore, it seems reasonable that the experimental activation energy is far larger than that of the usual cationic polymerization.60 The cation formed reacts further with monomer to give a cation of higher degree of polymerization. This corresponds to the propagation process. Since a polymer molecule contains one atom of chlorine according to the elementary analysis, a growing cation is considered to recombine with a chloride ion. Also, the polymer cation disappears on transfer withmonomer or solvent. The above explanation is summarized by eqs. (29)-(32).
ReCl5 + St ^ S t -------------------ReCL (29)
S t---------- ReCls + St -» S t------------ ReChSt+Cl- (30)
S t ------------ ReChSt+Cl' + St —> S t ------------- ReCl4St2+C H\ (31)
S t ------------ ReChSt.-i+Cl- + St -> S t ............ReCLStn+Cl- )
S t -----------ReCl4St„+Cl- - » S t ...........ReCl4StnCl (32)
1356 M. KAMACHI AND H. MIYAMA
When ethylene dichloride is added, the above scheme is not applicable for the results obtained. Kennedy et al.13 considered the formation of [CH3]+AlCh^ from AICI3 and CH3C1 for the polymerization of isobutene catalyzed by AIC13 in methyl chloride. Also, the absorption at 3060 A. in Figure 26 suggests the existence of an intermediate complex between rhenium pentachloride and ethylene dichloride. Therefore, the present case is explained by assuming the same type of complex formation as shown ineqs. (33)-(36).
K, KtReCh + CH2C1 - CH2C1 ReCh . . . C1CH2 - CH2C1
ReCl6~ + +CH2CH2C1 (33)hi
+CH2CH2C1 + St -» (CH2CH2Cl)St+ (34)kp
(CH2CH2Cl)St+ + St -» (CH2CH3Cl)St2+
kp(CH2CH2Cl)StK- 1+ + St -> (CH2CH2Cl)St, + (35)
kt(CH2CH,Cl)StB+ + ReCh" -> (CH2CH2Cl)StKCl + ReCh (36)
By applying stationary state approximation for this scheme, the stationary rate Rs is given by
Rs = ( W ^ X M O 0 C]S°-6[E]S°-6[M]S2 (37)
If [C], is equal to [C]o and [E]s equal to [E]0, this equation is very similar to eq. (3). Therefore, the experimental activation energy of 13.6 kcal./ mole is that of (7viA2)0-5.
The authors wish to thank Dr. J. Tsuji and Mr. M. Morikawa for their advice, to Dr. K. Nukada and Mr. Y. Goto for the measurement of N M E spectra and to Messrs. K. Sugiyama and J. Takeda for their help in the experiment.
References1. Tsuji, J., M. Morikawa, and T. Nogi, Chem. Ind ., 1964, 543.2. Olah, G. A., FriedePCrafts and Related Reactions, Interscience, New York, 1963,
p. 276.3. Miyama, H., and K. Kamachi, B ull. Chem. Soc. Japan , 36, 1696 (1963).4. Alfrey, T., A. Bartovics, and H. Mark, J . A m . Chem. Soc., 65, 2319 (1943).5. Plesch, P. H., The Chemistry o f Cationic Polymerization, Pergamon Press, Oxford,
1963, (a) p. 288; (b) p.285; (c)p. 125.6. Burnett, G. M., M echanism o f Polymer Reactions, Interscience, New York, 1954,
p. 109.7. Okamura, S„ and T. Higashimura, J . Polym er Sci., 21, 289 (1956).8. McRae, E. G., •/. P hys. Chem., 61, 562 (1957).9. Plesch, P. H., Cationic Polymerization and Related Complexes, Heffer, Cambridge,
1963, p. 109.

KINETICS OF STYRENE POLYMERIZATION 1357
10. Jordan, D. 0., and F. E. Treloar, J . Chem. Soc., 1961, 729, ibid., 1961, 734.11. Higashimura, T., private communication.12. Ludvig, E. B., A. R. Gantmakher, and S. S. Medvedev, Polym er Sci., USSR, 1,
516, 529(1961).13. Kennedy, J. P., I. Kushonfaum, and R. M. Thomas, ./. Polym er Sci., Al, 331
(1963).
RésuméOn a obtenu un polystyrène de haut poids moléculaire et avec un bon rendement, par
polymérisation du styrène catalysée par le pentachlorure de rhénium, dans une solution de benzène ou de benzène-dichloro-éthylène. Le mécanisme de cette polymérisation a été étudié par des mesures cinétiques et spectroscopiques. On peut expliquer les résultats expérimentaux si on accepte qu’un complexe 7r entre le pentachlorure de rhénium et le monomère initie la polymérisation cationique dans le cas de la solution benzénique et que +CH2CH2C1 initie la polymérisation en présence de dichloro-éthylène.
ZusammenfassungHochmolekulares Polystyrol wurde in guter Ausbeute durch die Rheniumpenta-
chlorid in Benzol oder Benzol-Äthylendichloridlösung katalysierte Polymerisation von Styrol erhalten. Der Mechanismus dieser Polymerisationsreaktion wurde durch kinetische und spektroskopische Messungen untersucht. Die Versuchsergebnisse lassen sich durch die Annahme, dass -»--Komplexe zwischen Rheniumpentachlorid und dem Monomeren im Falle der Benzollösung die kationische Polymerisation starten und dass +CH2CH2C1 die kationische Polymerisation in Gegenwart von Äthylendichlorid anregt, gut erklären.
Received Ju ly 15, 1964 (Prod. No. 4501A)

JOURNAL OF POLYMER SCIENCE: PART A VOL. 3, PP. 1359-1371 (1965)
Shear Dependence of Viscosity—Molecular Weight Transitions. A Study of Entanglement Effects
SU R E S H N. C H IN A I and W IL L IA M C. S C H N E ID E R , F i b e r s D i v i s i o n ,
A m e r i c a n C y a n a m i d C o m p a n y , S t a m f o r d , C o n n e c t i c u t
SynopsisThe flow behavior of concentrated polymer solutions covering molecular weights up
to 150,000 were examined at shear rates up to 200,000 sec.-1. The viscosity-molecular weight-shear rate results of previous workers recognizing only single critical molecular weight M *, above which ordinary Rueche entanglements dominated the flow, were compared with our findings in -which two distinct critical molecular weights, upper M * and lower M ** exist. These results are compared with the theory, and new interpretations are presented.
INTRODUCTION
The viscosity of concentrated solutions of polymers has been the subject of many investigations. Typical systems reported include: cellulose nitrate,1 polystyrene,2 polyisobutylene,3 cellulose tributyrate,4 poly (methyl methacrylate),6 poly(vinyl alcohol),6 and many others.
I t has been evident in all of these studies that the primary effect of shear is a breaking down of molecular interactions arising from chain entanglement and/or attractive forces between polar groups. Since chain entanglement is a function of both size and number of molecules, solute molecular weight and concentration are controlling factors. Bueche7 has shown that the low-shear viscosity no of concentrated polymer solutions is proportional to molecular weight M below a critical value, M * , whereas above M * , it increases rapidly and becomes proportional to M 3-4.
W ith respect to concentration Ferry et al.8 and later Fox and Loshaek9 have shown empirically that the zero-shear viscosity is proportional to the fifth power of the concentration for M values above M * .
Accordingly, the dependence of the zero-shear viscosity on concentration and molecular weight for values of molecular weight greater than M * can be expressed by the equation:
Vo oc C W 3-4 (1)
Porter and Johnson10 have discussed the effect of shear rate on the observed transitions in the viscosity as molecular weight is varied. Figure la shows their estimation of the viscosity behavior at low and high shear limits. The viscosity transition point is interpreted as reflecting the onset
1359

1360 S. N. CH1NAI AND W. C. SCHNEIDER
(0) fl>)
Fig. 1. Possible shear dependence of viscosity-molecular weight function of polymers.
of a network structure due to entanglement. Porter and Johnson state that “ if the importance of imagined polymer entanglement becomes less w ith shear, then lim iting high shear viscosity should increase with molecular weight in a way similar to that for simple molecules.” The lim iting Newtonian behavior can be approximated by extending the slope in Figure la for low molecular weights up into the non-Newtonian region. Further, this implies that the viscosity dependence on molecular weight varies smoothly from the 3.4 power at very low shear to the first power at very high shear rate.
Recently Schreiber et al.11 have presented data on polyethylene over a wide molecular weight range ( M * < M < 7 0 M * ) . A general representation of their findings is shown in Figure 16. This figure also indicates that the critical molecular weight M * for in itia l chain entanglement is independent of shear. However, it differs from Figure la in providing significant evidence that as shear is increased there is a sharp, shear-dependent transition in either the degree or type of entanglement. The molecular weight at which this second or ¡3 transition occurs is lower the higher the shear rate. Above this (3 transition, the molecular weight dependence falls to a fractional power, suggesting the involvement of segmental motion, and thus the flow is again non-Newtonian. Schreiber12 has presented a qualitative view of molecular motion in the entangled state to account for his findings.
The purposes of our work are: ( a ) to elucidate the role of chain entanglements in the non-Newtonian flow of polymer solutions; (6) to gain a better understanding of the shear-rate dependence of the viscosity-molecular

VISCOSITY-MOLECULAR WEIGHT TRANSITIONS 1361
weight function for a relatively complex system, i.e., A N -M M A copolymer/ aqueous N aCN S solvent; (c) to check Bueche’s theory of polymer entanglement and the various ways of representing as well as estimating the low- and high-shear viscosity limits.
EXPERIMENTAL
Materials
Several copolymers of acrylonitrile and methyl methacrylate (90/10) were prepared in a continuous reactor w ith a chlorate-sulfite redox system as catalyst. The weight-average molecular weight ( M w) of the copolymers was determined by light scattering and covered a range between 20,000 and 156,000. Reagent grade sodium thiocyanate and deionized water were used to prepare 48% by weight aqueous N aCN S solvent which was subsequently used to prepare polymer solutions containing up to 13% by weight of polymer.
Apparatus and Procedure
An Ubbelohde glass viscometer was used for viscosity measurement at very low shear rate. The flow measurements at high shear rates were made by using the stainless steel capillary viscometer described earlier.13 End effect corrections were assumed to be negligible, since the capillary employed had a length/diameter ratio of 165. K inetic energy corrections were applied at low concentrations.
Calculation of Viscosity
The values of the consistency variables, apparent shear rate D , and maximum shear stress at the capillary wall t „ were calculated from the equations:
D = 4Q/ttî’3 (2)
t w = APr/2Z (3)
where Q is the volume flow rate in cubic centimeters/second, l is the capillary length in centimeters, r is the capillary radius in centimeters, and AP
is the applied pressure in dynes/square centimeter corrected for kinetic energy loss. The apparent shear rate D was converted to maximum shear rate at the capillary wall, D w by using the Rabinowitsch equation:
Dm = D( 3 + y ) / 4 (4)
where y is defined as d log D/d log rw at any D. The ratio of r„ to Dw gives the viscosity at the wall in poises.

1362 S. N. CHINAI AND W. C. SCHNEIDER
RESULTS AND DISCUSSION
Concentration and Molecular Weight Dependence of Viscosity at LowShear Rates
The concentration dependence of specific viscosity at a constant temperature of 30°C. is shown in Figure 2, wherein the highest molecular weight polymer examined was 156,000 while the lowest one was 20,000.
Fig. 2. Concentration dependence of low-shear specific viscosity at 30°C.
The results show that the specific viscosity rises exponentially w ith concentration. This effect is more pronounced and occurs at a lower concentration, the higher the molecular weight of the material. A two- decade change in concentration extends over nearly five decades of specific

VISCOSITY-MOLECULAR WEIGHT TRANSITIONS 1363
Fig. 3. Molecular weight, and concentration dependence of low-shear absolute viscosityat 30°C.
viscosity at high molecular weight level while the corresponding range at low molecular weight level is about three decades.
The solid lines in Figure 2 are drawn with a slope of 5, indicating that above a certain critical value C * , specific viscosity rjsv °c C6. In our work, this appears to occur only at i j ,p values greater than 300.
The molecular weight dependence of the low-shear absolute viscosity at 30°C. for solutions of various concentrations is shown in Figure 3. In accordance w ith the findings of other investigators, our system also shows an abrupt change of slope in the viscosity values above a certain critical molecular weight. This transition point is assumed to reflect Bueche entanglements.

1364 S. N. CHINAI AND W. C. SCHNEIDER
The manner in which the slope of the viscosity-molecular weight relation depends on concentration is not very clearly understood. Examination of the data indicates that two broad categories can be formed: one including concentrations up through 5% and the other, concentrations of 8% and above. In the latter category, M * , in agreement w ith theory, is inversely proportional to concentration (shown by the dotted line in Fig.3). Also, at high molecular weight the viscosity is proportional to the theoretical 3.4 power of molecular weight. The agreement can be judged by noting that the experimental points fa ll on the straight lines which are drawn with a slope of 3.4. Since the viscosity measurements are accurate to ±1%, the failure of the highest molecular weight value to fall on the lines of slope 3.4 suggests that this polymer sample may actually have had a molecular weight of 138,000 instead of 156,000 as shown. Below M * , the slope is essentially equal to 1, indicating Newtonian behavior.
In the first category, the lines above M * have also arbitrarily been drawn to pass through 138,000 at the highest molecular weight. However, M * has lower values, and although it still appears to be roughly inversely proportional to concentration, the relation is by no means certain. Further, the slopes of the t]w- M plots deviate markedly from the theoretical values, decreasing gradually to 0.5 above M * and to near zero below M *
at low concentration.The reason for such a gradual change in the slopes both above and below
M * , and the deviations from a theoretical lim iting value of unity is not clearly understood, since no permanent viscosity degradation is observed in this system.
Evaluation of M * C *
Examination of the slopes in Figures 2 and 3 makes it obvious that precise determination of M * and C * is difficult.
I f the same results are plotted in accordance with eq. (1), it becomes possible to interrelate the dependence of viscosity on concentration and molecular weight by a single composite curve as shown in Figure 4. A t high values of the abscissa, the curve has a linear portion with a slope of unity. For those combinations of M and C which lie on this straight line, the flow behavior is dominated by ordinary Bueche polymer entanglement, that is one polymer molecule has at least one other molecule so entangled with it that the two must move essentially as one. Deviation from the straight line indicates that eq. (I) is no longer valid, and the minimum values of M and C at which this occurs are designated as critical values M * and C * .
Examination of Figure 4 suggests that eq. (1) is valid between the lim its :
12.0<(5 log C + 3.4 log M ) < 1 3 . 5 (5)
Ferry4 has suggested that the product C M be taken as a measure of the average number of Bueche entanglements per molecule, £. The average molecular weight between entanglements, M e, is M ex/ v 2, where M ex is the

VISCOSITY-MOLECULAR W EIGHT TRANSITIONS 1365
Fig. 4. Dependence of low-shear relative viscosity at 30°C. on C5M 3A.
value of M e extrapolated to the hypothetical undiluted polymer in an uncrystallized state and v2 is the volume fraction of polymer and is equal to C / p, where p is the density of the undiluted polymer. In other words, the value of C/ p represents the fraction of the volume occupied by the polymer at a given concentration. I f we assume that at the onset of a continuous network, £ is 2, then for a given polymer when M = M * :
£ = M / M e = M / M ex V2 = C M / PM ex = 2 (6)
The experimental data can be used to check this assumption. Ferry10 has suggested that an estimate of M ex can be obtained by plotting as abscissa log M + log C and as ordinate log — 1.6 log C , so that above C M * all the data would coincide on a straight line of slope 3.4. I t was found that the values of C M * above 8500 ± 2000 do fa ll on a straight line w ith slope of 3.4. This then, from eq. (6), corresponds to M ex equal

1366 S. N. CHINAI AND W. C. SCHNEIDER
to 3600. From Figure 4, we have C6M3-4 = 1012 as the point of deviation from a straight line with slope of unity. Thus, for a 10% (by weight) solution, M* would be 71,000, and vJS'I* would be 7500, and £ would be close enough to the value 2. This treatment is valid only within the molecular weight range and concentrations examined. At very high concentrations and molecular weights, calculations of £ do not come close to a value of 2, and therefore the general validity of the above treatment is questionable.
Shear Rate Dependence of Absolute Viscosity
The shear dependence of the viscosity-molecular weight function for concentrated macromoleeular solutions is shown in Figures 5-8. At the
Fig. 5. Shear dependence of viscosity-molecular weight function for a 13% by weightsolution at 30°C. Values in parentheses indicate the slopes of the lines.

VISCOSITY-MOLECULAR WEIGHT TRANSITIONS 1367
highest concentrations, the variation in viscosity with shear rates is very large. For example, at 13% by weight concentration, there is a 100-fold variation in viscosity when the shear rate is changed from 101 to 105 sec. while at 5% concentration the corresponding variation is only 7-fold.
Further, these solutions of AN-MMA copolymer in aqueous NaCNS seem to be unique, in that this is the first system that appears to possess two distinct critical molecular weights. Therefore, it is important to define the terminology that has been used to distinguish them.
Fig. 6. Shear dependence of viscosity-molecular weight function for a 10% by weight solution at 30°C. Values in parentheses indicate the slopes of the lines.
M* refers to the critical molecular weight associated with Bueche-type chain entanglements. Thus, M* is the molecular weight at which there exists an abrupt change in the slope (dlnr\/ dlnM). It is usually independent of shear, but experimental evidence has been presented by Schreiber11 indicating a system wherein M* appears first to increase with shear rate and then decrease at still higher shear rates, the smallest M* value being at the lowest shear rate. M** refers to the second critical molecular weight, and it is the highest molecular weight at which 17 appears to be independent of shear rate D. I t is lower than M* and has been assumed to be associated with entanglements arising from dipole-dipole interactions or hydrogen bonding.

1368 S. N. CHINA! AND W. C. SCHNEIDER
Fig. 7. Shear dependence of viscosity-molecular weight function for an 8% by weight solution at 30 °C. Values in parentheses indicate the slopes of the lines.
There are three distinct regions which must be critically examined. These are: (a) a region above the upper critical molecular weight M*;(6) a region below M* but greater than the lower critical molecular weight M**; and (c) a region below M**.
In accordance with the Bueche7 theory of ordinary chain entanglements, the highest viscosity-molecular weight slope of 3.4 was obtained above M* and at low shear rates. The limiting theoretical value below the transition M* and at high shear rates may be unity for certain systems over a narrow molecular weight range. However, our findings are that the viscosity-molecular weight-shear function changes as follows.
(a) At molecular weights greater than M*, the influence of ordinary chain entanglement diminishes at increased shear rates and ultimately attains a limiting value at high shear; simultaneously, the viscosity- molecular weight function also attains a limiting slope of one half. Thus, in this region, the contribution to non-Newtonian viscosity comes from coupled or entangled chains and their deformation due to flow orientation at increased shear rates. Another novel observation in these results is

VISCOSITY-MOLECULAR WEIGHT TRANSITIONS 1369
Fig. 8. Shear dependence of viscosity-molecular weight function for a 5 % by weight solution at 30°C. Values in parentheses indicate the slopes of the lines.
that the various shear rate lines of the plot do not extrapolate to a common intersection point M*, even though M* remains essentially constant at all shear rates examined. This is Indicated by the dotted line in the figures labeled M*. The variation of the breakpoint from the dotted line position is indicative of the experimental precision at increased shear rate. Such behavior does not agree with those reported by other investigators, which is shown in Figure 1.
(ib) At molecular weights lower than M* but greater than M**, the slopes of the viscosity-molecular weight lines decrease from 1.16 to near zero with increasing shear rates. Also, the limiting slope at high shear rate increases as the concentration is lowered from 13% to 5%, and it appears that a limiting slope of one-half will result in this region also at some lower concentration.
A qualitative explanation of this is that at higher concentrations there are a large number of strong secondary interactions which are associated with dipole-dipole interaction or hydrogen-bonding. These interactions result in a more stable quasi-lattice structure which has a different relaxation behavior than that existing at lower concentration.
The triangular area between the highest and lowest shear curves bounded by M** and M* also contracts as the concentration is lowered. It is

1370 S. N. CHINAI AND W. C. SCHNEIDER
believed that in this region, the contribution to non-Newtonian viscosity comes from entanglement arising from dipole-dipole interaction or hydrogen bonding. The fact that the lower critical molecular weight M** occurs at such a low molecular weight signifies that in this system, non- Newtonian viscosity behavior is not due to deformation of individual molecules as expressed by Porter and Johnson14 in their general description of non-Newtonian flow.
Contrary to the behavior observed for M * in (a) in this region, the plots in Figures 5-8 extrapolate to essentially a common value corresponding to a lower critical molecular weight M** below wdnch viscosity is expected to be independent of shear. The value of M** was found to be inversely proportional to concentration in a manner similar to M*. At very low molecular weight where any contribution of entanglement effects to non-Newtonian viscosity is absent, and the behavior should be Newtonian at attainable shear rates.
In this study, the molecular weight distribution is broad in all samples, and its effect on the exponents is not detectable. In general, the broader the molecular weight distribution in a given polymer, the more the viscosity will decrease with increasing shear rate.
Some scatter at high shear rates in the data at M>M* is observed and is believed to be due to the variations in the molecular weight distribution which causes differences in shear dependence. The limiting slope may also depend upon the polymer, the solvent, and the polymer-solvent system.
In studying the viscosity slope values, it was noticed that the slope of the line has in general the same value at a given shear rate, irrespective of the initial concentration of the polymer in the macromolecular solution. This behavior may be due to an important fundamental property of the macromolecule whereby the manner and rate of its deformation at a given shear rate are a characteristic of the polymer-solvent system and are independent of the initial concentration.
From the results of Figures 5-8, it appears that the critical molecular weights M * and M** are essentially independent of the velocity gradient.
The reduction in the value of the viscosity slopes is due to deformation and reduced intermolecular entanglement effects at increasing shear rate. At the limiting shear rates, the macromolecules are presumed to be in a well oriented, unentangled configuration.
The authors acknowledge and thank Dr. M. L. Miller of the Exploratory Research Department for valuable discussions during the preparation of this manuscript.
References1. Claesson, S., and U. Lohmander, M akromol. Chem., 44, 461 (1961).2. Passaglia, E., J. T. Yang, and N. Wegemer, J . Polymer Sci., 47,333 (1960).3. Porter, R. S., and J. F. Johnson, J . A pp l. P hys., 32, 2326 (1961); J . A p p l. Polymer
Sci., 3, 107 (1960); Polymer, 3,11 (1962).4. Landel, R., J. Berge, and J. D. Ferry, J . Colloid Sci., 12, 400 (1957).5. Simha, R., and J. L. Zakin, J . Colloid Sci., 17,270 (1962).

VISCOSITY-MOLECULAR W EIGHT TRANSITIONS 1371
6. Oyanagi, Y., and M. Matsumoto, J . Colloid Sei., 17,426 (1962).7. Bueche, F., J . Chem. P hys., 20, 1959 (1952); ibid., 25, 599 (1956); Und., 30, 748
(1959); J . Polym er Sei., 45,267 (1960); J . A p p l. P hys., 24,423 (1953).8. Ferry, J., L. Grandine, and D. Udy, J . Colloid Sei., 8,529 (1953).9. Fox, T. G, and S. Loshaek, J . A p p l. P hys., 26, 1980 (1955).
10. Porter, R., and J. Johnston, A m . Chem. Soc., Div. Polymer Chem. Preprinls, Washington, D. C., 3, No. 1, 26 (1962).
11. Schreiber, H., E. Bagley, and D. West, Polymer, 4, 355 (1963).12. Schreiber, H. P., Polymer, 4 , 365 (1963).13. Chinai, S. N., and W. C. Schneider, J . A p p l. Polym er Sei., 7 , 909 (1963).14. Porter, R. S., and J. F. Johnson, Trans. Soc. Rheol., 7, 241 (1963).
RésuméLe comportement à l’écoulement de solutions concentrées de polymères de poids
moléculaires allant jusqu’à 150.000, a été étudié à des vitesses de cisaillement allant jusqu’à 200.000 sec-1. Les résultats de la viscosité/du poids moléculaire/de la vitesse de cisaillement, donnés par des auteurs antérieurs, qui admettant seulement un poids moléculaire critique M *, au-dessus duquel les emmêlements ordinaires de Bueche dominent l’écoulement, sont comparés avec les découvertes qui montrent l’existence de deux poids moléculaires critiques différents, un M * plus élevé et M ** plus bas. Ces résultats sont comparés avec la théorie, et de nouvelles interprétations sont présentées.
ZusammenfassungDas Fliessverhalten von konzentrierten Polymerlösungen wurde im Molekular
gewichtsbereich bis hinauf zu 150,000 bei Schubgeschwindigkeiten bis zu 200,000 sec-1 untersucht. Die Viskositäts-Molekulargewichts-Schubgeschwindigkeitsergebnisse früherer Autoren, bei denen nur ein kritisches Molekulargewicht M * auftrat, oberhalb welchem gewöhnliche Bueche-Verschlingungen das Fliessen bestimmten, wurden mit unseren Befunden verglichen, bei welchen zwei verschiedene kritische Molekulargewichte, oberes M * und unteres M ** bestehen. Die Ergebnisse werden mit der Theorie verglichen und eine neue Interpretation wird gegeben.
Received May 1, 1964 Revised August 25, 1964 Revised November 9, 1964 (Prod. No. 4529A)

JOURNAL OF POLYMER SCIENCE: PART A VÒL. 3, PP. 1373-1390 (1965)
A rom atic Polypy rom ei I itim ides from A rom atic Poly am ie Acids*
C. E. SROOG,f A. L. ENDREY,J S. V. ABRAMO, C. E. BERR, W. M. EDWARDS, and K. L. OLIVIER,§ Film and Plastics Departments, E. I. du Pont de Nemours and Company, Inc., Experimental Station Laboratory,
Wilmington, Delaware
SynopsisAromatic diamines react with pyromellitic dianhydride in solvents such as dimethyl-
acetamide to form solutions of high molecular weight polyamic acids. These soluble polymers can be converted to insoluble aromatic polyimides. The aromatic poly- imides exhibit zero strength temperatures above 700°C. and possess excellent thermal and oxidative stability. The stability characteristics of films and the relation of chemical structure to thermal and hydrolytic stability and to polymer properties such as crystallinity are described.
INTRODUCTION
We have been interested for some time in the possibilities of preparing intractable condensation polymers by conversion of a high molecular weight, tractable precursor. Most studies of condensation polymerization have been concerned with rather simple elimination reactions to form polymers which are Theologically manageable, thereby permitting formation of variously shaped objects. We wish to report the preparation and properties of a new group of condensation polymers, the aromatic polyimides, which are unusually high melting, intractable, insoluble, and possess outstanding thermal stability.
Earlier workers in this field prepared polyimides by polyamide-salt techniques.1 3 Thus, pyromellitic dianhydride was reacted with ethanol to form the diester-diacid, which was treated with diamine to precipitate the monomeric diester-diacid salt. The salt was then heated to form a polymerizing melt, which, after dehydration and dealcoholation in the melt, formed the polyimide. Recently several du Pont patents4 and patent applications5 disclosing other synthetic routes have appeared and have been
* Presented at the 147th meeting of the American Chemical Society, Philadelphia, April 1964, and at the Bad Nauheim meeting of the Fachgruppe “Kunstoffe und K au t- schuk,” Gesellschaft Deutscher Chemiker, April 1964.
f To whom inquiries should be addressed.t Present address: Union Carbide Corp., Parma, Ohio.§ Present address: Union Oil Company of California, Los Angeles.
1373
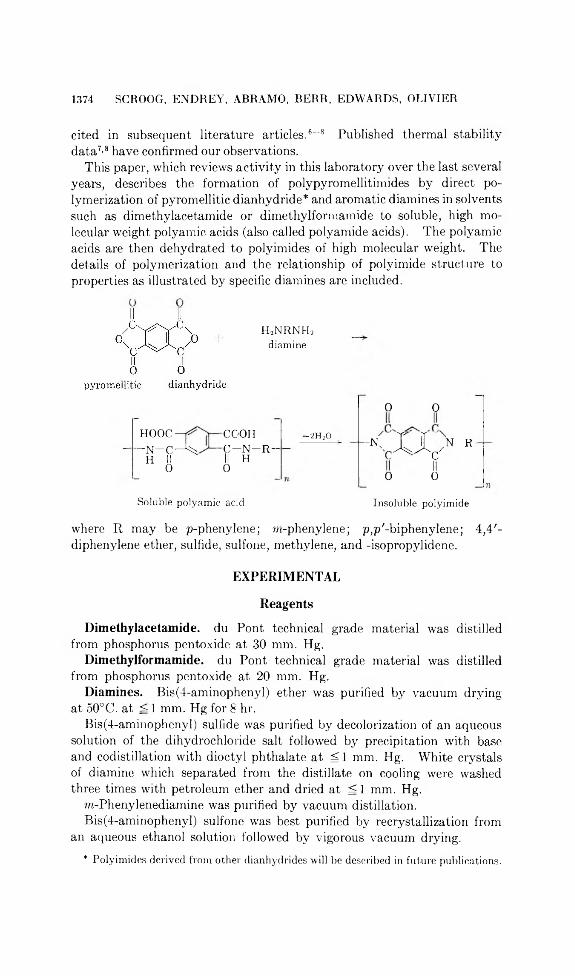
1374 SCROOG, ENDREY, ARRAMO, BERR, EDWARDS, OLIVIER
cited in subsequent literature articles.6“8 Published thermal stability data7’8 have confirmed our observations.
This paper, which reviews activity in this laboratory over the last several years, describes the formation of polypyromellitimides by direct polymerization of pyromellitic dianhydride* and aromatic diamines in solvents such as dimethylacetamide or dimethylformamide to soluble, high molecular weight polyamic acids (also called polyamide acids). The polyamic acids are then dehydrated to polyimides of high molecular weight. The details of polymerization and the relationship of polyimide structure to properties as illustrated by specific diamines are included.
H2NRNH2diamine
HOOC- N — C—1
H II 0
COOHC - N - R - II H 0
- 2 H 20
Soluble polyamic acid
0 0
-N' , I X . N- R-c
0
cII0
Insoluble polyimide
where R may be p-phenylene; m-phenylene; p,p'-biphenylene; 4,4'- diphenylene ether, sulfide, sulfone, methylene, and -isopropylidene.
EXPERIMENTAL
Reagents
Dimethylacetamide. du Pont technical grade material was distilled from phosphorus pentoxide at 30 mm. Hg.
Dimethylformamide. du Pont technical grade material was distilled from phosphorus pentoxide at 20 mm. Hg.
Diamines. Bis(4-aminophenyl) ether was purified by vacuum drying at 50°C. at 5= 1 mm. Hg for 8 hr.
Bis(4-aminophenyl) sulfide was purified by decolorization of an aqueous solution of the dihydrochloride salt followed by precipitation with base and codistillation with dioctyl phthalate at ^ 1 mm. Hg. White crystals of diamine which separated from the distillate on cooling were washed three times with petroleum ether and dried at ^ 1 mm. Hg.
m-Phenylenediamine was purified by vacuum distillation.Bis(4-aminophenyl) sulfone was best purified by recrystallization from
an aqueous ethanol solution followed by vigorous vacuum drying.* Polyimides derived from other dianhydrides will be described in future publications.

A R O M A T I C P O L Y P Y R O M E L L lT lM lD E S i3 7 S
Pyromellitic Dianhydride. Technical grade material of the du Pont Explosives Department was sublimed through silica gel at 220-240°C. and 0.25-1 mm. mercury pressure.
PolymerizationsTypical Preparation of a Polyamic Acid. A 500-ml. flask fitted with
mercury-seal stirrer, nitrogen inlet, drying tube, and stopper is carefully flamed to remove traces of water on the walls and is allowed to cool under a stream of dry nitrogen in a dry box. In the dry box 10.0 g. (0.05 mole) bis(4-aminophenyl) ether is added to the flask through a dried powder funnel, and residual traces are flushed in with 160 g. of dry dimethyl- acetamide. There is then added 10.90 g. (0.05 mole) pyromellitic dianhydride to the flask through a second dried powder funnel over a period of 2-3 min. with vigorous agitation. Residual dianhydride is washed in with 28 g. dry dimethylacetamide. The powder funnel is replaced by the stopper and the mixture is stirred for 1 hr. A small surge in temperature to 40°C. occurs as the dianhydride is first added, but the mixture rapidly returns to room temperature.
The above procedure yields a 10% solution which can be stirred without difficulty. In some cases the mixture becomes extremely viscous, and dilution to 5-7% solids may be required for efficient stirring. Polyamic acids so prepared exhibit inherent viscosities of 1.5-3.0 at 0.5% in dimethylacetamide at 30°C.
The polymer solutions may be stored in dry, sealed bottles at — 15°C. until needed.
Preparation of Polyamic Acid Films. Thin layers (10-25 mils) of polyamic acid solutions are doctored onto dry glass plates and dried for 20 min. in a forced draft oven (with nitrogen bleed) at 80°C. The resulting films are only partly dry and after cooling can be peeled from the plates, clamped to frames, and dried further in vacuo at room temperature.
Polyimide Conversion. Films of the polyamic acids which have been dried to a solids level of 65-75% are clamped to frames, heated in a forced draft oven to 300°C. for an additional hour. Further heating at 300°C. causes essentially no increase in the imide infrared absorptions at 5.63 and 13.85 /x.
Property MeasurementCrease Test. A crease and bend test was used as a criterion of failure
for films exposed in an oven with temperature control ±3°C. to 500°C. In the crease test, a narrow strip of the film was cut off and creased sharply between the fingers. In each case, several strips were cut from the sample and failure was recorded when more than half of the strips failed the test. The orders of stability as determined by this crease test correlated qualitatively with weight loss measurements.
Zero Strength Temperature. The du Pont Zero Strength Temperature Test was used to measure the temperature at which a polymer film (gen

1376 SCROOG, ENDREY, ABRAMO, BERR, EDWARDS, OLIVIER
erally in the range of 20-75 n thick) failed under a tensile load of 1.4 kg./ cm.2 (20 psi) 5 ± 0.4 sec. after contact with a preheated metal bar. This technique is relatively insensitive to film thickness within the range stated, and depending on sample uniformity, has the following precision: (1) about ±5°C. for Mylar polyester film (near 240°C.) (2) ±15-20°C. for poly- [Ai’,iV'(p,p,-oxydiphenylene)pyromellitimide] film (800-900°C.).
In practice, film strips 0.25 in. wide and 5 in. long are attached to a clamp at one end, and sufficient weight is attached to the other end to give a tensile load of 20 psi. The film strip is then contacted with a heated metal cylinder and a plot is made of the time required for failure (burning or melting through) versus the temperature of the cylinder. Measurements are made at several temperatures above and below that at which 5 sec. is required for failure, and a curve is drawn through the points. The zero strength temperature is then determined from the curve.
Van de Graaff Irradiation. The sample is moved under the electron beam 10 cm. below an aluminum window at a rate of 2.27 cm./sec. with a beam scanning width of 20 cm. For 2 M.e.v. electrons and a beam current of 250 /¿amp., one pass gives a flux at the surface of 12.5 watt-sec./ cm.2. For a material with a density of one and an electron range of 1 cm., the average dose per pass is 1.25 Mrads (1.25 X 10s ergs/g.).
Brookhaven Pile Exposure. Samples of film placed in the Brookhaven Pile were exposed to thermal neutrons, 7-rays, and other radiation. The flux in the pile is expressed in neutrons/cm.2/sec. (nvt).
Viscosity Measurements. Solution viscosities were measured on dilute solutions utilizing the indicated anhydrous solvents, concentrations, and temperatures. Dissolution (or dilution in the case of polyamic acid 10-15% solutions) was generally achieved by shaking at the temperature of measurement (30 or 15°C.). The work with fuming nitric acid requires cooling to minimize molecular weight degradation. The glass viscometers used were conventional Ostwald-Fenske types with capillaries sized to give flow times in the 40-120 sec. range, and bath temperatures were held to within ±0.05°C.
Thermogravimetric Analyses. Measurements of weight loss were conducted in a continuous-recording thermobalance, (Amineo Thermo-Grav), in controlled atmospheres. Temperature-programmed curves were obtained at slow rates (3°C./min.), while isothermal runs were made by preheating the chamber, then inserting the sample and holding to within ±0.5°C. The rate of gas flow was 100 ee. - min.
X-Ray Measurements. Diffraction patterns were obtained on a General Electric XRD-5 diffractometer, utilizing nickel-filtered copper Ka radiation (1.54 A.) at 50 kv. and 16 ma. and pinhole collimation. The flat- plate Laue photographs were obtained with a 2.5-cm. sample-to-film distance; a 1.25-mm (50 mils) specimen thickness and various appropriate exposure times were used.
Mechanical and Electrical Properties. These measurements were obtained by utilizing official ASTM methods (designation D-150-59 for the

A R O M A T IC P O L Y P Y R O M E L L I T I M I D E S 1377
dielectric measurements and D-882-61T for the tensile properties). The electrical measurements utilizing an improved Schering Bridge and specimens were 25 ¿1 (1-mil) films sprayed with silver paint electrodes to give precise areas in intimate contact. Tensile tests were conducted at strain rates in the range of 30-100%/min.
RESULTS AND DISCUSSION
Synthesis of Polyamic Acids
The preparation of polyamic acids is generally carried out by adding pyromellitic dianhydride to a solution or slurry of the diamine in a polar solvent such as dimethylacetamide or dimethylformamide. The polymerization may be conducted heterogeneously by addition of pyromellitic dianhydride as a solid or as a slurry in a relatively inert liquid such as acetone, y-butyrolactone, or benzonitrile. The rate of reaction appears to be limited by rate of solution of pyromellitic dianhydride; normally 30-60
TABLE IEffect of Temperature of Polymerization on Inherent Viscosity of Polyamic Acid
[Reaction of Bis(4-aminophenyl) Ether and Pyromellitic Dianhydride]
Solvent
Bis(4-amino- phenyl) ether
Pyromelliticdianhydride
Solids,%
Temp.,°C.
Timeat
temp.,min. Vinh*g- Moles g- Moles
DMAe 1 0 . 0 0 0.05 10.90 0.05 1 0 . 0 25 1 2 0 4.05DMAc 1 0 . 0 0 0.05 10.90 0.05 1 0 . 0 65 30 3.47DMAe 2 0 . 0 0 0 . 1 0 21.80 0 . 1 0 1 0 . 6 85-88 30 2.44DMAc 2 0 . 0 0 0 . 1 0 21.80 0 . 1 0 10.7 115-119 15 1.16DMAc 2 0 . 0 0 0 . 1 0 21.80b 0 . 1 0 10.3 125-128 15 1 . 0 0
DMAc 2 0 . 0 0 0 . 1 0 21.80" 0 . 1 0 15.7 135-137 15 0.59IV-Me capro- 1 0 . 0 0 0.05 10.90 0.05 14.2 150-160 2 0.51
lactamV-Me capro- 1 0 . 0 0 0.05 10.90 0.05 12.9 175-182 1 - 2 Only partly
lactam solubleV-Me capro- 2 0 . 0 0 0 . 1 0 21.80 0 . 1 0 15 2 0 0 1 Insol.
lactam
a Determined at 0.5% concentration in the particular solvent at 30°C. b Increment of 0.35 g. pyromellitic dianhydride added before determination of 17i„i,. c Increment of 0.25 g. pyromellitic dianhydride and then 0.21 g. of bis(4-amino-
phenyl)ether added before determination of ^„h.
min. is adequate for laboratory-scale polymerization. Total solutes average 10-15%, although it has been possible to attain high molecular weight polyamic acids at concentration levels of 35-40%. At such high concentrations, the slurry method of addition enables the best mixing, and efficient cooling is required to compensate for the heats of reaction and stirring. When the solid pyromellitic dianhydride is added, a red-orange color is observed at the solid-liquid interface; this rapidly lightens to a lemon-

1378 SCROOG, ENDREY, ABRAMO, BERR, EDWARDS, OLIVIER
yellow as the pyromellitic dianhydride dissolves and reacts with the diamine.
Best results are obtained from both types of procedure at temperatures of 15-75 °C.; above 75 °C. a decrease in the molecular weight of the poly- amic acid becomes marked. Above 100 °C. cyclization to imide is appreciable, causing eventual precipitation of polyimide as well as a lowered molecular weight of the polyamic acid (Table I). Above 150 °C., the cyclization is so rapid that polyimide sometimes precipitates before all of the dianhydride can be added.
Conversion to Polyimide
Conversion of Polyamic Acid to Polyimide. Cyclization to polyimide may be carried out by heating a film of polyamic acid from 25 to 300°C. at a carefully controlled rate. As cyclization proceeds, the color of the polyamic acid darkens from a pale yellow to a deep yellow or orange.
Complete infrared spectra and ultraviolet spectra for poly [N,N'(p,p'- oxydiphenylene)pyromellitimide] are shown in Figures 1-4. (The instru-
c m - l4 0 0 0 2 0 0 0 1 0 0 0 8 0 0
Big. 1. Infrared spectrum of 0.1 mil poly[.V,.V'(p,p'-oxydiphenylene)pyromellitimide] (POP-PI) film. The film was heated to 300°C. over a period of 45 min., then held at 300°C. for 1 hr.
cm~l
Fig. 2. Near infrared spectrum of POP-PI film 14 mils thick, scan 50 A./sec.

AROMATIC POLYPYROMELLITIMIDES 1379
cm-18 0 0 7 0 0 6 0 0 5 0 0 4 5 0 4 0 0
Fig. 4. Ultraviolet and visible spectrum of 0.1 mil POP-PI film
merits used were the Perkin-Elmer Model 21 with NaCl or KBr optics, and the Cary Model 14.) The cyclization can be followed spectrophoto- metrically9 (Fig. 1) by disappearance of the N-H band (3.08 /x) and ap-
TABLE IINitrogen Analyses for Polypyromellitimides
(R = Diamine Component)
N, %R Calculated
9.7
7.7
7.4
7.3
Found
9.89.57.9 7.77.57.6
7.3
so2 6.5 6.66.7

1380 SCROOG, ENDREY, ABRAMO, BERR, EDWARDS, OLIVIER
pearance of imide bands (5.63, 13.85 ¿u). Nitrogen analyses correspond to the converted ring structure (Table II) .
PropertiesPolyamic Acids. Polyamic acids are soluble in a variety of solvents,
such as dimethylacetamide, dimethylformamide, dimethylsulfoxide, and
DAYS AT 25 °C
Fig. 5. Effect of added water on 0.23 molal POP-PA [polyamic acid from bis(4-amino- phenyl)ether and pyromellitic anhydride] solution in dimethylacetamide (DM Act
Fig. 6. Effect of concentration on stability of POP-PA in DMAc at 23°C.

AROMATIC POLYPYROMELLITIMIDES 1381
cm-14000 2000 1000 800
tetramethyl urea. The amic acid polymer is sensitive to hydrolysis by water, similar to the monomeric phthalamic acids as previously noted by Bender10 (Fig. 5). The stability at 23°C. of the polyamic acids in solution is dependent upon the polymer concentration, dilute polymer solutions decreasing in viscosity much more rapidly than concentrated solutions (Fig. 6).
Films of polyamic acids containing 25-35% of residual solvent can be prepared by careful drying of cast solutions. These films on dissolving exhibit considerably lower inherent viscosities than the original polyamic acids (Table III). Polyamic acids have no true softening points, since dehydration occurs with heating to form polyimide; as noted above this can occur in solution at temperatures as low as 100 °C. The polymer, or
TABLE IIIDecrease of Inherent Viscosity of Polypyromellitamic Acids During Film
Casting and Drying (R = Diamine Component)
l?inhsolu- in h
R Solvent tion Drying conditions film
Dimethylacetamide 2.12.1
30 min., 80°C. 30 min., 80°C.
1.3
5 days, 23°C. 1.3Dimethvlacetamide 1.0 10 min., 120°C. 0.4
1.2 30 min., 80°C. 0.33Benzonitrile/di-
methylformamide(3/2)
1.0 15 hr., 25°C. 0.5
DimethylacetamideDimethylacetamide
1.32.3
6 hr., 70°C.20 min., 110°C.
0.70.5
^ r y s ^ [ y - Dimethylacetamide 1.2 30 min., 120°C. 0.5
^ > s03“O Dimethylacetamide 0.7 30 min., 120°C. 0.4
° POP-PA film is polyamic acid from his(4-aminophenyl) ether and pyromellitic dianhydride.

film cast from solution, will not cyclize extensively until temperatures of 120-150 °C. are reached. A characteristic infrared spectrum of such a polyamic acid film from bis(4-aminophenyl) ether is shown in Figure 7.
Polyimides. A series of polypyromellitimides, some of which are summarized in Table IV, was prepared. Aromatic polypyromellitimides are extremely high melting, difficultly soluble polymers with outstanding resistance to heat, oxygen, and irradiation; their softening points, as determined by zero strength temperature of films, are normally well over 700°C. (in comparison, aluminum foil has a zero strength temperature of 550°C.). In contrast with polyamic acids, polyimides are colored compounds whose intensity of color depends upon the diamine component. The polyimide derived from bis(4-aminophenyl) sulfone is pale yellow; the polyimides from m-phenylenediamine, p-phenylenediamine, and bis(4- aminophenyl) ether are yellow to orange, while that based upon bis (4- aminophenyl)sulfide is deep red.
1382 SCROOG, ENDREY, ARRAMO, BERR, EDWARDS, OLIVIER
TABLE IVPolypyromellitimide Films (R = Diamine Component)
R V'mh* Density
»/¡-Phenylenediamine > 0 .3 1.43p-Phenylenediamine 0.5 1.41p ,p '-Biphenylenediamine > 0 .3 b 1.43Bis(4-aminophenyl)methylene 1.7 1.36Bis( 4-aminophenyl ) isopropylidene 0.5 1.30Bis(4-aminophenyl) thioether > 0 .3 h 1.41Bis(4-aminophenyl) ether 1.0b 1.42Bis(4-aminophenyl) sulfone > 0 .3 1.43Bis(3-aminophenyl) sulfone 0.5 —
* 0.5% in HiSO*. b Fuming HN03.
Thermal Stability. Thermal stability has been determined for poty- imide films by weight loss measurements in air and helium atmospheres and by retention of film creasability upon heating in air. The data, summarized in Figures 8-10 and Table V, indicate that polyimides as a class possess outstanding thermal stability. When considered along with the retention of mechanical integrity as evidenced by zero strength temperatures in the metallic range, these stabilities become truly significant. Thus, the polypyromellitimide derived from bis(4-aminophenyl) ether showed isothermal weight loss in helium atmosphere of only 1.5% after ■ 15 hr. at 400°C., 3.0% after 15 hr. at 450°C., and 7% after 15 hr. at 500°C. In other weight loss measurements during constant rate of temperature increase (3°C./min.) the polyinrides derived from m-phenylenediamine, benzidine, and bis(4-aminophenyl) ether exhibited a 1-1.5% weight loss in the heating period to 500 °C. The thermogravimetric analyses are lent additional significance by the retention of film toughness after thermal aging summarized in Table V. Films derived from wholly aromatic poly-

AROMATIC POLYPYROMELLITIMIDES 1383
■Qo3
c3sShO-aH O
G0>GOftaOa<x>G'§c3
Ph
a>Sh-G DC b£) o3 •S g s p
N I p02 Öa>
H - |3oGoaoP-t
O
ao
Ph
02>> G6 G'"Ö T3 J3 o o oB o O OCM <x>o a a at-H B i-H J>
t-H* rH t-H t-HA t—1 1 CO A A A
>>A
a a7 <p o A
O O o o o o oO o o o GO o >o05 05 05 CO to CO CO
Ü
<DÜ6g üg £§ oo • -
02<x>
"g 'Sp gc? *■*
O
O c3
DG oGG k-. G-t-= _>>>-»-=> ^ 02 W rl r~! **->bb & bb £
£ CO
«G
o
-OG
o
_Qoj
Ü
OI « .
G +15 o £?o® oG
o£ o o
o£
O£ O oG OO * - Tow CO xn w ffi m CO
& 9-stTcß a>2 k .5
bßGs
«6G
W6G
bDGs
bßG’§
WÖG
£c5GG o o G G o O
< O O Ph Ph O o
As
mea
sure
d by
ret
entio
n of
film
cre
asab
ility
.

1 3 8 4 S C 1 1 0 0 G , E N D R E Y , A B R A M O , B E R R , E D W A R D S , O L I V I E R
Fig. 8 . Effect of diamine structure on weight loss of polypyromellitimides during constant rise in temperature (3°C./min.).
TIME (minutes)
Fig. 9. Weight loss of
pyromellitimides retain toughness for months at elevated temperatures in air.
Hydrolytic Stability. The hydrolytic stability of the polypyromellitimides is, with certain exceptions, of a high order (Table VI) and may be considered quite unusual. The polypyromellitimides derived from bis(4- aminophenyl) ether and bis(4-aminophenyl) thioether, which already possess an outstanding level o: thermal stability, retain toughness after one year and after three months respectively in boiling water. However, polyimides derived from diamines such as w-phenylenediamine and p- phenylenediamine exhibit poor hydrolytic stability, becoming embrittled after one week or less in boiling water.

A R O M A T I C P O L Y P Y R O M E L L I T I M I D E S 1 3 8 5
TABLE VIHydrolytic Stability of Polypyromellitimides
(R = Diamine Component)
R
Retention of film flexibility in boiling H20
£ > 1 week
1 week
T > ° T > 1 yr.
- 0 — 0 >3 mo.
Radiation Resistance. The data in Table ATI indicate that films of the aromatic polypyromellitimides are outstandingly resistant to irradiation from high energy electrons and from thermal neutrons. Thus films of the polypyromellitimide from bis (4-aminophenyl) methane exhibit good mechanical and electrical properties after high energy electron exposure of over 10,000 Mrad in the Van de Graaff generator while films of polystyrene and polyethylene terephthalate) become embrittled after 500-600 Mrad. Films of the polyromellitimide from bis (4-aminophenyl) ether remain creasable after 40 days exposure to thermal neutrons at 175°C. in the Brookhaven pile.
O

1 3 8 6 S C R O O G , E N D R E Y , À B R A M O , B E R R , E D W A R D S , O L I V I E R
TABLE VIIAEffect of Radiation on Polypyromellitimide Films
(Exposure Van de Graaff 2 M.e.v. Electrons)
Polymer Thickness, Numberfilm mils passes Dose, Mrad Remarks
DDM-PI» 2 . 0 8000 1 0 , 0 0 0 Retains toughness,good electrical properties
Mylarb 2.0-3.0 2 0 0 240 Creasable2 .0-3.0 500 600 brittle, yellow
3.0 yellow, brittlePolystyrene 1 . 2 500 600 Yellow, extremely
brittlePolyethylene 6 - 1 0 2 0 0 240 Very weak
(branched) 6 - 1 0 sticky gum
» Polypyromellitimide from bis(4-aminophenyl)methane. b Du Font’s registered trademark for its polyester film.
TABLE VIIBEffect of Radiation on Polypyromellitimide Films
(Thermal Neutron Degradation»)
Thick- Tempera- Flux 1013
Polymer ness, Exposure, ture, neutrons/film mils days °C. cm.Vsec. Remarks
POP-PIb 2-2.7 40 50-75 0.4 Slightly darkened,brittle in spots
40 175 0.5 Darkened, tough80 175 0.5 Darkened, brittle
Polystyrene 1 . 2 10 50-75 0.4 Yellow, very brittlePolyethylene 3.0 10 50-75 0.4 Sticky, rubbery
(branched)3.0 40 50-75 0.4 Brown varnish
Mylar” 3.0 10 50-75 0.4 Failed3.0 20 175 0.5 Yellow, brittle
» Courtesy of Brookhaven National Laboratory.b Polyimide from bis(4-aminophenyl)ether and pyromellitic dianhydride. 0 Du Pont registered trademark for its polyester film.
Solution Properties. The polyimides are insoluble in conventional solvents. Thus far, only fuming nitric acid has been found to be a general solvent for the species suitable for qualitative molecular weight evaluation at low temperature; concentrated sulfuric acid is effective for some polyimides. The stabilities of solutions of various polyimides in fuming HN03 and in concentrated H2S04 are summarized in Figures 11 and 12.
Crystallinity. Several of the polyimides are crystalline as made, for example, the polypyromellitimide from p-phenylenediamine (Fig. 13). Others are more or less ordered, depending on their structure. Thus, polypyromellitimides derived from m-phenylenediamine, bis(4-amino- phenyl)methane, bis(4-aminophenyl)isopropylidene, bis(4-aminophenyl)

A R O M A T I C P O L Y P Y R O M E L L I T I M I D E S 1 3 8 7
Fig. 11. Inherent viscosity vs. time for dilute solutions of polyimide; 15°C., 0.5 g.polymer/ 1 0 0 ml. solvent.
Fig. 12. Stability of polypyromellitimides in concentrated H 2SO4 ; 30°C.
sulfide, and bis(4-aminophenyl) ether normally exhibit a low degree of order as prepared. High temperature treatment will cause crystallization of film derived from m-phenylenediamine and of films based upon bis (4- aminophenyl) ether (Fig. 14). Films, despite the slight weight loss upon heating noted previously, retain structural integrity for short exposures to 750-800°C. in air; up to this temperature there appears, for the polymers studied, to be no evidence of crystal melting. These include the poly- pyromellitimide derived from bis(4-aminophenyl) ether, m-phenylenediamine, and p-phenylenediamine. No true second-order transition temperatures have been determined.
Mechanical and Electrical Properties. Polyimides, in addition to the outstanding permanence characteristics noted above, possess an excellent

1 3 8 8 S C R O G G , E N D R E Y , A B R A M O , B E R R , E D W A R D S , O L I V I E R
Fig. 13. Laue transmission x-ray diffraction pattern of unannealed poly(p-phenylene pyromellitimide) (filtered CuKa radiation).
(c ) (d)Fig. 14. Laue transmission x-ray diffraction patterns of (a) polypyromellitimide from
m-phenylenediamine, not annealed; (i>) same, annealed 2 min. at 400°C.; (c) polypyromellitimide from bis(4-aminophenyl) ether, not annealed; (d ) same, annealed at 400°C.

A R O M A T I C P O L Y P Y R O M E L L I T I M I D E S 1 3 8 9
balance of mechanical and electrical properties. The films are stiff and strong and retain mechanical strength to high temperatures. The electrical properties of the various polyimides are all excellent and are summarized as a range characteristic for polyimides in Table VIII. A great deal of information has been obtained for H film, which is derived from bis(4-aminophenyl) ether. The data are summarized in Table IX.
The aromatic polypyromellitimides exhibit outstanding thermal stability
TABLE VIIIElectrical Properties of Polypyromellitimide Films (1-2 mil)
23°C. 150°C. 200°C.
Dielectric constant (1000 cycles/sec.) 3 .1-3.7 2.9-3.1 2 .8-3 .2
Dissipation factor (1000cycles/sec.) 0.0013-0.002 0.006-0.0014 0.0005-0.0010
Volume resistivity (23°C., 50% R.H.), ohm-cm. 1017-5 X 10¹⁸ >10'“ 10H-10'5
Dielectric strength, v./mil 4550-6900 - 4600-5900
TABLE IX Properties of H Film“
Thermal stability in airb 250 °C. 10 yr. (extrapolated)275°C. 1 yr.300°C. 1 mo.400°C. 1 day
Melting point, °C. >900Zero strength tempera- 815
ture, °C. Solvents NoneDensity 1.42Glass transition temp., °C. >500Tensile strength, psi
4°K. Flexible25°C. 25,000
200°C. 17,000300°C. 10,000500°C. 4,000
Elongation, % 25°C. 70
200°C. 90300°C. 120500 °C. 60
Tensile modulus 25°C. 400,000
200°C. 260,000300°C. 200,000500°C. 40,000
“ Data of Tatum et al.u b Retention of film flexibility.

1 3 9 0 S C R O O G , E N D R E Y , A B R A M O , B E R R , E D W A R D S , O L I V I E R
matched and supported by a unique property combination which has not been characteristic for other polymeric systems. In addition to thermal stability, the properties include outstanding radiation resistance, unusual resistance to solvent attack, film toughness and its retention under rigorous conditions of air aging, and a level of mechanical properties which make the films useful over a range from extremely low to extremely high temperatures.
Dr. Gordon D. Patterson, Jr. directed the analytical support for this work and contributed much valuable advice. Numerous helpful discussions were held with Professor George S. Hammond, California Institute of Technology.
References1. Edwards, W. M., and I. M. Robinson, British Pat. 570,858; U.S. Pat. 2,710,853
(1955).2. Gresham, W. F., and M. A. Naylor, U. S. Pat. 2,731,447 (1956)3. Edwards, W. M., and I. M. Robinson, U. S. Pat. 2,900,369 (1959).4. E. I. du Pont de Nemours & Co., French Pat. 1,239,491 (1960).5. E. I. du Pont de Nemours & Co., Australian Application 58,424(1960).6. Anonymous, C h e m . W e e k , 88, 46, June 17, 1961.7. Jones, J. I., F. W. Ochynski, and F. A. Rackle3r, C h e m . I n d . (L o n d o n ) , 1962,
1686 (Sept. 22, 1962).8. Bower, G. M., and L. W. Frost, J . P o ly m e r S r i . , Al, 3135 (1963).9. Arcoria, A., and R. Passerini, B u ll . S e t . F a c . C h e m . I n d . B o lo g n a , 15, 121 (1957);
C h e m . A b s tr . , 52, 15244 (1958); S. P. Sadtler and Son, Inc., IR Spectrum #16607.10. Bender, M. L., J . A m . C h e m . S o c ., 79, 1258 (1957); M. L. Bender, Y.-L. Chow,
and F. Chloupek, ib id ., 80, 5380 (1958).11. Tatum, W. E., L. E. Amborski, C. W. Gerow, J. F. Heacock and R. S. Mallouk,
paper presented at Electrical Insulation Conference, Chicago, Illinois, September 17, 1963.
RésuméDes diamines aromatiques réagissent avec le dianhydride pyromellitique dans des
solvants tels que le diméthylacétamide pour former des solutions d’acides polyamiques de poids moléculaires élevés. Ces polymères solubles peuvent être transformés en polyimides aromatiques insolubles. Lés polyimides aromatiques présentent une force nulle à des températures situées au-dessus de 700°C et possèdent une stabilité thermique et une stabilité à l’oxydation excellentes. Les caractéristiques de stabilité des films et la relation entre la structure chimique et la stabilité thermique et hydrolytique et les propriétés du polymère telles que la cristallinité sont décrites.
ZusammenfassungAromatische Diamine reagieren mit Pyromellitdianhydrid in Lösungsmitteln wie
Dimethylacetamid unter Bildung von Lösungen hochmolekularer Polyamidsäuren. Diese löslichen Polymeren können in unlösliche aromatische Polyimide umgewandelt werden. Die aromatischen Polyimide verlieren ihre Festigkeit erst oberhalb 700°C und besitzen ausgezeichnete thermische und oxydative Stabilität. Die Stabilitätscharakteristik von Filmen sowie die Beziehung der chemischen Struktur zur thermischen und hydrolytischen Stabilität und zu Polymereigenschaften wie Kristallinität wird beschrieben.
Received April 12, 1964 (Prod. No. 4453A)

J O U R N A L O F P O L Y M E R S C I E N C E : P A R T A V O L . 3 , P P . 1 3 9 1 - 1 3 9 9 ( 1 9 6 5 )
Viscosity Behavior of Branched and Linear Potassium Carboxymethyl Dextrans
W. M. PASIKA* and L. H. CRAGG,f 1Department of Chemistry, University of Alberta, Edmonton, Canada
SynposisSamples of branched and linear dextran of near identical intrinsic viscosities have
been carboxymethylated to varying degrees and converted to the potassium salts. The reduced viscosity-concentration curves of the branched and linear carboxymethyl dextran polyelectrolytes of identical degree of substitution in aqueous potassium chloride solutions (O.OOIA and 0.0005A) were compared. Significant differences were observed to exist. At low degrees of substitution (0.06-0.20 carboxymethyl group per anhydro- glucose unit) the branched macroion possessed larger reduced viscosities than did its linear counterpart. At a higher degree of substitution (ca. 1.0 carboxymethyl group per anhydroglucose unit) the reduced viscosity curves of the branched and linear macroions crossed. These differences were shown to be independent of shear rate, molecular weight and molecular weight distribution. I t is concluded that branching is responsible for the differences in the reduced viscosity-concentration behavior of the branched and linear potassium carboxymethyl dextran samples because of the higher charge density in the branched macroion.
Introduction
On the basis of theoretical calculations, Zimm and Stockmayer1 concluded that the effect of branching on macromolecular extension should be to reduce the mean square radius. Thurmond and Zimm2 compared the intrinsic viscosities of linear and branched polymer samples of identical molecular weight and showed that the predicted reduction in mean square radius is manifested in a lower intrinsic viscosity for the branched sample. This difference in intrinsic viscosities between branched and linear samples has been utilized in the development of a viscometric method of branch detection and estimation.2-6 Unfortunately the method is limited. Only in high molecular weight regions (>100,000) does a difference in intrinsic viscosity between linear and branched polymer samples exist.
It is incorrect to ascribe the disappearance of the difference between the intrinsic viscosities of the branched and linear polymer samples to the absence of branches in the low molecular weight region, since evidence exists to indicate otherwise. Senti and co-workers7 have shown that the amount of formic acid produced per anhydroglucose unit (AGU) in a branched dex-
* Present address: Donnan Laboratories, University of Liverpool, England.f Present address: Mount Allison University, Sackville, New Brunswick, Canada.
1391

1392 W. M. PASIKA AND L. H. CRAGG
trail is independent, of molecular weight from 9.5 X 10⁶ to 1.8 X 10⁴, even though the intrinsic viscosity difference between branched and linear dextran samples apparently vanishes below a molecular weight of 106. (The amount of formic acid produced can be related to the amount of branching in dextran samples.) This means, of course, that the branching frequency is identical throughout the entire molecular weight range, and some reason other than the absence of branches must be sought to explain the lack of a difference in intrinsic viscosity between linear and branched polymer samples at low molecular weights (<100,000).
On the basis of evidence presented by Trementozzi8 that long-chain branching increases with molecular weight for branched polyethylene samples (which had lower intrinsic viscosities than their linear ho mo logs), it is not unreasonable to postulate that the same obtains with other branched polymeric systems and that the viscometric molecular weight, method of branch detection and estimation can be applied only to polymer samples with long branches and that the method is insensitive to short branches.
In a study undertaken to develop a viscometric method which would not be insensitive to short branching, it was demonstrated9 that, large viscosity differences between low molecular weight branched (short branches10) and linear dextran samples can be effected if the samples are first converted to sulfate macroions and then their reduced viscosity-concentration behavior determined in aqueous simple salt solutions (i.e., 0.001./V KC1). To substantiate that the results obtained with the sulfate polyelectrolytes are not artifacts of the sulfate polyelectrolyte system and to extend the study to take into account the possible influence of such factors as molecular weight distributions, range of degree of substitution, and shear rate, we have studied the reduced viscosity-concentration behavior of linear and branched potassium carboxymethyl dextran poly electrolytes.
ExperimentalThe branched and linear potassium carboxymethyl dextran polyelectro
lytes studied were derived from the branched and linear dextran samples used in the preparation of branched and linear potassium dextran sulfate poly electrolytes.9 The intrinsic viscosity of the branched dextran sample was 0.15t dl./g. and that of the linear sample 0.164 dl./g. The viscometry was also identical to that carried out in the previous study,9 i.e., same viscometer, solvent aqueous 0.001./V or 0.0005./V KC1, 25°C. Shear rate data were obtained with the aid of a variable shear viscometer.11 The carboxymethyl dextran samples of low degree of substitution were prepared by reacting the dextran samples in aqueous sodium hydroxide with sodium monochloroacetate at 0°C. The sodium chloroacetat.e was prepared by the slow addition of monochloroacetic acid (3 times the stoichiometric amount required for complete substitution of the dextran) to 240 ml. of 20% (w/v) sodium hydroxide kept at 0°C. as the acid was added. Dextran (3 g.) dissolved in 90 ml. of the 20% sodium hydroxide was added to the 240 ml. of the sodium hydroxide-sodium chloroacetate solution.

P O T A S S I U M C A R B O X Y M E T I I Y L D E X T R A N S 1 3 9 3
Aliquots were withdrawn after 24-hr. periods and dialyzed against tap water until strong basicity in the dialyzing tap water was not detectable with litmus paper. Static dialysis against demineralized distilled water was continued for six changes (each change 4 liters). The solutions from the dialysis bags were then passed through potassium-charged cation-exchange resin (Dowex 50) and the potassium carboxymethyl dextran samples isolated by freeze drying. The highly substituted potassium carboxymethyl samples having «1.0 carboxymethyl group (CMG) per AGU were prepared at 18°C. via a two-stage carboxylation. Three linear dextran samples of molecular weight 1.35 X 10s, 1.194 X 10s, and 7.31 X 10⁴ (determined with the aid of an ultracentrifuge by the Archibald method) were carboxymethylated to the same degree (0.80 CMG/AGU) at 18°C.
Sedimentation velocity coefficient distributions of the branched and linear dextran samples were obtained as described by Gupta, Robertson, and Goring12 and also described in greater detail by Claesson and Moring- Claesson.13
Results
The effect of shear rate D on the reduced viscosity, i)sv/c, of a branched potassium carboxymethyl dextran (PCMD) sample with 0.21 CMG per
1.60..
1.50..
1.40..
1.30..
1.20..
-.— 0,1% PDS in H20
Kspc
Cdl/g)1.10..
1.00.
0.90..
0.1% PC MO in H2o
0.80.
0.70..■0.5% PDSinH20 -•-0.1 PDS in N/1000 KCI
0.60.
0.50. _ 0
..--- .----- 0.5%PCMDin H20---- .-------*-0.1%PCMD in N/1000 KCI
10 20 30 40 50 60 70 D x103sec 1
Fig. 1. Plots of reduced viscosity vs. shear rate for a linear potassium dextran sulfate (PDS) with 0.69 sulfate groups per anhydroglucose unit and a branched potassium carboxymethyl dextran (PCMD) with 0.21 carboxymethyl groups per anhydroglucose unit, both measured in a shear viscometer."

1 3 9 4 W. M. PASIKA AND L. H. CRAGG
AGU at concentrations of 0.1% and 0.5% in water and 0.1% in aqueous O.OOliV KC1 as solvent is shown in Figure 1. Also in Figure 1 are the results of a shear study on linear dextran sulfate (0.69 sulfate groups/ AGU) at the above concentrations and in the above solvents. It is evident
c(g/ioomi.)Fig. 2. Plots of reduced viscosity vs. concentration for linear potassium carboxymethyl
dextrans of the same degree of substitution (0.80) but differing molecular weights. (The M w is that of the parent dextran samples.)
5.5C.
5.00.
4.50.
4.00.
3.50.
3.00.
2.50..
2.00.
V
VN»
0 0.2 04 0.6 0.8 1.0 1.2c(g/100ml.)
Fig. 3. Plots of reduced viscosity vs. concentration for linear potassium carboxymethyl dextrans of same degree of substitution but differing molecular weights normalized by the appropriate ratio of the reduced viscosities at the maxima: (■) M „ =135,000; ( • ) M „ = 119,400; (A) M w = 73,100.

P O T A S S I U M C A R B O X Y M E T H Y L D E X T R A N S 1 3 9 5
that the reduced viscosity is independent of shear rate, and, therefore, shear rate effects cannot be responsible for any differences in viscosity behavior for our polyelectrolyte systems.
In order to discover to what extent, if any, the differences in the reduced viscosity-concentration behavior of linear and branched polyelectrolyte samples might be due to differences in molecular weight or molecular weight
SiFig. 4. The distribution function g(s 1) vs. the sedimentation velocity coefficient sj
for solutions of ( • ) linear and (A) branched dextrans of concentration 0.42%.
F i g . 5 . P l o t s o f r e d u c e d v i s c o s i t y v s . c o n c e n t r a t i o n f o r p o t a s s i u m c a r b o x y m e t h y ld e x t r a n s o f lo w d e g r e e o f s u b s t i t u t i o n i n a q u e o u s 0 .0 0 0 5 N K C 1 : ( ■ ) l i n e a r p o l y e l e c t r o l y t e s ; ( • ) b r a n c h e d p o l y e l e c t r o l y t e s .

1 3 9 6 W . M . P A S I K A A N D L . H . C R A G G
distribution, reduced viscosity-concentration curves were obtained for three potassium carboxymethyl dextran samples substituted to essentially the same degree (0.82,0.80,0.82, CMG/AGU) but differing in molecular weight (parent dextran Mw 135,000; 119,400; 73,100). If there are no differences in the reduced viscosity-concentration curves for different molecular weight polyelectrolyte samples, then the molecular weight distribution of a polyelectrolyte sample (a spectrum of molecular weights) should not influence the reduced viscosity-concentration relationship. The reduced viscosity-concentration behavior of the different molecular weight
Fig. 6. Plots of reduced viscosity vs. concentration for highly substituted potassium carboxymethyl dextrans in aqueous 0.001 N KC1: ( • ) branched, 1.14 carboxymethylgroups per anhydroglucose unit; (■) linear, 1.22 carboxymethyl groups per anhydro- glucose unit.
potassium carboxymethyl dextrans in 0.001 N KC1 are reproduced in Figure2. On preliminary inspection, it appears that the curves all belong to the same family. In fact they do; any curve can be reduced to the other by an appropriate ratio of (ysp/c)$ “ d /(y,P/c)$**,). The coincidence of these curves is shown in Figure 3. This means that increasing the molecular weight only shifts the reduced viscosity-concentration curve to higher values of »jsp/ c—a vertical shift with no horizontal shift.
It has been established indirectly9 and directly by proton magnetic resonance14 that very little or no degradation took place in the conversion of the linear and branched dextran samples to their respective potassium dextran sulfates. A comparison of the infrared spectra of branched dextran samples and their corresponding carboxymethyl derivatives indicated no branch degradation in the conversion. Therefore, the molecular weight distribu-

P O T A S S I U M C A R B O X Y M E T H Y L D E X T R A N S 1 3 9 7
lions of the polyelectrolytes will be essentially the same as those of the parent dextran samples.
In Figure 4 are plotted the sedimentation velocity coefficient distributions for the linear and branched dextran samples used in preparing the polyelectrolytes (sulfate9 and carboxymethyl). It is evident from Figure 4 that there is very little difference between the distributions for the linear and branched parent dextrans and, therefore, no difference in molecular weight distribution that could be responsible for the differences in the viscosity behavior of the branched and linear potassium dextran sulfate9 and the branched and linear potassium carboxymethyl dextran samples.
The reduced viscosity-concentration curves for paired branched and linear potassium carboxymethyl dextran samples of low degrees of substitution (range 0.06 to 0.21 CMG per AGU) in 0.0005W KC1 are shown in Figure 5. The reduced viscosity of the linear member of the pair is lower throughout the entire concentration range studied.
Differences in viscosity behavior were more marked when linear and branched potassium carboxymethyl dextran samples of much higher degree of substitution (linear sample 1.22 CMG/AGU and branched sample 1.14 CMG/AGU) were compared. Because of the higher degree of substitution, 0.001IV KCL aqueous solutions were used as solvent. A crossover of the two curves is observed with these carboxymethyl dextran samples (Fig. 6).
DiscussionExperimental results obtained in this reduced viscosity-concentration
study with branched and linear potassium carboxymethyl dextran samples both confirm and supplement the findings of the viscosity study on the branched and linear dextran sulfate samples.9
With both polyelectrolyte systems it was observed that the reduced viscosity-concentration curves obtained for branched and linear polyelectrolyte samples (derived from parent dextran samples of near identical intrinsic viscosity) of the same degree of substitution (a degree of substitution near 1 ionogenic group per AGU) in the same solvent (i.e., aqueous KC1) were of the same general shape but nevertheless crossed one another. This crossover, it. is evident, cannot be due to differences in molecular weight or molecular weight distribution, to differences in degree of substitution, or to differences in the ionic strength of the solvent. The crossover can only be due to the difference in branching of the samples.
An explanation of why branching causes a crossover of the reduced viscosity-concentration curves of branched and linear poly electrolyte samples at high degrees of substitution (near 1 ionogenic group per AGU) and why at low degrees of substitution (in the range 0.06-0.21 ionogenic groups per AGU) this does not occur despite the fact that the branched polyelectrolyte has the higher reduced viscosity throughout the concentration range studied, is as follows. On the average, the contour length of the linear dextran macromolecule would be of the order of 240 AGU, since the weight- average molecular weight of the sample was 40,000. The contour length of

1 3 9 8 W . M . P A S I K A A N D L . H . C R A G G
the branched macromolecule of weight-average molecular weight 61,000 would be 148-178 AGU (assuming average branch lengths of 1.5-2 AGU). Consider now the consequences of (a) introducing charged sites—'the same number per gram of macromoieeule—onto the linear and branched macromolecules in solution, and (5) subsequent dilution of the solution. Because of branching, the local charge density will be greater in the branched than in the linear polyelectrolyte macromolecules and, therefore, the expansion of the branched macromolecules will be greater at the initial high concentration (ca. 1.0 g./dl.) of polyelectrolyte. Consequently iuv/c for the branched polyelectrolyte solution will be greater than for the linear one at the same concentration. As the solutions are diluted, the branched and linear polyelectrolyte macromolecules expand further. Ultimately, the linear polyelectrolyte macromolecules should occupy the larger volume, partly because of their greater (average) contour length and partly because they would be less sterically hindered in achieving a “fuller extension.” Thus at the high concentration, r)sp/c would be greater for the branched polyelectrolyte than for the linear one, but with sufficient dilution, the Vsp/ c would become greater for the linear polyelectrolytes. In the lightly substituted branched and linear poly electrolyte samples the charges are scattered much more thinly on the macromolecules. Nevertheless, in the coiled, branched polyelectrolyte macromolecules, the overall charge density is still greater than in the coiled linear polyelectrolyte macromolecules. Hence, relative expansion would again be greater for the branched polyelectrolyte macromolecules. With the low degree of substitution polyelectrolyte samples, however, the extent of possible expansion of the polyelectrolyte macromolecules is very small. At these small expansions, the restrictive factors to expansion such as steric hindrance and inherent inflexibility of the branch structure do not come strongly into play. Therefore, no crossover of the reduced viscosity-concentration curves is observed for polyelectrolyte samples of low degrees of substitution.
We are grateful to the Defense Research Board of Canada for financial assistance in the form of a research grant.
References1. Zimm, B. H., and W. H. Stockmayer, J . Chem. Phys., 17, 1301 (1949).2. Thurmond, C. D., and B. H. Zimm, J . Polymer Sei., 8, 477 (1952).3. Stockmayer, W. H., and M. FLxman, A n n . N . Y . Acad. Sei., 57, 334 (1953).4. Zimm, B. H., and R. W. Kilo, J . Polymer Sei., 37, 19 (1959).5. Kilb, R. W., J . Polymer Sei., 38, 403 (1959).6. Bueche, F., J . Polymer Sei., 41, 549 (1959).7. Senti, F. R., et al., J . Polymer Sei., 17, 527 (1955).8. Trementozzi, Q. A., J . Polymer Sei., 22, 187 (1956).9. Pasika, W. M., and L. H. Cragg, J . Polymer Sei., 57, 301 (1962).
10. Jeanes, A., Polysaccharides in Biology, Transactions o f the Third Conference, The Josiah Macy Sr. Foundation, May 1957, p. 138.
11. Cragg, L. H., and H. van Oene, Can. J . Chem., 39, 203 (1961); H. van Oene and L. H. Cragg, J . Polymer Sei., 57, 175 (1962).
12. Gupta, P. R., R. F. Robertson, and D. A. I. Goring, Can. J . Chem., 38, 259 (1960).

P O T A S S I U M C A R B O X Y M E T I I Y L D E X T R A N S 1 3 9 9
13. Claesson, S., and I. Moring-Claesson, in A Laboratory M anual o f A nalytical Methods o f Protein Chemistry, Vol. III, P. Alexander and R. J. Block, Eds., Pergamon Press, New York, 1961, p. 119.
14. Pasika, W. M., and L. H. Cragg, Can. J . Chem., 41,777 (1963).
RésuméOn a carboxyméthylé à différents taux des échantillons de dextrane ramifié et linéaire
de viscosités intrinsèques presque identiques, et on les a transformés en sels de potassium. On a comparé les courbes de la viscosité réduite en fonction de la concentration pour les polyélectrolytes de carboxyméthyle-dextrane ramifié et linéaire possédant un degré de substitution identique, en solution aqueuse de chlorure de potassium (0.001 N à 0.0005 N ). On a observé des différences importantes. Pour un degré de substitution faible (0.06-0.20 groupe carboxyméthylé par unité d’anhydroglucose), le macroion ramifié possède une viscosité réduite plus grande que l’analogue linéaire. Pour un degré de substitution plus élevé (environ 1.0 groupe carboxyméthylé par unité d’anhydroglucose) les courbes de viscosité réduite des macro-ions ramifiés et linéaires se croisent. On a montré que ces différences sont indépendantes de la vitesse de cisaillement, du poids moléculaire et de la distribution du poids moléculaire. On en a conclu que la ramification est responsable des différences dans le comportement des échantillons de potassium car- boxyméthyle-dextranes ramifié et linéaire, en ce qui concerne la viscosité réduite en fonction de la concentration, à cause de la densité de charge plus élevée dans le macro-ion ramifié.
ZusammenfassungProben von verzweigtem linearem Dextran mit nahezu identischer Viskositätszahl
wurden in verschiedenem Ausmass karboxymethyliert und zun Kaliumsalz umgewandelt. Die Kurven, reduzierte Viskosität gegen Konzentration, der verzweigten linearen Karboxymethyldextranpolyelektrolyte mit identischem Substitutionsgrad in wässriger Kaliumchloridlösung (0,0017V und 0,00057V) wurden verglichen. Es bestanden signifikante Unterschiede. Bei niedrigem Substitutionsgrad (0,06-0,20 Karboxymethylgruppen pro Anhydroglukoseeinheit) besassen die verzweigten Makroionen eine höhere reduzierte Viskosiät als die linearen. Bei höherem Substitutionsgrad (zirka 1,0 Karboxylmethyl- gruppen pro Anhydroglukoseeinheit) kreuzten sich die reduzierten Viskositätskurven der verzweigten und linearen Makroionen. Dieser Unterschied erwies sich als unabhängig von der Schubgeschwindigkeit, dem Molekulargewicht und der Molekulargewichts Verteilung. Man kommt zu dem Schluss, dass die Verzweigung wegen der höheren Ladungsdichte in den verzweigten Makroionen für die Unterschiede in der Abhängigkeit der reduzierten Viskosität von der Konzentration bei verzweigten und linearen Kaliumkarboxymethyldextranproben verantwortlich ist.
Received September 21, 1964 (Prod. No. 4525A)

J O U R N A L O F P O L Y M E R S C I E N C E : P A R I' A V O L . 3 , P P . 1 4 0 1 - 1 4 3 4 ( 1 9 6 5 )
Analysis o f O ligom erization K inetics o f S tyrene on the E lectron ic D igital C om puter
EISHUN TSUCHIDA, Department of Polymer Chemistry, Waseda University, Tokyo, Japan, and SETSUO MIMASHI,
Computer Department, Toyo Koatsu Industries, Inc., Tokyo, Japan
SynopsisThe mechanism of radical oligomerization by chain transfer reaction was studied in
connection with the distribution of molecular weight of the obtained oligostyrene. In this case, the styrene-CCU system was selected as model for this purpose. The kinetics of the chain transfer reaction is difficult to analyze because the concentrations of components in the system varies along with oligomerization. The rates of component reactions expressed by t he simultaneous different ial equations were solved by utilizing an electronic digital computer (IRM 650). Consequently, the analytical values and the experimental data showed good agreement, and the correlation among the coefficients of kinetic velocity in the system was clarified, yielding much information regarding the control of oligomerization.
INTRODUCTION
The molecular weight distribution of a polymer is determined by the mechanism of polymerization, namely the type of polymerization and the velocity of each component reaction. Then, if the type of polymerization and an accurate molecular weight distribution are given, the velocity coefficient for each component reaction can be treated quantitatively. In addition, the accuracy of the distribution can be examined from the velocity coefficients thus obtained.
The types of radical polymerization have been studied thoroughly, and the relations between velocity coefficients for component reactions and the molecular weight distribution have also been formularized theoretically.1 By means of this relation, the polymerization kinetics could be analyzed, although it has not been studied enough since many difficulties are involved in obtaining an accurate molecular weight distribution.
In view of this fact, the author's have studied lower polymerization by chain transfer reactions.2 The products of this reaction have a molecular weight distribution just as high polymers do. Oligostyrene, as a typical case, has been fractionated effectively by means of elution column chromatography and the results of fractionation discussed.3 The mechanism of oligomerization by chain transfer reaction was formularized, and it was found that the molecular weight distribution is determined by the ratio of the molar concentration of the monomer to the chain transfer agent.
1 4 0 1

1 4 0 2 E . T S U C I I I D A A N D S . M I M A S H I
Many assumptions must be introduced in order to solve all the component reactions because both the concentrations of the monomer and the chain transfer agent, and hence also their ratio, vary with the process of polymerization. An electronic digital computer was employed to solve the simultaneous differential equations for the velocity of all component reactions, in order to follow the changes of the reaction system accurately. The oligomerization of styrene was discussed by comparing the solution of these equations with the molecular weight distribution observed and the velocity of oligomerization.
COMPONENT REACTIONS OF POLYMERIZATION AND THEIR RATE EQUATIONS
Oligomerization (telomerization) of styrene in carbon tetrachloride by chain transfer mechanisms can be divided into the component reactions of eqs. (l)-(5) which can be formulated in five steps.
Decomposition of initiator:kd
R-R - ' 2R* (1)Initiation:
R* + Sko
-► S* (2)
Chain growth:
S* + M
Mi* + M
k\
-> M,*fa-> m 2* (3)
Mfl_!* + Mkn
-> Mn*
Chain transfer:
Mi* + Sk ' 2
m 2* + s -»
Pi + S*
P2 + S* (4)
k 'n
Mn* + S P, + s*
Termination:k'o
s* + *s s—s (5)

O L I G O M E R I Z A T I O N K I N E T I C S O F S T Y R E N E 1 4 0 3
where R-R denotes initiator, S is transfer agent (solvent), M is monomer, Yn is polymer molecule containing n units, R* is the primary radical from initiator, S* is the radical produced in transfer reaction with S, M* is a radicalformed in transfer reaction with monomer molecule, M„* is a polymer radical containing n repeating units ; the rate constants are: kd the velocity coefficient for first-order decomposition of initiator, fc0 the velocity coefficient for chain transfer to solvent S, kn the velocity coefficient for reaction of M„_i with monomer (velocity coefficient for propagation for each step), k'n the velocity coefficient for chain transfer reaction of M„* to solvent S, and fc'0 the velocity coefficient for termination by combination of two S* radicals.
In addition to the equations above many other processes are also conceivable in this system, but these additional reactions are considered to be of negligible importance, if any. The discussion of other reactions being omitted, the process explained by the preceding component reactions is limited to the so-called telomerization.
In the component reactions of polymerization [eqs. (l)-(5)], if the concentration of each component is denoted as follows, the concentration of each component in the system shown as a function of time and the rate of change of concentration may be expressed as shown in eqs. (6)—(14) : C(rri = concentration of RR, Cr = concentration of R*, Cs = concentration of S, Co = concentration of S*, Cm = concentration of M, Cn* = concentration of M„*, Cn = concentration of P„, C* = concentration of whole growing radicals, C(rr)0 = initial value of C(rr>, Cm0 = initial value of Cm, Cs„ = initial value of Cg, C = concentration of whole polymer molecule. These concentrations are in units of moles/liter or number of molecules.
dC(RR)/dt — —kdC( rr)„ (6)
dCn/dt = 2/cdC(RR) — &o/CrCs (7)
dCo/dt = /co/CrCs - kC0Cu - fc'oC02 + C8(k'C* - a) (8)
dCu/dt = -fcCM(C0 + C* - Cn*) (9)
dCs/dt = CsihfCn + k'C* - a) (10)
dC*/dt = kCoCu - kC*CM - Cs(k'C* - a) (11)
dC/dt = Cs(k'C* - a) (12)
d.CC/dt = fcaCoCw - fc2Ci*CM - k'iCi*Cs dC2*/dt = hCCCu - hCSCu - k'iCi*Cs, dCz*/dt = /c3C2+CM - k,C3*CM - fc'3C3*Cs
( 1 3 )
dCn*/dt = /c„CVlCM - kn+iCn*Cu - k \C n*CS

1404 E . T S U C I J I D A A N D S . M I M A S H I
Here
t Ct* = C*
dCi/dt = k\C 1*Ca dCi/dt = k W C a dCi/dt = k'3C3*Ca
dCJdt => k 'nCn*C s
(ID
E c t = c¿=1
k\ = fco = /c3 . . . = kn = k
k \ = = kf3 = . . . = k 'm m /.•'
C*(fc' - fc/) + G\*(fc' - fc'2) + - r*) + CD(/c' - fc'4) = «
The initiation cfficietiey of polymerization can be represented by the sum
j ft - j i T %where/i is the efficiency of the radical formation by reaction (1), recombination of the radical being taken into consideration, % the efficiency of effective chain transfer to S in eq. (2), and / 3 the efficiency that radical S* attacks monomer M in the first step of eq. (3), then the rate of formation of radical S* is obtained by multiplying ¿oCrCs by / in eq. (8).
The velocity coefficients ki-kn of the propagation process, which actually are dependent on the chain length and have different values in the case where the degree of polymerization is low, arc approximated by the chain length-independent coefficient k' in order to simplify the treatment. Instead the rate constants for chain transfer k\-k% are differentiated based on the relation of k'/k, considering the variation of k' with chain length, although the rate constants beyond fc'5 are approximated by constants.
a is a correction term for the deviation of k \ k'., from the mean value k'. The telomerization reaction can then be expressed in (2n + 7) simultaneous differential equations from eqs. (6)-(14) and analyzed by solving these simultaneous differential equations.
CONCENTRATION OF THE COMPONENTS IN THE SYSTEM AND THE CALCULATION PROCEDURE
The Runge-Kutta method is used to obtain numerical solutions of the simultaneous eqs. (6)-(14). However it was shown to be impossible to solve these equations by the direct numerical calculation procedure with a computer because of too large errors and because the computer comes

O L I G O M E R I Z A T I O N K I N E T I C S O F S T Y R E N E 1405
to an overflow stop unless the time intervals on the calculation of the equations involving Cr, Co, C*, and C* are taken less than 10-9 hr. This difficulty arises from the fact that the reaction rates are too large to be successfully analyzed even with the high speed of the computer.
Actually the calculation performed by setting very short time intervals,i.e., 10-9 hr., for the variations in the concentration Cr, C0, C*, and C* demonstrated that from any starting value the equation for the radicals converges to a fixed value, within the time range of 10~6-10~5 hr., which did not cause any observable change on C(rr>, Cm, Cg, C*, .. ., etc. A short while after the beginning of the reaction, the radical concentrations of Cr, Co, and C* can be regarded as the stationary state is reached.
Then the preceding differential equations can be treated as follows. The left-hand sides of eqs. (7), (8), and (11) can be set to zero, yielding
Cr = 2fc<iC(RR)oe k,lt/k 0fCs (9')
Co = (2 fc/W ~*7fc 'o )V2 (10')C* = (fcCoCM + aCs)/k'C s (13')
By using the generating function, the radical concentration C„* can be expressed as
C(X) = E c n* \n71 = 1
in eq. (13).Thus
G{\)/dt = /c.CoCmX - hCSCuX - fchC/CgX
-T /c2CiCMX2 — /c3C2*CMX2 — fc'2C2*CsX2
+ fc3C2CMX3 - fc4C3*CMX3 - fc'3C3*CsX3
+ knCn-,Cuhn — kn+iCn*CjÆ n — k'nCn*Cs\ n — 0
If C * ~ C7_!,
C(X) = k C u C o X / [ ( k C m + k'Cs) — ZcCmX]= [1 - /cCmX/(/cCm + k'Cs)]~lkCMC„X/(kCm + k'Cs)
If we definekCm/ (kCm T k'Cs) 5
the bracketed term in the preceding equation can be developed as follows:
(1 - 6 X E 1 = 1 + S \ + (5X)2 + . . .
then,G(X) = C4*X + C2*X2 + C3*X3 + . ..

1 4 0 6 E . T S U C H I D A A N D S . M l M A S H I
If the coefficients of each X term are determined, Cn* can be obtained. As k'i ~ have been considered to be different, eqs. (13) and (14) will become as follows:
C,* = CJh.C2* = Cod,doC3* = Cohd2d3
Cn* = CodAdM»-*
dCi/dt — k'iCsCod, dCo/dt = k'oCsCodido dC3/dt = kr 3C sCod]_dod3
(13')
(14')
dCJdt = k'nCsCod1d,Midn- i
Here, d„ is expressed as follows:
d, = kCm/ (kCm !• k'iCs)
d2 = kCfi/(kCM + k'oCs)
d3 = kCu/(kCM + k'3Ca)
d4 = kC m/ (kC m + k\Ca)
d„ — kCyi/{kCu + k'JJ s)
Equations (6)-(14) were reduced to the calculation of the stationary state in eqs. (7'), (8'), (11'), and (13') and to the numerical calculation of the simultaneous differential equations (6), (9), (10), (12), and (14). The calculation can be carried out easily by using a medium-scale electronic digital computer, as time intervals of 0.1-0.2 hr. suffice.
The calculated results for eqs. (6)-(14) for very small intervals (10-9- 10~7 hr.) from any initial values which converge to the eqs. (7'), (8'), (11'), (13'), and (14') within the short range of 10~6-10~5 hr. are shown in Figures 1, 2, and 3. It is clearly seen from these figures that when the initial concentrations (7r , Co, C *, and C* are taken to be zero or several times, even hundreds of times of the concentration of stationary state, they always converge to the same values, though the convergence processes are not monotonous, depending on their natures of equations of reaction velocity. This fact shows that the radical concentrations always
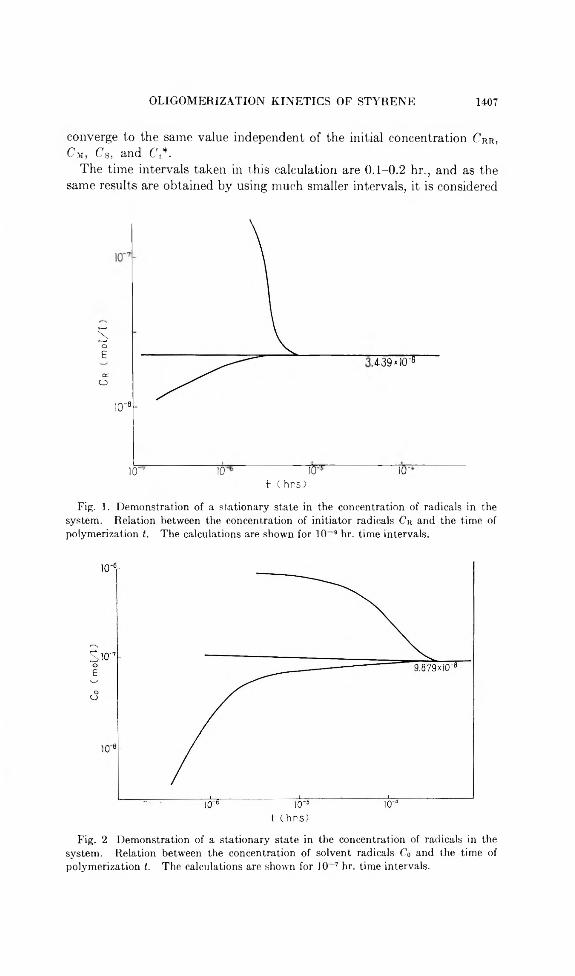
O L I G O M E R I Z A T I O N K I N E T I C S O F S T Y R E N E 1 4 0 7
converge to the same value independent of the initial concentration CRR, Cm, Cs, and C\*.
The time intervals taken in this calculation are 0.1-0.2 hr., and as the same results are obtained by using much smaller intervals, it is considered
O£CCO
icr6-
.4-39 * 10'®
w 1 e rid lert ( hrs)
Fig. 1. Demonstration of a stationary state in the concentration of radicals in the system. Relation between the concentration of initiator radicals Cr and the time of polymerization t. The calculations are shown for 10 9 hr. time intervals.
F i g . 2 D e m o n s t r a t i o n o f a s t a t i o n a r y s t a t e i n t h e c o n c e n t r a t i o n o f r a d i c a l s i n t h es y s t e m . R e l a t i o n b e t w e e n t h e c o n c e n t r a t i o n o f s o l v e n t r a d i c a l s Co a n d t h e t i m e o f
p o l y m e r i z a t i o n t. T h e c a l c u l a t i o n s a r e s h o w n f o r 1 0 7 h r . t i m e i n t e r v a l s .

1408 E. TSUCHIDA AND S. MIMASHI
Fig. 3. Demonstration of a stationary state in the concentration of radicals in the system. Relation between the concentration of growing radicals C* and the time of polymerization f. The calculations are shown for 10 ~7 hr. time intervals.
that the assumption of the stationary state and the intervals taken are proper.
To apply the Runge-Kutta method, Gill’s procedure was used; this had been developed for an electronic digital computer and proved to have following advantages: (1) fewer numbers of storage and instructions are required; (£) the results are sufficiently accurate; (3) a smaller execution time is involved.
In regard to differential equations, i = 1, 2, . . ., n, the calculation procedure is as follows. Where j = 1, 2, 3, 4 in steps of the Runge-Kutta method,
dyu/dt = kn = /(t/i,3_i, 2/2,j_i, . . . , yn.j-1) (15)
Vi) = Vi,}-i + k[aj(ktj - b,qt,^i) ] (16)
Uij Qt.j-i T S[dj(kij bjQi'j—i)] CjKn (11)where the initial value qi0 = 0, and
O! = 1/2 &i = 2 Ci = 1/2a* = 1 - V V 2 62 = 1 c 2 = 1 - V l/2« 3 = 1 + V l /2 h = 1 c 3 = 1 + V l/2a4 = 1/6 64 = 2 = fc/2
Equations (15)-(17) may be calculated by looping them, and the flow chart on the computer is shown in Figure 4. It has been shown that

O L I G O M E R I Z A T I O N 1 K I N E T I C S O F S T Y R E N E 1 4 0 9
new. QH4P Progrès Start
Fig. 4. Flow chart for the computer.

1 4 1 0 E . T S U C E I D A A N D S . M I M A S H I
Runge-Kutta method is advantageous for the calculations by a computer of the kinetics models such as represented by the differential eqs. (0) (11) and yields sufficiently accurate numerical solutions from a single starting value. The IBM 650 computer was employed, and 1.7 min. was required to calculate one interval of the Runge-Kutta method by floating point arithmetic. The calculation of the distribution of molecular weight, which is expressed by 33 variables of simultaneous differential equations, consumed about 10 min. for each interval. If a large-scale electronic computer had been employed, it would have required only a few seconds or less for the calculation.
SELECTIONS OF THE VELOCITY COEFFICIENTS FOR THE COMPONENT REACTIONS AND THE SIMULATIONS
Oligomerization in this system can be analyzed by solving the eqs. (6)-(14). The velocity coefficients for the component reaction in polymerization in many cases have been measured by various methods, but
Fig. 5. Results of the simulations. Effects of the values of h i on the relation between the concentration of monomer Cm and the time of polymerization t: (O) experimental values.
do not always agree with each other. As our main object was to compare the experimental data with the results of calculations based on the assumption of a given reaction scheme, the calculations were carried out by selecting suitable values for the rate constants from the available information.1

O L I G O M E R I Z A T I O N K I N E T I C S O F S T Y R E N E 141 1
N o k d k k 0 k ' k ’o© 5 - 1 1.17*10-' 246* 1 0 * 2 4 6 4 0 s 2 8 3 4 0 1 9 * 1 0 ”A 5 - 2 i . 7 & ë i
X 5 - 3 351*10- - - • *
20 -
A Cm/ C mo (% )
Fig. 6. Results of the simulations. Effects of the value of kd on the relation between the conversion of monomer ACm/C mo and the number-average degree of polymerization n.
The velocity coefficient for the decomposition of initiator, a,a'-azo- bisisobutylonitrile in this experiment, is expressed generally by the following equation:6
kd = 10 exp {-30 .7 /RT} (18)
By inserting the reaction temperature, 80°C., into the equation above, kd is found to be 0.351 (mole/l.-hr.), which was used in this calculation. The efficiency of the initiation reaction /, which is discussed in the paragraph dealing with the rate equations for the component reactions, was assumed to be 0.7 for the general case.
As data about the velocity coefficient for reactions (2) and (3) are scarce, it may be permissible to set k0 equal to k, considering the nature of the reaction. The characteristics of oligomerization (telomerization) are dependent on the fact that chain transfer to produce an oligomer occurs before the chain grows too long. In this case, as the chain length of the oligomer is so small compared with that of polymers, it would be desirable to consider that the velocity coefficients of propagation for monomer andn.-mer take different values. Also, the same would be true for the process of termination. I t is, however, a very complicated problem to treat both constants at the same time, and there has been no example of the treatment

2 0
M k K.p_ k ’ ko6-135H0'?4M05P.46-105283-I036240’'f>? * ♦ 1.CM013
* 3540'26-4 " 9.7*I(FCb 5540™
o
3.0 4.0 5.0 6.0t ( h n S )
*
Fig. 7. Results of the simulations. Effects of the value of k '0 on the relation between the concentration of monomer Cm and the time of polymerization t for the case of k ’/ k = 0.0115: (O) experimental values.
No. kd k ko k' koO 6-13.5M0-'246x10»246-I05263401.62x10”A 6-2 " M0”0 6-3 - 9.5*10,JV6-4 * * * 87x10"X6-5 "MO"
\lO 20 30 40 50 60 70
A Cii/ C mo { % )Fig. 8. Results of the simulations. Effects of the value of k \ on the relation be
tween the conversion of monomer ACm/C mo and the number-average degree of polymerization n.

2.0
rb 2D ao to 5*0 to 70t- (hrs)
Fig. 9. Results of the simulations. Effects of the value of k '0 on the relation between the concentration of monomer Cm and the time of polymerization t for the case of k ' / k = 0.01: (0) experimental values.
No kd | k ko k’ ko9 [7-1 3.5M0~' 2.46*1052.46xl052.46*103 5*I0'2a 7-2 * 9*1012x [7-3 " '•62>:0'J
A C m / C m f % )
Fig. 10. Results of the simulations. Effects of the value of k '0 on the relation between the conversion of monomer ACm/C mo and the number-average degree of polymerization n for the case of k ' / k = 0.01.

1 4 1 4 E . T S U C I I I D A A N D S . M I M A S H I
Fig. 11. Results of the simulations. Effects of the values of k '0l k, and k ' on the relation between the concentration of monomer Cm and the time of polymerization t: (O) experimental values.
of the variation of velocity coefficients with chain length of growing radicals; hence the constants for the propagation velocity were assumed to be independent of the chain length and the deviations corrected by including the variations into the rate constants for the chain transfer.
The value k was estimated uo be 2.46 X 10⁶ by converting the value which was derived by Matheson and co-workers6 for polymerization of styrene to the value at 80°C., the effect of dilution also being considered.
As noted previously the velocity coefficients k are treated as single constant values regardless of the chain length, correction for the deviation caused by this assumption being included in k'.
Mayo7 obtained the value of k '/k experimentally for oligomers up to tetramer and assumed that k '/k to be constant in the range above pentamer. From this relation, k 'n is calculated by using the value of k previously determined.
In considering each component reaction determined in the precedingly section, the velocity coefficient for the chain termination k'0 was found to play an important role in the rate-determining steps of polymerization. If fc'o is small, C0 becomes larger, and the velocity of polymerization is promoted. I t is one of the objectives of this study to estimate k% which has not previously been known.

O L I G O M E R I Z A T I O N K I N E T I C S O F S T Y R E N E 1 4 1 5
^ C m / ' C m o i % )
Fig. 12. Results of the simulations. Effects of the values of k '0, and k on the relation between the conversion of monomer ACm/C mo and the number-average degree of polymerization n.
In the computer analysis of the kinetics of component equations based on available information of the kinetics, the effects of the variation of the following coefficients on the rate of decrease of monomer concentration, the rate of polymerization, and mean degree of polymerization were investigated: (1) the velocity coefficient for decomposition of initiatorkd, (2) the velocity coefficient for propagation k, (3) the chain transfer constants k'/k, (4) the velocity coefficient for the termination reaction k'o, and (5) determination of /c'0, corresponding to a proper value of coefficient.
The results of the simulation are shown in Figures 5-14, and the information obtained can be summarized as follows. (1) kd determines the shape of the curve. (2) If k '0 is large, S* is consumed at the termination step rather than at the initiation step; thus the effective initiation decreases and the limiting conversion is reached leaving a large quantity of monomer intact. The estimated k'0 is about 1.1 X 10¹³. (S) If theconsideration is limited to the rate of monomer depletion, the change of k value does not necessarily determine the shape of the curve, and the experimental results may be explained properly by choosing an adequate value for k'0 in combination with k. (4) Even in the theoretical curve which best fits the experimental results, the rate of decrement of C'y is

1 4 1 6 E . T S U C H I D A A N D S . M I M A S H I
Fig. 13. Results of the simulations. Relation between the concentration of monomer Cm and the time of polymerization l. Detailed calculations done by use of selected constants: (O) experimental values.
*
greater than the experimental value. This discrepancy may arise from a time lag in the experiment until a given temperature is attained and/or the loss incurred in the operation because of its low yields. (5) Apart from minor discrepancies, the general features of the experimental curve
TABLE IRelationship Between Polymerization Times and the Per Cent
Conversion in the Polymerization System
Exp.no.
Polymerizationtime,hr.
Yieldweight,
g-
Chlorinecontent,
0//o
Weight of styrene poly
merized, g.
Conversion in monomer
X
.Styrene concentration
C'm, mole./I.
0.0 -- - — 0.0 0.0 1.673si 0.167 0 .5 3.68 0.480 0 .0‘25o 1.632c2 0.25 0.95 5.68 0.898 0.047c, 1.597c3 0.50 2.2 4.25 2.190 0.114, 1.488s4 1.00 4.7 5.86 4.670 0.243s 1 .27695 2.0 7.7 5.90 7.651 0.398s 1.02046 3.0 9.7 7.22 9.625 0.5013 0 .849i7 4.0 11.5 7.44 10.571 0.551s 0.765»8 5.0 12.3 8.92 11.201 0.583» 0.711s9 7.0 13.7 10.66 12.133 0.6320 0.629s
10 10.0 14.2 10.70 12.522 0.6539 0.606s

OLIGOMERIZATION KINETICS OF STYRENE 1417
are fairly well explained by the theoretical value by choosing a suitable condition.
The experimental values for the reaction of this system are shown in Table I. Figures 15 and 16 show the results obtained by using the most probable values estimated from the simulation. The values of the chain transfer constants k'/k, 0.0115 and 0.010, derived for the case of high polymers will be examined in the following section.
No kd k ko k’ ^ 7 ^D-l 35MCT 24640s ?.4fixl05 9xl0,z •D-2 " " " 1x1013 X0 3 " " * " 1.3x10” A0 4 // " " 246x10’TMO” 00 5 " m xio61.23x|06 1.415x10* 5x10" o
Fig. 14. Results of the simulations. Relation between the conversion of monomer ACm/C mo and the number-average degree of polymerization. Detailed calculations done by use of selected constants.
As seen in Figures 15 and 16, the value 0.010 for k'/k gives 1.5-1.8 times larger degree of polymerization compared with experimental values at the same conversion, and the curve has also a slightly larger gradient. This suggests that k'/k lies in the range of 0.010-0.0115 if the calculation is correct. However it is difficult to determine whether a difference in the mean degree of polymerization of this extent is meaningful, as the accuracy of the measurement of molecular weight and other factors as well need to be taken into consideration. In this sense, the result of analysis of the kinetics seems to be more reliable.

1418 E. TSUCHIDA AND S. MIMASH1
1.5 (-
\ 1.0 o
JE
t:U
0.5
~ w kd kolO'5 k-10s k’,10“2kViffTkVW3- kVia5kni5'10'3' k’oD-6 0.351 3.46 1476 6.15 1.697 246 2.829 U5X1O0TFT " ' 1.26 5348 1476 2.139 246 1.25x10“
1.0 3.0 5.0 7.01 (h rs )
Fig. 15. Results obtained by using the most probable values estimated from the simulations. Relation between the concentration of monomer Cm and the time of polymerization i: ( A ) experimental values.
As seen above, quite good agreement is obtained between experiment and the calculated results for the mean degree and rate of polymerization by taking suitable values for the rate constants of component reactions. This fact shows the usefulness of this model in elucidation of the reaction mechanism for oligomer formation.
The values of constants which satisfy the reaction conditions are summarized in Table II.
MEAN MOLECULAR WEIGHT AND DISTRIBUTION FUNCTION Number-Average Molecular Weight
From the definition of number-average molecular weight, the following equation is derived;
Mn = I X A / E C . = £ (» M . + M')h » /£«" (19)
where Mn is the molecular weight of the n-mer, Cn is the concentration or number of molecules of n-mer, Ma is the molecular weight of monomer, and M is the molecular weight of the chain transfer agent.

OLIGOMERIZATION KINETICS OF STYRENE 1419
*
torH oo oo o2 2O o0 T—( T—1X Xto >o03
To 05X Cl
GOCOTJH10
All 03 03
T 05o CO COX 03 03
?o COt—H 05 i>X CO Th
7—1 — !
<N1o »o 00TPT—1 T-H COX CO to
TO7—t CO COX 03
-H rH
o CO COr-H tFX 03 03
1o 'CO COi—(X 03 03
3 toCO CO
o o ’CO b-6 1 1
£ Q Q

1420 E. TSUCHIDA AND S. M1MASHI
No kd koia5 k-10'5 k',10"! iciia5kVia3 kVia3k’n>5'l0 3 koD-6 0.351 2.46 246 1.476 6.15 1.697 246 2.829 ].15*10150-7 * ' 1.28 5.348 14761 2.139 2.46 125i 10T3
lO 30 50 70* Cm / C m- (%)
Fig. 16. Results obtained by using the most probable values estimated from the simulations. Relation between the conversion of monomer ACji/CMoand the number-average degree of polymerization n: (A) experimental values.
As 8 < 1, E 5" = 3/(1 — 3), eq. (19) can be converted to
AIn = [M05/(l - sy~ + M'h/(1 - 5) ;/|<i "(1 - 5)]
= M o / (1 - 5) + M f (20)
Pn = 1/(1 - 3) + M'/Mo (21)
Weight-Average Molecular Weight
Similarly to the case of number-average molecular weight, the following equations are derived.
Mw = = T(nAt0 + M')W/Y,inMa + M')5B
= + 2M0M'I>S”' + A f'*£8*J/(lf„En5B + M 'E « ^(22)
whereE«-3'‘ = 3(1 - 3)7(1 - 3)

OLIGOMERIZATION KINETICS OF STYRENE 1421
and
q = M0(l + 8) + 2M'{\ - 8) + (M,2/M0 )(1 - 3)2 ” (1 - 5) + {M'/Mo) (1 - 6)2
^ = (1 + 3) + 2(M7Afo)(l - 8) + (M/2/Mo2)(l - 3)2 w (1 - S) + (M V M 0)(1 - 5)2
(23)
(24)
If the degree of polymerization of oligomer is so high that M' can be regarded as negligible, the equation for Pn can then be reduced to a simpler form, which is equal to that for high polymers. Since the ratio M w/ M n which shows the inhomogeneity of the molecular weight distribution can be expressed as M w/ M n = 1 + 8 for high polymers in general, and the extreme case where 8 approaches 1, then M w/ M n ~ 2. This, however, represents the case of polymerization in a solvent whose chain transfer constant is negligible, or the case where Cs/G'm is extremely small, but not the case of oligomerization.
Molar Fraction Distribution Curve
If Nn denotes the molar fraction of n-mer
Nn = Cn = <5VI> (25)n = 1
N n ~ (1 - 8)8n~1 (26)
Weight Fraction Distribution Curve
If W„ shows the weight fraction of n-mer,oo
w n = A W E MnC,n (27)n — 1
In oligomers the endgroup cannot be neglected in determination of the molecular weight of n-mers. The molecular weight of the n-mer M„, then, is expressed as the sum N n = (nMa + M'), where M' and Mn denote molecular weights of end-groups and of monomer, respectively.
WK = (nM0 + M')Cn/Z(nM 0 + M')Cn= (nM08n + M'8n)/(J2nM08n + £#'«">■ (28)
coSince E n§n = 3/(1 — 3)2
n — 1
Wn = (nM0 + M ')(l - 5)2SK-V[M 0 + M 'il - 5)] (29)
The expression for the weight fraction distribution curve can be reduced to eq. (29). The value of n at which the curve reaches the maximum is obtained by differentiation of eq. (29).
àWn/àn = (l/A)8n(M0 + nM, In 8 + M * In 5) = 0 (30)

1422 E. TSUCHIDA AND S. MIMASHI
W nd n (33)
1)
Therefore,
n = -[(1 /ln S ) + (M'/Mo)] (31)
If the degree of polymerization is sufficiently large to permit M' to be neglected, n can be expressed as follows by utilizing the relationship — In S ~ (1 — 5),
n = 1/(1 - 5) (32)
Integral Weight Distribution Curve
The integral weight distribution function Fn is defined as
Fn = fo Wndn/ fo From eq. (30), IT, is expressed as
Wn ~ (1 /A)Sn(nMl] + M')
and
e ln \n In 8 - 1) + 1 + (M'/Mo) In 8(en ln 5 - ” T — (M'/Mo) In S
S,l(n ln 5 - 1) + (M'/Mo) In S(Sn - 1) + 1 1 - (M'/Mo) In 5
If M' can be neglected, eq. (34) is equal to the equation for high polymers
Fn = 8n(n | no 1) | I (35)
Index Expression of Distribution Function
The weight fraction and integral distribution curves are expressed in the form of an index,
5 = kCu/(kCu + k'Cs) = (1 + k'Cs/kCM)~l = (1 + 0 -» ) £ « 1 (36)
from ex = 1 + x + .r2/2 + . . . Ss 1 + #
Then,
(1 + ?)”’ = e~f = Sor (1 - 5) = f(l + f)-> (37)
From eq. (29)
(34)
= (nM o + M ’) f(2+n_ n = |n + (M’/M0)] ((n + l)n M0 + M'He-t 1 + (M '/M o )^ K ' (38)
Here, if the degree of polymerization n is large enough to permit M ' to be regarded as approximately zero, then
W M = n e e ~ m + t ) (39)

OLIGOMERIZATION KINETICS OF STYRENE 1423
On the other hand,
In 5 = In (1 + £ ) - * = - [f + ( |2/2) + (£3/3) + . . . ] - - £
F„ is expressed as follows from eq. (34),
p = 1 ~ (nf + l)e~Bt - (M'/Mp){e~ni - l)g " 1 + ( M '/ M 0)£ ...
(40)
If M' can be regarded to be zero as before, Fn becomes the distribution function for high polymers,
Fn = 1 — (1 + n$e~n( (41)
By comparing the equation with the distribution function proposed by Palit,8
Wr = rq2e~ar )[ (4 2 )
Fr = 1 - (1 + qr)e "r)
the eqs. (38) and (40) turn out to be identical because q = £, r = n from the definition in eqs. (39) and (41).
RELATIONSHIP BETWEEN THE PER CENT CONVERSION AND THE DISTRIBUTION ;CURVE FOR OLIGOSTYRENE
(EXPERIMENTAL)
Fractionation Samples
The samples of oligostyrene, the products of the polymerization under the conditions shown in Table III at different conversions, were selected in proper intervals, yielding five samples of different per cent conversion
TABLE IIIPolymerization System
Weight, Concentration, Volume, Concentration, Molarg- M ml. mole/1. ratio
Styrene 19.20 0.1843 21.26 1 .673 1.000CCL 141.79 0.9217 88.89 8. 368 5.001AIBN 1.51 0.0092 0. 0837 0.050
TABLE IVConversion and Fractional Samples
Sample
F-l F-2 F-3 F-4 F-5
Polymerization time, hr. 0.167 0.50 1.00 2.00 7.00Yield of polymer, g. 0.5 2.2 4.7 7.7 13.7Conversion of monomer, % 2.5 11.41 24.33 39.85 63.20Expended sample, g- 2.0038 2.0061 2.0062 2.0002 2.0073

1424 E. TSUCIIIDA AND S. MIMAS!II
of monomer over the range of 3-70%. They were fractionated and the relationship between the conversion rate and molecular weight distribution was examined (Table IV).
The oligostyrene was fractionated by elusion column chromatography, and the molecular weight of each fraction was determined by measuring the viscosity according to eq. (43) A9
M b— = 3.77 X 10-W ** (43)
A detailed method of measurement of molecular weight distribution and its accuracy are given elsewhere.2'3'9
Molecular Weight Distribution of Oligostyrene
Figure 17 shows an integral distribution curve which was obtained from the distribution function of the fractionated samples F-l-F-5. By differentiating the curve in Figure 17 graphically, the differential distribution curve in Figure 18 was obtained. Molar fraction distribution curves in the polymerization system are based on the distribution functions are shown in Figure 19. All these curves show a shift of the peak towards the lower molecular weight side with an increase of reaction time (as polymerization proceeds) and a tendency to converge to a certain value. This is explained by the fact that the rate of conversion decreases with increasing rate of polymerization toward the limiting value.
One of the features which should be noted in these distribution curves is the small difference in the widths of distribution curves even when the conversion rate is varied substantially. Whether this is due to experi-
Fig. 17. Integral distribution curves of molecular weight. Oligostyrene samples were fractionated by elution column chromat ography with MeOH-MEK as the developing agent, the composition being continuously varied.

OLIGOMERIZATION KINETICS OF STYRENE 1425
mental errors or to an essential character of lower polymerization reactions should be studied further. It is conceivable that the number of moles of products having higher degree of polymerization which are produced at the initial stage of the polymerization is rather small compared with the
Fig. 18. Differential distribution curves of molecular weight. Obtained by graphical differentiation of the curve in Figure 17.
Fig. 19. Molar fraction distribution curves of oligostyrene in polymerization system.
total number of moles of the products at the end of the reaction and that the former do not therefore contribute properly to the measurements. The increase in the number of moles at the low degree of polymerization with the increase in per cent conversion is noticeable, and the shape of the curves is approximately of Gaussian type.

1426 E. TSUCHIDA AND S. MIMASHI
MOLECULAR WEIGHT DISTRIBUTION OBTAINED BY ANALYSIS OF THE KINETICS
Estimation of Chain Transfer Constants and Parameter of Chain Transfer k'
The factors which govern the chain length of polymer in the system discussed here are the rate constants for propagation k and for the chain transfer k 1. It is assumed, as stated previously, that the k value is a constant independent of degree of polymerization, but k' depends on it and is not a constant.
However, actually both k ' and k depend upon the degree of polymerization, and in this sense the value of k ' does not represent the rate constant for the propagation itself, but a kind of parameter which includes the deviation of k caused by the assumption of a constant.
In general, the chain length for the obtained polymer in the system is controlled by k ' /k , hence if k is constant, the chain length can be determined by k 'n. So far, there has been no report on the measurement of k and k ' for this oligomerization system, while there are a few reports on polymerization systems. The literature values do not agree exactly with each other but are of the same order as to exponent. The k values used here were obtained by converting the values derived by Matheson to the given temperature and examined by utilizing the chain transfer constant (k '/k ) determined by Mayo. Mayo reported that the chain transfer constants for oligomers higher than the pentamer are constant but not those for lower degrees of polymerization than the tetramer.7 Then, from the results derived by Mayo et al. from the assumption that the velocity coefficients for propagation are independent of degree of polymerization k n = k, k ' values can be calculated, and of course fc5 <„ is constant. By what group of numerical values k 'n is expressed can be determined, if simulations are carried out by projecting various conditions on an electronic digital computer.
Velocity Coefficients Independent of Chain Lengths over Pentamer
The calculation results for the case of a fixed value of the parameter k 'n above pentamer are represented in Figure 20. The results are different from the experimental data in Figure 19, in that the maximum value in Figure 20 exists at n = 4-5, and over wide range of polymerization degree the curve is monotonously decreasing. It is quite natural to take this type of distribution in order to approximate the mean degree of polymerization to the experimental value at the same time keeping the maximum at n — 4-5, although this does not fit the experimental facts at all.
This deviation from the experimental data can be ascribed to an error in the rate constants for the component reactions, as there is no method to measure the constant accurately in such a complicated system, thus making the use of approximate values inevitable. The rate constants for the component reactions depend on the degree of polymerization, and

OLIGOMERIZATION KINETICS OF STYRENE 1427
Fig. 20. Distribution curves obtained from analysis of kinetics. Molar distribution curves obtained from the results of calculations for the case of a fixed value in the parameter k 'n & 6-
this dependency can not be ignored in the discussion of the region of oligomer.
Estimation of the Proper Series for the Parameter k'„Strictly speaking, the rate constants for component reactions should
be considered to be dependent on the degree of polymerization, and this is particularly the case in the region of low degrees of polymerization. Since it is too difficult to analyze and calculate the reactions including deviation of kn from constant k, a condition has to be found that renders the calculation possible. For this reason, as described before, the chain propagation was treated as independent of chain length, with only the chain transfer dependent on chain length, which means that k\-k'n are parameters of variation of rate constants, and in a polymerization system that the distribution of molecular weight of the oligomer resulting at any conversion depends predominantly on the factor k’n, if k( = k(i = 1 ~ n).
Based on the k\-k\ and fc's <M obtained from the experimental value of chain transfer constant (k'/k), some series of k'n were selected as models. In this case, it is important to select the series of k'n which may be different from the reported value of k'n that can explain the resultant distribution curves of molecular weight.
Six series of the models for k'n were selected. The series K-l is derived from Table V. Curves were selected for K-2 and K-3 by varying the gradient of K-l adequately at k\.

1428 E. TSUCHIDA AND S. MIMASHI
TABLE VChain Transfer Constants and Values of S
Initial concentration Cs/C m = 5
k \ / k = 0.0006 S, = 0.9970 M o = 104 (C8H 8)k \ / k = 0.0025 0 i = 0.9877 M ' = 154 (CCU)k 'z /k = 0.0069 Ss = 0.9667 M ' / M o = 1.4Sk 't / k = 0.0100 54 = 0.9534k ' / k = 0.0115 Ô = 9.9456
The K-4 series was obtained by gradual increase of the gradient at k ' i - k ' z , the K-5 series by directly increasing the gradient at k \ , and the K-6 series by shifting K-5 parallel to the n axis to the position of krn, where number-average degree of polymerization of the products shows a suitable value. Six cases are displayed in Figure 21. These k ’ n values are obtained by the method of least squares based on an arbitrary value of k ' n.
Distribution functions of each series from K-l to K-6 are given by solving the simultaneous eqs. (6)-(14) by an electronic computer. The correct k ' n may be obtained by comparing the analytical results with the
(K-5)
Fig. 21. Estimation of the proper series for the parameter k ’„. These k'„ values are obtained by the method of least squares based on an arbitrary value of k'„.

OLIGOMERIZATION KINETICS OF STYRENE 1429
Fig. 22. Distribution curves in the polymerization system under given conditions corresponding to each series of k 'n for a polymerization time of 1 hr.
experimental values. The distribution curves under the given conditions corresponding to each series of k ' n for a polymerization time of 1 hr. are shown as Figure 22 for the convenience of comparison of mutual relations. It is of interest to examine the adequateness of the series in K-l-K-6, in connection with Figures 21 and 22.
Consideration of the Distribution Curve Obtained by Analysis of Kinetics
On comparing Figure 22 with the experimental Figure 19, the series K-3 and K-6 are found to fit the experimental distribution of k'„ more closely. The series K-3 is, as is clearly seen from Figure 21, a system in which k 'n increases with considerable gradient in the domain above tetramer, but its gradient decreases gradually and is roughly constant, at near &V The K-6 series is obtained by shifting k \ - k \ about 6 units along the n axis and by diverging to k ’ n with the same gradient at the point of k't. This means that the parameter of chain transfer from 7c'i to k '6 is nearly equal to zero, gradually increases beyond k \ up to k 'w, and the gradient at k ' w is maintained above this point. Then, the parameter of chain transfer k’ is negligible at the very initial stage of the reactions, but it increases constantly above decamer. In other words, the value of k ’ n in the K-3 series, which has been discussed previously, does not converge at the point n S: 4, but at a higher degree of polymerization, for example n 20. In series K-6, k ' n 4 can be neglected at the beginning of polymerization, but beyond n 5, it increases gradually to infinity.
In the case of series K-6, this fact can be understood if we consider k 'n is a parameter involving the deviation caused by the assumption of k n = k.

1430 E. TSUC1IIDA AND S. MIMASHi
Fig. 23. Distribution curves in the polymerization system obtained by analysis of kinetics. The results obtained by using parameter series K-3 are shown.
Fig. 24. Distribution curves in the polymerization system obtained by analysis of kinetics. The results obtained by using parameter series, K-6 are shown.
From these observations, the most probable series of k'n is K-6, of course, the real value of k'n would differ a little from this value, but they would have a similar character. From these results, information about the absolute values of rate constants for each component reaction were obtained, but a more important finding is that the common concept of independence of rate constants from degree of polymerization is not necessarily true. At least concerning the oligomer, it is clear that the dependence of reaction rate on the degree of polymerization should be considered.
The distribution curves of degree of polymerization derived by adapting analysis of the kinetics on the proper models K-3 and K-6 are shown in Figures 23 and 24, respectively. It is of interest to note that these two

OLIGOMERIZATION KINETICS OF STYRENE 1431
curves are similar to the experimental curves in their shape. The conclusion derived from these two curves is that the series of k'n in K-6 shown in Figure 24 is more suitable for explaining the resulting products as to the variation of mean degree of polymerization with the degree of polymerization. This fact, however, does not necessarily indicate the correctness of parameters K-6, because the explanation is also possible with K-3 only by moving the curves parallel to the n axis. Thus, it can not be concluded at this stage which of the two models is more appropriate to explain the distribution of k ' n .
The essential differences between these two series lies in the question of whether k'n is a convergent series or a divergent one. It is very difficult, however, to decide which is more meaningful in representing the actual phase. The results which have been derived by comparing the experimental results with analysis of the kinetics are summarized as follows:(I) the distribution of k ' n appears to increase continuously up to a larger value of n than has been supposed; (2) the k' values below fc'6 are estimated to be smaller than those reported; (S) this discussion is valid only for the case when k ' n is treated as parameter in the sense as stated above; ( 4 )
those studies to determine more detailed k ' n value and micromechanisms of the reactions through these values in combination with experimental results are considered to be important.
The low polymer obtained by the telomerization has been said in general to have a wide distribution of molecular weight. However, it became evident after examining the distribution of molecular weight by fractionation that it had unexpectedly a narrow distribution. It is well known that in many cases the distribution pattern of the polymer is of Schultz type, in which a peak exists at relatively low degrees of polymerization. However, the distribution pattern of oligostyrene is, as seen from the results of measurements, relatively close to the Gaussian distribution, and is different from the distributions in high polymers.
So far there have been only a few reports on the distribution of the molecular weight of lower polymers and no established information in this regard. On the basis of the correct molecular weight distribution of oligostyrene some insight into the kinetics of polymerization would be obtained.
As has already been seen, the change of concentration of any component in this system was explained by detailed calculations with an electronic computer based on the chain transfer constants reported previously, and a probable value of the coefficient for the chain termination k ' 0 was estimated. But the concentration of obtained oligomer presented by eqs. (14') and (12), especially the change of the distribution of molecular weight with time, does not agree with the experimental value, the mean value being always smaller. It leads to a larger value of total moles of oligomer than in the experiment.
Apparently the too large values of the parameter k ' n which was used in the calculation seems to be solely responsible for this discrepancy. An
1432 E. TSUCIIIDA AND S. MIMASITI
adequate correction applied to k'n, therefore, suffices to bring the calculated distribution closer to the observed values. As is clearly seen in Figure 21, the conventional treatment of k'n constant above n = 5 is not valid, but k'„ has to be understood as a function of the degree of polymerization. This phenomenon is not limited to the case of oligostyrene, and apparently is common in the lower polymerizations of this kind. It is evident from this study that the k'n value of low polymers is almost equal to zero up to n ~ 5 but increases gradually with polymerization degree.
Of course, such a view is based on the assumption that the measurement of the distribution of molecular weight is correct, and it is proved that a quite accurate measurement of molecular weight can be carried out by elution column chromatography. It is one of the very important characteristics that the distribution of molecular weight of oligomer is rather narrow in comparison with that of high polymer.
In fact, if the calculation is made with the use of a computer from this standpoint, the phenomenon can be explained easily.
CONCLUSION
The detailed oligomerization kinetics of styrene was examined and a concept of the oligomerization, namely low polymerization, by radical mechanisms was established. An attempt was made to elucidate the reaction mechanisms of oligomerization with the aid of an electronic computer to follow the concentration change of components in the system along with the change in the degree of polymerization and with the distribution of molecular weight. The results may be summarized as follows.
(1) The rate equations for component reactions in the oligomerization consisting mainly of chain transfer reaction were established.
(2) The variation of concentration of multicomponcnts expressed as a function of time in the system are obtained by solving simultaneous differential equations with a medium-scale electronic digital computer (IBM 650) by utilizing Runge-Kutta method.
(3) A stationary state was reached within very short time of 10-8-10~° hr. When the initial value is zero, first the initiator radicals, next the solvent radicals, then finally the total concentration of radicals in the system reached a stationary state.
(4) Computer calculations indicate that the variation of concentration of radicals is almost constant at any point of time where the concentration of the feed components in the system (monomer, transfer agent, initiator) changes significantly. This fact suggests that a stationary state exists at any point of time independent of the rate of polymerization except at the initial and final stages of polymerization processes.
(-5) By comparing molecular weight distributions obtained by analysis of the kinetics with the experimental data it is possible to discuss the change of concentration of the system, the rate of polymerization (i.e.,

OLIGOMERIZATION KINETICS OF STYRENE 1433
conversion of monomer), and the number-average degree of polymerization of products quantitatively from the known velocity coefficients of component reactions and the distribution of molecular weight. The velocity coefficient for chain termination k'0 has also been estimated.
(6) The oligostyrenes have rather narrow molecular weight distributions in comparison with those of high polymers. The distribution curve which fits the experimental data was obtained by assuming the parameter k’n to be dependent on the chain length and at the same time to increase with the degree of polymerization.
In this paper an attempt to elucidate the reaction kinetics of a complex system for oligomerization with an electronic computer was reported. The equations contain many variables which often differ greatly in magnitude, and this made the analysis difficult. This difficulty was avoided by utilizing the conditions of a steady state.
We are still a long way from treating chemical reactions quantitatively by simulation on a computer, but this method is very useful in elucidating the fine mechanism of a reaction if adequate values are supplied for the essential constants and parameters.
The authors are grateful to Professor Dr. Isao Dhinohara, Professor Dr. Shu Kabara, and Professor Dr. Nobuhiko Saito for many helpful discussions and suggestions during this work. The computer used in this study was kindly supplied by Dr. Zentaro Ishihara manager of the computer department.
References1. Bamford, C. H., W. G. Barb, A. D. Jenkins, and P. F. Onyon, The K inetics o f V in y l
Polymerization by Radical M echanisms, Butterworths, London, 1958.2. Tsuchida, E., I. Shinohara, and S. Kambara, Kogyo K agaku Zasshi, 66, 824
(1963).3. Tsuchida, E., I. Shinohara, and S. Kambara, Kogyo K agaku Zasshi, 66, 828
(1963).4. Raison, A., and H. S. Wilf, M athematical Method for D igital Computers, Wiley,
New York, 1960, p. 114.5. Otsu, T., and K. Takemoto, Preparative M ethods o f V in y l Polymerization, Kyoritsu
Publications, Tokyo, 1960, p. 257.6. Matheson, M. S., E. E. Auer, E. B. Bevilacqua, audE. J. Hart, J .A m .C h e m . Soc.,
73, 1700 (1951).7. Gregg, R. A., and F. It. Mayo, J . A m . Chem. Soc., 70, 3689 (1948).8. Palit, S. It., J . Sci. Jnd. Res. [India), 15B, 158(1956).9. Tsuchida, E., et al., Kogyo K agaku Zasshi, 68 (1965)
RésuméNous avons étudié, en choisissant comme modèle le système styrène-CCL, les méca
nismes d ’oligomérisation radicalaire par transfert de chaîne, en connexion avec la répartition des poids moléculaires de l’oligostyrène obtenu. La cinétique de la réaction de transfert de chaîne est difficile à analyser, parce que les concentration des composants dans le système varient suivant l ’évolution de la réaction d’oligomérisation. Nous avons analysé, à l’aide du calculateur électronique digital IBM-650, l’importance des réactions composantes exprimées par les équations différentielles simultanées. Les valeurs analytiques et les données expérimentales sont en bon accord, et la corrélation entre les

1434 E. TSUCHIDA AND S. MIMASHI
coefficients de vitesse cinétique dans le système a été éclaircie. On a obtenu de nombreuses informations concernant le contrôle de la réaction d’oligomérisation.
Zusammenfassung
Der Reaktionsmechanismus der radikalischen Oligomerisation durch Kettenübertragung im als Modellsystem gewählten System Styrol CCL wird in bezug auf die Molekulargewichtsverteilung des erhalten Oligostyrols untersucht. Da sich die Konzentration der Komponenten im System während der Oligomerisation verändert, ist die Kinetik der Kettenübertragungsreaktion schwer zu analysieren. Mit dem “Elektronendigitalrechner IBM 650” wurde die Geschwindigkeit der Elementarreaktionen, die in simultanen Differentialgleichungen mit mehreren Unbekannten vorliegen, erhalten. Die analytischen und experimentellen Werte können in gute Übereinstimmung gebracht werden. Der Zusammenhang zwischen den kinetischen Geschwindigkeitskoeffizienten im System wird geklärt, und damit werden neue Kenntnisse über die Oligomerisation gewonnen.
Received June 26, 1964 Revised November 2, 1964 (Prod. No. 4527A)

JOURNAL OF POLYMER SCIENCE: PART A VOL. 3, PP. 1435-1442 (1965)
Scission Reactions in Some Vinyl and VinylidenePolymers
ARTHUR V. TOBOLSKY and PARRY M. NORLING, Department of Chemistry, Princeton University, Princeton, New Jersey, and the Textile
Research Institute, Princeton, New Jersey
SynopsisRates of autocatalyzed oxygen absorption and chain scission were measured at
160°C. and 1 atm. oxygen pressure for copolymers of ethyl acrylate-methyl methacrylate and ethyl acrylate-methyl a-chloroacrylate. The crosslinked homopolymers of both the vinylidene-type monomers were very resistant to oxygen uptake and oxidative scission. Increasing amounts of ethyl acrylate in the copolymer systems increased the rate of oxygen absorption and chain scission. Slightly crosslinked poly(methyl methacrylate) containing 5% of dicumyl peroxide showed rapid chain scission at 140°C. in the absence of oxygen and negligible chain scission in the presence of oxygen. The same experiment carried out with poly(ethyl acrylate) shows the reverse behavior: cross- linking and little scission in the absence of oxygen and efficient chain scission in the presence of oxygen. Chemical mechanisms are presented to account for these results.
Introduction
Chain scission is a most facile process when peroxide-initiated, radiation- initiated, or thermally induced degradations of vinylidene type polymers are conducted in the absence of oxygen at high temperatures. Recent studies of the dicumyl peroxide-initiated degradation of polyisobutylene1'2 have shown scission to be an efficient process; close to one scission is produced by each initiating radical. In the pyrolysis of poly(methyl methacrylate) and poly- «-methylstyrene it has been further demonstrated that an initial chain scission is followed by depropagation resulting in almost quantitative yields of monomer.3 It is well known that vinylidene polymers tend to degrade rather than crosslink when exposed to high energy radiation in the absence of oxygen.
Under similar conditions vinyl polymers give low yields of monomers;3 crosslinking accompanies and predominates over scission,4 and low ratios of scissions to initiating radicals are observed.5 Vinyl-type polymers will generally give crosslinked netwoi’ks when exposed to high-energy radiation in the absence of oxygen, though some scission accompanies crosslinking.
In the presence of oxygen a striking reversal takes place for these two classes of polymers.
It has been shown that each initiating radical abstracting a tertiary hydrogen, produces one chain scission during the benzoyl peroxide-initiated
1435

1436 A. V. TOBOLSKY AND P. M. NORLING
oxidation of polypropylene and poly(ethyl acrylate).5 In this paper, by contrast, we show that oxygen actually inhibits chain scission during the dicumyl peroxide-initiated degradation of poly (methyl methacrylate).
Autoxidation studies at 160°C. show that scission is rapid in poly(ethyl acrylate), a vinyl-type polymer. On the other hand it is very much slower in poly (methyl methacrylate) and in poly(methyl a-chloroacrylate). Rates of oxidative scission in ethyl acrylate-methyl methacrylate and ethyl acrylate-methyl a-chloroacrylate copolymers are consistent with earlier work,5’6 showing that it is the tertiary hydrogen along the polymer backbone that suffers the oxidative attack leading to scission. Free radical mechanism can be suggested to account for these results.
ExperimentalMonomers (The Borden Chemical Co.) were freed of inhibitor by alkali
and distilled water washings and were dried over magnesium sulfate. Solutions of 1 mole-% ethylene glycol dimethacrylate (EGDMA) in the monomers were prepared and to these was added less than 1% benzoin. Since the crosslinking agent may affect the rates of scission and oxygen uptake, all copolymers were prepared with 1 mole-% of crosslinking agent. Photo- polymerizations were carried out between Pyrex glass plates, Teflon gaskets being used to keep the thickness of the sheets at 15 mils. A General Electric RS sunlamp was used as the light source as previously described.7 The films were swollen in acetone and dried in vacuo. The poly (methyl methacrylate) was annealed in vacuo for 6 hr. at 140°C. The poly(methyl a-chloroacrylate) was similarly treated for 20 min.
The rates of chain scission were followed using the technique of stress relaxation.8 The amount of scission, the number of cuts/per cubic centimeter that have occurred up to time t was calculated from the equation:9
q(t) = - N 0 In (/,//„) (1)
where/,//o is the ratio of stress on the sample at time t to that at time zero. N0 is the crosslink density as calculated from the equation of rubber elasticity.7 Oxygen was flushed through the relaxometer so that the rates of scission would be independent of oxygen pressure as previously shown.5
Oxygen absorption measurements were run with a 20-cc. cell attached to a single water-jacketed manometer-buret containing dioctyl phthalate as the indicating fluid. A constant-temperature bath kept the cell at 160 ± 0.2°C. Calcium oxide was used to absorb volatiles.5 The rates of oxygen absorption were found to be independent of oxygen pressure at 1 atm. of oxygen. These rates were also found to be independent of sample thickness between 2 and 15 mils.
Densities were taken with a Weld pycnometer at room temperature. The values obtained were: poly(ethyl acrylate), 1.13 g./cc.; poly(methyl methacrylate), 1.19 g./cc.; poly(methyl a-chloroacrylate) 1.40 g./cc.
Dicumyl peroxide (Borden), recrystallized from ethanol was incorporated into poly (methyl methacrylate) by swelling the sample in a concentrated
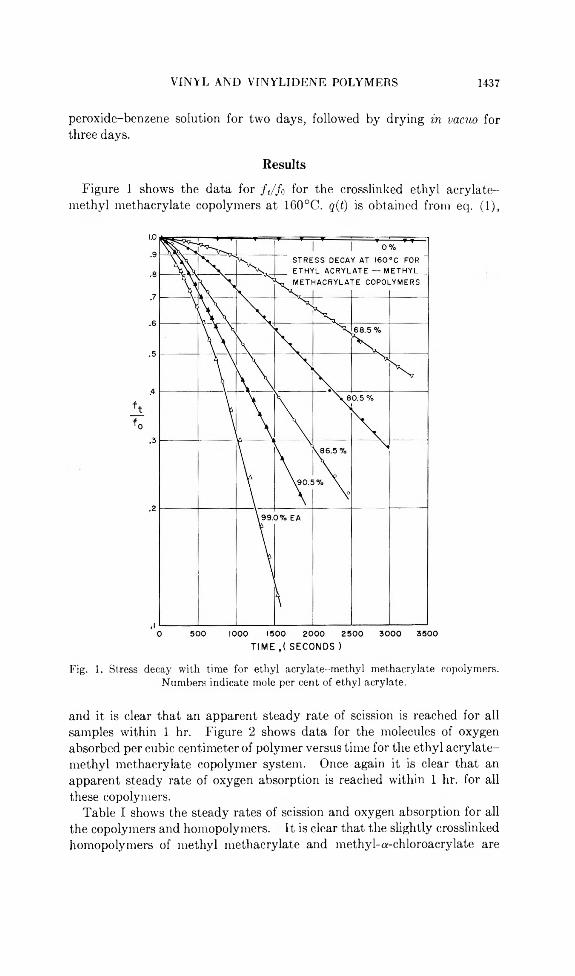
VINYL AND VINYLIDENE POLYMERS 1437
peroxide-benzene solution for two days, followed by drying in vacuo for three days.
Results
Figure 1 shows the data for ft/f0 for the crosslinked ethyl acrylate- methyl methacrylate copolymers at 160°C. q(t) is obtained from eq. (1),
TIME ,( SECONDS )
Fig. 1. Stress decay with time for ethyl acrylate-methyl methacrylate copolymers. Numbers indicate mole per cent of ethyl acrylate.
and it is clear that an apparent steady rate of scission is reached for all samples within 1 hr. Figure 2 shows data for the molecules of oxygen absorbed per cubic centimeter of polymer versus time for the ethyl acrylate- methyl methacrylate copolymer system. Once again it is clear that an apparent steady rate of oxygen absorption is reached within 1 hr. for all these copolymers.
Table I shows the steady rates of scission and oxygen absorption for all the copolymers and homopolymers. It is clear that the slightly crosslinked homopolymers of methyl methacrylate and methyl-a-chloroacrylate are

14,38 A. V. TOBOLSKY AND P. M. NORLING
TIME , ( SECONDS )
Fig. 2. Oxygen uptake with time for ethyl acrylate-methyl methacrylate copolymers.Numbers indicate mole per cent of ethyl acrylate.
comparatively very resistant to oxidation as measured by oxygen absorption or by chemical stress relaxation. Introduction of increasing amounts of ethyl acrylate into these polymers greatly increases the rate of oxygen absorption and of chain scission. As is evident from Table I, for a given mole per cent of ethyl acrylate, the methyl a-chloroacrylate copolymers display higher rates of scission than do the methyl methacrylate copolymers. The rates of oxygen uptake for the two systems are comparable. Under equivalent conditions then, a methyl group along the polymer backbone inhibits the scission reaction to a greater degree than does chlorine.
The relative inertness of poly (methyl methacrylate) to oxidative scission is dramatized by the following experiment. Dicumyl peroxide (about 5 wt.-%) was incorporated into thin strip samples of slightly crosslinked poly (methyl methacrylate). Chemical stress relaxation measurements were carried out at 140°C., alternately under purified nitrogen and under oxygen. Relaxation of stress (caused by chain scission) occurred under nitrogen but not under oxygen, as can be seen in Figure 3. (Negligible rates occurred without dicumyl peroxide in both nitrogen and oxygen.)

VINYL AND VINYLIDENE POLYMERS 1439
TABLE ISteady Rates in the Oxidation of Ethyl Acrylate-Methyl Methacrylate (EA-MMA)
and Ethyl Acrylate-Methyl Chloroacrylate (EA-MCA) Copolymers
CopolymerEA,
mole-%EGDMA,mole-%a
N„,chains/cc.
x io->s
dq/dtcuts/cc. sec.
X 10
dO i/d t, molecules/
cc. sec.X IO“*7
EA-MMA 0.0 1.03 13.4 0.14 0.568.5 1.08 8.6 2.8 2.080.5 1.07 8.4 3.9 2.686.5 1.27 8.0 5.4 3.490.5 0.99 7.1 6.5 3.899.0 1.00 7.1 12.3 4.6
EA-MCA 0.0 0.97 9.7 0.4 0.467.1 1.04 9.3 4.1 2.378.2 1.02 8.5 6.7 3.185.8 0.98 8.0 8.0 3.691.5 0.98 7.0 8.9 4.096.0 0.98 7.0 11.1 4.4
a Ethylene glycol dimethacrylate.
o
o.i
0.2
0.3
0.4
0 1000 2000 3000 4000 5000 6000 7000
TIME , ( SECON D S)
Fig. 3. Stress decay with time for poly(methyl methacrylate) with incorporated dicumyl peroxide. R,elaxometer was flushed alternately as noted with nitrogen and oxygen.
Exactly the reverse is true for poly (ethyl acrylate).6 In the absence of oxygen, a free radical source causes crosslinking, but very little scission. In the presence of oxygen, scission, without crosslinking is found.
Discussion of Possible Chemical Mechanisms
To account for these observations it is possible to formulate a coherent set of chemical mechanisms. These of course must be viewed as any newly
o ° *V
VV
X
• N2 Mi o 02 ME
I ASUREMEf ASUREMEN
TSTS
~ -G.
y%J
\\ _o
~o —----\
%X
V ,\
t ) -_
*\

1440 A. V. TOBOLSKY AND P. M. NORLING
proposed mechanisms. They are tentative and are to be used as the basis for future experiments. It is highly likely that a combination of processes other than those advanced here could be written to explain the experimental observations. The following is what we feel at present is the simplest explanation.
All of the results of this study are consistent with the proposal that tertiary peroxy radicals are stable propagating species which terminate slowly in comparison with primary or secondary peroxy radicals.
Previous work on the initiated oxidation of poly(ethyl acrylate)6 has shown that scission and termination are concomitant processes, since scission produces primary peroxy radicals that terminate rather than continuing the kinetic chain by abstracting another tertiary hydrogen [eqs.(2)-(5)]:
COOEt1 COOEtI[2—C—CH,-
1 - -*■ 2 -C H ,—C—CH, 1 - + o 2 (2)1GO-
!0-
I II
COOEtI COOEti-c c h ,
¿ .
------>• - C H 2—c 4~ •CH2'‘s° (3)
• c h , ~ + 0 2 ^ -0 0 —c h 2~ (4)2 -0 0 —CH2------ *HOCH,~ + 0 —C JI~ + 0 2 (5)
Therefore, in poly (ethyl acrylate) oxidation and scission are rapid; the tertiary hydrogen is vulnerable to attack to produce a stable propagating tertiary peroxy radical (I) which can also react to give the precursor to scission, the tertiary alkoxy radical (II). Termination follows immediately.
In poly (methyl methacrylate) however, no tertiary peroxy radical can be formed. In the initiated degradation in the absence of oxygen, an alkyl radical (III) can be formed by hydrogen abstraction which can be the immediate precursor to scission [eqs. (6) and (7) ] :
COOMe c h 3 COOMe CHa1
c - c h 2-1 + Q -
kÓ1-
o-1 1
— CH2- C - C H 2~ + |
0 > - C - ° H
CH3 CH3 c h 2- CHaIII (6)
COOMe COOMe
~c h 2- c -I c h 2~ —»• - c h 2- c + -c h 2~II V)CH2*
IIc h 2
In the presence of oxygen, however, this radical will add oxygen to form a primary peroxy radical which will rapidly terminate with no attended scission [eqs. (8) and (9)].

VINYL AND VINYLIDENE POLYMERS 1441
COOMei COOMe1'—O IL --c—c h 2~ 1 + O2 —* ^A ’H,-- c —c h 2~ 1 (8)
COO Mei
CH2.COOMe1
CHoOO-COOMeI
2—'CH j—C —CH2—-i — -O IL --C —CHI - + - - c h 2—c —c h 2~ + 0 2 1 (9)
c h 2o o - CHO CBLOH
Table I shows that scission is much lower in the methyl methacrylate copolymers than in the methyl chloroacrylate copolymers for a given ethyl acrylate concentration; this suggests that the methyl group on the polymer backbone serves to retard scission. A possible mechanism involves the formation of radical III as shown in eq. (10):
COOEt COOMe
~CHo—i —CH2— COOEt COOMe
O- H— —H —► ~ C H 2—i —CH2—i —CH2~ (10)
H ¿H -¿H 2
The methyl group presents to the alkoxy radical a hydrogen that can be abstracted readily through a six-membered transition state. Kabasakalian and Townley10 have shown that when a six-membered transition state can be formed, hydrogen abstraction can complete favorably with the cleavage reaction. The methyl group at low concentrations should effectively block three potential scission sites, the position occupied and the two adjacent. At higher concentrations several methyl methacrylate units retard scission at overlapping sites reducing the effectiveness of a single unit. Such a reaction then can qualitatively explain the observed variation of the rate of scission with mole percent of ethyl acrylate in the copolymer.
The fact that oxygen absorption is not so affected at low methyl methacrylate concentrations can rule out the formation of radical III by a propagating peroxy radical.
In conclusion, it may be expected that for numerous polymers the paths to scission under oxygen may be quite different than in inert atmospheres, and that reversals in stability may be found for systems other than the vinyl and vinylidine polymers.
The financial support of the Textile Research Institute and the Army Research Office (Durham) is appreciated.
References1. Thomas, D. K., Trans. Faraday Soc., 57, 511 (1961).2. Loan, L. D., J . Polymer Sci., A2, 2127 (1964).3. Grassie, N., Chemistry of H igh Polymer Degradation Processes, Interscience, New
York, 1956, pp. 24-68.4. Noel, C. J., A m . Chem. Soc. Polymer Preprints, 4, No. 1, 378 (1963).5. Tobolsky, A. V., P. M. Norling, N. H. Frick, and H. Yu, A m . Chem. Soc. Polymer
Preprints, 5, No. 2, 538 (1964); J . A m . Chem. Soc., 86, 3925 (1964).

1442 A. V. TOBOLSKY AND P. M. NORLING
6. Steele, R.., and H. Jacobs, J . A p v l. Polymer Sei., 2,86 (1959).7. Tobolsky, A. Y., D. W. Carlson, and N. Indictor, J . Polymer Sei., 54, 175 (1961).8. Tobolsky, A. Y., I. B. Prettyman, and J. H. Dillon, J . A p p l. P hys., 15, 380 (1944).9. Tobolsky, A. Y., D. J. Metz, and R. B. Mesrobian, J . A m . Chem. Soc., 72, 1942
(1950).10. Kabasakalian, P., and E. R. Townley, J . A m . Chem. Soc., 84, 2724 (1962).
RésuméLes vitesses d’absorption autocatalysée d’oxygène et de rupture de chaîne ont été
mesurées à 160°C, et sous une pression d’ une atmosphère d’oxygène pour les copolymères acrylate d’éthyle-méthacrylate de méthyle et acrylate d'éthyle-a-chloracrylate de méthyle. Les homopolymères pontés des deux monomères du type vinylidène résistaient très bien à l’absorption d’oxygène et à la rupture oxydante. Des quantités croissantes d’acrylate d’éthyle dans les copolymères augmentent la vitesse d’absorption d’oxygène et de rupture de la chaîne. Le polyméthacrylate de méthyle, contenant 5% de peroxyde de dicumyle, légèrement ponté, présente une rupture de chaîne rapide à 140°C en absence d’oxygène et une rupture négligeable en présence d’oxygène. La même expérience, effectuée avec le poly-acrylate d’éthyle, montre un comportement inverse: pontage et peu de rupture en absence d’oxygène et scission de chaîne en présence d’oxygène. On présente des mécanismes chimiques pour expliquer ces résultats.
ZusammenfassungDie Geschwindigkeit der autokatalysierten Sauerstoffabsorption und Kettenspaltung
wurde bei 160°C und 1 Atmosphäre Sauerstoffdruck an Athylacrylat-Met.hylmeth- acrylat- und Äthylacrylat-Methyl-a-chloracrylatkopolymeren gemessen. Die vernetzten Homopolymeren der beiden Monomeren vom Yinylidentyp waren gegen Sauerstoffaufnahme und oxydative Spaltung beständig. Steigende Mengen von Äthylacrylat im Kopolymersystem erhöhten die Geschwindigkeit der Sauerstoffabsorption und Kettenspaltung. Schwach vernetztes Poly(methylmethacrylat) mit einem Gehalt von 5% Dicumylperoxyd zeigte bei 140°C in Abwesenheit von Sauerstoff rasche Kettenspaltug und in Gegenwart von Sauerstoff vernachlässigbare Kettenspaltung. Der gleiche Versuch mit Poly(äthylacrylat) liefert das umgekehrte Verhältnis: Vernetzung und geringe Spaltung in Abwesenheit von Sauerstoff und wirksame Kettenspaltung in Gegenwart von Sauerstoff. Zu Erklärung der Ergebnisse werden chemische Mechanismen aufgestellt.
Received July 16, 1964 Revised September 24, 1964 (Prod. No. 4531A)
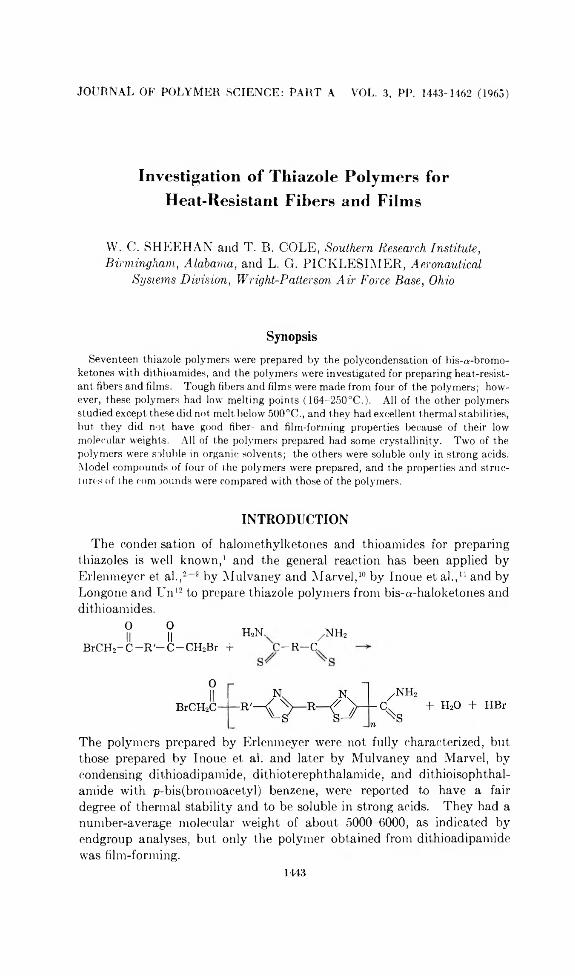
JOURNAL OF POLYMER SCIENCE: PART A VOL. 3, PP. 1443-1462 (1965)
Investiga tion o f T h iazo le Po lym ers fo r H eat-R esistant F ibers and Film s
W. C. SHEEHAN and T. B. COLE, Southern Research Institute, Birmingham, Alabama, and L. G. PICKLESIMER, Aeronautical
Systems Division, Wright-Palter son Air Force Base, Ohio
SynopsisSeventeen thiazole polymers were prepared by the polycondensation of bis-a-bromo-
ketones with dithioamides, and the polymers were investigated for preparing heat-resistant fibers and films. Tough fibers and films were made from four of the polymers; however, these polymers had low melting points (164-250°C.). All of the other polymers studied except these did not melt below 500°C., and they had excellent thermal stabilities, but they did not have good fiber- and film-forming properties because of their low molecular weights. All of the polymers prepared had some crystallinity. Two of the polymers were soluble in organic solvents; the others were soluble only in strong acids. Model compounds of four of the polymers were prepared, and the properties and structures of the compounds were compared with those of the polymers.
INTRODUCTION
The condensation of halomethylketones and thioamides for preparing thiazoles is well known,1 and the general reaction has been applied by Erlenmeyer et al.,2 9 by Mulvaney and Marvel,10 by Inoue et ah,11 and by Longone and TJn12 to prepare thiazole polymers from bis-a-haloketones and dithioamides.
o oIl II
BrCH2- C - R '- C - C H 2Br +HJSL /N H 2
C—R—C
The polymers prepared by Erlenmeyer were not fully characterized, but those prepared by Inoue et al. and later by Mulvaney and Marvel, by condensing dithioadipamide, dithioterephthalamide, and dithioisophthal- amide with p-bis(bromoacetyl) benzene, were reported to have a fair degree of thermal stability and to be soluble in strong acids. They had a number-average molecular weight of about 5000-6000, as indicated by endgroup analyses, but only the polymer obtained from dithioadipamide was film-forming.
1443

1444 W. C. SHEEHAN, T. B. COLE, L. G. PlCKLESlM ER
As a result of the work of Mulvaney and Marvel, thiazole polymers appeared to hold promise for the production of fibers and films of high thermal and chemical stability. The thiazole nucleus is remarkably resistant, to drastic treatment with acids and bases, and it is not readily attacked by oxidizing agents.18 It remained to be shown, however, that the thiazole polymers could be made into fibers and films with desirable properties; and our work has been directed toward this goal. The three thiazole polymers described by Mulvaney and Marvel and fourteen thiazole polymers that have not been reported previously have been synthesized from bis-a-bromoketones and dithioamides and evaluated in our program. Model compounds of four of the polymers were prepared, and the properties and structures of the compounds were compared with those of the polymers.
PREPARATION OF POLYMERS AND MODEL COMPOUNDSPolymers were prepared by condensing bis-a-bromoketones with aliphatic
or aromatic dithioamides. The monomers that were used are listed in Table I, together with references to the methods of synthesis, the yields, and the melting or boiling points of the monomers and their precursors that were made. 2,2'-Dithiobiphenamide and dithiodipicolinamide were the only monomers made that have not been reported previously.
The polycondensations of the bis-a-bromoketones and dithioamides were carried out by dissolving equimolar amounts of the monomers in a solvent and stirring the solutions in the presence or absence of air with or without heating. Polymerizations were rapid; the polymers, with few exceptions, began to precipitate from solution shortly after reaction commenced. Polymerizations were carried out in acetic acid, acetone, di- methylformamide, or dimethylacetamide for 0.5-89 hr. and at temperatures ranging from 28 to 152°C.
Table II gives the repeating units of the polymers made and summarizes data on representative reaction conditions, yields, inherent viscosities, molecular weights, and colors of the polymers. Unless otherwise specified, no attempt was made to exclude air from the reaction mixture.
Inherent viscosities of the polymers in formic or sulfuric acid were used to indicate the relative molecular weights of the polymers. Thiazole polymers behave as polyelectrolytes in acids, the only effective solvents for most of the polymers, and the formation of salts in the acid solutions probably accounts for the unusually large differences in the inherent viscosities of a polymer determined in different acids.
Number-average molecular weights of 800-80,000 were indicated by bromine endgroup analyses for some of the polymers that had been exhaustively purified by extraction and reprecipitation. These values are questionable because of the difficulties of analyzing for small quantities of bromine and because of the difficulties of removing the hydrogen bromide liberated by the monomer during the polymerization and possibly attached to the nitrogen atom of the thiazole ring, without removing the active bromine on the polymer chain end.

THIAZOLE POLYMERS 1445
TABLE IMethods of Synthesis, Yields, and Melting and Boiling Points of
Monomers and Precursors
Monomers and precursors
Methodof
synthesis(ref.)
Yield,%
Melting or boiling point, °C.H
Dithiooxamide From Eastman Chemical Co.Dithiomalonamide 8 51 210 (dec.)Dithiosuccinamide 9 41 143 (dec.)Dithioadipamide 14 54 175-178 (dec.)Dithiosebacamide 15 38 153 (dec.)Dithioterephthalamide 14 75 266-272 (dec.)Dithioisophthalamide 14 73 198-200 (dec.)4,4'-Dithiodiphenamide 16 80 282-283 (dec.)Dithiodipicolinamideb 85 233-235 (dec.)2,2'-Dithiodiphenamidec 93 195-196 (dec.)Perfluorosuccinodithioamide From Peninsular Chemical
Research,, Inc.p-Bis(bromoacetyl)benzene 17 85 167-173 (dec.)p-Bis( a-bromopropionyl)ben:zene 18 49 119-1204,4 '-Bis( bromoacetyl )diphenyl ether 19 30 109-110Isophthalamide 14 81 277-280Isophthalonitrile 14 41 156-1584,4'-Dicyanodiphenyl 20 27 236-237Dipicolinamide 21 94 320Dipicolinonitrile 22 38 125-1272,2'-Diphenamide 23 70 2152,2 '-Dicyanodiphenyl 24 86 170¡o-Dipropionylbenzene 25 19 97-98p-Propylpropionphenone 25 88 143-145/18 mm.
Hg4,4'-I)iacetyldiphenyl ether 26 77 105-107
“ Uncorrected.b Anal. Calc.: C,42.62%; H, 3.58%;
H, 3.63%; N, 21.14%; S, 32.20%.« Anal. Calc.: C, 61.78%; H, 4.45%;
N, 21.30%;
N, 10.29%;
S, 32.50%.
S, 23.53%.
Found: C, 42.53%;
Found: C, 61.69%;H, 4.65%; N, 10.17%; S, 23.50%.
Light-scattering techniques were tried for determination of the molecular weights of several polymers that were soluble only in strong acids, but they were unsatisfactory because of the color and fluorescence of the acid solutions. However, the weight,-average molecular weight of polymer XV, which was soluble in organic solvents, was determined in dimethylform- amide by light scattering and found to be 7800. This polymer had an inherent viscosity in formic acid of 0.59 dl./g. and a number-average molecular weight of 40,000 based on bromine analysis.
Polymers IV, and VI, and VII were the first polymers that we prepared. They were prepared initially by the procedures reported by Mulvaney and Marvel.10 Polymer IV was originally prepared by mixing hot acetic acid solutions of the monomers and stirring the mixture overnight at 60°C. Since the temperature of the monomer solution at the time of mixing was

1446 W. G. SHEEHAN, T. B. COLE, L. G. PICKLESIMER
JOO
O
rÌ3 +T ^ $0 Q 55/3 O bfl ^O§
fe 3p ci
tí ri .JO-+20 ^ < < H < H H
nher
eiis
cosi
ld
l./g
. 03£ zà m m gq m fa faOW rH oT(N <N o ' co" o t-h cq f-’' r-T
GO 00»“* > tí o d o d d O O
î£ O 00 CO »O C i
H io CO W N CO O iO
<M Tt<
HJPO<Eh
HciO
s"oPh«VHO>>3aa0m
T50&
PÌ
ft •S P
H
A o o o 00 co o LO LOo o o 03 ~ o o o03 CM(M (M o o <Mos d d d d d d o d
<x>aoOh
aj>>o
Ph
c tí£ S a a
- ç -9"O "Ö03 03Pi Pi
S
•■g g) S 8 S 8
T3 'tí Ç003 03 03W PÍ !*
03 03 ^ü Ü HC < l û
£ £ o o
__03 ^ ^ ’"c3Ph P h
ooCO
00 CO T* o (M CO CO 00rH <M CO cq rH rHO O LO o o >o o 00CO CO CO 03 CO CO CO
■3 fa« 5Í o ^« Q
A.

IV
-o-<
"7-(C
H,),
--('J
-A
ceti
c ac
id
0.0
78
60
20
47
0.7
4,
F.A
. T
an
s s
0.0
78
60
-48
16
64
1. 8
1, F
.A.
Tan
0
.09
2 60
16
75
1.
26,
F.A
. T
an
0.2
32
60
16
62
0.
37,
F.A
. T
an
0.0
78
80-6
0 18
70
3
.80,
F.A
. T
an
0.0
89
R.'i
-57
16
44
3.9
6,
F.A
. T
an
0.0
97
88
-50
16
53
3.0
7,
F.A
. T
an
DM
F
0.0
88
35
89
25
3.3
0,
F.A
. T
an
0.0
78
70
16
35
0.8
9,
F.A
. T
an
Ace
tone
0
.08
6
32
18
72
2.51
, F
.A.
80,0
00
Tan
~
0.0
80
33
16
35
2.41
, F
.A.
Tan
::c;
0
.086
33
16
46
3.
66,
F.A
. T
an
...... >
v -Q-(;r-
(cH,J~-
--<;Y--
Ace
tic
acid
0
.06
0
60
18
100
1. 7
8, F
.A.
42,0
00
Pal
e ye
llow
N
0 r
DM
F
0.0
60
60
18
54
0.7
3, F
.A.
Pal
e ye
llow
t:"
l '"0
0 r
--o<~J--
....::
VI
Ace
tic
acid
0
110
118
3 43
0.
14,
S.A
. G
ray
~
DM
F
0.0
79
10
0 6
87
0.15
, S
.A.
Yel
low
t:"
l :::0
0
.07
9
100
18
79
0.1
9, S
.A.
Yel
low
CF
1
0.2
00
152
4.5
56
0
.20,
S.A
. B
row
n 0
.18
0
152
16
87
0.1
2,
S.A
. 1
,66
0
Yel
low
0
.700
15
2 64
68
0
.16,
S.A
. Y
ello
w
Ace
tone
0
.06
4
38
64
44
0.20
, S
.A.
Yel
low
0
.031
28
64
66
0
.27,
S.A
. Y
ello
w
DM
A
0.0
79
100
6 86
0.
30,
S.A
. Y
ello
w
0.0
79
100
72
77
0.2
4, S
.A.
Yel
low
(co
nti
nu
ed
) .....
. ,.. ,;:.
--1

Rea
ctio
n co
nditi
ons
1 4 4 8 W . C . S l t E E I J A N , T . B . C O L E , L . G . P I C K L E S I M E R
Kam<1
£ £ s s*3 'ÔJ
oCOo
< < cc cc o cTT—( I—Id d
CO GO CO GO
o oHO O
Ci Ci L- r -o o
G
Q
e a03 o3
bi) bCG G
CO oCDoi oi cc d o
COCici
OO
Ci O I- Cio
0£0f-t-O173
CC
COi>
<CC
Ci1>oo
od
oLiOGO
CH
CC
Cit"o
b£s
cc
Cii>oo
<1 & < & <3 3 3a a a A G G
X X ><} XI

T I I I A Z O L E P O L Y M E R S 1 4 4 9
1 +o3 555 o bßS -2
M g
2 ^ O MO oCO> .2-+o COc .B- £ -3
J3 3fl .2
M "So zk s- 1 X
©
^ 43
’Öc3
’sf-. O£ pHin 43° .tÜ
03-d‘ oo3o 73
0) <1;* £ •CO i>> ’
© OS ft
o3 d
J§ =oo <30 4< 73 ® Ö
c3i ft* d O2 3t-H COÖ Ö
d 00O TI-4-35:3 tjT © (M d -
*3 CD
H—I s. *"O > 4<Jd© 73
Ö
d©bßO
H <-r-t ,JJd 3 03© ©42 d .COW 93 hi3 °3 d
rd 3 bß <d
42 3
>>"c3d . o3 © d
03o3
O -M K 03 c3 7373 © 2 £ S d.d co3 ®3
w S
©£ -a■+3 hXj
^ d ^ 2 o IE
jo_fT
?C- o ©fc £
C3 ^M «

1 4 5 0 W . C . S H E E H A N , T . B . C O L E , L . G . P I C K L E S I M E R
not reported by Mulvaney and Marvel, we investigated the effect of this temperature on the inherent viscosity of the polymer and, as shown in Table II, found that higher molecular weight products were obtained with an initial reaction temperature of 80-88°C. than with an initial and sustained reaction temperature of 60°C. Polymer IV was later prepared in acetone and in dimethylformamide at room temperature with inherent viscosities as high as those obtained in hot acetic acid. An experiment was made to determine the effect of reaction time on the inherent viscosity of polymer IV prepared in dimethylformamide at 30°C. with a total monomer concentration of 0.21 mole/1. Samples taken at various times had the following inherent viscosities in formic acid: 3 hr., 1.07; 7 hr., 1.18; 11 hr., 1.24; 23 hr., 1.27; 30 hr., 1.17; 54 hr., 1.33; 120 hr., 1.18.
Polymers VI and VII were originally prepared by refluxing a dimethylformamide solution of the monomers overnight, but in later work different reaction times, temperatures, and solvents wore investigated. The results showed that the inherent viscosities of polymer VI were apparently independent of reaction times (4.5-64 hr.) and reaction temperatures (28- 152°C.). Both polymers were obtained in hot acetic acid, and polymer VI was also obtained in acetone at room temperature and in dimethyl- acetamide at 100°C. Polymer VI having the highest inherent viscosity was obtained in dimethylacetamide.
Polymers II, III, and V were prepared by mixing acetic acid solutions of the monomers at 80°C. or above and stirring the mixtures overnight at 60°C. Each of these polymers was also prepared in hot dimethylformamide. Polymer I could not be prepared in hot acetic acid solution, but it was obtained in hot dimethylformamide and in acetone at room temperature.
Polymer IX was prepared by heating a dimethylacetamide solution of the momomer (0.079 mole/1.) at 100°C. for 6 hr. The polymer wTas completely soluble in highly polar organic solvents and had an inherent viscosity in sulfuric acid of 0.26 dl./g. Increasing the monomer concentration to 0.79 mole/1. and carrying out the polymerizations under nitrogen for 6, 24, 48, and 96 hr. gave polymers that were only partially soluble in dimethylformamide. The soluble fractions constituted about 75% of the total weights of the polymers, and they had inherent viscosities in sulfuric acid in the range of 0.22-0.24 dl./g. The insoluble fractions had inherent viscosities in sulfuric acid in the range of 0.39-0.52 dl./g. Increasing the reaction time from 6 to 48 hr. tended to increase the yield of the insoluble fraction, but had no effect on its inherent viscosity.
Polymer XI was prepared by refluxing a dimethylformamide solution of the monomers overnight, and polymers VIII and XVI were prepared by heating a dimethylformamide solution of the monomers at 100°C. for 6 hr. Polymers X, XII, XIII, XIV, and XV were prepared by heating a dimethylacetamide solution of the monomers at 100°C. for 6 hr.
The methyl groups of polymer XVI were oxidized with refluxing aqueous alkaline permanganate solution to give a thiazole polymer containing

T H I A Z O L E P O L Y M E R S 1 4 5 1
carboxylic acid groups at the 5-positions of the thiazole rings (polymer XVII). Polymer XVII was prepared to determine the effects of the carboxyl group on the solubility of thiazole polymers.
The polymerization of dithioperfluorosuccinamide with p-bis(bromo- acetyl)benzene was attempted in refluxing dimethylformamide, but the attempt was not successful. The thioamide apparently decomposed under the conditions of the experiment; and it appeared to be unstable, as indicated by a strong odor of hydrogen sulfide, even during storage under normal laboratory conditions.
Model compounds I, IV, VI, and IX were prepared for comparison with the structures and properties of polymers I, IV, VI, and IX, respectively.
The compounds were prepared by the condensation of a-bromoacetophe- none with the appropriate dithioamide. Model compounds IV and VI were prepared earlier by Mulvaney and Marvel.10 For comparison with the inherent viscosities of the polymers, the inherent viscosities of model compounds I, IV, VI, and IX in sulfuric acid were 0.03, 0.02, 0.03, and 0.02 dl./g., respectively, and the inherent viscosities of both model compounds IV and IX in formic acid were 0.05 dl./g.
STRUCTURE OF POLYMERS
Correct elemental analyses of polymers IV, VI, and VII, and ultraviolet spectra of the polymers and model compounds were given by Mulvaney and Marvel as evidence for the structure of these polymers. Since the other thiazole polymers were prepared by the same general reaction as that used to prepare polymers IV, VI, and VII, their structures, as represented by the repeat units in Table II, are assumed. This assumption is substantiated by the presence of absorption bands characteristic of the thiazole ring in the infrared spectra of the polymers and by the fair agreement between calculated and observed elemental analyses, which are shown in Table III.
Additional evidence was obtained to establish the structure of polymers I, IV, VI, and IX by comparing the infrared spectra of the polymers with those of model compounds. The infrared spectrum of each polymer agreed in all significant details with the infrared spectrum of its model compound.

1 4 5 2 W . C . S H E E H A N , T . B . C O L E , L . G . P I C K L E S I M E R
<P
Go"3o
X CM CM CO CM CM CO h - CO G i G i X6 ° © CO CO Tt< O G i CM X CM CO ° CO CM LO LO
- © Tt ‘ CO t—4 0 0 GO Gi © CO G i © © LO X CO COCM 04 CM CM T— 1 7—H i— 1 t-H i— 1
© 0 0 G i GO) CM CO G i CO CO CO T+lCO L'— CO CO 0 0 CM 1> © CO ,u I '- o CM CM
. ~ 7—4 O © © OC' GO CO CM CO CO o
© CO CO © CO Tt< © 0 0 I Q CM CO X© !> CM T—11—1 »o >—1 !>- GiW CM CO CO CO CO CO CO CO CM CO CO X CO X CO
© IQ T—1 00' CO o-. G i O 0 0 Xc S CO o O X CO 0 0 Gi G i CM G i GO CMX- 00 o CM rt< CO G i CM CM I '- G i ©
o © CO CO CO CO co co CO CO co CO CO t - CO CO
Jfi
„ aP*
aGaCP
s
3ofc
© Gi CM o G i © LO CMLO ,_l cm T_l X © CO X © t-h CM X ©7^ ,— 1 o © © X Tt<’ © r-t © CM © X
w V V
I - o t H X Xl '- © CO © X © CM l - © © X r-i LO © CMX TjH CM i—i co © X t H t H 1"- © X ThCM CM CM CM i—i r— 1
1 . 0 CO X CO © LO © © CM 'Tfi XX X CO Gi TjH © © © X © X X © CM 0 0 X ©A
o G i Gi GO GO X ©3
LO © © LO ©
o © G i CM I - X © © © XGi CO G i X CM Th X © © h - © CM XW CM X CO rh © CO CO X X co X X X Tt<
h - o LO CO a© CM X X 1 - © © ©S '- X I-- © X LO Gi © TJH r —1 l '- I '- © t-H r—1
CO cc Gi CM © LO LO © © © r - © XLO iO © © © © © LO © © © © t-- © ©
C3CP to+3 .a<P ’cco hi)©:rj OCC1—iHH ‘> 03
CQOTP^fe^CQCCQQptlajcQCQCQDQ&IoD^^b ^T ^ 'odc^ 'i^o^co 'T jrcL cT co 'oT ooN N C O iO N h h h N h c O N tPCOiO OO O O f M r H O O O O O O O O O O O
a>s
p-t
> a KA > > > * X
rt x,
S.A
., su
lfuric
aci
d;
F.A
., fo
rmic
aci
d.B
ased
on
brom
ine
anal
ysis
, ass
umin
g on
e br
omin
e at
om p
er c
hain
.

T H I A Z O L E P O L Y M E R S 1 4 5 3
PROPERTIES OF THE POLYMERS
General Characteristics
The character of the units between thiazole groups, which are represented by R and R' in the general formula,
was found to greatly affect the properties of the polymers.In polymers in which R' was a 1,4-phenylene unit and R was 0-8 meth
ylene units, the melting points and thermal stabilities of the polymers decreased and the solubilities and molecular weights of the polymers increased as the number of methylene units in R increased. Polymers having no methylene units were not fiber or film forming; polymers with two methylene units formed brittle fibers; and polymers with four or eight methylene units formed strong, flexible fibers. When R was also 1,4-phenylene, 1,3- phenylene, 4,4r-biphenylene, or 2,6-pyridylene, the thermal stabilities of the polymers were generally much higher, but the solubilities and molecular weights were lower, and the polymers formed only brittle and fragile fibers and films. However, when R was 2,2'-biphenylene, the properties of the polymer were similar to those of the polymer containing four methylene units, except for solubility. The former polymer was soluble in organic solvents when its inherent viscosity in sulfuric acid was less than 0.39 dl./g. Polymers in which R and R' were both 1,4-phenylene units and the thiazole rings contained methyl or carboxyl at the 5-positions of the thiazole rings, had very low molecular weights, were not fiber- or film-forming, and were soluble only in strong acids. The thermal stability of the polymer containing methyl groups was high.
When R' was diphenylene ether and R was 1,4-phenylene, 1,3-phenylene, or 2,6-pyridylene, the molecular weights of the polymers were low. The polymers had high thermal stabilities, were soluble only in strong acids, and formed brittle, fragile fibers. However, when R was 2,2'-biphenylene, the polymer melted at about 250°C., was soluble in organic solvents, had a relatively high molecular weight, and formed strong, flexible fibers and films.
The properties of the polymers appeared to depend primarily upon the flexibility of the polymer chain backbone; greater flexibility is correlated with higher molecular weight, increased solubility, and lower melting point.
Molecular Weight
As indicated by inherent viscosities, molecular weights by bromine end- group analyses, and fiber- and film-forming abilities, the relative molecular weights of the polymers were as follows: polymers IV and V, very high; polymers III, IX, and XV, high; polymers XI, XIII, and XIV, medium; polymers I, II, VI, VII, VIII, X, and XII, low; polymers XVI and XVII, very low.

1 4 5 4 W . C . S H E E H A N , T . B . C O L E , L . G . P I C K L E S I M E R
CrystallinityEach of the polymers had a detectible amount of crystallinity as indicated
by birefringence. X-ray diffraction diagrams (Fig. 1) have also shown some crystallinity in polymers I, IV, VI, and IX. From the examination of several x-ray diagrams for each of these polymers, the order of increasing crystallinity was polymer IX, polymer I, polymer IV, and polymer VI.
P o lym er I (a)
P olym er IV (6)
P o ly m er VI P o lym er IX(c) (d)
Fig. 1. Powder x-ray diffraction diagrams of polymers: (a) I; (6) IV; (c) VI; (d) IX,

T I I I A Z O L E P O L Y M E R S 14S S
Thermal Properties
The thermal properties in nitrogen of polymers 1 XVI are summarized in Table IV, and those of the model compounds in Table V. The differential thermal analysis curves of polymers I, VI, VI, and IX and their model compounds are shown in Figure 2. The differential thermal analysis curves of all of the polymers, with the exception of polymers XVI and XVII, are shown in Figure 3. The differential thermal analyses were carried out in nitrogen at a heating rate of 10°C./min.
Polymers III, IV, V, IX, and XV—the polymers with the more flexible chains—melted in the range of 164-26o°C., and, as indicated by differential
TABLE IVThermal Properties of Thiazole Polymers
Melting point by DTA, °C.“
Decomposition temperature, °C.Weight loss, %°Polymer Visual observation DTA«
I Noned >500, discolored at 280 >500 4II None >300, discolored at 200 >500 3III 265 315 290 23IV 250 — 487 0V 164 — 493 2VI None >500, discolored at 384 >500 3VII None >500, discolored at 250 >500 1V ili None >500, discolored at 340 >500 2IX 240-250 — >500 1X None >500, discolored at 200 >500 4XI 240 >500, discolored at 275-
290Partial
at 290—
X II None >500, discolored at 245 >500 2X III 340 >500, discolored at 250 >340 2XIV None >500, discolored at 250 >500 2XV 220-240 — >500 0XVI — >500, discolored at 315 — 9
° Determined in nitrogen at a heating rate of 10°C./min. Calcined aluminum oxide was used as the reference material.
b Determined by visual observation of sample in a capillary tube under nitrogen. c After heating in nitrogen at 250°C. for 24 hr. d Did not melt below 500°C.
TABLE VThermal Properties of Model Compounds by l)TA a
Modelcompound
Melting point, °C.
Boiling point, °C.
Decomposition temperature, °C.
I 230 342 -- -IV 85 — 315VI 218 278 —IX 58 400 —
0 D e t e r m i n e d i n n i t r o g e n a t a h e a t i n g r a t e o f 1 0 ° C . / m i n . C a l c i n e d a l u m i n u m o x id e
w a s u s e d a s t h e r e f e r e n c e m a t e r i a l .

1 4 5 6 W . C . S H E E H A N , T . B . C O L E , L . G . P I C K L E S I M E R
Fig. 2. Differential thermal analysis curves of polymers I, IV, VI, and IX, and their model compounds heated in nitrogen.
thermal analyses, polymer III decomposed at 290°C., polymers IV and V decomposed at 487- 490°C., and polymers IX and XV did not decompose up to 500°C. The high decomposition temperatures of these polymers indicate that the molten polymers are stable over a wide temperature range. Polymer XIII melted at 340°C. and polymer XI partially melted at 240°C., both without apparent decomposition. The other polymers did not melt or decompose up to 500°C.
The melting and decomposition temperatures of the model compounds, which are summarized in Table IV, are in good agreement with those of the corresponding polymers. Model compounds IV and IX melted below 100°C., whereas the corresponding polymers melted at about 250°C. ; and model compounds I and VI melted above 200°C., whereas the corresponding polymers did not melt below 500°C. Model compound IV was the only model compound that decomposed below its boiling point, and polymer IV was the only corresponding polymer that decomposed below 500°C.

T I I I A Z O L E P O L Y M E R S 1 4 5 7
Fig. 3. Differential thermal analysis curves of polymers I-XV heated in nitrogen.
The weight losses of the polymers, with the exception of polymer XI, were determined after they were heated at 250°C. for 24 hr. in nitrogen. The results are shown in Table IV. Polymer III lost 23% in weight; polymer VI lost 9% ; polymers I, II, V-X, and XII-XIV lost less than 5% ; and polymers IV and XV lost no weight. When heated at 250°C. for 24 hr. in air, polymers IV, VI, and XV lost 15%, 3%, and 0% in weight, respectively. For comparison, Nylon HT-1 and Teflon (polytetrafluoroethylene) lost 0.0% and 1.8%, respectively, when heated under similar conditions.
The percentage weight losses of polymers I and VI, Nylon HT-1, and Teflon when they were heated in nitrogen from 400 to 600°C. in 50°C. steps are given in Figure 4. Each temperature was maintained for 1 hr. and changing from one temperature to another required about 5 min. Polymer I had greater thermal stability than Nylon HT-1 or polymer VI. Below about 500°C., Teflon had the best thermal stability; but above this temperature, Polymer I was somewhat better. The thermal stability of Polymer VI was the lowest of the group studied.
Solubility
Table VI summarizes data obtained on the solubilities of the polythia- zoles in some strong acids and highly polar solvents. The polythiazoles,

1 4 5 8 W . C . S H E E H A N , T . B . C O L E , L . G . P I C K L E S I M E R
100
Fig. 4. Thermal stability of polymers heated in nitrogen.
with two exceptions, were found to be soluble only in strong acids. The exceptions were the polymers having a 2,2'-biphenylene group between thiazole rings, polymers IX and XV. These two polymers were also soluble in dimethylformamide, dimethylacetamide, and tetrahydrofuran. Polymer IX was insoluble in the organic solvents when its inherent viscosity in sulfuric acid was 0.39 dl./g. or greater.
The data in Table VI indicate that solubility of the polythiazoles is strongly dependent on the rigidity of the polymer chain. Replacing the1,4-phenylene group (polymers X and XIV) did not appear to increase the polymer solubility, nor did the introduction of a methyl or carboxyl group in the 5-position of the thiazole ring (polymers XVI and XVII). Oxidation of some of the methyl groups of polymer XVI to carboxyl groups (polymer XVII) did not significantly change the solubility characteristics of the polymer, probably because of the low degree of conversion of methyl to carboxyl groups. The low carboxyl content of polymer XVII was shown by elemental analysis and by lack of solubility of the polymer in a 20-30% aqueous solution of sodium hydroxide.
The following additional data were obtained on the solubilities of polymers I-VII.
Polymers I-VII were soluble in hot or cold naphthalenesulfonic acid. Phosphoric acid dissolved polymers II-VII, but it did not dissolve polymer I. Polymers IV and V were the only ones in this series of polymers that were soluble in boiling concentrated hydrochloric acid.

T H I A Z O L E P O L Y M E R S 1 4 5 9
TABLE VISolubilities of Thiazole Polymers in Strong Acids and Highly Polar Solvents3
Solubility“
Ben- Tri- Di- Di-zene- fluoro- methyl methyl Tetra- Di-
Sulfuric sulfonic acetic Formic acet- form- hydro- methylPolymer acid acid acid acid amide amide furan sulfoxide
III , +
+- - - - - -
III + + + + - - - -IV + + + + - _ | - -V + + + - - - -VII + + + - - - - -VIII + + + - - - - -IX b + + + + + + + -IX» + + - - - - - -X + + © - - - - -XI + + + © - - - -X II + + © - - - - -X III + + © - - - - -XIV + + © - - - - -XV + + + + + + + -XVI + + + - - - - -XVII + + + © - — — —
* Code: + soluble; © partially soluble; — insoluble. b ijmb in sulfuric acid of 0.22-0.26 dl./g. c 77¡nh in sulfuric acid of 0.39-0.52 dl./g.
Polymers III, IV, and V formed crystalline salts with sulfuric acid, ben- zenesulfonic acid, and naphthalenesulfonic acid that were slightly soluble (2-3% by weight) in hot nitrobenzene, triethylene glycol, and W-methyl- pyrrolidone. The minimum temperatures for complete solution of the salts were: 75°C. for polymer V, 120°C. for polymer IV, and 150°C. for polymerIII.
Polymers I, VI, and VII did not form crystalline sulfates, and the polymers wetted with sulfuric acid were not soluble in organic solvents. Solutions of polymers I and VI in sulfuric acid or benzenesulfonic acid could be diluted with nitrobenzene or m-cresol without precipitating the polymer, but only dilute solutions could be prepared in these mixed solvents.
Weak organic acids, such as acetic acid and benzoic acid, dissolved polymers I-VII. A few organic solvents, such as benzyl alcohol, triethanolamine, and m-cresol, dissolved very small amounts of polymers IV and V, but only at temperatures of about 200°C. or above.
Fiber- and Film-Forming PropertiesThe fiber- and film-forming properties of the polythiazoles having the
highest inherent viscosities obtained are given in Table VII.Evaluations of the fiber-forming properties of the polythiazoles were
made by inserting a stainless-steel probe in a melt (melt spinning) or solution (dry spinning) of the polymer and withdrawing it slowly, and by ex-

1 4 6 0 W . C . S H E E I I A N , T . B . C O L E , L . G . P I C K L E S I M E R
TABLE VIIFiber- and Film-Forming Properties of Thiazole Polymers
PolymerV inh
di./g.b
Fiber formation“Film
formation“Wet-spun Melt-spun Dry-spun
I 0.21 No No No NoII 0.24 No No No NoIII 0.87« Yes (b, fr) No No Yes (b, fr)IV 3.96« Yes (t, fl) Yes (t, fl) Yes (t, fl) Yes (t, fl)V 1.78' Yes (t, e) Yes (t, e) Yes (t, e) Yes (t, e)VI 0.16 No No No No
0.27 Yes (b, fr) No No Yes (b, fr)VII 0.17 No No No NoVIII 0.19 Yes (b, fr) No No Yes (b, fr)IX 0.26« Yes (b, fr) Yes (t, s) Yes (t, s) Yes (t, s)X 0.13 Yes (b, fr) No No Yes (b, fr)XI 0.34 Yes (b, fr) No No Yes (b, fr)X II 0.22 Yes (b, fr) No No Yes (b, fr)X III 0.49 Yes (b, fr) No No Yes (b, fr)XIV 0.33 Yes (b, fr) No No Yes (b, fr)XV 0.59« Yes (b, fr) Yes (t, s) Yes (t, s) Yes (t, s)XVI 0.08 No No No NoXVII 0.06 No No No No
a* II brittle, fragile; t, e = tough, elastic; t, fl =- tough, flexible; t, s = tough,stiff.
b In sulfuric acid unless otherwise indicated. c In formic acid.
trading a solution of the polymer from a hypodermic syringe beneath the surface of the liquid coagulant (wet spinning). The film-forming properties were determined by pouring a small amount of solution containing at least 10% of the polymer onto the surface of a pool of mercury in a flat-bottomed dish. The dish and its contents were heated on a water bath to evaporate the solvent, and the film that formed was removed from the surface of mercury with tweezers for examination of film properties. If a film was not formed by this method, a solution of the polymer was cast onto a steel sheet. The sheet was heated on a hot-plate to evaporate the solvent and to sinter the polymer, if possible, into a coherent film.
Tough fibers and films were obtained from polymers IV, V, IX, and XV. The fibers and films made from polymers IV, IX, and XV were stiff, and the fibers and films made from polymer V were rubbery. Fibers were formed from these four polymers by all three methods of spinning, but the fibers made from polymers IX and XV by melt and dry spinning were stronger than those made by wet spinning. Unless the inherent viscosities of polymers IV and V were greater than approximately 0.8 dl./g. in formic acid, the polymers formed brittle fibers. An inherent viscosity in formic acid greater than 2 dl./g. was required for obtaining good fiber-forming properties for Polymer IV. Polymers III, VI, VIII, and X-XIV could be spun into fibers only by wet spinning, and the fibers and films they produced

T H I A Z O L E P O L Y M E R S 1 4 6 1
were brittle and fragile. Polymers I, II, VII, and XVI could not be formed into fibers or films.
Fiber was made from Polymer IV having an inherent viscosity of 2.5 dl./g. in formic acid on laboratory continuous spinning equipment. The fibers were wet spun by extruding a 10% solution of the polymer dissolved in formic acid into a 30% aqueous formic acid coagulating bath. The fibers were drawn 0.75X, washed, dried, and taken up on a tube core. These fibers were approximately 6 den./filament and had a tenacity of approximately 1.5 g./den. and an elongation at break of 20%.
CONCLUSIONS
The results of this research program have shown that thiazole polymers can be made that have merit for fibers and films in respect to strength and thermal stability, but entirely suitable polymers for use in heat-resistant fibers and films have not yet been made. The properties needed in a poly- thiazole for use in preparing heat-resistant fibers and films are solubility in organic solvents, very high melting point or infusibility, thermal stability, and high molecular weight. High molecular weight polymers have been prepared that are soluble in organic solvents and that form strong, tough fibers; but they melt below 250°C. Other polymers have been prepared that are infusible and thermally stable up to 500°C., but they have low molecular weights and are soluble only in strong acids.
From examination of the structures and properties of the thiazole polymers that have been prepared, the properties appear to depend primarily upon the flexibility of the polymer chain backbone—greater flexibility is correlated with higher molecular weight, improved fiber-forming ability, increased solubility, and lower melting point. On the basis of these observations, attempts are being made to prepare polymers having the desired properties for heat-resistant fibers and films by controlling the flexibility of the polymer chain backbone.
The studies described in this paper were carried out under the sponsorship of the Aeronautical Systems Division, United States Air Force, under Contract No. AF 33(616)- 7697.
The authors take pleasure in thanking Dr. R. E. Burks, Jr., Mr. J. L. Dollar, and Dr. R. W. Liggett, for their contributions to this work. They also thank Mr. R. F. Schwen- ker, Jr., of the Textile Research Institute for some of the DTA curves given in the paper.
References1. Wiley, R. H., D. C. England, and L. C. Gehr, Org. Reactions, 6, 367 (1951).2. Lehr, H., and H. Erlenmeyer, Helv. Chim. Acta, 27,489 (1944).3. Bischoff, G., O. Weber, and H. Erlenmeyer, Helv. Chim. Ada, 27, 947 (1944).4. Erlenmeyer, H., W. Buchler, and H. Lehr, Helv. Chim. Acta, 27, 969 (1944).5. Erlenmeyer, H., and M. Erne, Helv. Chim. Acta, 29, 275 (1946).6. Erlenmeyer, H., and K. Deger, Helv. Chim. Acta, 29,1080 (1946).7. Erlenmeyer, H., and W. Buchler, Helv. Chim. Ada, 29,1924 (1946).8. Lehr, H., W. Guex, and H. Erlenmeyer, Helv. Chim. Acta, 27, 970 (1944).9. Lehr, H., W. Guex, and H. Erlenmeyer, Helv. Chim. Acta, 28, 1281 (1945).

1 4 6 2 W . C . S H E E H A N , T . B . C O L E , L , G . P I C K L E S T M E H
10. Mulvaney, J. E., and C. S. Marvel, J. Org. Chem., 26, 95 (1961).11. Inoue, H., M. Adachi, S. Fukui, and E. Imoto, Kogyo Kagaku Zasshi, 63, 1014
(1960).12. Longone, D. T., and H. H. Un, paper presented to Division of Polymer Chemistry,
145th Meeting of American Chemical Society, New York, Sept. 1, 1963; Polymer Pre- prints, p. 49.
13. Sprague, J. M., and A. H. Land, in Heterocyclic Compounds, Vol. 5, R. C. Elderfield, Ed., Wiley, New York, 1957, pp. 484-722.
14. Marvel, C. S., L. F. Audrieth, T. Moeller, and J. C. Bailar, Jr., WADC Technical Report 58-51, Part III, April, 1960, pp. 37-41.
15. Hanford, W. E., and P. L. Slazberg, (to DuPont), U. S. Pat. 2,280,578 (April 21, 1962).
16. Karrer, P., and J. Schukri, Helv. Chim. Acta, 28, 820 (1945).17. Ruggli, P., and E. Gassenmeier, Helv. Chim. Acta, 22,496 (1939).18. Wilson, S. D., and C. T. Cheng, J Am. Chem. Soc., 62,287 (1940).19. Tomita, M., H. Kumaoka, and M. Takase, J. Pharm Soc. Japan, 74, 850 (1954).20. Rapport, H., and H. Baldridge, Jr., J. Am. Chem. Soc., 74, 5365 (1952).21. Underwood, H. W., Jr., and E. L. Kochmann, J. Am. Chem. Soc., 46, 2069
(1924).22. Lukes, R., and M. Pergal, Chem. Listy, 52,68 (1958).23. DeMilt, C., and M. Sartor,./. Am. Chem. Soc., 62,1954 (1940).24. Underwood, H. W., Jr., and L. A. Clough, J. Am. Chem. Soc., 51, 583 (1929).25. Woolford, R. G., Doctoral Dissertation, University of Illinois, 1959; University
Microfilms, Doctoral Dissertation Sériés, Publication No. 59-2067, Ann Arbor, Michigan.26. Jones, M., D. Thornton, and R. Webb, Makromol. Chem., 49, 62 (1961).
RésuméOn a polymérisé dix-sept, thiazols par la polycondensation de bis-a-bromocétones avec
des dithioamides ; les polymères ont été étudiés pour la fabrication de fibres et de films, résistants à la chaleur. Avec quatre de ces polymères, on a obtenu des fibres et des films durs, et pourtant ces polymères ont un point de fusion bas (164-250°C). Tous les autres polymères, sauf un, n’entrent pas en fusion au-dessous de 500°C, ils ont une stabilité thermique excellente, mais ils n ’ont pas de bonnes propriétés pour la formation de fibres et de films, à cause de leur faible poids moléculaire. Tous les polymères préparés possèdent une certaine cristallinité. Deux de cas polymères sont solubles dans les solvants organiques; les autres sont seulement solubles dans des acides forts. Des composés modèles ont été préparés pour quatre de ces polymères et leurs propriétés et structures comparées à celles des polymères.
ZusammenfassungSiebzehn Thiazolpolymere wurden durch Polykondensation von Bis-a-bromoketonen
mit Dithioamiden dargestellt und die Polymeren auf ihre Fähigkeit zur Bildung hitzebeständiger Fasern und Filme untersucht. Feste Fasern und Filme wurden aus vier der Polymeren hergestellt; diese Polymeren besassen aber niedrige Schmelzpunkte (164- 250°C). Alle anderen untersuchten Polymeren mit Ausnahme eines schmolzen unterhalb 50U°C und besassen eine ausgezeichnete thermische Beständigkeit, lieferten aber wegen ihrer niedrigen Molekulargewichte keine guten Faser- und Filmbildungseigenschaf- ten. Alle dargestellten Polymeren besassen eine gewisse Kristallinität. Zwei Polymere waren in organischen Lösungsmitteln löslich; die anderen lösten sich nur in starken Säuren. Für vier der Polymeren wurden Modellverbindungen dargestellt und die Eigenschaften und Struktur dieser Verbindungen mit denjenigen der Polymeren verglichen,
Received May 9, 1964 Revised September 16, 1964 (Prod. No. 4532A)

J O U R N A L O F P O L Y M E R S C I E N C E : P A R T A Y O L . 3 , P P . 1 4 6 3 - 1 4 7 2 ( 1 9 6 5 )
Study of Swelling in Two New Ion Exchange Membranes
RUSSELL B. HODGDON, JR., and JAMES R. BOYACK, Direct Energy Conversion Operation, General Electric Co., Lynn, Massachusetts
SynopsisThe synthesis of two new ion-exchange membranes is presented. These are a partially
sulfonated polystyrenesulfonic acid resin and an interpolymer system composed of sul- fonated polystyrene-divinylbenzene polymerized within a poly(vinylidene fluoride) matrix. Each of these systems allows control of ion exchange capacity and physical properties over a wide range. The second is especially useful, in that ion-exchange capacity and swelling characteristics may be controlled independently. I t also has the distinct advantage of giving a clear, flexible film even with high crosslinking. On the basis of certain simplifying assumptions an equation is derived which permits approximate calculation from equilibrium water uptake data of an elastic constant which measures the resistance of the membrane to swelling forces. Equilibrium water content data for the two membrane systems are treated with this equation and analyzed in terms of internal structure.
In many applications of ion-exchange membranes it is desirable to have a high ion-exchange capacity and fully dissociated ionic groups in membranes of good dimensional stability and strength. These characteristics are to a certain extent mutually exclusive, in that a high ion-exchange capacity gives rise to high swelling pressure and high equilibrium water uptake, with resultant deterioration of physical properties. It is the task of the polymer chemist, therefore, to achieve the optimum balance for his specific purpose through control of the ion-exchange capacity and/or of the resistance of the resfn matrix to swelling forces.
The work that follows gives examples in which these objectives are at least partially realized. It is divided into two parts. The first section describes the synthesis and general characterization of two new ion-exchange membrane systems based on polystyrenesulfonic acid. The second section presents a study of the swelling characteristics of these two membranes in relation to their internal structures.
SYNTHESIS AND CHARACTERIZATION OF MEMBRANES
Case I : Partially Sulfonated Polystyrenesulfonic Acid
Following is a sulfonation procedure through which one may control accurately over a wide range the ion-exchange capacity of the resulting water-
1463
1 4 6 4 R . B . 1 i O D G D O N , J R . A N D J . R . B O Y A C K
insoluble polystyrenesulfonic. acid resin. In a typical preparation, 60 g. of polystyrene (Lustrex HH 77, M.W. = 40,000 NA) was dissolved in 1200 ml. of ethanol-stabilized chloroform (0.31% EtOH) in a two-liter resin kettle equipped with a stirrer and addition funnel. A solution of 42 g. of 99+% iron-free chlorosulfonic acid in 150 ml. chloroform was added dropwise with stirring over a 2-hr. period at room temperature. The partially sulfonated polystyrenesulfonic acid precipitated from the chloroform solution. Stirring was continued for an additional half hour. The liquid was decanted and the sulfonated polystyrene taken up in 1000 ml. methanol. The polymer was spray-dried from this solution to give a white powder which was washed to water neutrality in a filter press and dried at 50°C. for three days.
The polystyrenesulfonic acid prepared by the above procedure has an ion-exchange capacity of 1.80 ± 0.05 meg. H+/g. dry resin. Other ion- exchange capacities may be obtained merely by adjusting the quantity of chlorosulfonic acid added to the reaction mixture. At ion-exchange capacities greater than 3 meq. H+/g. dry resin, the polymer becomes water-soluble and methanol-insoluble. The resin may be compression-molded in the acid form into an ion-exchange membrane at its glass transition temperature of 161 °C. These films are flexible and fairly strong when wet, but become brittle when completely dry.
Case II: Interpolymer of Crosslinked Polystyrene-Divinylbenzenesul- fonic Acids within an Inert Matrix
Sheets of clear poly(vinylidene fluoride) film, usually about 0.2 cm. in thickness, were equilibrated in acetone at 35°C. for 24 hr. The swollen films were then quickly immersed in a bath consisting of monostyrene, divinylbenzene, and a 50/50 mixture of benzoyl peroxide and dicumyl peroxide in a concentration of 0.1% based on monostyrene. The bath should be large in order to favor effective displacement of the acetone in the films by the monomer-peroxide mixture. After removal from this bath, the membranes were placed between interleaves of stiff aluminum foil and heated to 150°C. in a flat bed press for 51 min. at 2000 psi. This process was repeated until the membrane weight increased 15-20% over that of the original film. This gives a compatible interpolymer mixture of crosslinked polystyrene-divinylbenzene with poly(vinylidene fluoride).
These films were then sulfonated by immersion in a chloroform solution of 15% chlorosulfonic acid for a period of 24 hr. This was followed by a washing in distilled water and hydrolysis for 37 hr. in distilled water at 65°C.
A clear transparent membrane is obtained which contains one sulfonic acid group for each aromatic ring. The films are flexible, even when dry, and have excellent physical properties. As will be discussed below, the equilibrium swelling in water can be controlled by adjusting the concentration of divinylbenzene in the monomer bath.
In order to confirm that this is in fact an interpolymer system and not a free radical graft of styrene to the poly(vinylidene fluoride), the following experiments were performed. Several membrane samples were placed under a sun lamp for several days. This degraded the polyelectrolyte to

S W E L L I N G I N N E W I O N E X C H A N G E M E M B R A N E S 1 4 6 5
such aia extent that it could be leached from the membrane with distilled water. The solids obtained after evaporation of the extract water corresponded to 98.5% of the polystyrenesulfonic acid present in the membrane. The elemental analysis of these solids gave C, 52.43%; H, 4.25%; S, 16.85%; F, 0.1%; double bonds, 7.0%, which corresponds very closely to pure polystyrenesulfonic acid.
The components of the system were also separated in another way. Membrane samples were heated in a bath composed of equal weights of acetone and dimethylacetamide at 50°C. for three days. Decanting the solvent from the jellylike mass remaining and evaporating it down to dryness left a white powder which proved to be essentially pure poly(vinylidene fluoride). Analysis of the dried jelly showed it to be crosslinked polystyrenesulfonic acid. Since there can be no chemical degradation involved here, this confirms the interpolymer nature of the membrane.
TABLE IResistivity of Interpolymer Membranes
Transverseresistivity,ohm-em.
Divinylbenzene, % (H + form, based on 1000 cyclesstyrene a.c.)
29.8% Polystyrene-divinylbenzenesulfonic acid 0.0 15.070.2% poly(vinylidene fluoride) 3.0 18.4
4.5 22.07.0 29.29.0 31.8
12.0 40.023.0% Polystyrene-divinylbenzenesulfonic acid 0.0 16.777.0% poly(vinylidene fluoride) 3.0 26.5
4.5 34.3
Without the sunlamp treatment, the interpolymer membrane containing no divinylbenzene crosslinks yielded no leachable polystyrenesulfonic acid, even when boiled for two weeks in water. This is in spite of the fact that, being fully sulfonated, it should be completely water-soluble. This undoubtedly is due to extensive chain entanglement and is an example of the well described “snake cage” effect in mixed bulk polymerizations.
In a mixture as we have here of a polyelectrolyte imbedded in nonpolar matrix, there is always the danger of discontinuity in the polyelectrolyte phase, thus rendering the material a poor ion exchanger and a poor electrical conductor due to absence of pathways between ionic sites. Such discontinuity is not important in the membrane described above as is apparent from the transverse resistivity data shown in Table I. These data were obtained at room temperature with fully hydrated membranes. The resistivities are not excessively high and are about what one would expect taking into account only the volume fraction of the conducting material.

1 4 6 6 R . B . H O D G D O N , J R . A N D J . R . B O Y A C K
SWELLING CHARACTERISTICS
Crosslinked polyelectrolytes in aqueous media imbibe water and swell until the water activity is the same in both the gel and the liquid phases. Crosslinked, fully sulfonated poiystyrene-divinylbenzenesulfonic acid has received the bulk of swelling studies over the last twenty years due to its extensive use in the field of ion exchange and due to the excellent chemical stability and ease of fabrication of these materials. References 1-12 give a selection from the work done in this field and Helfferich’s book13 gives a good review of the subject.
Briefly, the relationships emerging from these studies are that swelling is enhanced by high “free ion” content of the resin, large, and strongly hydrated counterions, and low valence of the counterions, whereas swelling is suppressed by high electrolyte concentration in the equilibrating solution and by increased crosslinking in the resin.
Swelling data are reported below for the two ion exchange membranes described above in equilibrium with pure water.
Theory
The swelling of an ion-exchange resin is most easily visualized on the basis of a model proposed by Gregor.14 This model conceives of the gel phase as being analogous to a compartment whose walls are moveable, but attached to each other by elastic springs, and which contains an electrolyte solution whose concentration is equal to that of the pore liquid in the actual resin. This compartment is conceived to be separated from the external water by a semipermeable barrier which is impermeable to the ions associated with the resin. Thus, if water were to enter the compartment as a result of osmotic forces, the compartment would expand until the contractile force of the springs became equal to the osmotic pressure of the internal solution. Using this model, the free energy change, AG, associated with swelling consists of two parts, one arising from the mixing of the water with the internal electrolyte, and another arising from the potential energy stored in the elastic polymer network. The change in free energy is a minimum at equilibrium, so that
(i)AG/dn.w)míxing -|- (dAfr/d/Ty-jeiastic = 0 (1)
where n w signifies the number of moles of water in the gel phase. To a first approximation we may consider the polymer network to have the nature of Hookian springs in three dimensions, giving
AGelas-.ic = y 2ir (A 7 )2 (2)
where K ’ is a proportionality constant and AF the change in volume on swelling. Taking the derivative of eq. (2) yields
( d A G / d O e n s t i c = K ' A V V t ( 3 )

S W E L L I N G I N N E W I O N E X C H A N G E M E M B R A N E S 1 4 6 7
where V m is the molar volume of water. Equation (3) can be written since absorbed water adds very nearly its own volume to the swollen system. This has been experimentally confirmed to within experimental error for the two membranes under consideration in this paper.
In order to evaluate the first term in eq. (1), we make the assumption of ideal behavior, which will be modified later. This gives
Xfjniixing = n wR T In x w i% p R T In x T (4)
In eq. (4)x„ is the mole fraction of water and x T that of the resin, which is taken to be entirely made up of the contribution of the counter ions. Differentiating eq. (4) gives
(dAG/dnB)miXinE R T In x w (5)
Combining eqs. (4) and (5) and dividing through by V w results in
K A V / V o = ~ ( R T / V W) In xffl (6)
In eq. (6) K ' has been replaced by K / V 0, V 0 being the dry resin volume. Equation (6) is illustrated in Figure 1 for the data of Table III. Thestraight lines are plots of the left-hand side for various degrees of cross-linking, while the curved line is a plot of the right hand side. The left-hand side of eq. (6) expresses the elastic force which counterbalances the osmotic swelling pressure given by the right-hand side. The constant K is an intrinsic constant of the polymer network whose value represents the re-
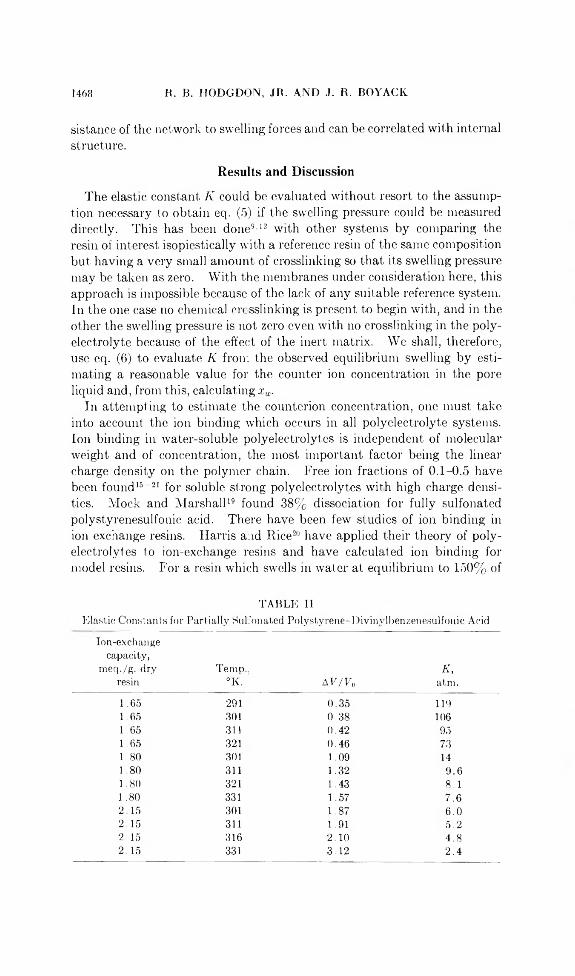
1 4 6 8 H . B . H O D G D O N , J R . A N D J . R . B O Y A C K
sistance of the network to swelling forces and can be correlated with internal structure.
Results and Discussion
The elastic constant K could be evaluated without resort to the assumption necessary to obtain eq. (5) if the swelling pressure could be measured directly. This has been done9’12 with other systems by comparing the resin of interest isopiestically with a reference resin of the same composition but having a very small amount of crosslinking so that its swelling pressure may be taken as zero. With the membranes under consideration here, this approach is impossible because of the lack of any suitable reference system. In the one case no chemical crcsslinking is present to begin with, and in the other the swelling pressure is not zero even with no crosslinking in the polyelectrolyte because of the effect of the inert matrix. We shall, therefore, use eq. (6) to evaluate K from the observed equilibrium swelling by estimating a reasonable value for the counter ion concentration in the pore liquid and, from this, calculating x w.
In attempting to estimate the counterion concentration, one must take into account the ion binding which occurs in all polyelectrolyte systems. Ion binding in water-soluble polyelectrolytes is independent of molecular weight and of concentration, the most important factor being the linear charge density on the polymer chain. Free ion fractions of 0.1-0.5 have been found15-21 for soluble strong polyelectrolytes with high charge densities. Mock and Marshall19 found 38% dissociation for fully sulfonated polystyrenesulfonic acid. There have been few studies of ion binding in ion exchange resins. Harris and Rice20 have applied their theory of polyelectrolytes to ion-exchange resins and have calculated ion binding for model resins. For a resin which swells in water at equilibrium to 150% of
TABLE IIElastic Constants for Partially Sulfonated Polystyrene-Divinvlbenzenesulfonic Acid
Ion-exchangecapacity,
meq./g* dry resin
Temp..°K. AF/Fo
K,atm.
1.65 291 0.35 1191.65 301 0.38 1061.65 311 0.42 951.65 321 0.46 731.80 301 1.09 141.80 311 1.32 9.61.80 321 1.43 8.11.80 331 1.57 7.62.15 301 1.87 6.02.15 311 1.91 5.22.15 316 2.10 4.82.15 331 3.12 2.4

S W E L L I N G I N N E W I O N E X C H A N G E M E M B R A N E S 1 4 6 9
its original volume, they arrive at a counterion dissociation of close to 40%. In treating our data, we shall assume that the free ion fraction is 35% in all the membranes and that this fraction of the counterions forms an ideal solution in the pore liquid of the membrane. Because of the uncertainty of these assumptions, our results are only semiquantitative. However, they still allow interesting correlations to be made.
Table II gives the results obtained at various temperatures with three examples of the partially sulfonated polystyrene-divinylbenzenesulfonic acid membrane of case I. Table III along with Figure 2 presents the data for interpolymer membranes of case II. The A F/F0 values were determined by measuring the water uptake in distilled water at a controlled temperature. In the case I membrane the value of the elastic constant must depend on a pseudo-crosslinking arising from coherence of hydrophobic hydrocarbon sections of the polymer chains and chain entanglement. It is

1 4 7 0 R . Ë . I I Ô D G D O N , J R . A N D J . R . Ë O Y A C K
apparent from Table II that, for this membrane at constant temperature, a small increase in ion-exchange capacity drastically lowers the value of the elastic constant. The reason for this effect is linked to the greater probability of coherence between hydrocarbon sections of the chains in membranes with lower ion exchange capacities. This factor, however, probably does not account for all of the large change in the elastic constant found in going from 1.65 meq. H+/g- tc 1.80 meq. H+/g-
The percentage of sulfonation is 18, 20, and 25% for the ion exchange capacities 1.65, 1.80, and 2.15 meq. H +/g-, respectively. The small difference in sulfonation between the first two membranes does not seem to justify the large variation observed in the elastic constant. One can consider other factors to explain the magnitude of this change, the most important,
TABLE IIIElastic Constante for Interpolymer Membranes as a Function o: Divinylbenzene Con
tent, T = 296°K.
System
Divinylbenzene, % based onstyrene A T /F o
K,atm.
23.0% Polystyrene-divinylbenzene, 0.0 1 02 15.277.0% polyfvinylidene fluoride); 3.0 0 58 57.9ion-exchange capacity = 1.25 4.5 0.40 89.3meq./g. 7.0 0.29 193
9.0 0.17 390
29.8% Polystyrene-divinylbenzene- 0.0 1.70 9.3sulfonic acid, 70.2% poly(vinyli- 1.0 1 15 18.9dene fluoride); ion-exchange ca- 3.0 0 85 32.8pacity = 1.62 meq./g. 4.5 0 69 49,4
7.0 0 51 73.79.0 0.44 99.5
12.0 0 39 117
perhaps, being chain entanglement. This characteristic would be expected to have a marked dependence on the history of the membrane. For instance, in a membrane soaked in water the restrictions due to chain entanglement would gradually diminish as the chains rearrange themselves by segmental notion to relieve strain. The experimentally determined K values would then diminish gradually with time.
Increasing temperature decreases the value of the elastic constants shown in Table II. Two effects are operative here. The elasticity of the individual polymer chains increases with increasing temperature as does also the water solubility of the hydrocarbon chain segments, thus reducing the effective pseudo-crosslinking.
From Figure 2 we see that for no crosslinking, both interpolymer membranes still exhibit an appreciable elastic constant, the value of which is about the same for the two different compositions. The poly(vinylidene fluoride) itself is not crosslinked, but its hydrophobic character together

S W E L L I N G I N N E W I O N E X C H A N G E M E M B R A N E S l 4 7 l
with the presence of crystalline regions acts to introduce effective “pseudo” crosslinks.
If sufficient poly electrolyte is present in the interpolymer membrane, the dependence of the elastic constant on divinylbenzene content is linear, as in the lower curve in Figure 2. If one considers the polyelectrolyte network alone, it is apparent that this network is initially already swollen by the inert matrix polymer. It is conceivable that, for small amounts of polyelectrolyte with high crosslinking, a situation may occur in which areas of the polyelectrolyte network reach a saturation condition of nearly full extension. This would greatly increase the resistance to further swelling. The upward curvature of the top curve in Figure 2 suggests that this may be the case for the membrane containing the smaller amount of polyelectrolyte.
CONCLUSION
We have discussed here two ion-exchange membrane systems which offer the possibility of controlling their physical and exchange properties over a wide range. For the case I membrane this control is effected by changing the ion exchange capacity. The higher exchange capacities lead to low resistance to swelling and high equilibrium water content, which may be disadvantageous for some applications. The case II interpolymer membrane system is particularly attractive, in that it allows independent control within wide limits of the ion exchange capacity, through variation of the amount of polyelectrolyte incorporated, and of the resistance to swelling forces, through variation of the divinylbenzene content. The presence of the poly(vinylidene fluoride) matrix also insures a flexible, strong membrane, even with high crosslinking.
The authors wish to thank the Direct Energy Conversion Operation of the General Electric Company for permission to publish the data in this paper. Special mention should also be given to John F. Enos and Edwin J. Aiken, who contributed significantly to the experimental program upon which this paper is based.
References1. Davies, C. W., and G. D. Yeoman, Trans. Faraday Soc., 49,968 (1953).2. Calmon, C., Anal. Chem., 24,1456 (1952); ibid., 25,490 (1953).3. Gregor, H. P., F. Gutoff, and J. I. Bregman, J. Colloid Sci., 6,245 (1951).4. Reiehenberg, D., K. W. Pepper, and D. K. Hale, J. Chem. Soc.., 1952, 3129.5. Gregor, H. P., M. H. Waxman, and B. R. Sundheim. J. Ph.ys. Chem., 57, 794
(1953).6. Boyd, G. E., G. F. Jumper, and S. Lindenbaum, J. Phys. Chem., 63, 1924 (1959).7. Gregor, H. P., J. Am. Chem. Soc., 70, 1293 (1948); ibid., 73, 642 (1951).8. Gregor, H. P., F. Gutoff, and J. I. Bregman, J. Colloid Sci., 6, 245 (1951).9. Gregor, H. P., B. R. Sundheim, K. M. Held, and M. H. Waxman, J. Colloid Sci., 7,
511 (1952).10. Katchalsky, A., and S. Lifson, J. Polymer Sci., 1 1 ,409 (1953).11. Katchalsky, A., and M, Zwick, J. Polymer Sci., 1 6 ,221 (1955).12. Boyd, G. E., and B. A. Soldano, Z. Eleklrochem., 57,162 (1953).13. Helfferich, F., Ion Exchange, McGraw-Hill, New York, 1962.14. Gregor, H. P., J. Am. Chem. Soc., 70,1293 (1948); ibid., 73, 642 (1951).

1 4 7 2 R . B . I I O D G D Ó N , J R . A N D J . R . B O Y A C K
15. Nagasawa, M., and I. Kazawa, J. Polymer Sci., 25, 61 (1957).16. Huizenga, J. R., P. F. Gruger, and F. T. Wall, J. Am. Chem. Soc., 72, 2636 (1950).17. Kern, W., Z. Physik. Chem., A18,249 (1938).18. Tereyama, H., and F. T. Wall, J. Polymer Sci., 16,357 (1955).19. Mock, R. A., and C. A. Marshall, J. Polymer Sci., 13,263 (1954).20. Rice, S. A., and F. E. Harris, Z. Physik. Chem. (Frankfurt), 8,207 (1956).21. Rosenberg, N. W., J. H. B. George, and W. D. Potter, J. Electrochem. Soc.., 104, 111
(1957).
RésuméOn présente la synthèse de deux nouvelles membranes échangeuses d ’ions. Elles sont
formées d’une résine d’acide polystyrène sulfonique partiellemnt sulfonée et d’un système interpolymérique, composé de polystyrène-divinylbenzène sulfoné, polymérisé dans une matrice de fluorure de polyvinylidène. Chacun de ces systèmes permet le contrôle de la capacité d’échange et des propriétés physiques dans un large domaine. Le second est spécialement utile par le fait que la capacité d'échange d’ions et les caractéristiques de gonflement peuvent être contrôlées indépendamment. Il possède également l’avantage de donner un film clair et flexible, même lorsqu’il est fortement ponté. Sur la base de certaines suppositions permettant de faire des simplifications, on a déduit une équation, qui permet de faire des calculs approximatifs d’une constante d’élasticité à partir des résultats de l’absorption d’eau à l’équilibre, et qui permet de mesurer la résistance de la membrane aux forces de gonflement. Les résultats concernant la teneur en eau à l’équilibre de ces deux membranes sont traités au moyen de cette équation et analysés en vue d’obtenir la structure interne.
ZusammenfassungDie Synthese zweier neuer Ionenaustauschmembranen wird angegeben. Es sind dies
ein partiell sulfoniertes Polystyrolsulfonsäureharz und ein Interpolymersystem, bestehend aus in einer Polyvinylidenfluoridmatrix polymerisiertem sulfoniertem Polystyrol- Divinylbenzol. Jedes dieser Systeme erlaubt eine Kontrolle der Ionenaustauscherkapazität und der physikalischen Eigenschaften in einem weiten Bereich. Das zweite ist besonders interessant, da die Ionenaustauscherkapazität und Quellungscharakterisitik unabhängig voneinander eingestellt werden können. Es besitzt auch den entschiedenen Vorteil, dass es sogar bei hoher Vernetzung einen klaren, flexiblen Film liefert. Unter gewissen vereinfachenden Annahmen wird eine Gleichung abgeleitet, welche die angenäherte Berechnung einer elastischen Konstanten als Mass für den Widerstand der Membranen gegen Quellungskräfte aus der Gleichgewichts-Wasseraufnahme gestattet. Daten für den Gleichgewichts-Wassergehalt der beiden Membransysteme werden mit dieser Gleichung behandelt und anhand der inneren Struktur analysiert.
Received June 30. 1964 Revised November 9,1964 (Prod. No. 4533A)
J O U R N A L O F P O L Y M E R S C I E N C E : P A R T A V O L . 3 , P P . 1 4 7 3 - 1 4 8 2 ( 1 9 6 5 )
Effect of Temperature on Ozone Cracking of Rubbers
A. N. GENT and J. E. AIcGRATH, In s t i tu te o f R u b b e r Research, U n iv e rs ityo f A k ro n , A k ro n , O hio
SynopsisThe rates of growth of single ozone cracks have been measured for vulcanizates of a
series of butadiene-styrene copolymers, over a temperature range from — 5°C. to 95 °C. The rates appear to be determined by two mechanisms. At low temperatures, near the glass transition temperature, they are quantitatively related to the segmental mobility of the polymer. The principal rate-controlling step in this case is concluded to be movement of the polymer chains after scission to yield new surface. At high temperatures the rate approaches a limiting value of 1(U3 cm./sec./mg. of ozone/1. This is about 1 /1000 of the maximum possible value -when instantaneous reaction of one incident ozone molecule causes scission of one network chain.
INTRODUCTIONIn an earlier communication1 it was noted that the rate of growth of
ozone cracks increased markedly with temperature, for rubbers of relatively low segmental mobility. It was concluded that the segmental mobility governs the rate of crack growth in these cases. In accordance with this concept, the rates were increased when a plasticizer was included in the mix formulation, and the rates for different rubbers were in the order of their expected segmental mobilities, with two exceptions: polychloroprene, for which a lower degree of reactivity with ozone was assumed, and relatively mobile rubbers, such as natural rubber, for which the rate was virtually unaffected by temperature changes or plasticization. It seemed probable that reaction with ozone had become the rate-determining step in the latter case, so that further increases in segmental mobility were without effect.1'2
A quantitative study has now been carried out, and is described below, of the effect of segmental mobility on the rate of growth of single ozone cracks. In order to vary the mobility over a wide range without altering the specific chemical reaction leading to molecular scission, a series of butadiene-styrene copolymers, containing 0-80% styrene, was examined over a wide temperature range, from — 5°C. to 95 °C.
EXPERIMENTAL DETAILS Materials
The butadiene-styrene copolymers were prepared by emulsion polymerization at 50 °C. The polybutadiene sample (Budene, 94% cts-1,4)
1473

1 4 7 4 A . N . G E N T A N D J . E . M c G R A T H
TABLE IMix Formulations and Vulcanization Conditions Employed to Prepare Test Sheets
A B C D E
cis-Polybutadiene 100 — — — —75/25 Butadiene/styrene copolymer — 100 — — —
44/56 Butadiene/styrene copolymer — — 100 — —33/67 Butadiene/styrene copolymer — — — 100 —20/80 Butadiene/styrene copolymer — — — — 100Zinc oxide 5 5 5 5 5Stearic acid 2 2 3 3 2Sulfur 1 1 2 2 2Benzothiazyl 2-cyclohexyl sulfen-
amide (CBS) 0.7 0.7 1 .5 1.5 1.5
Vulcanization time, min. at 145°C. 90 90 90 90 90
was obtained from The Goodyear Tire and Rubber Company. Each polymer was compounded and vulcanized as described in Table I to yield thin vulcanized sheets. The sheets were extracted with hot acetone to remove antioxidants, by-products of the vulcanization reaction, etc. Test pieces in the form of parallel-sided strips were then cut from them.
Glass Transition Temperatures
The glass transition temperatures T g were estimated for each material from Gehman low temperature torsion flex measurements,3 by means of Trick’s procedure.4 The values obtained are given in Table II. For materials B, C, D, and E values were also calculated from Wood’s relationship5 for emulsion copolymers prepared at 50°C.:
TABLE IIGlass Transition Temperatures
MaterialStyrene content, (% by weight) O p
A 0 -110B 25 -5 7C 56 -1 3D 67 + 10E 80 +38
T g (°C.) = ( -8 5 + 135S)/(1 - 0.5S )
where S is the weight fraction of styrene in the copolymer. These values were found to be closely similar to those given in Table II.
Test Piece
Each test piece was about 5 cm. long, 0.6 cm. wide, and 0.03 cm. thick. A sharp cut about 0.05 cm. long was made through the central region as

O Z O N E C R A C K I N G O F R U B B E R S 1 4 7 5
m m n m m
m u n u m m
T
Fig. 1. Crack growth test piece.
shown in Figure 1. A weight of about 8 g. was applied to the lower end of the test piece yielding a tensile stress of about 0.45 kg./cm.2, an extension of about 3%, and a value for the potential energy T available for cut growth by unit area6 of about 650 erg/cm.2. This value is considerably larger than the minimum necessary for ozone crack growth to occur in unprotected rubbers,6 about 100 erg/cm.2. It is too small, however, to induce tearing. No cut growth occurred in the absence of ozone, and the growing cut came to a halt if the ozone supply was stopped. It has previously been shown that the rate of growth of a single ozone crack is independent of the applied stress provided this is (1) above the minimum value, and, (2 ) not so large that tearing occurs.1 The present stress values lie within this range.
The test piece was suspended from the roof of a glass test chamber immersed in a water bath held at the required temperature. Growth of the cut when an ozonized oxygen gas stream was passed through the test chamber was observed by means of a low power microscope with a calibrated eyepiece scale.
Ozone Supply
A stream of ozonized oxygen was obtained as before1 by passing cylinder oxygen through a drying tower and then around a quartz mercury-vapor lamp (Hanovia lamp, No. 84A-1). The gas stream passed through a glass coil immersed in the bath to attain the bath temperature, and then through

1 4 7 6 A . N . G E N T A N D J . E . M c G R A T I I
the test chamber to a collecting flask, for analysis of ozone by Wadelin’s method.7 The rate of gas flow was 20 l./hr., corresponding to about three changes of the test atmosphere per minute. The ozone concentration was generally 3.0 ± 0.2 mg./l.
EXPERIMENTAL RESULTS AND DISCUSSION
Rate of Crack Growth
The cut was found to grow equally at both ends, and linearly with time. The rate R of crack growth has therefore been taken as the velocity of one tip, i.e., one-half of the rate of growth of the whole cut.
The measured rates for the five materials examined are plotted in Figure 2 against the test temperature. They are seen to form a series of parallel relations displaced to higher temperatures with increasing styrene contents of the copolymers. The general parallelism resembles that shown by the viscous response of polymers having different glass transition temperatures. The measured rates were accordingly replotted against the interval T — T 0 by which the test temperature exceeded the glass transition temperature (Fig. 3). In this representation the results for all the materials were found to lie on a single curve over ' he entire temperature range, for rates which varied 3000-fold.
The variation with temperature of the segmental jump frequency <f> is given for amorphous polymers by the Williams, Landel, and Ferry relation8
= 40 ( T - T g) / (52 + T — T „ ) (1)
to a first, approximation, where <f>r„, the jump frequency at the glass temperature, is about 10-1/sec.9a This relation is plotted as a broken curve
Fig. 2. Experimental relations between the rate of crack growth and temperature.

O Z O N E C R A C K I N G O F R U B B E R S 1 4 7 7
Fig. 3. Relation between the rate of crack growth and T — T r The materials are represented by the same symbols as in Figure 2. The broken curve is of the form given in eq. (1), adjusted vertically to coincide with the experimental results at low temperatures. The dotted curve is of the form given in eq. (4).
in Figure 3, with the vertical position chosen to coincide with the experimental results at low temperatures. Over a 30°C. temperature range, corresponding to a 500-fold range of crack growth rate, it is seen to describe the experimental results satisfactorily. At temperatures more than 60°C. above T „ , however, the measured rates depart from this temperature dependence and approach a limiting value of about 3 X 10⁻³ cm./sec.
It thus appears that the rate of growth of ozone cracks at low temperatures is determined by the segmental mobility, whereas at higher temperatures it approaches a constant value. These two features are discussed separately below.
Temperatures near T g
One possible mechanism for the observed temperature dependence is the slow diffusion of ozone through a partially-degraded surface layer to reach the effective crack tip. As the rate of diffusion of gases is proportional to the segmental mobility of the polymer molecules, the rate of crack growth would depend on temperature in the observed way. Another possible mechanism is the slow rearrangement of molecular positions to yield new surfaces after ozonolytic scission. The retardation time n for a single chain is directly related to the jump frequency <£9b:
T-i = 2 N 2a * / T 282<t>, (2)
where N is the number of “independent” segments comprising the chain, a is the segment length, and 8 is the jump distance for a segment. The rate of crack growth would therefore vary with temperature in the observed way if slow movement of the rubber molecules in and near the surface were the rate-controlling step.

1 4 7 8 A . N . G E N T A N D J . E . M c G R A T H
There are two reasons for considering the second mechanism more important, if not dominant. They are: the observed rates are in fairly good quantitative agreement with those calculated from chain response times (below), and the rate of crack growth is not simply proportional to the concentration of ozone (below), as would be expected for a diffusion- controlled process.10a
A third, more complex, rate-controlling mechanism might be considered in which both slow diffusion and simultaneous chemical reaction occur. However, except in the unlikely case that the (assumed first-order) rate constant governing the reaction varies with temperature in the same way as the coefficient of diffusion, the rate of crack growth would not depend on temperature in accordance with eq. (1), as is observed. Also, the rate would again be expected to be proportional to the ozone concentration,1015 contrary to experiment.
Calculated Chain Response Times. The coincidence of the relation for <t>T given in eq. (1) with the experimental results of Figure 3 was achieved by employing the scaling factor
R T = (1.2 X K ti12 cm.)(f>T (3)
The fundamental retardation time n for a single chain may be calculated in terms of <f> by means of eq. (2). We take as reasonable values; N = 100, a = 10 A., 5 = 2 A. Hence,
n = 5 X 10⁴/>
Substituting in eq. (3) we obt ain
Rt = (6 X 10 ~8 cm .)/nr
This result seems quite reasonable. The bracketed quantity represents the amount by which the cut is found to advance within the response time of a single chain; in accordance with this concept it is of molecular dimensions.
A check on the validity of the absolute values of 4> and hence n is afforded by comparing the value obtained for n from eq. (2) with that obtained from creep or dynamic measurements. At a temperature of T s + 50°C., </> is calculated to be 3 X 10⁷/sec. from eq. (1). On substituting in eq. (2), a value for n is obtained of 1.7 X 10_s sec. This is in good agreement with the value of about 6 X 10^3 sec. deduced from the maximum in the retardation time spectrum reported by Hueche,90 when reduced to the same temperature.
Effect of Ozone Concentration. Measurements were made of the rate of cut growth at 40°C for materials A and C, using various concentrations of ozone. The results are plotted on logarithmic scales in Figure 4. A direct proportionality would be shown by a linear relationship with a slope of unity. This is found to be t ie case for material A, in accordance with previous work.1 For material C the dependence on ozone concentration is much smaller, the slope being only about 0.2, Moreover the test tern-

O Z O N E C R A C K I N G O F R U B B E R S 1 4 7 9
Ozone Concentration (mg/i)
Fig. 4. Relations between the rate of crack growth at 40°C. and the concentration of ozone for materials A (T — T f = 150°C.) and C (T — T„ = 53°C.).
perature of 40°C., i.e., 53°C. above T „ for material C, is rather high to be considered characteristic of the low temperature region, since departures from eq. (1) are evident above about T s + 60°C. (Fig. 3). It seems likely that the dependence on ozone concentration at lower temperatures would be still smaller.
If delayed molecular motion is the rate-controlling step at low temperatures, the rate of cut growth would be expected to be independent of the ozone concentration. The small dependence observed suggests that this mechanism is correct.
Rate of Crack Growth at High Temperatures
The dependence of the rate of crack growth upon temperature at high temperatures is seen to be quite small (Fig. 3). An apparent energy of activation was calculated for material A, using the measured rates over the temperature range 0-100°C., corresponding to the range T „ + 110°C. to T g + 210°C. The value obtained was 1.4 kcal./mole, decreasing to 1 kcal./mole when allowance was made for the increase of collision frequency with temperature. Even this low value probably contains a residual contribution from the viscous mechanism dominant at low temperatures. It appears, therefore, that the scission process does not require significant amounts of thermal energy.
In order to make a quantitative comparison with the experimentally observed rates of crack growth, we consider an ideal process in which the mere collision of a suitably oriented ozone molecule with a butadiene unit results in chain scission, no activation energy being required for reaction. An estimate of the maximum possible rate of crack growth under these circumstances is obtained below from simple collision theory.
The number of ozone molecules incident on unit surface per second at ambient temperature is about 8 X 10¹⁹c, where c is the ozone concentration in milligrams per liter. For a crack tip of width d in a sheet of thickness t

1480 A. N. GENT AND J. E. McGRATU
(both assumed larger than molecular dimensions) the rate of incidence of ozone molecules is thus about 8 X 10¹⁹ cdt/sec. The number of network chains per unit volume is about 6 X 10¹⁹ for a normal vulcanízate, having a molecular weight between crosslinks of 10,000. Thus, ahead of the crack t ip there are about (> X 1019 dt chains per unit distance. The maximum possible rate of crack growth is obtained by assuming that each ozone molecule impinging at the crack tip reacts instantaneously to sever one network chain. The value obtained is therefore about 1.3 cm./sec./mg. of ozone/1.
At high temperatures the rate of crack growth appears to approach a limiting value (Fig. 3) which is directly proportional to the ozone concentration. It corresponds to about 0.8 X 10~3 cm./sec./mg. of ozone/1., in fair accord with the value obtained previously1 at somewhat lower temperatures, namely 0.3 X 10~3 cm./sec./mg. of ozone/1.
The limiting rate is thus about one-thousandth of the maximum possible value deduced above. The factor relating them may be considered a measure of the probability of reaction per collision, reduced below unity due to various steric requirements of the absorption and reaction processes. It may, however, be a serious underestimate of the real probability of reaction, since no allowance has been made for the lowered ozone concentrations and hence rates of incidence which would be expected near reactive surfaces, or for inefficient reaction of ozone, i.e., with chains which have already been severed.
An activation energy of the order of 1 kcal./mole or less and a “steric.” factor of greater than 10-3 suggests that the scission reaction is extraordinarily efficient. This might be attributed to the initiation by each ozone molecule of a chain reaction, presumably involving oxygen, leading to a number of scissions. Such an explanation seems unlikely, however, since McCool11 has reported that oxygen-free ozone caused similar cracking to ozone diluted with oxygen.
We conclude that the maximum rate of crack growth is in accord with the simple collision theory of reaction rates when a value of 10~3 is assumed for the probability of reaction of an incident ozone molecule, and the energy of activation is treated as negligibly small. Previously,1 the rate has been shown to decrease as the degree of crosslinking, and hence the number of network chains, is increased. This is also in accord with 1 he present simple kinetic scheme.
Effect of Butadiene Content
The experimental measurements suggest that the limiting rate of crack growth at high temperatures is proportional to the butadiene content, and hence to the degree of unsaturation of the copolymer. This trend is obscured by the large experimental scatter and also by variations in the degree of crosslinking of different materials. For simplicity, therefore, differences in unsaturation have been ignored in the present work.

OZONE CRACKING OF RUBBERS 1481
CONCLUSIONS
The rate of growth of ozone cracks is apparently determined by two mechanisms. At temperatures near the glass transition temperature it is directly proportional to the segmental jump frequency 4>T , probably reflecting the sluggish motion of rubber molecules in and near the surface, and largely independent of the ozone concentration. At high temperatures it is not very dependent on the segmental mobility, and hence on the temperature, but is directly proportional to the ozone concentration. Over the entire temperature range the rates may be very approximately described by considering the two mechanisms of delay as additive, i.e.,
l / R = ( l / R d + (1 / R t ) (4 )
where R \ is the low-temperature rate, given by eq. (3), and R 2 is the high- temperature rate, given by
R-i — 0.8 X 10~3 c cm./sec.
where c is the ozone concentration in milligrams/liter. The predictions of eq. (4) are represented by the dotted line in Figure 3. The transition from one delay mechanism to another is clearly not as abrupt as eq. (4) suggests; in consequence, the predicted values at intermediate temperatures are about twice as large as the measured values. However, eq. (4) should provide a useful guide to the behavior of unprotected rubbers over a wide range of temperatures and ozone concentrations.
The rate R i at low temperatures is quantitatively related to the retardation time of a single network chain, the cut advancing by a molecular distance during this time interval. The rate R2 at high temperatures is in accord with the simple collision theory of reaction rates, with a “steric” factor of about 10~3 and a negligibly small energy of activation.
References
1. Braden, M., and A. N. Gent, J . Ap-pl. Polym er Sci., 3, 90 (1960).2. Braden, M., and A. N. Gent, K aulschuk Gum mi, 14, WT157 (1961); Rubber Chem.
Technol, 35,200(1962).3. Standard Method of Measuring Low-Temperature Stiffening of Rubber and Rub
berlike Materials by Means of a Torsional Wire Apparatus: ASTM D1053-61, American Society for Testing Materials, Philadelphia, 1961.
4. Trick, G. S., J. A p p l. Polymer Sci., 3, 253 (1960).5. Wood, L. A., J. Polymer Sci., 28, 319 (1958).6. Braden, M., and A. N. Gent, J. A p p l. Polym er Sci., 3, 100 (1960).7. Wadelin, C. W., A nal. Chem., 29,441 (1957).8. Williams, M. L., R. F. Landel, and J. D. Ferry, J . A m . Chem. Soc., 77, 3701 (1955).9. Bueche, F., Physical Properties o f Polymers, Interscience, New York, 1962, (a)
p.108; (b) eq. (3.8) and (6.8); (c) Figure 51, p. 182.10. Crank, J., The M athematics o f D iffusion, Oxford University Press, London, 1956,
(a) Chap. 7; (b) Chap. 8.11. McCool, J. C., Rubber Chem. Technol., 37, 583 (1964).
1482 A. N. GENT AND J. E. McGRATH
RésuméOn a mesuré la vitesse de croissance des crevasses provoquées par l’ozone sur des vul
canisais d’une série de copolymères butadiène-styrène, dans un domaine de températures allant de — 5°C à 95°C. Les vitesses sont déterminées par deux mécanismes. Aux basses températures, près de la température de transition vitreuse, elles dépendent quantitativement de la mobilité des segments du polymère. On peut conclure que, dans ce cas, l ’étape principale, déterminante de la vitesse est le mouvement des chaînes de polymères après la rupture pour former une nouvelle surface. A températures élevées, la vitesse approche une valeur limite de 10-3 cm/sec/mg d’ozone/1. C’est environ 1/1000 de la valeur maximale possible, lorsque la réaction immédiate d’une molécule d’ozone incidente provoque une rupture d’un réseau de la chaîne.
ZusammenfassungDie Wachstumsgeschwindigkeit einzelner Ozonrisse wurde in Vulkanisaten einer Reihe
von Butadien-Styrolcopolymeren im Temperaturbereich von —5° bis 95°C gemessen. Die Geschwindigkeit scheint durch zwei Mechanismen bestimmt zu sein. Bei niedrigen Temperaturen in der Nähe der Glasumwandlungstemperatur steht sie in quantitativer Beziehung zur Segmentbeweglichkeit des Polymeren. Der wichtigste geschwindigkeitsbestimmende Schritt ist in diesem Fall die Bewegung der Polymerketten nach der Spaltung zur Bildung einer neuen Oberfläche. Bei hoher Temperatur nähert sich die Geschwindigkeit einem Grenzwert von 10 ~8 cm/sec/mg Ozon/1. Das ist etwa ein Tausendstel des bei momentaner Reaktion eines auftretenden Ozonmoleküls unter Spaltung einer Netzwerkkette möglichen Maximalwerts.
Received August 22, 1964 Revised September 24, 1964 (Prod. No. 4536A)

JOURNAL OF POLYMER SCIENCE: PART A VOL. 3, PP. 1483-1498 (1965)
Kinetic Study o f the Polym erization o f a-rl-Styrene and/or Styrene by H om ogeneous Catalysis. Part II*
C. G. OVERBERGER and P. A. JAROVITZKY, Department of Chemistry, Polytechnic Institute of Brooklyn, Brooklyn, New York
SynopsisInitial rates of polymerization using the (C6H5)2TiCl2-Al(C2H 5)2Cl homogeneous
catalyst system, were determined for homo and copolymerizations of styrene, styrene-a- C14, a-d-styrene, p-methylstyrene, and m-methylstyrene. Homopolymerization rates of styrene as a function of Al/Ti ratio indicate three rate maxima of apparently equal magnitude near Al/Ti ratios of 3.0, 11.0, and 16.0. Copolymerizations of Si 97.5% a- d-styrene and styrene as a function of Al/Ti ratio yielded no rate maxima but appeared to be a linear function of the Al/Ti ratio employed. a-d-Styrene yielded higher initial polymerization rates than styrene under all tested experimental conditions. These rate increases as a function of monomer deuteration at the a position are related to a higher concentration of active centers. A reaction scheme is proposed in which the predominant mode of formation of active centers occurs via alkylation of titanium but by a cationic mechanism. The observed isotope effect with the use of a-d-styrene is related to the stability of the cationically formed active centers. Destruction of these active centers is is suggested to result in either an a-alkylated new monomer and/or low molecular weight oligomers. An isotopically controlled unimolecular decomposition step is suggested as a mode of termination and/or destruction of potential active centers resulting in divalent titanium; probably (C2H5)2Ti. The predominant mode of termination and/or destruction of active centers appears to occur by a bimolecular mechanism which is related to the experimentally observed monomer dependence of the initial rate of polymerization.
INTRODUCTION
It lias been shown'- 9 that during the reaction of an aluminum alkyl and (C5H6)2TiCl2, soluble species are produced which have the ability to catalyze the polymerization of some olefins. The rate of polymerization was shown to be proportional to the concentration of intermediate complexes formed, specifically,5 it was shown that the rate of polymerization of ethylene was proportional to the concentration of an alkylated complex of titanium e.g. (C6H5)2TiRCl-AIR2GI.
The formation of an alkylated complex (C5H5)2Ti(C2H5)ChAl(C2H6)Cl2(II) and its reduction to a final inactive form (CsHsRTiCl-Al^H^Ck(III) , resulting from a reaction of (C6H6)2TiCl2 and A1(C2H6)2C1, have been
* Part I : See Reference 9. This paper comprises a portion of a dissertation submitted by P. A. Jarovitzky in partial fulfillment of the requirements for the degree of Doctor of Philosophy in the Graduate School of the Polytechnic Institute of Brooklyn.
1483
1484 C. G. OVERBERGER AND P. A. JAROVITZKY
associated with changes in the spectral intensities at 520 and 750 niju; respectively.4 It was further shown4 that formation of II can occur by a unimolecular rearrangement of (C5H6)2TiCl2-Al(C2H5)2Cl (I) or by a reaction of the latter with excess AI(C2H6)2CI; also, the disappearance of II was shown to be zero-order and first-order in respect to II in the range of Al/Ti ratios 5=2/1 and ¡5:4/1, respectively, both measured in the absence of monomer.
Breslow and Newburg3 observed for the (C6H5)2TiCl2-Al(C2H5)2Cl catalytic system that dialkylated complexes of titanium may play a role in these catalytic reactions. These authors also found that the rate of polymerization of ethylene, when conducted in toluene, appears to go through a maximum near Al/Ti ratios of 4; no such effect was noted when solvent was n-heptane. In toluene the viscosity-average molecular weights decreased drastically at Al/Ti ^ 1. Only a small decrease of viscosity-average molecular weights was observed in hexane with increasing Al/Ti ratios in the range of 2.0 and 6.0. The physical properties of the polyethylene prepared by this homogeneous process are as good as those obtained by heterogeneous Ziegler-Natta catalysis. A linear polymer with a narrow molecular weight distribution resulted by homogeneous catalysis, indicating that here as well as for Ziegler-Natta catalysis, coordinated growth of polymeric chains probably occurs.
Chien,2 studying the kinetics of the reaction between (C6H6)2TiCl2 and A1(CH3)2C1 as a catalyst for the polymerization of ethylene, indicated that chain termination is a result of a bimolecular decomposition of active centers, resulting in disproportionation of alkyl groups. This appeared to be the preferred termination step, at least in the studied range of Al/Ti ratios of 2-3. Also, the overall activation energy for the ethylene polymerization by this homogeneous method was 11.75 kcal./mole, compared to11.5 ± 0.05 kcal./mole reported by Natta for the polymerization of propylene by TiCl3-Al(C2H5)3 heterogeneous catalysis.
Although ionic or nearly ionic species were indicated by Long,1 Shilov et al.5-8 suggest an essentially 100% ionic character to the catalytically active species, resulting from a reaction of (CsH/kTiCk and aluminum sesquihalides. The latter supported their work by conductometric studies. Furthermore, Shilov et al.6’8 suggested that a reaction which destroys the catalytic site involves an a-H exchange with an alkyl group from the catalyst, resulting in a new, a-alkylated monomer and an inactive catalyst site. It is this type of reaction which has been claimed to be responsible for the inability of these catalytic systems to polymerize propylene or n-heptene.8
In our own laboratory it was shown,9-10 that the use of a-d-styrene instead of styrene results in a higher effective concentration of active centers by heterogeneous TiClrA1(C2H6)3 and homogeneous (CsH/kTiCL-Al- (C2H6)2C1 catalysis. It was further shown9 that the rate of formation of III was first order in II in the presence of monomer and one-half order in II in the absence of monomer. The monomers being styrene and/or a-d-styrene and Al/Ti ratio = 18.2 It was also shown that ( — d(II)/d%

POLYMERIZATION BY HOMOGENEOUS CATALYSIS. II 1485
< (—d(II)/dt)u, where the subscripts zero and M refer to the absence and presence of monomer, respectively, and ( — d(II)/clt)D > ( — d(II)/dt)H, where the subscripts D and H refer to a-d-styrene and styrene, respectively. The existence of a single isosbestic point near 650 m/i as shown earlier4 was also confirmed. It was also shown that primarily CH4 rather than CH3D was collected during a reaction of (C6H5)2TiCl2-Al(CH3)3 with 100% a-d-styrene. A reaction scheme was proposed to account for the experimental observations.
Polymerizations conducted with CD2= C D 2 by Ziegler-Natta catalysis12 showed no rate or molecular weight increase when compared to ethylene. More recently, using CD2= C D 2 and a homogeneous (C6H6)2TiCl2-Al- (CH3)2C1 catalyst11 system, no rate but molecular weight increases Avere obtained compared to ethylene. It was further shown13 by the use of NMR, that for (CsH^TiCh-A1(CH3)3 or A1(CH3)2C1 catalytic systems and using phenylacetylene as the monomer, only the titanium moiety appeared to be involved in the formation of active centers. Similar results have been obtained using styrene as the monomer and a (C6HB)2TiCl2-A1(CH3)3 catalytic system.15
It is the purpose of the following to further elucidate the proposed mechanism9 of (C6HB)2TiCl2-Al(C2H5)2Cl catalysis for the polymerization of styrene and/or a-d-styrene, in the light of additionally available data.
EXPERIMENTAL
Monomer Preparation and Purification
a-d-Styrene. a-d-Styrene was prepared by reduction with LiAlD4 as described earlier.9'10 Mass spectroscopy indicated a 97.5% purity, the majority of the impurity being styrene itself. Monomer was triply distilled in vacuum.
Styrene. Commercial samples of Matheson styrene used Avere either triply distilled in vacuum only or treated as folloAvs: (1) extracted with ca. 10% aqueous potassium hydroxide solution, (2) Avashed with distilled water until wash water remained neutral, (3) dried over molecular sieves overnight, (4) distilled in vacuum over calcium hydride. Both of these methods proved to be equally acceptable in respect to reproducibility of observed polymerization rates and final polymer intrinsic viscosities.
Styrene-a-C14. The preparation of styrene-a-C14 and subsequent determination of radioactive carbon in the polymer, carried out by means of a proportional counting technique, were reported earlier.14
p-Methylstyrene. A commercially available sample (Borden Company) was used after vacuum distillation: b.p. 59.5°C./15 mm.
m-Methylstyrene. The monomer was conveniently prepared by a Grignard reaction with m-bromotoluene and acetaldehyde. The resulting alcohol was pyrolyzed over alumina at ca. 300°C. to give the desired product in a 48.5% overall yield and pure as shown by a single peak via

I486 C. G. OVERBERGER AND P. A. JAROVITZKY
vapor-phase chromatography. The monomer was vacuum distilled; b.p. 83°C./13 mm.
Solvents
Benzene was purified by a process described earlier10 and stored over calcium hydride. Hexane was vacuum distilled over calcium hydride and stored over calcium hydride.
Determination of Polymerization Rates
The experimental technique for the determination of rates of polymerization is that used and reported earlier for the heterogeneous Ziegler-Natta system,10 a dilatometer with a 3 mm. precision bore capillary being used. Specifically a 0.37F (formality) solution of A1(C2H5)2C1 was prepared and the (C5H5)2TÌCI2 used is a commercially available sample from Chemicals Procurement Laboratories, Inc.
Polymerization rates were measured in respect to a critical time Tc, defined as the time elapsed between first contact of (C5H6)2TiCl2 and A1(C2H5)2C1 and the addition of monomer. Reaction conditions were varied in respect to Tc, Al/Ti ratio, total monomer concentration, and type of monomer and/or solvent employed.
Homopolymerization and/or copolymerization rates were determined for styrene or styrene-a-C14, with a-d-styrene, p-methylstyrene, or in- methylstyrene being used as comonomers.
3 . 0 -
a.>
Fig. 1. Effect of critical time Tc on initial polymerization rate of styrene by homogeneous catalysis with Al(C2H6)2Cl-(C»H6)2TiCl2.

Tot
ala-
d-
n-
mon
omer
M
(C2H
6)2Ti
Cl3,
St
yren
e,
Styr
ene,
B
enze
ne,
Hex
ane,
Te
mp.
, [M
t],
Tc,
vv,
Con
ver-
(2
9.3°
C.,
Run
m
ole/
1.
Al/T
i m
ole-
%
mol
e-%
vo
l.-%
vo
l-%
°C.
mol
e/1.
m
in.
cm./h
r. sio
n, %
Ce
H6)
POLYMERIZATION BY HOMOGENEOUS CATALYSIS. II 1487
05 CO CO 00 00 COO I ° o o oO o o o © o
»O 05 CO CO
O Tf IQ N CO CO
oo
CO HO COo o o o o o o o o o
OOOOINOOIXM^^COCO^OOOIOO^0 3 .........................................................^N^OrfiMOiOCOC^iOOOiOjOCDN
^ 0 5 O ^ CO
o i-O oo O 0 5 LO io CO O oO GO CO o CO CO O 05 rt4 05 COn 00 o 05 Of) cO CO o 0 5 r“H Tt4 Of; rh COo cO r-H CO ‘O iO I" UO 1 CO 1- 0 5 o CO CO 1- oO T“10 5 r-H 0 5 ° 0 5 o 0 5 0 5 0 5 o rH CO
iO t - L- oo L-» »o GO lOt"h t-H
COCO r G G
iO©-H »O 0 5 0 5 0 5
CO CO cO t H 0 5 0 5 0 5 0 5 0 5 0 5
O0 5
o o o : io o
io0 5
i-i O0 5 CO
05Oo ~
o O CO 0 5 0 0 GO O 0 5 0 0 5
iO C D C O " ** 0 5 0 5 O 0 5 0 5 "* iO N
GO 05 O O ~ O O
0 5
00O
~ CO
b n
% 77 2 50
Tot
al r
eact
ion
time
= c
onst
ant
= 40
min
.; to
tal v
olum
e =
cons
tant
= 0
.042
5 1.

1488 C. G. OVERBERGER AND P. A. JAROVITZKY
g3ü
«S I
HJPQ<1H ’ü
03 Q6 3
Gj>>OftOü
O•?« ta
o
01Ö «¿ \0s CDOhd
>> <D-d d
>> 2 Æ d
CD « d -< g O5- àVl
O
CO CO£ I o (M>o O <M
O O-fl -h
OCO (M
CD C i - , C O CO ' O ^i i i '*»?
CDd<vNJdCD
-d
dCD>OCG
cTCO
H«Í
OBG5OO
OHWd
TÍHO
r‘ÖdoOdo
«

POLYMERIZATION BY HOMOGENEOUS CATALYSIS. II 1489
All reported polymerization rate data were obtained by a least-square analysis of the raw data but are reported only in terms of centimeters/hour. A value in terms of moles/liter/hour would be subject to a considerable error, the magnitude of which would be directly proportional to unprecipitated reaction products. As it will be pointed out in the body of this report, relatively large amounts of methanol ■ HCl-soluble reaction products are formed by this mode of catalysis and with the use of styrene and/or a-d-styrene and/or styrene derivatives. These soluble oligomers then have contributed to the measured rate without being accounted for in the reported per cent conversion.
2.0 4.0 6.0 8.0 10.0 12.0 14.0 16.0 18.0 20.0[AI]/[Ti]
Fig. 2. Effect of Al/Ti ratio on initial polymerization rate with styrene and/ora-d- styrene by homogeneous catalysis with A l^H shCH CsH sLTiCL: (O) 100% styrene, Te = 5 min.; (▼) 100% styrene, Tc = 7 min.; ( • ) 100% styrene, Tc = 8 min.; (□) g 07.5% a-d-styrene, Te = 5 min.; (X ) g97.5% «-d-styrerie, Tc = 7 min.
Polymerization data obtained for homopolymers and/or copolymers of styrene and/or a-d-styrene are summarized in Table I. Polymerization data obtained for copolymers of styrene-a-G14 and p-methylstyrene and homopolymers of the styrene derivatives are summarized in Table II.
A plot of polymerization rates for styrene as a function of Tc at Al/Ti ratio of 3.0 is shown in Figure 1.
A plot of polymerization rates as a function of Al/Ti ratio for styrene and monomer mixtures of ^97.5% a-d-styrene and styrene is shown in Figure 2.
A plot of polymerization rate of styrene as a function of monomer concentration is shown in Figure 3.

1490 C. G. OVERBERGER AND P. A. JAROVITZKY
Fig. 3. Initial styrene polymerization rate vs. [M]1-5 by homogeneous catalysis with Al(C2H5)2C1~(C5H5)2TiCl2: ( X ) Al/Ti = 3.0; (O) Al/Ti = 18.2.
DISCUSSION
Based upon the data presented in Tables I and II and plotted as Figures 1-3, a reaction scheme is proposed and shown in Figure 4. I t is the purpose of the following to justify the proposed scheme which is essentially a more detailed version of the one presented earlier,9 in the light of new experimental evidence obtained in this laboratory as well as data previously published by a number of authors.
When (CsH^TiCk is reacted with AliCiHs^Cl in the absence of monomer, a series of color changes result which are very much affected by the nature of the solvent employed. If the solvent is benzene, the original orange-red solution of only (CsHs^TiCh in benzene is quickly changed to a dark reddish-green which will then change to a lighter but predominantly blue solution. If the solvent employed is hexane there is no color developed for the original (C5H5)2TiCl2-hexane mixture, probably primarily due to its poor solubility in hexane. Upon the addition of A1(C2H6)2C1 a yellow color develops which slowly darkens to a yellow-brown. These shades of yellow are quite stable up to the poim of monomer introduction, upon which an

POLYMERIZATION BY HOMOGENEOUS CATALYSIS. II 1491
2A1R2C 1 ^ = ^ A 1 2R4C12
Cp2TiCl2 + V2A12R4C12
[Cp2TiCl2 • A1R2C 1 ] [Cp2TiCl® - - - AlR2Cl2e]
[Cp2TiCl-AIR,Cl2
R.X ;[M ][A l] [T i +
[Cp2TiCl-AlR2Cl]
[Cp2Ti( M LR® - - - A1R2C120]
IReaction Sequence Similar to [Cp2TiR®— AlR2Cl2e]
[Cp2TiCl-AlR2Cl] + (M , - R)_h + (M , - R ), „
Cp2Ti + (M , — R )- h + R — H| [T i(IV )-A l)
[T i ( I I I ) • A l]
A,ic*l
K2[A1][TP
[Cp2TiCl-AlR2Cl]
R
[Cp2TiR® — A1R2C129]
fc [M ][A l][T i+]a n d /o rK [A l][T i+ ]
Dialkylated, Ti(IV) complexes
Reaction sequence similar to monoalkylated, Ti(IV) complexes
[Cp2TiCl-A1R2C1] *„(M1[C*1*1 |------------ * (M)„
(M)xI
R
Decomposition sequence similar to [Cp2TiCl-AlR2Cl]
(MLI
RPig. 4. Reaction scheme for the polymerization of styrene by homogeneous catalysis
with Al(C2Hs)2Cl-(C6H6)2TiCl2. '
immediate development of green occurs which quickly changes to a predominantly blue solution; e.g., the change to the blue is much quicker than in a benzene solution, once a green shade has formed, all other conditions being equal. As has been pointed out previously,9 the use of monomer accelerates the production of the inactive blue solution. Specifically, the use of a-d-styrene produces a blue solution faster than does styrene. Moreover, the use of solvent of high hexane content rather than benzene alone, as well as the use of 2; 97.5% a-d-styrene rather than 100% styrene results in a high yield of a solid polymeric product under experimental conditions which for 100% styrene and 100% benzene yield only trace quantities of solids; (compare IV-11, IV-56, and IV-52 of Table I).

1492 C. G. OVERBERGER AND P. A. JAROVITZKY
I t is suggested that benzene produces an equilibrium which favors ionic species, e.g.,
+[(C5H 5)2TiCl2-Al(C2H 5:2Cl] v± [(C5H5)2TiCl........A1(C2H6)2C12] (1)
the stability of which appears however, not to be due to dielectric effects of the solvent but rather due to complexation with the x-electron systems of an aromatic moiety; e.g.,
(C5H5) 2TiCl- -A1(C2H5)2CI2
which is a type of Friedel-Craft adduct. This further suggests that toluene probably functions primarily as a 7r-complexer rather than providing a high dielectric medium. It is then plausible that I is converted to an active species for polymerization by alkylation on titanium but that this reaction can be accomplished in at least three ways. Two of these methods have been suggested earlier, 4 e.g., a unimolecular rearrangement of I to form (C5 I I.u/I'iRCl • AKCYl U)Gli( II) and by a reaction of I with excess A1(C2H5)2- C1 to form II. I t is now proposed that the alkylation of I with excess A1(C2H 6)2C1 occurs primarily with its ionic form, as shown in Figure 4, in solvents which either have high dielectric properties and/or are aromatic, while unimolecular formation of II probably occurs in solvents which have low dielectric properties and/or are nonaromatic. Complex II arising from a reaction of A1R2C1 and the ionic form of I is probably better represented by (C6H6)2TiRCl-AIR2CI. A third possibility of forming active centers occurs in aromatic and/or solvents of high dielectric properties with monomer and the ionic forms of species I and II; this, in turn, appears to be a faster reaction than alkylation by excess A1(C2H5)2C1, as shown in eq. (2) for the ionic forms of I, but omitting the solvation of the ion pair.
[(C6H5)2TiCl_____ A1(C2H„)02C12]H
(C5H6)2Ti—CH2—C! \
Cl R
C H i= G H R
_A1(C2H 5),C1,>/=(A1RîC1)2
(C5H5>,TiCl ■ A1(C2H 6)2C1( = II-M )
Ah.R—C—H
!C2II6 (2)
Species II-M is essentially like II, differing only in the nature of R. While this is a mode of production of active centers, it can equally well be a mode of cationic propagation, e.g., with formation of

POLYMERIZATION BY HOMOGENEOUS CATALYSIS. II 1493
(C5H5)2TiCLAl(C2H5)2Cl
CH2I
R —C— H i—I—1c 2h 5
(Cp )2TiCl • A1R2C1
where (Cp) = (C5H5) and where x may be unity and if larger than unity is probably small under these experimental conditions. It was therefore of interest to copolymerize styrene with styrene derivatives which support an a-carbonium ion, e.g., p-methylstyrene. These experiments are summarized in Table II. The use of styrene-a-C14 permitted determination of copolymer composition by using a method reported earlier.14 The data of Table II (using rim IV-36 of Table I as a reference) indicate that: (a) the rate of homopolystyrene formation is much slower than the rate of homo- poly-p-methylstyrene formation; (b) a 50/50 mole-% feed of styrene and p-methylstyrene results in polymer of ^70 mole-% of p-methylstyrene, near 30% conversion; (c) the increase in the rate of polymerization is an approximate linear function of the ¡»-methylstyrene content of the comonomer mixture.
Visually, the rate of appearance of the blue color was much enhanced (almost doubled) when p-methylstyrene was used rather that styrene. These data collectively support a predominantly cationic initiation mechanism. The use of m-methylstyrene (IV-62 in Table II) results in a rate of polymerization which is the same (within experimental error) as that for styrene itself. Visually, the rate of appearance of blue is the same for both m-methylstyrene and styrene. Nevertheless, m-methylstyrene results in a 100% methanol-HCl-soluble reaction product. These data, although at present not clearly understood, suggest a mode of termination without accompanying destruction of active centers, suggesting a penultimate effect in coordinated anionic growth resulting in termination by monomer.
It should be noted that the orientation of monomer in respect to titanium in species II-M should be such that the more stable carbonium ion results and therefore contrary to the orientation one would expect for an essentially nonionic or coordinated-anionic mechanism via monomer insertion into II. The latter could then be referred to as normal or coordinated catalysis proposed earlier by many authors: e.g., a coordinated-anionic propagation of styrene, as shown in eqs. (3) and (4) for II and II-AI^.
(C5H6)2TiCl-AlR2ClI
R IIII
CsHiICHi=CH
(CsHs )2TiCl • A1R2C1 (Cp)2TiCl • AlRiClI
(M)„
R
R
(3)

1494 C. G. OVERBERGER AND P. A. JAROVITZKY
(C6H5)2TiCl • AlRaClI
(MEI
R
II-M ,
c 6h 6
CHjJur-> (C5H5)2TiCl • A1R2C1 (Cp),TiCl-AlR,Cl
H—C—C6H6
¿h2 =‘—I—1»(MER
(M)ff
(MEI
R (4)
Here y represents the number of monomer units incorporated by Coordinate-anionic propagation. H is expected that a ratio of y/x would increase with decreasing stability of an intermediate monomer carbonium ion, e.g., ethylene should by this mechanism have a maximum ratio of y/x.
For propylene however, the same alkylated products would probably be obtained by either use of the ionic species of I to form II or a normal initiation by II.
It is proposed that the reaction of the ionic species of I or II provides the clue to the observed isotope effect by the use of a-d-styrene, e.g., the increase in the rate of polymerization. This is shown in eq. (5) for the ionic species of I :
[(C5H5)2TiCl_____ A1(C2H5)2C12]/ H ( D ) \
CHj = C + K (A 1R 2C1)2 r-AIRChCeHs / R
Kdf( C*)(II-M ) [(C5H5)2TiCI■ Al(C2H5)2Cr -------- > (C5H5)2Ti +
ClC H i=C
HEC6H5—C—H(D)
IR
K d KC *)*
(III) [(C6H5)2TiCl-Al(C2H6)2Cl] [Ti(III) • Al]
l R—H(D)c 6h 5
[T iIV -A l]
II/
c h 2= c\
c 6h 6
+ (D)H—CH2-
H(D)
-A
kR
iH6
(5)
Neither a unimolecular nor a bimolecular decomposition mechanism of active centers (C*) alone appears to be able to account for all experimental facts; i.e., both should be retarded by a-deuterium or have a low value for the isotope factor / ; e.g., one must explain both, the increase in rate of polymerization and the increase in production of inactive species with the use of cc-d-styrene when compared to styrene.
The earlier and more general scheme9 indicated the formation of an unknown species X, which in turn must result in inactive complexes of Ti(III)

POLYMERIZATION BY HOMOGENEOUS CATALYSIS. II 1495
but probably at a slower rate than a more direct formation of inactive Ti(III) complexes from a decomposition of active centers.
I t is now felt that X is produced by a unimolecular decomposition of active centers and probably corresponds to divalent titanium; e.g., (C6HS)2- Ti. The latter can react further with [Ti(IV)-Al] complexes to result in inactive [TillTAl] complexes by disproportionation. The disproportionation reaction of Ti(II) and Ti(IV) would probably be the rate-determining step for the production of inactive [Ti(III)-Al] complexes by unimolecular decomposition of active centers.
The decomposition of species I I - b y either mechanism would result in the formation of an a-alkylated new monomer when x — 1. When x > 1, low molecular weight oligomeric products would result. A similar mechanism has been suggested for the failure of this and similar catalytic systems to polymerize propylene and heptene.8’11
A bimolecular disproportionation of active centers has been suggested to be the exclusive mode of polymer termination in the (CsHg^TiCVAKCHa^ C1 system.2
Spectral data collected by the writers9 and others4 at 520 niju for the (CsH^TiCh • A1(C2H5)2C1 system indicate a decomposition of active centers (if in fact absorption at 520 m/x represents the absorption of active centers) which is zero- to first-order, depending on the Al/Ti ratio and/or the presence of monomer.
Moreover, careful examination of the spectra indicates that in the presence of monomer absorption for the (CsHs^TiCk -A l^H s^C l system also occurs at ca. 450 m/x. The disappearance of this peak, however, appears to vary between one-half and first order in respect to the absorbing species for lower and higher monomer concentrations respectively ; e.g. also showing no correspondence to a bimolecular decomposition.
It is felt at present that little weight can be given to spectral changes in this system, since all available polymerization data taken collectively for the (CsH/hTiCk -Al(CiH5)2Cl system appear to favor a bimolecular decomposition of active centers as the predominant mode of termination.
Initial efforts to polymerize styrene by the (CsHs^TiCk- A1(C2HB)2C1 system in the presence of varied substrates have shown that if the substrate represents a large surface area (e.g., activated charcoal), the lifetime of active centers can be almost doubled, and this supports a bimolecular decomposition mechanism of active centers.
Examination of Figure 2 indicates that three rate maxima exist near Al/Ti ratios of 3.0, 11.0, and 16.0. Although three rate maxima are indicated, available intrinsic viscosity data show only a small dependence on Al/Ti ratio in this range. Polymers were rated visually as to their color after purification by methanol washing and vacuum drying at ca. 60°C. and 10-15 cm Hg. It was evident that drying under these conditions produced a deterioration of polymer color roughly inversely proportional to the rate at which they were formed. All samples appeared to contain some low molecular weight products as shown by Schliering of the methanol wash of the solid reaction product. It is believed that low molecular weight

1496 C. G. OVERBEIIGER AND P. A. JAROVITZKY
oligomers are formed under all experimental conditions but especially so at those Al/Ti ratios where rate minima are indicated. As per the reaction scheme shown in Figure 4, the decomposition of complexes of type 11-3,1 j. would explain the low molecular weight oligomeric products representing cationically formed oligomers. The use of a-d-styrene results in solid, polymeric products at all tested Al/Ti ratios and in polymerization rates which, contrary to styrene, appear to be a linear function of the Al/Ti ratio employed.
It is believed that the excessive formation of methanol-HCl-soluble reaction products with styrene is based on a maximum concentration of ionic species, yielding maximum concentrations of active centers, but where the decomposition rates are larger than the propagation rates. The fact that further increases in the Al/Ti ratio can again yield rate as well as molecular weight maxima may then reflect a stepwise build-up of equilibria as suggested by the reaction scheme shown in Figure 4. Eventually this may lead to dialkylated, tetravalent titanium at minimum concentration of ionic species.
While it is most difficult at best to explain the existence of three rate- maxima in the Al/Ti range of S.0-16.0, it is, however, reasonable to suggest (based on the scheme as shown in Fig. 4) that these maxima are due to:(a) different modes of production of species of type II which may differ in their stability and/or mode of reduction to inactive species or (b) different modes of production of dialkylated species which may differ in their stability and/or mode of reduction to inactive species.
A combination of both (a) and (b) may then yield three rate maxima. At Al/Ti near 3.0 essentially monoalkylatcd species may be involved compared to an Al/Ti ratio near 16.0 where essentially dialkylated species may be involved. It is probable that the rate maximum near Al/Ti near 11.0 is a complicated function of bo:h monoalkylated and dialkylated species.
An attempt is made below to evaluate kinetically the scheme presented in Figure 4 with the following assumptions: (a) Ai[I] « /v2[Ti+][Al] < Ki [Ti+] [A1 ] [M ]; (6) steady-state conditions can be applied to the production of active centers; (c) bimolecular disproportionation of active centers is the predominant mode of decomposition. Then:
d[C*]/dt = /i,[Ti+][Al][M] - kdf[C*]2 = 0
where/denotes the fact that an isotope effect is operative, i.e., a small value of / is expected for a-d-styrene and a large value of / for styrene.Thus
[C*] = (K i [Ti+] [A1 ] [M ]/K J ) ,/" = K [M ]°-s
and
V, = A„[C*][Mr
where Vv = observed polymerization rate, K v = overall polymerization constant, [C*] = concentration of active centers of type (C5H6)2TiItCl--

POLYMERIZATION BY HOMOGENEOUS CATALYSIS. II 1497
A1R0C16, | A I ) = monomer concentration, and r = order of propagation with respect to monomer.
ThenVp = K pK[Mr+o-o
It is therefore suggested that the experimentally observed monomer dependence is an overall monomer dependence derived from the propagation reaction proper and the production of an effective concentration of active centers [C*]; e.g.,
= K,[ C*][UY = K vK[MY+a = K PK[Ml*
where x = experimentally observed overall monomer dependence, r — real or true monomer dependence of the propagation reaction, a = monomer dependence of [C*!.
Based on the above, the overall monomer dependence x can then be expected to be equal to 1.5 for a predominantly bimolecular termination- reduction.
Based on the data of Table I plotted in Figure 3, the polymerization rate does appear to be proportional to [M]1-5 at the two extremes of experimental Al/Ti ratios.
A similar treatment for Ziegler-Natta catalysis with styrene and/or a-d-styrene has yielded identical results.10
We wish to thank Mr. Toby Chapman of the Polytechnic Institute of Brooklyn, Department of Chemistry, for supplying the styrene derivatives and the radioactive counting of the copolymers prepared with styrene-a-C14.
References1. Long, W. P., Am. Chem. Soc., 81, 5312 (1959).2. Chien, J. C. W., J. Am. Chem. Soc., 81, 86 (1959).3. Breslow, D. S., and N. R. Newburg, J. Am. Chem. Soc., 81, 82 (1959).4. Long, W. P., and D. S. Breslow, J. Am. Chem. Soc., 82, 1953 (1960).5. Stepovik, L. P., A. K. Shilova, and A. E. Shilov, Dokl. Akad. Nauk SSSR, 148 ,122
(1963) .6. Zefiiova, A. K., N. N. Tichomirov, and A. E. Shilov, Dokl. Akad. Nauk SSSR, 132,
1082 (1960).7. Zefirova, A. K., and A. E. Shilov, Dokl. Akad. Nauk SSSR, 136, 599 (1960).8. Shilov, A. El, A. K. Shilova, and B. N. Bobkov, Vysokomol. Soedin., 4, 000 (1962).9. Overberger, C. G., F. S. Diachkovsky, and P. A. Jarovitzky, J. Polymer Sci., A2,
4113 (1964).10. Overberger, C. G., and P. A. Jarovitzksr, paper presented at International Sym
posium of Macromolecular Chemistry, Paris, France, July 1-5, 1963; J. Polymer Sci., C4, 37 (1964).
11. Grigoryan, E. A., F. S. Diachkovsky, and A. E. Shilov, Vysokomol. Soedin., in press.
12. Rekasheva, Z. F., and L. A. Kiprianova, Vysokomol. Soedin., 3, 1446 (1961).13. Diachkovsky, F. S., P. A. Jarovitzky, and V. F. Bystrov, Vysokomol. Soedin., 6,
659 (1964).14. Overberger, C. G., and F. Ang, J. Am. Chem. Soc., 82, 929 (1960).15. C. G. Overberger, F. S. Diachkovsky, and P, A. Jarovitzky, unpublished data
(1964) .

1498 C. G. OVERBERGER AND P. A. JAROVITZKY
RésuméLes vitesses initiales de polymérisation ont été déterminées dans le cas de la poly
mérisation et de la copolymérisation du styrolène, a-C1'1 styrolène, a-d-styrolène, p- méthylstyrolène et i/t-u léthy Ist y ri ilèi le avec un système catalyseur homogène (CôH5)2- TiCl2-Al(C6H5)2Cl. Les vitesses d’homopolymérisation du styrolène en fonction du taux Al/Ti indiquent la présence ce trois maxima de vitesse, d’intensités sensiblement égales, ayant lieu pour des taux Al/Ti voisins de 3.0, 11.0 et 16.0. Des copolymérisations à 5: 97.5% d’a-d-styrolène et de styrolène ne présentent plus de maximum de vitesse en fonction du taux Al/Ti mais semblent suivre une relation linéaire en fonction du taux utilisé. L’a-d-styrolène présente des vitesses initiales de polymérisation plus grandes que celles du styrolène dans les conditions expérimentales employées. Cet accroissement des vitesses en fonction de la deutération du monomère en position « est à relier avec une plus grande concentration des centres actifs. Un schéma réactionnel est proposé dans lequel le mode de formation prédominant des centres actifs à lieu par alcoylation du titane mais par un mécanisme cationique. L’effet isotopique observé dans le cas de l’a-d-styrolène est à relier à la stabilité des centres actifs cationiquement formés. La destruction de ces centres actifs semble produire soit un nouveau monomère «-alcoylé, et des oligomères de bas poids moléculaire. On a proposé un pas de décomposition monomoleculaire isotopiquement contrôlé comme mode de terminaison ou de destruction des centres actifs potentiels provenant du titane divalent, probablement du (CsH,)2- Ti. Le mode prédominant de terminaison ou de destruction des centres actifs semble se produire par un mécanisme bimoléculaire en rapport avec la relation expérimentale observée entre la vitesse initiale de polymérisation et le monomère.
ZusammenfassungDie Anfangspolymerisationsgeschwindigkeiten der Homo- und Copolymerisationen
von Styrol, Styrol-a-C14, «-d-Styrcl, p-Methylstyrol und m-Methylstyrol wurden bestimmt, wobei das homogene (CäHskTiCL-AKCoHshCl Katalysatorsystem verwendet wurde. Die Geschwindigkeiten der Homopolymerisation von Styrol zeigen in Abhängigkeit vom Al/Ti Verhältnis drei Maxima von offensichtlich gleicher Grösse in der Nahe der Al/Ti Verhältnisse von 3.0, 11.0 and 16.0. Copolymerisationen von ä 97.5% a-d-Styrol in Abhängigkeit vom Al/Ti Verhältnis wiesen keine maximalen Geschwindigkeiten auf, waren aber dem angewandten Al/Ti Verhältnis direkt proportional. «-d-Styrol hatte unter allen angewandten experimentellen Bedingungen höhere Angangspolymerisationsgeschwindigkeiten als Styrol. Diese Geschwindigkeitszunahmen in Abhängigkeit von der Deuterierung am «-Kohlenstoffatom stehen mit der höheren Konzentration an aktiven Zentren in Zusammenhang. Es wird eign Reaktionsmechanismus vorgeschlagen, in dem die Bildung von aktiven Zentren hauptsächlich durch Alkylierung des Titans erfolgt, wobei aber ein kationischer Mechanismus vorliegt. Der bei der Verwendung von a-d-Styrol beobachtete Isotopeneffekt wird auf die Beständigkeit, der kationisch gebildeten aktiven Zentren zurueckgeführt. Es wird vorgeschlagen, dass die Zerstörung dieser aktiven Zentren entweder zu a-akylierten neuen Monomeren und/oder zu niedermolekularen Oligomeren führt. Als eine Abbruchsreaktion und/oder Zerstörung von möglichen aktiven Zentren wird eine isotopisch kontrollierte monomolekulare Zersetzung vorgeschlagen, wobei bivalente Titaniumverbindungen, wahrscheinlich (C5H6)2Ti, entstehen. Die überwiegende Abbruchsreaktion und/oder Zerstörung von aktiven Zentren scheint über einen bimolekularen Mechanismus zu erfolgen, der auf die experimentell beobachtete Abhaengigkeit der Anfangspolymerisationsgeschwindigkeit von der Monomerenkonzentration zurueckgeführt wird.
Received May 21, 1964 (Prod. No. 4438A)

J O U R N A L O F P O L Y M E R S C I E N C E : P A R T A V O L . 3 , P P . 1 4 9 9 - 1 5 1 4 ( 1 9 6 5 )
Ferrocene-Containing Polymers. V. Polycondensation of )imethylamiiiomethylferrocene
EBERHARD W. NEUSE and EDWARD QUO, Polymer Laboratory, Missile & Space Systems Division, Douglas Aircraft Company, Inc., Santa
Monica, California
SynopsisThe self-condensation of the ferrocenyl Mannich base, Ar,A-dimethylaminornethyl-
ferrocene, in the presence of a ZnCL-HCl catalyst system in the melt phase leads to soluble polymers containing ferrocenylene units interlinked by methylene groups. The crude condensation products exhibit number-average molecular weights in the range 4000-8000. Elemental and infrared spectroscopic analyses as well as viscometric data show the structure to be essentially identical with that of the polymer derived from hydroxymethylferrocene described in an earlier communication. The optimum molar ratio of the reactants (Mannich base, ZnCL, and HC1) is 2:1:2. Dimethylammonium tetrachlorozineate has been isolated as by-product, and an intermediary complex composed of Mannich base, ZnCl2, and HC1 in the same 2:1:2 ratio has been intercepted during the polycondensation. Some mechanistic inferences are discussed.
INTRODUCTION
In a recent communication,1 the acid-catalyzed polycondensation of ferrocenyl carbinols was described. The polymers obtained were composed of recurring units of the type +Ci0H8Fe-CHR+, with R standing for H, CH3, and CeH6 in the instances investigated (following conventional usage, the abbreviated forms C10H9Fe- and -Ci0H8Fe- denote the mono- substituted ferrocenyl and disubstituted ferrocenylene groups,respectively). Accordingly, in the simplest case with hydroxymethylferrocene (I) as starting material, the resulting polycondensation product was assigned the novolac-type structure +CioH8Fe-CH2+ K.
I
A random distribution sequence was assumed, which involved the homo- arid heteroannular dispositions depicted by the segment structures II. For the purpose of this paper, the structure of the hydroxymethylferrocene polymer may be represented by the simplified scheme III, in which the
1499

1500 E. W. NEUSE AND E. QUO
position of the left-hand substituent link reflects the random substitution pattern involving the segments II. As a result of a terminating selfsubstitution reaction, the backbone of III was believed to contain a terminal (R" = H) or internal (It" = residual polymer chain) double-bridged segment as represented by the four possible homo- and heteroannular structures IV. Propagation was assumed to proceed by an ionic mechanism, and metallocarbonium ions, in the simplest case exhibiting the general structure V, were postulated as intermediates.
IV, R = residual polymer chain; R" = H or residual polymer chain

FERROCENE-CONTAINING POLYMERS. V 1501
Va. R = H Via, n = 1Vb, R = residual polymer chain VIb, n > 1
It has now been found that a polymer having essentially the same structure III results from polycondensation of V,V-dimethylaminomethyl- ferrocene (Via). This Mannich base2 is a precursor in the sequence of preparative steps leading to carbinol I. The new synthesis described in this paper, therefore, represents a more direct route to polymer III.
RESULTS AND DISCUSSION
Polycondensation Reaction and Polymer Structure
The self-condensation of Mannich bases derived from phenolic compounds to form low-molecular polymers of the novolac type, i.e., compounds with aromatic nuclei and methylene groups alternating in the chain, has recently been reported in the literature.3 Polycondensation through elimination of dimethylamine was brought about by simply heating the starting material at 200°C. in the absence of catalysts. The reaction was assumed to proceed via polynuclear compounds bearing terminal or possibly internal amino groups, carbonium ions being involved in the formation of these intermediates.
Attempts in this laboratory to eliminate dimethylamine from the corresponding ferrocenyl derivative Via by applying analogous experimental conditions were unsuccessful, and no polymer formation was observed. Therefore, the effect of a variety of acidic compounds as potential catalysts was investigated. The generation of iron-carbonium ions of the type V would be expected in the presence of such catalysts. These transitory species should propagate by a mechanism similar to that operative in the polycondensation reactions of the carbinol I, except that polymeric amines would possibly be involved as intermediates in place of ethers. The experiments showed mineral acids such as HC1 and H2SO4 to be inefficacious in catalyzing linear polycondensation, with competing reactions resulting instead in crosslinking and decomposition of the ferrocene unit. Similar side-reactions, albeit coupled with some polymer formation, were observed with strong Lewis acids, such as A1C13 or BF3. I11 contrast, the weak Lewis acid, zinc chloride, proved to be a highly efficacious catalyst and, hence, was employed in all reactions herein described. However, in order to attain high polymer yields within acceptable reaction times, it was necessary to use the compound in a concentration as high as 50 mole-% and in combination with 100 mole-% of hydrogen chloride. HC1 could be

1502 E. W. NEUSE AND E. QUO
introduced either as hydrochloric acid or in the form of the hydrochloride of the Mannich base, VII (prepared by reaction or equimolar amounts of Via and HC1 in methanol). The latter procedure, while offering the
CII3
CioH9Fe—CH2— -HC1\
CH3VII
advantage of accurate dosage coupled with short reaction times, was not always found to give reproducible yields, probably because of incomplete homogenization of the reactants owing to the infusibility of VII. By adding, instead, the required equimolar amount of HC1 as aqueous hydrochloric acid, the initial reaction mixture remained liquid long enough to allow for more homogeneous distribution of the Lewis acid. Therefore, this procedure, which also avoided the additional step of preparing the hydrochloride VII, was preferred in spite of the longer reaction times involved.
The polycondensations were carried out by reacting in the melt phase, in a molar ratio of 2:1:2, the Mannich base, Via, with zinc chloride and concentrated aqueous hydrochloric acid (analogously, for condensations
TABLE II
Expt.no.
Crude Polymer Anal. foundb for crude polymer
Mn M.p.. CC.° c, % H, % Fe, %°
i 4,150 150d 66.44 5.47 27.512 9,800 — 66.66 5.57 27.783 4,900 170d 66.78 5.30 27.684 3,200 140d 66.80 5.25 27.725 1,320 130 67.25 5.33 24.31=6 3,150 150d 66.62 5.21 27.627 5,850 155 66.98 5.09 27.788 1,780 200f 66.30 5.42 25.79s9 4,850 160d 67.08 5.22 27.43
10 5,750 170d 66.79 5.24 27.82
* Upper limiting value of melting range. b Anal. Calcd. for III: C, 66.71%; H, 5.09%; Fe, 28.20%.0 Up to 0.8% low for higher molecular compounds. See experimental part. d Partial melting. e Impure; contains 0.52% N.' Sintering only. e Impure; contains 1.86% Cl.
of the hydrochloride VII with zinc chloride, the molar ratio employed was 2:1). The temperatures applied ranged from 150 to 180°C., preferably 170°C., with total heating times of 3-7 hr. Upon suitable separation from both the dimethylamine salt VIII (see below) and traces of cross- linked material, the crude polymer was obtained as a yellow powdery solid in yields of 85-95%, with number-average molecular weights Mn in the range of 4000-8000. The first two experiments summarized in Table
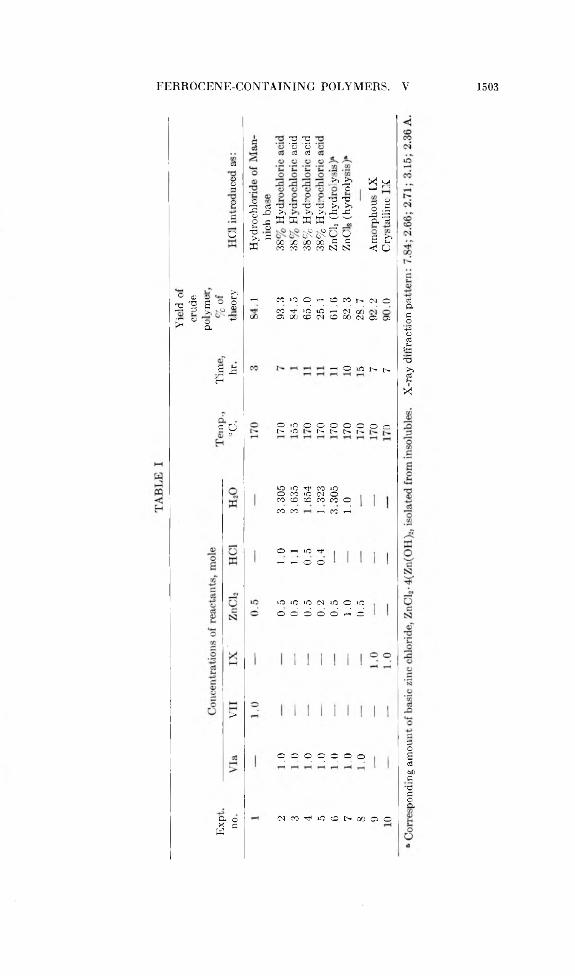
FERROCENE-CONTAINING POLYMERS. V 1503
c3
©©©O
O
O <D © ^2 'S i 1 2S ü o ^r * CL
a 2H
S 9
>
A o x Ö W
I jo ^ O X £ o ©3>> Öw
^ 2'Ö '©o3 c3
S,£> X k>O s—i r :T3 "Ö5>jW ffiCO CO CO CO
T3 ^ "Ö T3 >> >->>i >> ¿3 r©w a ^iSk§0 OCO CO C =co co CS3 IS3
r-t u;§ .s-Ö ¡3o. o3S &< o
rH CO > o o l-H CD CO i> (N oCO TiH >C IO rH ©1 0 0
0 0 0 5 O J CD ON CD 0 0 o\ 0 5 0 5
r-< O u© 1>- j>.
0»0 0 0 0 0 0 0 o t" »O t> I— l> 1>
*D IO Ti< CO ioo CO ID <N oCO CD CD CO CO oCO CO T-( CO i—i
O H IQ Tt<
r-H H © ©
IQ IO IO (M lO O lO O O © © © T-i ©
O O O O O O o
CiCO^iOcONcOQO
c3ftÖo’-+30gSB-S£Lh1X
©oa03bOC'SÖ©ft

1504 E. W. NEUSE AND E. QUO
I are representative examples of both procedures discussed. The pertinent analytical data for the crude polymers are given in lines 1 and 2 of Table II. In both instances, the elemental analyses show satisfactory agreement with structure III.
Slight increases in the concentration of HC1 over the stoichiometric limits, while resulting in essentially unchanged yields and compositions, led to noticeable reductions in the overall heating time, as is demonstrated by experiment 3. At the same time, however, increasing crosslink formation and even decomposition of the ferrocene unit was observed, necessitating careful control of the proceeding condensation to ensure termination at the point of optimum content of soluble polymer. With HC1 concentrations increasing well above the 1.1 mole level (for every mole of Mannich base), the yield in soluble polymer dropped progressively in favor of crosslinked matter and decomposition products, to reach near-zero level with a twofold molar excess of HC1 after 2 hr. at a temperature as low as 130°C. On the other hand, with concentrations of both or either one of the catalyst components reduced below the 2:1:2 ratio, correspondingly decreased yields and molecular weights were observed even at considerably prolonged reaction periods. In addition, the condensation products frequently showed deviations in elemental composition from that of structure III. Typical experiments demonstrating these observations are listed in Tables I and II as experiments 4, 5, and 8. The last-named experiment was conducted with the use of zinc chloride as the sole catalyst. If, in this instance, water was added in concentrations of 0.5-3.5 mole/ mole of Mannich base, run 6 being a typical example, considerably improved yields were observed, coupled with good agreement between found and calculated composition. Here, the amount of HC1 required as cocatalyst was probably generated by partial hydrolysis of the zinc salt. Consistent with this view, still further yield improvements were achieved by employing an equimolar ratio of Mannich base, zinc chloride, and water (No. 7) so as to establish approximately the same 2:1:2 stoichiometry of Via, ZnCl2, and HC1 as employed in examples 1 and 2. The hydrolysis of zinc chloride was confirmed in experiments 4, 5, 6, and 7 by the isolation of basic zinc chloride, ZnCl2-4Zn(OH)2, identified by x-ray diffraction.
For analytical purposes, in several instances the crude polycondensation products were subdivided into fractions of improved monodispersity. This was accomplished by fractional precipitation of the chromatographically prepurified polymers in the conventional manner. Each fractionation series was so conducted as to bring the total number of fractions to 12-15. Individual Mn values of fractions thus obtained were in the range of 1500-20,000. The analytical data on 12 subfractions of a typical polymer batch are collected in Table III, along with melting points, M„, and weight fraction. Again, agreement in elemental composition with structure III is demonstrated for all fractions, as was previously shown for the unfractionated polymers. In particular, the constancy of the composition with

FERROCENE-CONTAINING POLYMERS. V 1505
TABLE III
Fractionno. M n
M.p.,»°C.
Weight fraction, %°
Anal. Foundb
C, % H, % Fe, %i
i 19,900 — 9.1 66.50 5.20 27.852 15,700 — 11.6 66.79 5.15 27.593 12,200 — 12.2 66.83 5.09 27.804 10,100 — 8.9 66.67 5.16 27.955 9,000 — 5.1 66.51 5.08 27.766 7,900
ooCM 13.2 66.97 5.33 27.977 6,400 200e 4.9 66.71 5.07 28.018 4,850 170-200' 8.8 66.49 5.22 28.079 3,250 160-175' 11.1 66.66 5.14 27.91
10 2,940 160-165 6.8 66.89 5.20 28.2811 2,260 155 4.6 66.99 5.31 27.8312 1,710 150 3.7 66.60 5.08 28.13
" Upper limiting value of melting range.b Mean values from duplicate determinations. Anal. Calcd. for III: 66.71%; H,
5.09%; Fe, 28.20%.c In % of total weight of fractions collected. Evaporation residue from final mother
liquor, mainly consisting of decomposition products (<5% of initial polymer weight. Only partially soluble in benzene) is not included in this compilation.
d Up to 0.8% low for higher-molecular compounds. See experimental part.0 Sintering only.' Partial melting.
varying molecular weight, as required for III, becomes apparent from this tabulation.
In conformity with these analytical findings, the polymer did not differ in appearance and properties from the polycondensation product III of hydroxymethylferrocene.1 While the crude polymer, due to mutual depression by its polyhomologous constituents, showed partial melting in the 130-160°C. range, the fractionated material, with the exception of the lower members, was no longer fusible within the temperature range investigated (up to 300°C.). The infrared spectra of the fractionated and unfractionated polymer, within comparable molecular weight ranges, proved to be superimposable with those of polymer samples derived from the carbinol I, showing absorption characteristic of the substituted ferrocene system and the methylene bridging unit as discussed previously1 at greater length.
Employing a number of sufficiently monodisperse fractions, a viscosity- molecular weight relationship was established. To this end, dynamic viscosities ri were measured at different concentrations in benzene solution, from which in the usual manner the intrinsic viscosity [jj] was derived. In Figure 1, the [?;] values are plotted on a log-log scale against the number- average molecular weight. The graph obeys a common Mark-Houwink relation of the following type:
[v] = 8.2 X 10- 4 MOAOFor comparison, the plot contains three points determined on fractions of
the hydroxymethylferrocene polymer. The points, depicted by filled-in

1506 E. \V. NEUSE AND E. QUO
Fig. 1. Intrinsic viscosity [jj] vs. number-average molecular weight M n for polymer III prepared by condensation of: (O) iVpV-dimethylaminomethylferrocene; ( • )hydroxymethylferrocene.
circles, show satisfactory coincidence with the curve, thus giving further evidence for identity of both polymer series III in their essential structural features. The low value of the exponent in the above relationship suggests the polymeric molecules to be more globular than rodlike in shape, as was earlier concluded for a related polymer series.1 Such globular shape, brought about by side-chain formation, is further substantiated by spectroscopic data (below).
Assuming an ionic mechanism involving electrophilic attack by cationic species of the type V, the resulting polymer backbone is unlikely to be composed of building units strictly identical with respect to the relative substituent positions. Rather, as in the case of polymer III derived from carbinol, one has to assume a mixed structure in which isomeric recurring units as represented by the three segment formulae II are randomly distributed along the chain. Aside from steric influences, these orientations are probably governed primarily by inductive and hyperconjugative effects resulting in homoannular activation and, hence, predominant homoannular substitution along the backbone (steric factors would suggest slight predominance of the 1,3-pattern4-8).
With increasing chain length and correspondingly diminishing concentration of monosubstituted ferrocenyl endgroups an increasing extent of branching should be expected,1 with branch points for steric reasons appearing prevailingly on heretofore unsubstituted “hetero” rings (see below). In order to demonstrate this expected decreasing availability of unsubstituted rings with growing molecular weight, the per cent homo- annularity was determined spectroscopically for 15 fractions of different molecular weight following a previously described procedure1 based on a quantitative evaluation of the 9-/r band.9 The fractions were randomly selected from various fractionation runs, employing polymer batches obtained under the experimental conditions of runs 1-4 and 7 of Table I. The per cent homoannularity is defined as the ratio, in per cent, of the number of ferrocene units bearing an unsubstituted cyclopentadienyl ring

F E R R O C E N E - C O N T A I N I N G P O L Y M E R S . V 1507
Fig. 2. Per cent homoannularity vs. number-average molecular weight M n for polymer I II prepared by condensation of: (O) V,Ar-dimethylaminomethylferrocene; ( • ) hy- droxymethylferrocene.
to the total number of ferrocene units in a given molecule. Figure 2 presents a plot of the values found as a function of Mn.
It can be seen from this graph that early prevalence of homoannularity in the backbone is indeed quickly offset by a growing extent of branching via hetero-ring substitution as observed in the analogous curve for the hydroxymethylferrocene polymer1 replotted in Figure 2 for comparison.* In the idealized structure III this branching effect was not taken into account.
Dimethylamine Salt VIII and Adduct IX
The requirement, discussed above, for a 2:1:2 molar ratio of Mannich base, ZnCl2, and HC1 to achieve optimum polyeondensation conditions strongly suggests that ZnCl2 and HC1, if used in concentrations not exceeding the stoichiometry, rather than functioning as catalysts in the strictest sense of the word, be considered as reactants that are consumed during the process of condensation. In support of this view, it was possible to isolate from the final reaction mixtures a saltlike by-product in 75-85% yield, for which elemental analysis was in agreement with the composition VIII of an adduct of dimethylamine, ZnCl2, and HC1 in the molar ratio 2:1:2. For this complex in its crystalline state (investigated as protio- and deutero- compound), chemical, infrared, and NMR spectroscopic evidence points to the ionic structure of dimethylammonium tetrachlorozincate.
CH3
2HN/ -ZiiCl2-2HC1
^CHsVIII
In aqueous solution, the salt was found to dissociate into the dimethyl- ammonium cation and the tetrachlorozincate anion following eq. (1). Molecular weight determinations conducted in ethanolic solution were
* The upward shift of this curve suggests a lower degree of branching for the hydroxymethylferrocene polymer as compared to the Mannich base condensation product, which may be the result of the substantially milder reaction conditions applied (0.75-1.5 hr. at 110-125°C. compared to 1-11 hr. a t 155-170°C.).

1508 E. W. NEUSE AND E. QUO
consistent with this ionization scheme, the found M n value being little higher than one-third of that calculated for the undissociated compound, which suggests the tetrachlorozincate dissociation equilibrium (ZtiCh2 Zn2+ -f 4 Cl~) to be far to the left.
+ [ZnCL,]2“ (l)
This high-yield formation of by-product VIII, pointing to the possibility of intermediary occurrence of defined Mannich base adducts of analogous composition, prompted an investigation of the reaction products of poly- condensation experiments that were terminated prematurely. I t was felt that the interception and characterization of such intermediates would shed some light upon the mechanism of polycondensation. From reactions initiated as in examples 1 and 2 of Table I and interrupted at an early stage of condensation, it was indeed possible to isolate in yields up to 85% an x-ray-amorphous, glassy compound which could be slowly dissolved at room temperature in water or methanol (heating resulted in partial hydrolysis) to crystallize from these solutions as yellow, nonhygroscopic prisms exhibiting a defined melting point and x-ray diffraction pattern. Elemental analyses and molecular weight determinations in 2-butanone (nonpolar solvents such as dibromomethane resulted in association) showed this compound in its amorphous, i.e., supercooled melt form as well as in its crystalline state to be composed in a 2:1:2 ratio of starting material Via, ZnCl2, and HC1 as represented by IX.
CH3/
2Ci0H9Fe—CEE—N -ZnCl2-2HCl\ CH3
IX
2HN
c h 31-----MÜ
\
i___
•ZnCl,-2HCl . ' 2 H,N\
CH3 c h J
Consistent with this adduct composition, crystalline IX was also obtained directly by interaction of hydrochloride VII with zinc chloride in methanolic solution. The adduct was found to self-condense in the melt phase in the absence of any additional catalyst, giving polymer III in the same high yields (runs 9 and 10 of Tables I and II) as obtained by employing the 2:1:2 combination of Via, ZnCl2, and HC1. In polar solvents IX dissociates into protonated Mannich base and tetrachlorozincate anion [eq. (2)], as was shown by chemical reactions, molecular weight measurements in ethanol, and proton magnetic resonance data.
CH3/
2 ClcH 9Fe—CHo—N • ZnCh • 2HC1M\ CH,
CioHgFe—CH2—HNCH3
c h 3_
+ [ZnCl4p - (2)
From this dissociation behavior one would, in analogy with the dimethyl-

FERROCENE-CONTAINING POLYMERS. V 1509
ammonium salt VIII, assume an X,V-dimethyl(ferrocenylmethyl)am- monium tetrachlorozincate structure. However, while for the compound in the dissolved state (chloroform) such ammonium structure is indeed indicated by the strong and very broad infrared absorption near 3.7n, infrared data on IvBr pellets of the crystalline or amorphous compound are inconsistent with N protonation in the solid state (lack of absorption in the NH+ stretching region at 3.8-4.2p., where the ammonium salt VII absorbs strongly). Possibly, coordinate covalent N —>- Zn bonding is involved here, as would be supported by the ease of self-polycondensation of IX in contrast to the indifferent VII or corresponding Mannich base- hydrochloric acid mixtures.
Reaction MechanismOn the basis of (1 ) the 2:1:2 ratio determined as optimum in the poly
condensation of Mannich base, ZnCl2, and HC1, (2) the isolation of the tetrachlorozincate VIII, (3) the interception, in high yields, of adduct IX, and (//) the capability of the latter intermediate to undergo nearly quantitative polycondensation to give III, it is now possible to draw some plausible conclusions regarding the overall mechanism of polycondensation . In the first stage, the three components interact to form adduct IX as depicted by eq. (3).
.CHj2 C,0H9Fe-CH2-N<' .ZnCI2 ZHCI
CH3
The second phase of the reaction, represented in simplified, schematic form by eq. (4), involves the overall sequence: of ionization, propagation, and termination steps leading to polymer III and by-product VIII.
jl(2 2 v/CHj
C|0H9Fe-CH2—NlV ZnCI2 -2HCICH3 t * ]

15 1 0 E. W. NEUSE AND E. QUO
Considering the low probability of simultaneous ionization at two sites in the same molecule of IX, the generation of metallocarbonium ions Va from this adduct is likely to proceed in two steps. This necessarily leads to the assumption of intermediary occurrence of an additional complex of the overall composition X arising from IX as a result of the first ionization step. In eq. (4) the possible involvement of the hypothetical adduct X (work on the isolation of which is in progress) has been taken into account.
CH3 c h 3
CioHtFe—CH,—N -HN -ZnCl2-2HCl\ \
c h 3 c h 3X
For cations V formed from IX and X, and later also from corresponding polyhomologs of these two intermediary complexes, it would appear reasonable to assume further reaction in much the same manner as in the polycondensation of ferroccnyl carbinol.1 These cations, mononuclear initially (Va) and polynuclear in an advanced stage (Vb), may undergo reaction by any of the three following steps: (1) nuclear substitution of complexes IX and X and their polyhomologs; {2) self-substitution by the cation’s carbonium site on the penultimate ferrocene unit; (3) nuclear substitution of nitrogen-free polymer. Step 1, a growth reaction, would lead to polymeric complexes polyhomologous to IX and X (in reactions employing ZnCl2 and HC1 in concentrations insufficient for these components to combine with the entire starting amount of Via as adduct IX, free polynuclear Mannieh base species VIb as well as complexes different from polyhomologs of IX and X may also arise). The self-substitution of step 2 would result in the formation of a terminal double-bridged segment of one of the types IV and, hence, would give rise to polymer species devoid of amino groups (for steric reasons, this self-substitution step is restricted to those cationic species exhibiting either a 1,2- or a 1,1'-disposition of the substituents on the last ferrocene unit, whereas 1,3-orientation precludes such intramolecular attack); being a nongrowth reaction, it would thus eliminate the terminal a-carbon atom of the cation as a site of further reaction.* Step 3, again, is a growth reaction leading to higher polyhomologs of the nitrogen-free polymer species resulting from step 2.
In the initial phase of polycondensation, step 1 must prevail. However, as elimination of amino groups proceeds (these groups being involved in
* For cations Va generated from I in sulfuric acid medium, Rinehart and co-workers10 demonstrated a reaction course leading to the diferricinium cation of 1,2-diferrocenyl- ethane (related reactions involving the ferrocenylphenylcarbinyl cation have been discussed by McEwen et al.11,n). An analogous reaction course involving cations Va or Vb could be visualized as an additional termination step in the present case, giving rise to polymeric ethane derivatives with the two ferrocene units adjacent to the ethyl bridge existing in the ferricinium state. However, in reactions of the present type conducted in the melt phase the instantaneous concentrations of Va and Vb are probably too low to allow for dimerization of these cations in their mesomeric radical ion forms. In accord with this assumption, no chlorine (or hydroxyl generated therefrom through hydrolysis) was ever detected analytically in the polymeric end products.

FERROCENE-CONTAINING POLYMERS. V 1511
the formation of VIII), polymeric Mannich base complexes created in this first step, while showing a growth in molecular weight, decrease in concentration. Consequently, further cation reaction must progressively occur via the remaining two steps, until Mannich base complexes are no longer available for ionization and all polymeric species present in the melt consist essentially of nitrogen-free products of the composition III. Further growl,h by step 3 of the nitrogen-free polymers formed in the course of step 2 may arise from substitution on any one ferrocene unit of the polymer chain including the terminal ferrocenylene group created by step 2 as part of the double-bridged segment.
In all cases of endgroup substitution, the result is linear chain extension. In more advanced stages of polycondensation, however, as the concentration of endgroups is reduced, the statistical probability for cation attack on internal ferrocenylene units with resulting side-chain formation should increase. The prevailing 1,3-substitution pattern lacks any sterically favored sites on the “homo” rings. Therefore, additional substitution will predominantly occur on unsubstituted “hetero” rings, thus resulting in the observed decrease of the per cent homoannularity with rising molecular weight. As in the previous work,1 the asymptotic trend of the curve in Figure 2 may be interpreted in terms of a balance of the growth process between the initiation of branches and their early linear growth.
EXPERIMENTAL
Materials and General Analytical Procedures
The procedure described by Lindsay and Hauser2 was employed for the preparation of V,iV-dimethylaminomethylferrocene (Via), b.p. 130- 132°C./3 mm. The hydrochloride VII, fine yellow needles infusible up to 300°C., was prepared in 80.5% yield from Via and HC1 in methanol.
Anal. Calc.: Cl, 12.73%; Fe, 20.06%. Found: Cl, 13.02%; Fe, 20.40%,
All other materials and solvents were obtained from commercial sources and were purified as described.1 Iron determinations were performed by titration of Fe2+ with dichromate; polymeric samples required a HN03- HCIO4 mixture for complete dissolution. Values were usually 0.5-0.8% low for high molecular compounds requiring long acid digestion times. Carbon, hydrogen, nitrogen, and chlorine analyses were conducted by G. I. Robertson, Jr., Florham Park, N. J. Viscosity and molecular weight measurements were conducted as in the earlier paper.1 For infrared recording, a Perkin-Elmer Model 521 double-beam spectrophotometer equipped with grating optics was used. X-ray powder diffraction diagrams were recorded with a Norelco x-ray diffractometer, using vanadium-filtered K a chromium radiation. Principal interplanar spacings, d are listed in decreasing order of intensity within the 2d range 10-35. High-resolution NMR spectra were obtained at 25°C. with a Varian Associates, Model A60, NMR spectrometer operating at 60 Mcycle/sec. over a sweep width of 500 cycle/sec. Chemical shifts, t, are given in ppm relative to tetramethylsilane (TMS) as internal standard with an assigned

1 5 1 2 E . W . N E U S E A N D E . Q U O
value of 10.00 (external standard for recordings in H20 or D20 solution). Coupling constants J are given in cycles/second with average spread ± 0.2 cycle/sec. at 100 cycle/sec. sweep width (± 2 cycle/sec. for the quadrupole coupling signals).
Polycondensation Reactions : Formation of III
With the use of the equipment described earlier1 for ferrocenyl carbinol condensations, the components were heated with stirring under nitrogen for reaction periods and at molar ratios and temperatures as specified in Table I. The reaction products were freed by water extraction from excess ZnCl2 and tetrachlorozincate V III .
VIII formed colorless prisms, m. p. 173-176°C., from methanol-ether.
Anal. Caled. for C4Hir,Cl„N2Zn: C, 16.05%; H, 5.39%; Cl. 47.37%; N, 9.36%; Zn, 21.84%; mol. wt. 299. Found: C, 16.48%; H, 5.57%; Cl, 47.02%;; N, 9.51%; Zn, 20.95%; M n, 120 (methanol). X-ray diffractogram: 7.10, 5.69, 6.04, 4.23, and 3.90 A.
The products were reprecipitated from benzene solution by 95% aqueous isopropanol. Concentration of the mother liquor in each case gave a small second polymer crop. The combined portions were washed with isopropanol and were dried for 10 days at 60°C. i n vacuo. Yield and analytical data for the products thus obtained are recorded in Tables I andII. The polymer showed the appearance, solubility, and spectral behavior of the hydroxymethylferrocene polycondensation product described previously.1
A number of subfractions was carried out in the conventional manner* to obtain fractions of enhanced monodispersity for the plots in Figures 1 and 2. For the 12 subfractions of a typical series the analytical data are collected in Table III. The solvents and précipitants used in these subfractions were deaerated, and all operations were conducted under a nitrogen blanket to prevent oxidation. Fractions prepared without observing these precautions were tan to brown in color and showed decreased solubility in carbon tetrachloride, carbon disulfide and even benzene; the infrared spectrum exhibited carbonyl bands of medium intensity near 6.1 ti- This oxidation sensitivity was enhanced with rising molecular weight. Typical elemental analytical findings for a partially oxidized fraction with M „ = 7000 (M „ determined on benzene-soluble portion, 71.2% by weight) are as follows; C, 63.14%; H, 5.05%; Fe, 24.68%.
Formation of Adduct IX
The reactants, Mannich base (Via), anhydrous zinc chloride, and 38% aqueous hydrochloric acid, were heated for 15 min. in a 2 :1 :2 molar ratio at 170°C. as described before. Extraction of the melt with boiling chloroform and precipitation by ether gave crude IX (84.3% yield), which was purified by reprecipitation in the same manner. The dried (20 days at 50°C. in high vacuum) complex was a pulverizable, x-ray-amorphous solid; m.p. 80-100°C.

F E R R O C E N E - C O N T A I N I N G P O L Y M E R S . V 1 5 1 3
Anal. Calcd. for CMH36C1 ,Fe.,N2Zn: C, 44.90%; H, 5.22%; Cl, 20.39%; Fe, 16.06%; N, 4.03%; mol. wt. 695.5. Found: C, 44.68%; H, 5.42%; Cl, 20.71%; Fe, 15.91%: N, 3.93%. M„, 1340 (dibromomethane, average of 3 determinations); 620 (2-butanone)230 (ethanol).
The compound was similarly prepared (79.5% yield) by heating the well- ground mixture of VII and ZnCl2 (molar ratio 2:1) for 6 min. at 170°C. and working up the melt as described above.
Crystallization from water yielded the adduct as orange prisms, m.p. 128 1
Anal. Found: C, 44.59%; H, 5.34%,; Cl, 19,89%; Fe, 16.54%; N, 4.01%,; %n, 8.95%; M m 1270 (dibromomethane); 660 (2-butanone); 240 (ethanol). X-ray dif- fr&ctogram: 5.67; 4.48; 5.95; 5.15; 4.92; 3.88; 3.50 A. Allotropic modification from 2-butanone: 4.27; 4.56 ; 5.40; 3.51 A.
The same crystalline compound was also directly obtained from a 2:1 molar mixture of VII and ZnCl2 in methanolic solution. The crystals dissolved readily in water and methanol, less so in higher aliphatic alcohols, ketones and ehlo»hydrocarbons, and were practically insoluble in ether, hexane and benzene. From aqueous solution, AgN03 immediately precipitated chloride ion (titration of the aqueous solution with 0.1 N AgN03 solution against sodium chromate gave 20.71% Cl). On addition of KOH, basic zinc chloride precipitated with concomitant liberation of Via (picrate,m.p. and mixed m.p.2 175°C.
Anai,. Calcd. for C is H io F e N ^ ? : N , 11.87%; Found: N , 11.68%.
The same picrate was directly obtained from methanolic solution of IX by addition of picric acid.)
The proton magnetic resonance spectra recorded on aqueous solutions of IX, practically identical with those of VII, gave proton signals (r values in parentheses) for the substituted ferrocene ring (5.66 ppm), unsubstituted ferrocene ring (5.78 ppm), methylene (5.91 ppm), and methyl (7.32 ppm) groups in the expected 4 :5 :2 :6 area ratio. In common with VIII, the ammonium proton failed to give an individual signal, owing to rapid exchange with the solvent, and both the methyl and methylene peaks emerged as singlets. On acidification of the aqueous (and also methanolic) solution (5.0 X .10 bV) with HC1, proton exchange was sufficiently suppressed to give rise to doublet splitting of the methyl signal ( J = 4.2 cycle/sec.). However, in contrast to VIII (triplet centered at r = 2.25 ppm, with J = 52 cycle/sec.), the conditions of temperature and concentration (25°C., 16% w/v solution) applied did not permit triplet formation due to N u quad- rupole interaction,13 nor was an N-H singlet observed (probably merged with O-H).
Work presented herein was conducted by the Missile & Space Systems Division, Douglas Aircraft Company, Inc., under company-sponsored research and development funds. The contribution by Messrs.S. H. Yanderweide and H. N. Holland in conducting the viscosity measurements and iron determinations is gratefully acknowledged. The authors are also indebted to YIessrs. W. H. Kimberly and R. L. Harvey for recording the infrared spectra and x-ray diffractograms.

151-4. E . W . N E U S E A N D E . Q U O
References1. Neuse, E. W., and D. S. Trifan, J . A m . Chem. Soc., 85, 1952 (1963).2. Lindsay, J. K., and C. R. Hauser, J . Org. Chem., 22, 355 (1957).3. Burke, W. J., B. A. Barton, P. D. Gardner, and J. D. Lewis, J . A m . Chem. Soc., 80,
3438 (1958).4. Rosenblum, M., and R. B. Woodward, J . A m . Chem. Soc., 80, 5443 (1958).5. Rinehart, K. L., Jr., K. L. Motz, and S. Moon, J . A m . Chem. Soc., 79, 2749
(1957).6. Rosenblum, M., J . A m . Chem. Soc., 81,4530 (1959).7. Rosenblum, M., and W. G. Howells, J . A m . Chem. Soc., 84,1167 (1962).S. Hall, D. W., and J. H. Richards, J . Org. Chem., 28,1549 (1963).9. Rosenblum, M., Ph.D. Thesis, Harvard University, 1953.
10. Rinehart, K. L., Jr., C. J. Michejda, and P. A. Kittle, J . A m . Chem. Soc., 81,3162 (1959).
11. Berger, A., J. Kleinberg, and W. E. McEwen, Chem. Ind . {London), 1960, 204.12. Berger, A., J. Kleinberg, and W. E. McEwen, Chem. In d . {London), 1960, 1245.13. Ogg, R. A., Jr., Discussions Faraday Soc., 1954, 215; J. D. Roberts; J . A m .
Chem. Soc., 78,4495(1956).
RésuméL’auto-condensation de la base de Mannich ferrocényle, le iV,iV-diméthyl amino-
méthylferrocène, en présence du système ZnCF-HCl comme catalyseur dans la phase fondue, conduit à des polymères solubles, contenant des unités ferrocénylènes intercalées de groupes méthylènes. Les produits de condensation bruts fournissent des poids moléculaire moyens en nombre de 4000 à 8000. Les analyses élémentaires et la spectroscopie infrarouge, aussi bien que les résultats viscosimétriques, montrent que la structure est essentiellement identique à celle du polymère dérivé de l’hydroxyméthyl ferrocène, précédemment décrit dans une communication antérieure. Le rapport molaire optimum des réactifs (base de Mannich, ZnCl2 et HCl) est 2:1:2. Le tétrachlorozincate de diméthyl-ammonium a été isolé comme produit secondaire, et un complexe intermédiaire, composé de la base de Mannich, du ZnC)2 et HCl, a été isoléda ns le rapport 2:1:2, durant la polycondensation. Certaines conclusions concernant le mécanisme sont soumises à discussion.
ZusammenfassungDie Selbstkondensation der Ferrocenyl-Mannichbase, !V,A-Dimethyläminomethyl-
ferrocen, in Gegenwart eines ZnCL-HCl-Katalysatorsystems in der Schmelze führt zu löslichen Polymeren mit methylengruppenverknüpften Ferrocenylenbausteinen. Das rohe Kondensationsprodukt besitzt Zahlenmittel-Molekuarlgewichte im Bereich 4000- 8000. Elementaranalyse und Infrarotspektroskopie sowie viskosimetrische Daten zeigen, dass die Struktur im wesentlichen mit derjenigen des in einer früheren Mitteilung beschriebenen, von Hydroxymethylferrocen abgeleiteten Polymeren identisch ist. Das 2 :1 :2-Dimethylammoniumtetrachlorzinkat wurde als Nebenprodukt isoliert und ein Komplex aus Mannichbase, ZnCl2 und HCl im gleichen 2 :1 :2-Verhältnis wurde als Zwischenprodukt während der Polykondensation abgefangen. Einige mechanistische Gesichtspunkte werden diskutiert.
Received June 15, 1964 Revised September 15, 1964 (Prod. No. 4530A)

J O U R N A L O F P O L Y M E R S C I E N C E : P A R T A V O L . 3 , P P . 1 5 1 5 - 1 5 2 6 ( 1 9 6 5 )
Hydrodynamic Friction Coefficients for Cellodextrins in Water*
SHELDON F. KURATH and DONALD D. BUMP,T h e In s t i tu te o f P a p e r C h e m istry , A p p le to n , W is c o n s in
SynopsisThe diffusion coefficients for the cellobiose through cellohexaose members of the cello-
dextrin series were determined in water. The molecular friction coefficients calculated on the basis of the Einstein diffusion equation can be represented by, Lv = YG + 2L7 where is the monomeric friction coefficient of an anhydroglucose unit, f« is a friction coefficient assigned to a terminal monomer unit due to its additional hydrodynamic surface, and N is the degree of polymerization. For the cellodextrins, {■„ is 1.25 X 10⁻⁹ dyne-sec./cm., and is 2.42 X 10⁻⁹ dyne-sec./cm. The monomeric friction coefficient of the anhydroglucose unit was found to agree with the value calculated from literature data on the diffusion of cellulose in cadoxen. The calculations were based on the Ptitsyn- Eizner theory for the hydrodynamic behavior of the “wormlike” chain. The partial specific volumes of the cellodextrins were found to decrease from glucose to eellotriose and then to increase from eellotriose to cellohexaose.
INTRODUCTION
Marrinan and Hermans1 have analyzed viscosity, sedimentation, and light-scattering data on cellulose derivatives in dilute solution and have written the expressions derived by Debye and Bueche2 and Kirkwood and Riseman3 for sedimentation and intrinsic viscosity in a form which is independent of the applicability of Gaussian statistics. The modified Kirkwood-Riseman equations were found to be compatible with existing data and acceptable values for the size of the monomer units were obtained. The theory of Kurata and Yamakawa4’5 which takes into account both intramolecular and intermolecular interaction between chain segments is also well suited to the structural interpretation of experimental data. Finally, Ptitsyn and Eizner6’7 have derived expressions for the intrinsic viscosity and the friction coefficient of the “wormlike” chain8 and have shown that reasonable values for the persistence length and radius of the momomer unit can be obtained for cellulose derivatives.
The monomeric friction coefficient plays an important role in all of the hydrodynamic theories. In the past, the treatments of Debye and Bueche and Kirkwood and Riseman have lead to values of the monomeric friction
* This work was supported by a grant from the Pioneering Research Program which is administered by the Pioneering Research Committee of The Institute of Paper Chemistry on behalf of several sponsors.
1 5 1 5

1 5 1 6 S . F . K U R A T H A N D D . D . B U M P
coefficient that are too small.9’10 At least part of the difficulty is due to the manner in which the hydrodynamic theories are applied.1
In their work on sodium carboxymethyl cellulose, Sitaramaiah and Goring11 used the computational procedure suggested by Marrinan and Hermans to determine the monomeric friction coefficient which was compared with the friction coefficient estimated from the diffusion coefficient of sucrose in water. A more acceptable estimate would be desirable; however, suitable diffusional data are not as yet available.
There is a distinct need for diffusion measurements on low molecular weight oligosaccharides in the molecular weight region where hydrodynamic shielding is unimportant. In the present work the diffusional behavior of the cellobiose through cellohexaose members of the cellodextrin series is examined in an attempt to obtain an acceptable value for the monomeric friction coefficient of an anhydroglucose unit in water.
EXPERIMENTAL
Materials
Two cellodextrin series containing the cellobiose through cellohexaose members were obtained through the courtesy of N. S. Thompson and W. Bliesner. In addition, Eastman cellobiose was used in certain experiments.
The cellodextrins were isolated by chromatographic separation on a column containing an adsorbent composed of a 50-50 mixture of charcoal (Darco G-60) and Cellite (Cellite 545). The adsorbent was pretreated with stearic acid-ethanol solutions12'13 to prevent irreversible adsorption of the cellodextrins.
Whatman cellulose powder was hydrolyzed with fuming hydrochloric acid,14 neutralized with sodium bicarbonate, and filtered to remove salts and undissolved materials. The filtrate containing the cellodextrins was added to the column and washed with distilled water to remove salts and glucose. The cellodextrins were eluted with a solution consisting of 40 vol.-% ethanol in water. The isolated sugars were then purified by the procedure described by Wolfrom and Dacrons.16
At one point in the preparation, the samples were inadvertently subjected to bacterial attack. The solutions were heated to destroy the bacteria and the sugars were recrystallized to constant melting or decomposition points. Fringe analysis16 from subsequent diffusion experiments indicated that all samples were of high purity.
Partial Specific Volume and DiffusionSeveral sources of water were used during the course of this work. Par
tial specific volume measurements were conducted in ordinary distilled water, and the diffusion measurements on cellobiose were conducted in distilled water obtained by distilling deionized water containing alkaline potassium permanganate. All other experiments were conducted in water prepared according to the procedure described by Bauer.17 All solutions were prepared by weight,

C E L L O D E X T R I N S 1 5 1 7
Density determinations were conducted at 30.00 ± 0.005°C. in Sprengle bottles. Partial specific volumes were calculated from density measurements by means of Kraemer’s formula.18
Diffusion experiments were conducted in free diffusion in a Spinco Model H electrophoresis-diffusion instrument using 2-ml. and 11-ml. Tiselius cells, the Rayleigh diffusiometer, and green light from a G. E. H 100 A-4 mercury vapor lamp. All experiments were conducted with the cellodextrin solution diffusing against pure water. Fringe patterns were recorded on Eastman type M photographic plates. The fringe fraction was determined from photographs taken during the boundary sharpening procedure. The fringe fraction and fringe positions were measured with a Gaertner traveling microscope.
Fringes were paired according to the procedure of Longsworth19'20 and diffusion coefficients, D , were calculated from
- X]) / 2 M Z * = 2 ( 1 )
where X j - j and x } are fringe locations, Z * is the reduced cell coordinate, M the magnification factor, and t the time. Zero time corrections were applied by using eq. (2):
I f = IH\ f Ai/t ' ) (2)
where t and l ' are the true and experimentally observed diffusion times, respectively, and D and D ' are, respectively, the true and slightly erroneous diffusion coefficients based on t and t ' .
Computations were carried out on an IBM 1620 computer. Values of D ' were calculated from eq. (1) on the basis of experimental times f and then used to calculate the zero-time correction from a least-squares treatment of eq. (2). The zero-time correction was then applied to the original times and the entire calculational procedure repeated until the zero time correction was less than 1 sec.
The refractive index difference, A n , across the boundary was calculated from the equation,
A n = J X / a , (3)
where J is the total number of fringes, a is the cell thickness, and X is the wavelength of the monochromatic light. A cell thickness of a = 0.6457 cm. was obtained for the 2-ml. micro cell and a = 2.596 cm. for the 11-ml. standard cell. The wavelength of the monochromatic light is X = 5462 A.
EXPERIMENTAL RESULTS
The results of the diffusion experiments on the eellodextrins in water are given In Table I and for cellobiose in aqueous 0.2958M NaCl in Table II. The diffusion coefficients are reported in terms of D A, the diffusion coefficient based on the reduced height-area ratio along with the standard deviation for the diffusion coefficient, the total number of fringes, J , and the zero time correction A t. A single cellobiose experiment was conducted in a

1 5 1 8 S . F . K U R A T H A N D D . D . B U M P
3 xh—I <©PQ 'P
£ H '©
O
3it
1o
2 xm
i iTJ
X© CDCO O 00 TtH00 CMon t> CMO 1—1 CO CDCDTfHo o 1- Of)n" ]> 05 00 00 00 05 CMCMCOCOa iOto to to TjHTji Tfi COCO
IO ,
o<1
-dPdofXSoO
05 rH OO O
00 CM01CMto t-HrH CMCMH
CDCM to o © COCMCOl'- © 05 (X)M to Tt< CD«5 to 00 00 CO
I -t? && 0 bfl in © 3 ^ o i ,e> :
GO CDi“H iHo o o’ ©
^ ON i-H CD t-Ho o oh d 05 tD M CD t-h CM o O cm CMO O O o o o
o o o o o o o o o o
00 CMTtHon T—1,—i CDon 00 onCD Tt<CM05 05 TJHTinO COH CMCM 05 CM COt_HCOr- CO,_H■CO CO CMCD 00 CMi—i
to^(MHGOCODCOCONDCM^COCMCDCOOQOCO^COCON-COOOOCOO'^^ h cD ^ cO O iOIMh oo o o o o o o o o oo o o o o o o o o o0 0 0 0 0 0 ) 0 0 0 0
05CM05GOooo
00 TtHCMCDCDon CDtoCO 00 CMto CMu- CDr©' CMCM CDCDto CD 00 o00 OO 00 CMCO05 CD o TfHO CMrH
3 O rHo O p CDH O o O o o O o o O
o o O © o o O o o O
o©
o
ao
o3Ph©rd-1-3bfl
o
o3 o-4-3 c3c X © © Ph P2o o r© ”© o o
oog'aCOo3
D
.s+3oo

C E L L O D E X T R I N S 1 5 1 9
TABLE IIDiffusion Coefficients for Cellobiose in 0.2958M NaCl a t 30.00 ± 0.02°C.
AC,mole/l.
c,mole/1. J
At,sec.
D a x 10s, cm.2/sec.
Std.dev. X 10s,
cm.2/sec.
Cellsize,ml.
0.02778 0.01389 31.72 17 5.636 0.010 20.00832 0.00416 37.57 66 5.643 0.013 110.00286 0.00143 12.82 167 5.665 0.061 11
Spinco Model E ultracentrifuge with the use of a double-sector boundary- cell and the Rayleigh optical system.
In the case of cellobiose and cellotriose, diffusion coefficients were determined as a function of concentration. For the higher members it was only possible to conduct experiments at low concentrations due to the limited quantities of material available and inherent solubility limits.
Diffusion coefficients are shown in Figure 1 as a function of concentration. For cellobiose, there is a marked increase in D A at low concentrations. It is apparent that this behavior is sharply depressed by the addition of NaCl. It was not possible to conduct an extensive investigation in this low concentration region, since low concentrations result in low total fringe numbers, making reliable fringe analysis impossible.
The refractive index difference across the boundary may be expressed as,
An = K XA C + K 2A C 2 (4)
where AC is the concentration difference in grams per milliliter. The coefficients Ah and K-> are given in Table III.
Fig. 1. Diffusion coefficients for cellobiose ((x2) and cellotriose (Ga) as a function of mean concentration in water at 30°C.; (O) measurements in water; ( • ) measurements in 0.2958AÎ NaCl.

1520 S. F. KURATH AND D. D. BUM P
TABLE IIIDifference in Refractive Index Between Cellodextrins Solutions and Water at 30.00 ±
0.02°C. According to Equation (4)
Compound K i X UP Ah X UP
Cellobiose 2.787 0.007»Cellotriose 2.775 -0.038r,Cellotetraose 2.68 0.02,Cellopentaose 2.59 —Cellohexaose 2.68 —
The results of the partial specific volume determinations are given in Table IV and Figure 2 for the cellodextrins and other sugars. The rather large error reported for the partial specific volume of cellohexaose is the result of the very low solubility of this polysaccharide in water.
In order to conduct an analysis on the effect of molecular weight on diffusion it will be necessary to neglect the increase in diffusion coefficient, at low concentrations and assume that this will cause an error of only a few per cent. The diffusion coefficients, D N , for the eellodextrin series will be taken as, A = 7.58 X 10-», A = 5.71 X HA6, A = 4.87 X M A 6, A = 4.28 X 10 À A — 3.82 X HA6 and A = 3.38 X HA6 cm.2/see., where the subscript N refers to the degree of polymerization of the eellodextrin in
TABLE IVPartial Specific Volumes of the Cellodextrins and Other Polysaccharides in Aqueous
Solution
CompoundMolecular
weightConcentration,
rnole/1.
Partialspecificvolume,ml./g.
Partial molar
volume, ml./mole
Glucose“ 180.16 — 0.621 111.9Cellobioseb 342.30 0.03100 0.6148® 210.4Cellotriose’’ 504.45 0.01910 0 .6109e 308.2
0.00960-, 0.6110e 308.2Cellotetraose1’ 666.59 0.01497 0.6132e 408.5Cellopentaose’’ 828.73 0.006213 0.6279e 520.3Cellohexaoseb 990.86 — 0 .63J —Sucrose® 342.30 — 0.613 209.9Maltose1 342.30 — 0.6170 211.2Raffinose“ 594.52 — 0.6078 306.6Dextran8 — — 0.603’’ —Amylose’ — — 0.60 —
a Data of ref. 21.b Data from present work, temperature 30.00°C. c Estimated error ± 0.0002 ml./g. d Estimated error ± 0.05 ml./g. e Data of ref. 27.I Data of ref. 26. g D ata of ref. 24.II Estimated error ± 0.003 ml./g.’ Data of ref. 25.

C E L L O D E X T R I N S 1 5 2 1
J
M , D E G R E E O F P O L Y M E R I Z A T I O N
Fig. 2. Partial specific volumes of the cellodextrins and other sugars. (O) cellodextrins; ( • ) maltose; (A) sucrose; (□) raffinose.
question. The value for glucose was obtained from the work of Gladden and Dole21 after correcting for viscosity and temperature differences.16
DISCUSSION
Diffusion Relations
Costing16 has discussed a number of theoretical and empirical expressions used in the correlation of diffusion data. Only two of these will be considered here. Longworth19 has proposed the empirical equations,
and
D = A / ( M '/3 - B )
D = A 7 ( V ' /3 - B )
(5)
(6)
where A , A ' , B , and B ' are empirical constants, V is the partial molar volume, and M is the molecular weight. According to these equations, a plot of D M 1/3 or D V ' /Z versus D should yield a straight line, as shown in Figures 3 and 4. A least-squares fit of the data results in the relations,
D = 28.0 X 10- 6/( i l /v> - 2.04)and
D = 25.2 X 10~6/ ( V '/z - 1.52)
(7)
(8)
Equations (7) and (8) fit the data to within ±5% and ±2%, respectively, as found by Longworth.19 The straight lines in Figures 3 and 4 represent eqs. (7) and (8), respectively. Reasonably good agreement is observed in both plots, although the agreement is somewhat better in the molar volume correlation.
It is possible to describe the molecular weight dependence of diffusion in a more fundamental manner. To do this the Einstein diffusion equation is written as
D n — JcT / £ n (9)

1 5 2 2 S . F . K U R A T I I A N D D . D . B U M P
Fig. 3. The product D AM 113 as a function of D A for the cellodextrins in water at 30°C.
Fig. 4. The product D AV 113 as a function of D A for the cellodextrins in water at 30°C.

C E L L O D E X T R I N S 1523
Fig. 5. Molecular friction coefficients for the cellodextrins and maltodextrins in water at30°C .: (O) cellodextrins; (A) maltodextrins.
where In is the friction coefficient of the molecule and the subscript N refers to the degree of polymerization. Let l a represent the friction coefficient of an anhydroglucose unit and let f e be an added frictional effect to be assigned to a terminal monomer unit due to the additional hydrodynamic surface of the end. The friction coefficient for the cellodextrin series can then be written as
I n = Nta + 2 f e (10)
If la and l e are assumed to be independent of molecular weight, then a plot of lN versus N should yield a straight line as shown in Figure 5. Neglecting the diffusion coefficient of glucose, a least-squares treatment of the data indicates that the friction coefficient of the cellodextrin series in units of dyne-seconds per centimeter can be represented by
I n = M .2 5 X 10⁻⁹ + 2 X 2.42 X 10~9 (11)
Bourne et al.22 have determined the integral diffusion coefficients of a series of maltodextrins in aqueous 0.05M glucose solutions at 25°C. After correction to 30°C. for temperature and viscosity effects, the friction coefficients for the glucose through maltohexaose members can be represented by eq. (10) with l a = 1.26 X 10~9 and l e = 2.46 X 10~9 dyne-sec./cm. This is in excellent agreement with the results obtained for the cellodextrins, as shown in Figure 5, where the results for both series are displayed.
The fact that the same value for the monomeric friction coefficient is obtained from both series is of considerable interest. It means that it is

1 5 2 4 S . F . K U R A T I I A N D D . D . B U M P
not necessary to differentiate between a- and /3-linkages insofar as the monomeric friction coefficient of the anhydroglucose unit is concerned.
Hydrodynamic TheoriesSitaramaiah and Goring11 have employed the modified equations1 for
the Kirkwood-Riseman and Debye-Bueche theories in analysis of then- results on the sedimentation and diffusion of sodium carboxymethyl cellulose, CMC. For CMC in aqueous O.lAf NaCl the monomeric friction coefficient was found to be a function of the molecular weight. For the Kirkwood-Riseman theory the extrapolated value at zero molecular weight was = 1.3 X 10~9 dyne-sec./cm., which yields a value of £a/vo of 14 A., where rjo is the viscosity of the solvent. This is in agreement with the value of £a/ t)o = 15.6 A. for the cellodextrins in water. The agreement, however, must be considered fortuitous in view of the fact that a constant value of could not be found for CMC by this procedure. The range of degree of polymerization for CMC was 202-1611, which is such that the random coil assumption of the Kirkwood-Riseman theory would be expected to fail.
In the Ptitsyn-Eizner6 theory which is based on the wormlike chain, the same CMC diffusion-molecular weight data can be described by a constant value of fa/j/o = 39.6 A. and a corresponding persistence length of 63 A. The friction coefficient is somewhat larger than that obtained for the cellodextrins, as would be expected from the larger size of the CMC monomer unit.
From the data of Henley28 for the diffusion of cellulose in cadoxen, the Ptitsyn-Eizner theory yields £a/vo = 18-3 A. and a persistence length of 51 A. The friction factor agrees well with that obtained from the cellodextrins and is only slightly larger, as would be expected from the increase in size due to the cellulose-cadoxen complex.
In spite of the uncertainty which arises in comparing cellulose derivatives with the cellodextrins, it would seem that the Ptitsyn-Eizner theory can lead to realistic quantitative values of the monomeric friction coefficient. At present it does not appear necessary to introduce complications of internal circulation or molecular distortion in a gravitational field11 to explain the hydrodynamic behavior of cellulose derivatives.
Partial Specific VolumeThe partial specific volumes of the cellodextrins decrease from glucose to
cellotriose where they reach a minimum and then increase, as shown in Figure 2. The initial decrease is due to the replacement of intermolecular distances with the shorter carbon-oxygen bond distances.
If V a is the partial molar volume of an anhydroglucose unit and V e is the partial molar volume associated with the end of the molecule, then the partial molar volume V N for the cellodextrin series can be written as
VN = N V a + 2 V e ( 1 2 )

C E L L O D E X T R I N S 1 5 2 5
At low N , a plot of V N versus N becomes asymptotic to a straight line, from which, according to eq. (12), we find that V a = 98.15 and V e = 6.93 ml./ mole.
The partial specific volume calculated on the basis of eq. (12) is shown as the dashed line in Figure 2. At high degrees of polymerization the partial specific volume is expected to approach a limiting value of 0.605 ml./g., which agrees well with values reported for dextran24 and amylose.25 It should be noted that in spite of structural differences and slight differences in hydration that the disaccharides maltose26 and sucrose27 compare favorably with cellobiose and the trisaccharide raffinose20 compares favorably with cellotriose.
The partial specific volumes of cellotetraose and cellopentaose are significantly higher than would be expected on the basis of eq. (12). The hydration, the moles of H20 per HO-group, is known to decrease from glucose to cellobiose26 and this might be used to explain an increase in the partial specific volume. The increase, however, is most pronounced for cellotetraose and cellopentaose where the terminal anhydroglucose units are, respectively, 10.3 and 15.4 A. apart. These distances are great enough so that only minor changes of hydration with degree of polymerization would be expected. The added volume required by cellotetraose and cellopentaose is at present unexplained. Unfortunately, the solubility of cello- hexaose and higher members is too low for accurate partial specific volume measurements.
We are indebted to J. E. Tostevin for permission to use the results of his diffusion experiments conducted in the ultracentrifuge. The IBM 1620 program used in the present work is due in large part to his efforts. We are also grateful to J. A. Carlson and E.O. Dillingham for assisting us in the use of the facilities of the Lou Calder Plant Biochemistry Laboratory.
References1. Marrinan, H. J., and J. J. Hermans, J . P hys. Chem., 65, 385 ( 1961 ).2. Debye, P., and A. M. Bueche, J . Chem. P hys., 16, 573 (1948).3. Kirkwood, J. G., and J. Riseman, J . Chem. P hys., 16, 565 (1948).4. Kurata, M., and H. Yamakawa, J . Chem. P hys., 29, 311 (1958).5. Yamakawa, H., and M. Kurata, J . Chem. P hys., 32, 1852 (1960).6. Ptitsyn, O. B., and Yu. E. Eizner, Vysokomol. Soedin., 3, 1863 (1961).7. Eizner, Yu. E., and O. B. Ptitsyn, Vysokomol. Soedin., 4, 1725 (1962).8. Kratky, O., and G. Porod, Rec. Trav. Chim ., 68, 1106 (1949).9. Holtzer, A. M., H. Benoit, and P. Doty, J . P hys. Chem., 58, 624 (1954).
10. Hunt, M. L., S. Newman, H. A. Scheraga, and P. J. Flory, J . Phys. Chem., 60,1278 (1956).
11. Sitaramaiah, G., and D. A. I. Goring, J . Polym er Sci., 58,1107 (1962).12. Aim, R. S., A cta Chem. Scand., 6,1186 (1952).13. Miller, G. L., J. Dean, and R. Blum, Arch. Biochem. B iophys., 91,21 (1960).14. Jermyn, M. A., A ustra lian J . Chem., 10,55 (1957).15. Wolfrom, M. L., and J. C. Dacrons, J . A m . Chem. Soc., 74, 5331 (1952).16. Gosting, L. J., Advan. Protein Chem., 11,429 (1956).17. Bauer, N., Technique o f Organic Chemistry, Physical Methods, Part I, A. Weiss-
berger, Ed., Interscience, New York, 1949.

1 5 2 6 S . F . K U R A T H A N D D . D . B U M P
18. Svedberg, T., and K. O. Pedersen, The Ultracentrifuye, Oxford Univ. Press, London, 1940.
19. Longsworth, L. G., J . Am.. Chem. Soc., 74, 4155 (1952).20. Longsworth, L. G., J . A m . Chem. Soc., 75, 5705 (1953).21. Gladden, J. K., and M. Dole, J . A m . Chem. Soc., 75, 3900 (1953).22. Boume, M. C., G. O. Chichester, and C. Sterling, J . Polym er Sei., Al, 817 (1963).23. Henley, D., A rkiv K em i, 18, 327 (1961).24. Granath, K. A., J . Colloid Sei., 13, 308 (1958).25. Greenwood, C. T., and P. C. Das Gupta, J . Chem. Soc., 707 (1958).26. Shiio, H., J . P hys. Chem., 80, 70 (1957).27. Gosting, L. J., and M. S. Morris, J . A m . Chem. Soc., 71, 1998 (1949).
RésuméLes coefficients de diffusion du eellobiose à travers les régions de cellohexaose de la
série des cellodextrines ont été déterminés dans l’eau. Les coefficients de frottement moléculaire, calculés sur la base de l’équation de diffusion d ’Einstein, peuvent être représentés par fN = N ç a + 2f„ était le coefficient de frottement du monomère, d’une unité d’anhydroglucose, et f, était le coefficient de frottement, attribué à l’unité monomérique terminale, due à sa surface hydrodynamique supplémentaire, iV étant le degré de polymérisation. Pour les cellodextrines f „ est 1.25 10-9 et f, est 2.42 10“9 en unités dynes X sec X cm-1. Le coefficient de frottement monomérique de l’unité d’anhydroglucose correspond avec les valeurs calculées sur la base de données de la littérature concernant la diffusion de la cellulose dans le cadoxène Les calculs sont basés sur la théorie de Ptitsyn-Eizner relative au comportement hydrodynamique de la chaîne enpaloté statistique. Les volumes spécifiques partiels des cellodextrines diminuent du glucose au eellotriose et augmentent ensuite du cellotriose au cellohexaose.
ZusammenfassungDie Diffusionskoeffizienten für Zellobiose durch die Zellohexaoseglieder der Zello-
dextrinreihen in Wasser wurde bestimmt. Der mit der Einstein’schen Diffusionsgleichung berechnete molekulare Reibungskoeffizient kann durch fN = N + 2f, dargestellt werden, wo der Monomerreibungskoeffizient eines Anhydroglukosebausteins und fe ein dem endständigen Monomerbaustein wegen seiner zusätzlichen hydrodynamischen Oberfläche zugeschriebener Reibungkoeffizient und N der Polymerisationsgrad ist. Bei den Zellodextrinen ist = 1,25.10-9 und = 2,42.10“9 dyn. sec.-cm.“1. Der Monomerreibungskoeffizient des Anhydroglukosebausteins stimmte mit dem aus Literaturangaben über die Diffusion von Zellulose in Cadoxen berechneten Wert überein. Die Ber- echung beruht auf der Theorie von Ptitsyn-Eizner für hydrodynamisches Verhalten “wurmartiger” Ketten. Das partielle spezifische Volumen der Zellodextrine nahm von Glukose zu Zellotriose ab und dann von Zellotriose zu Zellohexaose zu.
Received September 3, 1964 Revised November 9, 1964 (Prod. No. 4540A)

J O U R N A L O F P O L Y M E R S C I E N C E : P A R T A V O L . 3 , P P . 1 5 2 7 - 1 5 3 3 ( 1 9 6 5 )
Poly- a-cyanostyrene
L. J. HUGHES and ELI PEKRY*| M o n sa n to Co., T e x a s C ity , T e x a s
SynopsisThe monomer a-cyanostyrene polymerized at a very slow rate under the influence of
free-radical initiators. Rapid polymerization to high molecular weight material was achieved by using anionic initiators (tri-re-butylphosphine and tetrakisdimethylamino- titanium). The polymer made at — 78°C. was colorless, fusible, soluble, and had a number-average molecular weight of over 5,000. The polymer prepared at 0°C. was brown, insoluble, and infusible. None of the polymer showed order in the x-ray diagram. The rate of dimerization of a-cyanostyrene under a wide variety of conditions was measured. Two new derivatives of the intermediate, 3-(7V’,V-dimethylamino)-2-phenylpropionitrile were prepared: the methiodide, m.p. 242-245°C. (decomp.), and the picrate, m.p. 116.5-117.5°C.
The monomer a-cyanostyrene is known,1'2 and copolymers of it with conjugate dienes have been claimed.3 Schildknecht points out that a-cyanostyrene will not polymerize by itself.4 This note describes the preparation of high molecular weight homopolymers of a-cyanostyrene via anionic initiation.
RESULTS
Under the influence of anionic initiators, a-cyanostyrene polymerizes rapidly in high yields to macromolecular substances (Table I). A diluent is required to help dissipate the heat of polymerization. The polymer prepared with the temperature initially at — 78°C is colorless, soluble [in dimethylformamide (DMF), dimethyl sulfoxide, ethylene carbonate, and YjA-dimethyl benzamide], has an intrinsic viscosity in DMF at 30°C. of 0.30-0.66 (corresponding roughly to number-average molecular weights of 5,000-20,000), and sticks to a metal bar at 250-260°C. The polymer prepared with the temperature initially at 0°C. is brown, insoluble, and infusible. All polymers give amorphous x-ray diagrams as obtained and after heat treating 72 hr. at 40°C. followed by 6 hr. at 100°C. Polyacrylonitrile exhibits order in the x-ray diagram and is infusible on a metal bar.
Free-radical initiation of a-cyanostyrene with azobisisobutyronitrile or benzoyl peroxide over the temperature range of 50-75°C. yields polymer at a very low rate of polymerization (ca. 0.02-0.21%/hr.). The traces of
* Present address: Chemstrand Research Center, Inc., Durham, North Carolina.t To whom correspondence should be sent.
1527

Po
lym
eriz
atio
n o
f «-
Cya
no
styr
ene
1528 L . J . H U G U E S A N D E . P E R R Y
©bp aj
■ s s, CÔM «
O o O
s uH S
o
d*ocio
O
a o(X) O
H
ao
o
oCOci
d
oCO.a
.a'ft 'ftd .U dg o3 ®
Î t i Îa ? ü
Ph
_ „ „ ____ S £'3 ¡a S 1 3 § p
«
s $
« I ^d jh c •- xi •-<3 | 3
m gq
Phffi H ,+ •
dcdCDJhfaflO^ CD s -S CDa d ^ h £ jü
f£ ^
bflO-f- CD CD +¡5
b£
.aT—l CD CD ,-t c3 i> CD £H.a 03 b£ s a jO bfi £3 O oSm ''CD CD oS-i'o Î 3 JO O Phi IS JOm H Eh
da
*2 d.a ^CO g CO d 03 rP^ tS■ v_$O
m
6« T—iiO 95 93 78 68 96 86 COCO
^r CO fO cm CO o f—CM CMCDCM
o ’“I O o o O O Oa o o o o © O o o
CD o ' © <Dp * PH
W-H Ph ȍH
£ d d5- & d ¡z ;PQ W PQ
Eh S H H § H
O © TtH o CM CM CMCM <M CM CM (M CM
Sc
CO CO CO CO <MCO (MCO CMCO CMCOCM CM (M CM i-H i-I 1-Ï r-i
C NCD . . CDjd CO ^ O w O
H H
PhWEh ,+ '
oH
oEh
oEh
oH

P O L Y - a - C Y A N O S T Y R E N E 1 5 2 9
polymer are colored, soluble in DMF, melt on a hot bar below 200°C., and have an intrinsic viscosity of less than 0.20 in DMF at 30°C. Copolymerization of a-cyanostyrene with styrene, by use of the free-radical initiators, proceeds at the same low rate. No polymerization occurs in the absence of the free-radical initiators.
DISCUSSION
Attempts to prepare poly-a-cyanostyrene by free radical initiation were unsuccessful, probably because of the inactivity of the resonance-stabilized radical:
CNR —CH2—C-
The propagation constant cannot be increased by the use of high temperatures because of the rapid rate at which a-cyanostyrene dimerizes to an inactive product. Polymerization initiated by anionic initiators is extremely rapid, much faster than the rate of dimerization at the low temperatures used (cf. Tables I and II). The color changes which occur during polymerization and after the addition of methanol when using the Ti- (NMe2)t initiator suggest either a change in valence of the titanium or the formation of a strong complex with the a-cyanostyrene. The absence of regularity in the solid state for poly-a-cyanostyrene is shown by the fact that the polymer gives no regular pattern in the x-ray powder diagram, in contrast to polyacrylonitrile. The [ t ]\ -M n relationship indicates a very stiff chain which may account for its inability to crystallize.
PROCEDURE
Preparation of a-Cyanostyrene
The a-cyanostyrene was prepared by condensation of benzyl cyanide with formaldehyde in the presence of base.6 A suitable method for purification involved condensing a-cyanostyrene with dimethylamine, purification of the 3-(A',Ar-diamethylamino)-2-phenylpropionitrile, and the pyrolysis of the hydrochloride salt of the latter.
3 - ( N , N -Dimethylamino) -2-phenylpropionitrile
A 104-g. portion of freshly prepared crude a-cyanostyrene was dissolved in 200 ml. of dioxane. The resulting solution was added to 90 g. (2.0 mole) of dimethylamine and 4 ml. of Triton B(benzyltrimethylammonium hydroxide) in 200 ml. of dioxane at a rate to maintain the temperature at 15-25°C. The mixture was aged at 45-50°C. for 3 hr., and the solution was poured into 1500 ml. of distilled H20. The organic layer was separated, and the water layer was extracted with three 300-ml. portions of benzene. The

1 5 3 0 L . J . H U G H E S A N D E . P E R R Y
combined organic layer and extracts were washed with 500 ml. of H20 and extracted with three 150-ml. portions of 10% HC1. The HC1 extract was washed with two 200-ml. portions of benzene and then made alkaline by addition of 50% NaOH. The organic layer was separated, the aqueous layer extracted with three 75-ml. portions of benzene, and the combined extracts and organic layer were washed with 100 ml. of H20 and dried over anhydrous sodium sulfate. The benzene was removed under vacuum, and the residue Avas distilled to give 74.3 g. (52.9% yield) of product boiling at 105-112°C./2 mm. Hg.
Two nerv derivatives, the methiodide, m.p. 242-245°C. (decomp.) and the picrate, m.p. 116.5-117.5°C., Avere prepared.
3- ( N , N -Dimethylamino) -2-phenylpropionitrile HydrochlorideAnhydrous HC1 gas was added below the surface of a solution of 144 g.
(0.825 mole) of 3-(Ar,Ar-dimethylamino)-2-phenyl propionitrile in 500 ml. of benzene while stirring and cooling to maintain the temperature below 40°C. The HC1 salt precipitated and eventually formed a semisolid mass, at which point the introduction of HC1 was discontinued. The solids Avere filtered and Avashed with 75 ml. of fresh benzene. After drying in a rotary dryer at 10 mm. Hg and room temperature, the yield Avas 120 g. (76%). The hydrochloride salt had a melting point of 130-135°C. (decomp.), (lit. value:6 133-134°C.) and a molecular Aveight of 170 (theory 174).
Pyrolysis of the Hydrochloride Salt of 3-(Ar,Ar-DimethyIamino)- 2-phenylpropionitrile
A 5-g. sample of the hydrochloride Avas placed in a 50-ml flask and the pressure reduced to 2 mm. Hg. An oil bath was so placed that the bulb of the flask was covered and the flask was heated to 160°C. Liquid product Avhich distilled out at 75-95°C. Avas collected in a receiver Avhich was cooled in a Dry Ice-acetone bath. The product was dissolved in 10 ml. of cold ether, the solution Avashed with 10 ml. of 10% HC1, 10 ml. of H20 and dried over anhydrous sodium sulfate. Removal of the ether and flash distillation of the product at 2 mm. Hg gave 2.8 g. of a-eyanostyrene (54% yield).
Dimerization Rate StudiesThe rate of dimerization of a-cyanostyrene was determined by folloAving
the change in molecular weight of the monomer-dimer mixture. The a- cyanostyrene used for these studies was crude material from the benzyl cyanide-formaldehyde condensation (fractionally distilled immediately before use). The molecular rveights were determined by use of a micro- ebulliometric apparatus built in these laboratories.7 The data were treated by the method of least squares applied to the second-order rate equation. The half life, was equal to 30 (1 — X 2) / ( X 2 — X L) , where X i Avas the initial mole fraction of dimer and X2 Avas the mole fraction of dimer after 30 hr. Typical data are plotted in Figure 1 for pure a-cyanostyrene, and

P O L Y -a -C Y A N O S T Y R E N 15 1 5 3 1
Fig. 1. Rate of dimerization of undiluted a-cyanostyrene. Change of molecular weight with time { M t denotes molecular weight at time i; M is molecular weight att = °o ).
the complete storage stability data are tabulated in Table II. The monomer was made available for polymerization as 25-50% solutions in toluene. The solutions were stored for less than 18 hr. at — 78°C. before use.
TABLE IIStorage Stability of a-Cyanostyrene
Condition of monomerTemperature,
°C.Half life ¿i/o,
hr.
Undiluted 26 23Undiluted 0 87Undiluted -78» 18850% in acetone 26 5250% in acetone 0 40050% in acetone -78» 137050% in benzene 26 13072% in benzene 26 38Contains 0.9% hydroquinoneContains 1% p-nitrosodi-
26 15
phenylamine 26 20Saturated with cupric acetate 26 21
“ Solids precipitated from the solution. The mass was warmed momentarily to obtain homogeneous samples for analysis.
Raw Materials
CP toluene was refluxed for 10 hr. over sodium and fractionated in an all-glass apparatus which had been flamed three times and cooled under

1532 L . J . H U G H E S A N D E . P E R R Y
pure, dry argon. CP tetrahydrofuran was purified by the same procedure as was used for toluene. Styrene (Monsanto, polymer grade) was dried three times over CaS04 and was fractionated in an all-glass apparatus in the same manner used for toluene. Azobisisobutyronitrile was recrystallized three times from ethanol, m.p. 102-103°C. Benzoyl peroxide was from Lucidol Corp. Tetrakisdimethylaminotitanium was prepared according to literature procedures.8 Tributylphosphine, b.p. 107-108°C./7.5 mm. Hg, was fractionated and stored in water-free equipment over argon. Argon (< 0.002% oxygen and < 0.0008% water) was dried further with Linde 5A molecular sieves before use.
Polymerization
Free-Radical Polymerization. The monomer solution was charged to clean Pyrex tubes which had been flamed three times at 200° C. and cooled under pure argon. Initiator solution was added, and the tubes were sealed and immersed in a constant temperature bath for a given length of time. After completion of the reaction, the tubes were cooled to 25°C., opened, and poured into a fivefold excess of MeOH to precipitate the polymer. The polymer was purified by solution in DMF and reprecipitation in MeOH (in which the dimer of a-cyanostyrene is soluble). Drying was accomplished at 40°C. at < 0.1 mm of Hg. All liquids were transferred by means of syringes which had been dried at 140°C. and cooled under pure argon.
Anionic Polymerization The monomer solution and solvents were charged to 25-ml-glass reaction flasks containing glass-coated magnetic stirrers. The apparatus had been freed of impurities by flaming three times under argon and held, thereafter, under a blanket of pure argon. After adjusting the bath temperature and waiting 15 min. for temperature equilibrium, the catalyst was added within 5 sec. At the end of the reaction period, dry excess MeOH at the temperature of the reaction was added to destroy the catalyst and to precipitate the polymer. Further workup and purification was the same as for the free radical-initiated reaction. All liquids were transferred in syringes as described above.
Number-Average Molecular Weight
M n was estimated by using a Mechrolab vapor-phase osmometer.
References1. Clifford, A. M., and J. R. Long, U. S. Pat. 2,362,049 (1944) to Wingfoot.2. Walker, J. F., U. S. Pat. 2,478,990 (1949) to Du Pont.3. Clifford, A. M , U. S. Pat. 2,444,870 (1948) to Wingfoot.4. Schildknecht, C. E., V in y l and Related Polymers, Wiley, New York, 1952.5. Newey, H. A., and J. G. Erickson, J . A m . Chem. Soc., 72,5645 (1950).6. Stewart, J. M., and C. H. Chang, J . Orq. Chem., 21, 635 (1956).7. Yates, W. F., private communication.8. Benzing, E. P., and W. Kornicker, Chem. Ber., 94, 2263 (1961).

P O L Y - a - C Y A N O S T Y R E N E 1533
RésuméLé a-cyanostyrène monomère polymerise à très faible vitesse sous l’influence de radi
caux libres initiateurs. La polymérisation rapide donnant des produits à haut poids moléculaire a été obtenue en utilisant des initiateurs anioniques (le tri-n-butylphosphine et le tétrakis-diméthylaminotitane). Le polymère obtenu à — 78°C était incolore, fusible, soluble et avait un poids moléculaire moyen de plus de 5000. Le polymère préparé à 0°C était brun, insoluble et infusible. Aucun des polymères ne montre une disposition régulière au diagramme des rayons-X. La vitesse de dimérisation de l’a-cyano- styrène a été mesurée dans de nombreuses conditions. Deux nouveaux dérivés de l’intermédiaire, le 3-(A,vV-diméthylamino)-2-phénylpropionitrile, ont été préparés—le sel quaternaire avec l’iodure de méthyl p.f. 242-245°C (décomp.) et le picrate p.f. 116.5- 117.5°C.
ZusammenfassungUnter dem Einfluss radikalischer Starter polymerisiert das Monomere a-Cyanstyrol
mit sehr geringer Geschwindigkeit. Mit anionischen Startern (Tri-n-butylphosphin und Tetrakisdimethylaminotitan) wurde eine rasche Polymerisation zu hochmolekularen Stoffen erreicht. Das bei — 78°C erzeugte Polymere war farblos, schmelzbar, löslich und das Zahenmittel des Molekulargewichts betrug über 5.000. Das bei 0° C hergestellte Polymere w'ar braun, unlöslich und umschmelzbar. Keines der Polymeren Hess im Röntgendiagramm eine Änderung erkennen. Die Dimerisierungsgeschwindigkeit von a-Cyanstyrol wurde unter einer grossen Vielfalt von Reaktionsbedingungen gemessen. Zwei neue Derivate des Zwischenprodukts 3-(.V,Ar-Dimethylamino)-2-phenylpropioni- tril wurden dargestellt, nämlich das Methiodid F.p. 242-245°C (Zersetzung) und das Pierat, F.p. 116,5-117,5°C.
Received September 4, 1904 Revised October 30, 1964 (Prod. No. 4545A)

JOURNAL OF POLYMER SCIENCE: PART A VOL. 3, PP. 1535-1543 (1965)
P oly (ch lo roaldehydes). I. Poly ch lo ra l S tabilization*
IRVING ROSEN, D. E. HUDGIN, C. L. STURM, G. H. McCAIN, and R. M. WILHJELM, T . R . E v a n s Research Center, D ia m o n d A lk a l i C om pany,
P a in e sv ille , O hio
SynopsisPolychloral diol, unlike polyoxymethylene diol, is not readily capped in the presence
of alkali catalysts. Polychloral is capped under acid conditions by acid anhydrides and chlorides and does not appear to undergo degradation during the process. Evidence for end-capping is provided by infrared analysis in the case of the low DP polychloral, metachloral. End-capped polychlorals possess good stability towards hot, dimethylformamide and good stability at elevated temperatures (255°C.). From the melting points of copolymers, polychloral itself is estimated to have a melting point of about 460°C. The high melting point is consistent with the rigidity of the polymer chain. A means of estimating the DP of the polymer is proposed, based on a form of endgroup analysis. By this technique, metachloral is estimated to have a DP of about 50.
INTRODUCTION
The structures of polymers derived from aldehydes polymerized through the carbonyl group can be classified as polyacetal diols because of their hydroxyl end groups. Any study involving the measurement of structural parameters at elevated temperatures (above the ceiling temperature) requires capping of the hydroxyl endgroups [eq. (1)] to prevent the decomposition of the polymer.
HO-fCHOA-H + 2R+ — RO-UCHOT-J'i + 211+ < 1)
R R
Extensive work has been carried out on the end-capping of polyoxymethylene.1 The method usually employed is an alkali-catalyzed acylation. The use of acid catalysts or acid reagents results in reduction of the polymer molecular weight by cleavage of the acetal links of the polymer chain, and hence is usually undesirable.
Only one report has been found on the end-capping of poly chloral; indeed, recent review articles disclose only a small amount of work published on polychloral itself.2 The one report on end-capping repeats many of the capping techniques described in the polyoxymethylene art, but gives little information as to the polymer structure.3 Our attempts
* Presented before the Division of Polymer Chemistry at the 148th National Meeting of the American Chemical Society, Chicago, September 1964.
1535

1 5 3 6 R O S E N , H U D G I N , S T U R M , M c C A I N , W I L H J E L M
to use base-catalyzed capping of polychloral resulted in polymer chemistry disasters with the loss of substantial amounts of the polymer. A more effective capping technique was needed.
This report describes an effective end-capping technique, provides some elucidation of the capped polymer structure and properties, and suggests a simple means of estimating polychloral molecular weights via a form of end-group analysis.
EXPERIMENTAL
Polymer and Reagents
The various polychlorals were washed with methanol and dried under vacuum at ambient temperatures prior to use. The acid chlorides were Eastman white label grade when available, and generally were used without additional purification. The acetic anhydride was distilled prior to use.
Typical Capping Procedure
The polychloral is slurried in an excess of the capping reagent and stirred, under an atmosphere of dry nitrogen, usually at 180°C. for 30 min. After cooling, the mixture is decanted into methyl ethyl ketone. The precipitate is filtered, washed with methanol, and dried under vacuum.
Capping Test
The efficiency of the end-capping was determined by stirring the sample in dimethylformamide at 130 °C. for 30 min. and recovering the undissolved polymer. The polymer which dissolves is decomposed, probably to monomer. Efforts at recovery from the reagent are fruitless. Polychloral which has not been end-capped essentially completely disappears in this treatment. Additional evidence of end-capping is obtained from the thermogravimetric analysis of the polymers at 255°C. under nitrogen, carried out in a Stanton thermobalance, Model HT-M. The end-capped polymer is substantially more heat-stable than the untreated polymer.
Analyses
Considerable difficulty is encountered in carrying out infrared analyses of polychloral because of its intractability and its insolubility. Evidence for capping, however, is provided by the intensity of the C—OH infrared absorption of a thick mull in Nujol (0.04 g./2 drops) with the use of a CaF2 prism. Novak and Whalley4 reported that the C—OH infrared absorption of polychloral occurs at 3360 and 3500 cm-1.
The analysis of the carbon and hydrogen content of the polymer before and after esterification provides evidence of end-capping, depending upon the degree of polymerization (DP) of the polymer and the reagent used.

P O L Y ( C H L O R O A L D E F I Y D E S ) . I 1 5 3 7
RESULTS
Table I summarizes some of the results obtained with various reagents. Most of the initial work on end-capping was carried out with low molecular weight polychloral (metachloral) prepared from chloral hydrate in sulfuric acid. Work with this polymer was carried out because it is known to contain C—OH end-groups, has a low DP, and chemical changes were expected to be discernible by infrared and elemental analysis techniques.
TABLE IReagents for End-Capping of Polychloral
Polychloraltype Reagent
Temp.,°C.
Yield,(?//C
%Stable
inDMF4
&255,b%/min.
Metachlor.il None 0 1.50“ C6H:,COCl 160 63 37“ “ 180 63 so 0.20“ CH3(CH2)3C0C1 125 76 68 0.35U CH3(CH2)]cCOCI 180 76 69 0.15(( CH3(CH,)14C0C1 ISO 75 48“ Ac20 140 64 71 0.21I t Ac20 + NaOAo 140 IS 90
DP'•*550” None 6 3.70U CH3(CH,)10COC1 180 94 94it e d h c o e i 180 93 81 1.08U CHsCOCl 140 93 95“ Ac20 140 75 97i t Ac20 + pyridine 140 30 60
4 Dimethylformamide at 130°C.b Stability at 255°C., measured by decomposition rate under nitrogen. c Estimated degree of polymerization (DP), by method described later.
Evidently, the best yield of polymer with good stability to hot DMF is obtained in the absence of alkaline catalysts. The anhydrides are much more effective alone, without base. The most convenient reagents to use in the laboratory are the higher acid chlorides at about 180°C.
In low molecular weight polychloral, the C—OH infrared absorption is readily discernible. After esterification, this absorption disappears and a carbonyl absorption appears at 1753 cm. ! (Fig. 1). There is also evidence of an ester absorption at 1260 cm.-1. Most samples have a carbonyl absorption at about 1770 c m . 1, prior to capping, which is attributed to the presence of small amounts of chloral monomer. In the high molecular weight polychlorals (DP~500), neither the C—OH nor ester absorptions are readily detectable either prior to or after capping.
The thermal stability of the capped polymers is considerably higher than that of the uncapped polymers which were prepared in our laboratories and by Ilyina et alp Whereas uncapped polymer appears to melt and

1 5 3 8 R O S E N , I T U D G I N , S T U R M , M c C A I N , W I L H J E L M
Fig. 2. Thermal decomposition of uncapped and end-capped metachloral at differenttemperatures.
decompose” above 200°C., the capped polymer possesses good stability at 255°C. (Table I). The marked increase in thermal stability after treatment is further evidence that capping has been achieved (Fig. 2). The energy of activation for decomposition of the uncapped polymer of metachloral (DP~50) is 19 kcal./mole. After end-capping, this polymer has a decomposition activation energy of 14 kcal./mole (Fig. 3). The changed activation energy is attributed to the decreased number of sites for the initiation of decomposition, resulting from the capping of the C—OH groups.
Additional evidence for end-capping was provided by the evaluation of the biological activity of the polymer. The uncapped polymer is an

P O L Y ( C H L O R O A L D E T T Y D E S ) . I 1 5 3 9
active herbicide, similar in activity to chloral. The capped polychloral, however, possesses little herbicidal activity. These observations demonstrate that the biological activity of uncapped polychloral is due to its breakdown to monomeric chloral.'
An item of concern was the possibility that degradation may take place during the end-capping process. The amount of degradation appeared minimal, from the following observations: (a) there was little change inthe relative ester absorption in the infrared even after additional heating
+.04 - io
_l__________________I_________________ 1_________________ L_1.8 1.9 2.0 2.1
io3/t noFig. 3. Arrhenius plot of thermal decomposition rates of uncapped and end-capped
metachloral.
in the capping reagent; (b) there was little change in the amount of polymer recovered after additional heating; (c) the powder x-ray diffraction pattern of the polychloral remained about the same; (d) in many cases, very high yields of capped polymer were obtained.
Attempts to determine the melting points of the capped polymers were unsuccessful. Investigation by use of both a hot stage on a polarizing light microscope and a melting point block indicated that the polymer appeared to slowly vaporize, without melting, as the temperature increased. Differential thermal analysis showed good stability of the polymer up until 220°C. No transition points were detected below this temperature. At 225°C., an endothermic reaction occurred, which increased with the temperature. Examination of the analysis sample cell after the measurement disclosed that the sample had vaporized.

1540 R O S E N , H E D G I N ' , S T U R M , M c C A I N , W I L I I J E L M
460
1400 10 20 30 40 50 60 TO 80 90 100M O LE % C H LO R A L
Fig. 4. Melting point of polychloral estimated from melting points of chloral-formaldehyde copolymers: (O) points obtained from literature.
A rough estimate of the melting point of polychloral was made from the melting points of some copolymers of chloral with formaldehyde and the use of some previously reported data.6 Two simplifying assumptions were made, namely, that formaldehyde is not isomorphous with chloral in the polymer crystal structure and that formaldehyde and chloral form copolymers with random distribution. The estimated value of the melting point is 460°C. (Fig. 4), which is unusually high. In the estimate, rather heavy reliance is placed on the previously reported point at 65 mole-% chloral, a figure we were unable to check, and which is described as a decomposition point rather than a melting point.
The rapid degradation polychloral v is d v is polyoxymethylene in the presence of alkali can be explained in the light of the different electronegativities of the substituents. The inductive effect of the chlorines in polychloral promotes the ionization of the hydrogen-oxygen bond and the sub-
DISCUSSION
RO-fCHO-F»H + OH" — RO-FCHO-T„_iCHO" + HOH
CCl. C O
RO-fCHO-T»-2CHO- + CHOCCfi (2)
etc.
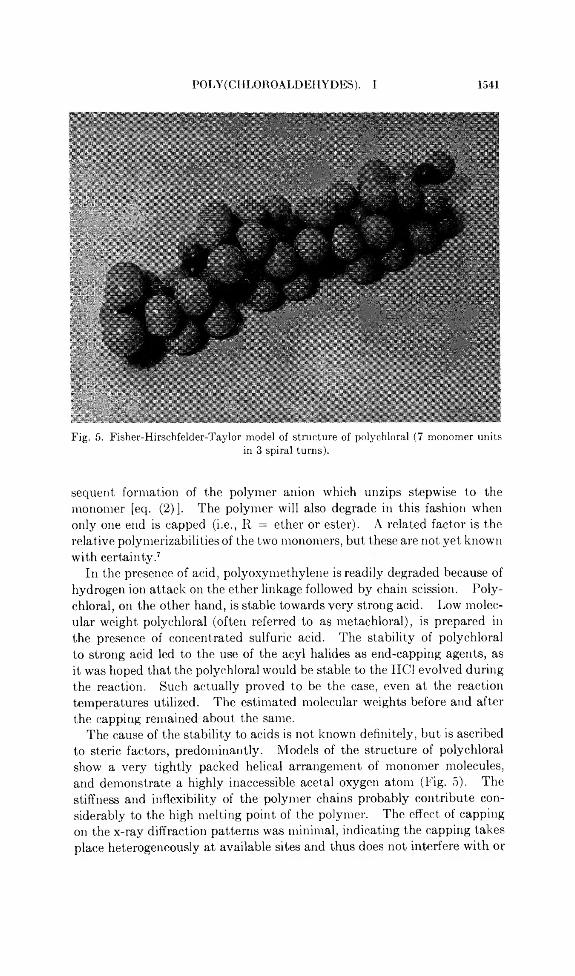
P O L Y ( C M L O R O A L D E H Y D E S ) . I 1 5 4 1
Fig. 5. Fisher-Hirschfelder-Taylor model of structure of polychloral (7 monomer unitsin 3 spiral tums).
sequent formation of the polymer anion which unzips stepwise to the monomer [eq. (2)]. The polymer will also degrade in this fashion when only one end is capped (i.e., R = ether or ester). A related factor is the relative polymerizabilities of the two monomers, but these are not yet known with certainty.7
In the presence of acid, polyoxymethylene is readily degraded because of hydrogen ion attack on the ether linkage followed by chain scission. Polychloral, on the other hand, is stable towards very strong acid. Low molecular weight polychloral (often referred to as metachloral), is prepared in the presence of concentrated sulfuric acid. The stability of polychloral to strong acid led to the use of the acyl halides as end-capping agents, as it was hoped that the polychloral would be stable to the HC1 evolved during the reaction. Such actually proved to be the case, even at the reaction temperatures utilized. The estimated molecular weights before and after the capping remained about the same.
The cause of the stability to acids is not known definitely, but is ascribed to steric factors, predominantly. Models of the structure of polychloral show a very tightly packed helical arrangement of monomer molecules, and demonstrate a highly inaccessible acetal oxygen atom (Fig. 5). The stiffness and inflexibility of the polymer chains probably contribute considerably to the high melting point of the polymer. The effect of capping on the x-ray diffraction patterns was minimal, indicating the capping takes place heterogeneously at available sites and thus does not interfere with or

1 5 4 2 R O S E N , H U D G I N , S T U R M , M c C A I N , W I L H J E L M
Fig. 6. Calculated variation of DP with per cent carbon in polychloral end-capped withtwo laurate groups.
alter crystallinity. Such was the situation even with capping of a polychloral of D P ~50 with laurate end-groups.
The so-called “solubility” of the polymer is considerably altered by the capping. Thus, uncapped polychloral has in the past been referred to as soluble in pyridine, although the polymer cannot be recovered because of decomposition.8 The capped polymer, on the other hand, is insoluble.
An interesting supplement to this investigation was the development of the end-capping technique to provide a rapid means for estimation of number-average molecular weight. The technique simply involves placement of a long hydrocarbon chain on the polychloral ends, followed by an elemental carbon and hydrogen analysis. The carbon and hydrogen content of polychloral is so low that addition of hydrocarbon causes a marked change. This is demonstrated in Figure 6, showing the variation of carbon content with the DP of polychloral, using laurate end-groups. The accuracy is best at the lower DP’s and begins to fall off considerably at a DP of about 300. Nevertheless, for purposes of estimation, the method proved adequate. The precision can be improved somewhat by the use of longer chains in the ester portion, by this method, the DP of metachloral is estimated to be about 50.
References1. Wilson, W., and H. May, Chem. In d . (London), 1962, 412; W. Kern, H. Cherdron,
and V. Jaacks, Angew. Chem., 73, 177 (1961); C. E. Schweitzer, R. N. MacDonald, and J. O. Punderson, J . A p p l. Polymer Set., 1, 158 (1959).
2. Bevington, J. C., B rit. P lastics, 35, 75 (1962); M. V. Chistyakova, R uss. Chem. Rev. (Engl. Transl.), 31, 224 (1962).
3. Belg. Pat. 596,904 (to Algemene Kunstzijde Unie N.Y.), Nov. 9, 1960.4. Novak, A., and E. Whalley, Trans. Faraday Soc., 55, 1490 (1959).5. Ilyina, D. E., B. A. Krentsel, and G. E. Semenido, J . Polym er Sci., C4, 999 (1964).6. White, E. F. T., Brit. Pat. 902,602 (to Courtaulds Ltd.), August 1, 1962.

P O L Y ( C I I L O R O A L D E H Y D E S ) . I 1 5 4 3
7. Busfield, W. K., and E. Whalley, Trans. Faraday Soc., 59, 679 (1963).8. Semenido, G. E., D. E. Ilyina, M. Y. Shishkina, and B. A. Krentsel, Dokl. A kad.
N a u k S S S R , 147, 1386 (1962).
RésuméLe polychloral-diol, contrairement au polyoxyméthylène-diol, n’est pas aisément pro
tégé en fin de chaîne, en présence de catalyseurs alcalins. Le polychloral a les fins de chaînes protégées par action en milieu acide des anhydrides et chlorures d’acide, et ne semble pas subir de dégradation pendant le processus. La preuve d’une protection en fin de chaînes est fournie par l’analyse infra-rouge dans le cas du polychloral de faible DP, métachloral. Les polychlorals protégés en fin de chaîne, possèdent une bonne stabilité vis-à-vis du diméthyl-formamide chaud et une bonne stabilité aux températures élevées (225°C). A partir des points de fusion des copolymères, on estime que le polychloral lui- même possède un point de fusion de 460°C environ. Le point de fusion élevé est en accord avec la rigidité de la chaîne polymérique. On propose un moyen pour estimer le DP du polymère, en employant une forme d’analyse de groupement terminal. Par cette technique, on estime que 1 ‘métachloral’ possède un DP d’environ 50.
ZusammenfassungPolychloraldiol kann im Gegensatz zu Polyoxymethylendiol in Gegenwart alkalischer
Katalysatoren nicht leicht mit Endgruppen versehen werden. Polychloral erhält unter sauren Bedingunge Endgruppen durch Säureanhydride und -Chloride und scheint während dieses Prozesses keinen Abbau zu erleiden. Die Endgruppen werden im Falle des niedermolekularen Polychlorals, Métachloral, durch Infrarotanalyse nachgewiesen. M it Endgruppen versehener Polychloral besitzt gute Stabilität gegen heisses Dimethylformamid bei erhöhten Temperauturen (225°C). Aus den Schmelzpunkten von Copolymeren wird der Schmelzpunkt von Polychloral selbst zu etwa 460°C geschätzt. Der hohe Schmelzpunkt entspricht der Starrheit der Polymerkette. Zur Bestimmung des DP des Polymeren wird eine Form einer Endgruppenanalyse vorgeschlagen Nach diesem Verfahren wird der DP von Métachloral zu etwa 50 bestimmt.
Received September 17, 1964 (Prod. No. 4548A)

J O U R N A L O F P O L Y M E R S C I E N C E : P A R T A V O L . 3 , P P . 1 5 4 5 - 1 5 5 2 ( 1 9 6 5 )
Poly (chloroaldehy des). II. Polymerization of Chloral*
IRVING ROSEN, C. L. STURM, G. H. McCAIN, R. M. WILHJELM, and D. E. HUDGIN, T . R . E v a n s Research Center, D ia m o n d A lk a l i
C om pany, P a in e sv ille , O hio
SynopsisChloral was polymerized by means of cationic and anionic initiators and the products
compared. Anionic catalysts readily produce high molecular weight polymer (DP ~ 300-600), but a DP of only 200 could be produced with cationic catalysts. The anionic system apparently initiates and propagates polymerization much more readily than the cationic system. This effect is attributed to the inductive effects of the chlorine atoms on the chloral. Little difference was found when products of similar DP were compared as to x-ray diffraction pattern, infrared spectrum and tractability. This is believed due to the single type of structure which is sterically favored. Various cyclic compounds of chloral could not be made to undergo polymerization under cationic initiation. The conditions required to effect ring opening were too rigorous to enable polymerization to take place.
INTRODUCTION
The growing interest in the area of aldehyde polymerizations has produced occasional reports on polychloral, although not nearly in the volume for the unsubstituted lower aliphatic aldehydes.1 The more recent work on polychloral has centered on the low-temperature ( —78°C.) polymerization with organometallic catalysts of the anionic or coordination type. Furu- kawa and co-workers found that chloral can be polymerized at — 78°C. with a BuLi catalyst.2 Using a polymer prepared in a similar way, Ilyina and co-workers investigated some of the thermal properties of the uncapped polymer.3 No evaluation of end-capped polymers has been reported.
Polychloral can be prepared with a variety of catalyst types, but little has been done on the comparative characterization of the polymers, or ascertaining their molecular weights. This paper describes the utilization of three different catalyst systems in attempts to obtain high molecular- weight poly chloral, and the comparison of some of the basic properties of these polymers.
In addition to the above, attempts were made to polymerize various cyclic compounds of chloral. The cyclic trimer of formaldehyde, trioxane, is used commercially as a starting material for the preparation of poly-
* Parts of this paper were presented before the Division of Polymer Chemistry at the 148th National Meeting of the American Chemical Society, Chicago, September 1964,
1545

1546 ROSEN, STURM, McCAIN, R. M. WILHJELM, HUDGIN
formaldehyde. I t appeared reasonable, therefore, to examine cyclic compounds of chloral as starting materials for the preparation of polychloral.
EXPERIMENTAL
The chloral monomer used in this work was purified by distillation under nitrogen and dried over molecular sieves. Vapor-pressure chromatography showed the chloral to be 99.9% pure, with <0.1% dichloroacetaldehyde as the major impurity. The water content was determined by a colorimetric Karl Fisher technique and could be controlled within a range of 2-20 ppm.
Polymerization was carried out in a resin kettle which was heated at 110°C. and then assembled under a stream of high purity nitrogen. Additions of monomer, solvent, and catalyst were carried out by means of heated and dried syringes. After polymerization, the polymer was filtered, washed with acidified methanol, methanol, then filtered and dried. The polymerizations and polymer treatments were carried out at temperatures below 40°C., which appears to be the ceiling temperature for polychloral.4
The degree of polymerization (DP) of the polymer was estimated with the aid of the end-capping technique described in the preceding paper5 of this series.
Infrared spectra were obtained on a Perk in-Elmer Model 21 spectrometer, using a Nujol null of the polymer. Powder x-ray diffraction patterns were obtained with nickel-filtered copper Ka radiation.
a-Parachloral, /3-parachloral, chloralide, hexachlorodimethyltetroxan, and 2-trichloromethyl-l,3-dioxolane, were prepared by following the directions reported in the literature for each of these compounds.6 Attempts were made to polymerize these materials alone and to copolymerize them with trioxane. The catalysts utilized included BF3-Et20, BF3, HF, HC1, A1C13, SbCl3, and p-toluenesulfonic acid, at temperatures ranging from 0 to 145°C.
RESULTS
Cationic Polymerization
A screening of various acid catalysts showed that the stronger Lewis acids, i.e., the metal halides, were most suitable for polymerizing chloral. The stronger the acid catalyst, the more effective the polymerization. Thus, A1C13, AlBr3, and ZrCl4 were more effective than SnCh. Most of the work was carried out with AlBr3 because of its effectiveness and good solubility in organic solvents.
The concentration of the catalyst was varied in a solution of chloral in methylene chloride (1:6 mole ratio) at — 20°C. (Fig. 1). The rate of polymerization increases with the catalyst concentration, but the optimum polymer DP appeared at a catalyst concentration of 6 mmole AlBr3/mole chloral. At this catalyst concentration, the polymerization temperature was varied over the range from +10 to — 75 °C. (Fig. 2). The optimum
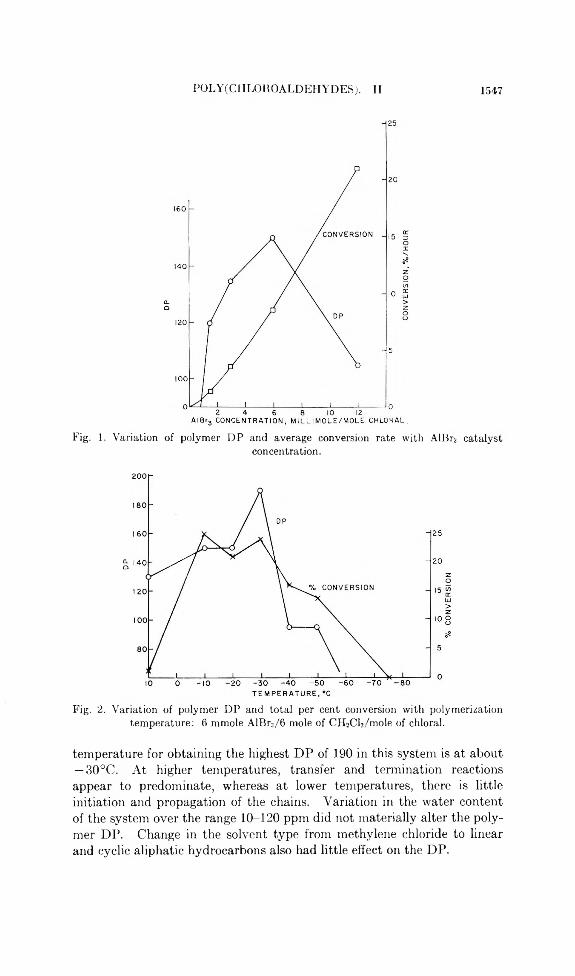
POLY(CIILOIIOALDEHYDES). II 1 5 4 7
Fig. 1. Variation of polymer DP and average conversion rate with AlBr3 catalystconcentration.
Fig. 2. Variation of polymer DP and total per cent conversion with polymerization temperature: 6 mmole AlBr3/6 mole of CHiCb/mole of chloral.
temperature for obtaining the highest DP of 190 in this system is at about — 30°C. At higher temperatures, transfer and termination reactions appear to predominate, whereas at lower temperatures, there is little initiation and propagation of the chains. Variation in the water content of the system over the range 10-120 ppm did not materially alter the polymer DP. Change in the solvent type from methylene chloride to linear and cyclic aliphatic hydrocarbons also had little effect on the DP.

1548 ROSEN, STURM, McCAIN, R. M. WILIIJELM, IIUDGIN
Alteration of the catalyst, solvent type, solvent concentration, water concentration, catalyst concentration, and polymerization temperature produced a change in polymerization rate, but altered the DP of the polymer only within a narrow range Some of the more pronounced effects on polymer DP were obtained by varying the polymerization temperature. For all the changes in conditions, we were not able to increase the DP above 200, and for the most part the DP varied within a range of 100-200.
Noncationic Polymerization
Many experiments in this area to achieve high DP polymer were unnecessary, as this was readily attained with a variety of nonacid catalysts in good yields over a short polymerization period (Table I).
TABLE INoncationic Polymerization of Chloral
Catalyst
Catalyst concentration, mmole /
mole chloral
Time,hr.
Conversion,
% DPTemp.,
°C. Solvent
(C4H 9)3N 6.5 0.1 78 220 0 Nitrobenzene(C4H 9)3CH3NI 4a 0.5 55 380 0 None
U 4a 0.5 28 260 0 Toluene« 4a 0.5 18 190 - 2 0 ((
E t2Zn 50 24 28 300 -7 8 Heptane2,6 DPLb + E t2Zn 29 1 59 600 -4 8 Propylene
a ({ U 43 170 - 5 11
a Catalyst dissolved in acetonitrile. b 2,6-Dimethoxyphenyllithium.
The catalysts found particularly effective for producing high DP polymer were the quaternary ammonium salts and organometallic compounds. The quaternary salts worked best at about 0°C. Lowering the temperature and increasing the dilution lowered the resulting polymer DP together with the conversion of monomer to polymer. With the combined Li and Zn compounds, high molecular weights could be obtained at temperatures below — 45 °C., but above this temperature the polymer DP decreased. Tertiary amines were rapid initiators, but usually gave polymer of lower DP than the other catalysts.
The anionic and quaternary salt-catalyzed systems displayed a much higher sensitivity to water than the cationic system. This is demonstrated in the results obtained with the quaternary salt catalyst (Fig. 3). Both the polymer DP and yield decrease as the water content of the system is increased,

POLY(CHLOROALDEHYDES). II 1549
Comparison of Infrared Spectra and X-Ray Diffraction Patterns
The infrared spectra of the capped polymers was investigated in the range of 750-5000 cm.-1, but no significant difference was observed in the spectra for the polymers derived from the various catalyst types. The absorption spectra and intensities of the bands were quite similar to those published by Novak and Whalley.7
The x-ray crystallinity demonstrated by the various samples appeared to be more affected by the DP than by the initiator. Samples of similar DP (over range 50-400) were compared, derived from the three catalyst types, and found to possess the same diffraction patterns and crystallinity. Most of the patterns resembled two reported by Novak and Whalley for the sulfuric acid- and pyridine-catalyzed polymers (designated A and B) .7
Cyclic Monomer Polymerization
The various cyclic compounds (I-V) gave negative results in all efforts to initiate homopolymerization and copolymerization with trioxane. In the latter case, when polymer was formed, it was found to be polyformaldehyde.
H
CCI3" '£'H
CC13
0 / 0A l-
CCha-PARACHLORAL
I
H
C C tA
0
C-^HI
-C-
'C r
HI
Yk-CCb
7 c c k
a-PARACHLORAL
II
o —c h 2—0CI3C—C l / yCH-CCls
'0 —c h 2—o'2, 6-BIS-(TRICHLOROMETHYL)- 1, 3, 5, 7-TETRAOXACYCLOOCTANE
HI
C k C -C — OCHCCla
o = c - o /CHLORALIDE
IV
CH2- 0I ^CH—CCI3
CH2- O2-TRICHLOROMETHYL- 1, 3-D IOXOLANE
V
The compounds are fairly stable, and only the use of the more elevated temperatures enables ring scission to take place. At that point, however, the temperatures exceed the polymer ceiling temperatures, and only decomposition takes place.

1 5 5 0 ROSEN, STURM, McCAIN, R. M. WILHJELM, TIUDGIN
4 0 0 H 80
a 2
3
WATER CONCENTRATION, ppm
Fig. 3. Effect of water on polymer DP and yield with tributylmethylammonium iodidecatalyst at 0°C.
The cationic polymerization of chloral cannot be terminated by a- hydrogen. This provides the expectation that high DP polymer would be obtained. Such is not the case, however, and it seems that traces of water or other system components probably cause the transfer and termination reactions. The similar DP’s obtained regardless of the change in conditions indicate the termination reaction takes place fairly readily. The fairly rapid cationic polymerization of chloral at low temperatures indicates a low Arrhenius energy and an ionic mechanism, possibly by the route indicated in eqs. (l)-(4). Initiation mechanisms involving both separation of charges and a neighboring gegenion were considered. Although it is not certain which mechanism is correct, the first type had more appeal because of the observed lack of influence of small changes in the concentration of water on the reaction.
Initiation:
DISCUSSION
H H
ChCCHO + AlBr„ — AlBivO -C + or Br2A10C+ AlBr4” (1)
Propagation:H H H
— AlBrs-OCOC+, etc.AIBnrO—C + + ChCCHO (2)

POLY(CHLORO ALDEHYDES). II 1551
Transfer:H H HO H
\ lC—CCI3 -*
/CCI, CC13 HO
H
H(OCH-
GC1,n+I
-OH + AlBr3~0—C + (3)
Termination:H H HO H
AlBr3-(OC— )-OC+ +\ l
C—CCI3 —/
cc ia a HOH
In the anionic polymerization, higher D P’s are more readily attained than in the cationic system. This also occurs when equivalent amounts of water are present in the polymerization systems. The anionic catalysts polymerized chloral much more readily and more rapidly than the cationic catalysts, indicating an even lower Arrhenius energy than required for the cationic system. Furthermore, the higher DP’s in the anionic system indicate a higher relative ratio of propagation to termination reactions.
Chloral is an unusual monomer, in that it is susceptible to both cationic and anionic polymerization by virtue of its easily polarizable carbonyl group. Although weak anionic catalysts were sufficient to polymerize chloral, strong acids such as AlBr3 were required in the cationic system. The observations lead to the conclusion that chloral is more readily polymerized by anionic catalysis. The results are attributed to the inductive effects of the three chlorine atoms on the chloral molecule. The large number of electronegative substituents makes the carbonyl group more readily polarizable by anionic catalysts.
The structures, as well as the solubility and melting characteristics of the medium DP (~200) polymers prepared by anionic and cationic polymerization appear to be about the same. The production of similar polymers by two different mechanisms is not entirely surprising when one considers models of the potential structures of polychloral. The most sterically favored structure contains the chloral units in an isotactic relationship arranged in a helical configuration. This structure, which has been proposed by Novak and Whalley, is apparently assumed by the polychloral, regardless of the propagation mechanism.7
All of the polymers produced were highly intractable. The high value of the extrapolated melting point described in the first paper of this series5 explains the intractability under conventional molding conditions. To approach the melting point requires temperatures considerably above the point at which the polymer decomposes rapidly.

1552 ROSEN, STURM, McCAIN, R. M. WlLHJELM, HUDGIN
The unsuccessful effort to polymerize the cyclic trimers of chloral is not altogether surprising, because the structural models showed the points of catalytic attack to be sterically hindered. In the case of the mixed cyclic acetals of chloral and formaldehyde, the reluctance to polymerize is apparently due to a combination of steric and inductive effects. The ring structures are broken only under fairly severe reaction conditions, which leads to degradation rather than the desired polymerization reaction. Of related interest is the observation that the cyclic trimer of acetaldehyde cannot be polymerized cationic-ally by conventional techniques.8
References1. Bevington, J. C., Brit. Plastics, 35, 75 (1962); M. V. Chistyakova, Russ. Chem.
Rev. (Engl. Transi.), 31, 224 (1962).2. Furukawa, J., T. Saegusa, and H. Fujii, Makromol. Chem., 44-46 398 (1961).3. Ilyina, D. E., B. A. Krentsel, and G. E. Semenido, J. Polymer Sei., C4, 999 (1964).4. Kamino, K., S. Kojima, and H. Daimon, Kogyo Kagaku Zasshi, 66, 246 (1963).5. Rosen, I., D. E. Hudgin, C. L. Sturm, G. H. McCain, and R. M. Wilhjelm, J . Poly
mer Sei., A3, 1535 (1965).6. Chattaway, F. D., and E. G. Kellett, J. Chem. Soc., 1928, 2709; A. Pinner, Ber.,
31, 1926 (1898); S. M. McElvain and M. J. C urry,./. Am. Chem. Soc., 70, 3781 (1948).7. Novak, A., and E. Whalley, Trans. Faraday Soc., 55, 1490 (1959).8. Goodman, M., and O. Vogl, private communication.
RésuméDu chloral a été polymérisé au moyen d’initiateurs cationiques et anioniques, et les
produits obtenus ont été comparés. Les catalyseurs anioniques produisent facilement un polymère de haut poids moléculaire (DP ~ 300-600), mais un DP de 200 seulement a pu être réalisé avec les catalyseurs cationiques. Le système anionique initie et propage la polymérisation beaucoup plus facilement que le système cationique. Cet effet est attribué aux effets inductifs des atomes de chlore sur le chloral. On a trouvé une légère différence lorsqu’on compare des produits de DP semblables par diffraction aus rayons-X, par étude infra-rouge et par l’étude de la traction. On croit que ceci est dû au type unique de structure qui est favorisée stériquement. Différents composés cycliques du chloral n’ont pas pu être polymérisés par initiation cationique. Les conditions requises pour effectuer l’ouverture du cycle étaient trop sévères pour permettre à la polymérisation d’avoir lieu.
ZusammenfassungChloral wurde mit kationischen und anionischen Startern polymerisiert und die Poly
merisationsprodukte verglichen. Anionische Katalysatoren führen leicht zu hochmolekularen Polymeren (DP ~ 300-6001, mit kationischen Katalysatoren konnte aber nur ein DP von 200 erreicht werden. Im anionischen System verläuft Polymerisationsstart und Wachstum offenbar viel leichter als im kationischen. Dieser Effekt wird auf die induktiven Effekte der Chloratome im Chloral zurückgeführt. Produkte mit ähnlichem DP zeigte nur geringe Unterschiede im Röntgenbeugungsdiagramm, im Infrarotspektrum und in der Verarbeitbarkeit. Wahrscheinlich ist dies dadurch bedingt, dass nur ein einziger Strukturtype sterische begünstigt ist. Verschiedene zyklische Chloral- verbindungen konnten bei kationischem Start nicht zur Polymerisation gebracht werden. Die zur Ringöffnung erforderlichen Bedingungen waren zu extrem, um das Eintreten einer Polymerisation zu ermöglichen.
Received September 17, 1964 (Prod. No. 4546A)

JOURNAL OF POLYMER SCIENCE: PART A VOL. 3, PP. 1553-1565 (1965)
Preparation and Aromatization of Poly-1,3-cyclo- hexadiene and Subsequent Crosslinking. Ill*
P. E. CASSIDY,f C. S. MARVEL, and SUVAS RAY, % Department, of Chemistry, University of Arizona, Tucson, Arizona
SynopsisThe polymerization of 1,3-cyelohexadiene with rs-butyllithium has given white poly
mers with inherent viscosities up to 0.23 and conversions to 98%. Bromination andpyrolysis of these polymers lead to polyphenyls which can be successfully sulfonated. then fused in molten alkali to give phenols, and finally crosslinked with formaldehyde. The final products display good heat stability, in that there is no weight loss on heating to 400°C. and only 30% loss at 900°C.
INTRODUCTION
In previous work1’2 on the polymerization of 1,3-cyclohexadiene, Ziegler catalysts and cationic initiators were found to effect polymerization but only to give products with inherent viscosities of 0.11-0.16. However, considerable success was achieved in the aromatization of these products by bromination and subsequent pyrolysis.
Kovacic and co-workers3-7 have converted benzene to polyphenyl, which is brown in color. In contrast, the polymer obtained from cyclo- hexadiene is black, and the halogen content is approximately 1% or less. Dawans and LeFebvre8 have also reported the polymerization of cyclohexadiene and its subsequent aromatization but only discussed the final product in general terms. It was the purpose of this investigation to prepare high molecular weight polyphenyl, to convert it to a poly (phenyl hydroxide), and to crosslink it in the Bakelite manner, thereby obtaining a product superior in heat stability properties to either the simpler polyphenyls or Bakelite polymers.
RESULTS AND DISCUSSION
Polymerization of 1,3-Cyclohexadiene
Cyclohexadiene was prepared in good yield by the addition of bromine to cyclohexene followed by dehydrobromination.9 Monomer free from ben-
* The work discussed herein was supported by Contract 33(657)-9969 with the Materials Laboratory, Wright Air Development Division, Wright-Patterson Air Force Base, Ohio.
f Present address: Sandia Corporation, Sandia Base, Albuquerque, New Mexico.X Present address: B. M. Das Rd., Patna-4(Bihar), India.
1553

1554 P. E. CASSIDY, C. S. MARVEL, AND S. RAY
zene and cyclohexene impurities was difficult to obtain, since 1,3-eyclohex- adiene has been found to disproportionate readily.8 However, further addition of these impurities (benzene and cyclohexene) did not seem to affect the polymerization.
Previously untried Ziegler catalysts (Table I) were prepared and used but were found to be generally no more successful than those used before to obtain high molecular weight polymers. Attempted polymerizations with butyllithium at low temperatures, lithium dispersions, and titanium tetrachloride also gave very low yields or oils (Table II).
TABLE IZiegler Catalysts
No.
Heptane,ml.
Monomer,
molesAIR3,moles
MX,,moles
Time,days
Temperature,°C.
Conversion,
%
1 50 0.0525 0 .003a 0.0015b 12 30 — —
2 140 0.06 0 .748a 0.419» 14 30 1.9 —
3 140 0.06 0 .748a 0.419» 14 - 7 8 — —4 140 0.06 0 .748a 0.419» 14 75 Oil —5 140d 0.06 0.748a 0.419» 14 30 3.6 —6 50 0.0525 0.003» 0.0015° 12 30 9.5 —7 50 0.0525 0.003» 0.0015' 12 30 7.7 Insoluble1*8 100 0.0525 0.01» 0 .005b 22 30 Trace 0 .035d9 100 0.0525 0.01» 0 .005b 22 - 2 0 Trace —
10 100 0.0525 0.01» 0.01b 22 30 Trace —
a Triisobutylaluminum.b Titanium tetrachloride.0 Vanadium trichloride.d Benzene solvent.e Triethylaluminum.f Titanium tetrachloride.
TABLE IIPolymerizations of 1,3--Cyclohexadiene
Catalystand
No. amount Solvent Yield, % fo]inha
1 BuLi, 0.3 ml.b Heptane0 1 0.1122 TiCL, 0.1 ml.d Heptane» 9 0.1423 Lithium, 0.405 g.e Benzene» Oil —4 Lithium, I0.180 g.» Benzene» Trace -- -
5 Lithium, 0.060 g.e Benzene' Trace —
6 Lithium, 1.550 g.» Benzene' Oil —
a In benzene solvent at 30.0°C. b Volume of 3.1M solution in heptane.0 In a nitrogen atmosphere. d Volume of 7.55AI solution in heptane.» Actual weight of lithium contained in a 30% mineral oil suspension. ' In an argon atmosphere.

POLY-1,3-CY CLOHEXADIENE. I l l 1 5 5 5
n-Butyllithium has been noted for its excellence as a catalyst for the specific cis-1,4 polymerization of conjugated dienes.8'10 Use of this catalyst in benzene solution of 1,4-cyclohexadiene did indeed afford polymers with consistently higher inherent viscosities, 0.23 (molecular weight of approximately 20,000) and conversions, 98%, than those of polymers obtained with Ziegler catalysts (Table III).
TABLE IIIPolymerizations of 1,3-Cyelohexadiene with Butyllithium“
No.
Catalystvoh,ml.b
Time,hr.
%Conversion M inhc
1 0.25 104 19 0.112 0.50 66d 77 0.1533 0.10 66d 24 0.1894 0.75 69d 62 0.1255 0.50 68 53 0.1696 1.00 70d 47 0.1437 0.05 234 1.0 0.0938 0.10 234 54 0.2129 0.10 234° 3.5 0.131
10 0.10 234f 2.4 0.1111 0.13 234f 4.1 0.1112 0.05 234f 0.5 0.08913 0.10 5 weeks1 48 0.16514 0.10 5 weeks1 24 0.23015® 0.3 9 weeks 1.0 0.11216h 17 32 days 98.2 0.20
a With 5 ml. monomer at room temperature except as noted. b Volume of 3.10Ai butyllithium solution in heptane.6 In benzene with No. 100 viscometer at 30.0°C. d Under argon instead of nitrogen.* At — 20°C. f At 60°C.e At —80°C. in 25 ml. of heptane.h Run at 60 times the usual volume; catalyst added in 1.0-ml. increments over 30
days.
Tetrahydrofuran as a solvent for these butyllithium polymerizations proved satisfactory although viscosities were somewhat less than those obtained by the use of benzene as solvent (Table IV). Low temperatures can be utilized to increase the percent conversion and viscosity.
Infrared spectra of all polymer samples were essentially superimposable. The most significant band is the double-bond stretching frequency at 1650 cm.-1. No band was observed for a hydroxyl group which might have arisen from chain termination by nucleophilic attack and heterocyclic ring cleavage of tetrahydrofuran.
It has been proposed8 that in benzene solution this polymerization is terminated by chain transfer and disproportionation to give cyclohexadiene

1536 P. E. CASSIDY, C. S. MARVEL, AND S. RAY
T A R L E IVPolymerization of Cyclohexadiene in Tetrahydrofuran
No.Temp.,
°C.Time,days
Catalystvoi.,ml.“
Conversion,
% M i n ilb
1 25 3 2 .0 81 0.0322 25 3 1.5 80 0.0363 25 3 1 .0 71 0.0544 25 3 0 .5 40 0.0795 50 3 2 .0 75 0.0506 50 3 1.0 79 0.0 377 - 2 0 7 2 .0 82 0.0388 - 2 0 7 1 .0 84 0.0569 - 8 0 6 1.0 85 0 .115
10 ■ - 8 0 6 2.0 85 0 .113
a Volume of 3.1A/ solution of n-butyllithium in heptane. b In benzene at 30°C.
and phenyl endgroups. Elucidation was attempted with ultraviolet spectroscopy, but the results are only partially useful, in that the bands present (261.1, 254.7, 248.7, and 242 mg) could be due to cyclohexadiene or phenyl endgroups or to benzene solvent trapped in the lattice.11 The only conclusion available is that chain termination by transfer does occur and is accompanied by an indeterminate amount of disproportionation.
In comparison, ultraviolet spectra of samples polymerized in tetrahydrofuran solution consisted only of very weak shoulders at approximately 265 mg. This obviously denotes much less chain transfer and disproportionation. These data and the observation of the loss of yellow color (long-chain anions) near the completion of the reaction tend to support the termination mechanisms postulated for alkyllithium-catalyzed polymerization of conjugated dienes in tetrahydrofuran.12'13 The ultraviolet
spectra showed no dependence on reaction temperature in the tetrahydrofuran series.
Preparing PolyphenylThe aromatization1.2 of polycyclohexadiene has been investigated further
and data are compiled in Tables V and VI. The bromination (Table V) with either V-bromosuccinimide or bromine8 was carried out at high temperature to promote allylic substitution. Bromine, in a ratio of two moles to each recurring unit, was the preferred agent, since it evidently gave a higher degree of bromination. The resultant product contained approximately only one bromine per recurring unit due to considerable dehydrobro- mination occurring simultaneously with bromination. Dawans and

POLY-1,3-CYCLOIIEXADIENE. I ll 1557
TABLE VBromination of Polycyclohexadiene
No.Brominating
agent
AnalysisEmpiricalformula
Yield,%ac , % H, % Br, %
1 Br2 71.31 7.57 19.03 C6H,.6Br0.2i> 952 NBSb 77.54 4.81 15.91 C6H4.4Br0.2 92.53 Br2 49.49 3.02 43.29 C6ÏÎ4.4Bro.8 83.34 Br2 54.05 3.27 37.23 C6H4.4Br0.7 79.75 Br2 50.02 2.88 40.36 c 6H4.lBro.75 78.66 Br2 53.22 3.88 43.40 ceH5.2Bro.73 957 Br2 52.63 3.96 42.68 c 6H5.4Bro.73 83.8
a Based on the empirical formula.b iV-Bromosuccinimide.
TABLE VIPyrolysis of Brominated Polymer
Start-ing Analysisma- Time, Temp., Empirical Yield,
No. terial“ hr. °C. C, % H, % Br, % formula % b
1 1° 15 200 89.78 8.71 1.08 Cö^Bro.oi 83.527 300
2 2e 42 300 89.65 5.12 4.82 C6H,uBro.oä 87.53 3d 25 350 87.04 4.22 4.68 CeH3.5Br0.05 82.04 4d 25.5 350 87.74 4.35 1.36 CeH3.eBr0.01 75.5
17 1605 3° 16.5 260 72.24 3.74 19.84 CeH3.7Bro.25 88.5
19.5 30017 160
6 4 16.5 260 77.13 4.00 12.65 CeH3.7Bro.15 77.819.5 300
7 5d 56.5 350 82.89 4.26 6.27 CeH3.7Br0.07 85.78 5e 24 300 76.74 3.70 10.92 CeH3.5Bro.13 64.1
31 3509 6» 120 400 95.32 5.12 — c 6h 3.» 77.2
42e 26010 7 23° 360 91.41 4.98 1.63 CeH3.02Bro.i6 85.5
83 380
a From Table II.b From polycyclohexadiene based on empirical formula. 0 With no heat transfer agent, in vacuo. d With p-terphenyl heat transfer agent. e At atmospheric pressure.
LeFebvre,8 however, reported complete bromination and dehydrobromina- tion in one step but used only one mole of bromine per recurring unit. Pyrolysis (Table VI), promoting complete dehydrobromination, to produce polyphenyl can be accomplished with or without a heat transfer agent (j>- terphenyl). The use of this agent is more difficult experimentally but per

1558 P. E. CASSIDY, C. S. MARVEL, AND S. RAY
mits utilization of lower temperatures and shorter reaction times. About 1% of bromine remains in almost all dehydrogenated polymers.
Crosslinking Polyphenyl
Samples of polyphenyl from both cyclohexadiene and benzene were sulfonated with the use as reagents of chlorosulfonic acid, fuming sulfuric acid, and concentrated sulfuric acid (Table VII), the last being the most satisfactory experimentally. The carbon: sulfur ratio can be varied from 6:1 (1 sulfur per ring) to 36:1 (1 sulfur per 6 rings) merely by changing reaction time and temperature. As the degree of sulfonation decreased, the yield increased and the solubility decreased. If the sulfur:ring ratio was 1:1.5 or gi'eater, the samples were soluble in acetone-water or ethanol- water. No other solvents were found.
TABLE VIISulfonation of Polyphenyl
No.
Startingma
terial“Time,
hr.Temp.,
°C.Yield,
g-b
AnalysisSulfur:ringC, % H, % S, %
1 c 113 250 0.96d 47.86 1.86 20.01 1:12 » 48 200 1.93 43.97 2.73 16.19 4:53 C 40 150 1.32 67.34 3.31 11.81 2:54 c 19 100 1.05 79.31 4.10 5.88 1:65 7 12 50 1.21 58.54 2.82 7.95 1:3.36 7 24 100 1.38 49.85 2.10 11.16 1:27 7 36 150 1.51 47.49 1.98 13.18 1:1.78 7 48 200 1.20e 46.93 1.75 13.07 1:1.79 7 96 250 0.38e 4 51.25 1.76 13.38 1:1.7
10 7 40 115 1.30 56.45 2.74 11.77 1:211 10 24 60 1.01 89.45 4.75 1.78 1:2012 10 24 200 1.08e 57.81 2.79 12.29 1:213 11* 24 115 1.17 71.69 3.76 7.88 1:4
“ Product number from Table VI unless otherwise noted. b Based on 1.0 g. of starting material.0 Polyphenyl prepared by Dr. P. Kovacic. d Inherent viscosity in 1:1 acetone-water a t 30°C. is 0.148.6 Loss of product occurred during washing. f Inherent viscosity in 1:1 acetone-water a t 30°C. is 0.057.e Fusion product number 11 from Table VIII was resulfonated since it had a very low
degree of substitution.
All sulfonated products were somewhat hygroscopic. Infrared analyses of mineral oil mulls of these compounds showed weak sulfonic acid bands at 3500, 1320, and 1040 cm .'1 which are not present after alkali fusion.
A polyelectrolyte effect is exhibited for soluble samples. Shown in Figure 1 are the changes in viscosity and pH with changes in concentration
.for ethanol and aqueous ethanol solutions, respectively, of polyphenyl-

POLY-1,3-C Y CLOHEXADIENE. I ll 1559
Fig. 1. Viscosity in ethanol and pH in ethanol-water (1:1) for sulfonated polypheny!.
Fig. 2. Viscosity of sulfonated polyphenyl in acetone-water (1:1) (compound 1, TableVII).
sulfonic acid. This effect is less noticeable but still evident when aqueous acetone is used as solvent (Fig. 2).
Fusion of the sulfonated polymers was conducted with sodium hydroxide- potassium hydroxide mixtures to give products in which approximately 97% of the sulfonic acid groups were replaced by hydroxyl (Table VIII). Again, the polymer was black and brittle and soluble only in acetone-water or ethanol-water and only when the degree of substitution was high. Infrared analysis was poor due to the inability to make good mulls; however, a band at 3600 cm.-1 (OIi stretch), which had not been present previously, appears.
The only apparent difference between the two types of polyphenyl up to this point is that on fusion; compounds prepared from Kovacic’s polyphenyl undergo a decrease in molecular weight, demonstrated by a decrease in inherent viscosity (0.148-0.034), whereas viscosities of sulfonated polymers from cyclohexadiene showed essentially no change (0.057-0.054) on fusion.
Poly(hydroxyphenyl) was crosslinked with formaldehyde (Table IX) with the usual base-catalyzed Bakelite procedure,14 and the products were submitted to thermogravimetric analysis. It is readily noted that the thermal stability increases with decreasing substitution (Fig. 3). The limit of this tendency was not determined.

1560 P. E. CASSIDY, C. S. MARVEL, AND S. RAY
TAREK VIIIAlkali Fusion of Poly (ben zenesulfonic Acid)
No.
Startingmaterial
HOtYield,
g-1’
Analysis
c , % H, % s, % Residue, %
1 1 0 .56c 47.79 2.99 1.11 26.87d2 2 0.71 75.79 4.61 2.98 0.593 3 0.63 84.08 4.65 0.47 <0.24 4 0.60 87.82 4.72 0.69 3.075 5 0.65 82.32 4.21 0.26 —6 6 0.60 80.03 4.03 0.38 0.617 7 0.52 77.46 3.86 0.58 —8 8 0.44 72.56 3.84 2.62 1.369 9 0.20° 70.72 3.82 1.67 1.14
10 10 0.66 77.49 3.93 1.01 —11' 11 0.98 89.02 4.67 0.55 —12 12 0.66 75.51 4.04 0.81 1.1213 13 0.85 86.64 4.83 0.29 —
a Product number from Table VII. b Based on 1.0 g. of starting material. c Inherent viscosity in 1:1 acetone-water a t 3()°C. is 0.034. d Iron oxide due to incomplete washing with acid.' Inherent viscosity in 1:1 acetone-water at 30°C. is 0.054.' Since this compound had a very low degree of substitution it was resulfonated in
reaction 13, Table VII.
TABLE IXCrosslinking Reactions
No.
Startingmaterial
no.a
w t.startingmaterial,
g-Yield,
g-
Analysis
c , % H, %Residue,
%
1 2 1.26 1.36 68.68 4.53 6.232 3 1.00 1.16 74.91 4.25 5.713 4 1.00 1.25 81.01 4.80 8.224 5 1.00 1.12 76.43 4.97 0.975 6 1.00 1.04 77.19 3.91 1.576 7 0.25 0.80 75.75 3.65 1.547 8 0.75 0.77 71.74 3.71 2.748b 10 1.50' 1.35 82.45 3.40 1.129 10 1.50' 1.34 80.61 3.26 2.85
a Product number from Table VIII. b Acid-catalyzed reaction.0 Used 15.0 ml. of 37% aqueous formaldehyde in these runs.
Acidic catalysis for crosslinking was also investigated with only slight improvement. However, the samples used for Figure 4 were pyrolyzed before thermogravimetric analysis to remove water and low molecular weight fractions and thereby to improve the TGA curve.

POLY-1,3-C YCLOII FX ADIEN E. I ll 1561
Fig. 3. Thermogravimetric curves for (1) polymer 1, Table IX; (2) polymer 2, Table IX; (3) polymer 5, Table IX. AT = 150°C./hr.; N2 atmosphere.
T em p era tu re °C
Fig. 4. Thermogravimetric curves for crosslinked polymers: (1) acid-catalyzedpolymer 8, Table IX, and (3) base-catalyzed polymer 9, Table IX. AT = 150°C./hr., N2 atmosphere.
All crosslinked products were hard, black, infusible powders and insoluble in all available solvents.
EXPERIMENTALElemental analyses were performed by Micro-Tech, Skokie, Illinois, and
thermogravimetric analyses by Dr. G. Ehlers, Materials Laboratory, WADD.

1562 P. E. CASSIDY, C. S. MARVEL, AND S. RAY
Materials
All solvents were purified, distilled and dried thoroughly before use. The concentration of the commercial n-butyliithium in heptane (Beacon Chemical Industries, Cambridge, Mass.) was determined to be 3.10M by the double titration method.15 1,3-Cyclohexadiene was distilled twice from a spinning band column (b.p. 78.0°C., nj§ 1.4675) to give a product which still contained 4% benzene, 1% cyclohexene, and 2% cyclohexane impurities upon analysis by gas chromatography.
Infrared and Ultraviolet Spectra
Infrared spectra of poly-1,3-cyclohexadiene samples were taken on a Perkin-Elmer Infracord from films prepared on salt windows from chloroform solutions. Spectra of other compounds were taken from Fluorolube mulls.
Solutions for ultraviolet spectra were prepared by dissolving 0.1-0.2 g. of polycyclohexadiene in 10 ml. of spectra grade chloroform. Spectra were then taken in 1 cm. cells on a Caiy Model 11 recording spectrophotometer from 400 to 235 ni/u-
Poly-1,3-cyclohexadiene
From Ziegler-Type Catalysts. In general, the procedures reported previously2 were used (see Table I).
From Lithium Dispersions. In either a nitrogen or an argon atmosphere samples of a 30% lithium dispersion were weighed into syringe bottles containing deoxygenated benzene which were capped and shaken to suspend the lithium. Then 5.0 ml. (4.2 g.) of pure 1,3-cyclohexadiene was injected and the mixtures were shaken at room temperature for three weeks. The catalyst was carefully decomposed with isopropyl alcohol and then methanol to yield gummy grey residue (Table II).
From n-Butyllithium in Benzene. Into a capped syringe bottle were injected 5.0 ml. each of 1,3-cyclohexadiene (4.2 g.) and benzene. The catalyst was added after thermal equilibration and the yellow solution was shaken.
In terminating the reaction, the viscous solution was diluted with benzene and precipitated slowly into 250 ml. of methanol containing V-phenyl- 2-naphthylamine antioxidant to give a white fibrous solid which was washed with methanol and dried in vacuo (Table III).
A nal. Calcd. for (C6H8): C, 90.00%; H, 10.00%. Found: C, 89.69%; H, 10.22 %.
From n-Butyllithium in Tetrahydrofuran. The same procedure is used here as with benzene solvent (Table IV).
Bromination of Poly-1,3-cyclohexadiene
With Bromine.8 In a 250-mh, three-necked flask equipped with a pressure-equalizing dropping funnel, mechanical stirrer, mantle, and con

POLY-1,3-CYCLOHEXADIENE. I l l 1563
denser with an outlet over a sodium hydroxide solution trap, was placed 100 ml. of 1,1,2-trichloroethane and 10.0 g. of poly-1,3-cyclohexadiene. This solution was brought to reflux under nitrogen and a solution of 40 g. of bromine (C=C/Br2 = V2) in 60 ml. of solvent was added slowly over 24 hr. After a total of 72 hr. of reaction, the mixture was cooled and poured into 1 liter of methanol to obtain a brown precipitate which was washed with methanol and dried (Table V).
With W-Bromosuccinimide. To a hot polymer solution prepared as that above was added cautiously a mixture of 24.5 g. of iV-bromosuccinimide and 3.0 g. of benzoyl peroxide. The reaction mixture was poured into methanol and the precipitate was extracted thoroughly with methanol to remove succinimide to leave a yellow-brown polymeric residue (Table V).
Pyrolysis of Brominated Poly-1,3-cyclohexadiene
Without Heat Transfer Agent. The brominated polycyclohexadiene was placed in a round-bottomed flask which was in turn repeatedly evacuated and filled with nitrogen to insure removal of oxygen. Then, while under vacuum, the flask was heated in a Wood’s metal bath at the proper temperature for the alotted time. The black residue was pulverized, extracted with benzene, and then with methanol, and dried (Table VI).
A nal. Calcd. for (C6H4)„: C, 94.70%; H, 5.30%. Found: See Table VI.
With Heat Transfer Agent. This process was the same as that previously reported1 except that the product was insoluble (Table VI).
Sulfonation of PolyphenylInto a three-necked, round-bottomed flask equipped with a mantle,
thermometer, mechanical stirrer, and gas inlet and outlet is placed the sulfuric acid (50 ml./g. of starting material unless otherwise stated). This is brought to the proper temperature under a nitrogen atmosphere. The polyphenyl is then added and after reaction the black mixture is cooled to room temperature and poured over ice. The black solid is isolated by suction filtration and washed well with water and dried in a vacuum oven at 100°C. Excessive washing with water results in a loss of product. If the degree of sulfonation is high, the pastelike product must be isolated and washed by using a centrifuge since filtration is very difficult (see Table VII for other experimental details).
Alkali Fusion of Poly(phenyIsuIfonic Acid)
In an iron crucible were mixed 5.0 g. of potassium hydroxide and 5.0 g. of sodium hydroxide under nitrogen and heat was applied to produce a melt (300°C.). To this was added with stirring 1.0 g. of sulfonated polyphenyl. The higher the degrees of sulfonation, the more the reaction foamed. After 12-24 hr. the mixture was cooled, dissolved in water and acidified with 6N hydrochloric acid. The black precipitate was isolated by filtration, washed well with concentrated hydrochloric acid to remove iron

1564 P. E. CASSIDY, C. C. S. MARVEL, AND S. RAY
impurities, washed with water, and dried in a vacuum oven at 100°C. (Table VIII).
Crosslinking of Poly (hydroxyphenyl)
Into a 50-ml. flask equipped with a magnetic stirrer and a reflux distilling head was placed 10 ml. of 37% aqueous formaldehyde and 0.10 g. of technical barium hydroxide (oxalic acid was used for acidic catalysis) and the solution was heated to reflux and 1.0 g. of poly (hydroxy phenyl) was added.14 After heating for 24 hr., the mixture was cooled and the product was removed by filtration. The black powder was triturated and washed well with water and dried in vacuo. The samples used for Figure 4 were heated at 300-400°C. for 38 hr. under vacuum prior to thermogravimetric analysis. The more highly substituted starting materials were obviously better for this reaction due to their greater solubility. In the elemental analyses of these products, the high thermal stability was probably responsible for the residues (Table IX).
The authors wish to thank Dr. Peter Kovacic for his samples of polyphenyl.
References1. Frey, D. A., M. Hasegawa, and C. S. Marvel, .7. Polymer Sei., A l, 2057 (1963).2. Marvel, C. S., and G. E. Hartzell, J . Am. Chem. Soc., 81, 488 (1959).3. Kovacic, P., and A. Kyriakis, Tetrahedron Letters, 1962, 467.4. Kovacic, P., and A. Kyriakis, J. Am. Chem. Soc., 85, 454 (1963).5. Kovacic, P., and R. M. Lange, J. Org. Chem., 28, 968 (1963).6. Kovacic, P., and F. W. Koch, J. Org. Chem., 28, 1864 (1963).7. Kovacic, P., F. W. Koch, and C. E. Stephan, J. Polymer Sei., A2, 1493 (1964).8. Dawans, F., and G. LeFebvre, J. Polymer Sei., A2, 3277 (1964).9. Schaefer, J. P., private communication.
10. Stille, J. K., Chem. Revs., 58, 541 (1958).11. Gillam, A. E., and E. S. Stern, An Introduction to Electronic Absorption Spec
troscopy in Organic Chemistry, Arnold, London, 1954.12. Fetters, L. J., Polymer Sei., B2, 425 (1964).13. Rembaum, A. A., S. P. Siao, and N. Indictor, J . Polymer Sei., 56, S17 (1962).14. Sorenson, W., and T. W. Campbell, Preparative Methods of Polymer Chemistry,
Interscience, New York, 1961, p. 254.15. Gilman, H., and M. Haubein, ./. Am. Chem. Soc., 66, 1515 (1944).
RésuméLa polymérisation du 1.3-cyclohexadiène avec le n-butyllithium donne des polymères
blancs possédant une viscosité inhérente allant jusqu’à 0.23 et des taux de conversion allant jusqu’à 98%. La bromation et la pyrolyse de ces polymères donne des poly- phényles, qui peuvent être sulfonés avec succès, puis subir la fusion alcaline pour donner des phénols et enfin être pontés avec le formaldéhyde. Les produits finaux résistent très bien à la chaleur. Il n’y a pas de perte de poids en chauffant jusqu’à 400°C et seulement 30% à 900°C.

P0LY-1,3-CYCL0TIEXADIENE. III 1565
ZusammenfassungDie Polymerisation von 1,3-Cyklohexadien mit n-Butyllithium lieferte weisse Poly
mere mit Viskositätszahlen bis zu 0,23 bei Umsätzen bis zu 98%. Bromierung und Pyrolyse dieser Polymeren führt zu Polyphenylenen, die erfolgreich sulfoniert und dann in geschmolzenem Alkali unter Bildung von Phenolen gelöst und schliesslich mit Formaldehyd vernetzt werden können. Die Endprodukte zeigen insofern gute Hitzebeständigkeit, als beim Erhitzen auf 400°C kein Gewichtsverlust und bei 900°C nur ein solcher von 30% auftritt.
Received September 17, 1964 Revised November 2, 1964 (Prod. No. 4552A)

JOURNAL OF POLYMER SCIENCE: PART A VOL. 3, PP. 1567-1571 (1965)
Kinetics o f Polym erization o f Styrene Initiated by Substituted Benzoyl Peroxides.
III. Induced Decom position
K. F. O'DRISCOLL,* P. F. LYONS, and R. PATSIGA.VUlanova University, VUlanova, Pennsylvania
SynopsisThe polymerization of styrene has been initiated by redox systems consisting of di-
ethylaniline and symmetrically substituted benzoyl peroxides. Decomposition rate constants and efficiencies of initiation were determined by the dead-end technique. Hammett plots of these rate constants and of those previously determined for polystyryl-radi- cal induced decomposition of substituted benzoyl peroxides have the same slope, suggesting that an mechanism is involved in the radical attack on peroxides just as in the radical attack on disulfides. The predictive ability of a combined Hammett-type equation was shown to be excellent for the decomposition rate constants of initiating systems consisting of both substituted diethylaniline and substituted benzoyl peroxide. The effect of substituents on the efficiency of initiation remains unexplained.
In the preceding paper1 a study of the kinetics of thermal decomposition of symmetrically substituted benzoyl peroxides at 90°C. produced values for the unimolecular decomposition rate constants and also for the constants for decomposition induced by the growing polystyryl free radical (kx). I t is of interest to compare these latter values with the rate constant kd for the well known decomposition induced by A^V-dialkylani- lines.2-4 Walling and Indicator3 have shown that dimethylaniline (DMA) probably induces the decomposition of benzoyl peroxide via an SN2 attack on the peroxide oxygen by the amine nitrogen.
The decomposition of unsubstituted benzoyl peroxide induced by substituted diethylanilines (DEA) has previously been studied6 and the decomposition rate constants correlated with the Hammett a. The value of p was found to be —2.7. In the work reported in this communication, the same experimental procedure was followed, and rate constants and efficiencies were calculated by the “dead-end” technique.4 Measurements were made at 30 and at 60°C.
The value of the rate constants and efficiencies derived from the dead-end calculations are shown in Table I. Figure 1 shows a Hammett plot of these rate data together with the induced decomposition rate constants
* Present address: Department of Polymer Chemistry, Kyoto University, Kyoto, Japan.
1567

1568 K. F. O’DRISCOLL, P. F. LYONS, R. PATSIGA
TABLE IDecomposition Rate Constants and Efficiencies of Polymerization Initiation for
Symmetrically Substituted Benzoyl Peroxides Induced by Dimethylaniline
Substituent
Efficiency / kd X 103, 1./mole-sec.
30°C. 60°C. 30°C. 60°C.
p-Methoxy 0.04 — 0.65 —p-Methyl 0.07 — 1.14 —None 0.08 0.04 2.29 12.5p-Chloro 0.12 0.06 19.4 55.1m-Bromo 0.10 — 39.2 —3,4-Dichloro 0.14 0.03 110. 646.
from the preceding paper.1 The slope of the plot gives a value for p of + 1.6. This value, obtained for 30 and 60°C., is the same as that obtained by Into to and Choe2 at 5°C. and demonstrates that p for the amine- induced decomposition is not temperature-dependent. This permits comparison with the 90 °C. data obtained for the radical-induced decomposition,1 which, since the data fall on the same line, has the same p value.
While this work was in progress Pryor and Guard6 obtained the first unambiguous proof that so-called SH2 reactions, bimolecular radical displacement reactions, have the same sort of transition state as the well- known Si?2 reactions. Their evidence took the form of a linear free 1000
1000
100
SUBST
10
I
0.1 H-----------------I-----------------.------------------.----------------- .-----------------.----------------- r-0.8 -0.4 0 0.4 0.8 1.2 1.6
20-Fig. 1. Hammett plot for decomposition of substituted benzoyl peroxides induced
by (O) dimethylaniline at 30°C.; dimethylaniline at ( X) 60°C.; (A) polystyryl radicalsat 90°C.

STYRENE POLYMERIZATION KINETICS. I l l 1 5 6 9
energy relation between the rate constants for nucleophilic and free radical attacks on the disulfide bond. Pryor had earlier suggested7 that the $#2 reaction might occur when free radicals attack either disulfides or peroxides, but experimental proof had been lacking.
There is some question as to the point of attack of a polystyryl radical on benzoyl peroxide. Walling and Savas8 have suggested that the ability to form charge transfer complexes in the transition states determines whether the radical-induced decomposition of benzoyl peroxide proceeds via a direct attack at the peroxide oxygen or by a concerted mechanism involving attack by the radical on the ortho or para ring positions. Secondary alkyl radicals attack the ring, while acyl radicals and radicals derived from ethers and alcohols attack the peroxide bond itself.8 In the absence of product studies it cannot be definitively said which occurs in the case of a polystyryl radical. However, the polystyryl radical is certainly quite capable of behaving as an electron donor, as demonstrated by its copolymerization behavior. It can also readily stabilize charge transfer complexes with the peroxide linkage, so it is not unreasonable to assume that attack does occur at the peroxide bond, the same linkage which DMA attacks.
If this is true, then the data reported in this and the preceding paper1 form exactly the same sort of proof for peroxides as Pryor has established for disulfides.6 The rate constants for peroxide decomposition induced by polystyryl radicals (kx) and by dimethylaniline (ka) obey the same linear free energy relation. It may therefore be concluded that the transition state requirements are quite similar, and that the radical-induced decomposition of peroxides follows an SH2 mechanism analogous to the 8^2 mechanism of their induced decomposition.3
When symmetrically substituted peroxides are used, Figure 1 demonstrates that the following Hammett equation holds for the decomposition rate constant kd'.
log (kd(ji,u)/kd(n,n)) = 1.6 (2ux) (1)where the subscript (X,H) refers to the peroxide substituent, X, and unsubstituted DMA. An earlier paper5 demonstrated that the analogous relation held for the reaction between unsubstituted peroxide and DEA having ring substituent Y :
log (kd(H,Y)/kd(s,s)) = —2.7 (cry) (2)Since there is little difference between the reactivity of DMA and DEA we may combine eqs. (1) and (2) to obtain.
log ( W x ,y ) A z ( h ,h ) ) = 1.6 (2<t x) — 2.7 (<7y) (3)We have tested this equation experimentally by using a variety of
substituted diethylanilines and benzoyl peroxides with each other as initiators of styrene polymerization at 30°C. The values of / and kd are given in Table II, along with the values of kd calculated from eq. (3). The excellent agreement which can be noted over more than three orders of

1570 K. F. O’DRISCOLL, P. F. LYONS, R. PATSIGtA
TABLE IIComparison of Observed and Calculated Rate Constants for Decomposition of Sub
stituted Benzoyl Peroxides Induced by Substituted Diethylanilines
kd X 102, 1./mole/sec.
substituent(X)
Benzoyl peroxide substituent (Y) / X 102 Observed
Calc’d. from eq. (3)
m-CHj m-Br 7.7 6.01 6.91p-Cl 15.2 2.53 2.13p-CH3 9.9 0.212 0.112
p-Cl ro-Br 11.7 0.994 1.13p-Cl 11.1 0.202 0.354p-CH3 16.9 0.024 0.019
p-CN m-Br 27.2 0.175 0.095(Unsubsti- >25 <0.004 0.0022
tuted) (46)»
a Calculated from values of initial Rp and calculated kd.
magnitude variation in ki{x,Y) suggests that the rate-determining step in decomposition is not at all complicated by ring substitution of either the amine or the peroxide.
However, when we consider the efficiencies of initiation contained in Table I and II and reference 5, it is more difficult to discern a pattern. Figure 2 shows a plot of some of the observed efficiencies versus 2 <rx or ay. It can be seen that when the peroxide is unsubstituted, electron-withdrawing groups on the amine strongly increase the efficiency. However when the amine is unsubstituted, electron-withdrawing groups on the peroxide increase the efficiency very little. And, if the amine has the electron-withdrawing p-chloro group, the efficiency is at a maximum for unsubstituted peroxide. This latter fact may be connected with the stabilization of benzoate radicals by both electron-withdrawing and electron-donating groups as noted in the previous paper.1 A more detailed explanation of the efficiency variation must await further work.
Fig. 2. Effect of substituents on efficiency: (A) / vs. a y when a x = 0; (O) / vs. 2<rXwhen a y = 0; (• ) / vs. 2o-x when a y = +0.23 (p-Cl).

STYRENE POLYMERIZATION KINETICS. I l l 1571
Support of this work by the Petroleum Research Fund and by the National Institutes of Health is greatly appreciated.
References1. O’Driscoll, K. F., and P. J. White, paper presented before the Polymer Division,
147th Meeting American Chemical Society, Philadelphia, Pa., April 1964; Polymer Preprints, 5, No. 1, 92 (1964); J. Polymer Sei., A 3, 283 (1965).
2. Imoto, M., and S. Choe, J. Polymer Sei., 1 5 ,485 (1955).3. Walling, C., and N. Indictor,./. Am. Chem. Soc., 80, 5814 (1958).4. O’Driscoll, K. F., and S. McArdle, J. Polymer Sei., 4 0 ,557 (1959); K. F. O’Driscoll
and J . Schmidt, J. Polymer Sei., 4 5 , 189 ( 1960).5. O’Driscoll, K. F., and E. Ricchezza, Makromol. Chem., 4 7 , 15 ( 1961 ).6. Pryor, W., and H. Guard, J. Am. Chem. Soc., 86,1150 (1964).7. Pryor, W., and T. Pickering, J. Am. Chem. Soc., 84, 2705 (1962).8. Walling, C., and E. Savas, J. Am. Chem. Soc., 8 2 ,1738 (1960).
RésuméLa polymérisation du styrène a été initiée par des systèmes redox: la diéthylaniline
et le peroxyde de benzoyle substitué symmétriquement. Les constantes de vitesse de décomposition et les efficacités a’initiation ont été déterminées par la technique de désactivation des fins de chaîne. Les diagrammes de Hammett pour ces constantes de vitesse et ceux déterminés antérieurement pour la décomposition induite du radical polystyryl des peroxydes de benzoyle substitués ont la même pente, ce qui fait supposer qu’un mécanisme Sjj2 intervient dans l’attaque des peroxydes par le radical, comme dans l’attaque des disulfures par un radical. On a montré qu’une équation combinée du type Hammett s’est avérée excellente pour prédire les constantes de vitesse de décomposition de systèmes initiateurs contenant de la diéthylaniline substituée et le peroxyde de benzoyle substitué. L’effet des substituants sur l’efficacité de l’initiation reste inexpliqué.
ZusammenfassungDie Polymerisation von Styrol wurde mit Redoxysystemen aus Diäthylanilin und
symmetrisch substituierten Benzoylperoxyden gestartet. Zersetzungsgeschwindig- keitskonstanten und Startausbeuten wurden nach dem “dead-end”-Verfahren bestimmt. In den Hammett-Diagrammen dieser Geschwindigkeitskonstanten und der früher für die Polystyrylradikal-induzierte Zersetzung substituierter Benzoylperoxyde bestimmten tritt die gleiche Neigung auf, was dafür spricht, dass beim Radikalangriff an Peroxyden ebenso wie beim Radikalangriff an Disulfiden ein S»2 Mechanismus auftritt. Eine Gleichung vom Hammett-Typ war ausgezeichnet zur Voraussage von Zersetzungsgesch- windigkeitskonstanten in Startersystemen aus substituiertem Diäthylanilin und substituiertem Benzoylperoxyd geeignet. Der Einfluss der Substituenten auf die Startausbeute bleibt ungeklärt.
Received September 29, 1964 Revised November 4, 1964 (Prod. No. 4538A)

JOURNAL OF POLYMER SCIENCE: PART A VOL. 3, PP. 1573-1586 (1965)
Reactivity of Condensed-Ring Hydrocarbons as Polymerization Retarders*
JUDSON L. IHRIG and SATYA PAL SOOD, Department of Chemistry, University of Haivaii, Honolulu, Hawaii
Synopsis
Seventeen condensed-ring hydrocarbons have been investigated as retarders or inhibitors of styrene and methyl methacrylate polymerization. Rates were measured dila- tometrically. Nine of the compounds tested retarded or inhibited the polymerization of styrene, but methyl methacrylate appears not to be affected by this class of substances. Styrene data obtained are examined in the light of Fukui’s “frontier electron” formalism for correlating structure and reactivity. I t is concluded that the principal locus of radical attack is at the meso carbon atoms, Fukui’s (<Ss) region, and that a substantial value of the (<Ss) density index is required for retardation, although when the molecule also possesses an appreciable (Sp) index, a synergistic action is noted. The point is made that since condensed-ring hydrocarbons do not have “functional groups” in the sense that quinones and other retarders do, the effect of monomer reactivity is likely to be of added importance in determining retarder efficiency. The lack of retardation effects in polymerizing methyl methacrylate is interpreted from this standpoint. A reverse chain- transfer reaction is tentatively proposed to account for the observed behavior.
INTRODUCTION
The relationship between structure and reactivity of condensed-ring hydrocarbons has been a subject of intense experimental and theoretical interest for over a generation. The extremely mobile ir-electron systems, giving rise to variations in electron density, delocalizability, and other semiempirical parameters, permit these molecules to participate in many types of chemical reactions especially those involving free-radical intermediates. Greatly intensifying such interest is the well known carcinogenic activity of many condensed-ring hydrocarbons and their derivatives. Thus there has resulted a voluminous literature concerned with these compounds, broadly ranging from physical studies of their spectral and magnetic properties to biological animal screening programs. Emphasis has been experimental, theoretical, and even polemical upon occasion.
Considering the background of the field it is somewhat surprising to find that so little investigation has been carried out of the reactivity of condensed-ring systems in polymerizing monomers. A priori, it might be predicted that, such compounds could well act as retarders or inhibitors of
* Taken, in part, from the Ph.D. thesis of S. P. Sood, University of Hawaii, 1963.1 5 7 3

1574 J. L. IHRIG AND S. P. SOOD
vinyl polymerization. Yet only three brief reports have so far appeared in the literature,1-3 the latest since the completion of this study. It seemed, then, of more than passing interest to investigate the quantitative kinetics of polymerization retardation and inhibition in the presence of such substances as one further step in the slow development of retardation mechanisms.
The present study was limited to the behavior of simple condensed-ring hydrocarbons, without side chains or heteroatoms, in the homo-polymerization of styrene and methyl methacrylate initiated by 2,2'-azobisisobutyro- nitrile. Another severe limitation is the very limited solubility of many of these compounds in the pure monomers and in other nonpolar aromatic and aliphatic solvents. This last factor probably precludes a truly complete mechanism study of this kind.
EXPERIMENTAL
Materials
Styrene monomer from Ram Chemicals Inc. was first distilled under reduced pressure in a nitrogen atmosphere. The distillate was washed several times with 2% sodium hydroxide, distilled water, 1% sulfuric acid, and finally with distilled water until the washings were neutral. It was then dried with calcium hydride overnight and refractionated in an all-glass apparatus employing a nitrogen bleed under reduced pressure. The column used was vacuum-jacketed and filled with about 90 cm. of glass helices. Only the constant-boiling middle fraction was collected. The monomer thus purified was stored in specially constructed containers under nitrogen and kept frozen in a Dry Ice-acetone mixture until used.
Methyl methacrylate from Rohm and Haas Co. was washed with 2% sodium hydroxide until there was no further dark coloration from the hydroquinone stabilizer. After rinsing with distilled water, the monomer was refrigerated overnight over a calcium chloride-sodium sulfate mixture. I t was then fractionated in the same way as was styrene and stored hr Pyrex, low-actinic flasks under refrigeration.
2,2'-Azobisisobutyronitrile from Eastman Organic Chemicals was recrystallized several times from methanol. Only the first crop of crystals was collected in each stage. This material was stored under refrigeration and recrystallized periodically.
The condensed-ring hydrocarbons used in this study are listed in Table I summarizing the experimental results. Most were obtained commercially, although some were synthesized for this work, for which particulars are available elsewhere.4 Briefly, these compounds were purified by extensive recrystallization and sublimation where practical. All were chromatographed by using alumina and silica columns (usually both). Melting points and, where possible, infrared spectra were checked with literature values.

CONDENSED-RING HYDROCARBONS 1575
Dilatometry
Polymerization reaction rates were followed by vacuum dilatometry. The temperature was 44.4°C. and controlled within ±0.005°C. The experimental procedure has been described earlier,5 and details, including calibration, may be found elsewhere.4 Slight modifications in the mixing steps were made necessary by the slow rate of dissolution observed with many of the hydrocarbon retarders, especially in the cold. Although the
Fig. 1. Primitive kinetic data for vacuum dilatometrie experiments, polymerization of styrene initiated by AIBN, with and without the presence of anthracene.
exact zero time was of importance only when inhibition periods were observed, all mixing and warming steps were performed in a uniform, timed sequence which gave satisfactory reproducibility. Preparation time varied between 10 and 20 min. depending upon solubility, and the first cathetom- eter readings of the liquid levels in the dilatometer capillaries could be made approximately 10-12 min. after immersion in the thermostat.
Figure 1 shows a sample plot of a run with styrene and initiator only and the same system retarded with anthracene. Figure 2 shows styrene runs in the presence of varying amounts of 3,4-benzpyrene which produced well defined inhibition periods of length T.

1576 J. L. I1JRIG AND S. P. SOOD
Fig. 2. Primitive kinetic data, polymerization of styrene initiated by AIBN in thepresence of different concentrations of 3,4-benzpyrene.
RESULTS
Table I summarizes the experimental results obtained with styrene. Following Kice.6 we define <£ = r/r0, where r is the rate of the retarded polymerization and r0 is the rate of the unretarded polymerization calculated for the same initiator concentration. Under our conditions r0 in per cent per hour was determined to be r0 = 6.12 [AIBN]’/!, where [AIBN] is the molar concentration of initiator. The final column in Table I is a calculated rate value for those hydrocarbons which exhibited retardation. This was done where appropriate in order to obtain comparable rates for different reactions for one initiator concentration.
In addition to the hydrocarbons listed in Table I, 2,3-benzanthracene, pentacene, picene, and 2',l'-anthra-l,2-anthracene were tested. Their poor solubility in styrene monomer did not permit sufficient variation in concentration to allow reliable rate data to be collected.
Methyl methacrylate data are given in Table II. For this monomer the unretarded rate in per cent per hour was found to be r0 = 29.3 [AIBN ]1/s + 0.18, in satisfactory agreement with previous work.7

CONDENSED-RING HYDROCARBONS 1577
The absence of retardation action in this monomer even for 2',3'-naphtho-3,4-pyrene, a potent retarder of styrene polymerization, is perhaps the most striking feature of the present study.
Kinetic Analysis of Results
We employ the generally serviceable Kice scheme as follows:I — R . Rate = 2 kdf (1)
R- + M -* R- K i R-][M ] (2)R- + X -> Z- K[ R-][X] (3)Z- + M - * R - *o[Z-][M] (4)
1 • + R • —>■ Inactive products WR-11Z-] (5)Z • + Z • —► Inactive products 2fe[Z-]2 (6)R • + R • — Inactive products 2^([R-]2 (7)
where / represents the initiator efficiency, X the added retarder, and Z • the radical formed by reaction of R • with retarder, either by the addition of R- to X or by transfer to R- from X. The other symbols have their usual meaning. From the usual steady-state assumptions an expression relating the pertinent variables is obtained:
* W ( 1 - ¿ 2) ( i + {1 + [C(1 - * * ) /* ]} ) l/*
= 2kfi/k jex{l + [C(l - 4>2)]/4>2}’a + 2kakt[M]/kxkc (8)
where R is defined as — d In [M ] / d t and C = 4 k tk z/ k c2. Since cross termination is known to be the preferred mode, the value of G is assumed to have an upper limit of unity and, usually, to be very much less than one. In the present work an assumed value of C = 1.0 X 10 ”4 gave straight-line plots of the experimental data for retarded polymerizations (but not for inhibited ones). Equation (8) is limited, in that the concentration of X must remain sufficiently constant over a period of time long enough to permit an accurate measure of the initial rate, which itself must not be too small. By considering these points, eq. (8) simplifies to :
02[X]/(1 - V ) = k tR / k pk x + k J e , [ M ] / k J e e (9)
which was the form used. The rate constants k0 may indeed be a combination of constants involving Z • in such reactions as:
Z- -» R- + X (10)Z- + M — ZH + R- (11)
Z- + M —»-X + P + R- (12)
where P represents a polymer molecule, not kinetically significant, and R • is a monomeric chain-carrying radical. For long-chain conditions, eq. (9) reduces to:
(1 - 4>2) / 0 2 = ( k r k c/ h k t) [X ]/[M ] (13)

1578 J. L. IHRIG AND S. P. SOOD
TABLE IStyrene Polymerization Rates in the Presence of Hydrocarbon Retarders
Hydrocarbon
Hydrocarbon concn. X 103
mole/1.
[AIBNJÄ X 102,
mole/1.T,
min.r,
% /hr. 0
Calc, rate % /hr., at [AIBN]1/* X 102 =
4.75 mole/1.
Naphthalene 39.0 6.16 0.357 0.954121. 7.49 0.455 0.993
Phenanthrene 27.7 5.77 0.357 1.0121.1 6.83 0.415 0.993
Chrysene 12.7 4.64 0.267 0.94214.6 6.73 0.400 0.971
Pyrene 29.7 5.49 0.347 1.0352.8 6.35 0.395 1.02
Triphenylene 23.7 5.47 0.361 1.0845.4 6.30 0.382 0.991
Perylene 10.4 6.67 0.405 0.99215.8 6.67 0.405 0.992
1,2-Benzpyrene 7.56 4.64 0.285 1.0013.7 4.64 0.287 1.01
1,2,3,4-Dibenzanthracene 5.43 4.87 0.301 1.011.46 4.87 0.298 1,00
1,2-Benzanthracene 4.21 4.65 16 0.292 i .014.82 4.65 17 0.289 1.025.49 4.65 18.5 0.267 0.946.22 4.65 20.5 0.257 0.918.11 4.65 24.5 0.286 1.009.20 4.65 27 0.290 1.02
1,2,5,6-Dibenzanthracene 0.832 4.65 14.5 0.289 1.011.01 4.65 15.5 0.320 1.121.47 4.65 17.5 0.249 0.8751.90 4.65 19 0.233 0.822.15 4.65 20 0.305 1.073.50 4.65 25.5 0.294 1.03
3,4-Benzpyrene 1.95 4.66 19 0.188 0.6602.19 4.66 20 0.180 0.6322.78 4.66 22.5 0.165 0.5793.47 4.66 25.5 0.148 0.5204.12 4.66 28 0.136 0.4785.61 4.66 34.5 0.136 0.478
Anthracene 3.70 4.75 0.252 0.8666.65 4.75 0.226 0.7778.92 4.75 0.208 0.715
10.4 4.75 0.199 0.68412.6 4.75 0.184 0 63115.8 4.75 O'. 163 0.56018.0 4.75 0.151 0.52019.25 4.75 0.147 0.50933.1 4.75 0.126 0.43334.9 4.75 0.121 0.416

CONDENSED-RING HYDROCARBONS 1 5 7 9
TABLE I (continued)
Hydrocarbon
Hydrocarbon concn. X 103
mole/1.
[AIBN]‘AX 10s, r , r,
mole/1. min. % /lir. <t>
Calc, rate % /hr., a t [AIBN]1/* X 10* =
4.75 mole/1.
1,2,9,10-Dibenznaphtha-cene 0.175 4.75 0.277 0.953
0.619 4.75 0.245 0.8431.31 4.75 0.203 0.6981 .73 4.75 0.182 0.6252.445 4.75 0.152 0.5233.54 4.75 0.125 0.4304.34 4.75 0.113 0.3885.09 4.75 0.100 0.344
1,2,3,4-Dibenzpyrene 0.980 4.75 0.258 0.8871.42 4.75 0.245 0.8421.904 4.75 0.230 0.7903.20 4.75 0.198 0.6803.65 4.75 0.188 0.6464.26 4.75 0.175 0.601
1,2,7,8-Dibenznaphtha-cene 0.425 4.75 0.254 0.873
0.597 4.75 0.240 0.8250.700 4.75 0.233 0.8010.812 4.75 0.224 0.7700.938 4.75 0.216 0.742
2,3,7,8-Dibenzplienan-threne 0.712 5.42 0.271 0.816 0.242
0.935 5.42 0.254 0.765 0.2231.17 5.42 0.236 0.711 0.2071.45 5.42 0.219 0.660 0.1911.63 5.42 0.208 0.629 0.183
2',3'-Naphtho-3,4-pyrene 0.21 6.43 0.176 0.451 0.1310.494 6.43 0.103 0.262 0.0760.807 6.43 0.072 0.183 0.0531.84 6.43 0.042 0.107 0.0312.25 6.43 0.034 0.0864 0.025
which compared with eq. (8) shows that the long-chain criterion is:5
k0/k c » R/lcp[M] (14)
which is in agreement with the observation of Kice8 that k0/k c is a measure of the relative stabilities of the intermediate radicals Z ■.
Table III gives kinetic data from plots of eq. (9), and Figure 3 shows a sample plot. k t and kv were calculated for this temperature from the relationships of Matheson and co-workers.9
Three of the compounds tested produced sharply defined inhibition periods. They were: 3,4-benzpyrene, 1,2,5,6-dibenzanthracene, and 1,2-

1580 J. L. IHRIG AND S. P. SOOD
TABLE IIMethyl Methacrylate Polymerization Rates in the Presence of Hydrocarbons
Hydrocarbon
Hydrocarbonconcn., X 103
mole/1.
[AIBNl’A X 102,
mole/1. r, % /hr. 4>
Naphthalene 16.5 4.24 1.62 1.144.79 5.26 1.77 1.03
Phenanthrene 6.09 7.05 2.22 0.98Anthracene 11.8 5.25 2.00 1.17
8.26 5.74 2.10 1.134.49 5.53 1.66 0.92
3,4-Benzpyrene 3.52 5.80 1.77 0.94
2',3'-Naphtho-3,4-1.11 6.46 2.01 0.97
pyrene 1.31 6.92 2.05 0.940.432 6.92 2.10 0.96
b e n z a n th ra c e n e . A s c a n b e seen fro m T a b le I , th e f ir s t o f th ese ca u se d a
re ta rd e d ra te a ft e r th e in h ib it io n p e rio d . I n a ll th re e cases th e le n g th o f th e
in h ib it io n p e rio d (c o rre c te d b y s u b t ra c t in g th e t im e zero d e te rm in e d fro m a
p lo t o f T v e rs u s in it ia l c o n c e n tra t io n o f in h ib it o r ) 4 w a s d ir e c t ly p ro p o rtio n a l
to th e in it ia l c o n c e n tra t io n o f a d d e d h y d ro c a rb o n . I f th e s to ic h io m e tric
c o e ffic ie n t n is c a lc u la t e d a c c o rd in g to th e w e ll-k n o w n e x p re ssio n , T = f i [ Z ] / 2 k df , w h e re T is th e co rre c te d in h ib it io n tim e , [Z ] th e in it ia l in h ib it o r
c o n c e n tra t io n , a n d 2 kdf th e ra te o f in it ia t io n , i t is fo u n d t h a t th e c h a in -
Fig. 3. Plot of kinetic eq. (9) for two typical retarders.

CONDENSED-RING HYDROCARBONS 1581
TABLE IIIRate Constants for Retarders of Styrene Polymerization
kx)1. /mole-sec. kx /kp
k 0/ k c X 1010
2',3'-Naphtho-3,4-pyrene 22,000 240 8.51,2,7,8-Dibenztetracene 1,460 13 4.51,2,9,10-Dibenztetracene 1,260 13 3.4Anthracene 170 2 2.03,4-Benzpyrene 1,360 14 24.02,3,7,8-Dibenzphenanthrene 1,260 13 0.51,2,3,4-Dibenzpyrene 550 6 10.6
s to p p in g e q u iv a le n c e is v e r y lo w . F o r a l l th re e su b s ta n c e s it is a p p r o x i
m a te ly 1 0 - 3 .
D I S C U S S I O N
C o n d e n s e d -rin g h y d ro c a r b o n s d iffe r fro m c o n v e n tio n a l p o ly m e r iz a t io n
re ta rd e rs , i..e., q u in o n e s, p h e n o ls, n it r o co m p o u n d s, e tc., in t h a t th e y do n o t
p ossess “ f u n c t io n a l g ro u p s ” in th e sen se t h a t t h is te rm is c o m m o n ly u se d in
o rg a n ic c h e m is t ry . T h e ir r e a c t iv it y a p p e a rs to be a f u n c t io n o f th e d is
t r ib u t io n a n d d e n s it y o f th e e le c tro n s (e s p e c ia lly x -e le c tro n s ) in d iffe re n t
“ re g io n s ” o f th e m o le cu le s. N u m e ro u s a tte m p ts h a v e b ee n m a d e to c o r
re la te c h e m ic a l b e h a v io r w it h e le c tro n ic p a t te r n a n d e n e rg ie s a s d e te rm in e d
b y m o le c u la r -o r b ita l c a lc u la t io n s . T h e v a r io u s tre a tm e n ts d iffe r in th e
a p p r o x im a t io n s e m p lo y e d ( a ll o f th e m d ra s t ic s im p lif ic a t io n s ) a n d in th e
te rm in o lo g ie s u se d b y t h e ir p ro p o n e n ts. W h ile one s u c h s y s te m m a y sh o w
b e tte r c o rre la t io n fo r c e rt a in c la sse s o f re a c tio n s t h a n a n o th e r, th e re is
u s u a lly c o n s id e ra b le e q u iv a le n c e in t h e ir re s p e c tiv e a p p ro a c h e s to th e
p ro b le m . M o s t re co g n ize tw o d is t in c t re g io n s o r lo c i o f r e a c t iv it y : (1) th e “ m e s o - a to m s ” (b y a n a lo g y w it h th e 9 a n d 10 p o s it io n s o f a n th ra c e n e )
a n d (2 ) th e “ exp o se d b o n d ” (s u c h a s t h a t c o n n e c tin g th e 9 a n d 10 p o s it io n s
o f p h e n a n th re n e ). T h e s e re g io n s a re d e p ic te d in F ig u r e 4 fo r th e e xa m p le
o f 1 ,2 -b e n z a n th ra c e n e .A n a d d it io n a l co m m o n fe a tu re is t h a t e ach sy s te m d e fin e s a t le a s t o n e
s e m ie m p ir ic a l p a ra m e te r to e xp re ss th e r e la t iv e e n e rg ie s o f e le c tro n s in
th e se tw o re g io n s, a n d t h u s t h e ir te n d e n c y to in t e ra c t w it h a t t a c k in g re
ag e n ts. T h e p a ra m e te rs a re k n o w n b y su c h n a m e s as “ fre e v a le n c y ,”
“ lo c a liz a t io n e n e rg y ,” “ s u p e r -d e lo c a liz a b ilit y ,” “ fro n t ie r e le c tro n d e n s it y ,”
a n d th e lik e .W it h in th e sco p e o f th e p re s e n t s tu d y , w e h a v e fo u n d th e g re a te st d egree
o f c o n s is te n c y in th e t re a tm e n t o f F u k u i a n d c o -w o rk e rs . 1 2 V e r y b rie fly ,
t h e y re la te c h e m ic a l r e a c t iv it y to w h a t a re c a lle d “ fro n t ie r e le c tro n s .”
T h e s e a re d e fin e d as th e tw o e le c tro n s o c c u p y in g th e h ig h e s t x - o r b it a l in
th e g ro u n d s ta te a n d a re re g a rd e d a s v a le n c e lik e in n a tu re . I n th e fo rm a
t io n o f a c o v a le n t c -b o n d b e tw e e n th e a t t a c k in g re a g e n t a n d th e x -e le c tro n
s y s te m , th e p o s it io n o f g re a te st d e n s it y o f th e tw o e le c tro n s in th e h ig h e s t

1582 J. L. IlIRIG AND S. P. SOOD
m o le c u la r o r b it a l o f th e g ro u n d sta te is m o st s u sc e p tib le to a t t a c k b y an
e le c t ro p h ilic re a g e n t. F o r a n u c le o p h ilic re a g e n t it is th e lo w e st v a c a n t
o r b ita l in th e g ro u n d sta te a t w h ic h re a c tio n is m o st l ik e ly to o cc u r. R a d
ic a l re a c tio n s , h o w e v e r, a re p re d ic te d to b e m o st l ik e ly to o c c u r a t th e
p o s it io n o f h ig h e r d e n s it y o f th e tw o e le ctro n s, one in th e h ig h e s t g ro u n d -
sta te o r b it a l a n d th e o th e r in th e lo w e st o rb ita l. P o s it io n s (1) a n d (2) a b o v e a re la b e le d ( S s) a n d ( S p) re g io n s, r e s p e c tiv e ly , w it h r e a c t iv it y a t each
s ite d ir e c t ly p ro p o rt io n a l to a n u m e r ic a l in d e x o f fro n t ie r e le c tro n d e n sity .
I n a p p ly in g th e F u k u i sch e m e to th e p re se n t d a ta , i t m u s t be re co g n ize d
t h a t a n y c o n c lu s io n s c a n o n ly b e o f th e m o st g u a rd e d s o rt, n o t o n ly b eca u se
o f th e lim it e d n u m b e r o f c o m p o u n d s a v a ila b le fo r te st b u t a lso b e ca u se o f
th e lim it a t io n s o f th e F u k u i m e th o d it s e lf, som e o f w h o se a s s u m p tio n s h a v e
b e e n c r it ic iz e d . 1 0 - 1 3 T h e fo llo w in g d is c u s s io n th e n is o f v a lu e p r im a r ily
fo r it s p o s s ib le p r e d ic t iv e v a lu e fo r fu t u r e s tu d ie s o f a lk y l- s u b s t it u t e d a n d
h e te ro c y c lic d e r iv a t iv e s o f th ese h y d ro c a rb o n s .
F r o m T a b le I it is seen t h a t th e f irs t e ig h t h y d ro c a r b o n s d id n o t re ta rd
s ty re n e p o ly m e riz a t io n .
T a b le I V lis t s th e h y d ro c a r b o n s teste d , in th e sam e o rd e r a s in T a b le I ,
w it h t h e ir F u k u i s u p e r -d e lo c a liz a b ilit y in d ic e s . T h e f irs t e ig h t co m p o u n d s
h a d n o effect u p o n th e p o ly m e r iz a t io n ra te o f s ty re n e ; th e n e x t th re e g a v e
in h ib it io n p e rio d s (w it h a s u b s e q u e n t ly re ta rd e d ra te in th e case o f 3 ,4 -
b e n z p y re n e ) ; a n d th e re m a in in g c o m p o u n d s b e h a v e d as re ta rd e rs.
I t is im m e d ia te ly a p p a re n t t h a t c o m p o u n d s n o t p o sse ssin g a n ( S s) re g io n
w ill n o t h a v e a n y r e t a r d in g effect w it h s ty re n e . I t seem s also t h a t r e t a r d a t io n w il l n o t b e o b s e rv e d fo r su b s ta n c e s la c k in g a n (S p) re g io n u n le s s th e ( S s) in d e x is in excess o f a th re s h o ld v a lu e ly in g so m e w h e re b e tw e e n 0 .7 2 a n d
0 .9 3 (cf. 1 ,2 ,3 ,4 -d ib e n z a n th ra c e n e a n d a n th ra c e n e ). W h e n b o th re g io n s
e x ist in th e m o le cu le , in t e ra c t io n o f th e tw o 7r-e le c tro n c e n te rs in th e d ire c
t io n o f e n h a n ce d r e a c t iv it y m a y b e e xp e cted . T h u s 1 ,2 ,5 ,6 -d ib e n z a n th ra -
cene w it h a r e la t iv e ly lo w ( S s) in d e x p ro d u c e s in h ib it io n , a n d 3 ,4 -b e n z
p y re n e w it h h ig h v a lu e s fo r b o th in d ic e s sh o w e d b o th in h ib it io n a n d r e t a r d a tio n .
I t is p r o b a b ly sa fe to c o n c lu d e t h a t th e p r in c ip a l lo c u s o f a t t a c k b y a
g ro w in g s t y r y l r a d ic a l is in th e ( S s) re g io n — a t a m e so c a rb o n , a t le a s t fo r
re ta rd e rs . A lth o u g h th e re a re too few e x a m p le s o f in h ib it o r s , i t is n o t u n
re a so n a b le to su gg e st t h a t c o m p e tit io n b e tw e e n a t t a c k a t ( S t) a n d ( S p) re g io n s m a y w e ll d e te rm in e w h e th e r a g iv e n co m p o u n d w i l l a c t in t h is w a y o r a s a re t a r d e r o r a s b o t h .

CONDENSED-RING HYDROCARBONS 1583
TABLE IVFrontier Electron Density Indices for Hydrocarbons
(S p) region (S s) region
Naphthalene — —
Phenanthrene 0.7306 —
Chrysene 0.7811 —
Pyrene 0.7865 —
Triphenylene — —Perylene — —1,2-Benzpyrene 0.8491 —
1,2,3,4-Dibenzanthracene — 0.71591,2-Benzanthracene 0.7594 0.87571,2,5,6-Dibenzanthracene 0.7844 0.57253,4-Benzpyrene 0.8151 1.0148Anthracene — 0.93481,2,3,4-Dibenzpyrene 0.7818 0.96961,2,9,10-Dibenznaphthacene 0.5332 0.86491,2,7,8-Dibenznaphthacene 0.5703 0.78992,3,7,8-Dibenzphenanthrene 0.7722 0.81892 ',3 '-Naphthopyrene 0.7209 1.0542
O n th e b a s is o f th e d a t a a v a ila b le n o q u a n t it a t iv e c o rre la tio n b e tw e e n
in d e x v a lu e s a n d k x/ k v r a t io s em erges, a lth o u g h th e s tro n g e st re ta rd e r, 2 ' , 3 '-
n a p h th o p y re n e , h a s th e h ig h e s t ( S s) in d e x , a n d th e w e a k e s t re ta rd e r,
a n th ra c e n e , is th e o n e re t a r d e r w h ic h re c e iv e s n o a s s is t fro m a n ( S p) re g io n .
C o m p a r is o n o f th e k 0/ k c v a lu e s sh o w s m u c h less o f a s p re a d t h a n w it h
k x/ k p. T h is in d ic a te s t h a t th e in te rm e d ia te ra d ic a ls , Z - , w it h in ca. 1 .5
o rd e rs o f m a g n itu d e , h a v e a b o u t th e sam e s t a b il it y . T h is m a y b e r a t io n a l
ize d p a r t ia l ly if o u r a s s u m p tio n t h a t R - r a d ic a l a t t a c k o c c u rs a t a w e ll-
d e fin e d re g io n (o r tw o s u c h ) o f th e m o le c u le r a t h e r t h a n ra n d o m ly . T h e
r e s u lt is t h a t th e ra n g e in th e n u m b e rs o f e q u iv a le n t c a n o n ic a l s t r u c t u r e s fo r
Z • r a d ic a ls is c o n s id e ra b ly le ss t h a n th e ra n g e in n u m b e rs o f s u c h s tr u c tu r e s
w h ic h m a y b e c o n s tru c te d fro m th e p a re n t h y d ro c a rb o n s .
P e rh a p s th e m o st s ig n if ic a n t re a so n fo r th e d is c re p a n c ie s b e tw e e n th e
s p re a d in kx/ k p v a lu e s c o m p a re d w it h t h a t fo r th e c o rre s p o n d in g k 0/ k c on es
is t h a t r e t a r d in g e ffic ie n cy is a s c lo s e ly t ie d to th e m o d e o f d is a p p e a ra n c e o f
Z • r a d ic a ls a s to t h e ir s t a b il it y . B e c a u s e o f th e s te ric b u lk o f th e Z ■ r a d
ic a ls re a c t io n ( 6 ) is e v e n le ss l ik e ly t h a n u s u a l. F o r th e sam e re a so n , re a c
t io n (5 ) m a y n o t b e a v a ila b le in c e rt a in case s a s in 2 , ,3 '-n a p h t h o p y re n e ,
w h e re th e seco n d ( S s) p o s it io n is b lo c k e d . S in c e t ra n s fe r to s ty re n e m o n o m e r is k n o w n to b e lo w , i t is n o t l ik e ly t h a t r e a c tio n ( 1 2 ) is a n im p o r ta n t
m o d e o f Z • d e s tru c t io n . B e y o n d t h is it is n o t safe to s p e c u la te u n t i l m o re
is k n o w n a b o u t th e r e la t iv e c o p o ly m e riz a tio n a f f in it y ( if a n y ) o f th e h y d r o
c a rb o n s a n d a lso u n t i l w e h a v e m o re h in t s a b o u t ( S p) a n d ( S s) 7 r-e le c tro n
in t e ra c tio n . I t is m o st u n fo r t u n a t e t h a t p e n ta ce n e a n d 2 ' , l ' - a n t h r a - l , 2 -
a n th ra c e n e c o u ld n o t b e te ste d in o rd e r to sh ed lig h t o n t h is la s t p o in t.
F in a l ly , som e n o te s h o u ld b e t a k e n o f th e d ra m a tic d iffe re n ce b etw ee n
th e r e a c t iv it y o f th e se c o n d e n se d -rin g h y d ro c a r b o n s w it h s t y r y l a n d w it h

1584 J. L. IHRIG AND S. P. SOOD
m e t h y l m e t h a c r y l r a d ic a ls . E a r l ie r i t w a s p o in te d o u t t h a t th ese re ta rd e rs
a c te d n o t b y v ir t u e o f “ f u n c t io n a l g ro u p s ” s e rv in g as r a d ic a l in te rc e p to rs
b u t r a t h e r t h ro u g h d iffe re n ce s in lo c a liz e d w -e lectro n d e n s ity . R e t a r d in g
o r in h ib it io n e ffic a cy w ill b e a m o re s u b tle , less c le a r-c u t fu n c t io n o f m o
le c u la r s tr u c tu r e t h a n w it h o th e r cla sse s o f re ta rd e rs — as m a y b e in fe rre d
fro m th e p re c e d in g d is c u s s io n . I n s u c h a case it is to b e e xp e cte d t h a t
d iffe re n ce s in m o n o m e r r e a c t iv it y s h o u ld ca u se p ro n o u n c e d d iffe re n ce s in
re t a rd e r r e a c t iv it y .F o r a n o b s e rv a b le r e t a r d a t io n th e R - r a d ic a l fo rm e d fro m th e m o n o m e r
m u s t be s u ff ic ie n tly r e a c t iv e to fo rm Z - w it h th e h y d ro c a r b o n (p e rh a p s
in it ia l ly as a Tr-com plex). I f th e s u rr o u n d in g m o n o m e r is r e a c t iv e eno u g h
to a b s tra c t H • fro m Z • o r it s co m p le x , s t a b il iz a t io n t h ro u g h re -a ro m a tiz a -
t io n re s u lts . I f th e m o n o m e r is n o t s u ff ic ie n tly r e a c t iv e fo r t h is to h a p p e n
a n d if a n o th e r R - - c a p t u r in g e v e n t does n o t ta k e p la c e q u ic k ly , th e c o m p le x
w ill b re a k d o w n to re fo rm R • a n d X . S in c e s ty re n e m o n o m e r is c o n s id e r
a b ly m o re re a c t iv e t h a n m e t h y l m e t h a c ry la t e m o n o m e r, w h ile th e (in v e rs e )
r e a c t iv it y d iffe re n ce o f t h e ir r a d ic a ls is le ss g re a t, th e p o ly m e riz in g s ty re n e
sy s te m p r o b a b ly c o m b in e s th e tw o fe a tu re s to a g re a te r e x te n t t h a n th e
m e t h y l m e t h a c r y la t e sy ste m . M e c h a n is t ic a lly , i t is o n ly n e c e ssa ry to
in v o k e a re v e rs e -tra n s fe r ste p to a c c o u n t fo r o u r o b s e rv a t io n s :
, - H~ \Z- + M -----Z- M — ► HM- + RX (15)
w h e re R X is th e a lk y l- s u b s t it u t e d h y d ro c a r b o n m o le cu le . C o m p a r in g th is w it h th e u s u a l p ro ce ss w it h a c h a in -t r a n s fe r a g e n t, S,
, - H ” v i \
R- + S ----->- R- S — *- RH + S- (16)
i t is seen t h a t in re a c tio n (1 5 ) E • t ra n s fe r is fro m r a d ic a l to m o le cu le w h ile
in r e a c tio n (1 6 ) it is fro m m o le c u le to r a d ic a l. T h e im p o rta n c e o f re a c tio n
(1 5 ) w il l d e p e n d u p o n th e r e a c t iv it y d iffe re n ce o f th e tw o m o n o m e rs a n d
s h o u ld be p ro p o r t io n a l to t h e ir r e a c t iv it y d iffe re n ce w it h a g iv e n c h a in
t ra n s fe r ag e n t. P u t a n o th e r w a y , in c o n v e n tio n a l c h a in t ra n s fe r th e m ore
r e a c t iv e r a d ic a l a b s tr a c t s th e la b ile h y d ro g e n fro m th e t ra n s fe r a g e n t m o st
r e a d ily , w h ile in re ta rd e r s t a b il iz a t io n th e m o re re a c t iv e m o n o m e r a b s tra c t s H ■ m o st r e a d ily .
I n a c o m p a ris o n o f t ra n s fe r c o n s ta n ts o f s ty re n e a n d m e th y l m e th a c ry la te
w it h n - b u t y l m e rc a p ta n , W a l l in g 1 4 fo u n d th e s t y r y l r a d ic a l to be 3 3 tim e s
a s e ffe ctiv e as th e m e t h y l m e t h a c r y l r a d ic a l in a b s tr a c t in g H - fro m th e s u lf h y d r y l g ro u p .
I t is in te re s tin g to n o te t h a t th e re v e rse t ra n s fe r re a c tio n (1 5 ) p ro p o se d
h e re h a s a lso b ee n sugg e ste d v e r y r e c e n t ly 16 as o n e p o ssib le e x p la n a tio n
fo r th e re t a r d in g a c t io n o f d ip h e n y l, a n o th e r s u b s ta n c e w it h o u t th e u s u a l fu n c t io n a l-g ro u p s u b s titu e n ts .
The authors are pleased to acknowledge the financial assistance of the University of Hawaii Research Committee for funds for the purchase of chemicals.

CONDENSED-RING HYDROCARBONS 1585
References1. Magat, M., and Boneme, Compt. Rend., 232, 1657 (1951); Discussions Faraday
Soc., 10, 226 (1951).2. Belonovskaya, G. P., Zh. D. Vasyutina, and B. A. Dolgoplosk, Zh. Obschei
K him ., 29, 955 (1959).3. Tudôs, F., M agy. Tud. A kad ., K em . Tud. Oszt. Kôzlemén., 21, 49 (1964).4. Sood, S. P., Ph.D. Thesis, University of Hawaii, Honolulu, Hawaii, 1963.5. Caldwell, R. G., and Ihrig, J. L .,,/. P olym erSci., 46, 507 (1960).6. Kice, J. L., J . A m . Chem. Soc., 76, 6274 ( 1954).7. Caldwell, R. G., Ph.D. Thesis, University of Hawaii, Honolulu, Hawaii, 1960.8. Kice, J. L., J . A m . Chem. Soc., 80, 348 (1958).9. Matheson, M. S., E. E . Auer, E . B. Bevilacqua, and E . J. Hart, J . A m . Chem. Soc.,
73, 1700(1951).10. Fukui, K., et al., Bull. Chem. Soc. Japan , 27, 423 (1954); ibid., 34, 1178 (1961);
ibid., 34, 37 (1961); J . Chem. P hys., 2 2 ,1433 (1954); ¿bid., 20, 722 (1952); ibid., 27, 1247 (1957); Gann, 5 1 ,67 (1960); Cancer Res., 1 5 ,233 (1955).
11. Greenwood, H. H., J . Chem. P hys., 23, 756 (1955); J . A m . Chem. Soc., 77, 2055 (1955).
12. Pullman, A., and B. Pullman, Cancer Res., 1 6 ,267 (1956).13. Chalvet, O., and R. Daudel, Compt. Rend., 242, 416 (1956).14. Walling, C., J . A m . Chem. Soc., 70, 2561 (1948).15. Haas, H. C., and H. Husek, J . Polym er Sci., A2, 2297 (1964).
RésuméOn a étudié l’effet retardateur ou inhibiteur de dix-sept hydrocarbures à noyaux
condensés, sur la polymérisation du styrène et du méthacrylate de méthyle. Les vitesses ont été mesurées par dilatométrie. Parmi ces composés, neuf retardent ou inhibent la polymérisation du styrène, mais il semble que cette classe de substances n ’affecte pas le méthacrylate de méthyle. Les données obtenues pour le styrène ont été examinées à la lumière du formalisme utilisé par Fukui “de la barrière électronique” en vue de relier structure et réactivité. On a conclu que l’attaque radicalaire se fait principalement sur l’atome de carbone méso, la région (S„) de Fukui, et que l’effet retardateur requiert un indice de densité (S „) important bien que l’on note une action synergétique lorsque la molécule possède aussi un indice (Sp) appréciable. On fait remarquer que l’effet de la réactivité du monomère a probablement une importance supplémentaire pour déterminer l’efficacité du phénomène retardateur puisque les hydrocarbures à noyaux condensés n ’ont pas de groupes fonctionnels comme en ont les quinones et d’autres agents retardateurs. C’est de ce point de vue qu’on interprète le manque d’effet retardateur dans la polymérisation du méthacrylate de méthyle. On propose une réaction inverse de celle du transfert de chaîne pour rendre compte du comportement observé.
ZusammenfassungSiebzehn kondensierte Ringkohlenwasserstoffe wurden als Verzögerer oder Inhibitoren
der Styrol- und Methylmethacrylatpolymerisation untersucht. Die Geschwindigkeit wurde dilatometrisc.h gemessen. Neun der untersuchten Verbindungen verzögerten oder inhibierten die Styrolpolymerisation, Methylmethacrylat scheint jedoch von dieser Klasse von Substanzen nicht beeinflusst zu werden. An Styrol erhaltene Ergebnisse werden im Lichte des “Elektronenfronf’-Formalismus von Fukui zur Korrelierung von Struktur und Reaktivität überprüft. Man kommt zu dem Schluss, dass der Hauptort des Radikalangriffs die Mesokohlenstoffatome, Fukui’s (S„)-Bereich, ist und dass ein wesentlicher Wert des (SJ-Dichteindex zur Verzögerung erforderlich ist; da da.s Molekül daneben auch einen merklichen («Sp)-Index besitzt, wird eine synergistische

1586 J. L. IRRIG AND S. P. SOOD
Wirkung festgestellt. Da kondensierte Ringkohlenwasserstoffe keine “funktionellen Gruppen” im Sinne der Chinone u n i anderen Verzögerer besitzen, ist wahrscheinlich der Einfluss der Monomerreaktivität von zusätzlicher Bedeutung bei der Bestimmung der Verzögererwirksamkeit. Der Mangel eines Verzögerungseffekts bei polymerisierendem Methylmethacrylat wird von diesem Gesichtspunkt aus interpretiert. Eine umgekehrte Kettenübertragungsreaktion wird versuchsweise zur Erklärung des beobachteten Verhaltens angenommen.
R e c e iv e d S e p te m b e r 2, 1964
R e v is e d O c to b e r 26, 1964
(P ro d . N o . 4 5 4 1 A )

JOURNAL OF POLYMER SCIENCE: PART A VOL. 3, PP. 1587-1599 (1965)
Infrared Spectra of Polybutadienes
J O H N L . B I N D E R , C e n tra l R esea rch L a b o ra to r ie s , T h e F ire s to n e T i r e a n d R u b b e r C o m p a n y , A k r o n , O hio
SynopsisI t is shown, by analytical resolutions of the spectra of isomerized cfs-l,4-polybuta
dienes, that the band due to hydrogen out-of-plane vibrations of cis-CH=CH groups appears a t 740 cm .-1 and that the apparent shift of this band to lower frequencies, as the amount of cfs-CH=CH decreases in a polybutadiene, is due to the presence of other bands in this region. Some possibilities as to the origins of these other bands are discussed. I t is also shown that there are some bands in the 10-11 n region of polybutadiene spectra which are probably connected with vibrations of eis-CH=CH groups and that there probably are others which are not due to either ds-C H =C H or frans-CH=CH or CH2= C H . Some possibilities regarding the origins of these bands are discussed. The bands found here explain in large measure the appearance of polarization spectra of high-cfs 1,4-polybut.adienes.
INTRODUCTION
T h e fre q u e n c y o f th e h y d ro g e n o u t-o f-p la n e v ib r a t io n o f th e c i s - C H = C H
g ro u p in th e s p e c tra of p o ly b u ta d ie n e s h a s b e e n th e s u b je c t o f c o n s id e ra b le
d is c u s s io n . I t is im p o r ta n t n o t o n ly in c o n n e c tio n w it h d e t e rm in in g th e
m ic ro s t r u c tu r e s o f p o ly b u ta d ie n e s b u t a lso in re g a rd to th e a c t u a l c o n
f ig u ra t io n o f s u c h p o ly m e rs . O n th e b a s is o f th e s p e c tra o f e m u ls io n a n d
s o d iu m p o ly b u ta d ie n e s H a m p t o n 1 a ss ig n e d t h is v ib r a t io n to a b a n d a t
7 3 0 c m .- 1 , w h ile B in d e r 2 a ss ig n e d i t to a b a n d a t 680 c m .- 1 . F r o m th e
s p e c t ra o f h ig h - a s - 1 ,4 p o ly b u ta d ie n e s , s u c h as d e s c rib e d b y N a t t a 3 a n d
o th e rs , S ila s , Y a t e s , a n d T h o r n t o n 4 c o n sid e re d a l l th e a b s o rp t io n in th e
1 2 .5 - 1 5 .5 u re g io n to b e d u e to c i s - C H = C H v ib r a t io n s b u t M o re r o et a l . 6
a ssig n e d th e a b o v e v ib r a t io n to a b a n d a t 7 4 1 c m .- 1 . I t w a s a lso o b s e rv e d
t h a t th e p o s it io n o f th e c fs -C H - C I I b a n d a p p a re n t ly s h ifte d in th e s p e c tra
o f p o ly b u ta d ie n e s , m a d e w it h Z ie g le r-ty p e c a ta ly s ts , fro m 7 4 1 c m . - 1
to w a rd lo w e r fre q u e n c ie s as th e a m o u n t o f c i s - 1,4 a d d it io n in th e p o ly m e rs
d e cre a se d . D e s p ite th ese d iffe re n c e s in th e a s s ig n m e n t o f th e fre q u e n c y
o f th e c f s - C H = C H b a n d , m ic ro s t r u c t u r e d e t e rm in a t io n s o f p o ly m e rs m ad e
in e m u ls io n s y s te m s o r w it h s o d iu m o r p o t a s s iu m c a t a ly s t s w e re v e r y s im i
l a r . 4 ' 6 ' 6 F o r p o ly m e rs m a d e w it h Z ie g le r-ty p e c a ta ly s ts , th e m ic ro s t r u c t u r e
d e t e r m in a t io n s w e re lik e w is e s im ila r . 4 ' 6
T h e s h if t in th e m a x im u m o f th e a b s o r p t io n fro m 7 4 1 c m .- 1 , in v ie w of
th e u n c e r t a in t y o f th e a s s ig n m e n t o f th e f re q u e n c y o f th e c f s - C H = C H
b a n d , ra is e d th e q u e s tio n as to w h e th e r i t w a s r e a l o r d u e to th e p re se n ce
1587

1588 J. L. BINDER
o f o th e r b a n d s in t h is re g io n w h ic h re m a in e d n e a r ly c o n s ta n t in in t e n s it y
as th e a m o u n t o f a s - 1 ,4 a d d it io n d ecre ased . P o la r iz a t io n s p e c tra b y
B in d e r 8 sh o w e d t h a t n o t o n ly w a s th e a b s o rp tio n in th e 1 3 - 1 5 n re g io n
c o m p le x b u t a ls o t h a t, in th e 1 0 - 1 1 ¡x re g io n , o th e r b a n d s m u s t b e p re s e n t
w h ic h a re n o t a p p a re n t in th e u s u a l a b s o rp t io n s p e c tru m .
V a r io u s a tte m p ts to re s o lv e th ese b a n d s w it h p r is m in s t ru m e n ts m e t
w it h no success. T h e re fo re a n a n a ly t ic a l m e th o d , b a se d o n c a lc u la t in g
b a n d e n v e lo p e s w a s tr ie d . T h e m e th o d u s e d a n d th e re s u lts o b ta in e d a re
d e s c rib e d here.
EXPERIMENTAL
Isomerization of Polybutadienes
P o ly m e rs c o n ta in in g v a r io u s a m o u n ts o f a s - C H = C H a n d i r a n s - C H = C H
w e re p re p a re d b y is o m e riz in g h ig h - a s - 1 ,4 p o ly b u ta d ie n e s in th e m a n n e r
d e s c rib e d b y G o lu b . 9 T h e s t a rt in g p o ly m e rs w e re m a d e w it h a lk y l a lu
m in u m a n d c o b a lt c h lo rid e o r t it a n iu m t e t ra io d id e c a ta ly s ts . A t f irs t
b en zen e s o lu tio n s o f th e p o ly m e rs , 1 g ./lO O m l, w e re is o m e rize d w it h a
m e r c u r y a rc a n d d ip h e n y l s u lfid e as in it ia t o r . T h e re s u lts re p o rte d h ere
w e re o b ta in e d w it h h e p ta n e s o lu tio n s o f th e p o ly m e rs a n d a l l y l b ro m id e as
in it ia t o r . T h e re a so n s fo r u s in g is o m e riz e d p o ly m e rs a n d th e ch a n g e in
th e m e th o d of is o m e riz a t io n a re g iv e n la te r. A liq u o t s w e re w it h d r a w n
fro m th e r e a c tio n v e ss e l a t v a r io u s t im e in t e r v a ls a n d th e a m o u n ts o f c is - C H = C H a n d ¿ r a w s - C H = C H in th e p o ly m e r d e te rm in e d b y a m e th o d
p r e v io u s ly d e s c r ib e d , 2 e x c e p t t h a t th e b a n d a t 1 6 6 7 c m . - 1 w a s u se d to
d e te rm in e a 's - C I I — C H .
T h e re s u lts o f th e a n a ly s e s sh o w e d t h a t th e a m o u n t o f a s - 1 ,4 a d d it io n in
th e p o ly m e r d e cre a se d a c c o rd in g to a f irs t -o rd e r ra te la w , a s sh o w n in
F ig u r e 5. T h e m a x im u m a m o u n t o f i r a n s - C H = C H fo u n d in a n y o f th e
is o m e riz a t io n e x p e rim e n ts w a s a b o u t 7 5 % . T h e ra te o f is o m e riz a t io n
b eca m e v e r y s lo w a ft e r 8 h r a n d , s in ce c o n s id e ra b le gel fo rm e d if th e iso m e riz a t io n w a s c a rr ie d o n 24 h r., th e re a c tio n s w e re g e n e ra lly sto p p e d a fte r
8 h r.
T h e m a in ch a n g e in th e lo n g -w a v e ( 1 3 - 1 5 y ) re g io n o f th e s p e c tra o f th e
iso m e riz e d sa m p le s w a s a g r a d u a l s h if t o f th e m a x im u m o f th e a b s o rp tio n
a t 7 4 1 c m . - 1 to lo w e r fre q u e n c ie s . T h u s th e m o st t h a t c o u ld b e le a rn e d
a b o u t th e fre q u e n c y o f th e a ' s - C H = C H b a n d in t h is re g io n w a s t h a t i t is
p r o b a b ly n e a r 74 0 c m .- 1 .
Resolution of Spectra
T h e f ir s t a tte m p ts to f in d in d iv id u a l b a n d s in th e 1 3 - 1 5 /x re g io n o f th e
s p e c tra o f th e iso m e riz e d p o ly b u ta d ie n e s w e re g ra p h ic a l, e ach b a n d b e in g
c a lc u la te d b y th e L o re n t z e q u a tio n
D „ = a / [ ( r - r 0) 2+ 6 2] (1 )

INFRARED SPECTRA OF POLYBUTADIENES 1589
Figure 1
w h e re a — b 2D 0, 2b = A v a t */2 D 0, r 0 is th e fre q u e n c y o f th e b a n d ce n te r,
D „ is th e a b s o rb a n c e a t a n y fre q u e n c y v, a n d D 0 is th e a b s o rb a n c e a t r 0.
I t w a s fo u n d t h a t s im p le s p e c tra o f e m u ls io n a n d s o d iu m p o ly b u ta d ie n e s in
th e 1 0 - 1 1 /x re g io n c o u ld be re p re se n te d b y a d d in g th e a b s o rb a n c e s o f a few
b a n d s c a lc u la te d w it h t h is e q u a tio n . O ne s u c h c o m p a ris o n is s h o w n in
F ig u r e 1, a n d it is c le a r t h a t th e a g re e m e n t b e tw e e n th e c a lc u la t e d a n d
o b s e rv e d s p e c tru m is q u ite g ood. I n these c a lc u la t io n s th e v a lu e s o f b w e re ta k e n fro m th e b a n d s.
W h e n it w a s fo u n d , in t h is w a y , t h a t a la rg e n u m b e r o f b a n d s w o u ld be
n e c e s s a ry to f it th e o b se rv e d s p e c tra in th e 1 3 - 1 5 g re g io n , i t w a s d e c id e d to
re s o lv e th e s p e c tra a n a ly t ic a lly . T h e a b s o rb a n c e , a t a n y fre q u e n c y v, in
th e s p e c tru m is th e su m o f th e a b s o rb a n c e s o f th e in d iv id u a l b a n d s a t t h is
fre q u e n c y . T h u s :
D v (o b s) = D l + D 2 + D 3 + . . . (2)
w h e re D 1, D 2, D 3, etc. a re th e a b s o rb a n c e s o f b a n d s 1, 2, 3 , etc. a t th e fre
q u e n c y v. F r o m eqs. (1 ) a n d (2 ),
Z)„ (obs.) = oi D 0' + 6j D o 2 + ci D o 3 + (3)
w h e re th e D 0 a re th e a b s o rb a n c e s a t v = r () fo r th e in d iv id u a l b a n d s a n d
th e co e ffic ie n ts, at, b t, C\, etc. a re c a lc u la te d fro m th e b a n d w id t h 6 a n d th e
s e p a ra tio n s o f th e fre q u e n c ie s o f th e in d iv id u a l D 0 fro m th e f re q u e n c y v. A g ro u p o f s im u lta n e o u s e q u a tio n s c a n th e n be set u p w h ic h c a n th e n be
s o lv e d fo r th e s e v e ra l D o’s.T h e b a n d w id t h s b w e re fo u n d fro m th e s p e c tru m , as d e s c rib e d b e lo w ,
a n d th e D 0 b y t r ia l a n d e rro r, i.e ., b y f in d in g th e m in im u m n u m b e r o f b a n d s
n e c e ssa ry to h t th e s p e c tru m . B a n d e n v e lo p e s w e re c a lc u la te d b y eq. (1 )
b y u s in g a c o n s ta n t b a n d w id t h a n d v a r io u s v a lu e s o f D 0. T h e s e w e re

1590 J. L. BINDER
FREQUENCY CM-'
Figure 2.
A
*
FREQUENCY CfH
Figure 3.
Figure 4.

INFRARED SPECTRA OF POLYRUTADIENES 1591
TIME MINS.
Figure 5.
p lo tte d (tw o e n v e lo p e s ) w it h v a r io u s s e p a ra tio n s o f th e D 0 a n d th e a b s o rb
a n ce s a d d e d a t v a r io u s fre q u e n c ie s to g iv e a s y n th e t ic sp e c tru m . A n e x
a m p le o f t h is is s h o w n in F ig u r e 2. O n t a k in g a D a t a n y fre q u e n c y in t h is
sp e c tru m , n o t n e a r th e m a x im u m , th e in t e r v a l b e tw e e n it a n d th e c u r v e a t
V 2D w a s fo u n d . I n a ll cases t r ie d t h is in t e r v a l w a s n e v e r m o re t h a n th e b u se d a n d so m e tim e s a b o u t 1 c m r 1 le ss f o r b n e a r 10 c m .- 1 . T h is sam e
p ro c e d u re w a s u se d w it h th e a c t u a l sp e c tra , th e ste ep p a r t b e tw e e n 1 3
a n d 1 3 .5 yu b e in g u sed . A v a lu e o f 10 c m . - 1 w a s fo u n d fo r b fro m th e s p e c
t r u m in th e 1 3 - 1 5 yu re g io n .
T h e co e ffic ie n ts, oti, b\, e tc., in eq. (3 ) w e re fo u n d w it h t h is v a lu e o f b a n d b y p la c in g b a n d s a t v a r io u s fre q u e n c ie s in th e s p e c tru m . T h e n w it h
th e o b s e rv e d a b s o rb a n c e s a t th e se fre q u e n c ie s th e D 0 v a lu e s w e re c a lc u la t e d
as w e ll as th e b a n d e n v e lo p e s. T h e a b s o rb a n c e s o f th e in d iv id u a l b a n d s
w e re a d d e d a t o th e r fre q u e n c ie s to d e te rm in e h o w w e ll t h e y a g re e d w it h th e
a c t u a l a b s o rb a n c e s a t th o se fre q u e n cie s. I n t h is w a y it w a s fo u n d t h a t,
f o r 5 = 10 c m .- 1 , b a n d s a t 7 5 0 , 74 0 , 7 3 0 , 7 2 0 , 7 1 0 , 70 0 , 690, a n d 680 c m . - 1
g a v e th e b e s t f it w it h th e o b s e rv e d sp e c tra . I t w a s a lso fo u n d t h a t, w it h
th e sa m e b a n d s , c h a n g in g th e b v a lu e s b y ± 2 c m . - 1 ch a n g e d th e D 0 fo r
th e s tro n g b a n d s b y a b o u t 0 .0 0 5 a b s o rb a n c e u n it s , o r, fo r th e sam e b, c h a n g in g th e b a n d p o s it io n b y 2 c m . - 1 ch a n g e d th e D 0 v a lu e s b y a b o u t th e
sa m e a m o u n t. T h e se th e n w e re a b o u t th e e rro rs in th e b a n d w id t h s a n d
p o s it io n s a n d in te n s itie s .
T h e b a n d w id t h o f th e b a n d s in th e 9 .5 - 1 1 .2 yu re g io n o f th e s p e c tra o f
th e iso m e riz e d p o ly m e rs w a s o b ta in e d fro m th e s p e c tra d ir e c t ly . W h ile
th e 9 1 0 c m . - 1 b a n d h a d a w id t h o f 4 .5 c m .- 1 , th e w id t h o f th e 9 6 7 c m . - 1
b a n d w a s fo u n d to b e 6 .5 c m .- 1 . S in c e th e 9 6 7 c m . - 1 b a n d a p p e a re d to
h a v e a s m a ll s h o u ld e r, a tte m p ts w e re m a d e to re s o lv e th e s p e c tra w it h a

1592 j. L. Bin d e r
aGG
=t
IO
O T5CO Ec
O 1XCO E
O TCiCO E°
O iOt>- crr
o it'-
cm
o i05Ib B
O ib BO
O 15b cm
O TlOb.
cm
O TCOIb hO
5b 1lo d
o
5b TCO riCi SO
‘O Tb- j¡Ci Go
>o T00Ci SCi
LO 1CiCi ECi
lO 1
CO H Ci 1—1 O ce 0300 h- Oi CO O X i—i üi 0503 (N r-1CO CO 05 05
(N h- Ci Ci CO Ci XOO OI CO 00 rh TÍH X 05 LOCO CO 05 1—1CO CO X 05
CO CO Ci 05 03 CO b- 05b» «5 Ci Ci Ib L-O05 COd CO 05 05 CO LO LO d
1-0b- Ci CO CO CO Ci 05Oi oo Oi 00 CO CO b- 05 LOd CO 05 OI tHd d X
CO i—1b- O ce I" COCO Ci 05 b r- LO LO 05iO d CO 05 LO LO LO d
CO CO CO tHr- X Ib COCO 105 b b b- 055b 5b CO d CO b b- LO LO
5b LO O LO CO CO CO 051—1CO LO b 05 o X XCi Ci Ib LO d X Ci d Ib
00 O 03 05 CO TfH iH X CiLO CO CMoo CO O Ci 1-15b00 CO 00 CO 05 CO d LO Ci1—1rH 05 05 1-1
Ci CO r- CO ce X X Cicii CO Ci Ci Ci CO LO XlO cd i—i O o cd X 05 d
O TP CO O 05 o b- COO l> CO •COO LO X 05O O 1—1 o o o 1-1
Ci tHO O O b cO LO O © O ©OI LO O CO O X X O o © ©O O O 05 d d © © d
Ib CO CO LO on Tf5 03 X ©CO CO TtH CO CO 1 15b i—i © XCi Tf Ci CO CO X CO b- 03 © ©03 CO CO 00 Oi i—H X CO X X ©
CO LO O O O LO X h- O © © ©O O O O TtH X O © © ©CO 1—1O O O 05 03 d © d © ©
CO O h- Ci CO b- Ci 05 X X LO(N CO CO X 05 rH 05 05 X ©CO CO CO CO CO CO X X X CO X X
CMO h- N- LO 05 05 LO 03 ©Ib H 00 CO CO o X 05 03 XIO d d d 5b «d d d d LO ©
Ci O X Ib 03 X LO © © X ©Ci CO 1b- CO b- b- © b XCO d d TjHC0 CO X X X d X d
f f l ü O H f e C t q o a H h OO O O O O P h PHIOh Ph Ph ^ P h
«
4

INFRARED SPECTRA OF POLYBUTADIENES 1593
FREQUENCYFigure 6.
b a n d w id t h o f 4 .5 c m .“ 1, b u t goo d a g re e m e n t b etw een th e c a lc u la te d a n d
o b s e rv e d s p e c t r a c o u ld n o t b e o b ta in e d . C o n s e q u e n t ly a b a n d w id t h o f
6 .5 c m . “ 1 w a s u se d fo r th e b a n d s b e tw e e n 1 0 0 5 a n d 9 6 7 c m .- 1 , a n d s a t is
fa c t o r y a g re e m e n t (g e n e ra lly w it h in 0 .0 0 5 a b s o rb a n c e u n it s ) w a s o b ta in e d
w h e n b a n d s w e re ta k e n a t 100 5 , 995, 985, 9 7 5 , 9 6 7, a n d 9 5 7 c m .- 1 .A n e x a m p le o f th e re s o lu t io n o f th e b a n d s in th e 1 3 - 1 5 /u re g io n fo r one
o f th e is o m e riz e d p o ly m e rs is g iv e n in F ig u r e 3. T h is p o ly m e r w a s m a d e
w it h a lu m in u m a lk y l a n d c o b a lto u s c h lo rid e . F ig u r e 4 sh o w s th e m o la r
s p e c ific a b s o rb a n c e s o f th o se b a n d s fo r a se rie s o f iso m e riz e d p o ly m e rs p lo t
ted a g a in s t tim e , a n d F ig u r e 5 sh o w s a p lo t o f th e s p e c ific a b s o rb a n c e s o f
th e 74 0 c m . “ 1 b a n d a g a in s t t im e o f is o m e riz a t io n . T h e m o la r s p e c ific
a b s o rb a n c e s a re g iv e n in T a b le I .
T h e re s o lu t io n o f th e b a n d s in th e 1 0 - 1 1 m re g io n is g iv e n in F ig u r e 6 f o r
a h ig h - m - l,4 - p o Iy b u t a d ie n e a n d in F ig u r e 7 fo r o n e o f th e is o m e riz e d
p o ly m e rs . T h e m o la r s p e c ific a b s o rb a n c e s o f th ese b a n d s fo r se rie s o f
is o m e riz e d p o ly b u ta d ie n e s a re g iv e n in T a b le I a lso . I n t h is ta b le , p o ly -

1594 J. L. BINDER
TIME - MINUTESFigure 8.
m e rs G A , G B , e tc., w e re is o m e riz e d a lu m in u m a l k y l -c o b a lto u s c h lo rid e
p o ly b u ta d ie n e s a n d th o se in th e P A , P B , etc. se rie s w e re is o m e riz e d a lu
m in u m a lk y l- t it a n iu m te tra io d id e p o ly b u ta d ie n e s . T h e s e a b s o rb a n c e s
a re p lo tte d , in F ig u r e 8 , a g a in s t t im e o f is o m e riz a tio n .
F ig u re s 3, 6 , a n d 7 sh o w t h a t th e a g re e m e n t b e tw e e n th e o b s e rv e d a n d
c a lc u la t e d s p e c tra is v e r y good. F ig u r e s 4 a n d 5 s h o w t h a t in th e 1 3 - 1 5 a
re g io n o n ly th e 7 4 0 c m . “ 1 b a n d fo llo w s a f irs t -o rd e r ra te la w . F ig u r e 8
a n d T a b le I sh o w t h a t , p r o b a b ly w it h in th e e x p e rim e n ta l e rro r, th e 1 0 0 5
a n d 9 85 c m . “ 1 b a n d s in th e 1 0 - 1 1 n re g io n re m a in e s s e n t ia lly c o n s ta n t in
in t e n s it y d u r in g th e is o m e riz a t io n a n d t h a t th e 99 5, 9 7 5 , a n d th e 9 5 7 c m . “ 1
b a n d s ch a n g e in in t e n s it y a c c o rd in g to a f ir s t o rd e r ra te law .
I t w a s sh o w n in th e fo llo w in g w a y t h a t th e s id e v i n y l g ro u p c o n tr ib u te d n o a b s o rp tio n to th e s p e c tru m a t o r n e a r 1 0 0 0 c m .“ 1. T h e r a t io o f th e
s p e c ific a b s o rb a n c e s o f th e 990 a n d 9 1 0 c m . “ 1 b a n d s w a s fo u n d fro m th e
s p e c tru m o f a h ig h 1 ,2 -p o ly b u ta d ie n e . W it h t h is r a t io a n d th e in t e n s it y
o f th e 9 1 0 c m . - 1 b a n d in th e se s p e c tra , th e in t e n s it y o f th e 990 c m . “ 1 b a n d
w a s c a lc u la t e d . I t w a s fo u n d to b e n e g lig ib le .
T h e a b s o rb a n c e v e rs u s fre q u e n c y s p e c tra n e c e s s a ry fo r t h is w o rk w e re
o b ta in e d in p a r t fro m t ra n s m it t a n c e v e rs u s w a v e le n g th s p e c tra a n d p a r t ly
fro m a b s o rb a n c e v e rs u s w a v e le n g th s p e c tra , a l l o f w h ic h w e re re c o rd e d
w it h a B e c k m a n I R 4 in s t ru m e n t. T h e g a in w a s 3 % , th e p e rio d 8 sec., a n d
th e speed 0 . 2 /¿ /m in . T h e c h a rt w a s e x p a n d e d in w a v e le n g th so t h a t 0 .1 /x re q u ire d 1 in . o f p a p e r. I n c o n v e r t in g t ra n s m it t a n c e v a lu e s a n d in p lo t t in g
th e a b s o rb a n c e s th e d e v ia t io n o f th e 1 0 0 % lin e a n d th e m is m a t c h o f th e
c e lls w e re t a k e n in t o a c c o u n t. C e lls o f v a r io u s th ic k n e s se s w e re u se d so
t h a t th e t ra n s m it t a n c e w a s a t le a s t 2 0 % . I n p lo t t in g th e m e a su re m e n ts

INFRARED SPECTRA OF POLYRUTADIENES 1595
th e sc a le u se d w a s s u c h t h a t 0 . 0 0 2 u n it s in a b s o rb a n c e a n d 0 . 2 in fre q u e n c y
c o u ld be p lo tte d . T h e a c c u r a c y o f th e a t t e n u a t o r co m b w a s k n o w n to b e 1 % .
DISCUSSION
Isomerization
I n t h is w o r k h ig h -c fs -1 ,4 -p o ly b u ta d ie n e s w e re is o n ie riz e d to o b ta in
p o ly m e rs c o n ta in in g v a r io u s a m o u n ts o f c f s - C H = C H a n d f o * a n s - C H = C H
fo r tw o re a so n s. T h is g u a ra n te e d t h a t th e o n ly ch a n g e in th e p o ly m e r
w as t h a t d u e to c o n v e r t in g c f s - C H = C H to f r c r o s - C H = C H a n d t h a t o th e r
fe a tu re s o f th e p o ly m e r w o u ld r e m a in u n c h a n g e d . S u c h a g u a ra n te e
w o u ld b e la c k in g fo r p o ly m e rs m a d e w it h c a ta ly s ts w h ic h d id p ro d u c e v a r
io u s a m o u n ts o f c f s - C H = C H a n d / r a n . s '- C H = C H . M ix t u r e s o f a h ig h -
c is -1 ,4 -p o ly b u t a d ie n e a n d a h ig h -£ ra w s -l,4 -p o ly b u ta d ie n e c o u ld h a v e b ee n
used to p re p a re p o ly m e r s o lu tio n s o f v a r io u s a m o u n ts o f c f s - C H = C H a n d
¿ r c m s - C H = C H b u t, fo r these, th e a b s o rp tio n m a x im u m a t 7 4 0 c m . - 1
w o u ld n o t s h if t b u t m e re ly d e cre a se in in t e n s it y .
T h e is o m e riz a t io n s o f c i s - 1 ,4 -p o ly b u ta d ie n e d id n o t p ro ce e d a s f a r as
G o lu b 9 re p o rte d , e ith e r w it h p h e n y l d is u lf id e o r a l l y l b ro m id e in it ia t o r s .
I n o rd e r to e lim in a t e a n y q u e s tio n o f th e p o ly m e r r e a c t in g w it h in it ia t o r ,
it w o u ld h a v e b e e n b e tte r to is o m e riz e w it h 7 -r a d ia t io n . So m e e x p e ri
m e n ts 1 0 w e re m a d e , b u t in a l l cases, so m u c h gel fo rm e d t h a t i t seem ed u n
w a rra n te d to ta k e th e s m a ll a m o u n t o f s o lu b le m a te r ia l to b e r e p re s e n t a tiv e
o f th e w h o le p o ly m e r.
A t t e m p t s to is o m e riz e a t r a n s - 1 ,4 -p o ly b u t a d ie n e w it h p h e n y l d is u lf id e
o r a l l y l b ro m id e in it ia t o r s w e re f ru it le s s a lso . So m u c h gel fo rm e d t h a t
it w a s im p o s s ib le to g e t a s a t is f a c t o ry s p e c tru m o f a film . T h u s it w a s n o t
k n o w n h o w m u c h is o m e riz a t io n o c c u rre d .
Resolution of Spectra
W h ile th e re is a q u e s tio n a s to th e a c t u a l sh a p e o f a n in fr a r e d b a n d , th e re
is n o d o u b t t h a t th e a p p a re n t ¿ r a n s - C H = C H b a n d a t 9 6 7 c m .- 1 , th e
s id e v in y l b a n d a t 9 1 0 c m .- 1 , o r th e ( C H a R b a n d in p a ra ff in s o r p o ly e t h y l
ene a t 7 2 0 c m . - 1 c a n b e re p re s e n te d b y th e L o re n t z e q u a tio n , eq. (1 ) ,
a n d t h a t th e s p e c t ru m in th e 1 0 - 1 1 ¡i re g io n ca n b e c a lc u la t e d b y a d d in g th e
a b s o rb a n c e s o f in d iv id u a l b a n d s . T h e sa m e r e s u lt w a s o b ta in e d b y R ic h
a rd s o n a n d Sa c.h e r1 1 f o r p o ly is o p re n e sp e c tra . I n v ie w o f t h is i t seem ed
u n n e c e s s a ry to ta k e in t o a c c o u n t th e e ffe ct o f f in it e s l it w id t h a s R a m s a y 1 2
d id to ge t t ru e b a n d in t e n s it ie s a n d e n v e lo p e s. I t w a s a ssu m e d h e re t h a t th e b a n d w id t h s b w e re th e sam e f o r a l l b a n d s in a p a r t ic u la r w a v e le n g th
re g io n e v e n t h o u g h th e s l it w id t h c h a n g e d d u r in g th e re c o rd in g s . I t is
p ro b a b le t h a t th e e rr o r c a u se d b y t h is a s s u m p t io n is n o t la r g e r (a b o u t 0 .0 0 5
a b s o rb a n c e u n it s ) t h a n th e c h a n g e in th e a b s o rb a n c e s a r is in g fro m s h ift in g
th e p o s it io n s o f th e b a n d s s lig h t ly . G r a p h ic a l r e s o lu t io n s h a v e b e e n u se d

1596 J. L. BINDER
b y m a n y in v e s t ig a to r s (see B r o d e 1 3 f o r re fe re n ce s) to lo c a te b a n d s in
in sp e c tra . I t is th o u g h t t h a t th e a n a ly t ic a l a p p ro a c h is e v e n b e tte r.
T h e g e n e ra l v a l id it y o f th e re s o lu t io n s g iv e n h e re is a tte s te d to b y th e
fo llo w in g . F ir s t , th e p o la r iz a t io n s p e c t ra o f h ig h c i s - l , 4 -p o ly b u t a d ie n e s 8
sh o w th e p re se n ce o f a d d it io n a l b a n d s in th e 1 3 -1 .5 a n d 1 0 - 1 1 p re g io n s o f
th e s p e c tra . So m e o f th e se a p p e a r a t a b o u t th e sam e fre q u e n c ie s as th o se
fo u n d b y th e re s o lu t io n s w h ic h w e re d o n e q u ite in d e p e n d e n t ly o f th e re s u lts
o f th e p o la r iz a t io n sp e c tra . A s is p o in te d o u t la te r, th e b a n d s fo u n d in th e
1 0 - 1 1 p re g io n e x p la in v e r y w e ll th e a p p e a ra n c e o f th e p o la r iz a t io n s p e c tra
in t h is re g io n . S e co n d , som e is o m e riz e d p o ly m e r s p e c tra w e re o b ta in e d
w h ic h h a d tw o d is t in c t b a n d s a t 7 3 0 a n d 695 cm . h I t w a s im p o s s ib le to
get s a t is f a c t o r y a g re e m e n t b e tw e e n th e c a lc u la t e d a n d o b s e rv e d s p e c tra
w it h a b a n d w id t h o f 1 0 cm a 1, a n d re a so n a b le a g re e m e n t w a s n o t o b ta in e d
u n t il th e b a n d w id t h u se d w a s re d u c e d to 6 cm . “ h I t w a s fo u n d t h a t th ese
b a n d s a ro se fro m d ip h e n y l d is u lf id e in th e p o ly m e r, a n d t h e y d is a p p e a re d
u p o n f u r t h e r p u r if ic a t io n o f th e p o ly m e rs . T h u s th e ag re e m e n t b e tw e e n
th e c a lc u la t e d a n d o b s e rv e d s p e c tra a p p e a rs to b e a te st o f th e v a l id it y o f
th e r e s o lu t io n s . I t m ig h t b e t h a t, w it h th e sa m e b a n d w id th , good a g re e
m e n t c o u ld a ls o b e o b ta in e d i f m o re b a n d s w e re u se d . W e h a v e no te st fo r
th e n u m b e r n e c e s s a ry , i t seem ed b e tte r to k e ep th e s p e c tra a s s im p le as
p o ssib le .
T h e u n iq u e n e s s o f th e re s o lu t io n o f th e sp e c tra , in th e 1 3 - 1 5 p re g io n a t
le a s t, is in d ic a te d b y th e fa c t t h a t o n ly o n e b a n d w a s fo u n d w h ic h d e cre a se d
in in t e n s it y w it h t im e o f is o m e riz a t io n a c c o rd in g to a first, o rd e r ra te la w .
I f th e re is a c f s - C H = C H b a n d in t h is re g io n t h is is to b e e xp e cte d . I t w a s
p o ssib le to f in d tw o b a n d s , a t 7 4 5 a n d 7 3 5 ra n .“ 1, w h ic h ch a n g e d in in t e n
s it y m o re r a p id ly t h a n a n y of th e o th e rs b u t n e ith e r of th e m fo llo w e d a
firs t o rd e r ra te la w . F ro m th e a p p e a ra n c e o f F ig u r e 4 th e q u e s tio n m ig h t
a ris e as to w h e th e r i t w o u ld be p o s s ib le to fin d one b a n d , s im ila r to th e
7 4 0 cm . : b a n d , s u c h t h a t th e sp e c ific a b so rb a n c e s of th e o th e rs re m a in e d
c o n s ta n t. I n th e co u rse o f t h is w o r k serie s of b a n d s w e re tr ie d , a t 10
c m . “ 1 in t e rv a ls , s t a rt in g a t 7 4 7 c m . - 1 a n d c h a n g in g th e p o s it io n s b y 2 - 3
c m .’ 1, i.e. 7 4 7 , 7 3 7 , 7 2 7 c m . “ 1 e tc .; 7 4 5 , 7 3 5 , 7 2 5 c m .- 1 , e tc .; h o w e v e r, s u c h a b a n d w a s n o t fo u n d .
T h e o r ig in s o f th e b a n d s in th e 1 3 - 1 5 p re g io n , a s id e fro m th e 7 4 0 c m . “ 1
b a n d , c a n n o t b e d e fin ite ly d e te rfn in e d . S in c e it is g e n e ra lly a c k n o w le d g e d
t h a t th e p o s it io n o f th e c f s - C H = C H b a n d , in th e lo n g -w a v e re g io n , is se n
s it iv e to th e e n v iro n m e n t o f t h is g ro u p , one p o s s ib ilit y is 1 4 t h a t th e o th e r
b a n d s w h ic h a re u n d o u b t e d ly p re s e n t, a lt h o u g h th e a c t u a l n u m b e r m a y n o t
be k n o w n e x a c t ly , a re d u e to c f s - C H = C H g ro u p s in d iffe re n t p a r ts o f th e
p o ly m e r c h a in . T h u s , a c z s - C H = C H g ro u p a t th e c h a in e n d , o r seco nd
o r t h ir d , etc. fro m th e c h a in end , m ig h t a b s o rb a t a d iffe re n t fre q u e n c y
t h a n a c t s - C H = C F I g ro u p in th e m id d le o f th e c h a in . I f t h is is th e case it
w o u ld be e xp e cte d t h a t th e a b s o rb a n c e s o f th ese b a n d s w o u ld be d iffe re n t in h ig h m o le c u la r w e ig h t p o ly m e rs t h a n in lo w s in ce , in th e la t t e r , th e re w o u ld
be m o re c h a in ends.

INFRARED SPECTRA OF POLYBUTADIENES 1597
A n o t h e r p o s s ib ilit y is t h a t o th e r s tr u c tu r e s o r g ro u p s a re p re s e n t w h ic h
w o u ld n o t b e e xp e cte d fro m th e s im p le a d d it io n re a c tio n s of th e m o n o m e r,
o r t h a t th e c h a in c o n fig u ra tio n ch a n g e s, d e p e n d in g u p o n th e c a ta ly s t .
T h e p o s s ib ilit y of o th e r re a c tio n s o c c u rr in g , e s p e c ia lly w it h Z ie g le r -N a tt a
c a ta ly s ts , h a s a lre a d y b ee n m e n tio n e d . 8 I t s h o u ld a lso be p o in te d o u t t h a t
th e s p e c tru m o f a c o m p le te ly d e u te ra te d cfs-1 ,4 -p o ly b u ta d ie n e , g iv e n b y
G o lu b a n d S h ip m a n , 1 5 is c o n s id e ra b ly d iffe re n t, a n d s im p le r, t h a n t h a t of
th e o r d in a r y p o ly b u ta d ie n e . F u r t h e r e v id e n c e fo r e x tra n e o u s s tr u c tu r e s
o r g ro u p s is e n fo rce d b y th e fa c t t h a t th e in fra re d s p e c tra o f f ilm s o f h ig h -
c is -1 ,4 -p o ly b u ta d ie n e s , w h ic h a re k n o w n b y x - r a y d iffra c t io n to be c r y s t a l
lin e , h a v e n o c r y s t a ll in it y b a n d s s im ila r to th o se o b s e rv e d in s p e c tra of
t r a m - 1,4 o r 1 ,2 -p o ly b u ta d ie n e s.
T h e re s o lu t io n o f th e b a n d s in th e 1 0 - 1 1 ¡x re g io n of th e iso m e riz e d p o ly
b u ta d ie n e s y ie ld s som e in te re s tin g re s u lts . T h e 995 c m . - 1 b a n d c h a n g e d in
in t e n s it y d u r in g is o m e riz a t io n a c c o rd in g to a f irs t-o rd e r ra te la w a n d t h u s
m u s t be c o n n e cte d w it h a v ib r a t io n of th e c f s - C H = C H g ro u p . T h is th e n
e x p la in s th e ch a n g e s o b s e rv e d in th e p a r a lle l a n d p e rp e n d ic u la r p o la r iz a
t io n s p e c tra o f a h ig h - m - 1 ,4 p o ly b u ta d ie n e . T h e c o n s ta n c y o f th e in
te n sit ie s o f th e 1005 a n d th e 9 85 c m . _ 1 b a n d s m u s t m e a n t h a t th e s tr u c tu r e s
g iv in g rise to th o se b a n d s r e m a in u n c h a n g e d in th e p o ly m e r. T h is is th e
re g io n in w h ic h b a n d s t h a t a re a ss ig n e d to c y c lic s tr u c tu r e s a p p e a r. O n
t h is a c c o u n t it w o u ld be in te re s tin g to o b t a in th e s p e c t ru m of a t r a n s - 1 ,4 -
p o ly b u ta d ie n e w h ic h w a s m ad e b y c o m p le te is o m e riz a t io n o f a cfs -1 ,4 -
p o ly b u ta d ie n e . I t s h o u ld be d iffe re n t fro m t h a t o f a ¿ro n s-1 ,4
p o ly m e r m ad e fro m th e m o n o m e r d ire c t ly . U n f o r t u n a t e ly , a c o m p le te
is o m e riz a t io n o f c t s - C H = C H to f r a ? r s - C H = C H a p p e a rs to b e im p o s sib le .
P e rh a p s it s h o u ld be p o in te d o u t t h a t th e 10 0 5 , 9 9 5, a n d 9 8 5 c m . - 1 b a n d s
c a n n o t be d u e to sid e v in y l g ro u p s in th ese p o ly m e rs . T h e ch a n g e s in
in t e n s ity of th e 9 7 5 a n d 9 5 7 c m . “ 1 b a n d s a lso fo llo w a f irs t -o rd e r ra te la w
a n d h e n ce s h o u ld b e a ssig n e d to a v ib r a t io n o f c t s - C H = C H . H o w e v e r
s in ce th e in te n s it ie s of th ese tw o b a n d s d ecre ase so r a p id ly w it h is o m e riz a
t io n it is d if f ic u lt to be su re .
A n o t h e r p o in t o f in te re s t is th e in t e n s it y o f th e re s o lv e d 9 6 7 c m . - 1 b a n d .
A s is s h o w n in F ig u r e 6 , i t is c o n s id e ra b ly m o re in te n se t h a n w o u ld b e d e
d u c e d fro m th e a b s o rb a n c e of th e s p e c tru m a t 9 6 7 c m . - 1 a n d th e a b s o rb a n c e
o f th e d a sh e d b a se lin e a t t h a t fre q u e n c y . T h is is a b a s e lin e t h a t is o fte n
u se d in m ic ro s t r u c t u r e d e te rm in a t io n s of p o ly b u ta d ie n e s . A ls o , it is a p
p a r e n t t h a t , if a s y m m e t ric a l c u r v e is d ra w n fro m th e 995 c m . - 1 b a n d , a n d
t h e d iffe re n c e in a b s o rb a n c e o f i t a t 9 6 7 c m . “ 1 a n d th e a c t u a l s p e c tru m is
t a k e n as th e a b s o rp t io n d u e to A a n s - C H = C H , th e a m o u n t w il l be s m a lle r
t h a n t h a t of th e re s o lv e d 9 6 7 c m . “ 1 b a n d . T h is p ro c e d u re h a s a lso b ee n
u se d in m ic ro s t r u c tu r e d e te rm in a tio n s .
CONCLUSIONSI n th e 1 3 - 1 5 n re g io n o f th e s p e c tra of c fs -1 ,4 -p o ly b u ta d ie n e s th e re is a
b a n d a t 7 4 0 c m . “ 1 w h ic h is u n d o u b te d ly d u e to th e h y d ro g e n o u t-o f-p la n e

1598 J. L. BINDER
v ib r a t io n o f c f s - C H = C H . T h e re a re o th e r b a n d s in t h is re g io n w h ic h
m a y a lso b e d u e to a v ib r a t io n o f t h is g ro u p o r to th e p re se n ce o f o th e r
s tr u c tu r e s in th e p o ly m e r.I n th e 1 0 - 1 1 m re g io n o f th e s p e c tra o f c ls -1 ,4 -p o ly b u ta d ie n e s th e re is a t
le a s t one b a n d a t 9 9 5 c m r 1 (th e re m a y b e th re e ) w h ic h is co n n e cte d w it h a
v ib r a t io n o f e /s - C H C l l . T h e r e a re tw o o th e r b a n d s , a t 1005 a n d 985
c m .- 1 , w h ic h a re n o t d u e to v ib r a t io n s of e ith e r cas- C H = C H o r t r a n s -
C H = C H . W h e t h e r th ese a re d u e to c y c lic o r o th e r s tr u c tu r e s in th e
p o ly m e r is n o t k n o w n .
T h e t r a n s - C H = C H b a n d a t 9 6 7 c m . - 1 in th e s p e c tru m of a h ig h -c ls -
1,4 - (9 5 % c fs-1 ,4 ) p o ly b u ta d ie n e is c o n s id e ra b ly m o re in te n s e t h a n m ig h t
b e d e d u ce d fro m d ra w in g b a s e lin e s o r fro m d ra w in g a b a n d e n v e lo p e fo r th e
9 9 5 c m . - 1 b a n d .T h e r e s u lts g iv e n h e re e x p la in , in p a r t a t le a s t, th e a p p e a ra n c e o f p o
la r iz a t io n sp e c tra o f h ig h -c fs - 1 ,4 -p o ly b u ta d ie n e s .
Many thanks are due H. C. Ransaw and G. E. Harris who recorded many of the spectra, made many of the measurements and helped with the reduction of the spectra used here. The author is indebted to K. W. Scott of the Goodyear Tire and Rubber Co. for irradiating polymer samples and is very grateful to J. J. Shipman, J. E. Field, E. F. Devlin, W. C. Sears, D. C. Smith, and R. E. Silas for their criticisms and suggestions regarding this work. The interest of F. W. Stavely and G. Alliger is greatly appreciated.
References
1. Hampton, R. R., A nal. Chem., 21, 923 (1949).2. Binder, J. L., A nal. Chem., 26, 1877 (1954).3. Natta, G., paper presented at 15th Annual Technical Conference of Society of
Plastics Engineers, Stereospecific Polymers Session, New York, Jan. 27-30, 1959.4. Silas, R. S., J. Yates, and V. Thornton, A nal. Chem., 31, 529 (1959).5. Morero, D., A. Santambrogio, L. Porri, and F. Ciampelli, C h im .ln d . (M ilan ), 41,
758 (1959).6. Meyer, A. W., R. Hampton, and J. A. Davidson, J . A m . Chem. Soc., 74, 2294
(1952).7. Binder, J. L., Ind . Eng. Chem., 46, 1727 (1954).8. Binder, J. L., J . Polym er Sci., Al, 47 (1963).9. Golub, M. A., J . Polym er Sci., 25, 373 (1957).
10. Scott, K. W. (Goodyear Tire & Rubber Co., Akron, Ohio), private communication.11. Richardson, W. S., and A. Sacher, J . Polymer Sci., 10, 353 (1953).12. Ramsay, D. A. J . A m . Chem. Soc., 74, 72 (1952).13. Brode, W. R, Chemical Spectroscopy, 2nd Ed., Wiley, New York, 1943, p. 207.14. Smith, D. C., and R. S. Silas, private communication.15. Golub, M. A., and J. J. Shipman, Spectrochim. Acta, 16, 1165 (1960).
Résumé
On a trouvé, par résolution analytique des spectres des w's-l,4-polybutadiènes iso- mérisés, que la bande attribuée aux vibrations d’hydrogène hors-du-plan des groupes cîs-C H =C H apparaît à 740 cm-1 et que le déplacement apparent de cette bande vers les fréquences plus basses, lorsque la teneur en c«s-CH=CH diminue dans le polybuta- diène, est provoqué par la présence d’autres bandes dans cette région. On discute des origines possibles de ces autres bandes. On a trouvé aussi qu’il y a certaines bandes dans

INFRARED SPECTRA OF POLYBUTADIENES 1599
la région de 10-11 mu du spectre du polybutadiène, qui sont probablement reliées aux vibrations des groupes cîs-C H =C H et qu’il y en a probablement d’autres qui ne sont dues ni au cis-CH=CH, ni au fr<ms-CH=CH ou CH2= C H . On discute des origines possibles de ces bandes. Les bandes que l’on trouve ici expliquent dans une large mesure l’apparition de spectres de polarization des m-l,4-polybutadiènes.
Zusammenfassung
Durch analytische Auflösung des Spektrums von isomerisiertem «s-l,4-Polybutadien wird gezeigt, dass die Bande der Aus-der-Ebene-Schwingungen des Wasserstoffs von cis-CH=CH-Gruppen bei 740 cm-1 auftritt und dass die Verschiebung dieser Bande mit abnehmender Menge an cj's-C H =C H in einem Polybutadien zu niedrigeren Frequenzen auf das Vorhandensein anderer Banden in diesem Bereich zurückzuführen ist. Einige Möglichkeiten für den Ursprung dieser anderen Banden werden diskutiert. Weiters wird gezeigt, dass im Bereich von 10-11 /r des Polybutadienspektrums einige Banden auttreten, die wahrscheinlich mit Schwingungen der cis-CH=CH-Gruppen Zusammenhängen und dass wahrscheinlich noch andere vorhanden sind, die weder auf «s-CH =CH , Irans-C H =C H oder CH2= C H zurückgefühert werden können. Einige Möglichkeiten für den Ursprung dieser Banden werden diskutiert. Die hier gefundenen Banden erklären zum Grossteil das Auftreten von Polarisationsspektren von hochgradigen «s-l,4-Polybutadienen.
R e c e iv e d S e p te m b e r 3 , 1964
R e v is e d N o v e m b e r 16, 1964
(P ro d . N o . 4 5 4 2 A )

JOURNAL OF POLYMER SCIENCE: PART A VOL. 3, PP. 1601-1608 (1965)
Synthesis an d P o lym eriza tion o f iV[2-(2-Methyl- 4 -oxopen ty l)]-acry lam ide—A New R eactive Vinyl
M onom er*
L . E . C O L E M A N . J . F . B O R IC , D . P . W Y M A N , f a n d D . I . H O K E ,
Chem ica l Research La b o ra to ry , T h e L v h r iz o l C o rp o ra tio n , Cleveland, O hio
Synopsis
The synthesis and polymerization reactivity of iV[2-(2-methyl-4-oxopentyl)]-acrylam- ide (diacetone acrylamide) is described. This reactive vinyl monomer is prepared in good yield from acetone, acrylonitrile and sulfuric acid. Diacetone acrylamide is a white crystalline solid with the water solubility characteristics of acrylamide and the organic solvent solubility of ,Y-alkyl acrylamides. Diacetone acrylamide readily homopolv- merizes and forms copolymers with a wide variety of comonomers. Reactivity ratios in the copolymerization of diacetone acrylamide with styrene and methyl methacrylate are reported and the Alfrey-Price Q and e values calculated. These results, along with data from the copolymerization of diacetone acrylamide with a group of typical vinyl monomers, are presented to indicate the high reactivity of this new monomer.
INTRODUCTION
T h is p a p e r d e scrib e s th e s y n th e s is o f a n e w re a c tiv e v in y l m o n o m e r—
A’ 12-(2-m eUtv 1~ 1 -oxopent.y 1) | a c ry la m id e (d ia c e to n e a c ry la m id e ). T h is
m o n o m e r c a n be s y n th e s iz e d in good y ie ld fro m r e a d ily a v a ila b le s ta rt in g
m a te ria ls . D ia c e to n e a c ry la m id e possesses th e r e a c t iv it y o f a n a c t iv a t e d
d o u b le b o n d , a n Y - s u b s t it u t e d a m id e , a n d a m e t h y l k e to n e. T h is re p o rt
w il l be lim ite d to th e s y n th e s is o f d ia c e to n e a c ry la m id e a n d a p r e lim in a r y
in v e s t ig a t io n o f it s p o ly m e r iz a t io n re a ctio n s.
RESULTS AND DISCUSSION
Monomer Synthesis
D ia c e to n e a c ry la m id e ( I ) w a s p re p a re d b y n e u t r a liz a t io n of th e re a c tio n
p r o d u c t o f a c r y lo n it r ile , a ceto n e , a n d s u lfu r ic a c id . B e s t y ie ld s w e re o b
t a in e d b y a d d in g 2.4 m ole o f s u lfu r ic a c id to 2.4 m o le of aceto n e a n d 1.0
m o le o f a c ry lo n itr ile .
* Paper presented at the 147th meeting of the American Chemical Society, Philadelphia, Pennsylvania, April 1964.
t Present address: Marbon Chemical Division, Borg-Warner, Parkersburg, WestVirginia.
1601

1602 L. E. COLEMAN, J. F. BORE, D. P. WYMAN, AND D. I. IIOKE
CH2= C H — C — N '0I II
(CH 3)2- C x x c — c h 3
c h 2
Diaoetone acrylamide I
D e c re a s in g th e q u a n t it y of s u lfu r ic a c id o r a ce to n e g a v e lo w e r y ie ld s of
p ro d u c t. O p tim u m re a c tio n te m p e ra tu re w a s 5C H 6 0 °C . T e m p e ra tu re s
a b o v e t h is ra n g e g a v e in c re a s e d y ie ld s of a p o ly m e ric re s id u e ca u se d b y
s u lfu r ic a c id c a ta ly z e d c o n d e n sa tio n of th e acetone. D u r in g n e u tr a liz a t io n
to fo rm d ia ce to n e a c ry la m id e , th e te m p e ra tu re s h o u ld be h e ld b e lo w 5 0 ° C .
to a v o id th e p o s s ib ilit y o f b a s ic h y d r o ly s is of th e p ro d u c t.
T h e s tr u c tu r e a s s ig n m e n t of d ia ce to n e a c ry la m id e w a s b ased o n n itro g e n
a n a ly s is a n d th e in fra re d a n d N M R sp e c tra . T h e p r in c ip a l c h a ra c te r is t ic s
o f th e s p e c tra are g iv e n in T a b le s I a n d I I . T h e N M R s p e c tru m w a s
o b ta in e d b y use o f te tra m e th y ls ila n e as th e in t e rn a l s ta n d a rd a n d c a rb o n
t e t ra c h lo r id e as s o lv e n t. F u r t h e r e v id e n ce fo r th e a ss ig n e d s tru c tu re is
th e s im ila r it y o f t h is re a c tio n to t h a t re p o rte d p r e v io u s ly 1 ’ 2 fo r th e p r e p a r a
t io n o f N - a lk y l a c ry la m id e s fro m a -o le fin s a n d a c ry lo n it r ile . I n a d d it io n ,
TABLE IInfrared Spectrum Characteristics of Diacetone Acrylamide
Absorption band, n Assignment
3.05 N— H3.4 C - H5.8 C = 0 (ketone)6.05 C = 0 (amide)6.25 C = C6.5 N—H (amide II)6.8, 7.25 C—H
10.2. 10.8 —c h = c h 2
TABLE IINuclear Magnetic Resonance
Spectrum Characteristics of Diacetone Acrylamidet Value Assignment
3.28 N—H3.90 ^>C=CH,4.55 — C H =C7.04 ^>CH2
0/
7.92 CH3C—8,60 (CH,),('■;(

A7[2-(2-METlIYL-4-OXOPENTYL)]-ACRYLAMIDE 1603
d ia c e to n e a c ry la m id e w a s a lso o b ta in e d w h e n e ith e r d ia c e to n e a lc o h o l o r
m e s it y l o x id e w a s u se d to re p la c e acetone.
Monomer Properties
D ia c e to n e a c ry la m id e , u n lik e m o st s u b s titu te d a c ry la m id e s , e x h ib its
w a t e r s o lu b ilit y s im ila r to t h a t of a c ry la m id e itse lf. S o lu b ilit y in e t h y l
a c e ta te , b e n ze n e , a n d acetone, h o w e v e r, is s im ila r to t h a t of th e s u b s titu te d
a c ry la m id e s . T h e se s o lu b ilit y d a ta a re s u m m a riz e d in T a b le I I I .
TABLE IIISolubility of Diacetone Acrylamide
SolventSolubility,
g./100 g. solvent at 25°C.
Water >100Ethanol >1001-Hexanol 98Acetone >100Ethyl acetate >100Benzene >100Heptane 1.0Petroleum ether 0.1
D ia c e to n e a c ry la m id e h a s good th e r m a l s t a b il it y a n d lo n g s h e lf life .
T h e re is no e v id e n c e o f p o ly m e r fo rm a tio n a ft e r one y e a r sto ra g e o f m o n o
m e r a t ro o m te m p e ra tu re . T h e m o n o m e r w il l p o ly m e riz e o n sto ra g e
a b o v e it s m e lt in g p o in t a n d in s o lu t io n a t ro o m te m p e ra tu re . D ia c e to n e
a c ry la m id e c a n be d is t ille d u n d e r re d u c e d p re s s u re in th e p re se n ce of
in h ib it o r w it h no d e co m p o sitio n .
Homopolymerization
D ia c e to n e a c ry la m id e w a s h o m o p o ly m e riz e d u n d e r a v a r ie t y o f c o n
d it io n s . P o ly m e riz a t io n in a q u e o u s s o lu tio n u s in g p o ta s s iu m p e rs u lfa te
in it ia t o r g a v e a w a te r- in s o lu b le p o w d e r w h ic h w a s o n ly p a r t ia l ly s o lu b le
in d im e th y lfo rm a m id e , to lu e n e , b u ta n o l, a n d acetone. T h e h o m o p o ly
m e rs p re p a re d in b en zen e s o lu tio n o r in b u lk w e re to u g h s o lid s w h ic h w o u ld
s w e ll in w a t e r a n d d is s o lv e in d im e th y lfo rm a m id e , to lu e n e , b u ta n o l, a n d
m e t h y l e t h y l ke to n e . T h e p ro d u c t is o la te d fro m a b en zen e s o lu tio n p o ly
m e r iz a t io n g a v e a n in t r in s ic v is c o s it y o f 2 .5 6 in d im e t h y lfo rm a m id e a t
3 0 ° C . A h o m o p o ly m e r, w h ic h w a s p re p a re d in 4 2 % y ie ld w it h th e u se of
s o d iu m in liq u id a m m o n ia , sh o w e d a n in t r in s ic v is c o s it y a t 3 0 ° C . o f 0 .7 5
in d im e th y lfo rm a m id e . S o lu b ilit y of t h is p o ly m e r w a s s im ila r to t h a t of
th e h o m o p o ly m e rs p re p a re d in b en zen e s o lu tio n w it h fre e r a d ic a l in it ia t io n .
D if f e r e n t ia l th e r m a l a n a ly s is o f th e p o ly (d ia ce to n e a c ry la m id e )s sh o w e d
s o fte n in g a t a b o u t 1 1 0 ° C . a n d d e c o m p o sit io n a t 2 8 0 -2 9 0 ° C . T h e s e d a ta
w e re o b ta in e d in a n itro g e n a tm o sp h e re w it h a h e a t in g ra te of 1 0 ° C ./m in .

1604 L. E. COLEMAN, J. F. BORK, D. P. WYMAN, AND D. I. HOKE
Copolymerization
I n i t i a l c o p o ly n ie riz a t io n e x p e rim e n ts in d ic a te d t h a t d ia c e to n e a c ry la m id e
w a s a m o re re a c t iv e m o n o m e r t h a n o th e r V - a lk y l a c ry la m id e s . C o n
s e q u e n tly , r e a c t iv it y r a t io d e te rm in a t io n s w it h s ty re n e a n d m e t h y l m e th
a c ry la t e w e re m a d e , a n d th e A lf r e y - P r ic e e q u a tio n s 3 w e re u se d to c a lc u la te
Q a n d e v a lu e s . T h e s e re s u lts , g iv e n in T a b le I V , c o n firm e d th e in c re a se d
r e a c t iv it y . C o m p o s it io n c u r v e s fro m th ese e x p e rim e n ts a re sh o w n in
F ig u r e 1.
TABLE IYReactivity Ratios of Diacetone
Acrylamide (M 2) with Styrene and Methyl Methacrylate
MonomerMi n *sé Qi fii Q2 €2
StyreneMethyl methacrjdate
1.77 ± .08 1.68 ± .06
0.490.57
± .06 1.00 ± .03 0.74
- 0 .8 0 0.42 0.40 0.41
-0 .4 2- 0 .0 2
C o p o ly m e rs of d ia c e to n e a c ry la m id e w it h a g ro u p of t y p ic a l v in y l
m o n o m e rs a re s u m m a riz e d in T a b le V . T h e v in y l a c e ta te a n d v in y l
c h lo rid e c o p o ly m e rs c o n ta in e d s ig n if ic a n t ly la rg e r a m o u n ts of d ia ce to n e
a c ry la m id e t h a n d id th e m o n o m e r ch a rg e . I n b o th s y ste m s th e v is c o s it y
o f th e c o p o ly m e rs in c re a se d w it h in c re a s in g in c o r p o ra t io n of d ia c e to n e
a c ry la m id e . T h e c o p o ly m e rs w e re s o lu b le in c y c lo h e x a n o n e a n d , w it h th e
e x c e p tio n of th e h ig h v in y l c h lo rid e c o p o ly m e r, w e re a lso so lu b le in b u ta n o l
a n d m e t h y l e t h y l k e to n e.
C o p o ly m e rs r ic h in d ia c e to n e a c ry la m id e w e re a lso fo rm e d w it h m a le ic
a n h y d r id e , v i n y l ste a ra te , e th y l v in y l e th e r, a n d V - v i n y l p y rro lid o n e .
MOLE FRACTION DIACETONE ACRYLAMIDE IN THE FEED
Fig. 1. Composition curves for -copolymers: (O) styrene-diacetone acrylamide; ( • ) methyl methacrylate-diacetone acrylamide.

JV[2-(2-METIIYL-4-OXOPEIVTYL) J-ACRYLAMIDE 1605
T h e m a le ic a n h y d r id e c o p o ly m e r, a fin e w h ite p o w d e r, a n a ly z e d fo r a n
e q u a l m o le r a t io o f m o n o m e r u n its .
D ia c e to n e a c ry la m id e fo rm e d c o p o ly m e rs w it h v in y lid in e c h lo rid e ,
a c r y lo n it r ile , m e t h y l v in y l k e to n e , m e t h a c r y lic a n d it a c o n ic a c id s , a n d
a c ry la m id e in a b o u t th e sam e r a t io as c h a rg e d . In t r in s ic v is c o s it ie s o f th e
a c id - c o n t a in in g c o p o ly m e rs in c re a s e d in v a lu e as th e c o p o ly m e r c o n c e n tra
t io n d ecre ased . N it r o g e n a n a ly s is o f th e a c r y lo n it r ile c o p o ly m e rs in d i
c a te d t h a t d ia c e to n e a c ry la m id e c o n te n t w a s r ic h e r t h a n t h a t in th e feed.
TABLE VSolution Copolymerizations of Diacetone Acrylamide (DA)
ComonomerTime,
hr.Temp.,
°C.
Conversion,
C7/O
Diacetoneacrylamide,
wt.-%Intrinsic viscosity in DMF
Charge Product at 30°C.
Vinyl acetate 4 65 82 75 89 1.35Vinyl acetate 4 65 60 50 79 1.19Vinyl acetate 4 65 35 25 65 0.99Vinyl chloride 20 60 87 75 86 1.29Vinyl chloride 20 60 80 50 70 1.05Vinyl chloride 35 60 54 25 44 0.44Maleic anhydride 16 60 73 63 68 —Vinyl stearate 20 70 70 75 87 0 .67aEthyl vinyl ether 20 70 83 75 90 0.82A7 Vi nylpyrrolidone 20 70 01 75 83 0.57Vinylidene chloride 18 60 70 50 55 0.37Acrylonitrile 4 65 91 75 ~75 —Acrylonitrile 4 65 98 50 ~ 50 2.73Acrylonitrile 4 65 87 25 ~25 3.06Methyl vinyl ketone 20 70 83 75 72 0.61Methacrylic acid 18 60 100 50 50 1.50Methacrylic acid 3 70 99 60 60 2.9-6 .0Itaconic acid 20 70 100 75 . 75 0.68-1.34Acrylamide 2 70 58 75 70 InsolubleAT-Vinyl carbazole 20 70 72 75 Good 0.32
a On soluble portion.
T h is h ig h v a lu e m a y be d u e to d if f ic u lt y in o b t a in in g a c c u ra te n itro g e n
a n a ly s is o n a c ry lo n it r ile -c o n t a in in g c o p o ly m e rs . D ia c e to n e a c ry la m id e
w a s a lso c o p o ly m e riz e d w it h a c r y lo n it r ile u s in g s o d iu m in liq u id a m m o n ia .
T w o f ra c t io n s w e re o b ta in e d . O n e , o b ta in e d in 3 3 % y ie ld , w a s a y e llo w
p o w d e r w h ic h w a s in s o lu b le in m e th a n o l a n d c o n ta in e d a b o u t 7 5 % a c r y l
o n itr ile . T h e seco nd f ra c t io n w a s a m e th a n o l-s o lu b le v is c o u s o il a n d c o n
ta in e d a b o u t 7 5 % d ia c e to n e a c ry la m id e . T h e in it ia l m o n o m e r ch a rg e
c o n ta in e d e q u a l p a r ts b y w e ig h t o f e a ch m o n o m e r.
v V -V in y l c a rb a z o le fo rm e d a c o p o ly m e r w it h d ia c e to n e a c ry la m id e .
In f r a r e d a n a ly s is w a s u se d to d e te rm in e in c o r p o ra t io n s in ce b o th m o n o
m e rs h a v e th e sam e n itro g e n co n te n t.

1606 L. E. COLEMAN, ,). F. BORK, D. P. WYMAN, AND D. I. IIOKE
D ia c e to n e a c ry la m id e w a s c o p o ly m e riz e d w it h b u ta d ie n e b y u se of a
s ta n d a r d S B - R re c ip e a t 5 0 ° C . fo r 18 h r. A w h it e r u b b e r y so lid w a s
is o la te d in 8 0 % y ie ld . T h e c o p o ly m e r, w h ic h c o n ta in e d 1 0 % d ia ce to n e
a c ry la m id e fro m a m o n o m e r c h a rg e of 2 5 % , w a s o n ly p a r t ia lly s o lu b le in
b enzene. T h is s o lu b le p o r t io n h a d a 0 .1 5 in t r in s ic v is c o s it y in b en zen e a t
3 0 ° C .
EXPERIMENTAL
Monomers
D ia c e to n e a c ry la m id e w a s p re p a re d b y a d d in g 2.4 m ole o f 9 6 % s u lfu r ic
a c id to a m ix t u re o f 2.4 m ole o f ac eto n e a n d 1.0 m ole of a c ry lo n itr ile .
(A ce to n e a d d it io n to a c id - a c r y lo n it r i le is n o t re co m m e n d e d b e ca u se of
th e v io le n t re a c tio n w h ic h o c c u rs o n m ix in g s u lfu r ic a c id a n d a c ry lo n it r ile .)
D u r in g a d d it io n o f s u lfu r ic a c id , th e te m p e ra tu re of th e m ix tu re w a s a l
lo w e d to rise r a p id ly to 5 0 ° C . a n d th e n w a s h e ld a t 5 2 - 6 0 ° C . w it h e x te rn a l
co o lin g . A f t e r th e a d d it io n w a s c o m p le te , th e m ix tu re w a s s tirre d fo r a n
a d d it io n a l 4 h r. a t 5 0 - 6 0 ° C ., t h e n p o u re d s lo w ly w it h s t ir r in g in to 4 8 0 g.
o f 2 5 % s o d iu m h y d ro x id e s o lu tio n . T h e te m p e ra tu re d u rin g n e u t r a liz a
t io n w a s h e ld n e a r 2 0 ° C . b y m ea n s o f a n ice b a th . T h e o rg a n ic la y e r w a s
se p a ra te d , w a sh e d w it h 25 m l. of 2 0 % s o d iu m h y d ro x id e s o lu tio n a n d
s tr ip p e d to 1 0 0 ° C . a t 25 m m . H g . T h e re sid u e w a s d is t ille d a t 1 0 0 - 1 3 0 ° C .
a t 9 m m . H g o r 7 0 - 9 0 ° C . a t 0.2 m m . H g . T h e d is t illa t e w a s fu rt h e r
p u rifie d fo r p o ly m e r iz a t io n b y d is s o lv in g in a n e q u a l w e ig h t o f b en zen e
a n d p o u rin g in to a la rg e v o lu m e o f c o ld p e tro le u m e th e r. T h e so lid
p ro d u c t w a s filte re d , w a sh e d w it h c o ld p e tro le u m e th e r a n d a ir d rie d .
Y ie ld s of 5 8 - 7 0 % of a w h ite c r y s t a llin e so lid , m e lt in g a t 5 2 - 5 3 .5 ° C ., w e re
o b ta in e d .
T h e o th e r m o n o m e rs u sed in t h is s tu d y w e re c o m m e rc ia l m a te ria ls a n d
w e re p u rif ie d b efo re use.
Reactivity Ratio Determinations
T h e e x p e rim e n ta l m e th o d s w e re e s s e n tia lly th o se of M a y o a n d L e w is . 4
S o lu tio n p o ly m e riz a t io n s in b en zen e w e re r u n u n d e r a n itro g e n a tm o sp h e re
in 4-oz. sc re w -c a p b o ttle s fitte d w it h T e flo n g ask e ts. P o ly m e riz a t io n w a s
in it ia te d b y a z o b is is o b u ty r o n itr ile a t 0 . 0 1 w t .- % b ased on m o n o m e r.
C o n v e rs io n s w ere b e lo w 8 .0 % . T h e p o ly m e rs w ere p re c ip it a t e d b y p o u rin g
th e b en zen e s o lu tio n in to n a p h th a o r p e tro le u m e th e r a t ro o m te m p e ra tu re .
P u r if ic a t io n w a s effected b y re p e a te d re p re c ip ita tio n s . T h e p u rif ie d p o ly m e rs w e re d rie d u n d e r v a c u u m to c o n s ta n t w e ig h t a n d th e c o m p o s it io n
o f th e c o p o ly m e rs w a s d e te rm in e d b y n itro g e n a n a ly s is .
R e a c t iv it y ra t io s w e re d e te rm in e d fro m th e d iffe re n tia l fo rm of th e
g e n e ra l c o p o ly m e riz a tio n e q u a tio n b y u s in g b o th th e m e th o d of in t e r
c e p ts 3 a n d th e F in e m a n a n d R o s s 5 p lo ts.

/V[2-(2-METI lYL-4-0X0PE\TYL) 1-ACRYLAMIDE 1607
Polymerizations
C o p o ly m e rs o f d ia c e to n e a c ry la m id e w it h v in y l m o n o m e rs w e re p re
p a re d in b en zen e s o lu tio n u n d e r a n itro g e n a tm o sp h e re . B e n z o y l p e ro x id e
a t 0 .0 1 - 0 .0 5 w t .- % b ased o n m o n o m e r w a s u se d as c a ta ly s t . P o ly m e r iz a
t io n t im e a n d te m p e ra tu re a re g iv e n in T a b le V . M o n o m e r c o n c e n t ra t io n
w a s in th e ra n g e o f 3 3 5 0 w t .- % . C o p o ly m e rs w e re p u rif ie d b y re p r e c ip i
t a t io n fro m s o lu t io n b y a n o n s o lv e n t a n d d rie d u n d e r v a c u u m . D ia c e to n e
a c ry la m id e in c o rp o ra tio n w a s c a lc u la te d fro m n itro g e n a n a ly s is a n d co n
firm e d b y in fra re d sp e ctra . C o m p o s it io n o f c o p o ly m e rs w it h c h lo rin e -
c o n ta in in g m o n o m e rs w a s c o n firm e d b y c h lo rin e a n a ly s is w h ic h a g ree d
w e ll w it h v a lu e s b ased on n itro g e n .
CONCLUSION
T h e s y n t h e s is a n d som e p r o p e r t ie s o f d ia c e to n e a c r y la m id e h a v e b ee n
re p o rte d . P r e l im in a r y e x p e rim e n ts h a v e in d ic a t e d th e p o t e n t ia l o f t h is
c h e m ic a l as a r e a c t iv e v in y l m o n o m e r.
References1. Bork, J. F., D. P. Wyman, and L. E. Coleman, J . A p p l. Polymer Sci., 7, 451 ( 1963).2. Plant, H., and J. J. Ritter, J . A m . Chem. Soc.., 73, 4076 (1951).3. Alfrey, T., J. J. Bohrer, and H. Mark, Copolymerization, Interscience, New York,
1952, Chaps. 3 and 4.4. Mayo, F. R., and F. M. Lewis, J . A m . Chem. Soc., 66, 1594 (1944).5. Fineman, M., and S. 1). Ross, J . Polymer Sci., 5, 259 (1950).
Résumé
On décrit la synthèse et la réactivité de polymérisation du iV(l,l-diméthyl-3-oxo- butyl)-acrylamide (diacétone acrylamide). Ce monomère vinylique réactif est préparé avec un bon rendement à partir d ’acétone, d’acrylonitrile et d’acide sulfurique. Le diacétone acrylamide est un solide cristallin blanc possédant les propriétés de solubilité dans l’eau de l’aerylamide et de solubilité dans des solvants organiques des jY-acryl- amides. Le diacétone acrylamide homo-polymérise facilement et forme des copoly- ' mères avec toute une série de comonomères. Les rapports de réactivité de la copolymérisation du diacétone acrylamide avec le styrène et le méthacrylate de méthyle sont donnés et les valeurs des fonctions d’Alfrey-Price Q et e sont calculées. Ces résultats, ainsi que les résultats de la copolymérisation du diacétone-acrylamide avec un groupe de monomères vinyliques typiques, sont présentés pour montrer la grande réactivité de ce nouveau monomère.
ZusammenfassungDie Synthese und die Polymerisationsfähigkeit von A'(l,l-Dimethyl-3-oxobutyl)-
acrylamid(Diacetonacrylamid) werden beschrieben. Dieses reaktionsfähige Vinylmonomere wird in guter Ausbeute aus Aceton, Acrylnitril, und Schwefelsäure dargestellt. Diacetonacrylamid ist ein weisser, kristalliner Festkörper mit der für Acrylamid charakteristischen Wasserlöslichkeit und der für A’-Alkylac.rylamide charakteristischen Löslichkeit in organischen Lösungmitteln. Diacetonacrylamid liefert leicht Homopolymere und bildet mit einer grossen Vielfalt von Comonomeren Copolymere. Reaktivitätsverhältnisse für die Copolymerisation von Diacetonacrylamid mit Styrol und Methyl- methacrjdat werden mitgeteilt und die Q- und e-Werte nach Alfrey-Price berechnet.

1608 L. E. COLEMAN, J. F. BORK, D. P. WYMAN, AND D. I. HOKE
Diese Ergebnisse werden mit weiteren Daten für die Copolymerisation von Diaceton- acrylamid mit einer Gruppe typischer Vinylmonomerer zum Beleg für die hohe Reaktivität dieses neuen Monomeren vorgelegt.
R e c e iv e d S e p te m b e r 29, 1964
R e v is e d N o v e m b e r 9, 1964
(P ro d . N o . 4 5 5 5 A )

JOURNAL OF POLYMER SCIENCE: PART A VOL. 3, PP. 1609-1615 (1965)
Polymerization of 4-Vinylcyclohexene by the Cyclic Polymerization Mechanism*
G E O R G E B . B U T L E R a n d M A R I O N L . M I L E S , D e p a r tm e n t oj C h e m is tr y , U n iv e r s i t y oj F lo r id a , G a in esv i l le , F lo r id a
Synopsis4-Vinylcyclohexene is an example of a 1,5-diene and is functionally capable of under
going cyclic polymerization. Polymerization to soluble polymers was accomplished by cationic and Ziegler-type initiators. Cationic initiation resulted in 28% conversion to polymer, of which 85% was soluble, having intrinsic viscosity of 0.11 dl./g. Infrared and nuclear magnetic resonance analyses led to the conclusion that cyclization of the monomer occurred to the extent of almost 50%. Ziegler-type initiation resvdted in 20% conversion to polymer of which 45% was soluble, essentially saturated, and having intrinsic viscosity of 0.04 dl./g. X-ray diffraction studies on these polymers indicated no appreciable degree of crystallinity.
T h e p r in c ip le o f c y c lo p o ly m e riz a t io n h a s n o w b e e n w e ll e sta b lis h e d .h *
N u m e r o u s c y c lic d ie n e s h a v e n o w b e e n c o n v e rte d to p o ly m e rs co n ta in in g ,
b ic y c lic u n it s fo rm e d d u rin g th e c y c lo p ro p a g a tio n s te p . 3 I t w a s th e
p u rp o se of t h is w o r k to d e te rm in e w h e th e r o r n o t 4 -v in y lc y c lo h e x e n e , a
D ie ls - A ld e r d im e r of 1 ,3 -b u ta d ie n e , c o u ld be c o n v e rte d to a p o ly m e r co n
t a in in g b ic y c lic u n it s , a n d if so, to w h a t e x te n t a n d u n d e r w h a t c o n d itio n s .
4 -V in y lc y c lo h e x e n e is a n e xa m p le o f a 1 ,5 -d ie n e , a n d is f u n c t io n a lly c a p a b le
o f u n d e rg o in g c y c lic p o ly m e r iz a t io n le a d in g to a p o ly (3 ,7 - m e t h y le n e [2.2.1 ]-
b ic y c lo h e p ta n e ) s tru c tu re .
RESULTS AND DISCUSSION
P o ly m e riz a t io n o f 4 -v in y lc y c lo h e x e n e w a s a c c o m p lish e d b y in it ia t io n ,
w it h b o ro n t r if lu o r id e , b o ro n t r if lu o r id e - d ie t h y l e th e ra te , a n d w it h a Z ie g le r c a ta ly s t . O th e r in it ia t o r s e m p lo y e d , n a m e ly , t it a n iu m t e t r a
c h lo rid e , n - b u t y ll it h iu m , a n d a ,a :-a z o b is is o b u ty ro n itr ile ( A I B N ) , u n d e r
th e c o n d it io n s s tu d ie d w e re e s s e n t ia lly in e ffe c tiv e in in it ia t in g p o ly m e r iz a t io n o f t h is m o n o m e r. L o w -te m p e ra tu re ( — 7 0 ° C .) p o ly m e r iz a t io n w it h
b o ro n t r if lu o r id e g as le d to 2 8 % c o n v e rs io n to p o ly m e r, o f w h ic h 8 5 %
w a s s o lu b le in c h lo ro fo rm a n d p re s u m e d to b e n o n c ro s s lin k e d . T h is
p o ly m e r h a d a n in t r in s ic v is c o s it y o f 0 .1 1 d l. /g . In f r a r e d a n d n u c le a r m a g
n e tic re so n a n ce a n a ly s e s o f th e p o ly m e r le d to th e c o n c lu s io n t h a t som e
* From the Ph.D. dissertation of Marion L. Miles, Department of Chemistry, University of Florida, April 1963.
1609

1610 G. B. BUTLER AND M. L. MILES
re s id u a l u n s a t u ra t io n re m a in e d . A f t e r n u m e ro u s p u r if ic a t io n s a n d le n g th y
S o x h le t e x t ra c t io n o f th e p o ly m e r, t h is u n s a t u ra t io n re m a in e d u n c h a n g e d ,
le a d in g to th e c o n c lu s io n t h a t c y c liz a t io n w a s n o t co m p le te . T h e N M R
s p e c tru m of th e p o ly m e r in c lu d e d a b ro a d p e a k fo r s p 3-b o n d e d h y d ro g e n s
a t a c h e m ic a l s h ift o f 8 . 6 ± 1 r a n d tw o p e a k s fo r s p 3-b o n d e d h y d ro g e n s
a t a p p r o x im a t e ly 4 .5 a n d 5 .2 r . T h e s p 2: s p 3 r a t io of 1 : 1 2 c a n be in t e r
p re te d in te rm s o f s tr u c tu r e s I , I I , a n d I I I
t h a t th e p o ly m e r is p r o b a b ly a c o p o ly m e r of s t r u c t u r a l u n it s I a n d I I I
in a p p ro x im a t e ly e q u a l p ro p o rtio n s , a n d t h a t c y c liz a t io n h a s o c c u rre d to
th e e x te n t o f a p p r o x im a t e ly 5 0 % . S t r u c t u r e I I c a n r e a s o n a b ly be e lim
in a te d fro m c o n s id e ra tio n s in c e in t e rn a l d o u b le b o n d s a re w e ll k n o w n to be
r e s is ta n t to p o ly m e r iz a t io n ; h o w e v e r, it w a s n o t p o ssib le to d is t in g u is h
b e tw e e n th e t y p e o f re s id u a l u n s a t u ra t io n b y e ith e r th e in fr a r e d d a ta o r th e
N M R d a ta . C a lc u la t io n s o f th e degree of c y c liz a t io n b a se d o n th e N M R
re s u lts w e re m ad e a c c o rd in g to a p ro c e d u re p r e v io u s ly p u b lis h e d . 4
T w o e x p e rim e n ts w e re c o n d u c te d in a n a tte m p t to in c re a se th e in
t r in s ic v is c o s it y o f th e p o ly m e r b y re d u c in g th e c a t a ly s t c o n c e n tra t io n fo r
th e gaseou s b o ro n t r if lu o r id e in it ia t io n . U s u a lly , th e b o ro n t r if lu o r id e
g as w a s e m itte d o v e r a s o lu tio n of th e m o n o m e r; th e re a c tio n fla s k w a s
th e n sea led , a n d th e m ix t u re w a s le ft s t ir r in g fo r th e re m a in d e r o f th e
re a c tio n p e rio d . I n t h is set o f e x p e rim e n ts th e gas w a s e m itte d a n d le ft
o v e r th e s o lu tio n fo r a c e rt a in p e rio d o f tim e . I t w a s th e n d is p la c e d
w it h d r y n itro g e n , a n d th e re a c tio n w a s a llo w e d to p ro ce e d fo r th e a llo tte d
tim e . T h is p ro c e d u re d id n o t a p p r e c ia b ly a ffe ct th e v is c o s it y , p o ly m e r
m e lt te m p e ra tu re , o r p e r ce n t s o lu b le fra c t io n , a lth o u g h it d id d ecrease th e
y ie ld . T h is t y p e of b e h a v io r is c o n s iste n t w it h a lo w degree o f p o ly m e riz a tio n .
C o n t in u o u s e x t r a c t io n o f th e c h lo ro fo rm so lu b le p o ly m e r w it h d ie t h y l
e th e r ca u se d som e f ra c t io n a t io n to o c c u r. B o t h th e e th e r-so lu b le a n d
in s o lu b le fra c t io n s , h o w e v e r, g a v e N M R a n d in fra re d s p e c tra e s s e n tia lly
th e sam e as th o se o f th e n o n fra c t io n a te d p o ly m e r.
T h e p o ly m e r o b ta in e d fro m th e b o ro n t r if lu o r id e e th e ra te in it ia t io n w7as
c o m p le te ly s o lu b le in c h lo ro fo rm b u t g a v e a lo w v a lu e fo r th e in t r in s ic
v is c o s it y (0 .0 3 d l. / g . ) . A h ig h c a ta ly s t :m o n o m e r r a t io w a s n e c e ss a ry fo r
h ig h c o n v e rs io n . T h e in fr a r e d s p e c tru m o f t h is p o ly m e r in d ic a te d v e r y
l it t le u n s a t u ra t io n , a n d th e N M R s p e c tru m sh o w e d a n s p 2 : s p :' r a t io o f 1 : 2 8
( 8 0 % c y c liz a t io n ).

4-VINYLCYCLOUEXENE POLYMERIZATION 101)
NJ©S'
M oa a a ® a g3 S’
î>>S3
T3O
.5H
a •6 ?
c¿5
-é=>© __;j> 9 £ro
gg> c
tí ^ 2 O £ £ © 5 O S
o ® o >ow I> O CO
i-O © 05 CO H ^ « H ci
re K 73 co cor>5 (>i i>ï Oa C3 o3 5 j á'‘O T3 ^ "Ö ”73
tí©4tí
O O b- I>-i I
COo3
03c3
03 03c3 a3
o o Ò ÜO & CDrH
o o
„ W ^ » , 3 o ^ „ m
£ ¡ ÿ ^ o 5 « ¡¿fg 3 Ú s p q p q n a è S C H
M LQ (M Ol N M
5 3 3 §• & g- 5k ' k S w w w kO O ü s é S O
Q*©wIss
>>"5s-»-3OH BF
.¡ ga
s w
as d
ispl
aced
fro
m r
eact
ion
vess
el a
fter
a c
onta
ct ti
me
of 1
5 m
in.

1612 G. B. BUTLER AND M. L. MILES
TABLE IIPhysical Properties of Soluble Polymers of 4-Vinylcyclohexene
Polymer
Polymermelt
temperature,°C.
Elemental analysis
Intrinsicviscosity
Caled. Found
c, % H, % c, % H, %
9b 173 0.11 88.82 11.18 88.82 11.19ite 168 0.07 88.82 11.18 88.69 11.229d 171 0.08 88.82 11.18 N.D."9e 108 0.03 88.82 11.18 84.50 10.439f 91 0.04 88.82 11.18 88.71 11.10
“ N.D. = not determined.
T h e Z ie g le r c a t a ly s t in it ia t io n y ie ld e d a p o ly m e r of w h ic h 4 5 % w a s
s o lu b le in ch lo ro fo rm . T h is s o lu b le f ra c t io n w a s e s s e n t ia lly s a tu ra te d
a n d h a d a p o ly m e r m e lt te m p e ra tu re o f 91 ° C . a n d a n in t r in s ic v is c o s it y of
0.0 4. T a b le I s u m m a riz e s th e p o ly m e r iz a t io n c o n d it io n s a n d y ie ld s fo r
t h is m o n o m e r. T a b le I I s u m m a riz e s th e p h y s ic a l p ro p e rt ie s o f th e p o ly
m ers. X - r a y d iffra c t io n s tu d ie s o n th e se p o ly m e rs d id n o t in d ic a te a n y
a p p re c ia b le degree o f c r y s t a ll in it y . T h e p ro n o u n c e d t e n d e n c y o f t h is
m o n o m e r to u n d e rg o c y c liz a t io n d u r in g p o ly m e r iz a t io n f u rt h e r s u p p o rts a n
in t r a m o le c u la r in t e ra c t io n in m o n o m e rs o f t h is t y p e as p r e v io u s ly p ro
p o s e d ,2 s in ce n e it h e r c a tio n ic n o r Z ie g le r-ty p e in it ia t o r s o r d in a r ily in it ia t e
p o ly m e r iz a t io n o f in t e r n a l o le fin s. T h e s e re s u lts c a n be in te rp re te d as
a d d it io n a l e v id e n c e fo r th e n o n b o n d e d in t e ra c t io n p r o p o s a l2 as a d r iv in g
fo rce to c y c lic p o ly m e r, th e n o n b o n d e d in t e ra c t io n p r o v id in g a lo w e r
e n e rg y p a t h w a y to p o ly m e r th ro u g h c y c liz a t io n .
EXPERIMENTAL
Equipment and Data
A l l te m p e ra tu re s h e re in a re u n c o rre c te d a n d re p o rte d in degrees c e n tig ra d e . P re s s u re s a re e xp re sse d in m illim e t e rs o f m e r c u ry , h a v in g b een
d e te rm in e d b y m e a n s o f e ith e r a Z im m e rli o r M c L e o d gauge. In f r a r e d
s p e c tra w e re o b ta in e d w it h a P e r k in - E lm e r In f r a c o r d d o u b le -b e a m in
fr a r e d re c o rd in g sp e ctro p h o to m e te r o r a P e r k in - E lm e r M o d e l 21 d o u b le
b e a m in fr a r e d re c o rd in g sp e c tro p h o to m e te r. R e f r a c t iv e in d ic e s w e re
o b ta in e d w it h a B a u s c h a n d L o m b A b b e 3 4 re fra c to m e te r e q u ip p e d w it h a n
a c h ro m a tic c o m p e n s a tin g p rism .
G a s - liq u id c h ro m a to g ra p h ic a n a ly s e s w e re m a d e w it h a W ilk in s A e r o
g ra p h M o d e l A - 1 1 0 - C g as c h ro m a to g ra p h ic in s t ru m e n t w it h th e use of
h e liu m fo r th e e lu e n t gas. U n le s s o th e rw ise in d ic a te d , g a s - l iq u id c h ro
m a to g ra p h ic a n a ly s e s w e re m a d e o n a 5 -ft. c o lu m n p a c k e d w it h 2 0 %
•Silicone G E S F -9 6 o n f ir e b ric k , a n d o n a 10 -ft. c o lu m n p a c k e d w it h 2 0 %
C a r b o w a x 10 0 0 o n 4 2 /6 0 fire b ric k .

4-VINYLCYCL01IEXE1NE POLYMERIZATION 1613
Nuclear magnetic resonance (NMR) spectra were obtained with a Varian DP-60 nuclear magnetic resonance spectrometer at a frequency of56.4 Mcycles with carbon tetrachloride as solvent. Melting point determinations of monomeric compounds were carried out in open capillary tubes in a Thomas-Hoover melting point apparatus. The polymer melt temperatures were determined by means of a Kofler micro hot stage. The polymer melt temperature is defined as the lowest temperature at which a wet streak is left on the hot stage upon pressing a sample of polymer with a spatula. Intrinsic viscosities were calculated from efflux times of solutions through a Cannon-Ubbelohde semimicro dilution viscometer set in a 25 °C. constant temperature bath. X-ray diffraction spectra were obtained with a Norelco x-ray diffractometer Model 12045 and a proportional counter. Elemental analyses were performed by Galbraith Laboratories, Knoxville, Tennessee.
Source and Purification of Materials
4-Vinylcyclohexene was obtained from Cities Service Research and Development Company. This material was dried for 48 hr. over anhydrous magnesium sulfate and then distilled immediately before use. It was shown to be pure by comparison of its boiling point, infrared spectrum, and refractive index data with literature values. Further criteria of purity were obtained by the fact that only one peak was obtained on the gas chromatographic columns previously referred to.
Tetrahydrofuran was obtained from Fisher Scientific Company. It was dried over sodium ribbon and then distilled. Allyl bromide and titanium tetrachloride were obtained from Peninsular ChemResearch, Inc. The allyl bromide was distilled before use, and the titanium tetrachloride was used as received. w-Butyllithium was obtained from Foote Mineral Company and used as received. Boron trifluoride (gas) was obtained from The Matheson Company and used as received. Triisobutylaluminum and triethylaluminum were obtained from Ethyl Corporation and used as received. Nitrogen used as a sweep gas in the polymerization experiments was Airco prepurified grade containing less than 20 ppm of oxygen.
Polymerization of 4-Vinylcyclohexene
Cationic Initiation
Boron Trifluoride-Diethyl Etherate Initiation. Into a 50-ml. sample bottle was placed 10.8 g. (0.1 mole) of 4-vinylcyclohexene and 3 ml. of CH2C12. The bottle was immersed in a Dry Ice-acetone bath and dry nitrogen gas emitted over the solution. After 30 min. at this temperature the vessel was sealed with a serum cap and 1 g. (7 mmole) of boron trifluoride etherate was injected into the solution by means of a hypodermic syringe. The bottle was then removed from the bath and placed in a refrigerator (0°C.) for 28 days. The contents of the vessel were poured into 200 ml. of methanol, and the polymer which precipitated was removed

1614 G. B. BUTLER AND M. L. MILES
by filtration and dried in a vacuum oven. This material was taken up in 15 ml. of cold dichloromethane and then precipitated by pouring this solution into 200 ml. of acetone. The polymer was collected and vacuum- dried at 60°C.; yield, 3.8 g. (35%); polymer melt temperature, 108°C.; intrinsic viscosity, 0.03 dl./g. (in chloroform). The infrared spectrum of this polymer revealed absorption bands as follows: 2930 cm.-1(C—H), 1630 cm.-TC- C), 990 « m r ^ S ^ H * ) , 910 c m .-H C H ^ H ^ 6 The NMR spectrum shows an sp2:sp3 hydrogen ratio of 1:28 (80% cyclization).
Anal . Calcd. for C8H12: C, 88.82%; H, 11.38%. Found: C, 84.50%; H, 10.43.
Boron Trifluoride Initiation. Into a three-necked 100-ml. flask equipped with a stirrer, reflux condenser connected to a mercury bubbler, and nitrogen inlet, was placed 9.0 g. (83 mmole) of 4-vin.ylcyclohexene and 10 ml. of dry spectrograde dichloromethane. The reaction vessel was immersed in a Dry Ice-acetone bath, and dry nitrogen was emitted over the solution. The solution was stirred for 30 min. at — 70°C., and then the nitrogen flow was stopped, and gaseous boron trifluoride was emitted over the solution. The reaction flask was sealed off. After a reaction time of 68 hr., the flask was opened, and its contents poured into 200 ml. of methanol. The polymer which precipitated was removed by filtration and then dried for 16 hr. at room temperature/3 mm. Hg; yield, 1.8 g. (20%). This polymer was taken up in 20 ml. of chloroform, filtered, and precipitated by pouring the solution into 200 ml. of methanol; yield, 1.4 g. (79%); polymer melt temperature; 173°C.; intrinsic viscosity, 0.11 dl./g. (in chloroform). The infrared spectrum of the soluble polymer (run in chloroform solution) revealed very little unsaturation. The NMR analysis gave an integrated peak area ratio for sp2:sp3 hydrogen of 1:12 (50% cyclization).
A nal. Calcd. for CSH12: C, 88.82%; H, 11.18%. Found: C, 88.82%; H, 11.19%.
Triisobidylaluminimi-Titanium Tetrachloride Initiation
In a screw-cap vial which contained 2.2 ml. of high purity n-hexane was placed, by means of a micro hypodermic syringe, 0.12 g. (0.6 mmole) of triisobutylaluminum and 0.12 g. (0.6 mmole) of TiCR After the catalyst had aged for 20 min. at room temperature 1.3 g. (12.0 mmole) of 4-vinyl- cyclohexene was added. All of the operations were, of course, carried out under a dry nitrogen atmosphere. The mixture was shaken well and allowed to stand at room temperature for 14 days after which it was decomposed by pouring into 200 ml. of methanol. The polymer which precipitated was removed by filtration and dried for 16 hr. at 50°C./1 mm.; yield, 0.26 g. (20%). This material was placed in a Soxhlet extractor and continuously extracted with benzene for 40 hr. The extract was poured into 200 ml. of methanol, and the polymer immediately precipitated. This soluble portion was dried for 16 hr. at room temperature/1 mm.; yield, 0.12 g. (45%); polymer melt temperature, 91 °C.; intrinsic vis

4-VIN YLC YCLOl IEXENE POLYMERIZATION 1613
cosity, 0.04 dl./g. (in benzene). The infrared and NMR spectra of the soluble polymer showed it to be essentially saturated.
A n a l . Calcd. for CsH,2: C, 88.82%; H, 11.38%. Found: C, 88.71%; H, 11.10%.
The authors are indebted to Dr. Wallace S. Brey, Jr. and his associates of this department for the NMR spectra and interpretations reported in this study.
The support of this work by the National Science Foundation under NSF Grant No. 10011 is kindly acknowledged.
References1. Butler, G. B., and R. J. Angelo, J. Am. Chem. Soc., 79 3128 (1957).2. Butler, G. B., J. Polymer Sei., 48 279 (1960).3. Butler, G. B., and M. L. Miles, SPE Trans., in press (this reference contains numer
ous references).4. Butler, G. B., M. L. Miles, and W. S. Brey, Jr., J. Polymer Sci., A 3, 723 (1965).5. Bellamy, L. J., The Infra-Red Spectra of Complex Molecules, Wiley, New York,
1954.
RésuméLe 4-vinylcyclohexène est un exemple de diène-1,5 et est capable de subir une poly
mérisation cyclique. La polymérisation, donnant des polymères solubles, a été initiée par des initiateurs du type cationique et du type Ziegler. L’initiation cationique fournit 28% de conversion en polymère dont 85% était, soluble, et possédait une viscosité intrinsèque de 0.11. Des analyses infra-rouges et de résonance magnétique nucléaire démontrent que la cyclisation du monomère se produit à environ 50%. L’initiation du type Ziegler donnait une conversion en polymère de 25% dont 45% était soluble, essentiellement saturé, et ayant une viscosité intrinsèque de 0.04. Les études de diffraction des rayons-X sur ces polymères n’indiquent pas un degré de cristallinité appréciable.
Zusammenfassung4-Vinylzyklohexen ist ein Beispiel für ein 1,5-Dien und ist funktionell zur zyklisieren-
den Polymerisation geeignet. Polymerisation zu löslichen Polymeren wurde durch kationische Starter und solche vom Ziegler-Typ erreicht. Kationische Anregung führte zu einem 28% igen Umsatz zueinem zu 85% löslichen Polymeren mit einer Viskositätszahl von 0,11. Infrarot- und kernmagnetische Resonanzanalyse führte zu dem Schluss, dass zu einem Ausmass von mindestens 50% Zyklisierung des Monomeren eintrat. Ziegler-Katalyse führte bei 20% igem Umsatz zu einem zu 45% löslichen, im wesentlichen gesättigten Polymeren mit einer Viskositätszahl von 0,04. Röntgenbeugungsuntersuchungen an diesen Polymeren zeigte keinen merklichen Kristallinitätsgrad.
Received September 17, 1964 (Prod. No. 4549A)
JOURNAL OF POLYMER SCIENCE: PART A VOL. 3, PP. 1617-1630 (1965)
M e c h a n is m o f th e A n io n ic P o ly m e r iz a t io n o f M e th y l
M e th a c ry la te . IV . C a lc u la te d M o le c u la r W e ig h t
D is t r ib u t io n s R e s u l t in g f r o m a R e v e r s ib le
T e r m in a t io n b y a B im o le c u la r E x c h a n g e R e a c t io n
SONJA KRAUSE, LESTER DEFONSO, and DONALD L. GLUSKER, Research Division, Rohm & Haas Co., Spring House, Pennsylvania
Synopsis
The previous papers in this series contain the experimental results which demonstrated the complexity of the homogeneous, nonterminated, anionic polymerization of methyl methacrylate. In order to explain the observed broad molecular weight distributions, it was necessary to postulate reversible “pseudo-termination” reactions, by which a large fraction of the total anions present in the system became inactive toward further polymerization, yet had a finite probability of recovery of polymerization activity by some process, such as ligand exchange, ring opening of a cyclic complex, etc. In this paper, we have examined the quantitative consequences of a mechanism in which this pseudotermination reaction occurs by a bimolecular exchange of activity between one active and one inactive chain. I t has been possible to calculate M w/ M n, the ratio of weight- average to number-average molecular weights, as a function of the fractional conversion a, the initial monomer to initiator ratio, M 0/ l 0, the fraction of total initiator as active chains, C i / R , and the ratio of ra+e of exchange of activity to rate of propagation, k t/ k p. The major results of these calculations are: (1) any value of M w/ M n between 1 and infinity is possible at a = 1; (2) M w/ M n at a = 1 decreases as kt/k„ increases; (S) M w/ M „ at a = 1 increases as M 0/ I o increases when k t/kp and C i / I 0 are small—under some conditions M w/ M n at a = 1 increases and then decreases slightly as M 0/ l 0 increases; (4) Mw/Mn goes through a maximum during polymerization if k t ^ 0; (5) M w /M n at any a decreases as C i / I 0 increases, for constant M o /Io and k t/kv. Concentrations of individual chains of any given length as a function of time may be readily calculated for the two special cases k t/k p —*• 0 or
Introduction
The great importance of association, dissociation, and exchange equilibria of the organometallic species which are responsible for both initiation and propagation in homogeneous anionic polymerization is universally recognized. In paper I of this series,1 data were presented which demonstrated that in the homogeneous anionic polymerization of methyl methacrylate initiated by 9-fluorenyllithium, the fluorenyl group of the initiator becomes chemically attached to the polymer chain in an irreversible initiation step and that no irreversible termination processes occurred.
1617

1618 S. KRAUSE, L. DEFONSO, D. L. GLUSKER
The molecular weight distributions to be expected from a polymerization involving only initiation and propagation reactions have been extensively considered.2-4 For such a mechanism, Mw/M n at 100% conversion equals 1.0 when initiation is rapid with respect to propagation and tends to 1.33 when initiation is very slow with respect to propagation. The polymers isolated from the fhiorenyllithium-initiated polymerization, however, had Mm/M n values which were frequently greater than 10. Furthermore, although none of the chains were irreversibly terminated, a large proportion had very low molecular weights, leading to a molecular weight distribution having two peaks. Kinetic studies2'5 showed that a strictly constant first-order rate of disappearance of monomer with time persisted to very high conversion after an initial almost instantaneous conversion of three monomer units per initiator molecule. Evidence was presented in the earlier papers to show that the tacticity of polymer chains produced in these polymerizations was determined by equilibria between electron-donating species and the lithium counterion and was independent of the kinetically important processes. I t is therefore meaningful to consider the kinetics of polymerization separately from the mechanism which controls tacticity in this particular case.
The extreme deviation of the Mw/M n ratio for methyl methacrylate polymerization from the expected behavior of an anionic polymerization consisting of a single initiation and propagation reaction prompted us" to propose a mechanism which included the following assumptions: (1)initiation and the addition of the first three monomer units to each initiator molecule are extremely rapid; (2) as soon as three monomer units have been added, only a certain fraction of the anions remains active and continues to add monomer; (3) the total number of active anions in the solution never changes, and the rate of polymerization is the same whether the addition is isotactic or syndiotactic. This assumption leads to a rate of polymerization which is first order in monomer.
To these assumptions we have added, for the purpose of the present calculations, an additional postulate: %) any active chain can interactat any time with any inactive chain by a bimolecular mechanism in such a way that the active chain becomes inactive and vice versa.
Coleman and Fox6 have independently proposed a multistate mechanism for homogeneous ionic polymerization. One major difference between their proposal and ours lies in the specific mode of transfer of a given chain from an active to an inactive state. Coleman and Fox have used independent probabilities for the change, while in our hypothesis the bimolecular exchange of activity leads to a strictly constant total concentration of chains of each type. The considerable mathematical simplification introduced by this constancy leads to another major difference between the two proposals. We have been able to avoid restricting our calculations to low conversion situations, i.e., assuming constant monomer concentration, which Coleman and Fox have done.

METHYL METHACRYLATE ANIONIC POLYMERIZATION. IV 1619
Derivation of Equations
The present mechanism postulates two types of polymer chains, J andK. J chains grow by adding monomer; Iv chains do not grow, but have the ability to switch activity with a J chain.
J„ + M -*■ J (,,+i) n > 3 (1)
•J„ + Kr„ t ,Jm + K„ (2)
where J„ is a J chain of n monomer units, K m is a K chain of m monomer units, M is one monomer unit, and n,m are any integers > 3. Reactions of type (1) and (2). are preceded by an initial step, the instantaneous formation of chains having three monomer units. Thus, at t = 0, the following initial conditions exist:
J 3 = Cx
whereKz = C%
Ci + C2 — la
and U = initial concentration of initiator and M = M o = initial concentration of monomer.*
E n J n = 3Cin = 3
E m K m = 3 C2m = 3
co
E ftV , = 9Cin = 3CO
E m * K m = 9C2m — 3
Since the total number of J chains and of K chains is constant, at any time t
E Jn = C,n = 3
and
E K m = C27tl = 3
* For simplicity, we have eliminated the use of concentration brackets around the symbols 70, M, M 0, Ci, and Ci in this derivation. I t should be understood that these quantities are in standard concentration units.

‘Adj
usta
ble”
par
amet
ers
Cal
cula
ted
valu
es f
or (
Mw/
Mn)
,1620 S. KRAUSE, L. DEFONSO, D. L. GLUSKER
t<3
'ÎOHh^ ONCOOO' tNN®OliO N O OfO NN i-O ’t H H HCO 1 CO H
rH r-< O © O t ^ O r ^ Q C O ^ r H N
r-( rH rH t— I rH N N O'. li CO O'- O OC rH TjH tH
£ lOO^NOWfOi Ol f f lMNONiOHHH( M N G O O S i O C O N C O ^ O C O O ^ C O C O H H H
OlON05MNO!3C‘fl'i, n N r ! H H H H H t"- —- Tt< i—» rHC O O J H N C O 0 O 1 N
■^NOlNOCOiOCi X r - l cO 1-1 M h
40 © CO — t CH — 1 CD CO — i CO o ‘O >c r n CO Tt< 05 40 CO 05 03o CM CO 00 05 ¿6 ■05 iô co O CM o o »o «0 40 CO CO 1 CO 00 oCM CO © 40 CO CO Tti Tl*’ d CO 00 CO 00 CO CO CO © CO IO CO d 40 rHO CO 00 I- Of) CO cO 00 (M CM CM 00 CM Ttl 40 IOCO •CO t"- CM 40 05 l'- ro 04
1— 1 rH
o Oil 05 CM x- «O CO X X rf 05 r - ( on h- 05 CO CO 03 CO CO CO OGO G t- Hf rH X' co 04 CO X X X X 05 CO Tt< CM 40 t- CO
CM CO -T) id 03 X 03 IO 40 00 iO iO iO lO lO 40 CM 03 CO X 40 03 03 03CM CM CM CM CM i—i rH 4« CO CD CM rO 40 rH CM
CM 05 05 h- o 03 Hf 40 CO 05 © O CO x X © 40 CO X CM 03 © ©«3 4-0 05 I- 40 CO o 40 CO CO CO 04 :/ © O 04 4 0
£ 05 05 05 40 X 05 04 40 1— 1 03 04 l“ 1 r-l rH rH 1-1 rH X © © X rH CO
O d O d o o o d © d d o © © © o © © © d © © © © o o
w h o» W O « N ^S t'- ^ r-H rH Og © CO CM 0 5 O © CO
^ CO 0 0 > 0 O W M O
CO iO 1.0 GO O O •Î O 1-0 (M O Tff ¡O ffi H N CO h
o © o o © o
N IO 05 ® O IOlO ^ ■'i IOrH t—I >—I i“H rH l>O O O O O H
C5 O H Tjl C3 Tfl HN CO H C l N 00 C l h »O C l N H CO
CO o rH rH O O
r H r H ^ O O O O O O O O O O O O O O O© © © r H r H r H O O © © © © © © © © © ©O O O O O O r H r H r - l O O O O O O O O O
1-» rH rH © O O OO O O rH rH rH oO O O O O O 1-H
o o o o o o o o o o o o o o o o o
o’rH iO © rH iO © i—I «Î oO O rH O © <—I © CD rH
o o o o o o o o or-I >0 © rH IQ © rH IO)O O r H O O r H O O
o o o o o o o oO rH40©rH4Q©rH40 rH O O ^ O O ^ O O
o o o o o o o o o
5fO O O O O O O O O O O O O O O O O O IO IO 110 IO IO IO no IOO O O O O O O O O O O O O O O O O O o o o o o o o oC I C I C I C I C I C I C I C I C I C I C I C I C I C I C I C I C I C I c O C O c O C O C O C O C O ©

60.5
0.
10
0.10
0 0.
541
0.41
7 28
.27
200.
62
7.09
5.
09METHYL METHACRYLATE ANIONIC POLYMERIZATION. IV 1621
O C O l O O O O W N N H H ! s . G O M t ' i O Q f O ’ f N Û O O ® H H HC 5 Q O I > r - < T - i O O O O l O O i i O i O f N C O C O O m O i C C N r - t O O O O O
t— I rH rH t— I r-( rH rH i—l H !>■» GO 05 GO CD GO 05 t"» tO rH rH rH r-I rH rH rH rH rH G O rH ^ rH
tOCMCO COrH 00 o COCD1*05 CMo o to o- r- to on CMCDr- COrH oGOCM© O oc t—i r- 05 tOtOoo CM05 CDo to to r)H0 5 to COCOCOo tOd CMrH tH rH rH rH 00 05 00 05 d rh 00 00 to COCMCMrH rH rH
O rH 1> H tO rH rH
r- CM CM f'- CD CM 0 5 CO t o 00 00 r-- c m 00 H t o THCM o CD 00 CM CO CMO0 CM CO t O O 0 5 O TtHo CD t o CD 00 o o 1> rH 0 5 rH tOCD 0 5 o 0 5
CO 0 5 CO CM CM CM l> CD I- CM 00 rH t o 0 5 CO 00 00 r H d rH CO rH rH rH 00 r-CD t O t o 0 5 r- CO 00 Th 00 t o CM o CM CM CM
CO CD CD 0 5 0 5 t o CO0 5 CM rH CO
i - CD CD t O © CM >o t O © i - 0 0 CM CM CM © © © c d © © © t O CM CM0 5 t O 0 5 0 5 0 5 0 5 o o CM t o CD t o CD CO CO t o CM CM CM © T-1
CD Or H
CM t O d CD t O tO d CO©
r H 0 5 CD CO0 0
CM©
0 0r H
> oCO
f rr h
oo d oc © 1> 0 0 t O © ©
to 00 00 00 © 00 00 © r- rH © H h- co TfHto to to co rH 00 © © © ©© to to © © CM 05 CO© © © COh- © CMCMco CMCM© rH © © © © o o © © 05 CMto © rH CMCM© © rH © o © © © ©© d © © © © © © © © © © © © © © © © © © © d © © © © ©
00 © CM © GO IH © © rH © © tO to rH © © CO © 00 OC' © CM © r-' © T— ( rH© CM I> to to CD *o to to © CD I'- 05 TP CO hr © CM CM co CM CM CM© © © © © © © tO 1>* CO l> © l— 1 CM CO © © 1— 1 © © O o . © ©
© © © © © © © © © rH CM CO © © rH © © © © © © © © © © © ©
o o o o o o o oo o o o o o o oo o o o o o o oT-Hr-HrHOOOOOOOOOOOOOOOO O O r - i r H r H O O O O O O O O O O O OO O O O O O i- H i- i t -h O O O O O O O O O
O O O O O O O O O i— < tH j— ( O O O O O Or-I T-H rH o O O
© t o © r H t o © r H t o © LO © t o © rH tO © r H to © t o ©© © © © © © © © © o © © ’rH © © 7-1© © r H © o 'rH© © © © © © © © © © © © © © © © © © © © © © © © © © ©
iCKJiiiiOiOiOiOiOiOO O O O O O O O OCD C D CO CO CO < 0 CO C O CD
o o o o o o o o o o o o o o o o o oO O O O O O O O O O O O O O O O O Oloioioioioioioioioioioioioioioioioto
(con
tinue
d)

1622 S. KRAUSE, L. DEFONSO, D. L. GLUSKER
aP3<¡H
Ijâ
lÿ
O
jao3
T3<1
J 3O 0 0 LO RO r H r H nO h - LO co O c s OCO O O O CO O R - CO OS OO H - O O O O O
COO O O CO COO LO i r - ! r - l ,-4 i— i r —(' o ■JJ r-H T f i— i
' â
X
- 7 O O CO 00 ; CO CM fY"\ GO LO / LO 0 0 O 0 0 COi-O LO c O CM rH CO rH CM C 0 Ci r H Os rH r H (XJ r H CO CO
CM ai O 0 0 O lO LO 0 0 © ai r H CO (N T_i
1^2° G0 LO CM
X h - LO r H LO 0 CS CM CO C 0 CO LO LO O OC' Od CO U -2 CO ( N CO GM rH t - C i O CM J J (XJ CO rH CO t — rH LO CO
" O ; O CO LO CO O N » CO r H O LO CO CO CO 0 0 o c GOLO CO, rH CM CO I > CM CO LO CM CM CM CM
CO rH CO rH- 0 0 i co rH —H1 CO rH rH rH rH t-H
CO 0 0 r H î > r H t> .
^ 0 5 N N S
NOOO»OONN^iO
CO h- 00 00 O O O CO rH CS co co rH LOGO LO LO X Ci CS co co CO J) CMCO jco CO CS GMrH COO t-H CMO O O O © © © © ©
O O O O O O O O O O O O © © © © © ©
— ( rH h - 03 0 0 0 0 LO T-H CO CM r H H - r H CM LO ©LO 0 0 0 0 03 CO rH © CO co C S CM r c© T-H CM © 03 © CM CO O © © © © © © © ©
O O q C O O O O O O O O O O O O O O O O
— i i - H r H O O O O O O O O O O O O O O O0 0 0 - — ( r H t - H O O O O O O O O O O O O0 0 0 0 0 0 1 — I t- H t-h O O O O O O O O O
O O O O O
o o o o o o o o o o o o o o o o o o
o o o o o o o o o o o o o o o o o o o o o o o o o o o o o o o o o o o o

500.
0 0.
01
0.00
1 0.
600
0.45
1 22
8.59
21
841.
13
95.5
5 89
.93
METHYL METHACRYLATE ANIONIC POLYMERIZATION. IV 1623
OOr-)TfiCOaStO’THl>C5rHCïOCriT-<T-<1-H^ C O O Ü Û O Q O N ’ Î C R O O O O O O O O O O
0 ! © 0 > 0 3 î O N iO h h h h h h h h h
- ' c H C M O c O C 2 0 t - - O c O O O ' ' t f < M I > ! > 0 2 1- i C Ml O O O O î C C i C f O C O O i H H H H ^ O X C O t ' '
HOJNOCCiCOcOOO^NNXiC^HHH 02 CO i-. CO rH M r -
O O CO h- O lO T—i 02 co or 00 H LO COCO i> 10 O CO CMCM 0 5 O o o- LOCO I- oCO rH C5 CO i—i r-H co I- CO CO rfl O t-H CMO CO CO O 00 02 O CMuo CM*o lO oCO CMex: CO i— ! 00 CMCMi^ co CMCM H
O t H CM 0 0 CM CM b - LO t—1 CO LO 0 0 LO r-H 0 2 - 0 2 or0 2 CO LO h c q r H CM LO CO 0 2 0 2 r*! 0 2 0 2
NCOGONMCOcOOiHNM r-<CO ^ h N
i— 1 LO c o t H ■ 00 o r CM 0 0 T— ( h - 1- c o o c LO CO r -LO W rt< TtH LO O ) 0 0 » o o o o oo o t-H O r™i o o o o o o o o o
O o O O O o O O o o o o o o o o o
^eOON«50CONON©OO^Q«OMX)lOCOONOcOfOOH^iOOHHOOQC O C 2 r - c " c t < L O O i - ( C M O O O O O O O O O
1 - i r - i O O O O O O O O O O O O O O O
r - Î T - ^ O O O O O O O O O O O O O O O O O i— < i— > •— l O O O O O O O O O O O O O O O O O ^ t r ^ ^ O O O O O O O O OO O O O O O O O 1-1 1-1 h O O O O O o
i—i i—i r—( O O o
l O O ^ ^ O O r H l O O r - ( l O O » — f ^ O O r — I l O O O ’- l O O r M O O r - l O O ' — l O O r H O O ' — I
o o o o o o o o o o o o o o o o o
OOOlO
O O O O OO O O O OO O O O OlO lO lO »O IQ
O O O O OO O O O OO O O O OiO io >o io >o
O O O O OO O O O OO O O O OLO i O t o I O 4 0
O©OIO

1624 S. KRAUSE, L. DEFONSO, D. L. GLUSKER
The number-average degree of polymerization is given by
X* = ( E nJn + E mK ,„)/( E J„, + E iCB) =n = 3 m = 3 n ~ 3 m — 3
CO CO
( E n/» + E mKm)/{h) (3)7 / 1 = 3 ?? — 3
and the weight-average degree of polymerization by03 00 CO CO
= ( E + E E nJn + E (4)n = 3 m — 3 ?i — 3 m = 3
The corresponding molecular weight averages are found by multiplying the degree of polymerization by the molecular weight of the monomer. In order to calculate X n and X w as a function of time, t, we must solvethe following differential equations:
d Y ^ n J J d t = — k p M ^ n J n + kPM J 2 ( n + 1)«/» —
k t( Z n J n) ( Y , K m) + k , ( Z m K m) ( Z J n )
= kpMCi - ktC,EnJ„ + (5)
dYj'mKJdt = k(C2J2nJn — ktCiJ/mKm (6)
dZnV n/d t = 2kpM Z n J n + M ^ E ^ - C2fc J > 2J„ + Cxk ^ K m (7)
dV,vi-Km/dt = CJctY.nMn - CJc/52m2K m (8)
-d M /d t = kpMY.J'% = (9)
Equation (9) may be integrated directly to give
71/ = il/oe“ ^ 1' (10)
Summing eqs. (5) and (6), substituting eq. (10) for M, and integrating between limits t — 0 and t, we obtain
EnJn + Y,mKm = 31o + i l / o ( l - e~s) (1 1 )
where 6 = Substituting eq. (11) into eq. (5) and collecting terms,we obtain a standard first-order linear differential equation whose solution is
Z n J n = 3/0 + il/0(l ~ e ~s ) - 3C«Thl*/* +
C*(3 + Afo//0) (<TW/Cl - 1) -
[MohCz/Qih - C i ) ] (e ~ Wo*/Cl - e ~ 9) ( 1 2 )
h = kt/k p
hi 0d/ Ci = kjat
where

METHYL METHACRYLATE ANIONIC POLYMERIZATION. IV 1625
Adding eqs. (7) and (8) and combining with eqs. (10) and (12) and integrating gives
Z n 2J n + = 9/„ + Mo [2(3 + Mo//o) + 1] X
(1 - e~e) + M02(l - h)( 1 - e~2e)/(hIo - C\) +2Mo2CiC'2[e“ [(*Ae/Ci)/(Ci) - »] _ i ]//0[(w0)2 _ Ci2] (13)
then
Î , = eq. ( l l ) / /0 = 3 + (Mo//o) (1 - e~e) (14)
X w = eq. (13)/eq. (11) (15)
and
X J X n = eq. (13)/70 (16)
In order to evaluate the concentrations of individual chains at any time t, one must solve each of the differential equations of the form
dJt/dt = - k pJ 3M - ktJ 3Ci + kiKzCi (17)
dJJd t = k J v - iM - lcPJ nM - ktJnCi + ktK nCi n > 4 (18)
dK Jd t = ktJmC, - k,KjCi m > 4 (19)
This process is laborious in the extreme; however, for two limiting cases simple closed form solutions are possible:
For h = K ,/K p ~> 0
K t = C2 K n = 0
J n = Ci(M0/Ci)n~3 (1 - e~e)n~s Xg _ e-»)/c,]^M _ 3), for m > 4 (20)
For h —» co
J n = Ci(M0)”_3 (1 - e“0)K"3 e_[M(1 “ e"6)1/(ii - 3 ) ! n > 3 (21)
= C2(M0)“ - 3 (1 - e“ s)m~3 e“ [M{1 " e_8)1/(m - 3 ) \ m > 3 (22)Calculations of X w/ X n were made for a large number of cases. These
were programmed for a Bendix G15D computer. Calculation of the individual chain concentrations at any time is much more laborious and we include no cases here.
Results and Discussion
The equations for the molecular weight averages and the ratio Mw/M n include three adjustable parameters, M0/I 0, which is actually an experimentally established quantity; C i//0 which can vary only between 0 and 1;
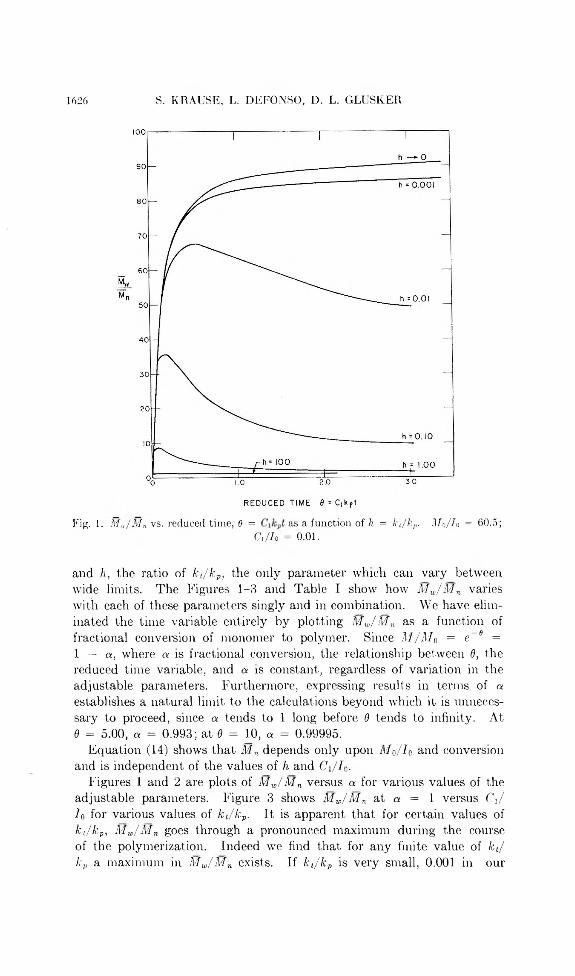
1626 S. KRAUSE, L. DEFONSO, D. L. GLUSKER
Fig. 1. M w/M n vs. reduced time, 6 = as a function of h = ki/k,,. M q/ I o = 60.5;CJh = 0.01.
and h, the ratio of kt/k P, the only parameter which can vary between wide limits. The Figures 1-3 and Table I show how Mm/M n varies with each of these parameters singly and in combination. We have eliminated the time variable entirely by plotting Mw/M n as a function of fractional conversion of monomer to polymer. Since M /M a = e~6 = 1 — a, where a is fractional conversion, the relationship between 6, the reduced time variable, and a is constant, regardless of variation in the adjustable parameters. Furthermore, expressing results in terms of a establishes a natural limit to the calculations beyond which it is unnecessary to proceed, since a tends to 1 long before 6 tends to infinity. At 6 = 5.00, a = 0.993; at d = 10, a = 0.99995.
Equation (14) shows that Mn depends only upon Mo//0 and conversion and is independent of the values of h and Ci/IB.
Figures 1 and 2 are plots of Mw/M n versus a for various values of the adjustable parameters. Figure 3 shows Mw/M n at a = 1 versus Ci/ Io for various values of kt/k p. I t is apparent that for certain values of kt/k p, Mw/M n goes through a pronounced maximum during the course of the polymerization. Indeed we find that for any finite value of fc(/ kp a maximum in Mm/M n exists. If kt/k p is very small, 0.001 in our

METHYL METHACRYLATE ANIONIC POLYMERIZATION. IV 1627
Fig. 2. M „./M n vs. reduced time, 6 = Cik„t as a function of C i/h- Mo/Io = 20.0;h = k,/k„ = 0.10.
calculations, then the maximum comes at very high conversions and is not very pronounced. At intermediate values of kt/k v the maximum may be more than double the final value of Mw/M n. At any given M0/ I0 and Ci/Io the conversion at the maximum Mw/M r decreases as k j kp increases. At any given kt/k p and Mo/I 0 the conversion at the maximum Mw/M n increases as Ci/I0 increases. In Table I we have compiled the values of conversion at which the given maximum Mw/M n occurs, the value of this maximum, and that of Mw/M n when a approaches 1. If kt/kP = 0, no maximum occurs, and Mw/M n increases continuously with conversion.
It may be noted from Table I that Mw/M n at a ~ 1 increases as M0/ 7o increases in most cases, decreases as k t/ k v increases, but does not necessarily tend to 1.0 as [M] —> 0. At first, glance, this conclusion differs from that of Fox and Coleman6; however, it should be remembered that their stated conclusion that Mw/M n —> 1.0 as M —> 0 was for constant monomer concentration, and in that sense is in agreement with our conclusion that the Mw/M n generally increases as M0/I 0 increases. Actually, Mw/

1628 S. KRAUSE, L. DEFONSO, D. L. GLUSKER
!oFig. 3. M JM „ at a = 1 vs. C i/h as a function of h = kt/k p. M o/h = 60.5.
M n at a = 1 may reach a maximum at some value of (M0//o). This value of M0/7o can be expressed as a function of Ci/Io and h.
(Mo//o)m« = 3/(7 - 6a) (2.3)where
a = 2 + /„(l - /tVCiK/i/o/CO - 1] - 2(72/C1[(W„/C1)2 - 1] (24)
(A/0//o) max does not exist for all values of A and Ci//». When h = 100 and Ci/Zo = 0.01 for example, (M0//o)max = 3.189, but when h = 0.001 and Ci/Jo = 0.01, (M0//o)max calculated from eq. (24) is negative and, therefore, does not exist. Another conclusion of Fox and Coleman which apparently differs from our own, that Mw/M n tends to 1.0 as t tends to infinity, was actually circumscribed by their assumption of fixed M, whereas we have allowed M to disappear by polymerization.
The assumptions in our present treatment of the fluorenyllithium- initiated polymerization of methyl methacrylate might be considered a

METHYL METHACRYLATE ANIONIC POLYMERIZATION. IV 1629
special case of the Coleman and Fox theory: that special case in which the independent probabilities for transfer from one state to another were equal, and in which the rate of polymerization in one of the states was 0. However, Coleman and Fox did not carry through the calculations in which M is allowed to decrease with time through the polymerization reaction, and were therefore not able to obtain all the conclusions shown in the present paper.
It should be reemphasized that our suggestion for a bimolecular exchange reaction was made on mathematical grounds as a simple way to obtain the exactly constant fraction of active chains demanded by the kinetics of the polymerization. If the difference in activity of the two states postulated here is considered to be the result of differing distributions of ligand about the counterions, it is apparent that, in reality, a number of states of differing activity may exist.
A specific example in which at least three states of differing activity have been demonstrated is that of the polymerization of styrene by butyl- lithium in the presence of tetrahydrofuran (THF).7 The species containing no THF or two THF’s per lithium are very inactive relative to that containing a 1:1 complex at the chain end.
Although we have no direct evidence that only two states exist and that bimolecular exchange actually takes place, this simple hypothesis has proved to be capable of many predictions which are consistent with available experimental data, and several which are susceptible to direct experimental test. The most straightforward experiment to check the predictions presented in this paper will be a search for a pronounced maximum in Mw/M n as a function of conversion under certain experimental conditions.
We have also carried through the calculations for a more complicated mechanism based on the experimental observation that the probability that an active chain becomes inactive apparently drops when the chain reaches a length of 8-10 units. This mechanism involved four states of differing activity with independent probabilities for transfer from one state to another. The maximum Mm/M n derivable from this mechanism was 5.6, which was clearly too small to merit further consideration, since experimental ratios are much greater, up to 55. The bimolecular exchange mechanism presented in this paper not only leads to any desired Mw/M n ratio, but also predicts bimodal molecular weight distributions for certain values of C i / /0 and k t/ k p.
References1. Glusker, D. L., E. Stiles, and B. Yoncoskie, J. Polymer Set., 49, 297 (1961).2. Glusker, D. L., I. Lysloff, and E. Stiles, J . Polymer Sci., 49, 315 (1961).3. Gold, L., J. Chem. Phys., 28, 91 (1958).4. Nanda, V. S., and R. K. Jain, J. Chem. Phys., 39, 1363 (1963).5. Glusker, D. L., R. A. Galluccio, and R. A. Evans, J. Am. Chem. Soc., 86,187 (1964).6. Coleman, B. D., and T. G. Fox, J. Am. Chem. Soc., 85, 1241 (1963).7. Bywater, S., and D. J. Worsfold, Can. J . Chem., 40, 1564 (1962).

1630 S. KRAUSE, L. DEFONSO, D. L. GLUS K ER
RésuméLes publications précédentes de cette série contiennent les résultats expérimentaux,
qui démontrent la complexité de la polymérisation anionique homogène “sans terminaison” du méthacrylate de méthyle. En vue d'expliquer les larges distributions des poids moléculaires observées, il a été nécessaire de postuler l’intervention de réactions réversibles de “pseudo-terminaison” au cours desquelles une grande partie de l’ensemble des anions présents dans le système devient inactive vis-à-vis d ’une polymérisation ultérieure, bien qu’une probabilité déterminée de réobtention d ’une certaine activité de polymérisation par des processus tels que l’échange de liants, l’ouverture de cycle par l’intervention d’un complexe cyclique etc. puisse également se présenter. Dans la présente publication, nous avons examiné les conséquences quantitatives d’un mécanisme au cours duquel cette réaction de pseudo-terminaison a lieu du fait d ’un échange bimoléculaire de l’activité entre une chaîne active et une chaîne inactive. Il a été possible de calculer Mw/M n, rapport du poids moléculaire moyen en poids au poids moléculaire moyen en nombre, en fonction du degré de conversion alpha, du rapport initial en monomère et en initiateur, Mo/Ia, de la fraction d’initiateur total en tant que chaînes actives C i/h et du rapport de la vitesse d’échange de l’activité à la vitesse de propagation ki/kp. Les résultats principaux de ces calculs sont (1) toute valeur de Mw/M„ comprise entre 1 et l’infini est possible pour alpha = 1; (2) Mw/AIn pour a = 1 décroît quand kt'.kp augmente; (3) M„/Mn pour a = 1 augmente quand Ma/I 0 augmente si k,:kp et C i/h sont petits—sous certaines conditions Mw/M„ pour a = 1 augmente et puis décroît faiblement quand M0/ / 0 augmente; (4) Mw/M n passe par un maximum au cours de la polymérisation si kt = 0; (5) M„/Mn pour n ’importe quelle valeur de a décroît quand Ci/I0 augmente pour des valeurs constante de M a/h et de k,/kp. Les concentrations en chaînes individuelles de n’importe quelle longueur donnée en fonction du temps peuvent être facilement calculées pour les deux cas spéciaux où k,/kp tend vers zéro ou bien vers l’infini.
ZusammenfassungDie früheren Mitteilungen in dieser Reihe enthalten experimentelle Ergebnisse, welche
den komplexen Charakter der homogenen “abbruchsfreien” anionischen Polymerisation von Methylmethacrylat zeigen. Zur Erlärung der beobachteten breiten Molekulargewichtsverteilung war die Annahme von reversiblen “Pseudoabbruchs”-Reaktionen notwendig, durch welche ein grosser Bruchteil des gesamten, im System vorhandenen Anions für weitere Polymerisation inaktiv wurde, jedoch eine endliche Wahrscheinlichkeit zur Wiedergewinnung der Polymerisationsaktivität durch gewisse Prozesse, wie Ligandenaustausch, Ringöffnung eines zyklischen Komplexes etc. besass. In der vorliegenden Mitteilung werden die quantitativen Folgerungen aus einem Mechanismus überprüft, bei welchem diese Pseudoabbruchsreaktion in einem bimolekularen Aktivitätsaustausch zwischen einer aktiven und einer inaktiven Kette besteht. Mw/M n, das Verhältnis des Gewdchtsmittels zum Zahlenmittel des Molekulargewichts, konnte als Funktion des Umsatzes a, des Anfangsverhältnisses des Monomeren zum Starter, Mo/Io, des Bruchteils des als aktive Ketten vorhandenen gesamten Starters, Ci/L>, und des Verhältnisses der Aktivitätsaustauschgeschwindigkeit zur Wachstumsgeschwindigkeit kt/kp berechnet werden. Die Hauptergebnisse dieser Berechnung sind : (1) Bei a = 1 ist jeder Wert für Mw/M n zwischen 1 und unendlich möglich; (2) Mw/M n bei a = 1 nimmt mit steigendem JL/fc,, ab; (3) Bei kleinem k,/kp und Ci/Co nimmt Mw/M„ bei a = 1 bei steigendem M0/ I 0 zu; unter gewissen Bedingungen nimmt M w/M n bei a = 1 bei steigendem M a/h zu und dann schwach ab; (4) Bei k, = 0 geht Mw/M n im Verlauf der Polymerisation durch ein Maximum; (5) M,0/M n nimmt für beliebiges a bei konstantem Mo/Io und kt/kp mit steigendem Ci/Ia ab. Die Konzentration individueller Ketten von beliebiger Länge kann als Funktion der Zeit für die beiden speziellen Fälle kt/kp —* 0 oder unendlich leicht berechnet werden.
Received September 11, 1964 Revised October 29, 1964 (Prod. No. 4547A)

JOURNAL OF POLYMER SCIENCE: PAR T A VOL. 3, PP. 1631-1640 (1965)
G la s s T e m p e r a t u r e s o f M ix tu re s o f
C o m p a t ib le P o ly m e r s
SONJA KRAUSE and NICHOLAS ROMAN, Research Division, Rohm & Haas Company, Spring House, Pennsylvania
SynopsisDilatometrie glass transition temperatures were measured on mixtures of isotaotic
and syndiotact.ic poly(methyl methacrylate) and on mixtures of poly(isopropyl acrylate) with poly(isopropyl methacrylate). The glass temperatures of copolymers of isopropyl acrylate with isopropyl methacrylate fall on the same glass temperature versus composition curve as those of the homopolymer mixtures. The data are compared with theoretical predictions of Fox, Gordon and Taylor, and Kanig. None of these treatments can adequately explain the results.
INTRODUCTIONTheoretical expressions which relate the glass transition temperatures of
polymer-solvent mixtures to the composition of the mixtures generally involve not only the glass transition temperature of the pure polymer, but also a glass transition temperature for the solvent.1- 3 Most solvents, however, crystallize so readily on cooling that no glass is ever formed, and thus no glass transition temperature can be measured. It therefore seemed of interest to investigate the variation of glass temperature with composition in some polymer-polymer solutions, where glass transitions can be observed in both pure components.
Most polymer-polymer systems do not form solutions over the whole composition range because the very small entropy of mixing of these large molecules generally is not enough to outweigh even a very small positive,i.e., unfavorable, heat of mixing. We therefore report on only two compatible systems, especially since we considered it desirable to work with homopolymers whose glass transition temperatures were at least 75°C. apart. Some low conversion “random” copolymers of one of these systems were studied in order to find out whether the presence of two different monomer units in the same molecule caused similar or different effects than they did when present in different molecules.
EXPERIMENTAL
PolymersThe syndiotactic poly (methyl methacrylate) was prepared by anionic
polymerization in liquid NH3 at — 70°C. with the use of a mixture of sodium and lithium amides as initiator.4 The polymer had the x-ray
1631

1632 S. KRAUSE AND TV. ROMAN
diffraction pattern of syndio tactic poly (methyl methacrylate).5 Its number-average molecular weight M„ was 9.52 X 10⁴, well above the value at which glass transition temperatures cease to vary with molecular weight. This value is probably about 4 X 10⁴. Fox and Flory,6 working with polystyrene fractions, found that Tg stops increasing at a value of M„ between 2.2 X 10⁴ and 8.5 X 10⁴, while Ueberreiter and Kanig,7 working with fractions of the same polymer, found that the limiting Tg was reached at Mn = 4.1 X 10⁴. They also found that the glass temperatures of mixtures of these fractions depended only on the M n of the mixtures, i.e., not on the molecular weight distributions. In the case of poly(methyl methacrylate), Beevers and White8 found that the limiting Tg was reached when Mn was between 3.8 X 10⁴ and 7.2 X 10⁴. For polyacrylonitrile, they9 found the limiting Tg between M n = 1.8 X 10⁴ and 6.6 X 10⁴.
The isotactic poly (methyl methacrylate) was prepared by anionic polymerization in toluene at 0°C. with phenylmagnesium bromide etherate as initiator.10 The sample had the x-ray diffraction pattern of isotactic poly (methyl methacrylate)11 [the assignments of isotactic and syndiotactic configurations to the different stereo forms of poly(methyl methacrylate) were reversed in reference 8] and a J value of 32.10 ./ values are a tacticity index based on the infrared spectrum of poly (methyl methacrylate). J values between 25 and 35 c.enote isotactic samples, the lowest J values denoting the highest degree of isotacticity. The number-average molecular weight of this sample was 2.97 X 10⁴. This sample, therefore, may not have exhibited the highest possible glass transition temperature of an isotactic sample.
Poly(isopropyl acrylate) was prepared from a 35% by weight solution of monomer in methyl propionate at 44.1°C. The azobisisobutyronitrile- initiated polymerization was taken to 30% conversion. The polymer had ff , = 1.28 X 10⁶.
Two samples of poly(isopropyl methacrylate) were prepared, both at 44.1°C., azobisisobutyronitrile (AIBX) being used as the initiator. Sample I was prepared from 42% by weight solution of monomer in benzene, taken to 7% conversion. Sample II was prepared from a 22% by weight monomer solution in methyl propionate, taken to 20% conversion. M n of sample I was 3.30 X 10“; that of sample II was 1.53 X 10“.
Three copolymers of isopropyl acrylate and isopropyl methacrylate were
TABLE IPolymerization Data for Isopropyl Acrylate (IPA)-
Isopropyl Methacrylate (IPMA) Copolymers
Copolymersample
Composition of polymerization mixture, wt.-%
Conversion,
%IPA,
mole-%M n X 10“5IPA IPMA
v-Xylene C6Hfi
Cl 8 10 78 4 5 30.8 2.85C2 12 6 75 7 10 50.0 1.22C3 15 3 75 7 6 73.7 0.845

GLASS TEMPERATURES 1633
prepared at 60°C. with AIBN as initiator in p-xylene solution. Small amounts of benzene were added to the solutions of monomer in p-xylene to serve as an internal standard for gas chromatography. Gas chromatography was used to follow the course of the copolymerizations and, thereby, to give data from which the average compositions of the copolymer samples could be calculated. Table I gives the polymerization data for these copolymer samples. The column giving mole per cent IPA refers to the composition of the copolymer as calculated from the gas chromatography data obtained during the polymei’ization. All values of M n were obtained frcm osmotic pressure measurements.
Preparation of Polymer Mixtures
Mixtures of polymers for dilatometric studies were prepared by mixing chloroform solutions of the two polymers and then evaporating the chloroform as slowly as possible. Chloroform solutions containing 5% of the mixed polymers of molecular weight >106 showed no signs of phase separation after several days at room temperature. When the chloroform was evaporated quickly from solutions containing mixtures of poly(iso- propyl acrylate) with poly (isopropyl methacrylate), the resulting films looked turbid; when the chloroform was evaporated slowly, the resulting films were usually clear.
DilatometryMercury was used as the containing liquid in dilatometers whose capil
laries had 2 mm. diameter in all cases. After a polymer film was placed in a dilatometer and the dilatometer was sealed off, residual chloroform was removed by heating the dilatometer under vacuum at the temperature at which the sharp edges of the film began to flow (usually 30-50°C. above the glass temperature) for at least 8 hr. The mercury was then added at room temperature, and the dilatometer bulb was heated again to the “degassing” temperature so that the mercury could fill all the voids in the sample. The dilatometric runs were generally made starting at the low temperatures, using 5°C. temperature intervals below room temperature and 10°C. temperature intervals above room temperature, each temperature being held for a time sufficient to establish a height of mercury in the capillary which did not change in a 10-min. period (this means that the temperature was changed approximately every half hour). Most polymer mixtures were run several times in order to find out whether the data would appear different as the sample history changed.
RESULTS
Poly (methyl Methacrylate) Mixtures
Figure 1 shows a typical volume-temperature plot for one of the mixtures of iso tactic with syndio tactic poly (methyl methacrylate). Although drawing four straight lines instead of a curve through these points smacks of overinterpretation of the data, we emphasize that approximately the

1 6 3 4 S. KRAUSE AND N.
a g £
o'tS<L>.aX
o o o oo : O CO
t-H r— < C 'l
o o o o+3 +J3 ■+_. -+JiO iO o >oCO CO CO CO
t i l l
o
X lO CD Q CD N CD
X GO N CO CD
Tft TjH Ti<
j3
03XJ
HH ”5 HH (1)W 1 ffl o< 3 PL, E“1 <+H
XoÖo
X"oÖ
h i M O ^
© rH 1-*
oO
£
oo
Öo<s
E~i
S*
iO O lO 1-0 Tt »O i-O lO
XI szri ö
ROMAN
50.7
75
10
14
9 0.
9 1.
5 4.
6 7.
0 -3
0 to
190
“ (r
erun
) 73
20
14
0 1.
0 1.
6 4.
8 6.
0 -3
5 to
220
74.9
88
5
160
1.0
1.7
4.6
6.3
-30
to 20
0“
(rer
un)
88
16
140
1.3
2.1
5.0
5.4
-35
to 20
079
.4
94
30
159
1.1
1.8
4.6
6.5
-35
to 21
0

G L A S S T E M P E R A T U R E S 1635
Fig. 1. Volume-temperature plot of a mixture of 79.6% by weight syndiotactic poly- (methyl methacrylate) with 21.6% by weight isotactic polyfmethyl methacrylate).
same straight lines were drawn by both of us; furthermore, both of us obtained the same glass transition temperature from the plots. Most of the mixtures showed three transitions, although the two mixtures containing the least percentages of syndiotactic polymer did not exhibit the low temperature transition. The transition which fell between the glass temperatures of the homopolymers was chosen as the glass transition temperature of the mixture both because it was invariant with sample history, i.e., it did not change when a sample was rerun, and because the largest change in volume expansion coefficient occurred during this transition. Numerical results for the mixtures are shown in Table II. The meaning of T i, T2, kg', and a i/ is the same as that indicated in Figure 1.
Isopropyl Acrylate-Isopropyl Methacrylate Homopolymer Mixtures and Copolymers
Most of the poly (isopropyl aerylate)-poly (isopropyl methacrylate) mixtures showed only a single break in the volume-temperature plots. Four of the mixtures, as can be seen from the footnotes in Table III, however, showed a high temperature transition. One of the poly (isopropyl methacrylate) samples, on the other hand, exhibited a low temperature transition. Data for these mixtures and copolymers are shown in Table III.
The glass transition temperature of sample I of poly (isopropyl methacrylate) could not be determined until the second rerun of the sample. The volume-temperature plots in the first two runs were quite curved. Sample II, which had a lower molecular weight than sample I, showed much greater reproducibility in its volume-temperature plots, both in mixtures and when run alone. All data reported on mixtures made up with sample I are from reruns.

1636 S. KRAUSE AND N. ROMAN
TABLE IIITransition Temperatures of PIPA-PIPM A Mixtures and Copolymers
PIPMAsample
PIPMA,wt.-%
T1 gì°c.
O t-G
X 104O iL
X 104
Temperaturerange
over which data
obtained, °C.
0 - 5Mixtures
2.8 6.9 80II 12.2 - 2 3.4 6.7 160II 30.2» 15 3.0 6.4 160II “ (rerun)1’ 15 3.0 6.4 160I 49.8 25 2.7 6.8 140
II 49.9“ 25 2.7 6.7 160I 70.3 41 2.6 6.6 140
II 71.0d 39 2.6 6.7 - 3 5 to 160II 84.8 54 2.6 7.4 160I 85.4 53 2.4 6.5 140I 89.6 61 2.5 6.9 140
II 90.6 60 2.4 6.8 160I 94.8 65 2.5 7.0 140I “ (rerun) 68 2.2 7.0 140I 100° 83 2.5 6.6 140
II 100 78 2.1 6.7 (l60
C lf 28.6 10Copolymers
2.3 6.9 A ioC2f 52.9 24 2.5 6.6 — 35 to 130C3f 71.7 41 2.3 6.5 120
a t 2 = 116°C. ah' = 7.6 X 10“4. b T2 = 110°C. «l ' = 7.5 X 1e r 4, o T2 = 110°C. ah ' = 7.5 X 10~4. d T, = 113°C. ah' = 7.5 X 10“4. e 1\ = 11°C. «g' = 1.8 X 10~4 ! Copolymer sample number from Table I.
DISCUSSION
F ig u r e s 2 a n d 3 sh o w g la s s t r a n s i t io n t e m p e r a tu r e s v e r s u s c o m p o s it io n b y w e ig h t o f th e p o ly ( m e th y l m e t h a c r y la t e ) m ix tu r e s a n d th e is o p ro p y l a c r y la t e - is o p r o p y l m e t h a c r y la t e c o p o ly m e r a n d h o m o p o ly m e r m ix tu r e s . I n a d d it io n to th e e x p e r im e n t a l d a t a , F ig u r e 2 sh o w s a d a s h e d l in e , w h ic h is s im p ly th e s t r a ig h t l in e b e tw e e n th e g la s s t r a n s i t io n t e m p e r a tu r e s o f th e h o m o p o ly m e rs , a n d a so lid l in e , w h ic h r e p r e s e n t s th e G o rd o n -T a y lo r e q u a t io n :2
^ _ W \ T pa( o:la — ®ga) + W b T 0b ((Xl b ~ acm ) ^
w a ( « la — « ga) + Wb ( « lb ~ <*gb)
w h ic h w a s d e r iv e d fo r c o p o ly m e rs r a t h e r t h a n p o ly m e r m ix tu r e s . I n th is e q u a t io n , T „ is t h e g la s s t e m p e r a t u r e of t h e c o p o ly m e r , T g\ a n d T iB a r e th e g la s s t e m p e r a tu r e s o f th e c o r re sp o n d in g h o m o p o ly m e rs , d e s ig n a te d a s A a n d B , w \ a n d w u a r e t h e w e ig h t f r a c t io n s o f A a n d B in th e c o p o ly m e r , r e s p e c t iv e ly , a n d a LA, « ga, « t.b , a n d a GB a r e th e th e r m a l e x p a n s io n coeffi-

GLASS TEMPERATURES 1637
WT. % SYN DIOTACTIC POLYMETHYL METHACRYLATE
Fig. 2. Glass températures of poly(methyl méthacrylate) mixtures.
Fig. 3. Glass temperatures of isopropyl acrylate-isopropyl methacrylate homopolymermixtures and copolymers.
cients of the corresponding homopolymers in the following order: homopolymer A above the glass temperature, homopolymer A below the glass temperature, homopolymer B above the glass temperature, and homopolymer B below the glass temperature.
On Figure 2 the solid line also represents the Fox1 equation, which was originally derived for both copolymer and mixtures of polymers with plasticizers:
Tg = T,j.\ T„n/(w.\ Tgii + WbT sa) (2)
Figure 3 shows the data for the isopropyl acrylate-isopropyl methacrylate copolymers, homopolymers, and homopolymer mixtures. The data for the copolymers fall in line with the data for the homopolymer mixtures, a very surprising result. However, similar results have been obtained in dynamic mechanical measurements by Nielsen13 for 50/50 mixtures of poly (vinyl acetate) and poly (methyl acrylate) and for a random

1638 S. KRAUSE AND N. ROMAN
copolymer containing the two monomers in the same proportions. Glass transition temperatures are often considered to be associated with the onset of translational and vibrational motion of appreciable sections of the polymer backbone (comprising at least three monomer units). The moving portions of the polymer backbones are very different in the more or less random copolymers of isopropyl acrylate with isopropyl methacrylate than they are in the homopolymers in the mixtures. Even compatible polymers do not have their monomer units mixed as intimately as they are in copolymers.
The dashed line in Figure 3 is the straight line between the glass temperature of poly (isopropyl acrylate) and that of the low molecular weight sample of poly (isopropyl methacrylate). The solid curve labeled A represents the Fox equation [eq. (2) ] between the same two glass temperatures, and the solid curve labeled B represents the Gordon-Taylor equation [eq. (1) ] between these two glass temperatures. If the data for the high molecular weight poly (isopropyl methacrylate) sample had been used to calculate curves from eqs. (1) and (2), eq. (1) would have given the straight line between the glass transition temperatures of the homopolymers, and eq. (2) would have given a curve very similar to curve A .
On both Figures 2 and 3, the measured glass transition temperatures are well below any that can be calculated from eqs. (1) and (2). The Gordon-Taylor equation, which takes into account not only the glass transition temperatures of the homopolymers, but also the diffei'ences in their thermal expansion coefficients, gives especially poor results when compared with the data on the copolymers shown in Figure 3.
Recently, Kanig3 used the hole theory of liquids and the iso free volume theory of the glass transition temperature to derive general relationships for the glass temperatures of copolymers and of polymer-plasticizer mixtures. His relationship for the glass temperature of copolymers reduces to the Gordon-Taylor equation under certain conditions. Illers12 found that many copolymer systems which did not follow the Gordon- Taylor relationship did follow the Kanig relationship:
(T e b — 7\)/4>fA = Ci<j)fA + C2 (3)where Ci and C2 are constants for any particular copolymer system and
4>fA = Wa/[Wa + (aLB — o:gb)wb/(« la — «!-, \) J (4)If eq. (3) holds for a particular copolymer system, then a plot of (TgB — Tg)/<t>fA versus <£/A must be a straight line.
The relationship derived by Kanig for polymer-plasticizer mixtures is:
TgA Tg Tg A TgB _ „ <PfA. „ , ,( r p rp \ , rp r p 3 r p r p '
1 il ~ ‘ g B ) < P f B i g — j g B 1 g ~ 1 g B
where <£/B is defined just like $/A in eq. (4), changing all the A’s to B’s in the subscripts and vice versa. In those cases in which this equation holds, a plot of the left hand side of eq. (5) versus 0/A/ ( Tg — TgB) will be a straight line.
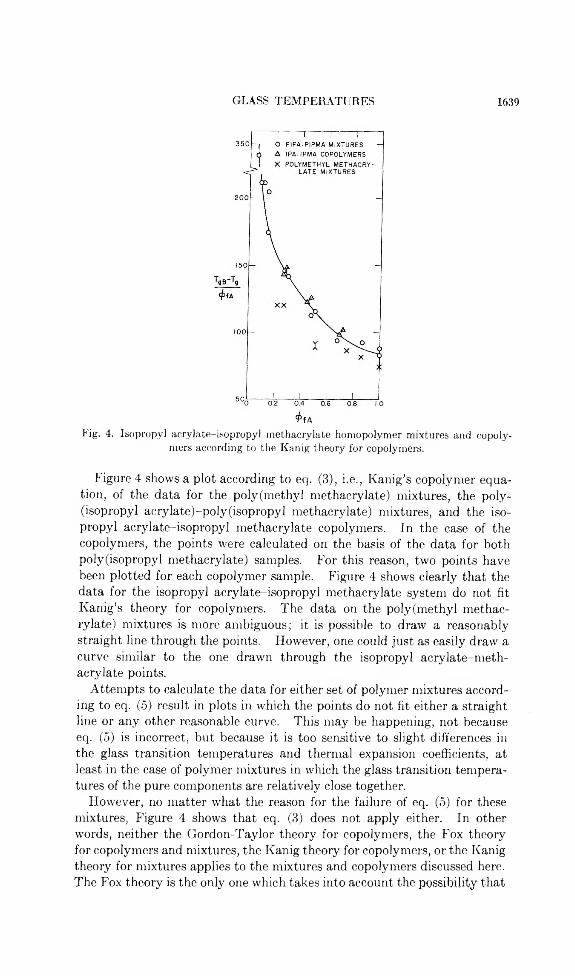
GLASS TEMPERATURES 1639
Fig. 4. Isopropyl acrylate-isopropyl methacrylate homopolymer mixtures and copolymers according to the Kanig theory for copolymers.
Figure 4 shows a plot according to eq. (3), i.e., Kanig’s copolymer equation, of the data for the poly(methyI methacrylate) mixtures, the poly- (isopropyl acrylate)-poly(isopropyl methacrylate) mixtures, and the isopropyl acrylate-isopropyl methacrylate copolymers. In the case of the copolymers, the points were calculated on the basis of the data for both poly(isopropyl methacrylate) samples. For this reason, two points have been plotted for each copolymer sample. Figure 4 shows clearly that the data for the isopropyl acrylate-isopropyl methacrylate system do not fit Kanig’s theory for copolymers. The data on the poly(methyl methacrylate) mixtures is more ambiguous; it is possible to draw a reasonably straight line through the points. However, one could just as easily draw a curve similar to the one drawn through the isopropyl acrylate-methacrylate points.
Attempts to calculate the data for either set of polymer mixtures according to eq. (5) result in plots in which the points do not fit either a straight line or any other reasonable curve. This may be happening, not because eq. (5) is incorrect, but because it is too sensitive to slight differences in the glass transition temperatures and thermal expansion coefficients, at least in the case of polymer mixtures in which the glass transition temperatures of the pure components are relatively close together.
However, no matter what the reason for the failure of eq. (5) for these mixtures, Figure 4 shows that eq. (3) does not apply either. In other words, neither the Gordon-Taylor theory for copolymers, the Fox theory for copolymers and mixtures, the Kanig theory for copolymers, or the Kanig theory for mixtures applies to the mixtures and copolymers discussed here. The Fox theory is the only one which takes into account the possibility that

1640 S. KRAUSE AND N. ROMAN
copolymers and mixtures might follow the same glass temperature-composition relationship. It seems obvious that a new theoretical treatment for the glass transition temperatures of copolymers and of mixtures is needed, one which allows for the fact that at least one system in which the homopolymers are reasonably compatible has the same glass temperature- composition relationship for homopolymer mixtures and for copolymers.
Thanks to R. Fettes, who provided the syndiotactic poly(methyl methacrylate) sample, to Mr. H. Webb, who prepared the isotactic poly(methyl methacrylate) sample, to Mr. R. P. Riordan, who prepared the poly(isopropyl acrylate) and the poly(isopropyl methacrylate) samples, to Mr. P. Fleischer, who prepared and did the gas chromatographic measurements on the isopropyl acrylate-isopropyl methacrylate copolymers, and to Mrs. E. Cohn-Ginsberg, under whose supervision the number-average molecular weights were obtained.
References1. Fox, T. G, Bull. Am. Phys. Soc., I , 123 (1956).2. Gordon, M., and J. S. Taylor, J. Appl. Chem., 2, 493 (1952).3. Kanig, G., Kolloid Z., 190, 1 (1963).4. Goode, W. E., W. H. Snyder, and R. C. Fettes, J. Polymer Sei., 42, 367 (1960).5. Fox, T. G, W. E. Goode, S. Gratch, C. M. Huggett, J. F. Kincaid, A. Spell, and
J. D. Stroupe, J . Polymer Sei., 31, 173 (1958).6. Fox, T. G, and P. J. Flory, J Appl. Phys., 21, 581 (1950).7. Ueberreiter, K., and G. Kanig, J. Colloid Sei., 7 , 569 (1952).8. Beevers, R. R., and E. F. White, Trans. Faraday Soc., 56, 744 (1960).9. Reevers, R. B., and E. F. White, Trans. Faraday Soc., 56, 1529 (1960).
10. Goode, W. E., F. H. Owens, R. P. Fellmann, W. H. Snyder, and J. E. Moore, J. Polymer Sei., 46, 317 (1960).
11. Fox, T. G, B. S. Garrett, W. E. Goode, S. Gratch, J. F. Kincaid, A. Spell, and J. D. Stroupe, J. Am. Chem. Soc., 80, 1768 (1958).
12. Biers, K. H., Kolloid-Z., 190, 16 (1963).13. Nielsen, L. E., Mechanical Properties of Polymers, Reinhold, New York, 1962, pp.
173-174.
RésuméOn a mesuré, par dilatométrie, les températures de transition vitreuse de mélanges de
polyméthacrylate de méthyle isotactique et syndiotactique, et de mélanges de poly- acrylate d’isopropyle et de polyméthacrylate d’isopropyle. Les températures vitreuses des copolymères d’aorylate d’isopropyle avec le méthacrylate d ’isopropyle sont les mêmes que celles des mélanges des homopolymères, dans un graphique température vitreuse/composition. On a comparé les résultats avec les prévisions théoriques de Fox, Gordon et Taylor, et Kanig. Aucune de ces théories ne peut expliquer d ’une façon adéquate les résultats obtenus.
ZusammenfassungAn Mischungen von isotaktischem und syndiotaktischem Poly(methylmethacrylat)
und an Mischungen von Poly(isopropylaerylat) mit Poly(isopropylmethacrylat) wurden dilatometrisch Glasumwandlungstemperaturen gemessen. Die Glasumwandlungstemperaturen der Copolymeren von Isopropylacrylat mit Isopropylmethacrylat liegen auf der gleichen Glastemperatur- und Znsammensetzungskurve wie diejenigen der Homopolymeren. Die Ergebnisse werden mit den theoretischen Voraussagen von Fox, Gordon- Taylor und Kanig verglichen. Keine d:eser Theorien liefert eine ausreichende Erklärung der Ergebnisse.Received September 11, 1964 Revised November 9, 1964 (Prod. No. 4553A)

JOURNAL OF POLYMER SCIENCE: PART A VOL. 3, PP. 1641-1660 (1965)
R a d ia t io n - I n d u c e d P o ly m e r iz a t io n a n d O th e r
R e a c t io n s o f n - P e r f lu o r o p e n ta d ie n e - 1 ,4 a t H ig h
T e m p e r a t u r e a n d P r e s s u r e *
D. W. BROWN, J. E. FEARN, and R. E. LOWRY, Polymers Division, National Bureau of Standards, Washington, D. C.
SynopsisThe radiation-induced polymerization of n-perfluoropentadiene-1,4 was studied at
temperatures of 100-170°C. and pressures of 8,000-15,000 atm. Kinetic evidence indicates tha t polymerization occurs by a free radical reaction; the activation energy is between 14 and 17 kcal./mole and the activation entropy is — 8 ± 5 e.u./mole. Transfer with monomer limits the number-average degree of polymerization to values of 40 or less except in special circumstances. Dimerization and double bond migration occur to some extent; n-perfluoropentadiene-1,3 is formed in the latter process. I t and the 1,4-diene copolymerize; the latter undergoes cyclic addition so tha t the polymers are soluble and have little perfluorovinyl unsaturation. The polymers are brittle if the fraction of 1,3- diene in the polymer is less than 0.1. They are rubbery and of considerably higher molecular weight if the fraction of 1,3-diene is greater than 0.4. The thermal stability of the polymers decreases as the content of 1,3-diene increases.
INTRODUCTION
Studies are being carried out on the synthesis and polymerization of n-perfluoro-a,co dienes, containing 5, 6, 7, and 8 carbon atoms. I t is expected that the polymerizations, to a considerable extent, will follow the alternating intra-intermolecular or cyclopolymerization mechanism described by Butler and Marvel.1'2 This paper presents results of studies on the 5-carbon diene. Applied to this compound, the expected process of cyclopolymerization can be represented as:
n ( CF ;= C F — CF 2—CF=(3fc> )
Active centers add to the CF2 group at one end of the molecule, and the adduct attacks the other end ; the result is the final structure shown.
* Based on research supported by the U. S. Army Research Office, Durham, North Carolina. Presented in part a t the Division of Polymer Chemistry, 145th National American Chemical Society Meeting, New York, New York, September 1963, Preprints p. 426.
1641

1642 D. W. BROWN, J. E. BEARN, R. E. LOWRY
Two main problems are considered in this study. One is the elucidation of the polymer structure, necessarily in the presence of complicating reactions. The other is the treatment of polymerization rate as a function of temperature and pressure in the presence of these reactions.
Fully fluorinated monomers are difficult to polymerize. For this reason, the reactions were carried out at pressures between 8,000 and 15,000 atm. and temperatures between 100 and 165°C. Polymerization occurs at reasonable rates under such conditions. At high pressure the monomer 4-chloroperfluoroheptadiene-l,6 formed a saturated soluble polymer of high molecular weight.3
EXPERIMENTALThe synthesis of the monomer has been described.4 As prepared, it
contained about 1% n-perfluoropentadiene-l ,3 (CF2= C F —CF=C F—CF3) and about 0.3% of an unidentified compound that was probably the 2,3- diene, (CF3—C F=C = C F—CF3), since an equilibrium exists between1,4-diene, 1,3-diene, 2,3-diene, and 2-pentyne.5
The pressure vessels and irradiation techniques have been described previously.6 In essence, degassed monomer in a steel bomb at known temperatures and pressures was exposed to radiation of known intensity from an external Co60 source. After removal from the bomb, the monomer and polymer were separated by heating the sample under vacuum. The final conditions were 100°C. at about 0.1 ¡x pressure for 3 hr. Appropriate runs were made in the absence of radiation. Polymer yields are accurate within 2%.
Measurements of the number-average degree of polymerization were made with a Mechrolab vapor-pressure osmometer, hcxafluorobenzene being used as solvent. The values obtained are imprecise by about 5%. At this level of precision, no concentration dependence of the calculated value was found for a degree of polymerization equal to 68. Thus, any systematic error probably is small compared with the imprecision of the measurements. Intrinsic viscosities were determined in hexafluorobenzene at 29.6°C.
Large amounts of nonpolymeric products were formed under some conditions. The content of 1,3-diene sometimes increased; this compound was identified by boiling point and absorption at 5.85 ^.6 Often the amount of the compound believed to be the 2,3-diene increased. A fraction boiling at 40°C. at 30 mm. pressure is thought to consist of dimers. The number of species in this fraction, as judged by peaks in vapor-phase chromatograms, varied with reaction temperature. It was three in fractions from runs at 110 and 135°C. and five from runs at 160°C. Vapor-phase chromatography (VPC) was used to determine directly the nonpolymeric compounds, except for that of the 1,4-diene. Values determined by VPC are uncertain by 5-10%. The percentage of 1,4-diene in the recovered material was calculated as 100 minus the sum of all the other components.
Infrared spectra usually were obtained from specimens that had been heated at 180°C. at 0.1 pressure. Such specimens were pressed into

r c - P E R F L U O R O P E N T A D I E N E -M 1643
films, usually at 140°C., between sheets of aluminum foil. Although the films often were brittle, small pieces could be obtained that were suitable for use in the beam-condenser attachment of a Perkin-Elmer 221. Film thickness was between 0.002 and 0.004 in.; it was measured with a micrometer. The symbol DP,/ refers to the degree of polymerization of these specimens, whereas DP„ is the degree of polymerization of samples heated at 100°C. and 0.1 DP,/ is greater than DP„ because more of the very low polymer (n = 2, 3, 4, 5) evaporates at 180°C. and 0.1 /x than at 100°C. and 0.1 tx pressure.
Comparative pyrolyses were performed by placing tubes containing different samples side by side in an evacuated heated tube. The loss in weight of each sample was determined over two time intervals at each temperature. The pyrolysis was explored at temperatures of 295, 334, and 395°C. The residues from the pyrolyses at 295°C. were used at 334°C., and those from the latter temperature were used at 395°C. The rates so obtained were extrapolated to zero conversion.
RESULTSOils or very low yields of solids were obtained at pressures of a few
atmospheres at 110°C. The first experiments at high pressure resulted in formation of soluble, rubbery polymer. Little monomer was recovered; the 1,3-diene and the dimer fraction were the main products. In later experiments under the same reaction conditions it was found that brittle, solid polymers sometimes were formed with reduced formation of side products. These polymers were soluble and transparent when molded and so are believed to be glasses. The infrared spectra of both types of polymers and also the dimer fraction showed bands in the double-bond region at 5.6 and 5.85 ¿x. Absorption at these wavelengths is a characteristic of compounds containing the groups —CF=CF2 and —CF=CF—, respectively.
In the course of this work several combinations of reaction conditions gave rubbery polymer in one instance and glassy polymer in another instance. Data from such experiments are paired in Table I. Listed are: reaction conditions, product composition, the fractional rate of polymerization Rv, intrinsic viscosity, DP„, DPre', the concentrations of —C F = CF— and —CF=CF2 groups in the polymer as calculated from infrared data, and a column headed FF', which has significance for the rate data.
The rate, Rp, is the fraction of polymer formed, divided by the product of irradiation time and the arithmetic mean of final and initial fractions of polymerizable monomer (which is taken as the sum of the fractions of1,4- and 1,3-diene). The mean monomer fraction is used to correct for the high conversion, which approached 35% in some runs; it is an approximation to the average monomer concentration. The time at temperature and pressure is used in runs performed without radiation.
I t is seen that the rubbers form more quickly than the glasses; they contain more internal double bonds and fewer perfluorovinyl groups. Both types of polymer formed in these experiments were completely

1644 D. W. BROWN, J. E. FEARN, R. E. LOWRY
Ph
coCQ
o"Oftc3
ftft(5
CjD 0) t ft►ft o
o3ft
Pm
ftCUo
0 ® g ® S .25P ft O N ftQ
fe,
P
hbd d - 3
O
OPh
ft*o
Ift£do
oftao
O
ftftOO
aS ’
§ 2 a x 'S-( H, A ,IH ft ^ O P-( CO ft H
ai dC Q C i p -o ti ^ n f3 £
& .a o
CD CM CMCMo CM CMP7CM
CDH d 1—1 CD d d
CO1—1I> H . »Oo o COo o o o
00 Oi o»o o’CO T-I
Q f i f l . a £ £ £ § £
Q Q Q£ 2 fc 8 £CD O TjH CO CM Q r-i O CDo' £ O O O
CQ ft2 -ft03 ^
>». *-< > i cC Q O
§ 1P i O P i O pi
»OCM00CMCMa>o H1—1o d o 1—1rH
t- 00 LO'T“1COCOft 1ftCMo o’COCO CO>—t ft
^ oo £
in pCD
P Q
Q Qm £ £
f l ° P £ o £
>> ® >? C Q f t C Q2 jd 2 c3 r-; ca
O P O
o »ft o 1ft or~iCO »ft CM 1—1o o CM oH o 00 CM 00
oo o CO o’
CDon »ft CDd CDo Oi oCOo »ft o »ftIQ CMCM CMi—1CMCO00 COTfH tHCTi Oi
i—<d d1-1r-h- t-oo T-* o oo’o o o oo o o CO CO1—1i—i o o1—1i—i 1—1
P 00
bfiCft
Psp
ft3.
©ftd
ftft
ft <5 c c £ f t
S.'s s jo. o +=C f_ «3rt a £.S - 3 "? o £ ® 8 pi 5 OCO ° f 1o a °ft F- ftft
C O
ftCO
SiCM
%>
ftrJiC
ftftft
&o¡1
PmQftftft
CQftObi)
Pmoa>>oft =t'o ’“J c ^
"ft
PmO
»ft rH 6 004 bfid
fto CO "3 o3X3 'o
"S CQ0bJDO00 fto o o 0D
cS0 -ft
00 00 i-d 0 > 03 ftd bnd (h_c
"Ht-T _o• r-i a 0 +->0a
o a -ft‘-4 H+=fto o o0 0-H0 ■+*~H«Hc3 00ft
o o a oo m rt o0t- orU 0xi ePh%-=o3 0ftH H p NHsi X3 0 ND
sig
nifie
s th
at t
he q
uant
ity w
as n
ot d
eter
min
ed.

n-PERFLUOROPENTA DIENE-1,4
c3o
h-1 £51—4 CDah •£ H S3 « g-< M H «
toW
Ph
_o*433doO
sOhQ
- O)« 'os
fenfa.
sH '
I X ,ws a :S-i +=Ph o3
D, .s y
P prH t o CM CD O 0 rH CO CM CD rHI d rH CO CO t o rH CD CD CD CD rH
n p PUO rH 0 5 CO CO z 0 0 0 5 !■- t oCM CM rH £ CM CM CM CO CM CM CO e d
TfH CD CD CO CD > 0 i O CD CO t o CMCM CO Q CM CO P CM CM CO CM rH
d d d Z d d d Z O O d d d
0 5 O CDr H CO t-H O CO CM 0 5 P CO CM rH 0 rH
d 7-1 rH Z 1-H17— * d z 0 1_H1d 7-h1 7_ 1
CM P - CM CM CM 0 5 rH rH CM CD 0 0 t o CMCM CO CO CM CM CM CM CM CM CO rH CM CM
1“ i rH i—1 7-1rH rH r H rH
T“ 1 r" 1 7-1rH
p- O CO O O H r H O O OCD 1 0 CM rH I - » O rH 0 0 5 CD CM O
O d O CO rH d d 0 5 CO CO 7-1CM
0 5 r HCO tH 0 CO p - 1—11 rH CD P~- t o t o rHrH 0 5 CO d rH t o t o d 0 0 0 5 CM CO CM
CM P - 0 5 rH rH t o 0 5
CM I t - 0 T_| p- CD 0 0 CD CD O 0 rH
7-1
CO CO rH 00 CM CO rH O CD rH »O
rH CO rH rH CD CM d 0 CO CO d d P-
0 CO CD P- rH 0 5 0 0
O 1“H O O d d O d 0 d O
0 5 t o CD CM CD CO 00 CM 0 5 CD CD CD0 5 P— 0 5 0 5 P- 00 0 5 0 5 00 0 5 0 5
t o COCO CO t-H t o !> CD t o 0 5 O 00 CO CM
CM t o CO rH CO rH CO O CO d CO rHi-H
O O 0 0 r H rH rH r H 0 5 0 5 0 5 0 5 0 5
00 00 00 0 0 rH rH rH rH rH rH r H r H r HrH rH
0 5 CM O CD 0 0 O O t o CD rH CO CDCD CO O I- CD CO H CD CO CO 0 CDi—l rH
CDd.21
CO
CM~
CO
©
§
I>rHodfaOd
C/2 (X lO rdP H
1645
The
radi
atio
n in
tens
ity w
as z
ero.

1646 D. W. BROWN, L E. FEARN, R. E. LOWRY
TABLE IIIEffect of Intensity Variation on R p and D P n
1,M rad/ hr. X
102
I 1/ 2;(M rad/hr.)‘AX 10
10*RP,102h r .- ' DP»
hi.dl./g. F '
Polymertype
Conditions
Temp.,°C.
Pressure, atm. X
IO-3
0.77 0.88 1.24 ND 0.26 2.7 Rubber 110 11.414 3.7 4.9 ND 0.10 2.3 Rubber 110 11.40 0 0.04 ND ND 1.13 Glass 110 11.40.77 0.88 0.25 18 ND 1.15 Glass 110 11.44.7 2.2 0.41 21 ND 1.11 Glass 110 11.4
14 3.7 1.10 23 0.04 1.13 Glass 110 11.44.7 2.2 0.20 19 ND 1.16 Glass 102 8.0
14 3.7 0.37 18 ND 1.11 Glass 102 8.0
soluble. The intrinsic viscosities of the rubbery polymers were determined because their molecular weights were too high to be measured with the Mechrolab instrument.
It was found that glassy polymer was obtained always if the 1,4-diene was degassed immediately after synthesis and stored at — 30°C. Storage under nitrogen at the same temperature for periods of up to three weeks before degassing usually permitted formation of the glassy polymer. Monomer stored under air for several days at — 5°C. invariably formed rubbery polymer.
Reactions in which glassy polymer formed were consistent enough for kinetic study. Table II contains results of experiments run at different temperatures and pressures. Listings are much the same as in Table I. The dose rate was 0.047 Mrad/hr. in all except the thermal polymerizations.
% UNITS WITH INTERNAL DOUBLE BONDS
Fig. 1. Polymer pyrolysis rate vs. per cent units with internal double bonds: (o) 394°C.:(•) £35°C.; ( 8 ) 295°C.

n-PERFLUOROPENTAD IENE-1,4 1647
Two polymer samples, those formed at conversions to polymer of 8.6 and 9.7%, were not completely soluble. The gel fraction of these was about 0.05.
The effects of intensity variation at constant temperature and pressure on Rv, DP„, or intrinsic viscosity are shown by data in Table III. Apparently Rv is nearly proportional to the square root of intensity, whether the polymeric product is glassy or rubbery. DP„ is substantially invariant with Rp for the glasses, but the intrinsic viscosity of the rubbery samples decreased as Rv increased.
Figure 1 shows plots of pyrolysis rate versus the per cent of the monomer units in the polymer that have internal double bonds. Three isotherms are shown. Pyrolysis rate increases with the content of internal double bonds.
DISCUSSION
Qualitative ConsiderationsSeveral reactions occur simultaneously in these experiments; in addition
to polymerization, there are three to five dimerization products and two products of double-bond migrations. I t is not known what agent causes these side reactions to assume great importance in some cases. The fact that storage under air precedes such results suggests that some product of oxidation or oxidative hydrolysis is involved. The general trends of the data in Table II indicate that temperature increases accelerate bond migration and dimer formation, even when glassy polymer is formed. The fact that 1,3-diene was not observed in the product from any experiment run at temperatures between 160 and 170°C. can be explained by the presence of internal double bonds in the dimer fraction. That is, it is felt the1,3-diene forms rapidly in this temperature range, but goes into dimers so much more rapidly that its concentration is decreased to an undetectable level (~0.05%). Presumably then, the rate at which dimers form is connected intimately with the rate of bond migration. We will not concern ourselves with quantitative aspects of the rates of bond migration and dimerization because the situation appears too complicated to handle with the data available.
Copolymerization Hypothesis
The 1,3-diene was regarded as being polymerizable, and it was thought that copolymerization of it with the 1,4-diene might explain the presence of internal double bonds in the polymer. The calculation below serves to demonstrate this.
Let us assume a copolymerization mechanism in which the rate of addition of a monomer unit to the attacking radical depends on the type of monomer but not on the radical. Then the fraction / of monomer units which have internal double bonds is:
/ = k'2M' / (h[M] + ft', [AT]) =(k W ([M '] /[M ])/[ l + (/c'2[M'])/(fc2 [,¥])]

1648 D. W. BROWN, J. E. FEARN, R. E. LOWRY
where fc2 and k \ are propagation rate constants for addition of 1,4-diene and1.3- diene, respectively, and [M] and [M' ] are the concentrations of these dienes. The density of the polymer is 2.0 g./cc.; from this one calculates that the sum of the concentrations of all monomer units is 9.4 mole/1. Thus, ci; the concentration of monomer units, which have internal double bonds, is:
c* = 9.4/
Another expression for c, is derived from the Beer-Lambert law; it is:
Ci = 2.3 log (Io/1)/Iks.gi
where 7c5.85 is the absorption coefficient at 5.85 a in units of liters/mole- centimeter, log /(,// is the absorbance at this wavelength, and l is the film thickness.
To test the possible identity of the expressions for c* a value is needed for /C5.85- One was obtained from the infrared spectrum of polyperfluoro- butadiene-1,3, made at high pressure, in the following way. Polyper- fluorobutadiene should contain one double bond per monomer unit; in concentration units this is 12 mole/1. Internal and external double bonds are present because 1,4- and 1,2-addition occur. The absorption coefficient for perfluorovinyl groups, fc6.6, was calculated to be 700 l./mole-cm. from the infrared spectrum of solutions of perfluoroheptene-1 in perfluoroheptane. From ¿5.6, the concentration of perfluorovinyl groups was calculated to be 0.5 mole/1. By difference the concentration of internal double bonds is11.5 mole/1.; this leads to a value of 29 l./mole-cm. for /c6.s6. This method has the advantages that a relatively large error in the perfluorovinyl group determination has only a small effect on the calculated value of /C5.85, line widths in the infrared spectra of both calibrant and unknown are the same, and, hopefully, cis and trans ratios are similar. A value of k6.g5 equal to 67 l./mole-cm. was obtained from the infrared spectrum of perfluorobutene- 2 (cis and trans ratio unknown) in perfluoroheptane. The line width is much less than in the polymer spectra, so the value used in our calculations is 29 l./mole-cm.
A question of importance is, “what is the proper value of [M']/[M] to use in the expression for/?” For the glassy polymers the arithmetic mean of initial and final values is believed to be reasonable because [M']/[M] changed little from its initial value. With the rubbery polymers the final value probably is a better average than the arithmetic mean. That is, it is felt that M '/M probably increased rapidly from its initial value to something like its final value, and then remained relatively constant for most of the reaction. An indication of this is that in experiments that gave rubbery polymer one finds that where the sum of the final content of 1,4-diene plus1.3- diene differed by a factor of about 12, the ratio [M']/[M] differed by a factor of only 3 to 4 (lines 1, 3, 5 of Table I).
Since kz'/kz is a ratio of rate constants it should be constant at one temperature and pressure. Thus one value of /c2'//c2 should apply to all data taken from runs at the same temperature and pressure. In Figure 2 is

n-PERFLUOROPENTADIENE-1,4 1649
Fig. 2. Internal double bond concentration calculated by Beer-Lambert law vs. the same quantity calculated according to the copolymerization hypothesis: (o) 109±1°C., 11,400 atm., k '2/ h = 11; (#) 110°C., 8,000 atm.; 103°C., 15,000 atm., k 'n / h = 11; © 137±3°C., 8,000, 11,400, and 14,900 atm., k \ / k t = 14.
plotted ct as calculated by the Beer-Lambert law versus ct as calculated by the copolymerization hypothesis. A value of k^/kt equal to 11 fits data from experiments performed at 109 ± 1°C. and 11,400 atm. over a 10-fold range of [M/j/ [M]. The same value of % fits data from runs at about the same temperature and pressures of 8,000 and 15,000 atm., indicating little effect of pressure on the ratio. A value of W/k« equal to 14 fits data from all but one run at 137 ± 3°C., indicating little pressure effect, but a small temperature effect on the ratio. The temperature effect is equivalent to a difference in activation enthalpy between the individual rate constants of about 2500 cal./mole.
Irregularities are encountered in trying to apply the calculation to data from runs in which j M' ] became too low to be detected. Glassy polymer formed in all such runs; the difficulty is connected with use of the arithmetic mean of final and initial values of [M']/[M]. If [M']/[M] is nearly zero long before the experiment ended then the mean is higher than the true average. The apparent value of is reduced by an amountthat increases with the fraction of time [M']/[M] was zero. This is unknown, so data from such runs are not entered on the plot. These include all runs at the highest temperature at each pressure and one run at 134°C. With the use of the ratios of 11 and 14 found to fit at 108 and 138°C., respectively, a value of 17 is indicated at 165°C.
The values of ct indicate that units derived from the 1,3-diene are present to the extent of 40-70% in the rubbery polymers and 4-14% in the glassy polymers. All other units presumably are derived from the 1,4-diene;

1650 D. W. BROWN, J. E. FEARN, R. E. LOWRY
now it is desired to determine the fraction of these that do not undergo cyclopolymerization.
A perfluorovinyl group will enter the polymer for each unit of 1,4-diene that does not cyclopolymerize. Thus the fraction desired is equal to c„/(9.5 — Ci) in high polymer, where cv is the concentration of perfluorovinyl groups. The value of 700 l./mole-cm., obtained as described above, was used to calculate the values of c„ listed in Tables I and II. These lead to values of c„/(9.5 — c-() that are between 0.002 and 0.07 for the rubbers and 0.03 and 0.2 for the glasses. It is reasonable to suspect that some —C F = CF2 groups are associated with chain ends. If one assumes one such group per polymer molecule, the fraction of 1,4-units that have not cyclized becomes (c„ — f.5 /D P ,/|/(9 j — ct). Where 1)P,/ is not given, the infrared spectrum was obtained on polymer that had not been heated at 180°C.; then DP„ should be used instead of DP,/. The correction should be negligible for most of the rubbery polymers but is appreciable for the glasses. For these, the range of the fractions of 1,4-units that enter but do not cyclize is from 0.09 to slightly negative numbers, i.e., overcorrection sometimes occurs. However, in 11 of 14 cases, the ratios are between 0.01 and 0.07; this is close to the ratios for the rubbers. Reservations are felt concerning the absolute accuracy of the values of cv and any values derived from them, because they are based on an absorption coefficient pertaining to a small molecule in a liquid medium. However, even a twofold error in the absorption coefficient usually leads to the conclusion that cycli- zation follows about 90% of the additions of 1,4-units. Thus, the structure of the polymers prc bably can be represented as:
In the rubbery polymers, x/(x + y + z) is greater than 0.4; in the glasses, it is less than 0.14. The mode of addition of the 1,3-units has not been proved but is believed to be 1,4-addition because polyperfluorobutadiene contained many more internal double bonds than CF2= C F ^ groups; this results in the x structure shown. In both types of polymer, y/( y + z) is greater than 0.9. No proof of ring size has been given, but the four-mem- bered ring is expected on steric grounds, i.e., the attacking radical will join to the terminal carbon atom of the vinyl group.
The copolymerization process assumed has certain implications for the polymerization rates. These and other details of the rate behavior are considered below.
Polymerization Rates
The polymerization mechanism is thought to be a free radical chain reaction because the G values for conversion to polymer are 120 or more, the rate increases with temperature (Table II), and about as the square root of

n-PERFLUOROPENT ADIENE-1,4 1651
radiation intensity at constant composition, temperature, and pressure (Table III). These are all characteristics of a free radical chain reaction. If 1,4-diene was the only monomer present the mechanism detailed in Table IV would be applicable; the usual assumptions are made that the kinetic chain length is great and that steady-state concentrations of radicals are achieved. In addition it is assumed that the cyclization rate constant is much larger than the product of monomer concentration and any possible propagation rate constants. This is in accord with the conclusions expressed above concerning the extent of cyclization.
Step
Initiation
Propagation
Cyclication
Transfer
Termination
TABLE IVPolymerization Mechanism of Perfluro-pentadiene-1,4
Reaction Rate
(d[Ri]/dt) = h ' l = 2 1 2 G (i)I/NV = h / V J ( d ( 2 [ R „ * ] ) / Æ ) = f e [ M ] ( 2 [ R , ] )
1 - ( d [ M ] / [ M ] Ä ) = f e ( 2 [ R „ ] ) = R„'
- ( d 2 [ R „ * ] / d i ) = kc{ 2 [ R „ * ] )
R » + M — P „ + R i (d[Pn\/dt) = f e ( 2 [ R „ ] ) [ M ]
IC4R n + R „ , — P „ + p „ , - ( d [ R ] / d i ) = d[Pn\/dt = 2 * 4( 2 [ R „ ] ) 2
M — R,ki
R-n M —► Rn+1*kc
Rn* — Rn
In Table IV the symbols M, R, P, and I refer to monomer, radicals, polymer, and radiation intensity, respectively. The symbols k2, kc, fc3, and Ica are rate constants; R„' is the fractional rate of conversion of monomer to polymer. The symbols n and m refer to the number of monomer units in the species being considered.
Since initiation results from absorption of energy from 7 -rays the rate of initiation in bulk monomer, k /I , also is given by the expression (212 G J/N V), where I is the radiation intensity in units of 100 electron volts per gram per unit time, Gt is the number of radicals produced per 100 e.v. of absorbed energy, 212 is the molecular weight of the monomer, V is its molar volume, and N is Avogadro’s number. At constant intensity k /I also equals fcjV-1, where kt is the fractional rate of initiation. The form used for the initiation rate is dictated by convenience; the symbol Aq is reserved for thermal initiation.
The assumption concerning the cyclization rate constant leads to the conclusion that the fraction of radical species R„* disappearing by processes other than cyclization is less than the ratio of initiation (or termination) to propagation. Thus, this fraction can be ignored since the kinetic chain is long; the steady state equation for species R* becomes:
d(2[Rn*])M = A2[M](2 [RJ) - fce(2[R,*]) = 0The same assumption justifies neglect of additions of M to species R*.
The terms in the above equation occur also in the steady-state equation for R„; on summing to zero they disappear from the latter equation. As a

1652 D. W. BROWN, J. E. FEARN, R. E. LOWRY
result, the cyclization rate constant does not enter the rate equation, which is the same as that obtained in the absence of cyclization:
I t ; = -d[M ]/[M ]dt = (fc/J/2fc4)1/2*2 (11
Transfer reactions involving species R„* and monomer can be ignored because (2[R„*]) is much less than (2[RJ). Thus, the expression for
n n(DPb-1) at constant temperature and pressure, if disproportionation is assumed, is:
(DP*-1) = m h ) + (2fc4Æ //fe2[M]) (2)If combination is assumed, the second term is (kiR'p/k 22[M]). This is the equation for DP„-1 in a polymerization not complicated by cyclization.
Copolymerization Rates
The presence of a comonomer affects the form of eqs. (1) and (2). To apply absolute rate theory to the data one should define the overall rate in terms of the individual rate constants of the chain reaction. In general copolymerization theory the overall rate expression is too complicated to handle because there are four propagation constants, several initiation constants, and at least three termination constants. In our work some simplification appears possible because only two propagation constants sufficed to relate c( to the monomer composition. Furthermore, it probably is valid to ignore effects of monomer composition on the initiation rate because all the compounds present are expected to have very similar values of G{.
The propagation reactions that were considered in assessing the structure of the polymers were :
M ' + R„ R '„+i
hi'M ' + R „' - R„+i'
where-d[M ']/d i = fc2'[M '](2[R J + 2[R /])
where
M T R „ ' — R n+]
M + R* —Rn+i
-»•/¡.\f | W/ = 7c2[M](2[Rre] + 2[R„'])
Radicals ending in M' are denoted R'. If it is assumed that the termination rate constant is independent of the radical species then the sum of the concentrations of different radicals is the same as in the absence of M*. The rate equation is:
Rv =/]M ]
2 k j ' 2 \ (M0] fetMo] ) (3)

n-PERFLUOROPENTADIENE-1 „4 1653
In this equation [M0] is the sum [M] + [M']; thus, Rp is the total fractional rate at which polymer is formed. The symbol F denotes the ratio by which Rp by eq. 3 exceeds l i , ' by eq. 1; this ratio we term the acceleration factor.
The variation in ct with monomer composition led to a value of &a'/&2 of 11 at 11,400 atm. pressure and 104°C. Data in the first four lines of Table I were obtained from experiments run under these conditions. If the mechanism is correct one should be able to use the equation above to predict the relative rates of formation of rubbery and glassy polymer. The predicted ratios are lower than those observed, being 2.1 versus 4.9 and 1.9 versus 4.5, respectively.
A considerably large acceleration factor is calculated if the rate constants for termination of species R ' are much less than that for mutual termination of R. If species R ' can not terminate the reaction rate becomes:
RPW [M ']\fa[M] J
V*k2FF' (4)
where the acceleration factor is FF'. Values of FF' are listed in Tables I and II. This equation predicts rate ratios of 5.1 and 4.0 when applied to the same pairs of data as above. This is close enough to reality to be regarded as in accord with the copolymerization hypothesis. Of course a termination rate of zero is unrealistic but a 10 to 100-fold difference between rate constants for termination should result in about the same difference in Rv for glassy and rubbery polymer as calculated above. The form of the equation will be more complicated because it will contain three termination rate constants.
Only experiments in which glassy polymer formed are considered in subsequent discussion of the rate data. In such experiments F varied from1.08 to 1.17, and FF' from 1.18 to 1.37. The true acceleration factor will be more than F but less than FF'. Judging by the calculations above it will be very close to FF'. Therefore, eq. (4) should describe the rate behavior with reasonable accuracy; according to this equation RP/F F ' equals Rv’, the polymerization rate of the pure, 1,4-diene [compare eqs.(1) and (4)]. Furthermore, the temperature and pressure dependence of Rp' and RP/FF' should be described by a single exponential function because the individual rate constants in the expression appear as a product, permitting summation of the individual exponents.
Effect of Temperature and Pressure on R P/ F F '
At constant intensity it is convenient to replace k / I in eq. (4) by kiV~1, which was defined above. Equation (4) becomes:
RP/FF' = ( k ^ h V Y ^ h (5)Absolute rate theory offers the most straightforward interpretation of
the effects of temperature and pressure on RP/FF'. Each rate constant

1654 D. W. BROWN, J. E. FEARN, R. E. LOWRY
can be expressed in terms of this theory, i.e., k, = V(k/h)T exp ( — AF * f RT) for second-order reactions (propagation, transfer, and termination), where F is the molar volume, k is the Boltzmann constant, h is the Planck constant, T is the absolute temperature, AF / is the free energy change in forming the transition complex of reaction j, and R is the gas constant. These expressions for the k’s are substituted in eq. (5). I t is assumed that Gi and so k. are independent of temperature and pressure. This assumption is in accord with the small temperature dependence of radiation- induced reactions that do not proceed by a chain mechanism. The equation for RV/FF' is:
* 2?} (0)RPFF'
k T Y 2 ,,— kt 7 2 exp 2 h ) P
A FRT
Equation (6) is transformed by standard methods into equations relating log (RP/F F ') to temperature at constant pressure and to pressure at constant temperature.7 These equations are:
log (10% /F F ') = V2 log T + [-(Aff,* - 0.5 Aif4*)/2.3 RT] + C1 (7)
for constant pressure data and,
log (10*RJFF') = |- (A FA - 0.5 AF4*)/2.3 RT]P + C2 (8)
for constant temperature data.In these equations AH* and AF* are the respective enthalpy and volume
changes that occur when the transition state forms, P is the pressure, and the C’s are integration constants. In deriving these equations it is assumed that A Hi* — 0.5 AH* is independent of temperature at constant pressure and that AF2* — 0.5 AV * is independent of pressure at constant temperature.
An analogy to the Arrhenius plot is in Figure 3; three isobars are shown. An imprecision of 5% in Rv and one degree in T was indicated by our earlier work along these lines. If this imprecision is assumed the data taken from experiments at 14,900 and 11,400 atm. can fall on straight lines; the variation possible in the slopes of these lines is equivalent to an uncertainty of 1 kcal./mole in AH * — 0.5 AH*. Greater scatter is exhibited by data from experiments at 8000 atm .; the overall trends indicate that the observed value of RP/FF' is too high at the lowest temperature and pressure. This point is ignored in drawing the 8000 atm. isobar. The uncertainty in AH * — 0.5 AH* at 8000 atm. is between 2 and 3 kcal./mole if the remaining pair of points have the same imprecision as assumed for the other two isobars.
Figure 4 is a plot of log 106 RP/FF' versus pressure; isothermal data were obtained from Figure 3 as the intersections of values of the abscissa with the isobars. The uncertainty in values of AF2* — 0.5 AF4* is about 1 cc./mole if RV/FF' is imprecise by 5% and P is imprecise by 100 atm. The good linear variation of log R,v with P would not have been obtained if (—AF2* + AF4*/2) had varied with pressure in the experimental range.
In Table V are listed values of thermodynamic quantities present in the
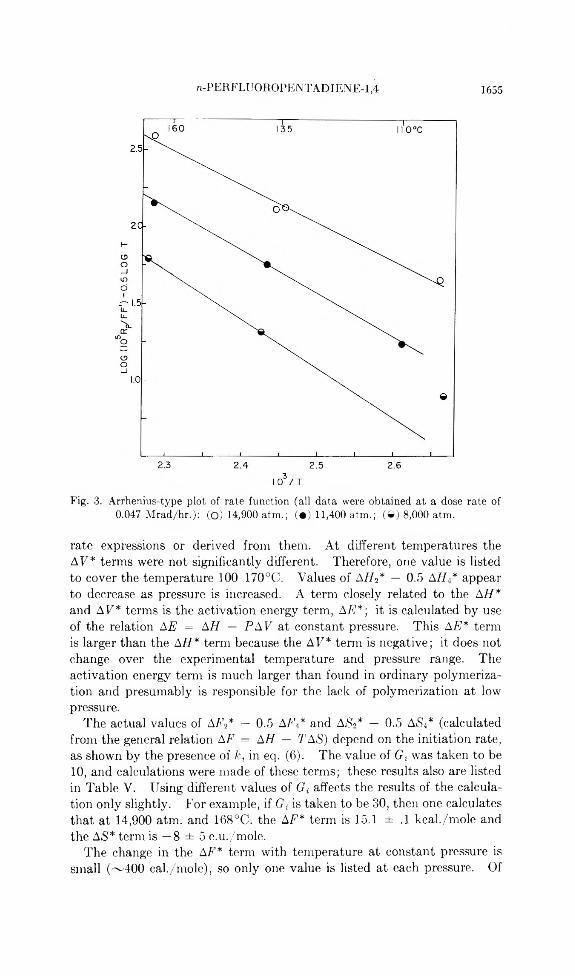
n-PERFLUOROPENTADIENE-1,4 1655
Fig. 3. Arrhenius-type plot of rate function (all data were obtained at a dose rate of 0.047 Mrad/hr.): (O) 14,900 atm.; (• ) 11,400 atm.; (©) 8,000 atm.
rate expressions or derived from them. At different temperatures the AF* terms were not significantly different. Therefore, one value is listed to cover the temperature 100-170°C. Values of AH2* — 0.5 AIL* appear to decrease as pressure is increased. A term closely related to the AH* and AF* terms is the activation energy term, AE*; it is calculated by use of the relation AE = AH — P AF at constant pressure. This AE* term is larger than the AH* term because the AF* term is negative; it does not change over the experimental temperature and pressure range. The activation energy term is much larger than found in ordinary polymerization and presumably is responsible for the lack of polymerization at low pressure.
The actual values of A b\* — 0.5 A Ft* and AS2* — 0.5 AS4* (calculated from the general relation AF = AH — TAS) depend on the initiation rate, as shown by the presence of kt in eq. (6). The value of Gf was taken to be 10, and calculations were made of these terms; these results also are listed in Table V. Using different values of Gt affects the results of the calculation only slightly. For example, if Gt is taken to be 30, then one calculates that at 14,900 atm. and 168°C. the AF* term is 15.1 ± .1 kcal./mole and the AS* term is — 8 ± 5 e.u./mole.
The change in the AF* term with temperature at constant pressure is small (~400 cal./mole), so only one value is listed at each pressure. Of

1656 D. W. BROWN, J. E. FEARN, R. E. LOWRY
oXH
cq '<1
aXH<pC3Ph
> .S w $hP -43CQ ^H I
G*
tíî ïT3
Ü3 >^ 5s
<N CO LO
<M <M-H -H -HO H Tfl N D CO
I I I
WWW © © ©-H -H -HCO o o
i o CO
j » T*H CO
o ,_i r-i Cd* *"
-H •tí i l<c3 o í LO t -O
LO LOi—H
O
-H -H -Hio >0 LO
© o o7 7 7
o o o»—i ’—i iM-H -H -H
IO N
CO<]
-i cS <D > tí 0) < Xi^ -4-=. rO03 tí§ o3
^ £ > 2 ^ G tí.° "tí^ 300rj lo<D ° c3 p <D O f-i _Q0 'O ^ c3r < >* -Û. -doTf CO <] c3 _ <D LO i-_tí
1 Q5*- a<i *
•2 © <D Ü Jtí ,bO °
.fc< CD > tí
-31tí xiCD ■+—•
S f-r
a

n-PER FLUOROPENTADIENE-1,4 1657
Fig. 4. Plot of log (\O hR v / F F ') vs. pressure (All data were obtained at a dose rate of 0.047 M rad/hr.) ( G) 167°C.; ( • ) 140°C.; (©) 106°C.
course, (AF2* — 0.5 AF4*)/T decreases as temperature increases. The AF* term decreases as pressure increases because of the decrease in the AH* term. The values of the A$* term are so uncertain that they do not change significantly over the experimental range. However, the AS* term is quite small in absolute amount, being about half that of the comparable term for the polymerization of perfluoroheptene-1.8 The AF* term for perfluoroheptene-1 is about 3 kcal./mole larger than that for the1,4-pentadiene. All of this difference is due to the smaller entropy term of the latter. I t is speculated that the small entropy term is connected with the diene character of the monomer; in a crude sense a diene should have twice the probability of orientation favorable for reaction as would a monoolefin.
Reversal of polymerization was observed with perfluoroheptene-1. I t is characterized by the occurrence of a maximum in the rate as temperature is increased. That it was not found in this work is attributed to the fast cyclopropagation. Radicals that can lose monomer units by depropagation are present in too low concentration to be important.
Table II contains data from three thermal polymerizations in addition to those already considered. The thermal rate is always less than 20% of the radiation-induced rate. The correction to the radiation-induced rate is less than 2% because of the square-root relation between overall rate and initiation rate; this was ignored in the discussion above. However, the variations in thermal rate can be used to calculate AHi* and AT]*, the

1658 D. W. BROWN, J. E. FEARN, R. E. LOWRY
enthalpy and volume changes associated with the formation of the transition complex of the thermal initiation act; the values were 5 ± 2 kcal./mole and —6 cc./mole, respectively, at 14,900 atm. and 168°C. The activation enthalpy is very much lower than encountered in hydrocarbon work. The negative value of ATT* is in accord with the argument that thermal initiation should result from an associative process.9
Degree of PolymerizationIf it is assumed that monomer transfer involves reaction of species M
with all kinds of radicals with a single rate constant, the equation connecting DP„_1 with Rp and monomer composition at constant temperature and pressure is:
D P ,- ’ = {h /hF ') + {2kiRp [M0 ]//c22 [M2 ] (F ')41 (9)
The first term is connected with monomer transfer; the second term is connected with the termination process and would be half as large if combination were assumed. I t is thought that if transfer is substantial it is with species M because the presence of large amounts of dimer, 1,3-diene, and 2,3-diene are not associated with especially low values of DP„.
There are difficulties in applying this equation because of the dimerization reactions and possible fractionation during polymer isolation. The effects of these are negligible when I )1’„ is high but can be quite substantial in our results, since the observed values of DP„ vary from 18 to 38. The presence of excess dimer lowers DP„, while evaporation of dimer and trimer raises DP„ in comparison with values for which equation 9 was derived.
In Table III are listed some experiments to which eq. 9 can be applied. The variation in F' is small enough to be ignored in the experiments in which glassy polymer formed; dimerization rates were very small under these conditions. Thus, the observed values of DP„ will be higher than predicted by eq. (9) except for the possible 5% error in the measurement. If it is assumed that most probable distributions form during the reaction and if dimer and trimer are removed quantitatively in some cases but not at all in others, then the possible deviation of the observed DP„ from that calculated by eq. 7 is thought to be +1 unit and — 4 units.
By plotting DP„_1 versus Rv with due allowance for these uncertainties and extrapolating to Rv equal to zero one finds that k^%2 is 0.05 ± 0.01 at 11,400 atm. and 110°C. Thus, although the transfer constant is rather uncertain, it appears that transfer largely but not necessarily completely determines DP„, since k2/k 2F' and DP„_1 are about equal. Conclusions from the data at 8,000 atm. and 110°C are similar. Apparently, transfer is important under the other reaction conditions also because the overall variations in DP„ and D P / of the glassy polymers are factors of four and two, respectively whereas Rv varied by 30-fold. In the absence of transfer DP„ should vary by the same factor as Rp, assuming no change occurs in the ratio of disproportionation to combination.
It is necessary to compare values of [jj] in trying to judge the effect of monomer composition on DP„. The ratio of the intrinsic viscosity of

n-PERFLU OROPENTADIEN E-l ,4 1659
rubbery polymer to that of the glassy polymer formed at the same temperature, pressure, and intensity is 2.5. The compositions differ in the two types of polymer; this may affect the relation between fo] and DP„, so the ratio of DP„’s is unknown. However, DP„ of the rubber almost certainly is larger than that of the glass. If transfer determines DP„ eq. (9) predicts the ratio of DPM of the rubber to that of the glass will be the same as the ratio of the F' values; this is 2.1. The larger ratio of 5.3 is obtained if transfer is negligible and the other term of eq. (9) determines DPre.
Considering now the variation in the intrinsic viscosity of the rubbery polymer with intensity, at constant temperature and pressure, one sees that [77] decreased by a factor of 2.6 as R„ increased by a factor of 4.3. Polymer compositions are similar, and if the distributions are alike the ratio of DPm’s should be between 2.6 and 6.7 (i.e., 2.62), depending on the solvent power of C6F6. There is some difference in the values of F' for the two samples. Equation (9) predicts that DP„ will be lower at high intensity by a factor of 1.2 due to the ratio of F' values, if transfer controls DP„, and a factor of 7.4 if transfer is insignificant.
Thus, comparisons of DP„ of rubbery polymer with that of glassy polymer and with that of another sample of rubbery polymer suggest that transfer is not all-important. This would imply that the correct value of k^/ki is about at the lower limit of the range given above, i.e., it is 0.04 at 11,400 atm. and 110°C.
The specific reaction involving transfer is not established. Donation of an F atom from the radical to olefin is favored in fluorocarbon compounds containing one double bond.10 However, with the 1,4-diene abstraction of F by the radical from the center carbon gives a radical of abnormal stability, CF2= C F —CF—CF=CF2, and so may favor abstraction as the transfer process. Each donation of F to monomer introduces one perfluorovinyl group into the polymer; each abstraction introduces two such groups.
Polymer PyrolysisThe pyrolyses were performed in an attempt to satisfy a speculation
concerning polymer stability. This was that the branches not associated with the rings would contribute instability to the polymer. Since each unit of 1,3-diene in the polymer contains such a branch it was expected that the pyrolysis rate would increase with the content of 1,3-diene units. This was found to be the case, as seen in Figure 1. Effects of initial DP„' appear to be minor, in keeping with the observation that the monomer fraction formed during pyrolysis was small.11 The double bonds may also contribute to instability but the branches are involved to some extent because the saturated polymers of perfluoropropylene and perfluoroheptene-1 also decompose at 300°C.12 On the basis of the results in Figure 1, it is believed that a homocyclopolymer of the 1,4-diene would pyrolyze at a rate of about 1%/min. at 400°C. This is much better stability than exhibited by any fully fiuorinated polymer except polytetrafluoroethylene. Possibly the

1660 D. W. BROWN, J. E. FEARN, R. E. LOWRY
cyclic structure tends to prevent depropagation and so reduces the length of the kinetic chain.
References1. Butler, G. B., J . P o lym er S e i., 48, 279 (1960).2. Marvel, C. S., J . P o ly m e r S e i., 48, 101 (1960).3. Fearn, J. E., and L. A. Wall, S P E T ra n s ., 3, 231 (1963).4. Fearn, J. E., D. W. Brown, and L. A. Wall, J . P o ly m e r S e i., in press.5. Miller, W. T., Jr., W. Frass, and P. R. Resnick, ./. A m . C hem . Soc., 83, 1767
(1961).6. Wall, L. A., D. W. Brown, and R. E. Florin, paper presented to the Division of
Polymer Chemistry, 140th Meeting, American Chemical Society, Chicago, 111., September 1961; P re p rin t, 366.
7. Hamann, S. D., P hysico-C hem ica l E ffec ts o f P ressure , Academie Press, New York, 1957, p. 162-163.
8. Brown, D. W., and L. A. Wall, S P E T ra n s ., 3, 300 (1963).9. Flory, P. J., P rin c ip le s o f P o ly m e r C hem istry , Cornell University Press, Ithaca,
N. Ah, 1953, pp. 130-131.10. Bryant, W. M. D., J . P o ly m e r So i., 56, 277 (1962).11. Straus, S., private communication.12. Straus, S., and L. A. Wall, S P E T ra n s ., 4, 56 (1964).
RésuméOn a étudié la polymérisation, induite par radiation, du re-perfluoropentadiène-1,4
entre les températures de 100° et 170°C et aux pressions de 8.000 et 15.000 atm. La cinétique indique que la polymérisation a lieu par réaction radicalaire. L’énergie d’activation est de l’ordre de 14 à 17 kcal/môle et l’entropie d’activation de l’ordre de — 8 ± 5 u.e./môle. Le transfert sur monomère limite le degré de polymérisation moyen en nombe à une valeur de 40 ou moins, sauf dans des circonstances spéciales. Il se peut qu’il y ait une dimérisation ou une migration de la double soudure, il se forme, dans ce dernier cas, le diène-1,3 qui copolymérise avec le diène-1,4. Le diène-1,4 subit des additions cycliques jusqu’à ce que les polymères soient solubles et aient une légère insaturation perfluorovinylique. Les polymères sont soit cassants, soit élastiques et de haut poids moléculaire, suivant que la fraction de diène-1,3 dans les polymères est inférieure àO. 1 ou supérieure à 0.4. La stabilité thermique de ces polymères diminue par l’augmentation de la fraction de diène-1,3.
ZusammenfassungDie strahlungsinduzierte Polymerisation von n-Perfluorpentadien-1,4 wurde bei
Temperaturen zwischen 100 und 170°C und Drucken von 8.000 und 15.000 atm untersucht. Die kinetischen Ergebnisse zeigen, dass die Polymerization eine radikalische Reaktion ist; die Aktivierungsenergie liegt zwischen 14 und 17 kcal/Mol und die Aktivierungsentropie beträgt — 8 ± 5 EU/Mol. Übertragung mit dem Monomeren setzt das Zahlenmittel des Polymerisationsgrades mit Ausnahme besonderer Umstände auf Werte von 40 oder weniger herab, ln gewissem Ausmass tritt Dimerisierung und Doppelbindungswanderung auf; bei letzterem Prozess wird n-Perfluorpentadien-1,3 gebildet. Dieses und das 1,4-Dien copolymerisieren ; letzteres zeigt zyklische Addition, sodass die Polymeren löslich sind und nur wenige Perfluorvinyldoppelbindungen besitzen. Wenn der 1,3-Dienbruchteil im Polymeren geringer als 0,1 ist, sind die Polymeren spröde. Bei einem 1,3-Dienbruchteil grösser als 0,4 sind sie kautschukartig und besitzen beträchtlich höheres Molekulargewicht. Die thermische Stabilität der Polymeren nimmt mit steigendem 1,3-Diengehalt ab.
Received September 11, 1964 (Prod. No. 4543A)

JOURNAL OF POLYMER SCIENCE: PART A VOL. 3, No. 4 (1963)
NOTE
P oly-2,6-(m-phenylene)-3,5-dimethyl-Diimidasolebensene*
A variety of polybenzimidazoles has been made previously,1“1 and the remarkable thermal stabilities of such polymers containing benzimidazole nuclei as recurring units have been noted. An improvement of the oxidative stability of polybenzimidazoles was attempted by replacing hydrogen atoms on the nitrogen atom of the imidazole rings with methyl groups. This modified polybenzimidazole (I) was prepared by melt condensation of l,3-dimethylamino-4,6-diaminobenzene with diphenyl isophthalate.
Previously the analogous phenyl derivative had been made2 and very little difference was noted in the thermal and oxidative stabilities of the unsubstituted and substituted polymers. The thermogravimetric analysis of the methyl derivative made in air and in nitrogen (Fig. 1) shows that the decomposition in air appears to be slightly less than was observed for an unsubstituted related polymer and for the phenyl derivative.2 The thermal stability in nitrogen appears to be little affected by the methyl substitution.
Experimental
1.3- Dimethylamino-4,6-dinitrobenzene. l,3-DichIoro-4,6-dinitrobenzene5 (47.4 g., 0.2 mole), sodium acetate (32.8 g., 0.4 mole) and 100 ml. of nitrobenzene were placed in a 300-ml., three-necked flask, provided with a stirrer and inlet and outlet tubes and surrounded by an oil bath. The bottom of the inlet tube was kept slightly above the liquid surface to prevent clogging and the outlet tube was connected with a Liebig condenser. The oil bath was heated to 160°C., and, then, methylamine gas [which was freshly liberated by adding dropwise an aqueous solution of methylamine hydrochloride (54.4 g., 0.8 mole) onto sodium hydroxide (32.0 g., 0.8 mole)] was introduced through the inlet tube over 6 hr. Then 100 ml. of methanol was added to the mixture and the precipitate was collected on a filter, washed several times with water and then with hot methanol, and finally recrystallized from dimethylformamide-methanol (1:1). Light-brown crystals were obtained in 90% yield (40.6 g.), m.p. 320-321°C.
Anal. Calcd. for C8H10N4O4: C, 42.48%; H, 4.46%; N, 24.77%; 0,28.29% . Found: C, 42.38%; H, 4.46%; N, 24.74%; 0,28.48%.
1.3- Dimethylamino-4,6-diaminobenzene. Adams platinum catalyst (40 mg.), 1,3- dimethylamino-4,6-dinitrobenzene (3.0 g., 0.013 mole) and 60 ml. of glacial acetic acid were placed in a 250-ml. glass bottle. After replacing the atmosphere completely with hydrogen, the pressure was kept at 30 psi a t room temperature. The bottle was shaken for 24 hr. under these conditions. Then the reaction mixture was filtered, and the filtrate
* The work described herein was supported by Contract AF 33(657)9969 with the Materials Laboratory, Wright Air Development Division, Wright-Patterson Air Force Base, Ohio. This is the fifth paper on polybenzimidazoles. For the fourth paper see Foster and Marvel.4
16 6 1

1662 JOURNAL OR POLYMER SCIENCE, VOL. A3, ISSUE NO. 4 (1965)
Fig. 1. Thevmogravimetric analysis of poly-2,6-(m-phenylene )-3,5-dimethyldiimidazole-benzene.
poured directly into 60 ml. of ice-cold concentrated hydrochloric acid. This filtration was carried out in a nitrogen atmosphere without exposing the mixture to air because the resulting amine was readily oxidized. The l,3-dimethylamino-4,6-diammobenzene tet- rahydrochloride which precipitated was collected on a filter and then purified by dissolving in a minimum amount of water and pouring this solution into ice-cold concentrated hydrochloric acid. White crystals separated and were collected on a filter. The yield was 52% (2.14 g.), m.p. 152-155°C. (dec.).
Anal. Calcd. for C8H i8N4C14: C, 30.77%; H, 5.77%; N, 17.95%; Cl, 45.51%. Found: C, 30.S6%; H, 5.95%; N, 17.17%; Cl, 42.25%.
Into a 100-ml., three-necked flask, which was placed in an ice-water bath, 20 ml. of 20% sodium hydroxide solution in oxygen-free water was placed. The atmosphere in the flask was kept under nitrogen. Then a solution of the amine tetrahydrochloride (3.0 g., 0.01 mole) in 10 ml. of oxygen-free water was added and stirred for 1 hr. under these conditions. Yellow crystals of the free amine were precipitated, filtered off in a nitrogen atmosphere, and dried under vacuum. The yield was 58% (0.93 g.), m.p. 127-129°C. This amine always seemed to contain some inorganic residue as shown in the analysis.
Anal. Calcd. for C8H14N4: C, 57.83%,; H, 8.43%,; N, 33.74%. Found: C, 55.80%; H, 7.74%; N, 31.45%; residue, 2.74%.
Melt Condensation of l,3-Dimethylamino-4,6-diaminobenzene with Diphenyl Iso- phthalate. The general melt condensation procedure1 was used. Diphenyl isophthalate (1.775 g., 5.58 mmole) and l,3-dimethylamino-4,6-diaminobenzene (0.927 g., 5.58 mmole) were placed in a 100-ml. flask without exposing the amine to air. The mixture was heated in a nitrogen atmosphere for a 0.5 hr. at 280°C. and then under vacuum for another 0.5 hr. at the same temperature. The resulting prepolymer was pulverized and again heated under vacuum for 20 hr. at 350°C. A yellow-brown polymer was obtained. This was washed with hot 95% ethanol (reflux) for five days and then dried under vacuum at 150°C. The yield was 90% (1.3 g.).

NOTE 1663
A n a l . Calcd. for (CI6H12N4)X: C, 73.83%; H, 4.65%; N, 21.53%. Found: C, 73.92%; H, 5.06%; N, 20.97%.
The polymer was slightly hygroscopic, soluble in concentrated sulfuric acid, and partly soluble in dimethyl sulfoxide. The inherent viscosity was measured with 0.2% solution in concentrated sulfuric acid, giving 0.214 at 30°C.
References
1. Vogel, H., and C. S. Marvel, J . P o lym er S c i., 50, 511 (1961).2. Vogel, H., and C. S. Marvel, J . P o lym er S c i., Al, 1531 (1963).3. Plummer, L., and C. S. Marvel, J . P o lym er S c i., A2, 2559 (1964).4. Foster, R., and C. S. Marvel, J . P o lym er S c i., A3, 417 (1965).5. Nietzki, R.., and A. Schedler, Ber., 30, 1666 (1897).
K eiryo Mitsuhashi C. S. M arvel
Department of Chemistry University of Arizona Tucson, Arizona
Received July 31, 1964

JOÜRNAL OF POLYMER SCIENCE: PART A VOL. 3, NO. 4
ERRATUM
Kinetic Study of the Polymerization of a-d-Styrene and/or Styrene by Homogeneous Catalysis. P art I
(article in J . P o ly m e f[S c i., A2, 4113-4121, 1964)
By C. G. OVERBERGER, F. S. DIACHKOVSKY, andP. A. JAROVITZKY
Department of Chemistry, Polytechnic- Institute of Brooklyn, Brooklyn,New York
On page 4114, Equation (2) should read:
<Q V -c= ch2 (£85%)D
0 -
OHI
c - c h 3I
D
A1zQ3, 305"310°C. 5-10 cm. H g 0; N 2
1664