
The Journal of Physical Chemistry 1969 Volume.73 No.8
334
THE JOURNAL OF P H Y S I C A L C H E M I S T R Y Volume 73, Number 8 August 1969 Proton Magnetic Resonance Spectra of Tautomeric Substituted Pyridines and Their Conjugate A c id s ...................................................................................... R. H. Cox and A. A. Bothner-By 2465 Coloring of Alkaline Earth Sulfides Induced by Application of S h ea r ................................................... Sumio Sakka 2468 Nitrogen Isotope Effect in Transition Metal Hexaammine Complex-Ammonia Systems. A Theoretical Consideration.............................................................. ... M. Jeevanandam and A. R. Gupta 2472 Spin-Free Quantum Chemistry. VI. Spin Conservation....................................... F. A. Matsen and D. J. Klein 2477 Spin-Free Quantum Chemistry. VII. The Slater Determinant........................... F. A. Matsen and A. A. Cantu 2488 Spin-Free Quantum Chemistry. VIII. The Crystal Field Problem................... F. A. Matsen and M. L. Ellzey 2495 Luminescence of Chromium(III) Compounds.......................................................... J. C. Hempel and F. A. Matsen 2502 Gas-Phase Reactions of Cyclohexene with Highly Energetic Tritium . . . Robert W. Weeks, Jr., and John K. Garland 2508 Energy Transfer to the Triplet Level of A)l-trans Retinal........................... Anthony V. Guzzo and Gary L. Pool 2512 The Dissociation of Lithium and Sodium Tetramethylaluminate in Solution . . E. S. Gore and H. S. Gutowsky 2515 High-Temperature Equilibria from Plasma Sources. I. Carbon-Hydrogen-Oxygen Systems . . . C. K. Weiffenbach, P. R. Griffiths, P. J. Schuhmann, and E. R. Lippincott 2526 High-Temperatrue Equilibria from Plasma Sources. II. Hydrocarbon Systems . . . P. R. Griffiths, P. J. Schuhmann, and E. R. Lippincott 2532 Recoil Reaction Products of Carbon-11 in Simple Aromatic Compounds . . . Ronald L. Williams and Adolf F. Voigt 2538 Temperature Dependence of the Phosphorescence Lifetime of Benzene and n-Alkylbenzenes between 4.2 and 1 0 0 °K ............................... ... Ingo H. Leubner and Joe E. Hodgkins 2545 Infrared Spectroscopic Investigation of Zeolites and Adsorbed Molecules. IV. Acetonitrile . . . C. L. Angell and M. V. Howell 2551 Pyrolysis Kinetics of Acetonitrile ........................................................... Thomas W. Asmus and Thomas J. Houser 2555 Ultraviolet Study for the Adsorption of Pyridine and 2,2'-Bipyridyl on Evaporated Metal Films . . . Kosaku Kishi and Shigero Ikeda 2559 Radiolysis of HCOOH + 0 2at pH 1.3-13 and the Yields of Primary Products in 7 Radiolysis of W ater................................................ I. G. Draganic, M. T. Nenadovic, and Z. D. Draganic 2564 On the Origin of Primary Hydrogen Peroxide Yield in the y Radiolysis of Water . . . Z. D. Draganic and I. G. Draganic 2571 General Nonequilibrium Theory of Chromatography with Complex Flow Transport . . . J. Calvin Giddings and Paul D. Schettler 2577 Application of the Nonequilibrium Theory of Chromatography to a Variable Flow Correlation Model of Complex Flow and Coupling....................Paul D. Schettler and J. Calvin Giddings 2582 Electron Spin Resonance Kinetic Studies of Two Dimethoxymethane Radicals in Aqueous Solution . . . Eileen L. Lewis and F. Sicilio 2590 The Effects of Magnetic Exchange Interactions on the Rates of Electron-Transfer Reactions . . John F. Endicott 2594 Further Observations on the Electrical Properties of Hemoglobin-Bound Water . . . Bernard E. Pennock and Herman P. Schwan 2600 Dimerization of Triphenylamine Cation Radicals. Evaluation of Kinetics Using the Rotating Disk Electrode............................................... L. S. Marcoux, R. N. Adams, and S. W. Feldberg 2617 31
-
Upload
khangminh22 -
Category
Documents
-
view
3 -
download
0
Transcript of The Journal of Physical Chemistry 1969 Volume.73 No.8

T H E J O U R N A L O F
P H Y S I C A L C H E M I S T R Y
V o l u m e 7 3 , N u m b e r 8 A u g u s t 1 9 6 9
Proton Magnetic Resonance Spectra of Tautomeric Substituted Pyridines andTheir Conjugate Acids......................................................................................R. H. Cox and A. A. Bothner-By 2465
Coloring of Alkaline Earth Sulfides Induced by Application of Shear...................................................Sumio Sakka 2468Nitrogen Isotope Effect in Transition Metal Hexaammine Complex-Ammonia Systems.
A Theoretical Consideration.............................................................. ... M. Jeevanandam and A. R. Gupta 2472Spin-Free Quantum Chemistry. VI. Spin Conservation.......................................F. A. Matsen and D. J. Klein 2477Spin-Free Quantum Chemistry. VII. The Slater Determinant........................... F. A. Matsen and A. A. Cantu 2488Spin-Free Quantum Chemistry. VIII. The Crystal Field Problem................... F. A. Matsen and M. L. Ellzey 2495Luminescence of Chromium(III) Compounds.......................................................... J. C. Hempel and F. A. Matsen 2502Gas-Phase Reactions of Cyclohexene with Highly Energetic Tritium
. . . Robert W. Weeks, Jr., and John K. Garland 2508Energy Transfer to the Triplet Level of A )l-tra n s Retinal........................... Anthony V. Guzzo and Gary L. Pool 2512The Dissociation of Lithium and Sodium Tetramethylaluminate in Solution . . E. S. Gore and H. S. Gutowsky 2515High-Temperature Equilibria from Plasma Sources. I. Carbon-Hydrogen-Oxygen Systems
. . . C. K. Weiffenbach, P. R. Griffiths, P. J. Schuhmann, and E. R. Lippincott 2526High-Tempera true Equilibria from Plasma Sources. II. Hydrocarbon Systems
. . . P. R. Griffiths, P. J. Schuhmann, and E. R. Lippincott 2532Recoil Reaction Products of Carbon-11 in Simple Aromatic Compounds
. . . Ronald L. Williams and Adolf F. Voigt 2538Temperature Dependence of the Phosphorescence Lifetime of Benzene and
n-Alkylbenzenes between 4.2 and 100°K ............................... ... Ingo H. Leubner and Joe E. Hodgkins 2545Infrared Spectroscopic Investigation of Zeolites and Adsorbed Molecules. IV. Acetonitrile
. . . C. L. Angell and M. V. Howell 2551Pyrolysis Kinetics of Acetonitrile ...........................................................Thomas W. Asmus and Thomas J. Houser 2555Ultraviolet Study for the Adsorption of Pyridine and 2,2'-Bipyridyl on Evaporated Metal Films
. . . Kosaku Kishi and Shigero Ikeda 2559
Radiolysis of HCOOH + 0 2 at pH 1.3-13 and the Yields of Primary Products in7 Radiolysis of Water................................................ I. G. Draganic, M. T. Nenadovic, and Z. D. Draganic 2564
On the Origin of Primary Hydrogen Peroxide Yield in the y Radiolysis of Water. . . Z. D. Draganic and I. G. Draganic 2571
General Nonequilibrium Theory of Chromatography with Complex Flow Transport. . . J. Calvin Giddings and Paul D. Schettler 2577
Application of the Nonequilibrium Theory of Chromatography to a Variable FlowCorrelation Model of Complex Flow and Coupling....................Paul D. Schettler and J. Calvin Giddings 2582
Electron Spin Resonance Kinetic Studies of Two Dimethoxymethane Radicals in Aqueous Solution. . . Eileen L. Lewis and F. Sicilio 2590
The Effects of Magnetic Exchange Interactions on the Rates of Electron-Transfer Reactions . . John F. Endicott 2594Further Observations on the Electrical Properties of Hemoglobin-Bound Water
. . . Bernard E. Pennock and Herman P. Schwan 2600
Dimerization of Triphenylamine Cation Radicals. Evaluation of Kinetics Usingthe Rotating Disk Electrode...............................................L. S. Marcoux, R. N. Adams, and S. W. Feldberg 2617
31

The Conductance of Solutions of Cesium in Liquid Ammonia................................................. Robert R. DewaldElectrical Conductances and Ionization Behavior of Sodium Chloride in
Dioxane-Water Mixtures at 100°...............................................Lawrence A. Dunn and William L. MarshallChronoamperometric Determination of the Rate of Dimerization of Some
Substituted Triphenylamine Cation Radicals.........................Robert F. Nelson and Stephen W. FeldbergThermodynamics of Micellization of Some Zwitterionic N-Alkyl Betaines . . . . J. Swarbrick and J. DaruwalaFlash Photolysis of Camphorquinone and Biacetyl..................... Ajit Singh, A. R. Scott, and F. SopchyshynHeats of Formation of the Acetyl Halides and of the Acetyl Radical . .Jerald A. Devore and H. Edward O’NealEffect of Cation on the Nuclear Magnetic Resonance Spectrum of Fluorenyl Carbanion . . . . Richard H. CoxDouble-Layer Effects in the Kinetics of Heterogeneous Electron Exchange Reactions . . . . David M. MohilnerElectron Spin Resonance Spectra of Peroxy Radicals Trapped in a 7 -Irradiated Single
Crystal of Trifluoroacetamide........................................................ Kazumi Toriyama and Machio IwasakiCharge-Transfer Interaction and Chemical Reaction. I. Reaction of Aniline with Chloranil
. . . Takashi Nogami, Keitaro Yoshihara, Haruo Hosoya, and Saburo NagakuraCharge Scavenging and Energy Transfer in 7 Radiolysis of Benzene Solutions
. . . Robert R. Hentz and Warren V. ShermanThe Solubility of Hydrogen Chloride in Ice................................................. P. N. Krishnan and R. E. SalomonThe Thermal Dissociation of Chlorine Trifluoride behind Incident Shock Waves
. . . J. A. Blauer, H. G. McMath, and F. C. JayeNuclear Magnetic Resonance of Oxygen-17 and Chlorine-35 in Aqueous Hydrochloric Acid Solutions of
Cobalt (II). II. Relaxation and Chemical Exchange. . . A. H. Zeltmann, N. A. Matwiyoff, and L. O. Morgan
Nuclear Magnetic Resonance Studies of Internal Rotation in Aliphatic Tertiary Amides. . . Laurine L. Graham and Ronald E. Diel
Photo- and Thermal Initiator Efficiency of 2,2'-Azobisisobutyronitrile at 25 ° . . R. D. Burkhart and J. C. MerrillRadical-Radical Reactions in Different Solvents. Propyl, Cyclohexyl, and Benzyl Radicals . . . R. D. BurkhartThe 7 -Ray Radiolysis of Monosilane and Monosilane-Ethylene Mixtures . . . J. F. Schmidt and F. W. LampeStudies of Contact and Solvent-Separated Ion Pairs of Cabanions. VI. Conductivities and
Thermodynamics of Dissociation of Fluorenyl Alkali Salts in Tetrahydrofuran and Dimethoxyethane. . . T. Ellingsen and J. Smid
Physical Adsorption Isotherms Extending from Ultrahigh Vacuum to Vapor Pressure..................... J. P. HobsonOsmotic and Activity Coefficients of the Group V Tetraphenyl Salts in Aqueous Solution
. . . George Kalfoglou and L. H. BowenGaseous Phosphorus Compounds. III. Mass Spectrometric Study of the Reaction between Diatomic Nitrogen
and Phosphorus Vapor and Dissociation Energy of Phosphorus Mononitride and Diatomic Phosphorus. . . Karl A. Gingerieh
Radiolysis of Ethanol Adsorbed on Silica............................................................Lloyd Abrams and A. O. AllenReactions of Radicals Containing Fluorine. V. The Addition of Trifluoromethyl Radicals to Ethylene
. . . J. M. Sangster and J. C. J. ThynneElectron Scavenging in Methanol-Water at 77 ° K ................................Takeshi Sawai and William H. HamillKinetic Isotope Effects in Nonequilibrium Thermal Unimolecular Systems.
Ethyl Isocyanide-ds.......................................Kenneth M. Maloney, S. P. Pavlou, and B. S. RabinovitchThe Solubility of Aromatic Hydrocarbons in Aqueous Solutions of Complex Ion Electrolytes
. . . W. L. Masterton, Tei Pei Lee, and R, L. BoyingtonCatalytic Polarographic Current of a Metal Complex. VII. Determination of the Charge of the
Electroactive Species for the o-Phenylenediamine-Nickel(II) Prewave. . . Lowell R. McCoy and Harry B. Mark, Jr.
Infrared Spectra of the Dichloro- and Dibromophosphinyl Radicals in Solid Argon. . . Lester Andrews and Donald L. Frederick
NOTESRadiative Neutron Capture Organic Yields as an Indication of the State of Aggregation of IC1
and I2 in C e-Hydrocarbon Matrices at 77 °K................. R. M. Lambrecht, H. K. J. Hahn, and E. P. RackChemistry of Crystalline Aluminosilicates. VI. Preparation and Properties of Ultrastable Hydrogen Zeolite Y
. . . George T. Kerr
2615
2619
262326272633264426492652
2663
2670
26762680
2683
2689
2696269927032706
27122720
2728
27342741
27462750
2756
2761
2764
2774
2779
2780
4 A • The Journal o f P hysica l Chem istry

Ionic Diffusion under High Pressure in Porous Solid Materials Permeated withAqueous, Electrolytic Solution .............................................................. R . A. H orne, A . F. Day, and R . P. Y ou n g 2782
Viscosities o f Protonated and Deuterated Water Solutions o f Alkali Metal Chlorides. . . A. G . Ostroff, B. S. Snow den, Jr., and D. E. W oessner 2784
The Electrochemiluminescence of the Diphenylanthracene Radical Anion. . . M ichael D. M albin and Harry B. M ark, Jr. 2786
Molecular Orbital Theory o f Electron Donor-Acceptor Complexes. III. The Relationship of State Energies and Stabilization Energies to the Charge-Transfer Transition Energy
. . . R obert L. F lurry, Jr., and Peter Politzer 2787
COM M UNICATIONS TO THE EDITOR
Temperature-Dependent Methoxyl and Hydroxyl Splitting Constants in the ElectronSpin Resonance Spectra o f Cation R adica ls....................................................................................... Paul D. Sullivan 2790
The Electron Attachment Cross Section for Hexafluoroacetone............................. P . H arland and J. C. J. T hyn n e 2791
Comments on “ The Electrical Conductivity of Boron Trifluoride in Pure andMixed Halogen Fluorides,” by M . S. Toy and W . A. C a n n o n ...................................................... K arl O. Christe 2792
Misstatements o f Thermodynamic Properties of Tetracyanoethylene-Aromatic Donor Molecular Compounds. . . W illiam C. H erndon and R ichard D. G ood in 2793
Volum e 73, N um ber 8 A ugust 1969 • 5A

A U T H O R I N D E X
Abrams, L., 2741 Adams, R. N., 2611 Allen, A. O., 2741 Andrews, L., 2774 Angeli, C. L„ 2551 Asmus, T. W., 2555
Blauer, J. A., 2683 Bothner-By, A. A., 2465 Bowen, L. H., 2728 Boyington, R. L., 2761 Burkhart, R. D., 2699,
2703
Cantu, A. A., 2488 Christe, K. O., 2792 Cox, R. H., 2465, 2649
Daruwala, J., 2627 Day, A. F., 2782 Devore, J. A., 2644 Dewald, R. R., 2615 Diel, R. E., 2696 Draganic, I. G., 2564,
2571Draganic, Z. D., 2564,
2571Dünn, L. A., 2619
Ellingsen, T., 2712
Ellzey, M. L., 2495 Houser, T. J„ 2555 Endicott, J. F., 2594 Howell, M. V., 2551
Feldberg, S. W., 2611, ïkeda, S., 2559 2623 Iwasaki, M., 2663
Flurry, R. L., Jr., 2787 Frederick, D. L., 2774 Jaye, F. C., 2683
Jeevanandam, M., 2472Garland, J K 2508 Kalfoglou, G., 2728Giddmgs, J. C., 2577, Kerr, q. t 2780
2582 Kishi, K., 2559Gmgench, K. A„ 2734 Klein, D. J., 2477 Goodm, R. D., 2793 Krishnan, P. N., 2680 Gore, E. S., 2515Graham, L. L., 2696 Lambrecht, R. M., 2779 Griffiths, P. R., 2526, Lampe, F. W., 2706
2532 Lee, T. P., 2761Gupta, A. R., 2472 Leubner, I. H., 2545 Gutowsky, H. S., 2515 Lewis, E. L., 2590 Guzzo, A. V., 2512 Lippincott, E. R., 2526,
Matwiyoff, N. A., 2689 McCoy, L. R., 2764 McMath, H. G., 2683 Merrill, J. C., 2699 Mohilner, D. M., 2652 Morgan, L. O., 2689
Nagakura, S., 2670 Nelson, R. F., 2623 Nenadovic, M. T., 2564 Nogami, T., 2670
O’Neal, H. E., 2644 Ostroff, A. G., 2784
Pavlou, S. P., 2756 Pennock, B. E., 2600 Politzer, P., 2787 Pool, G. L., 2512
Hahn, H. K. J., 2779 Hamill, W. H„ 2750 Harland, P., 2791 Hempel, J. C., 2502 Hentz, R. R., 2676 Herndon, W. C„ 2793 Hobson, J. P„ 2720 Hodgkins, J. E., 2545 Horne, R. A., 2782 Hosoya, H., 2670
2532Malbin, M. D., 2786 Maloney, K. M., 2756 Marcoux, L. S., 2611 Mark, H. B., Jr., 2764,
2786Marshall, W. L., 2619 Masterton, W. L., 2761 Matsen, F. A., 2477,
2488, 2495, 2502
Rabinovitch, B. S., 2756 Rack, E. P., 2779
Sakka, S., 2468 Salomon, R. E., 2680 Sangster, J. M., 2746 Sawai, T., 2750 Schettler, P. D„ 2577,
2582Schmidt, J. F„ 2706
Schuhmann, P. J., 2526, 2532
Schwan, H. P., 2600 Scott, A. R., 2633 Sherman, W. V., 2676 Sicilio, F., 2590 Singh, A., 2633 Smid, J., 2712 Snowden, B. S., Jr.,
2784Sopchyshyn, F., 2633 Sullivan, P. D., 2790 Swarbrick, J., 2627
Thynne, J. C. J., 2746, 2791
Toriyama, K., 2663
Voigt, A. F., 2538
Weeks, R. W., Jr., 2508 Weiffenbach, C. K.,
2526Williams, R. L., 2538 Woessner, D. E., 2784
Yoshihara, K., 2670 Young, R. P., 2782
Zeltmann, A. H., 2689
6 A • The Journal o f P h ysica l Chem istry

P H Y S I C A L C H E M I S T R YRegistered in U. S. Patent Office © Copyright, 1969, by the American Chemical Society
T H E J O U R N A L O F
VOLUME 73, NUMBER 8 AUGUST 1969
Proton Magnetic Resonance Spectra of Tautom eric Substituted
Pyridines and Th e ir Conjugate Acids
by R. H. Cox and A. A. Bothner-ByMellon Institute, Carnegie-Mellon University, Pittsburgh, Pennsylvania 16213 (Received February 14-, 1969)
The nmr spectra of 2-pyridone, N-methyl-2-pyridone, 2-chloro-, 2-amino-, and 2-methoxypyridine have been analyzed completely in terms of chemical shifts and coupling constants. Spectra were obtained of these materials in both neutral and acidic solution. The spectra of the sodium salt of 2-pyridone and of sodium 2-pyrazinol were also analyzed. The parameters obtained confirm the protonation of 2-pyridone at oxygen.
IntroductionThe existence of 2-pyridone (2-hydroxypyridine) in
the amide form (II) in neutral soltition has been firmly established by various spectroscopic techniques.1 However, a controversy has arisen concerning the structure of the protonated form. Results from uv2’8 studies have been taken as indicating O-protonation(IV ). Previously, the ir4 spectrum of the solid hydrochloride was interpreted as indicating N-protonation(III). The ir spectrum of the hydrochloride in the solid state and the Raman spectrum in aqueous solution were later determined and presented as evidence for N-protonation (III).6 Similar arguments were presented by each investigator for the structure of the conjugate acid of 4-hydroxypyridine. The ir spectra of some metallic salts6 of 2-pyridone and some salts of N-methyl-2-pyridone7 have indicated oxygen protonation.
Information regarding the site of protonation and electronic redistribution within a molecule upon protonation may be obtained from nmr spectroscopy. Hitherto, emphasis has been mainly on the chemical shift changes, but recently it has been shown that variations of H -H coupling constants also reflect changes in a molecule upon protonation.8 Nmr results obtained from the cation of 4-pyridone in sulfuric acid910 and of the hydrochloride in sulfur dioxide11 indicate that 4-pyridone is protonated predominantly at the oxygen atom.
Some substituted 2-pyridone cations have also been examined by nmr providing conclusive evidence for predominant O-protonation.12
HI n
nr IE
•yrr vnT
2465

2466 R . H . C o x a n d A . A . B o t h n e r - B y
Table I : Nmr Parameters of 2-Substituted Pyridines
H(4)(5) Hss A > H (3 )
(6) H ^ N ^ x
Sub-stituent Solvent Vi VS V6 Jub J 85 J 36 Ju Ja Jit
2-NH2 d2o 533.00 612.11 532.41 665.56 8.38 1.03 0.87 7.19 1.94 5.24(656.10) (735.21) (655.51) (788.66)
D20-DC1c 578.65 666.85 567.52 656.37 9.07 1.08 0.86 7.17 1.69 6.56(705.15) (793.35) (694.02) (782.87)
2-C1 ecu 725.70 759.21 716.15 831.97 7.98 0.97 0.88 7.41 1.97 4.83TFA11 812.41 865.98 808.45 878.72 8.40 1.12 0.70 7.77 1.82 6.04
2-OMe TFA 754.21 855.38 756.08 832.59 8.86 1.05 0.23 7.44 1.83 6.45ecu 663.07 744.20 674.25 806.71 8.32 0.96 0.79 7.10 1.99 5.07
2-OH CDCU 658.56 746.15 627.58 741.11 9.21 1.18 0.76 6.76 2.09 6.51DjO-DCF 608.99 708.63 614.56 694.58 8.89 1.04 0.78 7.38 1.90 6.29
(735.49) (835.13) (741.06) (821.08)D20-NaODc 520.22 622.06 526.80 660.58 8.63 1.03 0.82 6.95 2.25 5.26
(643.42) (745.26) (650.00) (783.78)N-Methyl, CDCU 653.90 731.66 614.72 732.06 9.18 1.38 0.63 6.66 2.09 6.76
2-OHTFA4 749.46 824.29 736.71 815.36 8.72 1.25 0.65 7.40 1.76 6.55
Pyrazine V3 vt V* J 35 J 88 J582-ONa 772.54 740.99 776.89 -0.08 1.41 2.99° In Hz from TMS or i-butyl alcohol (see ref 19), at 100 MHz. h In Hertz. c 2.5 N solution. d TFA = trifluoroacetic acid.
Since substituent effects on the tautomerism of 2-pyr- idone are quite large,13 it seemed desirable to investigate the site of protonation of the parent compound 2-pyri- done. In this paper we report the complete analysis of the proton nmr spectra of 2-pyridone, its N- andO-methyl derivatives, and of 2-amino- and 2-chIoropyr- idine. A few of these compounds have been examined earlier either with the determination of approximate coupling constants or with only the chemical shifts being reported.14-17 In this investigation, spectra were obtained for each compound in neutral and in acidic solutions. Analysis of the anion of 2-pyridone and of the sodium salt of 2-hydroxypyrazine are also reported. Protonation effects on the nmr parameters and possible structures for the cation and anion of 2-pyridone are discussed.
Experimental SectionMaterials. All compounds used in this investigation
were of commercial origin. 2-Aminopyridine was recrystallized from carbon tetrachloride and 2-pyridone from diethyl ether. The other compounds were used as received. Samples were made up gravimetrically to 10 mol % solution. Tetramethylsilane (2%) was added and used as an internal reference and lock signal source, except for the aqueous solutions where 2% ¿-butyl alcohol was substituted. All samples were degassed and sealed under vacuum. No impurity peaks were observed in any of the spectra examined.
Proton nmr spectra were obtained using a Varian As
sociates HA-100 spectrometer. Frequency-sweep spindecoupling experiments were performed using a Hewlett-Packard 201 CR audio oscillator monitored by a Varían V-4315 frequency counter. Calibration of spectra was by the usual side-band method. Line positions were obtained by averaging the results of two upheld and two downfield scans. A scan width of 50 Hz was employed with a sweep time of 1000 sec.
(1) "Physical Methods in Heterocyclic Chemistry,” Vol. II, A. R. Katritzky, Ed., New York, N. Y ., 1963.(2) S. F. Mason, J. Chem. Soc., 1253 (1959).(3) S. F. Mason, ibid., 5010 (1957).(4) P. Sensi and G. G. Gallo, Ann. Chim. (Rome), 44, 232 (1954).(5) E. Spinner, J. Chem. Soc., 1226 (1960).(6) C. L. Bell, J. Shoffner, and L. Bauer, Chem. In i. (London), 1353 (1963).(7) D. Cook, Can. J. Chem., 43, 749 (1965).(8) M. H. Palmer and B. Semple, Chem. Ind. (London), 1766 (1965).(9) R. A. Y . Jones, A. R. Katritzky, and J. M. Lagowski, ibid., 870 (1960).(10) P. J. Van Der Haak and T. J. de Boer, Rec. Trav. Chim., 83, 186 (1964).(11) A. R. Katritzky and R. A. Y. Jones, Proc. Chem. Soc. (London), 313 (1960).(12) A. R. Katritzky and R. E. Reavill, J. Chem. Soc., 753 (1963).(13) A. R. Katritzky, J. D. Rowe, and S. K. Roy, ibid., 758 (1967).(14) M. Freymann, R. Freymann, and D. Libermann, Compt. Rend., 250, 2186 (1961).(15) W. Brùgel, Z. Elektrochem., 66, 159 (1961).(16) V. J. Kowalewski and D. G. de Kowalewski, J. Chem. Phyi., 37, 2603 (1962).(17) J. A. Elvidge and L. M. Jackman, J. Chem. Soc., 859 (1961).
The Journal o f Physica l Chem istry

P m r S p e c t r a o f T a u t o m e r ic S u b s t it u t e d P y r id i n e s
ResultsSpectra were analyzed in terms of chemical shifts and
coupling constants using the computer program l a - o c n 3 .18 The results are presented in Table I. Differences between the observed and calculated line positions were, on the average, 0.05 Hz. The calculated probable errors for the parameters were always less than 0.03 Hz. The signs of the coupling constants were assumed to be positive. Although signals from proton 6 are broadened slightly due to residual coupling with the nitrogen atom, resolution was sufficient to observe the expected lines without recourse to heteronuclear spin decoupling. However, in the case of N-methyl-2-pyridone, there is a small coupling between the ring and methyl protons and spectra of this compound were recorded while irradiating the methyl signal.
DiscussionThe use of a common solvent for the neutral solutions
was frustrated by limited solubilities. In trifluoro- acetic acid, the signals of 2-pyridone are not resolved clearly making it necessary to use the D20 and DC1 solvent system. In D 20, well-resolved lines are observed. Chemical shifts obtained from aqueous solutions have been adjusted19 to make comparisons more meaningful (values given in parentheses in Table I). Therefore comparisons between chemical shifts are qualitative. Nevertheless, quantitative comparisons between coupling constants can be made since solvent has very little effect on coupling constants of nontautomeric pyridines.20
Several trends are apparent from comparison of data from neutral solutions in Table I. In general, the chemical shifts of the substituted pyridines appear to lower field as the electronegativity of the substituent is increased. The chemical shift of proton 4 for 2-pyridone and N-methyl-2-pyridone is very close to that of proton 6, whereas for 2-amino-, 2-methoxy-,21 and 2-chloropyri- dine, proton 4 has a chemical shift intermediate between that of protons 3 and 5 and proton 6. Also, the chemical shift of proton 5 and 6 of the pyridones is to higher field by -~0.6 ppm than the corresponding shifts in the other pyridines. This identical behavior has also been observed for the monosubstituted pyrazines.22 As for comparisons of the coupling constants, Ju and Jm appear to be the most revealing. Tor the normal 2-sub- stituted pyridines, Ju is 7.98-8.38 Hz and increases to ~9.20 Hz in the 2-pyridones. Similarly, Jm is 4.83-5.24 Hz in the normal 2-substituted pyridines and increases to 6.51-6.76 Hz in the 2-pyridones. This increase in magnitude for Ju and Jm of the 2-pyridones compared to their values in the other 2-substituted pyridines is the trend expected since the 2-pyridones have more double-bond character between these positions than do the normal 2-substituted pyridines.
The parameters found for 2-amino-, 2-methoxy-,21 and 2-chloropyridine are similar and clearly indicate
that 2-aminopyridine exists predominantly as a normal pyridine (V) rather than in the imin form (VI). Identical conclusions have been reached from ir and other evidence.23 Clearly the parameters obtained for 2-pyr- idone are more similar to those obtained for 2-methoxy- pyridine (Table I). Thus, like ir and uv,1 nmr spectroscopy confirms the existence of 2-pyridone predominantly in the amide (II) form in neutral solution. Furthermore, the low-field value of 12.05 ppm for the chemical shift of the N -H proton of 2-pyridone suggests that this compound exists as hydrogen-bonded dimers in solution similar to that found in the crystalline state.24
All protons, with the exception of proton 6 of 2-aminopyridine, are shifted to lower field upon protonation. The magnitude of these changes is similar to those found for pyridine.25 The factors responsible for these lower field shifts are complex and do not allow a quantitative interpretation at this time. However, the chemical shifts observed for the protonated 2-pyridones are very close to those obtained for protonated 2-methoxy- pyridine in contrast to their opposite behavior in neutral solution. It appears from the chemical shift values, as if the protonated 2-pyridones are behaving as normal protonated 2-substituted pyridines.
All coupling constants are affected by protonation with the largest change being observed for the vicinal coupling Jm- Upon protonation of 2-chloro-, 2-amino-, and 2-methoxy pyridine, ./34 increases by about 0.5 Hz, J45 increases by ~ 0 .3 Hz, and Jm increases by 1.2-1.4 Hz. These variations are similar to those observed for the respective couplings in pyridine,25 both in magnitude and direction. For the 2-pyridones we observe that Ju decreases by ~0 .3 Hz, J45 increases by ~0 .6 Hz, and Jm decreases by -~0.2 Hz upon protonation. From these observations it appears that the 2-pyridones are behaving differently from the normal 2-substituted pyridines upon protonation. Castellano26 has recently reported that for a series of N-substituted pyridines, J56 increases as the electronegativity of the N-sub- stituent is increased. Therefore, one would expect Jm
(18) A more efficient version of the program laocoon II, described by S. M. Castellano and A. A. Bothner-By, J. Chem. Phys., 41, 3863 (1964).(19) R. J. Abraham and W. A. Thomas, J. Chem. Soc., 3739 (1964). The following have been added to the chemical shifts where f-butyl alcohol was used as internal reference: acid, 1.265 ppm; neutral, 1.231 ppm; alkaline, 1.232 ppm.(20) J. A. Ladd and V. I. P. Jones, Spectrochim. Acta, 23A, 2791(1967) .(21) S. Castellano and R. Kostelnik, private communication. The coupling constants for 2-methoxypyridine are Ju = 8.32, Ju = 0.96, Jae = 0.79, Js:, = 7.10, Ju — 1.99, and Jm = 5.07 Hz.(22) R. H. Cox and A. A. Bothner-By, J. Phys. Chem., 72, 1646(1968) .(23) A. R. Katritzky and J. M. Lagowski in "Advances in Heterocyclic Chemistry,” Vol. I, Academic Press, Inc., New York, N. Y., 1962.(24) B. R. Penfold, Acta Cryst., 6, 591 (1953).(25) J. B. Merry and J. H. Goldstein, J. Amer. Chem. Soc., 88, 5560 (1966).(26) S. Castellano and R. J. Kostelnik, ibid., in press.
2467
Volum e 73, N um ber 8 August 1969

2468 S u m i ó S a k k a
of the 2-pyridones to increase if protonation takes place at nitrogen, rather than decrease as is observed. From a comparison of coupling constants (Table I) for proton- ated 2-methoxypyridine and the 2-pyridones, the similarity between these parameters, like the chemical shift data, would suggest that the protonated 2-pyridones have structures similar to that of protonated 2-me- thoxypyridine. Therefore, the nmr data are consistent only with protonation of the 2-pyridones taking place at oxygen (IV).2’3'6'7'12
As for the anion of 2-pyridone, two canonical structures may be drawn differing in the location of the charge. The chemical shift of proton 4 of the anion has a value intermediate between that of proton 6 and protons 3 and 5; i.e., the anion is similar to a normal pyridine. Furthermore, the magnitude of J 56 has decreased by 1.25 Hz (relative to neutral 2-pyridone) to 5.26 Hz which is similar to the value of ./6b in neutral 2-methoxypyridine (5.07 Hz). The value of J34 has also decreased in magnitude. Considering the above resonance forms as isolated structures, one would expect a decrease in J56 (relative to 2-pyridone) for both structures using 2-pyridone and 2-methoxypyridine as models for the
coupling J34, one would expect a value of ~ 8 .4 for VIII and a value of ~9 .2 for VII. The observed value is 8.63. To obtain further information, we have analyzed the nmr spectrum of sodium 2-pyrazinol in methanol solution (Table I). In this solvent ionization of the salt is not expected to a very large degree. The parameters obtained are almost identical with those obtained for 2-methoxypyrazine, indicating an aromatic rather than an amide structure. Therefore, in view of the similarity between the coupling constants of the anion of 2-pyridone and those of neutral 2-methoxypyridine and the upheld shift of proton 4 in the anion, the nmr data are consistent only with the majority of the negative charge residing on oxygen in the anion of 2-pyridone. These results are similar to those obtained from an ir study on the solid sodium salt of 2-pyridone.27
Acknowledgment. This research was performed with support from the National Institutes of Health under Grant FR-00292. We wish to thank Mr. R. H. Obenauf for technical assistance.
(27) J. A. Gibson, W . Kaynoston, and A. S. Lindsey, J. Chem. Soc., 4340 (1955).
Coloring of A lkaline Earth Sulfides Induced by Application of Shear
by Sumio SakkaMaterials Division, Rensselaer Polytechnic Institute, Troy, New York (Received April 22, 1968)
Alkaline earth sulfide powders such as CaS, SrS, and BaS have been found to be sensitive in coloring behavior to the application of shear; first, these powders are weakly colored by grinding, and second, they become photosensitive. Thus, as a result of grinding and subsequent exposure to ultraviolet light, CaS, SrS, and BaS powders develop absorption bands in the visible region, peak wavelengths being at 500. 550, and 670 my, respectively. Possible mechanisms of coloring are discussed.
IntroductionAlkaline earth sulfides, such as CaS, SrS, and BaS
doped with Ce, Mn, Eu, Sm, etc., have been known as infrared-sensitive phosphors, and much work has been done on the luminescent properties of these substances.1 As to the coloring behavior, Mourelo2 reported that CaS and SrS doped with Mn or Mn + Bi in amounts from 0.001 to 0.01% are phototropic, namely, white powders become pink or purple when exposed to direct sunlight and the darkened powders come back reversibly to the original white state when they are kept for a few minutes under diffuse (indirect) sunlight. However, the sulfides prepared in our laboratory did not show this phototropic property, in contrast to the
results of Mourelo. Instead, an interesting behavior was observed in our materials; the alkaline earth sulfides were very sensitive to mechanical shear in their coloring behavior, changing the color by application of shear and becoming photosensitive. This paper is mainly concerned with this matter. Also some attempts are made to explain the phototropy of alkaline earth sulfides as observed by Mourelo.
(1) G. Garlick, “ Luminescent Materials,” Clarendon Press, 1949; G. Fonda and F. Seitz, Ed., “ Solid Luminescent Materials,” John Wiley & Sons, Inc., New York, N. Y ., 1948.(2) J. R. Mourelo, Compì. Rend., 158, 122 (1914); 160, 174 (1915); 161, 172 (1915).
The Journal o f Physica l Chem istry

C o l o r i n g o f A l k a l i n e E a r t h S u l f i d e s I n d u c e d b y S h e a r 2469
Table I: The Color Change Induced in Alkaline Earth Sulfides
O rig in a l C o lo r p r o d u c e dS u lfid e c o lo r b y g r in d in g
CaS White YellowSrS White Light pinkBaS White Yellow green
C o lo r p r o d u c e d
P e a k w a v e le n g th o f th e a b s o r p t io n b a n d in L a t t ic e
b y s u b se q u e n t v is ib le r e g io n , c o n s ta n t ,u v e x p o su re m u â
Pink 500 5.68Dark pink 550 6.01Green 670 6.39
Experimental ProcedurePreparation of the Sulfide. Alkaline earth sulfides
(CaS, SrS, and BaS) were prepared by reducing the corresponding sulfates in hydrogen atmosphere: M S04 + 4H2 = MS + 4H20, where M = Ca, Sr, or Ba. The sulfates were obtained from the corresponding nitrates and sulfuric acid both of reagent grade by the method of precipitation in water solution. The content of iron and other heavy metal impurities estimated from the purity of the starting chemicals is <0.00005% for CaS, <0.0002% for SrS, and <0.0004% for BaS. In a typical run a sulfate was heated at 980° for 1.5 hr on a platinum boat in a tube furnace with a stream of hydrogen passing over it. During heating up to 980° and cooling from 980° to room temperature N2 was used as an inert atmosphere. By this method (Method I) a bulky mass of white or creamy powder was obtained. X-Ray diffraction patterns of the powders agreed with the known data of the alkaline earth sulfides.
Although most of the color measurements were conducted on the sulfide samples obtained in this way, the following methods of preparation were also tried.
Method II. After heating at 980° in hydrogen as in Method I, the samples were subjected to an additional heating at 1080° for 30 min in N2 atmosphere.
Method III. NaCl was added to the sulfate in an amount of 3 wt % as a flux. The heating schedule was the same as in Method I or Method II.
Method IV. This method corresponds to the one adopted by Mourelo for his preparation of phototropic sulfides.2 A mixture of CaC03, S, and flux (0.1% NaCl + 0.025% Na2C 03) was heated in a silica tube with one end open in N2 atmosphere up to 900° and held at this temperature for 30 min. Sulfur was added in excess by 10-30% over the amount corresponding to the equation 2CaC03 + 3S = 2CaS + 2C02 + S02.
The sulfide masses prepared by Methods II and III were sintered more than those prepared by Method I. Concerning the coloring behavior of the sulfide samples, similar results were obtained for all the samples prepared by the four different methods.
Color Measurement. Absorption spectra of the sulfide powder compacts were determined by an Applied Physics Corp. spectrophotometer Model Cary 14 with a total reflectance attachment consisting of a
sphere lined with barium sulfate. The double-beam method was used, and a BaS04 powder compact was used as a reference for 100% reflectance. To convert the values of reflectance R (%) to those of extinction log ( /„ //) , where I0 is the intensity of incident light and I is that of reflected light, the following formula was used: log (In/I) = 2 — log R.
ResultsColoring Behavior of “Pure" Sulfides. The alkaline
earth sulfides as prepared were not sensitive to uv light nor to X-ray radiation regardless of the method of preparation; no color change was observed after they were exposed to radiation. This observation was confirmed both with the outer surface of the sample mass as well as with the fresh surface if it is prepared with care not to apply shear stress. Mechanical shear applied to a mass of the sulfide powder, however, caused the color change. Thus, grinding, shaving, or compressing with a pestle and mortar induced coloration of the mass or powder of the sulfides as shown in the third column of Table I. This coloring occurred even when the sulfide sample was ground in darkness. This meant that shear itself was responsible for this kind of coloration without the help of irradiation.
The second effect of shear was to make the sulfides photosensitive. Once the sulfide samples were subjected to grinding, they became sensitive to radiation. Thus, the ground powders, now lightly colored by shear accompanying grinding action, became darker in color when they were exposed to room light (fluorescent lamp light), uv light (for example, the light from a black-ray lamp emitting 3660-A light) or X-ray. The resultant colors are given in the fourth column of Table I.
The absorption curves before grinding, after grinding, and after grinding and subsequent uv exposure are shown in Figures 1, 2, and 3, respectively, for CaS, SrS, and BaS. A black-ray lamp G. E. Model F6T5-BL which has an emission peak at 3660 A was used as uv source. The surface of the powder compact was exposed to the uv light for 20 min at a distance of 4 cm from the lamp. The measurements shown in the figures were conducted on the powders obtained by Method I. The samples prepared by Methods II and III were sintered more, and for these samples the determination of the reflectance curves before applica-
Volum e 78, N um ber 8 August 1969

2470 S u m i ó S a k k a
Figure 1. Absorption spectra of CaS.
Figure 2. Absorption spectra of SrS.
Figure 3. Absorption spectra of BaS.
tion of shear (grinding) was not possible, because pulverizing action necessary for the preparation of the powder compact for reflectance measurement already gave them color. It was confirmed, however, that these samples give curves similar, after grinding and
subsequent uv exposure, to those determined for the samples prepared by Method I. It was also observed that the color after grinding and subsequent uv irradiation becomes deeper with increasing extent of grinding, but the general shape of the absorption curves is not altered.
From the figures it is seen that the application of shear induces an increase of absorption in the region of shorter wavelength (at the wavelengths shorter than about 450 mp) and at the same time forms a weak absorption band in the region of longer wavelength. It is also seen that irradiation following the application of shear greatly enlarges the latter absorption band. The peak of this absorption band is at 500 rn.fi for CaS, 550 mp for SrS, and 670 mp for BaS as shown in the fifth column in Table I.
X-Ray diffraction patterns were determined for the sulfide powders before grinding, after grinding, and after grinding and subsequent uv irradiation. No substantial change was observed in the X-ray patterns of CaS, SrS, and BaS after grinding or uv irradiation. This suggests that no drastic chemical change occurs in these processes.
It is known that cupric oxide3 and iron-doped titanium oxide4 are subjected to color change easily in the presence of water or moisture. Since alkaline earth sulfides are not so resistant to moisture, it is suspected that moisture in air has some effect on their coloration during grinding. To check this, grinding and uv irradiation were conducted in a drybox which had an atmosphere of dry nitrogen gas. Possible adsorbed moisture on the sulfide mass was removed beforehand by heating it in a silica glass tube at 150-200° and evacuating, at the same time, with a vacuum pump. It was also found that in dry nitrogen gas the sulfides are colored lightly by grinding and colored deeply by subsequent uv exposure.
The stability of the color produced in the alkaline earth sulfides by grinding and subsequent irradiation was examined by heating the colored samples in an evacuated sealed tube. The color was bleached when the samples were heated at 250-300°. It was also found that the color is reproduced when the bleached powders are ground and then irradiated by uv light.
Effect of Impurity. A small amount (0.0001-0.1% by weight) of Cu, Ag, Bi, Mn, Fe, Ti, V, Ce, and combinations of them were incorporated info CaS, SrS, and BaS by adding their sulfides or chlorides to the alkaline earth sulfates, the starting compounds for the preparation of sulfides by Methods I, II, or III. With Mn and Bi and their combinations the doped sulfides were prepared also by Method IV. Generally, if the amount of the dopant was less than 0.01%, white or grayish sulfide powders were obtained.
(3) H. Hecht and G. Miller, Z. Phys. Chem. (Leipzig), 202, 403 (1954).(4) F. K. McTaggart and J. Bear, J. Appl. Chem., 5, 643 (1955).
The Journal o f Physica l Chem istry

C o l o r i n g o f A l k a l i n e E a r t h S u l f i d e s I n d u c e d b y S h e a r 2471
The doped sulfides, however, showed coloring behavior similar to the nondoped sulfides, except for CaS to which a combination of Ti and Fe was added. All other doped sulfides showed colors similar to the corresponding “ pure” (nondoped) sulfides as a result of grinding or subsequent uv irradiation.
When both Ti and Fe were incorporated into CaS in an amount of 0.001-0.01%, the resultant creamy mass of CaS showed coloration on uv exposure without help of grinding, although the color was slight, and the color was bleached at room temperature, slowly in darkness, and quickly under the room light. However, the effect of grinding on this substance was the same as that on nondoped CaS, that is, the powder was colored by grinding and subsequent uv exposure.
Discussion
Nature of the Coloration Due to Grinding and Subsequent Uv Exposure. The coloring of the alkaline earth sulfides studied in the present paper involves the action of uv light. The nature of uv-induced coloration of solids is different for different substances. Generally, the following three mechanisms of coloring may be considered:6 (1) isolation of a colored element or compound as a result of chemical decomposition; (2) coloring due to the valence change of impurity ions, usually transition metal ions; and (3) formation of color centers (electron- or hole-trapping centers) in the structure of a crystal.
Usually, however, it is not easy to determine which particular mechanism applies to a particular substance, because the mechanisms are often interrelated and, in addition, the concentration of centers causing color may be very small. None of the above three possibilities can be excluded or definitely established in the present case. Some discussion can be conducted, however, based on the chemical and physical information on the alkaline earth sulfides and related substances and the experimental observations made during the course of the present study.
If the first mechanism is assumed, the isolated colored substance responsible for coloring should be elemental alkaline earth metals, elemental sulfur, or some compounds consisting of them, since the original substance is alkaline earth sulfides. Alkaline earth metals are unstable chemically in air containing moisture if separated as an element, whereas the present colored products are quite stable in air up to near 200° (the color remains). Elemental sulfur shows a characteristic color (usually yellow) if it is separated, while the present colored products show different colors, depending on the kind of alkaline earth. As to the compounds consisting of alkaline earths and sulfur, there is little information. It is known that barium trisulfide, BaS3, shows yellow or green color.6 Since BaS shows green color after grinding and subsequent uv irradiation (see Table I), it is possible that BaS3 has been formed in this
case. No compounds of Ca and Sr that correspond to BaS3 are known.
As to the second mechanism, it should be recalled that the coloring was not sensitive to the presence of impurity ions. That is, the very pure sulfides prepared by us, of which the estimated heavy metal content was <0.5 ppm for CaS, <2 ppm for SrS, and <4 ppm for BaS, as well as the sulfides, to which known amounts (1 to 1000 ppm) of various metal ions were added, showed similar coloring behavior upon grinding and subsequent uv exposure. The only difference between very pure and impure sulfide samples was the color of the original powder; pure samples were white and impure ones were noticeably colored, the color tone depending on the kind of impurity ions. These observations may lead to the consideration that impurity ions are not the cause for the coloration induced by grinding and uv exposure, although a definite conclusion cannot be drawn before the behavior of a small amount (less than 0.5-4 ppm) of heavy metal ions or the other unknown impurities is checked thoroughly.
There is no positive observation denying or confirming the possibility of the third mechanism. Electron paramagnetic resonance measurements on the colored sulfides gave no signal, which does not tell presence or absence of color centers. Also no information on the color centers produced in alkaline earth sulfide crystals is found in the literature. It is interesting, however, to note that the peak wavelength of the absorption band in the visible region shifts to the longer wavelength side with increasing lattice constant of the sulfide (Table I ) . This regularity may mean that the nature of the color centers in CaS, SrS, and BaS is the same, if they are assumed responsible for the coloring. For alkali halides which have the face-centered cubic structure, it is known that the peak wavelength of F, Ri, R2, and M centers increases with increasing lattice constant, following the rule7
Ama* = Cd7 (1)
where Amax is peak wavelength and C and y are constants which depend on the kind of the color center. The value y is 1.84 for the F center. The data on the sulfides can be fitted to the formula (1) only very roughly, using y = 2.4.
To make the alkaline earth sulfides photosensitive, grinding was necessary. It is probable that the grinding makes the sulfide powders chemically active so that the reaction leading to the formation of colored compounds occurs, or it produces some kind of defect so
(5 ) S e e , f o r e x a m p l e , G . H . B r o w n a n d W . G . S h o w , R ev . P u r e A p p l . C h em ., I I , 2 ( 1 9 6 1 ) ; J . H . S c h u l m a n a n d W . D . C o m p t o n , “ C o l o r C e n t e r s i n S o l i d s , ” P e r g a m o n P r e s s , L o n d o n , 1 9 6 3 ; W . A . W e y l , “ C o l o u r e d G la s s e s , ” T h e S o c i e t y o f G la s s T e c h n o l o g y , 1 9 5 1 .
(6 ) R . C . W e a s t , S . M . S e l b y , a n d C . D . H o d g m a n , E d . , “ H a n d b o o k o f C h e m i s t r y a n d P h y s i c s , ” T h e C h e m i c a l R u b b e r C o . , C l e v e l a n d , O h io , 1 9 6 5 .
( 7 ) H . F . I v e y , P h y s . R ev ., 7 2 , 3 4 1 ( 1 9 4 7 ) .
Volum e 73, N um ber 8 August 1969

2472 M. J e e v a n a n d a m a n d A. R. G u p t a
that the color centers are formed upon subsequent uv irradiation. There are examples which show the effectiveness of grinding in promoting the reactivity of solids.8 Also there is an example which shows that crushing of quartz particles produces defects in it.9
Effect of Impurity. According to our experiments heavy metal impurities including Mn and Mn + Bi did not affect the coloration of the alkaline earth sulfides due to grinding or subsequent uv exposure. Further, the incorporation of impurities did not induce phototropic properties (reversible color change) as suggested by Mourelo, with the exception that a combination of Ti and Fe induced a very slight phototropy in CaS. These results are in disaccord with Mourelo’s results, since he claims that the alkaline earth sulfides doped with Mn or Mn + Bi are phototropic.2 This discrepancy may need explanation.
One possibility is that the sulfides prepared by Mourelo may have contained some unknown active impurity ions other than Mn or Bi. Actually, in our
experiments a combination of Ti and Fe made/CaS (unground) phototropic, although the color change was very slight.
Another possibility is the contamination of Mourelo’s sulfides with a small amount of phototropic material different from the alkaline earth sulfides. For example, phototropic sodalite may have been formed. In this method of preparation of sulfides all constituents necessary for the formation of sodalite10 seem to exist: silica and alumina from the porcelain crucible, NaCl as flux, and sulfur as one of the main starting materials.
Acknowledgments. The author thanks Professor J.D. Mackenzie for helpful discussions and the Glass Research Center, PPG Industries for the support of this work.
(8) T. Kubo, J. Chem. Soc. Jap., Ind. Chem. Sect., 71, 1301 (1968) (Symposium on Mechanochemistry).(9) J. Arends, A. J. Dekker, and W. G. Perdok, Phys. Status Solidi, 3, 2275 (1963).(10) R. D. Kirk, ./. Electrochem. Soc., 101, 461 (1954).
Nitrogen Isotope Effect in Transition Metal Hexaammine
Com plex-Am m onia Systems. A Theoretical Consideration
by M. Jeevanandam and A. R. GuptaBhabha Atomic Research Centre, Chemistry Division, Trombay, Bombay-85, India {Received June 8, 1968)
The nitrogen isotope effects in Co(NH3)63+- , Co(NH3)e2+- , Cr(NH3)63+- , Ni(NH3)62+- , and Rh(NH3)63+-N H 3 exchange systems have been calculated taking into consideration all the vibrational degrees of freedom of the complex ions. The vibrational frequencies of N-15 substituted complexes were computed using the modified Urey-Bradley force-field constants derived on the basis of the normal coordinate analysis of the fundamentals. The nitrogen isotope effects in Co(ND3)63+- and Ni(ND3)62+-N D 3 systems were also calculated. The results show that in such complicated systems, isotope effects cannot be correlated with any one particular force constant related to the internal coordinate of the isotopically substituted atom. There seems to be a direct relationship between the nitrogen isotope effects in these systems and the stability constant of the complexes involved.
Recently the nitrogen isotope effects in the exchange equilibria between transition metal ammines and ammonia in the liquid phase have been reported.1-3 Gupta and SarpaP have carried out an approximate theoretical calculation of the equilibrium constant for the nitrogen isotope exchange in the nickel hexaam- mine-ammonia system using the G(u) function of Bigeleisen and Mayer.4 They assumed a tetrahedral X Y 3Z model and used only the diagonal elements of the F and G matrices for the calculation of the frequencies of the N-15 substituted complex. In the
present work, we have considered the degrees of freedom of the whole complex molecule and carried out a more rigorous calculation of the nitrogen isotope effects in several transition metal ammine systems using the best available data on their vibrational frequencies.6-7 The
(1) T. Ishimori, Bull. Chem. Soc. Jap., 33, 520 (1960).(2) A. R. Gupta and S. K. Sarpal, J. Phys. Chem., 71, 500 (1967).(3) T. W. Swadle, L. F. Coleman, and J. P. Hunt, Inorg. Chem., 2, 950 (1963.)(4) J. Bigeleisen and M. Goeppert-Mayer, J. Chem. Phys., 15, 261 (1947).
The Journal o f P hysica l Chem istry

Isotope Effect in T ransition Metal Hexaammine Complex-N H 3 2473
results of the calculations are presented here, and the various factors which influence the isotope effects in such complex systems are discussed.
Calculations and ResultsIn general, the chemical exchange reaction between
metal hexaammine complex and ammonia can be written as
[M (14NH3)6]Z+ + 616NH3 ^[M (I8NH3)6]Z+ + 614NH3 (1)
The equilibrium constant (K ) and the isotope separation factor (a) for the above reaction are then related by
= ,/, = [Q15/Q 14]1/8complex“ [QWIammonia
(2)
where Q’s are the total molar partition functions of the N-15 and N-14 compounds. Urey8 and Bigeleisen and Mayer4 have shown that the equilibrium constant for isotopic exchange reactions could be expressed in terms of the isotopic partition function ratios which depend only on the vibrational frequencies of the isotopic molecules. Then the reduced partition function ratio is defined as4
(« /« ') / =3 : 6 u , ( 1 - e ~ ui' ) e - (ui/2)
i u / ( 1 - e ~ ut) e - {ui'/2). (3)
In the approximation that Aw, is small, one obtains
In a = V.3JV-6
2] GiujAut_ i Jcomplex
r3A -6X G ( U i ) A u t (4)
ammonia
where the symbols have their usual meanings.4 The summation is to be carried over all the (3N — 6) degrees of freedom, i.e., over 69 for the complex and 6 for the ammonia. The free rotation of NH3 ligands about the M -N bond axes accounts for six of them, leaving 63 degrees of vibrational freedom. This free rotation also increases the effective symmetry of the complex to Oh- The remaining 63 frequencies of the complex are distributed among the various symmetry species as: M -N stretching (Alg + E g + Fiu), symmetric N -H stretching (Aig + Ee + Fla), symmetric NH3 deformation (T ie + E g + Eiu), a symmetric N -H stretching (Fig + Fiu + Fig + F2u), degenerate NH3 deformation (Fig + Fiu + F^ + F2u), NH3 rocking (Flg + Flu + F2g + F2u), and N -M -N bending (Fiu + F2g + F2u). On the basis of the symmetry coordinates and the modified Urey-Bradley force field used by Nakagawa and Shimanouchi,7 the complete F and G matrices for the Raman (T lg, Eg, and F2g) and ir (FXu) active vibrational frequencies were constructed. The eigenvalue problem
|GF - FA | = 0 (5)
was then solved for the different symmetry species separately. The isotope dependence of the normal frequencies arises from the mass dependence of the G matrix and, of course, the F matrix is isotope independent. This makes it possible to calculate the frequencies of 15N- and D-substituted complexes using the same force constants.
It is necessary to know the Raman as well as ir vibrational modes of the complex before all the eigenvalue problems (four in number for each complex) pertaining to the different symmetry species can be solved. Raman frequencies of A 1k, Eg, and F2g species are available only for the rhodium complex. Therefore, it is only for this complex that all the four eigenvalue problems could be solved. The calculated and observed frequencies for this complex are shown in Table I. The frequency shifts due to 18N substitution, i.e., (vu — ris) cm-1 are also included in this table. As the similar Raman data for the other complexes are not available, only the seven ir active Flu frequencies could be calculated for them. For the isotopic ammonia molecules, the frequencies (2A + 2E) were calculated by a similar technique using the reported values of the force constants for 14NH3.9 Table II shows the calculated and observed frequencies for Co3+, Cr3+, Co2+, and Ni2+ complexes and the isotopic ammonias. To avoid the outer ion effect in the complex, and to generalize, we have calculated for the metal hexaammine chlorides in all the cases. For comparison, the vibrational frequencies for 14ND3 and 16ND3 and the corresponding complexes of C 0 3 + and Ni2+ have also been calculated and given in Table II.
Using the calculated frequencies from Table I for the rhodium complex and assuming the frequencies of the inactive F2u and Flg species as those of Flu, we have calculated the isotope effect (eq 4) and the value of a at 25° is 1.027. Here the summation is carried over all the frequencies with the degeneracies as described before. For the other complexes, the isotope effect has been calculated using the seven infrared active frequencies with the following over-all degeneracies: NH symmetric stretch (6), NH asymmetric stretch (12), NH3 symmetric deformation (6), NH3 asymmetric deformation (12), NH3 rocking (12), MN stretch (6), and NMN bend (9). Here it is assumed that the vibrational frequencies of the species other than Fiu are the same as those of Fiu species. The values of the separation factor at 25° for the various complexes, including the rhodium complex, calculated as above and some of the
(5) J. M. Terrasse, H. Poulet, and J. P. Mathieu, Spectrochim. Acta, 20, 305 (1964).(6) L. Sacconi, A. Sabatini, and P. Gans, Inorg. Chem., 3, 1772 (1964).(7) I. Nakagawa and T. Shimanouchi, Spectrochim. Acta, 22, 759 (1966).(8) H. C. Urey, J. Chem. Soc., 562 (1947).(9) T . Shimanouchi, I. Nakagawa, J. Hiraishi, and M . Ishii, J. Mol. Spectrosc., 19, 78 (1966).
V o lu m e 7 3 , N u m b er 8 A u g u st 1969

2474 M. Jeevanandam and A. R. Gupta
Table I : Frequencies and Nitrogen Isotope Shifts in [Rh(NHs)6]Cl3 (in cm'-1)
> (M N ) r (N E ), ! (N H ,) , 8(NH s)d i (N H .h S (N M N )
A ig Caled 516.1 3155.8 1328.1Obsd“ 512 3140 1320A b 14.1 2.6 8.1
E z Caled 464.1 3155.5 1323.8Obsd 478 3140 1320A 12.8 2.5 7.6
F2, Caled 3230.8 1583.0 835.9 251.1Obsd 3230 240A 9.8 2.0 3.8 6.4
Fiu Caled 472.1 3155.4 1320.6 3230.8 1583.2 844.9 309.6Obsd 470 3140 1320 3230 1550 830 310A 9.6 2.5 7.2 9.8 2.0 3.9 5.8
“ Observed frequencies for all the species are from ref 5. b A = (vit — va) cm '.
Table II: Calculated and Observed Frequencies (cm ') of Various Complexes and Isotopic Ammonias
> {N H ), . (N H ) , ¡ (N H ¡)d i (N H ,) , ¡ (N H i) r > (M N ) Í (N M N ) Ref[Co(NH3)6]3 + Caled 3240.8 3164.5 1615.4 1324.9 830.7 501.7 328.6[Co(NH3)6]C13 Obsd 3240 3170 1600 1325 820 503 325 7[Co(15NH3)6]3+ Caled 3231.0 3162.1 1613.1 1317.9 826.2 496.3 220.8[Co(ND3)6]3 + Caled 2396.9 2265.6 1165.6 1010.7 662.2 454.7 291.3[Co(ND3)6]C13 Obsd 2450 1155 1016 665 310 7[Co(15ND3)6]3 + Caled 2382.9 2261.9 1162.7 1000.9 657.2 451.1 286.3[Cr(NH3)6]3 + Caled 3267.8 3190.6 1611.9 1291.9 758.5 473.3 266.6[Cr(NH3)6]Cl3 Obsd 3260 3205 1600 1310 745 470 270 7[Cr(16NH3)6]3 + Caled 3257.9 3188.2 1609.4 1285.2 755.1 467.3 260.7[Co(NH3)6]2+ Caled 3338.5 3258.3 1605.2 1171.9 625.5 323.1 183.5[Co(NH3)6]C12 Obsd 3330 3250 1605 1160 634 318 192 7[Co(16NH3)6]3 + Caled 3328.5 3255.8 1602.8 1166.5 623.3 318.1 179.5[Ni(NH3)6]2 + Caled 3392.0 3309.7 1606.4 1197.9 673.1 334.7 214.0[Ni(NH3)6] Cl2 Obsd 3370 1610 1175 678 330 215 7
Obsd 3390 3303 1600 1170 676 337 5[Ni(15NH3)e]2 + Caled 3381.8 3307.1 1604.1 1192.2 670.2 330.4 209.0[Ni(ND3)6]2+ Caled 2505.9 2368.2 1159.0 905.3 515.6 314.6 192.5[Ni(NH3)6]Cl2 Obsd 1170 896 517 318 206 6[Ni(I6ND3)9]2+ Caled 2491.7 2364.5 1156.2 897.7 512.4 311.5 189.014NH3 Caled 3445.2 3340.1 1626.3 963.2»nh3 Obsd 3444 3336 1626 950 916NH3 Caled 3436.0 3337.6 1623.1 958.2“ND3 Caled 2534.8 2389.1 1180.3 730.914ND3 Obsd 2564 2420 1191 748 9>6nd3 Caled 2521.8 2385.5 1176.7 724.7
Table III : Separation Factors at 25° and Fd¡» Elements
Com plex In a In mP d ia (M N ) m d y n /A
F d ia (N H )am d y n /A
P dia(NHa)a m d y n /Â
P d ia (N H j)a m d y n /À
K { M N )°m d y n /Â
Rh(NH3)63 + 0 . 0 2 5 4 0 . 0 3 2 3 1.746 5.776 5.650 0 . 4 3 9 1 . 2 0
Co(NH3)63 + Co(ND3)63 +
0.02690.0263
0.02840.0281 1.390 5.810 5.684 0 . 4 4 3 1.05
Cr(NH3)e3 + O.O2 O9 0.0224 1.251 5.91 5.781 0.423 0.94Co(NH3)62 + 0.0112 0.0135 0.651 6.357 6.231 0.367 0.33Ni(NH3)62 + Ni(ND3)62 +
0.01460.0149
0.01610.0155 0.651 6.162 6.036 0.352 0.34
MUBFF stretching force constant for MN bond.
T h e J o u r n a l o f P h y s ic a l C h em istry

Isotope Effect in T ransition M etal Hexaammine Complex-N H 3 2475
diagonal elements of the F matrix are shown in TableIII. The calculations were done in the CDC 3600 computer at Tata' Institute of Fundamental Research, Bombay.
DiscussionThe isotope effect for the rhodium complex at 25°
calculated by the two methods, one by considering all the available frequencies (1.027o) and the other by considering only the Flu species (1.0257), differ by O.OOI3, i.e., about 5% change in In a. From an analysis of the vibrational frequency data for the rhodium complex in Table I, the following observations can be made, (i) Frequencies and isotope shifts of the ligand vibrational modes (e.g., v (NH)„ r(NH)as, etc.) hardly change from one symmetry species to another, (ii) Out of the skeletal modes, the rocking frequencies of Fiu and F2g species differ only by 9 cm-1, and their isotope shifts are the same, (iii) NMN bending vibration of Fig species is much smaller, but the isotope shift is slightly larger, than in Fiu species, (iv) p(MN) strongly depends on the symmetry species to which it belongs. The isotope shift of y(MN) of Ale and F g species are larger than in Fiu species. Point i clearly shows that the usual assumption made in the interpretation of vibrational spectra of transition metal ammines, namely, little or no interaction between the vibrations of one ammonia molecule with another, is quite valid. It is also clear from the above analysis that the difference of O.OOI3 in a values, calculated by the two methods, comes mainly from the MN frequencies of Aig and Eg species. This is probably an upper limit and in the case of the less stable complexes it will be much smaller. Further, the nonavailability of Raman data for other complexes makes it impossible to evaluate the additional force constants necessary for solving the eigenvalue problem for these species. It is for this reason that the procedure of using Fm frequencies for other species also, has been adopted here for the calculation of isotope effects. As the case of rhodium complex clearly shows, this procedure is capable of giving In a values which are within 3 or 4% of the more accurate values obtained by using the individual frequencies for the different symmetry species.
The calculated values of the separation factor, a, have been compared with the experimentally determined values wherever available. Gupta and Sarpal2 reported a value of 1.015 for the isotope separation factor in the nickel(II) hexaammine-ammonia system which agrees very well with our calculated value of 1.0147 (Table III). The equilibrium constant for the chro- mium(III) hexaammine-ammonia in liquid ammonia has been reported by Swadle, Coleman, and Hunt.8 This value when corrected for the vapor pressure ratio of isotopic ammonias gives a ~ 1.019 at 20°, which compares favorably with our calculated a of 1.021o, at 25°.
Isoto-pe Effects and Force Constants. The magnitude
of the primary isotope effects is governed chiefly by changes in force constants of the bonds made directly to the iso topically substituted atom.1011 In the ammonia complexes of the transition metal ions, this implies that the nitrogen isotope effect will be determined by the additional MN bonds formed by NH3 ligands. The metal sensitive x(MN) and ¿(NMN) frequencies as well as the isotope effects vary in the order Cos+ > Rh3+ > Cr3+ > Ni2+ > Co2+. But k(MN) depends essentially on F(M N ), and the values given in Table III clearly show that the latter varies in the order Rh3+ > Co3+ > Cr3+ > Ni2+ > Co2+. A better measure of the bond strength in such complexes is the diagonal element of the F matrix,7 Fdia (MN). This varies in the order Rh3+ > Co8+ > Cr3+ > Co2+ > Ni2+. Here, as well as in K- (MN) values, the rhodium complex does not follow the isotope effect sequence. This behavior of the rhodium complex is also observed in the case of the rocking frequency which is more sensitive to the nature of the metal ion. The coordination of ammonia decreases the N -H stretching frequency by 100-150 cm-1. The major cause for this change is attributed to the drainage of electrons12 from the nitrogen atom which in turn weakens the N -H bond. These N -H stretchings of the ligand appear as broad bands and are much influenced by the hydrogen bonding, hydration, and solid-state effects, thus complicating the situation. Such effects, however, make similar contributions in a series of complexes having a common anion, as we have studied here. Thus it becomes meaningful to compare ligand vibrations and the corresponding force constants. The symmetric and asymmetric N -H stretching frequencies and their corresponding Fa* values vary in the order Ni2+ > Co2+ > Cr3+ > Co3+ > Rh3+ whereas from the isotope effect sequence one would have expected Co2 + values to be larger than Ni2+ and Rh8+ values to precede Co3+ in this sequence. The anomalous position of rhodium is discussed later.
In the approximation of small ut and no interaction force constant in the force field, the following expression for the isotope effects can be derived13
ln « = IT E 7iF«1O ([_ i Jccmplex L i J ammonia
(6)
where A is a constant given as
1 / he \2/ 10* y 1 _ 1 \ 24\27rfc7y \c2M)\m' m) (V)
(10) M. Wolfsberg and M. J. Stern, Pure Appl. Chem., 8, 225 (1964).(11) A. J. Kresge, N. N. Lichtin, K. N. Rao, and R. E. Weston, Jr., J. Amer. Chem. Soc., 87, 437 (1965).(12) F. A. Cotton, "Modern Coordination Chemistry,” J. Lewis and R. G. Wilkins, Ed., Interscience Publishers, Inc., New York, N. Y., 1960, p 361.(13) J. Bigeleisen and M. Wolfsberg, Advan. Chem. Phys., 1, 16 (1958).
V o lu m e 7 3 , N u m b er 8 A u g u st 1969

2476 M. Jeevanandam and A. R. Gupta
M is the factor for conversion of atomic mass unit to grams, m is the atomic mass of the isotope in question, Fit is the diagonal element of the F matrix, and y { is the correction factor for a particular ut. The use of 7i increases the validity of eq 6 to higher values of ut.
We have calculated the separation factors for reaction 1 using eq 6, and they are also reported in Table III as ai. These values compare quite favorably with the more exact ones (a, in Table III), with the exception of that for the rhodium complex.
The anomalous position of the rhodium complex needs a little more explanation. The exact calculations of the isotope effects and the vibrational frequencies take into consideration various other factors like the mass of the metal atom, metal-nitrogen distance, etc., which are different from complex to complex. The comparison of the calculated isotope effects (from eq 4) with the individual force constants, the diagonal elements of the F matrix, and with isotope effects calculated from eq 6 (where the above-mentioned parameters do not play a role) can be erroneous, particularly if these parameters are very different for any one complex. In the case of the rhodium complex, the mass of the metal atom is almost twice that of the metal atom in the other complexes studied here and as such the comparison of the rhodium complex with the other complexes may not be strictly permissible. Thus if rhodium values are excluded from the comparisons, we can say that eq 6 gives correctly the order of magnitude as well as quite reasonable figures for the individual values of the isotope effects in a series of chemically similar compounds.
This is further supported by the a and cn values calculated for the completely deuterated system, i.e., for an exchange reaction between [M(NDs)6f + and NDS. The vibrational frequencies of Co(ND3)63+, Ni(ND3)63+, and ND3 were calculated using the force constants derived from the vibrational frequencies of the respective completely protiated molecules. The observed (wherever available) and calculated values of these frequencies are in reasonable agreement (Table II). Using these calculated frequencies, the isotope effect was evaluated employing eq 4. There is hardly any difference between the nitrogen isotope separation factors calculated for the completely deuterated and protiated nickel and cobalt species (Table III). As we have used the same force constants for the deuterated and protiated systems, this result means that the isotope effects depend mainly on the force constants of the internal coordinates of the atom involved in the exchange reaction. This is precisely what eq 6 also states.
Isotope Effects and Stability Constants. The isotope effects, like the stability constants, take an over-all picture of the various bonds and the vibrational frequencies involved. Some of these modes (the skeletal ones) make positive contributions to both, and some, like v(NH)s, make negative contributions. Kobayashi
and Fujita14 and Powell and Sheppard16 have observed similar trends, vis a vis some of the individual frequencies and stabilities of the complexes. When the latter authors tried to plot the individual frequencies against the function (In 0KV + In 55), which was taken as a measure of the stability of the complex, deviations from a smooth curve were found. However, when In a is plotted against the same function, a linear graph is obtained (Figure 1). /3av values for Co3+, Ni2+, and Co2+ complexes used in this figure were computed from the stability constant values compiled by Sillen and Martell.16 For the chromium complex only an estimate has been reported,17 which is used here. The linearity of the graph clearly shows that there is a direct relationship between the isotope effects and the measured stability constants of the complexes in aqueous solutions.
The isotope effect, as defined in eq 1 and 2, is the ratio of the stability constants of 14N and 16N complexes. The linearity of the graph in Figure 1, however, does not arise from this definition because a, stability constants of 14N and 16N complexes, all vary from complex to complex. The linearity of the graph in Figure 1, along with the definition of a, then implies that stability constant of the 15N complex is some polynomial function of the stability constant of the 14N complex. At present, no theoretical justification can
(14) M. Kobayashi and J. Fujita, J. Chem. Phys., 23, 1354 (1955).(15) D. B. Powell and N. Sheppard, J. Chem. Soc., 3108 (1956).(16) “ Stability Constants,” compiled by L. G. Sillen and A. E. Martell, Special Publication No. 17, The Chemical Society, London, 1964, p 149.(17) K. J0rgensen, “ Inorganic Complexes,” Academic Press, Inc., London, 1963, p 58.
T h e J o u rn a l o f P h y s ic a l C h em istry

Spin-Free Quantum Chemistry 2477
be offered for this sort of relationship. Further work on similar isotope exchange systems involving different transition metal complexes is in progress.
Acknoivledgment. The authors wish to express their sincere thanks to Dr. J. Shankar for his continued interest and encouragement during the course of this work.
Spin-Free Quantum Chem istry. V I. Spin Conservation1
by F. A. Matsen and D. J. KleinMolecular Physics Group, Department of Chemistry, The University of Texas, Austin, Texas (Received June 11, 1968)
Many chemical systems are well described by the Breit-Pauli Hamiltonian with the spin-free term and spin terms treated as zero-order and perturbation Hamiltonians, respectively. If the zero-order levels are widely separated and the spin effects are small, a system admits, to a good approximation, a spin-free formulation. Since the spin-free Hamiltonian commutes with the group of permutations on spatial electron coordinates, the partitions [X ] which label the irreducible representations of this group are good quantum numbers and label the spin-free states. In this regime [X] is conserved in collisions, chemical reactions, and electric dipole radiative processes. The Pauli principle restricts the physically significant permutation states and establishes a one-to- one correspondence with spin states. It follows that in the spin-free regime spin is a good quantum number and is conserved. Rules are derived for the conservation of permutational quantum numbers between separated and composite systems. The conventional spin analogs of these rules are the Wigner spin conservation rules. We discuss two types of breakdown of the spin-free permutational symmetry: (i) the breakdown of local permutational symmetry while preserving total spin-free permutational symmetry (an example is the enhancement of singlet-triplet transitions by collision with paramagnetic molecules); (ii) the breakdown of total spin-free permutational symmetry. The breakdown is practically complete in those cases for which the zero-order states are degenerate or near degenerate. A number of photochemical processes are discussed with particular reference to methylene and benzene.
I. IntroductionMany atomic and molecular systems are well de
scribed by the Breit-Pauli Hamiltonian
H = HSF + U (1.1)
where 0 contains all spin terms and / / SF is spin-free. The states of the Hamiltonian H are characterized by a rigorously exact total quantum number which we designate by k. (Such exact quantum numbers may be J(J = L + $), or F(F = I + 8), or an irreducible representation of a double point group, or just the energy sequence of the states.) If the matrix elements over 0 are small (e.g., Russell-Saunders coupling) one can apply perturbation theory taking HSF as the zero- order Hamiltonian and Q as the perturbation.
The Pauli-allowed portion of the total Hilbert space of the Hamiltonian H of (1.1) is
IF = Ct(FSF ® Fff) (1.2)
where V” is the fermion spin space, F sf is entirely spin-free, and 0. is the antisymmetrizer. The spin space F" may be decomposed into invariant subspaces with respect to the symmetric groups SN° of permutations on spin coordinates
F = E F " O T (1-3)
where the partitions [Xff] identify irreducible representations of SN°. Only partitions of the form
[Xff] = [AT - V, V) (1.4)
may appear in (1.3), since there are only |a) and ||3) spin orbitals. The partition [N — p, p] determines the spin quantum number S associated with the space FQX"]) through
NS = — - V (1-5)
The spin-free space F sf may be similarly decomposed
F sf = E FSF([XSF]) (1.6)[Xs* ]
The subspaces F sf([Xs f ]) are invariant with respect to the permutation group SNsy on spatial coordinates. Substituting the decompositions (1.3) and (1.6) into eq1.2 for IF and using the antisymmetrizer (as given in eq A.8) we see that
(1) This research is supported by the Robert A. Welch Foundation of Houston, Texas.
Volume 78, Number 8 August 1969
IWiSüJii rminviin#i'nirM

2478 F. A. Matsen and D. J. Klein
W = a E F SF([Xa]) ® y 'O X '] ) (1 .7 )[x17]
where [X1"] is the conjugate partition of [X']. Thus the only [XSF] which survive are of the form
[XSF] = [ r f = [AT ^ p -p ] = [2p,l if~2p] (1.8)
These partitions in (1.8) are called Pauli-allowed partitions.
From (1.7) it is apparent that confining a spin ket of V " to the permutational symmetry [Xa] = [A — p, p) implies that the corresponding spatial ket in an antisymmetrized spatial-spin ket is of spin-free permutationalsymmetry [\SF] = [X"]. A ket of pure permutational symmetry [2P,1N- 2V] will be contained entirely within
f sf([xsf]) <g> y'Qx“ ']).The zero-order Hamiltonian A SF operates only on
FSF. Since
[ffsf,Pl = 0 , P G S / F (1.9)
the partitions [Xsr] become the zero-order quantum numbers which label the zero-order states. We call these zero-order states permutation states and the [XSF] spin-free permutation quantum numbers. Those systems to which the zero-order theory applies are described in a spin-free formulation.2-7 Since in a spin-free formulation only SNsv and [XSF] are used, we will suppress the superscript SF.
In the spin-free formulation2-7 one in ay begin with a basis
B(v) = { |u;z>; i = 1 t o / “} (1.10)
To obtain an a priori labeling of the permutation states one forms a symmetry adapted basis
. /[X ]
B(vS) = z 53 {|vr;[X]r>; r = 1 to f [x1} (1.11)[X] r = l
related to B(v) by a basis transformation. Here the symmetry adapted basis ket j ut ; [X ]r) transforms as the rth row of the [X ]th irreducible representation of Snsf, t distinguishes between different basis kets with the same [X] and r quantum numbers, and / " [xl is the number of times the / [xl -dimensional [X]th irreducible representation of <SWSF occurs in the (reducible) representation T" generated from the basis B" in (1.10)
Ah]
= s x M(P)x\p)! P £ S t t
(1.12)
where x W (P) and x"(P) are characters, operator X such that
For any
[x,p] = o, p e s /F (1.13)
The Special Wigner-Eckart theorem holds
(vr;[X]r|z|uT';[X, ]r') =
S([X],[X, ])S(r/)(ur;[X]||z||i,r';[X]) (1.14)
where (vt; M\\x\\ vt' ; [X]) is-a reduced matrix element independent of r and r'. As a consequence of (1.14) with X = Hsf, the secular equation is broken into' block diagonal form, each block uniquely characterized by particular quantum numbers [X] and r. We denote the eigenvalues of this secular equation by E(v,K[\]) and its eigenkets by |u;K[X]r). If in (1.14) we choose
N
X = r = 53 7'o the dipole moment operator, one obtains4 = 1
the intercombination rule. Thus [XSF] is a good quantum number and is conserved in radiative electric dipole transitions between spin-free states. Similarly, when other chemical processes, such as internal conversion, collision, dissociation, or isomerization are well described by spin-free transition operators, [XSF] is again conserved. By (1.5) we see that spin S is a good quantum number and is conserved in these same processes.
Further, as a consequence of eq 1.7 even for a system with a Hamiltonian possibly containing spin interactions: spin is conserved if and only if spin-freepermutational symmetry is conserved.
II. Breakdown of Local Permutational SymmetryIn this section we discuss systems in which permuta
tion symmetry appears to be broken but is in fact conserved. Let A and B denote two molecules in a two molecule system which admits a spin-free description. We write the spin-free Hamiltonian as
t fSF = Hk + Hb + H ab (2.1)
where H A and HB are the Hamiltonians for the isolated molecules A and B, and HAb contains all remaining intermolecular interactions.
The molecule AB may be treated in the vector space
F ab = 53 P(VA ® F b) (2.2)P £ S s
generated from product kets
|AB;co) = |A;KA[XA]rA) <8 |B,\KB[XB]rB) (2.3)
Here the kets in VK are associated with electrons 1,2 , . . . , Na, and those in VB are associated with electrons A a + 1, A a -(- 2, . . . ,Aa + A b- We choose \A;Ka- [XaK ) and \B;Kb [XB]rB) to be eigenkets to HA and HB in vector spaces Vk and FB, respectively, and to have eigenvalues Ea(A;Ka[\a]) and Eb(B;Kb\\b}). There are bases for FAB which are symmetry adapted
(2) (a) F. A. Matsen, “ Advances in Quantum Chemistry,” Vol. I, P. O. Lowdin, Ed., Academic Press, New York, N. Y ., 1964; (b) F. A. Matsen, J. Phys. Chern., 68, 3282 (1965).(3) F. A. Matsen, A. A. Cantu, and R. D. Poshusta, ibid., 70, 1558 (1966).(4) F. A. Matsen, ibid., 70, 1568 (1966).(5) F. A. Matsen and A. A. Cantu, ibid., 72, 21 (1968).(6) F. A. Matsen and A. A. Cantu, ibid., 73, 2488 (1969).(7) F. A. Matsen and M. L. Elisey, ibid., 73, 2495 (1969).
T h e J o u rn a l o f P h y s ic a l C h em istry

Spin-Free Quantum Chemistry 2479
to SN; such symmetry adapted basis kets may be projected from the product kets of (2.3).
|4Scos;[X]r) = (Normalization)e„[xl|A.B;a>) (2.4)
Here e „ txI is a group theoretical operator called a matric basis element (see Appendix) and is such that the resulting ket (2.4) transforms as the rth column of the ath irreducible representation of SN.
We note that some of the terms (2.4) are identically zero for group theoretical reasons. The product kets \AR;w) transform as T[Xa1 0 T[Xb1 an irreducible representation of the group SNa 0 SNli. This irreducible representation of SNa 0 S,Vrt induces8 an outer direct product representation p [Xa,®[XbI in the group SN. The representation r [XAl®[XB] is reducible
p[XA]®[XB] _ ^ y[XA]®tX3];[X]p[X] [X]
(2.5)
The corresponding dimension statement is
r[XaI ÎXb] _ — R X a I H x b ] _ y > H X a 1 ® [ x b ] i [x ] H x ]
Na\Nb\J J t l(2.6)
For [XA] = [Xb] = [2, 1] we have a specific example of (2.5)
EP ®
(2.7)
Thus a product ket |AB;u>) has a component of symmetry only if / [Xa1® [Xb1 ; w ^ 0, that is
/ [XaI®[xb];[x1 = o = e „ [xl|A5;a)> = 0 (2.8)
Given [Xa] and [Xb], this requirement (2.8) restricts the partitions [X] which may arise. For the Pauli-allowed partitions [X] = \2V, \N~M] exactly one each arise for which N — 2p is such that9
(Na - 2'pa) + (Nb - 2pB) > (N - 2p) >|(A*a - 2pa) - (2Vb - 2pB)| (2.9)
We write this result asPraax
r [xA]®[xs] _ T[2”’ iw_2p] - fP=Pmin
Pauli-excluded partitions (2.10)
where pmin and pmax are defined by the limits of eq 2.9. This is a spin-free derivation for the Wigner spin conservation rule. The results obtained here may be
translated into the conventional spin formulation through the equivalence (1.5). A number of examples of the decomposition (2.5) or (2.10) of outer direct product representations are given in Table I.
Table I : Spin-Free Wigner Spin Conservation Rules“
Molecule A Molecule B Composite AB molecule[Sa] [Sb] [S][Sa] [Db] [D][Sa] [Tb] [T][Sa] [Qb] [Q][Da] [Db] [S] © [T][Da] [Tb] [D] © [Q][Da] [Qb] [T] © [Q'J[Ta] [Tb] [S] © [T] © [Q'][Ta] [Qb] [D] © [Q] © [S'][Qa] [Qb] [S] © [T] © [Q'] © [S'”
“ Note: the partitions [S] = [2P], [D] = [2*1], IT] = [2P,12], [Q] = [2*1'], [Q'l = 12*,V], [S'] = [2* P], and [S''] as [2*,V] represent singlet, doublet, triplet, quartet, quintet, sextet, and septet states; similar notation is used for the [Xa] and [Xb] partititions.
The eigenkets of the total Hamiltonian (2.1) in FAB may be expressed in terms of the kets (2.4) which are symmetry adapted to SN-
|AB;K[\]r) = £ £ |AS;ws[X]r)(o>s|A[X]r) (2.11)£») S
In the limit of large intermolecular separation there are particular local quantum numbers such that for many operators X
lim (AB;K[\]r\X\AB;K'[X']r') =R— ■»
(A ;A A” [XA“ ]rA“ |A'A|A;AA” , [XA” , ]rA” '> + (S/AB^XB^fBiXBl^/AB-'tXB-qrB” ') (2.12)
Since Hsf is one such operator, (2.11) becomes
lim |AB;K[\]r) = E |A5co”s;[X]r)(a>”s|A[X]r) (2.13)R-~*-co s
Another operator X which satisfies eq 2.12 is the dipole moment operator r. Thus we see in the limit as R -*■ oo; the local quantum numbers w” = { -Aa” [Xa"]- rA°,K-Ba [Xb” ]»^” } are exact, while for any finite R they are not exact. For finite but large R or for weakly interacting molecules co" may be expected to be a good approximate quantum number.
It follows from the above discussion that in a non- adiabatic spin-free collision (i.e., [X] fixed) between two molecules A and B a change in local permutational symmetry may take place
(8) G. de B. Robinson, “ The Symmetric Group,” University of Toronto Press, 1961.(9) The relations (2.8) and (2.9) follow from the graphical technique described by M. Hammermesh, “ Group Theory,” Addison-Wesley Publishing Co. Inc., Reading, Mass., 1962, pp 250-252.
V o lu m e 73, N iim b er 8 A u g u s t 1969

2480 F. A. Matsen and D. J. K lein
A([Xa]) + B ([\B]) — > A ([\A']) + S([Xb']) (2.14)
Before collision the bimolecular system AB has approximate local permutational symmetry [Xa] and [Xb]. After the collision the system AB can have different local permutational symmetry [XA'] and [XB'L which are restricted by (2.9). Additional restrictions on [XA' ] and [XB'] are often obtained on considering the energetics and dynamics of the system.
Many examples of collisions with changes in local permutational symmetry are known. The Cundall technique10 for measuring triplet yields of organic molecules involves the transfer of triplet state excitation energy
C6H6(3B1u) + 2-butene([S])C6H6(1Alg) + 2-butene([T]) (2.15)
The triplet-triplet annihilation mechanism11 for intersystem crossover explains the quenching of phosphorescence of organic molecules12’13 by oxygen
This behavior has been explained16-18 without recourse15 to the influence of the magnetic field of the paramagnetic species on the electron spins of the organic molecule.
In paper II of this series,2b a spin-free formulation of the paramagnetic effect was presented. We now repeat the spin-free formulation utilizing the notation of the present paper and the concept of local permutational symmetries. We consider the system to consist of one organic molecule A with low-lying states [SA°], [Sa1], and [Ta°] and one paramagnetic molecule with ground state [TB° ]. Typical energy levels of such a system are shown in Figure 1. Within the approximation of considering configuration interaction only between the [TA°] ® [Tb°] and [Sa1] <8> [TB°] separated molecule configur- tions, the triplet eigenkets of the AB system are
|[T2]) = V = 7 2(-«|[t a°][Tb°];[T]) +
| [Sa1] [Tb°] ;[T]>) (3.1)
C6H6(3B1u) + 0 2(32g- ) CeHeOA^) + 0 2(1Ag)(2.16)
In each of the collision processes indicated in (2.16) and (2.17) we note that other products do occur, and that in certain cases adducts or compounds may arise. In both these reactions, (2.15) and (2.16), the total [X] is conserved. Equivalently, using (1.5), the total spin S is conserved.
III. Effect of Paramagnetic Molecules on SpectraIt has been observed12-14-15 that paramagnetic species,
as 0 2, NO, or certain metal ions, often enhance permu- tationally forbidden transitions in organic molecules.
[s;i»[TB° l ------=[sT
Figure 1. Unperturbed energy levels of the organic molecule A and B in the separated molecule limit and the corresponding perturbed energy levels of the bimolecular collision complex.
Irr1]) = v “ (ITa°][Tb°];[t ]> +allSA^TB»];^])) (3.2)
|[T°]> = | [SA°] [Tb°] ; [T]) (3.3)
where we suppress K and r. The mixing coefficient a is then
4 - VA> + , , ,,° ---------- w ^ > — (3-4)
A s £ [S a>] - F [T a°] (3.5)
(¡Tab) = ( [Sa 1 ] [Tb°] ; [T]|F/ab| [TA°][TB°];[T]) (3.6)
Within the above approximations the transition dipole moment between [T°] and [T1] is
([T°]|f| [T1]) =
v ê + 7 * ( [Sa° 1 [Tb° ] ; [T ] |f 1 [Ta° ] [Tb° 1 ; [T ])
- 7 = ^ ( [ S A ° ] [ T B0];[T]|f|[SA1][TB°];[T]) (3.7)
(10) (a) R. B. Cundall and D. G. Milne, J . A m e r . C h e m . S o c . , 83, 3902 (1961); (b) R. B. Dundall, F. J. Fletcher, and D. G. Milne, J . C h e m . P h y s . , 39, 3536 (1963).(11) H. Sternlicht, G. C. Nieman, and G. W. Robinson, ib id . , 38, 1326 (1963).(12) G. Porter and M. W. Windsor, P r o c . R o y . S o c . , A245, 238 (1958).(13) K. Kawaoka, A. U. Khan, and D. R. Kearns, J . C h e m . P h y s . , 4 6 ,1842 (1967).(14) (a) D. F. Evans, J . C h e m . S o c . , 1987 (1967); (b) G. Porter and M. R. Wright, D i s c u s s i o n F a r a d a y S o c . , 27,18 (1959).(15) (a) D. F. Evans, J . C h e m . S o c . , 1351, 3885 (1957); (b) D . F. Evans, N a t u r e , 178, 534 (1957).(16) G. J. Hoijtink, M o l . P h y s . , 3, 319 (1960).(17) H. Tsubomura and R. S. Mulliken, J . A m e r . C h e m . S o c . , 82, 5966 (1960).(18) J. N. Murrell, M o l . P h y s . , 3, 319 (1960).
T h e J o u r n a l o f P h y s ic a l C h em istry

Spin-Free Quantum Chemistry 2481
Assuming that near the limit of large R the matrix element (F T a b ) in the coefficient a approaches zero more slowly than <[SA®][7’B0];[ î ,]|f| [7Y][7V];[T]>, then for large R
( [T0]|r| [T1]) — *■
- V | “ 2<[Sa#1[Tb0] ; [T]|?|[Sa11[Tb0]; [T]> (3.8)
Using (2.12) and assuming that the dipole moment of B is zero, as for 0 2, we obtain for the transition from [T°]- [T1]
I < [T° ] I r| [T1])!21 + a‘ |<SA°]lr| [Sa1]))2 (3.9)
In this formulation the enhancement of what appears to be a singlet-triplet transition borrows intensity from the singlet-singlet [Sa° ] -*■ [Sa 1] transition. Thus we have a spin-free mechanism for apparent singlet- triplet transitions.
An example is provided when the organic molecule A is benzene and the paramagnetic molecule B is oxygen
CeHeOAxe) + 0 2(32 g- ) ^ C6H6-0 2(h W 2 g-;[T ])
\ J + A-C6H6(3Blu) + 0 2(32g- ) ^ C 7H5-0 2(3Blu32 g-;[T ])
(3.10)
A process of similar nature may account19 for the quenching of triplet He in electrical discharges
He(ls2s,3S) + He+(ls,2S)
ÏHe(lsVS) + He+(ls,2S) “
- He2+(22 u+)
I -b"He2+(22 g+) (3.11)
IV. Breakdown of Spin-Free Permutation SymmetryThe eigenkets to the Breit-Pauli Hamiltonian are of
the form
toe) = E E |KSF[xSF])<A:SF[xSF]|3e) (4.1)Ksr [asf]
where k is a total quantum number and where |ifRF- [XSF]) is an antisymmetric space-spin ket (see Appendix).
|Ksp[Xs f]) = (Normalization) (i(|Ksp) 0 |M[XSF]r))
= (Normalization) E |-KSF[XSF]r) 0r
lA flx^r) (4.2)
Since
[H,Snsf 0 i ] ^ 0 (4.3)
[XSF] is not a good quantum number. Analogously,since
S is not a good quantum number either. Thus the eigenkets of (4.1) are of mixed permutational symmetry.
As an example, we take a system composed of two spin-free states, [S] and T ], which are mixed20 by the spin interactions 0. It is assumed that the spin-free energies 2J°[S] and E° [T ] are functions of a system parameter Q, e.g., an internal nuclear coordinate, such that the spin-free levels cross as shown in Figure 2. The eigenkets and eigenvalues for the Breit-Pauli Hamiltonian are
- V T T a
E( II) = y 2(F°[T] + F°[S] + F)
1|[T]ISl;I> = 7 r + o
E(I) = y 2(F°[T] + A°[S] - Y)
and where
(-o| (T )) + |[S]> (4.5)
(4.6)
(| [T]> + a| [S ]» (4.7)
(4.8)
A = 2?°[S] - E°[T]
<0)s<[T]|0|[S])
Y = V A2 + 4(i2)2
A - Ya =
2(0)
(4.9)
(4.10)
(4 .11)
(4.12)
The matrix element (0) which mixes permutational symmetries is in general nonzero21 unless required to be zero by reason of the double point group22 symmetry. With (0) ^ 0, the energy levels and extent of mixing are shown in Figures 2 and 3. It is assumed that A is strongly dependent on the system parameter Q and that(0) is relatively constant under changes in Q. (Q = Q0 at A = 0)
For Q < Q0, A » 0, a £* 0, E(I) S E°[T], and | [T] [S] ;I) S i [T]>. For Q > Q0, A « 0, a ^ » , E(I) = E° fS], and | [T ] [S] ;I> ^ |[S]). As Q slowly increases the following changes occur
|[T]>----- - |[T][S];I>----- -- |[S]> (4.13)Q < Qo Q = Qo Q > Qo
[H,a 0 S2] 9* 0 (4.4)
Such a process is called an intersystem crossover, since the molecule changes from triplet to singlet. We may also represent such a process in terms of electron pairs
(19) J. C. Browne, private communication.(20) Although there are three degenerate spin-free [T] states M = — 1, 0, + 1 , we need consider only one ket from this [T] space. All three [T] states are considered in the discussion attending Figure 5. We also neglect the diagonal part of the spin interaction.(21) J. von Neumann and E. P. Wigner, Phys. Z., 30, 467 (1929).(22) (a) D. S. McClure, J. Chem. Phys., 17, 665 (1949); (b) S. I. Weissman, ibid., 18, 232 (1950); (c) F. A. Matsen and O. R. Plummer, “ Group Lattices and Homomorphisms” in “ Group Theory and Its Applications,” E. M. Loebl, Ed., Academic Press, New York, N. Y „ 1968.
V o lu m e 73, N u m b er 8 A u g u st 1969

2482 F. A. Matsen and D. J. Klein
M: ■*-----*■ MZ)M: or M d
Mz> (4.14)Q <Qo Q = Qo Q > Qo
Here the two equivalent symbols M:<r+MZ) and MZ) represent resonance hybrids between the singlet M 3 and triplet M: forms. Another notation for this intersystem crossover process is obtained if one denotes the singlet [S] by tl and the triplet [T] state by ft
It -■— *■ ii •*— Tl - 'w~> Tl (4.15) Q < Qo Q = Qo Q > Qo
Here || *-* Tl represents a resonance hybrid. Representation of the intersystem crossover as in (4.15) gives rise to the description of this process as a spin-flip process. We note that the term “ spin-flip” may be misleading.23
We see that for this intersystem crossing process permutation quantum number [XSF] is not a good
Figure 2. Zero-order spin-free energy levels which cross at Q = Qo and corresponding perturbed energy levels which do not cross.
oVd + a2)
Figure 3. The fraction singlet (= n2/(l + a2)) character of the eigenket |[T] [S; ;I> as a function of A or Q.
quantum number and is not conserved. Correspondingly, S is not a good quantum number and is not conserved.
The rate at which an intersystem crossover occurs is a function of the shape of the potential surface, the matrix element (ii), and the characteristics of the initial wave functions of electronic and nuclear motion. Often one expects the rate of crossover to be a maximum when the kinetic energy of nuclear motion in the region of the zero-order crossing is near zero. Such nonradia- tive intersystem crossover is often referred to as the Landau-Zener effect.24 We note too that even though there is no crossing in the perturbed potential curves, certain processes, as high velocity collisions, may in effect act as though there were no perturbation and thus follow the zero-order potential curve and conserve [X]. Thus an alternate type of intersystem crossing process may occur
| [T]>------- | [T][S];I>-----^ | [S] [T];II>----- ► | [S]>Q < Qo Q ^ Q o Q < Qo (4.16)
Here we will call an intersystem crossing adiabatic if it follows the perturbed potential, as in (4.13), and non- adiabatic if it does not follow the perturbed potential, as in (4.16).
We now consider electric dipole radiative processes. Let | [S0]) be a lower lying pure singlet state as depicted in Figure 4. The dipole transition from [S°] to I is given by
|([S°]|r| [T] [S];I>|2 = ^ |<[S]|T| [S°]>|2 (4.17)
where we have used (4.7). For Q < Q 0, when a2/ ( l + a2) = 0, the transition is very weak. For Q < Q0, j [T ] [S ] ;I) = | [T ]) so that this very weak transition is called a singlet-triplet transition. For Q = Q0, when a2/ ( l + a2) = 4/ 2, the transition is moderately allowed. For Q > Q o , when a2/ ( l + a2) = 1, the transition is fully allowed. The moderately allowed transition which occurs for Q ~ Qg is said to steal intensity from the allowed [S0]-*- [S] transition.
V. Adiabatic Intersystem Crossover
The intersystem crossing process (4.13) which adia- batically follows the perturbed potential curves can occur in a number of chemical systems. In methylene, for
(23) In elementary discussion, a magnet with two and only two orientations is taken as a classical analog of the spin of an electron. In this model the orientation of one of the spins must flip in the transition | [T ]) -*»*-»■ | [S ]). Since the elementary magnet can take one of only two orientations, the model suggests that the spin flip occurs at a precise value of Q or for slow reactions at a precise time.
In general classical models of spin and spin conservation may break down. The so-called spin operators which occur in the Breit- Pauli equation result from the Dirac formulation which does not make an analogy to classically spinning particles.(24) (a) L. D. Landau, Phys. Zh. Sowjet., 2, 46 (1932); (b) C. Zener, Proc. Roy. Soc., A137, 696 (1932); (c) E. G. C. Stueckelberg, Helv. Phys. Acta, S, 369 (1932); (d) C. A. Coulson and K. Zalewski, Proc. Roy. Soc., A268, 437 (1962).
T h e J o u rn a l o f P h y s ic a l C h em istry

Spin-Free Quantum Chemistry 2483
example, there is evidence* 25’26 that the lowest lAi and 3Bi curves have a zero-order crossing at an HCH angle of about 125°. In the presence of spin interactions the noncrossing rule applies so that the perturbed potential curves appear as in Figure 5. In Figure 5 the potential curves are labeled by their symmetry in the appropriate double point group.22 Thus we may expect intersystem crossing of 'Ai methylene to 3Bi methylene, expecially for a vibrational level of 'Ai near in energy to the zero- order crossing.
In the flash photolysis of diazomethane26 high pressures of N2 give high yields of triplet [T] methylene, and low pressures of N2 give low yields of [T] methylene. Since CH2 is expected to be initially formed in singlet[S] state, the presence of N2 appears to enhance intersystem crossing. There are at least two mechanisms by which collision with N2 might induce intersystem crossing. First, in a plot of potential energy vs. CH2-N 2 intermolecular separation, there may be a zero-order crossing of [S] and [T] potential curves. Then following (4.13)
Energy
Figure 5. Behavior of the perturbed energy levels near the zero-order crossing of 'Ai and 3Bi levels in methylene.
by some other molecule which scavenges vibrational energy.
Intersystem crossover has been found27 to relate the
CH2 [S ] + N,[S] CH2[T] + N2[S]
i t+ 1
(CH2-N2) [S ] ----- (CH2-N2)[S] -«-► (CH2-N2)[T] > (CH2-N2)[T ]Q > Qo Q — Qo Q Qo (5.1)
where Q is a CH2-N 2 intermolecular separation. Alternately the N2 molecule may serve only to remove excess vibrational energy from an excited singlet electronic state of CH2. Such rapid vibrational relaxation could serve to enhance intersystem crossing in a situation as depicted in Figure 6. In this second mechanism we imagine process (iv) of Figure 6 to dominate in the absence of vibrational relaxation, and the processes (i), (ii), (iii) to dominate in the presence of rapid vibrational relaxation.
The first mechanism will not necessarily occur if N2 is replaced by some other molecule, since the intermolecular potentials may be different. The second mechanism however, is expected to occur whenever N2 is replaced
I[T][S];I>
Figure 4. Transitions from a lower lying singlet state |[S°]> to the perturbed state |[T] [Sj ;I > .
fluorescent and phosphorescent yields in Cr3+ octahedral complexes to the location of the crossing of zero- order 2E and 4T2 curves. This adiabatic intersystem crossover also explains certain predissociation phenomena. We also note that the crossing of zero-order 3T2 and *E curves in Ni2+ complexes accounts for28 an enhanced spin-forbidden transition. The effect of spin-orbit splitting on spin-free ligand field curves has been discussed and calculated by Liehr.29
VI. The Localization Mechanism and H2
If electrons are localized in different parts of the molecule, exchange terms between these electrons are small. In this localized state several different permutation states may be degenerate or near degenerate in zero order. Consequently, these states are highly mixed under the full Hamiltonian.
(25) (a) G. Herzberg, Proc. Roy. Soc., A262, 291 (1961); (b) G. Herzberg and J. W. C. Johns, ibid.. A295, 107 (1967); (c) G. Herzberg and J. Shoosmith, Nature (London) 183, 1801 (1959); (d) G. Herzberg, Can. J. Phys. 3 9 ,1511 (1961);(26) (a) P. C. H. Jordan and H. C. Longuet-Higgins, M o l . P h y s . 5, 121 (1962); (b) R. N. Dixon, Mol. Phys. 8, 201 (1964).(27) See for example: (a) G. B. Porter and H. L. Schlafer, Z . P h y s . Chem. (Frankfurt am Main), 37, 109 (1963); (b) H. L. Schlafer, H. Gausmann, and H. Zander, Inorg. Chem., 6, ¿528 (1967); (c) J. Hempel and F. A. Matsen, J. Phys. Chem., 73, 2502 11969).(28) J. S. Griffith, “ The Theory of Transition Metal Ions,” Cambridge University Press, 1964, p 306.(29) A. D. Liehr, J. Phys. Chem., 67,1314 (1963).
V o lu m e 73, N u m b er 8 A u g u st 1969

2484 F. A. Matsen and D. J. K lein
Figure 6. Two possible mechanisms for electronic relaxation of excited singlet methylene.
For diatomic molecule states in which the number of electron pairs in the separated atom limit is less than in the molecule, localization occurs for large internuclear separation. The extent of mixing of different permutation al symmetries will always be large for sufficiently large R, since the exchange energy falls off exponentially30 in R, whereas certain spin interactions fall off31’32 as l/R3 and l/R\
As an example of a localizable system we consider the singlet and triplet states arising from the interaction of two ground-state hydrogen atoms. The exchange energy becomes small for large internuclear separations; so that the lowest singlet [S ] and triplet [T ] states will be mixed by spin-interactions. Evaluating the total Hamiltonian including spin interactions over the zero-order antisymmetrical product kets, we find eigen- kets of the form
1 RK(S,I)(F.,Fb)(r)-,Mv) (6.1)
The spin S and the nuclear spin I quantum numbers are good for small R; the quantum numbers Fa (Fa = Si + /a) and Fb (Fh = & + 7b) are good for very large R; Mp is the only exact spin quantum number; r is a degeneracy index which is suppressed for otherwise unique kets. The amount of triplet character
% [T ] = 100(72K (S,I) (F a , F b ) ( t ) ;MF\e[T]\KK(S,I) (Fa,Fb) (t) ;Mf) (6.2)
as determined by Harriman and coworkers,32 is plotted in Figure 7.
% CTI
Figure 7. (Adapted from Harriman et al., ref 32)Per cent triplet character of the various states arising from the interaction of two ls,2S hydrogen atoms.
As the localization coordinate R increases, the exchange energy decreases and mixing increases. It is seen that R0 = 10a0 appears to be a degeneracy bound for the localization range. Thus for R > R0, the system is localized, and the permutational symmetries are mixed. Diatomic molecules at large internuclear separations and in particular H2 provide simple examples of a biradical system.
VII. BiradicalsA biradical state has been variously defined33 as a
triplet state, two noninteracting doublet states, or a state acting as though it has two monoradical functions. A state |K[X]K'[X'];3C) which is localized, or nearly so, might be referred to as a biradical state. Biradical states either are of mixed permutational symmetry or are able to attain mixed permutational symmetry by a vibrational motion. As a consequence permutationally forbidden transitions in a biradical are allowed.
(30) See, for example, C. Herring, Rev. Mod. Phys., 34, 631 (1962).(31) (a) W. J. Meath and J. Hirschfelder, J. Chem. Phys., 44 , 3197, 3210 (1965); (b) E. A. Power, W. J. Meath, and J. 0 . Hirschfelder, WIS.-TCI., 175 (1966); (c) W. J. Meath, J. Chem. Phys., 45, 4519 (1966).(32) J. E. Harriman, M. Twerdochilb, M. B. Milleur, and J. 0 . Hirschfelder, Proc. Nat. Acad. Sci. XJ. S., 57, 1558 (1967).(33) (a) G. R. Freeman, Can. J. Chem., 44, 245 (1966); (b) L. N. Ferguson, “ Electron Structures of Organic Molecules,” Prentice-Hall Inc., Englewood Cliffs, N. J., 1952, p 211.
T h e J o u rn a l o f P h y s ic a l C h em istry

Spin-Free Quantum Chemistry 2485
Biradicals are frequently postulated to arise as intermediates in a number34 of chemical reactions and uni- molecular isomerizations. Sometimes there are reasonable alternative concerted mechanisms in which the intermediate (or transition state complex) is not a biradical. Such a case of much interest35 involves the reactions of singlet [S ] and triplet [T ] methylenes with olefins. We note that whether or not a reaction is concerted is determined by the shape of the appropriate intermolecular potential surface,36 a dynamic property; it is not determined by the permutational symmetry. If a chemical reaction passes through a biradical intermediate, intersystem crossover may occur because of the localization and consequent near degeneracy. An example is provided by the reaction of ground state 3P carbon with an olefin double bond
c(sp) ¿A/ ->spiropentanes
(71)
Experimental evidence37 indicates that it is the biradical intermediate
tWwhich undergoes triplet to singlet intersystem crossing, rather than the intermediate
This is as we would expect, if the zero-order singlet and triplet states in the biradical intermediate are nearly degenerate. The process is indicated in Figure 8.
VIII. Photochemical Processes
Intersystem crossover processes between singlet and triplet states are well known in photochemistry. Previous discussions38 of such processes have pointed out that a spin interaction must be responsible, usually39 the spin-orbit interaction. The role of Franck-Condon factors has been emphasized.39,40 The possible role of isomerization processes in radiationless processes has also been discussed.41 Here we wish to point out that near degeneracy of zero-order potential surfaces can enhance intersystem crossing processes42 in photochemistry.
We assume that there is a vibrational coordinate Q for our molecule of interest, such that zero-order singlet[S] and triplet curves intersect as depicted in Figure 10. Thus the nonadiabatic intersystem crossing mechanism (4.16) may apply. We let the [S] and [T] curves of Figure 9 represent excited states of a molecule. A number of different photochemical processes are indicated in Figure 10. This figure is seen to be similar to
Energy
Figure 8. Possible potential for reaction 7.1.(The splitting of the perturbed curves I and II may be exaggerated in the region of the localized biradical intermediate.)
E n e r g y
Figure 9. Intersection of zero-order spin-free potential curves.
the usual Jablonski diagrams except that it includes the Q = Qo near degeneracy states [ A [S]A' [T] ;,TC) and
(34) Recent reviews are: (a) P. D. Bartlett, Science, 159, 833 (1968) ; (b) W. A. Pryor, Chem. Eng. News, 46, No. 3, 70 (1968).(35) (a) W. B. De More and S. W. Benson, Advan. Photochem., 2, 1 (1964); (b) P. P. Gaspar and G. S. Hammond in “ Carbene Chemistry,” W. Kirmse, Ed., Academic Press, New York, N. Y ., 1964, p 235.(36) R. Hoffman, J. Amer. Chem. Soc., 90, 1475 (1968).(37) P. S. Skell and R. R. Engel, ibid., 88, 3749 (1966).(38) (a) G. W. Robinson and R. P. Frosch, J. Chem. Phys., 37, 1962 (1962); (b) G. W. Robinson and R. P. Frosch, ibid., 38, 1187 (1963); (c) M. A. El Sayed, Accounts Chem. Res., 1, 1 (1968); (d) S. K. Lower and M . A. El Sayed, Chem. Rev., 66, 199 (1966) ; (e) R. B. Henry and M. Kasha, Ann. Rev. Phys. Chem., 19, iô l (1968); (f) M. Bixon and J. Jortner, J. Chem. Phys., 48, 715 (1968); (g) F. A. Mataen and D. J. Klein, Advan. Photochem., in press.(39) D. S. McClure, J. Chem. Phys., 20, 682 (1952).(40) (a) W . Siebrand, ibid., 47, 2411 (1967); (b) G. R. Hunt, E. F. McCoy, and I. G. Ross, Aust. J. Chem., 15, 590 (1962).(41) D. Phillips, J. Lemaire, C. S. Burton, and W. A. Noyes, Jr., Advan. Photochem., 5, 329 (1968).(42) (a) J. Franck and H. Sponer, J. Chem. Phys., 25, 172 (1956); (b) H. Sponer, Radiation Res. Suppl., 1,658 (1959).
V o lu m e 7 3 , N u m b er 8 A u g u s t 1969

2486 F. A. Matsen and D. J. K lein
*• |KCS]K'[T1; A.) a iKtSIK'CTli*.’>
Figure 10. Jablonski diagram showing the near degenerate |K[S]X'[T];k> and IK(S)A'[T] ■/> states at Q = Q„.Some primary photochemical processes are indicated:(i) absorption, (i') fluorescence, (ii) and (ii') intersystem crossing, (iii) and (iii') vibrational relaxation and excitation, and (iv) phosphorescence.
|K[S]K'[T];3C') and thus indicates an intersvstem crossing mechanism.
Process ii of Figure 10 may account for excited singlet to triplet intersystem crossing in benzene and other aromatic hydrocarbons. In the case of benzene it has previously been suggested43 that the observed rapid[S] to [T] intersystem crossing might involve states of mixed permutational symmetry, as for instance, |K[S]K'[T];3C) and |jqS]k'[T];3e'>. The nonadiabatic intersystem crossings (ii) and (ii') could occur at a rate greater than for the case where there is no zero-order crossing of potential curves.
Such nonadiabatic intersystem crossing can be involved in delayed fluorescence. E-type delayed fluorescence44 is indicated by processes (iii'), (ii'), and (i'). Another type of delayed fluorescence (ii), (ii'), and (i') might occur when vibrational relaxation is slow.
IX. ConclusionThe role of spin-free Hamiltonians and spin-free
vector spaces in quantum chemistry has been reviewed. If the zero-order spin-free energy levels are widely separated and spin effects are small, molecular systems admit a spin-free formulation. The spin-free quantum number [X] was found to be a good approximate quantum number in such cases. Spin conservation was found to be equivalent to conservation of spin-free permutational symmetry.
The spin-free analogs of the Wigner spin conservation rules were derived. The breakdown of local permutational symmetry, while conserving total spin-free symmetry, was discussed. Examples were given, with special attention to the case involving the effects of paramagnetic molecules in enhancing absorption in organic molecules.
The breakdown of total spin-free permutational symmetry was found to occur when spin interactions in
the full Hamiltonian are taken into account. In this case permutational symmetry [X] and spin S are not good quantum numbers. The breakdown and consequent large mixing of states of different permutational symmetries was found to be especially acute near points of degeneracy. Such large mixing of permutational symmetries gave rise to two mechanisms, (4.13) and (4.16), for intersystem crossing. Methylene and H2 were discussed as examples where such intersystem crossings may play a role.
It was found that biradicals could be formulated as localized states in which permutational symmetry is mixed or may easily become so. Intersystem crossovers involving states of mixed permutational symmetry were found to be possibilities in a number of photochemical processes.
Acknowledgments. The authors wish to acknowledge helpful discussions with Dr. A. A. Cantu and Dr. C. S. Burton.
Appendix. Permutational Symmetry AdaptationSymmetry adaption of a primitive space ket A ‘sr)
£ FSF to the [X ]th irreducible representation of SN may be accomplished by the application of any element of a [X ]th minimal invariant subalgebra of SN. Commonly used2’3'6’46 elements of this algebra are a matric basis element eT, , an immanant projection operator eIxl, or a structure projector .
Symmetry adaptation of a primitive spin ket is accomplished in a similar manner. A primitive spin ket | M) £ V" of the form
N /2 + M NIm ) = n a(i) n 0(j) (A. i)¿ = 1 j = N / 2 + M + l
is an eigenket of <SZ, and thus kets projected from it will be also. This ket |M) has invariance6 {7 } = {N/2 - f M, N/2 — M }, and generates a space Va{y} spanned by the kets P\M), P £ SN°. This space is decomposed
y ly ) _ ^ F ‘r(Tl([X'r]) (A .2)[V7]
The bases of these subspaces are
= I|Mr;[X"]r>, r = 1
We note
r = 1 t o f ^ } (A. 3)
(A. 4)
(43) G. B. Kistiakowsky and C. S. Parmeter, J. Chem. Phys., 42, 2942 (1965).(44) C. A. Parker, Advan. Photochem., 2, 305 (1964).
T h e J o u rn a l o f P h y s ic a l C h em istry

Spin-Free Quantum Chemistry 2487
and this last outer direct product frequency may be given by the spin-free conservation rules of eq 2.9 to yield the result
I; [X'] = [N — p, p] and N — 2p > 2M 0, otherwise
(A .5)
Since frequencies only of 0 or 1 arise, we will suppress the degeneracy index r. We also note there is a matric basis such that
e „ [x<rIjM) = 5Sr (Normalization)|MIX']r) (A .6)
Space-spin kets may be simultaneously symmetry adapted to Snsf <g> SN" and Snsf ki SN*. Symmetry adaptation of the space-spin ket |i£sr) <g> \M) to SNSF ® Sj/ is accomplished by symmetry adapting |Ksf) to Snsf and |M) to SNa; symmetry adaptation to the [^-representation of Snsf E3 SNa is obtained on application of the antisymmetrizer a. Since the antisymmetrizer a restricts the Snsf ® S#' symmetryto the form with [X ] = [XSF], we will label our symmetry-adapted fermion kets only with [XSF]. Thus we obtain the first part of (4.2)
|KsfM[Xs f ]> = (Normalization)Ct(|.KSF) ®|M[X^]r)) (A. 7)
To obtain the second part of (4.2) we use2a
a = £ ¿ 1 £ £ e „* ’ ] ® ers ] (A .8)[A0-] J r s
along with eq A.6
a(|KSF> ® |M[XSI>>) ets ]\KSF) ®
etr h rr ]\M)
= 6 ^ 1 K SF) ®
e,P^\M) (A. 9)
so that
|AsfM[Xs f ]> = (Normalization) £ |ASF[r]f> <g>t
|Jf[X']i> (A. 10)
We briefly mention the difference between the bar “ — ” and tilde symbols. Here [X] denotes the partition conjugate to [X]; the Young diagram for [X] has its rows and columns interchanged with that for [X]. Here the bar “ — ” denotes more than conjugacy; it denotes a specific representation. The representation T w is related to T w by
[P]r/ ] S ( - i n p ]rsw (a . i i )
The representations r w and r w may thus differ by a unitary representation. It is always possible to choose our representations such that F w = r w , except for the self-conjugate, [X] = [X], irreducible representations.
(45) R. D . Poshusta and R. W. Kramling, Phys. Rev., 167 139 (1968).
V o lu m e 73, N u m b er 8 A u g u st 1969

2488 F. A. Matsen and A. A. Cantu
Spin-Free Quantum Chemistry. VII. The Slater Determinant1
by F. A. MatsenMolecular Physics Group, The University of Texas, Austin, Texas
and A. A. CantuDepartment of Chemistry, University of Alberta, Edmonton, Alberta, Canada (Received June 11, 1968)
There exist spin-free analogs for Slater determinants including those with different orbitals for different spins. The spin-free analog of the resolution of a Slater determinant into pure spin states is the resolution of its spin- free analog into pure permutation states. Like a Slater determinant, its spin-free analog can accept an assignment of no more than two electrons to a spin-free orbital. The spin-free analog of a Slater bond function which lies in a pure spin state is a spin-free bond function which lies in a pure permutation state. Just as for a Slater determinant, the expectation value of a spin-free operator over its spin-free analog is the sum of contributions from pure states with “Sanibel” coefficients. Just as for a Slater determinant, its spin-free analog is a basis for a variety of self-consistent field calculations.
I. IntroductionThe earliest treatments of the A-clectron problem
were based on the theory of the symmetric group.2a In 1929 Slater2b proposed his determinantal method for the A-electron problem, a method which did not require a knowledge of group theory and which was inherently simple. The Slater determinant has been the basis of most of the development in quantum chemistry during the past 40 years.
However, the Slater determinant method requires explicit use of spin even for systems for which a spin- free Hamiltonian is sufficient. The close association of the A-electron problem with spin required by the Slater determinant method has led to the development of a spin-oriented language. The use of this spin- oriented language has led many chemists to believe that spin plays a dynamical role in the greater part of quantum chemistry.
The present series of papers3 has for its purpose the establishment of a viable spin-free quantum chemistry. Such a formulation has an interest and utility of its own, but, in addition, its existence should have the effect of demoting spin to its proper place in quantum chemistry.
Since most of the theoretical development in quantum chemistry has been in terms of Slater determinants, we exhibit a spin-free analog of the Slater determinant. This exhibition occurs in section IV. Sections II and III contain the required group theory. In section V are exhibited the spin-free analogs of a number of self- consistent field wave functions constructed on Slater determinants.
II. Primitive Kets and Their InvariantsLet the vector space V (7) which is spanned by a basis
V (y):B (y) = {¡7;!), i ranging} (2.1)
be an invariant vector space with respect to SN, the
group of permutations on N objects. Furthermore, let this space be generated from a given primitive ket I7) by applying' permutations of SN to the electron coordinates of 17). For this discussion we take ¡7) to be an orbital product of independent orbitals
¡7) = <t>k- ■ ■4>i) (2.2)
Here the orbital in the first position is assigned to the first electron, etc. The orbital product ket is characterized by the partition4
{7 } = { 71>72j ■ • -,7*} (2.3)where yk is the number of <t>k in I7). Note that
£ 7 * = N (2.4)k
We arrange the orbitals in I7) such that
71 > 72 > • ■ • > 7* (2.5)The partition {7} is called the invariance of I7). The invariance group of ¡7) is
Gy =
= Syi®Sy,® . .. ®Sy, C SN (2.6)
where Syk is the group of permutations on the 7* electrons assigned to 4>k and where
(1) This research is supported by the Robert A. Welch Foundation of Houston, Texas.(2) (a) See, for example, H. Weyl, “ Group Theory and Quantum Mechanics,” 1st ed, 1928. Reprinted by Dover, New York, N. Y . (b) J. C. Slater, Phys. Rev., 34, 1293 (1929).(3) The spin-free quantum chemistry series consists of the following papers: paper I : F. A. Matsen, “ Advances in Quantum Chemistry,” Vol. I, P. O. Lowdin, Ed., Academic Press, New York, N. Y ., 1964. Paper II: F. A. Matsen, J. Phys. Chem., 68, 3282 (1964). Paper III: F. A. Matsen, A. A. Cantu, and R. D. Poshusta, ibid., 70, 1558 (1966). Paper IV : F. A. Matsen, ibid., 70, 1568 (1966). Paper V: F. A. Matsen and A. A. Cantu, ibid., 72, 21 (1968). Paper VI: F. A. Matsen and D. J. Klein, ibid., 73, 2477 (1969). Paper V III: F. A. Matsen and M. L. Ellzey, ibid., 73, 2495 (1969).(4) A partition of N is a set of integers whose sum is N,
T h e J o u rn a l o f P h y s ic a l C h em istry

Spin-Free Quantum Chemistry 2489
Gay\y) = \y),Gy e G y (2.7)
The order of Gy is
n ly] = 7My2!. . .yM (2.8)
See Table I.
Table I : Invariance Group for Kets with N — 4
It) 17 } oy
¡01 20304) ibi,1,1} = i l4} {*}1 <¿>1010203) {2,1,1} = {2,1#
{2,2} = {2#{ >(12)}
101010202) {5(12)} {£1,(34)} = {5(12),(34),(12),(34)}
101010102) {3,1} {5,(12),(13),(23),(123), (132)} = S 3
¡0101010l) {4} S4
/ W W 4 E » a ' \ W (2-17)iv . p
is the number of times r lxl occurs in I '1'1'1. Here X„t7) and xP[xl are the characters of the pth class in r w and r w , respectively, and n9 is the number of elements in the pth class. See Table II.
Table II: /HUM for yr = 4
i t) [1 4] [2,1*1----[X]-----
[22] [3,11 HI1# 1 3 2 3 12,1# 0 1 1 2 12# 0 0 1 1 13,1} 0 0 0 1 14} 0 0 0 0 1
We define the idempotent operator
(2.9)
such that
s7|t) = |t> (2.10)
The vector space generated from the orbital product ket defined in (2.2) is
V (y):B (y) = {|y = 1 to /* 7*} (2.11)
where
It ; # = Piy\y) ( 2 .1 2 )
and P y is one of the left coset generators for SN with respect to Gy. The dimension of V(y) is equal to the index of Gy
-fÌTÌ _ *' ‘ _ J i y Ì
Nl N\T1 |72 !. •T !
(2.13)
Murnaghan6 has shown that6
= 0 if {y} > [\] (2.18)
According to (2.18), if {y} > [X], F(y) does not contain F(yo-;[X]). Further
/ ’7|[X1 = 1 if {7} = [X] (2.19)
and
= / [xlif { T} = { l w} (2.20)
The Pauli-allowed permutation states are characterized by partitions of the form [X] = [2P, l^ _2p]. Thus by (2.18) for { t } < [X], the primitive ket can only have invariances { y } = { 2s, l^ “ 28} with q < p. This implies that | y) is restricted to having q < p doubly occupied orbitals occuring among the first 25 electron coordinates. This is the spin-free exclusion principle which states that no more than two electrons can be assigned to a spin-free orbital. The frequencies7 of (2.17) for the allowed permutation states are given by
The vector space F(y) can be decomposed into a direct sum of minimal invariant subspaces (permutation states) under iS#
f\y) [X]F ( t ) = £ £ T ( t <t;[X]) (2. 14)
V (t 0- ; [x ]): H(t <t;[x]) ={ ITCTj[X]r), r = 1 t o / txI} (2.15)
and [X] is a partition of N. The decomposition of F (t ) induces a reduction of r lTl, the representation of iSjvonF(y). Thus
p f r l _ /H ) [x]p[x] (2 16)[M
where r l7) is an irreducible representation of SN and the frequency
[y)M = (N - 2q)l(N - 2p + 1) (p - q)\(N - q - p + 1)!
= 0
By (2.20) and (2.21)
q > p (2.21)
j.(iw) [x] _ ux] _ N\{N 2p + 1)1 J p l ( N - p + 1)!
There follow four important tool theorems. Theorem I
XIM(S7) = / l7l[xl
(2.22)
(2.23)
(5) F. D. Murnaghan, “ The Theory of Group Representation” John Hopkins University, Baltimore, 1938.(6 ) j 7 ) > [X] means 7 1 > X1 or if 7 1 = X1 then 7 * > Xs, etc.(7) J. C. Schug, T. H. Brown, and M. Karplus, J. Chem. Phys., 35, 1873 (1961). See also F. A. Matsen, Molecular Physics Group Technical Report, Austin, Texas, 1962, eq 671.
V o lu m e 73, N u m b er 8 A u g u s t 1969

2490 F. A. Matsen and A. A. Cantu
By eq 2.9
x txl(s^) = - ^ E x ix,(g : )n ' yl a
- - r a S V V ( a « )n p
where n j7 '1 is the number of elements in the intersection of the pth class and (P. According to Murnaghan (ref 5, p 94)
v v ! t !
nP ] = - j p r (2 • 25)
We substitute (2.25) into (2.24) and use (2.13) to obtain
x [XI(s7) = ^ n* ' 7V k ,= / l # )
Theorem II. There exist irreducible representations of SN such that
rp7l [x] i = for r,s = 1 t o / i7UXI 1 \ = 0 forr,s > / l7![X1 (2.26)
Since S7 is idempotent, we can choose a representation of ST such that
r?7l 1x1 f = Srsiorr ’s = 1 t0TOTS 1 = 0 for r,s > m (2.27)
The representation defined by (2.27) is said to be canonical to S7. By (2.27)
X[X1(S7) = E [8T] - [X1 = tn (2.28)r
By Theorem Im = / i7l[x (2.29)
(2.29) together with (2.27) constitutes the theorem.For an invariance group G* of a ket \p) we define an
antisymmetric idempotent
rf = E * ( ¿ V W (2.30)o
Theorem III
X'% '* ) = / W ^ (2.31)
where Plxl is the representation conjugate to r IX]. By (2.30)
x IX](^ ) = E « ( B / ) x [X]( P / )
= 4 d S x IX1(B /) (2.32)Tl a
The proof then follows that of theorem II.Theorem IV. There exists an irreducible representa
tion for SN such that
r mi [M \ = 8™for r>s = 1 t o / W 1X1 V ” ) = 0 for r,s > / wfx] (2.33)
The proof follows that of theorem II making using of theorem III.
Murnaghan (ref 5, p 151 if) has shown that for { p }
f WfM = i l fo r W < { m} = { 2M 2V- 211.0 otherwise (2.34)
(This is also shown in the Appendix of paper VI of ref3). Note that for the nonzero frequencies in (2.34), [X] must be of the form \2V, l A' ~2i'] with p < p.
Theorem V
VM= Z Cu1X1 for {p} = {2^,1^-^} (2.35)W<(Pi
Since i?" is an element in the group algebra we can expand it in the matric basis (section III)
(2.36)[X] r s
We substitute (2.33) and (2.34) into (2.36) to obtain the theorem.
We shall see in section IV that the group G" is to be associated with a spin ket of invariance {N — p, p\.
in. T h e Decomposition of V (7 )For the decomposition of F(y), we employ the matric
bases of the permutation algebra which contains elements of the form
f [X ][x] _ L -= ^ E iP a - ^ P a (3.1)
where [.Pa- 1]sr[xl is the s,rth element in the / [x] X / tx! matrix which represents Pa~l in r[x]- r[xl is chosen canonical to S7 (see theorem II, section II), i.e.
[X ]o 7 erstxl, 1 < s < / l7llxl 0, s > / l7)[XI
(3.2)(3.3)
The basis elements in (2.15) are defined by
17S>‘ [k]r) = # SIX1| 7) (3.4)
Then by (2.10), (3.2), (3.3), and (3.4)
17 5 / [X ]r> = ers[XIS7|7)
= ers[XI|7> l < s < / i7l[XI (3.5)
= 0 s > / i7)[xl (3.6)
It follows from (3.4) and the properties of unitary matric bases of the permutation algebra
<7s;[X]r|tf|7s';[X']r') = (y\eirMHerJ x,i\y)/[X]
= 5([X],[A'])5(r,r') Z [P a~'U™{y\HPa\y)
s',s = 1 t o / i7l[xl (3.7)
By (3.7) the representation of H in the matric basis of V (7) is factored into blocks, each characterized by [X], The [X]th block is factored into / [xl identical blocks
T h e J o u rn a l o f P h y s ic a l C h em istry

Spin-Free Quantum Chemistry 2491
each characterized by r and each of dimension X / l7)[xl. The eigenkets are of the form
17 # [AM = £ |7s;[AM(7s|tf[A]) (3.8)s
with eigenvalues FJ(7;iC[X]). The index r = 1 to / [M labels the degenerate eigenkets. Because of the degeneracy it is sufficient to consider the subspace
F(7;[A]1):{|7s;[A]1),S = l t o (3.9)
The fact that V (y ; [\]1) is not a minimal invariant subspace is of no consequence here. A general vector in 7 (7 ; [\]1) is
|7<r;[X]) = cM’ jy) (3.10)
f \ 7 I I'M
Mxl = X vs ersIX (3.11)
is called the sigma 'projector.
The modulus of a minimal invariant subalgebra A 1x1 of the algebra of the symmetry group A (SN) is defined by
.[X]e[xl = X e „ [x]
r/[X]
= X XM(Pa)Pa (3.12)
The identity element is a sum of the moduli in the several subalgebras. Thus
i = X « W (3.13)[X]
It follows that a primitive ket can be decomposed into a sum of components lying in the several permutation states. Thus
where
17> = â\y)
= X |7;[a])[X]
7;[A)> = e Ixl|7)
= 0 i f / l7l[x] = 0
(3.14)
(3.15)
I7J [X]) is called an immanant? The projection of the antisymmetric projector (2.30) into A 1X1 is by (2.35)
^ [XI = etxV = eu lxl for [X] ^ {ju} (3.16)
= 0 for [X] > {#}
The ket
\yo) = V n^ Y \ y) (3.17)
is shown in section IV to be the spin-free analog of the Slater determinant. By (2.35) and (3.4), (3.17) becomes
|7M> = « W X |7l;[X]l> (3.18)tx]< (?)where
| 7 l;[X ]l> ^ e M i7> E F (7 ;[X]1) (3.19)
By (2.14) and (2.18) irrespective of the representation chosen for the construction of enIxl
[71 ;[x]i) = 0 if {7 } > [X] (3.20)
Consequently
= X ¡7l;[X]l> (3.21)h ) < [XI < {*)
Note that if {7 } = { ¡1 } then (3.21) has the simple form of (3.17) and is in the pure permutation state [A] = [7]. If we now relax the restriction of the double occupancy in 17) to {7 } < {p. } and wish to retain the simple form of (3.17) we do this at the expense of projecting an impure permutation state. This in fact is the nature of the unrestricted Hartree-Fock scheme. (See Table IV.) If one projects on ¡7/1) with e[xl, the projected ket lies in a pure permutation state. This corresponds to the projected unrestricted Hartree-Fock and the extended Hartree-Fock schemes. (See Table IV.)
IV. The Spin-Free Analog of a Slater DeterminantA Slater determinant is defined by
O = ^ 7 = X « (Pa)Pa\y)Pa\p) (4.1)
where
y = | a ft a f i . . . a/3 a ................ a ) ( 4 .2 )1---- 2a-----1 lN - 2 mj
(J) is an eigenket to Sz with an eigenvalue of
NM = - - m (4.3)
From the theory of determinants
© * 0 (4.4)
only if 17) has an invariance
{7} = {2 ‘ , l N~™} 0 < g < M (4.5)
That is, no more than tv o electrons may be assigned to the same orbital. The maximum value of S for {7 } = { 28, I " ' 25} is
NK = - ~ q (4.6)
The Slater determinant Q is not an eigenfunction of S2. In fact its resolution into pure kets is given by
l©> = x \ m (4.7)M <S <K
(8) R. D. Poshusta and R. W . Kramling, Phys. Rev., 167, 139 (1968).
V o lu m e 7 8 , N u m b er 8 A u g u s t 1969

2492 F. A. Matsen and A. A. Cantu
u, „ » mi T\ f cl 4- t~% +. • 4 where (F is the invariance group of L) with {p\ =Table III: The Decomposition of Slater Determinants , , o r - i(J) and Their Spin-Free Analogs |yp) for N = 4 t N — p, p\. 1 hen
ÌtI \y) M u> [X] s <G)l<?lG» = E e (P0(y\HPi\y)a
(4.15)
{ l4} 01020304 {!*}{2,12}
|aaaa) | afUcta)
[141[l4] > [2,12]
22,1 It follows from (4.7) that
i 2,12} 01010203{2*} {P} {2,P} {22}
ja a/3)jaaaa)\a(3aa)
[1*],[2,1*],[2*]
[2,1=3
2,1,0
1 t o - » - 2 - t o r ®VWIbJ/ M <S <K .(4.16a)
\apap) [2,1=],[2=] 1,0}22} 01010202 { l4} laaaa) — — where
i 2,12} {22}
\afiaac) | otfia.fi) [2s] 0 r { ( o s \ H \ m
{ y }(4.16a)
Here
\ (l)S )^ es\0) (4.8)
where ©s is the Lowdin9 spin projection operator
& - k(k + 1)©s = n\ * s S (S + 1) - H k + l )
(4.9)
A Slater bond function is a linear combination of Slater determinants and is an eigenfunction of S'2. It provides a quantum mechanical model for a single molecular structure, Dx. For a molecule with p bonds, S = (N / 2) — p. For a singlet state, Dx contain p = N/2 bonds and the bond function is givenby 10-12
|©;*> = ¿ - 2 E l T O > (4 . io )R*
where R* permutes pairs of orbitals of opposite spin that are connected by arrows in Dx.
The number of independent singlet bond functions which can be formed from | Q)) with { y } = {1^} is
The expectation value of a spin-free Hamiltonian over a pair of bond functions is
( Q ; k\h \(1 ) ;x >) = E (P a) xX y \ H P a\y) (4.12)a
Schemes for the computation of the Pauling numbers (Pa)xx' have been proposed.13'14
and where coSM are the “ Sanibel” coefficients. Sasaki and Ohno16 have shown that for orthonormal orbitals and { y } = { l w}
(M m(2*+1)(f + 4 '(f-M)!" — « » K ; » - ( K _ s ) q + s + 1y
(4.17)
Theorem VI. The spin-free analog of a Slater determinant I© ) is as given in (3.17)
1yp) = v>\y) (4.18)
The equivalence of ]© ) and \yp) is established by showing that they give the same matrix element for a spin-free Hamiltonian. Thus
(yp\H\yp) =
= n w <7|#Vlr>
= £ * (Pa)(y\HPiy) (4-19)a
which is in agreement with (4.15).We now proceed to show some of the properties of
| yp) which parallel those already established for its spin analog | © ) . The purpose of this is to show that these properties arise merely from properties of the permutation algebra and not from spin.
By (3.21)
\yp) = n M £ |t 1;[X]1) (4.20)!y!< [ x] < W
The expectation value of a spin-free Hamiltonian over a Slater determinant is
<©|ff|©> = £ e (Pa)(y\H Pa\y)(p\Pa\p) (4.13)a
Now
= {1 for P a € G" 0 for Pa e IF
(4.14)
(9) P. 0 . Lowdin, Phys. Rev., 97, 1509 (1935).(10) J. C. Slater, ibid., 38, 1109 (1931).(11) A. Sherman and H. Eyring, J. Amer. Chem. Soc., 54, 239 (1932).(12) L. Pauling, J. Chem, Phys., 1,280 (1933).(13) L. Pauling and E. B. Wilson, “ Introduction to Quantum Mechanics,” McGraw-Hill Book Co., Inc., New York, N. Y ., 1935.(14) H. Eyring, J. Walter, and G. E. Kimball, “ Quantum Chemistry,” John Wiley and Sons, Inc., New York, N. Y ., 1944.(15) F. Sasaki and K. Ohno, J. Math. Phys., 4, 1140 (1963).
T h e J o u r n a l o f P h y s ic a l C h em istry

Spin-Free Quantum Chemistry 2493
Table IV : Spin-Free Function for Self-Consistent Calculation“
Primitive ket invariance Projector Projected ket characterization
1. Hartree {2N/2j / [2JV/2 ] u u ... u [AT]2. Restricted Hartree-Fock j2N/2j v{2"/2} [2N/2]3. Unrestricted Hartree-Fock (spin polarized) {1*} J 2 "72} [1 ] U [2,lAr~2] U ... U [2 /2]4. Projected unrestricted Hartree-Fock
(orbitals determined from 3 before projection){1*} e[X] M = eil[X] [X] < {a}
5. Projected extended Hartree-Fock (orbitals determined after projection)
{!*} «uN [X] < {a}
6. Optimum projected unrestricted HF (orbitals from 3, <r projector optimized)
{1"! ,w [X] > {l*}
7. Optimum projected extended HF (orbitals from 5, cr projector optimized)
{1*} O’[XI [X] > {1 }
8. Goddard19 GI method6 {t} „..[XI [x] > {7 }9. Poshusta-Kramling8 immanant {7 } «N [X[ > {7 )
10. Poshusta and Kramling8 optimum extended {7 } unrestricted HF(orbitals and a projector are simultaneously optimized)
o-txi [X] > Î7Î
a The a projector is given by (3.11) and can also be expressed in terms of the structure basis3,17)1X1 ,{7)1X1
erW = X cr5eis[X1 = X°VKIXIS K
6 The irreducible representations used in this matric basis is the Young orthogonal representation.
We shall see that the spin-free analog of the resolution of a Slater determinant into pure spin states, eq 4.7, is the resolution of its spin-free analog into pure permutation states, eq 4.20. See Table III. For
{#} = {2", l * - 2“ } 0 < p < N/2 (4.21)
Consequently (4.20) is the spin-free analog of (4.7).The spin-free analog of a singlet Slater bond function
is, using (4.18)
lw;*> = * ? \R* y)
and [X] < [#] it follows that
[X] = [2*,1"-2*] 0 < p < n < N/2 (4.22)
For [X] = [2”, 1^-20] anc[ {7 } < [X] it follows that the invariance of 17) is restricted to
{7 } = { 2 y " ~ M} 0 < q < p < p < N/2 (4.23)
Note that (4.23) contains the spin-free exclusion principle which excludes assignments of more than two electrons to a single spin-free orbital. This is in agreement with eq4.5.
Only the permutation states specified by q < p < p are contained in |y/i). In (4.20) 171 ; [X ] 1) is the spin-free analog of | Q) ;<S) where
N (4.24)s = - - p
The highest [X] is given by [2'i, lAr- 2#*]. ingly, the lowest value of S is
Correspond
i t )
The lowest [X] is given by { 25, l iv_2f}. ingly, the highest value of S is
Correspond-
NK - - - q (4.26)
= V n M n M Vis*7> (4 .27 )
where { p } = { N / 2 , N / 2 } and = (iV/2!)2.Furthermore, ¡8*7) = 8*17) where 8* is the symmetric idempotent of the group GK which exchanges the electrons in each bond in Dx. Here
and{*} = [2Nn\ = {2p}
n U) _ 2N/2 _ 2V
For example, for \p) = aßaßaß, we have { p } = 36 and
(4.28)
(4.29)
{3,3},
V = ¿ ( t f - (13) - (15) - (35) + (135) +36(153)) (g - (24) - (26) - (46) + (246) + (264))
A possible structure is
Te ,N*a
Dk A \6 . ^ 8
for which {* } = { 23}, n**1 = 23 and
8* = I (0 + (12)) (if + (34)) (g + (56))O
V o lu m e 7 3 , N u m b er 8 A u g u s t 1969

2494 F. A. Matsen and A. A. Cantu
For {7 } = { l w} the invariance of |g*7) = S*[-y) is { 2Nn}. Then by (4.20) and (4.27)
E |2x7l;[X ]l) (4.30)|2^/2) <[X]< ¡2^/2)We see that [s*/y ;[A]1) lies in a pure permutation state with [X] = [2^/2]; it is the spin-free analog of a Slater bond function with S = 0 (4.10). The independent spin-free bond functions span the space F(7;[X]1) (3.9). The dimension of this space is by (2.22)
y(ltf)[2Wq = N\(4.31)
N/2, ( f + l ) l
in agreement with (4.11) . We note that
N*Px\y)V n {x]n {~*]
(4.32)
where
N* = n fxV* (4.33)
andp* = n ixie,x (4.34)
are the antisymmetric and symmetric Young operators for the tableau T*1 . (4.32) is, to a phase factor, thedefinition of a spin-free structure operator employed in papers I and III. In paper III it was shown that
(yn;x\H\ytr,x') = E (p a)xx>{y\HP^7) (4.35)a
with the same coefficients as in (4.12).To derive the Sasaki-Ohno formula, eq 4.17, we
note that by (4.20), (3.19), and (3.20)
E(yfi) =
= n„ E ( jH g n ^ T )!'v!<[xi<[s] <7m|ym)
= Y o> [X] U )E(y [X]) (4.36)(7) <[x]<!ilwhere
yy\H\yy) (7^1 7 m)
E( 7 [X ] ) =
and
(7lenIxlg [7 )<7|en[M|7)
y fP - 1 ] [xi (y\HPa\y) . N \ ^ [ P a ]u (7 |e u [x]|7) ( 4 -3 ? )
(4.38). <7«uW 7>w[x][M)=rc —,— i— r-{yn\yn?
For {7 } = { l^ } and orthonormal orbitals, (4.38) becomes
w[x]W(N - y)ly\(N - 2p + 1)
pl(N — p + 1)! (4.39)
On the substitution of p = {N/2) — S and y = (N/2) — M, we obtain the Sasaki-Ohno formula (4.17).
We have thus shown by formal proof that 17/i) is the spin-free analog of the Slater determinant (J) and have demonstrated that properties obtained from Q) are easily established using | yy) indicating that spin is not a dynamical factor in the validity of these properties.
V. Self-Consistent W ave FunctionsThe self-consistent field procedure is a device for
obtaining optimum orbitals for description of atoms and molecules. In the conventional procedure (Hartree- Fock) a wave function is constructed from one or more Slater determinants. Poshusta and Kramling8 have given a spin-free formulation of this procedure. In Table IV we identify the spin-free analogs of several wave functions which are taken as bases in the computation of self-consistent field orbitals.
Functions 1 and 3 do not lie in pure permutation states so their physical significance is open to question. Function 3 has been used in the computation of spin density.16 Kets with {7 } = { 2*v/2} for which only the state [X] = {2Ar/2} (singlet) is contained are called closed shell kets. Kets with {7 } < { 2-v/2} are called open shell kets. Kets with { 7 } = {1^} are called different orbitals for different spin kets. In this table functions 1 through 7 are those commonly used to describe the “ singlet” ground state of a system. (Here “ singlet” has no meaning for functions 1 and 3). Functions 8 through 10, as formulated here, apply to the description of any permutation state. To adapt the first seven functions so that they describe “ excited” states one then has to consider different kets 17) and appropriate projectors. In common practice the [ 7) considered for the “ excited” states are formed by promoting electrons into “ virtual” orbitals forming what we called open-shell kets. Of the kets in the list, (10) has the greatest variability and so should yield the best energy.
Summary
In this series we have employed the symmetric group to develop a spin-free quantum chemistry. In this paper we have used the symmetric group to obtain a spin-free analog of the Slater determinant. The symmetric group has also been used as a tool in the conventional spin formulation.17-22
(16) A discussion of this point together with references is given in paper V.(17) M . Kotani, A. Ameniya, E. Ishiguro, and T . Kimura, “ Table of Moleeualr Integrals,” Maruzen, Tokyo, 1955.(18) M . Kotani, “ Handbuch der Physik,” Vol. 37, Part II, Springer, Berlin, 1961.(19) W . A. Goddard III, Phys. Rev., 157, 73, 81, 93 (1967).(20) F. E. Harris, “ Advances in Quantum Chemistry,” Vol. I l l , P. O. Lowdin, Ed., Academic Press, New York, N. Y ., 1967.(21) J. J. Sullivan, J. Math. Phys., 9,1369 (1967).(22) G. A. Gallup, J. Chem. Phys., 48,1752 (1968).
T h e J o u r n a l o f P h y s ic a l C h em istry
Spin-Free Quantum Chemistry 2495
Spin -Free Q u a n tu m C hem istry. V III. T h e C rysta l F ield P ro b le m 1
by F. A. Matsen and M. L. EUzeyDepartment of Chemistry, The University of Texas, Austin, Texas 78712 (Received June 11, 1988)
The spin-free crystal field problem is treated by the methods of spin-free quantum chemistry. An ¿V-electron spin-free Hamiltonian commutes with the symmetric group SN and with [G]‘v, the iVth rank inner direct product group of the crystal field point group G. The irreducible representations of the two groups supply exact quantum numbers for the system. For low field strengths one obtains the “high-spin” approximation, while for larger field strengths one obtains the “ low-spin” approximation. The perturbed metal ion model of Bethe, Tanabe, and Sugano, et al., is employed. Basis sets symmetry adapted to SN and [G]v are utilized. Results are given for the d2,8, d3,7, d4,6, and d6 octahedral systems.
I. IntroductionA spin-free Hamiltonian HB¥ is frequently employed to
obtain the coarse structure of a crystal field problem.2-8 With such a Hamiltonian, one obtains the dependence of weighted means of the spin multiplets on the strength of the crystal field.3®
For any W-electron problem9
[tfSF,Pa] = 0, P a G Ss (1.1)
where Pa is a permutation on spin-free electron coordinates and St? is the symmetric group. It follows that the states of HSF are characterized by the / Ixl- dimensional irreducible representations r[xl of >SN. These representations are identified by the partitions [X] of IV.
[X] 2fc%lAl] (1.2)
where
E g h e = N (1.3)0
The [X] are exact quantum numbers. The Pauli
[X] = [2p, l iV-2i’ ] (1.4)
allowed partitions are related to the multiplicities m by
m = N — 2p + 1 (1.5)
where the index p is termed the pair number.9 For any W-electron crystal field problem
[HSF,lGo]N] = 0 ,[G a ]" e iG ]N (1.6)
where G is the point group of order n of the crystal field, and [G]‘v is the Nth rank inner direct product of G.10-12 The group [(r]-v is isomorphic to G. It follows that the states of the spin-free Hamiltonian are characterized by the /®-dimensional irreducible representations T® of [G]1'7. These representations are identical with the irreducible representations of G itself. The ft are exact quantum numbers.
Since SN and [G]‘v commute with HS1 and with each other
[Pa,[Ga\N] = 0, P a £ S^lGa]* G [<?]* (1.7)
[X](or m) and <2 are both exact quantum numbers. Each state is identified by
Q = It ; “«} (1.8)
and represented by an f x '/^dimensional vector space V(y; ma) with basis B(y; m&)
V (y ;ma ) :B (y ;ma) = {|y; [X]r OR),
r = 1,2, . . . , / [XI;W = 1,2, . . . , / « } (1.9)
Here y represents all supplementary quantum numbers.
(1) Supported by the Robert A. Welch Foundation of Houston, Texas.(2) H. A. Bethe, Ann. Phys., 3 ,133 (1929).(3) (a) J. S. Griffith, “ The Theory of Transition-Metal Ions,” Cambridge University Press, London, 1961; (b) J. S. Griffith, “ The Irreducible Tensor Method for Molecular Symmetry Groups,” Prentice-Hall, Inc., Englewood Cliffs, N. J., 1962.(4) Y. Tanabe and S. Sugano, J. Phys. Soc. Jap., 9, 753 (1954).(5) B. R. Judd, “ Operator Techniques in Atomic Spectroscopy,” McGraw-Hill Book Co., Inc., New York, N. Y ., 1963.(6) C. J. Ballhausen, “ Introduction to Ligand Field Theory,” McGraw-Hill Book Co., Inc., New York, N. Y ., 1962.(7) B. G. Wybourne, “ Spectroscopic Properties of Rare Earths,” Interscience Publishers, New York, N. Y ., 1965.(8) H. Watanabe, “ Operator Methods in Ligand Field Theory,” Prentice-Hall, Inc., Englewood Cliffs, N. J., 1966.(9) The free-spin quantum chemistry series consists of the following papers: Paper I: F. A. Matsen, “ Advances in Quantum Chemistry,” Vol. I, P. O. Lowdin, Ed., Academic Press, New York, N. Y ., 1964. Paper II: F. A. Matsen, J. Phys. Chem., 68, 3282 (1964). Paper III: F. A. Matsen, A. A. Cantu, and R. D. Poshusta, Ibid., 70, 1558 (1966). Paper IV : F. A. Matsen, ibid., 70, 1568 (1966). Paper V: F. A. Mat- sen and A. A, Cantu, ibid., 72, 21 (1968). Paper VI: F. A. Matsen and D. J. Klein, ibid., 73, 2477 (1969). Paper V II: F. A. Matsen and A. A. Cantu, ibid., 73, 2488 (1969).(10) F. A. Matsen and M . L. Ellzey, “ Finite Associative Algebra With Examples,” Part I, Technical Report, Molecular Physics Group, The University of Texas, Austin, Texas, 1966.(11) M . L. Ellzey, Ph.D. Thesis, The University of Texas, Austin, Texas, 1966.(12) F. A. Matsen and O. R. Plummer, “ Group Lattices and Homo- morphisms” in “ Group Theory and Its Applications,” E. M. Loebl, Ed., Academic Press, New York, N. Y ., 1968.
V o lu m e 7 3 , N u m b er 8 A u g u st 1969

2496 F. A. Matsen and M. L. Ellzey
For reasons given below, r and R are called degeneracy indices.
Two semiempirical models are currently used for treating the crystal field problem: the molecular orbital model6 and the perturbed metal ion model.30"4 Both neglect closed shells and configuration interaction. The molecular orbital model utilizes orbitals of both the metal ion and the ligands, permitting explicit (although very approximate) inclusion of electron exchange and charge transfer between the metal ion and its ligands. The perturbed ion model uses only orbitals of the metal ion. Both models employ considerable empirical parameterization to overcome their inherent deficiencies.13-16 An excellent critique of the perturbed metal ion model has been given by Liehr.17 In this paper we consider the spin-free perturbed ion model, obtaining results identical with the conventional spin treatment with a spin-free Hamiltonian.
II. The Spin-Free Perturbed Ion ModelWe take for the perturbed metal ion Hamiltonian
Hsf = H° + H1 + H2 (2.1)where
= (2.1a)i = i
N „2H1 = 12 - (2.1b)
i<3 t'ij
# 2 = E t f i CF (2.1c)¿=1Here the effective single electron Hamiltonians, Hi and HiCF, refer to the fth electron in spherical and crystalline potentials, respectively. We represent the states of HSF by its eigenkets within the configuration space
V(lN): B(lN) = {\lN; k), k =1,2, . . . , (21 + i r } (2.2)
where
|lN; k) = \nlmi)\nlm2). . . \nlmN)
rrii = l, l — 1, . . . , — l (2.3)
Here | nlm is a central field orbital for an electron outside of closed shells.
We obtain eigenvectors and eigenvalues for HSF in this space in the usual way. The (21 + l)'v-order secular equation is
det|(Z*; k\HSF\lN; ¥ ) - X5(k, fc')| = 0 (2.4)
We denote the eigenvalues by E(lN; A[X] a). Here K is a supplementary quantum number which indexes the eigenvalues according to magnitude for fixed [X] and a. The range of K is from one to f ;[xl®. For a formula iorf,N’[x]a, see eq 3.3.
The quantum states are represented by the vector spaces
V(lN; A[X]a) = {|P; A[X]raft)
r = 1,2, = 1,2, . . . , / « } (2.5)
The eigenvalues are independent of r and R; hence, we call these indices degeneracy indices. The degeneracy of E(lN; K [X]a) is /[x,/ a .
In order to assign the group theoretical quantum numbers to the eigenvectors of HSF in V(lN), we note that these vectors are also eigenvectors of the class operators K r of SN and [G]-¥
K r\lN; K[\]raR) = K°\lN; K[\}raR) (2.6)
where a = [X] or a. The set of class eigenvalues K ra are sufficient for the unique assignment of [X] and a. We have listed class eigenvalues for the octahedral group in Table I and for SN, N = 2, 3, 4, 5, in Table II.
Table I: Class Eigenvalues KTa for the Octahedral Group. Notation for Classes and Irreducible Representations Is That of Griffith3»
s c. C 2 C i' C4
Ai 1 8 3 6 6 1As 1 8 3 -6 -6 1E 1 -4 3 0 0 2W 1 0 -1 -2 2 3t 2 1 0 -1 2 -2 3
1 8 3 6 6nr
The dimension statement for the transformation from B(lN) to the eigenvector basis
B(lN;HSF) = {|Z";A:[X]raÆ)
K = 1,2, . . . , / A,’ !x,a
r = 1,2, . . . , / [xl,
R — 1, 2, ■ ■ ■ f a} (2.7)
is
(21 + 1)¥ = E Z f : [x]« / [x]/ « (2.8)Pd &
By the Pauli principle, , only those states with [X] = [2P, \N~2V] are physically significant. We replace the partitions [X] in the Pauli-allowed states by the multiplicities m = N — 2p + 1 and label these states by
Q = {lN; K ma) (2.9)
(13) K. Rajnak and B. G. Wybourne, J. Chem. Phys., 41, 565 (1964).(14) J. S. Griffith, ibid., 41, 576 (1964).(15) J. S . Griffith, Mol. Phys., 3, 457, (1960).(16) D. R. Scott and F. A. Matsen, J. Phys. Chem., 72,16 (1968).(17) A. D. Liehr, ibid., 6 7 ,1314 (1963).
T h e J o u rn a l o f P h y s ic a l C h em istry

Spin-Free Quantum Chemistry 2497
Table II: Class Eigenvalues Adxl for the Symmetric Groups SN, N = 2, 3, 4, 5. Classes Are Denoted by Their Cycle Structures
[X]
N = 2 a1) (2)[2] l 1
[l2] l -1l
nT1
N = 3 u>) (2, 1) (3)
[3] l 3 2[2, 1] l 0 -1[l3] l -3 2
l 3 2nT
f [ M
121
/[U
[X]
N = 4 (P) (2, 1») (3, 1) (2 2) (4)
[4] 1 6 8 3 6 1[3, 1] 1 2 0 -1 -2 3[22] 1 0 -4 3 0 2[2, l2] 1 -2 0 -1 2 3[ 1 * 1 1 -6 8 3 -6 1
1 6 8 3 6Hr
[X]
N = 5 £1«) (2, 1*) (3, P) (2, U) (4,1) (3.2) (5)[5] 1 10 20 15 30 20 24 1[4, 1] 1 5 5 0 0 -5 -6 4[3, 2] 1 2 -4 3 -6 4 0 5[3, l2] 1 0 0 -5 0 0 4 6[22, 1] 1 -2 -4 3 6 -4 0 5[2, P] 1 -5 5 0 0 5 -6 4[P] 1 1 o 20 15 -30 -20 24 1
1 10 20 15 30 20 24«T
/■x]
Table III: Octahedral Group Frequencies of f N; [X]® for N = 2, 3, 4, 5. Multiplicities Are Given for Pauli-Allowed Partitions
1 3 — 2 4 — — 1 3 5 — — — — 2 4 6
[2 ] [I*] [31 [2 , 1 ] [i*i [41 [3 ,1] [22] [2 , P ] [pi [5] [4 ,1 ] [3 ,2 ] [3, P I [2 2, 1 ] [2 , P ] [i*iA i 0 2 3 1 0 5 3 5 1 0 7 10 8 3 4 1 l
1 0 2 1 l 1 5 2 2 0 5 10 6 6 3 1 0E 0 2 3 4 0 8 8 5 3 1 12 18 16 9 7 2 0T 2 1 3 5 2 7 14 4 7 0 13 28 21 18 8 3 0t2 1 2 5 5 1 9 13 7 5 1 17 28 22 15 10 3 0
III. Matrix Elements on Symmetry Adapted BasesThe secular equation of HSF is factored and the group
theoretical quantum numbers are assigned a priori to kets in a basis B(lNS) which is symmetry adapted10 to SN and [0r]JV'
B(lNS) = { |ZJV';[X]r;p(Lffi}, [X], a ranging; r = 1,2, . . . ; / [xl; R = 1,2,
p = 1 ,2 , (3 .1 )
where explicitly
V o lu m e 78, N u m b er 8 A u g u st 1969

2498 F. A. Matsen and M. L. Ellzey
\lN;[X]r;PaR) = £ \lNk)(lNk\[X]r;PaR) (3.2)k
A ket \lN;[\]r;p(XR) in this basis transforms according to the rth row of r [X)(<S ) and the Rth row of r®(G) under elements of SN and [G]7’', respectively. The index p distinguishes repeated a for a given [X]. Due to (1.7), each such space is invariant under [G]w and generates a representation r ,W;[x'([G]i0 which is generally reducible. The range/,ir;[xl® of p is equal to the number of times T® ([G]*7) occurs in r®W;[xl([G]2V) and is given by
(3.3)n T
Here xriAr’ 1x1 and xra are characters of the rth class and the corresponding inverse class of [G\N in r zXf;Ixl ([G]w) and r a([G]‘v), respectively. The number of elements in the rth class is nT and the number of elements in G is n. Values of / iW;[xl® for d77 and the octahedral group are given in Table III.
Since / / SF commutes with SN and [G]‘v, the special Wigner-Eckart theorem9 (Spin-Free VI) yields
(lN; [X }r;PaR\HSF\lN; [\')r';p'Q'R')= i([X], [X'])8(r, r')5(a, a')S(.R, R ')
(P;[X];pa||HSF||^;[X];p'a) (3.4)
Thus the Hamiltonian matrix on B(lN§) is reduced to block diagonal form. The [X], a block is /I'V;[xl® dimen-
LEVELS OF d2 ION IN OCTAHEDRAL FIELD C/B = 3.662 a /B = 0 .0 49
Figure 1.
LEVELS OF d3 ION IN OCTAHEDRAL FIELD C /B= i.727 o/B=0.09l
LEVELS OF d4 ION IN OCTAHEDRAL HELDC/B*4.6II */B"0
E/BvW20BJ* 20E/ vd*(20B &
Figure 3.
LEVELS OF d4 ION IN OCTAHEORAL FIELD C/B"4.6II «'B-O
E/BVh(V20Bj* 20E/AVW20B/AF
sional and is repeated / [xl/® times. Each block, called a reduced matrix, constitutes a factor of the secular equation. Consequently, the f N; [x] ® eigenvalues indexed by [X] and a are/^x,/®-fold degenerate.
Matrix elements of the electron interaction Hamiltonian H1 are independent of the finite group index a.
T h e J o u r n a l o f P h y s ic a l C h em istry

Spin-Free Quantum Chemistry 2499
<F; [X ]r;p& R\H l\lN; f\ ']r ';p 'a 'R ')
= «([X], [x-'])a(r, r')«(a, a ')m ,R ')(F ;[X ];p | | ff‘ | | r ;[X ];p ') (3 .5 )
The reduced matrix elements of H 1 are generally expressed in terms of the Slater-Condon parameters18 FK, K = 0, 2, 4, 21 and the polarization parameter19’20 a. These parameters are to be evaluated from experiment. For d^ configurations, it is often more convenient to replace the FK by the Racah parameters
LEVELS OF U5 ION IN OCTAHEDRAL BELO C/B *4.477 «/B*0E/Ba/I*(V20B11 ZOE/Wi WM)2
Figure 4.
LEVELS OF d6 ION IN OCTAHEDRAL FIELDC/»*«.«OS a/B-0E/bA*.(A/ ÎOBt* 20E/4/I »(20B/il£
Figure 5.
LEVELS OF d5 ION IN OCTAHEDRAL FIELD C/B*4.477 «/B*0E/B*/l*{V208)a 20E/4v4d2ÔBÂ)*
LEVELS OF d6 IN OCTAHEDRAL FIELDC/B-4.808 «/B-O__E/B/RÎ75W 20E/4yT 0B
LEVELS OF d7 ION IN OCTAHEDRAL FIELD C/B»3,9I6 ®/B *0075
Figure 6.
LEVELS OF dB ION IN OCTAHEDRAL FIELD C/B 3 4.457 o/ b = 0.074
Figure 7.
(18) E. U. Condon and G. H. Shortley, “ The Theory of Atomic Spectra,” Cambridge University Press, London, 1963.(19) R. E. Trees, Phys. Rev., 84,1089 (1951).(20) G. Racah, ibid., 85, 381 (1952).
V o lu m e 7 3 , N u m b er 8 A u g u st 1989

2500 F. A. Matsen and M. L. Ellzey
Table IV
/■-----------Wei ik field— -------s ✓-----------S trong field—[XI S m [X] s m
d 1 [1] 1/2 2 t1 m 1/2 2d 2 [l2] 1 3 t2 [i 2i 1 3d 3 [l3] 3/2 4 t3 [i 3l 3/2 4d 4 [l4] 2 5 t4 [2, l2] 1 3d5 [l6] 5/2 6 tfi [22, 1] 1/2 2d8 [2, 1*] 2 5 t 8 [233 0 1d7 [22, l3] 3/2 4 t6e7 [23, 1] 1/2 2d8 [23, l2] 1 3 t6e2 [23, l2] 1 3d 9 [24, 1] 1/2 2 t6e3 [24, 1] 1/2 2d 1» [26] 0 1 t8e4 [2s] 0 1
A = F° = (l/9)Fi
B = (1/49) (F2 — (5/9)F4) (3.6)
C = (5/63)F4
For octahedral d'v systems, matrix elements of the model field Hamiltonian IP are given in terms of A (= 10Dt). In the strong field limit, A is the splitting between the e and k orbitals.3®
We have calculated and solved by computer the spin- free secular equations for d^, N = 2 to 8 in octahedral model fields. The eigenvalues are plotted against A/20/J in Figures 1 through 7. Both the free ion limits on the left and the strong field limits on the right are
Table Vr V* Sign
l 1 0 0
l 2 + 4 2 2 14-5 1 3 V7
l 3 0 0
l 4 + 4 2 24-53
l 5 0 0
l 6 + 4 0 1 1 0
l 7 0 0
l 8 — 7 2 1 0 0
1©>OO 1 cc 1
l 9 0 0l 10 0 02 2 0 0
2 3 — 7 2 2 2 - 8-^ V 23-72 4 0 0
2 5 + 2 2 1 1 2 2 _ 4 l / 5 3 \ 7
2 6 0 0
2 7 + 2 3 2 2 12- 3- 5 I J
7 \ l l2 8 0 0
2 9 + 2 e 1 1 1 2 2-i3 / n r 3 \ 7-11
2 10 + 2 0 2 1
3 3 0 0
3 4 + 1 2 2 1 5 — -V !4
3 5 0 0
3 6 — 1 0 1 2 -^VTO
3 7 0 0
3 8 — 8 2 1 1 - ! ° J s3 \ 7
3 9 0 0
T r' Sign
3 10 04 4 0
4 5 + 0
4 6 0
4 7 + 0
4 8 0
4 9 + 0 2 1
4 10 — 05 5 0
5 6 + 0
5 7 0
5 8 — 1
5 9 05 10 06 6 0
6 7 + 0 3
6 8 0
6 9 + 0
6 10 — 0
7 7 0
7 8 — 1
7 9 07 10 08 8 0
8 9 — 1 2
8 10 — 19 9 09 10 0
10 10 10
00
2 1 +-V530
1 2 1 1 5a E 7V 11023 IT0 1 0 0 0 2 ? V n
0 2 -50
2 2 1 3V 70
52 2 —-V2 3000
1 2 1 2 3-13 ¡3^ 7 \ 11
01
0 2 1 1 bV70i
0 1 1 - V )0
1 1 1 1 _ l 2 ± 5 \ 7-11
000
5-i7 r22 0 10 2 — V n0 1 -V2-5
000
T h e J o u r n a l o f P h y s ic a l C h em istry

Spin-Free Quantum Chemistry 2501
Table VI: d6: 2Ti Total Matrix
1 2 3 4V 1 2 3 1L D D D F
<T 1 1 1 1
IDI 1(M + 14C+ 6a
20----=.A3v7 -6 V iiB 20 3 A
10A - 4 B 40V2. 02D1 + 10C A21+ 6a
10A - 6 B 5 VÎ4.3Z>1 + 8 C --------A3
-f- 6a:10A - 25B
1 F 1 + 10C+ 12a
5 2F1
0 1(71
7 2(71
8 1H1
5 6 7 8 92 1 2 1 1F a G H I1 1 1 1 1
0 0 8VÎS 3 A 0
22 V5. 0 Wä4 0 26 V53V7 A 3V771
7
0 VÏ0. 0 16V5. 07 A 3 V7 A
<1|iO I>|co
+ 0 0 23 V5 ---= A3 VU
10A - 9 B + 8C+ 20a
15V7A 0 5V2
3 A 0
10A + 3 B + 10C+ 12a
39 VÎ5 7VÎÎ A 0 5—=A V77
10A - 135+ 8C -J Ü 2 A \ 77 0+ 12a
lOd - 225 85 V2+ 10C 3 VÎT+ 30a
10112
0
0
—5A
0
0
- V10A
10A - 245 09 ill + 8C
+ 42a10A - 24 5
10 112 + 8C+ 42a
clearly shown. In contrast, the diagrams of Orgel21 and Tanabe and Sugano4 show only the free ion limit.
The permutation quantum number [X] of the ground state on the weak field and strong field sides can be predicted from the following rules, (i) The only allowed permutation states [X] = [2P, l iV~27’ ] are those with
0 ^ q g p N/2 (paper VII) (3.7)
where q is the number of doubly occupied orbitals, (ii) States of lowest p lie the lowest. This is the spin- free Hund rule (paper I). See Table IV. It is seen that from d4 to d7 the weak field ground states have lower p than do strong field ground states. Since S = N/2 — p, this is a spin-free derivation that weak-field ground states are high spin states, while strong-field ground states are low spin states.
IV. Conclusion
We have exhibited a spin-free treatment of a crystal field problem defined by a spin-free Hamiltonian. The assignment of spin multiplicities is independent of the spin dynamics and depends only upon spin-free pa
rameters. An example is the transition from high spin to low spin states with increasing crystal field strength. The spin-free formulation provides a unified group theoretical scheme placing permutational and point group symmetries on the same footing.
AppendixWe illustrate the evaluation of spin-free crystal field
matrix elements over kets which are symmetry-adapted first with respect to [f?(3)]Ar (free ion) and then with respect to [Ch]7'7. These are denoted
| In;\k ]t; vL;<t(LR) =£ IF ; [X }r;vLM)(LM\ <raR) ( A . 1) M
where the spin-free free ion kets \lN;[X]r;vLM) are classified by the seniority r,22 and the octahedral symmetry adaptation coefficients are available in the literature.38" 11 The reduced matrix elements of HSF over the kets defined by (A .l) are matrix sums of the electrostatic term
(21) L. E. Orgel, J. Chem. Phys., 23,1004 (1955).(22) G. Racah, Phys. Rev., 62, 438 (1942).
V o lu m e 73, N u m b er 8 A u g u st 1989
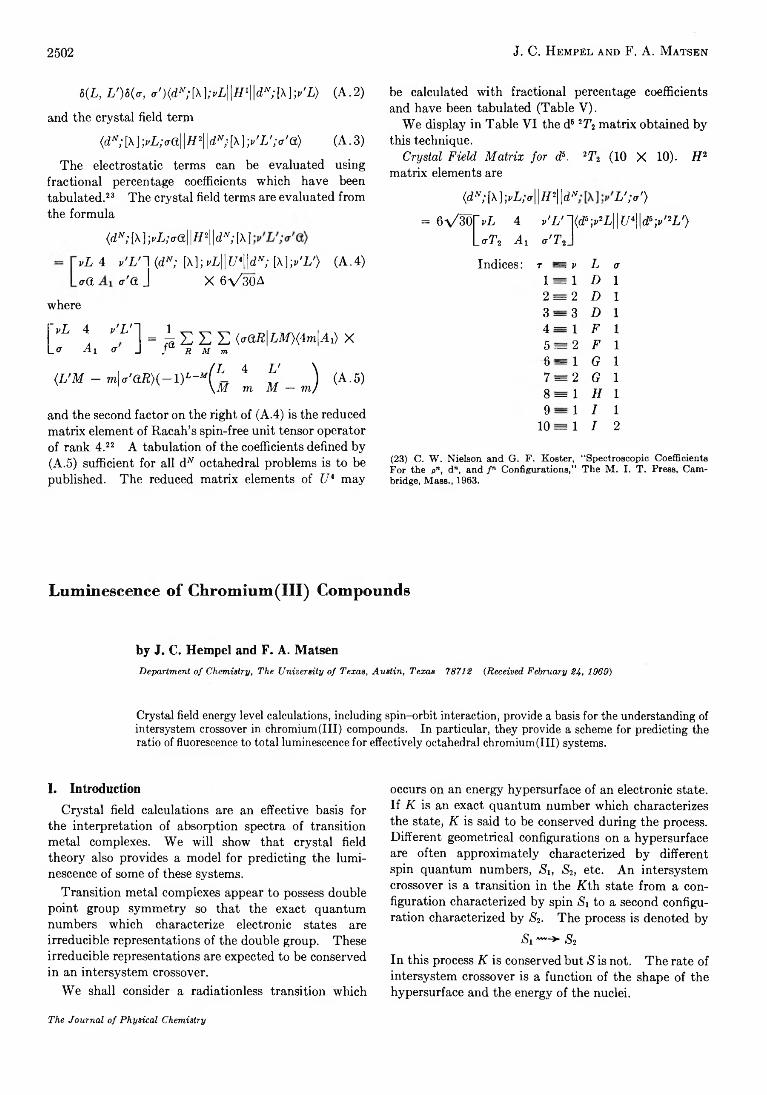
2502 J. C. Hempel and F. A. Matsen
5(L ,L')8(<r, M ){dN;[\);vL\\H^\\dN;[\)-,v'L) (A .2)
and the crystal field term
(dN; [X ] ;pL;aa\\H2\\dN; [X ] -/ L ';* ' a ) (A . 3)
The electrostatic terms can be evaluated using fractional percentage coefficients which have been tabulated.23 The crystal field terms are evaluated from the formula
(dN; [X ] ;vL;<rCt\\H2\\dN; [X ]
vL 4 v 'L 'l (dN; [X]; vL||i74||dAr; [X];*'Z/) (A .4)o-a o-'tt J X 6\/30A
where
~vL 4 / L 1 = ^ E E E (*aR\LM)(4m\Aù xL<r Ai <7 J r R M m
(L 'M - m W a R ) { - \ ) L~M( L„ 4 f ' ) (A .5) ' 1 \ M m M — m j
and the second factor on the right of (A.4) is the reduced matrix element of Racah’s spin-free unit tensor operator of rank 4.22 A tabulation of the coefficients defined by (A.5) sufficient for all dw octahedral problems is to be published. The reduced matrix elements of U4 may
be calculated with fractional percentage coefficients and have been tabulated (Table V).
We display in Table VI the d6 2T2 matrix obtained by this technique.
Crystal Field Matrix for ds. 2T2 (10 X 10). H2 matrix elements are
{dN! [X ] ’,vL;<r\ \H2\\dN L' ;a')
= W W v L 4 v 'L 'W -y L W u ^ -y M ') L<7T2 A i <j,T2_|
Indices: t = v L <r1 = 1 D 12 = 2 D 13 = 3 D 14 = 1 F 1 5 = 2 F 1 8 = 1 G 1 7 = 2 G 1 8 = 1 hf 1 9 = 1 7 1
10 = 1 I 2
(23) C. W. Nielson and G. F. Koster, “ Spectroscopic Coefficients For the />” , dn, and f n Configurations,” The M. I. T . Press, Cambridge, Mass., 1963.
L u m in escen ce o f C h rom iu m (III) Com pounds
by J. C. Hempel and F. A. MatsenDepartment of Chemistry, The University of Texas, Austin, Texas 78712 (Received February 24, 1969)
Crystal field energy level calculations, including spin-orbit interaction, provide a basis for the understanding of intersystem crossover in chromium(III) compounds. In particular, they provide a scheme for predicting the ratio of fluorescence to total luminescence for effectively octahedral chromium (III) systems.
I. IntroductionCrystal field calculations are an effective basis for
the interpretation of absorption spectra of transition metal complexes. We will show that crystal field theory also provides a model for predicting the luminescence of some of these systems.
Transition metal complexes appear to possess double point group symmetry so that the exact quantum numbers which characterize electronic states are irreducible representations of the double group. These irreducible representations are expected to be conserved in an intersystem crossover.
We shall consider a radiationless transition which
occurs on an energy hypersurface of an electronic state. If K is an exact quantum number which characterizes the state, K is said to be conserved during the process. Different geometrical configurations on a hypersurface are often approximately characterized by different spin quantum numbers, Si, S2, etc. An intersystem crossover is a transition in the Kth. state from a configuration characterized by spin Si to a second configuration characterized by S2. The process is denoted by
Si — >■ S2In this process K is conserved but S is not. The rate of intersystem crossover is a function of the shape of the hypersurface and the energy of the nuclei.
T h e J o u r n a l o f P h y s ic a l C h em istry

In this paper we make a formal analysis of the intersystem crossover process and the factors which affect phosphorescent intensity. We take as examples effectively octahedral chromium(III) complexes. That intersystem crossovers occur in transition metal complexes is evidenced by a study of the luminescence of chromium(III) complexes.1 Under favorable conditions the rate of intersystem crossover for chromium(III) compounds2 may be as high as 109 sec-1. We make extensive use of data and theories of Schlafer and coworkers.3
II. Electronic EnergiesWe represent a transition metal complex with N
valence electrons by an A’ -electron Hamiltonian of the form
H = HSF + i2 (1)
I1SF is a spin-free Hamiltonian4
HSF = H° + V (2)
where H° is the free ion Hamiltonian for which
[H°,Ga] = 0; Ga E IR(Z)]N (3)
[R(3) ]A' is the TVth rank inner direct product of the rotation group in three dimensions, R(3). The irreducible representations of [Ii(3)]JV’ are characterized by the integers L — 0, 1, 2 , . . . which are consequently quantum numbers for H°.
V represents the ligand field and
[V,Ga] = 0; Ga G [<?]* (4)
where [G]w is the Wth rank inner direct product of the point group G. For the octahedral group, the irreducible representations are denoted by a = A\, A2, E, T\, and T2 and are quantum numbers for HSF.
Finally
[HHF,PaSF] = 0 ; P FF G Snsf (5)
where SN8F is the group of permutations on the spatial coordinates of the N electrons. It follows that the partitions [X] of SN8F are also exact quantum numbers for Hsf. The states so characterized are called permutation states. Of these, only the permutation states labeled
[X] = [2 * ,l " - 2*] 0 < p < f (6)
are allowed by the Pauli principle. The Pauli allowed states can be labeled by the spin quantum number
NS = - - p (7)
or by the multiplicity quantum number
m = N — 2p + 1 (8)
The representation of HS¥ for an octahedral ligand
Luminescence of Chhomium(III) Compounds 2503
Figure 1. Energy eigenvalues of the FSF(d3) configuration plotted as a function of D q/B for a fixed C/B ratio.6
field in the 5'v dimensional spin-free configuration vector space FSF(dAr) is a function of the crystal field parameter Dq and the Racah parameters A, B, and C. The eigenkets are denoted \mL ; m a ) and the eigenvalues by 8° ( mL ; m a ) where mL indicates the free ion origin of the state. In Figure 1 the low-lying eigenvalues of the FSF(d8) configuration are plotted as a function of Dq/B for a fixed C/B ratio.5 From Figure 1 we note the following. (1) At intermediate values of Dq/B, &°(2G;2E) and &°(2G;2Ti) are independent of Dq. (2) 8°(4F ;4212) increases with increasing Dq/B. (3) S°- (4F ;4T2) crosses 8°(2G;2E) and 8°(2<7;27T1). We call crossings of this type spin-free crossings.
We take the spin interaction term in the Hamiltonian to be
v0 = x£f,-5, (9)
i
For the full Hamiltonian
(1) See, for example (a) K. de Armond and L. S. Forster, Spedrochim. Acta, 19, 1687 (1963); (b) G. B. Porter and H. L. Schläfer, Z. Phys. Chem., 37, 109 (1963); and (c) D. Valentine, Jr., “ The Photochemistry of Cobalt(III) and Chromium (III) Complexes in Solution,” “ Advances in Photochemistry,” Vol. 6, Interscience Publishers, New York, N. Y „ 1968, p 193.(2) K. K. Chatterjee and L. S. Forster, Spedrochim. Acta, 20, 1603 (1964).(3) (a) H. L. Schlafer, H. Gausmann, and H. Witzke, J. Chem. Phys., 46, 1423 (1967); (b) H. L. Schläfer, H. Gausmann, and H. U. Zander, Inorg. Chem., 6, 1528 (1967); and (c) references therein.(4) (a) F. A. Matsen and M . L. Ellzey, J. Phys. Chem., 73, 2495 (1969) and (b) F. A. Matsen and D. J. Klein, ibid., 73, 2477 (1969).(5) Figure after Y . Tanabe and S. Sugano, J. Phys. Soc. Jap., 9, 753 (1954).
V o lu m e 7 3 , N u m b er 8 A u g u s t 1969

2504 J. C. Hempel and F. A. M atsen
[H,PaSF] * 0 ; P f e SNm (10)
and
[H,Ga] * 0 ; Ga e [G]" (11)
so that neither [X] nor a are exact quantum numbers. However
[H,Ga] = 0 ; Ga £ [dG F (12)
where d(r is the double group of G. The irreducible representations of [d(?]JV’ for the octahedral double group arising for N odd are denoted da = E', E ", and U' and are quantum numbers for H.
The energy levels for the full Hamiltonian are obtained by diagonalizing the Hamiltonian in the space
V(dN) = e t t r ^ d " ) ® ^ " ) ) (13)
where x represents the spin orbitals a or /3 and a projects kets so that they are antisymmetric under simultaneous permutation of spin-free and spin coordinates. Figure 2 presents that part of an energy correlation diagram relevant to the subsequent discussion.6
Figure 2. Energy eigenvalues of the V(d3) configuration plotted as a function of Dq/B for a fixed X and C/B ratio.6
We have labeled the kets in the neighborhood of the spin-free crossing by |da;fc) where k distinguishes among kets with the same da. Away from the crossing we label the kets \ma-,Tda) where ma is the spin-free labeling, and t distinguishes among kets with the same ma and da. From a comparison of Figure 1 and Figure 2 we note that (1) the spin-free quantum numbers ma are not conserved over the full range of Dq/B; (2) many spin-free crossings become avoided crossings when O is introduced; (3) the effect of 0 is largest at the spin-free crossings and drops off rapidly away from these crossings.
The first group of excited states for F (d3) are described by kets of the form
| U';k) = |4r 2;lC/'><4T2;lf7'|[/';fc) +\2E;U')(*E;U'\U';k) +
|4r 2;2H0<4r 2;2C/it/';fc> +\ T1;U')(iTi;U,\U,;k) (14)
For illustrative purposes we neglect the last two terms in the wave function expansion and obtain the following two-level formulas
\uf;ir> = [1 + 1ffl2]v J l4 1^ ) +
\U,;I) = tl + 1q2]v,{ + I 'E M ) (15)
where a = [5 — [52 + 4(0)2]1/2]/2(Q) and (0) = (47VH7'|o|2E;?7'>; S = 5 (Dq/B) = 8 °(*G;*E) -
There are three cases (we suppress U' in the |ma;rf7')): Dq/B <K 2.1, a-*- “
| U';IV) ~ 12E)
| U';T) ~ — |4T2,T) (16)
Dq/B = 2.1, a = 1
\u ';ll) = ^ i l 4 ; 1) + |2£>}
|C/';I> = ^ { - \ < T 2;1) + \2E)} (17)
Dq/B » 2.1, a -► 0[f/';II) =* |4T2/1)
I U';l) ~ 12E) (18)
In the two-state approximation, the intersystem crossover in the lowest excited state may be denoted
14T2;1) — > | U';l) — > 12F) (19)
III. Nuclear MotionWe now treat the energies plotted in Figure 1 as
referring to one given complex. Each Dq/B value corresponds to a set of nuclear coordinates. We incorporate the additional contribution to the energy in the following way.
(1) The total energy in the ma state is
8(ma;Q) = 8°(” a) + l/Je{Q - Q(ma ) }2 (20)
where is the energy of the minimum of thestate relative to that of the ground state, Q is a normal coordinate for a symmetric vibrational mode, and Q(ma) is the value of Q at the minimum energy of the ma state referred to Q(4A 2) for the ground state. The parameter k (some average force constant) is taken to be independent of ma.
(6) Figure after A. D . Liehr, J. Phys. Chem.f 67* 1314 (1963).
T h e J o u rn a l o f P h y s ic a l C h em istry

Luminescence of Chromium (III) Compounds
Energy
Figure 3. Potential energy curves for the low-lying states of the FSF(d3) configuration for a Q(h42) corresponding to Dq/B < 2.1.9
(2) Q(ma) is determined from the slope of the levels in Figure 1. (a) Since 8 (2E) — £(L42) is essentially independent of Dq/B (and therefore of Q)
Q m = Q m (21)
(b) Since 8 (4T2) — S (h l2) increases with increasingDq/B (or decreasing Q)
Q m > QQA2) (22)This axiom, which is due to Orgel,7 is supported by
Tischer’s recent pressure studies on chromium(III) doped silicate glasses which show v(2E) is roughly independent of pressure while r(4T2) increases with increasing pressure.8
We set Q(*A2) = 0 so
& m = V JcQ*8 (IE) = 8 ° (2E) + l/M r
& m = 8 ° m + v 2k {Q - Q m ) 2 (23)
Following Schlafer and coworkers3 we make the following association with spectra.Absorption
* m = s ° m + v
v(2E) = 8 °(2E) (24)
2505
Fluorescence
v(F) = & ° m - v (25)
Phosphorescence
tel(MoCOiiSTa. (26)
where
v = v M Q m } 2 (27)
and
6 ° W ) - + '< « (28)
See Figures 3, 4, and 5 for schematic representations of the 4A 2, 2E, and 4T2 potential energy curves for Q(L42) corresponding to Dq/B less than 2.1, equal to 2 .1 , and greater than 2.1, respectively. 9 The introduction of the spin interaction term into the Hamiltonian results in avoided crossings analogous to those of Figure 2.
IV. IntensityWe now turn our attention to the intensity of ob
served spectra assuming that absorption and emission are localized on the chromium(III) ion. The ratio of
Energy
Figure 4. Potential energy curves for the low-lying states of the FSF(d3) configuration for a Q (h42) corresponding to Dq/B ^ 2.1.9
(7) L. Orgel, J. Chem. Phys., 23, 1824 (1955).(8) R. E. Tischer, ibid., 48,4291 (1968).
Volume 73, Number 8 August 1989

2506 J. C. Hempel and F. A. Matsen
Energy
e “ < W V
Figure 5. Potential energy curves for the low-lying states of the FSF(d3) configuration for a Q (4/ l 2) corresponding to Dq/B > 2.1.9
fluorescent to phosphorescent intensity for a given compound is given by
1(F) _ N(iT2)P(F) I(P) ~ N (2E)P(P)
where P is the probability of emission per molecule from the lowest vibrational state and N the number of molecules in that state. Now
P(F) = P m v(FyP(P) P(2E) v(P)2v(iTi) • 1
where P(2E) and P ( 4F2) are the probabilities for absorption to the 2E and iT2 states, respectively, and v the frequency of the indicated process.10 The ratio
i m = w m )I (2E) P(2E) [ }
is found experimentally to be always much greater than one.
Among the processes following absorption, which affect N (2E) and N (iT2), are (1) radiationless transitions from one excited state to another; (2 ) intersystem crossover in the first excited state (state | C/ 7 ;I)) ; (3) radiationless transitions from the first excited state to the ground state; (4) radiative transitions from the first excited state to the ground state.
In { 4>f / ® p )
Figure 6. A plot of In (^p/^p) vs. Z /T for a number of chromium(III) systems. Experimental points are identified in Table I.
For effectively octahedral chromium(III) complexes, process 1 is much faster than all others. Processes 2 and 3 are faster than process 4. 11 Assuming that a pseudo-Boltzmann equilibrium exists between the 2E minimum and the iT2 minimum of | U;I)
N(*T2) W m e ~ ^ ,n)/kTN (2E) ~ W(2E )e-s°m /kT { )
where W represents the statistical weight of the ma state. On substituting eq 26 and 28 into 32 and taking the natural log of both sides we obtain
N ( 4P 2)N (2E) = In (3) +
2p(P) - p(4P2) - v(F) 2 kT (33)
Taking the quantum yields 4>f and to be directly proportional to the intensity of the observed emission, the natural log of both sides of eq 29 yields
In = A + Z /T (34)<Pp
(9) Potential energy figures after H. L. Schläfer and coworkers, ref 3a.(10) For a discussion of absorption and emission intensities see, for example, N. J. Turro, “ Molecular Photochemistry,” W. A. Benjamin, Inc., New York, N. Y., 1967.(11) See ref 2 and H. L. Schläfer, J. Phys. Chem., 69, 2201 (1965).
The Journal of Physical Chemistry

Luminescence of Chromium(III) Compounds
Table I : Eatios of Quantum Yields at T = 130°K
Compound0
No.in
Figure 6 Z/T
$f/$ p,caicd&
<£f/$ p, exptlc
[CrCle]3- 23.7 >1000 F[CrF6] 3~ 20.3 >1000 F(NH4)3[CrF6] 19.1 >1000 F[CrF(H20 ) 5]SiF6 14.3 >1000 FK 2[CrF6(H20)] 9 .7 >1000 F[CrF3(H20 )3]H20 5.2 652 F[CrF3(H20 )a ]y 2H20 5.2 652 F[CrF3(H20 ) 3] 5.2 652 F[CrF3(H20 )3]2H20 4.2 240 F[Cr(antip)6: 3 + 1 2.4 39.5 F + P[Cr(urea)6]3 + 2 0.0 3.61 3.61[Cr(H20 ) 3]F3 3 - 0 . 4 2.46 F + P[Cr(D20 ) 6p + 4 — — 0.10NH4[CrF4(en)] 5 - 4 . 2 0.054 F + P
“ See Table II for spectral data and references. b This is theratio predicted with an A determined for [Cr(urea)6] 3+ in a water- glycerol glass. * Observed luminescence indicated by F and P (see Table II). Experimental quantum yields given in ref 2.
chromium(III) complexes assuming A is constant. Calculated values of * t/<i>P and Z /T and experimental values of where available are given in Table I.
A is expected to vary somewhat from system to system12 but remain a positive number since it is an In function and the experimentally observed intensity of related absorption curves, eq 31, indicates the argument will be greater than unity. A quantitative study of $ f/ ' ì>p vs. 1/T for a given chromium(III) compound will yield both A and the quantity Z.13 We predict (1 ) lowering the temperature enhances fluorescence for compounds with a positive Z; (2) lowering the temperature enhances phosphorescence for compounds with a negative Z.
In addition and independently of the Boltzmann approximation, we can divide chromium (III) complexes into three categories using absorption spectra data.
(1) We can predict that when14
R — v^TA/v^E) (35)
is less than 1 that S°(4r 2) « 8 °(2E) and only fluorescence will be observed. See Figure 3.
2507
Table II : Spectral Data
Compound0 vVTÒ vt*E) R r(F) -(P ) R ef
[CrCle]3- 13,060 14,480 0-901 11,600 — 3a[CrF6p - 14,900 15,700 0-949 12,830 — 3a(NH4)3[CrF6] 15,060 15,670 0-961 12,820 — 3bK 2[CrF5(H20 )] 15,850 15,130 1-047 12,650 — 3b[CrF(H20 ) 5] [SiF,] 16,080 14,930 1-077 11,200 — 3b[CrF3(H20 )3]H20 16,340 15,040 1-086 12,800 — 3b[CrF3(H20 )3] y 2H20 16,420 15,080 1-088 12,800 — 3b[CrF3(H20 )3]2H20 16,420 14,990 1-095 12,800 — 3b[CrF3(H20 )3] 16,420 14,930 1-099 12,500 — 3b[Cr(antip)6]s + 15,720 14,030 1-120 11,900 13,950 3a[Cr(urea)6]3 + 16,150 14,350 1-125 12,550 14,240 3a[Cr(H20 )6]F3 17,270 15,150 1-139 13,100 14,550 3bNH4[CrF4en] 17,270 14,970 1-153 13,430 15,010 3b[Cr(H20 )6]3 + 17,400 15,000 1-160 — 14,600 3a[Cr(H20 )6]Cl3 17,450 14,810 1-178 — 14,520 3b[Cr(ox)3]3- 17,500 14,350 1-219 — 14,390 3a[Cr(NCS)6]3- 17,700 13,010 1-360 — 12,850 3a[Cr(NH3)6]3 + 21,550 15,300 1-408 — 15,120 3a[Cr(acac)3] 18,400 12,950 1-420 — 12,840 3a[Cr(tn)3]s + 21,590 15,030 1-436 — 15,060 3a[Cr(en)a]3 + 21,850 14,950 1-461 — 14,890 3a[Cr(dip)3]3 + 22,000 13,750 1-600 — 13,740 3a[Cr(phen)3]3 + 23,800 13,700 1-737 — 13,720 3a[Cr(CN)e]3- 26,700 12,470 2-141 — 12,430 3a
antip, antipyrene; en, ethylenediamine ; ox, oxalate; acaci, acetylacetonate; tn, trimethylenediamine; dip, a, a '-dipyridyl; phen,o-phenanthroline.
where
P(F)W(*TAP (P )W (2P)
Z = {2p(P) - p(4P2) - v(F)}/2k In Figure 6 we plot In ( $ f/ $ p) vs. Z /T for a number of
(12) For example, the 4 r /ip ratio observed for Cr[(urea)6]X6 depends on the nature of X. See G. Gausmann and H. L. Schlàfer, J. Chem. Phys., 48, 4056 (1968).(13) Temperature studies have been carried out by (a) H. L. Schlafer, H. Gausmann, and H. Witzke, Z. Phys. Chem. (Frankfurt am Main), 56, 55 (1967), and (b) F. D. Camassei and L. S. Forster, J. Chem. Phys., 50, 2603 (1969).(14) For chromium (III), R — 10 Dq/21B, see D, L. Wood, J. Ferguson, K. Knox, and J. F. Dillon, Jr., J. Chem. Phys., 39, 890 (1963).
Volume 73, Number 8 August 1969

(2) When the ratio is greater than 1 but less than 2, fi°(47T2) ~ g°(2E) so that there is a possibility of observing both phosphorescence and fluorescence. See Figure 4.
(3) For ratios about 2 or greater 8 °(2E) « 8 °(4r 2) and only phosphorescence will be observed. See Figure 5.
Table II presents spectral data for a number of chromium(III) complexes classified according to this predictive scheme. An inspection of the table will show the excellent agreement of theory and experiment.
V. Summary(1) The luminescence spectrum for an effectively
octahedral chromium(III) complex can be qualitatively predicted from its absorption spectrum using the parameter R.
2508
(2) Intersystem crossover in the first excited state is characterized by
|4T2>— > |U';I) — >- \*E)(3) The fluorescent-phosphorescent intensity ratio
for a complex is given by
In ($F/‘i>pj — A ~t~ Z/77 (36)
(4) Equation 36 implies that the intersystem crossover rate is considerably higher than the rates of other processes involving the state \U';1), and that there exists a pseudo-Boltzmann distribution between the 2E and 47’2 minima.
Acknowledgment. This research is supported by the Robert A. Welch Foundation of Houston, Texas.
R obert W. W eeks, Jr ., and John K. Garland
Gas-Phase Reactions of Cyclohexene with Highly Energetic Tritium1
by Robert W. Weeks, Jr.,2a and John K. Garland2*5Department of Chemistry, University of Missouri, Columbia, Missouri 65201 (Received July 24, 1968)
The reactions of recoil tritium with cyclohexene were studied in the gas phase using noble gases as moderators. Both the ratio of cyclohexene/noble gas and total pressure of the system were used as experimental parameters. Troducts formed included HT, ethene-i, propene-i, 1,3-butadiene-i, 1- and/or 3-hexene-i, cyclohexane-i, methyl- cyclohexane-(, cyclohexene-i, and tritiated “polymers” (C8 and up) of low and high molecular weights. Reaction pathways involving ionic or excited-state tritium were evidenced in the HT, methylcyclohexane-i, and polymer-f yields which were higher in helium-moderated samples than in those that were xenon moderated. Species moderated to thermal or epithermal energies were shown to be the primary moieties in the formation of cyclohexane-^ and polymer-L
IntroductionEnergetic neutral tritium atoms have been postulated
as the reactive intermediate in the classical abstraction, substitution, and addition to olefinic bonds in recoil tritium hot atom chemistry. 3 However, other reaction pathways may exist. In a helium gas environment, Stier and Barnett have shown that H+ (and hence, T +) species can exist as an appreciable fraction of the hydrogen present. More recently, the recoil tritium work of Seewald and Wolfgang4 showed anomalously large yields of H T in helium-moderated systems. They attributed this to nonground-state reactions, presumably of T + ion or an electronically excited state of the T atom. In accordance with the adiabatic theorem and ionization potentials of the species involved, the existence of the T+ ion is favored in a helium environment. Helium is unique in so strongly favoring the T + ion.
In gases such as xenon whose ionization potential is less than that of hydrogen, the neutral tritium atom will predominate at energies below several kiloelectron volts .6 6 Indeed, by increasing the mole fraction of xenon in helium-moderated systems, Seewald and
(1) Presented in part before the Missouri Academy of Science, Kansas City, Mo., April 1968, and the 156th National Meeting of the American Chemical Society, Atlantic City, N. J., 1968; a portion of the material submitted by R. W. W. for the Ph.D. degree in chemistry.(2) (a) American Oil Company, Whiting, Indiana; (b) to whom enquiries should be addressed.(3) For a review see R. Wolfgang, Progr. Reaction Kinetics, 3, 97 (1965).(4) D. Seewald and R. Wolfgang, J. Chem. Phys., 47, 143 (1967).(5) P. M. Stier and C. F. Barnett, Phys. Rev., 103, 896 (1956).(6) S. K. Allison and M. Garcia-Munoz, “Atomic and Molecular Processes,” D. R. Bates, Ed., Academic Press, Inc., New York, N. Y „ 1962, p 746.
The Journal of Physical Chemistry

Gas-Phase R eactions of Cyclohexene with R ecoil T ritium 2509
Table I: Product Yields Relative to Cyclohexene-i = 100 (Gas Pressures in cm)
Cyclohexene ’He ’He Total HT4.4 1.5 5.0 10.9 2752.4 1,4 11.2 15.0 2732.4 1.4 11.2 15.0 2942.5 1.5 24.9 28.9 2733.4 1.1 78.3 82.0 3083.4 1.1 78.3 82.0 309
Xe2.9 1.5 14.6 19.0 2094.5 1.5 20.6 26.6 2335.0 1.8 36.4 43.2 204
“ Not resolved from cyclohexene owing to variation in procedure.
Ethene-iplusbuta-diene-i
71-Hexenes -i
Cyclo-hexane-i
Methyl-cyclo-
liexane-iLightPoly-mer-i
Heavypolymer-;
42 4.8 31 4.2 30 7536 4.6 41 10 28 10743 4.1 44 12 24 9932 2.7 62 17 38 12228 4.7 196 15 Lost 10730 5.3 195 11 53 138
34 5.8 37 6 19 2533 6.7 41 a 16 4328 5.9 46 5 19 95
Wolfgang observed a mono tonic decrease in the H T yield . 4 This was attributed to the lowering of the fraction of T+ (or excited state T) present with a subsequent lowering of the number of reactions involving the nonground-state atom.
Traditionally, ion-molecule (IM) reactions have reaction cross sections orders of magnitude larger than thermal atom-molecule reactions. The IM values are typically equal to or greater than collision rates. For certain ion-polar molecule reactions, similar to the T +-cyclohexene reaction, the observed reaction cross section consists of two terms. These result from the Langevin polarization potential (considering conservation of energy and angular momentum) as in ion-atom reactions, and also a contribution due to the permanent dipole of the polar molecule.7 An ionic pathway is a simple explanation of the preferential formation of certain products which were observed in a helium environment.
Experimental Section
Materials. Helium-3 (Mound Laboratory, Monsanto Research Corp.) was 99.62 mol % 3He with 0.38 mol % 4He impurity. Cyclohexene (Phillips Petroleum Co.) and xenon (Air Products and Chemicals, Inc.) were research grade. Commercial grade helium-4 was used.
Sample Preparation. Samples were filled with helium-3, cyclohexene, and noble gas moderator by sequential addition on a vacuum line. All pressures were measured using a mercury manometer. Pyrex 1720 capsules of about 20-ml volume were used. All were “ flamed out” prior to use.
Irradiation Procedure. Samples were irradiated in an aluminum irradiation vessel at the external face of the reflector of the Missouri Research Reactor. Irradiation times were 5 min at a nominal thermal neutron flux of 1.4 X 10¹² n cm - 2 sec-1 .
Analytical Procedure. A brass capsule breaker fitted with a gas-tight plunger was used to break the glass capsule. Volatile products and nonvolatile polymeric products were analyzed by the previously described procedures.8'9
ResultsProduct yields are shown in Table I. As seen in
Table I, the yield of products of unimolecular decomposition, ethene-i, and butadiene-i, decreases somewhat with increasing total pressure of the system. No clear dependence is noted with regard to the particular species used as moderator. Greater amounts of methylcyclohexane were produced in systems that were helium rather than xenon moderated. The methylcyclohexane yields are dependent on the mole ratio of cyclohexene to inert gas in the system.
Beyond the parent cyclohexene peak (135 min) two minor products appeared. The first of these, identified as propene-i, was eluted at 160 min with yields in the range 1.0 ± 0.5 relative to cyclohexene-i as 100 in all the samples reported in Table I. A second smaller peak, which remains unidentified, was eluted at 188 min in some samples. Because these peaks appear on the “ tailing” of the much larger cyclohexene-i peak, the accuracy of their measurement is less than other peaks.
The ratio of heavy to light polymers is greater on the average in helium-moderated samples than in xenonmoderated samples, and the total polymer yield relative to cyclohexene-/ seems to increase somewhat at higher pressures for both helium- and xenon-moderated samples. Cyclohexane-i yields increase more rapidly with increasing ratio of moderating gas.
The most clear-cut difference in product yields
(7) J. V. Dugan, Jr., and J. L, Magee, NASA Tech. Note TN D-3229, Feb 1966.(8) J. K. Garland, Anal. Lett., 1, 273 (1968).(9) K. I. Mahan, R. W. Weeks, D. C. Fee, and J. K. Garland, ibid., 1, 933 (1968).
Volume 78, Number 8 August 1969

between He- and Xe-moderated samples is that of HT. H T yields (relative to butadiene-f + ethylene-i + cyclohexene-i = 100) range from 193 to 240 with an arithmetic mean of 2 1 2 in helium-moderated samples with a definite trend toward higher H T yields at higher He mole ratios. The corresponding numbers of xenonmoderated samples are 156, 162, and 159, respectively. Thus, the yields in the helium-moderated systems (all systems with more helium than cyclohexene) average more than 30% higher than in xenon-moderated samples.
Discussion
Activation energies for decomposition of cyclohexene to ethylene and butadiene determined from shock tube and pyrolysis work fall in the range 66.3 ± 0.4 kcal/ mol. 10'11 The equivalence of different excitation modes for causing unimolecular decomposition has been shown by Butler and Kistiakowsky12 in their work with excited methylcyclopropane species. In the cyclohexene systems studied here, the fraction of the tritium found in molecules formed via unimolecular decomposition is from 3 to 10%. The amount of labeled cyclohexene appearing as product is a function of the amount of deactivation of the excited cyclohexene molecules formed by hot T for H substitution. The yield of cyclohexene-i should increase at the expense of ethylene- i and butadiene-i as a function of the total pressure of the system. The results followed this pattern, but a broader pressure range would be needed to obtain estimates of the average excitation.13
Cyclohexane-i formation likely results from the formation of cyclohexyl-i radical via T addition to the double bond. Proton abstraction by this radical would then lead to cyclohexane-i. Abstraction from the weak allylic C -H bonds on cyclohexene would be the most energetically favored pathway. The cyelo- hexenyl free radicals thus formed were not detected as only radioactive products were measured. The yield of cyclohexane-i was dependent on the mole ratio of [3He + moderator]/[cyclohexene] with He more effective than xenon as a moderator, as shown in Figure 1. With increasing moderator fraction collisions with moderator molecules bring a larger portion of tritium atoms into the thermal and epithermal energy range before hitting a cyclohexene molecule. Because tritium addition to the double bond is the lowest energy reaction in this system, these thermalized tritium atoms may add to cyclohexene to form cyclohexyl-i radicals. Some of these cyclohexyl-i radicals then abstract hydrogen to form cyclohexane-i while others add to cyclohexene to form polymeric materials. 14 Smaller amounts of cyclohexene-i could also be formed from these cyclohexyl-i radicals.
Propene-i could be formed by an IM condensation reaction followed by unimolecular decomposition as has been cited by Field for the C 2H5+ ion in chemical ioniza-
2510 R obert W. W eeks, Jr., and John K. Garland
Figure 1. Plot of yield of cyclohexane-i relative to cyclohexene-i = 100 vs. mole ratio [He3 + noble gas-cyclohexene]: O, helium moderated;▲, xenon moderated.
tion work . 16 Sufficient C 2H5+ to account for this relatively minor product might be formed via T + - cyclohexene reaction followed by ring opening and C 2
detachments.Polymeric materials are defined here as any material
not eluted from the column sequence during forward flow. This would include all unsaturated compounds greater than C 8. Pressure studies for the formation of these compounds showed both preference to greater yields in the helium-moderated samples and increasing yield as the moderator/cyclohexene ratio increased. Polymer formation could occur through free-radical pathways or by ionic pathways similar to those of Wagner16 (reactions 1-5).
CeHxo + T+ — ► C 6H 10T+ (DR -i+ -)- c-CeHio — » R'-i+ (2)
(any tritiated carbonium ion)
R '-i+ + c-C 6H10 — ^ R 'H -i + CeH9+ (3)
R-i+ -|- c-CgHjo — ► R( — H)-i + c-C 6Hu + (4)R-i + -f- C-CeHio — >• R-i -(- c-Cf,H1o+ (5)
The rate of occurrence of any charge-transfer molecule-ion reaction will be high in cases like T+ + X e — T + Xe+ where the ionization potential of T is greater than that of Xe. Therefore, we can presume that all polymer observed in Xe-moderated samples is formed via free-radical pathways. Conversely, the existence of
(10) W. Tsang, J. Chem. Phys., 42, 1805 (1965).(11) M. Uchiyama, T. Tomioka, and A. Amano, J. Phys. Chem., 68, 1878 (1964).(12) J. N. Butler and G. B. Kistiakowsky, J. Amer. Chem. Soc., 82, 759 (1960).(13) E. K. C. Lee and F. S. Rowland, ibid., 85, 897 (1963).(14) J. T. Hardwick, J. Phys. Chem., 66, 291 (1962).(15) F. H. Field, J. Amer. Chem. Soc., 90, 5649 (1968).(16) C. D. Wagner, J. Phys. Chem., 71, 3445 (1967).
The Journal of Physical Chemistry

Gas-Phase R eactions of Cyclohexene with R ecoil Tritium 2511
the T+ will be favored in an environment like He wherein the ionization potential of He is the greater of the two. Experimental evidence has shown that in the low kiloelectron volt energy region beams of monatomic hydrogen exist as the positive ion for more than 90% of the hydrogen species in a helium environment.6 T+ would not remain as extensively ionized in a heliummoderated hydrocarbon system as it would in pure helium. In fact, it was presumed for some time that even a small percentage of hydrocarbon would be sufficient to neutralize all T+ in recoil tritium systems before the energy range of bond formation was reached.3
Seewald and Wolfgang have since shown that T+ (or excited state T atoms) make significant contributions to the H T yield in helium-moderated recoil tritium- methane reactions. 4 H T was the only apparent IM product reported by Seewald and Wolfgang, and the IM contribution to its yield was about 6 % of the total tritium activity of all products. In the helium-moderated tritium-cyclohexene system we find (by comparison with results in xenon-moderated samples) apparent IM contributions to HT, methycyclohexane-f, and heavy polymer-f with the total of these contributions ranging around 2 0 % of the total observed tritium activity.
When the 3He (n,p) T reaction occurs, the recoil tritium is formed as an ion. It becomes neutralized in most environments long before reactive collisions are possible. Because this neutralization is impeded in helium, reactions involving tritium ions would be more favored in a helium environment than in xenon. The more favorable reactions would then exhibit higher product yields, such as are observed for HT. H T yields average more than 40% higher in helium-moderated samples. Some
H T formation in helium-moderated samples may be via atom transfer in grazing ion-molecule reactions known as stripping reactions. These were postulated by Henglein, et al.,17 and by Wolfgang3 who also illustrated them diagramatically. In such a reaction little energy or momentum is transferred to the entity struck. Not only is such a reaction possible, but similar dissociative ionizations have yielded useful information about bond energies. 18 In the formation of H T both free T atoms and T+ ions may take part. Possible reaction pathways are given in reactions 6-9, inclusive.
RH + T — > H T + R (6 )
RH + T+ — ► RH+ + T (7)
RH + T+ — >- H T+ + R (8 )
HT+ + RH — > H T + RH + (9)
It is similarly presumed that the greater yield of the heavy polymers in helium- than in xenon-moderated samples could be the result of a favorable environment for ion-molecule type reactions in helium. These may build up longer chains before termination than the free- radical polymerizations do.
Acknowledgments. Fellowship support from the Gulf Oil Corporation, Monsanto Company, and the donors of the Petroleum Research Fund (R. W. W.) is gratefully acknowledged. The authors wish to thank Dr.F. S. Rowland for helpful comments.
(17) A. Henglein, K. Lacmann, and B. Knell, J. Chem. Phys., 43, 1048 (1965).(18) W. B. Maier, II, ibid., 42, 1790 (1965).
Volume 73, Number 8 August 1969

2512 Anthony Y. Guzzo and Gary L. Pool
Energy Transfer to the Triplet Level of All-i rares Retinalla
by Anthony V. Guzzo and Gary L. PoollbChemistry Department, University of Wyoming, Laramie, Wyoming (Received August 27, 1968)
Energy transfer to all-frans retinal has been shown to take place from a series of compounds of known triplet energy and lifetime. Changes in the decay time of phosphorescence with changing acceptor concentration (retinal) were correlated with the overlap of the emission spectrum of the donor and the absorption spectrum of the acceptor. Using this procedure the height of the triplet level in retinal is tentatively placed at 38 kcal above the ground state. The rate constant for energy transfer appears to approach that measured by other workers for systems with good overlap and may approach the rate constant for a diffusion-controlled process at liquid nitrogen temperatures.
IntroductionIt is generally accepted that the primary event in the
visual excitation process is the absorption of a photon of light by the retinal-derived chromophore in rhodopsin. Consequently the various isomers of retinal have been the subject of study by a number of investigators with the result that their photoisomerization, 2 radical formation, 3 and photoconductive4 properties have all been characterized to some degree. In all of these investigations the first triplet level seems to be implicated as a precursor to the more interesting properties of these molecules. Unfortunately, the population of this state has not been directly observed, that is neither phosphorescence nor singlet-triplet absorption has been observed. There is evidence from flash photolytic studies that the triplet state is indeed populated upon illumination of retinal.5'6
In the present study we attempted to make use of the phenomenon of energy transfer to detect the presence of the triplet level of all-irons retinal. A series of phosphorescent molecules with known triplet level positions were chosen, and the effect of retinal on the lifetime of the donor phosphorescent state was found. It is well known that the efficiency of emission from a given molecule is dependent on the nature and concentration of other molecules present in solution. Energy transfer to these other molecules competes with the other means of deactivation of the excited state, one of which is the radiative process of phosphorescence. This competition decreases the quantum yield of emission and also shortens the lifetime of the state. Such changes are maximal when, assuming all other factors are the same, the emission spectrum of the donor overlaps maximally with the absorption spectrum of the acceptor.7 There are, however, great structural differences between the various donor molecules chosen, and therefore the overlap of the emission and absorption spectra may not be the only factor influencing transfer efficiency.
Our work involved the measurements of the change in triplet state lifetime, as measured by the lifetime of phosphorescence, as a function of retinal concentration.
As discussed below, the quantity representing the overlap integral was obtained from the data and plotted vs. triplet-state energy. We anticipated the development of a maximum in this quantity when donor-acceptor overlap was maximal.
Experimental SectionThe series of triplet donor molecules were selected
from a photosensitizer kit available from the J. T. Baker Co. and were used without further purification. The compounds used are given in Table I.
All-frans retinal was obtained from Distillation Products Industries and was used as received. All materials were stored at freezing temperatures to minimize degradation and freshly prepared solutions were used for each run. The total exposure of each sample to the light was minimized wherever possible.
The solvent used was a mixture of ethanol and diethyl ether in a 2 :1 volume ratio. This solvent system forms a glass at 77°K and dissolves the donor molecules at suitable concentrations. The concentrations were corrected for the contraction of the solvent upon cooling; however, in most cases this only produced minor changes. No interfering emissions were observed from the solvent.
The phosphorescence spectra and decay curves were obtained using the Aminco-Bowman spectrophoto- fluorometer equipped with the Aminco-Keirs phos- phoroscope attachment. The recording unit normally was a Moseley Model 135 X - Y recorder; however, for fast decay times the recorder was replaced by a Hewlett-
(1) (a) This work has been supported by the Atomic Energy Commission through Contract No. AT(11-1)-1627; (b) N.I.H. Predoc- toral Fellow supported through Grant No. 1-F1-GM-36, 155-01.(2) R. Hubbard, J. Biol. Chem., 241, 1814 (1966).(3) F. Grady and D. Borg, Biochemistry, 7, 675 (1968).(4) B. Rosenberg, Advan. Rad. Biol., 2, 193 (1966).(5) K. H. Grellman, R. Memming, and R. Livingston, J. Amer. Chem. Soc., 84, 546 (1962).(6) W. Dawson and E. W. Abrahamson, J. Phys. Chem., 66, 546 (1962).(7) N. Turro in “ Molecular Photochemistry,” Benjamin, New York, N. Y., 1967, Chapter 5.
The Journal of Physical Chemistry

Energy T ransfer to All-trans R etinal 2513
Table I : Comparative Transfer Efficiencies from the Triplet Donor Series to All-imras Retinal
Donor
(O-O)triplet®
energies,kcal/
einstein
Lifetime,sec
(77° K)1 /C a 0,6l./m ol
kET,el./(m ol sec)
Benzene 85 3 160Acetophenone 74 2.3 X 10~3 39.5Benzophenone 69 4.7 X 10⁻³ 35Biphenyl 65 4.4 10.3 2.3Phenanthrene 62 3.2 2.4Naphthalene 61 2.3 3.7Chrysene 57 1.6 17.01 '-Acetonaph- 56 0.22 91.0
thonePyrene 49 0.47 260Crystal violet 39 7.5 X 10~3 <42
a This notation represents the energy separation between the ground state and the lowest vibrational level of the first excited triplet state. 6 These values were obtained through the use of eq 5. c These values were obtained through the use of eq 6.
Packard Model 140A oscilloscope. For those compounds with fast decay times the rotating shutter of the phosphoroscope provided the on-off mechanism whereby the decay could be recorded. For longer lived emissions the excitation light was manually shuttered. Decay times were measured as the time required for the phosphorescence intensity to fall to 1 /e of its initial value. This quantity was either directly obtained from the decay curve or was obtained from a log plot of the decay. Either procedure gave quite similar values.
Results and DiscussionW ith donors having triplet energies in the region of
the retinal singlet-singlet absorption, we expect that the transfer should be of the T d -*■ Sa type and as the energy of the donor is lowered we expect T D -*■ T A transfer to become important. (We use the term “ triplet energy” to refer specifically to the energy separation between the lowest vibrational levels of the first excited triplet state and the ground state.) The mechanism of transfer in each case is different with a resonance-type transfer expected for the former and an exchange or collisional mechanism expected for the latter. Both forms of transfer are dependent on the extent of overlap of the phosphorescence spectrum of the donor and the absorption spectrum of the acceptor.
Forster’s expression for the rate of transfer is of the form8
&et = — /e(f)/(r)d? (1 )To
where C represents several factors and r0 is the lifetime of the donor in the absence of the acceptor; the integral is over the product of the phosphorescence spectrum of the donor normalized to unity on a wave number scale
<I—oozOuint-<ccceinInLTÌZ<ce
in_jCLceI -
inCLCC
( Kcal./Einstein)
Figure 1. The rate constant for triplet-triplet energy transfer as a function of the energy of the lowest vibrational level of the first excited triplet state of the donor, E T. Retinal is the acceptor. (The value of the rate constant at 39 kcal should be interpreted as a maximum value with the actual value less.)
and the absorption spectrum of the acceptor on a molar extinction scale. It can be seen that if we form the product T0fcET this quantity is proportional to the overlap integral above. Further it can be shown that when transfer is equally as probable as all other means of deactivation of the excited state the critical concentration
and thus
(2)
77~ö = C'fe(P)f(P)di> Ga
(3)
In the region of T d ~ > SA transfer the critical concentration (7a 0 can be found by fitting the decay data to the equation obtained by Bennett9 for Forster-type transfer, i.e.
7(0 = 7„exp (-f/ro) e x p (-2 C A/CA0)(f/ro) 1/2 (4)
where 1 (t) is the intensity of phosphorescence at time t after the decay began, J0 is the initial value of the phos-
(8) T. Fôrster, Discussions Faraday Soc., 27, 7 (1959).(9) R. G. Bennett, J. Chem. Phys., 41, 3037 (1964).
Volume 78, Number 8 August 1969

2514 A nthony V. Guzzo and Gary L. Pool
phorescence intensity, r0 is the lifetime of the donor triplet state in the absence of the acceptor, and CA° is the critical concentration discussed previously.
When I (t) has fallen to I 0/e, then
, 2 ( i / to) 1/2
A( T ^ '(5)
Values of (Ca0) - 1 for the high-energy donors are given in Table I.
On the other hand, triplet-triplet transfer occurs via a collisional mechanism and can be interpreted by consideration of exchange as has been done by Dexter. 10
We expect therefore that eq 1 may not produce a meaningful CA°■ For the low-energy donors we have determined /cE t directly as was done by Terenin and Ermolaev in their transfer studies on several donor- acceptor pairs. 11 Following these workers we may evaluate kEt using the relationship
1 = kETCA (6 )ToT
and extrapolating the data to CA = 1 M. Unfortunately, data are difficult to obtain in this low-energy region, particularly so since the acceptor, retinal, has a very intense absorption band in the usual region of donor excitation. This factor and the very high efficiency of thermal relaxation at low triplet energies allow only a small amount of the excitation available for transfer. Thus rate constants obtained from the application of eq 6 are to be considered approximate only; they are given in Table I.
Dexter10 has shown that the probability of transfer as given by the exchange mechanism is
p = ~Se{v)m dr
where
z J V dt ‘ - s"<PA So T11«Pd <pA dr
Here the overlap integral is the same as above and z is the coulombic part of the exchange energy between the donor and the acceptor. Note that there is no dependency of the lifetime of the donor nor on the oscillator strengths of the donor or acceptor transitions (except as e(v) and f(p) appear in the overlap integral; here they are used as normalized shape functions). The work of Sandros and Backstrom 12 and of several other investigators13 has shown that this may be the case in that the oscillator strength of the acceptor singlet-triplet transition and the lifetime of the donor (hence its oscillator strength) do not greatly influence transfer. The quantity of major importance in determining the extent of transfer is the overlap integral.
The quantity z would seem to be a sensitive function of the orbital shapes of the donor and acceptor. How
ever, triplet-triplet transfer follows Perrin’s formula
7 = exp(FC')-Í 0
where I and I 0 are the intensities of phosphorescence with and without the acceptor, C is the density of acceptors in molecules per cubic centimeter, and V is the volume of the “ sphere of influence” of the acceptor in cubic centimeters. As Ermolaev shows, the radius of this sphere is quite constant and almost independent of the structure of the acceptor. It would appear then that, assuming an overlap integral near unity, the z function very quickly increases to an asymptotic value in the region of molecular contact and that orbital shapes do not influence its value greatly.
However, Sandros and Backstrom 12 did note individual variations in the rate constants for acceptors having almost identical triplet-state energies. In some cases the rate constants were different by two orders of magnitude. In the Russian work11 the rate constants for the carbazole-naphthalene pair and the benzalde- hyde-naphthalene pair differ by three orders of magnitude yet their respective triplet-state separations are identical, i.e., 1 1 kcal. Clearly these points indicate that some caution is necessary in the extension of the conclusions.
The rate constant for energy transfer may be obtained from Dexter’s probability function. Since the quenching action through the exchange interaction is functionally similar to quenching produced by collision, we expect the relationship
/¡ET = k d ' P
where kd is the appropriate rate constant for a diffusion- controlled process and P is Dexter’s probability function. This relationship would suggest that /cEt should approach kd for those cases where the overlap integral is near unity and the z function has its limiting value. The approach of fcET and kd has been observed by Sandros and Backstrom using biacetyl as the donor; however, these experiments were done at 2 0 ° and no comparable data exist at 77 °K . The measurements of Terenin and Ermolaev11 do apply here, but they are not nearly as extensive as those of the Swedish workers. For the system benzaldehyde-naphthalene, with their respective triplet-state energies separated by 1 1 kcal, a value of /cet = 5 X 10² 1./(mol sec) is obtained. This compares favorably with the maximum value of kET we obtain for the retinal-pyrene system— 3 X 10² 1./(mol sec).
(10) D. L. Dexter, J. Chem. Phys., 21, 836 (1953).(11) A. Terenin and V. Ermolaev, Trans. Faraday Soc., 52, 1042 (1956).(12) K. Sandros and H. L. J. Backstrom, Acta Chem. Scand., 16, 958 (1962).(13) V. L. Ermolaev, Soviet Phys. Usp. (English Transi.), 80, 333 (1963), and references therein.
The Journal of Physical Chemistry

D is s o c i a t io n o f L i t h i u m a n d S o d iu m T e t r a m e t h y l a l u m i n a t e i n S o l u t i o n 2515
To have a sizable overlap integral, the donor triplet level must be blue shifted with respect to the acceptor triplet level. For maximum overlap the difference in triplet energies between donor and acceptor is crudely- seen as the average band width of the emission and S -T absorption spectra. Pyrene has a band width, obtained by direct measurement of the phosphorescence spectrum, of about 9 kcal. There is no direct way of obtaining the band width of the vibrational states of the retinal triplet since no absorption to this state can be observed. We may assume, however, that the triplet level width in retinal is similar to the width of the triplet level in dodeca-2,4,6,8,1 0 -pentenal, one of the systems studied by Evans14 using the oxygen perturbation technique. In this case, the singlet-triplet absorption spectrum indicates a band width of about 1 2 kcal. Using these values, the average bandwidth for the
donor-acceptor pair retinal-pyrene is 1 1 kcal, and this places the zeroth vibrational level of the first excited triplet of retinal at approximately 38 kcal above the ground state. This value suggests that if the phosphorescence of all-trans retinal could be observed it would be found near 880 nm.
In the pentenal derivative, Evans found that the zeroth vibrational state in the first excited triplet was 32 kcal above the ground state. If we accept the value found above for retinal, 38 kcal, then this indicates that the excited state singlet-triplet separation in retinal is smaller than in its pentenal analog. This conclusion, if confirmed by future work, would be highly significant with regard to our understanding of the retinal-derived chromophore involved in vision.
(14) D. F. Evans, J. Chem. Soc., 1735 (1960).
The Dissociation of Lithium and Sodium Tetramethylaluminate in Solution
by E. S. Gore and H. S. GutowskyW. A. Noyes Chemical Laboratory, University of Illinois, Urbana, Illinois 61801 {Received September 4, 1968)
The proton line shapes for the CH3 groups of lithium and sodium tetramethylaluminate (LiTMA and NaTMA), observed in the solvents ether, tetrahydrofuran (THF), and 1,2-dimethoxyethane (DME), have been used to determine the 27A1 spin-lattice relaxation rate Ri. The results are interpreted on the basis of an equilibrium between two kinds of ion pairs, an intimate ion pair in which Ri is large and a solvent-separated ion pair in which Ri is small. In ether solution, both LiTMA and NaTMA exist as intimate ion pairs while in DME they exist as solvent-separated ion pairs. In the THF solutions, the line shapes depend significantly upon both temperature and concentration, indicating that significant amounts of both ion-pair species are present. Theoretical equations are derived to fit the observed line shapes on the assumption that the chemical exchange processes are rapid. From the parameters determined by fitting the line shapes, estimates are obtained for the relative amounts of the two ion-pair species and also for some of the thermodynamic functions describing the equilibrium in the LiTMA-THF and NaTMA-THF solutions. With the equilibrium written as MA1- (CHsb ^ M+|| A1(CH3)4-, then for the LiTMA-THF system at 40° we find Ke<i = 110, AH° = -6 .5 kcal/mol, andA/S° = —lie u . Only Kcq can be determined for the NaTMA-THF system; the result is 11, also for 40°. By combining the proton line shape data with some 27A1 resonance data we find that J a u h for A1(CH3)4- in the intimate ion pair of LiTMA is 7.1 Hz and for NaTMA, 9.1 Hz. On the other hand, J a u h is found to be6.3 Hz for the solvent-separated ion pair, whether it be from LiTMA or from NaTMA. Other data bearing upon the equilibrium are presented and discussed.
I. IntroductionSeveral workers1 2 have observed the high-resolution
proton magnetic resonance spectrum of lithium tetramethylaluminate (LiTM A) in ether and 1 ,2 -dimethoxyethane (DME) solutions. In ether the methyl resonance of L iTM A is a single line whose line width decreases with decreasing temperature. In contrast to this the resonance in D M E is a rather sharp sextuplet which is practically independent of temperature. The six lines observed in the D M E solution arise from the
indirect spin-spin splitting by the 27A 1 nucleus (/ = 6/s) • The presence or absence of pmr splittings in the two
solutions can be explained in terms of an equilibrium between an intimate ion pair and a solvent-separated ion pair. In the solvent-separated ion pair the 27A1 nucleus experiences an electric field which has tetra-
(1) K. C. Williams and T. L. Brown, J. Amer. Chem. Soc., 88, 4134 (1966).(2) J. P. Oliver and C. A. Wilkie, ibid., 89, 163 (1967).
Volume 73, Number 8 August 1969
f m i Q Y i t n r n i «

2516 E. S. Gore and H. S. Gutowsky
hedral symmetry. Consequently, the electric field gradient at the 27A1 nucleus is very small, and the spin- lattice relaxation rate, Ri (R\ = 1/Ti), of the 27A1 nucleus is small enough that the 27Al-proton splitting is observed. On the other hand, in the intimate ion pair the proximity of the L i+ ion to the A 1(CH3)4- ion destroys the tetrahedral symmetry and causes the 27A 1
nucleus to experience a large electric field gradient. This in turn induces a large relaxation rate for the 27A1 nucleus which averages out </a i - h and causes the methyl resonance to collapse to a single line. Therefore, the observation of a single CH 3 group line in ether solutions of L iT M A and a sextuplet in D M E solutions indicates that L iT M A exists primarily as intimate ion pairs in ether and as solvent-separated ion pairs in D M E . 1 '2
Other studies3-6 have shown that the solvating power of tetrahydrofuran (THE) is intermediate between that of ether and D M E. Thus, one would expect TH F solutions of L iTM A to have significant amounts of both types of ion pairs. Consequently, the line shape for L iT M A should be intermediate between a single line and a sextuplet. Furthermore, the behavior of sodium tetramethylaluminate (NaTM A) should be related to that of LiTM A.
W ith these points in mind, we prepared several solutions of L iT M A and of N aTM A in T H F and examined the fine shape of the methyl resonance in them. We found that the pmr line shape for LiTM A in TH F exhibited pronounced changes with temperature and concentration, the line shape ranging from a partially collapsed sextuplet to a very broad resonance with almost no fine structure. Some examples of these spectra are shown in Figures 1 and 2. In contrast, the spectra for N aTM A in TH F exhibited only small changes with temperature and concentration, the spectrum being always very broad, with a width of about 40 Hz.
These experimental line shapes were fitted by exact theoretical line shape equations derived on the basis of an equilibrium between intimate ion pairs and solvent- separated ion pairs. In order to simplify the theoretical equations the chemical exchange involved in the equilibrium was assumed to be rapid. The spectra were fitted with these equations by means of a digital computer. The best-fit spectral parameters were used to estimate the relative amounts of the two types of ion pairs, which give in turn some thermodynamic quantities for the L iT M A -T H F and N aT M A -T H F solutions.
In addition, similar, less extensive studies were made of the systems LiTM A-ether, L iT M A -D M E , N aT M A - ether, and N aTM A -D M E . The results support the interpretation that in ether both LiTM A and N aTM A exist primarily as intimate ion pairs while in D M E they exist as solvent-separated ion pairs. Finally, some 27A1 resonance data were also collected and were used along with proton resonance data to determine the
Figure 1. The methyl group pmr spectrum of LiTM A in THF at 40° for three different LiTM A concentrations. The squares are experimental points and the solid lines are the computer determined best-fit line shapes.
value of the 27A1-CII3 coupling constant in the intimate ion pair of L iT M A and NaTM A.
II. Experimental SectionA. Nmr Data. The proton high-resolution spectra
were recorded on either a Varian A-60A or a Yarian A-56/60 spectrometer, each equipped with a V-6040 temperature controller. The temperature was measured before and after spectra were recorded. This was done by removing the sample from the probe and replacing it with a nonspinning nmr tube containing a thermocouple. Fifteen minutes was allowed for the thermocouple to equilibrate; then this temperature was recorded. If the before and after readings did not agree within 2°, the spectra were rerun. Before recording spectra, we allowed the sample to equilibrate for at least 30 min in situ. Although the temperature could be measured with a precision of ±0.5°, the accuracy is probably no better than ± 2 °.
A t least six spectra were recorded for each sample at each temperature. A freehand curve was drawn through each spectrum and the line shape was converted into digital form by means of a Benson-Lehner Decimal Converter, Model F. Depending on the
(3) (a) T. E. Hogen-Esch and J. Smid, J. Amer. Chem. Soc., 87, 669 (1965); (b) ibid., 88, 307 (1966); (c) ibid., 88, 318 (1966).(4) C. Carvajal, K. J. Tolle, J. Smid, and M. Szwarc, ibid., 87, 5548 (1965).(5) W. Strohmeier, H. Landsfield, and F. Gernert, Z. Elektrochem., 66, 823 (1962).
The Journal of Physical Chemistry

D issociation of Lithium and Sodium T etramethylaluminate in Solution 2517
Figure 2. The methyl group pmr spectrum of 1.23 m LiTMA in THF at several different temperatures. The squares are experimental points and the solid lines are the computer determined best-fit line shapes.
amount of fine structure in the spectrum, anywhere from 40 to 100 points were read. The points chosen were more closely spaced in the regions of the spectrum where the rate of change of the slope was greatest.
B y means of a program written in f o r t r a n II, we used an IB M 7094 computer to calculate the parameters giving the best least-squares fit with the experimental line shape. The parameters from several spectra at a given temperature were then averaged to give the final results. The equations used for fitting the line shape are based on the Anderson-Weiss theory and will be derived in section III. B.
The 27A1 spectra were recorded on a Varian DP-60 spectrometer operating at 13.6 kG and 15.08 MHz.
B. Materials and Procedure. Samples were prepared in a glove box under an argon atmosphere. The concentrations of the samples were determined by dissolving a weighed amount of a compound in a weighed amount of solvent. A syringe was used to transfer the solution into an nmr tube attached to a stopcock. After closing the stopcock, the tube was removed from the glove box, attached to a vacuum line, evacuated, and then sealed off with a torch. No pains were taken to remove the argon dissolved in the solutions. When not in use, the samples were stored
in a refrigerator at — 15°. The solutions appeared to be quite stable; two measurements made on one sample 3.5 months apart at 77° gave the same results within experimental error.
The solvents were purified by distillation over LiAlH 4 under argon atmosphere and stored over sodium wire in an argon atmosphere. The compounds were synthesized according to previously published methods. L iTM A was prepared by the reaction of methyllithium and trimethylaluminum in ether solution .6 The methyllithium was prepared from dimethyl mercury and lithium metal in ether solution.6
Sodium tetramethylaluminate (NaTM A) was prepared from sodium metal and trimethylaluminum in ether solution. The LiTM A and N aTM A were heated under vacuum ( ~ 1 mm) at 140° for several hours in order to remove any complexed solvent.
HI. Line Shape AnalysisA. Derivation of Fast Exchange Approximation. It is
not difficult to show7 that when there is fast chemical exchange in a two-site uncoupled system, the two resonances collapse to a single line whose chemical shift is the weighted average of the chemical shifts at the two sites. In the present study there is chemical exchange between two sites. However, each site involves protons coupled with a spin- 5/ 2 27A1 nucleus, so the proton resonance for each site can consist of from one to six lines, depending on the quadrupole relaxation rate of the 27A1 nucleus. Also, the rate at which the 27A1 nucleus is relaxing may be quite different for the two sites and consequently the two sites may not exhibit the same number of proton lines.
Thus, it is not obvious what effect chemical exchange will have on the high-resolution proton spectrum of the system. If the chemical exchange rate is greater than the chemical shift difference between the two sites, we expect the two multiplets to coalesce to a single multiplet, but if the multiplets exhibit different numbers of lines the averaged multiplet will have an intermediate appearance. Intuitively, we expect the spectral parameters of the averaged multiplet to be the weighted average of the parameters in each site, provided that the chemical exchange rate is fast compared to the difference in aluminum relaxation rates at the two sites. We consider now in some detail the circumstances under which fast chemical exchange does indeed give such a single multiplet.
We consider a two-site system, undergoing chemical exchange, in which each site has a magnetically equivalent set of spin- 1/ 2 nuclei coupled to a quadrupolar nucleus of spin S. The Anderson-Weiss theory8 is
(6) K. C. Williams, Ph.D. Thesis, University of Illinois, Urbana, 111., 1966.(7) J. A. Pople, W. G. Schneider, and H. J. Bernstein, “ High- Resolution Nuclear Magnetic Resonance,” McGraw-Hill Book Co., Inc., New York, N. Y., 1959.
Volume 73, Number 8 August 1969

2518 E. S. Gore and H. S. Gutowsky
used to derive the line shape equations for the spin- 1/ 2
nuclei. We call the low-field site A, and the high-field site B. The rate constants for chemical exchange are defined by
klA ^ B (1)
fc-1
with numerical terms describing the probability per unit time of transfer of magnetization due to quad- rupole relaxation of the nucleus with spin 8 . Examples of the a matrix have been given elsewhere. 9
In terms of A, the complex line shape is
(? (» )= W -(A - tA l) - l (9)
The resonance of each site consists of 28 + 1 transitions. Altogether then, in the absence of exchange effects there are 48 + 2 lines in the spectrum and we number these consecutively from 1 to 48 + 2 beginning with the line at lowest field. The frequency origin is chosen so that the chemical shift of sites A and B are —0 and 0 radians/sec, respectively. Let the T\ of the quadrupolar nucleus and the coupling constant between the quadrupolar nucleus and the spin-V2
where W = [pAlf , piTt], in which 1 is a column vector of l ’s, I f is the transpose of 1, and pA, Pb are the populations of sites A and B, and A is the difference, in radians/sec, between the frequency of the applied rf field and the origin about which the line shape is calculated. In order to put eq 9 in a form suitable for a fast exchange approximation, we introduce a transformation V such that
nuclei in the two sides be Txk, T ib, ®a, and CtB where the script a indicates the units are radians/sec (J is G(co) = W -V V -1(A - tA lJ - 'W - '- l =
the value of the coupling constant in Hz). Let the W-V(S - z'Al)_1V_1-1 (1 0 )natural fine width of the spin-y2 nuclei in the absence of exchange and quadrupole relaxation in the two sites where
be T2A° and Tm°. Finally, we let S = V^AV (1 1 )
Ria — 1/Tia ', R ib — I/T ib (2 ) If we let
andV r 2 —1/2I; - p ( l + p2) - 1/2I 1
(1 2 )fÜ2A° = 1 /T 2A° ; E 2B° = 1 / T V (3) |_2 ~1/2lj ( 1 + p*)~l/H J
According to the Anderson-Weiss theory we con- in which
struct a 48 + 2 order matrix, A, such that Ajk for j + k is the probability per unit time for transfer of
p = Ai/fc-i = Pb/Pa (13)
magnetization from site j to site k, and then eq 1 0 becomes
4S + 2Ajj = — J) A ^k- 1
(4) G(u) = [2 " 1/2lf ,0 f ] .(S - i A l ) " 1- ^ ' 1] (14)
Thus, Ajj~x is the exchange lifetime of nuclei at sitej. In the notation of Gutowsky, Void, and Wells, 9 the matrix is
A — iio + K + R2° (5)
where in the “ intramolecular” exchange case under consideration
where 0 = a column vector of zeros. If we let
(S - ¿Al) - 1"T, | T21_t »' It J
then from eq 14
<?(«) = lf-T i-1
(15)
(16)
and
r«A? - oi ......1L 0 ®b? + OlJEi a a — fcil i h i
fc_!Ï R i b & —
r - E 2A°i 0 1
" L o ! - e 2B°i J
In order to evaluate Ti, we set(6)
P a — R i a c c — E 2a° I + 7((Ja (5 ~ ^1) (17)
j'y j and
Pb = 72ib« — 722b°I + ¿(®b5 + Hi) (18)
Introduction of these definitions into A and use of (8 ) eq 1 2 for V enables one to convert eq 11 for S to
Other symbols are i = V — 1, I = the unit matrix, 0 = the zero matrix, (5 is a diagonal matrix with diagonal elements 8n = — 8 — 1 + l, and a is a matrix
(8) A. Abragam, “ The Principles of Nuclear Magnetism,” Oxford University Press, Oxford, 1961.(9) H. S. Gutowsky, R. L. Vold, and E. J. Wells, J. Chem. Phys., 43 , 4107 (1965).
The Journal c f Physical Chemistry

D issociation of Lithium and Sodium T etramethylaluminate in Solution 2519
1 Pa + pPB V 2 ( l + p 2r 1/2p(P3 - Pa) 11 + p|_2-1/2(1 + p2)1/2(PB — Pa) pPA + PB - (1 + p)(k 1 + fc_i)IJ
Making use of the general matrix identity10
(19)
[ - A j i n - 1 '(A - BD_1C)_1 j (C - DB-1A )-rL e i D J L(B - A C -® )-1 j (D - CA- B ) 1. (20)
in conjunction with eq 15 for (S - i AI)- 1, we obtain Ti and reduce eq 16 to the desired form
G (« ) =/ P a + p P b
l 1 + P
z'Al —(1 + vY (Pb - Pa)2 X
[ i f f - f t + i (21 )
the elements of Pa and PB. This is the condition of fast exchange. The observed spectrum can be analyzed by assuming that instead of two sites, each coupled to a nucleus of spin S undergoing chemical exchange, only one site coupled to a relaxing nucleus of spin S is present. Then the spectral parameters which are obtained by line shape fitting will be the weighted average of the spectral parameters in the two sites, i.e.
If one of the rate constants is much larger than the other rate constant and also much larger than the larger of R1A and P iB, then the last term in eq 21 is much smaller than the others and may be neglected. That is
P(1 + ? > )-2( P b - P a ) 2 X[ ( p P a + P b ) ( 1 + p ) - 1 -
(ki + fc_ i + f A ) I ] -1 <K
(P a + pPB)(l - V ) ~ l ~ *AI (22) and consequently the line shape will be given by
« = (23)
which may be rewritten as
G(w) = 1 1 * (pAP a + PbP b - *Al) _ 1 • 1 (24)
Finally, by letting
P = P a P a + P bP b (25)
we convert eq 24 to
G (w ) = If- (P — fA l)_1-l (26)
Thus, for this case the line shape is determined by the matrix P which is similar to the matrices PA and PB but with elements which are the weighted average of
R\ = Pa R ia + P b P i b , J — PaJ a + P bJ b
and
P 20 = PaRia0 + pBP 2B° (27)
The validity of this analysis rests upon that of the Anderson-Weiss theory in the fast-exchange limiu. The latter holds for chemical exchange of two spin- coupled nuclei if the nuclei are weakly coupled (i.e., ft » <5gj, where 5co is the difference in Larmor frequency of the two nuclei) and if r 25co2 » 1 (the adiabatic approximation), where r is lifetime for the exchange process. In the particular systems considered in this paper, both of these conditions are met. The frequency difference Su is about 8 t X 107 radians sec- 1 and a is about 40 sec-1 . The value of r corresponds to the smallest of TiA, T i b , 1 /h and 1 /k2, which is about 1 0 “ 6
sec- 1 in our experiments. However, if the 27A1 nuclei were to experience a very large quadrupole coupling constant and if the correlation time for quadrupolar relaxation were such that the 27A 1 T1 took its minimum value, the adiabatic approximation could fail.
B. Calculation of Line Shapes. As shown above, if the fast-exchange approximation is applicable, the observed spectrum is described by eq 26. It is a function of three parameters R\, J, and R«° where each is the population- weighted average of the values in the two sites, as contained in P. For the particular case under consideration, the matrix P is
r 5
- T * -- RC S* 0 0
-0
‘P3
- 2®23
- —Ri - Ä2°O Is' > 0 0
s* ' \R' - ¡ a - ? » - Ri° 0 s * 0
0 > 01 Q-a - -Äi - Ä2°2 4 lRl s *
0 0 lRl32® - ! *
- r2°
-0 0 0 l - >
52® _ ^R i - RCo
Volume 78, Number 8 August 1969

2520 E. S. Gobe and H. S. Gutowsky
A computer program was employed to determine the values of parameters in eq 28 which would give the best fit between the line-shape equation and an experimental spectrum. In order to make the program as efficient as possible it was necessary to avoid the use of complex arithmetic. To do this we note that the line shape, as given by eq 26, depends on the inverse of the matrix (P — iAl), and that P — fAl may be set equal to A + fB where A and B are the real and imaginary parts, respectively, of P — «Al. Now it can be shown10 that a complex matrix A + iB, where A and B are real, is isomorphic to the “ supermatrix”
A | - B '
_B j A _
Thus, the real and imaginary parts of (A + tB ) “ 1 are equal to the upper and lower left-hand blocks, respectively, of the matrix
'A
_B
Using the identity in eq 20 we have
(A + tB)“ 1 = (A + B A -B )-1 -t(B + AB_1A)_1 (29)
Therefore, the absorption is given by
<?(«) = I f-(A + B A - B ) " 1-I (30)
Equation 30 gives the line shape in terms of real quantities and was the formula used in the program to determine the line shape. Its use resulted in a considerable saving of machine time.
The program normalizes each of the experimental and calculated spectra by putting the area equal to 1. The area is determined by using the trapezoidal rule. It was assumed that the best fit was obtained when the sum of the squares of the deviations of the calculated curve from the experimental curve (called sumsquares) was a minimum. The frequency origin in the spectrum was taken to be the center of the multiplet, the center being chosen by eye. When the spectrum is partially collapsed it is difficult to locate the center of the spectrum exactly and consequently it was necessary to calculate the best fit a number of times, each time adjusting the origin until the sumsquares was a minimum. This trial and error adjustment was greatly facilitated by having the computer produce the output on a CALCO M P plotter with the experimental points as small squares and the calculated line shape a solid curve, as in Figure 1. Rarely was it necessary to adjust the origin more than twice. The origin could have been determined by having the computer calculate the first moment of the experimental line shape. However, this did not work too well because the first moment is a very senstive function of points which are far from the center on the wings of the line shape. Due to experi
mental difficulties, such as base line drift, these points could not be obtained with sufficient accuracy to guarantee reliable values of the first moment.
The “ goodness” of the best fit was satisfactory for the methyl proton line shapes of the TH F solutions but not for those of D M E or ether solutions. The line shapes for the D M E solutions exhibit some structure and by calculating contours of the multidimensional surfaces of the sumsquares, called sumsquares surfaces, we found that J could be determined quite accurately. The values of R\ and R-° depended on the starting point for the minimum seeking routine but the sum R2 + 2Ri appeared to be roughly constant. This is not unreasonable since intuitively one would expect the width of the proton lines in the D M E spectra, where the quadrupole relaxation of 27A 1 is slow, to be approximately equal to R2° plus the lifetime of the spin state of the 27A1 nucleus giving rise to the line. From the theoretical treatment published previously9 it can be shown that the (average) lifetime of the spin states of 27Al is indeed about 2 Rx (they are not all the same).
The spectra measured in ether solution showed no fine structure at all, and calculation of various sum- squares surfaces for these line shapes indicated that although none of the individual parameters could be determined accurately, the product J 2Ti could be obtained. This agrees with theoretical results of Allerhand and Thiele, 11 who showed that when the quadrupole relaxation collapses the multiplet to a single line, the line shape should be very nearly Lorentzian with a width, in Hertz, of
1A ri/2 — -
x
We verified this result numerically with the exact line shape equations, and also found that the experimental line shapes for the ether solutions vary only slightly from Lorentzian shape. Inspection of eq 31 shows that if J 2Ti » R-° then R2C can be neglected and J 2Ti is determinable from the width of the(nearly) Lorentzian line.
The sumsquares surfaces indicated that both J and Ri could be determined with good accuracy for the line shapes with well resolved structure for the TH F solutions. However, it was noted that the values of R2° obtained from the best fit, although usually about 0.4 ± 0 . 1 sec, were occasionally much too high to be taken seriously. We attribute this in part to the field inhomogeneity contributions to the effective R2°. Furthermore, the line shapes for the TH F solutions are very insensitive to large changes in R2°, so that the latter could not be determined at all accurately. For
(10) T h e m atrix a lgebra in v o lv e d is stra igh tforw a rd ; see, e.g,. N . J acobson , “ L ectures in A b stra ct A lgebra , V o l. I — B asic C o n cep ts ,” D . V a n N ostra n d C o., In c ., f le w Y o rk , N . Y . , 1951.(11) A . A llerhand and E . T h iele , J. Chem. Phys., 45 , 902 (1966 ).
R2° + 4-^ S (S + 1 )J 27\ (31)O _
The Journal of Physical Chemistry

D issociation of Lithium and Sodium T etramethylaluminate in Solution 2521
these reasons the values obtained for i?2° were ignored and will not be considered further in this work.
C. Validity of Fast Exchange Assumption. A critical feature of our line-shape analysis is the assumption of fast chemical exchange between two species in dynamic equilibrium. We define the equilibrium as
KM A 1(C H 3) 4 ^ M + | | A 1 ( C H 3)4- (32)
A A*
where M is Li or Na, and K = A */A is the equilibrium constant with A and A* designating the intimate ion pair and solvent-separated ion pair, respectively. The exchange process is simply the transfer of the M+ ion from an intimate ion pair to the “ solvent,” or the reverse. Our experiments in themselves tell us little about the structure of A or A*; in one the 27A1 R% is large and in the other it is small.
Whatever the other details may be, the exchange is essentially an ionic process and as such one would expect it to be fast. Our data are insufficient to determine the ionic exchange rates individually, but we were able to demonstrate the validity of using the fast- exchange approximation in our line-shape analyses. First, we explored in some detail the limits on the exchange and relaxation rates within which the fast-exchange approximation is valid mathematically. Then we tried fitting a typical experimental line shape with and without the fast exchange approximation to determine which approach gave the best fit.
Several line shapes were calculated exactly for a two- site system undergoing exchange, with each site coupled to a nucleus of spin 5/2- For these lineshapes all the parameters except fa, k-i, and Ri were kept constant. The ratio of fa to /:_i was kept constant at 100 but the ratio of fa to R ia (where R ia » R ib) was varied from 1 to 50. For each spectrum that part which corresponded to the site with the larger population was digitized (the other resonance was not even “ visible” ) and the curvefitting program was used to find the best possible fit using the fast-exchange approximation. The Ri which was calculated by the program was then compared with the true value calculated by taking the weighted average of the R /s for each site. As expected, for small values of the ratio fa/Ria the difference between the two Ri’s (the best fit and the true values) was quite large. As the ratio fa/R ia was increased the difference became smaller. For the ratio fa/R ia = 50 the difference between the two values was about 8 % .
Next, one particular set of experimental data was chosen (corresponding to a 1.54 m solution of L iT M A in TH F at 38°) and the line shape was fitted using a modified version of the line shape fitting program. Instead of the fast-exchange approximation, the complete line, shape equations were used with the constraint that some of the parameters were assumed to be
Figure 3. Temperature dependence of the 27A1 Ri for different concentrations of LiTM A in THF, as determined by analysis of methyl group proton line shapes such as those shown in Figures 1 and 2.
known (on the basis of the 27A1 resonance data), the ratio of fa to /c_i (and hence the populations) was kept fixed at 1 0 0 : 1 , and the ratio of fa to R ia was set at a particular value for which the best fit was determined. When the ratio fa/Ria becomes °°, the condition of fast exchange holds exactly. We wanted to see how well experimental line shape could be fitted with finite values of fa/RiA- It was found that when fa/RiA was 5 the fit was significantly poorer than the one obtained using the fast-exchange approximation. As the ratio was increased the fit became better and better until finally when the ratio was 25 or larger there was no significant difference with the fit obtained using the fast-exchange approximation. Thus, the computer experiment shows that fa/R ia > 25, and this ratio is sufficiently large to justify our use of the fast-exchange approximation.
IV. Results and DiscussionA. The 27Al Relaxation Rate Data. F o rth eL iT M A -
TH F system the proton line shapes were observed over the temperature range —60 to 90° in four solutions varying in concentration from 0.77 to 2.12 m in L iTM A. Computerized fitting of the proton line shapes gave the values for the aluminum Ei which are plotted in Figure3. Due to the smaller solubility of N aTM A in TH F we could not cover as wide a temperature and concentration range as for the L iT M A -T H F system. The proton resonance of two solutions, 0.60 and 1 . 1 0 m in N aTM A, was observed over the temperature range
Volume 78, Number 8 August 1969

2522 E. S. Gore and H. S. Gutowsky
io3/ t
Figure 4. Semilog plot of the temperature dependence of the 27A1 for solutions of NaTMA in THF, as determined by analysis of methyl group proton line shapes.
— 1 2 to 65°. The aluminum R\ was obtained by computer fitting of the proton line shapes and the results are plotted in Figure 4.
The proton line shapes of a solution of L iT M A in D M E (0.48 m) and a solution of N aTM A in D M E (1.13 m) were observed over the temperature range— 10 to 80°. Proton line shapes of two solutions of L iT M A in ether, 1.61 and 0.42 to, and two solutions of N aTM A in ether, 1.29 and 0.26 to, were observed over the temperature range —62 to 42°. Due to difficulties mentioned in section III.B, it was not possible to determine the 27A1 R\ in the D M E or ether solutions by proton line shape analysis.
However, the line width of the methyl resonance of L iT M A and N aTM A in ether is of interest because, as shown in eq 31, it is closely related to the 27A1 relaxation rate. Therefore, the temperature and concentration dependences of the line width were studied for the two solutions and the experimental results are plotted in Figure 5.
B. Analysis of Equilibrium in the LiTM A-THF System. The variation of Ri with temperature in the L iT M A -T H F system makes it obvious that R\ is determined by more than the quadrupole relaxation of a single molecular species. If only a single species were involved, a plot of In R\ vs. 1/T would give a linear Arrhenius plot with an activation energy of a few kilocalories. 12 The occurrence of a minimum in the temperature dependence of Ri indicates that there is another mechanism operating whose contribution to Ri has a temperature dependence opposing the quadrupole relaxation of a single species. The simplest mechanism of this sort is the equilibrium between a solvent- separated species and an intimate ion pair as given in eq 32, which accounts very satisfactorily for the observed temperature dependence of Ri.
The analysis is straightforward. Using the fast- exchange approximation we write the observed Ri as the weighted average of the Ri s in the two types of ion pairs
Ri = PaRia + Pa*Ria* or
Ri = Ria* + Pa(Ria - R ia*) (33)
Assuming the activity coefficients of the two species A and A* to be equal we have
Va = 1/(1 + K) (34)
and therefore
Ri = Ria* + (Ria ~ Ria*)/(l + K) (35)
In the solvent-separated species the 27A1 nucleus experiences something approaching a tetrahedrally symmetric electric field, but in the intimate ion pair, the proximity of the Li+ ion destroys the tetrahedral symmetry. This means that the electric field gradient at the 27A1 nucleus will be much greater in the intimate ion pair than in the solvent-separated ion pair. Since the relaxation rate due to quadrupole relaxation is proportional to the square of the electric field gradient, 13
then R1A » Ria*.Support for this model and estimates of Ria and
Ria* are provided by the following considerations. In ether solution at 40°, the 27A1 resonance of L iT M A is a single broad line with a width of 182 Hz determined by Ri. Therefore, the relaxation rate, Ri, of the 27A1 nucleus in ether is 570 sec-1 . In D M E solution at 40°, the proton resonance of L iT M A is a slightly broadened sextuplet. From the line width of the components of the multiplet it was estimated14 that Ri ~ 2 sec-1 . If we assume that in ether the L iT M A exists largely in the form of intimate ion pairs and in D M E as solvent-separated ion pairs, then in ether, Ria = 570 sec- 1 and in DM E, R ia* = 2 sec-1 . These relaxation rates depend on the correlation times characterizing the rotational motions of the species. 13 The correlation times are a function of viscosity and shape of the species,7 so they will not be the same for the the three solvents ether, D M E, and TH F. However, it seems reasonable to assume that the correlation times for the two species will have the same relative values in TH F as in ether and D M E. Thus, the ratio Ria/R ia* is about 285 in THF.
B y substituting the estimates of Ria and Ria* into eq 33, along with the observed value Ri = 7 sec-1 , we can estimate the populations of the two species in T H F at 40°. This gives p \ = 0.009 and consequently, K = 110. Thus, with A 1 at 40° and probably for the entire temperature range studied, and with R ia 'A> R ia*, we can simplify eq 33 to the form
Ri = (Ria/K) + Ria* (36)
(12) W. B. Moniz and H. S. Gutowsky, J. Chem. Phys., 38, 1155 (1963).(13) See ref 8, p 314.(14) J. A. Pople, Mol. Phys., 1, 168 (1958).
The Journal of Physical Chemistry

D issociation of Lithium and Sodium T etramethylaluminate in Solution 2523
The temperature dependence of Ri is obtained by introducing the relations12
Ri\ = A exp(EJRT) and
R1A* = A* exp(E */R T) (37)
in which A and A* are now frequency factors, and also the thermodynamic function
K = exp(— A G°/RT) (38)
The result is
Ri = A exp[(Fa + AG°)/RTJ +
A* e x p (E * / R T ) (39)
Furthermore, we know that K > 1 and hence that AG° < 0. If A(7° is sufficiently less than zero, then the exponent of the first term in eq 39 will be negative. The exponent of the second term is necessarily positive. Thus, the two terms have opposite dependences upon l /T and a plot of In Ri vs. 1/T will have a minimum. This is what is observed and shown in Figure 3.
The curves in Figure 3 were fitted by eq 39 in the following manner. As 1/T becomes large, the first term tends to zero, so a plot of In Ri vs. l /T for large 1/T should yield a straight line with slope EA*/R. I f this line is extrapolated to small l /T and the resulting values are subtracted from Rlt we then get the first term, A exp [(Fa + AG°)/RT], A plot of the logarithm of this term vs. l /T should give a curve whose slope is
d[(Fa + A G°)/RT] ö ( l/T) (Fa + AH °)/R (40)
In practice, these plots turned out to be very nearly straight lines. The numerical results are summarized in Table I. The average values of F a* and (Fa + AH°) for the four concentrations are 1.69 ± 0.04 and —4.8 ± 0.7 kcal/mol, respectively.
Table I : Thermodynamic Parameters for the Intimate Ion Pair-Solvent-Separated Ion Pair Equilibrium in the LiTM A-TH F System, Obtained by Means of Eq 40 and 39 from the Ri Data Shown in Figure 3“
Concn, F a * , OEa + A H 0) , AH0,m kcal/m ol keal/m ol kcal/m ol
0.77 1.64 -4 .9 5 - 6 . 61.23 1.68 - 4 . 0 - 5 . 71.54 1.70 -4 .5 5 - 6.252.12 1.74 -5 .6 5 - 7 . 4
The values given for AH ° are obtained from is + tel O
by assuming that 2?a = F a*.
If we assume that F a = F a* AH° may be estimated from F a* and (Fa + AH °); the results included in Table I give an average for A F ° of — 6.5 ± 0.7 kcal/mol. The shape of the intimate ion pair species is quite
different from that of the solvent-separated ion pair so one might expect this estimate of AH° to be poor if it were not for the fact that both F a* and F a are small. (-Fa* == 1-7 kcal/mol in L iT M A -T H F and, as shown later, F a = 1.1 kcal/mol for LiTM A in ether.) We estimate that the uncertainty in F a probably does not exceed ± 1 kcal/mol, which would introduce an error of about 15% in AH°. The AG° for the equilibrium can best be calculated from the equilibrium constant K = 110 at 40°, from which we find AG° = —2.9 kcal/mol. Finally, using the values of AH° and AG° which have just been determined, we can obtain a value for AS°. For the L iT M A -T H F system at 40° the Aj8 ° turns out to be — 1 1 eu.
It seems relevant to compare our results with those of Hogen-Esch and Smid, 3 who measured AH° for the intimate ion pair-solvent-separated ion pair equilibrium in the system fluorenyllithium-THF using absorption spectrophotometry and conductivity measurements. They found that AH° was —7.0 kcal/mol. In these intimate and solvent-separated ion pair equilibria, the solvent coordinates with the cation. The nature of the anion should have a secondary effect on the value of AH°. Thus, for similar systems having the same cation, AH° should be comparable. Accordingly, it is encouraging that two different physical techniques should give very nearly equal values of AH° for the two particular systems studied.
C. Analysis of Equilibrium in the NaTMA-THF System. The R\ temperature dependence for the N aT M A -T H F system does not show a minimum as in the case of the L iT M A -T H F system; however, the results in Figure 4 can be interpreted in the same general manner, for although the dependence is small there is a definite decrease with decreasing temperature. This must be due to a temperature-dependent chemical equilibrium similar to that in the L iT M A -T H F system because quadrupole relaxation would cause Ri to increase with decreasing temperature. However, the data obtained are insufficient for any detailed analysis of the thermodynamic parameters.
The equilibrium constant for this system can be estimated in the same manner in which it was calculated for the L iT M A -T H F system. It is found that at 40°, K = 11. Thus the equilibrium constant for the sodium salt is about one-tenth that for the lithium salt, indicating that the relative concentration of solvent-separated ion pairs is much lower for the sodium salt. Hogan-Esch and Smid3 found the same qualitative results for the two salts fluorenyllithium and fluorenylsodium in THF.
D. Reorientation of Intimate Ion Pairs in Ether. In ether the methyl resonance of both LiTM A and N aTM A is a single broad line over the whole temperature range. Since the resonance consists of a single line we are in the limit of fast 27A1 quadrupole relaxation. In this limit the line is very nearly Lorentzian with a
Volume 73, Number 8 August 1969

2524 E. S. Gore and H. S. Gutowsky
Figure 5. The temperature and concentration dependence of the inverse line width of the methyl resonance of LiTM A and NaTM A in ether solutions.
width governed by Ri as given in eq 31. Moreover, Ri° is negligible compared to (4ir2/3)S(S + 1 )J 2Ti and the inverse line width (l/Aiq/2) should be proportional to T\. In addition, Ri is proportional to tc, the correlation time characterizing molecular reorientations. 13 Therefore, a plot of In (l/Ari/2) against l /T should give an Arrhenius plot with an activation energy of a few kilocalories. Also, r0 is expected to increase with the viscosity, so Ri and hence \/A vx/2 should increase as the concentration of the solutions is increased.
The experimental results shown in Figure 5 are in agreement with these predictions. The activation energy for the LiTM A-ether solution is very nearly the same, 1 . 1 kcal/mol, at two different concentrations. Similarly, for the N aTM A-ether solutions the activation energy is 1.9 kcal/mol. Also, it is seen that l/ A ^1/2
increases as the concentration of L iTM A and N aTM A is increased.
There is no evidence that R\ is affected by changing proportions of intimate and solvent-separated ion pairs over the temperature ranges studied. The results in Figure 5 are described adequately by the first term in eq 33. In other words, we have
Ri = PaRia = A exp{EJRT) (41)
and we conclude that these systems exist very largely as intimate ion pairs; i.e., they have K ~ 0.
E. The Coupling Constant in MAI (C'//3)4.The 27A1CH3 coupling constant was determined under various conditions, giving the results summarized in Table II. For the D M E solutions, the values were obtained directly from the splittings observed in the proton spectra. In the case of the T H F solutions, the values given are the parameters obtained from the computerized best fits of the proton spectra. For the other solutions, the proton resonance of the MA1- (CH 3) 4 ion pair is a single broad Lorenzian line. Therefore, J was determined by making use of eq 31 as in the previous section, but with the T\ obtained from the 27A 1
Table I I : The Effects of Solvent Concentration and Temperature upon the 27A1-CH3 Coupling Constant J(A1-H) Observed in LiTMA and NaTMA Solutions
Conen, K at J (A l - H ) ,T em prange,
S olution m 40° Hz "C
LiTM A-D M E 0.48 CO 6.33 ± 0.02 -1 0 -8 0LiTM A-TH F 0.77-2.12 110 6.41 ± 0.04 -5 0 -9 0LiTMA-ether 1.61 ~ 0 7.1 40
N aTM A-DM E 1.13 ~ CO 6.27 ± 0.05 -1 0 -8 0NaTM A-TH F 0.60,1.10 11 6.43,6.49 -1 0 -6 5NaTMA-ether 1.29 ~ 0 9.1 40
resonance line width, along with the proton line width of the same solution, both at 40°.
From the data in Table II it is apparent that the value of J is independent of both temperature and concentration, within experimental error, for a given solute-solvent system. However, J definitely depends upon the solvent in an identical manner for both solutes. The results are entirely in keeping with the ionic equilibrium model developed in connection with the relaxation data. In DM E, the M T M A exists predominantly as solvent-separated ion pairs; the value of J is that characteristic of the solvated A1 (CH3)4_ ion which is the same for Li and Na solutions. Thus J is the same (~6.30 Hz) in the two solutions. In ether, on the other hand, the M T M A exists as intimate ion pairs which differ for the Li and Na salts. Therefore, we expect the J ’s to differ for the two salts, as they do (7.1 and 9.1 Hz) as well as being different from the 6.3 Hz value in DM E, which they are. The difference in J for the solvent-separated and intimate ion pairs of M T M A is similar to the result for the N aBF 4-H 20 systems, 16 for which ./(UB -F) was found to be 1.13 and 11 Hz for free ion and intimate ion pair, respectively.
For the TH F solutions, appreciable amounts of both ionic species are present so the J ’s should be intermediate between the values found for the other two solvents. This expectation also agrees with experiment. In fact, J can be calculated for the TH F solutions by taking the weighted average, based on K, of the values for the D M E and ether solutions, with results agreeing well with experiment. In principle, the J for the TH F solutions is both temperature and solvent dependent because of the equilibrium between the two ionic species. However, it was not detected because the K ’s are large and the J ’s for the two species differ by only a modest amount in comparison to experimental accuracy.
F. The Proton Chemical Shift. The chemical shift of the methyl proton resonance of L iT M A and N aTM A was measured at 60 MHz over a range of temperatures
(15) K. Kuhlmann and D. M. Grant, J. Phys. Chem., 68, 3208 (1964).
The Journal of Physical Chemistry

D issociation of Lithium and Sodium T etramethylaluminate in Solution 2525
Table I II : The Effects of Solvent and Concentration upon the Temperature Dependence of the Methyl Group Proton Chemical Shift in LiTM A and NaTMA Solutions
Concn, K atSolution m 40°
LiTM A-D M E 0.48 coLiTM A-TH F 0.77, 1.54 110LiTMA-ether 0.42, 1.61 ~ 0
N aTM A-DM E 1.13 /-»w- 00N aTM A-TH F 0.47, 1.67 11NaTMA-ether 0.26, 1.29 '"»'O
“ The shifts are for 60 M H z ; a positive S is an upfield shift.
A 8 / A T , a A S / A m ,
T em prange,
10 ~2 H z /d e g H z /m o l ” C
- 1 . 1 ^ 0 - 1 0 - 8 0COr—f 1oT
0.8 - 5 0 - 8 0- 9 . 8 4 . 5 - 5 0 - 4 2
- 1 . 1 ~ 0 - 1 0 - 8 0- 2 . 6 0 . 4 - 1 0 - 6 5- 3 . 0 2 . 5 - 6 2 - 4 0
for several of the solutions. In all cases the variation of the chenical shift with temperature was linear within experimental error. Most of the results are summarized in Table III. The shifts in the D M E and TH F solutions were measured (upfield) with respect to an internal TM S reference; those for the solutions in ether were measured (upfield) with respect to the center of the -C H 3 multiplet of the ether. The general features of the results are very similar to those given for J in the preceding section. The main difference is that the shifts in T H F and ether solutions exhibit substantial dependences upon concentration of the M T M A and upon temperature as well as some differences between the Li and Na salts.
For the D M E solutions, the Li and Na salts have the same proton shift 5, which is insensitive to concentration but which decreases quite linearly with increasing temperature, the rate of change being — 1 . 1 X 1 Q~ 2
Hz/deg. These observations support the view that in D M E both salts exist very largely in the form of solvated ions with 5 and its temperature dependence determined by the properties and solvation of the Al- (CH3)4_ ion.
In contrast, for the T H F and ether solutions 5 depends on the salt concentration and cation identity as well as upon temperature and solvent. In all cases an increase in salt concentration gives a larger 5 while an increase in temperature decreases 5. The results are consistent with the equilibrium postulated between intimate and solvent-separated ion pairs. However, the analysis is more complicated than for J because the effects upon 5 of changes in equilibrium proportions of the two ion-pair species are masked by large solvent and temperature dependences of 5a and 5a*, the shifts for the two species, especially of 5a which is sensitive also to salt concentration. The only point we will note here16 is that the temperature dependences A8/AT given in Table III for the TH F solutions, to which both species should contribute, are intermediate between the results for D M E and ether, which are assigned to intimate and solvent separated ion pairs, respectively. This supports the model.
G. The Aluminum, Resonance. In principle, the 27A1 resonance contains the same information as the proton resonance. The line shape is governed by J (Al-H) and by the Ri of 27A1 and that of the protons. Also, the 27A1 chemical shift is affected by the same interactions and equilibrium as is the methyl group proton shift. However, there are 12 protons for each aluminum in the T M A group, and the sensitivity for aluminum is also less. So it was much easier to obtain useful results from the proton resonance. Nonetheless, the 27A1 resonance was observed for five of the samples at the ambient temperature. (The L iT M A -D M E sample suffered an accident.) These spectra serve to confirm and supplement to some degree the data obtained from the proton spectra.
For all five systems, the 27A1 resonance was a broad line with no structure. The line width of the 27A1 resonance in the LiTM A-ether system (1.61 to) was 182 Hz and that in the N aTM A-ether system (1.29 m) was 102 Hz. In the TH F solutions L iT M A (1.23 m) gave a line width of 35 Hz and N aTM A (1.15 to) 63 Hz. The 27A1 resonance of N aTM A in D M E (1.13 to) was 24 Hz.
In ether the salts exist in the form of intimate ion pairs. The electric field at the 27A1 nucleus is asymmetric and consequently the most important relaxation mechanism for the 27A1 nucleus is quadrupole relaxation. The inverse of the line width of the 27A1 resonance in ether equals the Tx of the aluminum nucleus. For L iT M A the Tx is 1.75 msec and for N aTM A 3.12 msec. The difference in these values arises probably from a larger quadrupole coupling constant for the lithium intimate ion pair.
In D M E, the salts exist as solvent-separated ion pairs. The electric field is symmetric in this form, the 27A1 Rx is small, and therefore one might expect the 27A1 resonance to consist of 13 lines with binomial intensities arising from spin-spin coupling with the 1 2
(16) The temperature dependence of 5 has been analyzed in a manner equivalent to that given for Ri in section IV.8. Details are given by E. S. Gore, Ph.D. Thesis, University of Illinois, Urbana, 111., 1968.
Volume 78, Number 8 August 1969

2526 C. K. W eiffenbach, P. R. Griffiths, P. J. Schuhmann, and E. R. Lippincott
protons in the four methyl groups. The overall line- width An/, of 24 Hz found for the N aT M A -D M E solution agrees with the 4.4 / = 27 Hz value predicted for a 13-line mulfiplet with a binomial intensity distribution. However, only a single line was observed even though the proton spectrum of the solution indicates that the 27A1 relaxation rate is too small, Ri = 2 sec-1 , to average out the fine structure. The simplest explanation is that 1 2 protons contribute to the splitting and also to the broadening of each 27A1 transition by about 12EiH. It seems reasonable for the combined contributions to be 5 sec- 1 or somewhat more, which will prevent resolution of the fine structure in the 27A1 resonance (but not in the 7H) and will not add discernibly to its overall Avi/r
In the T H F solutions, appreciable amounts exist of both types of ionic species, and the 27A1 R\ is alone large enough to broaden out the fine structure, so the observation of a single line agrees with expectations.
The overall line widths of 35 and 63 Hz for the LiTM A and N aTM A solutions arise in part from the relatively large 27A1 R\ and in part from incomplete relaxation averaging of the splitting. It should be feasible to separate the effects and evaluate P iai by a line-shape fitting program. For present purposes, it is sufficient to note that the greater line width for the sodium salt is compatible with the 27A1 R, from the proton line shapes.
Acknowledgments. E. S. G. wishes to thank ProfessorT. L. Brown for many illuminating discussions of organometallic chemistry and Mr. L. Murrell for his advice on the synthesis of the compounds used in the work. We wish to acknowledge support of the research by the U. S. Office of Naval Research and by the National Science Foundation. Also, acknowledgment is made to the donors of the Petroleum Research Fund, administered by the American Chemical Society, for partial support of this research.
High-Temperature Equilibria from Plasma Sources. I.
Carbon-Hydrogen-Oxygen Systems1
by C. K. Weiffenbach, P. R. Griffiths, P. J. Schuhmann, and E. R. Lippincott
Department of Chemistry, University of Maryland, College Park, Maryland 20742 (Received September 16, 1968)
Some volatile organic oxygen compounds have been subjected to the action of a radiofrequency electrodeless discharge. The product distribution of both the solid deposit and the gas mixture is explained in terms of reaction sequences dominated by the tendency toward thermodynamic equilibrium at temperatures ranging from 2000 to 1000° K. Deviations from the calculated distribution are assigned to certain kinetic factors.
Introduction
Since Oparin2 first proposed that the prebiological atmosphere of the Earth was of a reducing nature, many workers8-6 have shown that organic molecules of biological importance can be synthesized in such conditions if sufficient energy is supplied to the system, for instance using a spark discharge8’6 or electron irradiation. Dayhoff, et ok,6 suggested a theoretical approach to the problem of predicting which molecules would be present in a prebiological atmosphere by calculating their equilibrium concentrations at various pressures and temperatures by minimizing the total free energy in the manner of White, Johnson, and D antzig .7
Although such an approach was very useful for predicting the concentrations of the major species present in the early atmosphere of many of the planets in the solar
system ,8 it did not predict the formation of many molecules of vital biological importance, e.g., sugars, purines, and most amino acids.6
(1) This research has been supported in part by a grant from the National Aeronautics and Space Administration.(2) A. I. Oparin, “The Origin of Life,” The Macmillan Co., New York, N. Y „ 1938.(3) S. L. Miller, J. Amer. Chem. Soc., 77, 2351 (1955).(4) C. Ponnamperuma, R. M. Lemmon, R. Mariner, and M. Calvin, Proc. Nat. Acad. Sci. U. S., 49, 737 (1963).(5) R. A. Sanchez, J. P. Ferris, and L. E. Orgel, Science, 154, 784 (1966).(6) (a) M. O. Dayhoff, E. R. Lippincott, and R. V. Eck, ibid., 146, 1461 (1964); (b) R. V. Eck, E. R. Lippincott, M. O. Dayhoff, and Y. T. Pratt, ibid., 153, 628 (1966).(7) W. B. White, S. M. Johnson, and G. B. Dantzig, J. Chem. Phys., 28, 751 (1958).(8) E. R. Lippincott, R. V. Eck, M. O. Dayhoff, and C. Sagan, Astrophys. J., 147, 753 (1967).
The Journal of Physical Chemistry

H igh-T emperature Equilibrium from Plasma Sources 2527
A program of work was planned in this laboratory in an attempt to verify experimentally the predictions made by Dayhoff, et al., on the basis of thermodynamic equilibrium. The only requirement for equilibrium conditions is that there is at least one reversible reaction path by which the compounds present at equilibrium may be formed, and specific reaction mechanisms need not be considered provided that the activation energies involved are sufficiently small to be overcome by the energies of the reacting species. In the present series of experiments, various organic oxygen compounds were subjected to a radiofrequency electrodeless discharge which raised the translational temperature of the gas above 2000°K besides splitting the reactant molecules into metastable and highly reactive radicals, atoms, and ions. The products of the reactions taking place as the species emerged from the plasma were studied, and some conclusions were drawn as to the nature of the processes occurring outside the region of the discharge.
Experimental SectionThe radiofrequency generator was operated at a
frequency of 10 M Hz with a maximum dc input power of 1125 W. The system was calculated to be about 60% efficient in converting the dc to rf and coupling the rf to the plasma. Power transfer from the oscillator to the plasma depends on impedance matching, and since the frequency of the oscillator was fixed, correct matching could only be made by adjusting the pressure of the gas, the optimum pressure for the gases used being in the region of 20 Torr.
The apparatus used is shown in Figure 1. It was first evacuated to 10 _2 Torr, at which point the discharge appeared purple and filled the whole apparatus. Stopcock 9 was shut off, and gas from 1 was passed fairly slowly into the reaction tube, 4. A t pressures below 10 Torr the appearance of the plasma was similar to that of a glow discharge, and extended beyond the coil, 5, by a distance varying inversely with the pressure in the reaction tube and reservoir flask, 8 ; this type of discharge will be termed a glow plasma. As the pressure was increased, the plasma became localized in the region of the coil and sometimes changed in appearance to an intense pink “ flame” at the center of the coil; samples which produced such a flame deposited a solid product almost immediately on the walls of the reaction tube, and the flame was seen to be caused by incandescent particles formed from reactions in the plasma; this type of plasma will be termed a flame plasma. With some of the samples, no transition to a flame plasma was seen, whereas with others the transition occurred at pressures between about 21 and 17 Torr. Below 20 Torr the plasma was very stable, but above this pressure small variations of pressure changed the impedance of the gas by an amount which was sufficient that rf power was no longer absorbed by the sample.
So that the elemental composition of the gas samples
Figure 1. Apparatus used in discharge experiments:1, sample containers; 2, proportioner-flowmeter; 3, air cooling fan; 4, reaction tube; 5, helical copper coil; 6, power supply and oscillator; 7, diaphragm pressure gauge; 8, gas product reservoir; 9 and 10, stopcocks; 11, gas pipet; 12, 1-m ir gas cell; 13, helium cylinder; 14, cold trap.
entering the reaction tube was known, pure compounds were used, and a flow system was employed so that the formation of a solid deposit did not change the overall composition of the reacting gas by a significant amount. When the pressure in the apparatus reached 20 Torr, stopcock 9 was opened sufficiently wide so that the input flow rate balanced the output flow rate and the pressure reading of the manometer, 7, remained constant. The discharge was maintained for 15 min; for longer times the same product concentrations resulted, but at times shorter than 1 0 min the product concentration was altered slightly owing to the different product distribution at the reduced pressures used at the start of each experiment. Finally, the reaction tube and reservoir were isolated, and the rf generator was switched off 1 min later to allow any unreacted gas to enter the region of the discharge. After cooling, part of the sample was collected in a 1 -m infrared gas cell, 1 2 ; the whole apparatus was then filled with helium, and a sample of the resulting gas mixture was collected in a gas pipet, 11, for analysis by gas chromatography. A Varian Aerograph 1520B gas chromatograph was used with a Linde 5B molecular sieve column and a thermal conductivity detector.
Results and DiscussionA . Solid Deposit. Six volatile liquids were studied
whose compositions are given in Table I, and the position of each composition is also shown on the C -H -0 ternary diagram in Figure 2. The significance of the three regions into which this diagram is divided is discussed by Dayhoff, et al.,6 and it is seen that compositions A, B, and C lie in the central reducing region of the diagram, whereas D, E, and F lie in the asphalt region. This difference is reflected in the types of discharge obtained for the two series of samples; whereas the transition from a glow to a flame plasma occurred for compositions D, E, and F, no such transition was undergone in the discharges for A, B, and C. As stated earlier, the flame plasma corresponded to the deposition of a solid product on the walls of the reaction tube, and thus for compositions in the asphalt region a solid product was formed, whereas at compositions
Volume 73, Number 8 August 1969

2528 C. K. W eiffenbach, P. R. Griffiths, P. J. Schuhmann, and E. R. Lippincott
C
Figure 2. Ternary diagram computed for C -H -0 systems at 1200°K and 20 Torr.
Table I : Experimental C -H -0 Compositions Used in the Plasmas
Com- % % %position Compound Carbon Hydrogen Oxygen
A Formic acid 20 40 40B Acetic acid 25 50 25C Methanol 16.7 66.7 16.7D Ethanol 22.2 66.7 11.1E Acetaldehyde 28.6 57.2 14.3F Acetone 30 60 10
only slightly removed from this region the products were entirely gaseous.
In a complete thermodynamic equilibrium, for all the compositions B through F, nearly all the carbon would be removed from the system in the form of graphite and the concentrations of all organic molecules except CO and CH 4 are computed to be very small. However, graphite is the end product of the polymerization of polynuclear aromatic hydrocarbons, a relatively long sequence of reactions. Dayhoff, et at.,6 propose that at moderate temperatures, the activation energies of the intermediate reactions would be too high and suggest that the metastable equilibrium of other compounds would be approached before significant amounts of graphite were produced. The exclusion of graphite from the calculations permits the concentrations of simpler molecules to build up to appreciable levels, and in certain regions of the C -H -0 diagram the computed total mass of aromatic compounds becomes very high. Large polynuclear aromatics become very important, often so concentrated that they would condense out from the gas phase. It is impossible to include every polynuclear aromatic specifically in the calculations, but since the large molecules must build up from the small ones, the kinetic properties in a given situation will dictate how far the polymerization will be allowed to go in the available time. This condensation of
aromatics was approximated by including aromatic molecules with less than four rings specifically in the computations together with a mixture called “ asphalt” which is a composite of 1 0 0 isomers with the molecular formula C 22H12. This is the same assumption made by Dayhoff, et al.,6 and although it represents an obviously unreal situation, it affords a good method of estimating the free energy of formation of the high molecular weight product . This approximation has been strongly criticized by Urey and Lewis, 9 who state that in view of the complex reaction sequence necessary in the formation of asphaltic hydrocarbons, graphite should be formed, since it is exceedingly stable thermodynamically. In the light of this objection, the nature of the solid deposit obtained from these experiments was investigated.
The deposit was in no case homogeneous along the reaction tube, rings of different colors and texture being formed at various distances along the tube; the deposit at either end was black, and between these the colors would vary from brown to light yellow. Most parts of the deposit fluoresced with a green glow in uv light, which indicates the presence of aromatic rings. It was found that the solid was partially soluble in benzene, the resultant solution being highly fluorescent, and that the degree of solubility increased with the depth of color of the deposit, i.e., the solid with the lightest color was the least soluble. The ir spectrum of the benzene soluble fraction as a mull in 1 ,2-hexachlorobutadiene in the region from 3300 to 2900 cm - 1 showed the presence of more aromatic than aliphatic C -H bonds. Analysis of this fraction by thin-layer chromatography on silica gel plates using benzene as the eluting solvent again indicated the presence of many aromatic hydrocarbons. Gas-liquid chromatography of the benzene soluble fraction at high temperature using either 2.5% SE-30 or 2.5% Apiezon L on Chromasorb W with a flame ionization detector gave a very complicated chromatogram indicating the presence of well over 50 components. B y comparison with the retention times of pure compounds, such polynuclear aromatic hydrocarbons as pyrene, chrysene, fluoranthene, and coronene have been tentatively identified. Other peaks appear to be due to these and other similar aromatic molecules with methyl and other aliphatic substituents.
The benzene insoluble fraction gave little indication of the presence of aromatic rings; the infrared spectrum of a mull indicates predominantly paraffinic C -H bonds, and the fluorescence in uv light is a very light blue, indicating some unsaturation but very little aromaticity. Elemental analyses of the whole product show approximately 70 atom % carbon and 30 atom % hydrogen, in fair correspondence with the assumed formula C 22H12. For a given solid, the C : H ratio of the benzene soluble fraction was slightly greater than the
(9) H. C. Urey and J. S. Lewis, Science, 152, 102 (1966).
The Journal of Physical Chemistry

H igh-T emperature Equilibrium from Plasma Sources 2529
overall ratio, and that for the benzene insoluble fraction was slightly less. The sum of the carbon and hydrogen percentages from the elemental analyses always accounted for the full weight of the sample analyzed for freshly prepared samples; however, if the sample was left in contact with air for some time it was shown to absorb up to 10% by weight of oxygen. When the sample was split into benzene soluble and insoluble fractions, the oxygen uptake was shown to occur solely in the benzene insoluble fraction.
These facts all point to the conclusion that the benzene soluble fraction consists of aromatic hydrocarbons with some aliphatic substituents, whereas the insoluble fraction consists largely of a cross-linked aliphatic polymer. This is a similar result to that found by many workers investigating the polymerization of acetylene by, for example, silent and semicorona discharge, 10 electron irradiation, 11 and X-ray polymerization . 12
Hydrocarbon polymers synthesized at various temperatures by a Fischer-Tropsch reaction have been investigated recently by Studier, et al.,13 who showed that at low temperatures aliphatic polymers predominate, which may be converted to aromatic hydrocarbons on sustained heating at 500°, while at 900° polynuclear aromatics were obtained in high yield. They suggest that metastable aliphatic polymers are produced at low temperature but are converted to the thermodynamically more stable aromatic compounds at high temperature. The solid product formed in the discharge may be formed by similar processes; i.e., aliphatic hydrocarbons are formed metastably in the region of the plasma, and these are subsequently modified by partial equilibration in the gas phase. It is difficult to visualize a model whereby aromatic molecules are synthesized directly from the atomic and radical fragments formed on breakdown of the starting material without going through the transition state of a metastable aliphatic intermediate. This accounts for the compounds deposited well away from the plasma region being predominantly aromatic, whereas the solid which was deposited almost immediately after it left the plasma contained a substantial proportion of aliphatic hydrocarbons.
Since so many of the physical and chemical properties of graphite and polynuclear aromatic molecules with more than ten condensed benzene rings are so similar, it is difficult to distinguish between them, and, in particular, the lack of solubility of such molecules makes molecular weight determination difficult. However, this insolubility can be used to make some conclusions on the formation of high molecular weight polynuclear aromatic molecules. It was shown that the benzene soluble fraction fluoresced strongly, indicating aromaticity, whereas the insoluble fraction showed only a light-blue fluorescence. If polynuclear aromatics with more than ten rings were present in the solid
product, their solubility properties would place them in the “ benzene insoluble” category. There is little indication of aromatic molecules in this fraction, and it is therefore concluded that the condensation reactions cease before graphite can be formed.
The question also arises on the justification of assuming that the product-determining reactions occur in the gas phase and not on the walls of the reaction tube. The temperature of the tube, which is air-cooled using a large-capacity fan, has been measured to be less than 500°, which is the minimum temperature which Studier, et al.,13 found necessary for the equilibration of metastable aliphatic polymers. It may also be noted that since the flame of the plasma is caused by incandescent solid particles, the formation of a solid product undoubtedly occurs away from the walls. It is extremely likely that the red-hot solid particles undergo partial equilibration before hitting the walls of the reaction tube, which are at such a low temperature that further reaction is stopped.
The large proportion of aromatic molecules (>70%), the overall composition of the solid deposit (~ 70 % carbon, 30% hydrogen), the absence of graphite, and the fact that the only sample compositions to yield a solid deposit fall in the asphalt region, even though other compositions fall in the graphite region of Day- hoff, et al. ,6'8 all suggest that the processes involving the formation of the solid are dominated by a tendency toward thermodynamic equilibrium somewhat modified by kinetic factors, and the assumptions made by Dayhoff, et al., with respect to asphalt formation from prebiological atmospheres apply equally to this work.
B. Gases. The gases present as major components were usually hydrogen, methane, ethane, ethylene, acetylene, carbon monoxide, and carbon dioxide.
Table II : The Production of Simple Molécules from C -H -0 Systems“
Composition Ha CH< CîHe C2H4 CîHa CO C02
Asphalt
A *** ____ — . — — * * s|e *** —
B *** * * * * *sfc* * —
C *** * * * ** *** sft —
D *** * * * ** *5fC* — 5ftE *** * * * ** **5fC — *P *** * * * ** *** — 5ft
“ ***, between 20 and 100%; **, between 2 and 20% ; *,detectable, below 2% ; — , not detected.
(10) A. Glöckler and C. A. Hollingsworth, Trans. Electrochem. Soc., 84, 97 (1943).(11) A. R. Jones, J. Chem. Phys., 32, 953 (1960).(12) S. C. Lind, D. C. BardweU, and J. H. Perry, J. Amer. Chem. Soc., 48, 1556 (1926).(13) M. H. Studier, R. Hayatsu, and E. Anders, Geochim. Cosmo- chim. Acta, 32, 151 (1968).
Volume 73, Number 8 August 1969

2530 C. K. W eiffenbach, P. R. Griffiths, P. J. Schuhmann, and E. R. Lippincott
Table I II : Comparison of Mole Fractions between Experimental and Computed Data“
Temp,°K Hi CO CO,
Composition A500 0.0393 0.0005 0.7275
1000 0.3506 0.2987 0.35061100 0.3333 0.3333 0.33331200 0.3151 0.3699 0.31511300 0.3056 0.3889 0.30561400 0.2857 0.4286 0.28571500 0.2857 0.4286 0.28572000 0.2357 0.4925 0.2537
Experi- 0.354 0.385 0.263mental
Composition B500 0.0026 0.0059 0.4907
1000 0.4984 0.4984 0.00111100 0.4996 0.4996 0.00021200 0.4999 0.4999 0.00011300 0.5000 0.5000 —1400 0.5000 0.5000 —1500 0.5000 0.5000 —2000 0.5000 0.5000 —
Experi- 0.485 0.459 0.014mental
Composition C500 0.0647 0.0003 0.2445
1000 0.6647 0.3323 0.00081100 0.6695 0.3298 0.00021200 0.6698 0.3299 —1300 0.6699 0.3300 —1400 0.6700 0.3300 —
1500 0.6700 0.3300 —2000 0.6700 0.3300 —
Experi- 0.688 0.259 0.004mental
“ — , < 10 -4; N.o., not observed.
Temp,CH« C2H2 "K H,
0.2325 _ 500 0.0027— — 1000 0.5151— — 1100 0.6380— — 1200 0.6916— — 1300 0.7056— — 1400 0.7008— — 1500 0.6617— — 2000 0.6262
N.o. N.o. Experi- 0.704mental
0.5008 — 500 0.00070.0020 — 1000 0.44900.0005 — 1100 0.55480.0001 — 1200 0.5983
— - — 1300 0.6130— — 1400 0.6046— — 1500 0.5718— ■ — 2000 0.5000
0.007 0.035 Experi- 0.648mental
0.6904 — 500 0.00080.0021 — 1000 0.50000.0006 — 1100 0.61570.0002 — 1200 0.66720.0001 — 1300 0.6896
— — 1400 0.6760— — 1500 0.6394
- — 2000 0.50000.018 0.031 Experi- 0.606
mental
CO CO* CH. CiH*
Composition D0.0048 0.2481 0.7444 —0.3030 — 0.1818 0.00010.2835 — 0.0780 0.00040.2746 — 0.0315 0.00220.2721 — 0.0131 0.00920.2641 — 0.0057 0.02940.2607 — 0.0024 0.07520.2525 — — 0.12120.217 N.o. 0.012 0.068
Composition E0.0204 0.3365 0.6426 —0.4081 — 0.1428 0.00010.3833 — 0.0615 0.00040.3752 — 0.0243 0.00220.3678 — 0.0102 0.00900.3628 — 0.0044 0.02820.3511 — 0.0019 0.07520.3300 — — 0.17000.252 N.o. 0.014 0.087
Composition F0.0176 0.2583 0.7233 —0.3265 — 0.1735 0.00010.3079 — 0.0759 0.00040.2982 — 0.0308 0.00250.2882 — 0.0124 0.00990.2868 — 0.0055 0.03170.3552 — 0.0023 0.08420.2500 — — 0.25000.303 N.o. 0.013 0.078
Table II summarizes the concentrations of these compounds for the six compositions, A through F, as determined by gas chromatography. Minor amounts of propane (<0.1% ) were measured for compositions B through F, and small amounts of benzene (<0.5%) were measured for D, E, and F. The concentration of C 2 hydrocarbons always varied in the order C2H2 > C 2H 4 > C 2H 6.
The equilibrium concentrations of over 30 compounds were computed for compositions A through F at a pressure of 20 Torr and temperatures from 500 to 2000°K. The free energies of formation used in these computations were those given by Rossini, et al.,u and the JAN AF Tables16 while that of asphalt was calculated using the group contribution method of Van Krevelin and Chermin. 16 Five components of the gas mixture were selected for a comparison between computed and experimental concentrations; these were hydrogen, methane, acetylene, carbon monoxide, and carbon dioxide, and their concentrations over a range of
temperatures are shown in Table III, together with the observed concentrations. These experimentally measured mole fractions are probably accurate to ± 1 0 % .
It is seen that the equilibrium concentrations of the major species at 500°K are completely different from those at temperatures over 1000°K. For compositions in the asphalt region, CH 4 and C 0 2 are the major compounds at 500°K, but H2 and CO become dominant above 1000°K, while at about 1400°K CH 4 and C 0 2
decrease to almost neglibible amounts. A t still higher temperatures, acetylene becomes an important constituent.
(14) F. D. Rossini, D. D. Wagman, W. H. Evans, S. Levine, and I. Jaffe, “ Selected Values of Chemical Thermodynamic Properties,” National Bureau of Standards Circular No. 500, U. S. Government Printing Office, Washington, D. C., 1961.(15) “ JANAF Thermochemical Data,” prepared under the auspices of the Joint Army-Navy-Air Force Thermochemical Panel at the Thermal Laboratory, The Dow Chemical Co., Midland, Mich.(16) D. W. Van Krevelin and H. A. G. Chermin, Chem. Eng. Sci., 1, 66 (1951).
The Journal of Physical Chemistry

High-T emperature E quilibrium from Plasma Sources 2531
The measured concentrations for compositions in the asphalt region, D, E, and F, are best reproduced by the computations for the temperature range 1300-1500°K, whereas the effective temperature for compositions B and C seems to be nearer 1000°K. The effective temperature for composition A is indefinite since the mole fractions of the major products cannot be specified within a temperature range. The translational temperature of the glow plasma produced by A, B, and C is expected to be lower than the flame plasma produced by D, E, and F since it is neither as dense nor as well defined as the flame plasma. It was not possible to measure the translational temperature of the plasmas since electrical methods must be eliminated because of the field produced by the rf oscillator and coil, and optical methods cannot be used because of the asphalt deposit. Estimates of the temperature at the center of similar plasmas have been made by Dodonova17 and Mould, et al.,n who report the translational temperature to be in the range 2000-4000°K. It is also not possible to determine precisely where the reactions occur since there is a fairly steep temperature gradient from the center of the coil along the reaction tube. The fact that solid formation is seen to occur near the center of the coil shows that considerable reaction must take place in this region; however, as particles flow through this region they must still be in a highly excited state and further reactions occur along the tube, until the energies of the reacting species become sufficiently low that the activation energies for further reactions cannot be overcome.
From Table III it is seen that the concentration of C 2H 2 corresponds to an equilibrium at a higher temperature than for any other compound, and a hypothesis for this will be put forward. The synthesis of molecules from atom and radical fragments can occur fairly easily outside the region of the plasma since the activation energy required for radical addition and substitution reactions is small, but the breakdown of large molecules into smaller ones is a process requiring the
input of far greater amounts of energy, and so can only occur close to the plasma. Acetylene must be one of the major species present as the gas emerges from the plasma, but as the temperature of the gas decreases along the tube, most of the acetylene must be converted to methane to maintain the equilibrium concentrations of both compounds; this process involves the splitting of a carbon-carbon bond and the total hydrogenation of both carbon atoms. It is suggested that some of the acetylene molecules become hydrogenated to form ethylene and ethane in concentrations far above their equilibrium mole fractions ( 1 0 _6 and 1 0 ~s, respectively), but the energy required for the cleavage of the C -C bond is too large and all the acetylene is not totally converted to methane.
The nature of the processes in the plasma itself has not been discussed, since in this series of experiments the discharge is merely used as a source of high energy species. It seems that the synthesis of large molecules from these highly excited species is a very rapid process leading to the formation of such high molecular weight molecules as polynuclear aromatic hydrocarbons (although not to the formation of graphite). As the molecules get further from the plasma region, their temperature decreases and the measured concentrations are those corresponding to reaction sequences dominated by a tendency to equilibrium occurring along a temperature gradient in the range from the temperature at the edge of the plasma (~2000°K) to a minimum of 1000°K.
In view of the many divergences from the concentrations predicted by an equilibrium theory, it must be stated that this method gives a useful means of predicting the major components, both qualitatively and to a lesser degree quantitatively, but anomalously high concentrations are found for some minor components.
(17) N. Ya. Dodonova, Dokl. Akad. Nauk SSSR, 98, 933 (1954).(18) H. M. Mould, W. C. Price, and G. R. Wilkinson, Spectrochim. Acta, 16, 479 (1960).
Volume 7S, Number 8 August 1969

2532 P. R. Griffiths, P. J. Schuhmann, and E. R. Lippincott
High-Temperature Equilibria from Plasma Sources. IL
Hydrocarbon Systems1
by P. R. Griffiths, P. J. Schuhmann, and E. R. LippincottDepartment of Chemistry, University of Maryland, College Park, Maryland 20742 (Received September 16, 1968)
Some common hydrocarbons have been subjected to a 3000-W radiofrequency electrodeless discharge. The distribution of the product approximates that calculated for a limited high-temperature equilibrium along a temperature gradient. The presence of the predicted asphalt barrier is confirmed both from the appearance of the plasma for mixtures of hydrogen and methane and from the product distribution using hydrocarbons whose elemental composition falls in the asphalt region of the C -H -0 ternary diagram computed by Dayhoff, et al. The free energy of formation of the solid product, of composition C25H10, over the temperature range 1000-1400°K is also estimated.
IntroductionIn the previous paper in this series, 2 which will be
subsequently referred to as I, it was shown how the product formation from a C -H -0 plasma could be explained in terms of reaction sequences dominated by a tendency to a limited thermodynamic equilibrium along the temperature gradient from the edge of the plasma. In the work described in this paper, a series of hydrocarbons are subjected to a more powerful electrodeless discharge, and a similar treatment is applied to test the general applicability of the method in the treatment of the action of discharges on organic molecules.
Experimental SectionThe apparatus uses the same principles described in
I, although the power supply (3 kV) and oscillator (7 MHz) were different, enabling 3000 W to be coupled into the plasma. The hydrocarbon samples used were either gases (of purity greater than 98%) from Matheson Scientific Inc. and Air Products and Chemicals Inc. or the vapors of analytical grade volatile liquids.
All of the compounds used lie in the asphalt region on the C -H axis of the C -H -0 ternary diagram and therefore the transition from a glow plasma to a flame plasma was always seen, although the pressure at which the transition occurred depended on the type of molecule. For saturated hydrocarbons the transition occurred at about 25 Torr and the working pressure used for these samples was 30 Torr, whereas for unsaturated hydrocarbons the transition occurs at about 14 Torr and the working pressure was 20 Torr.
A t the end of the experiment the apparatus was filled with 300 Torr of helium to facilitate the analysis of the products by gas chromatography, using a Varian Aerograph 1530B with a Linde 5B molecular sieve column packing in conjunction with both thermal conductivity and flame ionization detectors and also a
Perkin-Elmer 881 with a Porapak Q column with a flame ionization detector. The former of the instruments was used to separate the light components of the mixture, H2, CIL, C 2H6, C 2H4, and C 2H2, while the trace components such as the C 3 and C 4 hydrocarbons were separated on the second instrument. Concentrations of the lighter components were determined from the areas under the peaks, calibration being carried out using a standard gas mixture made up by Matheson Scientific Inc.
Computations, Results, and DiscussionIn all the computations which were performed, the
free energies of formation, AF °, of the simple hydrocarbons were those given by Rossini, et al.,3 while those of more complex molecules were calculated using the group contribution method of van Krevelin and Chermin. 4 Initially, the same approximation was made which was described in I, namely that all the high molecular weight product was assumed to be a composite molecule of 1 0 0 isomers with the formula C 22Hi2, and called asphalt,6 and in this way its free energy of formation could be calculated using the group contribution method.4 Graphite was excluded from the computations for the reasons given and experimentally justified in I.
These computations showed the formation of asphalt to be a major factor in determining the concentrations of
(1) This work was supported in part by a grant from the National Aeronautics and Space Administration.(2) C. K. Weiffenbach, P. R. Griffiths, P. J. Schuhmann, and E. R. Lippincott, J. Phys. Chem., 73, 2526 (1969).(3) F. D. Rossini, D. D. Wagman, W. H. Evans, S. Levine, and I. Jaffe, “ Selected Values of Chemical Thermodynamic Properties,” National Bureau of Standards Circular No. 500, U. S. Government Printing Office, Washington, D. C., 1961.(4) D. W. Van Krevelin and H. A. G. Chermin, Chem. Eng. Sci., 1, 66 (1951).(5) (a) M. O. Dayhoff, E. R. Lippincott, and R. V. Eck, Science, 146, 1461 (1964); (b) R. V. Eck, E. R. Lippincott, M. O. Dayhoff, and Y. T. Pratt, ibid., 153, 628 (1966).
The Journal of Physical Chemistry

H igh-T emperature Equilibria from Plasma Sources 2533
Figure 1. The change in calculated concentration of the major products with the elemental composition of the starting gases.
the gaseous products. For a given temperature and for starting elemental compositions ranging from 2 0 % carbon (CH4) to 50% carbon (C6H6), the concentrations of all the gases were shown to vary to a small degree, whereas that of asphalt varied considerably, accounting for the difference in total carbon content between the product gases and the reactant gas; this is illustrated in Figure 1.
The gases used to determine the initial C :H ratios and their elemental compositions are shown in Table I, and the measured concentrations of the major products as determined with the molecular sieve column and temperature programming to 300° are shown in Table II. I t is seen that the change in concentration of all these major components is insignificant over the five elemental compositions investigated. Qualitatively, these results may be explained using the computed C -H -0 diagram ;2 asphalt is deposited until the C :H ratio reaches the asphalt threshold. Since at this point all the gases have the same C :H ratio, the resultant gases would be expected to be present in the same proportions if the species emerging from the plasma were the same.
The pattern of concentrations of the minor products was similarly computed to vary only slightly for compositions from 20 to 50% carbon, and in this respect it is of interest that the gas chromatograms of the products reported on a Porapak Q column with temperature programming to 170° are almost identical, as demonstrated in Figure 2. This again indicates that the
Table I : Compounds Used and Their Elemental Compositions
Composi % %Compound tion Carbon Hydrogen
Methane A 20 80Ethane B 25 75Propane C 27.3 72.7Propylene D 33.3 66.7Benzene E 50 50
Table II: Concentrations of Major Components
Com-position H i C H . C2TI« C2H4 C2H2
A 7 3 .3 % 1 5 .4% 0 .0 % 2 .3 % 8 .0 %B 79.3 11.2 2.1 1.9 5 .5C 73.4 15.3 0.8 2 .9 7.7D 79.3 11.1 0.8 1.7 7.1E 77.1 13.5 1.5 1.4 6.6
different reactant gases are decomposed to the same species in the plasma, and in view of the different chemical nature of these reactant gases, the extent of the decomposition must be very great, and it seems unlikely that there is a high concentration of species containing more than two atoms.
In the set of peaks due to the C 3 hydrocarbons, it can be seen that for the propane plasma product (C) the intensities of the peaks due to propane and propylene
Volume 73, Number 8 August 1969

2534 P. R. Griffiths, P. J. Schuhmann, and E. R. Lippincott
AMenuafion * 5 0 xZO X20 x20 x 5 0 x500 x500Figure 2. Gas chromatograms of the product gases, measured using a 6-ft column of Parapak Q with temperature programming to 170°; A -E represent the starting elemental compositions.
are reversed compared to those for the propylene plasma product (D ); however, the difference is so small that it is calculated that less than 0 .0 1 % of the starting gas is left unreacted. It is also of interest that although acetylene is formed in higher yield than ethane and ethylene (in explanation of which a hypothesis was put forward in I), both propane and propylene are formed in higher yield than propyne, which is seen in Figure 2 as a small shoulder at the base of the propane peak. A t temperatures which would cause acetylene to predominate over ethylene and ethane, propyne should be present at a concentration of two orders of magnitude greater than either propane or propylene.
The formation of the minor products must be dominated by some factor besides thermodynamic equilibrium since the minor products are all present in far greater concentration than is computed for any temperature above room temperature. Figure 3 shows how the total equilibrium concentration of the hydrocarbons from Ci to C 5 varies with the number of carbon atoms present in the molecules, and except for the two smallest carbon numbers, where acetylene becomes favored over methane at high temperatures, the
logarithm of the sum of all the mole fractions, 2 nv of the hydrocarbons with a given number of carbon atoms varies monotonically with the carbon number. However, experimentally it is found that hydrocarbons with an even number of carbon atoms tend to predominate over those with an odd number; this is illustrated in Figure 4. Since the sensitivity of the flame ionization detector is roughly proportional to the carbon content of the hydrocarbon under investigation,6 the total area, A, under the peaks for each set of hydrocarbons with a given carbon content is divided by the carbon number, N, to give a measure to the total number of hydrocarbons with a given carbon content. Superimposed on the general downward trend is a clear indication that even carbon-numbered compounds predominate over those with an odd carbon number. It is interesting to note that Oro and Han,7 when pyrolyzing methane at 1 0 0 0 ° over silica gel, found that even-numbered carbon compounds predominated, especially in arene for-
(6) L. Onkiehong, Dissertation, The Technical University, Eindhoven, 1960.(7) J. Oro and J. Han, Science, 153, 1393 (1966).
The Journal of Physical Chemistry

H igh-T emperature Equilibria from Plasma Sources 2535
Figure 3. The variation of the total equilibrium concentration of all the hydrocarbons from Ci to C5 with the number of carbon atoms per molecule.
Figure 4. The experimentally determined variation of the concentration of the hydrocarbons from Ci to Ce with the number of carbon atoms per molecule.
mation, while Davis and Libby ,8 who subjected solid methane at 77 °K to 7 -ray radiolysis, found that there was a predominance of even carbon-numbered olefins. This may be connected with the fact that the C 2
radical has been identified spectroscopically as one of the major constituents in plasmas formed by the action of spark and glow discharges on methane. 9
It is of some importance that the minor compounds are present in greater, rather than smaller, concentra-
A^asphalt
Figure 5. The variation of the computed concentration of the major products with the free energy of formation of asphalt, C2BH10.
tions than expected; this indicates that the buildup of large molecules is fairly easily achieved by the species present in the plasma. The species which have been shown spectroscopically to be present in comets,
(8) D. R. Davis and W. F. Libby, Science, 144, 991 (1964).(9) L. W. Sieck and R. H. Johnson, J. Phys. Chem., 67, 2281 (1963).
Volume 73, Number 8 August 1969

2536 P. R. Griffiths, P. J. Schuhmann, and E. R. Lippincott
% H ydrogen
Figure 6. The variation of the equilibrium mole fraction of asphalt in mixtures of hydrogen and methane.
e.g., H, CH, and C 2,10 have also been shown to be present in these plasmas.9 Urey,11 Whipple,12 and Oro13 have suggested that the terrestrial capture of nonvolatile meteoritic matter and cometary collisions may account for a large proportion of the organic compounds on the Earth. The present investigation shows that the concentrations of hydrocarbons may
Figure 7. The variation of the pressure at which the glow plasma changed to a flame plasma with the flow rate of methane; the reading of the hydrogen flowmeter was kept constant at 15.
have accumulated above their equilibrium value by a similar mechanism.
The composition of the solid product on the walls of the reaction tube was found to be better approximated by a composition C 25H10 rather than C 22H12. The problem arose of what free energy of formation to use for asphalt of this composition in the computations, and a range of values was tried, from 140 to 320 kcal/ mol at a temperature of 1000°K and from 200 to 380 kcal/mol at 1400°K. Figure 5 shows how the computed concentrations of the major products change with these free energies of formation using composition A (methane). A t very low values of A F°asphait nearly all the carbon in the system is found in the asphalt and the mole fractions, n{, of the other hydrocarbons, i, are too low, while at high values of A i'°Mphsit, the concentration of asphalt becomes much smaller than is measured experimentally; the true value must take an intermediate value. The measured concentration of methane is best explained using AF°asrhait = 270 kcal/mol at 1 1 0 0 °K , while that of acetylene corresponds to AF°aSphait = 345 kcal/mol at 1350°K. It is therefore suggested that products are formed in their equilibrium concentrations along the temperature gradient from the center of the plasma, the final product distribution
(10) P. Swings and L. Haser, “ Atlas of Representative Cometary Spectra,” University of Liege, Astrophysical Institute, Louvain.(11) H. C. Urey, Nature, 179, 556 (1957).(12) F. L. Whipple, ibid., 189, 127 (1961).(13) J. Oro, ibid., 190, 389 (1961).
The Journal of Physical Chemistry

H igh-T emperature Equilibria from Plasma Sources 2537
being determined by the inability of the molecules to overcome the activation energies involved at temperatures lower than a minimum of 1000°K; this is the same process that was suggested in I.
Using values for AE°aSphait of 240 kcal/mol at 1000°K, 300 kcal/mol at 1200°K, and 360 kcal/mol at 1400°K, computations were performed for various mixtures of methane and hydrogen in order to find where the asphalt barrier on the C -H -0 ternary diagram cuts the C -H axis. For temperatures between 1000° and 1400°K, and for pressures between 20 and 100 Torr, this threshold is found in the range 80% H 2:2 0 % CH4 for low temperatures and 95% H 2:5 % CH 4 for high temperatures; see Figure 6. This corresponds to the region on the C -H axis of the ternary diagram between 3 % and 8 % of carbon.
Experimentally it was found that when a mixture of methane and hydrogen was subjected to the discharge, the plasma changed from a glow plasma to a flame plasma as the proportion of methane was increased. For high ratios of hydrogen to methane, the pressure in the reaction tube would have to be raised above the normal value of 30 Torr before this transition would occur. Experimentally, the measured rates of hydrogen and methane flow were kept constant, while the total pressure was increased until the transition from a glow plasma to a flame plasma occurred. The pressure at the transition to a flame plasma is plotted against various methane flow rates for a constant flow rate of hydrogen in Figure 7. It is seen that a flame plasma could not be formed at any pressure below a certain flow rate of methane. The ratio of the flow rates of hydrogen and methane for this point was exactly 10:1, corresponding to a composition of 4 % carbon and 96% hydrogen. In this fashion it is verified that a flame plasma corresponds to the formation of solid products in the discharge and that the value for the asphalt threshold determined in this manner falls in the computed range of values.
The carbon to hydrogen ratio of the gaseous products is approximately 12% carbon and 8 8% hydrogen, which should also correspond to the composition at the asphalt threshold. The significance in the difference in these figures and the values determined above may be understood in terms of the temperatures at the relevant reaction zones in the plasma. The tem
perature at the center of the plasma is greater than at the edges, and Figure 6 shows that the asphalt threshold shifts to a higher carbon percentage as the temperature is reduced. Thus it is to be expected that the two methods would give different values for the asphalt threshold, corresponding to the temperatures in the regions of the plasma where the reactions are occurring.
Conclusion to Papers I and II
Until now the usual method of investigating the action of electrical discharges on organic molecules has been from a consideration of the individual reactions occurring.9'14 It has been shown here that product formation can be explained using thermodynamic considerations and neglecting reaction mechanisms.
Results are in good agreement with calculations with respect to the formation of a high molecular weight solid product, and the assumption of a limited equilibrium with the exclusion of graphite made by Dayhoff, et al.,5 in their calculations of equilibria in supposed prebiological atmospheres is shown to be equally applicable to this work. The major gaseous products are formed in the ratio predicted for an equilibrium occurring in a temperature range between 1400 and 1000°K, but minor products do not follow the predicted trend. It is postulated that when the translational temperature of the molecules falls below a certain value, they possess insufficient energy to overcome the activation energies of the reaction sequences involved in the tendency to follow an equilibrium distribution at lower temperatures.
The results are therefore in the main compatible with an equilibrium theory, with the radiofrequency field merely serving the purpose of a high-temperature source of excited species.
Acknowledgments. We are grateful to Mr. Ronald Ace for designing and making the radiofrequency oscillator and to Mr. Kemp Cole for technical assistance.
(14) H . W ien er and M . B u rton , J. Amer. Chem. Soc., 75, 5815 (1 95 3 ); M . B u rton and J. L . M a gee , J. Chem. Phys., 23, 2192 (1 95 5 ); M . B u rton and J. L . M a gee , ibid., 23, 2195 (1 95 5 ); G . M ig n on a c and R . M igu el, Bull. Soc. Chim. Fr., 1727 (1 95 6 ); A . D . K ok u rin and V . V . G ruzdeva , Tr. Leningrad Tekhnol. Inst. Lensoveta, 5 1 , 113 (1 95 9 ); S . V . S tarod u btsev , Sh. A . A b la ev , and L . G . K eitlin , Izv. Akad. Nauk Uz, SSR , Serv. Fiz-M at. Nauk, 6 , 50 (1962).
Volume 73, Number 8 August 1969

2538 R onald L. W illiams and Adolf F. V oigt
Recoil Reaction Products of Carbon-11 in Simple Aromatic Compounds1
by Ronald L. Williams and Adolf F. VoigtInstitute for Atomic Research and Department of Chemistry, Iowa State University, Ames, Iowa 50010 (.Received September 20, 1968)
Carbon-11 was produced by the reaction 12C(7 ,n)uC in liquid benzene, toluene, and p-xylene, and the labeled products were analyzed by radiogas chromatography. A wide variety of products from methane to phenyl- acetylene was observed accounting for 20-35% of the total UC activity in the various systems. The remainder of the activity is shown to reside in higher boiling compounds. The production of analogous products in these systems is discussed, and the effect of the methyl groups on the product distribution is evaluated.
IntroductionThe reactions of atomic carbon in benzene have been
investigated in a number of laboratories in recent years with a variety of reported results.2-8 These studies have included all three phases,4'8 the effect of several scavengers,4 and double labeling techniques.6 In these results a limited number of low yield products were identified, significant polymerization was indicated, and a variety of yield values was reported. Some interesting hypotheses have been proposed, but the data have not been sufficient to decide among them.
The present work has extended the scope of liquid aromatic systems to include toluene and p-xylene which provide interesting analogies with the benzene system.6 Yield values have been determined for an extended number of products and are discussed briefly by comparing yield values of analogous products presumably produced by similar reaction routes. An estimate of polymerization yields determined by distillation techniques indicates the complexity of extended product analysis.
Experimental SectionLiquid samples prepared by vacuum techniques were
irradiated in the 70-MeV Iowa State University electron synchrotron, and the products resulting from the process 12C (7 ,n)nC were analyzed by radiogas chromatography. Details of ^he experimental techniques have been discussed previously.6'9 Product identity was determined by the retention time of carrier compound injected onto the chromatograph column with the irradiated sample. For most of the products reported the identifications were confirmed by similar techniques on one or more additional columns with different retention properties. No changes in yield values were observed with carriers indicating complete elution of all the compounds reported.
Phillips research grade benzene (99.94 mol % purity), toluene (99.97 mol % purity), and p-xylene (99.90 mol % purity) were used without further purification. Eastman Organic Chemicals 2,2'-diphenyl-l-picryl- hydrazyl (DPPH) was recrystallized from chloroform-
diethyl ether mixture and used as a free-radical scavenger at a concentration of 0.001 mole fraction.
To estimate the amount of 1 -containing “ polymer” formed, irradiated samples in their 0.2-ml bulbs were heated to various temperatures in a constant temperature bath and held for 5.0 min. The sample bulbs were removed from the bath and weighed, and the residual activity was counted and compared with the original, total activity in standard geometry above a 7.5 X 7.5 cm Nal(Tl) scintillation detector. An additional 5.0- min heat treatment at any step in the process did not change the residual activity at that temperature.
In a second experiment the bulbs were broken in the chromatograph in the usual manner and passed through a short column length (2.5 X 0.5 cm) packed with polyphenyl ether on Chromosorb P attached immediately downstream from the breaker. Empty tubing carried the more volatile portion to the gas-flow counter for the measurement of the fraction removed in each temperature interval. The 2.5-cm section was removed and counted.
The yield values for the parent hydrocarbons were
(1) W o rk w as perform ed in the A m es L a b ora tory o f the U . S. A to m ic E n ergy C om m ission ; this is C on tribu tion N o . 2421.(2) (a) A . G . Sehrodt and W . F . L ib b y , ./ . Amer. Chem. Soc., 78, 1267 (1 95 6 ): (b ) J. L . Sprung, S. W instein , and W . F . L ib b y , ibid., 8 7 ,1 8 1 2 (1965).
(3) A . P . W o lf, R . C . A nderson , and C . S. R ed va n ly , Nature, 176, 831 (1956).(4) B . S uryanarayana and A . P . W o lf, J. Phys. Chem., 62, 1369 (1958).(5) (a) A . P . W o lf, Ann. Rev. Nucl. Sei„ 10, 259 (I9 6 0 ) ; (b ) A . P . W o lf, “ C hem ical E ffects o f N uclear T ra n sform a tion s ,” V o l. I I , In ternational A to m ic E n ergy A gen cy , V ienna, 1961, p 3.(6) (a) E . P . R a ck , C . E . L ang , and A . F . V o ig t, J. Chem. Phys., 38, 1211 (1963 ); (b ) D . E . C lark and A . F . V o ig t, J. Amer. Chem. Soc., 8 7 ,5 5 5 8 (1965).
(7) (a) R . T . M u llen , “ T h e C hem ical In teraction s o f A ccelera ted C arbon -14 Ion s w ith B enzene,” P h .D . Thesis, U n iversity o f C aliforn ia , B erkeley, C alif., 1961; (b ) R . M . L em m on in “ C hem ical E ffects o f N uclear T ra n sform a tion s ,” V o l. I I , In ternationa l A to m ic E n ergy A gen cy , V ienna, 1961, p 2 7 ; (c) H . P oh lit, T . H . L in , W . Erw in, and R . M . L em m on , A bstracts, 155th N a tion a l M e e tin g o f the A m erican C hem ical S ociety , San F rancisco , C alif., A p ril 1968, N o . O 125.
(8) T . R ose , C . M a cK a y , and R . W olfga n g , J. Amer. Chem. Soc., 89, 1529 (1967).(9) G . F . P a lin o and A . F . V o ig t, ibid., 91 , 242 (1969).
The Journal of Physical Chemistry

Recoil R eaction Products of nC in Simple Aromatics 2539
Table I : Product Yields in Aromatic Systems“
Benzene Toluene p-XyleneProduct** Benzene -f DPPH Toluene + DPPH p-Xylene + DPPH
Methane 0.18 ± 0.03 0.43 ± 0.06 0.49 ± 0.03 0.51 ± 0.02 0.88 ± 0.06 1.04 ± 0.08Ethylene 0.65 ± 0.06 0.64 ± 0.06 1.27 ± 0.14 1.16 ± 0.09Acetylene 4.68 ± 0.14 4.59 ± 0.24 5.41 ± 0.24 5.32 ± 0.20 5.95 ± 0.28 5.68 ± 0.21Allene 0.14 ± 0.04 0.13 ± 0.03 0.15 ± 0.04 0.12 ± 0.02 0.29 ± 0.08 0.22 ± 0.02Methylacetylene 0.16 ± 0.05 0.14 ± 0.05 0.55 ± 0.07 0.50 ± 0.05 0.86 ± 0.20 0.69 ± 0.05(Vinylacetylene) 0.55 ± 0.05 0.62 ± 0.10 0.46 ± 0.07 0.61 ± 0.04 0.50 ± 0.08 0.53 ± 0.07P-l;e T-l (valylene) 0.08 ± 0.02 0.09 ± 0.02 0.14 ± 0.02 0.16 ± 0.02P-2; T-2(l-penten-3-yne) 0.10 ± 0.03 0.11 ± 0.03 0.20 ± 0.03 0.19 ± 0.02(Diacetylene) 1.58 ± 0.30 1.97 ± 0.16 0.67 ± 0 .13 1.25 ± 0.06 0.65 ± 0.05 0.82 ± 0.06P-3 (1,3-heptadiene-5-y ne) 0.20 ± 0.03 0.22 ± 0.04Benzene 3.54 ± 0.22 2.85 ± 0.10 0.59 ± 0.13 0.48 ± 0.06B-l 0.21 ± 0.04 0.35 ± 0.07B-2 0.28 ± 0.03 0.26 ± 0.14Toluene 2.64 ± 0.14 2.72 ± 0.15 2.70 ± 0.16 2.31 ± 0.12 1.11 ± 0.17 0.84 ± 0.07Cycloheptatriene 3.19 ± 0.33 2.13 ± 0.21T-3 (3-methylcy cloheptatriene) 0.11 ± 0.03 0.17 ± 0.02T-4(2-methyleyeloheptatriene) 0.14 ± 0.02 0.22 ± 0.05T-5 (1-methylcy cloheptatriene) 0.29 ± 0.06 0.34 ± 0.06p-Xylene 0.36 ± 0.06 0.52 dh 0.14 0.77 ± 0.03 0.76 ± 0.05 2.40 ± 0.18 2.06 ± 0.10P-4(l,4- and 2,5-dimethyl-
cy cloheptatriene) 0.97 ± 0.18 0.95 ± 0.13m-Xylene 0.25 ± 0.03 0.29 ± 0.04 1.05 ± 0.04 0.94 ± 0.05o-Xylene 0.15 ± 0.04 0.20 ± 0.02 1.15 ± 0.14 0.99 ± 0.09 0.63 ± 0.18 0.46 ± 0.09Ethylbenzene 0.22 ± 0.05 0.24 ± 0.08 3.65 ± 0.15 3.37 ± 0.21Styrene 0.53 ± 0.13 0.36 ± 0.09 3.77 ± 0.18 4.24 ± 0.16 1.01 ± 0.13 1.28 ± 0.14Phenylacetylene 1.90 ± 0.26 2.88 ± 0.15 0.94 ± 0.10 1.24 ± 0.08 0.57 ± 0.07 0.68 ± 0.101,2,4-Trimethylbenzene 0.16 ± 0.04 0.13 ± 0.04 2.13 ± 0.24 2.36 ± 0.221,3,5-Trimethylbenzene 0.09 ± 0.02 0.16 ± 0.02B-3 0.30 ± 0.07 0.29 ± 0.06p-Ethyltoluene 0.20 ± OAO* 0.03 ± 0.04" 5.09 ± 0.21 5.23 ± 0.35p-Methylstyrene 0.50 ± 0 .06li 0.30 ± 0.03" 7.02 ± 0.24 7.91 ± 0.19P-5; T-6(methylphenyl-
acetylenes) 1.10 ± 0.10 1.59 ± 0.11 1.18 ± 0.11 1.67 ± 0.19P-6 (2,5-dimethylstyrene) 0.39 ± 0.10 0.47 ± 0.11P-7 (2,5-dimethylphenyl-
acetylene) 0.71 ± 0.07 1.16 ± 0.16Total identified 20.86 20.97 25.77 26.69 34.15 35.78
“ Error limits are standard deviations. 6 Products are reported in the order of elution from one of the columns used: 15 ft X 8 mmglass column of 20% Igepal CO880 on Anakrom solid support. e This notation designates unidentified product in the various systems, e.g., P-1 = unidentified product number 1 in p-xylene system. Identities proposed on the basis of retention times are given in parentheses. d These yields include ortho and meta as well as -para compounds.
determined by the usual gas-flow detection system and verified by collecting and counting various fractions of the parent effluent in a standard geometry.
ResultsYield values in absolute per cent of the total carbon-11
activity produced are listed in Table I. Each system was studied over a range of total dose9 (0.015-0.090 eV/molecule), and each product yield was examined for dose dependence. In none of the observed products was the slope of a least-squares straight line through the yield values greater than the uncertainty in the slope. Therefore the reported yield values are the averages and standard deviations of the yield values over the entire dose range studied. The number of data points used in this analysis was from 10 to 20 for the various products
in the several systems. The distribution of error limits indicates variable dose dependence as well as experimental scatter.
The results of scavenger studies using 0.001 mole fraction DPPH in general show minor changes in yield values. The interpretation of these results as a criterion for hot vs. thermal radical reactions must be qualified in view of the results reported by other workers using a variety of scavengers including DPPH.4'8
An evaluation of the extent of polymerization and build-up products in the benzene system is summarized in Table II. More than 60% of the total carbon activity is retained on a 2.5-cm length of column at 225° and is thus in compounds containing three or more benzene rings. In the distillation experiment 32% remained in the uncrushed bulb at 225°. The differ-
Volume 73, Number 8 August 1969

2540 R onald E. W illiams and Adolf F. Voigt
Table II : Results of Distillation Experiments
A. Distillation from Sample Bulb“
oo Activity remaining, %
Activity removed in temp
increment, %
25 94.7 5.3100 60 35125 53 7150 39 14175 36 3200 33 3225 32 1
B. Elution from 2.5-cm Column with Flow Counting6
T , °CActivity in short
column, %
Activity removed in temp
interval, %
25 Not 5.3
25-100determined
78.0 15.6100-225 61.2 16.5
C. SummaryApproximate %
of total
Products analyzed and identified 20.8Two-ring compounds' 16Others distilling to 225° (but not 28
eluted from column in B) Residual activity at 225° 35
° Average values for five determinations. 6 A column section (2.5 X 0.5 cm) packed with polyphenyl ether on Chromosorb P was attached immediately downstream from sample breaker. This section was removed and its activity determined in a standard geometry. * Carrier samples of these compounds were separated by mass detection, but poor resolution of the corresponding activity prohibited detailed analysis.
ence, ~ 2 8 % , is attributed to compounds with boiling points considerably above 225° which decompose at this temperature or are carried by the benzene vapor. Analysis of high boiling compounds, including two-ring compounds, is presently prohibited by the maximum operating temperature of the gas-flow counting cell.9
DiscussionThe obvious difficulties of a mechanistic treatment of
these systems include the large number of products, the small percentage of the total activity identified, and the extreme fragmentations and rearrangements required for the production of some of the products. Several reaction intermediates have been proposed in previous discussions of the benzene system. W olf4 has suggested a seven-member ring as an insertion intermediate with alternative stabilization and rearrangement routes. Wolfgang8 proposed several stable adducts with x- bonded configurations and discussed the energetics of fragmentation of these intermediates. The results
shown in the present work are consistent with these proposals, and frequent use is made of a seven-member ring as an insertion intermediate which may fragment, stabilize, or undergo bimolecular reaction. On this basis the analogies among the three systems, benzene, toluene, and p-xylene, will be discussed with particular concern for the effect of the methyl substituents.
The low yield of methane from benzene is consistent with previously discussed trends in paraffins and olefins.6 In the systems with methyl groups the increased hydrogen availability results in larger yields of methane consistent with the successive hydrogen abstraction route suggested by Wolf. In the presence of radical scavenger the methane yield increases in all three systems. At present we have no explanation for this observation.
Ethylene was identified in the toluene and p-xylene systems but not in benzene indicating that it is produced by reactions at the methyl sites. Comparison of the ethylene yields in the two systems shows a statistical increase with the second methyl group.
One suggested reaction route for the production of acetylene from benzene is C atom insertion into a C -H bond followed by rupture of the two adjacent ring bonds (d to the nC) and pickup of a hydrogen atom.10
[c—CH] HC=CH (1)
A second type of mechanism proposes C atom insertion into the ring followed by rupture of a and /3 bonds, either immediately followed by H pickup by the active fragment as in eq 2a, or after a hydride shift with no H pickup being required as in eq 2b.
[hc— C‘]
*C
HC=CH (2a)
H
HC=CH (2b)
The results of W olf11 using mixtures of perdeuterated as well as selectively deuterated compounds indicate that C atom insertion in these types of reactions is more
(10) In term ediates in brackets are h igh ly rea ctive and are n o t intended to be detailed structures. S ince on ly the labeled p rod u cts o f these reactions h a ve been identified , the un labeled fragm ents w h ich m ust a ccom p a n y them are n o t show n.(11) A . P . W o lf, B rook h a v en N a tion a l L a b o ra to ry , p r iv a te com m u n ica tion , A u g 1967.
The Journal of Physical Chemistry

R ecoil R eaction Products op nC in Simple Aromatics 2541
plausible for the formation of acetylene than the insertion of methyne, UCH, into the ring followed by similar rupture processes.
If the compound contains a methyl group, additional pathways are available, including insertion into a side- chain C -H bond.
HC=CH (3)
In the methyl derivatives reactions similar to eq 2a and b will lead to methylacetylene, which is observed in very small yield in benzene and in considerably larger yield in toluene and p-xylene. This increase in yield is most probably due to C atom insertion into the ring bond adjacent to the side chain (eq 4). For a product
&
CH,
[■C— C— CH3] HC=CCH3 (4)
of carbon atom insertion into a ring C -H bond to contain the methyl group it would have to be a four-carbon compound such as 1,2-butadiene or butyne.
The relative production of acetylene by reactions 1, 2, and 3 can be estimated as follows. The data on unscavenged systems are used; those from scavenged systems give similar results. For both reactions 1 and 2 there are six locations per benzene molecule for attack by C atoms so that the probability per location is 4.68/6 = 0.78% . The probability of ring insertion into toluene to form methylacetylene can be considered to be the difference in the yield of this product in toluene and benzene (0.55 — 0.16 = 0.39%) or half this difference for p-xylene [(0.86 — 0.16)/2 = 0 .35% ]. The average of these values, 0 .37% , can be used as the probability per location for reaction 2 in benzene, if it is assumed that the probability of this process is not changed by the presence of the methyl groups. The probability of reaction 1 is then 0.78 — 0.37 = 0.41% . The probability of reaction 3, side-chain C -H insertion, can be estimated by subtracting the expected yields for five locations around the ring or 0.78 X 5 = 3.90% from the total acetylene yield from toluene, 5.41% . If this value, 1.51%, is attributable to three C -H bonds, the probability per bond is 0 .50% . A similar calculation for p-xylene gives 0.47% as the probability per bond.
Other highly unsaturated products from similar reactions are observed in small to appreciable yields. Intermediate I from C -H insertion or II from insertion into a ring C -C bond can fragment to give a C4H 3 fragment (III) which can pick up or lose a hydrogen to give vinylacetylene or diacetylene, both of which were
I II
\ /
[CH— C— CH— CH] (5)III
V \-H
CH=C— CH=CH2 CH =C— C==CH
tentatively identified on the basis of retention time. The presence of a methyl group on the ring could change intermediate III to a methyl derivative (see eq 6) which on adding a hydrogen atom would lead to a pentenyne such as valylene or its straight-chain isomer.
[CH— C— C— CH] CH=C—-C=CH 2 (6)
CH3 ch3
The other, less well-identified products could be expected to have similar formation paths.
The relatively high yield of labeled parent compound in aromatic systems has also been reported previously.4'7’8 Proposed reaction routes include (1) *C insertion into a ring C -C bond, hydride shift, expulsion of C atom to return to six-membered ring
Q + C (7)
(2) *C insertion into a ring C -C bond, expulsion of C -H followed by pickup of H atom by the C6H 6 radical
(3) *CH insertion into ring C -C bond, expulsion of C -H
In the methyl derivative, expulsion of a carbon atom with an attached methyl group will produce the simpler homolog, benzene from toluene, toluene from p-xylene, which leads to an interesting comparison. A probabil-
Volume 73, Number 8 August 1969

2542 R onald L. W illiams and Adolf F. V oigt
Table III : Probability of Expulsion Reaction
Reactant Product Conditions
Bz Bz Unscav.Tol Tol Unscav.Xyl Xyl Unscav.
Tol Bz Unscav.Xyl Tol Unscav.
Bz Bz Scav.Tol Tol Scav.Xyl Xyl Scav.
Tol Bz Scav.Xyl Tol Scav.
Yield, % No./molecule Probability/bond
3.54 ± 0.22 6 0.59 ± 0.042.70 ± 0.16 5 0.54 ± 0.032.40 ± 0.18 4
Av0.60 ± 0.05 0.58 ± 0.04
0.59 dh 0.13 1 0.59 ± 0.131.11 ±0 .1 7 2
Av0.55 ± 0.09 0.57 ± 0.11
2.85 ± 0.10 6 0.47 ± 0.022.31 ± 0.12 5 0.46 ± 0.022.06 ± 0.10 4
Av0.52 ± 0.03 0.48 ± 0.03
0.48 ± 0.06 1 0.48 ± 0.060.84 ± 0.07 2
Av0.42 ± 0.04 0.45 ± 0.05
ity of insertion followed by expulsion can be calculated on a per bond basis by dividing the appropriate yield by the number of such possible reactions per molecule. As shown in Table III, the probability of the reaction occurring is the same within experimental error whether the leaving group is C -H or C -C H 3.
The addition of a ring methyl group to the parent occurs in all cases. The most probable mechanism for this reaction is the insertion of methylene-1 4C into a C -H bond. However, degradation studies511,7012 on toluene-14C produced by the action of energetic 14C atoms on benzene have shown that 12-14% of the label is in the ring, not in the methyl group. A different mechanism is required for the explanation of this part of the toluene yield. A possibility would be ring insertion by carbon atoms followed by collapse with the ejected carbon atom remaining attached to the ring by one bond and subsequently picking up hydrogen atoms to form toluene.
It is, perhaps, incorrect to apply the results of the degradation studies to the present work since in that work much larger radiation dose is given to the sample (1-2 compared to ■~0.05 eV/molecule). Under such conditions products of more disruptive mechanisms might be expected.
Since such mechanisms need to be invoked for only a small part of the yield, the yields for the different compounds can be compared on the basis of the simpler methylene insertion. Such a comparison is shown in Table IV along with similar data on the products of methylene insertion into a side-chain C -H . It can be seen that in both the unscavenged and scavenged systems, the probability of the reactions occurring in one of the toluene ring positions is considerably greater than for the similar reaction in benzene. It appears that there is a strong preference for para addition, with ortho and meta following in that order but not widely different. The probability for this reaction occurring
in p-xylene is similar to that for the ortho and meta positions in toluene, considerably larger than the probability for benzene.
The idea of directed attack by methylene on substituted benzene is surprising since methylene is known to be a nondiscriminating reagent and one would expect that energetic methylene would show even less discrimination. Very little has been published on the reactions of methylene with substituted benzenes. Terao and Shida13 studied the photolysis of ketene in toluene in the gas phase at a few centimeters pressure. Their results are quite different from those of the present experiments, but the conditions were also quite different. The methylene which appeared in addition products was distributed as follows: m-xylene 40% , p-xylene 25% , ethylbenzene 25% , and o-xylene ~ 0 % . The absence of o-xylene was attributed to steric hindrance.
Meerwein, et ah,14 reported that in the photolysis of diazomethane in anisole nearly equal amounts of the o-, m-, and p-methoxytoluenes were produced, which would indicate an approximately twofold preference for para insertion. The only agreement among the results of these very different experiments is that para insertion appears to be favored above the expected value of 20% of the total yield for the three isomers. It is obvious, however, that no conclusions can be drawn from these few results.
Methylene additions to the side chain forming ethylbenzene from toluene and p-ethyltoluene from p-xylene are also observed in good yield. As expected, the reaction is more probable in xylene than in toluene, but not by a factor of 2. As shown in Table IV, the yield per bond is 1.22 in toluene and 0.85 in xylene.
(12) R . Visser, C . S. R ed va n ly , F . L . J. S ixm a, and A . P . W o lf, Ree. Trav. Chim., 80, 533 (1961).(13) T . T era o and S. Shida, Bull. Chem. Soc., Jap., 37 , 687 (1964).(14) H . M eerw ein , H . D isselnkòtter, F . R ap p en , H . v . R in te len , and H . va n d e V loed , Ann., 604 , 151 (1957).
The Journal of Physical Chemistry

R ecoil R eaction Products op nC in Simple Aromatics 2543
Table TV : Methylene Additions to Aromatic Hydrocarbons
Bonds/ Probabilit y/Reactant Product Conditions Yield, % molecule C-H bond
Bz Tol Unscav. 2.70 ± 0.16 6 0.45 ± 0.03Tol p-Xyl Unscav. 0.77 ± 0.03 1 0.77 ± 0.03Tol m-Xyl Unscav. 1.05 ± 0.04 2 0.52 ± 0.02Tol o-Xyl Unscav. 1.15 ± 0.14 2 0.57 ± 0.07Tol ZXyl’s Unscav. 2.97 - 0.15 5 0.59 ± 0.03P-Xyl 1,2,4-Tmb Unscav. 2.13 =e 0.24 4 0.53 ± 0.06Tol Et bz Unscav. 3.65 = 0.15 3 1.22 ± 0.05p-Xyl p-Et tol Unscav. 5.09 == 0.21 6 0.85 ± 0.04Bz Tol Scav. 2.31 = 0.12 6 0.38 ± 0.02Tol P-Xyl Scav. 0.76 = 0.05 1 0.76 ± 0.05Tol m-Xyl Scav. 0.94 = 0.05 2 0.47 ± 0.03Tol o-Xyl Scav. 0.99 = 0.09 2 0.50 ± 0.05Tol ZXyl’s Scav. 2.69 = 0.11 5 0.54 ± 0.02P-Xyl 1,2,4-Tmb Scav. 2.36 ± 0.22 4 0.59 ± 0.06Tol Et bz Scav. 3.37 ± 0.21 3 1.12 ± 0.07P-Xyl p-Et tol Scav. 5.23 ± 0.35 6 0.87 ± 0.06
Table V : C 2 Additions to Aromatic Hydrocarbons
Reactant Product Conditions Yield, %Bonds/
moleculeProbability/ C-H bond
Bz Phac Unscav. 1.90 ± 0.26 6 0.32 ± 0.04Tol (Me phac Unscav. 1.10 ± 0.10 5 0.22 ± 0.02)“Xyl (Di me phac Unscav. 0.71 ± 0.07 4 0.18 ± 0.02)Bz Phac Scav. 2.88 ± 0.15 6 0.48 ± 0.03Tol (Me phac Scav. 1.59 ± 0.11 5 0.32 ± 0.02)Xyl (Di me phac Scav. 1.16 ± 0.16 4 0.29 ± 0.04)Bz Sty Unscav. 0.53 ± 0.13 6 0.09 ± 0.02Tol Me sty Unscav. 0.50 ± 0.06 5 0.10 ± 0.01Xyl (Di me sty Unscav. 0.39 ± 0.10 4 0.10 ± 0.03)Bz Sty Scav. 0.36 ± 0.09 6 0.06 ± 0.02Tol Me sty Scav. 0.30 ± 0.03 5 0.06 ± 0.01Xyl (Di me sty Scav. 0.47 ± 0.11 4 0.12 ± 0.03)Bz Et bz Unscav. 0.22 ± 0.05 6 0.04 ± 0.01Tol Et tol Unscav. 0.20 ± 0.10 5 0.04 ± 0.02Bz Et bz Scav. 0.24 ± 0.08 6 0.04 ± 0.01Tol Et tol Scav. 0.30 ± 0.04 5 0.06 ± 0.01
Products in parentheses only tentatively identified ; see Table I (footnote ci.
The reaction by which styrene is produced from R — CH 3 + C* — > [RCH2— C*— H]toluene and p-methylstyrene from p-xylene is most likely C atom insertion into the C -H bond followed by stabilization as the olefin. Such reactions have been observed in many aliphatic systems. In this case the yield from xylene is close to twice the yield from toluene. On a per bond basis the yield of styrene from toluene is 1.25 (unscavenged) and 1.41 (scavenged) while the comparable values for methylstyrene from xylene are 1.17 and 1.32.
The formation of phenylacetylene from toluene (and of methylphenylacetylene from xylene) by C atom insertion in a side-chain C -H bond requires that two hydrogen atoms be lost, which appears to be a rather unfavorable process. To our knowledge the comparable aliphatic reaction
R C = C * H + 2H
has only been reported16 in the case of methane (R =H) which is not quite comparable.16 However, in the aromatic systems the yield of this reaction (R = C6H 5, P-CH3C6H 4) is appreciable, 1- 2% , and this mechanism may account for part of that yield. Another mechanism is discussed below.
The addition of labeled C2H,, fragments to the aromatic ring results in a group of products which are
(15) (a) C . M a ck a y and R . W olfg a n g , J. Amer. Chem. Soc., 83, 2399 (1961) ; (b ) G . S tock lin and A . P . W o lf, ibid., 8 5 , 229 (1963).(16) N o te A d ded in P r o o f . W e h a ve recen tly determ in ed y ie ld s o f sim ilar p rod u cts from aliph atic m olecu les, hexyn e-1 (2 .3 % ) from n-p en ta n e and h ep tyn e -1 (2.0 % ) from n-hexane.
Volume 73, Number 8 August 1969

2544 R onald R. W illiams and Adolf F. Voigt
observed in each of these systems (see Table V). The only one of these which has been reported previously is phenylacetylene from benzene.7 In recently reported studies on phenylacetylene from the action of accelerated 14C atoms on solid benzene,70 it was shown that ~ 9 6 % of the label is in the side chain. The major portion of this product which is side-chain labeled would appear to be formed from a OiHz fragment interacting with the aromatic ring. The formation of a C2H fragment is shown in eq 1 -3 ; less unsaturated fragments could result from hydrogen pickup or abstraction.
The formation of phenylacetylene from benzene and the homologous reaction in toluene and xylene involve the replacement of a hydrogen by the C -C H entity (eq 10).
c— CHQ + [C -C H ] — Q T + H (10)
In toluene such a reaction might involve either replacement of a hydrogen atom yielding methylphenyl- acetylene or of the methyl radical in which case phenylacetylene would result. This constitutes a second possible mechanism for the formation of phenylacetylene from toluene.
Pickup of hydrogens by the C -C H entity before it interacts with the parent compound or similar pickup by an intermediate after this reaction could lead to styrene and ethylbenzene from benzene and to their methyl derivatives from toluene and xylene. As seen in Table V, when the yields for these products are compared on a per bond or per position basis, the probabilities are fairly constant in many cases, but appreciably different in others. There is some uncertainty in com
pound identification in some of these cases, and further interpretation does not seem justified.
The yield of cycloheptatriene in the benzene system very likely results from the stabilization of the ring intermediate. However, the low yield of the methyl- cycloheptatrienes from toluene is difficult to explain. Carrier compounds for definite identification of the low yield products T -2 through T-4 (methylcyclohepta- trienes) and P-4 (dimethylcycloheptatrienes) are presently not available.
Additional conclusions can be drawn from the experiments on the fate of the remainder of the nC atoms. As shown in Table II, Section C, 20.8% of the total activity has been adequately identified. Two-ring compounds such as biphenyl, diphenylmethane, fluo- rene, and phenylcycloheptatriene account for an additional 16%, but in this work they were not resolved sufficiently for the determination of accurate yield values. Another fraction (28%) was removed in the distillation experiment and is attributed to compounds containing three or more rings which either decompose under these conditions or are carried by the benzene vapor. This 28% fraction could not be eluted from the2.5-cm column suggesting that the column provides considerable protection from decomposition. The final fraction (35% ), which was not removed from the sample bulb, was contained in a visible, viscous residue suggesting high-molecular-weight polymers. The maze of possible products and reactions involved in polymerization requires the development of techniques different from those used in this study.
Acknowledgments. The authors are very grateful to Dr. Alfred Bureau and the other members of the Iowa State University synchrotron staff.
The Journal of Physical Chemistry

Phosphorescence Lifetime of Benzene and w-Alkylbenzenes 2545
Temperature Dependence of the Phosphorescence Lifetime of
Benzene and n-Alkylbenzenes between 4 .2 and 100°K
by Ingo H. Leubner1 and Joe E. HodgkinsDepartment of Chemistry, Texas Christian University, Fort Worth, Texas 76129 (Received October 16, 1968)
The temperature dependence of the phosphorescence lifetime of benzene and its n-alkyl derivatives C6H5CnH2n+1, n = 1 to 13, has been measured in a rigid glass of a mixture of methylcyclohexane-isopentane (4:1 by volume) between 4.8 and 100° K. The phosphorescence lifetime is temperature independent below about 60° K, depending on the solute, and temperature dependent in a relatively small temperature range at higher temperatures. Arrhenius plots indicate that in this region there are two or more paths of externally influenced non- radiative decay contributing to the decay of the triplet state. The incoherence in previously reported data of phosphorescence lifetimes at 77° K of a specific molecule can be attributed to temperature and solvent effects while those at 4.2° K can be attributed solely to solvent effects. The phosphorescence lifetimes of the n-alkylbenzenes depend on the chain length of the alkyl substituent, but no simple relation to other molecular parameters has been found.
IntroductionMany experiments to explore the triplet state of
molecules have been performed, and the radiative lifetime of the S •*- T transition of numerous compounds has been measured. Yet, the incoherence of the reported phosphorescence lifetime of a single compound is often striking. To demonstrate this point we have compiled in Table I phosphorescence lifetimes of benzene and toluene as reported by several authors. Except for a heavy atom effect in the high-atomic- weight rare gas solvents (Kr, He)2 no explanation for these discrepancies could be found.
Furthermore, although it is widely known that the phosphorescence lifetime can vary widely with temperature,3-12 measurements of the temperature dependence have only rarely been extended below 7 7 °K .13 Measurements in this region usually have been made only at specific temperatures, he., 77° (liquid nitrogen), 20° (liquid hydrogen), or 4 .2 °K (liquid helium) (compare Table I). Additionally, Martin and Kalantar14 have recently observed that the phosphorescence lifetimes of hexadeuteriobenzene in eight different matrices and that of benzene, toluene, decahydrotri-o-phenylene, and biphenyl in 3-methylpentane and EPA (mixture of ether, isopentane, ethanol 5 :5 :2 by volume) at 77°K increase to constant values and have attributed this effect to glass relaxation. This behavior may be due to temperature effects.16
The triplet-state lifetime is dependent on at least two terms, the rate of emissive decay and the rate of an internal quenching process (not considering external quenching processes, e.g., by impurities). The latter type has been discussed by various authors,16-22 and the relative magnitude of the two in different types of molecules will probably continue to be debated for some time. The nonradiative process is mainly in
fluenced by the molecular structure and matrix interactions.17 The molecular structure seems to play the more important role.17-22 However, little is known concerning which molecular parameters are of significant influence except for effects of large spin-orbit coupling atoms.23 The problem becomes still more
(1) R o b e r t A . W elch F ou n d ation P ostd octora l F e llow . E astm an K o d a k C om p a n y , R och ester , N . Y . 14650.(2) (a) M . R . W righ t, R . P . F rosch , and G . W . R ob in son , J. Chem. Phys., 33, 934 (1960 ); (b ) G . W . R ob in son , J. M ol. Spectrosc., 6 , 58 (1961).(3) R . L iv in g ston and P . J. M cC a rtin , J. Phys. Chem., 67, 2511(1 96 3 ) .(4) R . L iv in g ston and W . R . W are, J. Chem. Phys., 39, 2593 (1963).(5) G . Jackson and R . L iv in gston , ibid., 35 , 2182 (1961).(6) S. J. L adner and R . S. B ecker, J. Amer. Chem. Soc., 86, 4205(1 96 4 ) .(7) S. J. L adner and R . S. B ecker, J. Chem. Phys., 43, 3344 (1965).(8) B . Stevens and M . S. W alker , Proc. Roy. Soc., A 281, 420 (1964).(9) N . H iro ta and C . A . H utch in son , Jr., J. Chem. Phys., 42, 2869(1965 ) .(10) G . P orter and L . J. Stief. Nature, 195, 991 (1962).(11) R . E . K e llogg and R . P . Schw enker, J. Chem. Phys., 4 1 , 2860(1 96 4 ) .(12) K . B . E isenthal and R . M urashige, ibid., 39, 2108 (1963).(13) J. E . H od gk in s and J. D . W o o d y a rd , J. Amer. Chem. Soc., 89, 710 (1967).(14) T . E . M a rtin and A . H , K alantar, J. Phys. Chem., 72, 2265 (1968).(15) I . H . L eubner, su bm itted for p ub lica tion .(16) M . G ou term an, J. Chem. Phys., 36 , 2846 (1962).(17) G . W . R ob in son and R . P . F rosch , ibid., 37, 1962 (1962).(18) E . F . M c C o y and I. G . R oss, Aust. J. Chem., 15, 573 (1962).(19) G . R . H un t, E . F . M c C o y , and X. G . R oss, ibid., 15, 591 (1962).(20) J. B . B yrn e, E . F . M c C o y , and I . G . R oss, ibid., 18, 1589(1 96 5 ) .(21) W . Siebrand, J. Chem. Phys., 46 , 440 (1967).(22) S. H . L in , ibid., 44, 3959 (1966 ); S, H . L in and R . Bersohn, ibid., 48, 2732 (1968).(23) D . S. M cC lu re , ibid., 17, 905 (1949).
Volume 73, Number 8 August 1969

2546 Ingo H. Leubner and Joe E. Hodgkins
Table I : Experimental and Theoretical Phosphorescence Lifetimes of Benzene and Toluene
Lifetime, Temp,sec °K Solvent® Ref
1. Benzene, experimental9.83 =b 0.15 4.2-32.0 MCH/IP 4:1 b
16; 15.8 4.2 CH, 1,216; 15.8 4.2 Ar 1,21 4.2 Kr Ie
0.07 4.2 Xe 1«7.0 ± 0.5 77 EPA d7.0 77 EPA e6 77 3MP f
4.70; 5.75 77 3MP 14°7.80; 8.45 77 EPA 14?7 77 EtOH ti8.54 ± 0.3 4.2 c 6d , j7.48 77 t-POH k4.75 77 CH k
2. Benzene, theoretical21.0 e28 ± 2 l
36 m
300 n
3. Toluene, experimental8.30 ± 0.15 5.0 -42.0 MCH/IP 4:1 b8.23 ± 0.24 5.10-31.8 MCH/IP 9:1 138 77 EPA 0
8.8 ± 0.2 77 EPA d7.10; 8.02 77 3MP 14°5.7 ? ? V
4.8 77 EtOH q2.44 77 None q5-6 90 CH r
“ Solvents: MCH/IP, methyIcyclohexane-isopentane; E!ether-isopentane-ethanol 5:5:2 ; 3MP, 3-methylpentane; EtOH, ethanol; CH, cyclohexane; i-POH, isopropyl alcohol. b This work. c External heavy atom effect. d D. S. McClure, J. Chem. Phys., 17, 905 (1949). e E. H. Gilmore, G. E. Gibson, and D. S. McClure, ibid., 20, 829 (1952); ibid., 23, 399 (1955). / A. C. Albrecht, ibid., 38, 354 (1963). ° Time dependence, see text. h D. N. Shigorin, G. A. Ozerova, and Y. D. Voznyak, Zh. Fiz. Khim., 41 (6), 1238 (1967); Chem. Abstr., 67, 95370i (1967). ’ By electron paramagnetic resonance. ’ S. D. Colson and G. W. Robinson, J. Chem. Phys., 48, 2550 (1968). k T. E. Martin and A. H. Kalantar, ibid., 48, 4996 (1968). 1 E. C. Lim, ibid., 36, 3497 (1962). m P. N. Sen and S. Basu, Int. J. Quantum Chem., 2 (2), 183 (1968). " D. G. Craig, J. M. Hollas, andG. W. King, J. Chem. Phys., 29, 974 (1958). ° Y. Kanda andH. Sponer, ibid., 28, 798 (1958). p P. P. Dikun, A. A. Petrov, and B. Ya. Sveshnikov, Zh. Eksp. Teor. Fiz., 21, 150 (1951). 4 B. A. Pyatnitskii, Izv. Akad. Nauk SSSR, Ser. Fiz., 15, 597 (1951). r Y. Kanda and R. Shimada, Speclrochim. Acta, 17, 279 (1961).
complex when the matrix becomes less viscous and diffusion-controlled reactions, such as triplet-triplet annihilation, become important. These problems indicate that more consistent data should be obtained.
We have studied the phosphorescence lifetimes and their temperature dependence of benzene and mono-
substituted benzene derivatives from 4.8 to 100°K. Our data show that there exists a dependence of the phosphorescence lifetime of the n-alkylbenzenes on the chain length of the alkyl substituent. This relationship is complex and could not yet be correlated to other molecular properties.
Experimental SectionApparatus and Measurements. The low-temperature
measurements have been done on a Helium-Cryotip Model AC-3L-I10, manufactured by Air Products and Chemicals, Inc., Allentown, Pa. The cooling gases (He, H2) are cooled to 77°K by liquid nitrogen; the helium is then cooled to 20 °K by liquid hydrogen (produced in the Cryotip) and liquefied by using the Joule-Thompson effect. The low-temperature chamber is isolated thermally by a vacuum of about 10 ~3 Torr. The sample container is an indium-sealed copper cell with quartz windows.
The temperature can be varied continuously by changing the back-pressure over the liquefied gases (He, H 2, N 2) and carefully regulating the flow of the gases in the Cryotip. By applying vacuum on the liquefied helium one can obtain temperatures lower than 4.2°K , but no change of. phosphorescence lifetime has been observed.
The temperature at the sample cell is measured with an iron-doped gold vs. silver thermocouple,24 and a Leeds & Northrop Type K-3-Universal potentiometer. Thus the temperature can be monitored continuously from room temperature to the temperature of liquid helium. The temperature of the sample has been found to be approximately 4 °K higher than that recorded by the thermocouple. The temperature difference was estimated by a comparison of independent lifetime measurements in liquid N 2 with measurements at a recorded temperature of 77°K (listed in Table II) in the apparatus described above.
The sample is irradiated for approximately 5 sec with an Osram HBO-200W mercury lamp located about 30 cm from the sample. This is done to avoid a change of temperature in the cell by irradiation and photochemical reactions. The short time of irradiation also prevents too high a concentration of molecules in the triplet state and thus diminishes the probability of triplet-triplet annihilation. The decay of the over-all phosphorescence intensity is observed by an IP-28 photomultiplier tube and recorded on a Tektronix Type RM-564-storage oscilloscope. The observation of the decay is extended over two to three lifetimes. The decay curve is then photographed with a Polaroid camera.
All measurements have been made in a mixture of
(24) C ryotip In stru ction and O perating M an u al, A ir P rod u cts and C hem icals, In c., A d va n ced P rod u cts D ep a rtm en t, A llen tow n , P a., 1965. H ere also a detailed description o f the apparatus can b e foun d.
The Journal of Physical Chemistry

Phosphorescence Lifetime of Benzene and w-Alkylbenzenes 2547
Table II : Average Intrinsic Phosphorescence Lifetimes and Lifetimes at 77°K and T i/2 Temperatures of Benzene and «-Alkylbenzenes C6H6C„H2n+i, n = 0 to 13 * 10
Temperature Number Average range of ofintrinsic intrinsic measure- Lifetime at
n lifetime, aec lifetimes, °K ments 77°K T i/a5
0 9 . 8 3 ± 0 . 1 5 4 . 6 - 3 2 . 0 15 4 . 2 9 771 8 . 3 0 ± 0 . 1 5 5 . 0 - 4 2 . 0 16 6 . 2 4 762» 7 . 7 9 ± 0 . 1 3 3 . 1 - 3 0 . 4 19 5 . 8 8 853 7 . 4 6 ± 0 . 1 0 4 . 8 - 3 3 . 1 18 5 .4 1 774 7 . 5 9 ± 0 . 1 0 4 . 8 - 3 9 . 5 19 2 . 1 4 735 7 . 4 2 ± 0 . 1 0 6 . 8 - 4 4 . 1 18 5 . 6 9 846 6 .14 ± 0 . 1 0 4 . 9 - 5 0 . 7 22 5 . 1 8 857 7 . 2 6 ± 0 . 1 0 4 . 8 - 3 6 . 0 19 5 . 6 0 858 6 . 7 7 ± 0 . 1 0 4 . 8 - 5 8 . 0 24 5 . 5 8 859 6 . 3 3 ± 0 . 1 0 4 . 9 - 4 2 . 0 17 4 . 4 4 84
10 7 . 6 0 ± 0 . 1 0 4 . 8 - 3 6 . 2 19 6.22 8411 7 . 2 7 ± 0 . 1 0 4 . 8 - 4 2 . 0 19 5 . 9 5 8512 7 . 1 6 ± 0 , 1 5 4 . 5 - 6 1 . 2 26 6 . 4 2 8613 6 . 8 0 ± 0 . 2 0 4 . 8 - 6 9 . 0 26 6 . 1 4 85
° See ref 13. b See text.
methylcyclohexane-isopentane (4:1 by volume). This solvent did not always form a clear rigid glass below 60°K . Our observations indicate, however, that this did not affect the phosphorescence lifetimes. All sample concentrations were chosen to be approximately10 ~3 mol/1. The alkylbenzenes were obtained from Aldrich Chemical Co., Milwaukee, Wis. The compounds were checked by gas chromatography and were found to contain less than 0 .5% impurity.
The solutions were outgassed by repeated freeze- pump-thaw cycles, finally purged with nitrogen, and transferred to the sample cell under nitrogen. The effect of nitrogen or oxygen on the phosphorescence lifetimes compared to fully outgassed samples was examined independently. The phosphorescence lifetime of benzene at 77°K was measured in an outgassed, in a nitrogen-, and in an air-purged sample and found to be 4.68, 4.71, and 4.77 sec, respectively. The agreement of these results is within the experimental error. This indicates that in this case nitrogen and oxygen do not detectably change the phosphorescence lifetimes. The solvents did not show absorption at wavelengths longer than 2500 A.
Calculation of the Phosphorescence Lifetimes. The decay curves of the phosphorescence intensity follow first-order kinetics and thus a rate constant k can be derived.
k = ( ln /2 — In I\)/{h — ti)
where h and h represent the phosphorescence intensity at the times h and t2. As k has the dimension sec-1 , another rate constant t = 1/k with the dimension “ sec” can be derived which is known as the “ phosphorescence lifetime.”
The data obtained from the phosphorescence intensity decay curves were analyzed with the aid of a computer (IBM 1401) and the phosphorescence lifetimes and their standard deviations from first order were calculated by the method of least squares, where the time base was considered error-free.25 The deviations from first order for the range of constant (“ intrinsic” ) lifetimes were less than 2% . The uncertainty for the average intrinsic lifetimes is listed for each compound in Table II. In the region where the phosphorescence lifetimes are temperature dependent the deviations from first order become greater with decreasing lifetime.
Martin and Kalantar26 have recently attributed the nonexponential decay of the phosphorescence decay of benzene in cyclohexane and methylcyclohexane at 77°K to the combination of two first-order lifetimes which they attributed to different molecular environments. It is improbable that this explanation holds for such a variety of molecules as studied here. Moreover, the intrinsic lifetimes are strictly of first order. Contrary to the reasoning of these authors second-order decay is very probable at 77 °K as the lifetimes of benzene and the alkylbenzenes are long enough (see Table II) that two excited molecules can meet during their lifetime by chance of diffusion for triplet-triplet annihilation.
DiscussionGeneral. Our experiments indicate that the tempera
ture dependence of the phosphorescence lifetimes is not represented by a simple function. Nevertheless, the plot of the lifetimes vs. temperature follows a definite and general pattern as can be seen from Figure 1.
At low temperatures the lifetimes do not change significantly from a constant value which will here be referred to as intrinsic (phosphorescence) lifetimes (see Table I I ) . In a specific solvent these are considered to be molecular constants (compare Table I, measurements at 4.2°K ). It should be noted that the region of these intrinsic lifetimes always extends to higher temperatures than that of liquid hydrogen (20°K). At higher temperatures the observed radiative decay becomes faster, i.e., the lifetimes become shorter. The temperature where the decrease of lifetime begins is determined by the solute. Comparing the various compounds listed here, this break is lowest for benzene (about 37°K ), while for the homologs with longer chain length the break occurs at about 60°K . Unfortunately, temperatures between 40 and 70°K are experimentally difficult to obtain. The decrease in lifetime is highly dependent on temperature over only a small range (15-20°) occurring at higher temperature. The center of this region may be characterized by the temperature Ti/„ where the lifetime has decreased to half its highest
(25) W e thank M r . J. S ach itano for the w riting o f the com puter program .(26) T . E . M a rtin and A . H . K alantar, J. Chem. Phys., 49, 244 (1968).
Volume 73, Number 8 August 1969

2548 Ingo H. Leubner and Joe E. H odgkins
Figure 1. Temperature dependence (°K) of the phosphorescence lifetime (seconds) of benzene (---------, X), n-pentylbenzene(------ , + ), and n-dodecylbenzene (-------- , O); solvent: methylcyclohexane-isopentane (4:1).
value (Table II). This temperature Ty, is dependent on the alkyl substituent and increases with chain length to a constant value of approximately 85°K .
To demonstrate how the lifetimes at 77°K can differ from the intrinsic lifetimes, we have also listed them in Table II. It is apparent that measurements at this temperature, even in the most favorable cases, give lifetimes shorter than the intrinsic lifetimes. This trend was found for all cases studied and must be considered in the interpretation of all phosphorescence lifetime measurements at this temperature.
The observed wide-range temperature dependence of the phosphorescence lifetimes has also been observed in other solvents.16 Thus the incoherence of the reported phosphorescence lifetimes, as shown in Table I for benzene and toluene, can be explained in a reasonable way. Differences in the phosphorescence lifetimes in the region of constant lifetimes must then be attributed to solvent effects (see Table I, lifetimes at 4 .2°K ).
“Temperature Dependence” of the Phosphorescence
Lifetime. The temperature dependence of the phosphorescence lifetimes has been described previously.3“ 13 Although it is commonly accepted that the temperature is not the only factor that affects the lifetimes, this effect will be referred to as “ temperature effect” in this paper. Experiments suggest that changes in the viscosity of the solvent seem to be the main factor contributing to this effect, but no coherent relationship between viscosity and the phosphorescence lifetimes has been offered.6-7’10'27'28 Some authors3-6 claim unknown quenchers are responsible for the temperature dependence and the deviations of the phosphorescence decay from first order when the matrix is melting. However, other data6'7-10-11 are not consistent with this argument. Parallel measurements of the viscosity of the solvent and the phosphorescence lifetimes have shown that the
(27) J. R . L om ba rd i, J. W . R a y m on d a , and A . C . A lb rech t, J . Chem. Phys., 40, 1148 (1964).
(28) J. R . L om ba rd i and G . A . D a fforn , ibid., 4 4 , 3882 (1966).
The Journal of Physical Chemistry

Phosphorescence Lifetime of Benzene and w-Alkylbenzenes 2549
Figure 2. Temperature dependence of the phosphorescence lifetime of benzene: I (O): log 1/r vs. 1/T (“K "1); II ( + ): log (1/ t — l /r 0) vs. 1/T solvent:methylcyclohexane-isopentane (4:1).
largest change of lifetimes occurs in a relatively small region of viscosity while outside this region the effect of viscosity is relatively small.6’7'“ ,27,2s has been suggested that this may be due to a drastic change of the relaxation time of the Brownian rotation and that coupling of molecular rotation with electronic motion may be of prime importance for the low-viscosity rate constant.10
Kalantar29 has recently shown that systematic errors in decay times may result from isotropic rotational relaxation of photoselected emitters, even if the exciting light is unpolarized. These errors will be noticeable, if the rotation time rr of the emitting molecules is in the order of the lifetime of the excited molecules. Rotation times Tr may, e.g., be obtained by measurements of the isotropic27 and anisotropic28 rotational relaxation in rigid media by polarized photoselection. Such measurements also will be very useful to electronic spectro- scopists to whom the rotational depolarization of emission is normally an undesirable property.
On the other hand, second-order reactions such as triplet-triplet annihilation and interactions of the excited molecules with solvent molecules may increase in importance as the mobility of the molecules is in-
Figure 3. Intrinsic phosphorescence lifetime (seconds) vs. chain length n of n-alkylbenzenes C6H5C„H2„+i; solvent: methylcyclohexane-isopentane (4:1).
creasing. This is consistent with our observation that the change of lifetime occurs at the lowest temperature for benzene. Benzene is the smallest and most symmetrical and thus most mobile of the molecules of this series. In the hope of getting more information, the temperature dependence of the phosphorescence lifetime of benzene has been studied in more detail.
If it is assumed that a decay process involves an activated state then the temperature dependence of the rate constant can be described by
log k = — (AE/2.30RT) + constant
where k is the rate constant at the temperature T (°K ), R is the gas constant, and AE the energy of activation.3’5 7’8'11 The plot of log k vs. 1/T is shown in Figure 2 (plot I).
One might reasonably assume that the internal radiative and nonradiative decay of the triplet state is temperature independent and represented by the intrinsic lifetime r0. In that case, the equation suggested by Lin and Bersohn22 should apply
log (1 /r — 1 /r0) = — (AE/2.30RT) + constant
where r is the phosphorescence lifetime at the temperature T. In this case the plot log (1 /r — l / r 0) vs. 1/T should yield a straight line. These results are shown in Figure 2 (plot II).
Although plots I and II do not yield straight lines some conclusions can be drawn. (1) Plot I indicates
(29) A . H . K alantar, J. Phys. Chem., 72, 2801 (1968).
Volume 73, Number 8 August 1969

2550 Ingo H. Leubner and Joe E. Hodgkins
that the internal radiative and nonradiative decay processes are not the only processes at higher temperatures. A t least one additional external decay process has to play an important role. (2) As the deviation from first-order decay at higher temperatures does not exceed3 -4 % , one might assume that there is only one additional temperature-dependent first-order external decay process. For this case, plot II should yield a straight line. Instead a somewhat continuous change of the slope takes place with rising temperature.
At temperatures over 80° K a reasonably straight line can be drawn in both cases. It is possible to calculate for this region an energy of activation of 2.01 and 2.33 kcal/mol (703 and 815 cm-1 , respectively) for plot I and plot II, respectively. The meaning of these values is not quite clear, but they are in the region of, e.g., benzene CH out-of-plane bending, methylene rocking (solvent!), and skeletal stretch vibrations. The latter presumably play an important role in the nonradiative decay of the triplet state of benzene.20
These results indicate that at higher temperatures two or more modes are contributing to the external nonradiative decay. A possibility is that with rising temperature a graduate change of the interaction of the excited molecules with surrounding molecules can occur, thus leading at higher temperatures to a pseudo- first-order decay process. No further effort has been made to fit the data to some Arrhenius-type expression.
Intrinsic Lifetime and Molecular Properties. Attempts were made to correlate the intrinsic phosphorescence lifetime to other molecular properties, so far available, as mass of substituent, Hammett a constants, dipole moments, energy and oscillator strength of ir bands, and magnetic susceptibility. No simple relationship could be found and no property of the n- alkylbenzenes is known to us which reflects a similar dependence on the chain length as the intrinsic phosphorescence lifetimes. It should be interesting to investigate the absorption and emission spectra and to try to correlate these data with the phosphorescence lifetimes via the Franck-Condon factors, e.g., by the method of Byrne, McCoy, and Ross.20
We have plotted the intrinsic lifetimes vs. the chain length of the alkyl groups (Figure 3, benzene = 0) and a general trend can be seen. Benzene (9.83 sec) and toluene (8.30 sec) have the longest lifetimes. With
increasing chain length the lifetimes decrease and approach a constant value. But the deviations must not be overlooked. These seem to follow a general pattern. After values of minimum intrinsic lifetimes, as that of 1-hexylbenzene (6.14 sec) and 1-nonylbenzene (6.33 sec), follow relative maxima of lifetimes, 1-heptyl- benzene (7.26 sec) and 1-decylbenzene (7.60 sec). Outside these extremes the lifetimes seemingly decrease uniformly. These deviations are outside the experimental error, and such an observation has not been previously reported. Further work is necessary to explain these results.
Conclusions
A device has been described to measure the phosphorescence lifetimes of organic molecules continuously in the temperature range between 4.8 and about 100°K. It has been shown that at temperatures below about 60°K , depending on the solute, the phosphorescence lifetimes approach constant values, which here have been called “ intrinsic (phosphorescence) lifetimes.” At higher temperatures the phosphorescence lifetimes are dependent on temperature-dependent effects, such as viscosity. Although this dependence follows a general pattern, it cannot be described by a simple function. Arrhenius plots indicate that with rising temperature two or more ways are contributing to the externally influenced nonradiative decay.
The incoherence of previously reported phosphorescence lifetimes at 77 °K has been attributed to the temperature- and solvent-dependent effects. Different reported phosphorescence lifetimes at 4 .2 °K are considered to be due to solvent effects only.
The intrinsic phosphorescence lifetimes of n-alkyl- benzenes, measured in a rigid glass mixture, methyl- cyclohexane-isopentane 4 :1 , have been found to be dependent on the chain length of the alkyl group. The temperature dependence as well as the intrinsic lifetimes have been shown to be dependent on the chain length. However, this relationship is not simple, and no relation to other molecular parameters has been found.
Acknowledgment. The authors wish to acknowledge the generous financial support of the Robert A. Welch Foundation during the course of this work.
The Journal of Physical Chemistry

Infrared Spectroscopic Investigation of Zeolites 2551
Infrared Spectroscopic Investigation of Zeolites and
Adsorbed Molecules. IV. Acetonitrile
by C. L. Angeli and M. V. HowellUnion Carbide Research Institute, Tarrytown, New York 10591 (Received November 1, 1968)
Acetonitrile, acetomtrile-d3, and benzonitrile were adsorbed on a variety of mono-, bi-, and tervalent cation exchanged Y and decationized Y zeolites. The C = N stretching bands occurred at higher frequencies than in the liquid or gas phases and were cation dependent. A correlation was shown between the electrostatic field of the cations and the frequencies of the C = N bands. Shifts of these bands also occurred on interaction with surface OH groups.
IntroductionIn part II of this series,1 it was shown that the
infrared spectrum of carbon monoxide adsorbed on bivalent cation-exchanged X and Y zeolites included a cation-dependent absorption band at a frequency higher than in the gas phase. The frequency of this band could be correlated with the size of the bivalent cation and the strength of the electrostatic field due to the cation. On this basis it was proposed that the interaction between a cation and the adsorbed carbon monoxide molecule was an electrostatic polarization phenomenon. Later, a quantitative measurement of the cation specific carbon monoxide band showed that this adsorption was of the Langmuir type.2 The infrared measurements combined with the adsorption isotherms made it possible to evaluate the number of sites responsible for the carbon monoxide adsorption; that is, it was possible to measure the number of bivalent cations existing in accessible positions on the zeolitic surface. Similar cation-dependent infrared absorption has been reported for carbon dioxide3 and for ethylene.4 The present work concerns the adsorption of acetonitrile, acetonitrile-d3, and benzonitrile on a variety of mono-, bi-, and tervalent zeolites5 as well as on decationized Y zeolites.5 The vibration of the CN bond occurs at higher frequencies than in the liquid or gas phases when the molecules are adsorbed on zeolites. The frequency of the C = N stretching vibration is cation dependent, showing that the adsorption of these molecules occurs on the cations. A correlation was found between the electrostatic field due to the cations and the frequencies of the C N bands both for acetonitrile and for deuterioacetonitrile. In the case of the decationized Y zeolites, the acetonitrile strongly hydrogen bonds with the surface hydroxyl groups. A shift of the C N fundamental frequency also occurs on interaction with OH groups.
Experimental SectionThe composition of zeolite samples not given pre
viously (part I, Table I ; for LaY see ref 6) are
SrY ().16Na/3-0.76SrO ■ 1.00A120 3 ■ 4.95Si02
BaY 0.20Na2O • 0.79BaO • 1 .QOA120 8 ■ 4.94Si02
CuY O.MNa^O • 0.79CuO ■ 1.00A120 8 ■ 5.44Si02
The short path length infrared cells and experimental techniques have also been described in part I .1 The infrared spectra were obtained on a Perkin-Elmer Model 225 spectrophotometer and on a Perkin-Elmer Model 112 single-beam spectrometer converted to grating operation. The acetonitrile and the benzonitrile were obtained from Fisher while the acetonitrile- d3 was obtained from C IB A; all were used without any further purification but were degassed by the freeze- pump-thaw technique. Zeolite samples were activated by flash vacuum activation at 500°. By observing the growth of bands with increasing pressure, it was found that saturation of the adsorption occurred at fairly low vapor pressures of the nitrile (about 2 Torr). The spectra were run either in the presence of the nitrile or after the sample had been evacuated to approximately 10 ~6 Torr pressure.
Deuterium exchange of the OH groups of decationized Y zeolite was achieved by heating the activated sample with 600 Torr of deuterium gas at 500° for 1 hr, then evacuating at the same temperature for 1 hr.
(1) P a r t i : C . L . A n gell and P . C . S c h a f f e r ,P I i j / s . C7iem., 69 , 3463(1 9 6 5 ) ; p art I I : C . L . A ngell and P . C . Schaffer, ibid., 70, 1413(1 96 6 ) .(2) J. A . R a b o , C . L . A ngell, P . H . K asai, and V . S ehom aker, Discussions Faraday Soc., 41 , 328 (1966).(3) (a) J . W . W a rd and H . W . H a b g o o d , J. Phys. Chem., 70, 1178 (1 96 6 ); (b ) C . L . A ngell, ibid., 70, 2420 (1966).(4) J. L . C arter, D . J. C . Y a tes, P . J. L ucchesi, J . J. E llio tt, and V . K evork ian , ibid., 7 0 , 1126 (1966).(5) T h rou gh ou t this article the ty p e Y zeolite is designated N a Y ; see U . S. P aten t N o . 3 ,130,007. F orm s in w h ich sodiu m has been exchanged w ith other cations are designated as C a Y , etc. T h e term “ decation ized Y ” w ill m ean N H 4Y w h ich w as heat treated to decom p ose the N H 4 ions (see U . S. P aten t N o . 3 ,130,006).(6) J. A . R a b o , C. L . A ngell, and V . Sehom aker, presented at the F ou rth In ternational C ongress on C ata lysis, M o sco w , June 1968.
Volume 73, Number 8 August 1969

2552 C. L. Angell and M. V. Howell
Table I : CN Stretching Frequencies of Nitriles Adsorbed on Zeolites (in cm *)
CH.CN-
Liquid 2293 2254NaY 2296 s 2263 vsMgY 2317 vs 2293 vs 2265 vsCaY 2310 vs 2279 vsSrY 2309 s 2278 vsBaYMnY
2302 s 2313 s,
2268 vs
2302 s 2286 vs 2268 vsCoY 2322 vs 2296 vs 2266 vsNiY 2323 vs 2296 vs 2263 vsZnY 2328 vs 2300 vs 2263 sAgY 2302 s 2269 vsDecat Y 2305 s 2275 sLaY
CunY
2304 s 2272 s (2260 shoulder) at low P
-------------------------- CDaCN--------------------------------------------.-Evac at R T ----------------- • ---------Evac at 500°----------
2263 22632278 vs 2285 m
2303 s 2280 vs 2299 s2291 vs 2285 s2287 vs 2282 s2275 vs 2275 s
2297 2284 22892309 s 2276 vs 2301 s2314 vs 2280 2314 vs 2280 s2314 vs 2276 s 2302 s
2305 s 2280 s2283 m (2263 m)
shoulder
2306 s
2317 s 2270 m
CsHsCN
22222248
2265, 2251
2252
ResultsThe spectrum of acetonitrile in the liquid phase
shows two bands in the CN fundamental stretching region. The band at 2254 cm-1 is assigned7 to the CN stretching vibration (j>2) while the band at 2293 cm-1 is due to Fermi resonance between the combination i>3 + Vi and the fundamental v2. When acetonitrile is adsorbed on N aY zeolite these bands show a small shift to 2263 and 2296 cm-1 . Both bands shift further to progressively higher frequencies when acetonitrile is adsorbed on the series BaY, SrY, CaY. When magnesium Y is reached, or when acetonitrile is adsorbed on zeolites containing transition metal cations, there are three bands observed in this region (Figure 1). The lower frequency band, which changes very little from its position in NaY, is attributed to some general adsorption of acetonitrile within the zeolitic cavity, while the other two bands are due to the acetonitrile attached to a cation. The bands did not change after evacuation at room temperature for 1 hr showing that the acetonitrile is quite strongly adsorbed on all of these zeolites.
Similar effects are observed on the adsorption of acetonitrile-ds on a series of zeolites. The fundamental frequency at 2263 cm-1 in the liquid shifts to 2278 cm-1 in the NaY. This band shifts to higher frequencies in the series BaY, SrY, and CaY and splits into two when the small magnesium or transition metal cations are used (see Figure 1). As in the case of acetonitrile, evacuation at room temperature for 1 hr did not change the bands. However, when the sample was evacuated at 500° for 2 to 5 min, in all cases where the spectrum previously showed two bands (M gY, NnY, CoY, NiY, ZnY) there was only one band left; this new band usually occurred at a somewhat lower frequency than the original higher frequency band (see Table I).
Figure 1. The CN stretching region in the spectra of CH3CN and CD3CN adsorbed on zeolites (after exposure, the samples were evacuated at room temperature for 1 hr): A, NaY with XTorr of CHSCN; B, CoY with 1 Torr of CH3CN; C, NaY with0.5 Torr of CD3CN; D, CoY with 2 Torr of CD3C N ;------,evacuated at 500° for 3 min.
These results indicate that the molecules responsible for the lower frequency band (general adsorption) are removed at high temperature, but the molecules attached to the cations (higher frequency band) are stable even at 500°. In the case of acetonitrile, only one sample (M nY) was evacuated at 500°; the original three bands gave place to two bands at 2308 and 2279 cm-1 .
Benzonitrile was adsorbed on a few samples only. On ZnY there was again a splitting of the C N stretching band, but the shift to high frequency from the liquid value was much smaller than for the acetonitriles.
When the nitriles were adsorbed on decationized Y or LaY, there was no splitting of the C N bands, and the
(7 ) P . V enkatesw arlu , J. Chem. Phya., 19, 293 (1951).
The Journal of Physical Chemistry

frequency shifts were not much more than those occurring on NaY. On exposure to about 0.5 Torr of any one of the nitriles, the OH bands showed no observable changes (see Figure 3), although two broad bands appeared at lower frequencies presumably due to hydrogen-bonded hydroxyl groups (see Discussion). When the pressure was increased to about 2 Torr, the 3640-cm-1 OH band was nearly completely removed, while the 3540-cm-1 band did not decrease at all. Evacuation of the samples at room temperature decreased all the bands of the nitrile and restored the 3640-cm-1 OH band. Similar observations were made on the deuterium exchanged decationized Y at a higher pressure of acetonitrile.
The other frequencies of the adsorbed nitrile molecules which could be observed in the available spectroscopic region (the methyl stretching and methyl deformation vibrations) did not change with the cation. Unfortunately, the carbon-carbon stretching vibration of these molecules could not be observed because the zeolite samples did not give any transmission in this region. Frequencies of the bands appearing in the CN stretching region are listed in Table I for acetonitrile, deuterioacetonitrile, and benzonitrile.
DiscussionIt was shown by Purcell8 that when acetonitrile
formed a coordination complex (adduct) with an electron acceptor molecule, the fundamental CN stretching frequency always increased. The increase of the CN stretching frequency was used to predict the strength of Lewis acidity for the acceptors. Molecular orbital calculations indicated that kinematic effects, that is, the coupling of the adduct bond with the C N stretching vibration, cannot be used to explain all the increase in the C N stretching frequency. The conclusion was that changes on coordination in the nitrogen 2s lone-pair orbital were responsible for the strengthening of the C N bond.
A similar interaction occurs between the acetonitrile molecule and the cations on the zeolitic surface. No previous reports have been found on the behavior of the Fermi resonance doublet in such coordination compounds. However, it was observed that the higher frequency component of the Fermi resonance doublet also shifted to higher frequencies on adsorption of acetonitrile (see Figure 2). This seems reasonable: when the fundamental frequency increases, it shifts the other band of the doublet to higher frequencies; the increase is smaller than for the fundamental itself, since one of the components (the + vi combination) does not change on coordination. To put this shift on a quantitative basis we have tried to find a relation between the increase of the C N stretching frequency and the electron accepting power of the cations. The electrostatic field generated by the cations on the zeolite surface was used as a measure of the latter.9
Infrared Spectroscopic Investigation of Zeolites 2553
Figure 2. Shifts from the liquid state values of the CN stretching frequencies of CH3CN and CD3CN adsorbed on various zeolites: O, the 2254-cm-1 band of CH3CN; A, the 2263-cm-1 band of CD3CN; □, the 2293-cm-1 band of CH3CN.
In Figure 2 we have plotted the shifts in frequency from the liquid phase value for three different bands: (a) the fundamental C N stretching vibration of acetonitrile at 2254 cm-1, (b) the higher frequency component of the Fermi doublet of acetonitrile at 2293 cm-1, and (c) the C N stretching vibration of deuterio- acetonitrile at 2263 cm-1 . The plot shows that for all three bands there is a fairly satisfactory relationship between the shift of the C N frequency and the field strength due to the cation. Actually, the shifts of the fundamentals of acetonitrile and its deuterated analog are practically the same. The relationship is more satisfactory for the closed shell alkaline earth cations than for the transition metal cations. The general correlation between the frequency shift and electrostatic field strength indicates that the cause of the frequency shift is essentially a polarization phenomenon, as in the case of carbon monoxide (see part I I 1). When the acetonitrile molecule is placed in the electrostatic field in the zeolite, the cations pull the electrons away from the lone-pair orbital of the nitrogen, thereby increasing the C N bond force constant. Purcell has shown8 that complex formation also affects the C -C bond force constant in acetonitrile. It is unfortunate, therefore, that no observation of the band due to the carbon- carbon single bond could be made.
(8) (a) K . F . P urcell and R . S. D rag o , J. Amer. Chem. Soc., 88, 919 (1 96 6 ); (b ) K . F . P urcell, ibid., 89 , 247 (1 96 7 ); (c) K . F . P urcell, ibid., 89, 6139 (1967).(9) P . E . P ick ert, J . A . R a b o , E . D em p sey , and V . S chom ak er, P roceedin gs o f th e T h ird In ternational C ongress on C ata lys is , Paris, 1965, p 728.
Volume 73, Number 8 August 1969

2554 C. L. Angell and M. V. Howell
Figure 3. Acetonitrile adsorbed on decationized Y : A,zeolite activated at 500° for 3 hr; B, with 0.5 Torr CH3CN at room temperature.
The frequency shifts in the case of acetonitrile are quite a bit smaller than those in the case of carbon monoxide. This probably indicates that the polarizability of the carbon monoxide molecule is considerably larger than than of acetonitrile. The deviations of points from the straight lines in the case of the three bands in Figure 2 seem to agree with each other in direction and magnitude. This indicates that deviations of these points are not random errors, but represent some systematic deviation from the relationship. Therefore, it is possible that the concept of electrostatic polarization does not completely account for the magnitude of the shifts. In the case of the transition metal cations, interaction of the d orbitals of the cation with the nitrile molecules represents an additional factor that may be responsible for the deviations.
In order to see the interaction of the nitriles with zeolites not containing any cations, we adsorbed them on a decationized Y sample activated at 500°. This zeolite contains OH groups,10 and interaction with acetonitrile would be expected. Figure 3 shows that when acetonitrile is adsorbed, a broad band appears at about 2900 cm-1 in addition to the bands of acetonitrile. At a higher pressure of acetonitrile, the 3640-cm-1 OH band disappears nearly completely, while the 3540- cm-1 band is practically unchanged. This has been observed previously in the case of several adsorbed molecules; for example, pyridine,11 propylene, and hexane.12 Exactly the same spectral features appear on the adsorption of deuterioacetonitrile or benzo- nitrile. The broad band at 2900 cm-1 is undoubtedly due to hydrogen bonding interaction of acetonitrile
with the hydroxyl groups on the surface. The shifts of the C N stretching vibrations both for acetonitrile and deuterioacetonitrile are somewhat larger than on sodium Y . These shifts from the liquid-state frequency are undoubtedly due to hydrogen bonding interaction, since hydrogen bonding also represents electron withdrawal from the nitrogen atom of the nitrile. It is not intended to make a quantitative comparison between interactions with cations and with hydroxyl groups: the first is a coordination interaction, while the second is a case of hydrogen bonding, but it is pointed out that the effect of hydrogen bonding is small compared to complex formation with most bivalent cations.
Addition of acetonitrile to LaY activated at 500° gave the same C N stretching frequencies as observed on decationized Y . This agrees with our previous argument6 that LaY does not have any cations in accessible positions on the surface. The acetonitrile shows interaction with the hydroxyl groups on the surface of the LaY, but not with any cations.
The spectrum of acetonitrile adsorbed on decationized Y (see Figure 3) shows a small, broad band at 2400 cm-1 . This band was not observed in the spectra of any of the cation-containing zeolites when acetonitrile was adsorbed on them. Addition of deuterioacetonitrile to decationized Y does not change either the broad hydrogen bonded band at 2900 cm-1 or the smaller band at 2400 cm-1 , indicating that the methyl group is not involved in this interaction. On the other hand, when a decationized Y is fully deuterium- exchanged to give OD groups and acetonitrile is then adsorbed, definite shifts of these bands occur. The band at 2900 cm-1 shifts to about 2300 cm-1, while the small band at 2400 cm-1 appears at around 1850 cm-1 .
The considerable shift of the 2400-cm-1 band on deuterium exchange indicates that this band represents a vibration involving a hydrogen atom. It is most likely an overtone of the OH bending vibration. This latter vibration is probably shifted from its normal position an hydrogen bonding with acetonitrile to a position where it can give rise to an overtone in the 2400-cm-1 region, or it is possible that the OH bending vibration does not shift on hydrogen bonding but greatly increases in intensity. Examples of this kind have been previously observed. (The authors wish to thank Professor G. Pimentel for bringing this fact to their notice.)
(10) M . R . B asila, Appl. Spectrosc. Rev., 1, 307 (1968).(11) J. W . W ard , (a) J. Catal., 9, 225 (1 96 7 ); (b ) J. Phys. Chem., 71, 3106 (1967).(12) R eferen ce 10, p p 340 -342 .
The Journal of Physical Chemistry

Pyrolysis K inetics of A cetonitrile 2555
Pyrolysis Kinetics of Acetonitrile
by Thomas W. Asmus1 and Thomas J. HouserChemistry Department, Western Michigan University, Kalamazoo, Michigan {Received November 4, 1968)
The pyrolysis kinetics of acetonitrile was studied in the temperature range of 880-960° at 1 atm total pressure, using a stirred-flow reactor and helium as the carrier gas. Under these conditions a fractional reaction order greater than 1 was found. Plots of reaction rate/reactant concentration vs. reactant concentration produced straight lines, the intercepts and slopes of which were equal to first-order, k x, and second-order, k2, rate constants, respectively. From Arrhenius plots of these rate constants the following expressions were obtained : h = 10u -8e x p ( -72,000 ± 4000/fiTr) sec“ 1, and h = 1020-6 exp(-120,000 ± 6000/ R T ) 1. mmol“ 1 sec"1. The major volatile products of the reaction were methane and hydrogen cyanide, the relative amounts of which shifted by about a factor of 2 in going from 7 to 60% reaction. Small amounts of ethylene and vinyl cyanide were also observed. A brown, nonvolatile polymeric residue was formed in the reactor’s exit which, from elemental analysis and infrared data, is believed to be of the cyano-substituted ethylenic type. The pyrolysis rate of acetonitrile-d3 was found to be about 40% slower than that of normal acetonitrile. To explain the rate and product data a dual mechanism was proposed consisting of first- and second-order contributions.
This work involved the study of the kinetics and products of the gas-phase, thermal decomposition of acetonitrile in the temperature range of 880-960° using a stirred-flow reactor. The literature has revealed no recent work on the thermal decomposition kinetics of acetonitrile. In 1942, Rabinovitch and Winkler2 studied the products of the thermal decomposition of acetonitrile at 865° and atmospheric pressure; however, no mechanism was proposed. These investigators reported hydrogen, methane, and hydrogen cyanide as the major volatile products. Acetylene and/or ethylene were reported as minor volatile products. McElcheran, et al.,3 in 1958, reported results of the photolysis of acetonitrile at 1849 A and proposed a mechanism to account for the observed products. They suggest that initiation may occur either by C -H or C -C bond breakage where the former process is more probable. These authors also suggest that H CN is formed predominantly by an H a:om abstraction of the CN group which is believed to occur through addition to the multiple bond with the formation of an unstable imine radical.
Experimental SectionApparatus and Procedure. Experiments were carried
out in a conventional flow system using a motor- driven syringe to inject the liquid reactant as described previously.4 The flow system was equipped with a stirred-flow reactor, constructed of Vycor, the design of which had been previously tested for stirring efficiency.6 After an experiment the volatile products and unreacted acetonitrile in the traps were transferred under vacuum at room temperature to a vial which contained a weighed amount of p-xylene to be used as as an internal standard for quantitative gas chromatographic analysis.
Materials. Eastman spectrograde acetonitrile (stored above Linde Type 3A molecular sieve for adsorption of water) was used without further purification. The reactant was checked for impurities by mass spectrometric analysis (all mass spectra were run on an Atlas Model CH 4) and found to be better than 99% pure. Matheson Coleman and Bell analytical grade p-xylene was used as the internal standard for the quantitative gas chromatographic determination of acetonitrile.
Analytical Techniques. For the quantitative determination of unreacted acetonitrile, diethylene glycol succinate was used as the liquid phase on a Chro- mosorb W (acid and DM CS treated) column in an F & M Model 720 gas chromatograph. A calibration curve of known acetonitrile to p-xylene weight ratios vs. peak area ratios was constructed. The selection of p-xylene as an internal standard was based on its resolvability with acetonitrile and hydrogen cyanide and on its ability to produce moderately broad peaks. The mass spectra of volatile products from several experiments covering a broad range of conditions were obtained also. The ratio of IIC N /C IL in the reactor’s exit stream was determined with a gas chromatograph which was linked to the flow system by a Beckman gas sampling valve. The column had a solid phase of Chromosorb W (acid and DM CS treated); dinonyl phthlate was used as the liquid phase. The
(1) T h is research is in partia l fu lfillm ent o f requirem ents for an M .S . degree.(2) B . S. R a b in o v itch and C . H . W inkler, Can. J. Res., 20B , 69 (1942).(3) D . E . M cE lch eran , M . H . J. W ijn en , and E . W . R . Steacie, Can. J. Chem., 36, 321 (1958).(4 ) T . J . H ouser and B . M . H . L ee, J. Phys. Chem., 71, 3422 (1967).(5) J. M . Sullivan and T . J. H ouser, Chem. Ind. (L on d on ), 1057 (1965).
Volume 73, Number 8 August 1969

2556 T homas W. Asmus and T homas J. Houser
detector cell (Gowmac Model No. 9677) was equipped with a pair of matched thermistors operating at room temperature which formed part of a Wheatstone bridge. This system was also used to determine the isotope effect using deuterated acetonitrile.
Results
Products. All peaks which appeared in the mass spectra of the exit gases with a height of at least 1% of the base peak height, along with the probable species to which they were attributed, are shown in Table I. The major volatile products of the pyrolysis of acetonitrile were hydrogen cyanide and methane. Unlike previously reported results from the study of this reaction at 865°,2 hydrogen did not appear in detectable quantities. Ethane also wTas not observed as a reaction product. Compared to the major volatile
Table I : Relative Intensities of Key Ions from Mass Spectrometer Analysis of Products
-Relative peak height— '
m/eAt 10% decomp
At 60% decomp Probable species
15 5 36 c h 316 5 47 c h <26 2 15 CN, C2H227 10 100 HCN, C2H328 1 7 Coll,38 9 2 CCN39 18 7 CHCN40 50 22 CH2CN41 100 47 CHsCN51 1 2 CCHCN, CHCCN52 1 2 CHCHCN, CH2CCN53 1 2 c h 2c h c n
products, ethylene (28) and vinyl cyanide (53) appeared only in relatively small amounts. There is a greater degree of uncertainty in the height of the 28 peak because of a relatively high nitrogen background in the instrument at the time the spectra were run.
A shift in the relative amounts of the major products was observed and, within the precision of the experiments, appears to be a function of the extent of reaction. The data from the gas chromatographic measurements are presented in Table II. Because it was not possible to calibrate the chromatograph for H CN and because the relative response factor was not available, the product mole ratios are not known with any degree of certainty.6 However, it can be seen that the relative amounts of H CN and methane changed by nearly a factor of 2, from about 1.0 to 1.9.
A brown, nonvolatile polymeric product, which was readily soluble in acetone and dimethyl sulfoxide, coated the walls of the reactor outlet and the cold traps. Quantitative elemental analysis of a sample
Table II : Relative Concentrations of Major Products
Contact Reactant Peak areatime, concentration, ratios %
sec mol % (HCN/CBU) reaction
T = 910°2.2 1.85 1.20 82.15 4.8 0.90 74.6 1.90 1.25 144.45 4.6 1.10 155.9 1.85 1.45 185.9 4.6 1.50 21
10.5 1.90 1.60 2810.1 4.6 1.55 30
T = 960°1.35 1.80 1.25 141.3 4.35 1.15 172.75 1.90 1.60 262.65 4.6 1.45 233.7 1.85 1.75 423.6 4.5 1.70 379.9 1.85 1.90 609.5 4.5 1.90 65
(physically removed from the apparatus near the reactor exit) suggested the following empirical formula,(CnIUNY),,, Quantitative analysis of the H CN in the exit stream (via cyanide ion determination) coupled with the amount of acetonitrile consumed indicated that roughly 25 -30% of the CN produced by the pyrolysis reaction remained in the apparatus in a polymeric residue. A network cyclic structure (para- cyanogen) has been suggested as a possible product resulting from the polymerization of cyanogen;7 however, these authors suggested that paracyanogen is unstable at temperatures above 850°. Consequently, it is felt that this polymeric residue is of the cyano- substituted ethylenic type. This argument is supported by the infrared spectrum of this material which shows major absorption at 2200 cm-1 . This roughly corresponds to the CN triple bond stretch which suggests that the CN groups are intact.
Kinetics. The kinetic data are shown in Table III. With a stirred-flow reactor, explicit values for the rate can be determined according to eq Is
rate = (c0 — c)/t = f(c) (1)
where c0 = intial concentration of acetonitrile and c =
(6) A n estim ate o f the relative response fa ctor for H C N o f 50 was ob ta ined b y extrapolation , to a m olecular w eight o f 27, o f a graph o f m olecu lar w eight vs. relative response fa ctors for the a lkyln itrile h om ologou s series. U sing this va lue and 36 for m ethane (relative to 100 for benzene) ind icates that the rate o f p rod u ction o f m ethane p rob a b ly is higher than that o f H C N at low extents o f reaction . H ow ever, the rate o f p rod u ction o f H C N is defin itely h igher than that o f m ethane at higher extents o f reaction . A ll re lative response fa ctors w ere ob ta in ed from A . E . M essner, D . M . R osie , and P . A . A rgabrigh t, Anal. Chern., 31, 230 (1959).(7) C . P . C ullis and J. C . Y a tes, J. Chem. Soc., 2833 (1964).(8) K . J. L aidler, “ C hem ical K in etics ,” 2nd ed, M cG ra w -H ill B o o k C o ., In c ., N ew Y o rk , N . Y ., 1965, p 24.
The Journal of Physical Chemistry

Pyrolysis K inetics of Acetonitrile 2557
Table HI : Pyrolysis of Acetonitrile Kinetic Data
Initial concentrationsContact
time, FractionRate,
m m ol/1.-Imol % mmol/1. sec reacted sec-1
8 0.824Data at 880°
6.2 0.103 0.01372 0.219 6.7 0.116 0.00312 0.206 13.4 0.171 0.00265 0.500 12.9 0.182 0.00718 0.825 12.4 0.215 0.01432 0.206 20.2 0.285 0.00295 0.516 19.2 0.250 0.00678 0.832 18.5 0.290 0.01312 0.206 26.5 0.300 0.00238 0.822 24.5 0.308 0.01035 0.515 25.5 0.325 0.00665 0.516 9.5 0.136 0.00735 0.516 16.2 0.203 0.00655 0.516 21.7 0.325 0.00778 0.820 16.2 0.217 0.01092 0.205 17.6 0.188 0.00228 0.820 15.8 0.246 0.0127
5 0.500Data at 910°
6.3 0.188 0.01502 0.200 6.5 0.174 0.00542 0.201 13.0 0.330 0.00515 0.505 12.3 0.361 0.01488 0.808 11.9 0.345 0.02348 0.807 17.9 0.399 0.01805 0.506 18.7 0.434 0.01172 0.202 19.2 0.352 0.00375 0.503 24.5 0.526 0.0108
2 0.196Data at 940°
6.3 0.333 0.01068 0.785 5.7 0.404 0.05562 0.196 12.5 0.504 0.00798 0.782 11.4 0.561 0.03852 0.196 18.7 0.574 0.00618 0.790 17.1 0.664 0.03062 0.177 2.6 0.177 0.0119
8 0.770Data at 960°
5.6 0.527 0.07322 0.192 12.3 0.676 0.01068 0.778 11.1 0.700 0.04898 0.776 16.6 0.765 0.03582 0.192 19.0 0.710 0.0072
concentration of acetonitrile at contact time, t (reactor volume/volume rate of flow).
Thus, it was possible to plot values of the rate against various functions of the concentration to obtain the best rate expression. Plots of log rate vs. log c yielded straight lines having slopes of about 1.2.
Since the apparent order of the reaction was greater than 1, a rate equation involving a first- and second- order term was tried and found to fit the kinetic data reasonably well. Thus, if
— dc/dt = rate = he + fc2c2 (2)
then a plot of rate/c vs. c should be a straight line with
the intercept equal to ki and slope equal to k2. The exclusion of other possible treatments of the kinetic data and the selection of this approach as best representing all the data will be discussed in the next section.
Table IV summarizes the values of k\ and hi obtained by least-squares treatments of the data. Arrhenius plots of the rate constants yield the following expressions.
h = 1011'8 exp(—72,000 db 4000/RT) sec-1 (3)
h = 1020-6 e x p ( -120,000 ± Q000/RT)1. mmol-1 sec-1 (4)
Table IV : Pyrolysis of Acetonitrile Kinetic Results
Temp, ki X 10*, kì X 102,°C sec-1 1. m m ol-1 sec-1
880 1.5 0.64910 3.3 1.9940 6.7 12.6960 14.6 19.8
Several experiments at 910° and about 5 mol % reactant were made to determine the effect of additives on the rate. Two experiments conducted with H CN added at a concentration of one-fifth that of the reactant produced no measurable effect on the rate of disappearance of reactant, indicating no autocatalysis by this product. On the basis of pyrolysis data for methane,9 it was assumed that methane was chemically inert (about 0 .1 % decomposed) at reaction conditions. Cyanogen bromide, a source of radicals at reaction temperatures, was also used as an additive in two experiments at a concentration of about one-eighth that of the reactant. With this additional concentration of radicals the rate would be expected to increase significantly if a radical-chain mechanism were operating. However, within the reproducibility of the experiments (about ± 10%) no increase in the rate was observed (the data for the additive experiments were subject to a greater experimental uncertainty).
Three experiments were made using deuterated acetonitrile (CD3CN) at a concentration of about 5 mol % , one at 910° and two at 940° at different contact times. These experiments were run immediately before or after an experiment with normal acetonitrile, with all experimental conditions unchanged for each pair of experiments to reduce experimental scatter. The normal acetonitrile reacted about 40 ± 10% (&h/&d = 1.4) more rapidly than the deuterated reactant based on either reactant consumption or product formation.
(9) H . B . Palm er and T . J. H irt, J. Phys. Chern., 67, 709 (1963).
Volume 73, Number 8 August 1969

2558 T homas W. A smus and T homas J. Houser
Discussion and ConclusionsThe magnitude of the reaction order, i.e., about 1.2,
and the observation that there is a large shift (about a factor of 2) in the relative amounts of the major products indicate that the pyrolysis mechanism is complex. A radical-chain mechanism was ruled out because additives had relatively small effects on the rate, and the observed activation energies (72 and 120 kcal/mol for the first- and second-order rate constants, respectively) were as large or larger than the weakest bond in the molecule, i.e., the carbon-hydrogen bond which is reported to have a bond energy of 72 kcal/ mol.10 It is believed that no simple mechanism could lead to the large shift in the relative quantities of the major products that was observed. Thus, it is reasonable to propose that at least two mechanisms are operating simultaneously to correspond to the two terms in the rate equation.
The first-order term could be accounted for by the following radical mechanism.
CHsCN CH2CN + H (5)ka
H + CH3CN — >- CH 3 + H C N (6)
CH3 + CH3CN CH 4 + CH2CN (7)
nCH„CN — >-
products (polymer, C2H 3CN, C2H 4, HCN) (8)
Steps 6 and 7 are assumed to be rapid enough to make step 5 rate controlling; i.e., steady state is assumed for the H and CH3 radicals. Thus, the apparent first- order rate constant for the disappearance of acetonitrile, ki, is equal to 3fc5-
The observation that the activation energy for the first-order rate constant and the reported C -H bond energy are the same supports a mechanism with C -H bond rupture as the rate-controlling step.
In addition, an isotope effect as large as 4 0% also indicates that the C -H bond rupture must play an important role in a rate-controlling step of the reaction. An estimate of the isotope effect to be expected for a simple bond rupture (as in reaction 5) can be made using the reported infrared spectral data for acetonitrile and acetonitrile-d3.u Using as a model the “ rigid” activated complex, i.e., all fundamental vibrational frequencies except that leading to bond rupture are assumed the same in both the complex and reactant molecule,12 a maximum isotope effect of about 70%
(hu/ho = 1.7) was calculated at a temperature of 1200°K. If the C -C bond rupture were the ratecontrolling step in the mechanism, then a maximum isotope effect of approximately 12% would be predicted from the infrared data and the above model. Thus, the observed and calculated isotopes effects appear consistent with the above mechanism being a major contributor to the over-all pyrolysis of acetonitrile.
For the above mechanism, the H C N /C H 4 molar ratio must be at least 1, with some increase occurring as the polymeric residue, and/or radicals leading to polymers, contribute additional H CN at longer reaction times. Therefore, to account for lower H C N /C H 4 product ratios it is necessary to assume that the second- order term represents a mechanism which leads to the production of higher concentrations of methane than HCN, at least initially. The more rapid decrease in the rate of reaction involving a second-order term than that involving a first-order term, as the reactant is consumed, would also contribute to the observed over-all shift in the product ratio.
The large activation energy for the second-order term may be due to the C -C bond rupture playing an important role in the rate-controlling step. The C -C bond dissociation energy was reported to be 110 and 122 kcal/mol from electron impact and photodissociation studies, respectively.13
It was found that an alternate rate equation consisting of first- and three-halves-order terms fit the data equally well. However, this equation was discarded because a radical-chain mechanism was required for the three-halves-order term which would have had an activation energy much lower than that observed experimentally.
Acknowledgment. We wish to express appreciation for the mass spectrometer analyses run by Dr. M . Grostic and Mr. R. Wnuk of the analytical laboratory of The Upjohn Company.
(10) V . H . D ibeler and S. K . L iston , J. Chem. Phys., 4 8 , 4765 (1968). A n earlier va lu e o f < 7 9 k ca l/m o l was rep orted b y R . F . P ottie and F . P . Lossing , J. Amer. Chem. Soc., 83, 4737 (1961).(11) E . L . P a ce and L . J. N oe , J. Chem. Phys., 4 9 , 5317 (1968).(12) T h e equation used for this m od el is &h /& d = sinh (JurS/2 k T ) / sinh (h vv/2k T ) , w here k is the B oltzm an n constant, h is th e P lanck con stant, T is th e absolute tem perature, and v is the fun dam enta l v ib ra tion a l frequ en cy o f the norm al m od e leading to reaction . J. B igeleisen, ibid., 17, 345 (1949).(13) D . D . D a v is and H . O kabe, ibid., 49 , 5526 (1968). T h e data for the 110 va lu e w ere ob ta in ed from C . A . M c D o w e ll and J. W . W arren , Trans. Faraday Soc., 48, 1084 (1952), w h o rep orted a va lu e o f 102 k ca l/m o l.
The Journal of Physical Chemistry

Uv Study of Adsorbed Pyridine and 2,2'-Bipyridyl 2559
Ultraviolet Study for the Adsorption of Pyridine and
2,2'-B ipyridyl on Evaporated Metal Film s
by Kosaku Kishi and Shigero IkedaDepartment of Chemistry, Faculty of Science, Osaka University, Toyonaka, Osaka, Japan (Received November 4, 1968)
Ultraviolet spectra for pyridine adsorbed on Ti, Fe, and Ni, and those for 2,2'-bipyridyl on Ti, Mn, Fe, Ni, and Cu are reported. The adsorbed pyridine on Ti gives a band at 257 m/x, on Fe two bands at 258 and 297 m/x, and on Ni a band with peaks of vibrational structure at 265.5, 260, 254.3, and 248 m/x. These bands near 260 m/x were assigned to 71— 71-* (’Lb) transition of the adsorbed pyridine. The 297-m/x band on Fe was assigned to a charge-transfer band and two types of x interaction were examined between tt orbitals of the pyridine ring and dx orbitals of adsorbent metal atoms. The spectral variations depending on these metals are discussed on the basis of the pyridine-metal bond character. The adsorbed 2,2'-bipyridyl gives two bands near 240 and 285 m/x on the metals used. Spectral change of the adsorbed species by evacuation shows an existence of species on various energy sites. Effects of admission of air on the spectra are also reported.
IntroductionUltraviolet spectra of /3-diketones1 and 8-hydroxy-
quinoline2 adsorbed on evaporated metal films were examined previously to clarify the differences of electronic states (mainly of x-electron systems) between the adsorbed species and the corresponding metal complexes. This kind of study for other types of adsorbates will give much more precise knowledge to surface chemistry, especially metal catalysis and corrosive reaction. In the present paper, «--bonding characteristics are examined between lone-pair electrons of nitrogen of adsorbates and an adsorbent metal atom on the basis of ultraviolet spectra of pyridine and 2,2'- bipyridyl adsorbed on some of the first transition metals. These heterocyclic compounds are known as the typical ligands coordinating through nitrogen. x-Bond formation is also discussed.
Experimental SectionA detailed description of the experimental procedure
has been reported previously.1 The experiments were conducted in a cell specially designed for use with a Hitachi EPS-2 spectrophotometer. The scan speed was set at about 10 min from 220 to 340 m/x.
A metal was evaporated from a tungsten filament onto quartz cell windows in a vacuum (2 X 10~5 mm). The background spectrum of the resultant metal film was recorded. The film was then exposed to pyridine or 2,2'-bipyridyl vapor, and the spectra of adsorbed species were recorded after various intervals of time up to about 20 hr. In the case of pyridine, the vapor in the cell was removed with a liquid nitrogen cooled trap. The condensed species was again warmed up to a room temperature for the subsequent adsorption after the scan was over.
A vessel containing solid 2,2'-bipyridyl was evacuated
(2 X 10”6 mm) for 2 hr and attached to the cell with a tapered joint after closing a stopcock of the vessel. After metal evaporation, the bipyridyl vapor was introduced to the cell through the stopcock which was opened throughout the vapor-adsorption procedure in the experiment. The pressure of the vapor is very low (less than 1 X 10_1 mm) at room temperature, and an absorbance by the vapor is negligibly small when the cell with 1-cm path length is used. The vapor was, therefore, not removed during spectrum scan for the adsorbed species.
The pyridine and the 2,2'-bipyridyl are Guaranteed Reagent grade from Nakarai Chemicals. The pyridine was further purified several times by fractional distillation in a vacuum.
Titanium, manganese, iron, nickel, and copper metals had purities of 99.8, 99.9, 99.99, 99.5, and 99.8% , respectively.
ResultsPyridine Adsorption. Figure 1 shows spectra of
evaporated films of Ti, Fe, and Ni exposed to pyridine vapor (15 mm) at a room temperature for the following times: Ti, (1) 10 min, (2) 2 hr, (3) 16 hr; Fe, (1) 30 min, (2) 2 hr, (3) 16 hr; Ni, (1) 5 min, (2) 30 min, (3) 2 hr, (4) 16 hr. These spectra were obtained as the difference between an absorbance of each recorded spectrum and that of the film background. The band positions of them are summarized in Table I, with those of pyridine at various states presented for comparison. In the case of Ni, the band has a structure and shows a steeper absorbance change at longer wavelengths as seen in the genuine band of pyridine. After prolonged
(1) K . K ishi, S. Ik eda , and K . H irota , J. Phys. Chem., 7 1 , 4384 (1 96 7 ); K . K ish i and S. Ik eda , ibid., 7 3 ,1 5 (1969).(2) K . K ish i and S. Ik ed a , ibid., 73, 729 (1969).
Volume 78, Number 8 August 1969

2560 K osaku K ishi and Shigero Ikeda
Table I: Ultraviolet Data of Pyridine at Various States
Wavelength, Wave number, Wavelength Wave numbermju X 102, cm-1 m y . X 102, cm“1
Gas 260.5 384 Complex'254 394 Pt(NH3)2py22 + 267.5 374249.5“ 401 260.5 384244.5 409 253.4“ 395239 418 249 402
pyH + in aq 262 382 Irpy2(NH3)3OH2 + 304* 329solution 256“ 391 271 369
~245 408 263“ 380Adsorbed on 261 383 258 388
silicic acid4 256“ 391 cis-Irpy2Cl3OH ~ 326* 307251 398 275 364
Adsorbed on 267“ 374Ti 257 389 IrpyCU2- 329.5d 304Fe 297 337 279“ 358
258 388 (broad)Ni 265.5 377 frans-Irpy2Cl3OH “ 329.5" 304
260“ 385 284.5“ 352254.3 393 (broad)248 403
“ The strongest peak of pyridine band. 4 Reference 3. 'Referenced. d The Ir-py charge-transfer band.
2 5 0 3 0 0 nrpu
Figure 1. Ultraviolet spectra of adsorbed pyridine on Ti, Fe, and Ni. Metal films were exposed to pyridine vapor (15 mm) for the following times: Ti, (1) 10 min,(2) 2 hr, (3) 16 hr; Fe, (1) 30 min, (2) 2 hr, (3) 16 hr;Ni, (1) 5 min, (2) 30 min, (3) 2 hr, (4) 16 hr.
condensation of the pyridine in a liquid nitrogen cooled trap, the intensity of the band decreased slightly.
In the case of Ti, the adsorbed species gives a very
broad band with appreciable intensity even around 290m/i.
Two broad bands at 258 and 297 my for Fe are much weaker in intensity than the bands for Ni and Ti.
2,2'-Bipyridyl Adsorption. The spectra of 2 ,2 '- bipyridyl adsorbed on Ti, Mn, Fe, Ni, and Cu are shown in Figure 2. These spectra were obtained by the same procedure as that for the pyridine. The film was exposed to the vapor for the following times: Ti, (1) 1.5 min, (2) 25 min, (3) 18 hr; Mn, (1) 10 min, (2) 2.5 hr, (3) 18 hr; Fe, (1) 5 min, (2) 20 min, (3) 18 hr; Ni, (1) 1.5 min, (2)'15 min, (3) 18 hr; Cu, (1) 2 min, (2) 1 hr, (3) 20 hr. The band positions are listed in Table II.
Table II: Ultraviolet Data for Adsorbed 2,2'-Bipyridyl (Wavelength in my.)
Bipyridyl in H20 233, 280Fe(bipy)s2 + in CH3OH4 245, 280, 299, 349
After exposureMetal Adsorbed bipyridyl to air
Cu 241, 280 -► 286 243, 302Ni 240, 280 — 283 (303) 239, 300 (315)Fe 241 — 239, 290 293 237, 296Mn 241 — 238, 287 — 290 ?, 295Ti 240, 285 239, 287 (303)
“ Reference 10. b Reference 13.
Two peaks are shown near 240 and 285 my for each metal investigated. Intensities of these bands grew very rapidly within a few minutes and after that increased
The Journal of Physical Chemistry

Uv Study of Adsorbed Pyridine and 2,2'-Bipyridyl
00 250 300
Figure 2. (a) Spectra of 2,2'-bipyridyl adsorbed on Ti and Mn. Spectra were recorded as a function of exposure time: Ti, (1) 1.5 min, (2) 25 min, (3) 18 hr;Mn, (1) 10 min, (2) 2.5 hr, (3) 18 h r ; ------, after 2 min(Ti), 10 min (Mn) from admission of air. (b) Spectra of 2,2'-bipyridyl adsorbed on Fe, Ni, and Cu. Exposure times: Fe, (1) 5 min, (2) 20 min, (3) 18 hr; Ni, (1)1.5 min, (2) 15 min, (3) 18 hr; Cu, (1) 2 min,(2) 1 hr, (3) 20 h r ; ------, after 10 min (Fe), 18 hr(Ni), 5 min (Cu) from admission of air.
very slowly except the case of Cu in which the intensities increased gradually from the beginning. For Ti, the 285-mii band after 1.5 min remained almost unchanged in intensity and position from that after 18 hr. Of these two bands, the longer wavelength one showed
bathochromic shift with the increase of exposure time except the case for Ti. The band shift was largest for Cu (from 280 to 286 m/i). In the case of Ni, the increase in intensity was remarkable at wavelengths longer than 280 mju, and then a new band appeared as a shoulder around 300 m/x.
The subsequent admission of air shifted the 285-mp band to longer wavelengths (except the case of Ti) and changed the band shape as shown by dotted curves in Figure 2. For Ti and Ni, a new band appeared at 303 and 315 m/x, respectively. These dotted curves were observed after (Ti) 2 min, (Mn) 10 min, (Fe) 10 min, (Cu) 5 min from the admission of air.
Figure 3 and Table III show the change in the spectra
2561
Table III : Effect of Evacuation on the Spectra of Adsorbed 2,2'-Bipyridyl
MetalBefore
evacuationAfter
evacuation
Ni 240, 280 243, 290 (318)Fe 240, 290 242, 297Mn 240, 287 240, 290Ti 240, 285 242, 293
of adsorbed species by evacuation. The metal film was exposed to the bipyridyl vapor for (Ti) 1 hr, (Mn) 30 min, (Fe) 1.5 hr, (Ni) 40 min, and then the cell was evacuated for 40 min after closing the stopcock from the bipyridyl vessel. Intensities of the two bands de-
Figure 3. Spectral changes of adsorbed 2,2'-bipyridyl by evacuation. The cell was evacuated for 40 min after metal films were exposed to 2,2'-bipyridyl for 1 hr (Ti), 30 min (Mn), 1.5 hr (Fe), and 40 min (Ni), respectively; ------, before evacuation;------, after evacuation.
Volume 73, Number 8 August 1969

2562 Kosaku K ishi and Shigero Jkeda
creased in all cases, and the remaining spectra showed band maxima near 240 m/t and at wavelengths longer than 290 m/i.
DiscussionPyridine Adsorption. Pyridine vapor shows a t - t *
band ('Lb) with a vibrational structure where the maximum peak is located at 249.5 m/i. The corresponding band of adsorbed pyridine on silicic acid3 (Table I) is located at slightly longer wavelength than the genuine band and at almost the same position with that of pro- tonated pyridine in acidic aqueous solution. This was interpreted as due to hydrogen bonding between the nitrogen of pyridine and a hydroxyl group on silicic acid surface. The bonding of pyridine to a metal surface, however, can be discussed more effectively when compared with those in pyridine-metal ion complexes. In Irpy4 Cl2+, Pt(NH3)2py22+: etc., the ir-ir* band does not show a much larger bathochromic shift from the genuine band of pyridine vapor.4 Some Ir(III) complexes as Irpy2- (NH3)3OH2+, Irpy2Cl3O H - , and IrpyCl52 -, however, have very broad bands, with vanishing vibrational structure, at relatively longer wavelength. The latter behavior of Ir(III) complexes is, according to Jprgen- sen,4 enhanced by the presence of many anions (Cl- , Br- , O H - ) and a low number of pyridine among the ligands. This has been attributed to an especially strong bonding of pyridine with a larger change of the 7r-electron system of this molecule than in most other complexes.
In the case of adsorbed pyridine on Ni, the vibrational structure is well defined and sharper than those of the metal ion complexes, the band position is not so much shifted from that of pyridine vapor, and the band intensity decreases a little with prolonged removal of the pyridine by a liquid nitrogen cooled trap. These facts indicate that the bonding between pyridine and the adsorbent nickel atom is weaker than that in the complexes, and the ir system of the ring is not so much perturbed with dx orbitals of the adsorbent. In fee nickel, there are only 0.55 3d-band holes and, hence, 0.55 sp electrons,5 and the similar tendency is expected on the evaporated nickel surface. The weaker bonding of pyridine is, therefore, most likely to be formed via coordination with lone-pair electrons of nitrogen to an empty 4s band of surface nickel. The failure of the adsorbed pyridine band on Cu can be explained in a similar way. In fee copper, the 3d bands are practically full and the sp electrons are richer than in the nickel.6 The coordination of lone-pair electrons of pyridine to such sp bands would be rather difficult energetically. The number of adsorbed pyridine would then be relatively small.
The absence of the vibrational structure in the cases of Ti and Fe strongly suggests that the pyridine ir system is largely perturbed on adsorption. The vanishing of the structure in some Ir(III) complexes men
tioned above is accompanied by a second band around 330 m/i.4 The second band has been assigned to a charge-transfer one from Ir to a lowest unoccupied ir orbital of pyridine. These two bands have been examined on calculating energy states of an idealized system composed of one Ir and one pyridine, with an assumption that electric charge of Ir was effectively zero in the complexes.6 tt interaction was considered between de orbital of Ir and pr system of the pyridine as shown in structure I of Figure 4. The above band assignments were then affirmed, and the vanishing of the structure with large band shift was explained by the relatively large contribution of another charge-transfer state to 'Lb- The same is also expected for the F e- pyridine adsorption system (where the second band is observed at 297 m/i) and for the Ti-pyridine system. The 297-m/i band would then by attributed to a charge transfer from iron metal to the pyridine.
However, another type of ir interaction like structure II in Figure 4 is also suggested for the following reasons. First, the ir-ir* band shift from the genuine pyridine band is about 1200 cm-1 for the pyridine on Fe and Ti while about 4000 cm-1 in the IrpyCL2 -, etc. Second, pyridine can form x-ir-type molecular complexes with 7r-type acceptors.7 The similar ir interaction has been proposed for the mechanism of the catalytic deuterium exchange reactions of pyridine with D 20 by group VIII transition metals.8 The pyridine is adsorbed only through lone-pair electrons of nitrogen in the vertical on a cobalt whereas the molecule is tilted, as structure II of Figure 4, on platinum with an increasing participation of the ir electrons of the ring in the adsorption process. The vanishing of the structure or the second band would be expected for such ir interaction.
In metallic eph titanium, bonding 3d bands are considerably empty. Then, on a titanium surface, some of 3d bands are probably available for a bonding with lone-pair electrons of pyridine. Another part of the empty 3d bands would take part in ir bonding by accepting p7r electrons of the ring as shown in Figure 4, structure II. Even if electrons are donated to an adsorbent metal atom through both <r and ir bonds, the charge accumulation on the adsorbent atom is not expected to be so remarkable because electrons on the adsorbent atom can be delocalized partly into the bulk metal atoms. Therefore, the type II adsorption is more probable on titanium surfaces.
(3) M . R o b in and K . N . T ru eb lood , J. Amer. Chem. Soc., 79, 5138 (1957).(4) C . K . J 0rgensen, Acta Chem. Scand., 11, 151, 166 (1957).(5) J. B . G ood en ou gh , Phys. Rev., 120, 67 (1960).(6) N . M a tag a and S. M a taga , p riva te com m unication .(7) R . E . M errifield and W . D . Phillips, J. Amer. Chem. Soc., 80 2778 (1958).
(8) G . E . C alf, J. L . G arnett, and V . A . P ickeles, Aust. J . Chem., 21 , 961 (1968).
The Journal oj Physical Chemistry

Uv Study of Adsorbed Pyridine and 2,2'-Bipyridyl 2563
V
(I)
Figure 4. Two types of x interaction between adsorbed pyridine and metal surface.
The pyridine band intensity is considerably weaker in the case of Fe than in the cases of Ni and Ti. The main reason for this is due to the difference in the number of adsorbed pyridines resulting from variations in electronic states of the metals and not to the difference of the surface area of the films or an extinction coefficient of the adsorbed pyridine. In bcc Fe, the number of 3d electrons is about five and sp electrons is about three.6 The former is larger than the number of 3d electrons in Ti and the latter than that of sp electrons in Ni. The two types of a bonding which were mentioned for Ti or Ni would then be rather difficult on iron surfaces and the number of adsorbed pyridines must be small. Such adsorption characteristics of a pyridine-on-iron surface can explain a low inhibitor efficiency of this molecule to corrosion of steel by hydrochloric acid.9 Hackerman9 emphasized the importance of metal-nitrogen x bonding in inhibitor efficiency to the corrosive reaction on the basis of data using a series of cyclic imines as the inhibitor. This is also reasonable on considering the less availability of iron surface for <r bonding. The x-bond strength and, hence, the number of adsorbed species must be a very important factor for the inhibitor efficiency.
2,2'-Bipyridyl Adsorption. The absorption bands of 2,2'-bipyridyl are observed at 233 and 280 mp in the near-ultraviolet region,10 and the latter band has been assigned to a x -x * transition.11 The good resemblance between the 2,2/-bipyridyl spectrum and that of the adsorbed species strongly suggests that the bipyridyl is adsorbed as a molecule on the metal used.
The band change observed after prolonged evacuation indicates that the bipyridyl molecules are bound at various energy sites and the longer wavelength species is more strongly adsorbed. The trans-2,2 - bipyridyl, which is more stable than the cis form in the solid state or in most solvents,12 is stabilized as the cis form upon chelation to a meral ion with two nitrogen atoms. In the metal complexes, the corresponding strong x -x * band is observed near 300 m/d3 although the spectra of the complex are complicated by various ligand-ligand or ligand-metal ion interactions. The strongly adsorbed species is, therefore, complexlike and coordinating to the metals through two nitrogen atoms, with rather strong x interaction between the x
( I) ( IV) (V)Figure 5. Adsorbed states of 2,2'-bipyridyl on metal surfaces.
system of the bipyridyl and the metal dx orbitals, as shown in Figure 5, structure III. The weakly adsorbed, shorter wavelength species is probably bound as shown in Figure 5, structures IV and V.
The band shifts with exposure time indicate that the species IV and V change slowly into III. The appearance of a new band fcr Ni strongly suggests that the bipyridyl adsorption nduced a loosening of metal- metal bonds of adsorbent atom with surrounding metal atoms, in other words the strengthening of the localized property of the adsorbent atom, and more complexlike species were formed. Some similar phenomena were also observed in the case of /3-diketone adsorption.1
The rapid saturation for the bipyridyl adsorption (except the case of Gu), in contrast with the slow adsorption of pyridine can be attributed to bidentate character of the bipyridyl. The slow growth of the bipyridyl band for Cu is likely to be due to the weak «--bonding character. The intensity of the bipyridyl band for Cu is, however, comparable to that for Ti or Ni. This is interpreted as due to the chelate effect for the bipyridyl-metal surface system.
The spectral shifts and new bands which were observed on exposure to air can be correlated with oxidation of the adsorbent metal. The adsorbent is at least partially oxidized by oxygen, consequently withdraws electrons more strongly from the bipyridyl-nitrogen; the metal-metal bond af surface atom becomes weaker. This would result in the formation of more complexlike species or the metal complex adsorbed on the surface. The partial oxidation of the film is also suggested by the fact that the fdm exposed to air is more transparent at longer wavelengths “Fan is the evaporated fresh film.
On the basis of the spectral changes with exposure time and air, the metals used are classified into three groups. These are (1) Ti, (2) Fe, Mn, (3) Ni, Cu; these were also reported previously in the adsorption study of 8-hydroxyquiroline.2
In the above discussion, very thin films of metals used are postulated to posses structural and bonding charac-
(9) N . H ackerm an , R . M . H urd , and R . R . A nnand , Corrosion, 18, 371 (1962).(10) P . K rum holz, J. Amer. Chem. Soc., 73, 3487 (1951).(11) Y . G on d o , J. Chem. P hjs., 41 , 3928 (1964).(12) P . E . F ie ld in g and R . J. L e F cv re , . / . Chem. Soc., 1811 (1951).(13) K . Sone, P . K ru m h o li, and H . S tam m reich , J. Amer. Chem. Soc., 77, 777 (1955).
(illw
© N 0
'/ M' u n i i I U
(ID
Volume 73, Number 8 August 1969

2564 I. G. Draganic, M. T. Nenadovic, and Z. D. D raganic
teristics similar to those of the bulk metals. This is quite reasonable because the bonding characteristics of the metal surface are interpreted well by the knowledge of electronic states obtained for the bulk metal. Further quantitative discussion will be carried out on the basis of the density-of-states curves of metals, especially
the degree of occupation of bonding or antibonding bands.
Acknowledgment. The authors thank Professor Noboru Mataga, Faculty of Engineering Science, Osaka University, for his kind discussion about the spectral data.
Radiolysis of HCOOH + 0 2 at pH 1 .3 -1 3 and the Yields of
Primary Products in y Radiolysis of Water
by I. G. Draganic, M. T. Nenadovic, and Z. D. DraganicBoris Kidric Institute o f Nuclear Sciences, Vinca, Yugoslavia (.Received November 16, 1968)
The radiation yields of carbon dioxide, hydrogen peroxide, and hydrogen from oxygenated ([02 ] = 1 X 10 ~3 M) aqueous formic acid solutions have been determined over the pH range 1.3 to 13. The formic acid concentration was varied between 1 X 10⁻⁴ and 5 X 10⁻² M and the absorbed doses ranged from 3 to 16 krads. The radiation chemical behavior of solutes is discussed paying particular attention to secondary reactions which may influence the measured initial yields of radiolytic products. Since these yields depend on solute reactivity they were corrected, before employing them to calculate the primary yields, using the Flanders-Fricke method and Kuppermann’s diffusion-kinetic theoretical curves. The contribution of the reaction HCOO- + H to the measured yields of C02 and H2 has also been taken into account. From the results obtained, one can calculate at pH between 3 and 13: G-h,o = 4.09, Gn + (?e = 3.18, G o b = 2.72, Gb* = 0.45, and (rao, = 0.68. The increase in acidity induces an increase in water decomposition. At pH 1.3 the following values were derived: G-h2o = 4.36, Gb + (?eaq~ = 3.49, Goa — 2.85, Gi<2 —- 0.43, and GbiOi = 0.76. These figures are discussed in the light of some uncertainties in corrections applied to measured values, as well as in reactions of formate ion at pH 12-13.
IntroductionThree recent rather comprehensive analyses have
shown that we still have no satisfactory answer concerning the pH dependence of primary yields in y radiolysis of water.1-3 These analyses serve to accentuate the following points concerning the use of a given chemical system for primary radical and molecular yield determination.
(a) It is necessary to know the yields of all the stable radiolytic products of the system studied; it is of special importance that the G values should be true initial yields.
(b) The reaction scheme must be complete, be., must take into account all possible secondary reactions. This condition is the more significant the less the condition of item (a) is satisfied.
(c) The effect of the solute concentration in general and the reactivity in particular should be reliably established. The reactivity is defined here as /cR+s X[S], where [S] is the concentration (in M) of the scavenger for the radical R and /cr+s the corresponding rate constant (in M~l sec-1).
The purpose of the present work is the determination of the primary yields in the y radiolysis of water at pH1.3 to 13 using the system HCOOH + 0 2. The radiation chemical behavior of HCOOH, HCOO- , 0 2, and products of their reactions with species formed in irradiated water have been the subject of many studies;4-12 from them we have detailed information on
(1) M . H aissinsky, R endem ents rad io ly tiqu es prim aires en solutions aqueuses neutre ou alcaline, in “ A ction s ch im iques et b io log iqu es des rad iation s,” V o l. 11, M . H aissinsky, E d ., M asson et C ie, Paris, 1967.
(2) E . H a yon , Trans. Faraday Soc.. 61 , 723 (1 96 5 ); in “ R a d ia t io n C h em istry o f A qu eou s S ystem s ,” G . Stein , E d ., In terscien ce P u b lishers, L on d on , 1968, p 157.(3) G . C zapski, A d va n ces in C hem istry Series, N o . 81, A m erican C hem ical S ociety , W ash ington , D . C ., 1968, p 106.(4) E . H art, J. Amer. Chem. Soc., 76, 4198 (1954).(5) E . H art, ibid., 76, 4312 (1954).(6) E . H a rt, Radiat. Res., 1, 53 (1954).
(7) E . H a rt and R . L . P latzm an , “ R ad ia tion C h em istry ,” in “ M echanism s in R a d io b io lo g y ,” V o l. I , M . E rrera and A . F orss- berg, E d ., A ca d em ie Press, N ew Y o rk , N . Y ., 1961, C hapter 2.(8) E . H art, J. K . T h om as, and S. G ord on , Radiat. Res. Suppl., 4 , 74 (1964).
(9) G . Scholes and M . S im ic, Nature, 199, 276 (1963 ).
The Journal of Physical Chemistry
mechanisms, rate constants, and the nature of intermediates. The establishment of a valid reaction scheme is especially important since it is not quite certain that condition (a) is fully satisfied here, i.e., that the real initial yields are measured. This is because the sensitivities of the methods of microanalysis impose limits on absorbed doses; in our experiments these doses ranged from 3 to 16 krads.
Fifteen years ago, Hart4-6 studied the radiolysis of HCOOH + 0 2 in aqueous solution and used the measured yields to calculate the yields of “ primary reactions” and, later,7 the primary yields of water radiolysis. However, it seemed to us that more recent data from other systems, as well as new information on the properties of certain intermediate species made available by pulsed radiolysis, justify the reinvestigation of this system. W e consider that the system satisfies the conditions of item (b) and we present new results which show the influence of the reactivity on the measured yields as required under item (c).
Experimental SectionSolutions. Water was triply distilled in a continuous
system (alkaline permanganate, acid dichromate, and finally without any additive) in an oxygen atmosphere. The formic acid and the formate were AR grade BD H products. The acid solutions were prepared by adding perchloric or sulfuric acid; the alkaline solutions were made up from sodium hydroxide freshly prepared by a special procedure.13 The oxygen concentration in the solutions was 1 X 10 M, except, in a few experiments, when it was varied down to 2 X 10~4 M on purpose for concentration effect studies. The ampoules were completely filled, leaving no gas space. The alkaline solutions were first degassed and then conditioned with oxygen.13 Acid and neutral solutions were prepared with freshly distilled water directly conditioned with oxygen, in order to avoid the loss of formic acid by evaporation during degassing.
Irradiation. The samples were irradiated using a 3000-Ci 60Co source. The dose rate, as determined with the Fricke dosimeter ((7(Fe3+) = 15.5), was 3 X 10¹⁹ eV ml-1 hr-1 . The absorbed doses were between 2 X 10¹⁷ eV ml-1 and 1 X 10¹⁸ eV m l“ 1.
Analyses. The gas products, C 0 2 and H2, and the 0 2 initially present, were determined by gas chromatography.14 In determining C 0 2 we paid special attention to the blank corrections. Generally, six to eight ampoules were prepared as a series and two or three of them were not irradiated. The C 0 2 content observed in these samples (< 3 .3 X 10-6 and < 1 .6 X 10~6 M, at pH 7 and 13, respectively) was plotted at zero absorbed dose on the dosage curve. The accuracies in G (C02) and G(H2) measurements were better than ± 3 % and ± 2 % , respectively. The H 20 2 was determined spectrophotometrically by the potassium iodide method.15 The acid and alkaline solutions were neu
Primary Y ields in the y Radiolysis of Water
tralized before adding the reagent. The molar extinction coefficient at 24° was 25,500 1. mol-1 cm“ 1. The reference and irradiated samples were prepared and measured simultaneously. The accuracy in Cr(H20 2) measurements was better than ± 2 % .
Calculations of the Initial Yields of H2Oi, CO , and H2. Concentration-dose plots were obtained by exposure of samples to five or six different doses. They were generally straight lines passing through the origin. The radiation chemical yields were calculated from their slopes; the errors did not exceed the maximal error of analysis given above.
At pH > 3 the dosage curves for H20 2 showed a yield dependence on the absorbed dose; with increasing dose the yields decreased due to attack by hydrated electrons. In the worst case, i.e., at largest dose where hydrogen peroxide concentration was at its maximum (6 X 10~5 M) and that of oxygen at minimum (9 X 1 0 '4 M), this decrease was about 5 % . In such cases the best line through the experimental points made an intercept with the ordinate and was not used for the yield calculations. On the other hand, the slope of the best line drawn through the origin always gave smaller yields than those calculated for the lowest doses. For this reason, we derived the initial (7(H20 2) by extrapolating the point by point yields to zero dose on a diagram where measured yields were plotted against doses. The error due to the extrapolation did not exceed the error in H 20 2 determination. Figure 1 represents the treatment of data for sodium formate (5 X 10⁻³ M) and oxygen (1 X 10~3 M) in a solution at pH ~ 7 . On the left side of the diagram the optical densities are plotted after corrections for blanks; on the right are given the corresponding yields, which were calculated by taking into account the dilution factor, the molar extinction coefficient, and the dose absorbed. As can be seen, with decreasing dose the calculated yields increase and at the zero dose the best line gives3.78 for the initial (7(H20 2). This value should be compared with 3.64, which may be calculated in the usual way from the slope of the concentration-dose plot drawn through the origin.
ResultsFigure 2 shows the yields of the stable radiolytic
products as a function of formic acid concentration. The measurements were made at pH 1.3, where the dis-
(10) J . P . K een , Y . R a e f, and A . J. S w allow in “ Pulse R a d io ly s is ,” M . E bert, J. P . K een e, A . J. S w allow , and J. H . B axendale, E d ., A ca d em ic Press, L on d on , 1965, p 99.(11) T . H a yon , Trans. Faraday Soc., 6 1 , 734 (1965).(12) C . E . B urch ill, F . S. D a in ton , and D . S m ith ies, ibid., 63 , 932 (1967).(13) Z . D ragan ic, I . D ragan ic, and M . K osan ic, J. Phys. Chem., 70, 1418 (1 96 6 ); 68 , 2085 (1964).(14) L j. P etk ov ic , M . K osan ic, and I . D ragan ic, Bull. Inst. Nucl. Sci., Boris Kidric (B elgrade), 15, 9 (1964).(15) A . O . A llen , C . J. H och an adel, J. A . G h orm ley , and T . W . D a v is , J. Phys. Chem., 56, 575 (1952).
2565
Volume 73, Number 8 August 1969

2566 I. G. ÜRAGANlé, M. T. NENADOVlé, AND Z. D. ÜRAGANIC
Figure 1. Hydrogen peroxide formation in 5 X 10“3 M HCOONa with 1 X 10 ~3 M 0 2 present, pH ~7 : O, optical density of irradiated solution; •, calculated G(H20 2).
Figure 2. The formic acid concentration effect on the measured yields of the stable radiolytic products at pH 1.3, with 1 X 10⁻³ M 0 2 present: measurements in the presence of H2SO<: □, H20 2; O, C02; A, H2. Measurements in the presence of HCICh: ■, H20 2; •, C02. Hart’s values4 at pH 1.28 with 0.42 X 10“ 3 M or 1.12 X 10“ 3 M 02:X, H202; d- , C02; V, H2.
sociation of the formic acid is negligible. The adjustment of pH with H 2S 0 4 gave slightly smaller yields than with HCIO4, but within the experimental errors.
In the concentration range studied, (?(H2) values
Figure 3. pH effect on the measured yields of the stable radiolytic products in 1 X 10⁻² M HCOOH or 5 X 10⁻³ M HCOO- with 1 X 10⁻³ M 02 present:□, H20 2; O, C02; A, H2.
remain unchanged; G(C 0 2) and (r(H20 2) increase with increasing concentration of formic acid. For comparison, Hart’s values4 obtained under experimental conditions similar to ours are also plotted on the diagram.
It can be seen that the increase of G(H20 2) follows the increase of G(C 0 2) ; the deviation of (r(H20 2) measured at 1 X 10⁻³ M HCOOH is larger than the possible experimental error.
Figure 3 represents the yields of C 0 2, H20 2, and H 2 measured as a function of pH in solutions 1 X 10⁻³ M 0 2 and 1 X 1 0 -2 M HCOOH or 5 X 10“ 3 M H C O O ".
The data indicate that at these concentrations of HCOOH and HCOO“ , only (?(H20 2) shows a slight pH dependence at pH < 3 . It is worthwhile to mention that a check by gas chromatography on the eventual presence of CO gave a negative result.
Figure 4 summarizes the radiolytic yields measured for different formate ion concentrations. The pH of solutions was between 4.4 and 13. It can be seen that the variation of pH has no influence on the yields measured; they depend on the formate concentration only. The trend is similar to that observed in acid medium (Figure 2) for increasing formic acid concentration. Here also Hart’s values4 are included.
At pH 13, where the reaction 0 2 + 0 “ might become significant, a series of (?(C02) determinations was performed in solutions having various 0 2/formate concentration ratios. It was found that measured carbon dioxide yields follow only the concentration changes of formate ion and do not depend on [02] /[H C 0 0 “ ] in the region studied (from 0.2 to 8). In experiments the results of which are shown in Figures 1-4, less than 10% of the initial oxygen concentration was consumed.
DiscussionPrimary and Secondary Reactions of Scavengers in
The Journal of Physical Chemistry

Primary Y ields in the y Radiolysis of Water
Figure 4. The HCOO concentration effect on the measured yields of the stable radiolytic products with 1 X 10 “3 M 0 2 present: pH 4.4-11.9: □, H20 2; O, C02; A, H2; pH 13:■, H20 2; ®, C02; A, H2. Hart’s values4 at 4.92-11.58 in the presence of 0.4 X 10⁻³ M or 1.2 X 10⁻³ M 0 2: X, H20 2;+ , C02; V, H2.
Studied Solutions. In the irradiated aqueous solution oxygen and formic acid react with the free radicals formed from water during irradiation. If not otherwise indicated, the rate constants of these reactions were taken from Anbar and Neta.16
Under our experimental conditions the reducing species are efficiently scavenged by molecular oxygen
0 2 + H = H 0 2; fci = 1.9 X 10¹⁰ M~l sec“ 1 (1)
0 2 + eaq_ = 0 2- + H 20 ;
k2 = 1.88 X 10¹⁰ M -1 sec -1 (2)
Undissociated formic acid does not compete with oxygen for H atoms since /ch+ hcooh ~ 1 0 “ 4fci; this is not the case with hydrated electrons, however.
HCOOH + eaq~ = H C O O H - + H 20 ;
h = 1.4 X 10⁸ M -1 sec-1 (3)
Taking into consideration the concentrations of 0 2, H+, and HCOOH, it is obvious that the contribution of this reaction will be most important at pH about 3. However, even here, its competition with reaction 2 is insignificant, as only 4 % of the hydrated electrons can participate in reaction 3. In addition, since the formed intermediate reacts efficiently with oxygen producing HCOOH + 0 2- the final results will be the same as if only reaction 2 occurs. The evidence for this conclusion may be obtained from the similarity in behavior of oxygenated solutions of oxalic acid13 as well as from Figure 2 where it can be seen that the increase of G(H20 2) follows the increase of G (C 02).
The formate ion does not compete with oxygen for hydrated electrons as &eaq-+Hcoo~ < 106 A f -1 sec-1 . However, the reaction
H C O Q - + H = H 2 + C O O -;
ki = 2.5 X 10s M~l sec-1 (4)
should be taken into account for [HCOO“ ] ^ 1 X 10- 3 M as, under our working conditions, [02] =1 X 1 0 -3 M.
Both formate ions and formic acid react very efficiently with hydroxyl radicals
HCOOH + OH = H 20 + HCOO (or COOH);
h = 2.5 X 10s M -1 sec -1 (5)
H C O O -+ OH =
O H - + HCOO (or H 20 + COO“ );
kt = 2.5 X 10⁹ M “ 1 sec-1 (6)
Measured H 20 2 and C 0 2 yields indicate the high efficiency of the reaction
0 2 + COOH (or HCOO or COO“ ) =
C 0 2 + H 0 2 (or O*-) (7)
The carboxyl radical reacts with formic acid and hydrogen peroxide but these reactions do not proceed in the presence of oxygen. This was shown by the absence of CO as a radiolytic product,17 confirmed also in this work, and the inhibitory action of oxygen on the chain reaction in the HCOOH + H 20 2 system.18 Likewise, it is known that carboxyl ion radicals dimerize efficiently to give oxalic acid (2k = 1 X 10⁹ M~l sec“ 1) .10 However, measurements using 14C-labeled formate19 have shown that oxalic acid is not formed in the presence of oxygen. Hence, it follows that the radicals produced in reactions 4, 5, and 6 disappear only via reaction 7.
Hydroperoxyl radicals formed in reactions 1, 2, and 7 undergo disproportionation
2 H 0 2 (or 2 0 2“ ) — H20 2 -f- 0 2 (8)
where fcHo2+H02 = 2.7 X 10⁶ M~l sec“ 1 and k0i-+ o,- = 1.7 X 10⁷ M - ' sec-1, according to Czapski and Dorfman.20 Reaction 8 explains the large yields of H 20 2 in the irradiated solutions. It should be pointed out that reaction 1 efficiently protects H20 2 from H atom attack, as /ch+h,o, = 5 X 10⁷ M “ 1 sec“ 1 and [H20 2] « [02]. However, as mentioned above, calculation shows the possibility of some peroxide loss due to attack by hydrated electrons. This was, indeed, found on dosage curves for pH > 3 . The decrease is small, not exceeding 5 % even under the worst conditions, and we consider that the method employed above to obtain the initial yields has eliminated this source of error. The corresponding gain in G (C 02) was within
(16) M . A n b ar and P . N eta , Int. J. Appl. Radiat. Isotopes, 18, 493 (1967).(17) G . E . A d am s and E . H art, J. Amer. Chem. Soc., 84 , 3994 (1962).(18) E . H a rt, ibid., 7 3 , 68 (1951 ).(19) Z. D ragan ic and M . N e ;ia d ov ic . Int. J. Appl. Radiat. Isotopes, 16, 227 (1965).(20) G . C zapski and L . M . D orfm a n , J. Phys. Chem., 68, 1169 (1964).
2567
Volume 73, Number 8 August 1969

2568 I. G. D ragani6, M. T. Nenadovi6, and Z. D. D ragani6
experimental error. It can also be shown that under the present working conditions other known reactions of H 20 2 (with OH or 0 “ ) cannot compete with reactions 5 or 6.
The concentration of H 2 in the solutions is smaller than 10-5 M which, since fcon+m = 4.5 X 10⁷ M -1 sec-1 , excludes a competition with reactions 5 or 6.
The concentration of C 0 2, or H C 0 3- , and C 0 32 - at higher pH, in irradiated solutions is considerable (from 2 X 10⁻⁵ to 1 X 10⁻⁴ M). Some fast reactions of these species with the primary products of water radiolysis are known.8'10 Still, as can be seen, their presence has no essential influence on the scheme given in reactions 1 to 8. The reaction C 0 2 + eaq- = COO - + H 20 with k = 7.7 X 10⁹ M~l sec-1, in the most inconvenient case, can consume 4 % of hydrated electrons in competition with reaction 2. Since the fate of the formed COO- is in reaction 7, it still holds stoichiometrically that only reaction 2 takes place. Bicarbonate and carbonate ions react rapidly with OH radicals (1 X 10⁷ M~l sec-1 and 3 X 10⁸ M~l sec-1 , respectively) but their concentrations are insufficient to compete with reaction 6 for OH radicals. The reactions of H C 0 3- and CO32 - with hydrogen atoms or hydrated electrons are slow (<106 M -1 sec-1), as are the C 0 2 reactions with H or OH radicals. Hence, it follows that the stable radiolytic products in the system HCOOH + 0 2, under appropriately chosen conditions, may not affect the simple reaction mechanism even in the case where the irradiation conditions are not strictly initial.
It should be added that in alkaline media where reaction O H - + OH = O - + H20 (fc = 3.6 X 10⁸ M~l sec-1) also occurs, there is no change in the measured yields of the stable radiolytic products. As is seen in Figure 4, the yields are the same as in a neutral medium. This implies that reaction 9 occurs.
HCOO- + 0 - = O H - + COO- (9)
Since fc9 is not known, we have tried to measure it from the competition with
0 2 + 0 - = Os- ; ho = 2.6 X 10⁹ M -1 sec-1 (10)
However, no competition could be observed, (?(C02) measured at pH 13 being independent of oxygen to formate concentration ratios between 0.2 and 8. This indicates that reaction 11 most probably occurs
HCOO- + O3- = COO- + H 0 3- (11)
As HO3- — O H - + 0 2,21 reactions 10 and 11 lead to the same yield as reaction 9. No other O - radical reactions can influence the observed radiolysis mechanism. This can be easily checked if one takes into account the concentration of the substances in the solution and the rate constants: &0 -+H! = 1.6 X 10s M~l sec-1
k0-+Hor = 7 X 10⁸ M -1 sec-1 ;
fco-+co3*- = 4.4 X 10⁷ M~l sec-1
Expressions for Primary Yield Calculations. The usual kinetic treatment of reactions 1 to 11 gives, independently of pH, the known relations
G (C02) = <7o h (12)
G(H20 2) = GHl(h + 0.5(G„ + (?esq- + Gem) (13)
G(H2) = Gn, (14)
The equation for material balance
CrOH + 2G1I2O2 = Gu + Geaq— h 2Gh, (15)
used with eq 13 and 14 gives, upon some rearrangement
Gn + Geaq~ = G(H20 2) — G(H2) (16)
Hence to calculate free radical yields, eq 12 and 16 were used. The yield of primary molecular hydrogen is given by eq 14. The yield of primary hydrogen peroxide was calculated from eq 15.
Corrections of M easured Values. Experimental yields (Figures 2-4) were not used directly in the above expressions; they were corrected beforehand for scavenging in the spur and, when necessary, also for the contribution of reaction 4 to the H2 and C 0 2 formation.
Among the various ways of carrying out the corrections due to the scavenging within the spur the most convenient seemed to be that given by Flanders and Fricke22 as used by Fielden and Hart.23’24
In this case we assumed that
0 551G (C02)eor = <?(C02) measd X T
iS
where I s is the fraction of radicals combining with the solute S. The values 0 .551 //s were taken from Table I of ref 22, for E = 2.5 and the corresponding values of B, a dimensionless parameter derived from the expression
b2B = —=r X fcoH+S X [S]
4Do
Here b ( = 5.8 A) is the radius of the spur for OH radicals (considered to be 2.7 times smaller than that for eaq-26 ’26), D = 2 X 10⁻⁶ cm2 sec-1 is the diffusion coefficient for the OH radical,25 fcoH+s the rate constants of the reactions 5 and 6, and [S] is the formic acid or
(21) G. Czapski and B. Bielski, J. Phys. Chem., 67, 2180 (1963).(22) D. A. Flanders and H. Fricke, J. Chem. Phys., 26, 1126 (1958).(23) E. M. Fielden and E. Hart, Radial. Res., 32, 564 (1967).(24) E. M. Fielden and E. Hart, ibid., 33, 426 (1968).(25) A. Kuppermann, “Radiation Research, 1966,” G. Silini, Ed., North-Holland Publishing Co., Amsterdam, 1967, p 212.(26) H. Schwarz in Proceedings of the Fifth Informal Conference on the Radiation Chemistry of Water, University of Notre Dame, Radiation Laboratory, AEC Report COO-38-519, Notre Dame, Ind., Oct 1966.
The Journal of Physical Chemistry

Primary Y ields in the 7 Radiolysis of Water 2569
Table I : Summary of Stable Product Yields in 7 Radiolysis of HCOOH + O2 at Different Forrr ic Acid Concentrations and Various pH. [02] = 1 X 10 ~3 M . Measured Yields Corrected for Scavenging in the Spur
Concn, ,--------------------- G(COi)-pH M a b c
1.3 1 X 10⁻³ 2.51i 2.54''
5 X 10-* 2.77 2.74 2.77
1 X o 2.832.91
2.792.87
2.832.91
2 .5 X 10-25 X 10-2 3.05 2.96 2.92
2.3 1 X 10⁻² 2.77 2.72 2.772.9 1 X 10⁻² 2.91 2.83 2.814.4 5 X 10⁻³ 2.90 2.77" 2.80*
~ 7 1 X 10⁻⁴ 2.48"5 X 10⁻⁴ 2.56 2.53 2.561 X 10 " 35 X 10- 3 2.98 2.85e 2.82*2 ..5 X 10-2 3.22 2.82* 2.72*5 X 10-2
10 5 X 10~3 2.85 2.72* 2.69*11.9 5 X 10⁻³ 2.90 2.77* 2.74"13 1 X 10⁻⁴ 2.40"
2 .5 X 10-4 2.64 2.64 2.645 X 10⁻⁴ 2.58 2.56 2.581 X 10⁻³ 2.66 2.61* 2.64*2 X 10-3 2.98 2.91* 2.92*5 X 10-3 2.90 2.77* 2.74*
----G(HjCh)---- ------------- N -G(Hi)-----------a b c a c
3.3511 0.42 0.433.50"3.90 3.80 3.81 0.42 0.434.07 3.97 3.98
0.40 0.41
4.07 3.97 3.944.05 3.96 3.903.67 3.58 3.573.78 3.69 3.653.76 3.67 3.633.69''3.68 3.59 3.60 0.43 0.44
0.43 0.43*3.78 3.69 3.64 0.50 0.48*
3.87 3.78 3.563.70 3.61 3.56
3.68 3.59 3.600.44 0.44*
3.77 3.68 3.63 0.49 0.47*
“ Measured yield. b Measured yield corrected according mann.25 d No correction, low hydroxyl radical reactivity.
to Flanders and Fricke.22 c Measured field corrected according to Kupper- * Corrected also for the contribution of reaction 4.
formate ion concentration in moles per liter. The substitution gives
B — 1.05 X 10⁻² X [HCOOH] (for formic acid)
and
B — 1.05 X 10⁻¹ X [HCOO- ] [for the formate ion)
where the concentration is expressed in moles per liter. G{C02) values obtained at [HCOO- ] ) 1 X 10~3 M are also corrected for reaction 4.
The oxygen concentration (1 X 10⁻³ M ) is such that reactions 1 and 2 also occur to some extent in the spur. As these influence the yields of (?(H202), we made corrections before introducing the measured values into eq 16. The corrections were calculated in the way described above. Parameter B was calculated as
B = 2.44 X [0*]
by taking from Fielden and Hart23 the data for hydrated electrons: b = 15.8 A and D = 4.8 X 10~6 cm2 sec-1 ; the oxygen concentration is in moles per liter.
Table I presents all our experimental values for the stable product yields and the values obtained after corrections described above. It gives also the measured values corrected according to Kuppermann’s diffusion- kinetic theoretical curves.26
It is certain that the corrections derived from diagrams are less precise than those obtained by using the Flanders and Fricke method of calculation.22 This may be especially true in the relatively low reactivity region, studied in the present work, where the effect of scavenging within the spur is not very significant. However, Kuppermann s curves offer greater possibilities for estimating the various corrections as they were derived from a more elaborate model of water radiolysis (seven primary species in a mechanism involving 20 reactions). The need for the different corrections can be seen from the following considerations. The increase in formic acid concentration leads not only to an apparent increase of ( ? o h but, by preventing the hydroxyl radical recombination, also to an apparent decrease in Gn,o>- The efficient scavenging of primary reducing species by oxygen leads not only to an apparent increase of Gred but also to a corresponding decrease in Ghj. Also larger reactivities toward hydrated electrons (1.9 X 10⁷ sec-1 in the case of I X 10-3 M of oxygen) and hydroxyl radicals (in the present work up to 1 X 10⁸ sec-1), prevent the water-forming reaction between OH + eaq- (or H) in the spurs and so leave in excess a certain number of primary oxidizing and reducing species, respectively.
As can be seen, the measured yields (column a) corrected according to the vwo methods (columns b and c)
Volume 7S, Number 8 August 1969

agree very well although the eorreetions differ, in some cases quite considerably, among themself. This is not surprising as in both cases the corrections are small compared to the measured yields to which they are applied; hence the fact that they differ is without particular importance in the present working conditions. In the primary yield calculations (eq 12, 14—16) we have used the mean values obtained by correcting the measured yield in the two ways mentioned above. Table I shows that only in a few cases do the corrections exceed 0.1 G unit, and that in most cases the uncertainty introduced into the stable products measurements by the corrections exceeds only marginally the experimental error.
Prim ary Yields in Water y-Radiolysis Calculated for Various pH . Figure 5 summarizes the values obtained from measurements in HCOOH + 02, by using the corrected data given in Table I and the eq 12, 14, 15, and 16.
It can be seen that the yields of primary products in the 7 radiolysis of water do not change in the range 3 < pH < 13: (r-mo = 4.09, Gn + Geaq- = 3.18, G o b . = 2.72, G b 2 = 0.45, and (?h2o2 = 0 .68 . The increase in acidity induces an increase in water decomposition. At pH 1.3 the following values are derived: GLhjo = 4.36, Gn + fj0an - = 3.49, G o b = 2.85, (7h2 = 0.43, and (?h2o2 = 0.76.
It is certain that the improvement in the diffusion radical model will require some changes in the parameters used in calculating the corrections. Nevertheless, such changes may not lead to significant variations in the values for the primary yields given above, as they were mostly derived from measurements in a reactivity range where the contribution of intraspur reactions is not very significant.
Concluding RemarksPrimary Yield Increase in Acid Medium. In contrast
with other published results, the data presented here show a relatively small increase (~7% ) in G -h 2o when the pH is varied from 3 to 1.3. The corresponding increase in the total reducing radical yield is of the same order ( ~ 10% ). This finding eliminates Hayon’s explanation of the pH effect2 in acid medium: if only the reactivity of H+ were in question, the increase in yield should be almost tripled. The figures given here indicated that only about one-third of the H atoms formed in the spur reaction
H30+ + eaq- = H + H20 (17)
reach the bulk of the solution and the rest disappear in recombination reactions inside the spur.
The Constancy o f Prim ary Yields at 3 < p H < 1 3 . Data from a number of published systems show the constancy of primary yields when the pH changes from neutral to alkaline: HP032~ + N 03_, 27 HCOO~ + Fe (CN)63~ + Fe (CN) 64~ ,12 C2042~ + 0 2,13 CO + 0 2,28
2570 I. G. D kaganic, M. T. Nenadovic, and Z. D. D ragani6
1 -------- I-------- »----- ----,-------- 1-------- 1
- w •
. V .
13 ........ 13"" D
1<
-O — or
; -
-X------ X
f 3 5 7 9 II 13pH.
Figure 5. The pH effect on the radiation chemical yields of water decomposition and the primary radiolytic products:•, H20 : □, e„<r + H; O, OH; X , H20 2; ▲, H2.
and BrO~.29'30 However, with the exception of the phosphite-nitrate system27 the calculated primary radical yields as well as the G - h 2o values are considerably lower than those obtained in the present work. The cause for this is more likely to lie in the incomplete fullfilment of the conditions, (a), (b), and (c) cited in the Introduction, rather than in some unknown primary processes which could occur with different efficiencies in the presence of different solutes. This conclusion is also reached in a critical analysis of some published values made recently by Czapsky.3 Considering his own data27 and also reviewing published results1 on the influence of pH on primary yields, Haissinsky draws the conclusion that the decomposition of water is the same over the whole pH scale; secondary reactions contribute to an increase of GLH2o in acid medium (about 10%) without influencing it appreciably in alkaline solution.
It is worth mentioning that the results presented here for neutral media are in a good agreement with recent measurements using the systems CO + 02,31 tetra- nitromethane + 0 2,32 air-saturated solutions of ferrous sulfate at low acidities, and neutral air-saturated solutions of ethanol and of sodium formate.33
The primary yields calculated for pH 12-13 should be
(27) M . Haissinsky, J. Chim. Phys., 62, 1141 (1965).(28) T . Balkas, F . S. Dainton, J. K. Dishman, and D. Smithies, Trans. Faraday Soc., 6 2 , 81 (1966).(29) C. H. Cheek and V. Y. Linnenbom, J . Phys. Chem., 6 7 , 1856 (1963).(30) G. Y. Buxton and F . S. Dainton, Proc. Roy. Soc., A304, 441 (1968).(31) C. J. Hochanadel and R. Casey, Radiat. Res., 25, 198 (1965).(32) B. H. J. Bielski and A. O. Allen, J . Phys. Chem., 71, 4544 (1967).(33) B. H . Bielski and A. O. Allen, I n t . J. Radiat. Phys. Chem., 1, 153 (1969). (Appeared after the present paper was subm itted.)
The Journal of Physical Chemistry

2571T he Origin of H20 2 in Water R adiolysis
regarded with some reserve since *he rate constants and the products for the reactions 9 and 11 are not completely established. However, on the basis of our present knowledge, it is unlikely that these values will vary much, as the increase of pH and the conversion of OH to O- does not change the measured yields of C02 and H202. Also, it is difficult to expect that the increase in hydroxyl ion concentration in this pH range (reactivities3.6 X 106 to 3.6 X 10⁷ sec-1) increases the yield of water decomposition.
Geaq- at 3 < pH < 13. If we take as Gh = 0.55,27 we can obtain for the yield of hydrated electrons in the studied pH region GCa,,- = 2.63. In a recent publication Fielden and Hart,23 analyzing the published values
as well as their own, conclude that the figure 2.63 ±0.1 can cover the results for hydrated electron yields obtained from four different systems at neutral pH. The value obtained from oxygenated formic acid solutions in the present work is in perfect agreement with Fielden and Hart’s figure. At pH 13, these authors find a higher electron yield, which is at variance with the data presented here. Another interesting conclusion drawn from the primary yields derived at 3 < pH < 13 is that Geaq- ^ G o H ^ 2 . 6 7 .
Acknowledgment. The authors are indebted to J. Sutton for reading the manuscript and for useful discussions.
On the Origin of Primary Hydrogen Peroxide Yield
in the 7 Radiolysis of Water
by Z. D. Draganic and I. G. DraganicBoris Kidri6 Institute of Nuclear Sciences, Vinca, Yugoslavia (Received December 16, 1968)
In an attempt to throw light on the origin of Gh,o,, hydrogen peroxide yields were determined in deaerated aqueous solutions (pH 1.3-13) of different substances, irradiated with 60Co 7 -rays. Only those systems for which the reaction mechanism enables the direct measurement of GW, were chosen: 1-propanol, ethanol, acrylamide, acetone, and potassium nitrate. Particular care was taken to ensure that the values derived represent the initial yields. It was shown that homogeneous kinetics can be used to express the dependence of GsiOi on hydroxyl radical scavenger concentration, and the origin of intraspur H202 in a pseudo-first-order process was considered. However, all experimental data obtained in this work demonstrate that Ghjo2 values depend on the reactivities as required in the diffusion kinetic model; the fractional lowering of primary peroxide yield decreases with increasing reactivity of the OH scavenger and increases with increasing eaq~ scavenger reactivity. Theoretical kinetic curves calculated by Kuppermann and by Mozumder and Magee, using the same parameters which furnish good agreement with LET effects, satisfy reasonably well the results presented here, hence the conclusion that the origin of ( ? h 2o2 lies in the recombination of OH radicals within the spur. The experimental results also enable the determination of the primary hydrogen peroxide yields from the 7 radiolysis of water: 0.76 ± 0.01 and 0.67 ± 0.01 at pH 1.3 and about 6, respectively. At pH 13 acrylamide solutions give 0.56 < Gb2o* < 0.67 and other studies are desirable before a definite conclusion is made.
IntroductionThe radical diffusion model for the radiolysis of water
assumes that OH radicals are produced in localized regions in the irradiated medium and that the primary hydrogen peroxide yield is formed by combination of these species as they diffuse from the spurs, short tracks, and blobs
OH + OH = H20 2 (1)
In the case that the reaction
OH + B ^ H202 (2)
competes efficiently with reaction 1, the formation of hydrogen peroxide is suppressed: (?h2o2 should decrease with increasing [S]. The diffusion model predicts that the ratio of peroxide yields, measured in the presence of hydroxyl radical scavenger (Gh2o2) to that observed in dilute solution when the solute has no effect (G°h2o2), should depend chiefly on the reactivities (v = kon+s X [S]) of the scavengers used.
After Sworski’s original observations on aerated bromide solutions,1 other results were published con-
(1) T . J. Sworski, J. Amer. Chem. Soc., 76, 4687 (1954).
Volume 73, Number 8 August 1969

2572 Z. D. D ragani6 and I. G. D eaganic
firming the decrease of measured (?h2o, with increasing[S]. The scavengers used were Br~,I_4 C l- ,6 I “ ,4 Ti+6,7 Ce3+,6 N02- ,4'8 Fe(CN)e3_ + CH3OH,9 and H2O2.10 Schwarz11 was the first to demonstrate that if G/G° is plotted against log [S], the resulting series of curves are all of the same shape and can be brought into coincidence by multiplication of the concentration by an appropriate factor. However, the comparison of published data does not clearly confirm the basic quantitative assumption, i.e., that the (?H2o2/ir0H2o2 values depend on the reactivity toward OH radicals only. In the case of the carefully studied halogenide ions, for example, the efficiency in decreasing the peroxide yield does not follow the order of their rate constants with the OH radical. It was also remarked9 that methanol, an efficient scavenger for OH radicals, does not contribute, even in 1 M concentration, to the (thsOj decrease in the system Fe(CN)63~ + CH3OH at pH 13. This raises doubts that reaction 1 is the main source of the primary hydrogen peroxide. Similar observations on the influence of scavenger concentration on (7H2 led Sworski12 to the conclusion that heterogeneous diffusion kinetics cannot quantitatively express the dependence of primary molecular hydrogen yields on solute concentration. If such were also the case for primary hydrogen peroxide then, following Sworski’s initiative, one could imagine the competition
X + H20 = H202 (3)
X + S H202 (4)
as the cause for the observed dependence of (?h2o2 on[S]. The chemical nature of the species X is not important for present work; it could be “excited water,” 12 an excited OH radical,13 OH+,14 or some other reactive intermediate. It is only important that it lives for a sufficient time to take part in reactions 3 and 4.
The purpose of this work was to get some information on the relative importance of reactions 1 and 3 in the formation of C?h2o2- The concentration influence of different scavengers on measured peroxide yields was studied at various pH. Only those systems were chosen where the reaction mechanism, reasonably well established, enables the direct measurement of GH2o2- The scavengers used had &oh+s values varying from very high (6 X 10⁹ M ~ l sec-1 for acrylamide) to low (<5 X 10⁶ M ~ l see-1 in the case of K N 03). Also the peroxide formation was followed in deaerated solutions of an efficient hydrated electron scavenger (KN03 at pH ~ 6) of a very efficient scavenger for hydrated electrons and moderately efficient for OH radicals (acetone at pH ~6) and finally, of a scavenger equally highly efficient for all primary short lived species (acrylamide at pH 1.3, ~ 6, and 13).
In choosing the working conditions we have paid particular attention to reducing as much as possible the secondary reactions that can influence the measured
H202 yields. The absorbed dose region was between 4 and 24 krads; hence the accumulation of product (P) and the importance of eventual reactions P + OH or P + H202 was considerably reduced. The scavenger concentration was generally sufficient to protect the H202 from H or eaq- attack, but when this was not the case as in neutral ethanol solutions, 1 X 10“ 3 M acetone was added. When the dosage curves were not straight lines, the corrected values were used as the initial yields. These were obtained as G h 2o 2 readings at zero dose on diagrams where point-by-point peroxide yields were plotted against dose.
Experimental SectionDeaerated solutions of 1-propanol, ethanol, acryla
mide, potassium nitrate, and acetone were irradiated. Triply distilled water was used in sample preparation, the pH being adjusted with HCIO4 or freshly prepared NaOH. Acrylamide (BDH) was purified before use.15 Other chemicals (AR Merck) were used without additional purification. Irradiations were performed in a 3000-Ci (nominal) radioactive cobalt source. The absorbed doses varied between 2.5 X 10¹⁷ and 15 X 1017 eV ml-1 as measured by the Fricke dosimeter assuming C?(Fe)3+ = 15.5. Hydrogen peroxide was determined spectrophotometrically by the K I method developed by Ghormley16 and, in the case of nitrate solutions, as modified by Schwarz and Salzman;8 molar extinction coefficients at 24° were, in our working conditions, 25,500 and 23,800 1. mol-1 cm-1, respectively. Solutions of pH 1.3 and 13 were neutralized with NaOH or HCIO4 before addition of the reagent. The readings were made in 4-cm cells and against water; reference samples contained the scavenger at the concentration under study and the reagent. They were prepared and measured simultaneously with irradiated samples.
(2) A. O. Allen and R. A. Holroyd, J. Amer. Chem. Soc., 77, 5852 (1955).(3) A. Rail and H. C. Sutton, Trans. Faraday Soc., 61, 877 (1965).(4) H. A. Schwarz, Proceedings of the Fifth Informal Conference on the Radiation Chemistry of Water, University of Notre Dame, Radiation Laboratory, AEC Document No. COO-38-519, Notre Dame, Ind., 1966.(5) T. J. Sworski, Radiation Res., 2, 26 (1955).(6) T. J. Sworski, ibid., 4, 483 (1956).(7) E. Hayon, Trans. Faraday Soc., 61, 723 (1965).(8) H. A. Schwarz and A. J. Salzman, Radiation Res., 9, 502 (1958).(9) C. Hughes and C. Willis, Discussions Faraday Soc., 36, 223 (1963).(10) M. Anbar, J. Pecht, and G. Stein, J. Chem. Phys., 44, 3635 (1966).(11) H. A. Schwarz, J. Amer. Chem. Soc., 77, 4960 (1955),(12) T. J. Sworski, Advances in Chemistry Series, No. 50, American Chemical Society, Washington, D. C., 1965, p 263.(13) V. V. Voevodskii, Kinet. Ratal., 2, 4 (1961).(14) M. Faraggi, D. Zehavi, and M. Anbar, J. Phys. Chem., in press.(15) K. W. Chambers, E. Collinson, F. S. Dainton, W. A. Seddon, and F. Wilkinson, Trans. Faraday Soc., 63, 1699 (1967).(16) A. O. Allen, C. J. Hochanadel, J. A. Ghormley, and T. W. Davis, J. Phys. Chem., 56, 575 (1952).
The Journal of Physical Chemistry

Tabl
e I:
Th
e In
fluen
ce o
f Sc
aven
ger
Con
cent
ratio
ns o
n M
easu
red
Hyd
roge
n Pe
roxi
de Y
ield
s in
Dea
erat
ed S
olut
ions
The Origin of H20 2 in W ater Radiolysis 2573
1 ? t W < a
O§d-H
ol—iod-Ho<o
o o o o oH H (N N hC O O o oo o o-H -H -HIC (M 05 Ow
O O-H -H
CO 05 CO 1> hO
Oo
o o o o O N N N o 2S 00© © d © o o o o § 8 8
?o o o o d o d o ® d do • -H -H -H -H • F -U -H -H : -H -H n
M a O O O C5 CO ZD CO CO CD CO CO COO W H NCO N H rjiO D N N LO s
© © O © d o d o o ¿ d
TO1 ?fcW S3 ft H
o o oCO H Ho o o o d d -H *H -HGì Gì Til CO Tin CO iO io >o
ood-Ho
o8d-HoCO
o o23o o d d -H -H05 SCO CO
o o o oH IN N COo o o o d o d o -H -H -H -H05 00 N Wco co LO oCO CO (N (Md o d o
o o >orH N Ho o oo-HCOCOlo
o o-H -HLO O 00 lO CO CO
O O O O orH rH rH r—1 rHo o o o od o o o d-H -H -H -H -H
o d o o o
LO O O LOH (N (M rHo o o oo o-H -H
o-H
o4i
CO rH J> 00LO 05 LO toCO LO CO
35 a
■3 +gJSHw
LO orH rHo o d o d o
o 00H o o o00oo
LO O o o o^ H d CI Ho o o O oo d d o o
-H -H : -H -H : -H ; -H -H +1 -H -HTiH l> rH o 05ooco OOCO Tri „ __ _ __COCO COCO LO CO CO (NN CO H T}1 Ni> 00 CO 00 LOo o o o o
»Oi'rOOOOOOOLOLO 00THOrHrHTHOrHrHiHrH i—IO O O O O O O O O O o o d d o o ' d d o d d d-H-H-H-H-H-H-H-H-H-H ; -HNCJiN(NN05C0fNTiic0^ ^ c o ^ j p o ^ o c o e o CM»O LO LO Trit- I> 1> COo d d d d d d d o d
a » a ^ 2K Pu a
ood
<NCOH-
O LO O LO rH O rH Oo o o oo o o o
O LO o o H H N COo o o oo o o o
05 CM rH Tri rtH CO 00 05LO LO rH TH (N O N NIs* t'» Is» CO LO LO 05 Oo o o o o o o o
a i io orH rHO X X
rH LO
I I I I I t o o o o o o
rHLOrH05LOrHLOrHCOLOrH05LO
Results and DiscussionThe Influence o f Scavenger Concentrations on M ea
sured Gu./h- Hydrogen peroxide yields were measured at various scavenger concentrations. Table I summarizes the experimental data. Each G value quoted here was obtained by exposure of samples at five or six different doses. In the yield calculation the absorbed dose was corrected for the electron density of the solution.
Although propanol and ethanol are known and often used as efficient OH radical scavengers, there are no published data of (7 H io , dependence on their concentrations. Jayson, et al.,17 give the value ~0.6 for the peroxide yield in a deaerated ethanol solution (1 X 10⁻² M ) at pH 1.2, but were not able to detect the peroxide at pH 5.5. This is why we used 1 X 10⁻³ M acetone to protect H202 from attack by hydrated electrons so that it could be measured. In both alcohols, and regardless of pH, the dosage curves were not strictly linear in spite of the relatively low dose used. The cause of this may be the reaction of hydrogen peroxide with the alcohol radical, which takes place in competition with the radical recombination. The rate constants for these reactions in ethanol solutions,181.5 X 105 and 2 X 10⁹ M ~ l sec-1, respectively, show that this could be the case. It can also be seen that both alcohols behave in a similar way, as one might expect from their reaction rates with OH radicals. Only in the case of 0.5 and 1.0 M solutions of 1-propanol is the decrease in the measured yields considerably greater. The reproducibility in these measurements was much poorer than in the corresponding ethanol solutions and we think that the reason for this may be impurities, present in trace amounts but sufficient to attack the micromolar amounts of peroxide formed. We have not considered these two values in further treatment of results. Table I shows that the increase of alcohol concentration from 5 X 10~6 to2.5 X 10- 3 M does not influence the measured yields; only with further concentration increase does the fall in (rmoj become visible.
The increase of monomer concentration from 1 X 10“ 5 to 5 X 10⁻⁴ M does not influence the peroxide yields measured in irradiated acrylamide solution at various pH. Further increase to 5 X 10⁻¹ M induces a decrease in measured peroxide yields to a value which is less than the half of that measured in dilute solutions. This finding is in contradiction with results of a systematic study of H202 formation in deaerated aqueous solutions: Collinson, et at.,19 have found that the value of Gh2o2 in neutral solutions rises from almost zero to a maximum of 0.90 ± 0.05 at a concentration of monomer
(17) G. G. Jayson, G. Scholes, and J. Weiss, J. Chem. Soc., 1358 (1957).(18) W. A. Seddon and A. 0. Allen, J. Phys. Chem., 71, 1914 (1967).(19) E. Collinson, F. S. Dainton, and G. S. MeNaughton, Trans. Faraday Soc., 53, 357 (1957).
Volume 73, Number 8 August 1969

2574 Z. D. D raganiC and I. G. D ragani6
Table II: Hydrogen Peroxide Yields in Dilute Solutions (G°h2o2) and Rate Constants Used in the Reactivity Calculations
fcOH+8, *x„-+s’pH Scavenger G°h202 M~l sec'1 M~l sec-1
1.3 1-Propanol 0.745 ± 0.010 1.5 X 10⁹“1.3 Ethanol 0.745 ± 0.010 1.1 X 10«1 <106 d1.3 Acrylamide 0.776 ± 0.010 6 X 10⁹' 2 X 10“ f
-6 Ethanol + 10 ~s M 0.677 ± 0.010 1.1 X 10«1acetone
-6 Acrylamide 0.680 ± 0.010 6 X 10⁹' 2 X 10“ 7-6 Nitrate 0.660 ± 0.010 <5 X 10⁶ d 1.1 X 10“ " ^-6 Acetone 0.670 ± 0.010 6.2 X 10⁷e 5 .9 X lO90’’'13 Acrylamide 0.561 ± 0.010 6 X 10⁹C 2 X 10“ '
“ G. E. Adams, J. W. Boag, J. Currant, and B. Michael in “ Pulse Radiolysis,” J. H. Baxendale, M. Ebert, J. P. Keen, and A. J. Swallow, Ed., Academic Press, London, 1965, p 131. 6 Reference 27. c Calculated from ref 15 and 24. d Reference 23. e R. W. Matthews and D. F. Sangster, J. Phys. Chern., 69, 1938 (1965). / Reference 15. g S. Gordon, E. J. Hart, M. S. Matheson, S. Ra- bani, and J. K. Thomas, Discussions Faraday Soc., 36, 193 (1963). h J. K. Thomas, S. Gordon, and E. J. Hart, J. Phys. Chern., 68, 1524 (1964). ’ E. J. Hart, S. Gordon, and J. K. Thomas, ibid., 68, 1271 (1964).
lying between 10-3 and 10-2 M , and subsequently falls again to about 0.25 in 0.4 M solutions. However, there is better agreement with the data obtained later in the same laboratory, in 4 X 10 -2 M solutions at various pH.20 It should be pointed out that at concentrations higher than 5 X 10⁻¹ M the irradiated solution becomes so viscous that the analysis for H202 is impracticable.
Potassium nitrate is an extremely inefficient OH radical scavenger i<5 X 10s sec-1) which reacts 104 times faster with hydrated electrons and it was chosen for this reason. As can be seen from Table I, increasing its concentration from 5 X 10⁻⁵ to 5 X 10⁻³ M in deaerated neutral solutions has no influence on GW>2 values. In contrast to the systems mentioned above, further increase to 0.5 M concentration induces an increase in G ^c,- This increase is not great (up to 18%) but is reproducible. As in similar measurements by Daniels and Wigg,21 further increase in nitrate concentration is followed by a decrease in hydrogen peroxide yield. It should be also pointed out that the dosage curves are straight lines in solutions where the nitrate ion concentrations are greater than 5 X 10⁻³ M . In more dilute solutions, the concentrations of N02- formed do not seem sufficient to protect the H202 from the attack of OH radicals, and the dosage curves bend slightly.
Acetone is a moderate OH scavenger (6 X 10⁷ M -1 sec-1) which reacts, like KNO3, very efficiently with eaq- . The concentration increase from 10-4 to 10-3 M does not influence the measured Gn,ov which is practically the same as the value obtained in the same concentration range for nitrate or other scavengers studied here at neutral pH. As in the nitrate case, an increase in H20 2 yield follows the further concentration increase of acetone; it passes through a maximum at about 0.5 M and subsequently falls to zero in 5 M solution. It is difficult to find an explanation for such a behavior. The radiolytic mechanism is very complex;22 the only reaction of H202 in deaerated acetone
solution which has been considered is that with the 2- hydroxypropyl radical. This may explain the bending of H 20 2 dosage curves but not the rapid drop of G'm , observed at concentration larger than 5 X 10⁻¹ M .
The Dependence of (?h,o2/I?0h!o2 on the Reactivity. In order to normalize the data of Table I for an intercomparison, values of G!H2o2/Gi0H2o2 were calculated for each solute where (t°h2o2 is the mean value of yields measured in the corresponding dilute solutions, where the solute has no influence on the peroxide yield; they are given in Table II, together with the rate constants used in the reactivity calculations.
The rate constants for the solutes studied here, as can be seen from a compilation made by Anbar and Neta,23 are fairly well established. This is not entirely true for the reaction OH + acrylamide. This reaction was studied in competition with the reaction OH -j- CNS- and the value 0.30 ± 0.07 was found for fcoH+acryiamide/fcoH+cNs--16 Taking into account recent values for &oh+cns- given by Baxendale and collaborators (2 X 10¹⁰ M ~ l sec-1 24 and 2.8 X 10l° M ~ l sec-125) considerably higher values are obtained than fcoH+acryiamide given by Chambers, et al.lb’2e In the present work the value 6 X 10⁹ M -1 sec-1 is used; it was calculated from the data given by Chambers, et al.,n and Baxendale, et al.2i
Figure 1 shows the dependence of (7h2o2/(t0h2o2 on the reactivity of hydroxyl radical scavengers. The points represent the experimental values obtained in
(20) F. S. Dainton and W. S. Watt, Proc. Boy. Soc., A27S, 447 (1963).(21) M. Daniels and E. Wigg, J. Phys. Chern., 71, 1024 (1967).(22) P. Reisz, Radiation Res. Suppl., 4 , 152 (1964).(23) M. Anbar and P. Neta, Int. J. Appl. Radiat. Isotopes, 18, 493 (1967).(24) J. H. Baxendale and D. A. Stott, Chem. Commun., 699 (1967).(25) J. H. Baxendale, P. L. T. Bevan, and D. A. Stott, Trans. Faraday Soc., 64 , 2389 (1968).(26) K. Chambers, E. Collinson, F. S. Dainton, and W. Seddon, Chem. Commun., 498 (1966).
The Journal of Physical Chemistry

T he Origin of H20 2 in Water Radiolysis 2575
------- 1— 1-------- 1— I—I A X I |q »fl x I
I y io • a â x I, / •— j I1.0 -
£
ojta 0.5 ■
-• — > Q f tj g o d e x j'»WrtFnj.Ty,. JJ. .(7§r- - - ~....o'g7,>-^.
'••9,s -s4V « *
\ ° x N
XH*\XnA\.*\
%i \\ V
0.0 _J__L -j__L_104 105 106 10r 10s
A h + S ÌS], SÔC ’.10s 10°
Figure 1. Dependence of Gh2o2/(?°h2o, on hydroxyl radical reactivity: □, 1-propanol, pH 1.3; O, ethanol, pH 1.3;•, ethanol + 1 X 10~3 M acetone, pH ~ 6 ; A, acrylamide, pH 1.3; A, acrylamide, pH ~ 6 ; X , acrylamide, pH 13.The dotted lines are the diffusion kinetic theoretical curves; upper curve is calculated by Mozumder and Magee28 and lower curve by Kuppermann.29
1.2
I too1■S?
0.8
2.6105 10s 10T 108 10’ 1010 10"
^ - +Sxrs], sec,-1.
Figure 2. Dependence of Gh,Oi/G°h2o2 on hydrated electron reactivity: O, K N 03, pH ~ 6 ; X , acetone, pH ~ 6 . The dotted line is the diffusion kinetic theoretical curve calculated by Kuppermann.29
this work. The spread, generally less than 0.1 unit of G/G°, seems to be due more to the experimental errors than to the difference in radiation behavior of the systems studied. It is almost double at the reactivity 3 X 10⁹ sec-1, but the working conditions here are particularly difficult: very low yields are measured in the presence of large scavenger concentrations (Table I). It is worthwhile mentioning that the fractional lowering of hydrogen peroxide yields in deaerated solutions of K N 02, observed by Schwarz and Salzman,8 agrees well with results given in Figure 1 if (7 °h2o2 = 0.6254 and fcoH+Nor = 3.6 X 10⁹ iff-1 sec-1.27
The dotted lines in Figure 1 are the theoretical diffusion kinetic curves calculated by Mozumder and Magee28 and by Kuppermann.29 They are both calculated assuming that the molecular yield is formed by radical recombination (eq 1), in competition with its reaction with solute (eq 2). It can be seen that practically all experimental results lie between these two curves. The upper one28 was calculated using the approximation that the track of an ionizing particle consists of essentially nonoverlapping spurs, blobs, and short, tracks. Kuppermann’s curve represents the lower limit. It is evident that both theoretical approaches require the falloff of G/G° to occur considerably earlier than was experimentally found.
Figure 2 shows how the increasing hydrated electron reactivity (v = fceaq-+s X [S ]) influences the G/G° values. The dotted line is the diffusion kinetic theoretical curve derived from Kuppermann’s results.29
Dependence of l/Gu,o, on Scavenger Concentration According to Homogeneous Kinetics. If reactions 3 and 4 are responsible for the formation of primary hydrogen peroxide in water radiolysis and its decrease with
increasing scavenger concentration, then the simple competition kinetics is expressed by the equation
1 _ 1 h _j_ fcx+s [S]G h20i C im o s i fcx+Hjo[H20 ]
(5)
In this case the data given in Table I should satisfy eq 5 and G° h 2o2 may be calculated from the intercept on the competition plots. As can be seen from Figure 3, this is true for the substances known as efficient hydroxyl radical scavengers which satisfy reasonably well the competition plots made according to (5) and experimental data in the concentration range 5 X 10⁻³ to 1 M . The G° HjOj calculated from intercepts are lower than the yields experimentally observed in corresponding dilute solutions (<5 X 10⁻³ M ) represented in Table II. A (?°h ,o, is found to be ~0.12 ± 0.02 and seems independent of pH and the chemical nature of the scavenger used. The values of relative rate constants for the reactions of the species X with solutes can also be derived from slopes and intercepts on the competition plots. They have the following trend: acrylamide >1-propanol > ethanol.
Concluding RemarksRecombination of OH Radicals as the Source of P r i
mary Hydrogen Peroxide. We have seen that the experimental data obtained in this work (Table I) could be used to express kinetically two different assumptions concerning the origin of (? h ,o2: reaction 3 and homo-
(27) G. E. Adams, J. W. Boag, and B. Michael, Trans. Faraday Soc., 61, 1417 (1965).(28) A. Mozumder and J. L. Magee, Radiai. Res., 28, 215 (1966).(29) A. Kuppermann in “ Radiation Research 1966,” G. Silini, Ed., North-Holland Publishing Co., Amsterdam, 1967, p 212.
Volume 78, Number 8 August 1969

2576 Z. D. D ragani6 and I. G. D raganic
Figure 3. Dependence of 1 /( ? h 2o2 on solute concentration:O, 1-propanol, pH 1.3; O, ethanol, pH 1.3; •, ethanol +1 X 10 “ 3 M acetone, pH ~ 6 ; A, acrylamide, pH 1.3; A, acrylamide, pH ^ 6 ; X , acrylamide, pH 13.
geneous kinetics (Figure 3) and reaction 1 and diffusion kinetics (Figures 1 and 2). However, the former assumption needs, in the first place, more precise information concerning the chemical nature of the species here called X. Secondly, it needs an explanation of the different mechanisms of scavenging the precursor of the primary H202, as reflected in the two different G° h,o, values (for dilute and concentrated solutions). It would be interesting to see if any physical significance is attached to the fact that AG °h2o2 calculated here is practically identical with A(?0h2 in Sworski’s similar considerations on the origin of primary molecular hydrogen.12 Finally, the homogeneous kinetic model should give an explanation of why efficient electron scavengers (KN03 and acetone in this work) induce an increase in C?h2o2 with increasing reactivity, as shown in Figure 2.
We think that the recombination of OH radicals, as given by the diffusion radical model, is a more probable source of the primary H202 yield. Qualitatively, the model predicts the experimentally observed decrease, as well as the increase, in measured (?h2o2 values at different scavenger concentrations. Quantitatively, the theoretical curves satisfy fairly well most of the experimental data, as can be seen in Figures 1 and 2. It is extremely important to note that these curves were obtained with the same parameters which furnish good
agreement with LET effects.28'29 The experimental results presented here show that the changes in Gfino, are a function of the reactivity only, regardless of the pH (1.3-13) and the scavenger used; this should be the case if reaction 1 is the source of primary (?H2o2.
It seems worthwhile to draw attention to the behavior of the three efficient scavengers for eaq~ used in this work: potassium nitrate, acetone, and acrylamide. The first one is a very weak OH scavenger, the second moderate, and the last a very efficient one. Qualitatively they behave as one would expect from the diffusion radical model. In connection with their quantitative behavior one point arises: to what extent should the decrease in CthsOj/G^HiO» with increasing reactivity of acrylamide, a good scavenger for all three primary radicals, follow that induced by 1-propanol and ethanol, both only efficient OH scavengers? Also, since fcoH+Nor « fcoH+acetone, to what extent should the increase in G/G° with increasing nitrate reactivity follow that observed in the case of acetone?
We feel that the answers should be looked for in the radiation chemistry of these systems (reactions in concentrated solutions, more accurate rate constants) as well as in the refinement of the diffusion radical model (secondary spur reactions of radicals with products of radical-solute scavenging reactions).
The Values fo r the Prim ary Yields of Hydrogen Peroxide at pH 1.3-13. The data in Table II enable an evaluation to be made of absolute primary hydrogen peroxide yields: 0.76 ± 0.01 and 0.67 ± 0.01 at pH1.3 and 6, respectively. These values are the mean values calculated from measurements in dilute solutions (the reactivities <5 X 10⁶ sec-1) of 1-propanol, ethanol, and acrylamide at pH 1.3 and, at pH about 6, in dilute solutions of ethanol, acrylamide, acetone, and potassium nitrate. In alkaline medium we have only the yields measured at pH 13 in 10 -5 to 10-4 M solutions of acrylamide: 0.56 ± 0.01. We feel that this value may be lower than the real £rH2o2 as it was obtained in solutions with a large [OH- ], hence, a large reactivity toward OH radicals (/coh+oii- X [OH- ] = 3 X 10⁷ sec-1). If we take Figure 1 as a calibration curve, we can see that Gm<n measured at this hydroxyl radical reactivity should be increased by about 15% in order to correspond to the value which would be measured at reactivities less than 5 X 10⁶ sec-1, i.e., in dilute solutions. This correction would give 0.65 for a primary hydrogen peroxide yield in alkaline medium, which is practically the value found for the neutral pH. However, this correction may be somewhat large and lead to a yield which is larger than the real (rH2o2 at pH 13, since the reaction OH + OH- gives O- ion-radicals which recombine also producing H202. The rate constant for the O- recombination reaction is 5-6 times smaller than that for OH radicals;23 also, it is not certain that the fate of all O- species in the spur lies in the recombination. Therefore, we think that it is more
The Journal of Physical Chemistry

General Nonequilibrium T heory of Chromatography 2577
correct to conclude that 0.56 < (rHlo2 < 0.67 and that other studies are desirable before a definite conclusion is reached on the primary hydrogen peroxide yield at pH 13.
Acknowledgment. The authors wish to thank Jack Sutton for reading the mansucript and useful discussions and Nikola Stancie for technical assistance in the experiments.
General Non equilibrium Theory of Chromatography with
Complex Flow Transport
by J. Calvin Giddings and Paul D. SchettlerDepartment of Chemistry, University of Utah, Salt Lake City, Utah (Received November 18, 1968)
The nonequilibrium theory of chromatography is developed in general terms for complex laminar flow involving local fluctuations in the direction and magnitude of the velocity vector. This theory leads to an effective diffusion coefficient which describes zone dispersion. It is shown that flow complexities are responsible for the phenomenon of coupled “ eddy diffusion” and the attendant transition of the effective diffusion coefficient from a second-power to a first-power dependence on flow velocity. Failure to account for this important phenomenon may lead to an error of several orders of magnitude. The two limiting cases and the transition region itself are discussed. The order of magnitude of equilibrium departure and the validity of the basic assumptions are established. The problems of devising realistic models for chromatographic media are also mentioned.
I. IntroductionThe distribution of a trace component migrating
down a chromatographic column (or through porous media generally) is determined mainly by the twin processes of diffusion and convection (flow displacement), with various kinetic steps often added in. The diffusion-flow combination in a single phase is described by the basic Fokker-Planck equation1
dc/dt = V -D V c - V-vc (1)
where c is local concentration, D is molecular diffusivity, t is time, and v is the local velocity vector. This equation gives the diffusive and convective contributions, respectively, to mass balance. Kinetic processes must be accounted for by additional dynamical expressions.
Equation 1 and its accessory expressions have been found intractable to direct solution under all but the simplest of circumstances. Unfortunately the physical processes underlying laboratory chromatography are not simple. The typical chromatographic column is a multiphase system of disordered geometry, an unpredictable flow pattern around irregular particles, a random relative distribution of phases, chemically non- uniform surfaces, and complex mass transport in and between phases. Equation 1 is thus made difficult by complex boundary conditions, diffusion space, and flow
profiles. A rigorous mathematical treatment is at present unapproachable.2
Despite the numerous obstacles, considerable theoretical progress has been achieved through judicious approximations which retain the essential features of the experimental phenomena. Most striking are glass bead loaded columns for which ‘ he effluent profile width can in favorable instances be predicted within 5-20% using only nonchromatographic parameters.3 This success can be attributed to two characteristics of the typical glass bead system: (a) diffusion in the stationaryphase is rate controlling and (b) the geometry of this stationary liquid is simple and well defined by virtue of the adjacent spherical surfaces. In the absence of these advantages the problems are more severe. Theoretical progress in category b has resulted from a formulation dealing with arbitrarily complex masses of absorbing stationary liquid.4 The present paper is intended to broaden the scope of theory in the absence of
(1) S. Chandrasekhar, Rev. Mod. Phys., IS, 1 (1943).(2) J. C. Giddings, “ Dynamics of Chromatography, Part I,” Dekker, Inc., New York, N. Y., 1965.(3) S. H. Hawkes, C. P. Russell, and J. C. Giddings, Anal. Chem., 37, 1523 (1965); M. R. James, J. C. Giddings, and H. Eyring, J. Phys. Chem., 69, 2351 (1965); J. C. Giddings, K. L. Mallik, and M. Eikelberger, Anal. Chem., 34, 1026 (1962).(4) J. C. Giddings, J. Phys. Chem., 68, 184 (1964).
Volume 73, Number 8 August 1969

advantage a, i.e., to account more realistically for mass transport in the mobile fluid in the presence of microscopic flow irregularities.
Even the most elaborate of previous chromatographic theories6 6 have been based on the assumption that all stream paths are parallel along the main flow axis z with an essentially constant velocity along each stream path. This constant flow assumption is valid for parabolic flow in open tubes of constant cross section (as for example in the so-called capillary column6 and for models constructed of capillary bundles. However, it is not valid for a packed column where fluid follows a tortuous and variably constricted path as it avoids the solid particles (this despite the laminar nature of such flow). Not only is the constant flow or “ capillary bundle” assumption wrong in detail, but it is known that the irregular flow pattern leads to a prominent form of zone dispersion inconsistent with the theory. This dispersion is known as eddy diffusion.2 The latter has become a controversial subject in gas chromatography.
In a granular medium one stream path may start out with a velocity greater than another, but the advantage is soon lost due to the random orientation of particles downstream. A trace component swept along in such an erratic stream disperses according to an apparent diffusion coefficient proportional to mean axial flow velocity (vz), i.e.. 2D = 1/2A(vz). (For the present, axial molecular diffusion is ignored; see later.) If only a fraction R of this solute is in the mobile fluid, the remainder held stationary by sorption, the effective diffusion coefficient is
® = (R /2)A(vz) (2)
where A is a geometrical constant.7 (Dispersion is usually related to “ plate height” H ; since H = 2lD/R(vz), then H = A in this case.) This equation and an estimate of constant A can be deduced from several simple theories,7 8 one involving a random walk model.8 A refinement of the random walk model to account for the diffusion of component molecules in and out of the various stream filaments has led to the coupling theory of eddy diffusion.2,9
35 = - y _________*_________ C3)2 ^ 1/A(v.) + 1/Cm(vz)> V J
As velocity decreases one passes from a first-power region characteristic of eddy diffusion to a second-power region stemming from lateral diffusion. The constant flow theories account only for the latter. They therefore by-pass the experimentally demonstrable fact that the transition exists.10 At high relative velocities, particularly important in liquid chromatography, the failure to account for this transition leads to a theoretical prediction of 2D too high by several orders of magnitude.
The intent here is to develop a fairly general and rigorous but still tractable theory which describes the transition and other consequences of erratic flow. The
2578
theoretical problems are similar to those encountered in the constant flow case, and a parallel theory could be developed. Instead we develop an alternate and more complete formalism which, in addition to the foregoing effects, incorporates a general expression for longitudinal diffusion.
II. Dependence of Peak Dispersion on Nonequilibrium
The differential nature of viscous flow leads to the unequal downstream displacement of different fluid elements. Since a concentration gradient invariably exists along the flow axis, the unequal motion of fluid elements leads to a “ lateral” concentration unbalance which decays more or less rapidly through molecular diffusion and velocity changes. A continued perturbation by the uneven flow gives assurance that the decay does not go to completion; a slight degree of lateral or local nonequilibrium is one of the ubiquitous characteristics of solute distribution in chromatographic zones. The presence of this nonequilibrium, of course, affects the forward transport of solute and thus its eventual distribution along the column axis. This will be shown presently.
Foremost among approximations used to simplify this dynamic situation is that which states that the departure from equilibrium in a cross section is small, i.e., that the concentration unbalance at any point is small compared to the concentration itself.211 This condition is expressed by e <K 1, where t is defined by
c = c * ( l + <) (4)
Quantity c* is defined as the equilibrium concentration within the mobile phase in a thin slab normal to the mean flow axis z. The expression e <SC 1 is one in a group of interrelated and physically reasonable approximations. Others are that c* is a slowly varying function of distance compared to e; the number of theoretical plates is restricted to A » 1; zone dispersion follows Fick’s laws, etc. These statements have led to a theory (generalized nonequilibrium theory) dealing in a rather general way with complex kinetic phenomena and having the concrete successes mentioned above. Here we extend the scope of this theory to complex flow transport with an emphasis on the close connection between peak dispersions and the laws of diffusion.
Our treatment utilizes, primarily, the equation
(5) J. C. Giddings, Anal. Chem., 34, 1186 (1962); J. C. Giddings, J. Gas Chromatogr., 1, 4, 38 (1963).(6) M. J. E. Golay in “ Gas Chromatography 1958,” D. H. Desty, Ed., Butterworth and Co. Ltd., London, p 36.(7) A. Klinkenberg and F. Sjenitzer, Chem. Eng. Sci., 5, 258 (1956).(8) J. C. Giddings, J. Chem. Educ., 35, 588 (1958).(9) J. C. Giddings, Nature, 184, 357 (1959).(10) J. H. Knox, Anal. Chem., 38, 253 (1966); D. S. Horne, J. H. Knox, and L. McLaren, Separation Sci., 1, 153 (1966).(11) J. C. Giddings, J. Chem. Phys., 31, 1462 (1959).
J. Calvin Giddings and Paul D. Schettler
The Journal of Physical Chemistry

General Nonequilibrium T heory of Chromatography 2579
expressing solute flux density at a point in terms of relate to the new dimensionless nonequilibrium param- diffusion and convection eter, 8
j = - D V c + vc (5)
(this is a precursor to eq 1 since dc/dt = — V • j). The substitution of eq 4 into this, followed by a cross sectional averaging, gives
( j ) = —D V c* + c*(v> - D (V c *e) + c*(ve) (6)
While the first pair of vectors on the right-hand side are directed along axis z (the second of the pair because axis z is defined with respect to mean flow direction; the first by virtue of the definition of c*), the second pair may have a different orientation. However, in determining axial dispersion the z component of ( j ) , only, is pertinent. Thus our main concern is with the scalar component j ,
\0 « ) = ~ D ~ Z + c% > ~
2D = —Rl{vz8) (13)
7 = 1 + l{d8/dz) (14)
Our main goal is to find a means for calculating the principal nonequilibrium diffusion term, 2D. This requires a more detailed knowledge of nonequilibrium in the system. We will arrive subsequently at the detailed equations describing 8.
III. Nonequilibrium EquationsIn this section we obtain the nonequilibrium terms,
e and 8, which are to be utilized in eq 10, 11, 13, and 14 to obtain the final peak dispersion parameters 3D and y .
The appropriate differential equation for concentration changes is simply dc/dt = — V j . Using eq 5 and the assumption that D is constant and flow is (locally) incompressible ( V • v = 0), this becomes
where scalar vz is the axial component of flow velocity, as used earlier.
We now tentatively assume that axial dispersion proceeds in accordance with the equations of linear diffusion. This postulate is in most direct possible accord with laboratory experience, where, in a great majority of cases, zone spreading can be described to good approximation by Fick’s law. Thus
(jz) ~ c*{vz) = - D ei{d(c*/R)/dz (8)
where the subtraction of c*(vz) is essentially a transformation to a coordinate system moving with mean (or equilibrium) peak velocity. Mobile phase concentration, c*, is divided by R to yield total equilibrium solute concentration (mobile and stationary) at a point along the tube axis. The comparison of (7) and (8) gives
D efi = yR D + 2D (9)
where
7
3D = —R(vze)/d In c*/òz (10)
m , , M .ò In c*/òz t ò In c*/òz (H)
— = D V 2c - v - V c (15)dt v ’
a somewhat simplified version of eq 1. A complete description of e is found by substituting c = c*( 1 + e) (eq 4) back into this. The difficulties of a rigorous treatment are moderated by the near-equilibrium and related approximations. Proceeding term by term in eq 15, we arrive at the following expressions.
1. òc/òt. As in the constant-flow formulation, òc/òt is replaced by òc*/òt. The latter is, under the assumed near-equilibrium conditions, governed to a close approximation by (nondispersive) solute transport at equilibrium. Thus
òc/òt ~ òc*/òt ~ —R{vz)òc*/òz (16)
Quantity R(vz) is, of course, the mean peak velocity. Equation 16 removes the explicit time dependence of eq 15. In the place of dc/dt is a zeroth-order term describing equilibrium transport.
2. D V 2c. The term D V 2c expands to
D V 2cr ò2c* de* de
= D (1 + e)— + 2— — + c* V 2edz2 dz dz
(17)
The latter approximation was obtained using (e) = 0; this is rigorously so in the case of no retention, R = 1, but even with 0 < R < 1 its integrity is confirmed by the smallness of e.
The diffusion postulate requires that 3D and y be constant, i.e., independent of c* and its derivatives. This can be assured if e is of the form
« = did In c*/dz (12)
where 8 is also free from dependence on concentration terms. Parameter l is a length (perhaps an average particle diameter) characteristic of the scale of € fluctuations in the system. Constants 3D and y now
Here we must recognize that e, while small, fluctuates rapidly with distance while c* does not. The distance, l, the characteristic length of e’s fluctuation, is roughly one particle diameter while significant variations in c* occur only in distance a, the standard deviation of the solute zone. This is related to the fact that strong flow variations exist over distance l and induce an equally fine-meshed nonequilibrium pattern. We rely on the following physical argument to achieve the simplification of eq 17. Nearness to equilibrium assures similar rises and declines in concentration at neighboring points (e.g., a distance l apart) despite a manyfold variation in the convective (flow) source. The equality is largely
Volume 73, Number 8 August 1969

2580 J. Calvin Giddings and Paul D. Schettler
maintained (except at high flow rates) by diffusion with nonequilibrium the sole driving force. Thus Dc*V2e accounts for mass exchange in amounts comparable to convection, but diffusion stemming from the equilibrium profile, c*, is much smaller; at most the latter contributes only about cr/L relative to convection, where L is the migration distance. These arguments give justification, to be reinforced more generally later, for the approximation
D V 2c Dc*V2e (18)
The same conclusion applies to the constant-flow case as can be shown from much simpler arguments.
8. v-Vc. A full expansion of this term, remembering that c = c*(l + e) and that c* is a function of axial coordinate z only, gives
v- Ve = c*[v-V€ + vz( l + e)ò In c*/dz] (19)
equilibrium, t = es. Other known conditions can be used when necessary.
IV. Theoretical Implications of NonequilibriumPeak spreading phenomena can be usefully visualized
in terms of the random walk or flight of individual molecules.812'13 Dispersion derives from the random displacements caused by nonuniform flow.2 The termination of a displacement (which controls the step length) has two basic causes; either the molecule diffuses into a new stream path with a different velocity or it acquires a new velocity through erratic variations in the original steam path. At low velocities the former prevails and at high velocities the latter dominates.
The two limiting cases are incorporated in the first and second terms, respectively, on the left side of eq 21. In the low velocity (or high diffusivity) extreme, eq 21 becomes
In general, we can discard neither the vector, V e
(because of sharp spatial variations in e), nor the scalar, 5 In c*/bz (because of the relative largeness of c*). In the constant-flow case, v - V e is virtually zero because the two vectors, v and V«, are essentially orthogonal. Complex flow, with its out-of-line flow fluctuations and nonconstant velocity, removes the orthogonality. The only immediate simplification of eq 17 is made by ignoring e compared to unity in the final term. Thus
v- Vc — c*[V' Ve + vzb In c*/bz] (20)
The substitution of eq 16, 18, and 20 into eq 15, followed by rearrangement, leads to the desired differential equation for e
D V h - v-Ve = (vz - R(vz))b In c*/bz (21)
This equation differs from that for the constant flow case, eq 4.5-1 of ref 2, by inclusion of the second term, - V - V e .
Equation 21 must be integrated with respect to spatial coordinates, but fortunately, not time. As an additional simplification, 2) In c*/bz may be assumed constant with respect to integration since c* varies slowly compared to e.
The boundary conditions accompanying eq 21 are virtually the same as those applicable to constant-flow nonequilibrium theory.2 A prototype theory based on R - 1 (no retention) is restrained only by the balance-of- nonequilibrium condition which states that e must average to zero and by the null-flux condition at surfaces which requires that the gradient of e normal to all impermeable interfaces be zero. In the general case, with R < 1, the balance-of-nonequilibrium condition becomes (e)R = — (es)(l — R ), where e8 is the departure term for the stationary phase. Impermeable surfaces are subject to the same null-flux condition, but interfaces between mobile and stationary phases are ordinarily governed by the assumption of interfacial
V 2e = (1 /D )(vz - R(vz))b In c*/bz (22)
This same equation is applicable to the constant-flow cases, a physical consequence of the fact that flow variations along a stream path occur so slowly that diffusion is entirely responsible for velocity exchange. For laminar flow a solution to eq 22 exists in the general form
« = g(r)((vz)/D )à In c*/bz (23)
where g = g(r) is some function of position (g is also a function of retention ratio R, but R is constant for a given solute). The substitution of this into eq 10 yields an effective diffusion coefficient proportional to velocity squared and inversely proportional to molecular diffusivity
R{v*g) (vz)2(vz) D
(24)
The random-walk model, eq 3, which gives 20 = RCm(vz)2/2 for the low-velocity limit, is therefore consistent in its velocity dependence. Although rough approximations have been given5 for the mobile phase nonequilibrium term, Cm, the use of eq 24 provides the first rigorous and well-defined form
Cm —2 (jflg)D (vz)
(25)
Parameter Cm is, of course, independent of flow velocity since with laminar flow the local velocity vz is always proportional to mean axial velocity (vz).
In the high velocity (or low diffusivity) extreme eq 21 reduces to
- V ' V e = (vz — R{vz)) ò In c*/0z (26)
This has a solution of the form
(12) J. C. Giddings and H. Eyring, J. Phys. Chem., 59, 416 (1955).(13) M. J. Beran, J. Chem. Phys., 27, 270 (1957).
The Journal of Physical Chemistry

General Nonequilibrium T heory of Chromatography 2581
6 = /(r)d In c*/bz (27)
where again / = /(r) is a function of position only for a given solute zone. In this case the use of eq 10 yields
2D = - R ( v J ) (28)
Comparison with the classical form, eq 2, shows the same velocity dependence; the constant A is given by
4 = - 2 (v j)/ (vz) (29)
This equation, unlike those derived from previous theories, gives precise definition to A . Ordinarily A is expressed as 2Xdv where X, a dimensionless constant of order unity, is the parameter absorbing the uncertainty due to complex flow. The latter expression is based on the concept that the correlation between velocities at two points on a streamline largely disappears as these points move a particle diameter dp apart.
General Flow Case: Dimensionless Formulation. The special solutions for velocity extremes, eq 24 and 28, each give SD as a product of measurable parameters (mean flow velocity and diffusivity) and a term which is constant and precisely defined for a given column and solute. In the flow region between extremes, which corresponds particularly to gas chromatographic practice, the solution does not appear as such a simple product. Nonetheless some understanding of the nature of the problem can be gained by going to dimensionless forms. This is particularly important since the coupling phenomenon occurring in the transition region is the least understood of major chromatographic effects.
Following eq 12, l is regarded as a length parameter characterizing the complex flow pattern. Dimensionless velocity and coordinates can be defined in terms of l as follows: v = Iv/D and r' = r/l. In addition thedimensionless nonequilibrium parameter 6, defined by eq 12, is reintroduced. With these changes our basic differential equation for nonequilibrium (eq 21) becomes
v ,20 = v-V'0 = V, - R{vf) (30)
where v2 is the scalar component of v along axis z; the average of this, (vf), is termed the reduced velocity.2 For a fixed R value we see that 6 = d(r\(vz)). Since 8 is independent of concentration and its derivatives, it satisfies the conditions essential to a linear diffusion analog of dispersion (see eq 12 and Discussion). The nonequilibrium dispersion coefficient, given in (13) as — Rl{vfi), can be expressed as the dimensionless ratio
2D/D = - R ( v f i ) = R F{(vz)) (31)
i.e., all positional dependence averages out and one is left with R times a function of reduced velocity {vf) only. Thus S)/D is independent of separate variations in vz, D , and l. Experimental work is in general accord with this picture and indicates that flow pattern is scaled, through parameter l, to column diameter as well
as to particle diameter dp. The conclusion that l — const. X dp is thus reasonably accurate when the diameter ratio remains constant, but otherwise such dependence is an oversimplification.
The Problems o f Approximating Real Systems. The principal step in the characterization of nonequilibrium lies in obtaining equilibrium departure « from eq 21 or 8 from eq 30. These equations, simplified as they are by the near-equilibrium approximation, are still extremely difficult to relate to real chromatographic media because of the complicated physical boundaries confining the flow space and the complex flow pattern. In fact the latter two properties are generally unknown. Nonetheless eq 21 and 30 provide a tractable means for treating various models. The singular advantage of this general theoretical approach is that the models can be elaborate enough to represent the essential phenomena of laboratory systems. Particularly with the help of a computer these models can be fairly complex and realistic.
Probably the best approach to complex flow in chromatographic materials is through a cell model. If the cells are all identical, this introduces an artificial degree of order into the medium which is particularly unrealistic for flow-controlled nonequilibrium (the A term, eq 2). Proper randomization must be introduced, either by using a complex cell, a series of cells with random “phases” or a set of unequal cells properly balanced to prevent any stream path from persisting with an unusually high or low velocity. The second of these approaches is pursued in the subsequent paper.
Degree o f Nonequilibrium. The degree of nonequilibrium not only affects zone dispersion, but it determines the validity of various approximations used in nonequilibrium theory.
The equilibrium departure term e can, of course, be calculated from the first principles using eq 21. In all cases e is proportional to d In c*/bz. The magnitude of the latter depends on experimental circumstances, as shown below.
Ordinarily a solute mixture is introduced at the top of a granular sorbent bed as a narrow spike, ideally as a 5 function. Initially, then, the concentration gradients are very high, causing a large departure from equilibrium. As the various dispersion processes occur, the solute zones broaden (as they separate) and d In c*/dz for each zone rapidly decreases. The resultant profiles are essentially Gaussians with a steadily increasing standard deviation a.
From eq 10 the order of magnitude of e is seen to be
£> d in c*R(vf) bz
(32)
Upon using the rough approximations 2D ~ a2/t and 15 In c*/bz\ ~ l/<r, along with R(vz)t = L where L is the distance migrated by the zone, we have
Volume 73, Number 8 August 1969

|€| ^ a/L (33)
For effective chromatographic separation a/L must of course be small. More quantitatively a/L = 1/N 1/2
and thus
|e| ~ 1 /N'h (34)
where N is the number of theoretical plates, usually reaching values from 103 to 104. Thus |ej ~ 0.03-0.01 at the end of a column; its value is only y/2 times larger at the column midpoint. The typical e is, then, indeed quite small along the bulk of the migration path.
In deriving eq 18 certain terms were dropped on the basis of physical arguments; the above knowledge of e’s magnitude shows the approximations to be self- consistent. Since e will fluctuate between extremes on essentially the same scale as fluctuations in the flow pattern— both scaled roughly to the particle diameter d p— we may ascribe to V2e a magnitude of e / d p2 and to d e / d z the magnitude t / d p . The three terms on the
2582
right of eq 17 are thus of magnitude c*/<r2, c*e/adv, and c*t/dp2. It is an experimental fact that theoretical plate height can be reduced to about one particle diameter but little less, i.e., L/N ~ dp. With this and eq 34 we deduce that the last term divided by the first term is roughly Ar‘/2, a number much larger than unity as initially assumed. The last term relative to the second term is also For this reason the first andsecond terms appear only as higher order terms in « and are thus negligible.
The theory presented above is clearly a limiting theory— becoming valid only for small departures from equilibrium or large plate numbers. This limit, however, is so much in accord with laboratory systems that the theory suffers very little loss of generality as a result.
Acknowledgment. This investigation was supported by Public Health Service Research Grant GM 10851-12 from the National Institutes of Health.
Paul D. Schettler and J. Calvin Giddings
Application of the Nonequilibrium Theory of Chromatography to a
Variable Flow Correlation Model of Complex Flow and Coupling
by Paul D. Schettler and J. Calvin GiddingsDepartment of Chemistry, University of Utah, Salt Lake City, Utah 84112 (Received November 18, 1968)
The nonequilibrium theory of chromatography, in the general form recently developed for complex flow transport, is applied to a two-channel flow model having a steplike velocity exchange between channels. Equations are obtained for an arbitrary degree of velocity correlation from cell to cell within the system. This model of complex flow is the first studied quantitatively to exhibit coupling effects. Numerical examples of this are presented and compared with experimental data. The calculated results suggest an alternate explanation for the experimentally observed decrease of peak dispersion with velocity when the latter is high.
The concept of coupling was originally proposed to explain some nagging anomalies observed in low velocity gas chromatographic experiments.1 B asically the theory attempts to account for the frequent breaking of the velocity correlation along a stream path which must accompany flow in any random, complex medium. Here we conduct and study quantitatively a simple model with the essential flow characteristics of a coupled system. The use of this and related models should eventually provide guiding principles for the optimization of column geometry factors. The existing theory of coupling is an approximate random walk model incapable of distinguishing between detailed geometrical parameters.1-2
In recent years considerable emphasis has been given to high-velocity chromatography because of its potential for increasing separation speed, an important factor in many applications.8 The coupling phenomenon becomes more important as velocity increases, both with respect to its effect on peak width and on separation speed. Since the key velocity parameter is the dimensionless one, v = (flow velocity) ■ (particle diameter) / (diffusivity), the highest effective velocities, perhaps up
(1) J. C. Giddings, Nature, 184, 357 (1959).(2) J. C. Giddings, “ Dynamics of Chromatography. Part 1. Principles and Theory,” Dekker, New York, N. Y., 1965.(3) H. Purnell, “ Gas Chromatography,” John Wiley & Sons, Inc., New York, N. Y „ 1962.
The Journal of Physical Chemistry
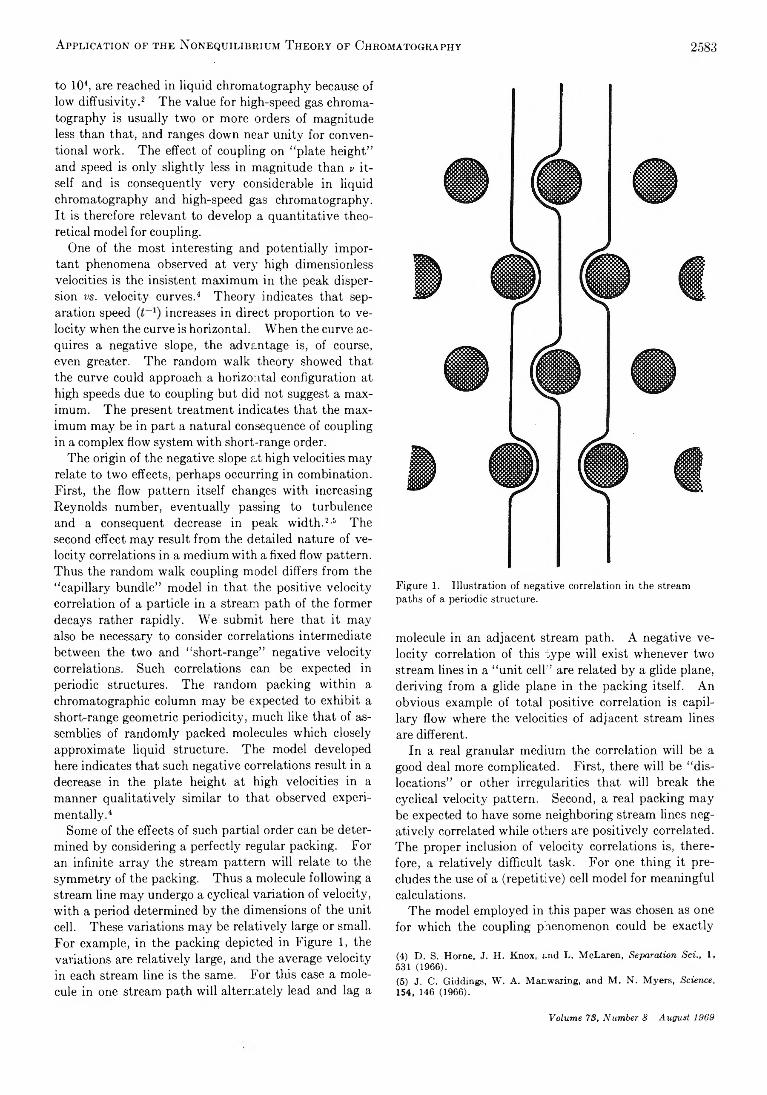
A pplication of the Nonequilibrium T heory of Chromatography 2583
to 104, are reached in liquid chromatography because of low diffusivity.2 The value for high-speed gas chromatography is usually two or more orders of magnitude less than that, and ranges down near unity for conventional work. The effect of coupling on “plate height” and speed is only slightly less in magnitude than v itself and is consequently very considerable in liquid chromatography and high-speed gas chromatography. It is therefore relevant to develop a quantitative theoretical model for coupling.
One of the most interesting and potentially important phenomena observed at very high dimensionless velocities is the insistent maximum in the peak dispersion vs. velocity curves.4 Theory indicates that separation speed increases in direct proportion to velocity when the curve is horizontal. When the curve acquires a negative slope, the advantage is, of course, even greater. The random walk theory showed that the curve could approach a horizontal configuration at high speeds due to coupling but did not suggest a maximum. The present treatment indicates that the maximum may be in part a natural consequence of coupling in a complex flow system with short-range order.
The origin of the negative slope at high velocities may relate to two effects, perhaps occurring in combination. First, the flow pattern itself changes with increasing Reynolds number, eventually passing to turbulence and a consequent decrease in peak width.2'6 The second effect may result from the detailed nature of velocity correlations in a medium with a fixed flow pattern. Thus the random walk coupling model differs from the “ capillary bundle” model in that the positive velocity correlation of a particle in a stream path of the former decays rather rapidly. We submit here that it may also be necessary to consider correlations intermediate between the two and “ short-range” negative velocity correlations. Such correlations can be expected in periodic structures. The random packing within a chromatographic column may be expected to exhibit a short-range geometric periodicity, much like that of assemblies of randomly packed molecules which closely approximate liquid structure. The model developed here indicates that such negative correlations result in a decrease in the plate height at high velocities in a manner qualitatively similar to that observed experimentally.4
Some of the effects of such partial order can be determined by considering a perfectly regular packing. For an infinite array the stream pattern will relate to the symmetry of the packing. Thus a molecule following a stream line may undergo a cyclical variation of velocity, with a period determined by the dimensions of the unit cell. These variations may be relatively large or small. For example, in the packing depicted in Figure 1, the variations are relatively large, and the average velocity in each stream line is the same. For this case a molecule in one stream path will alternately lead and lag a
Figure 1. Illustration of negative correlation in the stream paths of a periodic structure.
molecule in an adjacent stream path. A negative velocity correlation of this type will exist whenever two stream lines in a “ unit cell” are related by a glide plane, deriving from a glide plane in the packing itself. An obvious example of total positive correlation is capillary flow where the velocities of adjacent stream lines are different.
In a real granular medium the correlation will be a good deal more complicated. First, there will be “ dislocations” or other irregularities that will break the cyclical velocity pattern. Second, a real packing may be expected to have some neighboring stream lines negatively correlated while others are positively correlated. The proper inclusion of velocity correlations is, therefore, a relatively difficult task. For one thing it precludes the use of a (repetitive) cell model for meaningful calculations.
The model employed in this paper was chosen as one for which the coupling phenomenon could be exactly
(4) D. S. Horne, J. H. Knox, and L. McLaren, Separation Sci., 1, 531 (1966).(5) J. C. Giddings, W. A. Manwaring, and M. N. Myers, Science, 154, 146 (1966).
Volume 73, Number 8 August 1989

2584 Paul D. Schettlee and J. Calvin Giddings
a I j negative correlation
C no correlation
Figure 2. Illustration of flow model.
formulated without introducing excessive mathematical complications. It consists of two parallel stream channels, one having a higher velocity than the other. The velocity is assumed uniform over each channel cross section. After a cell length, L, the velocity bias may switch, Figure 2. Solute may diffuse freely within and between channels but may not pass to the outside. For simplicity we consider the velocity changes to be discontinuous, both across the boundary between the two stream lines and across the cell boundary. This discontinuous “ flip-flop” model does not, of course, conform exactly to Navier-Stokes flow. A fully consistent model would be considerably more difficult to treat. We believe that the present model contains the essential flow features which lead to coupling.
Theory
The following reduced nonequilibrium equation was derived in the previous paper6
V 20 - v-V0 = vz - vz (1)
where v is the dimensionless velocity, \x0/D, and v z is its downstream component. All distances used here and henceforth are relative to the single channel width Xo. The nonequilibrium parameter 9 is e/(d In c*/dz), where c* is the mean cross-sectional concentration, z the reduced distance along the flow coordinate, and e the basic nonequilibrium term (c — c*)/c*. We have chosen the case having a relative peak migration rate, R, of unity.
The solution for no velocity switching, Figure 2b, is obtained first. In this case 6 will be independent of z and the term v-V 9 will therefore be zero. Equation 1 reduced to
ò 2e(2)
w =
where Av is defined as \vz — ?e|a:/|a:|. eq 2 is
The solution to
9 = + [\x\2 - 2\x\) (3)
The Journal of Physical Chemistry
where the two constants of integration have been utilized so that
— = 0 at x = ± 1 (4)ox
(5)
Equations 4 and 5 are mathematical statements that the flux through the tube walls is zero, and that the point x = 0 is neither source nor sink.
Equation 3 can be substituted into the equation for effective diffusion constant,6 which in dimensionless coordinates and for the present model becomes
SO = ~ ( 9A v z ) D (6)
The substitution of eq 3 into eq 6 followed by integration, leads to
5D = l/s(A vz)*D (7)
The height equivalent to a theoretical plate, H , is ordinarily used to describe peak dispersion in chromatography.2 Since H = 2&/vz we have
2 (A v j ?
Zv(8)
The reduced plate height, a dimensionless parameter, becomes
h = H = _ 2(dAvz) = 2(Ayz)2 (9)Xo vz Zv2
This is the desired result. (The reduced plate height will be used hereafter as a measure of dispersion. Its relationship to the effective diffusion coefficient is h = 2T£>/vzX(s, as seen by comparing the above equations.)
We now turn to the more general case in which velocity changes may occur in an arbitrary manner and in which the variation of 6 with z must be considered. In all of these cases the value of 6 (as a function of x) at the entrance to a particular cell will be determined completely by processes in the previous cells. As we pass through the cell, 9 will relax to the value calculated for the “ steady-state” or constant flow case above. We therefore focus on the increment, 0r, relative to the steady-state value, 0SS
e = eaa + er (io)
Substitution into eq 1 yields
V 20r + V % 3 - V0r-v = An, (11)
Since V 20ss — Avz (see eq 2), we have
V 29r = v V 0 r (12)
which for the present model reduces to
(6) J. C. Giddings and P. D. Schettini-, J . Phys. Chem., 73, 2577 (1969).

A pplication of the Noneq uilibri um T heory of Chromatography 2585
ò % Ò% òdrÒX2 ^ Ò22 VZ Ò2
(13)
In any region for which vz is a constant (he., within a given cell or sequence of cells), eq 13 can be reduced by the separation of variables, 0r = Z (z )X (x ), giving
1 d2X Z ÒT2
(14)
and
ò*Z
òz2- \2Z = 0 (15)
These two equations yield the respective solutions
X = B " cos \x + A " sin \x (16a)
Z = Ce™ + D era (16b)
where
r2 = Vj.2 (t + ì- ' ) A <17)
When one sets \n = rnr/2, the expression
= E (B tittcos — x +
Z
n" sin Y iC) (^»'<T + D J 2Z) (18)
is obtained as the most general separable solution to eq 13.
The constants A n and B n are fixed by the shape of the 0 profile at z = 0. Also sin r2 is negative and >\ is positive, the Cn’s must be zero in order to obtain solutions which decay to 0r = 0 (0 = 0SS) for large z. Consequently
0 = 0 s s + E n (^An SÌnw n-ir '
sin — x + B n cos — x X
(19)
The steady-state 0, expressed in eq 3 as a second-order polynomial, can alternately be expressed as a Fourier series
0SS = E sA n sin -¡j- x (20a)n “
where
- A . ' = - ^ T 1 [ 1 - ( - 1 H (20b)
by the standard method of obtaining Fourier coef-
ficients. The first few coefficients are ssA i' = —0.5160|Ar2|, ssA2' = 0, SSA 3' = -0.01911[Ar2|, ssAi' = 0, and SSA 6' = — 0.00413|Ap2|. The combination of coefficients in eq 19 and the definition of a reduced coefficient !sd , = 7r3/|Ar2|8- SSA „' leads to
» = E (ssA re + A neriz) sin ~ +_ z
( o nirx\ { B n cos — I (21)
Let us seek an eventual solution for cell 0, with coefficient °A n and °Bn. The cell preceding cell 0 is designated as cell 1, and so on to the column entrance, cell M , with associated coefficients, MA n and MB n. The coefficients SSA„ are the same for each cell except for sign.
For a given cross section of cell 0, eq 21, a general Fourier series, can be used to express any distribution of 0’s with physical significance. This is done by fixing A n and B n so that (SSA„ + 4 / ”) and B nera have the appropriate (boundary) values at 2 = 0. Once this is done, the 0’s are properly expressed as a function of z for the entire cell. We note that for large z the solution decays to the steady state by virtue of a decreasing er!Z.
For a moment we focus on cell m. The 0 distribution at the beginning of this cell is determined entirely by the distribution at the end of the preceding cell, to + 1. However, the convention of having Avz positive for positive x (eq 2) requires a sign change if the velocity bias is switched between cells m and m + 1. Thus
mA n + ssA re = ± (ssA„ + m+1A neriL) (22)
with a similar equation for mB n. (Note that SSA„ = 0 for n even and ssB n = 0 for all n.) The negative sign applies in the event of a velocity switch. These formulas can be applied repeatedly to obtain <]A.n and °Bn in terms of the M cells preceding it, so that °A n and °Bn are ultimately expressed in terms of MA n and MB n and the switching sequence.
To obtain explicit expressions it is convenient to define the function
s(i, j ) = + 1 if an even number of velocity
changes occur between cell i and j (23a)
s(i, j ) = — 1 if an odd number of changes
occur between cell i and cell j (23b)
It should be noted that
s(0, L ) = I I s(f, i + 1) (24)i = o
The velocity sequence of an assembly of cells is fixed relative to some initial cell by a set of s(i, j ) ’s. One
Volume 78, Number 8 August 1969

2586 Paul B. Schettler and J. Calvin Giddings
obvious set of s(i, j ) ’s relative to cell 0 is s(0, 1), s(l, 2),. . . s(i, i + 1),. . ,s (M - 1, M ). Using eq 24, we can transform this to another set which also completely defines the sequence: s(0, 1), s(0, 2),. . .s(0, i). . .s(0, M ). The next step is to express °A n and °Bn
in terms of s(i, j ) ’ s. First eq 22 can be rewritten as
mA n + ssAn = *(m, to + 1)(SSA„ + m+1A neriL) (25)
with a similar equation for mB n. The application of these equations to to = 0 is obvious, resulting in °A n expressed in terms of lA n and s(0, 1). To this equation is added
0 = s(m, to + 1){ - m+1A n - ssA n +
s(to + 1, to + 2) [ssriB + m+2A ner’L)} (26)
with to = 0.This set of equations gives °A n and °Bn in terms of
2A n and 2B n. This process can be repeated with to = 1, 2, 3 . . . leading finally to
°A n = «(0, M )MA neMnL + asAn X
j l + 8(0, M )e(M~ l)nL +
M - 1 I[1 - enL] E s(0, m )e(m~ llnL> (27)
m = 1 /
Considerable simplification results immediately at the limit M -*■ oo, equivalent to taking cells which are far enough from the column entrance that any “ memory” of entrance condition is washed out. For this important case
kA n = - ssAn + M l - enL] X
E s(k, rn)e{m- k- l)riL\ n odd (28)m = k-\-1 /
and all the other coefficients are zero. The results are expressed for general cell, k. It should be noted that the series converges and that it may be truncated after some suitable number of terms as determined by the particular value of r2 (or v) used.
With eq 28, 21, and 6, the contribution to peak dispersion by cell 0 for any distribution of velocity sequences preceding that cell can be determined. The strong functional dependence of °A n + S3rin on the s (0, m)’s should be noted, particularly at high velocities. Here the dispersion within cell 0 will be determined more by the preceding sequence than by the detailed flow-diffusion processes in cell 0 itself. This conclusion is invalid at low velocities where transverse (and longitudinal) diffusion becomes the dominant factor in dispersion.
We are, of course, not so interested in the dispersion contribution of a single cell as in the average or total dispersion of a peak as it emerges from an assembly of cells. The latter is described by the apparent plate height, H , given by
H = ~ f Hdz = -j- E H (k ) (29) N L J N k=o
in which
H (k ) = | £ Hdz (30)
where H is the local plate height at z, H (k ) is the average plate height for a cell (k ) of length L, and N is the number of cells which make up the column. We shall investigate the limit as N -> 00.
Each H (k ) depends on the values of the s(k ,m )’s preceding it. The s(fc,m)’s can be written as elements of a row matrix; thus the matrix characterizes H (k ). For example, an alternating distribution could be written as the row matrix, (— 1, + 1 , — 1, + 1), corresponding to s(k, k + 1) = — 1, s(k, k + 2) = + 1 , etc. In general each cell k will have a unique matrix associated with it, although this uniqueness is not a necessity. The over-all plate height will be a function of the set of all row matrices.
One can look alternately at the column as an ensemble of cells, each preceded by a velocity bias distribution characterized by a matrix. The summation of eq 29 is then over an ensemble rather than each cell down the column.
When no correlation exists between successive cells, any row matrix will be as probable as any other. However, as stated in the introduction, we expect some degree of correlation. For example, a column in which channeling occurs may be represented by a positive correlation between successive units.
We assume that the degree of correlation is equal throughout the column. In the simplest case correlation can be represented by a Markov scheme in which the probability of acquiring a certain velocity bias is independent of the velocity bias of all cells save the immediately preceding. Furthermore we assume the “ switching” probability to be equal for either initial bias. The probability that no switching occurs is designated as P. If we now define the “ ensemble” average of s(l, i + 1) as
s = 8(1, i + 1) = E s(i, i + 1) (31)
we observe that s and P are related by
s = 2P - 1 (32)
Since the velocity biases are independent, it can be shown that
s(i, i + j ) = s1 (33)
Combining eq 6, 10, 20b, and 21, we get
h = - — f^ )2 E - + kA M (34)7T*VZ n U
The Journal of Physical Chemistry

Application of the Nonequilibrium T heory of Chromatography 2587
where h is the local plate height at point z and cell k. The application of eq 30 gives
h{k) =32(AVtY y 1
7TiV1 nA + * A 16 ~ 1 ]~¡s I -CLn T
r2 L
64(Afz)2 1r (2n + l) 4
1 + - 1 + (1 - enL) s(k, m)e= k + 1
(m — k — l)riL x
[enL - i nr,L J
(35)
Equation 35 gives the plate height contribution of a single cell in terms of the velocity bias distribution preceding it.
Taking the ensemble average (eq 29) and using eq 33, we have
h = — — Lir4 odd n*
value o f n
(S - l)(eriL ~ 1)~(1 — serlL)r2L _
(36)
where u = 2/i(Avz) 2/vz~2', eq 36 gives the final ensemble average of the reduced plate height in terms of s, the correlation parameter between adjacent cells. This plate height corresponds to the “ experimental” value.
Figures 3, 4, and 5 show the nature of the plate height dependence on velocity as a function of the correlation parameter s for two values of reduced cell length L. For convenience in plotting we have left out the longitudinal diffusion term. Addition of this term would make the curves hyperbolic in the low velocity limit. (This term is 2y/vz where y is the obstruction factor.) With this addition the over-all curves have the same qualitative shape throughout the velocity range as is observed experimentally.
We see that in all cases a decrease in the correlation parameter decreases the plate height by a significant amount. This phenomenon occurs at low velocities as
Figure 4. Plots of h vs. vz for L = 1.0 and various other s values.
well as high. A second pronounced feature is the limiting plateaus formed at high v for all values of s < 1. Of particular interest is the fact that for low values of s the plateau is below the maximum of the plate height curve. In fact, for the case of s = — 1, the high velocity limit is zero while the maximum is 0.1292. Finally we note that the limiting slope at low velocity is less for low values of correlation coefficient than for high. These phenomena combine so that at constant reduced velocity, fi is always lower for a column of small (or negative) s than a column with high s.
To investigate these phenomena more quantitatively, it is useful to formulate the high- and low-^velocity limiting forms of eq 36. These limits were discussed generally in the preceding paper.6 We investigate the low- velocity limit first. In this limit
r2L =mrL
+vzL~2
vJ*L
4nir
Noting that e ~n-r/2 and substituting
Volume 78, Number 8 August 1969

2588 Paul B. Schettler and J. Calvin Giddings
eq 36, we obtain by keeping only first-order terms.
ir4 n 4
— — L + 12
s + e - mrL/2 nir T \ 1s — L + s — 1
It “b s —* Lc 2 2
(37)
If we consider L large so that the velocity bias switches are isolated
h = - 0.630 1- ^ ) vz (38)
The quantity 1 — s is simply twice the probability, (1 — P ), that a velocity bias switch will occur in length L. If the limit is taken L —► <», or if lateral diffusion is neglected in the original nonequilibrium expression, the following low-velocity limit is obtained
h = cor2 (39)
which is equivalent to the result of a “ capillary bundle” treatment.2
A similar expansion may be made for the high-velocity limit. In this limit r2L may be approximated by- n 27r2L/4r2.
The net result of this substitution is that
1 + £ 1 — s
+ (40)
where a is a constant determined by an asymptotic series; it is positive if s < 31/2 — 2 and negative otherwise. Thus the largest value of s for which a plate height maximum occurs is approximately —0.268, corresponding to a somewhat negatively correlated column.
DiscussionWe have mentioned the qualitative agreement be
tween results of the “ flip-flop” model and experimental data. At this stage we do not expect to obtain a -priori quantitative agreement. One could, of course, expect a reasonable fitting of the curve if correlation parameter s and length L were treated as adjustable parameters. This would have some value in interpreting column behavior and providing a rational basis for relating this to controllable geometrical parameters (such as column and particle diameters and shapes).
Figure 6 shows the comparison of two of our theoretical curves with the extensive experimental compilation made by Horne, Knox, and McLaren.4 Shown also is a band corresponding to the classical constant flow or “ capillary bundle” models.7 The parameters of the higher of the two theoretical curves are y = 0.6, o> = 0.1, L = 104, and s = 0.999. It can be seen that this theoretical curve does indeed follow the qualitative be
Figure 6. Comparison of data compiled by Horne, McLaren, and Knox4 with results of the present model and with the classical “ capillary bundle” model.
havior of the experimental results. The lower curve was obtained by using the same parameters as before except a = 0.0015 and s = 0.8. While this results in a considerable improvement in the high-velocity region, agreement is less satisfactory in the low-velocity region.
The large range of reduced velocities represented in Figure 6— over six orders of magnitude— provides a critical test of theory. These high-velocity liquid curves tend generally to the horizontal, as required by coupling. The reasons for the detailed shape (particularly the gradual maximum) are not clearly understood at present. The velocity correlations, which we have incorporated into our model in the simplest way, are certainly more complicated and diverse than we have described. Not only are velocity changes continuous instead of discontinuous as we have portrayed them, but there are also a great variety of stream channels, each with unique velocity, tortuosity, cross section, and isolation from the neighboring channels with which diffusive interations take place. At high velocities turbulence also plays a role.4'8
Although our model is too crude to yield quantitative agreement with experimental results, it focuses attention on a previously unrecognized factor, that of velocity bias correlation. In fact the two broad models for the theory of chromatography, the constant flow (“ capillary bundle” ) and the coupling model, differ fundamentally only in the choice of correlation parameter.
If velocity correlation is indeed a significant factor in real columns, then it would appear that the detailed nature of the column packing would greatly influence column efficiency. Knox’s experiments concerning the effect of particle to column diameter ratio suggest that this is the case.4'8 If columns could be constructed with
(7) J. C. Giddings, Anal. Chem., 35, 1338 (1963).
The Journal of Physical Chemistry

Application of the Nonequilibrium T heory of Chromatography 2589
Figure 7. Plot of reduced local plate height, h = d<r2/dz, vs. z, with all parameters in dimensionless form. The nonequilibrium parameter B at the end of the preceding cell, immediately before the velocity switch, is assumed to have its steady-state value. Several reduced velocities (0.1, 1.0, 5.0) are represented.
a high degree of negative correlation, efficiency should be much improved, particularly in the important high- velocity region.
There are certain qualitative aspects of our calcula- tipns that have relevance in discussing correlation in real systems. First we note that eq 34 and 26 indicate that h (and hence D eu) is locally negative for a region following every velocity bias switch. Figure 7 shows this feature and the resultant exponential decay toward the steady-state value. The regions of negative effective dispersion result from the initial straightening up of a profile distorted by the previous cell’s bias. Thus consider two nondiffusing molecules initially having the same value of z, one in each stream channel. The velocity difference will tend to separate the two molecules. If, however, a velocity switch occurs, the molecule which was behind will start to catch up, thus “straightening” the profile. For the special case of perfect negative correlation there will be no net dispersion over the column, just equal regions of positive and negative local dispersion. This explains the zero limit approached for s = — 1.0 at high velocities, since for sufficiently high flow rates there is not time to diffuse between channels.
At lower velocities and/or with some randomness in velocity switches, regions of positive dispersion will be of greater extent than regions of negative dispersion, either because of transverse diffusion or because cells of opposite bias do not exactly balance in a finite random sequence. Thus for these “ real” cases dispersion exists at any velocity although it is restricted to finite values except where the velocity is constant along each given stream line (perfect positive correlation).
One of the implications of the present results is that the computer solution of column efficiency using detailed models will be more difficult than previously thought. We find that the boundary conditions fixed at the entrance to the cell, that is the functional form of 9 at z = 0, will in many cases have greater effect on the plate height than the details of the flow pattern within the cell. The boundary condition is presumably determined by the preceding cell; it would, of course, be inappropriate to assume that the preceding cell is identical in a random structure. Caution must be taken against introducing such artificial correlations into the model unless there is evidence that they actually occur. Unfortunately this problem becomes more severe at high velocities, the region of greatest interest.
Conclusions
For the model discussed, the degree of velocity correlation along a stream path is an important parameter in plate height (peak dispersion) vs. velocity curves. It is likely that such correlation also plays a significant role in actual columns although, especially at high velocities, it is difficult experimentally to separate the effect of turbulence from the effect of correlation. This model indicates that any cell model of chromatography can be expected to produce erroneous results unless care is taken to ensure that the cell boundary conditions do not introduce an improper degree of correlation. The model also suggests that widely divergent column efficiencies may be obtained depending on how the particles are packed.
Acknowledgment. This investigation was supported by Public Health Service Research Grant GM 10851-12 from the National Institutes of Health. The authors acknowledge the help of Mr. Christopher P. Russell in checking the derivations.
(8) J. H. Knox, Anal. Chem., 38, 253 (1966).
Volume 73, Number 8 August 1969

2590 E. L. Lewis and F. Sicilio
Electron Spin Resonance Kinetic Studies of Two
Dimethoxymethane Radicals in Aqueous Solution
by Eileen L. Lewis and F. SicilioDepartment of Chemistry, Texas A <$c M University, College Station, Texas 77843 {Received November 18, 1968)
In the Ti(III)-H202 flow system containing dimethoxymethane as a substrate, two radicals are produced by abstraction of hydrogen from the substrate by the “ -OH” radical. Both of the dimethoxymethyl radicals undergo apparent three-halves-order decays, with k = 6.8 X 10s and k = 4.0 X 1Û4 Af “ ‘■/l sec-1 at 27°. The specific reaction rate constant is independent of [Ti(III) ]0 and proportional to [ I L C h lo , indicating that substrate radicals are reacting with H2O2. Also, the substrate radicals are probably undergoing addition of ■ OH. Absence of secondary radicals and dimer products indicates that substrate radical combination reactions and decomposition play minor roles. The system is complicated by the presence of metal complexes. The main contribution to the apparent activation energies of 14.8 and 13.0 kcal/mol could be associated with the substrate radical-H202 reactions.
IntroductionThe reduction of hydrogen peroxide by transition
metals to yield the hydroxyl radical was reported by Uri.1 Using a flow system, Dixon and Norman2 treated TiCl3 in acidic media with H2O2 and observed a single resonance which was attributed to the hydroxyl radical. Subsequently, the Ti(III)-H 202 system has been studied by a number of investigators. Piette, et al , , 3 detected two esr signals and attributed the low- field peak (g = 2.0132) to H02- radicals and the high- field peak (g = 2.0119) to -OH radicals. Wall, et al.,4 assigned the low-field peak (g = 2.0128) as due to -OH radicals and suggested that the high-field peak (g = 2.0114) could be due to HO»- or -OH radicals com- plexed with Ti(IY) ions. Turkevich, et al.,6 interpreted the esr spectrum as arising from Ti(IV) complexes involving -OH and H02- radicals and concluded that uncomplexed -OH radicals are not detected by esr spectroscopy. This conclusion is supported by evidence that radiolytically produced hydroxyl radicals decay within tens of microseconds, as reported by Adams and Boag.6 Fischer7 interprets the two esr peaks as not due to -OH or H02- radicals but presumably to titanium peroxy radical species. Fischer’s suggestions were considered further by Wall, et al.,s in the attempt to explain features observed at intermediate substrate concentrations. These authors conclude that the two “ hydroxyl” species are probably forms of H02- complexes with Ti(IV). Takakura and Ranby9 assign the low-field peak to HCV and the high-field peak to •OH, both radicals being coordinated to Ti(IV) ions or Ti(IY)-H 202 complexes.
Many investigations involving the production of free radicals from organic substrates included in the Ti(III)- H20 2 system have been reported since Norman and Dixon’s2 initial work. Recently, Turkevich, et al.,6 have presented evidence that “ the formation of free
radicals of substrate molecules occurs in the complex rather than by direct action of the hydroxyl radical with the organic molecule.”
In this work the diether, dimethoxymethane (methylal), was used as a substrate in the Ti(III)- H202 flow system. Kinetic studies were performed to follow the decay of two radicals formed by the abstraction of hydrogen from the dimethoxymethane molecule. Emphasis was focused on the latter stages of decay of the substrate radicals in the hope of observing features to help clarify the behavior of the system.
Experimental SectionReagents. Titanium trichloride (20% solution, which
analyzed to 1.6 M TiCl3) was obtained from W. H. Curtin & Co. Dimethoxymethane was obtained from Distillation Products Industries. Potassium nitro- sodisulfonate, N0(S03K )2 or Fremy’s salt, was prepared by the method of Harvey and Hollingshead.10 Other reagents were ACS reagent grade.
Apparatus. The esr spectra were obtained with a Varian 4502-15 spectrometer system equipped with V-4560 100-kHz field modulation and Fieldial units.
(1) N. Uri, Chem. Rev., 50, 375 (1952).(2) (a) W. T. Dixon and R. O. C. Norman, Nature, 196, 891 (1962); J. Chem. Soc., 3119 (1963).(3) L. H. Piette, G. Bulow, and K. Loeffler, Preprint, Division of Petroleum Chemistry, American Chemical Society, Washington, D. C., April 1964.(4) F. Sicilio, R. E. Florin, and L. A. Wall, J. Phys. Chem., 70, 47 (1966).(5) Y. S. Chiang, J. Craddock, D. Michewich, and J. Turkevich, ibid., 70, 3509 (1966).(6) G. E. Adams and J. W. Boag, Proc. Chem. Soc., 112 (1964).(7) H. Fischer, Ber. Bunsenges. Phys. Chem., 71, 685 (1967).(8) R. E. Florin, F. Sicilio, and L. A. Wall, J. Phys. Chem., 72, 3154 (1968).(9) K. Takakura and B. Ranby, ibid., 72, 164 (1968).(10) G. Harvey and R. G. Hollingshead, Chem. Ind. (London), 244 (1953).
The Journal of Physical Chemistry

Esr K inetic Studies of Two D imethoxymethane Radicals 2591
Kinetic and spectral measurements were made at about 30-mW microwave power and 0.2-G modulation amplitude. At these settings, no saturation or modulation broadening was noticeable.
The Varian 4548 quartz aqueous solution cell and V 4549 liquid flow mixing chamber used in this work have been described previously.6 The remainder of the flow system is described in the following section.
Procedure. Normally, for each run, two aqueous solutions (0.01 M TiCl3, 0.1 M H2S04; 0.1 M H202, 0.50 M dimethoxymethane) were prepared, deaerated with nitrogen, and stored in 10-1. glass reservoirs. Flow was effected by using nitrogen, up to several atmospheres, to force the solutions, independently, through glass condenser coils which were immersed in a water bath. Via insulated polyethylene tubing, the separate flows entered the mixing chamber. The mixed single stream traversed a hold-up volume of 0.16 ml before reaching the sensitive portion of the quartz flat cell in the resonant cavity. Reaction temperatures, ±0.5°, were measured close to the flat cell. Flow rates, up to 13 ml/sec, were monitored by timing the collection of a given volume at the exit. The flow rate of each solution was adjusted independently by flow metering valves and Teflon stopcocks. Equal flow rates were maintained for all kinetic runs, except for those in which the effects of variation of initial concentrations were studied qualitatively. Reaction times (in seconds) were calculated from the ratio of hold-up volume (milliliters) to flow rate (milliliters per second).4
The composite spectra of the two dimethoxymethane radicals were recorded at various flow rates and temperatures. For kinetic measurements, the peak heights of the first derivative central hyperfine peaks (low-field signal of the doublet and central signal of the triplet) were monitored as a function of time. For ultimate calibration, peak height was related to area under the total absorption curve, computed by graphical double integration, and thence to the low-field hyperfine peak of 10~3 M manganous sulfate. Calibration was performed at 27, 15, and 3° since temperature dependency was noted for line width and sensitivity for Mn(II)4 and the ratio of peak height/area for the dimethoxymethane radicals. Linearity of the spectrometer signal level at several flow rates indicated that control of flow was good and that kinetic data could be reduced to a standard signal level with validity.
Magnetic field intervals were calibrated with the nitrosodisulfonate anion (a = 13.0 ± 0.1 G; g = 2.00550 ± 0.0000511). To measure g values, an aqueous solution of potassium nitrosodisulfonate was introduced into the flat cell after obtaining the first low-field peak of the triplet, without interruption of the scan.12
Results and DiscussionThe spectrum in Figure 1 shows that two radicals, a
Figure 1. Esr spectrum of dimethoxymethane when included as a substrate in the T i(III)-H 20 2 flow system. Magnetic field increases to right, (a) Experimental spectrum: initialconcentrations prior to mixing: 0 .0 1 M TiCh, 0 .1 M H2S04;0 .1 M H20 2, 0 .5 0 M CH3OCH2OCH3.(b) Computer-simulated spectrum (c/. program by B. D. Faubion, unpublished).
1:2:1 triplet of triplets, R\ (aa = 17.3 ± 0.2 G, ay — 0.73 ± 0.03 G, g = 2.0033 ± 0.0004), and a 1:1 doublet of septets, Ri (aa = 13.1 ± 0.2 G, ay = 0.71 ± 0.03 G, g = 2.0032 ± 0.0004) are formed. The parameters are not significantly different from those reported recently.12 The radicals are derived from the parent
(11) J. Q. Adams, S. W. Nieksic, and J. R. Thomas, J. Chem. Phys., 45, 654 (1966); J. S. Hyde, personal communication.(12) R. E. Florin, F. Sicilio, and L. A. Wall, J. Res. Nat. Bur. Stand., A, 72, 49 (1968).
Volume 73, Number 8 August 1989

2592 E. L. Lewis and F. Sicilio
îo’tli.c)
Figure 2. Reciprocal square root of peak height (P~1/2) vs. reaction time, at 27°, for Ri. Initial concentrations prior to mixing: 0.01 M TiClj, 0.1 M H2SO4; 0.1 M H2O2,0.50 M CH3OCH2OCH3.
compound, CH3OCH2OCH3, by abstraction of hydrogen. For convenience, a and 7 refer to protons at the site of the unpaired electron and two positions removed, respectively. Only five of the seven y-hyperfine peaks
•CH2OCH2OCH3 CH3OCHOCH3
a y y a y
R i R 2in R 2 are observed, corresponding to the intensity ratios (1) : 6:15:2 0 :15:6 : (1).
The kinetic data were treated by graphical methods. A regression analysis computer program was applied to all curves to determine which plot yielded the best straight line and to calculate the slope of that line. Kinetic plots for various orders were made for each temperature to determine which order would best describe the decays of Ri and R 2. The plot yielding the best straight line at long times, in each instance, was (peak height) vs, time (seconds), corresponding to three-halves order. However, first- order plots appeared to fit the data fairly well also. Figures 2 and 3 are representative three-halves-order plots of the kinetic data. The slopes of each plot were used to calculate the specific reaction rate constants, 7c, presented in Table I. The only definite indication of formation of a substrate radical in this system was at 3°, at which temperature a maximum in concentration for Ri was observed at about 40 msec. The rate of formation is sufficiently rapid to preclude the direct analysis of the rate of formation with this experimental setup.
The following mechanism has been proposed by Wall, et al.,* on the basis of esr kinetic studies to explain the reaction of Ti(III) with H20 2 in acidic media.
Ti(III) + H20 2 Ti(IV) + OH - + -OH (1 )
■ 0 H + - 0 H ^ H 20 2 (2)
•OH + Ti(III) — > OH - + Ti(IY) (3)
This simple mechanism is in agreement with the 2:1 consumption ratio of Ti(III)/H20 2 in the absence of reactive substrates.4,7-9 It was recognized that the •OH could be complexed with Ti(IV ) ,4,6,9 or that two titanium peroxy radical species develop.7,8 Evidently the uncomplexed -OH species is not observed.6-9
10Jt|iec]
Figure 3. Reciprocal square root of peak height vs. reaction time, at 15°, for Ri. ' Initial concentrations prior to mixing: 0.01 M TiCb, 0.1 M H2SO,; 0.1 M H20 2, 0.50 M CIROCIbOCHa.
Table I : Specific Reaction Rate Constants for Ri and R 2
k,
M axim umobserved
con centration , T em p,M ~ V» sec -* M °C
R , 6.8 X 10³ 1 . 1 x 1 0 - 4 273.1 X 10³ 6.9 X 10⁻⁶ 158.0 X 10² 5.5 X IO“3 3
r 2 4.0 X 10⁴ 1.5 X IO“3 271.2 X 10⁴ 6.1 X IO-5 156.3 X 10³ 5.5 X 10⁻⁶ 3
The following additional reactions should be considered in describing the system after inclusion of dimethoxymethane as a dissolved substrate in the H20 2
stream
•OH + CH3OCH2OCH3 —^ Rj + H20 (4)
•OH + CH3OCH2OCH3 — ► -R, + H20 (5)
The Journal of Physical Chemistry

Esr K inetic Studies of T wo D imethoxymethane R adicals 2593
•Ri -t~ -R i — R 1R 1 (6)
•R2 + ■ R2 >• R2R2 (7)
•Ri + " R 2 ^ R 1R 2 (8)
•Ri — *• decomposition (9)
•R2 — > decomposition (10)
■Ri + -OH — > RjOH (11)
•R2 + - O H ^ R 2OH (12)
•Ri + H20 2 — ^ RiOH + -OH (13)
•R2 + H2O2 — > R2OH + -OH (14)
The “ ■ OH” in these equations is symbolic and does not necessarily represent a unique species.
No evidence for dimeric products was found by gas chromatographic analysis of reacted streams, even when [Ti(III) ]0 was made 0.2 M in a titration-type experiment. Therefore, radical combination reactions 6 , 7, and 8 are relatively insignificant. Reactions 9 and 10 are probably minor contributors to the decay of Ri and R 2, since no secondary radicals could be detected by esr spectroscopy.
The products of (12) and (14) are probably unstable, and gas chromatographic analyses, though consistent with reactions 11-14, could not furnish a stoichiometric balance of predicted products for these latter reactions. The detection of final products in this system is complicated by reactions, such as hydrolysis, occurring after the time scale emphasized in the esr studies. Formaldehyde, formic acid, methanol, and a product in the molecular weight range of dimethoxymethane were detected, within an hour after mixing the reactant solutions. The gas chromatographic analyses were thus restricted to qualitative utility.
Different intermediates, with different specificities for abstraction, did not seem to develop for the range of [Ti(III)]/[H20 2] ratios used in these studies. This is supported, albeit inconclusively, by observation of no change in kinetic order or esr spectral detail as the ratio of flow rates for the two reactant streams, Ti(III)/H202, was varied from 0.4 to 2.6, a procedure which is effectively an alteration of initial concentrations. As can be seen from the data on actual variation of initial concentrations in Table II, k is relatively independent of [Ti(III) ]0. Quantitative evaluation of the data indicates that fc is closely proportional to the first power of [H 20 2]o, indicating the probable involvement of H20 2
in the decay of the substrate radicals as represented in reactions 13 and 14. Complications due to complexa- tion of Ti(IV) with H20 2 could exert a modifying influence. The qualitative aspects of these observations agree with the Ti(III)-H 202-C H s0 H system.8
The abstractive processes represented by (4) and (5) are very rapid relative to the decay reactions for the substrate radicals. The [Ri] and {R2] observed
Table II : Dependency of k for R, on Initial Concentration“
[H20 2]o = 0.1 M ; [CH8OCH2OCH3]0 = 0 . 5 1 ;T = 27°
k,(T i(III)]o M - 'A s e o - i
0.005 7.4 X 10s0.009 7.5 X 1030.10 6.8 X 10⁸
[T i(III)]0 = 0.01 At; [CH3OCH2OCH3]o = 0.,T = 27°
k,[H202]q M ~lA sec “I
0.05 3.0 X 1030.10 7.5 X 1030.25 13.9 X 10³
“ All initial concentrations are prior to mixing; ratio of flow rates maintained 1:1.
Figure 4. Arrhenius plots: O, Ri; A, R 2;log k (M ~112 sec“ 1) vs. l/T.
initially are at least several orders of magnitude greater than the concentration of complexed -OH, supporting Fischer’s7 interpretation that uncomplexed -OH is the abstracting agent. This also suggests that the rate of formation of complexed • OH is slower than the rates of the abstraction reactions 4 and 5, as noted by Turk- evich;6 the rate of decay of complexed -OH is also slow relative to (4) and (5). It has previously been noted that the rate of disappearance of a substrate radical is, in general, much more rapid than that of the complexed • OH and that a quasi-steady-state concentration of the latter can exist.12 Such a steady-state condition has been observed in this system with [Ti(III) ]0 = 0.026 M , [H2O2]0 = 0.1 M , and [CH3OCH2OCH3] = 0.5 M .
Volume 78, Number 8 August 1969

2594 John F. Endicott
It has been suggested that mixing may be incomplete even after the stream reaches the esr cavity4 and that reaction 1 cannot necessarily be assumed to be complete within the mixing chamber.13 A reasonable value8 for fci is -~103 M ~ l sec-1. Thus, reaction 1 could very well be a minor source for -OH up to several hundred milliseconds after mixing. The pure Ti(III)- H20 2 system without substrate is complicated,8 and additional sources for • OH could easily be present.
The possible contribution of Ti(IV) or its complexes to the decay of substrate radicals has been mentioned previously.13'14 Substrate complexes in the abstraction process were considered by Turkevich;8 (4) and (5) may therefore involve complexed CH3OCH2OCH3. Similarly, the substrate radicals in (11)—(14) may be serving as ligands in metal complexes, and this possibility is suggested by the low values of the velocity constants
for over-all decay relative to those expected for diffusion-controlled reactions of neutral molecules.
Arrhenius plots (Figure 4) of log k vs. T ~ l gave apparent activation energies of 14.8 and 13.0 kcal/mol and preexponential factors of 4 X 10¹⁴ and 1014 M ~ 'ft sec-1 for Ri and R 2, respectively. The apparent activation energies are high for purely diffusion- controlled reactions. Because of the low activation energies for radical combination reactions, the major parts of the E\ values could presumably be associated with reactions 13 and 14, respectively.
Acknowledgments. This research was supported by Robert A. Welch Foundation, Grant A-177. The esr spectrometer was made available by National Science Foundation Grant GP-3767.
(13) P. Smith and P. B. Wood, Can. J. Chem., 45, 649 (1966).(14) J. K. Kochi, Science, 155, 415 (1967).
The Effects of Magnetic Exchange Interactions on the Rates of
Electron-Transfer Reactions
by John F. EndicottDepartment of Chemistry, Boston University, Boston, Massachusetts 08215 (Received November 21, 1968)
Magnetic exchange interactions between adjacent paramagnetic metals in solids and in known binuclear complexes are often very large even at room temperature. Similar interactions would be expected to occur in the “activated complexes” of at least some electron-transfer reactions. Since such interactions would define the spin alignment of donor and acceptor orbitals (at the reductant and oxidant, respectively), some magnetic restrictions on the probability of electron transfer are to be expected. A simplified application of the theory proposed for magnetic interactions in solids leads to the conclusion that at least some very slow reactions may involve a magnetic restriction on the electron-transfer probability.
IntroductionElectron-transfer reactions between metal ions in so
lution are simple enough that very detailed mechanistic information may be obtained and that reasonably sophisticated theoretical treatments of the reaction rates have been developed. Many of the theoretical discussions have found qualitative and semiquantitative experimental justification (for pertinent reviews and discussion see ref 1-4).
Despite the great deal of analytical thought and discussion, very large reactivity differences in some of the seemingly simplest systems have not yet been satisfactorily accounted for. Probably the most remarkable instance of this frustration is the ~ 10 8-fold variation in
reactivity observed for the simple isotope-exchange rates between aquo ions in solution4
M 2+ + *M3+ M 3+ + *M2+
A common starting point in most theoretical discussions is the formation of a binuclear “ intermediate” in which the reactant metal centers are near enough that the interaction of donor and acceptor orbitals can lead
(1) R. A. Marcus, Ann. Rev. Phys. Chem., 15, 155 (1964).(2) W. L. Reynolds and R. W. Lumry, “ Mechanisms of Electron Transfer,” Ronald Press, Inc., New York, N. Y., 1966.(3) J. Halpern and L. E. Orgel, Discussions Faraday Soc., 29, 32 (1960).(4) A. G. Sykes, Advan. Inorg. Chem. Radiochem., 10, 153 (1967).
The Journal of Physical Chemistry

to electron transfer. Frequently these electron-transfer reactions involve more than one paramagnetic species. If both metal centers of the binuclear “ intermediate” involved in the electron-transfer step are paramagnetic, then there may be magnetic exchange and thus spin coupling in this species just as there is in many known, stable binuclear complexes.6 Such spin coupling can, in principle, result in an antiferromagnetic alignment of the magnetic orbitals of adjacent nuclei and thus inhibit electron transfer. The present paper uses the theory of magnetic exchange in insulating solids6 to classify electron-exchange reactions according to the probable spin alignment of paramagnetic nuclei in the reaction intermediate.
General and Kinetic ConsiderationsTo simplify the development of a model for magnetic
exchange interactions in the activated complex for electron-transfer reactions, most of the discussion in this paper will be confined to one-electron exchange reactions (e.g., Fe2+ + *Fe3+) so that AG'~ 0. This discussion will be further simplified by examining interactions only in those reactions in which one ligand (e.g., H20) acts as a bridging group between the reactant metal centers in the activated complex for electron exchange (i .e ., reactions of the inner-sphere type4).7 There are two principal advantages of this latter restriction: (1) the Anderson treatment of magnetic exchange interactions is directly applicable and (2) known binuclear complexes can be regarded as direct analogs. The possibility of removing these several restrictions is considered briefly in a later section of this paper.
A general reaction scheme (similar to that used by Marcus8) provides a convenient means of organizing the discussion. Thus the over-all reaction may be represented by a series of steps.
M -X + *M+ ^ M -X -*M + (1)
M -X -*M + M +-X - *M (2)
M +-X-*M M + + X -*M (3)
For purposes of this discussion it is not assumed that the intermediates, M -X -*M + and M +-X-*M , have the ligands so arranged that the donor and acceptor orbitals at the reactant metal centers are matched in energy. Thus, in the present treatment (1) and (3) represent simply the formation and dissociation of the respective dimeric species, and (2) simply represents the redistribution of charge within the binuclear intermediate. Following Halpern and Orgel,3 it is convenient to define an average lifetime, n , of the binuclear intermediate and a characteristic lifetime, re, for the redistribution of charge in the binuclear intermediate.9 There are then two important limiting cases : (1) r, 5i> re, in which case the over-all rate of electron exchange is proportional to the concentration of binuclear intermediate; (2) n « re, in which case the transfer of an electron between
Effects of Magnetic Exchange Interactions
metal centers is the rate-determining step. It is this second case which is of interest here.
It is necessary to consider the factors which can contribute to a low frequency of electron transfer. It is my view that at least three factors should be considered:(I) Franck-Condon restrictions arising from the different internuclear distances associated with M+ and M -X ; (2) weak interaction between donor and acceptor orbitals; (3) spin restrictions arising from magnetic coupling between nuclei. Franck-Condon restrictions have been treated by many authors, and these treatments are reviewed in ref 1 and 2. Interactions between donor and acceptor orbitals have been examined by several authors.10'11 This paper will examine only the possibility of spin restrictions (restriction 3).
A Model for Spin CouplingBased on Anderson’s review,6 three different kinds of
magnetic interaction will be considered: super exchange, direct exchange, and double exchange. In Anderson’s somewhat unconventional usage, these interactions are defined as follows.
1. Super exchange arises from the overlap of the wave functions of orbitals containing magnetic electrons. This mixing of the magnetic orbitals may be accomplished either by “ direct” overlap of the appropriate metal d-wave functions or by mixing the metal d orbitals with filled ligand s or p orbitals (to form what amounts to a partial covalent bond). This interaction is always antiferromagnetic.
2. Direct exchange arises from the two-electron exchange interactions between orthogonal orbitals. This interaction is always ferromagnetic.
3. Double exchange arises when net transfer of charge can occur between metal centers. This interaction is ferromagnetic, since only in this case can the energies of donor and acceptor orbitals at the two metal centers be matched. In the present formulation, double-exchange interactions will contribute to the ferromagnetic alignment of metal centers only when r:i » re.
It should be noted that super exchange and direct exchange, defined in this manner,6 do not provide
(5) See E. König, “ Landolt-Börnstein, New Series,” Vol. 2, K. H. Hellwege and X. M. Hellwege, Ed., Springer-Verlag, New York, N. Y „ 1966.(6) P. W. Anderson, "Magnetism,” Vol. 1, G. T. Rado and H. Suhl, Ed., Academic Press, Inc., New York, N. Y., 1963, Chapter 2.(7) This is not meant to imply that the aquo ion exchange reactions ali have inner-sphere mechanisms or that the mechanism of these reactions is unequivocal. The argument which follows only examines interactions which must occur for inner-sphere reactions. The aquo ion reactions are used for examples and comparison (Table III) because of their simplicity and because some relevant experimental information exists.(8) R. A. Marcus, J. Chem. Phys., 24, 966 (1956).(9) Note that in the present formulation Kt = k/k-t ^ 1 and that if v is the frequency of charge transfer in the intermediate, then re may be defined as re = 1 h .(10) See especially ref 3 and 11 and reviews in ref 1-4.(II) P. George and J. S. Griffiths, “ The Enzymes,” Academic Press, Inc., New York, N. Y „ 1959, pp 1, 289.
2595
Volume 73, Number 8 August 1969

2596 John F. Endicott
mechanisms for the net transfer of electronic charge. Furthermore, the interaction energies seem to run in the order:6,12 double exchange ^ super exchange > direct exchange. Thus in the present context, i.e., for r; < tb, the antiferromagnetic interactions are expected to be larger in magnitude.
Although super-exchange interactions are generally larger in magnitude than direct-exchange interactions, the net spin exchange interaction can be ferromagnetic if the number of the latter terms is sufficiently greater than the number of super-exchange terms.6 The most relevant of the d-orbital interactions are presented in Table I. For a linear M -X -*M + geometry, the classification of orbital interactions (Table I) follows Anderson’s prescriptions. With nonlinear geometries there is a much greater multiplicity of interactions,6 and they probably vary greatly in their magnitudes. For example a strong dz!,-p„-d*z„ (x) interaction in a linear geometry might be expected to be much weaker when the M -X -*M angle is less than 180°; furthermore, as the M -X -*M angle becomes small (^90°) the direct dxz~d*xz overlap should begin to make an antiferromagnetic contribution.6 Since the magnitudes of these interactions are difficult to assess, two limiting cases of bent geometries, the doubly bridged and triply bridged dimers, are also considered in Table I. In the case of the triply bridged (of face shared) dimer the antiferromagnetic interactions are probably either eg-s-e*g {a) or due to the direct overlap of t2g wave functions. The spirit of Anderson’s argument seems to be that the <r interactions would be much the largest and that the t2g-t*2g interaction would not be important except for cases where the t2g wave functions have considerable spatial extension or where the larger terms are not present. For purposes of the enumeration of terms in Table II no allowance has been made for difference in the different magnitudes of the various interactions. From a comparison of terms enumerated in Table I with data in Table II it can be concluded that direct, antiferromagnetic t2g-t*2g interactions are relatively small for the relevant first row transition metals. Thus these terms (included in parentheses in Table II) should be omitted in the comparison of ferromagnetic and antiferromagnetic terms.13,14
Anderson has shown that for a linear geometry the antiferromagnetic interactions are larger in magnitude than the ferromagnetic interactions.6 Thus a binuclear complex is expected to have two paramagnetic metals with their net spins parallel only if the number of ferromagnetic interactions significantly exceeds the number of antiferromagnetic interactions. Examination of Tables I and II suggests that (1) for a linear complex, the net spins of paramagnetic metals are paired if the number of antiferromagnetic terms, N a , is greater than one half the number of ferromagnetic terms, N f; (2) that for a doubly bridged complex, the antiferromagnetic interactions are weaker and the
Table I : Interactions between Magnetic Orbitals for Different Dimer Geometries“
Antiferromagnetic F erromagnetic
A. Linear geometry M -X -*Md2!-d*2! d22-(d*2;2, d*y2)dI2-d*X2 d*2-(d*22, d*y2)dg2-d*„2 dy2-(d *22, d * „ )
B. Bent geometry (singly bridged) M -X
M*d22-d*2* d22-d*„2d2s-d*2„ dyz~(d*22, d * „ )dyz d*y2 d i2-d*„2d*2-(d *2*, d *..)
C. Bent geometry (doubly bridged or edge-shared)X
/ \M M*
\ /X
d22-d*22 d22-d*yzdx 2_y 2 d * xy
dz2-„2-(d*;t2—y2, d*xz) dxz-(d*„z, d*xy)d i2-(d *22, d *ZZ, d*x2_y2) dyz“ (d*z2, d*xz)d _H*Alxy U. xyH -d*K1yz u yz
dxy-(d*xz, d*x2_y2)
D. Bent geometry (triply bridged or face-shared)X
/ \M —X — M*
\ /X
dz2-d*z2 d22~(d*xz, d*yz, d*xy)dx2_ 2 d a:2_y2 dx2_„2-(d*xy, d*xz, d*yz)dzy—d*a:y dxz-(d*22, d*x2-y2, d*xy, d*y2'd**-d *xz dx„-(d*yz, d*xz, d*22, d*x2_y2;d ~d*At yz At yz dyz-(d*22, d*x2-y2, d*xz, d*xy
“ To simplify enumeration, the following conventions are used for naming orbitals. (1) For singly bridged dimers the M -X bond defines the z axis and the X -M * bond the z* axis. The other coordinates of the M -X -* M plane are the x axis (perpendicular to M -X ) and the x* axis (perpendicular to X -*M ). Thus the z, z*, x, and x* axes are coplanar. (2) For the doubly bridged dimer, the bridging atoms are placed at the intersection of the z and z* axes and the x and x* axes. Again z, z*, x, and x* are coplanar. (3) For the triply bridged dimer, the bridging atoms are placed at the intersection of the z and z* axes, the x and x* axes, and the y and y* axes.
complexes can only be antiferromagnetic when N a N f; (3) that the bent, singly bridged dimer should be intermediate between the above two cases.
(12) P. G. de Gennes, P h y s . R ev ., 118, 141 (1960).(13) It should be noted that if only the eg orbitals are magnetic, the face-shared dimer would have spins coupled antiferromagnetically.(14) The face-shared and edge-shared dimers are not considered as useful models for reaction intermediates in the context of this discussion. The formation and dissociation of such an intermediate would have to occur in two or more steps, and this would tend to make the condition ti r e too restrictive.
The Journal of Physical Chemistry

Effects of Magnetic Exchange Interactions 2597
Table II : Examples of Magnetic Interactions in Some Known Binuclear Complexes
Probable d-Electronic Typical —Magnetic interaction terms'—- Observed5geometry configuration“ complex Antiferro Ferro magnetism
Linear t2g4 (R uC16)20 4 + 2 2 Antiferro6w [(NH3)6Cr]20 4+ 2 2 Antiferro1*t2g3eg2 [(HEDTA)Fe]20 2~ 3 7 Some spin coupling;
paramagnetic6Bent t2g3 [(NH3)5Cr]2OH3 + 2 2 Paramagnetic*1Edge-shared t2g3eg2 Fe2(OH)24+ (?) 7 + (1)" 8 Some spin coupling;
paramagnetic6,7t2g3 [(gly)2CrOH]2 2 + ( l )9 4 Paramagnetic5
Face-shared t2e2 V2CI03- (2)9 2 Paramagnetic5t2g3 Cr2Cl93- (3)9 6 Paramagnetic5t2B3ee2 Fe2Cl93~ 2 + (3)9 18 Paramagnetic5
° Of the metal ion in the corresponding monomer. b The complex is listed as “ antiferromagnetic” if it is diamagnetic at some temperature i$300°K. The complex is listed as “ paramagnetic” if it has been found to have some net paramagnetism at all observed temperatures. In those cases that the net paramagnetism per metal ion is less than that of the monomers, this is taken as evidence for spin coupling. 6 A. McL. Matheison, D. P. Mellor, and N. C. S. Stephenson, Acta Cryst., 5, 185 (1952). d Ref 17. * H. Schugar,C. Walling, R. B. Jones, and H. B. Gray, J. Amer. Chem. Soc., 89, 3712 (1967). ! L. N. Mulay and P. W. Selwood, ibid., 77, 2693 (1955). 1 Direct, t2g-t* 2g overlap terms in parentheses. 5 Ref 5.
Table III: Spin Interactions in Inner-Sphere Electron-Exchange Reactions
Magnetic interactiond -E lectron ic k ,a ,------------—term s“-------------------% E xchange
R eaction con figuration M "Vsec”1 N a. N f Geometry® allow ed? d
Y 2 + .3 + t2es-t* 2g2 0 .0 1 1 . 3 1.3 A No1 . 3 1.3 B No2 2 C Partially
Cr2+,3+ t2e3eg-t* 2g3 < 2 x 1 0 - 5 2 3 A No2.5 2.5 B No2 5 C Yes
Fe2 + ,3 + t2gv - t v e y 4.0 2 . 3 4 . 7 A Partially4 3 B Yes6 . 7 6 C Partially
Co2+ .3 + t2g5eg2-t* 2g6 1.97 0 0 A, B, C Yes6
“ Second-order rate constants at 25° from ref 4 and references cited therein. b N a = number of antiferromagnetic interactions; N f = number of ferromagnetic interactions. The several different ways of counting the odd electron in each complex have been evaluated separately, then averaged to obtain representative values of N a and N t. Direct t2g-t* 2g interaction in the edge-shared geometry has been neglected. 6 See Table I: A = linear; B = bent; and C = edge shared. d On the basis of the postulate that exchange isfully allowed only when the paramagnetic metal centers are ferromagnetically aligned and that this is satisfied for 2 iV a < 2Vp for geometries A and B and for N a < Nf for geometry C (Table I). 6 Assuming that the spin-multiplicity restriction is ASt — \AS — AS'| =0. This is probably only partially true.
One final point must be considered. If <S(2+) and iS(8+) are the net spin moments of the 2+ and 3 + metal centers, respectively, then the spin change at the two metal centers during electron exchange is AS = |S(2+) - S(3+)| and A S * = |S*(3+) - *S*(2+)| for M and *M +, respectively. In the limit of no interaction between M and *M + in M -X -*M + then one expects an allowed transition only if AS = 1 and A S * = 1 (one electron is exchanged). But for cases where there is an appreciable M -X -*M + interaction then electron exchange between M and *M + is “ spin allowed” if (condition 1) ASt = |a »S' — AjS*| = 0, and (condition 2) when M and *M + are both paramagnetic, the metals are ferromagnetically aligned. For pur
poses of the following discussion the latter will be assumed to be the case if 2N a < N r for a linear geometry.
Application to Aquo Ion Electron Exchange ReactionsObserved electron-exchange rates are compared to
predicted spin-coupling effects in Table III.15 Several different geometries of M -X -*M + are considered in Table III although the linear geometry is probably the most likely and the doubly bridged geometry is very
(15) To make systematic comparisons minimizing extraneous factors, the only exchange reactions considered in Table III are for transition metal ions which have similar coordination environments. Only for the aquo ion complexes is there sufficient information on several systems to allow comparisons.
Volume 73, Number 8 August 1969

2598 John F. Endicott
unlikely. It is clear that the two reactions for which the strongest antiferromagnetic interaction is predicted are the slowest. That the V 2+'3+ exchange is faster than the Cr2+'3+ exchange may reflect any of a number of specific differences between the two systems (e.g., n may be vastly different for the corresponding dimers as the rate of substitution on V 2+ is relatively slow16).
The prediction that the bent singly bridged (Fe- OH2-Fe)5+ geometry should lead to less of a spin prohibition on the exchange reaction than either the linear and doubly bridged geometries probably indicates the crudeness of the present assessment of d-orbital interactions for this most difficult geometry; any such error in enumerating orbital interactions will be most important in the Fe2+'3+ exchange reaction. Probably the most reliable evaluation of the interactions in the bent, singly bridged geometry would be to regard it as intermediate between the linear and the doubly bridged geometries.
On the whole, the model presented here seems to account qualitatively for the larger differences in the exchange rates listed in Table III. Unfortunately, there are few other reactions where so simple a comparison between the model and observed exchange rates can be made. Some more complex cases are considered briefly below.
One important, common kinetic feature of the four reactions in Table III is their inverse dependence of the exchange rate on [H+], This implies that the (M2+ + *MOH2+) exchange rate is much faster than the (M2+ + *M3+) rate. Within the context of the model considered here this situation will arise if either or both of the following occur: (1) (M-OH-*M)4+ may be somuch more stable than (M-OH2-*M )6+ that t -, > re for the former; (2) the geometry of (M-OH-*M)4+ may be different from the geometry of (M-OH2-*M )6+, and there may result differences in the tendencies of the metals to be aligned antiferromagnetically in the two complexes.
Application to Other Inner-Sphere Electron-Exchange Reactions
Available data do not permit a systematic comparison for several metal ions as in Table III, but there are some general features which should be observed as the bridging ligand X is changed. As Anderson has commented,617 the magnitude of the antiferromagnetic coupling constants should change as the bridging ligand, X, is systematically varied through a given group of the Periodic Table. It is to be expected that eg-oy-e*g (a■) coupling will increase and t2g-pz-t*2g (x) coupling will decrease in importance for the heavier elements X. Thus for a spin-coupling constant, J ,6'18'19 one expects the order J f - < J c i - < JBr-< J 1 - for the (r-coupling terms and the order J f- > Jci- > J Br- > Ji-for the x coupling.
For (V-X -V)4+ and (Cr-X-Cr)4+ dimers, the anti
ferromagnetic exchange terms are all of the t2g-pI-t*2g (x) type; therefore, antiferromagnetic interactions should decrease in the order J f - > Jci- > J Br- > Ji-. Since a decrease in antiferromagnetic coupling corresponds to an increase in the probability20 of electron transfer, electron-exchange rate constants for the Cr2+>3+ and V 2+,3+ reactions should increase in the same order; i.e., kf- < kCi- < kSr- < k i-. This is the experimental order for Cr2+’3+ exchange reactions;21-23 in fact, k B r -/ k f -~ 2 X 103.22
For the (Fe-X-Fe)4+ dimers, both <r- and x-type antiferromagnetic exchange terms (1 and 1.3, respectively) should be present, and there should be little change in net coupling for the different halide ions. Furthermore, as noted above, the (Fe-X-Fe)4+ dimer should not be strongly antiferromagnetic. Therefore, the Fe2+'3+ exchange rate constants should not be very sensitive to changing one bridging halide for another, and this is the experimental observation24-27 (Jf- ch 2&Br-).
It is to be recalled that the effects of different bridging ligands can be analyzed as above only if t , « re. Some bridging ligands may have the effect of reversing this inequality.
Outer-Sphere Electron-Exchange ReactionsElectron-exchange reactions for which the activated
complex does not have at least one ligand corrdinated simultaneously to both reacting metal centers are more difficult to analyze for spin-exchange interactions. The absence of a bridging ligand suggests that the dimer formalism developed above may not be directly applicable. There is an additional problem in that the geometry of the activated complex (i.e., the disposition of ligands around the M -*M + axis) is not well defined. Furthermore, the magnetic exchange interactions considered above are largest in magnitude when mediated by a ligand.6 And finally the interaction lifetimes are
(16) (a) J. M. Malin and J. H. Swinehart, Inorg. Chem., 7, 250(1968); (b) H. J. Price and H. Taube, ibid., 7, 1 (1968); (c) W.Kruse and D. Thusius, ibid., 7, 464 (1968).(17) Specifically with reference to the chalcogenide ions.(18) A. Earnshaw and J. Lewis, J. Chem. Soc., 396 (1961).(19) C. J. Ballhausen, “ Introduction to Ligand Field Theory,” McGraw-Hill Book Co., Inc., New York, N. Y., 1962; especially pp 243-245.(20) One may regard a decrease in the magnitude of the antiferromagnetic coupling constant as corresponding to an increase in the probability of finding M and *M + ferromagnetically aligned in M -X -*M +.(21) H. Taube and E. L. King, J. Amer. Chem. Soc., 76, 4053 (1954).(22) D. L. Ball and E. L. King, ibid., 80, 1091 (1958).(23) A. E. Ogard and H. Taube, ibid., 80, 1084 (1958).(24) J. Hudis and A. C. Wahl, ibid., 75, 4153 (1953).(25) R. J. Campion, T. J. Conocchioli, and N. Sutin, ibid., 86, 4591 (1964).(26) R. A. Horne, Ph.D. Thesis, Columbia University, cited in ref 2.(27) There is some ambiguity about this experimental comparison since the Fe2+ + FeCl2 + reaction proceeds only in part by means of a bridging Cl- .26
The Journal of Physical Chemistry

no doubt very short (probably of the order of “ solvent cage” lifetimes) for metal centers which react by means of an outer-sphere mechanism. For these reasons a specific model for magnetic exchange interactions in outer-sphere reactions is not considered here.
One point that should be noted is that there are probably also different spin-multiplicity restrictions for outer-sphere reactions: the rule of net spin conservation (Condition 1 : AiS't = 0) formulated above for inner-sphere reactions should be replaced by the more restrictive prohibitions on spin-multiplicity changes at each metal center (AS = 1, A$* = 1). This spin restriction has been suggested as a major reason for slowness of the Co(NH8)62+ + *Co(NH3)63+ reaction.4’28 ™
Extension to Reactions for Which aG ° ^ 0The above discussion of spin-correlation effects is, in
principle, as applicable to reactions between metal ions of different elements as it is to reactions between ions of the same element. Unfortunately, even a qualitative discussion of the “ mixed” electron-transfer reactions is far more complex. As noted above, several factors seem to make contributions to reactivity. In a consideration of exchange reactions some of these factors can be assumed similar through a series of comparisons or can be neglected altogether. A notable example of the latter is the variation of reactivity with the free energy of reaction. Although correlations between AG° and reactivity seem to be common for electron- transfer reactions, there is little agreement on the generality of such correlations or the form which they should take (see discussion in ref 1, 2, 4, and 31-33). Despite these difficulties some general observations concerning this application are of interest.
If the formalism of eq 1-3 is used to describe the “ mixed” reaction, then in general the equilibrium constant for step 2, K 2 > 1, and M -X-*M + and M +-X-*M are different chemical species. The magnetic exchange model discussed above should apply to both M -X-*M + and M +-X-*M . Electron transfer is magnetically allowed only if the transfer from donor to acceptor orbital does not require the electron to invert its spin moment.34
Effects of Magnetic Exchange Interactions
Summary and Critique
Anderson’s analysis of magnetic exchange interactions in solids and the magnetic properties of relevant binuclear complexes of transition metals have been used to develop a model for analyzing the effects of magnetic exchange on the rates of inner-sphere electron-transfer reactions. It has been shown that magnetic exchange effects can result in antiferromagnetic coupling between reactant metals and such coupling can account for the relative slowness of some electron-exchange reactions. Systematic, predictable variations in the kind of magnetic exchange terms also account for some of the specific ligand effects observed in these reactions.
The treatment presented here has necessarily been qualitative. The theoretical estimation of coupling parameters is still very crude.6 However as more reliable information becomes available about the magnetic properties of dimers formed from paramagnetic metals, it should be possible to obtain reasonably appropriate estimates of the magnitudes of the various interaction terms. Such information would permit a nearly quantitative evaluation of the effects of magnetic exchange on electron-transfer reactions.
Acknowledgment. The author gratefully acknowledges support of this research by the National Science Foundation through research grants GP 3467 and GP 7849.
2599
(28) (a) D. R. Stranks, Discussions Faraday Soc., 29, 73 (1960); (b) N. S. Biradar and D. R. Stranks, Trans. Faraday Soc., 58, 2421 (1963).(29) The exchange rate constant (extrapolated to 25°) of ~ 1 0 -12 M ~1 see-1® for this reaction can be contrasted to an exchange rate constant of ~ 1 0 3 M~l sec-1 for the Ru(NHs)s2+ + *Ru(NHa)58 + reaction.30(30) T. J. Myer and H. Taube, Inorg. Chem., 7, 2369 (1968).(31) N. Sutin, Ann. Rev. Phys. Chem., 17, 119 (1966).(32) R. C. Patel and J. F. Endicott, J. Amer. Chem. Soc., 90, 6364 (1968).(33) N. Sutin, Acct. Chem. Res., 1, 225 (1968).(34) This may be stated symbolically as follows: if S and S' are the total spin moments of M -X-*M + and M +-X -*M , respectively, then the transfer of an electron is spin allowed if S — S' = 0.
Volume 78, Number 8 August 1989

2600 Bernard E. Pennock and Herman P. Schwan
Further Observations on the Electrical Properties
of Hemoglobin-Bound Water
by Bernard E. Pennock1 and Herman P. SchwanElectromedical Division, The Moore School of Electrical Engineering, University of Pennsylvania, Philadelphia, Pennsylvania 19104 (Received November 21, 1968)
Solutions of horse hemoglobin of varying concentrations (7.5-26.6 g of Hb/100 cc) were prepared from crystallized Hb. Measurements of the complex dielectric constant of these solutions were made in the frequency range of 1-1200 MHz. This dielectric behavior is described in terms of the dipolar nature of the molecule, the dipolar nature of side chains extending out from the surface, and by a relaxation of a shell of water bound to the surface. The amount of bound water leading to the most reasonable dielectric behavior is 0.2 ± 0.05 g/g of Hb. This bound water is characterized by a change of enthalpy of abou t7 kcal/mol and a characteristic frequency of 500-1000 MHz.
IntroductionThe purpose of this paper is to relate the measured
values of the complex dielectric constant of the globular protein, hemoglobin, in solution, to certain structural features of the hemoglobin molecule (namely, water bound to the surface and polar side chains extending out from the surface). This paper is an extension of the paper by Schwan.2
History of Protein MeasurementsOneley3 measured the dielectric dispersions of hemo
globin, albumin, and other protein solutions. The hemoglobin dispersion was described by a characteristic frequency near 2 MHz. Oneley attributed this dispersion to the polar nature of the protein molecule and interpreted the characteristic frequency in terms of an ellipsoidal molecular shape. The highest frequency of measurement used by Oneley was 20 MHz.
Subsequently, Haggis, et oZ.,4 measured the dielectric constant of the protein, serum albumin, in solution at frequencies above 3 GHz. He found that the dielectric constant of the solution was lower than that predicted from an extrapolation of the dispersion studied by Oneley.3
Buchanan, et al.,& measured the dielectric constant of six other proteins at frequencies above 3 GHz. They found a discrepancy with the prediction of Oneley similar to that noted by Haggis.
Both of these investigators (Haggis and Buchanan) interpreted the lowering of the solution’s dielectric constant in terms of a shell of water bound to the surface of the protein. They reasoned as follows. The dielectric constant of naturally occurring water is completely described by a dispersion with a characteristic frequency of about 20 GHz, a low-frequency dielectric constant, e0, of about 80, and a high-frequency dielectric constant, of near 5. The protein molecule has a constant dielectric constant of about 2.5 at
frequencies above 20 MHz.6 Thus, at frequencies between 20 MHz and about 5 GHz a mixture of water (e ~ 80) and protein (e ~ 2.5) will have a dielectric constant between 2.5 and 80, the exact value depending on the volume of each component and the mixture equation (see Appendix).
Haggis and Buchanan derived a mixture equation for the protein in water, calculated the volume fraction of protein from the dry weight and known specific volume, and found that the calculated mixture dielectric constant was higher than their measured value. They attributed the discrepancy to the calculated molecular volume fraction and corrected it by assuming that a layer of water was bound to the protein surface making the protein volume appear larger than previously assumed. (The “ bound water” was assumed to have a dielectric constant of about 5 in the frequency range of interest (>3 GHz).)
Schwan7 discussed the critical dependence of the hydration value calculated by Haggis and Buchanan on the assumed dielectric constant of the water shell and protein and thus the resultant difficulty in obtaining hydration values from microwave measurements.
Schwan and Li8 and Schwan7 have observed an
(1) Woman’s Medical College, Philadelphia, Pa. 19129.(2) H. P. Schwan, Ann. N. Y. Acad. Sci., 12S, 344 (1965).(3) J. L. Oneley, “ Proteins, Amino Acids, and Peptides,” Reinhold Publishing Co., New York, N. Y., 1943.(4) G. H. Haggis, T. J. Buchanan, and J. B. Hasted, Nature, 167, 607 (1951).(5) T. J. Buchanan, G. H. Haggis, J. B. Hasted, and B. G. Robinson, Proc. Roy. Soc., A213, 379 (1952).(6) S. Takashima and H. P. Schwan, J. Phys. Chem., 69, 4176 (1965).(7) H. P. Schwan, “ Electrical Properties of Tissue and Cell Suspensions" in “Advances in Biological and Medical Physics,” Vol. V, C. A. Tobias and J. H. Lawrence, Ed., Academic Press, New York, N. Y „ 1957, p 61.(8) H. P. Schwan and K. Li, Proceedings of the First National Biophysics Conference, Columbus, Ohio, 1957 (Pub. 1959), p 355.
The Journal of Physical Chemistry

Electrical Properties of Hemoglobin-Bound Water 2601
additional dielectric dispersion of hemoglobin solutions in the frequency range of 10 to 1000 MHz. This dispersion was attributed to the rotation of polar subunits or to the relaxation of a shell of water bound to the hemoglobin. Schwan2 again considered the dielectric dispersion of hemoglobin solutions and cited reasons for preference of the interpretation of the results in terms of the bound water shell.
Grant9 suggested that part of the reason for the discrepancy between the values obtained by extrapolating the microwave and radiofrequency (rf) measurements was due to the choice of a single relaxation time for the former dispersion. By measurements on egg albumen (the only protein common to the investigations of both Onclev and Buchanan, et al.) the existence of a subsidiary dispersion at hundreds of MHz was revealed,10 thus supporting Schwan’s conclusion for hemoglobin. Further work on serum albumen showed a similar dispersion11 with a characteristic frequency near 500 MHz. This dispersion was interpreted in terms of the bound water shell.
PurposeThe dielectric dispersion observed by Schwan, with
hemoglobin, and by Grant, with the albumins, might be attributed to (1) the surface charges which develop as a result of the presence of a mixture of several substances (electrolyte, bound water, protein) of different complex dielectric constant (Maxwell-Wagner dispersion) ; (2) a frequency dependence of ep*, the complex dielectric constant of the protein, in the frequency range of interest (10 MHz-1 GHz), probably as a result of the presence of polar side chains on the surface of the protein or a spread of time constants of the rf dispersion first studied by Oncley;3 (3) a frequency variation of «b*, the complex dielectric constant of the bound water shell. This dispersion would be analogous to the dispersion of ice at lower frequencies and of water at higher frequencies.
An attempt will be made to determine the relative contribution of these effects to the observed dielectric relaxation behavior. The measured dielectric constant will be compared with that expected from a reference model consisting of unhydrated hemoglobin molecules (ep = 2.5) in an electrolyte (ew ~ 80) using the Maxwell mixture equation (eq 4). A dielectric increase (measured e > expected e) is to be expected from a polar relaxation (item 2 above) and a dielectric decrease (measured e < expected e) may be expected to result from the presence of a shell of bound water (item 3 above) if it is assumed that the dielectric constant of the bound water is smaller than that of free water. Precise measurements of the dielectric constant of solutions of hemoglobin shall be reported indicating that the former result occurs at frequencies below 100-500 MHz. We shall then adopt a model consisting of hydrated hemoglobin molecules in an electrolyte and calculate the
complex dielectric constant of the bound water shell. The temperature dependence of the characteristic frequency of its dispersion will be used to calculate the energies associated with the bound water’s relaxational behavior.
Materials and MethodHorse hemoglobin was crystallized out of solution by
slowly introducing ethyl alcohol.12 The crystals were resuspended in dilute KOH solution and crystallized a second time. The solution of these crystals in dilute KOH (pH <8) was used for the measurements. Measurements were made from 0.5 to 1200 MHz at hemoglobin concentrations from about 7 to 25% by weight, in approximately 5% increments. Measurements were made at 7, 16, and 25°.
Dielectric properties were obtained from 300 to 1200 MHz using a coaxial transmission line operating as a balance arm of a null detection system.13 Measurements from 0.5 to 250 MHz were made using a Boonton R-X meter and a sample cell as described by Schwan.14 The measured dielectric constant was accurate to within about 0.25 and the conductivity to about 2-3%.
The concentration of hemoglobin in solution was determined by drying a 2-ml sample of the hemoglobin solution to constant weight in an oven at 110°. An error of 1.0% in the value of the hemoglobin concentration was judged to be possible.
ResultsFigures 1 and 2 show the results of the measurement
of the dielectric constant and conductivity of an aqueous solution of hemoglobin of concentration of 22% by weight. The dispersion in the frequency range of 10- 1000 MHz as was previously described by Schwan14 is apparent as is the rf dispersion previously described by Oncley.3 The three curves of each figure represent results at 7,16, and 25°.
Measurements were also performed with hemoglobin solutions of other concentrations (7.5, 9.8, 14.7, and 26.6%) and at lower frequencies with the 22% concentration solution. All dielectric constants are presented in Tables I and II.
DiscussionThe outstanding features of the measured dielectric
data of the hemoglobin solution are (1) a dispersion with a characteristic frequency near 1 MHz; (2) a gradual decrease in the dielectric constant between the fre
es) E. H. G rant, P h y s . M e d . B i o l . , 2, 17 (1957).(10) E. H. Grant, N a t u r e , 196, 1194 (1962).(11) (a) E. H. Grant, A r m . N . Y . A c a d . S c i . , 125, 418 (1965); (b) E. H. Grant, J . M o l . B i o l , 19,133 (1966).(12) S. Takashima, A r c h . B i o c h e m . B i o p h y s . , 77, 454 (1958).(13) B. E. Pennock and H. P. Schwan, Proceedings of the 18th Annual Conference of Engineering in Medicine and Biology, 1965, p 25.(14) H. P. Schwan, “Physical Techniques in Biological Research,” Vol. 6, Academic Press, New York, N. Y., 1963.
Volume 73, Number 8 August 1969

2602 Bernard E. Pennock and Herman P. Schwan
Figure 1. Dielectric constant vs. frequency for a 22% solution of hemoglobin at three temperatures. The indicated predicted values are obtained assuming Maxwell’s mixture formula (eq 4) and considering unhydrated Hb in water.
Figure 2. Conductivity vs. frequency for a 22% solution of hemoglobin at three temperatures. The dotted lines represent the conductivity calculated assuming insulating hydrated hemoglobin molecules in solution with 0.25 g of bound H20/g of Hb.
quencies of 10 MHz and 1 GH z; (3) a decrease in the dielectric constant at high frequencies below that value calculated assuming a mixture consisting of unhydrated hemoglobin molecules of low dielectric constant (ep = 2.5) in an electrolyte; (4) a rising conductivity at high frequencies characteristic of behavior of electrolytes; (5) a conductivity higher than that which would be expected from either a hydrated or unhydrated insulating molecule.
investigated by him at frequencies below 20 MHz, by a single time constant dispersion obeying the relation
€ = +eo — too 1 + (cor)2 (1)
The subscripts 0 and °° indicate low- and high-frequency limit values of the dispersion under consideration and r its relaxation time constant. This expression may be rearranged as
€ — €„
«0 — «(2)
Thus, if the measured dispersion is characterized by a single time constant behavior, there will be an e„ and €0 such that a log-log plot of the two sides of eq 2 will give a straight line of slope 2. Figure 3 is a log-log plot of e — em/e0 — e vs. co for a 22% concentration solution where the value e0 = 170 is the measured value of the dielectric constant at 10 KHz (measured with a low- frequency bridge of high resolution described elsewhere16) with several values of t,„. All attempts to obtain a line of slope 2 were unsuccessful indicating that the measured dispersion could not be characterized by a single time constant.
We can, however, characterize the measured dielectric dispersion assuming a distribution of time constants. Normalizing eq 1 and assuming a distribution of time constants yields
= /X ln T
1 + (wr)-d In r (3)
Mathematical Description of the Dielectric Dispersion
Oncley3 was able to characterize the dielectric dispersion of dilute carboxyhemoglobin solution ( r 1%),
where x In r is a distribution function describing the number of time constants per logarithmic time constant
(15) H. P. Schwan and K. Sittel, T r a n s . A I E E (Comm. & Elec.), 114(1953).
The Journal of Physical Chemistry

Electrical Properties of Hemoglobin-Bound Water 2603
Table F
--------300 Mo-Concn, % Tem p, °C € K X 10'
7.5 7 77.7 1.1516 75.3 1.2025 72.9 1.40
14.7 7 72.3 1.5616 69.4 2.0425 66.9 1.73
9.8 7 75.5 1.6116 73.6 1.6925 71.6 1.79
26.6 7 60.8 1.7916 59.7 2.0425 57.8 2.32
/------ -500 Me------- . -700 Me------- -e K X 10* 6 K X 10»
77.0 1.80 77.0 2.9074.4 1.80 74.7 2.4572.1 1.90 72.2 2.40
72.3 2.34 70.6 3.2968.6 2.17 68.3 2.8166.6 2.17 65.8 2.52
75.7 2.17 75.4 3.1672.9 2.13 72.6 2.8471.0 1.87 70.2 2.51
61.1 2.61 60.5 3.5659.5 2.64 58.2 3,5157.6 2.73 56.6 3.29
—■—900 Me..... - ,-------1200 Mo-€ K X 10* 6
77.7 4.70 77.274.3 3.50 74.572.0 3.20 71.8
71.5 3.7668.3 4.0866.1 3.2975.4 4.6872.9 4.06 72.470.0 3.67 67.4
60.0 4.65 58.557.2 4.71 57.056.1 4.98 56.1
“ Summary of additional measurements of e and K made with the coaxial null measurement apparatus (Pennock and Schwan, 1965), not shown in the Figures 1 and 2. Concentration in g/100 cc; K in mho-cm.
Table IF
Concn, % Temp, °C
7.5 71625
9.8 71625
14.7 71625
26.6 71625
■20 Me-t K X 10*
80.0 0.5576.5 0.6673.3 0.78
78.3 0.9675.4 1.1173.0 1.31
75.9 1.1173.0 1.3370.6 1.55
68.3 1.3066.4 1.4864.5 1.72
•50 Me-« K X 10*
79.5 0.5975.4 0.7072.5 0.81
77.5 1.0074.3 1.1671.3 1.36
74.6 1.1671.6 1.3768.6 1.60
65.5 1.3663.2 1.5561.7 1.79
,----------100 Mc-€ K X 10*
78.5 0.6774.8 0.7672.0 0.85
76.9 1.0773.7 1.2270.9 1.42
73.8 1.2370.6 1.4367.7 1.61
63.8 1.4761.7 1.6860.0 1.89
--------150 Me-e K X 10*
78.2 0.7674.7 0.8471.8 0.95
76.3 1.1573.5 1.3070.8 1.46
73.4 1.3370.4 1.5067.1 1.72
63.2 1.5661.0 1.7559.0 1.97
° Summary of additional measurements of e and K made with the RX Boonton meter; K in mho-cm.
interval assuming that the individual dispersion contributions are of equal amplitude. Using the method described by Barlow and Lamb,16 it was possible to find an approximation for x In r. We then used this approximation of x In t in eq 3 to calculate the dielectric dispersion. Successive refinements of x In r were made to improve the fit of the calculated with the measured dispersion.
A good fit was found with the range of distribution functions shown in Figure 4.
The small peak could be shifted to the right or left within the limits shown, but it could not be broadened. The larger peak could be narrowed or broadened within the limits shown without violating a fit of experimental and calculated data within experimental accuracy (±0.5%) (see Figure 5).
Physical Model
The larger peak is clearly related to the rf dispersion of hemoglobin (rmax corresponds to a characteristic frequency of about 1 MHz). The distribution of time constants in this frequency region is probably related to polar-polar interactions between molecules in the concentrated solutions of hemoglobin used.
The smaller, separate peak at shorter time constants (higher frequencies) is most likely connected with a mechanism other than the rotation of the entire polar hemoglobin molecule. Moreover, examination of Figure 1 shows that there is a dielectric increase (above the level calculated assuming a mixture consisting of un-
(16) A. J . Barlow and J. Lamb, P r o c . R o y . S o c . , A253, 52 (1959).
Volume 73, Number 8 August 1969

2604
Frequency (MHz )
Figure 3. (e — e00)/(eo — e) vs. frequency for several values of assumed e„ for a 22% solution of Hb. The curves do not approach a slope of 2, thus indicating that the single time constant model is inadequate.
T x 10*
Figure 4. Distribution function of time constants for the hemoglobin dispersion: 1, single-peaked distribution calculated by the method described in the text; 2, double peaked distribution; 3, logarithmic symmetrical distribution. The shaded portion represents the range of distribution functions that satisfy the experimental points of Figure 5.
hydrated hemoglobin molecules of low dielectric constant (ep = 2.5) in an electrolyte) at frequencies below about 500 MHz and a decrease at higher frequencies.
The increase is partially caused by the previously described rf relaxation but this contribution is negligible above about 50 MHz (Figure 5). Assuming that the low-frequency limit of the dielectric constant of bound water is not greater than the low-frequency limit of the dielectric constant of free water, bound water could not cause this increase. Two other mechanisms which could cause the increase are (1) the relaxation of polar side chains and (2) the relaxation related to the induced dipole of the mixture of components of complex dielectric constant (Maxwell-Wagner dispersion). The only mechanism which comes to mind and which
could cause the decrease is (3) the presence of a shell of bound water having a dielectric constant which is lower than that of the suspending electrolyte.
In an attempt to separate these possible contributions to the measured dielectric relaxation we shall proceed as done before5'7 and postulate a macroscopic physical model of the hemoglobin solution consisting of particles with a protein core surrounded by a bound water shell suspended in an electrolyte medium (Figure 6). We will then be able to calculate the complex dielectric constant of the bound water shell which we will compare to that expected by analogy with free water and ice. The calculation proceeds as follows.
The measured dielectric constant and conductivity can be related to the dielectric constant and conductivity of the protein core, water shell, and surrounding electrolyte by a pair of mixture equations first given by Maxwell.17 These equations if written in complex form are (The use of the complex form of the equations includes Maxwell-Wagner dispersions,18 both of ee and e, and the possible contribution to the increase mentioned in item 2 above.)
Bernard E. Pennock and H erman P. Schwan
where R is the protein radius; d is the thickness of bound water shell; ep, K p are the dielectric constant and conductivity of the protein (hemoglobin), respectively; 6b, Kb are the dielectric constant and conductivity of the (bound water) shell, respectively; 6W, A'w are the dielectric constant and conductivity of the external medium (electrolyte), respectively; te, K e are the effective dielectric constant and conductivity of the hydrated hemoglobin molecule of radius (R + d), respectively; e, K are the measured dielectric constant and conductivity, respectively; and
* K *< e * = f e - 3 ------
uer
0)6r
er is the permittivity of free space; and p is the volume fraction of the total solution which is occupied by the hydrated hemoglobin particle.
We shall assign a dielectric constant and conductivity characteristic of dry hemoglobin powder to the core,
(17) J. C. Maxwell, “A Treatise on Electricity and M agnetism ,” Articles 310-314, Oxford University Press, London, 1892.(18) H . Pauly and H. P. Schwan, Z . N a t u r f o r s c h 14B, 125 (1959).
The Journal of Physical Chemistry

Electrical Properties of Hemoglobin-Bound Water 2605
Figure 5. Dielectric constant calculated assuming several distribution functions of time constants as shown in Figure 4. The crosses represent values as measured with a 22% Hb solution: 1, from single-peaked distribution (see Figure 4); 2, from double-peaked distribution; 3, from log symmetrical distribution.
Figure 6. Model of a hydrated hemoglobin molecule.
and we shall use known data for the electrolyte (e.g., see Hasted19) in eq 4 and 5. Having set the properties of the core protein and suspending phase, we extract the dielectric properties of the bound water shell from the experimental data by means of two successive operations involving the calculation of eK* from eq 4 and then the use of this value of e * in eq 5.
tions are made using several values of b chosen to bracket the value 0.3 g of bound IhO /g of Hb which is cited most often in the literature. Water is characterized to an excellent approximation by a single time constant dispersion.21’22 Hence, the real part of the complex dielectric constant ew* is ew and is calculable from the Debye equation
, €0w €co-w€w = L w + “ i } 7 ,1 + (cor)2 (6)
where the values of e0w, «»w, and r are taken from Hasted.19 The conductivity, K w, is calculated at each frequency from the equation
Tr , ( K aw - K ow) ( u t ) 2
- Aow -f- I _L / \21 + ( c o t ) 2
(7)
where the magnitude of the conductivity dispersion, (K-mw K q-w) , iS
Effective Dielectric Constant of Hydrated Hb Molecule, e?
A solution of eq 4 for ee and K e, the effective dielectric constant and conductivity of a homogeneous particle equivalent to the hydrated hemoglobin molecule, is found using e and K values chosen from a smooth curve drawn through the experimental points (see, for example, Figure 1). p, the volume fraction of the total solution occupied by the hydrated hemoglobin molecule is given by p — c(v + b), where c is the measured concentration of hemoglobin in g/100 cc, v is the specific volume of Hb20 (0.75), and b is an assumed value of grams of water bound to the hemoglobin surface. Calcula
t e - Kow) = tl(€0W' 6”w) (8)T
The value of K 0y, can be determined to a very good approximation using the Maxwell mixture equation
Ko Kow K oe KowKo + 2K(m ^ Koe T ‘2 K qw
(19) J. B. Hasted, “Progress in Dielectrics,” Vol. 3, Heywood and Co., L td., London, 1961.(20) G. S. Adair and M. E. Adair, P r o c . R o y . S o c . , B120, 422 (1936).(21) H . P. Schwan, Z . N a iu r f o r s c h . , A , 9 , 35 (1954).(22) E. H. G rant and R. Shack, B r i t . J . A p p l . P h y s . , 18, 1807 (1967).
Volume 73, Number 8 August 1989

2606 Bernard E. Pennock and Herman P. Schwan
Figure 7. Averaged value of the effective dielectric constant and conductivity vs. frequency for an assumed 0.25 g of shell/g of Hb. The horizontal lines at 1000 and 50 MHz give dielectric constants for an assumed shell weight of 0.15 and 0.35 g/g of Hb. A single conductivity curve is shown representing an averaged value over the three temperatures. The brackets indicate one standard deviation as determined experimentally by the spread of values at different concentrations.
where the zero subscript refers to limit values of conductivity approached at low frequencies. K 0 is the measured conductivity approached at low frequencies and is taken as the measured conductivity at 1 MHz. (The measured conductivity changes very little for frequencies below 1 MHz.) The equivalent homogeneous particle can be considered insulating at low frequencies (below 0.5 MHz) since the hemoglobin molecule itself is insulating and the conductivity increment due to hemoglobin’s polar conductivity dispersion does not become significant until a higher frequency region.
Separation of eq 4 into two real equations yields
(e — ew)(e + 2ew) -|--- — (K — K W) (K + 2K v)orer
(e + 2ew)2 + - l - (K + 2K v)>C0z€r
( * o — € w ) ( « e + 2ew) + — — (K e — i f w ) ( K e - f 2 K w)rp ------------------------------- ------------------------------
(«. + 2ew)2 + — ( K e + 2 K wy0t)Z€T
(10)
______ (K w 6 - K 6W) =
(e + 2ew)2 + (K + 2^w)2C0z€r
(€e + 2ew)2 + ~ ( * . + 2K vyore/
These two equations were solved for ce and K e using the Newton-Raphson iterative method23 for solving systems of nonlinear equations. The iterations were performed on an IBM 1620 digital computer. Figure 7 shows an average of the calculated values of ee for hemoglobin solutions of 9.8, 15, 22, and 26.6% concentration at three temperatures assuming b = 0.25 g of H20/g of Hb. Similar curves were calculated assuming 0.15 and 0.35 g of (bound water) shell/g of Hb, and the end points of these curves are shown in the figure.
Clearly the effective dielectric constant undergoes a dispersion corresponding to the measured dispersion; hence, the measured dispersion cannot be solely attributed to the heterogeneity of a mixture of a particle of a constant complex effective dielectric constant in an electrolyte of complex dielectric constant. This conclusion is also supported by the very close agreement (within a 0.1 dielectric unit) of the calculated effective dielectric constants with those calculated from eq 4 using real coefficients only (e’s instead of e*’s). It indicates that the heterogeneity dispersion effect is, in fact, negligible and that the equation with real coefficients would have been sufficient.12
The concentration variation of the calculated effective dielectric constant was found to be constant within the experimental error (i.e., 1.5 dielectric units) indicating that the effective dielectric constant was concentration independent.24 This behavior of the very
(23) J. B . S carborough , “ N um erica l M a th em atica l A n a ly sis ,” T h e Johns H op k in s Press, B altim ore , M d ., 1930.
The Journal of Physical Chemistry

Electrical Properties of Hemoglobin-Bound Water 2607
high frequency dispersion is quite in contrast to that observed in the rf range. In the latter case, macro- molecular interaction affects the dielectric data at solution levels as low as 10%. The concentration independence of the above discussed effective dielectric data up to levels as high as 27% appears to rule out macromolecular interaction phenomena as an influence on the reported data.
Dielectric Properties of Bound WaterOur next step is the calculation of «b and K b using eq
5. This complex equation, if written in terms of real parameters, reduces to two simultaneous fourth-degree equations in eb and K b
(ee — €b)(ee + 2«b) H— -—- (K e — Kb)(K e + 2Kb)CO e r
(ee + 2 6b)2 + ~ ( K e + 2K b )2 aver
(ft + d)3
(eP — «b) (ep + 2eb) H-----— r ( K p — K b) ( K p + 2 K b)CO c r
(eP + 2eb) 2 + - f l (K r + 2^ ) 2CO € r
(12)
€ eK-b GbK- e
(« . + 2eb) 2 + (K e + 2 K b )2co er
\R + d jePKb €b-Kp
(eP + 2eb)2 +1
(13)(K p + 2Kb)2
The values of ee and K e are chosen from Figure 7. The dielectric constant and conductivity of the hemoglobin core, €p and K p, is assumed to be about the same as that of dried hemoglobin powder, i.e., ep = 2.5, K p = 10~9 mho-cm.6 This assumes that a contribution to the complex dielectric constant from the rf dispersion and the polar side chains are negligible. The quantity (R/R + d y is calculated for each assumed value of b from the formula
( - * - \R + d
where v is the specific volume of Hb (0.75), and b represents g of shell/g of Hb, and the density of the bound water shell is approximated by one.
The shell constants calculated in this manner are shown in Figures 8 through 10. The graphs show that the shell complex dielectric constant is frequency dependent with the dielectric constant decreasing and the conductivity increasing with increasing frequency. Thus, the frequency variation of the dielectric constant
v + b(14)
Figure 8. Calculated dielectric constant and conductivity of bound water vs. frequency for an assumed hydration of 0.35 g of H20/g of Hb. The dielectric constant of the core was taken as 2.5. The lines at 1000 MHz show the dielectric constant for e = 5. The conductivity curve represents an average value at the three temperatures. The bracket marks indicate the expected spread of values corresponding to one standard deviation of the effective dielectric constant as shown in Figure 7.
of the hemoglobin solution cannot be explained by simply assuming the existence of a shell of bound water with frequency-independent properties.
The data invite the following discussion. (1) The dielectric constant of the shell is, for all hydration values, greater than 100 at frequencies below 100 MHz and seems to be steadily rising at decreasing frequencies. If bound water were to have a low-frequency dielectric constant similar to normal water and ice, a low- frequency limit value of about 80 to 100 would be anticipated. Clearly then, the rise above 100 at frequencies below about 100 MHz is either due to bound water having a higher low-frequency dielectric constant than ice and free water or perhaps more likely to be caused by some other relaxation such as the aforementioned relaxation of polar side chains.
A possible contribution of the relaxation of polar side chains to the measured increment at the lower frequencies of the high-frequency dispersion is supported by Kendrew’s studies of Hb. Kendrew25 suggests, from his X-ray crystallography picture of myoglobin, that
(24) B. E. Pennock, Thesis, Biomedical Engineering, University of Pennsylvania, Philadelphia, Pa., 1967, p 55.(25) J. C. Kendrew, B r o o k h a v e n S y m p . B i o l . , 15, 216 (1962).
Volume 73, Number 8 August 1969

2608 Bernard E. Pennock and Herman P. Schwan
Figure 9. Calculated dielectric constant and conductivity of bound water v s . frequency for an assumed hydration of 0.25 g of IJ20 /g of Hb. The dielectric constant of the core was taken as 2.5. The lines at 1000 MHz indicate the dielectric constant for e = 5. The conductivity curve represents an average value for the three temperatures. The bracket marks indicate the expected spread of values corresponding to one standard deviation of the effective dielectric constant as shown in Figure 7.
most of the polar groups of the molecule reside on the surface and that some of these are flexible and do not assume fixed configurations. Furthermore, the dielectric measurements of polypeptides having a length similar to that of the polar side chains of Hblla'26'27 suggest a dispersion for the side chains having a characteristic frequency of about 50-100 MHz. If we assume that side-chain relaxation does not contribute at frequencies above 100 MHz, then an assumed value of bound water of 0.35 g/g of Hb or greater gives the best agreement with the expected low-frequency limit of the dielectric constant of bound water.
(2) The value of the dielectric constant at 900 MHz is a function of temperature, of the assumed amount of bound water, and of the assumed value of the dielectric constant of the protein (see also Figure 11). If we assume the high-frequency limit value for the dielectric constant of bound water to be similar to that of water and ice, it should be near 5. We could account for the higher values observed at 900 MHz by noting that the dispersion is not completed at 900 MHz. However, Figures 8 and 9 indicate a tendency to be limiting at these higher values. A hydration value near 0.15 or 0.2 g/g of Hb would then appear to be likely since the
Figure 10. Same as Figures 8 and 9 except for an assumed hydration of 0.15 g of H20 /g of Hb.
dielectric constant could more nearly approach a high- frequency limit of about 5.
The conductivity at 900 MHz is about 20 mmho/cm and does not seem to have reached its maximum value. If we assume a characteristic frequency near 600 MHz (see the following paragraph), then eq 8 would predict a value of K „ for the bound water of about 30 mmho/cm for a As of 80 suggesting completion of the K dispersion not far above 1000 MHz again implicating a completion for the measured dispersion.
(3) We can estimate the characteristic frequency
/o = -— of the bound water dispersion by assuming 2ir r
a low-frequency limit for the dielectric constant of 85 and a high-frequency limit of 5 consistent with the approximate values for ice and water. At the characteristic frequency the dielectric constant is equal to y 2- (<o + e=) and hence 45. The characteristic frequencies obtained from Figure 10 at 7, 16, and 25° are 400, 550, and 850 MHz, respectively, for b = 0.15. These characteristic frequencies maintain their relative position as a function of temperature for other assumed conditions, with a higher b causing an increase in the characteristic frequencies and a higher ep decreasing the characteristic frequencies. The relative variation of the characteristic frequency with temperature allows
(26) W. P. Conner and C. P. Smyth, J . A m e r . C h e m . S o c . , 64, 1870 (1942).(27) H. D. M arcy and J. Wyman, i b id . , 63, 3388 (1941).
The Journal of Physical Chemistry

Electrical Properties of Hemoglobin-Bound Water 2609
Shell Weight, b(gm/gm Hb)
Figure 11. Shell dielectric constant at 900 MHz vs. assumed amount of (bound water) shell.
the calculation of bonding energies associated with the relaxing bound water if we accept the interpretation given by Glasstone, Laidler, and Eyring28 for the relationship between r and temperature, r = A eAH/RT, where R = universal gas constant, AH = change of enthalpy, and T — absolute temperature. The slope of the curve of In r vs. 1/r (Figure 12) is equal to AH/R and yields a value of AH of 7.3 kcal.
Both the characteristic frequencies of the bound water dispersion and the bonding energy hindering rotation indicate that bound water has a structure which is ordered to a degree somewhere between the rigid order of ice and clusters of water (Table III). Since both characteristic frequencies as well as enthalpy values are somewhat closer to the values for free water, bound water appears structurally closer to free water than ice.
Table in
'0 H, kcal Ref
Ice 13 Auty and Cole“Bound water 500 MHz 7.3Free water 20 KMHz 4 Hasted19R. P. Auty and R. H. Cole, J . Chem. Phys., 20,1309 (1952).
(4) Conclusions. The calculated dielectric properties of the shell surrounding the protein are consistent with a bound water shell of 0.15-0.25 g/g of Hb. The bound water relaxes near 500 MHz (dependent on temperature) and has a high-frequency limit dielectric constant below 10 and an enthalpy change of near 7 kcal/ mol.
Figure 12. Time constant vs. l/T for the bound water dielectric constant dispersion.
It is appropriate to compare the above results and their interpretation with those given for hemoglobin previously by Schwan2 and for albumen by Grant.11 In all cases the behavior of the macromolecules at frequencies above 100 MHz has been attributed as possibly due to a relaxation of bound water. Schwan has considered either bound water relaxation or polar side- chain relaxation as responsible for the behavior of Hb while Grant prefers the bound water relaxation hypothesis as responsible for the similar behavior of albumen. In this paper we have formulated the proposition that both side-chain rotation and bound water relaxation participate in the over-all frequency behavior above 30 MHz. Clearly, side-chain rotation can only contribute to the electric polarization, i.e., will cause an increment and, hence, the decrement values observed by us and previous investigators at frequencies above 100 MHz cannot be caused by partial side-chain orientation. Macromolecular interaction appears also not to be responsible since our conclusions for the bound water are independent of the Hb concentration. Thus, the hypothesis that bound water relaxation accounts, above 100 MHz, for the observed data appears the only reasonable explanation at hand.
However, the analysis of the increment data observed below 100 MHz is not as clear. This increment could be explained by the hypothesis of polar side-chain rotation or as a reflection of bound water static dielectric constant which is considerably larger than that of ice and free water. We have cited reasons why we prefer the former hypothesis, while Grant appears to consider the latter. He includes any side-chain rotation in the main ¡3 dispersion.
(28) S. Glasstone, K. J. Laidler, and H . Eyring, “Theory of Rate Processes,” McGraw-Hill Book Co., New York, N, Y., 1941, p 548.
Volume 78, Number 8 August 1989
2610 Bernard E. Pennock and Herman P. Schwan
The data which have been previously presented by one of us2 and those presented in this paper yield the same conclusions from a qualitative point of view. However, the present data indicate that the relaxation of bound water extends to higher frequencies than previously stated. Thus Schwan claimed that an effective dielectric constant of the hydrated Hb molecule of less than 10 is approached at a frequency of 900 MHz for hydration values of 0.3 and 0.4, while in the present study values between 10 and 15 are observed. This difference reflects perhaps the increased accuracy of the dielectric constants reported in this study or, less likely, the different hemoglobin preparation used in both studies. The present study is able to probe deeper into the relative contribution of various mechanisms since it extends to lower frequencies than the previous one and analyzes more accurate experimental data. It furthermore includes studies as a function of temperature, yielding enthalpy values which support the conclusion that bound water appears structurally to be placed between ice and free water, even though somewhat closer to the latter.
SummarySolutions of horse hemoglobin of varying concentra
tion (7.5-26.6 g of Hb/100 cc) were prepared from crys- talized Hb. Measurements of the complex dielectric constant of these solutions were made in the frequency range of 1-1200 MHz.
The measured frequency dispersion of the dielectric constant and conductivity were interpreted in terms of a physical model7 consisting of a solute of hemoglobin molecules of low dielectric constant, each surrounded by a shell probably representing a layer of bound water and suspended in an electrolyte solvent.
The dielectric mixture is described in two steps. (1) The “ effective” complex dielectric constant of a particle consisting of a hemoglobin core and a surrounding shell is calculated from the measured solution complex dielectric constant. (2) This “effective” complex dielectric constant is then used to calculate the complex dielectric constant of the shell surrounding a hemoglobin core of low dielectric constant.
Analyses of the measured, effective, and shell complex dielectric constants have led to a separation of the frequency dispersion of hemoglobin into three regions. Below 30 MHz the dispersion is attributed to the dipolar nature of the hemoglobin molecule. This disper
sion is characterized by a spread of relaxation times possibly representing Hb-Hb interactions at the high concentrations used. Between 10 and 100 MHz the dispersion is attributed to the relaxation of polar side chains extending from the surface of the molecule. Finally, above 100 MHz, the dispersion is attributed to a relaxation of a shell of water bound to the surface of the molecule.
This analysis of the experimental data is indicated if it is assumed that water bound to Hb shares with ice and free water a static dielectric constant in the range of 80 to 100.
The amount of bound water leading to the most reasonable dielectric behavior of the model is 0.2 ± 0.05 g/g of Hb. This bound water is characterized by a change of enthalpy of about 7 kcal/mol and a characteristic frequency of 500-1000 MHz, placing it structurally on both accounts between ice and free water, but somewhat closer to the latter.
AppendixConsider a parallel plate capacitor with the two di
electric materials constituting the medium («i = 2.5; «2 = 80).
(1) If the dielectrics are in series and are of equal volume, the total capacitance will be (A = area, d = total thickness)
5A 160A„ d X d 4.85AC T “ ------------------ 1-------- =
165 A d
~ < r
and the effective mixture dielectric constant would be 4.85.
(2) If the dielectrics are in parallel and are of equal volume, the total capacitance will be
_ 2 .5A / 2 ^ 80/1/2 _ 41.3A T d d d
and the effective mixture dielectric constant would be41.3. A change in the volume proportions will still cause the values to be between 2.5 and 80.
The series and parallel arrangements of the two dielectrics represent the two extremes of mixing. Other mixing configurations will yield intermediate results and the effective or over-all « will always be between2.5 and 80.
The Journal of Physical Chemistry

D imerization of T riphenylamine Cation R adicals 2611
Dimerization of Triphenylamine Cation Radicals. Evaluation of
Kinetics Using the Rotating Disk Electrode
by L. S. Marcoux, R. N. Adams,
D e p a r t m e n t o f C h e m is t r y , U n iv e r s i t y o f K a n s a s , L a w r e n c e , K a n s a s 6 6 0 4 4
and S. W. Feldberg1
H o t L a b o r a t o r y , B r o o k h a v e n N a t i o n a l L a b o r a to r y , U p t o n , N e w Y o r k 1 1 9 7 3 ( R e c e i v e d N o v e m b e r 3 5 , 1 9 6 8 )
The rotated disk electrode (RDE) has unique advantages for studying chemical reactions interposed between successive electron transfers (so-called ECE reactions). A simple modification of previously described digital simulation techniques allows various chemical kinetic complications to be introduced into the basic RDE hydrodynamic equations. These calculations have been applied experimentally to the important class of ECE reactions involving dimerization of cation radicals. The anodic oxidation of several substituted tri- phenylamines and their subsequent dimerization to tetraphenylbenzidines was studied at a platinum RDE. Second-order rate constants for dimerization in the range 103-104 1. mol-1 sec -1 were readily uncovered.
In a recent publication, Malachesky, Marcoux, and Adams have shown the feasibility of using the rotating disk electrode (RDE) to evaluate the kinetics of a first- order ECE reaction mechanism.2
e
A ^ ± B Electron transfer (1)k
B — > C Chemical step (2)e ~
C ^ ± D Electron transfer (3)
The validity of their approach is limited as was shown by Karp’s more rigorous calculations3 and as will be shown in this paper. The experimental data obtained by Malachesky, et al., was fortuitously within the range of the validity of their calculations.
These calculational limitations, as well as our interest in a variety of ECE-type mechanisms, led us to develop a method of digital simulation of the hydrodynamic-diffusion-kinetic processes at the RDE. A simple modification of a previously described digital
•simulation technique4-7 treats the hydrodynamic aspects of the problem. A complete description of this digital simulation technique is presented elsewhere.8 In the absence of chemical kinetics the treatment yields excellent agreement with the well-known Levich equation9 and with Hale’s numerical calculations describing the approach of the RDE limiting current to steady state.10
In this paper the effects of introducing various kinetic complications into the basic RDE calculation are presented, and the second-order rate constants for the dimerization of several substituted triphenylamine cations are evaluated.
Theoretical Working Curves. The RDE technique is a single-step technique as is polarography at the DME (and as opposed to a double-step technique such as cur
rent reversal chronopotentiometry). Consequently, the limiting current depends on chemical kinetics only when those kinetics precede an electron transfer. The ECE mechansim fulfills this criterion. We have considered a variety of first-order and second-order ECE mechanisms.
The first-order ECE mechanism (reactions 1-3) is more completely characterized when one considers the added reaction
hiB + C ^ t A + D (4)
k b
where ks and fcb are both very large and the reaction is always in equilibrium, with kf/kh = keq.a The working curves calculated using digital simulation are shown in Figure 1. The special case, kt = kh = 0, corresponds to the calculations of Malachesky, et al., and of Karp. Our working curve is virtually superimposable with Karp’s (curve K e„ = 0/0, Figure 1).
(1) W ork performed under the auspices of the XJ. S. Atomic Energy- Commission and N ational Science Foundation G rant GP-5079X. This support is gratefully acknowledged.(2) P. A. Malachesky, L. S. Marcoux, and R. N. Adams, J . P h y s . C h e m ., 70, 4068 (1966).(3) S. Karp, i b id . , 72, 1082 (1968).(4) S. W. Feldbefg and C. Auerbach, A n a l . C h e m ., 3 6 , 505 (1964).(5) S. W. Feldberg, J . A m e r . C h e m . S o c . , 88, 390 (1966).(6) M. D. Hawley and S. W. Feldberg, ./. P h y s . C h e m ., 70, 3459(1966) .(7) R. N. Adams, M. D. Hawley, and S. E. Feldberg, i b id . , 71, 851(1967) .(8) S. W. Feldberg in “Electroanalytical Chemistry,” Vol. 3, A. J. Bard, Ed., Marcel Dekker, New York, N. Y., 1969.(9) V. G. Levich, “Physicochemical Hydrodynamics,” Prentice- Hall, Inc., Englewood Cliffs, N. J., 1962.(10) J. M. Hale, J . E l e c t r o a n a l . C h e m ., 8, 332 (1964).
Volume 73, Number 8 August 1969

2612 L. S. Marcoux, R. N. Adams, and S. W. Feldberg
Figure 1. Working curves for first-order ECE mechanism at a rotating disk electrode.
The second-order ECE mechansime~
A ^ B (5)k
2B — ► C (6)2e-
C ^ D (7)k[
C + 2B ^ 2A + D (8)kb
is exactly analogous to the first-order case. The ambiguity of the mechanism of reaction 8, as well as the unlikely possibility of a third-order reaction, led us to consider only the three cases depicted in Figure 2. The difference between the case for K eq — 0/0 (be., kt = fcb = 0) and K eq — » is probably too small to be distinguished experimentally. As an added point of interest the classical disproportionation reaction
e ~
A ^ ± B
2B - V A + D
(9)
(10)
would present a working curve identical in form with the K eq = oo curve of Figure 2, but shifted right on the abscissa by 0.3 (= log 2). The reasoning is quite simple : when K eci — oo four molecules of species B per reaction 6 are consumed, while only two molecules of species B per reaction 10 are consumed.
The major simplifying assumption used in these calculations is that the diffusion coefficients of all species are equal. Some possible consequences of this are discussed later.
Experimental SectionPrevious studies have shown that if the triphenyl-
amine (TPA) is suitably substituted in the para phenyl
Figure 2. Working curves for second-order ECE mechanism at a rotating disk electrode.
positions, the oxidation stops at an initial one-electron stage to give a stable cation radical. This is the case, for instance, with tri-p-anisylamine. On the other hand, if the para phenyl positions are partially or completely unsubstituted, the intermediate cation radical rapidly dimerizes to a tetraphenylbenzidine (TPB). This is at least as easily oxidized as the starting tri- phenylamine and hence undergoes further oxidation.11 Thus the process is a second-order ECE mechanism (reactions 5-8) with the intermediate chemical step a second-order coupling reaction. This is illustrated for unsubstituted TPA.
TPA
C M'6n 5 \ .
c6h5-
c6h5.c6h5' :nCH0 >nc-c6h5
+ 2H+
TPB
—2e
(ID
(12)
TPB
= o o »TPB2'
(11) E. T. Seo, R. F. Nelson, J. M . Fritsch, L. S. Marcoux, D . W. Leedy, and R. N. Adams, J . A m e r . C h e m . S o c . , 88, 3498 (1966).
The Journal of Physical Chemistry

We have not written the reaction corresponding to reaction 8 because of the ambiguity of the mechanism for this reaction. The proximity of the working curves for K eq = 0/0, and K eq = <*> (Figure 2) indicate that the details of reaction 8 are not critical i f K eq 2> 1.
The preparation of all reagents has been described previously.11 The values of I I v s . u ' 1 for a typical situation, the oxidation of the mono-substituted 4-acetyl- triphenylamine, are shown in Table I. (All of the RDE measurements were made at a platinum disk electrode using conventional techniques.) As can be seen in column five of the table, the values of 1l/o»1/! decrease to a limiting value of about 4.70 at co > ~25 rps. This corresponds to the one-electron inf) initial oxidation. The ratio (ii/ w /r)u < 25rP8/4.70 represents wapp/ni for these lower rotation rates. (Since rq in all the TPA oxidations is unity, napp/»i = napp and this designation is used for brevity.)
D imerization of T riphenylamine Cation Radicals
Table I : Limiting Current-Rotation Rate Dependence for Oxidation of 4-Acetyltriphenylamine°
V ,r p su,
r a d ia n s /s e c u 'A«L,
ilt/a'h wapp
4 25.2 5.01 26.9 5.56 1.145 31.4 5.60 29.5 5.26 1.126 37.8 6.13 32.0 5.24 1.117 44.0 6.62 34.0 5.14 1.098 50.4 7.10 36.0 5.07 1.089 56.5 7.52 37.7 5.01 1.06
10 62.8 7.92 39.1 4.94 1.0514 88.0 9.38 45.5 4.84 1.0316 100.0 10.0 48.0 4.80 1.0218 113.0 10.6 51.0 4.74 1.0120 126.0 11.2 53.5 4.77 1.0225 157.0 12.5 59.2 4.73 1.0135 220.0 14.8 64.5 4.69 1.0045 282.0 16.8 78.8 4.68 1.0055 *c 346.0* 18.6* 87.3* 4.70* 1.00*65 408.0 20.4 94.8 4.64 0.99
“ Oxidation of 2.06 X 10 ~4 M 4-acetyltriphenylamine in acetonitrile with 0.1 M tetraethylammonium perchlorate supporting electrolyte. b Currents corrected for background. Electrode area = 0.23 cm2. c * = Values used to calculate diffusion coefficient of 4-acetyltriphenylamine; D = 1.74 X 10⁻⁶ cm2/sec (see accompanying text).
The ¿L-to behavior is determined for a range of concentration of the substituted triphenylamine. From these data the second-order rate constant may be evaluated by calculating
W a pP = t L 0 » “ V y ( iL O J “ V 2 ) l o w e r l im it = ¡1 .0 »“ ‘ ' 7 4 . 7 0 . ( 1 4 )fo r n = 1
and plotting this term vs. log (Co-1). The form of this curve should be the same as the K eq = 0/0, or K eq = co curves of Figure 2. Most important, if the rate step is second order, the curves obtained for different concentrations should lie on the same continuous curve.
2613
Figure 3. Comparison of experimental data at the RDE with theoretical working curves: upper, 4-cyanotriphenylamine;lower, 4-acetyltriphenylamine.
By overlaying the experimental and theoretical working curves (lower graph, Figure 3) this indeed appears to be the case. One can then establish that when
log (fcD“ 1/ja>- V /iC’) = 0.0 (15)
then
log (C'a»-1) = -4.22 (16)
and thus
10-4-22M>“ ‘/V /! = 1 (17)
The kinematic viscosity for acetonitrile is 0.00441 St, and the diffusion coefficient for the 4-acetyltriphenylamine can be calculated from the data in Table I (numbers with asterisks) and the Levich equation for steady-state currents at the RDE: D = 1.74 X 10⁻⁶. Thus the rate constant for the coupling reaction is easily calculated from eq 17. The rate constants for the 4-acetyltriphenylamine, 4-cyanotriphenylamine, and some additional substituted triphenylamines are shown in Table II.
DiscussionThe quality of data obtained by the RDE technique
is variable and depends on some well-known complicating phenomena, e.g., electroactive impurities, the onset of solvent-supporting electrolyte decomposition (background electrolysis), another electrochemical reaction close in potential, or electrode filming. Electrochemical reversibility, however, is not a determining factor since the measurements are made at potentials
Volume 78, Number 8 August 1969

2614 L. S. Marcoux, R. N. Adams, and S. W. Feldberg
Table II: Second-Order Rate Constants for SubstitutedTriphenylamine Cation Radical Coupling
Concentrations k,studied, 1. m o l"1 Error,0
Compound mol/1. sec-1 %4-Acetyl-TPA 2.06 X 10“ 4
4.11 X IO-4 6.18 X IO-4 8.25 X 10“ 4
2.6 X 10³ ±30
4-Cyano-TPA 8.4 X 10-s 2.11 X IO-4 4.22 X 10~4 6.35 X IO '4 8.45 X IO“4
1.1 X 10⁴ ±17
4-Chloro-TPA 6.41 X IO-4 8.56 X IO“4 8.0 X 10² ±19
TPA 3.44 X IO-4 5.16 X 10“ 4 5.55 X IO-4 8.60 X 10“ 4
3.0 X 10³ ±32
4-Nitro-TPA 4.17 X IO-4 6.27 X 10~4 8.34 X 10⁻⁴
1.0 X 10⁴ ±7
° Log error = (2(AZ)2/n — I)1/* where AZ = AkV'^D '^u-'C is the deviation of a given data point from the theoretical curve and n is the total number of data points. This error analysis strongly reflects the large deviations when napp approaches unity (Figure 3).
well into the limiting current region. The poorer agreement with theory as napp approaches unity (Figure 3) reflects the tenuous nature of the background corrections required at low concentrations.
As we pointed out earlier, the theoretical treatment of these mechanisms involves the simplifying assumption that the diffusion coefficient of all species is identical. It is reasonable that the substituted TPA and its cation
radical TPA+ have similar diffusion coefficients; it is unrealistic, however, to assume that the diffusion coefficient of the substituted TPB or T PB 2+ is the same as that of the monomeric species. A few calculations have indicated that a factor of 2 difference in diffusion coefficient produces a relatively small change in the working curve. Furthermore, if reaction 8 does occur, proceeding to the right to a significant degree, then the concentration of substituted TPB (species C) diminishes. Consequently, current dependence on the diffusion coefficient of TPB also diminishes. The characteristics of the final product (substituted T PB 2+) should have a commensurately diminished effect on the current. The experimental results (Figure 3) also indicate that the theoretical curves presented are adequate for the precision of the data that we can obtain.
A wide range of second-order rate constants can be measured by varying the concentration levels. It is theoretically possible to lower the initial concentration to the point where the follow-up chemical reaction is of little or no consequence and to use the A observed for the limiting situation napp = nx. Only by this technique, for instance, could the 4-cyano- and 4-nitrotri- phenylamine rate constants be measured. Similarly, slower rate constants may be measured at higher concentrations as was done for 4-chlorotriphenylamine. The variation of napp with concentration at fixed w provides useful mechanistic information. If napp at fixed value of C'a)-1 is independent of concentration, chemical reaction is clearly second order.
The promising aspect of this technique is that it is applicable to so many aromatic oxidation-reduction systems by virtue of the frequency with which the ECE mechanism occurs. The RDE provides a means by which relatively large rate constants can be studied by a quite simple technique. The calculational technique is sufficiently flexible so that the theory can be easily modified to account for mechanistic variations.
The Journal o f Physical Chemistry

Conductance of Solutions of Ce in Liquid NH3 2615
The Conductance of Solutions of Cesium in Liquid Ammonia1
by Robert R. DewaldDepartment of Chemistry, Tufts University, Medford, Massachusetts 02155 (Received November 27, 1968)
The conductivity of cesium-ammonia solutions at —33.9, —45.0, and —65.0° has been measured over the concentration range of 0.425 to 1.23 X 10~4 M . The method of Shedlovsky was used to evaluate the data in the dilute range. Values of 1142, 954, and 672 for the apparent limiting equivalent conductance, and4.87 X 10-3, 3.30 X 10⁻³, and 2.19 X 10~3 for the ion-pairing dissociation constants at —33.9, —45.0, and — 65.0°, respectively, were determined. The results are compared with data reported for other metal-ammonia solutions.
IntroductionThe properties of metal-ammonia solutions have been
studied extensively for the past century.2-4 There appears to be general agreement that in the very dilute concentration region (<10~3 M ), the solutions consist predominantly of solvated electrons and cations.6'6 Recent conductance studies7 indicate that the metal solutions in the dilute region conform to laws which govern the behavior of normal electrolytes. The conductance mechanism is typically ionic except the mobility of the solvated electron is about eight times that of the sodium ion, which suggests that an electron-jump6 or an inversion mechanism7“ is operative rather than migration of the cavity.
As the metal concentration increases from infinite dilution, the equivalent electrical conductance decreases until a minimum occurs.7“'8 The conductivity then increases with increasing metal concentration until it becomes metallic in nature for very concentrated solutions.89 For the intermediate concentration region between approximately 0.04 and 1 M , Arnold and Patterson10 have proposed a conduction mechanism which proceeds by the jumping of electrons from M centers to metal ions.
To obtain more information about the electrical properties of metal-ammonia solutions, the conductance of cesium-ammonia solutions was measured in the dilute and intermediate concentration range at —33.9, —45.0, and —65°.
Experimental SectionMaterials. Ammonia (Matheson 99.99%) was puri
fied in a manner which has been previously described.713 The specific conductance of the purified ammonia was determined prior to distillation of the metal in a number of runs. The pure solvent was found to have a specific conductance on the order of 10 ~7 ohm-1 cm-1 or less at — 33.9° and hence the conductance of the solvent was considered negligible in this study.
Cesium was obtained in 10-g ampoules as a gift from the Dow Chemical Co. (analysis: Na, <0.0008%; Li, <0.0001%; K, <0.0008%; Rb, 0.0010%). The cesium
was distilled in vacuo and stored in Pyrex capillaries. Break-seal tubes containing ammonium bromide (Fisher reagent) were prepared by a method described elsewhere.713
Apparatus and Procedure. The apparatus used in this study for measurements in the dilute concentration region (<0.014 M ) was similar to that described elsewhere.713 For measurements at higher metal concentrations, an apparatus similar in design was fabricated but with a cell constant of about 32.87. Only electrodes of bright platinum were used in this study. The cell constants were determined by established procedures.713'8 Measurements were made at 600, 1000, 2000, and 4000 Hz.
The procedure used in preparing the metal solutions and determining the resistance was identical with that described elsewhere.713 As observed with other metal- amine solutions in the dilute region,713'8'11 it was necessary to agitate the solution between the electrodes while determining the resistance of the solution. However, this difficulty was not observed during measurements in the intermediate concentration region (0.02 to 0.4 M ). The metal concentrations for each run (Table I) were determined by adding ammonium bromide to the cesium solution which resulted in the reaction
NH4Br + Cs — ► NH3 + CsBr + 0.5H2
(1) Contribution No. 380, Chemistry D epartm ent, T ufts University.(2) “Metal-Ammonia Solutions,” M . J. Sienko and G. LePoutre, Ed., Benjamin, New York, N. Y., 1964.(3) J . C. Thompson, in “ Chemistry of Non-Aqueous Solvents,” Vol. II, J. J. Lagowski, Ed., Academic Press, Inc., New York, N. Y., 1967, pp 265-315.(4) U. Schindewolf, A n g e w . C h e m . I n t e r n . E d . , 7, 190 (1968).(5) M. Gold, W. L. Jolly, and K. S. Pitzer, J . A m e r . C h e m . S o c . , 84, 2264 (1962).(6) J . L. Dye, A c c t . C h e m . R e s . , 1, 306 (1968).(7) (a) E. C. Evers and F. R. Longo, J . P h y s . C h e m ., 70, 426 (1966); (b) R. R. Dewald and J. H. Roberts, i b id . , 72, 4224 (1968).(8) C. A. Kraus, J . A m e r . C h e m . S o c . , 43, 749 (1921).(9) J. C. Thompson in “Solvated Electron,” Advances in Chemistry Series, No. 50, American Chemical Society, Washington, D. C., 1965, p 96.(10) E. Arnold and A. Patterson, Jr., J . C h e m . P h y s . , 41, 3098 (1964).(11) R. R. Dewald and J. L. Dye, J . P h y s . C h e m ., 68, 128 (1964).
Volume 73, Number 8 August 1969

2616 R obert R. D ewald
The volume and pressure of the evolved hydrogen were measured. Finally, the concentration of the cesium was calculated from the stoichiometry of the above reaction and the measured volume of the blue solution.
Table I : Conductance-Concentration Data forSolutions of Cesium in Liquid Ammonia * 2
R u nno.
- 3 3 . 9 ° 10» M A
- 4 5 . 0 ° IO3 M A
- 6 5 . 0 ° 103 M A
D-32 0.1227 1098 0.1256 918 0.1295 633D-36 0.1486 1082 0.1510 889 0.1537 624D-60 0.2561 1071 0.2617 873 0.2692 593D-38 0.4053 1038 0.4128 852 0.4261 578D-56 0.5816 1 0 1 0 0.5941 817 0.6096 554D-30 0.8120 994 0.8284 804 0.8527 539D-26 0.8536 990 0.8724 792 0.8939 532D-44 0.9027 985 0.9217 794 0.9510 527D-74 1.399 938 1.428 748 1.471 490D-52 1.972 917 2 . 0 1 2 731 2.081 462D-19 2.095 906D-62 3.006 865 3.071 673 3.111 431D-54 3.444 855 3.507 668 3.613 429D-64 4.217 824 4.211 643 4.329 407D-2 4.320 827D-42 5.879 779 5.985 610 6.216 385D-48 8.526 730 8.711 562 8.996 360D-5 13.72 670D-50 14.64 650 14.99 505 15.39 336D-46 17.80 619 18.15 486 18.72 325D-76 29.46 581 29.96 464 30.87 316D-66 34.22 565 34.74 461 36.15 313D-88 38.56 563 39.22 455 40.54 314D-86 61.51 564 62.67 465 63.83 334D-82 89.05 588 90.32 493 93.59 352D-72 128.2 642 129.9 534 134.6 378D-84 209.7 743 214.2 618 219.5 439D-90 425.3 957 432.3 776 445.5 547
Measurements were made at —33.9 ± 0.1, —45.0 ± 0.3, and —65.0 ± 0.3°. The temperatures were maintained for runs of metal concentrations less than2 X 10-2 M by using equipment and methods described elsewhere.7b For the more concentrated metal solutions, temperatures were maintained by a Harris Manufacturing Co., Model 1LE-BC2-075, convection fluid test chamber. Dow Corning No. 200 silicone fluid was used as the bath liquid.
Results and DiscussionThe values of the equivalent conductance, A, in Kohl-
rausch units and the concentration, M , in moles per liter, are given in Table I. The values of A at —33.9 ± 0.1, —45.0 ± 0.3, and —65.0 ± 0.3° are plotted vs. M ‘/! in Figure 1.
The apparent limiting values of the equivalent conductance, A0, were evaluated by using the method of Shedlovsky.12 Also, the apparent ion-pairing dissociation constants, K\, were evaluated at the three different temperatures. The dielectric constants,13'14 D , and the
Figure 1. Plots of A vs. M'^1 for solutions of cesium in liquid ammonia.
viscosities,16-17 7], used in the Shedlovsky analysis of the data were obtained by interpolation of available data. The extended Debye-Hückel expression was used to compute the activity coefficients. A distance of closest approach of 5.5 A was employed. Only concentration-conductance data below 1.4 X 10⁻³ M were used to calculate the values of the limiting equivalent conductances and ion-pairing dissociation constants given in Table II.
Table II : Apparent Limiting Equivalent Conductances,Walden Products, and Ion-Pairing Dissociation Constants for Solutions of Cesium in Liquid Ammonia
C on cen tra- V is-tion at D i- co s ity
m inim um , electric X 103,T,° C Ao Aoj?o M 10>iCi con stan t P
-33 .9 1142 2.92 0.046 4.87 21.8 2.558-45 .0 954 2.85 0.042 3.30 22.7 2.992-65 .0 672 2.90 0.038 2.19 25.1 4.320
(12) T. Shedlovsky, J . F r a n k l i n I n s t . , 22S, 738 (1938).(13) H. M. Grubb, J. F. Chittum, and H. H unt, J . A m e r . C h e m . S o c . , 58, 776 (1936).(14) D. F. Barow and J. J. Lagowski, in “Solvated Electrons,” Advances in Chemistry Series, No. 50, American Chemical Society, Washington, D. C., 1965, p 125.(15) H. M. Elsey, / . A m e r . C h e m . S o c . , 42, 2454 (1920).(16) C. J. Planck and H. H unt, i b id . , 61, 3590 (1939).(17) K. Fredenhagan, Z . A n o r g . A l lg . C h e m ., 186, 1 (1930).
The Journal of Physical Chemistry

Conductance of Solutions of Ce in L iquid NH3
Figure 2. Temperature coefficient of conductivity vs. metal concentration: open circles, cesium, this study, between—33.9 and —45.0°; closed squares, sodium, ref 7b, between — 33.9 and —45.0°; open squares, sodium, ref 17, between -33.5 and -40.0°.
Table III gives a summary of the temperature coefficients of the conductivity of the cesium-ammonia solutions. The values of d In n/dT were taken directly from log-log plots of k v s . M , where k is the specific conductivity in ohm-1 cm-1. Figure 2 shows the temperature coefficients computed for the temperature range of —33.9 to —45°. The temperature coefficients reported for dilute70 and concentrated18 sodium-ammo-
Table III : Summary of Temperature Coefficients of the Conductance of Solutions of Cesium in Liquid Ammonia
Concentration 10ad In , / d T ,a 10ad In * /d T ,1X 10», M deg“ 1 deg“ 1
0.15 1.70 1.840.30 1.76 1.900.60 1.86 1.981.00 1.97 2.062.00 2.13 2.174.00 2.23 2.226.00 2.36 2.24
10.0 2.35 2.1820.0 2.09 1.9740.0 1.78 1.8560.0 1.63 1.80
100.0 1.62 1.76150.0 1.61 1.74200.0 1.62 1.73
“ For temperature range from —33.9 to —45°. b For temperature range from —45 to —65°.
nia solutions are also plotted in Figure 2. For the dilute region (<6.5 X 10⁻³ M ), the temperature coefficients for sodium solutions appear to be about identical with those of cesium. Also, there are two maxima, a rather abrupt maximum found at about 0.91 M by Lucasse and Kraus18 and another found in this study at about 6.5 X 10 ~3 M . For cesium concentrations less than 6.5 X 10~3 M , the temperature coefficient decreases with decreasing concentration and tends to ap-
proach a value that parallels the fluidity of ammonia. The coefficients for the dilute concentration range (<6.5 X 10 ~3 M ) can be accounted for by the ion-pairing dissociation constants (Table II) as was shown to be the case for dilute sodium-ammonia solutions.7b
The variation of the ion-pairing dissociation constants with temperature (Table II) is also similar to that found for dilute sodium-ammonia solutions.7*3 A possible explanation for the temperature dependence of K\ is that it is related to thermal expansion of the cavity size of the solvated electron. Using Fuoss’ theory19 for ion- pair formation, distances of closest approach of 4.89, 4.48, and 4.03 A at —33.9, —45.0, and —65.0°, respectively, can be estimated from the values of the ionpairing dissociation constants given in Table II. With the above values, the coefficient of thermal expansion of the solvated electron can be estimated to be about1.3 X 10 ~2 deg-1 which is comparable with the value reported by Schindewolf.20 Also as suggested by Evers and Longo,7a it appears that in aggregates of metal ion and solvated electron some of the solvent molecules which are normally involved in the cavity unit are also participating in metal ion solvation. Hence, the distance of closest approach for the cesium ion-solvated electron aggregate is larger than for the sodium ion solvated electron aggregate. This would lead to less aggregation21 and, hence, higher conductance of the dilute cesium solutions than for sodium7*3 or lithium7“ solutions.
From Table II, it is noted that the position of the conductance minimum shifts toward lower concentrations with decreasing temperature. This observation is consistent with the concept that the total conductivity at concentrations around the minimum conductance can be treated as the sum of two mechanisms,10 i.e., an ionic transport mechanism for the dilute solution (<6.5 X 10~3 M ) and another mechanism10 for the intermediate concentration range (6.5 X 10"3 to ~ 1 M ). As shown in Figure 2, the temperature coefficient of the conductance for the jumping mechanism is smaller than that for the ionic transport such that overlap results in a shift of position of the conductance minimum toward lower concentrations with decreasing temperature.
The conductance mechanism suggested by Arnold and Patterson10 for the intermediate range predicts that the logarithm of the conductivity should be nearly proportional to 1 ¡ T and that there should be a rise in the temperature coefficient of conductivity in the tunneling range. However, Figure 2 shows a minimum for the temperature coefficients in this concentration region. Moreover, comparison of the A/Ao vs. M l/l plots for ce-
(18) W. W. L u casse and C. A. K raus, J. A m e r . C h e m . Soc., 44, 1941 (1922).(19) R . M . Fuoss, ibid., 8 0 , 5059 (1958).(20) U. S chindew olf, A n g e w . C h e m ., 79 , 585 (1967); A n g e w . C h e m . I n t e r n . Ed., 6, 575 (1967).(21) C. A. K raus, J. P h y s . C h e m ., 60, 129 (1956).
2617
Volume 73, Number 8 August 1969

2618 R obert R. D ewald
Figure 3. A v s . M '/* plots: open circles, closed triangles, and open triangles, cesium at —33.9, —45.0, and —65.0°, respectively; closed circles, sodium at —39.9°.
sium solutions at —33.9, —45.0, and —65.0° shown in Figure 3 indicates that the temperature dependence of the conductivity in the intermediate concentration region tends to follow that corresponding to the fluidity of the solvent. Also shown in Figure 3 is a comparison of the conductance of sodium and cesium solutions in liquid ammonia at —33.9°. In the dilute region, cesium solutions have a higher conductance than sodium which is consistent with less aggregation in the cesium system. Figure 3 also shows that the conductance functions for cesium solutions at —33.9, —45.0, and —65.0° are essentially identical in the intermediate concentration region while the conductance function for sodium follows the same curve form, but it is lower. Moreover, the difference in conductance of cesium and sodium solutions at —33.9 remains constant at about 100 ± 5 Kohlrausch units in the concentration range of about 3.6 X 10⁻³ to 0.4 M .
In this study, two experiments were performed to determine the effect on the conductance of cesium-ammonia solutions in the intermediate concentration region when K I is added. In one experiment, a metal solution having a cesium concentration of 0.213 M and specific conductance of 0.1612 ohm-1 cm-1 at —33.9° was prepared. Next KI, sufficient to make the solution 0.3180 M in KI, was added, and the specific conductance was found to be 0.1843 ohm-1 cm-1. In another experiment the specific conductance of a solution having cesium and KI concentrations of 0.392 (<c = 0.3573) and 0.4227 M , respectively, was 0.3429 ohm-1 cm-1 at -33.9°.
From reported conductance of K I in liquid ammonia22'23 the above results show a negative additivity of the specific conductance which indicates ion-pairing and/or anion-electron interactions.24
The Walden Products given in Table II are about constant and are in agreement with those found for solutions of sodium7b and lithium711 in liquid ammonia. The difference in the apparent limiting equivalent conductances of cesium (Table II) and sodium7b solutions corresponds approximately, within experimental error, to the difference in the conductance of the positive ions of these metals.26
Acknowledgment. This research was supported by the National Foundation under Grant No. GP-6239.
(22) V. F. Hnizda and C. A. Kraus, J . A m e r . C h e m . S o c . , 71, 1565 (1949).(23) E. C. Franklin, Z . P h y s . C h e m . (Frankfurt am M ain), 69, 272 (1909).(24) P. W. Doumaux and A. Patterson, Jr., J . P h y s . C h em .., 71, 3535 (1967).(25) J. Jander in “Chemie in wasserfreiem flüssigem Ammoniak," J. Jander, Ed., Interscience Publishers, New York, N. Y., 1966, p 169.
The Journal of Physical Chemistry

I o n i z a t i o n B e h a v i o r o f S o d i u m C h l o r i d e i n D i o x a n e - W a t e r M i x t u r e s 2619
Electrical Conductances and Ionization Behavior of Sodium
Chloride in Dioxane-Water Mixtures at 1 0 0 o1
by Lawrence A. Dunn2 and William L. MarshallReactor Chemistry Division, Oak Ridge National Laboratory, Oak Ridge, Tennessee S7880 {Received December 2, 1968)
The ionization behavior of sodium chloride in various dioxane-water mixtures (0-70 wt % dioxane) at 100° has been studied by conductance techniques. Conventional ionization constants obtained from the measurements have been examined in terms of the complete constant (K °), which incorporates the solvent as a reactant for the interpretation of equilibrium processes involving electrolytes. At 100° for sodium chloride, a net change (k) of 7.80 in waters of solvation upon ionization and a log K° value of —12.70 are obtained. The k correlates smoothly with previously published values of 6.4 at 25° from studies in dioxane-water (1 bar) and 10.2 from those in water at 400-800° (to 4000 bars). The common curve of k vs. temperature supports a generalization for simple salts, over a wide range of temperature, that varying the concentration of water either by hydrostatic pressure or by dilution with dioxane does not change the isothermal value of the complete constant. This constant depends only on temperature.
Introduction
The concept of a complete constant (K °) to describe the equilibrium behavior of electrolytes in both aqueous and mixed aqueous-nonpolar organic solvent mixtures has been proposed elsewhere.3 4 Thus, inclusion of the polar solvent species of variable concentration into the equilibrium expression provides a constant that is independent of isothermal changes in dielectric constant or other properties of the solvent. This approach to the problem of ion-ion-pair-solvent equilibria differs from the usual interpretations of ion-ion-pair equilibria which predict a linear dependence of the logarithm of the conventional constant (K ) on the reciprocal of the dielectric constant.6 '6 The complete constant has beensuc- cessfully evaluated for aqueous electrolytes at room temperature,3’4 where the water concentration was varied by either hydrostatic pressure or the addition of nonpolar dioxane as a diluent. Previously published values of K at 25° for two simple salts (MgSOJ’8andMnSO.t9•10) studied under both conditions provided essentially the same value for the net change (fc) in waters of solvation and of K °.i Results from conductance studies of several uni-univalent electrolytes in aqueous solution under high pressure at supercritical temperatures have also supported this more general principle.1112
The purpose of this present study was to establish whether the value of k obtained at 25° in dioxane-water mixtures could be correlated with those obtained at 400-800° in water solutions only. To do this, the ionization behavior of sodium chloride in dioxane-water mixtures, at saturation pressure, was determined at an intermediate temperature (100°) between 25 and 400°. The present success of this approach, further supporting the use of complete constants, is presented herein.
Experimental SectionThe dioxane-water solvent mixtures were prepared
by weight using Spectroquality p-dioxane (Matheson Coleman and Bell, Norwood, Ohio) and conductivity water, obtained by passing distilled water through a mixed-bed ion-exchange column and then redistilling it twice from a fused quartz distillation unit. Experimental specific conductances (k0) of these solvent mixtures at 100°, for use as background conductances in this study, were measured and are given in Table I. The sodium chloride solutions were prepared gravime- trically from single crystals of sodium chloride (Har- shaw Chemical Co., Cleveland, Ohio) and the various solvent mixtures. Five molarities of sodium chloride in the range 0.001-0.020 M were studied in each sol-
(1) R esearch sponsored b y the U . S. A to m ic E n ergy C om m ission under con tract w ith U n ion C arbide C orp oration .(2) M ellon Institu te , C arnegie-M ellon U n iversity , P ittsburgh , Pa. 15213.(3) W . L . M arshall and A . S. Q uist, Proc. Nat. Acad. Sci. U. S ., 58, 901 (1967).(4) A . S. Q uist and W . L . M arshall, J. Phys. Chem., 72, 1536 (1968).(5) J . T . D en ison and J. B . R am say , J. Amer. Chem. Soc., 77, 2615(1 95 5 ) .(6) R . M . Fuoss, ib id ., 80, 5059 (1958).(7) H. S. D u n sm ore and J. C . Jam es, J. Chem. Soc., 2925 (1951 ); in d ioxa n e-w a ter.(8) F . H. Fisher, J. Phys. Chem., 6 6 , 1607 (1 96 2 ); in w ater at pressures to 2000 bars.(9) G . A tk in son and C . J. H allada, J. Amer. Chem. S o c . , 8 4 , 721 (1962) ; in d ioxan e-w ater.(10) F . H. Fisher and D . F . D av is , J. Phys. Chem., 69, 2595 (1965) ; in w ater at pressures to 2000 bars.(11) (a) A . S. Quist and W . L . M arshall, ibid., 70, 3714 (1 96 6 ); (b) ibid., 72, 1545 (1 96 8 ); (c) ibid., 72, 684 (1 96 8 ); (d ) ibid., 72, 2100 (1968 ); (e) E . V . F ra n ck , Z. Physik. Chem. (F ra n k fu rt), 8, 107, 192(1 9 5 6 ) .(12) L . A . D u n n and W . L . M arshall, J. Phys. Chem., 73, 723 (1969).
Volume 73, Ntimber 8 August 1989

Lawrence A. D unn and W illiam L. Marshall2620
Table I: Properties of Dioxane-Water Mixtures at 100°
W t % d, V, 10**0,dioxane g cm -8 D cP oh m “ 1 c m -1
0 .0 0 .9 5 8 3 5 5 .5 0 0 .2 7 9 1 .02 9 .7 0 .9 6 9 7 3 5 .2 5 0 .4 1 5 4 .14 0 .3 0 .9 7 0 2 2 8 .6 0 0 .4 4 8 1 .65 0 .8 0 .9 6 8 0 2 2 .6 0 0 .4 7 5 0 .86 0 .5 0 .9 6 4 4 1 6 .8 0 0 .4 9 8 0 .57 0 .5 0 .9 5 9 7 1 1 .7 5 0 .5 1 0 0 .2
vent mixture. The conductivity apparatus and experimental procedures have been described previously.110 Two inner electrodes were used in this study, giving cell constants of 0.501 and 2.103 cm-1 at 100° as determined from cell calibrations using 0.01 and 0.1 demal potassium chloride solutions at 25°, followed by appropriate temperature corrections.
At 100° such physical properties of dioxane-water mixtures as density (d), dielectric constant (D ), and viscosity (rf) over the whole composition range are unknown experimentally. To obtain estimates of each of these quantities for the various experimental solvent compositions, data from the literature at various temperatures were plotted isothermally against wt % of dioxane in the solvent mixture. In general, data were available at ten temperatures from 0 to 80° and over the whole composition range for each of density, dielectric constant, and viscosity. From these isothermal plots, values were obtained at 0, 20, 40, 60, 80, and 100 wt % dioxane by interpolation. These interpolated values for each property were graphically extrapolated to 100° and then plotted against solvent composition at that temperature. The density, dielectric constant, and viscosity values given in Table I for the experimental solvent mixtures were interpolated from these plots. For these evaluations, the density data of Tommila and Koivisto,13 Geddes,14 Griffiths,18 Hovorka, Schaefer, and Dreisbach,16 Schott,17 Lind and Fuoss,18 Kunze and Fuoss,19 and Justice and Fuoss20 were used, and cover the temperature range 10-80°. For the dielectric constants at temperatures from 0 to 80°, the data of Akerlof and Short,21 Critchfield, Gibson, and Hall,22 Tourky, Rizk, and Girgis,23 Hasted, Haggis, and Hutton,24 Garg and Smyth,26 and Cook26 were used. The viscosity data used were those of Geddes,14 Lind and Fuoss,18 Kunze and Fuoss,19 Justice and Fuoss,20 and from Harned and Owen,27 and cover the temperature range 15-80°.
Results and DiscussionEquivalent conductances of sodium chloride in
various dioxane-water mixtures at 100° and saturation vapor pressure are given in Table II. These experimental data, together with the data of Quist and Marshall110 for five sodium chloride concentrations in the range 0.001-0.020 M under identical conditions in
aqueous solutions at 100°, have been analyzed by current conductance equations using the procedures described previously.110 The conductance equations of Robinson and Stokes,28 Fuoss, Onsager, and Skinner,29 and Shedlovsky30 gave essentially identical values, within the accuracy of the data, for the limiting equivalent conductances of sodium chloride in various dioxane-water mixtures at 100°. The A0 values given in Table III for the various solvent compositions are averaged values from the conductance equations used.
Values of the conventional ionization constant (K ) for the equilibrium
K
NaCl(aq) ^ Na(aq) + + Cl(aq) - (1)
in the various solvent mixtures at 100° and saturation vapor pressure were obtained from the Shedlovsky equation,30 which includes an ionization constant. With the experimental data of Table II and the limiting equivalent conductances of Table III, the Shedlovsky equation reduces to only one parameter, the conventional ionization constant. Negative logarithms of the conventional constants for sodium chloride in various dioxane-water mixtures at 100°, calculated by this procedure, are also included in Table III.
For the equilibrium behavior of various electrolytes in high pressure, supercritical water,11’12 the inclusion of the concentration of the polar solvent species into the equilibrium expression yields the complete ionization constant (K °) that is independent of isothermal properties of the solvent. For sodium chloride under these
(13) E. Tommila and A. Koivisto, S u o m e n K e m i s t i l e h t i B, 21, 18 (1948).(14) J. A. Geddes, J . A m e r . C h e m . S o c . , 55, 4832 (1933).(15) V. S. Griffiths, J . C h e m . S o c . , 1326 (1952).(16) F. Hovorka, R. A. Schaefer, and D. Dreisbach, J . A m e r . C h e m . S o c . , 58, 2264 (1936); 59, 2753 (1937).(17) H. Schott, J . C h e m . E n g . D a ta , 6, 19 (1961)(18) J. E. Lind and R. M. Fuoss, (a) J . P h y s . C h e m ., 65, 999 (1961); (b) i b id . , 65, 1414 (1961).(19) (a) R. W. Kunze and R. M. Fuoss, i b id . , 67, 911 (1963); (b) ib id . , 67, 914 (1963).(20) J. C. Justice and R. M. Fuoss, ib id . , 67, 1707 (1963).(21) G. Akerlof and O. A. Short, J . A m e r . C h e m . S o c . , 58, 1241 (1936).(22) F. E. Critchfield, J. A. Gibson, and J. L. Hall, ib id . , 75, 1991 (1953).(23) A. R. Tourky, H. A. Rizk, and Y. M. Girgis, J . P h y s . C h e m ., 65, 40 (1961).(24) J. B. Hasted, G. H. Haggis, and P. H utton, T r a n s . F a r a d a y S o c . , 47, 577 (1951).(25) S. K. Garg and C. P. Smyth, J . C h e m . P h y s . , 43, 2959 (1965).(26) H. F. Cook, T r a n s . F a r a d a y S o c . , 47, 751 (1951).(27) H. S. Harned and B. B. Owen, “The Physical Chemistry of Electrolytic Solutions,” 3rd ed, Reinhold Publishing Corp., New York, N. Y„ 1963, p 713.(28) R. A. Robinson and R. H. Stokes, J . A m e r . C h e m . S o c . , 76, 1991 (1954).(29) R. M. Fuoss, L. Onsager, and J. F. Skinner, J . P h y s . C h e m ., 69, 2581 (1965).(30) T . Shedlovsky, J . F r a n k l i n I n s t i t u t e , 225, 739 (1938); R. M. Fuoss and T. Shedlovsky, J . A m e r . C h e m . S o c . , 71, 1496 (1949).
The Journal of Physical Chemistry

Ionization Behavior of Sodium Chloride in D ioxane-W ater M ixtures 2621
Table II : Equivalent Conductances of Sodium Chloride in Dioxane-Water Mixtures at 100°
10 ‘C, A,mol/1. cm 2 ohm -1 eq u iv
(at 100°)
30.51029.7 Wt % Dioxane
236.667.134 224.2
166.56 214.0
9.22740.3%
227.728.032 218.370.950 206.9
128.45 197.9211.35 188.3
9.82650.8%
215.318.687 196.129.497 183.868.589 169.7
157.59 155.1
9.79060.5%
185.915.955 174.031.616 155.367.009 136.3
158.47 113.1
9.13870.5%
119.514.652 103.228.212 87.670.696 68.7
152.09 57.7
Table III : Limiting Equivalent Conductances and Conventional Ionization Constants for Sodium Chloride in Dioxane-Water Mixtures at 100°
Wt %Ao,
cm 2 oh m "1dioxane equiv“ 1 log K
0 .0 3 6 7 .7 0 .5 92 9 .7 2 5 2 .4 - 0 . 4 34 0 .3 2 3 9 .3 - 0 . 8 25 0 .8 2 2 6 .4 - 1 . 7 26 0 .5 2 1 5 .5 - 2 . 3 27 0 .5 2 0 9 .1 - 3 . 3 7
conditions, the ionization process may be represented by the equations
NaCl(aq) + fcH20 ^ Na(aq)+ + Cl(aq)- (2)
K ° = K /C ïhok (3)
log K = log K ° + k log CHl0 (4)
where CH,o is the molar concentration of water. The standard states for the several species are the hypo-
V(DIELECTRIC CONSTANT)0.(0 0.08 0.06 0.04 0.02 0
Figure 1. Variation of the conventional ionization constant of sodium chloride in dioxane-water mixtures at 100° with the molar concentration of water and the reciprocal of the dielectric constant of the solvent mixtures.
____ 4
\\ \
Y
//
/
HIGH PRESSURE:s
/ r a DlOXA _0 AT 1
N E -
/ rBAR
FF_ l
OM 101sllZATK N BEHAVIOR
0 ( 00 200 300 400 500 600 700 800TEMPERATURE (°C)
Figure 2. Variation with temperature of the net change (k ) in waters of solvation for sodium chloride in dioxane-water and water solutions.
thetical 1 M solutions in the particular solvent mixture, and the reference states are the infinitely dilute solutions for the solute species and the particular solvent mixture for water. Under these conditions, the activity coefficients are always defined as unity and are not required. Thus, cih2o = Ch.o and a (salt species) = C(salt species) at all compositions. These equations imply that a plot of log K against log Ch2o at constant temperature should be linear. This approach has been applied successfully to several studies of the ionization behavior of simple salts in aqueous solution under conditions of high temperature and pressure11'12 where the solvent concentration has been varied by changing the pressure. For mixed aqueous solvent systems at 25°, it has been shown3'4 that a similar approach can be
Volume 73, Number 8 August 1969

2622 Lawrence A. D unn and W illiam L. M arshall
made to the equilibrium process. For water-nonpolar- organic solvent mixtures, such as water-dioxane, it was proposed3 4 that the nonpolar dioxane acted essentially as a diluent, merely changing the concentration of the polar species involved in the equilibrium process. For these dioxane-water systems, plots of eq 4 are indeed linear. It is implied in eq 2-4 that only the polar component of the solvent mixtures discussed here is involved in the solvation process.
The above arguments are applied here to the ionization behavior of sodium chloride in dioxane-water mixtures at 100°. A plot of the log K data of Table III against log C h 2o for the various dioxane-water mixtures is shown in Figure 1. A comparative plot of log K against the reciprocal of the dielectric constant6-6 is also included in Figure 1. It is clear that in this system a linear log K vs. log Ch2o plot is again obtained, with an average deviation of ±0.06 pK unit, while there is marked curvature in the log K vs. l/D plot. The data of Kunze and Fuoss19a for sodium chloride in dioxane- water mixtures at 25° yield similar plots when treated this way.3'4 The slope (k) of the straight line in Figure 1 is 7.80 ± 0.34, as determined by least-squares analysis of the conventional ionization constants given in Table III, neglecting the value in pure water which, because of its magnitude, is commonly considered to have a large uncertainty. The simultaneously determined value of log K ° is —12.70. Comparative values of k for sodium
chloride in aqueous solutions at 25°,3'4 100°, and 400- 800°110 are plotted in Figure 2.
The value of k at 100° is certainly consistent with a smooth transition from its low value at 25° in dioxane- water mixtures to its higher and constant value over the range of 400 to 800° in (pure) water. We believe that this observation strongly implies that dioxane acts chiefly as a diluent. The curve of Figure 2 shows a little variation from that predicted previously.31
Ionization behavior at 25° of NaCl in water at high pressures is not available. However, the observation that studies of MgS047'8 and M nSOr’10 in both dioxane- water mixtures and aqueous solutions at high pressures yield for each salt approximately the same value of k, independent of condition of study,4 further suggests similar behavior for NaCl and for simple salts in general. The same value of k at 25° in both dioxane-water mixtures and water at high pressures is not observed for acids and bases,4 and may reflect, for these two classes of electrolytes, some significant interaction of H + and OH- with dioxane, or with water.4 The equilibrium for the complex salt, LaFe(CN)6, shows a difference in k at 25° in dioxane-water mixtures (fc = 10.8) and in water (k = 8.4).4 In this case also, it would appear that additional equilibria must be considered.
(31) W . L. M arshall, R e v . P u r e A p p l . C h e m ., 18, 167 (1968).
The Journal of Physical Chemistry

D imerization of Some Substituted T riphenylamine Cation R adicals 2623
Chronoamperometric Determination of the Rate of Dimerization of
Some Substituted Triphenylamine Cation Radicals
by Robert F. NelsonDepartment of Chemistry, Sacramento State College, Sacramento, California 95819
and Stephen W. Feldberg1Hot Laboratory Division, Brookhaven National Laboratory, Upton, New York 11973 (Received December 1+, 1968)
Recent studies of the electrochemical oxidation of triphenylamine and substituted triphenylamines have indicated that the cation radical undergoes dimerization to give the corresponding tetraphenylbenzidine. Mar- coux, Adams, and Feldberg evaluated the rate constants of dimerization for several of these triphenylamines from experiments with the rotating disk electrode. In this paper we discuss the application of chronoamper- ometry to evaluate second-order rate constants for dimerizations ranging from 9.4 X 10l 1. mol-1 sec-1 for 4- methyl TPA cation radical to 6.8 X 10³ for the 4-nitro TPA cation radical.
Recent studies of the electrochemical oxidation of triphenylamine and substituted triphenylamines (the generic term triphenylamine (TPA) will be used to denote both substituted and unsubstituted compounds) have indicated that the cation radical undergoes dimerization to give the corresponding tetraphenylbenzidine (TPB).2’3 Marcoux, Adams, and Feldberg evaluated the rate constants of dimerization for several of these triphenylamines from experiments with the rotating disk electrode.3 In this paper we discuss the application of chronoamperometry to studies of these reactions.
Theoretical. The mechanism for the TPA oxidation2 may be represented by
A .«-■ .* B + e~ electron transfer (1)
2B — C + 2H+ chemical reaction (2)
C — > D + e_ + e~ electron transfer (3)
kt
2B + C ^ 2A + D (4)fcb
and
K e q = ki/kb (5)
where A corresponds to the TPA molecule, B to the TPA cation radical, C to the TPB, and D to the quinoid T P B 2+. This is a second-order ECE mechanism, and reaction 4 is analogous to that discussed for a first-order mechanism.4 Reaction 3 has been shown to occur as two one-electron steps (as the notation in reaction 3 is meant to indicate) whose potentials may be approximately the same as in the case of the 4-nitro TPA5 or the second oxidation step may be as much as 200 mV positive to the first as in the case of the unsubstituted TPA.2 The coproportionation reaction
k t
C + D 2C+ (6)k b '
can also occur where C + is the monocation radical of TPB. The degree to which reactions 4 and 6 proceed will depend on the E °’s for reactions 1 and 3 as well as the kinetics of reactions 4 and 6. Happily, the currenttime-kinetic relationship depends primarly on the rate of dimerization (reaction 2). Because of the ambiguities of eq 4 and 6 we considered only three possibilities when calculating the theoretical relationships: (1) K m= 0; (2) K e, = oo ; and (3) K eq = 0/0 (i.e., kf = kh = 0). The chronoamperometric working curves for this mechanism are presented in Figure l.6 Calculational details are presented elsewhere.7'8 We have slightly
(1) P a rt of this work was conducted under the auspices of the U. S. Atomic Energy Commission.(2) E. T. Seo, R. F. Nelson, J. M. Fritsch, L. S. Marcoux, D. W. Leedy, and R. N. Adams, J . A m e r . C h e m . S o c . , 88, 3498 (1966).(3) L. S. Marcoux, R. N. Adams, and S. W. Feldberg, J . P h y s . C h e m ., 73, 2611 (1969).(4) M. D. Hawley and S. W. Feldberg, i b id . , 70, 3459 (1966).(5) R. F. Nelson, J . E l e c t r o a n a l . C h e m ., 18, 329 (1968).(6) The reaction B + C —<-A + C + can also occur (approximately reaction 4 proceeding halfway) ; the working curve for this reaction would fall between the curves for K e(l = <*> and K eq = 0/0.(7) S. W. Feldberg, “Electroanalytical Chem istry,” Vol. 3, A. J. Bard, Ed., Marcel Dekker, New York, N. Y.(8) Booman and Pence [G. L. Booman and D. T . Pence, A n a l . C h e m ., 37, 1366 (1965)] have calculated the chronoamperometric working curves for second-order disproportionation.
e -A <=* B
2B L A + CThe dynamic relationships for the disproportionation mechanism are identical with those for the second-order ECE mechanism (reactions 1-4) when K e q = 00. Shifting the working curve for K eq = 00 by + 0 .3 log un it will give the correct working curve for the disproportionation reaction (see ref 9).
Volume 73, Number 8 August 1969

2624
Figure 1. Chronoamperometric working curves for second-order ECE.
modified an earlier presentation of the chronoamperometric working curves9 by plotting
log(apparent n) vs. log (ktC*) (7)
where k is the second-order rate constant (reaction 2), t is the time elapsed after initiation of the chronoamperometric process, C* is the bulk concentration of the TPA and
apparent n = {it'/2)/ (ff'/!)t_0 (8)
The reasons for using this log-log representation are discussed in the Experimental Section.
Because we do not know the diffusion coefficient of the TPB, we assume that the diffusion coefficients of all species are identical. We have, however, calculated an additional curve assuming that the diffusion coefficient of the larger TPB molecule is half that of the other monomeric species and that K eq = 0/0 (dotted line, Figure 1). The change in the working curve effected by this exaggerated assumption is rather small. If, of course, K eq = c° } TBP (species C, reaction 4) becomes effectively nonexistent and its diffusion coefficient commensurately irrelevant. The effect for the case where K eq = 0 was not calculated.
Experimental SectionFor all experiments a single compartment cell was
used. The working electrode was a Beckman platinum button (area = 0.234 cm2), the auxiliary was a Pt foil, and the reference an aqueous calomel electrode. No leakage was detected from the calomel electrode so no salt bridge was used. The solvent (acetonitrile), the supporting electrolyte (tetraethylammonium perchlorate), and the TPA compounds were obtained as described previously.2 Cell temperature was maintained at 25 ± 2°.
The concentration of any given TPA was varied over approximately a threefold concentration range (except for 4-phenyl TPA). The lowest concentrations were of the order of 1.7 X 10 M and the highest about 1.5 X
10 ~3 M . The concentration of supporting electrolyte was maintained at 0.1 M .
A cyclic voltammogram was run for each compound, and the potential of the anodic current peak (Fpa) was noted. (See ref 2 and 5 for sample voltammograms and discussion.) For all the compounds described here, the two oxidation steps of the corresponding TPB both occur more easily than the oxidation of the substituted TPA indicating that
K eq > 1 (9)
The potentials used in the chronoamperometry are selected on the basis of the cyclic voltammetric E pa: initial potential = E m — 0.300 V; and stepped to potential = E ps. + 0.150 V. The current-time curve is recorded and the ifl/2 values are computed after subtracting the blank correction (blank correction at a given time = current at a given time in absence of electroactive species).
Several experimental limitations precluded direct evaluation of the term (iit'/s)k_o. Direct evaluation by removal of a reactant, as can be done in studies of a pseudo-first-order ECE mechanism,10 clearly is not applicable in this case. If measurements of the current-time curve can be made at sufficiently short times, then the rate constant is effectively zero; our instrumentation was not adequately fast. Direct measurement of the diffusion coefficient using a tracer technique11 is certainly applicable, but the data are at present unavailable. Consequently, we resorted to a method of data analysis suggested by Testa and Reinmuth.12 The experimentally available quantity log (it'h/C*) is plotted vs. log (tC*). By overlaying the experimental and theoretical plots and by appropriately shifting the experimental plot along the abscissa and ordinate of the theoretical plot, the two can be superimposed. The relative location of the experimental and theoretical axes permits evaluation of the rate constant, k, and the term (it'/2/C*)k=f,. Uncertainty in the position of optimum coincidence represents a fundamental uncertainty in the data.
The resulting plots of log (it'^'/C*) vs. log (tC*) fall on a single continuous curve for different concentrations of a given TPA, unequivocally confirming second-order kinetics. Using the overlay matching technique just described the experimental curves were best matched with the theoretical curve corresponding to K eq = 0/0. (Examples are shown in Figures 2 and 3.) The rate constants for the cation radical dimerization and the
(9) S. Feldberg, J . P h y s . C h e m ., 73, 1238 (1969).(10) R. N. Adams, M. D . Hawley, and S. W , Feldberg, ibid., 71, 851 (1967).(11) T. A. Miller, B. Lamb, K. Prater, J. K. Lee, and R. N. Adams, A n a l . C h e m ., 36, 418 (1964).(12) A. C. Testa and W. H. Reinmuth, J . A m e r . C h e m . S o c . , 83, 784(1961).
R obert F. Nelson and Stephen W. Feldberg
The Journal of Physical Chemistry
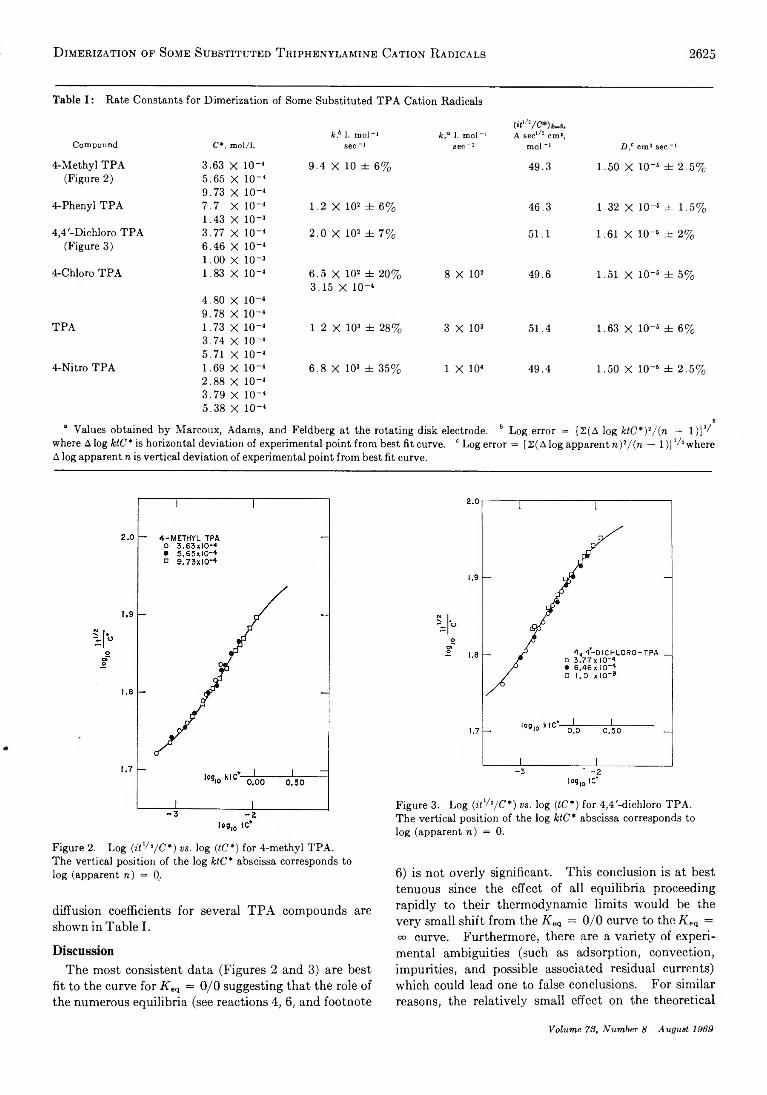
D imebization of Some Substituted Tbiphenylamine Cation Radicals 2625
Table I : Rate Constants for Dimerization of Some Substituted TPA Cation Radicals
C om pou nd C*, m o l/l .
4-Methyl TPA 3.63 X 10~4(Figure 2) 5.65 X IO“ 4
9.73 X 10~44-Phenyl TPA 7.7 X 10⁻⁴
1.43 X 10"34,4'-Diehloro TPA 3.77 X 10-“
(Figure 3) 6.46 X 10"41.00 x io-3
4-Chloro TPA 1.83 X IO“ 4
4.80 X IO“ 49.78 X 10⁻⁴
TPA 1.73 X 10-43.74 X 10-45.71 X IO“ 4
4-Nitro TPA 1.69 X 10“ 42.88 X IO“ 43.79 X 10~45.38 X IO"4
k} 1. m o l“ 1 k,a 1. m o l-1s e c " 1 s e c -1
9.4 X 10 ± 6%
1.2 X 10² ± 6%
2.0 X 10² ± 7%
6.5 X 10² ± 20% 3.15 X 10~4
8 X 10²
1.2 X 10³ ± 28% 3 X 10³
6.8 X 10³ ± 35% 1 X 10⁴
<Mxh/C A seeI/2 cm 3,
m o l " 1 D,e cm2 sec"149.3 1.50 X 10"6 ± 2.5%
46.3 1.32 X 10 “5 ± 1.5%
51.1 1.61 X 10"6 dh 2%
49.6 1.51 X 10~6 ± 5%
51,4 1.63 X 10"6 ± 6%
49.4 1.50 X 10"6 ± 2.5%
“ Values obtained by Marcoux, Adams, and Feldberg at the rotating disk electrode. b Log error = [2(A log ktC*y/(n — l)]1/ where A log ktC* is horizontal deviation of experimental point from best fit curve. ° Log error = [2( A log apparent re)2/(w — 1)]I//s where A log apparent n is vertical deviation of experimental point from best fit curve.
Figure 2. Log (it'^/C*) vs. log (tC*) for 4-methyl TPA.The vertical position of the log ktC* abscissa corresponds to log (apparent n) = 0.
diffusion coefficients for several TPA compounds are shown in Table I.
DiscussionThe most consistent data (Figures 2 and 3) are best
fit to the curve for K etl = 0/0 suggesting that the role of the numerous equilibria (see reactions 4, 6, and footnote
Figure 3. Log (it'^/C*) vs. log (tC*) for 4,4'-dichloro TPA.The vertical position of the log ktC* abscissa corresponds to log (apparent n) = 0.
6) is not overly significant. This conclusion is at best tenuous since the effect of all equilibria proceeding rapidly to their thermodynamic limits would be the very small shift from the K,.ri = 0/0 curve to the K,.tl = os curve. Furthermore, there are a variety of experimental ambiguities (such as adsorption, convection, impurities, and possible associated residual currents) which could lead one to false conclusions. For similar reasons, the relatively small effect on the theoretical
Volume 73, Number 8 August 1969

curve induced by assuming D t p b / D t p a = 0 . 5 precludes any quantitative evaluation of D t p b - However, data in Table I indicate that size effects on the magnitude of the diffusion coefficients are small. For example the diffusion coefficient of the 4-phenyl TPA is only 20% smaller than that for TPA. Thus it seems reasonable that
1 > Htpb/Htpa > 0.5 (10)
The kinetic data are in reasonable accord with values obtained using a different technique (the rotating disk electrode).3 The diffusion coefficients ranging in value from 1.3 X 10~6 to 1.6 X 10⁻⁶ cm2/sec are also in accord with the value of 1.74 X 10”5 em2/sec found at the rotating disk electrode.3 The values of the diffusion coefficient seem to decrease with increasing size of the substituted TPA, as might be expected.
There remains the question of an alternative mechanism. Seo, et al.,2 who proposed the mechanism shown in reactions 1-4, also suggested the possibility of a parent-cation radical reaction
A ¿ t B (11)
A + B - 4 - (AB) + 2H+ (12)
(AB) ^ C + e~ (13)
2626
C D + e - + e - (14)
The chronoamperometric working curve for this mechanism9 is qualitatively similar to (though different in detail from) the working curves presented in Figure 1. There is, nevertheless, a convincing body of evidence against this mechanism. The chronoamperometric data do not fit as well. Cyclic voltammograms are consistent with the mechanism represented by reactions1-4, and there is no evidence for the additional electron transfer (reaction 13). If this alternative mechanism obtains, it is also possible to devise a current reversal chronopotentiometric experiment so that species A becomes a pseudo-first-order reactant (when the forward electrolysis time is considerably less than n ). Current reversal chronopotentiometry of 4-methyl- triphenylamine showed that under these pseudo-first- order conditions, with a constant forward electrolysis time, the total reverse transition time decreases with increasing current density. This is not in accord with the expectation; i.e., the reverse transition time should have remained constant or, if anything, slightly increased since the concentration of species A is slightly diminished at higher current densities. Thus we are confident that the oxidation of triphenylamines is adequately described by reactions 1-3.
R obert F. Nelson and Stephen W. Feldberg
The Journal o f Physical Chemistry

T hermodynamics of M icellization of Zwitterionic N-Alkyl Betaines 2627
Thermodynamics of Micellization of Some Zwitterionic N-Alkyl Betaines
by J. Swarbrick and J. Daruwala1Division o f Pharmaceutics, Pharmacy Research Institute, The University of Connecticut, Storrs, Connecticut 06268 {Received December 6 y 1968)
The variation of cmo with temperature of the decyl (Ci0) and undecyl (Cn) N-alkyl betaines (N-alkyl-N,N- dimethylglycines) has been studied by light scattering. The standard free energies of micellization, AGm°, have been calculated at various temperatures using both the phase separation and mass-action models; good agreement between the two approaches is found. The phase separation model was used to compute the standard enthalpy, AHm°, and standard entropy, ASm°, of micellization. With increasing temperature, AHm° for both the Ci0 and Cn homologs changes from positive to negative. A similar change in the sign of AHm° is observed with increasing chain length at 25°. While the entropy of micellization, A<Sm°, is positive over the temperature range studied, it becomes less so at higher temperatures. Estimates of the enthalpy and entropy contributions attributable to the head group and alkyl chain have been made. The enthalpy change of the head group, A/fm(W-), is positive and intermediate between values derived for nonionic and ionic surfactants of equivalent chain length. The entropy contribution of the head group, A«S'm(W-), to the total entropy change is negative, indicating restriction of the head groups at the micelle surface. The enthalpy and entropy changes per methylene group increase and decrease, respectively, with increasing chain length. The results are discussed in terms of current theories of micellization.
Introduction
A survey of the literature reveals that, compared to ionic2-6 and nonionic7-12 surface-active agents, few workers have reported on the thermodynamics of micellization of zwitterionic compounds. 13’ 14
A previous study14 reported the standard free energy changes of micellization, AGm°, for five homologous, zwitterionic N-alkyl betaines. From these data, AGm° was resolved into the separate contributions from the hydrophilic head group, A(7m(W-), and the lipophilic methylene groups in the alkyl chain, A(Tm(-CH2-). When compared with results derived from other studies on ionic, nonionic, and zwitterionic surfactants, AGm (-CH4-) was found to be negative and independent of the type of surfactant. On the other hand, A(7m(W-) varied with the head group, although it was positive in the ten cases examined.
By following the variation in the critical micelle concentration (cmc) with temperature for the dodecyl N-alkyl betaine, the free-energy change for this homolog was separated into the enthalpy change, AH m°, and entropy change, ASm°. Since only one homolog was studied, it was not possible to resolve AH m° and ASm° into the separate contributions from the head group and the alkyl chain. Tori and Nakagawa13 have also derived AH m° for C-alkyl betaines from studies on the temperature dependence of cmc. Although the phase- separation model was used in both these studies, the effect of temperature on micellar molecular weights (mmw), which can affect the validity of the model, was not determined.
In the present work, we have studied the influence of temperature on the erne’s of the decyl and undecyl homologs. These data have been converted to stan
dard free energies using both the phase-separation and mass-action models of micellization and the values were compared. The free-energy changes have been split into the separate enthalpy and entropy contributions. These data, in conjunction with those for the Ci2 homolog, 14 have allowed the enthalpy and entropy changes per methylene group to be resolved. The energetics attributable to the head group on micellization have also been estimated. The results are discussed in terms of existing theories on the energetics of micellization and compared to those reported for ionic and nonionic surfactants.
Experimental SectionMaterials. The N-alkyl-N,N-dimethylglycines, C„-
(1) C iba P harm aceutica l C om p a n y , S um m it, N . J.(2) E . D . G od d a rd and G . C . B enson , Can. J. Chem., 35 , 986 (1957).(3) E . D . G od d ard , C . A . H oeve , and G . C . B enson , J. Phys. Chem., 61, 593 (1957).(4) B . D . F lock h art, J. Colloid Set., 16, 484 (1961).(5) H . F . H uism an, Koninkl. Ned. Akad. Wetenschap., Proc., B67 (4 ), 367 (1964).(6) M . F . E m erson and A . H oltzer, J. Phys. Chem., 71 , 3320 (1967).(7) M . J. S ch ick , ibid., 67, 1796 (1963).(8) E . H . C rook , G . F . T reb b i, and D . B . F o rd y ce , ibid., 68, 3592 (1964).(9) J . M . C orkill, J . F . G ood m a n , and S. P . H arrold , Trans. Faraday Soc., 60, 202 (1964).(10) P . H . E lw orth y and C . M cD o n a ld , Kolloid-Z. Z . Polym., 195 (1 ), 16 (1964).(11) J . M . C ork ill, J. F . G ood m a n , and J. R . T a te , Trans. Faraday Soc., 60, 996 (1964).(12) L . B en jam in , J. Phys. Chem., 68, 3575 (1964).(13) K . T o r i and T . N akagaw a, Kolloid-Z. Z . Polym., 189 (1 ), 50 (1963).(14) P . M o ly n eu x , C . T . R h od es, and J. S w arbrick , Trans. Faraday Soc., 61 , 1043 (1965).
Volume 73, Number 8 August 1969

2628 J. SWARBRICK AND J. ÜARUWALA
Figure 1. Scattering ratio, imlh, as a function of concentration of the Cio N-alkyl betaine. (Note: the y axis is displaced 10 units for each temperature below 65 °.)
H2k+1N+(CH3)2CH2COO- (N-alkyl betaines), in which n = 10 and 1 1 , have been described elsewhere. 14
Method. The change in cmc with temperature was studied using a Brice-Phoenix light-scattering photometer with narrow slits and a cylindrical cell (catalog No. C-101) painted black. At the wavelength employed (4358 A), no absorbance or fluorescence was detected with the N-alkyl betaine solutions. All solutions were prepared in double-distilled water and were clarified by repeated filtration through a 100 m/z on 10
mju Millipore filter disk combination at a pressure sufficient to give a flow rate of 1 ml/min. The solutions were assumed to be free of extraneous matter when the dissymmetry, Z45/135, was 1.04 or less.
Temperature control of the sample, to ± 0.1 °, was achieved by means of a cell jacket. 16 The temperature of the sample was read by means of a thermometer inserted through holes drilled in the photometer lid and the jacket and cell covers. Sufficient sample was placed in the cell so that the bulb of the thermometer, while completely immersed, was 5-6 cm above the light path. The bulb was rinsed with filtered sample prior to insertion. Readings with and without the thermometer in place showed it to have no effect on the scattering ratio.
ResultsThe ratio of the intensity of scattered light at 90° to
the intensity of the incident fight, ito/Io, for the Cw
homolog is plotted against total concentration in Figure 1. The straight fines were drawn using least-squares analysis and the cmc at each temperature was taken as the intercept. This was calculated from the formula
cmc = (y2 — yi + mxxx - rrhx2)/{mi — m2) (1)
where (xiyi) and (x2y2) are the coordinates for any point on the least-squares fine and mj and m2 are the statistical slopes below and above the cmc, respectively. A similar plot was obtained for the Cu homolog and the same procedure was used to calculate the cmc’s. The data for the Cio and Cu homolog are presented in Table I and the plots of the logarithm of cmc vs. T(°K ) - 1 are shown in Figure 2. Data obtained previously for the Cu homolog14 are also included in Figure 2.
Table I: Temperature Variation of Cmc and Standard Free Energies of Micellization of Cio and Cu N-Alkyl Betaines
cm c --------- A Gm \ kcal m o l-1----------- -T em p, (m olar) M ass Phase
Surfactant "C X 1<R action separation
C io 20 2.383 - 4 .0 7 - 4 .5 125 2.327 - 4 .1 8 - 4 . 6 031 2.269 - 4 .3 0 - 4 .7 137 2.183 - 4 .4 1 - 4 .8 343 2.186 - 4 .4 9 - 4 .9 250 2.206 - 4 .5 8 - 5 .0 358 2.244 - 4 .6 5 - 5 .1 465 2.336 - 4 .7 1 - 5 . 2 2
c „ 25 0.723 - 5 .0 5 - 5 . 3 035 0.682 - 5 .2 9 - 5 . 5 245 0.715 - 5 .4 4 - 5 . 7 055 0.736 - 5 .5 9 - 5 .8 365 0.763 - 5 .7 1 - 5 .9 8
DiscussionTwo models are commonly applied to the phenom
enon of micellization. The phase-separation model regards micelles as a separate phase and assumes that the monomer activity remains constant above the cmc. Using this model, Molyneux, et al.,u have shown that for a zwitterionic or nonionic surfactant
AGm° = R T In X, (2)
where AGm° is the standard free energy change (kcal mol-1) of micellization for the transfer of a mole of free monomer to the micellar form and Z f is the mole fraction of monomer at the cmc. The mass action model regards micelle formation as an equilibrium condition in which the monomer activity continues to increase, although at a much reduced rate, above the cmc. According to Corkill, et al.9
AGm° = R T [{ 1 - 1 /Aw) In X , + f(Aw)] (3)
(15) Q . A . T rem entozzi, J. Polymer Sci., 23, 887 (1957).
The Journal o f Physical Chemistry

T h e r m o d y n a m i c s o f M i c e l l i z a t i o n o f Z w i t t e r i o n i c N - A l k y l B e t a i n e s 2629
Figure 2. Variation of the logarithm of cmc with T (°K)_I for the Cio, Cn, and Cu N-alkyl betaines.
where A w is the weight-average aggregation number and f(Aw) is a function of the aggregation number. As a homologous series is ascended, A w increases while f(Aw) decreases rapidly. Thus, as the alkyl chain length is increased eq 3 reduces to eq 2 and the models approach one another.
Assuming AGm° to result from the additive contributions of the free energy changes associated with the polar head group and the nonpolar alkyl chain, it has been shown14 for zwitterionic or nonionic surfactants that
log cf =~A(?m(W-) -
eR T1.33 j
log w + m•Agm(-CHr ) '
eR T(4)
where c{ is the cmc (molar), e = In 10, A(?m(W-) and A(?m(-CH2-) are the free energy contributions from the head group and each methylene group in the alkyl chain, respectively, and w is the molar concentration of water (55.4 M ).
Table I shows the effect of temperature and the model used on the free energy of micellization of the Cio and Cn N-alkyl betaines. The functions f {A w) were calculated according to Corkill, et al.,9 using values of A v reported elsewhere.16 At equivalent temperatures, the Cio homolog loses less free energy than the Cn compound. With both homologs, the free-energy loss increases with temperature. These two effects are
related to the magnitude and sign of the enthalpy and entropy changes on micellization, as will be discussed in subsequent sections. The agreement between the two models is good, especially with the Cu N-alkyl betaine. Thus, for the C10 homolog, the free energies based on the mass action model are within 9-10% of the values derived from the phase-separation model. With the Cu betaine, the values agree to within 4-5%. These data support the earlier statement that the higher the aggregation number, the better the agreement between the two models.
For zwitterionic and nonionic surfactants, AGm° can be resolved into the standard enthalpy change, AH m°, and entropy change, ASm°, of micellization as follows14
log cf =AH m°
eR TASm°
eR+ log w (5)
When log Cf is plotted against l/ T (Figure 2), the slope is equal to AH m°/eR while the intercept equals log w — ASm°/eR. The values of AH m° and A6'm° obtained in this manner are shown in Table II.
Table II : Standard Enthalpies and Entropies of Micellization of the N-Alkyl Betaines
Temp A H m°, ASm°,N -Alkyl range, Tmin, kcal cal m ol-!betaine °C °c m ol-1 deg -1
Cio 2 0 -3 7 41 0 .9 2 1 8 .54 3 -6 5 - 0 . 6 1 1 3 .7
c„ 2 5 -3 5 35 0 .9 5 2 1 .03 5 -6 5 - 0 . 7 8 1 5 .4
G iT 1 0 -5 7 6 - 1 . 4 0 1 5 .5
“ Reference 14. 6 Absent in temperature range studied.
Enthalpy of Micellization. In contrast to the behavior observed with the Cx2 homolog,14 the cmc’s of both the Cio and Cn N-alkyl betaines show a minimum at a particular temperature, Tm¡n. In accordance with eq 5, this results in positive values of AH m° at the lower temperatures and negative values above T m¡n (Table II). This behavior may be rationalized in the following manner.
Goddard, et a l, have proposed that, at low temperatures and below the cmc, water forms an iceberg structure around the alkyl chain of the free monomer. This leads to a considerable loss in the entropy of the system.3 Since this restricts free rotation about the C -C bond, the configurational entropy of the chain is also reduced although this is not likely to be a large effect. The heat content of the system is reduced and the partial molal heat capacity of the monomer species is increased. Upon micellization, the iceberg structure is disrupted and the flexibility of the alkyl chain is in-
(16) J. D aruw ala, P h .D . Thesis, U n iversity o f C on n ecticu t, 1968.
Volume 73, Number 8 August 1969

2630 J. SwARBRICK AND J. DaRUWALA
Table III: Effect of Temperature and Alkyl and Polyoxyethylene Chain Lengths on A H m° for Various Surfactants
T em pï ’min.i
Surfactant ° c ° c 25° ►C*- O o 45° 50° 60° 6 5 ° R ef
N-Alkyl betaineCio 20-65 41 0.9 - 0 . 6 - 0 . 6 - 0 . 6 - 0 . 6 This
paperCu 25-65 35 0.9 - 0 . 8 - 0 . 8 - 0 . 8 - 0 . 8 - 0 .8 This
paperCl2 10-58 a -1 .4 -1 .4 -1 .4 -1 .4 -1 .4 -1 .4 14
C-Alkyl betainec 8 6-60 a 0.67 0.67 0.67 0.67 0.67 0.67 13Cio 10-60 a 0.57 0.57 0.57 0.57 0.57 0.57 13Cl2 10-60 a 0.55 0.55 0.55 0.55 0.55 0.55 13
Sodium alkyl sulfatec 8 10-70 29 -0 .7 - 1 . 2 4Cio 10-70 29 0.36 - 0 . 6 - 1 . 2 - 1 . 8 4c 12 10-70 26 - 1 . 1 - 1 . 8 - 2 . 6 4Cu 10-70 21 -1 .5 -2 .3 -3 .1 4
«-Alkyl hexaoxyethylene glycol monoether
C8 15-45 a 4.3 4.3 9Cio 15-45 a 4.2 4.2 9Cu 15-35 a 3.9 3.9 9
p-f-Octylphenoxyethoxy-ethanol
Eu 15-85 50 1.5 0.3 - 1 . 0 8E9 15-85 49 1.4 0.3 - 1 . 1 8
E8 15-85 51 1.3 0.3 - 1 . 2 8E, 15-85 51 1 . 2 0 . 2 -1 .3 8Es 15-85 47 1 . 0 0 . 2 - 1 . 6 8
e 5 15-85 39 0.5 - 0 . 1 -1 .9 8e 4 15-85 25 0 . 1 -0 .7 -2 .4 8E3 15-85 a -0 .4 -1 .3 -3 .1 8
E2 15-85 a - 1 . 0 - 2 . 2 -4 .1 8E1 15-85 a - 1 . 6 -3 .2 -5 .7 8
Tminnot observed within temperature range studied. 6 Extrapolated from values at 20 and 30°.
creased. The resultant gain in entropy produces a higher heat content and the partial molal heat capacity of the monomer in the micelle decreases to approximately one-third of that in the free state.3 Since
A H „heat content of a mole of surfactant in the micellar
_state just above the cmc _
heat content of a mole of surfactant in the free state at infinite dilution
(6)
then at low temperatures AH m° will be positive since the first term in eq 6 will exceed the second.
As the temperature is raised, the entropy loss of the free monomer below the cmc is reduced because of the decrease in the structure of water. Any rotational restrictions of the alkyl chain would also be less severe. The monomer in the free state below the cmc is already, therefore, a higher energy system than the same concentration of free monomer at the lower temperatures.
Consequently, upon raising the temperature, the second term in eq 6 increases. When the two terms are equal, AHm° = 0 and the temperature is T min. When the temperature exceeds T min, AH m° becomes negative.
According to other workers,17’18 micellization is mainly an interfacial effect. Due to the exposure of alkyl chains to water below the cmc, there certainly exists a large hydrocarbon-water interface and this could represent a high energy state with a large heat content. However, if micellization was predominantly an interfacial effect, the incorporation of monomers into a micelle would always be an exothermic process, regardless of temperature. Although a negative AH m° has been observed over the temperature range 10-57° for the C 12 N-alkyl betaine14 and 15-85° for certain homologs of p-f-octylphenoxyethoxyethanol,8 this is not always the case as shown by the present study and
(17) Y . O oshika, J. CoUoid Sci., 9, 254 (1954).(18) I . R e ich , J. Phys. Chem., 60, 257 (1956).
The Journal of Physical Chemistry

T hermodynamics of M icellization of Zwitterionic N-Alkyl Betaines 2631
other reports2’4-8 where A//m° changes from positive to negative. The C-alkyl betaines have been shown to have a positive AH m° over the range 10-60°.13 Consequently, while interfacial effects can be expected to exist over the entire temperature range and be exothermic, the sign of AH m° depends on whether the structural effect or the interfacial effect predominantes. Thus, we can write
AH mOAH m° contribution due to structural (entropy) effects
AH m° contribution due to interfacial energy effects
(7)
The observation that ASm° is higher at the lower temperatures (Table II) supports the theory that the entropy effects are greater at low temperatures. While eq 7 rationalizes the observed changes in AH m° with temperature, it does not predict Tmin. In those cases where no Tmin is observed (Table III), it may well be that the values lie outside the temperature range studied.
According to Goddard, et al.,z the AH m° contribution due to interfacial energy effects is — 13 kcal mol-1 for sodium decyl sulfate at 25°. The influence of the head group was neglected since the effective charge on the micelle was considered to be small. Applying this value to the Ci0 N-alkyl betaine at 25°, then the value of AH m° due to structural effects is approximately 14 kcal mol-1 ; i.e., the structural effects predominate over the interfacial effects at this temperature and give rise to a net positive enthalpy.
As the alkyl chain length is increased, the interfacial energy effects can also be expected to increase. Therefore, as any one homologous series is ascended at a constant temperature, AH m° should become less positive or more negative. Such a trend is apparent with the data in Table III. Decreasing the number of polyoxyethylene groups in a surfactant, which makes the molecule more lipophilic, has the same effect. As will be seen later, the rate at which the structural effects increase does in fact decrease with chain length; the net result is the eventual predominance of the interfacial effects.
It is apparent from Table III that the temperature at which AH m° — 0 (Tm;,,) decreases with increasing alkyl chain or decreasing polyoxyethylene chain. One can therefore reasonably assume that the more lipophilic a surfactant, the wider the temperature range over which micellization is an exothermic process. As the surfactant becomes more hydrophilic, micellization will be endothermic over a widening temperature range. Just how far this can be extrapolated is uncertain. Presumably, Tmin for the C 9 N-alkyl betaine will be higher than that for the Cw homolog. However, the freezing
point will limit extrapolation in many cases as the alkyl chain length is increased. Further, it may be less than coincidence that all reported values of Tmin in Table III lie within the range 25-50°. In this regard, it is perhaps significant that the heat capacity of water increases either side of a minimum value at 35°.
Unfortunately, there are insufficient data available to make any unequivocal statement regarding AH m (-CH2-). The relevant data in Table III suggest that A//m(-CH2-) for the Cio-Cu homologs in any one series are 2-3 times the values for those homologs with less than 10 carbon atoms. While this is speculative, it is in line, however, with the proposal that as the chain length is increased, the interfacial effects become more pronounced and micellization becomes more exothermic.
Some idea of the effect of the head group on the enthalpy of micellization can be deduced from the data in Table III. To do this it is necessary to choose a reference alkyl chain and assume that
AH m° = A//m(W-) + Atfm(-R) (8)
where AH m(W ~) and A//m(-It) are the enthalpy contributions of the head group and alkyl chain, respectively. Taking a Ci0 alkyl chain as a reference, the enthalpy change for the process n-decane in water —► n-decane liquid at 25° has been estimated to be — 1.4 kcal mol-1.8 This figure may be verified by reference to the work of Benjamin12 which shows that AH ° for the removal of n-decanol from an aqueous solution to pure liquid decanol is — 1.1 kcal mol-1. Assuming that the contribution of the -OH group is positive and small, the value of — 1.4 kcal mol-1 for a Ci0 alkyl chain is a reasonable estimate. Substitution of the AH m° values at 25° from Table III into eq 8 results in the data presented in Table IV, from which it is evident that incorporation of the head group into a micelle is an endothermic process. This may be due to desolvation, since heat is evolved in solvation. While too much weight should not be attached to the actual values shown in Table IV, the rank order can be regarded as significant. Thus, understandably, more heat is required to desolvate the hexaoxyethylene group than the sulfate group, which is probably not completely desol- vated due to the presence of gegenions. The betaine head groups are intermediate between the nonionic and ionic surfactants. It seems possible with the zwitter- ions that, in addition to the endothermic desolvation effect, there is an exothermic effect due to mutual charge desaturation brought about by the head groups adopting a “ checkerboard” pattern.14'19 However, the overall process is endothermic, suggesting that desolvation outweighs any charge saturation effect.
Entropy o f Micellization. As recorded in Table II, ASm° for the Ci0 and Cu homologs decreases with
(19) A. H . Beckett and R. J. Woodward, J . P h a r m . P h a r m a c o l . , 15, 422 (1963).
Volume 73, Number 8 August 1969

2632 J. SwARBRICK AND J. DARUWALA
Table IV: Heat of Micellization of Various Head Groups at 25°
S urfactant H ead group
A ffm(W ~ ), kcal
m o l- 1
n-Alkyl hexaoxyethylene -(OCH2CH2)6OH 5.6glycol monoethers
N-Alkyl betaines -N +(CH3)2CH2COO- 2.3C-Alkyl betaines (CH3)3N+CHCOO-
12 . 0
Sodium alkyl sulfates -S04“Na+ 1.7
increasing temperature. Such behavior has been noted with nonionic11 and cationic6 surfactants. The C12 homolog does not exhibit this trend, there being no minimum in the plot shown in Figure 2.
Even though micelles represent an ordered arrangement of monomers, the data in Table II indicate a net gain in entropy on micellization. As discussed earlier, this is due to the breakdown of the iceberg structure of water around the monomer when it enters the micelle.320 This, plus the gain in configurational entropy of the monomers, leads to a net entropy increase. As the temperature is increased, the structuring effect is decreased and the net gain in entropy is progressively reduced. Nevertheless, it would appear that some structuring around the monomers is still present at the higher temperatures since ASm° is positive over the entire range studied. Some workers7,8 have computed values for A»S'm° that changed from positive to negative as the temperature was raised. However, the entropy change was calculated on the unlikely assumption that AGm° was zero and therefore A*S'm° could be regarded as equal to AH m°/T. Under these conditions, ASm° necessarily had the same sign and changed in the same manner as AH m°. This point has been discussed in detail elsewhere.14
The effect of chain length on ASm° can be surmised from Table II. At temperatures in excess of Tmin, ASm° increases with chain length of the N-alkyl betaines. A similar trend apparently exists at temperatures below T min although no data are available for the Cja homolog. A similar increase in the entropy change
with chain length has been reported for the n-alkyl hexaoxyethylene glycol monoethers.11 While both of these data indicate that the structuring of water around the alkyl chain of the monomer increases with chain length, the entropy change per methylene group, A(Sm(-CH2-), decreases with increasing chain length, and will presumably approach zero. This implies a decrease in the surface-to-volume ratio, brought about by the longer alkyl chains tending to curl up, so as to minimize their contact with water. The reduction in ASm(-CH2-) with chain length, together with the previously observed increase in — AHm(-CH2-), supports the proposal of Corkill, et al.,n and Benjamin12 that at shorter chain lengths entropy is the main driving force for micellization. However, as the chain length increases, the enthalpy contribution to the whole process becomes increasingly significant.
Assuming,ASm° to be comprised of the separate contributions of the polar head, ASm(W ~), and the alkyl chain, ASm(-R), then
ASm° = AiSm(W-) + ASm(-R) (9)
The entropy change for the transfer of re-decane in water to re-decane liquid at 25° has been estimated as 29 cal mol“ 1 deg“ 1.3 Substitution of this value into eq 9 gives A$m(W-) for the Cio N-alkyl betaine as — 10 cal mol“ 1 deg“ 1. This loss in entropy upon micellization indicates that the head groups are more restricted in the micelle than when present as free monomers. With nonionic, polyoxyethylene heads, A»S'm (W-) is not always negative. Thus, Corkill, et al.,g used eq 3 to obtain a value of 35.9 cal mol“ 1 deg“ 1 for the re-decyl hexaoxyethylene glycol monoether at 25°. Substitution into eq 9 yields a value for A$m(W-) of 7 cal mol“ 1 deg“ 1. A positive entropy is not unexpected, since water must be presumed to form an iceberg structure around the polyoxyethylene chain in the head group of nonionic monomers. This is disarranged on micellization and contributes to the observed gain in entropy.
Acknowledgments. The authors wish to thank the University of Connecticut Research Foundation for support under grant No. 1002-35-068.
(20) P . M u k erjee , Advan. Colloid Interface Sci., 1, 241 (1967).
The Journal o f Physical Chemistry

Flash Photolysis of Camphorquinone and B iacetyl 2633
Flash Photolysis of Camphorquinone and Biacetyl12
by Ajit Singh,3 A. R. Scott, and F. SopchyshynMaterials Science Branch, Whiteshell Nuclear Research Establishment, Atomic Energy of Canada Ltd., Pinawa, Manitoba, Canada (Received December 16, 1968)
Flash photolysis of the solutions of camphorquinone in benzene, carbon tetrachloride, and isopropyl alcohol and of the solutions of biacetyl in carbon tetrachloride and isopropyl alcohol was studied. The irradiations were limited to the visible absorption bands of the two diketones. The absorption spectra of the transients formed were measured from 200 to 1125 nifi. The transient spectra in the benzene and the carbon tetrachloride solutions contain absorption bands at ~320 and 630-1100 m that are unique to the triplet excited molecules of the diketones and are attributable to the (i) 3ir* (3I) -*■ 3 <7* and (ii) the 3z* (3I) -*• 3?r* (3II) transitions, respectively. The camphorquinone triplet was photosensitized by benzophenone and quenched by anthracene and oxygen; the anthracene triplet was photosensitized by camphorquinone. Oxygen also quenched the biacetyl triplet. Both the diketones were photoreduced during flash photolysis of their isopropyl alcohol solutions. The spectra of the resulting hydrogen adduct free radicals were found to be very similar to those of the corresponding triplets in the ultraviolet region, but the free radicals were much longer lived.
IntroductionWe have been interested in determining whether tran
sients (excited molecules, free radicals, etc.) formed from optically active compounds exhibit characteristic optical activity of their own. Knowledge of the optical activity of transients could be of considerable use in molecular spectroscopy and in following the mechanisms of photochemical and radiolytic reactions. Similar interest has led to investigations by other workers, and their results about the feasibility of such studies are encouraging.4
We chose camphorquinone (CQ) for these investigations since it is optically active and its d isomer is readily available with high purity. The first part of the investigation was to determine whether the camphorquinone triplet (3CQ)5 and any other transients can be observed by absorption spectroscopy. The transients observed when solutions of camphorquinone in benzene, carbon tetrachloride, and isopropyl alcohol are flash photolyzed are reported here.
It is known that 3CQ is formed in crystalline camphorquinone and in rigid glassy solutions, from phosphorescence studies,6-8 but its absorption spectrum is not known.
In our investigations the spectra of the transients were measured from 200 to 1125 rap, a wider range of wavelengths than usual. The only aliphatic «-dike- tone whose flash photolysis had been investigated previously9-12 is biacetyl (BA). The biacetyl triplet (3BA) had been found10-12 to absorb at 317 mju, but the observation of absorption by transients had been limited to the ~250-600-rn|i region. We, therefore, investigated the flash photolysis of BA solutions over the wider wavelength range 200-1125 mju.Experimental Section
Chemicals. d-Camphorquinone (White Label, Eastman), (¿¿-camphorquinone (Aldrich), anthracene
(AN) and benzophenone (BP) (zone refined, James Hinton and Co.), biacetyl (Chromatoquality, Matheson Coleman and Bell), benzene and isopropyl alcohol (Spee- troquality, Matheson Coleman and Bell), and carbon tetrachloride (for spectroscopy, B.D.H.) were used without further purification. Reagent grade chemicals were used for filter solutions. Oxygen (Union Carbide) was passed through a silica gel tube, before use.
Apparatus and Technique. A conventional13'14 flash photolysis apparatus16 was used. Three 4.5-juF capacitors (Tobe Deutschmann) charged to 15 kV were dis-
(1) Presented, in part, at the International Conference on Molecular Luminescence, Chicago, 111., Aug 1968.(2) Issued as A.E.C.L. No. 3275.(3) To whom all correspondence should be addressed.(4) (a) P. A. Carapellucci, H. H. Richtol, and R. L. Strong, J. Amer. Chem. Soc., 89, 1742 (1967); (b) R. L. Strong and H. H. Richtol in “Fast Reactions and Primary Processes in Chemical Kinetics,” S. Claesson, Ed., Interscience Publishers, New York, N. Y., 1967.(5) The superscript on the left of the abbreviation of a compound denotes the multiplicity of the excited molecule. Unless otherwise indicated, the excited state referred to belongs to the first excited level of the parent molecule. An abbreviation without such superscript, e.g., CQ, denotes the molecule in its ground state.(6) R. A. Ford and F. Parry, Specirochim. Acta, 12, 78 (1958).(7) (a) A. Kuboyama and S. Yabe, Bull. Chem. Soc. Jap., 40, 2475 (1967); (b) T. R. Evans and P. A. Leermakers, J. Amer. Chem. Soc., 89,4380(1967).(8) (a) E. Charney and L. Tsai, Twenty-third Symposium on Molecular Structure and Spectroscopy, Columbus, Ohio, Sept 1968; (b) E. Charney, personal communication, 1968.(9) G. Porter, Proc. Roy. Soc., Ser. A, 200, 284 (1950).(10) G. Porter and M. W. Windsor, ibid., 245, 238 (1958).(11) G. Porter and F. Wilkinson, ibid., 264, 1 (1961).(12) A. Kellmann and L. Lindqvist in “ The Triplet State,” A. B. Zahlan, Ed., Cambridge, at the University Press, 1967, p 439.(13) G. Porter in “ Technique of Organic Chemistry,” Vol. VIII, part II, S. L. Friess, E. S. Lewis, and A. Weissberger, Ed., Inter- science, New York, N. Y., 1963.(14) J. G. Calvert and J. N. Pitts, Jr., “ Photochemistry,” John Wiley & Sons, Inc., New York, N. Y., 1966, pp 710-720.(15) Designed by E. E. Wuschke; assembled and maintained by R. E. Archinuk, of our laboratories.
Volume 78, Number 8 August 1969

2634 A. Singh, A. R. Scott, and F. Sopchyshyn
X ( I02m/i)
Figure 1. Transient spectra obtained upon flash photolysis of a 1.2 X 10~z M solution of CQ in benzene: O, maximum absorption; A, 20 Msec after the maximum absorption; • , 40 Msec after the maximum absorption; A, 60 Msec after the maximum absorption.
charged through three quartz flash lamps placed symmetrically around the reaction cell. The discharge was triggered by applying a 450-V pulse to a trigger transformer (TR-60, E.G.G.), the output from which triggered a spark gap (GP-22B, E.G.G.) in series with the capacitors.
The flash lamps contained air whose pressure was maintained at ~0.3 Torr through a continuous pumping arrangement in a mercury-free system. The width of the flash was 25 Msec. Potassium ferrioxalate actinom- etry16 showed that when the capacitors were charged to 12.5 kV, the reaction cell received ~ 5 X 10¹⁸ photons per flash, of wavelength 200-450 m/r.
A beam of light from a 1000-W Hanovia Xe arc in a lamp housing from Schoeffel Instruments (Model LH- 152N) was baffled down to 18-mm diameter and used to photoelectrically monitor the formation and decay of the transients. The lamp was operated with a d.c. power supply (Model MHX-2500-2S, Christie Electric Corp.) and an ignitor (Model IG-12, Christie Electric Corp.) was used to strike the arc. The light intensity of the arc showed a ripple of ~ 7 % , which was reduced to ~ l % by a regulator17 based on a design by Redfield.18 This maintained constant the intensity of light, as seen by a photocell, by shunting around the lamp a variable amount of current from the constant current power supply.
A 0.75-m Jarrell-Ash Czerny-Turner spectrometer (Model 78-496) with an adjustable slit assembly was used with slit widths up to 2.5 mm depending on the intensity of the light beam after passage through the reaction cell. The three Jarrell-Ash gratings used were: (i) 590 grooves/mm, blazed at 350 him; (ii) 590
grooves/mm, blazed at 500 m/i; and (iii) 295 grooves/ mm, blazed at 1300 him- Appropriate filters were used to eliminate possible interference by the spectra of orders higher than the first.
The photoelectric measurements were made with (i) an RCA 1P28 photomultiplier (200-700 him) and (ii) a Philips 150 CYP photomultiplier (650-1125 dim). A2-kV power supply (Model 412B, John Fluke) was used for the photomultipliers. The response of the photomultipliers was almost linear with intensity, and no corrections have been applied to the data reported here. The photomultiplier response was measured on a Tektronix 647 oscilloscope.
Optical benches and accessories, lenses, mirrors, etc., were obtained from various suppliers.19 The irradiation cells (Optical Cell Co.) were all made of fused quartz with high-purity fused quartz windows—path length 10 cm and o.d. 27 mm (unless otherwise stated). Each cell was attached to a pear-shaped Pyrex reservoir, through a quartz-Pyrex graded seal, to allow the solution being used to be degassed under vacuum13 by the conventional technique of freezing and thawing using an appropriate refrigerant.
Plexiglas tubes (0.25 in. thick, Johnston Industrial Plastics) were used as filters around the flash lamps to
(16) (a) C. A. Parker, Proc. Roy. Soc., Ser. A, 220, 104 (1953); (b) C. G. Hatehard and C. A. Parker, ibid., 235, 518 (1956); (c) ref 14, p 783.(17) Designed by E. E. Wuschke; assembled and maintained by J. E. Swiddle, of our laboratories.(18) D. Redfield, Rev. Sci.Instr., 32, 557 (1961).(19) “ The Optical Industry and Systems Directory,” Optical Publishing Co., Inc., Pittsfield, Mass., 1966.
The Journal of Physical Chemistry

Flash Photolysis of Camphorquinone and B iacetyl 2635
X (10 mf t )
Figure 2. Transient spectra obtained upon flash photolysis of a 1.2 X 10 “ 2 M solution of CQ in carbon tetrachloride: O, maximum absorption; A, 20 Msec after the maximum absorption;• , 40 fj.sec after the maximum absorption; ▲, 60 /¿sec after the maximum absorption.
X ( I02m.)Figure 3. Transient spectra obtained upon flash photolysis of a 1.5 X 10⁻² M solution of CQ in isopropyl alcohol:O, maximum absorption; A, 10 ^sec after the maximum absorption; A, 2 0 Msec after the maximum absorption (the absorption in the 1 0 0 0 -1 100-mM region could not be measured accurately but was estimated to be £ 2 % ) ; • , 100 Msec after the maximum absorption.
protect the solutions from irradiation with light of wavelengths <340 mju.
In the study of the binary solutions of camphorquinone with either benzophenone or anthracene, Vycor flash lamps with jackets for filter solutions were used. Light from these flash lamps passed through a ~5-mm layer of the filter solution before reaching the irradiation cell.
For studies in the presence of oxygen, the air above the solution was displaced by flushing with oxygen, the cell reservoir system was closed to air, the solution was shaken well, and the operation was repeated twice before flash photolysis. Then the procedure was repeated once after each flash to ensure that the concentration of oxygen in the solution was the same throughout the experiment.
Volume 73, Number 8 August 1969

2636 A. Singh, A. R. Scott, and F. Sopchyshyn
Table I : Absorption Maxima (m/i) of the Initially Formed Transient
Solute Solvent i 2 3 4CQ CeHe 314 404CQ CCI, <200 280 316CQ î-PrOH <220 276 320BA CCI, 220 310 330BA i-PrOH 210 304 330
5-Bands----
6 7 8 9 10 11b“ b“ 638 706 796 916 1070
500 590 638 705 796 916 1068~500 630 702 790 908 1060
720 796 916 1056725 800 910 1060
“ b, broad.
ResultsThe transient spectra obtained photoelectrically
during the flash photolysis of the solutions of CQ in benzene, carbon tetrachloride, and isopropyl alcohol are given in Figures 1-3. In preliminary work in solutions in benzene the transient spectrum obtained seemed to be the same whether the solute used was d-CQ or dl- CQ, as one would normally expect. In all the solutions studied (CQ and BA) absorption reached its maximum during the flash, and the spectra were measured at the point of the maximum absorption and at various time intervals (16-100 jusec) from that point.
The various absorption maxima (Figures 1-3) have been tabulated and numbered for reference in Table I.
In the flash photolysis of the binary solutions of CQ with BP and AN the effect of (i) the additives on the major transient absorption bands of CQ and (ii) CQ on the triplet absorption bands of the additives10’* 20 was measured, and the results are given in Tables II and III. Measurements at <400 m/x could not be made due to
Table I I : Flash Photolysis of Camphorquinone0 in the Presence of Benzophenone6 in Benzene Solutions (Filter,' CQ in Carbon Tetrachloride, 2 X 10_1 M )
■ Absorption, %■Band X, mp CQ C Q + BP BP3BP 540 5 5 328 705 19 28 39 800 36 41 1
10 900 26 37 211 1070 32 40 0
CO 00 X o M. 6 1 .1 X 1 0 -- l M. ' To reduce the direct lightabsorption by eamphorquinone.
poor transmission of the binary solutions. The reduced absorption at 540 m/a (Table II) by the benzophenone triplet in the presence of CQ shows that it is being quenched by the latter. The increased absorption of bands 8-11 in the presence of BP shows that the transient (s) from eamphorquinone responsible for these bands are being photosensitized. Similarly, the results in Table III show that CQ photosensitizes the formation of the anthracene triplet and anthracene quenches
Table I I I : Flash Photolysis of Camphorquinone“ in the Presence of Anthracene6 in Benzene Solutions (Reaction Cell, 100 X 35 mm (o.d.); Filter,' AN in Carbon Tetrachloride, 3 X 10⁻² M)
-Absorption, %-Band X, m u CQ CQ + AN AN3AN 430 15 90 227 640 10 2 08 705 28 0 09 780 30 0 2
10 900 48 3 211 1050 33 0 0
1.3 X IO "2 m . 6 1.9 ?oX
' To reduce th e d irectlight absorption by anthracene.
the transient(s) from camphorquinone. The results of the flash photolysis of CQ solutions in the presence of oxygen, given in Table IV, show that the transient absorption of all the bands was reduced by oxygen.
The transient spectra obtained photoelectrically during the flash photolysis of the solutions of BA in carbon tetrachloride and isopropyl alcohol are shown in Figures 4 and 5. The absorption maxima of the initially formed transient(s) from BA are also listed in Table I. The effect of oxygen on the appearance of these bands was also studied and the results, given in Table IV, show that oxygen quenches the transient(s) responsible for the spectra.
Measurable decomposition of CQ and BA was observed during flash photolysis of their solutions. Preliminary results showed that after 30 flashes the decomposition of CQ was ~ 1 % and was solvent dependent (benzene < carbon tetrachloride < isopropyl alcohol21) . The decomposition of CQ in the presence of oxygen, in carbon tetrachloride solution, was higher ( ~ 6% ). After 30 flashes BA solutions showed much higher de-
(20) (a) H. Tsubomura, N. Yamamoto, and S. Tanaka, Chem. Phys. Lett., 1, 309 (1967); (b) T. S. Godfrey, J. W. Hilpern, and G. Porter, ibid., 1,490 (1967).(21) A degassed and sealed solution of CQ in isopropyl alcohol was found to fade in color on exposure to normal laboratory lighting over a period of several weeks. A similar sample left in a dark cupboard did not fade. All the solutions were, therefore, kept in the dark, except when in use.
The Journal of Physical Chemistry

Flash Photolysis of Camphorquinone and B iacetyl 2637
Table IV : Effect of Oxygen“ on the Flash Photolysis of Camphorquinone and Biacetyl Solutions
---------------------------------------------------------------Absorption, %---------------------------------------------- ——Benzene Carbon tetrachloride Isopropyl alcoholBand6 CQC CQC + Oa CQ* CQ' + 0 2 BA4 BA4 + O2 CQ« CQ* + O2 BA4 BA4 + Oi
3 93 52 96 33 98 5 82 15 87 38 47 8 48 6 40 0 17 2 25 19 62 15 76 15 60 1 47 6 50 1
10 83 20 88 26 82 2 51 10 66 211 67 12 70 12 74 0 42 6 53 4
“ The concentration of oxygen has been estimated to be ~ 8 X 10~3, 1 X 10⁻², and 8 X 10⁻³ M in the benzene, carbon tetrachloride, and isopropyl alcohol solutions based on the data given in the International Critical Tables. b At about the wavelength of the maximum absorption. c 1.2 X 10~2 M. d 3.9 X 10~2 M. ‘ 1 .5 X 1 0 - ' M.
Figure 4. Transient spectra obtained upon flash photolysis of a 3.9 X 10⁻² M solution of biacetyl in carbon tetrachloride: O, maximum absorption; A, 20 jusec after the maximum absorption; • , 40 /¿sec after the maximum absorption; A, 60 Msec after the maximum absorption.
composition, ~ 10% (carbon tetrachloride < isopropyl alcohol).
DiscussionA. The Identity of the Transients. The two tran
sients most likely to be observed when the camphorquinone and the biacetyl solutions are flash photolyzed are the triplets (3CQ and 3BA) and the hydrogen adduct free radicals (CQH- and BAH-)- The evidence supporting the observation of these and our reasons for considering that some of the other possible transients contribute insignificantly are outlined below.
1. Singlet Molecules. On irradiation (>340 m/x) the two a-diketones (A, B) undergo n -*■ it* transitions6-22 to give the corresponding singlet excited molecules. The lifetimes of the singlet excited molecules are generally very short (< 10_s sec). The fluorescence lifetime of the biacetyl singlet is ~ 10~8 sec28 and that of the camphorquinone singlet is very probably similar.
H3C— C = 0I
o = c — ch3
A B
Since the measurements being reported were done in microsecond time scale, the likelihood of the excited singlet molecules having been directly observed is very small.
2. C-C Bond Breakage. On photodecomposition camphorquinone could give biradicals24 (C-E) by C-C
(22) J. W. Sidman and D. 3. McClure, J. Amer. Chem. Soc., 77, 6461 (1955).(23) N. J. Turro and R. Engel, ibid., 90, 2989 (1968).(24) The word biradical is used here to denote the transients formed upon C-C bond breakage in a cyclic system leading to two free- radical sites in the transient, e.g. ,C-E. This word (or diradical) has been used in the literature to denote some other types of transients as well. For comments on this and its use, see ref 25-28.
Volume 73, Number 8 August 1969

2638 A. Singh, A. R. Scott, and F. Sopchyshyn
2 3 4 5 6 7 8 9 10 II
X ( 10 m ¡x )
Figure 5. Transient spectra obtained upon flash photolysis of a 3.9 X 10 ~2 M solution of biacetyl in isopropyl alcohol: O, maximum absorption; A, 10 /¿sec after maximum absorption; • , 20 /¿sec after maximum absorption; ▲, 100 /¿sec after maximum absorption.
bond breakage at one of the carbonyl carbons. Anal-
C D E
ogous bond breakage in biacetyl would lead to two free radicals per molecule (CH3- + CH3COCO-, or 2CH3CO-). In BA the bond energy of the intercarbonyl C-C bond is 70 kcal/mol,29 and this is probably the weakest bond in the molecule. The bond energy of the intercarbonyl C-C bond in CQ is not known but is likely to be similar. This energy corresponds to light of wavelength 408 m/¿. The visible absorption maxima of CQ lie at ~475 m^,6 30 and thus only a very small proportion (~5% ) of the excited singlet molecules will have enough energy to undergo biradical formation. Even for those that have enough energy, there will be competition between (i) triplet formation (see later), (ii) fluorescence, (iii) collisional deactivation, and (iv) biradical formation. Thus, biradical formation from the excited singlet molecules of camphorquinone, in our system, should be insignificant.
The visible absorption maxima of BA lie at22 30 ^ 412- 447 rn/u and, compared to CQ, a larger proportion of the excited singlet molecules will have enough energy to undergo C-C bond breakage. Here, again, there will be competition between (i) triplet formation (see later), (ii) fluorescence, (iii) collisional deactivation, and (iv) C-C bond breakage. The quantum yield of C-C bond
breakage during the photolysis of BA solutions is not known, but from the published data31 can be surmised to be very low ( ~ 0.0 1) as compared to the triplet formation (~1, see later). Thus C-C bond breakage from the excited singlet molecules of BA, in our system, should be insignificant. Since the corresponding triplets of BA and CQ (3BA, 3CQ) have even lower energy than the singlets, C-C bond breakage from them is not expected.
3. Photoenolization. Since the first reported instance of photoenolization by Yang and Rivas,32 many more examples have been reported in aromatic systems.33 Photoenolization has also been reported to occur in aliphatic systems.34 -36 BA is known to enolize,37 and
(25) G. R, Freeman, Can. J. Chem., 44, 245 (1966).(26) W. Hückel, “ Theoretical Principles of Organic Chemistry,” Vol. 1, Elsevier Publishing Co., Amsterdam, 1955, pp 218-227.(27) C. Reid, “ Excited States in Chemistry and Biology,” Butter- worths, London, 1957, pp 93, 94.(28) W. A. Pryor, “ Free Radicals,” McGraw-Hill Book Co., New York, N. Y „ 1966, pp 6, 298-307.(29) Ref 14, p 825.(30) “ UV Atlas of Organic Compounds,” Vol. I, Butterworths, London, 1966.(31) S. A. Greenberg and L. S. Forster, J. Amer. Chem. Soc., 83, 4339 (1961).(32) N. C. Yang and C. Rivas, ibid., 83, 2213 (1961).(33) P. J. Wagner and G. S. Hammond in “Advances in Photochemistry,” Vol. 5, W. A. Noyes, Jr., G. S. Hammond and J. N. Pitts, Jr., Ed., Interscience Publishers, New York, N. Y., 1968.(34) R. O. Kan, “ Organic Photochemistry,” McGraw-Hill Book Co., New York, N. Y., 1966, pp 29, 30.(35) J. Lemaire, J. Phys. Chem., 71, 2653 (1967).(36) D. S. Weir, J. Chem. Phys., 36, 1113 (1962).
The Journal of Physical Chemistry

its photoenolization has been reported35 to proceed from its lowest triplet state with very low quantum yield ( ~ 0.0 1) when its solutions are irradiated in the visible.
Enolization of CQ will lead to a severe strain in the molecule. So far as enolization is concerned, CQ is structurally similar to bicyclo [2 .2 . 1 ]heptane-2 ,6-dione, which shows no tendency to enolize38 despite the fact that it is a /3-dicarbonyl. Usually, /3-dicarbonyls enolize very readily,89 but, in this case (F -► G) the strain introduced upon enolization more than counterbalances the favorable energy requirements for enolization
Flash Photolysis of Camphorquinone and Biacetyl
F G
of the /3-dicarbonyls. Since CQ is not a /3-dicarbonyl, the probability of its enolization cannot be any greater.
Photoenolization is, therefore, considered unimportant during the flash photolysis of CQ or BA solutions.
4- Triplet States of Camphorquinone and Biacetyl. The singlet excited molecules (‘CQ and ’BA) can undergo intersystem crossing to give the corresponding triplet molecules (3CQ and 3BA). This intersystem crossing is known to proceed with very nearly unit efficiency40'41 in the case of biacetyl and would be expected to be comparable in camphorquinone.
a. The Camphorquinone Triplet. The transient spectra obtained during the flash photolysis of the CQ solutions in benzene and carbon tetrachloride are very similar (Figures 1 and 2), suggesting that the same species are being observed. The rates of decay of each spectrum (Figures 1 and 2) suggest that the spectra are essentially due to a single transient. Photoreduction of CQ by benzene is possible but not by carbon tetrachloride; thus, the transient is not the hydrogen adduct free radical, CQH-. The transient spectra (Figures 1 and 2) are therefore attributable to the camphorquinone triplet.
The rate of decay of band 3 (•—-315 m/u) is lower than that of bands 8-11 (Figures 1 and 2). This is most likely due to a product formed from 3CQ and does not affect the assignment of the initial spectrum to the triplet. This will be discussed later.
If the transient formed in the CQ solutions (Figures 1 and 2) is the triplet, it should be possible to photosensitize it with a donor of higher triplet energy and to quench it with an acceptor of lower triplet energy. The triplet energies of camphorquinone,42 benzophe- none,43 and anthracene43 are 50, 69, and 42 kcal/mol, respectively. The results of the flash photolysis of a solution of CQ in the presence of the donor, BP, show (Table II) that the formation of the camphorquinone triplet is photosensitized and that of the benzophenone triplet is quenched. The results in the presence of the acceptor, AN, show that the camphorquinone triplet is
quenched and the anthracene triplet is photosensitized (Table III).
In the case of these two additives (BP and AN) photosensitization and quenching effects could not be measured at 314 m/i (band 3). However, the effect of oxygen on the transient formation in the benzene and the carbon tetrachloride solutions (Table IV) shows that all the major absorption bands of the transient spectra are quenched. These photosensitization and quenching studies support the assignment of the transient spectra (Figures 1 and 2) to 3CQ.
b. The Biacetyl Triplet. The transient spectrum obtained during the flash photolysis of BA in carbon tetrachloride (Figure 4) is remarkably similar to that of 3CQ (Figure 2). Oxygen quenches all the transient absorption bands (Table IV). The band at ~33() nxy. (band 3) has been observed upon the flash photolysis of BA solutions before10 _li and has been attributed to the biacetyl triplet. Therefore, on the basis of (i) the previous assignment,10-12 (ii) the similarity of the spectrum to that of 3CQ, and (iii) the quenching effect of oxygen, the whole of the spectrum in Figure 4 is attributed to 3BA.
5. Photoreduction. Hydrogen abstraction by carbonyl compounds in their excited triplet states is well known.33 44 The camphorquinone and the biacetyl triplets will therefore be expected to abstract hydrogen atoms from a suitable hydrogen donor. As a result, their hydrogen adduct free radicals will be formed (J-L) and the lifetimes of the triplets will be sharply reduced.
2639
Isopropyl alcohol is a good hydrogen donor and photoinduced hydrogen abstraction from it by carbonyl compounds is known to occur efficiently.45 The flash photolysis of CQ and BA in isopropyl alcohol solutions was studied to see if their photoreduction would also occur.
a. Camphorquinone in Isopropyl Alcohol. The time- dependent behavior of 3CQ in isopropyl alcohol shows (Figure 3) that the initially formed triplet very rapidly
(37) A. Gero, J. Org. Chern., 19, 1960 (1954).(38) C. D. Gutsche, “ The Chemistry of Carbonyl Compounds,” Prentice-Hall, Inc., Englewood Cliffs, N. J., 1967, pp 13, 14.(39) Ref 26, Chapter 5.(40) H. L. J. Backstrom and K. Sandros, Acta Chem. Scand., 14, 48 (1960).(41) G. B. Porter, J. Chem. Phys., 32,1587 (1960).(42) Calculated from the phosphorescence data in ref 6.(43) N. J. Turro, “ Molecular Photochemistry,” W. A. Benjamin, Inc., New York, N. Y., 1967, p. 132.(44) Ref 43, Chapter 6.(45) A. Beckett and G. Porter, Trans. Faraday Soc., 59, 2038 (1963).
Volume 73, Number 8 August 1969
is a Sr o m i i jn fm n y itn r t 'w w ii
1

2640 A. Singh, A. R. Scott, and F. Sopchyshyn
decays to another, very long-lived, transient which absorbs mainly in the ultraviolet (320 mju). The long- lived transient appears to be a product of the reaction of 3CQ with isopropyl alcohol and is reasonably identified as the hydrogen adduct free radical CQH • (J, K ).
Oxygen is seen to quench 3CQ (Table IV) and thus inhibit the formation of CQH •, confirming the involvement of the triplet in the photoreduction. Some direct reaction of oxygen with CQH • is also possible (reaction1), but must be of minor importance since its effect on
CQH • + 0 2 — > CQHOa • (1)
all the absorption bands is similar (Table IV).Our results are consistent with the recent findings of
Monroe, Weiner, and Hammond,46 who have observed the photoinduced formation of CQH- in an isopropyl alcohol solution of camphorquinone by esr spectroscopy. They used the Hg 2537 line to irradiate the solution and have suggested that 3CQ might be involved in the photoreduction step.
One would expect the two hydroxycamphors, endo-2- hydroxycamphor and enrZo-3-hydroxycamphor, to be formed as stable products by (i) hydrogen abstraction by CQH • (J and K) and (ii) the disproportionation of J and K with the various free radicals in the solution. The formation of these hydroxy camphors has been observed as a product in the photolysis of CQ in isopropyl alcohol solutions by Meinwald and Klingele47 and by Monroe, Weiner, and Hammond.46
In one respect our results are at variance with those of Meinwald and Klingele.47 In our case the presence of oxygen led to a reduced yield of CQH- which in turn would give a reduced yield of the hydroxycamphors. Meinwald and Klingele,47 on the other hand, found that the presence of oxygen was necessary for the photoreduction. It would seem that some experimental artifacts must have complicated their observations,47 and we tend to agree with Monroe, Weiner, and Hammond’s suggestion46 that the photoreduction observed by Meinwald and Klingele47 probably occurred during the periods when the solution became oxygen starved.48 It may be mentioned in passing that in contrast to their results47 we observed measurable decomposition of CQ but, in agreement with them,47 the decomposition was higher in the presence of oxygen.
b. Biacetyl in Isopropyl Alcohol. The time dependent behavior of 3BA in isopropyl alcohol (Figure 5) is very similar to that of SCQ (Figure 3) and shows that the initially formed triplet decays very rapidly into another long-lived transient which absorbs in the ultraviolet. Photoreduction of BA in isopropyl alcohol giving BAH ■ has been observed before49 by esr spectroscopy. The transient formed from 3BA in isopropyl alcohol is, therefore, identified as BAH • (L).
Oxygen quenches SBA (Table IV) and thus inhibits the formation of BAH- confirming the involvement of the triplet in the photoreduction. Some direct reaction
of BAH • with oxygen is possible (reaction 2) but must occur to a very small extent since the effect of oxygen
BAH ■ + 0 2 —■> BAH02 ■ (2)
on all the absorption bands is similar (Table IV).B. Spectral Features of the Transients. The two
most prominent features in the spectra of the transients observed are: (i) the absorption bands in the 630- 1100-m/x region of the spectra of the triplets (Figures 1-5) and (ii) the overlapping absorption bands in the ultraviolet in the spectra of the triplets and their hydrogen adduct free radicals (Figures 3 and 5). The first can be understood in terms of the energy levels of the a-diketones,6-22'60 but the second is harder to understand at this time. The following discussion of these complex spectra develops arguments for the most reasonable assignments.
1. The Camphorquinone and the Biacetyl Triplets. We want to emphasize that two categories of electronic transitions would be expected in these triplets; the transitions that are unique to the triplet excited molecules and those that are analogous to the transitions in the parent diketones. The main difference between the distribution of the electrons of the carbonyl chro- mophores in the ground-state singlet molecules of the diketones (BA and CQ) and the corresponding triplets (3BA, 3CQ) is the location of one of the nonbonding electrons. In the triplets one of the original n electrons is in the it* orbital in the triplet manifold. The transitions which further raise this electron to higher energy levels (i and ii, see later) are unique to the triplets. However, the triplets (3BA and 3CQ) also contain three n and four w electrons, as compared to four of each in the parent molecules (BA, CQ), in the original ground-state singlet manifold. Therefore, the transitions which raise one of these n on r electrons to one of the higher singlet levels (iii to viii, see later) in the triplets (3BA, 3CQ) would be analogous to and directly comparable with the same transitions in the parent molecules (BA, CQ).
The transitions that are more likely to be observed in the spectra of the triplets are listed below (i to viii). It is not known whether the selection rules for the triplet excited molecules will be the same as those for
(46) B. M. Monroe, S. A. Weiner, and G. S. Hammond, J. Amer. Chem. Soc., 90, 1913 (1968).(47) (a) J. Meinwald and H. O. Klingele, ibid., 88, 2071 (1966); (b) H. O. Klingele, “ Photochemical Reactions of Camphorquinone and Some Related 1,2-Diketones,” Ph.D. Thesis, Cornell University, 1965.(48) It is not unlikely that during the quenching of 3CQ by oxygen, a significant amount of peroxide (CQO2) is formed. This peroxide could conceivably lead to the formation of the hydroxy camphors through a series of complex reactions. Such a course of reactions could also have contributed to the results of Meinwald and Klingele.47(49) H. Zeldes and R. Livingston, J. Chem. Phys., 47, 1465 (1967).(50) H. Suzuki, “ Electronic Absorption Spectra and Geometry of Organic Molecules,” Academic Press, Inc., New York, N. Y., 1967.
The Journal of Physical Chemistry

Flash Photolysis of Camphorquinone and Biacetyl 2641
the parent molecules of the diketones; assuming that they are, the intensities of these transitions (i to viii) would be as indicated below. The regions where these transitions would be expected (discussed later) have also been indicated.Transitions unique to the triplets
V* (3I) — > 3ir* (3II) (strong, near-infrared) (i)
s7r* (3I) — > V* (strong, ultraviolet) (ii)
Transitions common to the triplets and the parent diketones
n — > V* (T) (weak, visible) (iii)
n — *■ V* (HI) (weak, ultraviolet) (iv)
n — *■ V* (weak, ultraviolet (v)
7r — > 1tt* (H) (strong, ultraviolet) (vi)
7r — ► 1w* (*II) (strong, ultraviolet) (vii)
t — > 1<r* (strong, ultraviolet) (viii)
Some pertinent information about the energy levels, etc., for the two diketones has been compiled in Table V. Since more information is available for biacetyl, we will draw conclusions for that system first and then for the camphorquinone system.
Table V : Electronic Energy Levels0 ,b ofCamphorquinone and Biacetyl
Molecular Spin-orbitalorbitals configuration ✓— - — -Electronic states-----------
for of n and Camphor-a-diketones ir levels Biacetyl® quinoned
o * -----------------II'Au -------- II'Bi--------II'Bg --------IFA2
(bands 8- 1 1 ) is most likely due to a strong electronic transition.
Owing to the interaction of the 7r-molecular orbitals of the two carbonyl groups, biacetyl has two 7r* orbitals (7T3*, 7T4* ; Table V) of different energy.22'60 The transition between the two (7t3*, tt4*) in the biacetyl triplet will be: 3tt* (3I) -*■ "*■* (3II) (Table V). In the 3I spin-orbital configuration two electronic states are available to the biacetyl triplet— I3AU (20,421 cm- 1 ) 22 and I3Bg (~20,028 cm- 1 ) ,22 the latter being ~400 cm“ 1 lower. The direct singlet —► triplet absorption is b\g —► I3AU, according to Sidman and McClure.22 However, the emission from the triplet is known to be from the lower state, FBg —► 4Ag. They conclude22 therefore, that the radiationless conversion from I3AU to I3Bg must be highly efficient. The n —*■ V* (T) singlet- singlet transition of biacetyl has been assigned ‘Ag -► I ‘A,,, but it is not clear whether the nearly 100% internal conversion40 41 of the excited singlet, to the triplet, is to the I3AU or the I3Bg state (Table V). Probably both the states are formed and are available for transitions to the higher states (Table V), unless the conversion I3AU -*■ I3Bg is very fast in which case only the lower state will be available.
In order of increasing energy the next allowed transitions available to these two triplets are (i) I3AU —► II3Bg and (ii) I3Bg —► II3AU. The energy separation of these is not known but can be obtained, approximately, by assuming that (i) the energy separation of II ‘Au and II3Au is the same as that of PAU and I3AU and that (ii) the energy separation of II3AU and II3Bg is the same as that of I3AU and PBg. Thus, we can derive the following approximate values for the transitions knowing22 that (i) >Ag PAU = 22,873 cm“ 1, (ii) *A, -► PAU = 20,421 cm“1, (iii) I3Bg-* >AU ~ 20,028 cm-1, (iv) ‘A ,-* IPAU = 31,475 cm“ 1.
7T4*--*-- ----- 'II----- 3II
IFA„-----I PBg-----
IPBi—i f a 2 FAU — > IPBg ~8210 cm“ 1 = 1218 m fi
7T3*----- ----- 'I----- 31
■-----FAu----- FBgFAu-----
----- FBi----- f a 2PBi-----
andI3Bg — 4- IPAu ~9000 cm“1 = 1111 m fi
111 Il2 ----- 'XPB*-----X'Ag——
f a *---------- X'Ai The observed absorption band system in the
m-m-
“ Not drawn to scale. b Not intended to be a complete representation; drawn mainly from ref 6 and 22. 'From ref 22. d From ref 6.
2. The 680-1100-mu Region, a. The Biacetyl Triplet. The intensity of the band system of the biacetyl triplet in this region is not much lower than that of band 3 at 330 m (Figure 4). Though we have not measured the extinction coefficient of these bands (8-11), it should not be much smaller than that of band 3 for which the extinction coefficient has been reported12’61 to be ~5000-6400. Thus the absorption band system
infrared is thus in the expected region. It may well be that the observed band system is solely due to the FBg -*■ IPAU transition and that the I3AU —► II3Bg transition has not been observed at all and lies farther into the near-infrared. The differences between the absorption maxima between the successive pairs of bands, starting at 720 npi, are -—-1320, 1650, and 1490 cm-1, respectively. These values correspond, in general, to the vibrational frequencies expected in the biacetyl excited molecules.62
b. The Camphorquinone Triplet. The intensity of the absorption bands (7-11) in the region relative to
(51) E. J. Land, Proc. Roy. Soc., Ser. A, 305, 457 (1968).(52) J. W. Sidman and D. S. McClure, J. Amer. Chem. Soc., 77, 6471 (1955).
Volume 73, Number 8 August 1969

2642 A. Singh, A. R. Scott, and F. Sopchyshyn
that of 3BA suggests that these bands are also due to a strong electronic transition. By arguments precisely analogous to those given for the biacetyl system above and based on the spectral information on camphorqui- none,6 we conclude that the camphorquinone triplet would be in the two electronic states I3A2 and PBi (Table V). The next allowed transitions available to the triplet are (i) I3A2 -> IPBi and (ii) PBi —► II3A2 (Table V). Their energy separation is not known. However, on the basis of the available data6-8 and by arguments analogous to those given for the biacetyl system we conclude that the absorption due these transitions will also be in the near-infrared.
The observed absorption bands (7-11) are thus in the expected region. The differences between the successive pairs of bands 7-11 (Table I) are ^1490, 1620, 1660, and 1540 cm-1, respectively. These values are close to the values in the vibrational progression of the 'Ai -*■ IFBi transition6 815 of camphorquinone. It is difficult to decide whether this vibrational progression is due to just one of the electronic transitions or due to both of them. The band system probably extends farther into the near-infrared and part or all of one of the electronic transitions probably lies there.
c. The Similarity of the Triplet Spectra. The similarity of the spectra of 3CQ and 3BA is quite remarkable. It emerges from theoretical considerations50 that the splitting of the two w* levels (Table V) depends on the angle between the two carbonyl groups in the a- dicarbonyl compound concerned. The splitting is about the same if the angle between the two carbonyls is either 0 or 180° (as is the case for CQ and BA, respectively).6’50 For other angles it is less, reducing to zero for 90°. Thus the similarity of these ir* (3I) —► it* (3II) transitions of the biacetyl and the camphorquinone triplets provides striking confirmation of this theoretical requirement. Previous work53 on the absorption spectra of a-diketones has also provided similar, though less striking, confirmation. An obvious prediction follows, that this 3ir* (3I) —► 37r* (3II) transition will move to longer wavelengths in the spectra of the triplets of a-dicarbonyl compounds as the intercarbonyl angle in them approaches 90°, e.g., in 3,3,7,7-tetra- methyl-l,2-cycloheptanedione.63
3. The 200-li50-mg. Region, a. The Biacetyl Triplet. The 330-m/x band (Figure 4) appears to be due to the 3tt* 01) — V* transition.54 It is too intense and too much shifted to be one of the n —► lir* transitions of the triplet (iii and iv) which are at ~295 and 430 m/x, respectively, in biacetyl. The n -*■ 1 a* transition will be at even shorter (<295 m/x) wavelengths and should be less intense. The -n- -*■ lr* (to H) transition (vi) in BA is at 190 m/x and the r -*■ 1t* (to HI) and ir —► V* transitions (vii and viii) again will be at even shorter wavelengths. So, a reasonable assignment for the 330-m/x band is 3tt* (H) -* V*, which is a transition unique to the biacetyl triplet.
The 310-m/x band (band 2) is either in the vibrational progression of the 330-m/x band or due to the n -*■ 1w*, *Ag IFAu transition (iv). The difference between the 310- and the 330-m/x bands is ~1950 cm-1 and should be consistent with a vibrational component. However, in the camphorquinone system (see later) a reasonable assignment of band 2 is the n -*• 1ir* (HI) transition. So, this band is tentatively assigned to the n —► 1tt* transition (iv). This transition, thus, is not unique to the biacetyl triplet. In biacetyl, the n —► ‘ ir* (HI) transition is at ~295 m/x in solutions30'55 and thus would seem to have shifted slightly to the red in the triplet.
The 220-m/x band could be either the 7r 7r* transition (vi) which is at ~190 m/x in biacetyl solutions, or the n —► 1u* transition (v). It is too intense to be the latter, if the latter should be as forbidden in 3BA as inBA. So, tentatively, it is attributed to the 7r -► 1ir* transition (vi) which again is not unique to the biacetyl triplet and seems to have shifted slightly to the red as compared to the one in biacetyl.
b. The Camphorquinone Triplet. Two absorption bands are observed in the stated region in the benzene solution, at 314 (strong) and 404 m/x (weak), and three in the carbon tetrachloride solution at < 2 0 0 (strong), 280 (weak), and 316 m/x (strong).
The separation of the 404- and the 314-m/x bands is 7060 cm“ 1. This large difference makes it unlikely that the two bands are the vibrational components of the same electronic transition. This transition could only be one of the n V* transitions (iii, iv). However, the n -*■ V* transition to HI would be expected at ~280 m/x and to H at ~450 m/x. It is possible that the presence of an electron at the 3I level raises the energy of the transition of the second n electron to the H level; thus, it could possibly be the n -*■ 'ir* (to H state) (transition iii). This band is not observed in the carbon tetrachloride solution, probably because the band at 316 m/x is broader.66
The band at 314 m/x (band 3, Table I) appears to be due to the 37r* —► V* transition, for reasons similar to those given for the same assignment for the 330-m/x band of the biacetyl triplet (transition ii).
The separation between the 280- and the 316-m/t bands (4100 cm“1) again appears to be too large for the two to belong to the same electronic transition. The n -*■ V* transition (to HI) of CQ is at ~280 m/x. The 280-m/x band appears to be due to the same transition.
The band at < 200 m/x is analogous to the 220-m/x band of 3BA and for similar reasons is tentatively
(53) N. J. Leonard and P. M. Mader, J. Amer. Chem. S o c 72, 5388 (1950).(54) It has been attributed to the Ti —► T3 transition by Porter and Windsor.10(55) Unpublished results.(56) It is not known whether this band is present in the spectrum of 3BA since a solution of BA in benzene was not flash photolyzed.
The Journal of Physical Chemistry

Flash Photolysis of Camphorquinone and B iacetyl 2643
assigned to the t —► 1ir* transition (vi). The r -*■ V* transition of CQ is at ~190 m/t.
c. The Free Radicals CQH■ and BAH-. These free radicals also absorb in the ultraviolet, their two absorption bands being almost precisely at the same wavelengths as bands 2 and 3 in their corresponding triplets (Figures 3 and 5; Table I). Various hydroxy free radicals57 have been found to absorb in the ultraviolet region with the absorption bands around 300 mu. Most likely, these absorption bands are due to the electronic transitions to excited levels of the unhybridized p electrons on the carbon atom carrying the free radical site.68 However, it is not known what would be the result of the interaction of this p electron with the orbitals of the neighboring carbonyl group in the free radicals CQH- and BAH- (J-L), and how this interaction will lead to electronic transitions with almost precisely the same energies as those in the corresponding triplets. The bands at ~320 m/i (Figures 3 and 5) are quite intense and should be due to a strong transition, probably of r -*■ t * type. The weak bands at — 300 mfj. could either be in the vibrational progression of the corresponding bands at ~320 m¡i (Figures 3 and 5) or the n —► 7t* transition of the carbonyl groups of BAH • and CQH-.
Absorption bands at about the same wavelength in the spectra of the triplets and the corresponding hydrogen adduct free radicals are not unique to the present systems, the case with the spectra of 3BP and BPH •20b being similar.
C. Different Rates of Decay. 315-m/j. Band vs. 700-1 lOO-my Bands. Two different photomultipliers were used for studies in these two regions (Figures 1 and 2). Though preliminary investigation66 showed that the slight but different nonlinearity of their response was not responsible for the different rates of decay of band 3 and bands 9-11, the possibility of an experimental artifact causing this effect cannot be ruled out, and the matter needs further investigation.
In the benzene and the carbon tetrachloride solutions of camphorquinone a small amount of CQH- can be formed by hydrogen abstraction by 3CQ from CQ itself. Since CQH • is much longer lived than 3CQ (Figure 3) but absorbs only in the ultraviolet, this would contribute to an over-all lower decay rate of the 315-m/i band than the bands in the 700-1100-m/i region.
Similar arguments will apply to the BA system.
Acknowledgments. It is a pleasure to acknowledge helpful discussions with Dr. Gordon Goodman on the spectral features of the transients. We are grateful to Dr. P. J. Dyne for help and encouragement. Detailed information about their flash photolysis equipment from Dr. R. L. Strong, Dr. H. E. Gunning, and Dr. J. W. Hunt is gratefully acknowledged. Thanks are due to Dr. E. Charney for information about some of his results.
(57) A Habersbergerova, I. Janovsky, and J. Teply, Radiat. Res. Rev., 1, 109 (1968).(58) C. N. R. Rao, “ Ultra-Violet and Visible Spectroscopy,” Butter- worths, London, 1961.
Volume 73, Number 8 August 1969

2644 Jerald A. D evore and H. Edward O’Neal
Heats of Formation of the Acetyl Halides and of the Acetyl Radical
by Jerald A. DevoreDepartment of Chemistry, University of Nevada, Reno, Nevada 89507
and H. Edward O’NealDepartment of Chemistry, San Diego State College, San Diego, California 92115 (Received December 18, 1968)
Heats of hydrolysis of acetyl chloride, bromide, and iodide have been redetermined calorimetrically, and vapor pressures of the halides have been measured over moderate temperature ranges in order to determine heats of vaporization and heats of formation of the liquid and vapor species. In conjunction with kinetic data, the heat of formation of the acetyl radical has been determined which, together with the results of other experiments, places the value for Afff°(CH3CO, 298°K) at —5.8 ± 0.4 kcal/mol and firmly establishes a number of controversial bond dissociation energies.
IntroductionCarson and Skinner1 determined heats of formation
for the liquid acetyl halides by measuring their heats of hydrolysis calorimetrically. Heats of formation of the vapor species were obtained using Trouton’s rule estimates for the heats of vaporization. Their values in kilocalories per mole for acetyl chloride, bromide, and iodide, respectively, are AHf°(298, liq) = —65.78 ± 0.02, -53.92 ± 0.07, -39.75 ± 0.03; AFf°(298, g) = -59 .0 , -46 .6 , -31 .8 ; AHvap° = 6 .8, 7.3, 7.9.2 Walsh and Benson3 recently measured the equilibrium constant for the reaction
CH3CHO + I2 CH3COI + HI (1)
spectrophotometrically at 208°. Using known and estimated entropies and heat capacities for the species of reaction 1, they arrived at a value of —30.3 ± 0.5 kcal/ mol for the heat of formation of acetyl io.dide vapor.
We have reinvestigated heats of hydrolysis of acetyl chloride, bromide, and iodide and have determined their heats of vaporization from vapor pressure measurements in order to obtain accurate heats of formation of the gaseous species. Of particular interest was the confirmation, in an independent manner, of the heat of formation of acetyl iodide vapor. This heat of formation is important since in conjunction with the kinetic data of O’Neal and Benson4 on the thermal reaction of acetyl iodide with hydrogen iodide, the heat of formation of the acetyl radical can be calculated. By combining the forward and back activation energies for the reaction
CH3COI + I • I2 + CH3CO (2)
O’Neal and Benson determined a reaction enthalpy of14.6 ± 0.5 kcal/mol at 217°. With known6 thermodynamic functions for I-, I2, and CH3COI (see Table III) and estimated3 heat capacities for CH3CO, the heat of formation of the acetyl radical in kilocalories per mole is given by
AFf°29s(CH3CO) = 25.6 + A #f°298(CH3COI, g) (3)
A reliable determination of the heat of formation of acetyl iodide therefore determines the acetyl radical heat of formation which in turn can be used to accurately establish many bond dissociation energies in organic compounds.
Experimental SectionThe Joule-type solution calorimeter consisted of a
constant temperature box in which was suspended a 660-ml Dewar flask with a well-fitted cork cover. A glass stirrer, calorimeter heater, thermistor probe, and sample bulb passed through the cork cover and into the flask. The thermistor formed one leg of a Wheatstone bridge, and temperature was measured by the recorded bridge imbalance which has been standardized against an NBS calibrated mercury in glass thermometer. All resistors in the bridge and heater circuits were accurate to within 0.05%. Voltages were measured with a K-3 Leeds and Northrup potentiometer to within ±0.01%. Temperature calibration consisted of 92 temperature- millivolt (recorder scale deflection) data points between 24 and 27° curve fitted to a second-degree polynomial by the method of least squares. The uncertainty in calorimeter temperature was ±0.003°.
The heat capacity of the calorimeter system was determined after each run by noting the temperature change resulting from the input of a known amount of electrical energy. The uncertainty in the energy input was ±0.04%. The definition 1 cal = 4.1840 abs joules was used to convert energy measurements into calories. The heat capacity was assumed to be constant over the range of temperature change. For dilute aqueous solutions near room temperature, a 1 ° change in tempera-
(1) A. S. Carson and H. A. Skinner, J. Chem. Soc., 936 (1949).(2) Walsh and Benson (ref 3) have suggested that for the heat of vaporization of acetyl iodide, an additional 1.3 kcal/mol is required to correct the Trouton’s rule estimate to room temperature.(3) R. Walsh and S. W. Benson, J. Phys. Chem., 70, 3751 (1966).(4) H. E. O’Neal and S. W. Benson, J. Chem. Phys., 37, 540 (1962).(5) “ JANAF Interim Thermochemical Tables,” D. R. Stull, Ed. Dow Chemical Co., Midland, Mich., 1961-1966.
The Journal of Physical Chemistry

Heats op Formation of A cetyl Halides and A cetyl Radical 2645
ture results in about a 0 .02% change in heat capacity. The greatest relative error was thus in the measurement of temperature, and the over-all uncertainty in the heat of hydrolysis measurements was estimated to be ±0.3%.
The calorimeter was checked for systematic errors by measuring the heat of neutralization of H2S04 in aqueous NaOH, a reaction whose enthalpy is known fairly accurately.6 -9 For the reaction
H2S04 • (0.2284)H2O + 2NaOH • (604.0)H20 — ►
Na2S04 • (1210.2) H20 + 2H20 (4)
an average of four determinations gave A/7r = 48.36 ± 0.20 kcal/mol. The heat of reaction calculated from existing thermodynamic data6-8 was 48.23 kcal/mol. The difference between the two values is less than the uncertainty in the calorimetric measurements or the uncertainty in the existing thermodynamic data for the reaction.10
Reagent grade acetyl chloride, bp 50-52°, and acetyl bromide, bp 75-77°, were purified by repeated bulb-to- bulb distillations under high vacuum. Calorimeter samples weighing between 0.5 and 2 g taken from the middle fraction of the final distillate were condensed into thin-walled Pyrex bulbs which were then sealed under about 0.5 atm of dry nitrogen. Samples of the halides were analyzed gravimetrically as the silver salts. An average of three determinations each gave 99.98 ± 0.08 and 99.96 ± 0.06% of theoretical for the chloride and bromide, respectively.
Acetyl iodide was prepared by the method used by O’Neal and Benson.4 The middle fraction of the final distillate was stored under vacuum at Dry Ice temperature and in the absence of light. The product was pale yellow, and no further color change was observed during several weeks of storage under these conditions. Calorimeter samples were prepared from a portion of the stored material which had been further purified by several bulb-to-bulb distillations and ranged from colorless to very pale yellow. It was necessary to make calorimeter runs with the iodide samples immediately after preparation since, even in the absence of light, appreciable coloration indicative of decomposition was observed in the sample bulbs after about 1 hr. Hydrolyzed samples of the iodide were titrated for I3~ using standard iodate and thiosulfate solutions and found to be 99.87% of theoretical. The impurity was most likely acetic acid.
Vapor pressures of the halides were measured with a specially constructed Bourdon gauge nulled against a mercury manometer. In operation, about 5 g of sample was further purified by several vacuum bulb-to-bulb distillations and condensed into the sample chamber of the gauge which was then immersed in a salt water-ice bath. The entire apparatus was wrapped with asbestos paper to help control temperature and to prevent light-sensi
tized decomposition of the sample. Temperature was measured to within ±0.03° using a mercury in glass thermometer graduated in 0.1° intervals. The average error in nulling the Bourdon gauge and reading the manometer was ± 0.4 mm.
Results
Heats of hydrolysis for the reaction
CH3COX + tH20 — ►
(CH3COOH + HX) • (x - 1)H20 (5)
were measured with the calorimeter, and heats of formation of the liquid acetyl halides at 298°K were calculated from the equation
AFf°(CH3COX, 1) = AHf°(CH3COOH +
HX) ■ (r — 1)H20 — AHf°(H20) — AHT (6)
where X = Cl, Br, I. Heats of formation of the reaction products were calculated using data taken from Rossini6 for solutions of the individual acids. For the concentrations of interest, heats of mixing are negligible. The heat of formation used for water was —68.317 kcal/mol.11 Results of these experiments are shown in Table I. For liquid acetyl chloride and bromide, the heats of formation given in Table I are in almost exact agreement with the results of Carson and Skinner.1 For acetyl iodide, the results differ by 0.5 kcal/mol. Considering the difficulty of avoiding at least some decomposition in the iodide samples prior to calorimetric determinations, it seems likely that the acetyl iodide heat of formation determined in this work represents the best lower bound for the exact value. This cannot be stated with absolute certainty, however, so that we have averaged our results with those of Carson and Skinner to give
A#fo298(CH3C0 I, 1) = -39.48 ± 0.27 kcal/mol
Vapor pressure measurements for the three halides are given in Table II. The vapor pressure of acetyl chloride was measured over the temperature range — 0.84 to 50.58°. A least-squares fit of the data gives
log P (mm) = 5.880 - 7.352 X10²T—1 - 7.605 X 10⁴T~2 (7)
(6) F. D. Rossini and D. D. Wagman, et al., “Selected Values oi Chemical Thermodynamic Properties," NBS Circular 500, Feb 1, 1952.(7) H. M. Papee, W. J. Canady, and K. J. Laidler, Can. J. Chew,., 34, 1677 (1956).(8) W. F. Giauque, E. W. Hornung, J. E. Kunzler, and T. R. Rubin, J. Amer. Chew. Soc., 82, 62 (1960).(9) S. R. Gunn, J. Phys. Chew., 69, 2902 (1965).(10) Gunn (ref 9) has presented a detailed discussion of the problems inherent in this and other reactions commonly used as standards for solution calorimetry.(11) G. N. Lewis and M. Randall, “ Thermodynamics,” 2nd ed, revised by K. S. Pitzer and L. Brewer, McGraw-Hill Book Co., Inc., New York, N. Y., 1961, p 672.
Volume 73, Number 8 August 1969

2646 Jerald A. D evore and H. Edward O’Neal
Table I : Calorimetric Results for the Heats of Hydrolysis and Heats of Formation of the Liquid Acetyl Halides
Moles of EhO/mole
Wt of CHaCOX, Moles of Ti, T2, Cp (system), - A Hr, — AH f 0 298,
Run of CH3COX g CHaCOX °C "C cal/°C kcal/mol kcal/mol
1 1212.9 0.7165 0.009128Acetyl Chloride
24.740 25.677 220.86 22.68 65.662 1500.4 0.4344 0.005534 25.351 26.101 164.44 22.30 66.103 1115.1 0.5845 0.007446 24.991 25.998 168.40 22.77 65.574 836.7 0.7790 0.009924 24.888 26.222 167.93 22.56 65.76
5 677.3 2.0097
AHt°298(CH3COCl, 1) = -6 5 .7 7 ± 0.11 kcal/mol
Acetyl Bromide0.016345 24.751 26.475 221.12 23.32 53.88
6 614.1 1.6975 0.013806 24.756 26.683 168.06 23.46 53.757 797.0 1.2810 0.010418 24.693 26.148 165.90 23.16 54.098 1004.6 1.0172 0.008273 24.777 25.927 167.38 23.28 54.00
9 896.1 1.5747
A fffo29s(CH3C0Br, 1) = -53 .92 ± 0.07 kcal/mol
Acetyl Iodide0.009266 24.744 25.969 170.29 22.50 39.20
10 997.9 1.4141 0.008321 25.215 26.311 169.88 22.37 39.3311 1913.8 0.7373 0.004338 25.161 25.730 171.63 22.52 39.20
A fft°298(CH3COI, 1) = -3 9 .2 1 ± 0.05 kcal/mol“
° Corrected for 0.13% impurity.
Table II: Vapor Pressure Data for the Acetyl Halides
Acetyl chloride Acetyl bromide Acetyl iodideT , °K P , mm T, °K P , mm T, °K P , mm
272.31 144.8 275.55 44.5 276.63 9.9272.91 146.6 282.84 62.5 280.04 12.7273.43 150.0 289.21 81.3 286.03 17.3279.56 186.0 294.12 102.9 289.31 20.9283.96 219.4 297.79 120.1 295.32 28.5286.85 244.3 301.97 141.2 301.35 37.6288.97 264.3 306.10 159.5295.00 327.1 310.53 198.5297.15 352.8 313.63 218.2299.29 379.8 318.53 256.7305.08 455.7 324.95 314.9308.66 502.7 328.84 357.3312.23 558.3 333.65 404.4317.38 639.0319.98 693.0323.73 756.3
where T = °K. The heat of vaporization at 298° K computed from the Clapeyron equation together with eq 7 is A //vap = 5.70 ± 0.04 kcal/mol. The uncertainty attached to the value is an estimate of the probable error and was calculated with a method given by Margenau and Murphy12 by assuming a linear relationship between log P and 1 /T. Equation 7 gives a normal boiling point of 50.2° for acetyl chloride and a boiling point of 50.8° at 769 mm, in good agreement with the value of 51.2° reported by Carson and Skinner at that pressure.
Kireev and Popov13 previously measured the vapor pressure of acetyl chloride from —20 to 50°. The heat
of vaporization computed from their data is 7.80 kcal/ mol at 298° K. The vapor pressure of CH3COCl has also been measured by Greenwood and Wade14 over the temperature range —37 to 18°. A least-squares fit of their data to an equation similiar to eq 7 gives 6.96 kcal/mol for the heat of vaporization at 298°K. In addition, Mathews and Fehland15 measured the heats of vaporization of CH3COCI and CH3COBr directly at the normal boiling points. Their values for the chloride and bromide, respectively, are 6.84 and 7.25 kcal/mol. In the absence of reliable heat capacities of the liquid species, however, it is difficult to accurately adjust these values to room temperature. Since there are fairly large differences between the reported values, it was decided to use the heat of vaporization determined in this work for computing the heat of formation of acetyl chloride vapor. However, further vapor pressure measurements may be necessary to confidently establish the heat of vaporization.
The vapor pressure of acetyl bromide was determined over the temperature range 2.40-60.48° and the resulting least-squares fit of the data gives
log P (mm) = 5.350 - 4.018 X
10*T~X - 1.707 X 10⁶T - 2 (8)
(12) H. Margenau and G. Murphy, “ The Mathematics of Physics and Chemistry,” 2nd ed, D. Van Nostrand Co. Inc., New York, N. Y., 1956, p 515.(13) V. A. Kireev and A. A. Popov. Zh. Obshch. Khim., 5, 1399 (1935).(14) N. N. Greenwood and K. Wade, J, Chem. Soc., 1527 (1956).(15) J. H. Mathews and P. R. Fehland, J. Amer. Chem. Soc., 53, 3212 (1931).
The Journal of Physical Chemistry
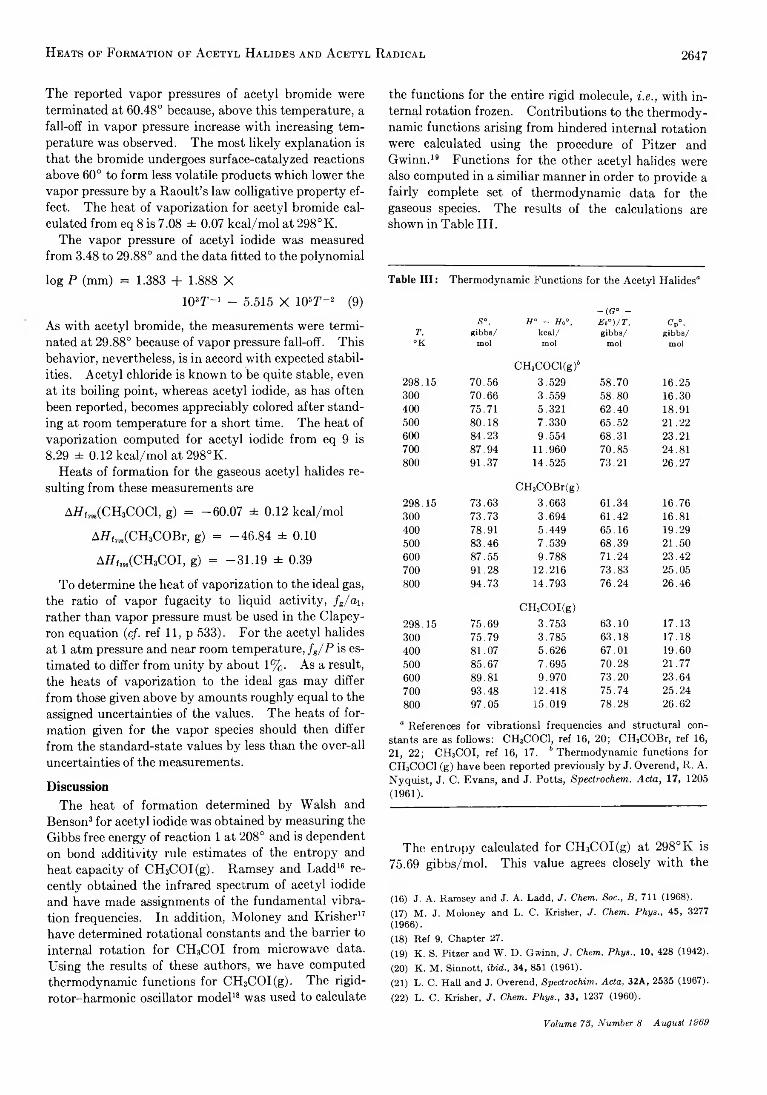
Heats of Formation of A cetyl Halides and A cetyl Radical 2647
The reported vapor pressures of acetyl bromide were terminated at 60.48° because, above this temperature, a fall-off in vapor pressure increase with increasing temperature was observed. The most likely explanation is that the bromide undergoes surface-catalyzed reactions above 60° to form less volatile products which lower the vapor pressure by a Raoult’s law colligative property effect. The heat of vaporization for acetyl bromide calculated from eq 8 is 7.08 ± 0.07 kcal/mol at 298°K.
The vapor pressure of acetyl iodide was measured from 3.48 to 29.88° and the data fitted to the polynomial
log P (mm) = 1.383 + 1.888 X1Q3J1- 1 _ 5.5i5 x 106T - 2 (9)
As with acetyl bromide, the measurements were terminated at 29.88° because of vapor pressure fall-off. This behavior, nevertheless, is in accord with expected stabilities. Acetyl chloride is known to be quite stable, even at its boiling point, whereas acetyl iodide, as has often been reported, becomes appreciably colored after standing at room temperature for a short time. The heat of vaporization computed for acetyl iodide from eq 9 is 8.29 ± 0.12 kcal/mol at 298°K.
Heats of formation for the gaseous acetyl halides resulting from these measurements are
AHf!#i(CH3COCl, g) = -60.07 ± 0.12 kcal/mol
AHf!S,(CH3COBr, g) = -46.84 ± 0.10
AH,J91(CH3COI, g) = -31.19 ± 0.39
To determine the heat of vaporization to the ideal gas, the ratio of vapor fugacity to liquid activity, f j a i, rather than vapor pressure must be used in the Clapey- ron equation (c/. ref 11, p 533). For the acetyl halides at 1 atm pressure and near room temperature, f j P is estimated to differ from unity by about 1%. As a result, the heats of vaporization to the ideal gas may differ from those given above by amounts roughly equal to the assigned uncertainties of the values. The heats of formation given for the vapor species should then differ from the standard-state values by less than the over-all uncertainties of the measurements.
DiscussionThe heat of formation determined by Walsh and
Benson3 for acetyl iodide was obtained by measuring the Gibbs free energy of reaction 1 at 208° and is dependent on bond additivity rule estimates of the entropy and heat capacity of CH3COI(g). Ramsey and Ladd16 recently obtained the infrared spectrum of acetyl iodide and have made assignments of the fundamental vibration frequencies. In addition, Moloney and Krisher17 have determined rotational constants and the barrier to internal rotation for CH3COI from microwave data. Using the results of these authors, we have computed thermodynamic functions for CH3COI(g). The rigid- rotor-harmonic oscillator model18 was used to calculate
the functions for the entire rigid molecule, i.e., with internal rotation frozen. Contributions to the thermodynamic functions arising from hindered internal rotation were calculated using the procedure of Pitzer and Gwinn.19 Functions for the other acetyl halides were also computed in a similiar manner in order to provide a fairly complete set of thermodynamic data for the gaseous species. The results of the calculations are shown in Table III.
Table III : Thermodynamic Functions for the Acetyl Halides0
S °, H ° - H o°,- ( G ° -E 0° )/ T , Cp°,
T, gibbs/ kcal/ g ibbs/ g ibbs/°K mol mol mol mol
298.15 70.56CH3COCl(g)6
3.529 58.70 16.25300 70.66 3.559 58.80 16.30400 75.71 5.321 62.40 18.91500 80.18 7.330 65.52 21.22600 84.23 9.554 68.31 23.21700 87.94 11.960 70.85 24.81800 91.37 14.525 73.21 26.27
298.15 73.63CH3COBr(g)
3.663 61.34 16.76300 73.73 3.694 61.42 16.81400 78.91 5.449 65.16 19.29500 83.46 7.539 68.39 21.50600 87.55 9.788 71.24 23.42700 91.28 12.216 73.83 25.05800 94.73 14.793 76.24 26.46
298.15 75.69CH3COI(g)
3.753 63.10 17.13300 75.79 3.785 63.18 17.18400 81.07 5.626 67.01 19.60500 85.67 7.695 70.28 21.77600 89.81 9.970 73.20 23.64700 93.48 12.418 75.74 25.24800 97.05 15.019 78.28 26.62
“ References for vibrational frequencies and structural constants are as follows: CH3COCl, ref 16, 20; CH3COBr, ref 16, 21, 22; CH3COI, ref 16, 17. b Thermodynamic functions for CH3COCI (g) have been reported previously by J. Overend, R. A. Nyquist, J. C. Evans, and J. Potts, Spectrochem. Acta, 17, 1205 (1961).
The entropy calculated for CHsCOI(g) at 298° K is 75.69 gibbs/mol. This value agrees closely with the
(16) J. A. Ramsey and J. A. Ladd, J. Chem. Soc., B, 711 (1968).(17) M. J. Moloney and L. C. Krisher, J. Chem. Phys., 45, 3277 (1966).(18) Ref 9, Chapter 27.(19) K. S. Pitzer and W. D. Gwinn, J. Chem. Phys., 10, 428 (1942).(20) K. M. Sinnott, ibid., 34, 851 (1961).(21) L. C. Hall and J. Overend, Spectrochim. Acta, 32A, 2535 (1967).(22) L. C. Krisher, J. Chem. Phys., 33, 1237 (1960).
Volume 73, Number 8 August 1969

2648 Jerald A. D evore and H. Edward O’Neal
Table IV : Thermodynamic Data
Species
ARf°î08,kcal/mol
S 0 298,gibbs/mol
S° « 1, gibbs/ mol
H°m - H°tn, kcal/ mol Ref
CH3CHO -3 9 .6 7 63.05 70.40 2.841 24,0ii 14.92 62.28 66.57 1.618 5CH3C01 -3 0 .9 8 75.69 84.12 3.535 6HI 6.30 49.35 52.70 1.282 5
“ Calculated using structural constants of ref 23 and fundamental vibration frequencies assigned by Pitzer and Weltner, ref 24. 3 See text.
bond additivity rules estimate3 of 76.0 gibbs/mol. The experimentally determined Gibbs free energy of reaction1 together with the thermodynamic data of Table IV yields a heat of formation for acetyl iodide of
Afff0m(CH3COI, g) = -30.78 ± 0.42 kcal/mol
where the uncertainty is an estimate of the over-all error. Since this value was obtained in a manner independent of the heat of formation of CH3COI determined in this work and both agree within error limits, we recommend a mean value of
AH(°m(CH3COI, g) = -30.98 ± 0.20 kcal/mol
Substituting this value into eq 3 yields a heat of formation for the acetyl radical of
Atff°2Si(CH3CO, g) = —5.4 ± 0.6 kcal/mol
Walsh and Benson3 also determined an enthalpy of14.3 ± 1 . 2 kcal/mol at 208° for the reaction
I- + CHaCHO ^ CHaCO + HI (10)
From this result they computed a value for the acetyl radical heat of formation of —6.2 ± 1.2 kcal/mol. An
average of these two independent determinations gives a mean value of
AHf°m(CH3CO, g) = -5 .8 ± 0.4 kcal/mol
With the heat of formation of the acetyl radical firmly established, a number of bond dissociation energies can now be computed (see Table V).
Table V : Bond Dissociation Energies at 298°K
Compound ProductsD (C H jC O -B ),
kcal/m ol Ref
CH3COCH3 CH3CO + CH, 80.0 a, b, cCH3CH0 CH3CO + H 86.0 a, b, dCH3C0 -COCH 3 CH3CO + CH3CO 67.0 b, eCH3C0 0 H CH3CO + OH 108.0 o , 6, dCH3COC1 CH3CO + C1 83.2 b, dCHjCOBr CH3CO + Br 67.8 b, dCH3COI CH3CO + I 50.6 b, d
“ Ref 25. 6 This work. c Ref 26, 27. d Ref 11, pp 672-686. ‘ Ref 28.
Acknowledgments. The authors wish to express their thanks to the National Science Foundation and to the U. S. Air Force Office of Scientific Research (AFOSR- 68-1354) for partial support of this research.
(23) R. W. Kilb, C. C. Lin, and E. B. Wilson, Jr., J. Chem. Phys., 26, 1695 (1957).(24) K. S. Pitzer and W. Weltner, J. Amer. Chem. Soc., 71, 2842 (1949).(25) S. W. Benson, “The Foundations of Chemical Kinetics,” McGraw-Hill Book Co., Inc., New York, N. Y., 1960, pp 662-664.(26) G. C. Fettis and A. F. Trotman-Dickenson, J. Chem. Soc., 3037(1961) .(27) D. M. Golden, R. Walsh, and S. W. Benson, J. Amer. Chem. Soc., 87, 4053 (1965).(28) H. E. O’Neal and S. W. Benson, J. Chem. Phys., 36, 2196(1962) .
The Journal of Physical Chemistry

Effect of Cation on the Nmr Spectrum of Fluorenyl Carbanion 2649
Effect of Cation on the Nuclear Magnetic Resonance
Spectrum of Fluorenyl Carbanion
by Richard H. CoxDepartment of Chemistry, University of Georgia, Athens, Georgia 30601 (Received December SO, 1968)
The nmr spectra of fluorenyl lithium, sodium, potassium, and rubidium have been analyzed in terms of chemical shifts and coupling constants. Cation has no effect on the coupling constants. Chemical shifts of the carbanion appear to lower field with increasing charge/radius ratio of the cations with lithium being an exception. The results are discussed in terms of bonding properties of the cations and of the types of ion pairs formed with the cations.
That the chemical shift of a proton in an aromatic molecule reflects to some degree the 7r-electron density on the attached carbon atom has long been recognized as a fundamental concept in nuclear magnetic resonance (nmr) spectroscopy.1 Earlier work in this area suggested a linear correlation between proton chemical shifts and the electron density located on the carbon atom.2-4 Schaefer and Schneider,6 in an attempt to further define this relationship, gave several additional effects other than electron density which must be considered. These additional contributions6 to the chemical shift are: (1) the magnetic anisotropy of heteroatoms and of substituents, ( 2 ) ring current effects, ( 3 )
solvent effects, and ( 4 ) ion association effects of aromatic ions. Of these contributions, the effects of the first three can be adequately treated in favorable cases.6-9 However, the effect of ion association or of counterion on the nmr spectra of aromatic ions has not been considered as extensively.10
Cation was reported to have no effect on the nmr spectrum of triphenylmethyl carbanion.11 Recently, we reported the analysis of the nmr spectrum of fluorenyl potassium (l) .12 From a comparison of chemical shifts with those reported for fluorenyl sodium6 and fluorenyl lithium,18 there appears to be a considerable effect of cation on the nmr spectrum of the fluorenyl
4 5 e
1 9 8
carbanion (1). Clearly, the effect of counterion should be taken into consideration in correlations of chemical shifts of aromatic ions. In this paper we wish to report on the nature of the effect of cation and ion association on the nmr spectra of carbanions. The nmr spectra of fluorenyl lithium, sodium, potassium, and rubidium have been analyzed under identical conditions in terms of chemical shifts and coupling constants. Results are discussed in terms of bonding properties of the cations.
Experimental SectionMaterials. Fluorene, of commercial origin, was used
without further purification. Samples were prepared under high vacuum in usual nmr tubes designed with an “onion-dome” bulb to accommodate the alkali metal mirror. Sodium and potassium mirrors were prepared by distilling the respective metals into the bulb. The rubidium metal was prepared by fusing rubidium chloride and calcium under vacuum. Freshly cut lithium metal, under an argon atmosphere, was placed in the bulb and the tube immediately placed under vacuum. In this maner, a “reactive” metal surface was available for the reduction. Tetrahydrofuran was distilled into the nmr tube after being dried with sodium benzophenone ketyl. Tetramethylsilane (TMS) was added and the samples were sealed. The final concentration of fluorene was 0.45 M.
Spectra. Proton nmr spectra were obtained using a Varian Associates HA-100 spectrometer with a probe temperature of 29°. Calibration of the spectra was by the usual side-band method. Line positions were ob-
(1) J. W. Emsley, J. Feeney, and L. S. Sutcliffe, “ High Resolution Nuclear Magnetic Resonance Spectroscopy,” Vol. 1, Pergamon Press, New York, N. Y., 1965, p 149.(2) H. Spiesecke and W. G. Schneider, Tetrahedron Lett., 468 (1961).(3) G. Fraenkel, R. E. Carter, A. McLachlan, and J. H. Richards, J. Amer. Chem. Soc., 82, 5846 (1960).(4) C. MacLean and W. G. Schneider, Mol. Phys., 4, 241 (1961).(5) T. Schaefer and W. G. Schneider, Can. J. Chem., 41, 966 (1963).(6) G. Fraenkel, D. G. Adams, and R. R. Dean, J. Phys. Chem., 72, 944 (1968).(7) J. A. Pople, J. Chem. Phys., 24, 1111 (1956).(8) C. E. Johnson, Jr., and F. A. Bovey, ibid., 29, 1012 (1958).(9) P. Laszlo in “ Progress in Nuclear Magnetic Resonance Spectroscopy,” J. W. Emsley, J. Feeney, and L. H. Sutcliffe, Ed., Vol. 3, Pergamon Press, New York, N. Y., 1967, p 231.(10) G. Fraenkel, D. G. Adams, and J. Williams, Tetrahedron Lett., 767 (1963).(11) V. R. Sandel and H. H. Freedman, J. Amer. Chem. Soc., 85, 2328 (1963).(12) R. H. Cox, E. G. Janzen, and J. L. Gerlock, ibid., 90, 5906 (1968).(13) J. A. Dixon, P. A. Gwinner, and D. C. Lini, ibid., 87, 1379 (1965).
Volume 73, Number 8 August 1969

2650 R ichard H. Cox
Table I : Nmr Parameters of the Fluorenyl Carbanion
Cation via Vi VZ V4 vg
Li 7.209 6.728 6.353 7.816 5.819Na 7.376 6.899 6.546 8.004 6.035K 7.272 6.808 6.442 7.865 5.893Rb 7.247 6.806 6.441 7.815 5.884
Jnb J13 Ju Jn Jn Ju J, 9
8.05 1.04 0.66 6.60 0.91 7.74 0.638.16 1.08 0.81 6.65 0.94 7.85 0.688.11 0.92 0.86 6.69 1.16 7.81 c8.12 1.06 0.81 6.61 1.22 7.84 0.72
° In ppm downfield from TMS. b In Hz. ' This coupling was not resolved and was removed by decoupling.
tained by averaging the results of two upheld and two downfield scans. A scan width of 50 Hz was employed with a sweep time of 1000 sec. Frequency-sweep spindecoupling experiments were performed using a Hewlett-Packard 201CR audiooscillator monitored by a Varían V-4315 frequency counter. The variable temperature experiments were carried out on a Hitachi R-20 spectrometer operating at 60 MHz.
Results and DiscussionThe reduction of fluorene with alkali metals first
produces the radical anion which at room temperature rapidly decomposes to give the carbanion.14 In this study, the reduction was followed by allowing the solution to come in contact with the alkali metal mirror until the signals from the C-9 methylene protons of the starting hydrocarbon could no longer be detected. At this point, the spectrum was that of the fluorenyl carbanion. The reductions were carried out under identical conditions (solvent, concentration, and temperature) so that any differences in the spectrum of the carbanion are due to the effect of cation. Spectra were analyzed in terms of chemical shifts and coupling constants with the aid of the computer program lacon3.16 Results from the analysis are given in Table I. That proton 9 is coupled to protons 4 and 5 was confirmed by a spin-decoupling experiment. The magnitude of this coupling is similar to other five-bond couplings in aromatic systems.16
The chemical shifts of fluorenyl carbanion (Table I) were assigned by comparison with the shifts of methyl- fluorenyl carbanions.17 Neither resonance considerations nor Hiiekel MO calculations alone account for the order of appearance of the chemical shifts in the spectra. Ring-current contributions7 to the shifts calculated using the tables of Johnson and Bovey8 also predict a different order for the chemical shifts than is observed. However, by using both the contribution due to ring currents and the contribution due to excess charge density, the correct order for the chemical shifts is predicted.18 Chemical shifts calculated in this manner agree to within 0.3 ppm with the experimental shifts of fluorenyl carbanion.
Cation has little effect uopn the coupling constants of fluorenyl carbanion (Table I). Although the couplings have changed considerably from their values in the starting hydrocarbon,19 changes in the coupling con
stants with cation are within experimental error. On forming the carbanion, an increase is found for Jn, Ju, J24, and Jn, whereas Jn and Jn are found to decrease. These changes in the vicinal coupling constants are in accord with those predicted from correlations between bond order and coupling constants.20'21
The chemical shifts are found to reflect the nature of the cation (Table I). Of the four cations, the chemical shifts of fluorenyl lithium appear at highest field whereas the shifts of fluorenyl sodium appear at lowest field. Similar results have been reported for the cyclopenta- diene carbanion.5 Considering all four cations, one might expect a correlation between the chemical shifts of the carbanion and some property of the cations relating their bonding properties. Making the reasonable assumption5 that the chemical shifts of the carbanion are related to electron density, then an increase in electron density between cation and carbanion should result in a decrease in the chemical shift values (higher parts per million) of the carbanion.
Examination of the data in Table I shows that the chemical shifts of the carbanion appear to lower field in the order Rb < K < Na. Fluorenyl lithium is an exception and will bp discussed separately. There is a reasonable correlation between chemical shifts of the carbanion and the following properties of the cations (Rb, K, N a): (1) ionic radius, (2) first ionization potential,and (3) charge/radius ratio. These results may be rationalized by employing Fajans’ rules.22 Fajans
(14) J. J. Eisch and W. C. Kaaka, J. Org. Chern., 27, 3745 (1962).(15) S. Castellano and A. Bothner-By, Mellon Institute, Pittsburgh, Pa., 1966.(16) M. W. Jarvis and A. G. Moritz, Aust. J. Chem., 21, 2445 (1968), and references therein.(17) R. H. Cox, unpublished results.(18) The bond orders and electron densities were calculated using a modified a' technique [A. Streitwieser, A. Heller, and M. F. Feldman, J. Phys. Chern., 68, 1224 (1964)]. Standard bond lengths and bond angles were assumed. Starting parameters used in the calculations were taken from A. Streitwieser, “ Molecular Orbital Theory for Organic Chemists,” John Wiley & Sons, Inc., New York, N. Y., 1961, p 135. The contribution to the chemical shifts due to excess charge density was calculated using the equation d = 10.6 ppm/ electron.5(19) K. D. Bartle and D. W. Jones, J. Mol. Struct., 1, 13 (1967).(20) N. Jonathan, S. Gordon, and B. P. Dailey, J. Chem. Phys., 36, 2443 (1962).(21) W. B. Smith, W. H. Watson, and S. Chiranjeevi, J. Amer. Chem. Soc., 89, 1438 (1967).(22) F. A. Cotton and G. Wilkinson, “ Advanced Inorganic Chemistry,” Interscience Publishers, New York, N. Y., 1962, p 157.
The Journal of Physical Chemistry

Effect of Cation on the Nmr Spectrum of Fluorenyl Carbanion 2651
stated that when two ions, A+ and B- , are placed in close proximity, there will be an interaction over and above their coulombic attraction, mutai polarization. The smaller and more highly charged the cation, the more distortion of the charge distribution in the neighboring anion. Stated another way, within a given series of cations bearing identical charges, the cation with the largest ionic radius will form the more ionic bond to a given anion. Therefore, there will be less distortion of the charge with rubidium than with sodium and, hence, the protons of fluorenyl rubidium should be more shielded than those of fluorenyl sodium. This interpretation is in agreement with the experimental results. However, this interpretation would predict that fluorenyl lithium should be deshielded relative to fluorenyl sodium.
Several studies of the absorption spectra of carban- ions23'24 and of the esr spectra of radical anions28'26 have recently provided conclusive evidence for the existence of two types of ion pairs in solution (solvent-separated and contact ion pairs). The equilibrium between the two types of ion pairs has been shown to depend on temperature, cation, and solvent.23-26 From their studies
R -M + + solvent 5 1 1 R~11M+ (1)
of the absorption spectra of fluorenyl carbanion with various cations, Smid and coworkers23,24 found that, in THF at room temperature, fluorenyl lithium exists predominantly as solvent-separated ion pairs whereas fluorenyl sodium and potassium are mainly in the form of contact ion pairs. Furthermore, they23-24 found that at —70° the equilibrium changes such that fluorenyl sodium exists predominantly as solvent-separated ion pairs and that fluorenyl potassium was unaffected. The important factor in determining the fraction of solvent-separated ion pairs appears to be the solvation state of the cation.24 At 25°, the solvation energy of the Li cation is large enough to overcome the coulumbic attraction between cation and anion whereas for fluorenyl sodium, a temperature of —70° is needed. Changing to more polar solvents also increases the fraction of solvent-separated ion pairs.23
The nmr spectrum of fluorenyl lithium is unaffected by lowering the temperature to —70°. However, at — 70° the spectrum of fluorenyl sodium has shifted up- field such that the chemical shifts are identical with those of fluorenyl lithium. The nmr spectrum of fluorenyl potassium is not affected by lowering the temperature. Therefore, the deviations of the chemical shifts of fluorenyl lithium may be rationalized by the difference in the type of ion pair formed. With solvent separating fluorenyl carbanion and the lithium cation, more of the charge will reside within the carbanion and, hence, the protons will be more shielded than expected from correlations of the charge/radius ratio of the cation. For fluorenyl carbanion, the shifts of the lithium salt appear to be limiting. It is doubtful, however, that the shifts of fluorenyl lithium are those of the “free” carbanion. Conductance studies show that, at the concentrations used in this study, only a few per cent of “free” ions are present.21
In conclusion, we have shown that the chemical shifts of a given anion are dependent on the nature of the cation. Furthermore, it appears that nmr spectroscopy may be used to distinguish between different types of ion pairs. If contact ion pairs are formed, then on the basis of the correlation between chemical shifts of the carbanion and the charge/radius ratio of the cations, the chemical shifts will appear to lower field in the order CS < Rb < K < Na < Li. When solvent-separated ion pairs are formed, deviations to higher field from the above order will be observed or if the ions are completely dissociated, cation will not have any effect on the chemical shifts of the anion.11
Acknowledgment. This work was partially supported by funds provided through the Director of General Research of the University of Georgia.
(23) T. E. Hogen-Esch and J. Smid, J. Amer. Chem. Soc., 88, 307, 318 (1966).(24) L. I. Chan and J. Smid, ibid., 90, 4654 (1968).(25) N. Hirota, ibid., 90, 3603 (1968).(26) N. Hirota, R. Carraway, and W. Schook, ibid., 90, 3611 (1968)
Volume 73, Number 8 A ugust 1969

2652 D avid M. M ohilner
Double-Layer Effects in the Kinetics of Heterogeneous
Electron Exchange Reactions
by David M. Mohilner
Department of Chemistry, Colorado State University, Fort Collins, Colorado 80521 (.Received December 26, 1968)
The effect of the electrical double layer on electrode kinetics is derived for electrode reactions governed by Marcus’ quantum mechanical theory of electron exchange. The potential-dependent form of the transfer coefficient a which is required to bring the classical pseudothermodynamic-absolute-rate equations for the electrode kinetics into agreement with the quantum mechanical theory is derived. It is shown that in each case a depends on the double-layer properties. Reactions involving nonspecific adsorption of reactants and products are considered first. Then, reactions involving specific adsorption of reactants and products are treated. Five different specific adsorption isotherms are considered. These are the Henry, Langmuir, logarithmic Temkin, virial, and Frumkin isotherms. It is shown, both for the cases of nonspecific and specific adsorption, that the logarithm of the formal, apparent exchange current density for fast reactions whose kinetics are measured near equilibrium by relaxation methods should exhibit a quadratic dependence on equilibrium potential similar to the overvoltage dependence previously predicted for the Tafel regions of slow reactions. The conclusion is reached that the faster is the intrinsic rate of the reaction the larger will be the quadratic effect.
In recent years the kinetic theory of electron exchange reactions at electrodes has undergone considerable development through an extension of the quantum mechanical theory of homogeneous electron transfer to the heterogeneous case.1'2 The theory has received experimental support primarily in two ways. First, a predicted correlation was verified between the values of the homogeneous electron exchange rate constants determined from isotopic exchange experiments and heterogeneous electron exchange rate constants obtained by the methods of electrode kinetics.3 More recently a second, and to the electrochemist perhaps, a more surprising prediction has also received some experimental support4 and evoked new theoretical discussions.6 This second prediction is that the Tafel equation of classical electrode kinetic theory is actually only an approximation and that, in the absence of slow mass transfer, the logarithm of the current density at potentials far from equilibrium is a quadratic, rather than a linear function of electrode potential. In other words, the transfer coefficient a which occurs in the classical formulation of electrode kinetics should be a linear function of electrode potential rather than a constant.
The precise form of this second prediction of the new theory depends, naturally, on the detailed nature of the double-layer effects involved in the electrode reaction. In the present paper the equation derived by Marcus1 for the standard (formal) electrochemical free energy of activation of a heterogeneous electron exchange reaction will be used in conjunction with current ideas about the structure of the electrical double layer® to predict the detailed form of the potential dependence of the log
arithm of the current density for electrode reactions involving specific as well as nonspecific adsorption of reactants and products. The corresponding equations for the classical transfer coefficient a will be derived. In addition, it will be shown that on the basis of Marcus’ theory a similar prediction may be made about the equilibrium potential dependence of the logarithm of the formal, apparent exchange current density for fast electrode reactions whose rates are measured close to equilibrium by small amplitude relaxation methods.
I. Nonspecific Adsorption of Reactants and Products
A. Specification of the Reacting System. Let the overall electrode reaction be
0(8) + ne(M) = R(S) (1)
where 0 and R are the chemical symbols for the oxidized and reduced forms of the redox couple, respectively, and n is the number of electrons involved in the electron transfer step. Let zo and zn be the ionic charges of the
(1) R. A. Marcus, J. Chem. Phys., 43, 679 (1965).(2) For extensive reviews of the literature of this subject, cf. R. A. Marcus, Ann. Rev. Phys. Chem,., 15, 155 (1964); V. G. Levich, Advan. Blectrochem. Eleclrochem. Eng., 4, 249 (1966).(3) R. A. Marcus, J. Phys. Chem., 67, 853 (1963).(4) R. Parsons and E. Passeron, J. Electroanal. Chem., 12, 524 (1966).(5) P. Delahay, “ Current-Overvoltage Characteristic with Potential Dependent Transfer Coefficient,” Technical Report No. 8, Office of Naval Research, Contract Nonr-285(65), April 1968.(6) For recent reviews, cf. (a) P. Delahay, “ Double Layer and Electrode Kinetics,” Interscience Publishers Inc., New York, N. Y., 1965; (b) D. M. Mohilner in “ Eleetroanalytical Chemistry,” Vol. 1, A. J. Bard, Ed., Marcel Dekker, New York, N. Y., 1966, pp 241- 409.
The Journal of Physical Chemistry

D ouble-Layer Effects 2653
designated species (including sign). Then, by conservation of charge
20 = Zr + n (2)
The specification (S) denotes that the species is present in the homogeneous bulk of the solution, and (M) denotes that the electrons are in the metal electrode. It is assumed either that no slow mass transfer is involved or that a correction for mass transfer has already been made. In the latter case the specification (S) denotes that the species is effectively outside the electric field of the double layer.
Reaction 1 is assumed to involve the following three steps
0(S) = O(OHP) (3)
O(OHP) + ne(M) = R(OHP) (4)
R(OHP) = R(S) (5)
Here the specification (OHP) denotes that the species is adsorbed nonspecifically at the outer Helmholtz plane? It is assumed that the adsorption-desorption steps (eq 3 and 5) remain in equilibrium. Equation 4 is the ratecontrolling step; it is an electron exchange step in the sense of Marcus’ definition.1
B. Equation for the Classical Transfer Coefficient a. According to Marcus’ quantum mechanical theory,1 the standard (formal) electrochemical free energy of activation for the specified reaction in the forward (cathodic) direction is given by
A (?*X wv + w1 nF(E — E0')4 "* 2 1 2 l"
[nF(E - E°Q + (wp - w1) ] 2 4X (6)
one mole of the designated species from the bulk of the solution through the field of the diffuse layer to the outer Helmholtz plane. Let </>2 denote the difference of electric potential across the diffuse layer.6 Then
wT = z0F<t>2 (7)
and
wp = zuFfo = ( z 0 — n)F<t> 2 (8 )
The potential drop across the diffuse layer <f>2 is a function of the electrode potential E. Thus, the standard free energy of activation can be written as the sum of two parts
A(?* = A(?*° + AC?*6 (9)
where A(?*° = A/4 is potential independent, while AC? * 6 depends on E. Combining eq 6 -8 one obtains
(2z0 — n)F<t> 2 2 +
nF(E - E0>) 2
+
n*F! [(E - E°Q - 02]2 4X
(10)
Equation 10 gives the electrical part of the standard electrochemical free energy of activation in the cathodic direction when neither reactant nor product is specifically adsorbed. The corresponding equation for the anodic direction may be obtained by replacing the quantity (E — E°r) by its negative and by interchanging the definitions of wr and wp. Thus, the electrical part of the standard electrochemical free energy of activation in the anodic direction is
(2z0 —;rì)F<t> 2 nF(E — E0')' 2 2
In eq 6 the quantity X is equal to the standard free energy of activation when the electrode potential equals the formal potential E0', and in the absence of doublelayer effects. X may be calculated theoretically from a suitable model,1 but for our purposes it suffices to remark that X is a quantity which is independent of the actual electrode potential E. For convenience we assume E and Ea' are both measured on the standard hydrogen scale, but any other reference electrode would serve as well. The IUPAC sign convention for the formal electrode potential is implied by eq 6 ; i.e., E0’ > 0 implies that the reduction half-reaction is spontaneous when the concentrations of both O and R are 1 MJ F is the faraday. The quantities w1 and wp in eq 6 denote the reversible work necessary to bring the reactants (species 0) or products (species R), respectively, in their standard states, from the bulk of the solution into the configuration relative to the electrode surface required for electron transfer. Under the assumption that neither species is specifically adsorbed, the work terms wr and wp are given by the electric work of transporting
n*F*[(E - E ') -4A 1 '
In principle, eq 10 and 11 contain all the information which is required to deduce the potential dependence of the current density (rate) for the specified electrode reaction. No transfer coefficient a appears in either of these equations, nor is one necessary. Actually, a was a quantity introduced in classical electrode kinetic theory to avoid the problem of obtaining a detailed quantum mechanical description of the electrical behavior of the activated state. It is of interest, nevertheless, to see what form the classical transfer coefficient a would have to take in order to bring the classical and quantum mechanical expressions for the rate constant into concordance. For this purpose, the most convenient method of deducing the classical expressions for
(7) Note that this is the opposite sign convention to that employed originally by Marcus.1 The IUPAC sign convention is used here because that convention is nearly always the one employed nowadays by electrochemists.
Volume 73, Number 8 August 1969

2654 David M. M ohilner
A(?*e and AG>e is the pseudothermodynamic-absoute- rate formalism originated by Parsons.8
The basic idea of Parsons’ method is to consider the reacting system in each of the following states: initial state, equilibrium state in the double layer immediately preceding the rate-controlling electron transfer step, equilibrium state in the double layer immediately following the rate-controlling electron transfer step, final state. Designate these states I, II, III, and IV, respectively. Calculate the electrical part of the standard electrochemical free energy Ge by the standard methods of electrochemical potentials. Then, when neither reactant nor product is specifically adsorbed, one obtains the following equations for Ge in the designated states
GTe = —nF(E - E«') + (z0 - n)F4>a (12)
Gn° = -n F {E - & ') + (z0 - n)F<j>a + z0F<t>2 (13)
Gme = +(zo — n)F<f>2 + (20 — n )F f> a (14)
Crive = + ( * > - n)F<j>a (15)
In eq 12-15, <f>a is the inner electric potential of the solution.9 In order to avoid the necessity of having an exact quantum mechanical description of the activated state, one now adopts a hypothesis. That hypothesis is that the change in the electrical part of the standard electrochemical free energy of the system in passing along the reaction coordinate from state II to the activated state *, i.e., (G*e — (?ne), is some fraction 0 < a < 1 of the total change of Ge in passing from state II to state III, i.e., {Gin — GiT). This hypothesis which has been called the “intrinsic hypothesis of electrode kinetics,” is tantamount to assuming that the electrical part of the standard electrochemical free energy of the system is a monotonic function along the reaction coordinate between states II and III even though the total electrochemical free energy passes over a hump at the transition state.6a It is ordinarily assumed that a is a constant. In order to bring the Parsons formalism into agreement with Marcus’ theory we now change the wording of the “intrinsic hypothesis” to the following: ((?*e — G n e) may be calculated from(Gur® — G 1 1 ) by multiplying the latter quantity by a function a{E) > 0. Using this new definition of a oneobtains the following expressions for A(?*e and A&’*e
A G*e = a n F [ ( E — E0') — <f>2] -f- ZoF<j>2 (16)
AG*e = (a - 1 )nF[(E - E0') - +(z0 — n)F<j>2 (17)
Equations 16 and 17 have precisely the same form as the expressions derived classically, but now a is to be regarded as a function of potential. The exact dependence of a on electrode potential can be derived simplyby equating the expressions for A(?*e given by eq 10 and
16 or, equally well, by equating the expressions for AG-'*6 given by eq 1 1 and 17. In either case, one obtains the following equation for the transfer coefficient
« = V* + 7£ [ ( E - E n - fc] (18)
Equation 18 shows how the transfer coefficient a of classical electrode kinetic theory must be redefined in order to bring the classical expression for the rate of the electrode process into agreement with Marcus’ quantum mechanical theory of heterogeneous electron exchange when neither the reactant nor the product is specifically adsorbed. Two points about a should be particularly noted.
First, a is a function of the difference between the actual electrode potential E and the formal potential E0' rather than of the ordinary over-voltage rj = (E — Ee) where Ee is the equilibrium potential given by Nernst’s equation. It is only in the case of a solution poised with an equimolar mixture of 0 and R that a depends simply on 77 (cf. ref 5). This basic dependence of the rate of the electron transfer reaction on (E — E0') rather than on g is a general feature of Marcus’ theory.1 Therefore, for convenience in notation, we define a new quantity 7?0'
tj0' = (E — Ea>) (19)
called the formal overvoltage. In terms of formal overvoltage the transfer coefficient becomes
« = 7* + ^ ( « ° ' - 4*) (20)
Secondly, a is a linear function of the formal overvoltage corrected for the potential drop, <f>2, across the diffuse layer. Thus, in order to make the transfer coefficient of classical electrode kinetic theory consistent with the quantum mechanical theory, a must include a double-layer term. This particular form of doublelayer dependence given for a by eq 20 is valid only for the case in which neither reactant nor product is specifically adsorbed.10 The form of a in the presence of specific adsorption of reactants and products is treated in section II.B. below. It is worth remarking at this stage, however, that no restriction on the presence or absence of specific adsorption of the supporting electrolyte is implied by eq 20.
(8) R. Parsons, Trans. Faraday Soc., 47, 1332 (1951). For a particularly clear discussion of the principles of this method, cf. Delahay, ref 6a, Chapter 7.(9) R. Parsons in “ Modern Aspects of Electrochemistry,” No. 1, J. O’M. Bockris, Ed., Butterworth and Co. Ltd., London, 1954, Chapter 3.(10) The assumption implicit in the above treatment, that the same OHP serves for both reactant and product species, is probably quite reasonable as a first approximation for electron exchange reactions. Since no chemical bonds are broken or formed in the reaction, the solvated, nonspecificaliy adsorbed species O and R should differ little in size. Thus, the same value of <fa should serve for each.
The Journal of Physical Chemistry

D o u b l e - L a y e r E f f e c t s 2655
C. Current-Potential Characteristics. The cathodic and anodic electrochemical (potential dependent) rate constants for an electron exchange reaction at an electrode are given1 by the equations
cathodic
k = KPZhete -*G*/RT = KPZheie - '/iRTe-^ * °/RT (21)
anodic
k = KPZhete -^ * /RT = KPZhete - x/iRTe-^ *°/RT (22)
Here Zhet is the heterogeneous collision number calculated for an uncharged species with unit area of the electrode surface; it is given by (kT/2irm*y/2 when the species has unit concentration and mass m*. (k in thisexpression is the Boltzmann constant and T is the absolute temperature.) k in eq 21 and 22 is a velocity- weighted transition probability summed over all energy levels in the electrode; it will be equal to unity for an “adiabatic” reaction, p is the square root of the ratio of the mean-square deviation of the distance of the reacting particle from the electrode surface to the mean-square deviation of the normal distance of the representative point of the system in configuration space to the reaction hypersurface. For most work using Marcus’ theory to date it has been assumed that «p ^ 1. For the purpose of this paper, which is concerned with the dependence of the reaction rate on electrode potential and double-layer properties, it suffices to assume that the product xpZhet is independent of electrode potential. The standard (formal) rate constant is given by
kP' = KpZhete -x/iRT (23)
The potential-dependent parts of the electrochemical rate constants are determined by the particular forms of
AG>e and AG*e which, in turn, depend on the assumed double layer model. When the reaction involves only nonspecific adsorption of reactant and product eq 10 and 11 hold. Thus the cathodic and anodic partial current densities, 7 and / , respectively, assuming no mass transfer control, are given by (cf. eq 10,11, and 19)
cathodic
I = nFkc0h =nFk° 'c0he ~ (2w ~ n'>F 2R Te ~ - h) !/ 4\r r g - rtf,»72« t
(24)
anodic
|/| = nFkcn
— nFk°'cn>e ~(2z>~n)F4,,/2RTe—n,F,W‘' - ‘h),/4>‘RT y
e nFv°'/2R T ( 2 5 )
In eq 24 and 25 the symbols c0b and cRb represent the bulk concentrations of species 0 and R, respectively.
The net, i.e., measured, current density at any potential is denoted by I where11
I = 7 - 1/1 (26)When the electrode potential is equal to Ee, the
equilibrium potential given by Nernst’s equation, no net current flows (7 = 0). Then the cathodic and anodic partial current densities have equal magnitudes. The common value of 7 or |7| at 7?e will be denoted 7a°' and called the formal, apparent exchange current density. (The word formal implies that concentrations rather than activities are used in the expression. The word apparent, following Delahay,12 implies that a doublelayer dependence is included.) The equation for 7a0' is obtained from eq 24 or 25 by substituting for if' its equilibrium value, y f = Ee — En', and for <j>2 the value <he of the potential drop across the diffuse layer prevailing at Ee. Thus13
7a0' = live0', <f>2e)= nFk0'cobe~ (-2z°~*>F't'K/2RTe~nV2<'’”’0'~'t’K /'4:XRI' X
e -nF„e°72RT (27)
From eq 27 one derives (note that d y f = dEe)
RT /rò In 7a°'\ ~Zo /'zo0 XnF\ àyf' )cob U (\n
0 - s )1 nF, ,J + 2TW - <f>2e) 1
1” òeJ Ì (28)
Equation 28 shows that the quantum mechanical theory predicts a quadratic dependence of the logarithm of the formal, apparent exchange current density on the equilibrium potential. This is an important prediction of the theory, because it means that the search for systems capable of yielding experimental proof of Marcus’ original prediction1 about the quadratic potential dependence on the standard (formal) free energy of activation need not be limited to slow reactions4,6 whose kinetics can be studied in the Tafel region.14 A more detailed discussion of this point is given in Appendix A. In fact eq 28 shows clearly that the faster is the intrinsic rate of the reaction, i.e., the larger is fc°' or the smaller is X, the better should be the chances of observing the quantum mechanical quadratic effect experimentally.
(11) The usual sign convention for current is employed. Thus, cathodic current is considered positive, and anodic current is taken as negative.(12) P. Delahay, “Advances in Electrochemistry and Electrochemical Engineering,” Vol. 1, Interscience Publishers, Inc., New York, N. Y., 1961, p 238.(13) By way of comparison one notes that the corresponding classical (Frumkin) equation12 for /¡¡' is (cf. eq 16 and 17)
I P = nFk°’cohe (27')
If the expression derived for a (eq 20) is substituted into eq 27', the corresponding equation derived on the basis of the quantum mechanical theory, eq 27 is obtained.(14) Apparently this prediction of Marcus’ theory has not been previously noted in the literature.
Volume 78, Number 8 August 1969

2656 David M. M ohilner
Because of the critical effect of both 02e and (ò<f>i(./òEe) on the actual value of the slope of a plot of (RT/nF) (ò In at given value of Ee, it will be necessaryto have available accurate values of these two doublelayer parameters as functions of potential for the system whose kinetics are being measured before this prediction of the theory can be verified conclusively. Such data for electron exchange reactions do not appear to be available in the literature, at least in easily usable form. However, there are strong indications that the V3+-V 2+ couple in perchloric acid solution may be a system which exhibits the quadratic effect. RandlesI6a measured the kinetics of this quasi-reversible electron exchange reaction by a small amplitude relaxation method (faradaic impedance) and also by polarography. The results of both experiments in 1 M HC104 gave values of the apparent transfer coefficient16 aapp ranging from 0.50 at J7e°' = -0 .05 V to 0.57 at Ve0' = 0.05 V. The required double-layer parameters for 1 M HC104 do not appear to have been determined. However, using the plot of <f>2 vs. E for 0.5 M HC104 given by Parsons and Passeron4 and an estimate of X for the vanadium II—III couple, one can make a rough test of eq 28. As a first approximation, one may estimate X by assuming that the logarithm of the ratio of the factors KpZhet for the V3+-V 2+ and the Cr3+-Cr2+ couples is small in comparison with the logarithm of the corresponding ratio of the formal rate constants. Then one deduces from eq 23 that
kP' + 1+Xy*+-V2+ = Xcr>+-Cr2+ — 4i?T In 7— (29)
kP Cr'+-Cr2 +
Using the value of Xcr»+-cr2+ — 44 kcal/mol determined by Parsons and Passeron, and the value of k0' given by these authors for Cr3+-Cr2+, and the value of k0' for the V3+-V 2+ couple given by Randles, one obtains Xv>+-v2+ == 30 kcal/mol. (Note that X is not an extremely sensitive function of k°' due to its logarithmic dependence on the latter quantity.) Now estimating the values of 02e and (ò02e/òEe) from the graph of Parsons and Passeron, and assuming that these values hold approximately for the 1 M HC104 solution, one calculates from eq 28 a range of slopes (aapp) of 0.52 at jje0' = -0 .05 V to 0.56 at Ve0' = 0.05 V. The calculated shift of slope (aapp) with change of formal overvoltage is in the right direction and of the proper magnitude. In a very recent study Randles and White- house15b remeasured the kinetics of the V3+-V2+ couple in perchloric acid by use of a new small amplitude relaxation method which involves the measurement of the second harmonic component of the faradaic current. The magnitude of the change of aapP with change of formal overvoltage was found to be somewhat smaller than reported in the earlier study.16® Nevertheless, the change was definite and in the direction predicted by eq 28. These results suggest strongly that the predicted quadratic effect may be present in the V3+-V 2+
system in perchloric acid medium. It should be noted that the intrinsic rate (k°') of the electron exchange for this system is about 400 times faster than for the Cr3+- Cr2+ couple, the only couple for which the quadratic effect has been previously reported. In view of these results it would appear advisable to undertake detailed experimental electrode relaxation and double-layer studies for a variety of fast electron exchange reactions over as wide a range of equilibrium potentials as possible.
The values of 7a°' required to test eq 28 may be determined from small amplitude relaxation experiments in exactly the same way12 as in the case of a reaction obeying classical theory. For example, in a potential-step chronoamperometric experiment one can determine from standard diffusion analysis the value of the electron transfer controlled current, I, at a given overvoltage v — V0> ~ Ve0'- For sufficiently low overvoltages a plot of 7 will then be directly proportional to t] as in the classical case. In order to show this, one notes first6 that for small overvoltages the value of the potential drop 02 across the diffuse layer will remain essentially constant at 02e- Then combining eq 24-27 one derives
J __ YlFkP'c ~ Zo~ — n2F2(i7e0' — <£2e)V4X-R!T y
( C o b C R b ) l/ie 1 “ niFH^ 0' - 4>*)/MtT)ve [ - n>F*/*\RW y
( e -n F v / 2 R T _ e + n F v/2RT^ ( 3 q )
Now one expands the four exponentials in 7? in Mac- laurin series and drops all terms involving quadratic and higher degree terms in rj. The result is
Equation 31 is exactly of the same form as the linearized current-overvoltage equation for classical electrode reactions. However, 7a°' is given by eq 27.
At sufficiently high cathodic or anodic overvoltages eq 26 shows that I will equal either / or / , respectively. In classical discussions of electrode kinetics these potential ranges are called the Tafel regions and the corresponding plots of In I vs. E are called Tafel lines. From eq 24 and 25 one sees that for reactions obeying Marcus’ theory the plots in the Tafel regions will be quadratic in potential. The slopes of the Tafel curves are
cathodic Tafel Slope
(15) (a) J. E. B. Randles, Can. J. Chem., 37, 238 (1959) ; (b) J. E. B. Randles and D. R. Whitehouse, Trans. Faraday S o c 64, 1376 (1968).
The Journal of Physical Chemistry

D ouble-Layer Effects 2657
anodic Tafel Slope
(33)
At the same value of r¡0' only
(34)
Equation 34 holds in the classical theory also. In the absence of double-layer effects it would be true regardless of the values of potential at which the slopes of the two Tafel lines are measured, since the classical cathodic and anodic Tafel slopes are —a and (1 — a), respectively. With nonspecific adsorption of reactants and products, plots of the so-called corrected Tafel lines17 have these slopes at any values of (E — fa).
II. Specific Adsorption of Reactants and ProductsA. Specification of the Reacting System. The over
all reaction is again given by eq 1, and eq 2 expressing conservation of charge is also still valid. However, it is now assumed that both the reactant species 0 and the product species R are specifically adsorbed.6 The overall electrode reaction thus involves the following three steps
site (inner layer) + O(S) = O(IHP) (35)
O(IHP) + ne(M) = R(IHP) (36)
R(IHP) = R(S) + site (inner layer) (37)
Equations 35 and 37 are the specific adsorption-desorption steps. They are assumed to remain in equilibrium. The specification (IHP) denotes that the electrical center of the specifically adsorbed ion is located at the inner Helmholtz plane. The electron transfer step, eq 36, is the rate-controlling step. (It is again assumed that either no slow mass transfer is involved or that a correction for mass transfer has already been made.)
The specific adsorption equations (35 and 37) employ a formalism which was introduced originally to describe adsorption of neutral organic molecules at ideal polarized electrodes18 and later extended to the case of specific ionic adsorption of reactants and products in faradaic electrode kinetics.19 The designation site in eq 35 and 37 under this formalism implies that the specific adsorption reaction may be represented by a replacement reaction in which solvent molecules adsorbed in the inner layer are desorbed in order to make room for the specifically adsorbing ion. The use of the term site does not necessarily imply any surface heterogeneity, although that case may be treated within the context of the formalism.
The standard electrochemical free energy of adsorption for species O will be denoted AGo° while that for species R will be denoted by A(7r°.
The standard electrochemical free energies of adsorption may be expressed as the sum of two parts, one of which depends on the electrical state of the system, while the other is independent of electrical state. In principle, the electrical state may be specified either by the value of the electrode potential E or of the excess charge density on the electrode, qM. For specific ionic adsorption qM is the most convenient electrical variable.6’20 Therefore we shall consider the standard electrochemical free energies of adsorption to be composed of two parts, one charge dependent, the other charge independent. Thus
AGo° — A(?on H- AGo" (38)
and
AGn° = AGE1 + AGE (39)
Here AGn denotes the charge-independent part and AG* the charge-dependent part of the standard electrochemical free energy of adsorption of the designated species. Because substances 0 and R differ only by the exchange of electrons it is realistic to assume, as a first approximation, that the differences in their AG° values arise only from differences in the charge-dependent parts. Thus we shall assume that
A(?o9 AGE (40)
but
AG0n = AGE (41)
B. Equation for the .Classical Transfer Coefficient a. Equation 6 for the standard (formal) electrochemical free energy of activation again holds since there is no restriction in the derivation of that equation on the type of adsorption. For the cathodic direction one has for the work terms wT and wp
wr = AGo° = AG0n + AGo" (42)
and
wp = AGr° = AGE + AGE (43)
Thus with specific adsorption of reactants and products, eq 6 becomes
(16) In the context of classical electrode kinetic theory the value of (.RT/nF){Z> In Ia0,/d>te0,)cob would equal — a, the so-called “ true transfer coefficient,” in the absence of any double-layer effects. In the presence of double-layer effects the slope of such a plot would be termed an apparent transfer coefficient; cf. eq 27', footnote 13.(17) K. Asada, P. Delahay, and A. K. Sundaram, J. Amer. Chem. Soc., 83, 3396 (1961).(18) P. Delahay and D. M. Mohilner, ibid., 84, 4247 (1962).(19) D. M. Mohilner and P. Delahay, J. Phys. Chem., 67, 588 (1963).
Volume 73, Number 8 August 1969

2658 David M. M ohilner
— > X AGo" + AGr” AGo5 + AGr5A(?* = ï + -----------2---------- + ---------- 2---------- +
nFrf' [nFri°' - (AG05 - AGr5) ]22 + 4X
(44)
The corresponding equation for the anodic direction is obtained by interchanging the definitions of w T and w p
and by substituting —if' for t?0' in eq 44. Thus
<— X AGo” + AGr” AGo5 + AGr5 A G , = i + -----------2 + g -
n F ^ ’ { ( - 1) [ n F f - (AGo5 - AGR5) ] j2 2 + 4X
As in the case of nonspecific adsorption of reactants andproducts, one notes the AG, and AG* may be written as the sum of two parts, one dependent on the electrical state of the system, the other independent of it. However, when there is specific adsorption of reactants and products the nonelectrical components are no longer given simply by X/4. Rather one has
c _ X AGp” + AGr" AG, 4 + 2 (46)
The electrical parts of the cathodic and anodic standard (formal) free energies of activation are then given by subtracting the quantity given by eq 46 from eq 44 and 45, respectively.
We now determine the functional form of the classical transfer coefficient a which is required to make the classical expressions for the rate constants for the cathodic and anodic reactions agree with those derived on the basis of Marcus’ quantum mechanical theory. As in the case of nonspecific adsorption of reactants and products, the approach is to equate the quantummechanical and classical expressions for AG® or AG®. The classical expressions were derived using the pseudo- thermodynamic absolute rate formalism by Mohilner and Delahay.19 For the cathodic direction the following equation was obtained
AG,® = AGo5 + a[nFv°' - (AG05 - AGr5)] (47)
Now equating the two expressions for AG,® one obtains
a = i + ¿ [n fy » ' - (AGo5 - AGr5)] (48)
tant and product are specifically adsorbed differs in functional form from eq 20 for the transfer coefficient when neither reactant nor product is specifically adsorbed only in the double-layer correction to the formal overvoltage. In the case of specific adsorption one subtracts AAG5 from ?f r; in the case of nonspecific adsorption, if' is corrected by subtracting $2.
C. Current-Potential Characteristics. The cathodic and anodic electrochemical rate constants, fc and k, will again be given by the basic equation of Marcus.1 In this case, however, the standard (formal) electrochemical free energies of activation will be given by eq 44 and 45, respectively. Thus with specific adsorption of reactants and products one has (cf. eq 21 and 22).
cathodic
7* _ y — &Gif/R T _k K p/j het
KPZhBte K/4RTe~(‘AG°n+ AG*n) /2BTe~ AG*e/R T (51)
anodic
k = KPZheie - AG*/RT =
KPZhe te-*/iRTe - (A(?on+ - ^ RT (52)
Again the formal rate constant W will be defined as the common potential independent part of k or k. In the case of specific adsorption of reactants and products, k0' will contain an additional exponential factor involving the sum of the charge-independent parts of the standard electrochemical free energies of adsorption of species 0 and R. Thus
fc°' = KpZhete - WiRTe - (AGon+AGRn)/2RT (53)
Combination of eq 51, 53, 49, 46, and 44 for the cathodic case and of eq 52, 53, 49, 46, and 45 for the anodic case then yields the following expressions for the electrochemical rate constants.
cathodic£.0 >e - AGot/R T& - nFW - A AGI)/2 R Tg - - A AGs) */4\R T
(54)
anodic£0/ - AGBS/Rrg+nF W - A AGt)/2RTg - n^0?°' - A AGs) t/4\RT
(55)
For convenience in notation define
AAG5 = (AGo5 - AGr5)/? iF (49)
Then
<* = ~ + - AAG5) (50)
Note that eq 50 for the classical transfer coefficient a for the electron exchange reaction in which both reac
The electrochemical rate constants for a reaction involving specific adsorption of reactants and products do not suffice, contrary to the case of nonspecific adsorption, to determine the current potential characteristics. In addition, in order to formulate the partial current densities, I and / , it is necessary to consider the type of specific adsorption isotherm obeyed by the electroactive species. Using the “site” formalism19 one can express the partial current densities as
The Journal of Physical Chemistry

D ouble-Layer Effects 2659
cathodic
I = nFkcohaa (56)
anodic
|/| = nFkcnas (57)
In eq 56 and 57 the symbol as stands for the activity of the sites, a quantity which is dependent on the surface concentration, r1, of the specifically adsorbed species in the inner layer. The particular form of the function as = as(r1') depends on the specific adsorption mechanism. Strictly speaking, specification of the type of isotherm does not suffice to establish the form of asir*) unequivocally; that requires also a knowledge of the adsorption-desorption rate equations.
The adsorption isotherm for a specifically adsorbed ion has the general form20
0a* = (Schy± = 0 'ch = - = G(rO (58) aa
In eq 58,0 = exp(— AG°/RT) where A(7° is the standard electrochemical free energy of adsorption (c/. eq 38 and 39), a± is the mean ionic activity, cb is the bulk concentration of the adsorbing ion, y± is the mean ionic activity coefficient, 0' = 0y±, and G(r4) is the characteristic surface concentration form of the adsorption isotherm. The symbol aA stands for the activity of the adsorbed species on the electrode surface; like as it is a function of the surface concentration IT Clearly specification of the isotherm determines only the ratio Oa/ us, and several alternative forms of the individual functions aA(r‘) and as(r') could yield the same characteristic ratio (aA/as) = GfT1). Determination of the particular forms of the functions aA(r*) and as(rO requires, in principle, a knowledge of the rate equations for specific adsorption-desorption, and such information is not presently available. However, it has been possible to postulate plausible forms for these activities for the most common isotherms by making an analogy to gas-phase adsorption kinetics. Thus, for example, when the logarithmic Temkin isotherm is obeyed it was assumed18 that the rate equations have the same form as was given by Temkin21 for adsorption from the gas phase. In the previous treatment of classical electrode kinetics with specific adsorption of reactants and products19 only the logarithmic Temkin isotherm was considered. In this discussion of electron exchange reactions obeying Marcus’ quantum mechanical theory we shall also consider four other important isotherms, namely : the Henry isotherm, the Langmuir isotherm, the Frumkin isotherm, and the virial isotherm.22
The Henry isotherm is always obeyed as a limiting law at sufficiently low surface concentrations, i.e., for sufficiently dilute solutions of the adsorbing species. In many experimental studies of electrode kinetics, particularly in relaxation studies of fast reactions, the
concentrations of species O and R will be low enough (millimolar range) that the Henry isotherm will be valid. We shall therefore examine the Henry isotherm first and in the most detail. Then we shall show how the current potential characteristics will differ from Henry behavior when one of the other isotherms is obeyed.
1. Henry Isotherm. This isotherm has the surface concentration form
0'ch = RTTi (59)
It is valid whenever the fractional monolayer of adsorbed ions in the inner layer is sufficiently dilute that interactions between neighboring ions may be ignored. Under such conditions the adsorbed layer behaves analogously to a two-dimensional ideal gas.20 In the Henry region then, the surface coverage 9 = Vi/T iiattX, where U m ax is the maximum possible value of U, is extremely low.22 In other words, the surface is essentially totally covered with sites. We now choose the surface totally covered with sites as the standard state for sites. Thus, for the Henry isotherm as = 1 and a a — RTT1. For the Henry isotherm therefore the partial current densities are given by (cf. eq 56 and 57)
(20) For a detailed discussion and a table of the most common isotherms see ref 6b, pp 364-380. See also R. Payne, J . E l e c t r o c h e m . S o c . , 113, 999 (1966), for a discussion of the advantages of expressing the isotherm in terms of the mean ionic rather than the salt activity.(21) M. I. Temkin, Z h . F i z . K h i m . , IS, 296 (1941).(22) In the discussion of adsorption isotherms to follow, it will always be assumed th a t the “sites” are equally available to species O and R and the characteristic function G (P ) will be assumed to apply to the to tal surface concentration of specifically adsorbed ions. T hat is T* = IV + F r’ where I V and Fr* are the individual surface concentrations of the indicated species. Therefore the activity of the adsorbed species, aA, appearing in the expression (aA/os) = (?(r*) in the equation for the adsorption isotherm (eq 58) m ust be defined as the geometric mean of the activities of the individual adsorbed species. Let a o A and orA stand for the activities of adsorbed O and R species. Let the individual adsorption isotherms for these species be
— = coby±e ~ AGo°/RT ( A )as
and
^ = cR*y± e - AG«°/RT ( B )as
In eq A and B the activity of the sites as is assumed to be the same and a function of the to tal surface concentration T*. We now define the mean activity of adsorbed species to be a x ~ («oaora) 1/ 2. N o w multiplying the two individual isotherms (eq A and B) together and then taking the square root we obtain the following m e a n a d s o r p t i o n i s o th e r m .
(cobCRb)7 !y±e - (AGo0 + AGKO)/2B:r = 0 ' c b (C)Therefore, in our discussion, when the adsorption isotherm is specified i t will always be the mean adsorption isotherm given by eq C which is implied, and the activity of the adsorbed species referred to will be the mean activity a a which, like as, will be w ritten as a function of the to tal surface concentration T \
Volume 73, Number 8 August 1969

2660 David M. Mohilner
cathodic
lu — nFkCob_ ^GoQ/RTg ~ nFtv°'- ^GQ)/2RT ^
e - n *F * W > ' - M ^ Q i P / W R T j'gQ'j
anodic
| /h | = n F % C R h
_ rç, °(>~~ RÎ/-^ ^ + n T(’/0, — &&Gq)/2RT y
e - n * F H i f l ' - A & G W / 4 K R T
The subscripts, H, on 7 h and / H in eq 6 0 and 6 1 imply Henry conditions. The partial current densities for other isotherms will then be derived as modifications of the partial current densities under Henry conditions.
When the Henry isotherm is valid the formal, apparent exchange current density, I0,&H, is given byJ0f H AGOeQ/RTg — nFirieP’ — &AGeQ)/2RT y
^_n22(qeo'_AAGeff)2/4Xi2r 02
In eq 62 the subscripts e denote the value of the indicated quantity at the equilibrium potential Ee. One derives from eq 62 (note that dt},.0' = dEe)
studied to date the variation of AGq with qM is generally either hnear or quadratic.6
The Tafel slopes for an electron exchange reaction with specific adsorption under Henry conditions are easily derived from eq 60 and 61. Thus
cathodic Tafel slope
RT/à In 7 h \
nF\ òr]0' Jed»C à AG o'1
nF ò M
VnF 11 / ÒAA GQ\- AAG») + 2J (l - C - p )
anodic Tafel slope
C ÒA6V„0/nF \ Òr/ / en1
"nFnF òqM
2X
(66)
RT [ à ln |/H|\
/ CRb
« ” - i4 e ‘) - ï l 1 - °' w !,dAA GQ\
(67)
Just as in the case of nonspecific adsorption one can again show that at the same value of ij0' (cf. eq 34)
RTV/Ò In |7h [\ _ / ò In / H\ 1 =
nF L\ W JCRb \ ò r /cobJ "(68)
RT/Ò ln 1°nF \ dr],0
= _ _ i' L 0b nl
ÒAGoe' nF òEe
n£ w - AA GS) + 2S i -
ÒAAG AòEe J (63)
Equation 63 can be transformed into an alternate form by noting that
ò ò ògM Ò ÒE ~ òqM ÒE ~ C òqM
(64)
where C is the differential capacitance.23 Therefore, again using the subscript e to denote that the quantity indicated is evaluated at the equilibrium potential, one obtains from eq 63
RT/Ò ln / f,,ai-A _ _ C ç_ ÒAGV nF \ ò??e0' )c o b nF ògeM
0' - AAGe1) + - CtÒAA G A ! àq™ )
(65)
Equation 63 (or 64) shows that when there is specific adsorption of reactant and product under Henry conditions the logarithm of I f will vary quadratically with equilibrium potential, and the smaller is the quantity X ; i.e., the faster is the intrinsic rate of the reaction, the more pronounced this quadratic dependence should be. As in the case of nonspecific adsorption, the potential variation is modified by the electrical double layer. When there is specific adsorption, however, the modification of the potential dependence arises from the charge variation of the standard free energies of adsorption of reactant and product. It may be noted that in cases of specific ionic adsorption which have been
2. Other Isotherms. The current-potential characteristics for electron exchange reactions with the specific adsorption of reactants and products obeying any other isotherm can easily be derived from the results for the Henry case provided the equations for the activity of the sites as are known. Thus comparison of eq 56 and 57 with eq 60 and 61 shows that for any isotherm
I — ZhUs (69)
|Z| — |Zh |u s (70)
70,a = / “'anas (71)
By taking logarithms of both sides of eq 69-71 and then differentiating with respect to r f or rtf', one obtains the characteristic slopes.
The four isotherms, Langmuir, logarithmic Temkin, virial, and Frumkin, together with the corresponding equations for the mean activity22 of the adsorbedspecies, the activity of the sites, and the required partial derivatives (d ln aa/dgM) are listed in Appendix B.
Note 1. It has been assumed throughout that the effect of the electrical double layer on the electrode kinetics will be due entirely to the work terms, wT and wp. There exists a possibility that the double layer could also influence the value of X itself.24 Calculation of such effects have not yet been made. However, it
(23) The differential capacitance in the presence of the faradaic reaction would probably have to be determined by extrapolation of the measured capacitance to infinite frequency. Such a technique would not work in the presence of adsorbed nonelectroactive organic sorbates.6 However, eq 63 would always be valid.(24) Cf. Appendix VII of ref 1.
The Journal of Physical Chemistry

Double-Layer Effects 2 6 6 1
appears likely that the double-layer effect on the work terms will be much larger than the effect on X except possibly in the case of an uncharged reactant.25 If the double layer did affect the value of X appreciably, the equations derived above would have to be corrected by the addition of a term involving the derivative of X with respect to electrode potential. Thus, for example, it would be necessary to add to eq 28 the following terms: inF/2X2) W - <t>2e) (dx/d/ie) and -O A nF)(p\/dEe).
Note 2. The treatment of specific adsorption effects given in part II of this paper would not be applicable in cases in which the transferring electron itself was involved in the specific adsorption bond, for in that case the weak interaction provision of the theory could not hold. On the other hand, when the specific adsorption arises from the overlap of orbitals not involving the transferring electron, or from either permanent or induced dipole-field interactions, the weak interaction envisioned by the theory should still be operative and the equations derived should be valid subject to the restriction of Note 1 above.25
Acknowledgment. This research was sponsored by the Air Force Office of Scientific Research, AFOSR (SRC)—OAR, USAF, under Grant No. AFOSR-68- 1451. I am greatly indebted to Professor F. C. Anson, California Institute of Technology, for numerous helpful comments on an early draft of this paper and to Professor P. Delahay, New York University, for his interest and discussion of this work.
Appendix A
The extent to which the quadratic effect can be observed from a small amplitude relaxation measurement of the exchange current density will depend, naturally, both on the value of X and on the magnitude of the formal overvoltage, ge0' — Ee — E0', at which the measurement is made. One can obtain an estimate of the significance of the quadratic effect by calculating how much the exchange current density, 7q0', with quadratic effect would deviate from the value, h,0', which the exchange current density would have if there were no quadratic effect. 7q0' can be calculated by integrating eq 28 and 7 l 0 ' can be calculated by deleting the second term on the right-hand side of eq 28 and then integrating. The limits of the integration are -gf = 0 and ?;e0'. (The value 7L0/ obtained in this way corresponds to assuming a classical transfer coefficient a = 0.5) Figure 1 illustrates the type of behavior which can be expected for various values of X. The ordinate in that graph is the per cent deviation of the exchange current density with quadratic effect from the value which the exchange current density would have without quadratic effect and with a — 0.5. For the purpose of this illustration the double-layer effect was ignored (by neglecting the terms in 4>2e and (d<t>ie/dEe)). The per cent deviation of 7 q 0 ' from 7 l 0 ' was then given by (c/. eq 28).
r / o' _ j o'i
p " H t t u N *100{exp[ — n2F2(r/e°') 2/4Z2 TX ] - l} (Al)
One sees from Figure f that the per cent deviation of 7q0' from 7l0' at any fixed value of -qf increases considerably as the value of X diminishes, i.e., as the electrode reaction becomes intrinsically faster. (If the double-layer effect had been included in the estimation of the per cent deviation by assuming a particular functional dependence of <t>-e and of (d<f>2e/dEe) on electrode potential the result would have been, in general, to skew the graphs somewhat.) As an example of what can be expected for a moderately fast reaction consider the graph for X = 20kcal/mol. For a one-electron reaction at 25° ffiis value of X corresponds to a formal rate con-
Figure 1. Graphical illustration of the quadratic effect as a function of formal overvoltage and X. Curves from top to bottom correspond to X va.ues of 44, 30, 25, 20, and 15 kcal/mol, respectively.
stant I f = 0.18 cm/sec. At the formal potential (??e0' = O ) there is no quadratic effect, but when \ve'\ = 110 mV corresponding to a redox ratio ( [O ]/ [R ]) = 72, the per cent deviation is 12.7. The extent to which one can expect to detect the quadratic effect by relaxation methods is clearly a function of how accurately one can measure the exchange current. Modern instrumentation, in particular computerized instrumentation, should be capable of measuring exchange currents to within a few per cent in favorable cases. An indication of the quality of kinetic data one may now be able to achieve is given by Randles and Whitehouse,16b who indicate that by the.r second harmonic method it should be possible to determine a to ±0.001.
(25) R. A. Marcus, private communication.
Volume 73 , Number 8 August 1969

2 6 6 2 David M. Mohilnee
Of course, eq Al also gives the per cent deviation by which the current density I q in the cathodic Tafel region with quadratic effect would be expected to deviate from the classical current density 7l (with a — 0.5) on the classical Tafel line. For slow reactions such as Cr3+/Cr2+ (X 44 kcal/mol) one would indeed have a better chance of observing the quadratic effect by a measurement in the Tafel region. The extent of the deviation at higher formal overvoltages than given in Figure 1 could be easily calculated from eq Al. On the other hand, for fast reactions for which Tafel analysis is impossible, low amplitude relaxation measurements of exchange current density should be capable of showing the quadratic effect. From Figure 1 it would appear the V3+-V2+ reaction (X 30 kcal/mol), which is a quasireversible reaction, is only a borderline case. Tests of the existence of the quadratic effect by relaxation methods would be better made with reactions which are intrinsically faster.
Appendix BThe Langmuir, logarithmic Temkin, virial, and
Frumkin isotherms and the equations for a\, as, and à In as/dgM are listed below. (Subscript letters H, L, T, V, and F indicate the isotherm considered.)
1. Langmuir Isotherm6
P ' c b = _ e 2gT i/R T
Ust(B5)
Here g is a van der Waals type particle-particle interaction parameter, g > 0 implies particle-particle repulsion; g < 0 implies particle-particle attraction.
a A T = e^ - ^ o r t / R T
a S T = e - ^ r t / S T
(B6)
(B7)
XT is the Temkin “ coverage parameter” and has values in the range 0 < Xt < 1.
d In asT~ à < ÿ ~
— — 2XtE7“ mdr*
7d ?(B8)
3. Virial Isotherm6 (Product of Henry and Logarithmic Temkin Isotherms)
f3'cb = — = RTYie2<lVt/RT f ls v
uav = uahUat
d g v = dSH dST = d'ST
d In usv d In dsT dqu = dqM
(B9)
(BIO)
(Bll)
(B 12)
o r b __ a A L _ ( r y r V n « )
PC ~ dSL “ 1 - ( r ' / r ^ a x )
where r*max is the maximum possible value of T*.
a al = r ' / r 'm «
«si, = i - ( r y r w )
d In aSL 1 dr1dgM = r y Sx - r* d ?
2. Logarithmic Temkin /sottem6’18,19'21
D. Frumkin Isotherm6 (Product of Langmuir and Logarithmic Temkin Isotherms)
/3'cb = ^-FdSF
(r'/r'max) 2aT i/R T (B13)(B2) i - ( r y r W )
(B3) u a f = a a l U a t (B14)
(B4) Os F = dSLdST (B15)
d In as f à qu
d In aSL , d In Ost dqM dqM (B16)
The Journal of Physical Chemistry

Esr of Peroxy Radicals T rapped in T rifltjoroacetamide 2663
Electron Spin Resonance Spectra of Peroxy Radicals Trapped in a
Y-Irradiated Single Crystal of Trifluoroacetamide
by Kazumi Toriyama and Machio IwasakiGovernment Industrial Research Institute, Nagoya, Hirate-machi, Kita-ku, Nagoya, Japan (Received December 87, 1968)
It was found from the electron spin resonance spectra that the • CF2CONH 2 radical trapped in y-irradiated trifluoroacetamide reacts with atmospheric oxygen to give the peroxy radical, • OOCF2CONH 2. The esr spectra of the peroxy radicals showed a remarkable change with the observation temperature. The g tensors at 77 and 300°K were determined by analysis of the spectra of single crystals to be gi = 2.0022, g2 = 2.0074, g3 = 2.0384 at 77°K and g3 = 2.021o, g2 = 2.0182, g?, = 2.0082 at 300°K. The decrease of the anisotropy of the g tensor at 300°K was well interpreted in terms of the partial averaging of the g tensor due to the internal rotation around the C -0 bond. In addition, from the principal directions of the g tensors at both temperatures, the geometrical structure of the peroxy radical was approximately determined, by comparison with the principal direction of the hyperfine tensor of the a-fluorine atom of the CF2CONH 2 radical trapped in the crystal together with the peroxy radicals.
IntroductionIt is well known that carbon radicals trapped in irra
diated polymers react with atmospheric oxygen when air is introduced after irradiation under vacuum.1 However, there have been few reports on such a reaction occurring in irradiated organic crystals of simple molecules.2’3 It was reported in our previous paper4 that sodium salts and amides of some perfluorinated carboxylic acids gave radicals produced by the detachment of a fluorine atom bonded to the carbon a to the carboxylic group when y-irradiated under vacuum at room temperature. During the course of this study it was found that some of these samples gave esr spectra due to peroxy radicals when they were irradiated in air, or air was introduced after irradiation under vacuum. The compounds giving peroxy radicals were CF3- COONa, CF3CF2COONa, CF3CF2CF2COONa, and their corresponding amides. It is interesting that these perfluorinated compounds react with atmospheric oxygen in the solid state even in a large single crystal. Furthermore, the spectra of these peroxy radicals showed a reversible change with the temperature at which the observations were made.
In the previous paper of one of the authors (M. I.) and his coworker,6 it was reported that esr spectra of peroxy radicals trapped in y-irradiated polytetrafluoro- ethylene exhibited a similar temperature change, that is, when measurements were made at room temperature, </ll was smaller than g±, while g was much larger than g± at 77°K. This change of the spectrum was reversible and was interpreted in terms of the rapid molecular motion around the chain axis at room temperature due to the so-called room temperature transition of polytetra- fluoroethylene. The spectral changes of peroxy radicals in amides and sodium salts of fluorinated carboxylic acid may be also interpreted as a result of some
molecular motion. In this case, however, the kind of molecular motion is considered to be internal rotation, because there is no possibility of molecular rotation as a whole.
To make this clear, the g tensors were determined both at 77 °K and at room temperature for peroxy radicals trapped in single crystals or in powders of trifluoroacetamide. In addition, an attempt was made to determine the geometrical structure of peroxy radical with reference to the structure of the forerunner radical •CF2CONH2.
Experimental SectionSingle crystals were made by slow evaporation from
aqueous solutions at a temperature below 10°. The appearance of the single crystal used is shown in Figure 1. From the esr spectra it was found that this crystal has a monoclinic symmetry, and the c axis is parallel to the longest edges of the crystal. The single crystals of trifluoroacetamide studied by Lontz and Gordy,6 and by Rogers and Kispert7 were also assigned monoclinic symmetry. From our experiment, it was found that the a and b axes assigned by Lontz and Gordy are [hkO] and [h'k'O], respectively. The correct crystalline b axis lies in between their axes a and b.
In our crystals, the plane, (100), which was not devel-
(1) W. B. Ard, H. Shields, and W. Gordy, J. Chem. Phys., 23, 1727 (1955); H. Fisher, K. H. Hellwege, and P. Neudorfl, J. Polym. Sci., Part A-l, 2109 (1963).(2) R. J. Lontz, J. Chem. Phys., 45, 1339 (1966).(3) A. Faucitano, A. Perotti, and G. Adler, Ric. Sci., 37, 1149 (1967).(4) M. Iwasaki, K. Toriyama, and B. Eda, J. Chem. Phys., 42, 63 (1965).(5) M. Iwasaki and Y. Sakai, J. Polym. Sci., Part AS, 265 (1968).(6) R. J. Lontz and W. Gordy, J. Chem. Phys., 37, 1357 (1962).(7) M. T. Rogers and L. D. Kispert, ibid., 46, 3193 (1967).
Volume 73, Number 8 August 1969

2664 Kazumi Toriyama and Machio Iwasaki
Figure 1. Sketch of a typical crystal and axes chosen.
oped in the crystal used by Lontz and Gordy appeared as shown in Figure 1. So, the orthogonal axes a', b, and c were chosen as indicated by the arrows in Figure 1. Our experimental coordinate system a'bc was the same as that used by Rogers and Kispert,7 although they have stated that they chose the same coordinate system used by Lontz and Gordy.
Samples were irradiated by 60Co y rays at room temperature under vacuum. The total dose was about 5 X 10⁶ R at a dose rate of 2 X 10⁶ R/hr. After irradiation under vacuum, oxygen was introduced into the sample tubes, and the samples were kept at —20° for about 1 month in order to get a strong enough signal due to the peroxy radicals to make an accurate measurement, since the peroxy radical in trifluoroacetamide is rather unstable, and it decays even at room temperature.
Esr spectra were measured both at 300 and at 77°K with a Japan Electron Optics Model 3BS spectrometer operated at 24 and 9.4 GHz. The spectra of single crystals were recorded as second derivative curves with the double modulation of 100 KHz and 80 Hz, while those of powder were recorded as first derivative curves with 100-KHz modulation. The signal of Mn2 + in ZnS was used as a marker for the magnetic field. The resonance position and the hyperfine splittings of Mn2+were calibrated using the signal of DPPH and a side-band technique of the proton magnetic resonance.
Experimental ResultsPowder Spectra. Figure 2a shows the powder spec
trum of CF3CONH2 7 -irradiated at room temperature under vacuum. The origin of this spectrum is the radical -CF^ONRj, as already reported.4 6'7 When air was introduced into this sample, an asymmetric spectrum appeared gradually at a position of slightly lower field than the strong peak at the center as shown in Figure 2b. When the sample was allowed to stand at — 20° for about 1 month, the signal of • CF2CONH2 disappeared leaving the asymmetric spectrum alone shown in Figure 3. The spectrum showed a remarkable change of line shape depending not only on the micro-
Figure 2. The esr spectra of 7 -irradiated powders of trifluoroacetamide: (a) observed under vacuum; (b) observedin air. Measurements were made at 300 °K using a 9.4-GHz spectrometer.
wave frequency but also on the observation temperature as indicated in Figures 3 and 4. All these changes were perfectly reversible. It is evident that the asymmetry of the spectum is due to the g anisotropy. The principal values of the g tensor estimated from the line shape were gi = 2.0022, <h = 2.0075, and g% = 2.0384 77°K and were g\ = 2.021q, g\ = 2.0182, and g\ = 2.0082 at 300°K. The g tensors at both temperatures are nearly axially symmetric, that is, g% ~ g\\, g\ ~ ¡72 ~ g±- It should be noted that at 77°K <jy is larger than gLt while at 300°K g'y is smaller than g \ , and the g anisotropy is remarkably reduced. However, the averaged g values were 2.015s and 2.016o at 300 and 77°K, respectively. The reversibility of the temperature change and the invariance of the averaged g values strongly indicate that the change in the g tensor is caused by partial averaging due to some molecular motion. To confirm this interpretation, the principal directions of the g tensors both at 77 and at 300°K were determined from the angular dependence of the spectra using single crystals.
Spectra of Single Crystals. Experiments were carried out using the single crystal in which the mother radical • CF2CONH2 coexists. A typical example of the spectra of a single crystal is shown in Figure 5. Ob-
The Journal of Physical Chemistry

Esr of Peroxy R adicals T rapped in T rifltjoroacetamide 2665
'--------------------->50 G
Figure 3. The esr spectra of powders of trifluoroacetamide kept at —20° for about 1 month in air after y irradiation at room temperature under vacuum: (a) measured at 9.4 GHz;(b) at 24 GHz. The arrows indicate the position of the resonance field of DPPH.
servations were made at a microwave frequency of 24 GHz. The three lines having the intensity ratios 1:2:1 are the signal due to -CF2CONH2, and the remaining single line exhibiting the large g anisotropy corresponds to the asymmetric line of the powder spectrum. Since the crystal has monoclinic symmetry, two sets of these signals were observed when the external magnetic field was applied in the (a'b) or in the (be) plane. At room temperature, the two sites accidentally coincided with each other in the (be) plane. The angular dependences of the g values of the single line observed both at 77 and 300°K are shown in Figures 6, 7, and 8. From these angular dependences the g tensors were determined at both temperatures and are listed in Table I. Further, the calculated g values are indicated by solid (77 °K) and dotted (300° K) lines in Figures 6, 7, and 8. The poor agreement with the observed values in the (a'b) plane is due to overlapping of the spectrum with that of the coexisting radical • CF2CONH2 which made it difficult to measure the position of the single line accurately.
24 GHzFigure 4. Temperature change of the esr spectra shown in Figure 3: (a) observed at 300°K; (b) observed at 77°K.The microwave frequency used is 24 GHz. The arrows indicate the position of the resonance field of DPPH.
The principal values agree with those obtained from the line shapes of the powder spectra within the experimental error. The principal values and their directions at 300° K are quite different from those at 77 °K.
Table I: Observed Principal Values and Their Direction Cosines for the g Tensors of OOCF2CONH2 at 77 and 300°K
Direction cosines with respect Principal ✓--------------------- to o ', b, c-----------values o' b C
7 7 ° K Si 2.0022 -0.290 ±0.943 -0.163S2 2.0074 +0.944 ±0.254 -0.208S3
( s )
2.03842.0160
+0.155 ±0.215 +0.964
300°K Si' 2.0210 -0.151 ±0.089 -0.985Si' 2.0182 -0.736 ±0.655 + 0.172S3'<s'>
2.00822.0158
+ 0.660 ±0.750 -0.033
There are no data on the crystal structure and the molecular geometry for this compound. Therefore, in order to define the principal directions of the g tensor to
Volume 731 Number 8 August 1969

2666 Kazumi T oriyama and Machio Iwasaki
Figure 5. The esr spectra of a single crystal of trifluoroacetamide exposed to air after y irradiation under vacuum: (a) measured at 300°K; (b) at 77°K. Themicrowave frequency used is 24 GHz. The magnetic field was applied along the a' axis. The arrows indicate the position of the resonance field of DPPH.
Figure 6. Angular dependence of the observed and calculated g values of the peroxy radical in trifluoroacetamide. The magnetic field was applied in the (a'b) plane. The white and black dots are observed g values at 77 and 300°K, respectively. The solid and dotted lines show the calculated angular dependence of g values for 77 and 300 °K, respectively.
the structure of the radical, the «-fluorine hyperfme tensor of -CF2CONH2 coexisting with this single line was also determined, because its principal directions were well defined to the radical geometry. The results are tabulated in Table II. Although Rogers and Kis- pert7 suggested that the hyperfme tensor of the «-fluorine nucleus deviates slightly from axial symmetry, we could not find the evidence at any field directions at 300° K. The tensor elements obtained are in agreement with those reported by Lontz and Gordy,6 although the maximum principal value and its direction for the «-fluorine tensor are very close to those determined by Rogers and Kispert.7
Analysis and DiscussionAveraging of the g Tensor by Molecular Motion. To
interpret the experimental results in terms of the molec-
Figure 7. Angular dependence of the observed and calculated g values of the peroxy radical in trifluoroacetamide. The magnetic field was applied in the (6c) plane. The dots and the lines are used in the same manner as in Figure 6.
Figure 8. Angular dependence of the observed and calculated g values of the peroxy radical in trifluoroacetamide. The magnetic field was applied in (ca') plane. The dots and the lines are used in the same manner as in Figure 6.
Table II: Observed Principal Values and Their Direction Cosines for the a-Fluorine Hyperfine Tensor of •CF2CONH2 at 300°K
Principalvalues
«?)Direction cosines with respect
---------------- to a\ b, c--------------a' b c
A || 177 + 0.842 ±0.539 0.000+ X 25 ± to A||
The Journal of Physical Chemistry

Esr of Peroxy Radicals T rapped in T rifluoroacetamide 2667
ular motion the partial averaging of the g tensor, which is expected when rotation around some axis takes place, was calculated. Suppose that gh g2, and gz are the principal values of the g tensor, £, 17, and f their principal directions, and X , F, and Z the cartesian coordinate system, where Z is the axis of molecular rotation. When rotations around more than one axis are to be taken into consideration, the axis of the invariance for the entire molecular motion should be taken as the Z axis. The coordinate systems £(£,?7,f) and X(X,Y,Z) are related by the transformation matrix L.
i = LX (1)
The elements of the L matrix are easily expressed by the Eulerian angles 8, 4>, and x> shown in Figure 9. The g tensor in the new coordinate system X is expressed by the following equations.
where
L = [Li,]
g x = Lg'fL
g f = ~9i 0 0 "0 0 2 0
_ 0 0 03_
(2)
cos 8 cos 4> cos x — sin 4> sin x
— cos 8 cos <j) sin x - sin <t> cos x
sin 8 cos 4>
cos 8 sin (f> cos x + cos 4> sin x
— cos 6 sin <f> sin x + cos <p cos x
sin 6 sin <f>
—sin 6 cos x
sin 6 sin x
cos
(3)
If rotation around the Z axis takes place, the coordinate system % rotates with respect to the coordinate system X which is fixed in space. Therefore, the elements of gx should be averaged with respect to angle 4>. Then the gx tensor becomes the (gx),*. tensor, the elements of which are
(1gzz}* = gi sin2 8 cos2 X +
g2 sin2 9 sin2 x + 03 cos2 6 (4)
(gxx)* = {grr)* = 1 filial + 02 + g») - (gzz)*\ (5)
(gxY)$ = (gyz)$ — igzx)* — 0 (6)
Consequently, the coordinate axes X, Y, and Z become the principal axes for such a system, and the tensor has axial symmetry around the rotational axis, that is, <0zz}<*> = g {ot and (0xx),*> = (Orr)* = 0xr°‘ - Taking into account that sin 6 cos x> sin 9 sin x, and cos 8 in eq 4 are the direction cosines Lu, L23, and L33 of the rotational axis Z with respect to the principal axes of gx, !7|,rot may be expressed as
0||rOt — 0iLi32 + 02L232 + 08 332 (7)
This is evident from the fact that (gZz)+ is unchanged with the rotational motion since gzz is independent of angle 4>. Therefore, <7||rot is easily obtained from the tensor component to the rotational axis. Equation 5 indicates the invariance of the trace of the tensor from which g xrot is obtainable using the value of gi||rot. If the oscillational amplitude is smaller than one revolution, one may have small off-diagonal elements of the gx tensor, resulting in a slight discrepancy of the tensor from axial symmetry.
Figure 9. The relation between the space-fixed coordinate X(X, F, Z) and the molecular fixed coordinate |(£, ’?, f ) which are connected by the Eulerian angles 6, cf>, and x-
Temperature Change of the g Tensor. The origin of the single line is attributable to peroxy radical -OOCFj- CONH2, from the fact that the spectrum has no hyper- fine structure but has a large g anisotropy with nearly axial symmetry, and that this spectrum appears at the expense of the signal due to • CF2CONH2 when air or oxygen gas is introduced into the sample tube.
In fact, the principal values of the g tensor obtained at 77 °K are in good agreement with those of HOO- in a single crystal of an H20 2-urea addition compound8 or ROO • in polytetrafluoroethylene previously reported by one of the authors (M. I.) and his coworker. The values of the former are g\ = 2.001s, g2 = 2.008i, and g3 = 2.0495, and those of the latter are gi = 2.002g, g2 = 2.007i, and g3 = 2.0384. The averaged g values for these cases are 2.016o, 2.019g, and 2.016o, respectively.
It is well known from theoretical considerations that in peroxy radicals the direction of the largest g value should be parallel to the 0 - 0 bond, and this was verified by analysis of the esr spectra of HOO • in a single crystal of an H20 2-urea addition compound.8 Hence, if the system is rigid enough at 77 °K, the direction of g3 is considered to be parallel to the 0 - 0 bond. Suppose that the rotation around some axis in a molecule takes place at room temperature; the new principal axes of the
(8 ) T. Ichikawa, M. Iwasaki, and K. Kuwata, J. Chem. Phys., 44, 2979 (1966).
Volume 73, Number 8 August 1969

2668 Kazumi T oriyama and Machio Iwasaki
g tensor should be formed as a result of the partial averaging by molecular motion, resulting in an axially symmetric tensor as described in the foregoing section. Actually, the observed g tensor at room temperature has reduced principal values with an approximately axial symmetry. Therefore, one may be able to assume that g'% ~ g\\TOt and V2 (g\ + g'%) ~ J7j_rot, and that the direction of g'3 ~ <7||rot is along the rotational axis. If these assumptions are allowed, the angle between the 0 - 0 bond and the rotational axis is directly determined to be 76° from the directions of g% and g'% (= gTOt). Since the complementary angle 104° is reasonable as the bond angle <COO, this rotational axis may be assigned to the 0 -0 bond.
If this is the case, the observed principal values of the g tensor at 300° K must be explained in terms of rotation around the C -0 bond using the principal values obtained at 77°K and the bond angle < C 0 0 = 104°. Therefore, the grot tensor expected for the rotational system was calculated by the equation derived in the foregoing section, assuming the following two cases. (1) Only rotation around the C -0 bond is allowed at 300° K. (2) Rotation around the 0 - 0 bond takes place simultaneously.
In applying eq 4, 5, and 7 to our system, the Z and £ axes should be taken as the C -0 bond and the 0 - 0 bond directions, respectively. Then the direction cosines of gr||rot with respect to the original principal axes in eq 7 can be obtained from the experimental directions of g'z, gi, g%, and g3. It is obvious that angle 6 is the complementary angle of < C 0 0 , that is, 76°. For case 2, it should be noted that the axis of invariance of the molecular motion is still along the C -0 bond and consequently <7l|rot is simply obtained by taking the further average with respect to angle x in eq 4.
?i|rot = <ffzz)*,x = lMgi + gd sin2 e + g% cos2 e (8)
9.1.™* = {gxx)t,x = (:9yy} ,x =
Y.K9x + <72 + fft) - 0||rot] (9)
The calculated principal values of the grot tensor thus obtained are in good agreement with those observed at 300°K, in either case as listed in Table III.
Table III: Observed and Calculated Principal Valuesof grot Tensor of -OOCFiCONHa
.----------------- Calcd-------------- -Obsd (1) (2)
0||r°‘ 2.008 2.005 2.007g 2 020» 2.022 2.021
“ This value is the arithmetic mean of g\ and g\.
In above discussion, the observed g tensor at 300° K was considered to be axially symmetric, assuming that g±TOt = l/z(g'i + g'%). Strictly speaking, the g tensor at
300° K is not axially symmetric, as shown in Table I. The slight deviation from axial symmetry is caused by the rotation, which is not rapid enough to give all the vanishing off diagonal elements of the g x tensor at 300°K, as mentioned before.
Structure of the Peroxy Radical. To confirm the assignment of the rotational axis of the C -0 bond and to get geometrical information about the peroxy radicals, the principal directions of the g tensor at two different temperatures were compared with those of the «-fluorine hyperfine tensor of • CF2CONH2.
It is well known that the hyperfine tensor of the a- fluorine atom has its maximum principal value parallel to the half-filled carbon 2p-7r orbital and the minimum principal value parallel to the C -F bond.9 Therefore, if one can determine the directions of the smallest principal values of the two fluorine atoms in the forerunner radical -CF2CONH2, the direction of the C-C bond may be obtained from their bisector and then the direction of g'%, which is assigned to the C -0 bond, may be compared with this direction. If the assignment of the direction of g'% is correct, one should get a reasonable value for angle <CCO. However, unfortunately the directions of the two C-F bonds were not determined in this radical, because the hyperfine tensor was almost
Î A n
Figure 10. (a) Illustration of angles used in eq 10. (b)Variation of angle a with angle \p calculated by eq 10, using the observed value of 'F.
(9) R. J. Cook, J. R. Rowlands, and D. H. Whiffen, Mol. Phys., 7, 31 (1964).
The Journal of Physical Chemistry

Esr of Peroxy R adicals T rapped in T rifuoroacetamide 2669
b)
Figure 11. (a) Illustration of the angles used in eq 11. Thedirection of the C-C bond is taken to be parallel to the projection of the C-0 bond on the plane, that is, <p in Figure 10a is taken to be 180°. (b) Variation of angle Í2 with angleu calculated by eq 11, using the observed values of /3 and 'P.
axially symmetric. Consequently, the direction of the maximum principal value of the hyperfine tensor which corresponds to A|| was compared with the direction of g'-¿. From the experimental direction, the angle, XF, between the directions of g'z and A\\ was estimated to be 16°.
Now, the observed direction of A\\ may be vertical to the molecular plane CCONH2 in which the C-C bond lies. [In fact, at 300°K the deviation from planarity was estimated to be less than 8° by Rogers and Kis- pert,7 from the hyperfine splitting of C13 of -C13F2- CONH2.] The angle, a, between the C-C bond and the direction of g\ depends on the direction of the C-C bond in the molecular plane as illustrated in Figure 10a. Therefore, angle a was related to the observable angle, 'F, using as a parameter the angle \p between the C-C bond and the projection of the direction of g'z on the molecular plane, since the direction of the C-C bond in the molecular plane is not known. From Figure 10a, it is easily seen that
cos a = sin 42 cos ip (10)
If the direction of g'z corresponds to the C -0 bond, a should be angle <CCO, and then one should get a reasonable value of angle a from the observed angle 42 for some value of the parameter \p. Thus, the variation of angle a with parameter \p was calculated using 42 =
Figure 12. The skeletal structure of the radical and the direction of the half-filled 2p orbital in the radical.Interchange of the carbonyl oxygen atom and the NH2 group is also allowed, but which case is actually the correct one was not determined.
16°. As is seen in Figure 10b, a ranged from 74 to 106° while the parameter \p ranged from 0 to 180°. The value, a = 106°, obtained for ip = 180° is close to the tetrahedral angle, which is reasonable as angle <CCO. As shown in Figure 12, the radical structure corresponding to ^ = 180° is easily achieved by bonding of the carbon 2p-7r orbital of -CF2CONH2 and oxygen without causing any change of the orientation of the mother radical and involving no internal rotation around the C-C bond, except the change from sp2 to sp3 hybrid orbitals for the radical carbon. The fact that one could get this reasonable radical structure from the observed directions of g% and A|| strongly indicates that the original assignment of the rotational axis to the C -0 bond is correct.
Based on the radical structure thus obtained one can next determine the conformation of the 0 - 0 group with respect to the C-C bond from the observed direction of gz which corresponds to the direction of the 0 - 0 bond. The angle, 12, between the 0 - 0 bond and the direction of A\\ depends on the conformation of the 0 - 0 bond as illustrated in Figure 11a and may be expressed by the following relation involving the angle, w, between the C -0 bond and the projection of the 0 - 0 bond on the molecular plane
cos d = sin 42 sin 12 cos a> — cos 'F cos 12 (11)
where ff is angle <COO, which is the complementary angle of 8 as already determined from the directions of <73 and g'z. Using the observed values, XF = 16° and /3 = 104°, the variation of 12 was calculated from eq 11 and the result is shown in Figure lib . The observed angle of 12 obtained from the directions of g% and A u was 91°. A value close to this angle was obtained for ~ 180° which corresponds to the trans conformation. Finally, we propose the structure of the peroxy radical shown in Figure 12.
Volume 78, Number 8 August 1969

2670 T. Nogami, K. Y oshihaea, H. Hosoya, and S. Nagakura
As for the direction of the principal value gi, which may correspond to the half-filled 2p-7r orbital on the oxygen atom, it might be expected to lie in the COO plane, or to be perpendicular to it, from the symmetry of the radical. However, the direction of the 2p-7r orbital determined from these experiments is neither in the COO plane nor perpendicular to it. It was shown from the experimental direction that the half-filled 2p- 7r orbital on the oxygen atom makes an angle of 27° from the COO plane. The deviation of 27° from the COO plane may be caused by the interaction of the unpaired electron with the CONH2 group in the radical and/or that with the neighboring molecules.
Conclusion
The esr spectra and the structure of the peroxy rad
ical trapped in an organic simple molecule have been studied using single crystals of trifluoroacetamide. The marked temperature change of the observed g tensor has been satisfactorily interpreted as resulting from rapid rotation around the C -0 bond at room temperature. The approximate structure of the peroxy radical has been determined from the principal directions of its g tensor and the «-fluorine hyperfine tensor of the forerunner radical • CF2CONH2. It was concluded that the 0 - 0 bond in the peroxy radical lies nearly parallel to the plane of the forerunner radical and that the conformation of the 0 - 0 bond to the C-C bond is trans. This structure is quite reasonable if one supposes that the oxygen molecule bonds with the half-filled C2p_r orbital of •CF2C()XH2 without causing any change of the mother radical structure except the change in hybridization of the orbital of the radical carbon.
Charge-Transfer Interaction and Chem ical Reaction. I.
Reaction of Aniline with Chloranil
by Takashi Nogami, Keitaro Yoshihara, Haruo Hosoya, and Saburo NagakuraInstitute for Solid State Physics, The University of Tokyo, Roppongi, Minato-ku, Tokyo, Japan {Received December 30, 1968)
The interaction of aniline with chloranil in mixed solvent of ether-isopropyl alcohol (3:1) was studied by measuring ultraviolet, visible, and infrared absorption spectra at various temperatures ranging from 36° K to room temperature. The (x,tt) type outer complex was found to exist stably in an equilibrium with the component molecules at low temperatures below ~200°K. The equilibrium constant was determined by the aid of the Benesi-Hildebrand equation at several temperatures between 115 and 195° K. The heat of formation and entropy change of the complex were evaluated to be —2.1 (kcal/mol) and —7.2 (cal/deg mol), respectively, from the temperature dependence of the equilibrium constant. With increasing temperature the reaction proceeds yielding 2,5-dichloro-3,6-dianilino-p-benzoquinone as a reaction product. The reaction mechanism through inner (<x) complexes was proposed and discussed.
IntroductionSince Mulliken presented the well-known theory1 of
the charge-transfer (abbreviated hereafter to CT) interaction between electron donor and acceptor, it has been successfully and widely applied to many interesting research subjects.2 One of them is the possible role of CT complexes in chemical reactions.3 CT complexes are known to take part in many reactions such as addition, substitution, and condensation reactions.
One of the detailed studies carried out so far on this line is that by Rappoport,4 who investigated the system including N,N-dimethylaniline as an electron donor and
tetracyanoethylene as an electron acceptor. He presented the following scheme as the reaction path of this system.
Recently, White, et al., measured the ultraviolet, visi-
(1) R. S. Mulliken, J. Amer. Chem. Soc., 74, 811 (1952); J. Phys Chem., 56, 801 (1952).(2) G. Breigreb, “ Elektronen - Donator - Acceptor - Komplexe,” Springer-Verlag, Berlin, 1961. L. J. Andrews and R. M. Keefer, “ Molecular Complexes in Organic Chemistry,” Holden-Day, Inc., San Francisco, Calif., 1964.(3) For a review of this subject, see E. M. Kosower, Progr. Phys. Org. Chem., 3, 81 (1965).(4) Z. Rappoport, J. Chem. Soc., 4498 (1963).
The Journal of Physical Chemistry

R eaction op Aniline with Chloranil 2671
H3Cn /CHa N
NC^ / CNc
/ C\NC CN
(outer (tt) complex)
H,CV © /= \ /H pN pN
H 3C
Vs-C*/ LI \CN CN
(inner (<r) complex (I))CN\
H,C
H3C
c— CN cT + HCN
CNble, and infrared absorption spectra and the nmr spectrum of the inner (<r) complex in this system6 and determined its structure to be (I) in accordance with the Rappoport assumption. Although similar studies have also been carried out for several other systems, the important problem whether outer ( 71- ) complexes are formed in independent side reactions or whether they are essential intermediates is still a matter of controversy and is left to be solved experimentally in the future. Under these circumstances, we have undertaken to study in detail the CT interaction for various systems containing electron donors and acceptors, paying special attention to the contribution of outer (x) and inner (<r) complexes to reaction mechanisms.
Gore and Wheals6a and also Mukherjee and Chandra61’ independently investigated the CT interaction of chloranil with aromatic amines such as aniline and its methyl derivatives by the aid of electronic absorption spectra. They observed the CT absorption bands characteristic of the ( 71-, i t ) type outer complex and discussed the relation of their peak positions to the electron-donating ability of aromatic amines. On the other hand, some aromatic amines, for example aniline, are known to cause a nucleophilic substitution reaction with chloranil under drastic conditions. Therefore, aromatic amine-chloranil systems may be regarded as typical examples suitable to study the role of CT complexes in the substitution reaction. From this point of view, we have taken the aniline-chloranil system as the first example in a series of investigations.Experimental Section
Chloranil and aniline were purified by repeated recrystallizations from acetone and by vacuum distillation, respectively. Ethyl ether used as a solvent was
purified by distillation after dehydration by sodium. Commercially available isopropyl alcohol was used without further purification.
Visible and ultraviolet absorption spectra were measured with a Cary recording spectrophotometer Model 14M and infrared absorption spectra with a Hitachi E P I2 infrared spectrophotometer. A Hitachi spectrometer (X-band, 100-kc modulation) was used for the measurements of esr spectra.
Temperature was regulated by a Cryo-Tip (Air Products and Chemicals Incorporated).7 Precise temperature regulation was possible from 20°K up to about 200° K, but regulation at temperatures higher than 200°K was less accurate. Temperature was measured with a gold-cobalt-copper thermocouple. It took about 60 min to reach liquid hydrogen temperature at the position of a specimen holder starting from room temperature. Quartz cells of 1-cm path length were used throughout our experimental work.
Results and DiscussionThe ether-isopropyl alcohol (3:1) solutions of aniline
and chloranil were mixed with each other at 77 °K, and the temperature dependence of ultraviolet and visible absorption spectra were measured. As is clearly seen in Figure 1, an absorption band appears at 560 mu at low temperature. With increasing temperature, this band decreases its intensity and a new absorption band appears at 385 m/Li. No other absorption band was observed at the longer wavelength region than 350 mn throughout the reaction.
Absorption Band at 560 m\i. The absorption band at 560 m/i is undoubtedly due to neither aniline nor chloranil from its peak position. When the solution was warmed from 36 to 200°K, the intensity of the band always decreased. Upon recooling to 36°K, the absorption band recovered its original intensity completely. This suggests the existence of a stable equilibrium between the CT complex and the component molecules at low temperatures below 200°K. Furthermore, the observed peak position is well coincident with that of the CT absorption band predicted for the aniline-chloranil complex from the observed ionization potential of aniline (7.69 eV).8 These facts support the interpretation that the 560-in^ band can be regarded as the CT band.
We measured the concentration dependency of the 560-mju band intensity at 195°K changing the concentration of aniline in the range of 2.5 X 10~2~ 2 .0 X 10_1 M and keeping the concentration of p-chloranil constant (4.0 X 10⁻³ M). The plots of the reciprocal of the ob-
(5) P. G. Farrell, J. Newton, and P. F. M . White, J. Chem. Soc., 637 (1967).(6 ) (a) P. H. Gore and B. B. Wheals, Anal. Chim. Acta, 30, 34 (1964); (b) D. C. Mukherjee and A. K. Chandra, J. Phys. Chem., 68, 477 (1964).(7) D. White and D. E. Mann, Rev. Sci. Instr., 34, 1370 (1963).(8 ) F. I. Vilesov, Soviet Phys. Usp., 6 , 8 8 8 (1964).
Volume 78, Number 8 August 1969

2672 T. Nogami, K. Y oshihara, H. Hosoya, and S. Nagakura
W A V E L E N G T H , m j!
Figure 1. Temperature dependence of the ultraviolet and visible absorption spectra of the aniline-chloranil system in ether-isopropyl alcohol (3:1): aniline, 2.0 X 10"1 M;chloranil, 2.5 X 10 3 M ; ------------, 36°K;----------83°K;------------------, 182°K;................ , 300°K;after--------, keeping at 300°K for 24 hr.
served absorbance9 at 560 m/x against the reciprocal of the concentration of aniline fit well to a straight line within an experimental error, the following Benesi-Hil- debrand equation10 being satisfied
i (i)a Kt [D] e
Here, a, [D], and [A] denote the absorbance at 560 m/x, the concentration of aniline, and the concentration of chloranil, respectively. K and e are the equilibrium constant and the molar extinction coefficient of the CT band at 560 m/t, respectively. This result leads to the conclusion that a 1:1 CT complex is formed between aniline and chloranil. By the aid of the Benesi-Hilde- brand relation, e and K were estimated to be 1250 (M~l cm-1) and 21 (M~r) at 195°K, respectively. Assuming e independent of temperature, we determined the equilibrium constant of the CT complex at several different temperatures in the region of 115-195°K. That is to say, K can be obtained from the concentrations of the components and the absorbance at 560 m/x observed at the respective temperatures by the equation
(«[A] — a)[D]
From the temperature dependence of the equilibrium constant, the heat of formation and entropy change of the CT complex were estimated to be —2.1 (kcal/mol) and —7.2 (cal/deg mol), respectively.
Absorption Band at S85 m/x. The absorption band at 385 m/x which appeared with raising temperature of the
solution containing aniline and chloranil in ether-isopropyl alcohol (3:1) mixed solvent continued to increase its intensity until the end of the reaction. This shows that the band is due to the reaction product. The brown reaction product precipitated 24 hr after mixing the solutions of aniline and chloranil. An elementary analysis of the reaction product corresponds to Ci8Hi2- CI2N2O2, indicating that two chlorine atoms of chloranil are replaced by two anilino groups.11 To confirm this, we measured ultraviolet, visible, and infrared absorption spectra of the reaction product and compared them with those of 2,5-dichloro-3,6-dianilino-p-benzoquinone (abbreviated hereafter to DDB) measured by Draber, et al.u The satisfactory agreement leads to the conclusion that the reaction product is DDB.13
Time Dependence of Absorption Spectra at 0°. We measured at 0° the time dependence of the absorption spectrum of the solution containing aniline and chloranil in ether-isopropyl alcohol (3:1) mixed solvent, with the result shown in Figure 2. This figure shows that the intensity of the 560-m/x band is almost constant at the initial stage of the reaction,14 whereas the 385-m/x band gradually increases its intensity. The similar tendency was observed at several temperatures above 200° K, whenever the temperature was kept constant. This is because the reaction product (DDB) has a weak absorption band (e 700) at 550 m/x12 in addition to the strong 385-m/x band. The increase of this band and the decrease of the CT band at 560 m/x (e 1250) may be expected to cancel each other at the initial stage of the reaction.
Reaction Mechanism. One can see from Figure 1 that with increasing temperature from 36°K up to room temperature more rapidly than the formation rate of the reaction product, the absorption band at 560 m/x immediately decreases its intensity. This can be explained by the decrease in the equilibrium constant between the CT complex and its component molecules with increasing temperature. The intensity of the 385-m/x band hardly changes immediately after the temperature rising and increases gradually after an apparent induction period. These observations suggest that a clear time delay exists between the decay of the outer complex and the formation of the product. This means
(9) The absorbance values are corrected for the volume contraction on cooling.(10) H. A. Benesi and J. H. Hildebrand, J. Amer. Chem. Soc., 71, 2703 (1949).(11) Elementary analysis: Calcd for CiaHuCLNaCh: C, 60.17; H, 3.34; Cl, 19.22; N, 7.80. Found; C, 59.63; H, 3.38; Cl, 20.27; N, 7.79.(12) K. Wallenfels and W. Draber, Tetrahedron, 20, 1889 (1964).Infrared absorption spectra of D D B: 3279 cm - 1 (N— H stretching), 1662 cm - 1 (C = 0 stretching), 1568 cm -* (C = C stretching), 1496 cm -1, 1453 cm -1. Visible and ultraviolet absorption spectra of D D B: 550 mM (e 700), 385 (« 16,800), 265 m/i (e 16,000).(13) Nakazawa synthesized DDB by boiling the ethanol solution of aniline, chloranil, and sodium acetate (S. Nakazawa, J. Soc. Org. Synth. Chem. (in Japanese), 21, 49 (1963)).(14) Curve 4 corresponds to about 4% product formation.
The Journal of Physical Chemistry

R eaction of Aniline with Chloranil 2673
Figure 2. Time dependence of the electronic absorption spectra at 0°: 1, 20 min after mixing the aniline solution with thechloranil solution; 2, 29 min; 3, 37 min; 4, 44 min.
that the rate (k2,k'2) of dissociation of the outer (tt) complex is much faster than the rate (k%,k'z) of its conversion into the product. In this connection, we measured in detail the time dependency of the absorption intensity of the 385-mn band at 0°. The result shown in Figure 3 was analyzed for the purpose of clarifying the reaction mechanism.
Let us consider the following two reactions.
k . i l . k', ^ D + A ^ w — > Pk't u
(I)
h , ktD + A ^ z t i r — > I ^ P
ki(II)
Here D, A, x, I and P denote aniline, chloranil, the outer (tt) complex, intermediate specimens, and the reaction product, respectively. In reaction I, the outer (w) complex directly converts into the product, and no intermediate exists between them. On the other hand, in reaction II, intermediate reaction steps exist between them.
By solving the rate equations on the assumptions given in the Appendix, the concentration of the product can be obtained as follows.16
[P] = Toil - e~,a'lDlt) (for reaction I)
ksk4[DWo f e~™ - 1 _ - 1\1 J h - ki [D] V h hi [D] )
(for reaction II)
Here ir0 is the initial concentration of the outer (t) complex. The relations between [P] and t for reactions I and II are represented in Figure 4. In particular, for reaction II the [P ]-t and [I ] (intermediate specimen)-f
Figure 3. Time dependence of the absorption intensity of the reaction product at 0° in ether-isopropyl alcohol (3:1): aniline, 2.0 X 10~2 M] chloranil, 1.0 X 10⁻³ M.
Figure 4. Theoretical time dependencies of the reaction product (P) and reaction intermediates (I): curve 1, for reaction I; curves 2 and 2', in the case of fc.[D] = 1.2fc3 for reaction II; curves 3 and 3', in the case of fc4[D] = 2fc3 for reaction II; curves 4 and 4', in the case of i;4[D] = 8k3 for reaction II.In our experiment, [D] is ~10~2 M .
curves are obtained for various values of fc3:fc.i[D]. In the initial stage, [P ] increases linearly and quadratically with respect to t for reactions I and II, respectively. By paying special attention to this point, it is known that the experimental curve shown in Figure 3 corresponds to the [P H relation for reaction I I . This means
(15) The solution for reaction II holds also for the case where several reaction intermediates (Ii, I 2, . . . Ii) exist between the outer complex and the reaction product.
Volume 78, Number £ August 1969

2674 T . N o g a m i , K. Y o s h i h a r a , H . H o s o y a , a n d S. N a g a k u r a
that intermediate reaction steps exist between the outer(V) complex and the reaction product.16'17
We certified the existence of inner ( c r ) complexes for various complexes consisting of meto-substituted anilines and chloranil and found a parallel relationship between the electron donating power of the meia-substi- tuted groups and the stability of the corresponding inner (cr) complex,17 which was found to decrease in the order:1,3,5-triaminobenzene ~ N,N-dimethyl-m-phenyl- enediamine ~ m-phenylenediamine > m-aminophenol > m-anisidine.
From an analogy with the above-mentioned systems, the inner ( c r ) complex may be expected to exist as a reaction intermediate also for the aniline-chloranil system. However, we could not detect it by the aid of the absorption spectrum measurement. This may be because it is even less stable than the inner ( c r ) complex formed between m-anisidine and chloranil which is unstable and can exist only for a few seconds even at a temperature as low as 195°K.
outer 0) complex inner (r) complex, I,
Reaction mechanism A
HC1
From an analogy with the structures of the intermediate inner complexes actually observed for the similar systems and also from the structure of the reaction product, we may expect the following two possibilities for the inner (<r) complexes as the intermediate states of the an- iline-chloranil system.18
outer (ir) complex
Reaction mechanism B
2HC1
The present study cannot provide any answer as to which one is the more reasonable reaction path, mechanism A or B.
Another problem to be left unsolved in the present
(16) An important reason why we cannot detect the reaction intermediate I may, of course, be that its concentration is rather low. Another reason is that the absorption band of the inner (tr) complex, conceivably corresponding to I, may be considered to appear in the wavelength region of 500 mg17 and therefore to be covered by the CT band of the outer (v) complex.(17) T. Nogami, T. Yamaoka, K. Yoshihara, and S. Nagakura, to be published.(18) Reaction mechanisms through ion radicals as reaction intermediates may safely be disregarded for this system. This is because no esr signal can be detected for the present case.
The Journal of Physical Chemistry
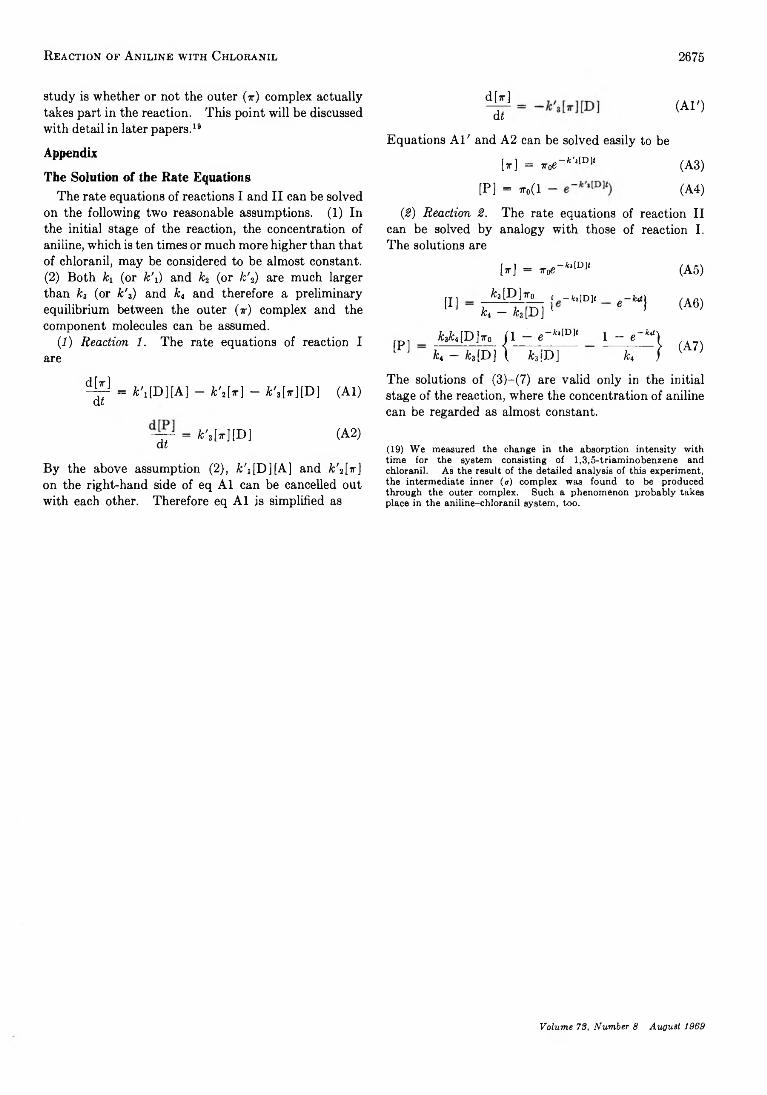
R eaction of Aniline with Chloranil 2675
study is whether or not the outer (t ) complex actually takes part in the reaction. This point will be discussed with detail in later papers.19
Appendix
The Solution of the Rate EquationsThe rate equations of reactions I and II can be solved
on the following two reasonable assumptions. (1) In the initial stage of the reaction, the concentration of aniline, which is ten times or much more higher than that of chloranil, may be considered to be almost constant. (2) Both kt (or fc'i) and k2 (or k\) are much larger than k3 (or k'3) and k4 and therefore a preliminary equilibrium between the outer (ir) complex and the component molecules can be assumed.
(1) Reaction 1. The rate equations of reaction I are
d Mdi
(A l')
Equations A l ' and A2 can be solved easily to be
[r] = Toe~k'’lD]t (A3)
[P] = t„(1 - (A4)
(£) Reaction 2. The rate equations of reaction II can be solved by analogy with those of reaction I. The solutions are
[P]
M = roe"*“® 11
[I]k3 [D]ttq r —fc,[D]t
k,« - *,[D] 1
W 4[D]7r0 (1 - e - k>lD]t 1 - e~M\ h - fc,[D] \ k3{D] h Ì
(A5)
(A6)
(A7)
^ = *'x[D][A] - k\[r] - fcOk][D] (Al) di
= fc'3W [ D] (A2)di
By the above assumption (2), fc'i[D][A] and k\[v] on the right-hand side of eq A l can be cancelled out with each other. Therefore eq A l is simplified as
The solutions of (3)—(7) are valid only in the initial stage of the reaction, where the concentration of aniline can be regarded as almost constant.
( 1 9 ) W e m e a s u r e d t h e c h a n g e i n t h e a b s o r p t i o n i n t e n s i t y w it h t i m e f o r t h e s y s t e m c o n s i s t i n g o f 1 , 3 ,5 - t r i a m i n o b e n z e n e a n d c h l o r a n i l . A s t h e r e s u l t o f t h e d e t a i l e d a n a ly s i s o f t h i s e x p e r i m e n t , t h e i n t e r m e d i a t e in n e r (<r) c o m p l e x w a s f o u n d t o b e p r o d u c e d t h r o u g h t h e o u t e r c o m p le x . S u c h a p h e n o m e n o n p r o b a b l y t a k e s p l a c e i n t h e a n i l i n e - c h l o r a n i l s y s t e m , t o o .
Volume 73, Number 8 August 1969

2676 R obert R. Hentz and Warren V. Sherman
Charge Scavenging and Energy Transfer in y Radiolysis of Benzene Solutions
by Robert R. Hentz and Warren V. Sherman1Department of Chemistry and the Radiation Laboratory, 2 University of Notre Dame, Notre Dame, Indiana 46556 (Received January 6, 1969)
The 7 radiolysis of benzene solutions of N20 was studied over the concentration range 5-400 mM. Values of G(Ns) are fitted with a published empirical equation for electron scavenging by N20 in cyclohexane. The equation corresponds to a model which involves (1) electron capture by N20 and (2) reaction of an anion produced via reaction 1 with another molecule of N20; both reactions compete with charge neutralization. Each occurrence of reaction 1 not followed by reaction 2 yields one molecule of N2; each occurrence of reaction 1 followed by reaction 2 yields two molecules of N2. Reaction 1 is characterized by a parameter a which is proportional to the specific rate (fcs) of the reaction and to an effective decay time (r) for the distribution of geminate cation-electron separations produced in the solvent. For reaction 2, a parameter (3 is the analog of a. For G(geminate ions) = 3.9, best fit to the data is obtained for G(free ions) = 0, a in the range 0.65-0.75 Af-1, and corresponding values of (3 in the range 32-15 M~l. Such a low value of a, as compared to a = 16 M~y in cyclohexane, is interpreted in terms of an effect of solvent on ka and t. Suppression of G(N2) is observed with C-C4F8, CHjBr, or irons-stilbene present in the fSbO-CeBU solutions. In turn, N20 suppresses the radiation-induced isomerization of fraws-stilbene in benzene; analysis of the effect by use of a = 0.70 M~l gives an estimate of direct and ionic contributions to benzene excitation in 7 radiolysis as G = 2.0 and G = 3.4, respectively.
IntroductionThere has been much interest recently in the formu
lation of quantitative descriptions of the nonhomogene- ous kinetics of charge scavenging in the radiolysis of liquid alkane solutions.3-7 Schuler and coworkers7 have adduced considerable experimental evidence for validity of the empirical relationship8
G $ — G n + G t i \ / a .S / { )- + V a S ) ( I )
In eq I, S denotes molarity of the scavenger; the 100- eV yield of scavenged electrons or cations is denoted by Gs, that of geminate ion pairs (be., those sibling cation-electron pairs whose members do not escape from their mutual coulombic fields) by G gi, and that of free ion pairs (those that do escape geminate recombination) by Gn. The parameter a in eq I can be considered proportional to the specific rate of the chargescavenging reaction and to an effective decay time for the distribution of geminate cation-electron separations (at electron thermalization) produced in the solvent.6-7 Thus, a should depend on such solvent properties as (1) those that determine ion and electron mobilities, (2) dielectric constant, (3) ionization potential and electron affinity in the liquid state, and (4) those that determine electron thermalization distances.9 Benzene differs appreciably from alkane solvents with respect to certain of these properties. Consequently, it is of interest to test the applicability of eq I to charge scavenging in benzene and, if possible, to obtain values of a for comparison with the corresponding values in an alkane.
In radiolysis of benzene, product yields that can be measured with reasonable convenience and accuracy are small (G s« 0.04-0.07) and cannot be correlated quantitatively with yields of specific primary p r o ce ss e s .10’11
Consequently, quantitative study of charge scavenging in benzene via an effect of scavengers on solvent product yields is precluded. Charge-scavenging studies in benzene also are restricted by its susceptibility to ring addition of reactive precursors (free radicals, atoms, and radical ions) of the measured products of certain charge-scavenging reactions (e.g., as in the use of alkyl halides7). In the present study, formation of nitrogen as a consequence of electron capture by nitrous oxide7’12 was chosen as the least ambiguous charge-scavenging reaction for quantitative test of the validity of eq I in benzene. Effects of the electron scavengers CH3Br and c-CiFg on <7(N,) from benzene solutions of N20 and of all three electron scavengers on the radiation-induced
(1) Chicago State College, Chicago, 111. 60621.(2) The Radiation Laboratory of the University of Notre Dame is operated under contract with the U. S. Atomic Energy Commission. This is AEC Document No. COO-38-628.(3) F. Williams, J. Amer, Chem. Soc., 8 6 , 3954 (1964); J. W. Buchanan and F. Williams, J. Chem. Phys., 44, 4377 (1966).(4) G. R. Freeman, ibid.. 46, 2822 (1967).(5) A. Hummel, ibid., 48, 3268 (1968).(6 ) R. R. Hentz and R. J. Knight, J. Phys. Chem., 72, 1783 (1968).(7) J. M. Warman, K.-D. Asmus, and R. H. Schuler, Advances in Chemistry Series, No. 82, American Chemical Society, Washington,D. C., 1968, p 25.(8 ) The form of this relationship for \ /“ S <JC 1 conforms with that expected on the basis of a theoretical treatment by Hummel.6
(9) Thermalization distance for an energetic electron in hydrocarbons is determined by rate of energy loss to ( 1) electronic excitations (governed by the number, character, and energies of solvent excited states),(2 ) intramolecular vibrations (perhaps via formation of transient negative ion states), and (3) intermolecular vibrations; of., A. Mozumder and J. L. Magee, J. Chem. Phys., 47, 939 (1967).(10) H. F. Barzynski, R. R. Hentz, and M. Burton, J. Phys. Chem., 69, 2034 (1965).(11) E. A. Cherniak, E. Collinson, and F. S. Dainton, Trans. Faraday Soc., 60, 1408 (1964).(12) G. Scholes and M. Simic, Nature, 2 0 2 , 896 (1964).
The Journal of Physical Chemistry

7 Radiolysis op Benzene Solutions 2677
isomerization of frans-stilbene in benzene also were studied.
Experimental Section
Materials. Fisher Certified benzene was recrystallized three times, dried over Drierite, and filtered. Nitrous oxide, methyl bromide, and perfluorocyclo- butane (all obtained from Matheson Co.) were purified by three trap-to-trap distillations on the vacuum line with rejection of head and tail fractions. Scintillation grade ¿rans-sti Ibene of Matheson Coleman and Bell which had been purified by recrystallization was kindly supplied by H. P. Lehmann of this laboratory.
Procedures. The procedures for sample preparation, 7 irradiation, and gas product analysis have been described.13 Nitrous oxide concentrations were calculated by use of an Ostwald solubility coefficient of 3.714 and a dead-space volume estimated to be equal to the volume occupied by the solution. Complete solubility was assumed for calculation of c-C4F8 and CH3Br concentrations. The irradiated liquids were analyzed on an F & M Model 810 gas chromatograph with a flame- ionization detector; a 6-ft column of 5 wt % silicone grease (DC 11) on Chromosorb G was used at 175° for biphenyl analysis and at 200° for stilbene analysis. Polymer yields were determined on separate samples; solvent and volatile products were removed from the irradiation cell by pumping through traps at 77°K on the vacuum line until the cell reached an approximately constant weight (after hr). Because polymers of lower molecular weight (e.g., biphenyl) may be removed to some extent by such a procedure, polymer yields so determined are expected to be somewhat low.
Results
Yields obtained in the radiolysis of benzene solutions of N20 are presented in Table I. The values of G(H2) and G(biphenyl) for pure benzene are in accord with previously published values,10-11 and values of G(N2) for the N20 solutions are in good agreement with the results of Sato, et al.u There is no significant dependence of yields on dose up to ■~1020 eV ml-1; at a dose of 1.3 X 10²¹ eV ml-1, values of G(N2) are 20-30% lower than those obtained at low doses. The polymer yield (in terms of benzene molecules equivalent to the weight of polymeric residue) was determined in two experiments at a dose of 1.3 X 10²¹ eV ml-1. Values of 0.60 and 2.9 were obtained for G(polymer) from pure benzene and from a 0.2 M N20 solution, respectively. Thus, the increase in (7 (biphenyl) with increase in N20 concentration (c/., Table I) is accompanied by an enhancement of the total polymer yield.
In chromatographic analysis of the irradiated liquids, just prior to the biphenyl peak a composite peak (with an area ~ 6 0 % of that of the biphenyl peak) was obtained which is attributable to a mixture of partially hydrogenated biphenyls.11 In the presence of N20 , an
Table I : Product Yields in y Radiolysis of BenzeneSolutions Containing N20“[NîO], m» G(Hi) G(Ni) Gfbiphenyl)
0 0.039 0.0765 0.241 0.107 0.306
10 0.536 0.1015 0.043 0.4420 0.656 0.1530 0.044 0.6550 0.035 0.92 0.14
100 1.316 0.20200 1.826 0.23300 0.040 2.06 0.23400 0.031 2.36 0.27
“ Dose rate = 1.3 X 10¹⁸ eV ml-1 min-1; dose = 1.3 X 10¹⁹ eV ml-1. b Calculated from G for total gas volatile at 77°K by assuming (?(H2) = 0.04.
additional unidentified peak was observed between the benzene peak and that attributed to the partially hydrogenated biphenyls.
The effect of other electron scavengers on G(N2) from N20 solutions is shown in Table II. Radiolysis of benzene solutions of CH3Br produced appreciable yields of methane; G(CH4) = 1.36 was obtained at a dose of7.8 X 1019 eV m l-1 to a 0.4 M CH3Br solution. For a given dose, the concentration dependences of methane and biphenyl yields from CH3Br solutions parallel, qualitatively, those of nitrogen and biphenyl yields, respectively, from N20 solutions. However, because of a dose dependence, methane yields from CH3Br solutions cannot be used as a reliable quantitative measure of the electron-scavenging reaction. For example,
Table II: Effect of a Second Solute on G{N2) from Benzene Solutions of N20“
[NîO], m M Solute
Concn,m M G ( Nî)
20 c-C4F8 20 0.2720 400 0.05
100 100 0.62400 400 1.0520 CH3Br 20 0.2620 200 0.11
100 100 0.58200 200 0.9350 irans-Stilbene 10 0.54
400 50 1.94“ Dose rate = 1.3 X 10¹⁸ eV ml-1 min-1; doses in units of 1019
eV ml-1 were 3.9, 7.8, and 1.3 for c-C4F8, CH3Br, and stilbene solutions, respectively.
(13) R. R. Hentz and W. V. Sherman, J. Phys. Chem., 72, 2635 (1968).(14) S. Sato, R. Yugeta, K. Shinsaka, and T. Terao, Bull. Chem. Soc.Jap., 39, 156 (1966).
Volume 73, Number 8 August 1989

2678 R obert R. Hentz and Warren V. Sherman
Figure 1. Effect of N20 on the radiation-induced isomerization of irons-stilbene in benzene: O, no N20;•, 0.4 M N20. Dose = 1.3 X 10¹⁹ eV ml-1.
©(CH4) = 0.92 is obtained at a dose of 1.3 X 10¹⁸ eV ml-1 to a 0.4 M CH3Br solution. Such a decrease in yield with decrease in dose suggests a secondary reaction in which CH3 is converted into CH4 by H abstraction from a radiolysis product (in competition with addition to benzene).
The effect of 0.4 M N20 on isomerization of trans- stilbene is shown in Figure 1. Results for trans- stilbene isomerization in the absence of N20 (c/. Figure 1) agree well with those reported previously.16,16 Measurements of G(m-stilbene) in 5 and 20 mM trans- stilbene solutions with 0.4 M c-CJ‘\ present gave values experimentally indistinguishable from those shown in Figure 1 for the corresponding frcms-stilbene concentrations with 0.4 M N20 present. Study of the effect of 0.4 M CH3Br was precluded by a catalysis of the isomerization reaction during irradiation (perhaps by Br atoms17) .
DiscussionElectron Scavenging by N 2O in Benzene. The inten
sity of uv-excited fluorescence from benzene and from scintillators in benzene is unaffected by the presence of N20 (unpublished results from this laboratory). Thus, formation of N2 from 7-irradiated benzene solutions of N20 reasonably can be considered a consequence only of electron capture by N20. Such a conclusion is confirmed by the effectiveness of other electron scavengers in suppression of G{N2) from the N20 solutions (c/. Table II). As shown by the observed increase in ©(biphenyl) and G(polymer), electron capture by N20 or CH3Br yields more benzene decomposition per ion pair than the charge neutralization reaction between CeH6+ and the electron (or CeHf,“ ). The ineffective
ness of scavengers in suppression of ©(H2) from benzene, as shown for N20 in Table I, has been noted before.10
There is some uncertainty with regard to the detailed mechanism by which nitrogen formation occurs as a consequence of electron capture by N20 ,7 particularly in benzene.18 However, various plausible mechanisms conform to the same model and, therefore, should give an equation of the same form for dependence of ©(N2) on N20 concentration. A model is postulated (as in the case of alkane solutions6,7) in which the reactions are (1) electron capture by N20 and (2) reaction of an anion produced via reaction 1 with another molecule of N20. Both reactions 1 and 2 compete with charge neutralization. Each occurrence of reaction 1 not followed by reaction 2 yields one molecule of N2; each occurrence of reaction 1 followed by reaction 2 yields two molecules of N2.
Mechanisms that conform to the proposed model are
Mechanism A
e - + N20 — ► N2 + O - (1)
O - + N20 — ► N2 + Os- (2)
Mechanism B
e - + N20 — ► N20 - (1)
N20 - + N20 — » N2 + N20 2- (2)
N20 -(o r N20 2-) + C+ — ► N, + ? (3)
Mechanism C
e - + N20 — > N2 + 0 “ (1)
O - + C6H6 — ► C6H60 - (la)
C6H60 - + N20 — > N2 + ? (2)
Mechanism D
e - + N20 — > N20 - (1)
N20 - + C6H6 — > N2 + C6H60 - (la)
C6H60 - + N20 — > N2 + ? (2)
An argument has been presented in support of mechanism B for alkane solutions.7 Mechanism D appears most plausible for benzene solutions.18
For the postulated model, Schuler and coworkers7 have proposed a modification of eq I that gives
< ? (N ,) = 2 © fi + G gi ( v / aS/(l + \ /a < S ) ] X
[i + v m i + v m ) (ii)
(15) R. R. Hentz, D. B. Peterson, S. B. Srivastava, H. F. Barzynski, and M. Burton, J. Phys. Chem., 70, 2362 (1966).(16) E. Fischer, H. P. Lehmann, and G. Stein, J. Chem. Phys., 45, 3905 (1966).(17) H. Steinmetz and R. M. Noyes, J. Amer. Chem. Soc., 74, 4141 (1952).(18) See, e.g., S. J. Rzad and J. M. Warman, J. Phys. Chem., 72, 3013 (1968).
The Journal of Physical Chemistry

y Radiolysis of Benzene Solutions 2679
Figure 2. Test of eq II (with ¡3 = ba) for representation of £?(Nj) from 7 -irradiated benzene solutions of N20; for each curve, (?gi = 3.9. Curve 1: On .«= 0, b = 0, a = 3.67 M~l. Curve 2: 2Ga = 0.07, b = 1.88, a = 1.04 M~K Curve 3:Ga = 0, 6 = 1.88, a = 1.16 M -1. Curve 4: Gn = 0 ,6 = 20-50, a = 0.75-0.65 M^1 (experimental points, O).
in which S is the molarity of N20 and the parameter 0 is for reaction 2 the analog of a for reaction 1. Results obtained in cyclohexane solutions conform reasonably well to eq II7 for Gn = 0.09, Gg; = 3.9, a = 16 M _1, and /3 = 30 M~l (he., /3 = 1.88 a).
A computer program was written to test the applicability of eq II, with the substitution /3 = ba, to the data of Table I. For {?gi = 3.9 and fixed values of b (he., (8/a) and Gn, values of a were calculated from eq II using the values of G(N2) at the five largest N20 concentrations (for which nitrogen yields are largest and, therefore, most reliable). The mean of these five a values then was used, with Ggi = 3.9 and the fixed values of b and Gn, to generate the curve corresponding to eq II for the entire range of N20 concentrations. Four such curves are presented with the data from Table I in Figure 2.
It is evident from the poor fit of curve 1 (for ¡3 = b = 0) to the data that, as in the case of alkane solutions, eq I is not adequate for calculation of G(N2) from benzene solutions of N20 ; thus, some additional process, such as reaction 2, is required. A set of curves was generated for b = 1.88 (the value obtained in cyclohexane7) and values of 2Gn in the range 0-0.1. For 2Gn > 0.07, as shown by curve 2, there is considerable divergence from the data at low N20 concentrations; best fit for b = 1.88 corresponds to Gn ~ 0 (curve 3). Clearing-field measurements by Schmidt and Allen give Gn = 0.05 in benzene.19 Experimental errors and the effect of electron-scavenging impurities at low N20 concentrations may preclude detection of a small Ga by fit of nitrogen yields with an empirical equation such as eq II.
Curves calculated as described are surprisingly
insensitive to the value chosen for b within a large range of values. With increase in b from 1.88 to 20, for Gn = 0, calculated curves shift from curve 3 to 4. Curve 4 corresponds to Gn = 0 and values of b in the range 20-50, each with its corresponding best value of a.20 Such values of a lie in the range 0.75-0.65 M~l; therefore, corresponding values of /? are in the range 15-32 M _1. With further increase in b above 50, calculated values of G(N2) become larger again for [N20 ] < 0.1 M and smaller for [N20 ] > 0.1 M. With b — 00 f a = 0.43 is obtained; for such values, the calculated curve is almost identical with curve 2 for [N20 ] < 0 .1 M but lies below curve 2 and all three experimental points for [NjO] > 0.1 M. Thus, curve 4 gives the closest approach to all experimental values of (r(N2) except those, apparently aberrant, for 10 and 20 m l N20. Curve 4 also provides the best least-squares fit to all the data.
The low value of a « 0.70 M~l in benzene, as compared to a — 16 M~l in cyclohexane, can be understood in terms of those solvent properties on which a is expected to depend (see Introduction). For example, it can be argued that electron capture by N20 occurs with lower specific rate from a primarily formed benzene anion, as compared to that for capture of an unattached electron in cyclohexane; the unattached electron may have a greater reaction cross section and a greater mobility.6 Also, it can be very reasonably argued that electron thermalization distances are smaller in benzene9 with a resultant decrease in geminate decay times. In nanosecond pulse radiolysis of 0.003-0.1 M biphenyl in benzene, Cooper and Thomas21 observe little or no yield of biphenyl anion that can be associated with geminate decay (i.e., a rapid initial decay); however, for 0.1 M biphenyl in cyclohexane a value of G ~ 1 is observed for biphenyl anions which decay rapidly over 50 nsec.22 Such observations indicate that geminate decay in benzene is essentially complete in less than 10 nsec.
Stilbene Isomerization. In cyclohexane, radiation- induced isomerization of frans-stilbene has been postulated to be a consequence of electron and positive charge capture by stilbene; isomerization occurs via a stilbene triplet state formed in subsequent neutralization of the stilbene ions.16 In benzene solutions, it was argued,15 electron capture by stilbene becomes appreciable only at stilbene concentrations for which excitation transfer from benzene is essentially complete. Thus, at low stilbene concentrations in benzene, isomerization pre-
(19) W. F. Schmidt and A. O. Allen, J. Phys. Chem., 72, 3730 (1968).(20) For any particular N2O concentration in the range 2—400 mM, values of (7 (N2) identical to the second decimal place are calculated from eq II with values of b in the range 20-50 (each with its corresponding best value of a and with Ggl — 3.9 and Gn — 0).(21) R. Cooper and J. K. Thomas, J. Chem. Phys., 48, 5097 (1968).(22) J. K. Thomas, K. Johnson, T . Klippert, and R. Lowers, ibid., 48, 1608 (1968).
Volume 73, Number 8 August 1969

2680 P. N. K rishnan and R. E. Salomon
dominantly is sensitized by solvent excited states which are formed (1) in neutralization of solvent ion pairs (i.e., C6H6+ with e- or C6H6_) and (2) in direct excitation of solvent molecules by energetic electrons. Present results support such conclusions.
That stilbene is a good electron scavenger is shown by its effectiveness in suppression of G(N2) from benzene solutions of N20 (cf. Table II). In cyclohexane, a = 16 M _1 for N20 appears close to an upper limit for good electron scavengers.7 Consequently, the value of a » 0.70 M _1 for N20 in benzene is a reasonable upper limit for a of stilbene. For such a value of a in eq I, ~ 1 6 % of the electrons are scavenged by 0.05 M stilbene. For triplet transfer from benzene to stilbene, a value15 of fct/fca = 120 M^1 (i.e., specific rate of transfer divided by specific decay rate of the benzene excited state) gives 86% triplet transfer to 0.05 M stilbene; singlet transfer with kt/kd ~ 1000 (unpublished results) is 98% complete.
Suppression of stilbene isomerization by N20 (as shown in Figure 1) is expected if neutralization of a benzene or stilbene cation by the anion formed in electron capture by N20 does not produce excitation. In that case, for a stilbene concentration at which excita
tion transfer is efficient and with a relatively large N20 concentration, the fractional reduction, /, in G(cfs-stil- bene) is given approximately by eq III.
/ = [eGi/icGi + Ge) ] [ V « S / ( 1 + V ^S)} (III)
In eq III, S is the molarity of N20, G-, is the total ion- pair yield, e is the excitation probability in neutralization of an ion pair not including the anion from N20, and Ge is the yield of directly excited benzene molecules. For 0.05 M stilbene and 0.4 M N20 with a = 0.70 M _1 and / = 0.215 (from Figure 1), eq III gives eGi =1.64Ge. This relationship combined with that for the total yield of stilbene triplets, eGi + Ge = 5.4,23 gives Ge = 2.0 and eG; = 3.4;24 for G; = 4, e = 0.85. Such values are only approximate but do indicate the relative magnitudes of the direct and ionic contributions to benzene excitation in y radiolysis.
(23) From ref 15 in which ©(stilbene triplets) = 1.85 X ©(cis-stil- bene) was used.(24) From the effect of N2O on radiation-induced isomerization of 0.25 M cis-2-butene in benzene, a value of eGi = 2 has been estimated by R, B. Cundall and W. Tippett, Advances in Chemistry Series, No. 82, American Chemical Society, Washington, D. C., 1968, p 387. For such an estimate, essentially complete electron scavenging by 0.2 M N 2O was assumed.
T h e Solubility of Hydrogen Chloride in Ice
by P. N. Krishnan1 and R. E. SalomonDepartment of Chemistry, Temple University of the Commonwealth System of Higher Education, Philadelphia, Pennsylvania {Received January 7, 1969)
A method has been devised to measure the equilibrium solubility of HC1 in ice. Single crystals of ice were placed in contact with a polycrystalline disk of ice containing radioactive HC1. After a specified time, the diffusion profile was measured, and the solubility was determined by extrapolation to infinite time using Fick’s laws of diffusion. Fickian diffusion was demonstrated, and the diffusion coefficient was determined.
IntroductionThe existence of solid solutions in which ice is the
major component has only been demonstrated for NH,SF,2’3 HF,4 F from CsF,5 and a few organic acids.6 Micheli and Iribarne7 established that incorporation of several ions in ice occurs. Claims for the establishment of solid solutions of H20 2 in ice have been made8“ 10 and later disputed.11'12 Only impurities containing N and F are known to dissolve in the normal form of ice. These impurities are believed to enter the ice lattice substitutionally.13 The extent and mode of dissolution in ice of ions with radii larger than those of the fluoride and nitrogen ion have not been determined. The
dissolution of ions in ice has a bearing on activity measurements, freezing of living cells,14 and geophysical
(1) Based on a Ph.D. dissertation submitted to the Graduate Board of Temple University.(2 ) K. Lonsdale, Nature, 158, 582 (1946).(3) (a) S. Zaromb and R. Brill, J. Chem. Phys., 24, 895 (1956); (b) R. Brill and S. Zaromb, Nature, 173, 316 (1954).(4) R. Brill and H. Ender, ibid., 176, 925 (1955).(5) E. J. Workman, Science, 119, 73 (1954).(6 ) R. Ballo, Z. Phys. Chem. (Frankfurt am Main), 72, 439 (1910).(7) M. Micheli and V. Iribarne, J. Chim. Phys., 60, 767 (1963).(8 ) O. Maass and O. W. Herzberg, J . Amer. Chem. Soc., 42, 2569 (1920).(9) P. A. Giguere and O. Maass, Can. J. Res., 18b, 6 6 (1940).
The Journal o f Physical Chemistry

Solubility of HCl in Ice 2 6 8 1
problems such as thunderstorm electricity.15 To permit meaningful theoretical analysis, it is desirable to measure the solubility of a substance containing only one atom which is foreign to ice. HC1 was chosen because of the prevalance and importance of chloride ion in nature and the similarity of HC1 to HF.
Preliminary experiments indicated that the diffusion of HC1 into ice is too slow to permit the attainment of saturated solutions of HC1 in ice in reasonable periods of time with samples large enough to permit ignoring surface contamination. These same experiments indicated that the solubility was so low that experiments on pulverized, cracked, or even clear polycrystalline samples would be meaningless because of the dominance of surface and grain boundary incorporation. Accordingly, it was realized that significant results could only be obtained by working with large single crystals of ice. The difficulties associated with the long time periods required to establish equilibrium could be obviated by allowing only a significant concentration gradient to develop and then, from the shape of the concentration profile, calculating the saturation solubility using the appropriate diffusion equations.
Experimental SectionThe method used to grow single crystals of ice is
based on the observation that ice formed on still water is known to have a preferred orientation,16 such that the C axis is perpendicular to the water surface. Deionized distilled water which had been degassed by purging with nitrogen for many hours was placed in a polished stainless steel beaker (7.5-cm diameter and 11-cm height). Three separate heating coils, equally spaced, were wound about the beaker. Each heater was separately controlled to give a desired temperature gradient. The heaters were covered by glass tape, and both the side and bottom of the beaker were then heavily insulated with styrofoam and glass wool. The assembly was placed in the interior of a cold box maintained at —20.0°. Air in the cold box was circulated by means of a blower. The current in the three heaters was adjusted and maintained to give a uniform temperature of 1.0° in the beaker. By reducing the current in the upper coil a supercooled surface layer formed, and eventually the entire surface was covered by a thin ice layer. Further downward growth continued until a large clear ice crystal was formed. The crystals were grown at a rate of 0.4 mm/hr. The ice was freed from the container by heating the walls and its single crystallinity was confirmed by observation with crossed polaroids and with a formvar etch pit technique which is described elsewhere.17'18 The single crystals were cut into suitable lengths and irregularities from the sides were removed with a sharp- edged metallic tube. Samples were immersed in a pool of precooled mercury to eliminate evaporation and kept in a cold box at —10° for purposes of annealing.
After several hours of annealing, the sample was frozen to a metallic base and inserted into a tight-fitting plexiglass tube. A disk of ice containing excess radioactive H86C1 was frozen on to the exposed sample face. This cap of ice containing radioactive HC1 was prepared by nonequilibrium freezing and contained enough HC1 to saturate the entire sample. The diffusion couple was placed in a cold bath maintained at a specified temperature, and the diffusion run was allowed to continue for many hours.
After several hours, the sample was removed from the cold bath and sectioned. Each section was weighed and its activity determined using a Packard Tri-Carb liquid scintillation spectrometer. From a knowledge of the density of ice19 at a particular temperature and the measured weight of a section, the volume and height of the section was determined. The average concentration in each section was then calculated.
ResultsTable I gives the results for runs at —18.0, —11.0,
and —4.0°.The frozen cap serves as a reservoir of HC1 which
maintains a saturated surface on the ice crystal during the entire diffusion time. If C(x, t) denotes the concentration of HC1 at a distance x from the interface at time t, the boundary conditions can be expressed as
C (x ,0 ) = 0(1)
0 (0 , t) = Co
where C0 is the saturation solubility. The results warranted the use of diffusion equations appropriate to a semi-infinite system which with the above boundary condition is
C(x,t) = Co 1 — erfx
2 V D t _(2)
To use eq 2 directly it is necessary to analyze extremely thin sections, and this leads to problems in boundary definition. It was found more convenient to integrate eq 2 between the boundaries of large sections and to equate the total HC1 in these slabs to the integral. This is given as
(10) O. Kubaschewski and W. Weber, Z. Elektrochem., 54, 200 (1950).(11) W. T. Foley and P. A. Giguere, Science, 113, 754 (1951).(12) W. T. Foley and P. A. Giguere, Can. J. Res., 29, 123 (1951).(13) F. Truby, Science, 121, 404 (1955).(14) A. U. Smith, “ Biological Effects of Freezing and Supercooling,” Williams and Wilkins Co., Baltimore, Md., 1961.(15) H. R. Pruppacher, E. N. Steinberger, and T. L. Wang, J. Geophys. Res., 73, No. 2, 571 (1968).(16) D. Brewster, Phil. Mag., 4, 245 (1834).(17) K. Higuchi, Acta Met., 6, 636 (1958).(18) K. Higuchi and J. Mugurama, J. Met. Soc. Japan, 37, 71 (1959).(19) K. Lonsdale, Proc. Roy. Soc., A247, 426 (1958).
Volume 73, Number 8 August 1969

2682 P. N. K rishnan and R. E. Salomon
This equation contains two unknowns, namely C 0 and D , and hence, it was necessary to utilize the data obtained from two slabs. A check on the applicability of Fick’s laws was provided by examination of data obtained on other slices. The agreement was found to be quite good. The actual calculations were performed by
Table I : Solubility Data”
S e c t io n
T e m p ,°c
A c t iv it y ,C i /m in
H e ig h t o f s e c t io n ,
c mV o lu m e ,
m lS o lu b i l ity ,
m o l 1. “ 1
U -18 0.0594 2.35502 0.0684 2.70813 17,425 0.0688 2.7269 6.67 X IO“84 11,066 0.0732 2.8985 6.92 X 10-«5 9,039 0.1250 4.9503 7.39 X 10-«6 2.397 0.1073 4.2508 7.45 X IO“81 -11 0.0599 2.21452 0.0426 1.68753 22.943 0.0584 2.3121 7.0 X 10-«4 22,828 0.0730 2.8931 6.9 X 10-*5 8,775 0.0341 1.3510 7.1 X IO"66 12,676 0.0608 2.4099 6.9 X 10-«7 7,915 0.0478 1.8951 6.9 X 10"61 -4 0.0575 2.27572 0.0513 2.03063 34,415 0.0770 3.0152 7.4 X 10“84 14,225 0.0343 1.3585 8.0 X 10-«5 14,741 0.0381 1.5080 7.9 X 10-'6 12,504 0.0344 1.3633 8.1 X IO“87 13,880 0.0417 1.6582 8.2 X 10-«
“ Results for 312 hr diffusion time. 2.01 X 10⁹ Ci/(min ml) corresponds to 1 mol of HCl/ml. D — 2.2 (±0.06) X 10”8 cm2 sec-1 at —18°; D = 4.9 (±0.4) X 10-8 cm2 sec-1 at —11°; D = 1.6 (±0.4) X 10~7 cm2 sec-1 at —4°. 6 Section 1 is measured from the interface in all cases.
evaluating ratios of r for various values of D (these ratios are independent of Co) on a CDC-6400 computer. Experimentally determined ratios of r enabled the determination of D . By introducing the value of D
determined by the above procedure into eq 3, the value of Co was determined. The temperature dependence of the diffusion coefficient was found to conform to the
Arrhenius equation D = D0 exp with D0 = 8.9
X 10 ~7 cm2 sec-1 and Da = 15.9 kcal/mol. An error analysis revealed that the diffusion coefficients were precise to 0.09% and the solubility to 4%.
The most significant result is the finding of a small but finite solubility of HC1 in ice. Although greater amounts of HC1 can be incorporated by growing ice at
a rapid rate from a HC1 solution, a fact of practical importance, such results are of no thermodynamic significance.
The thermodynamic analysis of our results is simplified by the fact that the concentrations of HC1 in ice is low enough to warrant the use of the concentration in place of the activity. Although the frozen cap admits of no simple thermodynamic representation (since it is not an equilibrium system), it can be replaced for purposes of theoretical analysis by an aqueous solution of HC1 whose freezing point is the same as the temperature of the ice. In other words, the results on solubility are equivalent to those that would be obtained if the originally pure ice crystal was kept in contact with an aqueous solution of HC1 whose freezing point was the ice temperature and the system was allowed to equilibrate. Although such an experiment is conceptually easier to understand, it is plagued by numerous experimental difficulties, the major one being the continuous melting and subsequent recrystallization of ice. Although not observed, and not a necessary part of the above argument, there is good reason to assume the existence of a liquidlike layer at the interface between the cap and the ice monocrystal. Such a layer most likely provides the path for Cl- to go from the cap to the sample. Since the cap contains HC1 concentrations in excess of the solubility of HC1 in ice and Cl- is not appreciably hydrated in solution, transport through the cap is not rate determining. The results clearly justify this assumption.
The ratio of Co to the activity of H C 1 in an aqueous phase is taken as the equilibrium constant, K, for the process H C 1 (aqueous solution at freezing point) H C 1
(ice saturated with H C 1 ) . Then
d In K A H o ...--------- - ----- (4)bT R T2 v
where A H o is the enthalpy change for the process referred to. The activity of HC1 in water is obtained by extrapolation of the formula used by Akerlof and Teare,20 namely
log 7 =—uy/m
1 + 2\/m-j- Bm + C m 2 + Dm3 + Emi (5)
where B , C , D, and E are empirical constants that vary linearly with temperature, g is a universal constant, and to the molarity. Using this equation it was found that a plot of log K vs. l/T gave a straight line and yielded a value of A H o of —3.8 kcal/mol.
From the data we also find that A G o = 0.905, 0.700, and 0.525 kcal/mol at the temperatures —18.0, —11.0, and —4.0°, respectively. We also find that A S o = — 18.5, —17.2, and —16.11 cal/(mol deg) at temperatures of 18.0, —11.0, and —4.0°, respectively. We may
(20) G. Akerlof and J. W. Teare, J. Amer. Chem. Soc., 59, 1855 (1937).
The Journal of Physical Chemistry

also estimate the thermodynamic quantities for the process HC1 (gas) HC1 (ice) and find that AH0 = —21.68kcal/mol, AG0 = —7.88 kcal/mol, and A(S0 = —48.2 cal/(mol deg). These results are obtained using well- known thermodynamic data for the process HC1 (gas)
HC1 (water).20 The equilibrium constant, K = (concentration of HC1 in ice)/(activity of HC1 in water), is 6.39 X lO“ 6, 1.78 X 10"6, and 2.14 X 10"8 at temperatures of —4, —11, and —18°, respectively.
The mode of incorporation of chloride ion in ice and the path of diffusion is suggested by the large hexag- onally shaped channels that appear in the ice struc
T hermal D issociation of Chlorine T rifluoride
ture. These channels define the C axis, and this is the direction of diffusion. It is proposed that diffusion proceeds through and dissolution occurs in these hexagonal channels. On the basis of the above model we may predict that diffusion perpendicular to the C axis should be much slower than diffusion along the C axis.
The technique described in this paper should be applicable to solubility studies in other solids that have low melting points, as long as they can be prepared in the form of large single crystals. In cases where the solubility is appreciable, the requirement of large single crystals may be obviated.
2 6 8 3
The Therm al Dissociation of Chlorine Trifluoride behind
Incident Shock Waves
by J. A. Blauer, H. G. McMath, and F. C. JayeAir Force Rocket Propulsion Laboratory, Air Force Systems Command, Edwards, California 93523 {Received January 8, 1969)
The thermal dissociation of C1F3 behind incident shock waves has been studied in the temperature range of 800-1300° K. The course of the dissociation was followed by means of ultraviolet absorption spectroscopy centered at 2200 ± 250 A. Initial slope measurements gave a value of ki = l018-5±0-4 exp — [(28,200 ± 1700)/ RT] cc/mol sec for the rate constant of the reaction C1F3 + M = C1F2 + F + M. The collision efficiency of C1F relative to argon was found to be 35 ± 5 to 1. Evidence is presented which favors a heat of formation for C1F2 of —19 ± 2 kcal/mol at 0°K.
IntroductionIt is likely that the thermal decomposition of C1F3
proceeds initially by simple unimolecular bond rupture, i.e.
C1F3 + M = C1F2 + F + M (1)
It can be shown from the elementary theory1'2 of unimolecular reactions that the rate of this reaction should have fallen to 50% of its high-pressure limit at approximately 30 atm if the reaction temperature is 1000°K. Furthermore, at pressures below 5 atm, the reaction should be bimolecular.
The nature of the reactions successive to reaction 1 can be inferred by analogy from the mechanism given by Schumacher3 for the photochemical reaction of C1F3and F2 to form C1F6. The reaction path is
C1F2 + M = C1F + F + m (2)■C1F2 + F = C1F + F2 (3)
C1F3 + C1F = 2C1F2 (4)F + F + M = F2 + M (5)
In addition to these reactions, one other possibility will be considered here, i.e.
F + C1F3 = C1F2 + F2 (6)
At present, there are no published kinetic results concerning the decomposition of C1F3; however, thermal data4 are available.
The choice of a technique based upon uv absorption for following the course of the dissociation was made possible by the very large extinction coefficient for C1F3 relative to those for C1F and F2 under the conditions of
(1) S. W. Benson, “ The Foundations of Chemical Kinetics,” M cGraw-Hill Book Co., Inc., New York, N. Y ., 1960, p 234.(2) Values for the Kassel integral were furnished by Dr. T. A. Jacobs of Aerospace Corp., El Segundo, Calif. For this calculation we assume that the molecule has six effective oscillators and that the collisional deactivation efficiency has a value of about 0.1. The dissociation energy was assumed to be 37 kcal/mol with v = 1014 sec(3) R. L. Krieger, R. Gatti, and H. J. Schumacher, Z. Phys. Chem., 51, 240 (1966).(4) H. Schmitz and H. J. Schumacher, Z. Naturforsch., 2a, 362 (1947).
Volume 73, Number 8 August 1969

2684 J. A. Blauer, H. G. M cMath, and F. C. Jaye
measurement. Although these ratios varied somewhat with temperature, at 900° K they were found to be represented approximately by 1:0.04:0.02. Any optical interference due to the intermediate species CIF2 was ignored in the analysis, it being assumed that its concentration remained low during the course of the reaction and that its extinction coefficient is not large.
Experimental SectionThe shock tube, of Avco6 design, is of stainless steel
and has an inside diameter of 3.75 cm. The overall length of the test section is 7.5 m, and the entire inside surface is finished to a grade-8 smoothness. The observation port is equipped with sapphire windows held in compression by close-tolerance brass collets. Window-shock tube sealing is effected with indium wire gaskets. The driver, having an overall length of 1.7 m, was separated from the downstream section by means of scribed diaphragms of cold-rolled steel. The downstream section was in turn separated from a 220-1. dump tank by means of a thin sheet of Mylar.6
Shock detection was by means of moderate response (ca. 7 nsec) piezoelectric detectors7 having a spatial resolution of 2 mm and placed at intervals of 76.2 cm along the entire length of the downstream section. After amplification, the outputs of these detectors were displayed on a Tektronix Model 535 oscilloscope which was equipped with a rastor sweep and a Radionics Model TW M crystal-driven timing generator.
The course of the dissociation was followed by means of a once-through, single-light-path, ultraviolet absorption spectrometer.8 The source was a Beckman deuterium arc lamp. Spectral isolation was by means of a Baird-Atomic interference filter centered at 2200 ±o250 A. Detection was by means of a Type 1P28 photomultiplier tube. The instrument had a spatial resolution of 2 mm and an overall relaxation time of 3 ¿¿sec.
Argon having a purity of 99.998% was purchased from Matheson and used without further purification. Gaseous F2 with a minimum purity of 98.2% was purchased from Allied Chemical Corp. A mass analysis revealed the presence of 0.7% 0 2 and 0.2% HF as the only significant impurities. After passage through a column of NaF pellets, the gas was used without further purification. Gaseous C1F, having a purity of 98.0%, was purchased from Ozark-Mahoning Co., and was further purified by trap-to-trap distillation using a Freon-12 liquid slurry at —140°. Gaseous C1F3, having a purity of approximately 98%, was purchased from Matheson and was further purified by forming the KF complex, KC1F4, at ambient temperatures after which the C1F3 was recovered by vacuum distillation at 200°. Infrared and mass spectral analyses of the purified C1F3 and C1F samples showed no indication of HF or oxygen-containing compounds.
Mixtures of Ar, C1F3, F2, and C1F which contained 0-1.88% C1F3, 0-2.80% F2, and 0-5% C1F were
Figure 1. Absorption trace for test no. 6: 0.1-V ordinate divisions, 20-fisec fast sweep and 200-/isec slow sweep abscissa divisions, 0.94% C1F3 in Ar, 912°K, 5.7 atm incident shock pressure.
prepared and stored in stainless steel tanks, which were pre-passivated with C1F3 and F2. Compositions were determined by differences in direct weighing for C1F3 and by pressure differences for all other gases. Heise gauges, whose scales could be read to 0.1% of full scale, were used in all mixing operations.
Immediately before using a gaseous mixture in a test, its CIF3 content was determined by reading its optical density at 2200 A. Beer’s law gave an excellent description of the results. No change in optical density was observed upon allowing the mixtures to stand for several days.
The initial gas pressure within the shock tube was measured by means of a Wallace and Tiernan 0-60 psia gauge. Tests were conducted using either helium or nitrogen as the driver gas.
Results and DiscussionWith the assumption of Beer’s law, the optical
density of the reacting mix can be described by the relationship
A = A(C1F3) + A(C1F) + L(F2) (7)
Here K, N, and L represent the absorption coefficients for C1F3, C1F, and F2, respectively. The initial conditions behind the shock wave were obtained by means of a solution of the Rankine-Hugoniot equations. This permitted an evaluation of the absorption coefficient for C1F3 by simple linear extrapolation of the oscillogram to the origin of no reaction; see Figure 1. The temperature dependence of these coefficients is illustrated in Figure 2. The absorption coefficient for fluorine was found by testing binary mixes of F2 and argon. The absorption coefficient for C1F was taken
(5) AVCO Corp., Wilmington, Mass.(6) Trade name.(7) Kistler Instrument Corporation, Model 601.(8) Furnished by Rocketdyne, Inc., Canoga Park, Calif., under Contract No. AF 04(611)-5963.
The Journal o f Physical Chemistry

T hermal D issociation of Chlorine Trifluoride 2 6 8 5
Table I : Compositions and Shock Parameters for Individual Tests
(Ar)o X 10», (ClFi)o X 10«, OXê
(ClF)o X 10«, Ti, Ti, P, fci X 10-'Test mol/cc mol/cc mol/cc mol/cc °K B °Kb atm sec-11 0.0406 0.778 0 .0 0 .0 1272 1144 4.3 20.92 0.0898 0.764 0.0 0 .0 1011 923 3.4 1.23 0.0396 0.758 0 .0 0 .0 703 660 2.3 N.R.4 0.0765 0.726 0 .0 0 .0 856 830 5.4 0.275 0.0937 0.890 0 .0 0 .0 1168 1109 9.1 12.36 0.0750 0.711 0 .0 0 .0 912 874 5.7 0.87 0.0863 0.818 0 .0 0 .0 856 820 6.1 0.168 0.173 0.815 0 .0 0 .0 876 858 12.5 0.659 0.151 0.711 0 .0 0 .0 916 897 10.8 0.55
10 0.146 0.691 0.0 0 .0 792 775 9.6 0.0611 0.145 0.686 0 .0 0 .0 844 826 10.1 0.1512 0.128 0.604 0 .0 0 .0 856 837 9.0 0.3013 0.208 0.978 0 .0 0 .0 1159 1128 19.8 23.414 0.0742 0.0351 0 .0 0 .0 910 890 5.6 0.7015 0.333 0.801 0 .0 0 .0 996 985 27.3 6.916 0.478 1.12 0 .0 0 .0 805 797 31.6 0.1717 0.326 0.697 9.89 0 .0 946 935 26.1 2.418 0.202 0.528 5.98 0 .0 1086 1060 19.4 13.619 0.0889 0.889 0.0 4.44 960 919 7.0 1.520 0.0598 0.637 0 .0 3.18 1086 1032 5.7 7.7
“ Conditions immediately behind the incident shock wave. b Conditions at equilibrium.
Figure 2. Molar absorption coefficients for C1F3 illustrated as a function of temperature.
from the conditions prevailing at equilibrium; see Figure 1. The values of N and L were found to vary only slightly with temperature. At 900°K the ratio K :N :L = 0.55:0.02:0.01 was found to apply.
Resort was made to the method of initial slopes for an estimation of the rate constant of reaction 1. The results are tabulated in Table I. A close examination of these results reveals that the estimated unimolecular rate constant is nearly a linear function of the concentration of possible collision partners. Consequently, the data were assumed to refer to a unimolecular reaction in its low-pressure region. The resulting bimoleeular rate constant has the form
/ 28,200 ± 1700\ . ,fci = 1013-5±0-4 ex p (-----------— --------j cc/mol sec (8)
The results are graphically illustrated in Figure 3.
11«.
u7-
10*-
|t!F3l/|«r| syhioi a0.0192 o0.0095 □0.0047 A A0.0024 •0.0020 ▲O.OOlt ■»i=io,3Si|iw j,!,; f ,Vc/».i</ni
IJS-1.0|t/T!*10!"K-1
Figure 3. Temperature dependence illustrated for apparent second-order reaction rate constants. Solid triangles represent mixes containing 2.8% fluorine. Solid squares represent tests containing 5.0% C1F.
The experimental activation energy of a unimolecular reaction in its bimoleeular region is related to the dissociation energy1 of the molecule by means of the relationship
D = E* + (s - 3A)RT (9)
If 1000°K is taken as the average temperature at which data were taken, and the number of internal degrees of freedom, s, is assumed to be 6, eq 9 gives a value of 37 ± 2 keal/mol for the dissociation energy. Although this calculation is uncertain, due to the uncertainty in s, the result will be substantiated at a later point in the paper.
Volume 73, Number 8 August 1969

When used in conjunction with the best thermal data presently available,4'9-10 this translates into a heat of formation for C1F2 at 0°K of —19 ± 2 kcal/mol. In subsequent analysis, more complete thermal data were required for the assumed intermediate, C1F2. These were generated by assuming for it a structure similar to that of H20 with vibrational frequencies of 750, 700, and 360 cm-1. The Cl-F bond distance was estimated at 1.65 A.
In an attempt to obtain further information from the data, the entire suggested mechanism consisting of eq 1 through 5 was subjected to numerical integration by means of a nonequilibrium computer program11 which solves the conservation equations simultaneously with the reaction rate equations. The overall reduction of rate data proceeded by matching observed and calculated reaction profiles and repeating the process with a new estimated set of rate constants. Only one rate constant was varied at a time until the best overall fit of the data was obtained.
The initial estimate for k x was taken as eq 8. The initial estimate for fc2 was taken as
fc2 = lO14-0«-23’000/®2, cc/mol sec (10)
The activation energy for step 2 was estimated from the best available thermal data10 used in connection with our suggested value for the heat of formation of C1F2 and eq 9 with s = 3.
Reaction 3 was assumed to have a near-zero activation energy and to have a steric factor of approximately 0.01. The resulting rate constant was assigned a value of
Is = 1 X 10¹² cc/mol sec (11)
The effect of reaction 4 was obtained by difference between those tests having added C1F and those to which it was not added. As a consequence, it initially was deleted from consideration in those tests not containing added C1F. The rate constant for reaction 5 was taken from the work of Diesen.12 All reverse rates were computed from thermal data and the assumption of detailed balancing.
An illustration of the comparison between the experimental data and the corresponding computed reaction profile for one test is shown in Figure 4. Here normalized optical density is plotted against laboratory time. Although the use of eq 8 is sufficient to force the computed profile to pass through the initial portion of the data, the bulk of the computed profile exhibits a far slower overall reaction rate than was experimentally observed. The reason for this behavior lies in the rapid temperature drop brought on by reaction 1 coupled to the slow recombination of fluorine atoms. No reasonable combination of reaction rates for the four reactions thus far considered was sufficient to describe the entire reaction profile. Increases in fc2 or /c3 by an order of magnitude were found to have only
2686
SYMBOL ASSUMED k)— k,(E q.8)
J. A. Blauer, H. G. McMath, and F. C. Jaye
Figure 4. Comparison of computed and observed reaction profiles for test no. 1 which was taken at 1272 °K. The reaction model used excluded consideration of steps 4 and 6.
a minor effect upon the overall reaction rate, whereas changing the value of fci by a factor of 2 changed the computed reaction rate by approximately the same factor.
Since the effect of large amounts of C1F upon the initial reaction rate is not gross, see Figure 3, it was decided to test the effect of the addition of reaction 6 to the model. If a heat of formation of —19 kcal/mol is assumed for C1F2, this reaction will be thermoneutral and should, as a consequence, exhibit only a small activation energy. The initial estimate for fc6 was
fc6 = 0.5 X 10¹¹ cc/mol sec (12)
This value was based upon the near steady-state concentration given for F atoms by the above described attempt to compute the reaction profile coupled to the increase in reaction rate required to describe the later stages of the reaction; see Figure 1.
After adjusting the value of fc6 until the best fit for all of the experimental data was obtained, the following expression resulted
fce = 0.75 X 10ue~2500/JiT cc/mol sec (13)
During the course of these calculations, it was found necessary to make a slight adjustment in the expression for fci. The final result was
ki — 0.7 X 10¹⁴e_30’000/ftr cc/mol sec (14)
The results of these calculations are illustrated in Figure 5 for several tests conducted over a wide range of experimental conditions. Increases in the values of fc2
(9) H. H. Claassen, B. Weinstock, and J. G. Malm, ./. Chem. Phya., 28, 285 (1958).(10) “ JANAF Thermoehemical Tables,” Dow Chemical Co., Midland, Mich., July 1968.(11) Furnished by Dr. T. A. Jacobs, Aerospace Corp., El Segundo, Calif.(12) R. W. Diesen, J. Chem. Phys., 44, 3662 (1966).
The Journal of Physical Chemistry

T hermal D issociation of Chlorine T rifluoride
SYMBOL BUN To"K Pillimi self] Xf2
Figure 5a. Comparison of computed and observed reaction profiles.
SYMBOL BUK Ti'K Pilli*! MIFj W2 KSNUttO 2 1011 3.4 l.U 0.0□ 12 <SG ),0 0.47 0.1A 10 792 9.B 0.47 0,0
Figure 5b. Comparison of computed and observed reaction profiles.
UI0BBI0BT TIME |jjS£C|Figure 5c. Comparison of computed and observed reaction profiles.
and k3 by an order of magnitude had little effect upon the computed reaction profile.
In an attempt to evaluate the effect of reaction 4, two tests were conducted with mixes containing 5.0% C1F and 1.0% C1F3 in argon. Although both tests gave high values for the initial slope, see Figure 3, these results were not conclusive due to the apparent scatter in the experimental data. As a consequence,
2687
Figure 6. Comparison of computed and observed reaction profiles for mixes containing 5% initial C1F.
kcaf/moteSYMBOL RUN VK Po [atm] %CIFj %Ti IAHf]ClF2 ASSUMED k6
Figure 7. Comparison of computed and observed reaction profiles. The absorption due to initial fluorine was subtracted from the optical densities.
the above mechanism was used to compute the reaction profiles for these tests, and the results are illustrated in Figure 6. From these figures, it is apparent that C1F has a very marked effect upon the course of the reaction. Accordingly, calculations were made with various assumed efficiencies for C1F relative to argon as a collision partner in step (1) of the reaction. The final result indicated that, under the conditions considered, k4 and k4 are in the ratio of 35 ± 5 to 1. Although these calculations do not establish that reaction 4 actually occurs, they do give strong evidence for it.
Once the collision efficiency for C1F relative to argon in step 1 of the reaction had been established, the reaction profiles for all tests illustrated in Figure 5 were re-computed. The results were identical with those illustrated. This was primarily due to the low concentrations of GIF,, used in these experiments coupled to the fact that, in the absence of added C1F, reaction 4 has its greatest effect late in the course of the decomposition.
The effect that a small change in the value of kr> has upon the computed reaction profile is graphically illustrated in Figures 5b and 7. An examination of these figures reveals that fc6 can be specified at any temperature with an uncertainty of about 50%. This
Volume 73, Number 8 August 1969

2688 J. A. Blauer, H. G. M cMath, and F. C. Jaye
Table II : A Comparison of Experiment with Statistical Theory
T est(A r)c X 10*,
m o l/c c T, " KD (th eo ),k c a l/m o l
1 0.0406 1272 372 0.398 1011 37
10 1.464 792 37
■/t(sec-i) x 1 0 - « --------- -Caled Obsd m (ca lcd ) m (obsd)
58.0 2.1 0.9 0.83.8 0.12 0.8 0.80.15 0.006 0.7 0.8
would indicate that the activation energy given in expression 13 has an uncertainty of about 2 kcal/mol.
Finally, an attempt to establish an error criterion for the heat of formation of C1F2 was made. The reaction profiles for several tests were re-computed with the assumption of —23 kcal/mol for this quantity. Although no appreciable effect was noticeable for tests conducted with mixes containing no added fluorine, a very sizeable effect was noted when fluorine was in excess. This result is illustrated in Figure 7. This effect was found to be primarily due to the reverse of reaction 6. As a consequence of these calculations, it appears that the suggested value for the heat of formation of C1F2 is uncertain by about 2 kcal/mol. Furthermore, this result demonstrates that the inclusion of step 6 in the reaction model gives results that show a high degree of internal, thermodynamic as well as kinetic, consistency.
Comparison with Statistical TheoryKeck13 has recently extended the statistical theory of
molecular dissociation to cover the case of moderately complex molecules. The theory permits the estimation of the dissociation rate constant and its pressure dependence from a knowledge of the dissociation energy and other molecular parameters. In the absence of a knowledge of the dissociation energy, the theory estimates it and the resultant reaction rate constant from a knowledge of the experimental activation energy.
In the present instance the activation energy was taken from eq 14 as 30 kcal/mol. The energy exchange cross section via, which is required by the theory, was assumed to be 1 X 10“ 16 cm2. The calculations were performed for three representative tests and the results are tabulated in Table II. The observed pressure dependence of the reaction was obtained by fitting the following equation to the experimental data
h/( Ar)m = A e -E*/RT (15)
The best fit of the experimental data results for m =0.8 ± 0.2.
Although the theory does give a satisfactory description of the pressure dependence of the reaction and estimates the dissociation energy at 37 kcal/mol, it gives a rate constant which is about a factor of 25 larger than is actually observed. Since the theory normally overestimates the rate constant by a factor of from 2 to 3, the actual discrepancy is only a factor of 10.
It is is assumed that during the initial phase of the
reaction only steps 1, 3, and 5 are operative, a steady- state treatment gives the following result.
&obsd = k\\kz/{k-iM + fc3)] (16)
If /c_1M ~ lOk), a possible explanation of the discrepancy between experiment and theory seems obvious.
For test no. 15, (Ar) = 0.33 X 10“ 3mol/cc. Since we estimate that ki ~ 10fcOb sd , this gives a value at 996°K of 0.1 X IO16 ccVmol2 sec for fc_i. The resulting value required for k., is 0.4 X 10¹¹ cc/m ol sec. These estimates were used to compute the reaction profile for this test. The result showed an over-all reaction rate which was nearly an order of magnitude larger than the observed rate for the first 50% of the decomposition. The computed rate then slowed to that observed indicating that the steady state had been achieved. The assumption k-iM ~ 100/c3 gave similar results. The inclusion of step 2 into the reaction scheme made little difference.
Accordingly, it appears that the initial slope measurements are indeed good estimates for the rate of reaction 1. This indicates that the theory is unable to give a satisfactory description of the thermal decomposition ofCIFa.
ConclusionsIn conclusion, the thermal decomposition of C1F3 at
elevated temperatures (ca. 1000°K) is a complex reaction which exhibits at least two separate reaction paths, one of which may be a chain. Under the conditions specified in this study, the chain mechanism appears to be competitive with a mechanism involving simple unimolecular bond rupture followed by interaction of the fragments among themselves.
Although recent statistical theory does predict the proper pressure dependence for the reaction, it fails to give a satisfactory value for the absolute magnitude of the reaction rate constant itself. An attempt to explain this discrepancy on the basis of a steady-state treatment only substantiated the observed magnitude of the rate constant.
The heat of formation of C1F2 at 0°K was estimated to have a value of —19 ± 2 kcal/mol. This value was found to give a high degree of internal consistency to the suggested reaction scheme when it was compared to the experimental data.
(13) J. Keck and A. Kalelkar, J. Chem. P h y s 49, 3211 (1968).
T h e J o u rn a l o f P h y s ic a l C h em istry
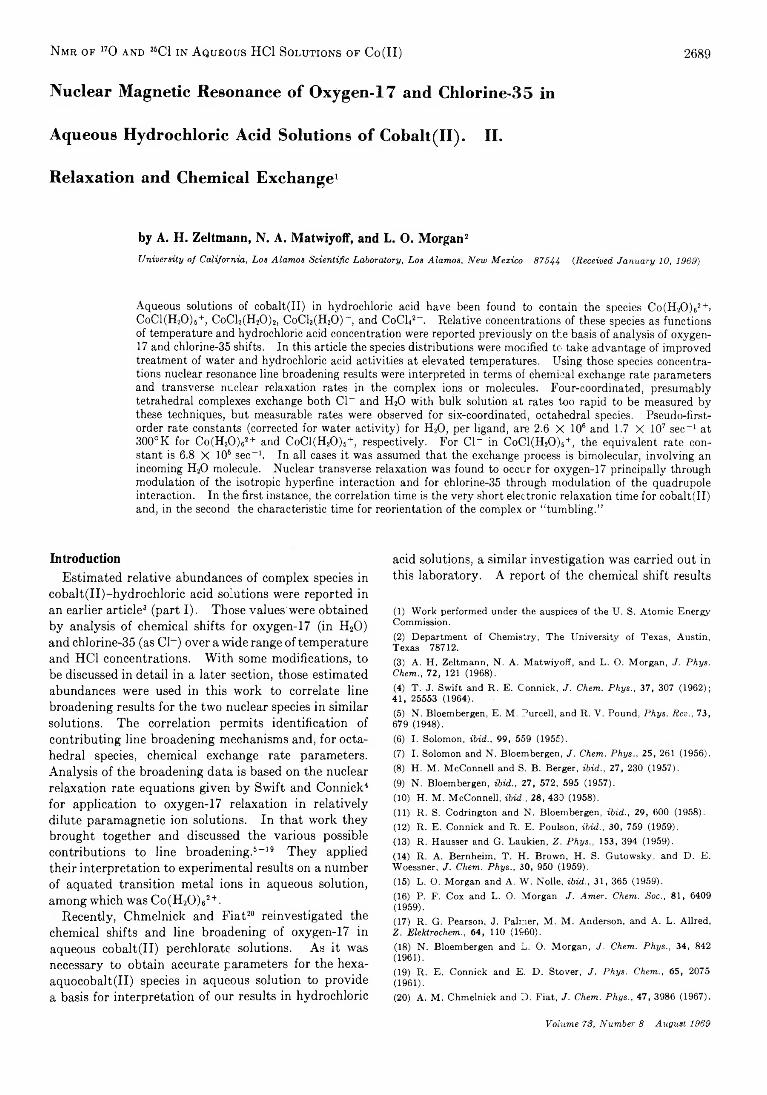
Nmr of 170 and 36C1 in A queous HC1 Solutions of Co (II) 2689
Nuclear Magnetic Resonance of Oxygen-17 and Chlorine-35 in
Aqueous H ydrochloric Acid Solutions of C o b alt(II). II.
Relaxation and Chem ical Exchange1
by A. H. Zeltmann, N. A. Matwiyoff, and L. O. Morgan2University of California, Los Alamos Scientific Laboratory, Los Alamos, New Mexico 8754-4 (Received January 10, 1969)
Aqueous solutions of cobalt(II) in hydrochloric acid have been found to contain the species Co(H20)62+> CoC1(H20)5+, CoC12(H20)2, CoC13(H20)~, and CoCl42-. Relative concentrations of these species as functions of temperature and hydrochloric acid concentration were reported previously on the basis of analysis of oxygen- 17 and chlorine-35 shifts. In this article the species distributions were modified to take advantage of improved treatment of water and hydrochloric acid activities at elevated temperatures. Using those species concentrations nuclear resonance line broadening results were interpreted in terms of chemical exchange rate parameters and transverse nuclear relaxation rates in the complex ions or molecules. Four-coordinated, presumably tetrahedral complexes exchange both Cl“ and H20 with bulk solution at rates too rapid to be measured by these techniques, but measurable rates were observed for six-coordinated, octahedral species. Pseudo-first- order rate constants (corrected for water activity) for H20, per ligand, are 2.6 X 10⁶ and 1.7 X 10⁷ sec-1 at 300°K for Co(H20)62+ and CoCl(H20)5+, respectively. For Cl- in CoC1(H20)5+, the equivalent rate constant is 6.8 X 10° sec-1. In all cases it was assumed that the exchange process is bimolecular, involving an incoming H20 molecule. Nuclear transverse relaxation was found to occur for oxygen-17 principally through modulation of the isotropic hyperfine interaction and for chlorine-35 through modulation of the quadrupole interaction. In the first instance, the correlation time is the very short electronic relaxation time for cobalt(II) and, in the second, the characteristic time for reorientation of the complex or “tumbling.”
IntroductionEstimated relative abundances of complex species in
cobalt(II)-hydrochloric acid solutions were reported in an earlier article3 (part I). Those values were obtained by analysis of chemical shifts for oxygen-17 (in H20) and chlorine-35 (as Cl- ) over a wide range of temperature and HC1 concentrations. With some modifications, to be discussed in detail in a later section, those estimated abundances were used in this work to correlate line broadening results for the two nuclear species in similar solutions. The correlation permits identification of contributing line broadening mechanisms and, for octahedral species, chemical exchange rate parameters. Analysis of the broadening data is based on the nuclear relaxation rate equations given by Swift and Connick4 for application to oxygen-17 relaxation in relatively dilute paramagnetic ion solutions. In that work they brought together and discussed the various possible contributions to line broadening.6-19 They applied their interpretation to experimental results on a number of aquated transition metal ions in aqueous solution, among which was Co(H20) 62+-
Recently, Chmelnick and Fiat20 reinvestigated the chemical shifts and line broadening of oxygen-17 in aqueous cobalt(II) perchlorate solutions. As it was necessary to obtain accurate parameters for the hexa- aquocobalt(II) species in aqueous solution to provide a basis for interpretation of our results in hydrochloric
acid solutions, a similar investigation was carried out in this laboratory. A report of the chemical shift results
(1) Work performed under the auspices of the U. S. Atomic Energy Commission.(2) Department of Chemistry, The University of Texas, Austin, Texas 78712.(3) A. H. Zeltmann, N. A. Matwiyoff, and L. O. Morgan, J. Phys. Chem., 72, 121 (1968).(4) T. J. Swift and R. E. Connick, J. Chem. Phys., 37, 307 (1962); 41, 25553 (1964).(5) N. Bloembergen, E. M. Purcell, and R. V. Pound, Phys. Rev., 73, 679 (1948).(6) I. Solomon, ibid., 99, 559 (1955).(7) I. Solomon and N. Bloembergen, / . Chem. Phys., 25, 261 (1956).(8) H. M. McConnell and S. B. Berger, ibid., 27, 230 (1957).(9) N. Bloembergen, ibid., 27, 572, 595 (1957).(10) H. M. McConnell, ibid., 28, 430 (1958).(11) R. S. Codrington and N. Bloembergen, ibid., 29, 600 (1958).(12) R. E. Connick and R. E. Poulson, ibid., 30, 759 (1959).(13) R. Hausser and G. Laukien, Z. Phys., 153, 394 (1959).(14) R. A. Bernheim, T. H. Brown, H. S. Gutowsky, and D. E. Woessner, J. Chem. Phys., 30, 950 (1959).(15) L. O. Morgan and A. W. Nolle, ibid., 31, 365 (1959).(16) P. F. Cox and L. O. Morgan J. Amer. Chem. Soc., 81, 6409 (1959).(17) R. G. Pearson, J. Palmer, M. M. Anderson, and A. L. Allred, Z. Elektrochem., 64, 110 (1660).(18) N. Bloembergen and L. O. Morgan, J. Chem. Phys., 34, 842 (1961).(19) R. E. Connick and E. D. Stover, J. Phys. Chem., 65, 2075 (1961).(20) A. M. Chmelnick and D . Fiat, J. Chem. Phys., 47, 3986 (1967).
V o lu m e 7 3 , N u m b er 8 A u g u st 1969

was given in part I, and those for line broadening are included here. They are in substantial agreement with the results obtained by Chmelnick and Fiat, but some details of interpretation are different. Those are pointed ou t in the discussion to follow.
At low hydrochloric acid concentrations, cobalt(II) solutions are pink, changing to deep blue at higher concentrations. If chloride ions are present, the pink solutions also change to blue at high temperatures and the temperature at which the change takes place decreases with increasing hydrochloric acid concentration. In the intermediate concentration range the purplish color of the solutions may be converted into pink by lowering the temperature to 0° and below. Those qualitative observations are borne out by the quantitative species abundances, if the pink to blue color change is associated with the transition from octahedral to tetrahedral species, which apparently occurs at the dichloro complex, CoCkflTOb- In the absence of chloride ions, as in aqueous cobalt(II) perchlorate solutions, the pink color becomes more intense with increasing temperature. Spectra of solutions at temperatures as high as 150° do not show any indication of the characteristic tetrahedral spectral components, but do reveal increased absorbance at the position of the octahedral doublet (ca. 20,000 cm“ 1) and a shift of the band to lower energy. Those changes probably do not indicate appearance of a new species, but reflect thermal excitation to higher levels in the electronic ground state. Chemical shift data give no indication of lower coordination number at elevated temperatures in those solutions.
Results reported here confirm the absence of exchangeable water in the highest chloro complexes and substantiate the species distributions determined by chemical shift measurements.3 Dependence of both chlorine-35 and oxygen-17 relaxation on the rate of chemical exchange of chloride and water between the complex octahedral species over a considerable range of both concentration and temperature permits evaluation and comparison of the exchange rate parameters for such species.
Experimental SectionCobalt(II) perchlorate (G. Frederick Smith Co.) was
recrystallized twice from perchloric acid solution. The resulting crystals contained a small amount of free perchloric acid. Solutions prepared by dissolving the recrystallized cobalt (II) perchlorate in water containing enriched H20 17 were analyzed for cobalt(II) by titration with ethylenediaminetetraacetic acid. Total cation equivalence of the solutions was determined by displacement of hydrogen from a cation-exchange resin and titration of the acid solution. Upon subtraction of the cobalt(II) equivalence, a value of the hydrogen ion concentration in the crystals was obtained. The difference between the weight of crystals used in preparation of the solution and the known amounts of cobalt(II)
2690
perchorate and perchloric acid was assumed to be water. That value was then used to correct the enrichment factor for oxygen-17 in the solutions used in magnetic resonance measurements.
Cobalt(II) chloride solutions were prepared, as described previously,3 by mixing weighed amounts of analyzed stock solutions. Cobalt(II) concentrations ranged from 0.10 to 0.30 m. Oxygen-17 contents were in the range 2.0-3.2%.
Nuclear measurements were made as before,21 except that a proton magnetometer was employed for calibration of spectra.
Results
Solution compositions and line broadening for both oxygen-17 (8.000 MHz) and chlorine-35 (5.000 MHz) at 300°K are given in Table I (see Figure 1). Relative species abundances, am, listed there differ from those given in part I, as small errors were introduced in the original analysis by using incorrect solute activities in a few cases. The activities listed in the previous tabulation were correctly entered, however. While making the necessary corrections, it was decided to include temperature-corrected solute and water activities in order to obtain more realistic enthalpies and entropies of reaction. The method by which those corrections were made is given in the Appendix. The indices m — 0,1, 2, 3, 4 refer to Co(H20) 62+, CoC1(H20 )6+, CoC12(H20 )2, CoC13(H20 ) - , and CoC142~, respectively. In Tables II and III, revised values are listed for the reaction parameters and other derived quantities. Those values
A. H. Zeltmann, N. A. Matwiyoff, and L. O. M organ
Figure 1. Dependence of oxygen-17 and chlorine-35 line broadening on HC1 molal concentration. Solid lines were calculated using eq 5, species abundances from Table I, and parameters listed in Tables III and IV: •, oxygen-17 at 8.0000 MHz; O, chlorine-35 a,t 5.0000 MHz (all at 300°K).
(21) A. H. Zeltmann and L. O'. Morgan, J. Phys. Chem., 70, 2807 (1966).
The Journal of Physical Chemistry

Nmr of 170 and 36C1 in Aqueous HC1 Solutions of Co(II) 2691
Table I: 0xygen-17a and Chlorine-356 Line Broadening in Aqueous HC1 Solutions at 27 ± 1°
,—---M o la li t y----- v Tap' o l » ) - ’; x io-« (T a p 1 CI») 1 X 10 - »H C l C o C ls °±e <ih2o «0 ttl ai as ai E x p tl C a le d E x p t l C a le d
0.424 0.109 0.49 0.973 0.916 0.084 0.000 0.000 0.000 144 151 5.3 5.60.932 0.117 0.97 0.951 0.843 0.156 0.000 0.000 0.000 145 144 11.4 10.71.99 0.123 2.39 0.898 0.674 0.324 0.002 0.000 0.000 125 127 18.0 23.93.41 0.122 5.63 0.815 0.439 0.549 0.011 0.000 0.000 109 101 40.9 46.13.89 0.115 7.21 0.798 0.373 0.610 0.017 0.001 0.000 104 92.2 48.1 53.75.79 0.139 18.8 0.672 0.148 0.750 0.091 0.009 0.002 67.0 63.1 102 99.56.66 0.123 27.6 0.615 0.088 0.712 0.166 0.027 0.008 53.7 52.6 132 1357.88 0.133 45.0 0.541 0.035 0.530 0.296 0.088 0.050 31.6 37.3 245 2218.21 0.139 51.1 0.521 0.026 0.458 0.325 0.114 0.076 28.4 32.7 287 2558.97 0.157 71.6 0.468 0.009 0.253 0.347 0.191 0.200 18.0 20.0 378 3649.70 0.138 94.2 0.426 0.003 0.122 0.292 0.232 0.351 11.1 11.5 484 459
10.20 0.168 113 0.396 0.001 0.064 0.231 0.238 0.466 7.6 7.3 512 51811.00 0.136 151 0.355 0.000 0.021 0.140 0.215 0.624 3.3 3.6 606 58912.01 0.152 213 0.307 0.000 0.005 0.065 0.163 0.767 1.4 1 . 6 642 65012.38 0.147 240 0.291 0.000 0.003 0.048 0.143 0.806 664 66712.96 0.159 289 0.268 0.000 0.001 0.030 0.116 0.853 714 68913.12 0.173 302 0.261 0.000 0.001 0.026 0.109 0.863 745 69513.81 0.141 370 0.238 0.000 0.000 0.015 0.085 0.900 745 71714.43 0.209 443 0.215 0.000 0.000 0.009 0.066 0.925 705 73515.36 0.151 567 0.189 0.000 0.000 0.004 0.046 0.949 771 758“ 8.0000 MHz. 65.0000 MHz. c Mean ion activity of HCl.
Table II: Equilibrium Parameters for Cobalt(II) Species in Aqueous Hydrochloric Acid Solutions“
E q u il ib r iu m A S , bc o n s t a n t A H , b e n t r o p y( 3 0 0 ° K ) k c a l /m o l u n its
Ki (0.18 ± 0.03) 3.6 ± 1.0 8.7 ± 3.6K a (2.0 ± 0.2) X 10-3 5.5 ± 1.1 6.0 ± 3.8K3 (3.6 ± 0.4) X 10-3 10.6 ±1.2 24.0 ± 4.2K< (6.8 ± 0.5) X lO-3 6.6 ± 0.4 12.1 ±1.5
“ See ref 3 for representations of the K„ which apply to forma-tion of species n and are semithermodynamic. Kn = a„an2o/ a„-ia± except for K2 — a2aBi03/aia±. 6 AH and AS apply to temperature dependence of the Kn values as written and are not truly thermodynamic. AS, especially, should be interpreted with caution, as the ratio of species activity coefficients is not included in the K n.
Table III : Coupling Constants for Oxygen-17 and Chlorine-35 in Cobalt(II) Complexes
N u c le u s S y m m e t r y(A ta/ui)
X 10*
{ A / h ) X I O "? , r a d ia n s e c -1
( A / h ) X i o - » ,
H z
Cl36 Octahedral 36.3 ± 6.4 1.31 2.06Cl36 Tetrahedral 115.9 ± 0.6 4.34 6.91Q 17 Octahedral 169.5 ± 1.1 8.44 13.5Q17 Tetrahedral 354.0 ± 10.2 18.4 29.3
were used in obtaining species abundances for interpretation of line-broadening data.
The value given in Table III for the coupling constant of oxygen-17 in octahedral coordination, (A/h) =1.35 X 10⁷ Hz, is to be compared with the value 1.70 X 10⁷ Hz reported by Chmelnick and Fiat.20 The line shifts on which both constants are based are essentially equivalent. We can only conclude that their value was calculated using the free electron g value, whereas ours was obtained with ^er = 5.00 [for octahedral cobalt- (II) jin
( A a = (1/3 ,S(S + l)(A/kT)gefiP/fiy]<i (1)
Reduction of line width data to normalized relaxation rates was dope as in previous work.21 The quantity (T2p') includes correction for total cobalt(II) concentration through
p' = moles of cobalt(II)/moles of H20 (or Cl- ) (2)
but does not contain the coordination number n for exchanging ligands, or fractional abundance am, of specific complexes. The complete factor for a particular species is
■p - p'amn (3)
Temperature dependences of chlorine-35 and oxygen- 17 line broadening are shown in Figures 2 and 3 and discussed in the following section. Data were also obtained at 1.99 and 7.88 m HC1 for chlorine-35 and at 2.14 and 7.80 m for oxygen-17, which were included in the statistical analysis of results. As they reveal no features not represented in the figures, they were omitted in order to simplify the graphical presentations.
Volume 73, Number 8 August 1969

2692 A. H. Zeltmann, N. A. Matwiyoff, and L. 0 . M organ
Figure 2. Temperature dependence of chlorine-35 line broadening. Solid lines were calculated using eq 5 and parameters listed in Tables II, III, and IV: O, 13.77 m HC1 at 5.0000 MHz; O , 5.79 m HC1 at 5.0000 MHz; •, 5.79 m HC1 at 3.0000 MHz.
Figure 3. Temperature dependence of oxygen-17 line broadening. Solid lines were calculated using eq 5 and parameters listed in Tables II, III, and IV: O, CofCKhh in 0.2 m HC104 solution; O , 5.73 m HC1; •, 8.74 m HC1 (all at 8.0000 MHz).
One set of data for chlorine-35 broadening in 5.79 m HC1 solution was taken at 3.0000 MHz for comparison with 5.0000 MHz results and is also presented in Figure2.
Oxygen-17 broadening was measured in 0.100 m cobalt(II) perchlorate solution (300°K) at 5.0000,3.0000, and 2.0000 MHz to obtain values for (Tip') ~l of7.8 X 105, 3.0 X 10⁵, and 1.6 X 10⁵ sec-1, respectively. The corresponding value at 8.0000 MHz is 1.55 X 10⁶ sec-1.
Discussion
For both chlorine-35 and oxygen-17, the dominant
factors governing variations in line broadening with temperature and HC1 concentration, appear to be relative species abundances and coordination number. For chlorine-35 a reasonable fit to experimental data over the entire range of HC1 concentrations at room temperature (300°K) may be obtained with a two-parameter equation
(T2P' c i)-1 = CVi + C2(2a2 + 3a3 + 4a4) (4)
but the contributions to C\ and C2 must be resolved by analysis of temperature dependence data, and a better fit results from consideration of concentration effects on relaxation parameters. There appears to be a marked difference in the behavior of octahedral and tetrahedral species, the latter producing more effective relaxation. Similarly, for oxygen-17 broadening at 300°K, the data are fitted well by an expression involving only octahedral species
(TVP'o)-1 = C3a 0 + Ciai
However, a small residual broadening at higher HC1 concentrations suggests some contribution from tetrahedral aquochloro complexes.
The general expression for transverse relaxation of exchanging ligand nuclei in dilute paramagnetic solutions, according to Swift and Connick,4 is
/m I \ n<Xm[ Tlm- l(Tim~l + Tm-1) + Ac0m2”| /rNU2P L)n ~ frp _i , _n2 1 A 2 W
Tm L (Tim + Tm 1) 2 + ACdm2 J
in which T2m is the intrinsic relaxation time for ligand nuclei L in the complex species m, rm is the residence time in the complex, and Awm is the chemical shift relative to nuclei in the bulk diamagnetic environment. The assumptions are made that all enhancement of the nuclear relaxation rate occurs in the first coordination sphere of the complex species, that the fraction of com- plexed nuclei is small, that is, p « 1, and that no direct exchange between complexes occurs. The first assumption is quite good if relaxation in the coordination sphere is the result of contact interaction or quad- rupole interaction markedly stronger than that in the bulk solution. Only the bulk solvent line or the collapsed line is observed.
Limiting forms of eq 5 have been given4'20 which correspond to solutions obtained by neglecting the various factors at the outset. Of particular concern here are those represented by eq 5a-f.
(a) In the limit of slow exchange
Tm T2m; (T2Pl )m 1 " TlOimTm 1 (5a)
This result is obtained regardless of the value of Acom.(b) In the limit of fast exchange
T m T i m i ( T l P L ' ) m ~ l =
namT2m~1( 1 + T2mrTOAwm2)( l + rm2Acom2) -1 (5b)
In this instance, the result clearly depends on the
The Journal of Physical Chemistry

Nmr of 170 and 36C1 in A queous HC1 Solutions of Co (II) 2693
relationships among rm, T2m, and Aum, as in the following cases.
(c) If Awm is very large
T2mTmAwm2, rm2Awm2» 1; (TipL')m- 1 = nanTm- x (5c)
as in (5a).(d) If Tm is very short
TimTmA&>m2, Tm2 Aum2 « l j{TipLr)m~l = namTim~x (5d)
(e) In the intermediate cases
T2mrmAwm2 S 1 » rm2AwOT2;(TipL')m~l = namTim- l( 1 + T2mrm Awm2) (5e)
T2mTmAoim2 » 1 » r m2Aojm2;
(TipL')m~l = n a mTmA u m2 (5f)
Because the temperature dependence of rm is often much greater than that of Tim or Awm, it may be possible to see relaxation behavior as a function of temperature in which each limiting case obtains. Starting at low temperatures where rm is long, with increasing temperature (5a) -*■ (5b) (5d), and (5b) mightappear as (5e) or (5f).
Equation 5 contains parameters essentially constant at a single temperature for a given solution species, except that rm may vary with solution composition if there is a dependence of chemical exchange rate on composition. Changes in rm as a function of solution composition are expected to be (a) small, if exchange is controlled by unimolecular decomposition, (b) larger if the process is bimolecular and involves attack by solvent water molecules, and (c) very much larger if attack by Cl- is the dominant process. The absence of strong medium effects in this instance suggests that a and/or b is responsible for exchange in cobalt (II) complexes, or that relaxation is in the limit 5d. To a good approximation, Tim is expected to be independent of HC1 and H20 activities but may vary with viscosity and density, if relaxation is through the quadrupole interaction modulated by tumbling of the complex.
In Figure 1 the normalized relaxation rates for oxygen-17 and chlorine-35 are shown as functions of HC1 molal concentration. Variation of relaxation rate with temperature is given in Figure 3 for oxygen-17 and in Figure 2 for chlorine-35. In each case the data presented illustrate relaxation behavior at HC1 concentrations chosen to represent the regimes in which the various contributions to relaxation are best evaluated. We find that present results for both oxygen-17 and chlorine-35 relaxation require that the complete eq 5 be used for each octahedral species and that the limit 5d is attained by tetrahedral species. We have made the further assumption that Tim is essentially the same for a given nucleus in any tetrahedral species on the basis of the linear dependence of chlorine-35 broadening on
tetrahedrally complexed chloride. Contributions of tetrahedrally coordinated oxygen-17 to over-all broadening are so small that a similar assumption there should lead to negligible error.
All rate and relaxation processes were taken to have exponential dependences on temperature, characterized in each case by a 300°K value and an apparent activation energy, Ea. For chemical exchange, rate expressions were written to include terms for the activity of water. However, the experimental data used for evaluation of rates involving a given complex species cover such a limited range of water activities in HC1 solutions that the inclusion of such a term is not an absolute necessity. As the results were slightly more consistent with the term present, it was retained, but the conclusions reached are not significantly affected by it. Each was of the form
T m = (f c 'a in o ) -1 (6 )
with aH,o equated to unity at infinite dilution and 25°.A nonlinear least-squares program22 for the CDC-
6600 was adapted to analysis of broadening data at all temperatures and concentrations, using species concentrations given in Table I, based on parameters in Table II and relative shifts listed in Table III. The several relaxation and rate constants, together with their temperature dependences, were treated as variables in the statistical analysis. A simultaneous solution using all available data was found to be impractical, and the following procedure was adopted. (1) Relaxation and exchange rate parameters for oxygen-17 in Co(H20 )62+ were determined in the absence of chloride. (2) Temperature dependence of electronic relaxation, which is important in determining the temperature variation of Tim for electron-nuclear spin exchange, was taken to be that observed for protons14 in Co(H20 )62+, — 1.5 kcal/mol (for both octahedral species). (3) Parameters for chlorine-35 in tetrahedral species were evaluated separately, using data obtained at 13.77 m HC1 where concentrations of octahedral species are negligible (over 90% of cobalt(II) is present as CoCl42- at 300°K). (4) All data were then processed to determine the remaining parameters. (5) As a check on the assumptions, tetrahedral complex parameters were fixed for oxygen-17, and the program was used to evaluate all octahedral parameters, including those for Co(H20 )62+. The results were the same within the specified error.
In analysis of chlorine-35 data in 13.77 m HC1 solutions, T ^ -1 was separated into two terms, one for contact relaxation9
(T2m- 4)s = (2/3 )S(S + 1 )(A/nyTe (7)
assuming t „ = r s = Tu = T2s, because of the expected
(22) R. H. Moore and R. K. Zeigler, Los Alamos Scientific Laboratory Report LA-2367, Los Alamos, N. M., Oct 1959, available from the Office of Technical Services, U. S. Department of Commerce, Washington, D. C.
Volume 73, Number 8 August 1969

2694 A. H. Zeltmann, N. A. Matwiyoff, and L. 0 . Morgan
Table IV : Relaxation and Chemical Exchange Rate Parameters for Cobalt(II) Species in Aqueous HC1 Solutions
,---------------------Co(HjO)62 +----------------------.CoChflLOL, CoCli(HsO) -,
Complex species This work Ref 14 CoCl(H¡0)» + CoCh2"
Activation energies, kcal/molChemical exchange, H2170
Chemical exchange, (36C1)-
11.9 ± 0.7 10.4 (AHA1) (AS* = 5.3 eu)
13.8 ± 0.7
13 ± 1Spin-exchange (contact) relaxation -1.5° -1 .5“ 0.3 ± 0.5
Rate constants, chemical exchange, 300 °K, sec 1H2170 (fc' X 10-6) (36C1)- (k ' X 10-6)
2.6 ± 0.2 2.4 17 ±3 6.8 ± 0.7
>10s>5 X 10⁷
Relaxation constants, 300°K, sec 1(r2m-1)„ for oxygen-17 (X 10-4) (T2I»-1)S for chlorine-35 (X 10-3) (7’2ro-1)a for chlorine-351’ (X 10—3)
1.6 ± 0.8 1.3 2.3 ± 0.8
5.3 ± 0.7
4.2 ±1.8 6.5 ± 1.0 6.8 ± 0.3
Electron relaxation times, t, ( = T\, = Tie), sec 1Oxygen-17 data (X 1013) Chlorine-35 data (X 1013)
9 4.6' 13 5413
“ Fixed (ref 17). A single temperature dependence was assumed for all octahedral species. Similarly, a single value was assumed for all tetrahedral species, as determined from chlorine-35 data. 6 Determined by water viscosity at 300°K. (Tim*1), = (Tim~v)qm-(rj/r)/(t7HJo/300). c Using (A/h) = 1.35 X 10⁷ Hz, this value becomes 7.4 X 10~13 sec (see Results). d Subject to large error because of the small contribution to over-all broadening. Errors in estimation of temperature coefficients are particularly significant.
short relaxation time for cobalt(II) species, and a second term for quadrupolar relaxation23
= (3/40) [(2/ + 3 ) / /2(2 / - 1)] X
a + (,•'•) ®
in which t) is an asymmetry factor and is neglected here; (e2qQ) is the electric quadrupole coupling constant; t0 is the correlation time and is taken to be the tumbling time of the complex in solution. Temperature dependence of (T2m-1)s was assumed to be that of ri/T (rj = bulk viscosity). Estimation of rj/'F values is described in the Appendix. No evidence was found for quadrupolar relaxation of oxygen-17, and in that case (T2m-1) = (T2m-1)s.
Results of the complete data analysis are given in Table IV and the expected behavior of line broadenings as functions of HC1 concentration and temperature, calculated with those parameters, is plotted as solid lines in Figures 1, 2, and 3. Agreement appears to be satisfactory to within experimental error.
The observed frequency dependence of oxygen-17 relaxation may be accounted for in terms of T2m-1, A&>m, and rm, using the listed parameters in Tables III and IV. Based on the observed value for (T2p'on)-1, 1.55 X 10⁶ sec-1, at 8.0000 MHz, those at 5.0000,3.0000, and 2.0000 MHz were calculated to be 6.6 X 105,3.0 X 105, and 1.9 X 10⁵ sec-1. The corresponding observed values are 7.8 X 10⁵, 3.0 X 10⁵, and 1.6 X 10⁵ sec-1, in reasonable agreement with expectation.
Using the reported values for (T2m~v) t for octahedral and tetrahedral chloride with eq 8 and estimating tc « 3 X 10-11 sec, we find the values (e2qQ/h) to be 6.8 and
7.6 MHz, respectively. In the absence of measured values for comparison we can only say that those values are quite reasonable (see ref 23, p 348). In any event, they depend on the chosen value of rc in each case and must be considered to be crude estimates at best.
Values for (T2m-1)s may be used to estimate re through eq 7 and (A /%) from Table III. Those results are also given in Table IV. Again, it can only be said that they are compatible with the expectation that cobalt (II) species in solution have electronic relaxation times of the order of 10-13-10 -12 sec. Without detailed information on the relaxation processes, no further deductions can be made. The discrepancy between the value of re = Tu obtained in this work and that of Chmelniclc and Fiat14 is more apparent than real. It arises from the different assumptions for activation energy for the electronic relaxation. At high temperatures, where data are most reliable, the two are essentially equal.
Ligand residence times, rm, for Cl- and H20 are related to individual ligand exchange rates, k', by
auioh' - rm-1 (9)
and to the over-all reaction rate constants k by
k = nk' = wrm-IaH! o -1 (10)
in which n is the number of equivalent exchanging species in the complex. Thus for H20 exchange between Co(H20 )62+ and bulk solvent
R = fc [Co (H20 ) 62+]aHao (11)
(23) A. Abragam, “ The Principles of Nuclear Magnetism,” Oxford University Press, London, 1961, p 314.
The Journal of Physical Chemistry

N mr of 170 and “ Cl in A queous HC1 Solutions of Co(II) 2695
and n = 6, so that
k = 6k' = 6rm-1aH!0_1 (12)
Because a^o is equated to unity at 25° and infinite dilution, the units of k are reciprocal seconds in all cases, regardless of the molecularity of the rate-determining step. The involvement of water in a bimolecular exchange process for both Cl“ and H20 is not proved, as was indicated earlier. However, treatment of the data without the factor for water activity changes the resulting rate constants by only a small factor, and relative values are essentiallly unchanged.
The specific ligand exchange rate for H20 is significantly increased by substitution of chloride in the octahedral coordination sphere, although the energy barrier for exchange is greater for the chloro complex. While this indicates a larger positive activation entropy change for the latter process, it is hazardous to draw mechanistic conclusions in the absence of detailed understanding of the exchange reaction. It is entirely possible that mechanisms in the two instances are actually different, if, for example, exchange in Co(H20 )62+ is bimolecular and that in CoC1(H20 )6+ is unimolecular, or if the two paths are competitive for each complex species.
In a similar vein, chloride exchange in CoC1(H20 )6+ has a rate constant 2.5 times less than that for water molecules, but the apparent activation energy is approximately the same. Again, a bimolecular step involving attack by water with elimination of chloride is indicated but not substantially proved.
These results may be compared with those of Luz24 for CoC1(CH3OH)5+ in which proton shift and relaxation data were interpreted to obtain rate constants for methanol exchange. Substitution of the chloride ion in the coordination sphere of Co(CH3OH)62+ increases the methanol exchange rate26 by a factor of ca. 300 (at 25°, estimated from —63° results). In that case, the activation energy decreases from 15 to 12 kcal/mol. Luz attributes the rapid exchange to ligands in equatorial positions in CoC1(CH3OH)5+ and uses n — 4 to obtain the rate constant. The constant we have listed for CoC1(H20)5+ is the mean value for all five positions, as there is no basis for evaluating separate equatorial and axial rates from oxygen-17 line broadening data.
Exchange rate constants for both chloride and water are too large to be measured in any tetrahedral species, and no information other than lower limits for exchange rates is obtainable in the working temperature range. As the tetrahedral species are observed primarily at very high HC1 concentrations, attack by chloride in bimolecular processes may be significant for both chloride and water exchange as well as that by water molecules. Five-coordinated intermediate species should be readily formed, and we anticipate that associative mechanisms are probably dominant for the higher chloro species.
ConclusionsIn this complex system, it is difficult to isolate specific
regions of temperature or solution compositions where a single species or a small number of parameters dominate the analysis. However, a consistent analysis of both the chemical shift and line-broadening data for oxygen-17 and chlorine-35 require the following.
(1) Octahedral cobalt(II) complexes predominate at low HC1 concentrations and low temperatures; tetrahedral species are favored at higher HC1 concentrations and high temperatures. At the highest HC1 concentrations studied, cobalt(II) exists predominantly in the form of C0CI42“ . The transformation of complexes from octahedral to tetrahedral forms occurs simultaneously with the addition of the second chloride ion.
(2) The exchange of H20 or Cl- with octahedral species is substantially slower than exchange with tetrahedral species.
(3) The transverse relaxation of Cl“ in tetrahedral species is due to quadrupolar and contact chemical shift relaxation effects whereas the relaxation of H20 17 in both octahedral and tetrahedral species is dominated by the contact mechanism.
AppendixHC1 activity data were obtained as a function of
temperature from Harned and Owen26 below 4 m and from Akerlof and Teare27 above that concentration. In each case the activity data were extrapolated above and below the range 0-50° for which experimental data were available. Below 4 m it was necessary to program equations to express constants tabulated by Harned and Owen. Since Akerlof and Teare expressed the necessary constants as analytical functions of temperature, those equations were extrapolated.
Analysis of data for quadrupolar relaxation requires that values of viscosity for HC1 solutions at all experimental temperatures be known. In the absence of precise measured values in all cases we have used the room temperature values for HCl-water solutions28 and the shape function for water over the range of temperatures.26 Where values of HCl-water mixtures are known,28“ 30 they were found to correspond satisfactorily with the calculated values.
An equation was obtained by least-squares fit of data for variation of relative viscosity of water as a function
(24) Z. Luz, J. Chem. Phys., 41, 1756 (1964).(25) Z. Luz and S. Meiboom, ibid., 40, 2686 (1964).(26) H. S. Harned and B. B. Owen, “ The Physical Chemistry of Electrolyte Solutions,” 3rd ed, Reinhold Publishing Corp., New York, N. Y „ 1958, p 469.(27) G. Akerlof and J. W. Teare, J. Amer. Chem. Soc., 59, 1855 (1937).(28) “ International Critical Tables,” Vol. V, McGraw-Hill Book Co., Inc., New York, N. Y ., 1929, pp 10, 12.(29) M . A. Klochko, J. Gen. Chem. USSR (Eng. Transl.), 26, 1149 (1956).(30) M. A. Klochko and M . Sh. Kurbanov, Bull. Sector, Phys. Chem. Anal. Akad. Sci. USSR, 24, 237 (1954).
Volume 78, Number 8 August 1969

2696 Laurine L. Graham and R onald E. D iel
of temperature. The relative viscosity of H20 was taken to be 1.00 at 20° and
17*20 = exp(16,262/T - 163.6976 +0.64316T - 0.00117107T2 + 8.0685 X 10⁻⁷r 3)
where T = °K.Another equation representing the variation of vis
cosity of HC1 solutions at room temperature (25°) as a function of molality was also fitted. The viscosity of F m HC1 solutions at 25° relative to water at the same temperature is
r, = 1.004 + 0.05603E - 7.493 X10⁻⁵E2 + 9.865 X 10⁻⁵E3 - 2.535 X 10⁻⁶E4
The viscosity of any HC1 solution at a given temperature was taken to be the product of the two functions.
Acknowledgments. We are indebted to Dr. W. Burton Lewis and others for helpful comments during discussions of the work reported here. We also wish to thank Patricia Stein, who made many of the measurements, and Dr. B. B. Mclnteer and Mr. R. M. Potter of the Los Alamos Scientific Laboratory for supplying the enriched NO17.
N u c le a r M a g n e t ic R e s o n a n c e S tu d ie s o f I n t e r n a l
R o t a t i o n in A l ip h a t i c T e r t i a r y A m id e s
by Lanrine L. Graham1 and Ronald E. DielDepartment of Chemistry, Northern Illinois University, DeKalb, Illinois 60115 (Received January 13, 1969)
The temperature dependence of the nmr line shapes of N-methyl-N-n-butyltrimethylacetamide, N-acetyl-2-methylpiperidine, N,N-dimethyltrimethylacetamide (TMA), and N,N-diethyltrimethylacetamide show that the peaks due to the N-methyl protons are coalesced at 35° but gradually separate into two nmr signals at low temperatures. Therefore, at 35°, these highly substituted amides are rotating faster about the central C-N bond than simple amides such as dimethylacetamide. The activation energy for rotation of TMA in 10 mol % methylene chloride solution was found to be 11.5 ± 0.3 kcal/mol; log A, 12.3 ± 0.3; and the stan-
The method of total line shape analysis was used to calculate
amide (V), and N-acetyl-2-methylpiperidine (VI)- Two factors may cause the observation of only one set of N-alkyl resonance peaks at 35°: either very slow rotation about the C -N bond with one rotational isomer favored, or fast rotation about the C -N bond, resulting in both cis- and irans-N-alkyl protons experiencing the same magnetic environment. The first possibility was studied by preparing two new amides, N,N-dimethyltri- methylacetamide (VII) and N,N-diethyltrimethylacet- amide (VIII). The nmr spectra of these pure amides at 35° also contain only one N-alkyl peak for each type of N-alkyl proton. If amides VII and VIII were confined to the planar state II, two N-alkyl resonance peaks would have been observed, one for the group cis to the carbonyl oxygen atom and one for the group trans. Thus, the rate of rotation cannot be slow (on the nmr
(1) Author to whom inquiries should be addressed.(2) L. A. LaPlanehe and M. T. Rogers, J. Amer. Chem. Soc., 85,3728 (1963).
dard free energy of activation, 12.2 kcal/mol. the activation parameters.
IntroductionThe cis/trans isomer ratios of eleven unsymmetrically
N,N-disubstituted amides were determined at 35° using nuclear magnetic resonance (nmr) spectroscopy.2 The rotation about the C -N bond for most of the amides is slow enough at 35° to observe two sets of N-alkyl proton peaks, one when the protons are cis and the other when trans to the carbonyl oxygen atom.
R l If 2 R l It 2\ / \ + /
C—N -<-------- > C = N/ \ / \
o r 3 - o r 3I II
However, only one set of N-alkyl proton peaks was observed for four highly substituted amides :2 N-meth- yl-N-ethyltrimethylacetamide (III), N-methyl-N-n-bu- tyltrimethylacetamide (IV), N-methyl-N-i-butylacet-
The Journal of Physical Chemistry

Nmr of Internal R otation in Aliphatic T ertiary Amides 2697
time scale). We have been able to show that the second suggestion is correct by examining the nmr spectra of amides IV, VI, VII, and VIII at low temperatures. To understand the process in a quantitative manner, the activation parameters for internal rotation were determined for VII in a 10 mol % methylene chloride solution.
Experimental Section
The amides were synthesized from the appropriate acid chloride and secondary amine with the exception of N-formyl-2-methylpiperidine (IX) which was prepared by refluxing 2-methylpiperidine with formic acid in xylene. All amides were fractionally distilled in vacuo and were pure by vapor phase chromatography and by nmr spectroscopy. A 10 mol % solution of VII in methylene chloride was prepared, degassed, and sealed in a thin-wall nmr sample tube. A small amount of tetra- methylsilane (TMS) had been added for use as an internal reference and for homogeneity adjustments at various temperatures.
A Varian A-60A nmr spectrometer, with variable temperature apparatus, was used for all nmr measurements. Sample temperatures were determined from the separation of the proton peaks in the Varian-supplied methanol or ethylene glycol standards. Van Geet3 has shown that the chemical shift (Ar) of methanol is related to the temperature, T (°K), in the following way at 60 Mcps, where A v is in cps.
T = 435.5 - 1.193Ar - 29.3(0.01 X Ar)2
For ethylene glycol, the equation is8
T = 466.0 - 1.695Ar
For the determination of the activation parameters of VII, the N-methyl peak was recorded at a sweep width of 1 or 2 cps/cm and a corresponding sweep rate of 0.1 or 0.2 cps/sec. The sample tube was then replaced by the methanol standard, and the peak separation was measured. The amide solution was replaced in the probe, and the spectrum was recorded again. Only when two consecutive amide spectra were superimposable were they used for computation of the lifetimes. The spectrum of VII in methylene chloride was recorded at ten different temperatures, from —52.2 to —28.8°. At each temperature, the field homogeneity and the phase were adjusted on the TMS peak before the N-methyl signals were recorded.
The Calculation of Thermodynamic ParametersTo find the lifetime, r, at each temperature, between
33 and 57 points (relative intensity vs. frequency) were taken from each experimental spectrum. These points were used in a f o r t r a n IV computer program4 along with estimates for three adjustable parameters, (1) r, (2) the center of the peak(s), and (3) the separation of the peaks in the absence of exchange, Sv. The line
shape equations used in the program are those given by Gutowsky and Holm5 for exchange averaging of an asymmetrical doublet, as reformulated by Rogers and Woodbrey.6 In the case of VII, the fraction of protons at each site is equal to 0.5. The only other parameter needed is 2 /T2) the line width (in radians per second) at one-half maximum intensity in the absence of exchange. This value could not be found by cooling the solution to a temperature at which no further separation of the N-methyl peaks occurred because the freezing point of the solution was reached first. Since the N-methyl protons in VII are very slightly coupled to any other nuclei, the value of 2/T2 was set at 3.8 sec-1. This is equivalent to saying that the major contribution to T2 is field inhomogeneity. In a careful study of the effects of various parameters upon the activation energy of dimethyl- amides, Fryer, et al.,7 found that the temperature dependence of T2 was small Therefore a value of 3.8 sec-1 was used for 2/¡P2 at all temperatures.
Neuman, et al.,s have recently discussed the temperature dependence of 5v in dimethylamides. The average value of 5v in this temperature range was 16.01 cps. In brief, the program calculated theoretical relative intensities from the input parameters at each measured frequency and compared these with the input intensities. The difference in intensity was squared, and the sum of the squares of the deviations was calculated. This sum was minimized by multiplying the relative intensities by a constant factor and by adjusting the three variables.
The activation energy and the frequency factor A were found from r and T by the method of least squares using the Arrhenius equation
log (l/2 r ) = log A - EJZ.ZmRT (1)
The usual thermodynamic equations were used to calculate the activation parameters at 298.2°K (assuming the transmission coefficient to be unity). The errors given are the most probable errors in the least-squares fit of a straight line.9
The exact temperature at which peak coalescence occurs is difficult to measure; thus the error in our values for the coalescence temperature (Tc) is estimated at ± 3 ° . Values given ir. the literature for the same amide
( 3 ) A . L . V a n G e e t , A n a l . Chem., 40, 2 2 2 7 ( 1 9 6 8 ) . W e w is h t o t h a n k D r . V a n G e e t f o r c o m m u n i c a t i n g t h e r e s u l t s o f h i s w o r k p r i o r t o p u b l i c a t i o n .
(4 ) W e a r e i n d e b t e d t o W i l l i a m T u n g o f M i c h i g a n S t a t e U n iv e r s i t y f o r t h e u s e o f t h i s p r o g r a m . T h e N o r t h e r n I l l i n o i s U n i v e r s i t y c o m p u t e r is a n I B M 3 6 0 -4 0 .
(5 ) H . S . G u t o w s k y a n d C. H . H o l m , J. Chem. P h ys ., 2 5 , 1 2 2 8 (1 9 5 6 ) .
( 6 ) M . T . R o g e r s a n d J . C . W o o d b r e y , J. P h ys. Chem., 66, 5 4 0 (1 9 6 2 ) .
(7) C . W . F r y e r , F . C o n t i , a n d C . F r a n c o n i , Ric. Sci., 8, 7 8 8 ( 1 9 6 5 ) .
( 8 ) R . C . N e u m a n , J r . , W . S n id e r , a n d V . J o n a s , J. P h y s . Chem., 72, 2 4 6 9 (1 9 6 8 ) .
(9 ) H . M a r g e n a u a n d G . M . M u r p h y , “ T h e M a t h e m a t i c s o f P h y s i c s a n d C h e m i s t r y , ” 2 n d e d , D . V a n N o s t r a n d C o . , I n c . , N e w Y o r k , N . Y „ 1 9 5 9 , p 5 1 9 .
V o lu m e 73, N u m b er 8 A u g u st 1969

2698 Laurine L. Graham and R onald E. D iel
vary by more than this. One reason may be that the authors did not use the same method for determining Tc. We have used the Rogers6 * * * criterion whenever possible: for a symmetrical coalescing doublet, Tc is the lowest temperature for which the ratio of maximum to central minimum intensities is unity.
ResultsThe initial efforts of this study were directed toward
finding the reason for the observation of only one set of N-alkyl peaks in the nmr spectra of amides III-VTO. It was soon apparent from temperature studies of amides IV and V I-V III that all of these amides had coalescence temperatures below 35°, as shown in Table I. The only amide for which Tc could be measured without solvent was VI. Although all of the other amides are liquids at room temperature, they either freeze or become extremely viscous before reaching T0.
Table I : Coalescence Temperatures ofHighly Substituted Amides
A m ide, To.A m ide Solvent m ol % °KIV CH2C12 10 241VI 100 291VI ch2ci2 50 292VII ch2ci2 50 225VII ch2ci2 10 233VII TMS 5 217Vili CH2C12 10 257
The activation parameters of VII in 10 mol % methylene chloride solution are E&, 11.5 ± 0.3 kcal/mol; log A, 12.3 ± 0.3; AE*298.2, 12.2 kcal/mol; A #*298.2, 10.9 kcal/mol; AS*ms.2, —4.3 eu. Estimating an error of ±0.3 kcal/mol in AF* - m .2 and Aif*298.2, the error in AS*298.2 is about ± 2 eu.
DiscussionThe coalescence temperatures of the amides in Table
I are indeed low when compared with those of similar, but less highly substituted amides. Table II compares the activation parameters and values of Tc for aliphatic dimethylamides in which the size of R increases from H to ¿-butyl. Small differences in the values given in Table II may not be significant because the first three amides were measured as pure liquids and the last two were studied in solution. However, the large decreases in To, Ea, and AF* for VII are significant, as are the comparatively low Tc values for IV and VIII (Table I ) . The To value of VI, an acetamide, should be compared with that of IX , the corresponding formamide, which is 369°K. Amide VIII should be compared with other diethylamides. (In dilute solutions of diethylformamide and diethylacetamide in CFCL, the values of Ta are 377 and 322°K, respectively.10 11)
Table II : Activation Parameters of N,N-Dimethylamides, RCON(CH3)2
Ea, AE*298.î,To. k ca l/ k ca l/
R °K m ol m ol log A R ef
H 386» 20.5 20.6 12.7 gch3 3426 19.6 18.2 13.8 hch3ch2« 327 21 18 15 a(CH3)2CH-“ 299 16.2e i(CH3)3Cy 233 11.5 12.2 12.3 3Ref 7. b The average of two values of To given in ref 7.
e Not measured by the method of total line shape analysis. d Measured in o-dichlorobenzene solution (concentration not given). e Evaluated at T0. 1 10 mol % amide in CH2C12 solution. 0 A. Pines and M. Rabinovitz, Tetrahedron Lett., 3529 (1968). h Ref 11. * G. Isaksson and J. Sandstrom, Acta Chem. Scand., 21, 1605 (1967). 1 This work.
Until very recently, a quantitative relationship between substituents on the amide molecule and their effect on the barrier to internal rotation did not exist. However, Neuman, et al.,n have developed a linear correlation between the standard free energy of dimethyl- amides and the Taft constants, <7* and Es, the polar and the steric substituent constants, respectively. A plot of( —AF*r + Ai,*cH,)/2.3RT vs. (p*a* + SEs) gives a straight line when p* and S are equal to — 1 and — 2, respectively. (The symbol R in the free-energy expression represents the substituent on the carbonyl carbon atom.) When the appropriate Taft constants12 are substituted into the expression (p*<r* + SEs) for the R groups given in Table II, one would predict that AF*r should decrease as R changes from H to ¿-butyl. As the electron-donating ability of R increases or as the steric size of R increases, AF*n decreases. Using the Neuman correlation for the ¿-butyl substituent, one predicts aAE*298.2 equal to 13.6 kcal/mol. In attempting to assess the dominant effect causing the low value of thefree energy in VII, compare the value of a* ( — 0.300) with that of Es ( —1.54) for the ¿-butyl group. Clearly, it is the steric size of the ¿-butyl group which is most important in lowering the free energy. A molecular model of VII indicates that there are large steric interactions between the ¿-butyl protons and those of the N-methyl groups. We feel then that our results for VII tend to confirm the linear free-energy relationship proposed by Neuman. The 1.4 kcal/mol difference between the
( 1 0 ) A . G . W h i t t a k e r a n d S . S i e g e l , / . Chem. P h y s ., 4 3 , 1 5 7 5 ( 1 9 6 5 ) . T h e Tc v a l u e s g i v e n h e r e a r e t h o s e m e a s u r e d w h e n t h e N -C -C H 3
p r o t o n p e a k s c o a l e s c e . T h e N -C H 2 p r o t o n p e a k s u s u a l l y d o n o t c o a l e s c e a t t h e s a m e t e m p e r a t u r e . T h e m e t h y l p r o t o n s w e r e c h o s e n f o r c o m p a r i s o n b e c a u s e t h e y a r e n o t a s a f f e c t e d b y s o l v e n t a s t h e m e t h y l e n e p r o t o n s .
(1 1 ) R . C. N e u m a n , J r . , a n d V. J o n a s , J. A m e r. Chem . S o c 90, 1 9 7 0 ( 1 9 6 8 ) .
( 1 2 ) J . E . L e f f l e r a n d E . G r u n w a l d , “ R a t e s a n d E q u i l i b r i a o f O r g a n i c R e a c t i o n s , ” J o h n W i l e y & S o n s , I n c . , N e w Y o r k , N . Y . , 1 9 6 3 , pp 224-228.
T h e J o u r n a l o f P h y s ic a l C h em istry

Initiator Efficiency of 2,2,-Azobisisobutyronitrile 2699
predicted and the measured AF*298.2 may be due to the solvent. Only studies of pure amides were used to develop the correlation. A solvent effect upon 7ia in di- methylamides has been recognized,18,14 but a quantitative relationship between Ea or AF* and solvent properties has not yet been developed. It would be of value to measure the activation parameters of all dimethyl- amides in the same solvent. However, it would be necessary to find a solvent, preferably inert, which remained liquid from about 225 to 395 °K.
It is likely that the other amides in Table I will also have relatively low values for Ea and AF*M8.2, primarily because of their very low coalescence temperatures
when compared with similar but not as highly substituted amides.
Acknowledgments. We would like to thank Lester Isbrandt for synthesizing amides IV and V I-IX . Chang Y. Chang, Gary Martinie, and Michael Schafer have also assisted at various stages of this project. We wish to acknowledge the support of the National Science Foundation through summer research institutes in which L. I. and R. E. D. participated.
(13) J . C. Woodbrey and M. T . Rogers, J . A m e r . C hem . S o c ., 84, 13 (1962).(14) A. G. Whittaker and S. Siegel, J . C h em . P h y s 42, 3320 (1965).
Photo- and Thermal Initiator Efficiency of 2,2'-Azobisisobutyronitrile at 25 °
by R. D. Burkhart and J. C. Merrill1D ep a r tm en t o f C h em istry , U n iv e rs ity o f N eva d a , R en o , N eva d a (R ece iv ed J a n u a ry IS , 1 9 6 9 )
Using thiols as free-radical scavengers and exceedingly long reaction times, the fraction of kinetically free radicals produced in the thermal decomposition of 2,2'-azobisisobutyronitrile (ABN) has been measured in benzene and cyclohexane at 25°. Using a chain reaction as a radical counter, a similar fraction is obtained for the photodecomposition of ABN thereby providing, for the first time, a comparison of these efficiencies at a common temperature. The photoprocess is found to be somewhat more efficient in both solvents but both photo- and thermal decompositions are less efficient in cyclohexane than in benzene.
IntroductionPeroxides or azo compounds are widely used as
initiators of free-radical reactions, but they rarely function with 100% efficiency; therefore independent experimentation is needed to measure actual rates of initiation. The techniques usually used include addition of known amounts o: a radical inhibitor followed by a measurement of the inhibition period or by the use of a radical chain reaction for which the overall rate constant is known and which, therefore, can function to measure the frequency of the initiation process. Another method involves the use of a scavenger such as iodine, a thicl, or a molecule containing an unpaired electron so that radicals produced in a kinetically free state can be counted by the rate of disappearance of the scavenger.2
In the present study the last of the above methods has been used to measure the fraction of kinetically free radicals produced in the thermal decomposition of 2,2'- azobisisobutyronitrile (ABN) at 25°. Interest in the reaction is an outgrowth of kinetic studies being carried out in these laboratories on the radical chain reaction between triethyl phosphite (TEP) and various thiols.
All of this work has utilized ABN as initiator,8,4 and at the outset, rates of initiation in the photochemical process were determined by measuring rates of polymerization of methyl methacrylate.
It was decided to make another evaluation of the initiator efficiency in this reaction for several reasons. First, it has been noted6 that not all radical scavengers perform their function with equal efficiency. Also, the evaluation of polymerization rates relied on gravimetric analyses of polymer formed, and a more accurate and precise analytical method was desired. A rather straightforward solution to these problems would be to evaluate the initiator efficiency directly, using a thiol as scavenger. The potentiometric titration of thiols using
(1) N D EA Predoctoral Fellow, 1966-1969.(2) G. M. Burnett and W. H . Melville, “Technique of Organic Chemistry,” Vol. V III, Part I I , S. L . Friess, E . S. Lewis, and A. Weissberger, Ed., Interscience Publishers, Inc., New York, N. Y ., 1963, pp 1109-1110.(3) R . D . Burkhart, J . P h y s . C h em ., 70, 605 (1966).(4) R . D . Burkhart, J . A m e r . C hem . S o c ., 9 0 , 273 (1968).(5) (a) J. C. Bevington, T ra n s . F a ra d a y S o c ., 51, 1392 (1955); (b) J. C. Bevington, H . Bradbury, and G. M. Burnett, J . P o ly m er S c i . , 12, 469 (1954).
V o lu m e 73, N u m b er 8 A u g u st 1969

2700 R. D. Burkhart and J. C. M errill
mercuric ion can be carried out with good precision and accuracy and disulfides do not interfere with the analysis.6 7 Furthermore, the scavenger reaction, involving abstraction of a thiol hydrogen atom, is the same as the assumed initiation step for the thiol-TEP reaction. Unfortunately, the extinction coefficient of ABN at 366 m/d is so small that the necessary experiments would be too lengthy to be practical using photodecomposition. It was decided, therefore, to measure the efficiency of the thermal process which, even though more time consuming, had the virtue of not requiring equipment needed for other work and made possible an indirect determination of the efficiency of the photoprocess.
In spite of the extensive investigations made on ABN decompositions,8 it is interesting that the efficiency for thermal decomposition has never been measured at 25°. Also, the efficiencies of photo- and thermal processes have never been measured at a common temperature.
Experimental SectionPurification of the thiols and ABN (Aldrich Chemical
Co.) and of triethyl phosphite and benzene (Eastman Organic Chemicals) has been described previously.3,4 Cyclohexane (Eastman) was extracted several times with concentrated H2S04, was washed with dilute base and with water, and was then dried over anhydrous sodium sulfate. It was then distilled twice through a 30-in. Vigreux column; center fractions only were retained on each distillation.
The apparatus used to carry out photochemical reactions has also been described before.4 The vessels used for thermal reactions were in the shape of an inverted Y with 15-mm Pyrex tubing forming the two arms branching off from the central 20-mm tube. A 24/40 ground-glass joint was sealed to the end of the central tube so that the vessel could be attached to the vacuum system by way of an adapter and stopcock.
Scavenger experiments were carried out by separately preparing solutions of ABN and of the thiol. Five milliliters of each of these solutions was then placed in each arm of the reaction vessel. In these experiments one of the arms of the vessel was constricted near the branch of the Y so that it could be pulled off later. The separated solutions were subjected to several freeze-evacuate-thaw cycles to remove oxygen. They were then mixed in the arm having the constriction, and the mixture was immediately frozen. The arm was then carefully pulled off under vacuum by heating at the constriction. The solutions were kept in the dark in a constant temperature water bath at 25° for periods on the order of 10 weeks. Another 5-ml portion of the ABN solution was mixed with 5 ml of the thiol solution and then analyzed to provide a zero-time thiol concentration .
Reactions between TEP and the thiol, initiated by
the thermal decomposition of ABN at 25°, utilized the same type of inverted Y vessel described above. In these experiments the initiator solution was kept separate from the solution containing thiol and TEP during degassing. The solutions were brought to thermal equilibrium in the dark at 25° before being mixed. Zero time was taken at the instant of mixing. Here again a replicate of the reaction solution was prepared and analyzed to give a zero-time thiol concentration.
In all reactions the thiol analyses were carried out by potentiometric titration using mercuric ion.6 Light intensities were measured using the potassium ferrioxa- late actinometer.9 The monochromaticity of the light transmitted by the Corning No. 5840 filter and the Pyrex reaction cell was checked by preparing a transmission curve for this combination using a Cary 14 spectrophotometer. It was found that less than 1% of light above 3960 and below 3130 A is transmitted. Taking into account the relative intensities of the emission lines from the mercury arc, it is estimated that greater than 98% of the quanta counted by actinometry result from the 3660-A emission.
Results and DiscussionTable I gives a summary of the scavenger experiments
carried out in benzene and in cyclohexane. Values of f were obtained from the relation
[RSH]0 - [RSH], = 2 /, [ABN]o[l - ex p (-k At)] (1)
Table I: Values of / ' for the Thermal Decomposition of ABN in Benzene and Cyclohexane at 25°
Reaction[RSH]o [RSH h [ABN]o timeX 102, X 10", X 102, X 10"6,
M M M sec S’
Benzene3.79“ 2.95 3.28 6.05 0.562.84“ 1.89 4.09 6.03 0.542.96!i 1.77 0.500 6.11 0.540.9486 0.623 1.40 6.04 0.54
Av 0.54Std dev 0.01
Cyclohexane0.9676 0.755 1.01 6.10 0.492.236 2.13 0.439 6.24 0.501.286 1.13 0.627 6.55 0.52
Av 0.50Std dev 0.01
“ 1-Octadecanethiol. h 1-Butanethiol.
(6) J. S. Fritz and T . A. Palmer, A n a l. C h em ., 33, 94 (1961).(7) P. Smith and A. M. Rosenberg, J . A m e r . C h em . S o c ., 81, 2037(1959).(8) See, for example, H. P. Waits and G. S. Hammond, ibid., 86, 1911 (1964), and references cited therein.(9) C. G. Hatchard and C. A. Parker, P r o c . R o y . S o c ., A235, 518 (1956).
T h e J o u rn a l o f P h y s ic a l C h em istry

Initiator Efficiency of 2,2'-Azobisisobutyronitrile 2701
and assumed a 1:1 stoichiometry. The decomposition rate constant for ABN at 25° was calculated from the Arrhenius parameters obtained by Van Hook and Tobolsky* 10 and is found to be 4.05 X 10⁻⁸ sec-1. For present purposes, the quantity of interest is f ' k d which has the average value 2.20 X 10⁻³ sec-1 in benzene and2.03 X 10-8 sec-1 in cyclohexane. Only Walling and Kurkov11 and Carlsson and Ingold12 have made measurements of f at temperatures approaching those used here. The former workers found a value of 0.22 (at 29.5°), and the latter authors concluded that the best value was 0.50 (at 30°). We have found no tendency for / ' to vary with either changing thiol or ABN concentration. Also, 1-octadecanethiol and 1-butanethiol apparently have the same scavenger efficiency, and the effect of changing solvent is of small but measurable magnitude. Reaction times, in units of days, varied from 69.8 to 75.8 corresponding to ABN conversions of21.5 to 23.3%. Conversions with respect to thiol varied from 4.5 to 40.2%. Neither of these variations seemed to have an appreciable effect o n /'.
The next series of experiments involved measurement of the rates of reaction between 1-butanethiol and TEP using thermal initiation by ABN. Previous work3'4 has shown that when [TEP]/[RSH] is sufficiently large therate of thiol disappearance obeys the relation
—d[RSH]/df = V ^ v I R S H ]# /72 (2)
where, for thermal initiation R\ = f k A[ABN]. The over-all mechanism which has been found consistent with this rate law is
ABN — ^ 2A + N, (3)
A + RSH — > AH + RS (4)
RS + P(OEt)* —*■ R + SP(OEt)3 (5)
R + RSH - X RH + RS (6)
2R — ► products (7)
A possible dimerization involving thiyl radicals to form products such as disulfides is inconsistent with the observed rate law. The point of these experiments was to evaluate k p/ k t '/! so that subsequent rate experiments utilizing photoinitiation could be used to find photochemical initiation rates. Table II summarizes the results of rate experiments utilizing thermal initiation.
The average error in k p/ k t l/l found here is about 5% where TEP and ABN concentrations are varied about sixfold and the thiol concentration about tenfold. Apparently, therefore, eq 2 is valid either for photo- or thermal initiation, and this finding certainly enhances the credibility of the mechanism proposed3 for the reaction. Also, we have here the unusual situation that the scavenger reaction and the supposed initiation process for the chain reaction are identical, and given by eq 4. Thus, whether or not variability in scavenger efficiency exists is irrelevant for the present system.
Table II: Values of kv/k '^ for the Thermally Initiated 1-Butanethiol-TEP Reaction in Benzene at 25°a
[R SH ]o [T E P ], [A B N ], kp/kt1'1X 10», X 10», X 10», (M -1
M M M s e c -» )1' 8
2.59 14.0 2.60 1.783.27 19.5 3.03 1.942.34 23.8 0.358 2.022.17 16.6 2.62 2.180.621 4.73 0.750 1.831.06 12.4 1.67 1.970.302 3.55 0.477 2.02
Av 1.96Std dev 0.13
“ f'kd is taken to be 2.20 X 10 8 sec-1.
The photochemical experiments utilized the 366-m/u mercury emission, and since ABN is the only component of the reaction mixture which absorbs light at this wavelength, it is assumed that k p/ k t '/2 is independent of the mode of initiation. For the photo process Rd = 2.303/oflF [ABN ] where h is the incident light intensity, l is the optical pathlength, e is the decadie extinction coefficient (equal to 9.7 at 366 m/P), and $ is the fraction of radicals produced per quantum of light absorbed. The results of experiments utilizing photoinitiation of the thiol-TEP reaction are summarized in Table III.
Table III : Evaluation of $ at 25° in Benzene for the Photodecomposition of ABN Utilizing the 1-Butanethiol-TEP Reaction“
[RSH ]o [A B N ],X 10», [T E P ]o, X 10‘ ,
M M M 4
1.63 0.158 2 . 6 8 0.412.19 0.174 2 . 6 8 0.381.23 0.179 2 . 6 8 0.321 .2 1 0.152 2 . 6 8 0.381.92 0.162 2 . 6 8 0.35
Av 0.37Std dev ±0.03
“ Calculations assume fcp/ct'72 = 1.96.
Smith and Rosenberg7 have already found that the quantum yield for photcdecomposition of ABN is 0.47. Thus, the fraction of radicals produced per decomposition which subsequently initiate the chain reaction is / = 0.78. This is probably a much larger efficiency than one might have predicted for this reaction and is
(10) J. P. Van Hook and A. V. Tobolsky, J . A m e r . C h em S oc ., 80, 779 (1958).(11) C. W alling and V. P. Kurkov, ib id ., 89, 4895 (1967).(12) D. J. Carlsson and K . IT. Ingold, ib id ., 89, 4885 (1967).
V o lu m e 73, N u m b er 8 A u g u s t 1969

2702 R. D. Burkhart and J. C. Merrill
over a factor of 2 larger than that obtained previously3 using methyl methacrylate as the scavenger. Although one might suspect that this large value of / results from a photoinitiation process which does not involve ABN, it has been found3 that no detectable reaction occurs when a degassed solution containing thiol and TEP is irradiated in the absence of ABN.13 It should be pointed out that Rit defined in terms of the rate of production of initiator radicals, is
d [A • ]/d< = 2Ri (8)
and kt is defined by
—d [R -]/d i = 2kt [R-Y (9)
Experiments similar to those described above utilizing benzene as the solvent were also carried out in cyclohexane. The results of thermally and photochemically initiated reactions are summarized in Tables IV and V.
Table IV: Values of kp/kt^2 for the Thermally Initiated Thiol-TEP Reaction in Cyclohexane at 25°
[R S H ]«“ X 10i,
M[T E P jo,
M
[A B N ], X 10«,
M k„/ktV2i
4 . 6 4 0.708 1.38 21.14 . 6 4 0.708 6.90 27.83.22 0.708 3.02 22.23.22 0.708 0.91 28.3
Av 24.9Std dev ±3.2
“ 1-Butanethiol. b Assuming f 'k d = 2.03 X 10~8 sec-1.
Table V : Evaluation of 4> at 25° in the Photodecomposition of ABN
Cyclohexane for
[R SH ]o° [A B N ]oX 10*, [T E P ]o, X 106,
M M M <t>b
1.96 0.944 1.24 0.222.90 0.708 0.62 0.252.71 0.708 2.48 0.292.62 0.944 0.55 0.362.95 0.708 1.48 0.34
Av 0.29Std dev ±0.05
“ 1-Butanethiol. 6 Assuming k p/k, = 24.9.
It will be noted that there is a considerable influence of solvent on the over-all rate constant for the chain reaction, in fact, more than a factor of 10 increase. Assuming 0.47 to be the correct quantum yield for ABN decomposition in cyclohexane, one finds that the fraction of radicals which initiate chains per decomposition is 0.62 in this solvent. Although the precision is not as good in cyclohexane, it is still possible to conclude
that both the thermal and photochemical efficiencies are smaller in cyclohexane and that in both solvents the photochemical efficiency is larger than the thermal.
Since cyclohexane has a higher viscosity than benzene (0.89 cP vs. 0.61 cP at 25°), the lower efficiency in the former solvent seems reasonable and is in general agreement with the findings of Booth and Noyes14 in their study of iodine atom reactions in various solvents. The larger efficiency found for processes involving light absorption is somewhat unusual for decompositions of azo compounds although there have apparently been no direct comparisons made under the same conditions as those used here. Nelsen and Bartlett,15 however, have investigated the thermal and photochemical decomposition of azocumene, and from their data it is possible to estimate values of / ' and / at 25°. They are 0.70 and 0.62, respectively ; that is, the thermal efficiency is slightly greater than the photochemical. Data of Hammond and Fox16 on the decomposition of ethyl 2,2'-azobisisobutyrate (EAB) in CC14 and chlorobenzene suggest that thermal and photochemical efficiencies are probably not too different for that system at 25°. It has been inferred from these results that both processes involve decomposition from a singlet state. The fact that sensitized photolyses of both azocumene and EAB using triplet sensitizers yield the same / values as are found by direct photolysis16,17 has been interpreted to mean that the spin relaxation process is fast compared to cage recombination. If this interpretation is correct, then the similarity in thermal and photochemical efficiencies gives no information about the possible intermediacy of a triplet state in the direct photoprocess. It would be tempting to attribute the greater efficiency for the photoprocess in ABN decompositions to intersystem crossing prior to dissociation. Bartlett and Engel,18 however, have found that the sensitized decomposition of azo-2-methyl-2-propane is mainly due to the transfer of singlet excitation, and it is quite possible that a similar situation holds for ABN.
A practical result of the present experiments is that it is now possible to obtain more reliable quantitative data for the thiol-TEP reaction. Using results from Tables III and V it is found that kp/k^' should be revised downward from 0.81 to 0.53 (M _1 sec“ 1) 1/2 for the a -
toluenethiol-TEP reaction and from 2.24 to 1.46 (M _1 sec_1) 1/! for the 1-pentanethiol-TEP reaction.4 Similarly, kt values involving benzyl and pentyl radicals are decreased somewhat to 1.8 X 10⁹ and 4.3 X 10⁸ M~l
(13) This test was more recently repeated with the same result as that reported in ref 3.(14) D . Booth and R. M. Noyes, J . A m e r . C h em . S o c ., 82, 1868(1960).(15) S. F . Nelsen and P. D. Bartlett, ibid., 88, 143 (1966).(16) G. S. Hammond and J. R . Fox, ibid., 86, 1918 (1964).(17) J. R . Fox and G. S. Hammond, ibid., 86, 4031 (1964).(18) P. D. Bartlett and P. S. Engel, ibid., 90, 2960 (1968).
T h e J o u rn a l o f P h y s ic a l C h em istry

R adical-R adical R eactions in D ifferent Solvents 2703
sec-1, respectively. One finds, therefore, that these recombination processes are even further removed from the diffusion-controlled limit than was previously supposed. This point is more thoroughly explored in connection with studies of the effects of solvents on¿t-19
Acknowledgments. Acknowledgment is made to the donors of the Petroleum Research Fund, administered by the American Chemical Society, for support of this research.
(19) R . D . Burkhart, J . P h y s . C h em ., 73, 1741 (1969).
Radical-Radical Reactions in Different Solvents. Propyl,
Cyclohexyl, and Benzyl Radicals
by R. D. BurkhartD e p a r tm en t o f C h em is try , U n iv e rs ity o f N ev a d a , R e n o , N eva d a (R ece iv ed J a n u a r y 18, 1 9 6 9 )
Rate constants for radical-radical reactions involving the propyl, cyclohexyl, and benzyl radicals have been determined in both cyclohexane and benzene. Steady-state radical concentrations were monitored using the thiol-triethyl phosphite reaction, and rate constants for the reaction R • + RSH — RH + RS • were also obtained. Both k-R. + r. and kn. + rsh when measured in cyclohexane are larger than or equal to those found in benzene. The solvent effect is greatest for the propyl radical and essentially nonexistent for the benzyl radical with cyclohexyl intermediate in behavior. The results can be rationalized by using the assumption that the alkyl radicals interact with benzene to form a complex species.
IntroductionIn recent years there has been considerable activity
in the measurement of rate constants for hydrocarbon radical recombination1 reactions in solution. Some of these studies have utilized spectroscopic methods2 making use of esr signals or uv absorption to measure the decay of radicals produced by pulsed radiolysis or flash photolysis. Rotating sector experiments have also been employed3'4 in making these measurements. A rather sizable body of information has, therefore, been built up concerning radical-radical reactions in solution.
Many of the available data have been obtained at ambient temperatures, and the solvent most often used is cyclohexane, although an exception was the work on the recombination of pentyl and benzyl radicals in benzene.4 This study utilized rotating sector measurements carried out on the radical chain reaction between triethyl phosphite (TEP) and the appropriate thiols and yielded a kt value of 1.0 X 10⁹ M~x sec-1 for the recombination of pentyl radicals. This value seemed to agree reasonably well with results obtained in cyclohexane by other workers; however, recent studies on rates of initiation for the thiol-TEP reaction5 show that earlier estimates of this rate were probably too low. The recalculated kt for pentyl radicals in benzene was
found to be 0.43 X 10⁹ M~l sec-1. This number is considerably smaller than rate constants for similar radicals obtained by others in cyclohexane and suggests that there is either a significant solvent effect in these recombination reactions or else there is some problem associated with the thiol-TEP monitor reaction. Because it is a natural part of a continuing study on the kinetics of radical recombinations and because of this basic disagreement with the results of others, it was decided to investigate in more detail the comparison of kt values in benzene and cyclohexane. The particular species chosen for study were propyl, cyclohexyl, and benzyl radicals representing unpaired electrons at primary and secondary carbon atoms and a delocalized system.
(1) In most of the processes to be discussed here, products may result either from combination or disproportionation reactions. In what follows, the term, recombination, shall be used to describe these reactions and the symbol k t is used for the rate constants.(2) (a) R . J . Hagemann and H . A. Schwarz, J . P h y s . C h em ., 71, 2694 (1967); (b) E . J. Burrell, Jr., and P. K . Bhattacharyya, ib id ., 71, 774 (1967); (c) M. C. Sauer, Jr., and I. Mani, ib id ., 72, 3856 (1968); (d) S. Weiner and G. S. Hammond, J . A m e r . C h em . S o c ., 9 0 , 1959 (1968).(3) (a) R . W. Fessenden, J . P h y s . C h em ., 68, 1508 (1964); (b)D . J . Carlsson and K . U. Ingold, J . A m e r . C h em . S o c ., 90, 1055 (1968).(4) R . D . Burkhart, ib id ., 90, 273 (1968).(5) R . D. Burkhart and J. C. Merrill, J . P h y s . C h em ., 73,2699 (1969).
V o lu m e 78, N u m b er 8 A u g u s t 1969

2704 R. D. Burkhart
Results and DiscussionThe experimental methods employed have been
discussed previously and were used without alteration in the present work.4-5 In all of the reactions studied the ratio [TEP]/[RSH] was kept sufficiently large so that the rate of thiol disappearance obeyed the equation
—d[RSH]/df = (fcPA tV!)[RSH]Ri'A (1)
where fib is one-half the rate of production of initiator radicals and fct is the rate constant for the reaction of interest, namely
2R- — > products (2)
and is defined by the equation — d[R- ]/d t = 2fct [R • ]2. The rate constant kp refers to the reaction
R • + RSH — > RH + RS • (3)
A summary of the values of fcp/fcJ 2 resulting from experiments utilizing photoinitiation with light of constant intensity is presented in Table I. The results show that the influence of solvent depends on the radical species involved, no effect being observed for the benzyl radical. In both solvents there is an increase in over-all rate constant in the series benzyl through cyclohexyl to propyl, but the trend is much more evident in cyclohexane.
Table I : Values of kp/kt/1 for the Reaction of TEP with Various Thiols at 25° in Benzene and Cyclohexane
R a d ica lspecies Solvent
kp/kt1'1,(M~l s e c “ 1)
Benzyl Benzene 0.53Cyclohexyl Benzene 1.61Propyl Benzene 2.04Benzyl Cyclohexane 0.51Cyclohexyl Cyclohexane 15.8Propyl Cyclohexane 68.8
Rotating sector experiments were carried out in order to evaluate lifetimes of radical centers in these reactions. The usual curve-fitting technique was used involving ratios of steady-state radical concentrations obtained with intermittent and constant illumination graphed vs. the logarithm of the illumination time. In each case the expected type of curve was found using illumination times between 0.0625 and 45 sec and a dark period to light period ratio of 3:1. The specific rate constants deduced from these data are summarized in Table II.
The values of kp found in benzene are not very sensitive to the type of radical involved; in fact, the kp found earlier for pentyl is the same as that obtained here for the propyl radical. Even the benzyl radical has a kp only slightly smaller than that found for the alkyl radicals in benzene. In view of the insensitivity
Table II: Rate Constants kp and fct for theReaction of TEP with Various Thiols
R a d ica lkp,c
M~l s e c -1ktc X IO “ », M s e c “ 1
BenzylSolvent Benzene
2.2 X 10⁴“ 1.8“Cyclohexyl 3.0 X 10⁴& 0.366Propyl 3.0 X 10* 0.21
BenzylSolvent Cyclohexane
2.3 X 10⁴ 2.0Cyclohexyl 3.9 X 10⁶ 0.60Propyl 2.9 X 10s 1.7
“ See ref 4 and 5. b Values obtained using measured kp/kt^ and setting fcp equal to the average of those found for propyl and pentyl radicals. c The over-all precision in fcp and kt values is estimated to be ±10 and ±25%, respectively, of the reported values.
of fcp to the type of radical involved, it has been assumed that fcp for the cyclohexyl radical will be the same as that found for the propyl and pentyl radicals in benzene. This approximation is, of course, not valid in cyclohexane. Borrowing a term from acid-base chemistry, the effect which benzene exerts on the rate constants fcp may be described as a leveling influence. That is, when one considers the rate constants fcp in cyclohexane, the three different types of radicals much more clearly display their individuality. Benzene has also been found to strongly modify the reactivity of chlorine atoms in solution.6 The present data clearly point out, however, the very much different influence which a change in solvent has upon the recombination process. In a consideration of the fct values it is cyclohexane rather than benzene which exerts the leveling influence, the fct values ranging only over a factor of 3 in the former solvent but over a factor of 9 in the latter. Common to both fcp and fct, however, is that the differences in these rate constants between the two solvents are in the order propyl > cyclohexyl > benzyl. In view of the facts presented above it seems reasonable to propose that hydrocarbon radicals may interact with benzene to form a complex and that the strength of the radical-benzene interaction is dependent on the type of radical involved. Furthermore, the driving force behind such an interaction would probably involve delocalization of the unpaired electron into the aromatic nucleus and one would, therefore, not expect to see appreciable interaction between benzene and the benzyl radical. The fact that fcp values in benzene for cyclohexyl, propyl, and pentyl radicals are only slightly larger than that for the benzyl radical is consistent with this interpretation. Also there is spectroscopic evidence7 that benzene interacts with iodine atoms to
(6) G. A. Russell, J. Amer. Chem. Soc., 80, 4987 (1958).(7) S. J. Rand and R. L . Strong, ibid., 82, 5 (1960).
T h e J o u rn a l o f P h y s ic a l C h em istry

Radical-R adical R eactions in D ifferent Solvents 2705
form charge-transfer complexes. Thus, the type of interaction proposed here is not completely unprecedented. Using data quoted by Pryor,8 it is possible to estimate the rate constant for 'he addition of methyl radicals to benzene at 65° as 1.2 M _1 sec-1. At 25° the rate constant is probably less than half of the 65° value, and the relative rates of thiol hydrogen abstraction vs. radical addition to benzene would be in excess of 100:1. It is partly for this reason that the observed solvent effect is interpreted in terms of complex formation rather than direct addition of the radical to benzene.
How can the proposed interaction between alkyl radicals and benzene be used tc interpret the results obtained for fct? If radical stability per se were decisive in determining kt, then benzene rather than cyclohexane would be expected to exert the leveling influence. If the reaction were controlled purely by diffusion rates then complex formation between, for instance, the propyl radical and benzène would necessarily be accompanied by a decrease of over a factor of 8 in diffusion coefficient.9 When it is realized that a large molecule such as octadecane has a diffusion coefficient in benzene only about 2.5 times smaller than pentane,10 then this second explanation becomes very nearly as unattractive as the first.
An alternate way of viewing the recombination process in benzene is one similar to the solvent stripping mechanism proposed for certain ion combination reactions in water.11 Symbolizing the proposed radical-benzene complex by C, one would have
C +k-1
_____ ki _______C- C A 7-- R • R • + 2S
k - 2__________ £gR • R • — 3*- products
where S represents a solvent mclecule and the species under the overhead bars are meant to represent nearest- neighbor pairs. The symbol R- represents radical species which react to form final products very rapidly compared to the reverse of step 2. That is, R ' does not necessarily represent the bare hydrocarbon radical. Applying a stationary-state treatment and assuming kz > fc—2, one finds
kt = kik%/ (k2 -\- k-1)
In terms of this mechanism the competition involving k2 and fc_i is important in determining whether or not the recombination process is diffusion controlled. Presumably, the observed fct values found in cyclohexane are similar because they are more critically dependent on diffusion coefficients and encounter diameters, and these would not be expected to differ greatly among the radicals studied. An obvious criticism of this mechanism is that there is no direct
evidence for the existence of the proposed complex species; however, there is also no evidence that an attempt has been made to find such a species by spectroscopic or other means. It should be noted that Weiner and Hammond12 have compared kt values for the cumyl and ¿-butyl radicals in benzene and cyclohexane. Here again, it appears that the highly delocalized unpaired electron of the cumyl radical results in no solvent effect; hcwever, an increase by a factor of 3 in kc for the ¿-butyl radical is observed when cyclohexane rather than benzene is used. A solvent effect was also observed for the 2-cyano-2- propyl radical.
In addition to the effects of solvent on kt observed here, the complex formation hypothesis may also be used to explain the earlier result that kt for pentyl radicals is four times smaller than for benzyl radicals when both measurements are made in benzene.4 In fact, it appears to be generally true that, in benzene, kt values for alkyl radicals deviate much further from the diffusion-limiting value than does the benzyl radical. Even if one is willing to attribute these more obvious results to the formation of a complex and to the mechanism presented above, there remain several less obvious findings which are not readily explained. An example is the factor of 2 difference in kt for the propyl and pentyl radicals in benzene. Another example is the fact that the specific rate constant for the recombination of cumyl radicals12 is a factor of 4 larger than that found for the benzyl radical. These and other observations which are difficult to understand on the basis of present models must await further experimentation with the hope that rational patterns of reactivity will emerge.
Since the initial impetus for this work arose from a noticeable lack of agreement between kt values obtained using the thiol-TEP monitor reaction and values obtained by other methods, the extent to which these differences have been resolved should be noted. There appear to be no previous measurements of kt for propyl radicals in cyclohexane; however, Carlsson and Ingold13 find a value of 1.1 X 10s M~l sec-1 for the structurally similar n-hexyl radicals using the rotating sector method in reasonably good agreement with the present work. The kt value for benzyl radicals in cyclohexane reported
(8) W. A. Pryor, “Free Radicals,” M cGraw-Hill Book Co., Inc., New York, N. Y ., 1966, pp 223-225.(9) This assumes a constant encounter diameter in the two solvents.(10) R . Varoqui, M. Daune, and L. Freund, J . C h im . P h y s ., 58, 394(1961).(11) For a recent review see E . M. Eyring and B. C. Bennion, A n n . R ev . P h y s . C h em ., 19, 129 (1968).(12) S. Weiner and G. S. Hammond, presented at the 156th National Meeting of the American Chemical Society, Atlantic City, N. J., Sept 1968.(13) D. J. Carlsson and K . U. Ingold. J . A m e r . C h em . S o c ., 90, 7047 (1968).
Volume 73, Number 8 August 1969

2706 J. F. Schmidt and F. W. Lampe
by Hagemann and Schwarz2* is exactly the same as that found in this work and, although partly fortuitous, such agreement is particularly gratifying in view of the completely different experimental methods used. The results obtained for the cyclohexyl radical show a larger disparity than one might have expected. In units of 109 M~l sec-1, kt values range from a low of 0.6 found in the present work to 2.0.20 It is not clear at this time
why the range of values is so large for this particular radical.
Acknowledgments. Acknowledgment is made to the donors of the Petroleum Research Fund, administered by the American Chemical Society, for support of this research. The author is grateful to Professor C. 0 . Guss and Mr. Gary Lee, who synthesized the cyclo- hexanethiol used in this work.
The 7-Ray Radiolysis of Monosilane and Monosilane-Ethylene Mixtures1
by J. F. Schmidt and F. W. LampeDepartm ent o f Chem istry, The P ennsylvania State U niversity, U niversity P a rk , Pennsylvania 16802 (.Received January 17, 1969 )
The 7-ray radiolysis of pure monosilane at 300°K produces hydrogen and disilane with 100-eV yields of 17.0 and 5.3, respectively, and consumes monosilane with an estimated G(—SiH4) of 22. Considerable amounts of a brown polymeric substance are also observed. Ethylene partly inhibits the formation of hydrogen and disilane producing ethylsilane and diethylsilane in chain processes that are at least partially independent. The yields of all products in both the pure monosilane and in the mixtures with ethylene are affected by the surface-to-volume ratio. The most reasonable mechanism in accord with all observations is based on the conclusion that, in pure monosilane, disilane and hydrogen are produced simultaneously in free-radical and ionic processes. In the monosilane-ethylene mixtures, ethylsilane appears to be formed exclusively by a free- radical reaction and diethylsilane by an ionic process.
IntroductionIn contrast to the case of simple paraffinic hydro
carbons and mixtures of these paraffins with olefins, very little is known of the radiation chemistry of the structurally similar silanes and of mixtures of these compounds with olefins.
Ando and Oae2 studied the gas-phase 7-ray radiolysis of SiH4 and of mixtures of SiH4 with C 02, H20, and C2H2. In the case of pure SiH4, these authors reported as products H2, Si2H6, traces of higher SiJ!H2fl+ 2 compounds, and a polymeric compound of empirical formula (SilL)! as products. For a given initial pressure of SiH4 they found that (7(H2) decreased with increasing conversion from a value of 42.8 to about 23, remaining essentially constant thereafter. For a given total dose per gram, Ando and Oae2 found that G(H2) decreased with initial pressure of SiH4 while the addition of C 02, C2H2, and H20 resulted in marked increase of G(H2). Others3 have reported, at very high pressures and in the temperature range -195-450°, G values for SiH4 consumption of 3000-35,000. Since SiH4 just begins to decompose thermally at a measurable rate at temperatures about 400°,4-6 it is possible that in some of the higher temperature experiments some thermal initiation obtained;2 nonetheless, while we must have some
reservation about the exact magnitude of G values reported,3 it is clear that very large G values for SiH4 consumption by radiation initiation can be obtained. Mains and Tiernan7 have studied the high-energy electron radiolysis of SiH4 and have found G(H2) and <7(Si2H6) to behave with pressure and dose as reported by Ando and Oae,2 but to be lower, by a factor of over2. Mains and Tiernan reported, in addition, that the results of radical-scavenging techniques indicate that a considerable amount of the H2 produced is formed from reactions other than those of hydrogen atom abstraction by hydrogen atoms. The magnitudes of G values for hydrogen formation and for silane consumption point to the conclusion that the radiation-induced conversion of SiH4 takes place via a chain reaction.
(1) A E C Docum ent NYO-3570-6.(2) W . Ando and S. Oae, Bull. Chem. Soc. Jap ., 35, 1540 (1962).(3) K. Held and R . J. Goldman, A tom ic Energy Commission Report NYO-10472.(4) J. Ogier, A n n . Chim. P h ys ., 20, 37 (1880).(5) T . R . Hogness, T . L. Wilson, and W . C. Johnson, J . A m er. Chem. Soc., 58, 108 (1936).(6) G. Fritz, Z . N aturforsch ., B , 7, 507 (1952).(7) (a) G. J. Mains and T . Tiernan, U. S. A tom ic Energy CommissionR eport NYO-2007-8. (b) T . Tiernan, P h.D . Thesis, CarnegieInstitute o f Technology, Pittsburgh, Pa., 1966.
T h e J o u rn a l o f P h y s ic a l C h em istry

7-Ray R adiolysis of SiH4 and SiH4-C 2H4 2707
Ando and Oae2 suggested a radical chain involving the reaction
SiHa -)- SiH4 — Si2He -j- H (A)
but in view of Mains and Tiernan’s observation7 with radical-scavenging systems and the fact that (A) is endothermic by over 12 kcal/mol8 it is not likely that (A) is significant in this system.
The radiation-induced addition of silanes to olefins has been shown by a number of authors to be an efficient chain process.9-12 Most authors9-11 have treated this addition as a free-radical chain reaction, although evidence has been presented12 to the effect that there is an important ionic chain component to the addition.
Experimental SectionAll irradiations were conducted in the gas phase in
cylindrical Pyrex vessels of 26-cm length and of 240- cm3 volume. 7-Rays from the Co60 irradiation Facility at the Pennsylvania State University were used in all experiments as the initiating ionizing radiation. Dose rates (to 50 Torr of SiH4) ranged from 4.9 X 10¹⁵ to8.3 X 1016 eV cm-3 hr-1 as determined by propylene dosimetry (G(H2) = 1.1)13 and standard electron energy- loss data.14
Analyses of the irradiated gases were accomplished by a combination of gas chromatography and mass spectrometry. All quantitative analyses were carried out by gas chromatography using two 8-ft columns, one containing high-activity silica gel (Burrell 341-173) and the other 20% hexadecane on 45-60 Chromosorb P.
A Burrell Model K-2 Chromotog with thermal conductivity detection was employed in all gas chromatographic measurements. For purposes of product identification in the monosilane-ethylene mixture irradiations, the effluent from the chromatograph was fed directly (after pressure reduction) to a Nuclide 12-90 G-sector mass spectrometer. After product identification was made in this way it was checked, when possible, by retention times of the pure compounds on the gas chromatograph.
Monosilane was prepared by the lithium aluminum hydride reduction of silicon tetrachloride in anhydrous diethyl ether solvent.16 The monosilane and the diethyl ether solvent were separated by distillation on the vacuum line, the monosilane being collected at— 195° after passage of the evolved gases successively through traps held at —95 and —131°. Disilane was prepared by a similar reduction of Si2Cl6-16 Ethylsilane and n-butylsilane were similarly prepared from ethyl- trichlorosilane and n-butyltrichlorosilane, respectively, which were obtained from Peninsular Chemresearch, Inc. Diethylsilane, obtained from the same source, was purified by vacuum line distillation. Nitric oxide and prepurified hydrogen were obtained from the Matheson Co. The nitric oxide was degassed at— 195° and distilled at —159° just prior to use. The
ethylene used was Phillips Research grade, which was further purified before use by the same procedure described for nitric oxide.
Results and DiscussionPure Monosilane. The products observed in the
7-ray radiolysis of monosilane at 50 Torr pressure and room temperature are hydrogen, disilane, and, at higher doses, a light brown deposit on the vessel surfaces. At the gas chromotograpkic sensitivities used, higher silanes were not detected.
The concentrations 0: hydrogen and disilane produced as a function of total dose are shown in Figure 1. It is apparent from this figure that both (j(H2) and (7(Si2H6) decrease quite rapidly with increasing dose, an effect which is likely due to radical reactions with the disilane product. To evaluate better the initial (?(Hi) and G(Si2H6), we have plotted in Figure 2 the apparent G values vs. cose. Here we see that both (r(H2) and (?(Si2H6) decrease rapidly with dose to constant values of 12.5 and 1.7, respectively. The solid lines drawn through the points of Figure 2 are calculated from a least-squares fit of the data to the relationship
Gapp = Go + aD + bD2 (I)
where a and b are empirical constants, D is the dose, and Go is the yield at zero dose. The initial G values so obtained for pure monosilane are
<?(H2) = 17.0 ± 1.1
(?(Si2H6) = 5.3 ± 0.4
Considering these data ir_ the light of both our observations of insignificant formation of higher silanes (or, indeed, of anything else in the gas phase) and Ando and Oae’s observation2 that the solid deposit has the empirical formula (SiH2)*, we may estimate G(—SiH4) to be 22. Using this estimate we calculate that a dose of 7.4 X 10¹⁶ eV/cm3 corresponds to 1% conversion of monosilane.
Within the precision of the data in Figures 1 and 2 there was no effect on the G values of variation of the dose rate by a factor of 1.7. The thereby suggested weak dependence of yields on dose rate is borne out by comparison of our yields with those of Mains and
(8) W . C. Steele, L . D . Nichols, and F. G. A . Stone, J . A m er. Chem. Soc., 84, 4441 (1962).(9) G. Rabilloud, B ull. Soc. Chim . F r „ 2152 (1965).(10) D . W . Roper, Thesis, University of M ichigan, Ann Arbor, M ich ., 1961.(11) A . M . E l-Abbady, J . Chem. U . A . R „ 9 , 281 (1966).(12) F. W . Lampe, J. S. Synderman, and W . H. Johnston, J . P h ys . Chem., 70, 3934 (1966).(13) J. Y ang and P. Gant, ib id ., 65, 1861 (1961).(14) National Bureau of Standards Circular N o. 577, U. S. G ovt. Printing Office, Washington, D . C., 1958.(15) A. E. Finholt, A. C. Bond, K . E. W ilzbach, and H. I. Schles- inger, J . A m er. Chem. Soc., 69, 2692 (1947).(16) L. G. L. W ard and A. G. M acDiarm id, ibid., 82, 2151 (1960).
V o lu m e 73, N u m b er 8 A u g u s t 1969

2708 J. F. Schmidt and F. W. Lampe
Figure 1. Product formation in pure SiH4 radiolysis: O, H2; A, Si2H6.
Figure 2. Apparent G values of product formation as a function of dose: O, H2; A, Si2H6.
Tiernan.7 Our plateau values (Figure 2) for f?(H2) and G(Si2H6) are 12.5 and 1.7, respectively, while Mains and Tiernan find plateau values of 9.0 and 3.0, respectively; yet these latter authors used high-energy electrons as the radiation source, and we estimate that their dose rate was 40 times higher than ours. Examination of their data and comparison with ours suggest that there is a small, but real, dose rate dependence in which G(H2) decreases while ^(SbHe) increases with increasing dose rate. This is to be expected if disilane arises, in part, at least, in a reaction second order in transients (such as the combination of silyl radicals) and if hydrogen is not produced to any significant extent by reactions of second order in transients. On the other hand, working at higher pressures and with dose rates lower than ours by a factor of 2, Ando and Oae2 found values of (?(H2) and (?(Si2H6) significantly higher than ours or those of Mains and Tiernan.7 This is particularly evident when the results of Ando and Oae2 are extrapolated to our pressure of 50 Torr and suggests a very strong dose rate effect, and an unusual one too, in that the effect on G(Si2H6) is opposite to that expected and found by comparison of our work with that of Mains and Tiernan.7 We have no explanation for this contradiction, but since we see no reason to mistrust our data and since the results of Ando and Oae2 are in
conflict with the probable direction of any dose rate effect on the ratio G(H2)/G(Si2H6), we accept the validity of the comparison of our work with that of Mains and Tiernan7 and conclude that there exists a slight dose rate dependence in which (?(Si2H6) increases and (7(H2) decreases with increasing dose rate.
The effect of added ethylene on the yield of disilane at a constant total pressure of 60 Torr is shown in Figure 5. Here we see that the yield of disilane is decreased by the addition of ethylene to a constant value that is 38% of the yield in pure monosilane. Under total scavenging conditions (16.4% C2H4) the yield of hydrogen is reduced to 65% of its value in pure monosilane. Nitric oxide present at 0.7% had an identical effect on the yield of disilane. The results of these radical-scavenging experiments are in excellent agreement with the results of Mains and Tiernan.7 A few studies of the effect of NO on the hydrogen yield were inconclusive. Ethylene is known to be an effective scavenger for hydrogen atoms17 and, as has been suggested by White and Rochow18 and as also will be shown later, it is an effective scavenger for silyl radicals. Thus we conclude that 38% of the disilane yield and 65% of the hydrogen yield in the radiolysis of monosilane arise from reactions not involving hydrogen atoms or silyl radicals.
Increasing the surface-to-volume ratio, to the extent of a factor of roughly 100, by packing the reaction vessel with quartz wool resulted in a threefold increase in the hydrogen yield and a 48% decrease in the disilane yield. When the radiolysis is carried out in the packed reaction vessel under complete radical scavenging conditions (16.4% of ethylene present), the yield of disilane is reduced by a factor of 2.5 as compared with radiolysis of the radical-scavenged system in the unpacked vessel; this observation suggests that the nonradical precursors of disilane are terminated on the surface.
The hydrogen yield is also increased with increasing surface-to-volume ratio in the radical-scavenged system and by a factor of about 3.5. However, since ethylene (a hydrogen-containing substance) is used as the radical scavenger, this observation provides us with no information on the mechanism of radiolysis of pure monosilane.
It is evident that the radiolysis of monosilane is a very complex process and that it is at present impossible to write down a complete detailed mechanism. Nonetheless, the above observations coupled with the known ion-molecule reactions in monosilane19 provide us with a guide toward at least a partial mechanism that we think encompasses the principal elementary reactions. Thus we write, as a mechanistic scheme consistent with the observations, the following reactions.
(17) F . W . Lampe, J . A m er . Chem . S oc., 82, 1551 (1960).(18) D . G. W hite and E. G. Rochow , ibid., 76, 3897 (1954).(19) G. G. Hess and F. W . Lampe, J . Chem. P h ys ., 44, 2257 (1966).
T h e J o u rn a l o f P h y s ic a l C h em istry

7-Ray R adiolysis of SiH4 and SiH4-C 2H4 2709
SiH4
— > SiH3 + H
—> SiH2 + H2
— ► SiH3+ + H + e
— SiH2+ + H2 + e
H + SiH4 — *■ H2 + SiH3
SiH3 + SiH3 — Si2H6
SiH2 + SiH4 — ► Si2H6
SiH2+ + SiH4 — > SiH3+ + SiH3
SiH2+ + SiH4 — > Si2H4+ + H2
Si2H4+ + SiH4 — > Si3H6+ + H2
Si„H2n+ + SiH4 — > Si„+1H2n+2+ + H2
SiBH2n+ + SiH4 — ► Si„H2„+2 + SiH2+
SinH2„ + + e_ (surface) — > polymer
SiH3+ + e~ (surface) — *■ polymer
(la)
(lb)
(lc)
(ld)
(2)
(3)
(4)(5)(6)
(7)(8)
(9)(10)
(11)
Additional initiation steps undoubtably occur but, in view of the increasing energetic requirement to remove more hydrogen in neutral initiation steps and the fact that SiH3 and SiH2+ are the major ions in the mass spectrum of monosilane,19 we feel an adequate representation of the mechanism is possible by (la )-(ld ).
Reactions 2 and 3 are eliminated by the addition of ethylene (above about 7-8% ) with a consequent reduction but not elimination of the hydrogen and disilane yields. The insertion reaction of SiH2 reaction 4 is suggested as the most plausible reaction of these radicals with SiH4. The hydrogen abstraction reaction to form two SiH3 radicals is probably endothermic, since the bond dissociation energy D(H3Si-H) is 94 kcal/mol8 and the sum of the bond energies D(HSi-H) and -D(H2Si-H) is 121 kcal/mol.8'20 We do not think that SiH2 is formed in very significant abundance in this system because when ethylene is added the most likely product of its reaction with ethylene, namely vinyl- silane, is not observed.
Reaction 5 is the major ion-molecule reaction observed in monosilane,19 although the ionic product of this reaction, namely SiH3+, is inactive. Hence, as far as chemical conversion is concerned reaction 5 represents simply another source of SiH3 radicals. Reaction 6 is the second major ion-molecule reaction observed in monosilane.19 SiH2+ ions react also with ethylene,21 but the rates of the two processes are such that the presence of 16% ethylene would be expected to inhibit (6) only by about 10%. Thus ethylene is not an efficient scavenger of the ion-molecule reactions but is of the free- radical processes. In addition to (5) and (6), other ionic products of the SiH2+-SiH4 reaction are Si2H6+, Si2H3+, Si2H2+, and Si2H+ with the appropriate stoichiometric amounts of H2 and H. However, these other ionic processes make up a minor amount of the
SiH2+-SiH4 interaction and, since they add nothing to this partial representation of the mechanism, we have, for simplicity, omitted them.
Reactions 7 and 8 have not been observed but are proposed as extensions of (6) to explain the radiation- induced polymerization.2'7 Reaction 9, which is an H2- transfer from SiH4, could not be observed in mass spectrometric studies of pure monosilane19 since no suitable reactant ions were present in sufficient abundance. However, the H2- transfer from SiH4 has been observed to occur when C2H2+ and C2H4+ ions attack SiH4. We propose (9) as a mechanistic step, in analogy to the H2~ transfer to C2H2+ and C2H4+, in order to account for the unscavenged yield of disilane and the reported presence of higher silanes.2'7 Note that (9) is a chain-transfer step in the polymerization since SiH2+ is regenerated.
The termination reactions 10 and 11 are proposed to account for the effect of increasing the surface-to- volume ratio on the radical-scavenged yield of disilane.
Monosilane-Ethylene Mixtures. We have already pointed out that the addition of ethylene to monosilane has an inhibitory effect on the radiolytic yields of H2 and Si2H6. This inhibition reaction is particularly interesting because the products of the inhibition are formed with yields larger than the expected free-radical yields of the radiolysis. Thus, when 5:1 mixtures of monosilane-ethylene are irradiated, four major products appear. These are H2 and Si2H6, formed in reduced yields, as already mentioned, and C2H6SiH3 and (C2H6)2- SiH2. The latter two products were positively identified by mass spectrometric analysis of the gas chromatographic peaks and retention time measurements of samples of the pure compounds; it is particularly noteworthy that the 1:2 telomer is diethylsilane and not n-butylsilane. The yields of these four major products as functions of total dose (to a 5:1 mixture of SiH4/C 2H4) are shown in Figures 4 and 5, from which we derive the following 100-eV yields.
G(H2) = 11.1 ± 0.7
(?(Si2H6) = 1.7 ± 0.1
(7(C2H6SiH3) = 30.9 ± 2.9
G(C2H6SiH2C2H6) = 7.8 ± 0.9
Trace amounts of other products have been observed which we have tentatively identified as Si3H8, C2H6Si2H6, and SiH3CH2SiH3.
The yields of H2 and Si2H6 in the monosilane-ethylene mixtures do not decrease with increasing dose as was observed in pure monosilane (Cf. Figures 1, 4, and 5). Thus the presence of ethylene appears to eliminate the auto-scavenging effect observed in pure monosilane
(20) A . E. Douglas, Can. J . P h ys ., 35, 76 (1957).(21) D . P. Beggs and F. W . Lampe, J. P h ys. Chem ., in press 1969.
V o lu m e 73, N u m b er 8 A u g u st 1969

2710 J. F. Schmidt and F. W. Lampe
Figure 3. Ethylsilane and hydrogen formation in the radiolysis of SiH4-C2H4 mixtures: O, H2; A, C2H6SiH3.
Figure 4. Diethylsilane and disilane formation in the radiolysis of SiH4-C2H4 mixtures: O, (C2H5)2SiH2; A, Si2H6.
Figure 5. Inhibition of disilane formation by ethylene.
(Figures 1 and 2), and since ethylene is a good atom and radical scavenger, this tends to confirm the suggestion made earlier that radical scavenging by Si2H6 was responsible.
It has already been mentioned that an increase of the surface-to-volume ratio by about 100-fold results in an increase in the yield of hydrogen and a decrease in the yield of disilane; the yields of ethylsilane and diethylsilane are also reduced and by the same factor of reduction as for disilane. This is particularly significant in the case of the disilane yield because the radical contribution to disilane formation (reaction 3) has been eliminated by the competition reaction of SiH3 radicals with ethylene (Figure 3). This shows conclusively that the ionic component of disilane formation is reduced by an increase in the surface-to-volume ratio suggesting that SiH2+ and Si2nH2n+2+ neutralization at the wall are the most important ionic termination steps. Since the principal reaction of SiH2+ ions is the formation of SiH3 radicals via (5), and hence, since this formation mode of SiH3 will be reduced by an increase in surface area, the decrease in yields of ethylsilane and diethylsilane do not permit us to conclude that these telomer products arise from ionic reactions.
Nitric oxide is known to be good scavenger of silyl radicals,22'23 and its effect on the formation of the telomer products in the monosilane-ethylene system is particularly interesting. The addition of 0.6% nitric
(22) M. A. Nay, G. N. C . Woodall, O, P. Strausz, and H . E . Gunning, J . A m e r . C h em . S o c ,, 87, 179 (1965).(23) E . Kamaratos and F . W. Lampe, unpublished results.
The Journal of Physical Chemistry

7-Ray R adiolysis of SiH4 and SiH4-C 2H4 2711
oxide reduces the yield of ethylsilane to zero (or at least to undetectable quantities) but at the same time reduces the yield of diethylsilane only by a factor of about 2. The use of higher concentrations of nitric oxide reduces the yield of diethylsilane further, so that at 1.6% NO its yield is essentially zero. This difference in behavior of the ethylsilane and the diethylsilane toward nitric oxide addition indicates that ethylsilane and diethylsilane arise, at least in part, from independent mechanisms.
The same conclusion is reached when one examines the effect of the [C2H4]/[SiH4] ratio on the yields of ethylsilane and diethylsilane. Over a fourfold range in this ratio, namely from 0.05 to 9.20, no effect on the relative yields of ethylsilane and diethylsilane is observed. From the magnitude of the 100-eV yields, a chain reaction must be occurring. Any free-radical chain requires either a dependence of the relative yields of ethylsilane and diethylsilane on the [C2H4]/[SiH4] ratio or an induction period in diethylsilane formation. Since neither is observed, we conclude that these products cannot both be formed exclusively in free- radical chain processes. We suggest that, to a first approximation, ethylsilane is formed in a free-radical chain process and that the diethylsilane formation is ionic. Indirect support for this point of view comes from results of studies of the mercury-photosensitized addition of silane to ethylene.18 In this reaction system, which of necessity is purely free radical, ethylsilane was observed along with n-butysilane, but no diethylsilane was reported. On 'he other hand, in our radiolytic experiments only trace amounts, if any, of n-butylsilane are formed. As additional support, we may mention that the rearrangement required in the reaction intermediates to produce diethylsilane are thought to occur much more readily in ions than in free radicals.24 We should also mention that our experiments were conducted at considerably higher ratios of the [SiH4]/ [C2H4] than obtained in the work of White and Rochow.18 Our failure to observe n-butylsilane is explained by the effect of the [SiH4]/[C 2H4] ratio on the relative yields of ethylsilane and butylsilane which, free radically, are formed in the competition processes
SiH3CH2CH2 ■ + SiH4SiH3C2H5 + SiH3 (12)
SiH3CH2CH2 ■ + c 2h 4SiH3CH2CH2CH2CH2 • (13)
SiH3CH2CH2CH2CH2 • + SiH4 — >n-C4H 9SiH3 + SiH3 (14)
In mass spectrometric studies of the ion-molecule reactions in monosilane-ethylene mixtures21 we have observed that H2~ transfer from SiH4 to an attacking ion occurs readily if it is energetically feasible, and we think that it is a quite general reaction. We have also
observed that SiH2+ adds to C2H4 and that C2H4+ adds to SiH4. Since, in our radiolysis system, SiH4 is always present in considerable excess ([SiH4]/[C 2H4] > 3), we may, as an approximation, consider that radiolytic initiation occurs only in SiH4 via (la )-(ld ), and we need consider for the proposed ionic formation-mode of (C2H6)2SiH2 only the addition of SiH2+ to C2H4. We suggest this occurs by the following steps.
SiH2+ + C2H4 W W X HSi (15)
/H
■ \H
H \ / H> c -------- c < (
Hr V / XH Si C2H6SiH+ (16)
H H
C2H6SiH+ + C2H4
H\ / H> c ----------c <H / V / X H
Si
H \ /H> C --------C <
W \ + / X H Si
/ \H C2H6
(17)
(C2H5)2Si+ (18)
H C*IIS
The ionic addition to ethylene stops with (18) because no further proton shifts to produce more stable sili- conium ions are possible. The formation of diethylsilane then occurs by H2~ transfer from SiH4, viz.
(C2H6)2Si+ + SiH4 (C2H6)2SiH2 + SiH2+ (19)
Mass spectrometric studies of the isotopic distribution in the ionic products of SiD2+-C2H4 collisions21 show that the H and D are essentially equivalent in the collision complex. This observation supports the cyclic structure drawn in (15).
In terms of a sequence of elementary reaction steps, we suggest that the ethylene-inhibited radiolysis of monosilane ([SiH4]/ [C2H4] > 3) occurs as follows: (1)the initiation is represented by (la )-(ld ), described in the section on radiolysis of pure monosilane; (2) all reactions that occur in pure monosilane radiolysis occur to some extent (depending on the ethylene concentration) in the mixture; (3) the additional elementary reactions below also occur.
(24) F . H . Field and J. L . Franklin, “Electron Impact Phenomena,” Academic Press, New York, N. Y ., 1957.
V o lu m e 78, N u m b er 8 A u g u s t 1969

2712 T. E l l i n g s e n a n d J. S m i d
SìH3 + C2H4 — > SiH3CH2CH2 (20)
SiH3CH2CH2- + SiH4 — SiH3C2H6 + SiHa (12)
SiH2+ + C2H4 — ► SiC2H6+ (15), (16)
SiC2H6+ + C2H4 — ► SiC4H10+ (17), (18)
SiC4H10+ + SiH4 — »■ (C2H6)2SiH2 + SiH2+ (19)
} + e - (wall) — polymer + H2 (21)0IU4XXIO 7
The proposed details of the elementary steps (15)-(19) were discussed previously.
While not complete, we believe this mechanism is the most reasonable representation of this complex system that is in accord with all the experimental observations.
Acknowledgment. This work was supported by Contract No. AT (30-l)-3570 with the U. S. Atomic Energy Commission.
Studies of Contact and Solvent-Separated Ion Pairs of Carbanions.
VI. Conductivities and Thermodynamics of Dissociation of
Fluorenyl Alkali Salts in Tetrahydrofuran and Dimethoxyethane
by T. Ellingsen and J. SmidC h em is try D ep a r tm en t, S ta te U n iv er s ity o f N e w Y o r k C ollege o f F o res try , S y ra cu se , N ew Y o r k 1 3 2 1 0 0R eceived J a n u a r y 2 0 , 1 9 6 9 )
The conductance behavior of the lithium, sodium, potassium, and cesium salts of the fluorenyl carbanion in1,2-dimethoxyethane and that of fluorenylpotassium in tetrahydrofuran was studied over a temperature range of 25° to —70°. In DME, none of the salts shows a dissociation behavior consistent with the simple “sphere in continuum” model. Only the cesium ion pair remains a contact ion pair over the whole temperature range. The potassium salt changes from a predominantly contact ion pair structure at 20° to a solvent-separated ion pair at —60°, with the enthalpy change being —4.6 kcal/mol as determined from spectroscopic measurements. Its behavior resembles that of fluorenyl sodium in THF. The potassium salt in THF remains a contact ion pair, and its behavior is very similar to that of the cesium salt in DME. The lithium salt in DME is solvent separated over the entire temperature range, the sodium below 0°. It was shown that reasonably good thermodynamic data can often he obtained from a measurement of the temperature dependence of the conductance at one salt concentration only.
Direct physical evidence for the existence of contact and solvent-separated ion pairs has come chiefly from studies of the optical absorption spectra of alkali salts of certain carbanions1 and of radical anions1'2 and from nmr and esr investigations, both of which have provided detailed information on the structures of ion pairs and their solvates.2’3 In addition, conductance measurements on carbanion and radical ion salts (and those of certain inorganic salts) in ethereal solutions have yielded valuable information on the solvation state of both the alkali ion pairs and that of the free alkali ions.4-8
In a previous publication,4 we reported on the conductivities and thermodynamics of dissociation of fluorenyllithium, sodium, and cesium in tetrahydrofuran over the temperature range of 25 to —75°. Correlation of these conductance data with spectral studies
on fluorenyl alkali salts made it possible to rationalize the values of the respective dissociation constants and of
( 1 ) T . E . H o g e n - E s c h a n d J . S m i d , J . A m e r . C h em . S o c ., 8 7 , 6 6 9 ( 1 9 6 5 ) ; 8 8 , 3 0 7 ( 1 9 6 6 ) ; L . L . C h a n a n d J . S m i d , ib id ., 9 0 , 4 6 5 4 ( 1 9 6 8 ) .
( 2 ) E . d e B o e r , R ec . T rav . C h im ., 8 4 , 6 0 9 ( 1 9 6 5 ) ; R . V . S l a t e s a n d M . S z w a r c , J . A m e r . C h em . S o c ., 8 9 , 6 0 4 3 ( 1 9 6 7 ) ; N . H i r o t a , ib id ., 9 0 , 3 6 0 3 ( 1 9 6 8 ) .
( 3 ) J . A . D i x o n , P . A . G w i n n e r , a n d D . C . L i n i , ib id ., 8 7 , 1 3 7 9 ( 1 9 6 5 ) ; L . L . C h a n a n d J . S m i d , ib id ., 8 9 , 4 5 4 7 ( 1 9 6 7 ) ; K . H . W o n g a n d J . S m i d , ib id ., i n p r e s s .
( 4 ) T . E . H o g e n - E s c h a n d J . S m i d , ib id ., 8 8 , 3 1 8 . ( 1 9 6 6 ) .
( 5 ) R . V . S l a t e s a n d M . S z w a r c , J . P h y s . C h em ., 6 9 , 4 1 2 4 ( 1 9 6 5 ) .
(6 ) D . N . B h a t t a c h a r y y a , C . L . L e e , J . S m i d , a n d M . S z w a r c , ib id ., 6 9 , 6 0 8 ( 1 9 6 5 ) .
( 7 ) C . C a r v a j a l , K . J . T o i l e , J . S m i d , a n d M . S z w a r c , J . A m e r . C h em . S o c ., 8 7 , 5 5 4 8 ( 1 9 6 5 ) .
( 8 ) D . N i c h o l l s , C . S u t p h e n , a n d M . S z w a r c , J . P h y s . C h em ., 7 2 , 1 0 2 1 ( 1 9 6 8 ) .
T h e J o u rn a l o f P h y s ic a l C h em istry

Contact and Solvent-Separated Ion Pairs of Carbanions 2713
the heats and entropies of dissociation in terms of differences in ion-pair structure for the various fluorenyl salts.
We now have extended our conductance studies to the behavior of fluorenyl alkali salts (including the potassium salt) in 1,2-dimethoxyethane. The solvent DME, from all we know, is a better solvating agent for alkali ions than tetrahydrofuran, and one may therefore expect a rather drastic difference in the conductance behavior of the various alkali salts. The optical spectra for these salts in DME were also recorded. This affords a direct determination of the fraction of contact and solvent-separated ion pairs over the investigated temperature range. The conductance of fluor- enylpotassium in THF, not included in our previous work, was also determined.
Experimental SectionThe purification of tetrahydrofuran and dimethoxy-
ethane by N a-K alloy and benzophenone has been described elsewhere.1 The fluorenyl salts were prepared in THF. When needed in DME, the THF was removed under vacuum and replaced by pure DME. Trace quantities of THF left after evaporation did not interfere with the measurements.
The fluorenyllithium salt was prepared by adding a THF solution of fluorene to butyllithium (from which heptane was removed) or to recrystallized ethyllithium. In both cases an essentially 100% yield of the salt was obtained. The sodium, potassium, and cesium salts were prepared by first stirring a THF solution of 1,1- diphenylethylene on the respective alkali metal mirrors. This produces rapidly and quantitatively the deeply red colored dianion of 1,1,4,4-tetraphenylbutane, i.e., (Ph)2CCH2CH2C(Ph)2. To this solution, a slight excess of fluorene is added, yielding instantaneously and quantitatively the yellow-orange solutions of the fluorenyl alkali salts. The salts can also be produced by directly stirring a fluorene solution on the respective alkali mirrors. However, the reactions are not quantitative, and particularly in the case of the potassium and cesium salts the solutions have a much darker appearance with small deviations noticeable in their optical absorption spectra. Since the formation of the fluorenyl anion by this method probably proceeds by an electron-transfer process,9 small quantities of other anions may be introduced. These impurities may interfere with the conductance measurements. The latter solutions are also less stable. Solutions prepared by the first method are stable even at 10-6 M. All manipulations during the preparation of the fluorenyl solutions were carried out under vacuum.
A full description of the conductance apparatus and the procedure used in obtaining the conductance data have been reported previously.4'6 The experiments were performed in an all-glass apparatus provided with a conductance cell and three optical cells of different
path lengths. The walls of the completely enclosed apparatus (no stopcocks) were first purged with a fluorenyl solution, and the solvent of this solution was then distilled and mixed with a more concentrated fluorenyl solution on which the actual measurements were carried out. The construction of the apparatus was such that the concentration could be changed by transferring part of the solution to a side tube and distilling the solvent back to the remaining solution. Conductivities were measured between 10 ~4 and 5 X 10 ~6 M salt concentration, and at each concentration the temperature was varied from 25 to —70° at about 10° intervals. The conductance data were obtained with a Leeds and Northrup A-C conductance bridge operating at 1000 Hz, with a General Radio Corp. tuned amplifier and null detector being used as a balance instrument.
The salt concentrations were measured spectroscopically at room temperature, using the absorption peak in the 360-372-mg region (for the K+ and Cs+ salt the respective maxima are 362 and 364 mg, while for the Li + and Na+ salt the 372-mg peak of the solvent- separated ion pair was used). No appreciable decomposition of the carbanion was observed during a series of temperature-conductance measurements even at the lowest fluorenyl salt concentration. For all salts, a molar extinction coefficient e 12,000 was used (determined as described in ref 1 and accurate to within 5%). A small correction must be made in the case of F~, Na+ since at room temperature a small fraction of contact ion pairs is present as indicated by a shoulder in the spectrum at 356 mg.
ResultsFor each concentration, a plot of resistance vs.
temperature was made, and the interpolated resistance values at —70, —60, —50, etc. up to 25° were determined from this plot in order to obtain the conductance data of the salt as a function of its concentration at one particular temperature. The set of data was fed into an IBM 1620 computer to calculate the variables of the Fuoss conductance equation. This, of course, requires a knowledge of the changes of density, viscosity, and dielectric constant with temperature. The relationships describing the temperature dependence of these physical properties of both THF and DME have previously been reported on4'7 and were used in these calculations (see also Tables I and II).
Typical plots of equivalent conductance vs. temperature for fluorenylpotassium in DME are shown in Figure 1. The appearance of a maximum in such a curve is due to the compensating effect of two factors, viz., the decrease of the ionic mobility at lower temperature due to the enhanced viscosity of the medium and the exothermicity of the dissociation process which
( 9 ) J . J . E i s c h a n d W . C. K a s k a , J . O rg . C h em ., 2 7 , 3 7 4 5 ( 1 9 6 2 ) ;E . G . J a n z e n a n d J . L . G e r l o c k , J . O rg. M e ta l. C h em ., 8 , 3 5 4 ( 1 9 6 7 ) .
V o lu m e 73, N u m b er 8 A u g u s t 1969

2714 T. Ellingsen and J. Smid
Figure 1. Temperature dependence of the equivalent conductance A for fluorenylpotassium in DME at different salt concentrations.
decreases considerably at lower temperatures.4 We will return to this point in the Discussion part.
Application of the Fuoss conductance equation,10 F/A = 1/A0 + fCA/FKdAo2, requires a reasonable estimate of the respective A0 values. Unfortunately, extrapolation of plots of A vs. \/c are somewhat uncertain due to the rather low degrees of dissociation. The A0+ values of Na+ and Cs+ in DME have been determined with reasonable accuracy from measurements on alkali tetraphenylborides and were found to be 55.7 and53.7, respectively.7 In THF, the mobilities of Li+ and Na+ were found to be the same,8 and it is reasonable to assume that this is also the case in DME, since in both solvents the Li+ and Na+ ions will be fully solvated. Since in DME the A0+ for Cs+ is only slightly less than that of Na+, it is again a reasonable assumption that the A0+ for K+ falls in between that of Na+ and Cs+. In other words, all the free alkali cations are believed to be solvated in DME, and the radius of the solvated ions is nearly independent of the size of the bare alkali ion. In our calculations we have therefore taken an average value of A0+ = 55 cm2/ohm equiv for all four alkali ions, thereby indicating that the small experimental differences in the respective A0+ values are actually within experimental error.
The Ao_ for the fluorenyl anion in THF was previously estimated to be 50.4 Although application of the Walden rule would also give a A0~ value of 50 in DME (the viscosities of DME and THF are nearly the same at 25°), various conductance data for radical anion salts8 and also for the BPh4_ ion in THF and DME7 indicate that A0~ values in DME are higher on the average by about 10% compared to those in THF. We have, therefore, chosen a A0~ value of 55 for the fluorenyl anion in DME. Hence, the total A0 will be 110 cm2/ohm equiv for all fluorenyl alkali salts in DME. In THF, the A0+ for K+ ion was found to be 50,6 and the total A0 for F~,K+ in this solvent at 25° is therefore equal to 100, similar to that of F~,Na+ and F~,Li+.
Walden’s rule was applied to obtain the A0 values for the salts at lower temperatures. The viscosities over the investigated temperature range are known.7 Direct measurements of A0 values on sodium salts of aromatic radical anions in THF by Nichols, et al.,s show that the Walden product is nearly temperature independent, whereas for alkali tetraphenyl borides in THF and DME7 a small increase of not more than 10% is observed over a temperature range of 25 to —70°. Since this is within the accuracy of our A0 values, we
Figure 2. Fuoss conductivity plots for fluorenylpotassium in DME at different temperatures.
( 1 0 ) F . A c c a s c i n a a n d R . M . F u o s s , “ E l e c t r o l y t i c C o n d u c t a n c e , ” J o h n W i l e y a n d S o n s , I n c . , N e w Y o r k , N . Y . , 1 9 5 9 .
The Journal of Physical Chemistry

Contact and Solvent-Separated Ion Pairs of Carbanions 2715
have simply assumed the Walden product to be constant in both THF and DME for all fluorenyl alkali salts.
Using the A0 values thus calculated, the Fuoss plots for the various salts can now be computed. In all cases, good straight lines are obtained, as shown for fluorenylpotassium in DME (Figure 2). For the lithium, sodium, and potassium salts, the A0’s determined from the intercepts of these plots are within 10% of the calculated A0 values. For the cesium salt, and for F~,K+ in THF, the Fuoss plots are too steep for a reasonable extrapolation. In these cases the calculated 1/A0 values were used as intercepts of the Fuoss lines.
Recently determined A0~ values for aromatic hydrocarbon radical anions in DME show that the A0_ for the anthracene radical anion is 71 in DME at 25°.8 It was suggested therefore that the A0~ for the fluorenyl anion should also have a A0~ value of about 70, since the two molecules are similar in size and shape. However, we have carried our conductance measurements for F~,Na+ in DM E with three different preparations, and in each case the A0 for this salt in DME as determined from the Fuoss plot intercept at 25° was found to be not more than 110, rather slightly less. A value of 70 for Ao- would make A0 at least 125 for all the alkali
Table I : Dissociation Constants of Fluorenyl Salts in Tetrahydrofuran between 25 and — 70°°
T em p ,"C Ao
A d X 10?, M Ao
A d X 107, M
F-,Li+ F-,Na+25 100 30 100 6.220 95 34 95 7.510 83 34 83 130 74 51 74 21
-10 65 61 65 37-20 56 75 56 66-30 48 90 48 115-40 40 106 40 206-50 34 129 34 300-60 27.0 150 27 405-70 21.5 155 21.5 480
F-,K+ F--,Cs+25 100 1.6 120 0.1420 95 1.9 113 0.1510 83 2.6 100 0.180 74 3.4 8 8 0.21
-10 65 4.7 78 0.25-20 56 6.4 67 0.28-30 48 8 . 8 58 0.32-40 90 12.7 49 0.37-50 34 15.5 41 0.41-60 27.0 23.0 33 0.49-70 21.5 33.0 26 0.55
“ The relationships describing the “emperature dependence of the viscosity ij and the dielectric constant c of tetrahydrofuran are the following (see ref 4 and 7): log r; = —3.655 + 393/T ; * = -1.49 + 2660/T.
salts, which would leave us with too low an intercept in all Fuoss plots. It should be remembered that, although size and shape may be similar for the two anions, the charge is more localized in the fluorenyl carbanion than in the anthracene radical anion, and therefore ion-solvent dipole interactions which affect the solvation of the two anions and consequently their mobility may be quite different.
The dissociation constants for the various salts were computed from the slopes of the Fuoss plots, using the calculated A0 values. The results are shown in Tables I and II, where we have also listed the A0 values which were used in computing the K d values. Included in Table I are the data for the lithium, sodium, and cesium salts in THF which were previously determined.4 The lithium salt values in THF were recalculated, taking slightly higher Ac values than those used in ref 4.
Table II : Dissociation Constants of Fluorenyl Salts in 1,2-Dimethoxyethane between 25 and — 70°°
T em p ,°C Ao
A d X 10«, M
T em p ,°C Ao
A d X 10«, M
F-,Lib F-,Na +25 ilo 25 110 5.515 99 6.2 20 105 6.45 88 7.4 10 93 8.4
-5 77 9.4 0 82 10.5-15 66 11.5 -10 71 13.4-25 56 13.6 -20 61 16.5-35 46.5 16 -30 51 19.7-45 37.5 18 -40 42 24-55 29.5 21 -50 33 30-65 23.5 21.4 -60 26 34
-70 21 37F-,K + F-,Cs +
25 11020 105 2.9 25 11010 93 4.1 15 98 0.250 82 5.8 5 86 0.35
-10 71 9.2 -5 76 0.49-20 61 12.6 -15 67 0.66-30 51 17.5 -25 57 0.91-40 42 22.4 -35 47 1.30-50 33 27.4 -45 39 1.75-60 26 32.6 -55 31 2.30-70 21 31.4 -65 24 3.0
° The relationships describing the temperature dependence of the viscosity rj and the dielectric constant « for 1,2-dimethoxy- ethane are the following (see ref 7): log ij = —3.773 + 425/T ; i = -2.83 + 2950/77.
The plots of log K d vs. 1/T are shown in Figures 3 and 4. For the sake of comparison we have included in Figure 3 the previously determined lithium, sodium, and cesium salts in THF. A look at the two sets of plots immediately shows that in spite of the similar dielectric constants (e for DME at 25° is even slightly less than that for THF), the conductance behavior for
V o lu m e 73, N u m b er 8 A u g u s t 1969

2716 T. Ellingsen and J. Smid
Figure 3. Temperature dependence of the dissociation constants of fluorenyl alkali salts in THF.
Figure 4. Temperature dependence of the dissociation constants of fluorenyl alkali salts in DME.
Figure 5. Optical absorption spectrum of fluorenyl potassium in DME.
fluorenyl alkali salts in DME at various temperatures, the optical absorption spectra of the salts were recorded between 25 and —70° at concentrations of 10~2 M. An example of such a spectrum is shown in Figure 5 for F - ,- K + in DME. It can be concluded from these spectra that F _,Li+is a solvent-separated ion pair over the entire temperature range (Xmax 372 m/t). The sodium salt still contains a small fraction of contact ion pairs at 25° (about 10%), but below 0° it is essentially solvent separated. The potassium salt is a contact ion pair at room temperature (Xmax 362 mp), but solvent separated at —70°, with the ratio of the two ion pairs changing at intermediate temperatures (see Figure 5). The cesium salt is essentially a contact ion pair (Xmax 364 mju) over the whole temperature range, with evidence of a small fraction of solvent-separated ion pairs at —70° (a shoulder at X 372 mp is clearly visible).
The thermodynamic data for the dissociation of the fluorenyl alkali salts in THF and DME at 25° are summarized in Table III. Affd° was obtained from the tangent of the log K d-1/T plot at 25°, and ASd° calculated from the relationship ASd° = AH°/T + R In K d.
Discussion
the sodium, potassium, and cesium salt is very different in the two solvents.
To establish the type of ion pair present in solutions of
Previously reported results4 on the conductance of fluorenyllithium, sodium, and cesium in THF showed that only the behavior of the cesium salt could be reasonably well described by the “ sphere in continum”
The Journal of Physteal Chemistry

Contact and Solvent-Separated Ion Pairs of Carbanions 2717
Table in : Enthalpies and Entropies of Dissociation of Fluorenyl Alkali Salts in THF and DME at 25°
--------------------T H F ------------------- - ,------------------- D M E —
CationA ffd° ,
kcal/molA Sd°,
euA H d°,
kcal/molA Sd°,
eu
Li+ - 3 . 5 - 3 7 - 2 . 9 - 3 3Na+ - 8 . 3 - 5 6 - 3 . 9 - 3 7K + - 4 . 7 - 4 7 - 5 . 9 - 4 5Cs+ - 2 . 9 - 4 6 - 4 . 6 - 4 5
model for which Fuoss10 calculated the dissociation constant K d to be
K d = (3000/4TriVa3) e x p (-e 2/aDkT) (1)
The experimentally determined dissociation constant at 25° yielded a center to center distance, a, for the F - ,- Cs+ ion pair of 3.8 A, which appeared to be a reasonable value. In addition, the heats and entropies of dissociation over the entire temperature range were in agreement with those calculated from the Denison-Ramsey equation.11
AHd° = (Ne2/aD)(l + d In D/d In T) (2)
TASd° = (Ne2/aD)d In D/d In T (3)
With a = 3.8 A, the calculated AHd° and ASd° values at room temperature for F~,Cs+ were found to be —2.4 kcal/mol and —45 eu, respectively, the experimental AHd° value being —2.7 kcal/mol. These observations led to the conclusion that the fluorenyl- cesium ion pair is a contact ion pair in THF, as is also indicated by its 364-myu absorption maximum, and that the free Cs+ ion is not, or only very little, specifically solvated by THF molecules. The higher A0+ value for Cs+ in THF, compared to the other alkali ions, is in agreement with this. A similar conclusion was arrived at from studies of the conductance of cesium tetra- phenylboron in THF.7
A comparison of Tables I and II shows that the cesium salt is substantially mere dissociated in DME than in THF, although the dielectric constants differ very little. In fact, the e at 20° is lower for DM E than for THF, yet the K d is higher by a factor of 15. ^If eq1 were applied, it would lead to an a value of 4.7 A, but this in turn would yield a AHdc = —2.7 kcal/mol (the value of 1 + d In D/d In T for DME is —1.28; see ref7) while the observed AHd° = —4.6 kcal/mol (see Table III), which is close to the observed AHd° = —4.0 kcal/mol for polystyrylcesium in D M E.12 This inconsistency clearly results from a specific solvation effect which is not taken into account in the derivation of the above equations. The free Cs+ ion is specifically solvated by DME molecules as indicated by the fact that its Ac+ value in DME equals the A0+ values of the other alkali ions. This extra solvation energy leads to a higher —AHd° value, and
also to higher K d values, a conclusion which was also arrived at from the conductance behavior of cesium tetraphenylboride in DME.7 Apparently, the F~,- Cs+ ion pair remains a contact ion pair in DME, since the absorption maximum remains at 364 m/i over the entire temperature range, although at the lower temperatures a shoulder in the spectrum is clearly noticeable at 372 mu, indicating that a small fraction (about 0.05-0.1) of solvent separated ion pairs may exist at -6 0 ° .
Decreasing the size of the alkali ion will lead to stronger specific interactions with the ethereal solvent molecules. This is clearly noticeable when the behavior of F~,K+ is compared with that of F~,Cs+. A comparison of Tables I and II and of Figures 3 and 4 shows that the behavior of F _,K + in THF is very similar to that of F~,Cs+ in DME. The dissociation constants of the two salts over the entire temperature range do not differ from one another by more than 30% at each temperature, hence their log K d-1/T plots are very similar. At 20°, the AHd° for F _,K+ is —4.7 kcal/ mol and for F~,Cs+ in DM E —4.6 kcal/mol. The respective entropies of dissociation are —47 and —45 eu. This behavior indicates that F _ ,K+ is a contact ion pair and that it remains this way over the entire temperature range. The 362 mu absorption band for F _ ,K+ in THF confirms this statement. A small fraction of solvent-separated ion pairs appears to be present at very low temperatures as indicated by the appearance of a shoulder in the main band at 372 m/x. Like the Cs+ ion in DME, the free K + ion is apparently specifically solvated in THF. This is supported by the observation that its A0+ value in this solvent is similar to that of the Na+ and Li+ ion. This specific solvation is the prime reason that F _,K+ is considerably more dissociated in THF than F _,Cs+.
In DME the potassium salt is substantially more dissociated than in THF. The dissociation constants at 20° differ by a factor of almost 20, and the AHd° value at this temperature is —5.9 kcal/mol and only — 4.7 kcal/mol in THF. Apparently the ion pair is now also being solvated since the spectrum of F “ ,K+ in DME (Figure 5) clearly shows a change in ion-pair solvation from predominantly contact ion pairs at room temperature to solvent-separated ion pairs at lower temperatures. Using similar calculations as carried out for F~,Na+ in THF,* 1 one can make a log K —l/T plot for F -,K + in THF, where K , = [F-||K+]/[F-,K+]. This plot is depicted in Figure 6 and the enthalpy of solvent-separated ion pair formation from the contact ion pair as calculated from the slope was found to be AHi = —4.6 kcal/mol, considerably less than the —7.6 kcal/mol found for F~,Na+ in THF. At 20° the ratio
( 1 1 ) J . T . D e n i s o n a n d J . B . R a m s e y , J . A m e r . C h em . S o c ., 7 7 , 2 6 1 5 ( 1 9 5 5 ) .
( 1 2 ) T . S h i m o m u r a , J . S m i d , a n d M . S z w a r c , ib id ., 8 9 , 5 7 4 3 ( 1 9 6 7 ) .
V o lu m e 73, N u m b er 8 A u g u s t 1969

2718 T. Ellingsen and J. Smid
Figure 6. Temperature dependence of the contact ion pair solvent separated ion pair equilibrium for fluorenylpotassium in DME.
F-||K+/F-,K+ is still close to 0.30. Since AHd° = AHs° + A H i / (1 + K i ) , 4 one finds A H , , 0 (the heat of dissociation for the solvent separated ion pair) at 20° equal to —5.9 + 4.6/1.3 = —2.4 kcal/mol, and A H 0°
for the contact ion pair = —7 kcal/mol at 20°. The overall behavior of F _,K + in DME is similar to that of F - ,Na+ in THF. Here again one can describe the log K a . vs. l/T plot by using the relationship A H d ° = AH a° + A H i / ( l + K i ) , since K - , can be determined spectrophotometrically and A Hi = —4.6 kcal/mol and essentially a constant over the entire temperature range. AHb° changes with temperature according to the Denison-Ramsey equation, being —2.4 kcal/mol at 20° and approximately —1.5 kcal/mol at —60°.
The sodium salt at room temperature still contains about 10 to 15% contact ion pairs, but its fraction decreases rapidly at lower temperatures. The lithium salt is solvent separated over the entire temperature range. Its behavior is well described by the Fuoss equation, which leads to an a value of 6.3 A for the solvent-separated ion pair, the same value as found for F _,Li+ in THF at low temperature where it also exists only as a solvent-separated ion pair. At 15° the 6.3 A distance leads to AHd° and A$d° values of —2.4 keal/ mol and — 30 eu, respectively, which is reasonably close to the experimental values (see Table III). Whether the 6.3 A distance represents a true picture of the distance between the Li+ ion and the carbanion is difficult to say. It was pointed out before4 that it represents very closely the interionic distance of a solvent-separated ion pair in which a THF molecule is situated between an Li+ and the carbanion. One would expect a slightly smaller distance with a DME molecule, but the
conductance data do not bear this out. One should, therefore, not give too much significance to the 6.3 A value, since particularly with F _,Li+ a specific interaction between Li+ and the fluorenyl ring may lead to a somewhat smaller distance between the Li+ and the carbanion. Under conditions where the ion pairs exist only as solvent-separated ion pairs, the Kd values of the Li salts are always lower than those of the Na salts at comparable temperatures in both THF and DME. This was also observed for the alkali tetraphenylborides and for the lithium and sodium salts of radical anions6'7 and was interpreted as a possible indication of a slight difference in the respective sizes of the solvated Li+ and Na+ ions (but apparently not enough to be detectable as a difference in their respective A0+ values). It also may be indicative of slight differences in the structures of the solvated ion pairs, as specific interactions between the cation and the aromatic rings may affect the arrangement of the solvent molecules in the solvation shell around the alkali ion.
The behavior of F~,Na+ and F _,Li+ in THF has already been described.4 The conductance data are in agreement with spectral observations, i.e., that F - ,- Na+ changes from a contact ion pair at 25° to a solvent- separated ion pair at —60° (AHi = —7.6 kcal/mol, AHC° = —9.6 kcal/mol). The lithium salt still contains about 25% contact ion pairs at room temperature, but rapidly changes to a complete solvent-separated ion pair at lower temperature.
In some cases, particularly when one is dealing with rather unstable species like carbanions, it is possible to obtain reasonably accurate thermodynamic data from a measurement of the temperature dependence of the conductance at one concentration only. Plots of A vs. T were shown in Figure 1, and in many instances the curves go through maxima which shift to lower temperatures at decreasing salt concentration. Let us assume that the Walden product P = A0r? is independent of temperature (the change over a 100° temperature range for various salts in THF and DME was found to be less than 10%). Neglecting interionic interaction forces, and using concentrations instead of activities, one can substitute the Arrhenius relationship, a = A/A0, into the Walden product, i.e.
A = Pv- 4a = P r ,- '[ -K + (A 2 + 4KC)'/2]/2C
where K is the dissociation constant of the salt and C is the salt concentration. Differentiating In A with respect to l/T, one obtains the relationship
R d In A /d (l/T) = - E via - AHd(l - 1 /A)
where Evie is the activation energy of viscous flow and A = 2 - K[ ( l + AC/K)'h - l ] /2 C. Plots of log vvs. l/T show straight lines for both THF and DM E, and the respective Evis values are 2.0 and 1.8 kcal/mol. The above expression can be simplified if the experimen-
T h e J o u r n a l o f P h y s ic a l C h em istry

Contact and Solvent-Separated Ion Pairs of Carbanions 2719
tal conditions are chosen such that C » K (see in this respect also ref 5 and 13). This leads to A = 2 and
R d In A /d (l/T) = - E vis - y ,A Hd
For conditions where K C, i.e., complete dissociation, one obtains A = 1 and R d In A /d (l/7 7) = —Evis, indicating, of course, that the temperature dependence of the conductance simply follows the change of ionic mobility with viscosity.
The maxima in the A vs. l/T plots change to higher temperatures at lower salt concentration. Since the value of A in the expression for R d In A /d (l/T ) changes from 2 to 1 as the concentration C decreases, the maximum in the A vs. l/T plot should come at increasingly higher — AHd values. The —AHd values increase at higher temperatures, and consequently Tmax will increase at lower salt concentrations (see Figure 1).
Reasonably good AHd° values can be obtained from a In A vs. l/T plot under conditions where C K, e.g., C « 1 0 M. For example, the AHd° at 20° for fluorenylsodium in THF as determined from the log K d vs. l/T plot is —8.3 kcal/mol (see Table III and ref 4). From the tangent of the In A vs. l/T plot at C = IO-4 M one obtains a value of AHd = —8.1 kcal/mol. The 7'mox for this salt at C = IO-4 M is —47°. At this temperature AHd — — 2£’vis = —4 kcal/mol. From the log A d vs. l/T plot one finds that a AHd = — 4 kcal/mol is obtained at —48 ± 4°. Similar calculations for F~,K+ in DME give a value of —5.5 kcal/mol for AHd° at 20° as compared to —5.9 kcal/mol determined from the log Kd~l/T plot (see Table III). In THF the
respective values are —5.1 and —4.7 kcal/mol. On-' can also calculate the AHd° values at other temperatures, but since K d rapidly increases at lower temperatures, the condition CH> K may not hold anymore.
Although it is realized that the above treatment utilizes some simplifying approximations, the calculations afford a set of reasonable AHd° values, since in our work the salt concentrations are not higher than a few times 10~4 M and the K d’s are usually low. As stated before, this method is helpful in cases where the ionic species are rather unstable. This is true for many carbanion and radical ion salts in ethereal solvents, where the ions can disappear through side reactions with the solvent, particularly at low salt concentration where a high free ion concentration may speed up these reactions. Conductance measurements at these low concentrations are therefore often difficult, but a simple temperature-conductance curve at a higher concentration can nevertheless yield valuable information regarding the heat of dissociation.
Acknowledgment. The support of this research through a grant from the Petroleum Research Fund administered by the American Chemical Society and a grant from the Research Foundation of the State University of New York is gratefully acknowledged. We also wish to thank D. Klossner for assisting in the conductance measurements, and the Royal Norwegian Council for Industrial and Scientific Research for a research fellowship to T. Ellingsen.
(13) P. Biloen, Thesis, University of Amsterdam, 1968.
V o lu m e 73, N u m b er 8 A u g u s t 1969

2720 J. P. Hobson
Physical Adsorption Isotherms Extending from
Ultrahigh Vacuum to Vapor Pressure
by J. P. HobsonRadio and Electrical En gin ee rin g D iv is io n , N a tio na l Research Council, Ottawa, Canada (.Received Ja n u a r y 20, 1969)
Physical adsorption isotherms of argon, krypton, and xenon on an adsorbent of porous silver at T = 77.4°K have been measured, using a combination of conventional and ultrahigh vacuum techniques. The measurements covered the relative pressure range 10~13 < p/p0 < 1. At low pressures the data could be represented by the Dubinin-Radushkevich equation, while at higher pressures the data could be represented by the BET equation. The adsorbent area as measured by the Dubinin-Radushkevich method was less than that measured by the BET method. An analytic expression for the isotherms is proposed which represents all the measured data well, and in addition predicts the onset of Henry’s law at pressures below those measured. This analytic expression contains four constants, for which a physical interpretation is proposed.
I. IntroductionThe use of ultrahigh vacuum techniques for the
measurement of physical adsorption isotherms over the relative pressure range 10-13 < p/po < 10-3 has become commonplace during recent years.1-16 For the relative pressure range 10 ~3 < p /p0 ^ l a great body of isotherm data exists.16-18 However, data spanning both these pressure ranges simultaneously in a single experiment are fragmentary and are the central subject of the present paper. If such data extend from the Henry’s law range to the vapor pressure, then a complete record is available of adsorption as it proceeds through various stages from no adsorbate-adsorbate interaction to complete adsorbate-adsorbate interaction in the bulk condensate. A more specific need for such data exists to permit a comparison of analytic methods developed separately in each pressure range.19 In particular, the Dubinin-Radushkevich (DR) isotherm equation20 has been found to correlate low-pressure data well and yields a measure of adsorbent area, which we will call the DR area. The DR area is of importance in ultra- high vacuum technology since it is a major parameter in the use of the adsorbent as a cryosorption pump.21 At higher pressures the BET equation22 has been widely used to yield the BET area of an adsorbent. Kaganer23 finds that the DR and BET areas are the same within 3% for the adsorption of nitrogen, argon, and krypton on a series of particulate solids. However, Hobson and Armstrong2 (argon on Pyrex glass), Ricca and Medana3 (methane on Pyrex glass), and Ricca, et al.10 (argon, krypton, and xenon on Pyrex glass), measure DR areas as much as an order of magnitude less than the geometric area of their adsorbent and hence presumably at least this factor smaller than the BET area, although the latter was not measured. Cazard, et al.,2i found agreement between the DR and BET area for nitrogen on graphite (0.002 < p/p0 < 0.2) but found different areas for each method over the upper
and lower portions of this pressure range. Thus it was desirable to measure the DR and BET areas in a single experiment spanning both the ultrahigh vacuum and higher pressure ranges.
The experimental requirements for adsorption iso-
(1) N. Hansen, V a k u u m -Te c h ., 11, 70 (1962).(2) J. P. Hobson and R . A. Armstrong, J . P h ys . Chem ., 67, 2000 (1963).(3) F . Ricca and R. Medana, H ie. Sc i., 34, 617 (1964).(4) S. A. Stern, J. Y . Mullhaupt, R . A. Hemstreet, and F. S. DiPaolo, J . V ac. Sci. Technol., 2, 165 (1965).(5) B. G. Baker and P. G . Fox, Tra n s . F a ra d a y Soc., 61, 2001(1965) .(6) F . Ricca, A. Bellardo, and R. Medana, R ic . Sc i., 36, 460 (1966).(7) N. Endow and R. A. Pasternak, J . V ac. Sci. Technol., 3, 196(1966) .(8) R . Haul and B. A. Gottwald, Surface Sci., 4, 321 (1966).(9) R . Haul and B. A. Gottwald, ibid., 4, 334 (1966).(10) F. Ricca, R . Medana, and A. Bellardo, Z . P h ys . Chem. (Frankfurt am Main), 52, 276 (1967).(11) F . Ricca and A. Bellardo, ib id ., 52, 318 (1967).(12) A. Schram, Com pt. R end., C264, 248 (1967).(13) A. Schram, S u p p l. Nuovo C im ., 5 , 291 (1967).(14) L . B. Harris, J. B. Hudson, and S. Ross, J . P h y s . Chem ., 71, 377 (1967).(15) B. A. Gottwald and R. Haul, Surface S c i., 1 0, 76 (1968).(16) S. Brunauer, “The Adsorption of Gases and Vapors,” Princeton University Press, Princeton, N. J., 1945.(17) D. M. Young and A. D. Crowell, “Physical Adsorption of Gases,” Butterworth, and Co. Ltd ., London, 1962.(18) S. J. Gregg and K . S. W. Ling, "Adsorption, Surface Area and Porosity,” Academic Press, London, 1967.(19) J. P. Hobson, “The Solid-Gas Interface,” Marcel Dekker, New York, N. Y ., 1967, Chapter 14.(20) M. M. Dubinin and L . V. Radushkevich, P ro c . A ca d. Sci. U S S R , 55, 331 (1947).(21) P. A. Redhead, J. P. Hobson, and E . V. Kornelsen, “The Physical Basis of Ultrahigh Vacuum,” Chapman & Hall, London, 1968.(22) S. Brunauer, P. H. Emmett, and E. Teller, J . A m e r. Chem. Soc., 6 0 , 309 (1938).(23) M. G. Kaganer, D o k l. A k a d . N a u k S S S R , 138, 405 (1961).(24) J. Cazard, D. A. Degras, F . M. Lang, P. Magnier, and A. Schram, J . C h im . P h ys ., 6, 920 (1966).
T h e J o u rn a l o f P h y s ic a l C h em istry

Physical Adsorption Isotherms 2721
therm measurements in the ultrahigh vacuum and higher pressure ranges tend to be contradictory.19 At low pressures, where gas-phase cooling of the adsorbent vanishes, it is necessary to maintain the adsorbent in close thermal contact with the bath. The simplest arrangements have small adsorbent areas. However, the ratio of quantity adsorbed to quantity in the gas phase is so great that areas of a few square centimeters are sufficient, and normally the wall of the vacuum system has been used as adsorbent. At higher pressures the relative amount of adsorption is much less and larger adsorbent areas (at least a few thousand square centimeters in many cases) are required. However, the adsorbent can be a loose powder since thermal contact with the bath is provided by the gas. In some cases, e.g., the absorption of xenon on glass at 70°K,26 it is possible to use the wall of the vacuum system near p/pa = 1, but such measures are restricted to temperatures well below the normal boiling temperature of the adsorbate. To permit adsorption measurements on adsorbates at temperatures near their normal boiling temperatures, an adsorbate was sought which would be firmly bound to the walls of the vacuum system, would survive ultrahigh vacuum processing, and would increase the adsorption area of the wall by a factor of at least several hundred. These conditions were fulfilled by an adsorbent of porous silver.
Adsorption isotherms at T = 77.4°K are reported below for argon, krypton, and xenon on porous silver over the relative pressure range 10~13 < p/p0 < 1.
II. Apparatus and Experimental ProcedureThe preparation of the adsorbent was based on the
work of Cambron and McKim,26 who developed porous silver as a catalyst for the oxidation of ethylene. In the present application, an alloy of silver and calcium (8.5% Ca) was flame-sprayed27 onto the interior of a stainless steel cylindrical pot 10 cm in diameter and 10 cm high. The upper^cap of the pot was not in place during this operation. The calcium in the alloy was next oxidized in steam at 325°. Calcium oxide was removed with 20% acetic acid, leaving porous silver bonded to the stainless steel; 50 g of silver was used yielding a layer 1.25 mm thick. The cap of the stainless steel pot was welded in place, and the pot was attached to an ultrahigh vacuum system (volume 2710 cm3) made mainly of aluminosilicate glass (Corning 1720). This system contained a modulated suppressor gauge28 (used in the pressure range 5 X 10-11 < p < 2 X 10~3 Torr), and a high-pressure ionization gauge29 (used in the pressure range 10~4 < p < 1 Torr). Before admission of gas, the system was pumped to a background pressure of 5 X 10~n Torr using procedures standard in this laboratory.30 The baking schedule was 12 hr at 500°.
The experimental procedure in the relative pressure range 10-13 < p/pa < 10~3 paralleled that described earlier.2 The volumetric method was used. Thermal
transpiration corrections were made using Liang’s formula and pressure shifting constants31 in conjunction with the modified helium constants measured by Edmonds and Hobson.32 For measurements in the relative pressure range 10 ~3 < p/p0 < 1, the ultrahigh vacuum system was connected, without breaking vacuum, to a conventional vacuum system containing a capacitance manometer (10-2 < p < 1 Torr), a McLeod gauge trapped with Dry Ice and acetone (10~2 < p < 1 Torr), and a mercury U-tube manometer similarly trapped (0.5 < p < 350 Torr). Where necessary, corrections were made for pressure differences caused by mercury vapor flow into the trap, by the method described earlier.32 The precision of these mercury manometers was about ±0.5% . With the enlarged vacuum system the volumetric method was also used, the total volume of the system varying with the gauges being used but never exceeding 4888 cm3. At the highest pressures, the magnitude of adsorption was measured by comparing the pressure changes observed with the adsorbate under study with those observed with helium gas. Helium was assumed to yield no measurable adsorption at 77.4°K. This method was equivalent to the measurement of the helium dead space.17 All pressure gauges were calibrated against one another in their ranges of overlap. Absolute sensitivities could be assigned eventually to all gauges, although care was required in pressure regions where the ion gauges were nonlinear with pressure. In general, measurements were made proceeding from the lowest pressures to higher pressures, although many specific variations in this procedure occurred. It was found, after the whole isotherm had been measured, that a complete reprocessing of the system was required for the re-achievement of good ultrahigh vacuum background conditions (p = 5 X 10~11 Torr). During adsorption the adsorbent was immersed in an open dewar of liquid nitrogen. Intermittent checks on the temperature of the bath showed variations of ±0 .1°K from day to day. The absolute value of the bath temperature was of minor importance in the present work and was not measured with precision. It was taken nominally as 77.4°K.
III. Experimental ResultsTests for thermodynamic equilibrium were first per-
(25) P. Chènebault and A. Schürenkampfer, J . P h ys. Chem ., 69, 2300 (1965).(26) A. Cambron and F. L. W . M cK im , U. S. Patent 2,562,858 (1951); Canadian Patent 475366 (1951).(27) G. L. Osberg, A. Tweddle, and W . C. Brennan, Can. J . Chem. E ng., 41, 260 (1963).(28) P. A. Redhead and J. P. Hobson, Brit. J . A p p l. P h ys., 16, 1555 (1965).(29) G. J. Schultz and A. V . Phelps, Rev. Sci. Instr., 28, 1051 (1957).(30) P. A. Redhead, E. V. Kornelsen, and J. P. Hobson, Can. J . P h ys., 40, 1814 (1962).(31) S. C. Liang, J . P hys. Chem., 57, 910 (1953).(32) T . Edmonds and J. P. Hobson, J. Vac. Sci. Technol., 2, 182 (1965).
V o lu m e 73, N u m b er 8 A u g u s t 1969

2722 J. P. H o b s o n
formed on each adsorbate. Argon pressures reached thermodynamic equilibrium quickly after the adsorbent was cooled, in agreement with earlier results for argon on Pyrex glass,2 but both krypton and xenon pressures showed some time dependence after cooling, which appeared to be complete after about 1 hr. The time required for thermodynamic equilibrium became less as the pressure rose. The argon result is taken as evidence that the adsorbent reached bath temperature quickly. This conclusion is supported by the calculated magnitude of the thermal cooling time for the porous silver layer r = d2cp/k = 0.1 sec. Here d = thickness = 0.125 cm, c = specific heat = 0.046 cal g -1, p = density = 10.5 g cm“ 3, k = thermal conductivity = 0.084 cal g-1 cm-1 °K _1. The latter figure is that of Osberg, et a l21
For argon, experimental cold times were always greater than 15 min, while for krypton and xenon, cold times were greater than 60 min at low pressures and were never reduced below 20 min at higher pressures. For both Kr and Xe, very large pressure drops upon cooling were measured (about seven orders of magnitude at the lowest pressures). Pressure drops of this magnitude impose severe requirements on the purity of the adsorbate. For example, 1 ppm of helium impurity in these gases, with no further precautions, could cause most of the pressure reading with adsorbent cold to be helium pressure and, since a mass spectrometer was not used, some uncertainty remains on this point. However, a small ion pump in the system was turned on while the adsorbent was cold. This should have removed all helium in less than 5 min while not substantially changing the total quantity of adsorbate in the system, since the overwhelming majority of the adsorbate was in the adsorbed state. Further, a second cooling gave the same time dependence for Kr and Ar pressures indicating that these data did actually represent the true time behavior of adsorbate pressure. One statement can be made with certainty: the trueadsorbate cold pressure must be less than or equal to that measured. As will be seen later, the conclusions of this paper will be emphasized rather than weakened if the true pressure were actually lower than measured.
The main isotherm results are shown in Figure 1. They span thirteen orders of magnitude in pressure and nearly seven orders of magnitude in surface coverage. Measurements were carried to approximately 100 mono- layers of coverage and thus include a direct measurement of the vapor pressure p0. The measured values of Po are listed in Table II and are in good agreement with published values of p0 for argon,33 krypton,33 and xenon,34 respectively, at 77.4°K. As noted in section II, it was necessary to reprocess the system entirely after the measurement on each adsorbate. This subjected the adsorbent to an additional bake at 500° for 12 hr under vacuum on each occasion. It appeared possible that some sintering might take place. To
o„ m Xe Kr A
IO22 ------- ------- --------------- ------- ------- r i — i— — — — n r-IO22 ITo,~2I £
&aD ÈO8
. 20< □a2 L
S
P D□ 3 • ° □°d < °
< T?®3=o°°
o> •
in 18< ( a ° p»"" A H A
A L< o>
o0
-IO'7A
A AO
CP°
A o
IO'5 Oid11 ioHO icr9 icr8 io-7 icr6 icr5 1er4 icr3 lcr2 icr1 i io I02
PRESSURE ABOVE ADSORBED LAYER (TORR)
Figure 1. Adsorption isotherms of argon, krypton, and xenon on porous silver adsorbent at T = 77.4°K. Solid points were taken in a check run after the main measurements to establish whether the adsorbate had sintered since the first measurements.
L_-12 -II -10 -9 -8 -7 -6 -5 -4 -3 -2 -I 0
l°9 io p/po
Figure 2. Adsorption isotherms of argon, krypton, and xenon on porous silver adsorbent at T = 77.4°K plotted as a function of the logarithm of relative pressure.
check this possibility, the solid points of Figure 1 were measured in a separate run at the end of the three main measurements. In this run the adsorbates were changed without any additional processing. The essential agreement between the solid and open points indicates that sintering after the first bake at 500° is small and that the results may be taken as representative of a reproducible absorbent. The data of Figure 1 are next analyzed in various ways.
IV. Analysis of Experimental ResultsA. General Features of Results. The results of
Figure 1 are reexamined in Figure 2 by drawing a smooth line through the data of Figure 1 and converting the abscissa into the relative pressure scale log p/p0
(33) R . E. H onig and H. O. H ook, R C A Review, 21, 360 (1960).(34) H . H . Podgurski and F. N. Davis, J . P hys. Chem ., 54, 1343 (1961).
The Journal of Physical Chemistry

Physical A dsorption Isotherms 2723
COcroCO
ez = [RT In p /po ]2
Figure 3. Adsorption isotherms on porous silver adsorbent plotted as a function of e2; T — 77.4°K; constants are obtained from the straight line: (a) argon;(b) krypton; (c) xenon.
using the measured values of po- Figure 2 shows that the isotherms do not differ greatly in form at low pressure, being gently concave to the pressure axis. Hen
ry’s law (a straight line at 45°) is not found in any of the data. These results are in substantial agreement with those reported earlier by ourselves and others.1-15 The isotherms in Figure 2 come close together with some crossing in the vicinity of p/p0 ~ 0.01 and develop their most characteristic differences at higher relative pressures. The sharpness of the transition to the bulk phase increases decisively from argon through krypton to xenon. The xenon data actually show some evidence of supersaturation (see section I VC below).
B. Test of Dubinin-Radushkevich (DR) Isotherm. Figures 3a, b, and c show the data for argon, krypton, and xenon, respectively, plotted in a form suitable for testing the DR isotherm equation. This equation is
where
In A = In A m — Be1
—RT In p/pa
(1)
(2)A is the number of atoms adsorbed, A m is the number of atoms adsorbed in the D R monolayer, and B is a constant. The product of A m and the atomic area of the adsorbate yields the “ DR area” of the adsorbent. The straight line portions at the left of Figures 3a, b, and c represent conformity with the DR equation. The constants of these straight lines are given on the figures. The quantity R ~ 1/! has the dimensions of energy. The interpretation to be placed upon it depends on the model being considered. If the surface is heterogeneous and an approximation to a Langmuir isotherm is chosen as the local isotherm on each homo- tattic patch,36 then the most probable energy of adsorption, in excess of the bulk energy of sublimation (or vaporization) is
B~'hE* - V 5 (3)
For argon, krypton, and xenon at 77.4° K, E\ has the values 933, 996, 894 cal mol-1, respectively, collected in Table I I .
C. Examination of Data in the Range 0.01 < p/p0 < 1. The data are plotted in Figure 4 with a linear abscissa. At small values of p/p0 all isotherms appear conventional and are of type I I . 16 The flatness of the isotherms for 0.1 < p/po < 1 increases from argon through krypton to xenon, the latter showing evidence of supersaturation (p/po > 1)- The latter result was not anticipated. We have repeated the xenon measurements in the region p/po ~ 1 on several occasions, using minor variations in experimental technique. Most, but not all measurements showed supersaturation, but we have not identified the decisive factors involved. The result should therefore be regarded as tentative. There is no doubt, however, that the
(35) J. P. Hobson, Can. J . P h ys., 43, 1934, 1941 (1965).
V o lu m e 73, N u m b er 8 A u g u s t 1969

2724 J. P. H obson
Table I : Area of Porous Silver Adsorbent Obtained by Various Methods
A d sorbate
ArgonKryptonXenon
from D R , m olecules
1,7 X 10192.5 X 10193.2 X 1019
JVmfrom B E T , m olecules
7.4 X 10195.0 X 10194.4 X 1019
from P oin t B , m olecules
6.6 X 10195.8 X 10195.2 X 1019
Surface area from D R ,
cm 2
2.4 X 1044.0 X 1046.0 X 104
Surface area from B E T ,
cm 2
1.1 X 10®8.1 X 1048.3 X 104
Surface area from P oin t B,
cm 2
9.5 X 1049.4 X 1049.8 X 104
Table II: Constants for Plotting Analytic Form of Isotherms (Eq 5)
A dsorbate
PO,measuredT orr
N m,atom s
Ei,cal
m o l“ 1
Ei,cal
m o l“ 1
E 3,cal
m o l-1
Argon 205 1.7 X 10¹⁹ 933 0 882Krypton 1.86 2.5 X 10¹⁹ 996 872 -48Xenon 0.00184 3.2 X 10¹⁹ 894 108 -53
Figure 4. Adsorption isotherms of argon, krypton, and xenon on porous silver adsorbent, plotted as a function of p/po.
transition to the bulk phase for xenon is very sharp, as found also by Chenebault and Schiirenkampfer26 for the adsorption of xenon on glass at 77°K.
D. Comparison of Surface Areas Obtained by DR, BET, and Point B Methods. Point B coverages18 may be obtained directly from Figure 4 as shown. Similarly, BET plots may be made which are straight lines over the conventional BET range 0.03 < p/p0 < 0.3, and BET monolayer coverages may be obtained.
The “ monolayer” coverages obtained from the DR, the BET, and the Point B methods are collected in Table I. The results have also been converted into surface areas using the following atomic areas: argon14.4, krypton 16.2, and xenon 18.8 A2. While minor differences occur between the BET and the Point B areas, the most striking feature of the results of Table I is the discrepancy between the D R and BET areas. This discrepancy is least for xenon, being about 38%,
increasing to a factor 2.0 for krypton, and a factor 4.6 for argon, the DR area always being less than the BET area.
Thus one of the main conclusions of this study is
area measured by DR ^ area measured by BET (4)
This result is consistent with all the results cited in section IYA. The ordering of the DR areas with respect to adsorbate is the same as found by Ricca and Bellardo11 for the adsorption of krypton and xenon on films of tungsten and molybdenum, but opposite to the ordering found by Ricca, et al.,10 for the adsorption of argon, krypton, and xenon on glass.
E. Analytic Form of Isotherms. An analytic expression for the whole isotherm from Henry’s law to the vapor pressure has been constructed. This expression combines forms which have been successful in the past in representing experimental data over their respective ranges of pressure. The form is first presented and a comparison made with the data of Figure 1, and then a brief interpretation is suggested for the whole isotherm.
The analytic expression for the isotherm is
V . X , { ! + [ * * <a ;+ 4E“ >'/ '] } X
e x p (-e 2/2F i2) for e < (5a)£11
E 3 db (F32 + 4F2e)Vi] j x
/ e Hi2 \ E-feXP \ RT + 2R2T2) ioT ( > r t (5b)
N, Nm, and Ex have been defined in eq 1 and eq 3; e has been defined in eq 2. As discussed below, it is necessary from physical considerations to select the term in the square brackets real and positive. Equation 5 contains four constants (Nm, Eu Et, and Ef), the first two of which are evaluated in Figures 3a, b, and c and eq 3. The other two constants, E2 and E3, have been selected by matching eq 5a to the experimental data of Figure 1 at relatively high and low values of e (typically e = 1000 and e < 250). All constants required for plotting eq 5 have been collected in Table II, and plots using these constants are shown as curves in Figure 5. General agreement is achieved over the whole range of
N = N r , H
T h e J o u rn a l o f P h y s ic a l C h em istry

Physical Adsorption Isotherms
Figure 5. Lines represent plots of analytic form of the isotherms (eq 5) using the constants of Table II. Points are the experimental data of Figure 1.
available experimental data. The predicted transition to Henry’s law (straight line at 45° to abscissa at the left of each plot) is not tested by the present data. However, the data of Schram13 for the adsorption of argon on nickel at temperatures between 78 and 120°K, in which Henry’s law is found for T > 100°K, are in qualitative agreement with the argon curve of Figure 5. The combination of positive E2 and negative E;i permits two solutions of eq 5a for negative e (p/p0 > 1) thus allowing supersaturation. Detailed numerical agreement with the data is not achieved, however, as seen in Figure 6. Supersaturation, although not extensively documented in physical adsorption, has been examined theoretically by Singleton and Halsey36 and is a subject of major interest in the nucleation of thin films.87
The interpretation suggested for eq 5 is as follows. At very low pressures (large «) the onset of Henry’s law (eq 5b) is given by
6 = ES/RT (6)
Since Ei ~ 1000 cal mol-1 (Table II), it is clear why Henry’s law is so seldom found experimentally for the adsorption of vapors. Equation 6 provides a convenient analytic description of the graphical method for finding the onset of Henry’s law proposed earlier.2 It is also equivalent to the transition predicted by the heterogeneous energy model for she case of zero adsorbate-adsorbate interaction energy.36
At pressures immediately above the Henry’s law range the term within the square brackets in eq 5a is small relative to unity and eq 5a approaches eq 1. Equation 1 is interpreted as arising from a heterogeneous distribution of energies of adsorption with no adsorbate-adsorbate interaction,36 except that the occupancy of a site prevents further occupancy of the same site. A m in eq 1 is interpreted as being the greatest number of atoms that can be placed on the surface before it becomes necessary to consider adsorb
2725
Figure 6. Comparison of experimental data (solid lines) with analytic form (dashed lines of isotherms for large values of p/po-
ate-adsorbate interactions. These single atoms are designated Ax, and it is assumed that Ax can be inserted into eq 1, i.e., Ni — A m exp ( — Be2). In practice, this noninteracting configuration of N m atoms is not achieved at any pressure because clusters begin to form before the coverage A m is reached. A number of cluster atoms (A 0) is defined as the excess above Nx. Thus
N = N i + A0 (7)
The extension of the isotherm upward in pressure beyond the range of eq 1 requires relations for A c, which should be more analogous to relations governing multilayers than those governing monolayers.
In seeking appropriate relations governing A c we have been influenced by a paper of Singleton and Halsey.36 These authors discuss multilayer isotherms of the form
e = - r - C (8)n
where A and C are constants, n is the number of layers (in the BET sense), anc r has a value between 2 and 3. The first term on the ifight of eq 8 represents an adsorbent-adsorbate interaction energy which declines as the number of layers increases, and the second term represents an adsorbate-adsorbate interaction energy which is a constant. Negative C represents a reduction in the heat of sublimat on (or vaporization, depending on the temperature) caused by a geometrical mismatch between the adsorbed phase and the bulk phase. In analogy with eq 8 we have first written
€ = 3 Y E2 + D (9)\ N 0/
(36) J. H . Singleton and G. D . Halsey, Can. J. Phys., 33, 184 (1955).(37) J. S. Sandejas and J. B Hudson, Surface S ci., 11, 175 (1968).
V o lu m e 73, N u m b er 8 A u g u s t 1969

2726 J. P. H o b s o n
where Nc/Ni replaces the relative coverage n and r has been chosen equal to 2 for simplicity; E2 and D are once again constants. As n becomes very large, negative C in eq 8 permits negative values of e, i.e., supersaturation. From physical considerations, C cannot be truly constant and must approach zero at very large n because 6 = 0 for the bulk condensate. To satisfy this requirement we have further modified eq 9 to
‘ " ( t ) E ‘ + ( t ) ®* <10)Equation 10 has the correct physical limit e = 0 as N0 —■► 00 ■ Inversion of eq 10 yields
E, ± (ff32 + 4F26)vn2e J ' '
Substitution of eq 11 into eq 7 and identification of N i = Nm exp( —62/2F i2) leads immediately to eq 5. The energies Eh E2, and E3 are all energies in excess of the energy of sublimation qs. It is necessary to add qs to Ei, E‘i, and E3 to obtain the respective absolute energies. This is done in Table III.
high expectation of representing the temperature variation of the entire isotherm. This claim is based on the fact that the adsorbed amount is expressed only as a function of the potential e to retain the general form of the potential theory of adsorption. The potential theory has been verified experimentally2’16’35 over a wide range of pressures and temperatures and is necessarily correct at e = 0.
F. Values of B~' \ The quantity B, through eq 1, describes the behavior of the isotherm at low pressures, and the quantity B ~ l/t has been interpreted, through eq 3, as a measure of the most probable adsorption energy on the heterogeneous surface. It is useful to compare values of B ~l/l obtained by various workers for the adsorbates argon, krypton, and xenon on different adsorbents. This has been done in Table IV for five adsorbents. We draw two main conclusions from this table: (a) for the adsorbates krypton andxenon, B - 1/2 has about twice the value for molybdenum and tungsten films as it has for the other three adsorbents; (b) for a given adsorbate, the values of B ~1/2 for glass, porous silver, and zirconium films are remarkably similar.
Table III : Energies of Adsorption
Qs,a El -j- Qs, Es + Qs, E3 4- qe.A dsorbate cal m o l-1 cal m o l" 1 cal m o l-1 cal m o l-1
Argon 1920 2853 1920 2802Krypton 2708 3704 3380 2660Xenon 3792 4686 2900 3639° Heat of sublimation.
While the interpretation suggested for eq 5 is different from that underlying the BET equation,16 it is clear that eq 5 can also generate the familiar type II isotherm as demonstrated in Figure 6. However, no change is suggested in the conventional interpretation of the BET monolayer, this being primarily the coverage at which a rapid change takes place in the heat of adsorption. The present considerations would suggest that the greater the discrepancy between the DR and BET areas, the greater the magnitude of lateral adsorbate-adsorbate interactions, and the less sharp the “ knee” in the type II isotherm. This correlation was, in fact, found in the present study.
Equation 5 has not been “ derived” in any rigorous sense. However, the deficiencies in the derivation and interpretation of eq 5 should not obscure its positive features. It is perhaps the first simple isotherm equation for physical adsorption on a heterogeneous surface having simultaneously the properties: (1)correct physical limits— Henry’s law at low coverage and vapor pressure at high coverage; (2) ability to represent experimental data over a very large and probably the whole pressure range of the isotherm; (3)
Table IV: Values of B (calories per mole) Obtained by Fitting Isotherms with DR Equation
✓---------------------------------------A dsorbent--------------P oroussilver(this Zr M o w
A dsorbate Glass w ork) film film film
Argon 1177“ 1320 1220e116561230'
Krypton 13796 1410 1360e 2304/ 2650/1340“14806
Xenon 15436 1265 1275e 2950/ 3409/1450*I860'
“ Ref 2. b Ref 10. 'Ref 9. d Ref 7. e Ref 1; valuesobtained from ref 1 were calculated by the present author. ' Ref 11.
The explanation suggested for these two results is that (a) is representative of adsorption on metal films which have not come to equilibrium with the background gases of the vacuum system, while (b) is representative of adsorption on surfaces that have come into equilibrium with the background gases of the vacuum system. The surfaces in (b) were not, therefore, “ clean” in the sense of being representative of the bulk adsorbent but may well have reflected the background gas composition. The background gas composition of an ultrahigh vacuum system is remarkably independent of the particular system and is frequently dominated by the gases hydrogen and carbon monoxide.21
T h e J o u rn a l o f P h y s ic a l C h em istry

Physical Adsorption Isotherms 2727
One might speculate that the surfaces of many materials in ultrahigh vacuum systems are covered by compounds containing the three atoms H, C, and 0 , and that these surfaces are essentially similar from the viewpoint of physical adsorption. Fuller, et al.,3i have found that even after outgassing at 500° (the highest temperature normally used in processing ultrahigh vacuum systems) substantial amounts of water remain on thorium oxide, together with substantial amounts of carbon.
V. Summary1. Physical adsorption isotherms covering the
relative pressure range 10-13 < p/pv < 1 have been measured in a single experiment using an adsorbent of porous silver with a surface of about 105 cm2, deposited on a geometric surface of 354 cm2. Since 50 g of adsorbent was used, the specific surface area was 0.2 m2/'g. The adsorbates were argon, krypton, and xenon, and the temperature was 77.4°K.
2. It was found that the area of the adsorbent as measured by the DR (Dubinin-Radushkevich) method was less than the BET area, the discrepancy increasing from xenon, through krypton, to argon. It is suggested that the DR coverage is the greatest coverage for which lateral adsorbate-adsorbate interactions can be neglected.
3. An analytic expression was presented which described all the main Matures of the available experimental data. This e>pression passed from Henry’s law at very low pressures, through a region representative of physical adsorption on a heterogeneous surface, to a region increasingly characterized by adsorbate- adsorbate interactions, with a final limit at the bulk condensate at p/p0 = 1.
4. It is suggested that the reason a wide variety of nominally different adsorbents show very similar physical adsorption isotherms at low pressures is that their surfaces are mainly determined by the residual gases, H2 and CO, whic i are common in many vacuum systems.
Acknowledgments. Thanks are due to Mr. F. Liuzzo of the Division of App ied Chemistry of these laboratories who prepared the adsorbent; Mr. J. Yandon performed many of the measurements. Professor G. D. Halsey kindly supplied is with recent unpublished considerations on supersaturation,39 based on equations presented in Chapter 16 of “ The Solid-Gas Interface.”
(38) E . L . Fuller, Jr., H . F . Holmes, and C. H . Seeoy, J . P h y s . C h em ., 70, 1633 (1966).(39) G. D . Halsey, Jr., “The Solid-Gas Interface,” Marcel Dekker, New York, N. Y ., 1967, Chapter 16.
V o lu m e 73, N u m b er 8 A u g u s t I 960

2728 George Kalfoglou and L. H. B owen
Osmotic and Activity Coefficients of the Group V Tetrapkenyl
Salts in Aqueous Solutionlab
by George Kalfoglou2 and L. H. BowenD ep a r tm en t o f C h em is try , N o rth C a ro lin a S ta te U n iv er s i ty , R a le ig h , N o rth C a ro lin a 2 7 6 0 7 (.R ece iv ed J a n u a r y 2 0 , 1 9 6 9 )
Osmotic coefficients of Ph4PCl, Ph4PBr, (Ph4P)2S04, Ph4AsCl, Ph4AsBr, (Ph4As)2S04, Ph4SbCl, Ph4SbBr, and (Ph4Sb)2S04 have been determined in aqueous solution at 37° by vapor pressure lowering. Aqueous conductivities have been measured at 25° and limiting ionic conductances of Ph4P+, Ph4As+, and Ph4Sb+ have been calculated. The plots of equivalent conductance vs. square root of concentration indicate complete dissociation of the salts in water. The plots of osmotic coefficient vs. square root of concentration for the compounds with the same anion and different central atoms have the same general shape, indicating that the solution properties of these cations are largely dominated by the nature of the substituent phenyl groups on the central phosphorus, arsenic, and antimony atoms. The osmotic and activity coefficients of the salts show large negative deviations from the Debye-Hiickel limiting law. This is explained in terms of the interaction of water molecules with the 7r-electron orbitals of the phenyl groups. The tetraphenylonium cations act as structure breakers, which lower the osmotic and activity coefficients.
The interaction between organic ions and water structure has been the subject of considerable interest in recent years. Deviations from the Debye-Hiickel limiting law for osmotic and activity coefficients of organic ions in solution have been interpreted largely in terms of the flickering-cluster model for water structure of Frank and Wen.3 The positive deviations observed for many quaternary ammonium salts4 are strong evidence for the structure-enforcing characteristics of these compounds. The negative deviations of quaternary ammonium iodides have been explained as due to structure-enforced ion pairing.6 Boyd, et al.,6 substituted one benzyl group on tetramethylammonium halides and observed lowered osmotic coefficients, attributed to ion pairing in the solutions. Bonner, et al.,’’ in studies on aromatic and aliphatic sulfonates have observed that the lower osmotic coefficients of the aromatic sulfonates are due to a structure-breaking effect of the aromatic sulfonate ions, rather than ion pairing.
Although tetraphenyl group V-onium salts have been used extensively as analytical reagents,8 no osmotic or activity coefficient data have been available in aqueous solution, possibly due to limited solubility of many of these salts. However, this group provides an ideal set of compounds to study the effect of the aromatic ring in solute-solvent interactions in analogous fashion to the work on tetraalkylammonium salts in aqueous solution. These salts have an advantage over the aromatic sulfonates in that the charge center of the ion is surrounded by organic groups, and thus the observed effects should be more directly related to the properties of the aromatic ring itself. The thermoelectric method for determining osmotic coefficients by vapor pressure lowering9 makes it practicable to measure osmotic
coefficients even for slightly soluble salts. We have used this method to determine osmotic coefficients for several salts of tetraphenylphosphonium, -arsonium, and -stibonium ions. In addition, conductivity measurements have been made on a number of these to aid in interpretation of the osmotic coefficients.
Experimental SectionTetraphenylstibonium Salts. Tetraphenylstibonium
bromide was prepared by the method of Chatt and Mann.10 The salt was obtained by the reaction of triphenylstibine with bromobenzene in the presence of A1C13. This method yields a product which is a mixture of the chloride and bromide salts. The Ph4SbOH was precipitated from a solution of Ph4SbBr in warm water by adding dilute NH4OH in excess. The solvent was removed with a vacuum evaporator. The salt was recrystallized from 50% ethyl alcohol and dried at 80° for 6 hr in a vacuum oven.
( 1 ) ( a ) A b s t r a c t e d i n p a r t f r o m t h e P h . D . t h e s i s o f Y . K a l f a o g l u ( G . K . ) , N o r t h C a r o l i n a S t a t e U n i v e r s i t y , 1 9 6 8 ; ( b ) p r e s e n t e d a t t h e S o u t h e a s t e r n R e g i o n a l M e e t i n g o f t h e A m e r i c a n C h e m i c a l S o c i e t y , D e c 1 9 6 8 .
( 2 ) T e x a c o I n c . , R e s e a r c h a n d T e c h n i c a l L a b o r a t o r y , B e l l a i r e , T e x a s 7 7 4 0 1 .
( 3 ) H . S . F r a n k a n d W . Y . W e n , D is c u s s io n s F a ra d a y S o c ., 2 4 , 1 3 3 ( 1 9 5 7 ) ; H . S . F r a n k , P r o c . R o y . S o c ., A 2 4 7 , 4 8 1 ( 1 9 5 8 ) .
( 4 ) S . L i n d e n b a u m a n d G . E . B o y d , J . P h y s . C h em ., 6 8 , 9 1 1 ( 1 9 6 4 ) ; B . J . L e v i e n , A u s t . J . C h em ., 1 8 , 1 1 6 1 ( 1 9 6 5 ) ; W . Y . W e n , S . S a i t o , a n d C . L e e , J . P h y s . C h em ., 7 0 , 1 2 4 4 ( 1 9 6 6 ) .
( 5 ) R . M . D i a m o n d , ib id ., 6 7 , 2 5 1 3 ( 1 9 6 3 ) .
( 6 ) G . E . B o y d , A . S c h w a r z , a n d S . L i n d e n b a u m , ib id ., 7 0 , 8 2 1 ( 1 9 6 6 ) .
( 7 ) O . D . B o n n e r , ib id ., 7 2 , 2 5 1 2 ( 1 9 6 8 ) ; O . D . B o n n e r , C . R u s h in g , a n d A . L . T o r r e s , ib id ., 7 2 , 4 2 9 0 ( 1 9 6 8 ) .
( 8 ) H . H . W i l l a r d a n d L . R . P e r k in s , A n a l. C h em ., 2 5 , 1 6 3 4 ( 1 9 5 3 ) .
( 9 ) D . E . B u r g e , J . P h y s . C h em ., 6 7 , 2 5 9 0 ( 1 9 6 3 ) .
( 1 0 ) J . C h a t t a n d F . G . M a n n , J . C h em . S o c ., 1 1 9 2 ( 1 9 4 0 ) .
T h e J o u rn a l o f P h y s ic a l C h em istry

O s m o t i c a n d A c t i v i t y C o e f f i c i e n t s o f t h e G r o u p Y T e t r a p h e n y l S a l t s 2729
PhiSbCl. The required amount of Ph4SbOH was dissolved in ethyl alcohol at room temperature. A dilute solution of HC1 was added until the pH was about 6.5. The solvent was removed and the salt was recrystallized several times from 50% ethyl alcohol and dried at 80°. The melting point was 208-210°; the reported melting point was 202-205°.11
PhiSbBr. Tetraphenylstibonium bromide was prepared from Ph4SbOH by neutralizing it with HBr and recrystallized in the same way as Ph4SbCl. The melting point was 216-218°; reported melting points were 210-218°,10 210-215°,11 and 215-217°.12
(PhtSb)iS0 4 . An alcohol solution of Ph4SbOH was neutralized with dilute H2S04 solution until the pH was7.1. The solvent was removed and the product was dissolved in distilled water, filtered, and the solvent was removed again. The (Ph4Sb)2S04 salt was recrystallized several times from chloroform by adding carbon tetrachloride to the solution and was dried at 80°. The melting point was 234-237°.
Tetraphenylarsonium Salts. Tetraphenylarsonium hydroxide was prepared by dissolving Ph4AsCl (Columbia Organic Chemicals, Co., Inc.,) in water and adding an excess of moist, freshly prepared silver oxide. The slurry was heated at 50-60° for several hours, was filtered, and the solvent was removed. The salt was recrystallized from ethyl alcohol by adding absolute ether to the solution and was dried at 80°.
PhiAsCl. This salt (Columbia Organic Chemicals Co., Inc.) was recrystallized several times from ethyl alcohol by adding absolute ether to the solution and was dried. The melting point was 258-260°; reported melting points were 256-257°13 and 261-2630.14
PhiAsBr. Tetraphenylarsonium bromide was prepared by neutralizing an aqueous solution of Ph4AsOH with HBr and was recrystallized by the same process as Ph4AsCl. The melting point was 278-280°; reported melting points were 277-281010 and 279-281°.12
(P/t4As)2<S04. Tetraphenylarsonium sulfate was prepared by neutralizing an aqueous solution of Ph4AsOH with H2S04 in the same way as (Ph4Sb)2S04. The salt was recrystallized by the same process as Ph4AsBr. The melting point was 260-263°; the reported melting point was 257-258°.16
Tetraphenylphosphonium Salts. Tetraphenylphos- phonium hydroxide was prepared by dissolving Ph4PCl (City Chemical Corp.) in water and treating it with silver oxide exactly as in the case of Ph4AsOH. The crude Ph4POH salt was recrystallized several times from ethyl alcohol.
PhtPCl. This salt (City Chemical Corp.) was recrystallized in the same way as Ph4AsCl. The melting point was 274-276°; reported melting points were 265°16 and 265-267.11
PhiPBr. Tetraphenylphosphonium bromide was prepared from Ph4POH by neutralizing it with HBr and recrystallized in the same way as Ph4AsBr. The
melting point was 293-295°; the reported melting point was 287°.16
{PhiP)iSOi. Tetraphenylphosphonium sulfate was prepared from Ph4POH by neutralizing it with H2S04, and it was recrystallized in the same way as (Ph4As)2- S04. The melting point was 299-302°.
Experimental Measurements. Osmotic coefficients were determined at 37° using the A. H. Thomas Isothermal Molecular Weight Apparatus, modified with a more sensitive thermoregulator and relay. Resistance readings were taken on each solution for about 20 min or until a plateau was reached. The basis of the thermoelectric method for determining osmotic coefficients has been outlined by Burge.9 The difference in resistance readings between solvent and solution, AR, is related to the osmotic coefficient, <f>, by the equation
A R = <l>vKm (1)
where v is the number of moles of ions per mole of salt, m is the molality, and K is the calibration constant of the instrument. Sodium chloride solutions were used for calibration. Concentrations covering the same range as those of the salts to be studied were used, and the value of K was checked before and after each set of measurements on a given salt. Osmotic coefficients for NaCl were interpolated from data given by Robinson and Stokes.17 The reproducibility and accuracy of the apparatus were verified by checking osmotic coefficients obtained for several inorganic salts with reported values in the literature.
Equivalent conductances were determined at 1000 Hz with a Beckman RC-18 conductivity bridge and fill-type cell with cell constant 1.505 cm-1, calibrated with KC1. These measurements were made at 25°. For both conductance and osmotic coefficient measurements, the bath temperature was regulated to ±0.005°.
ResultsOsmotic Coefficients. The upper concentration limit
for determination of osmotic coefficients was governed by solubility. Although experimental values were calculated to three figures, the errors in <j> are estimated at 10% for the lowest concentrations (about 0.005 m) and less than 1% for m > 0.1.
The experimental osmotic coefficients were weighted according to their errors and fitted by a nonlinear least- squares technique, using the IBM 360/75 of the
( 1 1 ) H . H . W i l l a r d , L. R . P e r k i n s , a n d F . F . B l i c k e , J . A m e r . C h em . Soc., 7 0 , 7 3 7 ( 1 9 4 8 ) .
( 1 2 ) V . G . W i t t i g a n d K . C la u s s , A n n . C h em ., S 7 S , 2 6 ( 1 9 5 2 ) .
( 1 3 ) F . F . B l i c k e a n d E . M o n r o e , J . A m e r . C h em . Soc., 5 7 , 7 2 0 ( 1 9 3 5 ) .
( 1 4 ) A . I . P o p o v a n d R . E . H u m p h r e y , ibid,., 8 1 , 2 0 4 3 ( 1 9 5 9 ) .
( 1 5 ) F . F . B l i c k e a n d E . L. C a t a l i n e , ibid., 60, 4 2 3 ( 1 9 3 8 ) .
( 1 6 ) J . D o d o r o w a n d H . M e d o x , C h em . B e r ., 6 1 , 9 0 7 (1 9 2 8 ) .
( 1 7 ) R . A . R o b i n s o n a n d R . H . S t o k e s , “ E l e c t r o l y t e S o l u t i o n s , ” 2 n d e d , A c a d e m i c P r e s s , N e w Y o r k , N . Y . , 1 9 5 9 , p p 4 8 0 - 4 8 3 .
Volume 73, Number 8 August 196.9

2730 G e o r g e K a l f o g l o u a n d L. H. B o w e n
Triangle Universities Computation Center, to a power series of the form
1 — <t> = a m'/2 + ftm + 7 (2)
where a, ft, and y are empirical constants, m is the molality, and <j> is the osmotic coefficient.
Osmotic coefficients corresponding to as low as 0.005 m solutions were used in fitting. The data of the less soluble compounds Ph4PBr, (Ph4P)2S04, Ph4AsBr, Ph4SbCl, and Ph4SbBr were fitted with two constants a and ft. The rest of the compounds were fitted with three constants. These values are reported in Tables I—III, and plots of the experimental points and smoothed curves are given in Figures 1 and 2.
Table I : Osmotic Coefficients for Chloride Salts. Ph4PCl: 0 = 1 - 1.335m'/* + 1.167m - 0.4761m’/*;
i4AsC1 : 0 = 1 - 1.268m'/* + 0.9758m - 0.6294m’/*;>4SbCl : 0 = 1 - 1.063m1/* - 0.4045m
m P h iP C l m PluA sC l
0.005414 0.953 0.005310 0.9520.01068 0.932 0.009675 0.9250.02216 0.866 0.02215 0.8510.03187 0.836 0.03098 0.8090.05040 0.779 0.05217 0.7460.1025 0.689 0.06512 0.7260.2051 0.582 0.07851 0.7050.3954 0.504 0.1018 0.6780.5639 0.454 0.2011 0.5700.8011 0.398 0.2478 0.533
m PhiSbC l
0.005179 0.9280.01014 0.8860.02092 0.8350.0294 0.802
Table II : Osmotic Coefficients for Bromide Salts. PhJPBr: 0 = 1 — 0.8053m'/* - 0.3362m; PfuAsBr: 0 = 1 - 0.9693m'/* + 0.1880m; PluSbBr: 0 = 1 - 0.9384m1/* - 0.6493m
m Ph(P B r m PhéAsBr
0.005782 0.947 0.005312 0.9310.01051 0.919 0.01100 0.9090.02134 0.876 0.01982 0.8630.03244 0.838 0.03020 0.8380.04190 0.818
m P h .S bB r
0.00520 0.9310.009953 0.8990.01520 0.873
Using the Gibbs-Duhem equation in the form
d In 7± = d<p + (<t> — 1) d In m (3)
one obtains an expression for the mean ionic activity
Table III : Osmotic Coefficients for Sulfate Salts. (Ph4P)2S04: 0 = 1 - 1.776m'/* + 1.109m;(Ph4As)2S04: 0 = 1 - 2.108m'/* + 2.575m - 0.7822m’/*; (Pb4Sb)2S04: 0 = 1 - 2.234m'/* + 2.828m - 1.059m’/*
m (Ph4As)2S04 m (Ph<Sb)iSO<0.00591 0.891 0.005225 0.9400.01075 0.842 0.01019 0.8750.02362 0.735 0.01975 0.7110.03185 0.702 0.03084 0.6960.04956 0.654 0.05001 0.6620.1015 0.561 0.07842 0.5700.1829 0.509 0.09964 0.5350.2626 0.490 0.2367 0.461
0.3873 0.4500.5636 0.469
m (Ph.P SO.0.005436 0.8660.01027 0.8210.02043 0.7540.03103 0.7170.04065 0.689
coefficient y ± in terms of the empirical constants determined in eq 2. This is
In = —3 am'/* — 2ftm — (5A ) 7 (4)
Since the lowest concentration at which measurements were taken was about 0.005 m, one is justified in extrapolating the empirical relationship to m = 0, thus avoiding explicit use of the Deybe-Hiickel limiting law. Values of y± calculated from eq 4 are tabulated in Tables IV-VI.
Table IV : Mean Ionic Activity Coefficients for Chloride Salts
m P h .P C l Ph<AsCl Ph4SbC l
0.00500 0.762 0.771 0.7950.0100 0.685 0.696 0.7210.0200 0.593 0.605 0.6270.0300 0.533 0.543 0.5620.0400 0.490 0.5010.0500 0.455 0.4660.0600 0.426 0.4360.0700 0.402 0.4110.0800 0.381 0.3890.0900 0.364 0.3700.100 0.347 0.3530.200 0.248 0.2460.300 0.197 0.1880.400 0.1650.500 0.1430.600 0.1260.700 0.1130.800 0.102
Equivalent Conductances. Experimental equivalent conductances were fitted to straight-line phoreograms (A vs. y/C) by weighted least squares. The results are
The Journal o f P hysica l Chem istry

O s m o t i c a n d A c t i v i t y C o e f f i c i e n t s o f t h e G r o u p Y T e t r a p h e n y l S a l t s 2731
Figure 1. Osmotic coefficients vs. square root of molality for the more soluble salts. The lines are the computer fits to the experimental data: □, Ph4AsCl; •, PhJPCl; m, (PhAs)2S04; A, (Ph4Sb)2S04.
Figure 2. Osmotic coefficients vs. square root of molality for the less soluble salts. The lines are the computer fits to the experimental data: •, Ph4PBr; A, Ph4AsBr; n, Ph4SbBr;O, Ph4SbCl; ■, (Ph4P)2S04.
reported in Table VII. The slopes are also compared with the Onsager limiting law.18 In all cases the slopes are less in absolute magnitude than the Onsager law. Thus, the experimental curves he slightly above those for simple electrolytes. No evidence in any case was observed of deviations from the straight lines over the range of measurements (to 0.02 N). The \o+ values calculated for the cations are compared in Table VIII
Table V : Mean Ionic Activity Coefficients for Bromide Salts
m Ph4P B r
0 . 0 0 5 0 0 0 .8 4 00 .0 1 0 0 0 .7 8 00 .0 2 0 0 0 .7 0 10 .0 3 0 0 0 .6 4 50 .0 4 0 0 0 .6 0 2
P hiA sB r Ph4SbB r
0 .8 1 6 0 .8 1 40 . 7 5 0 0 .7 4 50 .6 6 8 0 . 6 5 40 .6 1 1
Table VI : Mean Ionic Activity Coefficients for Sulfate Salts
TO (P h4P )sS 0 4 (P h4A s)2S 0 4 (P b 4Sb)2S 04
0 .0 0 5 0 0 0 .6 9 4 0 . 6 5 6 0 .6 4 00 .0 1 0 0 0 . 6 0 0 0 .5 5 9 0 . 5 4 00 .0 2 0 0 0 .4 9 2 0 . 4 6 4 0 . 4 3 20 .0 3 0 0 0 .4 2 5 0 .3 8 8 0 . 3 6 80 .0 4 0 0 0 .3 7 6 0 .3 4 3 0 . 3 2 40 .0 5 0 0 0 . 3 1 0 0 .2 9 10 .0 6 0 0 0 . 2 8 4 0 . 2 6 50 .0 7 0 0 0 .2 6 3 0 . 2 4 40 .0 8 0 0 0 .2 4 5 0 .2 2 70 .0 9 0 0 0 .2 3 1 0 .2 1 20 . 1 0 0 0 . 2 1 7 0 . 2 0 00 .2 0 0 0 . 1 4 7 0 . 1 3 20 . 3 0 0 0 . 1 1 9 0 . 1 0 40 .4 0 0 0 .0 8 8 60 . 5 0 0 0 .0 7 9 2
Table VII : Limiting Equivalent Conductances and Slopes of the Phoreograms at 25°
Slope (exptl) /
— (S lop e ), — (S lop e ), s lopeSalt Ao exptl Ons. (Ons.)
Ph4PCl 96.3 ± 0.1 73.6 ± 0.8 82.2 0.895Ph4AsCl 95.8 ± 0.1 76.6 ± 0.8 82.1 0.933Ph4SbCl 95.2 ± 0.3 66.4 ± 2.5 82.0 0.810PffiSbBr 97.2 ± 0.3 77.2 ± 2.8 82.4 0.937(Ph4Sb)2S04 99.4 ± 0.3 114.2 ± 2.3 158.6 0.722
Table VIII: Limiting Ionic Conductances and Stokes Radii for the Tetraphenyl Group V Cations
Salt Xo +Xo+,av
Xo +, lit.
r +,Stokes,
APh4PCl 1 9 . 9 ± 0 . 1 1 9 . 9 ± 0 . 1 1 7 . 7 “ 4 . 6Ph4AsCl 1 9 . 4 ± 0 . 1 1 9 . 4 ± 0 . 1 1 9 . 2 6 4 . 7PhuSbCl 1 8 . 8 ± 0 . 3Ph4SbBr 1 9 . 1 ± 0 . 3 1 9 . 1 ± 0 . 3 2 9 ± I e 4 . 8(Ph4Sb)2S04 1 9 . 4 ± 0 . 3
“ Value reported at 18°; V. H. Schindlbauer and A. Honiger, Ber. Bunsenges. Phys. Chem., G8, 597 (1964). b A. I. Popov and R. E. Humphrey, J. Amer. Chem. Soc., 81, 2043 (1958). c M. D. Morris, P. S. McKinney, and E. C. Woodbury, J. Electroanal. Chem., 10, 85 (1965).
( 1 8 ) R . A . R o b i n s o n a n d R . H . S t o k e s , r e f 1 7 , p 1 4 3 .
Volum e 73, N um ber 8 August 1969

2732 G e o r g e K a l f o g l o u a n d L. H. B o w e n
with values from the literature. The PhiP+ and Ph4As+ agree with earlier measurements, considering the temperature of measurement. Our value for Ph4Sb+ of X0+ = 19.1 ± 0.3 is the average of three independently prepared salts and is more in line with the other cations than that previously reported by Morris, et al.19 Stokes radii have also been calculated for the cations by the equation
r = F*/6ttNVo\o+ (5)
where F is the Faraday, N is Avogadro’s number, and tjo is the viscosity of water. The calculated Stokes radii (Table VIII) are slightly smaller than predicted by summing covalent atomic radii, but the trend is reasonable on the basis of increasing size of the central atom from P to Sb.
DiscussionThe smoothed osmotic coefficients and activity
coefficients for tetraphenylphosphonium and -arsonium chlorides show no outstanding differences up to 0.12 m. The same is true for Ph4SbCl up to 0.03 m, beyond which osmotic coefficients could not be measured due to the limited solubility. The Ph4PCl has higher osmotic and activity coefficients than Ph4AsCl above 0.12 m. In the case of bromides and sulfates the order is clearer, and the osmotic and activity coefficients decrease in the order Ph4P+ > Ph4As+ > Ph4Sb+.
The osmotic and activity coefficients of bromides at a given concentration are higher than those of the chlorides, while those of the sulfates are the lowest. The interesting fact is that the osmotic coefficient curves for the same anion and different cations have the same shape (see Figures 1 and 2). Those for the chlorides and bromides show a continuously decreasing trend. In the case of (Ph4Sb)2S04, there is a leveling off and a slight rise in osmotic coefficient. This behavior is different from that encountered with simple electrolytes, where the curve rises abruptly at higher concentrations. Because of the nature of the functional relationship, activity coefficients lag behind rising osmotic coefficients, reaching minima at higher concentrations. Had (Ph4Sb)2S04 been more soluble, its activity coefficient would most likely have exhibited a minimum. The (Ph4As)2S04 curve resembles that of (Ph4Sb)2S04. It too shows a leveling off, but due to the lower solubility, a minimum was not observed.
At high concentrations the increase in <f> for (Ph4Sb)2- S04 could be due to the effect of hydration on the sulfate ion. Hydration leads to an increase in the effective ionic radius and the removal of water molecules from the solvent. This will increase the free energy of the solution and, thus, the osmotic coefficients of the more concentrated solutions.
When the activity coefficients of the electrolytes under study are compared with those of simple electrolytes of the same type, it is seen that those of the former
Figure 3. Mean ionic activity coefficients vs . square root of molality for some of the 1-1 salts. The Debye-Hiickel limiting law is shown as a dashed curve; a, Ph,PBr; b,PhjAsBr; c, Ph .PC l; d, PffiAsCl.
are lower, even in the dilute region. In other words, the osmotic and activity coefficients of the tetraphenylphosphonium, -arsonium, and -stibonium salts show negative deviations from the Debye-Hiickel limiting law (see Figure 3 for representative curves). The extended Debye-Hiickel equation gives no better fit, as it results in negative values for the mean ionic distances, which, of course, have no physical meaning.
Considering the cause of this negative deviation, the first phenomenon that comes to mind is ion association. The fact that the charge on the cation is embedded in the center of the ion and is screened by the four phenyl groups around it decreases the likelihood of formation of ion pairs by coulombic attraction. So, if association is to occur, it would likely be due to structure-enforced ion pairing, as proposed by Diamond.5 This is a tempting conclusion due to the fact that the cations are large hydrophobic ions, which would assist the formation of tightly held hydrogen-bonded cavities around them, and might force the anions together with the cations. However, evidence from the conductivity measurements does not support the above conclusion. The slopes of the phoreograms indicate no ion association occurring, at least up to 0.02 N. Therefore, structure-enforced ion pairing cannot be accepted as an explanation for the osmotic coefficient behavior in dilute solution.
In order to explain the observed behavior, closer attention should be given to the cation, and specifically to the phenyl groups. The central metal atom has only a minor role on the behavior of the ion, as indicated by the fact that the osmotic coefficient curves of all the -onium salts had the same shape for any given anion. The larger the radius of the central atom, the lower the osmotic coefficient. This indicates that it is mainly the size factor that affects the osmotic coefficients, rather than an interaction between the central atom and the solvent molecules. Lindenbaum20 re-
(19) M. D. Morris, P. S. McKinney, and E. C. Woodbury, J . E le c - troa n a l. C h em ., 1 0 , 85 (1965).(20) S. Lindenbaum, J . P h y s . C h em ., 72, 212 (1968).
The Journal o f Physica l Chem istry

O s m o t i c a n d A c t i v i t y C o e f f i c i e n t s o f t h e G r o u p V T e t r a p h e n y l S a l t s 2733
ported lower osmotic coefficients for tri-n-alkylsulfo- nium salts than for the corresponding alkylammonium salts, and plots of <f> vs. y/c had a similar shape. He concluded that the solution properties of these cations were largely determined by the nature and length of the hydrocarbon substituents. However, these salts did not exhibit negative deviations from the Debye- Hückel limiting law.
Even though phenyl groups are also hydrocarbons, they differ from alkyl groups in their behavior in aqueous solution. It has been known21 that aromatic compounds will form hydrogen bonds by electron donation to a weak protonic acid, so water molecules in the solvent can interact with the ir-electron orbitals of a phenyl group, unlike the situation with alkyl groups. It is expected that water molecules in cluster form could exist near the edges of an aromatic ring and, through hydrogen bonding, be attached to the phenyl group.22 This would have a disruptive effect on the water structure. Thus, the ion-solvent interaction of the tetra- phenylphosphonium, -arsonium, and -stibonium cations should exert a structure-breaking effect on the solvent. This is, of course, the opposite of the effect of aliphatic substituents on the solvent. Since the structure-making effect of the ion on the solvent leads to higher osmotic and activity coefficients, the structure-breaking effect should decrease the osmotic and activity coefficients. A lowering of activity coefficient was indeed observed by Boyd, et al., with benzyltrimethylammonium salts, as compared with tétraméthylammonium salts.6 The interpretation that was given, however, was that the lowering could have been caused by extensive ion pairing. Bonner, et al.,7 also reported low activity coefficients for aromatic sulfonates and related this to the structure-breaking effect on the solvent by the aromatic groups, rather than ion pairing.
The activity coefficients reported in this work are somewhat lower than the ones reported for either benzyltrimethylammonium salts or the simple sulfonate salts, although not as low as those of some of the bola- form sulfonates reported recently.7 The cations in this work have four phenyl substituents, each of which is presumably acting as a structure breaker, and the net result is a lower activity coefficient in general than from only one aromatic group.
The relative order of the osmotic and activity coefficients merits some consideration. In the case of quaternary ammonium salts the activity coefficients of the chloride salts are higher than those of the bromides, whereas the results obtained in this work have the opposite relative order. In view of the presumed importance of the ion-solvent interaction, a change in relative order is not too surprising. The quaternary ammonium ions are structure making, whereas the tetraphenyl-onium ions are structure breaking. Although the bromide ion is considered more effective as a structure breaker than Cl- ,23 the similar relative order of the tetraphenyl-onium halides to that of the alkali halides17 is understandable in that the anion influence is essentially the same in both cases and is determined by solvation and electrostatic interactions primarily, rather than the large structural effects of the cations.
Acknowledgment. The assistance of Dr. G. G. Long and G. E. Parris was of great help in preparing the compounds for study.
(21) M. Tamres, J . A m e r . C h em . S o c ., 74, 3375 (1952); I. M. Gold- man and R. O. Crisler, J . O rg. C h em ., 23, 751 (1958).(22) G. Nemethy and H. A. Scheraga, J . C h em . P h y s ., 36, 3401 (1962).(23) J. Greyson, J . P h y s . C h em ., 71, 2210 (1967).
Volum e 73, N um ber 8 August 1969

2734 K a r l A. G i n g e r i c h
Gaseous Phosphorus Compounds. I I I . Mass Spectrom etric Study of the
Reaction between Diatom ic Nitrogen and Phosphorus Vapor and
Dissociation Energy of Phosphorus Mononitride and Diatom ic Phosphorus
by Karl A. Gingerich1B aU elle M e m o r ia l In s t itu te , C o lu m b u s L a b ora tor ies , C o lu m b u s, O h io 4 82 0 1 ( R ece iv ed A p r i l If., 1 9 6 8 )
The gaseous equilibria between N2, P, P2, and PN have been studied by means of the Knudsen effusion technique combined with mass spectrometric analysis of the vapor above a condensed UP-BN mixture. The dissociation energy of the P2 molecule has been obtained from the measurement of the equilibrium P2(g) = 2P(g) as D ° 298 = 117.0 ± 2.5 kcal/mol. The corresponding D°0 value is 116.1 ± 2.5 kcal/mol or 5.04 ± 0.11 eV. The dissociation energy of the PN molecule, D°m = 147.5 ± 5.0 kcal/mol has been calculated from the measured enthalpies of the reactions P2(g) + N2(g) = 2PN(g) and 2P(g) + N2(g) = 2PN(g) and from pertinent literature values for P2 and N2. The corresponding D°0 value is 146.6 ± 5.0 kcal/mol or 6.4 ± 0.2 eV. The standard heat of formation of gaseous PN, was derived as 45.3 ± 4.0 kcal/mol.
IntroductionSpectroscopic evidence for the gaseous molecule PN
was first reported by Curry, Herzberg, and Herzberg2a and an upper limit of 7.8 eV was given for its dissociation energy, D °0, as obtained from a linear Birge-Sponer extrapolation of the observed vibrational levels of the X l2 + ground state. In their detailed presentation and interpretation of the optical spectra of this molecule, these authors2b gave the value 6.3 eV the preference for the approximate dissociation energy of PN. This value was obtained by a linear Birge-Sponer extrapolation of the observed vibrational levels of the A1!! excited state with corrections to ground-state species. Since extrapolation methods usually give high dissociation energies, both values were considered upper limits. The lower energy was preferred because extrapolation is over a shorter range. Curry, et oi.,2b also noted that in view of the relatively small number of observed vibrational levels (10 out of approximately 95 possible for the ground state, and 9 out of approximately 76 possible for the excited state) these estimated values for the dissociation energy of PN are not very accurate. Gaydon3 confirmed the extrapolations by Curry, et al., and selected D °0 = 6.0 ± 0.8 eV (138 ± 19 kcal/mol) as the probable value for the dissociation energy of PN, while Herzberg4 reported only an approximate value of6.3 eV (145 kcal/mol).
The equilibrium concentration of PN in an equi- atomic mixture of phosphorus and nitrogen was measured by Huffman, et al.,6 at 895 and 905° using a static method, and a dissociation energy, Z)°0 of 7.1 ± 0.05 eV (163.7 ± 1.2 kcal/mol) was derived. In view of the unfavorable conditions under which these measurements were made it can at the least be said that the accuracy claimed for the dissociation energy is too
optimistic. The results by Huffman, et al., were recalculated by Potter and DiStephano6 to give a dissociation energy, D°0 = 165.8 ± 1.2 kcal/mol. This latter value was adopted by the JANAF Thermochemical Tables.7
In view of the large uncertainties in the values estimated from spectroscopic data and in the available thermochemical value, a new measurement of the dissociation energy of the PN molecule appeared desirable. In the present investigation the enthalpy of the gaseous reactions N2 + P2 = 2PN and 2P + N2 = 2 PN were measured using the Knudsen effusion method in combination with mass spectrometric analysis of the vapor. An independent evaluation of the equilibrium P2 = 2P was also performed. After the completion of this investigation the results by Uy, et al.,6 of a Knudsen cell mass spectrometric investigation of the congruent vaporization of P3N5 came to the author’s attention. According to Uy, et al., the dissociation energy D°0 of PN, as derived from the enthalpy of the reaction P2(g)
(1) Department of Chemistry, College of Science, Texas A & M ■ University, College Station, Texas 77843.(2) (a) J. Curry, L . Herzberg, and G. Herzberg. J . C h em . P h y s . , 1, 749 (1933); (b) J. Curry, L . Herzberg, and G. Herzberg, Z . P h y s .. 8 6 , 348 (1933).(3) A. G. Gaydon, “Dissociation Energies and Spectra of Diatomic Molecules,” 2nd ed, Chapman and Hall, Ltd., London, 1953.(4) G. Herzberg, “Molecular Spectra and Molecular Structure. I. Spectra of Diatomic Molecules,” 2nd ed, D. Van Nostrand, New York, N. Y ., 1950.(5) E. O. Huffman, G. Tarbutton, K . L . Elmore, W. E. Cate, H. K . Walters, Jr., and G. V. Elmore, J . A m e r . C h em . S o c ., 76, 6239 (1954).(6 ) R. L . Potter and V. N. DiStefano, J . P h y s . C h em ., 65, 849 (1961).(7) “JA N A F Thermochemical Tables,” D. R. Stull, Ed., Dow Chemical Co., Midland, Mich., 1965, and quarterly supplements.(8 ) O. M. Uy, F. J. Kohl, and K . D. Carlson, J . P h y s . C h em ., 72, 1611 (1968).
The Journal o f P hysica l Chem istry

G a s e o u s P h o s p h o r u s C o m p o u n d s 2735
+ N2(g) = 2PN(g) is 7.57 ± 0.03 eV, which is close to the upper limit obtained by Curry, et aZ.,2a from extrapolation of the ground state.
Experimental SectionThe measurements were performed with a Nuclide
Corporation 12-90 HT mass spectrometer, similar to the one described by Chupka and Inghram.9 Additional design features of the instrument and the general experimental procedure used in the mass spectrometric experiments have been described previously.10 The ion source used in this investigation employed magnetic focusing of the electrons in order to increase the efficiency of ion production.
The sample was contained in a tungsten Knudsen effusion cell of the same design as the one previously described,10 but with an orifice area of 1.25 X 10”2 cm-2 and a Clausing factor of 0.8.11 The sample consisted of a powdered, approximately 2:1 molar ratio mixture of uranium monophosphide and boron nitride. The uranium phosphide was the same as described elsewhere.12 The boron nitride was a Grade K 721 A, 325 M sample, from Electronic Space Products, Inc. A vacuum fusion analysis of it resulted in 0.11 wt % oxygen. Its principal other impurities in wt % as obtained from a spectroscopic analysis were: Fe, 0.1; Cr, 0.02; and Ni, 0.03. A small amount of graphite powder and a weighed amount of silver were also added to the sample. The evaluations were based on the temperatures measured with a calibrated optical pyrometer by viewing the blackbcdy hole in the bottom of the cell. Experimentally determined window and prism corrections were applied. The temperature at the orifice in the temperature range covered in this investigation was compared with that measured at the bottom blackbody hole after the completion of the vaporization of the sample. Both simultaneously measured temperatures agreed within 10° K.
The molecular beam was ionized with 25-eV electrons, the electron emission current was 500 /¿A, the acceleration voltage 3 kV, and the voltage at the entrance shield of the multiplier was 1.5 kV. The ionic species originating from the sample were identified by their mass to charge ratio, ionization efficiency, and shutter profile measurements. All species showed normal shutter profiles.
The measurement of the ion current of PN + and N2+ was complicated by the presence of background peaks at the corresponding mass numbers. The background contribution in per cent is given as [I (total) — /(shuttered)] X 100/7(total). It was between approximately 99.5 and 90% of the total ion current measured for m/e 45. Similarly, the background contribution at mass 28 during this investigation was between 60 and 95% of the total ion current. For P + (mass 31) and P2+ (mass 62) the background contribution was for all values below 10 and 3%, respectively.
The actual measurements of the ion currents of PN + were performed at the low side of the mass peak 45 at a position (approximately at 0.1 to 0.2 of the maximum ion current for m/e 45) where the largest absolute shutter effect was observed. This way the background contribution in the measurements reported below could be lowered to between 95 and 60% of the total peak intensity for mass 45, and a more sensitive scale could be used for the measurement of the ion current, both factors permitting a higher precision of measurement. This procedure was possible because of the partial mass separation of the hydrocarbon background peak at mass 45 and the PN peak at mass 45 by the mass spectrometer. For the highest ion currents of PN + which were measured in this investigation, the procedure of measurement at the low side of mass 45 and the measurement at the top of mass peak 45 gave identical results within the precision of the measurement.
For each major peak, for w hich only a small background contribution was present, e.g., Ag+, P+, P2+, and U+, the focusing controls of the ion source were adjusted as to yield a maximum ion current. For the measurement of PN+ the same focusing settings as for P and P2 were used, giving identical results within the accuracy of measurement. For N2+ the same focusing settings were used as for P+. This procedure used for PN + and N2+ is assumed to ascertain that the ion source samples the same molecular beam for PN+ and N2+ as for the species where little background contribution was present.
With respect to the changing relative background contribution for the ion currents corresponding to m/e 28 and m/e 45 it was observed that the absolute value of the nonshutterable ion current, which is mainly attributed to the background, increased for both mass numbers slightly with temperature, and in case of m/e 28 possibly with the N2 partial pressure, the latter possibly being due to a contribution of scattered N2 originating from the effusion cell.
Observations during an independent experiment, in which the vaporization of AIN was studied with the same mass spectrometer.13 permit one to set an upper limit for such a contribution of scattered nitrogen. At partial pressures of nitrogen between 10-3 and 10-4 atm it was observed that 90% of the ion current of m/e 28 was shutterable and showed a normal shutter profile. This observation may appear to be unusual because permanent, noncondensable gases such as N2 or 0 2 are often found to be difficult to shutter, due to
(9) W. A. Chupka andM. G. Inghram, J . P h y s . C h em ., 59,100 (1955).(10) K . A. Gingerich, J . C h em . P h y s ., 49, 14 (1968).(11) S. Dushman and J. M. Lafferty, “Scientific Foundations of Vacuum Technique,” 2nd ed, John Wiley and Sons, Inc., New York, N. Y ., 1962.(12) B. A. Scott, K . A. Gingerich, and R. A. Bernheim, P h y s . R ev ., 159, 387 (1967).(13) K . A. Gingerich, unpublished data.
Volum e 73, N um ber 8 August 1969

2736 K a r l A. G i n g e r i c h
scattering.8'14 The observation for the N2+ ion current over AIN shows, however, that with the particular instrument used the scattering problem appears to be minor. The principal reason for this is seen in the design of the pumping system with its high speed mercury diffusion pump connected to the Knudsen cell region by a wide, circular tube that permits very effective pumping. In further support of this explanation, it may be noted that the differential pumping permitted us in the AIN study to maintain a pressure differential as high as 102 between the Knudsen cell region and the ion source section with a pressure of about 10-5 to 10-6 mm in the Knudsen cell region and a pressure of about 10“ 1 mm in the Knudsen cell itself.
In the present investigation involving gaseous PN the highest N2 partial pressures in the Knudsen cell itself were near 10-3 mm and in the Knudsen cell region near 10 ~7 mm. At these comparatively lower pressures, less relative contribution of scattered nitrogen to the background at m/e 28 in the ion source is expected as in the AIN experiment. Therefore, the contribution of scattered nitrogen to the background is estimated to be less than 10% of the ion current measured for the shuttered nitrogen. If one now in addition takes into account that the focusing was maximized on the well shutterable P + peak, thus assuring a sampling of the same part of the molecular peak as for the condensable species, a possible influence of the scattered nitrogen on the measured value for the shuttered ion current of N2+ is estimated to correspond less than to the precision of the measurement itself.
Using the evidence for N2 discussed here, and the fact that Uy, et al.,8 had serious scattering problems with N2 but not with PN, it can also be concluded for PN that the measured shuttered ion currents are representative for the partial pressures inside the Knudsen cell and that there are no systematic errors in the measurements of the ion currents attributed to the partial pressures of PN.
Experimental ResultsThe principal ionic species that were identified during
the early stages of the evaporation at temperatures below and near 1900° K were mass 28 (N2+ and CO+), P2+, and P+, in the order of decreasing intensity. During this initial period, oxygen-containing species such as BO+, C 02+ and C20 + were also observed. These latter species vanished after a relatively short period to near or below their detection limit, indicating the depletion of the sample of most of the oxygen impurity. Near and above 1900° K, U +was observed as an important species, UO+ as a minor species. A measure of the depletion of the condensed system of oxygen is provided by the 7(U +)//(UO+) ion intensity ratio which was 20 at the beginning of the measurements involving gaseous PN and which increased to approximately 500 at the end of this investigation. With this
high U+/UO+ ratio the possible contribution of CO + to the ion current attributed to N2+ was from thermodynamic considerations well below the precision of measurement. At each constant temperature the ion current of U+ increased with time during the measurements involving PN, whereas the ion currents for N2+, P2+, and P+ decreased with time. The B+ ion was observed as a minor species at temperatures above 2000° K. At the highest temperatures of this investigation ionic species attributed to UN+ and UP+ were also observed, in concentrations of about 10~3 of that of U+.
Measurements of the ionization efficiencies for N2+, P+, PN+, P2+, and U+ indicated that these ions were formed by direct ionization from the corresponding neutral species. The appearance potential for PN+ was measured as 12.5 ± 0.4 eV with reference to that measured for P+ taken as 10.5 eV,15 in fair agreement with the value of 11.8 ± 0.1 eV determined by Uy, et al?
In some instances small fluctuations in the ion currents were observed for the species originating from the Knudsen cell. They were strongest for N2+ during a period of temperature rise and were probably due to kinetic effects during the assumed solid-state reaction between the loose component powders consisting of grains of variable size. A solid-state reaction of the type
UP(s) + 2BN(s) = UB2(s) + N,(g) + -P,(g) (1)x
where x is either 1 or 2, may be considered the principal contributer to the gaseous nitrogen and phosphorus effusing from the Knudsen cell.
Emphasis of the mass spectrometric measurements was on the investigation of the reaction
P.(g) + N,(g) = 2PN(g) (2)
In order to obtain corresponding equilibrium partial pressures of the reactants at a given temperature, the ion currents for N2+ and P2+ were at each temperature measured before and after the measurement of the PN+ ion current and the ion currents for N2+ and P2+ that corresponded to the moment of the PN+ measurement were obtained by interpolation. For PN+ two or three measurements were performed and averaged into one data point, by giving the higher values more weight. The corresponding sets of ion currents for P2+, N2+, and PN+ are presented in Table I. The corresponding ion currents of P+ are also included for the temperatures at which they were measured. All data are listed in chronological order. It is noteworthy that after the measurement at 2058° K the nitrogen ion
(14) R. T . Grimley in “The Characterization of High-Temperature Vapors,” J. L . Margrave, Ed., John Wiley and Sons, Inc., New York, N. Y ., 1967, pp 195-243.(15) C. E. Moore, “Atomic Energy Levels,” National Bureau of Standards Circular 467, U. S. Government Printing Office, Washington, D. C., 1958.
The Journal o f Physica l Chem istry

G a s e o u s P h o s p h o r u s C o m p o u n d s 2737
Table I: Experimental Ion Currents for PN+, P2+, N2+, and P+ over UP-BN System
T, ---------------------------------------------------Ion intensities, A-°K 7(PN +) n R i+) J(N 2+) 7(P+)
1952 3.40 X 1 0 ~“ 3 .15 X 10-9 2 . 1 1 X 10-91889 1.06 X 1 0 “ “ 1 .17 X 10-9 4.40 X 10-91930 1.87 X 1 0 ~“ 2 ., 0 2 X 10⁻⁹ 6 . 2 0 X 10-91918 1 . 2 0 X 1 0 - “ 1..75 X 10-9 4.80 X 10⁻⁹ 1 . 2 0 X IO ' 9
1869 3.50 X 1 0 - 1 2 5 .50 X 1 0 - 1 0 1.70 X 10-91916 1.40 X 1 0 - “ 1 ..92 X 10-9 5.10 X 10⁻⁹ 1 .38 X IO “ 9
1970 4.10 X 1 0 - “ 4 .60 X 10-9 1 . 0 2 X 10⁻⁹ 3 . 2 0 X IO - 9
1985 4.40 X 1 0 - “ 6 .09 X 10-9 1.18 X 10⁻⁹ 4. 0 0 X IO “ 9
2019 6.90 X 1 0 - “ 9 .50 X 10-9 2.45 X 1 0 -*2036 1.05 X 1 0 - 1 0 1..40 X 10-9 2.80 X 10⁻⁹ 9. 18 X IO “ 9
2059 1 . 1 0 X 1 0 - 1 0 1 ..78 X 10-9 2.50 X 10⁻⁹ 1 . 1 1 X 10-91921 1.60 X 1 0 - “ 1 .60 X 1 0 - ' 1 . 1 0 X 10-91921 1 . 0 0 X 1 0 - “ 1 .40 X 1 0 -» 4.50 X 10⁻⁹ 1 . 1 2 X 10-91996 3.55 X 1 0 - “ 5..43 X 10-9 7.10 X 1 0 -» 4 .30 X 10-92061 1.32 X 1 0 - ! 0 1 .49 X 10-9 2 . 0 0 X 10-9 1..04 X 1 0 -*2088 1.57 X 1 0 - 1 0 1 .98 X 1 0 -* 3.43 X 10⁻⁹ 1 .53 X 10-92125 2.58 X 1 0 - 1 0 3 .35 X 10-9 5.60 X 10-92116 2.90 X 1 0 - 1 0 3..04 X 10-9 4.33 X 10⁻⁹ 2 .15 X 10-92142 3.90 X 1 0 - 1 0 3. 71 X 10-9 5.70 X 1 0 '« 3.. 0 0 X 10-92144 3.65 X 1 0 - 1 0 3..46 X 10-9 5.55 X 10⁻⁹ 2 .78 X 1 0 -*2058 1 . 2 2 X lO-io 9. 62 X 10-9 4.20 X 10⁻⁹ 9 . 0 0 X 10-92176 2.39 X 1 0 - 1° 3. 24 X 10-9 1.65 X 10⁻⁹ 3 . 0 1 X 10-92172 1 . 2 0 X 1 0 - 1° 1.98 X 10⁻⁹ 1.15 X 10⁻⁹ 2 .78 X 10-92170 8.50 X 1 0 - “ 1 .85 X 10-9 7.10 X 10⁻⁹ 2 .44 X IO - 8
2198 8.40 X 1 0 - “ 2 .42 X 10-9 4.80 X 10⁻⁹ 3 .17 X IO - 8
2194 6.95 X 1 0 - “ 1 .90 X 10-9 3.40 X IQ - 9 3 .16 X IO ” 8
current dropped significantly. This is taken as an indication that solid BN was no longer present any more as an individual phase in the condensed system. The decrease in /(N 2+) is accompanied by a corresponding relatively smaller decrease in I (PN +) if one takes the influence of temperature also into account.
The third-law enthalpies for the pressure independent reaction 2 were obtained from the measured ion currents using the relation
AH°^/T = - R Inffp - A [((?\ - H°m)/T] (3)
where — A[((t°t — H°2 )/T] represents the free energy function change of reaction 2. The necessary free energy functions for the reactants were taken from the JANAF Tables.7 The values for the equilibrium constant for reaction 2, K p(2), were calculated on the basis of the relation
, v = [/+(PN)T]V(P2)t(P2)v(N2)7(N2)pl j [/+(P2)T ][/+ (N 2)77][tr(PN)7 (PN)P 1 ’
where m are the relative ionization cross sections and 7i the relative multiplier gains. In view of the symmetry of reaction 2 the product <r(P2) 7 (P2)<r(N2) 7 (N2) was assumed equal to [<r(PN)7 (PN)]2, leaving the simplified expression K p(2) — [/+ (PN )]2/ [ / +(P2)] X [7+(N2)] for eq 4.
For temperatures for which the corresponding ion currents of P2+, N2+, PN+, and P + were measured, the pressure-dependent reactions
2P(g) + N,(g) = 2PN(g) (5)
and
P2(g) = 2P(g) (6)
were also evaluated. The absolute partial pressures which were needed for the calculation of the third-law enthalpies of reactions 5 and 6 were determined from the relation
Pi = kih+T (7)
where
ki — Ag (8)<7i7i
The sensitivity constant, k g- was obtained by means of an integral silver calibration and is estimated to be accurate within 30%. The effect of neglecting the possible influence of the Clausing factor has been included in this estimate.
The relative maximum ionization cross sections for single ionization were taken from Mann.16 The relative maximum cross section of Ns was obtained by multiplying Mann’s atomic cross section for nitrogen with an experimentally determined factor of 1.93.17 The relative cross sections of P2 and PN were estimated by multiplying the sum of Mann’s atomic cross sections
(16) J. B. M ann, J . C h em . P h ys., 4 6 , 1646 (1967).(17) R. F. Pottie, ib id ., 4 4 , 916 (1966).
Volum e 73, N um ber 8 A ugu st 1969

2738 K a r l A . G i n g e r i c h
Table II: Relative Multiplier Gains, -/■„ Ionization Cross Sections, tr„ and Sensitivity Constants, k¡, Used in the Calculation of Absolute Partial Pressures
Relative multiplier gains W tas
Relative ionization cross sections, <n, at 25 eV, in A2
Sensitivity constants, ku in atm/A X °K
Ag1.00
5.44
2.50 X 10~2
N.2.29
1.09
5.45 X IO“2
P,1.77
5.88
1.31 X IO“2
PN2.03
3.91
1.72 X IO"2
P1.78
4.20
1.90 X 10"2
Table III: Third-Law Evaluation of the Enthalpies of Reactions: (R2): P2(g) + N2(g) = 2PN(g); R(5): 2P(g) + N2(g) = 2PN(g) and R(6): P2(g) = P(g) over UP-BN System
-A 1(0°T - H°m)/T], A H°m,
■K R2 R5 R6 R2 R5 R6 R2 R5 R61952 21.780 2.989 48.31889 21.325 2.984 45.91930 20.835 2.987 46.01918 21.809 -10.127 33.687 2.986 -24.439 27.424 47.5 -66.3 117.21869 22.343 2.983 47.21916 21.501 -10.080 33.332 2.986 24.438 27.423 46.8 -66.1 116.41970 20.344 -9.561 31.656 2.990 -24.460 27.450 45.9 -67.0 116.51985 20.910 -8.650 31.311 2.992 -24.467 27.459 47.5 -65.7 116.72019 21.458 2.994 49.32036 20.822 -7.038 29.610 2.996 -24.493 27.487 48.4 -64.2 116.32059 20.882 -6.688 29.326 2.997 -24.502 27.500 49.2 -64.2 117.01921 22.131 2.987 48.21921 21.962 -9.812 33.525 2.987 -24.438 27.425 48.0 -65.8 117.11996 20.526 -8.513 30.7 90 2.992 -24.474 27.465 46.6 -65.8 116.32061 19.362 -8.086 29.203 2.997 -24.505 27.501 46.1 -67.2 116.92088 20.318 -6.166 28.235 2.999 -24.516 27.515 48.7 -64.1 116.42125 20.359 3.002 49.62116 19.194 -6.750 27.695 3.001 -24.526 27.575 46.9 -66.2 116.82142 18.959 -6.033 26.742 3.003 -24.537 27.542 47.1 -65.5 116.32144 19.031 -6.130 26.912 3.003 -24.538 27.544 47.2 -65.8 116.82058 20.305 -6.869 28.925 2.997 -24.503 27.500 47.9 -64.6 116.12176 18.172 -6.506 26.429 3.006 -24.551 27.557 46.0 -67.5 117.52172 19.215 -4.811 25.777 3.005 -24.550 27.555 48.3 -63.8 115.82170 19.487 -4.912 26.150 3.005 -24.549 27.555 48.8 -63.9 116.52198 19.295 -4.584 25.629 3.007 -24.562 27.569 49.0 -64.1 116.92194 18.884 -4.526 25.161 3.007 -24.560 27.567 48.1 -63.8 115.7
Average 47.6 -65.3 116.6
Table IV: Summary of Third-Law and Second-Law Reaction Enthalpies for Gaseous Equilibria between N2, PN, Ps, and P
Exptl Third-lawtemp '-------- Second-law evaluation-------- v evaluation,range, AH°t, Ai/°298, Ai/° 298,Reaction °K kcal mol“1 kcal mol-1 kcal mol-1
P2 + N2 = 2PN (2) 1870-2200 41.1 ± 4.2 40.8 ± 4.2 47.6 ±1.2 This work1890-2200 42.7 ± 4.9 42.4 ± 4.9 51.2 ±1.2 This work970-1120 -10.0 ± 4.1 -8.02 ± 0.61 Uy, Kohl, and Carlson8
1170-1180 (14.2) Huffman, et al.s2P + N2 = 2PN (5) 1890-2200 -78.1 ± 5.6 -76.3 ± 5.6 -65.3 ±1.4 This workP2 = 2P (6) 1890-2200 120.8 ± 2.3 118.7 ± 2.3 116.6 ±0.5 This work
with an empirical factor of 0.7.17 From the experimen- the relative cross sections for single ionization withtal ionization efficiency curves it was determined that 25-eV electrons were within 5% of being equal to the
The Journal o f P hysica l Chem istry

G a s e o u s P h o s p h o r u s C o m p o u n d s 2739
relative maximum cross sections for Ag, P, P2, and PN and were a factor of 0.41 smaller for N2. This latter factor compares with the one of 0.60 obtained in a different investigation under similar conditions with the exception of the use of a different ion source.18 The multiplier gains for Ag+, P+, P2+, and N2 + were measured with a grid collector. The multiplier gain of PN + was assumed to be equal to the arithmetic mean of that measured for P2+ and N2+. In Table II, the relative ionization cross sections, <n, multiplier gains, 7i, and the calculated calibration constants, ki, used for the calculation of the absolute partial pressures according to eq 7 are summarized.
The free-energy functions of monatomic phosphorus needed in the calculation of the third-law enthalpies of reactions 5 and 6 were taken from the JANAF Tables.7 The equilibrium constants, free-energy function changes, and derived third-law enthalpies for reactions 2, 5, and 6 are represented in Table III.
The second-law enthalpies of reactions 2, 5, and 6 have been calculated using the relation
AH \ = - R d In A p/d ( l /T ) (9)
The corresponding AH°MS values were obtained by using the JANAF H °T — / / ° 298 values for the reactants and products.7 The results are summarized in Table IV, together with the average values for the third-law reaction enthalpies listed in Table III. Also given in Table IV are the third-law and second-law evaluations for reaction 2 using absolute partial pressures for those data sets for which the P+ ion currents were also measured (see Table I). It should be noted that these enthalpies of reaction 2 correspond to the sums of the enthalpies of reactions 5 and 6. All uncertainties given in Table IV for the enthalpies of the reactions 2, 5, and 6 represent the corresponding standard deviations. The results by Uy, et al.,s and Huffman, et al,,5 are also included in Table IV for the purpose of comparison.
The second-law entropy changes, ASr, in eu, for reactions 2, 5, and 6 have been measured as —0.2 ±2.1, —30.3 ± 2.7, and 29.5 ± 1.2, respectively, where the given uncertainties represent the standard deviation. The corresponding third-law entropies7 are 3.1, —25.4, and 28.5, respectively.
Assessment of Experimental ResultsThe estimated accuracy of the measured properties,
where not given in the text, is as follows. The ion currents of Ag+, P+, and P2+ have been measured with an accuracy of better than 5%, those for N2+ and PN+ with an accuracy of better than 30% with the possible exception of the lowest measured values, where the uncertainty may have been larger, due to the correspondingly larger background contribution for these values. The occasionally observed slight fluctuations in the measured ion currents have been included in these estimates.
The relative multiplier gains given in Table II are based on average values of 10-40 measurements for each ionic species. The estimated accuracies are 5, 10, and 20% for P2+, P+, and N2+, respectively. The estimated accuracy of the derived value given for PN is 25%;
With respect to the energy dependence of the ionization cross sections, it is noteworthy that PN behaved similar to Ag, P, and P2 rather than to N2, a fact that accounts for the larger part of the discrepancy in the third-law enthalpies of reaction 2 using either the simplified form of eq 4 or the absolute partial pressures P i = hliT.
The Dissociation Energy of Pz(g). The enthalpies of reaction 6 shown in Tables III and IV represent directly the dissociation energy of P2. In a previous mass spectrometric investigation, a value of D°MS = 115 ± 6 kcal/mol was obtained19 for the dissociation energy of P2 and was taken as a confirmation of Herzberg’s spectroscopic value of H°298 (P2) = 116.9 kcal/mol.20
In the present investigation, the conditions for the measurement of the equilibrium between P2 and P were more favorable than those in the previous one19 in that no temperature gradient was present and a lower ionization energy was used, the latter thus minimizing possible fragmentation. The good agreement of the second- and third-law enthalpies and entropies for reaction 6 in this investigation is taken as evidence that equilibrium in the gaseous phase, as well as between the vapor and the condensed system, was essentially attained for the phosphorus species and that the observed slight fluctuations upon heating to a new temperature had little effect on the equilibrium values of the partial pressures, other than increasing the scatter of the data.
Taking the estimated uncertainties in the values for the absolute partial pressures and temperature measurement into account and giving predominant weight to the third-law data, the dissociation energy, D°M8, of P2 is obtained as 117.0 ± 2.5 kcal/mol in further confirmation of the spectroscopic value for the dissociation energy of P2 that has been obtained with high precision from the predissociation limit, provided the basis of the spectroscopic interpretation is correct.20 In the evaluation of reaction 2, the spectroscopic value for the dissociation energy of P2 has been used, thus making reactions 2 and 5 independent. Alternately, the coincidence of the experimental value obtained in this investigation for the dissociation energy of P2 with the spectroscopic value can be taken as added evidence for the correctness of the silver calibration and derived partial pressures of the reactants.
The Dissociation Energy and Heat of Formation of PN (g). As can be seen from Table IV, the second- and
( 1 8 ) K . A . G in g e r i c h , J . Chem. P h y s . , 4 9 , 1 9 ( 1 9 6 8 ) .
( 1 9 ) K . A . G in g e r i c h , ib id ., 4 4 , 1 7 1 7 ( 1 9 6 6 ) .
( 2 0 ) G . H e r z b e r g , A n n . P h y s . , 1 5 , 6 7 7 ( 1 9 3 2 ) .
V olum e 73, N um ber 8 August 1969

2740 K a r l A. G i n g e r i c h
third-law enthalpies for each of the reactions 2 and 5 are in fair agreement. The same holds for the corresponding second- and third-law entropies. The agreement is in each case not as good as was found for reaction 6. Furthermore, the agreement is slightly better for the pressure-independent reaction 2 than for the pressure-dependent reaction 5. In addition, the enthalpies of reactions 2 and 5 give, within the standard deviation, identical values for the dissociation energy of PN. These observations are taken as an indication that equilibrium conditions prevailed for reactions 2 and 5 during the measurements. As can be seen from Tables I and II this assumption appears to be further supported by the observation that there is no systematic trend in the third-law reaction enthalpies with temperature and with the observed shift in the relative ion currents and thus partial pressures of the reactants. The observations noted above, that there was no complete equilibrium between the solid and gaseous phase, especially for N2, are assumed to have led primarily to the scatter in the results that can be seen from Tables1 and II and not to a significant systematic error. The limited accuracy in the measurement of the ion currents, particularly those of PN+ and N2+, has also contributed to the observed scatter.
Giving in each case more weight to the third-law value, the values selected for the enthalpies of reaction2 and 5 are 47.0 ± 7 . 0 and —68.0 ± 8.0 kcal/mol. Here the estimated uncertainties include the effects of the limited accuracies in the measurements of the ion currents for PN+ and N2+ and the effect of the slight deviations from equilibrium conditions between the gaseous phase and the condensed system. The estimated uncertainties also include the effects of uncertainties in the relative ionization cross sections, multiplier gains, and temperature measurement. Combining the selected values for the enthalpies of reactions 2 and 5 with the JANAF values7 for the dissociation energies, Z)°298, of P2 (116.9 ± 1.0 kcal/mol) and of N2 (226.0 ± 2.0 kcal/mol), the dissociation energy, D °2gg, of PN(g), in kcal/mol, is calculated as 148.0 ±5.0 and 147.0 ± 5.0 from reactions 2 and 5, respectively. The selected value is Z)°298 (PN) = 147.5 ± 5 kcal/mol, and the corresponding value for °K reference temperature is D °o (PN) = 146.6 ± 5 kcal/mol or 6.4 ± 0.2 eV.
From the selected value for the enthalpy of reaction 2 and the JANAF value7 for the standard heat of formation of P2(g) of 42.7 ± 0.5 kcal/mol, the standard heat of formation, A//'f°298, of gaseous PN is calculated as44.9 ± 3.8 kcal/mol. Similarly, a value of 45.8 ± 4.5 kcal/mol is obtained for AH{°29a (PN) on the basis of the selected value for the enthalpy of reaction 5 and the JANAF value for the standard heat of formation of P(g) of 79.8 ± 1.0 kcal/mol. The selected value, AHf°298 (PN) = 45.3 ± 4.0 kcal/mol, compares with the value of 25.0 ± 1.2 kcal/mol that has been adopted by the JANAF tables.
DiscussionThe selected value for the dissociation energy of
PN(g), D°0 = 146.6 ± 5.0 kcal/mol or 6.35 ± 0.22 eV compares well with the preferred estimated approximate value of 6.3 eV by Herzberg4 and the value of 6.0 ±0.8 eV estimated by Gaydon,3 both of which estimates were based on the spectroscopic data by Curry, et al.2b It is, however, considerably lower than the value of 7.1 ± 0.05 eV by Huffman, et al.? and the value of 7.57 eV by Uy, et al?
Further information concerning the dissociation energy of the PN molecule can be obtained from ab initio calculations that are available in literature. The total Hartree-Fock energy for PN (’ S +), at equilibrium distance, of —395.18571 au has been calculated by McLean and Yoshimine.21 Together with dem enti’s22 total Hartree-Fock energies for the ground states of N(4S) of —54.40091 au and P(4S) of —340.71866 au one obtains the Hartree-Fock dissociation energy: N(4S)+ P(4S) - PN (1S+) as 0.06614 au or 1.80 eV. The molecular extra correlation energy that needs to be added to this value in order to obtain the actual dissociation energy has been assumed the same as the one reported for N2(12g+), namely 4.63 eV.23 This assumption is according to Clementi24 valid since the number of extra pairs in PN in going from P(4S) + N(4S) to PN (42 +) is equal to the number of extra pairs in N2 in going from N(4S) + N(4S) to N2(12g+) and is expected to lead to an error in the calculation dissociation energy of PN of only a few tenths of 1 eV, and certainly of less than 1 eV. Thus the dissociation energy, D °0 (PN), resulting from ab initio calculations is 6.43 eV or 148.3 kcal/mol in excellent agreement with the experimental value obtained in the present investigation.
The higher value reported for the dissociation energy of gaseous PN by Huffman, et al.,5 may possibly be explained by the unfavorable experimental conditions of measurement these authors had to deal with and by their limited number of experimental data. Relatively small errors in the measurement of pressures and temperatures could already have caused the observed discrepancy.
The mass spectrometric investigation by Uy, et al.? yields internally consistent second- and third-law results for the enthalphy of the reaction 2PN(g) = P2(g) + N2(g). Weak points in the investigation by Uy, et al., besides the problem with the shutterability of N2, appear to be the uncertainty in the value for the vaporization coefficient of PaN5(s) and in the measured values for the P4+ ion currents. However, these uncertainties are unlikely large enough for causing the
( 2 1 ) A . D . M c L e a n a n d M . Y o s h i m i n e , “ T a b l e s o f L i n e a r M o l e c u l e W a v e F u n c t i o n s , ” I B M C o r p . , N e w Y o r k , N . Y . , 1 9 6 7 .
( 2 2 ) E . C l e m e n t i , “ T a b l e s o f A t o m i c F u n c t i o n s , ” I B M C o r p . , N e w Y o r k , N . Y . , 1 9 6 5 .
( 2 3 ) E . C l e m e n t i , I B M 9 , 2 ( 1 9 6 5 ) .
( 2 4 ) E . C l e m e n t i , p r i v a t e c o m m u n i c a t i o n , 1 9 6 8 .
The Journal o f P hysica l Chem istry

R a d i o l y s i s o f E t h a n o l A d s o r b e d o n S i l i c a 2741
rather large observed discrepancy with the present investigation in the corresponding reaction enthalpies. A possible explanation of the observed discrepancy may be found in the slow rate of the decomposition of PN (g) into the N2 and the observed phosphorus species. Huffman, et al., have needed 100 hr to reach equilibrium for the decomposition of gaseous PN into the gaseous molecules of the component elements at about 1 atm of pressure and at temperatures that were comparable to those used by Uy, et al. In the present investigation considerably higher temperatures have been used which certainly effected a much more rapid equilibration between the reactants. This argument would assume the measurement of the heat of vaporization of P3N3(s) (reaction: P3N6(s) = 3PN(g) + N2(g)) by Uy, et al, to be correct within the uncertainty limits given by the authors.
A calorimetric determination of the heat of formation of P3Ns(s), together with the heat of vaporization of P3Ns(s) that was measured by Uy, et ad, would provide a
test for the above explanation of the discrepancy in the experimental dissociation energy of gaseous PN by Uy, et al., and the present investigation. On the basis of the heat of formation of gaseous PN, AH{°2ss = 45.3 ± 4.0 kcal/mol measured in the present investigation, and the heat of vaporization of P3N6(s), AH°2n = 282 ± 20 kcal/ mol8 the standard heat of formation for P3N5(s), AH(°2W, becomes —146 ± 30 kcal/mol. This compares with the value of —230 ± 20 given by Uy, et al.,8 that was based on the higher value for the dissociation energy of PN(g) found by these latter authors.
Acknowledgments. The author wishes to express his thanks to Professor G. Herzberg for valuable comments and to Professor K. D. Carlson for making the manuscript by O. M. Uy, F J. Kohl, and K. D. Carlson available prior to its publication. He also thanks Professor E. D. Cater for a critical reading of this manuscript, and Dr. E. Clementi for making him aware of the possibility to obtain a value for the dissociation energy of PN(g) from published ab initio calculations.
Radiolysis of Ethanol Adsorbed on S ilica la
by Lloyd Abrams:b and A. O. AllenC h em is try D ep a r tm en t, B rooh h a ven N a tio n a l L a b ora tory , U p ton , N ew Y o r k 1 1 9 7 3 (R ece iv ed J a n u a r y 24 , 1 9 6 9 )
Ethanol on high-surface silica (Cabosil) is mainly held by physical adsorption, but a few per cent is held irreversibly in a form shown by infrared absorption studies to consist of Si-0-C2H6 and Si-O-H groups. When the system is irradiated by y rays, considerable decomposition of ethanol results from transfer of excitation energy from the silica. The major gaseous products (hydrogen, carbon monoxide, and methane) occur in about the same ratio as in radiolysis of liquid ethanol and probably result from excitation of adsorbed ethanol molecules, but small yields of ethane and ethylene vary in a peculiar manLer which suggests that they arise from ethyl carbonium ions formed at acid sites created by radiation on the silica surface.
A number of papers have appeared2-9 on the radiolysis of organic materials adsorbed on silica or other minerals which show that energy originally taken up from radiation by the solid can be transferred to the adsorbed molecules and bring about their decomposition. The mechanism by which this transfer occurs is not clear. It was thought3 that overlap in the wave functions of the adsorbed molecules and of excited electrons trapped in surface states would be sufficient to bring about the required energy transfer. As an alternative, it has been proposed6 that the radiation might bring about transient alterations in the surface to produce sites of an acidic character similar to those existing in silica-alumina catalysts, which would be capable of bringing adsorbed molecules
into chemical reaction. Support for this hypothesis would seem to be given by the reported formation6 of
( 1 ) ( a ) R e s e a r c h p e r f o r m e d u n d e r t h e a u s p i c e s o f t h e U . S . A t o m i c E n e r g y C o m m i s s i o n ; ( b ) P i g m e n t s D e p a r t m e n t , E x p e r i m e n t a l S t a t i o n , E . I . d u P o n t d e N e m o u r s a n d C o . , W i l m i n g t o n , D e l .
( 2 ) J . M . C a f f r e y , J r . , a n d A . O . A l l e n , J . P h y s . C h em ., 6 2 , 3 3 (1 9 5 8 ) .
( 3 ) J . W . S u t h e r l a n d a n d A . C . A l l e n , J . A m e r . C h em . S o c ., 8 3 , 1 0 4 0 (1 9 6 1 ) .
( 4 ) J . G . R a b e , B . R a b e , a n d A . O . A l l e n , J . P h y s . C h em ., 7 0 , 1 0 9 8 (1 9 6 6 ) .
(5 ) ( a ) C . B a r t e r a n d C . D . W a g n e r , ib id ., 6 8 , 2 3 8 1 ( 1 9 6 4 ) ; ( b )C . B a r t e r a n d C . D . W a g n e r , Md., 6 9 , 4 9 1 ( 1 9 6 5 ) .
(6 ) H . W . K o h n , ib id ., 6 6 , 1 1 8 5 (1 9 6 2 ) .
( 7 ) E . A . R o j o a n d R . R . H e n : z , ib id ., 7 0 , 2 9 1 9 (1 9 6 6 ) .
( 8 ) V . I . V l a d i m i r o v a , G . M Z h a b r o v a , B . M . K a d e n a t s i , V . B . K a z a n s k i i , a n d G . B . P a r i i s k i i , D o k l. A k a d . N a u k S S S R , 1 6 4 , 3 6 1 ( 1 9 6 5 ) .
Volum e 73, N um ber 8 August 1969

2742 L l o y d A b r a m s a n d A . 0 . A l l e n
carbonium ion colors on irradiation of numerous aromatic compounds adsorbed on silica. The present work on 7 radiolysis of ethanol adsorbed on silica was undertaken to determine whether use of a more highly polar substrate than employed in previous investigations might shed some light on the mechanism of the energy transfer. Specifically, if the acid site mechanism was of importance, one would expect that dehydration reactions to give ethylene would become much more important in the adsorbed state radiolysis than they are in the normal radiolysis of liquid ethanol.
Experimental SectionSilica used was Cabosil Grade M-5 silica spheres
obtained from the Cabot Corporation and stated by the manufacturer to have a surface area of 200 m2 g_1. Our determination of the surface area by the BET method agreed with the manufacturer’s determination within 1%. For ease in handling, the loose powder was compressed at 1000 psi into 1-in. diameter wafers. The wafers were broken up into smaller pieces for weighing.
Commercial Solvents Corp. 95% ethanol was thoroughly dried over calcium oxide and finally distilled over magnesium chips and iodine. The ethanol was transferred for degassing to a greaseless vacuum system employing Hoke bellows-sealed valves, where it was distilled under vacuum from CaO and stored under vacuum.
Four-gram Cabosil samples were weighed into cylindrical vessels of fused quartz which were fitted with break-seals. After heating in air to 550° the containers were sealed to the grease-free vacuum system. The samples were outgassed at 550° and treated at temperature with oxygen to destroy any remaining organic matter that might be retained on the surface of the silica. Samples were then outgassed at 550° for about 70 hr to a residual pressure of 6 X 10~6 Torr. Ethanol, measured as a liquid in a calibrated tube, was distilled onto the cooled silica samples which were then sealed off under vacuum at liquid nitrogen temperature. The weight of Cabosil taken initially in each sample was4.07 g, which yielded a weight of 4.00 g of silica after outgassing.
Samples were irradiated at about 23° with cobalt-60 7 rays at a dose rate of 0.275 or 1.0 Mrad/hr. The fraction of ethanol decomposed by radiolysis was about 1% for most runs. After irradiation the ampoule was sealed to a vacuum line, the break-seal was opened, and the gaseous products were pumped through a series of liquid nitrogen traps to a McLeod gauge. Aliquots were analyzed in a Perkin-Elmer Model 154 C gas chromatograph using a 2-m column of silica gel at room temperature with helium or argon as carrier gas. Amounts of gas were determined from peak areas calibrated by known samples. A light hydrocarbon fraction was then collected in the McLeod gauge by raising the temperature of the traps to —80°; this
Figure 1. Hydrogen yield (molecules/100 eV) from Cabosil without adsorbate, irradiated with y rays to 0.45 Mrad, as a function of outgassing temperature.
fraction was analyzed on the same column at a temperature of 100°.
No additional gas was obtained when the ampoule was heated to 150° for recovery of the ethanol. Heating to this temperature resulted in recovery of more than 90% of the ethanol, but the remaining few per cent was apparently adsorbed irreversibly and could not be recovered, even if the sample had not been irradiated.
Measurements of infrared spectra were made by a Perkin-Elmer 521 recording spectrophotometer, equipped with a Model 621 interchange and a 1-A globar source. The Cabosil samples were irradiated in cells made of fused quartz fitted with infrared transmitting windows made either of Infrasil (Amersil Co.) or Yitreosil (Thermal American Fused Quartz Co.) brands of purified silica. The windows had absorption bands in the region 3000 to 2100 cm-1 necessitating the use of a reference cell in the recording of spectra. The windows were opaque below 2100 cm-1.
In order to determine how much of the ethanol was actually adsorbed on the silica and how much remained in the vapor phase, the adsorption isotherm of ethanol
(9) P. J. Dyne and N. H. Sagert, Nature, 210, 1153 (1966).
T he Journal o f P hysica l Chem istry

R a d i o l y s i s o p E t h a n o l A d s o h b e d o n S i l i c a 2743
on Cabosil was determined. At one monolayer coverage at 24° the relative pressure p /p 0 of ethanol is 0.11 where p0 is the vapor pressure of liquid ethanol. Less than 0.6% of the added ethanol was in the gas phase in our cells, at any coverage. For the calculation of the number of monolayers adsorbed, we took Wade’s value10 of 25.8 A 2 for the area per ethanol molecule. Using the BET method with ethanol vapor at room temperature we obtained areas ranging from24.3 to 31.3 A2. This determination was not very accurate and we use the literature value.
Results
When Cabosil was irradiated in the absence of any added adsorbed material, a yield of hydrogen was obtained which decreased with increasing degassing temperature of the sample as shown in Figure 1. No other gases than hydrogen were seen (except some CO from a sample not preheated in oxygen). The hydrogen presumably arises from hydroxyl groups held on the silica surface. The number of OH groups per unit silica surface as a function of degassing temperature has been given by Borello, et ai.n When (7(H2) was plotted on log-log paper against the number of OH groups, a straight line was obtained which showed that (t(H2) (at 0.45 Mrad) was proportional to the 3.5 power of the surface OH concentration. At a temperature of 550°, the hydrogen yield is negligible compared to the yields of this gas produced during irradiation of adsorbed ethanol and this outgassing temperature was used in all the ethanol runs recorded here. No appreciable quantity of gas was produced when ethanol was added to a preirradiated sample of Cabosil.
Yields of hydrogen found at a total dose of 0.45 Mrad are shown in Figure 2 as a function of the coverage in monolayers of ethanol. The upper curve for G'0(H2) shows the molecules of hydrogen formed per 100 eV absorbed by the whole system, silica plus ethanol. The lower curve marked “ liquid” represents the yield that would be seen if only energy absorbed directly by the ethanol present were effective in producing hydrogen and if the specific hydrogen yield were the same in the adsorbed state as in the liquid ethanol (Gx(H2)). The difference between the two curves, AG, may be taken to represent the yield of hydrogen resulting from energy transfer from the silica to the adsorbed ethanol layer. Energy is assumed to be absorbed by each phase in proportion to its electron density. Thus, AG is given by Go — G%«, where e is the electron fraction of ethanol in the mixture, and AG is equal to the number of molecules decomposed or produced by energy transfer from the silica, divided by the total dose to the entire system in hundreds of electron volts. A more logical unit would seem to be the molecules decomposed by energy transfer per unit energy absorbed in the silica alone. This quantity is given by AG/(l — «).
Figure 2. Upper curve, hydrogen yield from ethanol adsorbed on Cabosil, irradiated with y rays to 0.45 Mrad, in units of molecules/100 eV taken up by the entire system of ethanol plus silica, as a function of the surface coverage in monolayers of ethanol. Lower curve, G(H2) for liquid ethanol multiplied by e, the electron fraction of ethanol in the system.
8 (MONOLAYERS)
Figure 3. Product yields in the ethanol silica system. Ordinate, additional yield AG due to the presence of silica (this is the difference between the two curves of Figure 2) divided by the mole fraction of silica, 1 — e. Abscissa, amount of ethanol, given as electron fraction e (bottom) or number of monolayers on the silica surface (top).
( 1 0 ) J . B a r t o , J . L . D u r h a m , V . F . B a s t o n , a n d W . H . W a d e , J . Colloid Interface Sci., 2 2 , 4 9 1 (1 9 6 6 ) .
( 1 1 ) E . B o r e l l o , A . Z e c c h i n a , a n d C . M o r t e r r a , J. Phys. Chem., 7 1 , 2 9 3 8 ( 1 9 6 7 ) .
Volum e 78, N um ber 8 August 1969

2744 L l o y d A b r a m s a n d A . 0 . A l l e n
Figure 3 shows the yields of product gases at exposures of 0.45 Mrad in terms of this quantity, A (?/(l — e), plotted on a logarithmic scale for convenience. The coverage is shown both as number of monolayers and as electron fraction of ethanol. For the calculation, values of G% for each product were taken from the work of Myron and Freeman.12
From the yields of the major product, hydrogen, and also those of methane and carbon monoxide, it may be seen that the majority of the energy transfer occurs with only a single monolayer present. A slight increase in energy transfer is, however, indicated by the slow rise in the curves at coverages beyond the first monolayer, contrary to what was found in the case of pentane.2 At high coverages the ratios of the yields of these three gases appear to be approaching those characteristic of the pure liquid, suggesting that the mechanism of the formation of the gases in the adsorbed layer and in the liquid is not very different. Quite different results are found, however, for the yields of ethane and ethylene. At the lowest coverage studied the yield of ethane is already high while that of ethylene is small. With increasing coverage, however, the yield of ethane falls rapidly as the yield of ethylene rises. The sum of the two yields is nearly constant below 4 monolayers, and one gets the impression of a competition between two processes for some C2 precursor. At coverages higher than 4 monolayers both yields fall, and the yield of ethane in fact becomes smaller than GLe, so that the value could not be represented on the present plot. Evidently not only must the mechanism for formation of these products in the adsorbed state be very different from that occurring in the liquid but the mechanism which holds in the liquid must be, to a great extent, suppressed in the adsorbed state.
Changing the total dose over the range 0.2-2.5 Mrads had no significant effect on the yields of carbon monoxide and methane. An increase in dose resulted in considerable decrease of the ethylene yield at coverage of 1 mono- layer, but there was no corresponding increase in the ethane yield. A different dose effect was found on the yield of hydrogen, which increased from 2.4 to 2.82 in AG as the dose increased from 0.2 to 1.2 Mrads, with no further increase at a higher dose. The results suggested that the hydrogen first formed was being taken up by the silica surface under the influence of the radiation. That this occurs was shown by measuring the pressure decrease when a sample of outgassed Cabosil was irradiated under a pressure of 0.3 Torr of hydrogen. The pressure, p, was found to decrease gradually with increasing dose D, according to the law p0 — p = a D 0M. Samples irradiated in hydrogen atmosphere showed the growth of a band at 2284 cm-1, which is close to the position of the band assigned to the SiH2 grouping by Low and Morterra.18 The same band at 2284 cm-1 appeared when the Cabosil was heated in hydrogen to 750°. This band was not seen to form
FREQUENCY (cm-1)Figure 4. Differential infrared absorption spectra of a sample of 1 monolayer of ethanol adsorbed on Cabosil, irradiated with 7 rays to 2.5 Mrads, and then pumped out at increasing temperatures: curve a, 100°; b, 160°; c, 260°; d, 400°; e, 475°; f, 550°; taken against a Cabosil sample that had been exposed neither to ethanol nor to 7 rays.
when ethanol was radiolyzed on a sample outgassed at 550°, but did appear when ethanol was radiolyzed on a sample outgassed at 750°.
A different band is formed by the adsorption of ethanol on silica. Figure 4 shows the differential spectrum of a Cabosil sample which had been outgassed at 550°, had a single monolayer of ethanol put on, was irradiated to a dose of 2.5 Mrads, and was then pumped out at different temperatures. The spectra were all taken as differences from another sample of Cabosil that had been outgassed at 550° but had not been exposed to ethanol. The high-frequency absorbance is due to OH stretching. At lower frequencies there is a characteristic group of six bands at 2886 (shoulder), 2907, 2938, 2952 (shoulder), and 2986 cm-1 which is still noticeably present at 400° but disappears on outgassing at higher temperatures. This spectrum was found to be matched almost exactly, with a shift of only six wave numbers, by the absorption spectrum of a thin layer of
( 1 2 ) J . J . J . M y r o n a n d G . R . F r e e m a n , C a n . J . C h em ., 4 3 , 3 8 1 (1 9 6 5 ) .
( 1 3 ) C . M o r t e r r a a n d M . J . D . L o w , C h em . C o m m u n ., 2 0 4 ( 1 9 6 8 ) .
The Journal o f P hysica l Chem istry

ethyl orthosilicate. It is thus assigned to the stretching vibrations in the grouping SiO-C2H8. The same spectrum was found at about half the intensity when a sample of Cabosil was exposed to ethanol without radiation, and formation of this grouping no doubt accounts for the irreversible adsorption of ethanol mentioned above. This irreversible adsorption amounts to approximately 10% of the total adsorbed at coverages below one monolayer; the amount is not increased by additional ethanol above one monolayer.
On heating samples of irradiated adsorbed ethanol up to 500°, yields of gaseous product were found which were several times greater than the gas appearing at room temperature. These yields were not reproducible in either amount or composition and presumably arose from pyrolysis of the irreversibly adsorbed ethanol. Carbon dioxide was always a major component of this pyrolysis gas.
Discussion
The C2 intermediate which is the precursor of ethane and ethylene is most plausibly taken to be the ethyl carbonium ion C2H8+. At low coverage this entity would be expected usually not to find another ethanol molecule in the vicinity to react with and would pick up an electron from the silica to form an ethyl radical, which would eventually react with an ethanol molecule by H abstraction to form ethane. At somewhat higher
R a d i o l y s i s o f E t h a n o l A d s o r b e d o n S i l i c a
coverages the C2H8 + would have a greater probability of donating a proton to a neighboring ethanol molecule to form ethylene. The e :hane formed in the radiolysis of liquid ethanol, which is a more prominent product than with adsorbed ethanol, probably arises from ethyl radicals. Myron and Freeman12 suggest the reaction of solvated electrons with acid cations C2H8OH2+ as a possible source of ethyl radicals. This reaction would not be expected to occur in the adsorbed phase, where neither solvated electrons nor protonated ethanol molecules would probably be formed to a great degree. Instead, the acid character of the silica could result in the transient formation of the ethyl carbonium ions. Thus the C2 hydrocarbon yields suggest the participation of acid sites on the silica surface in the ethanol radiolysis. However, the yield of these products is very small and the larger yields of hydrogen and methane appear to be formed by processes similar to those occurring in the liquid. It seems probable, therefore, that at room temperature most of the energy transfer resulting in radiclysis does not involve particular sites on the surface but is merely a result of excitation of normal surface states on the silica which can interact with the adsorbed molecules. The reaction rate of acid sites with ethanol on silica-alumina catalysts increases rapidly with temperature, and we would expect an increase in G(C2H4) if radiolysis of ethanol adsorbed on silica were conducted at an elevated temperature.
2745
V olum e 73, N um ber 8 A u gu st 1969

2746 J. M. S a n g s t e r a n d J. C. J. T h y n n e
Reactions of Radicals Containing Fluorine. V. The Addition of
Trifluorom ethyl Radicals to Ethylene
by J. M. Sangster and J. C. J. ThynneC h em is try D ep a r tm en t, E d in b u rg h U n iv ers ity , E d in b u rg h , S co tla n d (R ece iv ed J a n u a r y 2 7 , 1 9 6 9 )
The addition of trifluoromethyl radicals to ethylene in the gas phase has been studied over the temperature range 18-201° using the abstraction of a hydrogen atom from hydrogen sulfide as the competing reaction. The Arrhenius parameters determined for the addition reaction were 1011-39 mol-1 cm-3 sec-1 and 2.4 kcal mol-1.
The addition of trifluoromethyl radicals to various unsaturated compounds has been studied by Szwarc and coworkers1-3 using a competitive technique, the abstraction of a hydrogen atom from 2,3-dimethyl- butane being the alternative reaction; hexafluoro- azomethane was the radical source.
CF3 + CH2=CHR —^ CF3CH2CHR
CF3 + C6H14 - V CF3H + C6H13
Their method suffers from the disadvantage that no product resulting directly from the addition reaction is measured or even observed, the analytical method depending upon changes in the CF3H /N 2 ratio when the olefin was added. In the case of ethylene,2 if the reported value4 for the activation energy for reaction 2 is used, the activation energy for the addition reaction is negative, which is unlikely.
We have therefore studied the gas-phase addition of trifluoromethyl radicals to ethylene in the temperature range 18-201°, measuring the products formed as a result of the addition reaction.
Experimental Section
The source of trifluoromethyl radicals chosen was the photolysis of hexafluoroacetone since preliminary experiments with ethylene showed that this source gave a less complex set of reaction products than did trifluoromethyl iodide.
A competitive technique was used, the addition reaction of the radical being measured relative to a hydrogen atom abstraction reaction. Experiments showed that abstraction from cyclohexane was too slow and that methyl mercaptan reacted directly with the ketone to form a nonvolatile complex. No such reaction was observed between hydrogen sulfide and the ketone, even at 200°, and since hydrogen sulfide reacted readily with the radical to lose a hydrogen atom it was used as the reactive substrate. Because of the very facile addition to ethylene it was found that optimum conditions for accurate measurement of products were
obtained with mixtures rich in hydrogen sulfide, namely H2S /C 2H4 ~ 10.
Apparatus and Procedure. The reaction cell was a quartz cylinder (volume 159 cm3) which was housed in a heavy aluminum block furnace fitted with quartz side windows. The temperature of the furnace was controlled to better than ±0.1° by a Bikini-Fenwall relay unit. The light source was a Mazda 250-W M E /D lamp, a parallel beam being arranged to fill the cell. The reaction cell was connected to the usual type of high vacuum line comprising cold traps, McLeod gauge, and gas buret. After reaction the contents of the reaction cell were expanded into the analytical line and trapped at liquid nitrogen temperature. The noncondensable products were removed by pumping. The condensable products were then warmed to room temperature and analyzed gas ehromatographically, CF3H and CF3CH2CH3 being measured on an 11-m 30% diethyl adipate on firebrick column maintained at 0° and CF3CH2CH2CH2CH3 on a 1.7-m 20% dinonyl phthalate on firebrick column maintained at room temperature. Calibrations were performed at the end of each experiment.
Materials. Hexafluoroacetone was prepared by dehydration of the sesquihydrate (Koch Light) followed by low-temperature vacuum distillation at —60° and pumping at —127°. Hydrogen sulfide was prepared using a Kipp apparatus followed by pumping at —160° and several vacuum distillations at —100°. Ethylene (Matheson cylinder) was used with no further purification beyond degassing.
For calibration and identification purposes the following compounds were used: trifluoromethane (Matheson cylinder), hexafluoroethane (DuPont) and trifluo- ropropene (Pierce Chemical Co.). Since the other
( 1 ) P . S . D i x o n a n d M . S z w a r c , T ra n s . F a ra d a y S o c ., 5 9 , 1 1 2 ( 1 9 6 3 ) .
( 2 ) J . M . P e a r s o n a n d M . S z w a r c , ib id .. 6 0 , 5 6 4 ( 1 9 6 4 ) .
( 3 ) G . E . O w e n , J . M . P e a r s o n , a n d M . S z w a r c , ib id ., 6 1 , 1 7 2 2 ( 1 9 6 5 ) .
( 4 ) G . O . P r i t c h a r d , H . O . P r i t c h a r d , H . J . S c h i f f , a n d A . F . T r o t m a n - D i c k e n s o n , ib id ., 5 2 , 8 4 9 ( 1 9 5 6 ) .
The Journal o f P hysica l Chem istry

CF3 A d d i t i o n t o E t h y l e n e 2747
compounds (such as 1,1,1-trifluoropropane, hexaflu- orobutane, 1,1,1-trifluoropentane, and hexafluoro- hexane) were unavailable commercially they were prepared by lengthy photochemical decomposition of mixtures of the appropriate compounds, followed by separation by low-temperature distillation and gas chromatography. The identity of the compounds was confirmed where possible by using two different radical sources to provide the same compound (e.g., CF3C2H5 produced from C2F6CHO-CF3COCF3 and CF3COCF3- C2H6 mixtures).
Results and Discussion(a) Reaction of CF3 Radicals with Hydrogen Sulfide-
Since the abstraction of hydrogen atoms from hydrogen sulfide by trifluoromethyl radicals was chosen as the competing reaction, it was necessary to know the Arrhenius parameters for reaction 3 in order to establish the addition reaction results on an absolute basis.
CF3COCF3 - X 2CF3 + CO
CF3 + H2S CF3H + SH
2 C F 3 - U - C * F .
Reaction 3 has been studied previously5 and the following Arrhenius parameters have been reported: log A 3(mol_1 cm3 sec-1) = 11.65 ± 0.16 and E3 (kcal mol-1) = 3.88 ± 0.26. As a check on the applicability of this result to our system we examined the reaction briefly, measuring the rate constant ratio k3/ki'/l at a few temperatures. Our results for log k3/kf^ were, at 314, 333, and 385°K, 2.25, 2.45, and 2.68, respectively. The data of Arthur and Bell5 yield values of 2.27, 2.43, and 2.77 for the ratio at these same temperatures. Our data are clearly in good accord with theirs and, since they examined the reaction in greater detail, we have used in this work the parameters they reported.
(ib) Reaction of CF% Radicals with Ethylene. When trifluoromethyl radicals were generated in the presence of ethylene, a variety of reaction products were observed, including some high boiling substances whose identity could not be determined. The reaction was not studied extensively under these conditions because of its complexity; however, for a typical run at 81° using a 10:1 hexafluoroacetone-ethylene mixture, the product disti'ibution was (in micromoles): CF3C H = CH2, 0.117; CF3CH2CH3, 0.169; CF3CH2CH2CF3, 0.110; CF3CH2CH2CH2CH3, 2.06; CF3C4H8CF3, 0.718; CF3H and C2F6 were formed only in negligible amounts.
The small yields of CF3H and C2F6 indicate that addition of trifluoromethyl radicals to ethylene is very rapid; the extensive formation of trifluoropentane is evidence that the trifluoropropyl radical also reacts readily by addition.
These observations may be interpreted in terms of the following reactions.
CF3 + C2H4 - 4 » CF3CH2CH2
c f 3 + c f 3c h 2c h 2 —^ c f 3h + c f 3c h = c h 2
c f 3c h 2c h 2c f 3
2CF3CH2CH2 -A - c f 3c h = c h 2 + c f 3c h 2c h 3
- V c f 3c 4h 8c f 3
c f 3c h 2c h 2 + c 2h 4 c f 3c 4h 8
c f 3 + c f 3c 4h 8 c f 3h + c f 3c 4h 7
c f 3c 4h 8c f 3
c f 3c h 2c h 2 + c f 3c 4h 8 c f 3c h 2c h 3 + c f 3c 4h 714
c f 3c h = c h 2 + c f 3c 4h 9
The negligible yield of trifluoromethane suggests that reactions 6 and 11 do not occur significantly. The results of the product distribution given above indicate that the steady-state concentration of the CF3C4H8 radicals is greater than that of the CF3C2F4 species. The relatively small yield of hexafluorobutane confirms this and suggests that reaction 12 will contribute more significantly toward hexafluorohexane formation than will reaction 9. Similarly, it is likely that trifluoropro- pene formation by (14) is more extensive than via (8) although the respective contributions cannot be deduced.
(c) Reaction of CF3 Radicals with Ethylene-Hydrogen Sulfide Mixtures. When trifluoromethyl radicals were produced in C2H4-H 2S mixtures rich in hydrogen sulfide, the reaction pattern described in (b) was considerably simplified, fewer products being observed. By suitable variation o: the H2S/C 2H4 ratio, conditions were found (ratio ~10 ) where CF3H, CF3CH2CH3, and CF3C4H 9 were the predominant reaction products, other products mentioned in (b) being absent or formed in trace quantities only.
The mechanism suggested to explain product formation involves the following reactions in addition to (3),(5), and (10)
CF3CH2CH2 + H2S - 4 - CF3CH2CH3 + SH
CF3C4H8 + H2S CF3C4H 9 + SH
Our experimental results are reported in Table I. The absence of C2F6, CF3CH =CH 2, CF3CH2CH2CF3, and CF3C4H8CF3 in this reaction system suggests that the radical-radical reactions leading to their formation are completely inhibited, and that product formation is entirely due to the reaction of trifluoropropyl and trifluoropentyl radicals with hydrogen sulfide. The
(5) N . L . Arthur and T . N . Bell, Can. J . C h e m 44, 1445 (1966).
V olum e 73, N um ber 8 August 1969

2748 J. M. S a n g s t e r a n d J. C. J. T h y n n e
Table I : Product Yields and Product Ratios for the Reaction of CP3 Radicals with H 2S -C 2H 4 Mixtures“
T, t, (HsS/ CFaH CF3C2H5
°K sec K (CsHDav CiHOav CFsH CF3C2H5 CFjCîH» 2 CF3C2H4 CF3C4H»291.0 1800 175 15.9 11.0 6.33 2.90 0.172 2.06 0.06296.0 1800 171 15.3 11.2 6.58 2.95 0.327 2.01 0.11323.0 1320 171 15.0 11.4 6.53 3.46 0.408 1.69 0.12323.0 1320 173 15.3 11.3 6.16 3.31 0.364 1.68 0.11323.0 1080 171 15.1 11.2 6.31 3.21 0.343 1.78 0.11336.5 1080 173 15.9 10.9 4.10 2.42 0.262 1.53 0.11337.0 1080 175 15.6 11.2 5.53 3.13 0.358 1.59 0.11353.0 900 174 15.5 11.2 9.52 2.97 0.329 2.89 0.11353.0 900 173 14.6 5.52 7.43 4.40 0.557 1.50 0.11353.0 420 174 15.8 5.27 3.90 2.34 0.390 1.42 0.17353.0 900 173 16.3 21.1 6.98 1.31 0.227 4.54 0.14353.0 780 171 16.7 20.5 3.26 0.55 0.130 4.82 0.22353.0 900 870 16.0 10.8 5.74 2.30 0.200 2.30 0.09383.0 600 171 15.0 11.4 9.52 3.45 0.386 2.48 0.11398.0 480 160 14.5 11.0 9.64 2.73 0.124 3.38 0.05398.0 480 172 15.8 10.9 7.88 2.62 0.105 2.89 0.04398.0 480 166 15.1 11.0 7.55 2.65 0.153 2.69 0.06411.0 360 169 15.5 10.9 7.63 2.13 0.370 3.05 0.18431.0 420 171 15.6 11.0 8.73 2.84 0.100 2.97 0.04432.0 420 175 16.0 11.0 8.08 2.81 0.076 2.81 0.03443.0 300 170 15.8 10.8 8.55 2.18 0.109 3.73 0.05473.0 300 168 15.5 10.8 10.87 2.15 0.163 4.71 0.08“ K = hexafluoroacetone. All concentrations given in 10s mol. 2 CF3C2H4 = C F 3C 2H 5 + CFaCiHg.
continued formation of CF3C4H 9, even at high hydrogen sulfide concentrations (H2S/C2H4 = 20), was rather surprising and indicated the ease with which trifluoro- propyl radicals reacted with ethylene.
The possibility exists that some of the trifluoropropyl and trifluoropentyl radicals may react with the mer- captyl radicals formed in the hydrogen atom abstraction reactions. We were unable to examine for this possibility by suitable variation of the hydrogen sulfide/ ethylene ratio because of experimental limitations; ratios below about 5 lead to the formation of side products and for mixtures too rich in hydrogen sulfide the abstraction obscured the addition reaction. It was noted, however, that variation in the mixture ratio by a factor of 4 at constant ketone concentration had no effect on the rate constant ratio (see eq A below).
We are therefore obliged to ignore such reactions as
CF3CH2CH2 + SH A - CF3CH2CH3 + S
A - CF3CH2CH2SH19
CF3C4H8 + SH — > CF3C4H 9 + S
A - c f 3c 4HsSh
and our mass balance method (discussed later) is subject to this uncertainty, although of course the occurrence of reactions 17 and 19 will have no effect on the final rate ratio. We consider that the possible radical loss by reactions 18 and 20 is not serious because, as we have noted, radical-radical reactions do not occur
significantly and also because the variation in reaction mixture composition (although small) showed no indication of such an effect.
In this discussion it has been assumed that the CF3CH2CH2 radical is stable and does not decompose reversibly, i.e.
CF3CH2CH2 - A CF3 + C2H4
Szwarc6 has reported that for ethylene (but not for several other olefins), addition is not reversible. This conclusion was based upon the constancy of the CF3H / N2 product ratio when the concentration of the radical source was altered at constant ethylene/hydrocarbon ratios. This is in accord with our observation that, at 81°, variation of the ketone concentration by a factor of 2 for a constant H2S-C2H4 mixture has no marked effect on the rate ratio.
If reactions 10 and 15 represent the fate of the trifluoropropyl radicals formed by (5), and (16) that of the trifluoropentyl radicals formed by (10), then the following mass balance relationship holds, where Rx refers to the rate of formation of X
•RcF.cmcm = ¿5(CF3)(C2H4) = .RcfjCseu + -KcFscnn
Since Rcfsh = fc3(CF3)(H 2S), then
______Rcvja______ (C2H4) ^ kz ^-RcFsCzHi + jRcFsCmn (H2S) fc5
(6) H . Komazawa, A. P . Stefani, and M . Szwarc, J . A m er . Chem . S o c 85, 2043 (1963).
The Journal o f P hysica l Chem istry

CF3 A d d i t i o n t o E t h y l e n e 2749
Some of the trifluoropentyl radicals formed by reaction 10 may react by further addition to ethylene to produce trifluoroheptyl radicals (21), and neglect of this reaction could disturb the mass balance relation for trifluoropropyl radicals and affect the accuracy of k6.
CF3C4H8 + C2H4 CF3C6H12
We consider that neglect of heptyl radical formation by (21) could lead to uncertainties of about 0.2-1% and 5-10% in the formation of the CF3C2H4 and CF3C4Hs radicals, respectively. These errors, particularly for the trifluoropropyl radical, are not serious and may reasonably be neglected. It is likely, however, that the error introduced is appreciably less than these figures suggest, if the reasonable assumption is made that as the fluoroalkyl radical gets larger so the influence of the polar end group is “ diluted” and the radical will begin to react with ethylene more like an alkyl radical. If this is so, then k2\ is likely to be smaller than, say, /c10 or k-0. This change will not be reflected in the rate constant for the abstraction reaction since there appears to be little difference between the reactivities of methyl and trifluoromethyl radicals with hydrogen sulfide.5'7 The net effect will be for the ra*io ku/kw < ku/k2i and hence the radical loss by reaction 21 will be less than the above estimates suggest.
When our experimental data are treated by the method of least mean squares we find, using values5 of 11.65 ± 0.16 and 3.88 ± 0.26 for log A 3 (mol-1 cm3 sec-1) and Es (kcal mol-1), that
log k6 (mol-1 cm3 sec-1) =
11.39 ± 0.29 -(2370 ± 490)
2.303RT
The error limits for reaction 3 are included in ours (which are standard deviations). It should be noted that these are the error limits imposed on the Arrhenius parameters by virtue of the least-squares treatment. The absolute errors due to the neglect of reactions such as (18), (20), and (21) have been neglected and may well cause the error limits to be somewhat larger.
At 164° (where 2.3037?T is 2000), log ks (mol-1 cm3 sec-1) is 10.2, so that the addition reaction clearly is very rapid.
Szwarc2 has obtained Arrhenius parameters for reaction 5 relative to those for reaction 2. Using the reported values4 for reaction 2 (log A2 = 10.17 and E2 = 1.7) he finds log A 5(mol-1 cm3 sec-1) = 10.5 and E$ = —0.6 kcal mol-1.
It has been observed8 that, for many hydrocarbons, an activation energy difference of about 3 kcal mol-1 is obtained for reactions 22 and 23, little difference being noted between the A factors.
CH3 + RH CH4 + R23
CF3 + R H - > CF3H + R
In the case of 2,3-dimethylbutane,9 log A 22 = 11.3 (mol-1 cm3 sec-1) and En = 7.8 kcal mol-1. It might therefore be expected that for CF3 radical attack on2,3-dimethylbutane, Arrhenius parameters of ~ 1 0 n-* and 4.8 kcal mol-1 would be obtained instead of the values reported.4 We therefore consider that the parameters reported for reaction 2 are incorrect, although comparison of the predicted and measured rates (at 164°, 108-9 and 109-3, respectively) suggest that the actual rate constants4 are not grossly in error. Hence Szwarc’s data indicate log kb = 1010-8 (mol-1 cm3 sec-1), which is in good accord with our measured rate constant. Further support for our parameters may be obtained by considering the reported values10 of 11.2 and 4.7 kcal mol-1 for log A 24 and Eh.
CF3 + (CH3)3CH CF3H + (CH3)3C
It is likely that the parameters for (2) are very similar to this; substituting these values in Szwarc’s data we find log As ~ 11.5 (mol-1 cm3 sec-1) and Eb ~2.35 kcal mol-1, both cf which values are very close to our experimental values.
(d) Reaction of CF3CH2CH2 Radicals. Our data enable us to draw some conclusions regarding the rate at which trifluoropropyl radicals react by addition to ethylene. We may derive the mass balance ratio (neglecting any heptyl radical formation)
flcFiC.Hi ( H 2S ) _ fcio
I CFjCiHs (C2H4) /Cl5
Neglect of trifluoroheptyl radical formation leads to an underestimate in the formation of the pentyl radical, and so will cause our values of kw/klb to be too small by5-10%.
Because of the small quantities of trifluoropentane formed, our results for this ratio are somewhat scattered and no accurate value for Ew — El5 may be deduced, although it is apparent that Elb > Ew. The rate constant ratio may be examined more profitably and we find, at 164°, that ki0/k13 ~ 0.9. If we make the assumption [compare reaction 3] that kib at this temperature is 109-7, then kw ~ 109-6 (mol-1 cm3 sec-1), although this value is speculative and subject to considerable error.
(e) Comparison of Radical Reactivity. In Table II we show data for the Arrhenius parameters and the velocity constants at 164° for the addition of various radicals and atoms to ethylene. It is apparent that trifluoromethyl radicals are by far the most reactive species, reacting some 300 times faster than do methyl
(7) N . Im ai and O. Toyam a, Bull. Chem. Soc. Jap., 33, 652 (1960).(8) G. O. Pritchard, G. H. Miller, and J. K. Foote, Can. J. Chem., 40, 1830 (1962).(9) A . F . Trotm an-Dickensen, J. R . Birchard, and E. W . R . Steacie, J. Chem. Phys., 19, 163 (1951).(10) P. B. Ayscough and E, W . R . Steacie, Can. J. Chem., 34, 103 (1956).
Volume 78, Number 8 August 1969

2750 T a k e s h i S a w a i a n d W i l l i a m H . H a m i l l
Table II: Arrhenius Parameters and Velocity Constants at 164° for the Addition of Various Radicals to Ethylene“
R + CH2 = CH, — > RCH2CH2
R Log A ELog k (164°)
Relativereactivity Ref
cf3 11.39 2.4 1 0 . 2 320 This workCC13 9.5 3.2 7.9 1 . 6 1 1
ch3 1 1 . 1 6 . 8 7.7 1 6
c3h, 10.4 5.1 7.9 1 . 6 bcf3ch2ch2 9.6 50 This workH 13.4 3.3 11.7 1 0 4 c0 10.7-11 ©J © T—1
00 d
“ A and k in mol- 1 cm3 sec-1; E in kcal mol-1. 6 L. Endrenyi and D. J. Le Roy, J. Phys. Che-rn., 71, 1334 (1967). c J. H. Knox and D. G. Dalgleish, Int. J. Chain. Kinetics, in press. d F. Kaufman, Progr. Reaction Kinetics, 1, 1 (1961).
radicals. The reason for this difference lies principally in the activation energy difference of 4.4 kcal mol-1 for
the two radicals, since the preexponential factors are very similar.
Trichloromethyl radicals, although also requiring a low activation energy,11 are much less reactive than trifluoromethyl by virtue of the very low preexponential factor, thus reflecting the steric limitations for such a bulky radical.
Table II also shows the reaction of oxygen and hydrogen atoms with ethylene; these reactions are faster than (5) but only by about an order of magnitude.
Our rate constant for the trifluoropropyl radical is of interest, since this radical also reacts readily by addition, much faster than does the propyl radical. This suggests that the effect of the polar end group is transmitted through the radical and enhances its reactivity.
( 1 1 ) J . M . T e d d e r a n d J . C . W a l t o n , T r a n s . F a ra d a y S o c ., 6 2 , 1 8 5 9 ( 1 9 6 6 ) .
E l e c t r o n S c a v e n g in g i n M e t h a n o l - W a t e r a t 7 7 ° K
by Takeshi Sawai1 and William H. HamillD ep a rtm en t o f C h em is try a n d the R a d ia tio n L a b o ra to ry , 2 U n iv er s ity o f N o tr e D a m e , N o tr e D a m e, In d ia n a 4 ^ 5 5 6 {R ec e iv ed J a n u a r y 8 0 , 1 9 6 9 )
Competitive electron scavenging in CH30H-H20 matrices, -irradiated at 77°K, has been examined for Cp.He, CpHpOH, C6H6CH2OCOCH3, (C6H5)2, Cd2+ or Ag+ with H+ or N03- . The mobile electron, e,„+, precursor of the solvated trapped electron, ea- , reacts efficiently with aromatic compounds in polar as well as nonpolar matrices while e3- is much less reactive with these compounds. Cd2+, Ag+, and N03~ react efficiently with both es~ and em~, while H+ is unreactive toward em- . Similar results are expected in polar liquids, including water.
IntroductionIt is commonly assumed that the mobile electron,
em~, is the precursor of the trapped electron, et~, in irradiated solids. On this basis one can readily account for the effects of electron scavengers to reduce the 100-eV yields G(et~) by trapping em~. The effects tend to be similar in organic solids3,4 and in aqueous solids.6 Also, the relative reactivities of ClCH2COO_ , N 0 3- , CH2- CHCONH2 and several other solutes are about the same in ice and in water. According to Kevan, “ one may properly describe em- as a mobile solvated electron in ice.” 6 He assumed that the electron reacts with scavenger while tunneling between adjacent tetrahedral trapping sites. Because em- is, in this sense, solvated the similarity of reactivities for em_ and eaq- can be accounted for.6
One might alternatively propose that em~ is continuously mobile until trapped and that the high-frequency dielectric constant applies since the similarity of reactivity with eaq- rests on limited evidence. On this
( 1 ) O n l e a v e o f a b s e n c e f r o m t h e T o k y o M e t r o p o l i t a n I s o t o p e R e s e a r c h C e n t e r .
( 2 ) T h e R a d i a t i o n L a b o r a t o r y o f t h e U n i v e r s i t y o f N o t r e D a m e is o p e r a t e d u n d e r c o n t r a c t w i t h t h e U . S . A t o m i c E n e r g y C o m m i s s i o n . T h i s i s A E C d o c u m e n t n u m b e r C O O - 3 8 - 6 5 0 .
( 3 ) W . H . H a m i l l , “ I o n i c P r o c e s s e s i n y - I r r a d i a t e d O r g a n i c S o l i d s a t — 1 9 6 ° , ” i n “ R a d i c a l I o n s , ” E . T . K a i s e r a n d L . K e v a n , E d . , J o h n W i l e y & S o n s , I n c . , N e w Y o r k , N . Y . , 1 9 6 8 , C h a p t e r 9 .
(4 ) J . E . W i l l a r d , “ R a d i a t i o n C h e m i s t r y o f O r g a n i c S o l i d s , ” i n “ F u n d a m e n t a l s o f R a d i a t i o n C h e m i s t r y , ” P . A u s l o o s , E d . , J o h n W i l e y & S o n s , I n c . , N e w Y o r k , N . Y . , C h a p t e r 9 .
(5 ) L . K e v a n , “ R a d i a t i o n C h e m i s t r y o f F r o z e n A q u e o u s S o l u t i o n s , ” i n “ R a d i a t i o n C h e m i s t r y o f A q u e o u s S y s t e m s , ” G . S t e i n , E d . , J o h n W i l e y & S o n s , I n c . , N e w Y o r k , N . Y . , 1 9 6 8 .
( 6 ) L . K e v a n , J . A m e r . C h em . S o c ., 8 9 , 4 2 3 8 ( 1 9 6 7 ) .
The Journal o f P hysica l Chem istry

E l e c t r o n S c a v e n g i n g i n M e t h a n o l - W a t e r a t 77 °K 2751
basis it can be expected that em~~ in a dipolar solvent or matrix has a rather higher energy than eaq_ and that the relative reactivities will be markedly different for at least some solutes. The trapped and solvated electron es~, should more nearly resemble eaq~.
Possible examples of such a difference between em~ and es” can be inferred from results for aqueous acid solids. Yields of trapped H atoms in 0.129 mole fraction H2S04 are strongly suppressed by small concentrations of HNO3 or H20 2, and a similar result was found for 0.129 mole fraction HCIO4, both at 77 °K.7 The mobile electron appears to be unreactive with acid, unlike eaq~. Similarly, (j(N)2 > 1.5 for 0.0116 M N20 in 5 M H2S04 or in 7.3 M HC104 with 0.0063 M N20 at 77°K.8
Cd2+ and several other metal ions have been found to trap electrons efficiently at [M "+ ] = 10-2 M in 5.4 M H2S04 at 77°K.9
This report describes an attempt to demonstrate differences in reactivity between em~ and es~. Methanol, with 5 mol % or 62 mol % H20 , has been used for neutral matrices at 77°K to provide media comparable to aqueous solids and compatible with organic and inorganic electron scavengers, including acid at small concentrations.Experimental Section
Suprasil cells ~ 2 mm thick were used for irradiation and optical measurement. Methanol-water solutions were purged with bubbling nitrogen prior to 60Co irradiation (1.2 X 10¹⁸ eV /g min) at 77°K. Samples were glassy with only a few small cracks. Optical measurements have been described.3 For measurements during warmup the cell was placed in an aluminum block with an appropriate optical slit. Spontaneous warming at a convenient rate ( ~ 2°/min) occurred when liquid nitrogen was removed from the dewar flask.
Methanol was purified by distillation on a spinning band column after refluxing 24 hr with 2,4-dinitro- phenylhydrazine. Water was triply distilled. Other chemicals were used as received.
ResultsCd2+ reacts efficiently with electrons in water (k =
5.2 X 10¹⁰ M~l sec-1) 10 as well as with em~ in glassy H2S04 (G(e« - ) e (Cd+) = 4.9 X 10⁴ at Amax 300 nm where e, the extinction coefficient, is in 1. mol-1 cm-1).9 A system consisting of 0.1M CdCl2 in 38 mol % CH3OH- 62 mol % H20 showed both the ~560-nm band of es_ , with OD decreased from 1.50 ~o 0.70, and a ^330-nm band attributed to Cd+ following irradiation at 77°K (Figure 1), indicating that Cd2+ traps em~, as expected. Upon warming, OD(es~) decreased while OD(Cd+) first increased, attributed to reaction by diffusion between Cd2+ and es~ (Figure 2) as viscosity decreased, then decayed. In a parallel experiment with 0.1 M CdCl2 in CH3OH the results shown in Figure 3 were qualitatively similar, with OD(es~) decreased from ~ 3 .2 to 1.75 by solute. In the same matrix with 0.2 M HC1 also present,
Figure 1. The effect of temperature on the spectrum of 0.1 M CdCl2 in 38% CH3OH-62% H20 irradiated to 1.1 X 10¹⁹ eV/g at 77'°K.
Figure 2. The effect of temperature on OD(Cd)+ and OD(ea~) for 0.1 M CdCl2 in 38% CH3OH-62% H20 irradiated to 1.1 X 10¹⁹ eV/g at 77 °K.
both O D (er) and OD(Cd+) were appreciable initially, but considerably smaller than in the preceding experiment. Upon warming OD(es~) decreased more rapidly than before, presumably due to reaction with H+, while OD(Cd+) did not increase at any time (Figure 3).
A series of experiments with AgC104 in 95% CH3-
( 7 ) R . L i v i n g s t o n a n d A . J . W e i n b e r g e r , J . C h em , P h y s . , 3 3 , 4 9 9 ( 1 9 6 0 ) .
( 8 ) F . S . D a i n t o n a n d F . T . J o n e s , T ra ils . F a ra d a y S o c ., 6 1 , 1 6 8 1 ( 1 9 6 5 ) .
( 9 ) D . M . B r o w n a n d F . S . D a i n t o n , ib id ., 6 2 , 1 1 3 9 (1 9 6 6 ) .
( 1 0 ) J . H . B a x e n d a l e , E . M . F i e l d e n , a n d J . P . K e e n e , P r o s . R o y . S o c ., A 2 8 6 , 3 2 0 (1 9 6 5 ) .
V olum e 73, N um ber 8 August 1969

2752 T a k e s h i Sawai a n d W i l l i a m H . H a m i l l
Figure 3. The effect of temperature on OD(Cd)+ and OD(e„- ) for 0.1 Af CdCl2 in 95% CH3OH-5% H20, irradiated to 2.2 X 10¹⁹ eV/g at 77° (•) neutral and (O) with 0.2 M HC1.
OH-5% H20 showed OD(es- ) at 525 nm decreased from1.18 (with no solute) to 0.82 by 0.075 M AgClCV Increasing [HCIO4] to 0.8 M caused OD(es- ) to decrease to —0 while the “ Ag” bands at 310, 328, and 363 nm decreased by half and then remained constant at higher concentrations of HC104. These results are summarized in Table I.
Table I : Competitive Electron Scavenging in 7 -Irradiated 95% CH3OH-5% H20 at 77°K with 0.075 M AgCICh and Various [HCIO4]
H CIO 4 , O D (525 O D (363 O D (3 2 8 O D (310M n m )° n m )8 n m )8 n m )8
0.0 0.82 0.59 0.71 0.820 . 2 0.25 0.41 0.48 0.580.4 0 . 1 1 0.33 0.38 0.470 . 6 0 . 0 2 0.27 0.29 0.400 . 8 0 . 0 1 0.26 0.29 0.38“ The band due to ea- ; with no solute OD(525 nm) = 1.18;
dose 8.4 X 10¹⁸ eV/g. 6 These bands arise from reduction products of Ag+. One of them is presumed due to Ag, others have been attributed to Ag2+, AgH+, etc., but details are not important since they behave alike in these experiments. The rate constant k(Ag+ + e„,- ) = 3.2 X 10¹⁰ (ref 10).
Samples containing 0.1 M benzyl acetate in CH3OH were examined for comparison. At 0.3 M HC1OD (C6H5- CH2) decreased only ~ 1 0 % while OD(e„- ) decreased from 1.05 to 0.47 at [HC1] = 0, and then to 0.03 at [HC1] = 0.3 M (Figure 4). The rate constant for es- and benzyl acetate to form CeHsCEU- and CH3CO2- has not been reported but it must be rather small since there was no evidence of reaction during warmup (Figure 5).
The rate constant for phenol (PhOH) and eaq- has been measured recently11 and k = 1.8 X 10⁷ M -1 sec-1. The spectrum of PhOH- has not been reported and none was observed for it in methyltetrahydrofuran (MTHF). By analogy with benzene (PhH) which yields the cyclohexadienyl radical C6Ht 12 (Xmax 320 nm) in CH3OH, but no stable anion, the 345-nm band in
Figure 4. The effect of acid concentration on 0.1 M benzyl acetate in 95% CHaOH-5% H20, irradiated to 7 X 10¹⁸ eV/g at 77°K. At [HC1J = 0, OD(C6H6CH2) = 1.08 at 318 nm and OD(e,- ) = 0.47.
Figure 5. The effect of temperature on OD(C6H5CH2 •) and OD(er) for 0.1 M benzyl acetate in 95% CH3OH-5% H20 irradiated at 77°K to 8.4 X 10¹⁸ eV/g.
Figure 6 . The spectrum of 0.7 M C9H6OH in 38%CH3OH-62% H20 irradiated to 2.2 X 10¹⁹ eV/g at 77°K and subsequently warmed. The band at 344 nm is attributed to C6H6OH radical; the small bands are not identified.
Figure 6 is attributed to the C6H6OH- radical. The large 560-nm band due to e8- was decreased from ~ 3 .2
( 1 1 ) E . J . L a n d a n d M . E b e r t , T r a m . F a ra d a y S o c ., 6 3 , 1 1 8 1 ( 1 9 6 7 ) .
( 1 2 ) T . S h i d a a n d W . H . H a m i l l , J . A m e r . C h em . S o c ., 8 8 , 3 6 8 9 (1 9 6 6 ) .
The Journal o f P hysica l Chem istry

E l e c t r o n S c a v e n g i n g i n M e t h a n o l - W a t e r a t 77°K 2753
Temperature (®K)
Figure 7. The effect of temperature on OD(344 nm) and OD(560 nm) for 0.7 M C6H6OH in 38% CH3OH-62% H20 irradiated to 2.2 X 10¹⁹ eV/g at 77°K and subsequently warmed.
Figure 8. The effect of temperature on OD(344 nm) and OD(525 nm) for 0.5 M CJDOH in 95% CH3OH-5% H20 irradiated to 2.2 X 10¹⁹ eV/g at 77° K and subsequently warmed.
to 1.14 by 0.7 M PhOH. The system of small bands was not identified but may involve C6H50 at 400 nm and other radicals previously reported.11 Upon warming irradiated samples of 0.7 M PhOH in 38% CH3OH-62% H20 there was no growth in the initially large OD at 345 nm (Figure 7), which is consistent with the low reactivity of PhOH and eaq~. Qualitatively similar results were obtained upon warming 0.5 M PhOH in CH3OH (Figure 8). Samples of the same composition, except for addition of 0.1 M HC1, showed OD(es~) decreased by 35% but OD(340 nm) decreased by <3% . In contrast 0.1 M NaN03, which is known to react with em~, gave decreases of 45 and 57%, respectively. These results appear in Table II. The results for 0.7 M PhOH in 38% CH3OH-62% H20 are qualitatively similar but more striking.
The rate constant for PhH and eaq- is only < 7 X 10⁶ M ~l sec-1,13 but PhH reacts efficiently with em~ in CH3- OH (and in several other matrices3) as measured by OD-
(315 nm)for C6H7-. Benzene resembles PhOH in that the yield of trapped em_ (measured as H adducts) was not suppressed by HC1 but was suppressed by NaN03. The results are summarized in Table II.
Table II: Competitive Electron Scavenging in 7 -Irradiated CH30H-H20 at 77°K with C6H6 or C6H6OH and HC1 or NaN03
Mol % CHjOH Solutes, M OD(es-)° OD(ArH0
38c 0.7 PhOH 1.12 0.750.7 PhOH, 0.1 HC1 0.88 0.760.7 PhOH, 0.1 NaNOs 0.10 0.18
95d None 1.760.5 PhOH 0.47 0.510.5 PhOH, 0.1 HC1 0.31 0.500.5 PhOH, 0.1 NaNOa 0.26 0.22
95* 0.2 PhH 0.58 0.650.2 PhH, 0.1 HC1 0.33 0.650.2 PhH, 0.1 NaN03 0.41 0.40
° Xmax(es- ) at 560 nm in 38% CH3OH, 525 nm in 95% CH3OH. 3 Amax at ~345 nm for PhHOH and at 315 nm for CSH7. e Dose = 2.1 X IO19 eV/g. d Dose = 1.2 X IO19 eV/g. 'Dose = 7.2 X 10¹⁹ eV/g.
Biphenyl, (Ph2), reacts efficiently with ee_ in alcohol at 25° (/c = 4.3 X 10⁹ M~l sec-1) but less efficiently than H + in methanol (k — 39 X 109M -1 sec-1)-14 Biphenyl in CH3OH shows several bands, in addition to that for es~ (Figure 9). The principal band of Ph2” at 404 nm and of Ph2H- at 320 nm are well known and reliably measurable. A band at 363 nm can be attributed to Ph2H- (of which there may be three isomers present) but overlaps the Ph2~ band system and cannot be measured reliably.3'14 Only the OD’s of the principal band of Ph2~ at 404 nm and of Ph2H- at 320 nm will be reported. Addition of 0.1M Ph2 decreased OD(es~) from1.05 to 0.60 and gave OD(320 nm) = 0.74, OD(404 nm) = 0.75. Addition of 0.5 M HC1 decreased OD(ea~) nearly to zero, decreased OD(Ph2~) by ~ 6 0 % , but had little effect on OD(320 nm). The rate of the slow conversion of Ph2_ to Ph2H- by proton transfer from CH3- OH was not affected by added HC1. Optically bleaching the solvated electron band, OD(es_) = 0.60, (which is known to release H atoms but not em~) increased OD(320 nm) by only ^0.05, showing that Ph2H- has em~ rather than H as its precursor. The results are summarized in Table III.
To test further whether H-atom scavenging is responsible for Ph2H • formation, runs with 0.1 M Ph2 and0, 0.3 and 0.6 M c-C6H i0 were performed. There was no
( 1 3 ) E. J . H a r t , S . G o r d o n , a n d J . K . T h o m a s , J . P h y s . C h em ., 6 8 , 1 2 7 1 (1 9 6 4 ) .
( 1 4 ) S . A r a i a n d L . M . D o r f m a n , J . C h em . P h y s . , 4 1 , 2 1 9 0 ( 1 9 6 4 ) ;1 . A . T a u b , M . C. S a u e r , a n d L . M . D o r f m a n , D is c u s s io n s F a ra d a y S o c ., 3 6 , 2 0 6 ( 1 9 6 3 ) .
Volume 73, Number 8 August 1969

T a k e s h i S a w a i a n d W i l l i a m H. H a m i l l2754
X nm
Figure 9. The spectrum of 0.1 M Ph2 in CH30H (------- ) andthe effect of 0.75 M NaOH (--------) in 95% CH3OH-5% H20.Dose = 7.2 X 10¹⁸ eV/g.
M N o O H
Figure 10. The effect of [NaOH] on e3~, Ph2_, and Ph2H ■ in 95% CH3OH-5% H20. From top to bottom: e3~, [Ph2] = 0, dose = 6.0 X 10¹⁸ eV/g; Ph2- , Ph2H and e3- , [Ph2] = 0.1 M, dose = 7.2 X 10¹⁸ eV/g.
Table III : Competitive Electron Scavenging in 7 -Irradiated 95% CH3OH-5% H20 at 77°K with 0.1 M (C6H5)2 and Various [HC1]
HC1, O D (525 nm ) O D (404 nm ) O D (3 2 0 nm )M e3~ P h 2- P h 2H
0.0 0.598 0 . 7 5 0.740.06 0.47 0.67 a0.09 0.41 0.69 0.76»0.12 0.33 0.55 0.730.24 0.29 0.45 0.740.27 0.13 0.42 0.70»0.50 0.04 0.29 0.730.55 0.04 0.22 0.700.70 0.03 0.17 0.73
“ Measurement impossible or uncertain because when these experiments were performed the OD at 320 nm was not considered significant and maxima occurred near the recorder range shift. Dose 7.2 X 10¹⁸ eV/g.
significant change in OD of the bands at 320, 404, and 525 nm, which leaves the large initial OD(320 nm) unaccounted for. To test another possible mechanism, rapid proton hopping between the correlated trapped hole, CH3OH2+ and Ph2- , several experiments were performed over the range 0-1 M NaOH. The results in Figures 9 and 10 show that the yield of es- was appreciably enhanced by NaOH when [Ph2] =0. With 0.1 M Ph2, OD(Ph2~) was strongly enhanced, OD(es- ) changed little, and OD (Ph2H •) was decreased somewhat. Neither acid nor base had any evident effect on the unresolved ~363-nm band.
Discussion
Of the aromatic compounds examined in this work the results for PhH and PhCH2OCOCH3 are most easily described because the spectra for the products of electron attachment are well known and can be measured
reliably. For PhOH only two of the bands shown in Figure 6 have been reported, those at 388 and 404 nm by photolysis in various media and attributed to PhO •, but none have been reported for radiolysis.16 The major band at 345 nm is attributed to a product deriving from PhOH- and CH3OH because no absorption bands at X >300 nm for PhOH in MTHF were observed (eliminating PhOH- ) and because of the known reactions between aromatic anions and hydroxylic solvents to give H adducts which have sharp bands at X > 320 nm. It is plausible (but not essential) that the species is C6H6OH and that the 360-nm band is that for an isomer. It will be assumed here that OD(345 nm) measures the yield of transient PhOH- .
The results for Ph2 do not evidently fit the pattern for the other aromatics tested. The spectrum itself presents some difficulties. The band at ~ 365 nm belongs to neither Ph2- (e.g. in 3MP and MTHF it is absent) nor Ph2+ and may be attributed to an isomer of Ph2H. If there is a third band for the remaining isomer it must be obscured by the very strong absorption of Ph2 itself at X < 300 nm. Another complication of Ph2 systems is the rather large 320-nm absorption present initially. Its insensitivity to C6Hi0 eliminates H-atom addition. The overall effects of H+ and OH- do not clearly support proton jumping as the responsible mechanism since OD(Ph2H -) did not increase with added acid. The effect of base could be attributed to the reaction Ph2H • + CH30 - -*- Ph2- + CH3OH. The remaining possibility is that Ph2- is initially excited and promptly reacts ■with CH3OH. This would be insensitive to [H + ] and [OH- ]. After thermalization the same reaction occurs slowly.
Since the decrease in QD(Ph2- ) caused by acid is not
( 1 5 ) E . J . L a n d , G . P o r t e r , a n d E . S t r a c h a n , T ra n s . F a ra d a y Soc., 5 7 , 1 8 8 5 ( 1 9 6 1 ) .
The Journal o f P hysica l Chem istry

matched by increased OD(Ph2H-), the effect must be attributed to electron scavenging. Because there is no evidence for em~ scavenging by H+ with other aromatic additives the effect will be attributed to the observed depression of OD(eB~) by H+ which occurs in all systems. One must assume then that es~ contributes to the yield of Ph2~, which would be consistent with the fast reaction between Ph2 and es~ in ethanol at room temperature14 and may also account for the observed dissimilarity with PhH and PhOH which do not react rapidly with es~. Possibly Ph2~ originates principally from es“ and Ph2H- from the rather more energetic em_.
There appear to be no exceptions to the generalization that aromatic compounds trap electrons efficiently in nonpolar media, but this does not apply to es~. Since PhH, PhOH, and PhCH2OCOCH3 react efficiently with em_ and not with es~, one concludes that em~ in a polar medium is a dry (i.e., nonsolvated) electron. The fact that there is little or no competition between these reagents and H + is quite consistent with earlier similar results in other media, including water. It must be concluded that em_ (or e_) is relatively unreactive with CH3OH2+ and H30 + which have no low-lying vacant orbitals,16 unlike aromatic compounds.
Efficient scavenging of both em~ and e8_ in CH3- 0H -H 20 glasses by Ag+, Cd2+, and N 03~ is quite similar to their behavior in aqueous solids and in water. These results serve to exemplify the generality of the phenomena under study and also to provide standards against which the “ abnormal” behavior of the aromatics can be contrasted. The inorganic reagents, considered alone, do not provide as clear evidence for the es~-H + anomaly as do the aromatic compounds. Thus, OD (es ~)
E l e c t r o n S c a v e n g i n g i n M e t h a n o l - W a t e r a t 77 °K
and OD(Cd+) are depressed proportionately, but this can be attributed to reaction between Cd2+ and e,~ competing with the reaction between H + and e8~ (Figure 3) which is evident with rising temperature but which may also occur at 77 °K.
The results for A g+ in Table I do provide further evidence for the e„_-H + anomaly if it is generally valid to approximate the ratio of rate constants for scavenging electrons in water and in alcohols, even at different temperatures. The normalized ratio A OD(es~)/AOD- (Ag) is not ~ 1 , as expected, but ~40. One must also consider the earlier work with these and other reagents in aqueous acid solids6- 9 which lead to the same conclusion.
The conversion ©m 6 s? which is evident in polar solids, must have its counterpart in polar liquids. That is, the dry electron e~ is the precursor of the solvated electron, and e_ should be scavengable in polar liquids prior to solvation. Appropriate reagents and suitable concentrations can be inferred from experiments with nonpolar liquids, and the yield of G = 4 reacting electrons in alcohol (compared with G(es~) = 1) provides evidence.17 Some of the results for electron scavenging in water can also be interpreted in terms of a population of dry electrons, G(e~j = 1.4, in addition to G(eiq~) ~ 2.7.18
( 1 6 ) J . L . M a g e e , P r o c e e d i n g s o f t h e F o u r t h I n f o r m a l C o n f e r e n c e o n t h e R a d i a t i o n C h e m i s t r y o f W a t e r , U n i v e r s i t y o f N o t r e D a m e , 1 9 6 1 .
( 1 7 ) J . A . W a r d a n d W . H . H a m i l l , J . A m e r . C h em . S o c ., 8 7 , 1 8 5 3 (1 9 6 5 ) .
( 1 8 ) W . H . H a m i l l , J . C h em . P h y a ., 4 9 , 2 4 4 6 ( 1 9 6 8 ) ; J . P h y s . C h em ., in p r e s s .
2755
V olum e 78, N um ber 8 A ugust 1969

2756 K. M . M a l o n e y , S. P. P a v l o u , a n d B. S. R a b i n o v i t c h
K in etic Isotope Effects in Nonequilibrium Therm al Unim olecular
Systems. Ethyl Isocyanide-rf5la
by Kenneth M. Maloney,lb S. P. Pavlou, and B. S. RabinovitchD ep a rtm en t o f C h em is try , U n iv ers ity o f W a sh in g to n , S eattle, W a sh in g to n 9 8 1 0 5 ( R ece iv ed F eb ru a ry 10 , 196 9 )
The thermal isomerization of C2D5NC has been studied at 230.9° over a range of pressures from 10- 3 to 102
mm. The fall-off corresponds to an enhanced value of the “effective number of oscillators” relative to C2H5NC. The difference in the observed high-pressure activation energy of the two species is very small [(EaD — =0.15 kcal mol“1] or zero. The data were treated on an RRKM quantum statistical basis. Calculations were made for several vibration-rotation models. The calculations are in good agreement with experiment. Ethyl isocyanide provides another reaction system for which the large inverse intermolecular secondary isotope effect predicted earlier is found; ks/kv declines from 1 . 1 0 at p = to 0 . 2 1 at p ^ 1 0 ~ 3 mm; the agreement between theory and experiment supports a value of around 0 . 2 at p = 0 .
IntroductionThe differential quantal effects that occur in uni
molecular reactions as a consequence of the change in frequency pattern of the molecule upon isotopic substitution, e.g., of H by D, were originally described quantitatively by Rabinovitch, Setser, and Schneider.2 An inverse secondary intermolecular isotope effect in nonequilibrium thermal activation systems was predicted and has now been verified for methyl-methyl- d33a’b and methyl-methyl-di3c isocyanide systems, and for the cyclopropane-eyclopropane-dfi pair.4 This is pure secondary isotope effect of a statistical-weight nature, unlike conventional secondary isotope effects studied in equilibrium systems whose origin is basically mechanistic and which involve a change in critical reaction energy E0 upon isotopic substitution; the present effect increases with the increasing degree of isotopic substitution, even at positions remote from reaction site such that AE0 = 0, and is a maximum at the low pressure limit.
In continuation of the study of the isocyanide reaction system, the ethyl-ds isocyanide has now been examined. Relative to the effect caused by the substitution of three H atoms in perdeuterated methyl-rA isocyanide, the pentadeuteration in the ethyl-d5 isocyanide system is expected to lead to a large increase in isomerization rate relative to the light molecule. The present paper reports the temperature and pressure dependence of the C2H5NC-C2D5NC kinetic isotope effect. As in the earlier detailed study of ethyl isocyanide,6a chain lengthening is accompanied by a decrease in the ease of experimental accessibility of the low concentration limit and makes impossible the extension of these studies to the lower limit for the ethyl system or for higher isocyanide homologs.
Experimental SectionReactant. C2D5NC was prepared by allowing C2D5I
(Merck Sharp and Dohme, Ltd.) to react with AgCN
in the molar ratio 1:2 by the modified Gautier method.311 It was purified by glpc. The isotopic purity was determined by parent peak analyses with an AEI M S/9 mass spectrometer and was found to contain 3.3% C2HD4NC.
Apparatus and Procedure. An internal comparison method and procedure similar to that described pre- viously3a,b’6 was employed. A reactant mixture of C2H5NC and C2D5NC of composition 1.82:1.00 was used. Different reactors were used in various overlapping pressure regions. Reaction vessels of different sizes, ranging from 1.07 ml at the highest pressures up to 12 1. at the lower pressures, were used; there were no apparent systematic disparities in the overlap regions. Runs were carried out at a temperature of 230.9°. The conversion of reactants was kept as low (average ~ 3 0 % ) as was convenient for analysis.
Analysis. The products were separated from the reactants by means of a short column of AgCN which quantitatively removed unreacted isocyanide. The residual nitrile products were analyzed on the M S/9 spectrometer with the use of parent M and M — 1 (M — 2 for C2D5CN) peak intensities at 70-V electron energies. Repeated calibrations were made with standard
(1 ) (a ) T h i s w o r k w a s s u p p o r t e d b y t h e N a t i o n a l S c i e n c e F o u n d a t i o n . ( b ) A b s t r a c t e d f r o m t h e P h . D . T h e s i s , U n i v e r s i t y o f W a s h i n g t o n , 1 9 6 8 , o f K . M . M a l o n e y .
( 2 ) B . S . R a b i n o v i t c h , D . W . S e t s e r , a n d F . W . S c h n e i d e r , C a n . J . C h em ., 3 9 , 2 6 0 9 ( 1 9 6 1 ) ( c a l l e d R S S ) ; s e e a l s o B . 8 . R a b i n o v i t c h a n d J . H . C u r r e n t , ib id ., 4 0 , 5 5 7 (1 9 6 2 ) .
( 3 ) ( a ) F . W . S c h n e i d e r a n d B . S . R a b i n o v i t c h , J . A m e r . C h em . S o c .,8 4 , 4 2 1 5 ( 1 9 6 2 ) ; ( b ) F . W . S c h n e i d e r a n d B . S . R a b i n o v i t c h , ib id .,8 5 , 2 3 6 5 ( 1 9 6 3 ) ; ( c ) B . S . R a b i n o v i t c h , P . W . G i l d e r s o n , a n d F . W . S c h n e i d e r , ib id ., 8 7 , 1 5 8 (1 9 6 5 ) .
( 4 ) B . S . R a b i n o v i t c h , P . W . G i l d e r s o n , a n d A . T . B l a d e s , ib id ., 8 6 , 2 9 9 4 ( 1 9 6 4 ) .
( 5 ) ( a ) K . M . M a l o n e y a n d B . S . R a b i n o v i t c h , J . P h y s . C h em .( c a l l e d p a r t I ) , 7 3 , 1 6 5 2 ( 1 9 6 9 ) . ( b ) K . M . M a l o n e y a n d B . S .R a b i n o v i t c h , ib id ., 7 2 , 4 4 8 3 ( 1 9 6 8 ) .
The Journal o f P hysica l Chem istry

K i n e t i c I s o t o p e E f f e c t s i n C 2H 5N C - C 2 D 6N C 2757
Table I: Pressure Dependence and Relative Isotopic Magnitudes of Experimental Isomerization Rate Constants for C2D5NC Determined by Internal Comparison (T = 230.9°)
P , k D X 10*,mm ,-------- fcn X 104,° s e c " 1--------------- s s e c " 1 fcH/&Hco ¿ d A doo -&h A d 6----------
0.00075 0.249 (0.277) 1.32 0.0178 0.090 0.210 (0.210)0.00075 0.243 (0.270) 1.27 0.0173 0.087 0.212 (0.211)0.00085 0.285 (0.309) 1.36 0.0198 0.093 0.227 (0.227)0.0018 0.328 (0.345) 1.57 0.0221 0.108 0.220 (0.220)0.0021 0.342 (0.359) 1.53 0.0230 0.105 0.235 (0.235)0.0023 0.340 (0.357) 1.66 0.0229 0.114 0.215 (0.215)0.0024 0.353 (0.370) 1.57 0.0237 0.108 0.235 (0.235)0.0079 0.52 (0.52) 1.68 0.0334 0.115 0.310 (0.310)0.0088 0.58 (0.58) 1.79 0.0371 0.123 0.323 (0.323)0.0099 0.64 1.87 0.041 0.128 0.344 (0.344)0.0388 1.85 3.56 0.119 0.244 0.52 (0.52)0.092 3.11 4.6 0.199 0.318 0.67 (0.68)0.267 5.8 7.6 0.371 0.52 0.76 (0.76)1.93 12.0 12.7 0.77 0.87 0.94 (0.94)2.14 12.0 12.2 0.77 0.84 0.98 (0.98)2.15 12.4 13.0 0.79 0.89 0.96 (0.96)
13.31 15.6 14.4 0.99 0.99 1.08 (1.06)16.9 16.0 15.1 1.01 1.03 1.06 (1.08)22.5 15.8 14.8 1.00 1.01 1.07 (1.08)87 15.8 14.1 1.00 0.97 1.12 (1.08)87 15.6 14.0 0.99 0.96 1.11 (1.10)90 16.0 14.5 1.01 0.99 1.10 (1.10)
00 14.5° 1.10 (1.09)° Constants in parentheses are uncorrected for heterogeneity,
intensity of C2H5CN and the M — 2 peak intensity of CjDsCN.1 Isotopic ratios in parentheses are determined from the M — 1 peak ° Based on the data of part I becomes 14.2; see text.
C2H6CN-C2D6CN mixtures for each series of analyses. The results were corrected for C13 and N 16 contributions.
ResultsCorrections to the Data. The experimental corrections
described in part I were applied to the present data. The presence of the small percentage of d4 isomer was allowed for in the analytical calculations.
Figure 1. Plot of k/k™ vs. pressure for C2D5NC, □, and C2H5NC, O, fall-off at 230.9°. The solid line in each case represents the prediction of the E-3C0 models (after pressure factor correction). The data presented for C2H6NC were determined within this study, all by mass spectroscopic analysis; these data accord well with earlier fall-off measurements (see Figure 1, part I). The effect of heterogeneity at the lowest pressures in a 12-1. reactor is evident (see ref 5b).
Isotopic Rate Ratio. The relative rates of isomerization of C2H5NC and C2D5NC at 230.9° are tabulated in Table I and the individual rate dependence on pressure is shown in Figure 1. The observed limiting high pressure ratio (kn/ko)«, is 1.10 and has declined at the lowest pressure to 0.21 (Figure 2).
Temperature Dependence of Rate Ratio. Measure-
Figure 2. Plot of ti/fo is. pressure for the C2H6NC-C2DcNC system at 230.9°. Experimental data, •; calculated behavioron the E-300 model,--------, shifted slightly to coincide atp — a, but not corrected for pressure misfits of the separate fall-off curves. It is evident from Figure 1 that, with pressure correction, the calculated E-300 ratios and the observed ratios curves would coincide very closely down to 10_s mm.
Volume 73, Number 8 August 1989

2758 K. M . M a l o n e y , S. P . P a v l o u , a n d B . S. R a b i n o v i t c h
Figure 3. Arrhenius plots of log (iWfoX„ vs. 1/T.
ments of the ratio (kn/kn) „ were made over a range of temperatures from 190.0 to 259.6° at 100 mm (Figure 3). This is in the high-pressure region for both of the reactions. The M peak intensities gave a value of AFa«» = —0.2 kcal mol-1; the M — 1 and M — 2 peak intensities gave a value of AE& = —0.1 kcal mol-1 which is intrinsically slightly less reliable. The true value is in any case close to zero.
Measurements of the temperature dependence in the low-pressure region were not pursued.
C2 D5NC High-Pressure Rate and Fall-off Behavior. The absolute value of knm measured at 230.9° is 14.5 X 10⁻⁴ sec-1. However, at this temperature fcH„ is15.6 X 10-4 sec-1 from part I, and since (kn/ko) „ =1.10 the value of on this basis is 14.2 X 10⁻⁴ sec-1. Because of the large number of measurements made in part I for /cn™ and the greater accuracy of relative internal comparison measurements, the latter value is adopted.
The experimental fall-off curve (Figure 1) corresponds to a curvature and shape characterized by a Slater n value of 6.9.
DiscussionHigh Pressures. At the high-pressure equilibrium
limit the reaction coordinate is the rearrangement of the activated complex. The secondary isotope ratio is
(kn/ko)a> = {lTnQ+nQ-D/lTDQnQ+T))e AEo',R'r (1)
where7r = <T(I+J +-B,I+c)''/l/<j+{IfJ-e,Ic)lh is an inertial moment ratio of the activated complex and molecule, and Q+ and Q represent the total partition function
Table II: Moments of Inertia (amu, A2) of the C2H5NC and C2D6NC Molecules and Activated Complexes and Vibrational Partition Functions
IA Ib 7c It
c2d6nc 15.36 1 1 0 . 0 126.3 1.281E-300 complex 20.33 129.3 133.3c2h5nc 12.55 97.81 110.4 1.182E-300 complex 14.64 110.5 117.0
Qy +Qv (E-300)
C2H5NC (230.9°) 16.65 11.69C2D5NC (230.9°) 37.76 25.62
Table HI: Vibration Frequencies (cm'x) for the G2D5NC Molecule and Activated Complex
E-300—--------- M olecule- —n Grouping complexC-D str 2230
2160 2 1 2 0 (2 ) 2085
2146 (6 ) 2143 (5)
N=C str 2161 Ring def. 1990CD3 bend 1070 (2)'
1150 1105(5)CD2 bend 1050CD2 wag 1185CD3 rock 958CD2 twist 968 928 (4) 945 (3)C-C str 910C—N str 877 Ring def. 562CD3 rock 766CD2 rock 670C-C-N bend 420 324C-N-C bend 249
205CD3 torsion 165
product for the internal degrees of freedom of the activated complex and molecule, respectively. Because AE0 is close to zero, and because th e /r (Table II) and (Q+/Q) ratio of ratios in eq 1 are almost inevitably close to unity, only a small pure secondary isotope effect occurs under equilibrium conditions. The behavior for C2D5- NC was calculated for the transition-state models E-300 and E-300 mol rot., characterized in part I. The vibrational frequency assignments for the deuterio system are given in Table III.
In its dependence on the (Q+/Q) ratio, the isotope effect at high pressures is normal or inverted depending on whether there is bond tightening or bond loosening in the activated complex relative to the molecule; the ratio here is 1.03. (¿hA d)» for ethyl isocyanide isfound here to be 1.10, which compares very well with the theoretical value of 1.16 based on AE& = —0.15 and6 AE0 — —0.19 kcal mol-1, and is slightly greater than that measured for methyl-d3 isocyanide.2b
The absolute value of the measured high-pressure rate constant is kD„ = 14.2 X 10⁻⁴ sec-1 = Ae~E<>o/RT = 1013-56 e - 3 7 -80i r t s e c - i j the theoretical A a value is 1013-44 sec-1.
Fall-off Region. The general quantum statistical formulation of Marcus and Rice (RRKM theory)7“ for the unimolecular rate constant is
= L e ~ ^ RT r Y P {E \ r) e -E+'RT dE+Qh J a +=o P E P (E +vr) ( }
+ coh N(EVI)
(6 ) N o t e t h a t E0h = Eaa> — 0.63 f r o m p a r t I a n d Eqd = £ac0 — 0 .5 9 h e r e , s o t h a t s u b s t a n t i a l l y A U am = A E 0.
(7 ) ( a ) R . A . M a r c u s , J . C h em . P h y s . , 2 0 , 3 5 9 ( 1 9 6 2 ) ; ( b ) E . V . W a a g e a n d B . S . R a b i n o v i t c h , C h em . R ev ., s u b m i t t e d .
The Journal of Physical Chemistry

K i n e t i c I s o t o p e E f f e c t s i n C2H5NC-C2D5NC
Table IV : Equivalent Classical Fall-off Shape Parameters s and n for C2D5NC and Other Molécules (230.9°)
CH3NC Exptn
4.68
3.3300 3.3 2.6300 + fig. rot. 4.4 3.2
CD3NC Expt 5.2 3.7300 3.8 2.9300 + fig. rot. 5.0 3.6
c2h5nc Expt 6.1 4.5E-300 6.0 4.5E-300 -(- mol rot. 6.4 4.8
c2d5nc Expt 6.8 5.1E-300 7.0 5.2E-300 + mol rot. 7.5 5.6
where 2P(E+VI) is the sum over the degeneracy of the active vibration-rotation energy levels of the activated complex; w is the collision frequency and the strong collision assumption is used; N(Evr) is the density of the vibration-rotation energy levels of the molecule. Equation 2 ignores centrifugal effects.7b
Equivalent classical shape parameters, Kassel’s s and Slater’s n, are given in Table IV. The experimental shape is well approximated by the E-300 model, as shown in Figure 1, and less so by the active molecule rotation model (Table IV ). The effect of deuteration is to increase the Slater n value from 6.1 for C2H6NC to6.8 at 230.9°, which is in close agreement with the calculated value of 7.0.
Due to heterogeneity effects613 which precluded very low pressure measurements, the theoretical and experimental curves were compared as to pressure at the arbitrarily chosen value of k/ka = 0.2, instead of at k/km = 0 . 1 which has been more customary.3 '6a The pressure correction factors which must be applied to the calculated curves to bring coincidence with experiment at k/k„ = 0.2 are given in Table V for collision diameters of 5.0 A.
The theoretical isotopic rate ratio kn/kn is obtained by use of eq 2 for k-g. and kn The theoretical and experimental ratios are compared in Figure 2. The agreement is very good until the low-pressure limit is approached, and further discussion requires consideration of the low-pressure region.
The observed activation energy difference between the light and heavy systems was not measured as a function of pressure (Figure 3). It may be predicted2 that the difference AE“a = E “ ad — f?” aH is bigger at the high-pressure than at the low-pressure limit since the parameter s(C2D6) exceeds s(C2H6) (Table IV). Recently, Lin and Laidler8 have pointed out that the difference AEh first increases to a maximum as the pressure decreases below the high-pressure limit, before decreasing to the low-pressure limiting value. We
2759
Table V: Pressure Correction Factors for Calculated C2D6NC Fall-off (230.9°)“
Correctionfactor
E-300 1.48E-300 + mol ret. 2.2
“ v = 5.0 A.
may readily explain this behavior in terms of the differential quantum effects described earlier.2 Since the value of the classical s parameter is larger for the deuterated than for the light system, the light system enters the fall-off region at higher pressure with concomitant decrease in EaH. Thus at a pressure just below the high-pressure limit for the light system, the observed value of AEa is E “ aD — Eag, which exceeds A Ea„ = E° aD Ej aH, hence, A Ej a first increases ivith decrease of pressure before eventually starting to decrease.
Low Pressures. At the low-pressure limit, &h/&d reduces to
n \ /m V " 61 f ’( ¥ ) - ( w ) x “4 ?--------\ W o W h / Q a r N ( K j De- E W RT d /? vr
J EqD
(3)
where M is the molecular weight. For a pure secondary isotope effect, Eon = E0d- Since the ratio of the normalizing partition functions, Qn/Qn, is not much larger than unity, especially at low temperatures, the enhancement of the rate constant fcD relative to fcH depends on the large difference in the quantum statistical densities of active energy states, N(EVr), for the two molecules at energy levels E > E0, i.e., on the larger proportion of deuterated molecules that exist about E0 for the Boltzmann distribution.
Owing to wall effects that are important in this system below 10-2 mm in a 12-1. vessel,6 the pressure dependence of the fall-off of rate for the individual isotopes deviates from the theoretical behavior at lower pressure; thus, the isotopic rate ratio might not be expected to follow the theoretical prediction very well at such low pressures. Actually, Figure 2 shows that due to mutual compensation of the heterogeneity effects, the rate ratio continues to show reasonably good adherence to theory down to a pressure of ~ 5 X 10_3 mm; thereafter, fca/fa> levels off at a value of 0.21. Because the agreement between theory and experiment is otherwise excellent, the calculated rate ratio at P = 0 of 0.188 for AZ?0 = 0 may be considered
(8) M . C. Lin and K . J. Laidler, Trans. Faraday Soc., 64, 927 (1968).
Volume 78, Number 8 August 1969

2760 K. M. M a l o n e y , S. P. P a v l o u , a n d B. S. R a b i n o v i t c h
Table VI: Calculated Values of Average Excess Energy of Reacting Molecules (cm-1) for Several Isocyanides (T = 230°)“
( E +) r - 0 { e +)p=» 00
ch3nc 425 870CD SNC 431 1089C2H5NC 483 1575C2D3NC 495 1921
For E-300 model.
to be close to the correct value. The limiting ratio is 0.228 for AE0 = —0.19 kcal.
Thus, the C2H5NC-C2D6NC system illustrates another thermal unimolecular reaction system in which the existence of a large inverse secondary isotope effect has been found, and which is in accord with theory with regard to both magnitude and pressure dependence. The limiting ratio for the case of pentadeuteration of ethyl compares suitably with the theoretical value of 0.29 (with AE0 = 0) for trideuteration of methyl isocyanide (measured = 0.28).3b
Effects of Variation of Molecular Parameters on Nonequilibrium Unimolecular Behavior. The n and s shape parameters for the methyl-methyl-d3 and ethyl-ethyl- di isocyanide systems were determined analytically from the shape of the fall-off by analytical computation6® (Table IV). The computer program accepted values of k/k„ at various intervals of pressure and determined n and s values for the intervals by comparison with a reference set of entries calculated for a range of s and n values from the theoretical relations9 of RRK (with 6 = Eo/RT) and Slater theory. The values of n and s reported herein supersede the earlier less accurate values3a'b of n and s reported for methyl and methyl-d3 which were obtained by a method of visual superposition of fall-off plots.
Trideuteration of methyl isocyanide has been shown experimentally to increase the values of n and s by
~ 0 .6 and <~0.4, respectively. Therefore, the replacement of three H atoms by three D atoms has the effect of “ adding” one-half an “ effective oscillator.” An increase in the chain length from methyl to ethyl isocyanide results in an increase of the observed n and s values by ~ 1 .5 and ~1.2, respectively; addition of a methylene group results in approximately three times the effect of substitution by three deuterium atoms. Similarly an increase in the chain length from methyl- d3 to ethyl-ri3 isocyanide causes n and s to increase by ~1 .7 and -—-1.4, respectively. Pentadeuteration of ethyl results in an increase in n and s of 0.8 and 0.6, respectively. Therefore, substitution of five deuterium atoms adds a little less than one “ effective oscillator.”
The pressure correction factors are 1.2 and 1.5, respectively, for the methyl and methyl-d3 300 models, with <r = 4.5 A at 230°. The factors for ethyl and ethyl-d5 are 1.35 and 1.5, respectively, for the E-300 models, using a = 5.0 A.
The variation of the average energy of reacting molecules with chain length has been mentioned in part I. In Table VI is shown the calculated variation with pressure of the average energy of the reacting molecules (E+) for the members of the isocyanide series under investigation. Although the variation has been calculated for all regions of k/k„, in the interest of brevity only limiting values are given here. The quasi-constancy of (E+)p=o with change in molecular structure is contrasted with that of (E+)p=a,; the latter increases in a manner dependent on, but not precisely commensurate with, the change in n (Table IV).
The RRKM theory not only predicts the change in n and s values with variation of molecular complexity but also correctly predicts the observed pressure shift of the fall-off. The effects of chain lengthening as in propyl, isopropyl, n-butyl, and ¿-butyl isocyanides have been discussed elsewhere.5
( 9 ) ( a ) N . B . S la t e r , “ T h e o r y o f U n im o l e c u l a r R e a c t i o n s , " C o r n e l l U n i v e r s i t y P r e s s , I t h a c a , N . Y . , 1 9 5 9 ; ( b ) L . S . K a s s e l , “ K i n e t i c s o f H o m o g e n e o u s G a s R e a c t i o n s , ” R e i n h o l d P u b l i s h i n g C o r p . , N e w Y o r k , N . Y . , 1 9 3 2 .
The Journal of Physical Chemistry

Solubility of Aromatic Hydrocarbons 2761
The Solubility of Arom atic Hydrocarbons in Aqueous
Solutions of Com plex Ion Electrolytes
by W. L. Masterton, Tei Pei Lee, and R. L. BoyingtonDepartment of Chemistry, The University of Connecticut, Starrs, Connecticut (Received February 10, 1969)
Benzene, naphthalene, and phenanthrene are salted in by salts containing the irans-[Co(en)2NCSCl]+ cation. Since the extent of salting in increases with the polarizability of both the anion and the hydrocarbon molecule, dispersion forces appear to play a major role. The Setschenow parameters can be fitted in a semiempirieal manner to the equation of Bockris, et al.; the McDevit-Long equation is less successful.
IntroductionA few years ago, data were reported for the solu
bility of the neutral coordination complex [Co(NH3)3- (NO,),] in aqueous solutions of several alkali halides.1 In almost all cases this compound was salted in; i.e., its solubility in salt solutions was greater than in pure water. This effect was attributed to dispersion forces between the coordination complex and ions in solution.
There appears to have been virtually no work done on the “ reverse problem,” the effect of complex ion electrolytes on the solubility of simple molecular species. Relatively strong dispersion forces have been postulated to explain the abnormally low osmotic and activity coefficients of these salts.2'3 These forces should cause coordination compounds to salt in nonelectrolytes, particularly those consisting of large, highly polarizable molecules.
The complex ion electrolytes chosen for this study are of the type trans-[Co(en)2NCSCl]X, where X = Cl, Br, or I. These 1:1 coordination compounds lend themselves to solubility studies since they are relatively soluble and kinetically stable in water solution.2 The three nonpolar hydrocarbons, benzene, naphthalene, and phenanthrene, were chosen to cover a range of molecular size and polarizability.
Experimental SectionThe three complex ion electrolytes were prepared and
purified as described previously.2 Thiophene-free benzene was distilled over a 5-ft column at a reflux ratio of 1:20; the portion boiling at 80.1° was collected. Naphthalene was purified by sublimation; the sublimate melted sharply at 80.2° (lit. mp 80.0°). Phenanthrene was recrystallized from alcohol to give a product melting at 101° (lit. mp 100.3°).
The salt solutions, contained in 100-ml flasks with ground-glass stoppers, were shaken mechanically with excess solute in a constant temperature bath at 25.0 ± 0.05°. Shaking was continued for 24 hr; preliminary tests indicated that saturation was achieved within about 12 hr. The solutions were allowed to stand for
2-3 hr before sampling; tests with a Tyndall beam gave no evidence of suspended hydrocarbon under these conditions. In each run, one of the flasks contained distilled water which was saturated with hydrocarbon in the same manner as the salt solutions.
The benzene solutions were sampled by siphoning under slight air pressure to avoid loss of volatile solute. The first 5 ml of solution was discarded; 3-4 ml of the saturated solution was then allowed to run into a flask nearly filled with a measured volume of chromatographic grade heptane (about 15 ml). The weight of the aqueous sample was determined by weighing before and after its admission to the flask. The density of the aqueous phase was determined to ±0.003 g/ml from measurements on the sample remaining in the saturation flask.
The two-phase mixture was shaken for about 3 min to extract the benzene into the heptane. A sample of the heptane phase was then withdrawn and analyzed for benzene with a Model DU Beckman spectrophotometer, using the absorption peak at 254.6 mp. The ratio of the solubility of benzene (moles/liter) in the salt solution to that in pure water was calculated using optical density and volume data for the water sample included in each run.
The naphthalene and phenanthrene solutions were sampled with a pipet whose tip was covered with a small piece of filter paper to prevent particles of solid from entering. The samples were extracted with heptane and analyzed spectrophotometrically, using the peak at 275 mp for naphthalene and the one at 252 mp for phenanthrene.
The methods of saturation, sampling, and analysis described above are similar to those of Bohon and Claus- sen4 except for the heptane extraction. This extra step
(1) W. L. Masterton and R. N. Schwartz, J. Phys. Chem., 69, 1546 (1965).(2) W. L. Masterton, ibid., 71, 2885 (1967).(3) W. L. Masterton, T. I. Munnelly, and L. H. Berka, ibid., 71, 942 (1967).(4) R. L. Bohon and W. F. Claussen, J. Amer. Chem. Soc., 73, 1571 (1951).
V o lu m e 73, N u m b er 8 A u g u s t 1969

2762 W. L. M asterton, T ei Pei Lee, and R. L. Boyington
Table I : Solubilities at 25° of Aromatic Hydrocarbons in Solutions of ¿rans-[Co(en)2NCSCl]X
Benzenec . S/So
X =0 . 0 5 0 1 .0 0 4
0 . 0 9 8 1 .0 2 10 . 1 9 2 1 .0 4 70 .2 8 3 1 .0 7 0
0 . 0 5 0 1 .0 1 50 . 0 9 8 1 .0 3 90 . 1 9 2 1 .0 6 60 .2 8 3 1 .0 8 4
0 . 0 4 0 1 .0 1 70 . 0 5 4 1 .0 2 30 .0 6 9 1 .0 3 1
N aph thalene
S/So
Phen-anthrene
S /S o
1 .0 5 4 1 .1 3 91 .1 1 4 1 .1 8 51 .1 9 5 1 .4 7 51 .3 2 6 1 .7 1 4
1 .0 4 7 1 .1 3 21 .1 3 4 1 .2 9 81 .2 6 2 1 .5 7 81 .4 1 9 1 .9 3 0
1 .0 6 0 1 .1 4 8
1 .0 7 7 1 .1 7 41 .1 1 4 1 .2 5 6
was necessary to prevent interference from the complex cation, which absorbs strongly in the ultraviolet. Preliminary experiments indicated that the heptane phase obtained by extracting a concentrated solution of [Co- (en)2NCSCl] + gave no measurable absorption at the wavelengths used.
Duplicate solubility determinations were made at each salt concentration. Solubility ratios at a given concentration ordinarily agreed to within ±0.5% .
ResultsValues of the solubility ratio, S/S0, are reported in
Table I for each of the aromatic hydrocarbons in solutions of complex ion electrolytes of molarity Cs. In each case, salting in occurs (S > So) ■
The data in Table I can be represented, within experimental error, by the Setschenow equation
log So/S = ksCs (1)
The Setschenow parameters derived from least-squares analysis of the solubility data are listed in Table II.
It should be pointed out that salting in of nonpolar molecules is relatively uncommon. The tetraalkylam- monium salts are the only other general class of compounds known to salt in benzene and its derivatives.6
DiscussionThe classical electrostatic theory of salt effects, pro
posed originally by Debye and McAulay6 and modified most recently by Conway, Desnoyers, and Smith,7 predicts that the sign of the Setschenow parameter should depend solely upon the direction in which the dielectric constant of water is changed by addition of nonelectrolyte. Clearly, simple electrostatic theory is incapable of explaining salting in of aromatic hydrocarbons by complex ion electrolytes on the one hand and salting out by alkali halides on the other.
Table II : Setschenow Parameters for tram- [Co(en)2NCSC1] X at 25°
X = Cl X = Br X = I
Benzene -0 .1 0 -0 .1 3 -0 .1 9Naphthalene -0 .4 3 -0 .5 4 -0 .6 5Phenanthrene -0 .8 4 -1 .0 3 -1 .4 0
The most generally successful theory of salt effects is probably that of McDevit and Long.8 This theory predicts that the sign of ks will be determined by the effect that the salt has on the structure of water. If it “ compresses” the water structure, it becomes more difficult to introduce nonelectrolyte molecules and salting out occurs. If the water structure is “ loosened” by the addition of salt, salting in is predicted. The M cDevit- Long equation is
F ;(FS - f ,° ) 2.3/30RT
(2)
where F; is the molar volume of the (liquid) nonelectrolyte, F s is the molar volume of the liquid salt, Vs° is the partial molar volume of the salt at infinite dilution, and do is the compressibility of water.
Since values of F s are not available for complex ion electrolytes, it is impossible to use eq 2 to calculate values of fcs to compare with those listed in Table II. One can, however, use this equation to predict how the value of h for a given salt should vary with the nonelectrolyte. The molar (liquid) volumes, F i , of benzene, naphthalene, and phenanthrene at 25° are 89, 123, and 158 ml, respectively. On this basis, one would predict from eq 2 that the Setschenow parameters for benzene, naphthalene, and phenanthrene should increase in the ratio 1: 1.4:1.8. Examination of Table II shows that the order is more nearly 1:4:8. In other words, ks increases to a much greater extent than would be expected on the basis of molar volumes alone. Even if the benzene data are excluded, the Setschenow parameters for phenanthrene are approximately twice those of naphthalene as opposed to a predicted increase of only about 30%.
In searching for a more satisfactory explanation of the trends shown in Table II, it is important to note that ks increases regularly with the polarizability of the nonelectrolyte (benzene < naphthalene < phenanthrene) and the anion (Cl- < Br~ < I - ). The anion effect in particular suggests that dispersion forces may be of major importance in salting in by complex ion
(5) J, E. Desnoyers, G. E. Pelletier, and C. Jolieouer, Can. J. Chem. 43, 3232 (1965).(6) P. Debye and J. McAulay Physik. Z., 26, 22 (1925).(7) B . E. Conway, J. E. Desnoyers, and A. C. Smith. Phil. Trans. Roy. Soc. London, Ser. A, 256, 239 (1964).(8) W. F. McDevit and F. A. Long, J. Amer. Chem. Soc., 74, 1773 (1952).
T h e J o u r n a l o f P h y s ic a l C h em istry

Solubility of Aromatic Hydrocarbons 2763
electrolytes. Many authors have emphasized the role of dispersion forces in salt effects,6 9'9 10 but the only quantitative treatment that includes them is that of Bockris, et al.n The Bockris equation can be simplified to the approximate form
r i 11 I-- + - - B
Lr+ r__ L (r+) 3 (r_)3_ ( 3 )
where r+ and r_ are the radii of cation and anion, respectively, a+ and a_ their polarizabilities. The quantities A and B incorporate several parameters characteristic of the solvent and nonelectrolyte. The first term on the right of eq 3 gives the electrostatic contribution to ka while the second term accounts for dispersion forces.
For aqueous salt solutions of benzene, it is possible to evaluate A and B empirically from the vast amount of data available for the effect of alkali halides and tet- raalkylammonium salts on the solubility of benzene, If this is done, using the ion polarizabilities (ml) of Fa- jans12 and the hydration radii (A) of Conway, el al.,7 the best fit is obtained when A — 0.43 and B = 0.70. From these values for benzene, it is possible to calculate the corresponding quantities for naphthalene and phen- anthrene, making use of the approximations11
A oc F i ( 4 )
B « Fi ( 5 )
where Ri is the molar refraction of the hydrocarbon, extrapolated if necessary to 25° (26.2 ml for benzene, 42.7 ml for naphthalene, 61.0 ml for phenanthrene), Rw is the molar refraction of water (3.68 ml), and Vw is the molar volume of water, 18.0 ml. In this way, it is possible to arrive at the following equations for the three hydrocarbon systems
Benzene
Naphthalene
Phenanthrene
0.76 - + - - 2.52 «+ , ’Lr+ r__ L0+)3 (r -)3J
The electrostatic, salting out terms in these equations can be evaluated if one takes r+ to be 4 A, as estimated from a scale model of the [Co(en)2NCSCl] + cation. At the present time, the polarizability of the complex cation is not known, so the dispersion term cannot be calculated. However, if the measured values of k3 are used to calculate the bracketed quantity in the dispersion term, it is possible to get an idea of the validity of the Bockris approach. This quantity should increase in the order Cl~ < Br~ < I - (a_ increases more rapidly than (r_)3), but should be independent of the hydrocarbon solute. The data in Table III indicate that these predictions are borne out surprisingly well, particularly in view of the several approximations involved in arriving at eq 6-8.
Table III: Values of [(a+ /(r+ )3) + (<*_/(r_)3)] Calculated from Eq 6-8
c i - B r " I "
Benzene 0.51 0.57 0.66Naphthalene 0.51 0.58 0.65Phenanthrene 0.52 0.60 0.74
It appears that the equation of Bockris, et al., which includes a dispersion term, explains salting in by complex ion electrolytes more adequately than that derived from any other theory of the salt effect. It should be pointed out, however, that the value of A (0.43) in eq 6 required to fit the solubility data for benzene is ab >ut t .vice that calculated from theory.7
Acknowledgment. This work was supported by the National Science Foundation under Grant GP-6163 and by funds provided by the United States Department of the Interior as authorized under the Water Resources Research Act of 1964, Public Law 88-379.
(9) T. J. Morrison and N. B. B. Johnstone, J. Chem. Soc., 3655 (1955).(10) E. J. F. Duynstee and E. Grunwald, Tetrahedron, 21, 2401 (1965).(11) J. O’M. Bockris, J. Bowler-Reed, and J. A. Kitchener, Trans. Faraday Soc., 47, 184 (1951).(12) K. Fajans and G. Joos, Z. Physik, 23, 1 (1924).
V o lu m e 7 8 , N u m b er 8 A u g u s t 1969

2764 Lowell R. M cCoy and Harrf B. M ark, Jr .
Catalytic Polarographie Current of a Metal Com plex.1 V II.
Determ ination of the Charge of the Eleetroactive Species
for the o-Phenylenediam ine-Niekel(II) Prewave2
by Lowell R. McCoy and Harry B. Mark, Jr.Department of Chemistry, University of Michigan, Ann Arbor, Michigan 48104 (Received February 13, 1969)
In previous studies of the polarographic prewave obtained with Ni(II) and o-phenylenediamine, the dependence of the prewave height on the outer Helmholtz potential, ip°, of the electrode double layer required that a charge of +1 be assigned to the electroactive species rather than the value of +2 expected for a complex formed from Ni(II) and an uncharged ligand. In those experiments the desired variation in i/'0 was obtained by the use of a range of concentrations of supporting electrolytes, offering the possibility that the charge value obtained in this manner was the result of fortuitous changes in the reactant activities. This problem has been reexamined using a method of analysis which permits a determination of this charge value at a single electrolyte concentration, eliminating the activity uncertainty and substantiating the charge value found earlier. The propriety of equating the potential, \p0, with the potential of the reaction plane in the case of a large organic molecule has been investigated in terms of the probable orientation of the adsorbed ligand. An extension of the Frumkin parallel capacitor electrode model to a three-component surface system indicates that the molecule occupies a planar position for surface concentrations present in the polarographic measurements. In this position the reaction plane is virtually coincident with the outer plane. At higher surface concentrations, reorientation to a vertical position occurs. Analysis of adsorption data for o-phenylenediamine on mercury using the Frumkin isotherm indicates that strong repulsive forces arise between the adsorbed molecules at electrode potentials of concern to the prewave as the surface concentration is decreased to approach the low values present in the polarographic measurements. This fact, taken together with the negative shift of the potential of zero electrode charge with increasing volume concentrations of the organic ligand, suggests that electrolyte anions are coadsorbed with planar-oriented o-phenylenediamine molecules at not too negative electrode potentials. If the coadsorbed anion is an active partner in the surface reaction, a charge of +1 would be expected for the electroactive complex.
The behavior of the polarographic prewave observed in the reduction of Ni(II) in the presence of the organic ligand o-phenylenediamine (OPDA) has been examined in two recent papers.2d’e The dependence of the prewave height on the experimental variables, drop time, and the ligand surface concentration was found consistent with that predicted for a surface reaction between the hexaaquoniekel ion and the adsorbed ligand yielding an eleetroactive complex. While variations in the prewave height with changes in the electrode double layer substantiated the existence of a surface reaction, the relationship found between the prewave height and the potential, \f/°, of the outer Helmholtz plane required that the eleetroactive complex possess a charge of + 1 rather than the value of + 2 expected for a complex formed from Ni(II) and an uncharged ligand.
In the double-layer calculations made previously, the desired variation in was necessarily obtained by changing the concentration of the supporting electrolyte. A possibility, therefore, existed that an incorrect charge was obtained as a result of variations in reactant activities. This paper will present an analysis of the prewave at a single electrolyte concentration which eliminates this source of error and which
substantiates the charge value found in the earlier work. In these calculations it is assumed that the location of the reaction plane is reasonably coincident with the outer plane of the electrode double layer. The physical size of the OPDA molecule requires that it be planar rather than vertically oriented to the electrode surface if this assumption is to be valid. Evidence favoring planar orientation at concentrations used in the polarographic measurements is given. An explanation for the unexpected charge of the electroactive complex is offered on the basis of evidence of coadsorption of electrolyte anions with OPDA.
The surface concentrations of OPDA on mercury and the electrode charge data used in this paper were obtained from differential capacitance measurements. The experimental methods used to make both these and
(1) This research was supported in part by grants from the National Science Foundation, NSF GP-4620 and GP-6425, and the U. S. Army Office of Research (Durham), No. DA-31-124-ARO-D-284.(2) For other papers of this series: (a) H. B. Mark, Jr., and C. N. Reilley, J. Eledroanal. Chem., 4, 189 (1962); (b) H. B. Mark, Jr., ibid., 7, 276 (1964); (c) H. B. Mark, Jr., L. R. McCoy, E. Kirowa- Eisner, and H. C. MacDonald, Jr., J. Phys. Chem., 72, 1083 (1968); (d) L. R. McCoy, H. B. Mark, Jr., and L. Gierst, ibid., 72, 4637 (1968); (e) L. R. McCoy and H. B. Mark, Jr., ibid., 73, 953 (1969).
T h e J o u rn a l o f P h y s ic a l C h em istry

Catalytic Polarographic Current of a M etal Complex 2765
the polarographic measurements have been described previously. 2d'e
The Charge of the Electroactive ComplexIt has been shown previously211 that the height of a
prewave resulting from a 1:1 surface reaction between an adsorbed ligand and a metal ion to form an electroactive complex can be related to rp0, the potential of the outer plane of the electrode double layer, by the following expression
X = fcf0[L]ad»V/<V d
(1)
where X is a rate parameter calculated from the ratio of the observed prewave current to the diffusion limiting current for the metal ion using Koutecky’s3 mathematical relationship derived for a heterogeneous electrode reaction. The term fcf° is the forward chemical reaction rate constant for the complexation reaction, t is the drop life, D is the diffusion coefficient for the metal ion, [L]ads is the surface concentration of the adsorbed ligand, and z is the charge of the electroactive complex, the quantity of interest here. The other terms have their usual electrochemical meaning.
Equation 1 is valid only where the electrode process is controlled by the chemical rate of formation of the electroactive complex and, in the case of the OPDA- Ni(II) prewave, its application is limited to a small (perhaps 50 mV)2d'e and ill-defined electrode potential range in any given electrolyte before a significant fraction of the current represents direct reduction of the hexaaquonickel ion. It is for this reason that correlations between the prewave height and were made previously using several electrolyte concentrations at an electrode potential corresponding to the prewave plateau. While necessary variations in \p° were thus obtained under conditions where eq 1 would be applicable, possible variations in the activities of the reactants added an element of uncertainty to the results of these experiments.
Analysis of the prewave for a single electrolyte concentration (avoiding changing reactant activities) would be possible if an expression valid for the entire wave could be written as the electrode potential span available for calculations would then be much expanded. While a rigorous solution to this problem presents some mathematical complexity, an approximate relationship can be developed without difficulty. If an equilibrium condition at the electrode surface is assumed whereby the rate of depletion of the surface complex by both chemical and electrochemical processes is exactly balanced by its rate of formation, the following relationship will exist.
M L ]a ds [Ni (H20 ) 6 ]z=02 + =fcb[Ni(H20 )YL]ads2+ + M [Ni(H20 )YL]ada2+ (2)
where kb is a pseudo-first-order reaction rate constant
incorporating the water released by the complexation reaction, and M is the electrochemical rate constant. Equation 2 may be solved for the surface concentration of the electroactive complex in terms of the reactant concentrations at the electrode surface (x = 0). The dependence of the current on these concentrations then becomes
i = nFker— [L]ad8[Ni(H20 )6L=o2 + (3)kei + ^
The current dependence shown here differs from that of the chemical rate limiting case only in the identity of the rate constants.2d The relationship between a new rate parameter (shown here as £ to distinguish it from X used in the chemical rate limiting case) may therefore be written as
[L U V f ...5 “ m + kb V d ( )
where
* - K
As before, the mathematical relationship between £ and i/id is that given by Koutecky4 for a heterogeneous electrode reaction.
In the derivation of eq 1 and 4, it has been assumed that [L]ads is a time-invariant quantity. It has been shown26 that the equilibrium surface concentration, T, can be substituted for this term in eq 1 if the adsorption of the ligand is sufficiently rapid.6 While the same assumption must also be made in the case of eq 4, an additional problem is presented here by the fact that [L]ads must now represent the “ free” or noncomplexed portion of the surface concentration of the ligand. At low values of M , some fraction of the total surface concentration will be present as part of the metal- ligand complex. Some error must, therefore, result from the substitution of T for [L]ads at low values of fcei even where equilibrium coverage is attained rapidly. While the degree of error from this source depends on the formation constant for the surface complex as well as fcei, it will be seen that this problem has least consequence in that portion of the prewave of concern to the immediate problem of determining the charge of the electroactive complex.
Equation 4 represents the relationship expected in the absence of any contribution from the electrode double layer. As this situation is contrary to experi-
(3) J. Koutecky, Collect. Czech. Chem. Commun., 18, 597 (1953).(4) The original relationship derived by Koutecky3 was written in terms of the symbol x- The symbol £ used here equals \ /7/ i2 x ‘(5) This substitution is permitted in the case of slow adsorption only if the ratio i/id is multiplied by the ratio of the equilibrium surface concentration to the actual surface concentration at time i.2e The “ corrected” current ratio may then be used to determine £.
V o lu m e 7 3 , N u m b er 8 A u g u s t 1969

2766 Lowell R. M cCoy and Harry B. M ark, Jr .
mental evidence,2d it is necessary to correct eq 4 for double-layer effects. The rate constants calculated from this equation will, in any actual experiment, be those described by Gierst6 as “ apparent” rate constants. The relationships between these and the “ true” rate constants, i.e., those which would be observed if \p° were zero, are given by Gierst6 as
where k f and kei° are the true rate constants, a is the transfer coefficient, na is the number of electrons transferred in the rate-controlling electrochemical step, and
o>Ox
-o A
„ A ----------Ö K' X •
A Z= + l
- 4 F 4 x I0”4 M. OPDA
1
//i0.1 M. KCI
O io"3 M Ni2 + ,5 s e c
7& A I0"3 M Ni2+ , 3sec
/ X öxlÖ^M N',2+ , 3sec
/ 0.1 M L iC I0 4
• 5xlO'4 M N i2+, 3sec
i i i 1 1
-0.70 -0.75 -0.80 -0.85 -0.90P o te n tia l, V o lts , S .C .E .
Figure 1. Dependence of the corrected rate parameter on the electrode potential; charge value, z = + 1 .
\pT is the rational potential defined by Grahame7 as the difference between the measured electrode potential and that potential corresponding to zero electrode charge in the absence of specific adsorption of the ions of the electrolyte. Two charge terms, z and z*, are shown here. The charge of the electroactive complex, as before, is z. Frumkin, et al.,& have shown that z* in eq 6 must refer to the charge of the ion approaching the electrode surface and must in this case be unambiguously assigned a value of + 2 corresponding to the charge of the hexaaquonickelion.
Correction of the reverse reaction constant, kb, cannot be so easily resolved. If the electroactive complex exists only at the electrode surface, it should not be subject to the concentration polarization in the diffuse zone which, according to Gierst,6 requires the correction for the other rate constants. While at this time an exponential term will be arbitrarily written for k h identical
00b
P o te n t ia l, V o lts ,S .C .E .
Figure 2. Dependence of the corrected rate parameter on the electrode potential; charge value, z = + 2 .
with that shown for k { in eq 5, this point will be examined later with reference to the experimental data.
After substituting the rate constants shown in eq 5 and 6 into eq 4, replacing [L]ads with F, and performing an algebraic rearrangement, the following relationships are obtained.
To simplify the following discussion, the left-hand members of eq 7a and b will be designated as a and b, respectively. These may each be regarded as parameters corrected for variations in the potential-depen- dent terms, T and \p°. At high values of keh a must approach a constant value equal to b if these corrections are properly made. Some of the terms of a, £, and F, may be determined by experiment; others, D and may be assigned values from the literature. Only the charge z thus remains as an undetermined constant. An arbitrary value may be assigned to z, however, and member a calculated as a function of electrode poten-
(6) L. Gierst, “ Transactions of the Symposium on Electrode Processes,” John Wiley & Sons, Inc., New York, N. Y., 1961, p 109.(7) D. C. Grahame, Chem. Rev., 41, 441 (1947).(8) A. N. Frumkin, O. A. Petry, and N. V, Nikolaeva-Fedorovich, Electrochim. Acta, 8, 177 (1963).
T h e J o u rn a l o f P h y s ic a l C h em istry

2767Catalytic Polarographic Current of a M etal Complex
tial. Only if a exhibits the required approach to a constant value can this choice of z have been correct.
Experimental determinations of z have been made in this manner from polarograms of the Ni(II)-OPDA prewave obtained in 0.1 M solutions of potassium chloride and lithium perchlorate. The values for T at polarographic concentrations of OPDA were obtained by empirical extrapolation of surface concentrations calculated from differential capacitance measurements in these electrolytes using ligand concentrations ranging from 10-3 to 2 X 10_1 M.2e Values of were taken from the report by Grahame and Soderberg,9 the electrode potential scale being corrected to see from the nee used there. As D for the hcxaaquonickel ion is a constant in a given electrolyte and very nearly so for all 0.1 M electrolytes, only f / r y/t was calculated for each experiment. The results obtained with various drop times and reactant concentrations in two electrolytes appear in Figures 1 and 2 where z has been assigned values of + 1 and + 2 , respectively. Only where z has been given the value of + 1 does the corrected rate parameter approach a constant value at increasingly negative electrode potentials. As this method of analysis presupposes rapid attainment of at least nearequilibrium surface coverage, experiments were also made with a series of OPDA concentrations. As may be seen in Figure 3, the data approach limiting values at volume concentrations of OPDA equal to or greater than 10-4 M, confirming earlier findings in this regard.2e
Further information can be obtained from eq 7a and b by examining the potential dependence of a. This may be done conveniently by combining these equations in the manner
log t ~ = 9 ^ ------+ constanto — a 2.3RT\_ \ana / J
(8)
The term 2 in eq 7a has been given the value of + 1 here. As a first approximation, eq 8 can be simplified by assigning a value of 0.5 to a and of 2 to na. Recalling that \[/T equals the electrode potential, E, minus a constant, eq 8 is reduced to
(i — (V-Yllog -------- = ----- - “„T? + constant' (9)
s b - a 2.3RT v '
If the exponential term including the kb is omitted from eq 7a, eq 9 becomes
log + V) + constant' (10)
These equations have been tested using the experimental data represented by the average curve in Figure 1 with the results shown in Figure 4. It is evident that the linear relationships predicted by eq 9 or 10 are not obtained although an approach to linearity is present at more negative electrode potentials in each
2 .0 -
ki .o -
sx
x
3X
A8
z=+iO.! M KCIICt3 m Ni2+4 x IO"4 M OPDA2 » » «i „ „
0.5 " " "
&<___I______I______I______I___
-0.40 -0.75 -0.80 -0.85 -0.90Potential, V o lts, S .C .E .
Figure 3. Dependence of the corrected rate parameter on the electrode potential and OPDA concentration.
E.+4'°
-0.70 -0.75 -0.80 -0.85 -0.90
Figure 4. Dependence of the electrochemical rate on the electrode potential.
case. This departure from linearity should, however, be anticipated in view of the substitution of F for the “ free” surface concentration of the adsorbed ligand. As noted previously in this paper, the error from this source should be reliably small only at more negative potentials where kel is large. Back extrapolation of the data in this region thus permits an estimate to be made of the percentage of the total ligand surface concentration present as the surface complex. From the data in Figure 4, it may be calculated that about 40% of F
(9) D. C. Grahame and B. A. Soderberg, Technical Report No. 14 to the Office of Naval Research, Feb 18, 1954, Amherst College, Appendix, p 7.
V o lu m e 73, N u m b er 8 A u g u st 1969

2768
1 2 3 4 51----'----1--- --------- *—
Distance, A
Figure 5. Physical dimensions of the OPDA molecule.
exists as the surface complex at —0.675 V vs. see, an electrode potential corresponding very nearly to the “ foot” of the prewave. A substantial formation constant for the surface complex is thus indicated.
From the linear portions of the curves shown in Figure 4, new values of ana may be calculated and inserted into the bracketed member of eq 8 (or its counterpart equation omitting the exponential term from fcb) and the data replotted to yield successively more correct values of ana. The effect of this reiterative process is small in either case. This product obtained from the first approximations shown in Figure 4 is 0.74 or 0.63 depending on the choice of E or E + \p° as the abscissa. As the transfer coefficient for most electrode processes are usually less than 0.5, a two electron- transfer reaction is indicated. Unfortunately, this cannot be regarded as a certainty as values of a greater than 0.5 have also been reported in the literature.10 In the absence of an independent check for a “ correct” value of a, this question remains unresolved as does the necessity of providing an exponential correction for kh. These calculations do offer a means of checking the consistency of the data with the behavior expected for a surface reaction. In general, the agreement between theory and experiment is believed to be satisfactory.
As these investigations substantiate the earlier conclusions that the charge of the electroactive complex is + 1, it is apparent that the charge of one of the reactants shown in eq 3 must be incorrect or some fault must be found in the procedure of correlating the prewave height with xp°.
Location of the Reaction PlaneIn deriving expressions for the theoretical dependence
of the prewave height on \p°, it has been implicitly assumed that the reaction plane is nearly coincident with the outer plane. If the reaction plane were, in fact, well removed from that location, some doubt might be cast on quantitative results obtained from correlations employing values of \f/°. The orientation of an adsorbed molecule of the size of OPDA thus assumes
some importance in these studies. If, as shown in Figure 5, the molecule were vertically oriented, the functional groups would project into the solution well beyond the outer plane. Grahame and Parsons11 have estimated that the outer plane is located approximately3-4 A from the electrode surface. If the molecule were planar oriented, it is probable that the protons of the functional groups would be attracted and the donor electrons repelled by the negatively charged (at the electrode potential at which the prewave is observed) electrode surface. In this case the reaction plane would be quite near, though perhaps slightly within, the outer plane. Planar orientation would therefore represent a more agreeable situation in attempting correlations with \f/a.
Lowell It. M cCoy and Harry B. M ark, Jr .
Figure 6. Differential capacitance curves; OPDA in 0.1 M KC1.
At high bulk concentrations of OPDA (2 X 10_1 M) and at electrode potentials in the prewave range the evidence clearly favors a vertical orientation as saturation coverage approaches 5.5 X 10⁻¹⁰ mol/cm2. This surface concentration corresponds to an area of about 30 A2 per molecule. Although the area occupied by a molecule this size in a planar position is subject to uncertainty in terms of the maximum packing density commensurate with rotational freedom, this area would be at least two to three times the experimental limit given above.
While vertical orientation is indicated for high surface coverage, there remains the possibility that reorientation to a planar position occurs as surface concentrations approach those present at the low volume concentrations used in the polarographic measurements of prewave heights (1 to 4 X 10⁻⁴ M). Reorientation as a function of both concentration and electrode potential (or electrode charge) has been shown by Parry and
(10) P. Delahay, “ Advances in Electrochemistry and Electrochemical Engineering,” Vol. 1, Interscience, New York, N. Y., 1961, p 248.(11) D. C. Grahame and R. Parsons, J. Amer. Chem. Soc., 80, 1291 (1961).
T h e J o u rn a l o f P h y s ic a l C h em istry

Catalytic Polarographíc Current of a M etal Complex 2769
Parsons12 for the p-toluenesulfonate anion and Damas- kin, et al.,13 for aniline. Barradas, et al.,14 have considered the reorientation of various amines with changing concentrations while Hansen et al.,13 have speculated on this possibility with regard to phenol.
Both phenol and p-toluenesulfonate exhibit two cathodic adsorption peaks in their differential capacitance curves which vary with the bulk concentration of the absorbate. A peak appears at low concentrations which grows and then subsides to be replaced by a new peak at a more negative potential as the concentration of the substance is increased. Parry and Parsons12 have ascribed this phenomenon to a changing orientation with increasing concentration. As may be seen in Figure 6, no such occurrence is observed with OPDA.
There is, however, some basis for believing that reorientation does occur with changing surface concentrations of OPDA. The principal evidence for this statement is to be found in an examination of the manner in which the electrode charge varies with the surface concentration. Frumkin16 has suggested a model of an electrode surface consisting of two parallel capacitors, one representing the fraction of the electrode surface covered with water dipoles, the other, that fraction covered by the adsorbed substance. The electrode charge then varies linearly with the fractional surface coverage, 0, in the following manner
q = ?8 = o(l — 0) + Q$=iO
(ID= qeA x * - 4 :
where qe = 0 is the electrode charge observed in the absence of adsorption and g„=i is the electrode charge that would be observed if the surface were covered with a complete monolayer of the adsorbate. The surface concentration in a monolayer condition is represented by IT. This model has been criticized because it makes no provision for lateral interactions.17 While the model does not, in fact, work well for anion adsorption, possibly for this reason, less difficulty should be expected from this source in the case of electrically neutral adsorbed substances.
The linear relationship between q and T predicted by eq 11 is clearly not satisfied by the experimental data for OPDA in 0.1 M potassium chloride shown in Figure 7. The failure of the simple, two surface species model might be expected, however, if the adsorbed molecules were present in two orientations at intermediate values of T. An adsorbed molecule in a planar position would obviously require a different value for IT than would the same molecule in a vertical position. Barradas, et al.,14 note that the effective dipole moments would be different in these two cases and Parry and Parsons12 have discussed the difference in the polarizability of the benzene ring in planar and vertical orientations.
Surfece Concentration f * IO 10 m o le s/cm 2
Figure 7. Electrode charge-surface concentration data for OPDA in 0.1 M KC1.
It is reasonable to assume, therefore, that qg = l is not the same for each of these two orientations. Molecules in each orientation would therefore have to be regarded as separate species. In terms of the Frumkin parallel capacitor model, consideration of a three-component system would be required in such a case.
Extension of the Frumkin model to a three component system requires tha~ 0 be redefined. Molecules in a planar position will be arbitrarily assigned to state 1; those in a vertical position to state 2. The symbol / will be used to designate the fraction of adsorbed molecules in state 1. As before, F will represent the total surface concentration without regard to state. Then
0 = 01 + 02 r(i) r(2)_ r.(l) IT (2) (12)
/r ( 1 - /) rIT(1) + IT (2)
(12) J. M. Parry and R. Pa-sons, J. Electrochem. Soc., 113, 992 (1966).(13) B. B. Damaskin, I. P. Mishutushkina, V. M. Gerovich, and R. I. Kaganovich, Zh. Fiz. Kh'.m., 38, 976 (1964).(14) R, G. Barradas, P. G. H imilton and B. E. Conway, J. Phys. Chem., 69, 3411 (1965).(15) R. 8. Hansen, D. J. Kelsh, and D. H. Grantham, ibid., 67, 2316 (1963).(16) A. N. Frumkin, Z. Phys., 35, 792 (1926).(17) P. Delahay, “ Double Layer and Electrode Kinetics,” Interscience, New York, N. Y., 1965, p 94.
V o lu m e 73, N u m b er 8 A u g u s t 1969
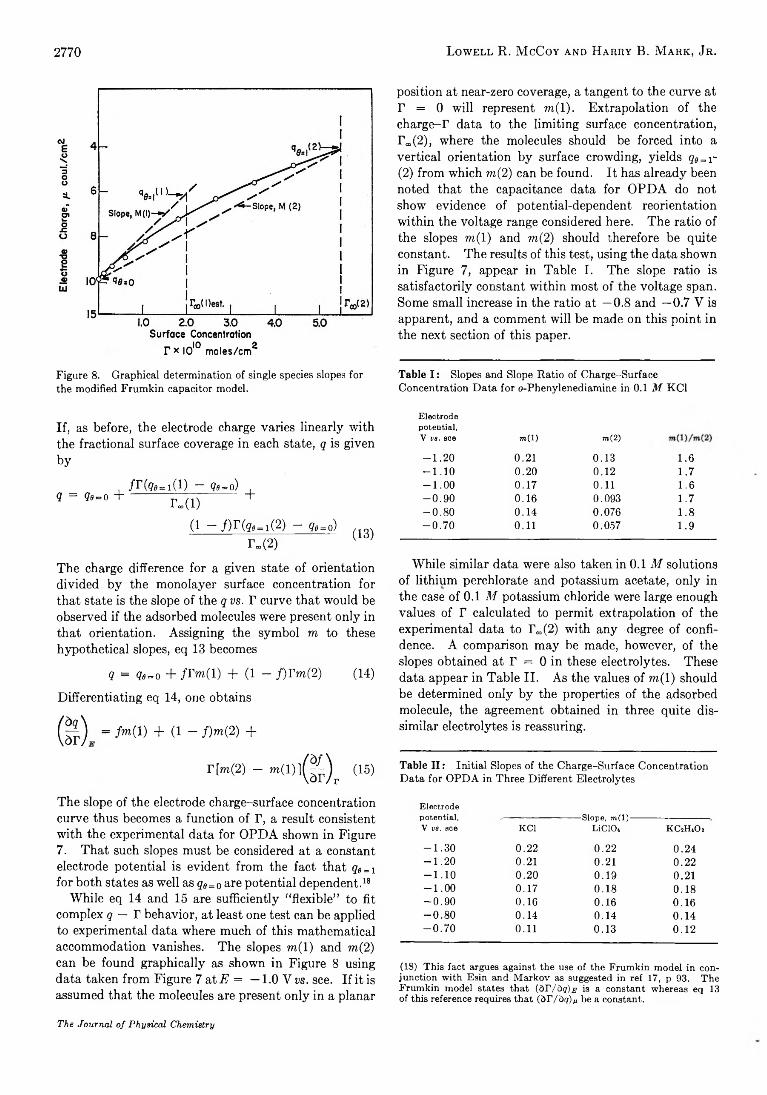
2770
T * IO10 m oles/cm 2
Figure 8. Graphical determination of single species slopes for the modified Frumkin capacitor model.
If, as before, the electrode charge varies linearly with the fractional surface coverage in each state, q is given by
q = ç<>=o +/rfe=i(i) — <70=0)
+r»(i)(1 - / ) r ( g „ 1(2) - ge=o)
r-(2) (13)
The charge difference for a given state of orientation divided by the monolayer surface concentration for that state is the slope of the q vs. T curve that would be observed if the adsorbed molecules were present only in that orientation. Assigning the symbol to to these hypothetical slopes, eq 13 becomes
q = <?0 = o + /rwi(l) + (1 - f)Tm(2) (14)
Differentiating eq 14, one obtains
( ^ ) = M l ) + (1 - f)m(2) +
r[m(2) - ™ (D ](^ ;)r (15)
The slope of the electrode charge-surface concentration curve thus becomes a function of T, a result consistent with the experimental data for OPDA shown in Figure 7. That such slopes must be considered at a constant electrode potential is evident from the fact that qe = i for both states as well as qg=0 are potential dependent.18
While eq 14 and 15 are sufficiently “ flexible” to fit complex q — T behavior, at least one test can be applied to experimental data where much of this mathematical accommodation vanishes. The slopes m( 1) and m(2) can be found graphically as shown in Figure 8 using data taken from Figure 7 at E = —1.0 V vs. see. If it is assumed that the molecules are present only in a planar
Lowell R. M cCoy and Harry B. Mark, Jr .
position at near-zero coverage, a tangent to the curve at T = 0 will represent m( 1). Extrapolation of the charge-r data to the limiting surface concentration, r co(2), where the molecules should be forced into a vertical orientation by surface crowding, yields qe = r (2) from which to(2) can be found. It has already been noted that the capacitance data for OPDA do not show evidence of potential-dependent reorientation within the voltage range considered here. The ratio of the slopes to(1) and to(2) should therefore be quite constant. The results of this test, using the data shown in Figure 7, appear in Table I. The slope ratio is satisfactorily constant within most of the voltage span. Some small increase in the ratio at —0.8 and —0.7 V is apparent, and a comment will be made on this point in the next section of this paper.
Table I : Slopes and Slope Ratio of Charge-Surface Concentration Data for o-Phenylenediamine in 0.1 M KC1
E lectrod epotential.V vs. see m (l)
- 1 . 2 0 0.21- 1 . 1 0 0.20- 1 . 0 0 0 . 1 7- 0 . 9 0 0 . 1 6- 0 . 8 0 0 . 1 4- 0 . 7 0 0.11
ml 2)
0 . 1 3 1.60.12 1 . 70.11 1.60 .0 9 3 1 . 70 .0 7 6 1.80 .0 5 7 1 . 9
While similar data were also taken in 0.1 M solutions of lithium perchlorate and potassium acetate, only in the case of 0.1 M potassium chloride were large enough values of T calculated to permit extrapolation of the experimental data to T„(2) with any degree of confidence. A comparison may be made, however, of the slopes obtained at T = 0 in these electrolytes. These data appear in Table II. As the values of to(1) should be determined only by the properties of the adsorbed molecule, the agreement obtained in three quite dissimilar electrolytes is reassuring.
Table II: Initial Slopes of the Charge-Surface Concentration Data for OPDA in Three Different Electrolytes
E lectrodepotentia l,V vs. see KC1
- 1 . 3 0 0.22- 1 . 2 0 0.21- 1 . 1 0 0.20- 1 . 0 0 0 . 1 7- 0 . 9 0 0 .1 6- 0 . 8 0 0 . 1 4- 0 . 7 0 0.11
•Slope, m{\)-------L iCIO i KCsHiCL
0.22 0 . 2 40.21 0.220 . 1 9 0.210 . 1 8 0 . 1 80 . 1 6 0 . 1 60 . 1 4 0 . 1 40 . 1 3 0.12
(IS) This fact argues against the use of the Frumkin model in conjunction with Esin and Markov as suggested in ref 17, p 93. The Frumkin model states that (dT/dq)E is a constant whereas eq 13 of this reference requires that (dT/dr/G be a constant.
T h e J o u rn a l o f P h y s ic a l C h em istry

Catalytic Polarographic Current of a M etal Complex 2771
A second test may be applied to the experimental data to determine compliance to the model. Equation 14 may be solved for/, yielding
f = 9 ~ g>-o____________ m (2)m( 1) — m( 2) m( 1) — m( 2)
In view of the constancy of the slcpe ratio over most of the electrode potential range, a similar constancy should be exhibited by f vs. T values over the same range. In the absence of any independent means of obtaining values of / , however, judgment as to the validity of such values must reside in a consideration of whether the results appear reasonable in terms of the size of the molecule and its probable behavior with surface crowding. Again using the data presented in Figure 7, values of / were calculated by eq 16. These values appear in Figure 9. Planar orientation is indicated as the sole state up to about 0.5 X 10⁻¹⁰ mol/cm2 with some small proportion of vertically oriented molecules appearing at 1 X 10 ~10 mol cm2. Considering T „(l) to be about 1.5 to 2.0 X 10⁻¹⁰ mol/cm2, this result seems at least intuitively reasonable as surface collisions should result in some vertically oriented molecules long before saturation coverage in planar orientation is reached. The peak displayed by 0(1) at about 2.0 X 10~10 mol/cm2 may or may not fortuitously coincide with r ra(l).
Some small proportion of planar-oriented molecules is apparently retained up to the limiting concentration. This permits some comment on eq 15. The term containing the partial differential df/dr does appear to be zero at T = 0, and the use of a tangent to the experimental data at that point should yield a correct measure of m( 1). Conversely, the differential term is not zero at r„(2 ) and m(2) must be determined from the charge-T coordinates as shown in Figure 8, not from a tangent to the curve at r,„(2).
If the above conclusions are correct, the adsorbed OPDA molecule exists almost wholly in a planar orientation at surface concentrations present in the polarographic measurements (r < 0.5 X 10⁻¹⁰ mol/cm2). As stated in the beginning of this section, this should place the reaction plane in near proximity to the outer plane of the electrode double layer. It is unlikely, therefore, that an anomalous charge value for the electroactive complex can be attributed to errors from this source.
o-Phenylenediamine-Anion CoadsorptionAs the previous sections indicate no obvious source of
error in the double-layer analysis of the prewave, an explanation for the indicated charge of the electroactive complex must be sought in the state of the reactants. Considering the nickel ion first, it can be reasoned that the actual species reacting with the adsorbed organic ligand is of the form Ni(H20 )6X +l, where X -1 is either an electrolyte anion or an hydroxyl group. If such an ion
Surface Concentration r x i o 10 m oles/cm 2
Figure 9. Surface orientation of ODPA as a function of surface concentration.
existed in rapid equilibrium with the hexaaquonickel ion, a charge of + 1 for the electroactive complex would be anticipated. If this explanation is correct, the prewave height should vary significantly in different electrolytes or be greatly affected by changes in pH. Electrolyte anion participation can be ruled out by the fact that the prewave is observed in noncomplexing electrolytes such as nitrates or perchlorates.2d The variations in prewave heights found in various electrolytes under comparable conditions can be well accounted for by known changes in either ip° or OPDA surface concentrations. 2d'e The possibility that X -1 may be a hydroxyl group is contraindicated by the lack of response of the prewave height to changes in pH above 6 where the OPDA is then present almost entirely as the free base.2b
If the nickel ion cannot provide an explanation for the charge of the complex, attention must be directed to the other partner in the reaction, the adsorbed OPDA molecule. Coadsorption of electrolyte anions with OPDA offers one solution to this problem for, if the coadsorbed anion were an active partner in the surface reaction, the charge of the reaction product would be that found above.19 That such a possibility exists is suggested by the change of the electrode potential at zero charge with increasing bulk concentrations of the organic ligand as shown in Figure 10. Although nearly all adsorbed neutral organic substances cause the potential at zero charge to move toward more positive potentials with increasing concentrations, the shift at
(19) The possibility that coadsorption of anions might occur in this case was first suggested by R. Parsons in a private communication to the authors as an explanation for anomalies observed in differential capacitance curves for OPDA in more concentrated electrolytes.
V o lu m e 73, N u m b er 8 A u g u s t 1969

up to moderate concentrations of OPDA is toward more negative potentials. This behavior parallels that observed with specifically adsorbed anions.7’9 The reversal of this trend at high concentrations of OPDA is the result of desorption beginning at potentials negative to the potential of zero charge. The only other substance known to exhibit a similar behavior is phenol.16 The concept of anion coadsorption has been discussed by Damaskin, et al.,13 who suggest that the x electrons of planar-oriented aromatic molecules form bonds with a positively charged electrode surface leaving electronic “ holes” which attract anions. In this instance, however, anion coadsorption in the potential range of the prewave would require that the same phenomenon occur at a negatively charged electrode.
O P D A
2772
- 0 . 4 0 -0 .4 5 -0 .5 0 - 0 .5 5 P O T E N T IA L,V O LT S , S .C .E .
Figure 10. Variation in the electrode charge-potential relationship as a function of OPDA concentration in 0.1 M KC1.
If anion coadsorption does take place here, some evidence for it should be found in a greater particle- particle interaction between adsorbed molecules bearing a charge as compared to that expected for neutral molecules. In principle, information on this point can be gained by an analysis of experimental data by the use of isotherms containing an interaction term. In practice, this operation is made difficult by disagreement among experts on some vital points, and the reader is referred to a review of this subject by Dela- hay.20 Although a number of isotherms contain an interaction term, this discussion will be limited to the Frumkin16 isotherm which has the form
where a3 is the activity of the adsorbed substance in solution and g is a term representing particle-particle interaction (negative in sign for repulsion, positive for attraction) between the adsorbed molecules.21 The symbols 6 and T have already been defined previously in this paper. The term, (3, is given by
13 = “ V b t ) m
where AG° is the standard electrochemical free energy of adsorption. Equation 17, therefore, represents an attempt to isolate the particle-electrode interactions in the term ¡3, and the particle-particle interactions in the term, g. To study g, it is desirable to maintain /3 as a constant. This requires the establishment of a constant electrical state. This has been a matter of controversy with constant voltage and constant charge both having been proposed.20
If the activity of the substance being adsorbed is taken as proportional to its concentration, c, and the temperature and electrical state are constant, eq 17 may be rearranged and written as
9 2gFT / ,log —-------- - = — —— + constant (19)
s c(l - 6) 2.3RT K
If the left-hand member of eq 19 is shown graphically as a function of T, the slope of the curve should reflect only the variations in the particle-particle interaction term, g. The magnitude of g, particularly at large values of F, will be greatly affected by the choice of the isotherm; its sign, indicating repulsion or attraction, will not be. At low values of T, the choice of a proper isotherm is of lesser consequence as the additional exponential terms which these contain20 have a smaller effect on the results.
In view of the uncertainty in the choice of a proper electrical state, adsorption data for OPDA in 0.1 t f potassium chloride have been plotted in accordance with eq 19 at constant electrode potential in Figure 11 and at constant electrode charge in Figure 12. The results obtained in 0.1 M solutions of lithium perchlorate and potassium acetate are qualitatively the same as those shown in Figures 11 and 12. Attractive forces are evident in both cases at high values of T, a result consistent with van der Waals forces operating in a closely packed condition. At lower values of I1, the results are seen to be strikingly dependent on the choice of the electrical state. At constant electrode potential, a change from an attraction between the molecules to a repulsion is indicated as the electrode potentials become less negative. This reversal in sign does not occur where the electrode charge is held constant, but an increase in repulsive forces is indicated at lower values of
(20) Reference 17, p 81 if.(21) Reference 20 employs the same sign convention for g but incorrectly omits the negative sign for the exponential term in eq 17; see ref 13 and 15.
Lowell R. M cCoy and Harry B. M ark, Jr .
T h e J o u rn a l o f P h y s ic a l C h em istry

Catalytic Polarographic Current of a M etal Complex 2773
Figure 11. Frumkin isotherm at constant electrode potential; OPDA in 0.1 M KC1.
Figure 12. Frumkin isotherm at constant electrode charge; OPDA in 0.1 M KC1.
electrode charge. In both cases, increased repulsive forces are indicated for the surface concentrations and electrode conditions of interest to the prewave. These results are therefore consistent with anion coadsorption under these conditions.
While coadsorption of anions with the organic ligand provides a convenient explanation for the charge of the electroactive complex, it raises some questions with regard to the analyses performed in this paper. In the study of the orientation of OPDA, anion coadsorption should result in some increase in the slope of the q vs. T curves at P = 0. That it may do so is indicated by the increase in the slope ratios shown in Table I at less negative potentials. While this could be attributed to direct adsorption of the chloride ion at these electrode potentials, it is of interest to note that the initial slopes of the curves shown in Table II are very nearly the same, although the acetate and perchlorate ions are not significantly adsorbed on mercury at these potentials.11 The degree to which these slopes are affected may depend on the site occupied by the anion. If it were located on the aromatic ring as suggested by Damaskin, et al.,13 rather than on the electrode surface itself, the repulsive forces might be somewhat lessened. This still leaves unresolved the problem of anion coadsorption at negative electrode charges. Some information of inter
est to this point could be gained from a study, now in progress, of the isomers of OPDA.
If, as suggested here, two complexities exist in the case of OPDA (anion coadsorption as a function of electrode potential and reorientation as a function of surface concentration), it would seem unlikely that any isotherm representing the adsorption properties of a single species can be expected to conform to the experimental data. While it is presumptuous to express a preference for an electrical state in view of this statement, the relative constancy found for the ligand orientation data over the total voltage span argues against a physical change in the molecular adsorption state that could account for the change in the sign of g found where the electrode potential was chosen as the constant electrical state. The monotonic changes (at low values of T) at constant electrode charge are at least consistent with this data.
No attempt has been made to modify the Frumkin isotherm as was done for the Frumkin capacitor model used in the orientation studies. In this case it may be preferable to establish a better basis for interpreting deviations of data from simple models of single species isotherms. Even this task would require a greater body of experimental data than is presently available in the literature.
V o lu m e 73, N u m b er 8 A u g u s t 1969
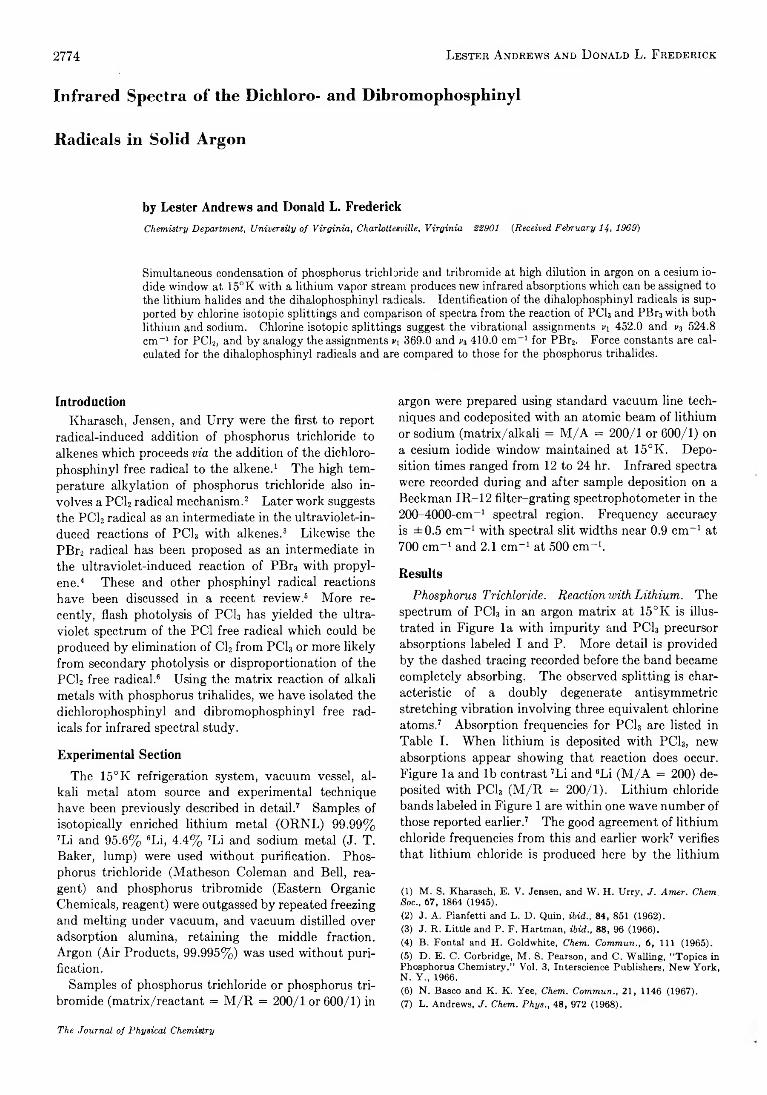
2774 Lester A ndrews and D onald L. Frederick
Infrared Spectra of the Diehloro- and Dibrom ophosphinyl
Radicals in Solid Argon
by Lester Andrews and Donald L. FrederickChemistry Department, University of Virginia, Charlottesville, Virginia 22901 (Received, February 14, 1969)
Simultaneous condensation of phosphorus trichloride and tribromide at high dilution in argon on a cesium iodide window at 15°K with a lithium vapor stream produces new infrared absorptions which can be assigned to the lithium halides and the dihalophosphinyl radicals. Identification of the dihalophosphinyl radicals is supported by chlorine isotopic splittings and comparison of spectra from the reaction of PC13 and PBr3 with both lithium and sodium. Chlorine isotopic splittings suggest the vibrational assignments n 452.0 and v3 524.8 cm-1 for PC12, and by analogy the assignments v\ 369.0 and r3 410.0 cm-1 for PBr2. Force constants are calculated for the dihalophosphinyl radicals and are compared to those for the phosphorus trihalides.
IntroductionKharasch, Jensen, and Urry were the first to report
radical-induced addition of phosphorus trichloride to alkenes which proceeds via the addition of the dichloro- phosphinyl free radical to the alkene.1 The high temperature alkylation of phosphorus trichloride also involves a PC12 radical mechanism.2 Later work suggests the PC12 radical as an intermediate in the ultraviolet-induced reactions of PC1S with alkenes.3 Likewise the PBr2 radical has been proposed as an intermediate in the ultraviolet-induced reaction of PBr3 with propylene.4 These and other phosphinyl radical reactions have been discussed in a recent review.6 More recently, flash photolysis of PC13 has yielded the ultraviolet spectrum of the PCI free radical which could be produced by elimination of Cl2 from PC13 or more likely from secondary photolysis or disproportionation of the PC12 free radical.6 Using the matrix reaction of alkali metals with phosphorus trihalides, we have isolated the dichlorophosphinyl and dibromophosphinyl free radicals for infrared spectral study.
Experimental SectionThe 15°K refrigeration system, vacuum vessel, al
kali metal atom source and experimental technique have been previously described in detail.7 Samples of isotopically enriched lithium metal (ORNL) 99.99% 7Li and 95.6% 6Li, 4.4% 7Li and sodium metal (J. T. Baker, lump) were used without purification. Phosphorus trichloride (Matheson Coleman and Bell, reagent) and phosphorus tribromide (Eastern Organic Chemicals, reagent) were outgassed by repeated freezing and melting under vacuum, and vacuum distilled over adsorption alumina, retaining the middle fraction. Argon (Air Products, 99.995%) was used without purification.
Samples of phosphorus trichloride or phosphorus tribromide (matrix/reactant = M /R = 200/1 or 600/1) in
argon were prepared using standard vacuum line techniques and codeposited with an atomic beam of lithium or sodium (matrix/alkali = M /A = 200/1 or 600/1) on a cesium iodide window maintained at 15°K. Deposition times ranged from 12 to 24 hr. Infrared spectra were recorded during and after sample deposition on a Beckman IR-12 filter-grating spectrophotometer in the 200-4000-cm_1 spectral region. Frequency accuracy is ± 0.5 cm-1 with spectral slit widths near 0.9 cm-1 at 700 cm-1 and 2.1 cm-1 at 500 cm-1.
ResultsPhosphorus Trichloride. Reaction with Lithium. The
spectrum of PCI3 in an argon matrix at 15°K is illustrated in Figure la with impurity and PCI3 precursor absorptions labeled I and P. More detail is provided by the dashed tracing recorded before the band became completely absorbing. The observed splitting is characteristic of a doubly degenerate antisymmetric stretching vibration involving three equivalent chlorine atoms.7 Absorption frequencies for PC13 are listed in Table I. When lithium is deposited with PC13, new absorptions appear showing that reaction does occur. Figure la and lb contrast 7Li and 6Li (M /A = 200) deposited with PCI3 (M /R = 200/1). Lithium chloride bands labeled in Figure 1 are within one wave number of those reported earlier.7 The good agreement of lithium chloride frequencies from this and earlier work7 verifies that lithium chloride is produced here by the lithium
(1) M. S. Kharasch, E. V. Jensen, and W. H. Urry, J. Amer. Chem. Soc., 67, 1864 (1945).(2) J. A. Pianfetti and L. D. Quin, ibid., 84, 851 (1962).(3) J. R. Little and P. F. Hartman, ibid., 88, 96 (1966).(4) B. Fontal and H. Goldwhite, Chem. Commun., 6, 111 (1965).(5) D. E. C. Corbridge, M. S. Pearson, and C. Walling, “ Topics in Phosphorus Chemistry,” Vol. 3, Interscience Publishers, New York, N. Y., 1966.(6) N. Basco and K. K. Yee, Chem. Commun., 21, 1146 (1967).(7) L. Andrews, J. Chem. Phys., 48, 972 (1968).
T h e J o u rn a l o f P h y s ic a l C h em istry

Ir Spectra of D ihalophosphintl R adicals 2775
Table I : Phosphorus Trichloride and Tribromide Infrared Absorptions (cm -1) in an Argon Matrix at 15°K
PC13
Argonmatrix® Liquid6
v\ 511.1 506Vi 258.5 260Vz 500.5, 496.5 494Vi
PBr3
190
Argonmatrix® Liquid6
V\ 392.5 392V2 161vz 401.0 392Vi 115
This work. b Reference 15.
atom-PCl3 reaction. Two additional new absorptions near 525 and 452 cm-1 are labeled Aj and A» in Figure 1 and are listed in Table II for the various experiments. No additional absorptions were observed except C 02 impurity at 664 cm-1.
Additional experiments were run with more dilute PC13 (M /R = 600/1) and lithium (M /A = 200/1), and decreased lithium concentration (M /A = 600/1) with PCI3 (M /R = 200). The spectra from these experiments are essentially the same as those illustrated in Figure 1; no concentration effects were observed.
Reaction with Sodium. Figure Id illustrates the spectrum recorded for the reaction of PC13 (M /R = 600/1) with sodium (M /A = 200/1). The bands A! and A2 are again observed although the band A2 is surrounded by intense broad bands labeled N at 467 and 443 cm-1 which are seen only in the sodium experiments. No absorption appropriate for NaCl was observed.7
Table II : New Absorptions (cm -1) Produced by Reactions of Alkali Metals with PC13 and PBr3 in an Argon Matrix at 15°K
M/RExperimentM/A Reactants Ai Aa
200 200 ’Li, PCI, 525.0 451.5522.6 447.5
200 200 6Li, PC13 524.7 452.0522.7 447.5
600 200 Na, PC13 524.0 453 ± 2
Bi Ba
200 200 ’Li, PBr3 410.0 369.0200 200 6Li, PBr3 410.0 369.5200 200 Na, PBr3 410.0 371.0
Figure 1. Infrared spectra in the 430-630-cm-1 region for phosphorus trichloride deposited in an argon matrix: (a)without alkali metal; the dashed spectrum shows spectral detail before the sample became completely absorbing;(b) with ’ Li; (c) with 6Li; and (d) with Na.
Diffusion Experiments. Warm-up experiments have been conducted on most of the runs previously described. The temperatures attained range from 30 to 45 °K, and the results show varying degrees of change due to the increase in light scattering of the sample after warming and the difficulty in performing these experiments. In several warm-up operations, the bands Ai and A2 decreased in intensity by about one- half. In the sodium experiment illustrated in Figure Id, the A bands disappeared upon sample warming while the N absorptions increased slightly in intensity.
V o lu m e 7 3 , N u m b er 8 A u g u s t 1969

Unfortunately, the most intense absorption8 of P2Cl4is near 508 cm“ 1 and likely would not be observed here due to overlap with the intense PCI3 band if P2CI4 were produced during diffusion.
Phosphorus Tribromide. Reaction with Lithium. Figure 2a shows the spectrum of PBr8 in an argon matrix
2776
Figure 2. Infrared spectra in the 300-550-cm-1 region for phosphorus tribromide deposited in an argon matrix: (a)without alkali metal; (b )w ith 7Li; (c) with 6Li; and (d) with Na.
with the PBr3 parent absorptions labeled P and an impurity band labeled I. This spectrum was recorded early in the PBr3 experiment without lithium in order to show detail on the PBr3 absorption; these frequencies are also listed in Table I. When phosphorus tribromide (M /R = 200/1) was codeposited with 7Li and 6Li (M /A = 200/1) the spectra illustrated in Figure 2b and (c) were recorded. Lithium bromide bands noted in Figure 2 agree within experimental error with LiBr
absorptions recorded in earlier work.9'10 The LiBr is produced here as a product of the lithium atom- PBr3 reaction. Additional new absorptions labeled Bi and B2 in Figure 2 near 410 and 370 cm-1 appear when PBr3 is deposited with lithium and not without the alkali metal. Table II lists these new absorptions. Carbon dioxide impurity was the only other band observed in these spectra. PBr3 (M /R = 600/1) deposited with Li (M /A = 200/1) yielded similar results to the more concentrated PBr3 experiments.
Reaction with Sodium. The sodium (M /A = 200/1) reaction with PBr3 (M /R = 200/1) produces the spectrum in Figure 2d. The Bj and B2 bands are again observed but are much weaker in the sodium experiment; these frequencies are listed in Table II for comparison. As in the PCl3-sodium reaction, two new broad bands labeled N were found near 350 and 332 cm-1 in the PBr3-sodium experiments which were not present when PBr3 reacted with lithium. No band was observed which could be attributed to NaBr.
Diffusion Experiments. Sample warming experiments with the PBr3 sample were unsuccessful. Due to light scattering, the sample became opaque in the region of the B bands and their behavior on sample warming could not be observed.
DiscussionWe now turn to the identification and vibrational
analysis of the molecular species responsible for the new infrared absorptions.
Identification of A and B Absorbers. When PC13 and PBr3 are codeposited with lithium in an argon matrix, new absorptions appear which are not present in the matrix spectrum deposited without lithium. The observation of LiCl and LiBr, respectively, indicates halogen abstraction by lithium making the PC12 and PBr2 radicals likely products. Such an expectation is reasonable in view of similar alkali metal reactions7’10 with CCI4 and CBr4 to produce the CC13 and CBr3 free radicals.
The Ai and A2 bands maintain approximately constant relative intensity in the lithium and sodium experiments with PC13 as is also observed for the B4 and B2 bands in analogous PBr3 experiments. We conclude that the A bands likely belong to the same molecular species and that the B bands can be attributed to a single molecule.
The disappearance of the A bands on diffusion is consistent with their assignment to a small, reactive molecular species. Unfortunately, diffusion behavior of the B bands was not observed.
The spectra recorded for the reaction of PC13 with alkali metals are analogous to those using PBr3. Bromine
( 8 ) S . G . F r a n k is s a n d F . A . M i l l e r , S p e c t r o c h im . A c t a , 2 1 , 1 2 3 5 (1 9 6 5 ) .
( 9 ) S . S c h l i c k a n d O . S c h n e p p , J . C h e m . P h y s . , 4 1 , 4 6 3 ( 1 9 6 4 ) .
( 1 0 ) L . A n d r e w s a n d T . G . C a r v e r , i b id . , 4 9 , 8 9 6 ( 1 9 6 8 ) .
Lester Andrews and D onald L. Frederick
T h e J o u rn a l o f P h y s ic a l C h em istry

Ie Spectra of D ihalophosphinyl R adicals 2777
substitution for chlorine provides a pseudo-isotope effect. The splittings observed on the Ai and A2 bands illustrated in Figure 1 are qualitatively in agreement with the shifts and intensities expected for a molecular species containing two equivalent chlorine atoms, based on the natural abundance of chlorine isotopes. Similar splittings have been observed for CCI211 and SiCl212 trapped in argon matrices. Thus, the splittings observed for the A bands are likely due to chlorine isotopes which suggest that the A absorber contains two equivalent chlorine atoms and likely contains a single phosphorus atom.
Unfortunately, the A absorptions are weak, particularly in comparison to the completely absorbing CC13 band where comparable LiCl band intensities were observed.7 We examined the spectra for evidence of secondary reactions of PC12 to give PCI and dimerization to form P2CI4. No absorption for PCI was found near6 570 cm-1, and the most intense P2C14 band9 lies under the PCI3 absorption. Therefore, we attribute the weak absorption observed here to low vibrational extinction coefficients for this species.
The B bands are very intense in the lithium-PBr3 experiments and they are likely due to a primary reaction product. In fact the spectra for the lithium reactions are relatively simple; only two new bands are observed. By analogy with the A species, the B absorber likely contains two equivalent bromine atoms and a single phosphorus atom.
Complexes have been observed between radicals and alkali halides in a number of recent matrix reactions.13 The substitution of sodium for lithium usually produces changes in band shape and/or frequency shifts and a marked increase in intensity of the radical-alkali halide complex absorption relative to that for the isolated radical since the sodium halide complex is favored over the lithium halide complex in these reactions. Therefore, in view of the absence of any appreciable differences for bands A and B produced from 7Li, 6Li, and Na as listed in Table II, we attribute the A and B absorptions, respectively, to the PC12 and PBr2 free radicals. The bands labeled N in the sodium experiments are assigned to the P X 2-N aX complex. These assignments are supported by the diffusion disappearance of the A bands and stability of the N absorptions mentioned earlier. We observe no additional bands for association with a PX 2-L iX complex in the lithium experiments where only two new bands are observed and assigned to the radical. However, nearly 20 cm-1 of the spectral region of interest is completely masked by the parent, and any absorption concealed here cannot be detected. The approximately 2 cm-1 positive sodium shifts on the As and B2 bands are likely due to difficulty in accurately measuring these weak bands due to the N bands overlapping A2 and the asymmetry of the very intense B2 bands compared to the weak B2 band in the sodium experiment. The constant relative intensities of Ai and
A2 as well as Bi and B2 are particularly significant in the interpretation of the sodium spectra. The bands A2 and B2 are weak like their A4 and Bx radical counterparts, in contrast to the much stronger N bands attributed to the PX 2-N aX complexes.
Vibrational Analysis. The observation of two bands in the phosphorus-chlorine stretching region which are assigned to PC12 indicates that the molecule is bent since the linear symmetrical species would have but one infrared active P-Cl stretching mode. Likewise, the PBr2 radical is bent and both radicals possess C2v symmetry, with three infrared-active vibrational modes vi (ai, symmetric P -X stretch), v3 (a*, X -P -X bend), and v3 (bi, antisymmetric P -X stretch).
We must consider the twm absorptions observed for PC12 for assignment to n and v3 or conversely to v3 and v\ since the correct assignment is not obvious from the infrared spectrum. The Raman spectrum14 of SC12 indicates that the higher 535-cm"1 band is depolarized while the lower 514-cm"1 absorption is polarized which determines the assignment of the higher frequency to v3 and the lower band to n. Milligan and Jacox12 have recently observed SiCl2 and their assignments to v3 and vi best fit the observed chlorine isotopic frequencies for Vi 513 cm-1 and vx 502 cm-1 for a Cl-Si-Cl valence angle of 120°. Therefore, we performed normal coordinate calculations for both possible assignments.
The antisymmetric vibration (v3) is alone with bi symmetry. We use the approximate separation of high and low frequencies to remove the unobserved bending mode (vi) from the symmetric block of the G and F matrices. Normal coordinate calculations were done for valence angles of 90, 100, 110, and 120° for both possible assignments to n and v3 for PC12 and PBr2. The symmetry coordinate potential constants were combined to give the stretching force constant Fr and the stretch-stretch interaction force constant F „ which are listed in Table III. For comparison, we performed potential constant calculations for PC13 and PBr3 using the approximate separation of frequencies. Our calculated force constants for PCla and PBr3 are compared in Table IV to those calculated from all of the observed frequencies neglecting "he stretch-bend interaction force constant.16
The first assignment to PC12 (v3 > vi) and PBr2(r3 > vi) produces a much more reasonable potential function than does the second assignment (¡u > v3) . The interaction force constants (F„) for the latter assignment are unreasonably large, which is some basis for preferring the former assignment where the Frr values are smaller as in PC13 and PBr3.
(11) L. Andrews, J. Chem. Phys., 48, 979 (1968).(12) D. E. Milligan and M. E. Jacox, ibid., 49, 1938 (1968).(13) E.g., T. G. Carver and L. Andrews, “ Infrared Spectrum of the Dibromomethyl Radical in Solid Argon,” ibid., in press.(14) H. Stammreich, R. Forneris, and K. Sone, ibid., 23, 972 (1955).(15) P. W. Davis and R. A. Oetjen, J. Mol. Spectrosc., 2, 253 (1958).
V o lu m e 73, N u m b er 8 A u g u s t 1969

Lester Andrews and D onald L. Frederick2778
Table III : Force Constant (m dyn/A) Calculations for PC12 and PBr2 Using the Approximate Separation of Frequencies in the Symmetric Symmetry Block
PCI,
Valence /•---------Assignment I--------- s ------- Assignment II------angle, pi 452.0, v z 524.8 cm“1 pi 524.8, P3 452.0 cm“1deg Fr Ftp Fr F rt90 2.32 -0 .3 4 2.32 0.34
100 2.31 -0 .1 3 2.37 0.56110 2.33 0.08 2.46 0.79120 2.35 0.33 2.56 1.06
PBr,
. .__angle, pi 369.0, n 410.0 cm 1 pi 410.0, vz 369. 0 cm“1deg Fr Fit Fr F rr90 1.97 -0 .2 4 1.97 0.24
100 1.97 0.01 2.03 0.50n o 2.04 0.26 2.16 0.77120 2.16 0.54 2.37 1.09
Table IV : Force Constant (m dyn/A) Calculations for PCI3 and PBr3 with Valence Angles of 100°
-PCI3------------— ,---------------PBra---------- —. Fre-Fr F rr Fr F rr quencies Calcn
2.38 0.16 2.17 0.31 a 62.33 0.17 2.12 0.34 c c2.17 0.32 1.83 0.24 c d
0 Argon matrix, this work. 6 Using approximate separation of frequencies. c Liquid, ref 15. d Neglecting stretch-bend interaction, ref 15.
Table Y shows the calculated frequencies for the P37C12 isotope based on the observed P36C12 frequencies for each possible assignment. The average observed splitting for the 525-cm-1 Ai band is 2.2 cm-1 and for the 452-cm-1 A2 band is 4.0 cm-1. These shifts to lower frequency correspond to the P36C137C1 isotope and should be approximately halfway between the P36C12 and P37C12 isotopes. The larger chlorine isotope splitting is associated with the symmetric P-Cl stretch vi as Table V illustrates, and the 452-cm-1 band has the larger chlorine isotope splitting which suggests its assignment as vi and the 525-cm-1 band as vs. These assignments are best fit by the 120° bond angle calculation for assignment I. The conclusions reached here for PC12 are similar to those deduced by Milligan and Jacox for SiCl2.12 By analogy between PC12 and PBr2, we
Table V: Chlorine Isotope Splittings (cm *) for PC12
.--------Assignment I-------- . .-------- Assignment II-------- .Valence PI vz VI VZangle, 452.0 524.8 524.8 452.0deg cm-1 cm“1 cm“1 cm“1
Calculated Splitting = (35-31-35) - (37-31-37)90 5.9 6.8 6 .8 5.9
100 6.5 6.2 7.4 5.4110 7.2 5.7 8.2 4.9120 8.0 5.1 9.1 4 .4
Average Observed Splitting = (35-31-35) — (35-31-37) 524.8 cm-1 2.2 cm -1452.0 cm-1 4 .0 cm-1
suggest the assignment of the higher frequency (410 cm "1) to vz and the lower frequency (369 cm "1) to iq of PBr2, and that the valence angle may be near 120°.
Conclusions
These studies lead to vibrational potential constants for two new free radical intermediates and invite consideration of the bonding in these species.
Potential Constants. The phosphorus-chlorine stretching force constant FT = 2.35 ± 0 . 1 mdyn/A and the stretch-stretch interaction force constant FIT = 0.33 ± 0.2 mdyn/A. deduced here for the dichlorophos- phinyl radical are approximately the same as those calculated for phosphorus trichloride using the approximate separation of frequencies. In like manner for the dibromophosphinyl radical, Fv — 2.16 ± 0.1 mdyn/A and Frr = 0.54 ± 0.3 mdyn/A, which are near those we calculated for phosphorus tribromide.
Bonding in Dihalophosphinyl Radicals. We have shown earlier10'11 that normal single bonds are present in dichlorocarbene and dibromocarbene. In view of this finding, we were eager to determine the bonding in an electronic system containing an additional electron. The phosphorus atom also provides the interesting possibility of using its d orbitals in bonding. However, we find that the phosphorus-halogen valence force constants in the dihalophosphinyl radicals are near those for their phosphorus trihalide percursors which suggests similar bonding in these radicals and stable molecules. Apparently, any mechanism for stabilization of these dihalophosphinyl radicals has too high an energy to make any significant contribution to the bonding.
Acknowledgment. We gratefully acknowledge financial support by the National Science Foundation under Grant GP-8587.
T h e J o u rn a l o f P h y s ic a l C h em istry

2779
NOTES
Radiative Neutron Capture Organic Yields As an
Indication o f the State o f Aggregation o f ICI
and I2 in C6-Hydrocarbon M atrices at 7 7 °K 1
by R. M. Lambrecht, H. K. J. Hahn, and E. P. Rack
Department of Chemistry, University of Nebraska,Lincoln, Nebraska 68508 (Received January 3, 1969)
Organic yields induced by nuclear transformations can give useful information about the state of aggregation of a solute and its tendency toward complexing.2 Constant organic yields over an appreciable halogen concentration have been ascribed to the formation of preferred (X 2)„ (where X = Br and I) cluster sizes and/or similar numbers of halogen molecules at sites in polycrystalline organic matrices.2'3 This note represents an extension of the nuclear transformation technique to deduce information on clustering and segregation during crystallization of ICI and I2 in polycrystalline n-hexane and 2,2-dimethylbutane, and glassy3-methylpentane (3MP) at 77°K. The study is unique in that 128I yields from ICI and I2 may be compared, and the state of aggregation of ICI may be traced by both 38C1 and 128I formed by the radiative neutron capture processes. An interesting test for the nuclear transformation technique as a valid indicator of the state of aggregation would be whether 128I and 38C1 from ICI gave similar results.
The organic yields resulting from the 127I(n ,y)128I and the 37Cl(n,y)88Cl reactions as a function of ICI4'6 and I2 concentration in polycrystalline n-hexane are depicted in Figure 1. The 128I data for I2 in polycrystalline n-hexane have been reported previously3 but are presented again for purposes of comparison to the organic yields from ICI. The 128I and 3SC1 organic yields from ICI are identical, within experimental error, with those of 128I from I2 over the concentration range studied. Below ~ 1 0 “ 6 mf (mole fraction) ICI no 38C1 organic yields are reported because of lack of 38C1 detection sensitivity. Under the conditions of monomolecular dispersion, the organic yields are about 52%. Since the organic yields are nearly constant at 10% between 1 X 10~5 and 2 X 10⁻⁴ mf halogen, we conclude that the ICI and I2 apparently form similar (X 2)„ cluster sizes and/or are composed of similar numbers of halogen molecules at sites in the polycrystalline organic matrices. Different halogens would not necessarily be expected to form (X 2)„
clusters and give the same or constant organic yields at comparable halogen concentrations. For example, in polycrystalline n-hexane, the 80Brm(IT)80Br organic yields are about 5% between 5 X 10~4 and 1 X 10~2mf Br2, whereas 127I(n ,y)128I organic yields are about 10% between 1 X 10 ~6 and 2 X 10 “ 4 mf I2.
Figure 1. The effect of ICI and I2 concentration (mole fraction) on 38C1 and 128I organic yields in polycrystalline w-hexane at 77 °K.
The 38C1 and 128I organic yields in polycrystalline 2,2- dimethylbutane were similar in trend and in magnitude to those observed in polycrystalline n-hexane. This result is not surprising since Iyer and Willard2 found the S0Brm(IT)80Br organic yields at 5 X 10⁻³ mf Br2 in polycrystalline n-hexane and n-pentane to be similar (i.e.,4.7 and 4.2 ± 1%, respectively). The low organic yields (<1% ) at the higher concentrations of halogen have in the past been ascribed to clumping or total seg-
(1) This research was supported by the U. S. Atomic Energy Commission under Contract No. AT(11-1)-1617. This is AEC Document No. COO-1617-12.(2) R. M. Iyer and J. E. Willard, J. Amer. Chem. Soc., 88, 4561 (1966).(3) R. L. Ayres, E. J. Kemnitz, R. M. Lambrecht, and E. P. Rack, Radiochim. Acta, in press.(4) The determination of the organic yields of I28I and “ Cl is complicated by the reaction of ICI with products (probably olefins) of radiolysis formed by the reactor irradiations. The extent of this reaction was determined in separate experiments by irradiating the hydrocarbons at 77 °K, liquefying, and adding 38C1- and 128I-labeled ICI. The corrected organic yields are equal to the observed organic incorporation of “ Cl and I28I, reduced by the per cent of activity that would have entered as a result of reaction with stable radiolysis products. When the small correction was applied, the 38C1 and I28I data from ICI were similar to the 128I from I2 data. Willard5 has shown that I2 does not react with stable radiolysis products formed by the reactor irradiations. Bromine solid state organic yields are also affected by the presence of stable unsaturated products formed by radiolysis.5(5) R. M. Iyer and J. E. Willard, J. Phys. Chem., 71, 3070 (1967).
V o lu m e 73, N u m b er 8 A u g u st 1969

2780 Notes
Figure 2. The effect of IC1 and I2 concentration (mole fraction) on 38C1 and 128I organic yields in glassy 3MP at 77°K.
regation of the halogen species from the hydrocarbon during the freezing process.2’3’6-8
The effect of I2 and IC1 concentration on the I28I and 38C1 organic yields in glassy 3MP is depicted in Figure2. The 128I yields from I2 in glassy 3MP under the conditions of monomolecular dispersion (1 X 10⁻⁶ and below) are 59 ± 3% and are similar to those observed in polycrystalline hydrocarbons containing a very dilute concentration of halogen. However, between 1 X 10⁻⁵ and 1 X 10⁻³ mf halogen the organic yields decrease uniformly from 59% to less than 2%. The 128I and 38C1 organic yields are not constant over any appreciable halogen concentration range greater than 1 X 10⁻⁶ mf; hence, freezing the IC1 or I2 in glassy 3MP apparently results in a partial segregation of the halogen in the hydrocarbon matrix, rather than inducing the formation of preferred sizes of (X2)„ clusters in the glassy matrix. The 128I and 38C1 yields from IC1 are the same within experimental error and are similar in trend to the 128I from I2 as a function of halogen concentration. However, the 128I and 38C1 organic yields from IC1 are a few per cent higher than the corresponding 128I from I2 data at a comparable halogen mole fraction.
Several conclusions can be drawn from this study.(1) The experiments with IC1 in which the two different halogen atoms acquire a radioactive label and trace their environment without chemical selectivity have confirmed earlier results obtained with bromine and iodine. These results offer additional evidence that the nuclear transformation technique is a useful method for obtaining qualitative information about the state of aggregation of a solute in a solid hydrocarbon matrix.(2) In glassy and polycrystalline halogen-hydrocarbonsystems, the organic yields under the conditions of monomolecular dispersion are about 55 ± 5%. (3) Inpoly crystalline hydrocarbons containing bromine,2 iodine,3 or iodine monochloride, rather constant organic yields over appreciable halogen concentration ranges suggest the formation of preferred (X 2)„ cluster sizes
and/or similar numbers of halogen molecules at sites in the hydrocarbon matrix. (4) Similar clustering of halogens does not occur in glassy 3MP.
Experimental SectionTo obtain meaningful experimental data from the IC1
and I2 solid state studies it is imperative that rigid repurification of the hydrocarbons be employed. Phillips research grade hydrocarbons (quoted 99.9+ mol % purity) were repurified by stirring with concentrated H2S04 at 22° for 48 hr. The H2S04 was replaced if the acid turned yellow or discolored during the repurification treatment. The hydrocarbon solution was washed with aqueous NaHC03, distilled H20, dried over silica gel, and fractionally distilled through a 25-cm bubble- cap column. The hydrocarbon was then purged with He to remove trace gaseous impurities.3 All operations were performed in a dimmed room. In thoroughly cleaned quartz ampoules 1-ml samples were degassed, quick-frozen, and stored under liquid N2. Prior to the neutron irradiation the samples were inserted in plastic bags, filled with mineral oil, and equilibrated to 77°K. Following the 10-sec or less thermal neutron irradiations, the ampoules were removed from the crystalline oil, washed with a series of halocarbon baths, and then broken under extraction solution. If possible, the operations were performed before the solid sample liquefied.
The NajSCb-CCh extraction procedure and reactor characteristics have been described previously.9 The radiohalogens were assayed with a 3 X 3 in. N al(TI) crystal and a RID L 400-channel pulse height analyzer. Spectrum stripping techniques were used to determine the 38C1 and 128I activities.(6) R. M. A. Hahne and J. E. Willard, J. Phys. Chem., 68, 2582(1964).(7) J. A. Merrigan, W. K. Ellgren, Jr., and E. P. Rack, J. Chem. Phys., 44, 174 (1966).(8) J. A. Merrigan, J. B, Nicholas, R. M. Lambrecht, N. J. Parks, and E. P. Rack, J. Phys. Chem., 70, 2417 (1966).(9) J. A. Merrigan and E. P. Rack, ibid., 69, 2795 (1965).
Chem istry o f Crystalline Alum inosilicates.
V I. Preparation and Properties o f
Ultrastable Hydrogen Zeolite Y 1
by George T. Kerr
Mobil Research and Development Corporation,Central Research Division Laboratory, Princeton, New Jersey 08540 {Received January 10, 1969)
An earlier article described the removal of tetra- hedrally coordinated aluminum from sodium zeolite Y using ethylenediaminetetraacetic acid.1 Removal of
(1) Part V: G. T. Kerr, J. Phys. Chem., 72, 2594 (1968).
T h e J o u r n a l o f P h y s ic a l C h em istry

Notes 2781
25-50% of the aluminum effected a significant increase in the thermal stability of the sodium zeolite. This technique has been extended to ammonium zeolite Y. Controlled thermal decomposition of the ammonium ion in the aluminum-deficient zeolite yields a hydrogen zeolite which is markedly more stable than the hydrogen form containing 192 (Si + Al) -etrahedra per unit cell normally present in faujasites.
Experimental SectionLattice parameters were measured by double-scan
ning diffractometry using the Siemens diffractometer with scintillation counter and strip chart recorder. A Du Pont 900 differential thermal analyzer was used to determine the temperature at which crystal lattice collapse occurred.1'2 Thermogravimetric analyses were conducted with the Du Pont 950. The heating rate was 10°/min. The normally closed bell jar on this apparatus was fitted with a gas inlet tube at its rounded end, through which a helium purge of 190 ml/min was passed. Thus the entire balance system was continuously purged. During thermal decomposition of the ammonium zeolite, the effluent gas was passed into a solution of 2 ml of 4% boric acid in 50 ml of water. The adsorbed ammonia was titrated with standard sulfamic acid solution using methyl purple indicator. Continuous and almost instantaneous determination of the quantity of ammonium ion decomposed was achieved using this technique. The procedure for the reaction of the zeolite with ethyleneciaminetetraacetic acid (H4EDTA) was described earlier as were other techniques and apparatus used but not described here.1
The ammonium zeolite used in this study had the unit cell formula Na3.6H3.7(NH4)42.7(A102)5o(Si02)i42 calculated on the anhydrous basis. The zeolite actually contained 13.88% sorbed water.
Results and DiscussionThe Composition of Aluminum-Deficient Ammonium
Zeolite Y. The quantities of ELEDTA and ammonium zeolite used should have resulted in removal of 33% of the aluminum from the zeolite together with 33% of the cations. The stoichiometry was based on the general equation for aluminum removal presented earlier.1 The unit-cell formula of the product was Na8.8(NH4)34.s (A102)32.s (Si02)i42; this corresponds to removal of 31% of the aluminum and 27% of the cations.
Thermal Decomposition of Aluminum-Deficient Ammonium Zeolite Y. A sample of the aluminum-deficient ammonium zeolite was thermally decomposed in the thermogravimetric analyzer. Ammonia was first detected in the effluent purge gas at 200° and ammonia evolution ceased at 475°. The total quantity of ammonia found showed that the ammonium ions had completely decomposed. On heating from 500 to 1000°, the sample underwent a weight loss of 3.00 mg/100 mg of ash (ash is sample weight at 1100°). Most of the
weight loss occurred from 725 to 800°. Assuming the ammonium zeolite was converted to the hydrogen form at 500°, the calculated weight loss resulting from dehy- droxylation (loss of constitutive water) on further heating is 2.78 mg/100 mg of ash. Benesi has shown that the normal ammonium zeolite Y can also be thermally decomposed in two distinct steps: loss of ammonia from 200 to 500° and the loss of chemical water from 600 to 900°.3
The Properties of Aluminum-Deficient Hydrogen ZeoliteY. The lattice parameter, ato, of the normal hydrogen zeolite Y, prepared by calcination of the original ammonium zeolite, was 24.74 A; <xo for the aluminum-deficient hydrogen zeolite was 24.51 A. Thus a lattice contraction of 0.93% occurred on removal of 31% of the tetrahedral aluminum from the normal hydrogen zeolite. The ultrastable faujasite described by McDaniel and Maher was contracted by about 1% relative to the “ de- cationated Y .” 4 Although it is not clear what is meant by the term “ decationated,” McDaniel and Maher were probably referring to either hydrogen zeolite Y or its de- hydroxylated form or perhaps to a combination of these forms.6
Differential thermal analyses indicated that the crystal structure of the normal hydrogen zeolite Y collapsed at 850° compared with 1010° for the aluminum- deficient hydrogen zeolite. A striking improvement in the hydrothermal stability of the hydrogen form on aluminum removal has also been observed. Normal hydrogen zeolite Y sorbs about 35% water at 12 mm; attempts to remove the sorbed water by heating to 300° or higher results in complete lattice collapse as shown by cyclohexane sorptive capacity measurements (under 1%) and X-ray diffraction powder photographs. Aluminum-deficient hydrogen zeolite Y sorbs about 42% water which can be removed by heating to 400° or higher. The water-free product sorbs about 19% cyclohexane at 20 mm and X-ray analysis indicates the material to be highly crystalline. The cyclohexane sorptive capacity of a freshly prepared sample of the aluminum-deficient form is about 24%, indicating that hydrothermal treatment, while not destroying the crystal lattice, does effect some change. This is presently under study. The higher sorptive capacities of aluminum-deficient Y zeolites were discussed previously.1
ConclusionsThe present and previous studies16 convincingly dem
onstrate that removal of a portion of the tetrahedrally
(2) A. S. Berger and L. K. Yakovlev, Zh. Prikl. Khim., 38, 1240(1965).(3) H. A. Benesi, J. Catal., 8, 368 (1967).(4) C. V. McDaniel and P. K. Mahler, “ Molecular Sieves,” Society of Chemical Industry, London, 1968, p 186.(5) For a discussion of the need for an improved nomenclature for thermal products of ammonium zeolite Y, see G. T. Kerr, J. Cat- tanach, and E. L. Wu, J. Catal., 13, 114 (1969).(6) G. T. Kerr, J. Phys. Chem., 71, 4155 (1967).
V o lu m e 73, N u m b er 8 A u g u s t 1969

2782 N otes
coordinated aluminum from zeolite Y effects a marked improvement in thermal and hydrothermal stability. The removal of aluminum is accompanied by a contraction of the unit cell which is not surprising since new Si-O-Si bonds are probably formed where Si-O -Al-O-Si sites existed in the original zeolite.1’7 These findings support the conjecture of McDaniel and Maher, who assumed that “ stabilization of the structure is a direct result of cell shrinkage.” 4 It now seems quite clear that the ultrastable faujasite of McDaniel and Maher is an aluminum-deficient material with regard to the tetrahedral framework. These workers stated that their ultrastable faujasite had a significantly lower cation exchange capacity than normal faujasites. The aluminum removed from the framework not only reduces the number of anionic sites but also occupies cation sites as previously described.6 To simplify nomenclature, it is suggested that aluminum-deficient zeolite Y be referred to in the future as simply zeolite Y '.
Acknowledgment. The help of Dr. D. H. Olson in measuring lattice parameters is gratefully acknowledged. Mr. Arthur Julian rendered valuable assistance in the experimental work.
(7) The formation of these Si-O-Si bonds involves a dehydroxyla- tion reaction distinct from that involving simple hydrogen zeolites. Dr. E. Dempsey, using zeolite models, demonstrated to the author that Si atoms, adjacent to aluminum-deficient sites, could be geometrically oriented to form new Si-O-Si bonds without disrupting the remainder of the faujasite structure.
Ionic Diffusion under High Pressure
in Porous Solid M aterials Permeated
with Aqueous, Electrolytic Solution
by R. A. Horne,1 A. F. Day, and R. P. Young
Arthur D. Little, Incorporated, Cambridge, Massachusetts (.Received December 3, 1968)
Richardson, Bergsteinsson, Getz, Peters, and Sprague2 studied ionic diffusion in aqueous solutions of seawater constituents under high pressure using a fritted glass diaphragm. Unfortunately, the experiment proved to be a difficult one and although the “ approximate average of data scatter limits” of the integral binary diffusion coefficient appeared to increase from about 1.48 X 10 ~5 cm2/sec to about 1.6 X 106 cm2/ sec in going from 1 atm to 1000 bars (dashed curve in Figure 1) for a 3.5 wt % NaCl solution at 28°, the experimental scatter was so great that the authors concluded that “ the influence of the pressure on the ordinary diffusion coefficient... was found to be negligible” over that pressure range.
Figure 1. Pressure dependence of various solution properties. Curve 1, viscosity of pure water at 20°; R. A. Horne and D.S. Johnson, J. Phys. Chem., 70, 2182 (1966). Curve 2, electrical conductivity of 0.100 m KC1 at 25°; R. A. Horne and R. A. Courant, J. Chem. Soc., 3548 (1964). Curve 3, specific volume of pure water at 20°; E. H. Amagat, Ann. Chim. Phys., 29, 68, 505 (1893). Curve 4, dielectric constant of pure water at 20°; S. Kyropoulos, Z. Physik, 40, 507 (1926). Curve 5, dielectric constant of pure water at 20°; B. B. Owen, R. C. Miller, C. E. Milner, and H. L. Cogen, J. Phys. Chem., 61, 2068 (1961). Curve 6, self-diffusion of pure water at 30°; G. B. Benedek and E. M . Purcell, J. Chem. Phys., 22, 2603 (1954). Curve 7, proton relaxation time at 30°; G. B. Benedek andE. M . Purcell, ibid., 22, 2603 (1954). Curve 8, diffusion of THO in H20 at 25°; R. B. Cuddeback, R. C., Koeller, and H. G. Drickamer, ibid., 21, 589 (1953). Curve 9, transference number of K + in 0.1 N KCI at 25°; F. T. Wail and J. Berkowitz, J. Phys. Chem., 62, 87 (1958); F. T. Wall and S. J. Gill, ibid., 59, 278 (1958).
We have examined the relative rates of diffusion of aqueous electrolytic solutions through 06 Selas micro- porous porcelain disks (capillary radius less than 0.2 X 10~4 cm) into pure water, without stirring and at
(1) Woods Hole Oceanographic Institution, Woods Hole, Mass.(2) J. L. Richardson, P. Bergsteinsson, R. J. Getz, D. L. Peters, and R. W. Sprague, “ Sea Water Mass Diffusion Coefficient Studies,” Philco Corporation Aeronutronic Division of Applied Research Laboratories Publication No. U-3021 (Dec 1964), Office of Naval Research Contract No. Nonr-4061(00).(3) L. Devel, Acta Chem. Scand., 16, 2177 (1962).(4) (a) R. A. Horne and D. S. Johnson, J. Phys. Chem., 70, 2182(1966); (b) R. A. Horne, Sur. Progr. Chem., 4, 1 (1968).(5) R. A. Horne in “ Advances in High Pressure Research,” Vol. 2, R. S. Bradley, Ed., Academic Press, London, 1969, in press.
T h e J o u rn a l o f P h y s ic a l C h em istry

Notes 2783
different hydrostatic pressures, by following the decay of the electrical resistance of the system. The results are shown in Figures 2 and 3. Although we could
Figure 2. Resistance decay (diffusion rates) for 3.0 M KC1 under pressure.
readily observe the increased rate of diffusion with increased temperatures at 1 atm over the range 15 to 45°, the parallel slopes in these figures lead to the conclusion that, in agreement with Richardson, et al.,2 hydrostatic
- 0« V * * 0.1 M KCI in 0.1 Mole— 0» ♦ * Fraction Ethanol 25°C- % cf V ♦
0 c* ♦O <f . V ♦
- © <9 V ♦
- « o*v ♦
• - ♦- 0 s v ♦
Ô * % ♦0*
♦ 1,000 kg/cm^© ©• i
v 1 atm © o •
• 1,300 kg/cm^ © o
- o 1 atm
:<d 660 kg/cm^ ©
©
■________I___________1__________J___________ 1___________1__
0 10 20 30 40 50 60Time, Minutes
Figure 3. Resistance decay (diffusion rates) for 0.1 M KC1 in ethanol-water under pressure.
pressure up to 3000 kg/cm 2 has little effect (less than 10%, dashed curve in Figure 2) on diffusion rates. Experiments were also made on more dilute (0.3 M)
KC1 solutions, in ethanol-water systems (Figure 3), and 0.1 I MgS04 solutions with comparable results. In the latter case, more gentle slopes reflected the slower diffusion of this strong structure-maker.3
This conclusion may be surprising in view of the profound influence of hydrostatic pressure on the structure of pure liquid water and aqueous electrolytic solutions in the bulk phase;4a'b'6 however, it should be noted that the pressure dependence of various water and solution properties in general exhibit virtually no correlations with one another (Figure 1).
Unfortunately, because of their relative nature and the experimental and interpretation uncertainties, the present results are compatible with and cannot distinguish between two quite different descriptions of the diffusion process: (1) the traditional point of viewthat absolute ionic diffusion coefficients in aqueous solution in porous media do not differ appreciably from the corresponding values in free solution, and at 2000 kg/cm 2, like viscous flow, diffusion is facilitated by a few per cent; or (2) in contrast to the structurebreaking effect of pressure on the bulk phase mentioned above, that “ . .. solid and liquid surfaces can modify the intermolecular structure of water and that these structural effects can be of a long-range nature and cannot be accounted for on the basis of monolayer or, indeed, multilayer adsorption.’’6 Soviet scientists have suggested that the properties of this specially structured interfacial water is quite different from that of “ normal” bulk water.7 Its density is 1.2 to 1.3 times greater and accordingly it appears to be much more stable than the Frank-Wen clusters with respect to hydrostatic pressure8— a possible explanation for the absence of pressure effects in the present experiments. It tends to exclude selectively certain solutes8— and its viscosity may be as much as 10 to 15 times greater than that of normal water, which would be expected to result in a general retardation of transport process in the porous medium— a retardation which appears in ionic conduction in membranes9 but which the present experiments fail to confirm because of their relative nature. That is to say the present results are also not incompatible with highly structured water in the microporous disk resulting in a diminution of the ionic diffusion coefficient by a factor as great as 10 to 15, and little dependence of diffusion on hydrostatic pressure.
Acknowledgment. This work was supported in part by the Office of Naval Research.
(6) F. Franks, Chem. Ind. (London), No. 18, 560 (1968).(7) B. V. Derjaguin, Discussions Faraday Soc., 42, 109 (1966), and the references cited therein.(8) R. A. Horne, A. F. Day, R. P. Young, and N-T. Yu, Electro- chim. Acta, 13, 397 (1968).(9) J. H. B. George, R. A. Horne, and C. R. Schlaikjer, “ An Investigation of the Transport Properties of Ion Exchange Membranes,” Arthur D. Little, Inc., Final Report (Dec., 1967), Office of Saline Water Contract No. 14-01-0001-962.
V o lu m e 73, N u m b er 8 A u g u s t 1969

2784 Notes
Viscosities o f Protonated and Deuterated W ater
Solutions o f Alkali M etal Chlorides
by A. G. Ostroff, B. S. Snowden, Jr., and D. E. Woessner
Field Research Laboratory of Mobil Research and Development Corporation, Dallas, Texas 75221 (Received January 17, 1969)
Comparison of the viscosities of the D20 and H20 electrolyte solutions1 should provide insight into the effects of various ionic species on the structure of the solution. Since pure D20 and H20 are considered to have different structural characteristics, the introduction of the alkali metal ions should affect the structure of the two types of water differently. This structural difference is expected to be reflected in the viscosity measurements. The series of alkali metal ions is particularly appropriate for this study because it contains ions which have the same net charge but a wide range of charge-to- radius ratio. A comparison of the H20 and D20 viscosities of these ionic solutions should demonstrate the effect of these ions on an aqueous solution.
The object of this work is the determination of relative viscosities of both protonated and deuterated water solutions of LiCl, NaCl, KC1, RbCl, and CsCl at 25°. Although some of these data are available in the literature, we remeasured them to confirm our experimental technique.
Experimental Section
Equipment. Cannon-Fenske kinematic viscometers of different capillary diameters were used in these measurements because of the range of viscosities studied. These viscometers were cleaned initially and periodically with chromic acid cleaning solution, washed with distilled water, and dried with a current of filtered dry air.2 Flow times were measured using stop watches equipped with indicating counters that could be read directly to 0.1 of a second. Viscosities were measured in a thermostatically controlled water bath which was adjusted to control temperature to 25 ± 0.01°. The temperature of the bath was adjusted and monitored with a National Bureau of Standards calibrated thermometer. A Mettler Type H15 analytical balance was used in measuring the solution densities and in weighing the solvent and solute used in making the solution.
Materials and Solutions. Lithium, sodium, and potassium chloride solutions were made using Baker’s Analyzed grade chemicals. Rubidium and cesium chloride solutions were prepared using pure grade reagents obtained from E. H. Sargent Co. Distilled water was used in the H20 solutions and >99.5% deuterium oxide in the D20 solutions.
Solutions were made on a weight basis by weighing both solvent and solute. The dilute solutions of RbCl
and CsCl were prepared by diluting on a weight basis solutions stronger than 3 m.
Procedure. Solutions were loaded into the viscometer and placed in the bath and an hour was allowed for equilibration at the bath temperature of 25°. The solutions for density measurements were also placed in this bath. A minimum of five flow-time readings was taken for each solution.
Solvent flow times were measured in all viscometers. The reported density values represent an average of at least three readings. A specific timer was used with a particular viscometer. Densities were measured at 25° using a plummet and an analytical balance. These densities were used in calculating relative viscosities.
Results and DiscussionThe measured relative viscosities and densities of the
alkali metal chlorides in both protonated and deuterated
Figure 1. Relative viscosities of alkali metal chlorides vs. mole fraction.
water solutions are listed in Table I. The values for LiCl in H20 are in good agreement with those reported in ICT3 as well as those reported by Jacopetti.4 Both
(1) D. E. Woessner, B. S. Snowden, Jr., and A. G. Ostroff, J. Chem. Phys., 49, 371 (1968).(2) it. C. Hardy and R. L. Cottington, J. Res. Nat. Bur. Stand., A, 42, 573 (1949).(3) E. W. Washburn, Ed., “ International Critical Tables,” Vol. V, McGraw-Hill Book Co., Inc., New York, N. Y., 1929, p 12.(4) M. Jacopetti, Gazz. Chim. Ital., 72, 251 (1942).
T h e J o u rn a l o f P h y s ic a l C h em istry

Notes 2785
Table I : Measured Viscosities and Densities of Alkali Metal Chlorides
Mole Relative Density, Mole Relative Density,fraction viscosity g/ml fraction viscosity g/ml
LiCl in H20 RbCl in H20
0.0169 1.144 1.0198 0.3078 0.986 1.03440.0268 1.237 1.0327 0.3148 0.982 1.06760.0375 1.342 1.0465 0.3199 0.976 1.09100.0511 1.490 1.0631 0.3244 0.970 1.11150.0649 1.675 1.0801 0.3255 0.969 1.11710.0782 1.829 1.0941 0.0326 0.969 1.14870.0819 1.905 1.0995 0.3429 0.973 1.19370.0895 2.013 1.1071 0.0513 0.978 1.22930.0919 2.063 1.1117 0.0588 0.984 1.2604
0.0675 0.997 1.2947LiCl in D20 0.0754 1.009 1.3264
0.0151 1.120 1.1233 0.0822 1.027 1.35280.0257 1.212 1.13600.0346 1.295 1.1449 RbCl in D20
0.0517 1.480 1.1650 0.0090 0.980 1.14540.0669 1.659 1.1787 0.0178 0.961 1.18310.0829 1.878 1.1983 0.0265 0.950 1.22240.0967 2.107 1.2124 0.0350 0.944 1.25990.1117 2.427 1.2288 0.0437 0.942 1.2962
0.0516 0.939 1.3285NaCl in H20 0.0596 0.942 1.3606
0.0181 1.098 1.0371 0.0682 0.947 1.39350.0355 1.222 1.0754 0.0746 0.952 1.41720.0545 1.381 1.1131 0.0803 0.962 1.43820.0729 1.587 1.14950.0917 1.861 1.1844 CsCl in H20
0.0089 0.983 1.0600NaCl in D 20 0.0177 0.966 1.1199
0 .0069S1 1.028 1.1192 0.0263 0.953 1.17690.0142 1.063 1.1347 0.0351 0.951 1.23320.0212 1.106 1.1494 0.0431 0.952 1.28270.0280 1.140 1.1630 0.0515 0.955 1.33290.0348 1.191 1.1767 0.0593 0.957 1.38030.0414 1.231 1.1885 0.0677 0.966 1.42650.0480 1.288 1.2014 0.0828 0.984 1.51040.0521 1.313 1.2097 PoPÎ in TA C\0.0593 1.391 1.2246 GSGI 111 I/2V
0.0672 1.473 1.2394 0.0072 0.978 1.15430.0750 1.571 1.2533 0.0143 0.957 1.20130.0826 1.646 1.2663 0.0230 0.938 1.2575
0.3315 0.928 1.3106KC1 in H20 0.0397 0.921 1.3587
0.0089 0.997 1.0197 0.3450 0.913 1.39120.0175 0.998 1.0414 0.3514 0.917 1.42770.0264 0.999 1.0624 0.3597 0.914 1.47560.0348 1.007 1.0820 0.3678 0.917 1.51940.0431 1.011 1.1003 0.3831 0.934 1.60070.0513 1.027 1.11840.0593 1.037 1.13570.0671 1.051 1.1526
KC1 in D 20
0.0090 0.986 1.12550.0178 0.984 1.14650.0264 0.978 1.16620.0350 0.981 1.18380.0433 0.981 1.20220.0516 0.988 1.21660.0596 0.995 1.23540.0676 1.005 1.2496
NaCl and KC1 values in H20 correspond to those in ICT.® Values for CsCl in H20 are in general agreement with those reported by Lyons and Riley5 at the low and high concentrations; however, the values reported in Table I are slightly higher in the 0.0375-0.0650 mole fraction range.
A four-parameter least-squares fit was made of the relative viscosity data, and parameters were determined for calculating relative viscosities of the alkali metal chlorides. The general equation for this calculation is
Vr = Cl + C 2x + C 3x * + C & * (1)
where Ci, C2, C2, and C\ are coefficients given in Figure 1 and x is the mole fraction of solute. This equation allows the calculation of the relative viscosities at 25°. Standard deviations (a) for these curve-fitting equations are given in Figure 1. An indication of the goodness of eq 1 is seen from the fact that the Ci values are very close to unity, as is required by the definition of rjT.
Smoothed viscosity data for KC1, RbCl, and CsCl in both H20 and D20 are shown in Figure 1. Each of these salts decreases the relative viscosity. This effect increases with increasing cation radius. In the alkali metal ions, the largest increase in viscosity with concentration is shown by LiCl and the next largest with NaCl.
Figure 1 also illustrates that the decrease in the relative viscosity is greater in D20 solutions than in H20 solutions. It is known that the viscosity, temperature of maximum density, and heat capacity of liquid D20 are higher than for liquid H20 .6 This has been interpreted as indicating that liquid D20 is more structurally ordered than liquid H20 because the degree of hydrogen bonding is greater7 in the former than in the latter. The relative viscosity measurements of both the small (Li+ and Na+) and large (K+, Cs+, and R b +) cations are consistent with the hypothesis that D20 has more structural order than H20. The viscosity results appear to substantiate the hypothesis8 that the structural order in these aqueous solutions decreases with decreasing charge-to-size ratio.
Acknowledgments. The authors wish to thank JackT. Wall for his contribution in measuring the viscosities, J. S. Grisham, Jr., for his contribution to the computer programming, and to Mobil Research and Development Corporation for permission to publish this work.
(5) P. A. Lyons and J. F. Riley, J. Amer. Chem. Soc., 76, 5216 (1954).(6) I. Kirshenbaum, “ Physical Properties and Analysis of Heavy Water,” National Nuclear Energy Series, Manhattan Project Technical Section, Division III, IVa, McGraw-Hill Book Co., Inc., New York, N. Y „ 1951.(7) L. J. Kavanau, “ Water and Solute-Water Interactions,” Holden- Day, San Francisco, Calif., 1964.(8) D. E. Woessner, B. S. Snowden, Jr., and A. G. Ostroff, J. Chem. Phys., 50, 4714 (1969).
V o lu m e 73, N u m b er 8 A u g u s t 1969

2786 Notes
T he Eleetrochem ilum inescence o f the
Diphenylan thracene Radical Anion
by Michael D. Malbin and Harry B. Mark, Jr.
Department of Chemistry, The University of Michigan,Ann Arbor, Michigan (Received February 13, 1969)
The one-electron electrolytic reduction1 of diphenyl- anthracene2 or rubrene at a platinum or mercury stationary electrode immersed in a dimethylformamide solution (containing tetrabutylammonium perchlorate) was found to give rise to a concomitant emission of light.3 The luminescence which occurs was identical
+.5 0.0 -.5 0 -1 .00 -1.50 -2 .0 0
V O LTS (vs. S C E)
Figure 1. Cyclic voltammogram with light emission as a function of potential. Scan rate = 200 mV/sec; [diphenylanthracene] = 3.0 X 10⁻³ M in D M F; solution was exhaustively degassed with prepurified helium; platinum electrode.
with the fluorescence spectrum of the neutral hydrocarbon.4 Unlike the previously reported electrochem- iluminescent systems6 which require stepping to positive potentials after the reduction process has taken place in order to effect light emission, this study reports low intensity light emission (approximately 3 orders of magnitude less than annihilation intensities) which occurs upon direct reduction of the hydrocarbon and which is directly related to the rate of diffusion of the hydrocarbon to the electrode.
Chronoamperometric experiments with potential reversal6 and cyclic voltammetry show that the electrode process is a one-electron reversible reaction. Chronocou- lometric experiments with a double potential step show linear slopes for Q plotted vs. t'f* for the reduction process and a linear slope vs. [(£)1/2 — (t — r)1/!] for the reoxi
dation process indicating a negligible amount of electrogenerated anion radical is consumed by the subsequent processes. These solutions were deoxygenated with prepurified helium by bubbling for periods of 15-30 min. It is interesting to note that a solution which was maintained at the reduction potential of diphenylanthracene, — 1.9V (vs. see), exhibited a constant light emission when stirred vigorously with a stream of prepurified helium. Furthermore, when the potential is sufficiently negative so that the dianion of the hydrocarbon is the product, r.o light is observed.
Although other workers have previously suggested that direct formation of excited states may be possible at an electrode,61 the following experiments demonstrate conclusively that a reaction must occur in the “ bulk” (i.e., diffusion layer) of solution. Similar conclusions have been made theoretically for such a process at a metal electrode.7 In cyclic voltammetry experiments (scan rate = 200 mV/sec potential range between 0 and —2.0 V) emission is observed as the reduction peak occurs and the light decays only slowly during the reoxidation portion of the cycle as the electrode proceeds to more positive potentials (see Figure 1). One concludes that some of the product of the charge-transfer reaction has diffused away from the electrode and has engaged in a homogeneous chemical reaction in the bulk of the solution since the rate constant is much too long for emission from an excited state (£i/2 of decay > 20 sec). A second type of experiment which corroborates this conclusion was a chronoamperometric study in which the poten- tiostat was turned off after 15 sec of electrolysis. The solution was then bubbled vigorously with prepurified helium after standing for 15-30 sec. Emission accompanies the bubbling by helium as the diffusion layer is destroyed.
The nature of the reaction following electron transfer has been studied qualitatively. These results also indicate that the light emitted arises from a bulk chemical reaction. On changing solvents from dimethylform-
(1) (a) All electrochemical experiments were carried out with athree-electrode potentiostat. (b) D. D. DeFcrd, presented before the Analytical Division, 133rd National Meeting of the American Chemical Society, San Francisco, Calif., 1958; (c) W. M. Schwarzand I. Shain, Anal. Chem., 35, 1770 (1963).(2) (a) K. S. V. Santhanam and A. Bard, J. Amer. Chem. Soc., 88, 2669 (1966); (b) R. E. Sioda, J. Phys. Chem., 72, 2322 (1968).(3) Emission was measured using an EMI 6256s photomultiplier tube operated at 1700 V.(4) Spectra were obtained using a Jarrell-Ash 0.25-m monochromator.(5) (a) A. Zweig, A. K. Hoffman, D. L. Maricle, and A. H. Maurer, Chem. Commun., 106 (1967); (b) A. Zweig, A. K. Hoffman, D. L. Maricle, and A. H. Maurer, J. Amer. Chem. Soc., 90, 261 (1968); (c) D. L. Maricle and A. Maurer, ibid., 89, 188 (1967); (d) A. Zweig,D. L. Maricle, J. S. Brinen, and A. H. Maurer, ibid., 89, 473 (1967);(e) E. A. Chandross and R. E. Visco, J. Phys. Chem., 72, 378 (1968);(f) A. Zweig and D. L. Maricle, ibid., 72, 377 (1968); (g) R. E. Viscoand E. A. Chandross, J. Amer. Chem. Soc., 86, 5350 (1964); (h)E. A. Chandross, J. W. Longworth, and R. E. Visco, ibid., 87, 3259(1965).(6) W. M. Schwarz and I. Shain, J. Phys. Chem., 69, 30 (1965).(7) R. A. Marcus, J. Chem. Phys., 43, 2654 (1965).
T h e J o u rn a l o f P h y s ic a l C h em istry

Notes 2787
Figure 2. Cyclic voltammogram with light emission as a function of potential. [Diphenylanthracene] = 3.0 X 10 ~3 M in DM F; scan rate = 200 mV/sec. Solution was bubbled for 30 min with nitrogen gas containing 1% 0 2. The first cycle shows the irreversible peak due to adsorbed material on the platinum electrode. All subsequent cycles (10) gave traces identical with those shown for cycle 2.
amine to dimethylacetamide8 the luminescence was still observed with approximately the same intensity under identical conditions. These experiments indicate that the chemical reaction is not proton abstraction from the solvent. Also, trace known amounts of water and phenol were added to the system and it was found that in both cases light emission intensity decreased with increasing proton-donor concentration.
Attempts were made to remove completely all traces of molecular oxygen from the system by use of a more sophisticated bubbling technique,8*1 but as shown previously,8*1 they were found to be unsuccessful although the oxygen levels were well below the limits of electrochemical detectability. It was found that when bubbling solutions with nitrogen mixtures containing small known amounts of oxygen (1 to 5%), the intensity of the emitted light was enhanced as the oxygen content increased and were considerably greater when compared to those which had been exhaustively deoxygen- ated by helium. It was also found that in each case the first cycle of a continuous cyclic voltammetry study was accompanied by a more intense emission than any succeeding cycle and usually the electrochemistry showed a very small irreversible peak at —0.85 V (see Figure 2). This peak corresponds to that observed for
oxygen reduction in nonaqueous media.9 Oxygen adsorbed on the platinum electrode accounts for the abnormally high oxygen concentration observed on the first cycle. This suggests that the superoxide ion may be involved in the process. The reactions of aromatic hydrocarbon radical anions with molecular oxygen, superoxide amon, and peroxide are currently under study in hopes cf relating the above process with other luminescent systems which have been reported.10
Although aromatic hydrocarbon radicals10a and anionic species11 have been shown to produce luminescence on reaction with oxygen, this constitutes the first evidence for such a reaction of aromatic hydrocarbon radical anions.
Acknowledgment. Tae authors wish to acknowledge the support of the Petroleum Research Fund through Grant No. PRF 2880-A3,5.
(8) Some controversy exist3 in the electrochemistry of aromatic hydrocarbons as to whether a proton abstraction reaction can occur to a significant extent in dimethylformamide. See (a) M. Peover, “ Electrochemistry of Aromatic Hydrocarbons and Related Substances” in “ Electroanalytical Chemistry,” Vol. II, A. Bard, Ed., Marcel Dekker, Inc., New York, N. Y., 1967, p 28, and references cited therein. For evidence that dimethylformamide is labile in the presence of a strong base and/or electron donor, see (b) H. Brederick,F. Effenberger, and R. Gleiter, Angew. Chem. Int. Ed., 4, 951 (1965), and (c) J. C. Powers, R. Weidner, and T. G. Parsons, Tetrahedron Lett., 1713 (1965). For a more current study of the reactions of aromatic hydrocarbon radical anions with proton donors, see (d) J. Janata and H. B. Mark. Jr., J. Phys. Chem., 72, 3616 (1968). The use of dimethylacetamide negates this possibility.(9) (a) D. L. Maricle and W. G. Hodgson, Anal. Chem., 37, 1562 (1965); (b) A. D. Goolsby and D. T. Sawyer, ibid., 40, 83 (1968).(10) (a) R. F. Vassil’ev and A. A. Vichutinski, Nature, 194, 1276(1962); (b) J. Stauff, Photochem. Photobiol., 4, 1199 (1965); (c)J. Stauff, Angew. Chem. Int. Ed., 7, 477 (1968); (d) E. J. Bowen, "Organic Photochemistry,” International Symposium, Strasbourg, 1964, Butterworth and Co. Ltd., London, p 473.(11) K. D. Legg and D. M. Hercules, J. Amer. Chem. Soc., 91, 1902 (1969).
M olecular Orbital Theory o f Electron D on or-
Acceptor Complexes III. The Relationship
o f State Energies and Stabilization Energies
to the Charge-Transfer Transition Energy
by R. L. Flurry, Jr., and Peter Politzer
Department of Chemistry, Louisiana State University in New Orleans, New Orleans, Louisiana 70122 (Received February 17, 1969)
In the earlier papers of this series (parts I and II),1 there has been presented a linear combination of molecular orbitals approach to the quantum-mechanical description of donor-acceptor complexes. An important feature of this treatment is the explicit inclusion of the
(1) Part I: R. L. Flurry, Jr., J. Phys. Chem., 69, 1927 (1965); part II; R. L. Flurry, Jr., ibid., 13, 2111 (1969).
V o lu m e 73, N u m b er 8 A u g u s t 1969

2788 Notes
m.k c a l / m o l e
Æ c t J e y
Figure 1. Relationship between heats of formation and charge-transfer energies for various iodine complexes: O, methylbenzenesas donors; •, simple amines as donors.
potential energy of the electrostatic interaction between the two components of the complex which would result if there were a complete transfer of one electron. In parts I and II, it is shown how the energies of the ground state, of the excited state, and of the charge-transfer transition between these two states can be calculated. The equations to be used will differ depending on whether the original donor and acceptor are charged or neutral species, and each of the four possible combinations of a neutral or negative donor with a neutral or positive acceptor must therefore be handled separately.
In these equations, there appear several quantities which cannot be readily evaluated either experimentally or theoretically. Two of these are the coefficients a and b which appear in the expressions for the wave functions of the complex in its ground state
>F]sr = aipv + b\p\ and in its excited state
SFe = b\pd — a\p a
Here, \pn and are the wave functions of the molecular orbitals which serve as donor and acceptor, respectively, of the electron which is transferred between the two interacting entities. A third quantity which is difficult to evaluate is the resonance integral, /3da = §\p-o*H\pk&t, which reflects the extent of interaction
between the donor and the acceptor. The coefficients a and b and the integral /3da can often be estimated or approximated in some manner,1 but their presence generally constitutes a problem and often a limitation upon the applicability and usefulness of the whole theoretical procedure.
It is the purpose of this paper to point out some simple substitutions which will permit all three of these quantities to be eliminated from the equations and thereby remove the necessity of assigning them values. This can be done without introducing any new approximations.
Of the four possible combinations involving variously charged donors and acceptors, one shall be treated in detail; the others can be handled in exactly the same manner. Consider the case of a negatively charged donor and a positive acceptor. On the basis of the discussion given in part II, the energies of the ground and excited states of the complex are
En = a2D + b2A + 2u6/3da - aWm (1)
Eb = b2D a.2A — 2cx6/3da — b2 F„s (2)
while the transition energy is
AZ?ct = E e — E]si 1
(b2 - a2) (D - A - Ves) - 4a6/3DA (3)
T h e J o u rn a l o f P h y s ic a l C h em istry

Notes 2789
In these equations, D is interpreted as the negative of the ionization potential of the donor, A as the negative of the electron affinity of the acceptor, and Fes is the electrostatic interaction term which was mentioned previously. All of these quantities are discussed in detail in the earlier papers of this series.1
Taking 4% 'Fr, 'Pa, and pn to be normalized and the overlap integral fpo* 'pxd.r to be zero, as is done throughout this treatment, it follows that a2 + 62 = 1. Using this to substitute for a in eq 1-3 gives
jE’n = (1 — ¥)D + b2A +26(1 - fe2) 1/2/Sda - (1 - b2)Ves (4)
Ee = b2D + (1 - b2)A -26(1 - 62) '/!/3da - 62FM (5)
AEct = (262 — 1)(D — A — Fes) -46(1 - 62) ,/!/3da (6)
Eliminating /3Da between eq 4 and 6 and between eq 5 and 6, and simplifying, leaves
i?N = 0.5 (D + A — Fes — AEqt) (7)
Ee — 0.5 (D + A — Fes + AEct) (8)
Exactly the same equations are obtained for the three other types of donor-acceptor interactions, except that when a negative donor and a neutral acceptor are involved, the term Fes does not appear; it was suggested in part II that this term may be neglected in such a situation. In each case, the quantities a, 6, and /?da are eliminated; the ground- and excited-state energies are now given as functions of parameters which can, for the most part, either be determined experimentally or calculated theoretically with fairly good accuracy. The electrostatic interaction terms, Fes, which differ for each charge combination, may present greater problems, although it should be possible to make reasonable estimates of these in many instances. In any case, three troublesome quantities are removed from the equations.
Equations 7 and 8 can readily be transformed into relations between the stability constants of the complexes
and the observed charge-transfer bands. This has recently been done for the oxygen and carbon monoxide complexes of various hemoglobins.2 The stabilization energy of the complex, AEst, is, to a first approximation
AE,t = EN — D = 0.5 (A - D - Fes - A E c t ) (9)
Thus, for a series of closely related complexes, where Fes is constant or varies linearly within the series and where the acceptor remains the same, a plot of AEst (or log K st) 3 v s . A E c t should yield a straight line (in view of the linear relationship between D and AEct)-1 On the other hand, if the complexes are dissimilar, no such linear relationship would be expected, because of the probably irregular variation of the term Fes. Briegleb has compared the heats of formation of a number of complexes with their charge-transfer energies.4 For a random group of donors with a given acceptor, there is no linear correlation. If, however, series of closely related complexes are considered separately (for example, the methylbenzenes or the simple amines, as donors, with iodine as the acceptor), good linear relationships are observed within these series (Figure 1).
The discussion and derivations presented in this paper have been based upon the one-electron treatment of donor-acceptor complexes which was given in parts I and II .1 In the Appendix to part II, however, it is shown that the one-electron equations are formally correct for a polyelectron approach as well. The results which have been obtained here should therefore also be valid in the more general treatment.
Acknowledgment. The authors wish to thank the Petroleum Research Fund of the American Chemical Society for financial support of this work (Grant No. 2796-A5).
(2) P. Politzer, Biochim. Biophys. Acta, 153, 799 (1968).(3) In those cases where the energy of stabilization can be set equal to the standard free energy of stabilization, then
AE,t = A F\t = -2 .3 0 3 RT log K etA more complete discussion of this point is given in ref 2.(4) G. Briegleb, “ Elektronen-Donator-Acceptor-Komplexe,” Springer-Verlag, Berlin, 1961, p 130 ff.
V o lu m e 73, N u m b er 8 A u g u s t 1969

2790
COMMUNICATIONS TO THE EDITOR
Tem perature-Dependent M ethoxyl and
Hydroxyl Splitting Constants in the Electron
Spin Resonance Spectra o f Cation Radicals1
Sir: The accurate measurement of temperature dependent hyperfine coupling constants in esr spectra can often lead to interesting information on its own account and may sometimes be explained by physical models. For example, the temperature dependencies of alkali metal splittings give much information about the structure of ion pairs.2 Also, the temperature dependence of alkyl groups may be ascribed to the existence of preferred conformations and may be used to obtain an estimate of their potential barriers to rotation.3 In this communication we wish to report the accurate measurement of the temperature dependencies of the methoxyl and hydroxyl group protons in a number of cation radicals. Reasons for their dependence are suggested and a method for estimating potential barriers to rotation is indicated.
The cation radicals studied together with their measured temperature dependencies of the methoxyl and hydroxyl proton splitting constants are shown in Table I.4 The radicals were produced in the H2SO4- CH3CO26 and AICI3-CH3NO26 systems. The spectra were analyzed by previously described methods7 and the splitting constants were found to vary linearly between 200 and 300°K.
Two results of particular significance are apparent from a perusal of Table I: first, the temperature dependencies increase along the two series I, II, III and
Table I
Cation radical
Temperature dependence of
the hydroxyl or methoxyl group proton splitting
constants, mG °C “1
Hydroquinone (I) 0.841,4-Dihydroxynaphthalene (II) 1.589,10-Dihydroxy anthracene (III) 2.872,3-Dimethyl-l,4-dihydroxynaph- 1.94
thalene (IV) Durohydroquinone (V) 1.40
1,4-Dimethoxybenzene (VI) ~ 0 .0 91,4-Dimethoxynaphthalene (VII) 0.419,10-Dimethoxyanthraeene (VIII) 1.16Dimetkoxydurene (IX ) 1.50
VI, VII, VIII. Second, the hydroxyl groups are always more temperature dependent than their methoxyl counterparts (i.e., compare II and VII). It has been shown previously that I and VI exist as cis and trans isomers at low temperatures,8'9 indicating a preferred conformation of the hydroxyl and methoxyl groups in the plane of the aromatic ring. The temperature dependence can therefore be considered to arise from torsional oscillations (which change the splitting constants) about a potential minimum, either in or close to the aromatic plane. The amount of temperature dependence will depend upon the depth of the potential well which will in turn depend on two factors. These are the bond order of the > C -0 bond which will tend to constrain the group in the aromatic plane and steric interactions which will try to force the group out of the plane. A combination of these two factors, a decrease in bond order plus an increase in steric interactions, will account for the variations along the series I, II, III and VI, VII, VIII.
The generally larger temperature dependence of hydroxyl over methoxyl groups may, to a large extent, be accounted for by the mechanisms of the hyperfine interactions. Thus, when the hydroxyl group is in the aromatic plane the proton splitting arises via a spin polarization mechanism to the unpaired spin on oxygen.10 If the hydroxyl group is twisted out of the plane by some angle 9 the spin density on oxygen will decrease by a factor cos2 6, thereby decreasing the magnitude of the splitting constant. In addition the hydroxyl proton may now couple with the unpaired spin on the adjacent carbon atom via a hyperconjuga- tive mechanism. This interaction which will be proportional to sin2 9 will be of opposite sign compared to the spin polarization interaction. The two mecha-(1) Presented in part at the 157th National Meeting of the American Chemical Society, Minneapolis, Minnesota. Research supported in part by Grant No. NSF-GP-8416 from the National Science Foundation.(2) N. Hirota, J. Phys. Chem., 71, 127 (1967).(3) G. ChapeleLLetourneux, H. Lemaire, R. Lenk, M-A. Maréchal, and A. Rassat, Bull. Chim. ¿Soc. Fr., 3963 (1968).(4) Radicals IV, VII, and VIII have not previously been reported and will be discussed in greater detail in a later publication.(5) P. D. Sullivan and J. R. Bolton, J. Mag. Res., 1, 356 (1969).(6) W. F. Forbes and P. D. Sullivan, J. Amer. Chem. Soc., 88, 2862(1966).(7) P. R. Hindle, J. Dos Santos Veiga, and J. R. Bolton., J. Chem. Phys., 48, 4703 (1968).(8) A. B. Barabas, W. F. Forbes, and P. D. Sullivan, Can. J. Chem., 45, 267 (1967).(9) W. F. Forbes and P. D. Sullivan, Can. J. Chem., 44, 1501 (1966).(10) A. Carrington and H. C. Longuet-Higgins, Mol. Phys., 5, 448 (1962).
T h e J o u rn a l o f P h y s ic a l C h em istry

Communications to the Editor 2791
nisms will combine to give a rapid decrease in the hydroxyl group splitting constant ( a 0 H H ) when the group is twisted out of the plane. Thus
CT'OHH = —A (cos2 6) -f- B (sin2 8)
where A and B are constants and the ( ) brackets denote a time-averaged value. The methoxyl group, on the other hand, couples via a hyperconjugative mechanism to the unpaired spin on oxygen, which is at a maximum when the methoxyl group is in the plane of the ring and will decrease as the methoxyl group is twisted out of the plane such that
uochj11 = C (cos2 8)
The above discussion provides a basis for expecting a greater temperature variation for the hydroxyl group. Further calculations enable us to estimate the depth of the potential well from the temperature dependencies. This may be done by evaluating (cos2 8) for various temperature and barrier heights, using the procedures of Stone and Maki.11 A comparison of calculated and experimental temperature dependencies leads us to estimate the barrier heights for VI, VII, VIII, and IX as 16 ± 4, 5 ± 1, ~ 0 .8 and ~ 1 .8 kcal/ mol, respectively. Further work on the hydroxyl compounds should enable us to similarly obtain their potential barriers which may then be compared with the potential barriers already obtained by line-width alternation studies.12
Acknowledgments. The author wishes to thank Dr. J. R. Bolton for his continued encouragement and helpful comments and also Dr. G. Vincow for a copy of his computer program.
(11) E. W. Stone and A. H. Maki, J. Chem. Phys., 37, 1326 (1962).(12) P. D. Sullivan, J. Amer. Chem. Soc., 89, 4294 (1967).
D epartment of Chemistry Paul D. SullivanUniversity of M innesota M inneapolis, M innesota 55455
R eceived A pril 1 0 , 1 9 6 9
The Electron A ttach m en t Cross Section
for Hexafluoroacetone
Sir: Among the processes which may occur when an electron suffers a collision with a molecule is electron capture, a negative ion being formed
AB + e — > AB~
Although such interactions have been studied extensively, in few cases has the molecule-ion been suf
ficiently stable to be detected, the more usual process being the dissociative capture reaction
AB e ^ A - -)- B
SF6- is the classic example of a stable molecule- ion1'2 and the SF6~ abundance curve has been used to mirror the electron energy distribution and calibrate the electron energy scale.
Recently, we reported that hexafluoroacetone formed a stable negative ion3 as a result of secondary electron capture, but we were unable to observe its formation at very low electron energies. Using an improved experimental technique, we now report the formation of the CF3COCF3~ ion at low electron energies following primary electron capture and have obtained a value for the electron attachment cross section of the ketone, relative to that for sulfur hexafluoride.
Results were obtained using a Bendix time-of-flight mass spectrometer, Model 3015. The electron energy was measured using a Solatron digital voltmeter LM 1619 and “ negative” voltages were obtained by incorporating a 3-V dry cell into the electron energy circuit. Using two channels of the mass spectrometer analog output scanners enabled the SF6_ and CF3COCF3~ ions to be measured simultaneously on 1-mV Kent poten- tiometric recorders. The electron current was kept constant automatically over the energy range studied. Ion source pressures were usually maintained below 5 X 10⁻⁶ mm.
When hexafluoroacetone (HFA) was studied at electron energies ~ 0 eV a fairly abundant parent ion was observed; admission of sulfur hexafluoride to the ion source considerably reduced the intensity of the parent ion, suggesting that the attachment cross section for the reaction
SF6 + e SF6-
was much greater than for
CF3COCF3 + e CF3COCF3-
In Figure 1 (full circles) we show the data obtained for SF6- ion formation using a 50-50 mixture of HFA and SF6; “ negative” voltages were obtained by introducing a 3-V dry cell into the electron energy circuit. The smooth curve reflects the electron energy distribution.
In Figure 1 (open circles) we report our experimental data for the CF3COCF3~ ion, the ordinate being 58.9 times more sensitive than that for SF6_ . It is apparent that the two curves have a very similar distribution, both reaching a maximum value at the same electron energy. The ketone is slightly broader in the wings;
(1) W. M. Hickam and R. E. Fox, J. Chem. Phys., 25, 642 (1956).(2) G. J. Schulz, J. Appl. Phys., 31, 1134 (1960).(3) J. C. J. Thynne, Chem. Commun., 1075 (1968).
V olu m e 7 3 , N u m b er 8 A u g u s t 1969

2792 Communications to the Editor
Figure 1. Ion current vs. electron accelerating energy: full circles, SFa- ; open circles, CF3COCF8“. Ion current scale for HFA 58 - 9 times more sensitive than that for SF6.
this may reflect a slightly different energy dependence for electron attachment or the experimental inaccuracies in measuring very small ion currents.
We therefore conclude that, because of the similar energy dependence, the relative peak heights may be used to evaluate the relative attachment cross sections for reactions 1 and 2. Denoting the X - ion current by 7(X~), the electron attachment cross section of X by d(X) and the ion source pressure of X by [X], then
g(BF,) _ Z(SFe-) [HFA] or (HFA) ~ 7 (HFA- ) [SF#]
We have assumed that both ions have the same collection efficiency. Our experimental data indicate that <r(SF6)/<r(HFA) = 58.9. By means of an electron- swarm technique, Compton, et al.,4 have measured a value of 3.6 X 10⁻¹⁶ cm2 for <r(SF6). Using this result in conjunction with the above data yields o-(HFA) = 0.61 X 10⁻¹⁶ cm2.
Ahearn and Hannay6 have reported that at electron energies >14 eV, SF6- ion formation occurs as a result of secondary electron capture, the secondary electrons being produced by such processes as
SFi e — > SF6+ F —|— 2e
Accordingly, using a 39.2:1 mixture of HFA-SF6, we measured the intensities of the HFA- and SF6- ions at ten electron energy intervals over the range 15-60 eV. Our data indicated a constant value for 7(SF6- ) / 7(HFA- ) of 1.44 ± 0.06 over the entire energy range, indicating that o-(SF6)/ir(HFA) = 56 ± 2. This ratio is in good accord with our directly measured value at low electron energies.
(4) R. N. Compton, L. G. Christophorou, G. S. Hurst, and P. W Reinhardt, J. Chem. Phys., 45, 4634 (1966).(6) A. J. Ahearn and N. B. Hannay, ibid., 21, 119 (1953).
D e p a r t m e n t of C h e m i s t r y P. H a r l a n d
E d i n b u r g h U n i v e r s i t y J. C . J. T h y n n e
E d i n b u r g h 9 , S c o t l a n d
R e c e i v e d A p r i l 2 8 , 1 9 6 9
C om m ents on “ The Electrical Conductivity o f
Boron Trifluoride in Pure and Mixed Halogen
Fluorides,” by M . S. Toy and W . A . Cannon
Sir: Toy and Cannon1 have reported the preparation and identification of difluorobrominium tetrafluoro- borate, BrF2+BF4- . A recent study of bromine fluorides in our laboratory resulted in data quite different from those reported by Toy and Cannon for
Table I : Specific Conductivity of Liquid and Solid BrF2
Temp,°C
Liquid
Sp conductivity, ohm"* 1 cm"1
0 .2“ 2.32 X 10"5.8° 2.44 X 10-
12.2 2.66 X 10"21.6 3.00 X 10-36.8 3.42 X 10-53.0 3.00 X 10"19.46
Solid
2.71 X 10-
- 2 2 .5 CO .016 x 10-0 0.43 X 10-5.8 1.91 X 1 0 -7.2 3.72 X 10 -9.0 26.9 X 1 0 -9.8 75.3 X 1 0 -
° Supercooled liquid. b This value was measured after completion of the heating cycle and indicates that no detectable amount of sample had either decomposed or reacted.
Similar behavior has been noted for hexafluoro- acetone,3 and we considered that competition between SF6 and C F 3 C O C F 3 for secondary electrons might enable us to measure the relative capture cross sections for reactions 1 and 2.
BrF2+BF4- . According to Toy and Cannon,1 BrF2+- BF4- is a white solid having a melting point of 180°. They could prepare their compound only in poor yields
(1) M. S. Toy and W. A. Cannon, J. Phys. Chem., 70, 2241 (1966).
T h e J o u rn a l o f P h y s ic a l C h em istry

Communications to the Editor 2793
and characterized it by elemental analysis and infrared spectroscopy. Our data2 show conclusively that B F 3
and BrF 3 do not form an adduct stable at room temperature. The following facts lend additional support to our finding, (i) All known halogen fluorides form more stable adducts with AsF 5 than with B F 3. Since BrF2+AsF6- has only marginal stability at ambient temperature, 3 the existence of a considerably more stable BrF3 -BF3 adduct, having a melting point of 180°, would indeed be very surprising, (ii) The adduct formation between halogen fluorides and Lewis acids always proceeds rapidly and in high yields, especially in the presence of a liquid phase. The fact that the high-melting solid reported by Toy and Cannon1 * was obtained only in poor yields indicates that it most likely was an impurity or hydrolysis product. Whereas the appearance of an absorption at about 1050 cm - 1
in the ir spectrum of Toy and Cannon’s product can be rationalized in terms of any B F 4- -containing salt, no plausible explanation can be given for the reported elemental analysis (adding up to 99.99% and being very close to the values calculated for BrF2 +BF4~).
We have also redetermined the specific conductivity of liquid and solid B rF 3 and have measured its temperature dependence (see Table I). The observed specific conductivities were of the same order of magnitude as those reported previously. 1 ,4 '6 The fact that our values are lower by a factor of about 3 indicates that the B rF 3 samples used in the present study were of somewhat higher purity. I t should be pointed out, however, that in our study a normal6 temperature dependence of the specific conductivity of liquid BrF3
was observed. In the temperature range 0-30° the temperature coefficient is clearly positive. Only above this temperature does the temperature coefficient become negative. Previous investigations4 had indicated an abnormal negative temperature coefficient for the entire liquid range, which was explained by the low thermal stability of the two postulated ions, BrF2+ and BrF4- .
Acknowledgment. This research was supported by the Office of Naval Research Power Branch. The author wishes to express his gratitude to Dr. D. Pilipovich for his help in this work.
(2) Materials and apparatus: all materials were handled in a well passivated 304 stainless steel-Teflon PEP vacuum system. Bromine trifluoride and BF3 (both from the Matheson Co.) were purified by fractional condensation. All specific conductivities were measured in a Teflon FEP cell with smooth platinum electrodes (cell constantI. 9 cm-1). The cell resistance was measured with an Electro Scientific Industries Model 250 DA Universal Impedance Bridge operating at a frequency of 1000 Hz. A melting point of 10.2° was obtained for our BrFa sample. However, the slight increase of the mp, when compared to the reported value of 8.77° (G. D. Oliver andJ. W. Grisard, J. Amer. Chem. Soc., 74, 2705 (1952)) might be due to our measuring technique since only the external bath temperature was measured.
Bromine trifluoride-BFa system: liquid BrFa (33.3 mmol) absorbed BFs (21.4 mmol) at ambient temperature at a BF3 partial pressure of 910 mm. In the course of the exothermic reaction, the yellow color of BrFa faded and the viscosity of the liquid increased.
On cooling, the mixture of adduct and unreacted BrF3 solidified. This solid was treated at -12 6° with a large excess of liquid BFa (84.0 mmol). Unreacted BF3 (73.6 mmol) was removed by vacuum distillation at -126°. Additional BFa (10.4 mmol) could be removed by vacuum distillation at —80°. This indicates that all BFa added at —126° was recovered at —80°. Since BrF3-BF3 is stable at —80° (see below) the uptake of some BFs at —126° cannot be due to the formation of BrFa • BF3, but most likely is due to the formation of some BrF3-2BF3 in analogy to NF20+BF4- (stable at -9 5 °) and NF20 +B2F,~ (stable at -126°) (K. O. Christe and W. Maya, Inorg. Chem., 8, 1253 (1969)).
The BrF3-BF3 adduct itself is a white solid stable at —80° and has a reproducible dissociation pressure of 4 mm at —31°. At a temperature slightly higher than —31°, melting of the solid occurred. The resulting, faintly yellow liquid showed at 0° an inconstant dissociation pressure of several hundred millimeters. At 23° all material could be removed from the trap by pumping and no residue was left. These observations are in fair agreement with the short statement made by Brown, Dixon, and Sharp (Chem. Commun., 654 (1966)) suggesting the existence of two adducts, 2BF3-BrF3 (stable to —120°) and BF3*BrF3 (stable to —80°). However, the preparation of well defined 1:1 and 2:1 adducts between BF3 and BrF3 may be more difficult.(3) K. O. Christe and C. J. Schack, to be published.(4) A. A. Banks, H. J. Emeleus, and A. A. Woolf, J. Chem. Soc., 2861 (1949).(5) L. A. Quarterman, H. H. Hyman, and J. J. Katz, J. Phys. Chem., 61, 912 (1957).(6) G. KortUm, “ Lehrbuch der Elektrochemie,” Verlag Chemie, GMBH, Weinheim, Germany, 1952, pp 188-193.
R o c k e t d y n e , A D i v i s i o n o f N o r t h K a r l O . C h r i s t e
A m e r i c a n R o c k w e l l C o r p o r a t i o n C a n o g a P a r k , C a l i f o r n i a 9 13 0 4
Received May 22, 1969
Misstatements of Thermodynamic Properties of Tetracyanoethylene-Arom atic Donor
Molecular Compounds
Sir: Tetracyanoethylene (TONE) is generally considered to be an exceptionally strong acceptor molecule which combines with aromatic donors to form members of the class of molecular compounds called variously charge-transfer complexes, donor-acceptor complexes, or more specifically, ir-molecular compounds. 1 The opinion regarding the acceptor strength of TO N E is engendered by comparisons of equilibrium constants which are collected in several tables in the reviews on donor-acceptor complexes by Briegleb2 and by Andrews and Keefer. 3 To illustrate, Table IV-54 of the book by Andrews and Keefer gives the following equilibrium constants for complexes with hexamethylbenzene, units given as 1. mol- 1 : iodine monochloride, 13.2 (solvent CC14, temp 25°) ;6 1,3,5-trinitrobenzene, 5.7 (CC14,
(1) A discussion of the suitability of these names is given by M. J. S. Dewar and C. C. Thompson, Jr., Tetrahedron, Suppl. No. 7, 97(1967).(2) G. Briegleb, “ Elektronen-Donator-Acceptor-Komplexe,” Springer-Verlag, Berlin, 1961.(3) L. J. Andrews and R. M. Keefer, “ Molecular Complexes in Organic Chemistry,” Holden-Day, Inc., San Francisco, Calif., 1964.(4) Reference 3, p 99.(5) N. Ogimachi, L. J. Andrews, and R. M. Keefer, J. Amer. Chem. Soc., 77, 4202 (1955).
Volume 73, Number 8 August 1969

2794 Communications to the Editor
20°) ;6 maleic anhydride, 0.15 (CHC13, 25°) ;7 TC N E , 263 (CH2C12, 22° ) : 8 The unusual acceptor attribute of T C N E is ascribed to the electron-withdrawing character of the cyano substituents and is correlated with the high electron affinity of T C N E and the half-wave potential for one-electron reduction.9
The last citation (ref 8 ) in the list above is to the pioneering research on molecular complexes of T C N E by Merrifield and Phillips.8 Both Briegleb2 and Andrews and Keefer3 have misquoted this work, erroneously appending units of liters per mole to the unitless (mole fraction) equilibrium constants determined by Merrifield and Phillips.8 Accordingly, equilibrium constants quoted in the two reviews should be reduced with a factor of ca. 0.064, the molar volume of the solvent, CH 2C12, in liters. W ith corrected values, a comparison of data from several sources indicates that T C N E 1 -8 is a moderately efficient complexing agent, comparable to iodine monochloride,6 '10 chloranil, 11 and several cyano-substituted compounds. 12
Recent important papers by Kroll13 on the gas-phase properties of TCNE-arom atic hydrocarbon complexes repeat the error described above. Entropies calculated by Kroll for the liquid-phase complexes should therefore be corrected by addition of —5.5 cal mol- 1 deg- 1
(ca. R In 0.064). With this correction, gas-phase13
and liquid-phase8 entropies for formation of T C N E molecular complexes are the same within experimental error. Kroll.finds that the gas-phase complexes are more stable, and one may now conclude that this in
creased stability is primarily due to a more negative enthalpy of gas-phase reaction. Since charge-transfer forces would be favored in a dielectric medium like the solvent CH 2C12 in comparison to the gas phase, 14 we consider that these results support the contentions that very little charge transfer is involved in stabilizing T C N E molecular compounds. 1 -16
(6) R. Foster, J. Chem. Soc., 1075 (1960).(7) L. J. Andrews and R. M. Keefer, ./. Amer. Chem. Soc., 75, 3776 (1953).(8) R. E. Merrifield and W. D. Phillips, ibid., 80, 2778 (1958).(9) Reference 2, p 183; ref 3, p 101.(10) L. J. Andrews and R. M. Keefer, J. Am,er. Chem. Soc., 74, 4500 (1952).(11) G. Briegleb and J. Czekalla, Z. Elektrochem., 58, 249 (1954); R. Foster, D. Ll. Hammick, and B. N. Parsons, J. Chem. Soc., 555 (1956); R. Foster, D. Ll. Hammick, and P. J. Placito, ibid., 3881 (1956).(12) L. R. Melby, R. J. Harder, W. R. Hertler, W. Mahler, R. E. Benson, and W. E. Mochel, J. Amer. Chem. Soc., 84, 3374 (1962); P. R. Hammond, J. Chem. Soc., 3113 (1963); A. S. Bailey, B. R. Henn, and J. M. Langdon, Tetrahedron, 1 9 , 161 (1963); M. W. Hanna and A. L. Ashbaugh, J. Phys. Chem., 68, 811 (1964).(13) M. Kroll and M. L. Ginter, ibid,, 69, 3671 (1965); M. Kroll, J. Amer. Chem. Soc., 9 0 , 1097 (1968).(14) O. K. Rice, Int. J. Quantum Chem., IIS, 219 (1968).(15) R. J. W. LeFevre, D. V. Radford, G. L. D. Ritchie, and P. J. Stiles, Chem. Commun., 1221 (1967); M. W. Hanna, J. Amer. Chem. Soc., 9 0 , 287 (1968); W. C. Herndon and J. Feuer, ibid., 9 0 , 5914(1968); J. P. Malrieu and P. Claverie, J. Chim. Phys., 65, 735 (1968); M. J. Mantione, Theoret. Chim. Acta, 11, 119 (1968).
Department of Chemistry William C. HerndonTexas Technological College Richard D. GoodinLubbock, Texas 79409
Received May 22 , 1969
The Journal of Physical Chemistry