![Archway [1966] - Internet Archive](https://static.fdokumen.com/doc/165x107/632711976d480576770d17bd/archway-1966-internet-archive.jpg)
The Journal of Physical Chemistry 1966 Volume.70 No.3
352
THE JOURNAL OF PHYSICAL CHEMISTRY Registered, in U. S. Patent Office © Copyright, 1966, by the American Chemical Society VOLUME 70, NUMBER 3 MARCH 15, 1966 The Kinetics of the Photoinitiated Reaction between Triethyl Phosphite and 1-Pentanethiol by R. D. Burkhart Department of Chemistry, University of Nevada, Reno, Nevada (Received November 5, 1965) The photoinitiated reaction between triethyl phosphite and 1-pentanethiol (RSH) has been studied using 2,2'~azobisisobutyronitrile (ABN) as initiator in an attempt to deter- mine the suitability of the reaction for use in measuring average alkyl radical lifetimes in solution. Clean-cut kinetics are observed for [ABN] ^ 5 X 10 _5 M and an incident light intensity of 4.67 X 10~7 einstein/1. sec. Under these conditions the major chain-termina- tion process is a bimolecular reaction involving two alkyl radicals. The ratio / crsh+r -/ fcR.+R.I/2 = 3.0. At larger values of [ABN] the kinetics are complex probably as a result of additional radical-destroying reactions involving fragments from the photoinitiator. Introduction Previous studies by Walling and co-workers1’2 have shown that the reaction between isobutyl and n- butyl mercaptan and each of several different tri- valent phosphorus compounds is a radical-chain proc- ess. In the case of triethyl phosphite the over-all reaction may be described by RSH + P(OEt)i — > RH + SP(OEt)3 and propagation of the chain presumably occurs by the reactions RS- + P(OEt)3 —> R- + SP(OEt)3 R. + RSH —►RS- + RH The original studies of Hoffman and co-workers3 indi- cate that a similar mechanism may be involved when n-octyl and benzyl mercaptan are used. Apart from its apparent utility in syntheses, the re- action is interesting for other reasons. If, for instance, it turned out that the chain-termination step in the re- action were a bimolecular one involving the interaction of two alkyl radicals, it would be possible to determine the average lifetime of alkyl radicals in solution using the reaction as a system for monitoring the steady- state radical concentration. Such average lifetime studies are apparently not feasible using the more direct flash-photolysis methods since alkyl radicals absorb strongly only at very short wavelengths around 2300 A where solvent absorption would also be quite strong.4 The present study has, therefore, been carried out in order to determine the suitability of the mer- captan-phosphite reaction for use in making these (1) C. Walling and R. Rabinowitz, Am. Chem. Soc., 79, 5326 (1957). (2) C. Walling and M. S. Pearson, ibid., 86, 2262 (1964). (3) F. W . Hoffman, R. J. Ess, T. C. Simmons, and R. S. Hanzel, ibid., 78, 6414 (1956). (4) Private communication, Prof. G. Porter, University of Sheffield, Sheffield, England. 605
-
Upload
khangminh22 -
Category
Documents
-
view
1 -
download
0
Transcript of The Journal of Physical Chemistry 1966 Volume.70 No.3

T H E J O U R N A L OF
P H Y S I C A L C H E M I S T R YRegistered, in U. S. Patent Office © Copyright, 1966, by the Am erican Chemical Society
VOLUME 70, NUMBER 3 MARCH 15, 1966
The Kinetics of the Photoinitiated Reaction between Triethyl Phosphite
and 1-Pentanethiol
by R. D. Burkhart
Department of Chemistry, University of Nevada, Reno, Nevada (Received November 5, 1965)
The photoinitiated reaction between triethyl phosphite and 1-pentanethiol (RSH) has been studied using 2,2'~azobisisobutyronitrile (ABN) as initiator in an attempt to determine the suitability of the reaction for use in measuring average alkyl radical lifetimes in solution. Clean-cut kinetics are observed for [ABN] ^ 5 X 10 _5 M and an incident light intensity of 4.67 X 10~7 einstein/1. sec. Under these conditions the major chain-termination process is a bimolecular reaction involving two alkyl radicals. The ratio /crsh+r - / fcR.+R.I/2 = 3.0. At larger values of [ABN] the kinetics are complex probably as a result of additional radical-destroying reactions involving fragments from the photoinitiator.
IntroductionPrevious studies by Walling and co-workers1’2 have
shown that the reaction between isobutyl and n- butyl mercaptan and each of several different tri- valent phosphorus compounds is a radical-chain process. In the case of triethyl phosphite the over-all reaction may be described by
RSH + P(OEt)i — > RH + SP(OEt)3
and propagation of the chain presumably occurs by the reactions
RS- + P(OEt)3 — > R- + SP(OEt)3
R . + RSH — ► RS- + RH
The original studies of Hoffman and co-workers3 indicate that a similar mechanism may be involved when n-octyl and benzyl mercaptan are used.
Apart from its apparent utility in syntheses, the reaction is interesting for other reasons. If, for instance,
it turned out that the chain-termination step in the reaction were a bimolecular one involving the interaction of two alkyl radicals, it would be possible to determine the average lifetime of alkyl radicals in solution using the reaction as a system for monitoring the steady- state radical concentration. Such average lifetime studies are apparently not feasible using the more direct flash-photolysis methods since alkyl radicals absorb strongly only at very short wavelengths around 2300 A where solvent absorption would also be quite strong.4 The present study has, therefore, been carried out in order to determine the suitability of the mercaptan-phosphite reaction for use in making these
(1) C. Walling and R. Rabinowitz, Am. Chem. Soc., 79, 5326 (1957).(2) C. Walling and M . S. Pearson, ibid., 86, 2262 (1964).(3) F. W . Hoffman, R. J. Ess, T . C. Simmons, and R. S. Hanzel, ibid., 78, 6414 (1956).(4) Private communication, Prof. G. Porter, University of Sheffield, Sheffield, England.
605
606 R. D. B t j b k h a r t
average lifetime measurements. Since the rotating- sector method would probably be used, it was decided to carry out these experiments using photoinitiation rather than thermal initiation.
Experimental SectionReagents. Triethyl phosphite was prepared accord
ing to the method of Ford-Moore and Perry.5 Final purification was accomplished by two distillations under reduced pressure. Purity was established by physical constants (bp 50-51° at 15 mm, n26d 1.4107) and from the observation of single elution peaks of the gas chromatograms. Commercial triethyl phosphite (MCB Chemical Co.), redistilled twice under vacuum through a 30-in. Vigreux column, gave the same rates of reaction as the material prepared as described above.
2,2 '-Azobisisobutyronitrile (ABN) was prepared according to the method of Overberger and co-workers6 and was recrystallized from ethanol before use, mp 102-103°.
Thiophene-free benzene (Baker Chemical Co.) was redistilled before use as was the 1-pentanethiol, the latter distillation being carried out in a nitrogen atmosphere. The same rates of reaction were obtained for samples of 1-pentanethiol from Chemicals Procurement Laboratories and from MCB Chemical Co. Gas chromatograms of the thiol showed single elution peaks and n2id 1.4438 compared with a literature value of 1.4439.7
Methyl methacrylate (MCB Chemical Co.) was washed five times with 10% NaOH and five more times with distilled water. After drying over anhydrous Na^SOi, it was distilled under vacuum in a nitrogen atmosphere, only the center fraction being retained. It was placed in a Corex vessel and was prepolymerized using ultraviolet light. In a final redistillation eight separate vials, each containing about 3 g of monomer, were filled. The purified samples were stored in the dark at —5°.
Apparatus and Procedure. The light source used in these experiments was a Hanovia mercury arc lamp (Model No. 6322). Glass optical parts and a Pyrex reaction cell were used so that no light below 325 m/r was transmitted. Before entering the reaction cell, the collimated light beam was made to traverse a Corning No. 5840 filter which has a high wavelength cutoff at 405 m/t. Thus, the major component of the transmitted light is due to the 366-01// line of the mercury emission. Of the three reactants only ABN absorbs light in this wavelength range, and so the primary process in this reaction is undoubtedly the photodissociation of ABN.
The reaction vessel was a Pyrex tube of 48-mm length and 17.5-mm i.d. It was fitted, at its upper end, with a ground-glass joint so that it could be attached, by means of an adapter, to the vacuum system. It was also fitted with three solid glass arms emanating in a radial direction just below the ground-glass joint. These arms fit into grooved positions of a platform in the insulated box in order to provide for reproducible placement of the reaction vessel.
Thermostating was accomplished by the use of a series of copper coils wound inside an insulated box. Water, thermostated at 25° was pumped through the coils, and all reactions were carried out at 25 ± 0.1°.
Before each experiment all glassware was washed with a mixture of hot concentrated nitric and sulfuric acids and was rinsed several times with tap water and several more times with distilled water before being dried for at least 2 hr at 150°. Solutions for reaction were made up by weighing the reactants directly into a 25-ml volumetric flask with final dilution to the mark with benzene. For the very low ABN concentrations, weighed amounts of an ABN-benzene solution of known composition were used. The reaction solution (11 ml) was placed in the reaction vessel. The solution was degassed by freezing at —40° and evacuating. At least three freeze-thaw cycles were used. When the degassed solutions had warmed to 25°, they were placed in the thermostated box and photolyzed for the desired length of time.
The extent of each reaction was measured by determining the amount of mercaptan present before and after the run. The determinations were made by potentiometric titration using Hg2+ ion.8 It was found that these analyses could be carried out with a high degree of precision for mercaptan concentrations from 0.09 to 0.002 M.
Measurements of the incident light intensity were made by photolyzing 11-ml samples of potassium ferrioxalate solution contained in the reaction cell under conditions identical with those used for the rate experiments. The actinometry method of Parker and Hatchard was used here.9
Rates of Initiation. The light intensity was too small for a direct measurement of the photodecomposition of ABN, and so it was necessary to use an indirect
(5) A. H. Ford-Moore and B. J. Perry, “ Organic Syntheses,” Coll. Vol. IV, John Wiley and Sons, Inc., New York, N. Y ., 1963, p 955.(6) C. G. Overberger, P. Huang, and M. B. Berenbaum, ref 5, p 67.(7) B. C. Cossar, J. O. Fournier, D. L. Fields, and D. D . Reynolds, J. Org. Chem., 27, 93 (1962).(8) J. S. Fritz and T. A. Palmer, Anal. Chem., 33, 93 (1961).(9) C. A. Parker and C. G. Hatchard, Proc. Roy. Soc. (London), A23S, 518 (1956).
The Journal of Physical Chemistry

607R eaction between T riethyl Phosphite and 1-Pentanethiol
method. It was decided to use the present experimental arrangement to carry out a radical-chain reaction for which the over-all rate is known for a given rate of initiation. A convenient choice was the free- radical polymerization of methyl methacrylate for which the rate law
—d[M]/d£ = RP = R?hkp[M]/tih (1)
is found to be valid.10 In this equation Rp is the rate of polymerization, Ri is the rate of initiation, [M] is the concentration of methyl methacrylate, kp is the propagation rate constant, and kt is the termination rate constant.
Ferington and Tobolsky11 have determined the Arrhenius parameters for this reaction and from their data, assuming termination by disproportionation,12 one may calculate that at 25° kp/kt'/2 = 7.97 X 10⁻² M ~l/2 sec“ 1/\ Using the integrated form of eq 1 we have
R 'h = (28.8/1) log [M]0/[M ] (2)
where [M]0 is the initial monomer concentration and [M] is the concentration of monomer at time t. The latter concentration was evaluated by gravimetric analysis of the polymer formed in the reaction.
The measured rates of initiation are summarized in Table I. In these experiments the initial monomer concentrations were held between 0.11 and 0.13 M, and the intensity of absorbed radiation was calculated using the Beer’s law relation with a decadic molar extinction coefficient of 9.7013 and an effective path length for the cell of 1.34 cm. The measured incident light intensity was 4.67 X 10~7 einstein/1. sec.
Table I : Rates of Initiation at 25° for the Polymerization of Methyl Methacrylate Induced by the Photodissociation of ABN
1010Bi, M-i sec -1
107/s, einsteins/
1. seca
16.7 4.5522.6 2.8020.3 0.4863.84 2.71 X 10~20.627 3.41 X 10"30.0523 3.50 X IO"4
° The intensity of absorbed light.
[ABN ],M
0.1230.0306 3.76 X 10"3 1.94 X HT4 2.44 X 10“6 2.51 X 1 0 's
It is seen that a linear relation between Ri and 7a holds only at the three smallest ABN concentrations studied although one might expect that the rate of initiation is always equal to the rate at which primary
radicals are formed. The failure of this linear relation at ABN concentrations higher than 2 X 10 ~4 is most likely due to the reaction of primary radicals either with polymeric radicals or with each other in competition with chain initiation. The primary radical effect has been described and widely discussed in the literature.14'15 For the three smallest ABN concentrations studied the linear equation which best fits the data is
Ri = 0 . 1 5 8 / a (7a ^ 2.7 X 10~9 einstein/1. sec) (3)
The numerical coefficient of Ia in eq 3 is the product of the fraction of radicals which escape geminate recombination, / , and the fraction of ABN molecules which absorb light that actually decompose, 0. The latter quantity was found by Smith and Rosenberg to have the value 0.4713 so that, as determined here, / = 0.34. This value of / is smaller than those determined from thermal decompositions of ABN16; however, as Hammond and Fox17 have pointed out, a positive temperature effect might be expected in view of results which show that a decrease in solvent viscosity tends to increase the fraction of radicals which escape the solvent cage.18 Furthermore, the / value found here corresponds well with a value of 0.38 found for the photodecomposition of ethyl 2,2'-azo- bisisobutyrate17 also at 25°.
Mercaptan-Phosphite Reaction Rates. In agreement with the observations of Walling and Rabinowitz,1 it was found that this is indeed a radical reaction which proceeds by long chains. In fact, at the smallest ABN concentrations used, over-all quantum yields on the order of 105 were observed. It was also found that atmospheric oxygen exerts a strong inhibiting influence on the reaction so that degassing must precede all rate experiments if reproducible results are to be obtained.
No reaction was observed when a degassed mercaptan-phosphite solution was irradiated in the absence of ABN. This fact combined with studies of the effect
(10) L. M . Arnett, J. Am. Chem. Soc., 74, 2027 (1952).(11) T. E. Ferington and A. V. Tobolsky, J. Colloid Sci., 10, 536 (1955).(12) C. Walling, “ Free Radicals in Solution,” John Wiley and Sons, Inc., New York, N. Y ., 1957, p 84.(13) P. Smith and A. M. Rosenberg, J. Am. Chem. Soc., 81, 2037 (1959).(14) C. H. Bamford, A. D. Jenkins, and R. Johnston, Trans. Faraday Soc., 55, 1451 (1959).(15) T. Manabe, T. Utsumi, and S. Okamura, J. Polymer Sci., 58, 121 (1962), and references cited therein.(16) Some of these values are summarized in ref 17.(17) G. S. Hammond and J. R. Fox, J. Am. Chem. Soc., 86, 1918 (1964).(18) D . Booth and R. M. Noyes, ibid., 82, 1868 (1960).
Volume 70, Number 3 March 1966

608 R. D. Burkhart
of ABN concentration on the rate leads to the conclusion that the extent of direct photolysis in this reaction is negligible compared to the photosensitized reaction. It was also found that negligible reaction occurred when a reaction mixture was exposed to the normal fluorescent lighting of the laboratory for several hours.
The rate of the reaction was studied over a 10,000- fold change in initiator concentration from 2.4 X 10⁻⁶ to 3.9 X 10⁻² M. For a large part of this range of concentrations, very complex kinetics were observed. It was eventually discovered, however, that for the 20-fold range in ABN concentration from 2.4 X 10⁻⁶ to 5 X 10⁻⁸ M a simple rate equation would fit all of the available data. No experiments were carried out at lower ABN concentrations because of the small rates encountered.
When the concentration of ABN was sufficiently small, the data fit a rate equation of the form
-rl[R S H j = fc8 [RSH ] [ABN ]'/2 (4)df
As mentioned above, the concentration of ABN is essentially constant during the course of a run, and so values of fcs from the integrated form of eq 4 are readily obtained. The data and the calculated values of ka are given in Table II.
Table II : Rate Data and the Corresponding Rate ConstantsCalculated from the Integrated Form of Eq 4a
Reaction 103fc8,
103[RSH],b 10[TEP],C ltfOABN], 103A[RSH], time, M ~ '/*M M M M sec sec-1
9.23 1.99 4.11 0.47 1600 4.94.76 2.12 4.14 0.26 2030 4.49.82 4.91 4.14 0.58 1800 5.223.6 2.08 4.24 1.10 1800 4.11.99 2.10 4.16 0.14 3060 3.741.3 4.43 4.15 1.40 1800 3.09.56 9.53 4.70 0.59 1800 5.29.83 2.59 0.258 0.35 5400 4.29.52 9.55 0.243 0.44 5400 5.6
Av 4.5 Std dev 0.8
“ Reaction temperature 25°; incident light intensity 4.67 X 10 “7 einstein/1. sec. b 1-Pentanethiol. c Triethyl phosphite.
Keeping in mind the two proposed propagation steps in this reaction, it would be expected that alkyl radicals are most likely to be the major chain-carrying species when the rate of the reaction R- + RSH —►
RH + RS- is small compared to the rate of the reaction RS • + TEP R • + STEP (STEP symbolizes the phosphorothionate). It is for this reason that the concentration of the phosphite has been held in excess in these experiments.
Since 7a is proportional to [ABN] at the small initiator concentrations used in Table II, one should also expect a half-order dependence of the rate on 7a. It seemed desirable, therefore, to check this idea by carrying out experiments at a different incident light intensity. By inserting a wire mesh screen in the light path, it was possible to decrease the incident light intensity to 9.50 X 10~8 einstein/1. sec or a factor of4.92 smaller than was used for the experiments of Table II. Duplicate runs at this lower light intensity yielded an average value of ka equal to 1.8 X 10~3 M ~x/i sec-1. When compared with the average ks of Table II, one finds that the experimental order of the reaction with respect to / a is 0.57, in fairly good agreement with a half-order dependence. A better form for the rate equation would therefore be
~ d[^ SH] = fcs'[RSH]7a1/! (5)dfWhen the concentration of ABN was increased above
5 X 10⁻⁶ M, the simple rate equation (5) was no longer adequate for the prediction of rates. For instance, a series of runs was carried out in which the initial mercaptan and triethyl phosphite concentrations were held constant at 0.009 and 0.4 M, respectively, while the ABN concentration varied from 2.5 X 10⁻⁴ to 1.2 X 10⁻³ M. Values of ka' calculated from eq 5 decreased from 1.82 to 1.24 over this concentration range indicating a decrease in the order of the reaction with respect to / a. It was found that this trend continues to higher initiator concentrations and that above 0.019 M ABN little or no dependence of the rate on ABN is found. Of course, part of this effect is due to the fact that the fraction of incident light absorbed in traversing the reaction cell is approaching unity at these large initiator concentrations; however, as we shall see presently, there is a real decrease in the dependence of the rate on 7a as well. It was also found that the order of the reaction with respect to mercaptan and triethyl phosphite also changes with increasing [ABN] and that for [ABN] greater than 0.019 M reaction rates could be predicted by the equation
-d [R S H ] = kh [RSH ]1/s [TEP ]l/" (6)df
where fch is a pseudo rate constant since it contains a small dependence on the intensity of absorbed radiation.
The Journal of Physical Chemistry

R eaction between T riethyl Phosphite and 1-Pentanethiol 609
Table III : Rate Data and Corresponding Rate ConstantsCalculated from the Integrated Form of Eq 6“
Re-10" 10 10" 10"A action 103&h.
[RSH], [TEP], [ABN], [RSH], time, Af'iM M M M sec sec-1
50.6 0.642 19.3 6.9 540 4.9048.5 3.99 19.5 5.6 150 6.0950.9 9.43 19.5 5.7 120 4.6649.0 14.4 19.6 8.3 120 6.2249.9 0.466 19.6 6.0 600 4.0549.4 0.333 19.5 5.1 600 4.736.60 4.81 19.4 1.1 600 5.816.75 9.58 19.5 1.5 600 5.5448.9 4.08 38.9 4.5 120 5.57(5.11)14.5 4.08 19.4 1.5 250 5.9027.4 4.04 19.5 2.1 153 4.8650.4 4.08 78.0 4.9 120 6.50(5.65)
Av 5.40Std dev 0.7
“ Reaction temperature 25°; incident light intensity 4.67 X 10~7 einstein/1. sec.
Table III contains a summary of values of kh calculated from the integrated form of eq 6.
Since 7a is so very insensitive to changes in the concentration of initiator, it is not surprising to find reasonably constant values of kh even for a fourfold variation in [ABN]; however, by decreasing the incident light intensity, as described above, to 9.50 X 10⁻⁸ einstein/1. sec, duplicate experiments gave an average value of kh equal to 3.9 X 10⁻³ when [ABN] = 0.039 M. Thus, the order of the reaction with respect to 7a does decrease at these larger initiator concentrations and is found here to equal 0.20 indicating complex kinetics. The rate constants given in parentheses in Table III were corrected, using this 7a dependence, to the value of kh for [ABN] = 0.0195 M. Not much change in the kh value at 0.0389 M ABN is found, but the corrected value for 0.0780 M ABN represents a significant improvement.
Discussion
The simple form of the rate equation found for [ABN] < 5 X 10_s M can be derived from the mechanism
A B N — > 2 A - + N2 (a)
A- + RSH — RS- + AH (b)
RS- + TEP — > R- + STEP (c)
R- + RSH — ■> RH + RS- (d)
2R- —-> products (e)
A steady-state treatment of this mechanism assuming a large kinetic chain length leads to
~ di^ SH] = fcd[RSH](/0/aAe)V! (7)
Since the decadic molar extinction coefficient of ABN is 9.70 and the effective path length of the reaction cell is 1.34 cm, the Beer’s law expression for 7a reduces to the simple form 7a = 29.970[ABN] for ABN concentration less than 5 X 10~6 M. Using the value for f4> found in the polymerization experiments and the value for 7o, the incident light intensity, for the experiments of Table II, it is found that ks in terms of the proposed mechanism is
fcs = 1.49 X 10 -3fcdAe‘/! (8)
Using the average value found for ka, the rate constant ratio kd/ke has the value 3.0. No rate constant ratios for reactions of exactly the type epitomized by reactions d and e are to be found in the literature, the work of Onyszchuk and Sivertz appearing to offer the closest comparison available.19 For the corresponding ratio these workers obtained a value of 6.1 for a reaction scheme involving thiol hydrogen abstraction by a free radical in which the unpaired electron is located at a secondary carbon atom and where the termination process involves interaction of these radicals.
A termination reaction involving the interaction of alkyl radicals seems most reasonable in view of estimated values of kc and kd- Thus, Walling and Pearson,2 on the basis of competition experiments, estimated that 1, = 2 X 10⁸ M -1 sec-1 while Onyszchuk and Sivertz19 obtained the result that kA is about two orders of magnitude smaller than k,,, again for secondary radicals. Since triethyl phosphite was held in excess for all of the experiments in Table II, it might be anticipated that the rate of the over-all process would involve alkyl radicals as the major chain-carrying species.
The form of the rate equation needed to satisfy the experimental data for relatively large ABN concentrations suggests a case of complex kinetics, and, indeed, we have found no mechanism which uniquely yields the correct rate expression. It seems clear, however, from the decreasing order of the reaction with respect to 7a that, as the concentration of ABN increases, the rate of light absorption becomes less important as the determining factor in the rate of chain initiation. As the order of the reaction with respect to 7a decreases, there is found a concurrent increase in the order of the reaction with respect to both mercaptan and phos
(19) M. Onyszchuk and C. Sivertz, Can. J . Chem ., 33, 1034 (1955).
Volume 70, Number S March 1966

610 R. D. Burkhart
phite. This fact, coupled with the observation that the reaction orders involving mercaptan and phosphite are half-integral, is a strong indication that these two reactants have somehow become involved in an initiation process.
The decrease in the order of the reaction with respect to 7a can be accounted for most simply by assuming the reaction
2A- — > products (f)
begins to compete successfully with (b) as a process for removal of radicals from the dissociation of ABN. In fact, a steady-state treatment of the mechanism including reaction f leads to a rate dependent upon the s/ 2 power of the mercaptan concentration and the 1/t power of 7a.20
While recombination of primary radicals gives the correct order of the reaction with respect to 7a and mercaptan, there is still to be explained the dependence of the rate on the x/i power of the triethyl phosphite concentration. It is possible that a further termination reaction must be considered which involves thiyl radicals. A likely possibility would be the interaction of A • and RS •; however, an exact solution for the steady-state concentration of R- yields an intractable expression for this particular mechanism, a simple form being obtained only after making several assumptions of unknown validity.
Another possibility involves the postulate that a complex is formed between triethyl phosphite and the mercaptan and that primary radicals preferentially attack this complex in the initiation step. Using infrared, ultraviolet, and nmr techniques, we have found no unequivocal evidence for the existence of such a complex. Also, it has been pointed out21 that thiyl
radicals are known to be present as such in these reactions since their addition products with olefins are found when olefins are present in the reaction mixture.2 These objections do not, however, rule out the possibility of the formation of a very weakly bound complex present in low concentration.
ConclusionsThe reaction between triethyl phosphite and 1-
pentanethiol initiated by the photochemical decomposition of 2,2'-azobisisobutyronitrile proceeds by a radical-chain process. At relatively large rates of initiation the reaction kinetics are complex apparently due, at least in part, to the interaction of primary radicals with themselves or with other radical intermediates or with both. At sufficiently low rates of initiation, the kinetics are uncomplicated and are best interpreted in terms of a chain reaction involving free thiyl and alkyl radical intermediates. The only termination process which is in accord with the observed kinetics is a bimolecular reaction involving two alkyl radicals. This latter result, coupled with the finding that normal purification of the reactants leads to reproducible reaction rates and that a convenient analytical method for measuring the extent of reaction is available, makes this system appear to be ideally suited for measurements of average alkyl radical lifetimes in solution.
Acknowledgments. The author wishes to thank Messrs. James Metzger, Dean Evans, and Michael Baker who prepared some of the reagents used in this work.
(20) This form for the rate is obtained only after making the assumption that 16/afcf/fcb2[RSH j2 1 .(21) C. Walling, private communication.
\
The Journal of Physical Chemistry

Charge-Transfer States in Boranes and Carbonium Ions 611
Charge-Transfer States in Boranes and Carbonium Ions. Their
Ultraviolet Spectra
by B. G. Ramsey1
Department of Chemistry of The University of Akron, Akron, Ohio,and Florida State University, Tallahassee, Florida (Received June 8, 1965)
The ultraviolet spectra of triarylboranes exhibit two intramolecular charge-transfer transitions in the ultraviolet region. Although the ¿-butylcarbonium ion is predicted to absorb below 2000 A, it is suggested that other saturated alkylcarbonium ions will show transitions in the near-ultraviolet region. The ultraviolet spec'ra of arylcarbonium ions are discussed in terms of charge-transfer transitions and correlated with the ultraviolet spectra of boranes.
Introduction
The borane class of organoborons, R3B, is of interest to the organic chemist, as well as to the spectroscopist, since boranes are isoelectronic with carbonium ions and analogs of the carbonyl functional group. Many of the reactions of boranes, carbonium ions, and carbonyl groups are quite analogous. The reaction of each of these with diazoalkanes is an excellent example of this ground-state functional similarity.2 A study of the ultraviolet spectra of boranes is of value in understanding the sometimes more elusive carbonium ions. Attempts have been made for instance to predict the ultraviolet transition energies of alkyl carbonium ions from a consideration of the spectra of alkylboranes.3 We wish to report here the results of the determination of the ultraviolet spectra of some triarylboranes along with the spectral correlations between boranes and carbonium ions.
Platt4 5 has demonstrated that correlations between ultraviolet transitions of isoconjugate molecules may be used in making assignments of ultraviolet transitions. The qualitative aspects of the spectra of arylcarbonium ions are easily appreciated on the basis of simple Hiickel theory.6 Therefore, an orbital correlation diagram of simple Hiickel energies, with the coulomb integral of boron equal to a — 0.9/3, is given in Figure 1 for the molecular orbitals of the planar arylcarbonium ion, the planar arylborane, and the case of the arylborane in which the ring is rotated 90° out of the plane of the boron sp2 bonds.6 This correlation
diagram, although an oversimplification neglecting first-order configuration interactions, makes possible several interesting predictions. One, there should be an intense transition in the spectrum of arylboranes with an energy of (1.7-1.8)^, approximately 300 mp,7 corresponding to the long wavelength transition of the triphenylcarbonium ion. Secondly, the ion radical Ar3B- (Ar = aryl) should exhibit one and perhaps two CT transitions of considerably lower energy than the parent borane. The failure of these predictions in earlier published spectra of triphenylborane8 prompted this study.
(1) The experimental portion of this work was carried out at Florida State University and supported in part by the Office of Naval Research.(2) (a) J. E. Leffler and B. Ramsey, Proc. Chem. Soc., 117 (1961); (b) H . Whitlock, J. Am. Chem. Soc., 84, 3807 (1962).(3) J. Rosenbaum and M . C. R. Symons, Proc. Chem. Soc., 92 (1959).(4) J. R. Platt, J. Chem. Phys., 19, 101 (1951).(5) A. Streitwieser, Jr., “ Molecular Orbital Theory for Organic Chemists,” John Wiley and Sons, Inc., New York, N . Y ., 1961, pp 226-230.(6) Models and theoretical calculations indicate that three aromatic rings grouped about an spMiydridized carbon or boron cannot be coplanar. One reasonable geometry supported by experimental evidence is that in which the rings are feathered out of plane in a propellerlike configuration. This corresponds to the D 3 symmetry point group for triphenyl-, tri-p-tolyl-, and trimesitylborane: N. C. Deno, Progr. Phys. Org. Chem., 2, 177 (1964).(7) In this and other calculations a spectroscopic value of jS =2.37 ev has been used: R. G. Parr, “ Quantum Theory of MolecularElectronic Structure,” W . A. Benjamin, New York, N. Y ., 1963, p 71.(8) (a) D . H. Geske, J. Phys. Chem., 63, 1062 (1959); (b) B. M . Mikailov, Opt. i Spektroskopiya, 7, 389 (1959).
Volume 70, Number 3 March 1966

612 B. G. Ramsey
Figure 1. Hüekel molecular orbital energies for a phenylcarbonium ion and a phenylborane.
Wave Numbers xIO" 130 35 40 45
Angstroms
Figure 2. Ultraviolet spectrum of trimesitylborane in methylcyclohexane or isooctane.
Results and Discussion
We have studied a series of four triarylboranes and observed the expected transitions in their ultraviolet spectra. The absorption maxima of these compounds, triphenyl-, tri-p-tolyl-, trimesityl-, and tri-l-naphthyl- borane in methylcyclohexane are tabulated in Table I. The spectra of trimesityl- and tri-p-tolylborane in methylcyclohexane are given in Figures 2 and 3. The spectra of triphenyl-9 and trinaphthylborane10 have been presented elsewhere.
Since Mulliken’s11 first proposals on charge-transfer complexes, charge-transfer transitions have received sufficient popularization that we will not review this area except to refer the reader to one of the numerous review articles which have appeared.12 The broad long wavelength absorption of the triarylboranes may be established as an intramolecular charge-transfer transition, from aromatic ring to the boron empty p orbital, by applying the usual criteria for a CT transition.
First, the transition energy Eet of a charge-transfer transition (abbreviated as CT) may be approximately expressed by the eq 1, where 7P is ionization potential of the electron donor, Ea the electron affinity of the electron acceptor, C is the coulombic electrostatic energy, and R represents the sum of the stabilization of the ground state and destabilization of the excited state on mixing the two states, usually considered
Ect = Ip — E* — C + R (1)
ANGSTROMSFigure 3. Tri-p-tolylborane in methylcyclohexane or isooctane.
negligible. If values of Iv = 9.2 ev for benzene and Eit = 0.0 ev for boron are assumed and the positive charge in the excited state is placed in the middle of the benzene ring for the purpose of calculating C, a CT transition energy in the neighborhood of 2800 A is predicted for triphenylborane, in agreement with
(9) B. Ramsey and J. E. Leffler, J. Phys. Chem., 67, 2242 (1963).(10) B. Ramsey, M . Ashraf el Bayoumi, and M . Kasha, J. Chem. Phys., 35, 1502 (1961).(11) R. S. Mulliken, / . Am. Chem. Soc., 74, 811 (1952).(12) J. N. Murrell, Quart. Rev. (London), 15, 191 (1961).
The Journal of Physical Chemistry

Charge-Transfer States in Boranes and Carbonium Ions 613
Table I : Ultraviolet Maxima of Arylboranes
Tri aryl- boron A 10 -»«“
W ax iA 10 -*e“
lâmaî,A 10
llraaxiA 10 -u“
Tri-l-naphthyl 3526 1.9 286511 0.94 2638 1.9 2214 15Trimesityl 3310 1.6 28256 0.33 2470 0.70 2035 8.7Tri-p-tolyl 2966 3.3 28206 1.9 2490 2 0 2350 1.5Triphenyl 2871 3.9 2757 3.5 2380 1.9 20006 10
“ Molecular extinction coefficient. b Shoulder.
e c t
Figure 4. Ionization potential (in electron volts) of ArH vs. ultraviolet transition energy of Ar8B.
the molecular orbital expectation and with the experimental results.
Second, as predicted by eq 1 the long wavelength transition energy, Xi, is seen in Figure 4 to be linearly related to the ionization potential of the corresponding aromatic hydrocarbons. As a point for later discussion, literature values18 for other boranes have been included in this figure.
Third, a plot of the transition energies of the arylboranes against the intermolecular CT transition energies of the corresponding hydrocarbon-iodine complexes gives an excellent linear relationship (Figure 5) of slope near unity.
Fourth, the CT transition is observed to disappear on complexing the arylborane with ammonia or an amine.
Fifth, it is generally recognized that the intensity of a CT transition is dependent on the overlap between donor and acceptor orbitals and is sensitive to steric hindrance to this overlap.12'13 14 This effect may be observed in the decrease of molar extinction coefficients in progressing from triphenyl- to trimesitylborane. Finally, the intensity and general appearance of the
Figure 5. Electronic transition energy of charge-transfer transitions of ArH-I2 vs. Ar3B.
long wavelength transition in the arylboranes is indicative of its CT character.
It is evident, however, on examination of the spectra, that the broad intense long wavelength envelope, Xi and X2 in Table I, of the triarylboranes consists of at least two and perhaps three overlapping transitions. Therefore, a few comments on the multiplicity of the long wavelength CT transition and multiple CT in general are necessary here. The origin of such multiplicity, which is not uncommon in aromatic hydrocarbon donors, has received attention from both Brieglob15 and Orgel.16 Orgel has suggested that the occurrence of two CT maxima in chloranil complexes with substituted benzenes results from the removal by the substituents of ground-state degeneracy in the benzenelike orbitals. Examination of eq 1 suggests that mul-
(13) (a) A. G. Davies, D. G. Hare, and L. Larkworthy, Chem. Ind. (London), 1519 (1959); (b) R. E. Lyle, J. Org. Chem., 21, 61 (1956); (c) C. D . Good and D. M . Ritter, J. Am Chem. Soc., 84, 1162 (1962).(14) J. Burgers, M . Hoefnagel, P. Verkade, H . Visser, and B. Wep- ster, Rec. Trav. Chim., 77, 491 (1958).(15) G. Briegleb, Z. Physik. Chem. (Frankfurt), 303, 316 (1961).(16) L. E. Orgel, J. Chem. Phys., 23, 1352 (1955).
Volume 70, Number 8 March 1966

614 B. G. Ramsey
tiple CT transitions might arise from donor molecular orbitals with different ionization potentials, acceptor orbitals of different electron affinities, or complexes of different geometry resulting in different values of C, the electrostatic contribution to the energy. Still another source of multiple CT transition arises when the molecules have sufficient symmetry to result in significant configuration interaction between degenerate CT states. For instance, a CT transition (neglecting first-order configuration interaction) in triphenyl- borane is threefold degenerate since we may consider promoting an electron from any one of the three rings. We will return to this point shortly.
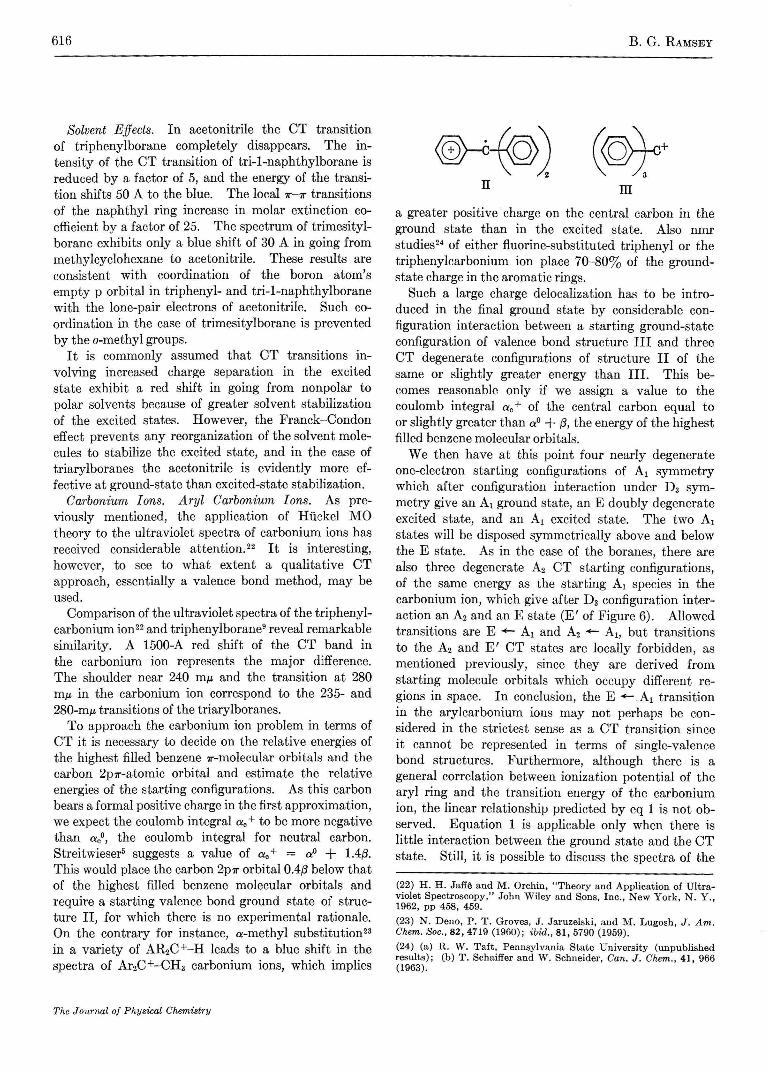
Murrell17 has pointed out that, given nearly degenerate donor ground-state molecular orbitals, resulting CT states may have different energies because of different charge distributions in the excited states. Structures la and lb depict the charge distribution in the CT state corresponding to each of the two highest filled benzene molecular orbitals. This is not moreover the equivalent of Orgel’s splitting of the degenerate ground- state benzenelike molecular orbitals by the substituents, which predicts that the transition from the orbital, la, nonnodal through the substituent, should be of greater energy. The point charge electrostatic approximation by Murrell predicts exactly the reverse assignment, as the CT state arising from the nonnodal molecular orbital la possesses the larger coulombic energy, C, in eq 1 and is therefore associated with the lower energy transition.
B "+1/3
41/12 . f l 41/12 +1/12 “ T i/12
+1/3
Atla
-'2V
B~ii+1/4 +1/4+1/4 +1/4
i■iB2lb
Utilizing the point charge estimation of Murrell, we expect two CT transitions in a phenylborane, arising from the degenerate benzenelike orbitals and differing in energy by approximately 1 ev. Since the first CT transition of a phenylborane is expected near 3.9 ev, the second transition should be in the neighborhood of4.9 ev, lying very close then to the benzene Lb transition also at 4.9 ev. However, as will be seen below, in order to avoid violation of the noncrossing rule in the correlation diagram (Figure 6). The second CT transition must lie below that of the localized benzene 7Lb transition. The argument for the assignment of the second CT transition follows.
First, in Figure 6 are given the term levels for a
Figure 6. Term-level correlation diagram for ArC+, ArB, Ar3B, and Ar3C+ (linear between 0 and 3).
benzyl cation with the appropriate assignments. Private communication from Olah and Pittman indicates that benzyl cations show two absorptions in the ultraviolet region near 3.2 (e 103) and 3.9 ev (e 104). These are the B2 •*- Ai and A! A! CT transitions, respectively. It should be noted that, although symmetry allowed, the B2 Ai transition is not locally allowed. The other term levels are calculated from simple Hiickel molecular orbitals and, while not quantitative, are qualitatively correct and will suffice to enable us to make the correct assignments in the phenyl- and triphenylboranes.
Next, in the term-level diagram (Figure 6) is the monophenylborane. In this case the terms are made up of a superposition without configuration interaction of the expected CT transitions of a phenylborane over the states for benzene. Here, it is seen that the noncrossing rule places the 4B2 CT state below the *Lb state of the same symmetry.
Next, consideration must be given to the CT state degeneracy resulting from the D 3 symmetry of the triphenylboranes. In the ground state, the boron atom may be considered as a reasonably effective insulator between aromatic rings. This assumption is justified by the nmr studies and calculations of Weismann and Schug18 on triarylboranes.
The Aj CT states, arising from each benzene orbital of charge symmetry la, under first-order configuration
(17) J. N. Murrell, Proc. Phys. Soc. (London), A68, 969 (1955).(18) T . J. Weismann and J. C. Schug, J. Chem. Phys., 40, 956 (1964).
The Journal of Physical Chemistry

Charge-Transfer States in Boranes and Carbonium Ions 615
interactions give rise to doubly degenerate states of E symmetry and a third state of Ai symmetry in a molecule belonging to the D3 point group. The Ax state will be of lower energy than the E state. However, only the E Ax transition is allowed. Similarly under D3 symmetry, the second CT state, B2, from the lb benzene molecular orbital results in CT states of A2 and E symmetry, of which the E symmetry state is of lower energy. (This second E state has been labeled E ' in Figure 6 to differentiate it from the first E state). Both A2 ■*— Ax and E ' ■*- Ax transitions are symmetry allowed. (They are locally forbidden, however, as they arise from starting molecular orbitals which occupy different regions in space.) The CT state of A2 symmetry, moreover, is nodal through the boron-carbon axis, and the previous conclusions of the discussion concerning the relative energies of the two CT states by Murrell’s point charge approximation remain valid with respect to the center of gravity of the CT states. The two doubly degenerate states should however be of the same energy, as there is no longer any difference in symmetry. Configuration interaction between the second CT state and localized xLb states will shift the 1hb -*■ 1K transition to the blue and the second CT transition somewhat to the red.
For the above reasons, it is felt that the 2825-A transition of trimesitylboron is the expected second CT transition. The 2470-A transition of trimesityl- borane is then assigned to the !Lb transition. The loss of structure in the 1 Lb transition and a large portion of the intensity of the CT transition is attributed to the mixing of CT and states.
The second CT transition of tri-p-tolyl- and tri- phenylborane should lie to the blue of the trimesityl- borane transition. The shoulder at 2820 A in the spectrum of tri-p-tolylborane may represent the second CT transition. This is uncertain, however, and at least for triphenylborane the second CT transition is obscured by the first. The 2380-A transition of triphenylborane and the 2400-A transitions of tri-p- tolylborane may be assigned as ’Lb.
These assignments and their correlation with the triphenylcarbonium ion are summarized in Figure 6. The term-level energies are those corresponding to the observed transitions, where possible, of triphenylborane and triphenylcarbonium ion.
The multiple transition nature of the first CT envelope obviously has several possible explanations. First, the envelope may represent the two CT transitions from ground state to the two CT states of E symmetry as previously described. A second possibility is the existence in solution of rotational isomers of the triarylboranes. Third, it is possible that not all
of the rings in a molecule are identical; that is, the existence of asymmetric propeller configurations such as postulated for the arylcarbonium ions may be an explanation.
Tri-p-tolylborane has an unusual envelope structure in its ultraviolet spectrum. Anomolous chemical shifts18 have also been reported by Weismann and Schug for the nuclear magnetic resonance spectrum of tri-p-tolylborane, in that the shifts are not accommodated by calculations assuming a symmetrical model. This, in conjunction then with the unusual appearance particularly of the first CT transition envelope, suggests that the tolyl rings may not be identical: a conformation in which two of the rings were nearly perpendicular and the third ring in or very nearly in the same plane as the boron sp2 a bonds would seem to accommodate both the nmr and the ultraviolet spectra.
Tri-l-naphthylborane represents a special case. In a previous communication13 it was suggested that the 2638-A transition of tri-l-naphthylborane2 corresponded to the naphthalene locally excited state shifted to the blue by configuration interaction with the CT state. It is now the opinion of this author that the 2638-A transition of tri-l-naphthylborane is a second CT transition from the second highest filled molecular orbital of naphthalene. The 2865-A transition is then considered as that of the locally excited naphthalene.
The two highest filled molecular orbitals of naphthalene are nondegenerate and separated by an energy of approximately 1 ev. The coloumbic energy of eq 1 calculated from Murrell’s approximation is the same for the two possible CT transitions of tri-l-naphthyl- borane.
Arylborane Radicals. The success of the treatment of the ultraviolet spectra of arylboranes in terms of CT transition encourages one to assign the transitions observed in the paramagnetic radical ions19 of tri- mesitylborane, Xmax 800 m/x, and tri-l-naphthylborane, Xmax 445, 470, and 630 m/x, to CT from boron to empty aryl 7r-molecular orbitals. Additional CT transitions should occur in the near-infrared region. In agreement with epr results,20 this places the odd electron in the ground state of these ion radicals largely in the boron 2p orbital with the conclusion that an electron has little steric requirement, a somewhat surprising result as pointed out by Brown.21
(19) (a) T . L. Chu and T. J Weismann, J. Am. Chem. Soc., 78, 24(1956) ; (b) C. W . Moeller and W . K . Wilmarth, ibid., 81, 2638(1959).(20) S. I. Weissman, et al., J. Chem. Phys., 21, 2227 (1953).(21) H . C. Brown and H. V. Dodson, J. Am. Chem. Soc., 79, 2303(1957) .
Volume 70, Number S March 1966
616
Solvent Effects. In acetonitrile the CT transitionof triphenylborane completely disappears. The intensity of the CT transition of tri-1-naphthylborane isreduced by a factor of 5, and the energy of the transition shifts 50 A to the blue. The local 1r-1r transitionsof the naphthyl ring increase in molar extinction coefficient by a factor of 25. The spectrum of trimesitylborane exhibits only a blue shift of 30 A in going frommethylcyclohexane to acetonitrile. These results areconsistent with coordination of the boron atom'sempty p orbital in triphenyl- and tri-1-naphthylboranewith the lone-pair electrons of acetonitrile. Such coordination in the case of trimesitylborane is preventedby the o-methyl groups.
It is commonly assumed that CT transitions involving increased charge separation in the excitedstate exhibit a red shift in going from nonpolar topolar solvents because of greater solvent stabilizationof the excited states. However, the Franck-Condoneffect prevents any reorganization of the solvent molecules to stabilize the excited state, and in the case oftriarylboranes the acetonitrile is evidently more effective at ground-state than excited-state stabilization.
Carbonium Ions. Aryl Carbonium Ions. As previously mentioned, the application of Huckel MOtheory to the ultraviolet spectra of carbonium ions hasreceived considerable attention. 22 It is interesting,however, to see to what extent a qualitative CTapproach, essentially a valence bond method, may beused.
Comparison of the ultraviolet spectra of the triphenylcarbonium ion22 and triphenylborane9 reveal remarkablesimilarity. A 1500-A red shift of the CT band inthe carbonium ion represents the major difference.The shoulder near 240 mJ.! and the transition at 280mJ.! in the carbonium ion correspond to the 235- and280-mJ.! transitions of the triarylboranes.
To approach the carbonium ion problem in terms ofCT it is necessary to decide on the relative energies ofthe highest filled benzene 1r-molecular orbitals and thecarbon 2p1r-atomic orbital and estimate the relativeenergies of the starting configurations. As this carbonbears a formal positive charge in the first approximation,we expect the coulomb integral ac + to be more negativethan aco, the coulomb integral for neutral carbon.Streitwieser5 suggests a value of ac + = aO + 1.413.This would place the carbon 2p1r orbital 0.413 below thatof the highest filled benzene molecular orbitals andrequire a starting valence bond ground state of structure II, for which there is no experimental rationale.On the contrary for instance, a-methyl substitution23
in a variety of AR2C+-H leads to a blue shift in thespectra of ArzC+-CH3 carbonium ions, which implies
The Journal of Physical Chemistry
B. G. RAMSEY
III
a greater positive' charge on the central carbon in theground state than in the excited state. Also nmrstudies24 of either fluorine-substituted triphenyl or thetriphenylcarbonium ion place 70-80% of the groundstate charge in the aromatic rings.
Such a large charge delocalization has to be introduced in the final ground state by considerable configuration interaction between a starting ground-stateconfiguration of valence bond structure III and threeCT degenerate configurations of structure II of thesame or slightly greater energy than III. This becomes reasonable only if we assign a value to thecoulomb integral ac+ of the central carbon equal toor slightly greater than aO + 13, the energy of the highestfilled benzene molecular orbitals.
We then have at this point four nearly degenerateone-electron starting configurations of Al symmetrywhich after configuration interaction under Dg symmetry give an Al ground state, an E doubly degenerateexcited state, and an Al excited state. The two Al
states will be disposed symmetrically above and belowthe E state. As in the case of the boranes, there arealso three degenerate A2 CT starting configurations,of the same energy as the starting Al species in thecarbonium ion, which give after Dg configuration interaction an A2 and an Estate (E' of Figure 6). Allowedtransitions are E - Al and A2 - Al , but transitionsto the A2 and E' CT states are locally forbidden, asmentioned previously, since they are derived fromstarting molecule orbitals which occupy different regions in space. In conclusion, the E -Al transitionin the arylcarbonium ions may not perhaps be considered in the strictest sense as a CT transition sinceit cannot be represented in terms of single-valencebond structures. Furthermore, although there is ageneral correlation between ionization potential of thearyl ring and the transition energy of the carboniumion, the linear relationship predicted by eq 1 is not observed. Equation 1 is applicable only when there islittle interaction between the ground state and the CTstate. Still, it is possible to discuss the spectra of the
(22) H. H. Jaffll and M. Orchin, "Theory and Application of Ultraviolet Spectroscopy," John Wiley and Sons, Inc., New York, N. Y.,1962, pp 458, 459.
(23) N. Deno, P. T. Groves, J. Jaruzelski, and M. Lugosh, J. Am.Chem. Soc., 82, 4719 (1960); ibid., 81, 5790 (1959).
(24) (a) R. W. Taft, Pennsylvania State University (unpublishedresults); (b) T. Schaiffer and W. Schneider, Can. J. Chem., 41, 966(1963).

Charge-Transfer States in Boranes and Carbonium Ions 617
arylcarbonium ions in terms of CT as a starting point.
Figure 6 again summarizes these arguments in a term-level correlation diagram. The energies for allowed transitions are taken from observed maxima in published spectra of the triphenylcarbonium ion. The energies indicated for E ' and Ai terms are required by the symmetry arguments.
Alkylboranes and Carbonium Ions. Included in Figure 6, a plot of ionization potential vs. CT energy of R 3B, are two alkylboranes and trivinylborane.13 The transition energies of these alkylboranes fall reasonably well near the line. It has been suggested that the transition of the alkylboranes are CT transitions and that the excited states may be represented in valence bond terms as H +C =B ~ hyperconjugated structures. If a plot of ionization potential vs. transition energy is to be linear, it is required that the coulombic term C and the electron affinity Z?a, of eq 1 be constant. It is obvious for instance that the coulombic terms for trivinylborane and the triarylboranes are quite different as the center of positive charge in the CT state of trivinylborane is much closer to the boron orbital containing the negative charge than in the case of the triarylboranes. Thus, the CT transition of trivinylborane is farther to the red than might be expected simply on the basis of ionization potential. The appropriate coulomb correction has been indicated by the open circle on the graph in Figure 6.
No coulombic energy corrections have been applied however to the transition energies of the alkylboranes. If we assume that the transitions are indeed CT transitions, then, in order for the coulombic energy contributions of the alkyl and aryl donor CT states to be roughly equal, it is necessary that the highest filled cr orbital of the alkane be delocalized essentially over the entire alkyl group, and not be a hyperconjugated localized C-H bond orbital adjacent to the boron atom.
Still utilizing eq 1, we may also estimate the transition energy of a CT transition in trimethylborane, taking the following values: 7P(CH4) = 13 ev, /?a(B) = 0, and C — 9 ev. If we add to this twice the estimated stabilization (1.5 ev) of trimethylborane by hyperconjugation,25 as the sum of the ground-state stabilization and excited-state destabilization by mixing of the ground state and CT state, a transition energy of 7 ev is predicted. Measurement of the ultraviolet spectrum of trimethylborane in the vacuum ultraviolet indicates as a preliminary result Amax 1750 A (7.1 ev).26
Assuming then that the 7.1-ev transition of trimethylborane represents the CT transition, we may get a rough idea of the transition energy to be expected in the case of the ¿-butyl cation from the relation
£ ct(Me3C+) = £ ct(Ph3C+) + £ 0t(Me3B) -Ect(Ph3B) + C(Me3B) - C(Ph3B) (2)
which may be derived from eq 1 by assuming the differences in resonance stabilizations between trimethylborane and triphenylborane and between the trimethyl- and the triphenylcarbonium ion are equal. This relationship (2) predicts that the ultraviolet ab- sorbtion of the ¿-butyl cacion should be in the neighborhood of 8.5 ev or 1450 A. Even if the CT transition of (CH3)3B is placed near 2000 A ,13 this still places the expected ¿-butyl carbonium ion transition in the far- ultraviolet region near 1700 A.
The above considerations then make it unlikely that the intense absorptions in the 2900-A region reported by Symons27 should be assigned to the ¿-butyl cation, but are more probably due to alkenyl cations.28 Since consistency required that the coulombic term C of eq 1 be approximately constant from triphenyl- to tri-n-butyl- borane, the trialkylcarbonium ions in which the alkyl group is n-butyl, n-pentyl, etc., should exhibit an ultraviolet transition in the neighborhood of 2700 A which arises from a delocalized a orbital. A similar conclusion may be arrived at by consideration of the differences in vertical ionization potentials of methane and higher hydrocarbons. Actually, 2700 A is probably too low a transition energy because we are ignoring the inductive effect of the C+ on the ionization potential of the alkyl group. Still the ultraviolet transition of carbonium ions such as R3C+, R > CH3CH2, should lie in the near-ultraviolet region and have an intensity comparable to that for the trialkylboranes.
Experimental SectionTriphenylborane was purchased from Aldrich Chemi
cal Co. or prepared by the method of Wittig and Raff.29 The triphenylboron was purified by recrystallization from benzene under nitrogen, mp 148.5-149°. Anal. Calcd for CigHisB: C, 89.3; H, 6.2. Found: C, 88.7; H, 6.4.
Tri-p-tolyl-, trimesityl-, and tri-l-naphthylborane were prepared by the general method of Wittig30 from boron trifluoride etherate and the appropriate Grignard reagent. After recrystallization under nitrogen the following melting points were obtained:
(25) R. S. Mulliken, Chem. Rev., 41, 215 (1947).(26) L. Goodman, Pennsylvania State University (unpublished results).(27) J. Rosenbaum and M . Symons, J. Mol. Phys., 3, 205 (1960).(28) N. Deno, J. Bollinger, N. Friedman, K. Hafner, J. Hodge, and J. Houser, J. Am. Chem. See., 85, 2998 (1963).(29) (a) G. Wittig and P. Raff, Ann., 573 (1961); (b) G. Wittig and W . Herwig, Ber., 87, 802 (1959).(30) L. J. Bellamy, J. Chem. Soc., 2412 (1958).
Volume 70, Number 3 March 1966

618 Julian Heicklen
Tri-p-tolylborane, 151.5-153°; trimesitylborane, 190.5- 191.5°; and tri-l-naphthylborane, 206-207 ° .
Solutions for spectra were prepared in a nitrogen glove box. Solvents used were isooctane or methyl- cyclohexane, Spectro Grade.
Spectra were recorded on a Cary 14 recording spectrophotometer using 1-mm path length cells. Infrared spectra of triphenyl- and tri-p-tolylborane prior to preparing solutions for ultraviolet spectra did not reveal the presence of any oxidation products, which have a very strong characteristic absorption in the infrared at 1350 cm-1.30
Since the infrared spectrum of Ph3B in carbon tetrachloride was found to differ from that published
previously,31 the absorption wavelengths and relative intensities are given here: 3090 s, 1960 w, 1925 w, 1840 w, 1775 w, 1680 w, 1590 s, 1440 s, 1400 sh, 1310 m, 1220-1280 vs, 1180 m, 1160 w, 1080 m, 1040 m, 1000 w, 940 w, 900 sh, 890 s, 860 w cm-1 in carbon tetrachloride.
Acknowledgments. The author wishes to acknowledge the consideration of M. Kasha of Florida State University in originally encouraging the study of this problem and L. Goodman of Pennsylvania State University in many helpful discussions.
(31) D. W . A. Shays and N. Shepard, J. Chem. Soc., 674 (1957).
Photolysis of Trifluoroethylene Iodide in the Presence of Nitric Oxide and Oxygen1
by Julian Heicklen
Aerospace Corporation, El Segundo, California {Received June 16, 1965)
When pure C2F3I is irradiated, a red solid is formed which is probably the polymer of C2F3I. The infrared bands show that product formation is inhibited as exposure increases, thus suggesting that I2 retards its formation. With NO present, F2CO and FCN are formed, presumably through the reaction sequence C2F3 + NO —► C2F3NO —► FCN + F2CO. Nitrogen and N 02 are also formed in a manner characteristic of the catalytic conversion of NO to N 02 and N2 in the presence of RNO. The evidence suggests that RNO in this system is the dimer of C2F3NO. With oxygen present, the products found were F2CO, CFIO, C2F3OI, (FCO)2CF2, and, at high 0 2 and C2F3I pressures, (FC02)- CF2(FCO). Undoubtedly I2 was also formed. The quantum yields of the products are large, and a chain mechanism must occur. The likely reaction sequence is presented, and some ratios of rate constants are estimated.
I . IntroductionThe reactions of CF3 radicals, produced from the
photolysis of CF3I, with oxygen and nitric oxide have been reported.2 As part of a continuing investigation in our laboratory, we have now examined the analogous reactions of C2F3 radicals, produced from the photolysis of C2F3I. The results of this investigation are reported here.
I I . Experimental SectionTrifluoroethylene iodide obtained from Peninsular
Chemresearch Corp. was used after degassing once at —196° and once at —160°. Infrared and gas
(1) This work was supported by the U. S. Air Force under Contract No. AF 04 (695)-469.(2) J. Heicklen, Report No. TD R -469(5250-40)-12, Aerospace Corp., May 1965; J. Phys. Chem., 70, 112 (1966).
The Journal of Physical Chemistry

Photolysis of C2F3I in Presence of NO and 0 2 619
chromatographic spectra showed no impurity peaks. Matheson Co. research grade HI, 0 2, N2, and NO were used. The nitric oxide was first degassed at — 196° and then warmed to —186°. The fraction volatile at this temperature was collected and used. In this way, trace amounts of N20 and N 02 were removed. The C2F4 was prepared by slowly addingl,2-C2F4Br2 to a mixture of zinc in methanol so as to keep the reaction temperature at 60°. The effluent gas passed through a reflux condenser to retain the methanol and then through water to remove the last traces of methanol. Finally, the gas was dried with Drierite. A gas chromatogram showed the gas to be over 99% C2F4 with only two impurities.
The reaction and optical arrangement are identical with those for the CF3I study.2 Analysis was by in situ infrared spectroscopy. The ultraviolet absorption spectrum of C2F3I is similar to that for CF3I, and the mercury lines at 3020 and 3130 A are principally responsible for the photolysis.
To identify and calibrate the products from the C2F3I -0 2 photolyses, lengthy exposures were performed and the products were separated on a Beckman GC-2A chromatograph employing a 10-ft column at 0° packed with Perfluorolube on firebrick. Infrared and mass spectra of the isolated products were then obtained.
I I I . Photolysis of C2F 3IResults. When pure C2F3I was irradiated, infrared
bands appeared at 5.6, 5.8, 7.35, 8.7, 9.38, 12.6, and13.8 u- As irradiation continued, their rate of growth diminished, and a red deposit was observed on the cell wall and windows.
After exposure, the reacted mixture was collected and passed through a gas chromatograph. Three products were found to be present in trace amounts. One of these products was in the C2-C 3 fluorocarbon region, one was in the C4 fluorocarbon region, and one had a retention time longer than C2F3I.
Discussion. Presumably, the photolysis of C2F3Iis analogous to that for other iodides
C2F3I + hv — > C2F3 + I (a)
The radicals and iodine atoms can interact
21 + M — > I2 + M (b)
2C2F3 — >■ products (c)
C2F3 + I — ► c 2f 3i (d)
However, molecular iodine is a powerful radical scavenger, and very quickly product formation is inhibited by
C2F3 + I2 ■—>■ C2F3I + I (e)
However, in this system, the olefinic reactant can also scavenge radicals
C2F3 + C2F3I C4F6I (f)
The resulting radicals can continue to add to the monomer or can undergo the reactions similar to (c), (d), and (e)
(C2F3)BIre_! + (C2F3)mIm_i — >- products (g)
(C2F3)J „_ 1 + I — > (C2F3I)„ (h)
(C2Fs) J b_! + I2 — > (C2F3I)n + I (i)
Thus, only trace amounts of radical-radical products are produced. However significant quantities of the polymer should be observed, and its formation should be inhibited with exposure time. Undoubtedly, the product infrared bands belong to the polymer, which is the red deposit we observed.
I V . Photolysis of C 2F 3I - N O MixturesResults. When mixtures of C2F3I and NO were
exposed, the infrared bands of F2CO and the N 02- N20 4-N 20 3 system were observed. In addition, a band at 4.38 u was seen in all runs. This band must be a C = N stretch, and we have associated it with FCN. Thus, the carbon-fluorine products are CF20 and FCN, which are the products analogous to CH20 and HCN found when NO reacts with C2H3 radicals.3 The optical densities of the F2CO and FCN bands grow linearly with exposure time and remain constant after exposure. The ratio of F2CO and FCN production is essentially invariant to all changes in initial conditions as are their individual quantum yields. The absolute quantum yield for F2CO is unity as found by comparison to the yield in the CF3I -0 2 system.2 Mass balance considerations require the FCN yield to be the same. Since absolute rates of F2CO production A[F2CO] are known, both the absolute absorbed intensity and the absolute rate of FCN production R- [FCN ] can be determined. The results are summarized in Table I. The total time of exposure r is also listed.
The N 02-N 20 4 product also was observed in many runs, especially at the higher NO pressures. From absolute calibration curves prepared earlier,2 the total N 02, reported as (N 02) + 2(N20 4), could be measured as a function of exposure time. For some runs in which N 02 was observed, the results are shown graphically in Figure 1. The log-log plots are all fitted by straight lines of slope 2.0 indicating that (N 02) + 2- (N20 4) grows as the square of exposure time. There is some deviation in some runs for pressures less than * 3506
(3) A. G. Sherwood and H. E. Gunning, J. Am. Chem. Soc., 85,3506 (1963).
Volume 70, Number S March 1966

Tabl
e I:
Ph
otol
ysis
of C
2F3I
-NO
Mix
ture
s at
24'
620 Julian Heicklen
CO CO 0 cq > 0 O O O 02 020 05 0 05 O cq . .1 0 CO cq TD ~
cq rH OO 0 >rH
1 aH 0 0 O O LO 0 H U0 CO CM cq O 05 05 ■ x O OrH 10 1—l CO cq a a
HCDOININCDOO O (N 0 0 <© N H • <M H lO 1-1 • • • O TfiO O rH )( o
tCOJOOHNNiO 05 H i n 03 • O 03 N
H H -C O • -C O(N rH o o
inoo iMinioiNN • 03 o co co o 03 >nrH CO • • • • <NO O O T-i o o
rHi-HOcOOrHr^r^CO 05 00 CO IQ 03 00 H
rH rH O O
N N O O N I O O I OC O C O O O N C O O i O O
Oo
H i 0 O c 0 H N C 0 0 5C O C O ( N c D C O O ) O O C O• • • rHrH 1-1 O O O
1 *n o CO N O N NH ^ | > N O ^ HCD (M o O rH T-i
NinOojiOCOCOrti H • CO N CO O CO O
03 H . • • rH0 0 O o 1-H rH o
M N CO m 05 N H GO N CD C30 ^
O O O rH
ocq<M©
oo
CO X 0 CO rH X CO 0CO 05 !> 1> 05 05 0 0a> iO iO cq»0 rH rH O O 0
O 0
05 cq O 05 O COcq 0 05 LO 05 rH cq 05H cq X Oa CO rH O rH Oo 0Pi O
03 CO d> *1-
■I £> ca i&
H« ,5
•SIf ^M 2rd
oCL do £a §O r H(D o Ph d
02 c3 <D '+-<§
oo©«+-1o
02 ■J3 <
o ' «
o©
030203rP
d •.2’-Hp, (-1 1 o
02 rP c3d03 ,bD
.2
6 ss &
aa a^ ahH ~fS o o £
a a« a
o 55 ci
H „ 4 .
. §88T3
'Pi 05 «1 ■» 3=;
o
f § <5 ,wO N o+ pC"2 Oho i£ <N
Figure 1. Log-log plots of (N 02) -f 2(N20.i) vs. exposure time for photolysis of C2F3I-NO mixtures.
0.1 mm, but this can be attributed to the large errors involved in obtaining accurate optical densities in this region.
After exposure, the N 0 2 concentration was followed, and it continued to increase even though the other products were unaffected. The incremental increase, (N 02) + 2(N20 4) — (N 02)o — 2(N 20 4)o, where the subscript 0 refers to the pressure at the onset of the dark period, grows linearly with time in the dark.
With large NO pressures, N20 3 was also formed at the expense of N 02. Fortunately, N20 3 also has a band near the N 02 band at 6.16 p. As discussed in an earlier report,2 the error involved in treating N20 3 as if it were N 02 is probably less than 10%, even with 600 mm of NO present; at lower NO pressures it is surely negligible.
For some runs, the reaction mixture was collected after irradiation and frozen to —210°. At this temperature, significant amounts of a noncondensible gas were detected on a McLeod gauge. This gas was surely N2 (NO has a vapor pressure of only about 10~3 mm at —210°). The mixture was then warmed and the fraction condensible at —196° was passed through the F & M chromatograph. The only product detected was C 02 from F2C0. (This chromatograph quantitatively converts F2C0 to C 02.)
Discussion. The simplest scheme to explain the carbon-fluorine products of the reaction of C2F3 radicals with NO is that analogous to the hydrocarbon system3
The Journal of Physical Chemistry

Photolysis of C2F3I in Presence of NO and 0 2 621
C2F3 + NO — > C2F3NO (j)
C2F3NO — >- F2CO + FCN (k)
That N 02 and N2 are produced, even in the dark, strongly suggests the presence of a stable RNO-type product. These molecules are well known to catalyze the conversion of NO to N2 and N 02.2’4 5 6 7~8 At first thought, it might seem that C2F3NO is the appropriate molecule. However, if it were, the fact that the N 02 production varies as the square of the light intensity could not be satisfied. A more satisfactory explanation is attained by assuming the appropriate molecule to be the dimer of C2F3NO. Thus, we introduce the reaction
2C2F3NO (C2F3NO)2 (1)
No product bands that could be associated with (C2- F3NO)2 or C2F3NO were detected; thus, the amount of product must be very small. Under all our conditions the rate of reaction 1, R( 1), must be very much smaller than the rate of reaction k, ff(k). The N 02- and N2-producing step would be2’4-8
(C2F3NO)2 + 2NO — >NO
(C2F3)2NO + Ns + NOs — > 2N 02 (m)
followed by
(C2F3)2NO + NO — > (C2F3NO)2 (n)
The mechanism predicts that
$[F2CO] = $[FCN] = 1.0 (1)
and that during irradiation
(NO)2i2(N 0 2) + 2 (N 20 4) = fcmfc,/a2 - (2)/Ck
and after irradiation
(N 02) + 2(N20 4) - (N 02)„ - 2(N20 4)o =
2fcmfci/a2(NO ) H t
fck2(3)
where the subscript 0 refers to pressures at the termination of exposure and r is the total exposure time.
In accordance with the predictions, (N 02) + 2- (N20 4) grows as the square of the exposure time in the light, and the incremental change in (N 02) + 2(N20 4) is linear with time in the dark. From the data, the quantities
(NO2) + 2(N2Q4) i2R2[F2CO]
fcmfcl(NO)2 (4)
and
(NQ2) + 2(N2Q4) - (NQ2)q - 2(N2Q4)q = fcmfci2irS2[F2CO] fck2 ( ’
(5)can be determined. In the left-hand side of the expressions, we have replaced Ja by A[F2CO] to take advantage of the internal actinometer. The values for the left-hand sides of the equations are tabulated in Table I and plotted in Figure 2 vs. the NO pressure. Two of the mechanistic predictions are satisfied;i.e., the intensity effect is satisfactorily explained (which is not the case if C2F3NO is the catalyst), and plots have slopes of 2.0 at low NO pressures. However, the mechanism fails badly in three particulars. First, the curves fall off at the highest NO pressures. Second, there is a marked effect of C2F3I pressure in the light with 100 mm o: NO, but there is none at all with 600 mm of NO. In the dark, the pressure effect is inverted and manifests itself with 600 mm of NO. Third, the positions of the curves are vastly different in the light and the dark.
We do not understand the reason for these failures. However, the pressure effects strongly suggest that a third body might be involved in some reaction. To test this, we exposed a mixture of 31 mm of C2F3I and 91 mm of NO to which 542 mm of N2 was added. To our surprise, N2 had no effect. The difference in the plots during and after exposure suggest a shifting equilibrium (or possibly radical participation). Perhaps higher polymers of C2F3NO are involved in the catalytic reaction.
V. Photolysis of C2F3I - 0 2 MixturesResults. When mixtures of C2F3I and 0 2 are photo-
lyzed, many infrared bands are observed. The optical densities of all bands except that at 6.60 n grow linearly with exposure time. The band at 6.60 u belongs to C2F3OI. Spectra of this compound show that the 6.6O-/1 band does not obey Beer’s law, whereas the other bands do. After exposure, all product bands remain unaffected upon standing for several hours. Thus, it can be concluded that all products are initial products and that they do not enter the reaction scheme.
Some of the infrared bands are immediately identifiable as belonging to F2CO. To identify the others,
(4) M . I. Christie, Proc. Roy. Soc. (London), A249, 258 (1958).(5) O. P. Strausz and H. E. Gunning, Can. J. Chem., 41, 1207 (1963).(6) M . I. Christie, C. Gilbert, and M. A. Yoisey, J. Chem. Soc., 3147 (1964).(7) M . I. Christie, J. M . Collins, and M . A. Voisey, Trans. Faraday Soc., 61, 462 (1965).(8) J. Heicklen, Report No. TDR-469(5250-40)-9, Aerospace Corp., Mareh 1965.
Volume 70, Number 3 March 1966

622 Julian Heicklen
CVJ4-
(NO), mm.
Figure 2. Log-log plots of [(N02) + 2(N20 4)] /i2i !2[CF20] during exposure or [(N02) + 2(N20 4) — (NO2)0 — 2(N2O4)0]/ 2irf22[CF20] after exposure vs. nitric oxide pressure for irradiated C2F3I-NO mixture.
lengthy exposures were performed, and the products were isolated on a Beckman GC-2A chromatograph. In addition to F2CO (which converts to C 02), three products were found. Chromatographic retention times on a Perfluorolube column at 24° are 4.3, 16,26.5, 33, and 45 min, respectively, for C 02, CF2(CFO)2, C2F3I, C2F3OI, and (CF02)CF2(CF0). While not much information can be learned from chromatographic retention times, some insight into molecular weight and type of molecule can be gained. For example, C2F3OI must surely have a longer retention time than C2F3I, and (FC02)CF2(FC0) must have a longer retention time than (FCO)2CF2. The results are consistent with these statements.
Infrared and mass spectra of the three products were obtained. The infrared spectra are shown in Figures 3-5, and the mass spectra are listed in TableII. The infrared spectra of two of the products have a band at 5.32 fi which is characteristic of the CC- (= 0 )F group. Furthermore, they do not have bands in the C = C double bond stretching region. Their mass spectra show prominent ions corresponding to the groups FCO, CF2, CF20, CF3, C2F3, CFaO, (FCO)2, and C2F30. The largest m/e observed (presumably the parent masses) were at 144 and 160. The two molecules are undoubtedly
F F F F F F
0 = C —C— C = 0 and 0 = C —0 — C— C = 0
F F
The mass spectral peaks corresponding to CF3 and CF30 can be formed by electron bombardment.
>• oi-OT o.io 2 111“ 0.30g 0.50
a 1.00 o ®2 4 6 8 10 12 14 16
WAVELENGTH, p
Figure 3. Infrared spectrum of (FCO)2CF2.
>- 0 1—(O 0.10 2 Ll I
° 0.30_ig 0.50
cl 1 .00 O ®2 4 6 8 10 12 14 16
WAVELENGTH, p
Figure 4. Infrared spectrum of (FC02)CF2(FC0).
— \ 1 1 1— I"' 1 1 1 I“
^ 1
' T
1 1 1 1 1 1
" 1 —
WAVELENGTH, p
Figure 5. Infrared spectrum of C2F3OI.
The infrared spectrum of the third product is shown in Figure 5. The carbonyl stretching band is definitely absent, and the band at 6.6 must correspond to a C = C double bond stretch. The mass spectrum definitely shows the presence of oxygen and iodine. Besides I2, there is only one peak at m/e greater than 224, and this seems to correspond to an unreasonable molecule. Presumably, it is the result of some ion- molecule reaction. All the other evidence clearly indicates that the molecule is F2C=C(F)O I.
During exposure of the C2F3I -0 2 mixtures, an additional infrared doublet at 5.40 and 5.44 n is formed which cannot be associated with any of the other four
The Journal o f Physical Chemistry

Photolysis of C2F3I in Presence of NO and 0 2' 623
Table I I : Mass Spectra (above Mass 44)
,------------- R ela tive height-(C FO 2)-
m/e Io n C F2(CFO) 2 C F2(CFO) C2F 3O I
45 0 1.3 3.146 2.6 0.5 1 .047 FCO + 100.0 43 100.048 1.8 0.7 4.449 0 1.2 2550 c f 2+ 28.2 100.0 19.551 0 2.3 13.152 0 0 1.860 0 0 1.662 c 2f 2+ 0 0 7.263.5 P + 0 0 34.266 c f 2o + 13.2 7.4 3.867 0 1.7 2.369 CF3+ 15.6 20 4980 0 0 0.881 c 2f 3+ 7.1 6.3 16.984 0 0 8.385 c f 3o + 2.6 5.2 27.586 0 0 6.493 1.2 0 094 (FCO)2+ 3.5 7.6 4.597 c 2f 3o + 1.5 1.8 59
100 c 2f 4+ 0 0.5 0104 c f 4o + ? 0 0 9.7113 c 2f 3o 2+ 1.2 0 0119 c 2f 5+ ? 0.9 0 0127 1 + 1.5“ 2. T 2086139 CI + 0 0 i l . T141 (FCO)3+ 0.9 1.3 0142 0 0 3.8144 CF2(CFO)2+ 1.2 0 0146 FI + 0 0 1 .0152 C2I + (151) ? 0 0 1.1155 COI+ 0 0.5 0.8158 CFI+ 0 0 34»160 (FC02)CF2(FC0) + 0 0.5 0170 c 2f i + 0 0 1.4174 CFOI + 0 0 0.6177 c f 2i + 0 0 7.5186 c 2f o i + 0 0 1 .0189 c 2f 2i + 0 0 16.94202 c 2f o 2i + 0 0 0.6208 c 2f 3i + 0 1.56 1264224 c 2f 3o i + 0 0 2.1236 c 3f 3o i + ? 0 0 0.7254 I2+ 0 0 i . r
“ m/e 128; is (FCO)C2F3. 6 m/e 208, 189, 158, 139, and 127from C2F3I impurity as well as C2F3OI. “ m/e 254 from I2 im-purity.
products. This band is characteristic of the group X C (= 0 )F , where X is neither fluorine nor carbon. The indicated molecule and one which we would surely expect as a product is F C (= 0 )I . Apparently, this molecule, as F2CO, converts to C 02 in the chroma
tograph and, thus, does not appear in the chromatograms.
Finally, molecular iodine must be a product, though we would not be able to detect it either by infrared analysis or by chromatography.
In order that quantitative computations can be made, it is necessary to be able to convert optical densities to pressures. For this purpose, calibration factors are needed. To obtain these factors, several routes were investigated, the results of which are summarized in Table III. Of course, the best method is by direct calibration, i.e., identical measurement of the pressure and infrared spectrum of a pure compound. Unfortunately, this is not always possible when dealing with molecules of limited stability. For the three products that were isolated, this method was tried. The two carbonyl compounds were so unstable that it was impossible to reproduce the results. Only a lower limit for the calibration factors could be obtained in this way. More success was achieved with C2F3OI. The results were fairly reproducible, and a reasonable calibration was obtained. If there were any error in this value resulting from decomposition, it would be such as to make the calibration factor low and the resulting quantum yields high. Of course, direct measurements could not be made for F2CO and CFIO, for these molecules were not isolated. However, the value for F2CO is known from other work in our laboratory.9
Another method for estimating calibration factors is by comparison with related compounds. Such an estimate was made for the carbonyl-containing compounds.
A third way of estimating absolute quantities is by comparison of chromatogram areas. Such estimates are usually good to within a factor of 2. For the three products that appeared on the chromatograms, the respective areas were measured. By using the factor measured directly for C2F3OI, we could estimate the factors for the other two products.
Estimates can be made from mechanistic considerations, too. As will be shown subsequently, the mechanism predicts that if[F2CO] — A(CFIO) in the presence of HI should equal R [(FCO)2CF2] in the absence of HI, other conditions being the same and E [(FC 02)- CF2(FCO)] being unimportant. The best calibration factor for (FCO)2CF2 is obtained in this way and was used in all calculations.
Finally, the carbon-fluorine mass balance predicts that$[F2CO] = $ [CFIO ] + $[(FCO)2CF2] +
$[(F C 02)CF2(FC0)] (6)
(9) D . Saunders and J. Heicklen, to be published.
Volume 70, Number 3 March 1966

624 Julian Heicklen
*2 .32 g
r& a
Q s
d.2‘■ +3c3*H
j f i
o
pOS3
H
rH03O
O
-H
o
• -H
S i l l sO r" f-< {-• u<3 fH ,rj bo c$
<*h C3 O
O c3
o
xTin 03
O
P ? . . Q O
c3 u .
_Q
O
^ od o<
£ eo s
o o >>pH
- A p i '
o R
g oC - o
O (Hv ooopH
02
S »3 -S o I j rs — o § o o
c
02 O
■§ c5 5 ofc
c3?hX
c3Oc3
2 5 t3'43 ^ Og p £
. Q pH ^s o 6
• & a. a
o r SP - oO f x cM o3 ‘
X+
pH
X 05 I> t > X 1-H O Oo o oA A
O O t>
* g .
- R ' g<n H
1 O Ao - g
-Ph §
X£
PRa 3 .
03 .
oo£=4
oo
r ?8 r m
0 ^ , 0 O
pH_ o
IB Ph -E? OS R - g OPh e* d fV i<d ro a>s (x H> x
d «-t-H .---J
o
pH£ o
B og o
Ph Ph
2 o ®g >< x*1 (J> 03
> f e - B« ¿ j W
o 8 o
+ Ph „ O
q So
•& &
2 q(h2 o
S #
d+3X
g
01
HH
P ?
o
j>>' o
XPh
X«3
H
r —1 1 CO X X X 03 1> .w CO (X) o - r 03 . x i f 5 ; x
03 03 03 03 03 03 CO ■ 03 i—i 03 co • 03
X ho 03^«^^(NCO^iMNOOIHflO^OiMCO C - 0 C C C 0 O 3 C 0 H 0 3 H O 3 O 3 0 3 H H ’—' 0 3
X CO
I, [H
1 o r?c§«« s
«<
+ fci R 3 !R °o ^ P o
H O ^ bPh O PP '-bO >& f£,
® B + °
X O X X t > i >
rH 03 03 1—l 1-1 rH
C5 X GO X
r—I r—( rH
rH
03
o a
iONOiflLOHCO’iN(NNiONNiOHTt ' lol > 0 3 X X X 0 0 3 X l > X X C O X O c O t - X o 3 L0 1 >
00 CO CO 03 03 03 CO 03 03 TH 0 3 03 CO ^ 03 CO CO C3 x GO
CO>—! 03 GO 03 i—( O X rHO N O O O C O N C O N C 3 C 3
i-H CO 0 5 t-H tHOj O X oO X cO O i—t030303^rHc0C003XO
6 Ofc, o
03 CO 0 0 X03X
oX 00 03
oCO
03CO
rHt - T—1 co X X 03
O o o X o o o CO o o o o 03 X o rH 03 i—i O i—i
O r t o o o o o o o o o o o o d o o d d d rH 03
* oV t l t i l i
Cho
ofHo
N I O 0 0 X 0 0 C 0 0 3 C 5 O H 0 3 C 0 0 3 C 0 i —i C 0 C 0 ' T C O O 3 X X T ^ C O
O O O O O O O O O O O O O O O O o o
l
2 O C 0 0 3 0 0 GC'G0 C0 0 3 I > O 0 3 l > C 0 X i - l C 0 Or 4 CO 00 -H ' T O LO r - 0 0 CO X X GO CO o O CO O X
O CO 03 CO 03 03*e<
oCho
0 3 CO 03 03 CO
rH X
i O X
0 3 0 3 0 3 i-H H Xh N Q ^ C O C O X X h ^ X
CO 03 CO 03 03 03 03 CO 03 03 03 03 CO " T " T CO X CO
03 03 03 I>-1 - Hfl X CO X X X Ttf 0 3 Tt< CO TjH o 03 03 X rH CO 03 X X r H l > . i - H i —( X i —i X C 0 I > » C 0 l ' r . C 0 O X C 5 X 0 5 X
O O O O O O O O t-hO O 1-1 O 03 03 03
1>- O i—( rH 00 0 3 r H O I > C 0 X O r H C 0 X ^ W C 5 0 0 X X X O 03 t-r. 1—l O O T t i ^ T - I C O C O X O X
1—1 x X tH i- H X X 1—I 1—I X X
O O 0 0 XO O X C 0 O C 3 O X X X I > O O1- H C 0 03 C O C O C O C O X X O X O O
The Journal of Physical Chemistry
Fo
r t
his
ru
n,
<t>
[-C
2F3I
] =
4
.7.
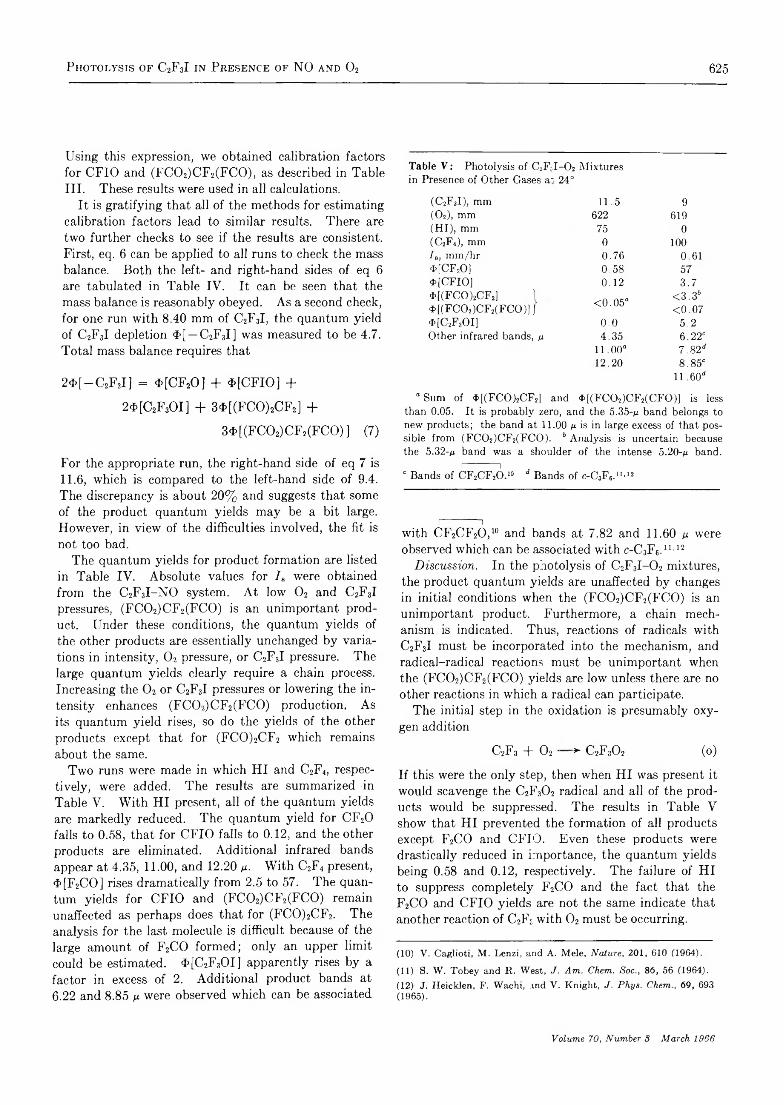
Photolysis of C2F3I in Presence of NO and 0 2 625
Using this expression, we obtained calibration factors for CFIO and (FC02)CF2(FC0), as described in TableIII. These results were used in all calculations.
It is gratifying that all of the methods for estimating calibration factors lead to similar results. There are two further checks to see if the results are consistent. First, eq. 6 can be applied to all runs to check the mass balance. Both the left- and right-hand sides of eq 6 are tabulated in Table IV. It can be seen that the mass balance is reasonably obeyed. As a second check, for one run with 8.40 mm of C2F3I, the quantum yield of C2F3I depletion $>[ — C2F3I] was measured to be 4.7. Total mass balance requires that
2<f>[ —C2F3I] = $[CF20 ] + $[CFIO] +
2$[C2F3OI] + 34>[(FCO)2CF2] +
3$[(F C 02)CF2(FC0) ] (7)
For the appropriate run, the right-hand side of eq 7 is11.6, which is compared to the left-hand side of 9.4. The discrepancy is about 20% and suggests that some of the product quantum yields may be a bit large. However, in view of the difficulties involved, the fit is not too bad.
The quantum yields for product formation are listed in Table IV. Absolute values for 7a were obtained from the C2F3I-NO system. At low 0 2 and C2F3I pressures, (FC02)CF2(FC0) is an unimportant product. Under these conditions, the quantum yields of the other products are essentially unchanged by variations in intensity, 0 2 pressure, or C2F3I pressure. The large quantum yields clearly require a chain process. Increasing the 0 2 or C2F3I pressures or lowering the intensity enhances (FC02)CF2(FC0) production. As its quantum yield rises, so do the yields of the other products except that for (FCO)2CF2 which remains about the same.
Two runs were made in which HI and C2F4, respectively, were added. The results are summarized in Table V. With HI present, all of the quantum yields are markedly reduced. The quantum yield for CF20 falls to 0.58, that for CFIO falls to 0.12, and the other products are eliminated. Additional infrared bands appear at 4.35, 11.00, and 12.20 m- With C2F4 present, 4>[F2CO] rises dramatically from 2.5 to 57. The quantum yields for CFIO and (FC02)CF2(FC0) remain unaffected as perhaps does that for (FCO)2CF2. The analysis for the last molecule is difficult because of the large amount of F2CO formed; only an upper limit could be estimated. $[C2F3OI] apparently rises by a factor in excess of 2. Additional product bands at 6.22 and 8.85 p were observed which can be associated
Table V : Photolysis of C2F ;I-02 Mixtures in Presence of Other Gases a" 24°
(C2FJ), mm 11.5 9(0 2), mm 622 619(HI), mm 75 0(C2F4), mm 0 100/ a, mm/hr 0.76 0.61$[CF20) 0.58 574>[CFIO] 0.12 3.74>[(FCO)2CF2] 1 <0.05° <3.3*4>[(FC02)CF2(FC0)] J <0.074>[C2F3OI] 0.0 5.2Other infrared bands, y 4.35 6.22°
11.00“ 7.82*12.20 8.85e
11.60*
“ Sum of $[(FCO)2CF2] and 4>[(FC02)CF2(CF0)] is less than 0.05. It is probably zero, and the 5.35-/1 band belongs to new products; the band at 11.00 m is in large excess of that possible from (FC02)CF2(FC0). b Analysis is uncertain because the 5.32-/t band was a shoulder of the intense 5.20-m band.
1 1c Bands of CF2CF20 .10 d Bands of c-C3F6.u’12
1 1with CF2CF20 ,l° and bands at 7.82 and 11.60 u were observed which can be associated with c-C3F6.n '12
Discussion. In the photolysis of C2F3I -0 2 mixtures, the product quantum yields are unaffected by changes in initial conditions when the (FC02)CF2(FC0) is an unimportant product. Furthermore, a chain mechanism is indicated. Thus, reactions of radicals with C2F3I must be incorporated into the mechanism, and radical-radical reactions must be unimportant when the (FC02)CF2(FC0) yields are low unless there are no other reactions in which a radical can participate.
The initial step in the oxidation is presumably oxygen addition
C2F3 T 0 2 ■ > C2F30 2 (o)
If this were the only step, then when HI was present it would scavenge the C2F30 2 radical and all of the products would be suppressed. The results in Table V show that HI prevented the formation of all products except F2CO and CFIO. Even these products were drastically reduced in importance, the quantum yields being 0.58 and 0.12, respectively. The failure of HI to suppress completely F2CO and the fact that the F2CO and CFIO yields are not the same indicate that another reaction of C2F;, with 0 2 must be occurring. 10 11 12
(10) V. Caglioti, M . Lenzi, and A. Mele, Nature, 201, 610 (1964).
(11) S. W . Tobey and K. West, J. Am. Chem. Soc., 86, 56 (1964).(12) J. Heicklen, F. Wachi, and V. Knight, J. Phys. Chem., 69, 693 (1965).
Volume 70, Number 8 March 1966

626 Julian H eicklen
C2F3 + 0 2 — ► F2CO + FCO (p)
Reaction p might result from “ hot” C2F3 radicals produced from the primary photolytic act. Because the FCO radical eventually becomes (FCO)2CF2 or (FC02)- CF2(FCO), k0/kp can be estimated. Under conditions in which (FC02)CF2(FC0) is negligible, we find
fco = 1 - $[(FCO)2CF2]fcp $[(FCO)2CF2] 1 j
From the results in Table IV, it can be seen that k0/kp = 1.8 ± 0.3.
The C2F30 2 radical must add to C2F3I to give a chain mechanism
C2F30 2 + C2F3I >• C2F3 T F2CO T CFIO (q)
To test this hypothesis, we performed an experiment in which C2F4 was added. The analogous reaction should also occur
C2F30 2 + C2F4 — > C2F3 + 2F2CO (r)
The results in Table V show that $[F2CO] > > $> [CFIO] as would be expected since (C2F4)/(C 2F3I) was 11. The competition between (q) and (r) leads to the expression
K = 2(C2F4)$[CFIO]fcr (C2F3I)($ [F 2CO] - 4-[CFIO]) 1
and involving the transfer of both an oxygen and an iodine atom. The mechanism predicts that
K = 2$ [CFIO]K $[C2F3OI] ■ ’
Values for the right-hand side of eq 10 are listed in Table IV. The values vary about a factor of 3 and seem to decrease as either the 0 2 or the C2F3I pressure is enhanced. The mechanism must be more complicated than presented here. Perhaps the FCO radical is involved in either CFIO or C2F3OI production.
Finally, the fate of the FCO radical must be considered. Presumably, this radical can add to either reactant
FCO + CJVI — > (FCO)C2F3I(FCO)2CF2 + I (u)
FCO + 0 2 —^ FC 03 ( v )
We assume that the addition of FCO to C2F3I ultimately leads to (FCO)2CF2 although the details are indeed obscure. Reaction v is a relatively slow radical addition to oxygen as the products of FC 03 only manifest themselves at high oxygen pressures. Presumably, FC03 undergoes the usual reactions
F C 03 + C2F3I — ^ FCO + F2CO + CFIO (w)
On the basis of the one run, kq/kr can be estimated to be about 1.5, which is certainly a reasonable value.
In the presence of C2F4, $[F2CO] increased dramatically to 57, whereas the other products were not much affected. These results indicate that C2F4 does not participate in the chain termination, whereas C2F3I does. Furthermore, there seem to be only two exothermic reactions that could produce C2F3OI
C2F30 2 + C2F3I C2F3OI + C2F30 ( s)
C2F30 + I — > C2F3OI (t)
We include both reactions in the mechanism and consider the formation of C2F3OI to terminate the chain. We envision reaction s as a four-center reaction involving the intermediate configuration
F FI IC— C— O— 0! ■ •F • F
I— C— CI IF F
C2FjI
F C 03 + C2F3I (FC03)C2F3IFCO + (FC02)CF2(FC0) + I + F2CO ( x )
2FC03 — > 2FC02 + 0 2 (y)
Reaction w is analogous to the chain propagation step q and explains the enhancement of $[F2CO] and $ [CFIO] when (FC02)CF2(FC0) is formed. Reaction x is a complicated reaction which we assume leads to FCO and (FC02)CF2(FC0) production. It is necessary that FCO be regenerated to explain the constancy of the (FCO)2CF2 yields even when large yields of (FC02)CF2(FC0) are formed. Finally, reaction y is the typical reaction of peroxygenated radicals and explains the reduction in (FC02)CF2(FC0) at higher intensities if the FC02 radical gives
FC02 + C2F3I — > (FCO)2CF2 + I (z)
As a final check on the mechanism, it predicts that, when (FC02)CF2(FC0) is small, then
$[C2F3OI] + 2$[(FCO)2CF2] = 2.0 (11)
Values for the left-hand side of (11) are tabulated in Table IV. This quantity is always similar to but
The Journal of Physical Chemistry
D ecarboxylation of Benzylmalonic Acid in Polar Solvents 627
greater than 2. Part of the excess might be attributed to (FC02)CF2(FC0), but more likely it reflects an error in the C2F3OI yields caused by a low calibration factor, as discussed earlier.
Acknowledgments. The author wishes to thank Mr. Ray Calloway for mass spectrometric analysis, Mr. Dennis Saunders for preparation of C2F4, and Mrs. Barbara Peer for assistance with the manuscript.
Further Studies on the Decarboxylation of Benzylmalonic Acid in Polar Solvents
by Louis Watts Clark
Department of Chemistry, Western Carolina College, Cullowhee, North Carolina (Received June 18, 1965)
The decarboxylation of benzylmalonic acid was studied in seven polar solvents: aniline, N-ethylaniline, N-sec-butylaniline, o-toluidine, N,N-dimethylaniline, quinoline, and 8- methylquinoline. Rate constants and activation parameters were obtained and compared with results obtained previously for the reaction alone and in four additional solvents. An interesting parallelism between benzylmalonic acid and malonanilic acid was observed.
Kinetic data on the decarboxylation of benzylmalonic acid in the molten state,1 in two of the fatty acids and two of the cresols,2 have been reported. An enthalpy- entropy of activation plot for the reaction series resulted in two parallel lines—one for the reaction in acids, the other for the reaction in the cresols—each having a slope of approximately 394°K or 121 °C. Such a slope is known as the isokinetic temperature of the reaction series3 since it corresponds to the temperature at which the rate constants of all the reactions conforming to the line are equal. (It is interesting to note that benzylmalonic acid melts at 121°.) Subsequent studies have shown4 5 that the isokinetic temperature for the decarboxylation of a large number of acids including malonic acid and many of its derivatives in all sorts of polar solvents is 422°K or 149°C. If two or more related reactions have the same isokinetic temperature, it is assumed that the different reactions all take place by the same mechanism.6 The fact that the decarboxylation of benzylmalonic acid in acids and cresols possesses a different isokinetic temperature from that of malonic acid suggested that, apparently, different mechanisms were involved in the two reactions. Subsequently, kinetic data on the decarboxylation of malonanilic acid in a large number of polar solvents
revealed that the mechanism of the malonanilic acid reactions was different from that of malonic acid.6
In order to try to obtain further insight into this aspect of the decarboxylation reaction, additional kinetic experiments were carried out in this laboratory on the decarboxylation of benzylmalonic acid in seven additional polar solvents, namely, aniline, N-ethylaniline, N-sec-butylaniline, o-toluidine, N,N-dimethyl- aniline, quinoline, and 8-methylquinoline. The results of this study are reported herein.
Experimental SectionThe benzylmalonic acid used in this research assayed
100.0% pure by titration with standard base using a Beckman Model H-2 glass electrode pH meter. The melting point of the benzylmalonic acid was 121° (cor). The solvents were reagent grade and were
(1) L. W . Clark, J. Phys. Chen., 67, 138 (1963).(2) L. W . Clark, ibid., 67, 1481 (1963).(3) S. L. Friess, E. S. Lewis, and A. Weissberger, Ed., “Technique of Organic Chemistry,” Vol. VIII, Part I, 2nd ed, Interscience Publishers, Inc., New York, N . Y ., 1961, p 207.(4) L. W . Clark, J. Phys. Chem., 68, 3048 (1964).(5) J. E. Leffler, J. Org. Chem., 20, 1202 (1955).(6) L. W . Clark, J. Phys. Chem., 68, 2150 (1964).
Volume 70, Number 8 March 1966

628 Louis Watts Clark
distilled at atmospheric pressure immediately before use. The apparatus and technique have been described previously.7 The course of the reaction was followed by measuring the volume of C 02 evolved at atmospheric pressure and at the temperature of a water- jacketed buret. The buret was calibrated by theU. S. Bureau of Standards at 20°. Water maintained at 20.0 ± 0.05° by means of a cooling coil and an electronic relay was pumped through the water jacket during the experiment. The temperature of the oil bath was controlled to within 0.005° using a completely transistorized temperature control unit equipped with a sensitive thermistor probe. A thermometer which also had been calibrated by the U. S. Bureau of Standards was used to read the temperature of the oil bath. The accuracy of the barometer used in this research was ensured by completely diassembling the barometer, replacing the barometer tube with a new clean tube of larger diameter, and refilling the tube with triply distilled mercury.
In each decarboxylation experiment a 0.3489-g sample of benzylmalonic acid was introduced in the usual manner into the reaction flask. On complete reaction, this weight of acid will produce 40.0 ml of C 02 at STP, calculated on the basis of the actual molar volume of C 02 at STP, namely, 22,267 ml. About 60 g of solvent, saturated with dry C 02 gas, was used in each experiment.
ResultsTwo decarboxylation experiments were carried out
in each solvent at each of three different temperatures over a 20° range. The decarboxylation of benzylmalonic acid gave smooth first-order kinetics in all of the solvents used in this research over the greater portion of the reaction in each case. In each experiment the log (F „ — Vt) was a linear function of time over more than 70% of the reaction. Rate constants were calculated from the slopes of the logarithmic plots, reproducibility between duplicate experiments being generally 1-3%. Average rate constants thus obtained are shown in Table I. The parameters of the absolute reaction rate equation8
k = — e ~AH*/RT eAS*/Rh
based upon the data in Table I are shown in Table II, along with corresponding data for malonanilic acid where available.
DiscussionIt will be observed in Table II that the enthalpy of
activation as well as the entropy of activation for the
Table I : Apparent First-Order Rate Constants for the Decarboxylation of Benzylmalonic Acid in Several Solvents
Temp, k X 104,Solvent ” C (cor) sec-1
Aniline 96.74 2.91106.28 5.65116.28 11.4
o-Tohiidine 96.51 2.01106.90 6.65116.23 16.8
N-Ethylaniline 95.47 2.84103.13 5.35110.13 9.31115.64 14.25
N-sec-Butylaniline 92.88 2.23103.08 4.91113.59 13.35
N,N-Dimethylaniline 96.51 1.56105.78 5.73116.28 23.3
Quinoline 90.49 3.7498.44 6.88
110.04 16.828-Methylquinoline 103.50 3.70
110.04 6.95120.00 17.1
Table II : Activation Parameters for the Decarboxylation ofBenzylmalonic Acid and Malonanilic Acid in Several Solvents
Benzylmalonic Malonanilic
AH*, AS*, AH*, AS/*,kcal/ eu / kcal/ eu/
Solvent mole mole mole mole
Aniline 19.8 -21 .64 27.6 - 1 .5N-Ethylaniline 21.9 -1 5 .8 31.9 10.0N-see-Butylaniline 26.56 -3 .6o-Toluidine 29.9 5.0N,N-Dimethylaniline 38.4 27.4Melt6 29.4 -2 .6n-Butyric acid' 23.0 -1 8 .9Decanoic acid' 26.9 -9 .0m-Cresol' 22.0 -2 5 .2 33.2 9.4p-Cresol' 27.1 -1 4 .2 34.0 11.54o-Cresol 35.5 15.5Quinoline 19.9 -19 .94 21.0 -1 7 .58-Methylquinoline 26.4 -4 .6 28.5 0.4
“ See ref 6. 6 See ref 1. ' See ref 2.
decarboxylation of both benzylmalonic acid and malonanilic acid increases as the steric hindrance and
(7) L. W . Clark, J. Phys. Chem., 60, 1150 (1956).(8) S. Glasstone, K . J. Laidler, and H. Eyring, “ The Theory of Rate Processes,” McGraw-Hill Book Co., Inc., New York, N . Y ., 1941, p 14.
The Journal of Physical Chemistry

D ecarboxylation of Benzylmalonic Acid in Polar Solvents 629
Table III: Comparison of Activation Parameters for the Decarboxylation of Several Acids in Various Amines“
Cinnamal- Tri-Malonic malonic Oxalic Oxamic Oxanilic chloroacetic /3-Resorcylic
acid6 acidc acidd acid® acid^ acid0 acid*1Solvent AH* AS* AH* AS* AH* AS* AH* AS* AH* AS* AH* AS* AH* AS*
Aniline 26.9 -4 .5 23.8 -1 3 .2 59.7 68.0 49.8 46.3 24.5 - 2 .6o-Toluidine 25.7 -7 .0 21.9 -1 7 .5 53.7 57.1 47.8 39.9 23.8 - 6 .8Quinoline 26.7 -2 .4 23.5 -1 6 .2 38.9 15.8 47.0 37.5 38.6 16.0 24.0 - 2 .4 34.5 5.958-Methylquinoline 24.4 --10.5 21.6 -2 1 .8 37.7 13.7 36.0 12.2 35.6 10.0 22.3 - 8 .4 22.9 -2 1 .8
° Units: AH*, kcal/mole; AS*, eu/mole. 6 L. W. Clark, J. Phys. Chem., 62, 79, 500 (1958). c L. W. Clark, ibid., 66, 836 (1962). d L. W. Clark, ibid., 61, 699 (1957); 62, 633 (1958). 6 L. W. Clark, ibid., 6 5 ,180, 659 (1961). ' L. W. Clark, ibid., 65,572,1460 (1961). " L. W. Clark, ibid., 63, 99 (1959). k L. W. Clark, ibid., 67, 2831 (1963).
nucleophilicity of the various solvents increase. This is exactly the reverse of the trend observed in the decarboxylation of the seven compounds listed in Table III which have been studied previously (malonic acid, cinnamalmalonic acid, oxalic acid, oxamic acid, oxanilic acid, trichloroacetic acid, and 0-resoreylic acid). If we confine our attention to corresponding solvents in the nine different reactions in question, it will be observed that a methyl group introduced in a ■position near the nitrogen function in either aniline or quinoline has qualitatively the same effect on the activation parameters in the seven decarboxylation reactions shown in Table III. However, in the decarboxylation of benzylmalonic acid and malonanilic acid (Table II), the effect is large and in the opposite direction. These results indicate that, in the seven examples shown in Table III, there is an effect due to the methyl group, possibly electronic but more probably steric. In the case of the decarboxylation of benzylmalonic acid and malonanilic acid, on the other hand, the effect of the methyl group in aniline and quinoline is qualitatively different. It need not, however, be the same effect with opposite sign as one might at first be tempted to postulate. This reversal of the effect in the decarboxylation of benzylmalonic acid and malonanilic acid may be due in part to the fact that these two compounds (but none of the other seven) have aromatic substituents and a part structure Ph—X — C = C .
A plot of enthalpy of activation vs. entropy of activation for the decarboxylation of benzylmalonic acid and malonanilic acid in the aniline series of amines, based upon the data in Table II, is shown in Figure 1. Similar plots for the decarboxylation of these two acids in the cresols, and in quinoline and 8-methylquinoline, respectively, are shown in Figures 2 and 3. The white circles represent the data for benzylmalonic acid, the black circles those for malonanilic acid.
The slope of the line in Figure 1 (the isokinetic tem-
AS*: eu/mole.Figure 1. Enthalpy df activation vs. entropy of activation plot for the decarboxylation of benzylmalonic acid and malonanilic acid in aniline and its derivatives based on data in Table II. Reactants: O, benzylmalonic acid; •, malonanilic acid.Slope of line = 378°K or 105°C.
perature of the reaction series) is 378°K or 105°C. The slope of each of the two parallel lines in Figure 2 is 393°K or 120°C. The slope of the line in Figure 3 is 423°Kor 150°C.
In the earlier studies on the decarboxylation of benzylmalonic acid in monocarboxylic acids and in cresols,2 it was suggested that there might be a correlation between the isokinetic temperature and the melting point of the reactant. This feeling was strengthened by the observation that the isokinetic temperature for the decarboxylation of oxanilic acid in a large variety of polar solvents (150°)9 was also the same as its melting point. The present results indicate, however, that benzylmalonic acid does not have one but a multiplicity of isokinetic temperatures, one of
(9) L. W . Clark, J. Phys. Chem., 66, 1543 (1962).
Volume 70, Number 3 March 1966

630 Louis Watts Clark
AS*, eu/mole.Figure 2. Enthalpy-entropy of activation plots for the decarboxylation of benzylmalonic acid in acids and cresols: line I, benzylmalonic acid in cresols; line II, malonanilic acid in cresols. Slope =393 °K or 120°C.
which, by coincidence, is very nearly identical with its melting point.
Petersen, et al.,10 have critically analyzed the problem of the validity of an observed linear enthalpy- entropy of activation relationship. They have shown that such an observed relationship is probably invalid as a result of experimental error if the range of AH* values is less than twice the maximum possible error in AH*. Applying their mathematical interpretation to the data shown graphically in Figure 1, we find that the range of AH* values is nearly 20.0 kcal/mole, whereas the maximum possible error in AH* (assuming
Figure 3. Enthalpy-entropy of activation plots for the decarboxylation of benzylmalonic acid and malonanilic acid in quinoline and in 8-methylquinoline.Slope = 423°K or 150°C.
a maximum fractional error in the rate constants to be 0.05) turns out to be 1.4 kcal/mole. On this basis the range of AH* values is more than seven times as great as twice the maximum possible error in AH*. These results inspire considerable confidence in the validity of the relationship shown in Figure 1.
Acknowledgment. Acknowledgment is made to the donors of The Petroleum Research Fund, administered by the American Chemical Society, for support of this research.
(10) R. C. Petersen, J. H. Markgraf, and S. D. Ross, Am. Chem. Soc., 83, 3819 (1961).
The Journal of Physical Chemistry

K inetic Study of the R eaction of Periodate with Iodide Ions 631
A Kinetic Study of the Reaction of Periodate with Iodide Ions
by Antonio Indelli, Francesco Ferranti, and Ferdinando Secco
Department of Chemistry, University of Ferrara, Ferrara, Italy, and Department of Chemistry, University of Camerino, Camerino, Italy (Received July 10, 1965)
The rate of the reaction of periodate with iodide in acidic media was studied. The rate equation for acid concentrations of up to 0.003 M is v = fci[I~][I04_ ] + fc2[I~ ][I04- ][H +]. At higher acid concentrations the expression also contains a term in [H+]1 2. This is confirmed by comparison with the data reported by Abel and Siebenschein. The reaction exhibits salt effects of low specificity, even in the presence of alkaline earth cations. Lanthanum and thorium ions have a retarding effect. The mechanism of reaction is discussed.
Introduction
In earlier investigations,1 the rates of oxidation of the iodide ions by various oxidizing agents were studied under various conditions, using a microtitration method in which the polarized platinum electrode was used as the indicator. The same method has now been applied to the determination of the rate of the periodate-iodide reaction. This reaction is known to take place in both acidic and neutral media,2 and this is the basis of the analytical distinction between the periodates and the iodates.3 The reaction is very fast under normal conditions, and no direct measurements appear to have been carried out in acidic media. Only Abel and Siebenschein4 have estimated the rate from experiments on periodate-iodate-iodide mixtures by measuring the quantities of periodate and iodate remaining after the iodide has been completely consumed. The results obtained by these authors indicate that the over-all process is the result of two simultaneous reactions, one of which is zero order and the other second order with respect to the hydrogen ion. The rate of the reaction in neutral media was studied by Abel and Fiirth5 using a method based, like ours, on the time of reappearance of the iodine. Their results were corroborated by Peschanscki.6
Experimental Section
The potassium periodate was a BDH Analar product. LiN03 was prepared from Li2S04 and Ba(NC>3)2 and recrystallized, while the other chemicals were the same as those used in the earlier work.1 The experimental technique was also, in general, the same. A
solution of Na2S20 3 was added to the reaction mixture in slight excess with respect to the iodine already present by means of an Agla microsyringe, and the time of reappearance of Aie iodine was read on a stopwatch. This procedure was repeated many times during each experiment. A small quantity of EDTA (7.5 X 10⁻⁶ M) was, as usual, present in all runs in order to avoid any possible catalysis by traces of heavy metal ions. Since the concentrations of the reagents, and in particular the equivalent concentration of the periodate, were much lower than in the earlier work, it was generally impossible to measure the initial rate directly, but first-order graphs had to be used. A reproducibility of about 2% was obtained in every case.Results
Orders of the Reaction. The first product of the reduction of periodate is the iodate ion, as5
I 0 4— + 21 - T- 2H + — ■> I 0 3— + I 2 + H20 (1)
At sufficiently low iodide ion and hydrogen ion concentrations, the subsequent reaction
(1) (a) A. Indelli, G. Nolan, and E. S. Amis, J. Am. Chem. Soc., 82, 3233 (1960); (b) A. Indelli, J. Phys. Chem., 65, 240 (1961); (c) A. Indelli and J. E. Prue, J. Chem. Soc., 107 (1959); (d) A. Indelli, J. Phys. Chem., 68, 3027 (1964).(2) P. Pascal, “Traité de Chimie Minérale,’ ' Vol I, Masson et C., Paris, 1931, p 760.(3) E. Müller and S. Friedberger, Chem. Ber., 35, 2655 (1920); L. Szekeres, Z. Anal. Chem., 172, 256 (1960).(4) E. Abel and R. Siebenschein, Z. Physik. Chem., 130, 631 (1927).(5) E. Abel and A. Fürth, ibid., 107, 313 (1924).(6) D . Peschanscki, J. Chim. Phys., 48, 489 (1951).
Volume 70, Number 8 March 1966

632 A. Indelli, F. Ferranti, and F. Secco
10*- + 51- + 6H+ — > 3I2 + 3H20 (2)
is so slow that it may be disregarded in practice. Moreover, the elementary iodine formed in the reaction was continuously reduced, so that if the concentration of hydrogen ions is much greater than the concentration of periodate, or if it has a secondary effect on the rate, it may be assumed that the apparent order of the reaction for the disappearence of periodate is the true order with respect to the periodate ion. Figure 1 shows graphs of log (a — x) as a function of time for a number of typical examples, where a is the quantity of thiosulfate corresponding to the initial periodate in accordance with reaction 1, and x is the quantity of thiosulfate added at the time in question. It can be seen that some of these graphs are linear for 90% of the reaction, indicating that the reaction is approximately first order with respect to the periodate. At hydrogen ion concentrations above 2.5 X 10⁻⁴ M, however, the graphs are no longer linear; instead, the points lie on a curve with downward concavity. It is nevertheless still possible to determine the initial rate from the initial slope of the curve, by multiplying this by the initial periodate concentration. Table I shows the values of the initial velocity for various concentrations of the reactants. The rate is approximately
Table I : Dependence of the Rate of Reaction, v, on the Concentrations of HCIO4, KI, and K I04 at 25° (concentrations, mole l.-1; v, mole l.“ 1 sec-1)
104[KIO4] = 0.625; 104[KI] = 2.5104[HC104] 0.5 1.0 1 .5 2.0 2 .5 3.0 3.5 5 .0 10.010V 7.59 8.00 8 .26 8.39 8. 39 8.62 8.83 9. 75 10.27
104[KIO4] = 0.625; 104[HClOd = 2.5104 [KI] 0.625 1.25 2.5 5.0 10.0108y 1.87 3.77 8.39 18.03 36.1
104[KI] = 2.5; 104[HC104] = 2.5104[KIO4] 0.1562 0.312 0.625 1.25 2.5108y 1.53 3.87 8.39 17.44 36.6
proportional to the concentration of iodide and periodate ions, and Figure 2 shows a graph of the logarithms of the rates against the logarithms of these concentrations, the other concentrations being kept constant. The slopes of the straight lines calculated by the method of least squares are 1.1 and 1.0, respectively, for the periodate and iodide ions. The concentrations vary in each case by a factor of 16. It is also obvious from Table I that the rate depends slightly on the hydrogen ion concentration. Figure 3 shows a graph of the rate as a function of the hydrogen ion concentration
Figure 1. First-order diagram for a number of typical experiments.
at values of the latter between 0.5 and 10 X 10-4 mole l.-1. In this range the rate is a linear function of the hydrogen ion concentration, the relationship being
v = Vo + fcH[H + ] (3)
Since the orders with respect to iodide and periodate are both practically equal to unity, eq 3 may also be written
v = * i[I - ] [I0 4- ] + k ,[I-][IO «-][H +] (4)The following values of fcj and fc2 are found from Figure 3
fci = 4.78 1. mole-1 sec-1 ;fc2 = 2.73 X 10³ 1.2 mole-2 sec-1
ki and fc2 should, however, be expected to depend on the ionic strength.7 In fact, fci relates to a reaction between two anions, and fc2 to a reaction between two anions and a cation. If Guntelberg’s formula8 is used to calculate the activity coefficients of the reagents and of the activated complex, it can be easily shown that
log h = log h« + 2AIl/2/ (1 + 7,/!) (5)
(7) A. A. Frost and R. G. Pearson, “Kinetics and Mechanism,” John Wiley and Sons, Inc., New York, N. Y ., 1953, p 138.(8) E. Güntelberg, Z. Physik. Chem., 123, 199 (1926); E. A. Guggenheim and T. D. Schindler, J. Phys. Chem., 38, 533 (1934).
The Journal of Physical Chemistry

K inetic Study of the R eaction of Periodate with Iodide Ions 633
log h = log k2° - 2 R /V7(1 + 71/2) (6)
where I is the ionic strength and A is the Debye-Hiickel constant, which is equal to 0.5085 for water at 25°. The ionic strength was not kept constant in the experiments reported in Figure 3, but this should not lead to serious errors, since the concentrations were very low in every case. The values of fci° and fc2° can be
calculated to a good approximation from the values of fci and fc2 reported above, using eq 5 and 6 and the mean value of the ionic strength for the experiments of Figure 3. This gives the following values for fci° and /c2°
fti° = 4.53 1. mole-1 sec-1 ;ki° = 2.89 X 10⁸ 1.2 mole-2 sec-1
Figure 2. Order of the reaction with respect to the I and the IOwions: circles, log [KIO4]; triangles, log [KI].
Figure 3. Dependence of the rate of reaction on the hydrogen ion concentration.
At higher perchloric acid concentrations, the determination of the initial rate of disappearance of periodate becomes rather difficult, since the graphs of the type shown in Figure 1 are nc longer linear after a very short distance. This is because the iodate formed in
Figure 4. Quantities of iodine liberated as a function of time. The curves are calculated on the basis of eq 7. HffiHClOd: curve A = 10; curve B = 2 0 curve C = 30; curve D = 40; curve E = 60 mole l.-1.
reaction 1 reacts further in accordance with reaction2,4 so that the thiosulfate is consumed by the iodine formed in both reactions. Since the iodide and hydrogen ion concentrations in any single experiment are practically constant, reactions 1 and 2 may be regarded as two consecutive first-order reactions,9 and the thiosulfate consumed in both can be calculated as a function of time. The following equation is obtained
[S20 32 -] = 2[IC>4- ] 4(1 - e o*4) +
3----— — (e- W - e- i W )kioz — kio,
(7)
(9) K . J. Laidler, “Chemical Kinetics,” McGraw-Hill Book Co., Inc., New York, N. Y „ 1950, p 22.
Volume 70, Number 3 March 1966

634 A. Indelli, F. Ferranti, and F. Secco
where [S2O32 -] is the total thiosulfate consumed at time t, [I04- ] is the initial concentration of periodate, fa0t is the pseudo-first-order constant of reaction 1, and fcio3 is the pseudo-first-order constant of reaction2. ki0i is given by
fcio, = fa[l~] + fa[I-][H+] (8)
where fa and fa are corrected by means of eq 5 and6. fao, can be obtained from the published data on the reaction of iodate with iodide,lb allowance being made for the fact that reaction 2 is second order with respect to both the iodide and the hydrogen ion and that the dependence of fao3 on the ionic strength is therefore given by
log k10l = log fc°I03 - 4 A /V!/(1 + Z‘/!) (9)
Table II gives the values of fa0t and fao, obtained in this way for the various conditions studied, and Figure 4 shows the points obtained in individual ex-
Table II : Pseudo-First Order Constants, foo, and h o3 Used in Eq 7 (104[KIO4] = 0.625; 104[KI] = 2.5)
lO'tHCIOd, 10%O4. 10*fclO3,M sec -1 sec-1
1 0 18.93 0.6512 0 25.55 2.47530 31.89 5.3540 38.0 9 2060 49.8 19 57
periments in comparison with the curves calculated from eq 7. The agreement is satisfactory up to a hydrogen ion concentration of 30 X IO-4 mole l.-1, particularly in view of the various approximations
Table I I I : Dependence of the Rate of Reaction on the Temperature (lOhKICh] = 0.625; 104[KI] = 2.5; 104[HC10i] = 2.5 mole l.-1)
10*1?,t, mole l“1 mole 1-1°c sec-1 sec-1
15 4.52 4.6720 6.49 6.3425 8.39 8.5130 11.60 11.3335 14.77 14.7940 19.75 19.5145 24.4 25.350 32.2 32.555 41.1 41.460 52.7 52.5
introduced. At higher acid concentrations, there is a systematic deviation which seems to point to another reaction path of the second order with respect to [H+],
Activation Parameters. Table III shows the rates at ten different temperatures between 15 and 60° and at the reactant concentrations indicated. The interpolated values, vint, obtained with the aid of the equation
Vint — 2.78 X 10-^39/r mole l.-1 sec-1 (10)
are also given, and the agreement gives an indication of the accuracy of the results. At these reactant concentrations and at 25° the second term on the right- hand side of eq 4 is only 11% of v. If we assume that the second term is much smaller than the first at all temperatures, the rate can be expressed approximately as
v = fc[I"][I04- ] (11)
It is then possible to calculate the activation energy E, the frequency factor A, and the enthalpy and entropy of activation AH* and AS*. The values obtained are: E = 10.2 kcal, A = 1.8 X 10s 1. mole-1 sec-1, AH* = 9.6 kcal, AS* = —23 eu. Values of A and AS* of this magnitude have long been found for numerous reactions between two univalent ions of the same sign.
Salt Effects. Table IV shows the values of the rate in the presence of various salts at different concentrations, the reactant concentrations being equal to those indicated in Table III. In most cases the salt effects are positive, as expected; negative salt effects are, however, observed in the presence of thorium nitrate.
DiscussionThe present results may be compared with those
obtained by Abel and Furth with regard to the reaction path which does not depend on the hydrogen ion concentration. Abel and Fiirth’s value6 of 5.63 for k° is to be compared with the value of 3.37 obtained by Peschanscki6 and with the value of 4.53 reported in the present paper. The agreement may be regarded as satisfactory in view of the difference in the experimental methods. The agreement between the activation energy reported in the present paper and that found by Peschanscki (12.0 kcal) is less satisfactory. A comparison can also be made with the data of Abel and Siebenschein. An elaborate calculation, taking into account all the salt effects, and the partial dissociation of the HSO4- , used by Abel and Siebenschein, shows that the curve calculated from our data agrees with the experimental points of these authors at low acid concentrations. At the high acid concentrations
The Journal of Physical Chemistry

K inetic Study of the R eaction of Periodate with Iodide Ions 635
Table IV : Rates of Reaction, v (mole l.-1 sec“ 1)) in the Presence of Various Salts of Different Concentrations(Temperature, 25‘ 2.5; 104[HC104] =
104[KIO4]= 2.5 mole l.-
= 0.625; ')
104[KI] =
[LiN03] 0.01 0.02 0.05 0.110% 9.39 9.69 11.37 12.78
[NaN03] 0.01 0.02 0.05 0.110% 9.36 10.01 11.26 12.69
[KN03] 0.01 0.02 0.05 0.1IO8« 9.56 10.36 11.89 13.0
[N a£04] 0.005 0.01 0.025 0.05108r 9.29 9.98 11.64 12.95
[K2S04] 0.005 0.01 0.025 0.0510%' 9.61 10.34 11.81 13.0
[Mg(N03)2] 0.005 0.01 0.025 0.0510% 11.87 12.31 13.80 16.03
[Ca(N03)2] 0.005 0.01 0.025 0.0510%: 11.83 12.25 13.67 15.64
[Sr(N03)2] 0.005 0.01 0.025 0.0510% 12.12 13.19 15.12 17.25
[Ba(N03)2] 0.005 0.01 0.025 0.0510% 12.03 12.95 14.78 16.86
[N(C2H5)4C104] 0.01 0.02 0.05 0.110% 10.12 10.69 12.12 12.84
[La(N03)3] 0.00333 0.00667 0.01667 0.033310% 12.94 12.39 10.39 9.33
[Th(N03)4] 0.0000125 0.000025 0.0000510% 6.59 4.62 1.87
there is a systematic deviation which indicates the intervention of a reaction path which is second order with respect to the hydrogen ion, so that the rate of the periodate-iodide reaction may be expressed by the equation
V [I 0 4- ] [ I - ] = ki + fc2[H + ] + fc3[H+]2 (12)
This is also confirmed by the results reported in Figure4. The term fc3[H + ]2, however, is relatively unimportant except at hydrogen ion concentrations higher than 0.02 M.
The mechanism of the reaction between periodate and iodide is therefore quite different from the mechanism of the reactions
X 0 3- + 5 X - + 6H + — > 3X2 + 3H20 (13)
where X is a halogen atom; these reactions are all characterized by an order of at least 2 with respect to the hydrogen ion.la’b’10 It is well known that the existence of a preequilibrium yielding X 0 2+ ions has been postulated for these reactions.100'11 It does not
appear that an ion of this type (e.g., I0 3+) should be postulated in the case of periodic acid. The latter behaves rather like chlorous acid,ld which also exhibits an essentially first-order dependence on the hydrogen ion concentration, although there are reaction paths independent of the concentration of H+ and possibly proportional to [H+]2.
In contrast to many other reactions between anions,10'11 the salt effects in this reaction at low acid concentrations exhibit a very low specificity. Moreover, the effect of tetraethylammonium perchlorate is not very different from those of the alkali metal nitrates, which in turn differ very little among themselves. Table IV clearly shows the Olson-Simonson effect12 in the presence of alkali metal sulfates. The alkaline earth salts have a slightly more vigorous effect than the alkali metal salts, and exhibit appreciable deviations from the Br0nsted-Debye law, although these deviations are smaller than those observed in other cases.13 Thorium nitrate has a characteristic inhibiting action, similar to that already observed in the reaction of iodate with iodide. Lanthanum nitrate has a fairly vigorous accelerating action at relatively low concentrations, but the rate diminishes as the concentration is increased. The formation of an invisible precipitate of thorium periodate, and possibly of lanthanum periodate, can be one cause of this inhibition. Another cause is probably the formation of ion pairs in which the periodate is less reactive than the free periodate ion.
In reactions between ions of the same sign, the ion pairs are usually much more reactive than the free ions. This is the case in electron transfer reactions between cations in which an anion bridge facilitates the process by the mechanism proposed by Libby,14 15 in electron transfer reactions between anions,lc’d’llb'd and in nucleophilic substitutions between anions. lla'°'18 The greater reactivity of the ion pairs in the last two cases is associated both with the weaker electrostatic repulsion between the reactants and with the inter
(10) (a) S. Dushman, J. Phys. Chem., 8, 453 (1904); (b) E. Abel and F. Stadler, Z. Physik. Chem., 122, 49 (1926); (c) K . J. Morgan, M . G. Peard, and C. F. Cullis, J. Chem. Soc., 1865 (1951); (d) E. Abel, Helv. Chim. Acta, 33, 785 (1950); (e) O. E. Myers and J. W . Kennedy, J. Am. Chem. Soc., 72, 897 (1950).(11) (a) A. Indelli, G. Nolan, and E. S. Amis, ibid., 82, 3237 (1960); (b) A. Indelli and G. C. Guaraldi, J. Chem. Soc., 36 (1964); (c) A. Indelli, Gazz. Chim. Ital., 92, 365 (1962); (d) J. C. Sheppard and A. C. Wahl, J. Am. Chem. Soc., 79, 1020 (1957).(12) A. R. Olson and T. R. Simonson, J. Chem. Phys., 17, 348, 1167 (1949).(13) (a) V. K . La Mer and R W . Fessenden, J. Am. Chem. Soc., 54, 2351 (1932); (b) J. I. Hoppé and J. E. Prue, J. Chem. Soc., 1775 (1957).(14) W . F. Libby, / . Phys. Chem., 56, 863 (1952).(15) A . Indelli and E. S. Amis, J. Am. Chem. Soc., 82, 332 (1960).
Volume 70, Number 3 March 1966

636 A. Indelli, F. Ferranti, and F. Secco
vention of nonelectrostatic effects, such as the polarization of one of the reactants or of the activated complex,15 or the change in the hydration sheath.16 The relatively weak accelerating action of alkaline earth cations and the inhibiting action of lanthanum nitrate indicate that, in this case, there is no increase in the rate of the reaction as a result of short-range forces. The acceleration is entirely due to long-range electrostatic forces, and can be expected in the case of polyvalent ions.17 The fact that the effect of the tetra- ethylammonium ion is no weaker than that of the alkali metal ions confirms this conclusion.18'19 In fact, when the cations exhibit a specific effect due to nonelectrostatic causes, the tetraethylammonium ions have a much weaker accelerating action.20
On the basis of the salt effects, we believe that the reaction of periodate with iodide is not an electron transfer reaction, but rather a transfer of an oxygen atom, or of two OH groups, from the periodate to the iodide, to form the IO~ ion. This reacts with another iodide ion to form iodine. The transfer of this oxygen atom involves a complete rearrangement of the octa
hedral structure of the periodate ion, which is transformed into the pyramidal iodate ion,21 with loss of water. This rearrangement is presumably hindered by the presence of cations, particularly those bearing large charges.
Acknowledgment. This study was supported in part by the Consiglio Nazionale delle Ricerche (Rome).
(16) B. Perlmutter-Hayman and G. Stein, J. Chem. Phys., 40, 348 (1964).(17) G. Seatchard, National Bureau of Standards Circular 534,U. S. Government Printing Office, Washington, D. C., 1953, p 185.(18) The fact that tetraethylammonium perchlorate has a slightly stronger accelerating action than the alkali metals may be connected with the changes in the structure of the water produced by the -CHa groups.19 This may explain why the results obtained by Abel and Fürth in the presence of acetate ions are higher than ours.(19) H. S. Frank and M . G. Evans, J. Chem. Phys., 13, 507 (1945) ; G. Némethy and H. A. Scheraga, ibid., 36, 3401 (1962); A. Ben- Naim, J. Phys. Chem., 69, 1922 (1965).(20) A. Indelli, ibid., 65, 972 (1961).(21) A. F. Wells, “ Structural Inorganic Chemistry,” Clarendon Press, London, 1950, pp 266, 268; N. Keen and M . C. R. Symons, Proc. Chem. Soc., 383 (1960); W . E. Dasent and T . C. Waddington, / . Chem. Soc., 2429 (1960).
The Journal of Physical Chemistry

Light Emission from A queous Solutions of T20 637
Light Emission from Aqueous Solutions of T2Ox
by Gideon Czapski and D. Katakis
Nuclear Research Center “ D em ocritosAghia Paraskevi Attikis, Athens, Greece {Received July 14> 1965)
Light emission was measured from aqueous solutions of T20 (1 curie/ml). It was shown that the emission is unquenchable by a large variety of solutes, up to high concentrations. Using solvents other than water had no effect on the spectral distribution of light emission. The light is emitted with GQiv) < 10-6. The results seem to indicate that the emitting species do not participate in chemical reactions with solutes. They may be their precursors. The light may originate from bremsstrahlung or from hot He+.
It has been proposed2-10 that in the radiolysis of water, in addition to the molecular (H2 and H20 2) and the radical products (H, OH, eaQ), excited water molecules are formed, having a lifetime long enough to participate in chemical reactions, or at least to act as the precursors of the radicals or the molecular products.
There are several investigators who suggested that the H atoms formed are rather excited H20* (described sometimes1 2 3 4 5 6 7 8 9 10 as H„), and Dainton and co-workers suggested that the increase in G( — H20 ) at pH below 2 and above 12 is due to the reaction of H20* with H+ or OH- , respectively, while at 2 < pH < 12, H20* is deactivated.
in view of these developments, it is of great interest to determine if there is any fluorescence of the H20*. Several attempts in the past11-12 failed to find any light emission in irradiated water, other than Cherenkov radiation.
A recent paper by Sitharamarao and Duncan,13 using more sensitive monitoring techniques, showed an emission of light in H20 irradiated with 7 rays, in addition to the Cherenkov radiation, which was attributed to excited H20 and OH*.
We decided to look for the emission of light in tri- tiated water as it has the advantage that no Cherenkov radiation exists, nor is the fluorescence of the vessel as important since the low-energy /3 rays do not penetrate deeply into the vessel walls. (On the other hand, one expects no difference in the excitation using 18- kev /8 or 7 rays.)
Experimental SectionMost of the measurements were done with a Philips
56AYP photomultiplier. Some of the measurements in mixed solvents were done with a low dark current EMI 9514S photomultiplier. Photomultiplier and sample were placed in a light-tight box. The signals were amplified, counted on a single-channel analyzer, and corrected for background noise. The count rate is proportional to the number of photons falling on the photocathode per unit time. The proportionality factor, which depends on the geometry, the quantum efficiency of the photomultiplier, etc., was found by calibration with P32 as described by Brown and Miller.12 The number of Cherenkov photons in the wavelength range studied per particle from P 32 is known.14
Tritiated water (1 curie/ml) was purified by distilla
(1) Research performed under the auspices of the Greek Atomic Energy Commission.(2) fa) F. S. Dainton and D. B. Peterson, Proc. Roy. Soc. (London), A267, 443 (1962); (b) F. S. Dainton and W . S. Watt, ibid., A275, 447 (1963).(3) J. T. Allan and G. Scholes, Nature, 187, 218 (1960).(4) E. Hayon, ibid., 194, 737 (1962).(5) E. Hayon, Trans. Faraday Soc., 60, 498 (1964).(6) E. Hayon, Nature, 196, 533 (1962).(7) H. Mahlman, J. Chem. Phys., 32, 601 (1960).(8) M . Anbar and D. Meyerstein, Report of Israel Atomic Energy Commission IA902, 1963.(9) M . Anbar, S. Guttman, and G. Stein, J. Chem. Phys., 34, 703 (1961).(10) M . Anbar and D. Meyerstein, Report of Israel Atomic Energy Commission, IA901, 1963.(11) M . A. Greenfield, A. Norman, A. H. Drowdy, and P. M. Dratz, J. Opt. Soc. Am., 43, 42 (1953).(12) L. O. Brown and N. Miller, Trans. Faraday Soc., 51, 1623 (1955).(13) D. N. Sitharamarao and J. F. Duncan, J. Phys. Chem., 67, 2126 (1963).(14) E. H. Belcher, Proc. Roy. Soc. (London), A216, 1221 (1953).
Volume 70, Number 3 March 1966

638 G ideon Czapski and D. K atakis
tion from acid K2Cr20 7. Sodium salicylate was purified by recrystallization. The other materials were of analytical grade and used without further purification.
ResultsA. Origin of the Light Emitted. In order to elimi
nate the possibility that the emitted light originated from fluorescence of the vessel walls (although the /3- ray range in water is only ~2 .3 X 10-4 cm), the following experiments were carried out.
(1) The amount of light emitted was measured as a function of the amount of T20 in the vessel. This was done by raising the height of T20 in the vessel from 0.1 to 6 mm (vessel cross section 4 cm2). Under these conditions, it is assumed that the geometry is not changed as the distance from the liquid to the photomultiplier was about 100 mm, compared to the change of 5 mm. The results show the light to be proportional to the amount of T20 (Figure 1).
(2) Using the same vessel and keeping the volume constant, the T20 was diluted. The light emitted was found to be linear with the T20 concentration (Figure 2).
(3) The same amount of light was detected when the vessel was covered with a 0.1-mm glass cover (microscope slide covers) while different Corning color filters decreased the light reaching the photomultiplier. These results indicate (taking into account the range of tritium /3 rays and the geometry of the vessel) that at least 95% of the emitted light comes from the solution and not from the surface of the liquid nor the gas phase above it. The G value for light emission was found to be '~10-5.
B. Influence of Quenchers and Spectral Distribution. In order to determine the nature of the light emitted from the bulk of the solution, we looked for quenchers and for the spectral distribution.
The light emission was the same in air-saturated or H2-saturated T20. The addition of 10-7 to 1.0 M F -, C l- , Br- , I - or 0.3 N HC104, 0.5 M CH3OH, 10-3 M C6H6, 0.1 M H20 2, 10-7 to 10-1 M acetone, 10-3 M K3Fe(CN)6, or 10-7 to 10-4 M sodium salicylate had no influence on the intensity of light emitted.
The addition of more than 0,1 t f acetone increased the emission; at 5 M acetone there was a tenfold increase. Adding 10-4 M K3Fe(CN)6 to a solution 5 M in acetone partially quenched this increased emission.
Similar behavior occurred in sodium salicylate solutions at concentration above 10-4 M; at 10-2 M the emission was increased by more than tenfold.
In other experiments, different solvents containing T20 were used, and the light emission was measured.
Figure 1. Dependence of light emission on the height of the solution in the vessel: X, no cover; O, with 0.1-mm glass cover.
Figure 2. Dependence of light emission on T20 concentration at constant height of solution in the vessel.
The results are given in Table I. It is noted that, in these mixed solvents, Cherenkov radiation from P 32 was, under the conditions of our experiments, essentially the same as in pure water.
Table I
Solvent0
Emitted light intensity, arbitrary units
h 2o 1000CHaOH 1490C2H6OH 12651-Propanol 13702-Propanol 1450Glycol 1350Glycerol 1400H2S04 (coned) 1120
° All solutions were made with 0.5 ml of T 2O-H 2O (1 curie/ ml) + 3 ml of the solvent.
The Journal of Physical Chemistry

Light Emission from A queous Solutions of T20 639
Our attempt to determine the spectrum using a Hilger monochromator failed because of the low intensity of the light. We obtained some information on the spectra from T 20 in H O , C H 3OH, and H2SO4 (concentrated), putting a series of more than 40 different Corning colored glass filters between the solution and the detector. The results with these three solutions showed no difference in spectral distribution. Only the intensities differed, as shown in Table I. The light signal going through each filter from the three solvents was in the same proportion as their signal without the use of any filter.
The difference of the numbers in Table I is not corrected for the different sensitivity of the detector at different wavelength, but the same spectral distribution found using the filters seems to indicate that Table I gives relative intensities of the emitted light.
We tried to construct the emission spectra using the known quantum efficiency of the photomultiplier at different wavelength and the absorption spectra of the filters. This treatment, however, is not very accurate, and all that can be said is that there was no indication for any clear difference in the light emission through the range 3000-5500 A. Thus, we could not find any peaks in this range using the above method.
D iscu ssion
The results show that a variety of solutes up to high concentration do not affect the emission. The increase at higher concentrations of acetone (0.1 M ) and sodium salicylate (10 -4 M ) seems to be due either to direct excitation of the solute molecules by the /3 rays or the slow electrons or to a fast energy transfer from excited solvent molecules to the solute. Thus, this system may serve as a scintillation counter for /3 rays.
The following possibilities are considered for the origin of the light: (1) surface of solution, (2) vesselwalls, (3) gas phase, (4) chemiluminescence, (5) excited states of H20 , OH, or H, (6) excited states of impurities, (7) bremsstrahlung or hot H e+. Our experiments ruled out the first three possibilities leaving us with the certainty that the light originates from the bulk of the solution.
As Sitharamarao and Duncar.13 found that the intensity increases with irradiation time reaching saturation after 2 hr, it could have been attributed to chemiluminescence of reactions of H, eaq, or OH radicals with the H20 2, H2, and 0 2, whose concentration may reach a steady state within approximately- 1 hr under these conditions.
The fact that addition of H or H20 2, presence or absence of 0 2, addition of B r~ (OH scavenger), acetone
(eaq scavenger), and C H 3OH (H and OH scavenger) have not influenced the emission excludes the possibility of chemiluminescence. I f the light originated in excited molecules or radicals, the questions are left as to what species they are and what kind of excitation we are dealing with.
As the water was triple distilled under self-irradiation with H2, 0 2, and H20 2, it is improbable that impurities will be left to account for the observed emission. In addition, the lack of an effect of adding other solutes makes impurities unlikely.
The possibility that the emission is due to triplets of H20 or quartets of OH which have a rather long lifetime is very improbable as none of our solutes quenched it.
The spin-allowed radiative transitions are expected to have lifetimes shorter than 10 _8 sec. Thus, even efficient scavengers would not quench them at concentrations below 10-2 M .
I f the H20 itself is an efficient quencher of the H O *, then the lifetime of H20 * would be much shorter owing to this quenching reaction. This will also very much reduce the yield of the fluorescence since most of the H O * will be quenched before light emission would occur. This assumption is not in accordance with the lack of almost any effect when the water is diluted with other solvents (Table I ) .
The possibility of an excited OH is not very probable because one can assume this species to react as fast as the OH radical in the ground state, and 1 ¥ L and B r~ should quench it. As to an excited singlet of H O , we do not know its chemical behavior. The ineffectiveness of quenchers cannot rule it out. From the high quantum yield of photolysis of H20 at 1850 A ,15 16'16 we know that the lifetime of this species is short, and we can expect the quantum yield of fluorescence to be low. Sitharamarao and Duncan13 reported that, after 2-hr irradiation of water, the absorbance in 1-cm cells at 3000 A reaches the saturation value of 0.4, which they attributed to the OH. This would require the steady state of OH to be at least 4 X 10 -5 M (assuming e 104), which is many orders of magnitude too high for the dose rates used. We believe that the long saturation time for the emission as well as the high absorption found may be due to wall effects of the vessel under irradiation. I t cannot be due to excited states of species in the solution.
These authors find a G value of light emission of the order of 0.1. In our experiment, the G value is at
(15) J. Barret and J. H. Baxendale, T ra n s. F a ra d a y S oc ., 56, 37 (1960).(16) U. Sokolov, Ph.D. Thesis, Jerusalem, 1965.
Volume 70, Number 3 March 1966

640 Wayne E. Bell and M. T agami
least four orders of magnitude less than that found by Sitharamarao and Duncan .13 (Our value, 10 -5, corresponds to much less than one photon per /3 disintegration!!) For 210Po a particles, Duguesne and K aplan17 found a G(hv) of the order of 10 -4.
I t would be surprising if 1 M I - or B r - , which may not only be expected to quench the light emitted but may also considerably change the water structure and hydrogen bonding, have no influence on the quantum yield of the fluorescence. The fact that 15 % solutions of water in H2S 0 4 and CH 3OH give emission that differs in intensity but not in spectral distribution from the one obtained from water makes excited H20 improbable.
We believe that there is no proof for an excited state that emits light. The experiments do not rule out excited states to occur under irradiation, but the results indicate strongly that the species decaying by radiative processes are characterized by such short
lifetimes that make their participation in chemical reaction with the solutes highly improbable. Their importance may be in the formation of the known radicals but not in reacting directly with solutes.
To summarize, it seems to us that the light emission is not obtained from any species participating in chemical reactions. The possibility that excited molecules of the solvent, which are precursors of the radicals but which have very short lifetimes, emit the light is not very probable either, as the spectral distribution of the light does not change in the various solvents. Thus, it seems quite possible that the light may originate from bremsstrahlung or from hot H e+ formed in the decay of the tritium. These light sources do not necessarily give a spectral dependence on the solvent.
Acknowledgment. The authors are grateful to M r.S. Kourakos for technical assistance.
(17) M. Duguesne and I. Kaplan, J . P h y s . R a d iu m , 21, 708 (1960).
Study of Gaseous Oxides, Chloride, and Oxychloride of Iridium1
by Wayne E. Bell and M. Tagami
G en era l A to m ic D iv is io n o f G en era l D y n a m ic s C o r p o r a tio n , J o h n J a y H o p k in s L a b o ra to ry f o r P u r e a n d A p p l i e d S c ie n c e , S a n D ie g o , C a li fo r n ia ( R ece iv ed J u ly 2 0 , 1 9 6 5 )
The vaporization behavior of iridium in oxygen, chlorine, and mixtures of the two gases was investigated using the transpiration method in the temperature range 1000 to 1500°. The important vapor species found were I r 0 3, IrC l3, and I r 0 2Cl. The data yield the following enthalpies and entropies of formation: 4.2 ± 1.0 kcal/mole and —10.5 ± 2.0 eu for I r 0 3(g) at 1600°K , 24.1 ± 2.0 kcal/mole and 1.3 ± 2.0 eu for IrC l3(g) at 150 0 °K , and — 1.9 ± 2.0 kcal/mole and — 7.7 ± 2.0 eu for I r 0 2Cl(g) at 1500°K .
IntroductionAs part of a continuing investigation of metals in
reactive gases at high temperature, a study by the transpiration method of the vaporization behavior of iridium in chlorine was undertaken. E arly in the study it became evident that oxygen contamination of the chlorine gas caused a pronounced increase in the
volatility of the metal. This result suggested the existence of a stable gaseous iridium oxychloride species. The study accordingly was widened in scope to include measurements of the volatility of iridium in oxygen and in chlorine-oxygen mixtures.
(1) This research was supported in part by the U. S. Atomic Energy Commission under Contract AT(04-3)-164.
The Journal of Physical Chemistry

Gaseous Oxides, Chloride, and Oxychloride of Iridium 641
The vaporization of iridium in oxygen at high temperature has been studied previously,2-4 but there appear to be no published data on the behavior of iridium in chlorine at high temperature and no published information on oxychlorides of iridium.
Experimental SectionThe general characteristics cf the transpiration
apparatus have been described previously.6 A mullite reaction tube mounted in a platinum-rhodium-wound tube furnace was used. A combination diffusion barrier and heat shield was placed upstream from the sample region, and a mullite capillary and condensing tube were located downstream. Needle valves (stainless steel or Monel) and bubblers containing sulfuric acid were used to adjust rates of flow of the carrier gas in and out of the reaction mbe. Measurements were made at total pressures in the range 0 .1 to 1.5 atm, and the pressures were maintained by balancing inflow and outflow of the carrier gas.
In the work on the oxides and oxychlorides of iridium, the reaction tube arrangement consisted of iridium metal sponge in a 9-mm i.d. mullite tube. In the work on the chlorides of iridium, a modified arrangement consisting of rolled iridium foil in a 5-mm i.d. tube was used in order to overcome kinetic difficulties.
Oxygen, chlorine, and mixtures of oxygen and chlorine were used as carrier gases. Effluent oxygen gas was collected over mercury in a known volume at reduced pressure. Effluent chlorine gas was collected in K I solution and determined by titration with thiosulfate solution. In experiments conducted at chlorine pressures below 1 atm, the chlorine gas was collected in a liquid nitrogen trap and later transferred into K I solution. Effluent oxygen-chlorine mixtures were collected in a known volume over K I solution. The dissociation of diatomic chlorine to monatomic chlorine was taken into account.
A calculation, using Merten’s treatment of diffusion effects in the transpiration method,6 showed that diffusion effects could be neglected for carrier gas flow rates above about 0.01 mmole of gas/min. In the calculation, the interdiffusion coefficient for the M X 3(g)-X 2 system was taken to be 1.0 at 1 atm and 1500 °K . Capillary dimensions were 0.10-cm diameter by 2.0-cm length.
A radiotracer method of analysis was employed. The iridium metal used was irradiated in a T R IG A reactor to produce 74-day I r 192. To determine the quantity of iridium condensed, the mullite condensing region was crushed, placed in a plastic vial, and counted in a well-type counter. To minimize geometry problems, each sample was counted and shaken at
least five times. For standards, samples of radioactive metal were weighed out, mixed with crushed mullite, and counted in the same manner as the unknowns. Activities of the unknowns ranged from about 200 to 50,000 counts/min. Specific activity of the metal samples ranged from 1000 to 24,000 counts/ min mg- 1 . Optimum counting conditions were obtained by window-counting the main 7-energy peak of I r 192 (0.32 Mev). The background was about 35 counts/min. Statistical counting errors were less than 2% standard deviation.
The materials used were iridium metal sponge (Johnson-Matthey, 99.995% purity), oxygen gas (Matheson, research grade), and chlorine gas (Matheson, 99.5% minimum purity). Mixtures of oxygen and chlorine were made up in stainless steel cylinders for use in the oxychloride studies. The gases flowed through a sulfuric acid bubbler and P 2 O 5 powder before entering the reaction tube.
The furnace configuration was described previously.6 Temperatures were measured with three P t—P t-10 % R h thermocouples located near the sample regions and contained in a mullite tube mounted alongside the reaction tube. The thermocouples were calibrated against standard P t—P t- 10 % R h thermocouples, certified by the National Bureau of Standards. With this procedure, temperature errors are believed to range from less than ± 2 ° at 900° to less than ± 4 ° at 1500°.
Results and DiscussionVolatility of Iridium in Oxygen. Each of the four
previous investigators2-4 reported that in the iridium- oxygen system at high temperature the major vapor species is I r 0 3; however, partial pressure data obtained by the previous investigators are not in complete accord.
The present investigation is a cursory study of the vaporization of iridium in oxygen in the range 1200 to 1500°. The transport of iridium was measured as a function of carrier gas flow rate, oxygen pressure, and temperature. The results are given in Table I. In calculating partial pressures from the experimental data, one gaseous molecule per iridium atom condensed 2 3 4 5 6
(2) (a) C. B. Alcock and G. W. Hooper, P r o c . R o y . S oc . (London), A2S4, 551 (1960); (b) H. Schäfer and H. J. Heitland, Z . A n o rg . A llg em . C h em ., 304, 249 (1960).(3) E. H. P. Cordfunke and G. Meyer, R ec . T rav . C h im ., 81, 495 (1962).(4) J. H. Norman, H. G. Staley, and W. E. Bell, J . C h em . P h y s . , 42, 1123 (1965).(5) W. E. Bell, U. Merten, and M. Tagami, J . P h y s . C h em ., 65, 510 (1961).(6) U. Merten, ib id ., 63, 443 (1959).
Volume 70, Number S March 1966

642 W ayne E. Bell and M. T agami
was assumed. Ir(s) was the condensed phase under the conditions of study. (A previous study7 has shown that the solid oxide (Ir0 2) dissociates to the metal at 110 5 ° in oxygen at 1 atm.)
Table I : Results of Transpiration Studies ofVaporization of Iridium in Oxygen
Oxygen IrOs Flow rate,Temp, press, press, mmole of
°C atm 103 atm 02/min
1204 0.993 1.08 0.0171303 0.986 1.31 0.0241304 0.987 1.31 0.0431303 0.986 1 .2 1 0.0961403 0.991 1.43 0.0421404 0.493 0.47 0.01881404 0.248 0.208 0.01121505 0.991 1.51 0.047
Examination of the results in Table I shows that the high flow rate experiment at 1303° yielded a relatively low partial pressure value, and the experiment at 1204° yielded a lower vapor pressure than one would expect based on the results at higher temperatures. This suggests that the carrier gas was not saturated under these conditions. On the other hand, consistency of the data at 1300, 1400, and 1500° obtained under normal flow conditions suggests that the carrier gas was saturated.
Previous investigators2-3 using the transpiration method have demonstrated the existence of I r 0 3(g). Norman, et ah ,4 using a mass spectrometric technique, confirmed the species I r 0 3(g), identified the species I r 0 2- (g), and obtained evidence for IrO(g). Using thermodynamic data given by Norman, et a l , for the formation of I r 0 2(g), one calculates the partial pressure of this species to be 3 X 10 -6 atm at 1400° and 1 atm of oxygen pressure, which indicates the species to be relatively unimportant under our experimental conditions.
Our results at 1400° in Table I show that within experimental error the oxide partial pressure is proportional to P o23/2, indicating the species I r 0 3(g), which is in agreement with the previous studies. Thus, under our conditions of study, the predominant vapor species is I r 0 3, and the important vaporization reaction is
Ir(s) + s/20 2 = I r 0 3(g) (1)
Equilibrium constants derived from the equilibrium vaporization data in Table I are plotted against 1 / T in Figure 1, and a straight line is drawn through the data. Lines derived from log K p vs. 1 / T relationships reported by other investigators are included in Figure 1.
Figure 1. Comparison of equilibrium constants for Ir(s) +V2O2 = Ir03(g) as a function of temperature as found by four investigators.
Comparison of the curves in Figure 1 shows that our data agree with the data of Cordfunke and M eyer .3 The data of Alcock and Hooper28- and Schafer and Heitland2b are somewhat lower. In the opinion of Cordfunke and Meyer, the differences could be caused by insufficient saturation of the carrier gas in the earlier studies. They point out that a high surface area is necessary for complete saturation of the carrier gas. Our limited flow rate data indicate that this could be the case.
From the slope of the line through our data in Figure 1, one obtains A ff° 160o = 4.19 ± 1.0 kcal/mole and from this A<S°i6oo = —10.5 ± 2.0 eu for reaction 1, where 16 00°K is the mean temperature of the measurements. The uncertainties were estimated.
On the basis of the average of heat capacity data for M X 3-type gaseous molecules given by K elley ,8 Cp for I r 0 3(g) is estimated to be 19.64 + 0.42 X 10 _3T — 1.32 X 10⁶T ~2 cal/mole °K . Combining this value with the heat capacity data for Ir(s) and 0 2(g) given by Kelley, one arrives at A ('p — 3.34 — 2.50 X 10 ~ 3T — 0.72 X 10⁶T ~2 cal/mole ° K for reaction 1.
B y use of the heat capacity equation, values of and A<S°298 for reaction 1 were calculated
from the above thermodynamic values and from values obtained by the other investigators using the transpiration method; the resulting values are given in Table I I . The agreement is good. The value of —12.6 eu for AaS°29s is in accord with typical entropy values given by
(7) W. E. Bell, R. E. Inyard, and M. Tagami, to be published.(8) K. K. Kelley, Bureau of Mines Bulletin 584, U. S. Government Printing Office, Washington, D. C., 1960.
The Journal of Physical Chemistry

Gaseous Oxides, Chloride, and Oxychloride op Iridium 643
Searcy9 for the formation of gaseous oxide molecules. The thermodynamic values found in the transpiration studies can be compared with A H ° lsm = 5.5 ± 1.5 kcal/mole and A<S°imo = —13 .1 ± 2.5 eu for reaction 1 as obtained by Norman, et a l.,i using a mass spectrométrie technique.
Table II : Comparison of Thermodynamic Values for the Reaction Ir(s) + V2O2 = Ir03(g), Derived from Data of Pour Investigators
In ve s tig a to rA/7°298,
kcal/moleA«S°298,
eu
Aleock ar.d Hooper 3.08 -1 2 .8Schafer and Heitland 3.02 -1 2 .7Cordfunke and Meyer 3.59 -1 2 .2Present investigators 3.13 -1 2 .5Av 3.20 -1 2 .6
Volatility o f Iridium in Chlorine. The volatility of iridium in chlorine was investigated in the temperature range of 1000 to 1500° and in the chlorine pressure range 0.1 to 1.0 atm. Under these conditions, Ir(s) is the condensed phase. (Iridium reacts with chlorine to form solid IrC l3, but the solid chloride dissociates at 768° under 1 atm of chlorine pressure, as found by Bell, et al.10)
The initial vapor pressure values obtained in the investigation of volatile chlorides were relatively inconsistent and flow-rate dependent. This behavior was attributed to a kinetic difficulty, which was apparently overcome by modifying the reaction tube arrangement in a manner to increase the surface area of iridium metal exposed to the carrier gas (see Experimental Section). Use of the modified arrangement resulted in data that were consistent and relatively insensitive to flow rates. (Flow rates ranged from about 0.02 to 0.2 mmole of Cl2/min, depending on temperature and pressure conditions. Experiments at 1400° and 1 atm of chlorine pressure yielded the apparent vapor pressures 0.81 X 10 -3, 0.74 X 10 ~ 3, and 0.55 X 10 -3 atm at the respective flow rates 0.28, 0.52, and 1.55 mmoles of Cl2/min, which shows that the apparent vapor pressures were not highly sensitive to flow rate.)
To determine if oxygen contamination in the chlorine carrier gas was a problem, several experiments were performed using an oxygen getter in the chlorine feed- iine. The oxygen getter used was Ir(s) (or IrC l3(s), depending on the chlorine pressure) held at about 700° in a separate furnace. Use of the getter, which limited the partial pressure of oxygen to about 10-3 atm
Figure 2. Effect of chlorine pressure on chloride vapor pressure at 1395 and 1500°.
on the basis of calculations using thermodynamic data for the formation of I r 0 2(s) and IrC l3(s),7’10 caused no change in the vapor pressure data.
To determine the identity of the vapor species, partial pressures of the chloride were measured as a function of chlorine pressure at 1395 and 1500°. The results are plotted in Figure 2. The data appear to fit the curves drawn with a slope of 1 .5 ; thus, the chloride partial pressure is proportional to P c \ ‘h, and the gaseous species is indicated to be Ir^Cb. Attempts were made to determine the number of iridium atoms in the gaseous molecule by measuring the effect of chlorine pressure on chloride partial pressure at temperatures around 700° where IrC l3(s) is the condensed phase. The results were erratic and inconclusive, undoubtedly because of kinetic difficulties. On the basis of experience with other gaseous platinum metal chlorides, one would predict that x = 1. Accordingly, the predominant reaction under our conditions of study is believed to be
(9) A. W. Searcy in “Survey of Progress in Chemistry,” A. F. Scott Ed., Academic Press Inc., New York, N. Y., 1963, p 52.(10) W. E. Bell, R. E. Inyard, and M. Tagami, to be published.
Volume 70, Number 3 March 1966

644 Wayne E. Bell and M. T agami
Ir(s) + S/ 2C12 = IrCl,(g) (2)
Pressures of IrC l3 were measured at 1 atm of chlorine pressure over the temperature range 1000 to 150 0 °; the resulting values are plotted in Figure 3. The values at 1395 and 1500° were taken from the pressure- dependence curves in Figure 2. The remainder of the values represent the results of individual measurements. Slight corrections were necessary to bring the latter values to 1 atm of chlorine pressure.
The straight line drawn through the data in Figure 3 corresponds to AH °m o = 24.1 ± 2.0 kcal/mole and A(S0i6oo = 1.3 ± 2.0 eu for reaction 2, where 150 0 °K is the mean temperature.
On the basis of heat capacity values for M X 3(g)-type species given by Kelley ,8 C p for IrC l3(g) is estimated to be 19.64 + 0.42 X H) - 3! 1 - 1.32 X 10⁶T - 2 cal/ mole °K . Combining this value with (7P values for Ir(s) and Cl2 given by Kelley, one obtains Cp = 0.81 — 1.24 X 10 ~ 3T — 0.30 X 10⁵T ~2 cal/mole ° K for reaction 2 .
Using this heat capacity equation and the thermodynamic values given above, one obtains A H °^ s =24.5 ± 3.0 kcal/mole and AiS°298 = 1.6 ± 3.0 eu for reaction 2. The uncertainties were estimated.
The AS ° values found for reaction 2 appear reasonable when compared to the following reported entropies of formation: 0.5 eu for CrCl3(g) at 29 8°K ,U 1.0 eu for R uC l3(g) at 14 0 0 °K ,12 0.2 eu for R hC l3(g) at 12 4 3 °K ,13 and 0.5 eu for FeC l3(g) at 29 8°K .14 However, A S values for the formation of most other M C l3(g) species are considerably more negative (around — 10 eu), as one can deduce from entropy data given by Kelley and K ing14 and by Searcy .9
Volatility of Iridium, in M ixtures of Oxygen and Chlorine. As the first step in the investigation of the volatility of iridium in oxygen-chlorine mixtures, experiments were performed to check for the existence of a condensed oxychloride of iridium. In each experiment an iridium metal sample was placed in a quartz reaction tube, and a gaseous mixture containing 52% 0 2 and 48% Cl2 was passed over the sample for a period of about 20 hr. The reaction tube was then withdrawn and quenched. Experiments were performed at 1100, 900, and 700°. A t the end of each experiment, the sample was examined visually and by X -ray analysis. A t 110 0 ° the sample was still Ir(s); at 900° the sample was converted partially to I r 0 2(s); at 700° the sample was converted almost completely to I r 0 2(s). X -R ay diffraction patterns indicated that small amounts of IrC l3(s) and Ir(s) were present in the sample at 700° and showed that I r 0 2(s) formed at 700° was not well crystallized, in contrast to the oxide formed at 900°.
Figure 3. Temperature dependence of IrCI3 pressure at 1 atm of chlorine pressure.
M aterial condensed from the vapor in these experiments was found to be I r 0 2(s). The fact that I r 0 2(s) formed at 700 and 900° and not at 110 0 ° is consistent with thermodynamic data for the formation of I r 0 2(s)(AH °i3oo = —54.0 kcal/mole and AiS ° i30c = —39.2 eu) as determined by Bell, et all These observations indicate that a condensed oxychloride is not stable under the conditions of the study.
It is interesting that the iridium metal sample at 700° oxidized to a much greater extent than the sample at 900°. An explanation of this behavior is that the metal at 700° first reacted with chlorine to form IrC l3(s) and then the resulting chloride reacted with oxygen to form Ir 0 2(s). This explanation seems reasonable since (1) in chlorine at 0.5 atm IrC l3(s) is stable at 700° but not at 900°; (2) IrC l3(s) is readily made by treating iridium metal powder with chlorine gas at 600° for about 12 hr, whereas the metal powder converts only partially to I r 0 2(s) even after days at 1000° in oxygen; and (3), as indicated above, X -ray analyses indicated the presence of IrC l3(s) in the sample at 700°.
The volatility of iridium in mixtures of oxygen and
(11) H. A. Doerner, Bureau of Mines Technical Paper 577, U. S. Government Printing Office, Washington, D. C., 1937.(12) W. E. Bell, M. C. Garrison, and U. Merten, J . P h y s . C h em ., 65, 517 (1961).(13) W. E. Bell, M. Tagami, and U. Merten, ib id ., 66, 490 (1962).(14) K. K. Kelley and E. G. King, Bureau of Mines Bulletin 592, U. S. Government Printing Office, Washington, D. C., 1961.
The Journal of Physical Chemistry

Gaseous Oxides, Chloride, and Oxychloride of Iridium 645
chlorine was measured in the temperature range 900 to 1500°. The results are given in Table I I I . Included in the table are (1) partial pressures of oxygen and chlorine derived from chemical analyses of the effluent gas mixtures, (2) observed total vapor pressures assuming one vapor molecule per iridium atom condensed, (3) partial pressures of I r 0 3(g) and IrC l3(g) calculated using thermodynamic values given above, assuming equilibrium conditions and the absence of other oxide and chloride gaseous species, and (4) partial pressures of the iridium oxychloride species derived by subtracting partial pressures of I r 0 3 and IrC l3 from the observed total vapor pressure values. The oxychloride gaseous species is clearly the predominant species under the conditions of the experiments. The oxychloride partial pressures are estimated to be uncertain by ± 5 to ± 10 % considering that they were obtained by the difference between the observed total pressures, which are probably uncertain to ± 5 % , and the individual pressures of I r 0 3(g) and IrC l3(g), which are also somewhat uncertain. Uncertainties in the partial pressures of oxygen and chlorine are estimated to be ± 0.01 to ± 0.02 atm.
Table HI: Vaporization of Iridium in Mixtures of Oxygen and Chlorine
Obsdto ta l vapor In d iv id u a l press,
Temp,°C
P 02. atm
* CI2» atm
press, 103 atm IrOa
-103 atm- IrCIa lT xO y C lZ
904 0.82 0.181 0.62 0.02 0.005 0.601003 0.47 0.52 7.47 0.12 0.051 7.301005 0.77 0.23 4.70 0.16 0.015 4.521003 0.91 0.087 2.88 0.17 0.004 2.711002 0.93 0.066 2.31 0.17 0.002 2.141104 0.83 0.158 15.5 0.82 0.017 14.71203 0.85 0.130 13.4 0.92 0.024 12.51203 0.82 0.156 13.2 0.88 0.032 12.31303 0.29 0.64 9.12 0.20 0.46 8.461302 0.44 0.85 17.1 0.38 0.71 16.01303 0.80 0.152 12.0 0.98 0.054 11 .01303 0.81 0.139 12.6 0.98 0.047 11 .61403 0.063 0.82 3.05 0.025 1.03 2.001404 0.30 0.57 9.59 0.25 0.60 8.741403 0.39 0.83 16.3 0.38 1.05 14.91403 0.41 0.82 16.1 0.39 1.03 14.71404 0.80 0.131 11 .6 1.05 0.066 10.51503 0.27 0.52 9.10 0.25 0.76 8.091504 0.75 0.123 9.11 1.08 0.088 7.94
“ Assuming one vapor species per iridium atom condensed.
Calculations using thermodynamic values for the formation of I r 0 2(s) and IrClj(s) (A i7°i30o = —54.0 kcal/mole and A/S°i3oo = —39.2 eu, A H ° 950 = —62.5
kcal/mole and A S0 wo = —60.0 eu, respectively) as determined by Bell, et al.,7’10 indicate that I r 0 2(s) was the condensed phase in the experiments conducted at 900 and 1000°, and Ir(s) was the condensed phase in the experiments conducted at higher temperatures. This is consistent with the break that occurs in a plot of the oxychloride partial pressure data vs. temperature between 1000 and 1100°.
An interesting aspect of the oxychloride vaporization studies is that kinetic difficulties were not encountered. The two experiments at 1203° were performed at different flow rates (0.054 and 0 .117 mmole of gas/min) with no apparent effect on partial pressures. This observation and the fact that the partial pressure data were consistent over the entire temperature range indicate saturation of the carrier gas. This behavior is in contrast to that found for the binary iridium- oxygen and iridium-chlorine systems described in previous sections and suggests, as did results of the condensed-phase studies, that a catalytic effect occurs when the combination of oxygen and chlorine are available for reaction with iridium.
Since Ir(s) and I r 0 2(s) are the condensed phases under the conditions of the study, the vaporization reactions can be written
*Ir(s) + ^0 2 + 2U = Ir.O ,Cl,(g)
and
z lr 0 2(s) + y~ = ^ 2X0 , + - U = I r A C b (g )
A single oxychloride vapor species is assumed. From the equilibrium constants for these reactions, the equations
log P irio„cL = | log P 0, + ^ log P ci, + log K z (3)
and
log P inOvCb = ~ 2 2X log P o , + ^ log Pci, + log Ah
(4)
are derived.The partial pressure data at 1000, 1300, and 1400°
given in Table I I I were used in evaluating x, y , and z. In each of the experiments at 1000°, I r 0 2(s) was the condensed phase; therefore, eq 4 is applicable to the data. Iridium metal was the condensed phase at 1300 and 1400°, and in these cases eq 3 is applicable. Each set of data was fitted to the appropriate equation by use of the method of least squares. The resulting
Volume 70, Number 3 March 1966

646 Wayne E. Bell and M. Tagami
solutions are y — 2x = 0.18, z = 1.21, and log = —1.94 using data from the four experiments at 1000°; y = 2 .12 , z = 1 .12 , and log K% = —1.38 using data from the four experiments at 1300 °; and y = 2.16, z = 1.26, and log K 3 = —1.34 using data from the five experiments at 1400°.
The integral values of x, y , and z which best fit the solutions are 1, 2, and 1, respectively: Thus, the predominant oxychloride vapor species is indicated to be I 1O 2CI, and the important vaporization reactions under our conditions of study are
Ir(s) + 0 2 + V 2CI2 = I r 0 2Cl(g) (5)
and
Ir 0 2(s) + V 2CI2 = I r 0 2Cl(g) (6)
To determine thermodynamic quantities for reaction 5, equilibrium constants calculated from the data in Table I I I are plotted against l / T in Figure 4. The equilibrium constants measured at 1000 and 900° were corrected by the heat and entropy of formation of I r 0 2(s)7 as given above, in order to obtain equilibrium constants that would have been observed if Ir(s) had been the condensed phase at these temperatures. This made it possible to fit all of the data to a single curve describing reaction 5.
The curve drawn through the data in Figure 4 corresponds to A if ° l5oo = —1.9 kcal/mole and A,S'0]6oo = — 7.7 eu for reaction 5, where 150 0 °K is the mean temperature of the measurements. On the basis of the spread in the data, uncertainties in the thermodynamic values are estimated to be ± 2.0 kcal/mole and ± 2 .0 eu. The A S value appears reasonable in comparison with the value of about — 12 eu found for
Figure 4. Equilibrium constants for Ir(s) + 0 2 + V2CI2 = IrOtCl(g) as a function of reciprocal temperature.
the formation of I r 0 3(g) and with typical values cited by Searcy9 for gaseous oxide molecules.
On the basis of heat capacity values for the elements and for gaseous metal oxides and halides given by Kelley ,8 ACP for reaction 5 is estimated to be near zero. Therefore, the thermodynamic values for reaction 5 are applicable at 298 °K with a little greater uncertainty.
From heats of formation for I r 0 3(g) and IrC l3(g) given in previous sections, one calculates the bond energies of 108.8 kcal/mole for I r - 0 and 72.0 kcal/ mole for Ir-C l at 1500°K . Using these values, one can estimate a heat of formation for I r 0 2Cl(g) of 10 kcal/ mole. The measured heat of formation of I r 0 2Cl(g) (—2.8 kcal/mole) is more exothermic than this value.
Acknowledgments. The authors are indebted to Dr.J . H. Norman and Dr. A. Searcy for helpful discussions and to R . E . Inyard for performing part of the experimental work.
The Journal of Physical Chemistry

Electrical D ouble Layer with Cation Specific Adsorption 647
The Electrical Double Layer with Cation Specific Adsorption.
Thallium(I) Fluoride
by Paul Delahay1 and Gilles G. Susbielles
C oa tes C h em ica l L a b o ra to ry , L o u is ia n a S tate U n iv er s i ty , B a to n R o u g e , L o u is ia n a 7 0 8 0 3 (.R eceived J u ly 23 , 1 9 6 5 )
Interfacial tension and differential capacity of the double layer were measured at 25° for mercury in T 1F solution at eight concentrations from 0.025 to 0.3 M and from 0.25 to — 0 .25 v vs. see (no T1 deposition). The following quantities were computed and interpreted: charge on the electrode, relative surface excesses of T l+ and F~ , amount ofspecifically adsorbed T1+, potential in the outer plane, and potential across the compact double layer. Esin and M arkov plots were prepared. The standard free energy of adsorption varies linearly with the charge on the electrode. Isotherm assignment and the effect of discreteness of charge are discussed.
Introduclion
The structure of the electrical double layer with anion specific adsorption has been studied in detail.2 A similar study has not been made for inorganic cations although at least one of them, namely, T1(I), exhibits strong specific adsorption, as was shown by Frumkin and co-workers3 4“ 5 and was confirmed by studies of the faradaic rectification6 and the electrode impedance7 for the discharge of T1(I) on thallium amalgam. A detailed study of the double layer with specific adsorption of T1(I) is reported here for potentials at which thallium is not deposited to any practical extent (1.5 X 10 ~6 M T 1 in Hg in the worst case; much less T1 in most cases). Tetraalkylammonium ions, whose double layer has been studied by several authors,8 are not suitable for a study of this type because of their marked “ organic” character toward adsorption. Ionic association also complicates interpretation as was pointed out by Gierst and coworkers.9
Fluoride was selected as anion for two reasons, (a) Complexation is negligible10 (pK = —0.10 for T1F), and consequently only T 1+ and F - must be considered. (b) Anion specific adsorption is the least pronounced (although not necessarily negligible) for fluoride among all anions. The more complex case of simultaneous specific adsorption of cation and anion was also studied by the authors11 but will not be dealt
with here as interpretation is significantly different and possibly more questionable than in this work.
Interpretation largely rests on the studies of Grahame and Parsons. The results of this work may be of interest in relation to recent investigations on discreteness effects in the double layer (particularly Barlow and Macdonald and also Levine and co-workers).
Experimental SectionPreparation o f TIF. The steps were
T 12S 0 4 — ! TlOH T 12C 0 3 TIF
(1) Department of Chemistry, New York University, Washington Square, New York, N. Y. 10003.(2) For a review, see, e .g ., P. Delahay, “Double Layer and Electrode Kinetics/’ John Wiley and Sons, Inc., New York, N. Y., 1965, pp 53-121.(3) A. N. Frumkin and A. S. Titievskaja, Z h . F iz . K h im ., 31, 485 (1957).(4) A. N. Frumkin and N. Polyanskaya, ib id ., 32, 157 (1958).(5) See ref 2, pp 57, 58.(6) G. C. Barker, “Transactions of the Symposium on Electrode Processes,” E. Yeager, Ed., John Wiley and Sons, Inc., New York, N. Y., 1961, pp 325-365.(7) M. Sluyters-Rehbach, B. Timmer, and J. H. Sluyters, R ec . T rav. C h im ., 82, 553 (1963).(8) See ref 2, p 229.(9) L. Gierst, J. Tondeur, R. Cornelissen, and F. Lamy, paper presented at the Moscow C.I.T.C.E. meeting, 1963.(10) J. Bjerrum, G. Schwarzenbach, and L. G. Sillén, “Stability Constants,” Part II, The Chemical Society, London, 1958, p 92.(11) G. G. Susbielles, P. Delahay, and E. Solon, unpublished work.
Volume 70, Number 3 March 1966

648 Paul D elahay and Gilles G. Susbielles
The absence of B a 2+ in T 12C 0 3 was verified. The T 1F solution was evaporated to dryness in a platinum dish and was molten at 300°. Iodate titration gave better than 99.5% T1(I).
Solutions were prepared with bidistilled water and were treated with purified activated charcoal (Barker technique) to remove traces of adsorbable organic impurities. T1(I) concentrations were ascertained by iodate titration after the charcoal treatment.
M easurements. The following cell was used
H g|TlF(c)|TlF (0.1 M )|N aF (0.42 M )|NaCl (4.2 M)\
saturated K C 1 calomel electrode
The nonthermodynamic liquid junction potentials in this cell do not matter since they remain constant. They were estimated to be about 0.010 v from the 0 .1 M T 1F compartment ( + ) to the saturated calomel electrode (—). The 4.2 M N aCl compartment was useless, as was soon realized, but of no consequence. I t was kept in all measurements since some data had been obtained with it in the initial phase of the work.
It suffices in the thermodynamic determination of relative surface excesses of T1(I) to keep the potential (£_) of the Hg electrode constant with respect to some hypothetical reference electrode that is reversible to fluoride. The voltage to be applied to the cell can be computed after correction for the T lF(c)- T 1F (0.1 M ) junction potential. This procedure was first applied by Grahame and Soderberg,12 who give the details. The approximate value of the T1(I) transference number in T 1F solution, t+ = 0.57, was computed from the ionic mobilities of T 1+ and F ~ at infinite dilution.13
Differential capacities of the double layer were measured at 400 cps with a dropping-mercury electrode and a bridge of fairly conventional design. Balance was achieved at 9 sec during drop life. The technique is classical.
Interfacial tensions were measured with a Gouy electrometer using a cathetometer (Griffin and George) reading to ± 0 .00 1 cm. A capillary with its inner wall coated twice with Desicote had to be used, presumably because uncoated capillaries were attacked by fluoride. Mercury “ stuck” to the wall of uncoated capillaries. Two coated capillaries were used and were calibrated with 0 .1 M potassium chloride14 15 before and after measurements. Difference between the two calibrations was less than 1% . The contact angle of the solution with glass was undoubtedly different from zero with a hydrophobic Desicote-coated capillary, but measurements appear reliable, probably because the contact angle did not vary appreciably in the limited range of
interfacial tensions that was covered. This view is supported by the good agreement between results obtained from electrocapillary and capacity measurements.
Results and Thermodynamic AnalysisElectrocapillary Curves, Differential Capacity, and
Charge on the Electrode. Electrocapillary curves (7 vs. E ) were determined twice for the following T 1F concentrations: 0.025, 0.055, 0.082, 0 .1 1 , 0.136, 0.164, 0.2, and 0.3 M . Readings were taken approximately every 0.02 v in the range —0.05 to —0.2 v vs. see. Differential capacities (C) were measured for the same concentrations every 0.025 v in the range + 0 .2 5 to —0.25 v vs. see. Some results are shown in Figures 1 and 2, and complete data are available.16 More positive potentials were not covered because T1(I) specific adsorption is weak and, furthermore, fluoride specific adsorption is enhanced.
Basically, 7 measurements are more tedious than capacity measurements. This is why a more limited range of potentials was covered than in the capacity measurements. Furthermore, capacity measurements with a continuously renewed electrode surface (drop- ping-mercury electrode) are less affected by traces of adsorbable impurities than interfacial tension measurements. The C vs. E curves must be integrated twice to obtain the 7 vs. E curves. Grahame’s procedure12'16 for computing the two integration constants could not be applied here because thallium deposition at the point of zero charge modifies the double-layer properties. 3'4 The following procedure was applied.
The charge q on the electrode was determined at a given point of the electrocapillary curve by graphic differentiation. This value of q and the corresponding interfacial tension gave the two constants needed for double integration of the C vs. E curve. The resulting curve was compared with the experimental electrocapillary curve. Some difference generally prevailed because of the error in graphic differentiation (and all other errors!). A value of q giving a better fit was
(12) D. C. Grahame and B. A. Soderberg, J . Cherm. P h y s . , 22, 449 (1954).(13) R. A. Robinson and R. H. Stokes, “Electrolyte Solutions,” 2nd ed, Butterworth and Co. Ltd., London, 1959, p 463.(14) Data from M. A. V. Devanathan and P. Peries, T ra n s. F a ra d a y S oc ., 50, 1236 (1954).(15) Deposited as Document 8637 with the ADI Auxiliary Publications Project, Photoduplication Service, Library of Congress, Washington, D. C. 20540. A copy may be secured by writing the Document number and remitting $1.25 for photoprints or $1.25 for 35-mm microfilm. Advance payment is required. Make checks or money orders payable to: Chief, Photoduplication Service,Library of Congress.(16) See ref 2, pp 30, 31.
The Journal of Physical Chemistry

Electrical D ouble Layer with Cation Specific Adsorption 649
E(Vvs.SCE)
Figure 1. Electrocapillary curves for T1F at 25° for different concentrations (M ). See Experimental Section for scale of potentials. Complete data for these and other concentrations are available.16
Figure 2. Differential capacity against potential for T1F at 25° for different concentrations. Same remarks as for Figure 1.
then selected, and an “ improved” electrocapillary curve was obtained by double integration. A fitting to better than 0 .1% could be achieved, and y and q were computed from 0.25 to —0.25 v vs. see. Some results are plotted in Figure 3, and complete data are available.16 We shall generally use q instead of E in subsequent plots, but conversion is immediate from Figure 3 and from complete data that can be made available .15
E( Vvs.SCE)
Figure 3. Charge on the electrode against potential at different concentrations. Same remarks as for Figure 1.
Relative Surface Excesses. The relative surface excess17 F+ of T1+ was computed by graphic differentiation of the plot of y against the chemical potential of T 1F at constant potential (EJ) against a reference electrode that is reversible to fluoride. Differentiation was repeated once to minimize errors, and the average value of T+ was used. The mean activity coefficient needed in the preparation of this plot and some subsequent diagrams were not available. They were estimated by analogy from the following series: acetates of T1(I), Na, and K and perchlorates of T1(I) and Na. D ata were taken from Robinson and Stokes13 and Harned and Owen.18 The following mean activity coefficients were used: 0.84 (0.025 M ), 0.78 (0.055 M ) , 0.76 (0.082 M ) , 0.73 (0 .11 M ) , 0.71 (0.136 M ), 0.70 (0.164 M ), 0.68 (0.2 M ) , and 0.64 (0.3 M ) . Minor uncertainty on the activity coefficient is not critical here.
Results are plotted in Figure 4 from which one notes that F + is positive at positive q values. Such a behavior is characteristic of cation specific adsorption. If there were no specific adsorption, one would expect from the Gouy-Chapman theory, as was shown by Grahame12’19'20 for K F , that a negative limiting value of F T + ~ —2 /¿coulombs cm -2 be obtained. The limiting value, if any, would correspond to more positive q values than in Figure 4 and could not be approached because of large errors at low T+ values. Such a limiting value of T + would not be reached if fluoride were to undergo sufficient specific adsorption, (iC f. the case of anions studied by Grahame.1219'20)
Relative surface excesses T_ of fluoride were computed from F F + and q and are plotted against q in Figure 5.
(17) See ref 2, pp 20, 24-27.(18) H. S. Harned and B. B. Owen, “The Physical Chemistry of Electrolytic Solutions,” Reinhold Publishing Corp., New York, N. Y„ 1958.(19) D. C. Grahame, C h em . R ev., 41, 441 (1947).(20) See ref 2, p 47.
Volume 70, Number 3 March 1966

650 Paul D elahay and G illes G. Susbielles
Figure 4. Plot of F r+ against q at different concentrations. Vertical scale holds for upper curve (0.3 M). All other curves are equally spaced downward by 0.5 unit for 0.2 M, by 1 unit for 0.164 M, etc.
Figure 5. Plot of — F r- against q at different concentrations.
Note that IN increases quite slowly as q becomes more positive because the increase of q is somewhat offset by decreasing specific adsorption of T1+. In the absence of cation specific adsorption, IN for fluoride for positive q values increases much more rapidly with q than in Figure 5 .12’21 Moreover, specific adsorption of T l+ causes IN to be larger than in the absence of specific adsorption, other conditions being the same.
E sin and M arkov Plot. Such plots22 were prepared for q = 6, 7, 8 , 9, 10, 1 1 , and 12 ¿icoulombs cm-2 and were linear. They were typical of specific adsorption much in the same way as the plots for halide ions studied by Parsons.23 This type of plot is readily correlated to the variations of P + with q at constant concentration of T 1F since one has23
(dF_/<V)s = - ( d T j d q ) , (1)
where m is the chemical potential of T1F. Since the plots of T + against q at constant p in Figure 4 are linear, the Esin and M arkov plots must also be linear. The slopes varied somewhat [from 0.7 (high q) to 0.8 (low q )} and were the same practically as for Figure 4 (0.7 to 0.9).
Nonthermodynamic AnalysisAm ount of Specifically Adsorbed T I+ and Potential in
the Outer Plane. The amount of specifically adsorbed T 1+ will be referred to as q <4 to indicate that it corresponds to the charge in the inner plane of closest approach, namely the plane “ 1.” The outer plane will be designated by the superscript or subscript “ 2 .” The charge q+ is calculated by subtracting from F r + the charge q + 2~ s of T1+ ions in the diffuse double layer. This can simply be done, as was shown by Grahame12-19-21 22 23 24 25 for the opposite case of anion specific adsorption, by applying the Gouy-Chapm an theory and by assuming that only one ionic species is specifically adsorbed. A more involved analysis, in which this assumption is not made, has been worked out by the authors11 but will not be applied here because specific adsorption of fluoride is too weak to allow treatment of data. The assumption that fluoride is not specifically adsorbed will be made with the fu ll realization o f its approximate nature. This assumption is supported to a certain extent by the good agreement Grahame26 obtained between calculated and experimental differential capacities of the double layer for N aF in the ranges of concentrations and charges similar to these data in this study. The agreement is not a full proof of the absence of fluoride specific adsorption,26-27 but it certainly shows that specific adsorption of fluoride cannot be very strong for the conditions prevailing here. Since fluoride is not supposed to be specifically adsorbed, F T - = g_2-s, where the latter quantity represents the negative charge in the diffuse double layer. From the Gouy-Chapm an theory one has
q - ~ * = -A[exp(/<fo/2) - 1] (2)
with
/ = F /R T
A = (R T ec /2if) 1/j
(3)
(4)
(21) See ref 2, p 26.(22) See ref 2, pp 53-59.(23) R. Parsons, Proc. Intern. Congr. Surface Activity, 2nd, London, 1957, 3 , 38 (1957).(24) See ref 2, pp 60-63.(25) D. C. Grahame, J. Am. Chem. Soc., 7 6 , 4819 (1954).(26) See ref 2, p 41.(27) K. M. Joshi and R. Parsons, Electrochim. Acta, 4 , 129 (1961).
The Journal o f Physical Chemistry

Electrical D ouble Layer with Cation Specific Adsorption 651
Figure 6. Potential in the outer plane of closest approach against potential at different concentrations.
Notations: fa, potential in the outer plane; c, concentration of T 1F ; €, dielectric constant, which is taken as that of water; and F , R , and T are as usual. The error arising from the use of e of water without consideration of saturation and the presence of the electrolyte is quite negligible as was indicated by Grahame28 and was more fully proved by Macdonald.29 Values of fa computed from eq 2 and the data of Figure 5 are plotted in Figure 6. Note that (a) fa decreases less rapidly as E becomes more negative than for N aF and (b) that fa for T 1F is larger than for N aF. Values of fa for N aF necessary for this comparison are tabulated by Russell30 on the basis of Grahame’s experimental results. (Russell erroneously refers potentials to see instead of nee.) These two observations are explained by specific adsorption of T l+ and by the increase of T+ as E becomes more negative. The charge g+2-s of T1+ in the diffuse double layer can now be computed from
q+2-8 = A [ e x p ( - f f a /2 ) - 1] (5)
and the charge q+ of specifically adsorbed T l+ ion is such that
F T + = gN + g+2-s (6)
The plots of q + l against q at constant c (Figure 7) are essentially linear. Such fairly linear plots were reported for iodide by Grahame31 and are to be expected for not too low values of q + l, as pointed out by Parsons.32 The maximum value of q + l for T 1+ (12.3
Figure 7. Charge of specifically adsorbed T l+ ions against the charge on the electrode at constant concentration of T1F.Same shift of curves as in Figure 4.
/¿coulombs cm-2) is definitely lower than the maximum value of q J for iodide (« 4 0 /¿coulombs cm -2) obtained by Grahame21 for a comparable concentration of K I (0.25 M ) . Higher values of q + l for T 1+ would prevail at more negative values of q, but discharge of T1+ then interferes.
Potential across the Compact Double Layer. Since fa is known from the previous calculation, one can compute the rational31 potential <j>M — fa across the compact double layer (E 2 = —0.446 v vs. see for our cell). The corresponding plots are linear (Figure 8) except in their lower range, and they are parallel for all practical purposes. Similar linear and nearly parallel plots were obtained by Grahame for I~ and by Grahame and Parsons33 for Cl~. A departure from linearity similar to that in Figure 8 was also noted forc i-.
We can divide31’33 fai — fa according to
<t>M ~ fa = 9+i(4>M — fa) + «(4>M — fa) (7)
where the two contributions correspond to the fractions of 0m — fa due to g+x and g, respectively. Introducing integral capacities33 (noted by the superscript “ i” ), we write
0m — fa — (q+’/C*) + (q/Cb) (8)
(28) D. C. Grahame, J . C h em . P h y s . , 18, 903 (1950).(29) J. R. Macdonald, ib id ., 22, 1857 (1954).(30) C. D. Russell, J . E lec tro a n a l. C h em ., 6, 486 (1963).(31) D. C. Grahame, J . A m . C h em . S oc ., 80, 4201 (1958).(32) R. Parsons, T ra n s. F a ra d a y S o c ., 51, 1518 (1955).(33) D. C. Grahame and R. Parsons, J . A m . C h em . S oc ., 83, 1291 (1961).
Volume 70, Number S March 1966

652 Paul D elahay and Gilles G. Susbielles
Figure 8. Variations of the rational potential across the compact double layer, at constant electrode charge (in Aicoulombs cm-2) with the amount of specifically adsorbed Tl+.
where CY corresponds to the charge q+ 1 and CV to the charge q. These capacities are directly obtained from Figure 8 and are CY ~ 32 to 34 /if cm-2 and CV ~ 16 to 17 /if cm-2 over the range of q values. The capacity CV can be compared with the integral capacity for the compact double layer in the absence of specific adsorption as was done by Grahame31 (using differential capacities) and Grahame and Parsons.33 They obtained comparable values for I - and C l- although values of CV for C l“ were somewhat lower for q > 8 /icoulombs cm“ 2 than in the absence of specific adsorption (K F). Grahame31 termed this agreement “ unexpected” and interpreted it as indicating that the dielectric constant in the compact double layer is not strongly affected by the field of specifically adsorbed ions. This point could be argued, but, at any rate, the near identity of CV with the integral capacity of the compact double layer does not hold for the data of Figure 8. (The integral capacity for K F for the q values in Figure 8 is approximately 3 1 /if cm“ 2.) Note that CY for T l+ (32 to 34 juf cm “ 2) is also much lower than the value34 of approximately 7 5 /if cm-2 f o r i - .
Unless specific adsorption of fluoride throws off the data completely, which is not very likely, it appears that the division of 0m — 02 into two contributions according to eq 7 is not justified. I t must be recalled that this equation is written on the basis of a simple equation of electrostatics correlating potential and charge. The model seems to break down. We are
examining this problem further in relation to our work11 on mixed adsorption of cations and anions (TINO3).
One can compute the ratio (x 2 — x f ) /x 2 from Cal and C b‘, Xi and x 2 being the distance from the electrode to the inner and outer planes, respectively. Thus, (x2 — X i) /x 2 = Cb'/CY is comprised between 0.5 and 0.6. This ratio hardly varies over the whole range of q (5 to 13 /icoulombs cm“ 2) but possibly increases very slightly as q becomes more positive. This ratio, as calculated by the same method, is approximately 0.4 for 1 “ (Grahame31) and 0.2 for C l“ (Grahame and Parsons33). Thus, specifically adsorbed T 1+ ions approach the electrode more closely than 1 “ ions and definitely more closely than C l“ ions. The T1+ ion is indeed known to be small (perhaps35 2 A). However, any conclusion derived from (x2 — x f ) /x 2 is tentative since the above calculation of this quantity is open to question.
Variations of the Standard Free Energy of Adsorption with the Charge on the Electrode. I f one assumes that the standard free energy of adsorption AG ° depends only on the electrode-particle interaction, to the exclusion of particle-particle interaction, one can write32'36 37 for the isotherm for T1 +
% V ) = a e x p ( - A G ° /R T ) (9)
= aj3
where f ( q O represents some function whose explicit form is discussed below. The parameter ¡3 characterizing AG ° is a function of some electrical variable characterizing the interface. We shall select the charge q as such a variable, in agreement with Parsons32 since this choice appears reasonable for ionic specific adsorption. (The potential may possibly be a better choice for uncharged species.36“ 38) The dependence of [3 on q can be deduced from the data obtained above. The approximate equation39
(d0 M- 2/ ^ +1)5 = (1//) (d In 0 /d q ) (10)
is applicable when the diffuse double layer is neglected. The following more rigorous equation deduced by Parry and Parsons40'41 takes into account the diffuse double layer
(34) R. Parsons, A d v a n . E lec troch em . E lec troch em . E n g ., 1, 12 (1961).(35) “Gmelins Handbuch der anorganische Chemie,” Vol. 38, Verlag Chemie, GMBH, Berlin, 1940, pp 38, 39.(36) R. Parsons, J . E lec troa n a l. C h em ., 7, 136 (1964).(37) B. B. Damaskin, ib id ., 7, 155 (1964).(38) R. Parsons, ib id ., 8 , 93 (1964).(39) R. Parsons, T r a n s . F a ra d a y S o c ., 55, 999 (1959).(40) J. M. Parry and R. Parsons, ib id ., 59, 241 (1963).(41) See ref 2, pp 89, 90.
The Journal of Physical Chemistry
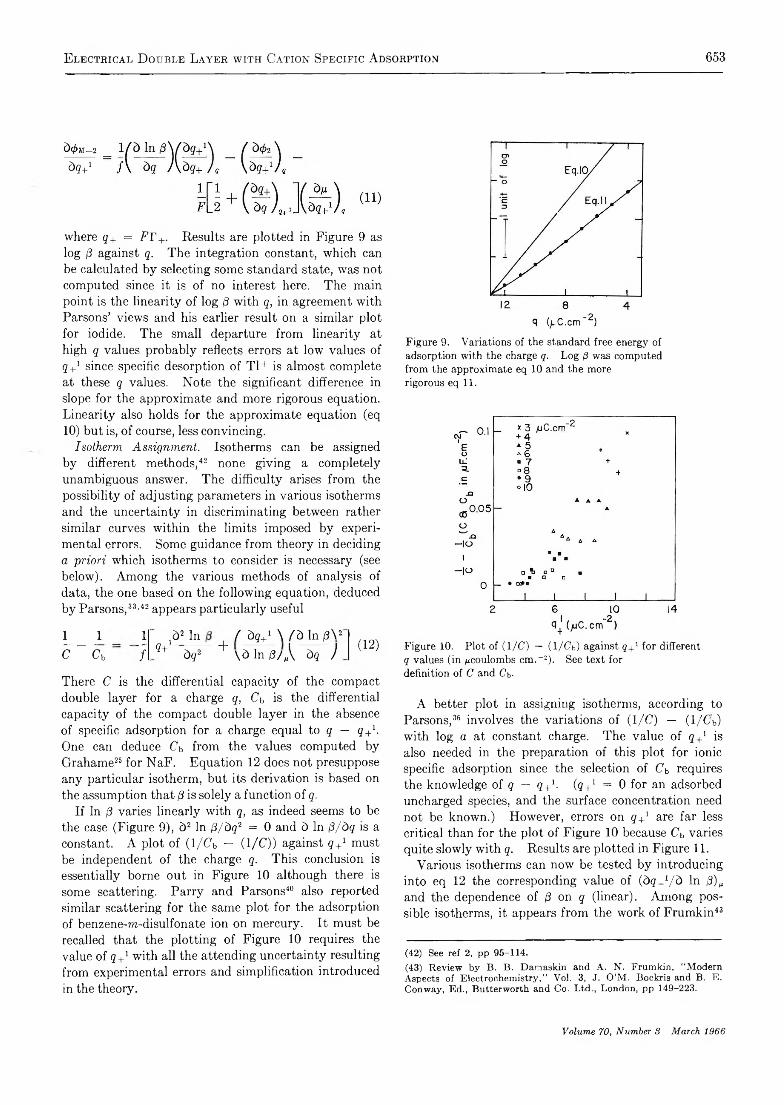
Electrical D ouble Layer with Cation Specific Adsorption 653
à<t> ai-2àç+'
where g+ = F r + . Results are plotted in Figure 9 as log ¡3 against q. The integration constant, which can be calculated by selecting some standard state, was not computed since it is of no interest here. The main point is the linearity of log d with q, in agreement with Parsons’ views and his earlier result on a similar plot for iodide. The small departure from linearity at high q values probably reflects errors at low values of q + l since specific desorption of T 1+ is almost complete at these q values. Note the significant difference in slope for the approximate and more rigorous equation. Linearity also holds for the approximate equation (eq 10) but is, of course, less convincing.
Isotherm Assignm ent. Isotherms can be assigned by different methods,42 none giving a completely unambiguous answer. The difficulty arises from the possibility of adjusting parameters in various isotherms and the uncertainty in discriminating between rather similar curves within the limits imposed by experimental errors. Some guidance from theory in deciding a 'priori which isotherms to consider is necessary (see below). Among the various methods of analysis of data, the one based on the following equation, deduced by Parsons,33'42 appears particularly useful
± _ _1C ~ C h
1'
7 .q+L
.Ò2 In
òg2+
l dOT1 \ / d ln ßV \ò ln ß / \ òq J (12)
There C is the differential capacity of the compact double layer for a charge q, Cb is the differential capacity of the compact double layer in the absence of specific adsorption for a charge equal to q — g+h One can deduce C h from the values computed by Grahame25 for N aF. Equation 12 does not presuppose any particular isotherm, but its derivation is based on the assumption that ¡3 is solely a function of q.
If In (3 varies linearly with q, as indeed seems to be the case (Figure 9), 5 2 In 13/d q 2 = 0 and 5 In /3/dg is a constant. A plot of ( 1/C b — (1 /C ) ) against q + l must be independent of the charge q. This conclusion is essentially borne out in Figure 10 although there is some scattering. Parry and Parsons40 also reported similar scattering for the same plot for the adsorption of benzene-m-disulfonate ion on mercury. I t must be recalled that the plotting of Figure 10 requires the value of q + 1 with all the attending uncertainty resulting from experimental errors and simplification introduced in the theory.
q (yC.cm"2 )
Figure 9. Variations of the standard free energy of adsorption with the charge q. Log 0 was computed from the approximate eq 10 and the more rigorous eq 11.
Figure 10. Plot of (1/C) — (1/Cb) against g.^1 for different q values (in /^coulombs cm.-1). See text for definition of C and Cb.
A better plot in assigning isotherms, according to Parsons,36 involves the variations of (1/(7) — (1/Cb) with log a at constant charge. The value of q + l is also needed in the preparation of this plot for ionic specific adsorption since the selection of C b requires the knowledge of q — g+L (g+4 = 0 for an adsorbed uncharged species, and the surface concentration need not be known.) However, errors on q + l are far less critical than for the plot of Figure 10 because Cb varies quite slowly with q. Results are plotted in Figure 1 1 .
Various isotherms can now be tested by introducing into eq 12 the corresponding value of (dg+Vd In (8)M and the dependence of (3 on g (linear). Among possible isotherms, it appears from the work of Frumkin43
(42) See ref 2, pp 95-114.(43) Review by B. B. Damaskin and A. N. Frumkin, “Modern Aspects of Electrochemistry," Vol. 3, J. O’M. Bockris and B. E. Conway, Ed., Butter worth and Co. Ltd., London, pp 149-223.
Volume 70, Number 8 March 1966

654 Paul D elahay and G illes G. Susbielles
Figure 11. Plot of (1/(7) — (l/Ci,) against the logarithm of the mean activity of T l+ for different q values (in ¿¿coulombs cm-2). See text for definition of C and Cb.
and Parsons36-38 that the Frumkin isotherm is especially to be retained. (The linear isotherm, of course, holds always as a limiting law.) Parsons recently pointed out44 that the Flory-H uggins isotherm,46’46 previously considered by Levine, Bell, and Calvert47 in the analysis of discreteness effect in the double layer, appears to hold in a number of cases. Actually, Parsons used the Flory-Huggins isotherm with a Frumkin type of correcting factor. The isotherms are
_____q ¿ _(g+Os - q+
l exp —A q+1 = fia+ (Frumkin) (13)
q+1/(q+1)*»•{i - k+1/(q+1)s]}¡
exp(S+1)*-
=
(Flory-Huggins with a Frumkin factor) (14)
where (g+4) 9 is the saturation value of q + l and r is the ratio of the maximum number of available sites to the number of sites at saturation.
The plots of (1/C) — (l/G'b) against log a are symmetrical for the Frumkin isotherm33 but asymmetrical for the Flory-Huggins isotherm.44 The curves in Figure 1 1 are almost symmetrical, thus indicating that the Frumkin isotherm may describe experimental results. The parameter A of eq 13 (not to be confused with A of eq 4) can be computed from the isotherm at constant charge (Figure 12). Thus, A = 22 ± 2 for q+ 1 between 7 and 1 1 ¿¿coulombs cm-2 for the assumed saturation value of 64 ¿¿coulombs cm-2. This saturation value was calculated by assuming that one adsorbed ion replaces a site of water molecules covering44 25 A 2. Levine, et al.,a assumed 80 ¿¿coulombs cm-2 at saturation for iodide, and the corresponding value of A for T1+ adsorption is 27 ± 2. Fitting of the
Figure 12. Plot of q + l against the mean activity of T l+ for different q values (in ¿¿coulombs cm-2).
curves in Figure 12 is as good as one wishes with these values of A , but this good agreement should not be overstressed. The sign and magnitude of A indicate48 strong repulsion between T1+ ions. This is apparent from Figure 12 , where the isotherms exhibit a pronounced curvature for coverages smaller than 0 .1 to 0.15. Nearly linear isotherms would be expected at low coverage for weak interactions. The above value of A is indeed high but is comparable to the A values ( ^ 10 depending on charge density) that we obtained by an identical analysis of Grahame’s data on iodide.31 Comparison of adsorption data for T1+ and I - indicates that, for comparable charge density and concentration, T1+ undergoes somewhat stronger specific adsorption than I - . The validity of eq 13 and 14 for ions with such seemingly strong interactions deserves further study and is now being examined.
Discreteness o f Charge. No detailed analysis of the effect of discreteness of charge was attempted on the basis of the work of Levine, et al.,*7 or the more rigorous treatment of Barlow and Macdonald.49-51 We may return to this problem,11 but the very small radius of specifically adsorbed T1+ ion seems to hamper appli-
(44) R. Parsons, personal communication.(45) P. J. Flory, J . C h em . P h y s . , 10, 51 (1942).(46) M. L. Huggins, J . P h y s . C h em ., 46, 151 (1942); A n n . N . Y . A ca d . S c i ., 43, 1 (1942).(47) S. Levine, G. M. Bell, and D. Calvert, C a n . J . C h em ., 40, 518 (1962).(48) See ref 43, p 158.(49) C. A. Barlow and J. R. Macdonald, J . C h em . P h y s ., 40, 1935 (1964).(50) J. R. Macdonald and C. A. Barlow, “Proceedings of the First Australian Conference on Electrochemistry,” A. Friend and F. Gutman, Ed., Pergamon Press Ltd., Oxford, 1964, pp 199-247.(51) J. R. Macdonald and C. A. Barlow, J . P h y s . C h em ., 68, 2737 (1964).
The Journal of Physical Chemistry

Electrical D ouble Layer with Cation Specific Adsorption 655
cation of theory. We did apply eq 4-27 of Levine, et al.,47 but found a varying ratio (x2 — X \)/x2 = 0.2 to 0.4 with q + 1. Grahame31 and Grahame and Parsons33 also found such a varying ratio for I - (0.4 to 0.8) and C l“ (0.2 to 0.5) when they attempted calculation based on isotherms. These authors did not use the Flory-Huggins isotherm, as Levine, et al., did. The discrepancy between the values of (x2 — x , ) /x 2 obtained by this approach and from the capacities CY and CV can be interpreted much in the same way as was done by Parry and Parsons.40 According to these authors,
the calculation based on CY and CV should be the more reliable. We believe that detailed model analysis in this case is only tentative at best.
Acknowledgment. This work was supported by the National Science Foundation. G. G. S. is indebted to the North Atlantic Treaty Organization for a fellowship. We thank Dr. Hubert Lauer, of this laboratory, who prepared the thallium fluoride. We also thank Dr. R . Parsons, University of Bristol, and Dr. J . R. Macdonald, Texas Instruments, Inc., Dallas, Texas, for helpful comments on the manuscript.
Volume 70, Number 3 March 1966

656 George G. Guilbault and Wallace H. M cCurdy, Jr .
Mechanism and Kinetics of the Silver(I)-, Manganese(II)-, and
Silver(I)-Manganese(II)-Catalyzed Oxidations of Mercury(I) by Cerium(IV)
by George G. Guilbault
D efe n s iv e R esea rch D ep a r tm e n t, U . S . A r m y C h em ica l R esea rch L a b o ra to r ie s , E d g ew ood A r s e n a l , M a r y la n d
and Wallace H. McCurdy, Jr.
U n iv er s i ty o f D ela w a re , N e w a r k , D ela w a re ( R ece iv ed J u ly 2 8 , 1 9 6 6 )
The rates of the silver(I)-, manganese(II)-, and silver(I)-manganese(II)-catalyzed oxidations of mercury(I) by cerium(IY) have been studied in perchloric and sulfuric acids at 50.0°. The kinetic expressions found are — d[Ce(IV)]/d£ = 0.304 [A g(I)][C e(IV )] + 0.0218 [Ag(I) ] [Ce(IV) ]/ [Hg22+] ; -d [C e (IY )]/d i = 1.28[C e(IV )][M n(II)] + 0 .14 3 - [Ce(IV )][M n (II)] / [Hg22+] ; and -d [C e (IV )]/d t = 0.304[Ce(IV)][Ag(I)] + 0.64[Ce(IV) ]- [M n(II) ] + 9.4 [A g(I)][M n(II)] + 2.7 X 10 1 2 [C e(IV )][A g(I)][M n(II)]/[H g22 * * + ] in 2.0 F perchloric acid-0.1 F sulfuric acid. Activation energies are 13.55, 12 .10 , and 10.05 kcal/ mole, respectively, for the silver(I)-, manganese(II)-, and silver(I)-m anganese(II)-catalyzed oxidations. Enhanced catalytic effects are observed in perchloric acid, but merely an additive effect is obtained in sulfuric acid. Reaction mechanisms are proposed in which silver(II) and manganese(III) are believed to be active intermediates in breaking the (H g-H g)2+ bond. The effect of acid is explained by the prior equilibrium step: C e(S0 4)2 + H + ^ C e(S04)2+ + H S 0 4-
In a previous paper,1 the mechanism and kinetics of the uncatalyzed mercury(I)-cerium(IV) reaction were discussed. This very slow reaction is catalyzed by silver (I), manganese (I I), and a combination of silver(I) and manganese(II) salts.2 The present study deals with the mechanism and kinetics of each of these three catalytic reactions. Energy of activation data are also presented.
Experimental SectionAll solutions were prepared from triply distilled
water and reagent grade chemicals.Reagents. Ceric sulfate solution, 0.10 F , was pre
pared by dissolving 52.8 g of C e(H S04)4 in 1 1. of sulfuric acid. Various amounts of perchloric acid were added in making the Ce(IV) solutions described.
Ceric perchlorate solution, 0.10 F , was prepared by dissolving soluble 100 mesh ceric hydroxide (G. F. Smith Chemical Co.) in 1 1 5 ml of 72% perchloric acid, and the resulting solution was diluted to 1 1. with dis
tilled water. This reagent was stored in a dark reagent bottle, and was standardized against arsenic(III) oxide.
Silver(I) and manganese(II) perchlorate solutions were prepared by dissolving the C P salts (G. F . Smith Chemical Co.) in triply distilled water. The s i lv e r ® perchlorate solution was standardized by precipitation of silver chloride and was found to be 0.07 F. The manganese(II) concentration was determined by the Ford-W illiams method8 and was found to be 0.0495 F .
M e r c u r y ® solution was prepared by dissolving 7.025 g of m e rc u ry ® nitrate monohydrate in 1 1. of 1 F perchloric acid. The solution was standardized gravimetrically by precipitation of m e rc u ry ® chlo
(1) G. G. Guilbault and W. H. McCurdy, Jr., J . P h y s . C h em ., 64, 1825 (1960).(2) W. H. McCurdy, Jr., and G. G. Guilbault, A n a l. C h em ., 32, 647 (1960).(3) W. W. Scott, “Standard Methods of Chemical Analysis," N. H.Furman, Ed., Vol. 1, D. Van Nostrand Co., Inc., New York, N. Y.,1939, p 571.
The Journal of Physical Chemistry

M echanism and K inetics of Oxidation of Hg(I) by Ce(IV) 657
ride and titrimetrically with standard ferric alum in the presence of thiocyanate. The solution was 0.025F.
M ercury(II) solution was prepared by dissolving 10.8305 g of dry mercury(II) oxide in 91 ml of 72% perchloric acid and diluted to 1 1. The solution was 0.050 F in mercury(II) and 1 F in perchloric acid.
Rate M easurements. The rates of the catalyzed oxidations of mercury (I) by cerium (IV) were followed spectrophotometrically by measuring the rate of disappearance of cerium (IV) at 280 m/i with a Beckman Model DU. All solutions were thermostated at 50.0 ± 0 .1° before mixing and during reaction. The initial rate of the reaction was calculated graphically from concentration vs. time curves by extrapolation to zero time, and by determining the slope of the curve at this point. In general, the tabulated results are averages of three or more determinations.
ResultsEffect of M ercu ry (I I ) , Cerium {I I I ) , and A cid Concen
tration. The effect of mercury(II) and cerium(III) on the rates of the silver(I), manganese(II), and silver- (I)-manganese(II) catalyzed reactions was tested in a mixture which contained 4.60 X 10 -3 F cerium(IV),1.89 X 10 ~ 3 F mercury(I), 2.0 F perchloric acid, 2.43 X 10 ~ 3 F silver (I) and/or 0.80 X 10 ~ 3 F manganese (II). The rates proved independent of the concentration of mercury(II) and cerium(III) ions over the range 0-0.05F .
The effect of increasing perchloric acid or sulfate on the rate of all three catalyzed reactions is similar to that described for the uncatalyzed reaction.1 The rate of oxidation increases with approximately first-order dependence on perchloric acid at low acid concentration, reaches a maximum in 4.0 F , then decreases (Tables I, I I , and I I I , C).
The first step in each mechanism is believed to involve a prior equilibrium step1
C e(S04)2 + H + C eS0 42+ + HSO*-
Hence, the increase in rate is due to the formation of the more reactive C eS042+ ion species; the addition of sulfate inhibits the reaction by shifting the equilibrium in the reverse direction. In concentrations of perchloric acid above 2.0 f , precipitation of cerium(IV) occurs, forming a heterogeneous system and a decreasing rate.
Since all further rate measurements were made in2.0 F perchloric acid-0.1 F sulfuric acid, the notation [Ce(IV)] will be used to denote the total cerium(IV) concentration.
Effect of Catalysts. With an excess of cerium(IV)
Table I: Initial Rate of the Silver(I)-Catalyzed Cerium(IV)-Mercury(I) Reaction as a Function of Silver(I), Perchloric Acid, and Initial Cerium(IV) and Mercury(I) Concentrations. [H2SO4] = 0 .1 F, T = 50.0°
— d [ C e ( I V ) ] / [ C e ( I V ) ]o [H g j i + l , [A g ( I )Jd i X 10S X 10», X 10 », X 10»,moles 1 . _ 1 moles moles moles
min- 1 1 . -i l.-i | - l [A c id ]
A0.230 3.77 1.39 0.486 2 F HC104
0.330 3.77 1.39 0.728 2 F HCIO4
0.610 4.24 1.89 1 . 2 2 2 F HCIO4
1.30 4.24 1.89 2.43 2 F HClOi0.107 0.376 1.89 2.43 2 F HCIO,0.220 0.752 1.89 2.43 2 F HCIO4
0.430 1.50 1.89 2.43 2 F HCIO4
0.880 3.00 1.89 2.43 2 F HClOi5.25 4.60 0.232 1.22 2 F HCIO4
2.70 4.60 0.464 1.22 2 F HCIO4
1.30 4.60 0 928 1.22 2 F HClOi0.882 4.60 1 392 1.22 2 F HClOi
B0.0192 4.60 500.0 1.22 2 F HClOi0.0181 4.60 100.0 1.22 2 F HCIO4
0.0176 4.60 2000.0 1.22 2 F HCIO4
C0.299 4.24 1.89 1.22 0.5 F HCIO4
0.545 4.24 1.89 1.22 1.0 F HCIO4
0.956 4.24 1.89 1.22 4 .OFHCIO4
0.752 4.24 1.89 1.22 6.0 F HCIO4
0.107 4.24 1.89 1.22 1 .0 F H 2SO40.075 4.24 1.89 1.22 2.0 F H2SO4
and mercury(I), a plot of In [Ce(IV) ]0/ [Ce(IV) ] vs. time at silver(I) concentrations of 0.486 and 0.728 X10 -3 F in 2.0 F perchloric acid-0.1 F sulfuric acid yielded a pair of straight lines (Figure 1). Moreover, the slope of curve B is 1.5 times greater than that of curve A, as would be expected if the rate of oxidation were first order in silver(I). This dependence is illustrated further by the data in Table I, A.
Likewise, the manganese(II)-catalyzed reaction was found to be first order in M n2+ concentration (Table I I , A). A plot of In [Ce(IV) ]0/[C e(IV ) ] vs. time at manganese(II) concentrations of 0.08 and 0.24 X 10 ~ 3 F produces straight lines, the slope of line B being three times that of line A (Figure 2).
A t constant cerium(IV), mercury(I), and silver(I) concentrations of 4.24, 1 .2 1 , and 6.08 X 10 -3 F , respectively, an increase in the concentration of manganese (II) produces a linear increase in the rate, indicating a first-order effect (Table I I I , A). Likewise, an increase in the silver (I) concentration at constant mercury(I), cerium(IV), and manganese(II) concen-
Volume 70, Number 3 March 1966

658 George G. Guilbault and Wallace H. M cCurdy, Jr .
Table II: Initial Rate of the Manganese(II)-Catalyzed Cerium(IV)-Mercury(I) Reaction as a Function of Manganese(II), Perchloric Acid, and Initial Cerium(IV) and Mercury(I) Concentrations.[H2S04] = 0.1 F, T = 50.0°
— d [ C e ( IV ) ]/ [C e (IV ) ]o [Hgs3+]o [M n ( ID ]d t X 10«, X 10>, X 1 0 », X UP,
moles moles moles moles1. -1 m in -1 1. - 1 l.- ‘ 1. [Acid]
A0.410 4.24 1.21 0.08 2 F HC1040.800 4.24 1.21 0.16 2 F HC1042.20 4.24 1.21 0.40 2 F HC1043.00 4.24 1.21 0.60 2 F HC1040.082 0.0846 1.21 0.80 2 F HC1040.120 0.127 1.21 0.80 2 F HC1040.610 0.635 1.21 0.80 2 F HC1041.21 1.27 1.21 0.80 2 F HC104
24.0 4.60 0.220 0.80 2 F HC10412.5 4.60 0.440 0.80 2 F HC1048.1 4.60 0.661 0.80 2 F HC1044.00 4.60 1.32 0.80 2 F HC104
B0.0560 4.60 500.0 0.80 2 F HC1040.0520 4.60 1000.0 0.80 2 F HC1040.0500 4.60 2000.0 0.80 2 F HC104
C1.60 4.24 1.21 0.40 1 F HC1042.01 4.24 1.21 0.40 2 F HC1042.98 4.24 1.21 0.40 4 F HC1040.310 4.24 1.21 0.40 1 F H2S040.190 4.24 1.21 0.40 2 F H2S04
TIME (MINUTES)Figure 1. Variation of In [Ce(IV)]0/[Ce(IV)] with time. [HC104] = 2.0 F, [Ce(IV)]0 = 3.77 X 10~3, [Hg23+]„ =1.89 X 10~3; curve A = silver(I) concentration of 0.486 X 10“ 3 M ; curve B = silver( I) concentration of 0.728 X 10 ~3 M.
trations produces a linear increase in the rate (Table IIT, A), illustrating a first-order dependence.
Table III: Initial Rate of the Silver(I)-Manganese(Ill- Catalyzed Mercury(I) Oxidation as a Function of Silver(I), Manganese(II), Perchloric Acid, and Initial Cerium(IV) and Mercury(I) Concentrations. [H2S04] = 0.1 F, T — 50.0°.
— d [C e (IV ) ]o/ [C e (IV )]o di X IO4, X 103, moles 1. -1 moles
m in -1 1._l
[H g 23+]o, X 103, moles
l . - i
[Ag] X 1 0 3,moles
I . - '
fM n2+] X 103, moles 1. - i [A cid ]
4.60 4.24A
1.21 1.22 0.40 2 F HC1046.80 4.24 1.21 1.22 0.60 2 F HC1049.51 4.24 1.21 1.22 0.80 2 F HC104
11.0 4.24 1.21 6.08 0.20 2 F HC10422.8 4.24 1.21 6.08 0.40 2 F HC10435.0 4.24 1.21 6.08 0.60 2 F HCIO,17.0 4.24 1.21 3.04 0.60 2 F HC1048.7 4.24 1.21 1.52 0.60 2 F HC1043.4 4.24 1.21 0.608 0.60 2 F HC1040.210 0.106 1.21 1.22 0.60 2 F HC1040.750 0.424 1.21 1.22 0.60 2 F HC1041.72 1.06 1.21 1.22 0.60 2 F HC104
69.0 4.24 0.121 1.22 0.60 2 F HC10413.0 4.24 0.606 1.22 0.60 2 F HC1043.5 4.24 2.42 1.22 0.60 2 F HC104
0.123 4.24B
300.0 1.22 0.60 2 F HC1040.107 4.24 500.0 1.22 0.60 2 F HC1040.097 4.24 1000.0 1.22 0.60 2 F HC104
2.40 4.24c
1.21 1.22 0.40 1 F HC1044.60 4.24 1.21 1.22 0.40 2 F HCIO,6.56 4.24 1.21 1.22 0.40 4 F HCIO,0.140 4.24 1.21 1.22 1 F H2S040.310 4.24 1.21 0.40 1 F H2S040.450 4.24 1.21 1.22 0.40 1 F H2S040.0450 0.424 1.21 1.22 0.40 1 F H2S040.0902 0.848 1.21 1.22 0.40 1 F H2S040.227 4.24 2,42 1.22 0.40 1 F H2S04
Effect o f C eriu m (IV ) and M ercu ry{I). In all three catalyzed reactions, the rate was found to be first order in cerium(IV) concentration (Tables I, I I , and I I I , A). In the doubly catalyzed reaction, a plot of In [Ce(IV)]0/[C e(IV )] vs. time at an initial cerium(IV) concentration of 0.106 X 10 ~ 3 F and mercury(I), silver(I), and manganese(II) concentrations of 1 .2 1 ,1.22, and 0.60 X 10 _3 F , respectively, yielded a straight line, in accordance with a first-order relationship.
Also, all reactions proved to be inversely proportional to mercury (I) at low concentrations, but independent at larger concentrations (Tables I, I I , and I I I , B) of mercury(I) (above about 0.5 F ).
Effect of Temperature. The effect of temperature on the rate of the silver(I)-, the manganese(II)-, and the silver(I)-manganese(II)-catalyzed oxidations of
The Journal of Physical Chemistry

M echanism and K inetics of Oxidation of Hg(I) by Ce(IV) 659
TIME (MINUTES)Figure 2. Variation of In [Ce(IV)]0/[Ce(IV)] with time. HCIO4 = 2.0 F, [Ce(IV)]0 = 4.24 X 10“ 3 M, [Hg22+] = 1.21 X IO-3 M ; line A = manganese(II) concentration of 0.08 X IO-3 M\ line B = manganese (II) concentration of 0.24 X 10_3 M.
Figure 3. Arrhenius plot of In K 'expti vs. 1 /T for the silver(I)-catalyzed oxidation cf mercury(I). [Ce(IV)]0 = 4.24 X 10⁻³ M, [Hg22+] = 1.21 X 10⁻³ M, [Ag(I)] = 1.22 X IQ"3 M, [HCIO4] = 2.0 F.
mercury (I) at low Hg22+ concentrations is shown in Table IV.
Table IV: Variation of Rate Constants K 'expti, A " e*Pti, and K ” 'exPti with Temperature for the Ag(I)-, Mn(II)-, and Ag( I )-Mn(II )-Catalyzed Reactions“
Temp, X'exptl, XAxpti,X///exptl, moles ~l
° C min -I min -1 min“1
30.0 0.00557 0.0421 99.150.0 0.0218 0.143 27060.0 0.0432 0.263 44970.0 0.0743 0.429 674
[Ce(IV)]„ = 4.24 X 10- 3 M, [Hg22+]o = 1.21 X 10“ 3[Ag(I)] = 1.22 X IO"3 M, [Mn(II)] = 0.40 X HT3 M, and [acid] = 2.0 F HClO4-0.1 F H2S04.
From the slope of the lines in Arrhenius plots of In K exPti vs. 1 /T ( = — E /R ) , similar to that for the silver- (I)-catalyzed reaction in Figure 3, the energy of activation, E * , was calculated to have the values 13.55, 12 .10 , and 10.05 ± 0.2 kcal/mole for the silver(I)-, the manganese(II)-, and the silver(I)-m anganese(II)- catalyzed reactions, respectively. These values may be compared to a value of 14.4 kcal/mole for the uncatalyzed reaction,1 and to the values 9.774 5 and 9.276 kcal/mole for the arsenic(III)-cerium (IV) reaction catalyzed by R u(IV ) and iodide ion, respectively.
Mechanisms and Kinetic ExpressionsSilver(I)-Catalyzed Reaction. As was shown above,
the rate of the silver(I)-catalyzed reaction is first order
with respect to silver(I) and cerium(IV) and is inversely proportional to mercury (I) at low concentrations. The mechanism proposed is
Ce(IV) + Ag(I) - ¿ 1 A g(II) + C e(III)k- 1
Ag(II) + Hg22+ Hg(I) + H g(II) + Ag(I)
Hg(I) + Ce(IV) C e(III) + H g(II)
Assuming steady-state formations of Ag(II) and Hg(I), and that fc2[Hg22+] > > fc_i[Ce(III)], the rate expression derived is
—d[Ce(IV) ]/df = 2fc1 [Ce(IV)][Ag(I)]
The observed kinetic expression, however, is
—d[Ce(IV)]/d t = 2fc1 [Ce(IV)][Ag(I)] +
K 'exptl[Ce(IV )][A g(I)]/[H g22+]
From concentration-time curves and the data in Table I, A and B , fci and K ' expt\ are calculated to be 1.52 X 10 _1 1. moles- 1 min- 1 and 2 .18 X 10 - 2 min- 1 , respectively. The rate expression then becomes
—d[Ce(IV)]/df = 0.304 [Ce(IV)][Ag(I)] +
0.0218 (Ce(IV)][Ag(I)]/[H g22+]
where all concentrations are in moles per liter and t is in minutes.
The proposed mechanism fits the kinetic data at large concentrations of mercury (I). The observed
(4) C. Surasiti and E. B. Sandell, J . P h y s . C h em ., 63, 890 (1959).(5) F. Lachiver, A n n . C h im . (Paris), 10, 92 (1955).
Volume 70, Number 3 March 1966

660 George G. Guilbault and Wallace H. M cCurdy, Jr .
inverse rate dependence on mercury(I) at low concentrations cannot be explained by this mechanism. This expression may be compared to the uncatalyzed reaction, in which the rate is first order with respect to mercury (I). In this case it is primarily silver(II) that breaks the (H g-H g)2+ bond, and not cerium(IV). The inversely proportional effect of mercury (I) is novel, but that the rate should be independent of the concentration of reductant has been observed in similar cases, as the ruthenium-catalyzed oxidation of arsenic (III) by cerium(IV), where the rate is independent of the arsenic (III) concentration4 or the thallium(I)-cerium(IV) reaction, which is independent of th a lliu m ® .6 7 8 9 10 11 Likewise, the existence of silver(II) as a reaction intermediate is well established.7-11
Higginson and co-workers reported that the rate expression observed for the silver(I)-catalyzed mercury- (I)-cerium(IV) reaction in pure perchloric acid at a small excess of mercury (I) was
—d[Ce(IV) ] /d t = 2fci [Ag(I) ] [Ce(IV) ]/
(1 + (K [Ce(III) ]/ [Hg22+]))
A t high concentrations of excess mercury(I), he noted a rate independent of mercury (I), and first order in s i lv e r ® and cerium (IV)(—d[Ce(IV)]/df = 2fcx[Ag- (I)][Ce(IV )]), similar to what was observed in this study.12 A t low concentrations of mercury (I), a rate dependent on mercury (I) was observed. E v idently, the reverse reaction of
Ce(IV) + Ag(I) C e(III) + Ag(II)k-1
contributes significantly in perchloric acid at small concentrations of excess m e rc u ry ® . No comparable results were obtained in perchloric-sulfuric acid in this study. Goto and Shiokawa, however, have shown that there is an essentially complete reaction between cerium(IV) and s i lv e r ® in sulfuric acid, and have used this as the basis of an analytical procedure.13
M anganese(II)-Catalyzed Reaction. The following mechanism is proposed for the M n(II)-catalyzed oxidation
kiCe(IV) + M n(II) M n(III) + C e(III)
k— 4 kb
M n(III) + Hg22+ — > M n(II) + H g ® + H g(II)
H g ® + Ce(IV) C e(III) + H g(II)
kbCe(IV) + M n(III) M n(IV) + C e(III)
M n(IV) + Hg22+ M n(II) + 2H g(II)
A kinetic expression may be derived, using the same method as described above for the silver(I)-catalyzed reaction
— d[Ce(IV) ]/di = 2fe4 [Ce(IV) ] [M n(II) ]
The observed kinetic expression is, however
— d[Ce(IV)]/d t = 2fc4[Ce(IV) ] [M n(II) ] +
K " expti [Ce(IV) ] [M n(II) ]/[H g22 + ]
From concentration-time curves, and the data in Table II , A and B , the constants fc4 and K " e pti were calculated to be 0.604 1. moles- 1 min- 1 and 1.43 X 10 - 1 min- 1 , respectively. The kinetic expression then becomes
—d[Ce(IV) ] /d t = 1.28 [Ce(IV) ] [M n(II) ] +
0.143 [Ce(IV) ] [M n(II) ]/ [Hg22+]
in which concentrations are in moles per liter and time is in minutes. Again, the proposed mechanism fits the observed kinetic data at high concentrations of mercury(I), but not at small concentrations. In the proposed mechanism, it is the kinetically more favorable intermediate M n(III) that breaks the (H g- H g)2+ bond, instead of cerium (IV). The presence of M n (III) was proved by spectrophotometric examination of the solution, and M n(IV) by chemical tests.14 15 Lingane and Selim16 have shown that M n(III) can be distinguished from permanganate spectrophotometri- cally, since M n (III) has a Xmax at 480 m y, whereas permanganate exhibits a saddle at 525 and 540 m/t. A typical spectrophotometric examination of the reaction solution in the manganese(II)-catalyzed oxidation of m e rc u ry ® at various times is indicated in Figure 4. A Beckman D B spectrophotometer was used, employing the uncatalyzed C e(IV )-H g22+ reaction mixture as a blank. Curve A represents the spectrum at the beginning of the reaction, provided a water blank is used, and is the spectrum of cerium(IV). Curve B was obtained midway during the reaction, and indicates the presence of M n (III). Curve C is
(6) B. Krishna and B. Sinha, Z . P h y s ik . C h em ., 212, 149 (1959).(7) A. Barbiéri, B e r . , 40, 3371 (1907).(8) J. Marshall, P r o c . R o y . S o c . (Edinburg), 23, 163 (1900).(9) A. A. Noyes, J. L. Hoard, and K. S. Pitzer, J . A m . C h em . S o c ., 57, 1221 (1935).(10) A. A. Noyes, K. S. Pitzer, and C. L. Dunn, ib id ., 57, 1229 (1935).(11) D. Yost, ib id ., 48, 152 (1926).(12) W. C. Higginson, D. R. Rosseinsky, J. B. Stead, and A. Sykes, D is c u s s io n s F a ra d a y S o c ., 29, 49 (1960).(13) H. Goto and T. Shiokawa, J . C h em . S oc . J a p a n , 64, 509 (1943).(14) W. W. Scott, ref 3, p 572.(15) J. J. Lingane and A. Selim, A n a l. C h im . A c ta , 21, 536 (1959).
The Journal of Physical Chemistry

M echanism and K inetics of Oxidation of Hg(I) by Ce(IY) 661
Figure 4. Spectrophotometrie curves of the Ce(IV)-Hg22+-M n(II) reaction solution at various times as described in the text; [Ce(IY)] = 4.24 X 10~3M; [Hg22+] = 1.21 X 10"3 M ; [Mn(II)] = 0.24 X 10"3 M.
the spectrum after reaction of all mercury(I), which is identical with permanganate. Both M n (III) and M n(IV) have been postulated in many reaction mechanisms, for example the Ce(IV) oxidation of thallium-(I) ,16 the arsenic (Ill)-cerium (I V) reaction,17 and the cerium(IV)-oxalate reaction,18 all catalyzed by Mn-(II) .
S ilver(I)-M an gan ese(II)-C atalyzed Reaction in P erchloric A cid. The rate of this doubly catalyzed reaction was found to be first order with respect to cerium- (IV), manganese(II), and silver(I), inversely proportional to mercury(I) at low concentrations, but independent at larger amounts. From the data in Table I I I and from concentration-time curves, the following kinetic expression can be written
— d[Ce(IV) ]/df = 0.304 [Ce(IV) ] [Ag(I) ] +
0.64 [Ce(IV) ] [M n(II) ] + 9.4[A g(I)][M n(II)] +
2.7 X 10 2[Ce(IV) ] [Ag(I) ] [M n(II) ]/ [Hg22+]
The enhanced catalytic effect that is noted in perchloric acid and not in sulfuric is explained by the term A [A g(I)][M n (II)]. Although the kinetics and mechanism are quite complicated and an exact mechanism could not be written which accounts for all of the data, the reaction sequence is believed to be
Ce(IV) + Ag(I) ^ C e(III) + A g(II) (1)
Ag(II) + Mn(II) ^ Ag(I) + Mn(III) (2)
M n(III) + Hg22+
H g(II) + Hg(I) + M n(II) (3)
Hg(I) + Ce(IV) V6ry ^ C e(III) + H g(II) (4)
The presence of manganese (III) and (IV) as intermediates was proved spectrophotometrically as above. That reaction I occurs has been well established.13 Reaction 2 is also well known10 and is predictable from oxidation-reduction potentials.
Silver(I)-M anganese(II)-C atalyzed Reaction in Sulfuric A cid. As is evident from the kinetic data in Table I I I and from the energy of activation results, there is an enhanced catalytic effect in perchloric acid. The rate of oxidation using the combined catalysts is greater than that expected by an additive catalytic effect. However, in sulfuric acid it is apparent (Table I I I , C) that there is merely an additive effect. The rate of reaction using 1.22 X 10 “' 3 F silver (I) plus 0.40 X 10 -3 F manganese(II) perchlorates in 1.0 F sulfuric acid is simply the sum of the rates using the two catalysts separately. Clearly, a different mechanism must be taking place here than in perchloric acid. The rate also is first order in cerium(IV), inversely proportional to mercury (I) at small concentrations, but independent at higher amounts, the same as in perchloric acid. A proposed mechanism is
Ce(IV) + M n(II) C e(III) + M n(III)
M n(III) + Hg22+ M n(II) + H g(II) + Hg(I)
Ce(IV) + Ag(I) - X C e(III) + Ag(II)
Ag(II) + Hg22+ Ag(I) + H g(II) + Hg(I)
2Ce(IV) + 2Hg(I) veryfa- ^ > 2H g(II) + 2C e(III)
Ce(IV) + M n(III) - X M n(IV) + C e(III)
M n(IV) + Hg22+ 2H g(II) + M n(II)
The observed rate expression is
- d [Ce(IV)]/df = 2 k i[Ce(IV) ] [M n(II) ] +
2fc1 [Ce(IV)][Ag(I)] +
K 'expti[Ce(IV) ] [M n(II) ]/ [Hg22+] +
K''exPti[Ce(IV) ] [Ag(I) ]/ [Hg22+]
which fits the data completely.
(18) P. A. Shaffer, C old S p r in g s H a rb o r S y m p . Q u a n t. B io l . , 7, 50 (1939).(17) J. W. Moore and R. C. Anderson, J . A m . C h em . S o c ., 6 6 , 1476 (1944).(18) L. Szebelledy and I. Tanay, P h a r m . Z en tra lh a lle , 79, 441 (1938).
Volume 70, Number 3 March 1966

662 K arl Notz and A. G. K eenan
Cation Selectivity of Pyrex Glass Electrode in Fused Ammonium Nitrate1*
by Karl Notzlb and A. G. Keenan
D ep a r tm en t o f C h em is tr y , U n iv er s i ty o f M ia m i , C ora l G a b les, F lo r id a 8 3 1 2 4 ( R ece iv ed J u ly 2 9 , 1 9 6 5 )
Using molten ammonium nitrate at 190° as an inert solvent, the emf of a Pyrex bulb electrode was measured as a function of the cation content of the melt. A fritted A g -A g + half-cell was used as a reference electrode. The nitrate salts of L i+, Na+, K +, A g +, T1+, and several divalent cations were added singly to the ammonium nitrate, in concentrations ranging from 0.05 to 30 mole % , and in various combinations. The Pyrex bulb electrode was responsive to monovalent cations in the order N a+ > Ag+ > L i+ > K + > N H 4+ = T l+. The results fit the ion-exchange rather than the liquid-junction model. Using N a + as a standard, values obtained for the selectivity constants (k) are 1.00, 0.3, 0.06, 0.007, 0.0007, and 0.0007 for the ions listed above. The rank order of the alkali metal ions is the same as that obtained by Eisenman for glass electrodes of similar composition in aqueous systems. Thus, concepts developed for glass electrodes in aqueous solutions can be applied in fused salts. Some implications of these findings are discussed.
IntroductionIn recent years there has been considerable interest
in the use of glass electrodes in molten salts. The major emphasis has been on their use as a reference electrode.2 Some work has also been done on the specific cation properties of certain glass electrodes in fused salts. Lengyel and Sammt3 found a Nernst response to N a+ for a soda-silica glass. Kolotii4 also obtained an approximately Nernstian behavior toward N a + by some glasses. However, attempts to prepare K +-sensitive electrodes from potassium glass and Li+-sensitive electrodes from lithium glass did not give quantitative results.3'5 In the above works, emf and cation concentration were related by the liquid- junction model with the usual assumption that the transport number of the cation was unity.
In aqueous systems, the liquid junction model is inadequate to explain fully the behavior of glass electrodes. The alkali error of glass pH electrodes and the cation response of cation-selective glass electrodes are best explained in terms of the ion-exchange model. This approach has been developed for two active species by Horovitz,6 Dole,7 Nicolskii,8 Eisenman,9'10 and others. The general case has recently been treated11 giving the equation
E = E ' + ( R T /F ) In (Ci + kC , + k 'C 3 + . . . ) (I)
Here the selectivity ratios k are related to the equi
librium constants for absorption at the glass surface and to mobilities in the glass by equations of the form kt =(■Ui/ui)K.
The present work is an initial attempt to apply to a highly ionic fused-salt system concepts which have already been developed for aqueous solutions. The system studied consisted of a Pyrex bulb immersed
(1) (a) This paper was presented before the Division of Physical Chemistry at the 149th National Meeting of the American Chemical Society, Detroit, Mich., April 1965. The work was supported by the Office of Naval Research under Contract Nonr-4008(07) and comprises part of the Ph.D. dissertation of Karl Notz; (b) NASA Fellow.(2) (a) IU. K. Delimarskii and B. F. Markov, “Electrochemistry ofFused Salts,” Sigma Press, Washington, D. C., 1961; (b) R. WLaity in “Reference Electrodes,” D. J. G. Ives and G. J. Janz, Ed., Academic Press Inc., New York, N. Y., 1961; (c) D. Inman, J . S c i . I n s t r . , 39, 391 (1963); (d) G. W. Harrington and H. T. Tien, J .P h y s . C h em ., 66, 173 (1962).(3) B. Lengyel and A. Sammt, Z . P h y s ik . C h em . (Leipzig), A181, 55 (1937).(4) A. A. Kolotii, U k r . K h im . Z h .. 29, 1169 (1963).(5) R. A. Osteryoung, Ph.D. Thesis, University of Illinois, D is s er ta tio n A b s tr ., 15,36 (1955).(6) K. Horovitz, Z . P h y s i k , 15, 369 (1923).(7) M. Dole, J . P h y s . C h em ., 2, 862 (1934).(8) B. P. Nicolskii, A c ta P h y s ic o c h im . U R S S , 7, 597 (1937).(9) (a) G. Eisenman, D. O. Rudin, and J. U. Casby, S c ie n c e , 126, 831 (1957); (b) G. Eisenman, B io p h y s . J . , 2, 259 (1962).(10) G. Karreman and G. Eisenman, B u ll . M a th . B io p h y s . , 24, 413 (1962).(11) F. Conti and G. Eisenman, B io p h y s . J . , 5, 247 (1965).
The Journal of Physical Chemistry

CATION SELECTIVITY OF PYREX GLASS ELECTRODE IN FUSED NH4NOa 663
LOG (mole %)
Figure 1. Emf VB. log (concentration). Data for series 5.
(12) (a) C, I. Colvin, P. W. Fearnow, and A. G, Keenan, lnor(J.Chem., 4, 173 (1965); (b) A. G. Keenan and B. Dimitriades, J.Chem. Phys., 37, 1583 (1962), and previous papers.
(13) (a) R. W, Laity and C. T. Moynihan, J. Phys. Chem., 67,723 (1963); (b) I. G. Murgulescu and D. I. Marchidan, ibid., 68,3086 (1964); (c) A. Berlin, F. Menes, S. Forcheri. and Monfrini,ibid., 67, 2505 (1963); (d) F. R. Duke, R. W. Laity, and B. B. Owens,J. Electrochem. Soc., 104, 299 (1957); (e) F. Lantelme and M.Chemla, Electrochim. Acta, 10, 663 (1965).
across a resistance of 1011 ohms in series with the cell.The potentiometer was a Leeds and Northrup TypeK-2. The stability of the cell potential at a given meltcomposition was ±0.1-0.2 mv, and the estimatedaccuracy of the readings is ± 1 mv.
The preconditioned electrodes were soaked overnightin AN prior to each run. In a separate measurement,the asymmetry potentials ,)f the bulbs were determined.These were usually 5 to 10 mv, for which an appropriatecorrection was applied. In each run, salt addition wasnot begun until a steady potential was obtained for thecell with pure AN. This took about 1 hr after theAN melted. After that, a constant potential wasusually attained for each salt concentration within30 min after the added s3,lt had dissolved completely.A complete run required 6 to 10 hr, depending on thenumber of different concentrations used.
Results and DiscussionFour reproducible series of runs were conducted
utilizing two different reference electrodes and threedifferent properly preconditioned bulb electrodes.Typical data are given in Table I for cell emf valuesand corresponding compositions for the addition ofNaNOa, AgNOa, LiNOa, and KNOa for series 5. Theother series gave similar results. If the liquid junctionmodel applies to the data of Table I, a plot of emfagainst log C should be linear. As shown in Figure1, all four species give plots which exhibit curvature,
2o-I-2
0No
EMF,mv
-100p
PLi
-200
in molten ammonium nitrate (AN) to which variouscations were added. AN was chosen as a solvent because it has a low melting point, is a good solvent formany metal nitrates, and, most important, was foundto be relatively inert toward a Pyrex electrode in preliminary work on this subject. Chemical decomposition of AN is virtually negligible at the temperatureused. 12 It is shown that the ion-exchange model correlates the data obtained and that the rank order ofthe selectivity ratios is related to that in aqueoussystems.
Experimental Section
The cell may be represented by
Ag,Ag+ (0.1 m)lfritlAN + cationslbulblAg+ (0.1 m), Ag
The frit-contained reference electrode consisted of alO-mm glass tube closed at the lower end with a gradeVF fritted disk which had been heated to decreasefurther its porosity. Ternary nitrate eutectic containing 0.1 m AgNOa was inside the tube. The exactcomposition of this melt was 17.1 mole % NaNOa,44.9 mole % KNOa, 37.2 mole % LiNOa, and 0.85mole % AgNOa.
The Pyrex bulbs were blown from 7-mm tubing.They were about 11 mm in diameter and had a wallthickness of approximately 0.1 mm. They had aresistance of 1 to 5 megohms and were reasonablysturdy. It was found that in order to obtain reproducible results it was necessary to precondition thebulbs by soaking them in a mixed nitrate melt forseveral days, occasionally passing a current of the orderof microamperes alternately in opposite directions.The bulbs were filled with the same Ag+-containingeutectic used for the reference solutions, and silverwires (99.9+%) were used for both electrodes. Thus,the end electrode emf values cancel, and, since junctionpotentials across a frit are known to be quite smallin fused salt systems of this type,la any changes in thecell potential as the composition of the AN melt isvaried arise at the Pyrex membrane.
The two electrodes dipped into 10 g of molten ANcontained in a test tube which was maintained at190.0 ± 0.5 0 in a thermostated bath. The variouscations tested were added in weighed increments asthe nitrate salts. There is a slight loss of AN due todecomposition and sublimation, amounting to about0.4 wt %/hr. The effect on melt composition isbarely within the limits of accuracy imposed by theemf measurements, but a correction was neverthelessapplied.
Because of the high resistance of the bulbs, a KeitWeyModel 603 electrometer was used as a null indicator
Volume 70, Number 3 March 1966

664 K arl Notz and A. G. K eenan
although to varying degrees. The N a+ line has the longest linear region, with a slope of 90.8 ± 1.4 mv for nine N a+ runs, in agreement with the Nernst value of 91.6 mv at 190°. The curves for the other ions approach this slope as limiting values.
Table I : Emf Data for Various Cations, Series 5
C o n cn , E m f , C o n cn , Emf,m o le % m v m o le % mv
Sodium Silver0.0 -226 .2 0.0 -226 .00.1467 -182 .8 0.0627 -217 .00.6700 -135 .6 0.2425 -198 .72.096 -9 4 .0 0.9323 -164 .26.602 -5 0 .4 2.897 -127 .9
14.432 -1 7 .2 6.446 -9 5 .624.741 4.2 12.132 -7 2 .5
Sodium (duplicate) Lithium0.0 -225 .3 0.0 -227 .30.1037 -190 .9 0.210 -222 .20.5236 -143 .7 0.769 -211.11.954 -9 6 .5 2.437 -188 .46.474 -5 0 .1 6.583 -157 .9
14.278 -1 8 .6 14.241 -129 .225.199 5.7
Potassium0.0 -227 .40.370 -227 .52.012 -222 .46.580 -208 .7
13.739 -197 .0
Equation 1 can be rewritten as
EM F (ca lc) , mv
Figure 2. Experimental emf vs. calculated emf.Data for series 5.
calculated from eq 1 by the computer program, plotted against the experimental. The agreement is seen to be excellent.
Table II: Selectivity Ratios (k) and Co Values
,•------------------------------- S e le c t iv i t y ra t io s -S eries N a + A g + L i + K +
3 1 0.332 0.00744 1 0.334 0.C55 0.00605 1 0.303 0.C58 0.00666 1 0.298 0.051 0.0070
Av 1 0.32 0.055 0.0068
Co (series 5) 0.079 0.079 0.076 0.076
lo g -1~ F (E - E 'Y
2.303R T _— Co H- kCì (2)
where C2 is the variable cation and C0 includes ammonium ion and impurities in the form C0 = ^nelCnhi + 2 ktCf. Since C0 turns out to be negligibly small when kC2 is greater than 1, the constant E ' is obtained directly from the N a+ data and eq 1 as the linearly extrapolated value of E at C2 = 1 mole % . This sets fcNa = 1. An IB M 7040 computer was used to fit least-squares lines to the data according to eq 2. The linearity was quite good giving average standard deviations of 0.0025, 0.0010, and 0.00035 for Ag+, Li+, and K + , respectively. The selectivity ratios are given in TableII. Because of the nature of the data, the most accurate values for C 0 are those calculated directly from the cell emf when C'2 = 0. These values differed somewhat from run to run; the values for series 5 are shown in Table I I . Figure 2 shows emf values
D ata were also obtained for the addition of N a+ to melts already containing A g + or K + , for the alternate addition of Ag+ and Na+, for the addition of Ag+ to a K +-containing melt, and, finally, for the addition of three species. The data are given in Table I I I . Again, eq 1 was used to calculate values for emf, with excellent agreement with the experimental values, as shown in Figure 3.
The reference potential E ' can be calculated by assuming that the experimental values found for the selectivity ratios in A N are also applicable to the mixed alkali nitrates inside the bulb. I t also implies the assumption that the activities of the alkali nitrates mixed with one another are the same function of concentration as those of the individual salts in A N solvent. That the individually determined selectivity ratios also apply to mixed alkali nitrates in A N solvent has already been demonstrated by the data of
The Journal of Physical Chemistry

Cation Selectivity of Pyrex Glass Electrode in Fused NH4N 03 665
EMF (cole), mvFigure 3. Experimental emf vs. calculated emf, for addition of two and three species.
Table III : Emf Data for Addition of More Than One Cation/---------- Ion concn, mole % Emf,
Na + K + A g + Co mv... 13.192 0.081 -5 6 .0
3.628 . . . 12.748 -2 7 .5
14.371 0.087 -176 .70.5552 14.330 • • • -125 .75.4093 13.679 . . . -4 9 .6
0.083 -208 .70.0540 -198 .50.1749 -185 .0
0.1565 0.1751 -159 .20.6493 0.1745 -125.10.6390 1.997 -102 .20.6115 6.389 -7 3 .04.893 6.131 -3 9 .6
13.808 5.573 - 7 .0
13.724 . . . 0.072 -192 .013.697 0.4779 -162 .713.562 1.718 -133 .5
2.459 13.242 1.678 -7 1 .87.841 12.531 1.588 -3 5 .8
Series 3, E' = — 118 mv. 6 Series 4, E' = —119 mv.
Table I I I . The reference potential was calculated from the equation
E ' = - ( R T / F ) In (CT + kC2' + k 'C s' + . . . )
which follows from the derivation of eq 1. Here the primed concentrations refer to the solution inside the Pyrex bulb. The calculated value of E ' is —118.8 mv, while the average of nine experimental values is — 119 .9 ± 2.4 mv. This excellent agreement not only helps confirm the various assumptions for this system, including a negligible junction potential at the frit, but also serves as a check on the internal consistency of the data and calculations.
From the expression for Co an approximate value for ¡¡n h , can be calculated by assuming that there are no cationic impurities present. Assuming that the minimum value of Co corresponds to a complete absence of all impurities, Icnh, = 0.00076. Correcting for the known N a+ content (0.003 mole % ) 14 15 of the A N gives him, = 0.00073. It is this small value of kNh, which makes it possible to use A N as an inert solvent relative to Pyrex membrane potential.
A number of other canons were examined briefly: T1(I), Pb(II), Cd(II), and H g(II). The effect of T1+ is negligible; i.e., replacing N H 4+ with T1+ has no appreciable effect on the membrane potential. Thus, fcTi ~ Icnii.- In aqueous systems, cation-sensitive glass electrodes which are used for monovalent cations are rather inert to divalent ions. However, in the present case a small response was noted. From the data, approximate values for the selectivity ratios were calculated, giving fcpb = 0.003, fccd = 0.008, and kHg — 0.05.
Table IV lists the selectivity ratios found for the monovalent cations and their corresponding radii. Although L i+ seems to be out of place from simple size considerations, the rank order of the alkali metals is the same as that found by Eisenman for his Class X glasses in aqueous solutions.9b He determined the selectivity rank order of 50% silica glasses as a function of the ratio of trivalent to monovalent cations and found that, when this ratio is greater than 0.7, the rank order was H + > N a+ > Li+ > K + > R b+ > C s+. For Pyrex16 the ratio of trivalent to monovalent cations is about 4, well within the proper range. The silica content of Pyrex is rather high, about 80%, but Eisenman has suggested that the trivalent/ monovalent cation ratio is the important factor in determining the rank order of the selectivity ratios.9b He postulates that this ratio determines the coordination number around the trivalent species, which in turn alters the field strength at the exchange sites and thus provides a basis for exchange specificity.
The Li+ data, as shown by the broken line in Figure 1, give positive deviations from the limiting Nernst slope in the concentration range of 15 to 30 mole % . This is apparently the one case in the present systems where the previous assumption of negligible and therefore essentially constant liquid junction potential is not quite valid. Other cases are of course also known.130'16
(14) Sodium analysis was kindly performed by Dr. P. F. Collins, Lithium Corp. of America, Bessemer City, N. C.(15) G. W. Morey, “Properties of Glass,” ACS Monograph, Reinhold Publishing Corp., New York, N. Y., 1938, p 83.(16) C. T. Moynihan and F.. W. Laity, J . P h y s . C h em ., 68, 3312 (1964).
Volume 70, Number § March 1966

666 K arl Notz and A. G. K eenan
Table IV : Selectivity Constants and Ionic Radii
Selectivityconstant, Radius,
Cation k A°
Na + 1.0 0.96Ag + 0.3 1.19Li+ 0.06 0.69K + 0.007 1.33n h 4+ 0.0007 1.43T1 + 0.0007 1.46
a Averages of Goldschmidt and Pauling radii.
Lithium, because of its small size, would be expected to show the greatest deviations. This was borne out by direct measurements of liquid-j unction potentials on cells of the type
Ag
A g N 0 3(25 mole %) N a N 0 3(25 mole %) K N 0 3(25 mole %) L iN 0 3(25 mole %)
A g N 0 3(25 mole %) X N 0 3(37.5 mole %) Y N 0 3(37.5 mole %) ZNO3(0 mole %)
Ag
frit
where X , Y , and Z represent various combinations of Na+, K + , and Li+. When Z was N a+ or K + , the cell potential was —1 and —3 mv, respectively, but, when Z was Li+, the cell potential was 10 mv. Thus, a change in L i+ concentration from 0 to 37.5 mole % caused the high-lithium side of the frit to become 1 1
to 13 m v more positive. This is almost exactly the magnitude of the deviation in AN.
For monovalent cations the primary cause of different mobilities is size difference.17 Thus, in a binary mixture the junction potential will become smaller as the cationic radii become more nearly equal. Fortunately, this is the case for K + in N I L + where the net change in cell potential in the present data is the smallest, and thus a changing liquid-junction potential would be least tolerable.
In view of the rather extensive use of glass bulbs as reference electrodes in fused salts, the importance of a high-sodium content in the melt should be emphasized for such applications. In high-sodium systems the addition of small amounts of other cations, or the inadvertent addition of N a+ as an impurity, will have the least effect on the membrane potential. In this context it may be mentioned that acidity and water content have a negligible effect on the emf measurements reported in this paper. These, however, are of interest with regard to the A N decomposition mechanism and will be discussed in detail in a future publication. Finally, the foregoing results suggest the possibility of using glass electrodes as specific cation indicators in fused salts, analogous to those now available for aqueous solutions. * 573
(17) (a) J. A. A. Ketelaar and E. P. Honig, J . P h y s . C h em ., 68, 1596 (1964); (b) B. De Nooijer and J. A. A. Ketelaar, R ec . T ra v . C h im .,573 83, (1964).
The Journal of Physical Chemistry

7 -R a d io l y s is of L iq u id 2 -P r o p a n o l 667
The 7 -Radiolysis of Liquid 2-Propanol. Effect of Nitrous
Oxide and Sulfuric Acid
by Warren V. Sherman
S oreq N u c le a r R esea rch C en tre , Y a vn e , I s r a e l (R ece iv ed J u ly 2 9 , 1 9 6 6 )
A study has been made of the 7 -radiolysis at relatively low dose of solutions of nitrous oxide and sulfuric acid in 2-propanol. The yields of gaseous products have been determined as a function of solute concentration. The results clearly indicate that nitrous oxide scavenges a precursor of molecular hydrogen, and that this precursor is the solvated electron. In addition, nitrous oxide can scavenge species which do not lead to hydrogen. The results of the radiolysis of solutions containing both nitrous oxide and sulfuric acid are consistent with this species being solvated electrons which do not escape the radiation spurs. The G value for solvated electrons which lead to hydrogen is 0.9. It is proposed that nitrous oxide may be used to determine the relative reactivity of solutes toward the solvated electron in 2-propanol, and values for several organic solutes are reported.
IntroductionHydrogen is the main gaseous product of the radiol
ysis of the lower aliphatic alcohols.1 Part of the hydrogen yield is sensitive to solutes which are good hydrogen-atom scavengers and/or electron acceptors.2 3 4 5 Two precursors of the scavengeable part of the hydrogen yield have been distinguished, namely, the hydrogen atom and the solvated electron.3-5 Nitrous oxide has been used extensively to study the reactions of solvated electrons produced by radiolysis6’7 or photolysis8’9 in water, since it has been shown6’9 that it undergoes a very fast reaction with hydrated electrons while the reaction with hydrogen atoms is relatively slow. Recently, it has been demonstrated10 that nitrous oxide is also an efficient scavenger of electrons produced in the radiolysis of cyclohexane solutions. This present study reports the effect of nitrous oxide on the hydrogen yield in the radiolysis of 2-propanol. Since this solvent is itself very reactive toward hydrogen atoms,11 it would appear to be an appropriate medium in which to use nitrous oxide as a specific reagent for the study of the reactions of solvated electrons.
Experimental SectionMaterials. 2-Propanol (BD H and Eastman Spec-
trograde) was purified by refluxing over dinitrophenyl- hvdrazine and sulfuric acid for 24 hr followed by distil
lation through a 1-m helix-packed column. Both operations were carried out in an atmosphere of nitrogen, and only the middle third of the distillate was retained for use. Nitrous oxide (Matheson) was purified by three trap-to-trap distillations on a vacuum
(1) W. R. McDonnell and A. S. Newton, J . A m . C h em . S oc ., 76, 4651 (1954).(2) P. J. Dyne, D. R. Smith and J. A. Stone, A n n . R ev. P h y s . C h em ., 14, 313 (1963).(3) J. H. Baxendale and F. W. Mellows, J . A m . C h em . S oc ., 83, 4720 (1961).(4) G. E. Adams and R. D. Sedgwick, T ra n s . F a ra d a y S o c ., 60, 865(1964) .(5) J. J. J. Myron and G. R. Freeman, C a n . J . C h e n ., 43, 381(1965) .(6) F. S. Dainton and D. B. Peterson, N a tu re , 186, 878 (1960); P r o c . R o y . S oc . (London), A267, 443 (1962).(7) G. Scholes, M. Simic, and J. J. Weiss, D is c u s s io n s F a ra d a y S oc ., 36, 214 (1963); G. Schoies and M. Simic, J . P h y s . C h em ., 68, 1731 (1964).(8) F. S. Dainton and S. A. Sills, N a tu re , 186, 879 (1960).(9) J. Jortner, M. Ottolenghi, and G. Stein, J . P h y s . C h em ., 6 6 , 2037 (1962).(10) G. Scholes and M. Simic, N a tu re , 202, 895 (1964); G. Scholes, M. Simic, G. E. Adams, J. W. Boag, and B. D. Michael, ibid., 204, 1187 (1964).(11) A. Appleby, G. Scholes, and M. Simic, J . A m . C h em . S o c ., 85, 3891 (1963). This paper reports ■K'h+CïH1ohAh+ Door = 2.25 and &h+C2H6oh/& h+ dc02~ = 0.7, hence k s + C3H7ohA h+C2HsOIi = 3.2. The absolute rate constant k s .+ C2H5OH has been found to be 1.5 X 101 M ~ ' sec-1 (J. P. Sweet and J. K. Thomas, J . P h y s . C h em ., 6 8 , 1363 (1964)). Hence * h+c,h7oh = 5 X 10» A /'1 sec"1.
Volume 70, Number 3 March 1966

668 Warren V. Sherman
line and then distilled into a previously evacuated bulb. The purified sample was cooled to liquid air temperature and pumped on the vacuum line for at least 30 min prior to use to ensure freedom from oxygen. All other materials were of reagent grade and were used without further purification.
Procedure. The radiation vessels, made of Pyrex, consisted of a spherical bulb 3.5 cm in diameter fitted with a break-seal and standard-taper joint. They were attached to the vacuum line and flamed out before use. Standard solutions of the solutes in 2-propanol were prepared, and aliquots (10 ml) were placed in the radiation vessels. These were then attached to the vacuum line and the solutions were thoroughly degassed by the freeze-thaw method. When nitrous oxide was to be added, it was distilled into a bulb of known volume until the desired pressure, measured by a mercury manometer, was reached. The radiation vessel was then cooled in liquid air and the nitrous oxide was allowed to distil in. It was then opened to the vacuum line and sealed. The reaction mixture was allowed to warm to room temperature and was shaken vigorously to ensure complete solution of nitrous oxide. The solutions were then irradiated at room temperature in the Co60 source (Gammacell 200, Atomic Energy of Canada, Ltd.) for 15 min. The total dose was 5.83 X 10 18 ev ml- 1 (determined by the Fricke dosimeter, 0 .1 N H 2S O 4, taking 6?(Fe3+) = 15.5, and correcting for the different electron density of 2-propanol).
The radiation vessel was then attached to the vacuum line and the break-seal was opened with a magnetic hammer. The solution was thoroughly degassed, and the gaseous products were transferred by means of a Toepler pump through a trap at liquid air temperature into a calibrated volume. The pressure was then measured with a McLeod gauge. The gas was then transferred to a gas sampling device and injected into the gas stream of a gas chromatograph (F and M Model 810). A 2-m column of 50-100 mesh molecular sieve 5A (Linde) was used to separate the components. The column temperature was 40° and the carrier gas was helium. The order of elution was hydrogen, oxygen, nitrogen, methane, and carbon monoxide, and the relative response of the hot-wire detector for gas samples in the range 10 -6 to 10 -4 mole was 1:4 0 :4 0 :3 5 :2 8 , respectively. In several experiments the hydrogen yield was measured by combustion over cupric oxide at 200°. The results were within ± 5% of the gas chromatography values.
ResultsThe products of the radiolysis of pure 2-propanol
Figure 1. Hydrogen yields in the presence of nitrous oxide, O, and sulfric acid, •.
which were volatile at liquid nitrogen temperature were hydrogen and methane with yields of (r(H2) = 4.00 and (?(CH4) = 1.36. These values are a mean of six runs, the greatest deviation being ± 3 % . Contrary to previous reports,12'13 no carbon monoxide could be detected.
1. Effect of N itrous Oxide. The results (Table I) are plotted in Figure 1. It may be observed that with
Table I : Effect of Nitrous Oxide on the 7 -Raciolysis of 2-Propanol. Total Dose 5.83 X 10¹⁸ ev ml- 1
Nitrousoxide,m M G(H2) ffCCHO G(Nî)
4 .0 0 1.361 . 0 3 .71 1.17 0 .8 51 .6 3 .6 2 1 .5 2 1.282 . 4 3 .51 1 .2 4 1 .3 43 .5 3 .4 0 1 .2 6 1 .5 95 .9 3 .3 7 1.37 1 .8 7
10 3 .2 5 1.41 2 .0 614 3 .1 6 1.47 2 .4 630 3 .1 5 1 .2 6 2 .3 548 3 .1 8 1 .4 5 2 .7 073 3 .0 6 1 .4 9 2 .7 689 3 .0 0 1 .4 4 3 .0 0
124 3 .1 6 1.38 3 .3 5200 2 .9 0 1.41 3 .5 2300 3 .0 0 1 .3 8 4 .4 4
(12) J. D. Strong and J. G. Burr, J . A m . C h em . S oc ., 81, 775 (1959).(13) R. H. Johnson and D. A. Becker, J . P h y s . C h em ., 67, 831 (1963).
The Journal of Physical Chemistry

7-Radiolysis of Liquid 2-Propanol 669
Table II: 7 -Radiolysis of Solutions of Nitrous Oxide in the Presence of a Second Solute. Total Dose 5.83 X 10¹⁸ ev ml- 1
N itrou sSolute, oxide, A G ( N i ) /
m l m M G (H Z) G (C H .) G (N j) G (N j) '
Sulfuric acid 5.0 5.0 3.95 1.31 1.19 0.51Sulfuric acid 1 0 1 0 3.98 1.23 1.31 0.57Sulfuric acid 50 50 3.90 1.38 1.84 0.47Sulfuric acid 50 1.0 4.45 1.15 0.05Sulfuric acid 5.0 50 2.90 1.26 2.55 0 . 6Benzene 50 1.0 3.65 1.18 0.45 0.89Benzene 50 1 0 3.30 1.35 1.85 0 . 1 1Benzene 50 50 2.94 1 . 2 1 2.64 0 . 0 2Benzene 1 0 0 0 1 0 2.06 1.14 0 . 6 6 2 . 1 2Nitrobenzene 2 . 0 5.0 2.82 1.23 0.94 0.92Nitrobenzene 1 0 1 0 2.96 1.36 0.60 2.44Nitrobenzene 50 50 2.48 1.42 0.82 2.30Nitrobenzene 50 1.0 2.64 1.24 0 . 0 0Carbon tetrachloride 50 50 2.56 1.29 0.83 2.26Benzophenone 50 50 2 . 1 2 1.47 1.17 1.30Acetone 1 0 1 0 3.33 1.32 1.30 0.59
0 AG(N2) = G(N2)0 — G(N2), where G(N2)o is the nitrogen yield in the absence of the second sclute.
increasing nitrous oxide concentration the nitrogen yield increased continuously while the hydrogen yield decreased to a limiting G value of 3 .1 at about 2 X 10 -2 M nitrous oxide, and then remained insensitive to further increases in the solute concentration. The yield of methane appears to be insensitive to nitrous oxide over the whole concentration range studied; No oxygen could be detected as a reaction product.
2. Competitive Studies with Nitrous Oxide and a Second Solute. Solutions of nitrous oxide were irradiated in the presence of sulfuric acid, benzene, nitrobenzene, benzophenone, acetone, and carbon tetrachloride (Table II). With one exception, the nitrogen yields were all less than those obtained when nitrous oxide alone was present. Only in the case of equimolar benzene and nitrous oxide was there no appreciable decrease in the nitrogen yield.
8. Effects of Sulfuric A cid. The hydrogen yields (Table I I I , Figure 1) were very sensitive to increase in acid concentration in the range of 10 ~ 3 to 10 -2 N but the increase became small above 10 _2 N . The methane yield is slightly decreased by the presence of acid, but the yield appears to be independent of changes in acid concentration.
Discussion
The results of the radiolysis of solutions of nitrous oxide in pure 2-propanol indicate that this solute can scavenge at least one intermediate species which leads to molecular hydrogen in the radiolysis of 2-propanol. Since nitrous oxide cannot decrease the hydrogen
Table III: Effect of Sulfuric Acid on the 7 -Radiolysis of 2-Propanol. Total Dose 5.83 X 10¹⁸ ev ml- 1
S ulfu ricacid,m M G O D G (C IL )
0.40 4.32 1 . 2 11.0 4.55 1 . 2 02 . 0 4.75 1.333.0 5.00 1.264.0 4.84 1.305.0 4.97 1.23
1 0 5.25 1 . 2 250 5.18 1 . 1 1
1 0 0 5.50 1.26
yield by more than a G value of 0.9 it must be assumed that this figure is the total yield of these intermediates. In the radiation chemistry of liquid aliphatic alcohols it is generally accepted that the part of the hydrogen yield amenable to scavenging results from the reactions of two primary species, the solvated electron and the hydrogen atom. The pertinence of a hydrogenscavenging process in the 2-propanol-nitrous oxide system must be rejected for the following kinetic considerations. The rate constant for the reaction of hydrogen atoms with 2-propanol in aqueous solution is given as 5 X 10⁷ M ~ l sec- 1 .11 For nitrous oxide at concentrations in the range of 10 ~ 3 to 10 ~ 2 M (i.e., 10~4 to 10 ~ 3 mole fraction) to compete favorably with this reaction, the rate constant would have to be of the order of not less than 10 11 sec- 1 . This figure is
Volume 70, Number 3 March 1966

670 Warren Y. Sherman
greater by about two orders of magnitude than a diffusion-controlled process in this solvent (k m = 3 X 10 9 M - 1 sec- 1 ), as calculated by Debye’s equation.14 Even if the Debye equation breaks down for such a small species as the hydrogen atom and if a reaction rate constant of ~ 1 0 H M ~ l sec- 1 were possible, it would be very difficult to accept such a high figure since in aqueous solution the rate constant was found to be only 1.25 X 10 4 M ~ l sec- 1 15 (a change in rate constant of seven orders of magnitude due to a change in solvent has never been observed).
The contention that the hydrogen precursor which is scavenged by nitrous oxide is the solvated electron is supported by the results of the radiolyses in which a second solute was present. Carbon tetrachloride, nitrobenzene, benzophenone, acetone, and benzene have been shown to be electron acceptors.16-19 All of these compounds decreased the yield of nitrogen, indicating competition with nitrous oxide for the hydrogen precursor. From the decrease in nitrogen yield the following sequence of reactivity obtains: carbon tetrachloride ~ nitrobenzene > nitrous oxide > acetone > > benzene. This sequence is identical with that for the hydrated electron.18'19 Furthermore, the observed greater reactivity of nitrobenzene compared with benzene is in accord with the reactive intermediate being highly nucleophilic in nature since the nitro group has a strong electron-withdrawing effect upon the aromatic ring which has been shown to be the site of attack of the hydrated electron.19
The effect of the presence of a large relative excess of the second solute was tested in the case of nitrobenzene. The complete inhibition of nitrogen indicates that there is no precursor of nitrogen which cannot be scavenged by a good electron acceptor.
The following is a modification of the mechanisms suggested by Adams and Sedgwick4 and Myron and Freeman5 for the formation of hydrogen from three kinetically distinguishable precursors in the radiolysis of alcohols, namely, solvated electrons, hydrogen atoms, and “ molecular” (nonscavengeable) hydrogen.
(CH3)2CHOH [(CH3)2CHOH+ + e- ] (1)
(CH3)2CHOH [(CH3)2COH + H - ] (2)
(CH3)2CHOH [products + H,] (3)
[e- + (CH3)2CHOH — > esoI- ] (4)
[eaoI- + (CH3)2CHOH+ — ^
(CH3)2CHOH*] — ► products (5)
e8„ ,- + (CH3)2CHOH — > (CH3)2C H O - + H- (6)
H- + (CH3)2CHOH — > (CH3)2COH + H2 (7)
The square brackets signify reactions and species within the radiation spurs. The free electrons formed in reaction 1 are rapidly thermalized while still within the spur.20 It has been suggested5 that some of the thermalized electrons are solvated while within the spurs (reaction 4), and the recapture of some of the electrons by parent ions, reaction 5, has been written as involving solvated electrons. This point will be reexamined later.
The presence of a solute, S, which scavenges solvated electrons which are precursors of hydrogen
esoi- + S — ► products (8)
leads to the kinetic expression for the hydrogen yield
1a G(h 2)
___ 1
G(esoi~)X
. , Æ6(C3H7OH)-|1 + J (A)
where A(7(H2) is the difference between the G value for pure 2-propanol (4.00) and in the presence of S, and G (eaoi- ) is the yield of solvated electrons which escape the spur. In Figure 2, 1/A(7(H2) is plotted against (C3H70 H )/(N 20 ). A linear plot is obtained in agreement with nitrous oxide playing a scavenging role. The intercept at (NsO) = 0 indicates a G value for solvated electrons which are precursors of hydrogen of 0.9; the slope gives the relative rate constant, ks/k s =5.9 X 10 3. Using the pulse radiolysis technique, Dorfman and his co-workers21 obtained G (eso¡~) = 1.0 ; the value obtained in the present work agrees well with this value. While no accurate figure for the rate constant for the reaction of solvated electrons with 2-propanol is available, it is known that in aqueous solution it is several orders of magnitude less than for nitrous oxide, in agreement with the present results.
Assuming the bimolecular process (8) for the formation of molecular nitrogen, the expression for l/fr(N 2) is identical with that for 1/A(7(H2). In Figure 3, l/G (N j) is plotted against 1/ (N 20 ). A linear plot is obtained differing in both slope and the value for G - (esoi- ) compared with the 1 / A G ( H 2) plot. The apparent yield of solvated electrons from 'h e 1/G (N 2) plot is 2.5. It is evident that nitrous oxide reacts
(14) P. J. W. Debye, T r a m . E lec troch em . S o c ., 82, 205 (1942).(15) F. S. Dainton and S. A. Sills, P r o c . C h em . S oc ., 223 (1962).(16) J. G. Guarino, M. R. Ronayne, and W. H. Hamill, R a d ia tio n R es ., 17, 379 (1962).(17) G. E. Adams, J. H. Baxendale, and J. W. Boag, P r o c . R o y . S oc. (London), A277, 549 (1964).(18) S. Gordon, E. J. Hart, M. S. Matheson, J. Rabani, and J. K. Thomas, D is c u s s io n s F a ra d a y S o c ., 36, 193 (1963).(19) M. Anbar and E. J. Hart, J . A m . C h em . S oc ., 8 5 , 5633 (1964).(20) A. H. Samuel and J. L. Magee, J . C h em ., P h y s . 21, 1080 (1953).(21) M. C. Sauer, S. Arai, and L. M. Doriman, ib id . 42, 708 (1965).
The Journal of Physical Chemistry

7 -R adiolysis o f L iquid 2 -P ropanol 671
Figure 2. Effect of nitrous oxide on the hydrogen yield.
Figure 3. Nitrogen yields in the presence of nitrous oxide, O, and hydrogen yield in the presence of sulfuric acid, •.
with electrons which yield hydrogen and, in addition, with a species which does not lead to hydrogen gas in the absence of nitrous oxide. The same conclusion has been arrived at by SCholes and Simic10 in their study of the nitrous oxide-cyclohexane system.
The suggestion has been made22 that in aqueous solution nitrous oxide can scavenge electrons which do not
escape the radiation spurs but are recaptured by parent ions (equivalent to reaction 5). B y analogy it is proposed that at least part of the nitrogen yield, G(N2), in excess of AG\H2) is due to this process in2-propanol. Freeman and Fayadh have calculated23 that for a solute to compete successfully with the geminate recombination reaction, expression B must be satisfied.
fce80l-+s (S) } 10 « * 1 sec-1 (B)
If it is assumed that the rate constant for the reaction of solvated electrons with nitrous oxide in 2-propanol is not significantly smaller than that found in water (9 X 10 9 M ~ l sec- 1 ),18 then nitrous oxide satisfies expression B.
It has been suggested that the enhanced hydrogen yield observed in the radiolysis of methanol3 and ethanol4 23 in the presence of acid is due to the hydrogen ion scavenging electrons ir_ the spurs. Since a thermal electron is solvated in ~ 1 0 -10 sec (the dielectric relaxation time of alcohols24), it is implicit in this suggestion that it is the solvated electron which is being scavenged, for even in the event of diffusion-controlled scavenging, an intermediate would have a lifetime of '~ 10 ~ 8 sec in the presence of 0 .1 M scavenger. Hence, to obtain information concerning the solvated electron yield within the spurs it was decided to study the effect of acid in the radiolysis of 2-propanol. The results (Table II) show that nitrous oxide decreased the enhanced hydrogen yield in acid solution, while (7(N2) for a given concentration of nitrous oxide was lower in the presence of acid than at neutral pH. In the case where sulfuric acid was present in 50-fold excess the nitrogen yield was virtually inhibited completely, while when nitrous oxide was present in tenfold excess the hydrogen yield was approximately that which was found when sulfuric acid was absent. It is clear that nitrous oxide and sulfuric acid compete for the same species, and furthermore, that there is no precursor of the enhanced hydrogen yield caused by sulfuric acid which cannot be scavenged by nitrous oxide. If the theory3'4 that the enhanced yields observed in the radiolysis of acidified alcohols are caused solely by the scavenging of electrons in spurs is correct, then the fact that C?(N2) can be reduced to virtually zero by acid would indicate that this process is solely responsible for the nitrogen yields being in excess of A(r(H2)
(22) E. Hayon, J. Phys. Chem., 68, 1242 (1964); Trans. Faraday Soc., 61, 723 (1965).(23) G. R. Freeman and J. M. Fayadh, J. Chem. Phys., 43, 86 (1965). The author is grateful to a referee for drawing his attention to this paper.(24) J. Sobhanadri, J. Sci. Ind. Res., 17B, 202 (1958).
Volume 70, Number 3 March 1966

672 W a r r e n V. S h e r m a n
in the radiolysis of 2-propanol containing nitrous oxide alone (see Table I).
Homogeneous kinetics cannot be applied to reactions in spurs, and the kinetic analysis used to derive expression A cannot be applied to the nitrogen yields in the2-propanol-nitrous oxide system or the hydrogen yields in the 2-propanol-sulfuric acid system. Rather, the situation is complex25 26 and a mathematical analysis is not attempted here. However, it is interesting to note that in both systems the yields conform to a homogenous “ scavenging plot” (Figure 3), and that the intercept at zero solute concentration in the 2-propanol- sulfuric acid system is approximately equal to the difference between the intercepts of the G (N 2) and ACr(H2) plots of the 2-propanol-nitrous oxide system.
Assuming the absence of any species, other than the electron, which could lead to nitrogen formation and then simple competition between nitrous oxide and a second solute, S, gives the expression
&eS0r + s _ AG(N2) (N2Q)K o r + w o _ (?(N2) (S) ( ’
Variation of the relative concentrations of nitrous oxide and S in the case of sulfuric acid, benzene, and nitrobenzene gave nitrogen yields conforming to the above expression (Table II). From the results of the competitive experiments the relative rate constants listed in Table IV may be calculated for the solvated electron in 2-propanol.
The relatively small rate constant obtained for the solvated hydrogen ion requires comment. In aqueous solution it was found that the hydrogen ion was about three times as reactive as nitrous oxide toward the hydrated electron.18 However, in water the recapture of a solvated electron by its parent ion should be less important than in 2-propanol (the acid effect
Table IV: Relative Rate Constants for the Solvated Electron in 2-Propanol
f*C90l + S/Solute kesol■ c3H70H
Carbon tetrachloride 1.3 X 10⁴Nitrobenzene 1.3 X 10⁴Benzophenone 7.7 X 10sNitrous oxide 5.9 X 10sAcetone 3.4 X 10sC3H7OH2 + 3.0 X 10³Benzene 1.2 X 10²
in water leads to an increase in reactive intermediates escaping the spurs of not more than 26% 26) because of the higher dielectric constant which decreases the coulombic attraction between charged particles. In2-propanol, in order to scavenge a major proportion of the solvated electrons produced by radiolysis, the hydrogen ion is required to penetrate the spur which is a region of high positive charge density. Hence, coulombic repulsion becomes an important influence and the observation of a lower rate constant is in accord with the proposed mechanism.27
Acknowledgment. The author is grateful to Dr. Arieh Rajbenbach for his interest and helpful comments. This work was carried out during the tenure of an Israel Atomic Energy Commission Fellowship. The author wishes to thank the staff of the Soreq Nuclear Research Centre for the hospitality extended to him.
(25) A. Kupperman, "Actions Chimiques et Biologique des Radiations,” Vol. 5, M. Haissinsky, Ed., Masson et Cie, Editeurs, Paris, 1961, pp 87-166.(26) A. O. Allen, Radiation Res., Suppl., 4, 54 (1964).(27) A referee has suggested an alternate explanation, namely, that the lower dissociation constant for sulfuric acid in 2-propanol may account for the apparent slowness of the esoi” + C 3H 7O H reaction.
The Journal of Physical Chemistry

C a r b o n I s o t o p e E f f e c t in F o r m a t io n o f H y d r o g e n M a l o n a t e I o n 673
Carbon Isotope Effect in the Formation of Hydrogen Malonate Ion
by W arren E . B uddenbaum , W illiam G . K och , and Peter E . Yankw ich
Noyes Laboratory of Chemistry, University of Illinois, Urbana, Illinois 6180S (Received July SO, 1965)
Measurement of the apparent intermolecular carbon isotope effect in the decomposition of hydrogen malonate ion (in water) as a function of the degree of its conversion to the malonate ion yields a number <j> which is independent of any dynamic quantity but which does depend on equilibria such as a complexing-by-solvent, formation of cyclic structures, etc. A variety of models for the reaction were considered. The results do not support the conclusion that there is a strong symmetrical intramolecular hydrogen bond in hydrogen malonate ion in water but are consistent with the finding of Chapman, Lloyd, and Prince to the effect that any such bond is weak and unsymmetrical. The best agreement between experimental and calculated values is found for a model in which there is complexing-by-solvent (impressed upon general solvation) of the carboxylate group; however, a value for the C - 0 stretching force constant must be assumed which is slightly lower than indicated by direct evidence. The results and the calculations are consistent with an equilibrium constant of about 1.0 1 at 100° for the reaction
H 0 0 C 12C 12H 2C 130 0 - -OO C12C 12H2C 13OOH
Introduction
A decade ago, in a pair of reports from this laboratory,1'2 it was proposed that results for the intermolecular and intramolecular carbon isotope effects in the decarboxylation of hydrogen malonate ion in quinoline solution required for their explanation the assumption that the equilibrium constant, K x, for the exchange reaction
H 0 0 C 12C 12H2C 130 0 - ^ -O O C12C 12H2C 13OOH (1)
was greater than unity and had normal temperature dependence. When the purely kinetic isotope effects were represented by the two-center model of Bigeleisen,3 values of K x were obtained for -COOH and - C 0 2~ sources of carbon dioxide, respectively, of 1.0081 and1.0051 at about 100°, but these results were totally dependent upon the model assumed for calculation of the kinetic isotope effects.
The malonate ion does not decarboxylate; K x is, formally, the ratio of a pair of isotopic acidity constants; the ionization of the second carboxyl group of malonic acid must entail isotope fractionation effects similar to those accompanying the ionization of the first. These three facts led us to the conclusion that the isotopic constitution of hydrogen malonate ion
would be a continuously varying function of the degree of its conversion, p, to the inert malonate ion, and that this variation would be reflected in the apparent value for the intermolecular isotope effect.
In this paper we discuss the relations among com- plexing, cyclization, and ionization isotope effects and report the results of experiments designed to yield a measurement of K x in water solvent at 100.03.
Experim ental Section
M aterials. The malonic acid was Eastm an Kodak Co. White Label grade; it was purified by being sublimed twice in vacuo at 100°. This acid had been subjected to isotope analysis by the methods described in an earlier publication1 ; it was assumed that the purification did not appreciably alter the carbon isotope homogeneity observed previously.
Water for dilution and for solution preparation was of conductance quality and was boiled vigorously just before use to expel carbon dioxide. W ater and solu
(1) P. E. Yankwich and H. S. Weber, J. Am. Chem. Soc., 77, 4513 (1955).(2) P. E. Yankwich and H. S. Weber, ibid., 78 , 564 (1956).(3) J. Bigeleisen, J. Phys. Chem., 56, 823 (1952).
Volume 70, Number 8 March 1966

674 W. E. B u d d e n b a u m , W. G. K o c h , a n d P. E. Y a n k w i c h
tions were stored, when necessary, in Ascarite-pro- tected vessels.
Sodium hydroxide solutions were made from Baker and Adamson Special Reagent low-carbonate sodium hydroxide pellets; potassium hydroxide solutions were obtained by dilution of Stansol standard volumetric concentrate (carbonate-free) potassium hydroxide. Base solutions were standardized against potassium acid phthalate, Baker’s Analyzed reagent, primary standard, which had been air-oven dried for 2 hr at 100°.
Standard acid solutions were prepared by dilution of Du Pont reagent grade sulfuric acid and standardized with one of the solutions of base.
Nitrogen and helium employed to pressurize or sweep were purified immediately before use by being passed through a train consisting of a Vycor tube at 750° containing copper oxide wire and one or more U traps cooled in liquid nitrogen.
Apparatus and Procedure. The type of reaction vessel employed in this study is shown, more or less schematically, in Figure 1. The reactor proper, C, had a volume of about 125 cc; the volumes of the base chamber, B , and acid chamber A, were approximately 75 and 40 cc, respectively; P is a break-off seal, and D, E , and F are thin-wall diaphragms which were broken as needed with glass-covered steel bars moved magnetically. Joints I, J , and N, and others (not shown) which were attached temporarily to tubes G and H served to connect the reactor to a vacuum system at various times.
A weighed sample of malonic acid (5.8-8.7 mmoles) was added through N ; C was then evacuated through N, the latter being sealed at M when evacuation was complete. In similar fashion, B was charged with water and sodium hydroxide solution under 1 atm of pure nitrogen. (The amounts of water and base were adjusted so that the desired degree of conversion of hydrogen malonate to malonate was achieved when the contents of B and C were mixed; the total concentration of organic species was always 0.1986 M at 100°.) Sulfuric acid sufficient to yield a solution of about pH 4 upon addition to the mixed contents of B and C was sealed into A, also under 1 atm of nitrogen.
Except for the uppermost parts of L and I, the entire reactor was immersed in an oil bath thermostated to100.0 ± 0.2°. After 10 min was allowed for establishment of thermal equilibrium, D was ruptured; solution transfer was complete in 3 sec or less, but the reactor was removed from the bath for not more than 20 sec and inverted several times to hasten solution. Reaction times corresponding to an average of 2 %
Figure 1. Reaction vessel for decarboxylations in water.
decomposition were calculated from the data of H all4 and ranged from 1 hr at p = 0.021 to 44 hr at p — 0.976.
When the reaction period had passed, the vessel was removed from the thermostat, and C was cooled in a D ry Ice-alcohol bath until about half of its contents were frozen. Diaphragm E was then ruptured, and the contents of C swirled as they warmed to room temperature. Meanwhile, the reactor was connected at I to a high-vacuum, system through a pair of U traps (cooled in liquid nitrogen) in series, and at J to the supply of pure helium. Diaphragm F and seal P were then broken. Carbon dioxide was swept to the traps by two or three repetitions of the following sequence: reactor and traps isolated from vacuum; helium admitted slowly through J until pressure in system was about 1 . 1 atm ; reactor and traps evacuated slowly.
Carbon dioxide product was purified by several distillations between traps at D ry Ice and liquid nitrogen temperatures. After manometric quantity determination, the carbon dioxide sample was reserved for mass spectrometric analysis.
(4) G. A. Hall, J. Am. Chem. Soc., 71, 2691 (1949).
The Journal of Physical Chemistry

C a r b o n I s o t o p e E f f e c t in F o r m a t io n o f H y d r o g e n M a l o n a t e I o n 675
Isotope A nalyses. The basic procedures employed have been described in detail in previous publications from this laboratory.5 6'6
Reference and Blanks. The reference carbon dioxide was obtained by combustion (in a Pregl-like apparatus) of a number of samples of twice-sublimed malonic acid. The mean mole fraction, X D, of C 13 in these samples was 0.010765 ± 0.000003.
Blank runs and carbonate blank determinations indicated the necessity for correcting the observed isotope ratio of product carbon dioxide, R e , for contamination by carbon dioxide from the atmosphere and from the base solution employed. The adjusted raw ratio (i.e., itself uncorrected for incomplete peak resolution and the contribution to m /q 45 of C 12- 0 160 17), R c , was obtained from the following computation
R _ / Rc'mc - ~ RlMlA ^° \ m e — ma — mb /
wrhere m , is an amount of carbon dioxide in micromoles and R , is a carbon dioxide isotope ratio (C1302/C 120 2); the subscript a refers to carbon dioxide in the laboratory atmosphere, and b refers to that from carbonate contaminant in the base solutions.
In typical experiments, J?a = 0.011785, R\, = 0 .0 118 15 , ma = 1.2 , and m b/ V base = 0.26/ml; the volume of base used ranged from 10 to 23 ml. The value of m e lay between 84 and 170, and R c ' was between 0.011444 and 0.011559. The average correction applied amounted to —0.000015, the range being —0.000010 to —0.000027; in the worst case contamination represented 6.2% of the product carbon dioxide, and in the best case it was only 1.8% .
The mole fraction of C 13, X C) in product carbon dioxide was calculated from the corrected value of Rc using the relation X = R / ( 1 + R ).
Calculations. Rigorously, the apparent intermolecu- lar isotope effect is given by X D/X c only in the limit of infinitesimal degree of reaction. Practically, the error inherent in the use of this expression is smaller than that associated with the mass spectrometry, provided the product is collected up to less than 4 -5% reaction.7’8
In Table I are shown the estimated values of the mole fractions (relative to original malonic acid) of the malonate ion, p, and free acid in each of the seven solutions studied. These values were calculated using K i = 1.40 X 10 ~ 3 (at 25°) for the first acid dissociation of malonic acid, as reported by Jeffery and Vogel,9 and K i = 6.4 X 10 -7 (estimated for 100°) from the data of Hamer, Burton, and Acree.10 * Although
K i and K-> are not known accurately at 100°, this is unimportant except in the case of the most acidic solution. Results obtained with that solution are excluded from consideration because H all4 has shown the rate of decarboxylation of the free acid to be ten times that of the monoanion; since we do not know accurately the intermolecular carbon isotope effect for the free acid decomposition in water, the isotopic constitution of about 20% of the product carbon dioxide obtained from runs with the most acidic solution is unknown. For experiments with the next most acidic solution, this error is one-tenth as large and can be ignored.
Table I: Composition of Solutions Decomposed
,-------------------------------------------M o le F raction ----------------------
Free acidM alon ate ion
(p)
0.021 0.021 ± 0.0050.0019 0.166 ± 0.0050.0005 0.333 ± 0.0060.0002 0.500 ± 0.0060.0000 0.833 ± 0.0070.0000 0.909 ± 0.0070.0000 0.976 ± 0.006
R esults
Measurements of the apparent intermolecular isotope effect were made at seven values of the relative mole fraction of malonate ion, p, between 0.021 and 0.976; values of X D/X :j for each experiment are listed in Table II. The calculated average value of this ratio is shown for each p in the last column of the table, the appended errors being average deviations from the mean; the mean precision of individual X n /X c values is estimated to be ±0.0003, but the scatter of the data is worse than this, ±0.0011. Values of (Xd/ X c)av from the last column of Table I I are plotted vs. p in Figure 2; the vertical open rectangles encompass the average deviations, while the short horizontal bars represent the maximum and minimum result at each p. The dashed line in the figure is a least-squares fit of the data, excluding those for p = 0 .21 (vide supra); its equation is
(5) P. E. Yankwich and R. L. Belford, J. Am. Chem. Soc., 75, 4178 (1953).(6) P. E. Yankwich and R. L. Belford, ibid., 76, 3067 (1954).(7) J. Bigeleisen, Science, 110, 14 (1949).(8) J. Y.-P. Tong and P. E. Yankwich, J. Phys. Chem. 61,540 (1957).(9) G . H. Jeffery and A. I. Vogel, J. Chem. Soc., 21 (1935).(10) W. J. Hamer, J. O. Burton, and S. F. Acree, J. Res. Natl. Bur.Std., 24, 269 (1940).
Volume 70, Number 3 March 1966

676 W. E. B u d d e n b a u m , W. G. K o c h , a n d P. E. Y a n k w i c h
X D/ X C = (1.0433 + 0.0010) -
p(0.0085 ± 0.0014) (3)
the mean deviation of the experimental points from the line is ±0.0016.
Table II : Apparent Intermolecular Isotope Effect in the Decarboxylation of Hydrogen Malonate Ion in Water Solution at 100°
p (X d / X c ) (XD/Xc)av
0.021 1.04391.0426 1.04181.0422 1.0426 ± 0.0006
0.166 1.04121.04151.04201.0420 1.0417 ± 0.0003
0.333 1.04021.03981.04201.0399 1.0405 ± 0.0008
0.500 1.03781.0406 1.0390 1.03821.0372 1.0386 ± 0.0010
0.833 1.04011.0397 1.0379 1.0385 1.03651.0348 1.0379 ± 0.0015
0.909 1.03711.0389 1.0376 1.03311.0337 1.0361 ± 0.0021
0.976 1.03191.03011.0327 1.0316 ± 0.0010
D iscussion
A completely general formulation for the isotope fractionation effects in the solution decomposition of a mono anion must take into account the effects of isotopy on the site of ionization, on degree of formation of the dianion, on solvation, complexing, and configurational (such as cyclization) equilibria, on the locus of the rate-controlling process, and on the result of the products arising from more than one chemical species. In no case reported to date have there been sufficient
0 0.2 0.4 0.6 0.8 1.0MOLE FRACTION OF M ALONATE, P
Figure 2. Influence of degree of conversion to malonate on the apparent intermolecular isotope effect in the decarboxylation of hydrogen malonate ion.
rate, equilibrium, and isotope effect data to permit consideration of such a general model.
In the system under consideration there are special complications due to the presence in each molecule ion of both an intact carboxyl group and a carboxylate function. The energies for hydration of these two are very different: for -COOH one would estimate a free energy of hydration of —1 or — 2 kcal mole- 1 ,11 while that for - C 0 2“ would be expected to be at least — 10 to —15 kcal mole- 1 (vide infra). It is possible that either end of the molecule ion interacts with the solvent in a manner so specific as to give rise to a situation in which the functional group could be said to be complexed by solvent; for the reason just indicated, this is especially true of - C 0 2~. Such a specific interaction would have to be distinguished from the general solvent-solute behavior described by the term solvation.
Further, the monoanions of dicarboxykc acids can form cyclic structures via internal hydrogen bonding,12'13 this being accompanied by such changes in solvation as might follow a significant shift in charge distribution in comparison with the unbonded forms. Such phenomena are also expected to give rise to isotope-fractionation effects.
Assum ptions. To reduce the problem to manageable dimensions, we assume at the start that only one
(11) D. Cartwright and C. B. Monk, J. Chem. Soc., 2500 (1955). This estimate is based on the product of the association constant and the molarity of solvent.(12) I. Jones and F. G. Soper, ibid., 133 (1936).(13) L. Hunter, Chem. Ind. (London), 155 (1953).
The Journal of Physical Chemistry

C a r b o n I s o t o p e E f f e c t in F o r m a t io n o f H y d r o g e n M a l o n a t e I o n 677
Table III: Notation for Equilibrium and Kinetic Processes
A. Species in solution
Mu -OOC12C12H2C12OOH Du -0 0 C 12CI2H2C120 0 -M2: -OOC12C13H2C12OOH D2: -0 0 C 12C1sH2C120 0 -M3:M4:
"OOC12C12H2C13OOH- OOC13C12H2C12OOH
D3j4: -0 0 C 12C12H2C130 0 -
Bg "OOC12C12H2C12OOHS Eu S-OOC12C12H2C12OOHB2: -OOC12C13H2C12OOHS E2: S-OOC12C13H2C12OOHB3: -OOC12C12H2Cl3OOHS E3: S-OOC12C12H2C13OOHB4: -OOC13C12H2C12OOHS Eg S-OOC13CI2H2C12OOH
—0 — H—0 - 0 - —H—0Fu. S-OOC12C12H2C12OOHS 1 1 1 !F2: S"OOC12C13H2C12OOHS Gu 0C 12C12H2C120 G3: 0C 12C12H2Ci30F3: S- 0 0 C '2C12H2C1300HS 0 - 0 - . . . H—0F4: S-OOC13C12H2C12OOHS 1 1 1 I
G2 : 0C 12CI3H2C120 G4: 0 C 13C12H2C120
B. Equilibrium constants
K t(Di)(H)
Ki’ =(Bi) 'Ai = (FO
KxKi
(Mi) (Mi)(S) (Ei)(S) As
Kd'(Ei)
K i" = (E.) As” = (E4)K i" (Es)
' (Mi)(S) (M2)(S) (M 4)(S) (Ms)(S)
"K ,(Fi)
"K 2 = (F2) "A , = (F4)"K i
(Fa)(Bi)(S) (B,)(S) (B4)(S) (Bs)(S)
AO (B4) _ y - IW - K\ b 3) -
Ah
« 1« II „ (E4) A*
x(Es) A „" A ry
Ki° = K iV 'K i) = K,."('AO (Fi) oK . CGi)(M 0(S)2 ** “ (MO
K2° = K iV 'K t) = K,i" ( 'A 2) (F.) 0 *. °^ 3(M2)(S)2 1 “ x°Kt
O 11 II >5 ."('As)(F3)
(Ms)(S)2
A4° = K iV 'K i) = K.i" ( 'A 0 (F4)(M 4)(S)2
C. Specific rate constants
- A - C12H3C120 0 - + C120 2fe
C13H3C120 0 " + C120 2
C12H3C120 0 - + C130 2
C12H3C130 0 - + C120 2
kind of complexing-by-solvent equilibrium can occur at each functional group in ~he hydrogen malonate ion. A bare functional group is one actually involved in just general interaction with solvent molecules; a complexed functional group is one involved in some specific interaction with one or more molecules of solvent— e.g., close association via hydrogen bonding of a single water molecule with charged oxygen in the carboxylate group. For convenience we will assume that all complexing equilibria involve a single solvent molecule. We assume that uncomplexed solute mole
cule ions can exist in both cyclic and noncyclic forms and that differences :n their states of solvation are small in comparison with those denoted bare and complexed just above. Further, we assume that carbon dioxide product may come from either a carboxyl or a carboxylate group and that this source group or that at the other end of the ion may be either bare or complexed by solvent.1’2’6'6’14-16 We assume that all 14
(14) G. Fraenkel, R. L. Belford, and P. E. Yankwieh, J. Am. Chem. Soc., 76, 15 (1954).
Volume 70, Number 3 March 1966

678 W. E. B u d d e n b a u m , W. G. K o c h , a n d P. E . Y a n k w i c h
possible chemical and related isotopic equilibria among the species which could be present are maintained.
Notation for Equilibria and K in etic Processes. Part A of Table I I I is a listing of the various species to be taken into account (note that D 3 and I)4 are identical). Part B summarizes the several kinds of acid and complexing equilibria (the superscripts of the K ’s index the type of equilibrium, and the subscripts index the relation of the site of C 13 to that of the interaction), H being hydrogen ion and S a molecule of solvent (here water). In part C is defined a consistent set of rate constants applicable to the decarboxylation of any species. (No malonate ion solvation or complexing equilibria are assumed; because that species is stable, such equilibria need be considered only in very concentrated solutions where the tie-up of solvent is of possible importance.)
Sim plifying Equalities. The identity of D 3 and D 4 imposes the following relations among the acidity constants, isotopic effects being assumed small
(4)
Carbon isotopy must have very small effects on equilibria involving sites far removed from the position of mass labeling. We do not expect a significant influence on the ionization of a carboxyl group because of an isotope switch in either the methylene or carboxyl- ate carbons17-19; by the same token, isotopy in the adjacent or second carbon atom removed should exert an essentially undetectable effect on solvation at either a carboxylate or carboxyl group. These views are the basis for the assumed equalities listed in part A of Table IV ; those equalities lead to certain others, which are shown in part B. No simple equalities exist among the ° K i because both functional groups are involved in the formation of each Gi. Below, we will show that the ° K i ratios are sensitive to the strength of the
Table IV: Relations among Certain Equilibrium Constants
A. Assumed equalities
K x = K 2 = ~ AY = AY = AY AY' = AY' = AY'
'Ki = 'K, = 'K , "K i = " A 2 = "K 4'Ki = AY "K i = K i"
cyclizing hydrogen bond and to the related symmetry of bonding in the bonded form.
Components o f the Apparent In term od u la r Isotope Effect ( X B/X c ) . The general expression for the apparent intermolecular isotope effect is
( I ) - “ (5)where
/W = ( | ) + ( 2 _ | ) P (6)
with
A = [1 + A x +
(S )(A XA Y + K I + A YA Y' + A Y ') +
(S)2( M 3° + A Y ) + (A x° A 3 + ° A 4)] (7)
and
B = [I + (S)(AY + A Y ') + (S ) 2A Y + ° A 4] (8)
The multiplier J depends on the nature of the group from which product carbon dioxide originates; its values are shown in part A of Table V. The rules by which/(p) and J can be simplified depend upon the equilibria assumed to occur in the system and are summarized in part B of Table V. Note that /(p) does not depend upon the source of carbon dioxide. Application of the relations shown in Table IV and rearrangement reduces eq 7 and 8 to the forms
A = Y Kna n (7')n
and
B = Y Kn ( 8 ')n
The Kn and a n are characteristic of the equilibria assumed to occur, and the summations are taken over all such; however, the terms for to = I must always be included. These quantities are shown in part C of Table V.
M ore than One Source o f Products. Equation 5 is derived for a model in which it is assumed that only one functional group in one kind of species in solution yields a product. Where this is not the case, we have to deal with the general reciprocal of eq 5 15 16 17 18 19
K P
B. Derived equalities7Y o _ jy~ t TZ ! tTV 2 — xV-l J X 1
KP = 'JC = (E8)(F4) A Y 'As (E 4)(F s)KP = 'JU = (B3)(F4) KP "K> (BO(Fs)
(15) P. E. Yankwieh and R. M. Ikeda, J.Am. Chem. Soc., 81, 5054 (1959).(16) P. E. Yankwieh and R. M. Ikeda, ibid. 82, 1891 (1960).(17) K. S. Pitzer, J. Chem. Phys., 8, 714 (1940).(18) K. S. Pitzer, ibid., 17, 1341 (1949).(19) E. Gelles and K. S. Pitzer, J. Am. Chem. Soc., 77, 1974 (1955).
The Journal of Physical Chemistry

C a r b o n I s o t o p e E f f e c t in F o r m a t io n o f H y d r o g e n M a l o n a t e I o n 679
Table V : Components of X ü / X c
A. The multiplier J
Sourceof C02 J
-COOH 1-co2- A*-COOHS Ky-co2-s (K J K ,)-COOH • • • “O- (°A ,/°A ,)- c o 2- - - h - A s(°A 1/ 0A4)
B. Simplification of /( p) and JSituation Rules
I. No complexing, no Ad = A i" = °Xi = 0;cyclizaticn
HIIfcciII
II. No cyclization, complexing at
°Ai = 0 and
a. -COOH only II o !*! II
b. -C 0 2~ only A i' = 0; A y = 1c. -COOH and-C 02- None
III. Cyclization only A i' = A i" = 0; A y = A a = 1IV. Both complexing and Zero and unity rules above, as
cyclization required
C. Values of Kn and an
n Kn «n
I 1 (1 + A ,) / A , \
Ila A,'(S) ( A y + l )lib X i"(S) (Ax + A,)
He Ki'K/'iSy (1+ *•)III °Kt W1MI:)]
\ x j /(p ) ? MrV (5 '>
where the subscript j denotes a species type such as M, B, E , G, or F (see part A of Table III) , and Y , is the relative mole fraction of a decomposing group in species j among all such. For example, suppose that both species M< and B* decompose and that the carboxyl group is the source of product. Then, after rearrangement, we have
fclM +( a - t ò ) ( r n ™ » ì ) .
( s ) . E ™ ] “ " I
I t is important to note that for a given system of decomposition modes the dependence of A n/A c on the
acidity is only through /(p), unless there are structural or mechanism changes brought about by variations in acidity, and to the approximation that activity coefficient variations can be ignored. This simplicity obtains because the hydrogen malonate ion is the only reagent, and the relative concentrations of its several isotopic, complexed, and solvated forms co not depend on acidity constants.
Elim ination of Kinetic Terms. According to eq 5, the quotient of values of X D/A c obtained at two different values of p should be independent of ki/ks and J ; it is still dependent on A x through/(p). We define a number <}> to be this quotient for p = 0 and 1
(X D/ X c)o = ( X c h = /(0 ) = ( ± \ (a)
( X D/ X c h (Xc)o / (l) * \ 2 B J 1 J
The quantity 4> is independent of X D and therefore is independent of isotopic inhomogeneity of the starting material; is a function of the extent of cyclization of the bare monoanion, the degree of complexing by solvent, and of the ionization, complexing, and cyclization isotope effects. From eq 3 and 9, we have
*f>expti = 1.0083 ± 0.0019 (10)
In later discussion it will be convenient to consider the experimental results in comparison with several extremal situations deriving from weak, K _ {S) < < 1, and strong, K -, (S) > > 1, complexing of carboxyl and carboxylate groups, and weak, % < < 1, and strong, ° K { » 1, cyclization. For the several situations described in part C of Table V, it is apparent that
<t>* = (a n/2 ) ( 11)
Because/(p) is a linear function of p, one cannot relate «Êexpti to alone. The interpretation of <f>exPti requires information about K y, K z, and the K -, (S), and/or about the several ° K , and their ratios to each other. No effect of solvation, complexing, cyclization, multiple product sources, etc., can alter the linearity of /(p). Our only insight into the chemical structure of this reaction system lies in the comparison of <£exPti to various 4>n, and estimation of intermediate situations.
For convenience, and to simplify our treatment, we divide the body of our discussion into separate consideration of the effects of complexing alone (situations II) and cyclization alone (situation III) .
M odel Calculations of Certain K ’s. The theory of the calculations of isotopic exchange equilibrium constants which we have carried out has been described in a number of publications of Bigeleisen and his co
Volume 70, Number 3 March 1966

680 W. E. BUDDENBAUM, W. G. KOCH, AND P. E. YANKWICH
The difference of these expressions is
In K x = AD.(~FtiGti - Gi/)Oii) (13)~,J x
where F H and Gii are the F- and G-matrix elementsrespectively, the suffixed prime (') indicates a valu~where the heavier of the two isotopes can appear inan is, D. is the familiar chemical operator, and Oii equals1 when the heavier of two isotopes does appear in is,but otherwise is zero. A ii is characteristic of is, butdepends upon the model as a whole and upon thetemperature; here it will contain appropriate constant factors also. We limit the set (i,j) to thosecoordinates which can be defined for the uncomplexedhydrogen malonate ion; when the ion is complexed,additional coordinates (m) can be defined.
Bigeleisen20 and Bigeleisen and Wolfsberg22 haveshown that in calculations involving isotopic substitution in a group of models which are structurally similarto each other and which have similar distributions ofvibrational frequencies, one can replace the A ii by anaverage value A; this is the origin of the "oy-barmethod." We limit this replacement to the coordinates (i,j). For K x , then, we have
workers20 - 23 ; the practice involves the use of Wilson'smatrix methods24 and the vibrational frequency computer program written by Schachtschneider25 (modifiedin our laboratory). Detailed discussions of certainproblems arising in such computational experimentshave been published recently by Wolfsberg andStern,26 and by Kresge, Lichtin, Rao, and Weston. 27
Our argument will be based on exact calculations',however, for convenience, the relationships amongthe results and various input parameters will be displayed through equations which have the form ofapproximations used before large-scale exact calculations became convenient to execute.
Consider an equilibrium between two species whichhave the same isotopic skeleton; examples for thesystem under discussion are represented by K x , 0 K x ,
K ry, and K rz (which belong to the class whose generalmember is K 1). The logarithm of the equilibriumconstant may be approximated by a double sum overthe internal coordinates, is, of these two species
In K 1 = D.(~AiiFtiGti - Gt/)Oii) (12)'.J 1
that is, a linear function of the changes upon complexingin those force constants associated with coordinateswhich include the isotopic atom. 26
Relative Values of K x , K y , and K z • Regardless ofthe specific site of interaction, complexing of thecarboxyl group would increase the bondedness of thatregion in the ion and operate to make K > K .ry x,
as a result, we expect K y to lie between unity and anumber slightly smaller. Similarly, complexing ofthe carboxylate group would operate to make K rz <K x ; as a result, we expect K z to lie between K x andunity. The simplest structure for complexing of thecarboxyl group involves -0-H· .. oil: hydrogen bonding between a water molecule and the carboxyl hydrogen, while at the carboxylate group thE. complexingwould likely be of the type -'0· .. HoH. 28.29 However,complexing might occur equally well through formation of bridged structures, as suggested by Luz andMeiboom30 and Cocivera and Grunwald,31 in which
(20) J. Bigeleisen and M. G. Mayer, J. Chem. Phys., 15, 261 (1947).
(21) J. Bigeleisen in "Proceedings of the International Symposiumon Isotope Separation, Amsterdam, 1957" North-Holland Publishing Co., Amsterdam, 1958, pp 121-157. '
(22) J. Bigeleisen and M. Wolfsberg, Advan. Chem. Phys. 1 15(1958). ' ,
(23) J. Bigeleisen, Proc. Intern. Conf. Peaceful Uses At. Energy, fJnd,Geneva, 1968, 4, 480 (1959).
(24) E. B. Wilson, Jr., J. C. Decius, and P. C. Cross "MolecularVibrations," McGraw-Hill Book Co., Inc., New York. N. Y., 1955.
(25) J. H. Schachtschneider and R. G. Snyder, Spe~trochim. Acta19, 117 (1963). '
(26) M. Wolfsberg and M. J. Stern, Pure Appl. Chem. 8 225(1964). ' ,
(27) A. J. Kresge, N. N. Lichtin, K. N. Rao, and R. E. Weston,Jr., J. Am. Chem. Soc., 87, 437 (1965).
(28) R. Blinc and D. Hadzi, Spectrochim. Acta, 16,852 (1960).
(29) Here and below, the prefixed prime (') associated with 0 isto identify a charged oxygen in a carboxylate group.
A[D.(~Fij(Gii - Gt/)Oii)t,J x
D.(~Fij(Gti - Gi/)Oti) ] -1,3 ry
[D.(~AmFm(Gm - Gm')5m)rJ (15)
a similar expression can be written for In K z• The important feature of eq 15 is that, regardless of theactual value of K x , the deviations from zero of In K y
(or In K z) arise in two effects due to complexing:first, changes in bonding about the skeletal positionsof isotopy; second, isotopic dependence of frequenciesassociated with new modes of vibration. If complexing produces no significant skeletal structurechanges, the first bracket in eq 15 becomes simply
[D.(t.r[(Fii)X - (Fii)ry][Gii - Gi/:Oti)] (16)
AD.(~Fti(Glj - Gi/)Oii) +t,J ry
D.(LAmFm(Gm - Gm')om) (14)m ry
while
In K ry
The Jotlrnal of Physical Chemistry

C a r b o n I s o t o p e E f f e c t i n F o r m a t io n o f H y d r o g e n M a l o n a t e I o n 681
Table VI: Elements of the Calculations of Several Ki
A. Input parameters C oordinate
Masses: amu; S = 18 bon dbends F
(G - G') X io»
Bond distances (A): C—C = 1.54; C—H == 1.085; C = 0 =1.24; C—0 = 1.45; (J— 'O = 1.36; 0 —H = 0.96; S— 'O = 0 = C —0 1.0 10.7710.986; S—H = 1.53 C—O—H 1.0 3.048
Bond angles: HGH = CCC = HCC = tetrahedral; COH = C—C— 'O 1.0 9.250105°; CCO = OCO = 'OC'O = 'OCC = S'OC = 120°; '0 —C— 'O 1.0 16.284SHO = 170° S— H—O
S— 'O—C1.01.0
03.447
B. Internal coordinatesHydrogen malonate ion: bond stretches (9), bond bends (12), Coordinate, (G - G')
out-of-plane wags (2), torsions to all end atoms (10)“ torsions F X 10*
HMI complexed at C(V~: those of HMI plus bond stretch (1), H—O—C—O 0.1 8.696bond bend (1), torsions (2) H—O—C—C 0.1 11.126HMI complexed at COOH: those of HMI plus bond stretch (1), 0 —C—C—H(2) 0.1 12.117
bond bend (1), torsion (1) 0 —C—C—H (l) 0.1 6.146C. Force constants and G-matrix element differences 0 = C —C—H(2) 0.1 7.950
0 = C —C—H (l) 0.1 14.610C oordinate,
b on dstretches pk (G - G ’)
X 101C
'0(2)—C—C—H(2) '0(2)—C—C—H(l)
0.10.1
13.2346.945
'O(l)—C—C—H(2) 0.1 6.945c —c 4.4 6.410 'O (l)—C—C—H(l) 0.1 10.229C—H 4.5 0 S—H—0 —C 0.1 3.271C = 0 12.1 6.410 S— '0 —C— '0 0.1 17.815C—O 5.0 6.410 S— '0 —c —c 0.1 3.7400 —H 7.7 0C— 'O 7.55' 6.410 O ut-of-p lane
S—H 4.0 0 wags
S— 'O 4.0 0 C—C—0 —0 0.2 29.482C oordinate, C—C— '0 —'0 0.2 28.123
bon d (G - G ')bends F X 10= D. Values of A at 100°
c — c —c 1.1 0 Ä = 0.5470H—C—C 0.68 2.704 As'oc(bend) = 0 5837H—C—H 0.53 0 Ac-'o(stretch) = 0.4870c —c = o 1.0 10.229 A sh o c ( torsion) = 0.7298C—C—0 1.0 8.622 As'oc'o( torsion) == Aa'occ( torsion) = 0.8513
“ It is assumed that there is noz intramolecular carboxylcarboxylate hydrogen bonding {vide infra). b Stretching force constants in mdynes/A; bend, wag, and torsion force constants in mdyne A. All interaction force constants are zero. ‘ Unit is (amu)-1. d Fc-'o was taken as 0.88 of the mean of Fc—o and Fc=o to imitate a net charge effect.
there are specific interactions with both hydroxyl hydrogen and carbonyl oxygen in the case of -COOH and with both C -'O oxygens in the case of -C O 2- . (Below, these types of complexing will be referred to as open and bridged, respectively.) Comparing the complexed and uncomplexed molecule ions, we conclude that, of the bonding changes32 and forces effective because of complexing, the largest is among the latter and is associated with the C - 'O -S bending mode. This leads to the prediction that \KZ — l| > > \Ky —ll. It is important to note here that K y and K z do not depend directly upon the largest of the F m, which is the stretching force constant for the direct association interaction, since that coordinate is carbon isotope
independent; the magnitude of this interaction is, of course, responsible for all of the changes in the F tj upon complexing and for the nonzero magnitude of the other F m. While it is possible for the deviation from unity of K z to exceed that of 7CX, the interaction responsible would have to be of anomalously great strength; in the situation obtaining in the system under discussion, it seems certain that
I f f , - l| > |K z - l| » |K y - 1| (17) 30 31 32
(30) Z. Luz and S. Meiboom, J. Am. Chem. Soc., 85, 3923 (1963).(31) M. Cocivera and E. Grunwald, ibid., 86, 2551 (1964).(32) K. Nakamoto and S. Kishida, J. Chem. Phys., 41, 1554, 1558 (1964).
Volume 70, Number 3 March 1966

682 W. E. B u d d e n b a u m , W. G. K o c h , a n d P. E. Y a n k w i c h
Table VII: <Calculations of Various K\ and 4> for 100°
1 2 3 4 5 6
Kx 1.00891 1.0124g 1.00891 1.00891 1.00891 1.00891(1.0124g) (1.0124g) (1.0124g) (1.0124g)
Ky 0.99950 0.999000.9975“ 0.9980
Kz 1.00403 1.006741.0060 1.0087
°k 3/°k 1 0.99923* 1.00300 0.99718 0 .9941g(0.99923)° (1.00300) (0.99718) (0.9941g)
°Ki/°Ki 1.00133 1.00034 1.00577 1.00285(1.0048g) (1.0038g) (1.00934) (1.00641)1.0034^ 1.0024 1.0003° 1.0002°
01 1.0045 1.00624> lia 1.0047 1.0067
1.0057 1.00774>IIb 1.0065 1.0096
1.0075 1.01061.0067 1.01011.0087 1.0121
1.0047 1.0061 1.0059 1.0024(1.0083) (1.0097) (1.0095) (1.0065)
0exptl ” 1.0083 ± 0.0019
° Bridged --COOH and/or -C 0 2- 6 Calculated with the force field for Kx = 1.00891. ° Calculated with the force field for if* =1.0124g. d One value shown because °fvx is independent of the force field used to compute Kx. ° The deviations from unity of thesevalues arise solely in the error due to our having not symmetrized the geometry of the molecule ion along with the force field; as wasassumed {vide supra) the error is negligible for our purposes.
Calculation In p u t Parameters. No structural information is available for hydrogen malonate ion. We employed a hypothetical geometry for the ion based upon the malonic acid structure used by Stern and Wolfsberg33 in their computational test of approximation methods for estimation and interpretation of kinetic isotope effects: (a) “ Twofold axis bisects theH CH angle; carbonyl groups trans; hydroxyl hydrogens in juxtaposition with opposite carbonyl oxygens; the two OH bonds lie in a plane perpendicular to the twofold axis; the two oxygens in each carboxyl group make equivalent torsional angles with the two methylene hydrogens, respectively.” (b) One carboxyl hydrogen is removed; without change of any angles, the C -'O bond distances in the resulting carboxylate group are set equal to the mean of the original C— 0 and C = 0 distances; the mass point S representing a molecule of water in an open complex is in the plane of 'OC'O or COH, as may be required.
The values of the bond distances, bond angles, and force constants required for the calculations were taken from Stern and Wolfsberg33 or other literature25’34 or were set by us at “ reasonable” levels. In Table Y I
are listed the input parameters and the (G tj — (?,/) for the coordinates defined for the assumed structure; a diagonal valence force field was assumed.
As mentioned above, the values of the various A ’s are characteristic of the S. The single coordinate values shown in part D of Table V I were obtained by noting the result of variation over a suitable range of the appropriate force constant. The value shown for A was obtained from a large number of exact calculations in each of which several force constant shifts were included; the shift ranges were 1 mdyne/A for bond stretches, 1 mdyne A for bond bends, and 0 .1 mdyne A for wags and torsions. The accuracy of A for these species (ion and two complexes) is better than 3% for \Ki — l| in the neighborhood of 0 .0 1; the accuracy increases rapidly as ¡K i — 1 approaches zero.
The influence of complex formation on the F {} should be small. I t seems likely that the largest such effect will be on Fc-'O when the carboxylate oxygen is the
(33) M . J. Stem and M. Wolfsberg, J. Chem. P h y s 39, 2776 (1963).(34) L. Jensorsky, Z. C h e m 3, 453 (1963).
The Journal of Physical Chemistry

C a r b o n I s o t o p e E f f e c t in F o r m a t io n o f H y d r o g e n M a l o n a t e I o n 683
site of interaction. The negative charge on that oxygen will be partially neutralized; however, the S-'O bond should have an order different from zero. We believe that these opposing effects are virtually compensatory. Thus, the first bracketed term in eq 15 is zero in the calculation outlined in Table V I. The results of the computation are shown in Table V II as calculation 1. The unitalicized figures are for open complexes and were obtained by exact calculation; the italicized figures are for bridged complexes and were obtained from adjustment of the exact calculation through eq 15.
Calculation 2 in Table V II was similar to 1 except in the following respects: for K y and K z, torsional force constants for coordinates containing S were given the very high value of 0.3 mdyne A ; for A x, F C- 'o was reduced to 7.0 mdyne/A, a low value not supported by definite evidence. These changes were designed to yield K\ values as deviant from unity as one could expect for models which were physically reasonable, though perhaps marginally so.
To estimate the influence on calculated K x of interactions comprising the difference between the situations in a solvent and in an ideal gas, we modified calculations 1 and 2, using eq 15, by setting all bending and torsional force constants to zero, in imitation of the constricting effect of the solvent. The results were K x = 1.0084 and 1.0 118 , respectively, a very small effect.
Interaction of H ydrogen M alonate Ion with Water. In the absence of a strong symmetrical intramolecular hydrogen bond, it seems likely that the solvations by water of the carboxyl and carboxylate groups in hydrogen malonate ion will be essentially independent of each other. The largest effect expected under these circumstances would be due to partial overlap of their hydration spheres.35 Neglect of this effect is consistent with the assumptions and simplifying equalities shown at the beginning of the Discussion and would be expected to introduce but small error in the estimation of isotopic differential effects.
Noyes36 has tabulated a number of thermodynamic quantities for the hydration of monatomic ions. Assuming that effective ionic radius and charge are the controlling factors, we estimate for the hydration of the carboxylate group —AF ° m — 10 - 15 kcal mole- 1 . The K f S ) related to this estimate is of the order of 108, a value sufficiently large to warrant characterization of the solvation at CO2- as very strong. For carboxyl group solvation, K - f 8) should be drastically smaller because the associated free energy change is that of an ordinary O -II • • O hydrogen bond in circumstances where the configurational entropy change
upon association is small. We estimate for carboxyl solvation that — A F ° m is 1 - 2 kcal mole- 1 ; this estimate seems small, but the relation to the same quantity for carboxylate solvation is appropriate. The K f S) related to this estimate is of the order of 10.
M odel Calculations Related to Cyclization. Part (a) of our description of the assumed geometry of hydrogen malonate ion (vide supra) locates the hydroxyl hydrogen between different end group oxygen atoms. The slight asymmetry of its placement should have little effect on the calculations for the ratios of the ° K ;, for Wolfsberg and Stem 26 have found that computed isotope effects are much less sensitive to changes in geometry than to force constant shifts of comparable magnitude. Calculations 3 -5 in Table V II are for structures which have intramolecular hydrogen bonding between the -COOH and - C 0 2- groups. In Table V III are gathered the force constants which are different from those in part C of Table V I. In calculation 3, the O • • • H bond is given a force constant of 0.4 mdyne/A,32 but none of the skeletal force constants is altered; in calculation 4, the bending force constant C -'O - -H is raised, and certain skeletal force constants are changed in conformity with the observations of Nakamoto and Kishida32; in calculation 5, we imitate a strong symmetrical hydrogen bond in which the nega-
Table VIII : Force Constants Altered for Cyclic Structures
C oordinate3
----------C a lo4
ulation n o .— 5 6
B on dstretches
c=o 12.1 8.056c—0 6.1 7.05°O—H 5.24C—'O 6.95 4.5 7.05'C— 'O S .O ö 5'0 - H 3.4 0.4 3.85 3.85
B on d bends
H ■ • 'O—C 0.1 0.5 0.75 0.750 —H -- '0 C—0 —H
0 . 1 0.1 0.1 0.10.75
T orsions
H—0 —C—0 0 0 0 0'0 —C— '0 - H 0.1 0.1 0.1 0.1
0 Stretching force constants in mdynes/A; bend and torsion force constants in mdyne A. b C— 'O. c C—'O • • • H.
(35) D. Chapman, D. R. Lloyd, and R. H. Prince, J. Chem. Soc., 550 (1964).(36) R. M. Noyes, J. Am. Chem. Soc., 84, 513 (1962).
Volume 70, Number 3 March 1966

684 W. E. B u d d e n b a u m , W. G. K o c h , a n d P. E. Y a n k w i c h
tive charge is divided equally between the two oxygens involved in the 'O ■ ■ H ■ • 'O bond; in calculation 6, we imitate a strong symmetrical hydrogen bond but distribute the negative charge equally over the four oxygen atoms, as in the structure discussed by Chapman, Lloyd, and Prince.85
Comparison of Extrem al </>cakd with <f>expu. The common link in situations I I (complexing) and I I I (cyclization) is K x, and the results may be compared conveniently for the reasonable (1.0089i) and marginally extreme (1.0124g) values of that quantity.
With K x = 1.0089i, none of the is a good match for 0expti; among the f n those derived on the basis of complexing of the carboxylate group are low and marginal if open complexes are assumed but are in excellent agreement with the experimental <j> if bridged complexes are assumed.
When K x = 1.0124g, all of the 4>u are acceptable if the complexes are open, and only complexing at both -COOH and - C 0 2~ (situation lie ) leads to a poor match with experiment if the complexing is of the bridging type; among the <f>m, only that of calculation 6 (negative charge distributed over four oxygens) is unattractive.
Recall that the </>caica values in this tabulation are all extremal values for their respective situations: for II , K i(S) » 1 ; for I I I , % > > 1. Any agreement with experiment which is observed for cyclization models requires assumption of an extreme force field for K x (which, however, may have real validity), as well as an intramolecular interaction so strong that inappreciable uncyclized hydrogen malonate ion remains in solution. While the former assumption is regrettable, the latter is inconsistent with the findings on such hydrogen bonding of Eberson and Wadso87 as well as those of Chapman, Lloyd, and Prince.85 Agreement with experiment for complexing molecules can be achieved for either level of K x, so the problem there is the degree of complex formation. I t seems reasonable that what we have called complexing (a specific solvent-solute interaction impressed upon
general solvation) should involve free energy changes no larger than a few kilocalories per mole; indeed, solvation and complexing of the carboxyl group and complexing of the carboxylate group are likely all in the same energy class, while solvation of the carboxylate group is a much more energetic phenomenon. The related K ¡(S) would be in the range 1- 10 .
These factors lead us to prefer weak complexing, particularly at -CCh- , and a reasonable force field for K x as a route to correspondence between theory and experiment, rather than the combination of an unusually low value of ic - 'o coupled with an assumed strong intramolecular hydrogen bond producing cyclization of the hydrogen malonate ion. Excellent agreement between calculated and experimental values of <t> can be achieved for complexing models with K ;(S) in the range indicated above and an Fc-'o equivalent t o K x = 1.0100.
Conclusions. The results reported here do not support the conclusion of Das and Ives88 that there is a strong symmetrical intramolecular hydrogen bond in hydrogen malonate ion in water solution. The data are consistent with the spectroscopic findings of Chapman, Lloyd, and Prince36 to the effect that any such bond must be weak and therefore unsymmetrical; however, the best correspondence of our results with this model requires the assumption of a value for the C -'O stretching force constant in the carboxylate group which is slightly lower than indicated by direct evidence.
Acknowledgments. We are indebted to our colleagues John A. Beel, R . A. Marcus, and L. B . Sims, for helpful suggestions and discussion. The National Science Foundation assisted W. G. K . by the award of a Science Faculty Fellowship. Mrs. Eula Ihnen and Mrs. Nancy Neilson performed the mass spectro- metric analyses. This research was supported by theU. S. Atomic Energy Commission. 37 38
(37) L. Eberson and I. Wadsô, Acta Chem. Scand., 17, 1552 (1963).(38) S. N. Das and D. J. G. Ives, Proc. Chem. Soc., 373 (1961).
The Journal of Physical Chemistry

V a p o r iz a t io n o f R h e n iu m T r ic h l o r id e a n d R h e n iu m T r ib r o m id e 685
The Vaporization of Rhenium Trichloride and Rhenium Tribromide1 2 3 4 5
by A lfred Biichler, Paul E . Blackburn, and Jam es L . Stauffer
Arthur D. Little, Inc., Cambridge, Massachusetts 02140 {Received August 2, 1965)
The vaporization of rhenium trichloride and rhenium tribromide has been studied mass speetrometrically and (in the case of the chloride) by weight-loss effusion measurements. The vapor was found to consist of effectively pure R e3C l9 and R e3B r 9, with the heats of sublimation of 48.7 ± 1.5 and 47.6 ± 2 kcal/mole, respectively. A gaseous mixed halide, R e3ClBrs, and several oxyhalides were also identified.
Introduction
A number cf compounds containing the trinuclear R e3 group have recently been identified.2-6 The stability of R e3C l9 clusters in solution and the ease with which rhenium trichloride is purified by sublimation6 suggested that R e3C l9 might also be stable in the vapor phase. An examination of the mass spectrum7 of rhenium trichloride vapor showed the trimer ion R e3C l9+ as the largest peak, but did not rule out the presence of monomer and dimer. In the present study we report a detailed examination of the vapor composition and vaporization thermodynamics of rhenium trichloride and tribromide by mass spectro- metric and classical effusion techniques. The results show the gaseous trimers R e3C l9 and R e3B r9 are, in fact, the only species present in the saturated vapor of the trihalides and thus demonstrate again the great stability of the trirhenium cluster.
Experim ental Section
M ass spectrometric experiments were carried out in a Nuclide Corp. 60°-sector, 12-in. radius direction focusing mass spectrometer. A nickel Knudsen cell designed for accurate second-law heat-of-vaporization measurements8 was used as an effusion source. The molecular beam produced was ionized by 60-v electrons. For work with rhenium chloride, an accelerating potential of 4000 v was used, giving a mass range extending to 1250 amu. For rhenium bromide, where the masses observed extended to 1270 amu. an accelerating potential of 3000 v was used. M ass numbers were assigned using a rotating-coil gaussmeter using the singly and doubly ionized mercury peaks at 200 and 100 amu as reference. Groups of peaks were also identified by
means of the isotope distribution of natural Re, Cl, an d B r.9
The vapor pressure of rhenium trichloride was obtained through a weight-loss effusion experiment. The effusion rate of a Pyrex Knudsen cell was measured by means of an automatic null balance designed after that of Cochran.10 A muffite furnace tube wound bifiliarly with Kanthal wire was used to heat the cell. A West proportional controller monitored the temperature through a magnetic amplifier and a saturable reactor. A t the temperatures of the experiment, the pressure in the system was in the 10 -7-torr range. To calibrate the balance, the vapor pressure of zinc11 was measured as a function of the furnace control emf
(1) This work was supported by the Army Research Office, Durham, N. C., under Contract No. DA-31-124-ARO-D-315 and by the U. S. Air Force Office of Scientific Research, Contract No. AF 49(638)-l 171, ARPA Order No. 315-62.(2) (a) J. A. Bertrand, F. A. Cotton, and W. A. Dollase, J. Am. Chem. Soc., 85, 1349 (1963); (b) W. T. Robinson, J. E. Fergusson, and B. R. Penfold, Proc. Chem. Soc., 116 (1963).(3) J. E. Fergusson, B. R. Penfold, and W. T. Robinson, Nature, 201, 181 (1964).(4) F. A. Cotton, N. F. Curtis, C. B. Harris, B. F. G. Johnson, S. J. Lippard, J. T. Mague, W . R. Robinson, and J. S. Wood, Science, 145, 1305 (1964).(5) F. A. Cotton and J. T. Mague, Inorg. Chem., 3, 1094, 1402 (1964).(6) F. A. Cotton and S. J. Lippard, ibid., 4, 59 (1965).(7) K. Rinke and H. Schafer, Angew. Chem., 77, 131 (1965).(8) A. Büchler and J. B. Berkowitz-Mattuck, J. Chem. Phys., 39, 286 (1963).(9) A convenient table of relative mass spectral abundances for Cl„ and Br„ (n = 1-8) is given by J. H. Beynon in “ Mass Spectrometry and Its Applications to Organic Chemistry,” Elsevier Publishing Co., Amsterdam, 1960, p 29S.(10) C. N. Cochran, Rev. Sci. Instr., 29, 1135 (1958).(11) D. R. Stull and G. C. Sinke, “ Thermodynamic Properties of the Elements,” American Chemical Society, Washington, D. C., 1956.
Volume 70, Number 3 March 1966

68 6 A. B ü c h l e r , P. E. B l a c k b u r n , a n d J. L. S t a u f f e r
in the same Knudsen cell used in the rhenium trichloride effusion experiments. A calibration curve was constructed for the control thermocouple voltage vs. the temperature calculated from the zinc pressure and Stull and Sinke’s table.11
Rhenium trichloride was obtained from Alfa Inorganics, Inc. A sample of rhenium tribromide was kindly provided by Dr. S. J . Lippard and ProfessorF. A. Cotton.
R esults
Rhenium Trichloride, a. M a ss Spectrometry. The mass spectrum of rhenium trichloride vapor is given in Table I. The relative intensities shown have been summed over all isotopic species, but no correction for multiplier efficiency has been made. R e3C l9+ is the strongest peak present, followed by a long series of ions showing subsidiary maxima at R e2Cl5+ and R eC l3+ and extending down to R e +. No other species were found up to about mass 1250. The pattern observed is in good agreement with the mass spectrum obtained by Rinke and Schaefer.7 The higher amount of fragment ions observed in the latter investigation is most probably due to differences in performance in the two instruments used. During the initial heating
Table I : Mass Spectra of Rhenium Trichloride and Rhenium Tribromide
Rhenium Trichloride----------- (X =This work
CD------ -— .Ref 7
Rheniumtribromide
(60-ev (70-ev (X = Br)electrons) electrons) This work
Re3X„+ 1 0 0 1 0 0 1 0 0Re3X 3+ 9 . 1 19 36Re3X 7 + 1 . 5 3 4.5Re3X 6 + 1 . 8 3 4.0Re3X 5 + 2 . 1 4 4.6Re3X 4 + 1 . 5 2 2.8üe3X3 + 1 . 1 2 1.6Re3X 2+ 0 . 3 1 1.1Re3X + 1 0.69Re3 + 0.19
Re2X 6 + 15 23 2.0Re2X 5 + 18 31 3.5Re2X 4 + 5 9 2.4Re2X 3 + 4 10 2.5Re2X 2 + 1.6 3 1.0Re2X + 0.75 2 0.48Re2 + 0.46 1 0.18
ReX4 + 2.7 1 0.37ReX3 + 7.3 12 1.5ReX2 + 3.0 6 0.01ReX + 1.6 4 0.14Re + 1.1 6 0.31
of our samples, several additional species, including some oxychlorides, were observed. These are discussed further below.
The ion R e3Cl9+ is obviously the parent ion corresponding to neutral gaseous rhenium trichloride trimer, R e3Cl9(g). There remains the question whether any of the other ionic species are parent ions corresponding to the neutral components of the vapor. In particular, since rhenium trichloride appears to vaporize stoichiometrically, the presence of the monomer Re- Cl3(g) and the dimer R e2Cl6(g) in the vapor might be expected. To resolve this point, the temperature dependence and appearance potential of the six most abundant ion species were obtained. The results of R e3C l9+, R e2Cl6+, and R eC l3+ are shown in Figures 1 and 2. D ata for all six species are summarized in Table II . The slopes of 2.3R log (I + T ) vs. l / T (where I + is the ion intensity in arbitrary units and T
Figure 1. Rhenium chloride slopes.
Figure 2. Appearance potential curves for rhenium trichloride ions.
The Journal of Physical Chemistry

V a p o r iz a t i o n o f R h e n iu m T r ic h l o r id e a n d R h e n iu m T r ib r o m id e 687
is the absolute temperature) for the six ions R e3C l9+, R e3Cl8+, R e2Cl6+, R e2Cl5+, ReCUV and R eC l3+ all fall within 2 kcal of each other, a result which strongly suggests that all of these ions stem from a single neutral precursor, R e3C l9(g). This conclusion is supported by the appearance potential of R e3C l9+ being2.5 ev below that of the next lowest value. In particular, it should be noted that the appearance potentials of R e2Cl6+ and R eC l3+ are, respectively, about 3 and5.5 ev above the appearance potentials of R e3C l9+.The rhenium trichloride monomer and dimer, if present, constitute probably less than 1% of the vapor, whichtherefore may be described as essentially pure R e3C l9.
Table II : Temperature Dependence and Appearance Potentials
fdU +D l2.303 log |_d(1/r)J kcal
Appearancepotential,“
ev
Re3Cl9+ 48.7 ± 0.3 10.5 ± 0.5Re3Clg+ 47.1 ± 1 . 5 13Re2Cl6+ 49.1 ± 0.6 13.5Re2Cl6+ 48.6 ± 0.5 13.5ReClD 47.8 ± 0.1 16ReCl3+ 48.7 ± 1.1 16
“ Corrected for AP(Hg+) = 10.4 ev.
b. Vapor Pressure M easurements. Since the mass spectrometric results indicated the presence of only a single species in the vapor over rhenium trichloride, vapor pressure measurements by the Knudsen-effusion weight-loss technique were undertaken. A 185-mg sample was used. A high initial rate of weight loss, due to highly volatile impurities, was observed. A quarter of the sample was therefore vaporized before measurements were taken. During the measurements the rate of effusion at a given temperature was invariant with respect to time, showing the removal of all impurities. The results obtained are summarized in Table I I I and are plotted in Figure 1. A least- squares fit to the data gives
log pEoîci. (atm) = (10,87 * ° ,39) - 12 .83 ± 0.72
(1)
The resulting heat of sublimation, 49.7 ± 1.9 kcal/ mole, is in excellent agreement with the mass spectrometric data.
Rhenium Tribromide. The mass spectrum of rhenium tribromide vapor is shown in Table I. Again
Figure 3. Rhenium bromide slopes.
Table III: Vapor Pressure of Re3Cl9(g)
T, °K p, atm
513.7 4.16 X 10“ 9529.5 2.11 X 10~8544.2 8.85 X 10~8560.7 2.50 X 10“8576.0 8.58 X 10⁻⁷
the trimer ion, R e3B r9+, with an appearance potential of 10 ev is the most prominent peak, followed by R e3B r8+ with an appearance potential of 12 .5 ev. The over-all pattern resembles that of the rhenium chloride mass spectrum, but the amount of the smaller fragment ions is relatively less. D ata for two runs are given in Figure 3. In this case also, the trimer R e3- B r9(g) appears to be the only species present in the vapor.
D iscussion
Thermodynamics o f Vaporization. Re^CU and R e3- B r s. Heats of sublimation and heats of formation for gaseous R e3C l9 and R e3B r 9 are summarized in TableIV . For R e3C l9 the mass spectrometric slope for R e3C l9(g) was taken as providing the best value. For R e3B r9(g) the four slopes of Figure 3 were averaged. The uncertainties given are estimates. The values of AH s given were obtained by combining the heats of sublimation with the calorimetric heats of formation of R eC l3(c) and R eB r3(c) obtained by King and Cobble.12 No correction was made for the relative
(12) J. P. King and J. W. Cobble, J. Am. Chem. Soc.t 82, 2111 (1960).
Volume 70, Number 8 March 1966

688 A. B ü c h l e r , P. E. B l a c k b u r n , a n d J. L. S t a u f f e r
Figure 4. Re3X 9 structure.
change in heat content between 298 and 550°K . It may be immediately noted that, while the heat of formation of R e3B r9(c) (—1 1 8 kcal/mole) is significantly lower than that of R e3C l9(c) ( — 189 kcal/mole), the two heats of sublimation are essentially equal, suggesting the same bonding between R e3X 9 groups in the two cases.
Table IV : Heats of Formation and Sublimation (kcal/mole)
Ai?aub.66o°K ARf°298
Re3Cl9(g) 48.7 ± 1.5 -1 4 0 ± 3Re3Br9(g) 47.6 ± 2 — 70 ± 4
From the vapor pressure for R e3C l9(g) and the heat of sublimation, we calculate AS3Ub,583°K = 58 eu.This entropy change represents the loss of six vibrational and the gain of three translational and three rotational degrees of freedom. It is probably safe to assume that the structure of the gaseous R esX 9 molecules is very close to that in the condensed phase (Figure 4). Using the distances5 R e -R e = 2.49 A, R e-C l (in-plane) = 2.42A, R e-C l (out-of-plane) = 2.34 A, and Cl (out-of-plane)-Re-Cl (out-of-plane) = 160°, one obtains13 for S transl $ r o t • 83 eu at 600°.The loss of six vibrational frequencies on going from solid to gas thus corresponds to 25 eu or six frequencies of about 150 cm- 1 , a not unreasonable value.
Other Vapor Species. During the initial stages of each experiment, a number of ions were observed which correspond to highly volatile rhenium halides or oxy- halides present as contaminants in the sample. The ions ReOCl.}+, ReOCl3+, and ReOCl2+, with relative intensities 27 :10 0 :9 0 , may be assigned to the known neutral species ReOCh(g).14 Similarly, the ions R e 0 3- C1+, R e 0 2Cl+, ReOCl+, R e 0 3+, R e 0 2+, and ReO+, with relative intensities 1 0 0 : 1 1 : 1 5 : 4 1 : 1 3 : 3 , may be assigned to R e 0 3Cl(g).15 A small amount of R e 0 2Cl2+ points to an as yet unidentified third oxyhalide.
Among halide species, early scans of the mass spec
trum showed the ions R eC l5+ and R e2Cl7+, accompanied by exceptionally high intensities of R eC l4+ and R e2Cl6+. Two of these ions may be assigned to R eC lB(g) giving ReCls+ and R eC l4+ in the ratio 1 : 3 . The precursor of R e2Cl7+ remains as yet unidentified.
In the case of rhenium bromide, the ions R e 0 3Br+, R e 0 3+, R e 0 2+, and ReO+ showed evidence for the existence of R e 0 3Br(g). Some contamination with rhenium chloride occurred in the first rhenium bromide experiment. As a result, the spectrum contained a series of ions R e3C lBrK (n = 1-8 ), showing the existence of the gaseous mixed halide R e3C lBr8.
Conclusions
Perhaps the most interesting feature of the vaporization of the rhenium trichloride is the fact that the vapor consists of a single species. In this respect there is a striking contrast to the tungsten and molybdenum oxides, for instance, where an entire series of polymers is found. Thus W30 9, the major species in tungsten trioxide vapor,16 is accompanied by W 40 i2(g) and W60 i6, while in the W -W 02 system17 the species W 03, W20 6, and W30 9 are found. There is thus every indication that the bond structure in the rhenium halides is much more specific than that in the tungsten trioxide polymers, involving, in fact, bonding through both the rhenium and halogen atoms. In this connection the prominence of R e X 4+ as a fragment ion is of interest since it suggests the bonding of rhenium to four halogens.
The rhenium trihalide trimers appear at this time to be unique in making available an inorganic vapor containing a single large polymeric species. A detailed study of their fragmentation under electron impact may thus be of interest. In the present work evidence for at least one metastable ion was found, corresponding to the reactions
R e3X 9 + e — > (R e3X 9+)* + 2e (2)
(R esX 9+)* — * R e3X 8+ + X (3)
The metastable peak underlies the normal R e3X 9+ group. In the case of rhenium chloride, the meta
(13) G. Herzberg, “ Infrared and Raman Spectra,” D. Van Nostrand Co., Inc., Princeton, N. J., 1945, pp 501-526.(14) N. V. Baryshnikov, A. N. Zelikman, and M. V. Teslitskaya, Zh. Neorgan. Khim., 7, 2634 (1962); Russ. J. Inorg. Chem., 7, 1368 (1962).(15) C. J. Wolf, A. F. Clifford, and W. H. Johnston, J. Am. Chem. Soc., 79, 4257 (1957).(16) J. Berkowitz, W. A. Chupka, and M. G. Inghram, J. Chem. Phys., 27, 85 (1957).(17) G. DeMaria, R. P. Burns, J. Drowart, and M. G. Inghram, ibid., 32, 1373 (1960).
The Journal of Physical Chemistry

D o u b l e - L a y e r C a p a c it a n c e o f AgBr a g a in s t M e t a l l ic E l e c t r o d e s 689
stable peak was about one-third as intense as the normal R e3Cl8+ ion for an ionization voltage of 16 ev (uncorrected), at which voltage the R e3Cl7+ peak had disappeared.
Finally, the appearance of a number of so far unassigned ions suggests the desirability of more extensive
studies of the vapor chemistry of the rhenium halides and oxyhalides.
Acknowledgments. We thank Professor F. A. Cotton and Dr. S. J . Lippard for useful discussions and for the gift of a sample of rhenium tribromide.
The Double-Layer Capacitance of Solid Silver Bromide against
Metallic Electrodes
by Douglas O. Raleigh
North American Aviation Science Center, Thousand Oaks, California (Received August 3, 1965)
The electrochemical double-layer capacitance of solid A gBr has been determined against P t and Au electrodes, using the cell C ,B r2(g)[AgBr(s)|(Pt or Au) at 246 and 293°. With cell voltages corresponding to low silver activities at the metal electrode, differential capacitance values of 200 and 300 yuf/em1 2 were found for P t and Au electrodes, respectively, which are essentially independent of temperature and cell potential. A t higher silver activities, there is an abrupt increase in the apparent capacitance which is attributed to the buildup of a monolayer of plated Ag on the metallic electrode as the decomposition potential of A gBr is approached. A theory due to Grimley and M ott accounts for a portion of the large double-layer capacitance as resulting from a high cation defect concentration in lattice layers of the electrolyte near the electrode interface. To explain the major portion, however, it is necessary to invoke additional sources of capacitance, which are believed to involve the layer of electrolyte ions in contact with the electrode and the precise surface condition of the electrode. The time dependence of the charging current indicates that more than one relaxation process is involved in the double-layer charging.
Introduction
Ionic polarization in crystalline solids has been studied for a number of years1 and has recently become of interest in semiconductor technology.2 In a relatively recent investigation, Friauf3 found anomalously high ac capacitances in polarization studies on AgBr with Ag or Au electrodes. This result was in qualitative accord with an earlier prediction by Grimley and M ott4'5 that a very large ionic defect concentration should exist in AgBr, and in ionic solids in general, at such electrode interfaces. In recent work by the
author on low-level hole conductivity in AgBr,6 an apparatus was employed which in principle can be
(1) See M. F. Manning and M. E. Bell, Rev. Mod. Phys., 12, 215 (1940), for a review of the early literature and P. W. M. Jacobs and J. N. Maycock, J. Chem. Phys., 39, 757 (1963), for an example of recent work and reference to other recent works.(2) F. C. Collins, J. Electrochsm. Soc., 112, 786 (1965).(3) R. J. Friauf, J. Chem. Phys., 22, 1329 (1954).(4) T. B. Grimley and N. F. Mott, Discussions Faraday Soc., 1, 3 (1947).(5) T. B. Grimley, Proc. Roy. Soc. (London), A201, 40 (1950).(6) D. O. Raleigh, J. Phys. Chem. Solids, 26, 329 (1965).
Volume 70, Number 3 March 1966

690 D o u g l a s 0 . R a l e i g h
used to observe electrochemical double-layer charging in this compound under well-defined electrode conditions. Owing to the fact that no previous studies of this type on ionic solids are known and in view of the above, an investigation was carried out.
Solid state polarization cells have been used in a number of instances6-9 to measure low-level electronic conductivity in ionic solids by blocking out ionic conduction. The general configuration of such cells is: reversible electrode| solid ionic conductor] inert electrode. In our earlier work on A gBr,6 we employed the cell C ,B r2(g)|AgBr(s)| (Pt or C). When a potential is impressed on this cell that is positive at the left electrode and is less than the potential thermodynamically required to decompose AgBr(s) into metallic silver and bromine vapor at the ambient electrode pressure (i.e., the potential of the galvanic cell C ,B r2- (g)|AgBr(s)|Ag), there can be no discharge of silver at the inert or so-called blocking electrode on the right and hence no steady-state ionic current from this source. With the cell in this condition, the activity of metallic silver and partial pressure of bromine at the blocking electrode are fixed electrochemically by the applied potential E and are given by
Age ~ (Ed — E ) F / R T
PBT2 V Br2- 2 E F / R T
(1)
(2)
where p°Br2 is the ambient bromine pressure at the reversible bromine electrode, E d is the thermodynamically defined decomposition potential, and F is Faraday’s constant. Equation 2 tells us that, with cell voltages of at least several tenths of a volt, there will be a negligible bromine pressure at the blocking electrode, allowing no steady-state current involving bromine discharge.
There is, then, a wide range of applied potential, about 0.4 to 0.8 v, over which there can be no steady- state ionic current. The cell in this condition is said to be completely polarized, having only a small steady- state electronic hole diffusion current. When one abruptly changes the dc voltage in this range, a transient ionic current flows that represents the charge transfer required to repolarize the cell at the new potential. Since the anode is reversible and one can show that there is no internal polarization in the bulk electrolyte,7 8 9 10 all of the charge transfer goes to repolarize the blocking electrode interface. (A very small portion goes to accommodate a slight stoichiometry shift in the exact A g : B r ratio in the bulk crystal in response to the change in pbt2, but this amounts to about only
of the observed repolarization currents to be reported.) In general, this charge transfer could in
volve both double-layer recharging and limited ionic discharge such as the plateout of, say, a partial mono- layer of Ag at reduced activity. Ionic discharge or faradaic processes, however, should only be important at voltages either approaching E á> where aAg becomes appreciable, or at low voltages, where pnr2 becomes significant. There is a broad middle range where both of these quantities are small and double-layer charging should predominate. In electrochemical terms, our cell arrangement is much like that o: Grahame’s for aqueous solutions,11 employing one ideally polarized and one ideally unpolarized electrode.
Experim ental Section
The preparation, assembly, and heatup procedure for the cell have been described in detail previously.6 The cell consists of a cylindrical single-crystal pellet of AgBr spring-loaded between electrodes, the bromine electrode involving a glass tube abutted to one face of the pellet, within which bromine vapor can be circulated about a graphite supporting electrode. A mirror- smooth high-purity Pt or Au foil on the other pellet face was used for the blocking electrode. The foils employed were polycrystalline with ~ 0 . 1 mm average grain size. The cell was operated in a furnace under a nitrogen atmosphere.
The circuitry for applying voltage steps to the cells is shown in Figure 1. A Philbrick SP656 operational amplifier used as a potentiostat12 maintains the voltage across the cell equal to a reference input voltage, regardless of the instantaneous cell current. The voltage input consists of a pair of standard voltage dividers and a C. P. Clare and Co. Model H G 2A 1072 mercury relay that connects the source of the initial cell voltage either to ground or the source of the step voltage. The cell current in response to a step is monitored across a variable measuring resistor, using a Tektronix Model 564 storage oscilloscope with a Type 63 differential amplifier and Type 3B 3 time base. In this manner, noise-free voltage steps with a 20-/¿sec rise time were obtained and peak currents as high as 20 ma could be examined.
The above arrangement was found to be a convenient one for studying polarization and any rectification effects in a cell of this type. E arly work was carried
(7) J. B. Wagner and C. Wagner, J. Chem. Phys., 26, 1597 (1957).(8) B. Ilschner, ibid., 28, 1109 (1958).(9) A. Morkel and H. Schmalzried, ibid., 36, 3101 (1962).(10) C. Wagner, Proc. Intern. Comm. Eleclrochem. Thermodyn. Kinet., 7, 361 (1957); Z. Elektrochem., 60, 4 (1956).(11) D. C. Grahame, Chem. Rev., 41, 441 (1947).(12) See,- for instance, H. V. Malmstadt, et al., “ Electronics for Scientists,” W. A. Benjamin, Inc., New York, N. Y ., 1962, pp 369, 370.
The Journal of Physical Chemistry

D o u b l e -L a y e r C a p a c it a n c e o f AgBr a g a in s t M e t a l l ic E l e c t r o d e s 691
IO K Û
Figure 1. Circuitry for voltage step application.
out on the cell C ,Br2|AgBr|Pt in the voltage range 0.4 to 0.7 v, where the silver activity and bromine pressure at the blocking electrode are both low, using voltage steps in the range 50-200 mv and cell temperatures 246 and 293°. The temperatures chosen correspond to an approximate fivefold change in the ionic conductivity of AgBr. Application of voltage steps gave abrupt ionic current transients, rising on the time scale of the voltage step, which represented the net passage of ions into or out of the crystal by means of the reversible electrode reaction. Peak currents in the milliamp range were obtained which decayed asymptotically toward zero on the time scale of milliseconds. Since this is slow compared to the rise time of the voltage step, the initial peak current gives the intrinsic or unpolarized resistance of the crystal. The experimental arrangement allowed study of current vs. time down to several per cent of the initial peak current by using various oscilloscope sweep rates and delayed-triggering techniques to amplify tail portions of the current. Using the storage oscilloscope, it was possible to obtain pictorial comparison of the effect of initial voltage, step size, and step direction by superposing current-time sweeps obtained under varying conditions. A more rapid, qualitative idea of these effects could be obtained by using a dc-biased square-wave signal as the input to the operational amplifier and observing the resultant cell current wave form as the bias, amplitude, and frequency of the square wave were varied.
When voltage steps were applied to the cell, successive current-time curves under the same conditions reproduced exactly. Plating out silver on the blocking electrode by exceeding the decomposition potential and then stripping it off to restore the polarized condition did not affect the current-time curves nor did cooling the cell to room temperature, flushing out the bromine, and restoring the bromine flow and cell
Figure 2. Cell current in response to +0.1-V step with Pt blocking electrode. Cell temperature 246°; initial voltage 0.5 v. Ordinate scale: 0.1 ma/cm; abscissa scale: 1msec/cm (upper curve) and 5 msec/cm (lower curve).Horizontal line shows zero current level.
temperature some days later. Figure 2 shows a typical current-time trace at two sweep speeds. The bottom horizontal line is the final steady-state current level, essentially zero, being composed of small hole diffusion and amplifier feedback currents.
I t was important to determine whether the bromine electrode was functioning as a “ well-behaved” reversible electrode, i.e., was acting simply as a shunt for the passage of ionic current into or out of the crystal. E arly trials showed that this could only be assured when the cell was pretreated to achieve good electrode contact. Two tests carried out to check reversibility were (a) the effect of the ambient bromine pressure on a repolarization current curve and (b) whether any rectification effects showed up when current curves for forward and reverse voltage steps (e.g ., 0.5 —*• 0.6 v and 0.6 -> 0.5 v) were compared. In test (a), bromine pressures of 65 and 180 mm were used. When electrode pretreatment was not used, it was frequently found that the initial peak current, which should indicate the intrinsic cell conductance, was higher with increased bromine pressure, that it was higher for forward than for reverse voltage steps, and that the dependence on voltage step direction increased with decreasing bromine pressure. Since the current following a forward voltage step represents the forward direction of the presumed reaction at the reversible electrode, B r _ = 1/ 2B r2(g) + e, and a reverse step represents the reverse direction, this indicated definite polarization and rectification effects at this electrode. I t was found, however, that all of these effects were removed when the cell was heated very briefly to the
Volume 70, Number 3 March 1966

692 D ouglas 0 . R aleig h
Figure 3. Cell currents in response to 0.1-v step for forward (0.5 —» 0.6 v) and reverse (0.6 —* 0.5 v) steps. Cell temperature 293°, Pt blocking electrode. Ordinate: 0.5 ma/cm; abscissa: 0.2 msec/cm (upper set), 1 msec/cm (lower). Curves are congruent on lower set; current for forward step is slightly higher on upper set.
melting point of A gBr to achieve local melting at the bromine electrode. This pretreatment step was carried out in all subsequent runs, and no further dependence of initial current on bromine pressure or voltage step direction was seen. In all cases, the initial current for a given step was independent of initial cell voltage, as expected. It is felt that the original effects explain the anomalous resistance drifts encountered in our previous hole current study6 when ac potentials were applied to the same cell.
Results
Our findings concern both the shape of the currenttime curves and the total integrated current. Comparative photographs under various conditions with the cell C ,B r2|AgBr|Pt showed that in the cell voltage range 0.4 to 0.7 v, both the shape and the total amount of repolarization current varied but little with initial cell voltage, direction of voltage step, and temperature. The first two dependences are shown for the cell at 293° in Figures 3 and 4, using photographs from different runs. A t 246°, the range of variation was smaller. Moreover, superposed current-time traces for step sizes in the range 50-200 mv, when suitably scaled up or down to account for the step size, showed close congruence, indicating the linearity of the repolarization effect. The results, especially the approximate independence of the initial cell voltage, representing a silver activity span at the blocking electrode of two orders of magnitude, indicated we were observing
Figure 4. Cell current in response to forward 0.1 v steps. Temperature, blocking electrode, and current and time scales are as in Figure 3. On upper curve set, initial cell voltage 0.4 v (top), 0.5 v (middle), 0.6 v (bottom).On the lower set, the assignments are the same to start, but the 0.5-v curve drops below the 0.6-v curve near the right end.
a straightforward recharging of the AgBr[Pt interface, which we believe to be pure double-layer recharging.
A t higher cell voltages, approaching the decomposition potential (0.853 v at 246° and 0.824 v at 293°) there was an abrupt increase in the characteristic repolarization time, indicating a considerable increase in the total integrated current. The effect was larger at the higher temperature and was accompanied by the onset of a considerable asymmetry in the current curves in response to forward and reverse voltage steps. The latter is illustrated in Figure 5. As will be discussed, one believes this represents the onset of a faradaic process, involving the limited discharge of Ag+ ions in addition to the double-layer recharging.
It was of interest to develop a graphical method to characterize the current-time behavior and measure the total charge passed in the repolarization. Plots of log (current) vs. time were of interest since our cell at least formally resembles an R C series, R being the resistance of the electrolyte and C the capacitance of the blocking interface. Moreover, this simple electrical analog is the generally accepted model for aqueous cells in the limiting case of one ideally polarized and one ideally unpolarized electrode.11'13 Unlike an R C series, however, plots of log i vs. t in our case were found to be linear only in the limit of long time, indicating that the current decay could not be repre-
(13) D. C. Grahame, J. Electrochem. Soc., 99, 370C (1952).
The Journal of Physical Chemistry

D o u b l e - L a y e r C a p a c it a n c e o f AgBr a g a in s t M e t a l l ic E l e c t r o d e s 693
Figure 5. Cell current in response to forward (lower curve) and reverse (upper) 0.1-v voltage steps at the 0.7-v low-side voltage. Pt blocking electrode, 246°.
sented by a single time constant. To see if the current decay could be represented by a mixture of time constants, the linear tail portion was back-extrapolated to t = 0, subtracted from the total current curve, and the process was iterated if necessary. In this way, it was found that current-time traces from several early runs could invariably be resolved into a mixture of three time constants. Figure 6 shows a typical graphical resolution of this type. Later results, however, indicated that at least part of the current decay shape is the result of the non-unidimensional current flow geometry in our cell since the bromine electrode was substantially smaller than the blocking electrode. In consequence, we do not have a true R C series since one end of our resistor is one face of the capacitor, and, with a non-unidimensional current flow geometry, partial currents flowing to various portions of the blocking interface will encounter different resistances. In later runs, b was possible to achieve an approximately unidimensional current flow geometry; in one run, by tapering down the face of the pellet at the blocking electrode and, in another, by the use of Ag|AgBr as the reversible electrode. In these runs, the short-lived third component was essentially absent, but, as seen in Figure 7, there still appear to be two components to the decay. I t is likely, in consequence, that other factors such as the existence of more than
m illise c (from trig g e r zero)
Figure 6. Three-component graphical resolution of a typical current-time curve from an early run. Dots and crosses are original current-time data; circles and diamonds are the results of the first tail subtraction; triangles are the results of the second tail subtraction. Point designations indicate data extracted from curves at various sweep rates and time delays. The lower two curves are displaced one decade downward for illustration.
one relaxation mechanism for the repolarization process may be involved. In fact, the achievement of resolution into straight exponential decay components may have been fortuitous but, as we shall see, provides a convenient method of calculating the total integrated current.
In general, the exact contributions of the various components of the current decay, considered as shape parameters, were somewhat sensitive to the exact manner in which the graphical analysis was performed and showed nothing definite by way of consistent trends as a function of, say, initial cell voltage or from one run to another. A clear-cut result, however, was
Volume 70, Number 3 March 1966

694 D ouglas 0 . R aleigh
Millisec (from trigger zero}
Figure 7. Two-component graphical resolution obtained from a later run with more nearly unidimensional current flow geometry. The lower curve is the result of the first tail subtraction.
obtained in the temperature dependence of the current decay shape in the cell voltage range 0.4 to 0.7 v. In this respect, it was found that the time scale of the repolarization process was determined solely by the specific conductivity of the A gBr electrolyte. This is shown in Figure 8, where we have compared actual data points at 246° with those predicted from 293° points by using the ratio of A gBr conductivities at the two temperatures to transform the current and time scales. This was done by dividing each current at 293° by o-(293°)/cr(2460) and multiplying each corresponding time by this factor. One sees that the detailed current decay shape is closely independent of temperature.
The total integrated current in response to a voltage step is readily calculated from the graphical analysis procedure of Figures 6 and 7 since, for an exponentially
decaying current component X coit>e-i/T,dt = i0r where
t is the time constant of the decay. In consequence, for the total charge transfer, Q = 2 i 0ir t. With this method, a portion of the total Q, about 15% , is extrapolated to infinity from existing data. The method
Figure 8. Shape comparison of curves obtained in a typical run at different temperatures.
ignores any possible long-time, low-level contributions to the integrated current but measures directly the charge transfer accompanying ~ 9 7 % repolarization of the blocking electrode, the rest being extrapolated on this basis. One feels that any low-level contributions not significant on the observed time scale would belong to an independent electrode process more properly the subject of a separate investigation.
The integrated current in response to a 0 .1-v step, obtained in this way, bore out the above observations from the current-sweep photographs. The results were found to be relatively insensitive to the detailed graphical analysis procedure. Results for a typical run are shown in Figure 9, where they are given in charge transfer per unit area, the blocking interface area having been taken as the area of the A gBr pellet face. Earlier runs in the initial cell voltage range 0.4 to 0.6 v with various A gBr pellets and P t foil samples reproduced the values shown to 5% or better. The same charge transfers per unit area were obtained with electrode interface areas varying by an approximate factor of 2 and with various pellet geometries, though the pellet geometry changed the shape of the current decay, as previously discussed. In the initial voltage range 0.4 to 0.6 v, results from current curves in response to forward and reverse voltage steps
The Journal of Physical Chemistry
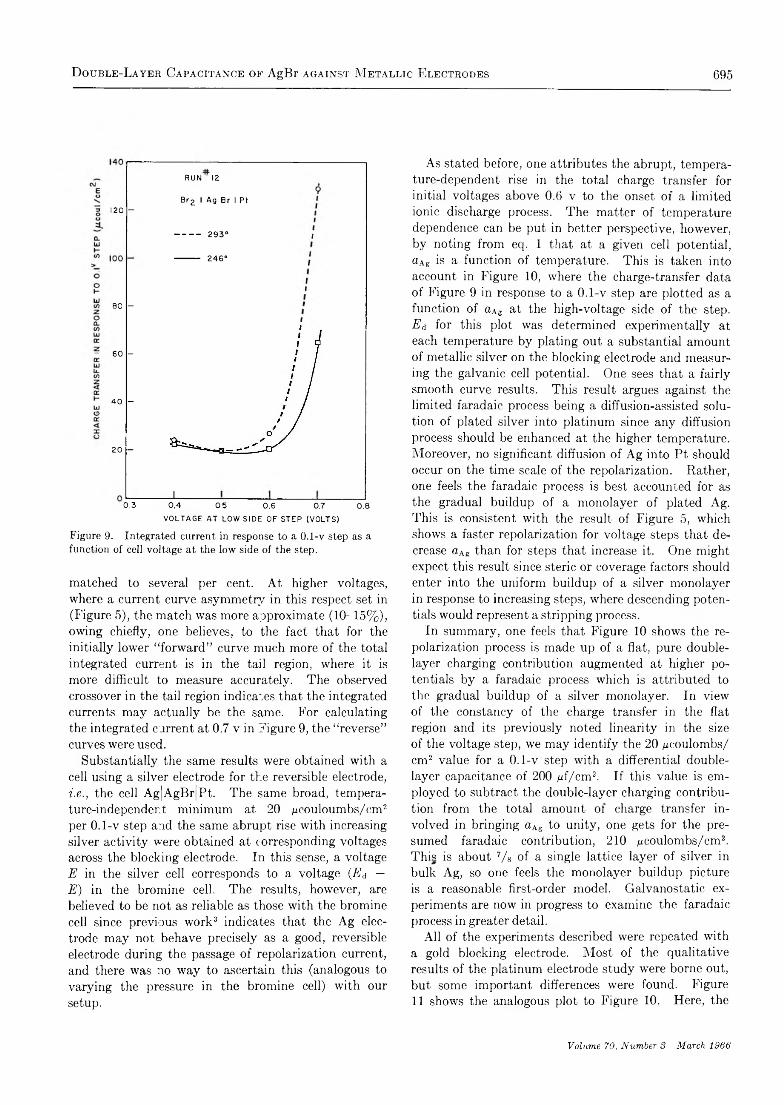
D o u b l e - L a y e r C a p a c it a n c e o f AgBr a g a in s t M e t a l l ic E l e c t r o d e s 695
120 -
80 -
- 6 0 -
4 0 -
20 -
RUN 12
B r z 1 Ag B r I P t
----------- 2 9 3 °
2 4 6 °
X0 .3 0 .4 0.5 0 .6 0.7 0 .8
VOLTAGE AT LOW SIDE OF STEP (VOLTS)
Figure 9. Integrated current in response to a 0.1-v step as a function of cell voltage at the low side of the step.
matched to several per cent. A t higher voltages, where a current curve asymmetry in this respect set in (Figure 5), the match was more approximate (10 -15% ), owing chiefly, one believes, to the fact that for the initially lower “ forward” curve much more of the total integrated current is in the tail region, where it is more difficult to measure accurately. The observed crossover in the tail region indicates that the integrated currents may actually be the same. For calculating the integrated current at 0.7 v in Figure 9, the “ reverse” curves were used.
Substantially the same results were obtained with a cell using a silver electrode for the reversible electrode,i.e ., the cell Ag|AgBr|Pt. The same broad, temperature-independent minimum at 20 ¿tcouloumbs/cm2 per 0 .1-v step and the same abrupt rise with increasing silver activity were obtained at corresponding voltages across the blocking electrode. In this sense, a voltage E in the silver cell corresponds to a voltage (E d — E ) in the bromine cell. The results, however, are believed to be not as reliable as those with the bromine cell since previous work3 indicates that the Ag electrode may not behave precisely as a good, reversible electrode during the passage of repolarization current, and there was no way to ascertain this (analogous to varying the pressure in the bromine cell) with our setup.
As stated before, one attributes the abrupt, temperature-dependent rise in the total charge transfer for initial voltages above 0.6 v to the onset of a limited ionic discharge process. The matter of temperature dependence can be put in better perspective, however, by noting from eq. 1 that at a given cell potential, aAg is a function of temperature. This is taken into account in Figure 10, where the charge-transfer data of Figure 9 in response to a 0 .1-v step are plotted as a function of aAg at the high-voltage side of the step. .Ed for this plot was determined experimentally at each temperature by plating out a substantial amount of metallic silver on the blocking electrode and measuring the galvanic cell potential. One sees that a fairly smooth curve results. This result argues against the limited faradaic process being a diffusion-assisted solution of plated silver into platinum since any diffusion process should be enhanced at the higher temperature. Moreover, no significant diffusion of Ag into P t should occur on the time scale of the repolarization. Rather, one feels the faradaic process is best accounted for as the gradual buildup of a monolayer of plated Ag. This is consistent with the result of Figure 5, which shows a faster repolarization for voltage steps that decrease aAg than for steps that increase it. One might expect this result since steric or coverage factors should enter into the uniform buildup of a silver monolayer in response to increasing steps, where descending potentials would represent a stripping process.
In summary, one feels that Figure 10 shows the repolarization process is made up of a flat, pure doublelayer charging contribution augmented at higher potentials by a faradaic process which is attributed to the gradual buildup of a silver monolayer. In view of the constancy of the charge transfer in the flat region and its previously noted linearity in the size of the voltage step, we may identify the 20 ¿¿coulombs/ cm2 value for a 0 .1-v step with a differential doublelayer capacitance of 200 \xf/cm 2. I f this value is employed to subtract the double-layer charging contribution from the total amount of charge transfer involved in bringing aAg to unity, one gets for the presumed faradaic contribution, 210 ¿¿coulombs/cm2. This is about 7/ 8 of a single lattice layer of silver in bulk Ag, so one feels the monolayer buildup picture is a reasonable first-order model. Galvanostatic experiments are now in progress to examine the faradaic process in greater detail.
All of the experiments described were repeated with a gold blocking electrode. Most of the qualitative results of the platinum electrode study were borne out, but some important differences were found. Figure 1 1 shows the analogous plot to Figure 10. Here, the
Volume 70, Number 3 March 1966

696 D ouglas 0 . R aleig h
Figure 10. Integrated current in response to a 0.1-v step as a function of silver metal activity at the blocking interface at the high side of the step. Cell: Br2[AgBr|Pt.
CLUJ
Figure 11. Integrated current, in response to a 0.1-v step as a function of silver metal activity at the blocking interface at the high side of the step. Cell: Br2|AgBr|Au.
squares and triangles are results from one run, and the dots and crosses from an earlier, less accurately measured one. We see that there is not a well-defined flat region as with Pt, but rather an approach to flatness at low Ag activity. One observed, however, the same essential independence of the size and shape of the current decay on cell voltage, step direction, and temperature as for P t in the slow-rising portion of the Figure 1 1 curve and the same] onset of a forward-reverse current curve asymmetry at higher voltages. One believes the presumed Ag discharge process is setting in at lower activities and not so abruptly. This, however, might be expected from the thermodynamics of the A g-A u system14 since a silver activity of 0.01 at these temperatures corresponds to an average
Ag : Au alloy composition of 10 mole % Ag. I t is not possible, of course, to infer a surface monolayer composition on the basis of thermodynamic data for the bulk alloy, but one might expect a qualitatively similar activity-composition relation.
One also notes for the gold electrode that all of the integrated currents are higher than for Pt, for both the presumed double-layer and faradaic parts. The double-layer contribution, in fact, appears to be about 300 pf/cm2. I t is felt, however, that the doublelayer capacity of A gBr should be the same against any inert electrode metal under comparable electrode surface conditions. In consequence, we feel the difference is best accounted for by assuming a 1.5 surface roughness factor for Au relative to Pt. I f we do so, subtracting out the presumed double-layer charging contribution as before, it appears that the enlarged faradaic part is equally well explained since it amounts to 1.25 monolayer when the surface roughness is corrected for. Because of this and the fact that the same increasing asymmetry of current carves in response to forward and reverse voltage steps were noted as for P t at cell voltages in the rising part of the Figure 1 1 curve, one feels the monolayer buildup model is equally valid for the Au cell.
Finally, in the use of Au electrodes, one noted, on changing the cell voltage, low-level residual cell currents of 1 to 20 fj.ii lasting as long as 5 -10 min. The size and lifetimes of these currents increased with increasing temperature, in contrast to the shorter repolarization time on the millisecond time scale at the higher temperature. They also increased strongly near the decomposition potential. Since at these low current levels the blocking interface is better than 98% repolarized, one attributes the effects to low-level diffusion of plated Ag into the Au. This was verified by spectrographic analysis, which indicated indirectly that diffusion had occurred to the extent of several lattice layers of gold. Similar effects an order of magnitude smaller and shorter lived were seen with the P t electrode. I t is planned to investigate these diffusion processes in greater detail.
Theory
The double-layer capacitances obtained are considerably larger than values typical for aqueous solutions. One asks what can be used for a theory of the doublelayer capacitance of an ionic solid against a metallic electrode. Theoretical treatments have been worked out for aqueous solutions in which extension to ionic solids was suggested.15 Such treatments, however,
(14) A. Wachter, J. Am. Chem. Soc., 54, 4609 (1932).
The Journal of Physical Chemistry

D o xjble -L a y e r C a p a c it a n c e o f AgBr a g a in s t M e t a l l ic E l e c t r o d e s 697
assume a Boltzmann distribution of ionic carriers in the neighborhood of the interface, which Grimley and M ott4’6 have shown is not adequate for solids such as A gBr in view of the high interfacial defect concentrations involved. In the work of these authors, a more exact statistical-mechanical treatment has been worked out for the case of ionic equilibrium at the interface Ag|AgBr. A t the temperatures of our experiments, ionic conduction in A gBr is generally believed to involve equal concentrations of interstitial A g+ ions and Ag+ vacancies (cationic Frenkel defects) as current carriers.15 16 A t an Ag|AgBr interface, however, Grimley and Mott showed that there should arise in the A gBr in response to the electrode potential a distribution of excess cation vacancies about the interface, similar to the diffuse double layer in aqueous solutions. Since the details of this charge layer depend only on the potential across the interface and the defect structure of the AgBr, the treatment may be generalized to consider an arbitrary potential across the interface between A gBr and an inert metallic conductor, such as the blocking interface in our cell. Grimley6 gives for the charge density in this layer (electronic charges per unit area) an expression which, for the temperatures and voltages employed in our work, m ay be reduced with excellent approximation to
<nn/ K k T N \ 1/2j e V
\ 2ire2 ) \kT+ In
n°lN )
V2(3)
where K is the static dielectric constant of AgBr, n0 is the equilibrium concentration of ionized Frenkel defect pairs in the bulk of the crystal, N is the number density of anionic or cationic lattice sites, and V is the potential across the interface. Since any change in the voltage E across our cell will, after the cell has repolarized, cause a change in potential only across the blocking interface, one has b E /d V = 1, so that differentiating the above expression with respect to V gives us the contribution to the experimental differential double-layer capacity from the above process
Using the Grim ley-M ott estimate4 of the Ag|AgBr absolute electrode potential to obtain values of V corresponding to our cell potentials and employing suitable values17 18 of K and n0 for AgBr, one obtains a capacitance which varies only weakly with temperature and cell potential in our range as required but which amounts to an average of about only 40 gf/cm 2. Clearly, one needs an additional source of capacitance to match the experimental results.
Two additional sources of capacitance or charge storage capability are of interest. In aqueous solutions, there often exists an adsorbed layer of electrolyte ions on the metal electrode, whose adsorption-desorption over a range of interface voltage is a source of charge storage. In solid electrolytes, one sees that the last lattice layer against the electrode could be an analogous source since it might consist of predominantly anions or cations, depending on the interface potential. In terms of a crystal lattice picture of alternating layers of anions and cations, the capacitance effect could be considered a sublattice shift augmented by chemisorp- tive forces. The maximum charge storage available would be just one lattice layer since transferring the amount of charge required to remove such a layer would leave a layer of the opposite charge sign.
In AgBr, the charge in one lattice layer of anions or cations is 120 ¿¿coulombs/cm2. While it is difficult to translate this value into maximum capacitance, dividing by E d should give an order-of-magnitude estimate since this is the approximate maximum span of polarizing potential in our cell, voltages of zero and Ed corresponding to extremes of high chemical potential for B r2 and Ag at the blocking interface. One obtains a maximum capacitance of 145 ¿¿f/cm2, a considerably larger value than estimated from eq 4.
An additional capacitance source may be related to the precise surface condition of the electrode metal. We have already attributed our higher capacitance results for gold to a surface roughness factor. Rein, et a l.,is have quite recently shown that the doublelayer capacitance of an aqueous electrolyte (0.2 N H2S 0 4) against silver electrodes is increased by the presence of dislocations, grain boundaries, and abrasions on the electrode surface. A portion of these effects was attributed to an increase in the physical surface area resulting from such irregularities, but it was also felt that surface energy factors were involved. No attempt at a theory was made, but capacitance increases of as much as a factor of 6.6 over that of a liquid mercury electrode (~ 2 0 ¿tf/cm2) were noted. Such effects may well contribute to the capacitances observed in our work, despite the smoothness and relatively large grain size in our electrode foils. Future experiments with single-crystal P t are planned.
(15) J. R. MacDonald and M. K. Brachman, J. Chem. Phys., 22, 1317 (1954); J. R. MacDonald, ibid., 22, 1857 (1954); J. R. MacDonald and C. A. Barlow, ibid., 36, 3062 (1962).(16) A. B. Lidiard, “ Ionic Conductivity, Handbuch der Physik,” Vol. 20, Springer Verlag, Berlin, 1957, pp 260, 261, 287, 288.(17) See ref 16, pp 264, 302.(18) R. G. Rein, C. M. Sliepeevich, and R. D. Daniels, J. Electro- cherrt. Soc., 112, 739 (1965).
Vohimè 70, Number 3 March 1966

698 D o u g l a s O . R a l e i g h
I t is also to be noted that the pellet-melting operation, employed in our work to achieve good contact at the bromine electrode, resulted in some recrystallization of the A gBr in the neighborhood of the blocking electrode, several large grains being formed. The melting operation, however, did not appreciably affect our observed double-layer capacitances. This result might be expected from the small degree of recrystallization and the relatively minor contribution of grain boundary conduction in A gBr at our temperatures.19
Qualitative confirmation of our large double-layer effects in A gBr was found in the work of Friauf,8 who measured the ac impedance of the conductivity cells Ag|AgBr|Ag and Au|AgBr|Au in the temperature range 210-29 2°. In both cells, frequency-dependent capacitance and electrode resistance effects were found which indicated partial discharge blocking at the electrodes. No quantitative values for double-layer capacitance can be inferred since the exact degree of discharge blocking was uncertain. Friauf’s results were compared with a polarization theory in which the double-layer capacity was considered indirectly, in that it was necessary to estimate it for use in the theory for the boundary condition of complete electrode blocking. Friauf used the dielectric constant of A gBr to estimate a Debye length, which he assumed contained ionic defects in the same concentration as in the bulk of the crystal. This leads to a doublelayer capacity of about 4 n f /c m 2. The theoretical results showed the correct frequency and temperature dependence, except that the measured capacitance effects were larger than theory by a factor of 40. It would seem that this constitutes an argument for the size of the double-layer capacitance we have found, even though exact numerical comparison is not possible.
The only other experimental results on double-layer capacity in ionic solids of which the author is aware are
in a brief communication by P al’guev, et a l.,20 regarding the solid electrolyte 0.85ZrO2-0.15CaO. A frequency- dependent ac capacitance was measured against a platinum electrode. Unfortunately, electrode conditions were not well defined in terms of the activities of the electrolyte components, and data were limited mainly to high ac frequencies, so that the full doublelayer capacitance was not measured. It was of interest, however, that in a single experiment, low-frequency capacitances in the range 100-300 /af/cm2 were observed.
Finally, some comment is in order on previous theoretical treatments8'21’22 of ionic polarization in solids under ac potentials. A basic difficulty with these treatments is the necessity of assuming a uniform equilibrium distribution of current-carrying ionic defects throughout the crystal, including the electrode regions, in the absence of the externally applied field. Lidiard23 has pointed out a difficulty in that the thickness of the static space charge effects associated with the double layer may be comparable with the thickness of the polarization layer induced by an ac voltage. Alternately stated, one would think that the electrode regions of the crystal, in view of the large double-layer capacitance, can act as reservoirs for ionic current carriers. This should result in polarization profiles quite different from those predicted by theory on the basis of a uniform static distribution of ionic carriers.
Acknowledgments. The author is grateful to Dr. Robert Osteryoung for encouragement and valuable discussions. Thanks are due to Mr. George Lauer for advice and assistance on matters electronic.
(19) I. Shapiro and I. M. Kolthoff, J. Chem. Phys., 15, 41 (1947),(20) A. T. Filyaev, S. V. Karpachev, and S. F. Pal’guev, Dokl. Akad. Nauk SSSR, 149, 909 (1963).(21) G. Jaffé, Ann. Physik, 16, 217, 249 (1933).(22) J. R. MacDonald, Phys. Rev., 92, 4 (1953).(23) See ref 16, p 320.
The Journal of Physical Chemistry
T h e r m o c h e m ic a l I n v e s t ig a t io n s o f W a t e r - A l c o h o l S o l v e n t S y s t e m s 699
Thermochemical Investigations of the Water-Ethanol and Water-Methanol
Solvent Systems. I. Heats of Mixing, Heats of Solution, and
Heats of Ionization of Water
by G ary L . Bertrand, Frank J. M illero , C hing-hsien W u , and Loren G . H epler
Department of Chemistry, Carnegie Institute of Technology, Pittsburgh, Pennsylvania (Received August 3, 1966)
Differential heats of solution (L) of water and ethanol in various solvents ranging from pure water to pure ethanol have been determined by measuring heats of solution of small quantities of pure water and ethanol in large quantities of the various solvents. Partial molal entropies, based on the pure liquids as standard states, have been calculated for ethanol in water and water in ethanol. The standard (hypothetical 1 m solution) partial molal entropy, heat of formation, and free energy of formation have been calculated for aqueous ethanol. The entropy data show that addition of small amounts of ethanol to water increases the structuredness of the solutions. Heats of solution of NaCl(c) have been determined in various water-ethanol mixtures. Heats of solution of aqueous H C1 and aqueous NaOH have also been determined and used in calculating AH values for solution of HCl(g) and NaOH(c) in the various solvent mixtures. The AH values for solution of NaCl(c), NaOH(c), and HCl(g) all show maxima in the water-rich region, while those for HCl(g) also show a minimum in the ethanol-rich region. Heats of reaction of NaOH with HC1 have been measured and used in calculating heats of ionization of water in the various solvent mixtures. The resulting AH values show a small maximum in the water-rich region. Some similar work has been done on water-methanol systems.
Introduction
Although water-alcohol solvent systems have been much used in a variety of chemical investigations involving determinations of acid ionization constants and rates of reactions as well as synthesis, there are few thermochemical data available for these important systems.
Part of our interest in water-alcohol solvent systems has developed from a general interest in the relations between structure and thermodynamic properties of hydrogen-bonded liquids and their mixtures. In this connection it is important to know some of the thermodynamics of mixing and also the thermodynamics of solution and reaction of various substances in water- alcohol mixtures. The experimental investigations reported here were concerned with determinations of enthalpies for some of these processes. The results permit us to calculate such quantities as excess en
tropies of mixing and partial molal entropies, which yield structural information about these solutions.
Our interest in water-alcohol solvent systems is also derived from recent investigations of the thermodynamics of ionization of organic acids and linear free energy relations.1-6 Since experimental investigations of heats and entropies of ionization of organic acids in water have contributed to our understanding of these processes and related linear free energy relations, it seems likely that similar investigations of other solvent systems will prove similarly useful. Knowledge of heats and entropies of ionization may
(1) L. G. Hepler, / . Am. Chem. Soc., 85, 3089 (1963).(2) C. D. Ritchie and W. F. Sager, Progr. Phys. Org. Chem., 2, 323 (1964).(3) L. G. Hepler, Symposium on Linear Free Energy Correlations, Durham, N. C., 1964.(4) C. D. Ritchie, see ref. 3.(5) L. G. Hepler, J. Phys. Chem., 68 , 2645 (1964).
Volume 70, Number 3 March 1966

700 G. B e r t r a n d , F. M i l l e r o , C. W u, a n d L. H e p l e r
also be expected to lead to better understanding of the solvent dependence of Hammett p values and to understanding certain specific solvent effects. As a first step in determining heats and thence entropies of ionization of organic acids in water-ethanol mixtures, we have determined the heats of ionization of water in various water-ethanol mixtures and report these results here.
Experimental Section
The calorimeter is patterned after one previously described,6 except that a Leeds and Northrup Mueller G-2 bridge and HS galvanometer were used with a nickel wire resistance thermometer for temperature measurements. Also, the resistance thermometer and calibration heater were contained in a glass spiral filled with mineral oil rather than wound on a silver cylinder. All of the calorimetric work reported here was carried out with 950 ml of water, alcohol, or water- alcohol mixture in the calorimeter dewar at 25.00 ± 0 .15 °.
Water-ethanol mixtures were prepared by weight in 950-ml lots from distilled water and U .S.P. 95% ethanol. Experiments with 95-100% ethanol were done with solvent prepared from Reagent QualityU .S.I. absolute ethyl alcohol. Water-methanol mixtures were prepared from either Commercial solvent (minimum purity 99.85%) methanol or 99.8% methanol from Baker. Samples used for heat of solution measurements were 99.8% methanol from Baker.
Aqueous solutions of NaOH and HC1 were prepared and standardized by common procedures. Baker reagent grade N aCl was dried and then used without further purification.
Calibrated pipets were used to obtain aliquots of various solutions for heat of solution and heat of reaction experiments.
Results and Discussion
We have determined heats of solution of small quantities (about 5 ml) of pure water and pure alcohol in large quantities (950 ml) of water, alcohol, and water- alcohol mixtures. The measured heats very closely approximate differential heats of solution from which we obtained L quantities and integral heats of mixing as discussed below. The results are given in Tables I and II . Each value in Tables I - IV is based on at least two measurements. Uncertainties in Lw values range from ± 1 cal mole- 1 in the water-rich region to about ± 4 cal mole- 1 in pure alcohol. Uncertainties in L e and Lm values range from about ± 10 cal mole- 1 in pure water to ± 1 cal mole- 1 in the alcohol-rich regions. In these tables and the following discussion,
Table I: Partial Molar Heats of Solution of Waterand Ethanol in Water-Ethanol Mixtures
Lw, Le,x e cal m ole-1 cal m ole-1
0.0 0 -23800.0335 - 8 -19900.0725 -4 8 -13400.0944 -8 0 -9060.118 -1200.144 -164 -3160.175 -1700.204 -2160.239 -223 +260.321 -2510.328 -248 +430.370 -243 + 510.490 -223 +220.507 -2080.563 -198 + 50.649 -1570.667 -1 30.751 -132 -2 50.768 -1380.875 -161 -2 50.938 -2391.0 -459 0
Table II: Partial Molar Heats of Solution of Waterand Methanol in Water-Methanol Mixtures
Lw, Lm,cal m ole-1 cal m ole-1
0.0 0 -17560.129 -6 0 -7950.241 -165 -3360.307 -207 -2110.399 -241 -1440.499 -2810.550 -2880.568 -294 -9 20.627 -3180.641 -318 -7 30.761 -396 -4 30.773 -4070.784 -4160.828 -461 -2 50.871 -5130.912 -573 - 71.0 -719 0
mole fractions are represented by X , and subscriptsw, e, and m refer to water, ethanol, and methanol,respectively. We have taken the pure liquids tobe reference states so that the differential heats are
(6) W. F. O’Hara, C. H. Wu, and L. G. Hepler, J Chem. Educ.% 38, 512 (1961).
The Journal of Physical Chemistry

T h e r m o c h e m ic a l I n v e s t ig a t io n s o f W a t e r - A l c o h o l S o l v e n t S y s t e m s 701
X2.Figure 1. Illustration of internal consistency of Li (water) and ¿ 2 (ethanol) values. Directly measured L values are represented by circles and L values calculated graphically by means of the Gibbs-Duhem equation from L values for the other component are represented by crosses.
equal to the corresponding L quantities. An illustration of the internal consistency of our data for the water-ethanol system is shown in Figure 1, where some directly measured L values are represented by circles and L values calculated graphically from other L values and the Gibbs-Duhem equation are represented by crosses.
Numerous workers have determined the heat of solution of ethanol in water, corresponding to our Le at X e = 0, and have reported7'8 values close to — 2.4 kcal mole- 1 , in satisfactory agreement with our value. Bose9 has measured heats of mixing in the water-ethanol system at 17 and 42°. Linear interpolations of his data yield integral heats of mixing to form one mole of solution that are in good agreement with values calculated from our data in Table I by means of the equation
A//mix = X 1L 1 + X ,L 2 (1)
Our Lw and Le values are more precise than those calculated by differentiation of Bose’s integral heats of mixing.
Integral heats of mixing in the water-methanol system that are calculated from our Lw and Lm data in Table I I are in good agreement with the directly measured integral heats of Benjamin and Benson.10
Although heats and entropies of mixing can be calculated from the temperature dependence of free
energies obtained from vapor pressures, we know of no relevant vapor pressure data that are accurate enough to justify such a calculation. However, the vapor pressure data of Dobson11 for the water-ethanol system at 25° have been shown by Guggenheim and Adams12 to be internally consistent, and we have used these data as follows. Taking the pure liquids as standard states, we calculate the difference between the partial rnolal entropy of either component and the partial molal entropy that component would have in an ideal solution of the same mole fraction, which could be called an excess partial molal entropy, from the equation
= St - 5 i (ideal) = § + R In (2)1 1 i
The results of these calculations, shown in Figure 2, demonstrate that addition of a little of either component to the other pure component has a structure- forming influence in the water-ethanol system.
Although some considerations might suggest that addition of a nonelectrolyte to water should result in a decrease in molecular order due to interference of the solute molecules with the normal hydrogen-bonded structure of water, these entropies show clearly that ethanol molecules increase the structuredness of the water, in agreement with the “ iceberg” picture of Frank and Evans.13 The positive slope of the AeE curve in Figure 2 shows that the effectiveness of a given molecule of ethanol in promoting structure decreases with increasing alcohol concentration, possibly owing to the resulting overlapping of “ icebergs” or highly disordered regions between “ icebergs.”
For thermodynamic calculations involving reactions in which aqueous ethanol is a reactant or product, it is desirable to have the standard free energy and heat of formation and the partial molal entropy in terms of the hypothetical 1 m solution. To this end we have used Dobson’s data11 for evaluation of the Henry’s law constant on the molality scale for aqueous ethanol and thence evaluated the standard free energy of solution of gaseous ethanol in water. From this AG ° value and the standard free energy of gaseous
(7) “ Selected Values of Chemical Thermodynamic Properties,” National Bureau of Standards Circular 500, U. S. Government Printing Office, Washington, D. C., 1952.(8) E. M. Arnett, W. G. Bentrude, J. J. Burke, and P. M. Duggleby, J. Am. Chem. Soc., 87, 1541 (1965).(9) E. Bose, Z. Physik. Chem. (Leipzig), 58, 585 (1907).(10) L. Benjamin and G. C. Benson, J. Phys. Chem., 67, 858 (1963).(11) H. J. E. Dobson, J. Chem. Soc., 2866 (1925).(12) E. A. Guggenheim and N. K. Adams, Proc. Roy. Soc. (London), A139, 231 (1933).(13) H. S. Frank and M. W. Evans, J. Chem. Phys., 13, 507 (1945).
Volume 70, Number S March 1966
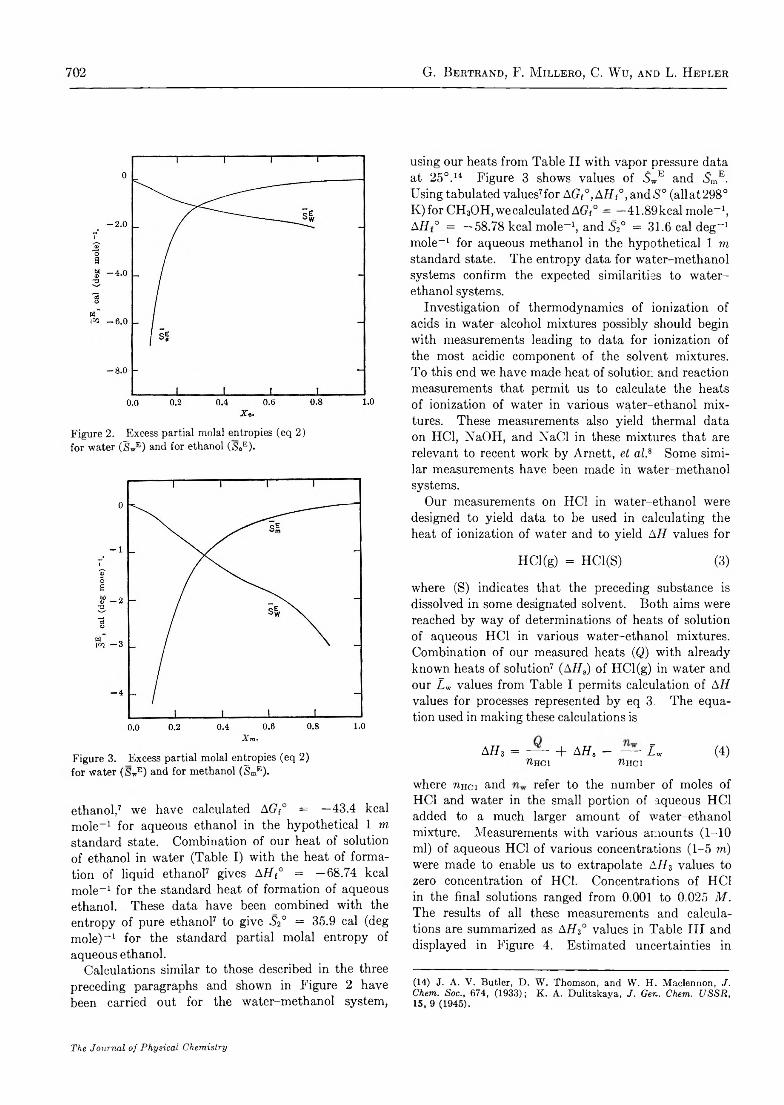
702 G. B e r t r a n d , F. M i l l e r o , C. W ü, a n d L. H e p l e r
Figure 2. Excess partial molal entropies (eq 2) for water (SWE) and for éthanol (SeE)-
Xm.
Figure 3. Excess partial molal entropies (eq 2) for water (SwE) and for methanol (SmE).
ethanol,7 we have calculated A G ¡° = —43.4 kcal mole- 1 for aqueous ethanol in the hypothetical 1 m standard state. Combination of our heat of solution of ethanol in water (Table I) with the heat of formation of liquid ethanol7 gives AH {° = —68.74 kcal mole- 1 for the standard heat of formation of aqueous ethanol. These data have been combined with the entropy of pure ethanol7 to give S\° = 35.9 cal (deg mole)- 1 for the standard partial molal entropy of aqueous ethanol.
Calculations similar to those described in the three preceding paragraphs and shown in Figure 2 have been carried out for the water-methanol system,
using our heats from Table I I with vapor pressure data at 2 5 °.14 Figure 3 shows values of 5 WE and 5 mE. Using tabulated values7for AGf°, A//f°,andiS'° (allat298° K ) for CH 3OH, we calculated AGf° = —41.89 kcal mole- 1 , AH ° = —58.78 kcal mole- 1 , and S i° = 31.6 cal deg- 1 mole- 1 for aqueous methanol in the hypothetical 1 m standard state. The entropy data for water-methanol systems confirm the expected similarities to w ater- ethanol systems.
Investigation of thermodynamics of ionization of acids in water-alcohol mixtures possibly should begin with measurements leading to data for ionization of the most acidic component of the solvent mixtures. To this end we have made heat of solution and reaction measurements that permit us to calculate the heats of ionization of water in various water-ethanol mixtures. These measurements also yield thermal data on HC1, NaOH, and N aCl in these mixtures that are relevant to recent work by Arnett, et al.H Some similar measurements have been made in water-methanol systems.
Our measurements on HC1 in water-ethanol were designed to yield data to be used in calculating the heat of ionization of water and to yield AH values for
HCl(g) = HC1(S) (3)
where (S) indicates that the preceding substance is dissolved in some designated solvent. Both aims were reached by way of determinations of heats of solution of aqueous HC1 in various water-ethanol mixtures. Combination of our measured heats (Q) with already known heats of solution7 (AH B) of HCl(g) in water and our Z w values from Table I permits calculation of A H values for processes represented by eq 3. The equation used in making these calculations is
A H 3 = — + AH a - — Z , (4)R h CI ilH C l
where nHci and refer to the number of moles of HC1 and water in the small portion of aqueous HC1 added to a much larger amount of water-ethanol mixture. Measurements with various amounts ( 1 - 10 ml) of aqueous HC1 of various concentrations ( 1-5 m) were made to enable us to extrapolate AH 3 values to zero concentration of HC1. Concentrations of HC1 in the final solutions ranged from 0.001 to 0.025 M . The results of all these measurements and calculations are summarized as AH 3° values in Table I I I and displayed in Figure 4. Estimated uncertainties in * 15
(14) J. A. V. Butler, D. W. Thomson, and W. H. Maclennon, / . Chem,. Soc., 674, (1933) ; K. A. Dulitskaya, J. Ger.. Chem. USSR,15, 9 (1945).
The Journal of Physical Chemistry

T hermochemical Investigations of Water-A lcohol Solvent Systems 703
-16.0-----------1----------- T ~ -------1----------- 1
-161 I i 1
X
-18.0 — >v — Ï -18 “ —jo hv. X f
1 \ E«
-20.0 44- -20 B
J X 1<1-22.0
1 1 1 1
-22
_______ 1_______ 1_______ 1 10 0.2 0.4 0.6 0.8 1.0
Xe.Figure 4. Heats of solution of HCl(g) in water-ethanol.
the derived &H3°e values indicated in Figure 4 are mostly due to uncertainties in the wwZ w/ tihci term in(4) and heats of dilution.
Table III: Heats of Solution (AH3°e ) of HCl(g)in Water-Ethanol Mixtures
- a h»°,, - a H,%.kcal kcal
Xe m ole"1 X , mole _1
0.0 17.96 0.372 19.50.0336 17.4 0.567 20.60.0727 16.9 0.653 22.10.0948 16.9 0.757 22.70.145 17.20 0.381 22.40.206 18.00 0.935 22.40.240 18.80 0.938 22.40.328 19.0 1.0° 20.7
“ The initial solvent was pure ethanol, but the final solution contained water (~ 0 .5% ) from HCl(aq) dissolved.
Although the explanation by Arnett, et al.,s accounts for the maximum in the water-rich region of Figure4, this explanation is not applicable to the minimum in the ethanol-rich region. Bezman and Verhoek16 observed a similar minimum in the equivalent conductance of HC1 in the same ethanol-rich solutions and have suggested an explanation which may be applicable to our heat data.
Slansky16 has measured heats of solution of HCl(g) in water-methanol mixtures, but made no measurements between X m = 0.64 and 1.00. We have therefore determined heats of solution of aqueous HC1 in the water-methanol system and have used eq 4 along with our previously given Z w values in the water-
0 0.2 0.4 0.6 0.8 1.0Xm.
Figure 5. Heats of solution of HCl(g) in water-methanol.Our data are represented by vertical lines showing estimated uncertainties while Slanky’s results are indicated by crosses, without estimated uncertainties.
methanol system to calculate heats of solution of HCl(g). These measurements were made at various concentrations and extrapolated to zero HC1 concentration to obtain the Af73°m values given in Table IV and shown in Figure 5 with Slansky’s results.
Table IV: Heats of Solution of HCl(g)in Water-Methanol Mixtures
All 3° nn A i f i " m,kcal kcal
X m mole“ 1 X m mole
0 .0 18 .1 0 .6 3 9 1 9 .70 .1 2 9 1 7 .40 .2 4 2 1 7 .7 0 .7 5 8 1 9 .80 .3 07 1 7 .7 0 .7 7 3 2 0 .60 .4 0 0 1 8 .6 0 .7 9 0 2 0 .20 .4 9 9 1 9 .0 0 .8 2 8 2 0 .00 .5 5 4 19 .5 0 .8 71 2 0 .50 .5 69 19 .7 0 .9 1 2 1 9 .70 .6 2 7 1 9 .8 1 .0 “ 1 7 .6
“ The initial solvent was pure methanol, but the final solution contained water (~0.5% ) from HCl(aq) dissolved.
The disagreements between our data and those of Slansky* 4 15 16 in solvent mixtures with X m > 0.3 are greater than the sums of estimated uncertainties. Since Slansky16 had experimental difficulty because of slow attainment of equilibrium and our final AH3°m values
(15) I. X. Bezman and F. H. Verhoek, J . A m . C h em . S o c ., 6 7 , 1330 (1945).(16) C. M. Slansky, ib id ., 6 2 , 2430 (1940).
Volume 70, Number 3 March 1966

704 G. Bertrand, F. M illero, C. Wu, and L. Hepler
are afflicted with uncertainties from heats of dilution and the nwLm/nnci term in (4), we cannot choose definitely between the two sets of results. We have, however, separately verified our method of measurement involving solution of aqueous samples as follows.
We have measured the heats of solution of KBr(c) and KBr(aq) in water-methanol solutions having X m — 0.641 to compare with Slansky’s16 AH = 3.80 kcal mole-1 for solution of the solid. Our measurements gave AH = 3.6 kcal mole-1 for solution of the solid. Combination of our measured heats of solution of aqueous KBr in water-methanol (X m = 0.641) with the heat of solution of KBr(c) in water7 and our Lw value from Table II in an equation like (4) leads to AH = 3.7 kcal mole-1 for solution of KBr(c) in this solvent mixture.
We have measured heats of solution of various amounts of aqueous NaOH of various concentrations in water-ethanol mixtures. Calculations using the resulting data in the appropriate modification of eq 4 lead to AH values for solution of NaOH(c) in the various solvents. These AH values for different NaOH concentrations were extrapolated to zero NaOH concentration to yield the AH° values listed in Table V. As for HC1 and also for electrolytes investigated by Arnett, et al.,s the heat of solution of NaOH(c) goes through a maximum in the water-rich region. There is no evidence for a minimum in the ethanol-rich region.
Table V : Heats of Solution (AH°) of NaOH(e) in Water-Ethanol Mixtures
- A fl°, - A H 0,kcal kcal
Xe mole-1 X e mole-1
0 .0 1 0 .2 0 .3 7 2 1 0 .70 .0 3 3 6 1 0 .3 0 .5 0 7 1 1 .70 .0 7 2 7 9 .8 0 .5 6 6 1 2 .20 .0 94 8 9 .7 0 .7 5 7 13 .50 .1 4 5 9 .4 0 .8 81 1 4 .00 .1 7 4 9 .5 0 .9 3 8 1 4 .80 .2 4 0 9 .8 1 .0 “ 15 .9
“ The initial solvent was pure ethanol, but the final solution contained water (~0.5% ) from NaOH(aq) dissolved.
In order to determine heats of ionization of water in water-ethanol mixtures, we have measured heats of reaction of solutions of HC1 with solutions of NaOH. Excess NaOH was used in every experiment to minimize effects of traces of carbonate impurity. Heats were measured for reaction of small volumes of concentrated aqueous NaOH with 950 ml of dilute HC1 in various water-ethanol mixtures. A few measurements
were also made for reaction of small volumes of concentrated aqueous HC1 with 950 ml of dilute NaOH in water-ethanol mixtures. Combination of these measured heats with previously measured heats of solution of concentrated aqueous NaOH and HC1 in water-ethanol mixtures gave AH values for the neutralization process represented by
H+(S) + OH- (S) = H20(S) (5)
Since these AH values were obtained for solutions having different concentrations, we could extrapolate to zero concentration of both NaOH and HC1 to obtain AH° values for the ionization of water (reverse of reaction 5) in the various solvent mixtures. . These AH° of ionization values are listed in Table VI.
Table VI: Heats of Ionization (AH°) of Waterin Water-Ethanol Mixtures
A H°, A H°,kcal kcal
X e mole-1 X e mole-1
0 .0 13 .3 0 .2 4 0 1 2 .00 .0 33 6 1 3 .6 0 .3 7 2 10 .30 .0727 13 .6 0 .5 6 6 8 .00 .0 94 8 13 .6 0 .7 5 7 5 .30 .1 4 5 13 .3 0 .881 5 .20 .1 7 4 1 2 .8 0 .9 3 8 5 .1
Measurements of heats of solution of NaCl(c) in water-ethanol mixtures had the dual purpose of giving thermal data for a typical 1:1 electrolyte (not involving either H+ or OH- ions) and also permitting another means of evaluating heats of ionization of water in these solvent mixtures. We have therefore measured the heats of solution of various amounts of NaCl(c) in water-ethanol mixtures with X„ < 0.57 and heats of solution of aqueous NaCl in mixtures with Xe > 0.57. The results, extrapolated to zero NaCl concentration, are given in Table VII as AH° values for
Table VII: Heats of Solution (AH°) for NaCl(c) in Water-Ethanol Mixtures
A H°, AH0,kcal kcal
X e mole-1 xe mole-1
0.0 0 .9 1 0 .2 4 0 2 . 5 70 .0 33 6 1 .34 0 .3 7 2 2 . 1 00 .0948 2 .1 8 0 .5 6 6 1 . 3 50 .1 45 2 .5 8 0 .881 0 . 70 .1 7 4 2 .6 4 0 .9 3 8 0 . 4
The Journal of Physical Chemistry

T hermochemical Investigations of Water-A lcohol Solvent Systems 705
NaCl(c) = Na+(S) + C1- (S) (6)
These AH° values go through the usual maximum in the water-rich region and exhibit no minimum in the ethandl-rich region.
We have combined the AH° of solution values and Z w values already reported in this paper with AH° =42.5 kcal mole-1 (ref 7) for the reaction
NaCl(c) + H20(1) = NaOH(c) + HCl(g) (7)
to obtain AH° of ionization values for
HsO(S) = H+(S) + OH-(S) (8)
from the relation
Aifg° = 42.50 — Aif°NaCl — AvAi7°NaOH + A77°HC1 (9)
These values at 0.1 mole fraction intervals are compared in Table VIII with the values obtained from heat of neutralization experiments that were summarized in Table VI.
We estimate that the uncertainties to be associated with the AH° values in Table VIII range from less than ±0.1 kcal mole-1 in pure water to not more than ±0.5 kcal mole-1 in the alcohol-rich region.
These heats of ionization of water in water-ethanol mixtures are required for subsequent calorimetric investigation of ionization of organic acids in these solvents. Combination of these heats with free
Table VIII: Comparison of Heats of Ionization (AH°) of Water in Water-Ethanol Mixtures
AH°, A S” ,kcal kcal
Xe mole -1° mole ~lb
0 .0 1 3 .4 1 3 .30 .1 1 3 .7 1 3 .60 .2 1 2 .6 1 2 .60 .3 1 1 .4 1 1 .30 .4 1 0 .2 1 0 .00 .5 8 .8 8 .70 .6 7 .4 7 .40 .7 6 .1 6 .20 .8 5 .3 5 .20 .9 5 .3 5 .1
“ These AH° values for reaction 8 were calculated from eq 9. b These AH° values for the same reaction were obtained by interpolation of the values determined from heat of neutralization experiments and listed in Table VI.
energies that can be obtained from determination of the ionization constant of water in these mixtures will give entropies of ionization that should contribute to understanding of the water-ethanol solvent system.
Acknowledgment. We are pleased to thank E. M. Arnett and D. McKelvey for their helpful discussions and the National Science Foundation and National Institutes of Health for their financial support of this research.
Volume 70, Number 3 March 1966

706 Goldberg, R iddell, W ingard, Hopkins, W ulff, and Hepler
Thermochemistry of Cobalt Sulfate and Hydrates of Cobalt and Nickel Sulfates.
Thermodynamic Properties of Co2+(aq) and the Cobalt Oxidation Potential
by R. N. Goldberg, R. G . Riddell,1 M . R. Wingard,2 H. P. Hopkins, C. A. Wulff, and L. G. Hepler
Department of Chemistry, Carnegie Institute of Technology, Pittsburgh, Pennsylvania (Received November 9, 1965)
Heats of solution of CoS04(c) and several hydrates have been measured. From the results of these measurements we have calculated Af7298 = —2.48 kcal mole-1 for CoS04-6H20(c) + H*0(1) = CoS04-7H20 (c ); AHms = -1 2 .8 kcal mole-1 for CoS04-H20(c) + 5H20(1) = CoS04-6H20 ( c) and A/7>98 = —6.1 kcal mole-1 for CoS04(c) + H20(1) = CoS04-H20 (c). We also use these results in calculating A77f° = — 13.9 kcal mole-1, 52° = —26.0 cal deg-1 mole-1, and AG ° = —13.3 kcal mole-1 for Co2+(aq). This free energy leads to 8° = 0.29 v for the C o/C o2+ standard oxidation potential. Heats of formation as follows have been calculated for the mono-, hexa- and heptahydrates of cobalt sulfate, respectively: A/7f° = —286.4, —640.8, and —711.6 kcal mole-1. We have also calculated S°MS = 42 cal deg-1 mole-1 for CoS04-H20(c). Heat of solution measurements lead to Ai7298 = — 15.1 kcal mole-1 for NiS04-H20(c) + 5H20(1) = NiS04-6H20(c) and to A H ° values of —283.9 and —640.6 kcal mole-1 for the mono- and hexahydrate.
Recent calorimetric measurements by Adami and King3 have led them to report AH ° = —212.0 ± 0.4 kcal mole-1 for CoS04(c). Our measurements of the heat of solution of CoS04 to form dilute aqueous solutions were undertaken to provide a AH° value to be combined with this new heat of formation to yield a reliable AH ° value for Co2+(aq). Our further measurements of heats of solution of CoS04-7H20(c) to form dilute aqueous solutions were undertaken to provide data to be combined with the third-law entropy of CoS04-7H20(c) recently determined by Rao and Giauque4 to yield the standard partial molal entropy of Co2+(aq). The AH ° and S2° values for Co2+(aq) lead to AG ° for this ion and thence to the standard oxidation potential for the C o/C o2+ couple that has resisted accurate determination by conventional electrochemical techniques.
Recent calorimetric measurements by Brodale and Giauque5 have led to AH°29S for hydration of CoS04- 6H20(c) to CoS04-7H20 ( c). Our measurements on CoS04-6H20 ( c) were undertaken to permit calculation of this same AH°2gS, partly because the heat of hydration of CoS04-6H20 to CoS04'7H20 calculated by Broers and Van Welie6 from their recent vapor
pressure measurements is not in agreement with the calorimetric measurements of Brodale and Giauque. We have also investigated CoS04-H20(c). Some similar measurements have also been made on hydrates of NiS04.
Experimental SectionThe calorimeter used is patterned after one previ
ously described,7 except that a Leeds and Northrup Mueller G-2 bridge and HS galvanometer were used with a nickel wire resistance thermometer for temperature measurements. Also, the resistance thermometer
(1) National Science Foundation Research Participant for High School Teachers.(2) National Science Foundation Research Participant for High School Teachers.(3) L. H. Adami and E. G. King, U. S. Bureau of Mines Report of Investigations No. 6617, Director, Mines Bureau, Pittsburgh, Pa., (1965).(4) R. V. G. Rao and W . F. Giauque, J. Phys. Chem., 69, 1272 (1965).(5) G. E. Brodale and W . F. Giauque, ibid., 69, 1268 (1965).(6) P. M. A. Broers and G. S. A. Van Welie, Rec. Trav. Chim., 789 (1965).(7) W . F. O’Hara, C. H. Wu, and L. G. Hepler, J. Chem. Educ., 38, 512 (1961).
The Journal of Physical Chemistry

T hermochemistry of Cobalt Sulfate 707
and calibration heater were contained in a glass spiral filled with paraffin oil rather than wound on a silver cylinder. All of the calorimetric work reported here was carried out at 25.0 ± 0.1°.
The cobalt sulfate and nickel sulfate used were Baker Analyzed reagents, the assays being 99.8 and 100.1%, respectively. Samples were recrystallized from dilute sulfuric acid.
Anhydrous cobalt sulfate was prepared by heating hydrated material at ~500° for periods ranging from 5 to 20 days, accompanied by periodic gentle grinding. Samples were stored with P20 5 in a desiccator.
Solubility measurements by Rohmer8 and vapor pressure measurements by Broers and Van Welie6 have shown that CoS04 • 7H20 , Co804-6H20, and Co- S04 • H20 are the hydrates that are thermodynamically stable under appropriate conditions of temperature and activity of water.
Material having approximately the composition CoS04'7H20 was obtained as the solid phase in equilibrium with saturated solution at room temperature. After this material had been separated from the solution by filtration and pressed on the filter, it was further dried by storing in desiccators with P20 5 until the compositions of two samples corresponded to C0SO4 • 6.994H20 and CoS04 - 6.075H2O. Hydration numbers were obtained by drying samples (~ 2 g) in porcelain crucibles to constant weight by heating at ~500°. Careful preliminary heating at ~100° was always done to avoid spattering.
Several precautions were taken to ensure that the hydrates referred to above could properly be regarded as mixtures of CoS0 4-7H20 and CoS0 4-6H20. During the course of drying with P20 5, lumps in the samples were broken by periodic gentle grinding. After samples had reached approximately the desired composition as determined by preliminary analysis, they were placed in closed bottles and allowed to stand for 2 weeks. After one last gentle grinding, analyses and heat of solution measurements were begun. Further analyses after all calorimetric sample bulbs had been filled, weighed, and sealed confirmed that the compositions had not changed. Average deviations in analyses in terms of hydration numbers were 0.002 for the “ 7” hydrate and 0.009 for the “ 6” hydrate.
A sample of CoSO4 0.833H2O was prepared by heating recrystallized hydrate at ^120° for 2 days, accompanied by periodic gentle grinding. Analyses and precautions were the same as described above. Average deviation in analyses in terms of hydration number was 0.003. Another sample having composition Co- S04 • 6.62H20 was also prepared.
Solubility measurements by Chretein and Rohmer9
have shown that NiS04-7H20, NiS04-6H20 (two forms), and NiS04-H20 are the thermodynamically stable hydrates under appropriate conditions.
Two samples of nickel sulfate hexahydrate (a form, blue) were prepared by allowing the recrystallized starting material to stand in desiccators with saturated solutions of nickel sulfate at 32-34°. Analyses by heating to constant weight at '~500° gave hydration numbers of 6.000 with average deviation 0.005 for both samples.
A sample of NiSO4-5.059H2O (average deviation, 0.009) was prepared by allowing a portion of the hexahydrate to stand in a desiccator with P20 5 for 1 month.
Results and Discussion
Heat of solution data for CoS04-6.994H20(c) and CoSO4-6.075H2O(c) are listed in Tables I and II. We take the average AH = 12.0 cal g -1 for the enthalpy of solution of CoSC>4-6.994H20 (c) to yield 0.0239 m solution. Heats of dilution mentioned later in this paper permit us to calculate from the data in Table II (referring to 0.0300 m solution) that AH = 4.14 cal g-1 for solution of CoSO4-6.075H2O(c) to form 0.0239 m solution. Considering both materials to be mixtures of CoS04-7H20 and CoS04-6H20, the measured heats of solution (represented by Ahm, given in cal g-1) can be expressed as
Ahm = x(A h,) + y{ Ah) (1)
in which x and y represent weight fractions of each hydrate present in the solid sample and Ah- and A/i6 represent heats of solution (cal g -1) of the pure hydrates. Solution of two such simultaneous equations leads to the desired heats of solution, which are AH = 3.39 kcal mole-1 for CoS04-7H20 and AH = 0.91 kcal mole-1 for CoS04-6H20. Both of the AH values refer to 0.0239 m solutions. Combination of these two values leads to AH-m — —2.48 kcal mole-1 for the process
CoS04-6H20 ( c) + H20(1) = CoS04-7H20 ( c) (2)
The uncertainty in this AH value is about ±0.05 kcal mole-1. Brodale and Giauque5 have recently reported A//098 = —2.455 ± 0.010 kcal mole-1 for this same hydration process. The vapor pressure measurements of Broers and Van Welie6 led them to report A //298 = —1.75 ± 0.11 kcal mole-1 for this process.
A second-law calculation based on the data of Broers and Van Welie6 leads to AS°2m = 33.6 cal deg-1 mole-1 for the process represented by
(8) R. Rohmer, Compt. Rend., 199, 641 (1934).(9) A. Chretein and R. Rohmer, ibid., 198, 92 (1934).
Volume 70, Number 3 March 1966

708 Goldberg, R iddell, W ingard, Hopkins, W ulff, and Hepler
Table I : Heats of Solution of CoS0 4 -6 .9 9 4 H20 (c) at 25.0°
g(c)/950 A H ,ml of H2O cal/g
6 .3676 12 .16 .3547 1 1 .9
Table II: Heats of Solution of CoSO4-6.075H2O(c) at 25.0°
g(c)/950 A H ,ml of H2O ca l/g
7 .5275 4 .3 07 .4 99 6 4 .2 57 .4 9 6 4 4 .2 2
CoS04-7H20(c) = CoS04-6H20(c) + H20(g) (3)
The third-law data of Rao and Giauque4 lead to a considerably more reliable value of A»S'°298 = 35.92 cal deg-1 mole-1. Since it is quite likely that the AG°29s for reaction 3 calculated from the log p equation given by Broers and Van Welie6 is more reliable than either AS0298 or AH°mS, which involve dAG/dT, we use their A(?°298 with A<S,0298 from the third law4 to calculate AH°ms = 12.96 kcal mole-1 for process 3. Combination of this value with the heat of vaporization of water at 298°K leads to AHMS = —2.43 kcal mole-1 for process 2. This last value, unlike the AH29s = —1.75 kcal mole-1 reported by Broers and Van Welie,6 is in satisfactory agreement with our Ai7298 = — 2.48 kcal mole-1 and AH298 = —2.455 kcal mole-1 from Brodale and Giauque.6
Heats of solution of CoS04(c) are listed in Table III. The average of these results is AH = —18.3 kcal mole-1, where the concentration of the final solution is 0.00546 m. Although the final solutions in our measurements were quite dilute, heats of dilution to zero concentration are not negligible. We estimate this heat of dilution as —0.5 (±0 .1 ) kcal mole-1, based on the work of Lange10 on NiS04 and ZnS04. We thus obtain AH° = —18.8 kcal mole-1 for the process
CoS04(c) = Co2+(aq) + S042-(aq) (4)
Combination of this heat of solution with heats of formation of CoS04(c) from Adami and King3 and of S042-(aq) from Circular 50011 leads to AH ° = —13.9 kcal mole-1 for Co2+(aq).
Heats of solution of CoSO4-0.833H2O(c) are listed in Table IV. In order to separate the measured heats into contributions due to heats of solution of CoS04 and CoS0 4-H20, we use heat of dilution data from
Table III: Heats of Solution of CoS04(c) at 25.0°
Moles of C0SO4/ A H ,950 ml of H2O kcal/mole
0 .005183 - 1 8 . 50 .005150 - 1 8 . 30 .005196 - 1 8 . 10 .005152 - 1 8 . 3
Lange10 and our measurements mentioned later to calculate A ho = —116-8 cal g -1 for the heat of solution of CoS04 to form 0.0132 m solution. Use of this value with data from Table IV in an equation like (1) leads
Table IV : Heats of Solution of CoSO4-0.833H2O(c) at 25.0°
g(c)/950 A H ,ml of H2O ca l/g
2 .1323 - 7 4 . 82 .1293 - 7 8 . 82 .1292 - 7 6 . 12 .1050 - 7 8 . 0
to AH = —12.0 kcal mole-1 for the heat of solution of CoS0 4-H20 to form 0.0132 m solution. The corresponding heat of solution at infinite dilution is AH° = —12.7 kcal mole-1 and that to form 0.0239 m solution is AH = —11.9 kcal mole-1. Combination of the AH° values for solution of CoS04 and CoS04- H20 leads to AH298 = —6.1 kcal mole-1 for the process
CoS04(c) + H20(1) = CoS04-H20 ( c) (5)
Further combination of AH values for solution of CoS0 4-H20 and CoS0 4-6H20 to form 0.0239 m solutions gives AHms = —12.8 kcal mole-1 for the process
CoS04-H20 ( c) + 5H20(1) = CoS04-6H20 ( c) (6)
Consideration of calorimetric uncertainties due to slow solution of CoSO4-0.833H2O along with uncertainties associated with sample composition and heats of dilution leads us to estimate that our total uncertainties in AH values reported for processes represented by (5) and (6) are about ±0.8 kcal mole-1. Vapor pressure measurements by Broers and Van Welie6 led these workers to report AH298 = —8.68 ± 0.35 kcal mole-1 for the process represented by (6).
(10) E. Lange in “ The Structure of Electrolytic Solutions,’ ' W . J. Hamer, Ed., John Wiley and Sons, Inc., New York, N. Y ., 1959; E. Lange and W . Miederer, Z. Elektrochem., 60, 34 (1956).(11) “ Selected Values of Chemical Thermodynamic Properties,” National Bureau of Standards Circular 500, U. S. Government Printing Office, Washington, D. C., 1952.
The Journal of Physical Chemistry

T hermochemistry of Cobalt Sulfate 709
Although our calculations already reported indicate that AG298 for reaction 2 from the work of Broers and Van Welie6 is satisfactory, it is clear that their AHMS and ASms values derived from dAG/dT are in error for that ‘reaction. The following calculations show that the same is true for their work relevant to reaction6. The log p equation given by Broers and Van Welie6 for the CoS04-6H20 -C oS 04-H20 -H 20(g) system leads (with S°298 values for C0SO4 • 6H20 and water from Rao and Giauque4 and Circular 500n) to S°ms = 29 cal deg-1 mole-1 for CoS04-H20(c). This value seems much too low, since various estimation procedures that work well for other hydrates of C0SO4 lead to S°298 values from 38 to 43 cal deg-1 mole-1 for this compound. On the other hand, combination of AG°ms from Broers and Van Welie6 with our AHMS leads to S°298 = 42 cal deg-1 mole-1 for CoS04-H20(c). We use this entropy along with our AH and AG° from Broers and Van Welie6 in subsequent calculations, but do not use any heats or entropies obtained from second-law calculations based on vapor pressure data.6
Heats of solution of material having the composition CoS04-6.62H20 were carried out with samples of various size so that solutions formed ranged from 0.010 to 0.034 m. These AH data lead to integral heats of dilution nearly identical with the more precise values obtained from direct measurements10 on solutions of NiS04 and ZnS04.
Results we have already quoted may be combined with heats of formation11 of H20(1) and S042~(aq) to yield AHf° values for the hydrates of CoS04. Further combination of these AHi° values with entropies of CoS04-7H20 and CoS0 4-6H20 from Rao and Giauque4 and for CoS04-H20 from this paper leads to AG° values. Entropies of the elements are taken from Kelley and King.12 The results of these calculations are listed in Table V.
Table V : Thermodynamic Properties (298°K)of Hydrates of C 0 SO4
CompoundASi°,
kcal/moleAOf°,
kcal/mole
S°,cal/deg
mole
C oS 0 4-H 20 ( c) - 2 8 6 .4 -2 4 8 .7 42CoS 0 4-6H 20 ( c) - 6 4 0 .8 -5 3 3 .7 87 .8634CoS 0 4-7H 20 ( c) -7 1 1 .6 -5 9 0 .6 97.0484
Consideration of the process represented by
CoS04-7H20(c) =Co2+(aq) + S042-(aq) + 7H,0(1) (7)
permits calculation of the standard partial molal entropy of Co2+(aq). The standard free energy of solution of CoS04-7H20 ( c), which is the solid phase in equilibrium with saturated solution at 298°K, is calculated from
AG° = —RT In s2y±2aw7 (8)
in which s, y±, and aw represent the molal solubility, the mean activity coefficient in saturated solution, and the activity of water in the saturated solution. The solubility is given by Brodale and Giauque.5 We estimate the desired activity coefficient from data given by Robinson and Stokes13 for NiS04, and similarly estimate the osmotic coefficient that permits calculation of the desired activity of water. The derived free energy of solution is AG° = 3.17 kcal mole-1. The standard heat of solution of CoS0 4-7H20 is obtained as AH° = 2.6i kcal mole-1 from our measured heats and the heat of dilution.10 The heat of solution of this compound reported by Brodale and Giauque6 combined with a less certain heat of dilution leads to AH0 = 2.6g kcal mole-1 for this process. Combination of our AH° with AG° leads to AS°29s = —1.9 cal deg-1 mole-1 for the process represented by (7). Further combination of this AS° with available entropies4-12 leads to S2° = — 26.0 cal deg-1 mole-1 for Co2+(aq).
Earlier calculations14 15 leading to the entropy of Co2+(aq) were averaged zo give S2° = —26.6 cal deg-1 mole-1. Since the entropies leading to this average were partly based either on estimates or on uncertain data, the present value is considerably more reliable.
Combination of AH° and 52° values leads to AG° = — 13.3 kcal mole-1 for Co2+(aq). This value is necessarily consistent with our tabulated AG° for CoS04- 7H20 and the standard free energy of solution. The above AG ° leads to the following oxidation potential
Co(c) = Co2+(aq) + 2e- (8° = 0.29 v) (9)
The difficulties associated with obtaining a satisfactorily reversible C o/C o2+ electrode system are illustrated by the 8° values ranging from 0.246 to 0.298 v quoted by Latimer.16 Our thermodynamic 8° = 0.29 v seems more reliable than any value presently available from electrochemical measurements.
(12) K. K . Kelley and E. G. King, U. S. Bureau of Mines Bulletin 592, U. S. Government Printing Office, Washington, D. C., 1961.(13) R. A. Robinson and R. H. Stokes, “ Electrolyte Solutions,” 2nd ed, Butterworth and Co. Ltd., London, 1959.(14) H. C. Ko and L. G. Hepler, J. Chem. Eng. Data, 8, 59 (1963).(15) W. M. Latimer, “ The Oxidation States of the Elements and Their Potentials in Aqueous Solutions,” 2nd ed, Prentice-Hall, Inc.,New York, N. Y „ 1952.
Volume 70, Number S March 1966

710 Goldberg, R iddell, W ingard, Hopkins, W ulff, and Hepler
Heat of solution measurements were made with two separate batches of NiS04-6.000H20. The results are listed in Table VI. Integral heats of dilution that are calculated from differences in these measured heats of solution are in good agreement with the more accurate values that were directly determined.10 The standard heat of solution is AH° = 1.15 kcal mole-1.
Table VI: Heats of Solution of NiS0 4 -6 H20 (c) at 25.0°
g(c)/950ml mi/2
AH,kcal/mole
2 .4 7 7 8 0 .0996 1 .7 73 .3921 0 .1165 1 .8 43 .7 68 0 0 .1 23 0 1 .8 54 .2 36 5 0 .1 30 4 1 .8 94 .5971 0 .1357 1 .8 94 .9 62 0 0 .1410 1 .8 95 .5 78 5 0 .1497 1 .9 05 .7375 0 .1518 1 .8 96 .4 68 8 0 .1612 1 .9 47 .2 2 3 0 0 .1703 1 .9 48 .2 51 0 0 .1 82 0 1 .9 89 .3048 0 .1933 1 .9 9
10 .1374 0 .2018 2 .0 012.7062 0 .2259 2 .0 4
Heats of solution of solid samples having composition NiSO4-5.059H2O are listed in Table VII. Combination of these results with the heat of solution from Table VI corresponding to the same solution concentration leads by means of an equation like (1) to AH = — 13.2 kcal mole-1 for dissolving NiS04-H20(c) to form a solution with concentration m = 0.0224. Combination of this AH with the appropriate AH from Table VI leads to AHMa = —15.1 kcal mole-1 for the process represented by
NiS04-H20(c) + 5H*0(1) = NiS04-6H20(c) (10)
Combination of the above heat of solution with the heat of dilution10 leads to AH° = —14.0 kcal mole-1 for the standard heat of solution of NiS04 • H20.
Table VII : Heats of Solution of NiSO4-5.059H2O at 25.0°
g(c)/950 AH,ml of H2O cal/g
5 .2 2 1 8 - 3 . 8 35 .1 9 0 0 - 3 . 8 7
It has been assumed in the preceding calculations that the material we worked with was a mixture of the stable hydrates NiS04 • 6H20 and NiS04 • H20. Samples containing a significantly larger fraction of the monohydrate were found to dissolve too slowly to permit accurate calorimetric investigation. The slowness of solution of NiS04 also prevented our measuring its heat of solution, which would have given us a new path to AG° of Ni2+(aq) and thence a variety of compounds of Ni (II).
The best available heat of formation of Ni2+(aq) appears to be AH ° — —12.7 kcal mole-1 (ref 14), which is combined with AH° = 1.15 kcal mole-1 for solution of NiS04-6H20 and AH0 = —14.0 kcal mole-1 for solution of NiS04-H20 to yield AH ° = — 640.6 kcal mole-1 and AH° = —283.9 kcal mole-1 for these compounds, respectively.
Acknowledgments. We are indebted to the National Science Foundation for support of this research in the form of NSF-GP-1947 and Research Participation Grants for R. G. R. and M. R. W. We also thank Dr. Gary Bertrand for his help with calorimetric measurements and for keeping the calorimetric apparatus in working order.
The Journal of Physical Chemistry

Heats of Formation of Beryllium Compounds 711
The Heats of Formation of Beryllium Compounds. II. Beryllium Sulfate
by I. J. Bear and A. G. Turnbull
Division of Mineral Chemistry, C.S.I.R.O., Melbourne, Victoria, Australia (.Received August 10, 1965)
Heats of solution in 22.6 wt % HF have been measured calorimetrically to obtain AHî°ms- (a-BeS04(c)) = —286.65 ± 0.5 kcal/mole and AHAgsCBeSChA^CKc)) = —577.95 ± 0.5 kcal/mole. Previously reported calorimetric and equilibrium data have been reinterpreted to find AHfO298(BeS04-2H20(c)) = —434.45 ± 0.6 kcal/mole, AJ7f°29S(BeS04- H20 (c)) = —362.9 ± 0.6 kcal/mole, and Ai7fo298(K2S04-BeS04(c)) = —638.75 ± 0.7 kcal/mole. Heat capacities, entropies, and free energies are estimated for all of the above
863°K 908°K .compounds. The total heat of the transitions a -------> ¡3 ------->■ y BeS04 is found to be3.3 kcal/mole.
Introduction
Beryllium sulfate and its hydrates are useful intermediates in the extraction of BeO from beryl since they are easily purified and decompose on heating to give a beryllium oxide with good sintering properties.1 11 A complete set of thermodynamic data characterizing this thermal decomposition has not been previously reported.
Marchai2 studied the thermal decomposition pressure of BeS04 and measured heats of solution3 of BeS04 and BeS04-4H20 in 2.8 M NaOH. The heats of solution of BeS04-4H20 and BeSOv 2H20 in water4'5 and heats of dilution6 of aqueous BeS04 have also been reported. Information available on partial molal heat capacity in solution7 and high-temperature heat capacity8 of BeS04 has enabled much of the above work to be corrected to 25°. However, the heats of formation derived9 rest on a long reaction chain which involved BeCl2/aq), Be(OH)2, and BeO, leading to considerable uncertainties.
In the present work heats cf formation of BeS04 and BeS04-4H20 are found by combining their heats of solution with that of Be metal in 22.6% HF. The heats of formation of BeS04-2H20 and BeS04-H20 are then found by a réévaluation of reported vapor pressure, calorimetric, and phase equilibrium data.
Experimental Section
Materials. The BeS04-4H20 used was BDH Analar reagent grade with the manufacturers’ limits of impurities: Al, 0.01%; alkali metals, 0.1%; Fe, 0.002%;
Pb, 0.002%; NH4, 0.1%; N 03, 0.002%; Cl, 0.001%. The weight loss on ignition to constant weight at 1050° was 85.8% found and 85.88% calculated. Since ignition at this temperature usually leaves ~ 0 .1 % SO3,1 the analysis is satisfactory. Analysis for sulfate by precipitation with BaCl2 gave 54.1% S04 found and 54.23% calculated. Finally, heating to constant weight at 400° gave a water content of 40.7% found and 40.67% calculated. The anhydrous BeS04 was made in this way just before use and stored in a vacuum desiccator over molecular sieves. The X-ray diffraction patterns of the materials agreed with published data for tetragonal a-BeSCY0 and tetragonal BeS04- 4H20 .u
(1) G. E. Darwin and J. H. Buddery, “ Beryllium,” Butterworth and Co. Ltd., London, 1960.(2) G. Marchai, J. Chim. Phys., 22, 493 (1925).(3) G. Marchai, ibid., 22, 337 (1925).(4) C. Matignon and G. Marchai, Bull. Soc. Chim. F-ance, [4] 39, 167 (1926).(5) J. Thomsen, “ Thermochemische Untersuchungen,” Johann Ambrosius Barth Verlag, Leipzig, 1882-1886.(6) W . Birnthaler and E. Lange, Z. Elektrochem., 43, 643 (1937).(7) A. F. Kapustinskii, B. M . Yakushevskii, and S. I. Drakin, Zh. Fiz. Khim., 27, 588 (1953).(8) A. R. Taylor, Jr., T. E. Gardner, and D. F. Smith, U. S. Department of the Interior, Bureau of Mines, Report of Investigations, No. 6240, Pittsburgh, Pa., 1963.(9) F. D. Rossini, D. D. Wagman, W. H . Evans, S. Levine, and I. Jaffe, National Bureau of Standards Circular 500, U. S. Government Printing Office, Washington, D. C., 1952.(10) D. R. Petersen, H. W . Rinn, and S. T. Sutton, J. Phys. Chetm., 68, 3057 (1964).(11) C. A. Beevers and H. Lipson, Z. Krist., 82, 297 (1932).
Volume 70, Number 3 March 1966

712 I. J. Bear and A. G. T urnbull
Microscopic examination showed the BeS04-4H20 to be well-formed crystals of 0.5- to 1-mm size. Under standard diffractometer conditions12 BeS04-4H20 of ~0.1-mm size gave a (112) X-ray line width of 0.16 ± 0.005°, 20, which may be assumed to be due to instrumental broadening only. Anhydrous BeS04 gave a (101) line width of 0.39 ± 0.01°, 20, corresponding to a mean crystal size of 300 A. As expected, considerable disruption of the BeS04-4H20 crystals occurs on thermal decomposition, and growth by intergranular diffusion is slow at 400°.
Method. All heats of solution were measured in the isothermal-jacket, platinum calorimeter previously described.12’13 Final temperatures were 21 ± 1° after solution. Electrical calibrations were performed before and after each reaction, except for H2S04 and water with HF(aq) for which duplicate calibrations were run after reaction.
Samples of ~0.35 g of BeS04-4H20 were lightly pelleted and added at room temperature (21 ± 1°) through a thin polythene addition tube. Solvents were 120.0 g of HF (22.6 wt % ) or 120.0 g of water, and solution was complete in 5 min in both solvents. Samples of <~0.2 g of BeS04 were added at room temperature as powders to minimize the solution time which was 15 min. No weight increase due to hydration was observed during the few seconds’ exposure to air during addition.
Samples of volumetric reagent grade H2S04 (1 N at 20°) were held in a 5-ml glass pipet inside the thermostat. After temperature equilibration with the calorimeter, the sample was added through a thin rubber tube by slowly depressing a syringe outside the thermostat. The sample weight of ~ 4 g was found to 0.1% accuracy by weighing the pipet before and after addition. The solvent was 120.0 g of 22.6% HF in which ^ 2 0 mg of Be had been dissolved.
Samples of water were added in a similar way to the solutions of ~0.35 g of BeS04-4H20 in 120.0 g of 22.6% HF obtained previously.
The calorimeter was tested with a check reaction of similar nature to those investigated. Using the same pipet arrangement, ~ 5 g of 1 N H2S04 was added to a small excess (123 g) of 0.0500 N NaOH at 24°. The heat of neutralization found was —32.15 ± 0.2 kcal/mole of H2S04 at 25°, in agreement with the accepted value of —32.0 kcal/mole9 for the reaction
[H2S04, 109H2O] + 2.5[NaOH, 1110H2O] — >[Na^SCh, 0.5NaOH, 2886H20 ] (1)
and are based on the 1961 scale of atomic weights. Uncertainties are given as twice the standard deviations.
Table I : Heats of Solution in 22.6% HF at 21°
Compd — AHS, kcal/moleAv — AH g, kcal/mole
BeS04-4H20(c)BeS04(c)
1 N H2S04o
6 .4 1 , 6 .5 8 , 6 .4 2 , 6 .3 6 , 6 .5 0 2 4 .05 , 2 4 .1 , 2 4 .2 , 2 4 .0 ,
2 3 .85 .4 0 , 5 .2 6 , 5 .3 6 , 5 .4 6 , 5 .2 2
6 .4 5 ± 0 . 1 5 2 4 .0 5 ± 0 .3 0
5 .3 4 ± 0 . 2 0
° Solvent contained ~20 mg of Be/120 g.
Table II: Heat of Solution of BeS04-4H20(c) in H20
Concn, n, moles
Temp, of HzO/Source °c mole
This work 21 433021 449021 490021 4760
Thomsen6 18 400Matignon and 17 1670
Marchai4 17 1220
AHr.n, AH298, 5000,kcal/ kcal/mole mole
- 1 . 9 9 - 2 . 1 5- 1 . 9 8 - 2 . 1 3- 2 . 1 1 - 2 . 2 3- 2 . 0 7 - 2 . 2 0
A v - 2 . 1 8 ± 0 .0 9- 1 . 1 0 - 2 . 2 5- 1 . 4 9 - 2 . 1 1- 1 . 5 8 - 2 . 3 4
Results
a-BeSOiic). The heat of formation may be calculated from the following summation representing average reactant ratios
Be(c) + 679 [HF, 3.8H20 ] — >[BeF2, 2580H A 677HF] + H2(g) (2)
[BeF2, 677HF, 2580H2O, H2S04] — ■>BeS04(a) + 679 [HF, 3.8H20 ] (3)
[BeF2, 677HF, 2580H2O] + [H2S04, 109H2O] — >[BeF2, 677HF, 2689H20, H2S04] (4)
H2(g) + 202(g) + S(rh) + 109H2O(l) — >[H2SO4-109H2O] (5)
[BeF2, 677HF, 2689H20, H2S04] — *-[BeF2, 677HF, 2580H2O, H2S04] + 109H2O(l) (6)
Be(c) + S(rh) + 202(g) — > BeS04(a) (7)
Heats of solution are given in Tables I and II in (12) I. J. Bear and A. G. Turnbull, J. Phys. Chem., 69, 2828 (1965).terms of the thermo chemical calorie (4.1840 joules) (13) A. G. Turnbull, Australian J. Chem., 17, 1063 (1964).
The Journal of Physical Chemistry

Heats of Formation of Beryllium Compounds 713
Reaction 2 represents the solution of beryllium metal in 22.6 wt % HF, for which the heat, AH2m(2) = —101.0 ± 0.3 kcal/mole, has been previously reported.12 The heat of reaction 3, the solution of a-BeS04 in22.6 wt % HF, is found from Table I, =24.05 ± 0.3 kcal/mole. Reaction 4 represents the solution of 1 N H2SO4 in 22.6 wt % HF, and the heat, Ai7294(4) = —5.34 ± 0.2 kcal/mole, is found from Table I. The heat of formation of [H2SO4, 109H2O] represented by reaction 5 is estimated to be AH22i(5) = —212.16 ± 0.05 kcal/mole from the average of two recent measurements14 of Af7f°298 [H2S04, 115H20 ] =— 212.20 ± 0.05 kcal/mole and appropriate concentration9 and temperature corrections. Finally, the heat of solution of water in 22.6 wt % HF containing BeS04 has been measured to be —71.75 cal/mole of H20, so that AH294(6) = 7.82 kcal. It is noteworthy that tabulated heats of dilution of HF(aq)9 give a value of Af7°298 = —72 cal/mole of H20 in good agreement since the low concentration of BeS04 would not be expected to alter the heat of dilution appreciably.
The heat of formation of a-BeS04(c), reaction 7, is thus found to be AHt°2u = —286.63 kcal/mole. From published heat capacity data8'9-16 ACPi22s(7) —— 2.88 cal/deg mole, so that the standard heat of formation AHf°298 = —286.65 ± 0.5 kcal/mole. This value refers to a-BeS04 of 300-A average crystal size and thus includes an appreciable surface energy term. Assuming spherical particles of density 2.5 g/cc, the surface area is 80 m2/g . The surface enthalpy may be taken as 1000 ergs/cm2, the average of values calculated for (100) faces of orthorhombic sulfates.16 Thus, the heat of formation of large-crystal a-BeS04 may be expected to be 2.0 kcal/mole more negative than the above value for thermally produced BeS04. The only previous heat of formation of BeS04 was —286.0 kcal/mole for an unspecified material.9
It should be noted that both low- and high-temperature heat capacity data8 refer to BeS04 made by heating BeS04-4H20 overnight at 540° with intermediate grinding. The surface area should thus be similar to that of the present sample, except that some reduction by sintering could occur during Cp measurements above 540°. Thus, Afl/^s and CV,T for a-BeS04 and Be, S, and 0 215 may be combined to calculate A //f r and A(7f r for this thermally produced a-BeS04 (Table III).
The equilibrium pressures measured by Marchal2 for the reaction
BeS04(c) ^ BeO(c) + SOs(g) (8)
may now be reevaluated using more recent information on the phases present, their heats of formation, and
Table III: Thermodynamic Functions for a-BeS04(c)
AHf°, A£?f°,T, °K kcal/mole kcal/mole
298.15 -286.65 -260.03400 -287.36 -251.94500 -287.64 -243.81600 -287.63 -235.67700 -287.32 -227.52800 -299.80 -220.73
(1028)° -296.88 -199.36
Metastable, extrapolated from 863°K.
their high-temperature heat capacities. Marchal measured the total pressure of the equilibrium mixture of S03 + S02 + O2 over BeS04 in the range 863-1103 °K.
In a recent review, Kellogg17 evaluated the partial pressures of S0 3 by applying the latest SO3-SO2-O2 equilibrium data.18 When treated by the “ 2-function” method, assuming ACP(8) = —10 cal/deg mole, pressures in the range 973 to 1083°K gave a consistent AG vs. T relation from which A/71028(8) = 39.9 kcal/ mole may be derived.
In this temperature range the phases present are y-BeS04 and BeO,19 and X-ray line broadening of quenched, partly decomposed samples suggests average crystal sizes of 500 and 1000 A, respectively.20 21 From heat of solution20 and heat content18 data, A //f 298 = —145.0 and Ai?fil028 = —144.6 kcal/mole for BeO of this size. Reaction 8 may then be evaluated to find AHf,io28(7-BeS04) = —293.55 kcal/mole.
’ 863 CK 908°KThe heats of the a —— >- /3 and (3------> 7 transitions19
may be found if the heat capacities of ¡3- and 7-BeS04 are estimated from an extrapolation (863 1028°K)of that of a-BeS04.8 The calorimetric Af7fi7. of a- BeS04 may then be compared to the equilibrium AHiit of 7-BeS04 to find an over-all a -*■ 7 transition heat of 3.3 kcal/mole. Although this value has a large associated error, it is similar to the transition heats of other sulfates (K2S04, 2.14 kcal; Na2S04, 0.7,2.0 kcal.; Ag2S04, 3.75 kcal)21 and provides a satis
(14) M. Mansson and S. Sunner, Acta Chem. Scand., 17, 723 (1963).(15) 11 JAN AT Interim Thermochemical Tables,” Sept 30, 1963.(16) A. G. Walton and D. R. Whitman, J. Chem. Phys., 40, 2722 (1964).(17) H. H. Kellogg, Trans. A IM E , 230, 1622 (1964).(18) W . H. Evans and D. D. Wagman, J. Res. Natl. Bur. Std., 49, 141 (1952).(19) I. I. Bosik, A. V. Novoselova, and Yu. P. Simanov, Rxiss. J. Inorg. Chem., 6, 1295 (1961).(20) A. G. Turnbull, unpublished data.(21) O. Kubaschewski and E. L. Evans, "Metallurgical Thermochemistry,” 3rd ed, Pergamon Press Ltd., London, 1953.
Volume 70, Number 3 March 1966
714 I. J. Bear and A. G. T urnbull
factory correlation between calorimetric and equilibrium results. Kellogg17 estimated an over-all transition heat of 5 kcal/mole by matching calorimetric and equilibrium entropies.
BeSOi-4-H2.0(c). The heat of formation may be found in a similar manner to that of BeS04(c) from the summation
Be(c) + 679 [HF, 3.81^0] —^[BeF2, 2580H2O, 677HF] + H2(g) (2)
[BeF2, 677HF, 2584H A H2S04] — ►BeS04-4H20(c) + 679[HF, 3.8H20 ] (9)
[BeF2, 677HF, 2580HaO] + [H2S04, 109H2O] — ►[BeF2, 677HF, 2689H20 , H2S04] (4)
H2(g) + 202(g) + S(rh) + 109H2O(l) — >[H2S04) 109H20 ] (5)
[BeF2, 677HF, 2689H20, H2S04] — ►[BeF2, 677HF, 2584H20, H2S04] + 105H2O(l) (10)
___________ 4H2(g) + 202(g) >• 4H20(I) (11)
Be(c) + S(rh) + 402(g) + 4H2(g) >BeS04'4H20(c) (12)
The heats of reactions 2, 4, and 5 at 294°K are taken as before. Reaction 9 refers to the solution of BeS04- 4H20(c) in 22.6 wt % HF and the measured heat A //294(9) = 6.45 ± 0.15 kcal/mole from Table I. The heat of reaction 10 is taken as that for the almost identical reaction 6 and Aff294(10) = 7.54 kcal. Finally, the heat of formation of water at 294 °K is taken as — 68.35 kcal/mole,9 and A f/294(11) = —273.40 kcal/ mole.
The heat of formation of BeS04-4H20(c), reaction 12, is thus found to be Af7f°294 = —577.91 kcal/mole. Heat capacities have not been measured for BeS04 hydrates, but the average CP|298 per mole of water in solid hydrates is 9.4 cal/deg mole22 so that CPi298- (BeS04-4H20 ) = 58 ± 1 cal/deg mole. Thus, ACp,298 of reaction 12 is —7 cal/deg mole and A/7fO298(BeS04- 4H20) = -577.95 ± 0.5kcal/mole.
The difference in heats of formation of BeS04 and BeS04-4H20 may also be found from the heats of solution in 2.8 M NaOH at 17° measured by Marchal:3 —34.5 ± 0.3 kcal/mole for BeS04 and —17.45 ± 0 .1 kcal/mole for BeS04-4H20. The difference of these reactions gives AH290(13) = —17.05 ± 0.4 kcal/mole for the reaction
BeS04(c) + 4(H20)2.8 m NaOH > BeS04-4H20(c)(13)
The heat capacity change, ACP(13), is found to be— 32.4 cal/deg mole, so that AH298(13) = —17.3 ± 0.4 kcal/mole.
The substitution of AHrf,298(BeS04) = —286.65 and AHf ,29s(H20 )2.8 m NaOH — —68.32 kcal/mole in reaction 13 leads to AHf,298(BeS04-4H20) = -577.25 ± 0.7 kcal/mole. This value is in good agreement with the present calorimetric results using 22.6% HF as a solvent.
BeSOi(aq). The heat of formation of aqueous Be- S04 has been found from the heat of solution of Be- S04-4H20(c) in water (Table II). Correction of the heats of solution to 298°K is possible with reported apparent molal heat capacities7 of BeS04 in the range 0.533 to 2.216 mat 298°K
<f>0 = -4 8 .0 + 31.3m'/! (14)
This equation has been used to obtain estimates of <j>Q(BeS04) at molalities down to 0.01 over the range 290 to 298°K. These values are combined with Cp- (BeS04-4H20(c)) = 58 cal/deg mole and (^ (^ O ) =18.0 cal/deg mole to find ACp for the solution of Be- S04-4H20. Correction of the heats of solution to a standard concentration [BeS04-5000H2C‘ ] is possible by the use of the reported heats of dilution,6 which cover the range 1:15 to 1:5000 at 298°K.
The corrected heats of solution show reasonable agreement between present results and those of Thomsen6 and of Matignon and Marchal.4 The overall average AH298 = —2.20 kcal/mole is used to find A //f°29s [BeSO.i ■ 5000 H2() ] = —306.85 kcal/mole. The additional heat of dilution to °° H20 may be then estimated from the corresponding values for the most similar compounds, MgS04 ( — 0.56 kcal/mole)9 and ZnS04 ( —0.58 kcal/mole),9 to obtain Ai7f°298[BeS04- °°H20 ] = —307.4 kcal/mole.
BeS0i-3H20(c). The heat of formation of BeS04- 2H20 may be established from the heat of solution in water to give [BeS04• 1002H20 ] at 15°, found by Matignon and Marchal4 to be —8.0 kcal/mole. Using a value of ACP = —40 cal/deg mole, derived as before, the heat of solution at 298°K is —8.4 kcal/mole. Combining this with the heat of solution of BeS04-4H20 to give [BeS04, 1002H20 ] at 298°K, found here to be— 1.54 kcal/mole, gives a heat of formation AHAgs- (BeS04-2H20) = —434.45 ± 0.6 kcal/mole.
This value may be confirmed by considering equilibrium data for the reactionBeS04-4H20(c) — > BeS04-2H20(c) + 2H20(g) (15)
From phase studies in H2S04(aq) and dilatometry, * 592
(22) K . K . Kelley and E. G. King, U. S. Bureau of Mines Bulletin592, U. S. Government Printing Office, Washington D. C.
The Journal of Physical Chemistry

Heats of Formation of Beryllium Compounds 715
Figure 1. Equilibrium pH2o over BeS04 hydrates. ♦ (ref 25) BeS04-4H20 (BeS04)sat sol + H20(g); log p(mm) = 9.0823 — 2326.7]T (293-343°). ■ (ref 23), ▲ (ref 26) BeS04-4H20 BeS04-2H20 + 2H20(g); log p(mm) = 10.806 - 2951/7(287-362°). • (ref 23) BeS04-2H20 ±=; BeS04-H20 + H20(g); log p(mm) = 10.265 - 0.29 log 7 - 3044/7 (324-543°). • (ref 23) BeS04-H20 ^ (BeS04)sat soi + H20(g); log p(mm) = 6.234 - 1288/7 (543-625°). ▼ (ref 24) BeS04-H20 BsS0 4 + H20(g); log p(mm) = 10.651 - 4032/7 (373-600°).
Campbell, et al.,23 found that the transition BeS04- 4H20 — BeS04 • 2H20 in contact with saturated aqueous solution occurs at 89 ± 1°, thus confirming the earlier result of Rohmer.24 25 The vapor pressure of such a solution may be found by a small extrapolation of the pressures over aqueous BeS04 at 20-70°, reported by Novoselova and Reshetnikova.26 'this gives 454 mm at 89° for the equilibrium pressure of reaction 15.
Ghosh26 has reported pressures found by isopiestic equilibrium with aqueous sulfuric acid at 14° of 3.84 mm over BeS04-4H20(c) + silica and 3.52 mm over BeS04-4H20(c) + sodium silicate.
Further approximate equilibrium pressures may be found from the concentrations of BeS04 and H2S04 in solutions coexistent with both BeS04-4H20 and BeS04-2H20 solid phases. Average values at 25, 50, 75, and 85° found by Campbell, et al.,23 using X-ray identification of the solid phases are given in Table IV. In the absence of detailed activity data for such solutions, it is assumed that the BeS04 is present as neutral molecules of unit activity coefficient, and the activity
Table IV : Equilibrium Pressures over BeS04 • 4H20 + BeS04 ■ 2H20
Temp, ------------ Concn, wt % 23------------ , Press,”C BeSOi H2SO4 mm
25 3.06 54.28 650 8.8 42.76 4175 23.43 21.86 20085 33.73 9.27 36789 42.5 0 454
coefficient of the H2S04 is unaffected by the BeS04, leading to the pressures given in Table IV. A final pressure is obtained from the fact that a solution containing 89.25 wt % EtOH and 0.4 wt % BeS04 is in equilibrium with BeS04-4H20 and BeS04-2H20 at
(23) A. N. Campbell, A. J. Sukava, and J. Koop, J. Am. Cbem. Soc., 73, 2831 (1951).(24) R. Rohmer, Bull. Soc. Chim. France, [5] 10, 468 (1943).(25) A. V. Novoselova and L. P. Reshetnikova, Vest. Mosk. Ser. I I : Khim., 11, 171 (1956).(26) B. Ghosh, J. Indian Chem. Soc., 22, 17 (1945).
Volume 70, Number S March 1966

716 I. J. Bear and A. G. T urnbull
Table V: Standard Thermodynamic Properties of Beryllium Sulfates
AH f °238, p°298, S° 298. AG[ °298|
kcal/ cal/deg cal/deg keal/Compd mole mole mole mole
a-BeSCfifc) -285.65 ± 0.5 20. 5 ± 0 .18 18.62 ± 0.1s -260.05 ± 0.5BeS04-H20(c) -362 .9 ± 0 .6 30 ± 1 26.4 ± 1 -3 2 2 .0 ± 0 . 7BeS04-2H20(c) -434.45 ± 0.6 39 ± 1 41.8 ± 1 . 5 -381 .5 ± 0 . 7BeS04-4H20(c) -577.95 ± 0.5 58 ± 1 56.5 ± 2 -496.15 ± 0.7(BeS04)5oooH2o -306.85 ± 0.6 -4 3 ± 1“K2S04-BeS04(c) -638.75 ± 0.7 47 ± 1 60.6 ± 1 -584 .0 ± 0 . 8K2S04 • BeS04 • 2H20( c ) -782 .0
“ Partial molar heat capacity.
25°.23 Neglecting the effect of the BeS04 in solution, a pressure of 10.5 mm is obtained in fair agreement with the value of 6 mm from the H2S04 solution studies.
A weighted plot of log p vs. l/T (Figure 1) for all of the above data gives AHm = 13.5 kcal/mole of H20 for reaction 15. Assuming A(7p(15) = —1.5 cal/deg mole of H20, a value of AH^s = 13.55 kcal/mole of H20 is obtained, thus confirming the more precise calorimetric result, AHMi(15) = 13.95 kcal/mole of H20. By a small extrapolation, a pressure of 1 atm at 99° is predicted, in agreement with the dta peak for this reaction which starts at 80° and peaks at 110°.10
From the equilibrium pressure of 8 mm at 298°K, a value of AG29s(15) = 2.7 kcal/mole of H20 is calculated. If this is combined with Ai7298(15) = 13.95 kcal/mole of H20, an entropy change AiS2ss(15) =37.7 cal/deg mole of H20 is obtained. This is consistent with the values for a number of inorganic salt hydrates which average 36 ± 1.5 cal/deg mole of H20 22 and with the hypothetical sublimation entropy of ice, about 35 cal/deg mole at 298°K.22 This is expected since the tetrahedral arrangement of water in BeS04- 4H2On (and probably in BeS04-2H20) is quite similar to that found in ice. The standard entropy $ °298 of BeS04-4H20 is calculated to be 56.5 ± 2 cal/deg mole from that of BeS04-2H20 and A529s(15).
BeSOi -HiO. No calorimetric data are available for BeS04-H20, but Campbell, et al.,u measured equilibrium pressures over a composition BeS04-1.37H20 in the range 324 to 543 °K. The phases present were not identified although the material was thought to be heterogeneous. In view of the recent characterization of BeS04-2H20 and BeS04 H20 by Peterson, et al.,10 and in the present work,20 it seems likely that the equilibrium studied was
BeS04-2H20(c) — > BeS04-H20(c) + H20(g) (16)
The equilibrium pressures are found to be best fitted by the equation
log p(mm) = —0.29 log T — 3044/T + 10.265 (17)
This implies a heat capacity change ACP(16) = —0.6 cal/deg mole, which appears reasonable for the formation of 1 mole of vapor. The reaction heats derived from this equation are Aif434(16) = 13.68 at the average temperature and A /f29s(16) = 13.76 ± 0.1 kcal/mole. From the latter, the heat of formation of BeS04- H20(c) is found to be A H °^ = —362.9 ± 0.6 kcal/ mole.
The equation predicts an equilibrium pressure of 0.2 mm at 298°, so that ACr298(16) = 4.9 kcal/mole and A<8298(16) = 29.7 cal/deg mole of H20. The standard entropy <S°298 of BeS04-2H20 is then found from that of BeS04'H 20 and A$298(16) to be 41.8 ± 1.5 cal/deg mole.
The equilibrium pressure becomes 1 atm at 187°, thus confirming the dta peak, ascribed to reaction 16 by Peterson, Rinn, and Sutton,10 which starts at 170° and peaks at 200°.
By difference, a heat of 18.45 kcal/mole is found for the final dehydration step at 298°K
BeS04-H20(c) — ► a-BeS04(c) + H20(g) (18)
This shows that the first water molecule is much more strongly bound than the succeeding ones, a situation which is also found in the hydrates of MgS04, ZnS04, and many other salts.9
There are no direct calorimetric or vapor pressure measurements for reaction 18, but phase studies by Rohmer24 suggest that the transition occurs at 100° in contact with 92.5 wt % H2S04. The solubility of BeS04 is negligible under these conditions, so an equilibrium pressure of 0.7 ± 0.5 mm may be estimated. This pressure is combined with the above value of A //298 to predict the vapor pressure curve shown in Figure 1. This curve reaches a pressure of 1 atm at 245°, in good agreement with the dta peak10 for this reaction which starts at 240° and peaks at 260°.
The Journal of Physical Chemistry

Heats of Formation of Beryllium Compounds 717
Campbell, et ad.,23 observed the appearance of a liquid phase at 270° on heating BeS04- 1.37H20. As shown in Figure 1, the pressures they measured above 270° may now be attributed to equilibrium between BeS04 • H20 and saturated solution.
The standard entropy of BeS04 • H20 is estimated to be 26.4 ± 1 cal/deg mole from that of a-BeS04, and an average value of A$298 = 7.8 ± 1 cal/deg mole of H20 is observed for the hydration of MgS04, CuS04, and CdS04 to the monohydrates.22
BeSOi-SHzO. Rohmer reported a thermal effect at —21.5° on quickly cooling a saturated solution in contact with BeS04-4H20. This is confirmed by extrapolating the BeS04 • 4H20-saturated solution equilibrium line, which is found to intersect the ice-water vapor curve at —21.5° (Figure 1). However, the stable hydrate below —16.4° was claimed to be Be- S04-5H20, and the saturated solution over this salt precipitated ice at —18.5°. Estimating the heat of hydration to be 13.5 kcal/mole, the BeS04-5H20 - BeS04-4H20 equilibrium pressure line may be drawn in Figure 1 to complete the BeS04-H 20 phase diagram.
K-iSOi ■ ReSO.t[c) . The heat of formation of the double sulfate of potassium and beryllium may be found from heats of solution in [H2S04, 15.86H20 ] at 17° reported by Marchal.3
BeS04-4H20(c) — > [BeS04, 4H20 ]3 m msoj (19)
K2S04(c) + [BeS04, 4H20 ]3 M HiSOi >[K2S04, BeS04, 4H20 ]3 M ILSO. (2 0 )
K2S04-BeS04(c) — > [K2S04, BeS04]3 M il s o , (21)
The heats of reactions 19, 20, and 21 are 3.14 ± 0.04, 8.60 ± 0.14, and 3.11 ± 0.16 kcal at 290°K, respectively. These must be combined with the heats of the reactions
4H20(1) + [K2S04-BeS04]3 M H2so. *■[K2S04-BeS04-4H20 ]3 M H.so< (22)
BeS04(c) + 4H20(1) —^ BeS04-4H20(c) (23)
for which values of —0.28 and —17.76 kcal at 290° are taken. Thus, the heat of formation of K2S04-BeS04-(c) from the component sulfates is found to be —8.85 kcal/mole at 290°K. Assuming ACP of formation from the component sulfates is zero and taking A i/f0298 for BeS04 from the present work and for K2S04 on the new H2S04 basis to be —343.23 kcal/mole9'14 gives AHf°298(K2S04-BeS04(c)) = -638.75 ± 0.7 kcal/ mole. The entropy iS°298 of K2S04 • BeS04 is estimated to be 60.6 cal/deg mole from the entropies of the component sulfates, and thus A(?f029s is found to be — 584.0 ± 0.8 kcal/mole.
Marchal3 also reported a single heat of solution of9.46 kcal/mole for K2S04 ■ BeS04 • 2H20 in the same solvent. A similar treatment of the above gives A iff°298 = —782.0 kcal/mole. Although it is difficult to assess the accuracy of this value, it implies a reasonable value of —13.75 kcal/mole of H20 for hydration of the anhydrous double sulfate with water vapor.
Acknowledgment. A program kindly written byC. H. J. Johnson was used for fitting p-T data by the least-squares method with the Elliott 803.
Volume 70, Number 3 March 1966

718 P. R uetschi and R. F. Amlie
Solubility of Hydrogen in Potassium Hydroxide and Sulfuric Acid.
Salting-out and Hydration
by P. Ruetschi1 2 3 4 5 and R. F. Amlie
The Electric Storage Battery Company, The Carl F. Norberg Research Center, Yardley, Pennsylvania (Received August 17, 1966)
While precise data on the solubility of hydrogen in water are available,2-4 the published work on the solubility of hydrogen in H2SO4 and KOH solutions is scant and shows considerable discrepancies. Besides the old data of Geffcken6 and Christoff6 there are known only two recent studies. Vertes and Nagy7 have reported hydrogen solubilities at 20, 30, 40, and 50° in 0.1 and 1.0 N H2S04 solutions, using Winkler’s method.8 Knaster and Apelbaum,9 whose paper was published during the present study, give values for the solubility of hydrogen in KOH up to 10 N. The pertinent results of these investigations are included for comparison with the values obtained in the present investigation.
Apparatus
The solubility apparatus (Figure 1) is similar to that of Ben-Naim and Baer10 and comprises a dissolution system, which is contained in the water bath, I, and a pressure-regulated gas (solute) input system which is external to the water bath. The Pyrex dissolution bottle, G, is provided with two opposed reservoir bulbs, f and f', which are connected to the bottle near its base by capillary side arms g and g', respectively, and to the bottle neck by 10-mm tubing. The liquid is agitated by means of a magnetic stirrer, J, placed beneath the bottle and bath. The dissolution bottle is connected to the measuring system at ground jointe. The volume of the bottle, calibrated at 30° to the level and mark designated by h, is 550 ml. The hydrogen uptake is measured with the 10-ml graduated buret, F. The manometer, E, serves both as a pressure reference (null) indicator and as a mercury cutoff between the gas input (or reference) and dissolution systems. The right arm, b, of manometer E is a graduated 1.0-ml capillary tube, and the total input capacity of the system shown is therefore 11 ml. Mercury levels in manometer E and buret F are regulated with leveling bulbs C and D, respectively. The dissolution section is thermostated at 30.0 ± 0.05° in the water bath.
The input or reference system comprises a gas reservoir, A, and a closed-end manometer, B. Stop
cocks 1 and 2 are for evacuating and filling the system, respectively. Sulfuric acid and potassium hydroxide solutions were prepared with reagent grade chemicals. Matheson Prepurified grade hydrogen (99.5% minimum purity) was used directly from the tank.
ProcedureThe bottle was initially filled to slightly above the
calibration mark, h, and cooled to about 3° after connection to the apparatus. The system was then slowly evacuated, and the solution was stirred at a rate sufficient to prevent excessive boiling. For evacuation, the mercury in manometer E was below both arms at the approximate level c, and stopcocks 2, 3, 4, and 5 were closed. The samples were degassed for about 3
(1) Leclanché S.A., Yverdon, Switzerland.(2) (a) A. Seidell, “Solubilities of Inorganic and Organic Compounds," Suppl to 3rd ed, D . Van Nostrand Co., Inc., New York, N. Y ., 1952, p 236; (b) “ International Critical Tables,” Vol. 3,McGraw-Hill Book Co., Inc., New York, N. Y ., 1928, p 256.(3) A. E. Markham and K. E. Kobe, Chem. Rev., 28, 519 (1941).(4) D. M. Himmelblau, J. Chem. Eng. Data, 5, 10 (1960).(5) G. Geffcken, Z. Physik. Chem. (Leipzig), 49, 268 (1904).(6) A. Christoff, ibid., 55, 622 (1906).(7) G. Vertes and F. Nagy, Magy. Kem. Folyoirat, 65, 450 (1960).(8) L. W . Winkler, Ber., 22, 1764 (1889).(9) M . B. Knaster and L. Y . Apelbaum, Russ. J. Phys. Chem., 38, 120 (1964).(10) A. Ben-Naim and S. Baer, Trans. Faraday Soc., 59, 2735 (1963).
The Journal of Physical Chemistry

Solubility of H2 in KOH and H2S04 719
hr at 3°, at which time no gas evolution was evident even with rapid stirring. The dissolution section was then raised to 30.0° with continuous degassing, and the liquid level was determined relative to the calibration mark, h. The level was usually slightly above this mark and was adjusted to it by additional evacuation with stirring.
After leak-testing the system, hydrogen was admitted to the input section, whereby the pressure was set at slightly above 1 atm by adjusting the mercury level in bulb A. Stopcock 6 was then opened to admit the gas into the dissolution section in contact with the unstirred solution. After establishing the desired gas pressure and mercury level in buret F, stopcock 5 was opened and the mercury level in manometer E was raised, sealing off the thermostated section. Preliminary experiments showed that at least 2 hr was required for a detectable quantity of gas to be absorbed by the quiescent liquid.
Dissolution was started by switching on the stirrer. To take volume readings stopcock 5 was closed, the input pressure (manometer B) was accurately set, and the mercury menisci in arms a and b of manometer E were exactly leveled by adjustment of the mercury level in buret F. Absorption of gas was initially rapid. About 2 hr was required with distilled water before the uptake ceased entirely, while almost 5 hr was required for the most viscous solutions studied. Supersaturation did not appear, and no volume change was evident by a reduction in stirring rate after equilibrium had been attained.
Acid and base normalities were determined by titration with standard NaOH or HC1 solutions after completion of the run.
Solubility ResultsThe data for hydrogen solubility in distilled water,4'11 12
taken to test the apparatus, are given in Table I, which demonstrates that excellent accuracy and precision can be attained. The standard per cent deviation is a very low 0.5%.
Table I : Solubility of Hydrogen in Water
Source
Cm8 of H2 (STP)/l. (at 30°) Dev
This workOperator A 17 .03 0 .0 4
A 16 .90 - 0 . 0 9B 17 .1 0 0.1 1B 16.93 - 0 . 0 6
Himmelblau4Seidell11
A v 16 .99 17.1 1 7 .0
± 0 .0 8
Solubility values of hydrogen in sulfuric acid and potassium hydroxide solutions are given in Tables II and III and Figures 2 and 3. Each experimental value is an average of either two or three determinations.
Table II : Solubility of H 2 in H 2SO4 Solutions at 30°
[H2SO4], Cm3 0f h 2/1.N (at 30°) B s
0.0011 17.09 00.100 16.66 0.00830.602 16.15 0.02211.02 15.17 0.04953.04 12.76 0.12435.05 10.83 0.1956.95 10.01 0.2309.67 8.87 0.28312.4 8.11 0.32215.2 7.68 0.345
Solubilities are given in cubic centimeters of gas at STP (0°, 760 mm) per liter of solution at 30°.
Discussion“ Salting-out” is the decrease in solubilitjr of a non
electrolyte in ionic solutions. The vast literature on this phenomenon is summarized in several comprehensive reviews.12-16 Empirically, salting-out is well described by the equation of Setchenow17
(11) See ref 2, p 553.(12) J. N . Sugden, J. Chem. Soc., 174 (1926).
Volume 70, Number 8 March 1966

720 P. R uetschi and R. F. Amlie
log (& "/& ) = kaCB (1)
where $2° and $2 are the solubilities (in cubic centimeters at STP per liter) of the nonelectrolyte molecules
Table III ; Solubility of H2 in KOH solutions at 30°
[KOH),N
Cm» of Ha/1. (at 30°)
T 50Log —S
0 .0091 16 .68 0 .0 030 .1 0 2 16 .29 0 .0 1 80 .5 1 0 14 .13 0 .0 8 01 .0 3 1 2 .13 0 .1 4 61 .9 8 9 .2 7 0 .2 6 43 .0 4 6 .7 1 0 .4 0 45 .0 0 3 .6 5 0 .6 6 67 .6 1 1 .5 9 1 .0 29
10 .23 0 .7 7 1 .3 4 4
Figure 2. Solubility of H2 in H2S04 solutions.
Figure 3. Solubility of H2 in KOH solutions.
in the solvent and in the ionic solution, respectively, and Ce is the concentration of the electrolyte in equivalents per liter.
Theories on salting-out may be grouped into three categories: (a) electrostatic theories, (b) internalpressure theories, (c) hydration theories.
Electrostatic Theories. By minimizing the electrostatic free energy, Debye18’19 derived the expression for the salting-out effect
S2/S20 = I - Zo-n; (2)
where
( 7 = 4 7r J 1 — exp[—(A /r)4]r2dr (3)Jri
The integration limits are between the radius of the (hydrated) ion r; and the radius rn of the spherical volume at disposal of one ion. The characteristic length R is defined by
A 4 =8irkTV\1 D2( ô iii hn<u
(4)
and depends on the molecular volumes of solvent and nonelectrolyte molecules Vx and F2, respectively, and the corresponding dielectric decrements, whereby the concentrations ni and n2 of solvent and nonelectrolyte are given in molecules/cm3. For values of Zcrn; close to 1, it follows from (2)
In (iS2°/&) = 2<m i (5)
Equation 5 is in qualitative agreement, but in quantitative disagreement, with experimental data.13’16'20-23 The electrostatic theory18-19 describes salting-out entirely in terms of dielectric effects. Nonelectrolytes with zero dielectric decrement (such as hydrogen) are thus predicted to show no salting-out, which is not in accord with experimental results. 13 14 15 16 17 18 19 20 21 22 23
(13) M . Randall and C. F. Failey, Chem. Rev., 4, 271, 285, 291 (1927).(14) H. S. Harned and B. B. Owen, “The Physical Chemistry of Electrolytic Solutions,” 3rd ed, Reinhold Publishing Corp., New York, N . Y ., 1958, p 531.(15) B. E. Conway and J. O ’M . Bockris, “ Modern Aspects of Electrochemistry,” Butterworth and Co. Ltd., London, 1954, p 95.(16) F. A. Long and W . F. McDevit, Chem. Rev., 51, 119 (1952).(17) A. Setchenow, Z. Physik. Chem. (Leipzig), 4, 117 (1889).(18) P. Debye and J. McAulay, Physik. Z., 26, 22 (1925).(19) P. Debye, Z. Physik. Chem. (Leipzig), 130, 55 (1927).(20) G. Scatchard, Trans. Faraday Soc., 23, 454 (1927).(21) G. Scatchard and M . A. Benedict, / . Am. Chem. Soc., 58, 837 (1936).(22) J. B. Hasted, D . M . Ritson, and C. H. Collie, J. Chem. Phys., 16, 1 (1948).(23) M . Givon, Y . Marcus, and M . Shiloh, J. Phys. Chem., 67, 2495 (1963); see also Y . Marcus, Acta Chem. Scand., 11, 329 (1957).
The Journal of Physical Chemistry

Solubility of H2 in KOH and H2S04 721
Very recently, Givon, et al.,23 have tried to improve the Debye treatment of salting-out by introducing into eq 4 a term describing the dependence of the dielectric constant on the ionic concentration of the solution. The neglect of dielectric saturation in the theory of Debye can cause serious errors in the distribution function of polar nonelectrolyte and solvent molecules near the central ion. Introduction of appropriate Dx(r) and D2(r) functions might lead to a more meaningful result than the use of an over-all ionic dielectric decrement.
Internal Pressure Theories. Based on concepts developed by Tait,24 Tammann,25 and Gibson,26 the salting-out effect has been explained by McDevit and Long27 in terms of an “ internal pressure,” exerted by the ions on the nonelectrolyte molecules. Values of fc8 calculated with the equation of McDevit and Long are 2-3 times larger than experimental data. However, the right order with respect to the relative effects of different ions is predicted.
The theory presumes equal compression of all solvent molecules in the system. In reality, only the water molecules in the hydration shells are “ compressed” owing to the dipole attraction and corresponding électrostriction. Nonelectrolyte molecules of nonpolar character are, however, expelled from the hydration shells, as discussed below.
Hydration Theories. Already in 1907, Philip28 pointed out that salting-out may be explained by assuming that some of the water becomes attached to the electrolyte ions as water of hydration and is thereby removed from its role of solvent.
This idea was pursued further by Sugden,12 who showed that hydration numbers derived from salting- out measurements were additive properties of the ions.
Eucken and Herzberg29 30 suggested that molecular hydrogen is an ideally suited test substance for studying ionic hydration by means of salting-out. Hydrogen molecules, being small, inert, unhydrated, nonpolar, and nonpolarizable particles, whose solubility is very small, whose effects on the dielectric properties are negligible, and whose dispersion interaction with ions80'31 is not perceptible, so that they are completely expelled from the hydration shells,29 should cause a minimum of distortion in the solution to be studied. Salting-out measurements of hydrogen should prove especially useful for the study of highly concentrated solutions, including strong acids and bases.
On the basis of the hydration concept, the ratio of the solubilities in the pure solvent and in the solution may be set simply equal to the ratio of the volumes of “ free” water
S2VS2 =(1
1SniVi) (6)
where F, is the self-volume of the hydrated ion. Taking the logarithm of (6) and expanding the right side, one derives
In (S2VS2) = SrqFi +(2niF !)2/2 + (SriiFi)3/3 + . . . (7)
The linear approximation, valid for dilute solutions
In (S2VS2) = 2 > iF i = 2mVi° (8)ni—»-0
(where Vi° is the ionic volume at infinitely dilute solution) represents the Setchenow equation. For a completely dissociated electrolyte n-v = v,ns, where v, is the number of ions of type i produced upon dissociation of one molecule of salt.
Thus
In (S2VS2) = n ^ V ? ) (9)
The slope of the Setchenow equation is therefore a measure for the ionic self-volumes F,0 at infinite dilution.
The neglect of the higher terms in (7) appears fortuitously compensated by the decrease in F;, and the Setchenow plot can remain linear up to relatively very high electrolyte concentrations.
If the electrolyte is incompletely dissociated, n; is no longer proportional to ns, and the Setchenow plot is no longer linear. This appears to be the case for sulfuric acid (Figure 4).
In view of (6) and (9) one derives the following interesting empirical relation for the decrease of the hydrated ionic self-volumes with concentration
In (S2VS2) = ns2 ^ F i ° = - I n [1 - ^ ( I ^ F ; ) ]
and
2 , ,v , - 1 -nB
(24) P. G. Tait, ref 14, p 379.(25) G. Tammann, “ Ueber die Beziehungen zwischen den inneren Kräften und Eigenschaften der Lösungen,” Voss, Leipzig, 1907, p 36.(26) R. E. Gibson, J. Am. Ckem. Soc., 56, 4 (1934).(27) W . F. McDevit and F. A. Long, ibid., 74, 1773 (1952).(28) W . Philip, Trans Faraday Soc., 3, 1 (1907); W . Philip and W. Bramley, J. Chem. Soc., 107, 377, 1831 (1915).(29) A. Eucken and G. Herzberg, Z. Physik. Chem. (Leipzig), 195, 1 (1950).(30) J. O'M . Bockris, F. Bowler-Reed, and M . Kitchener, Trans. Faraday Soc., 47, 184 (1951).(31) G. Kortum, Z. Elektrochem., 42, 287 (1936).
Volume 70, Number 3 March 1966

722 P. R uetschi and R. F. A mlie
Figure 4. Setchenow plots for H2 solubility. Figure 5. Schematic illustration of the ionic volume effect.
With (9) one obtains from the data of Figure 4 for the ionic self-volume of KOH at infinite dilution
r;Fi° = 5.12 X 10~22 cm3
which corresponds to two spheres of radius
fh = 3.94 A
The calculated radii are in the range of the internuclear separation distance K +-H 20, obtained by Moelwyn- Hughes,32 and are, as expected, slightly larger than those estimated from ionic transport processes,33 which pertain only to tight bonds, but not to the diffuse part of the hydration shell.29
Self-volumes, calculated with (9) from the data of ref 17 are listed in Table IV.
Table IV : Salting-out of Hydrogen and Ionic Hydration
Setchenow Self-volume,slope, cm3/molecule
Salt M -i X 1022
NaOH 0.140 5.37KOH 0.130 4.97NaCl 0.114 4.35KCl 0.102 3.90LiCl 0.076 2.90HCl 0.030 1.15
The above hydration theory may be extended to incorporate the Debye effect outside the hydration shell. As illustrated in Figure 5, each ion with crystallographic radius r0 carries a hydration shell of radius rh. If the solution contains 2ni ions/cm3, the volume at the disposal of one ion (dotted sphere) is
[ ' W rM r = (4/3)tt rn3 = — (11)Jo 2?ii
The distribution of nonpolar nonelectrolyte molecules outside the hydration shell is, according to Debye, given by
n2 = n2° exp[—(R /r)4] (12)
where n2° would be the concentration far away from the ion, that is, in the absence of electrolyte, and where R is defined by (4).
The number of nonelectrolyte molecules contained in the volume at the disposal of me ion is then
Zi = n2° f exp[—(R /r)4]47rr2dr (13)rh
In the absence of electrolyte, the number of nonelectrolyte molecules in the same volume would be
n2°Z20 = n2° I 47rr2dr = — • (14)J o 2 7li
The lower limit of the integral here is zero since the volume previously occupied by the ion is now also available for dissolution.
Comparing the numbers of nonelectrolyte molecules in the same volume, before and after the addition of salt, one has
Zi = (2Wi) f exp[— (A /r)4]47rr2dr J rh
= (2ni){ r^TD-Mr - P ü -W rh J rh
exp [ — (R /r)4 ])47rr 2dr 32 33
(32) E. A. Moelwyn-Hughes, “ Physical Chemistry,” 2nd ed, Pergamon Press Ltd., Oxford, 1961, p 887.(33) E. R. Nightingale, J. Phys. Chem., 63, 1381 (1959).
The Journal of Physical Chemistry

R ole of SF in the Pyrolysis of D ì-ì-butyl Peroxide 723
Urn /*rh4irr2dr — J 4-rr2dr —
J (1 — exp[— (R /r)4])47rr2dr >J rh J
= 1 - SVfm - Sam (15)
where is the self-volume of the hydrated ion and a an abbreviation, already defined in (3).
Since the ratio Z2/Z 2° obviously signifies the ratio of solubilities (S2/S20) per unit volume, eq 15 may be compared immediately with eq 2. For small elec
trolyte concentrations, eq 15 becomes, in analogy to(5)
In (S-fi/S-z) = SniFi0 + Sam (16)
which represents a refinement over eq 8 in the sense of the Debye theory. For zero dielectric decrements (nonpolar molecules), eq 16 reduces to (8).
Acknowledgment. The authors wish to express their appreciation to John W. Harman, III, and Thomas A. Black for their contributions to the experimental part of this study.
The Role of Sulfur Hexafluoride in the Pyrolysis of Di-f-butyl Peroxide:
Chemical Sensitization and the Reaction of Methyl Radicals with
Sulfur Hexafluoride
by Leslie Batt and Frank R. Cruickshank
Chemistry Department, University of Aberdeen, Aberdeen, Scotland (Received August 17, 1965)
The acceleration of the rate of decomposition of di-f-butyl peroxide by SF6 has been shown to be a chemical effect rather than a physical one as has been postulated previously. Detection and quantitative estimation of methyl fluoride gives the following value for the rate of attack of methyl radicals on SF6: log A: = 10.3 — 14,100 cal/4.575T 1. mole-1 sec-1. Detection of methyl fluoride also permits the following mechanism to be postulated which accounts satisfactorily for the accelerated rate. Me- + SF6 -*■ MeF + SFB-, SF5- -*■ SF4 + F ■, F • + dtBP HF + dtBP-_H, dtBP-_H -> f-BuO- + i-BuO, Me- + SFB- MeF + SF4. It is concluded that SF6 will not act as an inert energy transfer agent in the presence of organic free radicals particularly over 140°.
IntroductionThe gas phase pyrolysis of di-f-butyl peroxide (dtBP)
has been shown to be an uncomplicated, homogeneous first-order process by many workers.1 The decomposition is satisfactorily explained by the mechanism
d tB P — >2f-BuO- (1)
f-BuO • + M — > Me • + Me2CO + M (2)
Me- + Me2CO — ^ CH4 + CH2COMe (3) Me- + • CH2COMe — > EtCOMe (4)
2CH2COMe — ► (CH2COMe)2 (5)
2Me- — C2H6 (6)
(1) For a review, see S. W . Benson, “ The Foundation of Chemical Kinetics," McGraw-Hill Book Co., Inc., New York, N . Y ., 1960, pp 363-370.
Volume 70, Number 3 March 1966

724 Leslie Batt and Frank R. Cruickshank
However, there is evidence for about 2% chain participation indicated by the presence of isobutylene oxide (f-BuO).2
R + dtBP — > dtBP • _H + RH (7)dtBP • _H — *" i-BuO + £-BuO • (8)
(R = Me or ¿-BuO). Nevertheless, since the chain contribution is so small, the rate of reaction corresponds to step 1 and the rate constant is given by ki = 1018-65 exp( — 37.4 kced/RT) sec-1.2
The rate constant is unaffected, within experimental error, by a change in pressure of 0-600 mm, but in large spherical vessels (e.g., V = 500 ml) thermal gradients, arising from the high exothermicity (39 kcal/mole) of the reaction and the high specific rate constant, can be established and lead to variations in the rate constant as a function of pressure.2 The rate constant is also unaffected within experimental error by the addition of foreign gases such as N2, C 02, and with certain reservations CF4.3 However, in the presence of HC1,4 5’8 chloroparaffins,6'7 SiF4,3-6 and SF6,3'6 there is definite acceleration of the rate. The effect of HC1 and the chloroparaffins has been shown to be a chemical sensitization,6'7 but the effect of the latter two has been interpreted by Hinshelwood and his co-workers3'6 in terms of an extension to the theory of unimolecular reactions although chemical sensitization is not completely excluded.7 At the lower pressures studied it is doubtful whether a physical effect could operate in the decomposition of dtBP. Even if the methyl groups were treated as point masses and the C-H vibrational modes were ignored, a molecule consisting of ten atoms would exhibit “ falloff” characteristics only at pressures below 10-2 nun.8
If a physical effect is to be excluded, it has to be concluded that there is a chemical sensitization. The most probable source for this would be methyl attack on SFô followed by decomposition of the SFE radical so formed and fluorine atom attack on dtBP.
Me- + SF6 — > MeF + SF3 (9)
SF6- — ^ S F 4 + F- (10)
F- + dtBP — > HF + dtBP• _H (11)
dtBP • _H — > f-BuO + ¿-BuO • (8)(Isobutyraldéhyde may also be produced and is assumed to be produced from f-BuO ; see ref 2 and 5.) The object of this investigation is to find evidence for such a sensitization process.
Experimental SectionThe dtBP (Fluka) was purified by washing with water
and dried with anhydrous potassium carbonate followed
by low-temperature distillation under reduced pressure. It was stored in the dark at —80°. The 3F6 (Mathe- son) was dried by passing through a Dry Ice-acetone trap several times and stored in a 3-1. bulb. Methyl fluoride, used for glpc calibrations, was prepared by the method of Edgell and Parts,9 and was purified by bulb-to-bulb distillation. The purity of all materials was established by glpc, dtBP being greater than 99.9%, SF6 99%, the chief impurity being CF4, and CH3F 99%.
The apparatus was a conventional static system including purification and storage sections for dtBP and SF6, a 1-1. cylindrical mixing vessel heated electrically to 80°, a 300-ml multisurface reaction vessel in the form of seven 1.5-cm bore Pyrex tubes 27 cm long and joined together at both ends,2’10 a Springham Pyrex spiral gauge fitted with a 1-m optical lever with a magnification of 5, and an analysis section consisting of traps, an automatic Topler pump and a gas buret. The reaction vessel was heated in an electrical furnace controlled to 0.2° and having a temperature profile of ±0.2° along the length of the reaction vessel. The dtBP was distilled into the mixing vessel as before2 and heated to 80°. The SF6 was then expanded into the mixing vessel, its pressure being measured with the spiral gauge. This was allowed to mix for about 40 min and then expanded into the reaction vessel and pressure measurements were made at regular intervals using the spiral gauge. At the end of each run the contents of the reaction vessel were frozen into liquid nitrogen traps and the volatile fraction was pumped off and measured in the gas buret. A second fraction was then pumped off using a propanol slush bath ( —135°) and measured in the gas buret. The first fraction was analysed by glpc cn a Perkin- Elmer 2-m “ I ” column and was found to be almost entirely methane together with a trace of CO in agreement with Thynne.11 The second fraction was similarly analyzed using a Perkin-Elmer 2-m “ I” and a 2-m “ J” column separately. The remaining products were analyzed as a liquid by glpc using a Perkin-Elmer
(2) L. Batt and S. W . Benson, J. Chem. Phys., 36, 895 (1962).(3) F. W . Birss, Proc. Roy. Soc. (London), A247, 381 (1958).(4) J. H. Raley, F. F. Rust, and W. E. Vaughan, J. Am. Chem. Soc., 70, 2767 (1948).(5) M. Flowers, L. Batt, and S. W . Benson, J. Chem. Phys., 37, 2662 (1962).(6) A. N. Bose and C. Hinshelwood, Proc. Roy. Soc. (London), A249, 173 (1958).(7) G. Archer and C. Hinshelwood, ibid., A261, 293 (1961).(8) See ref 1, p 234.(9) W . F. Edgell and L. Parts, J. Am. Chem. Soc., 77, 4899 (1955).(10) This excludes the possibility of thermal gradients; see ref 2.(11) J. C. J. Thynne. private communication.
The Journal of Physical Chemistry

R ole of SF in the Pyrolysis cf D ì-2-butyl Peroxide 725
2-m “ T ” column. Runs were carried out over the temperature range 140-170° and over the pressure range 50-250 mm, the maximum pressure being limited by condensation of dtBP in the “ dead space.”
Results and DiscussionIn agreement with previous results,2 the rate con
stant at 140° for dtBP alone in the reaction vessel was independent of pressure. In the presence of SF6, however, there was a dramatic increase of the rate constant, which rapidly decreased with aging in the reaction vessel until virtually no catalytic effect was observable. At this stage reaction products with and without SF6 were identical.
At 150° a new product appeared and was detected and identified as methyl fluoride by glpc. At higher temperatures (160-170°) it was possible to estimate methyl fluoride quantitatively and in the light of these results the following mechanism is postulated to account for the catalytic decomposition of dtBP by SF6. (See reactions 8-11.)
It was impossible to detect SF4 as this reacts in a Pyrex system12 and attempts to detect HF by using the extremely sensitive color change test with auramine also failed.13 Presumably, the former was lost on the walls of the reaction vessel. Thus it was not possible to verify the mass balance demanded by the postulated mechanism that yield (MeF) = yield (SF4) or yield (HF). Correlation with the loss of SF6 and the formation of MeF was also inaccurate because of the large amount of SF6 used and the small amount of MeF formed. Analyses for typical runs are shown in Table I. One significant point immerges from the table. The proposed mechanism also demands that the yield of MeF should be equated with the extra yield of ¿-BuO. Thus f-BuO should be at least as large as MeF and because of the 2% chain already present ought to be larger.14 15 In fact, Table I shows that there is no correlation between MeF and the i- BuO and isobutyraldehyde formed and moreover this
Table I : Yield of MeP and i-BuO as a Function of SP6 Concentration. All Quantities Are Expressed in jumoles
CHaF CjH. SF«¿-BuO + aldehyde
Length of run,
secTemp,
°C
1 .9 l i e 563 1 .4 600 1572 .4 8 8 6 .4 838 1 .7 600 1574 .8 1 5 6 .8 1179 0 .9 600 1570 .1 7 0 7 2 .1 648 0 .8 210 1 6 7 .71 .9 4 6 8 .3 797 1 .1 210 1 6 7 .72 .1 6 5 6 .1 1020 1 .3 210 1 6 7 .7
is frequently less than MeF. Although in the glpc analyses f-BuO is very small and can also be masked by the dtBP and therefore the estimation of f-BuO would be rather inaccurate, the discrepancy is possibly real, suggesting that there may be another source for MeF. This can be realized via the disproportionation of Me- and SF5- and presumably one should also include combination between these two radicals which could also lead to MeF and SF4 via the splitting of the excited molecule so formed.
Me- + SF6 — > MeF + SF4 (12)
Me- + SF5- — >MeSFs (13)
This postulation leads to a “ physical” acceleration of the rate since the stoichiometric equation implies a stoichiometry of 4 for the decomposition of dtBP whereas rate constant calculations from pressure measurements are based on a stoichiometry of 3.
dtBP + SF6 — > 2MeF + 2Me2CO + SF4 (14)
SF4 probably has a certain stability in an “ aged” reaction vessel but is los j at a later stage in the analysis section of the apparatus.11 However, on the assumption that MeF is produced entirely from step 9, it is clear that a graph of yield(MeF)/yield(C2H6)'/2 against the SF6 concentration should be linear and have a slope of X 10-3/fc1/24F I/2 where t is the length of the run in seconds, V is the volume of the reaction vessel in liters, and the gases are expressed in pmoles. Such graphs, as shown in Figure 1, give good straight lines yielding the values for As of 1.1 and 1.65 X 10³ l./mole sec at 157 and 167.7°, respectively, based on a value for fc4 of 2.2 X 10¹⁰ l./mole sec.16 It was not possible to carry out studies above 170° since a large amount of decomposition would occur during diffusion of the reacting gases into the reaction vessel from the mixing vessel.
The Arrhenius parameters, which will probably have a large error because of the low temperature interval, are given by log fc9 = 10.3 — 14.10 kcal/4.57571 1. mole-1 sec-1. If the disproportionation reaction of Me • and SFg- participates, then as a maximum half the MeF should be subtracted; i.e., the preexponential factor is too high by a factor of 2. The high value of the preexponential factor is probably a reflection of the symmetry of the SF6 molecule. Thus the high
(12) H. L. Roberts, Q u art. R ev . (London), 14, 33 (1961).(13) H. E. O’Neal and S. W. Benson, J . C h em . P h y s . , 3 6 , 2196 (1962).(14) The chain will persist in the presence of SFi since the (Me)ss concentration will not be reduced by very much and (¿-BuO)a3 is not affected at all.(15) A. Shepp, J . C h em . P h y s . , 24, 944 (1956).
Volume 70, Number 3 March 1966

726 Leslie Batt and Frank R. Cruickshank
Figure 1. Effect of SF6 concentration on the ratio MeF/(C2H6) ‘/2 at 157 and 167.7°.
activation energy alone accounts for the stability of the SF6 molecule. Considering the high exothermicity of the reaction (~ 40 kcal/mole) this value is very unusual. In the presence of SF6 the rate of disappearance of dtBP is given by — d(dtBP)/df = fci(dtBP) + ku(F) (dtBP) = fci(dtBP) + fc9(Me)(SF6). If we assume that Me combination is the major termination process, then (Me)S3 = We cannow compare this expression with a typical run carried out by Hinshelwood, et al., at 160° where dtBP = 50 mm and SF6 = 200 mm (Me)ss = 6.46 X IO-9 mole/1. and — d(dtBP)/df = (4.96 X 10⁻⁴ + 2.8 X 10“ 5)- (dtBP) whence the assumed first-order velocity constant is 5.24 X 10⁻⁴ sec-1. This is in excellent agreement with the result computed from Birss3 of 5.19 X 10⁻⁴ sec-1. Reactions such as
F • + SF6 - F2 T SF5 • (15)
Me- + HF —-> C H 4- + F- (16)
Me- + HF —-> MeF + H- (17)
f-BuO • + HF —-> i-BuOH + F- (18)
can all be rejected on the grounds of their high endo- thermicity. However, it is interesting to compare the heats of reaction for the reactions Me + H X -► CH4 + X , and Me + X 2 —► M eX + X , where X stands for halogen, as shown in Table II. For the halogens we see that all of the reactions are very exothermic so that they are all good “ trapping” reactions for Me- but that F2 is probably the best (depending on the conditions) from the point of view of its highest exothermicity and that the strongest C -X bond is formed. Conversely, for the halogen acids it is HI which is the best “ trap” for Me-. The reaction for HC1 is just about thermoneutral, but HC1 is still an efficient “ trap” for M e-. Also for HF the reaction is so endothermic that it is completely useless as a “ trap” for Me-. This explains why, if HF is formed in the
SF6 + dtBP system, no chain reaction is propagated as in the HC1 + dtBP system.6-6
Table II: Heats of Reaction for the Processes Me- + X2 —*• MeX + X- and Me- + HX —- CH4 + X- Derived from Bond Strengths Listed in Cottrell“
AH 1X2), Aff(HX),(X) kcal/mole kcal/mole
F -7 4 33Cl -2 3 1.1Br -2 1 .5 -1 4 .4I -1 7 .5 -3 0 .5
“ T. L. Cottrell, “ The Strengths of Chemical Bonds,” Butter- worth and Co. Ltd., London, 1958.
As a general conclusion we can say that SF6 will probably act as an inert energy transfer agent in molecular decompositions and those not involving organic free radicals but for free radical reactions any results must be treated as suspect particularly over 140° and in photolytic systems where excited radicals are produced. Thus no effect is to be expected in the decompositions of N2O5,16 N 02C1,17 in the recombination of O atoms,18 and in the combination of Me radicals19 (since this was carried out to a maximum temperature of 100°). However, in the study of the vibrational deactivation of sec-butyl radicals,20 the decomposition of dimethyl cyclopropane, where a diradical could be produced, and of nitrosomethane,21 since there is evidence for a free-radical mechanism here,22 chemical reaction may well occur with SF6. Also, a chemical reaction is known to occur between CH2 and SF6 in the study of the flash photolysis of CH2C 0.23 24 There is no doubt that the acceleration in the rate of decomposition of C2H6 by SF6 found by Hinshelwood, et al.,2i is due to the reaction of Me radicals and H atoms with SF6, the SF5 radical probably decomposing at 630°
(16) M . Volpe and H. S. Johnston, J. Am. Chem. Soc., 78, 3903 (1956).(17) D . J. Wilson and H. S. Johnston, ibid., 75, 5763 (1953).(18) J. E. Morgan and H. I. Schifï, J. Chem. Phys., 38, 1495 (1963).(19) S. Toby and B. H. Weiss, J. Phys. Chem., 68, 2492 (1964).(20) G. H. Kohlmaier and B. S. Rabinovitch, J. Chem. Phys., 38, 1709 (1963).(21) L. Batt and B. G. Gowenlock, Transactions Faraday Soc., 56, 682 (1959).(22) B. G. Gowenlock, private communication.(23) G. B. Kistiakowsky and K. Sauer, J. Am. Chem. Soc., 80, 1066 (1958).(24) B. N. Parsons, C. J. Danby, and C. Hinshelwood, Proc. Roy. Soc. (London), A240, 333 (1957).
The Journal of Physical Chemistry

R adiation Chemistry of Fremy’s Salt in A queous Solution 727
C2H6 — >■ 2Me • (19)Me- + SF6 - -> C H 4 + s f 6- (9)
SF6------► SF4 + F- (10)F- + C2H6 —■>C2H6- + HF (20)
C2H6- + M — > C2H4 + H- + M (21)H- + SF6 — ^ S F 6- + HF (22)
Indeed, the authors themselves have evidence for the production of SF4. The catalytic effect of SF6 is limited since the F atom is effectively trapped once HF is formed.
Acknowledgment. F. R. Cruickshank gratefully acknowledges receipt of a Carnegie Scholarship from the Carnegie Trust for the Universities of Scotland.
On the Radiation Chemistry of Fremy’s Salt in Aqueous Solution
by N. Th. Rakintzis
Nuclear Research Center “ Dem ocritusRadiation Chemistry Laboratory, Aghia Paraskevi-Attikis, Athens, Greece
and Gabriel Stein
Department of Physical Chemistry, Hebrew University, Jerusalem, Israel (Received August 27, 1965)
The inorganic free radical nitrosodisulfonate (Fremy’s sab, N0(S03)22~) was irradiated with 7 rays in aerated aqueous solutions at pH >9.5. At pH 10-11 the solutions are stable in the absence of irradiation. On irradiation the decrease in OD at 242 m/i (e 1660 M~x cm-1) was followed and gave strictly zero-kinetics. In the presence of alcohols a limit of G = 6.1 was obtained. The correlation with CrH+e+oH at the pH employed is discussed.
IntroductionOne of the problems of the radiation chemistry of
aqueous solutions much discussed recently is that of the yields of the various primary intermediates over the accessible pH range. The application of suitable scavengers helps to elucidate this question. Fremy’s salt, K4(N 0(S03)2)2, dissolves in water to give relatively stable aqueous solutions of the inorganic free radical N 0(S03)22~, the nitrosodisulfonate radical ion, which we shall denote by F. As shown by Murib and Ritter,1 2 the stability of the aqueous solutions increases in moderately alkaline solutions. We found that when the now commercially available product is recrystallized, the purified crystals yield at pH 10-11 stable solutions, which on irradiation with 7 rays give highly reproducible kinetic results. From these solutions in
formation concerning the reactions of Fremy’s salt with the radicals in alkaline solution could be obtained and compared with other data from the literature. In the present paper results in aerated solutions are reported.
Experimental Section
Irradiations were carried out in aerated solutions with a 92-curie 60Co 7-ray source.2 The dose rate was 650 rads min-1 throughout the experiments. The irradiation cells, the cleaning technique used, the dosimetry, as well as the preparation of the triply distilled water, are described in a previous publication.3
(1) J. H. Murib and D. M . Ritter, J. Am. Chem. Soc., 74, 3394 (1952).(2) D. G. Marketos and N. Th. Rakintzis, Z. Physik. Chem. (Frankfurt), 44, 270 (1965).
Volume 70, Number 3 March 1966
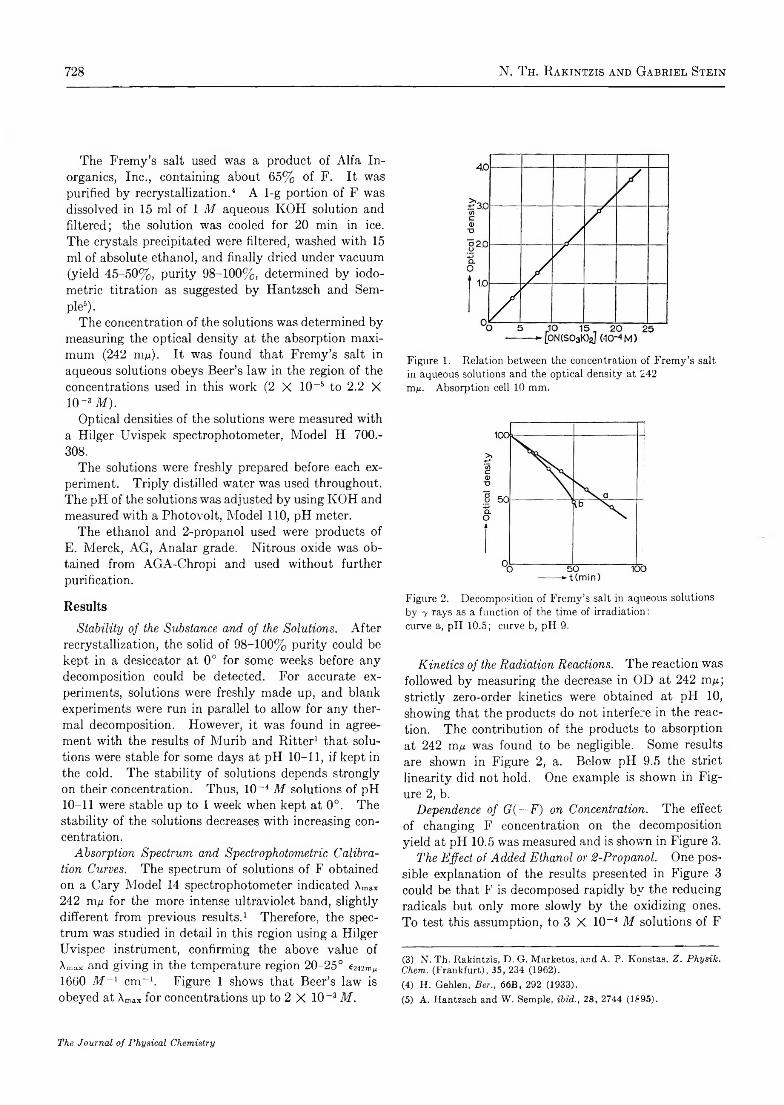
728 N. T h. Rakintzis and Gabriel Stein
The Fremy’s salt used was a product of Alfa Inorganics, Inc., containing about 65% of F. It was purified by recrystallization.3 4 A 1-g portion of F was dissolved in 15 ml of 1 M aqueous KOH solution and filtered; the solution was cooled for 20 min in ice. The crystals precipitated were filtered, washed with 15 ml of absolute ethanol, and finally dried under vacuum (yield 45-50%, purity 98-100%, determined by iodo- metric titration as suggested by Hantzsch and Semple5) .
The concentration of the solutions was determined by measuring the optical density at the absorption maximum (242 my.). It was found that Fremy’s salt in aqueous solutions obeys Beer’s law in the region of the concentrations used in this work (2 X 10“ 5 to 2.2 X 10 - 3M).
Optical densities of the solutions were measured with a Hilger Uvispek spectrophotometer, Model H 700.- 308.
The solutions were freshly prepared before each experiment. Triply distilled water was used throughout. The pH of the solutions was adjusted by using KOH and measured with a Photovolt, Model 110, pH meter.
The ethanol and 2-propanol used were products ofE. Merck, AG, Analar grade. Nitrous oxide was obtained from AGA-Chropi and used without further purification.
ResultsStability of the Substance and of the Solutions. After
recrystallization, the solid of 98-100% purity could be kept in a desiccator at 0° for some weeks before any decomposition could be detected. For accurate experiments, solutions were freshly made up, and blank experiments were run in parallel to allow for any thermal decomposition. However, it was found in agreement with the results of Murib and Ritter1 that solutions were stable for some days at pH 10-11, if kept in the cold. The stability of solutions depends strongly on their concentration. Thus, 10~4 M solutions of pH 10-11 were stable up to 1 week when kept at 0°. The stability of the solutions decreases with increasing concentration.
Absorption Spectrum and Spectrophotometric Calibration Curves. The spectrum of solutions of F obtained on a Cary Model 14 spectrophotometer indicated Xmax 242 myu for the more intense ultraviolet band, slightly different from previous results.1 Therefore, the spectrum was studied in detail in this region using a Hilger Uvispec instrument, confirming the above value of Xmax and giving in the temperature region 20-25° e242m„ 1660 M~l cm-1. Figure 1 shows that Beer’s law is obeyed at Xmax for concentrations up to 2 X 10~3 M.
Figure 1. Relation between the concentration of Fremy’s salt in aqueous solutions and the optical density at 242 my. Absorption cell 10 mm.
Figure 2. Decomposition of Fremy’s salt in aqueous solutions by 7 rays as a function of the time of irradiation: curve a, pH 10.5; curve b, pH 9.
Kinetics of the Radiation Reactions. The reaction was followed by measuring the decrease in OD at 242 mp; strictly zero-order kinetics were obtained at pH 10, showing that the products do not interfere in the reaction. The contribution of the products to absorption at 242 mp was found to be negligible. Some results are shown in Figure 2, a. Below pH 9.5 the strict linearity did not hold. One example is shown in Figure 2, b.
Dependence of G(—F) on Concentration. The effect of changing F concentration on the decomposition yield at pH 10.5 was measured and is shown in Figure 3.
The Effect of Added Ethanol or 2-Propanol. One possible explanation of the results presented in Figure 3 could be that F is decomposed rapidly by the reducing radicals but only more slowly by the oxidizing ones. To test this assumption, to 3 X 10~4 M solutions of F
(3) N. Th. Rakintzis, D. G. Marketos, and A. P. Konstas, Z. Physik. Chem. (Frankfurt), 35, 234 (1962).(4) H. Gehlen, Ber., 66B, 292 (1933).(5) A. Hantzseh and W . Semple, ibid., 28, 2744 (1S95).
The Journal of Physical Chemistry

R adiation Chemistry op Fremy’s Salt in A queous Solution 729
Figure 3. Variation of the decomposition yield of Fremy’s salt in aqueous solutions with its initial concentration.
Figure 4. Decomposition yield of Fremy’s salt in aqueous solutions as a function of the concentration of the alcohols added. [F] = 3 X 10⁻⁴ M: O, ethanol; •, 2-propanol.
at pH 10.5, ethanol or 2-propanol was added before irradiation (Figure 4). The results shown in the figure show the yields obtained at a constant concentration of F, with varying alcohol concentrations. A series of experiments was also carried out, where the concentration of F was varied at a constant concentration of 2- propanol (Figure 5).
Solutions Containing Safranine T. The effect of added alcohols appears consistent with the assumption that F is decomposed relatively slowly by the species of OH present. To test this further, Safranine T (S) was used, which was shown6 to react in acid solutions with OH only, but not with H 02. When 1.95 X 10~4 M F was added to a 3 X 10⁻⁵ M solution of S, G(—S) decreased from 1.06 in the absence to 0.86 in the presence of F. It is noteworthy that at higher F concentrations an oxidation of S by F could be observed. This effect is negligible at the concentration used in the above experiment.
Q--A —
o1--------------- 1__________ __________ _______ _____o 25 50 75 100--------------*-[0N(S03K)J ('10-5 M )
Figure 5. Plot of C?(—F) vs. its initial concentration, in the presence of 2 X 10 ~l M 2-propanol.
Figure 6. Variation of G{ — F) with the concentration of nitrous oxide added. [F] = 3 X 10~4 M.
The Effect of Added Nitrous Oxide. By adding appropriate quantities of a saturated aqueous solution of N20 of pH 10.5 to air-saturated solutions of F, the results shown in Figure 6 were obtained. Control experiments in the presence of initially added H20 2 showed that the thermal reaction of F with H20 2 did not contribute to the observed results.
DiscussionFremy’s salt is known7-8 to act as an oxidizing agent
itself, being reduced to hydroxylamine disulfonate according to
0N (S 03)22- + H — ► H 0N (S03)22- (1)
If acceptors are absent, slow self-decomposition of F occurs, in which half of F reacts according to (1), with a corresponding oxidation of the other half of the quantity, giving the over-all stoichiometric relation
40N (S03)22- + 7H2Q —2H 0N (S03)22~ + N20 + 4S042- + 4H30 + (2)
(6) N. Rakintzis, E. Papaconstantinou, and D. Schuite-Frohlinde, Z . Physik. Chem. (Frankfurt), 44, 257 (1965).(7) H. J. Teuber and G. Jellinek, Chem. Ber., 85, 95 (1952).(8) H. J. Teuber and W . Rau, ibid., 86, 1036 (1953).
Volume 70, Number 3 March 1966

730 N. T h. Rakintzis and Gabriel Stein
The results in Figure 3 show that at concentrations of the order of 10-4 M at pH 10-11 the decomposition yield is about 3 in aerated solutions. As the concentration is increased above 10-3 M, the G value slowly rises above 5. If, however, at the lower F concentration ethanol or 2-propanol is added, G = 6.1 is reached with [ethanol] or [2-propanol] = lO-1 M (Figure 4). With N20 added at the lower F concentration, G also rises but only to a value of about 4.6 (Figure 5). These results are consistent with the following assumptions. At the pH values employed in air-saturated solutions, the primary reducing radicals may react directly with F, as in reaction I
F -f- eaq~ — > product (la)
F + H -—> product (lb)
or via 0 2
eaq~ -f- 0 2 — > 0 2~ (3a)
H + 0 2 — > H 02 — > H+ + O*" (3b)
followed by
F + 0 2_ — > product + 0 2 (Ic)
The oxidizing radical OH may also react directly, to give the oxidation products N20 and SO42- as in (2).
F + OH — > products (4a)
or through previous dissociation at the pH employed
F + O- •— >• products (4b)
directly or via 0 29
0 2 + OH — > H 03 — > O r + H+ (5a)
0 2 + 0 - — > O r (5b)
F + 0 3~ — > products (4c)
The results obtained in the presence of the alcohols (Figures 4 and 5) are consistent with the assumption that the oxidizing reactions (4a-c) are relatively slow compared with the reduction reactions (Ia-c). The alcohols (RH2), which do not react with the reducing species, may react with the oxidizing ones according to
the reactions
RH2 + OH — > RH + H20 (6a)
RH2 + 0 “ — > RH + O H - (6b)
RH2 + 0 3- — > RH + O H - + 0 2 (6c)followed by
F -f- RH — > product + R (7)
or the reaction of the corresponding organic peroxide. If so, G in the presence of alcohols should be a measure of CrH+e+oH. The value of G = 6.1 obtained agrees well with those recently obtained.10 Assuming Gn = 0.6, Ge = 2.65, this corresponds to (?oh = 2.85 at pH10.5. In the absence of alcohol, radicals may be lost by recombination, e.g.
0 2- + 0 3- —> 202 + O2- (8)or by the corresponding other reactions of the various radicals.
The results with Safranine T confirm that F reacts with OH and does so at a relatively low rate. Using the method of calculation previously reported,11 the results indicate fc"OH” +sA"OH>>+F = 10, where “ OH” denotes the species reacting in the present experiments, possibly O3-. For OH itself, in neutral solutions,12 fcoH+s = 4 X 10⁹ M -1 sec-1.
The results in the presence of N20 (Figure 6) would indicate the occurrence of the reaction
N20 + eaq- — > N2 + 0 - (9)
possibly followed by (5b) and the previous sequence of events. Since alcohols are absent in these experiments, the total yield will be less than the maximum.
Acknowledgments. We wish to convey our thanks to Mr. D. G. Marketos for his discussion and Mr. D. Arapoglou for his assistance in carrying out the experiments.
(9) G. Czapski and L. M. Dorfman, J. Phys. Chem., 68, 1169 (1964).(10) K .-D . Asmus and A. Henglein, Ber. Bunsenges. Physik. Chem., 68, 348 (1964).(11) D. G. Marketos and N. Th. Rakintzis, Z. Physik. Chem. (Frankfurt), 44, 285 (1965).(12) D. G. Marketos, unpublished results.
The Journal of Physical Chemistry

R eaction op Isopropylbenzene on 7-Irradiated Silica-A lumina 731
The Reaction of Isopropylbenzene on /-Irradiated Silica-Alumina:
The Effect of Annealing and of Exposure to Hydrogen or Oxygen
by Robert R. Hentz,1 Lewis M . Perkey, and Robert H . Williams
Research Department, Socony Mobil Oil Company, Inc., Princeton, New Jersey (Received August 27, 1965)
Annealing experiments performed on 7-irradiated silica-alumina indicate that the long- lived radiation-induced excitations which cause dealkylation of isopropylbenzene can be thermally deactivated. More than one group of such excitations was found to be present in the irradiated silica-alumina. Those excitations that anneal at 77° (and are completely annealed in less than 24 hr at 115°) correlate with visible color centers that are thermally bleached. Certain of the excitations, not absorbing in the visible, are not annealed even at 300°. Exposure of the irradiated solid to hydrogen results in bleaching of the visible color centers, irreversible adsorption of hydrogen, and elimination of a portion of the excitations that are effective in dealkylation of isopropylbenzene. Expressed as molecules per gram of solid, the amount of hydrogen adsorbed is slightly greater than the reduction in benzene yield. The reduction in benzene yield is also approximately equal to the number of those excitations that can be completely annealed at the lowest temperatures, 77 and 115°. Oxygen has no effect on the visible color or the benzene yield. The excitations annealing at 77° are identified tentatively with the visible color centers which are believed to be associated with positive holes trapped at substitutional aluminum. The likelihood that visible color centers are distributed uniformly throughout the solid suggests that these excitations may be transferred over distances up to 50-100 A. The radiation-induced dealkylation activity has been found to decrease with age of the unirradiated solid. However, only the precursors of the excitations annealing at 77° are affected.
Introduction diated solids such as quartz, silica, silica gel, and aluminosilicate glasses.Study of the radiation-induced reactions of isopro
pylbenzene on microporous silica-alumina has been reported in a series of publications from this laboratory.2-4 Of particular interest is the observation that the silica-alumina is darkened by 7 -irradiation in the absence of isopropylbenzene and that subsequent introduction of isopropylbenzene bleaches the solid with concomitant benzene formation. To clarify the relationships between the color centers and the long- lived dealkylation excitations5 in irradiated silica- alumina, a study was made in which the irradiated solid was either annealed or treated with hydrogen or oxygen before being exposed to isopropylbenzene. The observed effects are compared with various chemical and physical phenomena associated with other irra
Experimental Section
The silica-alumina used in this work is a conventional catalyst (10 wt % alumina and surface area = 400 m2 3 4/
(1) Radiation Laboratory, University of Notre Dame, Notre Dame, Ind.
(5) The general expression “excitations” is used in the absence of definitive evidence for the mechanism of energy storage in the solid. It is considered probable that the long-lived excitations responsible for benzene formation are trapped electrons and/or concomitant positive holes. One objective of this research is the identification of such excitations with particular radiation-induced color centers or defects.
(2) R. R. Hentz, J. Phys. Chem., 66, 1625 (1962).(3) R. R. Hentz, ibid., 66, 2714 (1962).(4) R. R. Hentz, ibid., 68, 2889 (1964).
Volume 70, Number S March 1966

732 R. R. Hentz, L. M. Perkey, and R. H. W illiams
g) that has been designated as solid A in a previous publication4 in which its properties are described. The same isopropylbenzene and purification procedures were used.2-4 Matheson’s Prepurified grade of hydrogen was purified further by passage through a Serfass silver-palladium hydrogen purifier and then through a liquid nitrogen trap packed with glass beads. The oxygen used was Matheson’s CP grade; it was dried with magnesium perchlorate and also was passed through the liquid nitrogen trap.
The general procedures have been described.2-4 All irradiations were at 36° with cobalt-60; during the time period of these experiments the dose rate was6-7 X 10¹⁹ ev g -1 hr-1 to the ceric sulfate dosimeter solution.6 In all experiments a sufficiently large value of dose/(gram of solid), greater than 1.2 X 10²¹ ev g-1, was used to ensure attainment of the plateau yield (saturation). Benzene yields are corrected for the 0.7 X 10¹⁷ molecules/(g of solid) formed in blank experiments on the unirradiated solid. Gas yields reported are for total gas volatile at —118°. No gas was obtained in blank experiments.
In annealing experiments, the irradiated solid, still sealed in the reaction cell, was placed in an oven at the desired temperature. On removal from the oven, the reaction cell was sealed to the vacuum line, and isopropylbenzene was transferred to the solid by the previously described procedure.4 In other experiments, the reaction cell was sealed to the vacuum line, without prior annealing, and the irradiated solid was exposed to a measured quantity of hydrogen or oxygen for a given length of time after rupture of the break- seal. The gas was then removed from the solid by pumping prior to the introduction of isopropylbenzene. When small amounts of gas were used, the amount of gas irreversibly adsorbed by the irradiated solid was determined by transferring removable gas with a Toepler pump to a calibrated volume and measuring the pressure; the solid then was pumped upon directly for a given period of time and isopropylbenzene was introduced.
ResultsThe results of annealing experiments on the ir
radiated solid (c/. Table I) suggest that at least two, and perhaps three, groups of excitations capable of dealkylating isopropylbenzene were present in the irradiated solid at the time of these experiments: group 1, corresponding to about 9 X 10¹⁷ excitations/g, whose decay is essentially complete in 24 hr at 115°; group 2, corresponding to about 5 X 10¹⁷ excitations/g, whose decay is essentially complete in 280 hr at 205° or 23-69 hr at 250°; and group 3, corresponding to
Table I : Yields“ in Reaction of Isopropylbenzene on Annealed, y-Irradiated Silica-Alumina6
Anneal Annealtime, temp, Benzene Gas
hr °C yield yield
0 15 0 .6 04 77 13 0 .4 9
25 77 9 .6 0 .2 798 77 8 .6 0 .1 6
2690 77 6 .5 0.024 115 6 .0 0 .0 869 115 6 .1 0.0
287 115 5 .8 0.024 150 5 .3 0.024 205 2 .1 0.091 205 1 .6 0.0
280 205 0 .9 0.04 250 1 .9 0.0
23 250 1 .2 0.069 250 1.0 0.065 300 0 .7 0.016 400 0 .2 0.016 500 0.1 0.0
“ All yields correspond to a sufficiently large value of dose/ (gram of solid) to ensure attainment of saturation (plateau yields). Units are (molecules/gram of solid) X 10-17. b Irradiation temperature was 36°.
about 1017 excitations/g, which in 16 hr at 500° is near complete deactivation.
Visual observations and diffuse-reflectance spectroscopic measurements at 425 myu of the radiation-induced color indicate an approximate correlation between thermal bleaching of the color and annealing of the group 1 excitations; e.g., 22 hr at 150° gave a 95% decrease in absorbed intensity at 425 m/i. After 23 hr at 250°, a slight coloration appeared to persist in the irradiated solid, and diffuse-reflectance measurement indicated a 99.7% decrease in absorbed intensity.
The results of Table II show that hydrogen bleaches the radiation-induced color of the solid (within 5 min at the higher pressures) and that the number of molecules of hydrogen irreversibly adsorbed in the process is slightly greater than the reduction in the number of molecules of benzene observed on subsequent exposure of the solid to isopropylbenzene. The residual benzene yield is approximately equal to the yield obtained after thermal decay of the group 1 excitations that appear to be associated with bleaching. Oxygen is seen to have no effect on the radiation-induced color or on the benzene yield, although some oxygen is irreversibly adsorbed.
(6) S. I. Taimuty, L. H. Towle, and D. L. Petersen, Nucleonics, 17, No. 8, 103 (1959).
The Journal of Physical Chemistry
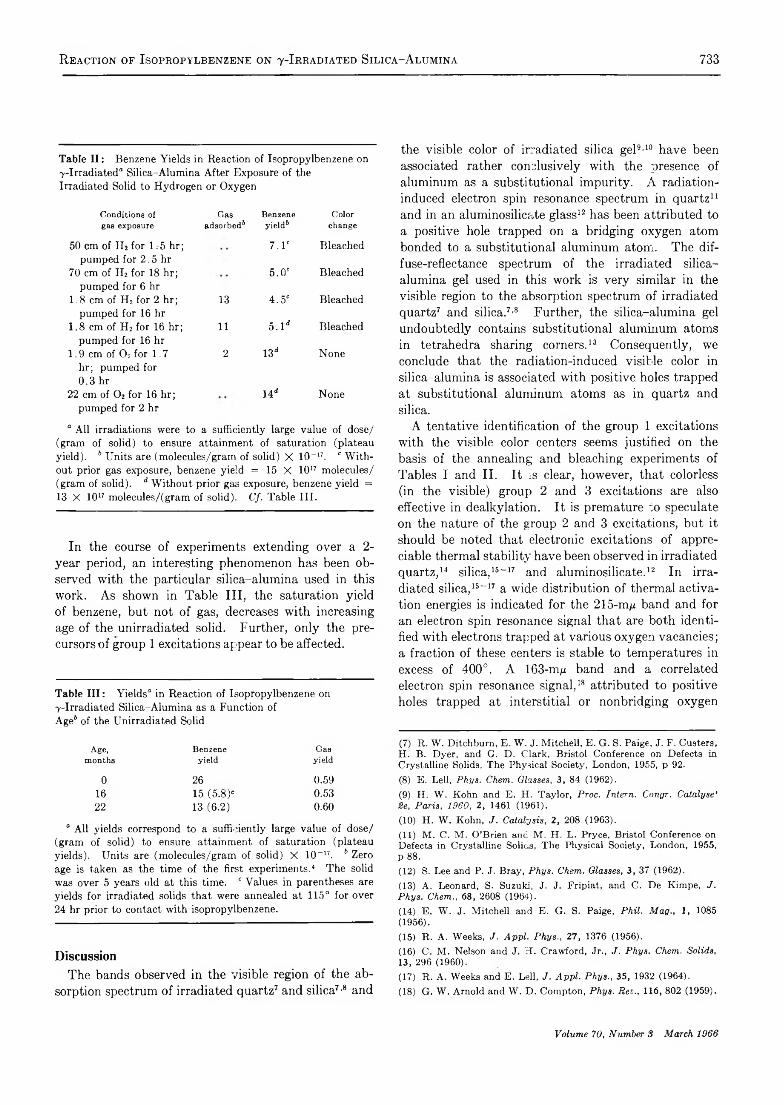
R eaction of Isopropylbenzene on y-Irradiated Silica-A lumina 733
Table I I : Benzene Yields in Reaction of Isopropylbenzene on 7 -Irradiated“ Silica-Alumina After Exposure of the Irradiated Solid to Hydrogen or Oxygen
Conditions of Gas Benzene Colorgas exposure adsorbed6 yield & change
50 cm of II2 for 1.5 hr; pumped for 2.5 hr
7 . Ie Bleached
70 cm of H2 for 18 hr; pumped for 6 hr
5.0e Bleached
1.8 cm of H2 for 2 hr; pumped for 16 hr
13 4.5e Bleached
1.8 cm of H2 for 16 hr; pumped for 16 hr
11 5.1d Bleached
1.9 cm of 0 2 for 1.7 hr; pumped for 0.3 hr
2 13d None
22 cm of 0 2 for 16 hr; pumped for 2 hr
14d None
“ All irradiations were to a sufficiently large value of dose/ (gram of solid) to ensure attainment of saturation (plateau yield). 6 Units are (molecules/gram of solid) X 10-17. ' Without prior gas exposure, benzene yield = 15 X 1017 molecules/ (gram of solid). d Without prior gas exposure, benzene yield = 13 X 1017 moleeules/(gram of solid). Cf. Table III.
In the course of experiments extending over a 2- year period, an interesting phenomenon has been observed with the particular silica-alumina used in this work. As shown in Table III, the saturation yield of benzene, but not of gas, decreases with increasing age of the unirradiated solid. Further, only the precursors of group 1 excitations appear to be affected.
Table I I I : Yields“ in Reaction of Isopropylbenzene on7 -Irradiated Silica-Alumina as a Function of Age6 of the Unirradiated Solid
Age, Benzene Gasmonths yield yield
0 26 0.5916 15 (5 .8 ) ' 0.5322 13 (6 .2 ) 0.60
“ All yields correspond to a sufficiently large value of dose/ (gram of solid) to ensure attainment of saturation (plateau yields). Units are (molecules/gram of solid) X 10-17. 6 Zero age is taken as the time of the first experiments.4 The solid was over 5 years old at this time. ' Values in parentheses are yields for irradiated solids that were annealed at 115° for over 24 hr prior to contact with isopropylbenzene.
DiscussionThe bands observed in the visible region of the ab
sorption spectrum of irradiated quartz7 and silica7’8 and
the visible color of irradiated silica gel9'10 have been associated rather conclusively with the presence of aluminum as a substitutional impurity. A radiation- induced electron spin resonance spectrum in quartz11 and in an aluminosilicate glass12 has been attributed to a positive hole trapped on a bridging oxygen atom bonded to a substitutional aluminum atom. The diffuse-reflectance spectrum of the irradiated silica- alumina gel used in this work is very similar in the visible region to the absorption spectrum of irradiated quartz7 and silica.7’8 Further, the silica-alumina gel undoubtedly contains substitutional aluminum atoms in tetrahedra sharing corners.13 Consequently, we conclude that the radiation-induced visible color in silica-alumina is associated with positive holes trapped at substitutional aluminum atoms as in quartz and silica.
A tentative identification of the group 1 excitations with the visible color centers seems justified on the basis of the annealing and bleaching experiments of Tables I and II. It is clear, however, that colorless (in the visible) group 2 and 3 excitations are also effective in dealkylation. It is premature to speculate on the nature of the group 2 and 3 excitations, but it should be noted that electronic excitations of appreciable thermal stability have been observed in irradiated quartz,14 silica,15-17 and aluminosilicate.12 16 17 In irradiated silica,15-17 a wide distribution of thermal activation energies is indicated for the 215-m/i band and for an electron spin resonance signal that are both identified with electrons trapped at various oxygen vacancies; a fraction of these centers is stable to temperatures in excess of 400°. A 163-m/a band and a correlated electron spin resonance signal,18 attributed to positive holes trapped at interstitial or nonbridging oxygen
(7) R. W . Ditchburn, E. W . J. Mitchell, E. G. S. Paige, J. F. Custers, H. B. Dyer, and G. D. Clark, Bristol Conference on Defects in Crystalline Solids, The Physical Society, London, 1955, p 92.(8) E. Lell, Phys. Chem. Glasses, 3 , 84 (1962).(9) H. W . Kohn and E. H. Taylor, Proc. Intern. Congr. Catalyse' Se, Paris, 1960, 2, 1461 (1961).(10) H. W . Kohn, J. Catalysis, 2, 208 (1963).(11) M. C. M . O’Brien and M . H. L. Pryce, Bristol Conference on Defects in Crystalline Solids, The Physical Society, London, 1955,p 88.(12) S. Lee and P. J. Bray, Phys. Chem. Glasses, 3 , 37 (1962).(13) A. Leonard, S. Suzuki, J. J. Fripiat, and C. De Kimpe, J. Phys. Chem., 68, 2608 (1964).(14) E. W . J. Mitchell and E. G. S. Paige, Phil. Mag., 1, 1085 (1956).(15) R. A. Weeks, J. Appl. Phys., 27, 1376 (1956).(16) C. M . Nelson and J. H. Crawford, Jr., J. Phys. Chem. Solids, 13, 296 (1960).(17) R. A. Weeks and E. Lell, J. Appl. Phys., 35, 1932 (1964).(18) G. W . Arnold and W . D. Compton, Phys. Rev., 116, 802 (1959).
Volume 70, Number S March 1966

734 R. R. Hentz, L. M. Perkey, and R. H. W illiams
atoms, persist at temperatures in excess of 500° in irradiated quartz,14 silica,16 and aluminosilicate.12
In a previous paper,4 two possible mechanisms were suggested for the dealkylation reaction on irradiated silica-alumina: (1) excitation transfer and (2) a catalytic-type dealkylation on a radiation-induced acid site (evidence for such sites in irradiated silica gel has been reported19). Because of the apparent correlation between the group 1 excitations and visible color centers, the bleaching of these color centers by hydrogen and isopropylbenzene is pertinent to the question of mechanism. In view of the previously cited evidence for association of the visible color in silica-alumina gel with positive holes trapped at substitutional aluminum, it seems likely that the visible color centers are distributed more or less uniformly throughout the solid, as is the case in irradiated quartz and silica. If such color centers do indeed correspond to the group 1 excitations, then these excitations must function by excitation transfer over distances up to 50-100 A. This is because reactions must occur on the surface of the catalyst and maximum pore-wall thicknesses are 100-200 A in silica-alumina catalysts. Behavior as acid catalytic sites would seem to require that the visible color centers be confined to the surface. Thus, the evidence, though by no means conclusive, suggests that a long-range excitation transfer must occur for a major portion of the excitations (group 1).
Kohn and Taylor9 have shown that oxygen poisons the H2-D 2 exchange activity of irradiated silica gel but is without effect on the color or the irreversible
hydrogen adsorption, whereas irreversible hydrogen adsorption bleaches the color but does not affect the exchange activity. Comparison of these results with the data of Table II strengthens the conclusion that irreversible hydrogen adsorption, visible color, and a major portion of the isopropylbenzene dealkylation are all associated with the same excitations. It is also evident that the radiation-induced catalytic sites responsible for H2-D 2 exchange do not correspond to the excitations effective in dealkylation of isopropylbenzene.
Evidence has been presented (c/. Table III) that defect precursors of the group 1 excitations are slowly destroyed by long periods of storage of the unirradiated solid in a closed bottle with atmospheric gases at room temperature. Such evidence tends to support the conclusion that the differences observed in radiation-induced dealkylation activity of several comparable silica-aluminas may be attributable to variations in the preparation and pretreatment techniques.4 In particular, the relatively low activity of solid A, which was over 5 years old at the time experiments were initiated, may be a consequence of this aging process. Solids B and C (activity of solid C was greater than that of solid B )4 were used within a relatively short period after synthesis (7 months and 1 month, respectively).
Acknowledgment. The authors gratefully acknowledge the contribution of George F. Shipman in the diffuse-reflectance spectroscopic measurements.
(19) C. Barter and C. D . Wagner, J. Phys. Chem., 68, 2381 (1964)
The Journal of Physical Chemistry

R e c o il T r it i u m R e a c t io n s w i t h B e n z e n e 735
Recoil Tritium Reactions with Benzene: the Role of the Cyclohexadienyl-t Radical1
by John K . G arlan d2 and F . S. R ow land3
jDepartments of Chemistry, University of Kansas, Lawrence, Kansas, and University of California, Irvine, California {Received August SO, 1965)
Recoil tritium atoms react with gaseous benzene to form only two important hot products, HT and benzene- , in the ratio of approximately 20:95. The presence or absence of scavenger molecules has relatively little effect on the yields, indicating that only a small fraction of the recoil atoms fail to react while still possessing extra energy. Comparable reactions in the liquid phase result in the formation of HT-benzene-i in the ratio of approximately 20:58. Both 1,3-cyclohexadiene-i and l,4-3yclohexadiene-f are found in liquid phase experiments in small yield, and a substantial fraction of the tritium radioactivity occurs in she form of polymeric materials of low volatility. The product yields in the gaseous and liquid phases differ because of varying rates of collisional deexcitation for cyclohexadienyl-f radicals formed through the hot addition of tritium atoms to benzene. The radicals stabilized in such liquid-phase collisions are subsequently found as cyclo- hexadiene-i or in polymeric forms, but decompose to benzene-f in the gas phase. The observation of appreciable yields of polymeric tritiated product permits clarification of the explanations of the yield vs. mole fraction curves obtained from recoil tritium reactions with binary mixtures containing aromatic compounds.
Introduction
The earliest studies of recoil tritium reactions established that hot reactions were of general occurrence in both aliphatic and aromatic systems, and provided a qualitative outline of the reactions to be expected in such systems.4-6 However, the detailed quantitative studies of recoil tritium reactions have concentrated largely on alkane and alkene hydrocarbon, and on halocarbon systems, and the mechanistic descriptions of hot reactions have been largely based on these studies. A number of investigations have been made of the reactions with aromatic systems in condensed phases, but the related gas reactions have received very little attention.7-20 The condensed-phase experiments have demonstrated that the abstraction and substitution reactions 1 and 2, which are so prominent with alkanes and hydrocarbons, also occur with good yields in aromatic systems. The substitution for other groups by tritium, as in (3) has also been shown to be an important reaction, although intramolecular determination of the location of the tritium atom in
T* + RH — > HT + R (1)
T* + RH — > RT + H (2)
T* + RX — > RT + X (3)
benzoic acid-£ has indicated that the mechanism of substitution is not completely the direct replacement 1 2 3 4 5 6 7 8 9 10 11 12
(1) This research was supported by AEC Contract No. A T -(ll-l)-407 and formed in part the work submitted by J. K. Garland in fulfillment of the Ph.D. requirements of the University of Kansas.(2) National Science Foundation Predoetoral Fellow.(3) Department of Chemistry, University of California, Irvine, Calif.(4) F. S. Rowland and R. Wolfgang, Nucleonics, 14, No. 8, 58 (1956).(5) F. S. Rowland, J. K. Lee, B. Musgrave, and R. M. White, “ Chemical Effects of Nuclear Transformations,” Vol. 2, International Atomic Energy Agency, Vienna, 1961, p 67.(6) M . Henchman, D. Urch, and R. Wolfgang, “ Chemical Effects of Nuclear Transformations,” Vol. 2, International Atomic Energy Agency, Vienna, 1961, p 83.(7) W. G. Brown and J. L. Garnett, Intern. J. Appl. Radiation Isotopes, 5, 114 (1959).(8) R. M. White and F. S. Rowland, J. Am. Chem. Soc., 82, 5345 (1960).(9) R. M. White and F. S. Rowland, ibid., 82, 4713 (1960).(10) M. Zifferero, Energia Nucl. (Milan), 4, 479 (1957).(11) A. N. Nesmeyanov, B. G. Dzantiev, V. V. Pozdeev, and E. F. Simonov, Radiokhimiya, 4, 116 (1962).(12) V. V. Pozdeev, Ya. Klas, A. N. Nesmeyanov, and B. G. Dzantiev, ibid., 4, 215 (1962).
Volume 70, Number 3 March 1966

736 J o h n K. G a r l a n d a n d F. S. R o w l a n d
reaction indicated, for mefa-tritiated benzoic acid has been observed from para- and ortho- substituted benzoic acids, etc.9 The energetic addition of hot tritium atoms to the aromatic ring, as in (4), was also suggested as a possibility, with close analogies to the known hot addition reactions found with olefinic molecules.5-7’18
(a) (b)
Subsequent investigations of aromatic systems have been largely concerned with changes in the relative yields of these reactions in correlation with changes in the parameters of the irradiated system. These parameter changes have included liquid vs. solid phase, behavior in complexes, and especially the study of the yields of hot reactions in competitive binary systems as a function of the mole fraction of each component.
Two conflicting interpretations of recoil tritium reactions with aromatic systems have been presented, each based largely on the interpretation of the relative yields observed for the T-for-H reaction (2) with two molecules in binary liquid mixtures. These interpretations differ chiefly in their assignment of the role of aromatic molecules in such binary mixtures. The present detailed study of the reactions of recoil tritium atoms with benzene in the gas and liquid phases provides sufficient additional information to enable a choice to be made between these two interpretations.21
Experim ental Section
General Procedure. The experiments involving recoil tritium reactions with benzene were carried out by the same general techniques employed in studying other systems, utilizing tritium atoms formed by neutron irradiation of He3 in gas phase experiments, and Li6 in condensed phase experiments.5 In addition, more elaborate procedures were used for investigations of radioactive products of low volatility than is customarily the case.
Gas Phase Irradiations. The gas phase samples were all irradiated in a room-temperature nuclear reactor facility, and were therefore limited to gas pressures just below the vapor pressure of benzene (~ 8 cm). These samples also contained approximately1.0 cm of He3, about 1 cm of 0 2 or NO as scavenger in some cases, and 30 to 60 cm of He4 in a few samples. Each gas sample was contained in an approximately 10-ml ampoule of Pyrex 1720 glass, and was irradiated for 0.5 to 6 hr (usually 2 or 3 hr) in a nominal neutron flux of 1.0 X I011 neutrons/cm2 sec. The actual neutron flux inside the bulbs was about 6 X 10¹⁰
neutrons/cm2 sec, the flux reduction resulting from neutron loss in reaction with the boron of the glass.5 Three aliquots from each sample were separated on different gas chromatographic columns and analyzed for their radioactive content by radio gas chromatographic techniques. The macroscopic composition of each sample was monitored with a thermal conductivity detector.
The liquid-phase samples were prepared by condensing benzene onto LiF powder in Pyrex 1720 capillaries to form a heterogeneous liquid-solid sample. These capillaries were then irradiated in the same nominal neutron flux, estimated to be about 8 X 10¹⁰ neutrons/cm2 sec within the capillary itself. Irradiation times lasted from 10 min to 6 hr, with 3 hr the usual length for liquid-phase irradiations. The recoil range of tritium formed by the Li6 (n, a)H3 nuclear reaction is sufficient (30-40 m) to transport the tritium atom from the particle of LiF in which it was created into the surrounding medium of liquid and other LiF particles.
Gas Chromatographic Analysis. The radio gas chromatographic analysis of benzene was initially carried out in a manner very similar to that used in previous experiments,5’22’23 with only slight modifications because of the lower volatility of some of the radioactive products relative to those typical of hydrocarbon and halocarbon systems. The normal analytical procedure involved the splitting of the sample into several aliquots, with separate analysis on different columns to ensure proper identification of each radioactive product. The columns used for this purpose included: a 2.5-m silica gel, a 6-m dimethylsulfolane (15%) on firebrick, a 4.6-m diethylene glycol (15%) on firebrick, and a 4.6-m diethylene glycol succinate (15%) on 13 14 15 16 17 18 19 20 21 22 23
(13) V. V. Pozdeev, B. G. Dzantiev, and A. N. Nesmeyanov, Kinetika i Kataliz, 3, 613 (1962).(14) V. V. Pozdeev, A. N. Nesmeyanov, and B G. Dzantiev, Radkokhimiya, 4, 398 (1962).(15) V. V. Pozdeev, A. N. Nesmeyanov, and B. G. Dzantiev, ibid., 4, 404 (1962).(16) E. N. Avdonina, ibid., 4, 617 (1962).(17) V. V. Pozdeev, A. N. Nesmeyanov, and B. G. Dzantiev, ibid., 4, 615 (1962).(18) A. Sokolowska, L. Haskin, and F. S. Rowland. J. Am. Chem. Soc., 84, 2469 (1962).(19) W. Herr, et at., “ Chemical Effects of Nuclear Transformations,” Vol. 2, International Atomic Energy Agency, Vienna, 1961, p 111.(20) A. M. Elatrash and R. H. Johnsen, “ Chemical Effects of Nuclear Transformations,” Vol. 2, International Atomic Energy Agency, Vienna, 1961, p 123.(21) J. K. Garland and F. S. Rowland, Radiochim. Acta, 4, 115 (1965).(22) R. Wolfgang and F. S. Rowland, Anal. Chem., 30, 903 (1958).(23) J. K. Lee, E. K. C. Lee, B. Musgrave, Y. N. Tang, J. W. Root, and F. S. Rowland, ibid., 34, 741 (1962).
The Journal of Physical Chemistry

R e c o il T r it iu m R e a c t io n s w i t h B e n z e n e 737
firebrick column. The last column provided the most desirable separation of 1,4-cyclohexadiene from benzene, and the last two provided separate independent identifications of the major peaks and their relative yields.
One of the more important problems in such radio gas chromatographic measurements involves the possible selective loss of less volatile components into stopcock grease in the gas-handling system. While this possible error cannot be completely ruled out in these experiments, its over-all effect is thought to be small. Successive aliquots have been run with several hours’ standing in the gas-handling system between them, and have shown a small variation in the ratio of HT to products of low volatility, such as benzene-f itself (<10% variation). The actual runs were not permitted to remain in the handling line any longer than necessary (a few minutes), and should have had a much less serious over-all effect. Finally, the procedure described below involved the opening of samples directly within the flow stream of the gas chromatograph, and hence subject only momentarily to possible contact with stopcock grease. These measurements did not indicate any serious deviations from the results obtained by the usual handling methods.
Chromatographic Analysis for Products of Low Volatility. After analysis of numerous liquid samples had established the essential absence of appreciable yields of any highly volatile radioactive product other than HT, a new technique of sample introduction was used to facilitate the measurement of products of low volatility. These samples were broken open24 in the flow stream of the gas chromatograph in a section heated by a heat lamp, and were carried directly into the single column used for analysis, usually the 4.6-m DEGS on firebrick column. The evaporation of the sample was not fast enough to give a sharp injection time, and some loss of resolution resulted, but separation of HT, cyclohexene, 1,3-cyclohexadiene, 1,4- cyclohexadiene, and benzene was still achieved within 35 min. The only place where this loss of resolution was a problem was in the separation of 1,4-cyclohexadiene from benzene. The major portion of the 1,4- cyclohexadiene peak was clearly separate, but the tailing of this peak carried it substantially into the benzene elution region. Since the first emerging peak was the smaller, no significant error was introduced into the measurement of either radioactivity yield.
After about 20 min, the injection section was opened momentarily, the sample breaker removed, and the stream reconnected for an additional 2 hr of normal operation. The direction of flow through the column was then reversed, and all volatile compounds with
retention times longer than the original time of forward flow were then driven backward through the system. This procedure brought forth a single broad radioactivity peak emerging as the time of reversed flow equalled the time of forward flow (full width at halfmaximum of 25 min after about 2.4 hr of forward flow and 2.4 hr of reverse flew). This peak does not represent any specific compound, but rather is a peak integrated over all compounds volatile enough to move onto the column in the first place, but with retention volumes too long to permit emergence during the period of forward flow.25 This back-flush peak was not accompanied by any macroscopic material that could be observed by our thermal conductivity measurements. While such measurements are not very sensitive for such a broad, late peak, they were easily sensitive enough to have detected the macroscopic peak if the radioactivity had been put into this chemical form by general radiation damage to benzene and benzene-f. The absence of this macroscopic material indicates that the radioactivity in this form has reacted in forms characteristic of the energetic tritium atom, and not those initiated by ionizing radiation in general.
Analysis for Nonvolatile Radioactive Products. After the opening of a sample directly in the flow stream, and the subsequent removal of the sample breaker from this stream, additional analysis was carried out for evidence of radioactivity in chemical forms sufficiently nonvolatile that they were not carried onto the chromatographic column by the flowing helium. The sample breaker, the pieces of glass from the capillary, and the LiF powder residue from the broken sample were all extracted with consecutive 5-ml aliquots of toluene in order to recover any soluble nonvolatile polymeric material. These aliquots were then counted in a Tri- Carb liquid scintillation spectrometer. The counting efficiency of the Tri-Carb spectrometer for tritium (3-rays was 21.5%, as measured with an internal standard.
There was no visible evidence of macroscopic poly
(24) The samples were placed in the middle of a ground-glass ball joint in the direct flow stream. Simple flexing of the joint sufficed to shatter the capillary and introduce its contents into the gas stream. The ball joint was actually greased, but the possible contact time was extremely short.(25) Operation of a radio gas chromatograph with temperature programming requires continuous adjustment of the gas inlets for the helium and the propane in order to maintain a constant composition for the mixtures, as required for stable proportional counter operation. The higher temperatures involved would also introduce possible problems such as isotopic exchange of tritium with the substrate, as well as operation of the proportional counter at higher temperatures than planned in its design. The procedure used above is described in greater detail, together with typical radio gas chromatograms, in the Ph.D. thesis of J. K. Garland, University of Kansas, 1963.
Volume 70, Number 3 March 1966

738 J o h n K. G a r l a n d a n d F. S. R o w l a n d
meric material among these fragments, although such observation is not very precise under the heterogeneous conditions of the irradiated capillaries. Certainly, however, no appreciable fraction of the benzene had polymerized, and the specific radioactivity of the polymer wa,s very much higher than that of the parent benzene itself.
Chemicals. Benzene (Fisher reagent grade) was out- gassed by bulb-to-bulb distillation and freeze-pumping prior to use. The He3, LiF, 0 2, and He4 came from the same sources described before;5'26 NO was obtained from the Matheson Co.
R esults and D iscussion
Comparison of Yields among Samples. The measurement of the distribution of recoil tritium atoms among various radioactive products is normally carried out by sequential measurement of a succession of compounds as each passes through the same flow proportional counter detector.22'23 This procedure permits cancellation of a number of factors affecting the efficiency of the detector for the tritium /3-radiation (residence time in the counter, counting volume, etc.), and provides comparatively high accuracy in the comparisons of relative activity in different chemical forms from the same irradiated sample. With a measurement of relative sizes of aliquots, these comparisons can be extended to all of the volatile radioactive components of a given sample. The study of yields from sample to sample, however, is much more subject to error, since it involves additional possible sources of discrepancies, such as variations in neutron flux and time of irradiation, concentration of He3 or Li6, stopping power of the target mixture (and therefore recoil loss in gas samples),27 28 etc. As our experiments with benzene were carried out over an extended period of time, and involved non-negligible recoil losses, absolute yield measurements are subject to large errors for comparison purposes, and have not been attempted except on a semiquantitative basis. All of the measurements have instead been referred to a common product within each sample, and expressed as relative yields. This procedure is accompanied by its own difficulties for intersample comparisons, requiring separate evaluation of the behavior of the yield of the standard itself as experimental parameters are varied.
Distribution of Radioactivity in Gas Phase Experiments. The gas phase experiments with alkanes and halocarbons have generally been conducted in the presence and absence of various scavenger molecules (02, NO, I2, etc.) and of inert diluents acting as moderators, (He4, Ar, Xe, etc.) in reducing the average kinetic energy of the tritium atom without undergoing
chemical reaction.6'6 More recently, the experiments have regularly been carried out over a range of pressures to search for evidence of unimolecular decomposition of highly excited products formed in the initial hot reactions.26,28
Recoil tritium reactions with gaseous benzene have been studied, as shown in Table I, with 0 2 and NO as scavenger molecules, and He4 as a moderator molecule. However, the lack of higher temperature irradiation facilities in the nuclear reactor limited the benzene pressure to a few centimeters. Experiments over a range of pressure were not performed, for they would have required reduction of the benzene pressure until comparable with that of the He3 and scavenger molecules, as well as increasing the recoil loss to a major fraction of the total tritium production.
Table I : Radioactive Products from Recoil Tritium Reactions with Benzene in the Gas Phase
R ela tiv e y ields/--------------C om position , cm ----------- -— * B en zen e -
Sam ple He* CiH. O ther HT ta
41 1.2 8.2 1 . 1 0 , (20) 93b36 1.2 8.2 0.9 NO (20) 9649 2.0 6.5 (20) 116'65 1.0 7.0 (20) 11567 1.0 7.0 (20) 11842 1.2 8.2 1.1 0 2; 59 He4 (20) 8143 1.7 8.2 61 He4 (20) IOC56 1.3 6.0 61 He4 (20) 10239 1.2 7.6 1.2 NO; 60 He4 (20) 65
“ These ratios are estimated to be accurate to ± 3 ; the statis-tical errors of counting alone are ± 1 or less. 6 C2H3T, 0.1; C 2H T , 0.2. ‘ C 2H 3T , 0.5; toluene-í, 0.3. d C 2H 3T , 0.6; C 2H T , 0.1; cyclohexane-f, 0.1; “ 1,3,5-hexatriene,” 0.2.
The only major radioactive products obtained from energetic tritium atom reactions with benzene in the gas phase are the substitution and abstraction products, benzene-i and HT, in the approximate ratio of 5 or 6 to 1, under all of the conditions employed. All
(26) Y. N. Tang, E. K. C. Lee, and F. S. Rowland, J. Am. Chem. Soc., 86, 1280 (1964).(27) The recoil energy of the tritium atom formed in the Hes(n,p)T nuclear reaction is 192,000 ev, and many interactions are required to remove this energy in bringing the tritium ion down to energies at which it is neutralized, and then down to thermal energies. The recoil range of such tritons is 5.9 cm in benzene at 20° and 1 cm pressure. With the bulbs and pressures used in these experiments, 60-75% of the recoiling tritium atoms actually do not lose all of their energy in the gas phase but recoil into tho glass walls. For further details of these calculations, see J. W. Root, Ph.D. thesis, University of Kansas, 1964.(28) E. K. C. Lee and F. S. Rowland, J. Am. Chem. Soc., 85, 897 (1963).
The Journal of Physical Chemistry

R e c o il T r it iu m R e a c t io n s w it h B e n z e n e 739
of the other products were formed in less than 1% yields, and are not of significance as major pathways of energetic reaction. In particular, the cyclohexa- dienes which are prominent liquid phase radioactive products are formed in amounts of less than 0.2% of the total tritium production.
In alkane and most other systems, the inclusion of scavenger molecules during irradiation drives the H T/ RT ratio down to lower values than obtained with the pure compound,6'6 but the reverse is true for gaseous benzene—the inclusion of scavenger molecules increases the HT yield relative to the yield of benzene-i. Moderator experiments with alkanes have demonstrated that HT is formed at Lower average energies (although still “hot”) than RT,6 and the effect of scavenger molecules is to compete at these lower energies, and at thermal energies, for atoms whose reactions might otherwise lead to the formation of HT. A similar effect is presumably operative for benzene, with the energy dependence of the two reactions reversed. The C-H bond dissociation energy in benzene is 105 kcal/mole, well above that in any alkane, and this abstraction reaction gives a relatively low yield with recoil tritium atoms.29 On the other hand, the aromatic ring of benzene is able to react with tritium atoms down to thermal energies, and probably serves as its own scavenger in the absence of O2 or NO. Precise absolute yield measurements could demonstrate the correctness of this postulate—the HT yield would be essentially the same, while the benz'ene-i yield would decrease with added scavenger. The semiquantitative estimates of absolute yield are consistent with this picture, but are not accurate enough to prove the necessary invariance of HT yields. Certainly, however, the yields of neither HT nor ben- zene-i are drastically reduced by scavenger molecule, indicating that both products are formed predominantly by hot reactions. Since the yields of these two products also account for 80-90% of all the tritium formed in these systems, the reaction cross sections for these two hot reactions are obviously substantial enough to ensure that only a small fraction of the tritium atoms formed in the system ever reach thermal energies as atoms, having undergone reaction to form a stable chemical bond prior to reaching thermal energies.
The data of Table I have been expressed with these postulates as the basis: (a) that the yield of HT from scavenged samples is likely to be reasonably independent of the presence or absence of these scavengers; and (b) that the unscavenged and moderated samples can then be expressed relative to HT as standard (= 20), although no accurate experimental support
exists for the assumption that the HT yield is really invariant to these changes in experimental parameter.
The data of Table I indicate that the qualitative effect of inclusion of a moderator lies in the same direction as that observed with alkanes— the HT/RT yield rises with the inclusion of moderator. The qualitative behavior of the scavenging and moderating processes are therefore different for the alkane and benzene systems; each increases the HT/RT ratio in the latter, while acting in opposite directions for the former. In all systems, the formation of HT is a simple direct reaction between the energetic tritium atom and the parent molecule, and is sensitive primarily to gross changes in the energy distribution of these energetic atoms. The substitution of T for H in an alkane is likewise a direct process occurring at relatively high energies (~ 5 ev average),28 and dependent upon its surroundings only in recoil tritium energy spectrum and in rapidity of collisional deexcitation for products formed in highly excited states. The substitution reaction with benzene to form benzene-i is, however, not necessarily such a simple process. The simple substitution presumably can also occur with benzene, but can be augmented by reactions proceeding through a longer-lived intermediate such as the radical that would be formed by the addition of a tritium atom to the 7r-electrons of the aromatic ring. The formation and subsequent reactions of such an excited radical will depend upon its surroundings for rapidity of collisional deexcitation to thermal energies, for ease of reaction to give benzene-i or more complex products, as well as for the effect of the surroundings on the energy spectrum of available tritium atoms.
The qualitative difference in scavenger-moderator behavior for benzene relative to the alkanes is already indicative of some difference in the basic reaction mechanisms involved. The addition of He4 moderator to the system greatly increases the total pressure, and hence the probability of a deexciting collision for a radical formed in (4), in competition with its decomposition to benzene-i and an H atom. Since the de- excited radical would probably not lead to benzene-i as the final product in the subsequent analysis, such behavior alone could account for the trend in the HT/RT ratio with the addition of moderator to the benzene. In any event, the gas phase results by themselves are unable to offer the additional information necessary to determine the nature of the reactions involved, and experiments with liquid phase samples were also performed.
(29) Experiments carried out by E. Tachikawa in our laboratory show the yield of HT from benzene to be as low or lower, per bond, than from the methane or any other alkane yet measured.
Volume 70, Number 8 March 1966
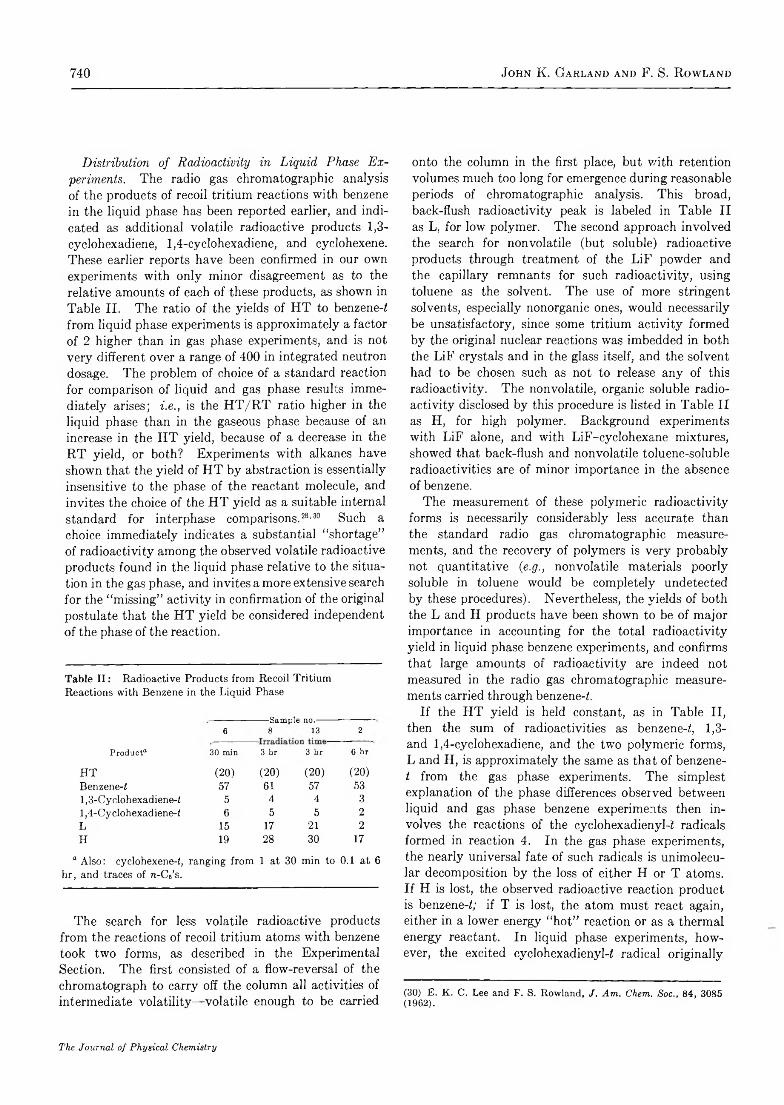
740 J o h n K. G a r l a n d a n d F. S. R o w l a n d
Distribution of Radioactivity in Liquid Phase Experiments. The radio gas chromatographic analysis of the products of recoil tritium reactions with benzene in the liquid phase has been reported earlier, and indicated as additional volatile radioactive products 1,3- cyclohexadiene, 1,4-cyclohexadiene, and cyclohexene. These earlier reports have been confirmed in our own experiments with only minor disagreement as to the relative amounts of each of these products, as shown in Table II. The ratio of the yields of HT to benzene-f from liquid phase experiments is approximately a factor of 2 higher than in gas phase experiments, and is not very different over a range of 400 in integrated neutron dosage. The problem of choice of a standard reaction for comparison of liquid and gas phase results immediately arises; i.e., is the HT/RT ratio higher in the liquid phase than in the gaseous phase because of an increase in the HT yield, because of a decrease in the RT yield, or both? Experiments with alkanes have shown that the yield of HT by abstraction is essentially insensitive to the phase of the reactant molecule, and invites the choice of the HT yield as a suitable internal standard for interphase comparisons.28,30 Such a choice immediately indicates a substantial “shortage” of radioactivity among the observed volatile radioactive products found in the liquid phase relative to the situation in the gas phase, and invites a more extensive search for the “missing” activity in confirmation of the original postulate that the HT yield be considered independent of the phase of the reaction.
Table II : Radioactive Products from Recoil TritiumReactions with Benzene in the Liquid Phase
—---------------------Sam ple no.-------6 8 13 2
P rod u ct“ 30 min 3 hr 3 hr 6 hr
HT ( 2 0 ) ( 2 0 ) ( 2 0 ) ( 2 0 )
Benzene-f 57 61 57 531,3-Cyclohexadiene-f 5 4 4 31,4-Cyclohexadiene-f 6 5 5 2
L 15 17 2 1 2
H 19 28 30 17
“ Also: cyclohexene-f, ranging from 1 at 30 min to 0.1 at 6 hr, and traces of ra-CVs.
The search for less volatile radioactive products from the reactions of recoil tritium atoms with benzene took two forms, as described in the Experimental Section. The first consisted of a flow-reversal of the chromatograph to carry off the column all activities of intermediate volatility—volatile enough to be carried
onto the column in the first place, but with retention volumes much too long for emergence during reasonable periods of chromatographic analysis. This broad, back-flush radioactivity peak is labeled in Table II as L, for low polymer. The second approach involved the search for nonvolatile (but soluble) radioactive products through treatment of the LiF powder and the capillary remnants for such radioactivity, using toluene as the solvent. The use of more stringent solvents, especially nonorganic ones, would necessarily be unsatisfactory, since some tritium activity formed by the original nuclear reactions was imbedded in both the LiF crystals and in the glass itself, and the solvent had to be chosen such as not to release any of this radioactivity. The nonvolatile, organic soluble radioactivity disclosed by this procedure is listed in Table II as H, for high polymer. Background experiments with LiF alone, and with LiF-cyclohexane mixtures, showed that back-flush and nonvolatile toluene-soluble radioactivities are of minor importance in the absence of benzene.
The measurement of these polymeric radioactivity forms is necessarily considerably less accurate than the standard radio gas chromatographic measurements, and the recovery of polymers is very probably not quantitative (e.g., nonvolatile materials poorly soluble in toluene would be completely undetected by these procedures). Nevertheless, the yields of both the L and H products have been shown to be of major importance in accounting for the total radioactivity yield in liquid phase benzene experiments, and confirms that large amounts of radioactivity are indeed not measured in the radio gas chromatographic measurements carried through benzene-f.
If the HT yield is held constant, as in Table II, then the sum of radioactivities as benzene-f, 1,3- and 1,4-cyclohexadiene, and the two polymeric forms, L and H, is approximately the same as that of benzene- f from the gas phase experiments. The simplest explanation of the phase differences observed between liquid and gas phase benzene experiments then involves the reactions of the cyclohexadienyl-f radicals formed in reaction 4. In the gas phase experiments, the nearly universal fate of such radicals is unimolecu- lar decomposition by the loss of either H or T atoms. If H is lost, the observed radioactive reaction product is benzene-f; if T is lost, the atom must react again, either in a lower energy “hot” reaction or as a thermal energy reactant. In liquid phase experiments, however, the excited cyclohexadienyl-f radical originally 30
(30) E. K. C. Lee and F. S. Rowland, J. Am. Chem. Soc., 84, 3085 (1962).
The Journal of Physical Chemistry

R e c o il T r it iu m R e a c t io n s w it h B e n z e n e 741
formed is frequently deexcited by collision,31'32 and then reacts subsequently as a lower energy, probably thermal, cyclohexadienyl-i radical33-36 by: (a) isotopic exchange with the benzene parent, leaving benzene-i as the product; (b) disproportionation with radicals in the system to form benzene-i or one of the cyclo- hexadienes;38 (c) hydrogen atom abstraction from benzene to form one of the cyclohexadienes (an endothermic process, restricted to ‘ 'hot” radicals); or(d) reaction with another radical or attack upon benzene, or another component in mixtures, to form dimeric or polymeric forms. Since our present experiments do no more than establish the existence of polymeric radioactivity with no positive indications of its chemical identities, nothing definitive can be said about the exact reactions involved.
The earlier experiments on the reactions of recoil tritium atoms with liquid phase benzene involved a brief search for radioactive dimeric products, in the form of measurements of the yield of biphenyl-i. This product was found to be of negligible importance, with a yield less than 3% as large as that of benzene-i. While biphenyl is a prominent product in the radiolysis of benzene, which involves phenyl radicals as an important intermediate radical,36 its radioactivity yield would be expected to be extremely low for the mechanisms of dimer and polymer formation outlined above, in which cyclohexadienyl-i is the primary radioactive intermediate. The original experiments were not extended to a search for phenylcyclohexadienyl-i or similar products, which might have been indicative of the cyclohexadienyl-i intermediate.
Other Radioactive Products. Perhaps the most conspicuous attribute of recoil tritium reactions with benzene in the gas phase is the almost complete absence of any appreciable yield of products other than HT and benzene-i. Examination of other systems discloses that recoil tritium atoms will usually substitute in some small yield for each of the groups at each of the bonds in the original molecule, forming smaller labeled products from the parent molecule. In cyclic compounds such as cyclopropane37 and cyclobutane,28 these reactions include riie attack of the tritium atom on a carbon-carbon bond, resulting in the formation of a C-T bond and the opening of the ring, e.g., T* + c-C4H8 CH2TCH3CH2CH2* -* CH2T- CH2CH==CH2 + H. While the corresponding reaction can be visualized with benzene, with the formation of an open chain radical, the yield of any such reaction must be very low from the absence of any corresponding radioactive products. However, the fragmentation of the benzene ring in such a reaction would require a very high activation energy, since the
reaction would necessitate the destruction of the aromatic ring with all its resonance stabilization energy, and the low yield for the reaction is a logical consequence.
The liquid phase yield of 1,4-cyclohexadiene-i is always somewhat greater than that of the 1,3- compound from the same irradiation. This order of relative yield is consistent with that observed from other cyclohexadienyl reactions. For example, the yield of the combination product, 3-isopropyl-l,4-cyclohexa- diene is 20% greater than that of 4-isopropyl-l,3- cyclohexadiene from experiments with cyclohexadienyl and isopropyl radical sources.33 Similarly, the combination-disproportionation reactions of cyclohexadienyl radicals with each other lead to 2.7 times as much 1,4- cyclohexadiene as they do 1,3-cyclohexadiene.34 35 These preferences can be attributed to the greater electron density at the position para to the methylene position,36i.e., that the radical structure of (4b) prevails at reaction over the contribution of structure (4a), which would lead to 1,3-cyclohexadienes as products.
Recoil Tritium. Reactions in Binary Mixtures Containing an Aromatic Molecule. Two separate interpretations of the reactions of recoil tritium atoms with aromatic systems have been presented, each based in part on measurements of the yields of the T-for-H reaction in aromatic-aliphatic binary mixtures. The first experiments on such binary mixtures involved the measurement of acetone-i, ethanol-i, and aniline-i in acetone-aniline and ethanol-aniline binary mixtures.18 In both of these cases, the acetone-i and ethanol-i specific radioactivities were essentially independent of the mole fraction of acetone or ethanol in the mixture with aniline, while the specific radioactivity of aniline-i steadily increased as the mole frac-
(31) If all of the cyclohexadienyl-i radicals were deexcited in the liquid phase, then the benzene-i yield remaining would be attributable to the direct T-for-H substitution reaction. However, experiments in which the measured radical decomposition product is not formed by any direct replacement reaction (e.g., CH3CHTCH=CH2 from T* -j- hexene-2) show that the decomposition reaction persists in the liquid phase, although with a reduced yield vs. the gas phase (16 in the gas phase at 10 cm, and 2 in the liquid phase for butene- 1-t from t r a m -hexene-2).32(32) E. K. C. Lee and F. S. Rowland, J. Chem. Pkys., 36, 554(1962) .(33) Experiments by D. G. L. James and R. D. Suart, J. Am. Chem. Soc., 86, 5424 (1964), have shown that the cyclohexadienyl radical can disproportionate with isopropyl radical by losing an H atom to it, but no indication was found of its gaining an H atom to form one of the cyclohexadienes. Disproportionation between two cyclohexadienyl radicals was, however, observed in ref 34 with the formation of both cyclohexadienes.(34) M . K. Eberhardt, J. Pkys. Chem., 67, 2856 (1963).(35) R. W. Fessenden and R. H. Schuler, J. Chem. Phys., 38, 773(1963) ; 39,2147 (1963).(36) J. P. Manion and M. Burton, J. Phys. Chem., 56, 560 (1952).(37) Y . N. Tang and F. S. Rowland, ibid., 69, 4297 (1965).
Volume 70, Number 3 March 1966

742 J o h n K. G a r l a n d a n d F. S. R o w l a n d
tion of aniline was reduced in the mixture. In each case, the total radioactivity in each compound increased monotonically with an increase in the mole fraction of that parent molecule— approximately linearly with mole fraction for ethanol and acetone, and with distinct curvature for aniline.
Subsequent experiments with cyclohexane-benzene mixtures showed a more complex behavior for the radioactive content of each of the labeled parent molecules.16 The most prominent effects can be described as follows: the fractions of the total volatile activity found as benzene-f and as cyclohexane-f are both higher in the high benzene mole fractions than would be anticipated from a linear dependence on she mole fraction of each component. The explanation postulated for this increase in the specific fraction of activity as cyclohexane-f in low concentration of cyclohexane depends upon a form of energy transfer within the system, such that the excitation energy of excited cyclohexane-f molecules is more rapidly removed by contact with aromatic molecules than with saturated molecules, thereby enhancing the parent yield at the expense of products involving additional reactions. The primary thesis of this postulate is thus that benzene is much more efficient than cyclohexane in carrying off such excitation energy.16
The original experiments on ethanol- and acetone- aniline mixtures were carried out with dissolved LiBr in the liquid mixtures, and thus permitted accurate measurement of tritium production in a known neutron flux. Furthermore, all of the samples of a given set of binary mixtures were irradiated simultaneously to provide as nearly equivalent neutron flux as possible in each sample. The benzene-cyclohexane mixture experiments were, however, carried out under conditions much more similar to those of our present measurements, with a heterogeneous mixture of solid L^CCh and the liquid mixtures. These conditions are much less conducive to knowledge of the actual tritium flux in the liquid fraction of the heterogeneous mixture, and the conclusions were based instead on the fraction of the total volatile radioactivity found as a particular compound. This assumption is a reasonable one for intersample comparisons only if the percentage of total tritium reacting in the mixtures leading to nonvolatile compounds is constant (preferably near zero). If, however, the fraction of nonvolatile radioactivity rises with the mole fraction of one of the components, then the standard of total volatile radioactivity is a shifting one, and calculations based on the fraction of total volatile radioactivity have a substantial systematic error.
A second investigation of the benzene-cyclohexane
mixture has given ratios of product yields in good agreement with the first series of experiments.38 In this case, however, the total activity observed in the radio gas chromatograph per milligram of Li2C 03 (and within equivalent neutron fluxes) has steadily decreased as the mole fraction of benzene in the mixture has increased, with the activity in high benzene mole fractions only about half of that observed in high cyclohexane mole fractions. This observation could be explained either by progressive changes in the neutron fluxes of the samples or by an increasing “loss” of radioactivity to products of low volatility as the benzene mole fraction is increased. The observed amount of low-volatility products (L and H in TableII) from pure benzene samples agrees quite well with the loss of activity noted by Sokolowska among the volatile products in high benzene mole fraction mixtures.
A consistent explanation of all of the binary liquid mixtures of benzene-cyclohexane is therefore possible, in which the total radioactivity of cyclohexane-f shows a linear rise with the mole fraction of cyclohexane, in consistent agreement with the general behavior of acetone and ethanol in competition with aniline. This linear rise with mole fraction eliminates the necessity for postulation of enhanced yields through enhanced energy transfer to aromatic molecules; in fact, the much different conclusion is reached that the stabilization of excited cyclohexane-f molecules by collision with its surrounding molecules is accomplished approximately as efficiently by collision with other molecules of cyclohexane as it is with benzene.
The results of Sokolowska do not indicate any appreciable change with mole fraction of the ratio of specific activities of cyclohexane-f to benzene-f.38 The behavior of benzene is thus different from that of aniline and benzoic acid, albeit in competition with different molecules. The relative reactivities of all three aromatic compounds are approximately the same in 50:50 mixtures, but the “scavenging” action by small mole fractions of aromatic compound is not found with benzene. The evidence for the scavenging reaction is, of course, the appearance of a higher specific activity of labeled parent molecule set low mole fractions, and failure to observe this excess of benzene-f could be assigned either to (a) no reaction between the low energy T atom and the aromatic ring, or (b) no decomposition of the cyclohexadienyl- f radical to benzene-f and H. Since low-energy hy
(38) A. Sokolowska, “ Chemical Effects of Nuclear Transformations,” Voi. 1, International Atomic Energy Agency, Vienna, 1965, p 255.
The Journal of Physical Chemistry

R e c o il T r it i u m R e a c t io n s w it h B e n z e n e 743
drogen atoms in radiolytic systems react with benzene, the second explanation must be the correct one.
Probably the competition between loss of an H atom and further reaction is much more toward the latter with cyclohexadienyl-i than for the comparable radicals from aniline and benzoic acid. The rate of “further reaction” is naturally a function of both the reactivity of the radical, and of the availability of a readily reactive molecule for its attack. The difference in behavior may well arise from ease of attack on benzene, rather than from any major change in the reactivity of the radical involved.
Measurements of total activity are not very useful in elucidation of the difference, for the most prominent higher specific activities of aniline-i and benzoic acid-1 occur only at the low mole fractions for which the total yield of aromatic activity is a minor fraction of the total tritium production.
Variations in Benzene-t Yield with Other Experimental Parameters. The reactions of recoil tritium atoms with benzene have been studied under a variety of other experimental conditions, including in the solid phase,15 in the nickel clathrate complex Ni(CN)2-NH3-C6H6,n and in solutions with halogens,14 methyl halides,14 lithium alkyls, and DPPH.11 The general result of most of the variations in experimental conditions are that the yields of benzene-1 are substantial!}' higher that that found in pure liquid phase experiments. These results are readily rationalized if the conditions involve solutes capable of reacting with cyclohexa- dienyl-1 radicals with the formation of benzene-1 as a product, or if they slow down the time scale for the bimolecular reactions necessary for the formation of radioactive polymeric material. Certainly, the crystalline environment of the solid phase materially alters the radical-radical combination time scale, and probably also makes more difficult the steric orientation required for any chemical interaction between a radical and a stable molecule. Since our determinations of polymeric tritium should certainly be regarded only as minimum values, the increase of a factor of two in the benzene-i yield in the solid phase over the liquid values represents primarily the diversion of this polymeric tritium to benzene-f by the altered conditions of reaction in the crystalline phase.
The increase in yield of benzene with the inclusion of DPPH, or halogen scavengers, and the concomitant
drop in cyclohexadiene-/ yields is indicative of general interference by the scavengers with the radical reactions in the liquid phase. It is possible, that the cyclohexadienyl-i radicals react with the halogen molecule to give the cyclohexadienyl-i iodide, which could then readily undergo the loss of HI to leave benzene-i as the observed radioactivity. The behavior of methyl iodide may well be as the original authors have indicated, the result of the radiolytic formation of molecular iodine under the heavy radiation damage conditions of these experiments. The high radiation dosage incurred in these experiments could also be a contributing factor toward the decomposition of relatively unstable molecules (e.g., cyclohexadienyl-i iodide) formed in the hot atom reactions. Precise determination of the role of the cyclohexadienyl-i radicals under each of these varying conditions invites repetition of the original experiments under conditions of low radiation dose, and with more extended searches for radioactive products of low volatility.
The subsequent chemical behavior of the possible radioactive products in nickel clathrate complexes and in solution with lithium alkyls is very uncertain. In each case, if cyclohexadienyl-i radicals were produced, nothing very definitive can be said about their expected reactions, and reaction to form benzene-i is not unlikely.
One additional experimental observation in earlier experiments can probably be rationalized through the knowledge of the existence of high specific activity polymeric radioactivity. Nesmeyanov, et al., reported that preheating their liquid samples of benzene to 200° for 1 hr before analysis, and after irradiation, led to an increase in the amount of volatile radioactive product observed.11 Irradiation of Li2C 03 without benzene followed by addition of benzene and preheating as before did not lead to a corresponding rise in volatile radioactivity. However, heating of the liquid benzene in contact with both high specific radioactivity polymer and a heterogeneous solid surface can very probably cause isotopic exchange between the polymer and the volatile components of the system, with a net transfer of radioactive tritium into volatile form.
Acknowledgment. The kind cooperation of the operating personnel of the TRIGA reactor of the OmahaV.A. Hospital is gratefully acknowledged.
Volume 70, Number 3 March 1966

744 P. M o s e r , P. G. S q u i r e , a n d O. T. O ’ K o n s k i
Electric Polarization in Proteins— Dielectric Dispersion and Kerr Effect
Studies of Isoionic Bovine Serum Albumin1
by P . M o se r , P . G . Squire, and C . T . O ’K onski
Department of Chemistry and Hormone Research Laboratory, University of California, Berkeley, California (.Received August 30, 1965)
Dielectric dispersion and transient birefringence data are reported for the isoionic and defatted monomer of bovine serum albumin as a function of concentration at 25°. Dielectric dispersion data are also presented for the monomer at 1° and the dimer at 25°. Crystalline albumin was defatted, deionized, and fractionated on a Sephadex column. Various mechanisms of electric polarization are considered and it is shown that the dielectric properties of the protein are due mainly to an orientation polarization process. This suggests that the protons of the isoionic protein are not sufficiently mobile to contribute a large ionic polarization or a fluctuation polarization at the dispersion frequency, and tends to reinstate dielectric dispersion for protein size and shape studies. A dipole moment of 384 D. was computed for the monomer. Interpretation of the dielectric and birefringence relaxation times leads to an axial ratio of 3.0 and a hydration of 0.64 g of H20 / g of protein for a prolate ellipsoidal model. The dielectric relaxation behavior at 1° shows the effect of strong intermolecular interactions even at the lowest concentrations which could be measured. These interactions are also visible at 25°, and are believed responsible in part for earlier interpretations which led to higher axial ratios. In this research, extrapolation to zero concentration was successful at 25°. Proton fluctuation phenomena are interpreted kinetically in a manner which permits important intermolecular forces to exist while contributions to the dielectric dispersion may be negligible.
The usefulness of dielectric dispersion measurements for studying rigid macromolecules in solution was demonstrated by Oncley and his co-workers in an extensive series of investigations of the dielectric properties of protein molecules during the late 1930’s and the early 1940’s.2 They showed how information could be obtained about the size and shape of the macromolecule, the permanent dipole moment, and the dipole direction with respect to the ellipsoidal axes. Their interpretations were based on the assumption that the dielectric increments were due solely to the orientation of permanent dipoles, and that the dielectric dispersion corresponded to rotation of the macromolecule as a rigid unit. The Clausius- Mosotti-Debye theory, developed for insulating dielectric systems, was used to calculate dipole moments, with the aid of an empirical constant.
Introduction Subsequent experimental studies suggested that polyelectrolyte macromolecules may exhibit dielectric dispersions associated with the motion of the counterions in an applied electric field.3 Studies of the Kerr effect in this laboratory showed that in certain macromolecules the electric field orientation effect was determined primarily by the polarization associated with ionic motions.4 5’6 Independent investigations by Eigen and Schwarz, who studied the anisotropy of conductiv
(1) This is paper X V III of the series, “ Electric Properties of Macro- molecules.” Presented at the Ninth Annual Meeting of the Biophysical Society, San Francisco, Calif., Feb 24-26, 1965.(2) (a) J. L. Oncley, Chem. Rev., 30, 433 (1942); (b) J. T. Edsall and J. Wyman, “ Biophysical Chemistry,” Vol. I, Academic Press, Inc., New York, N. Y ., 1958, Chapter 6.(3) H. M. Dintzis, J. L. Oncley, and R. M . Fuoss, Proc. NaÜ. Acad. Sci. U. S., 40, 62 (1954).(4) C. T. O ’Konski and A. J. Haltner, J. Am. Chem. Soc., 79, 5634 (1957).(5) C, T . O ’Konski, J. Phys. Chem., 64, 605 (1960).
The Journal of Physical Chemistry

E l e c t r ic P r o p e r t ie s o f M a c r o m o l e c u l e s 745
ity accompanying orientation of polyphosphates in an electric field, confirmed this.6'7 During the same period, several theoretical contributions were made in which alternative explanations for the dielectric properties of proteins were proposed. Among these were the concepts of proton fluctuation8 and ionic polarization,6'9 both of which presuppose appreciable mobility of charge carriers. These studies reopened the entire question of the interpretation of dielectric dispersion in protein systems. Thus, there is a need for definitive studies in which the various theoretical proposals are considered and evaluated in interpreting the experimental results. The necessity of doing this was illustrated by recent studies on various ion forms of montmorillonite,10 for which it was found that both orientation polarization and ionic polarization processes are important.
For the present study we have selected bovine serum albumin (BSA) as a typical example of a crystalline protein which may be obtained in highly purified form by recently developed techniques. It has been studied extensively with a wide variety of physicochemical methods.11 Interpretations of various kinds of measurements led to somewhat discordant conclusions regarding molecular parameters.12 A major source of difficulty has been the presence of polymeric forms of BSA in the preparations studied.
Measurements were made of dielectric constant and loss factor of BSA solutions over the dispersion region as a function of concentration, temperature, and sample preparation. To aid in interpreting the data, sedimentation constants were determined at low ionic strengths, and a precise molecular weight was obtained for highly purified monomer.13 Improved values of molecular size, shape, and hydration were obtained, after it was established that all data are consistent with a permanent dipole orientation mechanism. The results are discussed in relation to other data in the literature.
Experim ental Section
Materials. The preparation and characterization of the bovine serum albumin fractions used in this study will be described in detail elsewhere.13 These fractions had been (1) defatted by filtration at low pH,(2) fractionated by gel filtration into monomer, dimer, and oligomer fractions, and (3) deionized by being passed through a mixed-bed ion exchange column. Sedimentation velocity and equilibrium measurements13 demonstrated that the mass homogeneity, especially of the monomer fraction, was exceedingly high.
Dielectric Apparatus. A wide-range capacitance-
conductance bridge constructed in this laboratory14 was used in making measurements between 103 and 5 X I05 cps. The precision of the capacity readings is ±0.07% and of the conductance readings, ±0.5%. Between 5 X 10s and 3 X 10⁷ cps a General Radio reactance bridge, Type 1606-A, was used. Measurements of reactance with this instrument had a precision of ±0.2% at 5 X 10⁵ cps and ± 1 % at 3 X 10⁷ cps, while the resistance measurements had a precision of ± 1% from 0.5 to 5.0 Mcps. The errors in resistance measurements increase markedly above this frequency range, but resistance data were not required there because this was beyond the dispersion region. The reactance bridge output was detected by means of a tuned receiver. This provided high sensitivity and harmonic rejection.
The cell used in the dielectric measurements consisted of two concentric cylindrical platinum electrodes with sandblasted surfaces. This type of surface has been recommended by Oncley16 in order to reduce electrode polarization effects. The electrodes were rigidly mounted in a glass cell surrounded by a brass water jacket which acted as an electric shield. Water from a thermostat was circulated through the jacket, maintaining the temperature of the cell within ±0.1°. The temperature was recorded following each measurement, and corrections were applied for small temperature fluctuations.
Birefringence Apparatus. Birefringence decay measurements were carried out with the use of an apparatus described by Krause and O’Konski.16 Pulses of 1.6- pisec duration and of amplitudes up to 5C00 v were applied to the BSA solution contained in a strain- birefringence-free, temperature-controlled glass cell. The pulse decay time, 20% of the pulse height, was 0.02 psec. The platinum electrode assembly, with a separation of 1.98 mm, was similar to that described
(6) M. Eigen and G. Schwarz, J. Colloid Sci., 12, 181 (1957).(7) G. Schwarz, Z. Physik, 145, 563 (1956).(8) J. G. Kirkwood and J. B. Schumaker, Proc. Natl. Acad. Sci. U. S.’ 38, 855 (1952).(9) C. T. O’Konski, J. Chem. Phys., 23, 1559 (1955).(10) C. T. O’Konski and M. Shirai in “ Chemical Physics of Ionic Solutions,” B. E. Conway and R. G. Barradas, Ed., John Wiley and Sons, Inc., New York, N. Y ., in press.(11) J. F. Foster in “ The Piasma Proteins,” Vol. 1, Frank W . Put" nam, Ed., Academic Press, New York, N. Y ., 1960, Chapter 6.(12) R. A. Phelps and F. W Putnam, ref II, Chapter 5.(13) P. G. Squire, P. Moser, and C. T. O’Konski, in preparation.(14) C. T. O’Konski, J. Am. Chem. Soc., 73, 5093 (1951); unpublished notes of F. E. Harris, Jr., and C. T. O’Konski (1957); see also P. M. Gross, Jr., and R. M. Fuoss, Rev. Sci. Instr., 20 252 (1949).(15) J. L. Oncley, J. Phys. Chem., 44, 1103 (1940).(16) S. Krause and C. T. O ’Konski, J. Am. Chem. Soc., 81, 5082 (1959).
Volume 70, Number 3 March, 1966
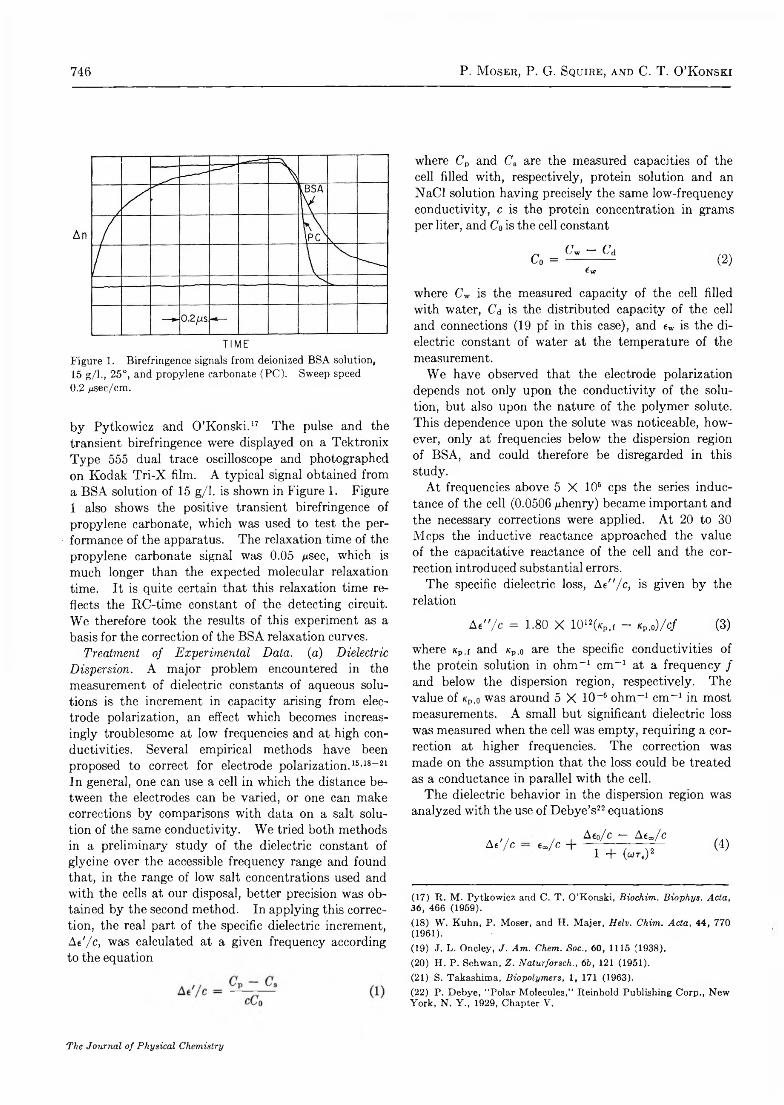
746 P. M o s e r , P. G. S q u i r e , a n d C. T. O ’K o n s k i
TIMEFigure 1. Birefringence signals from deionized BSA solution,15 g/1., 25°, and propylene carbonate (PC). Sweep speed 0.2 nsec/cm.
by Pytkowicz and O’Konski.17 The pulse and the transient birefringence were displayed on a Tektronix Type 555 dual trace oscilloscope and photographed on Kodak Tri-X film. A typical signal obtained from a BSA solution of 15 g/1. is shown in Figure 1. Figure 1 also shows the positive transient birefringence of propylene carbonate, which was used to test the performance of the apparatus. The relaxation time of the propylene carbonate signal was 0.05 /¿sec, which is much longer than the expected molecular relaxation time. It is quite certain that this relaxation time reflects the RC-time constant of the detecting circuit. We therefore took the results of this experiment as a basis for the correction of the BSA relaxation curves.
Treatment of Experimental Data, (a) Dielectric Dispersion. A major problem encountered in the measurement of dielectric constants of aqueous solutions is the increment in capacity arising from electrode polarization, an effect which becomes increasingly troublesome at low frequencies and at high conductivities. Several empirical methods have been proposed to correct for electrode polarization.15’18-21 In general, one can use a cell in which the distance between the electrodes can be varied, or one can make corrections by comparisons with data on a salt solution of the same conductivity. We tried both methods in a preliminary study of the dielectric constant of glycine over the accessible frequency range and found that, in the range of low salt concentrations used and with the cells at our disposal, better precision was obtained by the second method. In applying this correction, the real part of the specific dielectric increment, Ae'/c, was calculated at a given frequency according to the equation
where Cp and Ca are the measured capacities of the cell filled with, respectively, protein solution and an NaCl solution having precisely the same low-frequency conductivity, c is the protein concentration in grams per liter, and Co is the cell constant
a - ^ (2)€w
where Cw is the measured capacity of the cell filled with water, C'a is the distributed capacity of the cell and connections (19 pf in this case), and ew is the dielectric constant of water at the temperature of the measurement.
We have observed that the electrode polarization depends not only upon the conductivity of the solution, but also upon the nature of the polymer solute. This dependence upon the solute was noticeable, however, only at frequencies below the dispersion region of BSA, and could therefore be disregarded in this study.
At frequencies above 5 X 10⁶ cps the series inductance of the cell (0.0506 /¿henry) became important and the necessary corrections were applied. At 20 to 30 Mcps the inductive reactance approached the value of the capacitative reactance of the cell and the correction introduced substantial errors.
The specific dielectric loss, Ae"/c, is given by the relation
Ae"/c = 1.80 X 10¹² 21Ow ~ *p.oW (3)
where Kp,f and kp,0 are the specific conductivities of the protein solution in ohm-1 cm-1 at a frequency / and below the dispersion region, respectively. The value of k p ,o was around 5 X 10⁻⁶ ohm-1 cm-1 in most measurements. A small but significant dielectric loss was measured when the cell was empty, requiring a correction at higher frequencies. The correction was made on the assumption that the loss could be treated as a conductance in parallel with the cell.
The dielectric behavior in the dispersion region was analyzed with the use of Debye’s22 equations
A e'/c €»/C +Aeo/c — A e„/c
1 + ( « r e) 2(4)
(17) R. M. Pytkowicz and C. T. O ’Konski, Biochim. Biophys. Acta, 36, 466 (1959).(18) W. Kuhn, P. Moser, and H. Majer, Helv. Chim. Acta, 44, 770 (1961).(19) J. L. Oncley, J. Am. Chem. Soc., 60, 1115 (1938).(20) H. P. Schwan, Z. Naturforsch., 66, 121 (1951).(21) S. Takashima, Biopolymers, 1, 171 (1963).(22) P. Debye, “ Polar Molecules,” Reinhold Publishing Corp., New York, N. Y ., 1929, Chapter V.
The Journal of Physical Chemistry

E l e c t r ic P r o p e r t ie s o f M a c r o m o l e c u l e s 747
At "/ e =(Aeo/c — Ae»/c)cdre
1 + 0ore) 2(5)
in which Aeo/c and Ae»/c are the specific dielectric increments at frequencies below and above the dispersion region, respectively, w is the angular frequency 2irf, and r€ is the dielectric relaxation time. The effects of concentration dependence were eliminated by extrapolating the dispersion curves to infinite dilution. This was done by plotting the logarithm of the frequency for chosen values of the relative increment, (Ae' — Ae„)/(Ai0 — Ae„), vs. the concentration.23 In general, dispersion curves extrapolated to infinite dilution could not be represented by a one-term Debye equation, but could be closely approximated by an equation with two or three relaxation times
Ae' — Ae» y-, A¡Ae0 — Ae» i 1 + (Wei)2 (6)
The A t are the components of the relative increment having a relaxation time rei. Values of A t and rei were obtained with the aid of a digital computer by least-squares fitting of the experimental data.
The dipole moment y of the protein molecule may be estimated from the following equation due to Oncley19
¡9000kTMAet/c-------4rN b (7)
M = 0 . 4 0 3 V l A f t / c (8)
Here, N is Avogadro’s number, k is Boltzmann’s constant, M is the molecular weight, of the protein, Aet/c is the total dielectric increment at unit concentration (grams/liter), Aet/c = Ae0/c — Ae„/c, T is the absolute temperature, b is an empirical parameter given as b = 5.8 by Oncley from the known dipole moment of glycine, and y is in Debye units. Equation 7 is based on the original Debye equation for nonpolar solvents, but has been extended empirically to amino acids in polar solvents where it has been found to give reasonable results.
(6) Birefringence Decay. The optical retardation, 8, was calculated essentially as described by O’Konski and Haltner24 and Krause and O’Konski.16 Tracings of the enlarged photographs of the transients were used to find 8 as a function of time. Before and after each experiment the vertical axis of the screen of the oscilloscope was calibrated in terms of r, the angle of rotation of the analyzer from the crossed position. The retardation was obtained by a combination of eq 1 and 2 in ref 24 and eq 1 of ref 16.
In the calculation of the birefringence relaxation
time, r„, at low BSA concentrations, it was necessary to correct for the birefringence of the solvent. It was assumed that the total birefringence was a sum of contributions due to solvent and solute and that the water birefringence would decay with the same instrumental time constant as found for propylene carbonate, 0.05 ysec. The relaxation times were found from a plot of log 8 vs. time.24 It was seen by solving the differential equations for an exponentially decaying signal in an RC circuit that the finite time constant of the detecting circuit mentioned earlier, affected only the beginning of the decay curves. Apart from this initial period, the slopes of the log 5 vs. time curves did not change, and rn could be determined in the usual manner.17 At the lowest concentration the relaxation time was found independently by computer analysis and it agreed well with the one determined from the graph. The relaxation time determined from birefringence decay, r„, is related25-27 to the rotary diffusion coefficient, 9m by
9b = Ver,, (9)
and to the longer dielectric relaxation time, ta, by
Tn = r ei/3 (10 )
R esults
The specific dielectric increment and loss were measured throughout the frequency range 10s to 3 X 10⁷ cps at various concentrations of the purified BSA monomer at 25 and 1°, and of the purified dimer at 25°. In Figure 2a the specific dielectric increment of the BSA monomer at 25° is shown as a function of the frequency at three concentrations. In Figure 2b similar data at 1° are reported. Included in Figures 2a and 2b are the specific dielectric loss data at 44 g/1. The results of measurements of the dielectric loss at lower concentrations showed so much scatter due to the low value of the loss factor that they were not included. Similar results on the BSA dimer at 25° are given in Figure 3.
Due to the smallness of the specific dielectric increments, the measurements had to be carried out at fairly high concentrations. It was thus necessary to extrapolate the data to infinite dilution because of the effect of interactions on the dielectric increments and on the broadness of the dispersion curves. In 23 24 25 26 27
(23) H. M. Dintzis, Ph.D. Thesis, Harvard University, 1952.(24) C. T. O’Konski and A. J. Haltner, J . A m . C h em . S o c ., 78, 3604 (1956).(25) C. T. O’Konski and B. H. Zimm, S c ien ce , 111, 113 (1950).(26) H. Benoit, A n n . P h y s . , 6, 561 (1951).(27) I. Tinoco, J . A m . C h em . S o c ., 77, 3476 (1955).
Volume 70, Number S March 1966

748 P. M o s e r , P. G. S q u i r e , a n d C. T. O ’ K o n s k i
Figure 2. Dielectric dispersion curves of deionized bovine serum albumin monomer at three different concentrations: 95 g/1., X ; 44 g/1., □; and 12 g/1. (two independent experiments), O; (A) at 25° and (B) at 1°. The specific dielectric losses, Ae"/e, are shown on the same scale for the concentration 44 g/1., A.
Figure 4 the low frequency (static) specific dielectric increments of the BSA monomers and dimer are plotted as a function of concentration. It may be seen that the concentration dependence is substantial in the case of the monomer, at 1°, while the BSA dimer shows no detectable concentration dependence in the narrow range studied.
Data on a monomer fraction, obtained from a BSA preparation which had not been defatted, gave a normalized dispersion curve agreeing with that expected for the defatted material at the same concentration. However, this sample had a lower low frequency specific dielectric increment, 0.136 at 27.5 g/1., than the value of 0.189 of the defatted material.
The dispersion data were extrapolated to infinite dilution in two different ways. The first method, used with the monomer, consisted of an analysis of each dispersion curve at 25 and 1° in terms of the two- term Debye expressions, using the raw experimental data and finding the parameters A t, rei by computer analysis. Results are recorded in Table I. The r values were extrapolated to zero concentration by
Figure 3. Dielectric dispersion curves of deionized bovine serum albumin dimer at 25° for three different concentrations: 35 g/1., O; 24 g/1., D; and 12 g/1., V and A (two independent measurements). The specific dielectric loss, Ae"/c, is shown for the concentration 35 g/1., X.
Figure 4. Concentration dependence of the low-frequency specific dielectric increment for bovine serum albumin monomer at 25°, O; monomer at 1°, □; dimer at 25°, A .
linear regression.28 In the second method, the dispersion data were extrapolated to infinite dilution by plotting the logarithm of the frequency for chosen values of the relative dielectric increment, (Ae' — A e„)/(A e0 — Ae»,), against the concentration.23 Results of a computer fit to a two-term Debye equation are given, under c = 0, in Table I.
The dispersion of the relative dielectric increments for all three samples extrapolated to infinite dilution * 1951
(28) D. S. Villars, “Statistical Design and Analysis of Experiments for Development Research,” W. C. Brown Co., Dubuque, Iowa,1951.
The Journal of Physical Chemistry

E l e c t r ic P r o p e r t ie s o f M a c r o m o l e c u l e s 749
Table I : Dielectric Dispersion of Bovine Serum Albumin Monomer and Dimer
Concn, *'1/2»Sample Temp eA- Aeo/c Aeos/c A tt/c Tei, Msec Ai Te2, fiBGG Ai Mops Remarks
Monomer 25° 95 0.160 -0 .061 0.22 1.23 0.59 0.131 0.4144 0.195 -0 .062 0.26 0.98 0.43 0.140 0.5712 0.206 -0 .062 0.27 0.31 0.63 0.077 0.37 a12 C.190 -0 .062 0.25 0.26 0.68 0.067 0.32 a0 0.202 -0 .062 0.26 0.22 0.074 1.09 b
(-0 .0 8 3 ) c0 0.74 0.07 0.14 0.93 d
Monomer 1° 95 0.228 -0 .078 0.31 3.09 0.63 0.24 0.3744 0.271 -0 .069 0.34 1.66 0.44 0.29 0.5612 0.284 -0 .070 0.35 3.73 0.25 0.40 0.75 a12 0.321 -0 .070 0.39 1.89 0.27 0.32 0.73 a0 -0 .070 2.49 0.37 b
(-0 .0 9 5 ) c0 1.59 0.33 0.28 0.67 0.38 d
Dimer 25° 35 C .270 -0 .042 0.3124 C .270 -0 .042 0.31 e12 0.270 -0 .042 0.310 0.270 -0 .042 0.31 0.41
° Two independent measurements were made on the same sample at the same concentration. 6 Extrapolations to infinite dilution of the above Ae0/c and r(( values were made by linear regression. c Theoretical values of the high-frequency decrement were calculated from eq 6.14 of ref 5. d The parameters, A ¿, Tei, were fitted to a dispersion curve extrapolated to infinite dilution as outlined in the text. * See ref 5.
according to the second method is shown in Figure 5. In all three cases the experimental curves are broader than a single-term dispersion curve (dashed curve), suggesting more than one relaxation time. The deviations for the monomer at 25° from the theoretical curve for a single relaxation time are rather small. Nevertheless, the discrepancies were judged to be outside of experimental error. The dispersion curves for the monomer at 25 and 1° thus were both fitted with two relaxation times. Three relaxation times were used for the dimer, which had a much broader dispersion region. The values A t and rei determined in this manner are recorded in Table I.
Birefringence decay measurements were carried out at six different concentrations on solutions of monomer prepared in exactly the same way as the ones used for the dielectric experiments. Figure 6 shows the birefringence relaxation times, rn, determined from corrected log 5 vs. time plots, not presented here, as a function of the concentration at 25°. Below 30 g/h, straight log s vs. time curves were obtained, indicating single relaxation times. At 30 g/h, however, the plot of log s vs. time was curved due to concentration-dependent interaction, and a single rn could not be defined. The points in Figure 6 lie reasonably well on a straight line so that the relaxation time at infinite dilution could be found by linear regression. The
Figure 5. Relative dielectric increments for deionized BSA at infinite dilution vs. frequency. The points are values extrapolated to zero concentration as explained in the text for monomer at 25°, O; monomer at 1°, A ; dimer at 25°,□. The solid curves represent computer analyses of these points in terms of Debye dispersions with two relaxation times for the monomer and three for the dimer. The dashed curve represents a single Debye relaxation time.
value thus determined is rn,c=o = 0.076 jasec, and the corresponding rotational diffusion constant is dt = 1/ iTn = 2.18 X 10~6 sec-1 (see Table II). The specific Kerr constant extrapolated to zero concentration was found to be 17.0 X 10“9 in cgs units. This is higher
Volume 70, Number 8 March 1966

Tabl
e II
: D
iele
ctri
c D
ispe
rsio
n an
d Bi
refr
inge
nce
Rela
xatio
n of
Ser
um A
lbum
ins
750 P. M o s e r , P. G. S q u i r e , a n d C. T. O ’ K o n s k i
JSCfl WJA 13 H H
00cu CO
-aQ -5
I ¿4« S
cs a a
»a> CO o rH toX i o o CO F— o
¡S’ 1-1 rH o’ o’ d 1—4 d
■ <N\ GO o OCO rH rH, <£ 2 CO tO rH d CO
Xo 1 <N tO 00 rfH,-t « F- F- 05 05 coX ® €
cO rH CO F- CO l-HO (M<No' d rH rH
CO CO i> toa CO to <No o* o’ d d
F- CO to© tO CO to© o © o’ o*
»© CO GO to to 05CO a GO F- to1—I o 1—1 o rHeî o o’ o' © o’ o’
CJ9 <N <No 05 (N CO 3i> tO GO COS o’ o’ 1“Ho d o’
Q GOrH COCO oGO 8=£ CO cO CO
os CO CO rH tJ4COCO CO <N 05<3 o’ o d d o’<*
S3 o to g COCO GO is- O i> co8 o © o © o o o
< © o’ 1 1 o*1 d1 o'1 o1 d11 1 1 1'w' 1 1 1
(M o oo 1—4 i> 1> i>$ CO <M rHGO
< o’ o d d d
aO _j9O bD o o o
oO CO oo 1—)
ftg Ö o o o o © o
tO tO 1— 1 to to to o£ <N (N (N <N
o o o
or-o
00o
COtoo
Î Pi
to
<3mn
S-3
Saocoa<3 <3 <3 H m ce ¡b £3 « « H W
Figure 6. Concentration dependence of the birefringence relaxation time for BSA monomer at 25°, O- Data found in a previous investigation16 on BSA containing an unspecified amount of oligomer are shown by X, and one value, reported by P.Ingram and H. G. Jerrard, Nature 196, 57 (1962), and corrected to 25°, is shown by A .
than the value reported earlier, 13 ± 2 X 10⁻⁹, for unfractionated samples.
D iscussion
1 . M ech a n ism o f D ielectric D isp ersio n in P rotein s. Various models are available for interpretation of these dielectric dispersion data. They might be explained in terms of orientation of permanent dipoles, or by the motion of mobile charges associated with the macromolecule; in the general case both processes may contribute. One may assume the macromolecule is rigid, or one may include the possibility of flexibility. Because BSA is a crystallizable globular protein, and because it has considerable helical content,29'30 a rather compact and ordered structure is indicated at the isoionic point, pH 5.15, at which the present studies were made. There are numerous physicochemical studies on BSA in aqueous solutions, and the available data support the proposal that it is rigid, except in acid solutions, where subunit motion has been suggested.16 31 Foster11 argues from various
(29) E. Shechter and E. R. Blout, Proc. Natl. Acad. Sei. U. S., 51, 695 (1964).(30) J. T. Yang, Tetrahedron, 13, 143 (1961).(31) W. F. Harrington, P. Johnson, and R. H. Ottewill, Biochem. J., 62, 569 (1956).
The Journal of Physical Chemistry

E l e c t r ic P r o p e r t ie s o f M a c r o m o l e c u l e s 751
lines of evidence, including titration and denaturation studies, that the protein is tightly folded in aqueous solutions above pH 4. Therefore, we adopt a rigid model for interpretations of the present results.
In the deionized samples employed here, the only mobile charges which might possibly contribute to dielectric polarization would be protons. We may estimate the critical dispersion frequencies for relaxation of ionic polarization from equations given by one of the present authors6 if we know the size and shape of the macromolecule, the number of carriers on its surface, and the mobility of the carriers. It will be assumed that the protons are distributed uniformly over the surface of the macromolecule. Carboxyl and histidine groups are the only groups with pK close enough to the isoionic point to contribute to fluctuation polarization.8 From the known chemical composition,32 the number of carboxyl sites available for protons is 100. Titration studies give 96 for the number of carboxyl groups ionized at the isoionic point.33 This leaves four bound carboxyl protons. Assuming a prolate ellipsoid of revolution of axial ratio 3, with semiaxes a = 69 A, b = 23 A, reported in this research, we calculate a mean density of carboxyl protons of 2.4 X 10¹² protons cm-2. Assuming a proton mobility of 3.62 X 10⁻³ cm2 v-1 sec-1, the value of protons in aqueous solution, one may calculate from eq 2.2 of ref 5 a value of surface conductivity, A =1.4 X 10~9 ohm-1, which is of the order of previously reported values. This should be an upper limit because the actual mobility on the surface of the protein would be expected to be less due to binding. Inseiting this value into the equations6 for the longitudinal and transverse relaxation times of the prolate ellipsoid of revolution, we obtain the following estimates for the dielectric relaxation times and critical frequencies: r a = 4.8 X 10⁻⁹ sec; t „ = 1.0 X 10⁻⁹ sec; v ca —3.3 X 10⁷ cps; v cb = 1.6 X 10s cps. It is seen that these frequencies are well above the dispersion region which was observed experimentally. If the mobility of the protons on the surface were lower than the value used here, the dispersion would shift to lower frequency, perhaps into the range observed. Such a shift would require that the mobility be reduced by a factor of about 100. This decrease in mobility would be consistent with the recent observation that the dielectric dispersion frequency for the hydrogen form of a polyelectrolyte is considerably lower than that for the sodium form.10
If NaCl were added, one would expect that the chloride would be bound, and that the sodium counterions would shift the dispersion frequencies to higher values. In an experiment not mentioned in the Results section
above, it was found that addition of ' / 3 mole of NaCl per mole of protein shifted the critical frequency only slightly, and to lower rather than to higher values. This suggests that ionic processes are not very important. Similar results were obtained by Takashima34 35 in a study of the effect cf ions on the dielectric dispersion of ovalbumin solutions. Furthermore, the dispersion frequency observed here shifted to a lower value at lower temperature (1°) roughly as expected for a dipole orientation process. (Extrapolation of the data at 1° to infinite dilution was unsatisfactory. Experiments at 40° resulted in extensive denaturation.)
Most importantly, the dielectric relaxation times obtained from the analysis of the dielectric dispersion curves extrapolated to zero concentration agree with the values expected on the basis of other studies of size and shape of the BSA molecule, as discussed under Relaxation Times below.
In view of the above considerations, we conclude that the dielectric increments and dispersion in isoionic BSA solutions arise from a dipole orientation process. Some contribution from the proton fluctuation mechanism may exist, but it must be relatively small. This means that permanent dipoles are mainly responsible for the dielectric increments.
Attempts to identify an electric polarization contribution from the proton fluctuation mechanism have been made previously. For example, Haltner and one of the present authors4 measured the Kerr constant of tobacco mosaic virus solutions as a function of pH through the pK region of the amino acids present, and were not able to see a contribution from this process. More recently, Lumry and Yue36 advanced kinetic arguments against proionic contributions. Scheider also discussed the kinetics of the process,3611 but finally concluded that “more needs to be known about the protein-water surface before proton migration can be either discussed or satisfactorily analyzed.” Taka- shima’s data86*3 are not inconsistent with the presence of some contributions from proton fluctuations; he concluded, however, that the Kirkwood-Shumaker theory was not adequate to explain the results.
2. Relaxation Times. We shall adopt the usual model of an ellipsoid of revolution to describe the properties of the BSA monomer. As pointed out by Edsall,37 the two dielectric relaxation times of an
(32) P. F. Spahr and J. T. Edsall, J. Biol. Chem., 239, 850 (1964).(33) C. Tanford, S. A. Swanson, and W. S. Shore, J. Am. Chem, Soc., 77, 6414 (1955).(34) S. Takashima, J. Polymer Sei., 11, 2791 (1963).(35) R. Lumry and R. H. Yue, J. Phys. Chem., 69, 1162 (1965).(36) (a) W . Scheider, Biophys. J., 5, 617 (1965); (b) S. Takashima, J. Phys. Chem., 69, 2281 (1965).
Volume 70, Number S March 1966
752 P. M o s e r , P. G. S q u i r e , a n d C. T. O ’ K o n s k i
oblate ellipsoid cannot differ by more than 1 0 %, so this shape is ruled out by the dielectric and birefringence relaxation data (Table II); hence, we assume that the ellipsoid is prolate. We may attribute the longer dielectric relaxation time, rej, and the birefringence relaxation time, rn, to the rotation of the semimajor a axis about the short (b = c) axes.37 38 39 The corresponding rotary diffusion constant is 0,, = l/trA = Ver«.39 The short dielectric relaxation time, re2, corresponds to the rotation of the b = c axes about the a and b axes, with rotary diffusion constants 0B + db = l /r e2. Perrin40
has given the equations of r€i/ro = 0i /0& and ri2/r 0 = 20o/( 0„ + 0») where 0O and r0 are, respectively, the rotary diffusion constant and relaxation time of an equivalent sphere having the same volume as the ellipsoid, and are given by
0o = V 2 r0 = kT/8 irab% (1 1 )
where k is the Boltzmann constant and 770 is the viscosity of the solvent. The axial ratio, p = a/b, can be obtained easily from rei/re2 using a nomogram given by Wyman and Ingalls.41
The dielectric relaxation times obtained by the two methods of extrapolation to infinite dilution as described in the Results section have been shown in Table I. The obvious reason for the scatter of relaxation times of the monomer is related to the close approximation of the dispersion curve to a single-term Debye curve. This means that, with slightly different experimental results, substantial variations of the parameters A t, rei are possible. Therefore, conclusions about the shape of molecules cannot be drawn from the analysis of dielectric dispersion curves alone.
In order to eliminate the ambiguity of these interpretations, the dielectric dispersion results may be combined with results from other methods. The birefringence decay gives, as mentioned earlier, the rotary diffusion constants of the long axis around the short axes according to eq 9. Therefore, this rotary diffusion constant, which is unambiguously42 determined with reasonable accuracy, was used in combination with the dielectric dispersion curve in the following way. The parameter rel in the two-term Debye equation was set equal to 3rm and other parameters Ah A2, and r£2 were determined with the computer so as to give minimum rms deviation from the experimental data extrapolated to zero concentration. The values of the parameters found in this way are shown in Table III, together with the axial ratio and the dimensions of the BSA calculated on the basis of these relaxation times, using the Wyman-Ingalls plot to determine p, eq 11, and Perrin’s equations. The dispersion curve
calculated with these relaxation times and the Ai is shown as a solid curve in Figure 5 and it can be seen that it deviates only slightly and within the limits of experimental error from the experimental curve. The rms deviation for 20 points was 0.011, the estimated experimental rms uncertainty was 0 .0 2 . In comparison, the rms deviation of the closest possible fit of the extrapolated curve with two relaxation times (Table I) was 0.0074, also for 20 points. This shows that the constrained fitting with one predetermined parameter increases the deviation only slightly, but leads to a much more reliable value for the axial ratio. The best value, then, from this evaluation of the dielectric and birefringence relaxation times is p = 3.0, which gives a hydration of 0.64 g of H20 /g of protein.
Table III: Summary of Properties of Bovine Serum Albumin Monomer at Infinite Dilution“
Temperature 25°pH 5.15Relaxation times:
T e l = 3 T n 0 .2 3 iisecT e l 0.11 iusec
Rotary diffusion constants:8b 2.18 X 10⁶ sec-1{ 8 a + 8 b ) / 2 4.48 X 10⁶ sec-1
Harmonic mean of relaxation 0.15 Msectimes, Th
Dipole moment 384 D.Axial ratio, p = a/b 3.0Semimajor axis, a 69 ASemiminor axis, b 23 AHydrated volume, IT 153,000 A3Hydration (g of H20 /g of protein) 0.64
“ All values are obtained from dielectric and birefringence data of this research.
It was established in this research that it is important to extrapolate all data to infinite dilution. An example of the effect of concentration is the birefringence data shown in Figure 6 . The birefringence relaxation time found in this research, rn = 0.076 jusec, is to be
(37) J. T. Edsall in “The Proteins,” Vol. I, H. Neurath and K. Bailey, Ed., Part B, Academic Press, New York, N. Y., 1953.(38) J. L. Oncley in “Proteins, Amino Acids and Peptides,” E. J. Cohn and J. T. Edsall, Ed., Reinhold Publishing Corp., New York, N. Y„ 1943, p 543.(39) J. T. Edsall, ref 36, p 506.(40) F. Perrin, J . P h y s . R a d iu m , 5, 497 (1934).(41) J. Wyman, Jr., and E. N. Ingalls, J . B io l . C h em ., 147, 297 (1943).(42) Unambiguously, because it is clear that birefringence is related to molecular reorientation, whereas the dielectric relaxation may involve ionic relaxation processes.
The Journal of Physical Chemistry
E l e c t r ic P r o p e r t ie s o f M a c r o m o l e c u l e s 753
compared to the one determined in an earlier study in this laboratory16 where a value of rn = 0 .20 /¿sec was found. About one-half of the discrepancy is due to the fact that the relaxation times had not been extrapolated to infinite dilution but were measured at about 1% in the earlier study. The remainder may be due to the fact that the sample used in the earlier investigation had not been fractionated and probably contained as much as 20 to 30% cligomers. 11 Further, the faster oscilloscope used in this research provided better accuracy for short relaxation times.
The dispersion curve obtained by Oncley1 for horse serum albumin was broader than the one we have obtained for BSA monomer. As a consequence, the calculated axial ratio for the horse serum albumin is greater than that for BSA. In view of the persistent presence of polymeric products in serum albumin preparations, it seems likely that this broadening may have been due in part to heterogeneity. This leaves unanswered the question of whether the axial ratio of the equine monomer is actually greater than that of the bovine.
When the dielectric data of the monomer at Io were analyzed, it was found that the dispersions at comparable concentrations were wider than at 25°, indicating stronger intermolecular interactions. Due to the relatively low dielectric increment of bovine serum albumin, measurements could not be carried out on solutions with concentrations of less than 10 g/1. Dintzis23 was able to measure human mercaptal- bumin (HMA) at 0° down to lower concentrations, about 3 g/1., because it has a threefold higher dielectric increment than BSA. It was seen there that at relative increments > 0.6 the log/ vs. c plots were no longer straight at low concentrations, indicating strong interactions affecting mostly the long relaxation times. Because extrapolations of our data to infinite dilution were not quantitatively justified, we do not draw any conclusions from the relaxation times about the shape of the molecule at Io. It is interesting to note that the Stokes radii of BSA calculated by Longsworth43 from his own diffusion data at 1 and 25° (37.55 and 36.84 A, respectively) agreed rather well, though perhaps not within experimental error. This suggests that the shape and hydration are very nearly identical at the two temperatures in the buffer used by Longsworth (acetate, pH 4.6, ionic strength 0.16).
The harmonic mean of the best monomer relaxation times obtained by the constrained fitting described above, Th = 0.15 /¿sec, is in excellent agreement with the relaxation time found by Steiner44 from measurements of the fluorescence depolarization, r = 0.155 /¿sec at pH 5.22, and in fairly good agreement with the
value reported by Harrington, et al.,n 0.124 /¿sec at pH 7.3. All three values agree within the experimental errors of the measurements.
The good agreement between the harmonic means from fluorescence depolarization, and from a combination of dielectric and birefringence relaxation substantiates that the polarization is due to permanent dipole orientation and that the macromolecule rotates as a complete unit.
As is expected, the dimer dielectric dispersion, extrapolated to zero concentration, occurs at lower frequencies than that of the monomer. In addition, the dispersion curve is broader, requiring a series of three relaxation times for a satisfactory fit (rms deviation of 0.0063). The numerical results are shown in Table IV. Extrapolation to infinite dilution was made by only one method because of the very wide dispersion range and small concentration dependence. Three relaxation times were necessary to reduce the standard deviation to a reasonable value in a computer fit. This yielded the parameters Ai = 0.22, xei = 3.33 /¿sec, A, = 0.63, re2 = 0.353 /¿sec, A 3 = 0.151, xe3 = 0.067 /¿sec. For HSA, Dintzis23 obtained Ax = 0.25, xe 1 = 2 .0 /¿sec, A 2 = 0 .6, xe2 = 0.5 /¿sec, A3 = 0.15, xe3 = 0.16 /¿sec. The longest of the three dimer relaxation times, 3.33 /¿sec, cannot be explained by simple dimerization. It would correspond to a particle length of approximately 430 A which is much longer than a particle formed by end to end aggregation of two monomer molecules (Table III).
Table IV : Dielectric Dispersion ofBovine Serum Albumin Dimer
T em p, C oncn , Acoo/C, A et/c, *T/2,°c g/i. i./g L/g M cp s
25 35 -0 .042 0.3124 -0 .042 0.3112 -0 .042 0.310 -0 .042 0.31 0.41
S. Dielectric Increments. The dipole moment is the resultant of the group moments of individual amino acid residues, the moments of the charged groups about the hydrodynamic center of the macromolecule, and a polarization contribution from the solvent. The fact that the dipole moment of BSA is as small as 384 D. implies a low degree of asymmetry of the charge distribution.
(43) L. F. Longsworth, J . P h y s . C h e m 58, 770 (1954).(44) R. G. Steiner, A r c h . B io ch em . B io p h y s . , 46, 291 (1953).
Volume 70, Number 3 March 1966

754 P. M o s e r , P. G. S q u i r e , a n d C. T. O ’K o n s k i
The angle between the dipole moment and the long axis of the molecule, 4>. can be estimated from an equation given by; Oncley2a
tan <f> = fib/na = \/ A 2/A 1 (12)
Taking the values Ai = 0.4 and A 2 = 0.6 for the monomer at 25° from Table III, we obtain a dipole angle of 50°. This calculation is based on the assumption of a spherical cavity for the dipole in Debye’s theory. Since any angle less than 54° will tend to produce positive birefringence45 when the optical anisotropy factor is positive, this angle is consistent with the observation of positive birefringence. Assuming that the optical anisotropy of the molecule is due primarily to its shape rather than to a high intrinsic anisotropy, the observed positive birefringence is consistent with permanent dipole orientation. The value of the dipole moment of the dimer, 636 D., is 1.66 times the dipole moment of the monomer. A comparable relation, /¿dimer = 1.53/imonomer, has been found by Dintzis23 for human mercaptalbumin. We may, following the arguments given by Dintzis, assume that in the dimer the monomer dipole moments form a mean angle a = 68° (cos a/ 2 = fidimer/2/tmonomer) with each other to give the resulting dimer dipole moment. From these data it is not possible to decide whether the two monomer dipole moments are in a fixed position relative to each other to give this angle or whether it represents a mean angle as a result of rotation of the monomers around the linking bond. Furthermore, the angles estimated in this way are of uncertain accuracy because the local field depends upon the shape of the macromolecule.6
The high frequency dielectric decrement, Ae„, can be calculated from an equation which takes into account the shape-dependent depolarization factor A} of ellipsoids5
Ae„«1 3 E*3 j = a,b,c
tj/ti - 11 + («/Ai — 1 )Aj
(13)
where is the volume fraction of the solute (7.34 X 10~4 for a 1 g/1. solution), q is the dielectric constant of the solute along the,/ axis, ea = e6 = tc = 4.5, and a is the dielectric constant of the solvent. The high frequency dielectric decrements calculated by means of this equation have been entered into Table I to facilitate comparison with the values obtained from the experiments. In this calculation an axial ratio of 3 was assumed at 25° with the corresponding values Aa = 0.1085 and Ab = 0.445.6 It should be pointed out that the result depends very little upon the axial ratio. By reference to Table I, it may be seen that the theoretical values of the high frequency specific dielectric
decrement are about 0.02 lower than the experimental values. It seems possible that this small difference may be due to polarization of the proton distribution which, as pointed out above, might have a critical frequency much higher than that of the main dispersion.
Takashima46 has observed dielectric dispersion in BSA in the frequency region from about 3 kcps to 2 Mcps. He reported a small specific dielectric increment (0.089 l./g) and stated he was not able to determine the critical frequency accurately, indicating that it lay between 300 and 500 kcps. He calculated a dipole moment of 220 D., a value one-half of ours and stated that “it may be reasonable to conclude that the electric polarization of BSA is due to a permanent dipole . . . . ” Takashima’s lower value of dielectric increment may have been due to the fact that he did not defat his samples. We pointed out above that defatting increased the dielectric increment and Dintzis showed that the addition of oleic acid to defatted material decreased the dielectric increment.23
/ . Proton Fluctuations and Intermolecular Forces. It is interesting to explore the possible connections between the mechanism of dielectric dispersion in proteins and the processes producing intermolecular forces. Kirkwood and Shumaker,47 in an article immediately following their paper on dielectric dispersion and proton fluctuations, introduced the concept of intermolecular forces arising from proton fluctuations. One physical basis for attractive forces would be the reorientation of a macromolecular electric dipole by the field of another, that is, correlation of dipole orientations. In view of the conclusion that dipole fluctuations are not responsible for the dispersion, the question arises as to whether proton fluctuations might still be important in producing intermolecular forces. The studies of Timasheff, Dintzis, Kirkwood, and Coleman48 clearly suggest they are. They found that the reciprocal turbidity of isoionic solutions of BSA, bovine serum mercaptablumin, and human serum mercaptalbumin all varied as the one-half power of the concentration, indicating thermodynamic deviations in accord with Kirkwood and Shumaker’s prediction for a proton fluctuation mechanism. Permanent dipole »interactions would be expected to produce a linear dependence on the concentration, and therefore appeared unimportant. How can this be reconciled with the present
(45) C. T. O ’Konski and K. Bergmann, to be published.(46) S. Takashima, Biochem. Biophys. Acta, 79, 531 (1964).(47) J. G. Kirkwood and J. B. Shumaker, Proc. Natl. Acad. Sci., U. S „ 38, 863 (1952).(48) S. N. Timasheff, H. M. Dintzis, J. G. Kirkwood, and B. D. Coleman, J. Am. Chem. Soc., 79, 782 (1957).
The Journal of Physical Chemistry

E l e c t r ic P r o p e r t ie s o f M a c r o m o l e c u l e s 755
research? We considered the possibility that fluctuating dipoles with lifetimes greater than the time required to reorient a BSA molecule might be responsible for intermolecular forces, but would appear essentially as permanent dipoles on the time scale appropriate to molecular reorientation. We reject this explanation for the following reason. The magnitude of the mean attractive force between molecules depends upon the degree to which correlations occur between the dipoles of neighboring molecules. This correlation might occur by rotations of the macromolecules or by proton redistribution, but the mechanism which is more rapid would predominate. This, on the above assumption, would be dipole reorientation.
We may estimate the order of the relaxation time which will permit effective correlations from the Einstein equation or translational diffusion, A x 2 =
2D t , where D is the translational diffusion constant of BSA (6.97 X 10~7 cm2 sec-1 at 25° in H20). Inserting a root-mean-square distance of 100 A, which appears to us a reasonable estimate of the range of interaction, we find t = 0.7 X 10⁻⁶ sec. This is of the order of the observed molecular reorientation time. Thus, dipole fluctuations appreciably slower than the dielectric relaxation time could not permit effective dipole correlations at distances comparable to the nearest distance of approach of two protein molecules, whereas the dielectric dispersion (molecular reorientation) process is sufficiently fast to allow correlations of the translationally diffusing molecules.
HoW, then, can proton fluctuations result in attractive forces? The charge and multipole fluctuation theory presented by Kirkwood and Shumaker47 contains a term W U { R ) , which represents the interaction potential of fluctuating charges and fluctuating multipoles of two interacting molecules. Fluctuating dipoles are apparently ruled out by the present research. Fluctuating multipoles are expected to be of shorter range and therefore even less important than fluctuating dipoles. On the other hand, the fluctuations of the net charge, which we may refer to as fluctuating monopoles, will produce a long-range attractive force, which Kirkwood and Shumaker showed would yield divergent expressions for the thermodynamic functions, except for the existence of Debye-Hiickel screening. Now we argue that this type of interaction should be very important even if the fluctuations are slow, for then molecules charged oppositely may diffuse into close proximity before the forces become repulsive, and this will produce deviations of thermodynamic activity as observed in the light scattering studies.
The new concept in this discussion is that the rate of
the proton fluctuations serves as a deciding factor in the selection of the mechanisms which are important in the two related but significantly different processes of molecular polarization and intermolecular attraction. Thus, the conclusions of this research and the observations of Timasheff, et al., can be reconciled on the basis that the attractive forces arise from the existence of a distribution of the net charge of the protein molecules, with dipole and higher multipole contributions being unimportant.49-61 In general, we observe that fluctuating net charges, leading to the thermodynamic interaction potential W (n) (R ) do not necessarily yield a measurable dipole moment and, vice versa, that a permanent dipole moment does not necessarily give a measurable thermodynamic interaction if attractive forces of longer range predominate.
5. Comparison of Various Albumins. It is frequently considered that serum albumins obtained from various mammalian species are very similar.62 Striking differences in the dielectric properties are apparent, however. In Table II, we see that the dipole moment of bovine serum albumin, 384 D., is in good agreement with the value 380 D. found by Oncley for equine serum albumin but both values are much smaller than the value 700 D. found by Dintzis for human serum albumin (HSA). It is interesting that both the “spontaneous” dimer of bovine serum albumin and the mer- captalbumin dimer of human serum albumin have dipole moments approximately 50% greater than those of the corresponding monomers. Notable differences in the relaxation times n and r2 are also evident as well as marked differences in the amplitude factors Ai and A 2, but it would be difficult to judge the significance of their differences since the values assigned to these parameters are highly sensitive to traces of oligomer in the sample. Only in this work was the sample demonstrated to be essentially monodisperse.
The HSA monomer has a considerably higher dielectric increment than either BSA monomer or dimer. Therefore, in spite of some uncertainties in At and r£i values arising from presence of oligomer, HSA monomer has a larger dipole moment than BSA monomer.
Acknowledgments. This research was supported 49 50 51 52
(49) Here we refer to monopole interactions arising from net charge fluctuations. We expect additional contributions of a similar nature from microheterogeneity which was shown by Colvin, et al.,s0 to be a general property of proteins and by Foster, et al.,61 to be an important property of bovine serum albumin in particular.(50) J. R. Colvin, D. B. Smith, and W. H. Cook, Chem. Rev., 54, 687 (1954).(51) M. Sogami and G. F. Foster, J. Biol. Chem., 238, PC2245 (1963); G. F. Foster, M. Sogami, H. A. Petersen, and W. G. Leonard, Jr., ibid., 240, 2495 (1965); H. A. Petersen and G. F. Foster, ibid., 240, 2503, 3858 (1965).(52) J. F. Foster in ref 11, p 182.
Volume 70, Number 3 March 1966

756 M. H. L i e t z k e a n d R. W. S t o u g h t o n
in part by Grants-in-Aid from the Petroleum Research Fund, Grant No. PRF 581-A5, administered by the American Chemical Society, and from the U. S.
Public Health Service, Research Grant GM 12082-01, from the National Institute of General Medical Sciences.
Electromotive Force Studies in Aqueous Solutions at Elevated Temperatures.
VII. The Thermodynamic Properties of HCl-BaCl2 Mixtures1
by M . H . Lietzke and R . W . Stoughton
Chemistry Division, Oak Ridge National Laboratory, Oak Ridge, Tennessee (Received September 1, 1965)
The activity coefficient of HC1 in HCl-BaCl2 mixtures has been studied at 175°. At constant temperature and ionic strength the logarithm of the activity coefficient of HC1 in the mixtures varies linearly with the ionic strength fraction of BaCl2, in conformity with Harned’s rule. The activity coefficient of BaCl2 in the mixtures was calculated by using the parameters describing this variation and those for the variation of the activity coefficient of BaCl2 with ionic strength in pure BaCl2 solutions.
The thermodynamic properties of HBr-KBr mixtures2 and of HCl-NaCl mixtures3 have been described in previous papers in this series. In the present work emf measurements of the cell
Pt-H2(p) | HC1 (m2), BaCl2(m3) | AgCl-Ag
have been combined with values of the osmotic coefficient of BaCl24 5’6 to compute the thermodynamic properties of both HC1 and BaCl2 in HCl-BaCl2 mixtures.
Experim ental Section
The high-temperature, high-pressure experimental apparatus and the preparation of electrodes and solutions were the same as described previously.6'7 Since this apparatus was built for moderate accuracy over a wide temperature range rather than for maximum accuracy at low temperatures, the accuracy in the latter range is not as great as that claimed by other investigators.8 The emf measurements were carried out in the temperature range 25-175° in solutions of total ionic strength 0.5 and 1.0 in which the ratio of HC1
to BaCl2 was varied. The emf values taken at the same temperature were reproducible to ca. ±0.5 mv. No drift of emf with time was observed.
R esults and D iscussion
In treating the results, the hydrogen pressure was calculated by subtracting the vapor pressure of the solution from the observed total pressure, while the
(1) Research sponsored by the U. S. Atomic Energy Commission under contract with the Union Carbide Corp.(2) M . H. Lietzke and R. W. Stoughton, J. Phys. Chem., 67, 2573 (1963).(3) M. H. Lietzke, H. B. Hupf, and R. W. Stoughton, ibid., 69, 2395 (1965).(4) R. A. Robinson and R. H, Stokes, “ Electrolyte Solutions,’ ’ Academic Press, Inc., New York, N. Y., 1955, p 471.(5) C. S. Patterson, L. O. Gilpatrick, and B. A. Soldano, J. Chem. Soc., 2730 (1960).(6) R . S. Greeley, W. T. Smith, Jr., R. W. Stoughton, and M. H. Lietzke, J. Phys. Chem., 64, 652 (1960).(7) M . B. Towns, R. S. Greeley, and M. H. Lietzke, ibid., 64, 1861 (1960).(8) H. S. Hamed and B. B. Owen, “ The Physical Chemistry of Electrolytic Solutions,” 3rd ed, Reinhold Publishing Corp., New York, N. Y., 1958, p 456.
The Journal of Physical Chemistry

E m f S t u d ie s i n A q u e o u s S o l u t io n s a t E l e v a t e d T e m p e r a t u r e s 757
Table I: Values of the Emf in Volts for the Cell, Pt-H2(p)|HCl(m2), BaCl2(m3)|AgCl-Ag, and Deviations“ of the Emf Values Calculated from Smoothed Activity Coefficients
■t, °C-mi m% 25 60 90 125 150 175
0.3847 0.0382 0.2822+ 4
0.2661- 1
0.2471- 9
0.2205-1 1
0.1995- 4
0.1772 + 13
0.2463 0.0836 0.2975+ 4
0.2833+ 4
0.2655- 6
0.2415+2
0.2202- 6
0.19800
0.1228 0.1238 0.3180- 6
0.3065- 3
0.2915- 4
0.2694- 2
0.2513+ 5
0.7608 0.0846 0.2457+ 9
0.2256+5
0.2038- 2
0.17500
0.1531 + 12
0.5016 0.1701 0.2596- 4
0.2408- 8
0.2199-2 0
0.1701-2 5
0.1477-1 2
0.2567 0.2527 0.2820+ 3
0.2486+ 9
0.2224- 3
0.2026 + 1
0.1811+ 5
“ The deviations are given below each emf as observed emf values less the values calculated from smoothed activity coefficients. Thus, a positive deviation indicates that the emf reported here is algebraically larger.
vapor pressure of the solution was obtained by taking the vapor pressure of pure water at the temperature of measurement from the steam tables9 and correcting for the presence of BaCl2 and HC1 in solution by Raoult’s law. No correction was made for the amount of HC1 in the vapor phase since it was previously found unnecessary to do so below 250° in pure HC1 solutions.6 Each emf value was corrected to 1.00 atm of hydrogen pressure by subtracting (RT/23) In / Hj, where the hydrogen fugacity / h2 was taken equal to the hydrogen pressure. The solubility of AgCl was neglected and the ionic strength was taken to be equal to t o h c i + 3 m B a c h -
The corrected emf values E at each ionic strength were plotted as a function of temperature and the values corrected to the round values of the temperature, 25, 60, 90, 125, 150, and 175°. The temperature of measurement was never more than 1° from the corresponding round temperature. These corrected values are given in Table I.
The activity coefficient v± of HC1 at each temperature and set of concentrations in the mixtures was evaluated by using the Nernst equation and previous values10 11 of the standard potential E° of the Ag, AgCl electrode, except that 0.2223 v was used instead of 0.2220 vat 25°.
RT 2RTE = E ° --------In [m2(m2 + 2m3) ] ----------- In y± (1)
fF J
In this equation m2 and m3 are the molalities of HC1 and BaCl2, respectively, while T is the absolute temperature, R the gas constant, and T the Faraday.
A plot of In y± vs. ionic strength fraction of BaCl2 was made at each temperature and at the total ionic strengths 0.5 and 1.0. Also included in these plots were the values for pure HC110 at all temperatures and for 0.01 m HC1 in BaCl2u at 25 and 60°. (The values at 60° were obtained by extrapolations of data from 0 to 50°.) In all cases the plots were linear within experimental error in conformity with Harned’s rule.
Expressions for y± of HCl and BaCh in the Mixtures. The activity coefficients of HCl were smoothed as to HCl and BaCl2 concentrations and temperature and those of BaCl2 were evaluated as follows. In accordance with the treatment in the previous papers2’8 the excess free energy of the solution Ge, i.e.. excess over the molality and Debye-Huckel terms, was expressed as
Ge— = 2n2 In y2e + 3ns In y3e = 111
2£2?«—' + 2£cr„i j W ijk
U fU jU k
W2(2)
where n represents the numbers of moles of each solute, w is the number of kilograms of water, and the sums are taken over each solute i, j, k = 2 (for HCl) to 3 (for BaCl2). Bi} and CiJk are interaction coefficients tc be determined from the data.
(9) “ VDI-Wasserdampftafeln,” E. Schmitt, Ed., 4th ed, Springer- Verlag, Berlin, 1956.(10) M. H. Lietzke and R. W. Stoughton, J. Phys. Chem., 68, 3043 (1964).(11) See ref 8, p 456.
Volume 70, Number 8 March 1966

758 M. H. L i e t z k e a n d R. W. S t o u g h t o n
Then for the HC1
2 In y2e = G lRT
— ( — ) - bn2 \Rt J
+ Qj^CujmiVi] (3)i ij
while for the BaCl2
G:3 In 73e = — = éJ^Bann + tiECirfrnfntj (4)
il 1 i ij
Hence
In y2e = 2 1 B 22 + (f - ft’KI3I2 C222 — 2^— - — 222 Xz +
(cw + - ‘¿ J ]X32> (5)
and
ln 73e = 4/ 3IB z
+
2 P'CK
( r 23 - y ) x 2]
_ / C233 Cm\ f 2V 3 “ 9 J
( t + c “ - 2t )
X 2 +
(6)
In eq 5 and 6, X represents the ionic strength fraction of the designated component in the mixture and I represents the ionic strength of the solution given by 7 = m2 + 3m3. Since, as mentioned above, Harned’s rule appears to hold for the HC1 in the mixtures, the coefficient in parentheses of the X 3Z term in eq 5 is zero.
The total ln y Q is obtained by adding the Debye- Hiickel term to eq 5 and 6. This term was assumed to be Sp'AV ? /( l + 1.5V?) for ^ e HC1 and 2Sp'A- V ? /( 1 + 1.5 V / ) for the BaCl2, where S is the limiting slope for a 1-1 electrolyte and p is the density of water which corrects the ionic strength to a volume basis as required by the Debye-Hiickel theory.
The activity coefficients of HC1 in the HCl-BaCl2 mixtures were fitted by the method of least squares using eq 5 with the coefficient of the X 32 term set to zero. In the first attempt the B and C coefficients were assumed to vary with temperature according to equations of the type
These equations would give rise to excess enthalpies varying linearly with temperature and excess entropies varying linearly with In T. However, convergence difficulties were encountered in the resulting 12- parameter fit just as in the case of the HCl-NaCl mixtures studied previously.3 This was probably caused by the parameters in eq 7 and T being too strongly correlated. When CiH was expressed as in eq 8 with only two parameters
Gm = C'm + C "ilt/T (8)
and eq 7 and 8 used in eq 5, then no difficulties were encountered in the least-squares determination. Equation 8 is consistent with temperature-independent excess enthalpies and entropies. In the ionic strength range studied, the contribution of the B terms is much more important than that of the C terms "and hence the difficulty in determining as many parameters in the C coefficients).
The values of B'n, B "n, B '"M, B'n, B "n, B " 'n, C"222, £"'222, C"223, and C"n3 were obtained directly by the least-squares fit, while the values of C'm and C"nz were obtained by the application of Harned’s rule: C222 + C233 — 2 (7223 = 0. The additional parameters needed for calculating 73e by eq 6 , namely the coefficients Bzz and Cxa, were evaluated by the method of least squares using osmotic coefficient data4,5 on BaCl2 solutions. Since osmotic coefficients of BaCl2 solutions have been measured only at 25 and 100°, the values of B33 and C333 were determined separately at these two temperatures and the appropriate values used in eq 6 to compute the activity coefficients of BaCl2 in the mixtures only at these two temperatures.
The parameters for calculating the various B and C coefficients are given in Table II. Activity coefficients of HC1 and BaCl2 in the mixtures (I = 0.5 and 1.0) calculated using these parameters are shown as the solid lines in Figures 1 and 2. The values of the
Table II : Parameters of the B and C Coefficients (Eq 7 and 8) for the HCl-BaCfi System over the Range 25 to 175°
B'n = 6.09924 B"n = -227.202 r>rn _n 22 — -0.914405B'23 = 25.62597 B "n = -1176.159 B'"n = -3.77226C'm = 0.0740066 C"m = -23.6361C m = 0.1459287 C"m = -51.0375C"233 = 0.2095128 C"m = -93.5001
Bit = B’u + B " J T + B " ’lt ln T (7) S33 = 0.1310844At 25°
C33 3 = 0.0168507and
Cm = C'ija + C "m/T + C’" m In T (70B33 = 0.0911783
At 100°C333 = 0.0105197
The Journal of Physical Chemistry

E m f S t u d ie s in A q u e o u s S o l u t io n s a t E l e v a t e d T e m p e r a t u r e s 759
Figure 1. Log y HOi v s . X b h C H in HCl-BaCl2 mixtures:O, this paper; + , ref 10; X , ref 11.
activity coefficient of HC1 calculated from the observed emf values are shown as data points in Figure 1.
Values of the emf E were calculated, using the previously determined E° values and the B and C values for the smoothed activity coefficients (Table II) for each experimental point. The algebraic difference between the observed E values and those calculated are given below the observed E values in Table I.
The relationship between the B and C coefficients as defined by eq 7 and 8 and the «-coefficient of Hamed’s rule as well as the expressions for the partial molal free energy G„, the partial molal enthalpy I I q, and the partial molal entropy SQ for component q may be calculated using the expressions previously reported2 in the study of HBr-KBr mixtures.
Our results at 25° may be compared with those of Harried and Gary12 and of Rush and Johnson13 after expressing them in terms of Harned’s «-coefficients.
log 72 = log 72° — oi-id-i (9)
log 7 3 = log 7 3 ° — « 32/2 (10)
Figure 2. Log 7BaCi2 v s . X hci in HCl-BaCl2 mixtures.
where the ionic strength (/ = I2 + 1 3) is held constant and the superscript zero indicates a two-component or single-solute solution. The «-coefficients are given by the negatives of the right-hand sides of eq 5 and 6, respectively, after deletion of the first term inside each of the brackets, dividing by 2.303, and deletion of the coefficient of Z 32 in (5) in conformance with Harned’s rule. Thus
a23
and
«32
= 2 ^ B 22 - y ) + I (3C222 - C223) j 2.303 (11)
2 - C- f - C „ ) ] /2.303 (12)
(12) H. S. Harned and R. Gary, J. Am. Chem. Soc., 76, 5924 (1954).(13) R. M. Rush and J. S. Johnson, J. Phys. Chem., 68, 2321 (1964).
Volume 70, Number 8 March 1963

760 M. H. L i e t z k e a n d R. W. S t o u g h t o n
The coefficient « 23 depends only on ionic strength while a32 depends on both I and composition (i.e ., on I 2 = m2). Harned and Gary12 reported 0.0651 for «23 at I = 1.0 and 25°; on the assumption that «32 was independent of m2, they found a value of —0.0716 for «32- Rush and Johnson,13 by using ultracentrifuge techniques, found «23 = 0.0666 for data at I = 1 .0 only. They found 0.0617 at I = 1.0 when all their data were treated together (/ = 1.0, 2.0, 3.0, and 4.0). They obtained an essentially constant value (independent of m2) of —0.0740 for a32 at I = 1.0. In our work, eq 11 gives a23 = 0.0642 at I = 1.0 and 25°, while eq 12 gives « 3 2 = —0.0202 at to2 = 0 and —0.0602 at m2 = 1.0
It is interesting to compare the activity coefficient behavior observed in the present system with that ob
served in the HCl-NaCl and in the HBr-KBr systems. The plots of In y2 vs. X 3 (Figure 1 ) are very similar to the corresponding plots in the HBr-KBr system in that the slopes are negative at all temperatures and at both total ionic strengths. In contrast, the plots of In y2 vs. Xs in the HCl-NaCl system showed a positive slope at the higher temperatures. The plots of In 73 vs. X 2 in the present system are very similar to those observed in the HCl-NaCl system.
Acknowledgment. The authors wish to express their sincere appreciation to R. W. Whitfield and W. D. Armstrong for their assistance in making the emf measurements, to W. O. Crain for assistance in making the calculations, and to Dr. George Scatchard for his continued interest in our high-temperature program and for his helpful suggestions.
The Journal of Physical Chemistry

P u l s e R a d io l y s is o f A q u e o u s S o l u t io n s o f P o t a s s iu m F e r r o c y a n id e 761
The Pulse Radiolysis of Aqueous Solutions of Potassium Ferrocyanide1
by J. Rabani and M. S. Matheson
Argonne National Laboratory, Argonne, Illinois (Received September S, 1965)
The pulse radiolysis of deaerated aqueous ferrocyanide has been studied in acid, neutral, and alkaline solutions. fc(OH + ferrocyanide) was determined as (1.07 ± 0.1) X 1010 M -1 sec- -. In experiments in which OH + ferrocyanide competed with OH recombination, 2fc(OH + OH) = (1.26 ± 0.16) X 1010 M ~ l sec-1 was obtained. It was shown that 0 " reacts much more slowly with ferrocyanide than does OH, and, from the pH dependence of the apparent rate constant for OH + ferrocyanide, it was established that [O- ] = [OH] at pH 11.9 ± 0.2 in the equilibrium OH + OH- O- + H20. Because of experimental difficulties, precise rate constants for O- + OH and O- + O- recombination were not measurable, but limits for these k values have been estimated. While the full mechanism of radiolysis of aqueous ferrocyanide solutions still has not been unraveled, the rate constants and pAcm of this paper will be essential to the unraveling.
Introduction
Although extensive work2-9 has been published on the radiolysis (with steady ionizing radiation) of aqueous ferro- or ferricyanide solutions, a completely detailed mechanism still cannot be written which accounts for all results. The effect of pH is marked. For example, in aerated acid solutions ferrocyanide is oxidized (G0*id ~ 8-10)6’9 while in strongly alkaline aerated solutions ferricyanide is reduced (G = 2)T9 These pH effects must have at least part of their origin in the large differences in reactivity toward ferro- and ferricyanide ions of the pH-dependent forms of the reactants produced in the radiolysis of water. The important reactants exist in either of two forms depending upon the pH. A knowledge of the pA values of these reactants as well as their rate constants for reaction with ferro- and ferricyanide should aid in a fairly complete interpretation of the radiolysis results of aqueous ferro- and ferricyanide solutions. In fact, the pA values of the reactants other than H20 2 have been determined by pulse radiolysis, although it must be noted that the pA of H 02 = H+ + 0 2- was first determined by other techniques.10 The pA values are: OH 0 - , 11.9;« H +± eaq", < 9.7;12.13 and H 02 0 2- , 4.45.10'14’16 It is the purpose of this paper: (a) to describe experiments in the pulse radiolysis of deaerated aqueous ferrocyanide solutions, (b) to present the evidence for the value pA oh = 11.9, and (c) to pre
sent some rate constants for reactions of the OH radical These as well as other experimental results describee here should contribute toward a satisfactory interpretation of the radiolysis of aqueous ferro- or ferricyanide solutions. Recently, another paper16 on the pulse radiolysis of aqueous ferrocyanide solutions has ap- 1 2 3 4 5 6 7 8 9 10 11 12 13 14 15 16
(1) Based on work performed under the auspices of the U. S. Atomic Energy Commission.(2) H. Frieke and E. J. Hart, J. Chem. Phys., 3, 596 (1935).(3) X . Tarrago, E. Masri, and M. Lefort, Compt. Rend., 244, 343 (1957).(4) J. Rabani and G. Stein, Trans. Faraday See., 58, 2150 (1962).(5) F. S. Dainton and W. S. Watt, Nature, 195, 1294 (1962).(6) G. Hughes and C. Willis, J. Chem. Soc., 4848 (1962).(7) G. Hughes and C. Willis, Discussions Faraday Soc., 36, 223(1963).(8) F. S. Dainton and W. S. Watt, Proc. Roy. Soc. (London), A275, 447 (1963).(9) E. Masri and M. Haissinsky, J. Chim. Phys., 60, 397 (1963).(10) G. Czapski and B. H. J. Bielski, J. Phys. Chem., 67, 2180(1963) .(11) J. Rabani and M. S. Matheson, J. Am. Chem. Soc., 86, 3175(1964) .(12) J. Rabani, “ Solvated Electron,” Advances in Chemistry Series, No. 50, American Chemical Society, Washington, D. C., 1965, p 242.(13) M. S. Matheson in ref 12, p 45.(14) G. Czapski and L. M. Dorfman, J. Phys. Chem., 68, 1169(1964) .(15) J. Rabani, W. A. Mulac, and M. S . Matheson, ibid., 69, 53(1965) .(16) G. E. Adams, J. W. Boag, and B. D. Michael, Trans. Faraday Soc., 61, 492 (1965).
Volume 70, Number 8 March 1966

762 J. R a b a n t a n d M. S. M a t h e s o n
peared. The solutions in this latter work, however, were aerated. Our results in aerated solutions will be reported briefly in a later article.
Experim ental Section
The pulse radiolysis apparatus17-19 with multiple reflection cell16 and syringe technique for cell filling19-21 has previously been described. Syringes were baked at 500° and calibrated. For low ferrocyanide concentrations, the helium which purged the reaction cell17 18 19 20 21 was purified by passage through a molecular sieve surrounded by liquid N2. A 450-w Osram xenon lamp produced the analyzing light beam.22 With a Corning0-51 glass filter (no light below 3500 A) and a shutter between the lamp and the cell any photochemical effects were made negligible. The formation of ferri- cyanide was followed at 4200 A (e 1000 M ~l cm-1).3’4’9’23 A Tektronix 555 oscilloscope was used so that with the spectrograph18 the light signal could be followed either at two sweep rates or at two wavelengths. For some experiments, especially at short wavelengths (2500 A), a monochromator replaced the spectrograph. For most experiments a 0.4-^ sec. pulse gave a dose of -~6 X 10¹⁹ 26 ev/1. Irradiation temperature was 23°.
Two principal stock solutions were prepared for each set of experiments from triply distilled water. For the stock alkaline solution, carbonate-free, a portion of the supernatant liquid was taken from a solution ~ 1 M NaOH and ^-0.05 M Ba(OH)2. For stock ferro- eyanide solution K4Fe(CN)6-3H20 Mallinckrodt analytical reagent was dissolved in neutral air-free water at concentrations of 10-2 to 10-3 M. The stock alkali solution was stored 2 to 6 days, while the ferrocyanide solution was stored in the dark up to 30 hr in a refrigerator and up to 12 hr at room temperature. For solutions containing air, the ferrocyanide solution was injected into the aerated solution less than |30 min before use. Matheson Co. N20 was bubbled through three successive concentrated aqueous solutions of NaOH-pyrogallol and finally through pure water. The N20 so purified indicated 0.03% 0 2 by mass spectre- metric analysis. Other chemicals were analytical reagent grade and were used without further purification.
R esu lts and D iscussion
The radiolysis of water can be expressed by the process
H20 _ ~ v-> H;,, H20 2, H, OH, eaq- , H30+, OH- (1)where the right-hand side of (1) represents the products existing about 10-8 sec after the act of energy absorption. According to our present knowledge the steady-state radiolysis of ferro- or ferricyanide must
be explained in terms of reactions of these products with ferro- or ferricyanide or with each other or with the secondary products resulting from these reactions. Other products24-26 (H20 +, O, H20*) have been suggested, but the evidence is not yet conclusive and for the latter two species the proposed yields are small. We shall ignore these three possible products in this paper. Rate constants for reactions between the products of (1) have been summarized;27'28 H2, H30+, and OH- do not oxidize or reduce ferro- or ferricyanide, although the pH (due to added H30 + or OH- ) strongly affects the reactivity of other products. For ferrocyanide it is the oxidizing species OH and H20 2 which are of interest and OH is the stronger oxidant.29
The Reactivity of OH with Ferrocyanide in Neutral and Acid Solutions. OH oxidizes ferrocyanide at a rate more than 10 orders of magnitude faster than does H20 2.4'6'9 The product of reaction 2 is ferricyanide.9 Results differ as to whether the postulated reaction 3 occurs quantitatively,6’6-9 but this is unimportant for
OH + Fe(CN)64- — ► OH- + Fe(CN)63- (2)
H20 2 + Fe(CN)64- — ►OH- + OH + Fe(CN)63- (3)
our work since reaction 2 is complete in our pulse radiolysis experiments before any appreciable reaction of H20 2 occurs. Values for fc2 (Table I) have been determined by plotting the data from a number of pulse radiolysis experiments in the pseudo-first-order eq 4, where Dt and D„ are
In [DJ{D„ - D t)} = fc2[Fe(CN)64 -]f (4)
the optical densities at times t and when all of the OH radicals have reacted, respectively.
(17) M . S. Matheson and L. M. Dorfman, J. Chem. Phys., 32, 1870 (1960).(18) L. M. Dorfman, I. A. Taub, and R. E. Bilhler, ibid., 36, 3051 (1962).(19) S. Gordon, E. J. Hart, M. S. Matheson, J. Rabani, and J. K. Thomas, Discussions Faraday Soc., 36, 193 (1963).(20) C. Senvar and E. J. Hart, Proc. 2nd Intern. Conf. Peaceful Uses At. Energy (Geneva), 29, 19 (1958).(21) E. J. Hart, S. Gordon, and J. K. Thomas, J. Phys. Chem., 68, 1271 (1964).(22) S. Gordon, E. J. Hart, and J. K. Thomas, ibid., 68, 1262 (1964).(23) G. Czapski and G. Stein, ibid., 64, 219 (I960).(24) J. J. Weiss, Radiation Res. Suppl., 4, 141 (1964).(25) A. O. Allen, ibid., 4, 54 (1964).(26) (a) M. Anbar and D. Meyerstein, J. Phys. Chem., 68, 1713(1964) ; (b) E. Hayon, Trans. Faraday Soc., 60, 1059 (1964).(27) M. S. Matheson, Radiation Res. Suppl., 4, 1 (1964).(28) M. S. Matheson and J. Rabani, J. Phys. Chem., 69, 1324(1965) .(29) J. H. Baxendale, Radiation Res. Suppl., 4, 114 (1964).
The Journal of Physical Chemistry

P u l s e R a d io l y s is o f A q u e o u s S o l u t io n s o f P o t a s s iu m F e r r o c y a n id e 763
Table I : Rate Constant for OH + Ferrocyanide in Neutral and Acid Solutions
[Ferrocyanide],
hi,M^1 sec-1
Expt M X 105 Additives i . " X 1 0 -«»
1 2.4 N20 1 atm 0.285 1.452 2.5 N20 1 atm 0.164 1.153 2.6 N20 1 atm 0.230 1.254 4.8 N20 1 atm 0.310 1.075 5.9 N20 1 atm 0.285 1.16 33 N20 1 atm 0.255 |Too fast\7 76 N20 1 atm 0.310 \to follow/8 4.2 CC14 saturated 0.223 1.19 6.0 Air 1 atm 0.225 1.0
10 6.0 1.4 X IO-3 ili HC104 0.180 1.011 6.0 1.0 X IO-3 M HCIO4
+ air 1 atm0.2256 1.0
12 2.4 C02 1 atm 0.156 1.013 4.0 N20 1 atm + 0.30 M
Na2S040.355 1.2
14 2.7 N20 1 atm -f- 0.01 M Ba(C104)2
0.320 1.0
“ In those cases where a maximum occurred followed by a slight decay, D„ was taken at the maximum absorption. Light path, 80 cm at 4200 A. is a measure of the pulse intensity with appropriate assumptions for Cr(OH). b Taken at end of reaction 2.
In using eq 4 it was noted that reaction 5 would have an opposite effect on fc2 to that resulting from de-
OH + OH — ■> H20 2 (5)
pletion of ferrocyanide, but correction for neither was important. For experimental reasons the concentration of ferrocyanide was varied only ~2.5-fold; however, the results in Table I seem adequate to support the value k2 = (1.07 ± 0.10) X 1010 M~x sec-1 obtained by averaging.
Since the hydrated electron absorbs about threefold more intensely than ferricyanide at 4200 A, the additives in column 3 were used to suppress eaq~ absorption, as well as the reaction of eaq_ with ferricyanide. In the case of N20 there is an additional yield of OH resulting from reaction 6. With N20 solutions a given
N20 + eaq~ N2 + OH + OH- (6)
pulse intensity yielded twice (exact ratios were not measured) the ferricyanide obtained with CC14, 0 2 (neutral solution only), C02, or H30 +. Generally, however, twice the pulse intensity was used with these latter additives in order to obtain yields of ferricyanide similar to those with N20. In all our experiments N20 - either yielded OH in less than 1 psec (the reaction could not be followed for the first microsecond) or
seemed to behave kinetically like OH. The value of k2 measured in the presence of N20 is experimentally the same as that obtained with the other additives.
With CC14 and 0 2 (neutral solution) D increased to a plateau which remained constant as far as followed, 10 msec for CC14 and 10 sec for 0 2. With N20 a maximum D was attained followed by a decay of not more than 4%, which was attributed to the H atoms produced in neutral solution ((? h ~0.6 ).30 In acid (experiment 10, Table I), reaction 7 is very fast so that G h — G o h and
eaq- + H30+ — > H + H20 (7)
the decay was much more marked and could not be separated from the ferricyanide formation. In this case, fc2 was obtained by approximations. This decay is expected, since fc(H + ferricyanide)31 is close to 1010 M ~l sec-1 based on ,'t(H + 0 2) = 2 X 10¹⁰ M ~l sec-1, but the decay does not correspond to the full yield of H atoms which disappear mostly by recombination and other reactions. With C02, the optical density decayed 20% within the first millisecond indicating reduction of ferricyanide by C 02_.
The plateau in CC14 solutions corresponds to that expected for reaction 2 and is not followed by decay or further increase, suggesting that the products of reactions 8 and 9 do not reacn with either ferrocyanide or
eaq- + CC14 — > CCh- — ► -CC1, + C l- (8)
H + CC14 ^ • CCI3 + HsO+ + C l- (9)
ferricyanide. The absence of absorption at 5780 A in the presence of CC14 showed that eaq- had been scavenged and that the products of (8) and (9) do not absorb at this wavelength. Further, these products absorb little or no light at 4200 A. In competitive pulse radiolysis studies using thiocyanate, selenite, and carbonate ions to compete with ferrocyanide for OH radicals, Adams, et al,,u have determined k2 = 5.0 X 10⁹ M ~x sec-1, the absolute rate constants of the three reference ions having been previously measured. Our value was determined directly from the rate of formation of ferricyanide, and we believe the direct method, where feasible, is generally to be preferred to the competitive method.
The Reactivity of OH with Ferrocyanide in Alkaline Solutions: The Dissociation of OH to 0~. Evidence7'11’32 indicates that in alkaline solutions OH dis
(30) (a) J. T. Allan and G. Scholes, Nature, 187, 218 (1960); (b) J. Rabani, J. Am. Chem. Soc., 84, 868 (1962); (c) S. Nehari and J. Rabani, J. Phys. Chem., 67, 1609 (1963); (d) G. Scholes, M. Simic, and J. J. Weiss,.Discussions Faraday Soc., 36, 214 (1963).(31) (a) J. Rabani, J. Phys. Chem., 67, 361 (1962); (b) G. Navon and G. Stein, ibid., 69, 1384 (1965), report 1.5 X 10⁹ M -1 sec-1 at4°. Depletion of solute probably occurred in their experiments.
Volume 70, Number 3 March 1966

764 J. R a b a n i a n d M . S. M a t h j o n
sociates to 0~. In view of the very low H30 + concentration at the pH where the dissociation is postulated, the equilibrium must be established by
OH + OH- — > 0 - + H20 (10)
0 - + H20 — > OH + OH - (11)
This exchange must be quite rapid since the exchange of a proton between H20 and OH- has a rate constant38 of 5 X 10⁹ M ~x see-1, while Adams, et al.,u estimate fcJ0 = 3 X 10⁹ M ~l sec-1. If 0 - exists at high pH values, then reaction 2a must be considered. However, our
0 - + Fe(CN)64~ -5$. Fe(CN)63- + 20H~ (2a)
results show that fc2 > > fc2a and that (2a) may be neglected even up to pH 13.5. Neglecting (2a)
— d(OH]x/df = fc2 [OH ] [Fe(CN)64- ] (12)
where [0H]T is the total concentration of all forms of OH radical, thus
[OH] + [0 -] = [0H]t (13)
Since [OH- ] is always defined if [H30+] is known, we write the definition for the equilibrium constant, K
([0-][H +])/[0H ] = K (14)
Combining (13) and (14) to relate [OH] to [0H]T, assuming (10) and (11) always maintain equilibrium, and then substituting for [OH] in (12) gives
-d[O H ]T/di ={feLH+]/([H+] + K)} [OH]T[Fe(CN)64-] (15)
Integrating (15) and assuming an excess of ferrocyanide and that all OH radicals react in (2) yields
In [D j(D a - D t)] ={fc2[H+]/([H+] + K)} [Fe(CN)64_]i (16)
where [OH]T at time t is (D„ — Dt)/el and [0H]T at time zero is Da/d. Thus, eq 16 shows that from the usual pseudo-first-order plot an effective second-order rate constant “fc2” is obtained such that
“fc2” = fc2[H+]/([H+] + K) (17)
Rearranging (17) and taking logarithms yields
log - 1) = pH - pK (18)
This equation resembles eq 56 for H 02- 0 2_ equilibrium in ref 15, but examination of (10) and (11) shows that no “salt effect” is expected for the 0 H -0 ~ case.
The values of “k ” measured in the pH range 11 to13.5 are listed for various experimental conditions in Table II and plotted according to eq 18 in Figure 1.
pH
Figure 1. “ kz,” the effective rate constant for OH +ferrocyanide, as a function of pH (see eq 18 and Table II): •, 1 atm of N20 ; O, CCfi saturated in absence of N20 ; □, 1.02 X 10~s M Ba(C104)2, 1 atm of N20 ;■, 0.30 M Na2S0 4 , 1 atm of N20 ; A, 0.03 atm of N20, pulse intensity about fourfold that in other experiments.
From the intercept of the line on the pH axis the piv of OH is 11.9 ± 0.1. Adding in the error in fc2 (fc2 = (1.07 ± 0.10) X 1010 M~l sec-1), we set the pK of OH = 11.9 ± 0.2. The results are plotted with pH decreasing from left to right in order to emphasize the similarity to Figure 7 of ref 15 for H 02- 0 2-.
There are five experimental problems or difficulties which concern the validity of our interpretation of the results in Table II and Figure 1. However, arguments are presented below to show that these difficulties do not significantly affect our conclusions. The five problems are: (1) the use of N20 to convert eaq~ to OH;(2) traces of 0 2 can give rise to 0 3~ with an absorption peak at 4300 A ;14 (3) the possibility of competing reactions; (4) the presence of complexes such as Ba[Fe- (CN)6]2- ; and (5) the slight decay in absorption observed at long sweep times.
Our data indicate that reaction 6 proceeds as written. The experiments labeled pulse intensity C show that twice the amount of ferricyanide is produced in the presence of N20 as in its absence. This is also true in neutral solution. This doubling is expected from (6) if Ge ^ Gon- Cerenkov radiation interferes with measurements during the pulse, but from 1 gsec after the beginning of the pulse no indication in any experiment 32 33
(32) E. J. Hart, S. Gordon, and D. A. Hutchison, (a) J. Am. Chem. Soc., 75, 6165 (1953); (b) J. Chim. Phys., 52, 570 (1955).(33) A. Loewenstein and A. Szoke, J. Am. Chem. Soc., 84, 1151 (1962).
The Journal of Physical Chemistry

P u l s e R a d io l y s is o f A q u e o u s S o l u t io n s o f P o t a s s iu m F e r r o c y a n id e 765
Table II : Variation of k-, with pH
[Fe(CN)«*-] D m “ h ’ ’ ,c
Pulse [OH- ], (initial), followed lOio M -iExpt intensity® Deo“ Mb 10-5 M Other additives up to sec-1
1 A 0.275 0.00132 5.10 1 atm of N20 500 jusec 1.152 A 0.295 0.00338 5.00 1 atm of N20 20 msec. 0.773 C 0.520 0.00820 57.0 1 atm of N20 20 msec4 C 0.512 0.00840 27.0 1 atm of N20 20 msec5 B 0.255 0.00860 7.07 1 atm of N20 20 msec 0.496 A 0.310 0.0122 11.3 1 atm of N20
iSatd CChi 1 No NiO /
20 msec 0.3657 C 0.228 0.0291 18.0 20 msec 0.203
8 D 0.351 11 atm. of N2O Ì d0.0320 14.4 Ï10.30 M Na2S04J 20 msec 0.163
9 D 0.328 0.0335 9.10 \11 atm of N20 4- \ ^0.0102 M Ba(C104)2J 50 ttsec 0.238
10 A 0.320 0.0353 35.7 1 atm of N20 20 msec 0.1911* E 0.401 0.107 42.2 0.03 atm of N20 10 msec 0.075'12 A 0.345 0.114 108.0 1 atm of N20 20 msec 0.06313 A 0.345 0.115 13.3 1 atm of N20 20 msec 0.07114 A 0.330 0.118 42.0 1 atm of N20 20 msec 0.06515 C 0.234 0.125 29.6 <j
Satd CChi vNo N20 J 20 msec 0.076
16e F 0.485 0.266 52.7 0.03 atm of N20 10 msec 0.03017 B 0.295 0.311 60.7 1 atm of N20 20 msec 0.029
“ The pulse intensity for experiments with the same letter was similar. Dm is a measure of the pulse intensity if account is taken of the presence or absence of N20 and of the optical path length. A 0.4-/isec pulse was used with 80-cm optical path except where noted. 6 The [OH- ] was calculated from the total NaOH and Ba(OH)2 concentration, correcting for 1.5 wt % carbonate and water originally present in the NaOH. * Each value averaged from two or more oscilloscope pictures. d BaC03 separated before addition of Na2SOi. Subsequently, BaSCh removed. e Obtained with 1-jusec pulse and 32-cm light path. ' A 4% correction for second-order reactions. Other values of k2 not corrected for second-order reactions or ferrocyanide depletion.
was found that more than one reaction was forming ferricyanide. Finally, if eq 18 is valid, the slope of the expected plot in Figure 1 is —1, and the two experiments, 7 and 15, using CC14 instead of N20 to scavenge eaq~ give the same pK, although with a larger error. We conclude that N20 - gives OH or 0 “ in less than 1 psec, or else that N20 - behaves kinetically like OH at all pH values. This conclusion is also supported by results for the OH + Br- reaction.34
At high pH values in the absence of ferrocyanide, a small transient absorption was observed which was ascribed to 0 3~ (Xmax = 4300 A),14 resulting from the reaction of O- + 0 2. This occurred although considerable care was taken to obtain oxygen-free solutions.
In neutral solutions this absorption is not found, but it becomes important as the pK of OH is approached. In the absence of N20 lower optical densities are found, probably as a result of reactions of 0 3- (or O- ) with eaq~ and of competition of eaq~ and O- for 0 2. In an N20-saturated solution at pH 11.90, Dmax = 0.028 was obtained, while with added ferrocyanide and the same pulse intensity, Da = 0.440 resulted. (e4200o,- ~ 2000 M _1 cm-1 was estimated from separate experi
ments with added 0 2 or ferrocyanide35 in agreement with other results.16)
This absorption formed in about 100 ¡xsec and decayed within 2 msec. The formation agrees roughly with the assumption that traces of 0 2 react with excess 0~ in a pseudo-first-order reaction, with a rate corresponding to a second-order rate constant,35'36 k(0~ + 0 2) = 4 X 10⁹ M ~1 sec-1. The lifetime for decay did not agree with the results of Czapski and Dorfman.14 However, it is found36'36 that the decay of 0 3~ (the exact mechanism is obscure) is inhibited by 0 2, so that our results and interpretation do not contradict those of Czapski and Dorfman.14 Further work on the pulse radiolysis of alkaline N20 solutions is in progress.35
The source of the 0 2 (about 0.5 to 1 nM) in these experiments is obscure. Although traces of 0 2 (0.03%) were present in the N20, the Z),Iiax at 4200 was un
(34) M. S. Matheson, W. A. Mulac, J. L. Weeks, and J. Rabani, to be published.(35) J. Rabani, J. L. Weeks, and M. S. Matheson, unpublished data.(36) G. E. Adams, J. W. Boag, and B. D. Michael, Nature, 205, 898 (1965), find 2.6 X 10» M ~ l sec"1.
Volume 70, Number 3 March 1966

766 J. R a b a n i a n d M . S . M a t h e s o n
changed when 0.03 atm of N20 was used instead of 1 atm of N20. Further, 0 2 appears to be produced by the pulse, the Dm&x increasing for successive pulses on the same solution, 35’36 with Dmax for the second pulse being more than double that for the first pulse.
When a sufficient amount of ferrocyanide is present there is little or no decay of the absorption. This indicates a competition of ferrocyanide and 0 2 for OH or 0 “ . For all experiments in Table II the concentration of ferrocyanide was sufficiently high that any effects due to traces of 0 2 should be negligible. However, in some experiments in Table II, as mentioned above, a very slight decay occurred which cannot be explained by 0 2, but can be suppressed by further increasing the ferrocyanide concentration. In neutral or slightly alkaline solutions such a decay can be attributed to H + Fe(CN)63", but in strongly alkaline solutions H atoms are converted to eaq" , 28'300’37 and the eaq" cannot reduce ferricyanide in the presence of the electron scavenger N20 .
The experiments in Table II show that neither pulse intensity nor N20 nor ferrocyanide concentration affects the results. For example, in experiments 12, 13, and 14 an eightfold variation of ferrocyanide gives similar “k” and values. This shows that equilibrium between OH and 0~ is essentially maintained and that reactants other than OH- do not compete with ferrocyanide for OH. In Table II, experiment 1 has the highest [Fe(CN)64"]/[O H "] ratio. Taking fci0 = 3 X 10⁹ M ~l sec- 1 from Adams, Boag, and Michael, 16 reaction 10 proceeds 7 times more rapidly than reaction 2. In the other experiments the assumption of OH 0 " equilibrium should be a much better approximation. All alkaline solutions contained Ba- (OH)2, added to eliminate carbonate, and for experiments in Table II repeated tests at all pH values with and without ferrocyanide showed no absorption at 6000 A. Carbonate is known to react with OH to give a transient with a peak at 6000 A 38 (e6000 = 1780),38c so that the absence of absorption at 6000 A proves that OH + carbonate does not contribute to “k.”
Addition of 0.30 M Na2S04 or 0.0102 M Ba(C104)2 did not appreciably affect “k” (see Figure 1), so the effect of increasing pH on “k” is due to the effect of OH " and not to the Na+ or Ba2+ also added. Thus the complexes NaFe(CN)63" or BaFe(CN)62" which should be formed at high Na+ or Ba2+ concentration39 40 react with OH similarly to the unpaired Fe(CN)64".
The conclusion to be drawn from this discussion is that “k” does indeed decrease with increasing [OH"], and that the excellent fit of the experimental points to the theoretical line in Figure 1 justifies the assumptions
made in deriving eq 18, namely that fc2 > > fc2a and that the equilibrium of (10) and (11) is maintained. Assuming (2 a) contributes not more than 2 0 % of the reaction at pH 13.5, an upper limit of 7 X 10⁷ M ~l sec" 1 can be set for fc2a.
The Product of OH + Fe(CN)64". The product of reaction has been assumed to be Fe(CN)63" in this paper. Another possibility would be Fe(CN)5(H20 )2". However, although the radiolysis of aqueous ferricyanide gives a small yield of Fe(CN)5(H20 )3" , Fe- (CN)5(H20 )2" has not been reported as a direct product of the radiolysis of aqueous ferrocyanide.9 The penta- cyanoaquoferrate(III) has an absorption peak at 5650 A (e = 500 M ~l cm- 1 ) . 40 In the pulse radiolysis of four different solutions ((a) 0.2 atm of 0 2, pH 2. 8.3 X 10" 4 M ferrocyanide; (b) 0.2 atm of 0 2, pH 4, 1.37 X 10" 3 M ferrocyanide; (c) 0.2 atm of 0 2, pH ~ 7 ,2.07 X 10" 4 M ferrocyanide; and (d) 0.1 atm of N20, pH 13, 2 X 10" 3 M ferrocyanide) no absorption was observed at 5650 A. The absorption was followed, depending upon the experiment, for times up to 0 .1 , 1 0 , or 120 sec. Any pentacyanoaquoferrate(III) was less than 3% of the total product in these four experiments. This agrees with the conclusion of Masri and Hais- sinsky9 that radiolytic oxidation of ferrocyanide gives only ferricyanide as the direct product.
The Rate Constant for OH + OH (2k5). The competition between reactions 2 , (OH + Fe(CN)64"), and 5, (OH + OH) can be used to evaluate 2fc5. If [Fe- (CN)64"] is chosen such that about 40 to 60% of the possible yield of ferricyanide is produced, then the time dependence of the optical density, D, can be used in the evaluation. The experimental D vs. t curves were fitted with the aid of an IBM 1620 computer using three different mechanisms. Mechanism 1 includes the reactions of OH + Fe(CN)64" , OH + OH, H + OH, H + H, and H + Fe(CN)63~ with Gn = 0.5 and G0H = 5.2 (including the OH from eaq" + N20). Mechanism 2 assumes Gn = 0 but is otherwise similar. Mechanism 3 differs from (1) only in that H + OH and H + H were neglected. The effect of varying rate constants on the fit between computed curve and experimental points was tested. The fit obtained was about equally
(37) (a) J. Jortner and J. Rabani, J. Phys. Chem., 66, 2081 (1962);(b) J. Jortner and J. Rabani, J. Am. Chem. Soc., 83, 4868 (1961);(c) J. T. Allan, M. G. Robinson, and G. Scholes, Proc. Chem. Soc., 381 (1962); (d) M. S. Matheson and J. Rabani, Radiation Res., 19, 180 (1963).(38) (a) S. Gordon, E. J. Hart, M. S. Matheson, J. Rabani, and J. K. Thomas, J. Am. Chem. Soc., 85, 1375 (1963); (b) G. E. Adams, J. W. Boag, and B. D. Michael, Proc. Chem. Soc., 411 (1964); (c) J. Rabani and J. L. Weeks, to be published.(39) (a) J. C. James and C. B. Monk, Trans. Faraday Soc., 46, 1041 (1950); (b) C. W. Gibby and C. B. Monk, ibid., 48, 632 (1952).(40) M. Haissinsky, private communication.
The Journal of Physical Chemistry

Pulse Radiolysis of A queous Solutions of Potassium Ferrocyanide 767
good with the three different mechanisms except that, of course, a different 2 was obtained with each mechanism (Figure 2). The fit of D„ at the plateau depends only upon the ratio, 2fc5/fc2. However, the fit for the complete time dependence depends upon the individual rate constants, so that fitting the complete experimental curve amounts to a determination of both h and 2ks. The k2 so determined agrees with the value determined in the presence of excess ferrocyanide (Table I), and that value k2 = 1.07 X 10¹⁰ M -1 sec-1 was used for all computer calculations. With k2 so chosen, changing 2kb by 13% changed D„ by 4%. The total yield of OH radicals produced in these experiments by the given pulse intensity was measured in separate experiments using 0.08 atm of N20 and scavenging all OH radicals with 6.5 X 10⁻⁴ M ferrocyanide.
From ten kinetic curves such as shown in Figure 2, mechanism 1 gave 2fcs = (1.26 ± 0.16) X 1010 M~1 sec-1. Mechanism 2 gave 1.66 X 10¹⁰ and mechanism 3 gave 1.0 X 10¹⁰ M -1 sec-1. We prefer the value based on mechanism 1. The agreement between our 2fc5 = 1.26 X 10¹⁰ and previous values is satisfactory. Schwarz41 reported 0.8 X 10¹⁰ and Sweet and Thomas42 reported 1.2 X 10¹⁰ M~l sec-1. Ours is a more direct determination.
The Recombination of OH (or O- ) in Strong Alkali. In alkaline solutions near and above the pK of OH, reactions 5a and 5b should be considered.
h 2oO- + OH — > H 02- % % H20 2 (5a)
h 2o H;9O - + o - — > 0 22- — > H 02- HiO* (5b)
If N20 is present, and if H atoms react to produce hydrated electrons in the alkaline medium, then the variation of D with time should depend only upon (5), (5a), (5b), and (2). This would assume that OH and O- take part in no other reactions and are always in equilibrium with each other. The products of (5), (5a), and (5b), i.e., H20 2, H 02- and 0 22-, are all forms of H20 2. H20 2 has a pK of 11.8.43 However, the species 0 22- has not been found in water, and its lifetime is unknown.
If eq 19, which represents the rate of [OH ]T disappearance
_ d[OH]T _ di
2fc6[OH]2 + fc6a[OH ][0- ] + 2kbh(0~]2 (19)
is combined with eq 13 and 14, assuming equilibrium is maintained for OH O- , then (20) is obtained
— d[OHJT/d i ={2h A 2 + fc6aAB + 2kbhB2} [OH]t2 (20)
where A = 1/(1 + Zv/[H • J) and B = 1/(1 + [H + ] / K). Thus by a competition similar to that just described for neutral solutions, one should obtain an effective second-order rate constant, “2kb,” which corresponds to the coefficient of [OH]T2 in eq 20. The effective rate constant is a function of the constants ks,
Figure 2. Comparison of experimentally observed and computer calculated D (optical density at 4200 A) v s . t (time) during the competition of 0 3 + OH and OH + ferrocyanide in a pulse-radiolyzed aqueous neutral solution under 0.08 atm of N20. Pulse intensity was 1.38 X 10²⁰ ev/1. as determined from D = 0.384 ± 0.012 after 3 to 8 n s e c using6.5 X 10-4 M ferrocyanide with optical path length of 32 cm. The experimental points are the averages for three experiments; t = 0 at beginning of pulse, (a) [Fe(CN)64-] = 1.27 X10⁻⁶ M : O, experimental points; mechanism at, calculated assuming 2fc(OH + OH) = 1.2 X 10¹⁰, fc(H + ferricyanide) =1.0 X 101», /.(OH + H) = 1.2 X 101», 2fc(H + H) = 2.0 X 10¹⁰, fc(OH + ferrocyanide) = 1.07 X 10¹⁰ Ai-1 sec-1,(?h = 0.5, Goh (including OH from eaq- + N20 ) = 5.2. Mechanism a2, calculated assuming 2fc(OH + OH) =1.66 X 10¹⁰, fc(OH + ferrocyanide) = 1.07 X 10¹⁰ Ai-1 sec-1, 6 h = 0 agreed with the curve of mechanism a, within 1.5% for the first 10 Msec and within 1% in the region 12-200 Msec. Mechanism a3, 2fc(OH + OH) = 1.0 X 10¹⁰, k (H + ferricyanide) = 1.0 X 10¹⁰ M ~ l sec-1, G h = 0.5, G oh (including OH from N20 ) = 5.2. H atoms assumed to react only with ferricyanide. The curves for mechanism a2 and a3 essentially coincided, (b) [Fe(CN)64-] =6.5 X 10⁻⁶ M : --------- , mechanism bu calculated asfor au mechanism b2: calculated as for a2 agrees within 2% with the curve shown for bi.
(41) H. A. Schwarz, J. Phys. Chem., 66, 255 (1962).(42) (a) J. K. Thomas, ibid., 67, 2593 (1963); (b) J. P. Sweet and J. K. Thomas, ibid., 68, 1363 (1964).(43) (a) M . G. Evans and N. Uri, Trans. Faraday Soc., 45, 224 (1949); (b) J. Jortner and G. Stein, Bull. Res. Council Israel, A6, 239 (1957).
Volume 70, Number 3 March 1966

768 J. Rabani and M. S. M atheson
k6a, kf,h, and pAcm and of the variable pH. Of these only k*,a and k5b would be unknown in a given experiment. In principle, a series of experiments at pH values >12 would determine /c5a and kih. Unfortunately, only an approximate value for fea and an upper limit for b could be obtained.
(a) Recombination at pH ~13. The major source of uncertainty in determining “ 2k” is the weak transient already referred to which is observed at 4200 A in the absence of ferrocyanide. At pH ^ 1 3 the half-life for its formation was 20 psec and the half-life for decay ~300 nsec. The maximum optical density was 0.030 (il = 32 cm) for a pulse which in 1.21 X 10⁻³ M ferrocyanide gave Dmax = 0.417 (or 1.38 X 10²⁰ ev/1.). With certain reasonable assumptions one can find upper and lower limits for “ 2ks.”
The optical density, D, as a function of time, t, is plotted in Figure 3 for five different ferrocyanide concentrations in 0.107 M OH- plus 0.1 atm of N 20. The Z)max for the highest [Fe(CN)64~] was used as a measure of the pulse intensity, while the second highest [Fe- (CN)64_] yielded “ fc2” = 7.5 X 10s sec-1 for OHT + Fe(CN)64“ . Assuming this “k ” and a competition of(2) and (2a) with (5), (5a), and (5b) (and ignoring that part of the absorption which is due to the transient), computer calculations such as those used for neutral solution gave the results in Table III. The values in column two result from fitting the initial part of the curve, the values in column three from fitting the plateau for D. Three possibilities were considered:(1) that the oxidation of ferrocyanide is completely independent of the formation and decay of the transient at 4200 A observed in the absence of ferrocyanide;(2) that this transient species is formed from OH or O- (ie.g., 0 3- ) and that it decays by oxidizing ferrocyanide; and (3) that it is formed from OH or 0~ but does not oxidize ferrocyanide. The fact that the AD for decay is lower in the presence of ferrocyanide than its absence is evidence against (1). Our conclusion was that corrections would increase column two values, but would raise, lower, or leave unchanged column three values. The independence of “2k ” in Table III with respect to [Fe(CN)64_] shows corrections should not be large and we set “2fa” = (2.5 ± 0.4) X 109 M~l sec“ 1, where the error given includes only that error which is due to the possible corrections for (1) or (2) or (3) above. If 0 3~ is the absorbing transient species, only 2 to 5 X 10⁻⁷ M 0 2 would be necessary to produce the observed absorption.
(6) Recombination at pH >13. Similar competition experiments at a pH >13 are summarized in Table IV.
From these results “2k ” = (1.8 ± 0.8) X 109 M~l sec-1, with the larger error probably arising from a
Figure 3. Comparison of experimentally observed and computer calculated D (optical density at 4200 A ) vs. t
(time) during competition of OHt (OH + O- ) recombination with the reaction of OHt with ferrocyanide. Pulse-radiolyzed aqueous solutions, pH 13.0, 0.1 atm of N20 ; optical path length, 32 cm; pulse intensity = 1.38 X 10²⁰ ev/1. if G o n + 0 “ = 5.70; A)(OHt + ferrocyanide) = 7.5 X 10⁸ M ~ l sec-1; points are experimental, solid lines calculated; t = 0 at beginning of pulse: •, no ferrocyanide, 0.110 M OH- . Curve could be calculated using reasonable assumptions for O3- formation and decay. Less than 5 X 10⁻⁷ M 0 2 adequate to account for Dmax if absorption due to 0 3- ; ■, 1.07 X 10⁻⁵ M ferrocyanide, 0.109 M OH- ; 2i;(OHT + OHT) for bi = 1.8 X 10⁹ Af-1 sec-1, for b2 = 2.6 X 10⁹ Af-1 sec-1;X, 3.31 X 1 0 M ferrocyanide, 0.107 M OH- ; 2fc(OHr + OHt) for ci = 2.2 X 10⁹ Af-1 sec-1, for c2 = 2.6 X 10⁹ Af-1 sec-1; O, 7.12 X 10⁻⁶ M ferrocyanide, 0.103 M OH- ;2&(OHt + OHt ) for d, = 2 X 10⁹ M ~ l sec-1, for d2 =2.4 X 10⁹ Af-1 sec-1; □, 4.22 X 10⁻⁴ M ferrocyanide,0.108 M OH- ; results plot as pseudo-first-order reaction with /k(OHr + ferrocyanide) = 7.5 X 10⁸ Af-1 sec-1 after second-order corrections; A, 1.21 X 10⁻³ M
ferrocyanide, 0.104 M OH- ; plateau measures yield of OHt.
Table III : Effective Rate Constant for Recombination of O H (0- ) at pH ~13°
,--------- “ 2*6” X 109 M -' 1 sec-1—[Fe(CN).*-], From From
M initial curve ^max
7.12 x 10⁻⁵ 2.0 2 . 4
3.31 X 10⁻⁶ 2.2 2.61.07 X 10-5 1.8 2 .6
“ With 0.1 atm of N20 present.
relatively greater contribution of transient absorption at 4200 A. With ferrocyanide absent, a similar pulse intensity gave Z>ma* = 0.045 for both 0.03 and 1 atm of N20. There is no dependence of “2k ” on [N20 ], The smaller value of “2k” as compared to that at pH
The Journal of Physical Chemistry

Pulse Radiolysis of Aqueous Solutions of Potassium Ferrocyanide 769
Table IV: Effective Rate Constant for Recombination of 0H (0~) at pH >13
^-“2h” X 109 M 1 sec-1—*[Fe(CN)i*-] From FromX IO"* M Dmaxa V initial curve max
2.776 0.192 0.184 1.0 1.9103.06 0.440 0.435
1.21° 0.135 0.117 Not caled 2.03.74' 0.258 0.245 0.9 1.7
52. V 0.486 0.462
° There is a slight decay from D m ix to the final plateau over a period of about 1 or 2 msec. 6 With 0.25 M OH", 1 atm of N20, dose = 1.45 X 10²⁰ ev/L, “ fe” = 3.2 X 10s M ~ l sec-1 measured for ferrocyanide oxidation. ' With 0.275 (±0.005) M
OH- , 0.03 atm of N20, dose = 1.6 X 10²⁰ ev/1., “ fc2” = 3.0 X 10s measured.
13, if real, may mean OH + O- is still important at pH 13.
(c) Recombination at pH In the experimentsof Table V, the high concentrations of ferrocyanide were used to estimate pulse intensities. At pH ■~12 only part of the H atoms are converted to OH ^ O- under our conditions, so Gon -{- G0~ — 5.45 was used in estimating intensity. Since not all H atoms are converted, H-atom reactions were included in the computer calculations with 2fc(H + H) = 2 X 10¹⁰, fc(H + OH) = 1.2 X 10¹⁰, Jfc(H + OH- ) = 2 X 10⁷, fc(H + Fe(CN)64- ) = 5 X 10⁹ M -1 sec-1, and (Gs / G'oji) = 0.5/5.2. Assuming the values fitted to the plateau are more reliable, “2k ” = (9.6 ± 1.6) X 109 M -1 sec-1.
Table V : Effective Rate Constant for Recombination of O H (0- ) at pH ~12
- “ 2 fa" X From
109 M ~ l sec-1
[Fe(CN)e‘ - ] initial FromX 10-5 AT Daa curve Dœ
2.2b 0.310' 8.4 10n s b 0.604
0 d 0.028'1.71“ 0.240 7.0 9.2
51d 0.401
° l = 32 cm, l-jusec pulse. 6 [O H - = 8.2
isToX
atm of N20. e Decay of 2% in millisecond region neglected. " [OH- ] = 7.9 X 10 ~3 M , 1 atm of N20. * Dma*, D a = 0.
(d) Discussion of Recombination in Alkaline Solutions. The determination of a value of 2kb in neutral solution in agreement with previous values was straightforward. However, the situation is more complicated in alkaline solutions. In spite of the uncertainties, it has seemed worthwhile to summarize our present knowledge of recombination at high pH values and thus bring these complications to the attention of others investigating the ferrocyanide system. At pH ~11.9, where [O- ] = [OH] at equilibrium, “ 2k” is high. If OH and O- react only by (5), (5a), (5b), (2), and (2a), then fc5a = 2.6 X 10¹⁰ M~1 sec-1. Unfortunately, the situation may not be so simple. Reaction 21 is relatively slow in neutral solution26 and therefore unimportant under our conditions. However, at pH 11.9, reactions 21a, 22, and 22a may occur and it is possible that one of them is fast28 with a rate constant of the order of 1010 M -1 sec-1.
OH + H20 2 — i H2O -f- 02~ ~f- (21)
O- -|- h 2o 2 ^ H2O -f- Oí- (21a)
OH + H 02- ‘ ^ H2O -f- 02 — (22)
o - + h o 2- — > O H " + O*“ (22a)
Such reactions if fast could also be followed by reactions of OH and O- with O2- . Finally
OH + 0 2- — > 20H - + 0 2 (23)
O - + 0 2- OH- + 0 2 (23a)
the reaction of O- + 0 2 to give 0 3- could occur and we know nothing about reactions of O- and OH with 0 3- . Ozonide ion would produce ozone in the solution, but we have no evidence of the presence of 0 3 in our solutions. If these reactions occur to an appreciable extent “ 2k” will be overestimated. We estimate fc5a could be lowered as much as threefold if such reactions occur, with a maximum additional 30% lowering arising from errors in the pAoH and the other rate constants. Thus, k5a < 2.6 X 10¹⁰ A/-1 sec-1 and may be fourfold less.
Similar arguments lead to a value of 2k&b < 1.8 X 10⁹ M~l sec-1, but the actual value could be orders of magnitude less than the limit set here.
Acknowledgments. We wish to express our indebtedness to our colleagues, W. A. Mulac and J. L. Weeks, for aid in the experimental work, and to Ed. Backstrom for careful Linac operation and to Steve Petrek for maintenance of electronic equipment.
Volume 70y Number 8 March 1966

770 Joshua Jortner and R ichard M. Noyes
Some Thermodynamic Properties of the Hydrated Electron
by Joshua Jortner
Department of Chemistry, Tel-Aviv University, Tel Aviv, Israel
and Richard M . Noyes
Department of Chemistry, University of Oregon, Eugene, Oregon, and Max Planck Institut für physikalische Chemie, Gottingen, Germany {Received September 8, 1965)
Recent determinations of rate constants in both directions permit an estimate of the free energy change at 25° for the process H20(1) + eaq- = Hoq + OHaq- . This value can be combined with estimates of absolute thermodynamic properties of individual ions to indicate that AG° = —39.4 kcal/mole when electrons in the gas phase are transferred to water at the same concentration (provided any electrostatic potential change at the interface has been compensated). This quantity is smaller in magnitude than for other ionic species and indicates that the charge of the hydrated electron is dispersed in a region of radius about 3.0 A. Data on other anions have been extrapolated to this radius and used to estimate the comparatively small entropy change accompanying hydration. The calculations permit the prediction that the acid dissociation of aqueous hydrogen atom proceeds with positive AH° and negative AS° and with rate constant about 4 sec-1. They also predict that the unimolecular decomposition of the hydrated electron has an activation energy between 4 and 13 kcal/mole and probably not near either limit. In view of the rapid bimolecular decomposition of solvated electrons in water, it is not clear why this species is so inert to the same sort of process in ammonia.
Introduction
The solvated electron has long been known as a metastable species in alkali metal solutions in ammonia, aliphatic amines, and ethers.1 2 3 4 5 More recently, its transient existence in water has been demonstrated unequivocally by pulse radiolysis studies.2-6 The absorption spectrum of the solvated electron has been discussed previously on the basis of a phenomenological continuum model,6 but available experimental data have not permitted estimates of the thermodynamic properties of the ground state in aqueous solution.
Hart and Gordon7 have recently reported that in highly purified water the first-order rate constant for the disappearance of the hydrated electron at 25° could be reduced to a limiting value of 890 sec-1. They assumed that they were observing the net reaction
H,0(1) + eaq- — ► Hoq + OHaq- (1)
Matheson and Rabani8 have shown that the rate constant for the reverse of reaction 1 is 1.8 X 10⁷l./mole
sec at the same temperature. Combination of these data indicates that AG° = 5.87 kcal/mole for reaction 1 written as an equilibrium in which the standard state of water is pure liquid and the standard states of the other species are ideal 1 m solutions.
In the present paper, we show how these data can be combined with other quantities in order to estimate changes in thermodynamic properties associated with some equilibrium reactions of the hydrated electron
(1) See, for example, “Metal Ammonia Solutions,” G. Lepoutne and M . J. Sienko, Ed., W . A. Benjamin, Inc., New York, N. Y ., 1964.(2) G. Czapski and H. A. Schwarz, J, Phys. Chem., 66, 471 (1962).(3) E. Collinson, F. S. Dainton, D . R. Smith, and S. Tazuké, Proc. Chem. Soc., 140 (1962).(4) E. J. Hart and J. W . Boag, J. Am. Chem. Soc., 84, 4090 (1962).(5) J. P. Keene, Nature, 188, 843 (1960); 197, 47 (1963).(6) J. Jortner, S. A. Rice, and E. G. Wilson, “ Metal Ammonia Solutions,” ref 1, p 222.(7) E. J. Hart and S. Gordon, X X th Congress of International Union of Pure and Applied Chemistry, Moscow, U.S.S.R., July 14, 1965.(8) M . S. Matheson and J. Rabani, J. Phys. Chem., 69, 1324 (1965).
The Journal of Physical Chemistry

Some Thermodynamic Properties of the Hydrated Electron 771
and also to make some very rough estimates of yet unmeasured kinetic parameters.
Thermodynamics of Electron Hydration
Noyes9 has previously estimated that AG° = 103.81 kcal/mole at 25° for the process
y 2H2(g) + aq = Haq+ + [e~](aq) (2)
In this equation, the standard state of H2 is one atmosphere fugacity, and that of H+ is ideal 1 m aqueous solution. The symbol [e~](aq) denotes electrons in a hypothetical state having zero entropy, enthalpy, and free energy and in a vacuum at the bulk electrostatic potential of the interior of a body of water.
The following free energy changes are well known
y 2H2(g) = Hg (AG° = 48.575 kcal/mole) (3)
H20(1) = H aq+ + OHaq_(AG° = 19.10 kcal/mole) (4)
The free energy change is not known for the process
Hg + aq = Haq (5)
However, AGa is 4.67 kcal/mole for the corresponding solution of He and is 4.24 kcal/mole for the corresponding solution of H2. It can hardly be a serious error to assume AG° = 4.5 kcal/mole for reaction 5.
These processes can be combined to give a free energy of formation, AG{° = —37.5 kcal/mole for the process
[e~](aq) + aq = esq~ (6)
Although the state [e- ](aq) is probably the most convenient standard state to adopt for the electron when free energies of formation of charged aqueous ions are being considered,10 comparison with hydration of other gaseous ions makes it more interesting to consider the process
eg~(mole/l.) + aq = eaq~ (7)
where eg~(mole/l.) denotes gaseous electrons at one mole per liter (but at the electrostatic potential corresponding to bulk water). Since the free energy at 25° of the state eK~(mole/l.) is11 1.89 kcal/mole, we estimate that AG° = —39.4 for reaction 7. A very similar estimate of this quantity by Baxendale12 did not consider standard states so specifically.
It is hoped that this estimate of AG° for reaction 7 is accurate to within 1 or 2 kcal/mole; it seems certainly reliable enough to state that the free energy decrease associated with hydrating the electron is very much less than that for hydrating any other gaseous
anion. The charge on this interesting species must be very highly dispersed.
The methods developed previously9'13 14 permit an estimate of this dispersion and of the other thermodynamic properties associated with hydration. Data for halide ions indicate that when singly charged gaseous anions at 25° are transferred to ideal aqueous solution at the same concentration
AG° = 1.58r2 - 0.568 - 163.89/r + 19.79/r2 (8)
where r is the radius of the anion in angstroms and the computed value is in kilocalories per mole. The numerical value of the 1/r term is uniquely determined by the macroscopic dielectric constant of the medium, and the term independent of r is the PV change associated with the process. The other two numerical values are empirical, although the magnitude of the term in r2 is close to the surface free energy per unit area of the medium.
If it is assumed that the same equation will apply to the charge distribution for the hydrated electron, a AG° of —39.4 kcal/mole is what would be expected for an r value of 2.98 A. Jortner14 has performed calculations of a completely independent type indicating that this quantity lies between 2.5 and 3.0 A. Since r is a rather insensitive function of AG°, the radius of the charge distribution can hardly differ much from 3.0 A if eq 8 is applicable to this system.
A similar treatment9 of entropy data leads to
AS° = 1.48r2 - 9.720/r - 47.25/ r 2 (9)
where numerical values are in calories per mole degree and the process is the same as that for eq 8. For a radius of 2.98 A, this equation gives a A»S0 of 4.5 cal/mole deg. Combination with the computed gaseous entropy11 indicates that the entropy of the hydrated electron in ideal 1 m solution is 3.1 cal/mole deg greater than that of pure solvent. These results can be combined to give AH° = —38.1 kcal/mole for the process of eq7.
The thermodynamic properties computed for the hydrated electron are summarized in Table I. As has been indicated, the subscript f refers to formation from the state [e- ](aq) by reaction 6, and the subscript hyd refers to hydration from gas phase at a standard state of 1 atm fugacity. The standard states selected
(9) R. M . Noyes, J. Am. Chem. Soc., 86, 971 (1964).(10) R. M . Noyes, J. Chem, Educ., 40, 2, 116 (1963).(11) The calculation assumes an enthalpy of 6/tRT and an entropy computed for translation and spin.(12) J. H. Baxendale, Radiation Res. Suppl., 4, 139 (1964).(13) R. M . Noyes, J. Am. Chem. Soc., 84, 513 (1962).(14) J. Jortner, Radiation Res. Suppl., 4 , 24 (1964).
Volume 70, Number 3 March 1966

772 Joshua Jortner and R ichard M. Noyes
for these processes correspond to those most often used when discussing similar thermodynamic properties of other chemical species.
Table I : Estimated Thermodynamic Propertiesof Hydrated Electron
AGf° — 37.5 kcal/moleA Hi° — 36.6 kcal/moleS° 3.1 cal/mole degAt?°hyd — 37.5 kcal/moleAif°hyd — 38.1 kcal/moleAiS hyd — 1.9 cal/mole deg
If the free energy change for process 1 has been correctly assigned, the free energy values in Table I can hardly be seriously in error. The estimates of entropy and enthalpy are based on a model that is open to more serious question. However, the small free energy of hydration indicates a charge dispersal that requires a small entropy of hydration. Hence moderately reliable enthalpies can be estimated from free energy data whether or not eq 9 is really applicable to the system. The values in Table I should be regarded as working estimates until better ones are available.
Acid Dissociation of Hydrogen Atoms
Hart, Matheson, et al.,7 have already pointed out that the aqueous hydrogen atom can be regarded as a very weak acid and that the rate data referred to in the Introduction imply a pK of 9.7 for the dissociation
Haq = Ha,+ + eaq- (10)
Estimates of changes in other thermodynamic functions require values for the solvation of hydrogen atoms (reaction 5). We have chosen AH° = —1.0 kcal/mole for this reaction; the figure is intermediate between observed values for He and H2 and can hardly be seriously in error. Application of other known thermodynamic properties and the values for eaq_ derived above give for reaction 10 AH° = 11,1 kcal/ mole and AS0 = —7.1 cal/mole deg. Hence reaction 10 belongs to the comparatively rare class for which standard enthalpy and entropy changes have opposite signs.
It is hardly surprising that the reverse of reaction 10 is very fast with a rate constant16 of 2.2 X 10¹⁰l./mole sec. This latter figure can be combined with the equilibrium constant to give a rate constant of 4 sec-1 for reaction 10 in the forward direction. Since the rate of the reverse of reaction 10 is probably controlled to considerable extent by diffusion of re
actants together, and since the measurement of rate constant was performed on a nonequilibrium distribution of reactants, the rate constant in the forward direction refers to dissociations in which the proton and electron actually escape from each other and do not recombine by diffusion.15 16
Unimolecular DecompositionAs was indicated in the Introduction, forward and re
verse rate measurements indicate that AG° = 5.87 kcal/mole for the equilibrium of reaction 1. The values in Table I permit enthalpy and entropy changes to be estimated for the same reaction. The calculations require previous estimates9 for absolute thermodynamic properties of individual ions and also the estimate for hydration of hydrogen atoms discussed in connection with reaction 10.
The calculations indicate that for reaction 1, AH° —2.2 kcal/mole and AS° = —12.1 cal/mole deg. The opposition of signs is probable but not as certain as for reaction 10. Since the reaction is very close to thermoneutral, a major factor in the equilibrium is the entropy decrease when the dispersed charge of the hydrated electron becomes concentrated upon a single hydroxide ion.
As is indicated by the pK of reaction 10, the hydrated electron is unstable with respect to reaction 1 in acid and neutral solution, but it is not difficult to make a solution sufficiently alkaline that the electron is stable with respect to decomposition to atomic hydrogen. This kind of stability is even more pronounced in liquid ammonia. A calculation based on a previous rough estimate by Jortner17 indicates that the ammonia analog of reaction 1 is endothermic by about 28 kcal/ mole. The much greater ease with which solvated electrons can be kept in ammonia than in water is obviously due at least in part to the big difference in thermodynamic stability with respect to unimolecular decomposition.
These calculations also permit some rough estimates of the enthalpies of activation for the forward and reverse reactions of process 1. The forward rate constant of 890 sec-1 indicates a free energy of activation, AG* = 13.4 kcal/mole. Since this rather simple reaction proceeds with a considerable decrease in entropy, some of this decrease is undoubtedly reflected in the formation of the transition state. If A»S'* is negative, AH* is less than 13.4 kcal/mole and probably is distinctly less.
(15) For references, see L. M . Dorfman and M. S. Matheson, Progr. Reaction Kinetics, in press.(16) R. M . Noyes, ibid., 1, 129 (1961).(17) J. Jortner, J. Chem. Phys., 30, 839 (1959).
The Journal of Physical Chemistry

Some T hermodynamic Properties of the Hydrated Electron 773
For the reverse of reaction 1, AG* = 7.5 kcal/mole. Since this reverse process involves bringing two particles together, it could conceivably involve a negative entropy of activation, but the entropy loss could hardly be more than the 19.6 cal/mole deg entropy of translation of gaseous hydrogen atoms at the same molar concentration. This restriction indicates that AH * for the reverse reaction is at least 1.7 kcal/ mole, and entropy changes associated with charge dispersal will probably make this quantity distinctly greater.
When these limits are combined with the estimate of AH° = 2.2 kcal/mole for the equilibrium reaction, we conclude that AH * for the forward rate of process 1 lies between 3.9 and 13.4 kcal/mole and probably is not close to either limit. Experiments that we understand are in process18 should permit a direct test of this prediction. If activation energies can be measured for the rates of process 1 in both directions, it will also be possible to test the internal consistency of the entries in Table I.
Bimolecular Decomposition Reaction
Hydrated electrons can also decompose by the process
2H20(1) + 2eaq~ H2(aq) + 20H aq“ (11)
Matheson and Rabani8 report a rate constant of 5.5 X 10⁹ l./mole sec for this reaction indicating that it is essentially diffusion controlled. Since the estimates of this paper indicate that reaction 11 is exothermic by about 100 kcal/mole, it is hardly surprising that the reaction is quite rapid.
In liquid ammonia, solvated electrons can conceivably react in pairs to form molecular hydrogen by a completely analogous process. Since this reaction is also estimated17 to be exothermic by about 50 kcal/ mole, it is not clear why electrons in this solvent are so much more inert than in water with respect to decomposition to molecular hydrogen.
Discussion
Alternative Decomposition Mechanisms. The entire argument has been based on the assumption that reaction 1 does indeed describe the mechanism of uni- molecular decomposition of the hydrated electron. Dainton19 has questioned this assumption and has argued that the process
H20(1) + eaq- H2(aq) + Oaq- (12)
may be favored. It is possible but by no means certain that the equilibrium products of process 12 may be favored over those of process 1, but the transi
tion state for process 12 would involve incipient bonding between hydrogen atoms of the same molecule20 and would undoubtedly be quite strained. In addition, calculations by Noyes21 indicate that an incipient H -H bond contributes a smaller fraction of its energy to the stabilization of a transition state than does any other chemical bond considered.22 23 For these reasons, we believe that the interpretation based on process 1 is proper and that the conclusions of this paper can be considered reasonable working hypotheses.
Comparison of Water and Ammonia as Solvents. As has been discussed elsewhere,6'14 electron binding in a polar solvent can be treated phenomenologically by regarding the medium as a continuous polarizable dielectric. This simplified treatment properly handles the long-range interaction between the electron and the medium, but the short-range interactions are not properly included. The model of an electron localized in a cavity of radius 3-3.5 A is well established for dilute metal ammonia solutions.1,6 The cavity size in polar solvents is governed by the short-range electron- solvent repulsions and by the surface tension energy associated with the cavity formation. It should be stressed that for the localized electron center in liquid ammonia there is a substantial leakage of the electron charge outside the solvent cavity boundary.6 In spite of the large region of negative charge distribution in water, it is reasonable to assume that the cavity size (if a solvent cavity exists at all) is substantially smaller in this strongly hydrogen bonded solvent than it is in liquid ammonia.14,23 In the limit of zero solvent cavity size, the heat of hydration of the electron is given by6
A Ht° 25512 atomic units (13)
where Da is the static (low-frequency) dielectric constant. The calculated value of AH = —30.4 kcal/ mole is in reasonable agreement with the experimental value of —36.6 kcal/mole derived above from thermochemical data.
It is also interesting to speculate on the relative reactivities of solvated electrons in water and in am
(18) E. J. Hart, private communication.(19) F. S. Dainton, discussion following paper of ref 7.(20) Because of bond energy values, a transition state involving two water molecules and leading to H 2 + OH + OH - would almost certainly have a higher energy than the transition state of reaction 1 leading to H + O H - . It is possible in principle to devise complicated transition states in which protons or hydrogen atoms are transferred simultaneously around a ring, but they seem fanciful.(21) R. M . Noyes, unpublished results.(22) The failure to observe a bimolecular mechanism for ortho- parahydrogen conversion is related to this conclusion.(23) L. Onsager, Radiation Res. Suppl., 4, 34 (1964).
Volume 70, Number S March 1966

774 Joshua Jortner and R ichard M. Noyes
monia with respect to the bimolecular decomposition reaction. As we have pointed out, the fast bimolecular decomposition in water is not at all surprising. On the other hand, dilute metal ammonia solutions are remarkably inert with respect to this bimolecular decomposition. The reason for this big difference in behavior may involve the different short-range local solvent structure arising because the solvent cavity size in liquid ammonia is substantially larger than in water. In liquid ammonia, the disappearance of the solvent cavity may require a large negative entropy of activation which makes the solvated electron in this system inert to bimolecular as well as to unimolecular decomposition.
Optical Excitation Energy. Finally, it is interesting to consider the relation between the heat of solvation and the optical excitation energy of the solvated electron. It has been noted that the energy of the absorption peak of the hydrated electron (39.5 kcal/mole), which was assigned to the Is -*■ 2p transition,6 corresponds closely to the absolute value of the heat of solution (38.1 kcal/mole).
The excitation energy for the Is -► 2p transition can be expressed in the form6
^I'l8-»2p = — A ff0hyd + E2p(l9) (14)
where 2?2P<i») is the total energy of the system in the excited 2p state but in the nuclear configuration corresponding to the ground state. Due to these restrictions imposed by the Franck-Condon principle, the energy -Z?2p(is) in polar solvents is smaller than 0.1 ev,6,14 leading to the close correspondence between the heat of solution and the optical excitation energy of the solvated electron.
Acknowledgment. The treatment employed in this paper evolved from discussions during a visit of J. J. to Eugene, Ore. (supported by the U. S. Atomic Energy Commission) and of R. M. N. to Tel Aviv (while on a National Science Foundation Senior Postdoctoral Fellowship). Additional work in Gottingen was carried out during the tenure of the same fellowship.
The Journal of Physical Chemistry

Solvents Having High D ielectric Constants 775
Solvents Having High Dielectric Constants. XVII. Electromotive Force of the
Cell Pt, H2; HCl(m); AgCl-Ag in N-Methylacetamide-Dioxane Mixtures at 4 0 o1 2 3 4 5
by Lyle R. Dawson, K. Hong Kim, and Hartley C. Eckstrom
Department of Chemistry, University of Kentucky, Lexington, Kentucky (Received September 13, 1965)
The emf of the cell Pt, H2; HCl(m); AgCl-Ag has been measured at 40° in N-methyl- acetamide-dioxane mixtures ranging from 29.98 to 73.85% dioxane. Solute concentrations varied from 2 X 10⁻³ to 2 X 10⁻¹ m. In these mixtures the standard electrode potential varied from 0.16772 to 0.02727 v as the dielectric constant became smaller. Absence of regularity in the relationship of E° and dielectric constant is attributable to differences in basicity and other chemical properties of the solvent mixtures. Activity coefficients of HC1 in the solvent mixtures have been calculated.
Thermodynamic properties of solutions of hydrogen chloride in N-methylacetamide (NMA) have been investigated in this laboratory through electromotive force studies using platinum-hydrogen and silver- silver chloride electrodes.2,3 These electrodes are stable and reversible in this solvent which has a very high dielectric constant (165.5 at 40°). The mean molal activity coefficients of HC1 in NMA at given concentrations are greater, and these values decrease less rapidly with increasing concentration than in water or in ethanol.
The present investigation was designed to study the electromotive force of the hydrogen and silver-silver chloride electrode systems in NMA-dioxane mixtures. The dielectric constant of dioxane is approximately2. The resulting data were sought for use in determining some properties of solutions of hydrogen chloride in these solvent mixtures with which a wide range of dielectric constants can be obtained.
Experimental Section
The apparatus which was used has been described adequately earlier.2-5 Electrical leaks were minimized by shielding. Measurements were made at 40 ± 0.03° in a mechanically stirred mineral oil bath. The conductivity o: the NMA was 3-4 X 10⁻⁸ ohm-1 cm-1.
Hydrogen chloride solutions in the NMA-dioxane mixture were prepared conveniently by using (NMA)2- HC1. This salt was made by dissolving NMA in anhydrous ether and bubbling hydrogen chloride gas slowly
into the solution. The white precipitate of (NMA)2- HC1 was recrystallized three times from acetone and dried several hours in a vacuum desiccator over anhydrous magnesium perchlorate. Since the compound is quite hygroscopic, it was prepared and purified under I atm of nitrogen. The chloride content of the salt was found to be 19.37-19.40% (theoretical value 19.41) by the Volhard method.
Commercial dioxane was purified by the method described by Kraus and Vingee6 in which it was first refluxed over NaOH for 4 or 5 hr and then fractionally distilled. The middle portion of the distillate was retained and was refluxed over metallic sodium and then fractionated. The latter process was repeated twice.
Each cell solution in each solvent mixture was prepared independently in a 100-ml volumetric flask. For the stock solutions of HC1 in each solvent mixture, freshly prepared, purified, and analyzed samples of (NMA)2 ■ HC1 were used.
(1) This work was supported in part by a research grant from the U. S. Atomic Energy Commission.(2) L. R. Dawson, R. C. Sheridan, and H. C. Eckstrom, J. Phys. Chem., 65, 1829 (1961).(3) L. R. Dawson, W . H. Zuber, Jr., and H. C. Eckstrom, ibid., 69, 1335 (1965).(4) L. R. Dawson, E. D . Wilhoit, and P. G. Sears, J■ Am. Chem. Soc., 78, 1569 (1956).(5) R. G. Bates, “Electromotive pH Determinations,” John Wiley and Sons, Inc., New York, N. Y ., 1954.(6) C. A. Kraus and R. A. Vingee, J. Am. Chem. Soc., 56, 511 (1933).
Volume 70, Number 8 March 1966

776 L. R. Dawson, K. H. K im, and H. C. Eckstrom
The emf cell was provided with a stopcock5 which was kept closed during the time between series of readings to prevent poisoning of the hydrogen electrode by the trace amount of AgCl dissolved in the cell solution.
Four NMA-dioxane solvent mixtures ranging from 25 to 75 wt % NMA were prepared, and their dielectric constants were measured using a General Radio Type 821-A Twin-T impedance measuring circuit. A plot of dielectric constant vs. weight per cent of NMA was prepared. Dielectric constant values for the various solvent mixtures used were obtained from this graph. Densities and vapor pressures of the various solvent mixtures were obtained in a similar manner.
ResultsProperties of the solvent mixtures used for emf
measurements as well as data for those used to establish the graph for dielectric constants are shown in Tables I and II.
Table I : Properties of Solvent Mixtures at 40°
Dielec-Mix- Vap trietu re % % press, Density, conno. NMA dioxane mm g /cc stant
i 70.02 29.98 44.0 0.9632 89.5i i 56.90 43.10 54.2 0.9729 65.7
h i 26.15 73.85 78.2 0.9956 24.8
Table II: Experimental Values for Dielectric Constants of NMA-Dioxane Mixtures at 40°
Mixture % % Dielectricno. NMA dioxane constant
l 74.44 25.56 98.12 60.82 39.18 72.43 50.76 49.24 55.84 25.32 74.68 23.2
A summary of emf values, corrected to a pressure of 1 atm, as a function of molality of HC1 for three solvent mixtures is given in Table III. Values of E' were calculated from the equation2
2(2.303)RT , 2(2.303)RT r -E H---------- —------ log m -------------—-------a v m
V F
2(2.303)RTE = E ----------- —------ 18m
F
For NMA at 40°, the Debye-Hiickel constant, a,
equals 0.15465; f3 is an empirical constant. The terms making up E ' involve only experimentally determined quantities. Values of E ' were plotted vs. m to obtain a line with a slope of 2 ( 2 .3 0 3 ) R T /F and an intercept E ° . In each case a least-squares fit of the calculated values of E ' was obtained, and from this the intercept, E ° , was determined.
With the standard potential, E ° , for a given mixture
Table III: Summary of Emf Data for HC1 in NMA-Dioxane Mixtures at 40°
Molality Emf (cor),of HC1 V
Solvent mixture no. 1,
E', v
29.98% dioxane, E ° = 0.16772 V0.00245 0.49506 0.168250.00905 0.42593 0.167430.00958 0.42358 0.168010.01197 0.41117 0.167070.1544 0.39735 0.166270.02334 0.37657 0.166410.02527 0.37241 0.166240.02671 0 36907 0.165670.04291 0 34460 0.164670.06000 0.32759 0.163930.09350 0.30464 0.161980.12331 0.29040 0.160480.20345 0.26401 0.15628
Solvent mixture no. II,43.1% dioxane, E ° = 0.14041 v
0.00443 0.43646 0.138890.00713 0.41325 0.139990.00991 0.39783 0.141170.01394 0.37890 0.139230.02066 0.35906 0.138650.02642 0.34700 0.138420.03203 0.33838 0.138930.04701 0.31854 0.136890.05828 0.30705 0.135110.08878 0.28708 0.133510.11599 0.27392 0.131500.12736 0.26986 0.131230.19790 0.24737 0.12577
Solvent mixture no. Ill,73.85% dioxane, E ° = 0.02727 v
0.00217 0.37157 0.026300.00411 0.34217 0.025910.00632 0.32421 0.024470.00867 0.31012 0.024550.01135 0.29871 0.023230.01993 0.27316 0.016590.02383 0.26693 0.015610.03382 0.25506 0.012860.05018 0.23841 0.004230.06278 0.22976 -0.001130.10089 0.20562 -0.02190
The Journal of Physical Chemistry

Solvents Having H igh D ielectric Constants 777
the mean ionic activity coefficients at the various molalities were calculated from the equation
E = E°2(2.303)ßT,------- ------- log m± t±
Values of the activity coefficient for HC1 at rounded molalities in the three solvent mixtures are shown in Table IV.
Table IV: Activity Coefficients for HC1 in NMA-Dioxane Solvent Mixtures
Molality of HC1 L T±
0 .0 05 0 .9 40 .0 1 0 .9 20 .0 2 0 .9 00 .0 3 0 .8 90 .0 4 0 .8 70 .0 5 0 .8 60 .0 6 0 .8 60 .0 7 0 .8 50 .0 8 0 .8 50 .0 9 0 .8 40 .1 0 0 .8 4
II, HI, 7 *
0 .91 0 .6 80 .8 8 0 .5 90 .8 4 0 .5 00 .8 2 0 .4 40 .8 0 0 .410 .7 8 0 .3 80 .7 7 0 .370 .7 6 0 .3 50 .7 5 0 .3 40 .7 4 0 .3 30 .7 3 0 .3 3
DiscussionThe emf data plotted against molality of HC1 for
each of the solvent mixtures yield plots which are smooth curves. From these results and the general behavior of the electrodes during the study, it is assumed that the silver-silver chloride electrode is stable, reversible, and reproducible in NMA-dioxane mixtures.
At 40° the standard reduction potential of the silver- silver chloride electrode in NMA is 0.20573 v ;2 in water it is 0.21208 v.7 Values of 0.16772, 0.14041, and 0.02727 for E° found in this investigation indicate the rapid decrease in reduction potential with increasing
percentage of dioxane and the resulting decrease in dielectric constant of the mixture. Considering the E° value of 0.181 v for this electrode at 40° in form- amide8 with a dielectric constant between those for water and NMA, it becomes apparent that, even in media of very high dielectric constant, the chemical nature of the solvent molecules is a factor of major importance. A similar dependence of E° upon the chemical nature of the solvent was found by Harned and co-workers9 for several solvents having lower dielectric constants. Absence of complete uniformity in the relationship of E° and dielectric constant and the lack of applicability of the Born equation for charging ions in a solvent mixture has been attributed10 to preferential solvation of the ions by one of the components or HC1 being incompletely dissociated in mixtures having lower dielectric constants. In the solvents studied in this investigation the decrease in E° proceeds more rapidly than the decrease in dielectric constant. It is likely that the principal protonated species is NMA-H+. Strong interionic effects and even quite incomplete dissociation at higher solute concentrations may exist in the solvent mixtures containing larger percentages of dioxane. Indeed, the basicities of the components of the solvent mixture are important.
In addition, the activity coefficients of HC1 decrease much more rapidly with an increase in solute concentration in those solutions having larger percentages of dioxane and having lower dielectric constants. This would be expected as a result of the more effective interionic attraction as the dielectric constant is decreased.
(7) R. G. Bates and G. E. Bower, J . R es . N a tl . B u r . S td ., 53, 283 (1954).(8) M . Mandel and P. Decroly, T ra n s . F a ra d a y S o c ., 56, 29 (1960).(9) H. S. Harned and B. B. Owen, “The Physical Chemistry of Electrolytic Solutions,” Reinhold Publishing Corp., New York, N. Y „ 1958.(10) J. A. V. Butler and C. M . Robertson, P r o c . R o y . S oc . (London), A125, 694 (1929).
Volume 70, Number S March 1966
778 0. D. Bonner, K. W. Bunzl, and G. B. W oolsey
The Influence o f Solute-Solvent Interaction on the Osmotic Properties
o f N-Methylacetamide Solutions
by 0 . D . Bonner, Kurt W . Bunzl, and Gerald B. Woolsey
Department of Chemistry, University of South Carolina, Columbia, South Carolina (Received September 15, 1965)
The osmotic coefficients for a variety of quite different solutes in N-methylacetamide as a solvent have been measured. Positive and negative deviations from Raoult’s law were found and explained by the capability of the solvent to form hydrogen-bond and/or charge- transfer complexes with the solute. In one case the entropy of solution was also measured as a function of temperature and these results are in accordance with the concept of solute-induced structural changes of the solvent as deduced from the osmotic data.
Introduction
It has been shown1 that N-methylacetamide (NMA) is a highly associated liquid, consisting of ‘ "'polymer chains” of different length, whose units are held together by hydrogen bonds. From an analogy with aqueous solutions we would expect, therefore, that the large deviations from Raoult’s law which are observed in NMA solutions arise mainly from a structural change of the solvent, induced by solvent-solute interaction. (Due to the fact that all our measurements were made in very dilute solutions, we assume solute- solute interaction to be negligible.) In order to determine the deviations from Raoult’s law, we measured the osmotic coefficient, <£, of NMA solutions by using a variety of quite different solutes. Since we will discuss these results in the light of a possible structural change of the solvent, we also determined in one case the entropy of solution, which should show structural changes as well and should confirm the results obtained from the osmotic data.
Experimental Section
Pure NMA was obtained by the zone refining1 2 of three times vacuum-distilled material. The melting point of NMA thus purified is about 30.5°. The different solutes were purified in the following ways.(1) Ethyl oxalate was purified by repeated distillation under reduced pressure. (2) l,l,2,2-Tetrachloro-l,2- difluoroethane was purified by repeated fractional recrystallization (mp 24.7 ± 0.05°). (3) Phthalo-nitrile was purified by recrystallization from hexane.
(4) Benzonitrile was purified by fractional recrystallization. (5) o- and m-dinitrobenzene were purified by recrystallization from ethanol. (6) 2,4,6-Trinitrobenzene was purified by recrystallization from CCU and was dried under vacuum at 50°. (7) Anthra-quinone was purified by sublimation under vacuum. (8) Disodium 4,4'-bibenzyl disulfonate and 2,7-disodium anthraquinonedisulfonate were purified by recrystallization from a water-ethanol mixture. (9) Phenanthrene was purified by vacuum sublimation.(10) 2-Sodium anthraquinonesulfonate was purified by recrystallization from an ethanol-water mixture.(11) l,8-Diphenyloctance-4,4'-disulfonic acid disodium salt was purified by recrystallization from ethanol.(12) meso-Erythritol was vacuum dried 3 days over P2O5.
The osmotic coefficients were determined from freezing point measurements and the apparatus was the same as described by Bonner and co-workers.2
Solubility measurements (from which the entropy of solution was determined) were made in a thermostated air bath. An airtight variable volume cell was used, which also permitted magnetic stirring. After adding a known amount of solute to the solvent, the temperature was raised very slowly in intervals of 0.1° until the last crystals disappeared. The presence of solute crystals was detected by a Tyndall beam. Unwanted heat from the light source was avoided by using a
(1) R. Lin and W . Dannbausen, J. Phys. Chem., 67, 1805 (1963).(2) O. D . Bonner, C. F. Jordan, and K . W . Bunzl, ibid., 68, 2450 (1964).
The Journal of Physical Chemistry

Osmotic Coefficents of Solutes in N-M ethylacetamide 779
heat filter. The temperature of the solution was measured by thermistors within 0.05°.
The density of the solutions was measured in a Lipkin pycnometer over the temperature range 32- 62° in a thermostated air bath. The density of anthra- quinone was also measured pycnometrically by immersing the crystals in degassed distilled water over the temperature range 32-62°. The temperature of the air bath was in both cases determined with an NBS thermometer.
Results and Discussion
(a) Positive Deviations from Raoult’s Law. All osmotic coefficients of NMA solutions reported so far2 show large positive deviations from Raoult’s law (i.e., <t> < 1). Since for all of these nonpolar solutes (such as CCh) self-association is very unlikely and since attempts to show the existence of a solid solution proved negative, these results indicate that these solutes break the structure of NMA to a certain extent. This would cause the vapor pressure of the solvent to be higher than expected from Raoult’s law.
However, for aqueous solutions some solutes are also known3 to exhibit negative deviations from Raoult’s law (i.e., <j> > 1); e.g., sucrose and meso-erythritol. To explain this behavior it is usually assumed that these solutes hydrate strongly by means of their O-H groups and thus lower the vapor pressure of the solvent to a larger extent than predicted by Raoult’s law.
Since NMA is similar to water in that both liquids are highly self-associated, we would also expect to find NMA solutions of some solutes which solvate strongly enough to show similar negative deviations. Therefore, osmotic coefficients of several solutes having groups which should be able to form strong hydrogen bonds with NMA were measured. These results are shown in Figure 1. The fact that all of these solutes still show positive deviations from Raoult’s law indicates that hydrogen bonding between solvent and solute disturbs the formation of the “ polymer chains” of NMA enough to result in a structure-breaking of the solvent. Positive deviations from Raoult’s law are also observed for the two bolaform electrolytes, indicating that they also exhibit a structure-breaking effect (see Figure 2). It is of interest to note, however, that the osmotic coefficients of the bolaform electrolytes (2-1 electrolytes) are larger than those of potassium toluenesulfonate reported previously.2 This behavior which is also typical of aqueous solutions results from the incomplete overlap of the ionic atmospheres of the sulfonate groups.
(1b) Negative Deviations from Raoult’s Law. Some
Figure 1. Osmotic coefficients of NMA solutions vs. molality m : C, meso-erithritol; O, ethyl oxalate; —, phtalonitrile;9, phenanthrene; © , l,l,2,2-tetrachloro-l,2-difluoroethane.
Figure 2. Osmotic coefficients of NMA solutions vs. molality m: O, l,8-diphenyloctane-4,4'-disulfonic acid disodium salt;9, disodium 4,4'-bibenzyldisulfonate;C, potassium p-toluenesulfonate.
solutes were found, however, which exhibit fairly large negative deviations fronr Raoult’s law in NMA solutions. The osmotic coefficients of these three solutes are shown in Figure 3. Two of these solutes are sodium salts of aromatic acids and in calculating the osmotic coefficient, complete dissociation was assumed for them. The other solute is a nonelectrolyte. The observed lowering of the activity of the solvent to a value smaller than predicted from Raoult’s law shows that the structure of the solvent close to a solute molecule is apparently somewhat “ higher” than the structure of the pure solvent. In order to prove this assumption of a solvent structure increase, the entropy of solution of the system NMA-anthraquinone4 was
(3) O. D . Bonner and W . H. Breazeale, J. Chem. Eng. Data, 10, 325 (1965).(4) Anthraquinone was selected since it exhibits the largest negative deviation from Raoult’s law compared to the two other solutes and since its solubility is low enough that the entropy of solution can be calculated from solubility measurements. Furthermore, it is the only one whose heat of fusion is known.
Volume 70, Number 3 March 1966

780 O. D. Bonner, K. W. Bunzl, and G. B. W oolsey
Figure 3. Osmotic coefficients of N M A solutions vs. molality m: V, anthraquinone; 9 , 2-sodium anthraquinonesulfonate; O, 2,7-disodium anthraquinonedisulfonate.
measured. As Bohon and Claussen6 showed for some aqueous solutions of hydrocarbons, the increase in the order of the solvent structure gives rise to a negative “ entropy of freezing” of the solution. This entropy of freezing, A.SY, is defined by
AÂsoi = A Sv + ASf (1)
where a5 soi is the entropy of solution and ASV is the “volume” or “ expansion” entropy which accounts for the fact that the molar volume of the solute in the solution is much larger than the molar volume of the pure solute. A<SV can be calculated from
ASV = R In VW/VM (2)
where Fw is the volume of the solution containing one mole of dissolved solute and VM is the molar volume of the pure solute. Since A5s0i can be obtained from the partial molar heat of solution A/?,0i. we determined first the solubility of anthraquinone as a function of the temperature T which yields
AH soi = RT2"ö ln M
à T= - R
~d In AT _ö (l/T)_ (3)
where M is the molar solubility. The plot of In M vs. (1/7') in Figure 4 indicates that within experimental error the measured points lie on a straight line. From the slope of this curve one obtains Affsoi = 6.712 kcal/mole. Since anthraquinone is a solid at room temperature, the value of Affsoi is corrected to the one of a supercooled liquid by subtracting the heat of fusion of anthraquinone,6 or
Affsoi.se = —1.095 kcal/mole
Figure 4. Logarithm of the molarity M of saturated solutions of anthraquinone vs. the reciprocal absolute temperature.
in the temperature range 32-62°. The entropy of solution ASso, then is given by
A Affsol ,SCAAsoi = -
and is listed in Table I. In order to determine F m and Fw, the densities of anthraquinone and of the saturated solutions were measured as a function of the temperature. These values as well as ASv calculated from eq 2 are also shown in Table I. According to eq 1 we can now calculate ASf and as can be seen from Table I, large negative values for the entropy are obtained. This reveals quite clearly that the solvation of anthraquinone molecules is accompanied by a decrease in the entropy of the solvent or that the order of the solvent molecules has increased. This result confirms, therefore, our conclusions obtained from the osmotic data. If we divide ASf by A<Sf° (where AiSF0
(5) R. L. Bohon and W . F. Claussen, J. Am. Chem. S o c 73, 1571 (1951).(6) The heat of fusion of anthraquinone was obtained from the “ Handbook of Chemistry and Physics,” 44 ed, Chemical Rubber Publishing Co., Cleveland, Ohio, 1962, p 2409.
The Journal of Physical Chemistry

Osmotic Coefficients of Solutes in N-M ethylacetamide 781
Table I : Solubility and Entropy Data for the System NMA-Anthraquinone“
Tw,T,° K
M,mole/1 s*
ml/mole X 10 PA
Vm,ml/mole A.S'vol A S b ASf N
305.2 0.00588 0.9489 1.6998 1.4311 145.48 -3 .588 14.03 -17 .62 2.66308.2 0.00646 0.9468 1.5464 1.4306 145.53 -3 .553 13.84 -17 .40 2.63311.2 0.00720 0.9446 1.3875 1.4302 145.57 -3 .518 13.62 -17 .14 2.59314.2 0.00799 0.9423 1.2515 1.4297 145.62 -3 .485 13.42 -16.91 2.55317.2 0.00885 0.9399 1.1294 1.4293 145.66 -3 .452 13.22 -16 .67 2.52320.2 0.00978 0.9375 1.0217 1.4288 145.71 -3 .419 13.02 -16 .43 2.48323.2 0.01076 0.9350 0.9292 1.4284 145.75 -3 .388 12.83 -16 .22 2.45326.2 0.01186 0.9325 0.8431 1.4280 145.79 -3 .357 12.63 -15 .99 2.41329.2 0.01305 0.9300 0.7659 1.4275 145.84 -3 .326 12.44 -15 .77 2.38332.2 0.01432 0.9273 0.6980 1.4271 145.89 -3 .296 12.26 -1 5 .5 5 2.35335.2 0.01568 0.9248 0.6376 1.4267 145.93 -3 .266 12.08 -15 .34 2.32
a T is the temperature in °K, M is the molar solubility, 6S is the specific gravity of the saturated solutions, V w is the volume occupied by 1 mole of anthraquinone in a saturated NMA solution, pa is the specific gravity of anthraquinone, Em is the molar volume of anthraquinone, ASsoi is the observed entropy of solution, ASv = R In V w/Vm, A/Sf = AÂsoi — A<SV, and N is ASf/ — 6.618, where — 6.618 eu is the entropy of freezing of pure NMA; entropies in cal/deg mole.
is the entropy of freezing of pure NMA at its melting point; AiSf° = —6.618 cal/deg mole2), we obtain the number N of solvent molecules which would have to freeze completely around each anthraquinone molecule in order to account for the observed entropy effect. The values of N thus obtained are also listed in TableI. They are all around N ~ 2.5 and do not change appreciably with temperature. N can be equally well regarded as the lower limit of the solvation number of anthraquinone in NMA.
We believe that this solvation arises from the formation of an n,7r charge-transfer complex, with NMA as the electron donor and anthraquinone as the acceptor. If we now add one or two S03- groups to anthraquinone we are decreasing the acceptor strength (compared to anthraquinone), since the field of the negative charge of these groups cancels the electron withdrawing effect of the carbonyl groups to some extent. Consequently, we expect the two solutes 2- sodium anthraquinonesulfonate and 2,7-disodium an- thraquinonedi sulfonate to form weaker complexes with NMA and to exhibit, therefore, a smaller osmotic coefficient than anthraquinone. This behavior of <f> is indeed confirmed as can be seen from the data depicted in Figure 3. The possibility that the presence of a 7r-electron system is already sufficient for a structure-forming effect can be ruled out by the fact that phenanthrene, which has an even better conjugated ^-electron system than anthraquinone (but cannot act as an acceptor in a charge-transfer complex) shows 4> values smaller than 1 (see Figure 1). The explanation for the phenomenon that solvation of the solute via charge-transfer complex formation results in a
Figure 5. Osmotic coefficients of NMA solutions vs . molality m: O, 2,4,6-trinitrobenzene; ©, m-dinitrobenzene;© , o-dinitrobenzene; ® , benzonitrile.
structure enforcing of the solvent, while solvation via hydrogen bonding between solute and solvent results in a structure breaking (see paragraph a), is that NMA itself is associated by hydrogen bonds. Therefore, solute-solvent hydrogen bonding disturbs the self- association of NMA, while charge-transfer complex formation does not, but rather permits structure enforcing by the formation of a solvation sphere.
The influence of both effects can be observed in the osmotic behavior of nitrobenzene, o- and m-dinitrobenzene, and trinitrobenzene, where the osmotic coefficient increases in this order (see Figure 5). This is mainly due to the fact that the acceptor strength increases in the same order.7 Nevertheless, an appreciable structure-enforcing effect of these solutes
Volume 70y Number 3 March 1966

782 0. D. Bonner, K. W. Bunzl, and G. B. W oolsey
is not observed (<£ always <1) since the increase in the acceptor strength is accompanied by an increasing number of N 02 groups on the solute molecule, which will induce a structure-breaking effect by hydrogen bonding with the solvent.
One experimental fact requires further clarification, namely, that the osmotic coefficients of the solutions which exhibit negative deviations from Raoult’s law do not show any tendency to extrapolate to = 1 as the concentration approaches m = 0. One might attempt to explain this as a result of the high structure of NMA. It can be estimated from dielectric measurements of NM A1 that the average “ chain length” of the NMA polymers is about ten monomer units. For that reason, a structure-enforcing effect of the solute on the solvent is only possible as long as the distance between two solute molecules exceeds this distance of the average chain length. From a rough
estimation, we find that this corresponds to a solute concentration less than 0.005 m which is our lowest measured concentration. This can explain why the osmotic coefficient for this solute might go through a maximum of which it has been experimentally possible to verify only the descending branch.
In conclusion, we can say that the osmotic behavior of NMA solutions differs appreciably from that of aqueous solutions. This is mainly due to the extensive self-association of NMA in long “ polymer chains” and to its ability to form charge-transfer complexes with electron acceptors.
Acknowledgment. The support of this research by the National Science Foundation under Grant GP- 3475 is gratefully acknowledged. * 450
(7) The charge-transfer bond of NMA-trinitrobenzene lies at about450 mg.
The Journal of Physical Chemistry

M icelle Formation and Hydrophobic Bonding in D euterium Oxide 783
Micelle Formation and Hydrophobic Bonding in Deuterium Oxide12
by Pasupati Mukerjee, Paz Kapauan, and Herbert G. Meyer
Chemistry Departments, University of Southern California, Los Angeles, California 90007, and Brookhaven National Laboratory, Upton, New York (.Received September 16, 1965)
The critical micelle concentrations of sodium decyl and lauryl sulfates at 25° have been determined from precise conductance data in water and in heavy water. The critical concentrations in heavy water are slightly lower (by about 2.5%). The solubility of sodium lauryl sulfate at 9° is also only about 5% lower in heavy water. The conductances of both small ions and micelles approximately follow Walden’s rule. The interpretation of the solubility and the critical concentration data lead to somewhat conflicting estimates regarding the relative strength of hydrophobic bonding in the two media; the difference in either case appears to be small. It is suggested that this result may be misleading because of compensating effects of dimerization of the long-chain ions.
IntroductionLiquid deuterium oxide (D20 ) has been frequently
used in the past to study the solvent isotope effects on various solutes, particularly inorganic electrolytes and those capable of hydrogen bonding or acid-base equilibria. Recently, there has been some interest in the structural aspects of D20 3-6 and in the solubility of nonpolar solutes.4'7 This prompts us to report some results obtained several years ago, which deal with the nature of hydrophobic bonding of long- chain compounds in D20 and brings out some of the difficulties and complications involved. Since D20 is often used as a medium for studying biological macromolecules8-10 or even living cells,10-12 and since hydrophobic bonding is important in most of these systems, the perturbation of hydrophobic bonding in changing the medium from ordinary water to D20 as revealed by solubility and micellization effects may be of some general interest.
This work was originally done in the hope that D20 might prove to be a discriminating probe for the solvent structure aspects of hydrophobic bonding. H20 and D20 are extremely closely matched in all properties except those most sensitive to structure. Thus, the surface tension and the dielectric constant6 of D20 are lower than those of ordinary water at 25° by 0.05 and 0.5% only, and it was felt that any interfacial energy effects and the electrical interactions involved in monomer-micelle equilibria should be extremely similar in the two media. On the other
hand, the higher viscosity of deuterium oxide (23% higher than water at 25°), the higher heat capacity (12% higher), and the higher temperature of maximum density (11.2° compared to 4° for water),6 suggest that deuterium oxide is substantially more structured than ordinary water at room temperatures. Indeed, deuterium oxide has been compared to ordinary water at a lower temperature.11 It was expected, therefore, that the processes like micelle formation in which water structure is widely held to play a predominant role13 will be materially affected. However, 1 2 3 4 5 6 7 8 9 10 11 12
(1) Research performed under the auspices of the U. S. Atomic Energy Commission.(2) Research supported, in part, by PHS Research Grant GM 10961-02 from the Division of General Medical Services, Public Health Service, and by the Office of Naval Research.(3) C. G. Swain and R. F. W . Bader, Tetrahedron, 10, 182, 200 (1960).(4) C. G. Swain and E. R. Thornton, J. Am. Chem. Soc., 84, 822 (1962).(5) P. M. Laughton and R. E. Robertson, Can. J. Chem., 43, 154 (1965).(6) G. Némethy and H. A. Scheraga, J. Chem. Phys., 41, 680 (1964).(7) A. Ben-Naim, ibid., 42, 1512 (1965).(8) J. Hermans and H. A. Scheraga, Biochim. Biophys. Acta, 36, 534 (1959).(9) D. S. Berns, Biochemistry, 2, 1377 (1963).(10) A. Hattori, H. L. Crespi, and J. J. Katz, ibid., 4, 1213 (1965).(11) J. J. Katz, Am. Scientist, 48, 544 (1960).(12) H. F. DaBoll, H. L. Crespi, and J. J. Katz, Biotechnol. Bioeng., 4, 281 (1962).
Volume 70, Number 3 March 1966

784 P. M ukerjee, P. Kapauan, and H. G. M eyer
it seems that: “ A number of competitive processes are involved, concerning water-water interactions as well as water-solute or water-interface interactions. Since all of these change when one goes from H20 to D20, a straightforward prediction does not seem easy.” 13 14 15
Experimental Section
Materials. The sample of sodium lauryl sulfate (NaLS) was that of ref 15. For sodium decyl sulfate, the samples used for H20 and D20 were different, but they were prepared from the same batch of decyl alcohol in the same manner,16 17 and their conductivities below the critical micelle concentration (cmc) in H20 were in good agreement.16 Similar good agreement (within about 0.1%) was found for D20 also.
The D20 used had an isotopic composition of 99.5+% of deuterium.
Conductance Measurements. The apparatus is described in ref 17a. A dilution cell with a doughnutshaped conductance path, described previously171* was used.
Solubility Measurements.18 After long equilibration with the solid, the supernatant solution was filtered, and its concentration was determined by a spectro- photometric analysis using methylene blue.19
Results
The cmc values were determined from the specific conductance data. It is customary to plot these data against the concentration and to determine the cmc from the intersection of the two straight lines describing the data below and above the cmc, neglecting the region of curvature close to the cmc.20 Our conductance data of high relative precision (~0.02% ) showed evidence of slight curvature in regions well separated from the cmc. Since we were primarily interested in the small change in the cmc between H20 and D20, it seemed appropriate to use data over the same concentration range for both media, fit the best straight lines by least-squares methods, and obtain the cmc from the calculated intersection point. The precision of the relative values of the cmc was estimated to be about 0.5%. However, the slopes, particularly above the cmc, were of greater uncertainty because of the small concentration range covered.
Table I records the slopes and intercepts of the equation x = a + (3c, where x is the specific conductance, c is the molar concentration, and a and /3 are constants determined by least-square fits over concentration ranges (in moles/liter) of 1.8-2.8 (X 10-2) and 3.8-4.5 (X 10 -2) for NaDS and 3.1-6.8 (X10~3) and 10.2-11.6 (X 10 -3) for NaLS. The cmc values obtained
are also indicated. The cmc decreases by 2.7 and 2.4% for NaLS and NaDS, respectively, on passing from H20 to D 20.
The difference in the cmc values, though small, is quite real. This is illustrated in Figures 1 and 2 where deviation plots for specific conductance data are shown near the cmc region. The deviation functions were so chosen as to bring the data below the cmc on the same line, and the lower portion of this line is not shown. Above the cmc, the conductance data show a consistent difference between the two solvents for both systems. The cmc values are marked by arrows.
The cmc is not one single concentration but a range of concentrations. As may be seen from the graphs,
Figure 1. Plot of deviation function of specific conductance for NaLS at 25°: O, in D20, A x = x(exptl) — 0.05399c;A, in H20, Ax = x(exptl)/1.220 — 0.05399c +0.0129 X 10~4.
(13) E. D. Goddard, C. A. J. Hoeve, and G. C. Benson, J. Phys. Chem., 61, 593 (1957); P. Mukerjee and A. Rav, ibid., 67, 190 (1963).(14) H. S. Frank, personal communication, 1958.(15) K . J. Mysels and L. H. Princen, J. Phys. Chem., 63, 1696 (1959).(16) K . J. Mysels and P. Kapauan, J. Colloid Sci., 16, 481 (1961).(17) (a) P. Mukerjee, K . J. Mysels, and C. I. Dulin J. Phys. Chem., 62, 1390 (1958); (b) K . J. Mysels, ibid., 65, 1081 (1961).(18) H. G. Meyers, M.S. Thesis, University of Sou-hern California, 1959.(19) P. Mukerjee, Anal. Chem., 28, 870 (1956).(20) E. D. Goddard and G. C. Benson, Can. J. Chem., 35, 986 (1957).
The Journal of Physical Chemistry

M icelle Formation and Hydrophobic Bonding in D euterium Oxide 785
Table I : Constants for the Equation n = a + ß c and the Cmc Data
✓-------------------Below cm c-104« 10/3 104«
-Above cmc------------------- >10/5
Cmc,M
NaLS in H20 0.0800 0.6589 3.4663 0.2492 8 . 2 7 X 10-»NaLS in D20 0.0785 0.5399 2.8664 0.1936 8.05 X IO“ 3NaDS in H20 0.746 0.6161 11.627 0.2887 3.32 X IO“ 2NaDS in D20 0.756 0.5047 9.676 0.2306 3.25 X IO"2
however, the difference between the concentrations corresponding to the same changes are essentially constant throughout the range. A more objective and quantitative criterion is given by the concentration of micelles at the point selected as the cmc which can be generally obtained from precise data in the transition region.21 Thus, in our case Figures 1 and 2 show that the deviation of x, i.e., Ax, at the cmc, from the x expected in the absence of micellization, is very nearly the same for H20 and D20. The dx/dc above the cmc is a measure of conductance of micelles. The fraction that is micellized at the cmc calculated on this basis is 2.4 and 2.3% for H20 and D20 for NaDS and 3.4 and 3.3% for H20 and D20 for NaLS. This close agreement supports the relative values of the cmc.
The solubilities of NaLS were determined at 9.0°. The values were 7.31 ± 0.05 (X10~3) in H20 and 6.97 ± 0.07 ( X 10~3) in D20, a ratio of 1.05 ± 0.02.
DiscussionConductance Values. The equivalent conductances
(A) of inorganic ions like Na+ or Cl- in D20 and H20 do not follow Walden’s rule exactly. A0 values (at infinite dilution) in H20 and D20 are in the ratio of 1.20 for K+ and Na+ and 1.216 for Cl- at 25°22 compared to the fluidity ratio of 1.23.23 The difference is not large, however. The ratio of the equivalent conductances for NaLS and for NaDS at comparable concentrations below the cmc are 1.22 ± 0.01. The same ratio is shown by the ¡3 ( = dx/dc) values (below the cmc) quoted in Table I, which give an average measure of A in the concentration range covered.
The /? values above the cmc can be taken to a good approximation as a measure of the conductance of micelles. These are in the ratio 1.29 ± 0.04 and 1.25 ± 0.04 for NaLS and NaDS in H20 and D 20, and are not far from the fluidity ratios. The comparatively large uncertainties appear to be due to the presence of some curvature in the x-c data above the cmc and the relatively narrow range of concentrations available for direct comparison. The data for NaLS in D20 were somewhat more extensive that those in H20 for the same sample. If the much more extensive data for other similar samples of NaLS in H20 20’24 25 are used
Cone, of NaDS ( moles/liter) x I03
Figure 2. Plot of deviation function of specific conductance for NaDS at 25°: O, in D20, Ax = x(exptl) — 0.05047c;A, in H20, Ax = *(exptl)/1.221 - 0.05047c +0.145 X 10“ 4.
for comparison, the ratio of micellar conductances comes closer to the fluidity ratio. Thus, to the extent the structural aspects and electrical interactions of micelles are reflected in their conductance, the difference between H20 and D20 is small.
Charge Effects and Free Energies of Transfer. The solubilities of inorganic electrolytes in D20 have been extensively studied.26 It is found that anhydrous 1:1 electrolytes are less soluble in D20 by 2 to 20% at 25°. Most of the salts are highly soluble, so that it is
(21) R. J. Williams, J. N. Phillips, and K . J. Mysels, Trans. Faraday Soc., 51, 728 (1955).(22) L. G. Longsworth and D. A. Maelnnes, J. Am. Chem. Soc., 59, 1666 (1937).(23) R. C. Harday and R. L. Cottington, J. Res. Natl. Bur. Std., 42, 573 (1949).(24) K. J. Mysels and C. 1. Eulin, J. Colloid. Sci., 10, 461 (1955).(25) R. D. Eddy and A. W . C. Menzies, J. Phys. Chem., 44, 207(1940) ; see also A. H. Kimball “ Bibliography of Research on Heavy Hydrogen Compounds,” McGraw-Hill Book Co., Inc., New York, N. Y ., 1949.
Volume 70, Number S March 1966

786 P. Mukerjee, P. Kapauan, and H. G. M eyer
difficult to disentangle the effects due to differences in activity coefficients and purely ion-solvent interactions which appear at infinite dilution. However, Greyson has recently studied the transfer free energies (A(?) of some alkali metal chlorides from H20 to D20 in relatively dilute solutions (0.1 M) using ion-exchange membrane potential measurements.26 The estimated AG values at 9° from his enthalpy and entropy data are 130, 160, 200, and 200 cal/mole for Li+, Na+, K +, and Cs+ chlorides, respectively. In our case, AG, calculated by assuming that NaLS behaves as a 1:1 electrolyte with similar activity coefficients in H20 and D20, is 60 ± 20 cal/mole. Clearly, differences in ion-solvent interactions alone are more than sufficient to explain the solubility difference, and the chain contribution to AG of NaLS, if any, appears to be negative, the chain being stabilized, in D20.
For the interpretation of monomer-micelle equilibria, the ion-solvent interactions are irrelevant since all charges presumably remain in contact with water. This does not preclude some influence of short-range forces involving the solvent molecules at the highly charged micelle surface where interionic interactions are very strong. The difference in the free energy of micelle formation per monomer (AG'), between H20 and D20, calculated for the mass action model, neglecting dimerization and assuming a 70% binding of the counterions, is about 25 cal/mole for both NaLS and NaDS, AG' being more negative in D2O.27 The more elaborate theory of Overbeek and Stigter,28 assuming the same size for the micelle, gives about 30 cal/mole for NaLS. If all nonelectrostatic interactions involved in the micelles in H20 and D20 are assumed to be the same, the AG' calculations indicate that the chain is destabilized in D20 ; i.e., it has a greater hydro- phobic character in D20, but the difference is small.
Hydrophobic Interactions. The interpretation of the solubility and the cmc values are conflicting although the over-all solvent isotope effects on the long chains seem to be small. In the absence of any reliable theoretical framework, it is interesting to compare these effects with the relatively scanty results available for nonionic solutes. Some solubility ratios between H20 and D20 recently determined are 0.92 for argon, at 25°/ ~1.00 for He above 50°,29 and 0.98, 1.04, 1.07, and 1.10 for CH3F, CH3C1, CH3Br, and CH3I at 29.4°.4 There is a slight over-all trend toward higher ratios with increasing molecular size. Guseva and Parnov have recently determined the solubilities of some hydrocarbons, n-heptane, toluene, and cyclohexane, at relatively high temperatures.30 The ratios between H20 and D20 are about 1.10-1.12 between 80 and 100°, decreasing slightly with rising tempera
ture. Reasonable extrapolations of these values to room temperatures would give ratios of about 1.11- 1.20. For large chains in our case, even larger factors may be reasonably expected.
A possible explanation of the discrepancy between our results and these very rough expectations is that the cmc or the saturated solution may not truly reflect the monomer-micelle equilibrium or the monomer- solid equilibrium because of pre-cmc association, in particular, dimerization of the long-chain ions.17a'31’32 Since dimerization depends primarily on the hydro- phobic interactions between the chains, if the hydro- phobic character of the chains is stronger in D20, dimerization should increase, resulting in an apparent increase in the solubility or the cmc and thus compensating, in part, for the expected decrease.32
We conclude, therefore, that the differences in hydro- phobic interactions between H20 and D20 are unlikely to be very great, but they may be substantially greater than the small differences estimated from solubility or cmc data neglecting dimerization. Simpler equilibria, such as the distribution of monomers between phases or monomer-dimer equilibria, must be studied before more definitive statements can be made.33
Acknowledgment. We are very grateful to Professor Karol J. Mysels for his interest and helpful criticism.
(26) J. Greyson, J. Phys. Chem., 66, 2218 (1962).(27) P. Mukerjee, ibid., 66, 1375 (1962).(28) J. Th. G. Overbeek and D. Stigter, Rec. Trav. Chim., 75, 1263 (1956).(29) E. F. Stephan, W. E. Berry, and F. W. Fink, U. S. Atomic Energy Commission, BM1-1587, 1962; Chem. Abstr., 57, 14485 (1962).(30) A. N. Guseva and E. I. Parnov, Radiokhimiya, 5, 507 (1963); Chem. Abstr., 60, 1174 (1964). The solubility ratios quoted in this paper for 25° from the literature appear to be due to a misinterpretation and are in fact ratios of solubilities of H 2O and D 2O in hydrocarbon solvents.(31) F. Franks and H. T. Smith, J. Phys. Chem., 68, 3581 (1964)-(32) P. Mukerjee, ibid., 69, 2821 (1965), and references therein.(33) After this paper was submitted, a paper by G. C. Krescheck,H. Schneider, and H. A. Scheraga, J. Phys. Chem., 69, 3132 (1965), appeared, which reports related findings. The cmc of dodecyl- pyridinium iodide was found to be lower in D 2O by about 9 % , as determined from specific conductance data at 25°, and 17% , as determined from ultraviolet absorbance data at 22°. On the other hand, the solubilities, in molar units, of propane and butane at 25° were found to be lower in H 2O by about 2% , pointing out the difficulty of exact interpretation of these systems. The bigger solvent isotope effect on the cmc of dodecylpyridinium iodide, as compared to that of sodium dodecyl sulfate, may in part be due to the comparatively low cmc of the former, 5.4 X 10⁻³ M at 25°. This low value has been attributed recently to the stabilization of the micelles of dodecylpyridinium iodide by charge-transfer interactions between pyridinium and iodide ions at the micelle surface: P. Mukerjeeand A. Ray, submitted for publication. At the lower value of the cmc, any compensation of the solvent isotope effect on the cmc by the corresponding effect on dimerization32 is expected to be smaller. A solvent isotope effect on the interionic charge-transfer interactions may also be of some importance, particularly since equilibria between “ solvent-separated” or “ solvent-sharing” and “ contact” or “ intimate” pairs of ions are likely to be involved at the micelle surface: P. Mukerjee and A. Ray, submitted for publication.
The Journal of Physical Chemistry

Adsorption Separation Factors of Liquid Hydrocarbon M ixtures 787
Adsorption Separation Factors and Selective Adsorbent Capacities of
Some Binary Liquid Hydrocarbon Mixtures1
by Carleton N. Rowe2 and Robert W . Schiessler
Department of Chemistry, The Pennsylvania State University, University Park, Pennsylvania {Received September 20, 1965)
Separation of binary liquid mixtures by adsorption on solids can be adequately expressed in terms of the separation factor (a) and the selective adsorbent capacity (2). Langmuir’s adsorption theory is extended to binary liquid mixtures. An expression has been derived for a single-stage system which permits the direct and simultaneous determination of the equilibrium constant and the selective adsorbent capacity, both for adsorption for mixtures. Under certain conditions the equilibrium constant is identical with the separation factor. This identification makes it possible to evaluate certain thermodynamic properties of the physical displacement reaction at the surface. An equation for expressing the separation of multistage systems has been modified so that both a and 2 can be determined directly. Separation factors and selective adsorbent capacities have been determined for two low molecular weight and ten high molecular weight hydrocarbon systems with alumina and silica gel. Values of a vary from 1.8 to 17.4 with alumina and 9.0 to 28.8 with silica gel. The selective adsorbent capacities vary from 0.011 to 0.130 cc of liquid per gram of adsorbent on alumina and 0.06 to 0.31 cc of liquid per gram of adsorbent on silica gel. These capacities bear no simple relationship to pore volume. Values of a and 2 are discussed in terms of the chemical constitution of the hydrocarbon systems studied.
Introduction
The process of adsorption is an important separation tool for liquids because of its wide applicability, its simplicity and speed of operation, and the inexpensive equipment required. The separations obtained are the result of a concentration of one of the liquid components in a boundary layer on the surface of the solid. This concentrating action is a direct result of the heterogeneous affinities which normally exist between the surface of the solid and the molecular species in a contiguous phase. Thus, for a given solid adsorbent, the magnitude of the attractive forces will depend on the molecular structure and constitution of the species at the solid-liquid interface. The adsorptive process is a dynamic and an equilibrium one between the adsorbed and liquid phases.
Quantitative separations of binary mixtures may be expressed adequately by two parameters: a dimensionless number expressing the relative adsorptive affinity of the components for the adsorbent (called the separa
tion factor), and a number expressing the selective capacity of the adsorbent (i.e., that part of the adsorbent’s capacity which discriminates between the mixture’s components). It must be emphasized that the “ selective adsorbent capacity” is here defined as the total volume of material (expressed as liquid adsorbed per unit of adsorbent) that is enriched in the preferred component and is in equilibrium with the contiguous liquid phase. Any segment of adsorbed phase having the same composition as the liquid phase is unselective and is not included in the “ selective adsorbent capacity.” In 1949, Mair, Westhaver, and Rossini3 introduced in adsorption the separation factor,4’6 a, which is defined as
(1) Taken from a Ph.D. Thesis by C. N. Rowe, 1955.(2) Research Department, Socony Mobil Oil Co., Inc., Princeton, N. J.(3) B. J. Mair, J. W . Westhaver, and F. D. Rossini, Ind. Eng. Chem.,42, 1279 (1950).
Volume 70, Number 8 March 1966

788 Carleton N. R owe and R obert W. Schiessler
(NA/NBy(NA/NBy (1 )
where N indicates mole fraction, A and B represent the components with A being preferred by the adsorbent, and the superscripts a and 1 refer to the selectively adsorbed and liquid phases, respectively. This expression is analogous to the expression for relative volatility in fractional distillation.
Because an unambiguous method has not been discovered for physically separating the “ selectively” adsorbed phase from the equilibrium liquid phase, direct experimental analysis of the selectively adsorbed phase is still impossible, as is direct determination of its quantity. As a consequence of this rather troublesome difficulty, Mair and co-workers3 determined the capacity of a specified adsorbent for several low molecular weight hydrocarbons by vapor phase equilibration, and assumed the average of these capacity values equalled the selectively adsorbed phase in liquid- adsorbate equilibria. Employing an equation for separations by column (hereafter called the dynamic method) which is rather difficult to conceive theoretically, they were able to approximate separation factors. Subsequently, Schiessler and Rowe4 5 6 combined the vapor phase equilibration method in estimating the selective adsorbent capacity with a material balance equation at equilibrium conditions to calculate adsorption separation factors for a one-stage system (static method). Hirschler and Mertes6 have defined the selective adsorbent capacity in terms of pore volume, which was obtained by vapor phase equilibration studies, to calculate separation factors and adsorption isotherms for static systems. Separation factors determined by all three groups of workers3'8'6 decreased considerably with increasing concentration of the preferred component in the equilibrium liquid mixtures. This absence of constancy of separation factor over a range of concentration suggested that either the assumptions made in the measured “ selective adsorptive capacities” were erroneous, or else adsorption separation factors per se are not very meaningful if they are thus dependent on the composition of the equilibrium liquid phase.
The initial objective of this study was to develop a method for determining accurate selective adsorbent capacities and accurate separation factors. Such a method was discovered and was reported briefly.7 It involves the elimination of the preferred component’s composition between the separation factor expression and a material balance equation for equilibrium, followed by linearizing the resulting expression to
F ael FAeIFBelM 1
(F a1 - VAe')X Z ~ a - 1
where FAel is the volume fraction of component A in liquid phase at equilibrium, VA is the volume fraction of component A in initial mixture, F Bel = 1 — FAel, M is the mass of adsorbent, X is the volume of initial liquid, z is the volume of selectively adsorbed phase per unit mass adsorbent, and a is the separation factor. Linear plots of FAel vs. FAelF BeIM /(F Ai - FAel)X permitted the simultaneous evaluation of the selective adsorbent capacity and the separation factor from the slope and the intercept, respectively. Using this method, our findings for several binary hydrocarbon mixtures on alumina and silica gel are now reported. In addition, it seemed desirable to extend Langmuir’s theory of adsorption to binary liquid mixtures by including the “ selective adsorbent capacity” concept, and then to consider the thermodynamics derivable from such an extension.
Theoretical
Extension of Langmuir’s Adsorption Theory. There are two important aspects of the extension of Langmuir’s concept for gaseous adsorption to the adsorption of binary liquid mixtures. First, the constant in gaseous adsorption signifying the volume of gas in a monolayer will be taken to signify the volume of liquid in the enriched adsorbed phase (any adsorbate having the composition of the equilibrium liquid phase will not be included in the constant), and second, the adsorption separation will be considered to proceed by a displacement reaction.
At the moment a solid surface comes in contact with a binary liquid, the composition of the adsorbed phase will be identical with that of the liquid phase. Separation will then occur by the reaction
kiA + Bs , __ As + B
h
where A and B are the components with A being preferred by the adsorbent, and subscript S signifying molecules which are adsorbed. This reaction as written assumes that one molecule of A displaces one mole-
(4) The separation factor may be expressed equally well in terms of mole, weight, or volume fraction without influence on the numerical value.6 Analogously defined separation factors are useful in quantitative study of all physical separation processes, including distillation and extraction.(5) R. W . Schiessler and C. N. Rowe, J. Am. Chem. Soc., 75, 4611(1953) .(6) A. E. Hirschler and T. S. Mertes, Ind. Eng. Chem., 47,193 (1955).(7) C. N . Rowe and R. W . Schiessler, J. Am. Chem. Soc., 76, 1202(1954) .
The Journal of Physical Chemistry

Adsorption Separation Factors of Liquid Hydrocarbon M ixtures 789
cule of B. The equilibrium constant (A ) for the reaction is
= (As) (B) = h(A)(BS) fa '
Let 8 = fraction of enriched adsorbed phase (A + B) occupied by component A, Fa1 = volume fraction of A in liquid phase any time preceding equilibrium, FAel = volume fraction of A in liquid phase at equilibrium, z = volume of enriched adsorbed phase (A + B) per gram of adsorbent, and za = volume of A in enriched adsorbed phase per gram of adsorbent. Derivation of the equation for the adsorption of component A is
rate of adsorption of A = fa(l — 6)Va
rate of desorption of A = fa0F b1
(Note that composition of B is considered in the desorption of A because the net A desorbed equals the net B adsorbed.) At equilibrium
fa(l - 0) FAcl = k2dVBel (4)
Solving for 8 and substituting A = fa/fa from eq 3
9 ~ FBel + KV a*1 { )
but because zA = 8z
_ KzV a 1ZK F Bel + A FAel
Because zA cannot be directly experimentally determined for binary mixtures, a second relation involving Za must be employed. A material balance equation for component A between the two phases is
VAlX = Va X{X - Mz) + Mza (7)
where F a1 is the volume fraction of A in initial liquid, X is the volume of initial liquid, M is the mass of adsorbent, and FAel, z, and zA are as defined previously. Elimination of zA between eq 6 and 7 gives
(Fa! - FAel)X el KzVAelM + AZ F nel + A FAel (8)
Rearrangement gives
(F a* - FAel)A = A - 1 F a elF BelMz F Bel + A F Ael
Inverting and rearranging gives
d F AelF BeIM _____ l _ _A (Fa* - F Ael) A Z A - 1
(9)
(10)
Straight-line plots of FAel vs. FAelF BelA f/(F A* — FAel)X permit the evaluation of z from the slope and A from the intercept, and demonstrate that z is in fact constant over a major portion of the concentration range.
The evaluation of the equilibrium constant (A) of eq 10 assumes that one molecule of A desorbs one molecule of B and vice versa. This assumption will be correct when the cross-sectional areas occupied by both species on the surfaces of the selective sites are equal or nearly equal. Under these conditions the separation factor is identical with the equilibrium constant
= (F A/ F B)ea = FAeaFBel = (As) (B)“ (F A/ F B)el F AelF Bea (A)(Bs) (U)
At very low concentrations, both FAel and FAelFBelA f/{Va' — VAel)X in (10) approach zero, which is to say, a or A becomes infinite. In visualizing the separation process at low concentrations, there is an insufficient quantity of the 'preferred, component to satisfy all those sites having a strong preference for A. Consequently, the value of z (the slope of a plot of eq 10) would be expected to decrease. It would also be expected that the preferred component would go to the most selective sites which would have the effect of an increased a in the separation process. Thus, FAel will approach zero less rapidly than FAelF BclM / (Fa* — FAel)X . Experimental observations have supported this deduction by exhibiting curvature toward the ordinate at extreme low concentrations of the preferred component. However, linearity should be observed over a wide concentration range. The extrapolation of the linear relationship to negative values of FAel is only for convenience in determining the separation factor a effective in the linear range. The results of these studies are concerned with the linear region, and not with the low concentration region where a and z are changing constantly with concentration because they are responding to the spectrum of adsorptive site selectivities.
The extrapolation to negative values of FAel for determining a can be avoided by rearranging eq 10 to
FAelF BelM (F a’ - F a1) *
No particular advantage is to be had by either method of plotting.
Recently, Klinkenberg9 8 has taken an expression similar to eq 9 and by differentiation obtains an equation relating the maximum amount of preferential
(8) A. Klinkenberg, Ree. Trav. Chim., 78, 593 (1959).
Volume 70, Number 3 March 1966

790 Carleton N. R owe and R obert W. Schiessler
adsorption to the selective adsorbent capacity (z). Similarly, a is related to the equilibrium concentration at maximum conditions. By a plotting technique for which a hyperbola is obtained and using the law of conjugate diameters of conical sections, a and z can be determined. This technique for determining a and z is much more indirect than eq 10, but certainly appears to be valid.
Thermodynamics of Adsorption Separations. The identification of the separation factor with the equilibrium constant for the displacement reaction at the adsorbent-liquid interface, and the determination of separation factors at different temperatures, allows the evaluation of several thermodynamic properties for the separation process. The thermodynamic properties and equations are
A F = — R T In a (13)
i tt T2Ti ctiA H — m m R In
T 2 - T j(14)
A H — A F(15)A S -----------™—
T
where AF , A H , and A S are the free energy, the heat, and the entropy of the displacement reaction, respectively. The calculation of A H assumes it is constant over the specified temperature range. It should be stressed that these thermodynamic values are for the displacement reaction underlying the separation process. For example, A H is n ot the heat of adsorption when an adsorbent is brought in contact with a binary liquid mixture, but is the heat evolved when the more strongly adsorbed component displaces the more weakly adsorbed component.
Dynamic Adsorption Expression. Because of its simplicity and speed, our “ static” method (one-theoretical stage) for determining the separation factor and the selective adsorbent capacity is preferred. However, when the degree of separation is small, increased precision can be obtained by the “ dynamic” method since a number of theoretical stages are involved. Mair, Westhaver, and Rossini3 have derived an expression from rate relationships for a given cross section in a column of adsorbent which relates the separation factor with the net amount of either component transported across the cross section. Combining eq 40,41, and 51 of their work gives
“ “ 1 = 7 aW M p n - 2vA) (16)
where 2 va is the net volume of component A transported, and also equals net volume of component B transported in opposite direction, 7 a 1 and 7 b 1 are volume
fractions of components A and B in existing macroscopic amount of liquid phase at equilibrium conditions, which in this case, would be the initial mixture,9 M is the mass of adsorbent, and is the selective adsorbent capacity per unit mass adsorbent (z in static method). In the studies reported by Mair and coworkers, yum was determined by vapor phase equilibration with pure hydrocarbon liquids in order to calculate a. However, linearization of eq 16 to
Tr ! 7 a1 7 b 1M 1Va = -----------------M m ---------------- r
2 va <x — 1(17)
permits the determination of the selective adsorbent capacity from the slope of the plots of 7 a1 v s .
Va V-b M/2va and the separation factor from the intercept.
Experimental SectionAdsorbents. The adsorbents were alumina (Alcoa,
F-20 grade; 80-200 mesh) and silica gel (Davison Chemical Corp., No. 12-08-08-237; 28-200 mesh). A large quantity of each adsorbent was purchased in 5-lb lots, which were thoroughly mixed, and each adsorbent was stored in a tightly closed glass carboy to ensure uniformity throughout the studies. No pretreatment of the adsorbents was made before use. Nitrogen adsorption studies showed that the alumina had a surface area of 190 m2/g and a pore size distribution of 12-20-A radius with a high concentration of pores having a radius of 19 A. The surface area of silica gel was not determined.
Hydrocarbons. Toluene was purified by fractionation in a 200-plate helix-packed column at a reflux ratio of 15:1 and collected over CaH2. The fractions used had n 20D 1.49683.
n-Heptane (Phillips; 99 mole % min) was passed twice over silica gel; product n20d 1.38765. Methyl- cyclohexane (Phillips, Technical Grade; 95 mole % pure) was purified by fractionation in a 40-plate column at a reflux ratio of 20:1. The material used had n20n 1.42038.
The high molecular weight hydrocarbons had been prepared and purified by various workers at the Pennsylvania State University10 and had been stored under pure dry nitrogen in sealed glass ampoules. The hydrocarbons ranged in molecular weight from 138 to 353 and differed widely in structure. Table I lists
(9) A measurable quantity of liquid having the original composition must remain, since a quantity of adsorbent in excess of that required to give some separation of the entire charge would be incapable of changing the degree of separation, and therefore would be incapable of exhibiting its separation power.(10) R. W . Schiessler and F. C. Whitmore, Ind. Eng. Chem., 47, 1660 (1955).
The JournaTof Physical Chemistry

Adsorption Separation Factors of Liquid Hydrocarbon M ixtures 791
Table I : High Molecular Weight Hydrocarbons“
PSUno. Name Structure Mol wt
Reported“n25D
25 9-n-Oetylheptadecane Cs C Cg C8
352.7 1.4468
196 6-n-Octylperhydrobenz-(de)anthracene
343.6 1.5063
575 Perhydrochrysene 246.4 1.5194
500 7-n-Hexyltridecane c6— Ç—c6 268.5 1 4389
556 2,2,3,3,5,6,6-Heptamethyl-heptane
C6c c c c
c—c—c—c—c—c—c 1 1 1c c c
198.4 1.4440
531 n-Tetradecane n—Cu 198.4 1.4269
111 l-Cyclopentyl-4(3-cyclo-pentylpropyl)dodecane
[ > c3- c- cK ]C8
348.6 1.4688
19 l-Cyclohexyl-3(2-eyclo-hexylethyl)hendecane
<jT>—c2- c —c2—c8
348.6 1.4738
18 l-Phenyl-3(2-phenyl- ethyl) hendecane cw^o
C»336.5 1.5173
87 9(2-Phenylethyl) hepta- decane
{ ^ y ~ c2—ç—c„c8
r*
344.6 1,4787
559 1-a-N aphthylhendecane
c282.5 1.5379
567 1-Methylnaphth alene OÒ 142.2 1.6150
569 c-is-Decahydronaphthalene 03 138.2 1.4789
“ See ref 10.
the hydrocarbons, their molecular weights, reported refractive indices, and shows the carbon skeleton structures. All of the hydrocarbons, with the exception of 6-n-octylperhydrobenz (de) anthracene (PSU 196), have melting points below 25°, which was the temperature employed for the separation studies. PSU 196 is a mixture of isomers and is normally a supercooled liquid at ambient temperature. The data from several PSU 196-PSU 25 mixtures with silica gel indicated partial crystallization of PSU 196.
Similar evidence of crystallization was not found with alumina.
Volume Fraction-Refractive Index Relationship. A refractive index-composition diagram was evaluated for each pair of hydrocarbons since the refractive index was the property used to analyze the equilibrium binary liquid mixtures. Eight to ten mixtures were prepared by weighing the individual pure components to the nearest 0.1 mg and mixing thoroughly with the aid of heat. The refractive index of the binary mixture
Volume 70, Number 8 March 1966

792 Carleton N. R owe and Robert W. Schiessler
was determined using a five-place Valentine refractom- eter having a precision of ±0.00002 unit. The composition of the mixtures in volume fraction units was calculated from the weights of the components and their densities. The experimental volume fraction and refractive index data were fitted to a three-constant equation by the method of least squares
V = A{nY + B(n) + C (18)
where V is the volume fraction of component preferred by the adsorbent, n is the experimental refractive index, and A, B, and C are constants.
For those binary mixtures where volume change upon mixing was appreciable, a density-volume fraction diagram was approximated from the equation
i ¿¿a — dBA d = —------ -A n (19)nA — nB
where Ad is the deviation of density from linearity with composition, dA and dB are the density of components A and B, nA and nB are refractive indices of components A and B, and An is the deviation of refractive index from linearity with composition. The true density of a given composition approximately equals the algebraic sum of Ad and the density computed assuming volume additivity.
Static Method. Six to eight 1-cc binary liquid mixtures of varying compositions were prepared in small screw-cap vials lined with aluminum foil to give a tight seal. The refractive indices were determined to a precision of ±0.00002 unit. The liquid mixtures were weighed to the nearest 0.1 mg. Approximately 0.5 g of adsorbent weighed to the nearest 0.1 mg was added to the mixtures. The vials and contents were placed in a desiccator which in turn was placed in a constant-temperature box at 25.0 ± 0.5°. An equilibration time of 4 hr with intermittent manual shaking was found to be sufficient for equilibration.
After equilibration, the refractive index of the equilibrium phase was determined, and the composition in volume fraction units was determined using eq 18. On the average, depending upon the difference in the refractive indices of the pure components, a precision of 0.00001 refractive index unit was equivalent to approximately 0.0001 volume fraction unit. The experimental data were linearized according to eq 2, and the selective adsorbent capacity was determined from the slope and the separation factor from the intercept.
Dynamic Method. Approximately six binary liquid mixtures of varying compositions 6 to 7 cc each were passed through columns containing 50 g of adsorbent. The columns were 8-mm i.d. and 100 cm long. The
direction of flow was upward, and the rate of flow was controlled by a pressure head of desorbent in a parallel column. Rates of flow were 0.1 cm/min. Fractionally distilled methylene chloride (Fischer) was used as the desorbent.
The refractive indices of the fractions were determined, and the compositions were evaluated according to eq 18. The volume of component B transported (vb) was determined graphically by plotting volume fraction of A vs. volume per cent of charge. (Theoretically vA = vB, but experimentally vB is the more precise since vA may be in slight error due to the presence of desorbent.) The experimental data from all the column runs in the study were linearized according to eq 17, and both the separation factor and the selective adsorbent capacity were evaluated from the intercept and slope, respectively.
Results and DiscussionsLow Molecular Weight Hydrocarbons. Table II
lists the separation factors and selective adsorbent capacities for toluene/n-heptane systems on alumina and silica gel at —80 and 25°. The reproducibility is considered good. Graphs of representative studies according to eq 2 are shown in Figures 1 and 2, demonstrating the constancy of the separation factor (a) and the selective adsorbent capacity (z) over a wide concentration range.
For either adsorbent the separation factors are almost three times higher at the lower temperature, while the selective adsorbent capacity is evidently
Table II: Toluene-re-Heptane Systems
-------Alumina----------- - ✓----------------- Silica gelExpt Z, Expt Z,
no. a cc/g no. a cc/g
Temp 25°l 7.7 0.062 l 14.3 0.2612 7.7 0.0653 8.4 0.0604 9.0 0.0595 6 .9 0.0666 7.9 0.062
Av 7.9 0.062(± 0 .5 ) (±0.002)
Temp 1 GO O o
1 20.8 0.066 l 39.5 0.2612 16.2 0.069 2 41.7 0.2673 21.1 0.068 —4 22.8 0.058 Av 40.6 0.264
— (± 1 .1 ) (±0 .003)Av 20.2 0.065
(± 2 .0 ) (±0.004)
The Journal of Physical Chemistry

Adsorption Separation Factors of Liquid Hydrocarbon M ixtures 793
Figure 1. Toluene-n-heptane on alumina: •, T = -8 0 ° ; O, T = 25°.
Figure 2. Toluene—«-heptane on silica gel:•, T = -8 0 ° ; O, T = 25°.
independent of temperature. The thermodynamic properties will be discussed later.
The results with silica gel at 25° may be compared with data by other workers. “ Static” method equi
libria data by Lombardo11 were fitted to eq 2 in this study. The calculated values from Lombardo’s data are 14.5 for a and 0.264 cc/g for z, which check our results shown in Table II. Klinkenberg8 has fitted the toluene-n-heptane data of Hirschler and Mertes6 to eq 12 and found 20.5 and 0.28 cc/g for a and z, respectively. Klinkenberg also used an indirect method of plotting, which involves the use of the law of conjugate diameters of conic sections, to determine a and z. He found 18.5 and 0.28 cc/g for a and z, respectively, by this method. These comparisons with the results in Table II illustrate the utility and reproducibility of the method as well as the apparent uniformity in silica gels.
Table III gives the results for methylcyclohexane- n-heptane systems on both alumina and silica gel. The methylcyclohexane was preferred by the alumina, whereas an S-type diagram was observed on silica gel. An S-shaped plot of eq 2 is observed when one component is preferred by the adsorbent over a portion of the concentration range while the other com-
Table III: Methylcyclohexane-re-Heptane
Alumina Silica gel“(dynamic method) (static method)
Preferred Z, Z,
component a cc/g a co/g
Methylcyclo- 2.0 hexane
0.017 2.2 0.066
n-Heptane 2.5 0.057
“Composition of inseparable mixture = 0.59 to 0.60 volumefraction methylcyclohexane.
ponent is preferred over the remaining portion of the concentration range. The composition of the inseparable mixture on silica was about 0.59 to 0.60 volume fraction of methylcyclohexane and this composition was considered as a single component for calculating a and z. It is probably coincidental that the separation factors on both adsorbents have the same numerical value. A comparison of the selective adsorbent capacities of the above system with those of the toluene-n- heptane system indicates the dependence of the selective adsorbent capacity on toluene’s electron configuration. The pore volume or “ adsorbent” capacity determined by vapor phase equilibration with alumina was 0.192 cc/g for both pure n-heptane and pure methylcyclohexane. Thus it is obvious that the selec-
(11) R. J. Lombardo, Ph.D. Thesis, The Pennsylvania State University, 1951.
Volume 70, Number 8 March 1966

794 Carleton N. R owe and R obert W. Schiessler
Table IV : Separation Factors ( a ) and Selective Adsorbent Capacities (z) for Some Systems ofHigh Molecular Weight Hydrocarbons on Alumina and Silica Gel
PSU no.-System-
Structures
19*25 ( s) - c2- c- -c h 5 ) /556-531
¡ 1 I Ic—c—c—c—c—c—cc c
-Alumina- -Silica gel-
Method“ a
Z,
o c / e bZ,
a c e / e b
s 1.8 0.076 S-type diagram"
s 2.8 0,051 S-type diagram
D 1.5 0.046PSU 25 preferred
from vol fctn 0.1 to 0.9
D 2.9 0.011PSU 25 preferred
from vol fctn 0.1 to 0.9
D 3.6 0.013 S-type diagram
S 15.3 0.100 28.8 0.277
s 7.4 0.089 13.0 0.297
s 3.1 0.130 9.0 0.233
s 15.0 0.097 27.6 0.310
s 17.4 0.058 28.5 0.247
“ S = static; D = dynamic. b Adsorbent capacity in cubic centimeters of liquid selectively adsorbed per gram of adsorbent. e “ S- type diagram” is one in which one component is preferentially adsorbed at one end of composition range, and the other component is preferred at the other end of the mixture range. The cross-over composition cannot be separated by the subject adsorbent in such systems.
tive adsorbent capacity bears no simple relationship to pore volume.
High Molecular Weight Hydrocarbons. Separation factors and selective adsorbent capacities on alumina were determined for ten binary mixtures comprising 13 high molecular weight hydrocarbons, and on silica gel for five binary hydrocarbon mixtures. Figures 3 and 4 show the results for l-phenyl-3(2-phenylethyl)- hendecane-9-n-octylheptadecane on alumina and silica
gel, respectively, which are typical of the results obtained for unsaturate-saturate systems. Figure 5 shows the results for perhydrochrysene-7-re-hexyl- tridecane on alumina, which is typical of the precision obtained for saturate systems. All the plots are linear in the concentration range studied.
Table IV shows the binary systems studied, the corresponding separation factors, selective adsorbent capacities, and the method used for their determina-
The Journal of Physical Chemistry

Adsorption Separation Factors op Liquid Hydrocarbon M ixtures 795
Figure 3. l-Phenyl-3(2-phenylethyl)hendecane- 9-n-octylheptadeeane on alumina.
Figure 4. l-Phenyl-3(2-phenylethyl)hendecane- 9-n-octylheptadeeane on silica gel.
tion on alumina and silica gel. The hydrocarbon listed first in each binary system is the component preferentially adsorbed over the composition range studied for those systems for which values are listed.
Figure 5. Perhydrochrysene-7-n-hexyltridecane on alumina.
The static method values are the average from two or more experiments. Averaged over all mixtures, the reproducibility of the separation factor (a) was 5.6% for both alumina and silica gel. The average reproducibility of the selective adsorbent capacity (2) was 6.2% on alumina and 2.3% on silica gel. The dynamic method values are from a single study, but are considered to be reasonably precise because the values calculated from the net volume transported of either component are in agreement. Three of the saturated hydrocarbon systems exhibited S-type diagrams with silica gel, while for the remaining two the component preferred by silica gel was not the one preferred by alumina. If an S-type diagram existed in any of the systems for which values are listed, the inseparable mixture composition must be very close to the pure nonpreferred component, since an S-type diagram would have led to departure from linearity in the plots obtained.
The separation factors in Table IV range from 1.5 to 17.4 on alumina, and from 9.0 to 28.8 on silica gel. The selective adsorbent capacities vary from 0.011 to 0.130 cc of liquid/g of adsorbent for alumina (a12-fold difference), and from 0.233 to 0.310 cc of liquid/ g of adsorbent for silica gel. It is very significant that the selective adsorbent capacity (2) is not a constant for different systems, as was indicated by the vapor phase equilibrium data for liquids. A second important observation is that a and 2 do not appear to be related,
Volume 70, Number 3 March 1966

796 Carleton N. R owe and R obert W. Schiessler
even for systems of similar size molecules. The following qualitative correlations may be made between hydrocarbon structure and values of a and z.
A comparison of binaries 196-25 and 575-500 is interesting because of the structural relationships (Table IY). The separation factors (a) on alumina are1.8 and 2.8 for binary 196-25 and binary 575-500, respectively. The lower value for the 196-25 system may be attributed to the dilution effect on the more strongly adsorbed fused ring nucleus of the n-octyl group in PSU 196 (6-n-octylperhydrobenz(de) anthracene). The selective adsorbent capacities (z) for 196- 25 and 575-500 are 0.076 and 0.051 cc of liquid/g of adsorbent, respectively. The higher z for 196-25 may again be due to the n-octyl group, which may protrude away from the surface and thus not occupy sites selective for the fused ring. For this reason a larger liquid volume of PSU 196 would be involved in occupying the same selective sites as for PSU 575. In fact, only 17 of the 25 carbons in PSU 196 are cyclo- paraffinic, and 17/ 26 of 0.076 is 0.051, the same as z for the 575-500 binary.
The separation factor of 3.6 for the 556-531 binary is surprising because it is the highest value for the five systems composed of saturated hydrocarbons. The high a is counteracted by the low value of 0.013 cc of liquid/g of adsorbent for z, resulting in less separation than that in the systems 196-25 and 575-500. Relatively few sites are selective for 556-531, but those that are selective have substantial power for giving separation. In contrast, the selective adsorbent capacity for the 575-500 binary is about 300% larger, but its separation factor is 22% less. A reasonable explanation is that the separation factor for a given site is greater for the 575-500 binary than for the 556-531 system, and because of this a greater number of sites are selective for the 575-500 system. However, the additional sites exhibit low separation factors and thus the over-all a is relatively lower. (The separation factor associated with a heterogeneous surface is believed to be a statistical average of the values of a greater than unity.)
A comparison of the 111-25 binary and the 19-25 binary is in effect a comparison of the cyclopentyl and cyclohexyl rings. The system containing the cyclopentyl groups (111-25) shows a value of z which is approximately four times that of the system containing the cyclohexyl groups (19-25), but has a value of a which is only half as large. Once again the system exhibiting the higher a exhibits the lower z. Since the cyclopentyl ring is essentially planar, possibly it can achieve a larger “ ordered” electron concentration than the cyclohexyl, giving it a greater adsorptive
potential, and thus increasing the number of sites which have some selectivity for it. Again, such additional sites probably would be of low relative selectivity, and the average a found would be less than the average a for binary 19-25. This large difference between cyclopentyl and cyclohexyl groups demonstrates that apparently small structural changes may cause large variations in adsorptive behavior.
The binaries 19-25 and 18-25 differ only in that the rings are benzenoid in the latter system. In going from cycloparaffinic to aromatic, the separation factor increases fivefold and the selective adsorbent capacity ninefold. The effect of electron density is to increase greatly the number of selective sites, and possibly to orient the molecule on the surface so that the saturated parts of the molecule tend to protrude from the surface, thus permitting a more compact film.
A comparison of binaries 18-25 and 87-25 on both alumina and silica gel shows that the separation factor for the diphenyl system is about twice that for the monophenyl system. Assuming no interaction of the molecules in each binary, this might be expected because the adsorbabilities of aromatic hydrocarbons 18 and 87 should be largely determined by the phenyl rings. A continuation of this reasoning would predict separation factors of 2 for binary 18-87 on both adsorbents, whereas the experimental values are 3.1 and 9.0 for alumina and silica gel, respectively. The selective adsorbent capacities for the systems 18-25, 87-25, and 18-87 do not show the same trend on both adsorbents. The significance of this variance and of the trends shown on the respective adsorbents is unknown.
The separation factors for binaries 559-25 and 567- 569 are nearly equal on each adsorbent. The values of z for 559-25 are greater than for 567-569. This difference may again be attributed to the n-undecyl group protruding from the surface.
Relative Separation Power of Silica Gel and Alumina. Table Y shows the ratio of the separation factors on silica gel to those on alumina to be a constant of 1.78 (± 4 % ) for all of the mixtures in which one component was partly aromatic and the other a saturated hydrocarbon. The single system in which both components were partly aromatic gave a ratio which differed from the constant mentioned. This correlation indicates that, having determined the a for a specific binary system on one of these adsorbents, the a for the other adsorbent may be estimated with an expected precision of about 4%. It also suggests that this simple relationship could be used to relate the discriminating power of adsorbents to some “ standard” adsorbent for a given
The Journal of Physical Chemistry

Adsorption Separation Factors of Liquid Hydrocarbon M ixtures 797
Table V : Comparison of the Separation Factors between Silica Gel and Alumina
System Silica gel Alumina-------Ratio------*“ SiO s/“ AI2O1
% Deviation from average
^ ^— Ci— Ç— Ca / C8— Ç— Ct
C8 / Cg
7.9 1.81 1.7
15.0 1.84 3.4
17.4 1.64 7.8
15.3 1.88 5.6
7.4 1.75 1.7
Av 1.78 4.0
hydrocarbon-type system. An analogous relationship was not found for selective adsorbent capacity.
Thermodynamics of the Toluene-n-Heptane System. Table II lists the results of a brief study of the effect of temperature on the separation factor for the toluene- n-heptane binary. Assuming AH constant over the temperature range —80 to 25°, AF, AH, and AS were calculated according to eq 13, 14, 15 and are listed in Table VI. As previously stated, these equations are valid only when both molecular species have about the same cross-sectional area on the adsorbent’s surface.
The differences in the free energy change at the two
Table VI : Thermodynamic Properties of Toluene-n-Heptane Systems
Property AluminaSilica
gel
A F at — 8 0 ° , eal/m ole - 1 1 5 0 - 1 4 2 0A F at 2 5 ° , ca l/m ole - 1 2 2 0 - 1 5 8 0AH , cal/m ole - 1 0 2 0 - 1 1 4 0AS at — 8 0 ° , eu /m ole 0 .6 7 1 .4 5
AN at 2 5 ° , eu /m ole 0 .6 7 1 .4 7
temperatures on either adsorbent are small. The heats of the displacement reaction on the two adsorbents are similar, with the reaction on silica gel being slightly more exothermic. The entropy changes are positive, indicating an increase in “ randomness,” and apparently are constant with temperature for each adsorbent. The entropy increase in the system containing silica gel is approximately twice that of the system containing alumina. This can be interpreted as follows: the displacement reaction, as formulated above, considers the initial liquid phase to be pure component A (which is the component to be preferentially adsorbed), and the initial adsorbed phase to be pure componentB. Thus the displacement of the nonpreferred component by the preferred component on the adsorbent’s surface causes mixing in both adsorbed and liquid phases, increasing the “ disorder” of the system. Silica gel, exhibiting higher separation power than alumina, produces a higher degree of mixing, reflected then in a higher entropy increase than for alumina.
Acknowledgment. The authors are grateful to the American Petroleum Institute for the funds which made this study possible,
Volume 70, Number 3 March 1966

798 A. N. Hughes, M. D. Scheer, and R. K lein
The Reaction between 0 ( 3P) and Condensed Olefins below 100 “K 1
by A. N. Hughes, Milton D. Scheer, and Ralph Klein
National Bureau of Standards, Washington, D. C. 20234- (Received September 20, 1965)
The addition of oxygen atoms to condensed simple olefins has been studied in the 77 to 90°K temperature range. The ground-state 0 ( 3P) atoms were generated in the gas by dissociation of 0 2 on rhenium or tungsten surfaces heated to 2300°K. At 90°K and oxygen pressures below 40 mtorr, the major products were found to be the unfragmented epoxides and carbonyls. Above 50 mtorr, ozonides and oxygenated products characteristic of rupture at the double bond were observed. Above 100 mtorr only the ozonides and their fragments were produced. At 77°K, the ozonolysis reaction occurred at much lower oxygen pressures. Comparison of these results with those obtained in the gas phase at 300°K indicates that the low-temperature environment efficiently removes the excess energy from the excited biradical formed in the primary act of O atom addition to the double bond. In all cases studied, fragmentation was less extensive than the comparable gas phase process.
A number of techniques have recently been used to study the gas phase addition of O atoms to olefins.2 Avramenko and Kolesnikova have generated O atoms by electrical discharge through flowing 0 2 and Cvetano- vié and co-workers have used the photolysis of N 02 and the mercury-photosensitized decomposition of N20 in static systems. Different primary processes for the reaction of O atoms with olefins have been proposed by the two groups of workers, but Cvetanovic has shown that primary products may be removed by secondary reactions when 0 2 of N 02 are present in excess. Hence, the most comprehensive information about the primary process has been obtained using the N20 source.
Cvetanovié has shown that 0 ( 3P) atoms add to olefinic double bonds to form biradicals which rearrange to isomeric epoxides and carbonyl compounds. The latter are formed with about 90 and 115 kcal/ mole excess energy, respectively. Both the biradical and the hot molecules derived from it also spontaneously decompose into radical fragments. The hot molecule fragmentation can be largely suppressed by increasing the total gas pressure. At high pressure, it is only significant in the case of O atom addition to ethylene and propylene, in which the effective number of oscillators in the excited molecule is small. The direct fragmentation of the biradical is not sup
pressed even at high pressures on account of the extremely short lifetime of the biradical.
To investigate further the primary process in the O atom-olefin reaction, a cryogenic technique has been developed in which ground-state, thermalized O atoms, generated in the gas phase, react with thin films of solid olefin in the 77-90°K temperature range. This technique was first used by Klein and Scheer3 in their study of the H atom-olefin addition reaction. It offers a number of advantages in the study of primary processes of low activation energy. Not only are competing and secondary reactions of high activation energy excluded, but energetic intermediates are rapidly deactivated by transfer of excess energy to the solid matrix.
The dissociation of 0 2 on an incandescent metal surface provides a convenient gas phase source of 0 ( SP) atoms for reaction with olefins condensed on a nearby cold surface. A recent mass spectrometric determination of the products of very low-pressure oxidation of tungsten4 has shown that, while a number of 1 2 3 4
(1) Supported by the United States Public Health Service.(2) The subject has been fully reviewed by R. J. Cvetanovic, Advan. Photochem., 1, 115 (1963).(3) R. Klein and M . D. Scheer, J. Phys. Chem., 66, 2677 (1962).(4) P. O. Schissel and O. C. Trulson, J. Chem, Phys., 43, 737 (1965).
The Journal of Physical Chemistry

R e a c t i o n b e t w e e n 0 ( 3P) a n d C o n d e n s e d O l e f i n s b e l o w 100°K 799
tungsten oxides are formed at temperatures between 1400 and 2400 °K and vaporization of the metal occurs at temperatures greater than 2800°K, the predominant product of the interaction of low pressures of 0 2 and tungsten between 2400 and 2800°K is atomic oxygen. In the present work, O atoms have been generated by heating a tungsten ribbon to 2400°K in the presence of 10-140 mtorr of 0 2. Slow oxidation results in destruction of the ribbon under these conditions in about 10 min. Subsequently, rhenium at 2300 °K was shown to be an equally efficient O atom source, and since the rhenium ribbons lasted considerably longer than tungsten, they were used instead of tungsten for much of the experimental work reported here.
Experimental Section
The addition of O atoms to solid olefins at 77 and 90 °K was studied by exposing the olefin, uniformly condensed on the bottom of a conical 1000-cc Pyrex reaction vessel, to atoms produced on the incandescent ribbon. Figure 1 is a diagram of the apparatus. In order to prevent radiative heating of the hydrocarbon, the ribbon was not placed within direct line of sight of the olefin film. The ribbon (23 X 1 X 0.025 mm) was welded to heavy nickel leads, which were mounted in the vessel through Kovar glass seals, and was electrically heated by an alternating current of 9 amp from a 6-v source so that, when operating in vacuo, its temperature, as measured with an optical pyrometer, was 2300°K.
A layer of olefin (pure or diluted in an inert paraffin) was deposited on the 80-cm2 bottom surface of the reaction vessel by first immersing the surface in the refrigerant and then admitting the olefin at a pressure of ca. 100 mtorr. The total quantity deposited was about 20 nmoles. Gas mixtures were made up in a conventional greaseless vacuum line and pressures were measured with a diaphragm gauge. After deposition, the level of the refrigerant was raised to cool the entire vessel. The ribbon was then heated to 2300°K and 0 2 was admitted to the vessel to a predetermined pressure. The latter pressure, in the range 10-140 mtorr, was measured with a Pirani gauge which had been calibrated for 0 2 with a McLeod gauge.
Reaction was allowed to proceed for a measured time, usually 0.5 min, and the pressure was maintained constant by manual replenishment of the 0 2 from a reservoir. Reaction was terminated by turning off the ribbon current and pumping away the remaining 0 2. The reacted olefin film was vaporized before being transferred to a gas chromatograph for analysis. In some cases, the products were first transferred to a 40-cc (10-
cm path length) cell for infrared analysis and subsequently passed through the gas chromatograph.
Olefins and paraffin diluents were reagent grade whose low impurity levels were confirmed by analysis with an alumina column operated at 100°. The 0 2 was also of reagent grade, not further purified. The products of reaction were analyzed with Carbowax, ft/T-oxydipropionitrile, and bis [2 - (2 -methoxyethoxy)- ethyl] ether columns (operated between 0 and 40°) employing helium carrier gas and thermal conductivity detection. Products were identified by the coincidence of their retention times on more than one type of column with those of pure samples. Ozonides were prepared by the reaction of ozone with the solid olefin at 90 °K. Formaldehyde, which is not eluted from the columns used, was detected by its infrared absorption at 1743 cm-1. The identification of propylene ozonide was confirmed by the coincidence of its infrared spectrum with published data.6 Chromatograph sensitivities for the C4 ozonides were obtained by extrapolation of the linear dependence of peak area response upon molecular weight, which was shown to hold for the epoxide and carbonyl reaction products.
The role of ozonolysis during the reaction of O atoms with condensed olefins at 77-90°K was elucidated by treating ozone with the olefins under conditions in 5
(5) D. Garvin and C. Schubert, J. Phys. Chem., 60, 807 (1956).
Volume 70, Number S March 1966

800 A. N. H u g h e s , M. D. S c h e e b , a n d R. K l e i n
which no 0 atoms were present. Oxygen atoms were generated in the reaction vessel at 77°K, as described previously, in the absence of an olefin film. After switching the ribbon current off, the excess 0 2 was left in the vessel, together with any ozone formed in the reaction of 0 atoms with O2. Olefin was then deposited on the walls, which were maintained at 77 °K throughout. After a further 5-min reaction time, excess O2 and ozone were pumped away. The vessel was subsequently warmed to room temperature and its contents, containing the products of the olefin ozonolysis, were analyzed by gas chromatography. Alternatively, a low-temperature ozonolysis was studied by admitting a 3% mixture of 0 3 in 0 2 at a pressure of about 1 0 -mm to the reaction vessel in which an olefin film had been previously deposited at 77 or 90°K. After 1 0 -min reaction time, the remaining gas was pumped away and the condensed products were vaporized and analyzed by gas chromatography.
ResultsA preliminary survey showed that solid films of the
C2-C 4 olefins as well as m-2-pentene, all diluted 5:1 in propane, reacted with 0 atoms at comparable rates. The reactions were all studied at 90 °K with the exception of ethylene which reacted at 77 °K. Using films containing a total of 20 ¿unoles, sufficient product was obtained for accurate analysis by gas chromatography in a reaction time of 0.5 min. Propane was shown to be inert under these conditions.
Propylene and the 2-butenes were selected for detailed study. The experimental variables were (a) quantity of olefin deposited, (b) time of exposure to O atoms, (c) gas phase 0 2 pressure, and (d) temperature of the film, in the range 77-90°K.
Figure 2 represents the dependence upon reaction time of the product yields in the reaction of O atoms with pure propylene at 90°K with an 0 2 pressure of 30 mtorr. The solid curves show that the yields approach a limiting value as the reaction time is increased. The effect of diffusion in the solid matrix is illustrated by a comparison of the yields obtained by intermittent exposure of the film to O atoms under the same conditions (dashed lines). In the latter case, the film was exposed to O atoms for a 0.5-min interval and a 5-min pause during which the ribbon current was turned off and the 0 2 pumped away. These results suggest that the diffusion of propylene to the exposed surface which takes place during the 5-min interval is rapid enough to reestablish the initial surface concentration. A similar result has been obtained in the reaction of H atoms with propylene diluted with 3-methylpentane. 3 In the case of H atom addition to olefin, the products
----------------------------------------- ,-------------------------------------------.■5 I'O 1-5
(Fullcurves) DURATION of REACTION (M in)-------->
Figure 2. Time dependence of addition product yields for propylene (20 /¿moles) + O atoms at 90°K, Re ribbon at 2300°K, 80-cm2 film, 0.5-min reactions: X, propylene oxide; O, propanal; □, acetone; "O., acetaldehyde;+ , propylene ozonide.
0 2 PRESSURE (M ill ito r r ) - -----
Figure 3. Pressure dependence of addition products for propylene (20 ¿imoles) + O atoms at 90°K, Re ribbon at 2300°K, 80-cm2 film, 0.5-min reaction: X, propylene oxide; O, propanal; □, acetone; O, acetaldehyde;X X , propylene ozonide.
are very similar to those of the reactants. O atom addition, however, profoundly alters the physical properties of the reactants compared to the products, and the solubility of the oxygenated products in the
The Journal of Physical Chemistry

R e a c t i o n b e t w e e n 0 ( 3P) a n d C o n d e n s e d O l e f i n s b e l o w 100°K 801
------ — I *——— X ------------ x------------ x ----------------- -> -x0 40 80 120
0Z PRESSURE ( M i l l i t o r r l --------->
Figure 4. 0 2 pressure dependence of addition product yields for propylene (20 yumoles) + O atoms at 77°K, Re ribbon at 2300°K, 80-cm2 film, 0.5-min reaction: X, propylene oxide; O, propanal; X X , acetaldehyde; +, propylene ozonide (trace acetone unrecorded).
hydrocarbon matrix is expected to be low with slow diffusion rates.
Propylene. The products detected by gas chromatography in the reaction of pure propylene films with 0 atoms at 90 and 77 °K may be divided into two groups. They are, at low 0 2 pressure, propylene oxide, propanal, and acetone, while at higher 0 2 pressure, acetaldehyde and propylene ozonide. The 0 2 pressure dependence of the product yields is illustrated in Figures 3 and 4, which refer, to 90 and 77°K, respectively. In these and subsequent experiments, the time of O atom exposure was 0.5 min, and the quantity of olefin (or olefin plus diluent) was 20 /unoles. Infrared analysis showed that formaldehyde was also a product, comparable in yield to CH3CHO.
Figure 5a shows the results obtained in the reaction of a film containing propylene diluted 5:1 in 3-methyl- pentane. In this case, the propylene depletion during reaction was also measured and the material balance (Figure 5b) shows the quantities of propylene reacted and of products detected as a function of 0 2 pressure.
The “ high oxygen pressure products,” CH3CHO and the ozonide, are the same as the products obtained by the direct ozonolysis of propylene at 77-90°K. In the ozonolysis of pure propylene at 77°K, in which ozone was produced by generating O atoms for 0.5 min at an 0 2 pressure of 60 mtorr the subsequent addition
Figure 5. 0 2 pressure dependence of addition product yields for 20 /xmoles of 1:5 (propylene: 3-methylpentane) + O atoms at 90°K. (a): X, propylene oxide; O, propanal; □,acetone; t}, C H 3C H O ; +, propylene ozonide. (b) material balance: X , C 2 H 6 reacted; +, 2 C 3H 60 product; O , (ozonide + C H 3C H O ) .
of 20 ¿¿moles of olefin yielded CH3CHO and propylene ozonide (in a 2 : 1 ratio) as the only detectable products. In the ozonolysis carried out at 77 and 90°K using a 3% ozone-02 mixture as the ozone source, CH3CHO and the ozonide (in the ratio 1 :2 0 ) were again the only products detected.
2-Butene. The products at low 0 2 pressure in the O atom addition to frans-2-butene, diluted 5:1 in propane at 90 °K, were trans- and cfs-/3-butene oxide, methyl ethyl ketone, and isobutanal. The products at high 0 2 pressure were acetaldehyde and trans- and cfs-/3-butene ozonide (the trans :cis ozonide ratio was 2.0). The dependence of these product yields on 0 2 pressure is shown in Figure 6 . In the O atom addition to cfs-2 -butene, under the same conditions, the results were very similar to those obtained for the trans isomer. The main differences were that the rates of formation of the low-pressure products were smaller in the case of the cis isomer and the relative yields of these products were somewhat different. The relative product yields at an 0 2 pressure of 45 mtorr, were trans oxide: cis oxide: methyl ethyl ketone:
Volume 70, Number 3 March 1966

802
::° 1·0E
::-.....<.>:>00a:a.
0·5
O2 PRESSURE (Milli!orr)---
Figure 6. 0, pressure dependence of addition product yieldsfor 20 /lmoles of 1: 5 (trans-2-butene + propane) + 0 atomsat 9DoK, Re ribbon at 2300 oK, So-cm' film, D.5-min reactions:x, trans-{:I-butene epoxide; 0, methyl ethyl ketone; D.,0.5CH3CHO; 0, cis-tl-butene epoxide and isobutanal (1: 1);+, {:I-butene ozonide.
isobutanal: CHsCHO: ozonide = 1.0: 0.66: 0.86: 0.43:0.81 :0.17. The trans:cis ozonide ratio remained 2.0.
The low-temperature ozonolysis of the 2-buteneswas carried out using ozonized O2 as the ozone source.The only products detected were CHsCHO and theozonides. Assuming that part of the ozonide produced undergoes degradation to CHsCHO (2 molesof the aldehyde per mole of ozonide decomposed),the extent of such decomposition is measured by theratio 0.5CHsCHO/(0.5CHsCHO + ozonide). Thisratio had the values 0.24 and 0.58 at 90 0 K for theozonolysis of cis- and trans-2-butene, respectively. Thetrans: cis ozonide product ratios were 0.87 and 1.45.
Discussiono Atom Addition at Low O2 Pressure (0-4-0 mtorr).
A comparison of the products of reaction of 0 atomswith condensed propylene at 90 0 K with those obtainedin the gas phase at room temperature, either using theO2 discharge or the N20 decomposition source, illustrateseveral differences. Oxygen atoms produced in anelectrical discharge cause the breakdown of propylene,to CO, CO2, HCHO, CHsCHO, and CHsCOOH,due to the reaction of the primary adduct with excessO2 in the system. 2 In the reaction of 0 atoms fromN20, the primary adduct largely survives and forms theprincipal products, propylene oxide, propanal, and
The Journal of Physical Chemistry
A. N. HUGHES, M. D. SCHEER, AND R. KLEIN
acetone, but some decomposition occurs, as indicatedby the formation of such minor products as CO,CHsCHO, and C2H6• The latter product is attributable to the recombination of free methyl radicals.At 90o K, although excess O2 is present in the gas phase,the only products formed at low O2 pressures in the 0atom addition to condensed propylene are propyleneoxide, propanal, and acetone since the small CHsCHOproduction may be shown to be due to ozonolysis. 6
The formation of free alkyl radicals would be detectable by the presence of either radical dimer paraffinsor alkyl alcohols among the products. Alcoholshave been shown to result from the reaction of alkylradicals with added O2 in the N20 c.ecompositionstudies. Neither C2H 6 nor CHsOH nor their higherhomologs were detected in the present work. Thematerial balance (Figure 5b) verifies the completeconversion of the propylene consumed at low O2 pressures to the three primary products. Thus, in thecondensed phase, the primary product of the additionis effectively stabilized toward decomposition. Competing reactions of higher activation enf;rgy than theo atom addition, such as abstraction of H atoms fromG-H bonds, do not take place. In the case of abstraction from the paraffin diluents used, the resulting alkyland hydroxyl radicals would have a high probabilityof recombining to form alcohols, and tl:ese have notbeen observed.
The products of the 0 atom-propylene addition at900 K can be accounted for by the mechanism2
o. I
0+ CaH 6-CH3CHCH2 (Ia)
\6I .
CHsCHCH2 (lb)
(6) This has been verified by experiments in prog~ess in which thepyrolysis of N20 on incandescent rhenium has been used as a sourceof 0 atoms in the virtual absence of 02. In the addition of 0 atomsto cis-2-pentene at 114°K, at an N 2D pressure of 30 mtorr, theozonolysis products CH,CHO and C,H6CHO each constitute only2% of the total product yield.
R e a c t i o n b e t w e e n 0 ( 3P) a n d C o n d e n s e d O l e f i n s b e l o w 100°K 803
In the case of the 2-butenes, only one biradical intermediate is formed. This underoges H and CH3 transfer as well as ring closure
6 nI . / ° \
CH3CH—CHCH3- —*• CHaCH—CH • CH3CH3COCH2CH3(CH3)2CHCHO
By analogy, the nonterminal biradicals from propylene may also undergo CH3 transfer to form propanal but, as will be discussed below, this is probably unimportant at low temperatures.
The relative primary product yields obtained by Cvetanovic at 300 °K for propylene and cis- and trans- 2-butenes are compared with the present work at 90°K in Table I. At the low temperature, ring closure of
Table I : Comparison of Primary Products of O Atoms( 3P) + Olefin at 300 and 90°K
'— R ela tive y ield-------*Gas Solid
phase, phase ,a300° K , 9 0 °K , this
Olefin P rod u ct C v eta n ov ic5'■ w ork
Propylene Propylene oxide 0.5 0.56Propanal 1 0.5 0.38Acetone ) 0.06
irans-2-Butene Jrans-jS-Butene oxide 0.33 0.54ris-p-Butene oxide 0.15 0.04Isobutanal 0.21 0.04Methyl ethyl ketone 0.31 0.38
cis-2-Butene irares-/3-Butene oxide 0.26 0.35ris-0-Butene oxide 0.25 0.23Isobutanal 0.23 0.15Methyl ethyl ketone 0.26 0.27
a For oxygen pressures less than 30 mtorr.
the biradical is relatively favored over the H or CH3 transfer, and the low aldehyde yields from the 2 - butenes show that CH3 transfer is much reduced at 90°K. At 300°K it has been shown that the CH3 transfer is largely intermolecular, since much of it is suppressed with the simultaneous formation of CH3OH on adding excess 0 2. However, at 90°K no evidence for free methyl radicals has been obtained.
In the O atom addition to terminal olefins at 300°K, the low ketone : aldehyde ratio (ca. 0 . 1 for 1 -butene) has been taken to show that addition is strongly oriented toward the less-substituted carbon atom of the double bond. 2 For propylene at 90°K the ratio is 0.16. However, the ratio of the rates of reactions
lb and la may differ from this value if the probabilities of ring closure relative to H or CH3 transfer are different for the terminal and nonterminal biradicals.
At 300°K different and nonstereospecific ratios of cis and trans epoxides are obtained from the two isomers of 2 -butene, indicating that the rate of ring closure of the biradical intermediate is comparable with its rate of internal rotation. The results also show the trans biradical to be more thermodynamically stable than the cis isomer. The 90°K data are also consistent with partial equilibration of a rotating biradical, with the trans configuration relatively more favored than at 300°K. It also appears that the biradical obtained from the cis olefin is more susceptible to internal rearrangement than its trans isomer, perhaps because of the greater steric strain in the cis intermediate.
The dependence of product yields upon reaction duration, shown in Figure 2 , suggests, as has been argued in the case of H atom to solid olefin films, 3 that the O atom-olefin addition takes place on or near the exposed surface of the film and is rate-controlled by the solid phase diffusion of olefin toward the reaction site. Unlike the H atom-olefin addition at 90°K in which initially formed alkyl radicals undergo disproportionation and recombination reactions, there is no evidence for radical-radical interactions in the O atom-solid olefin additicn. In the reaction of O atoms with cfs-2-butene, diluted 5:1 in propane at 90°K, no frans-2 -butene was formed.
Products Obtained at Higher 0 2 Pressures. As the 0 2 pressure is increased above ca. 40 mtorr in the reaction of O atoms with propylene and 2-butene at 90 °K (Figures 3 and 6) the yields of primary addition products decrease and ozonides and carbonyl compounds are formed instead. The latter “ high-pressure” products are also the only products detected in the ozonolysis of these olefins at the same temperature. The products formed at low 0 2 pressure may be shown not to react further with O or 0 2 to form the high-pressure products since, as seen in Figure 2, the ratio of these two types of products is independent of reaction time in both the continuous and interrupted experiments.
The low-temperature ozonolysis experiments indicate both that 0 3 is formed under the conditions in which high-pressure products are obtained and that 0 3 reacts rapidly with olefins condensed at 77-90°K. The latter reaction must take place at the low temperature (rather than at some higher temperature during the vaporization of the olefin film after reaction) since any unreacted 0 3 would be pumped away prior to warming up the reacted film. The products of the
Volume 70, Number 8 March 1966

804 A. N. Hughes, M. D. Scheer, and R. K lein
ozonolysis consist of the ozonide and carbonyl compounds, the latter having carbon skeletons attributable to their formation by cleavage of the olefin at the double bond. (In the gas phase olefin- 0 3 addition, the initially formed ozonide is completely decomposed, primarily to the above-mentioned carbonyl compounds, but also to C 02, alcohols, acids, etc.7). Thus, the decreased production of primary products as the O2 pressure is increased can be explained by competition between the reactions of 0 atoms with olefin and with O2 (to form 0 3).
The formation of 0 3 from 0 + 0 2, which requires a third body, is not expected to take place in the gas phase at the low 0 2 pressures used in the present work. Ozone has been shown to be absent in electrically discharged 0 2 at room temperature at pressures up to 2 torr.8 However, 0 3 formation has been demonstrated both in solution and on surfaces at very low temperature, e.g., during 1849-A photolysis of 0 2 dissolved in liquid N29 and the deposition at 4°K of the products from discharged 0 2. 10
The material balance (Figure 5b) indicates that at high 0 2 pressures the reaction products are incompletely recovered, perhaps due to the formation of acids and peroxides which were not detected. It is likely that the decomposition of the ozonide takes place either as the film is being warmed up or when it is in the gas phase. Decomposition of the ozonide during the gas chromatographic analysis does not appear to occur, since the carbonyl compounds are also detected by infrared analysis and because the eluted ozonide peaks have a symmetrical shape.
Comparison of Figures 3 and 4 shows an increase of the yield of “ high-pressure” products relative to primary products as the temperature is reduced from 90 to 77 °K in the reaction of 0 atoms with propylene. It has also been observed that the ozonolysis of propylene and 2-butene by ozone is faster at 77 °K than at 90°K. These results would be expected if the adsorption of both 0 2 and 0 3 on the olefin film increases with decreasing film temperature. In this case, the rate of formation of 0 3, envisaged as being produced by a surface 0 + 0 2 reaction, would also be increased as the temperature is lowered.
Consequently, the reduction in primary product formation at 77°K, relative to 90°K, is due both to a reduced 0 atom-olefin addition rate and to a decreased availability of O atoms.
The rapid reaction of 0 3 with olefins at 77-90°K implies a very low activation energy for this process, and may be explained by the two-step ir-complex mechanism proposed in the case of the same reaction at room temperature.7 This involves an initial re
versible reaction to form an olefin-0 3 x complex which can subsequently rearrange to form the ozonide.
Secondary Reactions of the Biradical Intermediate. There are indications from the relative yields of both the primary and high-pressure products of the 0 atom- olefin reactions studied that the latter products are not solely produced by ozonolysis and that secondary reactions of the primary biradical take place under some conditions. The following points are of significance, with reference to Figures 3-6.
(a) The ratio of epoxide to carbonyl primary products decreases markedly as the 0 2 pressure is increased.
(b) The dependence of high-pressure aldehyde production upon 0 2 pressures shows that this product may be formed from more than one source. There is a significant increase in the high-pressure aldehyde: ozonide ratio over a small 0 2 pressure range just greater than the maximum in the primary product curves. The value of the aldehyde: ozonide ratio obtained in the ozonolysis of propylene and 2 -butene differed for the two methods of ozonolysis. For propylene ozonolysis at 77-90 °K under the conditions most nearly comparable to the 0 addition at high 0 2 pressure, CH3CHO: propylene ozonide = 0.05. In the case of O atom addition to propylene at high pressure at 77-90°K, the ratio was about 2.0.
(c) The trans:cis ozonide ratios obtained for the products of direct ozonolysis of cis- and irans-2 -butene at 90°K were 0.87 and 1.45, respectively. For the addition of O atoms at high 0 2 pressure, the ratio was 2.0 for both olefin isomers at 90°K.
It seems likely that under high-pressure conditions the biradical precursor of the epoxide undergoes reaction with O or 0 2 to form one or both of the high- pressure products and possibly other products undetected. The observation (a) suggests that the precursors of the epoxide and carbonyl primary product are different, as in the scheme
0 ( 3P) + olefin ■ [biradical] *
-»-biradical — (thermalized)
-»-carbonyl — ; (triplet)
epoxide
carbonyl(singlet)
This mechanism supposes that an initially formed ex
(7) T. Vrbaski and R. J. Cvetanovic, Can. J. Chem., 38, 1053 (1960).(8) J. T. Herron and H. I. Schiff, ibid., 36, 1159 (1958).(9) J. R. McNesby, J. Chem. Phys., 31, 283 (1959).(10) R. Klein, “ Stabilization of Free Radicals at Low Temperatures," National Bureau of Standards Monograph 12, U. S. Government Printing Office, Washington, D C., 1960.
The Journal of Physical Chemistry

K i n e t i c s a n d M e c h a n i s m o f t h e F l u o r i n a t i o n o f C o p p e r O x i d e 805
cited biradical can either be deactivated to a thermalized biradical or undergo fast internal rearrangement to carbonyl products. The thermalized biradical has insufficient energy to rearrange to carbonyl products but can form the epoxide by ring closure. The lifetime of the thermalized biradical may be sufficiently long for secondary reactions of the biradical with 0 or 0 2 to compete with epoxide formation.
A further test of the mechanism involves the reaction of 0 atoms with propylene dissolved in a fivefold excess of 3-methylpentane at 90°K, in which matrix it has been shown that diffusion of alkyl radicals and olefin molecules is hindered. 3 In this condition, the exposure time of a long-lived radical to gas phase or
surface-adsorbed 0 2 would be increased because of the reduced rate of diffusion of product biradicals away from the exposed surface. The results in Figure 5a show that the crossover of the epoxide and propanal product curves occurs at a lower 0 2 pressure than in the case of the reaction of undiluted propylene (Figure 3) at the same temperature, indicating that more efficient removal of the epoxide precursor occurs in the rigid matrix.
Acknowledgments. We wish to thank Drs. David Garvin, Dolphus E. Milligan, and Marilyn E. Jacox for technical advice and valuable discussion and Mr. Eugene Broadus for assistance in the experimental work.
The Kinetics and Mechanism o f the Fluorinatiom o f Copper Oxide. I.
The Reaction o f Fluorine with Copper(II) Oxide1
by Robert L. Ritter
Technical Division, Oak Ridge Gaseous Diffusion Plant, Union Carbide Corporation, Nuclear Division, Oak Ridge, Tennessee
and Hilton A. Smith
Department o f Chemistry, The University o f Tennessee, Knoxville, Tennessee (.Received September 24t 1965)
The kinetics and mechanism of the fluorination of spherical copper(II) oxide powder have been investigated in a totally enclosed thermobalance. The CuO powders employed were relatively uniform and spherical, with specific surface areas of 11.8, 18.6, and 25.8 m2/g . The reaction was found to take place by a diffusion-controlled mechanism at temperatures between 82 and 151° and at fluorine pressures between 40 and 800 mm. Possible mechanisms to explain the observed temperature and pressure dependence of the reaction rate are presented.
IntroductionThe literature abounds with kinetic investigations
of solid-gas reactions involving the oxidation of metals. However, the kinetics of the reaction of gases other than oxygen with solid material have received
relatively little attention, and the situation is even worse when one considers the reaction of a gas with a
(1) This document is based cn work performed at the Oak Ridge Gaseous Diffusion Plant operated by Union Carbide Corp. for the U. S. Atomic Energy Commission.
Volume 70, Number S March 1966

806 R obert L. R itter and H ilton A. Smith
solid other than a metal. It would be interesting to attempt to apply the existing theories of solid-gas reactions, most of which have been developed to explain the results of investigations of metal-oxygen systems, to a reaction involving a gas other than oxygen and a nonmetallic solid material. Fluorine is rapidly becoming a relatively common laboratory reagent, and much interest is currently being shown in its reaction with various materials. Accordingly, an investigation has been made of the kinetics of the reaction of fluorine with copper oxide powders. The fluorination of copper(II) oxide is reported in this paper; the kinetics of fluorination of copper(I) oxide will be presented in a subsequent publication.
The reaction of fluorine with CuO has been qualitatively studied by Haendler, et al.2 Stock CP CuO powder was used, undoubtedly of a relatively low specific surface area. The oxide samples were exposed to fluorine at temperatures between 300 and 500° and exhibited a maximum of 65% conversion to CuF2. The fluorine pressure and reaction time were not given. Haendler, et al. , 3 4~ 5 have also investigated qualitatively the reaction of fluorine with a series of metals and their oxides, including CdO, ZnO, NiO, T i02, Zr02, V20 5, SnO, and Sn02. Kuriakose and Margrave6'7 have recently described the kinetics of the reaction of fluorine with ZrC, ZrB2, HfC, and HfB2.
Experimental Section
Copper(II) Oxide Preparation. The CuO powders were prepared by thermal decomposition of malachite, a basic copper carbonate corresponding to the composition CuC 0 3-Cu(0H )2. The malachite was precipitated from aqueous solution using the method of Hsu.8 One liter of 1 .0 0 M CuS04 was mixed as rapidly as possible with an equal volume of 1.1 M KOH at room temperature. The initial precipitate was an extremely thick blue gel; after about 7 hr this had changed to a crystalline green precipitate and settled out. After a period of 24 hr, the precipitate was washed by decantation three times, filtered, dried at 110°, and pulverized with a mortar and pestle. It was identified from its X-ray diffraction pattern as malachite and had a specific surface area of 59.7 m2/g as measured by the nitrogen BET method.
The particle size and specific surface area of the CuO powder samples were controlled by varying the temperature at which the malachite was decomposed. The decomposition was performed in a glass tube, open to the atmosphere at one end. Water evolution was evident from each sample when the temperature reached about 150°, at which time the color of the powder began to darken. Samples were decomposed
at maximum temperatures of 360, 410, and 470° and possessed final specific surface areas of 25.8, 18.6, and 11.2 m2/g , respectively. Sample purity was determined to be better than 99.9%. Electron micrographs of the three powder samples are presented in Figure 1.
Fluorine. The fluorine employed in this investigation was commercial high-purity fluorine and analyzed99.3 mole % fluorine.
Apparatus. The thermobalance employed in this investigation was a totally enclosed continuously recording null-type balance suitable for use with corrosive gases under reduced pressures. Weights were added or removed from the beam in 50-mg increments by means of a manually operated pneumatic bellows system. Continuous recording of the weight change was achieved by means of a linear variable differential transformer as a sensing element, a modified Mauer amplifier, and a restoring solenoid. The input to the restoring solenoid was monitored on a Brown Elec- tronik recorder with a full-scale deflection of 50 mg.
The reactor and its associated furnace were located beneath the balance. During the reaction a small flow of fluorine was maintained through the reactor to purge out any by-product gases evolved by the reaction, thus keeping the fluorine partial pressure constant and reducing the possibility of formation of a gas phase diffusion block. A system of baffles in the reactor prevented this flowing stream of fluorine from affecting the measured weight changes. To reduce the possibility of the formation of a diffusion block in the powder bed, the bed depth was kept as small as was consistent with sufficient sample size. The reactor was heated by four separate heating elements which were automatically controlled to enable maintenance of a uniform temperature throughout the reactor within about ± 1 °. The pressure was automatically controlled to within ± 0 .1 mm.
Procedure. The CuO powder sample, weighing between 0.7 and 0.8 g, was placed in the sample pan and, following sealing and evacuation of the reactor, was dried at 300°. If the powder sample was initially exposed to fluorine at the desired elevated reaction temperature, a rapid surface reaction took place
(2) H. M. Haendler, et al., J . Am. Chem. Soc., 76, 2178 (1954).(3) (a) H. M. Haendler and W. J. Bernard, ibid., 73, 5218 (1951); (b) H. M. Haendler, et al., ibid., 74, 3167 (1952).(4) H. M. Haendler, et al., ibid., 76, 2177 (1954).(5) H. M. Haendler, et al., ibid., 76, 2179 (1954).(6) A. K. Kuriakose and J. L. Margrave, J. Phys. Chem., 68, 290 (1964).(7) A. K. Kuriakose and J. L. Margrave, ibid., 68, 2343 (1964).(8) C. T. Hsu, J. Appl. Chem. (London), 6, 84 (1956).
The Journal of Physical Chemistry

K i n e t i c s a n d M e c h a n i s m o f t h e F l u o r i n a t i o n o f C o p p e r O x i d e 807
which resulted in overheating of the particles and caused severe sintering to occur. To prevent this excessive overheating of the sample when exposed to fluorine, it was necessary to pretreat the sample as follows. When the sample had cooled to room temperature after drying, pure fluorine was admitted to the reactor at the desired pressure and the flowing stream was started. The resulting reaction rate was quite slow. The sample was then heated to the desired temperature. Using this technique, data collection could be started after the reaction was 3 to 5% complete.
Results and DiscussionTheory. In deriving the equations to be employed
for testing the data for obedience to the various kinetic laws, the following assumptions were made. (1) The equation of reaction between fluorine and CuO is
CuO + F2 — ► CuF2 + y«Os (1)
(2) The powders consist of uniform spherical particles of initial radius rt. (3) The fractional completion of reaction can be calculated from the weight-change data using the equation
AW F = --------
AWioo(2)
where AW is the observed weight change and AWioo is the theoretical weight change for complete conversion of the oxide to the fluoride as given by eq I.(4) The density of the solid product film is the equilibrium density as measured on bulk material, an assumption which is necessary to allow calculation of the coefficient of expansion for the reaction. (5) The solid product film is of uniform thickness, which implies that the reactant gas maintains free access to each spherical particle from all directions. (6 ) The true specific surface area of the powder is that determined experimentally by the BET9 method using nitrogen as the adsorbate. This assumption permits the calculation of the average particle radius from the equation
rs3 X 104
Ad(3)
where A is the specific surface area in square meters per gram, d is the solid density in grams per cubic centimeter, and rs is the particle radius in angstroms.
After the spherical particle has partially reacted, the radius of the solid reactant will have decreased to a value r0 and this solid reactant will be covered by a film of solid product of uniform thickness x. The gross radius, rg, of the particle will then be the sum of
the radius of the core of solid reactant and the thickness of the solid product film, i.e.
re = r0 + x (4)
Farrar and Smith10 have derived the relationships between these various radii and the fractional completion of reaction, F. These relationships are
r0 = n ( l - F ) l/3 (5)
re = fi[l + (J3 - 1 )F ] i/! = r,[l + cF]1'3 (6)
x = )'i[(L + cF)Vs - (1 - F ) 1/s] (7)
where (3 is the coefficient of expansion for the reaction, given by 0 = ( d o M p ) / ( d r M o ) (in which d o and d j ?
are the densities and Mq and M¥ are the molecular weights of the oxide and fluoride, respectively), and c = 13 — 1. For the conversion of CuO to CuF2, c = 0.685.
Early in this investigation it became obvious that the reaction rate did not decrease with time rapidly enough to exhibit obedience to any of the various forms of the logarithmic kinetic law or to the cubic kinetic law. Equations for testing the data for obedience to these laws were therefore not derived, and attention was concentrated on the form of the equations for the linear and parabolic kinetic laws.
The forms in which the equations for the linear and parabolic kinetic laws are usually written are
(8)
and
dx fcp di x (9)
respectively. These equations are valid only when ( 1 ) the interfacial area between the reacting species is constant, (2 ) the thickness of solid product is directly proportional to the quantity of reactant solid which has undergone reaction, and (3) the reaction is carried out at constant pressure. In general, none of these conditions are met in the reaction of a spherical particle, although the second condition would be fulfilled for the very rare reaction in which there is no expansion or contraction of the solid in the course of the reaction, i.e., where 0 = 1 .
Farrar and Smith10 have derived the relationship to be employed in testing the observed data for the re-
(9) S. Brunauer, P. H. Emmett, and S. Teller, J . Am. Chem. Soc., 60, 309 (1938).(10) R. L. Farrar, Jr., and H. A. Smith, J. Phys. Chem., 59, 763 (1955).
Volume 70, Number 3 March 1966

808 R o b e r t L. R i t t e r a n d H i l t o n A. S m i t h
action of a group of uniform spherical particles for compliance to the linear kinetic law. They started with the differential form of the law given by
dNpdt
= k-LdoP11 (10)
when No is the number of moles of oxide present, aa is the surface area of a single oxide particle, and P is the fluorine pressure. The final result of their derivation was the equation defining the linear function fi.(F)
h(F) = [1 - (1 - F)'h ] = (1 1 )doTi
This is the equation which was used in the present investigation to test the data for compliance to the linear kinetic law. A plot of the linear function, fl(F), vs . time at constant fluorine pressure should produce a straight line the slope of which would be inversely proportional to the initial particle radius.
In their derivation of the parabolic kinetic equation, Farrar and Smith10 made an assumption equivalent to setting jfl = 1 , and their final equation is valid only so far as this assumption is valid. Jander11 had earlier derived the same equation in his consideration of solid- state reactions.
The parabolic kinetic law arises when the rate-controlling reaction mechanism is the diffusion of one or more of the reacting species through the film of solid product. If such a diffusion mechanism were rate controlling in the present investigation, the rate of reaction would be determined by the rate of diffusion of the reaction species through a spherical shell of solid product with inner radius r0 and outer radius rg. Barrar12 has shown that this flux of the diffusing species is proportional to the quantity r0rg/(rg — r0). Beginning with the differential form of the diffusion- controlled kinetic law given by
dNp _ 47r/bpr0rgPn dt ~ rg — r0 ( '
Carter13 has derived the final equation given by
fr (F) = [(c + 1) - c(l - F )V! ( 1 + cF) v°] =2kvM0cPn
d 0ri2 1(13)
This equation was employed in the present investigation to test the data for compliance with a diffusion- controlled mechanism. A plot of the parabolic function, fp(F), vs. time at constant fluorine pressure should produce a straight line, the slope of which would be inversely proportional to the square of the initial particle radius.
l u11.2 m.2/9*
Figure 1. CuO powder samples.
Equations 11 and 13 have been derived with the assumption that the powders are composed of spherical particles of a uniform initial radius, rit The particles of the three powder samples used in this study approximated closely a spherical geometry (see Figure 1). To determine the validity of the assumption of uniform particles, the size of 500 particles of each of the powders was measured from the electron micrographs of Figure 1 and the average particle radius, f, was calculated from the resulting particle size distribution. The particle radius calculated from the specific surface area using eq 3 is given by
raJ 2 n tr i3_£____ (14)
where n, is the number of particles of radius r,. Thus, any nonuniformity of the particles will produce a value of rs biased toward the larger particles and will be reflected by a difference in the value of rs, calculated either from eq 3 or from the particle size distribution, and the value of f as calculated from the particle size
(11) W. Jander, Z. Anorg. Allgem. Chem., 163, 1 (1927).(12) R. M. Barrar, Phi2. M ag., 35, 802 (1944).(13) R. E. Carter, J. Chem. Phys., 34, 2010 (1961).
The Journal of Physical Chemistry

K i n e t i c s a n d M e c h a n i s m o f t h e F l u o r i n a t i o n o f C o p p e r O x i d e 809
distribution. The results of such a calculation are presented in Table I. It is seen that the value of f is significantly less than that of ra for each powder sample, indicating the particles to be somewhat non- uniform. The relatively good agreement between the value of rs calculated from the specific surface area and from the particle size distribution indicates the 500 particles used to determine the particle size distribution constituted a representative sample. The values of the initial particle radii, n, used to correlate the data for the three different powder samples, were the average radii, f, presented in Table I. The effect of the initial particle size distribution was also noted in the kinetic data collected at large fractional completions of reaction, where a decrease in reaction rate was observed. This was attributed to complete reaction of the smaller particles, effectively removing these from the reaction and increasing the initial particle radius applicable to the remaining portion of the run. For this reason, no kinetic data collected at fractional completions of reaction greater than 0.90 were employed in the correlation of the reaction rates.
Table I : Comparison of CuO Average Particle Radii Calculated from Specific Surface Area with Those Measured from Particle Size Distribution
Specificr8 calculated from specific Calculated from
surface area, surface area, /—-------size distribution--------m2/g A r8, A r, A
25.8 182 188 15718.6 252 246 21111.2 397 367 298
Early Reaction Stage. To initiate a fluorination run, the powder sample, after drying at 300° and cooling to room temperature, was exposed to pure fluorine at the desired pressure which, except in the runs to investigate the effect of fluorine pressure on the reaction rate, was 200 mm. The temperature was then increased to the desired level, usually 1 0 0 °, in a period of 3 to 4 hr. Reaction continued at a relatively slow rate until, after about 5 to 8 % completion of reaction, a period of rapidly increasing reaction rate was observed. A set of typical data is presented in Figure 2 where the thickness of the product film, calculated using eq 7, is plotted as a function of time. It is seen that each of the three powders entered this period of increased reaction rate after a fluoride film thickness between 10 and 15 A had been formed. Following this period of rapid reaction, the reaction rate decreased and
Figure 2. Product film thickness during initial reaction stage at 100° and fluorine pressure of 200 mm: O, 25.8 m2/g; □, 18.6 m2/g; A, 11.2 m2/g-
entered the period during which most of the kinetic data presented below were obtained.
Such sigmoid-shaped curves usually suggest occurrence of a nucleation phenomenon. However, such was apparently not the case here. To investigate this early reaction stage further, a run was made on the1 1 .2 -m2/g powder sample from which samples were removed after 1 0 hr of fluorination, before the accelerating rate period had been reached, after 17 hr, during the accelerating rate period, and after 37 hr, when the accelerating rate period had passed. Electron micrographs of these samples are presented in Figure 3. The presence of significant quantities of fine material and the appearance of several replicalike particles in the samples taken after 17 and 37 hr of fluorination suggest that the initially formed fluoride film may have disintegrated and peeled off, resulting in an increased reaction rate when the freshly exposed oxide surface encountered the fluorine gas.
The fluoride film formed during the remainder of the reaction remained intact, as is brought out below.
Volume 70, Number 8 March 1966
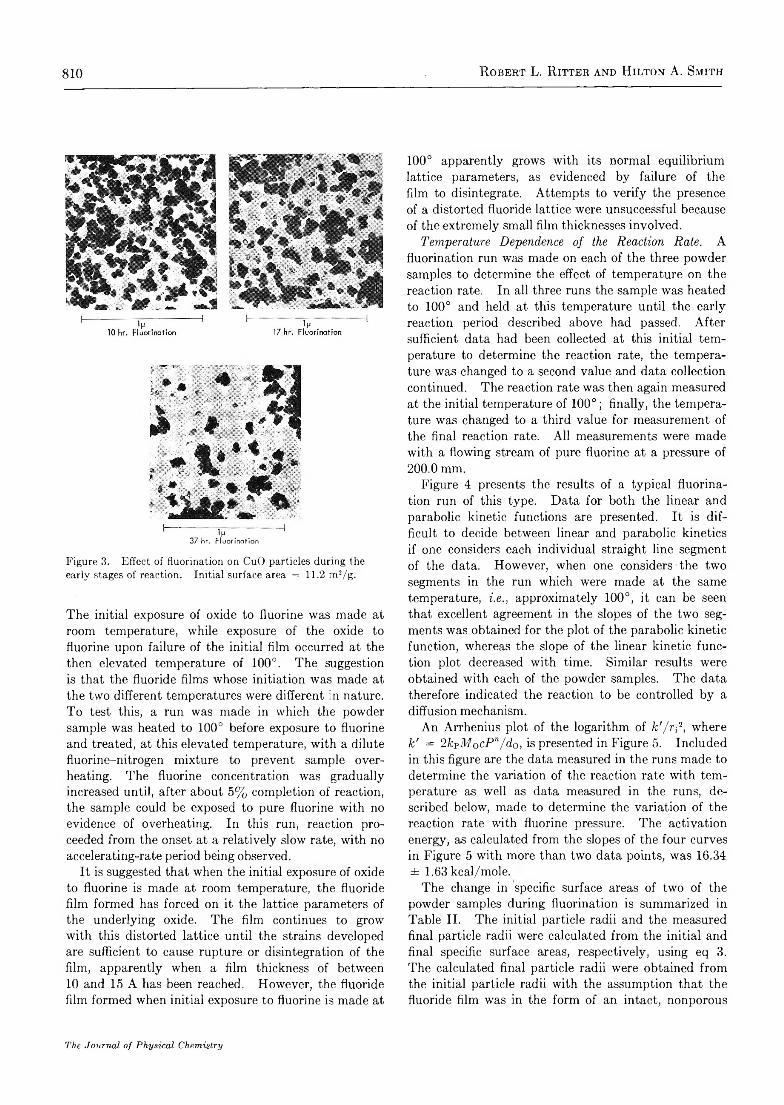
810 R o b e r t L. R i t t e r a n d H i l t o n A. S m i t h
37 hr. Fluorination
Figure 3. Effect of fluorination on CuO particles during the early stages of reaction. Initial surface area = 11.2 m2/g.
The initial exposure of oxide to fluorine was made at room temperature, while exposure of the oxide to fluorine upon failure of the initial film occurred at the then elevated temperature of 100°. The suggestion is that the fluoride films whose initiation was made at the two different temperatures were different in nature. To test this, a run was made in which the powder sample was heated to 1 0 0 ° before exposure to fluorine and treated, at this elevated temperature, with a dilute fluorine-nitrogen mixture to prevent sample overheating. The fluorine concentration was gradually increased until, after about 5% completion of reaction, the sample could be exposed to pure fluorine with no evidence of overheating. In this run, reaction proceeded from the onset at a relatively slow rate, with no accelerating-rate period being observed.
It is suggested that when the initial exposure of oxide to fluorine is made at room temperature, the fluoride film formed has forced on it the lattice parameters of the underlying oxide. The film continues to grow with this distorted lattice until the strains developed are sufficient to cause rupture or disintegration of the film, apparently when a film thickness of between 10 and 15 A has been reached. However, the fluoride film formed when initial exposure to fluorine is made at
1 0 0 ° apparently grows with its normal equilibrium lattice parameters, as evidenced by failure of the film to disintegrate. Attempts to verify the presence of a distorted fluoride lattice were unsuccessful because of the extremely small film thicknesses involved.
Temperature Dependence of the Reaction Rate. A fluorination run was made on each of the three powder samples to determine the effect of temperature on the reaction rate. In all three runs the sample was heated to 1 0 0 ° and held at this temperature until the early reaction period described above had passed. After sufficient data had been collected at this initial temperature to determine the reaction rate, the temperature was changed to a second value and data collection continued. The reaction rate was then again measured at the initial temperature of 1 0 0 °; finally, the temperature was changed to a third value for measurement of the final reaction rate. All measurements were made with a flowing stream of pure fluorine at a pressure of2 0 0 .0 mm.
Figure 4 presents the results of a typical fluorination run of this type. Data for both the linear and parabolic kinetic functions are presented. It is difficult to decide between linear and parabolic kinetics if one considers each individual straight line segment of the data. However, when one considers the two segments in the run which were made at the same temperature, i.e., approximately 1 0 0 °, it can be seen that excellent agreement in the slopes of the two segments was obtained for the plot of the parabolic kinetic function, whereas the slope of the linear kinetic function plot decreased with time. Similar results were obtained with each of the powder samples. The data therefore indicated the reaction to be controlled by a diffusion mechanism.
An Arrhenius plot of the logarithm of k'/r-,*, where k' = 2kpMocPn/do, is presented in Figure 5. Included in this figure are the data measured in the runs made to determine the variation of the reaction rate with temperature as well as data measured in the runs, described below, made to determine the variation of the reaction rate with fluorine pressure. The activation energy, as calculated from the slopes of the four curves in Figure 5 with more than two data points, was 16.34 ± 1.63 kcal/mole.
The change in specific surface areas of two of the powder samples during fluorination is summarized in Table II. The initial particle radii and the measured final particle radii were calculated from the initial and final specific surface areas, respectively, using eq 3. The calculated final particle radii were obtained from the initial particle radii with the assumption that the fluoride film was in the form of an intact, nonporous
The Journal of Physical Chemistry

K i n e t i c s a n d M e c h a n i s m o f t h e F l u o r i n a t i o n o f C o p p e r O x i d e 811
Time, hr.
Figure 4. Effect of temperature on the fluorination rate of CuO. Fluorine pressure = 200.0 mm; surface area = 25.8 m2/g; temperature as indicated.
layer of uniform thickness. The agreement between the calculated and measured final particle radii is good enough to indicate that the fluoride film possessed negligible porosity and did grow in the form of an intact, nonporous layer. This is additional evidence that the reaction rate was controlled by diffusion of the reacting species through a nonporous shell of CuF2. The agreement between the calculated and measured final particle radii could be improved even further by taking into account the fact that the effective initial particle radii were decreased during the initial stages of the reaction when the first formed fluoride film cracked and flaked off, but the uncertainties involved in the thicknesses of the initial films when they cracked off do not warrant such a refinement.
An additional test for a diffusion-controlled reaction mechanism is a consideration of the variation of the reaction rate with initial particle size. Equation 13 indicates that for a diffusion-controlled reaction the reaction rate should vary inversely as the square of the initial particle radius. Table III presents the results of such a calculation. The initial particle radii employed were the values of f as calculated from the
Figure 5. Arrhenius plot for the fluorination of CuO : A, 25.8 m2/g, P f2 = 200.0 mm; □, 18.6 m2/g, P f2 = 200.0 mm;O, 11.2 m2/g, P f2 = 200.0 mm; •, 11.2 m2/g,P f2 as indicated.
Table II : Comparison of the Initial and Final Particle Radii
Initial Cal- Meas-CuO Frac- Final culated ured
specific tional Final specific Initial final finalsurface conver- average surface particle particle particlearea, sion to density, area, radius, radius, radius,m2/g CuFs g/ec m2/g A A A
18.6 0.998 4.85 21.4 252 300 28911.8 0.934 4.95 13.8 397 472 439
particle size distributions of the initial oxide powders. The values of fc'/iq2 were read from the three curves of Figure 5 which were obtained at a fluorine pressure of 200 mm. It is seen that the agreement in 1;' is excellent at 1 0 0 °, and throughout the temperature range for the 25.8- and 18.6-m2/g samples. The larger values of k' for the 1 1 .2 -m2/g sample at the higher temperature is a reflection of the larger activation energy measured for that powder, from which the reaction rates of Table III were calculated. Indications are that this activation energy is actually substantially
Volume 70, Number 3 March 1966

812 R o b e r t L. R i t t e r a n d H i l t o n A. S m i t h
Table III: Variation of Reaction Rate with Initial Particle Radius
In itia lspecificsurface
In itia laverageparticleradius,
m‘/g A 100° 112°
25.8 157 1.991 X 10“ 3 3.503 X 10-318.6 211 9.910 X 10 “ 4 1.979 X 10~311.2 298 5.577 X 10~4 1.151 X 10⁻³
■k', A 4 h r " L125° 100° 112° 125°
6.821 X 10~3 49.1 86.4 1683.992 X 10~3 44.1 88.1 1782.101 X IO“ 3 49.5 102.2 213
lower since the activation energy measured in a later run on the 1 1 .2 -m2/g sample at a fluorine pressure of40.0 mm was in good agreement with those of the higher surface area samples. Use of this lower activation energy for the 1 1 .2-m2/g sample would give good agreement in k' for all three powder samples over the entire temperature range. This inverse relationship between the reaction rates and the square of the initial particle radii verifies the conclusion that the reaction exhibits a diffusion-controlled mechanism.
Pressure Dependence of the Reaction Rate. Three fluorination runs were made to determine the effect of fluorine pressure on the reaction rate. Two of these were made using the 1 1 .2-m2/g oxide sample at temperatures of 100.5 and 125.3°, and one using the 25.8-m2/g oxide sample at 100.5°. In each of these runs, the temperature was increased rapidly until the initial rapid reaction stage was completed; the temperature was then adjusted to the desired level. After sufficient data had been collected at an initial fluorine pressure, the pressure was changed to a different value and data collection continued. This procedure was repeated until termination of the run. Data from a typical run of this type are presented in Figure 6 . A plot of log k'/rf vs. the logarithm of the fluorine pressure is presented in Figure 7. The average slope of these curves is 0.54 ± 0.09. Thus, the reaction rate was found to be directly proportional to the square root of the fluorine pressure.
Such a pressure dependence can be explained by either of two possible mechanisms, depending on what is assumed to be the diffusing species. Fluorine atoms may diffuse inward through the fluoride film with subsequent reaction occurring at the CuO-CuF2 interface. The rate of diffusion, and therefore the reaction rate, would then be proportional to the fluorine atom concentration gradient across the fluoride film. If it is assumed that the actual reaction rate at the solid-solid interface is very rapid and that a fluorine atom reacts essentially instantaneously upon arriving at this interface, the effective concentration of fluorine atoms at the solid-solid interface is zero, or at least
Figure 6. Effect of fluorine pressure on the fluorination rate of CuO. Fluorine pressure as indicated; temperature = 100.5°; surface area = 25.8 m2/g.
extremely small. The reaction rate is then proportional to the fluorine atom concentration at the solid- gas interface. This in turn is proportional to the concentration of adsorbed fluorine atoms. If this concentration is controlled by an equilibrium of the type
F2 ^ 2F (15)
then it follows directly from the law of mass action that the concentration of adsorbed fluorine atoms, and hence the reaction rate, is proportional to the square root of the fluorine pressure. It should be noted that if fluorine atoms are the diffusing species, the above described mechanism requires removal of the liberated
The Journal of Physical Chemistry

K i n e t i c s a n d M e c h a n i s m o f t h e F l u o r i n a t i o n o f C o p p e r O x i d e 813
Figure 7. Variation of the fluorination rate of CuO with fluorine pressure: O, 11.2 m2/g, 125.3°; •, 11.2 m2/g, 100.5°; □, 25.8 m2/g, 100.5°.
oxygen by diffusion outward through the fluoride film and that this outward oxygen diffusion must be rapid enough not to be the rate-controlling factor in the reaction. One would expect the diffusion rate of an oxygen atom to be slightly less than that of a fluorine atom based on the slightly larger size of the oxygen atoms. However, since two fluorine atoms are required for the liberation of a single oxygen atom, the rate of removal of oxygen atoms by diffusion may be large enough to be in accord with the above proposed mechanism.
The other possible reaction mechanism is that the copper(II) and oxide ions diffuse outward through the fluoride film with the subsequent reaction occurring at the solid-gas interface. The surface reaction may be written
0 2- + 2F — > 2F - + V 2O2 (16)
As this reaction occurs at the surface through the migration of O2- ions through the CuF2 film, vacant oxide ion diffusion sites are produced in the bulk CuF2. The newly formed fluoride ions generated by the above reaction subsequently react with Cu2+ ions and be
come part of the CuF2 lattice, thus producing vacant Cu2+ ion diffusion sites in the bulk CuF-. An equilibrium is set up at the surface which may be representedasF2 ^ 2 F ^ CuF2 (as Cu2+ and 2F~) +
C u d 2+ + 0 D2- + y 20 2 (17)
where CuD2+ and On2_ represent vacant diffusion sites in the CuF2. The equilibrium constant for this reaction may be written
K =[Cua 2+][0 D2-][0 i
[Ft]
l'A(1 8 )
Since the liberated oxygen is swept away by the fluorine stream, the oxygen will assume a constant pressure. In addition, to preserve electrical neutrality, the number of vacant copper ion and oxygen ion diffusion sites formed by reaction 17 must remain equal. Hence the equilibrium relationship may be reduced to
K ' =[Cun 2 + ]2
[F.](19)
[Cua2+] = K 'P 'h (2 0 )
Thus, since the diffusion rate is controlled by the concentration of available or vacant diffusion sites, it follows from eq 2 0 that the reaction rate is directly proportional to the square root of the fluorine pressure.
Over-all Reaction Rate Constant. A total of 28 experimentally measured reaction rates was determined. If one assumes the form of the equation for the reaction rate constant to be the familiar Arrhenius equation
fcP = A e - * H/RT (21)
and substitutes the values for AH reported above, it is possible to calculate an average value for the constant A. The resulting equation for the diffusion- controlled reaction rate constant, fcp, as defined in eq 1 2 is
fcP = (7.199 ± 0.259) X 10-16e~16'34O/i:r (22)
where fcp is in moles A - 1 hr- 1 (mm) ~ l/\
ConclusionsThe reaction rate of fluorine with spherical particles
of CuO was found to be controlled by the diffusion of the reacting species through a solid spherical shell of CuF2. Evidence for this was threefold: (1) the data exhibited excellent obedience to the kinetic equation derived on the assumption that the reaction rate was controlled by such a diffusion, (2 ) the fluoride film was intact and nonporous, and (3) the reaction rate was inversely proportional to the square of the
Volume 70, Number 8 March 1966

814 S. L i n d e n b a u m
initial particle radius. The data collected in the early stages of reaction exhibited anomalies which were apparently caused by the cracking and flaking off of the initially formed fluoride film. It is believed that this was the result of initial exposure of the oxide to fluorine at room temperature rather than at the elevated reaction temperature.
The reaction rate was proportional to the square root of the fluorine pressure. Since this pressure dependence can be explained by assuming either fluorine atoms or copper ions to be the diffusing species, the data do not allow identification of the diffusing species.
Acknowledgments. The authors wish to express their appreciation to Drs. H. A. Bernhardt and R. M. McGill of the Oak Ridge Gaseous Diffusion Plant, Union Carbide Corporation, Nuclear Division, for their helpful suggestions during the course of this work. The authors are indebted to Mr. J. W. Grisard, who designed and constructed the thermobalance employed in this investigation. Thanks are also extended to Mr. T. W. Bartlett, who prepared the electron micrographs associated with this work, and to Mr. P. G. Dake, whose Powder Analyses Group furnished the required surface area measurements.
Thermodynamics of Aqueous Solutions of Tetra-n-alkylammonium
Halides. Enthalpy and Entropy of Dilution1
by S. Lindenbaum
Chemistry Division, Oak Ridge National Laboratory, Oak Ridge, Tennessee 37831 (Received September Si, 1965)
Heats of dilution of tetramethyl-, -ethyl-, and -n-propylammonium chloride, bromide, and iodide and tetra-n-butylammonium chloride and bromide were measured at 25° from near saturation to 0.2 to, or lower, to final concentrations of less than 0.003 to. The apparent molal heat contents, <j>L) were combined with the previously reported free energy data (osmotic and activity coefficients) to obtain the excess apparent molal entropies. A comparison of the apparent molal free energy, enthalpy, and entropy reveals that the values of the free energy are small compared to the enthalpy and entropy. It is suggested, therefore, that structural inferences drawn from free energy information alone can be misleading and that structural models describing these solutions must account for the very pronounced entropy and heat effects observed.
IntroductionIn a recent paper from this laboratory,2 osmotic and
activity coefficients of tetraalkylammonium halides at 25° were reported. It was found for dilute solutions of the chloride salts that the osmotic coefficients increased with the size of the cation, whereas for the bromides and iodides the reverse order was obtained. This reversal had been noted previously3,4 for measurements of dilute solutions of these salts at the freezing
point. Data at higher concentrations2 yielded osmotic coefficient curves which crossed each other in a 1 2 3 4
(1) Presented before the Division of Physical Chemistry, 150th National Meeting of the American Chemical Society, Atlantic City, N. J., Sept 12-17, 1965. Research sponsored by the U. S. Atomic Energy Commission under contract with the Union Carbide Corp.(2) S. Lindenbaum and G. E. Boyd, J. Phys. Chem., 68 , 911 (1964).(3) L. Ebert and J. Lange, Z. Physik. Chem. (Leipzig), 139A, 584 (1928).(4) J. Lange, ibid., 168A, 147 (1934).
The Journal of Physical Chemistry

T h e r m o d y n a m i c s o f S o l u t i o n s o f T e t r a - ti- a l k y l a m m o n i u m H a l i d e s 815
Table I : Experimental Calorimetric Data for Dilution of Tetraalkylammonium Chlorides
mi Vs m2*/2 Q <t>L
(CHANCI0.339 0.0493 68 -4 70.589 0.0500 172 -1510.857 0.0529 338 -3 1 60.888 0.0760 360 -3 2 90.907 0.0781 375 -3 4 31.014 0.0456 413 -3 9 31.168 0.0776 528 -4 9 61.396 0.0791 666 -6 3 51.476 0.0772 709 -6 7 71.669 0.0794 812 -7 7 92.174 0.0749 1035 -10042.585 0.0760 1088 -10572.816 0.0734 1117 -10873.241 0.0693 1059 -10303.615 0.0785 1005 -9 7 34.412 0.0797 644 -6 1 04.412 0.0756 630 -5 9 9
(CyEhhNCI0.384 0.0616 77 -5 10.634 0.0419 241 -2 2 30.640 0.0751 212 -1810.821 0.0600 304 -2 7 81.152 0.0727 468 -4 3 81.269 0.0605 491 -4 6 61.538 0.0788 543 -5 1 01.915 0.1017 476 -4 3 62.307 0.1007 254 -2 1 43.024 0.0784 -5 4 4 + 576
(n-C3H7)4NCl0.566 0.0362 -5 9 740.651 0.0403 -1 5 6 1730.746 0.0394 -2 1 7 2340.770 0.0556 -2 0 0 2241.344 0.0575 -1142 11661.417 0.0391 -1486 15031.764 0.0568 -2469 24932.098 0.0699 -3707 37363.216 0.0570 -6418 64423.216 0.0556 -6517 65403.216 0.0316 -6359 6373
(ra-C4H 9)4NCl0.229 0.0312 -1 3 3 1460.473 0.0510 -4 5 7 4800.537 0.0502 -561 5820.597 0.0112 -7 8 6 7910.857 0.0506 -1705 17261.008 0.0284 -2421 24331.008 0.0624 -2443 24691.008 0.0203 -2415 24231.008 0.0360 -2453 24681.203 0.0506 -3645 36661.581 0.0512 -6011 60332.271 0.0731 -8597 86273.276 0.0728 -9366 93963.983 0.0526 -9645 9667
complicated fashion. Tentative explanations of these phenomena were offered in terms of the organizing effect of these large paraffinlike ions on the water structure,5,6 the formation of “ water-structure-enforced ion pairs, ” 7 and the presence of micelles. It is the purpose of this work to report heats of dilution of the tetraalkylammonium halides and to combine this enthalpy data with the previously reported free energies to obtain entropies of dilution.
Experimental SectionMaterials. The tetra-n-alkylammonium halides are
the same as those used for the isopiestic vapor equilibration measurements reported in an earlier publication.2
Calorimetric Measurements. The calorimeter and associated circuitry are the same as previously described8 with the exception of the amplifier which has been replaced with a Keithley Model 150 AR Micro- voltammeter. The temperature sensitivity of the calorimeter was about 10_6°. All solutions were prepared by weight and measured into the calorimeter pipet from weight burets. The pipet had a capacity of about 3 ml, and the volume of water in the calorimeter dewar at the beginning of the experiment was about 500 ml accurately measured by weight. All dilutions thus resulted in final concentrations of 0 .0 1 m or less, requiring only small corrections to infinite dilution. The energy calibration of the calorimeter was performed as previously described, and the heat of solution of KC1 was determined periodically and compared with literature data9 as an over-all check of the calorimetric system. A correction for the heat of opening of the pipet (0.015 cal) was applied. All results are expressed in terms of defined calories (1 cal = 4.1840 absolute joules). In several cases replicate measurements were made of the heat absorbed on dilution of the same initial stock solution as a check on the reproducibility of the calorimeter.
Results and DiscussionThe calorimetric data obtained are summarized in
Tables I—III. The initial and final concentrations (moles/kg of water) are to, and m2, respectively. Q is the heat absorbed (cal/mole of solute), and <t>L 5 6 7 8 9 10
(5) H. S. Frank and M. W. Evans, J. Chem. Phys., 13, 507 (1945).(6) H. S. Frank and W.-Y. Wen, Discussions Faraday Soc., 24, 133 (1957).(7) R. M. Diamond, J. Phys. Chem., 67, 2513 (1963).(8) S. Lindenbaum and G. E. Boyd, ibid., 69, 2374 (1965).(9) G. Somsen, J. Coops, and M. W. Tolk, Pec. Trav. Chim., 82, 231 (1963).(10) T. F. Young and O. G. Yogel, J. Am. Chem. Soc., 54, 3030 (1932).
Volume 70, Number 3 March 1966

816 S. L i n d e n b a u m
is the apparent molal heat content. The correction from m2 to infinite dilution was made by assuming that at the lowest final concentration (0.003 m or less) the salts all have <t>L values equal to that of NaCl. 10 The error introduced by this assumption is probably no greater than 5 cal/mole. The <f>L values in TablesI—III are estimated in most cases to be accurate to 2% or 1 0 cal/mole, whichever is larger.
Table II : Experimental Calorimetric Data for Dilution of Tetraalkylammonium Bromides
miV» TO!1/! Q <t>L
(CH3)4NBr0.479 0.0318 167 -1 5 30.690 0.0472 324 -3 0 40.919 0.0590 512 -4 8 71.164 0.0553 714 -6 9 11.541 0.0839 988 -9 5 41.914 0.0953 1240 -12022.343 0.0867 1494 -1449
(C2H5)4NBr0.489 0.0327 201 -1 8 70.672 0.0482 343 -3 2 30.696 0.0462 360 -3 4 00.966 0.0596 572 -5 5 20.970 0.0663 576 -5 5 61.329 0.0816 794 -7 7 21.499 0.0924 861 -8 3 82.148 0.114 921 -8 9 82.649 0.114 764 -7 4 13.467 0.118 136 -1 1 4
(n-C3H7)4NBr0.522 0.0561 52 -2 90.697 0.0462 63 -4 40.971 0.0472 -8 9 + 1091.078 0.0576 -255 +2791.648 0.0579 1226 + 12502.098 0.0836 2547 +25812.934 0.0822 4253 +4287
(n-C4H9)4NBr0.380 0.0253 -191 2020.493 0.0324 -317 3310.711 0.0476 -962 9820.783 0.0473 1225 12451.070 0.0467 2482 25021.456 0.0673 4460 44881.997 0.0672 6332 63602.300 0.0903 6951 69882.811 0.0902 7462 74993.846 0.0659 7836 7863
Values of the relative partial molal heat contents of the solvent and solute, Zi and Z 2, respectively, were calculated from the equations10
Table III : Experimental Calorimetric Data for Dilution of Tetraalkylammonium Iodides
mi1/* mj1/* Q i’L
(CH3)4NI0.337 0.0460 129 —1100.481 0.0348 213 —1980.481 0.0344 230 -2 1 6
(C2H6)4NI0.471 0.0585 227 -2 0 30.546 0.0727 292 -2 9 40.631 0.0730 363 -3 6 50.805 0.0504 516 -5 1 40.970 0.0576 644 -6 4 31.349 0.0722 931 -9 3 31,349 0.0716 969 -9 7 1
(n-C3H7)4NI0.406 0.0416 92 -7 40.467 0.0329 117 -1 0 30.702 0.0439 138 -1 1 90.702 0.0397 150 -1 3 3
U = - ( 1/i»n,/,/55.51)(ô*i /ôV»n) (D
Z2 = <t>L + 1/ 2mI/'(ô< L/ ô v /m) (2)The smoothed <j>L vs. y/m curves were interpolated and differentiated11 to provide values of cf>L, Lh and Z 2 at even values of the molality. These data are presented in Tables IV-VI. The values of <fiL were combined with the previously reported osmotic and activity coefficients to determine the excess apparent molal entropies, SEX, according to eq 3 and 4 . 12-13
TSEX = HEX - Ge x ; H ex = 4>l
Gex = 2RTÇI - 0 + In 7 )(3)
(4)where <t> and y are the osmotic and activity coefficients, respectively. The thermodynamic functions calculated in this way are compared in Figure 1. Values of the entropy are plotted in Figure 2 together with those calculated for HC1, LiCl, NaCl, K C 1, and KNO s. The values of <j>, y, and <t>L for these calculations were obtained from tabulations in the literature. 14 Tables of Zi and Z2 are provided to enable the calculation of relative partial molal entropy functions used by other authors: Si — S ° i = L i/ T — R In a\/N\ for the solvent15 and Si — S ° 2 = U / T — 2R In y for the sol-
(11) The author is indebted to Dr. A. Schwarz for programming this calculation for the CDC 1604 computer.(12) H. L. Friedman, J. Chem. Phys., 32, 1351 (1960).(13) V. P. Vasil’ev, Russ. J. Phys. Chem., 36, 1077 (1962).(14) H. Harned and B. B. Owen, “ The Physical Chemistry of Electrolyte Solutions,” 3rd ed, Reinhold Publishing Corp., New York, N. Y., 1958.
The Journal of Physical Chemistry

T h e r m o d y n a m i c s o f S o l u t i o n s o f T e t r a - r - a l k y l a m m o n i u m H a l i d e s 817
Table IV : Apparent Molal and Relative Partial Molal Heat Contents of Tetraalkylammonium Chlorides
-(CHahNCl——*-------- - -(C2Hb)4NC1----------—, ,---- ---—•(re-CsHOiNCl- -(n-C4H„).NCl-m <t>L Li 10-«Li 4>L Li 10 <t>L Li 1C <t>L Li 10 -*¿2
0.1 (-3 6 ) (-1 0 ) (25) 185 -0 .4 3.90.2 -8 9 0.4 -1 .9 -100 0.6 -2 .5 (56) 400 -1 .6 8.40.3 -134 0.8 -2 .7 -164 0.9 -3 .4 91 -0 .6 1.9 625 -3 .6 130.4 -182 1.3 -3 .6 -215 1.3 -4 .0 124 -1 .1 2.7 850 -6 .8 180.5 -223 1.8 -4 .2 -256 1.6 -4 .3 165 -2 .0 3.9 1100 -1 1 240.6 -262 2.6 -5 .0 -286 2.0 -4 .7 215 -3 .1 5.0 1350 -1 7 290.7 -303 3.2 -5 .6 -317 2.4 -5 .1 261 -4 .4 6.1 1610 -2 1 330.8 — 3S8 3.4 -5 .7 -341 2.7 -5 .3 315 -6 .3 7.5 1830 -2 7 370.9 -359 3.8 -5 .9 -364 3.1 -5 .5 370 -8 .6 9.0 2070 -3 7 441.0 -390 5.4 -6 .9 -383 3.2 -5 .6 433 -1 2 11 2340 -4 7 491.2 -447 7.2 -7 .8 -415 4.0 -6 .0 570 -2 0 15 2810 -7 4 621.4 -501 9.1 -8 .6 -444 4.5 -6 .2 735 -3 2 20 3480 -120 831.6 -550 11 -9 .3 -466 4.2 -6 .1 932 -5 1 27 4200 -150 931.8 -597 13 -1 0 -480 3.8 -6 .0 1180 -7 9 36 4750 -150 932.0 -640 15 -1 0 -492 3.8 -6 .0 1470 -9 9 42 5200 -150 942.5 -738 20 -1 2 -510 1.1 - 5 .4 2070 -120 48 6040 -270 1203.0 -821 24 -1 3 -502 -8 .8 -3 .4 2560 -150 54 7590 -330 1403.5 -887 26 -1 3 -456 -2 1 -1 .2 3000 -190 60 8040 -150 1004.0 -940 26 -1 3 -405 -3 1 0.3 3420 -230 66 8290 -120 1004.5 -979 24 -1 3 -347 -4 8 2.5 3800 -270 71 8470 -110 985.0 -1010 23 -I S -272 -7 6 5.7 4160 -290 74 8590 -100 975.5 -1030 21 -1 2 -178 -110 9.1 4450 -300 75 8690 -110 986 -1050 19 -1 2 -7 5 -130 12 4710 -320 77 8790 -120 997 -1070 14 -1 2 132 -180 16 5170 -380 82 8950 -130 1008 -1080 2 -1 1 340 -240 20 5580 -460 88 9090 -160 1009 -1070 -1 4 -9 .9 546 -300 24 5960 -550 94 9220 -170 100
10 -1060 -3 1 -8 .8 6330 -660 ICO 9320 -180 10011 -1040 -5 3 — 7.7 9420 -200 10012 -1010 -8 0 -6 .4 9500 -190 10013 -976 -110 -5 .1 9570 -180 10015 -892 -200 - 1 .4 9650 - n o 10017 -775 -330 3.019 -638 -470 7.5
ute. 15 16'17 Values of L\ and Z 2 may also be applied to the calculation of temperature coefficients for osmotic and activity coefficients. 18 These values have been used to estimate the correction for the freezing point measurements of the tetraalkylammonium iodides3 to 25°, and it has been found in agreement with the experimental evidence2 that this correction is negligible over the concentration range covered.
Several features of the H EX curves of Figure 1 are of interest. The heats evolved on dilution of the tetra- butyl- and tetrapropylammonium chlorides and bromides are the largest of any 1 - 1 electrolytes previously reported. For a given halide, the order of heat evolved is (C4H 9)4N+ > (C3H7)4N+ > (C2H6)4N+ > (CH3)4N+ over the entire concentration range. For a given tetraalkylammonium ion, the order is Cl- > Br~ > I - . This regularity is quite striking in view of the apparent disorder observed in the activity coefficient curves. This order is also the one which would be expected
according to the “ competition principle” suggested by Fajans and Johnson, 19 which states that *he interaction of a salt with water is greater, the more the cation and anion hydration energies differ. The entropy curves also decrease in the order (C4H 9)4N + > (C3H7)4N+ > (C2H6)4N+ > (CH3)4N+.
The values of SBX reported for the tetrapropyl- and tetrabutylammonium halides are larger than those of any 1-1 electrolyte previously reported. This large entropy effect, due to the (C3H7)4N + and (C4- H 9)4N + ions, is in qualitative agreement with the
(15) H. S. Frank and A. L. Robinson, J. Chem. Phys., 8, 933 (1940).(16) R. H. Wood, / . Phys. Chem., 63, 1347 (1959).(17) F. R. Jones and R. H. Wood, ibid., 67, 1576 (1963).(18) K. 8. Pitzer and L. Brewer, “ Thermodynamics,” 2nd ed, McGraw-Hill Book Co., Inc., New York, N. Y., 1961.(19) K. Fajans and 0. Johnson, Trans. Electrochem. Soc., 82, 27 (1942).
Volume 70, Number S March 1966

818 S . L i n d e n b a u m
Table V : Apparent Molai and Relative Partial Molai Heat Contents of Tetraalkylammonium Bromides
✓---- ------ (CHsDiNBr- r-----------(C zH iO iN B r- -Cn-C3H7) 4N B r-----.--- - •(tt-C4H9)4N 3 r-m <t>L Li 10-2L2 4>L Li 1 0 -•‘Li 0L L i 10-*£,2 L i 1 0 -•‘L i
0.1 (-6 8 ) (-8 0 ) (-1 5 ) (130)0.2 (-140) (-150) (-2 5 ) 290 -1 .2 6.10.3 -196 0.9 -3 .7 -220 1.2 -4 .5 -3 5 0.1 -0 .6 450 -3 .2 100.4 -254 1.8 -5 .0 -300 2.0 -5 .8 -4 0 0.1 -0 .5 680 -6 .5 160.5 -320 2.6 -6 .1 -360 2.5 - 6 .4 -4 0 -0 .1 -0 .3 900 -1 1 220.6 -370 3.6 -7 .0 -412 3.2 -7 .1 -3 5 -1 .5 1.0 1190 -1 9 290.7 -430 4.4 -7 .8 -460 3.9 -7 .7 50 -4 .2 3.4 1480 -2 4 340.8 -470 5.2 -8 .3 -500 4.6 -8 .2 60 -7 .5 5.8 1740 -2 9 370.9 -520 6.6 -9 .3 -540 5.8 -9 .0 135 -9 .8 7.4 1980 -3 5 411.0 -560 7.0 -9 .5 -580 6.8 -9 .6 195 -1 0 7.7 2220 -4 2 461.2 -634 9.3 -1 1 -648 7.7 -1 0 300 -1 3 9.2 2670 -6 2 551.4 -704 12 -1 2 -699 7.9 -1 0 400 -1 9 11 3170 -8 2 641.6 -770 15 -1 3 -738 8.8 -1 0 510 -2 5 14 3600 -9 3 681.8 -830 16 -1 3 -775 9.8 -1 1 620 -3 4 17 3980 -100 722.0 -881 17 -1 4 -805 10 -1 1 740 -4 4 20 4310 -110 742.5 -987 23 -1 5 -868 11 -1 1 1070 -8 3 29 4940 -130 793.0 -1080 30 -1 6 -902 7.8 -1 0 1480 -140 41 5500 -170 873.5 -1180 38 -1 8 -916 2.6 -1 0 1930 -180 49 5990 -190 904.0 -1260 46 -1 9 -914 -3 .7 -8 .6 2320 -210 52 6360 -190 904.5 -1330 51 -2 0 -903 -1 3 -7 .5 2650 -230 55 6660 -190 905.0 -1400 53 -2 0 -879 -2 4 -6 .1 2940 -250 57 6870 -180 885.5 -1450 54 -2 0 -850 -3 3 -5 .1 3200 -270 59 7050 -170 886 -818 -4 4 -4 .1 3430 -290 61 7180 -150 867 -744 -7 1 -1 .8 3830 -310 63 7370 -140 858 -658 -110 1.1 4140 -300 62 7500 -130 849 -553 -170 4.9 7590 -120 83
10 -426 -240 9.3 7660 -120 8311 -281 -330 14 7720 -130 8412 -121 -450 20 7780 -130 8413 7820 -110 8314 7850 -8 8 82
Table VI: Apparent Molal and Relative Partial Molal Heat Contents of Tetraalkylammonium. Iodides
—(CH3)4NI— — (CiHmNI— ------ --------„ ------- — -(n-CiH,)4NI—Til <t>L Li 1 0 - ‘‘Li 4>l Li 10-2L2 <t>L Li 10-2L2
0.1 (-9 7 ) (-70 ) (-59 )0.2 -182 0.6 -3 .4 (-170) -8 4 0.2 -1 .30.3 -294 1.7 -6 .1 -103 0.3 -1 .60.4 -382 2.2 -6 .8 -120 0.5 -1 .80.5 -445 2.6 -7 .40.6 -498 3.2 -8 .00.7 -545 3.9 -8 .60.8 -587 4,6 -9 .10.9 -625 5.4 -9 .61.0 -661 6.4 -1 01.2 -729 8.9 -1 11.4 -798 13 -1 31.6 -872 18 -1 51.8 -956 28 -1 8
ideas of Frank and Wen,6 who have suggested that these large paraffinlike ions promote the structure of water.
A surprising result of the comparison of the entropy
curves in Figure 2 is the fact that those of tetrapropyl- ammonium chloride, bromide, and iodide fall very close together, and, similarly, the tetrabutylammo-
The Journal of Physical Chemistry

T h e r m o d y n a m i c s o f S o l u t i o n s o f T e t r a - w- a l k y l a m m o n i u m H a l i d e s 819
1000
-1000
</)UJ(E
- '0 0 0- 2000 (
1000
0- ‘ 000
-
-
-
_ (CH3 )4 N Cl _ ( )4 N Cl- E X x / ^ W 01
TS / /
-
X1___1_
t s ex " TSex EX -________ ^ ^ H ex
= ------------G h ex
i i i l in i0 2 4 6 8 ‘ 0 12 2 4 6 8 10 12 2 4 6 8 10 12
-
- (CH3)4 N Br-
- (C2H5)4 NBr - (nC3H7)4 NBr
-
-
-
-t s ex
I 1
l'
%m X
V gex
X -e>_
0 2 4 6 8 10 12 2 4 6 8 10 12 2 4 6 8 10 12
"t s ex- f x (CH3)4 N I y-H 3 4- V x
r - T S EX (C2H5)4 N I ^ H EX X Gex
■t s ex' h ex ( n CjH7)4 NI
“Gex-___ 1___ l___ 1___ 1----- 1----- 1----- 1 1___ 1___ 1___ 1___ 1___
TS
(nC4H9)4NCI
__ i___i___i___i_
0 2 4 6 8 10 12 0 2 4 6 8 10 12 0 2 4 6 8 10 12 14MOLALITY
Figure 1 . Excess apparent molal thermodynamic functions for tetraalkylammonium chlorides, bromides, and iodides at 25°
Figure 2. Concentration dependence cf the apparent molal excess entropy function T S EX at 25° for tetraalkylammonium halides and some o"her 1 - 1 electrolytes.
nium chloride and bromide curves coincide within the experimental error. This suggests that structural effects accompanying the solution of these salts in water are largely independent of which particular
anion is associated with these large tetraalkylammonium cations. This observation apparently conflicts with the explanation offered earlier2-7 for the fact that the activity coefficients of the tetra-n-alkylammonium chlorides increase with increasing cation size, while the opposite order is observed for the bromides and iodides. Diamond suggested that large hydrophobic cations and anions tend to combine with each other to minimize their interaction with the water. It was further suggested that iodide and, perhaps, bromide ions participate in the formation of these “ water- structure-enforced ion pairs,” whereas the chloride ion would not. It might have been expected that such a difference in ability to form water-structure-enforced ion pairs would result in a considerable difference in the entropy. The fact that this difference is not observed suggests that the concept of water-structure-enforced ion pairs should not be used to explain the difference in the order of the activity coefficients. This is not to say necessarily that water-structure-enforced ion pairs do not occur; it does suggest, however, that the degree to which this phenomenon occurs is largely independent of the size of the anion or that the water-structure-
Volume 70, Number 3 March 1966
820 S. L i n d e n b a u m
promoting property of the tetraalkylammonium cation6 overshadows the differences due to the sizes of the anions.
Alternatively, it is suggested that the contribution to the entropy and enthalpy due to the structural effect of these salts on the solvent is so great as to obliterate completely the entropy and enthalpy differences due to the sizes of the anions or their relative abilities to form ion pairs. Whereas these differences may be swamped out in the entropy and enthalpy, they show up as significant portions of the much smaller free energy. It is conceivable, therefore, that
differences in the abilities of the halides to participate in ion-pair formation are reflected in the reversals of the order of the activity coefficients and that this effect is not observed in the enthalpy and entropy.
Acknowledgments. The author is grateful to Dr.G. E. Boyd for his continued interest and encouragement in this work, to Dr. Fred Vaslow for his help and advice in setting up the calorimetric system, and to both of them for many illuminating discussions of this problem. Thanks are also due to Dr. M. A. Bredig for his careful review of the article and valuable suggestions toward its improvement.
The Journal of Physical Chemistry

O s m o t i c a n d A c t i v i t y C o e f f i c i e n t s o f Q u a t e r n a r y A m m o n i u m H a l i d e s 821
Structural Effects on the Osmotic and Activity Coefficients o f the
Quaternary Ammonium Halides in Aqueous Solutions at 2 5 01
by G. E. Boyd, A. Schwarz, and S. Lindenbaum
Oak Ridge National Laboratory, Oak Ridge, Tennessee S7831 (Received October 18, 1965)
The quaternary ammonium halides derived from tétraméthylammonium chloride and bromide by substituting either a /3-hydroxyethyl or a benzyl group, or both, for methyl groups were employed in a study of the effect of cation structure on electrolyte behavior in aqueous solution. The osmotic and mean molal activity coefficients of the (/3-hydroxy- ethyl) trimethylammonium (choline) salts were slightly smaller than those for the corresponding tétraméthylammonium salts at all concentrations. The coefficients for benzyl- trimethylammonium chloride and bromide were appreciably smaller than those for Me4NCl and Me4NBr, respectively, while those for (/3-hydroxyethyl) benzyldimethyl ammonium chloride and bromide were slightly smaller than those for the benzyltrimethylammonium salts at all concentrations. The ‘ ‘water-structure-breaking’ ' action of the (3-hydroxyethyl group was assumed to be the cause for the lower coefficients of the choline halides relative to the tétraméthylammonium salts. The very small activity coefficients of the benzyl- and the ethanolbenzyl-substituted derivatives have provided a basis for understanding the relatively large selectivity coefficients for bromide over chloride ion shown by cross-linked, strong-base anion exchangers.
The quaternary ammonium halides are of interest in researches on the physical chemistry of aqueous electrolyte solutions because of the possibilities they present for studies of the effect of cation size, shape, and structure on thermodynamic and transport properties. In a previous research2 the influence of cation size in the homologous series of symmetrical tetra- alkylammonium ions on the solute activity coefficients was measured. An increase in size was accompanied by an increase in the activity coefficients of the chloride salts in dilute solutions, but with the bromides and iodides a decrease was observed. The behavior of the chlorides was explained in terms of the ability of large organic cations to enforce the water structure, and, the more carbon atoms in an ion, the larger this effect. With the bromides and especially the iodides, however, ion-pair formation occurred to an increasing extent with increasing cation size, and this was reflected by the opposite sequence in the activity coefficients. The effect of substituting other than n- aliphatic groups in the tetramethylammonium cation was therefore of interest. Accordingly, in this paper
the change produced in the activity coefficient by replacing a methyl group in tetramethylammonium chloride and bromide by a /3-hydroxyethyl group was measured as well as the change on substituting a benzyl for a methyl group. The consequence of substituting both /3-hydroxyethyl and benzyl groups for methyl groups also was determined.
Two of the compounds examined, trimethylbenzyl- ammonium and (/3-hydroxyethyl) dimethylbenzylam- monium chloride and bromide, were of additional interest because these are “ model compounds” for the strong-base anion exchangers, Dowex-1 and Dowex-2, respectively. Thus, additional insight was obtained as to the role of ionogenic group structure in determining anion-exchange selectivity.
Experimental SectionMaterials. (/3-Hydroxyethyl) trimethylammonium
chloride (choline chloride), obtained from Eastman
(1) Research sponsored by the U. S. Atomic Energy Commission under contract with the Union Carbide Corp.(2) S. Lindenbaum and G. E. Boyd, J. Phys. Chem., 68, 911 (1964).
Volume 70, Number 3 March 1966

822 G. E. B o y d , A. S c h w a r z , a n d S. L i n d e n b a u m
Organic Chemicals Co., Rochester, N. Y., was re- crystallized from ethanol and dried. Trimethyl- benzylammonium chloride was purchased from Mathe- son Coleman and Bell, East Rutherford, N. J., as a 60% aqueous solution. Trimethylbenzylammonium bromide and choline bromide were prepared from the chloride by treatment with silver hydroxide and neutralization of the filtrate with HBr. Dimethyl-/?- hydroxyethylbenzylammonium chloride and bromide were prepared by reacting 2 -dimethylaminoethanol with benzyl chloride and bromide. The various salts were recrystallized from appropriate organic solvents, and their purity was determined by gravimetric analysis for their halide content by precipitation with AgN 03.
Osmotic Coefficient Measurements. Osmotic coefficients of binary aqueous solutions of the various quaternary ammonium chlorides and bromides were measured with two different, complementary techniques. The gravimetric isopiestic vapor pressure comparison method3 was used on solutions more concentrated than ca. 0 .2 m following procedures already described. 2 However, with dilute solutions equilibrium was attained extremely slowly with the gravimetric method. Accordingly, measurements on choline chloride (ChCl) and bromide (ChBr) in the concentration range 0.01 to ca. 0.5 m were conducted with a thermoelectric osmometer.4 In this method a steady-state temperature difference between a reference solution (KC1) and the test solution and pure water was determined. Thermistors were employed as temperature sensors, and their electric resistance was measured with a Wheatstone bridge arrangement. The osmolality (m0 )x of the test solution was computed from the osmolality (m0 )r of the reference solution and the measured resistance ratio (ARx/ART) with the relation
(m0)x = (Añx/Afír)(m0)r (1)A plot of the concentration dependence of the osmotic coefficients for dilute aqueous solutions of choline chloride and bromide is shown in Figure 1, where it may be seen that satisfactory precision as well as a reasonable approach of the data to the Debye “ limiting law” behavior was obtained. Moreover, these measurements appeared to lie on the same smooth curves as those determined by the gravimetric method. The measured osmotic coefficients, eq 1, and the isopiestic solution concentrations are given in Tables I and II.
Osmotic coefficients were calculated from the isopiestic solution concentrations with the relation
vxmx0x = rrmr0 r (2)
where v is the number of ions (v — 2 ), mx is the molality
Table I
a. Osmotic coefficients for dilute solutions from thermoelectric osmometer
wiChCL 0ChOl TrtChBr 0ChBr
0.0126 0.9606 0.0122 0.95690.0253 0.9367
0.0801 0.9083 0.0849 0.90470.1291 0.8901
0.2955 0.8675 0.2788 0.85160.4587 0.8547 0.4034 0.83090.7602 0.8370 0.7447 0.8015
b. Molalities of isopiestic solutions
TONaCl mChCl WNaCI mChBr
1.1044 1.2250 0.9937 1.19301.4525 1.6228 1.1044 1.34072.0784 2.3552 1.4525 1.80282.5324 2.8569 2.0784 2.66742.9706 3.3472 2.5324 3.29603.3918 3.8423 2.9706 3.91914.0083 4.5740 3.3845 4.51724.2903 4.9133 4.0083 5.46494.7994 5.5017 4.2903 5.89865.1191 5.9076 4.7994 6.6624
5.1191 7.1514
of the quaternary ammonium salt, and 6X is its molal osmotic coefficient; mr and 0 r are the molality and osmotic coefficient of the reference electrolyte (NaCl), respectively. The necessary values of 0r were computed from a least-squares “ fit” of the concentration dependence of the osmotic coefficients of the reference NaCl solutions.5
Mean molal activity coefficients were calculated from the osmotic coefficients with the Gibbs-Duhem equation
j " V » ,— ,—[( 1 — 0 )/V w ]d \ /m (3)
o
The integration required in eq 3 was performed numerically taking into account the fact that6
lim (1 - 0 ) /V m = a/ 3 = 0.3903 (4)m—► 0
Computed osmotic and activity coefficients for interpolated concentrations are given in Table III.
(3) R. A. Robinson and R. H. Stokes, “ Electrolyte Solutions,” 2nd ed, Academic Press Inc., New York, N. Y., 1959, p 177 ff.(4) A Model 301 vapor pressure osmometer manufactured by Mech- rolab, Inc., Mountain View, Calif., was employed.(5) M. H. Lietzke and R. W. Stoughton, ./, Phys. Chem., 66, 508(1962).(6) R. A. Robinson and R. H. Stokes, “ Electrolyte Solutions,” Butterworth and Co. Ltd, London, 1955, p 232 ff.
The Journal of Physical Chemistry

O s m o t i c a n d A c t i v i t y C o e f f i c i e n t s o f Q u a t e r n a r y A m m o n i u m H a l i d e s 823
Table II: Molalities of Isopiestic Solutions
M e2 0 E t- M e2 0 E t-OTNaCl M eaB zN C l M esB zN B r B zN C l B zN B r
0.1799 0.1933 0.2026 3.1944 0.20590.2350 0.2547 0.27260.2470 0.2679 0.2877
0.5043 0.6056 0.7157 0.6208 0.73790.5063 0.6054 0.7154 0.6233 0.74090.6215 0.7900 0.9906
0.6542 0.8462 1.0700.6974 0.9105 1.1750.9453 1.715 1.348 1.835
1.018 1.370 1.8511.039 1.401 1.9061.100 1.581 2.306
1.274 1.773 2.547 1.915 2.8251.348 1.882 2.736 2.039 3.0471.363 2.776 2.066 3. I l l
1.623 2.514 3.8121.668 2.385 3.537 2.619 3.9761.838 2.898 4.391
2.358 3.442 5.130 3.845 5.7652.530 3.685 5.474 4.139 6.2162.641 3.850 5.727 4.344 6.472
2.746 4.416 6.5893.102 5.058 7.4073.128 4.536 6.687 5.159 7.605
4.195 6.780 9.8624.213 6.069 8.9145.002 6.995 10.457
5.760 9.268 13.425.762 9.314 13.676.144 8.451 12.662
The osmotic and activity coefficients for choline chloride in Table III do not agree with previously reported values7 derived from measurements made with the gravimetric isopiestic solution comparison technique. The published activity coefficients are larger than those for tétraméthylammonium chloride at all concentrations, whereas our measurements show that choline chloride and bromide have smaller coefficients than the corresponding tétraméthylammonium salts.
Several attempts were made to determine the cause for the discrepancy between these two series of measurements on choline chloride. The isopiestic solution concentrations given in ref 7 were employed in a complete digital computer recalculation of the osmotic and activity coefficients according to eq 2-4. The recalculated values differed from those published by ap-
Figure 1. Concentration dependence of the osmotic coefficients for aqueous solutions of choline chloride and bromide at 25° (measurements with thermoelectric osmometer).
proximately 1.5%, so that computational errors do not appear to be a cause for the discrepancy. A direct comparison of approximately 1 to solutions of NaCl, KC1, MC4NCI, and ChCl was made with the gravimetric isopiestic apparatus in a special study with the results given in Table IV. The osmotic .coefficients for KC1 and Me4NCl were in good agreement with published values, and it may be seen that the coefficient for choline chloride was distinctly less than that for Me4NCl. The fact ‘ hat the substitution of a /3- hydroxyethyl for a methyl group in trimethylbenzyl chloride (and bromide) also lowered the osmotic and activity coefficients relative to the values for the latter salts also lends support to our belief in the correctness of the <f> and y values for choline chloride given in TableIII.
Discussion
The introduction of a /5-hydroxyethyl group either in tétraméthylammonium chloride or bromide or in tri- methylbenzylammonium chloride or bromide produced a lowering in the mean molal activity coefficient at all molalities (Figure 2). The substitution of a CH2OH group increased the size of the quaternary ammonium cation as measured by the apparent molal volume at infinite dilution, <£v°, from 89.1 ml mole- 1 for tetra-
(7) R. Fleming, J. Chem. Soc., 3110 (1961).
Volume 70, Number 3 March 1966
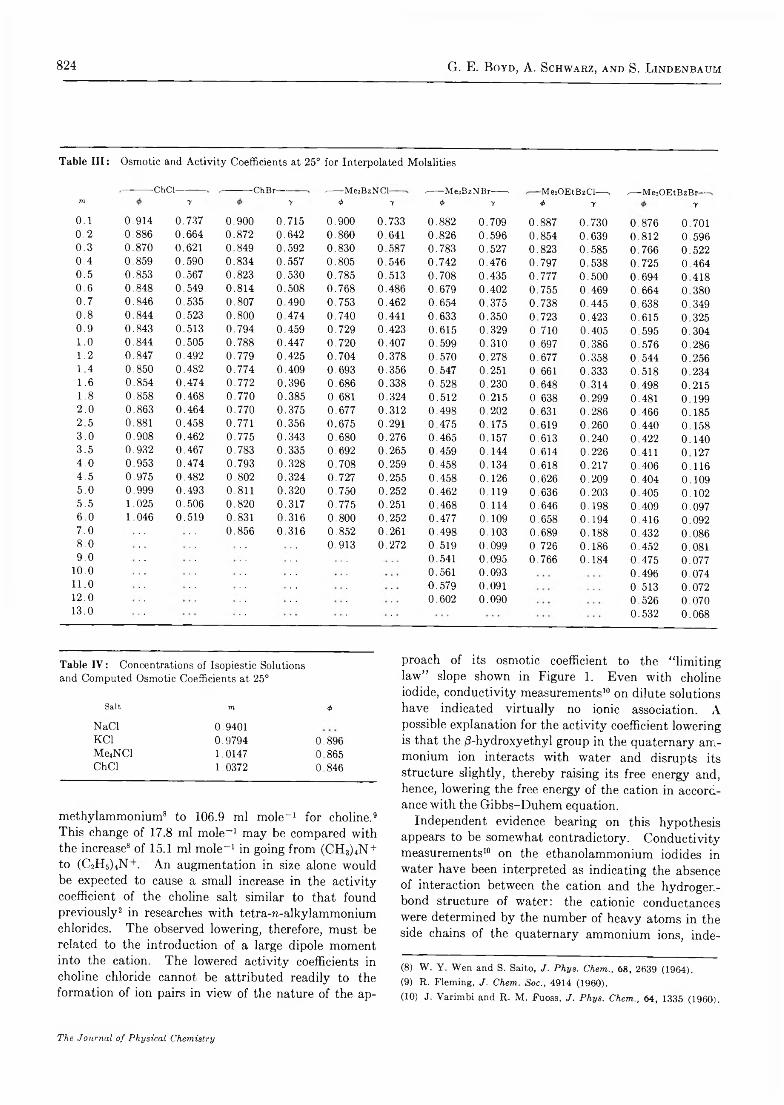
824 G. E. B o y d , A. S c h w a r z , a n d S . L i n d e n b a u m
Table III: Osmotic and Activity Coefficients at 25° for Interpolated Molalities
■ChCl- •ChBr— ,-------M ejB zN C l- *-------M egB zN B r------- • ■M eïO E tB zC l-—s -— M e z O E tB z B r -m 7 y 0 y <t> y ■#> y y
0 . 1 0.914 0.737 0.900 0.715 0.900 0.733 0.882 0.709 0.887 0.730 0.876 0.7010 . 2 0.886 0.664 0.872 0.642 0.860 0.641 0.826 0.596 0.854 0.639 0.812 0.5960 . 3 0.870 0.621 0.849 0.592 0.830 0.587 0.783 0.527 0.823 0.585 0.766 0.5220.4 0.859 0.590 0.834 0.557 0.805 0.546 0.742 0.476 0.797 0.538 0.725 0.4640 .5 0.853 0.567 0.823 0.530 0.785 0.513 0.708 0.435 0.777 0.500 0.694 0.4180.6 0.848 0.549 0.814 0.508 0.768 0.486 0.679 0.402 0.755 0.469 0.664 0.3800 .7 0.846 0.535 0.807 0.490 0.753 0.462 0.654 0.375 0.738 0.445 0.638 0.3490.8 0.844 0.523 0.800 0.474 0.740 0.441 0.633 0.350 0.723 0.423 0.615 0.3250.9 0.843 0.513 0.794 0.459 0.729 0.423 0.615 0.329 0.710 0.405 0.595 0.3041 . 0 0.844 0.505 0.788 0.447 0.720 0.407 0.599 0.310 0.697 0.386 0.576 0.2861 . 2 0.847 0.492 0.779 0.425 0.704 0.378 0.570 0.278 0.677 0.358 0.544 0.2561 . 4 0.850 0.482 0.774 0.409 0.693 0.356 0.547 0.251 0.661 0.333 0.518 0.2341 . 6 0.854 0.474 0.772 0.396 0.686 0.338 0.528 0.230 0.648 0.314 0.498 0.2151 . 8 0.858 0.468 0.770 0.385 0.681 0.324 0.512 0.215 0.638 0.299 0.481 0.1992 . 0 0.863 0.464 0.770 0.375 0.677 0.312 0.498 0.202 0.631 0.286 0.466 0.1852 . 5 0.881 0.458 0.771 0.356 0.675 0.291 0.475 0.175 0.619 0.260 0.440 0.1583 . 0 0.908 0.462 0.775 0.343 0.680 0.276 0.465 0.157 0.613 0.240 0.422 0.1403 . 5 0.932 0.467 0.783 0.335 0.692 0.265 0.459 0.144 0.614 0.226 0.411 0.1274.0 0.953 0.474 0.793 0.328 0.708 0.259 0.458 0.134 0.618 0.217 0.406 0.1164 .5 0.975 0.482 0.802 0.324 0.727 0.255 0.458 0.126 0.626 0.209 0.404 0.1095 . 0 0.999 0.493 0.811 0.320 0.750 0.252 0.462 0.119 0.636 0.203 0.405 0.1025 . 5 1.025 0.506 0.820 0.317 0.775 0.251 0.468 0.114 0.646 0.198 0.409 0.0976. 0 1.046 0.519 0.831 0.316 0.800 0.252 0.477 0.109 0.658 0.194 0.416 0.0927 . 0 0.856 0.316 0.852 0.261 0.498 0.103 0.689 0.188 0.432 0.0868. 0 0.913 0.272 0.519 0.099 0.726 0.186 0.452 0.0819.0 0.541 0.095 0.766 0.184 0.475 0.077
1 0 . 0 0.561 0.093 0.496 0.0741 1 . 0 0.579 0.091 0.513 0.0721 2 . 0 0.602 0.090 0.526 0.07013.0 0.532 0.068
Table IV : Concentrations of Isopiestic Solutions and Computed Osmotic Coefficients at 25°
Sait m 4>
NaCl 0.9401KC1 0.9794 0.896Me4NCl 1.0147 0.865ChCl 1.0372 0.846
methylammonium8 to 106.9 ml mole“ 1 for choline.9 This change of 17.8 ml mole- 1 may be compared with the increase8 of 15.1 ml mole- 1 in going from (CH3)4N+ to (C2H5)4N . An augmentation in size alone would be expected to cause a small increase in the activity coefficient of the choline salt similar to that found previously2 in researches with tetra-n-alkylammonium chlorides. The observed lowering, therefore, must be related to the introduction of a large dipole moment into the cation. The lowered activity coefficients in choline chloride cannot be attributed readily to the formation of ion pairs in view of the nature of the ap
proach of its osmotic coefficient to the “ limiting law” slope shown in Figure 1 . Even with choline iodide, conductivity measurements10 on dilute solutions have indicated virtually no ionic association. A possible explanation for the activity coefficient lowering is that the d-hydroxyethyl group in the quaternary ammonium ion interacts with water and disrupts its structure slightly, thereby raising its free energy and, hence, lowering the free energy of the cation in accordance with the Gibbs-Duhem equation.
Independent evidence bearing on this hypothesis appears to be somewhat contradictory. Conductivity measurements10 on the ethanolammonium iodides in water have been interpreted as indicating the absence of interaction between the cation and the hydrogen- bond structure of water: the cationic conductances were determined by the number of heavy atoms in the side chains of the quaternary ammonium ions, inde-
(8) W. Y. Wen and S. Saito, J. Phys. Chem., 68, 2639 (1964).(9) R. Fleming, J. Chem. Soc., 4914 (1960).(10) J. Varimbi and R. M. Fuoss, J. Phys. Chem., 64, 1335 (1960).
The Journal of Physical Chemistry

O s m o t i c a n d A c t i v i t y C o e f f i c i e n t s o f Q u a t e r n a r y A m m o n i u m H a l i d e s 825
Figure 2. Concentration dependence of mean molal activity coefficients of several quaternary ammonium chlorides in aqueous solution at 25°: curve 1: tétraméthylammoniumchloride (data from ref 2); curve 2: (/3-hydroxyethyl)trimethylammonium (choline) chloride; curve 3: trimethylbenzylammonium chloride; curve 4:(/3-hydroxyethyl)dimethylbenzylammonium chloride.
pendently of whether these were carbon or oxygen. However, a more recent conductance study11 of model hydrogen-bonding solutes in aqueous solutions at 25°, which included (d-hydroxyethyl)trimethylammonium chloride, has concluded that alternative explanations should be considered which might permit interactions of water with such dipolar cations without causing a decrease of their mobility. Calorimetric measurements12 on aqueous solutions of the related compound, tetra (/3-hydroxyethyl) ammonium bromide, have shown that the introduction of OH groups into an n-alkvl quaternary ammonium ion greatly diminished the heat capacity effect observed earlier with Bu4NBr, suggesting that a significant interaction with water must have occurred. Quite recently, activity coefficient and apparent molal volume measurements on tetra(/3-hy- droxyethyl) ammonium fluoride and bromide solutions
have appeared13 which also indicate that the OH groups interact with water and make the behavior of the cation much less abnormal.
The substitution of a benzyl for a methyl group in tétraméthylammonium, or in choline chloride or bromide, produced a large decrease in the osmotic and activity coefficients, especially at high concentrations (Figure 2). A significant increase in the size of the quaternary ammonium ion was produced by this substitution, so that an increase in the activity coefficients at least for the chloride might have been expected. The occurrence of extensive ion-pair formation in the case of the bromide salt, at least, was suggested by the fact that its osmotic coefficients fell below the “ limiting law” values (Figure 1) at the lowest concentrations.
The relatively small activity coefficients for the benzyl-substituted tétraméthylammonium chloride and bromide help to explain the fact that Dowex-l-type strong-base anion exchangers show greatly increased selectivity coefficients for bromide over chloride ion when compared with strong-base exchangers prepared by reacting polyvinyl chloride with ethylenediamine. In the latter exchanger the ionogenic groups are tri- methylethylammonium salts, while in Dowex-1 the groups are trimethylbenzyl. With the former exchanger the selectivity coefficient for the uptake of bromide ion by the chloride form is only slightly greater than unity, 14 while for Dowex-1 a value of1.9 was found15 even with very lightly cross-linked preparations. This increase follows from the general principle that the stronger the ion binding by a polyelectrolyte, the greater the ionic selectivity. The selectivity coefficient is proportional approximately to the square of the ratio of the mean molal activity coefficient of the chloride to the bromide salt. Thus, for example, from previously published data2 and Table III, we estimate values of 1.3 and 1.8 at 1 m for the selectivity coefficients of anion exchangers where the cation is tétraméthylammonium and trimethylbenzylammonium, respectively.
(11) H. O. Spivey and F. M. Snell, J. Phys. Chem., 68, 2126 (1964).(12) (a) H. S. Frank and W. Y. Wen, Abstract 30R, 136th National Meeting of the American Chemical Society, Boston, Mass., April 5-10, 1959; (b) H. S. Frank, private communication, Sept 1965.(13) W. Y. Wen and S. Saito, J. Phys. Chem., 69, 3569 (1965).(14) W. Slough, Trans. Faraday Soc., 55, 1036 (1959).(15) G. E. Boyd, S. Lindenbaum, and G. E. Myers, J. Phys. Chem., 65, 577 (1961).
Volume 70, Number 3 March 1966
826 D. W. S e t s e r
Calculated Unimolecular Reaction Rates for Thermally and Chemically
Activated Ethylene Oxide-d0 and and Acetaldehyde-d0 and -</4 Molecules1
by D. W . Setser
Department o f Chemistry, Kansas State University, Manhattan, Kansas 66501+ (Received September 21+, 1965)
The RRKM theory of unimolecular reactions is applied to the ethylene oxide and acetaldehyde molecules in thermal and various chemical activation systems. The calculated results are compared to experiment where data are available. The chemical activation system of particular interest is the formation of acetaldehyde by the thermal isomerization of ethylene oxide. These quantum statistical calculations support the earlier claims (Benson, Neufeld, and Blades) that vibrationally excited acetaldehyde molecules are important in the pyrolysis of ethylene oxide. Comparison is made between this work and some earlier calculations by the classical RRK theory of unimolecular reactions; some inadequacies of the latter are shown. Particular attention is given to setting upper and lower limits to the loose transition state for acetaldehyde decomposition. In addition, parallel calculations for ethylene oxide-d4 and acetaldehyde-d4 were done to illustrate the magnitude of expected isotope effects.
IntroductionIn this paper the results from RRKM quantum
statistical calculations of the unimolecular rate constants for acetaldehyde (CH3CHO) and ethylene oxide (C2H4O) are presented. Numerous possibilities exist for the unimolecular reactions of CH3CHO and C2H40 ; some of these experimental systems are enumerated in order to show the general usefulness of having such calculations available. One case is thermal activation. The complete kinetic analysis is complex; however, the initiation steps for CH3CHO2 and C2H40 3 are well represented by ( l ) .4 5 An asterisk denotes vibrational energy above e0, the critical energy for reaction;
CH3CHO -¿ 1 CH3CHO* -CH3 + -CHO (la)
C2H40 - ¿ L C2H40* CH3CHO (lb)
w is the collision frequency. Some workers6 question the validity of eq la, but apparently it is the dominant initiation reaction.2 Two CH3CHO chemical activation systems, the combination of methyl and formyl radicals and the thermal isomerization of ethylene oxide,6 are of immediate interest because meaningful calculations can be done since the thermochemistry is
reasonably well known (see Figure 1) and because some experimental data exist for comparison.
- ^ ■ C H 3 + - C H O (2a)
■ CH3 + -CHO — > CH3CHO*
-A - CH3CHO (2b)
C2H40 - A CH3CHO* - A CHsCHO (3b)
(1) This work was supported in part by the National Science Foundation.(2) (a) S. W. Benson, “ The Foundation of Chemical Kinetics,” McGraw-Hill Book Co., Inc., New York, N. Y., 1960, pp 380-383; (b) A. B. Trenwith, J. Chem. Soc., 4426 (1963); (c) R. W. Dexter and A. B. Trenwith, ibid., 5495 (1964).(3) (a) M. L. Neufeld and A. T. Blades, Can. J. Chem., 41, 2956(1963); (b) S. W. Benson, J. Chem. Phys., 40, 105 (1964); (c)K. H. Mueller and W. P. Walters, J. Am. Chem. Soc., 76, 330 (1954) ; 73, 1458 (1951).(4) The acetaldehyde formed by reaction lb is actually vibrationally excited and could be labeled with an asterisk; see eq 3.(5) M. Eusuf and K. J. Laidler, Can. J. Chem., 42, 1851 (1964).(6) B. S. Rabinovitch and M. C. Flowers, Quart. Rev. (London), 18, 122 (1964). Most chemical activation systems result from bi- molecular reactions; the exothermic thermal isomerization of ethylene oxide is an interesting case of a unimolecular activation reaction.
The Journal of Physical Chemistry

U n i m o l e c u l a r R a t e C o n s t a n t s f o r A c e t a l d e h y d e a n d E t h y l e n e O x i d e 827
Figure 1. A schematic of the thermochemistry of the C 2 H 4 O - C H 3 C H O system. The dotted lines represent zero-point energy changes for the deuterated molecules.The first and second numbers for and zero-point energy changes of the CH3CHO decomposition activated complex refer to the R6 and V complexes, respectively.
Reaction 3a has been suggested to be important in C2- H40 pyrolysis by Benson315 and by Neufeld and Blades.Sa It should be noted that if the CH3CHO molecules formed by the thermal isomerization of C2H4O do decompose, then this will be the general behavior of acetaldehyde formed by isomerization of ethylene oxide which may have been activated by other than thermal means. These two systems are at a low energy level. Several chemical activation cases at higher, but less accurately known, levels of energy also are experimentally possible but have not yet been realized under controlled conditions: -H + CH3CO CH3CHO*, €min = 89; CH2 + CH20 CH3CHO*, imin = 104; CH2 + CH2= 0 C2H40 *, emin = 76.5 ; O0 D) +CH2= C H 2 -> C2H40 *, €min = 128.3; the figure accompanying the above reactions is the minimum energy, in kcal mole-1, of the formed molecules.
The RRKM 7 theory of unimolecular reactions has enjoyed considerable success in matching and even predicting experimental behavior of unimolecular reactions.8 Used primarily by Rabinovitch and coworkers,9 it has been applied to nonequilibrium secondary isotope effects,9a'b falloff behavior in chemical6 * *'8 and thermal activation systems,9b c and decomposition reactions at various energies of such diverse molecules as ethyl radicals,9d cyclopropanes,9 e butyl radicals,9f ethane,9® and butane.9*1 This list includes reactions with tight (e.g., ethyl radicals and isocyanide) as well as very loose (e.g., ethane) transition states. Since the RRKM approach is evidently quite successful,
since the unimolecular reactions of CH3CHO and C2- H4O may occur in many instances, and since the thermochemistry is reasonably well known, it was decided to perform RRKM calculations for these molecules. Often the chemical systems in which the unintolecular reactions of these molecules take place are complex and the direct measurement of primary rates is impossible. It is hoped that these calculations may assist in the understanding of such systems.
Whenever possible, experimental results are compared with the calculations. Of specific interest is the proposal3*1’15 that the pyrolysis of C2H40 proceeds through vibrationally excited CH3OHO to give CH3 and CHO under most experimental conditions. Our calculations, which explicitly include the quantum statistical distribution function, support this claim which was previously based upon some experimental observations3*1 and some classical Ivassel-type calculations.315
The treatment for very loose transition states8'9*1 by the RRKM theory is somewhat awkward. The CH3- CHO decomposition complex is a loose type and various ways of treating the complex are discussed. Parallel calculations for CD3CDO and C2D 40 were performed in order to illustrate the magnitudes of the isotope effects that might be expected.
Procedure for CalculationsThermochemistry. The most important quantities
are the critical energies. The experimental activation energy (56.93a and 57.43c kcal mole-1) measured under conditions of maximum inhibition with propene leads to 60 for C2H40 as 55.3 kcal mole- 1 . 10 The ec for C2- D 40 is 56.7 as calculated from the relative zero-point
(7) R. A. Marcus and O. K. Rice, J. Phys. Colloid Chem., 55, 894 (1951) ; R. A. Marcus, J. Chem. Phys., 20, 352, 359 (1952).(8) R. S. Rabinovitch and D. W. Setser, Advan. Photochem., 3, 1(1964). This reference contains a summary of much of the chemical activation and nonequilibrium isotope work through 1964. The following errata should be noted in this reference: Figure 3 caption, last sentence, change “ should be" to “ is” ; eq 27, replace summation over c+ by integration; p 21, last sentence, replace “ breeding” by “ bending” ; Table XIII, absolute rates too low by a factor of 2 due to symmetry number oversight; Table XIV, rate constants column, replace 5.57 and 5.45 by 7.6 and 7.5.(9) (a) J. W. Simons, R. F. Kubin, and B. S. Rabinovitch, J. Chem- Phys., 40, 3343 (1964); J. Phys. Chem., 68, 1322 (1964); M. J- Pearson, B. S. Rabinovitch, and G. Z. Whitten, J. Chem. Phys., 42, 2470 (1965); (b) F. W. Schneider and B. S. Rabinovitch, J. Am . Chem. Soc., 84, 4215 (1962); 85, 2365 (1963); (c) G. M. Wieder and R. A. Marcus, J. Chem. Phys., 37, 1835 (1962); (d) J. C. Current and B. S. Rabinovitch, ibid., 38, 783, 1967 (1963); (e) D. W. Setser and B. S. Rabinovitch, Can. J. Chem., 40, 1425 (1962); (f) B. S. Rabinovitch, F. R. Kubin, and R. E. Harrington, J. Chem. Phys., 38, 405 (1963), and references quoted therein; (g) D. W. Setser and B. S. Rabinovitch, ibid., 40, 2427 (1964); (h) G. S. Whitten and B. S. Rabinovitch, J. Phys. Chem., 69, 4348 (1965).(10) S. Glasstone, K. J. Laidler, and H. Eyring, “ The Theory ofRate Processes,” McGraw-Hill Book Co., Inc., New York, N. Y.,1941, p 195.
Volume 70, Number 3 March 1966

828 D. W. S e t s e r
energy changes in the models (Appendix) of the molecules and complexes. For acetaldehyde a good experimental activation energy is not available; however, most small radical combination reactions have nearzero activation energy and the heat of the reaction CH3CHO — -CHO + -CH3 can be equated to e0. The following heats of formation lead to an e0 of 78.8 kcal mole- 1 which is taken as 79.0 for convenience: ATTf0 (CH3CHO) 11 = -37 .4 , Aiff°(CH3) u = 34.4, and A # f°(CHO) 12 = 7.0 kcal mole. “ 1 The Afff° (CHO) is not known with high accuracy but should be good to ± 3 kcal mole-1. For the tighter transition state of this reaction, small zero-point energy corrections to «o must be made, 13 as shown in Figure 1.
The other required thermochemical quantities are the minimum energies of the formed molecules which is the starting point for the distribution functions of the chemically activated molecules. For the systems discussed in the text, these energies were obtained from the following heats of formation: AHf^CTRO ) 11 = -9 .83 , A fff°(CH20 )u = -26 .3 , A # f°(CH2)14 = 93, Ai7f°(0 1D )15 = 104, Ai7f°(C2H4)u = 14.5, and D(CH3- CO-H)16 = 89, Afff°(0 3P) = 58.6.
Specific Rate Constants and Distribution Functions. The RRKM formulation has been amply discussed elsewhere.7’8 Here the equations will merely be listed. The microscopic specific rate constants are given as a function of energy by
' h Z C N * ( t vr) '
The terms Z i+ and Z * are the products of the partition functions for the adiabatic degrees of freedom of the activated complex and the molecule, respectively. SP(evr+) is the total sum of the degeneracies of all the possible energy eigenstates of the active (vibrational and rotational) degrees of freedom of the activated complex at total energy evr+; N * ( e VI) is the number of eigenstates per unit energy of the active degrees of freedom for the molecule at energy evr; h is Planck’s constant and €vr+ = evr — €0.
In real systems the molecules are always formed with a distribution of energies. Therefore, the specific rate constants, must be averaged according to the distribution function in order to compare calculated and experimental results. In thermal activation systems the distribution function of the activated molecules is, of course, the thermal quantum statistical Boltzmann distribution
R i ( € v r ) d € v r 'N * ( e VT) exp( — evr/ R T ) (b)
Zw* is the partition function for the active degrees of
freedom of the molecule. The thermal distribution function for C2H40 at 1000°K is shown in Figure 2. In chemical activation systems the distribution functions depend upon the activation techniques. If the molecules are formed by association of two species which are themselves in thermal equilibrium with the bath (for example, eq 2 ), the distribution is given by
„ / \ , k e 7 ^ ( ev r ) d e v r / Nf(evr)d£Tr = ------------------ (c)
k \ K (e VI) de„*) €0
The primed terms refer to the decomposition reaction which is the reverse of the association reaction leading to the formation of the molecules and K ( e VI) is given in eq b.
The distribution function for the chemically activated acetaldehyde molecules formed by the thermal isomerization of ethylene oxide presents an interesting case. The distribution function, which is given in eq d, must be the same for the formed acetaldehyde as for the reacting ethylene oxide, and in the falloff region, it is pressure dependent
f ( e ' v r ) d e , vr
h
ke +R ( G t ) d i Vr
W
K
kc +7^(£vr)dcvr
OJ
(d )
ke and K ( e VI) refer to ethylene oxide; the primes on the f(e)'di' call attention to the change of 27 kcal mole- 1 in the zero of energy between ethylene oxide and acetaldehyde. At limiting high and low pressures it has the
form kcK ( e VI)d t v T fceR(evr)devr and K ( e vi) d t v
respectively. The low and high
(103 cm) pressure distribution functions for CH3- CHO at 1000 °K are shown in Figure 2.
The principal use of the distribution functions was for the calculation of three quantities: falloff curves (log (fcuni/fc=) vs. log P) for thermal activation, ratios of stabilization to decomposition products (S/D) for chemical activation, and various average energy values.
(11) F. D. Rossini, “ Selected Values of Chemical Thermodynamic Properties,” National Bureau of Standards Circular 500, U. S. Government Printing Office, Washington, D. C., 1952.(12) K. H. Anderson and S. W. Benson, J. Chem. Phys., 39, 1677 (1963).(13) O. K. Rice, J. Phys. Chem., 65, 1588 (1961).(14) V. H. Dibeler, M. Krauss, R. M. Reese, and F. H. Harlee, J. Chem. Phys., 42, 3791 (1965).(15) C. E. Moore, National Bureau of Standards Circular 467, Vol. 1, U. S. Government Printing Office, Washington, D. C., 1949.(16) E. O’Neal and S. W. Benson, J. Chem. Phys., 36, 2196 (1962).
The Journal of Physical Chemistry

U n LUOLECULAR R A T E CONSTANTS FOR ACETALDEH YDE AND E TH YLE N E O X ID E 829
Figure 2. Specific rate constants for C2H40 and C2D4O; the 10 0 0 °K distribution function for the thermally activated C2H4O molecules (curve A); the 1000°K distribution function of chemically activated CH3CHO formed by thermal isomerization of C2H4O at high (B) and low (A) pressures.The discontinuities of these curves are due to the absence of low frequencies and active rotations in the complex.The grouping of frequencies tends to overemphasize this and little, if any, real meaning is associated with these discontinuities.For further comment on this point, see p 18 of ref 8 and 13.
In all of these calculations, the strong collision model for intermoleeular vibrational energy transfer was assumed8' 17 and a temperature-independent collision cross section of 4.9 A was used for both CH3CHO and C2H4O. The specific rate constants may be combined with the appropriate distribution function to give eq e and f .
03
ke +( € v r ) d e vr
03
I)
sft/ eo ke +
-f(evr)de
f€0
f (€vr)devr
(e)
(f)
In chemical activation systems, an apparent rate constant is often defined18 as = 03D/S.
After choosing the models for the molecules and complexes, the numerical evaluation of the terms 2 P(evr+) and (V*(eVr) was done by direct count methods
at low energies19 with an IBM-1410 computer. No provision was made for anharmonicity. At the higher energies the Haarhoff approximation method20 was used to obtain the sums and densities. The direct count was always matched to the Haarhoff approximation at intermediate energies before the latter was used. The integrals in (e) and (f) were evaluated by numerical integration on the 1410 computer. The final results are, therefore, based upon accurate, harmonic quantum statistical sums and densities.
Molecular Models. The vibrational frequencies and structural parameters for acetaldehyde-do21 and -d4 and for ethylene oxide-do22 and -d4 are well known. Frequencies of similar magnitudes were grouped together and the geometric mean was used as the representative frequency of the group. These models are summarized in the Appendix.
Ethylene oxide isomerizes via a tight complex and the changes in the moments of inertia are relatively small during the course of the reaction. Consequently, the over-all rotational degrees of freedom of the molecule are treated as adiabatic and all the vibrations as active.
The situation with acetaldehyde is not so clear cut. The decomposition certainly takes place by a loose complex but the exact description is not known. In order to describe the various types of complexes, two models of the molecule were used. The first, which correlates with the five-rotor (R5) and vibrational (V) complexes discussed below, has all the vibrations and also the internal rotation as active degrees of freedom; the over-all rotations are adiabatic. In the second model, which correlates with the six-rotor complex (R6 ), the rotation about the “ figure axis,” as well as the internal rotation, and all vibrations, are active.
Ethylene Oxide Activated Complex Model. The ethylene oxide isomerization complex was chosen so that it would fit the A factor measured in the propene-in- hibited isomerization of C2H40. Neufeld and Blades311 report 1014-13 in the temperature range of 643-702°K; Mueller and Walters30 give 1014-34, and Benson3b prefers 1014-80 sec-1. By analogy with cyclopropane915 isomerization to propene, which even after removal of
(17) D. W. Setser, B. S. Rabinovitch, and J. W. Simons, J. Chem. Phys., 40, 1751 (1964); 41, 800 (1964).(18) B. S. Rabinovitch and R. W. Diesen, ibid., 30, 735 (1959).(19) Computer programs were obtained from Professor B. S. Rabinovitch; several were written by G. Z. Whitten.(20) P. C. Haarhoff, J. Mol. Phys., 6, 337 (1963); 7, 101 (1963).(21) (a) K. S. Pitzer and W. Weltner, Jr., J. Am. Chem. Soc., 71, 2842 (1949); (b) R. W. Kilb, C. C. Lin, and E. Bright Wilson, Jr., J. Chem. Phys., 26, 1695 (1957).(22) (a) R. C. Lord and B. Nolin, ibid., 24, 656 (1956); (b) G. L. Cunningham, Jr., A. W. Boyd, R. J. Meyers, D. W. Gwinn, and W. I. Le Van, ibid., 19, 676 (1951).
Volume 70, Number 3 March 1966

830 D. W. S e t s e r
the symmetry factor has a slightly positive entropy of activation, the 1014-13 value for C2H40 must be slightly low. Therefore, the model for the present calculations was selected to have a positive entropy of 1.9 eu after removal of the reaction path degeneracy of 4. This corresponds to an Arrhenius A factor of 1014-48 at 700°K. The transition state is similar to that for cyclopropane. The H is envisioned as being symmetrically positioned between the carbon atoms; the reaction coordinate is simply but adequately represented as a C-H stretch. One carbon-oxygen bond of the ring is partially broken and the second carbon- oxygen bond is something between a single and a double bond. A more complete description is given in the Appendix.
The model of the complex for ethylene oxide-d4 was constructed by analogy with the do complex and satisfied the Teller-Redlich product rule to within 3%. The thermal isotope effect ratio of Arrhenius parameters at high pressures for the isomerization reaction is /ch/Zcd = 0.98 exp ( 1400/7? T). The rate constants calculated for ethylene oxide-d0 and -d4 are shown in Figure 2. It should be noted that the isotope effect is about 5 and 3 at e+ = 5 and 25 kcal mole-1, respectively. This change is to be expected.8'9a
A comparison of the specific rate constants for cyclopropane and ethylene oxide is illustrative. The e0 for C3H6 is 7.4 kcal mole- 1 higher than for C2H40 and cyclopropane also has six more degrees of freedom. Both features tend to decrease the magnitude of k e for C3H3 relative to C2H40 ; the ratio is 2 2 and 14 at e+ = 10 and 20 kcal mole-1, respectively.
Acetaldehyde-Activated Complex Models. Owing to the lack of experimental data, selection of the model for CH3CHO decomposition is somewhat arbitrary. From an analysis of the data from the pyrolysis of CH3CHO, which follows a Rice-Herzfeld mechanism, Benson7a suggested limits to the A factor of 1014-3 and 1015-3 sec. - 1 Another approach is to consider the equilibrium constant between CH3CHO CHO + CH3 and from the bimolecular combination rate constant evaluate the unimolecular rate constant.3b Unfortunately, the combination rate constant has not been measured either.23 However, from other small radical combination reactions reasonable upper and lower limits can be set. The upper limit to the combination rate for small radicals is given by the Gorin model24 and is equal to 1.05 X 10¹⁴ cc mole- 1 sec- 1 for CH3 and CHO at 700°Iv. The equilibrium constant which was calculated from the models of CH3 and CHO is 5.68 X 10² exp ( — 79,000/7?T) mole cc- 1 at 700°K. This leads to the upper limit for the unimolecular process of 6.0 X 10¹⁶ exp ( —79,000/T?T) sec-1. A lower limit can
be established by assigning to the combination rate a steric factor of 0.01.26 This would diminish the above unimolecular rate by an equal amount. Three models were investigated. The first two models of the transition state to be discussed below (R5 and R 6 ) are loose types and essentially fit the Gorin model. The third is a tighter complex that gives a combination rate constant equal to 9.3 X 10- 3 times that of the Gorin model, which is very close to the 1 X 10⁻² steric factor set above.
The Gorin combination model treates the over-all rotations of the complex as a diatomic rotor and maintains all the vibrations and rotational tumblings virtually unchanged relative to the unbound radicals. We have chosen one complex (R6) in the same way. The two over-all rotations of the complex were taken as adiabatic; all other internal degrees of freedom were considered active. The adiabatic partition function was calculated from the average internuclear distance (r+ = 4.8 A) of the combining radicals at our temperatures.26 A second loose model, R5, was also investigated; the difference between R5 and R 6 is that the rotation around the “ figure” axis is classified as adiabatic in R5. The active degrees of freedom then become nine vibrations, two CH3 tumblings, two CHO tumblings, and an internal rotation of CH3 relative to CHO .27 28 For the tighter complex (model V) the four tumblings of R5 were changed to active vibrations; 240 (2 ) and 140 (2 ). The internal rotation is still active. These models are summarized in the Appendix and their rate constants are shown in Figure 3.
Changing the “ figure axis” rotation from adiabatic (R5) to active (R6), lowered k e by a factor of 2 at e+ > 4 kcal mole-1 ; the effect is somewhat larger at lower energies.9d> 28 In view of the lack of good experimental information, a factor of 2 is not important for the CH3CHO system, and in the computation of re-
(23) The disproportionation combination ratio for this reaction may be unfavorable for combination; see ref 35.(24) (a) E. Gorin, Acta Physicochem, URSS, 6, 691 (1961);(b) H. S. Johnson and P. Goldfinger, J. Chem. Phys., 37, 700 (1962); eq 24 was used to calculate the combination rate with a = 144 X 10-60. (c) The classical recombination rate, 1/ 4cr2(8xfc77//i)1/ 2t with<y — 3.5 A gives 7.1 X 10¹³ cc mole-1 sec-1.(25) This is probably too small since ethyl radicals have a steric factor of only 0.09 at 50°: A. Shepp and K. O. Kutschke, J. Chem. Phys., 26, 102L (1957). However, we are setting a lower bound.(26) This procedure is the same as that used by Rabinovitch and Setser,8 pp 49, 50, and is subject to the same limitations. The problem of conservation of angular momentum in these reactions where r + > re is also mentioned there.(27) This type of complex was first used by Marcus7 in his treatment of C H 3 I . It has also been used to calculate decomposition rates for C H 4 , C 2 H 3 , C 3 H 8 , and C 4H 10.8 For the last two examples a loose vibrational model is probably more appropriate.96(28) J. C. Hassler and D. W. Setser, J. Am. Chem. Soc., 87, 3793(1965).
The Journal of Physical Chemistry

Uni molecular Rate Constants for Acetaldehyde and Ethylene Oxide 831
Figure 3. Specific rate constants for various decom position models of C H 3C H O and C D 3C D O . For the R 6, R 5 , and V complexes the ke curves begin at 460, 2 2 ; 3 .7 X 10 4, 2 .03 X 10 s; and _.03 X 104,6 .3 X 102 sec-1 for C H sC H O and C D 3C D O , respectively.
suits to be compared with experiment we have used only R 6 to represent the loose complex. There is little basis for this choice; however, strong coupling of internal rotation with “ figure axis” rotation could be expected for CH3CHO and also this model does fit the Gorin concept somewhat better than the R5 model. There is one point of contrast between R5 and R 6 that can be noted. R5 and R 6 should have identical thermal high-pressure preexponential factors since changing degrees of freedom from active to adiabatic cannot affect the partition functions. The actual values,7.97 X 1016 and 7.70 X 10¹⁶ sec-1 for R5 and R 6, respectively, are slightly different owing to small changes introduced into the partition functions when the over-all moments of inertia are separated. In terms of specific
rate constants, k„ = I keK (t)de. Since kc istJ €0
different in the two models (Figure 3), counterbalancing effects exist in the two distribution functions. The situation resembles the equilibrium and nonequilibrium isotope effects discussed by Rabinovitch in which important terms in the specific rate constant and in the distribution function counterbalance each other.
Calculations for comparison with experiment are done for the R 6 and the V models. It should be remembered that these models are designed to give the
Figure 4. Therm al unimolecular falloff curves. Pressures are in centimeters. T he log P scale for the V com plex of C H 3C H O and C D 3C D O has been shifted tw o units to the left. T h e dotted lines refer to ethylene oxide. H and D signify light and deuterated m olecules; 643 and 1000 are the temperatures in ° K . T he numerical values of k/ka m ay be obtained from the author upon request.
upper and lower limits to the true rate constant. Comparison at e+ = 5, 15, and 25 kcal mole-1 gives specific rate constant ratios of 39, 18, and 12 for these two models. Thus at high excitation energies the two models give somewhat similar results. Conversely, their greatest difference is at low energies and the systems given by eq 2 and 3 would be good for identifying the proper transition state.
It is worth noting that the predicted secondary isotope effect, ken/keD, is significantly larger for the V model than for R6. For example, between 2 and 20 kcal mole-1 the ratio of calculated isotope effects is approximately 1.35, and, in principle, measurement of the nonequilibrium isotope effect could be used to favor one model over the other. The high-pressure equilibrium thermal isotope effect has the values 0.69 and 0.85 exp ( —230/RT) for the R 6 and V models, respectively. The rather large inverse effect upon the A factor ratio for the R 6 model is a result of the way the moments of inertia were treated and is probably exaggerated.
Calculated ResultsThermal Activation. The results for C2H4O and
CH3CHO are shown as falloff curves in Figure 4. By matching the curvature29 30 of the RRKM falloff plots to that given by the classical Kassel integral,80
(29) E. W . Schlag, B. S. Rabinovitch, and F. W . Schneider, J. Chem. Phys., 32, 1599 (1960).(30) The Kassel integral was evaluated by numerical integration on the IBM 1410 computer at various pressures with A = 1 X 10¹⁶ and 3 X 10¹⁴ for CH3CHO and CjH jO, respectively.
Volume 70, Number 3 March 1966

832 D. W. Setser
the empirical parameter s can be obtained. A second way31 of obtaining this parameter is to compare the RRKM average energy of reacting molecules at limiting high pressure (e ”\ h ) to the classical value, e0 + s'RT. The values of s' for ethylene oxide-do and -d4 and acetaldehyde-do and -d4 at 643 and 1000°K are given in Table I. In general, both methods give about the same numerical value and also show changes with temperature and molecular structure in about the same way. It is interesting that for CH3CHO the Y model has larger s values than does the R 6 model. This is in spite of the fact that the V model is a tighter complex; e.g., it has a smaller Arrhenius A factor and smaller k( values than does the R6 model. At limiting low pressures the classical theory predicts that for £0 > > “ s” RT the average energy of the reacting molecules, (e°th), is to + RT. Rabinovitch, et al.,n have pointed out that quantum aspects may be important and that the average energy above e0 is larger than RT for real systems at usual reaction temperatures. The ratio, (e°th — to)/RT, measures this deviation and is also included in Table I.
Table I: Values of K assel s
MoleculeTemp,
°K sa s '6 to+/R Tc
C Ä O 643 3 .3 3 .8 1 .2 61000 5 .4 5 .7 1 .4 4
c 2d 4o 643 4 .7 4 .8 1 .2 71000 6 .6 6 .8 1 .4 4
C H 3C H O 643 5 .5 5 .6 1 .1 8(V m odel) 1000 6 .5 6 .8 1 .3 0C H 3C H O 643 4 .0 4 .9 1 .1 9(R 6 m odel) 1000 4 .8 5 .8 1 .3 3C D 3C D O 643 6 .0 6 .3 1 .2 0( V m odel) 1000 7 .4 7 .5 1 .3 8C D 3C D O 643 4 .5 5 .4 1 .2 1(R 6 m odel) 1000 5 .5 6 .5 1 .3 5
“ Evaluated b y matching R R K M and K assel falloff curves between log k/km = 0 .0 and — 2.0. Fractional s values have only qualitative significance. b E valuated from reaction e„ + = s'RT where + is the average energy above e0 at infinite pressure given b y the R R K M distribution function. c e0+ is the average thermal energy above e0 a t zero pressure evaluated from the R R K M distribution function.
Another indication of the importance of quantum statistics is the nonequilibrium low pressure inverse isotope effect8’9b in thermal activation systems. The RRKM treatment predicts 0.49 and 0.46 for ethylene oxide at 643 and 1000°K. The two models of acetaldehyde give 0.19 (R6) and 0.15 (Y) at 643 and 0.28 (R6) and 0.25 (V) at 1000°. The different magnitudes and
temperature dependence of the isotope effect for these two molecules is a reflection of the 1.4 kcal mole-1 difference in t0 between C2H40 and C2D 40 and also of the larger e0 for acetaldehyde relative to ethylene oxide.
Chemical Activation Systems. Calculations were done for the acetaldehyde systems described by eq 2 and 3 and the results are shown in Tables II through V. The thermochemistry is shown in Figure 1: emjn for acetaldehyde produced by C2H40 isomerization is 3.9 kcal mole-1 above to; emin for CH3CHO formed by association of CH3 and CHO is, of course, equal to e0.
Since the distribution functions for these two experimental situations are rather broad and since the specific rate constants are strong functions of energy, the calculated fca values show a wide dispersion between the high- and low-pressure limits. As was stated earlier, the distribution function of the CH3CHO molecules formed by thermal isomerization of C2H40 is pressure dependent. As a consequence, the average energy of the formed molecules is also dependent upon pressure. At 700 °K this average energy changes by about 4 kcal mole-1 between high and low pressures. This, as well as the very broad nature of the distribution function at all pressures, contributes to the wide dispersion of fca values in this system.
In addition to the large difference in the magnitudes of the rate constants, there are other interesting points of contrast between models V and R 6. For example, the average energy of the CH3CHO molecules formed by CH3 + CHO is larger for V than for R 6. At 800°K the average energy of the formed molecules (the values listed in the table are the average energy for the reacting molecules, but at low pressure (eR+) = average energy of formed molecules) is 9.86 and 8.49 kcal mole-1; the larger energy associated with the vibrational model is due to the higher heat capacity of low-frequency vibrations relative to rotations. A feature of Table IV which at first glance appears contradictory is the wider dispersion of fca with pressure for the V model even though R6 is the looser complex. The spread in /ca depends upon the variation of fce with energy. Although ke is a stronger function of energy from 6+ = 0-30 kcal mole-1 for the R 6 model than for the V model, the situation is reversed for the range, 4-34 kcal mole-1, which is the appropriate energy space for this case.
The normal, nonequilibrium isotope effect for acet-
(31) D . W . Placzek, B. S. Rabinovitch, G. Z. W hitten, and E. Tschuikow-Roux, J. Chem. Phys., 42, 4071 (1965). These authors give a thorough discussion of the relation of s to factors such as tem perature, vibrational frequency patterns, and number of internal degrees of freedom.
The Journal of Physical Chemistry

Tabl
e II
: S
/D V
alu
es f
or C
hem
ical
ly A
ctiv
ate
d A
ceta
ldeh
yde
(CH
3 +
CH
O —
> C
H3C
HO
*)
Unimolecular R ate Constants for Acetaldehyde and Ethylene Oxide 833
IOri Ox SrH ©IOd
*2 on On O iD8
O(M
vy l—^ CO X X
CO CD d O Tfl GO
xxXX?SI I 1 O O 'i-1 rHX XID ' »D COCD rH
>>%>
WoOO '
1o d d 1
o 05
o
00 too o1—1 T—1
1O
1o d d
t-H i—li io o
o> r-o orH r“H t í
i—i iD7 W ^ © X 00 X X
oID i-H
1—1
X X X oiD
COX
rH
X X X oiD
OO
rH rH
X X X X sIDID
OoCO
^ id diD
CO00r -rti <N CO
dID 05 O CD d ID Tt<
COIDI>
(M rH05 05 GO d
i—i CD TfH 05 On
1-1 CO r - (M I> r -
COrH -+H
t í
d rH 05 rH ID T—1 (N d on ID 05 T—1 I> -?
d otí Tfl ^ ^ O8 « x x ®O ^ T« o N3 2 N
d co
co
?o d
i—i d 7o ID
d drH
To
?o
rH
XID1> X X
rHCD
GOOn
XCOl—i X X CD
iD 25X
rH
X<NID
d CDID
TÍ1CO
Tfl CD i>On
d COCO
CD05 00 d
rH05
COo
d i—l rH CD iD d ID
XCD
T3títí
X
rj< CO CO •
■ CD
d«SO d d 1 d d
rH rHiD iD co
iDCO
COi—i
o CD rH On rHCO
X X CD <N X X rH CDX ID X X oo 00
O CO CO d © CO GO ID id !>• O rH CO 00 rH1> 05 00 rH f>
05 o T il rH
d Ttl On CO 1> d
Ò 2 2H CO Tf< COx 8 X X o0 °°
t i? d 2CO
Cl
d
THo On X X GO 8
(M ID X X CDrH i—i
0500CO
orH
CO On IDCD
05 CO ID d on05
o00 d d d on
X X S 2N t S HO GO 1-1
<N CO
CD ID l> Thi-l GO
d di—i 1—1 cr> oX X *>00 o 23 52O iD H Hd GO
IO
ouft
d dID Til rH ID TÍ1 o
X X X on rH ID CO X X iD2 dCD o Til CD d ID 05 rH
CD 05on O 05 O IDon on ID rH 1>
o flj CO CD
(MGO
O Orf1 n H H D H¡S § X X ^ 50 Q co ci H 2 20 t}H rH ^ 1"1
05 <M ftao
CO on *N H D CO CO
CO o
onID CD CO
CDd IDGO CD
X X05 CO ■ <N On05 i-l
o oi—l rHH 05 V V ® Oxtf . A Art O)
00 tH O - ‘00CO <NOn CO
tí<DT3tí
T3tí
CD ^ CD CD pi > pi > pí >
CD ^ CD CDtí > tí > tí >
CD CD CDtí > Ph > tí >
CO CD CDtí > tí > tí >
"Otítí<05d
M ~■o I
tíotío
tí*í
's<uCO +" 1
$ G 0N0>CO + " g
3 G0)CO«
rC O+ s 5 G•4 s SQ rii
M*5 o
+ " § tí K
& , a MO o O Oo o o oCO ID GO o1—1
oO
Volume 70, Number 3 March 1966
c Ref
ers
to t
he
aver
age
ener
gy o
f th
e re
acti
ng
mol
ecu
les
abov
e eo
wh
ich
is
79 a
nd
80.
1 k
cal
mo
le-1
for
th
e R
6 an
d V
com
ple
x, r
esp
ecti
vely
. d
Th
e av
erag
e en
ergy
of
the
form
ed m
olec
ule
s fo
r th
e R
6 an
d V
com
ple
xes
are
2.44
an
d 2
.41
kca
l m
ole
-1 a
t 3
00
°K,
4.4
7 an
d 4
.98
kca
l m
ole
-1 a
t 5
00
°K,
8.4
9 an
d 9
.85
kca
l m
ole
-1 a
t 8
00
°K,
11.6
1 an
d
13.4
6 k
cal
mo
le-1
at
10
00
°K,
resp
ecti
vely
. *
At
a p
ress
ure
of
104
cm,
S/D
is
62.
4 a
nd
20.
8 a
t 80
0 an
d 1
00
0°K
, re
spec
tive
ly.
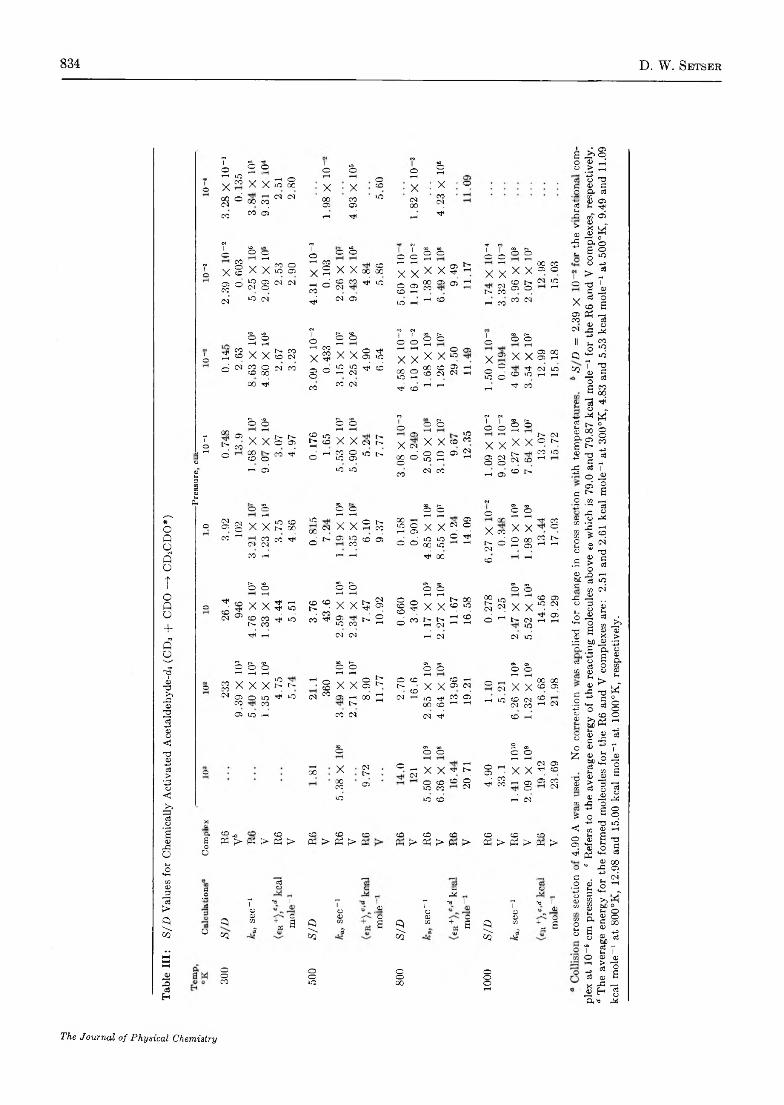
Tabl
e II
I:
S/D
Val
ues
for
Chem
ical
ly A
ctiv
ated
Ace
tald
ehyd
e-A
(CD
3 + C
DO
—>
CD
3CD
O*)
834 D. W. Setsek
T <0 | » aO
0 OrH 01 O d O drH 0
0
rHX
»OCO X X
rHID O
COtHX
tHX
OCD
rHX X O a
0004 d COrHCO 04 04 0005 CO05
ID 0400
CO04
0‘-H03
CO CO d rH d rH d f~tD' >
IN| eo| IIS N| •*r<| eoO
D+=O
CO0CD
d 0iH OCOOrH
O O0 O drH d O O d drH u
”0 X X X
COID
O05
rH
X X X 00CD00
rHX
rHX X X
05TtHIHtH X
rH
X X X0005 COO
|05CO d 10
04 050
04 04 rHCO
d CD04
CO d ID 0CD
05rH00CO
05 d rHrH
IH04CO
CD05 IHO04 IDrH O
04 id 04 d 04 05 ID rH rH CD rH CO CO 04 Xoreo
N eo «•» <N
TjHrH
dH drH1O drH d !
O1O drH d 1
O d drH II10
COCD X X
IHCD
CO04
r—1 COw co X ^ X X O05
rjnID
rH
XtHX X 0
X ^05
X05 X X
0505 00rH Qd 04 CO
CD 0CO 04 CO
S d iDrH ID04 d d 00
ID0rH
00CD CD
040504
rHrH 0
ID0
d CDTjHID 04rH DrH 05
00 d CO CO 04 d CD rH rH rH d CO
O
d d d d f O d T T d d-HC3
00
IH
tH rH tH 0 rH IDCO
0 0 r—1 HT0
05CO X X IH
OIH05
CDIHrH
IDCD X X 04
IHIH X
0504 X X <0 X
rHX X X
IHO 04
IHDaS
110T—i d 00CD 0
CO d d rH COID
O05 ID IH 00
0d 0
ID0rH
05 04tH 05
004O
IH04 CD
COrH ID <0-H0F->
rH d ID ID CO 04 CO rH 05 CD IH rD-H¡3§<U ti£ «5 00 IN .2
O 0 O O d d d d ’■+3q 04
05 04O X
tHX
»DIH
CDCO
IDCO 04
tH rH
X X OrH tHco00IDrH
rH005
rHX
rH
X 0505O
O
x00CO
rHX
rH
XtH CO
ODWm
CO rH04 CO
04 CO d d IH 05 iDCO CD d d d ID
00IDID
drH drH IH04
d 0rH 0005COrH IHrH
COObCO rH rH rH d 00 CD rH
.20bJ3
d d d d d d d d 0
0
26.4
946 X
CDIH
rH
XCOCO 4.
445.
51
3.76
43.6
rH rH
X X05 Tjl ID CO 7.
4710
.92
0.66
03.
40
tH
XIHrH
tH
XIH04 11
.67
16.5
8
0.27
81.
25 Xh-
rH
X04ID
14.5
619
.29 DO
f-45
d rH 04 04 d 04 04 ID |'B h
d d d d d d d a>O d
c3rH rH rH
IH
rH rH rH rH rH CO
0 COCO X X X IDIH
rH OCD X X
O05IHIH
OIH
CDCD X X
CD05rH04 O rH
04 X X00CD
00050 1 05
CO 0 10CO
d ID 04 CO 05 rHIH
00 rHrH 04 rH ID
00rJHCD
COrH drH rH ID CO04 04
COCDrH 04
£.2'+3
05 ID rH CO 04 04 d CO rH 00H00
d drH d0drH drH
0£
0rHCO X 04
IHO rH
04 X X ^rHIH O05
tHX X
04TH 05CD
00CO 05 0ID CD
COCO d
04 dCOCO rH 05
Od CO
04 ■8COID ID d d 04 CO
X &Oi
CD <■ft •c CD CD CD CD CD CD CD CD CD COa0 W > Pi ;> Pi ¡> Ph > P i !> Pm Pm > Pi ¡> Pm > Pi > P i > Pm >
0050 d
0___ 1 r—( 1 , 1 0c3 .2a C5 0 O O
.2 r* -+30
f hs 1 7 1 r* ■o 1 r* ■xs 1 0oi O O O IO 1
O <D CO<D O <D 'o O O 05 O CO
0M00
ClSQ
coS’
+A a
S/D co
Sa
S/D s + a
S/D CO
e?+
Pi B
0 O O O0 0 O OCO ID 00 OrH
The Journal of Physical Chemistry
plex
at
10-5
cm
pre
ssur
e. * R
efer
s to
the
ave
rage
ene
rgy
of th
e re
actin
g m
olec
ules
abo
ve e
o whi
ch is
79.
0 an
d 79
.87
kcal
mol
e-1
for
the
R6 a
nd V
com
plex
es, r
espe
ctiv
ely.
d T
he a
vera
ge e
nerg
y fo
r th
e fo
rmed
mol
ecul
es fo
r th
e R6
and
V c
ompl
exes
are
: 2.
51 a
nd 2
.61
kcal
mol
e-1
at 3
00°K
, 4.8
3 an
d 5.
53 k
cal m
ole-
1 at
500
°K, 9
.49
and
11.0
9 kc
al m
ole-
1 at
800
°K,
12.9
8 an
d 15
.00
kcal
mol
e-1
at 1
000°
K,
resp
ectiv
ely.

Tabl
e IV
: D
/S f
or A
ceta
ldeh
yde
(Eth
ylen
e O
xide
—>
CER
CH
O*)
Unimolecular R ate Constants for Acetaldehyde and Ethylene Oxide 835
T o O T o o T © b © b
oo
X
CO05coo
rHX
rHX
rHCD
rHiO
O
Xo00o X X 00
rHb-o
XrHb-CD© X
rHX ID IDO
O
Xb-00rHo X
rHX
© CM00 ID tH CMIDo b- id rH o 05 CD ID
3CMb-rH o ID 05 o o o ©b- © rH rH o CO rH
05 05 05 00 rH rH ID rH
CM CM © 00
© ID
00rHID
— iX X ID IDO
©
XrHrH X X ©rH ©CO X
CM00COO C0 COCD CD ID CO© © CMCM 00 © ID CM00 ©
—1 rH ITT ID
rH rHX X °o00 O CD to
ó 2 2 x s x x f e f e10 o ^ ^
rH»DO©
o oIDb-
— iX
w
X ©CM ©rH©IDrH rH X
rH
X ©© ©IDrHiD©
ID© XrH
X 00co COCMCMCM©
IDco©D© CM © ©
©0000
ID© © © rH ©CM ©© 00 © ©
—H rH rH rH rH rH ©©©
rH rH00CMCO
IDb- X X ©CM
© IDCM CM X X ID© ID00
rH00 CM X Xb*© b-© ©
CO X X© ID CO ©
ID 00 1> © rH coCMTt<© GO br © CM 00
CO©©
©rH 00 © rH rHCM
00
© o
§ 0 x x• <*> _ H M M H
CO CMiO CO
o ow w 05 05X X 10 ^b- b- <J> 00 b- b-
IDCM00
©
CO©rH rH rH © 00b-
rH rHX X H © ©CO X X CM
© rHb- rHCO rH ©rH © co00
©©rHrH CO
05 co
00 ©© X X 00lb- 00©© CM ©
CM 00 b-© Tji
» N X X t > < B© ^ CD rH © GO
CM O
iO ID 05 00 X00rH 00CO 00© rH X X rH
b-©[s. rH © rH CD b- © ID rHrH rH rH CM rH rH rH
CM rH rH
o 0o © © ©rH rH
rH rHrH © ©
rH 00© X X iD rH rHCM X XXXX CO CM
©CM rH rH©
CMbr
rHrH © © CO© ©
©IDrH
rHrH
CO rH ID
CD CD CDtí ¡> tí í> tí !>CD CD CDPÍ > pi f> pi >
CD CD CD Pi t> Pi > Pi >
CD © ©t í ¡> t í > t í >
QSq
o344 £ -o or s
$2
a«44> Or a
co
c3ü44
CO
c3O44
a w4) 0H
CO © © ©rH © © ©© b- CO ©rH
Volume 70, Number S March 1966
° C
olli
sio
n c
ross
sec
tion
= 4
.9 A
and
is in
depe
nden
t of
tem
pera
ture
. 6
Ref
ers
to t
he a
vera
ge e
nerg
y ab
ove
eo (
79 a
nd 8
0.1
kcal
mol
e 1
for
the
R6
and
V c
ompl
ex,
resp
ec
tive
ly)
of t
he c
hem
ical
ly a
ctiv
ated
ace
tald
ehyd
e m
olec
ules
.
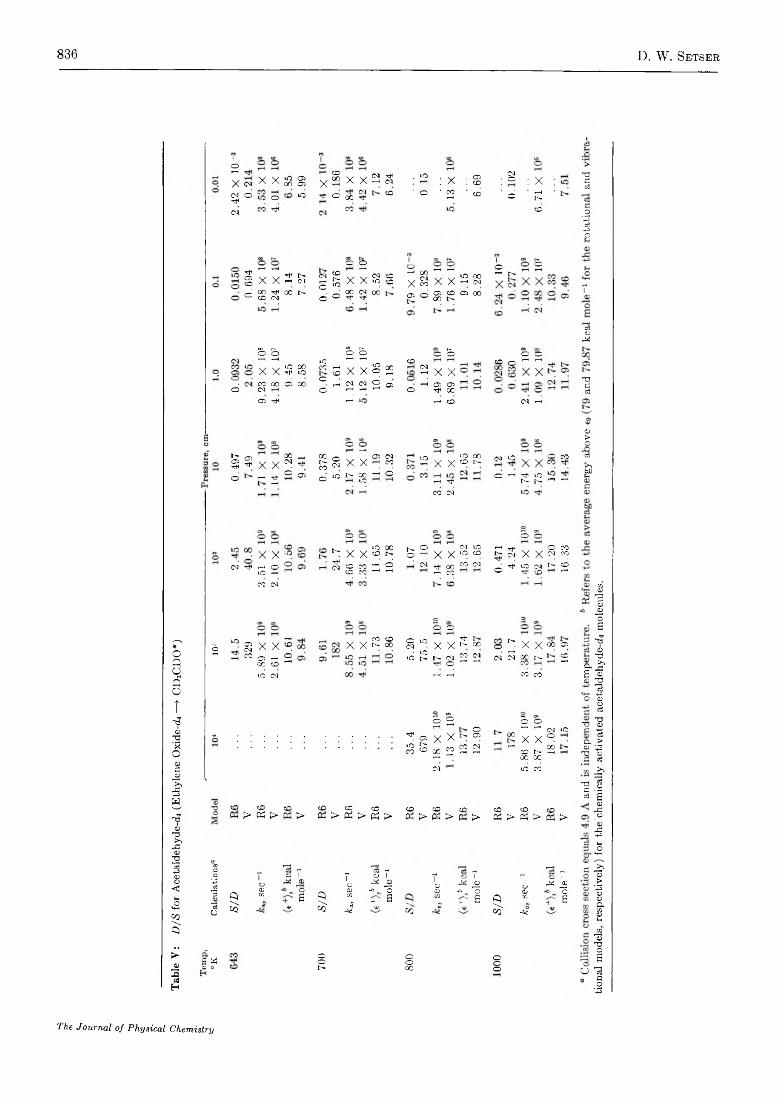
Tabl
e V
: D
/S fo
r Ac
etal
dehy
de-d
i (Et
hyle
ne O
xide
-d4 —
> CD
3CD
O*)
836 D. W. Setser
IOr-ix cmCM O ->tfCM
V" V »O 05A A on aOrtf
0505 X
CO00t-H X X 0 ?I—I rtfCM . »O : x . 05 . CO
CM • OlO rtf 0 00
CMTjH CO ' d • COrH CO d
O Ortf05CO
t-HX
rHX Tt<rH E-
01CMO
COb-tO XrHX CM»O COCO
COrHX
000 1CO
rHX
t-HX 10rH 00CM
d GOCO rtfCM GO b- d d GOrtf CMrtf GO 051> d 05CO CO 05 00
o: XrHb-CO
2 n h S
oO
d d d d 0 di-H rH to rH rH tO0
COX v ✓ »OX rt; 00
10CO i-HCO X X 00rH IO CMrH X X
CO 00 d GO 0 rH CM CM d 05 t-H 05 05CM © ’“J rH rH O rtf GO05 rtf rH rH CO
o oCO o ^ 7-1 T*
CM t-h
b-05rtf
05rtf X X00CMt-Hrtf
COe-CO
OCMXT-HX
05 CMCOO t-H rtfrH
d 05 O iO b- 00tOrH d
-tf CM tf
X X ' 1-« o !10 rH CO CM
„ to 0
05CMX XT-HCO
rH "tft-h CO05 t-H d
00 CO rHtOCM
10 tO 00S x x ^ ^rH rtfCO CM
(•si to , co co
o rH Til 10h N ^ H
E- X XtOCO 00E- b-O
Ot-H X X
CMto toCO rHE- rtfCM X XOCM COCO
rtfCM COCO COCOrHrH drH CM rtf 00
T-H COCO CM O rtf to CM rtf cO
1> COt-H
CO CO X X ^ wo o
§ 1 0 X X ^ So10 S I> co 2 23Tt< O ^ 1-1
t-H t-H CO CO
d d d c>rtf 1—1 O
00—1 t-H CM to
05 X X t> 05 ■ X X OtoCO
b-CO 00 CO COt-H CMt-H 1—1 rH CO E- 00rHrH rH 00 GOCM to CO
co co co Ph > Pi > > CO co CO Ph > Pi > Pi > CO CO copH > pH > pH >
o3rO'>dCo3
0.2'■+3c3-4-=o
O ^ X X “ ® C<l W CO N 2
o3o44
d0c3
CD>O<3rObo
Pi
a6o
didaCDd
dcc3CO CO co Cd i> P i > Pn t>
ecofl0 0 T _ "cSO T O T O T'•+3c3 0 44 <D O 44 r2 10 44 r2 l
0 44 r2r3130
a/s
<Dco<& <v
Oa
S/D 0)CO
S'r«4
-0
+ " 'UOa
Sq
CDCOCl
-0+ "
Oa
a/s
tDCOrfl
+""oa
<?3a4
a «05 oOO1>
ooCO
ooo oo
The Journal of Physical Chemistry
tiona
l mod
els,
resp
ectiv
ely)
for
the
chem
ically
act
ivat
ed a
ceta
ldeh
yde^
mol
ecul
es.

Unimolecular Rate Constants for A cetaldehyde and Ethylene Oxide 837
aldehyde generated by the combination of methyl and formyl is a secondary one. Since e+ is low, a rather large quantum statistical effect could be expected.8 The ratio (fcaH/fcaD)s/D=i is 4.6 and 5.5 at 300°K for the R6 and V complexes, respectively; the ratios decline to 1.8 and 2.1 at 1000°K. In the case of acetaldehyde formed by isomerization of ethylene oxide, the nonequilibrium isotope effect is a complex mixture of primary and secondary effects. The deuterated system has a 1.0 kcal mole-1 higher 6min than the light system and this diminishes the magnitude of the isotope effect and also brings the calculated results of R6 and V models into close agreement. Thus the predicted ratio for (fcaH/fcaD)s/D=i is about 1.8 and 1.3 at 643 and 1000°, respectively. This isotope effect is too small to be of real experimental interest or value and will not be discussed further.
Comparison with ExperimentThermal Activation. The results of Figure 4 and
Table I nicely demonstrate the effects of isotopic substitution911’32 and temperature31 32 upon the shapes as well as the position with respect to pressure of the fall- off curves. Increasing the temperature from 643 to 1000° increases the values of the Kassel s by about 2 units for ethylene oxide and 1 unit for acetaldehyde. The substitution of four deuterium atoms for hydrogen increased s by about 1 for both.
The formal similarity of the isomerizations of cyclopropane and ethylene oxide invites comparison. The s value for cyclopropane is 10.6 at 718°K. This is nearly 0.51, where t is the total number of vibrational degrees of freedom. For ethylene oxide s ~ 0.31 and actually resembles the methyl isocyanide case more than cyclopropane. The difference arises because of the lower e0 and, in general, higher frequencies of C2H40. The RRKM theory as employed here has been remarkably successful in giving the correct shape of experimental fall-off curves, 9b’c and relatively good in reproducing the pressure fit. For the latter, problems of the correct collision cross section and energy-transfer efficiency arise. Nevertheless, with use of the strong collision assumption the fit has usually been within a factor of 29b and very rarely worse than a factor of 10.90 These possible limitations should be kept in mind for the discussion below.
Neufeld and Blades3a measured the Arrhenius parameters for C2H40 at 30 cm pressure and between 643 and 702 °K. Our calculations indicate that especially at the higher temperature the reaction could be started into the falloff region. This may explain why their Arrhenius A factor seems a little low. They report an isotope effect for acetaldehyde formation at 30 cm
and 664°K of 3.1 ± 0.1. Our models give a rate constant ratio at the high pressure limit for the isomerization of C2H40 and C2D40 of 2.8, due mainly to the Ae0.
Considerable discussion of the pyrolysis of CH3CHO centers about the order of the initiation reaction, eq la. The system is usually studied at a temperature of ~800°K and 10-30 cm pressure and is 3/ 2 order in pure acetaldehyde. At 800° and 10 cm pressure, the calculated value of k/k* is 0.28 and 0.68 for the R6 and V model, respectively. These calculations definitely support the view2b'c that the reaction is in the pressure-dependent region although probably not in the purely second-order region. In this respect the pyrolysis of acetaldehyde and ethane are similar.98 A second similarity is that 2CH3 —► C2H6 may be an important chain-ending step in both cases and that it, too, is in the pressure-dependent region9« under these conditions.
Chemical Activation Systems. Probably the most interesting and important chemical activation system for these molecules is CH3CHO formed by the thermal isomerization of ethylene oxide. The calculated results Tables IV and V strongly support earlier claims 3a"b that the CH3CHO so formed does decompose under most conditions of temperature and pressure. Both V and R6 models predict this and they represent the lower and upper limits to the decomposition rate constants. Neufeld and Blades32 measured the ratio of acetaldehyde to carbon monoxide at 685°K over the pressure range of 0.6 to 80 cm under conditions of propene inhibition of the chain reactions. If it is assumed that no CH3CHO was removed by radical reactions, that all HCO decomposes33 to CO, and that there is no other source of CO, then this ratio is equivalent to the S/D of Table IV. Even if the absolute value of the ratio is not exactly S/D, it should show the same pressure dependence. The values of this ratio are 0.5, 1.0, 1.8, 2.3, and 4 at pressures (10-20% C2H40 in propene) of 0.6, 5, 10, 20, and 60 cm. These are in surprisingly good agreement with the results calculated from the V model at 700°K which gives S/D = 4.2 and 1.4 at pressures of 10 and 1 cm, respectively. These experimental results tend to support the tighter activated complex type for CH3CHO decomposition, although this depends upon how closely the acetaldehyde to carbon monoxide ratio actually simulates S/D.
(32) B. S. Rabinovitch, D. W . Setser, and F. W . Schneider, Can. J. Chem., 39, 2609 (1961).(33) Formyl radical kinetics are discussed in ref 12. If the radical chains are completely inhibited by propene, then these should be good assumptions.
Volume 70, Number 3 March 1966

838 D. W. Setser
Benson3b arrived at the same conclusions as those above by using the classical RRK approach to estimate the acetaldehyde decomposition rate constants at 723°K. He used a single Kassel s value of 10 to calculate the average energy and kt for CH3CHO. From Table I it is seen that two values of s are needed, one to calculate the average energy of the reacting C2H40 or formed CH3CHO, and a second to calculate fc£ for CH3CHO. Furthermore, s = 10 is a drastic overestimate for either purpose. One effect of this overestimate is to increase the value of the calculated average energy. Benson uses 85 kcal mole-1 as emin (we used 82.9, Figure 1); therefore, his average energy,(e) = 85 + sRT = 99.5 kcal mole-1 at 723°K. At the midpoint of the pressure range, Table IV gives(e) = 79.0 + 8 = 87 kcal mole-1 at 700°K. Benson then used the classical expression for the rate constant k€ = A [((e) — eo)/(e)]s-1 with A = 1015 sec-1 to obtain the numerical value of 5 X 10s sec-1. Our calculations give kt = 1.4 X 10⁸ and 4.5 X 10⁹ for the V and R6 complexes, respectively, at e+ = 8 kcal mole-1. It is thus apparent that the classical treatment with s = 10 gave the correct order of magnitude answer due to two counterbalancing errors: an overestimate of the average energy and an underestimate of the rate constant at a given energy; e.g., at the correct energy, e+ = 8 kcal mole-1, it predicts ke = 106 sec-1.
The ratios of rate constants in Figures 2 and 3 show that generation of ethylene oxide at an energy level above e0, for pressures at which it is possible for isomerization of C2H40 to occur, is always accompanied by the subsequent decomposition of CH3CHO. For example, at e+ = 10 kcal mole-1 C2H40 isomerizes with a rate constant of 3.7 X 10⁸ sec-1 ; however, the CH3CHO that is formed as a consequence of this isomerization (e+ = 13.9 kcal mole-1) will decompose with a rate constant between 1.5 X 10⁹ and 3 X 10¹⁰ sec-1. At e+ = 20 kcal mole-1, the rate constants are 5 X 10⁹ sec-1 for C2H40 compared to 2 X 10¹⁰ to 2.5 X 10¹¹ sec-1 for CH3CHO. Actual experimental systems in which these reactions may have taken place are the addition of 0 ( 3Pi) atoms to ethylene,34a photolysis of C2H40 ,34b and mercury-photosensitized decomposition of C2H40 .84c In these cases many of the products can be explained by reactions of HCO and CH3, although the possibility of the presence of excited rather than ground electronic state ethylene oxide must be kept in mind.
As was pointed out by Benson,3b the isomerization of the higher epoxide homologs gives vibrationally excited aldehydes and ketones in a manner similar to ethylene oxide. If desired, the rate constants for the
first and perhaps the second members of the series can be estimated from the rate constants given here, the way ke values are known to change in other homologous series,38 and cognizance of the changes in thermochemistry.
Data for other systems in which CH3CHO is directly formed by chemical activation are scarce. The combination of methyl and formyl radical has not apparently been studied. This may be because disproportionation dominates over combination,34 35 36-37 38 but it also may be due, in part, to the fact that most work37 has been done at relatively low pressures. From Table II it can be seen that pressure above 0.1 cm of an efficient deactivating gas should be used to measure readily stabilized CH3CHO at 300°K. The data from other cases such as H atom plus acetyl radical and the photolysis of acetaldehyde38 are not sufficient at the present time for profitable comparison with the calculations.
It is the hope that making these calculated values of ke available will induce further detailed experimental investigations of the many possible ethylene oxide and acetaldehyde systems in which vibrationally excited ground electronic state molecules may play a role.
Acknowledgments. The author wishes to thank Professor B. S. Rabinovitch of the University of Washington for making available preprints of ref 9h and 31 and for the generous loan of computer programs. He also wishes to acknowledge a summer research fellowship from Kansas State University.
AppendixThe frequencies and the moments of inertia of the
various models are listed in Table VI. The symmetry numbers associated with the rotations are listed as footnotes. The frequencies and moments of inertia
(34) (a) R. J. Cvetanovic, J. Chem. Phys., 23, 1375 (1955); (b)R. Gomer and W . A. Noyes, Jr., J. Am. Chem. Soc., 72, 101 (1950); (c) R. J. Cvetanovic and L. C. Doyle, Can. J. Chem., 33, 1684 (1955).(35) (a) For the alkyl radical series, see M . J. Pearson and B. S. Rabinovitch, J. Chem. Phys., 42, 1624 (1965); (b) for the olefin and cyclopropane series, see F. H. Dorer and B. S. Rabinovitch, J. Phys. Chem., 69, 1952, 1973 (1965).(36) R. J. Cvetanovic, Progr. Reaction Kinetics, 2, 112 (1964).(37) F. P. Lossing, Can. J. Chem., 35, 305 (1957). At a pressure of 1 cm of He at 55° only slight formation of CD3CHO or CH3CDO was found in the mercury photosensitization of mixtures of CD3CDO and CH3CHO.(38) C. S. Parmenter and W. A. Noyes, Jr., J. Am. Chem. Soc., 85, 416 (1963). It may be noted that these authors include the possibility that internal conversion from the first excited singlet state to the ground electronic state may occur. If so, then at 3340 A the CHaCHO molecule would have 85-88 kcal mcle-1 of energy and rate constants for decomposition of 8 X 10⁷ to 2 X 10⁹ sec-1 and extensive decomposition could be expected at pressures of 1 cm and below. Similar statements can be made for photolysis at shorter wavelengths.
The Journal of Physical Chemistry

Unimolecular R ate Constants for A cetaldehyde and Ethylene Oxide 839
Table VI
— ■ ......----------- — ... -'Molecule—■—•— -Complex—■——■—----------,------- 1, g cm2 X 1040—■—•—» /------—I, g cm2 X 1040---------- .
Frequency, cm _1 Active Adiabatic Frequency, cm-1 Active Adiabatic
Ethylene oxide-fn“3041(4) 884(2) 32.92 3029(3) 826(4) 23.001440(3) 814(2) 37.92 1488(3) 650(1) 61.491140(4) 59.50 1140(3) 79.36Ethylene oxide-d42235(4) 782(2) 41.25 2209(3) 711(2) 34.601173(3) 579(2) 54.27 1278(3) 557(3) 70.70957 (4) 72.67 939 (3) 93.96
Acetaldehyde-fuModel A (one active rotor)6 Five-rotor complex6 (R5)2879(4) 967(3) 3.67 14.83 3022(4) 1091(1) 2.92(2) 25.661740(1) 764(1) 82.58 1860(1) 950(1) 1.23 394.91393(4) 525(1) 92.23 1420(3) 20.22 412.4
4.17One-rotor complex6 (V)3022 (4) 1020(3) 4.17 18.411860(1) 240(2) 148.91420(2) 140(2) 161.5
Model B' (two active rotors) Six-rotor complex'1 (R6)2879(4) 967(3) 3.67 82.58 3022(4) 2.92(2) 383.8(2)1740(1) 764(1) 14.83 92.23 1860(1) 5.841393(4) 525(1) 1420(2) 19.00
1091 (1) 1.23950(1) 20.20
Acetaldehyde-d/Model A (one rotor active) Five-rotor complex' (R5)2065(5) 746(2) 7.33 24.01 2110(4) 5.79(2) 35.031091 (4) 570(1) 97.86 1860(1) 22.11 471.2944(1) 419(1) 11.44 1070(2) 2.08 452.1
828 (2) 7.12One-rotor complex' (V)2110(4) 828(2) 7.12 28.051860(1) 190(2) 186.91070(2) 115(2) 170.5
Model B (two rotors active)7 Six-rotor complex" (R6)2065(5 ) 746(2 ) 7.33 97.86 2110(4) 5.79(2) 437.7(2)1091(4) 570(1) 24.Cl 111.44 1860(1) 21.7944(1) 419(1) 1070(2) 11.69
828 (2) 2.0822.11
“ The symmetry number associated with over-all rotations was utilized as a reaction path degeneracy of 4. 6 Symmetry numberassociated with over-all rotation is unity for both complex and molecule. The symmetry number for CH3 internal rotation in the molecule ( / = 3.67 X 10~40) and in the complex ( / = 4.17 X 10~40) is 3. For the 5R complex the symmetry number for the methyl tumbling rotations (I = 2.92 X 10 ~40) is 2 and for CHO tumbling is unity. ' In the molecule, the symmetry number for internal rotation of CH3 (I = 3.67 X 10-40) is 3, the symmetry number for the active figure axis rotation ( / = 14.83 X 10-40) and the remaining over-all rotations is unity. * The tumbling CH3 and CHO groups have symmetry numbers of 6 and 1, respectively. The symmetry number for over-all rotation is unity. 8 See footnote b but note change in values of moments of inertia. 7 See footnote c but note change in values of moments of inertia. ° See footnote d, but note change in values of moments of inertia.
of the molecules were taken from the literature.21'22 The complexes are described below. The d4 activated complex models were chosen by analogy with the da counterparts and adjusted to fit; the Teller-Redlieh product rule to within 2-3% in ail cases.
The changes for the isomerization complex of C2H40 relative to the molecule, in addition to using a C-H stretch frequency as the reaction coordinate, were the following: a 895-cm-1 ring mode was lowered to 650 cm-1 to correspond more closely to a C—C = 0 bend,
Volume 70, Number 3 March 1966

840 D. W. Setser
a 1266 ring mode was raised to 1500 cm-1 to correspond to a C = 0 stretch frequency, and the CH2 twist, 1345 cm-1, was lowered to 800 cm-1, since this type of twisting motion must be more free in the transition state.
The decomposition complexes for CH3CHO used the carbon-carbon stretch as the reaction coordinate. The two models employ either freely tumbling CH3 and CHO radicals or CH3 and CHO with the addition of four low bending frequencies. The frequencies of CH3 and CHO are needed for both. The frequencies previously used8 for CH3 were employed; 3023 (3), 1420 (2), and 950 cm-1. The moments of inertia are2.92 and 5.84 X 10-40 g cm2. The frequencies employed for CHO39 were 2010, 1860, and 1091 cm-1 ;
the moments of inertia are 19.0, 1.23, and 20.2 X 10-40 g cm2. At 700°K the entropies of CH3 and CHO are54.5 and 61.4 eu, respectively. For the R6 complex the over-all moments of inertia were calculated from the average internuclear distance26 of 4.8 A. The over-all moments of inertia of the V model were obtained by assigning the C -C internuclear distance as2.5 A and using the geometries of the radicals. Changing the four rotations to vibration for the V complex raised the zero-point energy and, hence, €0 by 1.1 kcal mole-1. * 3032
(39) G. E. Ewing, W . E. Thompson, and G. C. Pimentel, J. Chem. Phys., 23, 927 (1960); D. W. Milliken and M. E. Jacox, ibid., 41,3032 (1964).
The Journal of Physical Chemistry

Concurrent Exchange and Hydrolysis R eactions of Bromoacetic Acid 841
Concurrent Exchange and Hydrolysis Reactions of Bromoacetic Acid.
Specific Cation Effect1
by J . F . Hinton and F . J . Johnston
Department of Chemistry, University of Georgia, Athens, Georgia (Received September 27, 1965)
The kinetics of the exchange and hydrolysis reactions of bromoacetic acid in aqueous solution have been studied in the presence of seven electrolytes in which only the cation was varied. The greatest ionic strength studied for a given salt ranged from 11 for Ca2+ to 3.5 for K+. Specific cation effects were observed for both reactions. The rate constants for the exchange reaction at 38.7° are described by the equation, log k = log fc0 + bn, where n is the ionic strength of the solution and b depends upon the salt. A similar relationship was not generally applicable to the hydrolysis reaction. The effect of added electrolyse upon the thermodynamic activity of the solvent water is considered in relationship to its effect upon reaction rate constants.
IntroductionBromoacetic acid in aqueous solutions containing
bromide ions undergoes simultaneously an exchange reaction with bromide ions (A' and a hydrolysis reaction (B).
CH2BrCOOH + Br~* ^CH2Br*COOH + Br~ (A)
CH2BrCOOH + H20 — >CH2OHCOOH + H+ + B r- (B)
Kinetics of the exchange reaction2 and the hydrolysis reaction3'4 have been separately described previously.
Studies of the effect of additives in a system in which a molecule undergoes two different reactions simultaneously afford a possibility of obtaining additional information concerning the mechanism of either or both processes. It was of interest to us to investigate cation effects in the bromoacetic acid exchange- hydrolysis system at high salt concentrations.
According to the usual thermodynamic transition state formulation, the observed rate constants of a bimolecular reaction vary with the activity coefficients of reactants and activated complex according to
log k = log fc0 + log Y a T b / y ± (1 )
The y ’ s represent the activity coefficients of reactants and activated complex, fc0 is the rate constant in a
chosen reference state. Equation 1 should be directly applicable to reaction A. A discussion of the hydrolysis reaction in terms of (1) must involve some assumptions concerning the mechanism.
It was our aim to measure activities of bromoacetic acid and mean activities of the bromide ion in the salt solutions by extraction procedures and to correlate these along with available activity data for water with the observed exchange and hydrolysis rate constants. We were unable to obtain significant activities of bromide in the concentrated salt solutions by this technique although limited data were obtained for bromoacetic acid.
It was not possible, therefore, to discuss the exchange and hydrolysis reactions completely in terms of eq 1. Meaningful comparisons were obtained, however, and this report describes our results.
Experimental SectionReagents. Eastman White Label bromoacetic acid
with a melting point range of 48 to 50° was used without further purification. Baker Analyzed reagent nitrate salts were used as electrolyte additives. Carbon
(1) This work has been performed under AEC Contract A T (40-1) 2826.(2) J. F. Hinton and F. J. Johnston, J. Phys. Chem., 67, 2557 (1963).(3) H. M . Dawson and N. B. Dyson, J. Chem. Soc., 49, 1133 (1933).(4) F. Kunze and H. Merkader, Z. Physik. Chem., 187, 285 (1940).
Volume 70, Number 3 March 1966

842 J. F. Hinton and F. J. Johnston
tetrachloride used in the extraction experiments was Fisher Certified reagent spectrally pure material. For the exchange experiments hydrobromic acid solutions were spiked with potassium bromide-82 obtained from Oak Ridge.
Procedure. In aqueous systems containing both bromoacetic acid and bromoacetate ions, additional bimolecular reactions contribute to the apparent hydrolysis reaction. Relative rate constants for bromide production from the several processes at 25° have been reported2 as: molecule-H20, 1; ion-H20, 1.55; ion- ion, 475; molecule-ion, 1770; and molecule-molecule, 0. In order to decrease the bromoacetate concentrations to a point where ionic contributions to bromide production were negligible in hydrolysis systems, it was necessary to carry out experiments in 0.50 M H N 03.
The rate constant for the exchange of bromoacetic acid with bromide ions is approximately 600 times greater than that for the bromoacetate ion-bromide exchange at 38.7°. Therefore, it was possible to study the exchange of molecular species at much lower HNO3 concentrations. However, in order to permit comparisons with the hydrolysis reaction, exchange experiments in this study were also performed in 0.50 M HNO3. The difference in hydrolysis and exchange rates required that these processes be measured separately but under identical conditions.
Our experimental results as well as those of Dawson and Dyson3 give no indication that direct reaction between bromoacetic acid molecules and nitrate ions is significantly involved in bromide ion production.
Experimental procedures and calculations for the evaluation of rate constants were similar to those described previously.2’5 Unless stated otherwise, rate constants were determined at 38.75 ± 0.05°.
Over the range of electrolyte concentrations used, the rates of the exchange and hydrolysis reactions were second- and pseudo-first-order, respectively. In the experiments described here, comparable concentrations of reactants were employed for both reactions. For the exchange reaction, the bromide ion concentration ranged from 0.0175 to 0.0209 M, while that of the bromoacetic acid ranged from 0.1889 to 0.2200 M. The bromoacetic acid concentration for hydrolysis covered a range of 0.1440 to 0.209 M .
Activities of water in the various electrolyte systems were evaluated (at the freezing point) from freezing point depression data6 using the equation7
log aH20 = -4 .209 X H )-30 - 0.2152 X lO -502 +0.359 X 1O“ 703 + 0.212 X 1O~904 + . . .
where 6 is the freezing point depression. Although this equation gives the activity of water at the freezing point,
the values obtained are useful for comparison at higher temperatures.
Results and DiscussionIt has been found that rate constants for reactions
involving neutral molecules or an ion and a neutral molecule vary at high salt concentrations in a number of systems according to8
In k = In fc0 + b/j. (2)
This result is consistent with the expression for the activity coefficient of a neutral molecule in concentrated salt solutions as
In 7 = b0ß ( 3 )
and with that for a charged species as
In 7 ¡ CC\fß1 + ß V i
+ biß ( 4 )
where ¡1 is the ionic strength of the solution. (For an ion-molecule reaction at high salt concentrations, the first term on the ring in (4) will effectively be canceled owing to contribution from the reactant ion and transition state.)
Figure 1 illustrates the dependence of the logarithm of the exchange rate constant on the ionic strength at 38.75° for the electrolytes studied. In each case, eq 2 adequately represents the data over the entire range studied. Marked specific cation effects are observed, however, corresponding to values of b from —0.014 for Th4+ to 0.059 for K+. Not shown in Figure 1 are results in Cu(NOs)2 solution in which complexing of the bromide ion occurs. A drastic decrease in the apparent exchange rate constant occurs such that at ju = 9, log fcx = —0.175. While the distinction between complexing and ion pairing must be maintained, this observation suggests that significant ion pairing involving bromide ion would result in a smaller apparent rate constant. This factor cannot be discounted in explaining the observed specific cation effects.
In Figure 2 is shown the effect of added salt on the hydrolysis rate constant. Specific cation effects are again observed but with the data being less well represented by eq 2.
Activation parameters were determined for several of the systems studied. The results are summarized
(5) J. F. Hinton and F. J. Johnston, J. Phys. Chem., 69, 854 (1965).(6) “International Critical Tables,” Vol. 4, McGraw-Hill Book Co., Inc., New York, N. Y ., 1929.(7) I. M . Klotz, “ Chemical Thermodynamics,” Prentice-Hall, Inc., New York, N. Y ., 1955, p 322.(8) A. A. Frost and R. G. Pearson, “ Kinetics and Mechanisms,”John Wiley and Sons, Inc., New York, N. Y ., 1961.
The Journal of Physical Chemistry

Concurrent Exchange and Hydrolysis R eactions of Bromoacetic Acid 843
Table I : Summary of Activation Parameters for the Hydrolysis and Exchange Reactions of Bromoacetic Acid in Several Salt Solutions
SystemA Hk*,
kcal mole“ 1AS**,
cal mole-1 deg“ 1A-ffh*.
kcal mole - 1ASh*,“
cal mole -1 deg -1
No added salt6 19.0 ± 0 .T -1 3 .4 ± 0 .2 23.0 ± 0.2 -1 2 .8 ± 0.33.00 M KN 03 19.0 ± 0 .2 -1 2 .4 ± 0.3 23.0 ± 0.3 -1 4 .5 ± 0.43.00 M NH4NO3 19.0 ± 0.3 -1 2 .8 ± 0.36 . 0 0 M NH4NO3
2.50 M Ca(N03) 2
18.0 ± 0.3 -1 5 .2 ± 0.423.2 ± 0.2 -1 5 .0 ± 0.4
Based upon the pseudo-first-order rate constants. 6 Concentration 0.500 M in nitric acid, 0.2 M in bromoacetic acid, and 0.02 Min bromide ref 2. ° Standard errors based on least-squares analysis.
Figure 1. Plot of the logarithm of the exchange rate constants at 38.7° vs. total ionic strength of solution for the reaction CH2BrCOOH + Br“ * — CH2Br*COOH + Br“ .The initial point corresponds to a reaction system in 0.50 M nitric acid with no added salt.
in Table I. The activation enthalpies for the hydrolysis are strikingly similar. Salt effects are reflected in the apparent activation entropies for the pseudo-first-order process. The parameters for exchange in the limited systems studied are also very similar. The lower activation enthalpy in the 6 M ammonium nitrate system is considerably beyond experimental error and must be assumed real.
The effect of various added electrolytes on the activity of water is shown in Figure 3. A comparison of these data with a plot of the hydrolysis rate constants vs. the molar concentration of added salt (Figure 4) reveals an interesting correlation between the two. Beyond 1.5 M, the hydrolysis rate constants vary with cation species in precisely the same order as the activity of water. (With the exception Ca2+ and Li+, which are interchanged, the cation order for the exchange reaction is also the same as that for water activity. However, without information concerning the effect of additives on the activity of the bromide ion or the
Figure 2. Plot of the logarithms of the hydrolysis rate constants at 38.7° vs. total ionic strength of solution for the reaction CHjBrCOOH + H20 —»•CH2OHCOOH + H+ + Br~. The initial point corresponds to a reaction system in 0.50 M nitric acid with no added salt.
role of ion pairing, one cannot justify discussion of the exchange reaction in terms of solvent behavior.)
These results strongly suggest the same factors which affect the activity of water in concentrated salt solutions affect its role in the hydrolysis of bromoacetic acid.
A possible interpretation of these results involves a consideration of “ structuring” abilities of ions with respect to solvent water. Choppin and Buijs9 list several structure-making and structure-breaking sequences of ions for concentrated solutions. According to these workers, structure-making cations were listed as La3+ > Mg2+ > H3C>+ > Ca2+ and structure-breaking cations as K + > Na+ > Li+ > Cs+. If one compares relative cation structure-breaking ability, the following sequence may be written
K+ > Na+ > Li > Ca2+
(9) G. R. Choppin and K. Buijs, J. Chem. Phys., 39, 2042 (1963).
Volume 70, Number 3 March 1966

844 J. F. Hinton and F. J. Johnston
Figure 3. Plot of activity of water as a function of molal concentration of added nitrate salts. The data were obtained from ref 6.
A comparison of this order with that of the cation effects observed for the hydrolysis reaction (Figure 5) reveals a close similarity. Our results do not allow further speculation along these lines.
In summary, specific cation effects are observed in both the exchange and hydrolysis reactions of bromo- acetic acid. Linear relationships exist between the logarithms of the exchange rate constants and the ionic strength or molarity of added salt. These results are consistent with previously suggested semiempirical expressions relating activity coefficients to ionic
Figure 4. Plot of hydrolysis rate constants at 33.7° vs. molar concentration of added nitrate salt.
strength in concentrated salt solutions. The specific effects cannot be explained on this basis, however.
Specific effects on the hydrolysis system at high concentrations of added salt are, for salts among which comparison was possible, in identical order with the effects on water activity. A relationship to structuring effects in aqueous systems is suggested.
The Journal of Physical Chemistry

Chemical R eactions Initiated by a Charge T ransfer 845
A Potential Step-Linear Scan Method for Investigating Chemical
Reactions Initiated by a Charge Transfer
by W . M . Schwarz and Irving Shain
Department of Chemistry, University of Wisconsin, Madison, Wisconsin (Received September 27, 1965)
A simple method has been developed for the investigation of electrode processes in which the product of the electron-transfer step is involved in a further chemical reaction to
kproduce an inactive species: 0 + ne R -*■ Z. The technique involves two steps. In the first, R is generated at a stationary electrode under diffusion-controlled conditions by applying a constant potential for a timed interval. During this interval, substance R diffuses into the solution and simultaneously reacts. Then in a second step, the potential is scanned rapidly in the anodic direction to reoxidize R back to 0. The resulting anodic peak current is a measure of the unreacted R and can be related to the rate constant k. An approximate solution to the boundary value problem for this combined diffusion- electron transfer-kinetic system was obtained for the case of a plane electrode. The method was applied to the reduction of azobenzene to hydrazobenzene which, in turn, undergoes the benzidine rearrangement. The pseudo-first-order rate constants in 50 wt % ethanol-water were found to range from 0.10 sec-1 in 0.4 M HC104 to 2.4 sec-1 in 1.0 M HC104, ir_ agreement with previously reported data.
Recently, several two-step electrochemical methods- ~3 have been described for the study of the general reduction-kinetic process4
ne
O ^ ± R
where the product of the charge-transfer step, R, is unstable and subsequently undergoes an irreversible homogeneous first-order chemical reaction to give an electroinactive species, Z. In these methods, a stationary electrode is used, and the electrolysis conditions are varied in a step functional manner: the first step corresponds to the reduction of O—the generation step; the second step corresponds to the reoxidation of the unreacted R —the measuring step. Experimentally, step functional electrolysis conditions can be obtained easily and from the theoretical standpoint the necessary diffusion-kinetic equations can be solved rigorously. On the other hand, the dependence of the measured quantities on the rate constant, k , is relatively complex, and working curves usually are required to estimate k.
In this work, an alternate two-step, controlled-po- tential method was investigated which combines the step functional method with linear scan voltammetry (stationary electrode polarography). In the first step, the potential is jumped to a value where the rate of generation of R (the cathodic current) is determined solely by the diffusion of substance O to the electrode surface. Then after a timed interval, the potential is scanned linearly in the anodic direction. The resulting anodic peak current gives a measure of the unreacted R which remains in the vicinity of the electrode. By using a linear voltage scan for the measuring step, a reasonably accurate value of the rate constant can be determined rapidly without the use of theoretical working curves. In addition, this method provides a rapid * 814
(1) (a) A. C. Testa and W . H. Reinmuth, Anal. Chem., 32, 1512 (1960); (b) O. Dracka, Collection Czech. Chem. Commun., 25, 338 (I960) ; (c) W . Jaenicke and H. Hoffmann, Z. Elektrochem., 66, 803814 (1962).(2) H. B. Herman and A. J. Bard, Anal. Chem., 36 , 510 (1964).(3) W . M. Schwarz and I. Shain, J. Phys. Chem., 69, 30 (1965).(4) Although the discussion emphasizes cases in which the initial charge transfer is a reduction, extension to oxidations is obvious.
Volume 70, Number 3 March 1966

846 W. M. Schwarz and Irving Shain
semiquantitative way of examining the products which are formed in the reduction and kinetic steps.
To test the applicability of this potential step-linear scan method for kinetic measurements, the azobenzene- hydrazobenzene system was investigated. This system follows reaction scheme I. Azobenzene is reduced to hydrazobenzene which, in acid solution, undergoes the benzidine rearrangement. Numerous studies have been made of both the electrochemical reduction step5 and the benzidine rearrangement reaction.6 The azobenzene system has been studied recently using the step functional, controlled-potential method,3 and the results of that study were used for direct comparison with the rate constants determined here.
TheoryThe usefulness of the potential step-linear scan
method depends on obtaining a simple but accurate relation among the electrolysis time, t, the anodic peak current, ip, and the rate constant, k. This can be done if the experimental conditions are arranged so that the rate of voltage scan during the second step is rapid compared to the rate of the kinetic process. Except for the approximations which can be introduced as a result of this restriction, the boundary value problem and its solution are very similar to the step functional, controlled-potential method.3
For a system following reaction I under conditions of semiinfinite linear diffusion, the dependence of the current on the surface concentration of R is3
t > 0, i = nFA\//~Dn(s -(- k)(C-R)x=o (1)
where the bar signifies the Laplace transform of the variable, s is the transform parameter, and the other symbols have their usual meaning.
During the initial potential step, C'r(i=0) varies with time
0 < t < T,
CR(*=o) = C0*VDo/DRe - ki/2Io(kt/2)
= C o^ D o/ D n e-^ F ^ U h kt) (2)
where Co* is the bulk concentration of species 0, Io(kt/2) is a modified Bessel function of zero order, and iFi is a confluent hypergeo metric series.3
During the anodic linear scan, assuming a reversible electron-transfer process, the ratio of the surface concentrations of 0 and R is given by
t > r, (Co/C b) = 0e°(i_r) (3)
where 8 = exp(nF/RT) (E' — E°) and a = nFv/RT. E' is the potential during the electrolysis step, and v is the rate of voltage scan. In addition, if Dz = Dr
t > 0, [Co + (CR + Cz)V D r/Do]x=0 = Co* (4)After the appropriate transformations, eq 2, 3, and 4
are used to eliminate Cr(s=o) from eq 1
t > 0, i = nFA Dr(s + fc) X
V D o/Dr f TCo*e-{s+W2)lo(kt/2)dt +Jo
(V D o/DrCo* - C z)x = 0e - St J /rN --------------- / ----- ----;— ---- d< (5)1 + V Z ) o /L > R 0 e o ( i~ r)
This expression still contains Cz(x=o)— a quantity which is not known explicitly for times greater than r. As a first approximation, however, it can be assumed that Cz(X=o) is equal to its value at time r, and that it does not change greatly during the scanning cycle
t > r, V.Do/DrCo* — Cz(x=o) ~
C0*VDo/DRe~kr/2Io(kT/2) (6)
Actually, at the start of the scan, Cz(x = o) increases slightly due to the continued predominance of the kinetic process over diffusion. Then, as the surface concentration of R becomes small (roughly at a time, ip, corresponding to the appearance of the anodic peak current) the kinetic process diminishes and Cz(x=o) begins to decrease. A quantitative idea of the accuracy of the approximation in eq 6 can be obtained by comparing \ /Do/DrCo* — C7j{x = o) at time r with the value which would be expected at time ip in the absence of the anodic scan. The ratio of these two terms is approximately equal to e-A(r_te>/2 indicating that the error in \^D0/Dr Co* — Cz(*=o) calculated from eq 6 is no greater than 3% as long as fc(r — tp) is less than about 0.06. Even with this approximation, however, the integral in the second term of eq 5 cannot be evaluated explicitly, but as will be shown below the exact time dependence of this term is not needed to obtain a useful solution.
The dependence of current on t, t, and k is obtained by introducing eq 6 into 5 and carrying out the indicated integrations and inverse transformations * 48 * * 51
(5) (a) A. Foffani and M. Fragiacomo, Ric. Sci. Suppl., 22, 139 (1952); (b) P. J. Hillson and P. P. Birnbaum, Trans. Faraday Soc.,48, 478 (1952); (c) C. R. Castor and J. H. Saylor, J. Am. Chem. Soc.,75, 1427 (1953); (d) S. Wawzonek and J. D. Fredrickson, ibid., 77,3985, 3988 (1955); (e) A. L. Markman and E. V. Zinkova, J. Gen. Chem. USSR, 29, 3058 (1959); (f) B. Nygard, Arkiv Kemi, 20, 163 (1963); (g) T. M . Florence and Y . J. Farrar, Australian J. Chem., 17, 1085 (1964); (h) L. Holleck and G. Holleck, Naturwissenschaften,51, 212, 433 (1964); (i) L. Holleck, A. M . Shams-El-Din, R. M. Saleh, and G. Holleck, Z. Naturforsch., 19b, 161 (1964); (j) L. Holleck and G. Holleck, Monatsh. Chem., 95, 990 (1964).(6) (a) M . J. S. Dewar in “ Molecular Rearrangements,” P. de Mayo, Ed., Interscience Publishers, Inc., New York, N . Y ., 1963, pp 295-344, and references therein; (b) C. K. Ingold, Boll. Sci. Fac. Chim. Ind. Bologna, 21, 34 (1963).
The Journal of Physical Chemistry

Chemical Reactions Initiated by a Charge T ransfer 847
t < T, io = nFACo*VD0/irt (7)
t > T
i + nFACo^Do/irt = nFACo*VDo/ir(t - r) X
\ e-kT/2I0(kr/2) + 2 e-kT/2e - kV- r)Z ] n(kr/2) X L n = 1
/*&(i—t) /»A2I ' ' ' I Xi”eXldXi. .dX„
Jo Jo_________________[*« - r)]n
nFACo*VD^e~kT/2I 0(kr/2)£~1 X
-T)d (Í - r)" V T + t e - f -L Jo l
_ — 8 ( £ '(8 )
where i c and i & refer to the cathodic and anodic currents, respectively.
Equation 7 describes the cathodic current-time curve for the first potential jump, and as expected, the cathodic current does not depend on the homogeneous kinetic processes. Equation 8 represents the anodic current-voltage curve which is obtained during the linear potential scan. The first term on the right side of this expression is the result expected for an anodic potential jump.3 The second term modifies this result and gives the dependence of the current on the anodic scan rate. As the scan rate becomes very large, a -*■ « , and the second term approaches zero.
Another limiting case of importance is that in which the rate of the kinetic step is negligible, ft —► 0. Then the bracketed part of the first term becomes unity, and eq 8 reduces tot > T,
fa + nFACo*^Do/irt = nFACo*VDo X
^1 / V 7r(t — r) — £
e~8(f-T)d(< _ t)
1 + V D 0/DRdea(t- T) )( 9 )
The right side of eq 9 is one of several equivalent expressions for the current for a reversible electron transfer with a linear potential scan at a stationary electrode,7 except that the time scale is measured from the point t — r. Thus, for this limiting case, the anodic peak current would be proportional to the original bulk concentration of substance O, to the square root of the rate of potential scan, and to the other experimental parameters of stationary electrode polarography.
Equation 8 can be simplified further by restricting k(t — r) to values less than 0.05, as indicated above. Then the quantities under the summation sign in the first term of eq 8 can be neglected since they always will
be less than 5% of the ether terms within the bracket regardless of the value o: fcr. In effect, the restriction on k(t — r) results in a decoupling of the r and (t — r) terms in eq 10 and leads to a simplified working equation which is never more than 5% in error
t > T,
fa + nFACo*VDo/irt = im —
nF A C o*V % e- kr/2I 0(kT/2) X
{ l / V r(t - t) - + ftf(0,a,s)]} (10)
Here, i m is the anodic current measured to the extension of the cathodic i-t curve as a base line, and f(0,<z,s) is the integral function of scan rate shown in eq 9.
The right side of eq 10 consists of the product of two distinct terms. One depends only on ft and (t — r)—not on t—and is represented by the quantity in the braces. This “ scan” term is the sole factor determining the shape of the anodic current-voltage curve. In general, it is not necessary to know the explicit form of this term, but only that it remains the same for all values of r, for a constant rate of potential scan.
The other term depends only on ft and r and is given by the quantities preceding the braces. In effect, this term acts as an amplitude term and determines the magnitude of i m for different values of r. The t dependence itself is contained in the expression for the surface concentration of R at time t. That is, im is directly proportional to the surface concentration of R at the switching time, r, as long as the rate of the voltage scan is fast compared to the rate of the kinetic process.
The same considerations also apply to cases in which the charge transfer is irreversible. The steps in the derivation are analogous, eq 10 is still valid, and the only change which results is in the form of the function f (6,a,s). The features which are important with respect to the chemical kinetics, however, remain unchanged—the anodic peak current is still directly proportional to the surface concentration of the reactive species at the switching time, and the same procedure can be used to determine the rate constant.
In the usual method of analysis using eq 10, the value of im is measured at a fixed value of (t — r) (or the equivalent voltage) for a series of different switching times. Since the peak current i p can be measured most accurately (Figure 1), (t — r) invariably is chosen as the peak time (tp — r). Normally, a provisional value of ft is obtained from the limiting slope of a In ip
(7) A. Sevcik, Coll. Czech. Chem. Commun., 13, 349 (1948); R. S. Nicholson and I. Shain, Anal Chem., 36, 706 (1964) and references therein.
Volume 70, Number 3 March 1966

848 W. M. Schwarz and Irving Shain
A60 pa.
0.15 sec.
Figure 1. A. Typical curves for the potential step-linear scan method, with 2.0 X 10⁻³ M azobenzene—50 wt % ethanol-water, scan rate = 4.15 v/sec. Solid line: 0.797 M HClOi, half-life of the benzidine rearrangement ~ r. Dashed line: 0.10 M HC104, half-life of the benzidine rearrangement >> r. B. Time dependence of the applied cell voltage.
vs. t plot. Then, a second plot including h ( k r / 2), which normally is close to unity, gives an accurate value of k.
Experimental SectionInstrumentation. The potentiostatic setup used in
this work has been described previously as “ potentio- stat B ” by Schwarz and Shain.3 For the present application, the booster amplifier was omitted.
The wave form shown in Figure 1 was obtained by combining a symmetrical triangular pulse with a square pulse of opposite polarity in a simple passive adding circuit. The square pulse was obtained from the gate output of a Tektronix Model 162 wave form generator. This unit, along with a Tektronix Model 161 pulse generator, provided a delayed trigger signal which was used to activate the triangular pulse generator. The length of the delay corresponded to the time r and could be varied continuously. The triangular wave itself was obtained from an operational amplifier multivibrator similar to that described by Underkofler and Shain.8
The accessory electronic equipment, as well as the cells, the electrodes, the chemicals, and the solution preparation have been described previously.3
Procedures. For all measurements the initial dc level of the working electrode was set at 0.3 v. vs. see. The cathodic polarization was carried out at — 0.1 v vs. see.
In the theoretical discussion, the switching time, t, and the generation time were considered as the time prior to the start of the linear scan. Actually, generation of the reactive species R continues during the scan cycle until the voltage reaches the value of E° for the system. In practice, therefore, an effective switching time, t , was defined as the time required for the potential to reach E°— i.e., the current to reach roughly 85% of the peak current on the reverse scan.7 This measure of switching time was used in place of r for all of the rate constant calculations.
In experiments involving long generation times, an anomalous stirring effect appeared. This was detected by a sharp increase in the cathodic current followed by rather large periodic fluctuations in the current-time curve. In addition, a direct observation of stirring was made by carrying out a reduction-oxidation cycle in the presence of 1,1 '-diethyl-4,4 '-dipyridinium ion, the reduced form of which is intensely colored. The onset of stirring was characterized by a very rapid tangential transport of material from the bottom of the mercury electrode to the top.
In general, the stirring effect was independent of inert electrolyte concentration, added surface-active agents like gelatin or Triton X-100, cell geometry, electrode shielding, temperature, auxiliary stirring, added products of the reduction or kinetic steps— i.e., benzidine, hydrazobenzene, or previously rearranged hy- drazobenzene, and the observation technique— i.e., chronopotentiometry, polarography, etc. On the other hand, stirring was less for more dilute azobenzene solutions and more cathodic reduction potentials and always seemed to be roughly proportional to the square of the acid concentration— i.e., to the rate of the homogeneous kinetic process.
One possible explanation assumes the formation of a surface-active side product intermediate by the kinetic process. As soon as this species reaches significant concentration levels, it becomes adsorbed on the electrode and disturbs the properties of the interface to the extent that stirring results. That such an effect can cause violent convection has been reported previously.9 By completing the kinetic measurements within the first half-life of the rearrangement reaction, however, the electrochemical results were totally unaffected by stirring effects.
For the actual kinetic measurements, 15 to 30 anodic current-voltage curves were obtained with each azobenzene solution. Each curve corresponded to the
(8) W . L. Underkofler and I. Shain, Anal. Chem., 35, 1778 (1963).(9) J. T . Davies and E. K . Rideal, “ Interfacial Phenomena,’ Academic Press Inc., New York, N. Y ., 1961, p 309.
The Journal of Physical Chemistry

Chemical Reactions Initiated by a Charge T ransfer 849
same scan rate but to a different value of r'. In addition, each curve was measured on a fresh hanging mer- curv-drop electrode. Reproducibility of any single curve was of the order of 2% in the most dilute solutions. The principal source of error was 60-cps pickup.
In all cases a blank correction for the charging current was made based on current-voltage curves measured on solutions containing no azobenzene. These corrections were generally small and amounted to no more than 5% of the peak current in the most dilute solutions.
Results and DiscussionIn this work, as in the previous investigation,3 the
dependence of the benzidine rearrangement rate on acidity was used to separate the kinetic and nonkinetic effects. Thus, one series of experimental curves was obtained in dilute acid solution where the rate of the kinetic process was negligible. These measurements were used to evaluate the general procedures of the potential step-linear scan method and to test the purely electrochemical behavior of the azobenzene- hydrazobenzene system. Then, a second series of measurements was obtained under identical experimental conditions but in more acidic solutions where the kinetic step was important. It was found that the electrochemical behavior was influenced by adsorption and other surface phenomena, and empirical corrections had to be applied in order to use the potential step-linear scan method to evaluate the rate constants for the rearrangement reaction.
Nonreacting Systems. The first set of experiments was carried out on azobenzene solutions (1, 2, 3, and 4 mM) containing only 0.1 M perchloric acid. Under these conditions, the half-life of the kinetic step was about 500 sec— a time very much longer than the switching times that were used. For each solution, eight scan rates were tested ranging from 0.417 to 8.34 v/sec, and for each scan rate 10 to 15 values of r were selected in such a way that the product vt covered the range of 0.4 to 4.0 v. The anodic peak currents, ip, were measured as shown in Figure 1 and analyzed according to eq 9. The experimental values of ir, were found to be independent of t ' for all scan rates and concentrations. These results indicate, as expected, that the reduction of azobenzene during the cathodic step is a simple diffusion-controlled process.
On the other hand, the dependence of the measured peak currents on both the scan rate and the surface concentration of R (i.e., Co*) showed marked deviations from theory. Plots of ip/Co* as a function of l/C< *, which should be horizontal straight lines are shown in Figure 2. The values of nFAN D0 used in the theo-
Figure 2. Comparison of experiment with theory when the half-life of the benzidine rearrangement ii> t '\ dashed lines, theoretical; points, experimental for azobenzene in 0.10 M HCIO4—50 wt % ethanol-water solutions at 25°.The scan rates (v/sec) are: A, 7.73; B, 3.84;C, 1.93; D, 0.764; E, 0.378; F, 0.194.
retical calculations were obtained experimentally from the diffusion-controlled current-time curves using eq7. Depending on the scan rate, the values of ip/Co* tended to be up to 15% too high for the solutions containing 1 mM azobenzene, and 11-15% too low for those with 3 and 4 mM azobenzene. The deviations were greatest with the fastest scan rates.
Normally, some deviations of ip/C0* from eq 9 are expected as a result of stirring in the diffusion layer10— an effect caused by movement of the mercury drop as the potential is varied. In general, such deviations are independent of concentration and amount to only3-4%. Thus, these factors cannot explain the large discrepancies observed with the azobenzene system.
The anomalous behavior of the azobenzene-hydrazo- benzene system probably can be attributed to surface phenomena. Recently, Holleck and co-workers6*1 "■> have studied the effect of traces of surface-active materials on the polarographie behavior of both azobenzene and hydrazobenzene in 30% methanol-water solutions of pH 1 to 12. From shifts in the half-wave potential, they concluded that such materials became adsorbed on the electrode and inhibited the electron-transfer step. In the oxidation of hydrazobenzene, not only were known adsorbers like gelatin and triphenylphosphine oxide effective inhibitors but so was azobenzene itself.
(10) I. Sham and K. J. Martin, J. Phys. Chem., 65, 254 (1961).
Volume 70, Number 3 March 1966

850 W. M. Schwarz and Irving Shain
Further evidence has been presented by Nygard,6f who studied the azobenzene system with several methods, including cyclic-scan experiments with stationary electrodes.
Results in agreement with those of Holleck were found in 0.1 M HC104—50 wt % ethanol-water solutions in the presence of 0.01% gelatin. The anodic current- voltage curves, obtained with single-scan stationary- electrode polarography were broader, and the peak current was about 25% lower than for comparable curves without gelatin. If adsorption of azobenzene has an analogous effect in this solution, then the low values of ip/Co* could be explained on the basis of inhibition of the normally reversible electron-transfer step.11 The concentration dependence arises because of the fact that the azobenzene is produced during the rising portion of the anodic current-voltage curve, and the greater the concentration, the more rapidly the adsorbed surface layer is formed.
One method of detecting the inhibition effect directly was attempted—the measurement of the separation of the cathodic and anodic peak voltages in cyclic-scan experiments. The results, however, were inconclusive, and, although the peak potential showed a slight variation with scan rate, the magnitude of the anodic- cathodic peak separation was always within 20 mv of the reversible value.
If the inhibition effect acts to decrease the peak current, a second effect must also be present to explain the high peak currents observed with low azobenzene concentrations. Again assuming an adsorption step, an additional current may result not from a faradaic process but from a change of the double-layer capacity during the adsorption process. For low azobenzene concentration, a capacitive current would be more noticeable and could cause an apparent net increase in the normal peak current. Whether the inhibition or capacitive effects would predominate for any given solution would depend on the depolarizer concentration.
Although the factors which influence the experimental data of Figure 2 are not known with certainty, one result is of particular importance in connection with the subsequent kinetic measurements. That is, the experimental line for each scan rate is nearly straight over a rather wide range of concentrations. Thus, Co*—i.e., CR(x = o)— can be expressed as a linear function of ip
t > r, (fp — m) = (ip/C0*)(¡Co* (11)
where m is the slope of the experimental line and (iv/ C o*)o is the extrapolated y axis intercept. This equation can be considered as the experimentally derived analog of eq 9 and must be used in place of eq 9 in esti
mating CR(x=0) from measured peak currents for the case where the kinetic step is negligible.
Reacting Systems. In the second set of experiments, measurements were obtained on azobenzene solutions (1.4, 2, and 3 m l ) containing from 0.4 to 1.0 M perchloric acid. For these acid concentrations the half- life of the rearrangement reaction ranged from about 6 to 0.3 sec. For each solution, from 15 to 30 curves were obtained each corresponding to a different value of t ' and the same scan rate. The values of t ' were selected in the range of 0.1 to 1.0 times the half-life of the reaction. In general, the scan rates were chosen such that the product v t ' remained between 0.4 and4.0 v, as with the nonreacting systems.
Normally, the experimental measurements would be analyzed in terms of eq 10. However, in view of the results of Figure 2 for dilute acid solutions, the direct proportionality between ip and surface concentration of R predicted by eq 10 seems unlikely for the more acidic azobenzene solutions. As a result, a semiempirieal equation analogous to eq 11 was used to estimate the rate constants
t > T,
(iv - m) = (ip/C0*)aCR{x=Q) =
(ip/Co*)oCo*e-kT'/%(kr//2) (12)
If it is assumed that the factors which cause the deviations from eq 9 in the dilute acid case cause similar deviations from eq 10 in the presence of the kinetic step, the values of m and (iv/Co*)o for a given scan rate should be identical with the slope and intercept obtained experimentally from Figure 2. Since m and (ip/C0*)o as well as v l% are constant for a given series of measurements, the rate constant, k, can be evaluated directly from the slope of a plot of In [(ip — m )//0 (fcr'/2)] vs. r'.
Several such plots are shown in Figures 3 and 4. In spite of the relatively good precision noted previously for the peak current measurements, there is considerable scatter in the points. This is primarily a result of the insensitivity of the peak current measurements to the kinetic process. The problem is one of detecting small changes in rather large currents and is common to all of the two-step electrochemical methods with systems of this type. Nevertheless, in all cases the experimental points describe a straight line. If eq 10 had been used directly without the correction term, the lines would be slightly curved and the apparent 11
(11) The low results were not caused by excessive uncompensated IB drop since solutions containing an additional 1.0 M NaClOi and the minimum possible Luggin capillary-HMDE separation gave results identical with Figure 2.
The Journal of Physical Chemistry

Chemical R eactions Initiated by a Charge T ransfer 851
Figure 3. Rearrangement of hydrazobenzene in 50 wt % ethanol-water at 25° and 2.00 X 10⁻³ M azobenzene with: A. 0.395 M HC104, v = 0.417 v/sec; B. 0.497 M HC104, v = 0.834 v/sec; C. 0.641 M HCIO4, v — 2.07 v/sec. (Curves have been normalized for presentation.)
0 0 .2 0 .4 0 .6 0 .8t', sec.
Figure 4. Rearrangement of hydrazobenzene in 50 wt % ethanol-water at 25° and 2.00 X 10~3 M azobenzene with:A. 0.797 M HCICh, v = 4.15 v/sec; B. 0.988 M HC104, v = 8.34 v/sec. (Curves have been normalized for presentation.)
rate constants much lower—of the order of 30% for 0.988 M acid to about 12% for 0.395 M acid. Thus, it is apparent that the “ adsorption” corrections are by no means small in the azobenzene-hydrazobenzene system.
The observed rate constants are summarized in Table I, along with the range of t values and the scan rates used in the measurements. For two of the acid concentrations (0.497 and 0.797 M) the scan rate was
Table I : Kinetic Data for the Perchloric Acid-Catalyzed Rearrangement of Hydrazobenzene in 50 Wt % Ethanol-Water at 25°
Perchloric Azobenzene Anodicacid concn Range scan
concn, X 10', of t', rate, k,M M sec v/sec sec-1
0.395 1.40 0.60-4.90 0.417 0 . 1 1 10 .395 2.00 0.60-3.90 0.417 0.106
0.497 1.40 0.70-3.70 0.534 0.2030.497 2.00 0.60-2.90 0.534 0.1910.497 3.00 0.50-1.90 0.534 0.2030.497 1.40 0.60-3.80 0.834 0.2020.497 2.00 0.45-3.15 0.834 0.2040.497 3.00 0.30-1.90 0.834 0.2110.497 1.40 0.50-3.60 1.66 0.2030.497 2.00 0.35-3.00 1.66 0.2020.497 3.00 0.25-1.70 1.66 0.200
0.641 1.40 0.24-1.56 2.07 0.5030.641 2.00 0.24-1.70 2.07 0.4850.641 3.00 0.24-1.39 2.07 0.502
0.797 1.40 0.15-0.86 2.77 1.260.797 2.00 0.16-0.88 2.77 1.070.797 3.00 0.15-0.87 2.77 1.010.797 1.40 0.12-0.86 4.15 1.150.797 2.00 0.12-0.86 4.15 1.060.797 3.00 0.12-0.70 4.15 1.010.797 1.40 0.10-0.88 8.34 1.180.797 2.00 0.10-0.83 8.34 1.110.797 3.00 0.10-0.83 8.34 0.95
0.988 1.40 0.06-0.47 8.34 2.640.988 2.00 0.07-0.42 8.34 2.330.988 3.00 0.06-0.37 8.34 2.25
varied over a threefold range and was shown to have no effect on the calculated rate constants. This result is in accord with eq 10 and indicates that a complete decoupling of t’ and (i — t') terms does occur with the scan rate to reaction rate ratios that were tested here.
For each of the acidities less than 0.65 M, the rate constants calculated from the three azobenzene concentrations are in good agreement. In general, they fall within ± 3% of an average value. For the more acidic solutions, however, the apparent rate constants tend to increase as the azobenzene concentration decreases. In magnitude the increase is of the order of 10-15% for a concentration change from 3.0 to 1.4 mJli. Ordinarily, a slight trend—but in the opposite direction— would be expected as a result of second-order side reactions involving hydrazobenzene.3,6 In the present case, such small kinetic deviations are completely masked by other effects namely surface phenomena. The semiempirical method of treating the data corrects for most of these effects; however, uncertainties enter
Volume 70, Number S March 1066

852 W. M. Schwarz and Irving Shain
Figure 5. Dependence of the rate of the hydrazobenzene rearrangement on the square of the hydronium ion concentration: solid points, data from the step functional, controlled-potential method; open points, data obtained here with the potential step-linear scan method. k is the average rate constant at each acidity.
into the calculations if the adsorption behavior of the azobenzene-hydrazobenzene system changes with acid concentration. When considering solutions whose acidities are as different as 0.1 and 1.0 M, such changes are probably significant and are no doubt the cause of the apparent dependence of k on concentration.
An idea of the accuracy of the rate constants in Table I can be obtained from a direct comparison with rate constants determined by the step functional, controlled- potential method.3 The adsorption effects encountered here do not affect the rate constant measurements with the latter method. Figure 5 shows the dependence of k on acid concentration for these two methods. The points for both series of rate constants fall on the same smooth curve well within the expected experimental error. These results indicate that the approximations, especially the correction for the dependence of ip/Co* on concentration, are valid and that such corrections are necessary to obtain accurate
rate constants for the benzidine rearrangement with the potential step-linear scan method.
ConclusionIn most aspects, the potential step-linear scan
method is very similar to the closely related step functional, controlled-potential method. For both methods, the generation step is the same and so are their general applicability and the range of rate constants that can be measured with an ideal system. In favorable cases, the accuracy of both methods is comparable, but, in general, because of the linear scan reoxidation step, rate constants measured with the potential step-linear scan method are subject to greater errors.
Perhaps the greatest source of difficulty with the potential step-linear scan method arises from interfacial phenomena, such as adsorption, which interfere with accurate peak current measurements. Also, for rapid scan rates, the charging current may be an appreciable fraction of the faradaic current.
On the other hand, the method is very flexible. By taking the view that the anodic peak current is a direct measure of the surface concentration of the reactive species, it is very easy to modify the theoretical working equation in a semiempirical way to correct for interfering effects. In any case, the rate constants can still be determined rapidly from the measurements without resorting to previously calculated working curves.
The application of the potential step-linear scan method to the azobenzene system illustrates the type of problem that can arise and the semiempirical method of analysis. In general, however, it is more difficult to use the semiempirical approach; seldom is it possible to determine the behavior of the system in the absence of the kinetic step. In such cases, the potential step- linear scan method is still useful in obtaining a rapid semiquantitative estimate of the rate constant.
Acknowledgment. This work was supported by funds received from the National Science Foundation under Grant No. G 15741.
The Journal of Physical Chemistry

S02 Elimination in D ecomposition of D iaryl Sulfones 853
Sulfur Dioxide Elimination in the Radiolytic Decomposition of
Solid Diaryl Sulfones
by Larry Kevan, P . L . H a ll, and E . T . Kaiser
Department of Chemistry, University of Chicago, Chicago, Illinois 60631 (Received September 37, 1965)
7 Radiolysis of solid p,p'-ditolyl sulfone results, almost exclusively, in simple S02 elimination with the production of an equivalent yield of p,p'-bitolyl. (r(S02) = (?(p,p'-bitolyl) = 0.05. Diphenyl sulfone and dibenzothiophene sulfone also show simple S02 elimination. However, the latter cyclic sulfone only gives G(S02) = 0.002 and is therefore 25 times more stable to radiation decomposition.
The radiolysis of organic compounds usually leads to a complex variety of products. This variety often obscures the mechanism and renders detailed interpretation difficult. However, we have found that solid p,p'-ditolyl sulfone undergoes, almost exclusively, simple S02 elimination and produces an equivalent yield of p,p'-bitolyl upon 7 radiolysis. Diphenyl sulfone and dibenzothiophene sulfone also show simple S02 elimination. However, the latter cyclic sulfone is 25 times more stable to radiation decomposition.
Experimental Section
Materials. All sulfones were Eastman White Label grade. Diphenyl sulfone was recrystallized from ethanol-water until impurity peaks could no longer be discerned on its gas chromatogram. p.p'-Ditolyl sulfone was used without further purification. Its gas chromatogram was free of impurity peaks. Dibenzothiophene sulfone was recrystallized several times from absolute ethanol until pure. Our criterion for judging whether compounds were “ pure” was based on the absence of detectable impurity peaks on gas chromatograms of saturated solutions in acetone taken at the maximum sensitivity of our instrument. (See organic product analysis.)
Sample Treatment. The purified sulfone was finely pulverized in a mortar and placed in a Pyrex vial fitted with a break-seal. The vial was degassed to 10 ~3 torr and sealed off under vacuum at 77 °K. Normal sample size was 1 g. The vials were irradiated in a Co60 source at a dose rate of 0.7 Mrad/hr.
Analysis. S02 analysis was carried out on a Wilkens Aerograph chromatograph, Model 661, using an electron-capture detector and a 2 ft X Vs in. silica gel column. At a flow rate of 40 ml/min N2 at 125° the S02 retention time was 3.2 min. Matheson S02 was used for calibration. Calibrations were run with each group of samples. Peak areas were measured with a disk integrator. S02 from irradiated samples was introduced in a vacuum line through the break-seal and pumped with a Toepler pump into an evacuated injection loop which was connected to the carrier gas flow system.
No analysis for H2 was made. Organic products were analyzed by hydrogen flame ionization detection on an Aerograph Hy-Fi, Model 600C. A 5 ft X Vs in. column containing 5% SE30 in 30-60 mesh Chromo- sorb W was used. Both H2 and N2 flow rates were 25 ml/min. For the products from diphenyl sulfone and dibenzothiophene sulfone a column temperature of 125° was used, and for the p,p'-ditolyl sulfone products 150° was used. A temperature of 200° was used to look for higher molecular weight products. Irradiated sulfone from a sample vial was weighed out and dissolved in acetone (dimethyl sulfoxide was used as a solvent for dibenzothiophene sulfone) and diluted to a known volume. The solution was injected with a Hamilton 10-ffi syringe. Calibrations were carried out with similar solutions of standard compounds.
Product yields are given as G values which refer to the number of molecules produced per 100 ev of radiation energy absorbed by the sample.
Volume 70, Number 3 March 1966

854 L. K evan, P. L. Hall, and E. T. Kaiser
Figure 1. Yield-dose plot for S02 from 7 -irradiated sulfones: O, p,p'-ditolyl sulfone; □, diphenyl sulfone;X, dibenzothiophene sulfone.
Figure 2. Yield-dose plot for p,p'-bitolyl (O) from 7 -irradiated p,p'-ditolyl sulfone and for biphenyl (□) from 7 -irradiated diphenyl sulfone.
Results and DiscussionThe S02 yields and organic products formed by 7
radiolysis of p,p'-ditolyl sulfone, diphenyl sulfone, and dibenzothiophene sulfone are given in Table I. Yield- dose plots are shown for the S02 yields in Figure 1 and for the organic yields in Figure 2. Initial yields could be determined from the linear portions at low dose which went through the origin in all cases except for the S02 yield from diphenyl sulfone. Note that the analytical methods used allowed the S02 yields to be measured down to 1 Mrad dose while the organic products could be measured only at somewhat higher doses. No other organic products were found and from our estimated limits of detection must have G < 0.005.
Table I : Product Yields from Sulfone Radiolysis
Parent sulfoneInitial product
yields
p,p'-Ditolyl sulfone
Diphenyl sulfone
Dibenzothiophenesulfone
G{ S02) = 0.05 G(p,p'-bitolyl) = 0.05 G{ unknown) = 0.004 G(SO2) > 0.02°G( biphenyl) = 0.05 <?(S02) = 0 . 0 0 2
G(biphenylene) 6
“ Initial yield could not be determined but is estimated to be ~0.05. b Limit of detection was several times greater than the expected G = 0.002; see text.
p,p'-Ditolyl Sulfone. The S02 yield of G = 0.05 from p,p'-ditolyl sulfone is linear with dose to about 13 Mrads, above which it falls off considerably from linearity. The initial S02 yield is equal within experimental error to the yield of p,p'-bitolyl. The only other organic product detected is a factor of 7 lower in yield and is unidentified. At a column temperature of 200° it appears at a retention time of 12.7 min as compared to 2.9 min for p,p'-bitolyl and 30 min for p,p'-ditolyl sulfone. Comparison with standards showed that the unknown minor product was not m,m'-ditolyl sulfone or 2,8-dimethyldibenzthiophene sulfone. Products of molecular weight greater than that of the parent sulfone, particularly in the dimeric range, were searched for with ñame ionization detection but were not found.1 The data on p,p'-ditolyl sulfone
(1) It has been pointed out by a referee that any reader familiar with the history of benzene radiolysis would immediately suspect "polymer” production. (See, for example, S. Gordon, A. R. Van- Dyken, and T. F. Doumani, J. Phys. Chew,., 62, 20 (1958).) This “ polymer” (G = 0.5-1.0) found after 7 radiolysis of 3500 ml of benzene to a total dose of about 1025 ev (about 50 Mrads) consists primarily of C12 and Cis systems; biphenyl and various hydrogenated
The Journal of Physical Chemistry

S02 Elimination in D ecomposition op D iaryl Sulfones 855
suggest that a simple decomposition as shown by eq 1 is the net consequence of radiolysis.
Ar-S02-A r — > S02 + Ar-Ar (1)
Diphenyl Sulfone. For diphenyl sulfone Figure 1 shows marked deviation from linearity in the S02 yield near the origin. It appears that, for higher doses, the S02 yield is 2-3 times less than the biphenyl yield of 0.05. This suggests that not all of the S02 was detected and that a significant amount was trapped in the irradiated crystals. After radiolysis, several irradiated diphenyl sulfone samples were heated to 100° (mp 125°) for 1 hr. This treatment did increase the S02 yields but did not give very reproducible results. We conclude that a simple decomposition, again represented by eq 1, also occurs in diphenyl sulfone. The yield of biphenyl from diphenyl sulfone is equal to the yield of p,p'-bitolyl from p,p'-ditoIyl sulfone, and hence both sulfones appear to have about the same stability toward radiolytic decomposition.
Dibenzothiophene Sulfone. Dibenzothiophene sulfone was studied to see what effect a more constrained structure in which the S atom was in a ring would have on S02 elimination. As in p,p'-ditolyl sulfone, the S02 yield is linear with dose to about 13 Mrads, after which it levels off. The initial S02 yield, however, is only G = 0.002 which is 25 times less than the initial S02 yield found in p,p'-ditolyl sulfone. The more constrained cyclic structure appears to result in a definite and rather dramatic increase in the radiolytic stability of the molecule. This stability could be partially due to back reaction to re-form the parent sulfone and partially due to more efficient energy delocalization. The expected biphenylene product could not be detected because the limited solubility of dibenzothiophene sulfone in the solvent dimethyl sulfoxide reduced the sensitivity of analysis. The limit of detection for biphenylene under our analytical conditions was several times greater than the amount of biphenylene expected.
It is interesting to compare our results on aryl sulfones with the radiolysis results of Ayscough, et al., on alkyl sulfones.* 2 3 Product analysis of several irradiated dialkyl sulfones, R -S 0 2-R , showed a small H2 yield which depended on the chain length of the alkyl group and smaller yields of S02, R2, and RH. Quantitative results are not given. This contrasts with the simple and predominant S02 elimination we observe in diaryl sulfones.
The radiolysis of aromatic compounds usually produces small yields of H2 and a number of different organic products. The H2 yields from benzene and biphenyl are 0.036s and 0.008,4 5 respectively. When the
sulfone group is present, the strength of the C-S bonds, which are weak as compared to C-C bonds, and the molecular stability of SC2 are important factors which cause solely S02 elimination to occur. More quantitative thermochemical consideration is precluded by lack of data for aryl sulfones.6 (?(S02) = 0.002- 0.05 which is in the same range as the H2 yields from the pure aromatic hydrocarbons. Scission of C-H bonds seems to be unimportant in the radiolysis of diaryl sulfones. There is no evidence for terphenyls or higher polymeric products that would probably be produced by H atom reactions in analogy to benzene.1'6 As stressed before in footnote 1, CV- and C24-containing compounds and higher polymeric products were not found under our experimental conditions, and it can be estimated that formation of Cis- and C24-containing products occurs with yields that are less than 10% of the yields of S02 and organic products that were observed.
Although the yields of S02 and the hydrocarbon product corresponding to material balance are small, the radiolytic elimination of S02 is unique in that a single, simple, specific molecular decomposition is the sole principal result of the y radiolysis of a rather complex type of organic compound. Also, cyclic aromatic sulfones show considerably more radiation stability than open-chain aromatic sulfones.
Acknowledgment. We wish to thank the Atomic Energy Commission and the Petroleum Research Fund for support of this research.
biphenyls as well as partially hydrogenated terphenyls have been isolated. Presumably, the percentage of higher molecular weight components in the “ polymer” increases with the total energy expended in the system. We found no indication in our studies that such “polymers” were produced in the radiolysis of solid aryl sulfones. Extensive gas chromatographic analysis of irradiated sulfones turned up only products mentioned in the text of this paper and no others. Surely, any polymeric species of from two to three aromatic residues or partially hydrogenated residues would be volatile enough to give noticeable peaks within 3 hr on chromatograms taken with a column temperature of 200°. Yet no peaks were found on such chromatograms other than the ones for the products mentioned in the text This finding, coupled with at least a rough material balance found in the production of SO2 and diaryl in diaryl sulfone radiolysis, makes it improbable that “polymer” production takes place to any extent within an order of magnitude below the production of SO2 and Ar-Ar (Ar = aryl).(2) P. B. Ayscough, K . J. Ivin, J. M . O’Donnell, and C. Thomson, “ 5th International Symposium on Free Radicals,” Uppsala, Sweden, 1961, Preprint 4.(3) S. Gordon and M. Burton, Discussions Faraday Soc., 52, 88 (1952).(4) J. G. Burr and J. M . Scarborough, J. Phys. Chem., 64, 1367 (1960).(5) J. P. McCullough, D. W . Scott, and G. Waddington in “ Organic Sulfur Compounds,” Vol. 1, N. Kharasch, Ed., Pergamon Press Inc., New York, N . Y ., 1961, p 20.(6) W . N. Patrick and M . Burton, J. Am. Chem. Soc., 76, 2626 (1954); T . Gaumann, Helv. Chim. Acta, 44, 1337 (1961).
Volume 70, Number 3 March 1966

856 I. M. K olthoff and M. K. Chantooni, Jr.
Conductometric, Potentiometrie, and Spectrophotometric Determination of
Dissociation Constants of Substituted Benzoic Acids in Acetonitrile1
by I . M . Kolthoff and M . K . Chantooni, Jr .
School of Chemistry, University of Minnesota, Minneapolis, Minnesota 55455 (Received October 4, 1965)
The two methods developed2’3 for the determination of the dissociation constant, A dh a ,
of uncharged weak acids in acetonitrile (AN) and also the methods for the determination of the homoconjugation constant, A ha,-, give reliable results only when certain conditions are fulfilled. In order to check the reliability of the methods the over-all dissociation constants, K dm k , of 3,5-dinitrobenzoic acid (HDNB), salicylic, p-nitrobenzoic, m-nitro- benzoic, p-hydroxybenzoic, and benzoic acids have been calculated from the characteristics of the conductometric titration curves with weak bases and the constants A dHA and A fha,- from potentiometric measurements with the glass electrode. A d2HA of HDNB and salicylic acids have also been calculated from spectrophotometric data with p,p'-dimethyl- aminoazobenzenê as indicator. Under the specified conditions there is a gratifying agreement among the results of the three methods which are reported. Theh omoconjugation constant of the salicylate ion was found to be unexpectedly large.
IntroductionIn previous studies it has been shown2 that the dis
sociation constant of an acid, HA, in acetonitrile (AN)
K d ha = [H + ][A -]/V [H A ] / H+ = / a- = / (1)
can be found from the location of and the conductance at the maximum in the conductometric titration curve and also from the analysis of the initial portion of the conductometric titration curve of the acid with a suitable amine, provided the formation constant, A fHa , - ,
of the homoconjugate is very large as compared to the
A W = [HA2-]/[H A ][A -] / ha, - = / a- (2)
ionic dissociation constant A dBHA of the salt and the mobility of the various ionic species are known. In the present paper are presented conductometric titration curves of substituted benzoic acids with various amines, B, and the dissociation constants of the acids A dHA were calculated,2 knowing the ionic mobilities.
It was desirable to check the reliability of the values of the constants thus found by independent methods. In a previous paper,3 it has been described how the dissociation constant A dHA of an acid and the homoconjugation constant, A ha,-, can be found from the shape of the potentiometric titration curve of HA with tetra-
ethylammonium hydroxide using the glass electrode as hydrogen electrode. In order to avoid presence of water and impurities in the hydroxide we have measured the paH of a wide range of mixtures of an acid with its tetraethylammonium salt. Also, the over-all dissociation constant of two acids, A d2HA = «H+aHA!-/[HA]2 = A dHAAfHA,-, was determined spectrophotometrically using p,p'-dimethylaminoazobenzene (DMAAB) as a Hammett indicator (DMAAB = I). The formation constant
RÎm+ = [H ?][I] /lH + = /h+ (3)
was determined spectrophotometrically in buffer solutions composed of mixtures of DMAAB, picric acid, and its tetrabutylammonium salt.
Since the homoconjugation constant of picric acid is negligibly small3
(1) This work was supported by the Directorate of Chemical Sciences, Air Force Office of Scientific Research, under Grant AF-AFOSR- 28-65.(2) I. M . Kolthoff and M. K. Chantooni, Jr., J. Am. Chem. Soc., 87, 1004 (1965).(3) I. M . Kolthoff and M. K. Chantooni, Jr., ibid., 87, 4428 (1965).
The Journal of Physical Chemistry

D issociation Constants of Benzoic Acid in Acetonitrile 857
[IH +H Pi-]/2[I][HPi]AdHpi
(3a)
pA dHPi being equal to 11.0 ± 0.1.3The indicator method must be applied with caution
in the determination of pA'Vha in mixtures of an acid with a large homoconjugation constant and its tetra- alkylammonium salt. Salts of amines with carboxylic acids (BHA) are slightly dissociated; therefore, it is anticipated that the ionic dissociation constant of the indicator salt IHA will be small. For this reason the spectrophotometric method with an indicator base can be applied only to mixtures which contain a large excess of carboxylic acid over tetraalkylammonium salt. In such mixtures the concentration of A~ is very small, and practically all of the anions are present as HA2~. The electroneutrality relation in these mixtures in the presence of the indicator base is
[R4N+] + [H+] + [IH+] = [HA,-] (4)
The two acid systems studied spectrophotometrically,3,5-dinitrobenzoic and salicylic acids, are extremely weak in AN; hence, [H + ] « [R4N+] in eq 4. Under our experimental conditions, R4NA and IHA can be considered completely dissociated.
From eq. 1, 2, 3 and 4 we obtain
® ! % r ,N + , + [IH+]} = / T W h AP (5) [IJm ih +
Since the ionic strength has been kept very small in both acid systems, activities were taken equal to concentrations. Also, the equilibrium acid concentration, [HA], in eq 5 is equal to the analytical concentration.
K lh a , - was derived from characteristics of the poten- tiometric titration curves and wherever possible from the solubility of a suitable salt of the acid in an excess of acid.4 5
Experimental SectionReagents. The following chemicals were prepared
and purified as described elsewhere: acetonitrile,6 N,N-dimethylbenzylamine,2 4-picoline,2 3,5-dinitro- benzoic acid,4 tetraethylammonium 3,5-dinitrobenzo- ate,4 and perchloric acid4 (in acetic acid).
Acids. Salicylic, p-N itrobenzoic and p-Hydroxy- benzoic Acids. These were Eastman Kodak White Label and were recrystallized from water and dried in vacuo at 70°: salicylic acid, mp 160°, lit.6 161°; p-hydroxybenzoic acid, mp 216-217°, lit.6 215-217°.
m-Bromobenzoic Acid. This was an Eastman Kodak White Label product, recrystallized from AR acetone. It was dried in vacuo at 70°: mp 156°, lit.6155°.
Benzoic Acid. This was a National Bureau of Standards product, dried at 110° at atmospheric pressure: mp 122°, lit.6122°.
Picric Acid. This was purified as described previously.3
Salts. Sodium Salicylate, Sodium p-Nitrobenzoate and Lithium Benzoate. These were prepared by neutralizing a 30% ethanol solution of the acid with 1 M aqueous sodium hydroxide or 0.1 M lithium carbonate solution. Both bases were Merck reagent grade products. Phenolphthalein served as external indicator. The alcoholic solutions were taken to dryness, and the residues were recrystallized from ethyl acetate and dried in vacuo at 90°.
Tetraethylammonium Salicylate, Benzoate, p-Nitrobenzoate, p-Hydroxybenzoate, and m-Bromobenzoates. These were prepared by neutralizing the acid with 1 M aqueous tetraethylammonium hydroxide solution6 after dissolving the acid in a minimum volume of absolute alcohol and adding 100 ml of water. Phenolphthalein served as external indicator. The resulting solutions were taken to dryness, and the residues were recrystallized from an ethyl acetate-ethanol mixture and dried in vacuo at 50-70°. Assay of tetraethylammonium salicylate by spectrophotometric titration of 5 ml of 0.004 M solution with 0.05 M perchloric acid (in AN) at 410 my, using o-nitro-p-chloroaniline as indicator, gave 99.1%, and assay of tetraethylammonium benzoate by conductometric titration of 5 ml of 0.0008 M solution with 0.05 M perchloric acid gave 99.0%. The water content of tetraethylammonium salicylate was estimated roughly by Karl Fischer titration of a 1-ml aliquot of 0.096 M stock solution in AN. After correcting for water content of the solvent, 0.001 M, it appeared that the tetraethylammonium salicylate contained 0.7% water by weight. The water content of tetraethylammonium benzoate was not determined. Both salts are very hygroscopic and were stored in a vacuum desiccator over magnesium perchlorate. Fortunately, the poH of mixtures of an acid and its salt is hardly affected by small concentrations of water.
Tetrabutylammonium Picrate. This was obtained from C. Gracias.7
N,N-Diethylanilinium Perchlorate. This was obtained from Dr. S. Bruckenstein.8
(4) I. M . Kolthoff and M. K. Chantooni, Jr., J. Am. Chem. Soc., 85, 426 (1963).(5) I. M . Kolthoff, S. Bruckenstein, and M. K. Chantooni, Jr., ibid., 83, 3927 (1961).(6) “ Handbook of Chemistry and Physics,” Chemical Rubber Publishing Co., Cleveland, Ohio, 1962.(7) C. Gracias, Ph.D. Thesis, University of Minnesota, 1961.
Volume 70, Number S March 1966

858 I. M. K olthoff and M. K. Chantooni, Jr .
Tetraethylammonium Perchlorate. This was prepared and purified as described by Kolthoff and Coetzee.9
p,p'-Dim.ethylaminoazobenzene. This was obtained from Dr. S. Bruckenstein.10
Solubility of Sodium Salicylate in the Presence of Salicylic Acid at 25°. Approximately 35 mg of sodium salicylate was placed in a 5-ml volumetric flask and was washed with three 1-ml portions of AN to leach out any acidic impurity on the surface. The preparation and shaking procedure of saturated salt solutions containing added acid has been described previously.4 The saturated solution was filtered through a fine- sintered-glass funnel, and an aliquot was titrated spectrophotometrically at 410 m/i with 0.050 M perchloric acid (in acetic acid), 3 X 10⁻⁶ M o-nitroaniline serving as indicator.
No suitable salt has been found for the determination Of Kl HAj- of benzoic and p-nitrobenzoic acids; the solubilities of lithium benzoate and sodium p-nitro- benzoate were too small to be determined with any degree of accuracy. From the conductance of the saturated solutions, assuming complete dissociation, the solubility of the above salts in AN was estimated to be of the order of 2 X 10⁻⁵ M.
Conductance Measurements. Conductometric Titrations. The conductance cell (cell constant 0.224), thermostat, conductivity bridge, and the procedure for the conductometric titrations were described previously.2'4 All measurements were carried out at 25°.
Spectra of o-p'-Dimethylaminoazobenzene (DMAAB) in Buffer Solutions. A 1.8-cm cylindrical Pyrex glass stoppered cell was used for all spectra and absorbance measurements at 25°. The reference cell was filled with AN. The blanks in both cells were —0.008 and —0.005 absorbance unit at 400 and 510 m/x, respectively. All absorbances were corrected for the appropriate blank.
Spectra of DMAAB in perchloric acid, 1,3-diphenyl- guanidine, and in N,N-diethylanilinium perchlorate were run in a Cary Model 15 recording spectrophotometer. Absorbance measurements at 400 and 510 m/x of DMAAB in the various buffers in AN were made in a Beckman DU spectrophotometer.
Glass Electrode Measurements. Details of the poten- tiometric technique for the determination of pan with the glass electrode have been described previously.3 For calibration of the glass electrode a picric acid- tetrabutylammonium picrate buffer has been recommended. The emf of our glass electrode cell, using a0.01 M AgN 03-A g reference electrode was checked daily in a 5.35 X 10~3 M picric acid-2.94 X 10~3 M
tetrabutylammonium picrate buffer. Over a period of 2 months, the potential was found to remain unchanged within ± 3 mv. For our glass electrode3 the relation between emf and paH is paH = (821 — £0/59.1.
Since E0, the potential of the electrode extrapolated to poH = 0, may vary considerably from one electrode to another, it is recommended that each worker calibrate his glass electrode.
A Beckman Model G pH meter with a millivolt scale was used for all paH measurements. All measurements were carried out in an air-conditioned room at 25 ± 1°.
ResultsConductometric Section. Ionic Mobilities. Conduct
ance data of tetraethylammonium salicylate in absence and in presence of 0.040 M salicylic acid are presented in Table I and those of corresponding benzoate systems in Table II. The following observed and calculated Onsager slopes of the A vs. y/c plots constructed from the data in Tables I and II are: for tetraethylammonium salicylate 800, 350; in presence of 0.040 M salicylic acid, 550, 334, and tetraethylammonium benzoate, 457, 337; in presence of benzoic acid, 380, 322, respectively.
Table I : Conductance of Tetraethylammonium Salicylate in AN at 25° in Presence and in Absence of Salicylic Acid
In presence ofNo salicylic acid added 0.040 M salicylic acid
M X 10= A M X 10= A
0.381 147 0.381 1300.951 140 0.674 1281.33 139 0.951 1241.88 131.5 1.33 1222.80 126.5 1.88 1163.70 123 2.80 113
A» = 163 3.70 109A0 = 141.5
Using Mine and Werblan’s value of 85u for Xoeun+ the following ionic mobilities are found: Xosai- =78, Xobz- = 62, Xogai-sai- = 56.5, and Xohb?.bz- = 45.
The mobilities of p-nitrobenzoate, p-hydroxyben- zoate, and m-bromobenzoate ions and their homocon- 8 9 10 11
(8) S. Bruckenstein and I. M . Kolthoff, J. Am. Chem. Soc., 78, 2974 (1956).(9) I. M . Kolthoff and J. F. Coetzee, ibid., 79, 870 (1957).(10) S. Bruckenstein and I. M . Kolthoff, ibid., 78, 10 (1956).(11) S. Mine and L. Werblan, Electrochim. Acta, 7, 257 (1962).
The Journal o f Physical Chemistry

D issociation Constants of Benzoic A cids in A cetonitrile 859
Table II : Conductance of Tetraethylammonium Benzoate inAN at 25° in Presence and in Absence of Benzoic Acid
In presence ofNo benzoic acid added 0.079 M benzoic acid
M X 103 A M X 103 A
0.384 141 0.384 1230.536 138.5 0.763 1200.763 132 1.50 115.51.50 128 3.55 106.53.55 122 6.53 986.53 110
Ao = 147 Ao = 131
jugates are assumed to be the same as that of benzoate and its homoconjugate. The mobilities of 3,5-dinitro- benzoate and its homoconjugate have been found4 to be 100 and 46, respectively. In a previous publication2 the mobilities of the N,N-dimethylbsnzylammon- ium and 4-picolinium ions (assumed to be equal to that of the 2,4-lutidinium ion) were reported as 70 and 87, respectively.
Viscosity Corrections. The viscosity of solutions used varied very little from that of pure solvent. When necessary, conductance data in Tables I and II have been corrected for viscosity.
Homoconjugation Constant of Salicylate from Solubility Data. Conductance data of solutions of sodium salicylate in AN entered in Table III yield AoNaSai equal to 147. From the slope of the Fuoss and Bray plot, 1.96 X 10_1, A dN a S a i is estimated equal to 2.4 X 10_4. Using this value of A dNasai and the determined total solubility, 5.9 X 1CU3 M (Table IV), the ionic solubility, [Na+], is found equal to 1.35 X 10⁻³ M, from which K sp = [Na+j2/ 2 = 1.4 X HD6.
From conductance data of sodium salicylate in the presence of 0.040 M salicylic acid, also given in Table
Table III: Conductance of Sodium Salicylate in AN at 25° in Presence and in Absence of Salicylic Acid
In presence ofNo salicylic acid added 0.04 M salicylic acid
M X 10s A M X 10s A
0.226 111.6 0.440 1180.535 94 0.860 1080.980 69 1,20 1051.56 56 2.00 825.87 29 2.80 80.5
Ao = 147 3.58 705.04 647.20 51.5
A0 = 128
III, AoNaHsai.sai = 128, while the slope of the Fuoss and Bray plot is equal to 2.0 X 10⁻², yielding a value of 3.1 X 10⁻⁸ for A dNaESai-sai- Table IV reports the solubility of sodium salicylate in the presence of salicylic acid. Using the method of calculation described previously,3 an average value of 2 X 10³ for A fHa,- is found.
Conductometric Titration Curves. Conductometric titration curves of a weak acid with a weak base are quite involved and usually exhibit a maximum in conductance either before or after the equivalence point.
Under conditions specified previously,2 [B(HA)2]m and also [A_ ]m « [BH + ]m, m referring to concentrations at the maximum and B(HA)2 to the salt formed. The following relations between the location of the maximum in terms of the formation constant of the salt, A fBHA, on one hand, and between the conductance at the maximum, Lm, and the dissociation constant of the salt, K dBHA, on the other hand, have been derived
A bh a = l / C a { C bm/ C a - v . }
and
103Am roTJ+1 CaV r W A Wh -B (H A ) 2 2 { 1 + a/K B H AK H A , - j
in which Obm is the analytical concentration of base at the maximum and Ca is the initial concentration of acid. The subscript m refers to the maximum,
Also, a relation has been derived2 which enables one to calculate the product A^bhaA^bha from the initial portion of the titration curve, knowing A fHA2-
101L[HA]
Aob(HA)2V A dBHAAfBHAAfHÄ2- IB]
where [HA] and [B] represent the equilibrium acid and base concentrations, respectively.
Conductometric titration curves of 3,5-dinitroben- zoic acid with various pyridines and N,N-dimethyl- benzylamine have been reported previously.2 In Figure 1 are presented the conductometric titration curves of 1.07 X 10~2, 5.36 X HD3, 2.68 X HD3, and 1.34 X 1(D® M p-nitrobenzoic acid and 1.07 X HD2 and 5.36 X 1(D3 M p-hydroxybenzoic acid with N,N- dimethylbenzylamine. Conductometric tritation curves of the following acids, also with N,N-dimethyl- benzylamine, are shown in Figure 2: 5.36 X HD3, 2.68 X 1(D3, and 1.34 X HD3 M m-bromobeozoic acid and 5.36 X 1CD3 and 2.68 X HD3 M benzoic acid. Also, the conductometric titration curves of 3.92 X HD2 and 1.87 X HD2 M salicylic acid with 4-picoline are shown in Figure 2.
Volume 70, Number 3 March 1966

860 I. M. K olthoff and M. K. Chantooni, Jr.
Table IV : Solubility of Sodium Salicylate in Presence of Salicylic Acid
Analytical acid concn, ca,
M X 102
Totalsolubility, St,
M X 102
[Na+],St - [NaSal] -
[NaHSal-Sal], M X 10» P
[HSal], Ca - St +
[NaSal], M X 10»
[NaHSal-Sal], M X 10» 7C4HA2- X 10-»
0 0.59 0.135 0.77 0 00.575 0.90 0.28 0.68 0.162 0.130 2.21.25 1.25 0.42 0.63 0.48 0.352 1.82.52 1.80 0.65 0.58 1.14 0.666 1.74.44 2.52 1.21 0.55 2.35 1.20 1.59.84 5.82 1.38 0.44 4.50 3.96 2.5
Av 2 X 10³
1X10⁻⁴ p9 -
2 -
1 X 10⁻⁶ _____I___I__I_I nil _____!___1_I I I I I I I__________|_____ |___1 I I I I I I2 3 4 5 6 7 8 9 2 3 4 5 6 7 8 9 2 3 4 5 6 7 8 9
10 100 1000 10,000 % titrated.
Figure 1. Conductometric titration curves of benzoic acids with N,N-dimethylbenzylamine. p-Nitrobenzoic acid:A, 1.07 X 10⁻² M ; B, 5.36 X 10“ 3 M\ C, 2.68 X 10“ 3 M;D, 1.34 X 10“ 3 M. p-Hydroxybenzoic acid:E, 1.07 X 10~2Af; F, 5.36 X 10“ 3 M. Abscissa and ordinate on logarithmic scales.
Plots of L /[H A ] vs. y/ [B] derived from the initial portion of the conductometric titration curves in Figures 1 and 2 are reproduced in Figure 3.
Table V summarizes the data with regard to the evaluation of pKdHA from the initial portion and maximum of the conductometric titration curves in Figures 1, 2, and 3. For benzoic, p-hydroxybenzoic, p-nitrobenzoic, and m-bromobenzoic acids the potentio- metric values of A fha,- have been used to calculate pA dHA, values of K lha„- obtained from solubility data for salicylic and 3,5-dinitrobenzoic acids were used.
The following relation between (pKfBH+)w (w denotes water) and the product p(KdBHAjKfBHA)AN has been derived previously2 (pAdHA)AN = p I ^ ’bhaA ^ haIax — (pAfBH+)AN = pCK BHA-K BHA N — (p ^ ffiH+)w + 7.1. The values of (pAfBH + equal to 6.00 and 8.80 for 4- picoline and N,N-dimethylbenzylamine, respectively, were quoted from references cited in a previous paper.2
10 100 1000 10,000 % titrated.
Figure 2. Conductometric titration curves of benzoic acids with N,N-dimethylbenzylamine or 4-picoline. Salicylic acid:A, 3.92 X 10“ 2 AT; B, 1.87 X 10_2Af (with 4-picoline; all other acids with N,N-dimethylbenzylamine). m-Bromobenzoic acid: C, 5.36 X 10~3M; D, 2.68 X 10⁻³Af; E,I. 32 X 10-3 M. Benzoic acid: F, 5.36 X 10~3M;G, 2.68 X 10~3 M. Curves C, D, and E, left-hand ordinate; curves A, B, F, and G, right-hand ordinate.Abscissa and ordinate on logarithmic scales.
In all cases the pA fBH + of the titrant base used in the conductometric titration is taken 7.1 pK units more negative in AN than in water (based upon pA dHp; =II. 0 ± 0.1; for a discussion see ref 3).
Indicator Measurements. Absorption spectra of 8.95 X 10 ~6 M DMAAB in 0.010 M 1,3-diphenylguanidine and in 0.05 M perchloric acid are shown in Figure 4. The absorbance maxima are at 410 and 510 mp, respectively. In these solutions the indicator is assumed to be entirely in its basic or acidic form, respectively. The dashed line in Figure 4 represents the spectrum of 8.95 X 10⁻⁶ M DMAAB in 1.40 X 10⁻² M picric acid, corrected for the absorption of 8.95 X 10⁻⁶ M picrate12 formed as a result of the complete conversion * 1960
(12) M. K . Chantooni, Jr., Ph.D. Thesis, University of Minnesota,1960.
The Journal of Physical Chemistry


862 I. M. K o l t h o f f a n d M. K . C h a n t o o n i , J r .
v Tb] x 102.
Figure 3. Plot of L/[HA] vs. a/ [B] from initial portion of conductometric titration curves of benzoic acids with 4-picoline or N,N-dimethylbenzylamine in dilute solution. A, p-nitrobenzoic acid: A, 1.34 X 10⁻³; A, 2.78 X 10~3M\B, m-bromobenzoie acid: •, 2.68 X 10⁻³; O, 5.36 X 10- 3 M\C, p-hydroxybenzoic acid: •, 5.36 X 10⁻³; O, 1.07 X 10~2 iW; E, benzoic acid: A, 2.68 X 10~3; A, 5.36 X 10~3 M, withN, N-dimethylbenzylamine; D, salicylic acid: •, 1.87 X 10~2;O, 3.92 X 10- 2 M, with 4-picoline. Left-hand ordinate to curves A, B, C, and E. Right-hand ordinate to curve D. Slopes: A, 0.26; B, 0.235; C, 0.0307,0.035; D, 0.076, and E, 0.056.
of the indicator base to its protonated form by picric acid. The dashed curve and curve 7 practically coincide, indicating that the same acid form is present in the picric and perchloric acid solutions.
The spectra of 8.95 X 10~6 M DMAAB in the presence of 3.0 X 10⁻⁴ to 9.0 X 10~3 M N,N-diethylani- linium perchlorate, combined with the other curves in Figure 4, illustrate that there is an isosbestic point at 452 mp which indicates that only one basic and one acidic form are in equilibrium, i.e., I and IH+. Beer’s law plots of the basic form at 400 mp and the acidic form at 510 mp are linear to at least 10“ 5 M. The molar absorbance indices of the basic form are 2.8 X 10⁴ and ca. 1.4 X 10³ at 400 and 510 mp, respectively, while those of the acidic form are 8 X 10² and 5.2 X 10⁴, respectively.
The ratio of [IH+] to [I] in mixtures of picric, 3,5- dinitrobenzoic, and salicylic acids with their tetra- alkylammonium salts was obtained from the absorption at 510 mp. At this wavelength, neither picrate,
Wavelength, m/x.
Figure 4. Spectrum of 8.95 X 10 ~6 M DMAAB in solutions of various acidity in AN: 1, in 0.010 M 1,3-diphenylguanidine; 2, in 3.0 X 10⁻⁴; 3, 6.0 X 10"4; 4, 1.50 X 10“ 3; 5, 3.0 X lO "3; 6 , 9.0 X 10~ 3 Af N,N-diethylanilinium perchlorate; 7, in 0.050 M perchloric acid; dashed line, in 1.40 X 10~ 2 picric acid (corrected for picrate absorption); 1.93-cm cell.
3,5-dinitrobenzoate, salicylate, nor the parent acids absorb. However, a small correction must be applied for the absorbance of the yellow (I) form of DMAAB, which seldom exceeds 4% of the total absorbance. The approximate concentration of [IH + ] was calculated from the absorbance at 510 mp, neglecting the contribution made by the alkaline form (I). Subtracting [IH+] from the total concentration of the indicator yields the approximate value of [I]. From the absorbance index of I at 510 mp the contribution of I to the absorbance at 510 mp is then calculated and subtracted from the observed absorbance to obtain the absorbance and the concentration of IH+. If necessary, this procedure is repeated.
As there is a considerable absorbance of picrate,12 picric acid,12 and also 3,5-dinitrobenzoate at 400 mp, no attempt was made to measure the absorbance of the yellow form of DMAAB at this wavelength in systems of these acids. Since neither salicylate nor salicylic acid absorb at 400 mp, the absorbance of the yellow
The Journal o f P hysica l Chem istry

D i s s o c i a t i o n C o n s t a n t s o f B e n z o i c A c id s i n A c e t o n i t r i l e 863
Table VI : K h a + of DMAAB in Mixtures of Picric Acid and Tetrabutylamraonium Picrate“
CHPi, M X 10"
CBuiNPi. M X 10‘ Agio IIH "*"]/[I ]
[H + ],M X 10» P
A fIH+10-10
1.82 0.386 0.205 5.67 46.1 0.97 1.21.82 0.771 0.180 2.82 24.2 0.95 1 . 21.82 1.53 0.150 1.56 12.9 0.92 1 . 21.82 2.67 0.121 0.94 7.7 0.89 1.21.77 4.91 0.090 0.54 4.2 0 . 8 6 1.31.74 8.38 0.066 0.30 2.53 0.82 1.30.727 0.193 0.188 3.45 38 0.99 0.90.727 0.386 0.163 2 . 0 0 18.5 0.98 1 . 6 40.727 0.771 0.128 1.07 9.8 0.95 1 . 10.727 1.15 0.109 0.75 6 . 8 0.92 1.10.727 2.67 0.070 0.35 3.1 0.89 1.14
Av 1 1 6 X 10¹⁰ * *
° pAdHPi = 11.0; 2.4 X IO- 6 M DMAAB; cell path length, 1.93 cm.
form of DMAAB was measured in salicylic acid- salicylate mixtures. The correction for the absorbance of the acid form of DMAAB at 400 m/i was applied in the same way as the correction for the absorbance of the alkaline form at 510 m/x.
Determination of K*m+ for DMAAB. From Table VI an average value of 1.2 X 10¹⁰ was obtained for A {ih +using eq 3a.
Determination of K d2hA of 8,5-Dinitrobenzoic and Salicylic Acids. Tables VII and VIII present the spectrophotometric data of the reaction between DMAAB and 3,5-dinitrobenzoic acid and salicylic acid, respectively, in mixtures of the acid and its tetra- ethylammonium salt. In the salicylic acid-salicylate system, the indicator ratio [IH +]/[I], calculated from the corrected absorbance of the acid form at 510 m#*, agrees with the ratio calculated from the corrected absorbance of the basic form at 400 m/x. It therefore appears unlikely that there are specific interactions between the indicator base and salicylate or ion pairing between IH+ and salicylate ion.
Values of 1.7 X 10~13 and 2.2 X HD14 for A d2HA of 3,5-dinitrobenzoic acid and salicylic acid, respectively, were found using eq 5.
Potentiometric Measurements. In a previous publication3 an equation was derived (eq 6) which describes the potentiometric titration curve of a weak acid with tetraalkylammonium hydroxide and which allows the calculation of K dnA from aH+ in mixtures of acid and its salt
f 2Csan+2 — /dH-A’dHA { (Ca + CV) +A W ( C S - Ca)2} + A dHACa = 0 (6)
where C H and C s denote the analytical acid and salt concentrations, respectively. The following assump-
Table VII : Spectrophotometric Determination of ■Kd2HA of 3,5-Dinitrobenzoic Acid“
Chdnb , M X 10!
Ceundnb . M x 105 Agio
[IH+]/[I]
X d!HA X 10»
4.93 0.197 0.094 0.71 0 . 84.93 0.393 0.079 0.51 0.94.93 0.785 0.060 0.36 1 . 14.93 1.38 0.045 0.25 1.37.03 0.393 0.130 1.50 1.47.03 0.785 0.116 1.05 1 . 6 67.03 1.57 0.088 0.65 1.97.03 2.55 0.067 0.43 2 . 07.03 4.12 C .050 0.29 2 . 17.03 7.46 C .032 0.17 2 . 2
12.9 0.590 C.175 2.70 1 . 112.9 1.57 0.151 1.70 1.512.9 3.91 0.113 0.97 2 . 012.9 5.90 0.091 0.61 1.912.9 9.77 0.069 0.40 2 . 012.9 16.7 0,048 0.25 2 . 2
Av 1.7 X IO' 13
tions were made in deriving eq 6: (a) [H+] < < C„since the acid is very slightly dissociated; (b) acid- base dissociation of the salt is negligible; (,c) the homoconjugate and normal salts are completely dissociated.
At the midpoint of the potentiometric titration curve fi/tah+1/s = A dHA, which means that the p<xH and, hence, the potential at the midpoint (HNP) are independent of concentration of acid and salt when / is assumed to be 1. The subscript V2 denotes the midpoint.
From HNP a value of K {hA„- can be calculated from the potential at any point on the titration curveusing eq 6a3
Volum e 70, N um ber 3 M arch 1966

864 I . M. K o l t h o f f a n d M. K . C h a n t o o n i , J r .
Table VIII: Spectrophotometric Determination of Kd2h a of Salicylic Acid“
Oh Sal. OEtiNSal, —---------- [iH+]/m- -K2HA5 XM X 10 M X 105 Am .<4.610 400 mfj. 510 mu 1014
1.04 0.394 0.090 0.076 0.43 0.51 1.91.04 0.768 0.097 0.060 0.29 0.36 2.51.04 1.34 0.105 0.040 0.20 0.22 2.41.04 2.50 0.116 0.026 0.10 0.13 2.61.73 1.92 0.083 0.077 0.45 0.47 2.71.73 3.84 0.096 0.053 0.25 0.28 3.81.73 9.61 0.109 0.030 0.10 0.16 4.51.81 0.394 0.052 0.137 1.43 1.56 2.21.81 0.961 0.066 0.112 0.90 1.00 2.91.81 1.54 0.078 0.096 0.61 0.74 3.21.81 2.50 0.092 0.077 0.38 0.52 3.51.81 3.94 0.100 0.062 0.21 0.38 4.01.81 6.73 0.112 0.031 0.14 0.16 2.9
Av 2.2 X 10~14
“ 2.4 X 10"6 M DMAAB; cell path length 1.93 cm. 6 Calculated from [IH+]/[I] at 510 m>i.
Table IX: Glass Electrode Potential E in Table X : Potential E in Mixtures of HSal and EtiNSalMixtures of HDNB and EtiNDNB
C'a, C8, H h iA 'i XCa, CB, KfHA2- X M X 10» M X 10s E 10~3
M X 103 M X 10* E l0 -<0.192 1.92 -262 1.8
0.404 1.11 -254 1.9 0.384 1.92 -238 1.60.795 1.09 -198 1.6 0.960 1.90 -205 2.12.20 1.01 -102 0.7 1.34 1.89 -1875.00 0.855 -023 1.0 1.87 1.88 -168
10.3 0.855 +005 0.6 2.44 1.87 -150 1.321.8 0.855 +043 0.7 3.70 1.86 -118 2.1
7.11 1.84 -072 2.00.202 3.51 -344 1.0 22.4 1.84 -001 2.20.404 3.47 -327 1.1 71.5 1.84 +054 1.90.795 3.41 -301 1.2 132 1.84 +093 2.11.85 3.22 -253 1.53.40 2.94 -156 0.8 0.192 5.76 -317 1.74.22 2.80 -124 0.7 0.384 5.76 -304 2.26.42 2.43 -072 0.8 0.960 5.71 -268 1.7
12.9 2.43 -022 0.8 1.87 5.65 -241 1.730.2 2.43 +026 0.8 3.70 5.45 -202 1.6
5.44 5.42 -1650.202 7.02 -381 1.0 8.81 5.18 -111 2.30.404 6.94 -360 1.0 16.0 4.80 -057 2.30.795 6.82 -334 0.9 27.5 4.12 -012 2.61.85 6.44 -295 0.7 50.0 4.12 + 004 1.33.40 5.88 -250 0.7 103 4.12 +054 1.91.28 5.05 -054 1.4 156 4.12 +083 2.32.37 5.05 000 1.3
Av 2 X 10s5.62 5.05 +052 1.2Av 1.0 X 10⁴ HNP -167, pKdHA = 1 6 .7
HNP -177, pXdHA = 16.9
Potentiometric data of the glass electrode vs. 0.010 Car2 — r\ (Ca + C's) + K^Ai-iCs — C'a) 2} + Ca = 0 M AgN03-A g reference electrode in mixtures of 10-3
(6a) 6 X 1 0 - M tetraethylammonium salts of the following acids in the presence of 4 X 10~4 to 10-2 M parent
in which r = aH+/aHn/,- acid are given in Tables IX to X IV : 3,5-dintro-
The Journal o f P hysica l Chem istry

D i s s o c i a t i o n C o n s t a n t s o f B e n z o i c A c id s i n A c e t o n i t r i l e 865
Table XI : Potential E in Mixtures of p-Nitrobenzoic Acid and Tetraethylammonium p-Nitrobenzoate
M X 10®Ca,
M X 10® EK{ha2_ X 10-4
0.146 2.85 -451 l . i0.365 2.83 -406 0.60.656 2.80 -384 0.61.08 2.77 -369 0.81.60 2.73 -341 0.82.06 2.69 -315 0.52.76 2.64 -2793.33 2.60 -252 0.73.82 2.55 -234 0.75.04 2.46 -209 0.67.05 2.30 -176 0.6
10.45 2.02 -148 0.5
HNP -284, pAdHA = 18.7Av 7 X 10³
Table XII : Potential E in Mixtures of m-Bromobenzoic Acid and Tetraethylammonium m-Bromobenzoate
Ca,M X 10®
Cg>M X 10® E
■KfHA2“ X IO“®
0.318 2.23 -442 4.50.620 2.20 -428 5.81.12 2.15 -392 7.02.08 2.10 -3382.62 2.06 -3133.40 2.00 -284 4.34.85 1.90 -252 4.2
10.4 1.90 -193 5.526.9 1.90 -130 6.7
0.620 4.40 -456 4.21.12 4.31 -436 4.72.08 4.19 -409 6.72.89 4.07 -379 7.03.94 4.03 -3386.15 3.62 -273 4.3
13.0 3.62 -205 5.221.8 3.62 -162 7.342.0 3.62 -123 7.3
HNP -334, pXdHA = 19.5Av 6 X 10s
benzoic (HDNB), salicylic (HSal), p-nitrobenzoic, m-bromobenzoic, p-hydroxybenzoic, and benzoic (HBz) acids. The HNP at various concentrations of acid and salt were obtained at CJCS = 1 from plots of E vs. log [Ca/Cs]. They agreed within ± 4 mv for a given acid-salt system. Such a deviation is likely attributed in part to ionic strength effects and in part to liquid junction potential effects. The average
Table XIII : Potential E in Mixtures of p-HydroxybenzoicAcid and Tetraethylammonium p-Hydroxybenzoate
Ca,M X UP
C8,M X 101 E
K’HA2- X 1(R
0.109 6.09 -468 1.70.218 6.09 -4350.381 6.09 -4280.540 6.04 -4141.07 5.96 -3832.10 5.86 -353 0.94.04 5.64 -322 0.81.29 5.64 -258 1.03.70 5.64 -182 1.3
HNP -407, pXdHA = 20.8Av 1 X 10³
Table XIV: Potential E in Mixtures of HBz and EtiNBz
Ca, C„ ■KfHA2- XM X 10® M X 10® E 10®
0.161 2.42 -528 3.00.322 2.42 -511 3.20.565 2.42 -492 3.80.968 2.42 -469 2.41.29 2.37 -449 3.31.61 2.33 -436 4.72.02 2.30 -4102.42 2.29 -3913.63 2.22 -354 4.67.75 2.04 -301 2.8
25.3 2.04 -223 3.6
0.403 5.66 -549 3.50.806 5.66 -531 3.91.62 5.50 -504 4.23.24 5.25 -456 3.94.84 5.13 -4077.26 4.79 -344 6.99.70 4.56 -310 5.6
24.6 4.56 -243 4.9Av 4 X 10³
HNP -404, pXdHA = 20.7
values of HNP of the above acid-salt systems are entered in Tables IX to XIV.
D iscussion
Table X V presents a comparison of all the constants reported in this paper. For the acid systems used the potentiometric and spectrophotometric methods yield the most reliable values for X dHA, and the agreement between the results of the two methods for 3,5-dinitro- benzoic and salicylic acids is good. No suitable indicator was available for the other acids. The conducto-
V olum e 70, N um ber 3 M arch 1966

8 6 6 I. M. K o l t h o f f a n d M. K . C h a n t o o n i , J r .
Table XV : pAdHA and p-KfHA2- of Benzoic Acids in AN
Acid
Conductometric
titration“Potentiometric6
Speetro- photometric
with DMAAB SolubilityPotentio
metric pAlHA
HDNB 17.2 16.9 17.0 4.2 4.0 12.9HSal 16.9 16.7 16.95 3.3 3.3 13.4p-Nitrobenzoic 19.0 18.7 3.8 14.9m-Bromobenzoic 19.1 19.5 3.75 15.7p-Hydroxybenzoic 20.3 20.8 3.05 17.7Benzoic 20.1 20.7 3.6 17.1
° Average of values obtained from initial portion and from maximum of conductometric titration curve. 6 Recommended values. c From potentiometric data.
metric method involves many assumptions, and the values derived from this method are more approximate than those from the potentiometric one. Considering the limitations of the conductometric method,2 the agreement between K dua values derived from it and the potentiometric method is gratifying. For the systems used, the potentiometric method also yields more reliable values for K luA2- than the solubility method ; again the agreement between the results found by the two methods is satisfactory. For future
reference the values of K dHA and K fha2- derived from the potentiometric method are recommended.
The value of K {HAl- for salicylic acid is of the same order of magnitude as that for benzoic and p-hydroxy- benzoic acids and is unexpectedly large, considering that the salicylate ion is stabilized by intramolecular hydrogen bonding. Apparently, this bond is much weaker than the intermolecular one between the carboxylate ion and the carboxyl hydrogen of a second molecule of salicylic acid.
The Journal o f P hysica l Chem istry

F o r m a t i o n o f E t h a n e i n t h e G a s - P h a s e P h o t o l y s i s o f A z o m e t h a n e 867
Intramolecular Formation of Ethane in the Gas-Phase Photolysis of Azomethane1
by S . T oby and J. N im oy
School of Chemistry, Rutgers, The State University, New Brunswick, New Jersey 08903 {Received October 4, 1965)
The photolysis of gas-phase azomethane was reinvestigated in order to ascertain the importance of the intramolecular formation of ethane. The quantum yields of the intramolecular formation of ethane at 100, 135, and 180° had an average value of 0.007 ± 0.001. These values show good agreement with literature values from experiments done in the presence of radical scavengers and mixed isotopes. It has already been shown that oxygen has no appreciable effect on the primary radical split and this work confirms that the primary molecular split is also unaffected by oxygen. At the usual intensities employed, the fraction of the ethane from the intramolecular split is negligible below 80°. However, at 180° half of the total ethane comes from the intramolecular split. The identity of the precursor of the intramolecular split was considered and postulated to be an azomethane triplet. The effect on the Arrhenius parameters is generally to increase the measured activation energy of abstraction by approximately 0.3 kcal mole-1 so that for accurate work the intramolecular split should be taken into account.
Introduction
The photolysis of gaseous azomethane (A) was first studied quantitatively by Jones and Steacie.2 The main steps in the mechanism are
A + hv —-> 2CH3 + N2 (A)
2CH3; — > C2H6 (1)CH3 + A — > c h 4 + - c h 2n 2c h 3 (2)
from which it follows that a = Ru/Re '-IA] =fc2/fci'/s (units l.1/! mole” 1/2 sec- 1/1 throughout) where Rm = d[CH4]/df, Re = d[C2H6]/di, and a is introduced for convenience. Toby and Weiss found, however,3 that a showed marked dependence on azomethane concentration, particularly at and above 100° and at pressures far too high for the third-body restriction on methyl combination to be important. Their results suggested a second source of ethane in the azomethane photolysis but were not consistent with a simple intramolecular split A -► C2H6 + N2 and so a tentative mechanism invoking the CH3N2- radical was suggested.
Rebbert and Ausloos4 have photolyzed mixtures of azomethane and azomethane-d6 in the presence of oxygen as a radical scavenger. They obtained evidence of the occurrence of the intramolecular split in the gas phase. More recent work by Rebbert and
Ausloos5 gave stronger evidence for the occurrence of the intramolecular formation of ethane and cast doubt on the reactions involving CH3N2-. This doubt is well founded, for a subsequent esr study of the photolysis of azomethane6 showed no sign of the CH3N2- radical at temperatures as low as —196°.
Since azomethane is an extensively used source of methyl radicals, it is important to establish at least the main features of its photolysis. The present work was done with the intention of repeating and extending Toby and Weiss’s work using the photolysis of azomethane alone. This has the advantage of avoiding any possible secondary effects due to the presence of the oxygen scavenger and it also avoids any possible ambiguity in the results due to isotope effects.
Experim ental Section
The apparatus and techniques used have been pre
(1) Presented at the Physical Chemistry Division, 150th National Meeting of the American Chemical Society, Atlantic City, N. J., Sept 1965.(2) M. H. Jones and E. W. R. Steacie, J. Chem. Phys., 21, 1018 (1953).(3) S. Toby and B. H. Weiss, J. Phys. Chem., 66, 2681 (1962).(4) R. E. Rebbert and P. Ausloos, ibid., 66, 2253 (1962).(5) R. E. Rebbert and P. Ausloos, ibid., 67, 1925 (1963).(6) P. B. Ayscough, B. R. Brooks, and H. E. Evans, ibid., 68, 3889 (1964).
Volum e 70, N um ber 3 M arch 1966

8 6 8 S. T o b y a n d J. N i m o y
viously described.3 An Osram HBO-75W high-pressure mercury arc was powered by a constant-wattage transformer. The output was made parallel with a quartz lens and filtered with a Corning 7-37 filter to give light mostly in the 3660-A region (filter A). One series of experiments was performed using the more monochromatic filter described by Kasha7 which eliminates the 3340-A lines (filter B). The intensity was varied with neutral density filters. Photolysis products were partially separated with a low-temperature still and the methane, ethane, and nitrogen were analyzed gas chromatographically using a silica gel column at 25°.
R esu lts
Experiments were done in the range 50-180°. Figure 1 shows a plot of a vs. azomethane pressure. There is no dependence on azomethane pressure at 50° but there is increasing dependence as the temperature is raised.
The effect on a of varying the incident intensity at constant azomethane pressure is shown in Figure 2 where, for convenience, intensity is shown as rate of nitrogen formation.
If we now assume a second primary process
A T hv ^ C2H6 d- K2 (B)
where <j>A + 4>b = 1 from Jones and Steacie’s work,2 then the rate law becomes
a - 2 = Rv[A]2/Ru2 = h/h* + 0BftN[A]2//?M2
A graph of a -2 vs. .Rn [A]2/.Rm2 is shown in Figure 3. The value of 0B at 180° shows a slight pressure dependence. If this is ignored, then we obtain for <£B at 100, 135, and 180° values of 0.0071 ± 0.001, 0.0081 ± 0.0005, and 0.0052 ± 0.0005, respectively.
At 50° the scatter is too great for a meaningful slope to be obtained. This is because the intramolecular split is relatively unimportant at this temperature as will be discussed later. In order to ascertain the importance of hot-radical effects, a series of experiments was performed at 50° with the more monochromatic filter B. If hot radicals were present with filter A, the effect of filter B would be to increase the values of a -2. Actually, filter B reduces the values of a~2 slightly and shows that </>B has a slight dependence on wavelength, as Rebbert and Ausloos noted.4
D iscussion
Although the value of <pn appears to be independent of temperature, the fraction of the total ethane from the intramolecular split varies considerably with both temperature and absorbed intensity. As the intensity
,201-
.0021-------1-------1------- 1-------1------- ‘------- 1------- 125 50 75 lOO 125 150 175Pazo, mmHg
Figure 1. Semilogarit.hmic plot of a v s . azomethane pressure at various temperatures.
Figure 2. Semilogarithmic plot of a v s . absorbed intensity (expressed as rate of nitrogen formation) at the temperatures and azomethane pressures noted.
decreases, the intramolecular split becomes relatively more important and we may write
lim $e = <£bla—►O
This is shown graphically in Figure 4 At sufficiently low intensities all curves extrapolate to a value of <j>B of 0.006. However, at the higher intensities normally used, the fraction of intramolecular ethane is about 50% at 180° but only 1.5% at 50°. This accounts for the scatter shown in Figure 3 at 50° which is imposed by the limitations of analytical errors. It should be noted that the results shown in Figure 3 cannot be obtained at constant incident intensity and
(7) M. Kasha, J. Opt. Soc. Am., 38, 929 (1948).
The Journal o f P hysica l Chem istry

F o r m a t i o n o f E t h a n e i n t h e G a s - P h a s e P h o t o l y s i s o f A z o m e t h a n e 869
Figure 3. Plot of a -2 as a function of 7Jn[A]2/.Rm2 at various temperatures and azomethane pressures.
this explains why Toby and Weiss’s results3 do not give a value for <j>b.
It is of interest to compare the present work with work done by Rebbert and Ausloos with CH3N2- C H 3 - C D 3 N 2 C D 3 mixtures and in the presence of oxygen.4'5 Good agreement is obtained, as shown in Figure 5, with an estimated value for <f>b of 0.007 ± 0.001 independent of temperature. Increase of azomethane pressure appears to increase <j>B slightly. Work on the photooxidation of azomethane8 has shown that primary process A is not appreciably affected by the presence of oxygen and the comparison shown in Figure 5 shows that primary process B is also not affected.
Role of Electronically Excited States of Azomethane. The thermal decomposition of azomethane has been extensively investigated by Forst and Rice9 at about 300° and they concluded that the reaction had no significant molecular component. It therefore seems likely that any intramolecular rearrangement in the photolysis occurs via an electronically excited state. Certainly, if steric effects alone were important, one would expect a significant split in the photolysis of the isoelectronic molecule, acetone, where the methyl radicals are closer together, and this has not been observed.
Although cfs-azomethane has recently been isolated in the liquid and solid phases,10 gaseous azomethane is
Figure 4. Quantum yield of ethane as a function of absorbed intensity (expressed as rate of nitrogen formation).
. 0 1 5
$®
$
pi I I I 1 I I I I II 1 I I I I I I 1 I I 50 100 150 200
T. °C'Figure 5. Quantum yield of the intramolecular formation of ethane as a function of temperature. Data: •, Rebbert and Ausloos;4 O, Rebbert and Ausloos;5 this work.
almost certainly entirely trans. The probable instability of gaseous m-azomethane could account for the intramolecular ethane formation, the isomerization occurring via rotation about the N -N bond in the triplet state of azomethane. However, the triplet must be quite short-lived since cxygen has no effect on the intramolecular split.
Indirect evidence for a triplet intermediate comes from calculations by Kearns on the potential barrier to photoisomerization in azoalkanes.11 He showed that an n-Tr* singlet intermediate will lead to an appreciable activation energy for azoalkane photoiso
(8) G. R. Hoey and K. O. Kutschke, Can. J. Chem., 33, 496 (1955).(9) W. Forst and O. K. Rice, ibid., 41, 562 (1963).(10) R. F. Hutton and C. Steel, J. Am. Chem. Soc., 86, 745 (1964).(11) D. R. Kearns, J. Phys. Chem., 69, 1062 (1965).
Volum e 70, N um ber S M arch 1966

870 S. T o b y a n d J. N i m o y
merization. However, an n-7r* triplet would lead to an activation energy of zero in accordance with the temperature independence found in this work.
Rebbert and Ausloos have found12 that small quantities of azomethane quenched the phosphorescence of acetone and biacetyl but not the fluorescence. They found that the triplet azomethane molecules either gave two methyl radicals or were collisionally deactivated to the ground state. However, a small contribution from an intramolecular split would have been hard to detect. In addition, as they point out, an excited azomethane molecule produced by photosensitization may have considerably less vibrational energy than one produced by direct photolysis. Thus, the precursor of the intramolecular split appears to be a triplet azomethane molecule although it is uncertain whether or not the triplet is in its ground vibrational state. If spin is conserved, then the triplet cfs-azo- methane may produce two methyl radicals in such close proximity that combination occurs before scavenging is possible.
Effect of the Intramolecular Split on Arrhenius Parameters. Taking the intramolecular split into account one obtains
h / k i ^ = H m / [ A ] ( H e - H R n Y /2
The $bRn term corrects for the intramolecular ethane and it is of interest to test the effect of this correction on the literature values for the Arrhenius factor ratio Ai/Aih and the abstraction activation energy E2. In order to apply the correction, one needs the values of Rn and, unfortunately, only two of the relevant papers give these values. Table I gives a summary of the results. The parameters found in the present work are higher than any other reported values. However when Jones and Steacie’s (footnote a in Table I) results are corrected for the intramolecular split, the parameters show agreement with the present work within the combined experimental errors which are ±0.3 kcal mole-1 in all cases. Toby’s data (footnote d in Table I) were obtained at lower temperatures where the effect of the intramolecular split is negligible.It was shown that the methyl abstraction reaction had
a heterogeneous component at low temperatures which probably accounts for the low value of E2. The other data given in Table I were obtained at higher temperatures, but the magnitude of the intramolecular split correction would depend on the light intensities used.
Table I : Effect of Intramolecular Split on Arrhenius Parameters in Photolysis of Azomethane
A i / A i ' / i ,
.— 1.V: mole'"V2 sec -1/ 2—— r------Ef, kcal mole-1------»Uneor Cor Uneor Cor Ref
480 1070 7 .6 8 .2 a310 7 .3 b
1700 8 .4 c160 160 6 .9 6 .9 d600 7 .8 e
2000 8 .7 This work
“ M. H. Jones and E. W. R. Steacie, J. Chem. Phys., 21, 1018 (1953). 6 P. Ausloos and E. W. R, Steacie, Can. J. Chem., 32, 593 (1954). CS. Toby and K. 0. Kutschke, ibid., 37, 672 (1959). “ S. Toby, J. Am. Chem. Soc., 82, 3822 (1960). e P.Gray and J. C. Thynne, Trans. Faraday Soc., 59, 2275 (1963).
The effect of the intramolecular split on the measured abstraction activation energy for the photolysis of azomethane in the presence of added substrates was considered. Again, however, there was a dearth of articles in which the values of Rn were given. Sample calculations showed that the effect of the intramolecular split was not large and generally increased the measured abstraction activation energy by approximately 0.3 kcal mole-1, which was within the experimental errors. For future work where greater accuracy is desired the intramolecular split should be taken into account.
Acknowledgments. We wish to thank the National Science Foundation for its support of this work. J.N. acknowledges with gratitude a Lever Brothers Fellowship.
(12) R. E. Rebbert and P. Ausloos, J. Am. Chem. Soc., 87, 1847 (1965).
The Journal o f P h ysica l Chem istry

T h e r m o d y n a m i c S t a b i l i t i e s o f H4B40 4(g) a n d H4B60 7(g) 871
Thermodynamic Stabilities of H4B40 4(g) and H4B60 7(g)1
by Suresh K . G upta and Richard F . Porter
Department of Chemistry, Cornell University, Ithaca, New York (Received October 7, 1965)
The molecular species H4B40 4 and H4B60 7 have been identified mass spectrometrically as products of high-temperature reactions in the H -B -0 system. For the reactions 4/3H3Bs03(g) = H4B40 4(g) and H4B40 4(g) -}- B203(l) = H4B607(g), Af7°i2oo°K = —2.5 ±2.0 and —0.9 ± 2.0 kcal/mole, respectively. Heats of formation of H4B40 4(g) and H4B6- 0 7(g) are —392 ± 4 kcal/mole at 298°K and —691 ± 5 kcal/mole at 1200°K, respectively.
Introduction
Gaseous products identified in high-temperature reactions of H20(g) with boron include H3B3O3 (borox- ine) and H3B30 4 (hydroxyboroxine).2a With H2 pressures between 10-10 and 10_4 atm and temperatures near 1400°K, H3B30 3 is the major product while H3B3O4 is lower in abundance by an order of magnitude. Thermochemical data for H3B30 3 and H3B30 4 have been reported earlier.2 3 Infrared spectral data3,4 have been obtained for H3B30 3(g) which can be isolated at ordinary temperatures for a short period of time. The infrared spectrum of H3B30 3 indicates a six-membered ring structure of alternating boron and oxygen atoms. The inference that H3B30 4 is the monohydroxy derivative is reasonable in view of the reported work on trihydroxy boroxine.6 In this paper the thermodynamic stabilities of species in the H -B -0 system containing more than three boron atoms are reported.
Experim ental Section
The experimental apparatus including the mass spectrometer,6 the high-temperature Knudsen cell assembly, and the gas inlet system28 have been described earlier. The cells which served as containers for boron samples were constructed of molybdenum. These were mounted to a stainless steel inlet tube through which water vapor could be introduced externally through an all-metal valve. The flow rate of H20 was arbitrarily set to maintain a pressure in the cell below about 10“ 4 5 atm. At the temperatures of these experiments the gas effusing from the cell is mostly hydrogen. The oven was heated by radiation and electron bombardment from a tungsten filament. Temperatures were measured with a platinum—■
platinum-rhodium thermocouple. Boron samples were in the form of pressed pellets. The use of pellets tended to minimize the contact area between the boron and the molydenum oven. However, after several high-temperature experiments with a single sample, embrittlement of the container was noted, indicating that reaction had occurred between the boron and molybdenum. For certain calculations to be noted later, precise knowledge of the thermodynamic state of boron is not required. In some cases, however, it was advantageous to note the effects resulting from the addition of excess B20 3 to the system.
R esults
Mass spectra of the gaseous species produced in the H20 (g )-B reaction were obtained over a range of cell temperatures between 1100 and 1500°K. Illustrated in Figure 1 are the high-mass regions of the spectra for the fully hydrogenated and fully deuterated products. The latter were observed when D20 was used in place of H20 in the reaction scheme. The ion of highest intensity in the hydrogenated spectra is always at mass number 33 corresponding to H2B303+, a fragment from H3B30 3. Ion intensities in the high-
(1) Work supported by the Army Research Office (Durham) and the Advanced Research Projects Agency.(2) (a) W. P. Sholette and R. F. Porter, J. Phys. Chem., 67, 177 (1963); (b) R. F. Porter and S. K. Gupta, ibid., 68, 280 (1964).(3) G. H. Lee, W. H. Bauer, and S. E. Wiberley, ibid., 67, 1742 (1963).(4) S. K. Wason and R. F. Porter, ibid., 68, 1443 (1964).(5) D. J. Meschi, W. A. Chupka, and J. Berkowitz, J. Chem. Phys., 33, 530 (1960).(6) R. F. Porter and R. C. Schoonmaker, J. Phys. Chem., 62, 234 (1958).
Volum e 70, N um ber 8 M arch 1966

872 S u r e s h K. G u p t a a n d R i c h a r d F. P o r t e r
ioo-80 -60-
>, 40-1 20- Q>S o
Deuterated Spectrum
-TT+110 Ihufnllrll 120 nmi|iinmir 130 140 150
iTi'i ttti n~n i 160 170 180
Hydrogenated Spectrum
HB/Cr"1' and
I 100% 80 cr.
60 40 20 -0 Yrfr finnn11itIIlit\111111111111111 nnn 11nlim i[n1111iri| mt n 11 1 n 11 rrr
110 120 130 140 150 160 170 180m/e
Figure 1. Mass spectra of high molecular weight species in the H -B -0 and D -B -0 systems.
fragmentation from the same precursor as H3B60 7+ H3B40 4+ arises from a different parent molecule. The two major species in the high-mass region are assigned the molecular formulas H4B60 7 and H4B40 4. Parent ion intensities for H4B60 7+ and H4B40 4+ are observable but are very small as expected by analogy with the mass spectrum of H3B30 3.2a The molecular precursor for H3B40 5+ is tentatively identified as H3- B40 4(0H).
For the gas phase reaction
V 3H3B30 3(g) = H4B4C'4(g) (1)
we may write
K e q = ( P H<B.O<)/( P HsBjOa) ^ =C (IH jBiOi +)/ (7m BjOs 0 (2)
mass region (Figure 1) constitute only a few per cent of the total. Mass identification was made by counting background peaks from mass 83. Checks on the identification of the highest masses were made by mass calibration with a small quantity of C3F4C14 which provided an easily recognizable fragmentation pattern. The number cf boron atoms in each ion group was established from the isotopic structure assuming a normal 10B /nB ratio of 0.25. The number of hydrogen atoms in each species was determined from the mass shift observed on deuterium substitution. The oxygen compositions were then obtained by subtracting the boron and hydrogen mass contributions from the mass number of the ion. Important mass groups for the hydrogenated species in the m/e ranges 109-112, 122-129, 150-154, and 177-182 were identified as H3B40 4+, a mixture of HB40 5+ and H3B4Os+, H2B60 6+, and H3B60 7+, respectively. The presence of two species in the mass group 122-129 is more evident in the deuterated spectra where the boron isotope structure is clearly resolved.
Precursor relationships among the ions were determined by noting variations in ion current ratios as a function of temperature and H2 pressure. For a temperature between 1000 and 1200° the ratios Im/ hso and Im/hu were constant within the limits 2.2 ±0.2 and 4.0 ± 0.4, respectively, for an ionizing electron energy of 75 v. An obvious variation was observed for the /lao/Ziii ratio. In one set of experiments with a fresh boron sample this ratio changed from 0.95 to 0.28 as the temperature was raised from 900 to 1100°. As we note later, the ratio Im/Im was found also to be sensitive to H20 leak rate. These observations indicate that while H2Bo06+ and HB40 6+ are formed by
where C incorporates a number of factors including ionization cross sections and ion detection efficiency terms. The temperature-dependent factor in C was considered negligible in view of the cver-all uncertainties in measuring the temperature coefficients for the reaction. The ionizing electron energy was maintained at 75 v. As a test of the equilibrium conditions for reaction 1, changes in the relative pressures of H3B30 3 and H4B40 4 were noted from ion current measurements as the flow rate of H20 was changed while the cell was held at constant temperature. These results are shown on a logarithmic plot in Figure 2. The experimental points fall on a curve with a slope close to the theoretical value of 0.75. A series of temperature dependence measurements for reaction 1 is shown in Figure 3. The three sets of data shown were obtained with relative flow rates of H20 in the same range as those corresponding to the conditions illustrated in Figure 2. A rapid drop-off in ion intensities was observed when the temperature of the effusion cell was decreased below about 1000°K. Since this behavior was observed when either boron or B -B 20 3 mixtures were used, it appears that the effect is not due to a sudden change in the thermodynamic state of the condensed phase. Most probably, the reaction between H20 and boron at the lower temperatures is too slow to maintain equilibrium conditions. From a series of five temperature dependence determinations we obtain for reaction 1 a value of A77°i25o°k = —2.5 ± 2.0 kcal/mole, where the limits are maximum deviations. With a small estimated Acp of R cal/mole deg and the heat of formation of H3B30 3 ( — 291 ± 2 kcal/mole), we calculate for the heat of formation H4B40 4 at 298 °K —392 ± 4 kcal/ mole.
The Journal o f P h ysica l Chem istry
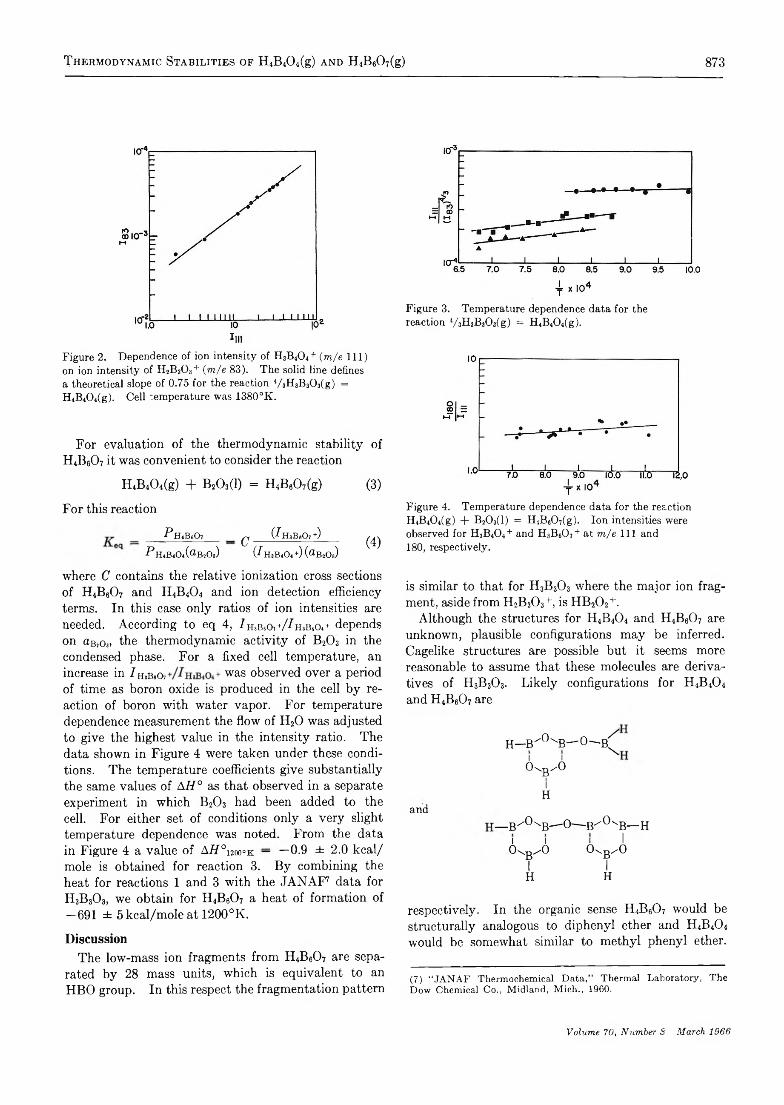
T h e r m o d y n a m i c S t a b i l i t i e s o f H 4B40 4(g) a n d H 4B60 7(g) 873
Figure 2. Dependence of ion intensity of H3B40 4+ (m/e 111) on ion intensity of H2B30 3 + (m/e 83). The solid line defines a theoretical slope of 0.75 for the reaction 4/ 3H3B30 3(g) = H4B40 4(g). Cell temperature was 1380°K.
For evaluation of the thermodynamic stability of HJhCb it was convenient to consider the reaction
H4B40 4(g) + B20 3(1) = H4B607(g) (3)
For this reaction
_____ P ILBsOi _ g ( HaBtOj-1-) ^■PmBiOil BjO.) (^HiBiOiO^BjOs)
where C contains the relative ionization cross sections of H4B6O7 and H4B40 4 and ion detection efficiency terms. In this case only ratios of ion intensities are needed. According to eq 4, IHiPnC +flihvHo,+ depends on aB;Oj, the thermodynamic activity of B20 3 in the condensed phase. For a fixed cell temperature, an increase in /mB.o, was observed over a periodof time as boron oxide is produced in the cell by reaction of boron with water vapor. For temperature dependence measurement the flow of H20 was adjusted to give the highest value in the intensity ratio. The data shown in Figure 4 were taken under these conditions. The temperature coefficients give substantially the same values of AH° as that observed in a separate experiment in which B2O3 had been added to the cell. For either set of conditions only a very slight temperature dependence was noted. From the data in Figure 4 a value of AH°im°K — —0.9 ± 2.0 kcal/ mole is obtained for reaction 3. By combining the heat for reactions 1 and 3 with the JANAF7 data for H3B3O3, we obtain for H4B60 7 a heat of formation of —691 ± 5kcal/moleat 1200°K.
DiscussionThe low-mass ion fragments from H4B60 7 are sepa
rated by 28 mass units, which is equivalent to an HBO group. In this respect the fragmentation pattern
Figure 3. Temperature dependence data for the reaction 4/3H3B30 3(g) = H4B40 4(g).
Figure 4. Temperature dependence data for the reaction H4B40 4(g) + B20 3(1) = H4B60 7(g). Ion intensities were observed for H3B40 4+ and H3B60 7+ at m/e 111 and 180, respectively.
is similar to that for H3B3O3 where the major ion fragment, aside from H2B30 3+, is HB20 2+.
Although the structures for H4B40 4 and H4B60 7 are unknown, plausible configurations may be inferred. Cagelike structures are possible but it seems more reasonable to assume that these molecules are derivatives of H3B303. Likely configurations for H4B40 4 and H4B607 are
and
H—B/C K B—
V/o
-o\r-o
1H
— B/ 0 x -B ^ -°—B/ 0 "l
O-
/-O
d \ O-
o-
/-O
d \
1H
lH
B— H I0
respectively. In the organic sense H4B607 would be structurally analogous to diphenyl ether and H4B40 4 would be somewhat similar to methyl phenyl ether.
(7) “JANAF Thermochemical Data,” Thermal Laboratory, The Dow Chemical Co., Midland, Mich., 1960.
V olum e 70, N um ber S M arch 1966

874 R. A. K e n t , J. D. M c D o n a l d , a n d J. L. M a r g r a v e
The molecules need not have over-all planar symmetry but planarity would probably be retained in the individual boroxine rings. We can visualize the formation of IRBsOt as elimination of a H2 molecule in a reaction of H3B3O3 at a B -H bond with EURCMOH) at the O-H bond. Similarly, H4B40 4 could be formed from H3B3O3 and H2B(OH) (hydroxyborane).8 1 2 3 4 5 Ion currents of HBO+ and HBOH+ are always observable in these experiments but, because these ions are formed by fragmentation from a number of precursors, it is difficult to assess the importance of the molecular contribution of HBO and H2BOH. These species may be
important in the kinetics of reaction as precursors to boroxine.
The pressure dependences of reactions 1 and 3 show that the equilibrium concentrations of H4B40 4 and H4B6- 0 7 should increase relative to H3B30 3 as the pressure of H3B30 3 increases. Relatively high concentrations of H4B40 4 and H4B607 should be possible in a static system where the partial pressure of H2 over B -B 20 3 mixtures is of the order of 1 atm at temperatures near 1400°K.
(8) R. F. Porter and S. K, Gupta, J. Phys. Chem., 68, 2732 (1964).
Mass Spectrometric Studies at High Temperatures. IX. The Sublimation
Pressure of Copper(II) Fluoride
by R . A . K en t, J. D . M cD on a ld , and J. L . M argrave
Department of Chemistry, Rice University, Houston, Texas 77001 (Received October 8, 1965)
Mass spectrometric studies of CuF2 sublimation from a Knudsen cell have established CuF2(g) as the major vapor species and A/7°298[sublimation] = 63.9 ± 1.0 kcal mole-1. The dissociation energy of CuF(g) is 87 ± 9 kcal mole-1 (3.8 ± 0.4 ev).
I . Introduction
Previous papers in this series1-4 have reported mass spectrometric and microbalance measurements of Knudsen and/or Langmuir vaporization and/or sublimation rates for various transition metal fluorides. In this investigation, the sublimation rate of CuF2 has been measured, and the vapor species have been identified by the Knudsen technique employing a mass spectrometer.
II . Experim ental Section
The mass spectrometer has been described previously.6 Temperatures were measured with an infrared pyrometer as described previously.4 The CuF2 sample, 99.8% purity, was generously provided by Professor J. W. Stout of the University of Chicago.
Choice of the Knudsen cell material presented a slight problem inasmuch as CuF2 has one of the weakest metal-fluorine bonds of any of the first-row transition metal fluorides, and, thus, CuF2 is an effective high- temperature fluorinating agent. Preliminary experiments showed that CuF2 reacted with tantalum at high temperatures to produce Cu(s) and TaF5(g). Finally, the CuF2 was contained by using an MgO
(1) R. A. Kent, T. C. Ehlert, and J. L. Margrave, J. Am. Chem. Soc., 86, 5090 (1964).(2) T. C. Ehlert, R. A. Kent, and J. L. Margrave, ibid., 86, 5093 (1964).(3) R. A. Kent and J. L. Margrave, ibid., 87, 3582 (1965).(4) R. A. Kent and J. L. Margrave, ibid., 87, 4754 (1965).(5) G. D. Blue, J. W. Green, R. G. Bautista, and J. L. Margrave J. Phys. Chem., 67, 877 (1963).
The Journal o f P h ysica l Chem istry

S u b l i m a t i o n P r e s s u r e o f C o p p e r ( I I ) F l u o r i d e 875
Knudsen cell to line the tantalum cell. The MgO had previously been heated to 800° in an atmosphere of fluorine gas. In the temperature range covered in this investigation, the sublimation pressure of MgF2 is several orders of magnitude lower than that of CuF2,6,7 and the expectation was that a protective layer of MgF2 would be formed which would prevent reaction between the MgO cell and the CuF2 sample. This expectation was justified when the only ions formed by electron bombardment of the effusate from the cell were CuF2+, CuF+, and Cu+.
III. Results and DiscussionThe Sublimation of CuF2. The rates of sublimation
were measured, and the vapor species were identified between 897 and 1026°K by means of the mass spectro- metric technique. The ionic species which were formed by electron bombardment of the effusate from the Knudsen cell were CuF2+, CuF+, and Cu+. No dimers or higher polymeric species were observed although the spectrum was scanned to mass 400. Using as a standard the known value of the ionization potential of mercury, 10.4 ev,8 the appearance potentials of the ions CuF2+, CuF+, and Cu+ were observed to be11.3, 12.4, and 16.5 ev, respectively, with estimated uncertainties of ±0.3 ev. These values indicate that the ions CuF+ and Cu+ result from the dissociative ionization of CuF2(g) rather than from the simple ionization of the species CuF(g) and Cu(g). The ion CuF2+ is attributed to the simple ionization of CuF2(g). The relative abundances of ions at masses 63 and 65, 82 and 84, and 101 and 103 were checked and found to correlate with the known isotopic abundances of 63Cu and 65Cu.
Two independent methods were employed to determine the heat of sublimation of CuF2 from the experimentally observed ion currents of CuF2+. The intensity of the 103CuF2 + peak using 75-v electrons was followed as a function of temperature. By making use of the ion current-pressure relationship P = kIT9 and the integrated form of the Clausius-Clapeyron equation, a value of AHT which is independent of the proportionality constant k may be found from the slope of the curve obtained by plotting log (I+T) vs. 1/T. The slope of this plot yielded a heat of sublimation of AH°970 = 59.5 ± 0.6 kcal mole-1, where the uncertainty given is the standard deviation of the least- squares treatment. The true uncertainty may be two or three times this figure owing to such factors as temperature gradients in the crucible. Because no heat capacity data for CuF2(s) were available, the thermodynamic functions for CuF2(s) were estimated from a combination of available data for MnF2(s),10
NiF2(s),n and Mn(s), Ni(s), and Cu(s)12. Thermodynamic functions for CuF2(g) were calculated from the parameters presented by Brewer and co-workers.13 When corrected to 298 CK the second-law heat of sublimation becomes AH°29S = 62.8 ± 0.6 kcal mole-1.
An alternative approach is to calculate AH°298 for each temperature from the absolute pressure and the free energy function change, Afef, for the reaction. In order to determine the instrument constant k a weighed sample of previously degassed CuF2 was vaporized from the crucible at a constant temperature, and the intensity of the 103CuF2+ peak was followed as a function of time. At 950°K, 3.86 X 10⁻³ g effused in 150 min through an orifice whose area was 8.02 X 10⁻³ cm2 (Clausing factor, 0.479). By use of the Knudsen equation, the pressure was calculated to be 7.7 X 10⁻⁶ atm. The value of k determined was combined with the least-squares equation for log (I+T) as a function of reciprocal temperature to yield the vapor pressure equation
log Patm = -(1 .300 ± 0.013) X 104/T +(8.58) ± 0.14)
The value of k was also used to calculate a value of log P for each observation. The values of log P were then combined with the free energy functions for CuF2 (s) and CuF2(g) to obtain the third-law heat of sublimation. The results of the mass spectrometric runs are presented in Table I and plotted in Figure 1.
While the small standard deviation in the third- law heat reflects the reproducibility of the measurements, the true uncertainty must reflect errors in the estimated thermodynamic functions; hence, the third- law heat is taken to be 63.9 ± 1 . 0 kcal mole-1. The major inherent errors in the second-law result are those in temperature measurement. In practice, uncertainties of ± 3 kcal mole-1 are usual in the temperature range covered in this investigation, and the second-law heat of sublimation is taken to be62.8 ± 3.0 kcal mole-1. The heat of formation of 6 7 8 9 10 11 12
(6) J. W. Green, G. D. Blue, T. C. Ehlert, and J. L. Margrave, J. Chem. Phys., 41, 2245 (1964).(7) M. A. Greenbaum, H. C. Ko, M. Wong, and M. Färber, J. Phys. Chem., 68, 965 (1964).(8) C. E. Moore, National Bureau of Standards Circular 467, U. S. Government Printing Office, Washington, D. C., 1949.(9) W. A. Chupka and M. G. Inghram, J. Chem. Phys., 21, 371 (1953).(10) A. D. Mah, U. S. Department of Interior, Bureau of Mines, Report of Investigation 5600, Mines Bureau, Pittsburgh, Pa., 1960.(11) A. Glassner, Argonne National Laboratory Report ANL 5750, Jan 1958.(12) D. R. Stull and G. C. Sinke, Advances in Chemistry Series, No. 18, American Chemical Society, Washington, D. C., 1956.
Volum e 70, N um ber 3 M arch 1966

876 R. A. K e n t , J. D. M c D o n a l d , a n d J. L. M a r g r a v e
Table I : Mass Spectrométrie Data for CuP2 Sublimation
Temp,°K
J(CuF2+),arbitrary
units— Log
P a tm
- <W,cal deg-1
mole-1
A R ° 2 0 8 ,
kcalmole-1
983 1197 4 .6 7 9 4 3 .7 6 6 4 .1991 1677 4 .5 31 4 3 .7 6 6 3 .9
1004 2352 4 .3 7 8 4 3 .7 5 6 4 .01015 3750 4 .2 1 9 4 3 .7 7 6 4 .01026 4350 4 .1 3 2 4 3 .7 8 6 4 .31021 4250 4 .1 6 2 4 3 .7 8 6 4 .21008 3470 4 .2 5 6 4 3 .7 6 6 3 .81004 2900 4 .3 3 6 4 3 .7 5 6 3 .8
995 2502 4 .5 1 4 4 3 .7 5 6 4 .0988 2118 4 .5 9 0 4 3 .7 6 6 4 .0981 1752 4 .6 7 4 4 3 .7 7 6 3 .9985 2046 4 .6 0 5 4 3 .7 6 6 3 .9978 1704 4 .6 8 7 4 3 .7 7 6 3 .8974 1413 4 .7 7 0 4 3 .7 7 6 3 .9971 1248 4 .8 2 7 4 3 .7 8 6 4 .0963 1098 4 .8 8 5 4 3 .7 8 6 3 .7959 933 4 .9 5 8 4 3 .7 8 6 3 .7950 703 5 .0 8 5 4 3 .7 9 6 3 .7948 633 5 .1 3 2 4 3 .8 0 6 3 .8937 434 5 .3 0 0 4 3 .81 6 3 .8933 377 5 .3 6 4 4 3 .81 6 3 .8929 319 5 .4 3 9 4 3 .81 6 3 .8922 257 5 .5 3 5 4 3 .8 2 6 3 .8912 184 5 .6 8 5 4 3 .8 3 6 3 .7897 118 5 .8 8 5 4 3 .8 5 6 3 .5950“ 680 5 .1 1 3 4 3 .7 9 6 3 .8
Av 63.9 ± 0 .2
0 Absolute pressure measurement, corrected for change in multiplier gain.
CuF2(g) from the elements in their reference states at 298°K is calculated to be —63.0 ± 3.0 kcal mole-1, based on the available heat of formation o: CuF2(s).13
The Dissociation Energy of CuF. When the heat of sublimation of CuF2 is combined with the heat of formation of CuF2(s),13 the heat of sublimation of copper,12 and the atomization energy of fluorine,6 one calculates a dissociation energy of CuF2(g) into atoms of 181.8 ± 4.0 kcal mole-1 and an average Cu-F bond strength of 90.9 kcal mole-1 (3.94 ev). From the appearance potential data one calculates AHa < 202 kcal mole-1, with the large uncertainty caused by the unknown thermodynamic state of the fluorine produced on complete dissociation. If the ratio D (M F )/A ffa(MF2) = 0.46 ± 0.02 as found for the alkaline earth fluorides5 and other transition metal fluorides,3 then, the value of D(CuF) becomes 83.6 ±4.0 kcal mole-1 (3.63 ± 0.2 ev).
Calculations of dissociation energies, based on an ionic model like that used by Rittner14 for the alkali halides, appear to be useful. One may calculate the polarizability for the Cu+ ion from the prescription a = 3r2/2 /(M ), given by Kauzmann15 with the value for r2 calculated by Hirshfelder, et al.,16 and the second ionization potential for Cu from Moore.8 The polarizability of F - was calculated by Pauling,17 and the electron affinity of F atoms was taken from the JANAF tables.18 The bond length in CuF, re, was estimated as 1.70 A while Herzberg19 gives we = 623 cm-1. From these parameters one calculates -D(CuF) = 3.66 ± 0.4 ev, in good agreement with the prediction based on the heat of atomization.
Manganese metal powder was added to CuF2 in the MgO cell in an attempt to produce CuF(g) and determine its dissociation energy. However, the Mn reduced the CuF2 to Cu(s), and the major species which effused from the crucible were MnF2(g) and MnF(g). The dissociation energy of MnF(g) has been established as 4.39 ± 0.15 ev,1 and this value can be taken as an upper limit for the dissociation energy of CuF(g).
(13) L. Brewer, G. R. Somayajulu, and E. Brackett, Chem. Rev., 63, 111 (1963).(14) E. S. Rittner, J. Chem. Phys., 19, 1030 (1951).(15) W. Kauzmann, “ Quantum Mechanics,’1 Academic Press Inc., New York, N. Y„ 1957, p 514.(16) J. O. Hirshfelder, C. F. Curtiss, and R. B. Bird, “ Molecular Theory of Gases and Liquids," John Wiley and Sons, Inc., New York, N. Y„ 1954, p 955.(17) L. Pauling, Proc. Roy. Soc. (London), A114, i81 (1927).(18) D. R. Stull, Ed., “ JANAF Thermochemical Data,” Dow Chemical Co., Midland, Mich.(19) G. Herzberg, “ Molecular Spectra and Molecular Structure. I. Spectra of Diatomic Molecules,” D. Van Nostrand Co., Inc., New York, N. Y„ 1953.
The Journal o f P h ysica l Chem istry

V a p o r P h a s e R e a c t i o n o f M e t h y l R a d i c a l s w i t h T o l u e n e 877
CuF2 was reduced when heated in a tantalum Knud- sen cell. The appearance potential of the ion CuF + produced in this reducing system, 8.6 ± 0.3 ev, when combined with the value obtained in the nonreducing system 12.4 ± 0.3 ev, yields D(FCu-F) = 4.2 ± 0.5 ev and D(CuF) = 3.7 ± 0.5 ev, with the uncertainty mainly to allow for the unknown thermodynamic state of the fluorine after electron impact; i.e., is it F, F~, F2, or F2_? Simple subtraction (12.4 — 8.6 =3.8 ev) for D(FCu-F) would seem to indicate I) (CuF)/Affa(CuF2) > 0.5 in disagreement with available data for similar fluorides, but would give Z)(CuF)
» 4 . 1 ± 0.5 ev. Until further data are available, D(CuF) = 3.8 ± 0.5 ev is a reasonable choice.
Acknowledgment. The authors wish to thank Professor J. W. Stout of the University of Chicago for the CuF2 sample. Financial support for high-temperature research at Rice University is provided by the United States Atomic Energy Commission, by thè National Aeronautics and Space Administration, by the Advanced Research Projects Agency through the Army Research Office, and by the Robert A. Welch Foundation.
The Vapor Phase Reaction of Methyl Radicals with Toluene at 1 0 0 -3 0 0 °
by M a rk Cher, C . S . H ollingsw orth, and F . Sicilio1
North American Aviation Science Center, Thousand Oaks, California (.Received October 15, 1965)
The rates of reaction of methyl radical, produced by photolysis of acetone between 100 and 300° or by pyrolysis of azomethane at 300°, with the aliphatic and aromatic C-H bonds in toluene, toluene-ds, toluene-d3, and toluene-d8 were determined from measurements of the rates of production of methane and ethane and from the isotopic composition of the methane. The dominant reaction is the abstraction from the side chain, for which the activation energies are 9.5 kcal/mole for C6H6CH3 and 11.3 kcal/mole for C6H5CD3 and the A factor is 1011-6 cc mole-1 sec-1 independent of deuteration. The ring reaction is complex with at least two mechanisms having different temperature dependences operating simultaneously. At high temperatures direct abstraction from the ring takes place, the rate constant is given by rh = 1010-7 exp(—10 kcal/RT), and the deuterium isotope effect is rh/fd ~ 10-15. At low temperatures methyl radicals appear to add to the aromatic ring, and the approximate values of the Arrhenius parameters are log A ~ 7 and E ~ 4 kcal/mole. These values are little affected by deuterium substitution in the ring.
Introduction
In a previous publication2 we have shown that at 60° methyl radicals abstract hydrogen from both the ring and the side-chain positions of toluene and that the ratio between these two rates of reaction is sensitive to the deuterium content of the toluene. In ordinary toluene the ring abstraction is about one-tenth of the total abstraction; in toluene-d3 (C6HfiCD3) the ring
abstraction is about equal in magnitude to the side- chain abstraction; and in toluene-ds (C6D5CH3) the ring abstraction is essentially negligible. Since the C6H6-H bond strength is approximately 20-25 kcal/ mole higher than the C6H6CH2-H bond strength,3
(1) Visiting Scientist, summer 1963.(2) M. Cher, J. Phys. Chem., 68, 1316 (1964).
V olum e 70, N um ber 3 M arch 1966

878 M. C h e r , C . S . H o l l i n g s w o r t h , a n d F. S i c i l i o
the detection of any ring reaction appeared very surprising. In order to confirm our original conclusions it seemed worthwhile to study in some detail the temperature dependence of each of these reactions. For this purpose we have carried out an extensive series of photolyses and pyrolyses of mixtures of acetone or azomethane with the various isotopic toluenes over the temperature range 100-300°. Rate parameters were obtained as before from measurements of the isotopic composition of the product methane2 and also from the measurement of the rates of production of methane and ethane using the repeated gas chromatographic sampling technique.4 The results confirm the occurrence of the ring reaction and establish a complex temperature dependence with the apparent activation energy increasing with increasing temperature.
Experimental Section
Apparatus. The apparatus and general procedure have been described previously.2'4 An all-glass chamber containing a magnetically operated stirring paddle was used for mixing and storing vapor mixtures. Mixture composition was established either by measurement of weight or partial pressure of individual components. In the acetone photolysis experiments the Pyrex window served to filter out wavelengths below ca. 3000 A. In the azomethane pyrolysis experiments a quartz reaction cell, total volume 283 cc, was immersed in a molten salt bath maintained at 300 ± 1°.
Materials. Azomethane was prepared from 1,2- dimethylhydrazine hydrochloride by the procedure of Renaud and Leitch5 and purified as described previously.2 Toluene-d3 and toluene-d8 were purchased from Merck Sharp and Dohme of Canada, Ltd. Toluene-ds was purchased from U. S. Nuclear Co. Toluene-do was Baker Analyzed reagent grade. Each of these compounds was purified by preparative gas chromatography and subsequently dried with Drierite. Their low-voltage mass spectra showed 6-7% toluene-
impurity, where n is the number of D atoms in each of the parent compounds. Spectro Grade acetone (Matheson Coleman and Bell) was used without purification.
Results
As indicated previously2 we assume that the formation of methane and ethane in the photolysis of mixtures of acetone and toluene is explained in terms of the reactions
CH3COCH3 + hv — ► 2CH3 + CO
CH3 + A - A - CH4 + CH3COCH2
CH3 + T - A - CH4 + C6H6CH2 (side-chainabstraction)
CH, + T CH4 + CH3C6H4 (ringabstraction)
CH3 + CH3 C2H6
(1)
(2)
(3)
(4)
(5)
In these equations A and T denote ac etone and toluene, and a, s, r, and k, are rate constants. The rate constants are related to the rates of production of methane and ethane by eq 6.6
G = —1 fi.cm
C 0Ä0 U/CjHe‘A«XA bxTfc/A + fc-I/s
(6)
where xa and xt are the mole fractions of acetone and toluene, Co is the initial total concentration of vapor in the reaction cell, and b = s + r. In the repeated gas chromatographic sampling technique4 Rem and Rc2h6 are given by the slopes of the linear plots [CH4]/ u /t vs. t and [C2H6] vs. ar( 1 — a /r')/(l — a), where [CH4] and [C2H6] are the concentrations of methane and ethane measured at time t, a is the ratio of the pressures in the reaction cell before and after sampling, and t is the interval between samplings. A summary of the data obtained in the photolysis of mixtures of acetone with toluene, toluene-d3 (C6HSCD3), toluene- d$ (CeD6CH3), and toluene-d8 (C6D6CD;) is shown in Table I. The value of b/k,'A was calculated on the basis of eq 6 making use of the formula log a/k/ A = 4.885 — 2156/71 (units: cc mole-1 sec-1), which was determined previously4 from the photolysis of acetone alone. Plots of log b/ktl/> vs. 1000/T fcr each of the isotopic toluenes are shown in Figure 1. The points are seen to fall along two separate curves such that bo ~ bo and b3 ~ b8. The subscripts here are used to indicate the number of deuteriums in the parent toluene. Despite the scatter, it is evident that the data are fitted better by curved lines than by straight lines. Similar curvatures are observed when log [(oxa + bXT)/k/h] is plotted against 1000/T, even though in this case the scatter is much smaller.
In order to obtain the values for the individual rate constants Sh, sd, n,, and rd, where the subscripts d or h indicate whether deuterium or hydrogen is present
(3) T. L. Cottrell, “ The Strengths of Chemical Bonds,” Butter- worth and Co. Ltd., London, 1958.(4) M. Cher and C. S. Hollingsworth, Anal. Chem.. 38, 353 (1966).(5) R. Renaud and L. C. Leitch, Can. J. Chem., 32, 545 (1954).(6) S. Benson, “ Foundations of Chemical Kinetics,” McGraw-Hill Book Co., Inc., New York, N. Y., 1960, p 379.
The Jou rnal o f P hysica l Chem istry

V a p o r P h a s e R e a c t i o n o f M e t h y l R a d i c a l s w i t h T o l u e n e 879
Table I:: Rate Constants in the Reaction ofMethyl Radicals with Toluene
Rate ofproduction X 1012,
cc1/ 2 mole'“Vi sec-1/ 2t, /—/¿moles c c '1—■ ✓—mole cc _I sec-]—>"C [A] [T] CH40 CsHe‘ G 6/fciVî
Toluene107 3.18 3.54 5.48 12.9 0.227 0.283112 4.38 3.98 9.70 20.0 0.260 0.332134 2.97 3.30 10.3 12.5 0.464 0.535139 3.82 4.03 15.7 14.8 0.520 0.592150 2.85 3.18 14.7 11.4 0.722 0.811163 3.77 3.43 34.3 20.4 1.05 1.26178 2.75 3.07 23.1 7.58 1.44 1.58199 3.37 3.56 63.6 11.7 2.69 3.24224 2.49 2.78 34.7 2.80 3.94 4.29235 2.74 2.49 54.7 4.12 5.16 6.02267 2.69 2.84 63.6 1.66 8.92 10.0281 2.21 2.46 41.3 0 596 11.5 13.0300 2.05 1.86 51.1 0.653 16.2 19.5
Toluene-d5106 3.34 3.30 5.29 13.6 0.216 0.270134 3.13 3.09 11.1 14.1 0.476 0.568150 3.02 2.98 15.8 12.9 0.733 0.847178 2.85 2.81 23.4 8.59 1.41 1.53224 2.60 2.57 36.0 3.06 3.97 4.38252 2.47 2.45 42.3 1.47 7.09 8.14284 2.32 2.29 43.2 0.627 11.8 13.3
Toluene-d3100 3.88 3.84 2.25 13.6 0.079 0.032105 2.42 2.52 1.60 9.71 0.104 0.059134 3.09 3.23 5.83 15.0 0.238 0.097150 3.42 3.39 12.8 19.9 0.420 0.215150 2.99 3.13 9.08 14.1 0.395 0.180179 2.80 2.93 15.1 10.8 0.805 0.331200 3.05 3.03 27.9 11.2 1.37 0.60224 2.54 2.66 25.7 4.60 2.30 1.09250 2.79 2.77 45.9 4.02 4.12 2.44267 2.05 2.15 28.6 1.48 5.60 3.46278 2.47 2.46 43.2 1.87 6.40 3.45300 2.00 1.98 42.2 0.995 10.62 7.82
Toluene-dg102 3.16 3.33 2.50 14.2 0.102 0.067107 3.33 3.41 2.22 10.6 0.101 0.042115 3.22 3.29 3.95 17.7 0.144 0.076124 3.27 3.44 4.55 13.3 0.186 0.093133 3.08 3.16 4.54 9.55 0.236 0.097151 2.95 3.02 9.92 17.5 0.397 0.201152 3.05 3.22 9.30 12.8 0.415 0.190175 2.23 2.34 11.4 9.95 0.789 0.408179 2.81 2.88 15.83 12.6 0.785 0.292194 2.80 2.94 23.6 10.9 1.25 0.66224 2.50 2.57 27.0 5.29 2.39 1.11234 2.57 2.71 35.5 4.80 3.07 1.86270 2.42 2.54 34.8 1.63 6.05 3.93284 2.24 2.29 39.0 1.33 7.49 4.65
“ Slope of linear plot [CH4]/aV T vs. t. b Slope of linear plot [C2H6] v s . <*t(1 - « í/t)/(1 - <*)■
Figure 1. Temperature dependence of the over-all rate constant 6 = s + r for the reaction of methyl radicals with toluene.
in the side chain or ring, we collected the methane produced in experiments with toluene-d3 and toluene- d5 and measured the isotopic composition with a mass spectrometer. The results are shown in Table II. The rate constants sd and rd/fc //! are calculated by means of eq 7 and 8. which are readily derived by consideration of the mechanism written above.
Sd _ b V XT
W 2 ~ c h 4+ CHaD
I'd _ f r s /x T
kt'h ~ CH4 + CH3D
In these equations G is defined according to eq 6 and CH4/C H 3D represents the yield ratio of these substances in a given experiment. Once these two sets of constants are obtained, the rest of the constants are calculated from the definitions of b and the smoothed curves in Figure 1 using eq 9-12.
for toluene-d3 (7)
for toluene-da (8)
Volum e 70, N um ber S M arch 1966

880 M. C h e r , C. S. H o l l i n g s w o r t h , a n d F. S i c i l i o
Sh h A 1(9)k p k P k l u
; = lò o_
■ l/>a lV t O&3 Sd
' ' / * ' I. Va(10)
Sd bs rd(11)k j = W 2 ~ k p
r h
k ' h63
k l hSd
k j(12)
In the case of eq 12 a correction for the presence of isotopic impurity in the toluene is significant and was applied in our calculations.* 3 7 The variation of all of these rate constants with temperature is shown in Figure 2. Reasonable straight lines are obtained for the side-chain rate constants sh/ k J and sd/fc //2. Arrhenius parameters for these constants were calculated assuming log k, — 13.34 and are tabulated in Table III.
Table II : Rate Constants from Measurements of the Isotopic Composition of Methane
i
G,cc1/ 2 Rate constants,
t,°c
mole V 2 sec-i /2 X T
CH«/ . CHsD
r------- CC1/ 2
rd/kt1/*mole-1/ 2 sec
Sh/k,'/tb;-‘A------Si/k,V*=
Toluene-d5106 0.216 0.497 49 0.0087 0.254 0.039134 0.476 0.497 78 0.012 0.550 0.098150 0.733 0.497 126 0.012 0.855 0.169178 1.41 0.497 266 0.011 1.72 0.386224 3.97 0.497 354 0.023 4.70 1.26252 7.09 0.497 408 0.035 8.10 2.39284 11.8 0.497 330 0.072 14.3 4.61
sd/k,'/*d rh/kt1/* sh/kt1/
Toluene-d3105 0.104 0.511 7.29 0.025 0.015 0.227134 0.238 0.511 6.32 0.064 0.035 0.516150 0.395 0.511 5.68 0.116 0.047 0.802179 0.805 0.511 5.08 0.259 0.103 1.59224 2.30 0.511 4.44 0.829 0.358 4.27267 5.60 0.511 4.05 2.17 0.920 9.40
“ See eq 8. b See eq 9. ‘ S eeeq ll. d See eq 7. e See eq 12, See eq 10.
Independent sets of measurements of the r/s ratio as a function of temperature were also obtained using the isotopic techniques described previously.2 Figure3 shows the CH4/CH3D yield ratio for three different temperatures in a photolysis of mixtures of acetone with toluene-d3. Figure 4 shows the CH4/CH3D yield
1.7 1,8 1.9 2 .0 2 .1 2 .2 2.3 2.4 2.5 2.6 2.7 2.8 2.9 3.0 3.1 1000/T°K.
Figure 2. Temperature dependence of the individual rate constants in the reaction of methyl radicals with toluene. The data at 60° were taken from ref 2
Table III
Rate constant, cc mole-1
sec-1 Log A E10 —
at 182°
Source used for
calculation
Sh 11.6 9 . 6 9 . 4 Eq 9Sh 11.4 9 . 3 8 . 4 Eq 10Sd 11.8 1 1 . 3 2 . 1 Eq 11Sd 11.5 1 1 . 2 1 . 4 Eq 7Th (10.7) (10.2) 0.62 Eq 12Tda 11.6 9.9
0.051 Fig. 2 Ref 4
in the 300° pyrolysis of mixtures of azomethane with toluene-ds, toluene-d5, and toluene-d8- The total pressure in the experiments of Figures 3 and 4 ranged from 30 to 100 mm, with most of runs being in the neighborhood of 80 mm. The intercepts of Figure 3, which measure directly rh/s d, are seen to decrease with
(7) The correction applies to the value of bz/ktV* and is given by bz/kty* (cor) = bz/kt1 / 2 (obsd) — 1/zysh/ktV*, where y is the mole fraction of toluene-dg in the toluene-d3 (7 ~ 0.07).
T he Journal o f P h ysica l Chem istry

V a p o r P h a s e R e a c t i o n o f M e t h y l R a d i c a l s w i t h T o l u e n e 8 8 1
Figure 3. Methane isotopic composition in the photolysis of acetone-toluene-A mixtures.
Figure 4. Methane isotopic composition in the 300° pyrolysis of mixtures of azomethane with toluene-d3, toluene-<4, and toluene-d8.
increasing temperature. Comparison of the toluene- d3 intercept of Figure 4 with the corresponding intercept obtained previously2 in photolysis at 60° leads to the same conclusion regarding the temperature dependence of fh/sd- Furthermore, comparison of the toluene-ds results at 60 and 300° shows that sh/ rA increases with increasing temperature.
Measurements of the relative yields of xylene and ethylbenzene were made by gas chromatographic analysis of the condensable residues from several of
the photolysis experiments, and the results are shown in Table IV.
Table IV: Relative Yields of Xylene and Ethylbenzene
Xylene0/T, ethyl ,— Xylene isomers, %“— •
Reactant °C benzene ortho m eta paraToluene-do 107 0.075 51 31 18Toluene-do 281 0.027 37 42 21Toluene-ds 106 0.045 54 23 23Toluene-d5 284 <0.014 36 32 32Toluene-d3 105 0.52 50 31 19Toluene-d3 267 0.046 32 47 21Toluene-ds 107 0.52 55 27 18Toluene-dg 284 0.017 34 41 24
“ Based on peak height ratios.
DiscussionThe data of Figure 2 and Table III indicate not
surprisingly that the ring reaction rate constant rh is small compared to the side-chain reaction rate constant Sh, as both the A factor ratio and the activation energy difference Erh — ESh favor sh. Indeed, Figure 1 shows that our measurements of bo/k,' are in good agreement with those of Trotman-Dicken- son8 and of Rebbert,9 both of whom assumed negligible ring reaction. A maximum discrepancy of about 25% occurs at the extremes of temperature, and our average activation energy of 9.5 kcal/mole is1-2 kcal/mole higher than that found in the earlier works. These differences may well be accounted for by experimental error. Rebbert’s results were obtained by conventional analysis of the yields of methane and ethane in the photolysis of acetone-toluene mixtures, and so the largest errors may be expected at the temperature extremes where the yields of either methane or ethane are small. This source of error is less significant with our gas chromatographic technique. Trotman-Dickenson’s results are subject to some uncertainty since the heavy acetone used in his isotopic measurements contained 32% acetone-c4, and this required unusually large corrections.
The decrease in the magnitudes of lh and bs relative to b0 and b5 reflects largely the inhibition of the side- chain reaction rate as a result of the substitution of D for H in the side chain. The isotope effect accounts also for the increased curvature in the b3 and b$ data.
(8) A. F. Trotman-Dickenson and E. W. R. Steacie, J. Chem. Phys., 19, 329 (1951).(9) I. B. Burkley and R. E. Rebbert, J. Phys. Chem., 67, 168 (1963).
V olum e 70, N um ber 3 M arch 1966

882 M. C h e r , C. S. H o l l i n g s w o r t h , a n d F. S i c i l i o
The average activation energy of b3/k,'/i and b3/ktl/l is 10.6 kcal, and the A factors for both sets of constants are equal within experimental error.
The magnitude of ?'h is established by the small difference between b3 and Sd, and therefore the absolute value at any one temperature may be in error by as much as a factor of 2. Likewise, rd is subject to considerable error since the yield of CH3D in the toluene- db experiments is very small. In principle, — rd could have been determined by the differences b0 — 65 or b3 — b%. This was not possible, however, because the error in the determination of b0 — b5 or 63 — bs is of the same order of magnitude as rh — rd. In spite of these difficulties, the energetics shown in Table III appear reliable and self-consistent with the qualitative conclusions derived from data of Figures 3 and 4. Thus, the decrease in the slopes of the curves in Figure 3 with increasing temperature requires2 ESd — E& ~ + 2 kcal/mole, where Ea is the activation energy for the acetone rate constant a. Setting Ea = 9.9 kcal/ mole we calculate ESd ~ 12 kcal/mole, while the directly measured ESi is 11.3 kcal/mole. As indicated previously2 the intercept of the CH4/C H 3D vs. A /T plots give the ratio i\/sd for toluene-d3 and Sh/rd for toluene-d5. Therefore, if we consider the intercepts of Figures 3 and 4 and compare these with our previous data at 60° we conclude Erh — ESd < 0 and Erd — ESh < 0. Thus, we expect Erh to lie between 11.3 and9.6 kcal/mole, where the lower limit is set equal to the observed ESh by bond strength considerations. The observed Erh, calculated from Figure 2 by drawing an average slope through the runs in the temperature range 100-300° is 10 kcal/mole.
The second inequality derived from the isotopic measurements leads to the very surprising conclusion that Erd < Erh, or Erd < 9.6 kcal/mole. Direct supporting evidence for this conclusion is shown in Figure 2, as the average slope for the rd curve is more positive than that for rh. Clearly, this result is not sensible unless we assume that the ring reaction is complex with at least two mechanisms operating simultaneously, each of these having different temperature dependences. The simplest scheme that we may envision is for the methyl radical to react either via direct abstraction through a three-center linear complex similar to the type described by Johnston10 for aliphatic compounds (mechanism a) or via a preliminary addition to the ring to form a cyclohexadienyl radical, which subsequently disproportionates with a second methyl radical to yield the final products (mechanism b). The latter mechanism has been proposed by Szwarc11 for the liquid phase reaction.
Mechanism a, dominant at high temperature, is
characterized by high activation energy (E > 10 kcal/ mole), normal A factor (A ~ 10u cc mole-1 sec-1), and normal deuterium isotope effect (T/kA d ~ 10-14, depending on temperature). Mechanism b, dominant at low temperatures, is characterized by low activation energy, low A factor, and small deuterium isotope effect. The situation is depicted schematically by the dotted lines in Figure 2, in which we use our previously determined data at 60° to extend the temperature range.
The difference in the magnitudes of the isotope effects of mechanisms a and b is consistent with the implicit assumption that the H atom being transferred is much more actively involved in the formation of the transition complex in mechanism a than in mechanism b. Although the Arrhenius parameters for mechanism b cannot be reliable determined from the data of Figure 2, the values A ~ 107 cc mole-1 and 7? ~ 4 kcal/mole, based on the sketched dotted lines, seem reasonable estimates.
The relative magnitudes of the several A factors are determined primarily by differences in vibrational entropy of activation for the various transition complexes. The geometrical configuration of the transition complexes presumably resemble the structures
CH3
CH:
O -H --C H 3 I. ring abstra:tion, mechanism a
— ( V I I . ring abstraction, mechanism bV - / CH3
( ^ y ~ CH2— H— CH3 III. side-chain abstraction
The value of 104 for the ratio of A factors corresponding to mechanisms a and b requires a vibrational entropy difference between structures I and II of about 18 eu. This is not unreasonable if we consider that the bending vibration frequencies of the attacking methyl group in molecule I are likely to be very much lower than those in molecule II. Moreover, the vibration frequencies of molecules I and III should be quite similar, and therefore the A factors for the direct abstraction reactions from the ring and side-chain positions should be nearly equal, as is indeed the case.
Inasmuch as the ultimate product from both molecules I and III is ethylbenzene,12 while the ultimate product from molecule II is xylene, we should expect the yield ratio of xylene to ethylbenzene to increase 10 11 12
(10) H. S. Johnston, Advan. Chem. Phys., 3, 139 (1961).(11) M. Levy and M. Szwarc, J. Am. Chem. Soc., 77, 1949 (1955).(12) The tolyl radical formed from molécule I probably reacts with toluene to form toluene and benzyl radical, and the latter finally recombines with excess methyl.
The Journal o f P h ysica l Chem istry

R a d i a t i o n C h e m i s t r y o f I s o t a c t i c a n d A t a c t i c P o l y p r o p y l e n e 883
with decreasing temperature. Thus, the data in Table IV further support the mechanism outlined above. It is interesting to note that the addition of
methyl radicals to the ring is nonselective with respect to the three ring positions, as the yields of o-, m-, and p-xylenes are close to the statistical ratio 2:2:1.
Radiation Chemistry of Isotactic and Atactic Polypropylene. III. Radiolysis in
the Presence of Nitrous Oxide1
by M arm oru K on do and M a lco lm D ole
Department of Chemistry and Materials Research Center, Northwestern University, Evanston, Illinois 60201 {Received October 18, 1965)
Using Co60 y rays, isotactic and atactic polypropylene were irradiated in the presence and absence of about 60 cm pressure of nitrous oxide gas. G(H2) and L'(CH4) were reduced by the N20 in the same ratio, a fact which is in line with the recent postulates of Dyne. On the other hand, cross-linking and chain degradation were enhanced, cross-linking somewhat more than degradation. The N20 probably acts mainly as an electron scavenger.
Introduction
Lyons and Dole2 3 4 5 investigated the gas yields during the radiolysis of polyethylene in the presence of nitric and nitrous oxides and they did one experiment on polypropylene. The latter experiment with nitric oxide showed that the reaction mechanisms in the case of polypropylene were probably the same as in the case of polyethylene, but no experiments were done on polypropylene using nitrous oxide. The latter experiments should be of considerable interest because polypropylene undergoes both cross-linking and chain scission on irradiation.
Okada3-5 discovered that in the case of polyethylene, nitrous oxide dissolved in the polymer increased the cross-link yield, but that in the case6 of polyisobutylene, the yield of chain scissions was reduced 30% by the nitrous oxide. It became of interest to see whether or not nitrous oxide could both increase the crosslink yield and at the same time decrease chain degradation in polypropylene during radiolysis. The results given below demonstrate on the contrary that both the cross-link yield and the G value of chain scissions were
increased by the presence of the nitrous oxide. This conclusion is of further interest in connection with the general mechanism of the radiolysis of aliphatic hydrocarbons of Dyne,7 who proposed that the major products of radiolysis all stem from an identical reaction intermediate, A*, and that solutes depress radiolysis yields by reacting with the precursor of A*, either directly or as a negative ion after gaining an electron, to give a reaction intermediate which is not A*. We shall see that, in line with Dyne, hydrogen and methane yields were depressed in the same ratio by nitrous oxide but that the cross-link yield was increased relatively more than chain degradation.
(1) The previous paper of this series was R. W. Keyser, B. Clegg, and M. Dole, J. Phys. Chem., 67, 300 (1963).(2) B. J. Lyons and M. Dole, ibid., 68, 526 (1964).(3) Y. Okada and A. Amemiya, J. Polymer Sei., 50, S22 (1961).(4) Y. Okada, J. Appl. Polymer Sei., 7, 695, 703, 1153 (1963).(5) Y. Okada, ibid., 8, 467 (1964).(6) Y. Okada, ibid., 7, 1791 (1963).(7) P. J. Dyne, Can. J. Chem., 43, 1080 (1965).
V olum e 70, N um ber S M arch 1966

884 M a r m o r u Iv o n d o a n d M a l c o l m D o l e
Experimental SectionMaterials. The polymers used and some of their
physical constants are collected in Table I. We have no explanation for the discrepancy in the Mn values of samples 1 and 2.
Table I : Properties of Polypropylene Samples,------------------------ Sample no.------------------
1 2 3
Tacticity Iso tactic Isotactic AtacticManufacturer Hercules Hercules EssoDesignation X9467-70-3 XA18-1-4 1457-83M w X KP6 5.24 2.0 0.772M n X 10- 5 1.08 0.40 0.148M n X 10"5“’6 0.78 0.77 0.141p, g cm-3 at 25° 0.897, 0.912“Film thickness, mm 0.025 0.025 Powder% stabilizer 0.25 0.2 0
“ As measured in this laboratory. 6 As calculated from the equation [tj] = 2.5 X 10- W n, valid for tetralin as the solvent at 25° (G. Ciampa, C h i m . I n d . (Milan), 38, 298 (1956)).
Irradiation Procedures. A Co60 y-ray cell which initially contained 1288 curies was the radiation source. The radiation intensity and temperature of the radiation cell during this investigation were approximately 4.64 X 10¹⁹ ev g -1 hr-1 or 0.742 Mrad hr-1 and 35°. All irradiations were carried out under vacuum or in the initial presence of 60 cm pressure of N20 (gel and viscosity experiments) or 74 cm (gas evolution experiment). Before making the viscosity measurements, the film samples were annealed to a temperature just below the softening point to remove any residual free radicals.
Gel and Intrinsic Viscosity Measurements. The fraction of insoluble polypropylene created by the irradiation was measured by inserting the polymer sample into a stainless steel basket and extracting with boiling toluene to constant residual weight. The extraction time varied from 150 to 400 hr. The antioxidant 2,6-di-Fbutyl-p-cresol was added to the extraction solvent.
The G values for cross-linking were calculated in the same manner as in the paper of Schnabel and Dole8 using the equation of Charlesby and Pinner9
s + sVi = (j(S)/2£r(X) + 100WA/rM wG'(X) (1)
assuming Mw to be the original weight-average molecular weight, M w,o, and the molecular weight-distribution to be random. As discussed below, these assumptions are certainly not correct, but the G values are valuable for comparison purposes nevertheless. In eq 1, s
Figure 1. Charlesby-Pinner plots: curves 1 and 3, atactic and iso tactic polypropylene under vacuum (samples 3 and 2); curve 2, atactic in 60 cm of N20 ; curves 4 and 5, isotactic (samples 2 and 1) in 60 cm of N2O.
is the fraction of soluble component after a dose r, Na is Avogadro’s number, and G(ß) and (?(X) are the G values for chain scissions and interchain cross-links, respectively, in units of events per 100 ev of energy absorbed in the polymer. The degree of reproducibility of the data is illustrated by the G values collected in Table II. In Table II we also list I, which is G(S )/ 2G(X), the intercept of the curves of Figure 1, 2, the slope of the straight lines of Figure 1, and re, the dose to the gel point. The latter was calculated from the ratio z/(2 — I) in which 2 and I were calculated from a least-squares analysis of the data.
The intrinsic viscosity measurements were carried out at 135° using tetralin as the solvent and Ubbelohde- type viscometers. Kinetic energy correction factors to multiply the observed relative viscosity for each viscometer were calculated from the expression
ato2
(8) W. Schnabel and M. Dole, J. Phys. Chem., 67, 295 (1963).(9) A. Charlesby and S. H. Pinner, Proc. Roy. Soc. (London), A269, 367 (1959).
The Journal o f P hysica l Chem istry

R a d i a t i o n C h e m i s t r y o f I s o t a c t i c a n d A t a c t i c P o l y p r o p y l e n e 885
Table II : Gel Measurement Data and Derived Quantities
/------------------------------- Sample no.-------------------------1 ,-------------2-------------• ,-------------3-------
tactic /------- Isotactic------- ■> ,--------- Atactic------------------------- Radiation conditions----------------N20 Vacuum N20 Vacuum N20
I 0.360 0.5560.547
0.4010.390
0.367 0.318
Z X 10-“ , ev g "1
2.63 18.9420.44
9.3210.32
45.3 30.52
rg X HI ' '■*, ev g -1
1.60 13.1214.06
5.826.41
27.79 18.14
G(X) 0.44 0.150.16
0.320.29
0.17 0.26
m s) 0.32 0.180.16
0.260.23
0.13 0.16
where t is the time of flow of the solution, t0 is the same for the solvent, and a and 3 are constants of the equation for the viscosity, rj0, of the solvent
Vo = cepoio — p0/3/i0
in which po is the density of the solvent. Actually, the kinetic energy correction was usually negligible. The solutions contained 1% antioxidant. A computer routine was programmed for calculation of the intrinsic viscosity from a least-squares analysis of plots of (pr — l ) /c and In yT/c where 7]T is the relative viscosity and c is the concentration in grams per 100 ml as a function of the concentration. The intrinsic viscosity was taken as the average of the intercept of these plots at zero concentration.
Gas Analyses. Mass spectrometric gas analyses were carried out on the gases liberated from sample 2 during the vacuum irradiation experiment and the experiment with 74 cm of N20. From the relative peak heights of masses 2 and 16 in the vacuum experiment the relative concentration of hydrogen and methane were determined. From measurements of the pressure, volume, and temperature of the final gaseous products, (7(total gas) of the vacuum experiment was calculated in units of molecules of gas per 100 ev of energy absorbed in the polymer. Knowing the relative moles of hydrogen and methane, it was then easy to calculate C?(H2) and 6?(CH4). From the peak heights of masses 2 and 15 in the N20 experiment, as compared to the vacuum experiment, the relative yields of hydrogen and methane were calculated, and from these values, G(H2) and G(CH4) for the N20 irradiation experiment were obtained. Inasmuch as N20 may decompose under irradiation partly into N + NO and as the mass spectrum of NO has a significant
peak at mass 15, it is necessary to consider what contribution, if any, NO may have made to the mass 15 peak which we have assumed to be due entirely to the fragment CH3+ from methane (in methane the mass 15 peak is 86% of the parent peak at mass 16). We concluded that the amount of NO in the final gaseous product was negligible because (a) NO reacts about three times faster with irradiated polypropylene than N20 ; (b) the ratio of the mass 30 peak (the parent peak of NO) to the 44 mass peak was less than it should have been if all mass 44 were N20 ; i.e., the pressure of NO should have made it greater; (c) the mass 44 peak (1130 units) could have included neither a significant contribution from C 02 because the mass 12 peak was so small (1.2 units) nor one from propane because its most abundant peak at mass 29 was only 3.4 units; and (d) the ratio, Cr(CIl4)/ir(H 2), was practically the same in the vacuum and N20-irradiated experiments.
The G value for N2 was obtained by subtracting from the total pressure, measured at liquid nitrogen temperature but corrected to room temperature, the pressures of H2 and CH4. The small mass 12 peak demonstrated that the CO content of the gas could not have been more than 1 or 2% of the nitrogen fraction.
(7(— N20 ) could not be calculated directly from the mass spectral data because the relative magnitudes of the peaks at masses 44, 30, and 14 did not agree with the known ratios for N20 (the peaks at masses 30 and 14 were too low in comparison to that at mass 44 even after correcting the latter for possible contributions from C 02 or propane), but was estimated as follows. The pressure of the gaseous products as measured at 25° at the end of the irradiation was the sum, P h2 + P n2 + Pern + P n2o + vp(H20), where the last term in the sum is the equilibrium vapor pressure of water at that temperature. Subtracting the latter from the sum and also subtracting PH! + Rs- + Pcm at 25° as calculated from the pressure measured at liquid nitrogen temperature, we obtained PNio (final). Subtracting the latter from PNl0 (initial) gave APN„0 and from the latter G( — N20) was readily calculated.
Although the mass spectral data definitely indicated the presence of water vapor, a quantitative calculation of (?(H20) from them was lower than chat estimated from other data, so C?(H20) was determined by comparing the increase with dose of the total pressure before the saturation vapor pressure of water was reached with that afterwards. The initial rate of pressure increase can be expressed by the ratio A (PHz + Pn2 + Pch4 + Ph2o + Pn2o)/A»', where r is the dose in ev g -1, and the final rate of pressure increase by the ratio A(Ph2 + Pn2 + Pea, + Rn2o)/A?\ The dif
Volum e 70, N um ber 3 M arch 1966

8 8 6 M a r m o r u R o n d o a n o M a l c o l m D o l e
ference between these ratios multiplied by the factor IOONa V/qR T, where N a is Avogadro’s number, V is the volume of the irradiation cell, g is the weight of the polymer, R is the gas constant, and T is the absolute temperature, gave (7(H20).
Results and DiscussionG Value of Evolved Gases. Table III contains G
values in both the vacuum and N20 experiments as well as previously determined G values of Schnabel and Dole8 for comparison, while in Table IV are tabulated ratios of G values of the N20 experiments to those of the vacuum-irradiated samples. We consider first the G values of the gases liberated or consumed.
Table III: G Values (Molecules or Events per 100 ev of Energy Absorbed in Polymer)
--------- Type of polymer----------------Xsotactic Atactie------- Type of irradiation-------------------->
VacuumS and D“ K and D6 N2O Vacuum NsO
G{total gas) 2.85 2.80G(H2) 2.78 2.63 2.03G(CH4) 0.072 0.17 0.14G (-N 20 ) 3.57G( N„) 2.33G(H20) 0.45i?(X )-l' 0.272 0.438G(X)-2 0.153 0.307G(X)-3 0.172 0.255G(S)-1 0.244 0.315G(S)-2 0.170 0.243G(S)-3 0.126 0.162
“ From Schnabel and Dole.8 6 This paper. Average valueswhen available. c G(X)-1 means G(X) for sample 1, G(X)-2for sample 2, etc.
Table IV: Ratio of G Values Determined in the N20 Experiments to the Vacuum Irradiation Values
G value-Polymer Hi CH4 X S
IsotacticSample 1 1.61 1.29Sample 2 0.77 0.81 2.01 1.43
Atactic 1.48 1.29
It is interesting to note that the presence of the N20 reduces 0 (II2) and (r(CH4) in the same proportion within the limits of experimental error. This result, as mentioned above, is in line with the proposed mech
anism of Dyne.7 As suggested previously,2 N20 probably acts as an electron scavenger or reacts directly with a positive charge and prevents the normal subsequent reactions leading to hydrogen and methane. The fact that Cr(H2) and Gr(Cll.i) are reduced in the same proportion by N20 strongly suggests that N20 depresses the concentration of the precursor that normally leads to H2 and CH4. It is interesting to note that Sholes and Simic10 came to the same conclusion in their study of the effect of N20 at different concentrations on reducing (?(H2) in liquid cyclohexane. They found that the reduction in C?(H2) was only slightly less than Gf(N2) and they suggested that, at low N20 concentrations, at least, G(Na) was equal to the number of electrons scavenged by the N20. In our case, (t(N2) is about four times as great as the decrease in (?(H2), but since we are dealing with a semicrystalline solid in which the N20 may only be soluble in the amorphous regions and in which the reaction kinetics may differ considerably from the liquid case, data obtained in liquid cyclohexane could not be expected to agree exactly with data obtained with polypropylene as the reacting species. As pointed out previously,2 the N20 may decompose partly into N and NO as well as react with an electron to form N2 + O- as suggested by Scholes and Simic. The NO produced by the decomposition of N20 could then react according to the mechanism previously discussed,2 yielding about 1 mole of N2 for every 3.5 moles of NO consumed. However, if the decomposition into NO is only 20% of the total decomposition as found by Harteck and Dondes,11 for the radiolysis of N20 in the gas phase, then this mode of reaction is not too important for the explanation of the data of this paper. We shall return below to the discussion of reaction mechanisms.
Intrinsic Viscosity. Figure 2 illustrates the change in intrinsic viscosity of both isotactic (sample 2) and atactic polypropylene as a function of the radiation dose for both the vacuum-irradiated samples and the same materials irradiated in the presence of 60 cm pressure of N20. The vacuum results are substantially the same as those previously observed1 by Keyser, Clegg, and Dole, but the intrinsic viscosity of the atactic polypropylene changed very little with dose either for the vacuum-irradiation case or the N20 experiment. If the number of radiologically produced chain scissions equals the number of cross-links, then there would be no change in the number-average molecular weight and probably little change in the intrinsic viscosity. Although the condition of equal (?(X) and G(S) does not
(10) G. Scholes and M. Simic, Nature, 202, 85 (1964).(11) P. Harteck and S. Dondes, Nucleonics, 14, 63 (1956).
The Journal o f P h ysica l Chem istry

R a d i a t i o n C h e m i s t r y o f I s o t a c t i c a n d A t a c t i c P o l y p r o p y l e n e 887
Figure 2. Intrinsic viscosity of polypropylene as a function of radiation dose: solid lines, vacuum experiments; dotted lines, in 60 cm of N2O; two lower curves, atactic sample 3; two top curves, isotactic sample 2.
exist exactly, this is approximately true and may explain the small dependency of the intrinsic viscosity on the dose. Furthermore, the effect of the nitrous oxide in increasing G(X) and G(S) is nearly the same for both, Table III; hence, again, the change in the net number of molecules on irradiation would be nearly zero.
The small change of the intrinsic viscosity of the atactic sample with dose may also be partly explained by the rather low intrinsic viscosity to begin with and partly by the nature of the polypropylene itself. In our previous publication we suggested that the initial rapid decrease with dose of the intrinsic viscosity may have been due to the effect of radiation on weak bonds between a few head to head structures such as -C H 2CH(CH8)CH(CH3)CH2- in the polypropylene. At that time, we knew of no evidence for such “ weak points” in the chains. Recently, Bailey, Liotta, and Fung12 observed 91% propane in the gases evolved during the first minute of pyrolyzing isotactic polypropylene at 340°. They stated, “ This is dramatic evidence that the postulated weak spots in polypropylene exist,” because according to their mechanism of degradation, propane would arise only from struc
tures of the type -C H 2CH (CH3)CH(CH3)CH2~. Hence, the initial rapid decrease in [?? ] with dose of the isotactic sample as compared to the very small change of [77 ]
in the atactic experiments is probably the result of more head to head structures in sample 2 than in sample 3.
Keyser, Clegg, and Dole found that the intrinsic viscosity with dose followed the empirical equation
In Mr/Mo = Aq + Bqi/2 (2)
where q is the square root of the dose and A and B are empirical constants. The applicability of eq 2 to the data of this paper is illustrated in Figure 3 where {log W t /M o l/f is plotted as a function of q. In agreement with a similar plot of Inokuti and Dole,13 the vacuum experiment data give a line of zero slope. However, the line representing the N20 experiment data has a positive slope. Inasmuch as the slope depends13 partly upon G(X) — [(7(S)/2b], where b is the ratio of the weight- to number-average molecular weights, it can be seen that for B to have a nonzero value, G(X) must have been increased by the N20 more than (7(S)/2fr. From the data of Table IV this appears to be the case for all of the G(X) and (7(S) values determined from the gel data. Thus the viscosity and gel data are consistent with each other. Quantitative calculations can be made in the following way. Referring to the B constant of eq 2, according to a previous analysis of the intrinsic viscosity of a polymer undergoing simultaneous cross-linking and degradation,14 the B constant is given by the expression
(4«.17,v/10(W a) { G(X) - [G(S)/26]} (3)
where a is the exponent of the Mark-Houwink viscosity eq 4. For sample 2, (4cM w/100Aa) is approximately equal to 10~20 and since the slope of the N20 curve of Figure 3 is 0.059 X 10~20, it is clear that G(X) — [(t(S )/26] must equal 0.059 to explain the results of this work.
As suggested in our previous publication,2 in the initial stages of the vacuum irradiation where the B constant of eq 2 is zero, G(X) — [(?(S)/26] must equal zero, and since G(X) is estimated to be 0.15 (Table II) and 2b about 10, (7(S) initially must be 1.5. If this value of G(S) is increased by the presence of nitrous oxide by the factor 1.43, given in Table IV, then in order to make G(X) — [G(S)/26] equal to 0.059, see the previous paragraph, G(X) must have increased
(12) W. J. Bailey, C. Liotta, and D. Fung, Technical Report, AFML- TR-65-100, April 1965.(13) M. Inokuti and M. Dole, J. Polymer Sci., Al, 3289 (1963).(14) M. Dole, J. Phys. Chem., 65, 700 (1961).
Volum e 70, N um ber 3 M arch 1966

88 8 M a r m o r u K o n d o a n d M a l c o l m D o l e
Figure 3. Test of eq 2. Isotaetic polypropylene, sample 2, under vacuum, solid line, and in 60 cm of N20, dotted line.
to 0.27. This value of G(X) is close to the observed G(X) for the N20 experiment, 0.30, and is evidence in favor of the assumption that N20 affects G(S) in the same ratio at the beginning as well as at the later stages of the radiolysis. The new value of G(X) was calculated from the expression
G(X) = 0.059 + 1.43g(S)2b
0.059 + (1.43) (0.15) = 0.27
We have been unable to interpret the A constant of eq 2, either its absolute magnitude or the small change in A from —0.11 X 10~10 to —0.099 X 10⁻¹⁰ [g/ev]‘/! between the vacuum and N20 experiments. Inasmuch as A depends upon the number of branch points produced in the polymer by cross-linking (decreases the intrinsic viscosity), on the decrease in the weight- to number-average molecular weights due to degradation, and on the variation of the K constant with dose of the Mark-Houwink eq 4
M = KMw* (4)
the situation is too complex to unravel at the present time. We would have expected A to be more negative in the N20 experiments than in the vacuum experiments, because of the effect of N20 in increasing G(S).
The Gel Data. The fact that the gel data when plotted, Figure 1, according to the Charlesby-Pinner eq 1 follow a linear relationship demonstrates that, by the time that the gel point has been reached, chain degradation has probably been sufficient to produce a random molecular weight distribution. Thus, we imagine the polymer first to be degraded to give this distribution and then to be cross-linked to produce gel. Because of the initial rather high G(B) values,13 the initial weight-average molecular weight cannot be used to compute G values for cross-linking G(X). However, the ratio of Cr(X)N!o to G(X)Vac can be calculated from the inverse ratio of the slopes of Figure 1, «YacANsO, provided that the value of the weight- average molecular weight valid for eq 1 is the same for both the vacuum and N20 experiments. This calculation yields, of course, the same ratio as (7(X)N2o/ f?(X)vac when Mw is held constant, but it is rather impossible to know what should be the correct value of My, to be used in the Charlesby-Pinner equation. In the N20 experiment, G(S) is apparently greater than in the vacuum experiment, but the dose to the gel point was only about one-third as great. What we need to know in order to estimate a reasonable value of Mw is not the initial (7(S) values nor the final, but an average value valid over the dose range 0 to rg. Overlooking these uncertainties, the data of Table IV show that in all cases G(X) is increased by the N20 gas more than G(S) which also increases. On the other hand, (t(H2) and G(CH4) are decreased by the N20 in practically the same ratio.
Material Balance. Another difficulty in understanding the effect of N20 on gel formation is concerned with deriving a material balance from the data. Unfortunately, this has not been possible even in the vacuum-irradiation case because of the uncertainty in the Cr(X) values due to the uncertainty in knowing the proper value of M w to use in the calculations. Ordinarily one would write
U(H2) = G(X) + Cr(db) (5)
where (?(db) represents the G value for any double bonds or unsaturation produced. In the N20 experiments G(H2) decreased but G(X) increased. We know nothing about (?(db); it may have decreased more than G(H2) and in this way maintained material balance. However, if there are mechanisms by which
The Journal o f P h ysica l Chem istry

R a d i a t i o n C h e m i s t r y o f I s o t a c t i c a n d A t a c t i c P o l y p r o p y l e n e 889
cross-links can be produced without the evolution of molecular hydrogen, then eq 5 would no longer be valid. We consider such mechanisms in the next section.
Reaction Mechanisms. In all probability, molecular hydrogen is produced partly by reactions of the type16
— CH2CH------- ► — CH2C— + H2 (6)I II
c h 3+ c h 2
— c h 2+— + — c h 2------- >— CH3+— + — CH— (7)
— CH3+— + e - — ► — CH— + H2 (8)
Nitrous oxide could interfere with these hydrogen evolution reactions by reactions of the type2’10
N20 -f- e— — ^ N20 — (9)
N20 - + — CH2+--------> N2 + OH • + — CH— (10)
OH- + — CH2-------> — CH— + H20 (11)
The two free radicals of eq 10 and 11 could combine to form a cross-link without the evolution of hydrogen gas. The N20 should also depress the formation of unsaturation as well as the production of H2 and CH4 gas. However, Okada6 found that, in the case of polyethylene, N20 increased the vinylene unsaturation by 87%, even more than the 44% increase in the number of cross-links. Unfortunately, Okada did not determine the effect of N20 on (7(H2) in his polyethylene experiments. The production of one molecule of water should balance either one cross-link or one double bond in the material balance equation. Furthermore, (j(H20) should be as large as and probably larger than the reduction in G(H2) (the absolute reduction of G'(CH4) is negligible by comparison). This is
not quite true, since A(?(H2) was 0.60 and (7(H20 ) was 0.45, but considering the difficulty of estimating (t(H20), the agreement is quite satisfactory. (7(N2) was considerably greater than A(7(H2), 2.33 as compared to 0.60. This indicates that N20 was reacting by some independent mechanisms, not involving a precursor of hydrogen. Another unexplained discrepancy is the fact that G( — N20), 3.57, was greater than either G(N2) or A(7(H2). Nitrous oxide may have been degraded to N + NO and these products may then have reacted directly with the polypropylene without liberating molecular nitrogen.
The mechanism by which N20 enhanced degradation can only be speculated on. A greater production of free radicals by N20 which enhanced cross-linking may also have enhanced degradation. Some of this increase in G(S) due to NaO may have been an artifact resulting from the 2.2-fold lower dose to the gel point in the N20 experiments as compared to the vacuum. With a much smaller dose to the gel point, the degradation up to the gel point would be less by a factor 2.2/I. 43 or 1.54 in the N20 case than in the vacuum, thus giving the possibility of greater degradation beyond the gel point in the N20 experiments. Fewer of the “ weak points” would have disappeared at the gel point, leaving more to be degraded beyond it.
Acknowledgments. This research was supported by the U. S. Atomic Energy Commission and by the Advanced Research Projects Agency of the Department of Defense through the Northwestern University Materials Research Center. We are indebted to Dr.J. H. Elliott of the Hercules Powder Co. and to Dr. John Rehner, Jr., of the Esso Research and Engineering Co. for the polypropylene samples.
(15) For a review, see M. Dole in “ Crystalline Olefin Polymers,” R. A. V. Raff and K. W. Doak, Ed., Interscience Publishers, Inc., New York, N. Y., 1965, Chapter 16.
V olum e 70, N um ber 8 M arch 1966
890 H o m e r F a y
The Electrical Conductivity of Liquid A120 3 (Molten Corundum and Ruby) *
by H om er Fay
Union Carbide Corporation, Linde Division, Speedway Laboratories, Indianapolis, Indiana {Received October 22, 1965)
The electrical conductivity of pure liquid A120 3 has been measured at ca. 2400°K and found to be 384 mhos m-1 ± 5%. This value is one-fourth that usually quoted. The measurements were made in an iridium crucible with a coaxial iridium rod as the second electrode. By measuring the resistance as a function of the immersion depth of the iridium rod, both the conductivity and the series circuit resistance were determined. The cell was calibrated with aqueous electrolyte solutions after correcting for polarization effects. The possibility that the electrical conductivity is dependent on the oxidation-reduction properties of the atmosphere is considered.
Introduction
Data on the electrical conductivity of liquid metal oxides are still quite scarce. The conductivities of the more refractive oxides in particular, have in most cases only been estimated from electric furnace measurements. Mackenzie* 1 classifies oxide melts as either nonconducting “ network liquids” or as ionic or electronic conductors. Liquid A120 3 is considered to be an ionic conductor. The most comprehensive study of the conductivities of molten oxides is probably still that of van Arkel, Flood, and Bright.2 They measured the conductivities of several of the lower melting oxides and compared them with halides. They also tabulated values for MgO, CaO, T i02, Zr02, Th02, Cr20 3, and Al2- 0 3; these, however, were not measured directly but were estimated from electric furnace operations. The conductivity of A120 3 at the melting point is given as 15 X 102 mhos m-1.
Recently, we have been experimentally investigating the possibility of growing crystals from melts maintained by inductive coupling of radiofrequency power directly to the melt. In this process, the melt acts as its own susceptor, and its conductance is very significant. Although not quantitative, these experiments have rather consistently indicated that the conductivity of A120 3 was considerably lower than the values given by van Arkel. We, therefore, decided to attempt a direct measurement of the conductivity of liquid A120 3 (molten corundum or white sapphire) and of this liquid doped with Cr20 3 (molten ruby).
Experim ental Section
The scarcity of high-temperature conductance data is due to the difficulty of finding sufficiently inert and refractory materials to use for crucibles and electrodes. After some experimentation, an iridium crucible as one of the electrodes and a small-diameter iridium rod as the other were found to be satisfactory for this purpose. A diagram of the electrode and crucible configuration is shown in Figure 1. The crucible was ca. 1.25 in. in diameter and 1.2 in. deep but was slightly rounded on the bottom. A 2.25-in. diameter rim was welded to the top edge of the crucible, and an iridium lead wire was welded to this rim. The crucible was supported by its rim inside a special oxy-hydrogen combustion furnace, the combustion zone being directly outside the crucible. The central iridium electrode was mounted in a Jacobs chuck of a drill press and was adjusted to be approximately coaxial with the crucible. The drill press permitted vertical movement of this electrode, and measurements were made at various immersion depths as described below.
Resistance measurements were made with a General Radio Type 650A bridge driven by an internal oscillator at 1000 cps. This bridge has but a single balancing
* This research is part of project Defender under jcint sponsorship of the Advanced Research Projects Agency, the Office of Naval Research, and the Department of Defense.(1) J. D. Mackenzie, Advan. Inorg. Chem. Radiochem., 4, 293 (1962).(2) A. E. van Arkel, E. A. Flood, and N. F. H. Bright, Can. J. Chem., 31, 1009 (1953).
The Journal o f P hysica l Chem istry

E l e c t r i c a l C o n d u c t i v i t y o f L i q u i d A120 3 891
— 1/2"—Figure 1. Iridium crucible and electrode configuration (scale shows immersion depth in inches).
control when used for ac resistance, and thus can measure only relatively pure resistances. A General Radio 1000-pf variable capacitor was, therefore, inserted in the bridge in parallel with either the arm adjacent to or opposite to the unknown, as required to sharpen the balance. The bridge contained a tuned amplifier and was balanced using a Tektronix oscilloscope as the final detector. The cell was connected to the bridge through a coaxial cable, with extended lengths of bare copper wires and clips to attach to the iridium wire and to the chuck holding the iridium rod. The crucible was connected to the shield of the cable, which was grounded at the bridge. A measure of the lead resistance could be made by shorting out the leads where they connected to the iridium. This did not, however, correct the readings for the resistance of the iridium, which was not negligible. The crucible was charged with fragments of pure crystalline A120 3 and heated until the charge was melted. The temperature was maintained at ca. 2400°K as measured by an optical pyrometer uncorrected for emissivity. The central iridium electrode was then lowered until it just touched the melt surface. This position was noted and identified as the “ zero” position. The electrode was then lowered in Vs-in. intervals to a depth of 3/ 4 in. below the zero point. A series of resistance measurements was made with the electrode descending and later repeated as the electrode was withdrawn. (When the electrode was at a depth of 3/ 4 in., a few measurements were attempted with a radiofrequency bridge. Quantitative data were not obtained, but the radiofrequency measurements gave
no indication of any appreciable dispersion or change in resistance with frequency.) The audiofrequency measurements yielded resistance values from 0.15 to 0.38 ohm, after subtracting the lead resistance. A small but arbitrary quantity of Cr20 3 was then added to the charge, and the measurements were repeated while lowering the central electrode.
After the crucible was cooled, the crystallized ruby was removed, and an estimate was made of the liquid level. The electrical assembly was then reconstructed, without the furnace, and the cell was filled to the same level with nearly saturated NaCl solution. The electrical conductivity of this solution was measured with a calibrated dip cell to be 10.3 mhos m-1. Resistance measurements were then made as a function of immersion depth of the electrode. However, in this case the zero resistance reference point was obtained by directly contacting the crucible with the central electrode. It was found that the cell polarized quite badly when this electrolyte was used. A similar polarization had not occurred with the fused AI2O3. In fact, the reactance corrections were negligibly small in the high-temperature measurements, and the external capacitor was used only to sharpen the balance. Large values of external capacitance, up to a few tenths of a microfarad, tvere required to obtain a satisfactory balance with the electrolyte. It was, therefore, necessary to correct the bridge readings. It was assumed that the capacitive reactance was in series with the solution resistance, dielectric effects being negligibly small for this solution. The equivalent series resistance was calculated, and from this the cell constant, K, was determined as a function of immersion depth. This calibration curve is shown in Figure 2. The cell constant was never “ constant” but always decreased with immersion. However, the variation, over a range of depths, was smooth enough to allow reasonably accurate measurements.
The measured resistances in the A120 3 experiments have been plotted as a function of the cell constant, K, as shown in Figure 3. The points should lie on a straight line, since R = R0 + K/a. When the data taken with the electrode descending and ascending are treated separately, good linear fits are obtained. The two straight lines in Figure 3 have been fit by the method of least squares. The values obtained forRo and a are
Ro, <r,ohm mhos m“1
Electrode descending 0.0702 385Electrode ascending 0.0535 383
The variation in R0 may represent real changes in contact resistance but is more likely an effect of the
V olum e 70 , N um ber 8 M arch 1966

892 H o m e r F a y
IMMERSION DEPTH, INCHES
Figure 2. Cell constant calibration curve as determined with aqueous NaCl solutions.
meniscus at the electrode. The mean conductivity at 2400°K is o- = 384 ± 8 mhos/m. The range limits have been calculated from an analysis of variance and represent a probable error of 2%. However, the absolute value of the cell constant is in doubt by more than this amount, and we thus estimate the conductivity to be accurate to 5%.
The addition of Cr203 to the charge caused a definite initial decrease in conductivity. As the measurements progressed, however, the resistance values for ruby approached those for pure AI2O3, and the last two points measured fit the average slope very well. Apparently, the conductivity was not constant during these measurements but was drifting toward an equilibrium value identical with that of pure A120 3. Finally, measurements were made of the resistance of the charge as the furnace was cooled. The values of resistance increased smoothly but very rapidly as the melt solidified. The high-temperature conductivity of the solid is apparently not negligible, but it is still much less than that of the liquid.
D iscussion
The method used for measuring the conductivity of high-melting oxides in metallic crucibles appears to
3/U 5 /8 1/2 3 /8 l/l| 1/8
Figure 3. Measured resistance vs. cell constant for pure A120 3 and ruby at 2400 °K: straight lines, least-squares fits to the equation R = R0 + K/<r; 0 , pure A120 3, electrode descending; 0 , pure AI2O3, electrode ascending;X, ruby (AI2O3 + C^Oa), electrode descending only. Ruby points at Vs and 1/i in. are off scale.
be capable of considerable accuracy, despite the fact that the “ cell constants” are rather small and the cell must be calibrated for various immersion depths.
The conductivity of pure liquid A120 3 near its melting point is, according to the present study, 384 mhos m-1. This is almost a factor of 4 lower than the value of 15 X 102 mhos m-1 quoted by van Arkel.2 The conductivity is, however, still sufficient to consider liquid AI2O3 to be an ionic conductor. The chargecarrying species are apparently small and mobile. No further structural inferences can be made from these few measurements. It is unfortunate that the atmospheric composition could not be controlled during these measurements. The fusion was made in the open air but the local atmosphere could have been somewhat reducing from the flame gases. Other observations indicate that the appearance of the melt, its viscosity, and its conductivity may all depend on the atmosphere, reducing conditions favoring a higher conductivity. One possible mechanism that could account for such behavior is the establishment of an equilibrium between the oxygen in the atmosphere and oxygen “ vacancies” in the liquid. We hope eventually to test this hypothesis by further experiments in controlled reducing and oxidizing atmospheres.
The addition of small amounts of Cr203 to the melt definitely decreases the conductivity, but the effect is apparently only temporary. This further indicates
The Journal o f P hysica l Chem istry

S t r u c t u r e s o f C ^H ^O C o m p o u n d s A d s o r b e d o n Fe 893
that some process of equilibrium with the atmosphere is taking place.
Acknowledgment. The author thanks B. J. Corbitt for his assistance in making the measurements and R. M. Youmans and P. V. Vittorio for making avail
able the furnace. He also is indebted to Dr. M. N. Plooster for valuable discussions on the properties of A120 3 melts and to the Crystal Products Department of the Linde Division for permission to publish these results.
Structures of Some CxHÿO Compounds Adsorbed on Iron1
by G . Blyholder and L . D . N e ff
Department of Chemistry, University of Arkansas, Fayetteville, Arkansas (Received October 22, 1965)
The infrared spectra over the range 4000 to 300 cm“ 1 of methyl, ethyl, n-propyl, n-butyl, isopropyl, isobutyl, and ¿-butyl alcohols, acetaldehyde, ethylene oxide, acetone, methyl ethyl ketone, diethyl ether, methyl vinyl ether, and tetrahydrofuran adsorbed on Fe have been obtained. All except diethyl ether and tetrahydrofuran, which gave no infrared evidence of adsorption, adsorb at 25° to give an alkoxide structure as the main stable surface species. The alkoxide structure is shown to be in accord with the main stream of thought on the stability of organometallic compounds, thus linking surface chemistry and organometallic chemistry firmly on a structural basis. An alkoxide structure is proposed for intermediates in the Fischer-Tropsch synthesis reaction.
Introduction
Carbon-, hydrogen-, and oxygen-containing molecules have been found to undergo many interesting and occasionally useful reactions on metal surfaces. As well as hydrogenation and hydrogenolysis of many kinds of compounds, dehydration of many compounds including alcohols, which yield aldehydes and esters, have been observed. CO and H2 interact on metal surfaces under appropriate conditions to produce hydrocarbons and alcohols. Although there is a voluminous literature on reactions occurring on metal surfaces, there is relatively little direct experimental evidence about the structure of species adsorbed on metal surfaces. Infrared spectroscopy has proved to be one of the most effective ways of obtaining structural information about adsorbed species. Most of the spectral work has concerned CO and hydrocarbons with carbon-, hydrogen-, and oxygen-containing molecules being somewhat neglected. The interaction of
methyl and ethyl alcohols2 and a variety of alcohols and other oxygen-containing molecules3 adsorbed on Ni have been studied by infrared spectroscopy in this laboratory. On Ni these studies indicated that at room temperature chemisorbed CO and acyl structures are the most stable species. When the carbon atom to which the oxygen is bonded is bonded to only one other carbon atom, that C-C bond is readily broken to produce chemisorbed CO. This decomposition to CO and acyl structures indicates that hydrogen atoms are fairly readily removed by the surface interaction.
In this paper the infrared spectra of a variety of CAI/.) compounds adsorbed on Fe are examined. Since Fe is generally found to be not so good a dehy-
(1) This paper is taken in part from the Ph.D. dissertation of L. D. Neff, University of Arkansas, 1964.(2) G. Blyholder and L. D. Neff, J. Catalysis, 2, 138 (1963).(3) G. Blyholder and L. D. Neff, in preparation.
V olum e 70, N um ber 3 M arch 1966

894 G. Blyholder and L. D. Neff
Table I : Spectra and Assignments of Adsorbed Species on Pe
Model compoundFrequencies, frequencies,
Adsorbate cm -1 cm -1 Assignments
Methyl alcohol Methyl alcohol81.5 cm for 1.5 hr 1058 s 1112 (liq), CH3 rocking
1057 (gas)1030 s 1030 s CO str1800 vw Added CO
Ethyl alcohol Ethyl alcohol81.5 cm for 4.5 hr 1920 vw Chemisorbed
CO1273 m CH2 twist
1148 vw 1149 vw CH3 rocking1095 s 1089 s CHj rocking1050 s 1050 s Skeletal str888 s 880 s Skeletal str
802 w c h 2657 vs OH bend433 m Skeletal bend
476 w M -0 str1800 w Added CO571 w Added CO
n-Propyl alcohol n-Propyl alcohol®1.6 cm for 1 hr 1140 w
1095 sh 1100 m1075 sh
1055 s 1060 s1015 m 1020 s
990 w970 sh 972 s
918 w908 w
890 w 890 m860 w
540 w M -0 str1800 w Added CO
n-Butyl alcohol n-Butyl alcohol100.7 cm for 8 hr 1112 vw 1114 m
1060 s 1070 s1040 s 1043 s
1021 w997 m
960 m 954 m890 w 904 w840 vw 853 m540 w M -0 str
1800 w Added CO
IsopropylIsopropyl alcohol alcohol11
2.5 cm for 2.5 hr 1250 s OH bend1158 m 1162 s Skeletal str
and bend1130 sh Skeletal str
1118 s 1113 sh CH3 rocking950 s 950 s CH3 rocking935 sh 933 sh Skeletal plus
CH3
Model compound Frequencies, frequencies,
Adsorbate cm-1 cm -1 Assignments825 m 818 m Skeletal str
485 m Skeletal bend420 m Skeletal bend
530 w M -0 str1850 m
IsobutylAdded CO
Isobutyl alcohol alcohol121.4 cm for 6 hr 1160 w 1150 ir.
1135 sh1120 sh 1125 sh1100 m 1112 s
1085 w 1048 w
1025 m 1030 s985 m 990 s
968 m 942 vw
915 m 912 s895 sh 895 sh820 w 560 w
820 mM -0 str
1875i-Butyl
Added CO
i-Butyl alcohol alcohol13'14 1242 m Skeletal str1201 s Skeletal str
1165 m 1185 s, sh Skeletal str1023 m CH3 rocking
920 m 915 s CH3 rocking875 w 880 sh765 w 750 s Skeletal str
465 Skeletal bend424 Skeletal bend
1900 m Added CO580 w
Adsorbed ethylAdded CO
Acetaldehyde alcohol above2.6 cm for 3 hr 1150 w 1148 vw CH3 rocking
1090 m 1095 s CH3 rocking1045 m 1050 s Skeletal str885 w 888 s Skeletal str
1850 wAdsorbed ethyl
Added CO
Ethylene oxide alcohol above2.7 cm for 3 hr 1090 w 1095 s CH3 rocking
1035 w 1050 s Skeletal str885 vw 888 s Skeletal str610 w, vb Chemisorbed
oxygenAdsorbed isopropyl alcohol
Acetone above2 cm for 5 hr 1140 w 1158 m Skeletal str
and bend1115 w 1118 CH3 rocking950 w 950 s CH3 rocking
The Journal of Physical Chemistry

Structures of CzH„0 Compounds Adsorbed on Fe 895
Table I (C o n tin u ed )
Model compoundFrequencies, frequencies,
Adsorbate cm -1 cm -1 Assignments
930 sh 935 sh Skeletal plusc h 3
820 w 825 m 530 w
Skeletal str
1925 m
Adsorbed isobutyl alcohol
Added CO
Methyl ethyl ketone above2.4 cm for 4.5 hr 1160 vw 1160 w
1120 sh1100 w 1095 m1030 w 1025 m990 w 985 m910 vw 915 m
895 sh820 vw 820 w560 vw
1900 m560 w
Added CO
Diethyl ether No bands4 cm for 5 hr
1950 s
Adsorbed methyl alcohol
Added CO
Methyl vinyl ether above2 cm for 2.5 hr 1048 1058 s CH3 rocking
1015 m 1030 s CO str1920 m Added CO
Tetrahydrofuran No bands3 cm for 3 hr
1950 s Added CO
d r o g e n a t i o n c a t a l y s t a s N i , t h e h y d r o g e n - s t r i p p i n g
r e a c t i o n s o b s e r v e d w i t h N i a r e e x p e c t e d t o b e l e s s
p r o m i n e n t . T h e i n t e r a c t i o n s o f a l c o h o l s w i t h F e a r e
o f i n t e r e s t i n F i s c h e r - T r o p s c h m e c h a n i s m s t u d i e s s i n c e
F e i s a g o o d c a t a l y s t f o r t h e r e a c t i o n , a n d a l c o h o l i c -
t y p e i n t e r m e d i a t e s h a v e b e e n p r o p o s e d . 4 I t h a s a l s o
b e e n f o u n d t h a t a l c o h o l s f e d i n t o t h e r e a c t a n t g a s
s t r e a m a r e i n c o r p o r a t e d i n t o t h e p r o d u c t s . 5 W e h a v e
p r e v i o u s l y s t u d i e d t h e i n t e r a c t i o n o f C O a n d H 2 o n
s i l i c a - s u p p o r t e d F e . 6 B e c a u s e o f t h e s i l i c a s u p p o r t ,
t h e u s a b l e i n f r a r e d r a n g e i s l i m i t e d t o f r o m a b o u t 4 0 0 0
t o 1 3 5 0 c m - 1 . T h i s l i m i t e d r a n g e m a k e s i d e n t i f i c a
t i o n o f s u r f a c e s p e c i e s d i f f i c u l t i n m a n y c a s e s . I n
t h i s s t u d y a w i d e s p e c t r a l r a n g e t e c h n i q u e d e v e l o p e d
i n t h i s l a b o r a t o r y i s u s e d t o e x a m i n e t h e s t r u c t u r e o f
s t a b l e s u r f a c e s p e c i e s a t 2 5 ° . B y d e t e r m i n i n g t h e
s t r u c t u r e o f s t a b l e s u r f a c e s p e c i e s i t i s h o p e d t h a t t h e
r e l a t i o n s h i p b e t w e e n s u r f a c e c h e m i s t r y a n d t h e r e s t o f
o r g a n o m e t a l l i c c h e m i s t r y c a n b e m a d e m o r e e x p l i c i t .
Experim ental Section
T h e w i d e s p e c t r a l r a n g e e x p e r i m e n t a l t e c h n i q u e ,
w h i c h h a s b e e n d e s c r i b e d i n d e t a i l e l s e w h e r e , 7 c o n s i s t s
o f e v a p o r a t i n g F e f r o m a n e l e c t r i c a l l y h e a t e d t u n g s t e n
f i l a m e n t i n t h e p r e s e n c e o f a s m a l l p r e s s u r e o f h e l i u m .
T h e m e t a l p a r t i c l e s f o r m e d i n t h e g a s p h a s e d e p o s i t i n
a n o i l f i l m o n t h e s a l t w i n d o w s o f a n i n f r a r e d c e l l .
T h e g a s t o b e s t u d i e d i s t h e n a d m i t t e d t o t h e c e l l ,
a n d t h e s p e c t r u m o f t h e c h e m i s o r b e d s p e c i e s i s o b
t a i n e d . S p e c t r a a r e r e c o r d e d b e f o r e a n d a f t e r a d
m i s s i o n o f t h e g a s t o t h e c e l l . F i v e m i n u t e s o f p u m p i n g
h a s b e e n f o u n d s u f f i c i e n t t o r e m o v e a l l s p e c t r a d u e t o
g a s p h a s e m o l e c u l e s . F o r t h r e e - a n d f o u r - c a r b o n a t o m
m o l e c u l e s 0 . 5 h r m a y b e r e q u i r e d t o p u m p o u t m o l e
c u l e s d i s s o l v e d i n t h e o i l f i l m .
T h e s p e c t r a w e r e o b t a i n e d u s i n g P e r k i n - E l m e r M o d e l
2 1 a n d 3 3 7 s p e c t r o p h o t o m e t e r s . T h e M o d e l 2 1 i s
e q u i p p e d w i t h C s B r o p t i c s w h i c h p e r m i t s c a n n i n g
f r o m 7 1 5 t o 2 5 0 c m - 1 . T h e 3 3 7 , w h i c h i s a g r a t i n g
i n s t r u m e n t , i s u s e d t o s c a n t h e r e g i o n f r o m 4 0 0 0 t o
4 0 0 c m - 1 .
T h e a d s o r b a t e s w e r e o b t a i n e d a s r e a g e n t g r a d e
c h e m i c a l s f r o m c o m m e r c i a l s o u r c e s . T h e y w e r e d e
g a s s e d b y r e p e a t e d f r e e z e - t h a w c y c l e s w i t h p u m p i n g
a n d d i s t i l l e d i n t o s t o r a g e v e s s e l s o n t h e v a c u u m s y s t e m .
T h e C O w a s p a s s e d t h r o u g h a n a c t i v a t e d - c h a r c o a l
t r a p c o o l e d w i t h l i q u i d a i r .
R esults
T h e e x p e r i m e n t a l r e s u l t s a r e g i v e n i n T a b l e I . 8 -1 4
I n c o l u m n 1 a r e l i s t e d t h e a d s o r b a t e s a n d t h e l e n g t h
o f t h e i r e x p o s u r e t o t h e a d s o r b e n t . I n t h e s e c o n d
c o l u m n a r e l i s t e d t h e o b s e r v e d b a n d s f o r t h e a d s o r b e d
s p e c i e s . T h e s e s p e c t r a w e r e r e c o r d e d a f t e r t h e a d
s o r b a t e w a s e v a c u a t e d f r o m t h e g a s p h a s e a n d t h e o i l
f i l m . I n t h e t h i r d c o l u m n a r e l i s t e d t h e b a n d s f o r
a p p r o p r i a t e c o m p a r i s o n c o m p o u n d s w h i l e t h e l a s t
c o l u m n l i s t s a s s i g n m e n t s f o r t h e c o m p a r i s o n c o m p o u n d s
t h a t a r e a s s u m e d a l s o t o a p p l y t o b a n d s f o r a d s o r b e d
s p e c i e s o n t h e s a m e l i n e i n t h e t a b l e . 4 5 6 7 8 9 10 11 12 13 14
(4) H . H . Storch, N. Golumbic, and R. B. Anderson, “ The Fischer- Tropsch and Related Synthesis/' John W iley and Sons, Inc., New York, N . Y ., 1951.(5) R. B. Anderson, C ata lysis , 4, 257 (1965).(6) G. B lyholder and L. D . Neff, J . P h y s . Chem., 66, 1664 (1962).(7) G. Blyholder, J . Chem. P h ys ., 36, 2036 (1962).(8) C. Tanaka, N ip p o n K a g a k u Z assh i, 83, 792 (1962).(9) American Petroleum Institu te , Project 44, Spectrum No. 427.(10) American Petroleum Institu te , Project 44, Spectrum No. 429.(11) C. Tanaka, N ip p o n K agaku Z a ssh i, 83 , 521, 657 (1962).(12) American Petroleum Institu te , Project 44, Spectrum No. 431.(13) C. Tanaka, N ip p o n K a g a k u Z a ssh i, 83, (1962).(14) American Petroleum Institu te , Project 44, Spectrum No. 432-
Volume 70, Number 8 March 1966

896 G. Blyholder and L. D. Neff
A l l a d s o r p t i o n s w e r e d o n e a t a b o u t 2 5 ° , w h i c h i s t h e
a v e r a g e r o o m t e m p e r a t u r e . A f t e r t h e s p e c t r a o f t h e
a d s o r b e d s p e c i e s w e r e r e c o r d e d , t h e s a m p l e s w e r e
e x p o s e d t o a b o u t 1 0 m m o f C O , a n d t h e s p e c t r a w e r e
a g a i n r e c o r d e d . T h e b a n d s r e s u l t i n g f r o m t h i s t r e a t
m e n t a r e a l s o l i s t e d i n c o l u m n 2 o f T a b l e I a n d a r e
l a b e l e d “ a d d e d C O . ” S e v e r a l s p e c t r a a r e s h o w n i n
t h e f i g u r e s s o t h a t a n i d e a o f t h e b a n d s h a p e s o b s e r v e d
f o r t h e a d s o r b e d s p e c i e s m a y b e g a i n e d .
A d s o r p t i o n b a n d s a s c r i b e d t o C - H s t r e t c h i n g a n d
d e f o r m a t i o n v i b r a t i o n a l m o d e s a r e o b s c u r e d b y c o r
r e s p o n d i n g b a n d s o f t h e h y d r o c a r b o n o i l i n t o w h i c h
t h e F e i s e v a p o r a t e d . T h e s e b a n d s a r e l o c a t e d i n t h e
g e n e r a l r e g i o n o f 2 9 0 0 , 1 4 6 0 , a n d 1 3 7 0 c m - 1 . A d
s o r p t i o n o f a g a s s a m p l e r e s u l t s i n a n i n c r e a s e i n t h e
b a n d i n t e n s i t i e s i n t h e s e r e g i o n s . S i n c e t h e s e c h a n g e s
a r e d i f f i c u l t t o i n t e r p r e t w i t h a n y s e n s e o f a s s u r a n c e ,
t h e y a r e n o t d i s c u s s e d .
D iscussion
S u r p r i s i n g l y u n i f o r m b e h a v i o r i s f o u n d f o r t h e i n
t e r a c t i o n o f t h e a l c o h o l s , a l d e h y d e s , k e t o n e s , a n d
e t h e r s t e s t e d . I n a l l c a s e s t h e a s s i g n m e n t s i n T a b l e
I l e a d t o p r i n c i p a l s t a b l e s u r f a c e s p e c i e s w h i c h h a v e a n
a l k o x i d e s t r u c t u r e . T h e a s s i g n m e n t s h a v e b e e n m a d e
b y c o m p a r i s o n w i t h t h e s p e c t r a o f a l c o h o l s . I n s o m e
c a s e s d e t a i l e d a s s i g n m e n t s w e r e n o t a v a i l a b l e i n t h e
l i t e r a t u r e , b u t e v e n h e r e t h e s p e c t r u m o f t h e a d s o r b e d
s p e c i e s i s i n g o o d a g r e e m e n t w i t h t h a t o f t h e a l c o h o l .
I n f a c t , t h e a g r e e m e n t i n a l l c a s e s i s s o g o o d t h a t o n e
m a y w o n d e r w h y s u b s t i t u t i n g a m e t a l a t o m f o r a n
H a t o m d o e s n o t h a v e a l a r g e r e f f e c t o n s k e l e t a l v i b r a
t i o n s . T h i s a g r e e m e n t a p p e a r s t o b e d u e t o b o t h t h e
H a n d t h e m e t a l h a v i n g l i t t l e e f f e c t o n t h e s k e l e t a l
v i b r a t i o n s . T h e H a t o m s h a v e l i t t l e e f f e c t b e c a u s e ,
w h i l e t h e O - H f o r c e c o n s t a n t i s l a r g e , t h e h y d r o g e n s
a r e t o o l i g h t t o g r e a t l y a f f e c t s k e l e t a l v i b r a t i o n s . I n
t h e c a s e o f m e t a l a t o m s t h e m e t a l - o x y g e n b o n d i s
r e l a t i v e l y w e a k s o t h a t t h e m e t a l - o x y g e n f r e q u e n c i e s
a r e e x p e c t e d t o b e a r o u n d 4 0 0 t o 5 0 0 c m - 1 . I t i s a
w e l l - k n o w n p r i n c i p l e t h a t , w h e r e t h e r e i s a l a r g e s e p a
r a t i o n i n f o r c e c o n s t a n t s o r v i b r a t i o n a l f r e q u e n c i e s ,
t h e m o d e s o f m o t i o n a r e f a i r l y i n d e p e n d e n t . 16 T h i s
a g r e e m e n t b e t w e e n a l k o x i d e s p e c t r a a n d f r e e a l c o h o l
s p e c t r a h a s a l s o b e e n f o u n d i n t h e f e w i n f r a r e d s p e c t r a
t h a t h a v e b e e n r e p o r t e d f o r A 1 a n d T i a l k o x i d e s . 1 6 -1 9
T h e p o s s i b i l i t i e s o f s o m e o t h e r s t r u c t u r e s w e r e c o n
s i d e r e d a n d d i s c a r d e d f o r a v a r i e t y o f r e a s o n s . S t r u c
t u r e s c o n t a i n i n g h y d r o g e n a t o m s a t t a c h e d t o u n
s a t u r a t e d c a r b o n a t o m s w e r e e l i m i n a t e d b e c a u s e o f
t h e a b s e n c e o f C - H s t r e t c h i n g v i b r a t i o n s a b o v e 3 0 0 0
c m - 1 . W h i l e t h e o i l b l o c k s o u t t h e s a t u r a t e d C - H
s t r e t c h i n g r e g i o n , b a n d s f o r u n s a t u r a t e d C - H g r o u p s
w h i c h u s u a l l y o c c u r n e a r 3 1 0 0 c m - 1 20 s h o u l d b e
c l e a r l y v i s i b l e . S t r u c t u r e s c o n t a i n i n g O - H g r o u p s
w e r e e l i m i n a t e d b e c a u s e o f t h e a b s e n c e o f O - H s t r e t c h
i n g a n d b e n d i n g v i b r a t i o n s w h i c h a r e c l e a r l y e v i d e n t
w h e n g a s p h a s e a l c o h o l i s i n t h e c e l l . T h e i n t e n s i t y o f
O H b a n d s f o r f r e e a l c o h o l s i s n e a r t h a t o f t h e o t h e r
b a n d s s o t h a t , i f t h e s u r f a c e s t r u c t u r e s c o n t a i n O H
g r o u p s , t h e i r b a n d s s h o u l d h a v e b e e n s t r o n g . L i k e
w i s e , s t r u c t u r e s c o n t a i n i n g c a r b o n - o x y g e n d o u b l e
b o n d s w e r e e l i m i n a t e d b e c a u s e o f t h e a b s e n c e o f a
b a n d a r o u n d 1 7 0 0 c m - 1 . E v e n i r - c o m p l e x e d d o u b l e
b o n d s a r e o n l y s h i f t e d w i t h i n a b o u t 1 0 0 c m - 1 s o t h e s e
t o o a r e p r e s u m e d a b s e n t . T w o - p c i n t ( o r m o r e ) a t
t a c h m e n t t o t h e s u r f a c e , i n w h i c h b o t h a c a r b o n -
m e t a l a n d a n o x y g e n - m e t a l b o n d a r e p r e s e n t , i s e l i m i
n a t e d i n t h e c a s e o f m e t h y l a l c o h o l a d s o r p t i o n b e c a u s e
o f t h e p r e s e n c e o f t h e C H 3 r o c k i n g b a n d a t 1 0 6 0 c m - 1
a n d i n t h e o t h e r c a s e s b e c a u s e m u l t i p l e a t t a c h m e n t i s
e x p e c t e d t o p e r t u r b t h e s k e l e t a l v i b r a t i o n s m o r e t h a n
i s o b s e r v e d . W h e n i t i s s t a t e d t h a t t h e s e s t r u c t u r e s
a r e e l i m i n a t e d , i t i s n o t m e a n t t h a t t h e y c a n n o t e x i s t
i n s m a l l c o n c e n t r a t i o n s o n t h e s u r f a c e b u t o n l y t h a t
t h e y d o n o t e x i s t i n s u f f i c i e n t c o n c e n t r a t i o n t o b e o b
s e r v e d i n o u r s p e c t r a .
I t m a y b e n o t e d i n T a b l e I t h a t t h e e x p o s u r e t i m e s
v a r y c o n s i d e r a b l y . I t w a s f o u n d t h a t t h e s p e c t r a w e r e
u n c h a n g e d f o r e x p o s u r e t i m e s g r e a t e r t h a n 1 h r s o t h e
a c t u a l t i m e s u s e d w e r e d i c t a t e d b y c o n v e n i e n c e . 15 16 17 18 19 20
cm-1
Figure 1. Spectrum of methyl alcohol adsorbed on Fe at 25°.
(15) E. B. Wilson, Jr., J. C. Decius, and P. C. Cross, "M o lecu la r V ibrations,” M cG raw -H ill Book Co., Inc., New York, N. Y ., 1955.(16) J. V. Bell, J. Heisler, H . Tannenbaum, and J. Goldenson, A n al. Chem., 25, 1720 (1953).(17) D. L. Guertin, S. E. W iberley, W. H. Bauer, and J. Goldenson, J . P h ys. Chem., 60, 1018 (1956).(18) R. C. W ilho it, J. R. Burton, F. Kuo, S. Huang, and A. Viguesnel, J . Inorg. N u cl. Chem., 24, 851 (1962).(19) V. H . Kriegsmann and K . L ich t, Z . Elektrochem., 62, 1163 (1958).(20) K . Nakanishi, “ Infrared Absorption Spectroscopy,” Holden- Day, Inc., San Francisco, Calif., 1962.
The Journal of Physical Chemistry
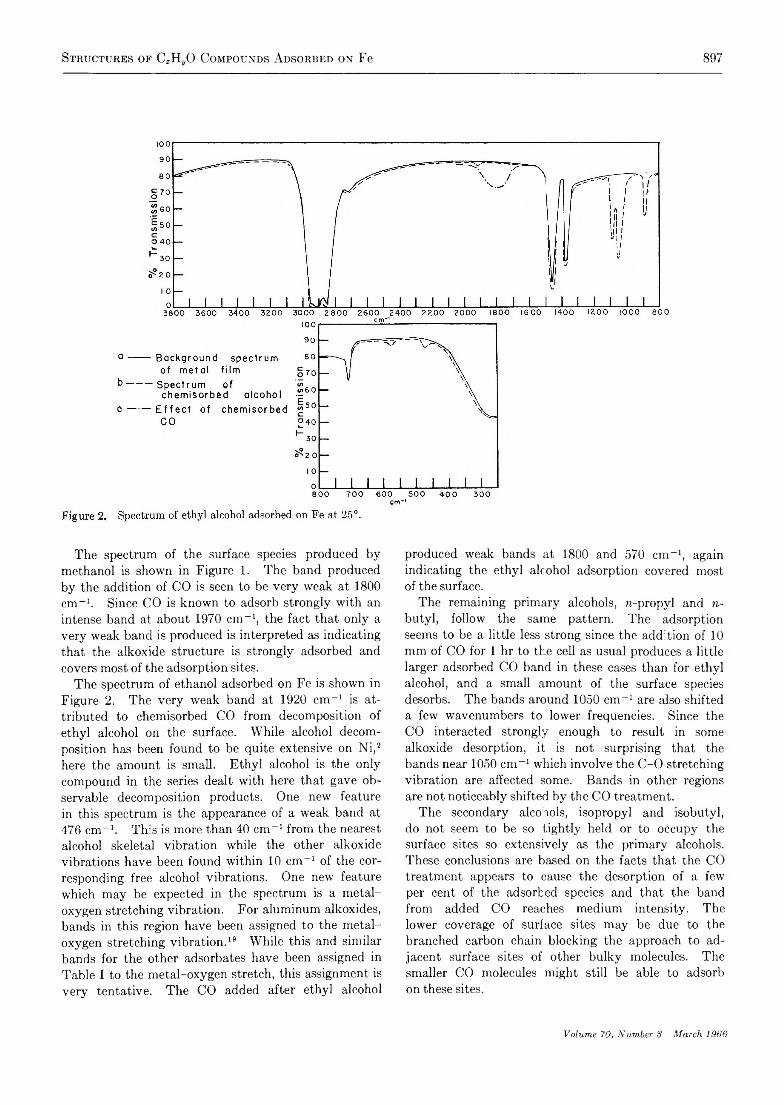
Structures of C^H^O Compounds Adsorbed on Fe 897
T h e s p e c t r u m o f t h e s u r f a c e s p e c i e s p r o d u c e d b y
m e t h a n o l i s s h o w n i n F i g u r e 1 . T h e b a n d p r o d u c e d
b y t h e a d d i t i o n o f C O i s s e e n t o b e v e r y w e a k a t 1 8 0 0
c m - 1 . S i n c e C O i s k n o w n t o a d s o r b s t r o n g l y w i t h a n
i n t e n s e b a n d a t a b o u t 1 9 7 0 c m - 1 , t h e f a c t t h a t o n l y a
v e r y w e a k b a n d i s p r o d u c e d i s i n t e r p r e t e d a s i n d i c a t i n g
t h a t t h e a l k o x i d e s t r u c t u r e i s s t r o n g l y a d s o r b e d a n d
c o v e r s m o s t o f t h e a d s o r p t i o n s i t e s .
T h e s p e c t r u m o f e t h a n o l a d s o r b e d o n F e i s s h o w n i n
F i g u r e 2 . T h e v e r y w e a k b a n d a t 1 9 2 0 c m - 1 i s a t
t r i b u t e d t o c h e m i s o r b e d C O f r o m d e c o m p o s i t i o n o f
e t h y l a l c o h o l o n t h e s u r f a c e . W h i l e a l c o h o l d e c o m
p o s i t i o n h a s b e e n f o u n d t o b e q u i t e e x t e n s i v e o n N i , 2
h e r e t h e a m o u n t i s s m a l l . E t h y l a l c o h o l i s t h e o n l y
c o m p o u n d i n t h e s e r i e s d e a l t w i t h h e r e t h a t g a v e o b
s e r v a b l e d e c o m p o s i t i o n p r o d u c t s . O n e n e w f e a t u r e
i n t h i s s p e c t r u m i s t h e a p p e a r a n c e o f a w e a k b a n d a t
4 7 6 c m - 1 . T h i s i s m o r e t h a n 4 0 c m - 1 f r o m t h e n e a r e s t
a l c o h o l s k e l e t a l v i b r a t i o n w h i l e t h e o t h e r a l k o x i d e
v i b r a t i o n s h a v e b e e n f o u n d w i t h i n 1 0 c m “ 1 o f t h e c o r
r e s p o n d i n g f r e e a l c o h o l v i b r a t i o n s . O n e n e w f e a t u r e
w h i c h m a y b e e x p e c t e d i n t h e s p e c t r u m i s a m e t a l -
o x y g e n s t r e t c h i n g v i b r a t i o n . F o r a l u m i n u m a l k o x i d e s ,
b a n d s i n t h i s r e g i o n h a v e b e e n a s s i g n e d t o t h e m e t a l -
o x y g e n s t r e t c h i n g v i b r a t i o n . 19 W h i l e t h i s a n d s i m i l a r
b a n d s f o r t h e o t h e r a d s o r b a t e s h a v e b e e n a s s i g n e d i n
T a b l e I t o t h e m e t a l - o x y g e n s t r e t c h , t h i s a s s i g n m e n t i s
v e r y t e n t a t i v e . T h e C O a d d e d a f t e r e t h y l a l c o h o l
p r o d u c e d w e a k b a n d s a t 1 8 0 0 a n d 5 7 0 c m - 1 , a g a i n
i n d i c a t i n g t h e e t h y l a l c o h o l a d s o r p t i o n c o v e r e d m o s t
o f t h e s u r f a c e .
T h e r e m a i n i n g p r i m a r y a l c o h o l s , n - p r o p y l a n d 71- b u t y l , f o l l o w t h e s a m e p a t t e r n . T h e a d s o r p t i o n
s e e m s t o b e a l i t t l e l e s s s t r o n g s i n c e t h e a d d i t i o n o f 1 0
m m o f C O f o r 1 h r t o t h e c e l l a s u s u a l p r o d u c e s a l i t t l e
l a r g e r a d s o r b e d C O b a n d i n t h e s e c a s e s t h a n f o r e t h y l
a l c o h o l , a n d a s m a l l a m o u n t o f t h e s u r f a c e s p e c i e s
d e s o r b s . T h e b a n d s a r o u n d 1 0 5 0 c m - 1 a r e a l s o s h i f t e d
a f e w w a v e n u m b e r s t o l o w e r f r e q u e n c i e s . S i n c e t h e
C O i n t e r a c t e d s t r o n g l y e n o u g h t o r e s u l t i n s o m e
a l k o x i d e d e s o r p t i o n , i t i s n o t s u r p r i s i n g t h a t t h e
b a n d s n e a r 1 0 5 0 c m - 1 w h i c h i n v o l v e t h e C - 0 s t r e t c h i n g
v i b r a t i o n a r e a f f e c t e d s o m e . B a n d s i n o t h e r r e g i o n s
a r e n o t n o t i c e a b l y s h i f t e d b y t h e C O t r e a t m e n t .
T h e s e c o n d a r y a l c o h o l s , i s o p r o p y l a n d i s o b u t y l ,
d o n o t s e e m t o b e s o t i g h t l y h e l d o r t o o c c u p y t h e
s u r f a c e s i t e s s o e x t e n s i v e l y a s t h e p r i m a r y a l c o h o l s .
T h e s e c o n c l u s i o n s a r e b a s e d o n t h e f a c t s t h a t t h e C O
t r e a t m e n t a p p e a r s t o c a u s e t h e d e s o r p t i o n o f a f e w
p e r c e n t o f t h e a d s o r b e d s p e c i e s a n d t h a t t h e b a n d
f r o m a d d e d C O r e a c h e s m e d i u m i n t e n s i t y . T h e
l o w e r c o v e r a g e o f s u r f a c e s i t e s m a y b e d u e t o t h e
b r a n c h e d c a r b o n c h a i n b l o c k i n g t h e a p p r o a c h t o a d
j a c e n t s u r f a c e s i t e s o f o t h e r b u l k y m o l e c u l e s . T h e
s m a l l e r C O m o l e c u l e s m i g h t s t i l l b e a b l e t o a d s o r b
o n t h e s e s i t e s .
Volume 70, Number 8 March 1966

898 G. Blyholdee and L. D. Neff
T h e c h a n g e s o n g o i n g f r o m t h e p r i m a r y t o s e c o n d a r y
a l c o h o l s a r e c a r r i e d f u r t h e r u p o n g o i n g t o t h e t e r t i a r y
a l c o h o l , ¿ - b u t y l . H e r e t h e b a n d s f o r t h e a d s o r b e d
s p e c i e s a r e l e s s i n t e n s e t h a n f o r t h e o t h e r a l c o h o l s , a n d
t h e a d d e d C O b a n d i s o f m e d i u m t o s t r o n g i n t e n s i t y .
T h e b a n d s a t 1 1 6 5 , 9 2 0 , a n d 8 7 5 c m “ 1 w e r e a l l s h i f t e d
b y a f e w c m - 1 t o l o w e r f r e q u e n c i e s b y t h e C O a d s o r p
t i o n b u t w e r e n o t n o t i c e a b l y d e c r e a s e d i n i n t e n s i t y .
O n e p o s s i b l e c a u s e o f t h e s h i f t i s s t e r i c i n t e r a c t i o n
w i t h C O a d s o r b e d o n a d j a c e n t s i t e s .
T h e f i r s t o f t h e n o n a l c o h o l s t o b e c o n s i d e r e d i s a c e t
a l d e h y d e . A c e t a l d e h y d e m i g h t h a v e b e e n e x p e c t e d
i n a s t r a i g h t f o r w a r d a s s o c i a t i v e o r d i s s o c i a t i v e m a n n e r
t o p r o d u c e c h e m i s o r b e d C O u p o n d i s s o c i a t i o n o r a n
a c y l s t r u c t u r e b y l o s i n g h y d r o g e n o r t o b o n d c o o r d i -
n a t i v e l y t h r o u g h t h e o x y g e n w h i l e m a i n t a i n i n g a
C - 0 d o u b l e b o n d . C o m p a r i s o n o f t h e o b s e r v e d b a n d s
i n T a b l e I t o k n o w n s p e c t r a l e a d s t o t h e c o n c l u s i o n
t h a t a n a d s o r b e d t w o - c a r b o n a l k o x i d e s t r u c t u r e i s
p r o d u c e d . T h e b a n d p o s i t i o n s a l l a g r e e w e l l w i t h
t h o s e p r o d u c e d b y a d s o r b e d e t h y l a l c o h o l . T h i s
s t r u c t u r e r e q u i r e s t h e a d d i t i o n o f a h y d r o g e n a t o m t o
a c e t a l d e h y d e . T w o p o s s i b l e s o u r c e s f o r t h i s h y d r o g e n
a r e c r a c k i n g o f t h e h y d r o c a r b o n o i l m a t r i x a n d d e
c o m p o s i t i o n o f s o m e o f t h e a c e t a l d e h y d e . A c e r t a i n
a m o u n t o f h y d r o g e n f r o m t h e f i r s t s o u r c e w o u l d n o t b e
u n e x p e c t e d s i n c e t h e F e p a r t i c l e s a r e e x p e c t e d s t i l l t o
b e f a i r l y h o t w h e n t h e y e n t e r t h e o i l d u r i n g t h e e v a p o
r a t i o n p r o c e s s . B e e c k 21 h a s r e p o r t e d t h a t h y d r o g e n
l a y e r s o n F e a r e m o b i l e a t r o o m t e m p e r a t u r e s o h y
d r o g e n p r o d u c e d a n y w h e r e o n t h e s u r f a c e i s a v a i l
a b l e e v e r y w h e r e . T h e b a n d s f o r t h e a l k o x i d e s t r u c
t u r e p r o d u c e d f r o m a c e t a l d e h y d e a r e s o m e w h a t l e s s
i n t e n s e t h a n t h o s e f r o m e t h y l a l c o h o l s o t h e s u r f a c e
m a y w e l l b e p a r t i a l l y c o v e r e d w i t h d e c o m p o s i t i o n
p r o d u c t s w h i c h d o n o t h a v e a n y b a n d s o t h e r t h a n
C - H b a n d s , w h i c h w o u l d b e m a s k e d b y t h e o i l , s t r o n g
e n o u g h t o b e o b s e r v e d . T h e i n t e r a c t i o n o f a c e t a l d e
h y d e w o u l d s e e m t o h a v e t o b e c l a s s e d a s a d s o r p t i o n
p l u s r e a c t i o n . T h e p r o d u c t i o n o f t h e a l k o x i d e s t r u c
t u r e f r o m a c e t a l d e h y d e i s t a k e n a s a n i n d i c a t i o n o f
t h e s t a b i l i t y o f t h e s t r u c t u r e o n F e .
E t h y l e n e o x i d e i s a s t r u c t u r a l i s o m e r o f a c e t a l d e
h y d e , b u t t h e s p e c t r u m l i s t e d i n T a b l e I i n d i c a t e s
t h a t o n e o f t h e s t a b l e s t r u c t u r e s f o r m e d i s a n a l k o x i d e
s t r u c t u r e s i m i l a r t o t h a t f o r m e d b y e t h y l a l c o h o l a n d
a c e t a l d e h y d e . H o w e v e r , t h e b a n d s a r e w e a k a n d a
n e w f e a t u r e e n t e r s t h e s p e c t r u m i n t h a t a w e a k , b r o a d
b a n d a t 6 1 0 c m - 1 i s o b s e r v e d . T h i s b a n d h a s b e e n
p r e v i o u s l y o b s e r v e d u p o n o x y g e n t r e a t m e n t o f a n F e
s u r f a c e a n d s o i s a s c r i b e d t o a n o x i d e s t r u c t u r e . S i n c e
C O d i d n o t a d s o r b a f t e r t h e e t h y l e n e o x i d e t r e a t m e n t
a n d t h e i n t e n s i t i e s o f t h e a l k o x i d e b a n d s d o n o t i n d i
c a t e n e a r l y e n o u g h o f t h a t s t r u c t u r e t o a c c o u n t f o r
t h i s b e h a v i o r , t h e s u r f a c e i s p r e s u m e d t o b e l a r g e l y
c o v e r e d b y d e c o m p o s i t i o n p r o d u c t s . O n e o f t h e s e i s
a p p a r e n t l y a s u r f a c e o x i d e . A l t h o u g h n o o t h e r a d
s o r b e d s p e c i e s w e r e d e t e c t e d , i f e t h y l e n e , p r o d u c e d
b y r e m o v i n g a n o x y g e n a t o m f r o m e t h y l e n e o x i d e ,
i s a s s o c i a t i v e l y a d s o r b e d , o n l y s a t u r a t e d C - H s t r e t c h
i n g v i b r a t i o n s w o u l d b e p r e s e n t , a n d t h e s e w o u l d b e
m a s k e d b y t h e o i l . I f g a s p h a s e e t h y l e n e o r e t h a n e
h a d b e e n p r o d u c e d e v e n i n r e l a t i v e l y s m a l l q u a n t i t i e s ,
t h e y s h o u l d h a v e b e e n d e t e c t e d b y c h a r a c t e r i s t i c
b a n d s a t 9 4 9 a n d 8 2 1 c m - 1 , r e s p e c t i v e l y . N o b a n d s
w e r e o b s e r v e d a t t h e s e p l a c e s b e f o r e t h e g a s p h a s e w a s
e v a c u a t e d f r o m t h e c e l l .
T h e t w o k e t o n e s , a c e t o n e a n d m e t h y l e t h y l k e t o n e ,
f o l l o w e d t h e p a t h o f t h e a l d e h y d e s t o p r o d u c e t h e c o r
r e s p o n d i n g a l k o x i d e s t r u c t u r e s . I n b o t h c a s e s m e d i u m -
i n t e n s i t y c h e m i s o r b e d C O b a n d s r e s u l t e d f r o m s u b s e
q u e n t C O e x p o s u r e , i n d i c a t i n g o n l y p a r t i a l s u r f a c e
c o v e r a g e . F r a c t i o n a l s u r f a c e c o v e r a g e b y t h e k e t o n e s
i s a l s o i n d i c a t e d b y t h e w e a k n e s s o f t h e a l k o x i d e b a n d s
p r o d u c e d .
O n e o r d i n a r y a n d o n e c y c l i c e t h e r , d i e t h y l e t h e r a n d
t e t r a h y d r o f u r a n , w e r e e x p o s e d t o t h e s u r f a c e w i t h t h e
r e s u l t t h a t n o b a n d s f o r a d s o r b e d s p e c i e s w e r e o b s e r v e d
i n e i t h e r c a s e . S u b s e q u e n t C O e x p o s u r e p r o d u c e d a
s t r o n g b a n d a t 1 9 5 0 c m “ 1 i n e a c h c a s e i n d i c a t i n g t h a t
t h e s u r f a c e h a d n o t a c c i d e n t l y b e c o m e d e a c t i v a t e d .
W h i l e o r d i n a r y e t h e r s d o n o t a p p e a r t o p r o d u c e
s t a b l e s u r f a c e s p e c i e s a t 2 5 ° o n o u r s a m p l e s , m e t h y l
v i n y l e t h e r w a s o b s e r v e d t o g i v e t h e m . T h e b a n d s
l i s t e d i n T a b l e I a r e m o s t c o n s i s t e n t w i t h a m e t h o x i d e
s u r f a c e s p e c i e s . S i n c e o r d i n a r y e t h e r s d i d n o t p e r m a
n e n t l y i n t e r a c t w i t h t h e s u r f a c e , t h e s t r o n g i n t e r a c t i o n
h e r e i s p r e s u m e d t o b e d u e t o t h e p r e s e n c e o f t h e
v i n y l g r o u p . E t h y l e n e i s k n o w n t o c h e m i s o r b r e a d i l y
o n F e . 22 P r e s u m a b l y , o n c e t h e v i n y l g r o u p h a s s e c u r e d
t h e m o l e c u l e t o t h e s u r f a c e , t h e m e t h o x y g r o u p m i g r a t e s
f r o m c a r b o n a t t a c h m e n t t o m e t a l a t t a c h m e n t .
L o o k e d a t f r o m t h e s t a n d p o i n t o f o r g a n o m e t a l l i c
c h e m i s t r y , w h i c h h a s r e c e n t l y r e c e i v e d a g r e a t d e a l
o f a t t e n t i o n , t h e a l k o x i d e s t r u c t u r e i s n o t a s u r p r i s e .
A l k o x i d e s o f m o s t t r a n s i t i o n m e t a l s a r e w e l l k n o w n . 23
W h a t i s p e r h a p s a l i t t l e u n e x p e c t e d i s t h e u n i f o r m i t y
w i t h w h i c h t h e c o m p o u n d s i n v e s t i g a t e d p r o d u c e d t h e
a l k o x i d e s t r u c t u r e w i t h v e r y f e w s i d e r e a c t i o n s . T h i s
i s a f u n c t i o n o f t h e s p e c i f i c i t y o f t h e F e s u r f a c e s i n c e
t h i s s a m e s e r i e s o f c o m p o u n d s w h e n e x p o s e d t o a N i
(21) O. Beeck, A dvan. C a ta ly s is , 2, 151 (1950).(22) D . O. Hayward and B. M . W. Trapnell, “ Chemisorption,” 2nd ed, Butterw orth Inc., Washington, D . C., 1964.(23) D. C. Bradley, Progr. Inorg. Chem., 2, 303 (1960).
The Journal of Physical Chemistry

Structures of C^H^O Compounds Adsorbed on Fe 899
s u r f a c e e i t h e r d e c o m p o s e s t o g i v e c h e m i s o r b e d C O
o r p r o d u c e s a n a c y l s u r f a c e s t r u c t u r e . 3 A c e t a l d e h y d e
c o u l d h a v e r e a d i l y p r o d u c e d a n a c y l s t r u c t u r e o n F e
b y a d s o r p t i o n w i t h d i s s o c i a t i o n o f t h e h y d r o g e n a t
t a c h e d t o t h e c a r b o n y l c a r b o n , b u t i n s t e a d i t h y d r o
g e n a t e d t o g i v e t h e a l k o x i d e s t r u c t u r e i n s p i t e o f t h e
l i m i t e d h y d r o g e n s u p p l y . F o r t h e a l c o h o l s t o f o r m a n
a l k o x i d e s t r u c t u r e , t h e y n e e d o n l y l o s e t h e h y d r o x y l
h y d r o g e n . T h e l a b i l i t y o f t h i s h y d r o g e n o n m e t a l
s u r f a c e s h a s b e e n d e m o n s t r a t e d b y d e u t e r i u m - e x c h a n g e
e x p e r i m e n t s . 24 25' 26
T h e s y n t h e s i s o f s e v e r a l F e ( I I I ) a l k o x i d e s h a s b e e n
r e p o r t e d . 26 T h e y h a v e b e e n f o u n d t o b e p o l y m e r i c
w i t h p r e s u m a b l y a l k o x i d e o x y g e n b r i d g e s b e t w e e n F e
a t o m s . T h i s r a i s e s t h e q u e s t i o n a s t o w h e t h e r t h e
a l k o x i d e o x y g e n o f t h e s u r f a c e s p e c i e s i s b o n d e d t o
o n e o r m o r e F e s u r f a c e a t o m s . T h e d a t a s o f a r o b
t a i n e d f o r t h e s p e c t r a i n t h e m e t a l - o x y g e n s t r e t c h i n g
r e g i o n a r e n o t s u f f i c i e n t t o a n s w e r t h i s q u e s t i o n .
C o n s i d e r a t i o n s f r o m o r g a n o m e t a l l i c a n d c o o r d i n a
t i o n c h e m i s t r y o n b o n d s t a b i l i t i e s a r e e x p e c t e d t o
a p p l y t o t h e s e s u r f a c e s p e c i e s . A q u o l i g a n d s a r e
a m o n g t h e l e s s s t a b l e l i g a n d s f o r F e ( I I ) a n d F e ( I I I )
i o n s i n s o l u t i o n . I f t h e c h a r g e d i o n s s h o w l i t t l e
t e n d e n c y t o a c c e p t a p a i r o f e l e c t r o n s t o f o r m a c o o r d i
n a t i o n b o n d , t h e n e u t r a l a t o m s o n t h e s u r f a c e m a y b e
e x p e c t e d t o s h o w e v e n l e s s t e n d e n c y t o a c c e p t e l e c
t r o n s i n a c o o r d i n a t i o n b o n d . T h i s i s i n a c c o r d w i t h
t h e f a c t t h a t t h e e t h e r s , w h i c h w i t h o u t e x t e n s i v e
d e c o m p o s i t i o n c a n o n l y a d s o r b b y c o o r d i n a t i o n o f t h e
o x y g e n l o n e p a i r e l e c t r o n s , d o n o t a d s o r b . A p p a r e n t l y
p u r e d o n a t i o n o f c h a r g e f r o m t h e l i g a n d t o a n i r o n
s u r f a c e a t o m d o e s n o t p r o d u c e a s t a b l e s t r u c t u r e .
W h e r e a p u r e <r b o n d i s n o t s t a b l e , t h e a d d i t i o n a l
f o r m a t i o n o f s o m e it b o n d i n g s o m e t i m e s l e a d s t o s t a
b i l i t y . H o w e v e r , t h e o x y g e n p o r b i t a l s w h i c h m i g h t
p a r t i c i p a t e i n a j b o n d w i t h t h e m e t a l d o r b i t a l s a r e
f i l l e d s o t h a t t h i s i n t e r a c t i o n c a n l e a d o n l y t o m o r e
c h a r g e t r a n s f e r t o t h e m e t a l , w h i c h w o u l d a p p a r e n t l y
a l r e a d y b e t o o m u c h i n a p u r e ^ - c o o r d i n a t i o n b o n d .
I n t h e c a s e o f t h e a l k o x i d e s t r u c t u r e , t h e o x y g e n
l i g a n d i s d o n a t i n g o n l y o n e e l e c t r o n i n t o t h e a b o n d .
T h i s a p p a r e n t l y l e a d s t o s t a b i l i t y . N o w t h e a p p r o
p r i a t e l y o r i e n t e d v a c a n t d o r b i t a l s o f t h e F e a t o m c a n
a c c e p t s o m e c h a r g e f r o m t h e f i l l e d l i g a n d p o r b i t a l s .
T h e f u l l u t i l i z a t i o n o f m e t a l d o r b i t a l s i s a p p a r e n t l y
d e s i r a b l e t o a c h i e v e m a x i m u m s t a b i l i t y . 27 I t m a y b e
n o t e d t h a t , i n t h e c a s e o f N i , t h e d o r b i t a l s a r e n e a r l y
f i l l e d s o t h e i n t e r a c t i o n w i t h f i l l e d l i g a n d o r b i t a l s i s
n o t e x p e c t e d t o l e a d t o s t a b i l i t y , a n d i n d e e d t h e
a l k o x i d e s t r u c t u r e i s n o t f o u n d f o r a d s o r p t i o n o n N i . 3
T h e r e i s a l w a y s a n u n c e r t a i n t y i n v o l v e d i n a p p l y i n g
i n f o r m a t i o n g a i n e d a b o u t s t a b l e s u r f a c e s p e c i e s t o
r e a c t i o n m e c h a n i s m c o n s i d e r a t i o n s s i n c e t h e r e a c t i o n
m a y p r o c e e d t h r o u g h a s m a l l n u m b e r o f a c t i v e s i t e s
w h i c h c o n t a i n s p e c i e s d i f f e r e n t f r o m t h o s e a d s o r b e d
o n t h e m a j o r i t y o f s i t e s . H o w e v e r , o n t h e a s s u m p
t i o n t h a t r e a c t i o n i n t e r m e d i a t e s b a s e d o n s t a b l e s t r u c
t u r e s a r e a t l e a s t a s w o r t h w h i l e c o n s i d e r i n g a s t h o s e
f o r m u l a t e d i n t h e a b s e n c e o f s u c h i n f o r m a t i o n , s o m e
c o m m e n t s o n t h e F i s c h e r - T r o p s c h s y n t h e s i s w i l l b e
m a d e . O n e f u r t h e r r e s e r v a t i o n i s t h a t i r o n s y n t h e s i s
c a t a l y s t s a r e n o t p u r e i r o n b u t a r e p r o m o t e d w i t h
v a r y i n g p e r c e n t a g e s , u s u a l l y l e s s t h a n 1 0 % , o f v a r i o u s
o x i d e s s u c h a s S i 0 2, A 1 20 3, T h 0 2, a n d K 20 .
S t o r c h , G o l u m b i c , a n d A n d e r s o n 4 p r o p o s e d o x y
g e n a t e d i n t e r m e d i a t e s c o n t a i n i n g m a i n l y O H g r o u p s .
E m m e t t a n d c o - w o r k e r s i n a s e r i e s o f t r a c e r e x p e r i
m e n t s o n t h e i n c o r p o r a t i o n o f a l c o h o l s a n d o t h e r
c o m p o u n d s i n t h e s y n t h e s i s p r o d u c t s h a v e f o u n d e v i
d e n c e s u p p o r t i n g t h e i d e a o f o x y g e n a t e d i n t e r m e
d i a t e s . 28" 32 I n t h e s e p a p e r s t h e a t t a c h m e n t o f t h e
c o m p l e x t o t h e s u r f a c e h a s b e e n p r e s u m e d t o b e t h r o u g h
a c a r b o n - m e t a l b o n d . I t h a s b e e n s u g g e s t e d t h a t
a t t a c h m e n t t o t h e s u r f a c e m a y b e t h r o u g h b o t h
c a r b o n - m e t a l a n d o x y g e n - m e t a l b o n d s . 33
T h e m e c h a n i s m p r e s e n t e d b e l o w i s b a s e d o n t h e
f i n d i n g o f t h i s p a p e r t h a t t h e a l k o x i d e s t r u c t u r e s e e m s
t o e n j o y a s p e c i a l s t a b i l i t y o n F e . I t i s a s s u m e d t h a t
w h a t i s a s t a b l e s t r u c t u r e a t r o o m t e m p e r a t u r e w i l l
b e a m o d e r a t e l y r e a c t i v e i n t e r m e d i a t e a t a s y n t h e s i s
t e m p e r a t u r e o f a b o u t 2 0 0 ° . T h e F i s c h e r - T r o p s c h
s y n t h e s i s d o e s r e q u i r e a n i n t e r m e d i a t e t h a t i s s t a b l e
e n o u g h o n t h e s u r f a c e t o u n d e r g o r e p e a t e d c h a i n -
a d d i t i o n s t e p s . T h e c h a i n - p r o p a g a t i o n s t e p c o u l d b e
R R ------------ C
I I / H0 + C O ( g ) — > O 0 — ►
1 I /
R R
\\
\
C CH1 h ^O
<NwO
— > O
\ / 1
F e F e
(24) J. R. Anderson and C. Kemball, T rans. F araday Soc., 51, 966 (1955).(25) C. Kem ball and Stoddart, Proc. R oy. Soc. (London), A241, 208 (1957).(26) D. C. Bradley, R. K . M ultan i, and W. Wardlaw, J . Chem. Soc., 4153 (1958).(27) J. W. Richardson, “ Organo M eta llic Chemistry,” H . Zeiss,Ed., Reinhold Publishing Corp., New York, N . Y ., 1960.
V olum e 70, N um ber 3 M arch 1966

900 G. Blyholder and L. D. Neff
T h e r e a r e a n u m e r o u s w a y s i n w h i c h t h e c h a i n - l e n g t h e n
i n g p r o c e s s c o u l d o c c u r u s i n g a n a l k o x i d e s t r u c t u r e .
T h e s e c o n d s t e p i n t h e a b o v e s c h e m e , r a t h e r t h a n b e i n g
h y d r o g e n a t i o n , c o u l d b e a r e a r r a n g e m e n t t o a n a c i d
s t r u c t u r e .
R R
1 \R C C c h 2
\ 1 / \ \
O 0 1- » * O 0 — > 0
\ / \ / /F e F e F e
( 2 )
C o n c e r n i n g t h e p o s s i b l e o c c u r r e n c e o f a n a c i d i n t e r
m e d i a t e , i n a n i n f r a r e d s t u d y o f t h e i n t e r a c t i o n o f C O
a n d H 2 a t 1 8 0 ° o n s i l i c a - s u p p o r t e d F e , b a n d s f o r a
s u r f a c e s p e c i e s w e r e f o u n d a t 1 4 4 0 a n d 1 5 6 0 c m - 1 .6
N o a s s i g n m e n t s w e r e m a d e f o r t h e s e b a n d s i n t h a t
s t u d y , b u t i t m a y b e n o t e d t h a t a b i d e n t a t e a c e t a t e
l i g a n d h a s C - 0 s t r e t c h i n g v i b r a t i o n s a t a b o u t t h e s e
f r e q u e n c i e s . 28 29 30 31 32 33 34 T h e s e b a n d s c o u l d n o t b e p r o d u c e d b y
t h e i n t e r a c t i o n o f C O a n d 0 2 a l o n e i n t h e i n f r a r e d
s t u d y . I n f o r m a t i o n o n t h e i n c o r p o r a t i o n o f a c i d s
i n F i s c h e r - T r o p s c h p r o d u c t s m i g h t s h e d s o m e l i g h t
o n t h e p o s s i b i l i t y o f a n a c i d i n t e r m e d i a t e .
F o r a c h a i n - b r a n c h i n g s t e p t h e a d d i t i o n o f a s e c o n d
a l k y l g r o u p f r o m a n a d j a c e n t a l k o x i d e s t r u c t u r e ,
r a t h e r t h a n a s e c o n d h y d r o g e n a t o m i n t h e l a s t s t e p
o f e q 1 , m a y b e p r o p o s e d . F o r a c h a i n - i n i t i a t i n g s t e p
t h e h y d r o g e n a t i o n o f a t e m p o r a r i l y o x y g e n - a t t a c h e d
C O m o l e c u l e m a y b e p r o p o s e d t o p r o d u c e a m e t h o x y
s t r u c t u r e . T h e g r e a t p o w e r o f a l c o h o l s t o a c t a s
c h a i n i n i t i a t o r s i s s e e n a s t h e r e s u l t o f a l c o h o l a d s o r p
t i o n t o p r o d u c e a n a l k o x i d e i n t e r m e d i a t e b e i n g m o r e
p r o b a b l e t h a n C O h y d r o g e n a t i o n t o m e t h o x i d e . T h e
f i n d i n g t h a t p r o p i o n a l d e h y d e 32 i s a l s o a g o o d c h a i n
i n i t i a t o r i s i n a c c o r d w i t h t h e a l k o x i d e i n t e r m e d i a t e
m e c h a n i s m b e c a u s e a l d e h y d e s w e r e f o u n d h e r e t o
a d s o r b t o p r o d u c e a n a l k o x i d e s t r u c t u r e .
I n e q 1 a n d 2 t h e p r e s e n c e o f o x y g e n - a t t a c h e d C O
o n t h e s u r f a c e i s n o t s u g g e s t e d a s a s t a b l e f o r m s i n c e
i n f r a r e d s t u d y o f C O o n F e 35 i n d i c a t e s c a r b o n a t t a c h
m e n t a s t h e s t a b l e f o r m a t 2 5 ° . H o w e v e r , i n t h e i n
f r a r e d s t u d y o f t h e i n t e r a c t i o n o f C O a n d H 2 o n s i l i c a -
s u p p o r t e d F e , i t w a s s h o w n t h a t n o r e a c t i o n o c c u r r e d
u n t i l a h i g h e n o u g h t e m p e r a t u r e w a s r e a c h e d t h a t t h e
g a s p h a s e C O w a s i n d y n a m i c e q u i l i b r i u m w i t h t h e
a d s o r b e d C O . U n d e r r e a c t i o n c o n d i t i o n s C O m o l e
c u l e s w i l l b e c o n t i n u a l l y c o l l i d i n g w i t h t h e s u r f a c e ,
a n d o x y g e n - e n d f i r s t c o l l i s i o n s w i l l b e a s l i k e l y a s
c a r b o n - e n d f i r s t c o l l i s i o n s . T h e o x y g e n - a t t a c h e d C O
m o l e c u l e s i n e q 1 a n d 2 a r e r e g a r d e d a s m o l e c u l e s f r o m
t h e g a s p h a s e c o l l i d i n g w i t h t h e s u r f a c e .
T h e k i n e t i c s o f t h e F i s c h e r - T r o p s c h r e a c t i o n h a v e
r e c e i v e d a t h o r o u g h t r e a t m e n t b y H a l l , K o k e s , a n d
E m m e t t . 32 C h a n g i n g t h e s t r u c t u r e s o f t h e i n t e r m e
d i a t e s t h e y w r o t e d o w n t o o n e s l i k e t h o s e p r o p o s e d
h e r e d o e s n o t c h a n g e t h e i r k i n e t i c e q u a t i o n s s o t h e s e
i n t e r m e d i a t e s a r e i n a c c o r d w i t h t h e o b s e r v e d k i n e t i c s .
I n s u m m a r y , o u r i n f r a r e d s t u d y i n d i c a t e s t h a t t h e
s t a b l e s t r u c t u r e p r o d u c e d b y t h e a d s o r p t i o n o f a n u m
b e r o f C jH ^ O c o m p o u n d s o n e v a p o r a t e d - i n t o - o i l F e
a t 2 5 ° i s a n a l k o x i d e s t r u c t u r e . T h i s s t r u c t u r e i s
s e e n t o b e i n a c c o r d w i t h t h e m a i n s t r e a m o f t h i n k i n g
o n t h e s t a b i l i t y o f o r g a n o m e t a l l i c c o m p o u n d s . T h u s ,
a r e l a t i o n s h i p b e t w e e n s u r f a c e c h e m i s t r y a n d o r g a n o
m e t a l l i c c h e m i s t r y i s f i r m l y e s t a b l i s h e d o n a s t r u c t u r a l
b a s i s . T h e i n t e r m e d i a t e s i n t h e F i s c h e r - T r o p s c h
r e a c t i o n a r e p r o p o s e d t o h a v e a n a l k o x i d e s t r u c t u r e .
T h e s e i n t e r m e d i a t e s h a v e a t l e a s t t h e v i r t u e , i f n o
o t h e r , o f b e i n g i n a c c o r d w i t h t h e l a t e s t f i n d i n g s o n t h e
s t r u c t u r e o f s u r f a c e s p e c i e s .
Acknowledgment. A c k n o w l e d g m e n t i s m a d e t o t h e
d o n o r s o f t h e P e t r o l e u m R e s e a r c h F u n d , a d m i n i s t e r e d
b y t h e A m e r i c a n C h e m i c a l S o c i e t y , f o r p a r t i a l s u p p o r t
o f t h i s r e s e a r c h .
(28) J. T . Kummer, H . H . Podgurski, W. B. Spencer, and P. H. Em m ett, J . A m . Chem. Soc., 73, 5641 (1951).(29) J. T . Kum mer and P. H . Emmett, ib id ., 75, 5177 (1953).(30) W. K . H a ll, R. J. Kokes, and P. H. Em m ett, ib id ., 79, 2983 (1957).(31) R. J. Kokes, W. K . H a ll, and P. H. Em m ett, ib id ., 79, 2989 (1957).(32) W. K . H a ll, R. J. Kokes, and P. H . Emm ett, ib id ., 82, 1027 (1960).(33) G. B lyholder and P. H. Emm ett, J . P h ys. Chem., 63, 962 (1959).(34) K . Nakamoto, “ In frared Spectra of Inorganic and Coordination Compounds,” John W iley and Sons, Inc., New York, N . Y., 1963.(35) G. Blyholder, in preparation.
The Journal of Physical Chemistry

Vapor Phase Association of T rifluoroacetic Acid 901
Vapor Phase Association of Trifluoroacetic Acid with
Acetone and Cyclopentanone
by Chii Ling, Sherril D . Christian, and H arold E . Affsprung
D epartm ent o f C h em istry , The U n iversity o f O klahom a, N orm an , Oklahom a 73069 (Received October 2 5 , 1 9 6 5 )
T h e v a p o r p h a s e a s s o c i a t i o n o f t r i f l u o r o a c e t i c a c i d w i t h a c e t o n e a n d w i t h c y c l o p e n t a n o n e
h a s b e e n i n v e s t i g a t e d u s i n g a v a p o r d e n s i t y t e c h n i q u e . E q u i l i b r i u m c o n s t a n t s a n d
e n t h a l p i e s o f t h e h e t e r o a s s o c i a t i o n r e a c t i o n s a r e r e p o r t e d .
Introduction
P r e v i o u s l y , w e s t u d i e d t h e v a p o r p h a s e h e t e r o
a s s o c i a t i o n o f t r i f l u o r o a c e t i c a c i d w i t h v a r i o u s p r o t o n
a c c e p t o r s ; 1 - 3 h o w e v e r , o n l y i n t h e c a s e o f t h e t r i
f l u o r o a c e t i c a c i d - a c e t i c a c i d s y s t e m w a s a n e n t h a l p y
o f f o r m a t i o n o f t h e h y d r o g e n - b o n d e d c o m p l e x r e p o r t e d . 3
I n v i e w o f t h e e x c e p t i o n a l s t a b i l i t y o f t h e t r i f l u o r o
a c e t i c a c i d - a c e t i c a c i d c o m p l e x , w e d e c i d e d t o d e t e r m i n e
e q u i l i b r i u m c o n s t a n t s a n d e n t h a l p i e s c h a r a c t e r i s t i c
o f t h e r e a c t i o n o f m o n o m e r s o f t r i f l u o r o a c e t i c a c i d a n d
k e t o n e s t o f o r m h e t e r o c o m p l e x e s . K e t o n e s a r e k n o w n
t o r e a c t r e a d i l y w i t h p r o t o n d o n o r s i n s o l u t i o n t o f o r m
h y d r o g e n - b o n d e d c o m p l e x e s ; h e n c e , i t w a s e x p e c t e d
t h a t h y d r o g e n b o n d s f o r m e d b e t w e e n t h e k e t o n e o x y
g e n a n d t h e t r i f l u o r o a c e t i c a c i d w o u l d b e u n u s u a l l y
s t r o n g .
Experim ental and R esu lts
T h e v a p o r d e n s i t y t e c h n i q u e a n d m e t h o d o f t r e a t i n g
m i x e d v a p o r d e n s i t y d a t a h a v e b e e n d e s c r i b e d p r e v i
o u s l y . 1 - 8 B r i e f l y , t h e a p p a r a t u s c o n s i s t s o f a 5 -1 .
f l a s k w i t h a m e r c u r y - s e a l e d s i n t e r e d g l a s s d i s k p o r t f o r
s a m p l e i n t r o d u c t i o n a n d a T e f l o n n e e d l e - v a l v e s t o p
c o c k s e r v i n g a s t h e e v a c u a t i o n v a l v e . T h e t r e a t
m e n t o f t h e d a t a r e s t s u p o n t h e s o l u t i o n o f t h e e q u a t i o n s
P = T K u P a ' p b 1i j
( 1 )
tta = Y . ÍK i j P a ' v b 3i j
( 2 )
7TB = X j ' A o P a W ( 3 )» j
w h e r e p i s t h e t o t a l p r e s s u r e , tta a n d 7t b a r e t h e f o r m a l
p r e s s u r e s o f s p e c i e s A a n d B , r e s p e c t i v e l y , pa a n d p B
a r e t h e p a r t i a l p r e s s u r e s o f t h e m o n o m e r i c f o r m s o f t h e
c o m p o n e n t s , a n d t h e K u v a l u e s a r e e q u i l i b r i u m c o n
s t a n t s f o r t h e r e a c t i o n o f m o n o m e r s t o y i e l d t h e c o m
p l e x A 4B t N o t e t h a t b y d e f i n i t i o n K w = 0 , K w = 1 ,
a n d K 0i = 1 . C o n s t a n t s o f t h e t y p e K i0 a n d K 0J, w i t h i a n d j g r e a t e r t h a n 1 , r e p r e s e n t s e l f - a s s o c i a t i o n c o n s t a n t s
f o r t h e p u r e c o m p o u n d s A a n d B , r e s p e c t i v e l y . I n f o r
m u l a t i n g e q 1 - 3 i t i s a s s u m e d t h a t e a c h c o m p l e x i n d i
v i d u a l l y o b e y s t h e i d e a l g a s e q u a t i o n . T h e c o m p o u n d s
u s e d i n t h e e x p e r i m e n t s w e r e p u r i f i e d b y d i s t i l l a t i o n
t h r o u g h a 2 5 - p l a t e O l d e r s h a w c o l u m n a n d s t o r e d i n
v a p o r c o n t a c t w i t h a d e s i c c a n t p r i o r t o u s e .
B e c a u s e o f t h e r e l a t i v e l y l o w v a p o r p r e s s u r e o f c y c l o
p e n t a n o n e , t h e t r i f l u o r o a c e t i c a c i d - c y c l o p e n t a n o n e s y s
t e m w a s i n v e s t i g a t e d i n t h e t e m p e r a t u r e r a n g e 4 0 t o
6 0 ° ; t h e t r i f l u o r o a c e t i c a c i d - a c e t o n e s y s t e m w a s s t u d
i e d i n t h e r a n g e 2 1 t o 4 0 ° . T a b l e I l i s t s v a p o r d e n s i t y
d a t a f o r t h e t w o s y s t e m s ; v a l u e s o f t h e f o r m a l p r e s s u r e
o f t r i f l u o r o a c e t i c a c i d , 7rA , t h e f o r m a l p r e s s u r e o f k e t o n e ,
7tb , a n d t h e c o r r e c t e d t o t a l p r e s s u r e , p, a r e i n c l u d e d i n
c o l u m n s 1 - 3 .
I n f i t t i n g t h e d a t a f o r e a c h s y s t e m , s e v e r a l c h o i c e s o f
p l a u s i b l e h e t e r o a g g r e g a t e s w e r e m a d e . T h e d a t a w e r e
a d e q u a t e l y e x p l a i n e d b y a s s u m i n g t h a t t h e e q u i l i b r i u m
A + B = A B a c c o u n t s f o r t h e i n t e r a c t i o n b e t w e e n t h e
a c i d a n d k e t o n e v a p o r s , w h e r e A r e p r e s e n t s t h e m o n o - * 2378
(1) C. L in , Ph.D. Dissertation, The University of Oklahoma, Norman, Okla., 1964.(2) S. D. Christian, H . E, Affsprung, and C. Ling, J . Chem. Soc.,2378 (1965).(3) C. Ling, S. D . Christian, H . E. Affsprung, and R. W. Gray, ib id ., in press.(4) S. D . Christian, H . E. Affsprung, and C. L in , J . Chem. E duc., 40, 323 (1963).(5) S. D . Christian, ib id ., 42, 604 (1965).
V olum e 70, N um ber 3 M arch 1966

902 C. Ling, S. D. Christian, and H. E. Affsprung
Table I : Binary Vapor Pressure Data
System
Trifluoroacetic acid- acetone, 21°
Trifluoroacetic acid- acetone, 30°
Trifluoroacetic acid- acetone, 40°
Trifluoroacetic acid- cyclopen tanone,40°
* A . 7TB.m m m m
0.74 2.380.74 4.710.74 7.140.74 9.561.25 2.381.25 4.711.25 7.142.03 2.382.03 4.712.03 7.142.54 2.382.54 4.712.54 7.144.27 4.714.27 2.38
3.76 2.433.76 4.703.76 7.193.76 9.593.76 12.023.76 14.537.49 2.437.49 4.707.49 7.197.49 9.567.49 12.029.85 2.439.85 4.709.85 7.199.85 9.599.85 12.02
2.62 2.582.62 5.122.62 7.692.62 10.232.62 12.844.60 2.584.60 5.124.60 7.694.60 10.234.60 12.847.99 2.587.99 5.127.99 7.697.99 10.237.99 12.84
1.50 0.801.50 1.661.50 2.511.50 3.381.50 4.261.59 0.801.59 0.801.59 1.661.59 1.661.59 2.51
p. pealed
m m m m
2.81 2.775.08 4.987.41 7.349.74 9.723.07 3.055.31 5.197.62 7.503.54 3.505.58 5.547.69 7.773.78 3.795.89 5.787.92 7.966.55 6.654.76 4.80
4.88 4.917.05 6.859.10 9.05
11.26 11.2113.46 13.4515.72 15.797.19 7.219.30 9.03
11.17 11.0713.07 13.0615.22 15.168.54 8.64
10.43 10.4012.39 12.3714.31 14.3216.13 16.33
4.59 4.566.92 6.889.27 9.26
11.63 11.6514.06 14.126.04 5.958.21 8.17
10.44 10.4712.67 12.7615.01 15.158.21 8.22
10.33 10.3412.63 12.5214.82 14.7117.05 16.99
2.09 2.042.89 2.813.67 3.574.49 4.375.14 5.182.19 2.122.21 2.122.98 2.882.97 2.883.78 3.64
System
Trifluoroacetic acid- cyclopen tanone,50°
Trifluoroacetic aeid- cyclopentanone,60°
»■A. 1TB.
m m m m
1.59 2.511.59 3.381.59 3.381.59 4.261.59 4.262.35 0.802.35 0.802.35 1.662.35 1.662.35 2.512.35 2.512.35 3.382.35 3.382.35 4.262.35 4.262.47 0.802.47 1.662.47 2.512.47 3.382.47 4.26
1.80 0.921.80 1.751.80 2.621.80 3.531.80 4.471.80 5.331.84 0.921.84 1.051.84 2.621.84 3.531.84 4.471.84 5.332.50 0.922.50 1.752.50 2.622.50 3.532.50 4.472.50 5.332.50 0.922.50 2.622.50 3.532.50 4.472.50 5.334.02 0.924.02 1.754.02 2.624.02 3.534.28 0.924.28 1.054.28 2.624.28 3.53
2.73 0.952.73 1.862.73 2.762.73 3.682.73 4.57
p. pealed^
m m m m
3.68 3.644.57 4.434.51 4.435.12 5.235.26 5.232.71 2.672.79 2.673.34 3.433.52 3.434.24 4.174.26 4.174.88 4.934.97 4.935.54 5.715.54 5.712.79 2.793.59 3.524.29 4.254.90 5.015.56 5.79
2.50 2.493.26 3.234.10 4.024.87 4.855.67 5.716.51 6.512.57 2.532.65 2.644.16 4.054.97 4.885.80 5.746.56 6.543.04 3.083.81 3.794.55 4.565.33 5.366.17 6.206.73 6.983.05 3.084.59 4.565.35 5.366.19 6.206.84 6.984.35 4.305.06 4.985.77 5.706.42 6.474.58 4.515.31 5.186.04 5.906.62 6.65
3.48 3.444.27 4.265.09 5.085.95 5.926.72 6.74
The Journal of Physical Chemistry

Vapor Phase Association of T rifluoroacetic Acid 903
Table I (C o n t i n u e d )
SystemJ-A, ITB,
m m m m
2.73 5.462.73 6.432.91 0.952.91 1.862.91 2.762.91 3.682.91 4.572.91 5.462.91 6.432.99 1.862.99 2.762.99 3.682.99 4.572.99 5.462.99 6.434.04 0.954.04 1.864.04 2.764.04 3.684.04 4.574.04 5.464.15 0.954.15 1.864.15 2.764.15 3.684.15 4.574.15 5.46
p, pealedmm mm
8.43 8.468.43 8.463.58 3.604.36 4.425.17 5.236.00 6.076.83 6.887.72 7.708.56 8.604.57 4.495.30 5.306.16 6.136.95 6.957.73 7.768.57 8.664.51 4.585.38 5.376.23 6.167.00 6.987.83 7.778.63 8.564.58 4.675.49 5.466.22 6.257.08 7.067.87 7.858.68 8.65
m e r o f t r i f l u o r o a c e t i c a c i d , B t h e m o n o m e r o f t h e
k e t o n e , a n d A B t h e 1 : 1 c o m p l e x . N o i m p r o v e m e n t i n
t h e f i t o f d a t a w a s r e a l i z e d b y a s s u m i n g t h a t o t h e r
h e t e r o c o m p l e x e s w e r e p r e s e n t i n a d d i t i o n t o t h e 1 : 1
c o m p l e x . T h e l e a s t - s q u a r e s m e t h o d r e p o r t e d p r e
v i o u s l y w a s a p p l i e d i n d e t e r m i n i n g b e s t v a l u e s o f t h e
h e t e r o a s s o c i a t i o n c o n s t a n t s a n d t h e s t a n d a r d d e v i a t i o n s
o f t h e c o n s t a n t s . 2 ’ 3 '6 T a b l e I I l i s t s p r e v i o u s l y r e p o r t e d
v a l u e s o f t h e t r i f l u o r o a c e t i c a c i d s e l f - a s s o c i a t i o n c o n
s t a n t s , c a l c u l a t e d v a l u e s o f t h e h e t e r o a s s o c i a t i o n c o n
s t a n t s , A a b , t h e s t a n d a r d e r r o r o f e a c h c o n s t a n t , a n d
t h e m i n i m u m v a l u e o f s , t h e r o o t - m e a n - s q u a r e d e v i a
t i o n , f o r e a c h s y s t e m . V a l u e s o f m i n i m u m s a r e c o m
p a r a b l e t o e x p e c t e d u n c e r t a i n t i e s i n t o t a l p r e s s u r e .
T h e f i n a l c o l u m n i n T a b l e I l i s t s v a l u e s o f t h e c a l c u l a t e d
p r e s s u r e , p ca lcd , o b t a i n e d u s i n g t h e c o n s t a n t s i n T a b l e
I I .
D iscussion
T h e v a l u e s o f K a b i n T a b l e I I i n d i c a t e t h a t b o t h a c e
t o n e a n d c y c l o p e n t a n o n e f o r m v e r y s t r o n g h y d r o g e n
b o n d s w i t h t r i f l u o r o a c e t i c a c i d i n t h e v a p o r p h a s e . A
s u r p r i s i n g r e s u l t i s t h a t t h e a c e t o n e - t r i f l u o r o a e e t i c a c i d
c o m p l e x h a s a f o r m a t i o n c o n s t a n t a p p r o x i m a t e l y e q u a l
t o t h e d i m e r i z a t i o n c o n s t a n t o f t h e a c i d , w h e r e a s t h e
c y c l o p e n t a n o n e c o m p l e x f o r m a t i o n c o n s t a n t i s e v e n
l a r g e r t h a n K Al a t t h e t h r e e t e m p e r a t u r e s f o r w h i c h
d a t a w e r e o b t a i n e d .
F r o m t h e t e m p e r a t u r e d e p e n d e n c e o f K AB, e n t h a l p i e s
a n d e n t r o p i e s o f t h e h e t e r o a s s o c i a t i o n r e a c t i o n m a y b e
e s t i m a t e d . I n t h e c a s e o f t h e a c e t o n e c o m p l e x , A H ° i s
— 1 4 . 4 ± 1 . 0 k c a l / m o l e a n d A ( S ° i s — 5 0 . 8 ± 3 . 3 e u /
m o l e , w h i l e f o r t h e c y c l o p e n t a n o n e c o m p l e x , A H ° =
— 1 1 . 7 ± 1 . 0 k c a l / m o l e a n d A S ° = — 4 0 . 9 ± 3 . 2 e u /
m o l e . ( V a l u e s o f A $ ° a r e b a s e d o n s t a n d a r d s t a t e s o f
1 m m f o r e a c h s p e c i e s . ) W e d e t e r m i n e d p r e v i o u s l y
t h a t t h e 1 : 1 c o m p l e x b e t w e e n t r i f l u o r o a c e t i c a c i d a n d
a c e t i c a c i d h a s a n e n t h a l p y o f f o r m a t i o n o f a p p r o x i
m a t e l y — 1 7 k c a l / m o l e ; b y c o m p a r i n g t h i s v a l u e w i t h
t h e e n t h a l p i e s o f f o r m a t i o n o f o t h e r c o m p l e x e s i n v o l v i n g
c a r b o x y l i c a c i d s , w e c o n c l u d e d t h a t t h e h y d r o g e n b o n d
b e t w e e n t h e t r i f l u o r o a c e t i c a c i d p r o t o n a n d t h e a c e t i c
a c i d c a r b o n y l o x y g e n h a s a n e n t h a l p y o f f o r m a t i o n o f
a b o u t — 1 1 k c a l / m o l e . 3 S i n c e k e t o n e s a r e s u c h g o o d
b a s e s f o r h y d r o g e n b o n d i n g , t h e b o n d b e t w e e n a k e t o n i c
o x y g e n a n d t h e t r i f l u o r o a c e t i c a c i d p r o t o n s h o u l d b e a t
l e a s t a s s t r o n g a s t h e b o n d b e t w e e n t h e t r i f l u o r o a c e t i c
a c i d p r o t o n a n d t h e a c e t i c a c i d o x y g e n . H e n c e , i f t h e
t r i f l u o r o a c e t i c a c i d - k e t o n e c o m p l e x i n v o l v e s b u t a
s i n g l e h y d r o g e n b o n d , i t i s n o t u n r e a s o n a b l e t o e x p e c t
t h e b o n d t o h a v e a n e n t h a l p y o f f o r m a t i o n o f a p p r o x i -
Table II : Equilibrium Constants and Minimum s Values
K a „ mm“ 1 K a b , mm-1 Minimum s, mm
K a 2, mm-1 K a b , mm-1 Minimum s, mm
Trifluoroacetic acid-acetone system 21° 30°
0.43 ± 0.03 0.22 ± 0 .0 10.43 ± 0.05 0.18 ± 0 .0 1
0.077 0.111Trifluoroacetic acid-cyclopentanone system
40° 50°0.11 ± 0.01 0.048 ± 0 .0020.16 ± 0.02 0.105 ±0 .009
0.100 0.077
40°0 . 1 1 ± 0 . 0 1
0.089 ± 0.004 0.072
60°0.0234 ± 0.0005
0.054 ± 0.002 0.047
V olum e 70, N um ber 3 M arch 1966
904 Stanley H. Langer and Howard Purnell
m a t e l y — 12 k c a l / m o l e . T h i s p r e d i c t e d v a l u e a g r e e s
w e l l w i t h t h e v a l u e o b t a i n e d f o r t h e c y c l o p e n t a n o n e
c o m p l e x . O n t h e o t h e r h a n d , AH f o r t h e a c e t o n e c o m
p l e x i s s o m e w h a t g r e a t e r i n m a g n i t u d e t h a n t h e p r e
d i c t e d v a l u e .
T h e r e s u l t s p r e s e n t e d h e r e i n d i c a t e t h a t h y d r o g e n
b o n d s h a v i n g e n t h a l p i e s m o r e n e g a t i v e t h a n — 10 k c a l / m o l e a r e p r e s e n t . T h e s e b o n d s a r e a m o n g t h e
s t r o n g e s t h y d r o g e n b o n d s y e t r e p o r t e d .
Acknowledgment. T h i s r e s e a r c h w a s s u p p o r t e d b y
G r a n t N o . 1 4 8 1 - A 5 f r o m t h e P e t r o l e u m R e s e a r c h
F u n d o f t h e A m e r i c a n C h e m i c a l S o c i e t y .
Gas-Liquid Chromatographic Study of the Thermodynamics of
Solution of Some Aromatic Compounds. II. Solutions in
Di-n-propyl Tetrachlorophthalate12
by Stanley H . Langer and H ow ard Purnell
D epartm en t o f Chem ical E ngineering, U n iversity o f W isconsin , M a d iso n , W isconsin 53706, and D epartm en t o f P h ysica l C hem istry, U n iversity o f C am bridge, Cam bridge, E ngland {Received October 29, 1965)
A g a s - l i q u i d c h r o m a t o g r a p h i c s t u d y o f t h e e l u t i o n c h a r a c t e r i s t i c s o f a n u m b e r o f
t y p e s o f i s o m e r i c a r o m a t i c c o m p o u n d s f r o m c o l u m n s c o n t a i n i n g d i - n - p r o p y l t e t r a c h l o r o -
p h t h a l a t e i s d e s c r i b e d . D a t a a r e p r e s e n t e d f o r e l u t i o n a t 1 0 0 a n d 1 1 0 ° a n d t h e s e a r e
c o m p a r e d w i t h p r e v i o u s l y p u b l i s h e d d a t a f o r t h e s a m e s o l u t e s e l u t e d f r o m o t h e r l i q u i d
p h a s e s . T h e r e s u l t s a r e d i s c u s s e d i n t e r m s o f p a r t i a l e x c e s s m o l a r t h e r m o d y n a m i c q u a n t i
t i e s a n d a n a t t e m p t i s m a d e t o e s t a b l i s h c e r t a i n c h a r a c t e r i s t i c s o f s o l u t e - s o l v e n t i n t e r
a c t i o n . F o r s i m i l a r c o m p o u n d s , t h e r e i s g e n e r a l l y a l i n e a r c o r r e l a t i o n b e t w e e n t h e p a r t i a l
e x c e s s h e a t s a n d e n t r o p i e s o f s o l u t i o n . A l a r g e p r o p o r t i o n o f t h e p a r t i a l m o l a r e n t r o p i e s
o f m i x i n g m a y b e a c c o u n t e d f o r i n t e r m s o f t h e F l o r y - H u g g i n s e q u a t i o n .
G a s - l i q u i d c h r o m a t o g r a p h y ( g l c ) p r o v i d e s a r a p i d
a n d c o n v e n i e n t m e a n s t o o b t a i n a l a r g e v o l u m e
o f d a t a o n s o l u t e - s o l v e n t i n t e r a c t i o n s . T h e o b j e c t i v e
o f t h i s s e r i e s o f p a p e r s i s t o p r o v i d e c a r e f u l l y d e t e r
m i n e d r e t e n t i o n v o l u m e s f o r a v a r i e t y o f s i m p l e a r o m a t i c
i s o m e r s o n s e v e r a l s t a t i o n a r y p h a s e s o v e r a l i m i t e d
t e m p e r a t u r e r a n g e w i t h l i q u i d p h a s e s w h i c h a r e s e l e c
t i v e f o r i s o m e r s e p a r a t i o n . A s w e l l a s p r o v i d i n g i n
f o r m a t i o n b e a r i n g o n t h e o r i e s o f s o l u t i o n , i t i s t o b e
h o p e d t h a t , e v e n t u a l l y , t h i s i n f o r m a t i o n s h o u l d m a k e
i t p o s s i b l e t o d e v i s e a m o r e q u a n t i t a t i v e a p p r o a c h t o
l i q u i d p h a s e s e l e c t i o n a n d d e s i g n .
P r e v i o u s l y ,2 w e r e p o r t e d d a t a f o r t h r e e s e l e c t i v e l i q u i d
p h a s e s ( a r o m a t i c t y p e s ) i n e a c h o f w h i c h a r o m a t i c
s o l u t e s s h o w e d p o s i t i v e d e v i a t i o n f r o m R a o u l t ’ s l a w .
I n t h i s p a p e r , w e p r e s e n t r e s u l t s f o r s y s t e m s c o n t a i n i n g
d i - n - p r o p y l t e t r a c h l o r o p h t h a l a t e , 3,4 w h e r e i n t h e a r o - 1 2 3 4
(1) Presented in part at 150th National Meeting of American Chemical Society, A tlan tic C ity , N . J., Sept 1965.(2) F irs t paper in series: S. H . Langer and J. H . Purnell, J . P h ys. Chem., 67, 263 (1963).(3) S. H . Langer, C. Zahn, and G. Pantazopolos, J . Chrom atog., 3, 154 (1960).(4) S. H . Langer, C. Zahn, and G. Pantazopolos, Chem. In d . (London), 1145 (1958).
The Journal of Physical Chemistry

Thermodynamics of Solution of Aromatic Compounds 905
m a t i c s o l u t e s s t u d i e d s h o w n e g a t i v e d e v i a t i o n f r o m
R a o u l t ’ s l a w ; a t t h e s a m e t i m e , t h e o r d e r o f c h r o m a
t o g r a p h i c e l u t i o n o f i s o m e r s s u c h a s m- a n d p - x y l e n e i s
r e v e r s e d , b o t h f r o m t h a t o b s e r v e d w i t h o t h e r l i q u i d
p h a s e s a n d f r o m e x p e c t a t i o n b a s e d o n t h e i s o m e r v a p o r
p r e s s u r e s . W e h a v e a l r e a d y p r e s e n t e d e v i d e n c e 4 i n d i c a t i n g t h a t c h a r g e - t r a n s f e r f o r c e s 5,6 a r e o p e r a t i v e
i n t h i s s o l v e n t a n d a r e p r o b a b l y r e s p o n s i b l e f o r t h i s
n o v e l f i n d i n g w i t h t h e x y l e n e s a n d o t h e r i s o m e r s .
I t s h o u l d b e e m p h a s i z e d a g a i n t h a t p r e c i s e d e t e r m i
n a t i o n o f r e t e n t i o n v o l u m e s f o r s e v e r a l r e f e r e n c e s u b
s t a n c e s i n a p a r t i c u l a r l i q u i d p h a s e i s i m p o r t a n t , s i n c e
m o s t w o r k e r s r e p o r t r e l a t i v e r e t e n t i o n d a t a . T h e s e
c a n a l l b e c o n v e r t e d i n t o a c t i v i t y c o e f f i c i e n t s o r s p e c i f i c
r e t e n t i o n v o l u m e s f o r t h e t e m p e r a t u r e o r t e m p e r a t u r e s
o f i n t e r e s t i f o n l y o n e a b s o l u t e d a t u m i s a v a i l a b l e .
Theory
T h e a c t i v i t y c o e f f i c i e n t f o r s o l u t e a t i n f i n i t e d i l u t i o n
i n a s t a t i o n a r y p h a s e , 7 " , m a y b e r e l a t e d t o t h e c o m
p r e s s i b i l i t y - c o r r e c t e d r e t e n t i o n v o l u m e ( m e a s u r e d f r o m
t h e a i r p e a k ) p e r g r a m o f s o l v e n t a t c o l u m n t e m p e r a
t u r e ,2,7,8 V gT, b y t h e e q u a t i o n
y T _ R T
8 Mp°y" ( 1)
w h e r e M i s t h e m o l e c u l a r w e i g h t o f t h e s t a t i o n a r y
p h a s e a n d p° i s t h e v a p o r p r e s s u r e o f t h e p u r e s o l u t e .5 6 7 8 9 E x c e s s p a r t i a l m o l a r f u n c t i o n s a r e c a l c u l a t e d f r o m
A G " = R T I n y ” ( 2 )
„ 0 I n 7 "
ò ( i m ~ A e( 3 )
a n d
A G " = A H " - T A S " ( 4 )
w h e r e AGe" i s t h e e x c e s s p a r t i a l m o l a r f r e e e n e r g y o f
m i x i n g a t i n f i n i t e d i l u t i o n , A H " i s t h e ( e x c e s s ) p a r t i a l
m o l a r e n t h a l p y o f m i x i n g a t i n f i n i t e d i l u t i o n , a n d A S " i s t h e e x c e s s p a r t i a l m o l a r e n t r o p y o f m i x i n g a t i n f i n i t e
d i l u t i o n .
Experim ental Section
T h e a p p a r a t u s , c o l u m n s , a n d p r o c e d u r e h a v e b e e n
d e s c r i b e d p r e v i o u s l y .2 C o r r e c t i o n w a s m a d e f o r s l i g h t
e v a p o r a t i o n o f s t a t i o n a r y p h a s e , a n e f f e c t w h i c h w a s
m e a s u r e d b y m o n i t o r i n g V gT f o r t o l u e n e . P r e p a r a t i o n
o f p u r e d i - w - p r o p y l t e t r a c h l o r o p h t h a l a t e ( d 100 = 1 . 3 0 0
g / m l ) h a s b e e n d e s c r i b e d .10
R esults
V a l u e s o f V gT a n d t h e c o r r e s p o n d i n g c a l c u l a t e d
v a l u e s o f 7 " , f o r a v a r i e t y o f a r o m a t i c s o l u t e s , b o t h
Table I: Specific Corrected Retention Volumes“ (ml/g ofLiquid) and Activity Coefficients on Di-n-propyl Tetrachlorophthalate
Activitycoefficient,
'---------v gT 7 e0, at
100° 1 1 0 ° 1 0 0°
l Methylcyclohexane 70.8 56.8 1.1432 Heptane 46.9 36.7 1.6073 Benzene 90.2 71.8 0.4924 Toluene 204.1 156.0 0.5285 Ethylbenzene 361.3 269.9 0.6466 Propylbenzene 655.6 478.9 0.7347 Butylbenzene8 o-Xylene 571.5 418.1 0.5299 m-Xylene 427.6 316.4 0.600
1 0 p-Xylene 445.6 328.2 0.5601 1 l-Methyl-2-ethylbenzene 929.1 661.4 0.6351 2 l-Methyl-3-ethylbenzene 715.0 515.6 0.73213 l-Methyl-4-ethylbenzene 745. 6 540.1 0.70114 1,2,3-Trimethylbenzene 1504 1062 0.56315 1,2,4-Trimethylbenzene 1149 816 0.59216 1,3,5-Trimethylbenzene 825.4 591.1 0.71917 Isopropylbenzene 508.2 1470 0.76118 i-Butylbenzene 817.6 375.5 0.80419 Styrene 593.9 581.9 0.5282 0 Phenylacetylene 575.6 435.22 1 Anisole 761.3 546.8 0.5562 2 Fluorobenzene 1 0 1 . 0 78.8 0.50123 Chlorobenzene 411.1 307.8 0.49124 Bromobenzene 811.3 591.2 0.51925 Iodobenzene 1891 1328 0.62926 o-Chlorotoluene 897.6 649.3 0.52827 m-Chlorotoluene 905.0 649.6 0.58628 p-Chlorotoluene 960.5 688.3 0.54329 o-Dichlorobenzene 1799 1268 0.53330 m-Dichlorobenzene 1306 931.9 0.56531 p-Dichlorobenzene 1504 1061 0.51332 o-Chlorobromobenzene 3543 244633 m-Chlorobromobenzene 2513 1766 0.63334 p-Chlorobromobenzene 2915 2037 0.620
“ Retention volume of air taken as zero.
e l e c t r o n d o n o r s a n d a c c e p t o r s , e l u t e d f r o m d i - w -
p r o p y l t e t r a c h l o r o p h t h a l a t e a r e l i s t e d i n T a b l e I .
T h e v a p o r p r e s s u r e s u s e d i n t h e c a l c u l a t i o n s h a v e
b e e n l i s t e d p r e v i o u s l y .2,3 I t i s s e e n t h a t f o r e a c h
(5) R. S. M ulliken, J . A m . Chem. Soc., 74, 811 (1952); J . P h ys. Chem., 56, 801 (1952).(6) L . J. Andrews, Chem. R ev., 54, 713 (1954).(7) A. T . James and A. J. P. M artin , Biochem . J ., 50, 679 (1952).(8) (a) A. B. L ittlewood, C. S. G. Phillips, and D . T . Price, J . Chem. Soc., 1480 (1955); (b) M R. Hoare and J. H . Purnell, T rans. F araday Soc., 52, 222 (1956).(9) A ctua lly , fugacity rather than vapor pressure should be used in eq 1. We have explained reasons for using vapor pressures in ref 2. Other calculational procedures also are explained there.(10) S. H. Langer, C. Zahn, and M . H . V ial, J . Org. Chem., 24, 423 (1959).
Volume 70, Number 3 March 1966

906 Stanley H. Langer and Howard Purnell
s o l u t e t h e r e i s a l a r g e n e g a t i v e d e v i a t i o n f r o m R a o u l t ’ s
l a w w h i c h c o n t r a s t s s h a r p l y w i t h t h e b e h a v i o r o f t h o s e
s a m e a r o m a t i c s i n t h e s o l v e n t s s t u d i e d e a r l i e r .2E x c e s s p a r t i a l m o l a r q u a n t i t i e s c a l c u l a t e d via e q 2 ,
3 , a n d 4 f r o m t h e d a t a o f T a b l e I a r e l i s t e d i n T a b l e I I .
E r r o r s o f t h e o r d e r o f 1 % i n y " i n d u c e a n e r r o r o f o n l y
ca. ± 8 c a l / m o l e i n t h e c a l c u l a t e d AC re" . H o w e v e r ,
a s i m i l a r e r r o r i n y°° i n d u c e s a n e r r o r o f c l o s e t o 3 0 0
c a l / m o l e i n c a l c u l a t i n g A H f°. S i n c e r e t e n t i o n v o l u m e s
w e r e m e a s u r e d r e l a t i v e t o t h e r e f e r e n c e s o l u t e , t o l u e n e ,
a n d s u c h r e l a t i v e v a l u e s a r e r e a d i l y r e p r o d u c i b l e t o
w i t h i n a f e w t e n t h s o f 1 % , v a l u e s o f A H f° a r e m u c h
m o r e r e l i a b l e o n a r e l a t i v e b a s i s t h a n t h e y a r e a s
a b s o l u t e q u a n t i t i e s . A s w e i n d i c a t e d e a r l i e r ,2 i t w o u l d
b e d e s i r a b l e t o c o r r e c t f o r g a s i m p e r f e c t i o n s ; h o w e v e r ,
s u c h c o r r e c t i o n s c o u l d b e m i s l e a d i n g i n t h i s i n s t a n c e
s i n c e f e w f u g a c i t i e s h a v e b e e n m e a s u r e d a n d t h e o
r e t i c a l c o m p u t a t i o n f o r a r o m a t i c v a p o r s c a n n o t b e
u t i l i z e d r e l i a b l y . F u r t h e r m o r e , s i n c e f u g a c i t y c o r -
Table II: Excess Partial Thermodynamic Quantities at Infinite Dilution in Di-ra-propyl Tetrachlorophthalate
A Ge“ A He”(100°), (105°), ASe”cal/ kcal/ (100°),mole mole eu
- 1 Methylcyclohexane 99 0 . 7 9 1.862 Heptane 352 0.28 -0 .2 03 Benzene -526 0.22 2.004 Toluene -474 -0 .0 3 1.175 Ethylbenzene -324 0.10 1.306 Propylbenzene -229 0.37 1.618 o-Xylene -472 -0 .1 3 0.929 m-Xylene -379 0.03 0.92
10 p-Xylene -430 -0 .1 7 0.7011 l-Methyl-2-ethylbenzene -337 -0 .1 1 0.6112 l-Methyl-3-ethylbenzene -231 -0 .3 1 -0 .2 613 l-Methyl-4-ethylbenzene -264 -0 .0 8 0.4914 1,2,3-Trimethylbenzene -426 0.06 0.9815 1,2,4-Trimethylbenzene -389 0.00 1.0216 1,3,5-Trimethylbenzene -245 0.14 0.2817 Isopropylbenzene -202 0.42 1.6718 ¿-Butylbenzene -162 -0 .0 7 0.2519 Styrene -474 0.02 1.3421 Anisole -435 -0 .1 3 0.8222 Fluorobenzene -513 -0 .1 7 0.9223 Chlorobenzene -528 0.00 1.4224 Bromobenzene -486 -0 .2 0 0.7725 Iodobenzene -344 0.16 1.3526 o-Chlorotoluene -474 0.00 1.2727 m-Chloro toluene -396 -0 .2 2 0.4328 p-Chlorotoluene -453 -0 .4 5 0.0029 o-Dichlorobenzene -467 0.13 1.6030 m- Di chlorobenzene -424 0.12 1.5931 p-Dichlorobenzene -495 -0 .1 3 0.9833 m-Chlorobromobenzene -339 0.37 1.9534 p-Chlorobromobenzene -354 0.65 2.79
r e c t i o n s a r e a b o u t e q u a l f o r a r o m a t i c i s o m e r s , s u c h c o r
r e c t i o n , u n l e s s k n o w n p r e c i s e l y , w o u l d n o t f u r t h e r a i d
t h e i d e n t i f i c a t i o n o f i n t e r a c t i o n s ; h e n c e , d i s c u s s i o n o f
t h e relative v a l u e s o f t h e r m o d y n a m i c q u a n t i t i e s a p p e a r s
t o b e t h e b e s t a p p r o a c h a t t h i s t i m e .
D i s c u s s i o n
7 " and A Gf° Values. S i n c e t h e s e f u n c t i o n s a r e
l o g a r i t h m i c a l l y r e l a t e d , t h e y m a y b e d i s c u s s e d q u a l i
t a t i v e l y a n d i n t e r m s o f r e l a t i v e m a g n i t u d e a t t h e s a m e
t i m e . A s c a n b e s e e n f r o m t h e p l o t o f F i g u r e 1 , t h e
o r d e r o f d e c r e a s i n g a c t i v i t y c o e f f i c i e n t s ( o r A G " ) f o r s e v e r a l g e n e r a l c l a s s e s o f a r o m a t i c i s o m e r s i s t h e
s a m e i n d i - n - p r o p y l t e t r a c h l o r o p h t h a l a t e s o l u t i o n s
a s i t i s i n t h e a r o m a t i c , e l e c t r o n - d o n o r , l i q u i d p h a s e s ,
7 , 8 - b e n z o q u i n o l i n e a n d b e n z y l d i p h e n y l ; i.e., 7 “ f o r
m e t h y l e t h y l b e n z e n e s > x y l e n e s > c h l o r o t o l u e n e s >
d i c h l o r o b e n z e n e s . F u r t h e r , a l t h o u g h t h e t e t r a h a l o -
p h t h a l a t e i s e x p e c t e d t o b e a n e l e c t r o n a c c e p t o r ,
t h e h a l o a r o m a t i c s ( a l s o e l e c t r o n a c c e p t o r s ) h a v e l o w e r
a c t i v i t y c o e f f i c i e n t s t h a n t h e a r o m a t i c h y d r o c a r b o n s
i n t h i s p h a s e j u s t a s t h e y d o i n e l e c t r o n - d o n o r s o l v e n t s .2 T h u s , w h i l e t h e r e a r e c l e a r l y s o m e s p e c i f i c a t t r a c t i v e
i n t e r a c t i o n s b e t w e e n t h e h y d r o c a r b o n - s u b s t i t u t e d
a r o m a t i c s a n d t h e e l e c t r o n - a c c e p t o r l i q u i d p h a s e ,5,6 a s e x e m p l i f i e d i n t h e n e g a t i v e d e v i a t i o n f r o m R a o u l t ’ s
l a w a n d t h e m/p-xy l e n e e l u t i o n i n v e r s i o n , t h e s e
e v i d e n t l y d o n o t p r o d u c e g r e a t e r s o l u t i o n e f f e c t s t h a n
t h o s e r e s u l t i n g f r o m t h e s t r u c t u r a l r e s e m b l a n c e o f t h e
s o l u t e m o l e c u l e s ( h a l o g e n - s u b s t i t u t e d ) t o t h e s o l v e n t
a n d a s s o c i a t e d c o m m o n c h a r a c t e r i s t i c s o f i n t e r a c t i o n ;
i n c l u d e d h e r e i s t h e e a s e o f f i t t i n g s o l u t e m o l e c u l e s i n t o
t h e s o l v e n t l a t t i c e .
I n t e r e s t i n g l y , f o r e a c h i s o m e r g r o u p i n s o l u t i o n i n
d i - n - p r o p y l t e t r a c h l o r o p h t h a l a t e t h e o r d e r o f d e c r e a s
i n g a c t i v i t y c o e f f i c i e n t i s t h e s a m e , m- > p- > 0 -; h o w e v e r , i n t h e h y d r o c a r b o n s o l v e n t s t h e o r d e r o f
a c t i v i t y c o e f f i c i e n t d e c r e a s e i s n o t t h e s a m e f o r h y d r o
c a r b o n i s o m e r s a s f o r c h l o r i n e - s u b s t i t u t e d i s o m e r s .
Excess Heats and Entropies of Mixing. W h i l e i t i s
7 “ w h i c h w i t h p° d e t e r m i n e s s e p a r a t i o n f a c t o r s ( a ) , a t
a g i v e n t e m p e r a t u r e , i t i s A H f° w h i c h d e t e r m i n e s t h e
t e m p e r a t u r e v a r i a t i o n o f 7 " a n d s o m e t i m e s a. T h i s i s
e s p e c i a l l y t r u e f o r a r o m a t i c i s o m e r s w h e r e v a p o r
p r e s s u r e s m a y b e e x p e c t e d t o v a r y i n a u n i f o r m m a n n e r ,
b e c a u s e h e a t s o f v a p o r i z a t i o n o f i s o m e r s a r e o f t e n
a p p r o x i m a t e l y e q u a l . O n e m u s t r e m e m b e r ( f r o m t h e
c a l c u l a t i o n p r o c e d u r e ) t h a t c a l c u l a t e d v a l u e s o f A H em a r e s e n s i t i v e a l s o t o a n e r r o r i n p u r e s o l u t e v a p o r p r e s
s u r e s i n c e t h i s c o n t r i b u t e s t o a c o r r e s p o n d i n g e r r o r
i n 7 “ a t a g i v e n t e m p e r a t u r e .
B e c a u s e o f t h e s e n s i t i v i t y o f c a l c u l a t e d A H f° v a l u e s
t o e r r o r s i n 7 ” r e s u l t i n g f r o m s m a l l e r r o r s i n m e a s u r e
The Journal o f Physical Chemistry

Thermodynamics of Solution of Aromatic Compounds 907
m e n t o f F g , i t i s d i f f i c u l t t o v o u c h f o r v a l u e s o f T a b l e
I I i n a n a b s o l u t e s e n s e . H o w e v e r , b e c a u s e r e l a t i v e
r e t e n t i o n v o l u m e s ( b a s e d o n t o l u e n e ) w e r e u s e d , t h e
r e l a t i v e v a l u e s o f A H " a r e r e l i a b l e t o w i t h i n t h e c e r
t a i n t y o f t h e v a p o r p r e s s u r e d a t a . S u r p r i s i n g l y ,
v a l u e s a r e c o n s i d e r a b l y l e s s n e g a t i v e t h a n v a l u e s r e
p o r t e d f o r s o l u t i o n i n a r o m a t i c h y d r o c a r b o n t y p e
l i q u i d p h a s e s ; 2 i n s e v e r a l i n s t a n c e s , t h e y a r e s u f
f i c i e n t l y p o s i t i v e t o l e a v e n o d o u b t o f t h e s i g n o f A H " . T h i s i s e s p e c i a l l y t r u e f o r h a l o g e n - s u b s t i t u t e d a r o m a t i c s
a n d a r o m a t i c s w i t h l a r g e r a l i p h a t i c s u b s t i t u e n t g r o u p s .
V a l u e s c l o s e t o z e r o , o f c o u r s e , i n d i c a t e t h a t a c t i v i t y
c o e f f i c i e n t s d o n o t v a r y g r e a t l y w i t h t e m p e r a t u r e .
V a l u e s o f A S c" c a l c u l a t e d f r o m e q 4 w i l l b e p r o p o r
t i o n a t e l y a f f e c t e d b y a n y e r r o r s i n t h e m e a s u r e d p a r t i a l
e x c e s s m o l a r e n t h a l p y . T h e p o s i t i v e v a l u e s f o u n d h e r e
c o r r e s p o n d t o e n h a n c e d s o l u b i l i t y a n d a r e c o m p a t i b l e
w i t h t h e o b s e r v e d n e g a t i v e d e v i a t i o n s f r o m R a o u l t ’ s
l a w . T h i s r e s u l t i s t h e r e v e r s e o f t h a t f o u n d b y u s f o r
s e v e r a l o t h e r a r o m a t i c s o l v e n t s 2 a n d a l s o o f t h e f i n d i n g s
o f D e s t y a n d S w a n t o n . 11 F o r t h e f u s e d a r o m a t i c
t y p e l i q u i d p h a s e s e x a m i n e d e a r l i e r , A 5 e " w a s g e n e r
a l l y s u f f i c i e n t l y n e g a t i v e t o p r o d u c e p o s i t i v e d e v i a t i o n s
f r o m R a o u l t ’ s l a w i r r e s p e c t i v e o f t h e s i g n o f AHe". I t i s , i n p r i n c i p l e , d e s i r a b l e t o h a v e a n e g a t i v e A 5 e“ f o r
a s y s t e m s h o w i n g a t t r a c t i v e i n t e r a c t i o n s s i n c e t h e r e
s u l t i n g r e d u c e d s o l u b i l i t y g i v e s s h o r t e r r e t e n t i o n t i m e s
a n d f a s t e r c h r o m a t o g r a p h i c s e p a r a t i o n s . T h i s s i t u a
t i o n o c c u r s f o r t h e x y l e n e s , f o r e x a m p l e , i n 7 , 8 - b e n z o -
q u i n o l i n e a n d a c c o u n t s f o r t h e e x c e l l e n t c h r o m a t o
g r a p h i c f e a t u r e s o f s h a t s o l v e n t .
D e s p i t e t h e c o n s i d e r a b l e d i f f e r e n c e i n b e h a v i o r b e
t w e e n t h e d i - w - p r o p y l t e t r a c h l o r o p h t h a l a t e a n d t h e
a r o m a t i c h y d r o c a r b o n s 2 a s s o l v e n t s a n d t h e r e f l e c t i o n
o f t h i s i n t h e s i g n s a n d m a g n i t u d e s o f A H e " a n d A S e" ,
a s i n t h e l a t t e r s y s t e m s , t h e r e i s a g a i n a r e a s o n a b l y
l i n e a r c o r r e l a t i o n b e t w e e n t h e t h e r m o d y n a m i c q u a n t i
t i e s f o r t h e s o l u t e s s t u d i e d . T h i s c o r r e l a t i o n i s i l
l u s t r a t e d b y F i g u r e 2 . S u c h a r e l a t i o n s h i p i s o b
s e r v e d i n m a n y a r e a s a n d h a s b e e n d i s c u s s e d b y B e l l 12
f o r s o l u t i o n s i n g e n e r a l a n d b y u s 2 f o r t h e g a s c h r o m a
t o g r a p h i c s i t u a t i o n , i.e., t h e s m a l l s o l u t e m o l e c u l e
i n t h e p r e s e n c e o f a m u c h l a r g e r s o l v e n t m o l e c u l e .
S u c h c o r r e l a t i o n s , n o t u n e x p e c t e d l y , a p p e a r t o b e b e t t e r
t h e m o r e n e a r l y a l i k e t h e s o l u t e m o l e c u l e s a r e . I t
c a n b e s e e n t h a t t h e d a t a g e n e r a l l y f o r m t w o s t r a i g h t
l i n e s , o n e f o r t h e h a l o g e n a t e d a r o m a t i c h y d r o c a r b o n s
a n d t h e o t h e r f o r t h e a l i p h a t i c s u b s t i t u t e d a r o m a t i c s .
T h e i n t e r a c t i o n s a r e u n d o u b t e d l y c o m p l e x t h o u g h
w e a k a n d t h e h e a t a n d e n t r o p y e f f e c t s a r e t h u s n o t
e n t i r e l y i n d e p e n d e n t . T h e d e v i a t i o n s f r o m t h e l i n e a r
c o r r e l a t i o n s w h e r e t h e y o c c u r a r e i n t e r e s t i n g a n d c a n
b e u n d e r s t o o d i n t e r m s o f s p a t i a l c o n f i g u r a t i o n . F o r
Di-n-propyl7,8-Benzoquinoline, tetrachlorophthalate, Benzyldiphenyl,
100° 100° 100°
orth o - m eta - p a ra - orth o - m eta - p a ra - orth o - m eta - pa ra -
Figure 1. Activity coefficients in various liquid phases for o rth o -, m e ta -, and paro-disubstituted benzenes: 1, xylenes; 2, methylethylbenzenes; 3, chlorotoluenes;4, dichlorobenzenes.
ASe“ , cal/mole °K.Figure 2. Plot of excess partial molar heat of solution vs. entropy, at infinite dilution for solutes of Table I in di-n-propyl tetrachlorophthalate: •, halogenated aromatics; O, other aromatic compounds. See Table I for compound numbers.
i n s t a n c e , 1 , 3 , 5 - t r i m e t h y l b e n z e n e h a s a s l i g h t l y p o s i t i v e
i n t e r a c t i o n e n e r g y ( A H e") a n d a n u n u s u a l l y s m a l l
p o s i t i v e e n t r o p y ( A S " ) . I f t h e e s t e r g r o u p s o f t h e
t e t r a h a l o p h t h a l a t e e s t e r a r e f o r c e d o u t o f t h e p l a n e
o f t h e a r o m a t i c r i n g ( a s m o l e c u l a r m o d e l s i n d i c a t e ) ,
t h e 1 , 3 , 5 - t r i m e t h y l b e n z e n e c a n n o t l i e a s c l o s e l y a g a i n s t
t h e e l e c t r o n - a c c e p t i n g t e t r a h a l o p h t h a l a t e m o l e c u l e
(11) D. H. Desty and W . T . Swanton, J . P h ys. Chem., 6 5 , 766(1961).(12) R. P. Bell, Trans. F araday Soc., 33, 496 (1937).
Volume 70, Number 3 March 1966

908 Stanley H. Langer and Howard Purnell
a s c a n t h e o t h e r t r i m e t h y l a t e d b e n z e n e s . T h u s , o v e r
a l l i n t e r a c t i o n i s s t e r i c a l l y u n f a v o r a b l e a n d i s r e f l e c t e d
t h e r m o d y n a m i c a l l y i n a n u n u s u a l l y s m a l l e x c e s s e n
t r o p y o f m i x i n g . F o r i - b u t y l b e n z e n e , w e h a v e a n
a p p a r e n t l y s l i g h t l y n e g a t i v e e x c e s s e n t h a l p y b u t a n
u n f a v o r a b l e e n t r o p y d u e t o t h e s t e r i c e f f e c t o f t h e
b u l k y ¿ - b u t y l g r o u p .
G e n e r a l l y , h o w e v e r , t h e l i n e a r c o r r e l a t i o n h o l d s .
T h u s , p - x y l e n e w i t h a l o w e r i o n i z a t i o n p o t e n t i a l 4 ' 13
i n t e r a c t s 2 0 0 c a l / m o l e m o r e s t r o n g l y w i t h t h e t e t r a -
h a l o p h t h a l a t e l i q u i d p h a s e t h a n d o e s m - x y l e n e b u t t h e
e x c e s s p a r t i a l m o l a r e n t r o p y o f m i x i n g i s 0 . 2 e u s m a l l e r .
T h e c h r o m a t o g r a p h i c s e p a r a t i o n l o o k e d f o r o n i n t e r a c
t i o n g r o u n d s i s t h e r e b y d i m i n i s h e d , a g e n e r a l f e a t u r e
e x p e c t e d f r o m t h e l i n e a r A H “ / A Sff p l o t . T h e s t r o n g e r
i n t e r a c t i o n s t e n d t o h a v e t h e h i g h e r e n t r o p y r e q u i r e
m e n t s .
T h e i n t e r a c t i o n o f e n t h a l p y f a c t o r s a n d s o l u t e h e a t
o f v a p o r i z a t i o n i n p r o d u c i n g c h r o m a t o g r a p h i c s e p a r a
t i o n f a c t o r s i s o f i n t e r e s t f o r x y l e n e i s o m e r s . W i t h
7 , 8 - b e n z o q u i n o l i n e , t h e m/p-xy l e n e s e p a r a t i o n f a c t o r ,
a, v a r i e s f r o m 1 . 0 8 t o 1 . 0 6 o v e r t h e r a n g e 8 0 t o 1 1 0 ° ,
w h i l e t h e s e p a r a t i o n f a c t o r f o r p/m-xy l e n e f r o m t h e
t e t r a c h l o r o p h t h a l a t e p h a s e v a r i e s o n l y f r o m 1 . 0 5 t o
1 . 0 4 i n t h e s a m e t e m p e r a t u r e r a n g e . H e r e
T h e f a c t o r p 2° / p i ° v a r i e s f r o m 1 . 0 3 5 t o 1 . 0 2 7 b e t w e e n
8 0 a n d 1 1 0 ° f o r t h e r a t i o o f p - x y l e n e t o m - x y l e n e v a p o r
p r e s s u r e . T h e r e m a i n i n g c h a n g e i n s e p a r a t i o n f a c t o r
i s c a u s e d b y a c h a n g e i n a c t i v i t y c o e f f i c i e n t i n t h e 7 , 8 -
b e n z o q u i n o l i n e l i q u i d p h a s e . N o w , f o r t h e s t r o n g e r
i n t e r a c t i n g ( o n t h e b a s i s o f p a r t i a l m o l a r e n t h a l p y o f
s o l u t i o n ) t e t r a c h l o r o p h t h a l a t e , t h i s k i n d o f c h a n g e i n
v a p o r p r e s s u r e r a t i o i s m o r e f a v o r a b l e t o s e p a r a t i o n
s i n c e t h e p - x y l e n e ( t h e x y l e n e w i t h t h e h i g h e r v a p o r
p r e s s u r e ) i s h e l d u p i n t h e c o l u m n r e l a t i v e t o m- x y l e n e . H o w e v e r , t h i s i s o f f s e t b y a g r e a t e r d e c r e a s e
i n s e l e c t i v e i n t e r a c t i o n a s r e f l e c t e d i n t h e r a t i o o f a c t i v
i t y c o e f f i c i e n t s . T h e c o n s e q u e n c e i s t h a t t h e s e p a r a
t i o n f a c t o r i n v o l v i n g t h e h i g h e r s o l u t i o n e n t h a l p y d i f
f e r e n c e c h a n g e s l e s s o v e r t h e t e m p e r a t u r e r a n g e
s t u d i e d .
I t i s , a t f i r s t s i g h t , s u r p r i s i n g t o f i n d t h a t AH ff v a l u e s f o r a r o m a t i c h y d r o c a r b o n s i n p r o p y l t e t r a c h l o r o
p h t h a l a t e t e n d t o b e l e s s n e g a t i v e t h a n t h o s e f o r s o l u
t i o n i n 7 , 8 - b e n z o q u i n o l i n e , 2 s i n c e i t w a s r e c o g n i t i o n
o f t h e p r o b a b l e “ t - t ” i n t e r a c t i o n b e t w e e n t h e e l e c t r o n -
p o o r r i n g a n d t h e e l e c t r o n - r i c h x y l e n e s w h i c h l e d t o t h e
i n t r o d u c t i o n o f t h e t e t r a h a l o p h t h a l a t e l i q u i d p h a s e s . 4 - 6
H o w e v e r , i f w e r e c o g n i z e t h e t e t r a h a l o p h t h a l a t e m o l e
c u l e a s a c o m p o s i t e m o l e c u l e w i t h s e v e r a l s i t e s f o r i n
t e r a c t i o n , s u c h a s t h e c o m p l e x p o l a r e s t e r g r o u p a n d
t h e c h l o r i n e s u b s t i t u e n t s , t h e n w e s e e t h a t a n y o v e r - a l l
s o l v e n t i n t e r a c t i o n w i t h s o l u t e m o l e c u l e s , a t l e a s t i n
d i l u t e s o l u t i o n , m a y b e c o m p o s e d o f a n u m b e r o f i n
t e r a c t i o n s . T h e a c t i v i t y c o e f f i c i e n t m i g h t t h e n b e
r e p r e s e n t e d a s
_ „AO ^ / R T _ A H i / R T A H s / R T „ - AS,/ffi - ASi/fij — G — t/ V . . . o (/ . . .
( 6 )
w h e r e A I l h A L L . . . , A$u A S 2 . . . , e t c . , a r e h e a t s a n d
e n t r o p i e s a s s o c i a t e d w i t h i n d i v i d u a l i n t e r a c t i o n s .
S o m e o f t h e s e i n t e r a c t i o n s m a y i n v o l v e p o s i t i v e h e a t s
( u n f a v o r a b l e t o s o l u t i o n ) a n d t h e s e m a y w e l l o u t w e i g h
t h e s u m o f n e g a t i v e h e a t s , g i v i n g a r e s u l t a n t p o s i t i v e
h e a t o r a d e c e p t i v e l y s m a l l m o l a r h e a t o f s o l u t i o n .
T h e e n t r o p i e s a s s o c i a t e d w i t h e a c h i n t e r a c t i o n m a y ,
h o w e v e r , b e g e n e r a l l y p o s i t i v e a n d c u m u l a t i v e s o t h a t
t h e o v e r - a l l e f f e c t i s o n e w i t h a s m a l l n e g a t i v e o r e v e n
p o s i t i v e h e a t b u t a l a r g e p o s i t i v e e n t r o p y ( f a v o r a b l e
t o s o l u t i o n ) . T h e c h a r g e - t r a n s f e r i n t e r a c t i o n i t s e l f
c o u l d b e a n e n e r g e t i c a l l y w e a k o n e o f t h e “ c o n t a c t
t y p e ” 14 15 i n v o l v i n g o n l y a s m a l l i n t e r a c t i o n e n e r g y .
A s i m p l e f o r m o f t h e “ g r o u p i n t e r a c t i o n ” v i e w i s d e m o n
s t r a t e d i n t h e w o r k o f P i e r o t t i , D e a l , D e r r , a n d
P o r t e r . 16' 16 T h e r e a r e i l l u s t r a t i o n s o f i t i n t h i s w o r k
a l s o , i n t e r m s o f m o l a r e x c e s s f r e e e n e r g y o f s o l u t i o n .
T h u s , a s a m e t h y l g r o u p i s a d d e d i n t h e s e r i e s b e n z e n e ,
t o l u e n e , p - x y l e n e , 1 , 2 , 4 - t r i m e t h y l b e n z e n e , A Gff i s
c h a n g e d a n a v e r a g e o f a b o u t 4 5 c a l / m o l e p e r m e t h y l
g r o u p . H o w e v e r , t h i s i s a g r e a t l y s i m p l i f i e d v i e w s i n c e
A H ff a n d A S “ a r e n o t a d d i t i v e i n t h i s f a s h i o n . I n
d e e d , i t i s t h e f a c t t h a t t h e s e a r e n o t a d d i t i v e b u t a r e
i n t e r r e l a t e d i n a l i n e a r f a s h i o n ( s e e b e l o w ) a n d c o m p e n
s a t i n g w h i c h g i v e s a r e s u l t a n t a d d i t i v i t y t o A G “ f o r c e r t a i n a r o m a t i c s e r i e s .
Effect of Size of Solute. I n g a s c h r o m a t o g r a p h i c
s i t u a t i o n s , s o l u t i o n s g e n e r a l l y i n v o l v e s m a l l s o l u t e
m o l e c u l e s d i s s o l v e d i n l a r g e r s o l v e n t m o l e c u l e s . T h i s
d i f f e r e n c e i n s i z e i s e x p e c t e d t o c a u s e a p p r e c i a b l e d e v i a
t i o n f r o m i d e a l i t y . T h e F l o r y - H u g g i n s t r e a t m e n t i s
o n e s i m p l e a p p r o a c h t o e s t i m a t i o n o f t h i s e f f e c t . 2 ' 17' 18
(13) F. H . Field and J. L . Franklin, J . Chem. P h ys., 22, 1895 (1954).(14) L. E. Orgel and R. S. M ulliken, J . A m . Chem. Soc., 79, 4839 (1957).(15) G. J. P ierotti, C. H . Deal, E. L . Derr, and P. E. Porter, ib id ., 78, 2989 (1956).(16) Cf. also: (a) A. I. M . Keulemans, “ Gas Chromatography,”Reinhold Publishing Corp., New York, N . Y ., 1957, pp 164-169; (b) H . Purnell, “ Gas Chromatography,” John W iley and Sons, Ine., New York, N . Y ., 1962, pp 24-28; (e) A. B. L ittlewood, “ Gas Chromatography," Academic Press, New York, N . Y ., 1962, pp 64-72.(17) D. H . Everett and C. T . H . Stoddart, T rans. F araday Soc., 57,746 (1961).
The Journal of Physical Chemistry

T hermodynamics of Solution of Aromatic Compounds 909
F o l l o w i n g A s h w o r t h a n d E v e r e t t , 18 19 t h e a c t i v i t y c o
e f f i c i e n t i s t a k e n t o b e a p r o d u c t o f i n d e p e n d e n t t h e r m a l
a n d a t h e r m a l t e r m s s o t h a t t h e t h e r m a l c o n t r i b u t i o n
t o t h e a c t i v i t y c o e f f i c i e n t ( y t ” ) a n d t h e a t h e r m a l c o n
t r i b u t i o n ( y a“ ) a r e r e l a t e d t o t h e r m o d y n a m i c q u a n t i t i e s
b y
, „ A H " _ — A S "n Tt R T ; 7a R T ( )
. U s i n g t h e F l o r y - H u g g i n s a p p r o a c h , a t i n f i n i t e d i l u
t i o n
7 a ” = - e ( 1 - (1 /m )) ( 8 )m
w h e r e t o i s t h e s i z e r a t i o o f t h e s o l u t i o n m o l e c u l e s , a p
p r o x i m a t e d a s t h e m o l a r v o l u m e r a t i o o f s o l v e n t t o
t h a t o f s o l u t e . I n ( 8 ) , y a “ h a s a m a x i m u m v a l u e o f
u n i t y a t ma = 1 s o t h a t A S " i s p o s i t i v e f o r o t h e r v a l u e s
o f t o . T h i s i s q u a l i t a t i v e l y i n a g r e e m e n t w i t h t h e
r e s u l t s o f T a b l e I I . C a l c u l a t e d v a l u e s o f y a" a r e g i v e n
i n T a b l e I I I a n d c a n b e c o m p a r e d w i t h t h e o b s e r v e d
v a l u e s o f y " o f T a b l e I t o g i v e s o m e i d e a o f t h e c o n
t r i b u t i o n t o t h e a c t i v i t y c o e f f i c i e n t o f s i z e e f f e c t s .
F r o m t h i s w e s e e t h a t n e g a t i v e d e v i a t i o n s f r o m R a o u l t ’ s
l a w a r e p r e d i c t e d , t h o u g h n o t a l w a y s t o t h e e x t e n t o b
s e r v e d .
B y d i v i d i n g t h e c a l c u l a t e d a t h e r m a l c o n t r i b u t i o n
t o t h e a c t i v i t y c o e f f i c i e n t i n t o t h e m e a s u r e d a c t i v i t y
c o e f f i c i e n t , a t h e r m a l l y s e n s i t i v e c o e f f i c i e n t y t“ c a n
b e c a l c u l a t e d . T h e s e d a t a a r e a l s o t a b u l a t e d i n T a b l e
I I I ; t h e y i n d i c a t e t h a t a l l v a l u e s o f A H " s h o u l d b e
n e g a t i v e . F o r p u r p o s e s o f c o m p a r i s o n w i t h A H " o f
T a b l e I I , i t s h o u l d b e n o t e d t h a t A H " i s — 7 5 c a l f o r
y t “ = 0 . 9 a n d — 1 6 5 c a l f o r y t “ = 0 . 8 ( e q 7 ) . F o r a
f e w c o m p o u n d s (e.g., i - b u t y l b e n z e n e , a n i s o l e , f l u o r o -
b e n z e n e , b r o m o b e n z e n e , a n d o t h e r s ) , A H " v a l u e s c a l
c u l a t e d i n t h i s m a n n e r a r e s u r p r i s i n g l y , a l t h o u g h
p o s s i b l y f o r t u i t o u s l y , c l o s e t o t h o s e o b s e r v e d . G e n e r
a l l y , y t ” m i g h t b e r e g a r d e d a s a “ s i z e c o r r e c t e d ”
a c t i v i t y c o e f f i c i e n t .
T h e r a t i o o f y t " / y a“ a s g i v e n i n T a b l e I I I c a n b e
c o m p a r e d w i t h s i m i l a r r a t i o s r e p o r t e d p r e v i o u s l y , 2
a n d , i n c o n t r a s t , v a l u e s h e r e v a r y m u c h m o r e . T h e
c o n s t a n c y o f t h i s r a t i o m a y w e l l b e a t e s t f o r a n a r o
m a t i c selective g a s c h r o m a t o g r a p h i c s o l v e n t . W h e r e
t h e r a t i o v a r i e s , t h e r e i s c o r r e s p o n d i n g v a r i a t i o n i n
Table III: Flory-Huggins Type Calculated -ya" ; -y t ° = W t»“ . Di-ra-propyl Tetrachlorophthalate
7a" 7t”Methylcyclohexane 0.799 1.430 1.79Heptane 0.862 1.864 2.16Benzene 0.646 0.762 1.18Toluene 0.717 0.737 1.03Ethylbenzene 0.778 0.831 1.07Propylbenzene 0.830 0.884 1.06o-Xylene 0.768 0.688 0.90m-Xylene 0.778 0.772 0.99p-Xylene 0.780 0.718 0.92l-Methyl-2-ethylbenzene 0.820 0.775 0.94l-Methyl-3-ethylbenzene 0.828 0.884 1.07l-Methyl-Pethylbenzene 0.830 0.845 1.021,2,3-Trimethylbenzene 0.812 0.694 0.851,2,4-Trimethylbenzene 0.822 0.720 0.881,3,5-Trimethylbenzene 0.828 0.868 1.05Isopropylbenzene 0.830 0.917 1.10¿-Butylbenzene 0.871 0.923 1.06Styrene 0.748 0.706 0.94Anisole 0.722 0.770 1.07Fluorobenzene 0.674 0.744 1.10Chlorobenzene 0.695 0.707 1.02Bromobenzene 0.706 0.736 1.04Iodobenzene 0.729 0.863 1.18o-Chloro toluene 0.752 0.702 0.93o-Dichlorobenzene 0.734 0.726 0.99m-Dichlorobenzene 0.743 0.760 1.02p-Dichlorobenzene 0.742 0.692 0.93m-Chlorobromobenzene 0.865 0.732 0.85
a f f i n i t y f o r a r o m a t i c i s o m e r s . W h e r e t h i s r a t i o d o e s
n o t v a r y , t h e s o l v e n t (i.e., s t a t i o n a r y p h a s e ) t e n d s
t o b e n o n s e l e c t i v e .
Acknowledgment. T h e a u t h o r s t h a n k D r . C . P .
Q u i n n f o r m a n y h e l p f u l s u g g e s t i o n s a n d e x p e r i m e n t a l
a s s i s t a n c e . P a r t i a l s u p p o r t o f t h i s w o r k b y t h e R o y a l
S o c i e t y a n d t h e J o h n S i m o n G u g g e n h e i m F o u n d a t i o n
i s a l s o a p p r e c i a t e d . S . H . L . t h a n k s P r o f e s s o r R . G .
W . N o r r i s h f o r t h e h o s p i t a l i t y o f t h e P h y s i c a l C h e m i s t r y
D e p a r t m e n t a t C a m b r i d g e d u r i n g t h e e x p e r i m e n t a l
p o r t i o n o f t h i s i n v e s t i g a t i o n .
(18) D. E. M artire , “ Gas Chromatography,” L . Fowler, Ed., Academic Press, New York, N . Y ., 1963.(19) A. J. Ashworth and D. H. Everett, T rans. F araday Soc., 56, 1609 (1960).
Volume 70, Number 3 March 1966

910 W. G. Burns, R. A. Holroyd, and G. W. K lein
Radical Yields in the Radiolysis of Cyclohexene with
Different Kinds of Radiation
by W . G . Burns, R . A . H olroyd, and G . W . K lein
A tom ic E nergy Research E stablishm ent, H arw ell, D idco t, B erk s, E nglan d, andR ad ia tion Research Laboratories, M ellon In stitu te , P ittsburgh, P en n sylvan ia (Received J u ly 12, 1965)
D i l u t e s o l u t i o n s ( 1 - 2 0 m l ) o f 14C H 3I i n c y c l o h e x e n e w e r e i r r a d i a t e d , a n d y i e l d s o f r a d i o
a c t i v e m e t h y l - 3 - c y c l o h e x e n e , m e t h y l c y c l o h e x a n e , m e t h y l - l - c y c l o h e x e n e , e t h a n e , a n d
m e t h a n e w e r e d e t e r m i n e d a s f u n c t i o n s o f 14C H 3I c o n c e n t r a t i o n , e n e r g y i n p u t , d o s e r a t e ,
a n d L E T o f t h e r a d i a t i o n . T h e r e s u l t s a r e i n t e r p r e t e d o n t h e b a s i s t h a t t h e r m a l 14C H 3
r a d i c a l s a r e f o r m e d a n d r e a c t w i t h t h e s u r r o u n d i n g m o l e c u l e s o r r a d i c a l s . T h e e f f e c t o f
d o s e r a t e i n d i c a t e d t h a t a s t h e d o s e r a t e i s d e c r e a s e d , a l l r a d i c a l s r e a c t i n g r e a t e r p r o p o r
t i o n w i t h t h e c y c l o h e x e n e r a t h e r t h a n i n i n t e r r a d i c a l r e a c t i o n s . T h e e f f e c t s o f c o n c e n t r a
t i o n a n d o f L E T a t h i g h d o s e r a t e s a r e c o n s i s t e n t w i t h t h e c o n c e p t t h a t m e t h y l r a d i c a l s
a r e g e n e r a t e d b y e l e c t r o n c a p t u r e . A t h i g h d o s e r a t e s o f l o w L E T r a d i a t i o n o n l y i n t e r
r a d i c a l r e a c t i o n s o c c u r , a n d t h e G v a l u e s o f 3 - c y c l o h e x e n y l , 1 - c y c l o h e x e n y l , a n d c y c l o
h e x y l r a d i c a l s d e t e r m i n e d f r o m t h e a b o v e r a d i o a c t i v e p r o d u c t y i e l d s a g r e e d w i t h t h o s e
d e d u c e d f r o m t h e C 12 p r o d u c t y i e l d s f r o m t h e p u r e l i q u i d . W i t h i n c r e a s i n g L E T t h e
a p p a r e n t r a d i c a l y i e l d s f r o m t h e a c t i v i t y m e a s u r e m e n t s f e l l m o r e r a p i d l y t h a n t h o s e d e
d u c e d f r o m t h e C 12 p r o d u c t y i e l d s . T h i s m a y b e d u e t o t h e i n h o m o g e n e i t y o f t r a c k r e a c
t i o n s a n d c a n b e a c c o u n t e d f o r i f t h e C H 3 r a d i c a l s , f o r m e d p o s s i b l y b y e l e c t r o n c a p t u r e ,
h a v e a l a r g e r d i f f u s i o n c o n s t a n t a n d a l a r g e r i n i t i a l t r a c k r a d i u s t h a n t h e c y c l o h e x e n y l
a n d c y c l o h e x y l r a d i c a l s . D i f f u s i o n t h e o r y c a l c u l a t i o n s i n d i c a t e t h a t t h e r a t i o o f t h e t r a c k
r a d i i i s ~ 5 .
Introduction r a d i c a l s , t h e s p e c i f i c a c t i v i t y o f t h e o r i g i n a l 14C H 3I
b e i n g k n o w n . W h e r e d i s p r o p o r t i o n a t i o n c a n a l s o
o c c u r , t h e r a d i c a l s w h i c h r e a c t b y t h i s p a t h a r e a c
c o u n t e d f o r b y m u l t i p l y i n g t h e a c t i v i t i e s o f t h e
p r o d u c t s o f c o m b i n a t i o n b y ( 1 + ko/kc) w h e r e fcD / f c c
i s t h e r a t i o o f r a t e c o n s t a n t s f o r d i s p r o p o r t i o n a t i o n
a n d c o m b i n a t i o n . I t i s a n e s s e n t i a l r e q u i r e m e n t o f t h e
f u l l a n a l y s i s o f t h e m e t h o d 1,2 t h a t t h e r e a c t i o n s o c c u r
h o m o g e n e o u s l y , a n d t h e o n l y c o n d i t i o n f o r v a l i d i t y i s
t h a t fc i2 = 2 ( fc u /c 22) 1 /! w h e r e kn i s t h e c r o s s - r e a c t i o n r a t e 1 2 3 4 5
A c t i v i t y m e a s u r e m e n t s o f t h e r a d i o l y t i c p r o d u c t s
o f d i l u t e s o l u t i o n s o f 14C 2H 4 i n s a t u r a t e d l i q u i d h y d r o
c a r b o n s , a n d o f 14C H 3I i n s a t u r a t e d a n d u n s a t u r a t e d
l i q u i d h y d r o c a r b o n s h a v e p r o v i d e d u s e f u l i n f o r m a t i o n
o n t h e r e l a t i v e a n d a b s o l u t e G v a l u e s o f r a d i o l y t i c a l l y
p r o d u c e d r a d i c a l s . 1 -5 A t h i g h d o s e r a t e s o r l o w t e m
p e r a t u r e s w i t h l i g h t l y i o n i z i n g r a d i a t i o n , t h e 14C 2H 5-
o r 14C H 3 - r a d i c a l s p r o d u c e d f r o m t h e r e s p e c t i v e
s o l u t e s t a k e p a r t i n t h e p r e v a i l i n g i n t e r r a d i c a l r e a c t i o n s
w h i c h o c c u r t o t h e e x c l u s i o n o f r a d i c a l - s o l u t e r e a c t i o n s .
R e l a t i v e y i e l d s o f r a d i c a l s , f o r e x a m p l e R i a n d R 2,
a r e o b t a i n e d f r o m t h e r e l a t i v e a c t i v i t i e s o f 14C H 3R i
a n d 14C H 3R 2, w h e r e 14C H 3I i s t h e s o l u t e . A b s o l u t e
r a d i c a l y i e l d s a r e o b t a i n e d , f o r e x a m p l e , b y c o m p a r i n g
t h e a c t i v i t y o f 14C H 3R i w i t h t h a t o f 14C 2H e a n d f r o m
a k n o w l e d g e o f G ( 14C H 3 - ) , w h i c h i s o b t a i n e d b y a d d i n g
t h e a c t i v i t i e s p e r u n i t e n e r g y i n p u t o f a l l p r o d u c t s
f o r m e d f r o m t h e c o m b i n a t i o n r e a c t i o n s o f l4C H 3 -
(1) R. A. Holroyd and G. W. K lein, In tern . J . A p p l. R a d ia tio n Iso topes, 13, 493 (1962).
(4) R. A. Holroyd and G. W. K lein, J . P h ys. Chem., 69, 194 (1965)(5) W . G. Burns and R. Barker, “ Dose Rate and L E T Effects in Radiation Chemistry,” in “ Progress in Reaction K inetics,” G. Porter, Ed., Vol. I l l , Pergamon Press, Oxford, 1965.
(3) R. A. Holroyd and G. W. K lein, J . A m . Chem. Soc., 84, 4000(1962).
(2) R. A. Holroyd and G. W. K lein, ib id ., 15, 633 (1964).
The Journal of Physical Chemistry

Radical Y ields in the R adiolysis of Cyclohexene 911
c o n s t a n t f o r a n y t w o r a d i c a l s R i , R 2, w h o s e i n t e r
r e a c t i o n r a t e c o n s t a n t s a r e f c n a n d fc22.
I n t h e r a d i o l y s i s o f c y c l o h e x e n e t h e C 12 p r o d u c t s ,
2 , 2 ' - b i c y c l o h e x e n y l , 3 - c y c l o h e x y l c y c l o h e x e n e , a n d b i
c y c l o h e x y l , a p p e a r t o b e f o r m e d b y t h e i n t e r a c t i o n o f
r a d i c a l s , 6-7 a n d t h e G v a l u e s f o r t h e s e p r o d u c t s , 6 l i k e
t h o s e f o r t h e c o n d e n s e d p r o d u c t s f r o m c y c l o h e x a n e , 8
d e c r e a s e s i g n i f i c a n t l y w i t h i n c r e a s i n g L E T o f t h e r a d i a
t i o n . T h e e x p e r i m e n t s d e s c r i b e d h e r e o n d i l u t e s o l u
t i o n s o f 14C H 3I i n c y c l o h e x e n e w i t h d i f f e r e n t k i n d s o f
r a d i a t i o n w e r e u n d e r t a k e n t o d i s c o v e r w h e t h e r t h e
p a t t e r n o f d e c r e a s i n g p r o d u c t y i e l d s w i t h i n c r e a s i n g
L E T o f t h e r a d i a t i o n w a s p a r a l l e l e d b y a s i m i l a r
e f f e c t i n t h e r a d i c a l y i e l d s . V a r i a t i o n s w e r e m a d e i n
t h e d o s e , d o s e r a t e , a n d c o n c e n t r a t i o n o f 14C H 3I ,
a s w e l l a s i n t h e t y p e a n d e n e r g y o f t h e r a d i a t i o n .
Experim ental Section
Materials. T h e c y c l o h e x e n e u s e d w a s P h i l l i p s r e
s e a r c h g r a d e ; i t w a s f r a c t i o n a l l y d i s t i l l e d i n a i r i m m e
d i a t e l y b e f o r e u s e . 6 M e t h y l i o d i d e - 14C w a s p u r i f i e d a s
d e s c r i b e d p r e v i o u s l y , 2 a n d i t s a c t i v i t y w a s d e t e r m i n e d
b y i r r a d i a t i n g a s o l u t i o n i n c y c l o p e n t a n e , a s u b s t a n c e
w h i c h w h e n p u r e p r o d u c e s n o m e t h y l r a d i c a l s , a n d
m e a s u r i n g t h e n u m b e r o f m o l e c u l e s o f m e t h a n e f o r m e d
a n d t h e a c t i v i t y o f t h e m e t h a n e w i t h t h e s a m e e q u i p
m e n t a s u s e d f o r t h e a n a l y s i s . 2 M e t h y l c y c l o h e x a n e ,
3 - m e t h y l c y c l o h e x e n e , 1 - m e t h y l c y c l o h e x e n e , a n d 4 -
m e t h y l c y c l o h e x e n e u s e d f o r c h r o m a t o g r a p h i c i d e n t i
f i c a t i o n s w e r e A P I r e f e r e n c e s a m p l e s . E t h y l e n e , u s e d
f o r i d e n t i f i c a t i o n a n d e n e r g y - i n p u t c a l i b r a t i o n f o r
e l e c t r o n i r r a d i a t i o n , w a s P h i l l i p s r e s e a r c h g r a d e .
Irradiations. T h e i r r a d i a t i o n c e l l f o r t h e s o l u t i o n s
o f 14C H 3I , F i g u r e 1 , c o n s i s t e d o f a 1 . 5 9 - c m l e n g t h o f
1 . 9 0 - c m d i a m e t e r r o u n d c o p p e r b a r w i t h a n a x i a l h o l e
0 . 6 3 c m i n d i a m e t e r a n d 0 . 7 9 c m d e e p w h i c h w a s
p i e r c e d n e a r i t s b l i n d e n d b y a r a d i a l h o l e 0 . 4 7 c m i n
d i a m e t e r . A g l a s s - t o - m e t a l s e a l w h i c h e v e n t u a l l y
c a r r i e d t h e b r e a k - s e a l a n d r e s e r v o i r w a s h a r d - s o l d e r e d
i n t o t h e r a d i a l h o l e , a n d t h e o p e n e n d o f t h e a x i a l h o l e
w a s s e a l e d b y s o f t - s o l d e r i n g o v e r i t a t h i n ( ~ 2 m g c m - 2 )
n i c k e l w i n d o w ( C h r o m i u m C o r p . o f A m e r i c a ) w h o s e
w e i g h t a n d a r e a h a d p r e v i o u s l y b e e n m e a s u r e d .
D u r i n g i r r a d i a t i o n , t h e s o l u t i o n ( s a m p l e s i z e 0 . 2 m l )
w a s m a g n e t i c a l l y s t i r r e d u s i n g a s o f t i r o n r o d 0 . 4 8
c m l o n g , 0 . 1 6 c m i n d i a m e t e r . F o r h e a v y p a r t i c l e
a n d e l e c t r o n i r r a d i a t i o n s t h e M e l l o n I n s t i t u t e R a d i a t i o n
R e s e a r c h L a b o r a t o r y 3 - M e v V a n d e G r a a f f w a s u s e d ,
a n d t h e c e l l w a s f i x e d c e n t r a l l y w i t h r e s p e c t t o t h e b e a m ,
w h i c h w a s c o l l i m a t e d t o 0 . 2 4 c m d i a m e t e r a s d e s c r i b e d
p r e v i o u s l y . 6 A v a c u u m - t i g h t s e a l w a s m a d e b e t w e e n
t h e f r o n t f a c e o f t h e c e l l a n d t h e c o l l i m a t o r , s o t h a t t h e r e
w a s o n l y o n e w i n d o w b e t w e e n t h e m a c h i n e v a c u u m a n d
t h e l i q u i d u n d e r i r r a d i a t i o n . F o r e l e c t r o n i r r a d i a t i o n s
a t w o - w i n d o w s y s t e m w a s u s e d .
Estimation of Dose Rates. F o r p r o t o n s a n d a p a r t i c l e s t h e b e a m d i a m e t e r w a s 0 . 2 4 c m , a r e a 4 . 5 2 X
1 0 - 2 c m 2, a n d i t w a s a s s u m e d t o p e n e t r a t e w i t h t h e
s a m e d i a m e t e r t o t h e e n d o f i t s r a n g e , s o t h a t t h e m e a n
d o s e r a t e f o r a c u r r e n t o f 0 . 0 1 p a i s g i v e n b y 0 . 0 I Z f X
6 . 2 5 X 1 0 18/ p X 4 . 5 2 X 1 0 - 2 = 1 . 3 8 E X 1 0 18/ p e v
c m - 3 s e c - 1 , w h e r e E i s t h e b e a m e n e r g y i n M e v a n d
p t h e r a n g e i n c e n t i m e t e r s . V a l u e s o f p w e r e c a l c u l a t e d
f r o m s t o p p i n g d a t a 9 a n d f o r 0 . 5 - a n d 2 . 0 - M e v p r o t o n s
a n d 0 . 5 - , 0 . 7 - , 1 . 0 - , a n d 2 . 3 - M e v 4H e i o n s w e r e 7 . 9 , 8 0 . 5 ,
6 . 5 , 7 . 4 , 7 . 9 , a n d 1 5 . 5 X 1 0 - 4 c m , r e s p e c t i v e l y . F o r
f a s t e l e c t r o n s t h e v o l u m e i r r a d i a t e d i s m o r e d i f f i c u l t
t o e s t i m a t e , o w i n g t o b e a m s c a t t e r , a n d f r o m m e a s u r e
m e n t s o f t h e b e a m p r o f i l e m a d e b y i n t e r s p e r s i n g l a y e r s
o f c e l l o p h a n e c o n t a i n i n g a r a d i a t i o n - s e n s i t i v e d y e w i t h
l a y e r s o f m a t e r i a l o f l o w a t o m i c n u m b e r , a m e a n i r
r a d i a t e d m a s s o f 3 g f o r s u c h m a t e r i a l w a s t a k e n .
F o r 1 p a o f 2 - M e v e l e c t r o n s t h i s g i v e s a d o s e r a t e o f
6 . 2 5 X 1 0 18 X 2A « 4 X 1 0 18 e v g - 1 s e c - 1 .
Dosimetry. F o r h e a v y p a r t i c l e i r r a d i a t i o n s t h e
m e t h o d o f c h a r g e i n p u t 6 f r o m t h e b e a m o f c a l i b r a t e d
e n e r g y w a s u s e d , a n d t h e e n e r g y l o s s i n t h e w i n d o w w a s
c a l c u l a t e d f r o m p u b l i s h e d d a t a . 9 -10 * F o r e l e c t r o n i r -
(6) W. G. Burns and J. A. W inter, D iscu ssion s F araday Soc., 36, 124 (1964), and unpublished work.(7) B. R. Wakeford and G. R. Freeman, J . P h ys . Chem., 68, 2635 (1964).(8) W. G. Burns and J. R. Parry, N atu re, 201, 814 (1964).(9) W . W haling in “ Handbuch der Physik,“ Vol. 34, S. Flügge, Ed., Springer, Berlin, 1958, p 193.(10) D. I. Porat and K . Ramavatarum, Proc. P h y s . Soc. (London),78, 1135 (1961).
Volume 70, Number S March 1966

912 W. G. Burns, R. A. Holroyd, and G. W. K lein
Figure 2. Dependence of (7(14CH3' ) on [14CH3I] for different kinds of radiation: -o-, fast electrons, O, 2-Mev protons, energy input 3.4-6.8 X 10¹⁹ ev g_I; □, 0.5-Mev protons; A, 0.7-1.0-Mev 4He ions; V, 1.5-2.3-Mev 4He ions; 0 , 0.5-Mev 4He ions; filled symbols, lower dose rate (Tables II and III).
r a d i a t i o n s , t h e e t h y l e n e p r o d u c e d f r o m c y c l o h e x e n e w a s
d e t e r m i n e d a n d G v a l u e s c a l c u l a t e d r e l a t i v e t o ( 7 ( C 2H 4 ) .
T h e a b s o l u t e v a l u e o f ( 7 ( C 2H 4) f o r f a s t e l e c t r o n s w a s
m e a s u r e d u s i n g c h a r g e i n p u t m e a s u r e m e n t 11 12 i n a l a r g e
g l a s s i r r a d i a t i o n c e l l ( s e e F i g u r e 6 o f r e f 1 1 ) . C r ( C 2H 4)
w a s a l s o m e a s u r e d a t a l o w e r d o s e r a t e ( 6 X 1 0 17 e v
g - 1 m i n - 1 ) f o r “ C o r a y s , t a k i n g G ( F e 3 + ) f r o m t h e
F r i c k e s o l u t i o n t o b e 1 5 . 6 . T h e l o n g l i q u i d r a n g e o f
c y c l o h e x e n e ( f p — 1 0 4 ° ) m a d e i t p o s s i b l e t o u s e a n
e f f i c i e n t c o l d f i n g e r r e f l u x m e t h o d 12 f o r t h e r e m o v a l o f
C 2—C 4 v o l a t i l e p r o d u c t s . G ( C 2H 4) w a s f o u n d t o b e
0 . 2 4 6 ± 0 . 0 0 6 i n d e p e n d e n t o f t e m p e r a t u r e f r o m 2 5
t o — 8 0 ° a n d o f d o s e r a t e f r o m 6 X 1 0 17 e v g _ 1 m i n - 1 t o
3 X 1 0 20 e v g - 1 m i n - 1.
Analysis. I n t h e c a s e o f s o l u t i o n s t h e t o t a l s a m p l e
o f 0 . 2 m l ( a p a r t f r o m i n v o l a t i l e s u b s t a n c e s ) w a s i n
j e c t e d o n t o t h e c h r o m a t o g r a p h i c c o l u m n , a n d n o n -
r a d i o a c t i v e a n d r a d i o a c t i v e p r o d u c t s w e r e d e t e r m i n e d
s i m u l t a n e o u s l y , a s d e s c r i b e d p r e v i o u s l y . 1 ’ 2
R esults
T h e r e s u l t s a r e c o n t a i n e d i n T a b l e s I - I V a n d F i g u r e s
2 , 3 , a n d 4 . T h e m a j o r r a d i c a l s f o u n d w e r e c y c l o -
Figure 3. Dependence of G values and ratios of G values on dose rate for 2-Mev electrons: ■, (?(C6H9); •, G(C6Hu .) ; O, (?(CH4)/{G(CH4) + (7(CHr )};V, GiCeHnO/i^CeHn-) + G(C6H9)}.
L.E.T, IN «V/A
Figure 4. Dependence of G values and ratios of G values on LET: ▲, 10G(14CH3-); ■, (?(C6H9.); •, G(C6H „»); O, G(CH4) / {G(CH4) + G(CH3-)}; -□-, (?'(C6H9-); -o , (7'(C6H „-).
h e x y l a n d 3 - c y c l o h e x e n y l , w i t h a s m a l l c o n t r i b u t i o n o f
1 - c y c l o h e x e n y l , b u t t h e a c t i v i t y a s s o c i a t e d w i t h 1 -
m e t h y l c y c l o h e x e n e w a s t o o s m a l l f o r v a r i a t i o n s i n t h e
c a l c u l a t e d G v a l u e t o b e v e r y s i g n i f i c a n t . T h e c h r o m a
t o g r a p h i c c o l u m n u s e d d i d n o t s e p a r a t e 3 - m e t h y l -
c y c l o h e x e n e f r o m 4 - m e t h y l c y c l o h e x e n e , b u t s i n c e n o
4 - c y c l o h e x e n y l c o m p o u n d s a r e f o u n d i n t h e c o n d e n s e d
p r o d u c t s f r o m t h e p u r e l i q u i d , 6 ’7 i t w a s a s s u m e d t h a t
a l l t h e a c t i v i t y i n t h i s p e a k w a s d u e t o 3 - m e t h y l c y c l o -
h e x e n e .
(?(14CH 3-) w a s c a l c u l a t e d a s 10 0 S {A i( l + R i ) } / D s
w h e r e A 1, A 2, A 3, a n d A 4 a r e t h e a c t i v i t i e s i n c o u n t s
(11) R. H . Schuler, N u cl. In s tr . M ethods, 28, 99 (1964).(12) A. S. Newton, A n al. Chem., 28, 1214 (1956).
The Journal of Physical Chemistry

Radical Y ields in the R adiolysis of Cyclohexene 913
Table I : Results for 2-Mev Electrons
Runno.
Current,/.a
Dose rate, ev g _I sec-1
X 10»
Energyinput,
ev X 1019
64 160 640 4 .862 100 400 5 .765 40 160 12 .161 9 36 5 .663 0 .2 0 .8 1 1 .0
67 0 .2 0 .8 3 .7 266 0 .2 0 .8 4 .7 868 0 .2 0 .8 4 .4 577 0 .2 0 .8 3 .878 0 .2 0 .8 2 .279 0 .2 0 .8 2 .780 0 .2 0 .8 4 .281 0 .2 0 .8 3 .960 0 .2 0 .8 2 .2
[»CHal],m M
Cyclohexyl
3-Cyclo-hexenyl
1-Cyclo-hexenyl
3.63 0.89 2.58 0.063.38 1.12 2.76 0.103.41 0.58 1.31 0.042.38 1.32 2.13 0.082.76 1.18 0.66 0.04
1.81 2.1 4.12 0.176.57 1.05 2.72 0.13
18.8 0.82 2.95 0.133.94 1.32 3.05 0.144.56 1.32 2.82 0.114.56 2.05 4.13 0.204.08 1.79 3.64 0.184.05 1.69 3.42 0.163.63 1.7 3.39 0.16
G values-Cyelohexyl/(cyclohexyl u C a/+ 3-cyclo- («CHa + Temp.,
»CH i »C H 4 hexenyl) » c m ) "C
0 .2 2 0 .5 3 0 .2 6 0 .7 1 250 .1 8 0 .5 2 0 .2 8 0 .7 4 250 .0 7 5 0 .1 9 0 .3 1 0 .7 2 250 .1 17 0 .5 6 0 .3 8 0 .8 2 250 .0 5 0 .3 8 0 .6 4 0 .8 9 25
0 .1 9 5 0 .3 6 0 .3 4 0 .6 5 - 8 50 .2 4 0 .5 4 0 .2 8 0 .6 9 - 8 40 .4 2 0 .8 8 0 .2 2 0 .6 8 - 8 50 .2 4 0 .4 3 0 .3 0 0 .6 4 - 8 00 .2 2 0 .4 9 0 .3 2 0 .6 9 - 8 40 .2 0 0 .5 8 0 .3 3 (0 .7 4 ) - 8 30 .1 8 0 .4 2 0 .3 3 0 .7 0 - 8 40 .1 9 0 .4 2 0 .3 3 0 .6 9 - 8 50 .2 0 0 .3 3 - 8 2
Table II : Results for Protons, 25°
G values-Cyclohexyl/
Dose rate, Energy (cyclohexyl UCH*/Runno.
Energy,Mev
Current,ya.
ev g “ 1 sec“ 1 X 101»
input, ev X 1019
[^CHsI],mM
Cyclohexyl
3-Cyclo-hexenyl
l-Cyclo-hexenyl »CHa »CH i
+ 3-cyclo- ( l4CH3 + hexenyl) 14CH<)
7 2 .1 2 0 .0 1 3 9 .7 1 4 .4 1 1 .3 0 .5 2 1 .1 9 0 .0 41 0 .1 2 4 0 .3 0 415 1 .8 7 0 .0 1 4 4 .8 1 3 .9 8 .0 0 .5 3 1 .1 2 0 .0 35 0 .1 2 2 0 .3 2118 1 .7 6 0 .0 1 5 6 .5 1 2 .0 9 .1 0 .5 2 1 .1 4 0 .0 2 6 0 .1 3 2 0 .3 1 320 2 .0 1 0 .0 1 4 2 .1 1 3 .7 7 .7 0 .5 1 1 .1 3 0 .0 2 8 0 .1 23 0 .3 1121 2 .0 1 0 .0 1 4 2 .1 1 3 .7 8 .9 5 0 .5 1 1 .1 0 0 .0 26 0 .1 1 3 0 .3 1 722 2 .1 2 0 .0 1 3 9 .7 1 4 .4 8 .0 5 0 .5 3 1 .0 7 0 .0 2 6 0 .0 9 4 0 .3 3123 2 .0 0 0 .0 1 4 2 .3 3 .4 0 9 .6 0 .5 5 1 .2 2 0 .0 3 8 0 .1 6 6 0 .3 1 124 2 .0 0 0 .0 1 4 2 .3 6 .6 7 9 .1 0 .5 3 1 .2 0 0 .0 23 0 .1 4 9 0 .2 2 3 0 .3 0 6 0 .6 025 2 .0 0 0 .0 1 4 2 .3 6 .8 0 3 .0 2 0 .6 2 1 .3 0 0 .0 3 4 0 .0 8 4 0 .1 2 2 0 .3 2 3 0 .5 926 2 .0 0 0 .0 1 4 2 .3 6 .8 0 4 .8 3 0 .6 1 1 .2 9 0 .0 3 0 0 .1 0 3 0 .3 2131 2 .0 0 0 .0 1 4 2 .3 6 .8 0 5 .3 0 .5 6 1 .2 9 0 .0 31 0 .1 2 3 0 .3 0 3
27 0 .4 7 0 .0 1 111 6 .4 0 8 .9 5 0 .5 1 1 .2 0 0 .0 4 2 0 .0 8 8 0 .0 8 3 0 .2 9 8 0 .4 928 0 .5 0 0 .0 1 108 6 .8 0 9 .6 0 .4 8 1 .1 8 0 .0 3 4 0 .1 1 7 0 .2 8932 0 .5 0 0 .0 1 108 6 .8 0 7 .5 0 .5 7 1 .2 7 0 .0 4 4 0 .0 91 0 .3 1 033 0 .5 0 0 .0 0 4 43 7 .0 5 5 .0 3 0 .5 2 1 .1 5 0 .0 3 5 0 .0 71 0 .3 1134 0 .5 0 0 .0 1 108 6 .8 0 5 .9 1 0 .5 6 1 .2 6 0 .0 4 0 0 .0 7 9 0 .3 0 835 0 .5 0 0 .0 1 108 6 .8 0 1 5 .9 0 .5 2 1 .2 9 0 .0 43 0 .1 5 6 0 .2 8 7
o f t h e p r o d u c t s e t h a n e , m e t h y l c y c l o h e x a n e , 3 - m e t h y l -
c y c l o h e x e n e , 1 - m e t h y l c y c l o h e x e n e , r e s p e c t i v e l y , Ri i s t h e v a l u e o f t h e a p p r o p r i a t e d i s p r o p o r t i o n a t i o n t o
c o m b i n a t i o n r a t i o , s i s t h e a c t i v i t y i n c o u n t s p e r
m o l e c u l e o f t h e o r i g i n a l U C H 3I , a n d D i s t h e e n e r g y i n
p u t i n e l e c t r o n v o l t s . I n p r a c t i c e R i i s z e r o , a n d b o t h
Rz a n d R i a r e t a k e n a s z e r o . ( N o t e t h a t t h e r e a c t i o n
o f 3 - c y c l o h e x e n y l w i t h a s e c o n d a r y a l k y l r a d i c a l ,
c y c l o h e x y l , a p p e a r s t o g i v e v e r y l i t t l e c y c l o h e x a d i e n e ,
s i n c e t h i s p r o d u c t h a s a v e r y l o w G v a l u e . 6 '7) T h e v a l u e
o f R i ( f o r C H 3 - + c y c l o h e x y l ) w a s c a l c u l a t e d a s 0 . 2 2
a t 2 5 ° f r o m t h e e n t r o p y - d i f f e r e n c e m e t h o d 13 o f H o l r o y d
a n d K l e i n a n d t a k e n a s 0 . 3 2 a t ca. — 8 0 ° , s i n c e a t e m
p e r a t u r e e f f e c t w i t h R p r o p o r t i o n a l t o T ~ l h a s b e e n
f o u n d 14 f o r a l k y l r a d i c a l s . T h e G v a l u e s o f t h e r a d i c a l s 13
(13) R . A . H olroyd and G. W . Klein, ./. P h y s . C h em ., 67, 2273(1963).
Volume 70, Number 3 March 1966

914 W. G. Burns, R. A. Holroyd, and G. W. K lein
Table III : Results for 4He Ions, 25°
Runno.
Energy,Mev
Current,Dose rate,
ev g _l sec-1 X 10^
Energy input,
ev X 1019[14CH3I],
m MCyclohexyl
3-Cyclo-hexenyl
1-Cyclo-hexenyl >4CHî 14CHi
( cyclohexyl + 3-cyclo-
Lexenyl)
“ CH./ ( “ CHi +
“ c m )
36 0.70 0.01 160 2.99 10.3 0.25 0.62 0.022 0.059 0.2937 1.00 0.01 225 6.80 9.6 0.21 0.56 0.027 0.0486 0.2745 1.00 0.01 225 6.80 11.6 0.25 0.68 0.030 0.0547 0.2749 1.00 0.01 225 6.80 9.4 0.26 0.64 0.024 0.0504 0.2638 1.02 0.002 44 7.20 10.4 0.28 0.68 0.023 0.0533 0.0351 0.26 0.4040 1.00 0.01 225 6.80 19.2 0.23 0.63 0.026 0.0718 0.0452 0.27 0.3942 1.00 0.01 225 6.80 18.0 0.26 0.68 0.026 0.0714 0.28
44 0.5 0.01 131 6.80 18.0 0.29 0.72 0.027 0.0874 0.2947 1.5 0.01 170 6.80 18.5 0.23 0.62 0.028 0.0724 0.2748 2.3 0.01 252 6.80 19.0 0.25 0.64 0.025 0.0771 0.2850 2.3 0.01 252 6.80 18.1 0.26 0.67 0.028 0.0728 0.28
Table IV : Variation of G Values with LET
■ G values-
Energy,MeanLET, Cyclo 3-Cyclo-
Particle Mev ev/A hexyl hexenyl
e 0 . 02 1.60 3.41P 2.0 3.4 0.57 1.26P 0.5 6.8 0.53 1.234He 2.3 20.0 0.255 0.6554He 1.0 22.9 0.25 0.65
l-Cyclo-hexenyl 14CHs 14CHj
Cyclohexyl/ ( cyclohexyl
+ 3-cyclo- hexenyl)
I4CH ,/ (*4CH3 +
“ CH.)
0.16 0.23 0.49 0.32 0.680.031 0.11 0.165 0.311 0.600.040 0.071 (0.068) 0.301 (0.49)0.027 0.04 0.280.026 0.04 0.027 0.40
( i t i s a s s u m e d t h a t t h e s p e c i f i c a c t i v i t y o f t h e C 2H 6
i s t w i c e t h a t o f C H 3I ) a r e f i n a l l y g i v e n b y
G ( c y c l o h e x y l ) =
G ( 14C H r )
2 G ( C 2H 6)G ( m e t h y l c y c l o h e x a n e ) =
G ( 14C H 3 - )A 2( l + R ï ) ( 1 )
G ( 3 - c y c l o h e x e n y l ) =
G ( 14C H r )
2 G ( C 2H 6)G ( 3 - m e t h y l c y c l o h e x e n e ) =
G ( 14C H 3 - )
AxA 3 ( 2 )
G ( l - c y c l o h e x e n y l ) =
G ( 14C H r )
2 G ( C 2H e)G ( l - m e t h y l c y c l o h e x e n e ) =
G ( 14C H 3 - )
AxA 4 ( 3 )
A t r o o m t e m p e r a t u r e w i t h f a s t e l e c t r o n s t h e r e i s a
s i g n i f i c a n t d e p e n d e n c e o n d o s e r a t e o f a l l t h e s e c a l c u
l a t e d r a d i c a l G v a l u e s , p r o b a b l y d u e t o t h e i n c r e a s e d
p r o p o r t i o n o f r a d i c a l r e a c t i o n s w i t h c y c l o h e x e n e a s
t h e d o s e r a t e i s d e c r e a s e d , s o t h e v a l u e s t a k e n a s v a l i d
f o r c o m p a r i s o n w i t h w o r k a t h i g h e r L E T w e r e f r o m t h e
r u n s a t ca. — 8 2 ° w h e r e t h e s e r e a c t i o n s a r e s u p p r e s s e d .
T h e r a d i c a l G v a l u e s f o r f a s t e l e c t r o n s g i v e n i n t h e s u m
m a r y t a b l e ( T a b l e I V ) a r e t h e a v e r a g e s f o r r u n s 6 0 ,
7 7 , 7 8 , 7 9 , 8 0 , a n d 8 1 , i n w h i c h [ H C H J ] w a s m M .T h e v e r y l a r g e s p r e a d o f t h e e l e c t r o n r a d i c a l G v a l u e s
i s p e r h a p s a t t r i b u t a b l e t o t h e i n d i r e c t m e t h o d o f d o
s i m e t r y , b u t t h e r e i s c l e a r l y a s i g n i f i c a n t d i f f e r e n c e
b e t w e e n e l e c t r o n , p r o t o n , a n d 4H e i o n G v a l u e s . T h o s e
f o r 2 - M e v p r o t o n s a r e t h e a v e r a g e s o f r u n s 2 3 , 2 4 , 2 5 ,
2 6 , a n d 3 1 ( e n e r g y i n p u t 3 . 4 t o 6 . 8 X 1 0 19 e v ) , w h i c h
g i v e s l i g h t l y h i g h e r G v a l u e s t h a n t h e o t h e r r u n s o f
e n e r g y i n p u t 1 2 . 0 t o 1 4 . 4 X 1 0 19 e v . F o r 0 . 5 - M e v
p r o t o n s , 1 - M e v 4H e i o n s , a n d 2 . 3 - M e v 4H e i o n s , t h e
(14) P. S. Dixon, A. P. Stefani, and M . Szwarc, J . A m . Chem. Soc., 85, 2251, 3344 (1963).
The Journal of Physical Chemistry

Radical Y ields in the R adiolysis of Cyclohexene 915
C 6 r a d i c a l G v a l u e s g i v e n a r e t h e a v e r a g e s o f a l l r u n s
u n d e r t h e s e c o n d i t i o n s , s i n c e n o v a r i a t i o n i n e n e r g y
i n p u t w a s m a d e , a n d t h e r e a p p e a r s t o b e n o s i g n i f i c a n t
e f f e c t o f 14C H 3I c o n c e n t r a t i o n o n t h e s e G v a l u e s . R u n s
3 3 f o r p r o t o n s a n d 3 8 f o r 4H e i o n s s h o w n o s i g n i f i c a n t
d e p e n d e n c e o n d o s e r a t e u n d e r t h e c o n d i t i o n s u s e d .
Discussion
Dependence of G (UC H 3-) on [UC H J ] for Different Kinds of Radiation. T h e d e p e n d e n c e s h o w n i n F i g u r e
2 i s o n e i n w h i c h < ? ( 14C H r ) i n c r e a s e s w i t h i n c r e a s i n g
[ 14C H 3I ] f o r a g i v e n r a d i a t i o n t y p e a n d i n w h i c h , f o r
a g i v e n c o n c e n t r a t i o n , f 7 ( 14C H 3 - ) d e c r e a s e s w i t h i n
c r e a s i n g L E T o f t h e r a d i a t i o n . T h i s b e h a v i o r i s
q u a l i t a t i v e l y c o n s i s t e n t w i t h t h e c o n c e p t t h a t m e t h y l
r a d i c a l s a r e f o r m e d b y t h e r e a c t i o n w i t h m e t h y l i o d i d e
o f a r e a c t i v e s p e c i e s X w h i c h t a k e s p a r t i n a c o m p e t i n g
s e c o n d - o r d e r s p u r r e a c t i o n . A t i n c r e a s i n g L E T t h e
s p u r r e a c t i o n b e c o m e s p r o g r e s s i v e l y m o r e i m p o r t a n t .
A n a t t e m p t w a s m a d e t o f i t t h e s e i d e a s q u a n t i t a t i v e l y
i n t o t h e G a n g u l y - M a g e e 16' 16 m o d e l o f c o m p e t i n g r e
a c t i o n s X + X -*■ p r o d u c t s , X + C H 3I C H 3 +
p r o d u c t s , w h e r e t h e s p e c i e s X i s g e n e r a t e d i n s p u r s ,
i n w h i c h d i f f u s i o n t a k e s p l a c e . £ ? ( X ) w a s t a k e n a s
~ 6 , t h e d i f f u s i o n c o n s t a n t a s 2 X 1 0 - 6 c m 2 s e c - 1 ,
a n d v a l u e s o f t h e t r a c k r a d i u s r 0 = ( 4 Dtf)'^, k„ a n d k w e r e v a r i e d t o o b t a i n c u r v e s o f S ( ? ( X ) = ( 7 ( C H 3 - )
( w h e r e S i s t h e f r a c t i o n o f t h e s p e c i e s X w h i c h r e a c t s
w i t h C H 3I ) a g a i n s t G [ C H 3I ] w h i c h c o r r e s p o n d e d w i t h
t h e e x p e r i m e n t a l c u r v e s f o r t h e a p p r o p r i a t e v a l u e s o f
L E T . F i g u r e 5 s h o w s t w o s e t s o f t h e s e c u r v e s o b t a i n e d
f o r t h e v a l u e s o f t h e c o n s t a n t s g i v e n ; t h e v a l u e s o f
m e a n L E T t a k e n w e r e t h o s e f o r t h e r a d i a t i o n s u s e d
e x p e r i m e n t a l l y , n a m e l y f a s t e l e c t r o n s , 2 - M e v p r o t o n s ,
0 . 5 - M e v p r o t o n s , a n d 1 . 0 - M e v 4H e i o n s . T h e c a l c u
l a t e d c u r v e s c o r r e s p o n d b r o a d l y t o t h e r e s u l t s i n
F i g u r e 2 . R e g a r d i n g t h e n a t u r e o f t h e s p e c i e s X
w h i c h g e n e r a t e s m e t h y l r a d i c a l s , o n e p o s s i b i l i t y i s
t h a t t h e r m a l h y d r o g e n a t o m s u n d e r g o t h e f o l l o w i n g
r e a c t i o n s , w h i c h h a v e b e e n d i s c u s s e d b y H a m i l l ,
et al.17
^ C H 3 + H I
H + C H 3I — »■ [ C H 3 + H I ]
H o w e v e r , t h e r a t e c o n s t a n t o f t h e r e a c t i o n H + C H 3I
w o u l d n e e d t o b e i m p o s s i b l y l a r g e f o r i t t o c o m p e t e
w i t h t h e r e a c t i o n o f t h e r m a l h y d r o g e n a t o m s w i t h
c y c l o h e x e n e ( r a t e c o n s t a n t ~ 6 X 1 0 8 1. m o l e - 1 s e c - 1 ) 18
a t t h e r e l a t i v e c o n c e n t r a t i o n s ( ~ 1 0 3) o f c y c l o h e x e n e
t o m e t h y l i o d i d e u s e d i n t h e s e e x p e r i m e n t s .
Figure 5. Dependence of (?(14CH3-) on [14CH3I] for the types of radiation given in Figure 2, calculated fromGanguly-Magee theory: --------- , number of species perspur = 5.4, D = 2 X 10“6 cm2 sec-1, r0 = 10 A, k = 6.67 X 10111. mole-1 sec-1, i , = 4 X 10111. mole-1 sec-1;--------- , number of species per spur = 5.4, D = 2 X 10⁻⁵cm2 sec-1, r 0 = 17 A, k = 1.1 X 10121. mole-1 sec-1, k B = 1.38 X 10¹¹ 1. mole-1 sec-1.
A n o t h e r p o s s i b i l i t y w h i c h w e w i s h t o e x a m i n e i s
t h a t 14C H 3 - r a d i c a l s a r e g e n e r a t e d b y d i s s o c i a t i v e
e l e c t r o n c a p t u r e
e + C H 3I - ^ C H 3 - + I -
i n w h i c h c a s e t h e c o m p e t i n g s e c o n d - o r d e r r e a c t i o n i s
i o n - e l e c t r o n c o m b i n a t i o n . T h e G a n g u l y - M a g e e m o d e l ,
w h i c h a p p l i e s o n l y t o u n c h a r g e d s p e c i e s , c a n b e e x
p e c t e d t o g i v e o n l y a v e r y r o u g h c o r r e s p o n d e n c e w i t h
t h e r e s u l t s i f a n i o n i c m e c h a n i s m o c c u r s , b u t i t i s o f
i n t e r e s t t h a t t h e l i m i t i n g v a l u e o f ( ? ( 14C H 3 - ) f o r f a s t
e l e c t r o n s a t l o w [ 14C H 3I ] i s ~ 0 . 1 - 0 . 2 , o f t h e s a m e o r d e r
o f m a g n i t u d e a s t h e G v a l u e f o r f r e e i o n s f r o m h y d r o -
(15) A. K . Ganguly and J. L . Magee, J . Chem. P h y s ., 25, 129 (1956).(16) W. G. Burns and J. D . Jones, Trans. F araday Soc., 60, 2022 (1964).(17) S. Z. Toma and W . H . H am ill, J . A m . Chem. Soc., 86, 1478 (1964); J. R. Roberts and W. H. H am ill, J . P h ys. Chem., 67, 2446 (1963); L . J. Forrestal and W. H . H am ill, J . A m . Chem. Soc., 83, 1535 (1961).(18) T . J. Hardw ick, J . P h y s . Chem., 66, 291 (1962).
Volume 70, Number S March 1966

916 W. G. Burns, R. A. Holroyd, and G. W. K lein
c a r b o n s 19' 20 a s d e t e r m i n e d f r o m c o n d u c t i v i t y m e a s u r e
m e n t s o r b y i n f e r e n c e f r o m m e a s u r e m e n t s o f H D f o r m e d
o n t h e r a d i o l y s i s o f s o l u t i o n s o f N D 3 i n c y c l o h e x a n e . 21
A n i m p o r t a n t p o i n t w h i c h a r i s e s i n c o n n e c t i o n w i t h
t h e c o m p a r a t i v e l y l a r g e v a l u e o f G ( C H 3 - ) i s t h e q u e s
t i o n w h e t h e r r e a c t i o n o f t h e e l e c t r o n w i t h a s u i t a b l e
s c a v e n g e r c a n c o m p e t e w i t h i o n i c r e c o m b i n a t i o n i n a
l i q u i d , w h i c h h a s b e e n a p p r o a c h e d a n e w 21 b y a r e
c o n s i d e r a t i o n o f t h e i d e n t i t y o f t h e n e g a t i v e e n t i t y .
I f t h e l a t t e r s u f f e r s e n e r g y l o s s e s o n c o l l i s i o n s i m i l a r
t o t h o s e o f t h e f r e e e l e c t r o n , 22 t h e n t h e t i m e f o r i o n
r e c o m b i n a t i o n w i l l b e ' " T O " 13 s e c a n d s c a v e n g i n g w i l l
b e i m p o s s i b l e . H o w e v e r , i f t h e e l e c t r o n i s t e m p o r a r i l y
a t t a c h e d t o s u r r o u n d i n g m o l e c u l e s o r m o l e c u l a r f r a g
m e n t s , a p o s s i b l e a p p r o x i m a t i o n i s t o t r e a t t h e p o s i t i v e
a n d n e g a t i v e s p e c i e s a s i o n s o f m o l e c u l a r d i m e n s i o n s
a n d o p p o s i t e c h a r g e ; t h i s l e a d s t o a t i m e f o r r e c o m b i
n a t i o n o f ' " T O - 9 s e c , a n d r e a c t i o n o f t h e p o s i t i v e i o n
o r t h e n e g a t i v e e n t i t y w i t h a r e a c t i v e a d d i t i v e a t c o n
c e n t r a t i o n s ' ~ 1 0 ~ 3 M a n d a b o v e i s f e a s i b l e . 21 T h e s e
q u e s t i o n s a f f e c t t h e e s c a p e p r o b a b i l i t y o f t h e e l e c t r o n
a n d a l s o t h e c o m p e t i t i o n b e t w e e n r e c a p t u r e o f t h e
“ e l e c t r o n ” b y a p o s i t i v e i o n o r c a p t u r e b y a n e l e c t r o n
c a p t u r i n g a g e n t . Q u a l i t a t i v e l y , t h e b e h a v i o r s h o w n
i n F i g u r e 2 w i t h r e s p e c t t o L E T a n d c o n c e n t r a t i o n
c h a n g e s i s e x p e c t e d . T h e c r i t i c a l e s c a p e r a d i u s r0 a t
w h i c h t h e t h e r m a l e n e r g y o f t h e i o n p a i r i s b a l a n c e d b y
i t s c o u l o m b i c p o t e n t i a l e n e r g y i s g i v e n b y e 2/ e r 0 =
k T f o r a n i s o l a t e d i o n p a i r , w h e r e e i s t h e i o n i c c h a r g e ,
e i s t h e d i e l e c t r i c c o n s t a n t , k i s B o l t z m a n n ’ s c o n s t a n t ,
a n d T i s t h e a b s o l u t e t e m p e r a t u r e ; h o w e v e r , a
l a r g e r s e p a r a t i o n , w h i c h f e w e r i o n s w i l l a c h i e v e , i s
r e q u i r e d t o r e a c h t h e s a m e e n e r g y w h e n a c o l u m n o f
i o n i z a t i o n i s c o n s i d e r e d . T h u s t h e v a l u e s o f < 7 (14C H 3 •)
f o r l o w [ C H 3I ] w i l l d e c r e a s e w i t h i n c r e a s i n g L E T .
I n a d d i t i o n , a t h i g h e r c o n c e n t r a t i o n s , a t w h i c h t h e r e i s
e f f e c t i v e c o m p e t i t i o n i n t h e s p u r b e t w e e n t h e t w o f a t e s
o f t h e e l e c t r o n , t h e p r o b a b i l i t y o f r e c a p t u r e o f t h e
n e g a t i v e e n t i t y b y p o s i t i v e i o n s a s d i s t i n c t f r o m d i s s o c i
a t i v e c a p t u r e b y C H 3I w i l l b e g r e a t e r w i t h i n c r e a s i n g
L E T .
Variation of G{CHf) with Radiation Type (Table I V and Figure If). A t l o w L E T a l a r g e r p r o p o r t i o n o f
a c t i v i t y o c c u r s i n t h e 14C H 4 r a t h e r t h a n i n t h e 14C H 3 -
r a d i c a l s f o r m e d . S i n c e t h i s p r o p o r t i o n d e c r e a s e s a s
t h e L E T i n c r e a s e s , t h e r e i s a l a r g e r e f f e c t o f L E T o n
G ( 14C H 4) t h a n o n G r(14C H 3 - ) . I t s h o u l d b e n o t e d t h a t
t h e p r o p o r t i o n o f 14C H 4 f o r m e d b y d i s p r o p o r t i o n a t i o n
i s m i n o r , ' - " 1 0 % .
T h e a r g u m e n t g i v e n a b o v e a s t o w h y t h e r m a l h y
d r o g e n a t o m s a r e n o t a l i k e l y s o u r c e o f m e t h y l r a d i c a l s
a p p l i e s e q u a l l y t o m e t h a n e f o r m a t i o n . T h e e x p l a n a
t i o n p r e v i o u s l y a d v a n c e d 2 f o r m e t h a n e p r o d u c t i o n i s
t h a t h o t m e t h y l r a d i c a l s a r e f o r m e d i n d i s s o c i a t i v e
e l e c t r o n c a p t u r e , c a r r y i n g a w a y m o s t o f t h e e x c e s s
e n e r g y o f t h e r e a c t i o n , a n d t h a t t h e s e a b s t r a c t h y d r o g e n
f r o m t h e s u r r o u n d i n g m o l e c u l e s . T o f i t t h e p r e s e n t
c a s e i t i s r e q u i r e d t h a t a l a r g e r p r o p o r t i o n o f h o t
r a d i c a l s i s f o r m e d i n c y c l o h e x e n e a t l o w L E T a n d
t h a t t h i s p r o p o r t i o n s h o u l d d e c r e a s e w i t h i n c r e a s i n g
L E T . A n o t h e r p o s s i b i l i t y i s t h a t m e t h a n e i s f o r m e d
i n a n i o n - m o l e c u l e p r o c e s s , p o s s i b l y o f t h e s t o i c h i o
m e t r i c f o r m
R H + + C H 3I -—*■ R + + C H 4 + I
a n d i t s c o m p e t i t i o n w i t h e l e c t r o n r e c a p t u r e p r o v i d e s
a p o s s i b l e b a s i s f o r a n L E T e f f e c t .
Variations of G Values or Ratios of G Values with Dose Rate for Fast Electrons at Room Temperature ( F i g u r e 3 ) .
T h e 14C H 3I s c a v e n g i n g t e c h n i q u e i s v a l i d o n l y a t h i g h
d o s e r a t e s o r a t l o w t e m p e r a t u r e s , u n d e r w h i c h c o n d i
t i o n s r e a c t i o n s o f r a d i c a l s w i t h t h e s u b s t r a t e a r e s u p
p r e s s e d i n f a v o r o f r a d i c a l - r a d i c a l i n t e r a c t i o n s . A t
l o w e r d o s e r a t e s t h e q u a n t i t i e s g i v e n b y e q 1 , 2 , a n d 3
w i l l d e v i a t e f r o m t h e t r u e G v a l u e s o f t h e r a d i c a l s t o
a n e x t e n t d e p e n d e n t u p o n t h e d o s e r a t e a n d t h e r a t e
c o n s t a n t s o f t h e r e a c t i o n s o f r a d i c a l s w i t h e a c h o t h e r
a n d w i t h t h e s u b s t r a t e . W e a s s u m e t h a * t h e i m p o r t a n t
r e a c t i o n s a r e
( R u )4a
C 6H n - + C 6H 10 — > C J L i - C J L o -
\ 4 ' a
c 6h 12 + c 6h 9
c h 3 - + c 6h 1(
* 'l \
(R*-;C H 3 • C e H 10 •
c h 4 + c 6h 9 -
( R r )
C H r C e H x o - C T L o .
r 2 - + C 6H 1(
C H r C e H n + C 6H 9 -
( R 4 - )Ad
C 6H 9 - + C e H i o — C 6 H 9 - C 6H 10-
(19) A. 0 . Allen and A. Hummel, D iscu ssion s F araday Soc., 36, 95 (1963).(20) G. R. Freeman, J . Chem. P h ys ., 34, 988 (1963).
The Journal of Physical Chemistry

R adical Y ields in the R adiolysis of Cyclohexene 917
F ig u re 6. D e p e n d e n c e o f O v a lu e s a n d ra tios o f G va lu eso n d o se ra te , c a lcu la te d : -------------, k .c , = k bc , = fcdce = 1500s e c -1 , fc0c , = 20 3 s e c -1 , k . ' c , = 1000 s e c -1 , k b 'c, = 1000 s e c -1 , kc'c„ = 135 s e c -1 , k = 6 .8 X 1 0 9 1. m o le -1 s e c -1 , a ll / =all g = 0 ; -------------, k .c a = k bcs = kdC, = 21 0 0 s e c -1 ,kccB = 30 0 s e c -1 , k j c e = k b ’cB = 1400, kb'cB = 100, k = 6 .8 X 1 0 9 1. m o le -1 s e c -1 , / 2 = g-i = 0 .1 , / 6 = 0 .1 8 , h = 0 .5 , /s = ffs = 0 .2 5 , g 9 = 0 .2 9 , / 9 = 0, / 10 = ffio = 0 .2 5 , / n = 0 .1 8 , /is = / 2 0 = 0 .1 8 , /is = 0 , / 24 = S24 = 0 .0 5 ,/ 28 = 0 .0 5 , . . . . , kaCa — k bcs — kcCB = kdCg =1500 s e c -1 , i-a 'ca = &b'c 8 = fc0'c 8 = 10 00 s e c -1 , k = 6 .8 X 1 0 9 1. m o le -1 s e c -1 , a ll / = all g = 0.
a n d t h a t t h e C 42 a n d C i 3 r a d i c a l s R i •, R 3 •, a n d R 4 • a r e
s u f f i c i e n t l y u n r e a c t i v e d u e t o s i z e a n d s t e r i c h i n d r a n c e
t h a t t h e i r r e a c t i o n s w i t h t h e s u b s t r a t e a r e n o t i m
p o r t a n t . A s w e l l a s t h e s e r e a c t i o n s , a l l t h e r a d i c a l s
C H r , C e H i r , C e H 9 - , R i - , R 2 - , R 8 - , a n d R 4 - a r e a s
s u m e d t o i n t e r a c t , a n d t h e e f f e c t o f d o s e r a t e i s g i v e n
b y t h e e q u a t i o n s o f A p p e n d i x I . F i g u r e 6 s h o w s c a l
c u l a t e d v a l u e s o f ( / ( C 6H g - ) , ( / ( C e H n - ) , t h e f r a c t i o n o f
c y c l o h e x y l i n t h e C 8 r a d i c a l s , a n d t h e f r a c t i o n ( ? ( C H 4) /
{ ( j ( C H 4) + G ( C H 8 - ) } f o r t h e c o n s t a n t s c h o s e n , a n d
t h e c a l c u l a t e d q u a n t i t i e s s h o w t h e s a m e t r e n d s a s
t h e e x p e r i m e n t a l o n e s o f F i g u r e 3 . T h e d i s p r o p o r
t i o n a t i o n r a t i o s w e r e c h o s e n o n t h e b a s i s o f c o m p a r i s o n
w i t h k n o w n r e a c t i o n s o f s i m i l a r s m a l l e r r a d i c a l s .
T h e v a l u e o f kd, w h i c h d e t e r m i n e s t h e e x t e n t t o w h i c h
C e H g - a d d s t o t h e s u b s t r a t e , n e e d s t o b e i n t h e r e g i o n
1 5 0 - 2 1 0 1. m o l e - 1 s e c - 1 ( n o t e t h a t c s = [ C 6H i0 ] = 9 . 8 6
m o l e l . - 1 ) t o g i v e t h e t r a n s i t i o n i n ( / ( C e H g - ) a t t h e o b
s e r v e d d o s e r a t e . T h e c a l c u l a t e d G ( C 6H n - ) i s v e r y
m u c h i n f l u e n c e d b y k0 a s t h e d o s e r a t e d e c r e a s e s ,
s i n c e t h i s i s t h e r a t e c o n s t a n t f o r t h e f o r m a t i o n o f
C H 3- C 6H h b y a b s t r a c t i o n f r o m t h e s o l v e n t b y C H 3 -
C e H i o - ; c o m p a r i s o n o f t h e d o t t e d a n d t h e c o n t i n u o u s
l i n e s f o r G ( C 6H i i - ) s h o w s t h a t t h e l o w e r v a l u e o f kc ~
1 4 r a t h e r t h a n 1 0 0 1. m o l e - 1 s e c - 1 i s m o r e c o n s i s t e n t
w i t h e x p e r i m e n t . M e a s u r e m e n t s o f t h e r a t e s o f r e a c
t i o n o f a l k y l r a d i c a l s w i t h c y c l o h e x e n e i n t h e l i q u i d
p h a s e h a v e n o t b e e n m a d e e x c e p t f o r d e t e r m i n a t i o n s
o f t h e r a t i o s o f kb a n d kh‘ f o r m e t h y l a d d i t i o n a n d a b
s t r a c t i o n , w i t h t h e r a t e c o n s t a n t ki f o r m e t h y l a b s t r a c
t i o n f r o m 2 , 3 , 3 , - t r i m e t h y l p e n t a n e . S z w a r c 23 o b t a i n e d
r a t i o s o f 0 . 9 a n d 0 . 6 f o r f c t / f c i a n d kb'/ki, a n d h m a y b e
e s t i m a t e d f r o m v a l u e s 24 o f k\2/k, w h e r e k i s a n i n t e r
r a d i c a l r a t e c o n s t a n t , t o b e 2 3 - 4 6 1. m o l e - 1 s e c - 1 ,
d e p e n d i n g o n t h e v a l u e c h o s e n f o r k w i t h i n t h e r a n g e
1 0 9 t o 4 X 1 0 9 1. m o l e - 1 s e c - 1 . T h e v a l u e s o f r a t e c o n
s t a n t s f o r r e a c t i o n w i t h t h e s u b s t r a t e u s e d t o o b t a i n
F i g u r e 6 a r e p o s s i b l y r a t h e r h i g h . H o w e v e r , kh/ki a n d kb'/ki a s o b t a i n e d b y S z w a r c a r e a n o m a l o u s l y
l o w ; h i g h e r v a l u e s a r e o b t a i n e d f o r o t h e r u n s a t u r a t e s
a n d f o r r e a c t i o n o f m e t h y l r a d i c a l s w i t h p r o p y l e n e i n
t h e g a s p h a s e . 25 C o m p a r i s o n o f t h e c o n t i n u o u s a n d
d a s h e d l i n e s o f F i g u r e 6 s h o w s t h a t t h e i n c l u s i o n o f
d i s p r o p o r t i o n a t i o n r e a c t i o n s o f t h e l a r g e r a d i c a l s
f o r m e d a t l o w d o s e r a t e s r e d u c e s t h e d i f f e r e n c e b e t w e e n
t h e h i g h a n d l o w d o s e r a t e v a l u e s f o r G ^ C e H g - ) a n d
( / ( C e H i r ) ; s i n c e f o r C 6H g - a b e t t e r a g r e e m e n t w i t h
e x p e r i m e n t i s o b t a i n e d w h e n d i s p r o p o r t i o n a t i o n i s
n e g l e c t e d , i t i s p o s s i b l e t h a t t h i s r a d i c a l h a s a l o w
r a t i o o f kv/kc.Dependence of Measured Radical G Values on Radia
tion Type ( F i g u r e 4 ) . T h e m o s t s t r i k i n g f e a t u r e o f
T a b l e I V i s t h e d e c r e a s e i n t h e m e a s u r e d v a l u e s o f ( 7 ( 3 -
c y c l o h e x e n y l ) a n d ( Z ( c y e b h e x y l ) w i t h i n c r e a s i n g L E T
o f t h e r a d i a t i o n . T h e d e c r e a s e s a r e l a r g e r t h a n w o u l d
b e e x p e c t e d f r o m t h e d e c r e a s e s i n t h e c o n d e n s e d C 12 p r o d u c t y i e l d s , 6,26 a s s u m i n g t h a t t h e s e p r o d u c t s a r e
f o r m e d b y r a d i c a l c o m b i n a t i o n .
C 6H 9 - + C e H g - — > C 12H 18 Gk
C e H g - + C e H n - C 6H 9 ’ C 6H n Gb, kD/kc = 0 . 4
\2 C 6H 10
C e H n - + C e H n - — > C 12H 22 Gc, kD/kc = 1 . 0
I t i s a s s u m e d t h a t d i s p r o p o r t i o n a t i o n l e a d i n g t o
c y c l o h e x a d i e n e s m a y b e n e g l e c t e d , o w i n g t o t h e s m a l l
G v a l u e s f o r t h e s e s u b s t a n c e s ; t a k i n g t h e v a l u e s o f 21 22 23 24 25 26
(21) T . F. W illiams, J . A m . Chem. Soc., 86, 3954 (1964).(22) A . H . Samuel and J. L . Magee, J . Chem. P h y s 21, 1080 (1953).(23) M . Szwarc, J . A m . Chem. Soc., 83, 3005 (1961).(24) R. H . Schuler and R. R. Kuntz, J . P h ys . Chem., 67, 1004 (1963).(25) R. K . Brinton, J . Chem. P h ys., 29, 781 (1958); M . M iyoshi and R. K . Brinton, ib id ., 36, 3019 (1962).(26) W. G. Burns, et a l., to be published.
Volume 70, Number 8 March 1966

918 W. G. Burns, R. A. Holroyd, and G. W. K lein
Table V : Product and Radical Yields for Differing Radiations“
G'(CeHu')/ G(CiHii-)/Radiation Ga G b Gc G'(C.H,-) G'(C.Hn-)1 G'( C.0 G'«V) G(CeH9) G(CaHn-) G(Co-) G(Ca ■ )
2-Mev electrons 1.25 0.55 0.2 3.3 1.6 4.9 0.33 3.4 1.6 5.0 0.322-Mev protons 0.92 0.5 0.13 2.3 1.2 3.5 0.35 1.3 0.6 1.9 0.311-Mev 4He ions 0.43 0.5 0.1 1.6 1.1 2.7 0.41 0.65 0.25 0.9 0.28
° Values of G ' are radical yields calculated from the condensed product yields.
kn/kc g i v e n a b o v e , w e h a v e f r o m t h e p r o d u c t y i e l d s
t h a t G ( 3 - c y c l o h e x e n y l ) = ^ ' ( C e H g - ) = 2 G A + 1 . 4 ( t b ;
G ( c y c l o h e x y l ) = G ' ( C 6H U - ) = 4 Gc + 1 . 4 G B . T h e
p r o d u c t y i e l d s a n d t h e r a d i c a l y i e l d s G' d e d u c e d f r o m
t h e m , a n d a l s o r a d i c a l y i e l d s G d e r i v e d f r o m t h e 14C -
m t h y l i o d i d e m e t h o d , a r e g i v e n i n T a b l e Y f o r t h r e e
t y p e s o f r a d i a t i o n s .
A l t h o u g h t h e r e i s g o o d a g r e e m e n t b e t w e e n v a l u e s
o f G a n d G' f o r 2 - M e v e l e c t r o n s , t h e r e i s a d i s c r e p a n c y
b e t w e e n t h e r a d i c a l G v a l u e s f r o m p r o d u c t y i e l d s a n d
t h o s e f r o m a c t i v i t y m e a s u r e m e n t s a t h i g h e r L E T ,
w h i c h i n c r e a s e s w i t h i n c r e a s i n g L E T . A p o s s i b l e
r e a s o n f o r t h i s i s t h a t a t h i g h e r L E T i n c r e a s i n g p r o
p o r t i o n s o f t h e C 12 p r o d u c t s a r e f o r m e d i n m o l e c u l a r ,
n o n r a d i c a l m e c h a n i s m s , s o t h a t t h e v a l u e s o f O ' ( R - )
a r e t o o h i g h . A n o t h e r p o s s i b i l i t y i s t h a t i f t h e m e t h y l
r a d i c a l s d i f f u s e f a s t e r t h a n t h e C e r a d i c a l s a n d a r e
f o r m e d w i t h a l a r g e r e f f e c t i v e t r a c k r a d i u s , t h e n ,
c o m p a r e d w i t h t h e c a s e o f h o m o g e n e o u s d i s t r i b u t i o n a
l o w e r p r o p o r t i o n o f t h e m w i l l r e a c t t o g e t h e r o r w i t h C 6
r a d i c a l s i n t h e d i f f u s i o n s t a g e d u r i n g w h i c h t h e c o n
c e n t r a t i o n o f C 6 r a d i c a l s i s s u b s t a n t i a l l y r e d u c e d .
I n t h e t r a c k - o v e r l a p s t a g e , t h e p r o p o r t i o n o f C 6 r a d i c a l s
i s l e s s a n d t h a t o f C H 3 - r a d i c a l s i s g r e a t e r t h a n f o r
h o m o g e n e o u s r e a c t i o n , a n d t h e l a t t e r r a d i c a l s w i l l
u n d e r g o p r e f e r e n t i a l i n t e r a c t i o n . T h e r e s u l t i s t h a t
t h e o v e r - a l l f r a c t i o n o f C H 3 - r a d i c a l s w h i c h r e a c t t o
g e t h e r r a t h e r t h a n w i t h C 6 r a d i c a l s w i l l b e g r e a t e r t h a n
f o r h o m o g e n e o u s r e a c t i o n , a n d t h i s w i l l r e s u l t i n l o w e r
a p p a r e n t v a l u e s f o r G{C 6 r a d i c a l s ) . T h e s e e f f e c t s
w o u l d b e e x p e c t e d t o i n c r e a s e w i t h i n c r e a s i n g L E T .
T o i n v e s t i g a t e t h i s p o s s i b i l i t y , a d i f f u s i o n m o d e l h a s
b e e n s e t u p ( A p p e n d i x I I ) i n w h i c h t h e m e t h y l r a d i c a l s
a r e t r e a t e d a s o n e , a n d a l l C 6 r a d i c a l s a s a s e c o n d d i f
f u s i n g s p e c i e s , s i n c e t h e t h r e e - s p e c i e s s y s t e m l e a d s t o
a v e r y c o m p l e x s e t o f e q u a t i o n s . T h e i n i t i a l c o n d i t i o n
c o n s i s t s o f N i C 6 r a d i c a l s p e r c e n t i m e t e r , g i v e n b y
G reai ( — d K / d x ) 1 0 6, w h e r e ( — dE/dx) i s i n e l e c t r o n
v o l t s p e r a n g s t r o m a n d ( ? reai = G (C f ) , a n d N 2 C H 3
r a d i c a l s p e r c e n t i m e t e r , g i v e n b y ( r ( C H 3 - ) ( — d A / d z ) X
1 0 6 w i t h g a u s s i a n s p a t i a l d i s t r i b u t i o n s o f r a d i i rx a n d
r2, r e s p e c t i v e l y . T h e r a d i c a l s a r e a l l o w e d t o d i f f u s e
( d i f f u s i o n c o n s t a n t s D x a n d D 2) a n d t o r e a c t w i t h e a c h
o t h e r ( r a t e c o n s t a n t k = 3 . 4 X 1 0 9 1. m o l e - 1 s e c - 1 ) .
A f t e r a t i m e tt c o r r e s p o n d i n g t o t h e t i m e f o r t r a c k
o v e r l a p , t h e d i f f u s i o n i s s t o p p e d a n d t h e r e m a i n i n g
r a d i c a l s a r e a l l o w e d t o r e a c t h o m o g e n e o u s l y . T h e
j u s t i f i c a t i o n f o r t h i s i s t h a t a t l o w r a d i c a l c o n c e n t r a
t i o n s t h e s e i n h o m o g e n e i t i e s h a v e o n l y a s m a l l e f f e c t
o n t h e d e r i v e d v a l u e s o f ( 7 ( R - ) . T h e a p p a r e n t G v a l u e o f t h e C 6 r a d i c a l s , a s o b t a i n e d f r o m t h e a c t i v i t y
m e a s u r e m e n t s , i s ( s e e e q 1 a n d 2 )
G ( 14C H K ) X
_ G jC H r C g H u K l + Rt) + G ( C H 3 - C 6H 9)
app 2 G ( C 2H 6)
= Nafuf [2/22 X 1 0 6( - d E / d x ) ]
w h e r e f X2 i s t h e f r a c t i o n o f t h e t o t a l n u m b e r o f r a d i c a l s
w h i c h t a k e p a r t i n t h e c r o s s r e a c t i o n C H 3 - + C i -
a n d f22 i s t h e f r a c t i o n w h i c h t a k e p a r t i n C H 3 + C H 3.
T h e s e f r a c t i o n s , f o r h o m o g e n e o u s r e a c t i o n , a r e 2 N XN 2/ (N x + A ’2)2 a n d N 22/(N X + A 2) 2, a n d t h e i r v a l u e s f o r
v a r i o u s v a l u e s o f t h e t r a c k p a r a m e t e r s a r e g i v e n i n
T a b l e V I .
I n c a s e 1 , a s i n a l l c a s e s w h e r e D x = D 2 ( s e e e.g., c a s e
5 ) , / 12, J 22, a n d / 12//2 d i d n o t v a r y w i t h ts o v e r t h e r a n g e
1 0 - 7 t o 1 0 - 4 s e c . T h e r e a s o n f o r t h e e q u a l i t y o f Gapp a n d G reai i n c a s e 1 i s t h a t o w i n g t o t h e l o w L E T ( c o r
r e s p o n d i n g t o a l i m i t i n g f a s t e l e c t r o n c o n d i t i o n ) , N x a n d N 2 a r e s o s m a l l t h a t v e r y l i t t l e r e a c t i o n o c c u r s d u r
i n g t r a c k e x p a n s i o n a n d m o s t o c c u r s a f t e r t r a c k o v e r
l a p w h e n h o m o g e n e o u s i n t e r a c t i o n i s a s s u m e d . C a s e s
2 , 3 , a n d 4 i n v e s t i g a t e t h e e f f e c t o f i n c r e a s i n g D 2/ D x a n d r2/rx f o r ( — dE/dx) c o r r e s p o n d i n g t o 2 - M e v p r o
t o n s a n d a r e i l l u s t r a t e d i n F i g u r e s 7 , 8 , a n d 9 , r e s p e c
t i v e l y . I n c a s e 2 , w h e r e D 2/D x = r2/rx = 1 , t h e r a d i c a l s
s t a r t w i t h t h e s a m e t r a c k r a d i i , a n d t h e i r r e l a t i v e c o n
c e n t r a t i o n s a r e p r e s e r v e d t h r o u g h o u t d i f f u s i o n a n d
r e a c t i o n , s o t h a t / 11, In , a.ndfx2/f2 a r e t h e s a m e a s i f t h e
r e a c t i o n s o c c u r r e d h o m o g e n e o u s l y . T h i s f i n a l l y g i v e s
G rea i = G a p p . H o w e v e r , w i t h i n c r e a s i n g D 2/ D x a n d
r2/rx ( c a s e s 3 a n d 4 c o m p a r e d w i t h c a s e 2 ) l e s s o f t h e
r e a c t i o n C H 3 - + C e - a n d s t i l l l e s s o f t h e r e a c
t i o n C H 3 • + C H 3 • o c c u r d u r i n g t r a c k e x p a n s i o n , w h i l e
m o r e r e a c t i o n o f C e - + C 6 - o c c u r s , l e a v i n g f e w e r C e
The Journal of Physical Chemistry

Tabl
e VI
: So
me
Diff
usio
n M
odel
Res
ults
R adical Y ields in the R adiolysis op Cyclohexene 919
a ,_l t © 00 T* © rH Tf T—l i—l © 00 i—1 00 00 rH CO Tfl © © © 00 00S' © © rH rH I—l CM CM CO CO CM CM CM CM © © CM CM CM co CO co CO © © rH CO Til
C5 r r—l i—l i—1 rH 1—1 rH i—i r - 1r rH rH T“ ' r r r i—i rH rH i—1
Tfl CO to ©a 00 © © CM © i—l R- CO rH © © © r- Tjl to h- t - CO 1—1© 00 © 00 © © IO, « 00 00 © © © tO © Tf Tf Tf iO © © tO to Til Tfl Tfl Tfl Tjl CO © CO CO © ©
t* r r r r 1—1 rH i—l r l—1 i—l r rH rH r i—1 r rH rH rH - 1r r © © © © ©
W kO rr « us « us r- « CO r- U< «o© © © © © © © © © © © © © © © © © © © © © © © ©i—l 1—11—1i-H i-H rH l—1 rH rH rH rH rH rH rH 1—1 rH rH rH 1—1 rH rH 1—1rH
8 X X X X X X X X X X X X X X X X X X X X X X X X XCD© o © © © © © h- 00 1—1 rH rH © © © rH rH rH rH 1—(© © O T—1 © © © © © © © © © © © © © © © © © © © ©r r r rH i—l rH iH 1—1 r - 1rH rH r rH rH r r rH i—1 T—1 r r rH
« © © to 00 CM 00 © CM 00 CM CM CM CM CM 00 00 CM oo t> Tfl Tfl CO 1> © ©© © © © d Tf CO CO CM © © © to 00 00 to CO CO CO CM CM CM l> to Til © 00
<1 CO co CM CM CM CM CM CM CM CM CM CM CM CM CM CM CM CM CM CM CM CM CM CM CM CM rH 1—1
Tjl © © © r>- CO © © © © CM CO CO CO rH 00 Til © 00 00 © © to © © co ©© r- T—1 CM CO Tf r- 00 © tO © © © © io t-r X © © © © © © toO CM CO t T* Til Tjl Tf rf t* Til Tf Til Tf Til Tf Til Tjl TÌ1 Tfl Tfl Til Til to Tjl Tjl to © ©
© © © © © © © © © © © © © © © © © © © © © © © © © © © ©
CO © © © Tjl Tf Tf Tf CO CO Tf Tf Tf Til to to Tf Til Til CO CO CO CO © © to CO CM2 © i-H i-H rH rH rH rH 1—1 rH rH rH CM CM CM CM CM© r- 1 rH i—l rH rH 1—1 rH rH rH rH rH rH rH 1—1 rH rH rH rH rH rH rH tH rH rH rH rH rH© © © © © © © © © © © © © © © © © © o ' © © © © © © © © ©
t» r- t. <0 r t-© © © © © © © © © ©
i—l S-> i—i rH i—l rH ip ip rH rH rH rH« X X X X X X © © X X X X
Til 1—1 CO © CM CM Tf rH rH rHi—i
tp tp r- i—© © © © © © t- t. © © ©
a 1—1 i—l i—1o
X XO
X X X X© 10 10 X X X
T—t r—1 CO CO CO CO rH rH l—1
- US fIQ us US us US
o © © © © © © © © © © ©<n I—* rH rH 1—1 rH rH rH rH rH
a X X X X X X X X X X X© CM CM Tfl Tf CM Til 00 T}1 CM Tjl 00
rH u, Tus US US f
o © © © © © © © © © © ©<a rH i—l i—1 rH rH rH rH rH 1—1 rH
a X X X X X X X X X X X« CM CM CM CM CM CM CM CM CM CM CM
© © © & © & & © © d oi—l rH1 T—1 i—i rH rH rH rH tH1
s X X X X X X X X X X Xc CM CM CM CM CM CM CM CM © © ©
t* Tf Tf Tf Til Tf rH r 1—1
© © © © © © © © © © ©« rH r—l rH rH rH rH rH rH rH tH
'a X X X X X X X X X X Xo T Til Tf Tf Til Til Til CM CM CM
CO © © © © © © © CM CM CM
to © ©
I I© 2X X
to
2 S00 CO © ©
© 2
© ©
I©
X
I©
X
I©
XT*
USI©HXCM
X©
XCMCM
wo
CM
d
COCM
©
COCMT—1 ©
CMrH©
©©
©©
00Tji
0000
< 39 >I
I©rHXCO
TflCO
Tf<CO
TflCO
TtJCO
Tj<CO
T*CO
TfCO
© © © ©CM CM CM CMCM CM CM CM
Volume 70, Number 3 March 1966
506
1.90

920 W. G. Burns, R. A. Holroyd, and G. W. K lein
Figure 7. Diffusion model case 2: Ci no./cm of remaining C6 radicals; c2 no./cm of remaining CH3- radicals; fee,2,2kciCi, kc22 no./cm of radicals which have taken part in reactions C6- + C6-, C6- + CH3-, CH3- + CH3-, respectively, as functions of t for constants given in Table VI.
r a d i c a l s a v a i l a b l e f o r r e a c t i o n a t t h e t r a c k o v e r l a p
s t a g e , s o t h a t t h e C H 3 ■ r a d i c a l s l e f t m u s t p r e f e r e n t i a l l y
i n t e r c o m b i n e . T h i s m a k e s fn l e s s a n d / 22 g r e a t e r t h a n
f o r t h e h o m o g e n e o u s c a s e , a n d t h u s G app < ( j reai.
C a s e s 2 , 6 , a n d 7 s h o w t h e e f f e c t o f i n c r e a s i n g D 2/D x w i t h o t h e r p a r a m e t e r s c o n s t a n t . A c o m p a r i s o n o f
c a s e s 4 a n d 8 s h o w s t h a t i f Z ) 2 a n d D x a r e h e l d c o n s t a n t ,
t h e e f f e c t o f v a r y i n g t h e a b s o l u t e v a l u e s o f rx a n d r 2
i n t h e r a n g e 1 - 3 X 1 0 - 7 c m i s v e r y s m a l l i f t h e r a t i o
fx/r-i i s h e l d c o n s t a n t . I t w a s f o u n d t h a t w i t h D 2/D x = 2 , G r e a i /G a p p v a r i e d o n l y b y 2 % w h e n U w a s c h a n g e d
f r o m 1 0 - B t o 1 0 - 4 s e c (e.g., c a s e 4 ) , t i m e s w h i c h a r e a p
p r o p r i a t e f o r t r a c k o v e r l a p a t t h e b e a m c u r r e n t s u s e d .
I n c a s e s 9 , 1 0 , 1 1 , a n d 1 2 , i n w h i c h t h e v a l u e s o f N x a r e i n t h e r e g i o n c o r r e s p o n d i n g t o a 1 - M e v 4H e t r a c k ,
a n d v a l u e s o f rx, r 2, D 2, a n d D x a r e t h e s a m e a s 1 , 6 , 7 ,
a n d 8 , i t c a n b e s e e n t h a t t h e e f f e c t o f i n c r e a s i n g L E T ,
f o r t h e s a m e v a l u e s o f t h e l a t t e r p a r a m e t e r s , i s t o
i n c r e a s e t h e d i s c r e p a n c y b e t w e e n 6 > eai a n d G a p p .
I t i s f o u n d , a s i n t h e h o m o g e n e o u s c a s e , t h a t t h e e f f e c t
o f i n c r e a s i n g N 2 b y a f a c t o r B i s t o i n c r e a s e / 22 b y a
f a c t o r B 2 a n d / i 2 b y a f a c t o r B, t h u s / 12//22 b y a f a c t o r
B, b u t s i n c e G aPp = N 2f X2/2f22 X ( — d E / d a ;) X 1 0 6,
t h e r e i s n o e f f e c t o n G a PP.
Figure 8. Diffusion model case 3 (see Figure 7 and Table VI).
I t i s c l e a r t h a t t h e m o d e l a p p e a r s t o s h o w q u a l i
t a t i v e l y t h e c o r r e c t k i n d o f b e h a v i o r t o e x p l a i n t h e d i s
c r e p a n c i e s b e t w e e n t h e e x p e c t e d a n d t h e m e a s u r e d G v a l u e s . F o r t h e m o d e l t o h a v e t h e c o r r e c t q u a n t i t a t i v e
b e h a v i o r i t i s n e c e s s a r y t h a t f o r t h e p r o t o n c a s e ,
( — dE/dx) = 3 . 4 e v / A , G^\/G&pv s h o u l d b e ~ 1 . 8 a t
G reat = 3 . 5 , a n d t h a t f o r t h e 4H e i o n c a s e , ( — dE/<lx) =
2 2 . 9 e v / A , G reai / G apP s h o u l d b e ~ 3 . 0 a t G reai = 2 . 7 .
F i g u r e 1 0 s h o w s v a l u e s o f G reai / 6 ' app f o r t h e p r o t o n a n d
4H e i o n c a s e s , w i t h D x = 2 X 1 0 - B c m 2 s e c - 1 , D 2 = 4 X
1 0 - 6 c m 2 s e c - 1 ; t h e r a t i o D 2/ D x i s s u g g e s t e d b y t h e
r a t i o s o f t h e r e d u c e d m a s s e s o f t h e r a d i c a l s , a n d t h e
a b s o l u t e v a l u e o f D x i s s u g g e s t e d b y t h e s e l f - d i f f u s i o n
c o e f f i c i e n t o f a C 6 h y d r o c a r b o n . 27 T h e v a l u e o f U i s
a l s o h e l d c o n s t a n t a t 1 0 - 4 s e c , t h e a p p r o x i m a t e t i m e a t
w h i c h t r a c k o v e r l a p w o u l d o c c u r a t t h e c u r r e n t s u s e d ,
a n d t h e d e p e n d e n c e o f (7 reai / G app o n G reai i s g i v e n f o r
d i f f e r e n t v a l u e s o f r2/rx. I t i s s e e n t h a t t h e e x p e r i
m e n t a l c o n d i t i o n f o r t h e p r o t o n c a s e s t a t e d a b o v e o c c u r s
a t r2/rx = 6 , a n d f o r t h e 4H e i o n c a s e a t r2/rx = 4 .
T h e l a t t e r c a s e i s t h e l e a s t c e r t a i n , s i n c e G reai, g i v e n b y
4 G ( C x2H 22) + 2 . 8 G ( c y c l o h e x y l c y c l o h e x e n e ) + 2 G( 2 , 2 ' - b i c y c l o h e x e n y l ) , i s s u b j e c t t o a l a r g e u n c e r t a i n t y
w h e n t h e s e G v a l u e s a r e l o w . H o w e v e r , c o n s i d e r i n g
t h e a p p r o x i m a t i o n s m a d e , t h e v a l u e s o f 4 a n d 6 f o r
(27) D. W. M cCall, D . C. Douglass, and E. W. Anderson, J . Chem. P h y s., 31, 1555 (1954).
The Journal of Physical Chemistry

R adical Y ields in the R adiolysis of Cyclohexene 921
Figure 9. Diffusion model case 4 (see Figure 7 and Table VI).
ft/7T c a n b e c o n s i d e r e d i n r e a s o n a b l e a g r e e m e n t . S i n c e
n i s l i k e l y t o b e 1 0 t o 3 0 A , a v a l u e o f r 2/ r i = 5 l e a d s t o
r% = 5 0 - 1 5 0 A , w h i c h c o m p a r e s w i t h a n e s t i m a t e o f
6 0 A f o r t h e m e d i a n d i s t a n c e t r a v e l e d b y a n e l e c t r o n
b e f o r e t h e r m a l i z a t i o n i n a n o n p o l a r m e d i u m . 19
A n i m p o r t a n t a p p r o x i m a t i o n w h i c h h a s b e e n m a d e
i n t h e f o r e g o i n g d i s c u s s i o n i s t h a t t h e C 6 a n d C H S -
r a d i c a l s a r e g e n e r a t e d a t t h e s a m e p o i n t i n t i m e . T h o s e
C 6 r a d i c a l s f o r m e d b y v i b r a t i o n a l d i s s o c i a t i o n o f d i r e c t l y
e x c i t e d m o l e c u l e s o r b y f a s t i o n - m o l e c u l e r e a c t i o n s
i n v o l v i n g t h e s u b s t r a t e w i l l p r o b a b l y a l l b e g e n e r a t e d
w i t h i n a t i m e 1 0 - u s e c o f t h e p a s s a g e o f t h e i o n i z i n g
p a r t i c l e , w h e r e a s t h e f o r m a t i o n o f t h e C H 3 - r a d i c a l s
w i l l o c c u r i n a t i m e ~ l / f c , c B, w h e r e c 9 = [ C H 3I ] a n d
kB i s t h e r a t e c o n s t a n t f o r e + C H 3I -*■ C H 3 - + I - .
T h i s i s p r o b a b l y a f a s t r e a c t i o n a n d c o u l d b e e v e n f a s t e r
t h a n t h a t i n v o l v i n g t h e d i f f u s i o n a l a p p r o a c h o f u n
c h a r g e d s p e c i e s , s i n c e t h e e f f e c t i v e d i f f u s i o n c o n s t a n t
f o r t h e n e g a t i v e s p e c i e s w i l l b e l a r g e a n d t h e d e B r o g l i e
w a v e l e n g t h o f t h e f r e e t h e r m a l i z e d e l e c t r o n i s ~ 6 0 A ;
t h u s a t i m e o f 1 0 ~ 9 t o 1 0 - 8 s e c i s c o n c e i v a b l e f o r t h e
f o r m a t i o n o f t h e C H 3 - r a d i c a l s w i t h t h e e x p e r i m e n t a l
v a l u e s o f cB. I n s u c h t i m e s , i f m ( f o r t h e C 6 r a d i c a l s ) i s
~ 3 0 A , c o m p a r a t i v e l y l i t t l e d i f f u s i o n a n d r e a c t i o n
o f C 6 • w i t h C 6 • w o u l d h a v e t a k e n p l a c e ( s e e F i g u r e s 7 ,
8 , a n d 9 ) , a n d t h e e r r o r i n v o l v e d i n a s s u m i n g i n s t a n
t a n e o u s r a d i c a l g e n e r a t i o n i s s m a l l . I f , h o w e v e r , tt i s
Figure 10. Diffusion model calculation of ¿neai/Gapp as dependent on C?reai for D2 = 2A , i t = 1 0 sec, at varying values of r2/ri.
s m a l l ( s a y 1 0 A ) a n d 1 /kscB l a r g e ( s a y 1 0 - 7 s e c ) , a p
p r e c i a b l e r e a c t i o n a n d d i f f u s i o n o f C 3 r a d i c a l s w i l l h a v e
t a k e n p l a c e d u r i n g t h e f o r m a t i o n o f t h e C H 3 - r a d i c a l s .
T h e p o s t u l a t e o f u n e q u a l t r a c k r a d i i f o r t h e s u b s e q u e n t
d i f f u s i o n o f C fí a n d C H 3 - r a d i c a l s t h e n b e c o m e s l e s s
n e c e s s a r y (e.g., N i = 6 . 4 X 1 0 6 i n a n e x t r e m e c a s e w i t h
r i = 1 0 A i s r e d u c e d t o 3 . 4 X 1 0 6 i n 1 0 - 7 s e c w i t h a f i n a l
r a d i u s o f ~ 2 5 0 A ; s u c h a c o n d i t i o n e v e n f o r s u b s e
q u e n t d i f f u s i o n w i t h i t = r 2 r e q u i r e s v e r y l a r g e v a l u e s
o f r 2) . I t a p p e a r s t h a t t h e d e v i a t i o n s c a u s e d b y r e a c
t i o n o n t h e o n e h a n d a n d d i f f u s i o n o n t h e o t h e r w i l l
b e p a r t l y s e l f - c a n c e l l i n g . A n o t h e r c o n s i d e r a t i o n j u s t i
f y i n g t h e c o n c e p t o f s i m u l t a n e o u s g e n e r a t i o n o f C 6 -
a n d C H 3 - i s t h a t a l a r g e p r o p o r t i o n o f t h e C e r a d i c a l s ,
viz. , t h o s e f o r m e d o n i o n - e l e c t r o n c o m b i n a t i o n , w i l l i n
a n y c a s e b e f o r m e d a t t i m e s c o m p a r a b l e w i t h l / f c sc s .
F u r t h e r i n v e s t i g a t i o n m u s t a w a i t t h e d e v e l o p m e n t o f a
s u i t a b l e m o d e l f o r t h e e a r l y e v e n t s i n t h e t r a c k h i s t o r y
w h i c h t a k e s a c c o u n t o f e l e c t r o n d r i f t , c a p t u r e , a n d a t
t a c h m e n t u n d e r t h e i n f l u e n c e o f t h e p r e v a i l i n g c o u l o m -
b i c f i e l d s . T h e m o d e l u s e d h e r e i s a p p r o p r i a t e f o r t h e
d i f f u s i o n a n d r e a c t i o n o f u n c h a r g e d t h e r m a l i z e d s p e c i e s .
Conclusions
T h e c o m p a r a t i v e l y l a r g e G v a l u e s f o r G ( 14C H 3 - )
a t l o w c o n c e n t r a t i o n s o f [ 14C H 3I ] w i t h f a s t e l e c t r o n s
p o i n t t o a v e r y e f f i c i e n t m o d e o f e n e r g y t r a n s f e r w h i c h
Volume 70, Number 3 March 1966

922 W. G. Burns, R. A. Holroyd, and G. W. K lein
w e h a v e i n t e r p r e t e d a s d i s s o c i a t i v e e l e c t r o n c a p t u r e
b y C H SI . T h e r e a r e t w o d i f f i c u l t i e s w i t h t h i s i n t e r p r e
t a t i o n : ( a ) t h a t e l e c t r o n c a p t u r e h a s a l a r g e c r o s s s e c
t i o n o n l y a t t h e r m a l e n e r g i e s a n d t h a t i n a n o n p o l a r
m e d i u m t h e r e i s n o m e c h a n i s m f o r e n e r g y l o s s o f t h e
e l e c t r o n b e l o w t h e f i r s t v i b r a t i o n a l e x c i t e d s t a t e
o f t h e s u b s t r a t e ; ( b ) t h a t i o n - e l e c t r o n r e c a p t u r e i s a
v e r y f a s t p r o c e s s . B o t h o f t h e s e d i f f i c u l t i e s a r e
m o d i f i e d a n d l e s s e n e d b y t h e c o n s i d e r a t i o n t h a t
t r a n s i e n t e l e c t r o n a t t a c h m e n t t o t h e s u b s t r a t e i s
p o s s i b l e .
G(C 6 r a d i c a l s ) , a s m e a s u r e d f r o m t h e a c t i v i t i e s o f
c o m b i n a t i o n p r o d u c t s o f t h e r a d i c a l s w i t h 14C H 3 - ,
d e c r e a s e s w i t h i n c r e a s i n g L E T m o r e q u i c k l y t h a n t h e
G v a l u e s e x p e c t e d f r o m t h e c o n d e n s e d p r o d u c t G v a l u e s .
T h i s i s i n t e r p r e t e d o n t h e b a s i s t h a t t h e m e t h y l r a d i c a l s
f o r m e d b y e l e c t r o n c a p t u r e b y C H 3I a r e d i s t r i b u t e d
s p a t i a l l y m o r e w i d e l y t h a n C 6 r a d i c a l s a n d d i f f u s e
f a s t e r . T h e r a t i o o f t h e t r a c k r a d i i o f C H 3 - a n d C 6
r a d i c a l s i s ~ 5 .
Acknowledgments. W e w i s h t o t h a n k D r . R . H .
S c h u l e r , f o r m u c h t e c h n i c a l h e l p a n d a d v i c e , a n d M r .
E . J . Y o r k , M r . M . J . H o p p e r , a n d M r . B . A . L e w i s
o f T h e o r e t i c a l P h y s i c s D i v i s i o n , A . E . R . E . H a r w e l l ,
f o r v a l u a b l e a i d i n m a t h e m a t i c s a n d c o m p u t a t i o n .
Appendix I
( 0 . 0 5 2 1/k)l/t a n d e a c h o f t h e a b o v e e q u a t i o n s y i e l d s
i n t u r n x, y, z, p, q, r, a n d t
x = 0 . 0 0 2 7 /(kh'ca + khcs - f - ks)
y = kbcsx/(k0'cs + k0cs + ks)
z = kccay/ks
p = ( 0 . 0 3 4 7 + k jc aq + kc'cay + kb'csx)/(kdca + ks)
q = 0 . 0 1 6 7 / ( f c ac s + K 'c a + ks)
r = k&caq/ks
t = kdCap/ks
W e n o w w i s h t o c o n s i d e r t h e f o r m a t i o n o f t h e r a d i o
a c t i v e p r o d u c t s , 14C 2H 6, 14C H r C 6H 9, 14C H 3 C 6H n ,
a n d I4C H 4. T h e f i r s t i s f o r m e d o n l y b y t h e r e a c t i o n
t o g e t h e r o f m e t h y l r a d i c a l s ; t h e s e c o n d b y r e a c t i o n o f
14C H 3 - w i t h C 6H 9 - a n d a t l o w d o s e r a t e s i n t h e d i s
p r o p o r t i o n a t i o n r e a c t i o n s o f R 2 - , C H 3 C 6H i o - . T h e
t h i r d i s p r o d u c e d b y r e a c t i o n o f 14C H 3 - w i t h C 6H n •,
a n d a t l o w d o s e r a t e s b y t h e a b s t r a c t i o n f r o m t h e
s o l v e n t b y R 2 - , a n d a g a i n i n t h e d i s p r o p o r t i o n a t i o n
r e a c t i o n s o f R 2 - . 14C H 4 i s f o r m e d i n d i s p r o p o r t i o n a
t i o n s a n d a t l o w d o s e r a t e s b y a b s t r a c t i o n f r o m t h e s o l
v e n t . T h e i n t e r r a d i c a l r e a c t i o n s w e n e e d t o c o n s i d e r
a r e a s f o l l o w s , w h e r e C H 3 - i s a l w a y s 14C H 3 - a n d w h e r e
p o l d e s i g n a t e s a m o l e c u l e l a r g e r t h a n C 42
T h e t o t a l r e a c t i o n s c h e m e c o m p r i s e s t h e f o r m a t i o n o f
C 6H 9 - , C g H n •, a n d C H 3 - r a d i c a l s (G v a l u e s t a k e n a s
3 . 4 , 1 . 6 , a n d 0 . 2 , r e s p e c t i v e l y ) , t h e i r r e a c t i o n s w i t h t h e
s u b s t r a t e , a n d t h e i n t e r a c t i o n s o f t h e r a d i c a l s C H 3 - ,
C 6H u •, C 6H 9 •, R i •, R 2 •, R 3 •, a n d R 4 ■. I f t h e c o n c e n
t r a t i o n s o f t h e s e r a d i c a l s a r e x, q, p, r, y, z, a n d t, r e s p e c t i v e l y , i n m o l e c u l e s p e r c u b i c c e n t i m e t e r , t h e
s t a t i o n a r y - s t a t e e q u a t i o n s a r e a s f o l l o w s , w i t h s =
p + q + r + t + x + y + z a n d w i t h a c o m m o n r a t e
c o n s t a n t k f o r a l l r a d i c a l i n t e r a c t i o n s , w h e r e 7 i s t h e
a b s o r b e d d o s e r a t e i n e v c m - 3 s e c - 1 a n d c „ = [ C e H ^ ]
0 . 0 0 2 7 — (kb' + kb)csx — kxs = 0
khcax — (ke' + ke)cBy — kys = 0
kccsy — kzs = 0
0 . 0 3 4 7 + (k jq + kb'x + ke'y — kdp)cs — kps = 0
0 . 0 1 6 7 — (fca + k j) c aq — kqs = 0
fcac sg — krs = 0
kdcap — kts = 0
T h e s u m o f t h e s e i s 0 . 0 5 2 7 — ksi = 0 ; h e n c e s =
c h 4 + C 6H s
C 6H 9 - + C H a - ( A l )
^ C 6H r C H 3
C H 4 + C 6H 10
C 6H u - + C H 3 ( A 2 )
C 6H n - C H 3
C H 3 - C 6 H n C e H n - C e H g
R i ■ 4 " R 2 • C H a ■ C f J L j C o H n • C e H n ( A 3 )
p o l
C H 4 4 ~ C e H n ' C e H g
R i - + C H a - ( A 4 )
p o l
The Journal of Physical Chemistry

Radical Y ields in the R adiolysis of Cyclohexene 923
C H 3 - C 6H 9 + C H r G J I u
R 2 ■ “ I- R 2 ( A 5 )
R 2 * + R 3
p o i
f * C H a - C e H u + C H 3 - C 6H 10- C 6H 9
C H 3 C 6H 9 + C H a C e H j o - C s H n
p o i
C H 3 - C 6H u + C 6H 8
R * - + C 6H 9 — ■ - > C H 3 - C 6H 9 + C e H 10 ( A 7 )
p o i
C H 3 C 6H „ + C 6H 10
R 2 • + C 6H u ■ > C H r C 6H 9 + C 6H 12 ( A 8 )
p o i
c h 3 - c 6h 1 0 c h 3
R r + C H 3 ----------- C H 4 + C 6H 9 - C H 3
C H 4 + C H 3 - C 6H i o - C 6H 9
r 3 - + c h 3 -
( A 9 )
( A 1 0 )
R 4 • 4 “ R :'2 '
p o i
C H r C . H u + C 6H 9 - C 6H 9
- > C H 3 • C 6H 9 + C 6H 9 • C e H n ( A l l )
p o i
c h 4 + c 6h 9 - c 6h 9
r 4 - + c h 3 ( A 1 2 )
p o l
T h e y i e l d s o f t h e p r o d u c t s i n q u e s t i o n a r e a s f o l l o w s ,
w h e r e t h e v a l u e s / a n d g a r e t h e f r a c t i o n s o f t h e t o t a l
r a d i c a l i n t e r a c t i o n s w h i c h l e a d t o d i s p r o p o r t i o n a t i o n
a s i n d i c a t e d i n t h e r e a c t i o n s c h e m e a b o v e
C ( C 2H 6) = G i = 5 0 k x y i
G(CH4) = G2 = + far + Sva» +
fixp + fa q + f a y + f ia t i
G ( C H 3 - C . H h ) = C 3 =
1 0 0 & (kc'csyi \ " i r + f ’r s + t
fiVV + f m + ( 1 - U)xq + fnyt)
( A 6 ) G ( C H 3 - C 6H 9) = Qt =
1 0 0 /c ( fry*- j - y & y + - y + g*yz + g i i jv +
g m + f»yx + ( l - fi)xp + gnyt|
F o l l o w i n g t h e u s u a l p r o c e d u r e , t h e a p p a r e n t v a l u e o f
£ r ( 14C H 3 • ) i s g i v e n b y
C ( C H r ) = G, = 2 Gi + G3 + G 4
a n d t h e r a d i c a l G v a l u e s a r e g i v e n b y
G ( C . H u - ) = G & / 2 G & - h )
G ( C e H 9 - ) = (7 4G 6/ 2 G 1( 1 - ff)
I t i s s i m p l e t o s h o w t h a t a t h i g h d o s e r a t e s , w h e r e t h e
c o n c e n t r a t i o n s o f R j •, R 2 •, R 3 •, a n d R 4 • a r e v e r y l o w
c o m p a r e d w i t h t h o s e o f C 6H 9 - , C 6H n •, a n d C H 3 - ,
t h a t t h e d e r i v e d G v a l u e s o f t h e s e t h r e e r a d i c a l s b e
c o m e t h o s e o r i g i n a l l y c h o s e n f o r t h e s t a t i o n a r y - s t a t e
e q u a t i o n s , viz., 3 . 4 , 1 . 6 , 0 . 2 . A t l o w e r d o s e r a t e s a l l
t h e s e b e c o m e l o w e r , t h e o n s e t o f t h e e f f e c t d e p e n d i n g
m a i n l y o n k,\, kd a n d fca, k j , a n d p a r t l y u p o n kh, kh'. A t l o w e r d o s e r a t e s s t i l l G ( C 6H 9 - ) a n d f r ( C 6H n - ) r i s e
a g a i n a n d ( ? ( 14C H 3 - ) c o n t i n u e s t o f a l l d u e t o t h e i m
p o r t a n c e o f d i s p r o p o r t i o n a t i o n ; a t t h i s s t a g e ( ^ ( C . H u • )
i n c r e a s e s f a s t e r t h a n C ( C 6H 9 - ) , s i n c e G ^ C H j - C e H u )
i s f o r m e d b y t h e a b s t r a c t i o n r e a c t i o n o f R 2 - w i t h t h e
s u b s t r a t e . T h e s e e f f e c t s d e p e n d i n t u r n o n t h e v a l u e s
o f t h e d i s p r o p o r t i o n a t i o n r a t i o s a n d o n k f.I n c a l c u l a t i n g G ( I4C H 4) / [ ( 7 14( C H 4) + ( ? ( 14C H 3 - ) ]
a d o s e - r a t e i n d e p e n d e n t y i e l d o f m e t h a n e ( 0 . 4 3 ) n o t
f o r m e d via ( 7 ( 14C H 3 - ) w a s i n t r o d u c e d t o g i v e t h e
c o r r e c t r a t i o a t h i g h d o s e r a t e , s o t h a t t h e c a l c u l a t e d
r a t i o i n F i g u r e 6 i s i n f a c t [ G ( 14C H 4) + 0 . 4 3 ] / [ 0 . 4 3 +
( ? ( 14C H 4) + G ( 14C H 3 - ) ] .
Appendix II
D e t a i l s o f t h e t r a n s f o r m a t i o n s a n d c o m p u t a t i o n a l
m e t h o d s w i l l b e p u b l i s h e d e l s e w h e r e , b u t w e g i v e h e r e
t h e e q u a t i o n s t o b e s o l v e d , t h e i n i t i a l c o n d i t i o n s , a n d
Volume 70, Number 8 March 1966

924 Notes
t h e m e t h o d u s e d f o r s e p a r a t i n g t h e t r a c k - e x p a n s i o n
a n d t r a c k - o v e r l a p p a r t s o f t h e r e a c t i o n .
T h e i n i t i a l s t a t e i s a c y l i n d r i c a l g a u s s i a n d i s t r i b u t i o n
f o r t h e c o n c e n t r a t i o n o f e a c h t y p e o f r a d i c a l
~ò%_ ò r 2
' ò 2
ò r 2
+
+
1 ÒCi
r òr _ 1 ò c 2~
r òr _
f c i d 2 — /C12C1C2
Ä-2C22 — fci2CiC2
C , = I V e x p ( — r 1 2/ 2 ( r 0) f 2)
w h e r e i = 1 f o r t h e C 6 r a d i c a l a n d 2 f o r t h e C H 3 ■ r a d i c a l ,
a n d A i a n d A 2 a r e a p p r o p r i a t e c o n s t a n t s f o u n d b y i n t e
g r a t i n g t h e s e e x p r e s s i o n s o v e r s p a c e a n d s e t t i n g t h e
i n t e g r a l s o b t a i n e d b y t h e p r o g r a m e q u a l t o N 1 a n d 1V 2,
t h e t o t a l i n i t i a l n u m b e r s p e r u n i t l e n g t h o f e a c h r a d i c a l ,
i n t u r n . T h e c h e m i c a l r e a c t i o n s c o n s i d e r e d a r e
kiC b - + C b - — > p r o d u c t s ( B l )
C 6 - + 14C H S - 14C H 3 - C 6 ( B 2 )
14C H 3 + 14c h 3 i 4C 2 h 6 ( B 3 )
a n d t h e c o u p l e d p a r t i a l d i f f e r e n t i a l e q u a t i o n s a r e
w i t h b o u n d a r y c o n d i t i o n s dci/dr = d c 2/ d r = 0 a t r =
0 f o r a l l t a n d Ci = c 2 = 0 a t r = 00 f o r a l l t.T h e e q u a t i o n s a r e s o l v e d t o f i n d t h e n u m b e r s p e r
u n i t l e n g t h o f r a d i c a l s w h i c h t a k e p a r t i n r e a c t i o n s B l ,
B 2 , B 3 , u p t o t h e e n d o f t r a c k e x p a n s i o n a t t i m e U, I f t h e s e n u m b e r s a r e d e s i g n a t e d nn, n12, w 22, r e s p e c t i v e l y ,
t h e n u m b e r s p e r u n i t l e n g t h o f r a d i c a l s l e f t w i l l b e I V /
- N i — ( b u + fi.12/ 2 ) a n d I V / = 1V 2 — {n22 - f - W i2/ 2 ) .
T h e s e a r e t h e n a s s u m e d t o u n d e r g o h o m o g e n e o u s
i n t e r a c t i o n , a n d t h e n u m b e r s t a k i n g p a r t i n r e a c t i o n s
B l , B 2 , a n d B 3 w i l l b e i n t h e c a s e c h o s e n w i t h k, = /c 2,
n i / = ( N 7 ) 2/ W + N*’), nn' = 2N1'N 2'f {N 1l +
1V2 0 , a n d n 22 = ( A Y ) V ( A Y + N %% F i n a l l y , t h e f r a c
t i o n s o f t h e t o t a l n u m b e r o f r a d i c a l s w h i c h t a k e p a r t i n
r e a c t i o n s B l , B 2 , a n d B 3 w i l l b e f-A = ( % + tin ')/ (N i + 1V 2) , /12 = (W 12 + / ¡ i / ) / ( i V i + 2V a) , a n d / 22 =
( n 2 + n2 )/(N 1 + N 2).
N O T E S
Correlation of Nuclear Magnetic Resonance
and Infrared Spectra in Two Cyanophosphines
b y I . B . J o h n s , H . R . D i P i e t r o , R . H . N e a l e y ,
M o n s a n to R e s e a rc h C o r p o r a t io n , B o s to n , L a b o r a t o r y ,E v e re tt , M a s s a c h u se tts
a n d J . V . P u s t i n g e r , J r .
D a y t o n L a b o r a t o r y , D a y t o n , O h io ( R e c e iv e d A u g u s t 2 , 1 9 6 5 )
T h e i n f r a r e d s p e c t r a o f m a n y o r g a n o p h o s p h o r u s
c o m p o u n d s w i t h t h e n i t r i l e g r o u p a t t a c h e d t o t h e
p h o s p h o r u s a t o m s h o w t h e e x p e c t e d n i t r i l e a b s o r p t i o n
i n t h e 2 2 0 0 - c m _ 1 r e g i o n . H o l m s t e d t a n d L a r r s o n 1
h a v e r e p o r t e d s o m e p h o s p h o n y l n i t r i l e s t h a t a b s o r b
a t 2 2 3 2 c m - 1 . A c c o r d i n g t o B e l l a m y , 2 t h e n i t r i l e
g r o u p u s u a l l y a b s o r b s i n t h e r e g i o n o f 2 2 7 0 c m - 1 ,
w h i l e t h e i s o n i t r i l e g r o u p a b s o r b s i n t h e 2 1 8 0 - 2 1 2 0 -
c m - 1 r e g i o n . W e h a v e f o u n d t h a t d i p h e n y l c y a n o -
p h o s p h i n e , P h 2P C N ( I ) , a n d ( p - p h e n o x y p h e n y l ) p h e -
n y l c y a n o p h o s p h i n e ( I I ) d o n o t e x h i b i t d e t e c t a b l e
a b s o r p t i o n i n t h e 2 3 0 0 - 2 1 0 0 - c m “ 1 r e g i o n . ( P h d e
n o t e s t h e p h e n y l g r o u p . )
W h i l e t h e r e a r e r e p o r t e d c a s e s w h e r e t h e n i t r i l e
g r o u p v i b r a t i o n i s n o t d e t e c t e d i n t h e i n f r a r e d , n o t a b l y
t h e a - o x y g e n a t e d n i t r i l e s , 2’ 3 t h i s i s t h e f i r s t r e p o r t e d
c a s e o f a l a c k o f d e t e c t a b l e i n f r a r e d a b s o r p t i o n o f t h e
n i t r i l e g r o u p i n p h o s p h i n e c o m p o u n d s . W e a l s o w i s h
t o p r e s e n t e v i d e n c e s u g g e s t i n g t h e r e a s o n f o r t h i s
a n o m a l o u s b e h a v i o r .
E x p e r i m e n t a l S e c t i o n
Materials. D i p h e n y l c y a n o p h o s p h i n e ( I ) a n d ( p -
p h e n o x y p h e n y l ) p h e n y l p h o s p h i n o u s c y a n i d e ( I I ) w e r e
(1) B. Holmstedt and L. Larrson, A c t a C h e m . S c a n d . , 5, 1179 (1951).(2) L. J. Bellamy, “ The Infrared Spectra of Complex Molecules,” John Wiley and Sons, Inc., New York, N. Y., 1960, pp 263-267.(3) P. A. Argabright and D. W. Hall, C h e m . I n d . (London), 1365 (1964).
The Journal of Physical Chemistry
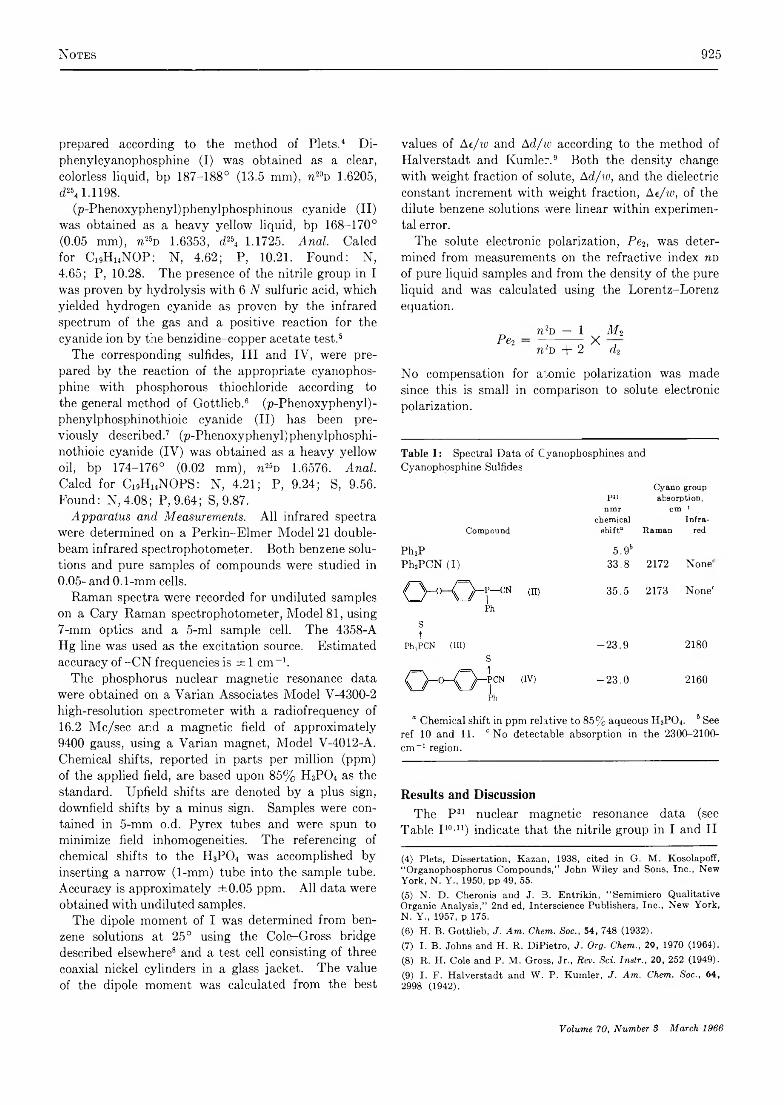
N o t e s 925
p r e p a r e d a c c o r d i n g t o t h e m e t h o d o f P i e t s .4 5 D i -
p h e n y l c y a n o p h o s p h i n e ( I ) w a s o b t a i n e d a s a c l e a r ,
c o l o r l e s s l i q u i d , b p 1 8 7 - 1 8 8 ° ( 1 3 . 5 m m ) , n 20d 1 . 6 2 0 5 ,
c P 4 1 . 1 1 9 8 .
( p - P h e n o x y p h e n y l ) p h e n y l p h o s p h i n o u s c y a n i d e ( I I )
w a s o b t a i n e d a s a h e a v y y e l l o w l i q u i d , b p 1 6 8 - 1 7 0 °
( 0 . 0 5 m m ) , w 25d 1 . 6 3 5 3 , d 264 1 . 1 7 2 5 . Anal. C a l c d
f o r C 19H 14N O P : N , 4 . 6 2 ; P , 1 0 . 2 1 . F o u n d : N ,
4 . 6 5 ; P , 1 0 . 2 8 . T h e p r e s e n c e o f t h e n i t r i l e g r o u p i n I
w a s p r o v e n b y h y d r o l y s i s w i t h 6 N s u l f u r i c a c i d , w h i c h
y i e l d e d h y d r o g e n c y a n i d e a s p r o v e n b y t h e i n f r a r e d
s p e c t r u m o f t h e g a s a n d a p o s i t i v e r e a c t i o n f o r t h e
c y a n i d e i o n b y t h e b e n z i d i n e - c o p p e r a c e t a t e t e s t .5T h e c o r r e s p o n d i n g s u l f i d e s , I I I a n d I V , w e r e p r e
p a r e d b y t h e r e a c t i o n o f t h e a p p r o p r i a t e c y a n o p h o s -
p h i n e w i t h p h o s p h o r o u s t h i o c h l o r i d e a c c o r d i n g t o
t h e g e n e r a l m e t h o d o f G o t t l i e b .6 ( p - P h e n o x y p h e n y l ) -
p h e n y l p h o s p h i n o t h i o i c c y a n i d e ( I I ) h a s b e e n p r e
v i o u s l y d e s c r i b e d .7 8 9 ( p - P h e n o x y p h e n y l ) p h e n y l p h o s p h i -
n o t h i o i c c y a n i d e ( I V ) w a s o b t a i n e d a s a h e a v y y e l l o w
o i l , b p 1 7 4 - 1 7 6 ° ( 0 . 0 2 m m ) , n 26D 1 . 6 5 7 6 . Anal. C a l c d f o r C 19H 14N O P S : N , 4 . 2 1 ; P , 9 . 2 4 ; S , 9 . 5 6 .
F o u n d : N , 4 . 0 8 ; P , 9 . 6 4 ; S , 9 . 8 7 .
Apparatus and Measurements. A l l i n f r a r e d s p e c t r a
w e r e d e t e r m i n e d o n a P e r k i n - E l m e r M o d e l 2 1 d o u b l e
b e a m i n f r a r e d s p e c t r o p h o t o m e t e r . B o t h b e n z e n e s o l u
t i o n s a n d p u r e s a m p l e s o f c o m p o u n d s w e r e s t u d i e d i n
0 . 0 5 - a n d 0 . 1 - m m c e l l s .
R a m a n s p e c t r a w e r e r e c o r d e d f o r u n d i l u t e d s a m p l e s
o n a C a r y R a m a n s p e c t r o p h o t o m e t e r , M o d e l 8 1 , u s i n g
7 - m m o p t i c s a n d a 5 - m l s a m p l e c e l l . T h e 4 3 5 8 - A
H g l i n e w a s u s e d a s t h e e x c i t a t i o n s o u r c e . E s t i m a t e d
a c c u r a c y o f - C N f r e q u e n c i e s i s ± 1 c m - 1 .
T h e p h o s p h o r u s n u c l e a r m a g n e t i c r e s o n a n c e d a t a
w e r e o b t a i n e d o n a Y a r i a n A s s o c i a t e s M o d e l V - 4 3 0 0 - 2
h i g h - r e s o l u t i o n s p e c t r o m e t e r w i t h a r a d i o f r e q u e n c y o f
1 6 . 2 M c / s e c a n d a m a g n e t i c f i e l d o f a p p r o x i m a t e l y
9 4 0 0 g a u s s , u s i n g a V a r i a n m a g n e t , M o d e l Y - 4 0 1 2 - A .
C h e m i c a l s h i f t s , r e p o r t e d i n p a r t s p e r m i l l i o n ( p p m )
o f t h e a p p l i e d f i e l d , a r e b a s e d u p o n 8 5 % H 3P 0 4 a s t h e
s t a n d a r d . U p f i e l d s h i f t s a r e d e n o t e d b y a p l u s s i g n ,
d o w n f i e l d s h i f t s b y a m i n u s s i g n . S a m p l e s w e r e c o n
t a i n e d i n 5 - m m o . d . P y r e x t u b e s a n d w e r e s p u n t o
m i n i m i z e f i e l d i n h o m o g e n e i t i e s . T h e r e f e r e n c i n g o f
c h e m i c a l s h i f t s t o t h e H 3P 0 4 w a s a c c o m p l i s h e d b y
i n s e r t i n g a n a r r o w ( 1- m m ) t u b e i n t o t h e s a m p l e t u b e .
A c c u r a c y i s a p p r o x i m a t e l y ± 0 . 0 5 p p m . A l l d a t a w e r e
o b t a i n e d w i t h u n d i l u t e d s a m p l e s .
T h e d i p o l e m o m e n t o f I w a s d e t e r m i n e d f r o m b e n
z e n e s o l u t i o n s a t 2 5 ° u s i n g t h e C o l e - G r o s s b r i d g e
d e s c r i b e d e l s e w h e r e 8 a n d a t e s t c e l l c o n s i s t i n g o f t h r e e
c o a x i a l n i c k e l c y l i n d e r s i n a g l a s s j a c k e t . T h e v a l u e
o f t h e d i p o l e m o m e n t w a s c a l c u l a t e d f r o m t h e b e s t
v a l u e s o f Ae/w a n d Ad/w a c c o r d i n g t o t h e m e t h o d o f
H a l v e r s t a d t a n d K u m l e r .9 B o t h t h e d e n s i t y c h a n g e
w i t h w e i g h t f r a c t i o n o f s o l u t e , Ad/w, a n d t h e d i e l e c t r i c
c o n s t a n t i n c r e m e n t w i t h w e i g h t f r a c t i o n , Ae/w, o f t h e
d i l u t e b e n z e n e s o l u t i o n s w e r e l i n e a r w i t h i n e x p e r i m e n
t a l e r r o r .
T h e s o l u t e e l e c t r o n i c p o l a r i z a t i o n , Pe2, w a s d e t e r
m i n e d f r o m m e a s u r e m e n t s o n t h e r e f r a c t i v e i n d e x no o f p u r e l i q u i d s a m p l e s a n d f r o m t h e d e n s i t y o f t h e p u r e
l i q u i d a n d w a s c a l c u l a t e d u s i n g t h e L o r e n t z - L o r e n z
e q u a t i o n .
Pe2n 2 d — 1
n 2 d + 2X
Mid2
N o c o m p e n s a t i o n f o r a t o m i c p o l a r i z a t i o n w a s m a d e
s i n c e t h i s i s s m a l l i n c o m p a r i s o n t o s o l u t e e l e c t r o n i c
p o l a r i z a t i o n .
Table I : Spectral Data of Cyanophosphines and Cyanophosphine Sulfides
Compound
Ph3PPhaPCN (I)
Ph
S1
Ph2PCN (III)S
Ph
Cyano groupP«
nmrchemical
shift®
absorption, cm -1
Infra- Raman red
5.9b33.8 2172 None'
35.5 2173 None'
-2 3 .9 2180
-2 3 .0 2160
“ Chemical shift in ppm relative to 85% aqueous H3PO4. b See ref 10 and 11. ' No detectable absorption in the 2300-2100- cm“ 1 region.
R esults and D iscussion
T h e P 31 n u c l e a r m a g n e t i c r e s o n a n c e d a t a ( s e e
T a b l e I 10’ 11) i n d i c a t e t h a t t h e n i t r i l e g r o u p i n I a n d I I
(4) Piets, Dissertation, Kazan, 1938, cited in G. M . Kosolapoff, “ Organophosphorus Compounds,” John W iley and Sons, Inc., New York, N . Y ., 1950, pp 49, 55.(5) N. D. Cheronis and J. 3 . E n trik in , “ Semimicro Qualitative Organic Analysis,” 2nd ed, Interscience Publishers, Inc., New York, N . Y ., 1957, p 175.(6) H . B. Gottlieb, J . A m . Chem. Soc., 54, 748 (1932).(7) I . B. Johns and H . R. D iP ietro, / . Org. Chem., 29, 1970 (1964).(8) R. H . Cole and P. M . Gross, Jr., Rev. Sci. In str ., 20, 252 (1949).(9) I . F. Halverstadt and W. P. Kum ler, J . A m . Chem. Soc., 64,2998 (1942).
Volume 70, Number $ March 1966

926 Notes
increases the electron density at the phosphorus atom. This increase in diamagnetic electron shielding is reflected in the large upheld displacement of the P31 resonance compared to Ph3P.
For a group to exhibit absorption in the infrared region, the vibration must give rise to a change of the dipole moment.12
It may be concluded that the shift of electron density from the cyano group toward the phosphorus atom in I and II alters the electronic distribution in the cyano group such that this vibration is now too weak to be detected.
Conversion of I and II to their sulfides, III and IV, results in a displacement of P31 resonance to lower fields suggesting an “ apparent” deshielding or lower electron density at the phosphorus nucleus. Such deshielding is accompanied by the appearance of nitrile group absorption in the infrared. The qualifying term “ apparent” is used because of the inability to distinguish between local diamagnetic and local paramagnetic contributions.
The nitrile groups of both I and II exhibit a strong line in the Raman spectrum at 2172 and 2173 cm-1, respectively. The slight displacement to a lower frequency from the normal 2250 ± 10 cm-1 for aliphatic nitriles13 suggests some bond conjugation between the nitrile groups and phosphorus atoms.
The dipole moment of diphenylcyanophosphine(I) was found to be 3.90 D. If we take the value of 3.5 to 3.7 D. as the group dipole moment of the nitrile group14 and 1.4 D. as the group moment of the diphenyl phosphorus group,16 the theoretical moment of diphenylcyanophosphine should be 3.7-4.0 D., based on the pyramidal structure of trivalent phosphorus compounds. The close agreement between the calculated and experimental dipole moments indicates no large charge separation in the molecule beyond that expected for a molecule containing the highly polar nitrile group.
Acknoivledgment. This study was supported in part by Air Force Materials Laboratory, Research Technology Division, Air Force Systems Command,U. S. Air Force, on Contract AF33(615)-1344. 10 11 12 13 14 15
(10) N. Muller, P. C. Lauterbur, and J. Goldenson, J. Am. Chem. Soc., 78, 3557 (1956).(11) H. Finegold, Ann. N. Y. Acad. Sci., 70, 875 (1958).(12) G. Herzberg, “ Infrared and Raman Spectra,” D. Van Nostrand Co., Inc., Princeton, N. J., May 1945, Chapter III.(13) S. Misushima, “ Raman Effect,” in “ Encyclopedia of Physics,” Vol. 26, S. FlUgge, Ed., Springer-Verlag, Berlin, 1958.(14) C. P. Smyth, “ Dielectric Behavior and Structure,” McGraw- Hill Book Co., Inc., New York, N. Y ., 1955, p 282.(15) H. Schindlbauer and G. Hajek, Chem. Ber., 2601 (1963).
Equilibrium among Vinyl Chloride, Hydrogen
Chloride, and 1,1-Dichloroethane
by R. G. Rinker and W. H. Corcoran
Chemical Engineering Laboratory of the California Institute of Technology, Pasadena, California {Received November 4, 1965)
Available thermodynamic data do not allow reasonably comparable values to be computed for the equilibrium constant1 for the gas-phase reaction
HC1 + CH2CHC1 ^ CH3CHCI2 (1)
Extrapolation of Mikawa’s data2 gives a value of 680 for K at 25°. Computations based on other available data3-6 yield a value of 22 for the same temperature. Neither of these numbers agrees with that directly developed in this laboratory in rate studies of the reaction given in eq 1. In the study of that reaction catalyzed by zinc chloride carried on Celite, an analysis of the experimental data showed the most probable form of the rate equation to be
JT.i C («H C l) ( « v e )«1,1K (2)
In this equation, ri,x is the rate of formation of 1,1- dichloroethane, C is a rate constant, « h c i, « vc , and a i.i are the gas-phase activities, respectively, of the compounds shown in eq 1, and K is the thermodynamic equilibrium constant. The equation suggests that the mechanism consists of a combination of a single molecule of HCI and one of vinyl chloride. Analysis of the product gases by use of gas chromatography, with didecyl phthalate as the partition liquid carried on Dicalite, showed only 1,1-dichloroethane as a product and no 1,2-dichloroethane. A free-radical mechanism is effectively eliminated by that observation, and two types of nonchain mechanisms are possible, both showing combination of a single molecule of HCI and one of vinyl chloride consistent with the implication in eq 2 relative to mechanism. The 1 2 3 4 5 6
(1) Standard state of perfect gas at unit fugacity.(2) Y . Mikawa, J. Chem. Soc. Japan, 73, 79 (1952).(3) J. H. Perry, Ed., “ Chemical Engineers’ Handbook,” 3rd ed, McGraw-Hill Book Co., Inc., New York, N. Y ., 1950, pp 220, 239.(4) K . A. Kobe and R. H. Harrison, Petrol. Refiner, 30, No. 11, 151 (1951).(5) F. D. Rossini, et al., “Selected Values of Chemical Thermodynamic Properties,” U. S. National Bureau of Standards Circular 500, U. S. Government Printing Office, Washington, D. C., 1952, Series I, p 132; Series II, p 603.(6) L. W . Daasch, C. Y . Liang, and J. R. Nielsen, J. Chem. Phys., 22, 1293 (1954).
The Journal of Physical Chemistry

N o t e s 927
Table I : Values and Sources and Thermodynamic Data Used in Establishing Eq 3
Component State
Thermodynamicquantity
HC1 Gas A77f 25HC1 Gas CpVinyl chloride Gas Aiff 25Vinyl chloride Gas C p
1,1-Dichloroethane Liquid Aíff 251,1-Dichloroethane A H , 67.41,1-Dichloroethane Gas Cp
Value Ref
—22.063 kcal/mole 36.70 + 0.0008477 cal/(mole)(°K) 38.072 kcal/mole 75.5 + 0.0244T cal/(mole)(°K) 4
— 36.4 kcal/mole 57.3 kcal/mole 57.3 + 0.0359T cal/(mole)( °K) 6
first type involves a bridged carbonium ion and the second a four-center reaction requiring a high degree of molecular orientation. Because of the relative slowness of the catalyzed reaction, the latter mechanism was considered to be primarily responsible for the formation of the 1,1-dichloroethane.
A least-squares analysis of eq 2 for data at 215°F, wherein partial pressures were taken to be numerically equal to activities, gave a value of 17.5 for K. Application of the van’t Hoff equation, with appropriate thermodynamic data,8-7 cited in Table I, gave the following equation for A as a function of temperature in °K
ln K = 8-“ 6 + U 8 7 x
(14135 \- ’T------- 4.900 In T + 0.005400T - 21.09 ) (3)
For a temperature of 25°, eq 3 gives a value for K of 3277, or 3280 to three significant figures. The previously noted values of 680 and 22 are significantly different. Related free energy changes for standard- state conditions are, as would be expected, not so strikingly different. At 25°, the standard free energy change is —4.80 kcal for a value of K of 3280, —3.86 kcal for 680, and —1.83 kcal for 22.
Further experimental work on the rate of the reaction shown in eq 1 gave values of K at 164 and 299 °F consistent with eq 3. Not too many runs were made at those temperatures so that no statistical analysis of the data was made. In a typical run at 164°F, the value of K by experiment was 50 compared to a value of 93 from eq 3. At 299°F a typical experimental value of K was 2.0 compared to a computed value of 1.8.
Acknowledgment. Grants from the Shell Companies Foundation and E. I. du Pont de Nemours and Company supported the studies on the kinetics of the reaction
between hydrogen chloride and vinyl chloride. Their assistance is gratefully acknowledged.
(7) J. R. Laeher, H. B. Gottlieb, and J. D. Park, Trans. Faraday Soc., 58, 2348 (1962).
Molecular Motion in the Solid
Hexamethylbenzene-Chloranil Complex
by J. E. Anderson1
Bell Telephone Laboratories, Inc., Murray Hill, New Jersey 07971 (Received August 9, 1965)
Harding and Wallwork2 have used X-ray techniques to determine the crystal structure of the solid complex formed by hexamethylbenzene and chloranil (tetra- chloroquinone, CeCLAs). In the course of this structure determination, a number of features were observed which suggested the presence of molecular reorientation. The existence of rotational degrees of freedom in this crystal would not be surprising, since Andrew3 has demonstrated two varieties of reorientation in solid hexamethylbenzene. On the other hand, nuclear quadrupole resonance studies4 on the complex indicate the absence of chloranil reorientation, at least on a time scale comparable to 1.9 kc, the observed 36C1 nqr line width.4a In this paper we report studies of the proton nuclear magnetic resonance in this solid complex. Measurements of the nmr second moment and spin- lattice relaxation time clearly reflect the motion of the 1 2 3 4
(1) Scientific Laboratory, Ford Motor Co., Dearborn, Mich. 48121.(2) T . T . Harding and S. C. Wallwork, Acta Cryst., 8, 787 (1955).(3) E . R.. Andrew, J. Chem. Phys., 18, 607 (1950).(4) (a) D . C. Douglass, ibid., 32, 1882 (1960); (b) G. E. Peterson (unpublished results) has observed two nqr frequencies in the vicinity of 37 M c/sec at room temperature. Those reported in ref 4a were measured at 77°K .
Volume 70, Number 3 March 1966

928 Notes
TEMPERATURE (°C)
Figure 1. Temperature dependence of the spin-lattice relaxation time in the hexamethylbenzene-chloranil complex, measured at 20, 30, and 50 Mc/sec.
hexamethylbenzene constituent about its sixfold axis. No features peculiar to charge-transfer complexes were observed.
Crystals of the hexamethylbenzene-chloranil complex were prepared by mixing equimolar solutions of the two constituents in heated CC14 and allowing the resulting solution to cool slowly. All of the chemicals were of reagent grade and had been obtained from commercial sources. Steady-state nmr spectra were taken on a Yarian DP-30 spectrometer operating under wide-line conditions. The spin-lattice relaxation time, Ti, was studied at frequencies of 20, 30, and 50 mc/sec between —130 and 100°. The 180-90° null method of Carr and Purcell5 6 was used, employing pulses of order 1-4 nsec. The recovery time of the system was about 10 nsec. Details of the pulse apparatus appear elsewhere.6
The steady-state nmr line width, 8H, was found to increase with decreasing temperature below —109°. The line width was about 3.1 gauss at —150° and
7 6 5 4 3 2103/ T (°K )
Figure 2. Temperature dependence of the spin-lattice relaxation time in the hexamethylbenzene-chloranil complex before and after heat treatment. The measurements were carried out at 50 Mc/sec.
showed no sign of reaching a plateau. 8H maintains a constant value of 1.65 ± 0.05 gauss between —109 and 100°. This small value is indicative of a high degree of rapid molecular reorientation in the solid. Five room-temperature spectra were graphically integrated in the appropriate fashion,7 giving an experimental second moment of 1.9 ± 0.1 gauss2. Owing to Andrew’s work on solid hexamethylbenzene,3 we were first interested in comparing this value with the calculated C6(CH3)6 second moment8' 9 assuming simultaneous rapid motions by the molecules about their hexad axes and by the methyl protons about their triad axes. Under these conditions, the intramolecular contribution to the second moment should be about (27.1/16) or 1.7 gauss2. The corresponding inter-
(5) H. Y . Carr and E. M . Purcell, Phys. Rev., 94, 630 (1954).(6) W . P. Slichter and D. D . Davis, J. Appl. Phys., 35, 10 (1964).(7) See, for example, E. R. Andrew, “ Nuclear Magnetic Résonance,” Cambridge University Press, London, 1958, p 153.(8) J. H. Van Vleck, Phys. Rev., 74, 1168 (1948).(9) H . S. Gutowsky and G. E. Pake, J. Chem. Phys., 18, 162 (1950).
The Journal of Physical Chemistry

Notes 929
molecular contribution is small owing to the crystal structure2 and may amount to 0.2-0.4 gauss2. The total second moment thus calculated is 1.9-2.1 gauss2 in satisfactory agreement with experiment. All other simple types of molecular motion result in calculated second moments which compare far less favorably with experiment.
Nuclear quadrupole resonance frequencies have been observed4 in the hexamethylbenzene-chloranil complex at 37.5042 and 37.7161 Mc/sec. The magnitude of these nqr frequencies establishes that the chloranil molecules reorient more slowly than the measured line width, 1.9 kc, since motions at comparable rates would average the field gradients experienced by the various chlorine nuclei and lower the resonant frequency accordingly. The nmr line width data show that the hexamethylbenzene molecules reorient at these rates above —109°, so we are faced with a two-component solid complex in which one component is moving much faster than the other. Indeed, the chloranil molecules may not be rotating at all.
The temperature dependence of the spin-lattice relaxation time is shown in Figure 1. There is an abrupt change in T\ near 45° which is independent of the measuring radiofrequency.10 This behavior is characteristic of a crystallographic phase change although none has been hitherto reported in this solid complex. Since the nmr line width does not change concurrently, it can be presumed that the high-tem- perature phase does not permit a new variety of motion; however, the larger Ti values show evidence for faster hexad reorientation. The temperature dependence of Ti below 25° changed after the sample had been heated above 45°. The Ti values depended on the temperature and length of the heat treatment. Prolonged heating at any temperature finally resulted in the curve for the heated sample in Figure 2. Further heating produced no apparent changes. Analysis11 of the data taken below 45° gives apparent activation enthalpies of 3.4 and 3.7 kcal/mole for the heated and unheated samples, respectively.12 A plot of the reciprocal absolute temperature of the Ti minima vs. frequency yielded an activation enthalpy of 3.5 ± 0.1 kcal/mole for the unheated sample. It is noteworthy that the minimum Ti value is 20% higher after heating and that the position of this minimum is displaced some 20° higher in temperature.13 Corresponding changes were not apparent in the line width experiment. Powles14 has reported similar behavior in polymeric systems at low temperatures, which he attributes to the presence of dissolved oxygen. It seems likely that the variations in 7\ observed in this complex are also due to low concentrations of paramagnetic centers,
which are removed by annealing in the high-temperature phase. Temperature-induced changes in paramagnetic concentration have been observed in esr studies of other donor-acceptor complexes.15
Acknowledgments. The author is grateful to W. P. Slichter, D. C. Douglass, D. W. McCall, and G. E. Peterson for their interest in this work.
(10) At each frequency, the Ti data were obtained with increasing temperature on freshly crystallized samples.(11) See, for example, A. Abragam, “ The Principles of Nuclear Magnetism,” Clarendon Press, Oxford, 1961, Chapter X .(12) The pressure dependence of Ti was also examined, giving an activation volume of 14 cm3/mole.(13) The freshly prepared samples were red-violet, but they turned dark violet-brown after heat treatment.(14) J. G. Powles, to be published.(15) J. W . Eastman, G. M . Androes, and M. Calvin, J. Chem. Phys., 36, 1197 (1962).
Intrinsic Viscosities of Isotactic Polypropylene
in Various Solvents
by R. ChiangContribution No. 888 from the Chemstrand Research Center, Inc., Durham, North Carolina (.Received September 16, 1965)
Highly accurate molecular weight and intrinsic viscosity data are required in order to define precisely the constants K r and a in the Mark-Houwink equation, [??] = K'Ma. Data that are inaccurate or restricted to only a narrow range of molecular weights cause uncertainty in the values of K' and a. It is seen repeatedly in the literature that the Mark-Houwink plots based on different sets of molecular weight and viscosity data obtained by different laboratories intersect and overlap in a certain molecular weight range, the higher (or lower) value of K' being compensated by the correspondingly lower (or higher) value of a.
Since the intrinsic viscosities can be determined with high precision, the main sources of uncertainty in K' and a can reasonably be assumed to lie in the experimental difficulties in the molecular weight determination. To circumvent this difficulty, Chiang1 suggested that the value of a can be evaluated, without detailed knowledge of molecular weights, directly from two sets of intrinsic viscosity data, one in a good solvent in which the viscosity data are used to define
(1) R. Chiang, J. Phys. Chem., 69, 1645 (1965).
Volume 70, Number 8 March 1966

930 N o t e s
the Mark-Houwink equation, and the other, in a insolvent. The validity of the procedure rests solely on the assumption that the linear relationship between [q]e and iff1/2 holds. The latter assumption is a highly rational one in view of the fact that it is both predicted by theory and has been verified experimentally for many different polymer-0-solvent systems.2-4 This being the case, the procedure becomes apparent because by eliminating M from eq 1 and 2
M = K ' M * CD
Me = KM'/2 (2)
we obtain
M = ( K ' / K 2a) M e 2 3 4 5“
or
log M = 2 « log Me + log (K'/K2a) (3)
Thus when log [17 ] is plotted against log h a straight line is obtained, the slope of which equals 2a, regardless of the molecular weight of the sample used. Since [77 ] and Me can be measured accurately, the accuracy of the value a obtained is largely determined by the measurement of the 0-point. Although the intrinsic viscosity changes rapidly near the 0-point (for example, d In [77]/di = 0.016 deg-1 for polydimethylsiloxane in methyl ethyl ketone,6 and 0.0070 deg-1 for polyethylene in diphenyl ether1) and an experimental error of 2° is likely, the upper limit of error in 0 will not result in serious error in [77 ]0 and therefore the value of a obtained in this way should be fairly reliable.
Isotactic Polypropylene
In this communication, the above method is extended to the evaluation of a for isotactic polypropylene. Isotactic polypropylene was chosen because the Flory(0) temperature for this polymer has been determined6 and the intrinsic viscosity data obtained in a good solvent (decalin at 135°) and in a 0-solvent (phenyl ether at 145°) are available.6’7 Furthermore, the linear relationship between [77 ]0 and Ikfn1/2 obtained by osmotic pressure measurements has been demonstrated (note that this information is not required in the evaluation of a here). A summary of the results obtained by Kinsinger and Hughes is given in Table I and the value of log [r?]decaiin, 135° is plotted against [r?]9 in Figure 1. The value of a obtained from the slope is O.8O5, which is identical with the value obtained independently by Kinsinger and Hughes7 and by Chiang.8 The agreement between the values of a obtained from the two sets of intrinsic viscosity data following the procedure described here and by
Figure 1. Log Mdecsim. 1 3 5 ° plotted against log [77] 0 for a number of polypropylene fractions.
direct light-scattering measurements lends support to the validity of the Mark-Houwink equation reported by us earlier. The value of K evaluated here is1.22 X 10-3 with [77 ]e in dl g -1.
Table I : Intrinsic Viscosity of Isotactic Polypropylene in Decalin at 135° and in Phenyl Ether at 145° (a 0-Solvent). Data Taken from Kinsinger and Hughes6,7
Sampledesigna
tion Mr, bid116 Me
C'-2 a 480,000 4.80 1 . 0 2C'-2 b 2 0 0 , 0 0 0 2.35 0 . 6 6D-2 130,000 1.70“ 0.58D-4 34,500 0.59“ 0.28
[ U ] d135 calculated from the equation [77] a135 = 1.38 X 10Afn0 80 (ref 6 ). These values are presumably experimentally determined quantities because Kinsinger and Hughes stated in their paper that the corresponding number-average molecular weights were calculated from these values.
(2) P. J. Flory, “Principles of Polymer Chemistry,” Cornell University Press, Ithaca, N. Y ., 1953.(3) G. Meyerhoff, Fortschr. Hochpolymer. Forsch., 3, 59 (1963).(4) M . Kurata and W . H. Stockmayer, ibid., 3, 196 (1963).(5) V . Crescenzi and P. J. Flory, J. Am. Chem. Soc., 86, 141 (1964); P. J. Flory, L. Mandelkern, J. B. Kinsinger, and W . B. Schultz, ibid., 74, 3364 (1952).(6) J. B. Kinsinger and R. E. Hughes, J. Phys. Chem., 67, 1922 (1963).(7) J. B. Kinsinger and R. E. Hughes, ibid., 63, 2002 (1959).(8) R. Chiang, J. Polymer Sei., 28, 235 (1958).
The Journal of Physical Chemistry
Notes 931
Ionization of Fluorophenols in Aqueous Solution
by F. T. Crimmins, C. Dymek, M. Flood, and W. F. O’Hara1Department of Chemistry, The College of the Holy Cross, Worcester, Massachusetts {Received September 20, 1965)
Thermodynamic ionization constants and heats of ionization have been determined for 0-, m-, and p- fluorophenol in aqueous solution at 25°. These values are used to calculate AG°, AH °, and AS0 of ionization of these acids. Relative acid strengths of the fluoro- and chlorophenols are discussed in terms of ease of proton removal from the various acid species.
Experimental SectionThermodynamic ionization constants for aqueous
0-, m~, and p-fluorophenol at 25.0 ± 0.1° were determined by a method described previously.2 Heats of ionization for these phenols at 25.0 ± 0.2° were determined in an 800-ml solution calorimeter similar to a 900-ml apparatus described before.3
All fluorophenols were obtained from Aldrich Chemical Co. and were further purified by distillation at atmospheric pressure. The distillation apparatus was all glass with a Vigreux column. Only middle cuts were used for all experiments. The following properties were recorded: o-fluorophenol, bp 148-150°; m-fluorophenol, bp 174-175°; p-fluorophenol, bp 183-185°, mp 45-47°. All boiling and melting points were uncorrected.
ResultsIonization constants for the three fluorophenols
and phenol at 25° are listed in Table I.
Table I : Thermodynamic Ionization Constants of Phenols in Water at 25°
P KAcid (± 0 .02 )
Phenol“ 10 .00o-Fluorophenol 8.73m-Fluorophenol 9.29p-Fluorophenol 9.89
0 H. C. Ko, W. F. O’Hara, T. Hu, and L. G. Hepler, J. Am. Chem. Soc., 86, 1003 (1964).
Heats of ionization of o-fluorophenol and m-fluoro- phenol were determined by measuring heats of neutrali
zation of the pure liquid phenol by aqueous NaOH (nine runs for o-fluorophenol, 0.014 to 0.003 M final solution, and ten runs for wi-fluorophenol, 0.014 to 0.003 M final solution). Heats of solution of the pure liquids were also determined (five runs for the ortho compound, 0.030 to 0.004 M final solution, and seven runs for the meta isomer in the same concentration range). The molar heats so obtained .were extrapolated to zero concentration using an IBM 1620 digital computer. This yielded standard heats of neutralization and solution, AH°n and AH°S0\n. General equations for these processes are
HA(1) + OH-(aq) = A~(aq) + H20(1)AH°n (1)
H A ( 1) = HA(aq) A H °80l„ (2)
Combination of these standard heats with the standard heat of ionization of water, A F°w = 13.50 kcal/ mole, yields AH °ion, the standard heat of ionization according to
AH0ion = AHcn + AH°W - AH°30ln (3)
Values of AH°n, AH°soin, and AH °ion for these two phenols are listed in Table II.
Eleven separate determinations of heats of neutralization of aqueous solutions of p-fluorophenol (0.022 to 0.008 M) by 3 ml of concentrated NaOH (9.09 N) were made. A general equation for these reactions is
HA(aq) + OH-(concd) = A “ (aq) + HsO(l) (4)
Ten other determinations of the heat effect associated with the breaking of the bulb containing the NaOH and dilution of the NaOH solution were made. Combination of these two heats yields AH6 for the reaction.
IIA(aq) + OH-(aq) = A~(aq) + H20(1) (5)
The values of AH6 so obtained were extrapolated to infinite dilution yielding the value of AH°n', the standard heat of neutralization of aqueous p-fluoro- phenol. This value is listed in Table II along with AH0 ¡on, the standard heat of ionization of p-fluoro- phenol calculated from AH°ion = AH°n' + A //°w. Standard free energies of ionization, AG°i0n, were calculated from the experimental pA values and are listed in Table II, along with AiS°i0n calculated from
AS° ¡on =A H ° ion - A (7 ° io
(6)
(1) To whom all correspondence should be addressed.(2) W . F. O’Hara, T. Hu, and L. G. Hepler, J. Phys. Chem., 67, 1933 (1963).(3) W . F. O’Hara, C. H. Wu, and L. G. Hepler, J. Chem. Educ., 38, 512 (1961).
Volume 70, Number 3 March 1966

932 N o t e s
Table II : Thermodynamics of Ionization of Aqueous Fluorophenols at 25°“
Acid
o-Fluorophenolm-FIuorophenolp-Fluorophenol
AÌ7°3oIq0.01 ± 0.02 0 . 1 5 ± 0.02
àH°n- 8 . 8 3 ± 0.05 - 7 . 8 3 ± 0.05
“ AH ° and AG° in kcal/mole and AS° in cal/deg mole.
a H°n'
7 .5 7 ± 0.05
A//° ion
4.66 ± 0 .05 5 .52 ± 0.05 5 .93 dfc 0.05
1 1 . 9 1 ± 0.03 12 .6 7 ± 0.03 13 .49 ± 0.03
AS ion
- 2 4 . 3 ± 0 .3 - 2 4 . 0 ± 0 .3 - 2 5 . 4 ± 0 .3
DiscussionBennett, el al,,4 5 have reported pK values of 8.81,
9.28, and 9.95 for o-, m-, and p-fluorophenol, respectively, under the same conditions as our experiments. Judson and Kilpatrick6 report pK = 9.81 for p- fluorophenol in water at 25°. The average of the two ionization constants for p-fluorophenol gives a pK value of 9.87 in good agreement with our value for p-fluoro- phenol. We agree very well with Bennett’s value for m-fluorophenol but our pK value for o-fluorophenol indicates that it is slightly more acidic than Bennett reports.
The thermodynamics of ionization of phenols may be examined in terms of reactions of the type shown by eq 7, where subscripts s and u indicate a substituted phenol and phenol, respectively.
HAs(aq) + A - U(aq) = HAu(aq) + A - 8(aq) (7)
Free energy, enthalpy, and entropy changes for these reactions are the differences between the standard changes for the ionization of the substituted phenol and phenol. These properties are represented by AG°1, AH° , and AS0?. In previous publications,6-8 it was shown that AH°7 may be expressed as the sum of contributions due to external or solute-solvent interactions and internal effects which are represented by AHint. These internal effects are due to breaking and forming O-H bonds in the unsolvated molehules of reaction 7. It was shown that the solute-solvent interaction enthalpy is directly proportional to A$°7 with the proportionality constant /3 = 280°. These considerations give
A H°7 = A Hint + 280°AS°7 (8)
Combination of (8) with AG°n = AH°i — TAS0 gives
AC°7 = (280 — T)AS°7A # int + A H int 1 8
It was also shown6 that (280 — T)AS°^/AHint « 1 and therefore AG°i = AHint for these reactions. Values of AH°1 were obtained from the standard heats of ionization of the substituted phenol and phenol itself.6 AS°i values were calculated from AG°~ (AAG°) and
A # °7. AH^t values are obtained from eq 8. All of these values are listed in Table III along with corresponding values for o-, m-, and p-chlorophenol obtained in earlier investigations.9'10
Table III: Thermodynamics of Proton Transfer(Reaction 7) for Halophenols"
HASAS°7
(±0.2)&H°i
( ± 0 . 0 5 )A 1 7 in
( ± 0 . 0 5 )AG°7
( ± 0 . 0 3 )
o-Fluorophenol 2 .5 - 0 . 9 9 - 1 . 6 9 - 1 . 7 3m-Fluorophenol 2 . 8 - 0 . 1 3 - 0 . 9 1 - 0 . 9 7p-Fluorophenol 1 . 4 0.28 - 0 . 1 1 - 0 . 1 5o-Chlorophenol 3 . 3 - 1 . 0 1 - 1 . 9 3 - 2 . 0 8TO-Chlorophenol 3 .0 - 0 . 3 6 - 1 . 2 0 - 1 . 2 5p-Chlorophenol 3 . 3 0 . 1 5 - 0 . 7 7 - 0 . 8 4
“ AH and AG° in kcal/mole, AS° in cal/deg mole.
Examining the acid strengths of these halophenols, it is found that the ionization constants decrease in the order o-CP > o-FP > m-CP > m-FP > p-CP > p-FP > phenol, where o-CP = o-chlorophenol, m-CP = m-chlorophenol, etc. This same order is followed by AH¡nt which is the internal part of AH>°7. The traditional explanation of this order of acid strengths is in terms of ease of proton removal due 70 inductive, field, and resonance effects. We find that the ease of proton removal from the isolated acid molecules and subsequent transfer to unsolvated phenoxide largely determines the relative order of strengths with respect to phenol in this series. This can be most easily seen in comparison of AG° and AH int values as shown in Figure 1. The significance of this relation is that
(4) J. M . Bennett, G. L. Brooks, and S. Glasstone, J. Chem. Soc., 1821 (1935).(5) C. M . Judson and M . Kilpatrick, J. Am. Chem. Soc., 71, 3110 (1949).(6) See footnote a in Table I.(7) L. G. Hepler and W . F. O’Hara, J. Phys. Chem., 65, 811 (1961).(8) L. G. Hepler, J. Am. Chem. Soc., 85, 3089 (1963).(9) L. P. Fernandez and L. G. Hepler, ibid., 81, 178S (1959).(10) W . F. O ’Hara and L. G. Hepler, J. Phys. Chem., 65, 2107 (1961).
The Journal of Physical Chemistry

Notes 933
Figure 1.
the effects of solute-solvent interactions on A //°7 and TAS°, are nearly equal and contribute very little to AG° . It is the AHint that determines the order of relative acid strengths in this series in accordance with the traditional explanation.
Acknowledgw.ent. This research was carried out under support of the Petroleum Research Fund of the American Chemical Society.
Reaction of Hydrogen with Beryllium Oxide
by M. J. D. Low and N. Ramasubramanian
School of Chemistry, Rutgers, The State University,New Brunswick, New Jersey {Received September 24, 1965)
Although there is considerable interest in BeO because of its potential use in nuclear reactor systems and as envelope material for vacuum tubes, relatively little is known about its surface properties. Hydrogen sorption is mentioned by Eucken and Heuer,1 who stated that the hydrogen adsorption isobar showed two maxima and minima but omitted data. Also, Maida- novskaya, et al,,2 studied hydrogen take-up by normal and irradiated BeO and suggested the nature of the process to be physical adsorption up to 250° and an activated adsorption above that temperature. However, contrary to the impression given by previous
studies, we have found the hydrogen sorption by BeO not to be reproducible.
Experimental SectionGas adsorption measurements were made with a con
ventional vacuum system capable of pressures of 10 _6 mm by following the pressure decline within the system using a dibutyl phthalate manometer. Palladium-diffused hydrogen and oxygen prepared by KM n04 decomposition were used. BeO was made by decomposing CP quality Be(OH)2 or Be(N 03)2 (Amend Drug and Chemical Co.) at 500° in vacuo. A Perkin- Elmer Model 521 spectrometer was used for spectroscopic examination of BeO pressed disks.
Experiments and ResultsThe various experiments on hydrogen sorption at
various temperatures, pressures, and degassing conditions can be summarized by stating that hydrogen uptake was not observed below 300° and that at 300 to 500° the hydrogen sorption by any one sample was not reproducible. On alternately exposing BeO to hydrogen and degassing at 500°, it was found that the amounts of hydrogen taken up declined with each successive exposure by about 27%.
An example of this effect and of the effects of oxygen are shown in Figure 1. A 2.18-g sample of BeO was degassed at 500°, heated in hydrogen to 460°, and sorbed 1.1 ml of H2/g. The data of plots A to F were then obtained in sequence, each sorption being preceded by a 12-hr evacuation at 500°. The general trend of declining hydrogen sorption on successive exposures is shown by plots A and B and, after the increased sorption caused by the oxygen treatments C and D, by plots E and F. This indicates a progressive change of the surface that could be reversed by oxygen treatment. The second oxygen sorption D was very small and suggests that the surface had been saturated by the oxygen treatment C. Quantitative relations between amounts of oxygen and hydrogen sorbed that indicated some surface reaction between the adsorbed gases, or of replacement of surface oxygen removed by reaction with hydrogen, were not apparent.
The BeO powder had a nitrogen BET surface area of 45 m2/g, leading to the estimate of a surface coverage of the order of Vio of a “ monolayer” of hydrogen atoms if each were bound to one surface atom.
(1) A. Eucken and K. Heuer, Z. Physik. Chem., 196, 40 (1950).(2) (a) L. G. Maidanovskaya, R. M . Kulikova, G. F. Ryabchenko, and E. A. Koleswa, Uch. Zap. Tansk Gos. Univ., 26,87 (1955); (b) L. G. Maidanovskaya, L. I. Bystrykh, and I. N . Bystrykh, Tr. Tomskago Gos. Univ. Ser. Khim., 170 , 26 (1964).
Volume 70, Number 3 March 1966

934 Notes
Figure 1. Hydrogen and oxygen sorption by BeO. The experiments were made in alphabetical sequence at 460° and 9 mm gas pressure: A, B, E, and F, hydrogensorption; C and D, oxygen sorption.
However, hydrogen species bound to the surface were never observed in many attempts using infrared spectroscopic techniques such as those described elsewhere.3 The transmittance of BeO above about 10 n decreased in the presence of hydrogen, indicating an increase in the electrical conductivity and hence implying the occurrence of some electron-transfer process. When the hydrogen-treated BeO was degassed, the transmittance increased. The failure to detect Be-H species is inconclusive and could be brought about by their absence, small number, or weak absorption. As the characteristic infrared bands of 3 and 6.1 p of water adsorbed on the BeO surface could be readily observed, however, it is unlikely that appreciable amounts of surface hydroxyls or water were formed on hydrogen sorption.
These effects, although incomplete, lead to the speculation that hydrogen sorption produced a chemisorbed protonic species of the type postulated3 to exist on ZnO, as the surface coverage was low, a charge transfer was indicated, and infrared bands of a hydroxyl species were not observed. The species was partly or wholly desorbed as water, possibly causing the formation of anion vacancies, leading to the observed progressive decline of the hydrogen sorption that could partially be reversed by oxygen sorption.
Acknowledgment. Support for this work by USAEL Contract DA36-039-AMC-02170(E) and NSF Grant GP 1434 is gratefully acknowledged.
(3) R. P. Eisehens, W . A. Pliskin, and M . J. D. Low, J. Catalysis,1, 180 (1962).
Vapor Pressures of Solutions of Europium and
Ytterbium in Liquid Ammonia— Evidence
of Hexaammoniates
by D. S. Thompson, M. J. Stone, and J. S. Waugh
Department of Chemistry and Research Laboratory of Electronics, Massachusetts Institute of Technology,Cambridge, Massachusetts 02139 (Received September 27, 1965)
Paramagnetic resonance and electronic spectroscopy indicate that both europium and ytterbium metals dissolve in liquid ammonia to give divalent cations and solvated electrons.* 1 1 2 3 4 These dark blue, paramagnetic solutions are quite similar to those obtained by dissolving alkaline earth metals in liquid ammonia. This seems to lend further credence to the observation that europium and ytterbium are actually more like alkaline earths in many respects than they are like other lanthanides.2
It has been known for many years that the alkaline earths form compounds with ammonia— the so-called metal hexaammoniates.3 More recent work shows that these hexaammoniates of the alkaline earths may not be true stoichiometric compounds, for Marshall and Hunt have shown that the apparent number of ammonia molecules associated with a given alkaline earth metal ion seems to vary somewhat with temperature.4
We have investigated the composition dependence of the vapor pressure of ammonia over solutions of both europium and ytterbium metals in liquid ammonia at —75.9°. We find that these two metals do behave in a manner similar to that of the alkaline earths in that both europium and ytterbium appear to form hexaammoniates.
Our experimental method was similar to that used by Marshall and Hunt.4 The sample container was so arranged that the metal samples could be introduced under an atmosphere of purified argon. The ammonia was triply distilled from potassium before use. A rotating permanent magnet, immersed in the thermostating bath below the sample bulb, both pro-
(1) (a) J. C. Warf and W . L. Korst, J. Phys. Chem., 60, 1590 (1956); (b) D . S. Thompson, E. E. Hazen, Jr., and J. 3. Waugh, to be published; (c) D . S. Thompson, D . W . Schaefer, and J. S. Waugh, to be published.(2) T. Moeller, “ The Chemistry of the Lanthanides,” Reinhold Publishing Corp., New York, N. Y ., 1963, Chapter 3.(3) (a) R. C. Meutrel, Compt. Rend., 135, 790 (19C2); (b) G. Roe- derer, ibid., 140, 1252 (1905); (c) C. A. Kraus, J. Am. Chem. Soc., 30, 653 (1908).(4) P. R. Marshall and H. Hunt, J. Phys. Chem., 60, 732 (1956).
The Journal of Physical Chemistry

Notes 935
Figure 1. Composition dependence of the vapor pressure over solutions of ytterbium in liquid ammonia at —75.9°.
vided stirring of the bath and drove a Teflon-encased stirring bar in the sample solution. The solutions were made up by weight, and small known amounts of ammonia were removed to vary the concentration. Precautions were taken to check the extent of decomposition by measuring any hydrogen pressure in the sample system. The appropriate corrections to the concentration could then be made when necessary.
We observed, upon gradual removal of ammonia from europium and ytterbium solutions, that the solutions turned from deep blue to bronze in color as the ratio of metal to ammonia increased. Ytterbium is less soluble than is europium. After enough ammonia had been removed that the vapor pressure over the sample went to about zero, a bronze-colored solid remained. Figure 1 shows the composition dependence of the vapor pressure over a solution of ytterbium in liquid ammonia. A similar curve was obtained for europium. The value of n in the formula M(NH3)„ was obtained by extrapolation to zero pressure. The values of n thus obtained for europium and ytterbium solutions are, respectively, 6.3 and 6.4. Thus the bronze-colored solid had the approximate composition M (NH3)6 where M is either europium or ytterbium. This solid phase gave up ammonia
upon warming to room temperature and left a gray residue which apparently contained metal and some metal amides as found by Warf and Korst.Ia
Acknowledgment. This work was supported in part by the Joint Services Electronics Program under Contract DA-36-039-AMC-03200(E) and in part by the National Science Foundation.
Radiolysis of Tetrafluoromethane1
by J. Fajer, D. R. MacKenzie, and F. W. Bloch
Brookhaven National Laboratory, Upton, New York {Received October 25, 1965)
We have been investigating the radiation chemistry of fluorocarbons2 because their properties make them potentially useful in the nuclear field. In the work reported here, tetrafluoromethane was chosen first because it is the simplest compound where only carbon-fluorine bonds can be attacked and second because the elusive perfluoroacetylene,3 C2F2, had been reported as a product in the radiolysis of perfluoro- alkanes.4'1 2 3 4 5
The CF4 radiation work reported to date includes the detection of CF3 radical in the y-6 and electron7 irradiations of CF4. Colebourne and Wolfgang8 studied the hot-atom chemistry of F18 with CF4 and found labeled CF4 and C2F6, due to both thermal and hot- atom reactions. Reed and Mailen4 found C2F6 and C2F2 in the pile and y-irradiation of CF4 at high pressure («560 atm). C2F2 was also tentatively reported by Kevan and Hamlet6 as a product in the radiolysis of C2F6. They found that the “ C2F2” yields increased in the presence of oxygen.
Experimental SectionIrradiations were done in a Co60 source, with doses
of the order of 109 rads. The dose rate was measured
(1) This work was performed under the auspices of the U. S. Atomic Energy Commission.(2) D . R. MacKenzie, F. W . 31och, and R. H. Wiswall, Jr., J. Phys. Chem., 69, 2526 (1965).(3) C2F2 has only recently been isolated by J. Heicklen and V. Knight, ibid., 69, 2484 (1965), who prepared it by photolysis of C2F4.(4) T . M . Reed and J. C. Mailen, TID 21576 (1963).(5) L. Kevan and P. Hamlet, J. Chem. Phys., 42, 2255 (1965).(6) R. E. Florin, D . W . Brown, and L. A. Wall, J. Phys. Chem., 66, 2672 (1962).(7) R. W . Fessenden and R. H. Schuler, J. Chem. Phys., 43, 2704 (1965).(8) N. Colebourne and R. Wolfgang, ibid., 38, 2782 (1963).
Volume 70, Number S March 1966

936 Notes
with FeS04 and corrected for electron densities. The irradiations were carried out at 50° in prefluorinated Monel vessels of 200-cc volume, at 10 atm. Matheson CF4 was degassed by freeze-thaw cycles under high vacuum, passed over N a-K alloy, and separated from impurities by trapping it at 77 °K while it was pumped from a bath kept at 100°K by circulating liquid nitrogen through a coil immersed in pentene. After irradiation, the bulk of the CF4 was removed from the less volatile products at 100°K by the same procedure. To ensure complete trapping of products, the bulk CF4 was monitored by mass spectrometry. The technique was also checked by adding C2F6 in amounts equivalent to those found after irradiation. Better than 98% of the perfluoroethane was recovered. After products were collected, the reaction vessel was heated to several hundred degrees to check for polymers. Products were identified by a combination of gas chromatography, infrared, and mass spectrometry using authentic samples for calibration. Chromatograms were run at 90°, using a 2-m, 0.25-in. o.d. silica gel column, at a flow rate of 60 cc/min, and a thermal conductivity detector.
Results
Chromatograms of products obtained from the radiolysis of CF4 containing 1% oxygen show peaks attributable to CF4, C2F6, and a peak with a retention time assigned to C2F2.3’9 The peak believed to be C2F2 was isolated. The infrared spectrum of the product showed strong bands at 1325, 1250, 1170, 970, and 695 cm-1. This spectrum does not correspond to that obtained by Heicklen and Knight,3 which shows a strong band at 1149 cm-1. Our spectrum is in fact identical with that reported for the ether CF3OCF3.10 This assignment is further confirmed by the mass spectrum of the “ C2F2” compound which shows a peak at m/e 135, attributed to C2F50 ion. It appears, therefore, first that C2F2 and CF3- OCF3 have similar retention times and second that the ether is a product in the radiolysis of CF4 containing oxygen. These results offer an explanation for the increased yield of “ C2F2’i on addition of 0 2 reported by Kevan and Hamlet.5 (These authors carefully pointed out that their identification was based solely on retention times.)
If the CF4 is treated so as to remove oxygen, the yields of C2F6 increase. Using the method described above, the oxygen content can be dropped to 0.03%. At this concentration, the G value for C2F6 is about 1 X 10⁻². As the oxygen content is increased, the C2F6 yield drops rapidly and the ether is the predominant
product. At ca. 1% oxygen, G values are 5 X 10⁻² for C2F60 and 10~3 for C2F6. The low G values are surprising but not inconsistent with esr data. Attempts to observe the CF3 radical in liquid or in solid CF4 (77 °K) were unsuccessful. The radical could be detected only at 4°K6 or in the presence of fluorine scavengers.7 We consider the following reaction: CF4 -► CF3 + F. In contrast to hydrocarbons, where H atoms can be removed by molecular hydrogen formation, in CF4, the corresponding combination, F + F F2, produces a species which is still reactive
CF3 + F2 — *■ CF4 + F (1)
Both the radiation stability and the esr data can be attributed to reactions I and 2
CF3 + F — > CF4 (2)
The free-radical recombination
CF3 + CF3 —^ C2F6
satisfactorily accounts for the C2F6 product since the yield of C2F6 is scavenged by 0.5 to 1% oxygen. The reaction CF4 CF2 + F2 (or 2F) does not appear to be a main process since no C2F4 is detected in the products (C2F4 could conceivably undergo further reactions).
As for the production of the ether, our results to date do not permit any significant conclusion regarding mechanisms. We have detected a small amount of volatile product which reacts with mercury to yield COF2. CF3OF (mp < — 215, bp —95) undergoes such a reaction.11 Fessenden and Schuler7 have observed two radical species during the irradiation of liquid CF4 containing 0 2 which they identified as F 0 2 and CF3OCF2-. Either of these could be CF30 2- and still be consistent with the observed spectra.12 We are presently investigating the radiolysis of the oxygenated species CF3OF, CF3OCF3, CF30 2CF3, and COF2 in the hope of shedding some light on the mechanism by which the ether reported here is formed.
(9) S. A. Greene and F. M . Wachi, Anal. Chem., 35, 928 (1963).(10) J. H. Simons, “ Fluorine Chemistry,” Vol. 2 Academic Press Inc., New York, N. Y ., 1954, p 479.(11) R. S. Porter and G. H. Cady, J. Am. Chem. Soc., 79, 5625 (1957).(12) The CFsOCFi- is consistent with the detection of the ether in the final products. In the presence of 0 .5% CH4, the authors readily detected CF3 radical and a polar species, presumably HF. In this context, it appears logical that the formation of oxyfluorides should also allow the detection of the CF3 •. Since this is not observed, we suggest the radical detected could be CFsCh-.
The Journal of Physical Chemistry
N o t e s 937
Adsorption of Nitric Oxide on
Potassium Chloride Films
by A. Granville and P. G. Hall
Department of Chemistry, University of the Witwatersrand, Johannesburg, South Africa (Received August 2, 1965)
Investigations of the physical adsorption of nitric oxide on ionic crystals have been limited to the determination of an isotherm on NaCl at —183°. Large attractive forces between adsorbed molecules, evident from the shape of the isotherm, were attributed to induced dipoles of opposite sign adjacent on the surface.1
With nitrogen adsorbed on NaCl and KC1, the quadru ple interaction with the surface is believed2"3 to be responsible for the higher heat of adsorption compared with argon and oxygen. The quadrupole moments of nitric oxide4 and nitrogen6 apparently have almost the same value; consequently, it was of interest to determine isosteric heats of adsorption of nitric oxide on KC1 films. A further interesting aspect arises from the possibility that adsorbed nitric oxide may exist in the dimerized form (NO)2.
Experimental Section
The Pyrex glass vacuum system was of conventional design, incorporating a mercury cutoff dosing system, a Pirani gauge, and an adsorption cell. The cell was similar to that used by Hall and Tompkins6 except that a platinum evaporating filament was preferred to molybdenum since the latter easily became brittle on heating. Before film evaporation, the cell was heated under vacuum at 300° until an outgassing rate of 10~6 mm/hr was achieved. Films of about 0.3 to 0.5 g were deposited using a current of 5 amp for 70 min with the cell kept at 0°. Surface areas of the films were measured by krypton adsorption at liquid nitrogen temperature (—197.1°). The latter was measured to a precision of 0.05° with a nitrogen vapor pressure thermometer.
Reproducible krypton isotherms showed that repeated cooling from 25 to —197°, followed by separate NO adsorption runs at —197, —185 (liquid oxygen), and —160° (melting isopentane) had no effect on the film surface area. The values of —185 and —160° correspond to the pure materials at the barometric pressure of 630 mm; these two temperatures were not measured. Several krypton adsorption measurements were made on three different films. Krypton
monolayer volumes estimated by the Kaganer method7 were usually lower than those corresponding to BET plots; we have taken the mean of the two to calculate surface areas from the cross-sectional area8 of 19.5 A2 for the krypton molecule.
Thermal transpiration corrections were made using the Takaishi-Sensui equation.9 The results obtained with krypton agreed to within 1% with the results calculated from the Bennett-Tompkins modification10 of Liang’s equation. With nitric oxide the Takaishi- Sensui constants for nitrogen9 were used since the collision diameter calculated from nitric oxide viscosity data11 was about the same as that reported9 for nitrogen. These corrections made a difference of up to 6% in the amount adsorbed.
Nitric oxide was either supplied by Matheson Co. or prepared from sodium nitrite, ferrous sulfate, and potassium iodide.12 The gas was purified by methods similar to those used by Gray13 and Nightingale, et al.1A After removal of water and N 02 over P2O5 and KOH, the gas was solidified under vacuum at — 197° to remove nitrogen before being fractionally sublimed several times to remove nitrous oxide and any additional impurities. Krypton of 99 to 100% purity, the balance being xenon, was supplied by British Oxygen Co.
Results and Discussion
Low-coverage nitric oxide isotherms on the KC1 films at —197, —185, and —160° were concave to the pressure axis, very similar to the isotherms reported for argon, nitrogen, and oxygen on cubic NaCl16 and cubic KCl.3 This contrasts with the convex shape at low coverage reported for nitric oxide on NaCl powder.1 The isotherms are not reproduced, since the derived 1 2 3 4 5 6 7 8 9 10 11 12 13 14 15
(1) F. C. Tompkins, Trans. Faraday Soc., 32 , 643 (1936).(2) L. E. Drain, ibid., 49, 650 (1953).(3) T. Hayakawa, Bull. Chem. Soc. Japan, 30, 243 (1957).(4) R. M . Hill and W . V. Smith, Phys. Rev., 82, 451 (1951).(5) W . V. Smith and R. Howard, ibid., 79, 132 (1950).(6) P. G. Hall and F. C. Tompkins, J. Phys. Chem., 66, 2260 (1962).(7) M . G. Kaganer, Russ. J. Phys. Chem., 33, 352 (1959).(8) G. L. Gaines and P. Cannon, J. Phys. Chem., 64, 997 (1960).(9) T . Takaishi and Y . Sensui, Trans. Faraday Soc., 59, 2503 (1963).(10) M . J. Bennett and F. C. Tompkins, ibid., 53, 185 (1957).(11) “ Handbook of Chemistry and Physics,” 41st ed, Chemical Rubber Publishing Co., Cleveland, Ohio, 1960, p 2191.(12) M . G. Suryaraman and A. Viswanathan, J. Chem. Educ., 26, 594 (1949).(13) R. W . Gray, J. Chem. Soc., 87, 1601 (1905).(14) R. E. Nightingale, A. R. Downie, D . L. Rotenberg, B. Crawford, and R. A. Ogg, J. Phys. Chem., 58, 1047 (1954).(15) T . Hayakawa, Bull. Chem. Soc. Japan, 30, 124 (1957).
Volume 70, Number S March 1966

938 Notes
heats are of more interest. Table I shows the isosteric heats of adsorption ( — AH) at different values of coverage, 0. These heats were obtained with a 0.39-g film of surface area 11.3 m2. The values of —AH are shown separately for the two ranges of temperature and d refers to an effective cross-sectional area16 of12.5 A 2 for the nitric oxide molecule.
Table I : Isosteric Heats of Adsorption ( — AH) for Nitric Oxide on KCl
e x io!- A H,a
kcal/mole 9 X 10²- A H,b
kcal/mole
0.7 4.25 7 3.71.3 4.2 13 3.52.7 4.0 20 3.67 3.6 27 3.7
“ Temperature range —185 to —160°. 6 Temperature range -197 to -185°.
No heats were obtained from the other two films deposited, but the isotherms for the 0.39-g film at —160 and —185° showed good reproducibility. The reproducibility of the —197° isotherm for this particular film was not checked. However, the heats, for the different temperature ranges at d = 0.07 agree to within the experimental error, which is probably not more than about ± 0.2kcal/mole.
Adsorption at higher coverage was investigated at — 197 and —185°. However, at —197° slow increases in pressure sometimes followed the initial rapid adsorption ; this was also observed with one of the other films. The resulting heats ranged from 3.5 to 1.7 kcal/mole with increasing coverage but in view of the anomalous pressure effect these are probably not reliable. The reason for the pressure increase is uncertain, although it may be due to desorption of nitrogen following a small amount of dissociative chemisorption.
The low-coverage heat of the order of 4 kcal/mole (Table I) is about 1 kcal/mole higher than the experimental zero-coverage heat for nitrogen3 on cubic KC1 and about 2 kcal/mole higher than that for argon.3 A comparison between our experimental value for nitric oxide and the calculated heat17 of 1.9 kcal/mole for argon can be made on an approximate basis using intermolecular energy parameters for these adsorbates. With the simplified function
4> = Ar~9 - Br~s (1)
for the interaction energy between like atoms or molecules and using the equilibrium separation energies18 of 2.71 X 10⁻¹⁴ and 1.46 X 10~14 ergs for nitric oxide and argon, respectively, it is evident that the heat for nitric oxide, excluding quadrupole interaction, should be about 1.8 times that (1.9 kcal/mole) for argon. The factor 1.8 is largely due to the smaller size of nitric oxide since the polarizabilities and repulsion constants are about the same.18 The difference of about 0.8 kcal/mole between the heat of 3.4 kcal/mole estimated on this basis and our experimental value may be attributed largely to surface heterogeneity arising from both surface imperfections and the presence of different crystal faces. According to the detailed investigations with argon on octahedral KC119 and with various nonpolar gases on cubic KC1,3 the heterogeneity effect is generally of this order. As pointed out by Haya- kawa,8 it is an apparent effect offset to some extent by dispersion attraction between adsorbed molecules.
In spite of the obvious limitations of the above treatment, it is evident that the quadrupole interaction term for nitric oxide on KC1 is not significant compared with the marked effect shown by nitrogen.8 However, without more definite proof of the actual value of the quadrupole moment of nitric oxide and, possibly, more detailed calculations on the lines followed by Hayakawa,16 17 the reason for this remains in doubt.
These results also show that the low-coverage adsorption of nitric oxide on KC1 conforms generally to the pattern expected for comparatively simple nonpolar molecules. There is no evidence either for dimerization or for the strong lateral interactions reported with NaCl.1 The difference between KC1 and NaCl is probably due to the most favorable adsorption sites being, respectively, above the center of a lattice square and above a sodium ion. For argon and nitrogen this is confirmed by calculation and attributed to the smaller size and repulsion constant of the sodium ion compared with the potassium ion.20
Acknowledgment. This work was supported financially by the South African Council for Scientific and Industrial Research.
(16) P. H. Emmett and S. Brunauer, J. Am. Chem. Soc., 59, 1553 (1937).(17) T. Hayakawa, Bull. Chem. Soc. Japan, 30, 332 (1957).(18) E. A. Moelwyn-Hughes, “ Physical Chemistry,” Pergamon Press Ltd., London, 1961, p 335.(19) D . M . Young, Trans. Faraday Soc., 48, 548 (1952).(20) T. Hayakawa, Bull. Chem. Soc. Japan, 30, 236 (1957).
The Journal of Physical Chemistry

N o t e s 939
Keto-Enol Tautomerism in /3-Dicarbonyls
Studied by Nuclear Magnetic Resonance
Spectroscopy. III. Studies of Proton Chemical
Shifts and Equilibrium Constants at
Different Temperatures1
by Jane L. Burdett and Max T. RogersDepartment of Chemistry, Michigan State University,East Lansing, Michigan 48823 (Received August 3, 1965)
As a part of a study of keto-enol tautomerism in 3- dicarbonyls by nuclear magnetic resonance (nimj spectroscopy2'3 we have investigated the temperature dependence of proton chemical shifts of various groups in a number o: substituted /3-diketones and /3-keto esters. The amounts of each isomer have also been measured as a function of temperature in several cases and free energies, enthalpies, and entropies of tauto- merization obtained.
The nmr method has previously been used to obtain a value of the enthalpy of tautomerization from the equilibrium tautomer ratios determined from integrated nmr intensities of peaks in the acetylacetone spectrum.4 5
Briegleb, et al.,6 have studied the temperature dependence of the keto-enol equilibrium for several compounds from isothermal distillation studies and earlier investigations had been made6'7 using bromine titration for analysis. Since the keto and enol isomers each give rise to a set of peaks in the nmr spectrum, integration of the areas of these provides a method for analysis of the mixtures without disturbing the equilibrium or requiring that either tautomer be isolated. In addition we looked for peaks characteristic of species such as the trans-enol8 and dienol9 forms which have been reported but found no evidence for them indicating that less than about 3% of those species exists in any of the materials studied.
Experimental SectionInstruments. Measurements were made with the
Varian A-60 nmr spectrometer, V-6031 probe, and V-6040 temperature accessory. Temperatures were calibrated using the ethylene glycol or methanol chemical shifts and are probably accurate to ± 3 ° . The percentages of keto and enol tautomer were found by integrating appropriate peaks in the spectrum of each and are accurate to about ±2% .
Materials. Ethyl a-cyanoaceto acetate, ¿-butyl a- chloroacetoacetate, a-chloroacetylacetone, ethyl a-
chloroacetoacetate, and ethyl a-bromoacetoacetate were synthesized in this laboratory by standard methods.3'10 The remaining compounds were obtained from commercial sources, purified by recrystallization, fractional distillation, or gas chromatography, and dried. Sample tubes were not sealed, and all samples contained TMS as an internal reference.
Table I : Chemical Shifts cf the Enol Hydroxyl and of Ketoand Enol «-Hydrogen Protons in /3-Dicarbonyls at Various Temperatures
Upheld ASchemical shift,
Temp -----cps------range, Enol Enol Keto
Compd °C OH a-CH *-CH
Acetylacetone -1 1 to 80 32“ 1 3Butyl acetoacetate -1 1 to 33 0 2 5¿-Butyl acetoacetate -3 3 to 80 5 2 5¿-Butyl a-chloroacetoacetate -3 3 to 87 10 16a-Chloroacetylacetone -3 3 to 80 25 10Ethyl acetoacetate -3 3 to 80 3 3 6Ethyl benzoylacetate 3 to 87 10 4 5Ethyl a-bromoacetoacetate -3 3 to 53 O6 10Ethyl a-n-butjdacetoacetate -1 1 to 33 46 2Ethyl a-chloroacetoacetate -3 3 to 106 8 16Ethyl a-cyanoacetoacetate 33 to 87 11 0Ethyl a-ethylacetoacetate -3 3 to 33 4 3CEthyl a-fluoroacetoacet-ate -1 1 to 87 13Ethyl trifluoroacetoaeetate -3 3 to 80 6 2 8Ethyl a-methylacetoacetate -1 1 to 80 0C 6Hexafluoroacetylacetone -3 3 to 59 5 3Trifluoroacetylacetone -3 3 to 80 37 0 9Methyl acetoacetate — 33 to 33 3a-Methylacetylacetone -1 1 to 1-6 13d 8
“ -1 1 to 87°. b -3 3 to 33°. c 33 to 80O d -1 1 to 80°-1 1 to 33°.
(1) This work was supported by a grant from the National Science Foundation.(2) J. L. Burdett and M. T. Rogers, J. Am. Chem. Soc., 86, 2105 (1964).(3) M . T. Rogers and J. L. Burdett, Can. J. Chem., 43, 1516 (1965).(4) L. W . Reeves, ibid., 35, 1351 (1957). The ratios reported inthis article were obtained from the averaged integrated intensities of at least five spectra; the latter were measured by weighing tracings of the spectra on bond paper: L. W . Reeves, private communication.(5) W. Strohmeier and G. Briegleb, Z. Naturforsch., 66, 1 (1951); W . Strohmeier and I. Hohne, ibid., 76, 184 (1952); G. Briegleb, W . Strohmeier, and I. Hohne, ibid., 8b, 219 (1953).(6) K. H. Meyer, Ber., 44, 1147, 2718 (1911).(7) P. Grossman, Z. Physik. Chem. (Leipzig), 109, 305 (1924).(8) M . I. Kabachnik, S. T. Yoffe, E. M . Popov, and K. V. Vatsuro, Tetrahedron, 12, 76 (1961); Zh. Obshch. Khim., 31, 2682 (1961).(9) D. N. Shigorin, Zh. Fiz. Khim., 24, 932, 954 (1950); 28, 584 (1954).(10) J. L. Burdett, Ph.D. Thesis, Michigan State University, East Lansing, 1963,
Volume 70, Number 3 March 1966

940 Notes
Table I I : Thermodynamic Quantities for the Tautomerization Equilibria in /3-Dicarbonyls (Pure Liquids)
Temprange, Log AF(33°), A H,
AS(33°),cal/mole
Compd "C Ae(33°) cal/mole cal/mole deg
Acetylacetone -1 1 to 59 0.570° -799 ± 70 -2840 ± 2006 -6 .6 6 ± 0.88a-Chloroacetylacetone 33 to 80 1.15 -1610 ± 110 -5920 ± 200 -1 4 .1 ± 1 . 0 1Ethyl trifluoroacetoacetate 5 to 80 0.780 - 1090 ± 180 -3910 ± 200 -9 .2 1 ± 1.24Ethyl a-chloroacetoacetate -3 3 to 105 -0 .185 259 ± 100 -875 ± 100 -3 .6 9 ± 0.57a-Methyiacetylacetone -1 1 to 89 -0 .285 399 ± 100 -1330 ± 100 -5 .6 5 ± 0.45
AcetylacetoneValues for gas phase tautomerization (ref 5)
0 . . . -1600 -1780 -0 .6 6140 -1060 -3770 -6 .5 5
Ethyl a-chloroacetoacetate 0 99 -3660 -1 3 .8160 1410 -100 -3 .5 0
° Values taken from graph of In K e vs. 1/T. 6 A value of —2705 ± 100 cal/mole was reported by Reeves (ref 4). Note that ,reported here is an average over the temperature range for each of the five compounds studied.
Results and DiscussionH
/ \H R ' O O
\ / 1 II
o o c c\ / \ f / \ / \
c c £d
-o
£1
0 R " R 'I keto II enol
The proton peaks for the a protons of the keto isomer (I) and for the hydroxyl proton of the enol isomer(II) are shifted to higher magnetic field with increase in temperature. The value of this upfield shift and the temperature interval for which it was observed are given in Table I. The a protons of the enol isomer are also shifted upfield by small amounts in a few cases. The remaining proton groups are essentially unaffected by temperature changes in the range studied.
The increasing shielding of the enol hydroxyl protons may be attributed to the breaking up of the intramolecular hydrogen bonds in the cfs-enol form with increasing temperature. The shift is larger for the /3-diketones than for the /3-lceto esters and, indeed, is negligible for several of the latter.
The a protons of the keto isomer (I) also shift to high field with increase in temperature, particularly for the halogenated compounds. The breaking up of inter- molecular hydrogen bonds would lead to an increase in shielding as observed. There is also the possibility that the carbonyl dipoles can rotate at higher temperatures increasingly into conformations where the electrostatic repulsions between them is larger; the proton chemical
shifts would then be altered through the change in long- range shielding effects. The a protons of the enol isomer are only slightly affected by temperature, but the shift is always upfield suggesting that intermolecular hydrogen-bonded species involving the enol a protons may be present to some extent but become less favored at higher temperatures.
The chemical shifts vary linearly with temperature, within experimental error, in most cases. However, there are a few rather large changes in slope of the 5 vs. T curves particularly for the enol OH protons in tri- fluoroacetylacetone, a-chloroacetylacetone, and ethyl trifluoroacetoacetate; also for the a-CH protons of ethyl a-fluoroacetoacetate and ¿-butyl a-chloroaceto- acetate.
The ratio of enol to keto tautomers (Ke) was determined from the integrated intensities of appropriate peaks in the spectrum of each isomer at each of several temperatures for the compounds listed in Table II. Values of In K e were plotted vs. the reciprocal of absolute temperature and the enthalpies of tautomerization found from the slopes; the errors are rather large since good linear plots are not obtained. Using Ke(33°) from the graph, values of AF (33°) and A»S(33°) were calculated for the tautomerization process keto — enol (see Table II). Some literature values obtained for the gas phase6 are also given in Table II for comparison. Since AH and AS are actually temperature dependent,6 the values reported in Table II are only averages over the temperature range employed in each case. The strong internal hydrogen bond of the cfs-enol form is presumably responsible for the large negative entropies of enolization.
The enol form becomes less stable with increasing temperature in each case studied here suggesting that
The Journal of Physical Chemistry

N o t e s 941
the intramolecular hydrogen bonds of the cfs-enol form are increasingly broken up at higher temperatures. This is in agreement with the increase in shielding of these protons (Table I) with increase in temperature. Our results are in reasonable qualitative agreement with those of Briegleb, et at.,* considering the change in phase. However, they do not agree with the earlier work of Meyer6 based on bromine titrations. The thermochemical data show that the enol form is, in general, the more stable form but that, because of the large negative entropies of enolization, the keto form is present in substantial amount and may even predominate.11
Acknowledgment. We wish to thank Yarian Associates for use of their equipment at the Pittsburgh Applications Laboratory.
(11) See G. Wheland, “ Advanced Organic Chemistry,” 3rd ed, John Wiley and Sons, Inc., New York, N. Y ., 1960, p 683, for example.
Glutaronitrile. The M etastable M odification
by Mitsuru Kubota and Gary 0 . Spessard1
Department of Chemistry, Harvey Mudd College,Claremont, California 91714 (Received August 19, 1965)
Infrared spectral studies revealed the existence of a metastable modification (crystal II) of glutaronitrile, which could be obtained by rapidly cooling this substance to 213°K. When crystal II was annealed at 233 °K, a stable modification (crystal I) was obtained. 2'8 While earlier thermometric studies indicated the existence of crystal II,4 a recent adiabatic calorimetric study of glutaronitrile questioned its existence.6 Failure to obtain the metastable modification in that study was attributed to the presence (or absence) of certain impurities or to inadequate quenching rates.
Verification of the existence of crystal II is of significance in view of the crucial role played by its infrared spectrum in the assignment of frequencies to the TT, TG, and GG rotational conformers of glutaro- nitrile.2'3 Correspondence of the spectrum of crystal I to that of the ligand in bis (glutaronitrile) copper (I) nitrate, in which the glutaronitrile was shown by crystallographic studies to be in the GG conformation,6 led to the conclusion that the GG conformation is assumed in crystal I.2’3 The absence of certain key bands in the spectrum of crystal II led to its assignment as the TG conformation. Frequencies in the
spectrum of liquid glutaronitrile which were not observed in the spectra of crystal I and crystal II were then assigned to the TT conformation.2'3 6 7 8 9
A center cut of vacuum-distilled Eastman White Label glutaronitrile was used in this study. Gas chromatographic analysis showed the presence of only one component. Anal. Calcd for CsHeNV C, 63.8; H, 6.42; N, 29.8. Found: C, 64.0; H, 6.51; N, 29.6; n21-8d 1.4345. The infrared spectrum of the liquid sample was identical with that reported.3 Calorimetric data were obtained with a Perkin-Elmer DSC-1 differential scanning calorimeter.7 Nitrogen gas was used to purge the detector housing. Calorimetric and thermometric calibrations were accomplished with data from the succinonitrile crystal I crystal II transition.8 The heat of fusion at 330°K determined for succinonitrile was 869 ± 46 cal/mole, which compares favorably with the value 885 cal/mole reported.8 The heat of fusion at 240°K found for glutaronitrile was 2840 ± 160 cal/mole, which may be compared with the values 2280 cal/mole determined from thermometric analysis4 and 3008 cal/mole determined by adiabatic calorimetry.6
Samples of glutaronitrile were cooled at controlled rates ranging from 2.5°/min to 30°/min,9 until exotherms indicative of crystallization were observed. In several trials, samples were quenched in liquid nitrogen and then quickly transferred to the probe which was previously cooled to 190°K. The differential scanning calorimetric thermograms were then recorded at a heating rate of 10°/min.
Figure 1 shows the results representative of 31 trials on eight different samples of glutaronitrile which ranged in size from 12.3 to 8.3 mg. The significant conclusion evident from the thermograms is that the magnitude of the exothermic transition of crystal II to crystal I is solely dependent upon the cooling rate of liquid glutaronitrile to form crystal I and crystalII. The amounts of crystal II present are indicated by the magnitudes of the exothermic heat of transition.
(1) Petroleum Research Fund Undergraduate Research Scholar, 1965.(2) I . Matsubara, J. Chem. Phys., 35, 373 (1961).(3) I. Matsubara, Bull. Chem. Soc. Japan, 34, 1719 (1961).(4) A. van de Yloed, Bull. Soc. Chim. Beiges, 48, 229 (1939).(5) H . L. Clever, C. A. Wulff, and E. F. Westrum, Jr., J. Phys. Chem., 69, 1983 (1965).(6) Y. Kinoshita, I. Matsubara, and Y. Saito, Bull. Chem. Soc. Japan, 32, 1216 (1959).(7) We thank A. W . Ehm and C. W . Keller, Jr., of the Perkin-Elmer Corp., for technical advice and for the use of the instrument.(8) C. A. Wulff and E. F. Westrum, Jr., J. Phys. Chem., 67, 2376 (1963).(9) This is approximately the maximum cooling rate attainable with the instrument in this temperature range.
Volume 70, Number 3 March 1966

942 N otes
Temp, °K.
Figure 1. Differential scanning calorimetric thermogram of liquid glutaronitrile solidified by cooling: (a) at 2.5°/min;(b) at 20°/min; (c) at 30°/min; and (d) by quenching on liquid nitrogen.
These ranged from 244 cal/mole for samples quenched in liquid nitrogen to 134, 65, 12, 18, and 1.5 cal/mole at cooling rates of 30, 20, 10, 5, and 2.5°/min, respectively. We failed to observe any reversibility in the transition from crystal II to crystal I.
Calculations by Wulff and Westrum indicate that the vibrational and rotational contributions to entropy are greater for the TG than the GG conformation.6 The observed exothermic transitions from metastable crystal II to crystal I, which is in the GG conformation,2'1 2 3 4 5 6 7 8 9 6 thus give additional support to the assignment2 of the TG conformation to the metastable crystal. However, the assignment of the metastable modification solely to the TG conformation remains to be established, in view of the dependence of the exothermic heats on the cooling rate.
Acknowledgment. Acknowledgment is made to the donors of The Petroleum Research Fund, administered by the American Chemical Society, for support of this research.
A Note on the Principle of Corresponding States
by F. Danon and J. C. RossiFacultad de Ciencias Exactas y Naturales, University ofBuenos Aires, Buenos Aires, Argentina (Received August 20, 1966)
As the nature of the molecular interactions in argon, krypton, and xenon satisfies the restrictive conditions required by the statistical-mechanical derivation of
the law of corresponding states,1 their thermodynamic properties have extensively been used to test the validity of this law.2 Reducing factors are derived from both critical constants and molecular parameters.2-4 The properties considered in this note are the second virial coefficient and the viscosity coefficient at low pressure reduced in terms of the parameters of the Kihara pair potential6 U = Uo [(po/ p) 12 — 2(po/p)6], where Uo is the minimum of the potential which occurs at p0. The intermolecular separation p is defined as the shortest distance between the outer surface of the cores. The given equation is valid for p ^ d, where d is the core diameter. For smaller values of p, C7 > » . The reduced expression for the second virial coefficient B is then B*{T*) = B{T*)/ 2ir/3po3, where T* = Tk/U0. Myers and Prausnitz6 have made a similar study for the second virial coefficient, but the experimental data now available, mainly at low temperatures,7 allow a more precise check on the corresponding states behavior. No transport property has previously been studied on a corresponding states basis, although calculations on argon only have been done by Barker, et al.s The core size we use is not an extra adjustable parameter but is independently fixed9 by the equation X = 7.0o> + 0.24, where A is a core parameter related to the mean curvature, Mo, of the core, and co is Hie acentric factor introduced by Pitzer.10 The heavy rare gases (Ar, Kr, Xe) have co = 0 and for a spherical core M0 = 2ird, so that the simple relationship d = 0.08p0 results. We thus obtain a two-parameter potential function as required by the theory.1
Parameters were obtained by simultaneous fitting of both second virial and viscosity coefficient data by automatic computation. We minimized the root mean square deviation between theoretical and experimental values of both properties. Results are shown in Table I and full details are given in ref 11.
Although the general quality of the Kihara potential was studied elsewhere,11 the theoretical curve is drawn
(1) K . S. Pitzer, J. Chem. Phys., 7, 583 (1939).(2) J. O. Hirschfelder, C. F. Curtiss, and R. B. Bird, “ Molecular Theory of Gases and Liquids,” John Wiley and Sons, Inc., New York, N. Y ., 1954.(3) J. M . H. Levelt, Physica, 26, 361 (1960).(4) F. Danon and K. S. Pitzer, J. Phys. Chem., 66, 583 (1962).(5) T . Kihara, Rev. Mod. Phys., 25, 839 (1953).(6) A. L. Myers and J. M . Prausnitz, Physica, 28, 303 (1962).(7) B. E. Fender and D. Halsey, J. Chem. Phys., 36, 1881 (1963).(8) J. A . Barker, W . Fock, and F. Smith, Phys. Fluids, 7 ,897 (1964).(9) F. Danon and K. S. Pitzer, J. Chem. Phys., 36, 425 (1962).(10) K . S. Pitzer, et al., J. Am. Chem. Soc., 77, 3433 (1955).(11) J. C. Rossi and F. Danon, Discussions Faraday Soc., in press.
The Journal of Physical Chemistry

Notes 943
T* (for upper curve).0.5 1 1.5 2
T* (for lower curve).Figure 1. Reduced second virial coefficient: • , argon; A, krypton; ■ , xenon.
Table I : Parameters of the Kihara Pair Potential
Standard deviations
Ua/k, PO, d, u X 10»B(T),
A3/m.ole-°K A A (i»T)V> cule
Argon 138 .0 3 .482 0 .279 0 .39 1 .60Krypton 196.1 3 .735 0 .299 0 .07 3 .9Xenon 263 .6 4 .07 8 0 .326 0 .0 3 1 .1
in Figure 1 to show the excellent agreement with the experiment over the entire range of temperature of B*(T*). Figure 1 clearly shows that the corresponding states behavior is closely followed by the second virial coefficient of Ar, Kr, and Xe. The reduced viscosity coefficient ij* = vRo2/VmUo is shown in Figure 2. Here
= 2~'/6po + d is the collision diameter and m is the
mass of the molecule. The recent data on Kr are included;12 this allows a comparison on a larger temperature range than was previously possible.2 The agreement between theory and experiment is again very good and it is seen that the principle of corresponding states is also followed by the property. Levelt3 has made a careful study of the compressibility of argon and xenon and concluded that it is impossible to represent the experimental B -T curve of argon and xenon by means of a Lennard-Jones 6-12 potential within experimental accuracy. These curves however can be brought into coincidence by means of two reduction factors for temperature and density. The PV/RT isotherm for argon may also be transformed into the compressibility isotherm of xenon by multiplying by
(12) D . G. Clifton, J. Chem. Phys., 38, 1123 (1963).
Volume 70, Number S March 1966

944 Notes
scale factors. Levelt found the “ ideal scale factors” ,3 i.e., best set of scale factors, to be 1.931 for the temperature and 0.633 for the density. The ratios of the reduction factors in terms of the molecular parameters are shown in Table II.
than if reduced with the Lennard-Jones 6-12 potential parameters, so that the compressibility factor of these gases can also be correlated using the principle of corresponding states.
Table II: Ratio of Reduction Factors
✓------Levelt------*L-J 6-12 Present work /----- “ Ideal” ------«
Temp Density Temp Density Temp Density
Param Xe i ggg Q 5gg j gl0 0 623 1-931 0 .633Param Ar
It is seen that the ratios we obtain are much closer to the ideal ones than Levelt’s. In order to obtain coincidence of the reduced isotherms, one should modify one set of parameters by about 1% in the temperature scale factor and by 0.6% in the density scale factor, values which are scarcely larger than the expected uncertainties of the parameters. Consequently, if the assumption of the pairwise additivity of the potential is valid, one expects that if the isotherms of argon and xenon are reduced with our set of molecular parameters they should come much closer to each other
Effect of Solvent on the Entropy of the
Tris-(I,10-phenanthroIine)iron(III)-(II) System
by Byron Kratochvil and John Knoeck
Department of Chemistry, University of Wisconsin,Madison, Wisconsin 58706 (Received August 80, 1965)
The partial molai entropy change occurring during a reversible electron transfer in solution can be obtained experimentally through measurement of a cell potential as a function of temperature. A compilation of temperature coefficients for a number of aqueous electrode potentials has been made by deBethune and Loud.1 These data indicate that for systems in which the
(1) A. J. deBethune and N. S. Loud, “ Standard Aqueous Electrode Potentials and Temperature Coefficients at 25°C ,” C. A. Hampel, Publisher, Skokie, 111., 1964.
The Journal of Physical Chemistry

Notes 945
electrode reaction involves electron transfer only between two positively charged species of the type
Fe2 3+ + e~ = Fe2+ (AS = 47 eu)
or
U 022+ + e - = U 02+ (AS = 33 eu)
the entropy change is positive, while for electron transfer between negatively charged species, such as
IrCl62“ + e~ = IrC V - (AS = —5.5 eu)
or
Fe(CN)63- + e - = Fe(CN)64- (AS = - 4 3 eu)2
the entropy change is negative. This is as expected if the major entropy difference between the oxidized and reduced forms is considered to be increased solvent ordering around the species of greater charge. Thus an entropy decrease with absolute charge decrease would be predicted for an electron-transfer process involving any species not undergoing rearrangement, complex formation, or other concurrent change.
George, Hanania, and Irvine3 have reported partial molal entropy values for the reactions
Fe(phen)33+ + e~ = Fe(phen)32+ (AS = —21 eu)
and
Fe(bipy)33+ + e_ = Fe(bipy)32+ (AS = —23 eu)
in aqueous solution. These do not follow the expected pattern, but show instead negative entropy changes, (phen = 1,10-phenanthroline, bipy = 2,2'-bipyi’idine). Since protonation of these complexes has been observed only in solutions of high acidity and since the complexes are both stable and inert, it does not appear that protonation, dissociation, or internal rearrangement can be invoked to explain these results.
To gain further insight into this problem, measurements of potential vs. temperature were made on the (phenanthroline)iron(III)-(II) couple and on a number of methyl-substituted derivatives in water and acetonitrile. The reference electrodes, saturated calomel in water and silver, 0.01 M silver nitrate in acetonitrile, were held at constant temperature for all measurements to give a thermal temperature coefficient for the couple at the indicator electrode. Thermal liquid junction potentials were neglected. The iron(III) complex in each case was prepared by electrolytic oxidation of the corresponding iron(II) compound at a platinum electrode in the appropriate solvent. The cathode was isolated by an ultrafine glass frit. All measurements were made using equimolar
amounts of the two oxidation states of the iron compounds in 0.1 M sodium perchlorate. Temperatures in the range of 0 to 10° were generally used to minimize slight decomposition of the methyl-substituted iron-(III) species and to provide more stable potentials. A check on the accuracy of the measurements in acetonitrile was made by measuring the potential of the parent couple in this solvent at five different sodium perchlorate concentrations. On extrapolation to infinite dilution a value of 0.824 ± 0.002 v vs. the Ag, 0.01 M AgN 03 couple was obtained at 25 ± 0.05°. This compares with the values of 0.846 v reported by Kolthoff and Thomas4 under the same conditions and 0.825 v by Bennett and Ward5 after adjustment of their data from 30 to 25°.
Results of the temperature variation measurements are given in Table I. The entropy value obtained in neutral aqueous solution in this work agrees well with the value found by George, Hanania, and Irvine for the parent compound in water at pH 2.35.3 The positive values observed in acetonitrile are in the direction expected for a system where solvent ordering follows the normal pattern of being greater around the ion of larger absolute charge. Both (phenanthro- line)iron(III) and iron(II) perchlorates have been shown by conductivity measurements to be highly dissociated
Table I: Temperature Dependence and Entropy Changes for the Iron(III)-(II) Couple with Various Ligands in Water and Acetonitrile
--------------------m o ------------------- , ,------------C H i C N -------------(d® / (d E /
dT)th armait d T ) th erm a l,Ligand mv/deg A S “ mv/deg A S “
Phen -0 .8 9 -2 0 .5 1.10 25.4-0 .9 0 6 — 20. Sb
5-Methyl phen -0 .1 2 - 2 .8 1.05 24.24,7-Dimethyl phen 0.06 1.4 0.92 21.25,6-Dimethyl phen 3,4,7,8-Tetramethyl
0.08 1.8 0.94 21.7
phen 1.03 23.8
“ ± 2 eu; corresponds to reaction written as a reduction process; thermal liquid junc~ion potentials neglected. b Values from ref 3.
(2) P. George, G. I. H. Hanania, and D. H. Irvine, Bee. Trav. Chim., 75, 759 (1956).(3) P. George, G. I. H. Hanania, and D. H. Irvine, J. Chem. Soc., 2548 (1959).(4) I. M . Kolthoff and F. G Thomas, J. Phys. Chem., 69, 3049 (1965).(5) W . E. Bennett and W . Ward, Abstracts of Papers, 133rd National Meeting of the American Chemical Society, San Francisco,Calif., April 1958.
Volume 70, Number 3 March 1966

946 Notes
in acetonitrile,4 so that ion association entropy effects can be considered negligible.
It can be seen that in acetonitrile the entropy change is not appreciably affected by methyl substitution on the phenanthroline, while in aqueous solution the entropy increases with methyl substitution. This suggests that the entropy change with substitution observed in water may be due to a solvent effect, and it becomes of interest to consider how greater water ordering might occur around Fe(phen)32+. One possible explanation is that hydrogen bonding may take place between water and electronegative regions of phenanthroline chelated to iron(II). The stability of the iron (II) chelates of bipyridine and phenanthroline has been attributed to electron donation from the iron to the n- orbitals on the ligands. Methyl substitution on the ligands decreases the relative stability of the iron(II) complex with respect to iron (III), as is shown by a decrease in reduction potential. Therefore, the presence of such groups may decrease hydrogen bonding with water because of shielding of electronegative ligand regions from water or because of charge redistribution over the metal-ligand system. Because of the large ionic radius of the (phenanthro- line)iron(II) complex, the charge density due to the + 2 charge at any given point on the periphery of the ligands is probably not very high, and hydrogen bonding to localized regions of electronegativity on such an ion, even though it has a net over-all positive charge, does not seem unreasonable. It should be noted that the planar configuration of the phenanthrolines provides a rather open chelate structure, and on the basis of models the presence of methyl groups should not prevent penetration of water molecules into spaces between the coordinated ligands.
In light of the above observations it was of interest to see whether the presence of methyl groups on the phenanthroline would produce a smaller potential shift upon addition of small amounts of water at constant temperature to acetonitrile solutions of the (phenanthroline)iron(III)-(II) couple. This was done with the parent and 5-methyl-substituted compounds, the water being added in 0.01-ml increments from a microburet. In each case the potential decreased by about 0.1 to 0.2 mv per increment for the first three or four increments, then somewhat more rapidly, but no significant difference between the two compounds was observed.
A decrease in entropy upon reduction has also been reported for the bipyridyl complexes of ruthenium(III) and osmium(III). (AS = —16 and —15 eu, respectively.3) It would be valuable to determine whether positively charged metal chelates of different
structure that undergo reversible electron transfer without secondary interactions exhibit similar behavior. Unfortunately, such compounds are not available at present.
Rate of Approach to
Sedimentation Equilibrium
by S. I. Klenin,1 Hiroshi Fujita,2 and D. A. Albright
Department of Chemistry, University of Wisconsin,Madison, Wisconsin (Received October 4> 1965)
Recently, Osterhoudt and Williams3 have proposed a new method of evaluating solute molecular weight (weight-average) and the light scattering second virial coefficient of a polydisperse, nonideal solution from sedimentation equilibrium experiments. The necessary data are the ratio Aceq/c 0 determined as a function of a parameter X at various fixed values of c0. Here c0 is the initial concentration of a given solution, Aceq is the difference in concentration, at sedimentation equilibrium, between the meniscus and the bottom of the solution column in the cell, and X is defined as X = w2(l — vp)(r22 — ri2)/2RT (for the notation see ref 4). In order to use this method for routine evaluation of polymer solutions it is highly desirable to develop procedures that minimize the time required to satisfy the equilibrium condition in an experiment. The use of a short liquid column is of utmost importance for this purpose.6 The theoretical work of Van Holde and Baldwin6 indicates that the time needed to bring a solution to a sedimentation equilibrium state from the state of uniform concentration is practically independent of the rotor speed if the condition \M < 1 . 2 is satisfied (M is the molecular weight of the solute). This condition for \M is also necessary for a satisfactory application of the method of Osterhoudt and Williams. Thus, if one always starts the sedimentation experiment with a uniform solution, the increase of the rotor speed (in the region in which XM < 1.2 is satisfied) 1 2 3 4 5
(1) Exchange Visitor of the USSR Academy of Sciences, Institute of High Molecular Compounds, Leningrad, U.S S.R.(2) Department of Polymer Science, Osaka University, Osaka, Japan.(3) H. .W. Osterhoudt and J. W . Williams, J. Phys. Chern., 69, 1050 (1965).(4) H. Fujita, “ Mathematical Theory of Sedimentation Analysis,” Academic Press, New York, N. Y ., and London, 1962, Chapter V.(5) K . E. Van Holde and R. L. Baldwin, J. Phys. Chem., 62, 734 (1958).
The Journal of Physical Chemistry

Notes 947
does not bring about any substantial economy of time. In the present study, we have examined the rate of approach to sedimentation equilibrium when the rotor speed is changed in stepwise fashion from a lower to a higher value (and vice versa), where the sedimentation equilibrium is attained at each speed. This procedure differs from the one in which the rotor is brought to a stop before proceeding to the next higher speed.
Experimental Section
An oligostyrene dissolved in cyclohexane was used for the present study. The oligomer dispersed immediately in the solvent at room temperature, there was no evidence of solute precipitation observed during the course of the experiment. The concentration of the test solution was about 0.32 g/dl. The number- average molecular weight, Mn, of the sample was determined by a vapor pressure osmometer and found to be 3300 ± 300.6 7 Separate sedimentation equilibrium experiments with this oligomer in cyclohexane at 20.0 and 34.2° (the latter is the 0 temperature for this system which was determined previously in this laboratory by Fujita, et alJ) yielded the value of 5600 ± 100 for the weight-average molecular weight, Mw, of the solute and zero for the second virial coefficients of the solution at the two temperatures. Thus the ratio of M w/Mn for the sample is 1.7. The diffusion coefficient of the sample at infinite dilution in benzene at 20°, determined by an interferometric diffusiometer of Tsvetkov,8 was 2.08 X 10~6 cm2/sec. Conversion of this value to that for cyclohexane at 25° with the Einstein-Stokes relation gives 1.53 X 10⁻⁶ cm2/sec.
The ultracentrifugation was performed at 25.0° using a Spinco Model E analytical centrifuge equipped with a temperature-regulating unit. The depth of the solution column in the cell was adjusted to about 2.5 mm, with glycerine having been introduced as a bottom liquid.3 The Rayleigh interference method was used to measure the concentration distribution in the cell. Photographs were taken at appropriate intervals of time, immediately developed, and examined on a microcomparator to determine the changes of the difference in fringe number, AJ, between the ends of the solution column during the experiment. When the value of A J became sensibly constant at a given rotor speed, the rotor was quickly brought to a higher (or lower) predetermined speed and the measurement of A<7 was continued.
Results and Discussion
The experimental results obtained are shown in Figures 1 and 2. Figure 1 represents the data for the
Figure 1. Change in the difference in fringe number, A J, between the ends of the solution column with time during the process of stepwise acceleration. A(AJ) = A2/ =( A j ) t=t — ( A / ) !_ 0. Vertical arrows indicate the points at which the state of sedimentation equilibrium is reached within the limits of experimental accuracy.A, 24,621 rpm, A /« = 9.66; B, 21,678 rpm, A /» =7.61; C, 17,211 rpm, A J«, = 4.94; D , 12,571 rpm, A/a= = 2.68; E, 0 rpm.
case in which the rotor was accelerated stepwise, with three intermediate speeds, from rest up to the speed of 24,621 rpm. Figure 2 shows the corresponding data for the case of a stepwise deceleration of the rotor from the highest speed taken. It is seen that, except in the step from rest to 12,571 rpm, the change of A/ with time follows an essentially similar pattern irrespective of the initial and final speeds for each step. The time needed to bring the solution from one sedimentation equilibrium state to the next may be estimated roughly from Figures 1 and 2 by measuring the interval of time from the start of each step to the point beyond which A J will be sensibly constant. The values obtained are given in the second column in Table I.
(6) S. V. Bushin and S. I. Klenin, Vysokomolekul. Soedin., in press.(7) H. Fujita, A. M . Linklater, and J. W . Williams, J. Am. Chem. Soc., 82, 379 (1960).(8) (a) V. N . Tsvetkov, Zh. Eksperim. i Teor. Fiz., 21, 701 (1951); (b) V. N. Tsvetkov and S. I. Klenin, J. Polymer Sci., 30, 187 (1958)
Volume 70, Number 8 March 1966

948 Notes
0 5 10 15 20 25Time, t, sec X 10 " 3.
Figure 2. Change in AJ with time during the process of stepwise deceleration: A , 21,708 rpm, AJ™ = 7.66;B, 17,200 rpm, A / » = 4.90; C, 12,554 rpm,AJ Co — 2.70.
This table also includes the values for X M W corresponding to the respective rotor speeds used; here Mw was taken to be 5600. It is seen that in the process of stepwise acceleration of the rotor, the time interval between successive sedimentation equilibrium states is progressively shortened, and the reverse is the case with the stepwise deceleration. Thus we find that by the use of stepwise acceleration the necessary data for dif-
Table I : Rates of Attainment of Sedimentation Equilibriumin Stepwise Acceleration and Deceleration of the Rotor"
TimeRotor speed, /— (sec) X 10 — *
rpm Obsd Calcd XMW = 1/a
0 - > - 12,571 21 2 0 .46 0 —► 0 .20712,571 —*■ 17,211 19 17.1 0 .207 —► 0 .38917,211 —*■ 21,578 16.5 15 .4 0 .38 9 -> -0 .6 1721 ,678 —*• 24,621 15 1 3 .4 0 .617 -» -0 .7 9 5
24,621 —*■ 21,708 16 14.4 0 .7 9 5 —>- 0 .61821 ,708 — 17,200 18 .5 18 .0 0 .61 8 -*■ 0 .38817,200 -*■ 12,554 21 19.8 0 . 388 —► 0 .207
“ Oligostyrene (M „ == 3300, M w = 5600) in cyclohexane at25 .0° ; concentration, 0.32 g /d l. b The experiments wereselected in such a way that \M w < 1; therefore, the functionF (a ) in the Van Holde and Baldwin equation is essentially constant for all of the speeds considered, and this value (20.4) for the time to equilibrium (5 = 0.01) represents the approximate time required for each of the speeds if the rotor is brought from rest initially.
ferent speeds (more correctly different X values) can be obtained faster than by the procedure in which the rotor is accelerated to desired speeds from rest. It should be noted, however, that the time saved by stepwise acceleration is not relatively laige in comparison with the experimental time spent when the other procedure is used.
As has been mentioned above, the calculation of Van Holde and Baldwin5 indicates that when the rotor is accelerated from rest, the time needed to bring a solution to a sedimentation equilibrium state is practically independent of the rotor speed, provided that the condition \M < 1.2 is satisfied. Table I suggests that in the case of stepwise acceleration or deceleration this time depends on both the initial and final speeds of the rotor in a particular experiment. In order to clarify this dependence quantitatively, we have extended the Van Holde-Baldwin calculation to the case where initially the solution is equilibrated at any given speed of the rotor, to0. The result of the theoretical derivation can be written in the form
t = (— D - Ù*G(a, cto) (1)
where
G(a, a0) = — - In [|H(a, a0)|«] (2)1 + 4 r2a2
with
H(a, a0)
«of 1 ------- ) (1 + 4ir2« 2)[exp(l/«o) — 1] X\ «o /
f 1 2 +1 l
\47T2« [(2a /ato) — l ] 2j/ a \ ( 1 / 2a\ l )
8 « 2( 1 ------ )< 1 + exp — r - 1 ------- \ xV «0 / I L ^a\ cto / J)
} + exp -)\(3)
In these equations, t is the time, after the rotor is brought from angular velocity oj0 to another value u, required for the concentration difference, Act, between the ends of the solution column to satisfy the condition
|(Aceq Act) / Aceq| — 5 (4)
The quantity r2 — n is the depth of the solution column, D is the diffusion coefficient (assumed to be independent of concentration) of the solute in the solvent being studied, and a and « 0 are dimensionless quantities defined by
The Journal of Physical Chemistry

N otes 949
a — (AM) 1; a0 = (A0M) 1 (5)
with A and A0 corresponding to to and o>0. Van Holde and Baldwin assigned the value of 0.001 for d, but it seems to us that this value is too severe a criterion for the attainment of a sedimentation equilibrium state. Probably, S = 0.01 would be sufficient for most practical purposes. In passing, it may be noted that eq 1 reduces to the result of Van Holde and Baldwin when wo = 0.
With 5 = 0.01, M = M w = 5600, and D = 1.53 X 10 ~6 cm2/sec, together with the proper experimental values for other parameters, we have calculated from eq 1 the values of t for the seven combinations of initial and final speeds which appear in Table I. These show a fairly satisfactory agreement between observed and calculated values.
Acknowledgment. This study was supported by Grant GB 3321, National Science Foundation, and was carried out in the laboratory of Dr. J. W. Williams.
The Interpretation of Secondary
Transitions in Polymers
by David W. McCall
Bell Telephone Laboratories, Incorporated,Murray Hill, New Jersey (.Received October 11, 1965)
The study of “ secondary transitions” in polymers has received a great deal of attention in the past 10 years or so. Most of the work has gone into the experimental characterization of these relaxations. The three principal methods employed can be classified as dielectric, mechanical, and nmr, even though the technique within a given category may vary widely. Certain qualitative aspects of the subject can be regarded as firmly established. Molecular motion is certainly the underlying phenomenon. In this paper we use the expression “ secondary transition” to distinguish processes that can be associated with small, definite molecular entities from processes that involve more general motions. The former might be exemplified by the rotation of a side group about a chemical bond while the latter will include glass transitions and, perhaps, certain other processes, e.g., the a transition in polyethylene.
A review1 of the existing literature reveals that the 'positions of the transitions on a frequency-temperature map are well correlated. That is, the dielectric,
mechanical, and nmr experiments usually give points on the map that lie on common loci. The slopes of these lines are related to activation parameters. The fact of the correlation indicates that the same molecular motions underlie the various experiments. A review1 of the literature also shows that the intensities of corresponding relaxation effects are not always correlated. For example, an intense dielectric loss peak may correspond to a relatively weak mechanical loss peak, or vice versa. To understand the intensities we must consider individually the manner in which the various experiments couple to molecular motions. Relaxation theory, in general, is not well enough worked out to allow us to hope for quantitative prediction of the effects but it is possible, in many cases, to evaluate certain molecular parameters. These parameters can be judged reasonable or unreasonable by comparison with similar parameters deduced for nonpoly- meric substances with similar molecular groupings.
The intensity251 of a dielectric loss peak can be shown to be2b
where N is the number of electric dipoles/cm3, ¡x2 5 is the mean-square effective211 dipole moment, and es and 6„ are the low- and high-frequency dielectric constants. Thus, Np? is the molecular parameter deduced from dielectric loss intensities observed for polymers.
In nmr experiments the depth of a T\ minimum can be shown to be proportional to a sum, 2rM~6, over internuclear vectors.3'4 For an assumed molecular reorientation this sum can be calculated or, at least, estimated. Nuclear magnetic resonance T2, resonance width, or “ second moment” measurements can be interpreted in terms of similar sums. Interpretations of nmr data in terms of internuclear distances and reasonable molecular motions are usually satisfying. However, there are several pitfalls and the interpretations may include complicating factors. For example, a small number of rotating groups can dominate Ti through the process of spin diffusion.6 Also, the severe
(1) D . W . McCall, unpublished; presented at the Polymer Research Group Meeting, Moretonhampst-ead, England, April 1964.(2) (a) The intensity is taken to be the area under an t ' vs. log v plot, where e " is the dielectric loss and v is the frequency, (b) C. J. F. Bottcher, “ Theory of Electric Polarisation,” Elsevier, Amsterdam, 1952.(3) N. Bloembergen, E. M . Purcell, and R. V. Pound, Phys. Rev., 73, 679 (1948).(4) C. P. Slichter, “ Principles of Magnetic Resonance,” Harper and Row, New York, N. Y ., 1963.(5) D . W . McCall and D. C. Douglass, Polymer, 4, 433 (1963).
Volume 70, Number 3 March 1966

950 Notes
limitation on frequency coverage makes intensity considerations more difficult when reorientation times are broadly distributed.6
Molecular mechanisms for mechanical relaxation in polymers are not so well established for secondary transitions although many workers have contributed in important ways to the proper appreciation of the factors involved. On the other hand, a very successful theory has been developed for the interpretation of sonic absorption in liquids.7 We propose that this model is appropriate for the interpretation of many secondary transitions in mechanical loss studies of polymers. If a polymer has a side group that can reorient between two sites the mechanical loss can be shown to have a maximum given by7
tan 5max = (RT/2)(A.H°/RT)1 2(Ma2c2/C p2) Xexp(— AH°/RT)exp(AS°/R) (1)
where a is the expansion coefficient, Cp the molar heat capacity, c is the speed of sound, and AH° and AS0 are the enthalpy and entropy difference between the two sites. Thus, AH° can be determined by analysis of the temperature dependence of the mechanical loss intensity. (Equation 1 is a simplified form valid when AH°/RT is greater than 2 or 3. More general forms are given by Lamb.7 A plot of T X tan 5max vs. 1/T will often yield a straight line with slope proportional to AH °.)
Let us now consider the ¡3 transition of poly (methyl methacrylate) in the context of the foregoing discussion. This transition is evident in dielectric, nmr, and mechanical results and the frequency-temperature map shows excellent correlation between the various experiments. The resultant activation energy is about 20 kcal/mole. Analysis of the dielectric loss intensity8 yields an effective dipole moment that increases from about 1.4 D. at room temperature to 1.7D. at 130°. This compares favorably with -~1.9D. found for ethyl acetate in solution.9 Nuclear magnetic resonance T, results make it clear that both the ester and main chain methyls are rotating rapidly at temperatures well below the 0 region.10 The depth of the Ti minimum corresponding to the ¡3 transition is consistent with rotation of the ester side group but only an approximate analysis has been made. Analysis of the mechanical loss intensity11-12 yields, for the enthalpy difference between sites, AH° =. 3.4 kcal/ mole. This is close to the value AH° ~ 3 kcal/mole found for ethyl acetate liquid by ultrasonic relaxation.7 We might suggest, on the basis of this comparison, that the energy difference has an intramolecular origin. The theory of Lamb7 reveals that the activation energy
measured is the lower of the two; i.e., the barrier is ~ 2 0 kcal/mole in one direction and -~23 kcal/mole in the other. AS° must be 3 or 4 eu. These considerations make it quite obvious that the j3 transition in polymethyl methacrylate corresponds to a reorientation of the ester side group. In addition, parameters characterizing hindrances to this motion have been evaluated.
It will be of interest to see how widely detailed interpretations such as these can be applied. In any case, relaxation intensities are a relatively untapped resource. Intensity analyses will lead to a more secure understanding of the mechanisms by which electric, magnetic, and elastic energies are converted to heat and clearer pictures of molecular motion.
Acknowledgment. It is a pleasure to acknowledge the assistance of W. P. Slichter in the development of this material. Helpful discussions were provided byD. C. Douglass, A. A. Bondi, and S. Matuoka.
(6) T. M . Connor, Trans. Faraday S o c 60, 1574 (1964).(7) J. Lamb in “Physical Acoustics,” II, A, W . P. Mason, Ed., Academic Press, New York, N. Y ., 1965, p 203. This chapter by Dr. Lamb contains a beautifully clear exposition of the theory and experimental documentation of its successes in liquids.(8) W . Reddish, Pure Appl. Chem., 5, 723 (1962).(9) C. P. Smyth, “ Dielectric Behavior and Structure,” McGraw- Hill Book Co., Inc., New York, N. Y ., 1955.(10) J. G. Powles, B. I. Hunt, and D. J. H. Sandiford, Polymer, 5, 505 (1964).(11) G. W . Becker, Kolloid-Z., 140, 1 (1955).(12) J. Heijboer, ibid., 148, 36 (1956).
Free Energy of Formation of Li2Te at 798°K
by an Electromotive Force Method1
by M. S. Foster and C. C. Liu
Chemical Engineering Division, Argonne National Laboratory, Argonne, Illinois (Received October 21, 1965)
The thermodynamic properties of the binary lithium-tellurium system have been studied using electromotive force measurements of a concentration cell without transference. Very little information pertaining to this system was found in the literature. The lattice constant of Li2Te was reported by Zintl, Harder, and Danth.4 A semiconductor character was predicted for Li2Te by Mooser and Pearson.3
(1) Work performed under the auspices of the U. S. Atomic Energy Commission.(2) E. Zintl, A. Harder, and B. Danth, Z. Elektrochem., 40, 588(1934).
The Journal of Physical Chemistry

Notes 951
The complete phase diagram for the sodium-tellurium system is given by Hansen and Anderko3 4 and shows both Na2Te (1226°K) and NaTe3 (709°K) as congru- ently melting compounds, while NaTe reportedly dissociates at 628°K.
Experimental SectionThe cell used in this investigation was contained
in a furnace well attached to the floor of an inert- atmosphere box. The helium atmosphere was continuously purified by recirculation through an activated charcoal trap immersed in liquid nitrogen.5
The cell configuration was similar to that described previously.6 The electrode contacts were tungsten rods. The chromel-alumel thermocouple used to monitor the cell temperature was contained in a small tantalum tube, closed on one end, which was immersed in the electrolyte. The reference electrode (anode) consisted of a two-phase mixture of Li3Bi(s) and a bismuth-rich liquid alloy of lithium and bismuth. The over-all composition of this electrode varied from60.3 to 56.0 atom % lithium during the experiment as lithium was coulometrically removed (initial quantities of lithium and bismuth were 5.4702 and 107.3808 g, respectively). The lithium metal used was obtained from Foote Mineral Co., Philadelphia, Pa., in the form of 1-lb ingots sealed in cans under an argon atmosphere. The impurity analysis supplied by the Foote Mineral Co. was 0.003% Na, 0.0028% K, 0.003% Cl, and 0.0031% N2. No further purification of the lithium metal was attempted, but only bright metal pieces were used. Bismuth metal was obtained in shot form from United Mineral and Chemical Corp., New York, N. Y. The impurity analysis furnished by United Mineral and Chemical Corp. showed 0.0004% Ag, 0.0001% Cu, 0.0002% Pb, and 0.0001% Fe. This metal was melted under helium and filtered to remove oxide impurities prior to use. The voltage of this electrode was previously determined against lithium.6
The second electrode in this study was an alloy of lithium and tellurium contained in a porous BeO crucible. A total of 14.6935 g of tellurium was added initially. Elemental tellurium was obtained from American Smelting and Refining Co., New York,N. Y. Impurity analysis furnished by American Smelting and Refining Co. showed 0.0001% Mg,O. 0001% Fe, and 0.0001% Cu. This material was melted under helium and filtered before use.
The electrolyte was the eutectic composition 30 mole % LiF, 70 mole % LiCl.7 This composition was made up in air, using reagent grade chemicals, and purified by the method of Maricle and Hume,8 i.e.,
Figure 1. Voltage-composition behavior of the cell:Li(in Bi(l) saturated with solid Li3Bi) | LiCl-LiF | Li in Te (X li = over-all atom fraction Li in Te) at 798°K.
chlorine gas was passed through the molten eutectic, after which the excess chlorine was removed by bubbling helium through the melt. The melt was sealed in Pyrex under vacuum and transferred to a helium- filled drybox where all subsequent operations were performed.
Lithium was added coulometrically to the tellurium from the reference electrode at a constant current of 0.5 amp. Sufficient coulombs were used to change the composition of the lithium-tellurium electrode by ^ 0 .5 atom % each time. After each increment of current was passed, the lithium-tellurium alloy was stirred and the cell potential read with a Leeds and Northrup Type K-3 potentiometer at 5-min intervals until constant to ±0.5 mv (usually *~20 min).Results
The concentration of lithium in the tellurium was calculated directly from the number of coulombs used and the assumption of 100% current efficiency. The behavior of the observed cell potential vs. the computed concentration of lithium in the tellurium is shown in Figure 1. The discontinuity at 0.39 atom fraction is believed to be the point at which the cathode alloy at 798°K becomes saturated with Li2Te. The
(3) E. Mooser and W. B. Pearson, J. Electronics, 1, 629 (1956).(4) M . Hansen and K. Anderko, “ Constitution of Binary Alloys,” McGraw-Hill Book Co., Inc., New York, N. Y ., 1958.(5) M. S. Foster, C. E. Johnson, and C. E. Crouthamel, “Helium- Purification Unit for High-Purity Inert-Atmosphere Boxes,” AN L- 6652 (1962).(6) M . S. Foster, S. E. Wood, and C. E. Crouthamel, Inorg. Chem., 3, 1428 (1964).(7) H. M . Haendler, P. S. Sennett, and C. M . Wheeler, Jr., J. Electrodiem. Soc., 106, 264 (1959).(8) D. L. Maricle and D. N. Hume, ibid., 107, 354 (1960).
Volume 70, Number 3 March 1966
952 Communications to the Editor
absence of breaks in the curve at atom fractions 0.25, 0.33, and 0.50 indicates the absence of LiTes, LiTe2, and LiTe, respectively (see corresponding phase diagram of Na-Te), in the system. If the data could be obtained through the 0.66 atom fraction, a sharp drop in emf would appear, the emf approaching —0.7 v on the plot in Figure 1 or 0 v with respect to a liquid lithium anode.
The observed cell potentials were converted to those for the cell
Li(l) [ LiCl—LiF| Li in Te(X u = atom fraction Li in Te) (1)
by adding 0.7055 v at 798°K (see ref 6). The standard states are taken to be Li(l) and Te(l) in the cell environment (saturated with electrolyte). Therefore, the excess chemical potential of Li in Te at the cell temperature (T = 798 ± 1°K) may be calculated
AMLiE = — FE — RT In X Li (2)
where F is the value of the Faraday and R the gas constant. These results are shown in Table I. The average excess chemical potential, A/tuE> is —37,145 ± 135 cal/mole. A least-squares fit of the data to a quadratic function of X u resulted in the equation
AMLE = -36,568 - 5736Xu + ll,676XLi1 2 (cal/mole)(3)
The standard deviation of this equation is 29 cal/mole. The cell reaction (1) may be written
Li(l) + y 2Te(l) (saturated with solid Li2Te) — >1/ 2Li2Te(s) (4)
for an over-all electrode composition of X u > 0.39. For this reaction we may write
AG = -F E = V2A(7f0 - l/2RT In X Te - y 2AMTeE(5)
where X ts is the atom per cent Te in the Li-Te liquid saturated with Li2Te(s), A^TeE is the excess chemical potential of Te in the same liquid, and AGf° is the standard free energy of formation of Li2Te(s) from the elements. The value of A/UTeE was calculated from the Gibbs-Duhem relationship. A constant value of A/iu E gave A,UTeE = 0, while eq 3 yielded A/iTeE = — 50 cal/mole. Using either value, the standard free energy of formation of Li2Te(s) at 798°K was calculated to be —77.9 kcal/mole. The standard deviation of this value is estimated as 0.4 kcal/mole.
Table I : Calculated Excess Chemical Potential of Li in Te
Cumulativetotal
coulombs
Calculated over-all
concentration of Li in Te
Observedcell
potential, - ¿Vl;E.added (atom fraction) V cal/mole
660 0.056 1 .0 9 1 2 368601260 0.10 1 .0 5 7 3 370251860 0 . 1 4 1 .0 39 2 371502460 0 . 18 1 .0244 3 7 18 13060 0.22 1 .0 1 7 5 373003660 0 .25 1 .0 0 75 372894460 0.29 0.9965 372635260 0.32 0.9854 371906060 0 .35 0.9756 3 7 1 1 26860 0.38 0.9686 370757860 0 .4 1 0.9666 a
8860 0.44 0.9644 a9860 0.47 0.9646 a
12060 0.52 0.9644 a
° Two-phase region existed at this over-all composition (see Figure 1 and text).
Acknowledgment. The interest of Dr. J. A. Plam- beck in this work is gratefully acknowledged.
COMMUNICATIONS TO THE EDITOR
The Mechanism of Ketene Photolysis
Sir: The photolysis of ketene has often been used as a source of methylene radicals,1,2 yet the mechanism of the photolysis is still in some doubt.3 Any proposed mechanism must account for the following facts,(a) At short wavelengths the methylene radicals formed in the photolysis are almost entirely singlet,
whereas at long wavelengths they are predominantly triplet.4 At an intermediate wavelength, 3200 A,
(1) T. Terao and S. Shida, Bull. Chem. Soc. Ja%an, 37, 687 (1964).(2) F. Casas, J. A. Kerr, and A. F. Trotman-Dickenson, J. Chem. Soc., 1141 (1965).(3) W . A. Noyés, Jr., and I. Unger, Pure Appl. Chem., 9, 461 (1964).(4) S. Ho, I. Unger, and W . A. Noyés, Jr., J. Am. Chem. Soc., 87, 2298 (1965).
The Journal of Physical Chemistry

Communications to the Editor 953
71% of the radicals formed are singlet and 29% triplet.5 (b) At long wavelengths, plots of twice the reciprocal of the quantum yield of carbon monoxide against ketene concentration are linear over a wide range of concentration and show no signs that the quantum yield reaches a limiting value at high concentrations.6’7 The intercepts and slopes of such plots decrease as the temperature is raised or the wavelength shortened. At high temperatures or short wavelengths the intercepts approach unity and the slopes fall to zero.
Neither the mechanism of Strachan and Noyes6 nor that of Porter and Connelly7 will account for (a), whereas the mechanism proposed recently by Ho, Unger, and Noyes4 will not account for (b). A mechanism which will account for both (a) and (b) is thefollowing.
CH2CO + hv = CH2CO(S) (1)CH2CO(S) = CH2(S) + CO (2)
CH2CO(S) = CH2CO(T) (3)CH2CO(S) + M = CH2CO + M (4)
CH2CO(T) = CH2(T) + CO (5)CH2CO(T) = CH2CO (6)
CH2(S or T) + CH2CO = C2H4 + CO (7)
where (S) denotes a singlet state and (T) a triplet state. Application of the usual steady-state assumption leads to
state molecules, in contrast to the excited singlet- state molecules, will be in thermal equilibrium with their surroundings, undergoing several collisions before either (5) or (6) occurs even at the lowest pressures normally employed.
At short wavelengths, fc2 will be larger than k3 and also larger than fc4(M) at ordinary pressures, in which case 2/<j>co = 1 and a = 1, in agreement with observations at 2700 A .4'6
At sufficiently long wavelengths, fc2 will become either zero or at least very much smaller than k3 so that
2 _ &5 “h k3 (k3 -}- k$) An. ,.too = h ” + hk, ( ; (C)
and a = 0. Plots of 2/<fcio vs. (M) will be linear and the slopes and intercepts will decrease with temperature. At 3660 A the experimental evidence is that a is well below 0.5, though whether it is essentially zero is not certain.4 Assuming that it is and that (C) is valid, an estimate can be made of the values of the various rate constants at this wavelength.
At 23° the intercept of the plot of 2/<pco vs. (M) is19.5 and the slope has the value 24.8 X 10³ I f -1.7 Between 27 and 154° the inverse slope increases with an apparent activation energy of 4500 cal mole-1.6 The latter will be accounted for if (3) has a small apparent activation energy of 1500 cal mole-1 and the activation energy difference E3 — E6 equals 3500 cal mole-1. Utilizing this information and assuming a collision diameter for ketene of 4.0 A, we calculate
_ 2 _
<ho
and
_____ 2 ~r &3_____ .ki + k3k3/(k3 + fce)
kj(M)hi + k3k3/ (&g + k3)
hiOi = ---------------------------—h + k3k3/ (k3 + k3)
(A)
(B)
where cj>co is the quantum yield of carbon monoxide and a is the fraction of methylenes formed which are singlet.
The rate constant for (2) is assumed to have the form k2 = v(l — Ho/H)5-1.8 It will therefore decrease from a limiting value v when E is large (short wavelengths) to zero when E approaches or becomes less than E0 (long wavelengths). Reaction 3 will also increase with E but much less rapidly than reaction 2 and remain slow even at high E because of the change of spin involved. Reaction 4 probably occurs on every collision. Reactions 5 and 6 will both be slow, (5) because it has an activation energy and (6) because it involves a change of spin. Therefore, the triplet-
h = 9.61 X W V T M -1 sec-1 k3 = 1.66 X 10⁹e-15°°/BT sec-1
h/h = 20.7e-350°/i27’With the above values, the intercept and slope of
2/$co vs. (M) at any temperature can be calculated. We have photolyzed ketene at 3660 A at four temperatures between 37 and 300° and Table I shows the experimental and calculated values of the intercepts (/) and slopes (S) of such plots. The agreement is reasonable and lends support to the proposed mechanism.
We have also photolyzed ketene at the same wavelength in the presence of two inert gases, sulfur hexafluoride and octafluorocyclobutane. We have found both to be equally as efficient as ketene at deactivating
(5) F. H. Dorer and B. S. Rabinovitch, J. Phys. Chem., 69, 1964 (1965).(6) A. N . Strachan and W . A. Noyes, Jr., J. Am. Chem. Soc., 76, 3258 (1954).(7) G. A. Taylor and G. B. Porter, J. Chem. Phys., 36, 1353 (1962).(8) N. B. Slater, “ Theory of Unimolecular Reactions,” CornellUniversity Press, Ithaca, N . Y . 1959.
Volume 70, Number 3 March 1966

954 C o m m u n ic a t io n s t o t h e E d it o r
Table I : Intercepts and Slopes of 2/<j>co vs. (M) at3660 A ( M - 1 X10⁻⁵)
Temp, I I 5 S°C (measd) (calcd) (measd) (calcd)
37 20.0 15.2 17.6 17.6150 4.6 4.1 3.05 2.91225 3.3 2.7 1.13 1.56300 0.8 1.9 0.97 0.93
the excited singlet state molecules, a result whichstrengthens the assumption that (4) occurs on every collision.
At intermediate wavelengths such as 3340 and 3130 A, plots of 2/fco vs. (M) should still be linear in accordance with (A), the slopes decreasing as the wavelength is shortened. Again this is in agreement with observation.7’9 The mechanism predicts that at these intermediate wavelengths the ratio of singlet to triplet methylene should vary with temperature as well as with wavelength. This is a prediction which could readily be tested experimentally.
(9) B. T. Connelly and G. B. Porter, Can. J. Chern., 36, 1640 (1958).
D e p a r t m e n t o f C h e m is t r y A. N. S t r a c h a n
L o u g h b o r o u g h C o l l e g e o f T e c h n o l o g y D . E . T h o r n t o n L o u g h b o r o u g h , L e ic e s t e r s h ir e , E n g l a n d
R e c e iv e d J a n u a r y 31, 1966
Determination of Ionic Partial Molal Volumes
from Ionic Vibration Potentials1
Sir: Ionic vibration potentials were predicted by Debye2a in 1933 and detected some 16 years later.2b While Debye proposed the effect as a means for evaluating the masses of solvated ions, subsequent considerations3’4 have indicated the effect to depend on the apparent masses (mass of solvated ion minus the mass of free displaced solvent). An important application for this effect, however, has not been called to attention, i.e., the determination of absolute ionic partial molal volumes. The purpose of this communication is to point out this application in the hope that wider interest in this effect will be generated.
If ionic atmosphere effects are neglected, for frequencies small compared to the ratio specific conductance to dielectric constant, the amplitude ($0) of the ac potential differences between points separated by a phase distance of one-half wavelength is4
$o = 3.10 X 10_7a0S(<jWj - d)/zj (volts)
where W j is the apparent mass of the solvated ion of the jth type, fj is the transference number, z, is the ionic charge, aa is the acoustical velocity amplitude, and d is a correction factor for diffusion.
The ionic partial molal volume V, in dilute solution corresponds closely to the intrinsic ionic volume minus the decrease in volume of the surrounding water molecules arising from électrostriction. Consequently, it can be readily shown that W-, = M- — FjSo where M\ is the molecular weight of the unsolvated ion and s0 the solvent density. The combination of the partial molal volume of the composite electrolyte with ionic vibration potential data permits the calculation of F,.
Table I summarizes data for 0.03 M electrolytes. Experimental details will be published later. False effects which heretofore have interfered to some extent5-9 have been eliminated as significant factors. The values for V, have been calculated from the over-all partial molal volumes F and the transference numbers tj at low concentrations or infinite dilution as compiled by Parsons.10 1 2 3 4 5 6 7 8 9 10 A comparison of the values for Fj for a given ion evaluated from measurements in different electrolytes indicates a consistency of approximately
Table I: Ionic Vibration Potentials at 200 kc and 22° and Partial Molal Volumes
Electrolyte
i v / ao ,
¡¡Vsec/cm t+ (-
V ,
cm3/mole
F+,cm3/mole i
! F
Cb <
-
HC1 0 .4 5 0 .8 2 0 .1 8 18.1 - 5 . 2 2 3 .3LiCl - 0 . 4 0 .3 4 0 .6 6 1 7 .1 - 7 . 3 2 4 .3NaCl 0 .8 0 .4 0 0 .6 0 1 6 .4 - 7 . 7 2 4 .1KC1 1 .8 0 .4 9 0 .5 1 2 6 .5 3 .1 2 3 .4RbCl 5 .1 0 .51 0 .4 9 3 1 .9 10 .7 2 1 .2CsCl 8 .1 0 .5 0 0 .5 0 3 9 .2 15 .1 2 4 .1NaBr - 3 . 2 0 .3 9 0 .6 1 2 3 .5 - 4 . 9 2 8 .4KBr - 1 . 5 0 .4 9 0 .5 1 3 3 .7 4 .7 2 9 .0Nal - 6 . 7 0 .4 0 0 .6 0 35 .1 - 3 . 1 3 8 .2K I - 4 . 4 0 .4 9 0 .5 1 4 5 .4 5 .6 3 9 .8
(1) Research supported by the U. S. Office of Naval Research.(2) (a) P. Debye, J. Chem. Phys.. 1, 13 (1933); (b) E. Yeager, et al., ibid,., 17, 411 (1949).(3) J. Hermans, Phil. Mag., [7] 25, 426 (1938); 26, 674 (1938).(4) J. Bugosh, E. Yeager, and F. Hovorka, J. Chem. Phys., 15, 592 (1947).(5) A. Hunter and T . Jones, Proc. Phys. Soc. (London), 79, 795 (1962).(6) A. Rutgers and R. Rigole, Trans. Faraday Soc., 54, 139 (1958).(7) E. Yeager, J. Booker, and F. Hovorka, Proc. Phys. Soc. (London), 73, 690 (1959).(8) A. Weinmann, ibid., 73, 345 (1959).(9) R. Millner, Z. Elektrochem., 65, 639 (1961); private communication, 1965.(10) R. Parsons, “ Handbook of Electrochemical Constants,” But- terworth and Co. Ltd., London, 1959, p 59.
The Journal of Physical Chemistry

Communications to the Editor 955
± 2 cm3/m ole. Since the most data are available for Cl- , we recommend the use of the average value 23.4 ± 0.5 cm3/mole for this ion as a basis for the evaluation of the absolute partial molal volumes of other ions from existing relative values.
(11) On leave from C N R S-C R M , Strasbourg, France.
C o n d e n s e d S t a t e C e n t e r R . Z a n a 11W e s t e r n R e s e r v e U n iv e r s it y E. Y e a g e r
C l e v e l a n d , O h io
R e c e iv e d D e c e m b e r 27, 1965
Comments on the Formation Kinetics of the
Nickel Monomalonate Complex
Sir: A paper which recently appeared in this journal1 has described a temperature-jump relaxational study of the kinetics of ionic association and complex formation in nickel malonate solutions. Rate constants were reported at three temperatures and at ionic strength I = 0.1 M for the reaction of divalent nickel ion with malonate (Mai2-) and bimalonate (HMal- ) ions.
It is interesting to note that a portion of the results obtained by Cavasino are in excellent agreement with those obtained previously2 by us with the pressure-step method. We determined the rate constants for the reaction
klNi(H20 ) 62+ + Mai2- ^ (H20 )4NiMal + 2H20
k,
at 25° and zero ionic strength. The forward and reverse rate constants were found to be 4.2 X 10⁵ M~l sec-1 and42 sec-1, respectively. In order to compare these with Cavasino’s results at the same temperature and ionic strength of 0.1, we must estimate the activity coefficient of free nickel and malonate ions (/±) at 0.1 ionic strength. The semiempirical generalized Davies equation3 for activity coefficients had been used in our work to reduce our measurements to zero ionic strength, and also by Cavasino to calculate some ionic activities. (This equation has been shown4 to give reliable estimates of ionic activity coefficients up to ionic strength 0.1.) The result for a divalent electrolyte in a medium of ionic strength 0.1 is / ± = 0.39. By dividing Cavasino’s bimolecular rate constant fc/ by / ±2, the two sets of data become comparable. The results are shown in Table I.
The two sets of data agree exceptionally well. It should be borne in mind that they were obtained with different relaxation methods under different conditions
Table 1: Comparison of Rate Constants for Nickel Malonateat 25° and Zero Ionic Strength
W (I = 0.1) k{ (I = 0) kt,M~* 42 l sec-1 sec-1
Cavasino 7 X 1 0 4(±1 3 % ) ~4.6 X 10s 44 (±13% )(T-jump method)
Our work (4.2 ± 0.4) 42 ± 4(P-step method) X 106
of pH and ionic strength and in the presence of an organic indicator in one case.
Acknowledgment. The work at Western Reserve University was supported in part by the Office of Naval Research under contract No. Nonr 1439(04).
(1) F. P. Cavasino, J. Phys. Chem., 69, 4380 (1965).(2) (a) H. Hoffmann, J. Stuehr and E. Yeager, paper presented at the May 1964 meeting of the Electrochemical Society, Toronto (Extended Abstracts: Theoretical Section, Vol. 2, Abstract 187, pp 98-104); (b) H. Hoffmann, paper presented at the Bunsentagung, May 1964, Berlin [See Z. Elektrochem., 68, 895 (1964)]; (c) H. Hoffmann, J. Stuehr, and E. Yeager, Technical Report 27, Office of Naval Research, Contract Nonr 1439(04), Western Reserve University, Cleveland, Ohio, June 15, 1964 [see Ann. Rev. Phys. Chem., 16,178 (1965)]; (d) H. Hoffmann, J. Stuehr, and E. Yeager, “ Study of Relaxation Effects in Electrolytic Solutions with the Pressure-Step Method,” B. E. Conway and R. G. Barradas, Ed., “ Chemical Physics of Ionic Solutions," John Wiley and Sons, Inc., New York, N. Y ., 1966, pp 255-279.(3) C. W . Davies, “ Ion Associition,” Butterworth and Co. Ltd., London, 1962, p 41.(4) C. W . Davies, ref 3, pp 39-45.
D e p a r t m e n t o f C h e m is t r y H . H o f f m a n n
W e s t e r n R e s e r v e U n iv e r s it y J . S t u e h r
C l e v e l a n d , O h io
R e c e iv e d J a n u a r y 12, 1966
Solvent Shifts in Charge-Transfer Spectra
of Tropylium Ion Complexes
Sir: We have examined the effect of solvent on the charge-transfer maxima of complexes of a cationic acceptor, tropylium ion,1 with two aromatic donors, pyrene and phenothiazine. This is the first study of solvent shifts of positive ion-neutral molecule complexes, and these shifts may be compared with those of other types of complexes which have recently been reported.2-4
In our study, the choice of solvent is limited by the properties of the salt, tropylium fluoroborate: it is insoluble in relatively nonpolar solvents, and it reacts
(1) M . Feldman and S. Winstein, J. Am. Chem. Soc., 83, 3338(1961).
Volume 70, Number S March 1966

956 C o m m u n ic a t io n s t o t h e E d it o r
Table I : Absorption Maxima“ of Complexes of Tropylium Fluoroborate with Pyrene and Phenothiazine
Pheno-Solvent 7lDb D’ Pyrene thiazine Zd TNB-P
(CH3)2CO 1.36 20.7 2 0 . 8 17.1 65.7 2 1 . 2(CH3C 0)20 1.39 20.7 20.5 17.1CH3CN 1.35 37.5 20.5 17.0 71.3 23.1c h 3c o 2h 1.37 6.15 20.3 16.9 79.2c 6h 5n o 2 1.55 34.8 19.3 15.9HCON(CH3) 2 1.43 36.7 co. 2 2 .2s 15.5 68.5(CH2C1) 2 1.44 1 0 . 6 18.7 14.9 64.2" 2 2 .6 "(CH3)2SO 1.47 45 co. 2 1 .3f 14.7 71.1 22.4
“ Wavenumber, cm 1 X 10~2 3, except where noted. 6 Refractive index. c Dielectric constant. d Maxima for l-ethyl-4-carbo- methoxypyridinium iodide, kcal/mole, ref 3. e Trinitrobenzene-tetraisoamylammonium iodide maxima, ref 4a. 1 Shoulder. " ForCH2C12.
with hydroxylic or basic solvents. Nevertheless, we have measured the position of charge-transfer maxima in eight solvents, ranging in dielectric constant from 6 (acetic acid) to 45 (dimethyl sulfoxide). The spectra were recorded with a Cary Model 14 spectrophotometer, and the maxima of the characteristically broad charge- transfer bands are known to ± 1 npi. All solvents were carefully dried (CaH2 and/or P20 5) and distilled immediately before the spectra were recorded. The results are given in Table I.
In general, the solvent shifts for the phenothiazine complex parallel those for the pyrene complex, with the notable exceptions of dimethylformamide and dimethyl sulfoxide. There is no apparent relationship between the maxima and the dielectric constants or refractive indices5 of the solvents, nor with the large shifts observed for l-ethyl-4-carbomethoxypyridinium iodide (Z values).3'6 The range of the solvent shifts for the tropylium complexes is similar to the range for complexes of anions with neutral molecules.4
For electrically neutral complexes, Davis and Symons2b have suggested that specific interactions between the solvent and the donor or acceptor, rather than the complex as a whole, are responsible for the complex solvent shifts. For those complexes, the solvent shifts of maxima of the individual components are the same order of magnitude as the shifts for the complexes. This circumstance is not evident for the tropylium complexes, whose components have electronic spectra which are relatively insensitive to solvent.7
If the tropylium complex is considered to be an extensively delocalized cation whose charge density is drastically redistributed in excitation, the charge- transfer frequency may reflect the stabilization of positive ions by solvent. This has been discussed for
the analogous anion-neutral molecule complexes.4 As already noted,4a this model takes no account of ion aggregation, which is also a function of solvent and which may contribute significantly to the total observed solvent effect. At this time, therefore, there appears to be no adequate theoretical model which provides a clarification of the solvent effects for complexes of ions with neutral molecules.
Acknowledgment. Mr. A. K. Ivoli kindly provided the tropylium fluoroborate used in this work.
(2) Complexes of electrically neutral donors and acceptors: (a)R. Foster and T. J. Thomson, Trans. Faraday Soc., 58, 860 (1962); (b) K. M . C. Davis and M. C. R. Symons, J. Chem. Soc., 2079 (1965); (c) H. M . Rosenberg and D. Hale, J. Phys. Chem., 69, 2490 (1965); (d) M. Kroll and M . L. Ginter, ibid., 69, 3671 (1965). The last reference reports measurements in the gas phase as well as in organic solvents.(3) Ion-pair complexes: E. Kosower, J. Am. Chem. Soc., 80, 3253 (1958).(4) Anion donors and neutral acceptors: (a) G. Briegleb, W . Liptay, and R. Fick, Z. Physik. Chem. (Frankfurt), 33, 181 (1962); Z. Elektrochem., 65, 851, 859 (1962); (b) J. E. Gordon, J. Am. Chem. Soc., 87, 4347 (1965). The last reference reports measurements in liquid salt solvents.(5) It has been suggested (ref 2c) that solvent shifts of some tetra- cyanoethylene complexes parallel the refractive indices (polarizabilities) of the solvents.(6) The solvent shifts of the charge-transfer maximum of tropylium iodide plot linearly against Z-values. Cf. E. Kosower, J. Org. Chem., 29, 956 (1964).(7) Most of the solvents used in this study are opaque in the ultraviolet region. However, the spectrum of tropylium fluoroborate has been recorded (K. M . Harmon, F. E. Cummings, D. A. Davis, and D. J. Diestler, J. Am. Chem. Soc., 84, 3349 (1962)) in the following solvents: H2SO4, Xraax 274 my, H20 , 275 my, CH3CN, 275 my, CH2C12, 278 mM.(8) National Science Foundation Undergraduate Research Participant, Summer 1965.
D e p a r t m e n t o f C h e m is t r y M a r t in F e l d m a n
H o w a r d U n i v e r s i t y B o b b ie G . G r a v e s 8W a s h in g t o n , D . C .
R e c e iv e d J a n u a r y 28 , 1 96 6
The Journal of Physical Chemistry