THE JOURNAL OF NUTRITION - Harvard University
117
October 2021 • Volume 151 • Number 10S A Publication of the American Society for Nutrition • https://academic.oup.com/jn THE JOURNAL OF NUTRITION JN The Global Diet Quality Score (GDQS): A New Method to Collect and Analyze Population-Based Data on Diet Quality Supplement Coordinators/Guest editors: Megan Deitchler, PhD Intake – Center for Dietary Assessment, FHI Solutions and Sabri Bromage, ScD Harvard T.H. Chan School of Public Health Published as a Supplement to The Journal of Nutrition Photo credit: Anatta Tan / Shutterstock
-
Upload
khangminh22 -
Category
Documents
-
view
2 -
download
0
Transcript of THE JOURNAL OF NUTRITION - Harvard University

October 2021 • Volume 151 • Number 10S
A Publication of the American Society for Nutrition • https://academic.oup.com/jnTHE JOURNAL OF NUTRITIONJN
The Global Diet Quality Score (GDQS): A New Method to Collect and Analyze Population-Based
Data on Diet Quality
Supplement Coordinators/Guest editors: Megan Deitchler, PhD
Intake – Center for Dietary Assessment, FHI Solutionsand
Sabri Bromage, ScDHarvard T.H. Chan School of Public Health
Published as a Supplement to The Journal of Nutrition
Photo credit: Anatta Tan / Shutterstock

The Global Diet Quality Score (GDQS): A New Method to Collect and Analyze Population-Based
Data on Diet Quality
Supplement Coordinators/Guest editors:
Megan Deitchler, PhDIntake – Center for Dietary Assessment, FHI Solutions
andSabri Bromage, ScD
Harvard T.H. Chan School of Public Health
Sponsorship Acknowledgement:
This supplement is sponsored by Intake – Center for Dietary Assessment, with funding provided by the Bill & Melinda Gates Foundation.
October 2021 • Volume 151 • Number 10S
Supplement 2
The GDQS research initiative was launched by Intake – Center for Dietary Assessment. The research was led by Harvard T.H. Chan School of Public Health, Department of Nutrition and carried out in collaboration with researchers at the National Public Health Institute (INSP), Mexico. Funding for the research was provided by FHI Solutions, recipient of a Bill & Melinda Gates Foundation grant to support Intake – Center for Dietary Assessment.
A Publication of the American Society for Nutrition • https://academic.oup.com/jnTHE JOURNAL OF NUTRITIONJN

The Journal of NutritionOfficial Publication of The American Society for Nutrition
October 2021 � Volume 151 � Number 10S
Contents
Supplement: The Global Diet Quality Score (GDQS): A New Method to Collect andAnalyze Population-Based Data on Diet Quality
Development and Validation of a Novel Food-Based Global Diet QualityScore (GDQS)
Sabri Bromage, Carolina Batis, Shilpa N Bhupathiraju, Wafaie W Fawzi, Teresa T Fung,Yanping Li, Megan Deitchler, Erick Angulo, Nick Birk, Analí Castellanos-Gutiérrez,Yuna He, Yuehui Fang, Mika Matsuzaki, Yiwen Zhang, Mourad Moursi, Selma Gicevic,Michelle D Holmes, Sheila Isanaka, Sanjay Kinra, Sonia E Sachs, Meir J Stampfer, Dalia Stern,and Walter C Willett
75S
Application of the Global Diet Quality Score in Chinese Adults to Evaluatethe Double Burden of Nutrient Inadequacy and Metabolic Syndrome
Yuna He, Yuehui Fang, Sabri Bromage, Teresa T Fung, Shilpa N Bhupathiraju, Carolina Batis,Megan Deitchler, Wafaie Fawzi, Meir J Stampfer, Frank B Hu, Walter C Willett, and Yanping Li
93S
Validation of Global Diet Quality Score Among Nonpregnant Womenof Reproductive Age in India: Findings from the Andhra Pradesh Childrenand Parents Study (APCAPS) and the Indian Migration Study (IMS)
Mika Matsuzaki, Nick Birk, Sabri Bromage, Liza Bowen, Carolina Batis, Teresa T Fung,Yanping Li, Meir J Stampfer, Megan Deitchler, Walter C Willett, Wafaie W Fawzi,Sanjay Kinra, and Shilpa N Bhupathiraju
101S
Exploration of Machine Learning and Statistical Techniques in Developmentof a Low-Cost Screening Method Featuring the Global Diet Quality Scorefor Detecting Prediabetes in Rural India
Nick Birk, Mika Matsuzaki, Teresa T Fung, Yanping Li, Carolina Batis, Meir J Stampfer,Megan Deitchler, Walter C Willett, Wafaie W Fawzi, Sabri Bromage,Sanjay Kinra, Shilpa N Bhupathiraju, and Erin Lake
110S
The Global Diet Quality Score Is Inversely Associated with NutrientInadequacy, Low Midupper Arm Circumference, and Anemia in RuralAdults in Ten Sub-Saharan African Countries
Sabri Bromage, Yiwen Zhang, Michelle D Holmes, Sonia E Sachs, Jessica Fanzo,Roseline Remans, Jeffrey D Sachs, Carolina Batis, Shilpa N Bhupathiraju, Teresa T Fung,Yanping Li, Meir J Stampfer, Megan Deitchler, Walter C Willett, and Wafaie W Fawzi
119S
The Global Diet Quality Score is Associated with Higher Nutrient Adequacy,Midupper Arm Circumference, Venous Hemoglobin, and Serum FolateAmong Urban and Rural Ethiopian Adults
Sabri Bromage, Christopher T Andersen, Amare W Tadesse, Simone Passarelli,Elena C Hemler, Habtamu Fekadu, Christopher R Sudfeld, Alemayehu Worku,Hanna Berhane, Carolina Batis, Shilpa N Bhupathiraju, Teresa T Fung, Yanping Li,Meir J Stampfer, Megan Deitchler, Walter C Willett, and Wafaie W Fawzi
130S
Performance of the Global Diet Quality Score with Nutrition and HealthOutcomes in Mexico with 24-h Recall and FFQ Data
Analí Castellanos-Gutiérrez, Sonia Rodríguez-Ramírez, Sabri Bromage, Teresa T Fung,Yanping Li, Shilpa N Bhupathiraju, Megan Deitchler, Walter Willett, and Carolina Batis
143S

Changes in the Global Diet Quality Score, Weight, and Waist Circumferencein Mexican Women
Erick Angulo, Dalia Stern, Analí Castellanos-Gutiérrez, Adriana Monge, Martín Lajous,Sabri Bromage, Teresa T Fung, Yanping Li, Shilpa N Bhupathiraju, Megan Deitchler,Walter C Willett, and Carolina Batis
152S
Higher Global Diet Quality Score Is Associated with Less 4-Year Weight Gainin US Women
Teresa T Fung, Yanping Li, Sabri Bromage, Shilpa N Bhupathiraju, Carolina Batis, Wafaie Fawzi,Michelle D Holmes, Meir Stampfer, Frank B Hu, Megan Deitchler, and Walter C Willett
162S
Higher Global Diet Quality Score Is Inversely Associated with Risk of Type 2Diabetes in US Women
Teresa T Fung, Yanping Li, Shilpa N Bhupathiraju, Sabri Bromage, Carolina Batis,Michelle D Holmes, Meir Stampfer, Frank B Hu, Megan Deitchler, and Walter C Willett
168S
There’s an App for That: Development of an Application to Operationalizethe Global Diet Quality Score
Mourad Moursi, Sabri Bromage, Teresa T Fung, Sheila Isanaka, Mika Matsuzaki,Carolina Batis, Analí Castellanos-Gutiérrez, Erick Angulo, Nick Birk, Shilpa N Bhupathiraju,Yuna He, Yanping Li, Wafaie Fawzi, Armen Danielyan, Sachit Thapa, Liseteli Ndiyoi,Marieke Vossenaar, Alexandra Bellows, Joanne E Arsenault, Walter C Willett,and Megan Deitchler
176S
Contents


The Journal of NutritionSupplement
Development and Validation of a NovelFood-Based Global Diet Quality Score (GDQS)Sabri Bromage,1 Carolina Batis,2 Shilpa N Bhupathiraju,1,3 Wafaie W Fawzi,1 Teresa T Fung,1,4 Yanping Li,1
Megan Deitchler,5 Erick Angulo,2 Nick Birk,1 Analí Castellanos-Gutiérrez,2 Yuna He,6 Yuehui Fang,6
Mika Matsuzaki,7 Yiwen Zhang,1 Mourad Moursi,5 Selma Gicevic,1,8 Michelle D Holmes,1,3
Sheila Isanaka,1 Sanjay Kinra,9 Sonia E Sachs,10 Meir J Stampfer,1,3 Dalia Stern,2 and Walter C Willett1,3
1Harvard T.H. Chan School of Public Health, Boston, MA, USA; 2National Institute of Public Health, Cuernavaca, Mexico; 3ChanningDivision of Network Medicine, Brigham and Women’s Hospital, Boston, MA, USA; 4Department of Nutrition, Simmons University,Boston, MA, USA; 5Intake - Center for Dietary Assessment, FHI Solutions, Washington, DC, USA; 6National Institute for Nutrition andHealth, Chinese Center for Disease Control and Prevention, Beijing, China; 7Johns Hopkins Bloomberg School of Public Health, Baltimore,MD, USA; 8London Centre for Integrative Research on Agriculture and Health, London, United Kingdom; 9London School of Hygiene andTropical Disease, London, United Kingdom; and 10Center for Sustainable Development, Columbia University, New York, NY, USA
ABSTRACTBackground: Poor diet quality is a major driver of both classical malnutrition and noncommunicable disease (NCD) and
was responsible for 22% of adult deaths in 2017. Most countries face dual burdens of undernutrition and NCDs, yet no
simple global standard metric exists for monitoring diet quality in populations and population subgroups.
Objectives: We aimed to develop an easy-to-use metric for nutrient adequacy and diet related NCD risk in diverse
settings.
Methods: Using cross-sectional and cohort data from nonpregnant, nonlactating women of reproductive age in
10 African countries as well as China, India, Mexico, and the United States, we undertook secondary analyses to
develop novel metrics of diet quality and to evaluate associations between metrics and nutrient intakes and adequacy,
anthropometry, biomarkers, type 2 diabetes, and iteratively modified metric design to improve performance and to
compare novel metric performance to that of existing metrics.
Results: We developed the Global Diet Quality Score (GDQS), a food-based metric incorporating a more comprehensive
list of food groups than most existing diet metrics, and a simple means of scoring consumed amounts. In secondary
analyses, the GDQS performed comparably with the Minimum Dietary Diversity - Women indicator in predicting an
energy-adjusted aggregate measure of dietary protein, fiber, calcium, iron, zinc, vitamin A, folate, and vitamin B12
adequacy and with anthropometric and biochemical indicators of undernutrition (including underweight, anemia, and
serum folate deficiency), and the GDQS also performed comparably or better than the Alternative Healthy Eating Index
- 2010 in capturing NCD-related outcomes (including metabolic syndrome, change in weight and waist circumference,
and incident type 2 diabetes).
Conclusions: The simplicity of the GDQS and its ability to capture both nutrient adequacy and diet-related NCD
risk render it a promising candidate for global monitoring platforms. Research is warranted to validate methods
to operationalize GDQS assessment in population surveys, including a novel application–based 24-h recall system
developed as part of this project. J Nutr 2021;151:75S–92S.
Keywords: diet quality metrics, dietary diversity, nutrient adequacy, noncommunicable disease, double burden of
malnutrition, nutrition transition, nutritional epidemiology, monitoring and evaluation, nutrition surveillance, GDQS
IntroductionDietary factors are responsible for a greater fraction of globalage-standardized adult mortality (22% of total deaths amongthose aged ≥25 y) than any other risk factor (1). Most diet-related mortality is caused by cardiovascular disease, type2 diabetes, and cancer (1), and 82% of diet-related deathsnow occur in low- and middle-income countries (LMIC) (2).
In addition to dietary imbalances contributing to metabolicrisks and noncommunicable disease (NCD) mortality, protein,energy, and micronutrient deficits continue to contribute toa dual burden of undernutrition in most LMIC and furtherthreaten health and livelihoods, particularly those of womenand children (3).
Valid, robust, and easily operationalized diet metrics areneeded to systematically assess, compare, and track risks of
C© The Author(s) 2021. Published by Oxford University Press on behalf of the American Society for Nutrition. This is an Open Access article distributed under theterms of the Creative Commons Attribution License (http://creativecommons.org/licenses/by/4.0/), which permits unrestricted reuse, distribution, and reproductionin any medium, provided the original work is properly cited.Manuscript received February 28, 2021. Initial review completed June 25, 2021. Revision accepted June 28, 2021.First published online October 1, 2021; doi: https://doi.org/10.1093/jn/nxab244. 75S

nutrient inadequacy and diet-related NCDs in populations andto inform effective, evidence-based policies and programs forimproving diet quality (4). Existing metrics have focused onspecific dimensions of diet quality (such as nutrient adequacyor NCD risk) or specific (usually high-income) populations, orhave high data needs (such as the use of food composition datafor analysis) that are not conducive to applications in limited-resource settings (5). Conversely, existing metrics that arefeasible to collect in limited-resource settings typically involvesimplistic ways of scoring amounts of foods consumed, whichlimit metric performance (5). Without a standard, validatedglobal metric that is feasible to collect in limited-resourcesettings and that can sensitively measure diet quality in termsof both nutritional adequacy and NCD risk, the internationalcommunity and UN Sustainable Development Goals lack acritical component of global health surveillance.
In 2018, Intake – Center for Dietary Assessment launcheda 2-y research initiative to help fill this gap. The aim of theinitiative was to develop a novel suite of simple yet robustmetrics for assessing diet quality at the population level indiverse LMIC. Such metrics were intended to be appropriate forwithin- and between-population comparisons and tracking overtime, applicable to program monitoring, evaluation, design,communication, and advocacy, and inherently simple andinexpensive to collect and analyze, and to have consistentinterpretation across settings and potential for integration inexisting data collection platforms and surveillance systems.The metrics to be developed were to be appropriate foruse among nonpregnant, nonlactating women of reproductiveage, considering the importance of this group as a majorfocus of nutrition interventions globally (4), but ideally wouldalso be applicable to other demographic groups and high-income countries as all nations are included in the SustainableDevelopment Goals.
Funding for the research was provided by FHI Solutions, recipient of a Bill& Melinda Gates Foundation grant to support Intake – Center for DietaryAssessment. Support was also provided by grants from the Bill and MelindaGates Foundation (OPP1179606), National Institutes of Health (U01 CA176726),and Wellcome Trust (083707, 084774, 084754, and 070797).Author disclosures: TTF is an associate editor of the Journal of Nutrition andplayed no role in the Journal’s evaluation of the manuscript. All other authorsreport no conflicts of interest.Published in a supplement to the Journal of Nutrition. Publication costs for thissupplement were funded by the Bill & Melinda Gates Foundation in conjunctionwith FHI Solutions, recipient of a Bill & Melinda Gates Foundation grant tosupport Intake – Center for Dietary Assessment. The opinions expressed in thispublication are those of the authors and are not attributable to the sponsorsor the publisher, Editor, or Editorial Board of the Journal of Nutrition. TheSupplement Coordinators for the supplement publication were Megan Deitchler,Intake – Center for Dietary Assessment at FHI Solutions, Washington, DC; andSabri Bromage, Harvard T.H. Chan School of Public Health, Boston, MA.Supplemental Methods are available from the “Supplementary data” link in theonline posting of the article and from the same link in the online table of contentsat https://academic.oup.com/jn/.The GDQS research initiative was launched by Intake – Center for DietaryAssessment. The research was led by Harvard T.H. Chan School of Public Health,Department of Nutrition and carried out in collaboration with researchers at theNational Public Health Institute (INSP), Mexico. Funding for the research wasprovided by FHI Solutions, recipient of a Bill & Melinda Gates Foundation grantto support Intake – Center for Dietary Assessment.Address correspondence to SB (email: [email protected]).Abbreviations used: AHEI-2010, Alternative Health Eating Index – 2010; ATP,Adult Treatment Panel; GDQS, Global Diet Quality Score; GDQS-, GDQSNegative Submetric; GDQS+, GDQS Positive Submetric; LMIC, low- andmiddle- income countries; MDD-W, Minimum Dietary Diversity - Women;MetS, metabolic syndrome; MUAC, mid–upper arm circumference; NCD,noncommunicable disease; NHS II, Nurses’ Health Study II; PDQS, Prime DietQuality Score; WRA, women of reproductive age; 24HR, 24-h recall.
Following a competitive solicitation process, Intake selecteda team at Harvard University to lead the research initiative.The team worked collaboratively with researchers from theNational Institute of Public Health, Mexico; the Chinese Centerfor Disease Control and Prevention; the London School ofHygiene and Tropical Medicine; the Center for SustainableDevelopment at Columbia University; the Addis ContinentalInstitute of Public Health, Ethiopia; and Intake to carry outthe requested metric development work. This paper providesa broad overview of the approach and results of metricdevelopment, whereas other papers in this Supplemental Issuedescribe detailed evaluations of metric performance in cross-sectional (6–10) and cohort (11–13) datasets.
MethodsStarting point for metric development: the Prime DietQuality ScoreWe selected the Prime Diet Quality Score (PDQS) (15) as the initial basisfor the development of novel metrics. The PDQS is a food-based metricof diet quality that includes 21 food groups, 14 of which are classifiedas healthy and 7 as unhealthy based on review of the literature ondietary contributors to nutrient intakes and NCD risk globally (16, 17).Healthy food groups are assigned more points for higher consumption(0 points for 0–1 servings/wk, 1 point for 2–3 servings/wk, and 2 pointsfor 4+ servings/wk). Scoring is reversed for unhealthy groups (morepoints are given for lower consumption). The PDQS food-based design,differentiation of healthy and unhealthy foods groups, and modestlyexpanded list of food groups compared with most existing metrics(5) allow it to be applied to a range of global diets and capture thecontribution of diet to both undernutrition and NCD risk withoutrequiring food composition data in analysis. The metric’s trichotomousapproach to scoring consumed amounts also provides a potentiallymore sensitive, though not overly complicated, means of capturingdiet quality than some existing metrics. Analyses have found higherPDQS scores to be correlated with key nutrient intakes in US women(18) and inversely associated with incident heart disease, gestationaldiabetes, hypertension, and all-cause mortality in US adults (15, 19, 20),cardiovascular risk factors among older Spanish adults (21, 22), andpreterm birth, low birth weight, and fetal loss in pregnant Tanzanianwomen (23).
Modifications to PDQS food groupsIn developing candidate diet quality metrics to be tested, we firstundertook modifications to the list of PDQS food groups to representthe diversity of nutritionally important foods more fully across LMICglobally, and the most up-to-date scientific evidence regarding relationsbetween different foods and health. Major changes included thefollowing:
• Removing “carrots”and adding 3 new deep orange food groups (deeporange fruits, vegetables, and tubers);
• Expanding “poultry” to also include lean game meats;• Expanding “fish” to also include shellfish and other important
seafood contributors to n-3 fatty acids and protein;• Modifying “fried foods away from home” to specifically target deep
fried foods that are purchased;• Treating “eggs” [which we have sometimes not included as a scored
component in adults (18, 20, 24)] as a healthy food group;• Adding a positively scored “low fat dairy” group;• Modifying the scoring approach for high fat dairy and red meat so
that increasing points are given until specific consumed amounts, afterwhich no points are given, to recognize modest consumption of thesegroups as an important source of nutrients and higher consumptionas an NCD risk factor;
• Adding juice (defined as any unsweetened or sweetened drink at leastpartly composed of fruit juice) as an unhealthy group.
76S Supplement

TABLE 1 Summary of datasets used to develop and evaluate metrics1
Diet methods and sampleFoods included
in data, nReference period or
no. of 24HRsPortion sizeinformation
FFQ frequency options(if applicable) Outcomes
Cross-sectional datasetsMillennium Villages Project (10 Sub-Saharan African countries) (25)
FFQ from 1624 rural NPNLWRA; separateinstrument developed
for each village
92–161,depending on
country
Past month Nonquantitative (noportion sizeinformation)
Never, 1/mo, 2–3/mo,1/wk, 2–3/wk,4–6/wk, 1/d, ≥2/d
Nutrient intake and adequacy, BMI,MUAC, hemoglobin
Anemia etiology in Ethiopia study (26)FFQ from 1604 mostly rural
NPNL WRA2
454 Past week Quantitative: 7 fooditem–specific portionsizes assessed foreach food
Never, 1/wk, 2–4/wk,5–6/wk, 1/d, 2–3/d,4–5/d, ≥6/d
Nutrient intake and adequacy, BMI,MUAC, hemoglobin, ferritin,serum folate, serum vitaminB12, blood pressure
24HR from 1593 mostlyrural NPNL WRA2
113 1 24HR, and 2nd insubset ofparticipants
Multiple-pass probeincorporatinginformation on no. ofmeals at which eachfood was consumed,no. of servings of eachfood consumed ateach meal, andaverage portion size ofeach food
NA Same as above
2010–2012 China National Nutrition and Health Survey (27)24HR from 15,173 urban
and rural NPNL WRA1615 3 consecutive d (2
wkd and 1 wkend)Quantitative: estimated g
consumed/last 24 heach d of the 3 d
NA Nutrient intake and adequacy, BMI,waist circumference, hemoglobin,glucose, HDL and totalcholesterol, triglycerides, bloodpressure, metabolic syndrome
Indian Migration Study and Andhra Pradesh Children and Parents Study (28, 29)FFQ from 3065 mostly rural
NP WRA 3
184 Past year Portion size estimateswith quantitative:standard householdutensils (e.g.,tablespoon, ladle, andbowl), data on no. ofportion sizesconsumed alsocollected
Never, yearly, monthly,weekly, daily
Nutrient intake and adequacy, BMI,hemoglobin, HDL and totalcholesterol, blood pressure
2012 and 2016 Mexican National Surveys of Health and Nutrition (30, 31)FFQ from 4975 urban and
rural NPNL WRA2
140 Past week Quantitative: 2–3 portionsizes offered for eachfood, data on no. ofportion sizesconsumed alsocollected
Never, 1/wk, 2–4/wk,5–6/wk, 1/d, 2–3/d,4–5/d, ≥6/d
Nutrient intake and adequacy, BMI,waist circumference, hemoglobin,ferritin, serum folate, serumvitamin B12, glucose, insulin, LDLcholesterol, HDL cholesterol, totalcholesterol, triglycerides,metabolic syndrome
24HR from 2545 urban andrural NPNL WRA2
544 1 24HR, 2nd in subsetof participants
Multiple 5-pass probeincorporating weighedamounts or commonhouseholdmeasurementimplements
NA Same as above
Cohort datasetsMexican Teachers Cohort (32)
FFQ from 8967 urban andrural NPNL WRA
125 Past year Semiquantitative:standard portion sizeor commonly used unitindicated
Never, ≤1/mo, 2–3/mo,1/wk, 2–4/wk,5–6/wk, 1/d, 2–3/d,4–5/d, ≥6/d
Weight change, waist circumferencechange
(Continued)
Global Diet Quality Score (GDQS) 77S

TABLE 1 (Continued)
Diet methods and sampleFoods included
in data, nReference period or
no. of 24HRsPortion sizeinformation
FFQ frequency options(if applicable) Outcomes
US Nurses’ Health Study II (33)FFQ from 56,321 urban and
rural NP WRA3
135 Past year Semiquantitative:standard portion sizeor commonly used unitindicated
Never or <1/mo,1–3/mo, 1/wk,2–4/wk, 5–6/wk, 1/d,2–3/d, 4–5/d, ≥6/d
Weight change, incident type 2diabetes
1In cross-sectional datasets, sample size corresponds to the number of participants with dietary data (for some outcomes, available sample size was smaller; refer to (25–33)for more details. MUAC, mid–upper arm circumference; NA, not applicable; NP, nonpregnant; NL, nonlactating; WRA, women of reproductive age; 24HR, 24-hour recall.2FFQ and 24HR data from the Anemia Etiology in Ethiopia Study were collected from the same sample. FFQ and 24HR data from the 2012 and 2016 Mexican National Surveysof Health and Nutrition were collected from separate samples.3The Indian Migration Study and Andhra Pradesh Children and Parents Study population consists of NP WRA (lactation was not ascertained). In analysis of the Nurses’ HealthStudy II, women were classified as NP (lactation was not ascertained), but 2-y time periods during which a pregnancy was reported were excluded from analysis to limit theinfluence of lactation.
Rationales for the inclusion and scoring approach of the 25 foodgroups retained in the final metric, details on the operational definitionof each food group, and rationales for excluding certain food groupsare provided in Supplemental Methods.
Modifications to the PDQS scoring methodWe also modified the trichotomous basis upon which PDQS food groupsare scored from servings per day to grams per day, to facilitate morecomparable assessments across countries and over time. We selectedthe gram per day cutoffs for each food group based on their abilityto produce a reasonably even distribution of categories of consumedamounts of each food group based on analysis of FFQ and 24-h recall(24HR) data from cross-sectional and cohort studies of nonpregnantand nonlactating women in diverse settings (Table 1). We implementedfurther minor adjustments to these cutoffs to facilitate primary datacollection, following methodology described by Moursi and colleaguesin this Supplemental Issue (14).
Refinement of candidate metricsUpon implementing initial refinements to PDQS food group definitionsand scoring to create an updated PDQS-like Metric, we scored themetric using FFQ, 24HR, or both FFQ and 24HR measurements in eachdataset (Table 1); evaluated associations between the PDQS-like Metricand outcomes available in each dataset using Spearman correlations andmultivariable regression models to examine trends in metric–outcomeassociations across metric quintiles; and made incremental refinementsto the scoring approach to optimize metric performance for predictingoutcomes across data sets. Refinements involved experimenting withgreater or fewer numbers of categories of consumed amounts for use inscoring food groups, exploring different combinations of point valuesassigned to categories of consumed amounts, and computing total met-ric scores using subsets of food groups (submetrics) instead of all foodgroups. Throughout metric evaluation and refinement, we statisticallycompared the performance of different candidate metrics and submet-rics (36 in total) by using Wolfe’s tests to compare metric–outcome cor-relation coefficients (34), and by entering pairs of metrics as predictorsin the same regression models and comparing metrics using Wald testsfor differences in linear trends (35). Analyses to evaluate and refine met-rics were conducted separately using FFQ and 24HR data (when bothwere available in a given dataset). Where data were available and samplesizes allowed, analyses were conducted both in aggregate and separatelyby urban compared with rural locality or season of data collection toevaluate robustness of metric performance across contexts and seasons.
Evaluating performance of final candidate metricsIn the last stage of metric development, we evaluated and compared theperformance of the final 3 candidates that we developed [the GlobalDiet Quality Score (GDQS), GDQS Positive Submetric (GDQS+), andGDQS Negative Submetric (GDQS-)] with a simplified version of theGDQS using fewer categories of consumed amounts for assigningpoint values, the PDQS-like Metric, and 2 existing metrics. Theexisting metrics were the Alternative Healthy Eating Index – 2010(AHEI-2010) (35), which captures diet-related chronic disease risk, and
the Minimum Dietary Diversity - Women (MDD-W) indicator (36),which is a proxy for nutrient adequacy (in our analyses, we treated theMDD-W as a continuous variable ranging from 0 to 10, rather thana binary indicator as it is sometimes used) (Table 2). Results of cross-sectional analyses reported in this paper focus on associations betweenmetrics and the outcomes they are intended to target by design (i.e.,the GDQS+ and MDD-W compared with nutrient adequacy–relatedoutcomes, the GDQS- and AHEI-2010 compared with NCD outcomes,and the GDQS compared with both categories); more expansive resultscan be found in references 6–10. In addition to analysis of cross-sectional datasets, we analyzed cohort data to evaluate longitudinalassociations between change in metrics compared with change in weightand waist circumference, and between metrics and incident type 2diabetes using the Cox proportional hazards models. In both cross-sectional and cohort data, we also graphically examined nonlinearity incovariate-adjusted metric-outcome relationships to identify GDQS andGDQS submetric cutoffs for defining categorical ranges of diet-relatedrisk for use at the population level.
Results
The GDQS metric is composed of 25 food groups that are glob-ally important contributors to nutrient intake and/or NCD riskas informed by current nutrition science and epidemiologic lit-erature (16, 17) (Tables 3 and 4). Points are assigned based on 3or 4 categories of consumed amounts (defined in g/d) specific toeach group. There are 16 healthy food groups (scored by givingmore points for higher intake), 7 unhealthy food groups (morepoints for lower intake), and 2 food groups classified as un-healthy when consumed in excessive amounts (increasing pointsare given until specific amounts have been consumed, afterwhich no points are given). The GDQS is obtained by summingpoints across all of the 25 food groups, ranges from 0 to 49,and is a summary measure of overall diet quality, with respect toboth nutrient adequacy and diet-related NCD risk, for use at thepopulation level. GDQS scores ≥23 are associated with a lowrisk of both nutrient adequacy and NCD risk, scores ≥15 and<23 indicate moderate risk, and scores <15 indicate high risk.
The GDQS+ submetric includes the 16 healthy food groupsincluded in the GDQS, is scored with the same categories ofconsumed amounts used in the GDQS, and ranges from 0 to32. The GDQS- submetric includes the 9 GDQS food groupsclassified as unhealthy or unhealthy in excessive amounts, isscored with the same categories of consumed amounts used inthe GDQS, and ranges from 0 to 17. The GDQS+ and GDQS-quantify the collective contribution of healthy foods (those thatshould be consumed in higher amounts) and unhealthy foods(those that should be consumed in lower amounts), respectively,
78S Supplement

TABLE 2 Summary of diet metrics included in the final evaluation1
(15)(36)
(35)
1Adapted from Fung et al. (15). AHEI-2010, Alternative Healthy Eating Index – 2010; GDQS, Global Diet Quality Score; GDQS+, GDQS Positive Submetric; GDQS-, GDQSNegative Submetric; MDD-W, Minimum Dietary Diversity – Women; PDQS, Prime Diet Quality Score.Up arrows (green cells) indicate positively scored components (given more points for higher consumption), down arrows (red cells) indicate negatively scored components(given more points for lower consumption), and curved arrows (yellow cells) indicate components for which maximum points are assigned at moderate amounts ofconsumption. This table excludes the Simplified GDQS (refer to footnote to Table 11 for description), which was also included in the final evaluation.
to overall diet quality (because higher consumption of red meatand high fat dairy are scored as unhealthy, these food groupsare included in the GDQS-). The GDQS submetrics can befurther subdivided to give more detailed information about the
contribution of smaller sets of food groups or individual foodgroups to diet quality in populations. We did not find evidenceto support ranges of GDQS+ or GDQS- scores for definingcategories of dietary risk.
Global Diet Quality Score (GDQS) 79S

TABLE 3 GDQS and GDQS submetric food groups and scoring1
Food groupCategories of consumed amounts (g/d) Point values
1 2 3 4 1 2 3 4
Food groups included in the GDQS andGDQS+Healthy
Citrus fruits <24 24–69 >69 0 1 2Deep orange fruits <25 25–123 >123 0 1 2Other fruits <27 27–107 >107 0 1 2Dark green leafy vegetables <13 13–37 >37 0 2 4Cruciferous vegetables <13 13–36 >36 0 0.25 0.5Deep orange vegetables <9 9–45 >45 0 0.25 0.5Other vegetables <23 23–114 >114 0 0.25 0.5Legumes <9 9–42 >42 0 2 4Deep orange tubers <12 12–63 >63 0 0.25 0.5Nuts and seeds <7 7–13 >13 0 2 4Whole grains <8 8–13 >13 0 1 2Liquid oils <2 2–7.5 >7.5 0 1 2Fish and shellfish <14 14–71 >71 0 1 2Poultry and game meat <16 16–44 >44 0 1 2Low fat dairy <33 33–132 >132 0 1 2Eggs <6 6–32 >32 0 1 2
Food groups included in the GDQS andGDQS-Unhealthy in excessive amounts
High fat dairy (in milk equivalents)2 <35 35–142 >142–734 >734 0 1 2 0Red meat <9 9–46 >46 0 1 0
UnhealthyProcessed meat <9 9–30 >30 2 1 0Refined grains and baked goods <7 7–33 >33 2 1 0Sweets and ice cream <13 13–37 >37 2 1 0Sugar-sweetened beverages <57 57–180 >180 2 1 0Juice <36 36–144 >144 2 1 0White roots and tubers <27 27–107 >107 2 1 0Purchased deep fried foods <9 9–45 >45 2 1 0
1GDQS, Global Diet Quality Score; GDQS-, GDQS Negative Submetric; GDQS+, GDQS Positive Submetric.2Due to the importance of cheese in many food cultures and the significantly different nutrient density of hard cheeses in comparison with other dairy products, werecommend converting consumed masses of hard cheeses to milk equivalents when calculating total consumption of high fat dairy for the purpose of assigning a GDQSconsumption category [using cheddar cheese as a typical example, a conversion factor of 6.1 can be computed as the mass of 1 serving of milk (237 mL × 0.95 g/mL = 225 g)divided by an isocaloric mass of cheddar cheese (37 g)] (38).
Associations between the GDQS and comparisonmetrics compared with energy-adjusted nutrientintakes and overall nutrient adequacy incross-sectional datasets
In analysis of cross-sectional data, we observed Spearmancorrelations between the GDQS and energy-adjusted intakes ofcalcium, fiber, folate, iron, protein, vitamin A, and zinc that weregenerally modest and weaker and in some cases had inverseassociations with specific fatty acids and vitamin B12 (Table 5).The GDQS tended to correlate more favorably (P < 0.05) thanthe MDD-W with energy-adjusted fiber, folate, iron, protein,saturated fat, and zinc intakes, whereas the MDD-W tendedto correlate better with energy-adjusted monounsaturated fat,vitamin A, and vitamin B12 intakes.
We also compared covariate-adjusted associations betweenmetrics and energy-adjusted aggregate measures of protein,fiber, calcium, iron, zinc, vitamin A, folate, and vitamin B12adequacy (refer to footnote to Figure 1 for derivation ofthese measures and adjustment covariates). In one dataset(Ethiopia FFQ data), the MDD-W outperformed the GDQS(P < 0.05) in predicting overall nutrient inadequacy (a binaryvariable defined as adequacy of <4 out of 8 nutrients in FFQ
analysis or <50% mean probability of adequacy in 24HRanalysis) in adjusted models: OR in the fifth quintile (comparedwith quintile 1) of the GDQS and MDD-W was 0.24 (95%CI: 0.16, 0.36) and 0.08 (95% CI: 0.08, 0.14), respectively(Figure 1) (9). Performance of the GDQS and MDD-W inpredicting overall nutrient inadequacy did not otherwise differ.The GDQS and MDD-W tended to correlate more strongly withenergy-adjusted intakes of nutrient intakes and adequacy thanthe GDQS+ and AHEI-2010, and the GDQS- tended tocorrelate weakly or negatively (6–10).
Covariate-adjusted associations between the GDQS,GDQS+, and MDD-W compared with anthropometricand biomarker outcomes related to nutrient adequacyin cross-sectional datasets
The GDQS and GDQS+ performed comparably with theMDD-W in predicting anthropometric and clinical indicatorsof nutrient adequacy in cross-sectional analyses. In adjustedregression models (refer to footnote to Figure 1 for adjust-ment covariates), the GDQS, GDQS+, and MDD-W weresignificantly (P for trend < 0.05) inversely associated withunderweight [BMI (kg/m2) <18.5] in Ethiopia FFQ data
80S Supplement

TAB
LE4
Des
crip
tion
ofth
eG
DQ
Sfo
odgr
oups
1
Food
grou
pDe
scrip
tion
Citru
sfru
itsW
hole
fruits
inth
ege
nus
Citru
sDe
epor
ange
fruits
Who
lefru
its(n
otin
clud
ing
juic
eor
spre
ads)
cont
aini
ng≥2
0re
tinol
equi
vale
nts/
100
gOt
herf
ruits
Who
lefru
itsno
tbel
ongi
ngin
the
othe
rfru
itca
tego
ries
(not
incl
udin
gco
conu
ts)
Dark
gree
nle
afy
vege
tabl
esLe
afy
vege
tabl
esco
ntai
ning
3 120
retin
oleq
uiva
lent
s/10
0g
Cruc
ifero
usve
geta
bles
Vege
tabl
esin
the
fam
ilyBr
assic
acea
eDe
epor
ange
vege
tabl
esN
ontu
bero
usve
geta
bles
cont
aini
ng≥1
20re
tinol
equi
vale
nts/
100
gOt
herv
eget
able
sVe
geta
bles
notb
elon
ging
inth
eot
herv
eget
able
cate
gorie
sLe
gum
esLe
gum
esan
dfo
ods
deriv
edfro
mle
gum
es,s
uch
asto
fuan
dso
ymilk
.Doe
sno
tinc
lude
bean
spro
uts
(cla
ssifi
edin
“Oth
erve
geta
bles
”)or
grou
ndnu
ts(c
lass
ified
in“N
uts
and
seed
s”)
Deep
oran
getu
bers
Tube
rous
vege
tabl
esco
ntai
ning
≥120
retin
oleq
uiva
lent
s/10
0g
(incl
udes
varia
nts
biof
ortifi
edw
ithvi
tam
inA)
Nut
san
dse
eds
Nut
s,se
eds,
and
prod
ucts
deriv
edfro
mnu
tsan
dse
eds,
such
asnu
t-bas
edbu
tters
(but
noto
ils).
Also
incl
udes
grou
ndnu
ts.S
eeds
that
are
used
assp
ices
are
incl
uded
whe
nus
edin
thei
rwho
le(n
otpo
wde
red)
form
Who
legr
ains
Who
legr
ains
and
who
le-g
rain
prod
ucts
.Doe
sno
tinc
lude
prod
ucts
with
sign
ifica
ntam
ount
sof
adde
dsu
gar(
clas
sifie
das
“Sw
eets
and
ice
crea
m”)
Liqu
idoi
lsAl
ltyp
esof
oils
that
are
liqui
dat
room
tem
pera
ture
,reg
ardl
ess
offa
ttyac
idpr
ofile
(this
incl
udes
palm
olei
n,liq
uid
palm
kern
eloi
l,an
dliq
uid
coco
nuto
il).D
oes
noti
nclu
deoi
luse
dto
deep
fryfo
ods
that
are
purc
hase
d,bu
tdoe
sin
clud
eoi
luse
dto
deep
-fry
food
spr
epar
edat
hom
eFi
shan
dsh
ellfi
shFi
sh(w
heth
erpr
oces
sed
orun
proc
esse
d)ba
sed
onph
ylog
enet
iccl
assi
ficat
ions
(incl
udin
gsh
arks
,eel
s,an
dra
ys),
and
othe
rsea
food
high
inn3
fatty
acid
s(in
clud
ing
shel
lfish
,jel
lyfis
h,ce
tace
ans,
and
pinn
iped
s,bu
tnot
echi
node
rms)
.Inc
lude
sor
gans
Poul
tryan
dga
me
mea
tUn
proc
esse
dpo
ultry
and
gam
e,in
clud
ing
ara
nge
ofun
dom
estic
ated
anim
als
and
bush
mea
t,e.
g.,p
rimat
es,r
oden
ts,c
anin
es,f
elin
es,m
arsu
pial
s,le
porid
s(ra
bbits
and
hare
s),w
ildbo
ar,b
ats,
bear
s,se
mia
quat
icm
amm
als
(incl
udin
got
ters
and
beav
ers)
,und
omes
ticat
edun
gula
tes,
rept
iles
(aqu
atic
and
terre
stria
l),an
dam
phib
ians
.Inc
lude
sor
gans
Low
fatd
airy
Redu
ced
orna
tura
llylo
wfa
tdai
rypr
oduc
ts(≤
2%m
ilkfa
t).In
clud
esfla
vore
dm
ilk,a
ndm
ilkor
crea
mad
ded
toco
ffee
orte
aEg
gsAl
ltyp
esof
eggs
.Doe
sno
tinc
lude
may
onna
ise
High
fatd
airy
High
fatm
ilkan
dda
irypr
oduc
ts(>
2%m
ilkfa
t).In
clud
esfla
vore
dm
ilk,a
ndm
ilkor
crea
mad
ded
toco
ffee
orte
a.Do
esno
tinc
lude
butte
rorc
larifi
edbu
tter.
This
cate
gory
also
does
noti
nclu
deic
ecr
eam
and
whi
pped
crea
mRe
dm
eat
Unpr
oces
sed
red
mea
tbel
ongi
ngto
dom
estic
ated
anim
als
(i.e.
,not
gam
e),i
nclu
ding
orga
ns.“
Red”
clas
sific
atio
nis
notb
ased
onco
lorb
uton
nutri
tiona
lcha
ract
eris
tics,
and
thus
incl
udes
pork
and
lam
bPr
oces
sed
mea
tPr
oces
sed
red
mea
t,po
ultry
,org
ame,
incl
udin
gor
gans
,and
excl
udin
gfis
han
dse
afoo
d.Pr
oces
sing
isde
fined
perI
nter
natio
nalA
genc
yfo
rRes
earc
hon
Canc
er:“
salti
ng,c
urin
g,fe
rmen
tatio
n,sm
okin
gor
othe
rpr
oces
ses
toen
hanc
efla
voro
rim
prov
epr
eser
vatio
n.”
Refin
edgr
ains
and
bake
dgo
ods
Refin
edgr
ains
and
refin
edgr
ain
prod
ucts
.Doe
sno
tinc
lude
prod
ucts
with
sign
ifica
ntam
ount
sof
adde
dsu
gar,
whi
chsh
ould
inst
ead
becl
assi
fied
as“S
wee
tsan
dic
ecr
eam
”Sw
eets
and
ice
crea
mSu
gar-s
wee
tene
dfo
ods
that
are
notb
ever
ages
;inc
lude
ssu
gara
ndot
herc
alor
icsw
eete
ners
adde
dto
othe
rfoo
dsan
ddr
inks
.Whi
pped
crea
mal
socl
assi
fied
inth
isca
tego
rySu
gar-s
wee
tene
dbe
vera
ges
Swee
tene
ddr
inks
that
dono
tcon
tain
any
fruit
juic
eat
all.
Incl
udes
,e.g
.,so
das,
ener
gydr
inks
,spo
rtsdr
inks
,and
beve
rage
sm
ade
usin
glo
w-c
alor
iesw
eete
ners
,suc
has
diet
soda
s.Sw
eete
ned
tea
and
coffe
e,an
dda
iryor
cere
al-b
ased
drin
ksar
eno
tinc
lude
dJu
ice
Unsw
eete
ned
orsw
eete
ned
drin
ksth
atar
eat
leas
tpar
tlyco
mpo
sed
offru
itju
ice.
This
cate
gory
also
incl
udes
fruit
smoo
thie
sm
ade
from
who
lefru
itW
hite
root
san
dtu
bers
Tube
rous
vege
tabl
esw
ith<
120
retin
oleq
uiva
lent
s/10
0g.
Incl
udes
flour
ssu
chas
pota
toor
cass
ava
flour
Purc
hase
dde
epfri
edfo
ods
Deep
fried
food
sfri
edin
anam
ount
offa
toro
ilsu
ffici
entt
oco
vert
hefo
odco
mpl
etel
y.On
lyde
epfri
edfo
ods
that
are
purc
hase
d(i.
e.,n
otpr
epar
edat
hom
e)ar
ecl
assi
fied
inth
isgr
oup.
Food
sin
this
cate
gory
are
“dou
ble
clas
sifie
d”an
dsh
ould
becl
assi
fied
asbe
long
ing
toth
epu
rcha
sed
deep
fried
food
grou
pas
wel
las
the
food
grou
pto
whi
chth
efo
odno
rmal
lybe
long
sif
notp
urch
ased
and
deep
fried
(e.g
.,de
epfri
edw
hite
pota
toes
that
are
purc
hase
dsh
ould
becl
assi
fied
inbo
thth
epu
rcha
sed
deep
fried
food
sgr
oup
and
inth
ew
hite
root
san
dtu
bers
grou
p).
1S
emis
olid
and
solid
fats
and
inse
cts
are
excl
uded
from
GD
QS
scor
ing.
Coc
onut
san
dco
conu
tpr
oduc
ts(e
.g.,
coco
nut
milk
)are
also
excl
uded
(the
exce
ptio
nis
liqui
dco
conu
toi
l,w
hich
isin
clud
edin
the
liqui
doi
lsgr
oup)
.The
follo
win
gbe
vera
ges
are
also
excl
uded
from
GD
QS
scor
ing:
alco
hol,
coffe
e,an
dte
a.H
owev
er,i
fm
ilkis
adde
dto
coffe
eor
tea,
the
adde
dm
ilksh
ould
becl
assi
fied
inth
ehi
ghor
low
fat
dairy
food
grou
p,an
dif
aca
loric
swee
tene
r(e
.g.,
suga
r)is
adde
dto
coffe
eor
tea,
the
calo
ricsw
eete
ner
shou
ldbe
clas
sifie
din
the
swee
tsan
dic
ecr
eam
food
grou
p.A
sa
sim
ple
met
ricof
diet
qual
ity,t
heG
DQ
Sdo
esno
tin
tend
toca
ptur
ein
form
atio
nre
late
dto
the
cons
umpt
ion
ofnu
trie
ntfo
rtifi
cant
s;fo
rtifi
edfo
ods
shou
ldbe
clas
sifie
din
the
food
grou
pth
atco
rres
pond
sto
the
unfo
rtifi
edve
rsio
nof
that
food
(e.g
.,or
ange
juic
efo
rtifi
edw
ithca
lciu
msh
ould
becl
assi
fied
inth
eju
ice
cate
gory
,liq
uid
oilf
ortifi
edw
ithvi
tam
inA
shou
ldbe
clas
sifie
din
the
liqui
doi
lcat
egor
y,et
c.).
GD
QS,
Glo
balD
iet
Qua
lity
Sco
re.
Global Diet Quality Score (GDQS) 81S

TAB
LE5
Com
paris
onof
Spe
arm
anco
rrel
atio
nsbe
twee
nth
eG
DQ
San
dM
DD
-Wco
mpa
red
with
ener
gy-a
djus
ted
nutr
ient
sam
ong
nonp
regn
ant
nonl
acta
ting
wom
enof
repr
oduc
tive
age
with
inur
ban
and
rura
lstr
ata
ofcr
oss-
sect
iona
ldat
aset
s1
Cal
cium
Fi
ber
Fola
te
Iron
MU
FA
Prot
ein
PUFA
SF
A
Vita
min
A
Vita
min
B12
Zi
nc
Dat
aset
n
G
M
G
M
G
M
G
M
G
M
G
M
G
M
G
M
G
M
G
M
G
M
Chi
na U
rban
24H
R
7047
0.
69*
0.65
* 0.
36*
0.36
*
0.
39*
0.28
* 0.
17*
0.09
* 0.
58*
0.45
* 0.
10*
0.04
* 0.
15*
0.19
* 0.
99*
0.81
*
0.
49*
0.36
* C
hina
Rur
al 2
4HR
81
26
0.53
* 0.
42*
0.14
* 0.
11*
0.22
* 0.
14*
0.15
* 0.
02
0.45
* 0.
40*
0.09
* 0.
07*
0.09
* 0.
15*
0.71
* 0.
67*
0.29
* 0.
30*
Ethi
opia
Urb
an 2
4HR
29
3 0.
03
0.11
-0
.02
-0.1
0 0.
48*
0.08
-0
.12*
0.
00
-0.4
4*
0.01
0.
12*
0.21
* -0
.40*
-0
.29*
-0
.15*
0.
11
0.12
* 0.
02
-0.1
1 0.
08
0.09
0.
18*
Ethi
opia
Urb
an F
FQ
287
0.30
* 0.
29*
0.19
* 0.
17*
0.17
* 0.
06
0.02
-0
.08
0.25
* 0.
41*
0.21
* 0.
28*
0.16
* 0.
11
0.08
0.
18*
0.17
* 0.
20*
0.15
* 0.
29*
0.24
* 0.
28*
Ethi
opia
Rur
al 2
4HR
12
98
0.16
* 0.
23*
0.04
0.
03
0.38
* 0.
12*
0.04
0.
05
-0.2
4*
0.02
0.
14*
0.13
* -0
.14*
-0
.06*
-0
.11*
0.
10*
0.25
* 0.
16*
-0.1
2*
0.08
* 0.
05
-0.0
1 Et
hiop
ia R
ural
FFQ
13
17
0.10
* 0.
13*
0.12
* 0.
10*
0.22
* 0.
15*
0.02
-0
.05
0.12
* 0.
30*
0.08
* 0.
15*
0.08
* -0
.04
0.03
0.
18*
0.09
* 0.
10*
-0.0
5 0.
18*
0.07
* 0.
09*
Indi
a U
rban
FFQ
42
8 0.
34*
0.47
* 0.
37*
0.34
* 0.
32*
0.38
* 0.
47*
0.49
* 0.
23*
0.34
* 0.
38*
0.48
* 0.
38*
0.41
* 0.
22*
0.40
* 0.
27*
0.30
* 0.
00
0.06
0.
27*
0.27
* In
dia
Rur
al F
FQ
2604
0.
01
0.15
* 0.
27*
0.19
* 0.
35*
0.36
* 0.
17*
0.17
* 0.
19*
0.23
* 0.
16*
0.28
* 0.
13*
0.10
* 0.
03
0.17
* 0.
08*
0.12
* -0
.14*
-0
.06*
0.
20*
0.24
* M
exic
o U
rban
24H
R
1515
0.
22*
0.18
* 0.
37*
0.21
* 0.
22*
0.17
* 0.
09*
0.10
* -0
.12*
-0
.03
0.32
* 0.
22*
0.17
* 0.
09*
-0.1
4*
-0.0
3 0.
23*
0.30
* 0.
11*
0.18
* 0.
27*
0.21
* M
exic
o U
rban
FFQ
27
66
0.30
* 0.
18*
0.34
* 0.
09*
0.39
* 0.
32*
0.24
* 0.
21*
0.02
0.
14*
0.37
* 0.
32*
0.02
0.
03
0.02
0.
10*
0.33
* 0.
38*
0.17
* 0.
23*
0.31
* 0.
24*
Mex
ico
Rur
al 2
4HR
10
30
0.11
* 0.
15*
0.36
* 0.
12*
0.28
* 0.
17*
0.07
* 0.
05
-0.1
5*
0.01
0.
27*
0.19
* 0.
16*
0.09
* -0
.16*
0.
06
0.12
* 0.
27*
0.00
0.
18*
0.20
* 0.
08*
Mex
ico
Rur
al F
FQ
2209
0.
28*
0.22
* 0.
35*
0.10
* 0.
25*
0.23
* 0.
16*
0.11
* -0
.06*
0.
07*
0.34
* 0.
33*
-0.0
1 0.
02
-0.0
3 0.
08*
0.25
* 0.
29*
0.07
* 0.
18*
0.27
* 0.
19*
MVP
Rur
al F
FQ
1624
-0
.02
-0.0
5 0.
25*
0.28
* 0.
24*
0.25
* 0.
02
-0.0
5 0.
28*
0.33
* 0.
14*
0.07
* 0.
12*
0.11
* 0.
05*
0.09
* 0.
15*
0.25
* 0.
09*
0.12
* -0
.11*
-0
.20*
1Va
lues
are
Spe
arm
anco
rrel
atio
nsun
less
othe
rwis
ein
dica
ted.
∗ P<
0.05
.Red
shad
ing
indi
cate
sρ
GD
QS
>ρ
MD
D−W
(Wol
fe’s
test
Pfo
rdi
ffere
nce
<0.
05)a
ndbl
uesh
adin
gin
dica
tes
ρG
DQ
S<
ρM
DD
−W.S
hadi
ngis
reve
rsed
for
satu
rate
dfa
t.G
/GD
QS,
Glo
balD
iet
Qua
lity
Sco
re;M
/MD
D-W
,Min
imum
Die
tary
Div
ersi
ty–
Wom
en;M
VP,
Mill
enni
umV
illag
esPr
ojec
t;24
HR
,24-
hour
reca
ll.
and India; low mid–upper arm circumference (<24.5 cm) inEthiopia FFQ data, India, and the Millennium Villages; andunassociated with underweight or anemia in urban or ruralChina (Table 6). These metrics were also inversely associatedwith serum folate deficiency (<3 ng/mL) in Ethiopia FFQ data,associated with higher serum folate concentrations in 24HRdata from urban Mexico, inversely associated with anemia(hemoglobin <12 g/dL) in the African Millennium Villages, andassociated with higher hemoglobin concentrations or inverselyassociated with anemia in Ethiopia FFQ data (Table 7).
Unlike the GDQS, the MDD-W was associated with higherodds of depleted iron stores (serum ferritin <15 μg/L) inEthiopia 24HR data (OR for tercile 3 compared with T1: 2.68,95% CI: 1.35, 5.20) (7), and both the MDD-W and GDQS+predicted lower ferritin concentrations in Mexico FFQ data(8) (Table 7). The GDQS+ was further associated with higherodds of serum vitamin B12 deficiency (<203 pg/mL) in EthiopiaFFQ data (OR for quintile 5 compared with quintile 1: 1.83,95% CI: 1.14, 2.98) and inversely associated with vitaminB12 concentrations in 24HR data from rural Mexico (quintile1 compared with quintile 5 difference in estimated marginalmean: 646 compared with 428 pmol/l) (7, 8).
Covariate-adjusted associations between the GDQS,GDQS-, and AHEI-2010 compared with the metabolicsyndrome and anthropometric and biomarkeroutcomes related to NCD risk in cross-sectionaldatasets
The GDQS significantly outperformed (P < 0.05) the AHEI-2010 in predicting the metabolic syndrome (MetS; definedaccording to ATP III criteria) in urban China: OR for MetSin the fifth quintile of GDQS (compared with quintile 1) was0.58 (95% CI: 0.45, 0.75) (9), whereas the AHEI-2010 was notsignificantly predictive (P = 0.63) (Table 8). In rural China, theAHEI-2010 was positively associated with MetS (fifth quintileOR compared with quintile 1 1.32, 95% CI: 1.06, 1.63)(9), whereas the GDQS was marginally associated with lowerodds of MetS (P = 0.054) and significantly associated withlower odds of high waist circumference (≥80 cm), hypertension(>130/85 mmHg), and low HDL cholesterol (<50 mg/dL)(Table 6, Table 8, Table 9). Both the GDQS and AHEI-2010were positively associated with overweight (BMI ≥25) and highwaist circumference in India (Table 6). Although not predictiveof the MetS in urban or rural Mexico in 24HR or FFQ analyses(Table 8), the GDQS was inversely associated with continuousBMI, waist circumference, and LDL cholesterol in FFQ analysis(8).
Like the GDQS, the GDQS- (of which higher scores indicatelower consumption of unhealthy foods) was significantlyinversely associated with MetS in urban China, low HDLcholesterol in rural China, and high waist circumference andtriglycerides (≥150 mg/dL) in both urban and rural China(Table 6, Table 8, Table 9). The GDQS- was also associatedwith lower waist circumference and odds of overweight in India,negatively associated with diastolic blood pressure in EthiopiaFFQ data, and negatively associated with total cholesterol inFFQ data from rural Mexico (Table 6, Table 8, Table 9).Although the GDQS- was not significantly associated with theMetS in rural Mexico (P = 0.85 and P = 0.82 in 24HR and FFQanalyses, respectively), it was associated with having a reducednumber of MetS components in FFQ analysis (Table 8) (quintile1 compared with quintile 5 difference in estimated marginalmean number of components: 2.54 compared with 2.35) (8).
82S Supplement

0.00
0.10
0.20
0.30
0.40
0.50
0.60
0.70
0.80
0.90
1.00
Q1 Q2 Q3 Q4 Q5
ycauqedanI tneirtuN l larev
O rof R
O
Metric Quintile
A
0.00
0.10
0.20
0.30
0.40
0.50
0.60
0.70
0.80
0.90
1.00
Q1 Q2 Q3 Q4 Q5O
R fo
r Ove
rall
Nut
rient
Inad
equa
cy
Metric Quintile
B
0.00
0.10
0.20
0.30
0.40
0.50
0.60
0.70
0.80
0.90
1.00
Q1 Q2 Q3 Q4 Q5
OR
for O
vera
ll N
utrie
nt In
adeq
uacy
Metric Quintile
C
Q1 Q2 Q3 Q4
0.00
0.10
0.20
0.30
0.40
0.50
0.60
0.70
0.80
0.90
1.00
Q1 Q2 Q3 Q4 Q5
MDD-W Quartile
OR
for O
vera
ll N
utrie
nt In
adeq
uacy
GDQS Quintile
D
Q1 Q2 Q3 Q4
0.000.100.200.300.400.500.600.700.800.901.001.10
Q1 Q2 Q3 Q4 Q5
MDD-W Quartile
OR
for O
vera
ll N
utrie
nt In
adeq
uacy
GDQS Quintile
E
0.000.100.200.300.400.500.600.700.800.901.001.101.201.30
Q1 Q2 Q3 Q4 Q5
ycauqedanI tnei rt uN llarev
O rof R
O
Metric Quintile
F
0.00
0.10
0.20
0.30
0.40
0.50
0.60
0.70
0.80
0.90
1.00
Q1 Q2 Q3 Q4 Q5
OR
for O
vera
ll N
utrie
nt In
adeq
uacy
Metric Quintile
G
0.00
0.20
0.40
0.60
0.80
1.00
1.20
1.40
1.60
T1 T2 T3
OR
for O
vera
ll N
utrie
nt In
adeq
uacy
Metric Tertile
H
Q1 Q2 Q3 Q4
0.000.100.200.300.400.500.600.700.800.901.001.10
Q1 Q2 Q3 Q4 Q5
MDD-W Quartile
OR
for O
vera
ll N
utrie
nt In
adeq
uacy
GDQS Quintile
I
Q1 Q2 Q3 Q4
0.00
0.20
0.40
0.60
0.80
1.00
1.20
1.40
1.60
1.80
Q1 Q2 Q3 Q4 Q5
MDD-W Quartile
OR
for O
vera
ll N
utrie
nt In
adeq
uacy
GDQS Quintile
J
GDQS: P < 0.001MDD-W: P < 0.001
P, diff = 0.350
GDQS: P < 0.001MDD-W: P < 0.001
P, diff = 0.308
GDQS: P < 0.001MDD-W: P < 0.001
P, diff = 0.030
GDQS: P < 0.001MDD-W: P < 0.001
P, diff = 0.669
GDQS: P < 0.001MDD-W: P < 0.001
P, diff = 0.361
GDQS: P < 0.001MDD-W: P < 0.001
P, diff = 0.369
GDQS: P < 0.001MDD-W: P < 0.001
P, diff = 0.187
GDQS: P < 0.024MDD-W: P < 0.001
P, diff = 0.446
GDQS: P < 0.001MDD-W: P < 0.001
P, diff = 0.589
GDQS: P < 0.001MDD-W: P < 0.001
P, diff = 0.378
FIGURE 1 Covariate-adjusted ORs for binary overall nutrient inadequacy by GDQS and MDD-W quintile, quartile, or tertile in nonpregnantnonlactating women of reproductive age in the total population or within urban stratum and rural strata of cross-sectional datasets. We definedseveral aggregate measures of protein, fiber, calcium, iron, zinc, vitamin A, folate, and vitamin B12 adequacy. In FFQ analysis, a continuousoverall nutrient adequacy variable was first constructed for each participant in the data, based on the number of nutrients (out of 8) meeting age-and sex-specific EARs from the Institute of Medicine (or adequate intake level, in the case of fiber) (39); iron adequacy was defined as ≥50%probability of adequacy based on a lognormal requirement distribution (40). In 24HR analysis [based on 3-day averages (China) or estimatedusual intakes based on the ISU method (Mexico) (41)], probability of adequacy for all nutrients was estimated using the full probability method(40). Iron requirement distributions and zinc EARs were adjusted to account for absorption characteristics of local diets (40,42–44). Becausenutrient requirements are age-specific, they indirectly account for age differences in energy intake to an extent, but not entirely. To accountfor residual confounding by energy, we therefore adjusted overall nutrient adequacy for energy using the residual method (45), and added theresulting residuals back to the mean of the raw overall nutrient adequacy variable. We derived a binary measure of overall nutrient inadequacydefined as <4 adequate nutrients (in FFQ data) or < 50% mean probability of adequacy (in 24HR data). We also derived a binary measureof energy-adjusted overall nutrient inadequacy (shown in this figure) by adjusting the continuous overall nutrient adequacy variable for energyusing the residual method, ranking the residuals, and assigning a value of 1 to those in the top Xth percentile and 0 to those in the bottom,in which X is the proportion of individuals in the raw data with <4 adequate nutrients (in FFQ data) or <50% mean probability of adequacy(in 24HR data). Energy-adjusted overall nutrient inadequacy therefore preserves the distribution of raw overall nutrient inadequacy. This figuredisplays linear trends in overall nutrient inadequacy across metric quintiles (P), statistically compared using regression models in which quintilesof 2 metrics are included in the same model and the parameter estimates associated with quintile 5 are compared using a Wald test (P, diff)(35). Models were adjusted for age (India and Millennium Villages); age, urban/rural locality, education, marital status, occupation (Ethiopia); age,socioeconomic status, education, physical activity, smoking, alcohol use, occupation, urban/rural locality (China); age, socioeconomic status,urban/rural locality (Mexico). Trends did not differ between GDQS and MDD-W, except in analysis of Ethiopia FFQ data (in which the MDD-Wwas more predictive). Due to limited variation across metric quintiles, MDD-W is presented in terms of quartiles in Mexico FFQ and 24HR data,and tertiles in Ethiopia 24HR data. India Total Population FFQ (n = 3065) (A), Millennium Villages Project Rural FFQ (n = 1624) (B), Ethiopia TotalPopulation FFQ (n = 1604) (C), Mexico Urban FFQ (n = 2766) (D), Mexico Rural FFQ (n = 2209) (E), China Urban 24HR (n = 7047) (F), ChinaRural 24HR (n = 8126) (G), Ethiopia Total Population 24HR (n = 1593) (H), Mexico Urban 24HR (n = 1515) (I), Mexico Rural 24HR (n = 1030) (J).EAR, estimated average requirement; GDQS, Global Diet Quality Score; MDD-W, Minimum Dietary Diversity – Women; 24HR, 24-h recall.
Longitudinal analysis of cohort datasets
In multivariable analysis of women in the Mexican Teachers’Cohort, a 1-SD increase in GDQS over 2 y was associatedwith 0.37 kg (95% CI: 0.27, 0.47) less gain in weight (AHEI-2010: 0.33 kg, 95% CI: 0.22, 0.44; MDD-W kg: 0.26 95%CI: 0.14, 0.37) and 0.52 cm (95% CI: 0.33, 0.71) less gain inwaist circumference (AHEI-2010: 0.24 cm, 95% CI: 0.03, 0.45;MDD-W: -0.42 cm, 95% CI: 0.20, 0.63) (11). The GDQS wassignificantly (P < 0.05) more strongly associated with weightchange than the MDD-W and with waist circumference changethan the AHEI-2010.
In multivariable analysis of women in the US Nurses’ HealthStudy II (NHS II) cohort, each 1-SD increase in GDQS andAHEI-2010 over 4 y was associated with an HR for 5-kgweight gain of 0.86 (95% CI: 0.85, 0.87) and 0.80 (95%CI: 0.80, 0.81), respectively, whereas each 1 SD increase inGDQS and AHEI-2010 was associated with a HR for type2 diabetes of 0.93 (95% CI: 0.91, 0.96) and 0.91 (95% CI:0.88, 0.94), respectively, (P < 0.05 for difference in metrics forboth outcomes) (12, 13). A 1-SD increase in the MDD-W wassignificantly (P < 0.05) less predictive than the GDQS of 5-kgweight gain (HR: 0.95, 95% CI: 0.94, 0.95), and did not predict
Global Diet Quality Score (GDQS) 83S

TAB
LE6
Cov
aria
te-a
djus
ted
asso
ciat
ions
betw
een
met
rics
and
anth
ropo
met
ricou
tcom
esam
ong
NP
NL
wom
enof
repr
oduc
tive
age
inth
eto
talp
opul
atio
nor
with
inth
eur
ban
orru
ral
stra
tum
ofcr
oss-
sect
iona
ldat
aset
s1
(47)
,
(47)
, OR
(46)
, OR
(48)
, EM
M
(48)
, OR
(46)
, OR
1Va
lues
indi
cate
OR
sor
EM
Ms
(95%
CIs
)per
1-S
Din
crea
sein
met
rics.
OR
san
dE
MM
sar
ees
timat
edfr
omco
varia
te-a
djus
ted
regr
essi
onm
odel
sof
asso
ciat
ions
betw
een
met
rics
(exp
ress
edin
quin
tiles
)and
cont
inuo
usou
tcom
es,o
rdic
hoto
mou
sou
tcom
esde
fined
acco
rdin
gto
clin
ical
lyre
leva
ntcu
toff
s.S
eefo
otno
teto
Figu
re1
fora
djus
tmen
tcov
aria
tes.
Col
orin
dica
tes
stat
istic
ally
sign
ifica
ntlin
eart
rend
acro
ssm
etric
quin
tiles
(P<
0.05
)(gr
een,
prot
ectiv
e;re
d,de
lete
rious
).∗ P
<0.
05,s
tatis
tical
lysi
gnifi
cant
Wal
dte
stco
mpa
ring
tren
dsbe
twee
nth
eG
DQ
San
dot
her
met
rics.
Sam
ple
size
corr
espo
nds
toth
enu
mbe
rof
part
icip
ants
with
diet
ary
data
[for
som
eou
tcom
es,a
vaila
ble
sam
ple
size
was
smal
ler;
refe
rto
(25–
33)f
orm
ore
deta
ils].
AH
EI-2
010,
Alte
rnat
ive
Hea
lthy
Eat
ing
Inde
x–
2010
;E
MM
,Est
imat
edM
argi
nalM
ean;
GD
QS,
Glo
balD
iet
Qua
lity
Sco
re;G
DQ
S+,
GD
QS
Posi
tive
Sub
met
ric;G
DQ
S-,
GD
QS
Neg
ativ
eS
ubm
etric
;MD
D-W
,Min
imum
Die
tary
Div
ersi
ty–
Wom
en;M
UA
C,m
id–u
pper
arm
circ
umfe
renc
e;M
VP,
Mill
enni
umV
illag
esPr
ojec
t;24
HR
,24-
hour
reca
ll.
84S Supplement

TAB
LE7
Cov
aria
te-a
djus
ted
asso
ciat
ions
betw
een
the
GD
QS,
GD
QS+,
and
MD
D-W
com
pare
dw
ithbi
oche
mic
alou
tcom
esre
late
dto
nutr
ient
adeq
uacy
amon
gno
npre
gnan
tno
nlac
tatin
gw
omen
ofre
prod
uctiv
eag
ein
the
tota
lpop
ulat
ion
orw
ithin
urba
nst
ratu
man
dru
rals
trat
aof
cros
s-se
ctio
nald
atas
ets1
(49)
,
(49)
, OR
(50)
, EM
M
(50)
,
(51)
, EM
M
(51)
,
(52)
, EM
M (52)
,
fola
te <
3ng
/mL
1Va
lues
pres
ente
das
OR
sor
estim
ated
mar
gina
lmea
ns(E
MM
)(95
%C
I)pe
r1-
SD
incr
ease
inm
etric
s.O
Rs
and
EM
Ms
are
estim
ated
from
cova
riate
-adj
uste
dre
gres
sion
mod
els
ofas
soci
atio
nsbe
twee
nm
etric
s(e
xpre
ssed
inqu
intil
es)a
ndco
ntin
uous
outc
omes
,or
dich
otom
ous
outc
omes
defin
edac
cord
ing
tocl
inic
ally
rele
vant
cuto
ffs.
See
foot
note
toFi
gure
1fo
rad
just
men
tco
varia
tes.
Col
orin
dica
tes
stat
istic
ally
-sig
nific
ant
linea
rtr
end
acro
ssm
etric
quin
tiles
(P<
0.05
)(gr
een:
prot
ectiv
e,re
d:de
lete
rious
).∗ P
<0.
05fo
rWal
dte
stco
mpa
ring
tren
dsbe
twee
nth
eG
DQ
San
dot
herm
etric
s.S
ampl
esi
zeco
rres
pond
sto
the
num
bero
fpar
ticip
ants
with
diet
ary
data
[fors
ome
outc
omes
,ava
ilabl
esa
mpl
esi
zew
assm
alle
r;re
fer
to(2
5–33
)for
mor
ede
tails
].E
MM
.est
imat
edm
argi
nalm
ean;
GD
QS,
Glo
balD
iet
Qua
lity
Sco
re;M
DD
-W,M
inim
umD
ieta
ryD
iver
sity
–W
omen
;MV
P,M
illen
nium
Vill
ages
Proj
ect;
24H
R,2
4-ho
urre
call.
Global Diet Quality Score (GDQS) 85S

TAB
LE8
Cov
aria
te-a
djus
ted
asso
ciat
ions
betw
een
the
GD
QS,
GD
QS
-,an
dA
HE
I-201
0co
mpa
red
with
bloo
dpr
essu
rean
dM
etS
amon
gno
npre
gnan
tno
nlac
tatin
gw
omen
ofre
prod
uctiv
eag
ein
the
tota
lpop
ulat
ion
orw
ithin
urba
nst
ratu
man
dru
rals
trat
aof
cros
s-se
ctio
nald
atas
ets1
(53)
, EM
M (53)
, OR
(53)
, EM
M (53)
, OR
(53)
, OR
(53)
, EM
M (53)
, OR
1Va
lues
indi
cate
OR
orE
MM
(95%
CI)
per
1-S
Din
crea
sein
met
rics.
OR
san
dE
MM
ses
timat
edfr
omco
varia
te-a
djus
ted
regr
essi
onm
odel
sof
asso
ciat
ions
betw
een
met
rics
(exp
ress
edin
quin
tiles
)and
cont
inuo
usou
tcom
es,o
rdi
chot
omou
sou
tcom
esde
fined
acco
rdin
gto
clin
ical
lyre
leva
ntcu
toff
s.S
eefo
otno
teto
Figu
re1
for
adju
stm
ent
cova
riate
s.C
olor
indi
cate
sst
atis
tical
lysi
gnifi
cant
linea
rtr
end
acro
ssm
etric
quin
tiles
(P<
0.05
)(gr
een,
prot
ectiv
e;re
d,de
lete
rious
).∗ P
<0.
05fo
rW
ald
test
com
parin
gtr
ends
betw
een
the
GD
QS
and
othe
rm
etric
s.S
ampl
esi
zeco
rres
pond
sto
the
num
ber
ofpa
rtic
ipan
tsw
ithdi
etar
yda
ta[fo
rso
me
outc
omes
,ava
ilabl
esa
mpl
esi
zew
assm
alle
r;re
fer
to(2
5–33
)for
mor
ede
tails
].A
HE
I-201
0,A
ltern
ativ
eH
ealth
yE
atin
gIn
dex
–20
10;A
TP,A
dult
Trea
tmen
tPa
nel;
EM
M.e
stim
ated
mar
gina
lmea
n;G
DQ
S,G
loba
lDie
tQ
ualit
yS
core
,Met
S,m
etab
olic
synd
rom
el24
HR
,24-
hour
reca
ll.
86S Supplement

TAB
LE9
Cov
aria
te-a
djus
ted
asso
ciat
ions
betw
een
the
GD
QS,
GD
QS
-,an
dA
HE
I-201
0co
mpa
red
with
bioc
hem
ical
outc
omes
rela
ted
toN
CD
risk
amon
gno
npre
gnan
tno
nlac
tatin
gw
omen
ofre
prod
uctiv
eag
ein
the
tota
lpop
ulat
ion
orw
ithin
urba
nan
dru
rals
trat
aof
cros
s-se
ctio
nald
atas
ets1
(53)
, EM
M
(53)
, OR
(53)
, EM
M
(53)
,
(54)
, (54 )
,
(53)
, EM
M
(53)
, OR
1Va
lues
indi
cate
OR
sor
EM
M(9
5%C
I)pe
r1S
Din
crea
sein
met
rics.
OR
san
dE
MM
sar
ees
timat
edfr
omco
varia
te-a
djus
ted
regr
essi
onm
odel
sof
asso
ciat
ions
betw
een
met
rics
(exp
ress
edin
quin
tiles
)and
cont
inuo
usou
tcom
es,
ordi
chot
omou
sou
tcom
esde
fined
acco
rdin
gto
clin
ical
lyre
leva
ntcu
toff
s.S
eefo
otno
teto
Figu
re1
for
adju
stm
ent
cova
riate
s.C
olor
indi
cate
sst
atis
tical
ly-s
igni
fican
tlin
ear
tren
dac
ross
met
ricqu
intil
es(P
<0.
05)(
gree
n:pr
otec
tive,
red:
dele
terio
us).
∗ P<
0.05
Wal
dte
stco
mpa
ring
tren
dsbe
twee
nth
eG
DQ
San
dot
herm
etric
s.S
ampl
esi
zeco
rres
pond
sto
the
num
bero
fpar
ticip
ants
with
diet
ary
data
(fors
ome
outc
omes
,ava
ilabl
esa
mpl
esi
zew
assm
alle
r;re
fer
to(2
5–33
)for
mor
ede
tails
).A
HE
I-201
0,A
ltern
ativ
eH
ealth
yE
atin
gIn
dex
–20
10;G
DQ
S,G
loba
lDie
tQ
ualit
yS
core
;24H
R,2
4-ho
urre
call.
Global Diet Quality Score (GDQS) 87S
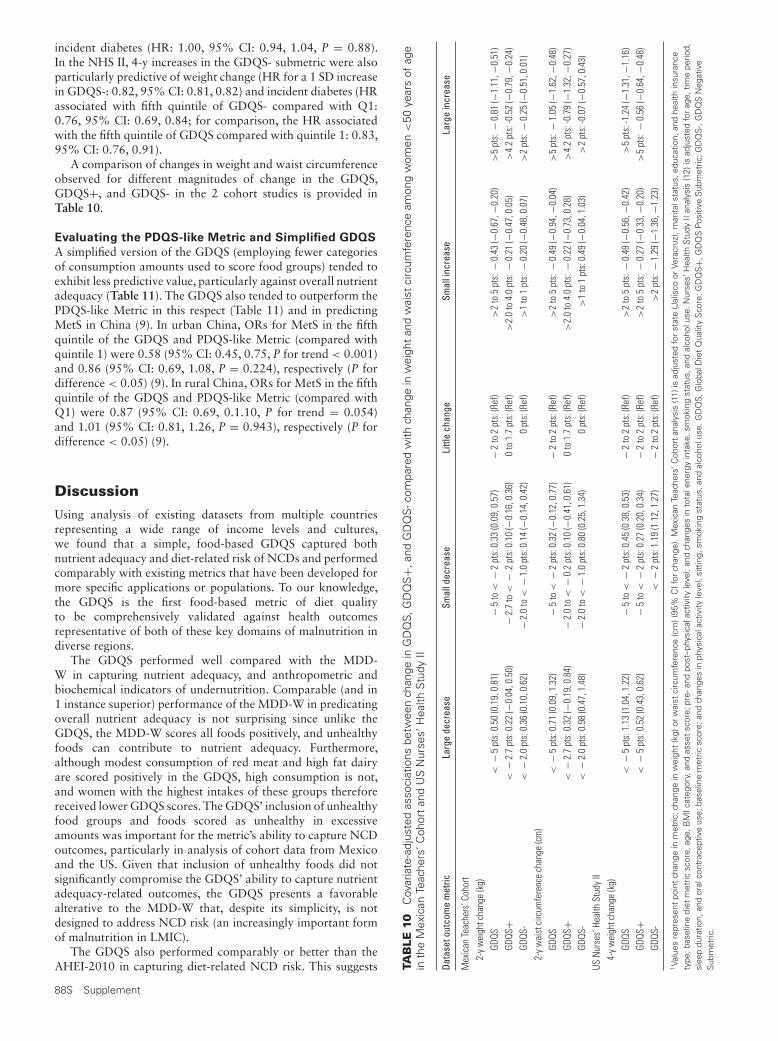
incident diabetes (HR: 1.00, 95% CI: 0.94, 1.04, P = 0.88).In the NHS II, 4-y increases in the GDQS- submetric were alsoparticularly predictive of weight change (HR for a 1 SD increasein GDQS-: 0.82, 95% CI: 0.81, 0.82) and incident diabetes (HRassociated with fifth quintile of GDQS- compared with Q1:0.76, 95% CI: 0.69, 0.84; for comparison, the HR associatedwith the fifth quintile of GDQS compared with quintile 1: 0.83,95% CI: 0.76, 0.91).
A comparison of changes in weight and waist circumferenceobserved for different magnitudes of change in the GDQS,GDQS+, and GDQS- in the 2 cohort studies is provided inTable 10.
Evaluating the PDQS-like Metric and Simplified GDQS
A simplified version of the GDQS (employing fewer categoriesof consumption amounts used to score food groups) tended toexhibit less predictive value, particularly against overall nutrientadequacy (Table 11). The GDQS also tended to outperform thePDQS-like Metric in this respect (Table 11) and in predictingMetS in China (9). In urban China, ORs for MetS in the fifthquintile of the GDQS and PDQS-like Metric (compared withquintile 1) were 0.58 (95% CI: 0.45, 0.75, P for trend < 0.001)and 0.86 (95% CI: 0.69, 1.08, P = 0.224), respectively (P fordifference < 0.05) (9). In rural China, ORs for MetS in the fifthquintile of the GDQS and PDQS-like Metric (compared withQ1) were 0.87 (95% CI: 0.69, 0.1.10, P for trend = 0.054)and 1.01 (95% CI: 0.81, 1.26, P = 0.943), respectively (P fordifference < 0.05) (9).
Discussion
Using analysis of existing datasets from multiple countriesrepresenting a wide range of income levels and cultures,we found that a simple, food-based GDQS captured bothnutrient adequacy and diet-related risk of NCDs and performedcomparably with existing metrics that have been developed formore specific applications or populations. To our knowledge,the GDQS is the first food-based metric of diet qualityto be comprehensively validated against health outcomesrepresentative of both of these key domains of malnutrition indiverse regions.
The GDQS performed well compared with the MDD-W in capturing nutrient adequacy, and anthropometric andbiochemical indicators of undernutrition. Comparable (and in1 instance superior) performance of the MDD-W in predicatingoverall nutrient adequacy is not surprising since unlike theGDQS, the MDD-W scores all foods positively, and unhealthyfoods can contribute to nutrient adequacy. Furthermore,although modest consumption of red meat and high fat dairyare scored positively in the GDQS, high consumption is not,and women with the highest intakes of these groups thereforereceived lower GDQS scores. The GDQS’ inclusion of unhealthyfood groups and foods scored as unhealthy in excessiveamounts was important for the metric’s ability to capture NCDoutcomes, particularly in analysis of cohort data from Mexicoand the US. Given that inclusion of unhealthy foods did notsignificantly compromise the GDQS’ ability to capture nutrientadequacy-related outcomes, the GDQS presents a favorablealterative to the MDD-W that, despite its simplicity, is notdesigned to address NCD risk (an increasingly important formof malnutrition in LMIC).
The GDQS also performed comparably or better than theAHEI-2010 in capturing diet-related NCD risk. This suggests TA
BLE
10C
ovar
iate
-adj
uste
das
soci
atio
nsbe
twee
nch
ange
inG
DQ
S,G
DQ
S+,
and
GD
QS
-com
pare
dw
ithch
ange
inw
eigh
tan
dw
aist
circ
umfe
renc
eam
ong
wom
en<
50ye
ars
ofag
ein
the
Mex
ican
Teac
hers
’Coh
ort
and
US
Nur
ses’
Hea
lthS
tudy
II
Data
seto
utco
me
met
ricLa
rge
decr
ease
Smal
ldec
reas
eLi
ttle
chan
geSm
alli
ncre
ase
Larg
ein
crea
se
Mex
ican
Teac
hers
’Coh
ort
2-y
wei
ghtc
hang
e(k
g)GD
QS<
−5
pts:
0.50
(0.1
9,0.
81)
−5
to<
−2
pts:
0.33
(0.0
9,0.
57)
−2
to2
pts:
(Ref
)>
2to
5pt
s:−
0.43
(−0.
67,−
0.20
)>
5pt
s:−
0.81
(−1.
11,−
0.51
)GD
QS+
<−
2.7
pts:
0.22
(−0.
04,0
.50)
−2.
7to
<−
.2pt
s:0.
10(−
0.16
,0.3
6)0
to1.
7pt
s:(R
ef)
>2.
0to
4.0
pts:
−0.
21(−
0.47
,0.0
5)>
4.2
pts:
-0.5
2(−
0.79
,−0.
24)
GDQS
-<
−2.
0pt
s:0.
36(0
.10,
0.62
)−
2.0
to<
−1.
0pt
s:0.
14(−
0.14
,0.4
2)0
pts:
(Ref
)>
1to
1pt
s:−
0.20
(−0.
48,0
.07)
>2
pts:
−0.
25(−
0.51
,0.0
1)2-
yw
aist
circ
umfe
renc
ech
ange
(cm
)GD
QS<
−5
pts:
0.71
(0.0
9,1.
32)
−5
to<
−2
pts:
0.32
(−0.
12,0
.77)
−2
to2
pts:
(Ref
)>
2to
5pt
s:−
0.49
(−0.
94,−
0.04
)>
5pt
s:−
1.05
(−1.
62,−
0.48
)GD
QS+
<−
2.7
pts:
0.32
(−0.
19,0
.84)
−2.
0to
<−
0.2
pts:
0.10
(−0.
41,0
.61)
0to
1.7
pts:
(Ref
)>
2.0
to4.
0pt
s:−
0.22
(−0.
73,0
.28)
>4.
2pt
s:-0
.79
(−1.
32,−
0.27
)GD
QS-
<−
2.0
pts:
0.98
(0.4
7,1.
48)
−2.
0to
<−
1.0
pts:
0.80
(0.2
5,1.
34)
0pt
s:(R
ef)
>1
to1
pts:
0.49
(−0.
04,1
.03)
>2
pts:
-0.0
7(−
0.57
,0.4
3)US
Nur
ses’
Heal
thSt
udy
II4-
yw
eigh
tcha
nge
(kg)
GDQS
<−
5pt
s:1.
13(1
.04,
1.22
)−
5to
<−
2pt
s:0.
45(0
.38,
0.53
)−
2to
2pt
s:(R
ef)
>2
to5
pts:
−0.
49(−
0.56
,−0.
42)
>5
pts:
-1.2
4(−
1.31
,−1.
16)
GDQS
+<
−5
pts:
0.52
(0.4
3,0.
62)
−5
to<
−2
pts:
0.27
(0.2
0,0.
34)
−2
to2
pts:
(Ref
)>
2to
5pt
s:−
0.27
(−0.
33,−
0.20
)>
5pt
s:−
0.56
(−0.
64,−
0.48
)GD
QS-
<−
2pt
s:1.
19(1
.12,
1.27
)−
2to
2pt
s:(R
ef)
>2
pts:
−1.
29(−
1.36
,−1.
23)
1Va
lues
repr
esen
tpo
int
chan
gein
met
ric:c
hang
ein
wei
ght
(kg)
orw
aist
circ
umfe
renc
e(c
m)(
95%
CIf
orch
ange
).M
exic
anTe
ache
rs’C
ohor
tan
alys
is(1
1)is
adju
sted
for
stat
e(J
alis
coor
Vera
cruz
),m
arita
lsta
tus,
educ
atio
n,an
dhe
alth
insu
ranc
ety
pe;b
asel
ine
diet
met
ricsc
ore,
age,
BM
Icat
egor
y,an
das
set
scor
e;pr
e-an
dpo
st–p
hysi
cala
ctiv
ityle
vel;
and
chan
ges
into
tale
nerg
yin
take
,sm
okin
gst
atus
,and
alco
holu
se.N
urse
s’H
ealth
Stu
dyII
anal
ysis
(12)
isad
just
edfo
rag
e,tim
epe
riod,
slee
pdu
ratio
n,an
dor
alco
ntra
cept
ive
use;
base
line
met
ricsc
ore;
and
chan
ges
inph
ysic
alac
tivity
leve
l,si
ttin
g,sm
okin
gst
atus
,and
alco
holu
se.G
DQ
S,G
loba
lDie
tQ
ualit
yS
core
;GD
QS+,
GD
QS
Posi
tive
Sub
met
ric;G
DQ
S-,
GD
QS
Neg
ativ
eS
ubm
etric
.
88S Supplement

TABLE 11 Comparison of Spearman correlations between the GDQS, simplified GDQS, and PDQS-like metric and continuousenergy-adjusted overall nutrient adequacy in nonpregnant nonlactating women of reproductive age within urban and rural strata ofcross-sectional datasets
GDQS Simplified GDQS PDQS-like Metric
Dataset n ρ ρ P, diff ρ P, diff
China Urban 24HR 6902 0.42∗ 0.32∗ <0.001∗ 0.35∗ <0.001∗
China Rural 24HR 8036 0.31∗ 0.25∗ <0.001∗ 0.23∗ <0.001∗
Ethiopia Urban 24HR 285 0.02 0.02 0.781 − 0.06 0.011∗
Ethiopia Urban FFQ 285 0.32∗ 0.25∗ 0.006∗ 0.16∗ 0.029∗
Ethiopia Rural 24HR 1283 0.08∗ 0.09∗ 0.013∗ − 0.07∗ <0.001∗
Ethiopia Rural FFQ 1311 0.25∗ 0.21∗ 0.002∗ 0.11∗ 0.000∗
India Urban FFQ 428 0.13∗ 0.13∗ 0.040∗ 0.14∗ 0.933India Rural FFQ 2600 0.32∗ 0.31∗ 0.817 0.21∗ <0.001∗
Mexico Urban 24HR 1464 0.32∗ 0.27∗ <0.001∗ 0.21∗ <0.001∗
Mexico Urban FFQ 2696 0.40∗ 0.34∗ <0.001∗ 0.28∗ <0.001∗
Mexico Rural 24HR 1003 0.22∗ 0.19∗ 0.010∗ 0.10∗ <0.001∗
Mexico Rural FFQ 2175 0.35∗ 0.30∗ <0.001∗ 0.19∗ <0.001∗
MVP Rural FFQ 1624 0.37∗ 0.36∗ 0.790 0.31∗ <0.001∗
The Simplified GDQS was generated by condensing the second and third consumption amount categories in Table 3 for all food groups (except red meat, for whichtrichotomous scoring was retained to allow for healthy scoring at higher intake amounts, as in the GDQS). Refer to footnote to Figure 1 for derivation of the continuousenergy-adjusted overall nutrient adequacy variable. P for difference (P, diff) is estimated from using Wolfe’s tests comparing metric-outcome correlation coefficients betweenthe GDQS and either the Simplified GDQS or PDQS-like Metric (34). ∗P < 0.05 correlations and Wolfe’s tests. GDQS, Global Diet Quality Score; MVP, Millennium VillagesProject; PDQS, Prime Diet Quality Score; 24HR, 24-hour recall.
that the GDQS’ expanded food list (as compared with otherfood-based metrics, such as the MDD-W) compensates forthe predictive advantage that might otherwise be gained byincluding nutrients in metric scoring. Strong performance of theGDQS against NCD outcomes is important given the relativeease of scoring the GDQS (a food-based metric) in comparisonwith the AHEI-2010, which requires food composition datato score, and which was not as sensitive to nutrient adequacyoutcomes in this analysis.
Throughout the process of refining the GDQS and iterativelyevaluating its performance, we found that including bothhealthy- and unhealthy-scoring food groups and scoring eachof them in a consistent manner independent of the outcomebeing targeted generally strengthened associations with bothnutrient adequacy and NCD risk-related outcomes. Thiscan be explained by the fact that consumption of healthy,nutrient-dense foods may serve to replace unhealthy foodsin the diet, or contribute directly to improved metabolichealth [for example, consumption of fruits and vegetables isassociated with lower blood pressure, lower blood sugar, weightloss, and reduced incidence of cardiovascular disease, certaincancers, and other diseases (55–58)]; conversely, consumptionof unhealthy foods may contribute to poorer nutrient adequacyby replacing healthy foods. Thus, although the GDQS+ andGDQS- outperformed the GDQS in certain cases, we proposethe GDQS as the most appropriate and broadly responsivemetric of diet quality. The responsiveness of the GDQS toboth nutrient adequacy and NCD risk further substantiatesconstruction and scoring of the submetrics and supports theiruse for understanding and tracking the relative contributionsof healthy and unhealthy food groups to overall diet quality inpopulations.
In many cases, the GDQS was more sensitive to outcomesthan a simplified version primarily employing dichotomouscategories for scoring consumed amounts. Based on this, wesuggest there is a benefit in using diet quality metrics thatincorporate more detailed quantity of consumption informationthan has previously been the case for simple food groupindicators developed for use in LMIC, such as the MDD-W,
despite the added burden for data collection that is implied.However, more detailed evaluations of this tradeoff betweenpredictive value and participant burden are needed.
An important consideration is that our primary objectivewas to develop a metric to assess average diet quality for apopulation or subpopulation. When calculated from a single 24-h recall of food intake, the GDQS will not provide appropriatedata on distributions of diet quality (for this reason performanceof the GDQS and other metrics tabulated using 24HR data inEthiopia and Mexico was usually poorer than when tabulatedusing the FFQ in the same settings). To accurately estimate thedistribution of usual intakes or associations between the GDQSwith health outcomes at the individual level, calculating theGDQS using an FFQ or repeated 24HRs or diet records in atleast a subgroup will be needed.
An important strength of the GDQS development workcarried out to date is its inclusion of datasets from a rangeof countries with different prevailing diet patterns, profilesof disease burden, and levels of economic development. Thescope of our analysis was considerable, including a range ofnutrient adequacy and diet-related NCD outcomes to developnovel metrics and characterize their validity and flexibility, anddisaggregation of datasets to compare metric validity acrossurban and rural subgroups. Analysis of both FFQ and 24HRdata allowed comparison of the performance of metrics scoredusing both types of instruments. Furthermore, inclusion ofcohort data from the US and Mexico allowed more powerfulevaluation of metric performance, particularly in capturingNCD-related outcomes (examining cross-sectional associationsbetween diet and NCD outcomes is challenging given thelatency period between dietary exposures and such outcomes,and the potential for reverse causation).
The GDQS’ food-based design is a notable strength of themetric. Analysis is simplified because food composition dataare not required to analyze the GDQS, and data collectionis therefore simplified because detailed information on foodpreparation methods need not be collected. This ease of useenables rapid and time-relevant assessments of population dietquality. Since many LMIC face a chronic lack of resources
Global Diet Quality Score (GDQS) 89S

for conducting detailed diet surveys and maintaining up-to-date food composition data, the GDQS’ food-based design andease of use are also conducive to cross-country comparisons.Furthermore, because the GDQS and GDQS submetrics provideinformation on the contribution of healthy and unhealthy foodgroups to diet quality in populations, they provide more easilycommunicated and actionable data for improving diet qualitythan metrics scored using nutrient components.
A limitation of this research is that it did not includeprimary data collection. Whereas secondary analysis allowedfor extensive data to develop and evaluate metrics, metricsscored using existing dietary data do not exactly represent whatwould be collected using stand-alone instruments designed toassess these metrics directly. Although existing 24HR and FFQdata have the benefit of extensive enumeration of foods withwhich to score metrics, they are subject to different sourcesof measurement error than a stand-alone GDQS tool wouldbe, including greater respondent burden owing to the moreextensive assessment. Carrying out primary validation studies ofstand-alone GDQS assessment methods in a variety of settingsand demographic groups will be a useful next step. On the otherhand, the existing datasets did demonstrate that the GDQS canbe usefully calculated from quantitative 24HRs and FFQs thatare already being used in many countries [we have publisheddetailed guidance for investigators interested in doing this (37)].Elsewhere in this supplement, Moursi and colleagues describedevelopment of a novel application–based 24HR data collectionsystem, combining a software application with physical foodgroup quantity models, for collecting GDQS data in populationsurveys (14).
A second limitation is that within each food group thereexists regional variation in foods (e.g., lean pasture-fed beefcompared with beef produced in concentrated animal feedingoperations), food processing methods (e.g., application orabsence of micronutrient fortificants in grain flours), andsusceptibility of populations to health effects of differentdiets (e.g., the marginal risk of NCD outcomes incurred byconsuming unhealthy foods may be greater in obese or diabeticpopulations than healthy ones). Although these considerationscould be addressed by adding complexity to the scoring system(e.g., by adding or subdividing food groups, or tailoring scoringweights by region or food processing methods), we avoided thisin favor of providing simple, standardized guidance for globaluse, as would presumably be needed for a metric for inclusionin global monitoring frameworks. In developing the GDQS,we ultimately attempted to balance the need for a valid metricresponsive to diverse outcomes of nutrient adequacy and NCDrisk in diverse settings, with that of an easily operationalizedmetric that can be in surveillance systems without addingundue burden to participants and surveyors that could hamperwidespread uptake.
A third limitation of this study was the lack of cohortdata in low-income countries. Although our analyses of largecohort studies in Mexico and the US provide strong evidencefor validity of the GDQS against NCD outcomes, the growingburden of NCDs in low-income countries, and middle-incomecountries outside of the Americas, warrants further prospectiveanalyses in these settings due to regional differences in the foodscomprising each food group and differences in the prevailinghealth status of the population.
Our evaluation demonstrates that the GDQS meets anurgent need for a valid and robust metric capable of jointlycapturing the immense and frequently coexisting burdens ofnutrient inadequacy and diet-related NCD risk affecting many
countries. We thus propose the GDQS and GDQS submetricsas appropriate metrics for integration in diverse surveillanceand research platforms, including health and nutrition surveys,household surveys, and epidemiologic platforms. We envisionnumerous applications of the GDQS in practice, includingstandardized assessment and monitoring of population dietquality, comparing diet quality between populations andsubpopulations, evaluating impacts of food-based nutritionprograms, and designing and communicating policies andguidelines for improving diets. Global application of theGDQS as a unified and comparable diet quality measurementsystem would provide a strong evidence-base to support thecoordinated approaches needed for reducing the global burdenof both undernutrition and metabolic disease.
Research is warranted to translate and validate the GDQSfor use in demographics beyond nonpregnant, nonlactatingwomen of reproductive age; evaluate performance of theGDQS in longitudinal analysis of NCD outcomes in low-income countries; and validate primary assessment methodsfor capturing GDQS data in population surveys. Furthermore,whereas the scope of our research was limited to diet qualityoutcomes, food systems also play a critical role in planetaryhealth. It would be valuable to explore relations betweenthe GDQS and environmental impacts of food systems indifferent populations, to identify opportunities for developingnovel metrics that jointly capture diet quality and foodsystems sustainability. Understanding these relationships mayalso inform dietary guidelines that optimize nutrition andplanetary health (17).
Acknowledgments
We thank Christopher Golden and Changzheng Yuan (HarvardT.H. Chan School of Public Health) for guidance on metric de-velopment and assistance with statistical software, respectively.We also thank all of the stakeholders who provided technicalinput as part of the GDQS Stakeholder Meeting held on 1September 2020.
The authors responsibilities were as follows—WCW, CB,SNB, WWF, TTF, YL, SB, MD, MJS: designed research; SK, SEC:provided essential materials; EA, NB, SB, AC, YH, YF, TTF,YL, MM, YZ: analyzed data; MM, SG, MDH, SI, DS: providedtechnical guidance and supervised analyses; SB, MD: wrote thepaper; SB: had primary responsibility for final content; and allauthors: read and approved the final manuscript.
References1. GBD 2017 Diet Collaborators. Health effects of dietary risks in 195
countries, 1990–2017: a systematic analysis for the Global Burden ofDisease Study 2017. Lancet North Am Ed 2019;393(10184):1958–72.
2. International Health Metrics and Evaluation. GBD Compare. [Internet].Available from: https://vizhub.healthdata.org/gbd-compare/.
3. Development Initiatives Poverty Research. 2020 Global NutritionReport: action on equity to end malnutrition. Bristol, United Kingdom:Development Initiatives; 2020.
4. Arimond M, Deitchler M. Measuring diet quality for women ofreproductive age in low- and middle-income countries: towards newmetrics for changing diets. Washington, DC: Intake – Center for DietaryAssessment/FHI 360; 2019.
5. Miller V, Webb P, Micha R, Mozaffarian D, Database GD. Definingdiet quality: a synthesis of dietary quality metrics and their validityfor the double burden of malnutrition. Lancet Planetary Health2020;4(8):e352–70.
6. Bromage S, Zhang Y, Holmes MD, Sachs SE, Fanzo J, Remans R, SachsJ, Batis C, Bhupathiraju SN, Fung TT, et al. The Global Diet QualityScore is inversely associated with nutrient inadequacy, low midupper
90S Supplement

arm circumference, and anemia among rural adults in ten Sub-SaharanAfrican countries. J Nutr 2021;151(Suppl 10):119S–29S.
7. Bromage S, Andersen CT, Tadesse AW, Passarelli S, Hemler EC, FekaduH, Sudfeld C, Worku A, Berhane H, Batis C, et al. The Global DietQuality Score is associated with higher nutrient adequacy, midupperarm circumference, venous hemoglobin, and serum folate among urbanand rural Ethiopian adults. J Nutr 2021;151(Suppl 10):130S–42S.
8. Castellanos-Gutiérrez A, Rodríguez-Ramírez S, Bromage S, Fung TT, LiY, Bhupathiraju SN, Deitchler M, Willett WC, Batis C. Performance ofthe Global Dietary Quality Score with nutrition and health outcomesin Mexico with 24-hr and FFQ data. J Nutr 2021;151(Suppl 10):143S–51S.
9. He Y, Fang Y, Bromage S, Fung TT, Bhupathiraju SN, Batis CB,Deitchler M, Fawzi WW, Stampfer MJ, Hu FB, et al. Applicationof the Global Diet Quality Score in Chinese adults to evaluate thedouble burden of nutrient inadequacy and metabolic syndrome. J Nutr2021;151(Suppl 10):93S–100S.
10. Matsuzaki M, Birk N, Bromage S, Bowen L, Batis C, Fung TT, LiY, Stampfer MJ, Deitchler M, Willett WC, et al. Validation of GlobalDiet Quality Score among nonpregnant women of reproductive agein India: Findings from the Andhra Pradesh Children and ParentsStudy (APCAPS) and the Indian Migration Study (IMS). J Nutr 2021;151(Suppl 10):101S–9S.
11. Angulo E, Stern D, Castellanos-Gutiérrez A, Mongue A, Lajous M,Bromage S, Fung TT, Li Y, Bhupathiraju S, Deitchler M, et al. Changesin the Global Dietary Quality Score, weight and waist circumference inMexican women. J Nutr 2021;151(Suppl 10):152S–61S.
12. Fung TT, Bromage S, Li Y, Bhupathiraju SN, Batis C, Fawzi WF, HolmesMD, Stampfer MJ, Hu FB, Deitchler M, et al. Higher Global DietQuality Score is associated with less 4-year weight gain in US women. JNutr 2021;151(Suppl 10):162S–7S.
13. Fung TT, Bromage S, Li Y, Bhupathiraju SN, Batis C, Fawzi WF, HolmesMD, Stampfer MJ, Hu FB, Deitchler M, et al. Higher Global DietQuality Score is inversely associated with risk of type 2 diabetes in USwomen. J Nutr 2021;151(Suppl 10):168S–75S.
14. Moursi M, Bromage S, Fung TT, Isanaka S, Matsuzaki M, Batis C,Castellanos-Gutiérrez A, Angulo E, Birk N, Bhupathiraju SN, et al.There’s an app for that: development of a mobile application tooperationalize the Global Diet Quality Score. J Nutr 2021;151(Suppl10):176S–84S.
15. Fung TT, Isanaka S, Hu FB, Willett WC. International food group-baseddiet quality and risk of coronary heart disease in men and women. AmJ Clin Nutr 2018;107(1):120–9.
16. Micha R, Shulkin ML, Peñalvo JL, Khatibzadeh S, Singh GM, Rao M,Fahimi S, Powles J, Mozaffarian D. Etiologic effects and optimal intakesof foods and nutrients for risk of cardiovascular diseases and diabetes:systematic reviews and meta-analyses from the Nutrition and ChronicDiseases Expert Group (NutriCoDE). PLoS One 2017;12(4):e0175149.
17. Willett W, Rockström J, Loken B, Springmann M, Lang T, VermeulenS, Garnett T, Tilman D, DeClerck F, Wood A, et al. Food in theAnthropocene: the EAT-Lancet Commission on healthy diets fromsustainable food systems. Lancet North Am Ed 2019;393(10170):447–92.
18. Gicevic S, Mou Y, Bromage S, Fung TT, Willett W. Development andevaluation of a novel diet quality screener for global use. Curr Dev Nutr2020;4(Suppl 2):1168.
19. Gicevic S, Gaskins AJ, Fung TT, Rosner B, Tobias DK, Isanaka S, WillettWC. Evaluating pre-pregnancy dietary diversity vs. dietary qualityscores as predictors of gestational diabetes and hypertensive disordersof pregnancy. PLoS One 2018;13(4):e0195103.
20. Gicevic S, Tahirovic E, Bromage S, Willett W. Diet quality and all-cause mortality among US adults, estimated from NHANES, 2003–2008. Public Health Nutr 2021:24(10):2777–872.
21. Alvarez-Alvarez I, Toledo E, Lecea O, Salas-Salvadó J, Corella D,Buil-Cosiales P, Zomeño MD, Vioque J, Martinez JA, Konieczna J,et al. Adherence to a priori dietary indexes and baseline prevalence ofcardiovascular risk factors in the PREDIMED-Plus randomised trial.Eur J Nutr 2020;59(3):1219–32.
22. Ojeda-Rodríguez A, Zazpe I, Alonso-Pedrero L, Zalba G, Guillen-Grima F, Martinez-Gonzalez MA, Marti A. Association between dietquality indexes and the risk of short telomeres in an elderly populationof the SUN project. Clin Nutr 2020;39(8):2487–94.
23. Madzorera I, Isanaka S, Wang M, Msamanga GI, Urassa W, HertzmarkE, Duggan C, Fawzi WW. Maternal dietary diversity and dietary quality
scores in relation to adverse birth outcomes in Tanzanian women. AmJ Clin Nutr 2020;112(3):695–706.
24. Gicevic S, Gaskins AJ, Fung TT, Rosner B, Sabanovic E, MilesevicJ, Kadvan A, Kremic E, Willett W. Demographic and socio-economicpredictors of diet quality among adults in Bosnia and Herzegovina.Public Health Nutr 2019;22(17):3107–17.
25. Sanchez P, Palm C, Sachs J, Denning G, Flor R, Harawa R, Jama B,Kiflemariam T, Konecky B, Kozar R, et al. The African MillenniumVillages. Proc Natl Acad Sci 2007;104(43):16775–80.
26. Tadesse AW, Hemler EC, Andersen C, Passarelli S, Worku A, SudfeldCR, Berhane Y, Fawzi WW. Anemia prevalence and etiology amongwomen, men, and children in Ethiopia: a study protocol for a nationalpopulation-based survey. BMC Public Health 2019;19(1):1369.
27. He Y, Zhao W, Zhang J, Zhao L, Yang Z, Huo J, Yang L, Wang J, HeL, Sun J, et al. Data resource profile: China national nutrition surveys.Int J Epidemiol 2019;48(2):368–368f.
28. Kinra S, Andersen E, Ben-Shlomo Y, Bowen L, Lyngdoh T, PrabhakaranD, Reddy KS, Ramakrishnan L, Bharathi A, Vaz M, et al. Associationbetween urban life-years and cardiometabolic risk: the Indian migrationstudy. Am J Epidemiol 2011;174(2):154–64.
29. Kinra S, Radha Krishna KV, Kuper H, Rameshwar Sarma KV,Prabhakaran P, Gupta V, Walia GK, Bhogadi S, Kulkarni B, KumarA, et al. Cohort profile: Andhra Pradesh Children and Parents Study(APCAPS). Int J Epidemiol 2014;43(5):1417–24.
30. Romero-Martínez M, Shamah-Levy T, Franco-Nuñez A, Villalpando S,Cuevas-Nasu L, Gutiérrez JP, Rivera-Dommarco JA. National Healthand Nutrition Survey 2012: design and coverage. Salud Publica Mex2013;55:S332–40.
31. Romero-Martínez M, Shamah-Levy T, Cuevas-Nasu L, Méndez Gómez-Humarán I, Gaona-Pineda EB, Gómez-Acosta LM, Rivera-DommarcoJA, Hernández-Ávila M. Methodological design of the NationalMid-Stage Health and Nutrition Survey 2016. Salud Pública Mex2017;59:299–305.
32. Lajous M, Ortiz-Panozo E, Monge A, Santoyo-Vistrain R, García-AnayaA, Yunes-Díaz E, Rice MS, Blanco M, Hernández-Ávila M, WillettWC, et al. Cohort Profile: the Mexican Teachers’ Cohort (MTC). IntJ Epidemiol 2017;46(2):e10.
33. Bao Y, Bertoia ML, Lenart EB, Stampfer MJ, Willett WC, Speizer FE,Chavarro JE. Origin, methods, and evolution of the three nurses’ healthstudies. Am J Public Health 2016;106(9):1573–81.
34. Wolfe DA. A distribution-free test for related correlation coefficients.Technometrics 1977;19:507–9.
35. Chiuve SE, Fung TT, Rimm EB, Hu FB, McCullough ML, Wang M,Stampfer MJ, Willett WC. Alternative dietary indices both stronglypredict risk of chronic disease. J Nutr 2012;142:1009–18.
36. WDDP Study Group. Development of a dichotomous indicatorfor population-level assessment of dietary diversity in women ofreproductive age. Curr Dev Nutr 2017;1(12):cdn.117.001701.
37. Intake – Center for Dietary Assessment. The Global Diet QualityScore: data collection options and tabulation guidelines. [Internet].Available from: https://www.intake.org/news/global-diet-quality-score-data-collection-options-and-tabulation-guidance.
38. Willett WC, Ludwig DS. Milk and health. N Engl J Med2020;382(7):644–54.
39. Institute of Medicine [US.]. Dietary reference intakes. the essential guideto nutrient requirements. Washington, DC: National Academies Press;2006.
40. Institute of Medicine [US.]. DRI Dietary Reference Intakes: applicationsin dietary assessment. Washington, DC: National Academies Press;2000.
41. Nusser SM, Carriquiry AL, Dodd KW, Fuller WA. A semiparametrictransformation approach to estimating usual daily intake distributions.J Am Statist Assoc 1996;91:1440–9.
42. Martin-Prevel Y, Allemand P, Wiesmann D, Arimond M, Ballard T,Deitchler M, Dop M, Kennedy G, Lee WTK, Moursi M. Movingforward on choosing a standard operational indicator of women’sdietary diversity. Rome, Italy: Food and Agricultural Organization ofthe United Nations; 2015.
43. Allen L, de Benoist B, Dary O, Hurrell R, editors. Guidelines on foodfortification with micronutrients. Geneva, Switzerland: World HealthOrganization; 2004.
44. International Zinc Nutrition Consultative Group (IZiNCG), BrownKH, Rivera JA, Bhutta Z, Gibson RS, King JC, Lönnerdal B, Ruel
Global Diet Quality Score (GDQS) 91S

MT, Sandtröm B, Wasantwisut E, et al. International Zinc NutritionConsultative Group (IZiNCG) technical document #1. Assessment ofthe risk of zinc deficiency in populations and options for its control.Food Nutr Bull 2004;25(1 Suppl 2):S99–203.
45. Willett W, Stampfer MJ. Total energy intake: implications forepidemiologic analyses. Am J Epidemiol 1986;124(1):17–27.
46. WHO Expert Committee on Physical Status. Physical status: the useof and interpretation of anthropometry, report of a WHO expertcommittee. Geneva, Switzerland: WHO; 1995.
47. Tang AM, Chung M, Dong K, Wanke C, Bahwere P, Bose K,Chakraborty R, Charlton K, Hong S, Nguyen P, et al. Determininga global mid-upper arm circumference cutoff to assess underweightin adults (men and nonpregnant women). Washington, DC: FHI360/FANTA; 2016.
48. International Diabetes Federation. The IDF consensus worldwidedefinition of metabolic syndrome. Brussels: 2006.
49. World Health Organization. Haemoglobin concentrations for thediagnosis of anaemia and assessment of severity. Vitamin and mineralnutrition information system. Geneva, Switzerland: WHO; 2011.
50. World Health Organization. Serum ferritin concentrations for theassessment of iron status and iron deficiency in populations. Geneva,Switzerland: WHO; 2011.
51. World Health Organization. Serum and red blood cell folateconcentrations for assessing folate status in populations. Geneva,Switzerland: WHO; 2015.
52. Allen LH. Vitamin B-12. Adv Nutr 2012;3(1):54–55.
53. Huang PL. A comprehensive definition for metabolic syndrome. DisModel Mech 2009;2(5-6):231–7.
54. Expert Panel on Detection, Evaluation, and Treatment of HighBlood Cholesterol in Adults. Executive summary of the thirdreport of the National Cholesterol Education Program (NCEP)expert panel on detection, evaluation, and treatment of high bloodcholesterol in adults (Adult Treatment Panel III). JAMA 2001;285(19):2486–97.
55. Appel LJ, Moore TJ, Obarzanek E, Vollmer WM, Svetkey LP, SacksFM, Bray GA, Vogt TM, Cutler JA, Windhauser MM, et al. A clinicaltrial of the effects of dietary patterns on blood pressure. N Engl J Med1997;336(16):1117–24.
56. Wiseman M. The second world cancer research fund/american institutefor cancer research expert report. food, nutrition, physical activity, andthe prevention of cancer: a global perspective: nutrition society andBAPEN Medical Symposium on ‘nutrition support in cancer therapy’.Proc Nutr Soc 2008;67(3):253–6.
57. Wang X, Ouyang Y, Liu J, Zhu M, Zhao G, Bao W, Hu FB. Fruit andvegetable consumption and mortality from all causes, cardiovasculardisease, and cancer: systematic review and dose-response meta-analysisof prospective cohort studies. BMJ 2014;349:g4490.
58. Bertoia ML, Mukamal KJ, Cahill LE, Hou T, Ludwig DS, MozaffarianD, Willett WC, Hu FB, Rimm EB. Changes in intake of fruits andvegetables and weight change in United States men and women followedfor up to 24 years: analysis from three prospective cohort studies. PLoSMed 2015;12(9):e1001878.
92S Supplement

The Journal of NutritionSupplement
Application of the Global Diet Quality Scorein Chinese Adults to Evaluate the DoubleBurden of Nutrient Inadequacy and MetabolicSyndromeYuna He,1 Yuehui Fang,1 Sabri Bromage,2 Teresa T Fung,2,3 Shilpa N Bhupathiraju,2,4 Carolina Batis,5
Megan Deitchler,6 Wafaie Fawzi,2,7,8 Meir J Stampfer,2,4,8 Frank B Hu,2,4,8 Walter C Willett,2,4,8
and Yanping Li2
1National Institute for Nutrition and Health, Chinese Center for Disease Control and Prevention, Beijing, China; 2Department of Nutrition,Harvard T.H. Chan School of Public Health, Boston, MA, USA; 3Department of Nutrition, Simmons University, Boston, MA, USA;4Channing Division of Network Medicine, Department of Medicine, Brigham and Women’s Hospital, Harvard Medical School, Boston,MA, USA; 5CONACYT—Health and Nutrition Research Center, National Institute of Public Health, Cuernavaca, Mexico; 6Intake – Centerfor Dietary Assessment, FHI Solutions, Washington, DC, USA; 7Department of Global Health and Population, Harvard T.H. Chan Schoolof Public Health, Boston, MA, USA; and 8Department of Epidemiology, Harvard T.H. Chan School of Public Health, Boston, MA, USA
ABSTRACTBackground: The double burdens of under- and overnutrition are changing the health of individuals and the economic
and disease burdens in China. Poor diet plays an important role; however, a valid and easily operationalized metric that
could capture the full range of characteristics of the diet that are relevant to both under- and overnutrition is lacking in
China.
Objectives: We aimed to examine the application of the Global Diet Quality Score (GDQS) to evaluate nutrient
inadequacy and metabolic syndrome in different demographic groups of Chinese adults.
Methods: A total of 35,146 individuals (men 14,978, women 20,168) aged >18 y from the 2010–2012 China National
Nutrition and Health Survey were included. We scored the GDQS using average intakes of 25 food groups from 3 d of
24-h dietary recalls. Double burden was defined as coexisting metabolic syndrome and nutrient inadequacy.
Results: Diet quality assessed by GDQS was significantly higher in urban than in rural residents (20.8 compared with
18.7), and increased with both educational level and household income (P-trends < 0.0001). A higher GDQS score
was inversely associated with metabolic syndrome and nutrient inadequacy, or both (P-trends < 0.0001): multivariate
adjusted ORs comparing extreme quintiles of GDQS were 0.79 (95% CI: 0.69, 0.91) for metabolic syndrome, 0.17 (95%
CI: 0.14, 0.20) for nutrient inadequacy, and 0.59 (95% CI: 0.50, 0.69) for the double burden. These associations were
consistent across different household income levels (P-interaction = 0.26), suggestively stronger in younger (<50 y),
females, urban residents, and the more highly educated (P-interaction < 0.05) compared with their counterparts.
Conclusions: A higher GDQS was inversely associated with a double burden of nutrient inadequacy and metabolic
syndrome across various subgroups of Chinese adults. The finding supports the use of the GDQS in different
demographic groups of Chinese adults to assess diet quality and nutritional status. J Nutr 2021;151:93S–100S.
Keywords: GDQS, double burden, China, metabolic syndrome, nutrient inadequacy
Rapid economic development, health promotion, and diseaseprevention strategies in China have led to better control ofinfectious diseases and marked reduction of undernutrition(1, 2). However, the overall burden of undernutrition andmicronutrient deficiencies remains high in China. As reportedby the China National Nutrition and Health Report 2015 (1),malnutrition affects 6% of adults and 9% of children andadolescents; the overall prevalence of anemia at age ≥6 y is9.7%, and is 17.2% in pregnant women. In the same time
period, rapid urbanization and industrialization in China havealso led to a steep decline in physical activity and a dramaticshift in diet from traditional to Western dietary patterns (3,4), which has been accompanied by marked increases in serumcholesterol concentrations (5), obesity (6), hypertension (7), andtype 2 diabetes (8) as well as cardiovascular diseases and avariety of cancers.
To date, we lack a simple, easy-to-apply metric that couldcapture the full range of characteristics of the diet that are
C© The Author(s) 2021. Published by Oxford University Press on behalf of the American Society for Nutrition. This is an Open Access article distributed under theterms of the Creative Commons Attribution License (http://creativecommons.org/licenses/by/4.0/), which permits unrestricted reuse, distribution, and reproductionin any medium, provided the original work is properly cited.Manuscript received March 1, 2021. Initial review completed April 1, 2021. Revision accepted April 29, 2021.First published online October 1, 2021; doi: https://doi.org/10.1093/jn/nxab162. 93S

relevant to both under- and overnutrition in China. To addressthis problem, we developed the Global Diet Quality Score(GDQS) (9): a new diet quality assessment method to captureboth under- and overnutrition. In brief, the GDQS is a food-based metric that incorporates a more comprehensive listof food groups than most existing diet metrics, and usesa simple method for scoring consumed amounts (9). TheGDQS performed comparably with the Minimum DietaryDiversity–Women (MDD-W) (10) score in association withanthropometric and biochemical indicators of nutrient inade-quacy; and comparably or better than the Alternative HealthyEating Index (AHEI) (11) in capturing outcomes related tononcommunicable diseases (9). Different from the simpleDietary Diversity Score (12) and MDD-W, the GDQS classifiesthe foods into healthy and unhealthy categories with differentdirection of scoring based on epidemiological evidence of theirhealth benefits/effects. Initially, the GDQS was aimed for use innonpregnant, nonlactating women of reproductive age.
The aim of the current study was to examine the associationbetween the GDQS and the double burden of malnutrition (bothunder- and overnutrition) in different demographic groups ofChinese adults. As defined by the WHO (13), the doubleburden of malnutrition is characterized by the coexistence ofundernutrition with overweight and obesity, or diet-relatednoncommunicable diseases. For this analysis, we used overallnutrient inadequacy as an indicator of undernutrition, andmetabolic syndrome as an indicator of overnutrition.
MethodsStudy populationThe 2010–2012 China National Nutrition and Health Survey(CNNHS) is a nationally representative cross-sectional study conductedby the Chinese Center for Disease Control and Prevention to assess
Funding for the research was provided by FHI Solutions, recipient of a Bill& Melinda Gates Foundation grant to support Intake – Center for DietaryAssessment. The 2010– 2012 China National Nutrition and Health Surveywas supported by the Special Fund for Health-Scientific Research in thePublic Interest (No. 20120212) from the National Health and Family PlanningCommission of the People’s Republic of China.Author disclosures: YL has received research support from the California WalnutCommission and Swiss Re Management Ltd. TTF is an associate editor ofthe Journal of Nutrition and played no role in the Journal’s evaluation of themanuscript. All other authors report no conflicts of interest.Published in a supplement to the Journal of Nutrition. Publication costs for thissupplement were funded by the Bill & Melinda Gates Foundation in conjunctionwith FHI Solutions, recipient of a Bill & Melinda Gates Foundation grant tosupport Intake – Center for Dietary Assessment. The opinions expressed in thispublication are those of the authors and are not attributable to the sponsorsor the publisher, Editor, or Editorial Board of The Journal of Nutrition. TheSupplement Coordinators for the supplement publication were Megan Deitchler,Intake – Center for Dietary Assessment at FHI Solutions, Washington, DC; andSabri Bromage, Harvard T.H. Chan School of Public Health, Boston, MA.Supplemental Figure 1 is available from the “Supplementary data” link in theonline posting of the article and from the same link in the online table of contentsat https://academic.oup.com/jn.The GDQS research initiative was launched by Intake – Center for DietaryAssessment. The research was led by Harvard T.H. Chan School of Public Health,Department of Nutrition and carried out in collaboration with researchers at theNational Public Health Institute (INSP), Mexico. Funding for the research wasprovided by FHI Solutions, recipient of a Bill & Melinda Gates Foundation grantto support Intake – Center for Dietary Assessment.Address correspondence to YH (e-mail: [email protected]) or YL (e-mail:[email protected]).Abbreviations used: AHEI, Alternative Healthy Eating Index; CNNHS, ChinaNational Nutrition and Health Survey; GDQS, Global Diet Quality Score; MDD-W,Minimum Dietary Diversity–Women; PA, probability of adequacy.
the health and nutrition of Chinese civilians in 2010–2012 (14). TheCNNHS 2010–2012 was conducted in 31 provinces, autonomousregions, and municipalities directly under the central government,throughout China (except Taiwan, Hong Kong, and Macao). Subjectswere selected using a multistage, stratified cluster, random samplingmethod. A detailed description of the survey design is provided inprevious publications (14).
In brief, the CNNHS 2010–2012 (14) selected 150 study sitesfrom 4 strata (Supplemental Figure 1): 34 big cities, 41 medium andsmall cities, 45 general rural areas, and 30 poor rural areas applyinga multistage, stratified cluster, random sampling method accordingto economic and social development characteristics as reported bythe 2010 China Population Census. CNNHS 2010–2012 selected6 communities/villages from each study site, and 75 householdsfrom each community/village. The data collections of the 2010–2012CNNHS included questionnaires, clinical physical examination, andlaboratory tests. All family members from the selected householdswere invited for blood draw sample collection. Of 120,226 invitedparticipants aged ≥18 y, 104,098 provided complete data on physicalexamination, blood lipids, and fasting glucose tests. Thirty householdswithin each set of 75 households were randomly selected to record theirdietary intakes, which resulted in 35,146 participants for the currentstudy. Household and family information was collected by face-to-faceinterviewer-administered questionnaires in the household, by trainedinvestigators.
Data collection and definition of nutrition inadequacyDietary information was collected using 24-h dietary recalls of all foodsand beverages consumed, with the exception of oils and condiments,which were weighed. Collection of dietary data was carried out over3 consecutive days (including 2 weekdays and 1 weekend day). Foreach dietary recall day, investigators went to the participant’s homeand helped to record food intake during the last 24 h. Pictures oftypical portion size of usually consumed foods were shown to theparticipants to help them recall the food weight consumed. For mixeddishes, investigators asked the participants to recall the individual foodingredients that participants consumed. Investigators also weighed thehousehold cooking oil and condiments (such as salt, soy sauce, orketchup that were used to add flavor to food) at the beginning and endof the 3 d of recall for the 24-h dietary survey. Nutrient intakes werecalculated using the China Food Composition Tables (FCT-2002/2004)(15, 16).
Probability of adequacy (PA) (17) of fiber, protein, and micronutri-ents (iron, thiamin, riboflavin, calcium, vitamin A, zinc, and vitamin C)was computed by applying the Chinese estimated average requirementcut-point (18–21). Mean PA, as a summary variable for nutrientadequacy, was formed by averaging all 9 PA values. Nutrient inadequacywas defined by mean PA <50%.
GDQS scoringThe average food intakes of 3 d from dietary recalls were grouped into25 food groups according to the GDQS coding method as described indetail by Bromage et al. (9). In brief, the GDQS consists of 16 healthyfood groups (dark green leafy vegetables, cruciferous vegetables, deeporange vegetables, other vegetables, deep orange fruits, deep orangetubers, citrus fruits, other fruits, legumes, nuts and seeds, poultry andgame meat, fish, whole grains, liquid oils, low fat dairy, and eggs), and9 unhealthy food groups (white roots and tubers, processed meats,refined grains and baked goods, sugar-sweetened beverages, sweets andice cream, juices, purchased deep fried foods, high fat dairy, and redmeat). Quantity of intake for each food group is classified into 3 or4 ranges. For healthy food groups, points between 0 to 4 are given toeach level of intake depending on the food group. For unhealthy foodgroups, 2, 1, or 0 points are given for the intake levels, so that lowerintake receives more points. The GDQS is a sum of all 25 GDQS foodgroup scores, with a possible score range of 0 to 49 points. A higherscore represents a healthier diet.
94S Supplement

Data collection and measurement of metabolicsyndromeFasting body weight, height, and blood pressure were measured bytrained investigators. Participants were requested to present to selectedstudy sites during morning hours for anthropometric measurements.Height without shoes and weight in the fasting state were measuredto an accuracy of 1 mm and 0.1 kg, respectively. Waist circumferencewas measured to the nearest 0.1 cm at the midpoint between thebottom of the rib cage and the top of the iliac crest at the endof exhalation using the skin touch measuring tape custom-made forCNNHS.
Subjects’ seated blood pressure was measured 3 times, using amercury sphygmomanometer on the right arm after 5 min of rest, tothe nearest 2 mmHg. The mean of the 3 measures was used for analysis.The cuff size was selected on the basis of the upper arm circumference.
Participants were invited for blood collection after ∼10–14 hovernight fast. The samples were centrifuged at 433 × g for 10 minat room temperature after being left standing for 30–60 min. Plasmaglucose was measured using a spectrophotometer with glucose oxidasekit in the laboratory of local units of the Center for Disease Controland Prevention within 4 h of blood draw. Reagents were purchasedfrom Beijing Zhongsheng Reagents Company. All local laboratoriesparticipated in the quality control program and passed the qualitycontrol testing of the National Center for Clinical Laboratories.
Serum was obtained from centrifuged blood samples and trans-ported to the central laboratory of the National Institute for Nutritionand Health. Total cholesterol, HDL cholesterol, and triglycerideswere measured by a Hitachi automatic biochemical analyzer (Model7600) with reagents from Wako Pure Chemical Industries, Ltd.Reagents of the same batch were used and purchased from BeijingZhongsheng Reagents Company. Serum cholesterol was measured usingthe cholesterol oxidase aminoantipyrin phenol method (CHOD-PAP);serum triglyceride was measured using the glycerol phosphate oxidase4-chloric acid method.
According to the joint interim statement of the InternationalDiabetes Federation Task Force on Epidemiology and Prevention;National Heart, Lung, and Blood Institute; American Heart Association;World Heart Federation; International Atherosclerosis Society; andInternational Association for the Study of Obesity (22), participantshaving ≥3 of the following conditions were defined as having metabolicsyndrome: abdominal obesity (waist circumference ≥90 cm in menand ≥80 cm in women); high triglycerides (≥1.7 mmol/L); lowHDL cholesterol (<1.04 mmol/L in men and <1.29 mmol/L inwomen); elevated blood pressure (systolic blood pressure ≥130 mmHgor diastolic blood pressure ≥85 mmHg or use of antihypertensivedrugs in a patient with a history of hypertension); or hyperglycemia(fasting plasma glucose ≥5.6 mmol/L or physician diagnosis ofdiabetes).
Statistical analysisThe 2010–2012 CNNHS was designed to provide accurate estimatesof nutritional status in the Chinese population according to sex, age,and level of economic development. Applying the poststratificationpopulation sampling weights derived for the dietary surveys from thesampling probability of the 2010 Chinese population aged ≥20 y (basedon census data), we estimated nationally representative populationlevels for intakes of foods and GDQS score, the prevalence of theoutcomes as well as the main association analysis, except the stratifiedand interaction analyses, in considering the sampling weight was notrepresentative of all subgroups.
Participants were divided into quintile categories of GDQS score. Weused logistic regression models to estimate ORs and 95% CIs comparingparticipants in a given quintile category of GDQS with those in thelowest quintile. To quantify a linear trend, we conducted a Wald testfor linear trend by assigning the median intake within each quintileand modeling this as a continuous variable. Multivariable models wereadjusted for age, sex, income, education level, living area, job categories,smoking status, and energy intake.
Separate analyses were conducted for different specific subgroups,including sex, age, urban/rural, education, and income levels. The
TABLE 1 Sample size according to the basic characteristics ofstudy population (n = 35,146)
Male Female Total
Total 14,978 20,168 35,146Age, n (%)
18–49 y 6085 (40.6) 9421 (46.7) 15,506 (44.1)≥50 y 8893 (59.4) 10,747 (53.3) 19,640 (55.9)
Living area, n (%)Urban 7565 (50.5) 10,423 (51.7) 17,988 (51.2)Rural 7413 (49.5) 9745 (48.3) 17,158 (48.8)
Educational level, n (%)Illiteracy 1001 (6.7) 3304 (16.4) 4305 (12.2)Elementary 4067 (27.2) 6279 (31.1) 10,346 (29.4)Middle school 5805 (38.8) 6433 (31.9) 12,238 (34.8)High school 2674 (17.9) 2815 (14.0) 5489 (15.6)Community college and above 1431 (9.6) 1337 (6.6) 2768 (7.9)
Annual per capita household income, n (%)<10,000 yuan 7338 (49.0) 9786 (48.5) 17,124 (48.7)10,000–14,999 yuan 2733 (18.2) 3782 (18.8) 6515 (18.5)15,000–24,999 yuan 2670 (17.8) 3531 (17.5) 6201 (17.6)≥25,000 yuan 1558 (10.4) 2084 (10.3) 3642 (10.4)No answer 679 (4.5) 985 (4.9) 1664 (4.7)
Smoking, n (%)Yes 9259 (61.8) 932 (4.6) 10,191 (29.0)No 5719 (38.2) 19,236 (95.4) 24,955 (71.0)
interaction between the GDQS score and each stratification variablewas evaluated by adding a multiplicative factor in the logistic regressionmodel and tested for significance using the −2log likelihood method.
All statistical analyses were conducted using SAS software, includingthe survey procedures software, version 9.4 (SAS Institute).
Results
A total of 35,146 participants from CNNHS 2010–2012 aged≥18 y, including 14,978 males and 20,168 females, wereincluded in our study. The sample distribution according to age,living areas, educational level, income, and smoking status areshown in Table 1.
Table 2 presents the average quantity of consumptionfor each of the 25 GDQS food groups. For the followingfood groups, the majority of the study population fell intothe lowest category for quantity of consumption for eachfood group: legumes (63.9%), nuts and seeds (86.1%), wholegrain (92.5%), fish (66%), deep orange fruits (99.3%), citrusfruits (90.2%), other fruits (75.7%), low fat dairy (99.9%),poultry (72.1%), cruciferous vegetables (75.6%), deep orangevegetables (80.4%), deep orange tubers (93.5%), high fatdairy (88.8%), juice (98.2%), processed meat (91.6%), whiteroots and tubers (61.2%), sugar-sweetened beverages (99.4%),sweets and ice cream (92.1%), and purchased deep fried foods(87.6%). Whereas for the following food groups the majorityof the sample occupied the highest category for quantity ofconsumption: liquid oils (87.3%), dark green leafy vegetables(47.1%), other vegetables (66%), red meat (47.3%), and refinedgrains and baked goods (99.98%).
The overall average GDQS score was 19.8 (SE = 0.03),similar for males and females (Figure 1). Urban residents hada significantly higher GDQS score (20.8 for urban comparedwith 18.7 for rural; P < 0.0001). The average GDQS scoresignificantly increased with educational and family income
Application of GDQS for double burdens in China 95S

TABLE 2 Quantity of intake for each food group and the distribution of the GDQS subscore for each food group included in theGDQS in the study population (n = 35,146)1
Average intake(mean (SE),2 g/d
Scoring ranges3 (cutoffs, g/d)low/middle/high
GDQSsubscores
Low%
Middle%
High%
Legumes 12.3 (0.2) <10/10–39/>39 0, 2, 4 63.90 27.74 8.36Nuts and seeds 3.8 (0.2) <4/4–16/>16 0, 2, 4 86.11 5.41 8.48Whole grains 3.6 (0.2) <4/4–17/>17 0, 1, 2 92.49 1.80 5.71Liquid oils 36.8 (0.5) <2/2–8/>8 0, 1, 2 8.04 4.66 87.29Dark green leafy vegetables 62.9 (0.7) <10/10–39/>39 0, 2, 4 35.25 17.62 47.13Fish and seafood 22.7 (0.4) <16/16–64/>64 0, 1, 2 65.98 20.80 13.23Deep orange fruits 0.5 (0.0) <28/28–114/>114 0, 1, 2 99.29 0.65 0.06Citrus fruits 7.0 (0.3) <18/18–75/>75 0, 1, 2 90.23 6.85 2.92Other fruits 30.1 (0.8) <26/26–106/>106 0, 1, 2 75.66 14.68 9.66Low fat dairy 0.4 (0.2) <34/34–140/>140 0, 1, 2 99.92 0.02 0.06Poultry and game meat 15.5 (0.3) <12/12–48/>48 0, 1, 2 72.09 15.70 12.21Eggs 22.3 (0.3) <7/7–29/>29 0, 1, 2 42.57 25.01 32.41Cruciferous vegetables 14.5 (0.3) <11/11–44/>44 0, 0.25, 0.5 75.57 11.96 12.47Deep orange vegetables 12.1 (0.3) <11/11–44/>44 0, 0.25, 0.5 80.39 9.83 9.78Deep orange tubers 4.2 (0.2) <14/14–57/>57 0, 0.25, 0.5 93.46 3.79 2.75Other vegetables 154.9 (1.1) <21/21–84/>84 0, 0.25, 0.5 8.54 25.45 66.01High fat dairy 14.1 (0.4) <34/34–140/140–734/>734 0, 1, 2, 0 88.75 7.94 3.29/0.02Red meat 59.3 (0.6) <12/12–48/>48 0, 1, 0 26.56 26.16 47.29Juice 2.0 (0.1) <35/35–141/>141 2, 1, 0 98.21 1.41 0.38Processed meat 3.0 (0.1) <8/8–31/>31 2, 1, 0 91.58 4.54 3.88White roots and tubers 32.7 (0.5) <25/25–101/>101 2, 1, 0 61.09 30.32 8.59Refined grains and baked goods 294.1 (1.1) <4/4–14/>14 2, 1, 0 0.01 0.00 99.98Sugar-sweetened beverages 0.9 (0.2) <52/52–210/>210 2, 1, 0 99.40 0.52 0.07Sweets and ice cream 3.3 (0.1) <11/11–46/>46 2, 1, 0 92.06 5.64 2.30Purchased deep fried foods 7.9 (0.3) <10/10–40/>40 2, 1, 0 87.64 4.45 7.92
1GDQS, Global Diet Quality Score.2Average intake and proportion were weighted by sampling weight.3Scoring ranges: the 3 categories here are the low, middle, and high separated by a solidus; for high fat dairy, 4 categories were classified: low, lower middle, high middle, andhigh (from left to right).
levels (Figure 1). The overall prevalence of nutrient inadequacybased on the 9 nutrients was 81.7%, which gradually decreasedwith an increasing GDQS score (Figure 2). Nutrient inadequacypresented in 90.9% of population with the lowest quintile ofGDQS and 61.6% in the highest quintile (Table 3). Comparedwith those in the lowest quintile for GDQS, the OR of nutrientinadequacy was 0.17 (95% CI: 0.14, 0.20) for individuals inthe highest quintile (Figure 3); per SD increasing GDQS wasassociated with a 52% lower odds of nutrient inadequacy(OR: 0.48; 95% CI: 0.45, 0.51) (Table 3). People within thehighest quintile of GDQS also had a 21% lower odds ofmetabolic syndrome compared with the lowest GDQS (OR:0.79; 95% CI: 0.69, 0.91) (Figure 3). A total of 22.0%of the study population had both nutrient inadequacy andmetabolic syndrome (coexisting in the same individual), whichwas similar across the lowest 3 GDQS quintile groups (22.3–25.2%; Table 3), but this proportion was significantly lower inthe 2 highest GDQS quintiles. The OR of the double burdenof nutrient inadequacy and metabolic syndrome, comparing theextreme quintiles, was 0.59 (95% CI: 0.50, 0.69; Figure 3).
The associations between GDQS and the double burdenof nutrient inadequacy and metabolic syndrome wereconsistent across different household income levels (P-interaction = 0.26; Table 4) but were significantly strongerin younger than older individuals (P-interaction = 0.02), infemales than males (P-interaction < 0.001), and in urban thanrural residents (P-interaction < 0.001) (Table 4). Comparingthe extreme quintiles of the GDQS, the OR for the doubleburden of nutrient inadequacy and metabolic syndrome was
0.71 (95% CI: 0.61, 0.81) in those with low education levels;0.48 (95% CI: 0.43, 0.55) for middle education levels; and0.39 (95% CI: 0.27, 0.58) for high education levels (Table 4).
Discussion
Based on these large-scale, nationally representative dietary andhealth data of Chinese adults, we observed inverse associationsbetween a simple, easy-to-use diet quality score designed forglobal use and odds of the double burden of nutrient inadequacyand metabolic syndrome in different demographic groups ofChinese adults. Our findings support the application of theGDQS score, originally developed for use in nonpregnant,nonlactating women of reproductive age, as a valid methodto capture the double burden of under- and overnutrition ofwomen and men across different age, income, and educationalgroups in China.
The concurrent double burden of undernutrition andovernutrition has been reported in many developing countries,especially in countries experiencing rapid economic and nu-trition transitions (4); whereas undernutrition often remains amajor problem in poor and less developed rural areas, increasesin sedentary behaviors and Westernized dietary practices canlead to obesity in the cities. Despite this geographical contrast,the double burden of undernutrition and overnutrition canalso coexist within the same family and even within thesame individuals; this coexistence poses further challenges forinterventions. In Egypt (23), undernutrition and stunting are
96S Supplement
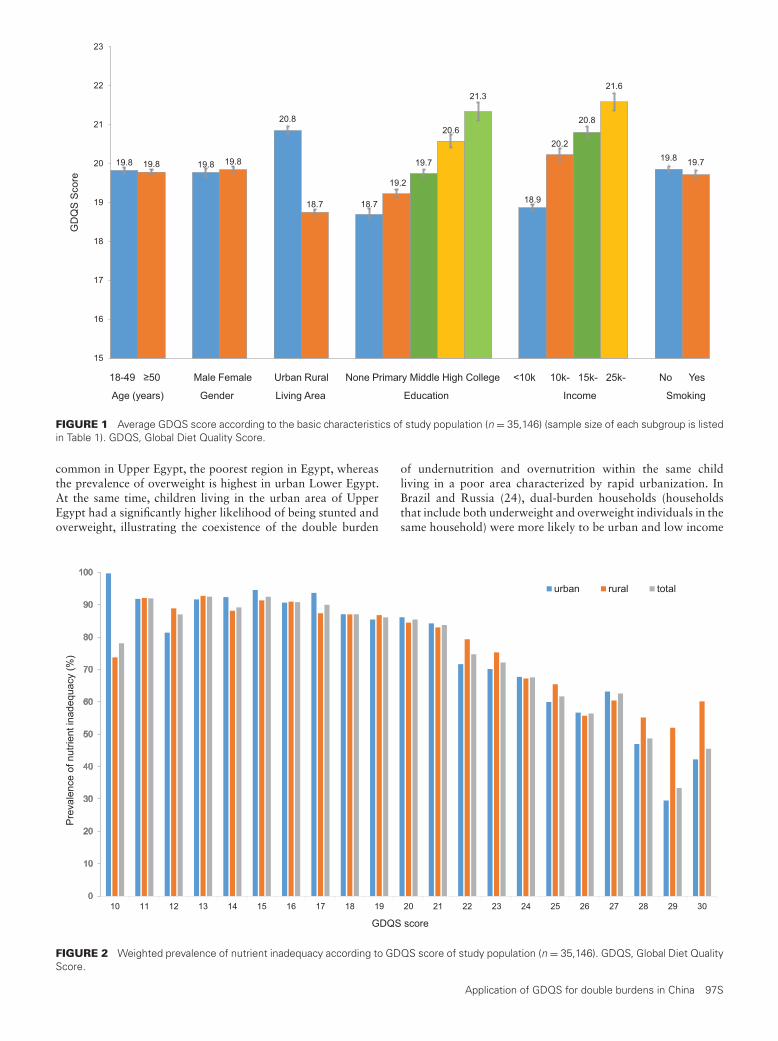
19.8 19.8 19.8 19.8
20.8
18.7 18.7
19.2
19.7
20.6
21.3
18.9
20.2
20.8
21.6
19.8 19.7
15
16
17
18
19
20
21
22
23
erocS SQ
DG
18-49 ≥50 Male Female Urban Rural None Primary Middle High College <10k 10k- 15k- 25k- No Yes
Age (years) Gender Living Area Education Income Smoking
FIGURE 1 Average GDQS score according to the basic characteristics of study population (n = 35,146) (sample size of each subgroup is listedin Table 1). GDQS, Global Diet Quality Score.
common in Upper Egypt, the poorest region in Egypt, whereasthe prevalence of overweight is highest in urban Lower Egypt.At the same time, children living in the urban area of UpperEgypt had a significantly higher likelihood of being stunted andoverweight, illustrating the coexistence of the double burden
of undernutrition and overnutrition within the same childliving in a poor area characterized by rapid urbanization. InBrazil and Russia (24), dual-burden households (householdsthat include both underweight and overweight individuals in thesame household) were more likely to be urban and low income
10 11 12 13 14 15 16 17 18 19 20 21 22 23 24 25 26 27 28 29 30
ycauqedanitneirtunfoecnelaverP
(%)
GDQS score
urban rural total
FIGURE 2 Weighted prevalence of nutrient inadequacy according to GDQS score of study population (n = 35,146). GDQS, Global Diet QualityScore.
Application of GDQS for double burdens in China 97S

TABLE 3 ORs (95% CI) of nutrient inadequacy and metabolic syndrome according to GDQS score in the study population(n = 35,146)1
Quintile of GDQS scoreQ1 (lowest
quintile) Q2 Q3 Q4Q5 (highest
quintile) P-trend Per SD
n (sample) 7080 7726 6510 6955 6875GDQS score (median) 14.5 17.5 19.75 22.0 25.25Nutrient inadequacy
Prevalence 90.9 89.0 85.8 79.8 61.6Age- and sex- adjusted OR 1.0 (Ref.) 0.81 (0.68, 0.96) 0.61 (0.50, 0.73) 0.39 (0.33, 0.47) 0.16 (0.14, 0.19) <0.0001 0.47 (0.44, 0.50)Multivariate adjusted OR 1.0 (Ref.) 0.82 (0.68, 0.98) 0.62 (0.51, 0.75) 0.40 (0.33, 0.48) 0.17 (0.14, 0.20) <0.0001 0.48 (0.45, 0.51)Further adjusted energy intake 1.0 (Ref.) 0.80 (0.66, 0.98) 0.58 (0.47, 0.71) 0.35 (0.29, 0.42) 0.17 (0.14, 0.20) <0.0001 0.48 (0.45, 0.51)
Metabolic syndromePrevalence 24.9 27.9 29.0 25.6 24.6Age- and sex- adjusted OR 1.0 (Ref.) 1.15 (1.02, 1.30) 1.21 (1.06, 1.39) 1.03 (0.91, 1.17) 0.98 (0.86, 1.12) 0.29 0.98 (0.94, 1.02)Multivariate adjusted OR 1.0 (Ref.) 1.08 (0.95, 1.22) 1.09 (0.95, 1.25) 0.89 (0.78, 1.02) 0.79 (0.69, 0.91) <0.0001 0.90 (0.86, 0.95)Further adjusted energy intake 1.0 (Ref.) 1.08 (0.95, 1.22) 1.09 (0.95, 1.25) 0.89 (0.78, 1.01) 0.79 (0.69, 0.91) <0.0001 0.90 (0.86, 0.95)
Coexisting double burdenPrevalence 22.3 25.2 25.1 20.5 16.4Age- and sex- adjusted OR 1.0 (Ref.) 1.15 (1.02, 1.31) 1.14 (1.00, 1.31) 0.89 (0.78, 1.01) 0.67 (0.58, 0.78) <0.0001 0.85 (0.82, 0.89)Multivariate adjusted OR 1.0 (Ref.) 1.08 (0.95, 1.22) 1.03 (0.90, 1.18) 0.77 (0.67, 0.88) 0.55 (0.47, 0.64) <0.0001 0.79 (0.75, 0.83)Further adjusted energy intake 1.0 (Ref.) 1.09 (0.96, 1.23) 1.04 (0.91, 1.20) 0.79 (0.69, 0.90) 0.59 (0.50, 0.69) <0.0001 0.81 (0.77, 0.85)
1Multivariate adjusted model adjusted for age, sex, income, educational level, living area (urban compared with rural), and smoking status. GDQS, Global Diet Quality Score; Q,quintile.
than households with only overweight members, because rapidurbanization is linked to poor diet and reduced physical activity(25). Approximately half of the overweight children youngerthan 5 y, and 1 of every 4 overweight children aged 5–19 yliving in poor rural areas of China coexist with stunting(26). Limited dietary diversity and intake of high-energy-dense foods were notably observed in stunted overweightchildren (27). Nearly 40% of Chinese adults aged 18–59 y
experienced overweight/obesity and micronutrient deficiencysimultaneously (28). Studies in adults in Burkina Faso (WestAfrica) (29, 30) indicated that a “traditional” dietary pattern,characterized by a higher intake of local cereals, legumes, andtraditional green leafy vegetables, was a significant contributingfactor to the double burden of malnutrition, where nutritionaldeficiency indicators included underweight, iron depletion, andvitamin A deficiency, and overnutrition indicators included
FIGURE 3 ORs (95% CI) of nutrient inadequacy and metabolic syndrome according to GDQS score in study population (n = 35,146). GDQS,Global Diet Quality Score.
98S Supplement

TABLE 4 ORs (95% CI) of the double burden of nutrient inadequacy and metabolic syndrome according to GDQS score stratified bybasic characteristics of the study population (n = 35,146)1
Quintile of GDQS score Q1 (lowest) Q2 Q3 Q4 Q5 (highest) P-trend P-interaction
Age18–49 y 1.0 (Ref.) 1.03 (0.91, 1.16) 0.95 (0.83, 1.08) 0.74 (0.65, 0.85) 0.49 (0.42, 0.57) <0.0001 0.02≥50 y 1.0 (Ref.) 0.96 (0.88, 1.06) 0.99 (0.89, 1.09) 0.86 (0.78, 0.96) 0.58 (0.52, 0.65) <0.0001
GenderMale 1.0 (Ref.) 1.08 (0.96, 1.22) 1.06 (0.94, 1.21) 0.90 (0.79, 1.02) 0.61 (0.53, 0.70) <0.0001 <0.001Female 1.0 (Ref.) 0.92 (0.84, 1.02) 0.91 (0.82, 1.01) 0.77 (0.69, 0.86) 0.52 (0.46, 0.59) <0.0001
Living areaUrban 1.0 (Ref.) 0.89 (0.78, 1.01) 0.87 (0.77, 0.99) 0.71 (0.63, 0.80) 0.48 (0.42, 0.55) <0.0001 <0.001Rural 1.0 (Ref.) 1.00 (0.91, 1.10) 0.99 (0.89, 1.10) 0.88 (0.78, 0.98) 0.65 (0.56, 0.75) <0.0001
Annual per capita household income<10,000 yuan 1.0 (Ref.) 1.00 (0.91, 1.10) 0.95 (0.86, 1.06) 0.84 (0.75, 0.94) 0.55 (0.48, 0.64) <0.0001 0.2610,000–14,999 yuan 1.0 (Ref.) 1.00 (0.83, 1.21) 1.09 (0.90, 1.32) 0.78 (0.64, 0.94) 0.60 (0.49, 0.73) <0.000115,000–24,999 yuan 1.0 (Ref.) 0.95 (0.76, 1.18) 0.93 (0.75, 1.15) 0.75 (0.61, 0.93) 0.54 (0.43, 0.66) <0.0001≥25,000 yuan 1.0 (Ref.) 0.82 (0.59, 1.12) 0.83 (0.60, 1.13) 0.84 (0.63, 1.13) 0.49 (0.36, 0.65) <0.0001
Educational level2
Low 1.0 (Ref.) 0.95 (0.85, 1.06) 0.92 (0.83, 1.04) 0.88 (0.78, 0.99) 0.71 (0.61, 0.81) <0.0001 <0.001Middle 1.0 (Ref.) 1.01 (0.90, 1.13) 0.98 (0.87, 1.10) 0.77 (0.68, 0.86) 0.48 (0.43, 0.55) <0.0001High 1.0 (Ref.) 0.77 (0.51, 1.15) 0.89 (0.60, 1.32) 0.58 (0.39, 0.85) 0.39 (0.27, 0.58) <0.0001
1Multivariate adjusted model adjusted for age, sex, income, educational level, living area (urban compared with rural), smoking status, and energy intakes except the stratifiedvariables. GDQS, Global Diet Quality Score; Q, quintile.2Education level: Low = illiteracy or elementary; Middle = middle school; High = high school, community college, and above.
obesity, hypertension, hyperglycemia, and dyslipidemia (29).In our study, we observed 27.7% with concurrent nutrientinadequacy and metabolic syndrome, which was associatedwith poor diet quality, as reflected by the GDQS. Preventingboth under- and overnutrition simultaneously in the samepopulation is a remarkable public health challenge, becauseproviding adequate food to prevent undernutrition can in turnenable an obesogenic environment. The findings highlight theimportance of nutritional quality in future dietary interventions.
Previous dietary scores that have been developed mainlyfocus either on prevention of chronic diseases or on identifyingrisk of malnutrition with limited food groups. To capturedietary characteristics that would associate with both nutrientadequacy and prevention of chronic diseases, the GDQS wasconstructed to consider 16 healthy and 9 unhealthy food groups(9). The validation studies in multiple countries in women ofreproductive age indicated that GDQS was a measurement wellsuited to capture metabolic risk, comparable to the AHEI-2010 (11); GDQS also compared well with the MDD-W (10)in its ability to measure diet quality, and to capture nutrientinadequacy (9). The lack of need to use a food compositiontable for analysis of the data collected is another merit of GDQSthat should be highlighted; which is important for its broadapplication worldwide.
The major limitation of our study is the cross-sectionaldesign, which does not permit a sequence of temporality to beestablished for dietary GDQS and the double burden of nutrientinadequacy and the metabolic syndrome, which precludesthe potential for reverse causality to be eliminated. Futureprospective cohort studies are warranted to verify our findings.Another limitation is that the 3 d of dietary records couldnot catch the potential variations of food intakes in differentseasons, which would influence the metric performance morein individuals from subsistence-oriented households, such asrural residents and less-educated populations. The presentstudy is the largest study of diet and the double burden ofunder- and overnutrition in China. Strengths of the currentstudy include the highly trained study staff to ensure the
standardization of data collection. National representativeness,including 31 provinces of China, is another strength.
In conclusion, higher diet quality, as evaluated with GDQS,was associated with a lower likelihood of both nutrientinadequacy and metabolic syndrome, with stronger associationsin younger, male, urban residents and those with a higher edu-cational level. These findings support the use of GDQS to guideapplication of dietary strategies for the improvement of thedouble burden of under- and overnutrition burdens in China.
Acknowledgments
We thank all the team members and participants involved in theChina National Nutrition Surveys.
The authors’ responsibilities were as follows—WCW, FBH,MJS, WF, MD, CB, SNB, TTF, YL, and SB: designed the research;YH and YF: analyzed data; YL: provided technical guidanceand supervised analyses; YH and YL: wrote the paper and hadprimary responsibilities for final content; and all authors: readand approved the final manuscript.
References1. National Health and Family Planning Commission, Disease Prevention
and Control Bureau. Report on nutrition and chronic disease statusof Chinese residents (2015). People’s Medical Publishing House; 2015[Internet]. [Accessed 2021 May 19]. Available from: https://www.chinadaily.com.cn/m/chinahealth/2015-06/15/content_21008408.htm.
2. Guo S, Zhao C, Ma Q, Sun HP, Pan CW. Prevalence of overweight andmalnutrition among ethnic minority children and adolescents in China,1991–2010. Sci Rep 2016;6:37491.
3. He Y, Li Y, Yang X, Hemler EC, Fang Y, Zhao L, Zhang J, YangZ, Wang Z, He L, et al. The dietary transition and its associationwith cardiometabolic mortality among Chinese adults, 1982–2012:a cross-sectional population-based study. Lancet Diabetes Endocrinol2019;7:540–8.
4. Popkin BM, Corvalan C, Grummer-Strawn LM. Dynamics of the doubleburden of malnutrition and the changing nutrition reality. Lancet2020;395:65–74.
5. Li JH, Mi SQ, Li YC, Zhang M, Bi YF, Jiang Y, Wang LM, Ning G, ZhaoWH. [The levels and distribution of the serum lipids in Chinese adults,2010] in Chinese. Zhonghua Yu Fang Yi Xue Za Zhi 2012;46:607–12.
Application of GDQS for double burdens in China 99S

6. Wu Y. Overweight and obesity in China. BMJ 2006;333:362–3.
7. Wu Y, Huxley R, Li L, Anna V, Xie G, Yao C, Woodward M, Li X,Chalmers J, Gao R, et al. Prevalence, awareness, treatment, and controlof hypertension in China: data from the China National Nutrition andHealth Survey 2002. Circulation 2008;118:2679–86.
8. Wang L, Gao P, Zhang M, Huang Z, Zhang D, Deng Q, Li Y, ZhaoZ, Qin X, Jin D, et al. Prevalence and ethnic pattern of diabetes andprediabetes in China in 2013. JAMA 2017;317:2515–23.
9. Bromage S, Batis C, Bhupathiraju SN, Fawzi WW Fung TT, LiY, Deitchler M, Angulo E, Birk N, Castellanos-Gutiérrez A, et al.Development and validation of a novel food-based global diet qualityscore (GDQS). J Nutr 2021;151(Suppl 10):75S–92S.
10. WDDP Study Group. Development of a dichotomous indicatorfor population-level assessment of dietary diversity in women ofreproductive age. Curr Dev Nutr 2017;1:cdn.117.001701.
11. Chiuve SE, Fung TT, Rimm EB, Hu FB, McCullough ML, Wang M,Stampfer MJ, Willett WC. Alternative dietary indices both stronglypredict risk of chronic disease. J Nutr 2012;142:1009–18.
12. Mirmiran P, Azadbakht L, Esmaillzadeh A, Azizi F. Dietary diversityscore in adolescents – a good indicator of the nutritional adequacyof diets: Tehran Lipid and Glucose Study. Asia Pac J Clin Nutr2004;13:56–60.
13. World Health Organization. Double burden of malnutrition [Internet].[Cited 2021 Apr 8]. Available from: https://www.who.int/nutrition/double-burden-malnutrition/en
14. Zhao L, Ma G, Piao J, Zhang J, Yu D, He Y, Huo J, Hu X, Yang Z, YangX. [Scheme of the 2010–2012 Chinese nutrition and health surveillance]in Chinese. Zhonghua Yu Fang Yi Xue Za Zhi 2016;50:204–7.
15. Yang Y. China food composition 2004. Beijing: Medical Publisher ofPeking University; 2004.
16. Yang Y, Wang G, Pan X. China food composition table 2002. Beijing:Beijing Medical University Publishing House; 2002.
17. Arimond M, Wiesmann D, Becquey E, Carriquiry A, Daniels M,Deitchler M, Fanou N, Ferguson E, Joseph M, Kennedy G, et al. Dietarydiversity as a measure of the micronutrient adequacy of women’s dietsin resource-poor areas: summary of results from five sites. Washington(DC): FANTA-2 Bridge, FHI 360; 2011.
18. National Health Commission of People’s Republic of China. Chinesedietary reference intakes—part 2: macroelement. Beijing: NationalHealth Commission of People’s Republic of China; 2018.
19. National Health Commission of People’s Republic of China. Chinesedietary reference intakes—part 3: trace element. Beijing: NationalHealth Commission of People’s Republic of China; 2017.
20. National Health Commission of People’s Republic of China. Chinesedietary reference intakes—part 4: lipid-soluble vitamin. Beijing:National Health Commission of People’s Republic of China; 2018.
21. National Health Commission of People’s Republic of China. Chinesedietary reference intakes—part 5: water-soluble vitamin. Beijing:National Health Commission of People’s Republic of China; 2018.
22. Alberti KG, Eckel RH, Grundy SM, Zimmet PZ, Cleeman JI,Donato KA, Fruchart JC, James WP, Loria CM, Smith SC, et al.Harmonizing the metabolic syndrome: a joint interim statement of theInternational Diabetes Federation Task Force on Epidemiology andPrevention; National Heart, Lung, and Blood Institute; American HeartAssociation; World Heart Federation; International AtherosclerosisSociety; and International Association for the Study of Obesity.Circulation 2009;120:1640–5.
23. Hu FB, Li Y, Overnutrition of children under 5 and women ofreproductive age in Egypt, In: Herbst CH, Elshalakani A, Kakietek J,Hafiz A, Petrovic O , editors. Scaling up nutrition in the Arab Republicof Egypt. Washington (DC): The World Bank Group; 2020. p. 29–56.
24. Doak CM, Adair LS, Bentley M, Monteiro C, Popkin BM. The dualburden household and the nutrition transition paradox. Int J Obes2005;29:129–36.
25. Angkurawaranon C, Jiraporncharoen W, Chenthanakij B, DoyleP, Nitsch D. Urban environments and obesity in southeast Asia:a systematic review, meta-analysis and meta-regression. PLoS One2014;9:e113547.
26. Li YP, Hu XQ, Jing Z, Yang XG, Ma GS. Application of the WHOgrowth reference (2007) to assess the nutritional status of children inChina. Biomed Environ Sci 2009;22:130–5.
27. Li Y, Wedick NM, Lai J, He Y, Hu X, Liu A, Du S, Zhang J, YangX, Chen C, et al. Lack of dietary diversity and dyslipidaemia amongstunted overweight children: the 2002 China National Nutrition andHealth Survey. Public Health Nutr 2011;14:896–903.
28. Huang Q, Wang L, Jiang H, Wang H, Zhang B, Zhang J, Jia X, Wang Z.Intra-individual double burden of malnutrition among adults in China:evidence from the China Health and Nutrition Survey 2015. Nutrients2020;12:811.
29. Zeba AN, Delisle HF, Renier G. Dietary patterns and physical inactivity,two contributing factors to the double burden of malnutrition amongadults in Burkina Faso, West Africa. J Nutr Sci 2014;3:e50.
30. Zeba AN, Delisle HF, Renier G, Savadogo B, Baya B. The double burdenof malnutrition and cardiometabolic risk widens the gender and socio-economic health gap: a study among adults in Burkina Faso (WestAfrica). Public Health Nutr 2012;15:2210–9.
100S Supplement
The Journal of NutritionSupplement
Validation of Global Diet Quality ScoreAmong Nonpregnant Women of ReproductiveAge in India: Findings from the AndhraPradesh Children and Parents Study (APCAPS)and the Indian Migration Study (IMS)Mika Matsuzaki,1 Nick Birk,2 Sabri Bromage,2 Liza Bowen,3 Carolina Batis,4 Teresa T Fung,2,5 Yanping Li,2
Meir J Stampfer,2,6 Megan Deitchler,7 Walter C Willett,2,6 Wafaie W Fawzi,2 Sanjay Kinra,8
and Shilpa N Bhupathiraju2,6
1Johns Hopkins Bloomberg School of Public Health, Baltimore, MD, USA; 2Harvard T.H. Chan School of Public Health, Boston, MA, USA;3King’s College, Department of Population Health Sciences, London, United Kingdom; 4CONACYT—Health and Nutrition ResearchCenter, National Institute of Public Health, Cuernavaca, Mexico; 5Department of Nutrition, Simmons University, Boston, MA, USA;6Channing Division of Network Medicine, Brigham and Women’s Hospital, Boston, MA, USA; 7Intake–Center for Dietary Assessment, FHISolutions, Washington, DC, USA; and 8London School of Hygiene and Tropical Medicine, London, United Kingdom
ABSTRACTBackground: In India, there is a need to monitor population-level trends in changes in diet quality in relation to both
undernutrition and noncommunicable diseases.
Objectives: We conducted a study to validate a novel diet quality score in southern India.
Methods: We included data from 3041 nonpregnant women of reproductive age (15–49 years) from 2 studies in
India. Diet was assessed using a validated food frequency questionnaire (FFQ). The Global Diet Quality Score (GDQS)
was calculated from 25 food groups (16 healthy; 9 unhealthy), with points for each group based on the frequency and
quantity of items consumed in each group. We used Spearman correlations to examine correlations between the GDQS
and several nutrient intakes of concern. We examined associations between the GDQS [overall, healthy (GDQS+), and
unhealthy (GDQS−) submetrics] and overall nutrient adequacy, micro- and macronutrients, body mass index (BMI),
midupper arm circumference, hemoglobin, blood pressure, high density lipoprotein (HDL), and total cholesterol (TC).
Results: The mean GDQS was 23 points (SD, 3.6; maximum, 46.5). In energy-adjusted models, positive associations
were found between the overall GDQS and GDQS+ and intakes of calcium, fiber, folate, iron, monounsaturated fatty
acid (MUFA), protein, polyunsaturated fatty acid (PUFA), saturated fatty acid (SFA), total fat, and zinc (ρ = 0.12–0.39; P
< 0.001). Quintile analyses showed that the GDQS was associated with better nutrient adequacy. At the same time, the
GDQS was associated with higher TC, lower HDL, and higher BMI. We found no associations between the GDQS and
hypertension.
Conclusions: The GDQS was a useful tool for reflecting overall nutrient adequacy and some lipid measures. Future
studies are needed to refine the GDQS for populations who consume large amounts of unhealthy foods, like refined
grains, along with healthy foods included in the GDQS. J Nutr 2021;151:101S–109S.
Keywords: diet quality metrics, dietary diversity, nutrient adequacy, noncommunicable diseases, double burden of
malnutrition, nutrition transition, nutritional epidemiology, India, South Asia, GDQS
Introduction
In recent decades, India has witnessed an exponential increasein the burden of cardiometabolic diseases, with cardiovasculardiseases contributing to 28.1% of total deaths and 14.1% of thetotal disability-adjusted life years in 2016 (1). The number ofindividuals with diabetes also increased substantially, from 26million in 1990 to 65 million in 2016 (2). The latest National
Family Health Survey–5 from 2019–2020 showed that in thesouthern state of Telangana, over 30% of men and womenwere overweight or obese (3). In contrast, 1 in 5 women ofreproductive age (WRA) from rural areas in Telangana wereundernourished, and nearly 60% of nonpregnant (NP) womenof reproductive age in rural areas were found to be anemic(3). The coexistence of noncommunicable diseases (NCDs)
C© The Author(s) 2021. Published by Oxford University Press on behalf of the American Society for Nutrition. This is an Open Access article distributed under theterms of the Creative Commons Attribution License (http://creativecommons.org/licenses/by/4.0/), which permits unrestricted reuse, distribution, and reproductionin any medium, provided the original work is properly cited.Manuscript received March 3, 2021. Initial review completed May 28, 2021. Revision accepted June 11, 2021.First published online October 1, 2021; doi: https://doi.org/10.1093/jn/nxab217. 101S

alongside undernutrition presents a dire public health crisisin low- and middle-income countries (LMIC) like India andsignifies a major challenge for sustainable human developmentin the 21st century (4). There remains an urgent need to developmultidimensional interventional and policy approaches to dealwith the unique challenges posed by the double burden ofmalnutrition.
Diet plays an important role for the prevention of bothundernutrition and chronic diseases. The 2030 agenda forthe Sustainable Development Goals recognizes nutrition asbeing crucial for ending hunger, achieving food security, andimproving nutrition globally (5). In 2016, the WHO andFAO adopted the Rome Declaration on Nutrition whichreaffirmed the need for more nutrition data and indicatorsfor effective nutrition surveillance and policy-making (6). Inparticular, it was recognized that special attention should begiven to nutritional issues for WRA (6). Although several globalmetrics of diet quality for WRA exist, such as the MinimumDietary Diversity for Women (MDD-W) and the Prime DietQuality Score, currently none can capture the double burdenof malnutrition (7, 8).
Because the double burden of malnutrition is prevalent inresource-limited settings like India, it is imperative that dietarymetrics to assess this be simple, cost-effective, and easy toadminister. This paper presents results for an Indian setting fromthe development and validation of the Global Diet Quality Score(GDQS), a novel and simple food-based scoring system thataims to measure diet quality in relation to the double burden ofmalnutrition. The development of the GDQS adds to previousmetrics like the MDD-W (7) by trying to measure diet qualityin populations experiencing the double burden of malnutrition.This study examined associations of the GDQS with variousNCD and undernutrition indicators among NP WRA—whosedietary habits and health status substantially influence maternal
Funding was provided by FHI Solutions, recipient of a Bill & Melinda GatesFoundation grant to support Intake–Center for Dietary Assessment. AndhraPradesh Children and Parents Study data collection was funded by the WellcomeTrust (grant numbers 083707, 084774, and 084754) and the Indian MigrationStudy data collection was funded by the Wellcome Trust (grant number 070797).Author disclosures: TTF is an Associate Editor for the Journal of Nutrition andplayed no role in the Journal’s evaluation of the manuscript. All other authorsreport no conflicts of interest.Supplemental Figure 1 and Supplemental Table 1 are available from the“Supplementary data” link in the online posting of the article and from the samelink in the online table of contents at https://academic.oup.com/jn/.Published in a supplement to the Journal of Nutrition. Publication costs for thissupplement were funded by the Bill & Melinda Gates Foundation in conjunctionwith FHI Solutions, recipient of a Bill & Melinda Gates Foundation grant tosupport Intake–Center for Dietary Assessment. The opinions expressed in thispublication are those of the authors and are not attributable to the sponsorsor the publisher, Editor, or Editorial Board of the Journal of Nutrition. TheSupplement Coordinators for the supplement publication were Megan Deitchler,Intake–Center for Dietary Assessment at FHI Solutions, Washington, DC; andSabri Bromage, Harvard T.H. Chan School of Public Health, Boston, MA.The GDQS research initiative was launched by Intake – Center for DietaryAssessment. The research was led by Harvard T.H. Chan School of Public Health,Department of Nutrition and carried out in collaboration with researchers at theNational Public Health Institute (INSP), Mexico. Funding for the research wasprovided by FHI Solutions, recipient of a Bill & Melinda Gates Foundation grantto support Intake – Center for Dietary Assessment.Address correspondence to MM (e-mail: [email protected]).Abbreviations used: AHEI-2010, Alternative Healthy Eating Index–2010; AP-CAPS, Andhra Pradesh Children and Parents Study; FFQ, Food FrequencyQuestionnaire; GDQS, Global Diet Quality Score; GDQS−, Global DietQuality Score negative submetric; GDQS+, Global Diet Quality Score positivesubmetric; IMS, India Migration Study; LMIC, low- and middle-income countries;MDD-W, Minimum Dietary Diversity for Women; NCD, noncommunicablediseases; NP, nonpregnant; WRA, women of reproductive age.
and children’s health—from southern India, using data from theAndhra Pradesh Children and Parents Study (APCAPS) and theIndian Migration Study (IMS).
MethodsStudy design and populationThe study population included NP WRA who participated in theAPCAPS and the IMS. The APCAPS was conducted in a rural/peri-urbanpopulation located near Hyderabad, the capital and the largest city ofthe Telangana state in southern India. Details about the APCAPS cohorthave been previously published (9). For the current study, we includedNP WRA who were part of the second (2009–2010) and third (2010–2012) waves of data collection. Participants who partook in multiplephases of the APCAPS were filtered to include data from only the earliestdate of valid measurements to avoid overrepresentation of any singleindividual.
The IMS was established in 2005–2007 to investigate the effectsof rural to urban migration on chronic disease risks in India among6510 participants. The study used a sibling pair design to comparechronic disease risk factors in migrant urban factory workers and theirspouses with those of their rural siblings. The IMS did not collectinformation on pregnancy status; however, some participants took partin the Hyderabad DXA Study (10), which required all women to beNP, and these women were included in the current analyses. All IMSparticipants who were included in the current analyses were from theHyderabad area and attended the same clinics at the same time as thesecond wave of data collection for the APCAPS. Details of the IMS havebeen published elsewhere (11).
In this study, we excluded participants who were missing infor-mation on any of the diet quality scores, age, sex, or pregnancystatus. Only NP women aged 15–49 years were included. Each variablewas checked for outliers, and extreme values were removed (e.g.,hemoglobin measurements >50 g/dl and plasma LDL concentrations>1000 mg/dL).
The APCAPS and IMS received approvals from the ethics commit-tees of the National Institute of Nutrition, the Indian Council of MedicalResearch, and the London School of Hygiene and Tropical Medicine.Approval was also sought from the village heads and their committees inthe study villages. The participants provided written informed consent,or a witnessed thumbprint if illiterate. The current study was approvedby the Institutional Review Board at the Harvard T.H. Chan School ofPublic Health, Boston, MA.
Exposure assessment
Dietary assessment.Diet was assessed by an interviewer-administered, validated, semi-quantitative FFQ that was developed for use in urban and ruralIndia (12). In the prior FFQ validation study, the FFQ was validatedagainst three 24-hour recalls among 530 factory workers and ruraldwellers, with deattenuated Spearman correlations (ρ) ranging from0.57 for total fat to 0.80 for protein. Food items that accountedfor 90% of between-person variability and 90% of contributions toindividual nutrient intakes were included in the FFQ. Study participantswere asked to report the number of servings (e.g., bowl, ladle, rawnumber) and the unit of frequency (e.g., per day, per week, per month,per year) of 98 commonly consumed food items over the past year.Mixed dishes were disaggregated into individual ingredients based onthe recipes that were specific to the Hyderabad region, which wereprovided by the National Institute of Nutrition, Hyderabad, India(unpublished work). Participants recorded the frequency of use ofdifferent types of cooking oil, and the most frequently used oil type wasused in all recipe calculations for everyone. Where this information wasunavailable, it was assumed that the individual used the same oil typeas another member of the household if this information was present.This was necessary to distinguish between liquid and nonliquid cookingoils.
102S Matsuzaki et al.

We calculated nutrient and food group intakes using nutrientdatabases developed in the IMS. Nutrient values for each ingredientwere derived from the Indian food composition tables (13). For fooditems where data were not available, the USDA nutrient database(Release No.14) or McCance and Widdowsons Composition of Foodswas used for nutrient composition (14, 15).
Diet quality metrics
Global diet quality score.The GDQS is a global measure of diet quality (16) and is based entirelyon 25 food groups. The GDQS food groups were adapted to representfoods in the Indian context. For example, due to high sugar contentsin juice sold in India, we assumed that the items labeled as juice inthe FFQ were actually referring to sugar-sweetened beverages. We didnot have information from the FFQ for 4 categories of food groups[juice (categorized to sugar-sweetened beverages), processed meat, lowfat dairy (2% or less fat content), and deep orange tubers], as thesefoods were not commonly consumed by APCAPS or IMS participants.Therefore, we assumed no consumption for these categories. For organmeats, based upon common recipes provided by the National Instituteof Nutrition, it was assumed that all liver was chicken liver and allbrain was lamb brain. Consequently, liver was added to the poultrycategory, while brain was added to the red meat category. Dailyaverages for each ingredient were determined, and each ingredientwas linked to its corresponding food group. For each food group,a set of scores were computed by summing the daily ingredientamounts for all ingredients within a given food group and categorizingthe intake levels to low, moderate, or high based on the predefinedcutoff levels (16). The GDQS values in this cohort ranged from 0 to46.5 points. We additionally computed the GDQS+ and GDQS−submetrics by only including 16 and 9 food groups, respectively. TheGDQS+ values ranged from 0–29.5, while the GDQS− values rangedfrom 4–13 points.
MDD-W.The MDD-W was developed to measure nutrient intake adequacyamong women living in under-resourced settings and in developingcountries (7). The MDD-W is based on 10 food groups, includingstarchy staples, pulses, nuts and seeds, dairy, meat, poultry and fish, eggs,dark green leafy vegetables, other vitamin A–rich fruits and vegetables,other vegetables, and other fruits. The MDD-W scores range from 0 to10, with 1 point allocated for each of the 10 food groups consumed overthe last 24 hours and 0 points allocated otherwise.
Alternative Healthy Eating Index–2010.The Alternative Healthy Eating Index–2010 (AHEI-2010) is based onfoods and nutrients that are predictive of chronic disease risk (17). Foreach of the 11 components, points range from a scale of 0 (poorest)to 10 (highest). Higher intakes of vegetables (excluding potatoes),fruit (excluding fruit juices), whole grains, nuts and legumes, long-chain n-3 fats, and PUFAs are scored positively, as is moderate alcoholconsumption. In contrast, higher intakes of sugar-sweetened beveragesand fruit juice, red and processed meats, trans fat, and sodium are scoredin reverse. The AHEI-2010 scores range from 0 to 110, with higherscores indicating higher diet quality. We did not include informationon alcohol and trans fat intakes for AHEI-2010 calculations, as theconsumption information was not fully available.
Outcome assessment
Nutrient measures.We calculated intakes of protein, fat, calcium, fiber, iron, cholesterol,zinc, vitamin A, folate, and vitamin B12 using nutrient compositiontables from the Indian Food Composition Database (13). The nutrientadequacy score is a sum of binary adequacy for 8 component nutrients(i.e., protein, calcium, zinc, vitamin A, folate, vitamin B12, fiber, andiron) in terms of daily consumption for the appropriate age groupbased upon National Institutes of Health’s dietary reference intakes (i.e.,<19 years old or 19–49 years old).
Anthropometric data.Weight was measured twice to the nearest 0.1 kg without shoesusing a digital SECA machine. Standing height was also measuredtwice without shoes to the nearest 1 mm with a Leicester plasticstadiometer (Chasmors Ltd.). The average of 2 measurements was usedin this analysis. BMI was calculated as weight (kg)/height (m)2. Waistcircumference (in cm) and midupper arm circumference (in cm) weremeasured using a nonstretchable metallic tape twice, and the average ofthe 2 measurements was used in the analyses.
Vascular and laboratory measures.Blood pressure was measured with a validated oscillometric device atthe right arm in the supine position using appropriate cuff sizes (OmronM5-I). Two measurements were taken and averaged for analyses.Fasting blood samples (at least 8 hours) were collected in appropriatevacutainers, transferred within 1–2 hours (in an icebox at 4–8◦C), andprocessed within 4 hours of collection. Glucose, triglycerides (TGs),total cholesterol, and HDL cholesterol were estimated with an autoanalyzer (ACE Clinical System; Schiapparelli Biosystems) using therecommended kits (Alfa Wasserman). LDL cholesterol was estimatedfrom triglycerides, total cholesterol, and HDL cholesterol using theFriedewald formula (18).
Statistical analysisWe included the following variables to capture the NCD risk: BMI,waist circumference, blood pressure, fasting glucose, triglycerides (TGs),and total, LDL, and HDL cholesterol. All variables were checkedfor outliers, and extreme values were removed (e.g., hemoglobinmeasurements > 50 g/dl and LDL cholesterol > 1000 mg/dl). Listwisedeletion was performed, where those who were missing any variablesthat are required for each analysis were removed from that analysis. Wecomputed the means and SDs of continuous predictors or the counts andrelative percentages within levels of categorical predictors. Descriptivecharacteristics of the study population were stratified by age (i.e., 15–29 and 30–49 years of age). Additionally, we tabulated the proportionof individuals in each food group consumption category (i.e., low,medium, high, and very high) (16). The cutoffs for those categorieswere developed from the analyses of FFQs and 24-hour recall data fromdiverse settings (16). The cutoffs were based on their ability to providea reasonably even distribution of categorical consumption ranges.
We computed energy-adjusted nutrient intakes using the residualmethod (19). Spearman correlations between diet-quality metrics(AHEI-2010, GDQS, GDQS+, GDQS−, and MDD-W) and unadjustedand energy-adjusted daily nutrient intakes were computed. Acrossquintiles of the GDQS, we computed age-adjusted least square meansof anthropometric outcomes, nutrient adequacy scores, and clinical out-comes. We ran the same models adjusting for education levels, occupa-tion types, and standard of living index scores, and found no differencesin substantive findings, except for in the GDQS− and waist circumfer-ence (P values changed from 0.033 to 0.077). We chose to include moreparsimonious models’ results in this manuscript. Each of these outcomeswas considered in both continuous and binary forms using predefinedcutoffs of clinical significance (16). Coefficients for each quintile and95% CIs were computed. We additionally report the overall P valuefor a linear trend across categories of the metrics. For the GDQS−,tertiles were used in place of quintiles due to a limited spread of thedata. The results of the quintile analyses for AHEI-2010 and MDD-Ware included in the Supplemental Table 1. Analyses were performed forthe full cohort (20, 21). We used R (version 4.0.2) for all analyses.
ResultsThe mean age of the women (n = 3041) in the cohortwas 32.4 ± 10.7 years. The mean BMI in the cohort wasin the normal range, although older women (30–49 yearsold) had a higher BMI than younger women at ages 15–29 years (22.8 compared with 19.5 kg/m2; Table 1). On
Validation of global diet quality score in India 103S

TABLE 1 Characteristics of the study participants who were nonpregnant women of reproductive age (15–49 years old) in theAndhra Pradesh Children and Parents Study and Indian Migration Study1
Overall cohortYounger women(15–29 years old)
Older women(30–49 years old)
P value2
(older comparedn = 3041 n = 1449 n = 1592 with younger)
Age, years 32.4 (10.7) 22.2 (3.7) 41.8 (4.8)Anthropometry
Height (cm) 152.0 (5.7) 152.8 (5.7) 151.3 (5.6) <0.001Weight, kg 49.2 (10.7) 45.6 (9.0) 52.4 (11.0) <0.001BMI, kg/m2 21.3 (4.3) 19.5 (3.5) 22.8 (4.4) <0.001
Dietary intakeEnergy, kcal/d 1975 (695) 2043 (705) 1913 (681) <0.001Protein, g/d 47.9 (18.2) 49.2 (18) 46.7 (18) <0.001Protein, % energy 9.7 (1.1) 9.6 (1.0) 9.7 (1.3) 0.011Fat, g/d 42.8 (23.0) 44.5 (23.0) 41.2 (24.0) <0.001Fat, % energy 19.2 (5.9) 19.3 (5.7) 19.0 (6.1) 0.127Calcium, mg/d 483 (280) 463 (242) 501 (309) <0.001Fiber, g/d 8.0 (4.6) 8.3 (4.5) 7.7 (4.6) 0.001Iron, mg/d 10.6 (5.6) 10.6 (4.9) 10.5 (6.1) 0.841Cholesterol, mg/d 129 (85.0) 131 (87.0) 128 (84.0) 0.454Zinc, mg/d 7.6 (2.7) 7.8 (2.7) 7.4 (2.7) <0.001Vitamin A, μg/d 622 (626) 569 (484) 670 (728) <0.001Folate, μg/d 201 (92.0) 208 (89.0) 194 (94.0) <0.001Vitamin B12, μg/d 3.1 (5.6) 2.5 (4.9) 3.6 (6.1) <0.001
Diet scoresGDQS 23.0 (3.6) 23.2 (3.5) 22.8 (3.7) 0.006GDQS+ 11.8 (4.0) 12.1 (3.8) 11.5 (4.1) <0.001GDQS− 11.3 (1.4) 11.1 (1.4) 11.4 (1.4) <0.001AHEI-2010 26.9 (4.8) 27.1 (4.8) 26.7 (4.9) 0.010MDD-W 6.3 (1.5) 6.3 (1.4) 6.3 (1.5) 0.223
1Values are means (SDs) unless otherwise noted. AHEI-2010, Alternative Healthy Eating Index–2010; GDQS, Global Diet Quality Score; GDQS−, Global Diet Quality Scorenegative submetric; GDQS+, Global Diet Quality Score positive submetric; MDD-W, Minimum Diet Diversity for Women.2Welch 2-sample t-test.
average, the consumption levels of fiber, zinc, and folate werehigher among younger women, while older women had higherintakes of calcium, vitamin A, and vitamin B12. Interestingly,younger women had higher scores on the GDQS and theGDQS+ submetric. In comparison, older women had a higherscore on the GDQS− submetric, indicating lower consumptionlevels of unhealthy foods.
In this study population, consumption of fruits, includingcitrus (83.9%) and deep orange fruits (89.1%), was low(Table 2). However, a larger percentage of women (77.7%)consumed medium to high amounts of other fruits, like apples,jackfruit, and tamarind. More than 90% of women had lowconsumption levels of cruciferous vegetables and deep orangevegetables, while more than half of the women consumedmedium to high amounts of dark green leafy vegetables. Nearly70% consumed whole grains in medium to high category levelsof the GDQS, while all women consumed high amounts ofrefined grains and baked goods. Interestingly, more than 70%of the study population had medium to high consumption levelsof plant protein in the form of legumes and nuts and seeds.The predominant form of animal protein that was consumedwas eggs, with about 46% of women having medium to highconsumption levels. In contrast, consumption levels of poultry,fish, and red meat were much lower, with 65.2% of womenconsuming low amounts of poultry, 93.2% consuming lowamounts of fish, and nearly 81% consuming low amounts ofred meat. Processed meat was not consumed in this cohort.While sugar-sweetened beverages were not widely consumed,nearly 80% of participants consumed medium to high amounts
of high fat dairy. Likewise, the majority had considerably highconsumption of liquid oils (94.9%).
The mean GDQS value was 23.0 (SD, 3.6), with a possiblemaximum point of 49 points. While GDQS+ values wereroughly normally distributed, with a mean score of 11.8(SD, 4.0), the distribution of the GDQS− values was slightlyleft-skewed, with a mean score of 11.3 (median, 11.0; Supple-mental Figure 1). Table 3 shows the correlations between eachscore and the energy-adjusted nutrient intake estimated fromthe FFQ, as well as other scores. The GDQS was more correlatedwith intakes of folate (ρ = 0.35), fiber (ρ = 0.29), total fat (ρ =0.26), iron (ρ = 0.25), zinc (ρ = 0.23), and protein (ρ = 0.23)than other nutrients. The GDQS+ was positively correlatedwith intakes of folate (ρ = 0.39), total fat (ρ = 0.34), fiber(ρ = 0.31), and iron (ρ = 0.27) and inversely correlated withintake of vitamin B12 (ρ = −0.14). As expected, the GDQS−submetric was inversely associated with intakes of total fat(ρ = −0.31), saturated fat (ρ = −0.23), and calcium (ρ =−0.23). The AHEI-2010 was positively correlated with intakesof polyunsaturated fat (ρ = 0.62), total fat (ρ = 0.39), and iron(ρ = 0.30), while the MDD-W was positively correlated withintakes of folate (ρ = 0.37), protein (ρ = 0.35), and total fat(ρ = 0.34). The GDQS was very strongly correlated with theGDQS+ (ρ = 0.94) and the MDD-W (ρ = 0.72) and was notcorrelated with the GDQS− (ρ = −0.08). The AHEI-2010 wasmost strongly correlated with the GDQS+ submetric (ρ = 0.43).
In the quintile regression with continuous outcomes(Table 4), BMI, midupper arm circumference, and waistcircumference were higher with higher values of the GDQS
104S Matsuzaki et al.

TABLE 2 Distributions of the categories for Global Diet Quality Scores1
GDQS Submetric Categories2 Low Medium High Very high3
Positive Citrus fruits 83.9 15.2 0.9 NACruciferous vegetables 95.3 4.7 0.1 NADark green leafy vegetables 43.1 54.1 2.9 NADeep orange fruits 89.1 10.1 0.8 NADeep orange vegetables 93.7 5.9 0.4 NADeep orange tubers4 100 0.0 0.0 NAEggs 54.0 41.9 4.1 NAFish and shellfish 93.2 6.4 0.5 NAWhole grains 26.7 26.2 47.1 NALow fat dairy4 100 0.0 0.0 NALegumes 3.0 59.8 37.3 NALiquid oils 4.0 1.1 94.9 NANuts and seeds 19.8 54.1 26.1 NAOther fruits 22.3 48.6 29.1 NAOther vegetables 0.9 72.3 26.7 NAPoultry and game meat 65.2 33.5 1.3 NA
Negative Processed meat4 100 0.0 0.0 NARed meat5 80.5 19.4 0.1 NAHigh fat dairy6 10.9 7.8 71.1 10.1Refined grains and baked goods 0.0 0.0 100 NAJuice7 100 0.0 0.0 NASugar-sweetened beverages 89.8 9.1 1.0 NASweets and ice cream 13.7 35.1 51.3 NAWhite roots and tubers 94.4 5.4 0.2 NAPurchased deep fried foods 28.4 54.4 17.3 NA
1The values are in percentages. GDQS, Global Diet Quality Score; NA, not applicable.2The categorization of the intake levels was done based on the application of Nurses’ Health Study’s FFQ standard portion sizes toPrime Diet Quality Score frequency groups. We doubled the cutoffs for refined grains and added a fourth scoring category for highfat dairy (equivalent to 3 + servings). Further adjustments were made to the cutoffs based on the analysis conducted for theoperationalization paper included in this supplement (22).3The “very high” category only applied to the high fat dairy category.4Deep orange tubers, low fat dairy, and processed meat consumption is uncommon in this population; therefore, all were assumedto have low levels of consumption.5Red meat is nonlinearly scored (0, 1, 0 points).6Points for high fat dairy categories were nonlinear.7Due to high sugar contents in juice sold in India, we categorized all juice consumption under sugar-sweetened beverages.
and GDQS+. As expected, the nutrient adequacy score washigher with higher scores on the GDQS and GDQS+ submetric.However, with higher GDQS and GDQS+ values, totalcholesterol was higher while HDL cholesterol was lower. Noassociations were seen between the GDQS and GDQS+ valuesand hemoglobin, fasting glucose, blood pressure measures, andtriglyceride concentrations. These trends tended to differ withthe GDQS−. Unlike the GDQS and GDQS+, increasing valuesof the GDQS− were associated with lower BMI, midupper armcircumference, and waist circumference values. Most notably,increasing values of the GDQS− were associated with lowernutrient adequacy scores. We found no associations between theGDQS− and measures of hemoglobin, fasting glucose, bloodpressure, or lipids.
Discussion
In this cross-sectional analysis of an urbanizing South Indianpopulation, we found that a global metric of diet quality wasvery strongly associated with measures of nutrient adequacy butless so with cardiometabolic outcomes. In particular, the GDQSand the GDQS+ submetric were positively associated withthe macronutrients protein and fat and several micronutrientsthat are of nutritional concern in LMICs, such as folate, fiber,
and iron. While the positive submetric was more stronglyassociated with these nutrients, the GDQS− submetric wasinversely associated with saturated fat. Interestingly, althoughthe GDQS and the GDQS+ submetric were adversely associatedwith anthropometric measures and lipid measures, higher scoreson the GDQS− submetric were associated with lower BMI,midupper arm circumference, and waist circumference values.
It is notable that both the GDQS and GDQS+ werecorrelated with intakes of folate and iron, 2 micronutrientsthat are of particular concern among women of reproductiveage in India (23, 24). Recent surveys estimate that close to75% of Indian women are folate insufficient (23), while nearlyhalf are iron-deficient (24). Most recently, WRA were includedas beneficiaries under the National Iron Plus Initiative of theGovernment of India. Under this program, WRA receive 100 mgof elemental iron and 500 ug of folic acid weekly throughoutthe year (25). However, the uptake of this program and thecoverage of beneficiaries has been poor at the national level(26). It is therefore especially significant that the GDQS wasable to assess nutrient adequacy in this demographic group.Despite evidence of associations between the scores and intakesof iron and an overall measure of nutrient adequacy, it isalso important to note that there was no clear evidence ofan association between the GDQS, AHEI-2010, or MDD-W and hemoglobin concentrations in this population. This is
Validation of global diet quality score in India 105S

TABLE 3 Correlation between diet quality scores and estimated nutrient intake1
GDQS GDQS+ GDQS− AHEI-2010 MDD-W
ρ P ρ P ρ P ρ P ρ P
Nutrient intakeCalcium 0.10 <0.001 0.18 <0.001 − 0.23 <0.001 0.19 <0.001 0.24 <0.001Fiber 0.29 <0.001 0.31 <0.001 − 0.12 <0.001 0.25 <0.001 0.23 <0.001Folate 0.35 <0.001 0.39 <0.001 − 0.21 <0.001 0.30 <0.001 0.37 <0.001Iron 0.25 <0.001 0.27 <0.001 − 0.11 <0.001 0.32 <0.001 0.27 <0.001Monounsaturated fat 0.21 <0.001 0.25 <0.001 − 0.18 <0.001 0.03 0.119 0.26 <0.001Protein 0.23 <0.001 0.25 <0.001 − 0.12 <0.001 0.17 <0.001 0.35 <0.001Polyunsaturated fat 0.20 <0.001 0.24 <0.001 − 0.17 <0.001 0.62 <0.001 0.19 <0.001Saturated fat 0.10 <0.001 0.17 <0.001 − 0.23 <0.001 0.03 0.108 0.23 <0.001Total fat 0.26 <0.001 0.34 <0.001 − 0.31 <0.001 0.39 <0.001 0.34 <0.001Vitamin A 0.14 <0.001 0.12 <0.001 0.01 0.414 0.12 <0.001 0.18 <0.001Vitamin B12 − 0.11 <0.001 − 0.14 <0.001 0.11 <0.001 0.01 0.502 − 0.03 0.147Zinc 0.23 <0.001 0.20 <0.001 0.03 0.156 0.05 0.008 0.26 <0.001
ScoreGDQS 1 0.94 <0.001 − 0.08 <0.001 0.38 <0.001 0.72 <0.001GDQS+ — 1 − 0.39 <0.001 0.43 <0.001 0.76 <0.001GDQS− — — 1 − 0.24 <0.001 − 0.29 <0.001AHEI-2010 — — — 1 0.34 <0.001MDD-W — — — — 1
1All estimated nutrient intakes were adjusted for energy. P values for score correlations are based upon asymptotic approximations of the t/F distribution. AHEI-2010,Alternative Healthy Eating Index–2010; GDQS, Global Diet Quality Score; GDQS−, Global Diet Quality Score negative submetric; GDQS+, Global Diet Quality Score positivesubmetric; MDD-W, Minimum Diet Quality for Women.
an area that requires future research, as anemia is commonamong WRA in India, with over 50% of WRA estimated tobe anemic in 2016 (27). The null association with hemoglobinconcentrations may be due to the fact that over 90% ofthe total iron present in the Indian diet is nonheme iron,which has much lower bioavailability (28). Additionally, ironabsorption inhibitors that are highly prevalent in the Indiandiet present an India-specific challenge in preventing anemia.For example, black tea, which is a rich source of polyphenolsand can inhibit iron absorption (29), was not included inthe score calculation but is widely and frequently consumed.Legumes contain phytates, another potential inhibitor for ironabsorption, are also consumed frequently in this population andare scored positively in the GDQS.
While the MDD-W showed similar associations withmicronutrients, it is important to note that the GDQS wasdesigned to capture the risks of both undernutrition andovernutrition, and may therefore be used in communitiesfacing the double burden of malnutrition. Interestingly, in thispopulation, higher scores on both the GDQS and GDQS+ wereassociated with higher anthropometric measures, includingBMI, midupper arm circumference, and waist circumferencevalues. However, it is worth mentioning that BMIs and waistcircumferences were in the healthy range across quintiles ofthe GDQS metric. The higher BMIs with higher GDQS scoresmay simply reflect better food security and access to a widervariety of foods. On the contrary, we did find that higherscores on the GDQS− submetric, indicating less consumptionof unhealthy foods, tended to be associated with a lowerBMI and a lower waist circumference. Notably, foods thatmake up the GDQS− submetric, including red meat, processedmeat, refined grains, sugar-sweetened beverages, sweets, andfried foods, have all been previously reported to be associatedwith adverse cardiometabolic outcomes (30–34). In a previouspublication of the IMS data, an “animal food” dietary patterncharacterized by intakes of red meat, poultry, fish/seafood,
and eggs was adversely associated with cardiometabolic riskfactors (35). Although a majority of participants consumed lowamounts of red meat, sugar-sweetened beverages, and whiteroots and tubers, all participants consumed high amounts ofrefined grains and baked goods, and a significant proportionconsumed fried foods. This pattern of distribution is reminiscentof the early stages of the nutrition transition (36) and maysignal more adverse changes to the diet for this urbanizingcommunity. Previous research from the subcontinent has shownthat excessive consumption of red meat showed a strongerassociation with cardiovascular disease than the protectiveeffects of physical activity (37).
There were several other findings that were unique to thisstudy setting. Most notable was the evidence of a negativeassociation of the GDQS with HDL cholesterol and a positiveassociation with total cholesterol. These associations may bedriven by dietary patterns of the subcontinent. For instance,legumes, termed as the poor man’s rich protein, are oftenconsumed with large amounts of white rice and other refinedgrain products. The most recent multinational ProspectiveUrban Rural Epidemiology study showed that higher intakeof white rice (≥450 g/day compared with <150 g/day)was associated with a 20% higher risk of diabetes, with anearly 60% higher risk among participants from South Asia(38). Another multi-ethnic study showed that carbohydrateintake may partially explain poor lipid profiles among SouthAsians (39). While it may not be feasible to convince the Indianpopulation to replace white rice with brown rice (40), a possiblebehavioral change may be to decrease the proportion of whiterice and increase the proportion of legumes. In fact, in 1 studyof Costa Ricans that follow a staple dietary pattern of white riceand beans, a higher proportion of beans to rice (2:1 and 3:1) wasassociated with higher HDL cholesterol, lower concentrationsof triglycerides and fasting glucose, and lower odds of metabolicsyndrome (41). Of note, there were several food items that werecommonly consumed in this population (e.g., coconuts) but
106S Matsuzaki et al.
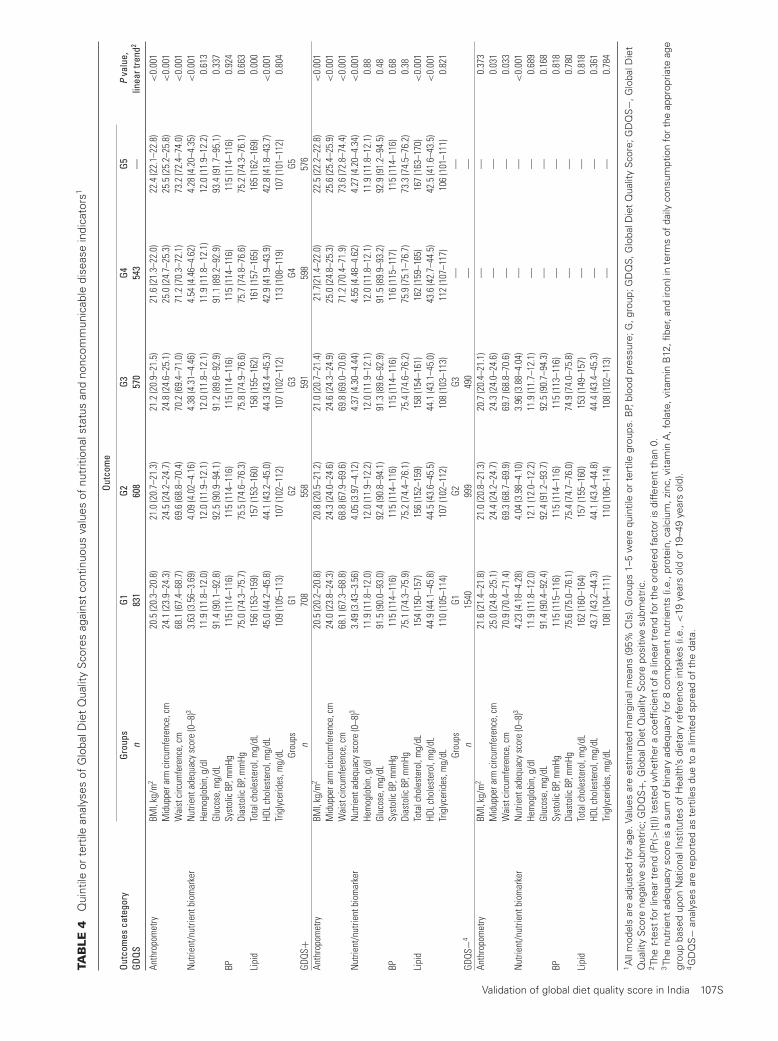
TAB
LE4
Qui
ntile
orte
rtile
anal
yses
ofG
loba
lDie
tQ
ualit
yS
core
sag
ains
tco
ntin
uous
valu
esof
nutr
ition
alst
atus
and
nonc
omm
unic
able
dise
ase
indi
cato
rs1
Outc
ome
Outc
omes
cate
gory
Grou
psG1
G2G3
G4G5
Pva
lue,
linea
rtre
nd2
GDQS
n83
160
857
054
3—
Anth
ropo
met
ryBM
I,kg
/m2
20.5
(20.
3–20
.8)
21.0
(20.
7–21
.3)
21.2
(20.
9–21
.5)
21.6
(21.
3–22
.0)
22.4
(22.
1–22
.8)
<0.
001
Mid
uppe
rarm
circ
umfe
renc
e,cm
24.1
(23.
9–24
.3)
24.5
(24.
2–24
.7)
24.8
(24.
6–25
.1)
25.0
(24.
7–25
.3)
25.5
(25.
2–25
.8)
<0.
001
Wai
stci
rcum
fere
nce,
cm68
.1(6
7.4–
68.7
)69
.6(6
8.8–
70.4
)70
.2(6
9.4–
71.0
)71
.2(7
0.3–
72.1
)73
.2(7
2.4–
74.0
)<
0.00
1N
utrie
nt/n
utrie
ntbi
omar
ker
Nut
rient
adeq
uacy
scor
e(0
–8)3
3.63
(3.5
6–3.
69)
4.09
(4.0
2–4.
16)
4.38
(4.3
1–4.
46)
4.54
(4.4
6–4.
62)
4.28
(4.2
0–4.
35)
<0.
001
Hem
oglo
bin,
g/dl
11.9
(11.
8–12
.0)
12.0
(11.
9–12
.1)
12.0
(11.
8–12
.1)
11.9
(11.
8–12
.1)
12.0
(11.
9–12
.2)
0.61
3Gl
ucos
e,m
g/dL
91.4
(90.
1–92
.8)
92.5
(90.
9–94
.1)
91.2
(89.
6–92
.9)
91.1
(89.
2–92
.9)
93.4
(91.
7–95
.1)
0.33
7BP
Syst
olic
BP,m
mHg
115
(114
–116
)11
5(1
14–1
16)
115
(114
–116
)11
5(1
14–1
16)
115
(114
–116
)0.
924
Dias
tolic
BP,m
mHg
75.0
(74.
3–75
.7)
75.5
(74.
6–76
.3)
75.8
(74.
9–76
.6)
75.7
(74.
8–76
.6)
75.2
(74.
3–76
.1)
0.66
3Li
pid
Tota
lcho
lest
erol
,mg/
dL15
6(1
53–1
59)
157
(153
–160
)15
8(1
55–1
62)
161
(157
–165
)16
5(1
62–1
69)
0.00
0HD
Lch
oles
tero
l,m
g/dL
45.0
(44.
2–45
.8)
44.1
(43.
2–45
.0)
44.3
(43.
4–45
.3)
42.9
(41.
9–43
.9)
42.8
(41.
8–43
.7)
<0.
001
Trig
lyce
rides
,mg/
dL10
9(1
05–1
13)
107
(102
–112
)10
7(1
02–1
12)
113
(108
–119
)10
7(1
01–1
12)
0.80
4Gr
oups
G1G2
G3G4
G5GD
QS+
n70
855
859
159
857
6An
thro
pom
etry
BMI,
kg/m
220
.5(2
0.2–
20.8
)20
.8(2
0.5–
21.2
)21
.0(2
0.7–
21.4
)21
.7(2
1.4–
22.0
)22
.5(2
2.2–
22.8
)<
0.00
1M
idup
pera
rmci
rcum
fere
nce,
cm24
.0(2
3.8–
24.3
)24
.3(2
4.0–
24.6
)24
.6(2
4.3–
24.9
)25
.0(2
4.8–
25.3
)25
.6(2
5.4–
25.9
)<
0.00
1W
aist
circ
umfe
renc
e,cm
68.1
(67.
3–68
.8)
68.8
(67.
9–69
.6)
69.8
(69.
0–70
.6)
71.2
(70.
4–71
.9)
73.6
(72.
8–74
.4)
<0.
001
Nut
rient
/nut
rient
biom
arke
rN
utrie
ntad
equa
cysc
ore
(0–8
)33.
49(3
.43–
3.56
)4.
05(3
.97–
4.12
)4.
37(4
.30–
4.44
)4.
55(4
.48–
4.62
)4.
27(4
.20–
4.34
)<
0.00
1He
mog
lobi
n,g/
dl11
.9(1
1.8–
12.0
)12
.0(1
1.9–
12.2
)12
.0(1
1.9–
12.1
)12
.0(1
1.8–
12.1
)11
.9(1
1.8–
12.1
)0.
88Gl
ucos
e,m
g/dL
91.5
(90.
0–93
.0)
92.4
(90.
8–94
.1)
91.3
(89.
6–92
.9)
91.5
(89.
9–93
.2)
92.9
(91.
2–94
.5)
0.48
BPSy
stol
icBP
,mm
Hg11
5(1
14–1
16)
115
(114
–116
)11
5(1
14–1
16)
116
(115
–117
)11
5(1
14–1
16)
0.68
Dias
tolic
BP,m
mHg
75.1
(74.
3–75
.9)
75.2
(74.
4–76
.1)
75.4
(74.
6–76
.2)
75.9
(75.
1–76
.7)
73.3
(74.
5–76
.2)
0.38
Lipi
dTo
talc
hole
ster
ol,m
g/dL
154
(150
–157
)15
6(1
52–1
59)
158
(154
–161
)16
2(1
59–1
65)
167
(163
–170
)<
0.00
1HD
Lch
oles
tero
l,m
g/dL
44.9
(44.
1–45
.8)
44.5
(43.
6–45
.5)
44.1
(43.
1–45
.0)
43.6
(42.
7–44
.5)
42.5
(41.
6–43
.5)
<0.
001
Trig
lyce
rides
,mg/
dL11
0(1
05–1
14)
107
(102
–112
)10
8(1
03–1
13)
112
(107
–117
)10
6(1
01–1
11)
0.82
1Gr
oups
G1G2
G3—
—GD
QS−4
n15
4099
949
0—
—An
thro
pom
etry
BMI,
kg/m
221
.6(2
1.4–
21.8
)21
.0(2
0.8–
21.3
)20
.7(2
0.4–
21.1
)—
—0.
373
Mid
uppe
rarm
circ
umfe
renc
e,cm
25.0
(24.
8–25
.1)
24.4
(24.
2–24
.7)
24.3
(24.
0–24
.6)
——
0.03
1W
aist
circ
umfe
renc
e,cm
70.9
(70.
4–71
.4)
69.3
(68.
7–69
.9)
69.7
(68.
8–70
.6)
——
0.03
3N
utrie
nt/n
utrie
ntbi
omar
ker
Nut
rient
adeq
uacy
scor
e(0
–8)3
4.23
(4.1
8–4.
28)
4.04
(3.9
8–4.
10)
3.96
(3.8
8–4.
04)
——
<0.
001
Hem
oglo
bin,
g/dl
11.9
(11.
8–12
.0)
12.1
(12.
0–12
.2)
11.9
(11.
7–12
.1)
——
0.68
9Gl
ucos
e,m
g/dL
91.4
(90.
4–92
.4)
92.4
(91.
2–93
.7)
92.5
(90.
7–94
.3)
——
0.16
8BP
Syst
olic
BP,m
mHg
115
(115
–116
)11
5(1
14–1
16)
115
(113
–116
)—
—0.
818
Dias
tolic
BP,m
mHg
75.6
(75.
0–76
.1)
75.4
(74.
7–76
.0)
74.9
(74.
0–75
.8)
——
0.78
0Li
pid
Tota
lcho
lest
erol
,mg/
dL16
2(1
60–1
64)
157
(155
–160
)15
3(1
49–1
57)
——
0.81
8HD
Lch
oles
tero
l,m
g/dL
43.7
(43.
2–44
.3)
44.1
(43.
4–44
.8)
44.4
(43.
4–45
.3)
——
0.36
1Tr
igly
cerid
es,m
g/dL
108
(104
–111
)11
0(1
06–1
14)
108
(102
–113
)—
—0.
784
1A
llm
odel
sar
ead
just
edfo
rag
e.Va
lues
are
estim
ated
mar
gina
lmea
ns(9
5%C
Is).
Gro
ups
1–5
wer
equ
intil
eor
tert
ilegr
oups
.BP,
bloo
dpr
essu
re;G
,gro
up;G
DQ
S,G
loba
lDie
tQ
ualit
yS
core
;GD
QS−,
Glo
balD
iet
Qua
lity
Sco
rene
gativ
esu
bmet
ric;G
DQ
S+,
Glo
balD
iet
Qua
lity
Sco
repo
sitiv
esu
bmet
ric.
2Th
et-
test
for
linea
rtr
end
(Pr(>
|t|))
test
edw
heth
era
coef
ficie
ntof
alin
ear
tren
dfo
rth
eor
dere
dfa
ctor
isdi
ffere
ntth
an0.
3Th
enu
trie
ntad
equa
cysc
ore
isa
sum
ofbi
nary
adeq
uacy
for
8co
mpo
nent
nutr
ient
s(i.
e.,p
rote
in,c
alci
um,z
inc,
vita
min
A,f
olat
e,vi
tam
inB
12,fi
ber,
and
iron)
inte
rms
ofda
ilyco
nsum
ptio
nfo
rth
eap
prop
riate
age
grou
pba
sed
upon
Nat
iona
lIns
titut
esof
Hea
lth’s
diet
ary
refe
renc
ein
take
s(i.
e.,<
19ye
ars
old
or19
–49
year
sol
d).
4G
DQ
S−
anal
yses
are
repo
rted
aste
rtile
sdu
eto
alim
ited
spre
adof
the
data
.
Validation of global diet quality score in India 107S

were not included in this validation study, as they did not fit intothe categories chosen during the development of the GDQS.Future work can modify the GDQS to fit culturally specificfoods that may be associated with nutrient adequacy and diseaserisks.
Previous research has shown that South Asians suffer adisproportionately higher burden of cardiometabolic diseasescompared to non-Hispanic whites and other Asian groups(42, 43). These findings on South Asian immigrants inWestern countries serve as an example of the potential healthimpacts of dietary shifts as India goes through a period ofunprecedented socioeconomic development. In this context, theGDQS provides a flexible framework for adjusting for dietaryshifts and capturing diet quality as the country undergoesnutrition transition.
Our study has several strengths. The availability of apreviously validated, ethnic-specific FFQ to measure dietsallowed us to capture foods that are unique to this region.In addition, the use of a well-phenotyped study populationthat lives in an urbanizing community allowed us to examineassociations between diet and various cardiometabolic riskfactors. However, there are several limitations that need tobe recognized. First, our study is cross-sectional in nature,thereby limiting us to make causal inferences of observedassociations. Second, while the GDQS was intended for NP andnonlactating women of reproductive age, our data set did nothave information on lactation status.
In conclusion, the GDQS is a promising and simple-to-use tool to monitor population-level changes in diet quality,especially for undernutrition-related indicators, in India. Whilethe GDQS offers a simple tool to monitor changes in dietquality in urbanizing areas of India, there are some context-specific challenges. Further refinement of the scores for theIndian context are needed. Future research should also focus onunderstanding how longitudinal changes in the GDQS influencesubsequent disease risks.
Acknowledgments
We gratefully acknowledge the following collaborators fortheir important contributions to this research: Santhi Bhogadi,Poppy Mallinson, and Srivalli Adanki. We also thank all of thestakeholders who provided technical input as part of the GDQSStakeholder Meeting held on 1 September 2020.
The authors’ responsibilities were as follows – WCW, SNB,WWF, TTF, YL, SB, MD, MJS: designed the research; SK:provided essential materials; MM, NB: analyzed the data;MM, SNB: provided technical guidance, supervised analyses,and wrote the paper; MM: had primary responsibility for thefinal content; and all authors: read and approved the finalmanuscript.
References1. Prabhakaran D, Jeemon P, Sharma M, Roth GA, Johnson C,
Harikrishnan S, Gupta R, Pandian JD, Naik N, Roy A, et al. Thechanging patterns of cardiovascular diseases and their risk factors inthe states of India: The Global Burden of Disease Study 1990–2016.Lancet Glob Health 2018;6(12):e1339–51.
2. Tandon N, Anjana RM, Mohan V, Kaur T, Afshin A, Ong K,Mukhopadhyay S, Thomas N, Bhatia E, Krishnan A, et al. Theincreasing burden of diabetes and variations among the states of India:The Global Burden of Disease Study 1990–2016. Lancet Glob Health2018;6(12):e1352–62.
3. International Institute for Population Sciences. Fact sheets.Key indicators 22 states/UTs from phase-I. National Family
Health Survey (NFHS-5) 2019–20 [Internet]. Mumbai, India:International Institute for Population Sciences; 2020. Availablefrom: http://rchiips.org/NFHS/NFHS-5_FCTS/NFHS-5%20State%20Factsheet%20Compendium_Phase-I.pdf
4. Clark H. NCDs: A challenge to sustainable human development. LancetNorth Am Ed 2013;381(9866):510–1.
5. Grosso G, Mateo A, Rangelov N, Buzeti T, Birt C; on behalf of theFood and Nutrition Section of the European Public Health Association.Nutrition in the context of the sustainable development goals. Eur JPublic Health 2020;30(Suppl 1):i19–23.
6. Food and Agriculture Organization, World Health Organization.FAO/WHO Second International Conference on Nutrition(ICN2) [Internet]. World Health Organization. Available from:https://www.who.int/news-room/events/detail/2014/11/19/default-calendar/fao-who-second-international-conference-on-nutrition-(icn2)
7. Food and Agriculture Organization and Family Health International360. 2016. Minimum dietary diversity for women: A guide formeasurement. Rome, Italy: The Food and Agriculture Organization ofthe United Nations.
8. Fung TT, Isanaka S, Hu FB, Willett WC. International food group–baseddiet quality and risk of coronary heart disease in men and women. AmJ Clin Nutr 2018;107(1):120–9.
9. Kinra S, Krishna KR, Kuper H, Sarma KR, Prabhakaran P, Gupta V,Walia GK, Bhogadi S, Kulkarni B, Kumar A, et al. Cohort profile:Andhra Pradesh Children and Parents Study (APCAPS). Int J Epidemiol2014;43(5):1417–24.
10. Taylor AE, Kuper H, Varma RD, Wells JC, Bell JD, V Radhakrishna K,Kulkarni B, Kinra S, Timpson NJ, Ebrahim S, et al. Validation of dualenergy X-ray absorptiometry measures of abdominal fat by comparisonwith magnetic resonance imaging in an Indian population. PLoS One2012;7(12):e51042.
11. Ebrahim S, Kinra S, Bowen L, Andersen E, Ben-Shlomo Y, Lyngdoh T,Ramakrishnan L, Ahuja RC, Joshi P, Das SM, et al. The effect of rural-to-urban migration on obesity and diabetes in India: A cross-sectionalstudy. PLoS Med 2010;7(4):e1000268.
12. Bowen L, Bharathi AV, Kinra S, Destavola B, Ness A, Ebrahim S.Development and evaluation of a semi-quantitative food frequencyquestionnaire for use in urban and rural India. Asia Pac J Clin Nutr2012;21:355–60.
13. Gopalan C, Rama Sastri BV, Balasubramanian SC. Nutritive valueof Indian foods (NVIF) : National Institute of Nutrition, Hyderabad,India [Internet]. Dev Publishers & Distributors; 1971. Availablefrom: https://www.abebooks.co.uk/Nutritive-Value-Indian-Foods-NVIF-Gopalan/7622043681/bd
14. US Department of Agriculture and Agricultural Research Service.USDA nutrient database for standard reference release 14. Beltsville,Maryland: USDA Nutrient Data Laboratory; 2001.
15. Welch AU, Buss D, Paul A, Southgate D. McCance and Widdowson’sThe Composition of Foods. Cambridge, UK: Royal Society ofChemistry; 1995.
16. Bromage S, Batis C, Bhupathiraju SN, Fawzi WW, Fung TT, LiY, Deitchler M, Angulo E, Birk N, Castellanos-Gutiérrez A, et al.Development and validation of a novel food-based global diet qualityscore (GDQS). J Nutr 2021;151(Suppl 10):75S–92S.
17. Chiuve SE, Fung TT, Rimm EB, Hu FB, McCullough ML, Wang M,Stampfer MJ, Willett WC. Alternative dietary indices both stronglypredict risk of chronic disease. J Nutr 2012;142(6):1009–18.
18. Friedewald WT, Levy RI, Fredrickson DS. Estimation of theconcentration of low-density lipoprotein cholesterol in plasma, withoutuse of the preparative ultracentrifuge. Clin Chem 1972;18(6):499–502.
19. Rhee JJ, Cho E, Willett WC. Energy adjustment of nutrient intakes ispreferable to adjustment using body weight and physical activity inepidemiological analyses. Public Health Nutr. 2014;17:1054–60.
20. Wolfe DA. A distribution-free test for related correlation coefficients.Technometrics 1977;19:507–9.
21. Institute of Medicine. 2006. Dietary reference intakes: The essentialguide to nutrient requirements. Otten JJ, Hellwig JP, Meyers LD,editors. Washington, DC: The National Academies Press. https://doi.org/10.17226/11537.
22. Mourad M, Bromage S, Fung TT, Isanaka S, Matsuzaki M, Batis C,Castellanos-Gutiérrez A, Angulo E, Birk N, Bhupathiraju SN, et al.There’s an app for that: Development of an application to operationalizethe Global Diet Quality Score. J Nutr 2021;151(Suppl 10):176S–84S.
108S Matsuzaki et al.

23. Das R, Duggal M, Kaur M, Senee HK, Dhanjal GS, Rosenthal J, KumarA, Rose C, Bhardwaj S, Serdula M, et al. Folate and vitamin B12status in Women of Reproductive Age in Rural Areas in Haryana,Northern India (P10-117-19). Curr Dev Nutr.[accessed 2021 February12]. doi:10.1093/cdn/nzz034.P10-117-19)
24. Rai RK, Fawzi WW, Barik A, Chowdhury A. The burden of iron-deficiency anaemia among women in India: How have iron and folicacid interventions fared? WHO South East Asia J Public Health2018;7(1):18–23.
25. Ministry of Health & Family Welfare. Guidelines for control ofiron deficiency anaemia. National Iron Plus Initiative. New Delhi,India: Ministry of Health & Family Welfare, Government of India;2013. https://www.nhm.gov.in/images/pdf/programmes/child-health/guidelines/Control-of-Iron-Deficiency-Anaemia.pdf.
26. Kapil U, Kapil R, Gupta A. National iron plus initiative: Current status& future strategy. Indian J Med Res 2019;150:239–47.
27. Nguyen PH, Scott S, Avula R, Tran LM, Menon P. Trends anddrivers of change in the prevalence of anaemia among 1 millionwomen and children in India, 2006 to 2016. BMJ Global Health.2018;3(5):e001010.
28. Thankachan P, Muthayya S, Walczyk T, Kurpad AV, Hurrell RF.An analysis of the etiology of anemia and iron deficiency in youngwomen of low socioeconomic status in Bangalore, India. Food Nutr Bull2007;28(3):328–36.
29. Thankachan P, Walczyk T, Muthayya S, Kurpad AV, Hurrell RF. Ironabsorption in young Indian women: The interaction of iron status withthe influence of tea and ascorbic acid. Am J Clin Nutr 2008;87(4):881–6.
30. Pagliai G, Dinu M, Madarena MP, Bonaccio M, Iacoviello L, Sofi F.Consumption of ultra-processed foods and health status: A systematicreview and meta-analysis. Br J Nutr. 2021;125(3):308–18.
31. Gadiraju TV, Patel Y, Gaziano JM, Djoussé L. Fried food consumptionand cardiovascular health: A review of current evidence. Nutrients2015;7:8424–30.
32. Imamura F, O’Connor L, Ye Z, Mursu J, Hayashino Y, BhupathirajuSN, Forouhi NG. Consumption of sugar sweetened beverages,artificially sweetened beverages, and fruit juice and incidence of type 2diabetes: Systematic review, meta-analysis, and estimation of populationattributable fraction. BMJ 2015;351:h3576.
33. Aune D, Norat T, Romundstad P, Vatten LJ. Whole grain and refinedgrain consumption and the risk of type 2 diabetes: A systematic review
and dose-response meta-analysis of cohort studies. Eur J Epidemiol2013;28(11):845–58.
34. Abete I, Romaguera D, Vieira AR, Munain AL, Norat T. Associationbetween total, processed, red and white meat consumption and all-cause, CVD and IHD mortality: A meta-analysis of cohort studies. Br JNutr. 2014;112(5):762–75.
35. Shridhar K, Satija A, Dhillon PK, Agrawal S, Gupta R, Bowen L, KinraS, Bharathi AV, Prabhakaran D, Srinath Reddy K, et al. Associationbetween empirically derived dietary patterns with blood lipids, fastingblood glucose and blood pressure in adults–The India Migration Study.Nutr J 2018;17(1):15.
36. Popkin BM. The nutrition transition in the developing world. Dev PolicyRev 2003;21(5-6):581–97.
37. Purohit N, Bhati DK, Gupta SD, Kundu AS. Quantifying socioeconomicand lifestyle related health risks: Burden of cardiovascular diseaseamong Indian males. Cent Asian J Glob Health 2015;4:218.
38. Bhavadharini B, Mohan V, Dehghan M, Rangarajan S, SwaminathanS, Rosengren A, Wielgosz A, Avezum A, Lopez-Jaramillo P, LanasF, et al. White rice intake and incident diabetes: A study of132,373 participants in 21 countries. Diabetes Care 2020;43(11):2643–50.
39. Merchant AT, Anand SS, Kelemen LE, Vuksan V, Jacobs R, Davis B, TeoK, Yusuf S; SHARE and SHARE-AP Investigators. Carbohydrate intakeand HDL in a multiethnic population. Am J Clin Nutr 2007;85(1):225–30.
40. Sudha V, Spiegelman D, Hong B, Malik V, Jones C, Wedick NM, HuFB, Willett W, Bai MR, Ponnalagu MM, et al. Consumer Acceptanceand Preference Study [CAPS] on brown and under milled Indian ricevarieties in Chennai, India. J Am Coll Nutr 2013;32(1):50–57.
41. Mattei J, Hu FB, Campos H. A higher ratio of beans to white riceis associated with lower cardiometabolic risk factors in Costa Ricanadults. Am J Clin Nutr 2011;94(3):869–76.
42. Volgman AS, Palaniappan LS, Aggarwal NT, Gupta M, KhandelwalA, Krishnan AV, Lichtman JH, Mehta LS, Patel HN, Shah KS, et al.Atherosclerotic cardiovascular disease in South Asians in the UnitedStates: Epidemiology, risk factors, and treatments: A scientific statementfrom the American Heart Association. Circulation 2018;138:e1–34.
43. Kanaya AM, Herrington D, Vittinghoff E, Ewing SK, Liu K, Blaha MJ,Dave SS, Qureshi F, Kandula NR. Understanding the high prevalence ofdiabetes in U.S. south Asians compared with four racial/ethnic groups:The MASALA and MESA studies. Diabetes Care 2014;37(6):1621–8.
Validation of global diet quality score in India 109S

The Journal of NutritionSupplement
Exploration of Machine Learning andStatistical Techniques in Development of aLow-Cost Screening Method Featuring theGlobal Diet Quality Score for DetectingPrediabetes in Rural IndiaNick Birk,1,2 Mika Matsuzaki,3,4 Teresa T Fung,5 Yanping Li,3 Carolina Batis,6 Meir J Stampfer,3,7,8
Megan Deitchler,9 Walter C Willett,3,7,8 Wafaie W Fawzi,10 Sabri Bromage,3 Sanjay Kinra,2
Shilpa N Bhupathiraju,3,8 and Erin Lake1
1Department of Biostatistics, Harvard TH Chan School of Public Health, Boston, MA, USA; 2Department of Non-Communicable DiseaseEpidemiology, London School of Hygiene and Tropical Medicine, University of London, London, United Kingdom; 3Department ofNutrition, Harvard TH Chan School of Public Health, Boston, MA, USA; 4Department of International Health, Johns Hopkins BloombergSchool of Public Health, Baltimore, MD, USA; 5Nutrition Department, Simmons University, Boston, MA, USA; 6CONACYT—Health andNutrition Research Center, National Institute of Public Health, Cuernavaca, Mexico; 7Department of Epidemiology, Harvard TH ChanSchool of Public Health, Boston, MA, USA; 8Channing Division of Network Medicine, Department of Medicine, Brigham and Women’sHospital, Harvard Medical School, Boston, MA, USA; 9Intake—Center for Dietary Assessment, FHI Solutions, Washington, DC, USA; and10Department of Global Health and Population, Harvard TH Chan School of Public Health, Boston, MA, USA
ABSTRACTBackground: The prevalence of type 2 diabetes has increased substantially in India over the past 3 decades.
Undiagnosed diabetes presents a public health challenge, especially in rural areas, where access to laboratory testing
for diagnosis may not be readily available.
Objectives: The present work explores the use of several machine learning and statistical methods in the development
of a predictive tool to screen for prediabetes using survey data from an FFQ to compute the Global Diet Quality Score
(GDQS).
Methods: The outcome variable prediabetes status (yes/no) used throughout this study was determined based upon a
fasting blood glucose measurement ≥100 mg/dL. The algorithms utilized included the generalized linear model (GLM),
random forest, least absolute shrinkage and selection operator (LASSO), elastic net (EN), and generalized linear mixed
model (GLMM) with family unit as a (cluster) random (intercept) effect to account for intrafamily correlation. Model
performance was assessed on held-out test data, and comparisons made with respect to area under the receiver
operating characteristic curve (AUC), sensitivity, and specificity.
Results: The GLMM, GLM, LASSO, and random forest modeling techniques each performed quite well (AUCs >0.70)
and included the GDQS food groups and age, among other predictors. The fully adjusted GLMM, which included a
random intercept for family unit, achieved slightly superior results (AUC of 0.72) in classifying the prediabetes outcome
in these cluster-correlated data.
Conclusions: The models presented in the current work show promise in identifying individuals at risk of developing
diabetes, although further studies are necessary to assess other potentially impactful predictors, as well as the
consistency and generalizability of model performance. In addition, future studies to examine the utility of the GDQS in
screening for other noncommunicable diseases are recommended. J Nutr 2021;151:110S–118S.
Keywords: GDQS, prediabetes, machine learning, GLMM, mixed model, cluster-correlation, LASSO, random
forest, survey, diabetes
C© The Author(s) 2021. Published by Oxford University Press on behalf of the American Society for Nutrition. This is an Open Access article distributed under theterms of the Creative Commons Attribution License (http://creativecommons.org/licenses/by/4.0/), which permits unrestricted reuse, distribution, and reproduction
in any medium, provided the original work is properly cited.Manuscript received June 30, 2021. Initial review completed July 26, 2021. Revision accepted August 2, 2021.
First published online October 1, 2021; doi: https://doi.org/10.1093/jn/nxab281.110S

Introduction
Type 2 diabetes (T2D) continues to increase substantiallyin South Asia (1) with more than half of T2D cases beingundiagnosed (2). To mitigate the increasing rates of T2D, it isimperative to identify individuals with prediabetes to preventprogression to T2D. This is especially crucial in rural areas inlow- and middle-income countries (LMICs) like India whereover two-thirds of the population live in resource-limited,rural areas (3). Because diagnosis for prediabetes and T2Dthrough laboratory measures can be expensive or unavailablein rural areas, lower-cost alternatives screening for higher-riskindividuals can offer a strategy in halting the rise of T2D ratesin resource-limited settings.
Machine learning (ML) and statistical methods may assistin discovering patterns present in data that are predictive ofdiabetes risk. ML techniques can be quite effective in identifyingprediabetes, although many predictive algorithms currently inexistence require expensive imaging technology or laboratorymeasurements (4). Some low-cost scoring methods using acombination of ML techniques and questionnaire data havebeen shown to be effective in screening for T2D (5, 6). However,similar affordable screening tools for prediabetes are currentlynot available, to our knowledge.
Because diet quality is a strong risk factor for T2D devel-opment (7), examining the predictive performance of low-costdietary assessment tools with ML techniques can potentiallylead to development of new screening methods for use in ruralareas in LMICs. The Global Diet Quality Score (GDQS), aglobal measure of diet quality, is a novel, low-cost, food-basedinstrument for measuring diet that is easy to interpret and hasbeen tested in a number of LMIC settings (8). The GDQS haspreviously been shown to be positively associated with nutrientadequacy among a cohort of nonpregnant Indian women of
Funding for the research was provided by FHI Solutions, recipient of a Bill& Melinda Gates Foundation grant to support Intake – Center for DietaryAssessment. Andhra Pradesh Children and Parent Study data collection wasfunded by Wellcome Trust grants 083707, 084774, and 084754.Author disclosures: TTF is an Associate Editor for the Journal of Nutrition andplayed no role in the Journal’s evaluation of the manuscript. All other authorsreport no conflicts of interest.Supplemental Tables 1–3 are available from the “Supplementary data” link inthe online posting of the article and from the same link in the online table ofcontents at https://academic.oup.com/jn.SNB and EL contributed equally to this work as senior authors.Published in a supplement to The Journal of Nutrition. Publication costs for thissupplement were funded by the Bill & Melinda Gates Foundation in conjunctionwith FHI Solutions, recipient of a Bill & Melinda Gates Foundation grantto support Intake—Center for Dietary Assessment. The opinions expressedin this publication are those of the authors and are not attributable to thesponsors or the publisher, Editor, or Editorial Board of The Journal of Nutrition.The Supplement Coordinators for the supplement publication were MeganDeitchler, Intake—Center for Dietary Assessment at FHI Solutions, Washington,DC; and Sabri Bromage, Harvard TH Chan School of Public Health, Boston,MA.The GDQS research initiative was launched by Intake – Center for DietaryAssessment. The research was led by Harvard T.H. Chan School of Public Health,Department of Nutrition and carried out in collaboration with researchers at theNational Public Health Institute (INSP), Mexico. Funding for the research wasprovided by FHI Solutions, recipient of a Bill & Melinda Gates Foundation grantto support Intake – Center for Dietary Assessment.Address correspondence to EL (e-mail: [email protected]).Abbreviations used: APCAPS, Andhra Pradesh Children and Parent Study;AUC, area under the receiver operating characteristic curve; EN, elastic net;GDQS, Global Diet Quality Score; GLM, generalized linear model; GLMM,generalized linear mixed model; ICC, intracluster correlation; LASSO, leastabsolute shrinkage and selection operator; LMIC, low- and middle-incomecountry; ML, machine learning; SMOTE, Synthetic Minority OversamplingTechnique; T2D, type 2 diabetes.
reproductive age (9) and also with lower T2D risk in a cohortof US women (10), suggesting that the score has potential asa screening method for prediabetes in this population whencombined with ML techniques and other relevant covariates.Background information and definition of the GDQS metricreferenced throughout can be found in this supplement via thefeature “Development and validation of a novel food-basedGlobal Diet Quality Score,” and thus will not be presentedhere.
The objective of the current study was to use severalML techniques, and compare their performance using areaunder the receiver operating characteristic curve (AUC), in thedevelopment of a prediction algorithm that utilizes measuresof diet quality and other simple predictors of diabetes risksuch as age and tobacco use that can be easily obtained fromquestionnaire data. The goal was to reduce the need to screenall individuals using laboratory-based measures and insteadprioritize testing for individuals identified as higher-risk via asuitable prediction equation.
Our analysis includes an exploration into several well-established ML and statistical methods (including one whichaccounts for correlated outcomes within-family) and provides aforay into viable analysis tools when cluster-correlation (similarto longitudinal correlation) is present in the dietary/diseasedata under study. A predictive tool for screening prediabetes,using the GDQS metric and other risk factors as predictors,is proposed, offering a unique contribution in prediabetesclassification. Although the GDQS alone can be used to assessrisk of several chronic diseases, we explore how it can be usedas a predictor among other variables when identifying predi-abetes specifically. We compare techniques via model perfor-mance with respect to AUC [where rule-of-thumb maintainsthat AUC >0.70 suggests good/adequate model performance,AUC >0.80 suggests great model performance, and AUC >0.90suggests excellent model performance (11)], sensitivity, andspecificity in the test data set.
MethodsCohort information and study populationThe current study examines a cross-sectional set of data from theAndhra Pradesh Children and Parents Study (APCAPS). Details of theAPCAPS have been published elsewhere (12). Briefly, the study’s firstwave of data collection in 2003–2005 examined children who werepart of the Hyderabad Nutrition Trial (1987–1990), which assessed theimpact of a governmental public health program on birth weight (12).These children are referred to as the APCAPS index children (n = 1492).Measurements were taken for this group of index children in 2003–2005 (n = 1492; first wave of data collection) and again in 2009–2010 (n = 2581; second wave). During the subsequent third waveof measurements taken in 2010–2012 (repeated measurements for theindex children), the cohort expanded to include the mothers, fathers,and siblings of the index children (n = 8383). Because it containedthe most recent information at the time of the present analysis, onlydata from the third wave were used in the current work. The APCAPSreceived approval from the ethics committees of the National Institute ofNutrition (Hyderabad, India), the Indian Council of Medical Research,and the London School of Hygiene and Tropical Medicine (London,United Kingdom).
For the current analyses, we excluded family members of indexchildren who did not participate in the third wave of data collectionand index children who were lost to follow-up (n = 7444). We onlyincluded participants ≥18 y of age who had complete information onage, sex, blood glucose, select demographic information, and all FFQdata (n = 5655) (Figure 1). This final sample of 5655 individuals camefrom 1728 different families.
Prediabetes prediction with machine learning, GDQS 111S

Initial Contacts &
Known FamilyMembersn = 14,388
Participants forData Collectionn = 6944
Participants with
Complete FFQData
n = 6700
Participants with
Outcome Datan = 6676
Participants with
All AdditionalCovariate Datan = 6146
Participants Age 18 y or oldern = 5655
Participants with
Prediabetes or Diabetesn = 1215
Participants without
Prediabetes or Diabetesn = 4440
FIGURE 1 Flowchart of study sample size.
Dietary assessmentDietary information was collected by trained interviewers through avalidated semiquantitative 98-item FFQ (12). This list of foods was asubset of a longer FFQ adapted for use in both urban and rural India(13). Participants reported how often they consumed each food in thepast year, using relevant references for portion size such as bowl, ladle,or raw number at frequencies of per day, per week, per month, and peryear. This questionnaire has been validated against 24-h dietary recallsand was found to have acceptable validity, with κ statistics ranging from0.07 to 0.51 for particular food groups (13).
GDQSWe calculated the GDQS for each individual by totaling daily intake ingrams for the GDQS food groups and categorizing these into categoriesof “low,” “medium,” and “high” consumption. For high fat dairy,we included an additional “very high” consumption category. Thepoints system used to compute the GDQS is included as supplementaryinformation (Supplemental Table 1), but in general, a higher GDQSmeans higher diet quality. We disaggregated mixed dishes into individualfoods which were then each classified into their corresponding GDQSfood groups based upon recipes derived from participants of theIndian Migration Study (14). Owing to their geographical location,all villages in the APCAPS cohort are considered part of the ruralHyderabad region. Because no recipes from this region included foodsfrom the deep orange tubers, juice, low fat dairy, or processed meatcategories, consumption amounts for these food groups were unknownfor all participants. As a result, these categories were not included incomputing the final GDQS. Details of the development of the GDQScan be found in the main article of this supplement (8).
Assessment of prediabetesFasting blood samples were collected in the APCAPS during follow-upand an assay was performed to determine blood glucose concentrations(12). Prediabetes status (yes/no) was determined based upon a fastingblood glucose measurement ≥100 mg/dL (15). The standard definitionfor diabetes based upon fasting blood glucose is a fasting blood glucosemeasurement ≥126 mg/dL (15). In the analyses, models predictingprediabetes thus define the outcome as individuals with prediabetes ordiabetes.
Assessment of predictorsDemographic information was collected during the APCAPS by atrained interviewer via questionnaire in the villages (12). Data onphysical activity over the past week were collected by semiquantitativequestionnaires previously adapted and evaluated for use in thispopulation (16). The questionnaires also collected information on useof a ration card or a public distribution system card (yes/no), inabilityto walk (yes/no), alcoholic beverage consumption (g/d), and tobaccouse (yes/no). Further, the data set contained information to denoteindividuals from the same family. This information would becomeimportant and was accounted for statistically when the generalizedlinear mixed model (GLMM) was explored as an analysis technique inthe current study. The GLMM adjusts for both the potential correlationof observations due to the genetic effect of familial relations, and thepotentially related dietary consumption within families.
Statistical methods
ML primer.ML is beginning to find its way into nutrition studies (17, 18), and inpractice can be broadly characterized by several cornerstone concepts(19). First, a modeling approach or algorithm is selected based on thetype of data under study, scientific question at hand, and relevant dataand modeling assumptions of importance. Second, the overall data setis typically split into “training” and “test” data sets according to aproportion chosen by the investigator (common ratios include 50:50,80:20, and 85:15). The training data set is then used to fit, build, or“train”predictive models, whereas the test data set is held entirely aside,and only later used to test the models that were fit using the trainingdata. The resulting performance of the models using the “fresh”test dataset, often captured by AUC and other performance metrics, is then notedas a means of understanding how well the original predictive modelsdescribe the potential association between a set of predictors and anoutcome of interest. This split between training and testing encapsulatesa critical element of ML, wherein algorithms/models are deployed todiscover existing relations between covariates and a specified outcomein the training data, and their performance on new data can bequantified through testing on new observations.
Data preparation.In order to assess the generalizability of each of the models explored inthis study, we randomly sampled 85% of the families from the cohortto create a training data set to ensure a high volume of observationsfor fitting the initial models. This random split in noncorrelated datasettings is typically done “by individual.” In this study, the split isperformed “by family”so as to avoid any overlap across the training andtest data sets of individuals who might be in the same family (and thuswith potentially correlated outcomes). This is especially important inrealistically assessing the performance of the GLMM, for reasons whichwill be further developed in the corresponding methods subsection. Thetest data, comprised of individuals from families entirely separate fromindividuals and families in the training data set, are held out in order toassess the performance of the predictive models that are built solely fromindividuals and families in the training data set. That is, we used the testdata to assess how the models performed on individuals they had neverscreened before. Further, in a real-life prediabetes screening scenario,screening independent individuals instead of entire family units may bethe most realistic occurrence. In order to simulate this scenario from theheld-out test data under study, the test data in the analyses for this studycontained 1 randomly selected individual from each of the remaining15% of families.
Modeling overview.Six algorithms or models were explored in the prediction of the outcomeprediabetes status (yes/no). Although overall diet quality was primarilyaccounted for using the GDQS, models were also fit using the dailytotals for each GDQS food group (g/d). In addition to poor diet, otherrisk factors commonly associated with T2D include lack of exerciseand smoking, among others, and so covariates including age, sex, hourssedentary, alcoholic beverage consumption, whether able to walk, useof ration cards, and tobacco use were considered in the models alongwith GDQS food groups or GDQS score. We developed the followingmodels to predict the outcome prediabetes status (yes/no).
112S Birk et al.
Random guessing model. This model was used to establishbaseline performance. We first measured the prevalence of prediabetesin the training set and then randomly drew from a uniform (0, 1)distribution. Where p = prevalence of prediabetes in the training set, allsampled values in the range [0, p] were classified as having prediabetesor diabetes, whereas values in the range (p, 1] were classified as nothaving prediabetes or diabetes.
Logistic regression model. This model utilizes a parametric formto compute a predicted probability of prediabetes status for eachparticipant. Models were fit to maximize the likelihood in the trainingset with regard to the prediabetes outcome (20). Logistic regressionmodels were implemented using the caret package in R version 4.0.5(R Core Team).
Least absolute shrinkage and selection operator regression.This model was used to correct for potential overfitting by the logisticregression model. Least absolute shrinkage and selection operator(LASSO) makes special use of shrinkage to enhance performancethrough an internal variable selection technique (21). The values ofthe model’s parameter λ which minimize binomial deviance weredetermined through Five-fold cross validation on the training data set.The current implementation of LASSO used a logistic model for thebinary prediabetes outcome. This model was implemented using theglmnet package in R version 4.0.5.
Elastic net. The aforementioned LASSO regression technique is aspecial case of the elastic net (EN) algorithm, where the parameter α
is set equal to 1 (22). LASSO tends to select only 1 (or few) from agroup of correlated predictors, whereas EN has greater facility to retaina larger number of correlated predictors, which can be a desirable modelselection feature in data containing possibly related questionnaire items.As in the LASSO model, we implemented a logistic model for EN inthe present work. Five-fold cross validation was utilized to assess theoptimal value of λ using the caret package in R version 4.0.5.
Random forest. This binary classification model was developedusing a nonparametric ML technique based upon an aggregation ofmany decision trees (23). We utilized 500 trees, a minimum node size of1, and 25 features used per tree in our implementation of the randomforest, chosen a priori. This algorithm was implemented using therandomForest package in R version 4.0.5.
Generalized linear mixed-effects model. The GLM, randomforest, and regularization (LASSO, EN) methods aforementioned eachassume independent and identically distributed outcome data (19).However, most commonly used ML methods do not account forcorrelated outcomes (whether longitudinal or clustered), with very fewresults to remedy this to date (24–26). The prediabetes data understudy exhibit clear within-family correlation (calculation is given in theResults section), so the GLMM was explored as an option to account fornonindependent observations within family clusters. GLMMs includerandom intercepts for family-level effects and thus allow for estimationof and adjustment for correlation between individuals within the samefamily (27). Thus, in keeping with (frequentist) statistical theory oncorrelated outcomes, when using the GLMM, the data are first analyzedaccording to the original study design (clustered by family) in thetraining step. Only the fixed-effects estimates gained from this step(which are now appropriately adjusted for intrafamily correlation) arethen used to build the prediction equation. That is, in order to avoidintroducing bias in the training step by assuming responses within-families are not correlated when they truly are, we continued to usethe GLMM to model such correlation structure via the random effectsfor family unit, in the training data set. However, we did not carry therandom effects into the test step, and instead only carried forwardthe resulting adjusted fixed-effects estimates from the GLMM fittedto the training data, to form the prediction model (which ultimately tookthe form of a GLM). This prediction model was then assessed using thetest data set.
Recall that the training/test data split was done by family to avoidoverlap. This is particularly important when using the GLMM, becausethe estimation of random (family) effects in the training step shouldbe based on data from individuals in family clusters that are entirelyseparate and independent from individuals in the test data, lest thepredictive model enjoy a boost in performance simply based on familialcorrelation shared between observations in the training and test datasets. This is not a problem in contexts where it is expected that newobservations will come from known clusters, but this is not a realisticscenario in our study. In summary, GLMMs were fit to the trainingdata, and the resulting intracluster correlation (ICC)-adjusted fixed-effects estimates were then used as the prediction equation (essentially aGLM, after dropping the random effects for the new, predictive model).The performance of this predictive model was then assessed using theindependent test data set. All GLMMs were fit using the lme4 packagein R version 4.0.5, using a penalized iteratively reweighted least-squaresalgorithm.
Model covariates and selection criteria.To establish baseline performance of the GDQS and age as predictors,2 separate models were fit via the GLM using each of these features asthe only predictor, respectively. A GLM including both age and GDQStogether as the only 2 predictors was also fit. As a comparison, a GLMMwas fit with both age and GDQS together, as well. It is importantto note that the GLMM was not solely using covariate (age, GDQS,etc.) data, but was also using the prediabetes and diabetes status ofother family members within a family cluster. A GLMM including ageand the GDQS food group totals (g/d) as fixed effects was also fit.Finally, all models (GLM, LASSO, EN, random forest, GLMM) wereassessed using the GDQS food group totals and the other previouslydescribed covariates as inputs. The LASSO, EN, and random forestmodels were only assessed using this full set of covariates because oftheir ability to perform feature reduction and the random forest’s abilityto handle nonlinear interactions between many covariates. Note that allmodels initially produce a predicted probability, rather than the binaryoutcome, as the output. The cutoff probability used to create a binaryclassification for the calculation of sensitivity and specificity was theprevalence of prediabetes in the training set (0.217).
For the GLM, LASSO, and random forest models, we also utilizedthe Synthetic Minority Oversampling Technique (SMOTE) resamplingmethod to retrain select algorithms with a more balanced distributionof the outcome (28). We identified the model with the highest AUC onthe test data set. We also reported sensitivity and specificity. The 95%CIs for the AUCs were computed using the DeLong method to comparerelated receiver operating characteristic curves (29).
ResultsParticipant characteristics
About 21% of the study population had prediabetes or diabetes(Table 1). The mean GDQS for all participants was 19.0 outof 42.5 points, and this value did not differ greatly betweenindividuals who had prediabetes or diabetes and individualswho did not have prediabetes or diabetes. The distribution ofthe GDQS was approximately normal within both groups. Themean age of participants was 36 y with a range from 18 y to85 y. The full data set contained 1728 unique families with1–10 individuals in each family. The median family size was3 individuals. The data set contained fewer individuals in theage range of ∼30–35 y than for all other ages. This may bean artifact of the sampling strategy used for the original study,because the age of the parents and siblings of the index childrensplit into a bimodal distribution, peaking at ∼25 and 45 y ofage.
The corresponding summary characteristics for both thetraining and test data are similar to those of the overall studypopulation. Although individuals with prediabetes or diabetes
Prediabetes prediction with machine learning, GDQS 113S

TABLE 1 Selected characteristics of participants at wave 3 in the Andhra Pradesh Child and ParentStudy1
CharacteristicsNo
prediabetes2
Prediabetes ordiabetes3 Overall
Participants 4440 (79) 1215 (21) 5655 (100)Age, y 34.6 ± 13 41.1 ± 14 35.6 ± 14Women 2099 (47.3) 534 (44.0) 2633 (46.6)Ever use of tobacco4 1060 (23.9) 378 (31.1) 1438 (25.4)Alcoholic beverage consumption, g/d 240 ± 701 344 ± 956 262 ± 764Unable to walk5 254 (5.7) 150 (12.3) 404 (7.1)Use of rations card 3117 (70.2) 687 (56.5) 3804 (67.3)Time spent in sedentary activities, h/d 5.51 ± 3.4 5.79 ± 3.6 5.57 ± 3.4Global Diet Quality Score 19.1 ± 3.6 18.9 ± 3.7 19.0 ± 3.6
1n = 5655. Values are means ± SDs or n (%).2Absence of prediabetes was defined as a fasting blood glucose concentration <100 mg/dL.3Prediabetes and/or diabetes includes individuals with a fasting blood glucose concentration ≥100 mg/dL.4Tobacco use is defined as having reported ever smoking, chewing, or snuffing tobacco products.5Unable to walk responses exclude reasons related to shortness of breath.
in the testing set had a higher average GDQS (representinghigher diet quality) than their counterparts without prediabetesor diabetes, this difference was not statistically significant(Supplemental Table 2). The prevalence of prediabetes ordiabetes in the training and test data was ∼21%.
Tuning of models
The implementation of EN determined that the best value ofα was 1.0, which is equivalent to LASSO, as mentioned in theMethods. The optimized value of λ for the LASSO model was0.01 when using GDQS food groups (g/d) among the othercovariates mentioned as predictors. The EN implementationused a slightly different value of λ, based on minor differencesbetween the functions used, so the performance reported wasnot identical. The LASSO model set many covariates to 0 butkept the food groups “red meat” and “refined grains and bakedgoods,” along with the covariates age, sex, and inability towalk. The number of trees used in the random forest wasset a priori to the default 500 and was not tuned for thisanalysis.
Predictive prediabetes model results
AUC values >0.70 for classifying the prediabetes outcome onthe testing data were obtained from several models, includingthe fully adjusted GLMM with a random intercept for family(Table 2), which performed slightly better than most. The GLMincluding only GDQS as a predictor achieved an AUC lowerthan the random guessing model. On the other hand, a GLMMincluding age and GDQS as fixed effects achieved an AUC of0.71 (95% CI: 0.64, 0.78), similar to the GLM using only ageand GDQS as predictors with an AUC of 0.71 (95% CI: 0.64,0.78). When we included additional predictors—sex, alcoholicbeverage consumption, hours of sedentary activity, tobacco use,use of a rations card, and inability to walk—as fixed effects,the highest AUC of 0.72 (95% CI: 0.65, 0.79) was achievedby the GLMM. Several models achieved a lower AUC on thetraining set than on the test set (when we would typicallyexpect the opposite); however, the CIs for train and test AUCsoverlapped in these cases, except for the random forest model.The GLMM AUC on the training data set was higher than forthe test set owing to this model’s capacity to leverage prediabetesand diabetes status among individuals within the same familycluster in the training set, whereas the test set consisted onlyof individuals that were randomly sampled from the held-out
test data [recall that no random effects (adjustment for familycorrelation) are performed in the test step for this model].The implementation of SMOTE for the random forest, GLM,LASSO, and EN did not yield significant performance gains onour data, so these results are not presented. Figure 2 shows thereceiver operating characteristic curves for the models on thetest data.
DiscussionModel performance
In this cohort of 5655 participants from rural South India, wefound that a GLM, LASSO, random forest, and GLMM witha random effect for family cluster all demonstrated adequatepredictive capability for identifying prediabetes using only pre-dictors derived from questionnaire data. The GLMM performedoverall similarly to the other ML methods explored in this studywhile also incorporating potential within-family correlationsbetween observations in the training data. Although the GDQSon its own did not perform strongly as a classifier, several modelsincluding the GDQS as well as models including the GDQSfood groups achieved AUCs >0.70. The GLMM using age andGDQS as predictors obtained an AUC only 0.001 lower thanthe GLMM using age and GDQS food groups as predictors,suggesting that accounting for the GDQS in either form leads tosimilar performance in this task, although using the food groupdaily totals provides the model with more information aboutspecific components of the diet. We found, not surprisingly, thatage was a strong predictor of prediabetes within this cohort,with a GLM using age as the sole predictor achieving an AUC>0.70. Although the addition of other predictors improvedmodel performance, an algorithm consisting of fixed effectsfor just age and GDQS as predictors performed well as apotential low-cost screening method for identifying prediabeteswith AUCs >0.70 in the test set.
Although age was a stronger predictor than the GDQSfor prediabetes, the GLM that included both age and GDQSslightly outperformed the GLM including age alone, althoughthe difference in AUC was only ∼0.01. Still, these results reflectthe importance of both age and diet quality as risk factorsfor developing T2D. Surprisingly, a GLM using GDQS aloneresulted in a lower AUC than the random guessing model.This may be because the GDQS was developed primarily toidentify nutrient adequacy and chronic disease risk among
114S Birk et al.

TABLE 2 Performance metrics of select models for predicting prediabetes1
Algorithm Predictors Train AUC (95% CI) AUC (95% CI) Sensitivity Specificity
Random guessing NA 0.531 (0.512, 0.551) 0.556 (0.473, 0.639) 0.811 0.246GLM Age 0.635 (0.616, 0.653) 0.702 (0.629, 0.774) 0.774 0.570GLM GDQS 0.515 (0.495, 0.534) 0.511 (0.423, 0.598) 0.547 0.488GLM Age and GDQS 0.636 (0.617, 0.654) 0.709 (0.640, 0.779) 0.774 0.575GLM Age, GDQS food groups, hours sedentary,
alcoholic beverage consumption, unableto walk, use of rations card, sex, tobaccouse
0.654 (0.635, 0.672) 0.716 (0.645, 0.787) 0.755 0.600
GLMM Age and GDQS, family random intercept 0.878 (0.867, 0.889) 0.710 (0.640, 0.779) 0.755 0.599GLMM Age and GDQS food groups, family random
intercept0.873 (0.861, 0.884) 0.711 (0.642, 0.781) 0.793 0.594
GLMM Age, GDQS food groups, hours sedentary,alcoholic beverage consumption, unableto walk, use of rations card, sex, tobaccouse, family random intercept
0.872 (0.861, 0.883) 0.722 (0.652, 0.792) 0.717 0.662
LASSO Age, GDQS food groups, hours sedentary,alcoholic beverage consumption, unableto walk, use of rations card, sex, tobaccouse
0.644 (0.625, 0.663) 0.705 (0.633, 0.776) 0.774 0.580
Elastic net (α = 1) Age, GDQS food groups, hours sedentary,alcoholic beverage consumption, unableto walk, use of rations card, sex, tobaccouse
0.641 (0.626, 0.659) 0.700 (0.627, 0.772) 0.774 0.570
Random forest Age, GDQS food groups, hours sedentary,alcoholic beverage consumption, unableto walk, use of rations card, sex, tobaccouse
1.000 (1.000, 1.000) 0.705 (0.633, 0.776) 0.774 0.517
1AUC, area under the receiver operating characteristic curve; GDQS, Global Diet Quality Score; GLM, generalized linear model; GLMM, generalized linear mixed model; LASSO,least absolute shrinkage and selection operator; NA, not applicable.
nonreproductive and nonlactating women of reproductive age(8). As such, cutoffs for assigning scores for GDQS food groupsmay need to be modified for other age groups and for men. Thismay also underscore the importance of adjusting for additionalfactors beyond diet quality alone if a researcher wishes to usediet in predicting diabetes risk. When examining the estimatedcoefficients of the individual food groups in the GLMM,it is worth noting that none of the individual food groupswere significantly associated with prediabetes (SupplementalTable 3). Further, the dimension reduction resulting from theLASSO model kept only the 1) red meat and 2) refinedgrains and baked goods food groups. Still, given that theGDQS was developed as a simple tool based on foodgroups rather than nutrient composition tables, the ease ofcollecting this metric highlights its utility as an initial low-costscreening tool for identifying risk of chronic diseases includingdiabetes.
Given the global applicability of the GDQS, its utilityis especially significant in LMICs and rural regions whereresources are scarce. Screening large groups of individualsmay often be difficult owing to lack of access to health carefacilities, and even when such facilities are available, otherlogistical constraints such as proper refrigeration of bloodsamples and expensive diagnostic tests may prevent individualsfrom being diagnosed. Further research can assess whetherconsumption of certain component food groups of the GDQSis associated with diabetes risk in ways distinct from theoverall score and how these associations may vary in differentpopulations.
Accounting for clustered data
The highest AUC in the test set was achieved by the GLMMwith all covariates included. That is, our analyses showedthat including family as a random intercept while fitting amodel provides a statistically valid approach to accommodatingfamily-cluster correlated data, while maintaining comparableperformance in the development of a predictive model forclassifying prediabetes in this population in rural South India.Although the performance of the GLMM was not significantlyhigher than that of other methods, there are other statisticaladvantages to properly adjusting for ICC when fitting a modelon data with known clustering, in the ML setting. Becausefamily is accounted for when fitting the model to these data,the fixed effects produced are thus ones which are adjusted forcorrelation within family. Of note, the ICC values were low at∼0.2, which may be due to the large range of ages within thefamily (intergenerational members). The ICC is calculated bydividing the random effect variance by the total variance fromthe model fit. The within-cluster variance is assumed to be equalto π2/3 for the random intercept logistic model (30).
The clustering in our data also explains why the AUC ofthe GLMM in the training data is much higher than those ofother models, aside from the random forest. In the fully adjustedmodel, the GLMM obtained an AUC of 0.87 (95% CI: 0.86,0.88). This is because the GLMM, by modeling the correlationstructure within each family via random effects and thenadjusting for such in the estimation of fixed effects (predictors),was able to properly account for the clustering of families in away that the other algorithms were not designed to do. In this
Prediabetes prediction with machine learning, GDQS 115S
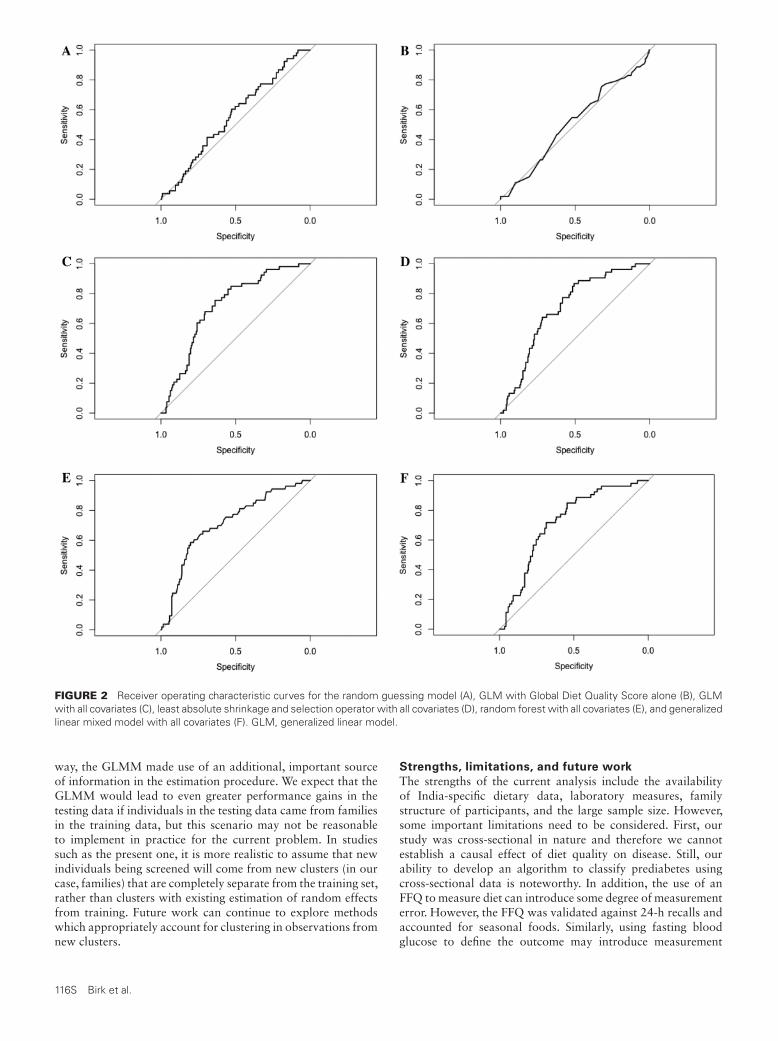
FIGURE 2 Receiver operating characteristic curves for the random guessing model (A), GLM with Global Diet Quality Score alone (B), GLMwith all covariates (C), least absolute shrinkage and selection operator with all covariates (D), random forest with all covariates (E), and generalizedlinear mixed model with all covariates (F). GLM, generalized linear model.
way, the GLMM made use of an additional, important sourceof information in the estimation procedure. We expect that theGLMM would lead to even greater performance gains in thetesting data if individuals in the testing data came from familiesin the training data, but this scenario may not be reasonableto implement in practice for the current problem. In studiessuch as the present one, it is more realistic to assume that newindividuals being screened will come from new clusters (in ourcase, families) that are completely separate from the training set,rather than clusters with existing estimation of random effectsfrom training. Future work can continue to explore methodswhich appropriately account for clustering in observations fromnew clusters.
Strengths, limitations, and future work
The strengths of the current analysis include the availabilityof India-specific dietary data, laboratory measures, familystructure of participants, and the large sample size. However,some important limitations need to be considered. First, ourstudy was cross-sectional in nature and therefore we cannotestablish a causal effect of diet quality on disease. Still, ourability to develop an algorithm to classify prediabetes usingcross-sectional data is noteworthy. In addition, the use of anFFQ to measure diet can introduce some degree of measurementerror. However, the FFQ was validated against 24-h recalls andaccounted for seasonal foods. Similarly, using fasting bloodglucose to define the outcome may introduce measurement
116S Birk et al.

error, because there is no way to confirm that all measurementswere taken after fasting, and this measurement may not providethe full context in diagnosis that additional information aboutan oral-glucose-tolerance test or glycated hemoglobin wouldprovide.
A further limitation of this work is the geographic distribu-tion of the study population. Because all APCAPS participantsreside in the same region of South India, rural Hyderabad,further work is necessary to validate these findings in other partsof India. Future research should compare whether adjustingfor the geographic region leads to performance gains in amodel deployed on a national or international scale, becauseprevalence of the outcome is likely to differ by region. Theutility of the GDQS in the present modeling efforts providessupport for the feasibility of this additional work because theGDQS metric can provide a single, standardized measure of dietquality even for individuals in different regions of the country.The use of GDQS food groups also provides the model withmore information about the components of an individual’s dietwhile requiring fewer questions to measure than a completeFFQ. Finally, the GDQS was developed for use in nonpregnant,nonlactating women of reproductive age and further validationis needed for other age groups, pregnant/lactating women, andmen. Nevertheless, this global metric of diet quality showedpromising results when combined with age, family, and othercovariates to classify prediabetes using a variety of algorithms.Future work needs to explore whether altering the point valuesassigned to consumption totals in each GDQS food group forother age groups would improve model performance for thisoutcome. In addition, future work can explore the impact ofoutlier values in certain food groups on prediction accuracy,because they were kept in the overall data set.
Additional limitations of the study relate to the availability ofdata and computational costs of further analyses. Although wewere able to define models with adequate classification abilityin the test data (AUC >0.70), additional work is required toconfirm the stability of these findings. This concern is raisedespecially when considering the low AUC values of some modelson the training data. It is possible that the testing data weresignificantly different from the training data in some wayowing to randomness in the splitting process, leading to lowerperformance in the training data. Splitting by family can leadto inconsistencies between the training and test sets if there arelarge differences between the families selected for each set. Thiscould then be reflected in the performance of models estimatedthen tested on these sets, respectively. By contrast, the randomforest model achieved perfect classification in the training databut achieved an AUC of 0.71 in the test data. This stronglysuggests the presence of overfitting during training of therandom forest. A simulation study assessing the performance ofthe same algorithms across many random splits of the trainingand test data can help to understand the stability of theseclassifiers. As an additional consideration, the testing performedin the current study involved individuals from the same studyas those used to train the model came from (although separateindividuals and families were used in the training/testing data),so it is possible that the classifier learned to detect patternsspecific to our cohort rather than generally applicable trends.External validation must be performed in future work to gaina more concrete understanding of the generalizability of theseresults.
Future classifiers may also wish to make use of otherfactors associated with diabetes risk, such as BMI, waist-to-hip ratio, or other physical measurements. Whereas our study
focused specifically on factors that could be measured usingonly a questionnaire, it may be necessary to record somephysical measurements to obtain more accurate assessmentsof diabetes risk. Our analyses demonstrated that age was avery strong predictor of this outcome and was necessary toimprove the performance of the GDQS for this outcome, and itis feasible that additional measurements, rather than any specificalgorithm, will most considerably improve the performance offuture classifiers.
Conclusion
Results from our study confirm that several models includingage and a global measure of diet quality can classify prediabeteswith reasonable discrimination. The GLMM, which modelsthe dependence between clustered observations and utilizes theresulting information in its estimates of fixed effects, couldprove an additional, helpful tool within the array of MLmethods when encountering correlated data. A facility foravoiding possible misspecification of models when encounteringcluster-correlated data in similar predictive ML tasks maybe a worthy contribution the GLMM offers, within thecontext of diet quality and disease studies. The random forestmodel provides the flexibility of a nonparametric approachfor modeling disease risk. The LASSO provides the benefitof identifying the features most important in predicting theoutcome and can help reduce the number of predictors neededfor the screening.
Given the high burden of diabetes, the use of low-cost andsimple-to-implement screening tools as a first step in identifyinghigh-risk groups shows considerable promise. Future studiesneed to examine the utility of the GDQS in screening for othernoncommunicable diseases.
Acknowledgments
The authors’ responsibilities were as follows—NB: wrote thepaper, designed the statistical analysis plans, and performed allanalyses; EL: helped write the paper and design the statisticalanalysis plans, supervised the analyses, and provided statisticalguidance; SNB and MM: supervised the initial analyses; TTF,YL, CB, MJS, MD, WCW, WWF, SB, and SNB: led the dietarymetric construction; SK: led data collection and management;and all authors: read and approved the final manuscript.
References1. Jayawardena R, Ranasinghe P, Byrne NM, Soares MJ, Katulanda P,
Hills AP. Prevalence and trends of the diabetes epidemic in South Asia: asystematic review and meta-analysis. BMC Public Health 2012;12:380.
2. Cho NH, Shaw JE, Karuranga S, Huang Y, da Rocha Fernandes JD,Ohlrogge AW, Malanda B. IDF Diabetes Atlas: global estimates ofdiabetes prevalence for 2017 and projections for 2045. Diabetes ResClin Pract 2018;138:271–81.
3. India Ministry of Home Affairs, Office of the Registrar General &Census Commissioner. Census of India 2011: provisional populationtotals. [Internet]. New Delhi (India): Office of the Registrar General &Census Commissioner; 2011. [Accessed 2021 Feb 25]. Available from:https://censusindia.gov.in/2011-prov-results/paper2/data_files/india/paper2_at_a_glance.pdf.
4. Thirunavukkarasu U, Umapathy S, Janardhanan K, ThirunavukkarasuR. A computer aided diagnostic method for the evaluation oftype II diabetes mellitus in facial thermograms. Phys Eng Sci Med2020;43:871–88.
5. Kaushal K, Mahajan A, Parashar A, Dhadwal D, Jaswal VMS,Jaret P, Mazta S. Validity of Madras Diabetes Research Foundation:Indian diabetes risk score for screening of diabetes mellitus amongadult population of urban field practice area, Indira Gandhi Medical
Prediabetes prediction with machine learning, GDQS 117S

College, Shimla, Himachal Pradesh, India. Indian J Endocrinol Metab2017;21:876–81.
6. Tian S, Dong W, Chan KL, Leng X, Bedford LE, Liu J. Screening forchronic conditions with reproductive factors using a machine learningbased approach. Sci Rep 2020;10:2848.
7. Sami W, Ansari T, Butt NS, Hamid MRA. Effect of diet on type 2diabetes mellitus: a review. Int J Health Sci (Qassim) 2017;11:65–71.
8. Bromage S, Batis C, Bhupathiraju SN, Fawzi WW, Fung TT, LiY, Deitchler M, Angulo E, Birk N, Castellanos-Gutierrez A, et al.Development and validation of a novel food-based Global Diet QualityScore (GDQS). J Nutr 2021;151(Suppl 10):75S–92S.
9. Matsuzaki M, Bromage S, Batis C, Fung T, Li Y, Deitchler M, StampferM, Willett W, Kinra S, Bhupathiraju S. Validation of a new instrumentfor assessing diet quality and its association with undernutrition andnon-communicable diseases for women in reproductive age in India.Curr Dev Nutr 2020;4:1451.
10. Fung T, Bromage S, Li Y, Bhupathiraju S, Batis C, Fawzi W, Holmes M,Stampfer M, Hu F, Willett W. A global diet quality index and risk oftype 2 diabetes in U.S. women. Curr Dev Nutr 2020;4:1401.
11. Metz CE. Basic principles of ROC analysis. Semin Nucl Med1978;8:283–98.
12. Kinra S, Radha Krishna K, Kuper H, Rameshwar Sarma K, PrabhakaranP, Gupta V, Walia GK, Bhogadi S, Kulkarni B, Kumar A, et al. Cohortprofile: Andhra Pradesh Children and Parents Study (APCAPS). Int JEpidemiol 2014;43:1417–24.
13. Bowen L, Bharathi AV, Kinra S, Destavola B, Ness A, Ebrahim S.Development and evaluation of a semi-quantitative food frequencyquestionnaire for use in urban and rural India. Asia Pac J Clin Nutr2012;21:355–60.
14. Shridhar K, Dhillon PK, Bowen L, Kinra S, Bharathi AV, PrabhakaranD, Reddy KS, Ebrahim S. Nutritional profile of Indian vegetarian diets– the Indian Migration Study (IMS). Nutr J 2014;13:55.
15. American Diabetes Association. Diagnosis and classification of diabetesmellitus. Diabetes Care 2004;27:s5.
16. Sullivan R, Kinra S, Ekelund U, Bharathi AV, Vaz M, Kurpad A, CollierT, Reddy KS, Prabhakaran D, Ebrahim S, et al. Evaluation of the IndianMigration Study Physical Activity Questionnaire (IMS-PAQ): a cross-sectional study. Int J Behav Nutr Phys Act 2012;9:13.
17. Morgenstern JD, Rosella LC, Costa AP, de Souza RJ, AndersonLN. Perspective: big data and machine learning could help advancenutritional epidemiology. Adv Nutr 2021;12:621–31.
18. Sharma V, Sharma V, Khan A, Wassmer DJ, Schoenholtz MD,Hontecillas R, Bassaganya-Riera J, Zand R, Abedi V. Malnutrition,health and the role of machine learning in clinical setting. Front Nutr2020;7:44.
19. Berk RA. Statistical learning from a regression perspective. New York:Springer-Verlag; 2008. p. 358.
20. McCullagh P, Nelder JA. Generalized linear models. 2nd ed. London(United Kingdom): Chapman and Hall; 1989.
21. Tibshirani R. Regression shrinkage and selection via the lasso. J R StatistSoc B 1996;58:267–88.
22. Zou H, Hastie T. Regularization and variable selection via the elasticnet. J R Statist Soc B 2005;67:301–20.
23. Breiman L. Random forests. Mach Learn 2001;45:5–32.
24. Dundar M, Krishnapuram B, Bi J, Rao R. Learning classifiers when thetraining data is not IID. In: Proceedings of the Twentieth InternationalJoint Conference on Artificial Intelligence. Hyderabad (India): ICJAI;2007. p. 756–61.
25. Ngufor C, Van Houten H, Caffo BS, Shah ND, McCoy RG. Mixed effectmachine learning: a framework for predicting longitudinal change inhemoglobin A1c. J Biomed Inform 2019;89:56–67.
26. Sela RJ, Simonoff JS. RE-EM trees: a data mining approach forlongitudinal and clustered data. Mach Learn 2012;86:169–207.
27. Raudenbush SW, Bryk AS. Hierarchical linear models: applications anddata analysis methods. 2nd ed. Thousand Oaks (CA): Sage Publications;2002.
28. Chawla NV, Bowyer KW, Hall LO, Kegelmeyer WP. SMOTE:Synthetic Minority Over-sampling Technique. J Artif Intell Res 2002;16:321–57.
29. DeLong ER, DeLong DM, Clarke-Pearson DL. Comparing the areasunder two or more correlated receiver operating characteristic curves:a nonparametric approach. Biometrics 1988;44:837–45.
30. Wu S, Crespi CM, Wong WK. Comparison of methods forestimating the intraclass correlation coefficient for binary responsesin cancer prevention cluster randomized trials. Contemp Clin Trials2012;33:869–80.
118S Birk et al.

The Journal of NutritionSupplement
The Global Diet Quality Score Is InverselyAssociated with Nutrient Inadequacy, LowMidupper Arm Circumference, and Anemia inRural Adults in Ten Sub-Saharan AfricanCountriesSabri Bromage,1 Yiwen Zhang,1 Michelle D Holmes,1,2 Sonia E Sachs,3 Jessica Fanzo,4 Roseline Remans,5
Jeffrey D Sachs,3 Carolina Batis,6 Shilpa N Bhupathiraju,1,2 Teresa T Fung,1,7 Yanping Li,1 MeirJ Stampfer,1,2 Megan Deitchler,8 Walter C Willett,1,2 and Wafaie W Fawzi1
1Harvard T.H. Chan School of Public Health, Boston, MA, USA; 2Channing Division of Network Medicine, Brigham & Women’s Hospital,Boston, MA, USA; 3The Earth Institute, Columbia University, New York, NY, USA; 4Berman Institute of Bioethics, Nitze School ofAdvanced International Studies, Johns Hopkins University, Baltimore, MD, USA; 5The Alliance of Biodiversity International and theInternational Center for Tropical Agriculture (CIAT), Geneva, Switzerland; 6CONACYT—Health and Nutrition Research Center, NationalInstitute of Public Health, Cuernavaca, Mexico; 7Department of Nutrition, Simmons University, Boston, MA, USA; and 8Intake – Centerfor Dietary Assessment, FHI Solutions, Washington, DC, USA
ABSTRACTBackground: Key nutrient deficits remain widespread throughout sub-Saharan Africa (SSA) whereas noncommunica-
ble diseases (NCDs) now cause one-third of deaths. Easy-to-use metrics are needed to track contributions of diet quality
to this double burden.
Objectives: We evaluated comparative performance of a novel food-based Global Diet Quality Score (GDQS) against
other diet metrics in capturing nutrient adequacy and undernutrition in rural SSA adults.
Methods: We scored the GDQS, Minimum Dietary Diversity–Women (MDD-W), and Alternative Healthy Eating Index–
2010 (AHEI-2010) using FFQ data from rural men and nonpregnant, nonlactating women of reproductive age (15–49 y)
in 10 SSA countries. We evaluated Spearman correlations between metrics and energy-adjusted nutrient intakes, and
age-adjusted associations with BMI, midupper arm circumference (MUAC), and hemoglobin in regression models.
Results: Correlations between the GDQS and an energy-adjusted aggregate measure of dietary protein, fiber, calcium,
iron, zinc, vitamin A, folate, and vitamin B-12 adequacy were 0.34 (95% CI: 0.30, 0.38) in men and 0.37 (95% CI: 0.32,
0.41) in women. The GDQS was associated (P < 0.05) with lower odds of low MUAC [GDQS quintile (Q) 5 compared
with Q1 OR in men: 0.44, 95% CI: 0.22, 0.85; women: 0.57, 95% CI: 0.31, 1.03] and anemia (Q5/Q1 OR in men: 0.56,
95% CI: 0.32, 0.98; women: 0.60, 95% CI: 0.35, 1.01). The MDD-W correlated better with some nutrient intakes, though
associated marginally with low MUAC in men (P = 0.07). The AHEI-2010 correlated better with fatty acid intakes, though
associated marginally with low MUAC (P = 0.06) and anemia (P = 0.14) in women. Overweight/obesity prevalence was
low, and neither the GDQS, MDD-W, nor AHEI-2010 were predictive.
Conclusions: The GDQS performed comparably with the MDD-W in capturing nutrient adequacy–related outcomes in
rural SSA. Given limited data on NCD outcomes and the cross-sectional study design, prospective studies are warranted
to assess GDQS performance in capturing NCD outcomes in SSA. J Nutr 2021;151:119S–129S.
Keywords: diet quality metrics, dietary diversity, nutrient adequacy, noncommunicable disease, double burden of
malnutrition, nutrition transition, nutritional epidemiology, Millennium Villages Project, sub-Saharan Africa, GDQS
Introduction
Traditional diets of sub-Saharan Africa (SSA) were largely plant-based, emphasizing fruits and vegetables, legumes, wild cereals,roots and tubers, and supplemented with fish, dairy, and modestamounts of game, poultry, and red meat (1). Diets shifteddramatically following colonial incursions, the introduction of
maize in the 1500s and its later emergence as the dominantstaple throughout SSA (2), and recent decades of increasingincomes, urbanization, and food market globalization (3). From2001 to 2018, the prevalence of inadequate energy intakesin SSA fell from 27.3% to 21.4%, but it remains amongthe highest of world regions (4). Dietary shifts have also ledto increased consumption of obesogenic processed foods and
C© The Author(s) 2021. Published by Oxford University Press on behalf of the American Society for Nutrition. This is an Open Access article distributed under theterms of the Creative Commons Attribution License (http://creativecommons.org/licenses/by/4.0/), which permits unrestricted reuse, distribution, and reproductionin any medium, provided the original work is properly cited.Manuscript received February 28, 2021. Initial review completed April 20, 2021. Revision accepted April 29, 2021.First published online October 1, 2021; doi: https://doi.org/10.1093/jn/nxab161. 119S

refined carbohydrates, which have replaced traditional andmore nutrient-dense foods (5, 6). The regional food supplycurrently contains the lowest percentage of calories suppliedper capita by protein-rich animal-source foods (8.2%) globally(7). Countries in SSA also face the highest burden of hiddenhunger globally (defined in terms of disability-adjusted life yearscollectively attributed to iron, vitamin A, and zinc deficiencies)(8), and the second highest prevalence of child stunting andwasting after South Asia (9).
SSA is also undergoing a steady epidemiological transitiontoward noncommunicable diseases (NCDs) (6, 10–12), andmost of the world’s countries with coexisting burdens ofstunting, anemia, and overweight are currently in Africa(13, 14). The increasing prevalence of overweight is drivenpredominantly by the urban population [unlike other worldregions, rural obesity rates in SSA are still lagging comparedwith urban areas (15)]. Since 2000 alone, the fraction of totalmortality contributed by NCDs in SSA increased from 22.7% to32.6% (16); hypertension and dyslipidemia are common (17–19); and the regional prevalence of type 2 diabetes is uncertainbut evidently increasing (20). At present, diet contributes asmaller percentage of age-standardized cardiovascular, cancer,and type 2 diabetes mortality in Central (15%), Eastern(14%), Western, and Southern (13%) SSA than any otherworld region (21), and consumption of dietary componentsassociated with NCD risk—red meat, sugar, saturated and transfat, and sodium—is relatively low (21–23). However, the age-standardized fraction of mortality attributable to dietary risksof NCDs in SSA has increased in 42 of 51 SSA countries from1990 to 2015 (from 10.4% to 12.2% in the region overall)(21, 24), and diet quality [measured using the AlternativeHealthy Eating Index–2010 (AHEI-2010)] has deterioratedmore in SSA than in other regions from 1990 to 2017(25).
Funding for the research was provided by FHI Solutions, recipient of a Bill& Melinda Gates Foundation grant to support Intake – Center for DietaryAssessment.Author disclosures: TTF is an Associate Editor for the Journal of Nutrition andplayed no role in the Journal’s evaluation of the manuscript. All other authorsreport no conflicts of interest.Publication costs for this supplement were funded by the Bill & Melinda GatesFoundation in conjunction with FHI Solutions, recipient of a Bill & MelindaGates Foundation grant to support Intake – Center for Dietary Assessment.The opinions expressed in this publication are those of the authors and arenot attributable to the sponsors or the publisher, Editor, or Editorial Board ofThe Journal of Nutrition. The Supplement Coordinators for the supplementpublication were Megan Deitchler, Intake – Center for Dietary Assessment atFHI Solutions, Washington, DC; and Sabri Bromage, Harvard T.H. Chan Schoolof Public Health, Boston, MA.Supplemental Tables 1–11 are available from the “Supplementary data” link inthe online posting of the article and from the same link in the online table ofcontents available at https://academic.oup.com/jn.The GDQS research initiative was launched by Intake – Center for DietaryAssessment. The research was led by Harvard T.H. Chan School of Public Health,Department of Nutrition and carried out in collaboration with researchers at theNational Public Health Institute (INSP), Mexico. Funding for the research wasprovided by FHI Solutions, recipient of a Bill & Melinda Gates Foundation grantto support Intake – Center for Dietary Assessment.Address correspondence to SB (e-mail: [email protected]).Abbreviations used: AHEI-2010, Alternative Healthy Eating Index–2010; EAR,estimated average requirement; FCT, food composition table; GDQS, Global DietQuality Score; GDQS−, GDQS negative submetric; GDQS+, GDQS positivesubmetric; MDD-W, Minimum Dietary Diversity–Women; MUAC, midupperarm circumference; MVP, Millennium Villages Project; NCD, noncommunicabledisease; PDQS, Prime Diet Quality Score; Q, quintile; SSA, sub-Saharan Africa;24HR, 24-h recall.
In light of persisting undernutrition throughout SSA,evidence that the increasing burden of NCDs is outpacingreductions in child and maternal malnutrition (24, 26), and thelikelihood that the regional NCD burden will increase signif-icantly as lifespans continue to lengthen, multiple coexistingburdens of malnutrition will continue to pose a major threatto the future of public health in SSA. Given the added contextof worsening diet quality in the region, it is especially importantthat SSA has the tools needed to measure and track diet qualityin terms of both dietary nutrient adequacy and NCD risk.Easy-to-use, food-based metrics are particularly attractive giventhe region’s limited resources for conducting diet surveys andlimited national food composition data with which to computenutrient intakes (27, 28).
In this article we describe a secondary analysis evaluatingthe performance of a novel food-based metric, the Global DietQuality Score (GDQS) (29) for predicting diet quality outcomesin rural men and women living in 10 SSA countries participatingin the Millennium Villages Project (MVP), and we compare theperformance of the GDQS with that of existing diet metrics.
MethodsStudy populationWe analyzed data from the MVP (30, 31). The MVP was a multiyearsustainable development project conducted from 2004 to 2015 in14 rural villages located in 10 sub-Saharan African countries. Thecurrent analysis included data collected from men and nonpregnantnonlactating women of reproductive age (15–49 y) living in 12Millennium Villages in 10 countries: Koraro (Ethiopia), Bonsaaso(Ghana), Dertu and Sauri (Kenya), Mwandama (Malawi), Tiby (Mali),Ikaram and Pampaida (Nigeria), Mayange (Rwanda), Potou (Senegal),Mbola (Tanzania), and Ruhiira (Uganda). We analyzed data from thefirst 2 waves of evaluations, which include data from 2005 to 2010 andevery calendar month. We pooled both waves of data in all analyses.Although the MVP included panel measurements, we did not analyzedata longitudinally given the challenge of adequately controlling for theinfluence of multiple large-scale community interventions implementedas part of the project; these interventions collectively brought aboutbroad nutritional improvements that could confound associationsbetween diet metrics and outcomes. This analysis was approved by theInstitutional Review Boards of Columbia University and Harvard T.H.Chan School of Public Health.
Dietary assessmentDiet was assessed from each participant using nonquantitative FFQsspecifically tailored to each country to capture local food consumption.All FFQs used a reference period of the last 1 mo and the followingfrequency response categories for all foods: never, 1/mo, 2–3/mo, 1/wk,2–3/wk, 4–6/wk, 1/d, ≥2/d. The number of foods assessed by each FFQranged from 92 to 161.
We derived standard portion sizes for each food through analysisof quantitative 24-h recall (24HR) survey data collected from womenof reproductive age in Burkina Faso, Ethiopia, Uganda, and Zambia(32, 33), in which we grouped similar foods together and computedthe median daily consumed mass of each food or food group. Theanalyzed 24HR surveys sampled women of reproductive age regardlessof pregnancy or breastfeeding status, and these surveys included somepregnant or lactating women; we retained these women in our analysisto ensure adequate statistical power for deriving standard portion sizesfor less frequently consumed foods. In addition to computing standardportions in the pooled population of 4 countries, we computed country-specific standards for Ethiopia and Uganda, which we supplementedwith published serving sizes for adults from Nigeria, Tanzania, andUganda (34, 35), to allow us to match foods, where possible, on acountry-by-country basis with foods consumed in the MVP data.
120S Supplement

We computed intakes of a set of nutrients we considered high pri-ority in low- and middle-income countries: protein, monounsaturatedfat, polyunsaturated fat, saturated fat, dietary fiber, calcium, iron, zinc,vitamin A, folate, and vitamin B-12. The primary source for nutrientcomposition of foods was the 2008 Food Composition Tables (FCTs)for Tanzania (36), including >400 foods (most of which are alsoconsumed outside of Tanzania) and detailed data on dietary fatty acids.For consumed foods missing from the Tanzania FCT, we abstracteddata from other African FCTs that also distinguished fatty acid fractions(Kenya, Senegal, Mozambique, and Egypt) (37, 38), and from the UnitedStates and Germany (for certain internationally available packagedfoods) (39, 40). In combining food composition data from multiplecountries, we rendered them compatible by adjusting nutrients asappropriate for differences in moisture and fat content according toFAO guidelines (41). Because each FFQ collected data primarily at thelevel of ingredients, calculation of recipes was not necessary, whereassome cooking yield and nutrient retention factors were drawn frominternational references and applied to raw ingredients (42–45).
Scoring diet metricsFor both men and women, FFQ data were used to tabulate the followingmetrics [refer to the article by Bromage et al. (29) introducing thisSupplement for information on how these metrics are constructed andscored]:
• Food-based metrics intended to reflect overall diet quality: theGDQS (29) and a Prime Diet Quality Score (PDQS)-like metric, anadaptation of an earlier metric (the PDQS) (46–48) from which theGDQS was developed.
• Food-based metrics intended to reflect nutrient adequacy: the GDQS-positive submetric (GDQS+) (29) computed using only the healthyGDQS food groups, and the Minimum Dietary Diversity–Womenindicator (MDD-W) (49). We acknowledged that the MDD-W wasoriginally intended for use in women only; furthermore, we treatedthis metric as a continuous integer variable ranging from 0 to 10,rather than as a binary indicator as it is sometimes used.
• Metrics intended to reflect NCD risk: the GDQS-negative submetric(GDQS−) (29)computed using only the unhealthy GDQS foodgroups, and the AHEI-2010 (50) scored using both food and nutrientcomponents.
Diet quality outcomesWe estimated energy-adjusted nutrient intakes using the residualmethod (51). We constructed a continuous measure of overall nutrientadequacy based on the number of nutrients (out of 8) meeting age- andsex-specific estimated average requirements (EARs) from the Instituteof Medicine (or adequate intake level, in the case of fiber) (52); ironadequacy was defined as ≥50% probability of adequacy based on a lognormal requirement distribution (53). Iron requirement distributionsand zinc EARs were adjusted to account for absorption characteristicsof local diets (53–56). We also created a binary measure of overallnutrient inadequacy using a cutoff of <4 (out of 8) adequate nutrients,as well as energy-adjusted continuous measures of overall nutrientadequacy and binary overall nutrient inadequacy.
In addition to nutrient intake and adequacy, we also analyzeddata on BMI (kg/m2); midupper arm circumference (MUAC); andhemoglobin collected from a subsample of participants using standardlaboratory procedures available in each country (adjusted for thealtitude of each village) (57) in men and women. The following cutoffswere applied to derive binary outcomes:
• Underweight and overweight/obesity: BMI <18.5 and ≥25 in bothmen and women (58)
• Low MUAC: <25.5 cm in men and <24.5 cm in women; these cutoffswere identified as those resulting in the lowest overall misclassificationof underweight BMI in an international analysis (59)
• Anemia: <13 g/dL in men and <12 g/dL hemoglobin in women(altitude-adjusted) (57)
Analysis of metric performanceWe evaluated and compared the performance of the GDQS, GDQS+,GDQS−, PDQS-like metric, MDD-W, and AHEI-2010 against dietquality outcomes. Methods involved computing Spearman correlationsbetween metrics and continuous diet quality outcomes; regressionmodels to determine unadjusted and age-adjusted estimated marginalmeans or ORs for different diet quality outcomes within each metricquintile and in terms of a 1 SD difference in each metric; and statisticalcomparisons of correlation coefficients, and trends in measures ofassociation across quintiles, between pairs of metrics (50, 60).
We excluded women who indicated they were currently pregnantor lactating. Within each sex, we also excluded participants withno reported food consumption, followed by participants with energyintakes <3 or >3 SDs from the mean, to limit the influence ofimplausible values. Correlation and regression analyses were performedseparately in the total population (i.e., pooled across villages) of menand the total population of women. For the GDQS alone, within pooledmen and pooled women we also determined partial correlations withenergy-adjusted nutrients controlling for village. In correlating metricsand energy-adjusted iron intakes in pooled analyses across villages, weexcluded participants from Ethiopia, whose iron intakes were extremelyhigh compared with those of other countries owing to the contributionof teff. In addition to correlation analyses pooled across villages, for allmetrics we also derived correlations within each village (in doing so, wepooled men and women within each village to optimize sample size).
In interpreting comparative metric performance, we prioritizedcorrelations with energy-adjusted nutrient intakes and age-adjustedregression models rather than unadjusted results, and defined a subsetof higher relevance diet quality outcomes in regression models (thecontinuous measure of energy-adjusted overall nutrient adequacy,and outcomes defined using clinically relevant cutoffs: overweight,underweight, low MUAC, and anemia) distinguished from lowerrelevance outcomes (the binary measure of energy-adjusted overallnutrient inadequacy and continuous outcomes for which clinicallyrelevant cutoffs exist: BMI, MUAC, and hemoglobin).
Statistical analyses were performed in R version 4.03 (R Founda-tion).
Results
FFQ data from 1547 men and 1624 nonpregnant nonlactatingwomen of reproductive age were analyzed in this study (agerange = 15–49 y and median = 30 y for both groups).Descriptive statistics on the number of participating men andwomen by village and survey wave, prevalence of binary dietquality outcomes by sex, and distributions of GDQS foodgroup consumption and metric scores by sex and village areprovided in Supplemental Tables 1–4. Pooling across villages,mean GDQS scores did not differ between men (22.6 ± 4.4) andwomen (22.5 ± 3.4) (P ≥ 0.05) (Supplemental Table 4). Withinvillages, pooling men and women, the lowest mean GDQSscore was found in Dertu, Kenya (18 ± 2.5) and the highestin Pampaida, Nigeria (26.3 ± 3.4). Correlations between thenumber of foods listed in the FFQs for each village comparedwith mean metric scores in each village were nonsignificant(P ≥ 0.05) (Supplemental Table 5).
In pooled analysis of all villages, the GDQS was significantly(P < 0.05) and at least modestly rank-correlated with energy-adjusted intakes of fiber (men: r = 0.22/women: 0.25), folate(0.13/0.24), monounsaturated fat (0.24/0.28), polyunsaturatedfat (0.12/0.12), and vitamin A (0.10/0.15) (Table 1). In women,we also observed a modest correlation with protein (r = 0.14),and a negative correlation with zinc (−0.11). The GDQS wasweakly (r < 0.1) or nonsignificantly (P ≥ 0.05) correlated withenergy-adjusted calcium, iron, saturated fat, and vitamin B-12intakes in men and women.
Evaluating the GDQS in sub-Saharan African adults 121S

TAB
LE1
Com
paris
onof
Spe
arm
anco
rrel
atio
nsbe
twee
nm
etric
s(s
core
dus
ing
FFQ
data
)and
ener
gy-a
djus
ted
nutr
ient
san
dcl
inic
alm
easu
rem
ents
inru
rals
ub-S
ahar
anA
fric
anad
ults
1
GDQS
GDQS
+GD
QS−
PDQS
-like
met
ricM
DD-W
AHEI
-201
0
Outc
ome
Sex
nr
rP-
diffe
renc
er
P-di
ffere
nce
rP-
diffe
renc
er
P-di
ffere
nce
rP-
diffe
renc
e
Calc
ium
M15
47−
0.04
−0.
102
<0.
0012
0.17
2<
0.00
12−
0.05
0.44
−0.
052
0.46
−0.
062
0.31
F16
24−
0.02
−0.
112
<0.
0012
0.23
2<
0.00
12−
0.09
2<
0.00
12−
0.05
0.20
−0.
052
0.33
Fibe
rint
ake
M15
470.
222
0.30
2<
0.00
12−
0.29
2<
0.00
120.
192
0.53
0.20
20.
440.
252
0.11
W16
240.
252
0.32
2<
0.00
12−
0.25
2<
0.00
120.
192
0.00
820.
282
0.04
120.
302
0.07
Fola
teM
1547
0.13
20.
212
<0.
0012
−0.
282
<0.
0012
0.04
<0.
0012
0.13
20.
870.
102
0.42
W16
240.
242
0.33
2<
0.00
12−
0.29
2<
0.00
120.
162
<0.
0012
0.25
20.
530.
222
0.25
Iron
inta
keM
1422
0.02
0.05
<0.
0012
−0.
132
<0.
0012
−0.
020.
43−
0.08
2<
0.00
12−
0.08
2<
0.00
12
W14
100.
020.
072
<0.
0012
−0.
132
<0.
0012
−0.
010.
59−
0.05
<0.
0012
−0.
082
<0.
0012
MUF
AM
1547
0.24
20.
202
0.00
120.
052
<0.
0012
0.15
2<
0.00
120.
262
0.32
0.29
20.
0392
W16
240.
282
0.27
20.
76−
0.05
<0.
0012
0.20
2<
0.00
120.
332
0.01
820.
322
0.12
Prot
ein
M15
470.
072
0.02
0.00
120.
082
0.63
−0.
062
<0.
0012
0.02
0.02
02−
0.11
2<
0.00
12
W16
240.
142
0.07
2<
0.00
120.
112
0.59
0.00
<0.
0012
0.07
2<
0.00
12−
0.02
<0.
0012
PUFA
sM
1547
0.12
20.
062
<0.
0012
0.13
20.
820.
192
<0.
0012
0.11
20.
870.
372
<0.
0012
W16
240.
122
0.06
2<
0.00
120.
102
0.58
0.16
20.
0142
0.11
20.
510.
292
<0.
0012
SFAs
M15
470.
020.
092
<0.
0012
−0.
162
<0.
0012
−0.
112
<0.
0012
0.08
20.
0042
−0.
132
<0.
0012
W16
240.
052
0.13
2<
0.00
12−
0.19
2<
0.00
12−
0.02
<0.
0012
0.09
20.
09−
0.11
2<
0.00
12
Vita
min
AM
1547
0.10
20.
212
<0.
0012
−0.
282
<0.
0012
0.22
2<
0.00
120.
222
<0.
0012
0.21
2<
0.00
12
W16
240.
152
0.26
2<
0.00
12−
0.32
2<
0.00
120.
272
<0.
0012
0.25
2<
0.00
120.
202
0.07
Vita
min
B-12
M15
47−
0.03
−0.
040.
680.
040.
0302
0.00
0.07
−0.
010.
17−
0.04
0.84
W16
240.
092
0.11
20.
09−
0.05
<0.
0012
0.10
20.
540.
122
0.15
0.03
0.02
92
Zinc
M15
47−
0.02
−0.
122
<0.
0012
0.20
2<
0.00
12−
0.12
2<
0.00
12−
0.15
2<
0.00
12−
0.27
2<
0.00
12
W16
24−
0.11
2−
0.22
2<
0.00
120.
282
<0.
0012
−0.
212
<0.
0012
−0.
202
<0.
0012
−0.
252
<0.
0012
ONA
M15
470.
342
0.38
2<
0.00
12−
0.15
2<
0.00
120.
252
<0.
0012
0.37
20.
130.
282
0.03
92
W16
240.
372
0.39
20.
0412
−0.
122
<0.
0012
0.31
2<
0.00
120.
372
0.94
0.34
20.
46BM
IM
360
0.00
0.05
0.06
−0.
152
0.05
−0.
010.
810.
112
0.00
320.
030.
27W
451
−0.
020.
020.
0352
−0.
112
0.17
0.00
0.46
0.03
0.11
0.02
0.42
MUA
CM
402
0.18
20.
252
0.05
−0.
152
<0.
0012
0.22
20.
380.
172
0.67
0.13
20.
46W
517
0.20
20.
302
<0.
0012
−0.
292
<0.
0012
0.22
20.
210.
232
0.26
0.12
20.
17He
mog
lobi
nM
495
0.14
20.
192
0.01
32−
0.15
2<
0.00
120.
242
<0.
0012
0.25
2<
0.00
120.
152
0.95
W55
40.
132
0.17
20.
0382
−0.
122
<0.
0012
0.19
20.
0062
0.16
20.
630.
122
0.92
1A
HE
I-201
0,A
ltern
ativ
eH
ealth
yE
atin
gIn
dex–
2010
;GD
QS,
Glo
balD
iet
Qua
lity
Sco
re;G
DQ
S−,
GD
QS
nega
tive
subm
etric
;GD
QS+,
GD
QS
posi
tive
subm
etric
;M,m
en;M
DD
-W,M
inim
umD
ieta
ryD
iver
sity
–Wom
en;M
UA
C,m
idup
per
arm
circ
umfe
renc
e;O
NA
,ene
rgy-
adju
sted
cont
inuo
usm
easu
reof
over
alln
utrie
ntad
equa
cy(n
umbe
rof
adeq
uate
nutr
ient
sou
tof
8);P
DQ
S,Pr
ime
Die
tQ
ualit
yS
core
;W,w
omen
.2In
dica
tes
stat
istic
ally
sign
ifica
nt(P
<0.
05)c
orre
latio
ns(r)
and
Wol
fete
sts
com
parin
gm
etric
-out
com
eco
rrel
atio
nsfo
rth
eG
DQ
Sco
mpa
red
with
othe
rm
etric
s(P
-diff
eren
ce).
Cor
rela
tions
for
iron
excl
ude
part
icip
ants
from
Eth
iopi
a.
122S Supplement

We observed moderate correlations between the GDQSand energy-adjusted overall nutrient adequacy (the number ofnutrients, out of 8, consumed in adequate amounts) of 0.34 inmen and 0.37 in women (P < 0.05) (Table 1). The GDQS+ wasmore strongly correlated with energy-adjusted overall nutrientadequacy than the GDQS in men (r = 0.38; Wolfe test Pfor difference with GDQS <0.001) and women (r = 0.39; P-difference = 0.041), the PDQS-like metric was less stronglycorrelated in men (r = 0.25; P-difference <0.001) and women(r = 0.31; P-difference <0.001), correlations with the MDD-Wdid not significantly differ in men (r = 0.37; P-difference = 0.13)or women (r = 0.37; P-difference = 0.94), and the AHEI-2010 was less strongly correlated in men (r = 0.28; P-difference = 0.039) whereas the correlation did not significantlydiffer in women (r = 0.34; P-difference = 0.46). The GDQS−,for which higher scores indicate less consumption of unhealthyfoods, was negatively correlated with energy-adjusted overallnutrient adequacy in men (r = −0.15) and women (r = −0.12)(P < 0.05). Comparisons of correlations between the GDQS andother diet metrics compared with individual energy-adjustednutrients are presented in Table 1.
Correlations between the GDQS and energy-adjusted nu-trient intakes and overall nutrient adequacy varied by village(Supplemental Table 6). In the total population of men and thetotal population of women, adjustment for village attenuatedmost correlations (correlation between the GDQS and energy-adjusted overall nutrient adequacy decreased from 0.34 to0.26 in men, and from 0.37 to 0.27 in women, but remainedsignificant in both sexes, P < 0.05) (Supplemental Table 7).
In age-adjusted regression models in both men and women,the GDQS was significantly (P-trend across quintiles <0.05)associated with higher nutrient adequacy [quintile (Q) 5–Q1range in estimated marginal means for men: 3.66–4.66 adequatenutrients (out of 8); women: 3.97–5.33], higher MUAC (Q5–Q1range: 24.25–25.52 cm in men and 24.05–25.83 in women),higher hemoglobin (Q5–Q1 range: 12.30–13.55 g/dL in menand 10.42–11.86 in women), lower odds of low MUAC (Q5compared with Q1 OR in men: 0.44, 95% CI: 0.22, 0.85;women: 0.57, 95% CI: 0.31, 1.03), and lower odds of anemia(Q5 compared with Q1 OR in men: 0.56, 95% CI: 0.32, 0.98;women: 0.60, 95% CI: 0.35, 1.01) (Table 2).
Similar to the GDQS, the GDQS+, PDQS-like metric, MDD-W, and AHEI-2010 were also associated with higher overallnutrient adequacy and hemoglobin in men and women in age-adjusted models; the GDQS+, PDQS-like metric, and MDD-W were also associated with lower odds of anemia in menand women (whereas the AHEI-2010 was only associated inwomen); and the GDQS+ and PDQS-like metric were furtherassociated with lower odds of low MUAC in men and women(whereas the MDD-W was associated in women and onlymarginally associated in men, P = 0.07). Statistical comparisonsof performance between metrics were nonsignificant (P ≥ 0.05)except that the GDQS+ outperformed the PDQS-like metric inpredicting overall nutrient adequacy (P < 0.05) (Table 3; Sup-plemental Tables 8 and 9). Figure 1 shows age-adjusted associ-ations between the GDQS and MDD-W compared with overallnutrient adequacy, low MUAC, and anemia in men and women.
The GDQS− was the only metric associated with a lowerodds of overweight BMI in age-adjusted models, in womenonly (Q5 compared with Q1 OR: 0.53, 95% CI: 0.21, 1.19)(P < 0.05) (Table 3). The GDQS− was also the only metricassociated with a higher odds of underweight BMI, in womenonly (Q5 compared with Q1 OR: 2.99, 95% CI: 1.33, 6.84)(P < 0.05).
Expanded correlation statistics and comparisons are pre-sented in Supplemental Table 10, and expanded regressionstatistics and model comparisons are presented in SupplementalTables 8 and 9, respectively. A summary of significant results ofregression analyses is presented in Supplemental Table 11.
Discussion
In this secondary analysis of rural men and nonpregnant non-lactating women of reproductive age in 10 African countries,we found modest positive correlations between the GDQS andenergy-adjusted intakes of fiber, folate, monounsaturated fat,polyunsaturated fat, protein, and vitamin A. GDQS-nutrientcorrelations were generally stronger in women than men,and varied by village. Controlling for village attenuated mostGDQS-nutrient correlations, indicating that between-villagevariation in diet quality is an important determinant of nutrientintakes and adequacy in this population.
In age-adjusted regression models, the GDQS was positivelyassociated with overall nutrient adequacy in men and women[consistent with findings of parallel GDQS evaluations inmen and women in China and Ethiopia, and women inIndia and Mexico (61–64)], reduced odds of low MUAC inmen and women [consistent with findings in Ethiopian andIndian women (61, 64)], and reduced odds of anemia in menand women [consistent with findings in Ethiopian women(61)]. Regression models did not find major differences in theperformance of the GDQS, GDQS+, a PDQS-like metric, andMDD-W in analyses of anemia or low MUAC (all 4 metricswere predictive of lower odds of these outcomes in men andwomen, though the MDD-W was marginally associated withlow MUAC in men), whereas the AHEI-2010 was not associatedwith either outcome in men or women. The GDQS− wasinversely associated with overweight/obesity in women (othermetrics were not associated).
In prior secondary analysis of the MDD-W using quanti-tative 24HR data from nonpregnant nonlactating women ofreproductive age in diverse resource-poor settings (includingrural populations in 3 African countries), Pearson correlationsbetween the MDD-W (scored as a continuous variable from 0 to10) and energy-adjusted mean probability of adequacy of 11 nu-trients ranged from 0.29 (rural Uganda), to 0.31 (rural Mozam-bique), to 0.48 (rural Burkina Faso) (49). Our current analysisfound a correlation of 0.37 for both the MDD-W and GDQScompared with overall nutrient adequacy in the total populationof women across 10 countries, although comparisons betweenthese studies are complicated by differences in the countries,dietary instruments, nutrient adequacy variable, and analyticalapproaches involved, including how the aggregate variable ofnutrient adequacy was defined. Only 1 prior study in Africa,involving secondary analysis of quantitative 24HR data from7533 pregnant Tanzanian women, has evaluated the compara-tive performance of the MDD-W and the earlier PDQS (uponwhich the GDQS is based) in predicting pregnancy outcomes,and found the PDQS to be inversely associated with pretermbirth, low birth weight, and fetal loss, whereas the MDD-W wasinversely associated with small for gestational age (48).
In the current analysis, the GDQS was more stronglycorrelated than the MDD-W with energy-adjusted proteinintake in women (likely reflecting the expanded list of animal-source food groups in the GDQS) and less negatively correlatedthan other metrics with zinc in both men and women. Thenegative correlation between the MDD-W and zinc was driven
Evaluating the GDQS in sub-Saharan African adults 123S

TAB
LE2
Age
-adj
uste
das
soci
atio
nsbe
twee
nth
eG
DQ
S(s
core
dus
ing
FFQ
data
)and
cont
inuo
usan
dca
tego
rical
diet
qual
ityou
tcom
esin
rura
lsub
-Sah
aran
Afr
ican
adul
ts1
Outc
ome
Stat
istic
Sex
nCa
ses,
nGD
QSqu
intil
e1
GDQS
quin
tile
2GD
QSqu
intil
e3
GDQS
quin
tile
4GD
QSqu
intil
e5
Per1
SDP-
trend
ONA
(#)
EMM
(95%
CI)
M15
473.
66(3
.53,
3.79
)3.
86(3
.73,
3.98
)4.
27(4
.14,
4.40
)4.
56(4
.43,
4.69
)4.
66(4
.53,
4.79
)0.
38(0
.32,
0.44
)<
0.00
12
F16
243.
97(3
.83,
4.11
)4.
56(4
.40,
4.71
)5.
26(5
.11,
5.41
)5.
61(5
.46,
5.76
)5.
33(5
.17,
5.48
)0.
51(0
.45,
0.58
)<
0.00
12
ONA
<4
OR(9
5%CI
)M
1547
539
REF
0.63
(0.4
6,0.
86)
0.36
(0.2
6,0.
50)
0.22
(0.1
5,0.
31)
0.18
(0.1
3,0.
26)
0.51
(0.4
5,0.
57)
<0.
0012
F16
2441
7RE
F0.
41(0
.30,
0.56
)0.
16(0
.11,
0.22
)0.
08(0
.05,
0.12
)0.
09(0
.06,
0.13
)0.
35(0
.30,
0.40
)<
0.00
12
BMI,
kg/m
2EM
M(9
5%CI
)M
360
20.5
0(1
9.92
,21.
09)
20.3
4(1
9.63
,21.
06)
20.8
0(2
0.11
,21.
48)
20.6
2(1
9.84
,21.
39)
20.4
5(1
9.67
,21.
22)
−0.
01(−
0.31
,0.2
9)0.
89F
451
21.3
4(2
0.55
,22.
13)
21.9
5(2
1.09
,22.
80)
22.3
1(2
1.49
,23.
12)
21.9
6(2
1.19
,22.
73)
21.6
1(2
0.74
,22.
48)
0.08
(−0.
28,0
.45)
0.68
BMI<
18.5
OR(9
5%CI
)M
360
88RE
F1.
18(0
.59,
2.36
)0.
67(0
.31,
1.37
)0.
93(0
.43,
1.97
)0.
89(0
.41,
1.87
)0.
95(0
.75,
1.21
)0.
59F
451
65RE
F0.
90(0
.40,
2.01
)0.
55(0
.22,
1.30
)0.
82(0
.38,
1.79
)0.
84(0
.36,
1.91
)1.
00(0
.76,
1.30
)0.
64BM
I≥25
OR(9
5%CI
)M
360
24RE
F1.
55(0
.47,
5.18
)1.
13(0
.31,
3.89
)0.
85(0
.17,
3.37
)1.
20(0
.29,
4.38
)0.
99(0
.65,
1.47
)0.
87F
451
75RE
F1.
31(0
.57,
3.02
)1.
46(0
.66,
3.26
)1.
64(0
.77,
3.60
)1.
05(0
.43,
2.50
)1.
06(0
.82,
1.36
)0.
74M
UAC,
cmEM
M(9
5%CI
)M
402
24.2
5(2
3.52
,24.
98)
24.0
2(2
3.17
,24.
86)
25.0
6(2
4.22
,25.
90)
25.5
3(2
4.56
,26.
51)
25.5
2(2
4.52
,26.
53)
0.50
(0.1
1,0.
89)
0.00
52
F51
724
.05
(23.
36,2
4.73
)23
.59
(22.
89,2
4.29
)24
.85
(24.
12,2
5.58
)26
.20
(25.
43,2
6.98
)25
.83
(24.
97,2
6.69
)0.
86(0
.52,
1.20
)<
0.00
12
Low
MUA
COR
(95%
CI)
M40
219
2RE
F0.
78(0
.43,
1.42
)0.
53(0
.29,
0.95
)0.
39(0
.20,
0.75
)0.
44(0
.22,
0.85
)0.
70(0
.56,
0.87
)0.
0022
F51
723
4RE
F1.
50(0
.89,
2.53
)1.
22(0
.72,
2.06
)0.
41(0
.23,
0.73
)0.
57(0
.31,
1.03
)0.
75(0
.62,
0.90
)<
0.00
12
Hem
oglo
bin,
g/dL
EMM
(95%
CI)
M49
512
.30
(11.
86,1
2.75
)12
.74
(12.
24,1
3.25
)13
.25
(12.
78,1
3.71
)13
.01
(12.
51,1
3.51
)13
.55
(13.
03,1
4.07
)0.
41(0
.20,
0.62
)<
0.00
12
F55
410
.42
(10.
02,1
0.82
)11
.01
(10.
52,1
1.49
)11
.27
(10.
83,1
1.71
)11
.68
(11.
26,1
2.10
)11
.86
(11.
41,1
2.31
)0.
52(0
.33,
0.71
)<
0.00
12
Anem
iaOR
(95%
CI)
M49
522
0RE
F0.
79(0
.45,
1.36
)0.
67(0
.39,
1.13
)0.
66(0
.38,
1.15
)0.
56(0
.32,
0.98
)0.
79(0
.66,
0.95
)0.
0412
F55
431
6RE
F0.
99(0
.57,
1.73
)0.
99(0
.58,
1.67
)0.
72(0
.44,
1.20
)0.
60(0
.35,
1.01
)0.
84(0
.71,
1.00
)0.
0262
1G
DQ
S,G
loba
lDie
tQ
ualit
yS
core
;EM
M,e
stim
ated
mar
gina
lmea
n;M
UA
C,m
idup
per
arm
circ
umfe
renc
e;O
NA
,ene
rgy-
adju
sted
cont
inuo
usm
easu
reof
over
alln
utrie
ntad
equa
cy(n
umbe
rof
adeq
uate
nutr
ient
sou
tof
8);R
EF,
refe
renc
e.2In
dica
tes
stat
istic
ally
sign
ifica
nt(P
<0.
05)l
inea
rtr
ends
acro
ssm
etric
quin
tiles
.
124S Supplement

TAB
LE3
Com
paris
onof
age-
adju
sted
asso
ciat
ions
betw
een
the
GD
QS
and
othe
rdi
etm
etric
sco
mpa
red
with
sele
cted
diet
qual
ityou
tcom
esin
rura
lsub
-Sah
aran
Afr
ican
adul
ts1
GDQS
Com
paris
onm
etric
Com
paris
onm
etric
Outc
ome
Stat
istic
Sex
nCa
ses,
nPe
r1SD
P-tre
ndPe
r1SD
P-tre
ndP-
diffe
renc
e
GDQS
+An
emia
OR(9
5%CI
)M
495
220
0.79
(0.6
6,0.
95)
0.04
10.
71(0
.59,
0.85
)0.
0062
0.17
F55
431
60.
84(0
.71,
1.00
)0.
026
0.82
(0.6
8,0.
97)
0.04
420.
66BM
I<18
.5kg
/m2
OR(9
5%CI
)M
360
880.
95(0
.75,
1.21
)0.
585
0.86
(0.6
6,1.
10)
0.25
0.21
F45
165
1.00
(0.7
6,1.
30)
0.64
40.
84(0
.63,
1.10
)0.
370.
24BM
I≥25
OR(9
5%CI
)M
360
240.
99(0
.65,
1.47
)0.
874
1.21
(0.7
8,1.
86)
0.56
0.29
F45
175
1.06
(0.8
2,1.
36)
0.74
11.
14(0
.88,
1.48
)0.
290.
25Lo
wM
UAC
OR(9
5%CI
)M
402
192
0.70
(0.5
6,0.
87)
0.00
20.
63(0
.50,
0.79
)0.
0052
0.90
F51
723
40.
75(0
.62,
0.90
)0.
000
0.60
(0.4
9,0.
72)
<0.
0012
0.05
ONA
(#)
EMM
(95%
CI)
M15
470.
38(0
.32,
0.44
)0.
000
0.43
(0.3
7,0.
49)
<0.
0012
0.08
F16
240.
51(0
.45,
0.58
)0.
000
0.55
(0.4
8,0.
62)
<0.
0012
0.15
GDQS
−An
emia
OR(9
5%CI
)M
495
220
0.79
(0.6
6,0.
95)
0.04
11.
35(1
.12,
1.63
)0.
0312
0.06
F55
431
60.
84(0
.71,
1.00
)0.
026
1.08
(0.9
1,1.
30)
0.06
0.08
BMI<
18.5
OR(9
5%CI
)M
360
880.
95(0
.75,
1.21
)0.
585
1.30
(1.0
0,1.
70)
0.19
0.31
F45
165
1.00
(0.7
6,1.
30)
0.64
41.
56(1
.17,
2.10
)0.
0022
0.16
BMI≥
25OR
(95%
CI)
M36
024
0.99
(0.6
5,1.
47)
0.87
40.
62(0
.41,
0.95
)0.
080.
20F
451
751.
06(0
.82,
1.36
)0.
741
0.83
(0.6
3,1.
07)
0.01
220.
33Lo
wM
UAC
OR(9
5%CI
)M
402
192
0.70
(0.5
6,0.
87)
0.00
21.
26(1
.02,
1.56
)0.
090.
07F
517
234
0.75
(0.6
2,0.
90)
0.00
01.
78(1
.47,
2.17
)<
0.00
120.
0382
ONA
(#)
EMM
(95%
CI)
M15
470.
38(0
.32,
0.44
)0.
000
−0.
18(−
0.24
,−0.
11)
<0.
0012
0.00
12
F16
240.
51(0
.45,
0.58
)0.
000
−0.
20(−
0.27
,−0.
12)
<0.
0012
<0.
0012
PDQS
-like
met
ricAn
emia
OR(9
5%CI
)M
495
220
0.79
(0.6
6,0.
95)
0.04
10.
65(0
.54,
0.78
)0.
0022
0.13
F55
431
60.
84(0
.71,
1.00
)0.
026
0.78
(0.6
6,0.
92)
0.03
220.
69BM
I<18
.5OR
(95%
CI)
M36
088
0.95
(0.7
5,1.
21)
0.58
51.
04(0
.81,
1.33
)0.
600.
24F
451
651.
00(0
.76,
1.30
)0.
644
0.94
(0.7
3,1.
23)
0.54
0.23
BMI≥
25OR
(95%
CI)
M36
024
0.99
(0.6
5,1.
47)
0.87
41.
10(0
.71,
1.69
)0.
530.
22F
451
751.
06(0
.82,
1.36
)0.
741
1.04
(0.8
1,1.
34)
0.82
0.76
Low
MUA
COR
(95%
CI)
M40
219
20.
70(0
.56,
0.87
)0.
002
0.66
(0.5
3,0.
83)
0.02
820.
55F
517
234
0.75
(0.6
2,0.
90)
0.00
00.
71(0
.59,
0.85
)0.
0032
0.44
ONA
(#)
EMM
(95%
CI)
M15
470.
38(0
.32,
0.44
)0.
000
0.30
(0.2
4,0.
36)
0.00
020.
06F
1624
0.51
(0.4
5,0.
58)
0.00
00.
46(0
.39,
0.53
)0.
0002
0.08
MDD
-WAn
emia
OR(9
5%CI
)M
495
220
0.79
(0.6
6,0.
95)
0.04
10.
63(0
.53,
0.76
)0.
0012
0.10
F55
431
60.
84(0
.71,
1.00
)0.
026
0.75
(0.6
2,0.
89)
0.03
120.
397
BMI<
18.5
OR(9
5%CI
)M
360
880.
95(0
.75,
1.21
)0.
585
0.86
(0.6
8,1.
09)
0.37
0.36
F45
165
1.00
(0.7
6,1.
30)
0.64
40.
91(0
.71,
1.17
)0.
410.
47BM
I≥25
OR(9
5%CI
)M
360
240.
99(0
.65,
1.47
)0.
874
1.44
(0.9
4,2.
26)
0.22
0.23
F45
175
1.06
(0.8
2,1.
36)
0.74
11.
24(0
.97,
1.60
)0.
130.
15Lo
wM
UAC
OR(9
5%CI
)M
402
192
0.70
(0.5
6,0.
87)
0.00
20.
65(0
.52,
0.81
)0.
070.
51F
517
234
0.75
(0.6
2,0.
90)
0.00
00.
71(0
.59,
0.85
)<
0.00
120.
20ON
A(#
)EM
M(9
5%CI
)M
1547
0.38
(0.3
2,0.
44)
0.00
00.
45(0
.39,
0.50
)<
0.00
120.
39F
1624
0.51
(0.4
5,0.
58)
0.00
00.
58(0
.51,
0.64
)<
0.00
120.
20
(Con
tinue
d)
Evaluating the GDQS in sub-Saharan African adults 125S

TAB
LE3
(Con
tinue
d)
GDQS
Com
paris
onm
etric
Com
paris
onm
etric
Outc
ome
Stat
istic
Sex
nCa
ses,
nPe
r1SD
P-tre
ndPe
r1SD
P-tre
ndP-
diffe
renc
e
AHEI
-201
0An
emia
OR(9
5%CI
)M
495
220
0.79
(0.6
6,0.
95)
0.04
10.
74(0
.61,
0.88
)0.
0022
0.35
F55
431
60.
84(0
.71,
1.00
)0.
026
0.86
(0.7
3,1.
00)
0.14
0.70
BMI<
18.5
OR(9
5%CI
)M
360
880.
95(0
.75,
1.21
)0.
585
1.05
(0.8
3,1.
32)
0.48
0.42
F45
165
1.00
(0.7
6,1.
30)
0.64
41.
02(0
.79,
1.32
)0.
819
0.44
BMI≥
25OR
(95%
CI)
M36
024
0.99
(0.6
5,1.
47)
0.87
41.
47(0
.98,
2.23
)0.
120.
34F
451
751.
06(0
.82,
1.36
)0.
741
1.19
(0.9
4,1.
53)
0.19
0.36
Low
MUA
COR
(95%
CI)
M40
219
20.
70(0
.56,
0.87
)0.
002
0.72
(0.5
8,0.
89)
0.00
320.
68F
517
234
0.75
(0.6
2,0.
90)
0.00
00.
80(0
.67,
0.96
)0.
060.
39ON
A(#
)EM
M(9
5%CI
)M
1547
0.38
(0.3
2,0.
44)
0.00
00.
32(0
.26,
0.38
)<
0.00
120.
20F
1624
0.51
(0.4
5,0.
58)
0.00
00.
50(0
.43,
0.57
)<
0.00
120.
31
1E
xclu
ded
from
this
tabl
ear
eou
tcom
esca
tego
rized
aslo
wer
clin
ical
rele
vanc
e(t
hebi
nary
mea
sure
ofen
ergy
-adj
uste
dov
eral
lnut
rient
inad
equa
cyan
dco
ntin
uous
BM
I,M
UA
C,a
ndhe
mog
lobi
n);r
efer
toS
uppl
emen
talT
able
9fo
rex
pand
edre
sults
.AH
EI-2
010,
Alte
rnat
ive
Hea
lthy
Eat
ing
Inde
x–20
10;E
MM
,est
imat
edm
argi
nalm
ean;
GD
QS,
Glo
balD
iet
Qua
lity
Sco
re;G
DQ
S−,
GD
QS
nega
tive
subm
etric
;GD
QS+,
GD
QS
posi
tive
subm
etric
;MD
D-W
,Min
imum
Die
tary
Div
ersi
ty–W
omen
;MU
AC
,mid
uppe
rar
mci
rcum
fere
nce;
ON
A,e
nerg
y-ad
just
edco
ntin
uous
mea
sure
ofov
eral
lnut
rient
adeq
uacy
(num
ber
ofad
equa
tenu
trie
nts
out
of8)
;PD
QS,
Prim
eD
iet
Qua
lity
Sco
re.
2In
dica
tes
stat
istic
ally
sign
ifica
nt(P
<0.
05)l
inea
rtr
ends
acro
ssm
etric
quin
tiles
(P-t
rend
)and
Wal
dte
sts
com
parin
gtr
ends
betw
een
the
GD
QS
and
othe
rm
etric
s(P
-diff
eren
ce).
mainly by plant-source components, namely, vitamin A–richfruits and vegetables, other vegetables, and other fruits; fruitand vegetable components also drove the negative correlationbetween the AHEI-2010 and zinc. Negative correlations withzinc (as well as calcium and iron) reflect the fact that, onan energy-adjusted basis, total consumption of fruits andvegetables (which are scored positively in all diet metrics)correlated negatively with total consumption of mineral-richanimal-source foods in this population (partial correlationcontrolling for energy was −0.14 in men and −0.17 inwomen; P < 0.001). Whereas GDQS fruit and vegetablegroups were also somewhat negatively correlated with mineralintakes, these groups are more disaggregated and numerousin the GDQS, which helps to moderate the extent to whichany particular group might drive metric-outcome associations(when computing the GDQS, this aspect of the metric mayalso mitigate the influence of measurement error in foodconsumption).
Conversely, the AHEI-2010 was more strongly correlatedamong metrics with energy-adjusted intake of polyunsaturatedfat (reflecting the inclusion of polyunsaturated fat as an AHEI-2010 scoring component), whereas the MDD-W exhibitedstronger correlations than the GDQS with monounsaturatedfat in women (driven mainly by the MDD-W nuts and seedscomponent), vitamin A in men and women (driven by thevitamin A–rich fruits and vegetables component), and fiberin women (driven by pulses, dark green leafy vegetables, andother vegetables and fruits). In settings where dietary diversityis very low, the MDD-W (which employs fewer food groups,no negatively scored groups, and a simpler scoring approach)may be similarly sensitive to nutrient adequacy (in such settings,the relative complexity of the GDQS may not necessarilyadd predictive value for assessing nutrient adequacy). In aseparate evaluation of a particularly resource-poor context (apredominantly rural population of Ethiopian men and women),we found the MDD-W to be more sensitive than the GDQS incapturing overall nutrient adequacy (61); however, this was notobserved in evaluating the GDQS in the current analysis, or inChina, India, or Mexico (62–64).
In the current analysis, we observed higher correlations forthe GDQS+ than the GDQS with energy-adjusted fiber, folate,and vitamin A intakes. This is due to the inclusion in the GDQSof negatively scored food groups that also contribute somedietary nutrients (white roots and tubers, and refined grains inparticular are significant sources of some nutrients in rural SSAgiven their volume of consumption, and scoring these foodsnegatively in the GDQS could somewhat attenuate GDQS-nutrient correlations). The GDQS partly addresses this by givingpositive scores to red meat and high fat dairy up until specificconsumption thresholds, after which these groups receive zeropoints. The inclusion of negatively scored food groups in theGDQS is intended to help the metric capture diet-related NCDrisk more sensitively than the GDQS+ and serve as a measure ofoverall diet quality (whereas the GDQS+ explicitly captures thecontribution of healthy foods to diet quality). Importantly, wedid not observe differences in associations between the GDQSand GDQS+ compared with overall nutrient adequacy, lowMUAC, or anemia, indicating that inclusion of negatively scoredfoods did not impair the ability of the GDQS to capture thesekey indicators of nutrient adequacy.
We also observed strongly negative correlations betweenthe GDQS− and energy-adjusted fiber, folate, iron, saturatedfat, and vitamin A intakes, owing to this submetric’s soleinclusion of negatively scored foods (with the exception of
126S Supplement

P-trend: <0.001, <0.001
P-trend: <0.001, <0.0010.00
0.25
0.50
0.75
1.00
1.25
1.50
Q1 Q2 Q3 Q4 Q5
OR
(95%
CI)
for L
ow M
UAC
Men: Low MUAC
0.00
0.25
0.50
0.75
1.00
1.25
1.50
1.75
2.00
2.25
2.50
2.75
Q1 Q2 Q3 Q4 Q5
OR
(95%
CI)
for L
ow M
UAC
Women: Low MUAC
P-trend: <0.001, <0.001
P-trend: 0.07, 0.002
0.00
0.20
0.40
0.60
0.80
1.00
1.20
1.40
1.60
1.80
Q1 Q2 Q3 Q4 Q5
OR
(95%
CI)
for A
nem
ia
Women: Anemia
0.00
0.20
0.40
0.60
0.80
1.00
1.20
1.40
Q1 Q2 Q3 Q4 Q5
OR
(95%
CI)
for A
nem
ia
Men: Anemia
P-trend: 0.031, 0.026
P-trend: <0.001, 0.041
3.40
3.60
3.80
4.00
4.20
4.40
4.60
4.80
5.00
Q1 Q2 Q3 Q4 Q5
AN
Ofo)IC
%59(M
ME
Men: Overall Nutrient Adequacy
3.80
4.00
4.20
4.40
4.60
4.80
5.00
5.20
5.40
5.60
5.80
6.00
Q1 Q2 Q3 Q4 Q5
AN
Ofo)IC
%59(M
M E
Women: Overall Nutrient Adequacy
FIGURE 1 Age-adjusted associations between quintiles of the GDQS (red) and MDD-W (blue) compared with overall nutrient adequacy,low midupper arm circumference (MUAC), and anemia in rural sub-Saharan African adults. Overall nutrient adequacy (ONA) defined as energy-adjusted number of adequate nutrients (out of 8). Low MUAC defined as <25.5 cm in men and <24.5 cm in women. Anemia defined as <13 g/dLin men and <12 g/dL in women (altitude-adjusted). GDQS quintiles correspond to scores <18.8, 18.9–21.3, 21.3–23.5, 23.5–26.5, and >26.5 inmen; and <19.0, 19.0–21.3, 21.3–23.5, 23.5–26.3, and >26.3 in women. MDD-W quintiles correspond to scores <5, 5.0, 6.0, 7.0, and >7 inmen and women. All Wald tests comparing linear trends across quintiles between the GDQS and MDD-W were nonsignificant (P ≥ 0.05). EMM,estimated marginal mean, GDQS, Global Diet Quality Score; MDD-W, Minimum Dietary Diversity–Women; Q, quintile.
moderate red meat and high fat dairy consumption) and thefact that these foods do contribute some dietary nutrients. TheGDQS− explicitly captures the extent to which unhealthyfoods contribute to dietary nutrient intake, but does not intendto capture undernutrition outcomes (and was unfavorablyassociated with overall nutrient adequacy, low MUAC, un-derweight BMI, and anemia in the current study). However,that the GDQS− was the only metric inversely associated withoverweight highlights its role in capturing diet-related NCDrisk, and further supports the inclusion of negatively scoredcomponents in the GDQS to allow more holistic measurementof diet quality (and which we have found add value to themetric in capturing NCD outcomes in parallel evaluations of theGDQS in China, Mexico, and the United States) (63, 65–67).
This study has many strengths. These include broadinclusion of villages across 10 SSA countries, use of FFQsspecifically developed for each country, and use of country-specific food composition data. This study also has limitations.First, although we derived standard portion sizes for asmany SSA foods as possible through analysis of open-ended24HR data from rural populations, error might arise dueto differences in diet between the sample demographics andcountries represented by the 24HR surveys (which includedrural women of reproductive age in 3 countries, and menand nonpregnant nonlactating women of reproductive age in
1 country) and the Millennium Villages (which included ruralmen and nonpregnant nonlactating women in 10 countries). Asecond limitation is that the cross-sectional nature of this studyprevented us from inferring causal relations between diet qualitymetrics and outcomes. A third important limitation of this studyis that it does not provide evidence to support that GDQS is asuitable metric for capturing NCD risk. This is due to the limitednumber of NCD-related outcomes in the current study, of whichonly fatty acid and fiber intakes, and overweight/obesity wereavailable (furthermore, the low prevalence of overweight, 7% inmen and 17% in women, diminished statistical power to deriveassociations for that outcome).
In conclusion, the GDQS is evidently a useful measureof nutrient adequacy, low MUAC, and anemia in SSA menand women. Based on comparison with the MDD-W, thedifferentiation of healthy- and unhealthy-scoring componentsby the GDQS did not appear to compromise its ability tosensitively capture nutrient adequacy–related outcomes. This isimportant given the emerging double burden of undernutritionand NCDs in SSA, and the need for an easily operationalizedmetric that captures both nutrient adequacy and diet-relatedNCD risk. Although we have found the MDD-W to besensitive to nutrient adequacy–related outcomes in this andother settings (61–64), and somewhat simpler to collect, its lackof differentiation between healthy and unhealthy food groups
Evaluating the GDQS in sub-Saharan African adults 127S

has limited its ability to capture NCD risks in other settings (63,65–67). Nonetheless, given the lack of data on NCD outcomesin this study, prospective studies are warranted to compareperformance of both these metrics and the AHEI in relation toNCD outcomes in SSA.
Acknowledgments
We thank Paola Kim-Bianco for assistance in managing the dataanalyzed in this study, and Bennet Nemsler for assistance withdietary instruments and data cleaning.
The authors’ responsibilities were as follows—WCW, SES,JS, SB, MDH, WWF: designed research; SES, JF, RR, JS:conducted research; SES: provided essential materials; SB,YZ, MDH, WWF: analyzed data; CB, SNB, TTF, YL, MJS,MD: provided technical guidance and supervised analysis;SB, YZ: wrote the paper; SB: had primary responsibility forfinal content; and all authors: read and approved the finalmanuscript.
References1. Muyonga JH, Nansereko S, Steenkamp I, Manley M, Okoth JK.
Traditional African foods and their potential to contribute to health andnutrition. In: Shekhar HU, Howlader ZH, Kabir Y, editors. Exploringthe nutrition and health benefits of functional foods. IGI Global; 2017.p. 320–46.
2. Miracle MP. The introduction and spread of maize in Africa. J Afr Hist1965;6:39–55.
3. Hollinger F, Staatz JM. Agricultural growth in West Africa. Market andpolicy drivers. Rome, Italy: FAO, African Development Bank, ECOWAS;2015.
4. Food and Agriculture Organization. Percentage of Undernourishedpeople by region in 2000 and 2019 [Internet]. [cited 2021 February27]. Available from: http://www.fao.org/sustainable-development-goals/indicators/211/en/.
5. Holmes MD, Dalal S, Sewram V, Diamond MB, Adebamowo SN,Ajayi IO, Adebamowo C, Chiwanga FS, Njelekela M, Laurence C,et al. Consumption of processed food dietary patterns in four Africanpopulations. Public Health Nutr 2018;21(8):1529–37.
6. Reardon T, Tschirley D, Liverpool-Tasie LSO, Awokuse T, Fanzo J,Minten B, Vos R, Dolislager M, Sauer C, Dhar R, et al. The processedfood revolution in African food systems and the double burden ofmalnutrition. Glob Food Sec 2021;28:100466.
7. Food and Agriculture Organization. FAOSTAT3 system [Internet].[cited 2021 February 27]. Available from: http://www.fao.org/faostat/.
8. Muthayya S, Rah JH, Sugimoto JD, Roos FF, Kraemer K, Black RE. Theglobal hidden hunger indices and maps: an advocacy tool for action.PLoS One 2013;8(6):e67860.
9. UNICEF, WHO, The World Bank. Joint child malnutrition estimates:levels and trends [Internet]. [cited 2021 February 27]. Available from:https://www.who.int/nutgrowthdb/estimates/en/.
10. Bosu WK. An overview of the nutrition transition in West Africa:implications for non-communicable diseases. Proc Nutr Soc2015;74(4):466–77.
11. Steyn NP, McHiza ZJ. Obesity and the nutrition transition in sub-Saharan Africa. Ann N Y Acad Sci 2014;1311:88–101.
12. Nnyepi MS, Gwisai N, Lekgoa M, Seru T. Evidence of nutritiontransition in Southern Africa. Proc Nutr Soc 2015;74(4):478–86.
13. Development Initiatives Poverty Research. 2020 Global NutritionReport: action on equity to end malnutrition. Bristol, United Kingdom:Development Initiatives; 2020.
14. Popkin BM, Corvalan C, Grummer-Strawn LM. Dynamics of the doubleburden of malnutrition and the changing nutrition reality. Lancet2020;395(10217):65–74.
15. NCD Risk Factor Collaboration (NCD-RisC). Rising rural body-massindex is the main driver of the global obesity epidemic in adults. Nature2019;569(7755):260–4.
16. International Health Metrics and Evaluation. GBD compare [Internet].[cited 2021 February 27]. Available from: https://vizhub.healthdata.org/gbd-compare/.
17. de Ramirez SS, Enquobahrie DA, Nyadzi G, Mjungu D, MagomboF, Ramirez M, Sachs SE, Willett W. Prevalence and correlates ofhypertension: a cross-sectional study among rural populations in sub-Saharan Africa. J Hum Hypertens 2010;24(12):786–95.
18. Noubiap JJ, Bigna JJ, Nansseu JR, Nyaga UF, Balti EV, Echouffo-Tcheugui JB, Kengne AP. Prevalence of dyslipidaemia among adultsin Africa: a systematic review and meta-analysis. Lancet Glob Health.2018;6(9):e998–e1007.
19. Bosu WK, Reilly ST, Aheto JMK, Zucchelli E. Hypertension in olderadults in Africa: a systematic review and meta-analysis. PLoS One2019;14(4):e0214934.
20. Atun R, Davies JI, Gale EAM, Bärnighausen T, Beran D, Kengne AP,Levitt NS, Mangugu FW, Nyirenda MJ, Ogle GD, et al. Diabetes insub-Saharan Africa: from clinical care to health policy. Lancet DiabetesEndocrinol. 2017;5(8):622–67.
21. GBD 2017 Diet Collaborators. Health effects of dietary risks in 195countries, 1990–2017: a systematic analysis for the Global Burden ofDisease Study 2017. Lancet 2019;393(10184):1958–72.
22. Imamura F, Micha R, Khatibzadeh S, Fahimi S, Shi P, Powles J,Mozaffarian D; Global Burden of Diseases Nutrition and ChronicDiseases Expert Group (NutriCoDE). Dietary quality among men andwomen in 187 countries in 1990 and 2010: a systematic assessment.Lancet Glob Health 2015;3(3):e132–42.
23. Chaudhary A, Gustafson D, Mathys A. Multi-indicator sustainabilityassessment of global food systems. Nat Commun 2018;9(1):848.
24. Melaku YA, Gill TK, Taylor AW, Appleton SL, Gonzalez-Chica D,Adams R, Achoki T, Shi Z, Renzaho A. Trends of mortality attributableto child and maternal undernutrition, overweight/obesity and dietaryrisk factors of non-communicable diseases in sub-Saharan Africa, 1990–2015: findings from the Global Burden of Disease Study 2015. PublicHealth Nutr 2019;22(5):827–40.
25. Wang DD, Li Y, Afshin A, Springmann M, Mozaffarian D, StampferMJ, Hu FB, Murray CJL, Willett WC. Global improvement in dietaryquality could lead to substantial reduction in premature death. J Nutr2019;149(6):1065–74.
26. Mbogori T, Kimmel K, Zhang M, Kandiah J, Wang Y. Nutritiontransition and double burden of malnutrition in Africa: a case studyof four selected countries with different social economic development.AIMS Public Health 2020;7(3):425–39.
27. Global Dietary Database. Survey availability information[Internet]. [cited 2021 February 27]. Available from: https://www.globaldietarydatabase.org/our-data/data-visualizations/survey-availability-information.
28. Agriculture and Food Systems Institute. World nutrient databases fordietary studies (WNDDS) [Internet]. [cited 2021 February 27]. Availablefrom: https://foodsystems.org/resources/wndds/.
29. Bromage S, Batis C, Bhupathiraju SN, Fawzi WW, Fung TT, LiY, Deitchler M, Angulo E, Birk N, Castellanos-Gutiérrez A, et al.Development and validation of a novel food-based global diet qualityscore (GDQS). J Nutr 2021;151(Suppl 10):75S–92S.
30. Sanchez P, Palm C, Sachs J, Denning G, Flor R, Harawa R, Jama B,Kiflemariam T, Konecky B, Kozar R, et al. The African MillenniumVillages. Proc Natl Acad SciU S A 2007;104(43):16775–80.
31. Mitchell S, Gelman A, Ross R, Chen J, Bari S, Huynh UK, Harris MW,Sachs SE, Stuart EA, Feller A, et al. The Millennium Villages Project:a retrospective, observational, endline evaluation. Lancet Glob Health.2018;6(5):e500–13.
32. Leclercq C, Allemand P, Balcerzak A, Branca F, Sousa RF, Lartey A, LippM, Quadros VP, Verger P. FAO/WHO GIFT (Global Individual Foodconsumption data tool): a global repository for harmonised individualquantitative food consumption studies. Proc Nutr Soc 2019;78(4):484–95.
33. Tadesse AW, Hemler EC, Andersen C, Passarelli S, Worku A, SudfeldCR, Berhane Y, Fawzi WW. Anemia prevalence and etiology amongwomen, men, and children in Ethiopia: a study protocol for anational population-based survey. BMC Public Health. 2019;19(1):1369.
34. Hotz C, Abdelrahman L, Sison C, Moursi M, Loechl C. A foodcomposition table for Central and Eastern Uganda. Washington (DC):International Food Policy Research Institute and International Centerfor Tropical Agriculture; 2012.
35. Sanusi RA, Olurin A. Portion and serving sizes of commonly consumedfoods, in Ibadan, Southwestern Nigeria. Afr J Biomed Res 2012;15:149–58.
128S Supplement

36. Lukmanji Z, Hertzmark E, Mlingi N, Assey V, Ndossi G, Fawzi WW.Tanzania food composition tables. Dar Es Salaam, Tanzania: MuhimbiliUniversity of Health and Allied Sciences and Harvard School of PublicHealth; 2008.
37. Food and Agriculture Organization. International network of food datasystems (INFOODS). Tables and databases, Africa [Internet]. [cited2021 February 27]. Available from: http://www.fao.org/infoods/infoods/tables-and-databases/africa/en/.
38. NutriSurvey. Country specific databases [Internet]. [cited 2021February 27]. Available from: http://www.nutrisurvey.de/.
39. Hartmann BM, Bell S, Vásquez-Caicedo AL.Bundeslebensmittelschlüssel II 3.1. Karlsruhe, Germany: FederalResearch Centre for Nutrition and Food; 2005.
40. Haytowitz DB. USDA national nutrient database for standard reference,release 24. Washington (DC): United States Department of Agriculture;2011.
41. Food and Agriculture Organization. FAO/INFOODS e-learning courseon food composition data [Internet]. [cited 2021 February 27]. Availablefrom: https://elearning.fao.org/course/view.php?id=191.
42. Bognár A. Tables on weight yield of food and retention factors of foodconstituents for the calculation of nutrient composition of cooked foods(dishes). Karlsruhe, Germany: Federal Research Centre for Nutritionand Food; 2002.
43. Matthews RH, Garrison YJ. Agriculture handbook no. 102: food yieldssummarized by different stages of preparation. Washington (DC): USDAAgricultural Research Service; 1975.
44. Nutrient Data Laboratory. USDA table of nutrient retention factors.Beltsville (MD): United States Department of Agriculture AgriculturalResearch Service; 2007.
45. Showell BA, Williams JR, Duvall M, Howe JC, Patterson KY, RoselandJM, Holden JM. USDA table of cooking yields for meat and poultry.Baltimore (MD): United States Department of Agriculture; 2012.
46. Fung TT, Isanaka S, Hu FB, Willett WC. International food group-baseddiet quality and risk of coronary heart disease in men and women. AmJ Clin Nutr 2018;107(1):120–9.
47. Gicevic S, Gaskins AJ, Fung TT, Rosner B, Tobias DK, Isanaka S, WillettWC. Evaluating pre-pregnancy dietary diversity vs. dietary qualityscores as predictors of gestational diabetes and hypertensive disordersof pregnancy. PLoS One 2018;13(4):e0195103.
48. Madzorera I, Isanaka S, Wang M, Msamanga GI, Urassa W, HertzmarkE, Duggan C, Fawzi WW. Maternal dietary diversity and dietary qualityscores in relation to adverse birth outcomes in Tanzanian women. AmJ Clin Nutr 2020;112(3):695–706.
49. WDDP Study Group. Development of a dichotomous indicatorfor population-level assessment of dietary diversity in women ofreproductive age. Curr Dev Nutr 2017;1(12):cdn.117.001701.
50. Chiuve SE, Fung TT, Rimm EB, Hu FB, McCullough ML, Wang M,Stampfer MJ, Willett WC. Alternative dietary indices both stronglypredict risk of chronic disease. J Nutr 2012;142:1009–18.
51. Willett W, Stampfer MJ. Total energy intake: implications forepidemiologic analyses. Am J Epidemiol 1986;124(1):17–27.
52. Institute of Medicine. Dietary reference intakes. The essential guide tonutrient requirements. Washington (DC): National Academies Press;2006.
53. Institute of Medicine. Dietary reference intakes: applications in dietaryassessment. Washington (DC): National Academies Press; 2000.
54. Martin-Prevel Y, Allemand P, Wiesmann D, Arimond M, Ballard T,Deitchler M, Dop M, Kennedy G, Lee WTK, Moursi M. Moving
forward on choosing a standard operational indicator of women’sdietary diversity. Rome, Italy: Food and Agricultural Organization ofthe United Nations; 2015.
55. Allen L, de Benoist B, Dary O, Hurrell R, editors. Guidelines on foodfortification with micronutrients. Geneva, Switzerland: World HealthOrganization; 2004.
56. International Zinc Nutrition Consultative Group (IZiNCG), BrownKH, Rivera JA, Bhutta Z, Gibson RS, King JC, Lönnerdal B, RuelMT, Sandtröm B, Wasantwisut E, et al. International Zinc NutritionConsultative Group (IZiNCG) technical document #1. Assessment ofthe risk of zinc deficiency in populations and options for its control.Food Nutr Bull 2004;25(1 Suppl 2):S99–203.
57. World Health Organization. Haemoglobin concentrations for thediagnosis of anaemia and assessment of severity. Vitamin andMineral Nutrition Information System. Geneva, Switzerland: WHO;2011.
58. WHO Expert Committee on Physical Status. Physical status: the useof and interpretation of anthropometry, report of a WHO ExpertCommittee. Geneva, Switzerland: WHO; 1995.
59. Tang AM, Chung M, Dong K, Wanke C, Bahwere P, Bose K,Chakraborty R, Charlton K, Hong S, Nguyen P, et al. Determininga global mid-upper arm circumference cutoff to assess underweightin adults (men and nonpregnant women). Washington (DC): FHI360/FANTA; 2016.
60. Wolfe DA. A distribution-free test for related correlation coefficients.Technometrics 1977;19:507–9.
61. Bromage S, Andersen CT, Tadesse AW, Passarelli S, Hemler E, FekaduH, Sudfeld C, Worku A, Berhane H, Batis C, et al. The Global DietQuality Score is associated with higher nutrient adequacy, midupperarm circumference, venous hemoglobin, and serum folate among urbanand rural Ethiopian adults. J Nutr 2021;151(Suppl 10):130S–42S.
62. Castellanos-Gutiérrez A, Rodríguez-Ramírez S, Bromage S, Fung TT, LiY, Bhupathiraju SN, Deitchler M, Willett WC, Batis C. Performance ofthe Global Dietary Quality Score with nutrition and health outcomesin Mexico with 24-hr and FFQ data. J Nutr 2021;151(Suppl 10):143S–51S.
63. He Y, Fang Y, Bromage S, Fung TT, Bhupathiraju SN, Batis CB,Deitchler M, Fawzi WW, Stampfer MJ, Hu FB, et al. Applicationof the Global Diet Quality Score in Chinese adults to evaluate thedouble burden of nutrient inadequacy and metabolic syndrome. J Nutr2021;151(Suppl 10):93S–100S.
64. Matsuzaki M, Birk N, Bromage S, Bowen L, Batis C, Fung TT, LiY, Stampfer MJ, Deitchler M, Willett WC, et al. Validation of GlobalDiet Quality Score among nonpregnant women of reproductive agein India: Findings from the Andhra Pradesh Children and ParentsStudy (APCAPS) and the Indian Migration Study (IMS). J Nutr2021;151(Suppl 10):101S–9S.
65. Angulo A, Stern D, Castellanos-Gutiérrez A, Mongue A, Lajous M,Bromage S, Fung TT, Li Y, Bhupathiraju S, Deitchler M, et al. Changesin the Global Dietary Quality Score, weight and waist circumference inMexican women. J Nutr 2021;151(Suppl 10):152S–61S.
66. Fung TT, Bromage S, Li Y, Bhupathiraju SN, Batis C, Fawzi WF, HolmesMD, Stampfer MJ, Hu FB, Deitchler M, et al. Higher Global DietQuality Score is associated with less 4-year weight gain in U.S. women.J Nutr 2021;151(Suppl 10):162S–7S.
67. Fung TT, Li Y, Bhupathiraju SN, Bromage S, Batis C, Holmes MD,Stampfer MJ, Hu FB, Deitchler M, Willett WC, et al. Higher global dietquality score is inversely associated with risk of type 2 diabetes in U.S.women. J Nutr 2021;151(Suppl 10):168S–75S.
Evaluating the GDQS in sub-Saharan African adults 129S

The Journal of NutritionSupplement
The Global Diet Quality Score is Associatedwith Higher Nutrient Adequacy, MidupperArm Circumference, Venous Hemoglobin,and Serum Folate Among Urban and RuralEthiopian AdultsSabri Bromage,1 Christopher T Andersen,1 Amare W Tadesse,2,3 Simone Passarelli,1 Elena C Hemler,1
Habtamu Fekadu,4 Christopher R Sudfeld,1 Alemayehu Worku,3 Hanna Berhane,3 Carolina Batis,5
Shilpa N Bhupathiraju,1,6 Teresa T Fung,1,7 Yanping Li,1 Meir J Stampfer,1,6 Megan Deitchler,8
Walter C Willett,1,6 and Wafaie W Fawzi1
1Harvard T.H. Chan School of Public Health, Boston, MA, USA; 2London School of Hygiene and Tropical Medicine, London, UK; 3AddisContinental Institute of Public Health, Addis Ababa, Ethiopia; 4Save the Children, Washington, DC, USA; 5CONACYT—Health andNutrition Research Center, National Institute of Public Health, Cuernavaca, Mexico; 6Channing Division of Network Medicine, Brighamand Women’s Hospital, Boston, MA, USA; 7Department of Nutrition, Simmons University, Boston, MA, USA; and 8Intake–Center forDietary Assessment, FHI Solutions, Washington, DC, USA
ABSTRACTBackground: Nutritionally inadequate diets in Ethiopia contribute to a persisting national burden of adult undernutrition,
while the prevalence of noncommunicable diseases (NCDs) is rising.
Objectives: To evaluate performance of a novel Global Diet Quality Score (GDQS) in capturing diet quality outcomes
among Ethiopian adults.
Methods: We scored the GDQS and a suite of comparison metrics in secondary analyses of FFQ and 24-hour recall
(24HR) data from a population-based cross-sectional survey of nonpregnant, nonlactating women of reproductive age
and men (15–49 years) in Addis Ababa and 5 predominately rural regions. We evaluated Spearman correlations between
metrics and energy-adjusted nutrient adequacy, and associations between metrics and anthropometric/biomarker
outcomes in covariate-adjusted regression models.
Results: In the FFQ analysis, correlations between the GDQS and an energy-adjusted aggregate measure of dietary
protein, fiber, calcium, iron, zinc, vitamin A, folate, and vitamin B12 adequacy were 0.32 in men and 0.26 in women.
GDQS scores were inversely associated with folate deficiency in men and women (GDQS Quintile 5 compared with
Quintile 1 OR in women, 0.50; 95% CI: 0.31–0.79); inversely associated with underweight (OR, 0.63; 95% CI: 0.44–
0.90), low midupper arm circumference (OR, 0.61; 95% CI: 0.45–0.84), and anemia (OR, 0.59; 95% CI: 0.38–0.91) in
women; and positively associated with hypertension in men (OR: 1.77, 95% CI: 1.12–2.80). For comparison, the Minimum
Dietary Diversity–Women (MDD-W) was associated more positively (P < 0.05) with overall nutrient adequacy in men
and women, but also associated with low ferritin in men, overweight/obesity in women, and hypertension in men and
women. In the 24HR analysis (restricted to women), the MDD-W was associated more positively (P < 0.05) with nutrient
adequacy than the GDQS, but also associated with low ferritin, while the GDQS was associated inversely with anemia.
Conclusions: The GDQS performed capably in capturing nutrient adequacy–related outcomes in Ethiopian adults.
Prospective studies are warranted to assess the GDQS’ performance in capturing NCD outcomes in sub-Saharan Africa.
J Nutr 2021;151:130S–142S.
Keywords: diet quality metrics, dietary diversity, nutrient adequacy, noncommunicable disease, double burden of
malnutrition, nutrition transition, nutritional epidemiology, Ethiopia, sub-Saharan Africa, GDQS
Introduction
Ethiopia has made significant progress towards combatingundernutrition in recent decades through extensive economic
and agricultural development efforts and nutrition interventions(1). From 2000 to 2016, the national prevalence of anemiaamong women of reproductive age (WRA) decreased from33.1% to 23.4% (2), but nonetheless remains highly prevalent,
C© The Author(s) 2021. Published by Oxford University Press on behalf of the American Society for Nutrition. This is an Open Access article distributed under theterms of the Creative Commons Attribution License (https://creativecommons.org/licenses/by/4.0/), which permits unrestricted reuse, distribution, and
reproduction in any medium, provided the original work is properly cited.Manuscript received February 28, 2021. Initial review completed March 18, 2021. Revision accepted July 20, 2021.
First published online October 1, 2021; doi: https://doi.org/10.1093/jn/nxab264.130S

particularly in rural areas and select provinces, and 2025projections are well above national targets (3, 4). Resultsof the 2016 National Micronutrient Survey also indicated amoderate to high prevalence of depleted iron stores (10.0%),zinc deficiency (33.8%), vitamin B12 deficiency (15.1%), serumfolate deficiency (17.3%), and red blood cell folate deficiency(32%) in WRA (5).
Alongside widespread nutrient inadequacy and undernu-trition, Ethiopia faces a steadily rising burden of metabolicdisease, especially in urban areas (6). Overweight and obesity(BMI ≥25 kg/m2) among urban nonpregnant (NP) WRAnearly doubled from 10.9% in 2000 to 21.4% in 2016 (ruraloverweight increased from 1.4% to 3.5%) (7, 8); the nationalprevalence of adult hypertension (≥140 mmHg systolic or≥90 mmHg diastolic blood pressure) increased from 21.5%in 2000 to 23.6% in 2015; and adult elevated fasting bloodglucose (≥7 mmol/l) rose from 2.8% in 2000 to 3.8% in2014 (9). The 2015 National Noncommmunicable Diseases(NCDs) Stepwise Approach to Surveillance survey also foundhypertriglyceridemia and elevated LDL cholesterol in 21.0%and 14.1% of adults, respectively; low HDL cholesterol in68.7%; and metabolic syndrome [based on the InternationalDiabetes Federation definition (10)] in 8.6% of women and1.8% of men (11).
Dietary inadequacies are key determinants of malnutrition inEthiopia. Owing to poverty, recurring drought, and a historicaldependence on staple grains, dietary diversity and food securityare poor throughout the population (1). Ethiopian adultsconsume exceedingly low quantities of fruits, vegetables, nutsand seeds, whole grains, PUFAs and omega 3 fatty acids, andcalcium for optimal health, and estimated intakes of all of thesecomponents are lower than African regional averages for adults;estimated consumption of red meat and milk are less than halfthe global averages (12). Low consumption of nutrient-richfoods is implicated in the high prevalence of inadequate protein,iron, zinc, and vitamin A intakes (48.5%, 12.9%, 50.4%, and
Funding for the research was provided by FHI Solutions, recipient of aBill & Melinda Gates Foundation grant to support Intake–Center for DietaryAssessment.Author disclosures: TTF is an Associate Editor of the Journal of Nutrition andplayed no role in the Journal’s evaluation of the manuscript. All other authorsreport no conflicts of interest.Publication costs for this supplement were funded by the Bill & Melinda GatesFoundation in conjunction with FHI Solutions, recipient of a Bill & MelindaGates Foundation grant to support Intake–Center for Dietary Assessment.The opinions expressed in this publication are those of the authors and arenot attributable to the sponsors or the publisher, Editor, or Editorial Board ofthe Journal of Nutrition. The Supplement Coordinators for the supplementpublication were Megan Deitchler, Intake–Center for Dietary Assessment at FHISolutions, Washington, DC; and Sabri Bromage, Harvard T.H. Chan School ofPublic Health, Boston, MA.Supplemental Tables 1–8 are available from the “Supplementary data” link inthe online posting of the article and from the same link in the online table ofcontents at https://academic.oup.com/jn.The GDQS research initiative was launched by Intake – Center for DietaryAssessment. The research was led by Harvard T.H. Chan School of Public Health,Department of Nutrition and carried out in collaboration with researchers at theNational Public Health Institute (INSP), Mexico. Funding for the research wasprovided by FHI Solutions, recipient of a Bill & Melinda Gates Foundation grantto support Intake – Center for Dietary Assessment.Address correspondence to SB (e-mail: [email protected]).Abbreviations used: AHEI-2010, Alternative Health Eating Index–2010; EAR,estimated average requirement; GDQS, Global Diet Quality Score; GDQS-−,GDQS negative submetric; GDQS+, GDQS positive submetric; IMAPP, IntakeMonitoring Assessment and Planning Program; MDD-W, Minimum DietaryDiversity–Women; MUAC, midupper arm circumference; NCD, noncommunica-ble disease; NL, nonlactating; NP, nonpregnant; PDQS, Prime Diet Quality Score;Q, quintile; T, tertile; WRA, women of reproductive age; 24HR, 24-hour recall.
81.9% of NP WRA nationwide, respectively) (13). National dietquality [as measured by the Alternative Healthy Eating Index–2010 (AHEI-2010), which measures diet-related chronic diseaserisk] has not changed substantially since 1990 (14), nor has thecontribution of diet to age-standardized NCD mortality (24.8%in 1990 to 25.3% in 2013) (15); however, these indicators willlikely worsen as Ethiopia’s nutrition transition accelerates.
To address persisting undernutrition and monitor emergingdietary contributions to NCDs, countries at an early stage inthe nutrition transition will benefit from easily operationalized,food-based metrics for measuring different aspects of dietquality. Given its shifting nutrition and epidemiologic profile,Ethiopia provides a useful context for developing such metrics.In this paper, we conducted a secondary analysis of data fromEthiopian men and women to evaluate the performance of anovel food-based Global Diet Quality Score (GDQS) (16) andcompare it with the performance of existing diet metrics.
MethodsStudy populationWe analyzed data from the Anemia Etiology in Ethiopia study (17):a cross-sectional, regionally representative 2-stage stratified sample of2520 WRA (18) (15–49 years) and 1044 men (15–49 years) living in6 regions of Ethiopia (Addis Ababa, which is predominantly urban, and5 predominantly rural regions: Afar, Oromia, Amhara, Tigray, and theSouthern Nations, Nationalities, and People’s Region). Separate sets ofparticipants were sampled in 2 survey waves [1 conducted in the dryseason (February–April 2019) and 1 in the wet season (May–September2019)]. The survey was approved by the Institutional Review Boardsof Harvard T.H. Chan School of Public Health and Addis ContinentalInstitution of Public Health.
Dietary assessmentDiet was assessed from each participant using 2 tablet-assisted methods[a 24-hour recall (24HR) followed by a quantitative FFQ] programmedin SurveyCTO (Dobility) and administered by trained interviewers (17)(owing to the breadth of the analyses performed in this paper, it wasnecessary to restrict the analysis of 24HR data to women). Analysesof FFQ and 24HR measurements in women allowed us to examinedifferences in predictive performance of diet metrics scored usingthe 2 instruments. Participants were initially asked when they wouldlike to be interviewed (to accommodate their schedules and mitigatethe burden of participation) and, in most cases, the FFQ and 24HRwere administered on the same day unless participants requestedotherwise. Both instruments were piloted in 1 urban and 1 rural kebele(ward) prior to the survey. In both seasons, all participants in 1 of12 randomly selected kebeles within each of the 6 regions included inthis survey were selected to provide a second 24HR within a medianof 3 days (maximum, 6 days) after the first to allow adjustment forwithin-person variation.
The FFQ was developed based on the list of foods included inthe Ethiopian Food Composition Tables (19) following establishedmethods (20), and assessed food consumption primarily at the levelof individual ingredients. Average portion sizes were assessed usingphotographic aids. The FFQ captured a reference period of 7 days andused 7 frequency response categories: never in the past week, 1 timea week, 2–4 times a week, 5–6 times a week, 1 time a day, 2–3 timesa day, 4–5 times a day, and ≥6 times a day. The assessment includedinformation on food preparation methods, relative grain content ofdifferent consumed flour products, whether different boiled and roastedgrains were consumed in whole or split form, and whether animalswere consumed in the form of meat and/or various organs. Although822 unique foods or variants of foods (distinguished by preparationmethod, grain content, grain processing, and parts of animals) wereincluded in the FFQ, the assessment employed branching logic thatonly asked about variants of a food if the food was first indicated
Evaluating the GDQS in Ethiopian adults 131S

to be consumed at all (allowing a more efficient assessment withoutcompromising the extensiveness of foods enumerated). Of the 822foods enumerated, 454 were observed to be consumed at least once byparticipants in the survey.
The 24HR was tailored to the unique cultural and dietary char-acteristics of Ethiopia, following guidelines by Gibson and Ferguson(21). The 24HR assessed the consumption of ingredients, as well asmany mixed dishes, and was implemented using a multiple-pass methodincorporating information on the number of meals at which each foodwas consumed, the number of servings of each food consumed at eachmeal, and the average portion size of each consumed food (assessedusing photographic aids). A total of 113 distinct foods were reportedto be consumed at least once by survey participants. When scoringdiet metrics using 24HR data, mixed dishes containing significantproportions of multiple food groups were disaggregated so thatfractions of the dish mass counted toward different metric components.
For both instruments, we computed intakes of energy and a set ofnutrients considered high priority in low- and middle-income countries(22–25): protein, monounsaturated fat, polyunsaturated fat, saturatedfat, fiber, calcium, iron, zinc, vitamin A, folate, and vitamin B12.Nutrient content of foods was determined using the Ethiopian FoodComposition Tables (which contain information on both ingredientsand mixed dishes) (19), supplemented as needed using data fromcomparable foods drawn primarily from the Tanzania, Uganda, orUSDA tables (26–28). Iron content in teff, the most commonlyconsumed grain, was adjusted for the influence of soil contaminationon iron bioavailability (29).
Scoring diet metricsSix metrics were scored in men (using FFQ data) and women [using FFQand 24HR data; refer to the article by Bromage et al. (16) introducingthis Supplemental Issue for information on how these metrics areconstructed and scored]:
• Food-based metrics reflecting overall diet quality: the Global DietQuality Score (GDQS) (16) and a Prime Diet Quality Score (PDQS)–like metric (30–32), an adaptation of an earlier metric (the PDQS)from which the GDQS was developed.
• Food-based metrics reflecting nutrient adequacy: the GDQS positivesubmetric (GDQS+) (16), computed using only the healthy GDQSfood groups, and the Minimum Dietary Diversity–Women indicator(MDD-W) (33). We acknowledge that the MDD-W was originallyintended for use in women only; furthermore, we treated this metricas a continuous variable ranging from 0 to 10, rather than as a binaryindicator as it is sometimes used.
• Metrics reflecting NCD risk: the GDQS negative submetric (GDQS−)(16), computed using only the unhealthy GDQS food groups, and theAHEI-2010 (34), scored using both food and nutrient components.
Results presented in this paper focus on 3 metrics (the GDQS, MDD-W, and AHEI-2010), while results for the GDQS+, GDQS−, and PDQS-like metric are provided in Supplemental Tables.
Diet quality outcomesNutrient intakes computed using 24HR data were adjusted for within-person variation using variance components estimated from the subsetof women for whom 2 recalls were available. This adjustment wasperformed using the Iowa State University method (35), implementedin the Intake Monitoring Assessment and Planning Program (IMAPP)for all nutrients except vitamin B12 [which was adjusted in SASversion 9.4 using the National Cancer Institute method (36), which canaccommodate episodically consumed dietary components].
We estimated energy-adjusted nutrient intakes using the residualmethod (37). In the FFQ data, we constructed a continuous measureof overall nutrient adequacy based on the number of nutrients (out of8) meeting age- and sex-specific estimated average requirements (EARs)from the Institute of Medicine (or adequate intake level, in the case offiber) (38); iron adequacy was defined as ≥50% probability of adequacybased on a lognormal requirement distribution (39). In the 24HRdata, overall nutrient adequacy was defined as the mean probability of
adequacy of the 8 nutrients based on the full-probability method (39).EARs and requirement distributions for iron and zinc were adjusted toaccount for absorption characteristics of local diets (39–42). We alsocreated a binary measure of overall nutrient inadequacy using a cutoffof <4 adequate nutrients (out of 8) in the FFQ data or <50% meanprobability of adequacy in the 24HR data, as well as energy-adjustedcontinuous measures of overall nutrient adequacy and binary overallnutrient inadequacy.
In addition to nutrient intake and adequacy outcomes, we assessedanthropometric and biomarker outcomes, including the means ofduplicate height, weight, midupper arm circumference (MUAC), anddiastolic/systolic blood pressure measurements; venous hemoglobinmeasured by Hemocue Hb 201+, adjusted for altitude, sex, andsmoking status (43); and serum ferritin [adjusted for C-reactiveprotein using the Biomarkers Reflecting Inflammation and NutritionalDeterminants of Anemia method (44)], folate, and vitamin B12,measured at International Clinical Laboratories in Addis Ababa. Thefollowing cutoffs were applied to derive binary outcomes:
• Underweight and overweight/obesity: BMI <18.5 kg/m2 and≥25 kg/m2, respectively (45).
• Low MUAC: <24.5 cm in women and <25.5 cm in men. These cutoffsresulted in the lowest overall misclassification of underweight BMI ina prior international analysis (46).
• Anemia: <12 g/dl hemoglobin in women and <13 g/dl in men (43).• Depleted iron stores: ferritin <15 μg/l (47).• Serum folate deficiency: <3 ng/mL (48).• Serum vitamin B12 deficiency: <203 pg/mL (49).• Hypertension: ≥130 mmHg systolic or ≥85 mmHg diastolic blood
pressure (50).
Analysis of metric performanceWe evaluated and compared the performance of the different metrics(scored using FFQ data in men and FFQ and 24HR data inwomen) against diet quality outcomes. Methods involved Spearmancorrelations between metrics and continuous diet quality outcomes;regression models to determine unadjusted and multivariable (adjustedfor potential sociodemographic confounders: age, urban/rural locality,education level, marital status, and occupation) estimated marginalmeans or ORs for different diet quality outcomes within each metricquintile and in terms of a 1-SD increase in each metric; and statisticalcomparisons of correlation coefficients, as well as trends in measures ofassociation across quintiles, between pairs of metrics (34, 51). We alsoexamined whether covariate-adjusted associations between metrics andhypertension were robust to further adjustment for BMI. In a regressionanalysis of 24HR data in women, metrics were analyzed using tertilesdue to limited variation in metric scores, except for the GDQS+ andGDQS− submetrics (which were excluded from the regression analysisof 24HR data, given insufficient variation in metric scores).
We excluded women who were currently pregnant or breastfeeding.Within each sex and dietary instrument (FFQ and 24HR), we excludedparticipants with no reported food intake and with energy intakes<3 or >3 SDs from the mean, to limit the influence of implausiblevalues. Correlation and regression analyses were performed separatelyin the total population of men and the total population of women.We also performed correlation analyses within subgroups defined byurban compared with rural localities (defined as Addis Ababa comparedwith all other regions) or dry compared with wet seasons (subgroupanalyses were performed separately so that seasons were pooled withinurban/rural subgroups, and vice versa), and selected comparisonsbetween groups (52). Given sample size constraints, subgroup analysesin regression models were limited to rural men in an FFQ analysis and(separately) rural women in both FFQ and 24HR analyses.
In interpreting comparative metric performance, we prioritizedcorrelations with energy-adjusted nutrient intakes/adequacy and age-adjusted regression models, and defined a subset of higher-relevancediet quality outcomes in regression models (the continuous measuresof energy-adjusted overall nutrient adequacy and anthropometricand biomarker outcomes defined using clinically relevant cutoffs),which were distinguished from lower-relevance outcomes (the binary
132S Bromage et al.

TAB
LE1
Spe
arm
anco
rrel
atio
nsbe
twee
nth
eG
DQ
S(s
core
dus
ing
FFQ
data
)and
ener
gy-a
djus
ted
nutr
ient
san
dcl
inic
alm
easu
rem
ents
amon
gE
thio
pian
adul
ts
Tota
lDr
yse
ason
Wet
seas
onRu
ral
Urba
n
Outc
ome
Men
,n
=97
6W
omen
,n
=16
04M
en,
n=
483
Wom
en,
n=
802
Men
,n
=49
3W
omen
,n
=80
0M
en,
n=
840
Wom
en,
n=
1317
Men
,n
=13
4W
omen
,n
=28
7
Calc
ium
0.17
10.
131
0.19
10.
191
0.13
20.
060.
161
0.10
10.
361
0.30
1
Fibe
r0.
201
0.14
10.
281
0.16
10.
103
0.10
20.
161
0.12
10.
361
0.19
2
Fola
te0.
231
0.21
10.
231
0.17
10.
231
0.26
10.
201
0.22
10.
391
0.17
2
Iron
−0.
010.
01−
0.07
−0.
070.
040.
102
0.00
0.02
−0.
100.
02M
UFA
0.07
30.
151
0.07
0.16
10.
060.
141
0.08
30.
121
0.08
0.25
1
Prot
ein
0.07
30.
111
0.02
0.11
20.
122
0.11
20.
083
0.08
20.
110.
211
PUFA
0.06
0.10
10.
000.
060.
122
0.14
10.
060.
082
0.10
0.16
2
SFA
0.01
0.03
0.02
0.06
−0.
010.
010.
030.
030.
040.
08Vi
tam
inA
0.14
10.
111
0.22
10.
121
0.02
0.08
30.
131
0.09
10.
281
0.17
2
Vita
min
B12
−0.
092
0.00
−0.
010.
00−
0.17
1−
0.08
3−
0.09
3−
0.05
0.04
0.15
2
Zinc
0.04
0.10
10.
000.
073
0.06
0.13
10.
040.
073
0.08
0.24
1
BMI
−0.
010.
101
−0.
050.
102
0.00
0.09
30.
000.
092
−0.
050.
11M
UAC
0.00
0.10
1−
0.02
0.09
20.
010.
102
0.01
0.09
1−
0.04
0.11
Hem
oglo
bin
0.03
0.07
20.
020.
083
0.06
0.08
30.
040.
073
−0.
020.
07Fe
rritin
−0.
030.
02−
0.15
2−
0.05
0.08
0.10
−0.
050.
010.
110.
10Se
rum
fola
te0.
131
0.20
10.
080.
132
0.18
10.
271
0.12
10.
191
0.22
30.
193
Seru
mB1
20.
073
−0.
02−
0.04
−0.
123
0.19
10.
113
0.06
−0.
030.
223
0.17
Syst
olic
BP0.
111
0.08
20.
123
0.07
0.09
0.09
30.
131
0.07
2−
0.03
0.12
3
Dias
tolic
BP0.
092
0.04
0.09
0.08
30.
080.
010.
112
0.05
−0.
030.
03
Sam
ple
size
s(in
pare
nthe
ses)
indi
cate
the
num
ber
ofpa
rtic
ipan
tsfo
rw
hom
food
and
nutr
ient
inta
keda
taw
ere
avai
labl
e(n
valu
esfo
rot
her
outc
omes
are
prov
ided
insu
bseq
uent
tabl
es).
Abb
revi
atio
ns:B
P,bl
ood
pres
sure
;GD
QS,
Glo
balD
iet
Qua
lity
Sco
re;M
UA
C,m
idup
per
arm
circ
umfe
renc
e.1P
<0.
001.
2P
<0.
01.
3P
<0.
05.
Evaluating the GDQS in Ethiopian adults 133S

measure of energy-adjusted overall nutrient inadequacy and continuousanthropometric and biomarker outcomes for which clinically relevantcutoffs exist).
Statistical analyses were performed in R v4.03 (The R Foundationfor Statistical Computing, Vienna, Austria) (excluding SAS and IMAPPanalyses where noted).
Results
FFQ data from 976 men and 1604 NP nonlactating (NL) WRAand 24HR data from 1593 NP NL WRA were analyzed in thisstudy. Replicate 24HRs were available from 163 women (73and 90 in the dry and wet seasons, respectively; 25 and 138in urban and rural areas, respectively). Ages ranged from 15 to49 years in both men (median, 34 years) and women (median,30 years). The numbers of men and women by urban/rural andseason subgroups are indicated in Table 1. Descriptive statisticson the numbers of FFQs, 24HRs, and replicate 24HRs analyzedby sex, season, and region; prevalences of diet quality outcomesby sex and urban/rural locality; and distributions of food groupconsumption and metric scores by sex, season, and urban/rurallocality for each instrument (FFQ and 24HR) are provided inSupplemental Tables 1–4.
Spearman correlations between the GDQS andenergy-adjusted nutrient intakes
In the analysis of FFQ data, the GDQS was significantly(P < 0.05) and weakly (0.1 ≥ ρ < 0.3) rank-correlated withenergy-adjusted intakes of calcium (men, ρ = 0.17; women,ρ = 0.13), fiber (men, ρ = 0.20; women, ρ = 0.14), folate(men, ρ = 0.23; women, ρ = 0.21), and vitamin A (men, ρ
= 0.14; women, ρ = 0.11; Table 1). In women, significantalbeit weak correlations were also observed for energy-adjustedmonounsaturated fat (ρ = 0.15), polyunsaturated fat (ρ =0.10), protein (ρ = 0.11), and zinc (ρ = 0.10). The GDQSwas nonsignificantly correlated with energy-adjusted iron andsaturated fat intakes.
As in the FFQ analysis, the GQDS scored using 24HR datain women was significantly (P < 0.05) and weakly (0.1 ≥ ρ
< 0.3) correlated with energy-adjusted intakes of calcium (ρ =0.14), folate (ρ = 0.40), protein (ρ = 0.14), vitamin A (ρ =0.22), and zinc (ρ = 0.06) and was nonsignificantly associatedwith energy-adjusted iron intake (P ≥ 0.05; SupplementalTable 5). Unlike the FFQ analysis, the 24HR analysis indicatedno significant correlation between the GDQS and energy-adjusted fiber intake (P ≥ 0.05), and indicated negativecorrelations with energy-adjusted fatty acids (monounsaturatedfat: FFQ ρ = 0.15 compared with 24HR ρ = −0.28;polyunsaturated fat: FFQ ρ = 0.10 compared with 24HR ρ =−0.19; saturated fat: FFQ ρ = 0.03 compared with 24HR ρ =−0.11) and vitamin B12 (FFQ ρ = 0.00 compared with 24HRρ = −0.11). The P values were ≥ 0.05 for FFQ saturated fatand vitamin B12 data only.
Spearman correlations between the GDQS, MDD-W,and AHEI-2010 compared with energy-adjusted overallnutrient adequacy
In the analysis of FFQ data, we observed significant (P < 0.05)correlations between the GDQS and energy-adjusted overallnutrient adequacies of ρ = 0.32 in men and ρ = 0.26 inwomen (Table 2). Correlations differed significantly (P fordifference < 0.05) between men and women in rural areas (menρ = 0.34 compared with women ρ = 0.25), but not in urbanareas, the wet season, or dry season (P for difference ≥ 0.05). TA
BLE
2S
pear
man
corr
elat
ions
betw
een
the
GD
QS
(sco
red
usin
gFF
Qda
ta)a
nden
ergy
-adj
uste
dov
eral
lnut
rient
adeq
uacy
amon
gE
thio
pian
adul
ts
Tota
l,n
=96
5m
en,
1596
wom
enDr
ySe
ason
,n=
478
men
,79
5w
omen
Wet
Seas
on,n
=48
7m
en,7
99w
omen
Rura
l,n
=83
2m
en,
1311
wom
enUr
ban,
n=
130
men
,285
wom
en
Sex
ρP
ρP
ρP
P-di
ff(d
ryvs
wet
)ρ
Pρ
PP-
diff
(urb
anvs
rura
l)
Men
0.32
<0.
001
0.31
<0.
001
0.32
<0.
001
0.43
20.
34<
0.00
10.
220.
010
0.08
6W
omen
0.26
<0.
001
0.27
<0.
001
0.25
<0.
001
0.33
50.
25<
0.00
10.
32<
0.00
10.
123
P-di
ff(m
envs
wom
en)
0.05
4—
0.22
6—
0.09
3—
—0.
013
—0.
156
——
Ove
rall
nutr
ient
adeq
uacy
isde
fined
asth
een
ergy
-adj
uste
dnu
mbe
rof
nutr
ient
s(o
utof
8)co
nsum
edin
adeq
uate
amou
nts.
Test
sfo
rsi
gnifi
canc
eof
diffe
renc
es(P
-diff
)bet
wee
nco
rrel
atio
nsfo
llow
the
met
hod
ofE
id,G
ollw
itzer
,and
Sch
mid
tfo
rin
depe
nden
tsa
mpl
es(5
2).A
bbre
viat
ions
:GD
QS,
Glo
balD
iet
Qua
lity
Sco
re.
134S Bromage et al.

TABLE 3 Comparison of Spearman correlations between the GDQS, MDD-W, and AHEI-2010 (scored using FFQ data) andenergy-adjusted nutrients and clinical measurements among Ethiopian adults
GDQS MDD-W AHEI-2010
Outcome Sex n ρ ρ P-diff ρ P-diff
Calcium Men 976 0.171 0.221 0.057 0.102 0.0123
Women 1604 0.131 0.161 0.229 0.01 <0.0011
Fiber intake Men 976 0.201 0.111 0.0012 0.231 0.301Women 1604 0.141 0.101 0.069 0.191 0.050
Folate Men 976 0.231 0.121 <0.0011 0.231 0.780Women 1604 0.211 0.121 <0.0011 0.251 0.173
Iron intake Men 976 − 0.01 0.00 0.864 0.04 0.131Women 1604 0.01 − 0.02 0.062 0.04 0.135
MUFA Men 976 0.073 0.301 <0.0011 − 0.181 <0.0011
Women 1604 0.151 0.361 <0.0011 − 0.121 <0.0011
Protein Men 976 0.073 0.201 <0.0011 − 0.211 <0.0011
Women 1604 0.111 0.201 <0.0011 − 0.111 <0.0011
PUFA Men 976 0.06 0.00 0.0082 0.261 <0.0011
Women 1604 0.101 0.03 <0.0011 0.261 <0.0011
SFA Men 976 0.01 0.191 <0.0011 − 0.341 <0.0011
Women 1604 0.03 0.201 <0.0011 − 0.331 <0.0011
Vitamin A Men 976 0.141 0.092 0.055 − 0.01 <0.0011
Women 1604 0.111 0.101 0.622 − 0.063 <0.0011
Vitamin B12 Men 976 − 0.092 0.161 <0.0011 − 0.421 <0.0011
Women 1604 0.00 0.251 <0.0011 − 0.391 <0.0011
Zinc Men 976 0.04 0.161 <0.0011 − 0.151 <0.0011
Women 1604 0.101 0.151 0.0022 − 0.082 <0.0011
ONA Men 965 0.321 0.481 <0.0011 0.121 <0.0011
Women 1596 0.261 0.461 <0.0011 0.03 <0.0011
BMI Men 965 − 0.01 0.131 <0.0011 − 0.02 0.801Women 1596 0.101 0.161 0.0103 0.063 0.230
MUAC Men 965 0.00 0.141 <0.0011 − 0.02 0.389Women 1596 0.101 0.171 0.0012 0.072 0.439
Hemoglobin Men 883 0.03 0.111 0.0103 − 0.04 0.0183
Women 1485 0.072 0.101 0.133 0.073 0.655Ferritin Men 869 − 0.03 0.01 0.089 − 0.02 0.906
Women 782 0.02 − 0.04 0.0293 0.04 0.413Serum folate Men 872 0.131 0.141 0.656 0.121 0.940
Women 784 0.201 0.211 0.431 0.112 <0.0011
Serum B12 Men 872 0.073 0.04 0.447 − 0.02 0.0143
Women 785 − 0.02 − 0.07 0.0032 − 0.07 0.141Systolic BP Men 976 0.111 0.121 0.538 0.04 0.0483
Women 1604 0.082 0.072 0.250 0.063 0.338Diastolic BP Men 976 0.092 0.141 0.053 0.05 0.166
Women 1604 0.04 0.063 0.400 0.02 0.502
ONA measures are energy-adjusted and continuous, showing the number of adequate nutrients out of 8. Abbreviations: AHEI-2010, Alternative Healthy Eating Index–2010; BP,blood pressure; GDQS, Global Diet Quality Score; MDD-W, Minimum Dietary Diversity–Women; MUAC, midupper arm circumference; MUFA, monounsatured fatty acids;ONA, overall nutrient adequacy; PUFA, polyunsatured fatty acids.1Statistical significance of correlations, and Wolfe’s tests comparing metric-outcome correlations for the GDQS compared with MDD-W and GDQS compared with AHEI-2010(P-diff): P < 0.001.2Statistical significance of correlations, and Wolfe’s tests comparing metric-outcome correlations for the GDQS compared with MDD-W and GDQS compared with AHEI-2010(P-diff): P < 0.01.3Statistical significance of correlations, and Wolfe’s tests comparing metric-outcome correlations for the GDQS compared with MDD-W and GDQS compared with AHEI-2010(P-diff): P < 0.05.
We also observed no differences between urban compared withrural areas or the dry compared with wet seasons in eithermen or women (P for difference ≥ 0.05). The MDD-W wassignificantly more strongly correlated than the GDQS (P for dif-ference < 0.05) in both women (ρ = 0.46) and men (ρ = 0.48),and the AHEI-2010 was significantly less strongly correlatedthan the GDQS in both women (ρ = 0.03) and men (ρ = 0.12).
In the analysis of 24HR data in women, correlationswith energy-adjusted overall nutrient adequacy were weak but
significant (P < 0.05) for the GDQS in the total population(ρ = 0.07), rural areas (P = 0.08), dry season (ρ = 0.07),and wet season (ρ = 0.08), but not in urban areas (ρ = 0.02;P ≥ 0.05; Supplemental Table 5). We observed no differencesin correlations between urban compared with rural areas ordry compared with wet seasons (P ≥ 0.05). The correlationbetween the MDD-W and energy-adjusted overall nutrientadequacy in the total population was ρ = 0.23 (P < 0.05; P fordifference with GDQS <0.05), while the AHEI-2010 was not
Evaluating the GDQS in Ethiopian adults 135S

TABLE 4 Covariate-adjusted associations between the GDQS (scored using FFQ data) and diet quality outcomes among Ethiopianadults
Outcome Statistic Sex n n, Cases Per 1 SD P-trend
ONA, # EMM (95% CI) M 976 — 0.41 (0.32–0.50) <0.0011
F 1604 — 0.32 (0.25–0.39) <0.0011
ONA <4 OR (95% CI) M 976 309 0.61 (0.52–0.71) <0.0011
F 1604 402 0.65 (0.57–0.73) <0.0011
BMI, kg/m2 EMM (95% CI) M 965 — − 0.08 (−0.25 to 0.10) 0.592F 1596 — 0.35 (0.17–0.53) 0.0012
BMI <18.5 kg/m2 OR (95% CI) M 965 354 1.09 (0.95–1.26) 0.284F 1596 435 0.88 (0.78–0.99) 0.0433
BMI ≥25 kg/m2 OR (95% CI) M 965 67 1.00 (0.76–1.32) 0.651F 1596 209 1.19 (1.02–1.40) 0.054
MUAC, cm EMM (95% CI) M 965 — − 0.09 (−0.26 to 0.08) 0.532F 1596 — 0.31 (0.15–0.48) 0.0032
Low MUAC OR (95% CI) M 965 566 1.13 (0.98–1.30) 0.120F 1596 741 0.84 (0.76–0.93) 0.0062
Hemoglobin, g/dL EMM (95% CI) M 883 — 0.06 (−0.05 to 0.17) 0.484F 1485 — 0.08 (0.01–0.15) 0.0343
Anemia OR (95% CI) M 883 80 0.81 (0.63–1.04) 0.057F 1485 254 0.84 (0.73–0.97) 0.0273
Ferritin, ng/mL EMM (95% CI) M 869 — − 2.97 (−8.22 to 2.27) 0.290F 782 — 0.30 (−3.33 to 3.93) 0.648
Low ferritin OR (95% CI) M 869 75 1.34 (1.05–1.73) 0.129F 782 173 0.94 (0.79–1.13) 0.829
Serum folate, ng/mL EMM (95% CI) M 976 — 0.24 (0.05–0.42) 0.0443
F 1604 — 0.48 (0.21–0.74) <0.0011
Folate deficiency OR (95% CI) M 976 569 0.79 (0.68–0.91) 0.0103
F 1604 510 0.76 (0.65–0.89) <0.0011
Serum B12, pmol/L EMM (95% CI) M 976 — 15.49 (2.28–28.69) 0.0473
F 1604 — 1.79 (−12.58 to 16.15) 0.478Serum B12 deficiency OR (95% CI) M 976 394 0.91 (0.79–1.04) 0.204
F 1604 355 1.08 (0.93–1.25) 0.408Systolic BP, mmHg EMM (95% CI) M 976 — 1.45 (0.52–2.37) 0.0022
F 1604 — 1.46 (0.69–2.23) 0.0012
Diastolic BP, mmHg EMM (95% CI) M 976 — 0.78 (0.16–1.41) 0.0193
F 1604 — 0.53 (0.03–1.03) 0.0443
Hypertension OR (95% CI) M 976 287 1.27 (1.10–1.46) 0.0022
F 1604 484 1.08 (0.97–1.21) 0.317
Models are adjusted for age, urban/rural locality, education level, marital status, and occupation. ONA measures are energy-adjusted and continuous, showing the number ofadequate nutrients out of 8. Abbreviations: BP, blood pressure; EMM, estimated marginal mean; GDQS, Global Diet Quality Score; MUAC, midupper arm circumference; ONA,overall nutrient adequacy.1Statistical significance of linear trends across metric quintiles (P-trend): P < 0.001.2Statistical significance of linear trends across metric quintiles (P-trend): P < 0.01.3Statistical significance of linear trends across metric quintiles (P-trend): P < 0.05.
significantly correlated with energy-adjusted overall nutrientadequacy (P ≥ 0.05).
Comparisons of correlations between the GDQS and otherdiet metrics with individual energy-adjusted nutrient intakesand overall nutrient adequacy are presented in Table 3 andSupplemental Table 5.
Adjusted regression models of the GDQS comparedwith diet quality outcomes
In men and women, adjusted for age, urban/rural locality,education level, marital status, and occupation, the GDQS(scored using FFQ data) was significantly (P for trend acrossquintiles < 0.05) associated with higher overall nutrientadequacy [quintile (Q) 1 to Q5 ranges in estimated marginalmean number of nutrients meeting dietary adequacy: men, 3.82to 5.09; women, 4.33 to 5.22] and lower odds of serum folatedeficiency (Q5 compared with Q1 ORs: men, 0.79; women,
0.76); lower odds of underweight and low MUAC in women(Q5 compared with Q1 ORs: men, 0.63; women, 0.84) andanemia in women (Q5 compared with Q1: 0.59); and higherserum vitamin B12 in men (Q5–Q1 range, 302–329 pmol/L;results per 1 SD of GDQS score are presented in Table 4;quintile-specific results are presented in Supplemental Table 6).Notably, the GDQS was also associated with higher bloodpressure in men (Q5–Q1 range in systolic blood pressure:121.0–125.2 mmHg) and women (Q5–Q1 range: 114.4–118.2 mmHg), and hypertension in men (Q5 compared withQ1 OR: 147). Upon further adjustment for BMI, the GDQSremained significantly associated with hypertension in men(P-trend < 0.05) and unassociated in women (P-trend ≥ 0.05).Results were similar when data were restricted to ruralparticipants, except that analyses of underweight BMI, as wellas hemoglobin and serum B12 levels, did not have significantassociations (P-trend ≥ 0.05), while the GDQS was associated
136S Bromage et al.

TABLE 5 Covariate-adjusted associations between the GDQS (scored using 24HR data) and diet quality outcomes among Ethiopianwomen
Outcome Statistic Sex n n, Cases Per 1 SD P-trend
ONA, % EMM (95% CI) F 1593 — 0.57 (0.22–0.91) 0.0011
ONA <50% OR (95% CI) F 1593 211 0.76 (0.65–0.88) <0.0012
BMI, kg/m2 EMM (95% CI) F 1571 — 0.14 (−0.04 to 0.32) 0.279BMI <18.5 kg/m2 OR (95% CI) F 1571 436 0.94 (0.84–1.06) 0.734BMI ≥25 kg/m2 OR (95% CI) F 1571 211 1.10 (0.94–1.28) 0.213MUAC, cm EMM (95% CI) F 1571 — 0.11 (−0.06 to 0.27) 0.325Low MUAC OR (95% CI) F 1571 727 0.94 (0.85–1.05) 0.527Hemoglobin, g/dL EMM (95% CI) F 1474 — 0.03 (−0.04 to 0.11) 0.243Anemia OR (95% CI) F 1474 255 0.85 (0.74–0.98) 0.0122
Ferritin, ng/mL EMM (95% CI) F 762 — 0.40 (−3.19 to 3.99) 0.599Low ferritin OR (95% CI) F 762 167 0.98 (0.82–1.18) 0.818Serum folate, ng/mL EMM (95% CI) F 1593 — − 0.01 (−0.29 to 0.27) 0.489Folate deficiency OR (95% CI) F 1593 494 1.07 (0.92–1.25) 0.237Serum B12, pmol/L EMM (95% CI) F 1593 — − 2.76 (−16.68 to 11.16) 0.467Serum B12 deficiency OR (95% CI) F 1593 345 1.12 (0.97–1.30) 0.105Systolic BP, mmHg EMM (95% CI) F 1593 — − 0.28 (−1.06 to 0.49) 0.134Diastolic BP, mmHg EMM (95% CI) F 1593 — − 0.28 (−0.80 to 0.23) 0.054Hypertension OR (95% CI) F 1593 472 0.99 (0.89–1.11) 0.466
Models are adjusted for age, urban/rural locality, education level, marital status, and occupation. ONA: energy-adjusted continuous measure of overall nutrient adequacy (meanprobability of adequacy of 8 nutrients). Abbreviations: BP, blood pressure; EMM, estimated marginal mean; GDQS, Global Diet Quality Score; MUAC, midupper armcircumference; ONA, overall nutrient adequacy; 24HR, 24-hour recall.1Statistical significance of linear trends across metric tertiles (P-trend): P < 0.01.2Statistical significance of linear trends across metric tertiles (P-trend): P < 0.05.
(P-trend < 0.05) with higher odds of overweight in women(Q5 compared with Q1 OR: 1.99; Supplemental Table 6).
In the analysis of 24HR data in women, there were fewersignificant associations between the GDQS and diet qualityoutcomes: the GDQS was significantly associated (P for trendacross tertiles ≥ 0.05) with increased overall nutrient adequacyand decreased odds of anemia across metric tertiles (T) in allwomen (T3–T1 range in mean probability of overall nutrientadequacy: 57.8%–59.3%; T3 compared with T1 OR foranemia: 0.64) and upon restricting to rural areas (T3–T1 rangein overall nutrient adequacy: 57.9%–59.4%; T3 comparedwith T1 OR for anemia: 0.61); and, unlike in analysis of FFQdata, the GDQS was further associated in rural areas with lowerdiastolic blood pressure (T3–T1 range: 80.1–78.2 mmHg) andodds of hypertension (T3 compared with T1 OR: 0.70; resultsper 1 SD of GDQS score are presented in Table 5; tertile-specificresults are presented in Supplemental Table 6). The significantassociation with hypertension was robust to further adjustmentfor BMI.
Comparing adjusted associations between the GDQS,MDD-W, and AHEI-2010 compared with diet qualityoutcomes
In the FFQ analysis, unlike the GDQS, higher MDD-W scoreswere significantly associated with lower ferritin levels in men(P for trend across quintiles < 0.05); unlike the GDQS, theMDD-W did predict anemia but not serum folate (Table 6;Supplemental Table 7). Restricting to rural areas, unlike theGDQS, the MDD-W was associated in women with increasedblood pressure and odds of hypertension [P-trend < 0.05;although upon further adjustment for BMI, the MDD-W wasmarginally associated (P-trend = 0.063)] and was positivelyassociated with low ferritin; however, the MDD-W was alsopositively associated with lower odds of underweight in women,lower odds of a low MUAC in men, and anemia in men andwomen (P-trend < 0.05; Supplemental Table 7). In both the
total population and in rural areas, the MDD-W was morestrongly predictive of overall nutrient adequacy than the GDQS(P for difference in trends < 0.05; Table 6; SupplementalTable 7). Unlike the GDQS, the AHEI-2010 was not signif-icantly predictive of higher blood pressure or hypertensionin the total population or of overweight in rural women (P-trend ≥ 0.05), although in rural women the AHEI-2010 wassignificantly positively associated with increased systolic bloodpressure (Supplemental Table 7). Further adjustment for BMIdid not produce significant associations between the AHEI-2010 and hypertension in men or women in either the totalpopulation or rural subgroup.
In the 24HR analysis in women, unlike the GDQS, theMDD-W was significantly (P < 0.05) associated with higherodds of low ferritin and was not associated with lower oddsof anemia in either the total or rural population, althoughthe MDD-W was positively associated with higher serumB12 levels in rural areas (Table 7; Supplemental Table 7).In the total population, the GDQS was significantly predictiveof overall nutrient adequacy, while the MDD-W was not. Inrural areas, the GDQS and MDD-W significantly predictedoverall nutrient adequacy; unlike the GDQS, the AHEI-2010did not predict lower odds of hypertension or lower diastolicblood pressure. Further adjustment for BMI did not producesignificant associations between metrics and hypertension.
Expanded correlation statistics and comparisons are pre-sented in Supplemental Table 5 and expanded regressionstatistics and model comparisons are presented in SupplementalTables 6 and 7, respectively. A summary of results of covariate-adjusted regression analyses is presented in SupplementalTable 8.
DiscussionIn an analysis of FFQ data from NP NL WRA and adult men inurban and rural Ethiopia, we found the GDQS significantly and
Evaluating the GDQS in Ethiopian adults 137S

TAB
LE6
Com
paris
onof
cova
riate
-adj
uste
das
soci
atio
nsbe
twee
nth
eG
DQ
S,M
DD
-W,a
ndA
HE
I-201
0(s
core
dus
ing
FFQ
data
)com
pare
dw
ithse
lect
edou
tcom
esam
ong
Eth
iopi
anad
ults
Com
paris
onM
etric
GDQS
Com
paris
onM
etric
Outc
ome
Stat
istic
Sex
nn,
Case
sPe
r1SD
P-tre
ndPe
r1SD
P-tre
ndP-
diff
MDD
-WBM
I<18
.5kg
/m2
OR(9
5%CI
)M
965
354
1.09
(0.9
5–1.
26)
0.28
40.
94(0
.81–
1.09
)0.
240
0.13
3F
1596
435
0.88
(0.7
8–0.
99)
0.04
310.
86(0
.76–
0.97
)0.
0191
0.51
8Lo
wM
UAC
OR(9
5%CI
)M
965
566
1.13
(0.9
8–1.
30)
0.12
00.
91(0
.79–
1.05
)0.
133
0.05
4F
1596
741
0.84
(0.7
6–0.
93)
0.00
620.
79(0
.71–
0.88
)<
0.00
130.
281
Anem
iaOR
(95%
CI)
M88
380
0.81
(0.6
3–1.
04)
0.05
70.
74(0
.57–
0.96
)0.
0121
0.20
5F
1485
254
0.84
(0.7
3–0.
97)
0.02
710.
75(0
.64–
0.88
)0.
0022
0.28
3Fo
late
defic
ienc
yOR
(95%
CI)
M97
656
90.
79(0
.68–
0.91
)0.
0101
0.84
(0.7
2–0.
98)
0.02
110.
578
F16
0451
00.
76(0
.65–
0.89
)<
0.00
130.
77(0
.66–
0.90
)0.
0012
0.74
8Lo
wfe
rritin
OR(9
5%CI
)M
869
751.
34(1
.05–
1.73
)0.
129
1.35
(1.0
4–1.
76)
0.02
410.
628
F78
217
30.
94(0
.79–
1.13
)0.
829
1.09
(0.9
0–1.
32)
0.23
70.
184
B12
defic
ienc
yOR
(95%
CI)
M97
639
40.
91(0
.79–
1.04
)0.
204
0.96
(0.8
3–1.
11)
0.42
80.
402
F16
0435
51.
08(0
.93–
1.25
)0.
408
1.12
(0.9
6–1.
31)
0.10
00.
334
ONA,
#EM
M(9
5%CI
)M
976
—0.
41(0
.32–
0.50
)<
0.00
130.
59(0
.51–
0.68
)<
0.00
130.
0351
F16
04—
0.32
(0.2
5–0.
39)
<0.
0013
0.57
(0.5
0–0.
64)
<0.
0013
0.00
42
BMI≥
25kg
/m2
OR(9
5%CI
)M
965
671.
00(0
.76–
1.32
)0.
651
1.11
(0.8
4–1.
46)
0.46
90.
439
F15
9620
91.
19(1
.02–
1.40
)0.
054
1.24
(1.0
6–1.
46)
0.03
310.
408
Hype
rtens
ion
OR(9
5%CI
)M
976
287
1.27
(1.1
0–1.
46)
0.00
221.
19(1
.02–
1.38
)0.
0131
0.40
3F
1604
484
1.08
(0.9
7–1.
21)
0.31
71.
12(0
.99–
1.25
)0.
0311
0.29
2AH
EI-2
010
BMI<
18.5
kg/m
2OR
(95%
CI)
M96
535
41.
09(0
.95–
1.26
)0.
284
1.08
(0.9
4–1.
25)
0.19
80.
744
F15
9643
50.
88(0
.78–
0.99
)0.
0431
0.93
(0.8
3–1.
04)
0.10
00.
727
Low
MUA
COR
(95%
CI)
M96
556
61.
13(0
.98–
1.30
)0.
120
1.17
(1.0
2–1.
35)
0.00
920.
528
F15
9674
10.
84(0
.76–
0.93
)0.
0062
0.87
(0.7
8–0.
96)
0.02
910.
481
Anem
iaOR
(95%
CI)
M88
380
0.81
(0.6
3–1.
04)
0.05
70.
93(0
.74–
1.18
)0.
707
0.26
4F
1485
254
0.84
(0.7
3–0.
97)
0.02
710.
86(0
.75–
0.98
)0.
105
0.43
2Fo
late
defic
ienc
yOR
(95%
CI)
M97
656
90.
79(0
.68–
0.91
)0.
0101
0.74
(0.6
4–0.
86)
<0.
0013
0.35
3F
1604
510
0.76
(0.6
5–0.
89)
<0.
0013
0.89
(0.7
6–1.
03)
0.10
70.
229
Low
ferri
tinOR
(95%
CI)
M86
975
1.34
(1.0
5–1.
73)
0.12
91.
16(0
.91–
1.50
)0.
304
0.22
7F
782
173
0.94
(0.7
9–1.
13)
0.82
90.
88(0
.74–
1.05
)0.
357
0.38
8B1
2de
ficie
ncy
OR(9
5%CI
)M
976
394
0.91
(0.7
9–1.
04)
0.20
41.
05(0
.92–
1.21
)0.
337
0.16
1F
1604
355
1.08
(0.9
3–1.
25)
0.40
81.
12(0
.97–
1.29
)0.
199
0.40
0ON
A,#
EMM
(95%
CI)
M97
6—
0.41
(0.3
2–0.
50)
<0.
0013
0.15
(0.0
6–0.
24)
0.00
620.
0161
F16
04—
0.32
(0.2
5–0.
39)
<0.
0013
0.02
(−0.
04to
0.09
)0.
618
0.00
42
BMI≥
25kg
/m2
OR(9
5%CI
)M
965
671.
00(0
.76–
1.32
)0.
651
0.86
(0.6
5–1.
13)
0.17
60.
210
F15
9620
91.
19(1
.02–
1.40
)0.
054
1.07
(0.9
1–1.
27)
0.42
70.
593
Hype
rtens
ion
OR(9
5%CI
)M
976
287
1.27
(1.1
0–1.
46)
0.00
221.
16(1
.00–
1.34
)0.
134
0.35
3F
1604
484
1.08
(0.9
7–1.
21)
0.31
71.
07(0
.96–
1.20
)0.
267
0.65
1
Exc
lude
dfr
omth
ista
ble:
outc
omes
cate
goriz
edas
low
ercl
inic
alre
leva
nce
(the
bina
rym
easu
reof
ener
gy-a
djus
ted
over
alln
utrie
ntin
adeq
uacy
and
cont
inuo
usan
thro
pom
etric
and
biom
arke
rout
com
es);
refe
rto
Sup
plem
enta
lTab
le7
fore
xpan
ded
resu
lts.M
odel
sar
ead
just
edfo
rag
e,ur
ban/
rura
lloc
ality
,edu
catio
nle
vel,
mar
itals
tatu
s,an
doc
cupa
tion.
ON
Am
easu
res
are
ener
gy-a
djus
ted
and
cont
inuo
us,s
how
ing
the
num
ber
ofad
equa
tenu
trie
nts
out
of8.
Abb
revi
atio
ns:A
HE
I-201
0,A
ltern
ativ
eH
ealth
yE
atin
gIn
dex–
2010
;EM
M,e
stim
ated
mar
gina
lmea
n;G
DQ
S,G
loba
lDie
tQ
ualit
yS
core
;MD
D-W
,Min
imum
Die
tary
Div
ersi
ty–W
omen
;MU
AC
,mid
uppe
rar
mci
rcum
fere
nce;
ON
A,o
vera
llnu
trie
ntad
equa
cy.
1S
tatis
tical
sign
ifica
nce
oflin
ear
tren
dsac
ross
met
ricqu
intil
es(P
-tren
d),a
ndW
ald
test
sco
mpa
ring
tren
dsbe
twee
nth
eG
DQ
San
dot
her
met
rics
(P-d
iff):
P<
0.05
.2S
tatis
tical
sign
ifica
nce
oflin
ear
tren
dsac
ross
met
ricqu
intil
es(P
-tren
d),a
ndW
ald
test
sco
mpa
ring
tren
dsbe
twee
nth
eG
DQ
San
dot
her
met
rics
(P-d
iff):
P<
0.01
.3S
tatis
tical
sign
ifica
nce
oflin
ear
tren
dsac
ross
met
ricqu
intil
es(P
-tren
d),a
ndW
ald
test
sco
mpa
ring
tren
dsbe
twee
nth
eG
DQ
San
dot
her
met
rics
(P-d
iff):
P<
0.00
1.
138S Bromage et al.

TABLE 7 Comparison of statistically significant covariate-adjusted associations between the GDQS, MDD-W, and AHEI-2010(scored using 24HR data) compared with selected diet quality outcomes among Ethiopian women
ComparisonMetric
GDQS Comparison Metric
Outcome Sex Statistic n n, Cases Per 1 SD P-trend Per 1 SD P-trend P-diff
AHEI-2010 Anemia F OR (95% CI) 1474 255 0.85 (0.74–0.98) 0.0121 0.86 (0.75–0.99) 0.052 0.342Low ferritin F OR (95% CI) 762 167 0.98 (0.82–1.18) 0.818 0.82 (0.68–0.99) 0.0091 0.167B12 deficiency F OR (95% CI) 1593 345 1.12 (0.97–1.30) 0.105 1.18 (1.02–1.38) 0.0341 0.434ONA, % F EMM (95% CI) 1593 — 0.57 (0.22–0.91) 0.0012 − 0.32 (−0.66 to 0.03) 0.361 0.0391
MDD-W Anemia F OR (95% CI) 1474 255 0.85 (0.74–0.98) 0.0121 0.90 (0.78–1.04) 0.372 0.594Low ferritin F OR (95% CI) 762 167 0.98 (0.82–1.18) 0.818 1.16 (0.96–1.39) 0.0041 0.234B12 deficiency F OR (95% CI) 1593 345 1.12 (0.97–1.30) 0.105 1.03 (0.89–1.20) 0.85 0.173ONA, % F EMM (95% CI) 1593 — 0.57 (0.22–0.91) 0.0012 1.72 (1.38–2.05) <0.0011 0.0201
Excluded from this table are outcomes categorized as lower clinical relevance (the binary measure of energy-adjusted overall nutrient inadequacy and continuousanthropometric and biomarker outcomes), and models in which individual trends for both the GDQS and comparison metric were not significant (P-trend ≥ 0.05) for both theAHEI-2010 and MDD-W; refer to Supplemental Table 7 for expanded results. Models are adjusted for age, urban/rural locality, education level, marital status, and occupation.ONA: energy-adjusted continuous measure of overall nutrient adequacy (mean probability of adequacy of 8 nutrients). Abbreviations: 24HR, 24-hour recall; AHEI-2010,Alternative Healthy Eating Index–2010; EMM, estimated marginal mean; GDQS, Global Diet Quality Score; MDD-W, Minimum Dietary Diversity–Women; ONA, overall nutrientadequacy.1Statistical significance of linear trends across metric tertiles (P-trend), and Wald tests comparing trends between the GDQS and other metrics (P-diff): P < 0.05.2Statistical significance of linear trends across metric tertiles (P-trend), and Wald tests comparing trends between the GDQS and other metrics (P-diff): P < 0.01.
weakly (0.1 ≥ ρ < 0.3) correlated with energy-adjusted intakesof key nutrients and overall nutrient adequacy. In regressionmodels controlling for sociodemographic characteristics, theGDQS was further associated with lower odds of serum folatedeficiency in men and women; low MUAC, underweight, andanemia in women; and higher serum vitamin B12 and odds ofhypertension in men. An analysis of 24HR data from womenproduced fewer and more modest associations.
Differences observed in metric-nutrient correlations areattributable to differences in metric construction and scoring.For example, the AHEI-2010’s inclusion of fatty acids andcontinuous scoring of red and processed meat were reflectedin higher correlations than the GDQS with polyunsaturatedand saturated fats. While the GDQS’ broad range of fruit andvegetable groups and separate, positively scored liquid oil andfish and shellfish groups were reflected in higher correlationsthan the MDD-W with fiber, folate, and polyunsaturated andsaturated fats, the GDQS’ approach of giving no points to highconsumption of high fat dairy and red meat was reflected inlower correlations than the MDD-W with monounsaturated fat,protein, vitamin B12, and zinc.
In a multi-country evaluation of men and rural NP NLWRA in 10 African countries and China and of women inIndia and Mexico, the GDQS was positively associated withoverall nutrient adequacy, with no significant difference withthe MDD-W (53–56). One reason for the MDD-W’s strongerassociation with overall nutrient adequacy in the current studyis the GDQS’ inclusion of negatively scored food groups, whichis intended to capture the diet-related NCD risk but which alsocontributes some dietary nutrients (the GDQS partly addressesthis by giving positive scores to red meat and high fat dairy upto specific consumption thresholds, after which these groupsreceive 0 points). Secondly, in populations with particularlylow dietary diversity (such as in rural Ethiopia), the GDQS’comparatively nuanced scoring system and food list may be lessbeneficial for capturing variation in nutrient adequacy and mayinstead add some noise, while the simpler MDD-W, designedto capture nutrient adequacy in resource-poor settings, may beparticularly adept in this regard.
Consistent with the above reasoning, the MDD-W wasmore frequently associated than the GDQS with anemia andanthropometric indicators of undernutrition in the analysis of
FFQ data in this study. However, in analyses of rural men andwomen in other African countries, we did not find significantdifferences in associations between either metric compared withlow MUAC or anemia, and these metrics also displayed similarassociations with low MUAC in an analysis of Indian women(53–55). In 1 secondary analysis of FFQ data from pregnantTanzanian women (the only prior comparison of the MDD-W and the earlier PDQS metric, from which the GDQS wasdeveloped), the PDQS was inversely associated with pretermbirth, low birth weight, and fetal loss, while the MDD-W wasinversely associated with infants being small for gestational age(32).
Although the MDD-W was not intended to capture the NCDrisk, a greater number of positive associations between theMDD-W and NCD outcomes than the GDQS in the currentstudy may highlight an advantage of distinguishing betweenfood scored as healthy and unhealthy in the GDQS. However, al-though observed associations between metrics and hypertensionin the current study were mostly robust to further adjustmentfor BMI, they were likely subject to confounding by physicalactivity and residual confounding by socioeconomic status [aswas also likely the case in a separate evaluation of the GDQS inpredominantly rural women in India (55)]. In a 2007 survey of1485 rural men and women in Malawi, Rwanda, and Tanzania,fruit and vegetable intake (scored positively in all diet metrics)was inversely associated with systolic and diastolic bloodpressure after adjustments for socioeconomic factors, BMI, andphysical activity; the mean BMIs were low in both that study(20.9 kg/m2 in men and 21.6 kg/m2 in women) and thecurrent study (19.9 kg/m2 in men and 21.0 kg/m2 in women),and BMI was positively associated with hypertension in bothstudies (57).
Performance of the GDQS and other metrics tabulated using24HR data was usually poorer than when tabulated using theFFQ, as we have also observed in an analysis of national surveydata from Mexico (56). One reason for this was high within-person variation in food consumption (a single recall does notreflect a person’s long-term diet, which is more relevant forhealth). Although we adjusted nutrient intakes for intra-personvariation (to better reflect correlations between metrics andestimated usual intakes), we did not attempt to adjust foodintake prior to computing metric scores. This approach allowed
Evaluating the GDQS in Ethiopian adults 139S

us to more closely reflect associations that might be observed in24HR surveys, in which 1 day of recall is often collected frommost participants.
Another reason for poorer associations observed in the24HR analysis was low between-person variation in foodconsumption. This is illustrated by comparison with an earliersecondary analysis of 24HR data from NP NL women across6 sub-Saharan African data sets, in which means ± SDsof the FGI-10ER (food group indicator summed from10 groups, minimum intake 15 g per group, equivalent to thecontinuous MDD-W used in the current study) ranged from3.0 ± 0.9 to 4.8 ± 1.2 (range in current study, 2.4 ± 0.8)and correlations between the FGI-10ER and the energy-adjusted mean probability of adequacy ranged from 0.29 to0.48 (correlation in current study, 0.23) (40). Low between-person variation in the 24HR data is primarily attributableto an extreme lack of dietary diversity in this population(only 113 unique foods were reported to be consumed atleast once in the past 24 hours). In addition to attenuatingassociations, low dietary diversity also limited our ability toobtain robust estimates of within-person variation for certainnutrients (particularly vitamin B12) due to the small number ofrepeat recalls with non-0 consumption.
Most GDQS-nutrient correlations were weaker in ruralthan urban participants, and restricting to rural participantsproduced fewer associations between the GDQS and anthro-pometric and biochemical outcomes of undernutrition. Thisis notable because although all undernutrition outcomes weremore prevalent in the rural than urban group, the mean GDQSscores were similar, suggesting that urban-rural differencesin measures of association were not driven by urban-ruraldisparities in diet quality but by the fact that poor diet quality isa more predictive determinant of undernutrition in urban areas.Given the context of rapidly urbanizing populations in Ethiopiaand sub-Saharan Africa, this reinforces the need for valid dietquality metrics for use in the region.
A strength of this analysis was its scope, comprising men andwomen in 6 regions and 2 seasons, a comparative analysis ofFFQ and 24HR data, and the availability of a range of dietary,anthropometric, and biomarker outcomes against which toevaluate metrics. Limitations included limited data on NCDoutcomes (of which only prevalent overweight and hypertensionwere available) and a low prevalence of overweight (7% in menand 13% in women), which diminished the statistical powerto derive associations. The cross-sectional study design alsolimited our ability to infer causal relations, particularly forNCD outcomes (owing to the latency period between dietaryexposures and such outcomes). Furthermore, the numberof replicate 24HRs collected from urban women (25) wassomewhat small [30 to 40 are recommended per stratum(39)], which may have led to residual within-person variationthat weakened associations between metrics and nutrientintakes.
In conclusion, we have found the easy-to-use, food-basedGDQS and MDD-W to be good measures of key undernutritionindicators among Ethiopian adults. The MDD-W is simplerto use and was more sensitive to nutrient adequacy thanthe GDQS, although the latter advantage may only applyto populations consuming extremely monotonous diets (53–56). The GDQS’ differentiation of healthy and unhealthy foodgroups should render it more suitable than the MDD-W forjointly capturing the NCD risk, as we have found in analysesof national survey data from China and Mexico and in cohortanalyses in Mexican and US women (54, 56, 58–60). This
should render the GDQS a more useful metric overall asEthiopia’s burden of disease shifts steadily toward NCDs anda more holistic means of measuring diet quality is needed.However, more extensive data, especially from longitudinalstudies, are needed to evaluate the GDQS’ sensitivity to NCDoutcomes in Ethiopia (and more definitively assess performanceof the AHEI-2010, which primarily targets the NCD risk).Given the numerous analyses presented in this paper and thepotential for associations to be significant by chance, furtherresearch should also endeavor to replicate the findings of thecurrent study.
Acknowledgments
We thank Dr. Martha Tamez for guidance in implementingthe National Cancer Institute method.
The authors’ responsibilities were as follows—WWF, CRS,SB, and WCW: designed research; AW, AWT, WWF, CRS, CTA,SP, ECH, HF, and HB: conducted research; SB, CTA, AWT,SP, ECH, CRS, and WWF: analyzed data; CB, SNB, TTF, YL,MJS, and MD: provided technical guidance and supervised theanalysis; SB: wrote the paper and had primary responsibility forthe final content; and all authors: read and approved the finalmanuscript.
References1 Global Hunger Index. Ethiopia: a closer look at hunger and
undernutrition [Internet]. Dublin (Ireland) and Bonn (Germany):Concern Worldwide/Welthungerhilfe; 2018. Available from: https://www.globalhungerindex.org/case-studies/2018-ethiopia.html
2 World Health Organization. Vitamin and Mineral Nutrition InformationSystem (VMNIS). [Internet]. Geneva (Switzerland): World HealthOrganization; 2021. Available from: https://www.who.int/vmnis/database/en/.
3 Amaha ND. Ethiopian progress towards achieving the global nutritiontargets of 2025: analysis of sub-national trends and progress inequalities.BMC Res Notes 2020;13(1):559.
4 World Health Organization. Global targets tracking tool. [Internet].Geneva (Switzerland): World Health Organization; 2021. Availablefrom: https://extranet.who.int/nhdtargets.
5 Ethiopian Public Health Institute. Ethiopian national micronutrientsurvey report. Addis Ababa (Ethiopia): Ethiopian Public HealthInstitute; 2016.
6 Ethiopia NCDI Commission. The Ethiopia Noncommunicable Diseasesand Injuries (NCDI) commission report summary. Addis Ababa(Ethiopia): Ministry of Health; 2018.
7 Central Statistical Agency [Ethiopia] and ORC Macro. Ethiopiademographic and health survey 2000. Addis Ababa (Ethiopia): CentralStatistical Agency and ORC Macro; 2001.
8 Central Statistical Agency [Ethiopia] and ORC Macro. Ethiopiademographic and health survey 2016. Addis Ababa (Ethiopia): CentralStatistical Agency and ORC Macro; 2017.
9 World Health Organization. The Global Health Observatory.Noncommunicable diseases: risk factors. [Internet]. Geneva(Switzerland): World Health Organization; 2021. Available from:https://www.who.int/data/gho/data/themes/topics/topic-details/GHO/ncd-risk-factors
10 Alberti G, Zimmet P, Shaw J, Grundy SM. The IDF consensus worldwidedefinition of the metabolic syndrome. Brussels (Belgium): InternationalDiabetes Federation; 2006.
11 Gebreyes YF, Goshu DY, Geletew TK, Argefa TG, Zemedu TG, LemuKA, Waka FC, Mengesha AB, Degefu FS, Deghebo AD, et al. Prevalenceof high blood pressure, hyperglycemia, dyslipidemia, metabolicsyndrome and their determinants in Ethiopia: evidences from theNational NCDs STEPS Survey, 2015. PLoS One 2018;13(5):e0194819.
12 Global Nutrition Report. Country nutrition profiles—Ethiopia. [Internet]. Bristol (UK): Development Initiatives; 2020.Available from: https://globalnutritionreport.org/resources/nutrition-profiles/africa/eastern-africa/ethiopia/
140S Bromage et al.

13 Ethiopian Public Health Institute. Ethiopia national food consumptionsurvey 2013. Addis Ababa (Ethiopia): Ethiopian Public Health Institute;2013.
14 Wang DD, Li Y, Afshin A, Springmann M, Mozaffarian D, StampferMJ, Hu FB, Murray CJL, Willett WC. Global improvement in dietaryquality could lead to substantial reduction in premature death. J Nutr2019;149(6):1065–74.
15 Melaku YA, Temesgen AM, Deribew A, Tessema GA, Deribe K, SahleBW, Abera SF, Bekele T, Lemma F, Amare AT, et al. The impact ofdietary risk factors on the burden of non-communicable diseases inEthiopia: findings from the Global Burden of Disease study 2013. IntJ Behav Nutr Phys Act 2016;13(1):122.
16 Bromage S, Batis C, Bhupathiraju SN, Fawzi WW, Fung TT, LiY, Deitchler M, Angulo E, Birk N, Castellanos-Gutiérrez A, et al.Development and validation of a novel food-based global diet qualityscore (GDQS). J Nutr 2021;151(Suppl 10):75S–92S.
17 Tadesse AW, Hemler EC, Andersen C, Passarelli S, Worku A, SudfeldCR, Berhane Y, Fawzi WW. Anemia prevalence and etiology amongwomen, men, and children in Ethiopia: a study protocol for a nationalpopulation-based survey. BMC Public Health 2019;19(1):1369.
18 World Health Organization. Reproductive health indicators: guidelinesfor their generation, interpretation and analysis for global monitoring.Geneva (Switzerland): World Health Organization; 2006.
19 Ethiopian Health and Nutrition Research Institute. Food compositiontable for use in Ethiopia. Part IV. 1995–1997. Addis Ababa (Ethiopia):EHNRI/FAO; 1998.
20 Willett WC. Food frequency methods. In: Nutritional epidemiology. 3rded. New York (NY): Oxford University Press; 2012.
21 Gibson RS, Ferguson EL. An interactive 24-hour recall for assessingthe adequacy of iron and zinc intakes in developing countries.Washington (DC): International Food Policy Research Institute (IFPRI)and International Center for Tropical Agriculture (CIAT); 2008.
22 Beal T, Massiot E, Arsenault JE, Smith MR, Hijmans RJ. Global trendsin dietary micronutrient supplies and estimated prevalence of inadequateintakes. PLoS One 2017;12(4):e0175554.
23 GBD 2017 Diet Collaborators. Health effects of dietary risks in 195countries, 1990–2017: a systematic analysis for the Global Burdenof Disease Study 2017. Lancet North Am Ed 2019;393(10184):1958–72.
24 Micha R, Shulkin ML, Peñalvo JL, Khatibzadeh S, Singh GM, RaoM, Fahimi S, Powles J, Mozaffarian D. Etiologic effects and optimalintakes of foods and nutrients for risk of cardiovascular diseases anddiabetes: systematic reviews and meta-analyses from the Nutrition andChronic Diseases Expert Group (NutriCoDE). PLoS One 2017;12(4):e0175149.
25 Willett W, Rockström J, Loken B, Springmann M, Lang T, VermeulenS, Garnett T, Tilman D, DeClerck F, Wood A, et al. Food in theAnthropocene: the EAT-Lancet Commission on healthy diets fromsustainable food systems. Lancet North Am Ed 2019;393(10170):447–92.
26 Lukmanji Z, Hertzmark E, Mlingi N, Assey V, Ndossi G, Fawzi WW.Tanzania food composition tables. Dar Es Salaam (Tanzania): MuhimbiliUniversity of Health and Allied Sciences and Harvard School of PublicHealth; 2008.
27 Haytowitz DB. USDA national nutrient database for standard reference,release 24. Washington (DC): United States Department of Agriculture;2011.
28 Hotz C, Abdelrahman L, Sison C, Moursi M, Loechl C. A foodcomposition table for Central and Eastern Uganda. Washington (DC):International Food Policy Research Institute and International Centerfor Tropical Agriculture; 2012.
29 Cercamondi CI, Fischer MM, Worku TGH, Wyss N, Herter-Aeberli I,Zimmermann MB, Egli IM, Hurrell RF. The potential of fermentationand contamination of teff by soil to influence iron intake andbioavailability from injera flatbread. Int J Vitam Nutr Res 2017;87:75–84.
30 Fung TT, Isanaka S, Hu FB, Willett WC. International food group-baseddiet quality and risk of coronary heart disease in men and women. AmJ Clin Nutr 2018;107(1):120–9.
31 Gicevic S, Gaskins AJ, Fung TT, Rosner B, Tobias DK, Isanaka S, WillettWC. Evaluating pre-pregnancy dietary diversity vs. dietary quality scoresas predictors of gestational diabetes and hypertensive disorders ofpregnancy. PLoS One. 2018;13(4):e0195103.
32 Madzorera I, Isanaka S, Wang M, Msamanga GI, Urassa W, HertzmarkE, Duggan C, Fawzi WW. Maternal dietary diversity and dietary qualityscores in relation to adverse birth outcomes in Tanzanian women. Am JClin Nutr 2020;112(3):695–706.
33 WDDP Study Group. Development of a dichotomous indicatorfor population-level assessment of dietary diversity in women ofreproductive age. Curr Dev Nutr 2017;1(12):cdn.117.001701.
34 Chiuve SE, Fung TT, Rimm EB, Hu FB, McCullough ML, Wang M,Stampfer MJ, Willett WC. Alternative dietary indices both stronglypredict risk of chronic disease. J Nutr 2012;142:1009–18.
35 Nusser SM, Carriquiry AL, Dodd KW, Fuller WA. A semi-parametrictransformation approach to estimating usual nutrient intakedistributions. J Am Statist Assoc 1996;91:1440–9
36 Tooze JA, Kipnis V, Buckman DW, Carroll RJ, Freedman LS, GuentherPM, Krebs-Smith SM, Subar AF, Dodd KW. A mixed-effects modelapproach for estimating the distribution of usual intake of nutrients: theNCI method. Stat Med 2010;29(27):2857–68.
37 Willett W, Stampfer MJ. Total energy intake: implications forepidemiologic analyses. Am J Epidemiol 1986;124(1):17–27.
38 U.S. Institute of Medicine. Dietary reference intakes. The essential guideto nutrient requirements. Washington (DC): National Academies Press;2006.
39 U.S. Institute of Medicine. DRI dietary reference intakes: Applicationsin dietary assessment. Washington (DC): National Academies Press;2000.
40 Martin-Prevel Y, Allemand P, Wiesmann D, Arimond M, Ballard T,Deitchler M, Dop M, Kennedy G, Lee WTK, Moursi M. Movingforward on choosing a standard operational indicator of women’sdietary diversity. Rome (Italy): Food and Agricultural Organization ofthe United Nations.2015.
41 Allen L, de Benoist B, Dary O, Hurrell R, eds. Guidelines on foodfortification with micronutrients. Geneva (Switzerland): World HealthOrganization; 2004.
42 International Zinc Nutrition Consultative Group (IZiNCG), BrownKH, Rivera JA, Bhutta Z, Gibson RS, King JC, Lönnerdal B, RuelMT, Sandtröm B, Wasantwisut E, et al. International Zinc NutritionConsultative Group (IZiNCG) technical document #1. Assessment of therisk of zinc deficiency in populations and options for its control. FoodNutr Bull 2004;25(1 Suppl 2):S99–203.
43 World Health Organization. Haemoglobin concentrations for thediagnosis of anaemia and assessment of severity. Vitamin and mineralnutrition information system. Geneva (Switzerland): WHO; 2011.
44 Namaste SM, Rohner F, Huang J, Bhushan NL, Flores-Ayala R, KupkaR, Mei Z, Rawat R, Williams AM, Raiten DJ, et al. Adjusting ferritinconcentrations for inflammation: Biomarkers Reflecting Inflammationand Nutritional Determinants of Anemia (BRINDA) project. Am J ClinNutr 2017;106:359S–71S.
45 WHO Expert Committee on Physical Status. Physical status: The useof and interpretation of anthropometry, report of a WHO ExpertCommittee. Geneva (Switzerland): WHO; 1995.
46 Tang AM, Chung M, Dong K, Wanke C, Bahwere P, Bose K,Chakraborty R, Charlton K, Hong S, Nguyen P, et al. Determininga global mid-upper arm circumference cutoff to assess underweightin adults (men and nonpregnant women). Washington (DC): FHI360/FANTA; 2020.
47 World Health Organization. Serum ferritin concentrations for theassessment of iron status and iron deficiency in populations. Geneva(Switzerland): World Health Organization; 2011.
48 World Health Organization. Serum and red blood cell folateconcentrations for assessing folate status in populations. Geneva(Switzerland): World Health Organization; 2015.
49 Allen LH. Vitamin B-12. Adv Nutr 2012;3(1):54–5.
50 Huang PL. A comprehensive definition for metabolic syndrome. DisModel Mech 2009;2(5–6):231–7.
51 Wolfe DA. A distribution-free test for related correlation coefficients.Technometrics 1977;19:507–9.
52 Eid M, Gollwitzer M, Schmitt M. Statistik und forschungsmethodenlehrbuch. Weinheim (Germany): Beltz; 2011.
53 Bromage S, Zhang Y, Holmes MD, Sachs SE, Fanzo J, Remans R, SachsJ, Batis C, Bhupathiraju SN, Fung TT, et al. The Global Diet QualityScore is inversely associated with nutrient inadequacy, low mid-upperarm circumference, and anemia among rural adults in ten Sub-SaharanAfrican countries. J Nutr 2021;151(Suppl 10):119S–29S.
Evaluating the GDQS in Ethiopian adults 141S
54 He Y, Fang Y, Bromage S, Fung TT, Bhupathiraju SN, Batis CB, DeitchlerM, Fawzi WW, Stampfer MJ, Hu FB, et al. Application of the GlobalDiet Quality Score in Chinese adults to evaluate the double burden ofnutrient inadequacy and metabolic syndrome. J Nutr 2021;151(Suppl10):93S–100S.
55 Matsuzaki M, Birk N, Bromage S, Bowen L, Batis C, Fung TT, LiY, Stampfer MJ, Deitchler M, Willett WC, et al. Validation of GlobalDiet Quality Score among nonpregnant women of reproductive agein India: Findings from the Andhra Pradesh Children and ParentsStudy (APCAPS) and the Indian Migration Study (IMS). J Nutr2021;151(Suppl 10):101S–9S.
56 Castellanos-Gutiérrez A, Rodríguez-Ramírez S, Bromage S, Fung TT, LiY, Bhupathiraju SN, Deitchler M, Willett WC, Batis C. Performance ofthe Global Dietary Quality Score with nutrition and health outcomesin Mexico with 24-hr and FFQ data. J Nutr 2021;151(Suppl 10):143S–51S.
57 de Ramirez SS, Enquobahrie DA, Nyadzi G, Mjungu D, MagomboF, Ramirez M, Sachs SE, Willett W. Prevalence and correlates ofhypertension: a cross-sectional study among rural populations in sub-Saharan Africa. J Hum Hypertens 2010;24(12):786–95.
58 Angulo E, Stern D, Castellanos-Gutiérrez A, Mongue A, Lajous M,Bromage S, Fung TT, Li Y, Bhupathiraju S, Deitchler M, et al. Changesin the Global Dietary Quality Score, weight and waist circumference inMexican women. J Nutr 2021;151(Suppl 10):152S–61S.
59 Fung TT, Li Y, Bhupathiraju SN, Bromage S, Batis C, Holmes MD,Stampfer M, Hu FB, Deitchler M, Willett WC, et al. Higher Global DietQuality Score is associated with less 4-year weight gain in US women. JNutr 2021;151(Suppl 10):162S–7S.
60 Fung TT, Bromage S, Li Y, Bhupathiraju SN, Batis C, Holmes MD,Stampfer MJ, Hu FB, Deitchler M, Willett WC, et al. Higher Global DietQuality Score is inversely associated with risk of type 2 diabetes in USwomen. J Nutr 2021;151(Suppl 10):168S–75S.
142S Bromage et al.
The Journal of NutritionSupplement
Performance of the Global Diet Quality Scorewith Nutrition and Health Outcomes in Mexicowith 24-h Recall and FFQ DataAnalí Castellanos-Gutiérrez,1 Sonia Rodríguez-Ramírez,1 Sabri Bromage,2 Teresa T Fung,2,3 Yanping Li,2
Shilpa N Bhupathiraju,2 Megan Deitchler,4 Walter Willett,2 and Carolina Batis5
1Health and Nutrition Research Center, National Institute of Public Health, Cuernavaca, Mexico; 2Harvard T.H. Chan School of PublicHealth, Harvard University, Boston, MA, USA; 3Department of Nutrition, Simmons University, Boston, MA, USA; 4Intake – Center forDietary Assessment, FHI Solutions, Washington, DC, USA; and 5CONACYT—Health and Nutrition Research Center, National Institute ofPublic Health, Cuernavaca, Mexico
ABSTRACTBackground: The Global Diet Quality Score (GDQS) is intended as a simple global diet quality metric feasible in low-
and middle-income countries facing the double burden of malnutrition.
Objective: The aim of this study was to evaluate the performance of the GDQS with markers of nutrient adequacy and
chronic disease in nonpregnant nonlactating (NPNL) Mexican women of reproductive age and to compare it with the
Alternate Healthy Eating Index-2010 (AHEI-2010) and the Minimum Dietary Diversity for Women (MDD-W).
Methods: We included NPNL women aged 15 to 49 y from the Mexican National Health and Nutrition Surveys (2012
and 2016) with 24-h recall (n = 2542) or a FFQ (n = 4975) (separate samples). We evaluated the correlation of the
GDQS with the energy-adjusted intake of several nutrients and evaluated its association with health parameters using
covariate-adjusted linear regression models.
Results: The GDQS was positively correlated with the intake of calcium, folate, iron, vitamin A, vitamin B-12, zinc, fiber,
protein, and total fat (rho = 0.09 to 0.38, P < 0.05) and was inversely correlated with the intake of added sugar (rho =−0.37 and −0.38, P < 0.05) using both instruments, and with total fat, SFA, and MUFA only with 24-h recall data (rho
= −0.06 to −0.16, P < 0.05). The GDQS was inversely associated with serum ferritin, BMI, waist circumference, and
serum total and LDL cholesterol using FFQ data (P < 0.05), and was positively associated with serum folate using 24-h
recall data (P < 0.05). Similar correlations and associations were observed with the MDD-W (only with micronutrients)
and the AHEI-2010 (only with chronic disease-related nutrients and health markers).
Conclusions: In comparison to other diet metrics, the GDQS can capture both dimensions of nutrient adequacy and
health markers related to the risk of chronic disease. The performance of the GDQS was satisfactory with either 24-h
recall or FFQ. J Nutr 2021;151:143S–151S.
Keywords: GDQS, diet quality, nutrient intake, nutrient adequacy, noncommunicable disease, Mexican women,
ENSANUT, 24-h recall, FFQ
Introduction
Poor diet quality is one of the main drivers of noncommunicabledisease (NCD) morbidity and mortality globally (1). In 2017,one-fifth of all deaths in adults and 15% of disability-adjustedlife years (DALYs) were attributed to dietary risk factors, mainlyhigh intake of sodium, low intake of whole grains, and lowintake of fruits. The double burden of malnutrition, which refersto both undernutrition and overweight/obesity, continues tobe a significant problem in many countries, in particular inlow- and middle-income countries (LMICs) (2). Consequently,the importance of adequately measuring diet quality at thepopulation level is apparent and has been met with increasing
efforts to develop low-burden diet quality instruments thatare feasible in LMICs where resources for data collection arelimited.
The nutritional transition that has occurred in Mexicoover the last decades has resulted in the steep rise ofoverweight/obesity and its associated NCDs (3). In 2016, two-thirds of the adult population was considered overweight orobese (4), 1 in 10 adults was diagnosed as having diabetes (5),and a quarter had high blood pressure (6). At the same time,the diet of the population is not providing enough nutrients tofulfill individual requirements, resulting in a high prevalence ofinadequate intake of micronutrients across all segments of theMexican population (7).
C© The Author(s) 2021. Published by Oxford University Press on behalf of the American Society for Nutrition. This is an Open Access article distributed under theterms of the Creative Commons Attribution License (http://creativecommons.org/licenses/by/4.0/), which permits unrestricted reuse, distribution, and reproductionin any medium, provided the original work is properly cited.Manuscript received March 6, 2021. Initial review completed April 12, 2021. Revision accepted June 1, 2021.First published online October 1, 2021; doi: https://doi.org/10.1093/jn/nxab202. 143S

The Global Diet Quality Score (GDQS) was developed toaddress the need for a simple metric that could capture bothdimensions of diet quality related to risk of NCDs and nutrientadequacy at the population level and that can be tabulatedwithout the need for food composition tables which may notbe available in many LMICs. Moreover, existing metrics of dietquality were mostly developed using data from high-incomecountries (HICs) and therefore, it is unclear whether they canadequately measure diet quality dimensions in LMICs giventheir distinct dietary patterns (8). The GDQS is intended to beused at a population level using dietary data obtained with a24-h dietary recall or an FFQ and therefore, it is importantto understand the advantages and disadvantages provided byboth methods for this purpose. The 24-h recall captures detailedinformation about food intake and is less prone to systematicerror compared with other methods, and the FFQ is a moreaffordable tool designed to capture long-term intake but moresusceptible to bias and less reliable for estimating absoluteintake of foods and nutrients (9–11). Alternatively, data can becollected using the GDQS app, an electronic tool developed toprovide a simple and low-burden instrument for data collectionwhen a 24-h recall or FFQ are not feasible (12).
The GDQS was developed with an initial focus on non-pregnant nonlactating (NPNL) women of reproductive age fortheir condition as a high-priority group for targeting nutritioninterventions given the relevance of their nutritional status forthemselves and their offspring.
As part of the research initiative to develop a novel metric tomeasure diet quality that would be appropriate to use in LMICs,the objective of this study was to evaluate the performance ofthe GDQS with markers of nutrient adequacy and NCDs inNPNL Mexican women of reproductive age. We used dietarydata from the Mexican National Health and Nutrition Survey(ENSANUT) from 2012 and 2016 obtained with 2 different
Funding for the research was provided by FHI Solutions, recipient of a Billand Melinda Gates Foundation grant to support Intake – Center for DietaryAssessment.Published in a supplement to the Journal of Nutrition. Publication costs for thissupplement were funded by the Bill & Melinda Gates Foundation in conjunctionwith FHI Solutions, recipient of a Bill & Melinda Gates Foundation grant tosupport Intake – Center for Dietary Assessment. The opinions expressed in thispublication are those of the authors and are not attributable to the sponsors orthe publisher, Editor, or Editorial Board of The Journal of Nutrition.The Supplement Coordinators for the supplement publication were MeganDeitchler, Intake – Center for Dietary Assessment at FHI Solutions, Washington,DC; and Sabri Bromage, Harvard T.H. Chan School of Public Health, Boston, MA.Author disclosures: TTF is an Associate Editor for the Journal of Nutrition andplayed no role in the Journal’s evaluation of the manuscript. All other authorsreport no conflicts of interest.Supplemental Table 1 and Supplemental Figures 1 and 2 are available from the“Supplementary data” link in the online posting of the article and from the samelink in the online table of contents at https://academic.oup.com/jn/.The GDQS research initiative was launched by Intake – Center for DietaryAssessment. The research was led by Harvard T.H. Chan School of Public Health,Department of Nutrition and carried out in collaboration with researchers at theNational Public Health Institute (INSP), Mexico. Funding for the research wasprovided by FHI Solutions, recipient of a Bill & Melinda Gates Foundation grantto support Intake – Center for Dietary Assessment.Address correspondence to CB (e-mail: [email protected]).Abbreviations used: AHEI-2010, Alternate Healthy Eating Index-2010; BLUP,best linear unbiased predictor; EAR, estimated average requirement; ENSANUT,Mexican National Health and Nutrition Survey; GDQS, Global Diet Quality Score;GDQS+, Global Diet Quality Score positive submetric; GDQS–, Global DietQuality Score negative submetric; INSP, Mexican National Institute of PublicHealth; LMIC, low- and middle-income country; MDD-W, Minimum DietaryDiversity for Women; MetS, metabolic syndrome; MPA, mean probability ofadequacy; NCD, noncommunicable disease; NPNL, nonpregnant nonlactating;SES, socioeconomic status; WC, waist circumference.
instruments (24-h recall and FFQ). Additionally, we comparedthe performance of the GDQS with the Alternate Healthy EatingIndex-2010 (AHEI-2010), a widely used metric associatedwith the risk of chronic disease (13), and with the MinimumDietary Diversity for Women (MDD-W), a population-levelfood group diversity indicator that serves as a proxy measureof micronutrient adequacy in women (14).
Methods
ENSANUTWe analyzed data from NPNL women aged 15 to 49 y from theENSANUT surveys from 2012 and 2016. Information was collectedby face-to-face interviews carried out between October 2011 and May2012 for ENSANUT 2012 and between May and October 2016 forENSANUT 2016. Informed consent was obtained from participantsaged ≥18 y and from the parent or guardian of participants aged <18 y.The survey protocol was approved by the Ethics Committee of theNational Institute of Public Health (INSP).
24-h recallA random subsample of ∼11% (n = 10,886) of the total respondentsof ENSANUT 2012 and ∼15% (n = 4341) of ENSANUT 2016was selected to provide dietary information using a 5-step multiple-pass 24-h dietary recall method developed by the USDA and adaptedto Mexican context. The detailed methodology for data collectionhas been described elsewhere (7, 15). Briefly, participants provideddetailed information about all the foods consumed on the day priorto the interview. Information about food quantity was provided inhousehold measures or food weight. Interviews were conducted bypreviously trained and standardized personnel using an automatedsoftware that follows a series of iterative steps to aid memory andminimize underreporting. A second 24-h recall was administered to arandomly selected subsample of ∼9% of the participants that respondedto the first recall. Both interviews were administered on nonconsecutivedays between Monday and Sunday.
FFQIn a separate subsample of the ENSANUT 2012 and 2016, dietaryinformation was collected using a semiquantitative FFQ that inquiresabout the intake over the past 7 d. The FFQ includes 140 food itemswith the following response options: never, 1 d/wk, 2–4 d/wk, 5–6 d/wk,7 d/wk; and a times per day frequency of: 1/d, 2–3/d, 4–5/d, and 6/d.Respondents also selected a portion size from predefined standard sizesand then indicated the number of portions consumed. We used theinformation on frequency, portion size, and number of portions tocompute intake per day (g/d) for each item.
The GDQSThe GDQS is comprised of 25 food groups divided into 3 or 4intake categories defined by pre-established cutoffs (g/d) and are scoredaccording to their health implications (16). Healthy food groups (16out of 25) were positively scored, meaning that higher scores wereassigned to higher intakes. Unhealthy food groups (9 out of 25) werenegatively scored, with the exception of high fat dairy and red meatthat received higher scores with moderate intake and lower scores withvery low or very high intakes. The GDQS ranges from 0 to 49 pointsand a higher score indicates higher dietary quality. The GDQS Positivesubmetric (GDQS+) is composed from the added score of the healthyfood groups and ranges from 0 to 32 points, and the GDQS Negativesubmetric (GDQS–) is composed from the added score of the unhealthyfood groups and ranges from 0 to 17 points.
We classified the foods reported in the first 24-h recall and in the FFQto their corresponding GDQS food group. The mixed dishes included inthe 24-h recall were disaggregated into individual foods specified by therespondent or following a standard recipe when the participant couldnot provide this information. The food items included in the FFQ that
144S Supplement

were complex mixed dishes were disaggregated into individual foodsfollowing a standard recipe and each ingredient was categorized in thecorresponding GDQS food group. Industrialized dairy drinks with sugarwere counted in the dairy group and home-made dairy-based drinkswere disaggregated with only the milk products included in the dairygroups and the rest of the ingredients in their corresponding group.The foods in the group of purchased deep fried foods were “double-counted,” meaning that they were also included in the correspondinggroup according to their characteristics, i.e. “French fries”were includedin deep fried foods and in white roots and tubers. Because there was notenough information to distinguish when foods were purchased or pre-pared at home, the purchased deep fried foods included single foods andmixed dishes that are typically acquired outside of home. We estimatedeach participant’s daily intake (g/d) of every food group and assignedthe point values that corresponded to their level of intake to computethe GDQS, GDQS+, and GDQS−. A more detailed description for thetabulation of the GDQS is described elsewhere in this supplement (16).
Comparison metricsWe compared the performance of the GDQS with the AHEI-2010and the MDD-W. The AHEI-2010 is a diet quality index based on11 foods and nutrients that are predictive of chronic disease risk (13).We estimated daily intake for each component except for alcohol intakeand assigned the corresponding score ranging from 0 to 10 points to theremaining 10 components, with a maximum total score of 100 points.A higher AHEI-2010 indicates higher diet quality and is associated withlower disease risk.
To estimate the MDD-W, we estimated daily intake (g/d) of10 predefined food groups (14) and assigned a value of 1 point whenintake was at or above 15 g/d and zero points otherwise. The MDD-W was developed to be used as a dichotomous indicator for dietarydiversity using a cutoff of ≥5 food groups consumed the previousday to serve as a proxy for micronutrient adequacy at the populationlevel. For this analysis, we used the values for the underlying dietarydiversity score obtained by adding the points for the 10 food groups,with a possible range of values from 0 to 10 points. A higher scorereflects higher dietary diversity and a better likelihood of micronutrientadequacy. A more detailed description of the estimation of the AHEI-2010 and the MDD-W can be found elsewhere in this supplement (16).
Health parametersInformation on weight, height, and waist circumference (WC) mea-surements were obtained by trained and standardized personnel usingconventional and internationally accepted protocols (17, 18).
To obtain measures of serum biomarkers, a venous blood samplewas obtained after a minimum 8-h fast and was centrifuged in situ at3000 × g for 20 min and stored at −70◦C until assay at the laboratoryof the Center for Nutrition and Health Research at INSP, Cuernavaca,Mexico.
Serum ferritin and folate concentrations were measured bychemiluminescent microparticle immunoassay technology in anautoanalyzer (ARCHITECT i 2000). Serum ferritin values wereadjusted for the concentration of C-reactive protein followingthe Thurnham equation (19). Serum glucose was measured by anautomatized glucose oxidase method using SynchronX equipment andinsulin by chemiluminescence using Access2 equipment. Blood lipiddeterminations were obtained using an automatic immunoanalyzer(Architect C18200), triglycerides by lipase hydrolysis, total cholesterolby enzymatic digestion and oxidation, and HDL cholesterol by adirect enzymatic colorimetric method. LDL cholesterol was estimatedaccording to the Friedewald equation (20).
Metabolic syndrome (MetS) was evaluated by estimating the num-ber of risk factors (out of 5) defined by the National Cholesterol Educa-tion Program (NCEP) Adult Treatment Panel III (ATP III) (21) that werepresent for each woman. Risk factors included WC ≥80 cm, high bloodpressure (known diagnosis or under pharmacological treatment), hyper-triglyceridemia (≥150 mg/dL or under pharmacological treatment), lowHDL cholesterol (<50 mg/dL or under pharmacological treatment), andhyperglycemia (≥100 mg/dL or under pharmacological treatment).
Sociodemographic informationWe obtained data on age, socioeconomic status (SES), and area ofresidence (urban/rural) from the ENSANUT 2012 and 2016 databases.SES is measured in ENSANUT with an index constructed using a firstcomponent analysis based on household information that included thetype of construction materials, number of rooms used for sleeping,water supply, car ownership, and number of household goods andelectrical appliances, and was divided into tertiles to categorize low,medium, and high SES. Urban areas were defined as locations with≥2500 inhabitants and rural areas were those with <2500 inhabitantsper basic geostatistical areas.
Nutrient adequacyWe estimated individual daily intake of calcium, fiber, folate, iron,monounsaturated fatty acid (MUFA), protein, polyunsaturated fattyacid (PUFA), protein, saturated fatty acid (SFA), total fat, vitaminA, vitamin B-12, and zinc, as well as energy intake using the foodcomposition tables compiled by INSP (22). The intake of added sugarswas calculated following a 5-step algorithm that has been describedelsewhere (23). We estimated usual nutrient intake and usual energyintake for the 24-h recall data obtaining the best linear unbiasedpredictors (BLUPs) following the Iowa State University (ISU) methodusing the Software for Intake Distribution Estimation PC-Side v.1.02(24) and used the BLUPs to obtain energy-adjusted estimates of nutrientintake following the residual method (25).
For the FFQ data, we considered as adequate intakes those above theestimated average requirement (EAR) established by the U.S. Instituteof Medicine DRIs for calcium, folate, vitamin A, and vitamin B-12,and above the adequate intake (AI) for fiber (26). The EAR for zincwas based on the recommendation by the International Zinc NutritionConsultative Group (IZiNCG) for a bioavailability of 25% (27). For the24-h recall data, nutrient adequacy for all nutrients except for iron wasbased on the probability of adequacy for the usual nutrient intake basedon a normal distribution with a mean = EAR and SD = CV(EAR). Ironadequacy was evaluated following a full-probability approach based onrequirement distributions adjusted to an assumed iron bioavailability of10% (28).
Overall nutrient adequacy was evaluated based on the intake ofcalcium, fiber, folate, iron, protein, vitamin A, vitamin B-12, and zinc.For the FFQ data, the value for overall nutrient adequacy is the sum ofnutrients with adequate intake and for the 24-h recall data, the value isthe nutrients’ mean probability of adequacy (MPA).
Statistical analysisWe estimated Spearman’s correlation coefficients to evaluate the relationbetween the diet quality metrics and the energy-adjusted intake ofnutrients. The association between the diet quality metrics and healthoutcomes was assessed using linear regression models with the z-scorevalues of the metrics as predictors and adjusted by age, SES, andurban/rural area. Additionally, we estimated separate covariate-adjustedmodels to test for interaction between age groups (15–29 y, 30–39 y,and 40–49 y) and the GDQS, the AHEI-2010, and the MDD-W forits association with all health parameters and we present the predicteddifference [β (95% CI)] in each group. An interaction was consideredsignificant with a P value < 0.10. For all other analyses, estimates wereconsidered significant with a P value < 0.05. To account for the possibil-ity of overstating statistical significance in the correlation and regressionanalyses that include multiple comparisons, we have additionallyindicated when estimations have a P value < 0.001. All correlationsand regression models were conducted in STATA v. 14.0 (StataCorp).
Results
We present the characteristics of the study sample and themean values of the diet quality metrics across subpopulations inTable 1 as well as the mean values of the individual componentsof the GDQS in Supplemental Table 1. The study sample wascomprised of 2542 NPNL women (1655 from ENSANUT 2012
Performance of the GDQS in Mexican women 145S

TAB
LE1
Cha
ract
eris
tics
ofth
est
udy
popu
latio
nan
ddi
strib
utio
nof
the
diet
qual
itym
etric
s1
24-h
reca
llFF
Q
n(%
)GD
QSGD
QS+
GDQS
−AH
EI-2
010
MDD
-Wn
(%)
GDQS
GDQS
+GD
QS−
AHEI
-201
0M
DD-W
All
2542
(100
)16
.4±
4.0
6.4
±3.
49.
9±
2.5
44.3
±10
.94.
3±
1.5
4975
(100
)20
.1±
3.8
11.1
±3.
89.
0±
2.4
52.8
±8.
76.
7±
1.5
Age 15
–29
y(R
ef.)
1411
(55.
5)15
.8±
4.1
6.2
±3.
39.
7±
2.6
43.0
±11
.04.
2±
1.5
1868
(37.
5)19
.3±
3.7
10.6
±3.
78.
6±
2.5
51.2
±8.
86.
6±
1.5
30–3
9y
621
(24.
4)16
.8±
3.82
6.6
±3.
2210
.2±
2.32
45.3
±10
.32
4.3
±1.
5216
61(3
3.4)
20.3
±3.
7211
.3±
3.72
9.1
±2.
4253
.1±
8.52
6.8
±1.
52
40–4
9y
510
(20.
1)17
.4±
3.92
7.0
±3.
6210
.4±
2.42
46.4
±10
.72
4.4
±1.
6214
46(2
9.1)
21.1
±3.
9211
.6±
4.02
9.5
±2.
3254
.4±
8.42
6.8
±1.
52
Area Ru
ral(
Ref.)
1030
(40.
5)16
.9±
3.8
6.7
±3.
110
.2±
2.3
46.8
±10
.64.
2±
1.5
2209
(44.
4)20
.3±
3.7
10.9
±3.
79.
4±
2.4
54.1
±8.
46.
6±
1.6
Urba
n15
12(5
9.5)
16.0
±4.
126.
3±
3.52
9.7
±2.
6242
.5±
10.7
24.
3±
1.5
2766
(55.
6)20
.0±
3.92
11.3
±3.
928.
8±
2.42
51.7
±8.
826.
9±
1.42
SES Lo
w(R
ef.)
833
(32.
8)16
.8±
3.9
6.5
±3.
110
.3±
2.3
46.9
±11
.04.
1±
1.5
1691
(34.
0)20
.0±
3.7
10.5
±3.
79.
5±
2.4
54.8
±8.
56.
4±
1.6
Med
ium
884
(34.
8)16
.3±
4.02
6.4
±3.
29.
8±
2.52
43.7
±10
.52
4.2
±1.
5217
23(3
4.6)
20.1
±3.
711
.1±
3.72
9.0
±2.
4252
.4±
8.62
6.8
±1.
42
High
825
(32.
4)16
.2±
4.22
6.5
±3.
89.
7±
2.62
42.3
±10
.62
4.5
±1.
6215
61(3
1.4)
20.4
±4.
0211
.8±
3.92
8.6
±2.
4251
.2±
8.52
7.1
±1.
42
Valu
esar
em
ean
±S
Dof
the
diet
qual
itym
etric
s.1A
HE
I-201
0,A
ltern
ate
Hea
lthy
Eat
ing
Inde
x-20
10;G
DQ
S,G
loba
lDie
tQ
ualit
yS
core
;GD
QS+,
Glo
balD
iet
Qua
lity
Sco
repo
sitiv
esu
bmet
ric;G
DQ
S–,
Glo
balD
iet
Qua
lity
Sco
rene
gativ
esu
bmet
ric;M
DD
-W,M
inim
umD
ieta
ryD
iver
sity
for
Wom
en;
SE
S,so
cioe
cono
mic
stat
us.
2D
iffer
ent
from
refe
renc
egr
oup
(P<
0.05
).
and 887 from ENSANUT 2016) with information from a 24-hrecall and 4975 NPNL women (1737 from ENSANUT 2012and 3248 from ENSANUT 2016) with information from anFFQ, between the ages of 15 and 49 y. The mean age was30.7 ± 9.7 y for women with FFQ data and 28.0 ± 10.9 yfor women with 24-h recall data. For both data sets, theGDQS increased with age and was slightly higher in the ruralpopulation compared with the urban population (P < 0.05).Across SES categories, the GDQS mean value was significantlyhigher in women with a low SES compared with medium andhigh SES for the 24-h recall data set, as opposed to the FFQ dataset, with a higher GDQS in women in the high SES category. Forthe 24-h recall data, the GDQS+ and the GDQS− submetricsfollowed a pattern similar to the GDQS across subpopulations;whereas for the FFQ data, the submetrics followed oppositetendencies in regards to area of residence and SES, with a lowerGDQS+ among rural women compared with urban womenand increasing with SES, whilst the opposite was true for theGDQS−. The AHEI-2010 and MDD-W were also higher inolder women compared with their younger counterparts. TheAHEI-2010 was distributed in the same way as the GDQS−across urban/rural area and SES for both data sets, and theMDD-W followed the same distribution as the GDQS+ onlyfor the FFQ data, whereas for the 24-h recall data the MDD-Wincreased with SES but did not differ between urban/rural area.
We present correlation coefficients with energy-adjustednutrient intakes in Table 2. The correlation observed in the 24-hrecall data set between the diet quality metrics and the MPA wasstronger for the GDQS than the MDD-W and the AHEI-2010.For the FFQ data, the GDQS and the MDD-W correlated inthe same way with overall nutrient adequacy and outperformedthe AHEI-2010. The GDQS was positively correlated with theintakes of calcium, folate, iron, vitamin A, vitamin B-12, zinc,fiber, and protein (rho = 0.09 to 0.38, P < 0.05) in both data setsand with total fat (rho = 0.03, P < 0.05) only using FFQ data;and was inversely correlated with the intake of added sugar inboth data sets, and with total fat, SFA, and MUFA (rho = −0.06to −0.16, P < 0.05) only using 24-h recall data. Compared withthe MDD-W, the GDQS showed a stronger positive correlationwith the intake of most micronutrients (except for vitaminA and vitamin B-12) and a stronger inverse correlation withthe intake of added sugar. The MDD-W was not significantlycorrelated with the intake of total fat and SFA in the 24-hrecall data and was positively correlated with these in the FFQdata. Compared with the AHEI-2010, the GDQS was morestrongly correlated with the intake of all micronutrients and hada similar correlation with the intake of added sugar but a weakercorrelation with fiber and all types of fat.
We present covariate-adjusted associations between dietquality scores and health parameters in Table 3. An increaseof 1 SD of the GDQS was inversely associated with serumferritin (β: −2.84 μg/L; 95% CI: −5.52, −0.17 μg/L), BMI(β: −0.25 kg/m2; 95% CI: −0.41, −0.08 kg/m2), WC (β:−0.81 cm; 95% CI: −1.31, −0.31 cm), total serum cholesterol(β: −2.91 mg/dL; 95% CI: −4.65, −1.16 mg/dL), and LDLcholesterol (β: −1.29 mg/dL; 95% CI: −2.46, −0.12 mg/dL)using FFQ data, and was positively associated with serum folate(β: 0.22 ng/mL; 95% CI: 0.01, 0.43 ng/mL) using 24-h recalldata. The GDQS+ was inversely associated with serum ferritin,BMI, WC, and total serum cholesterol only in the FFQ data;whereas the GDQS– was not associated with any evaluatedhealth parameter. The AHEI-2010 was inversely associatedwith BMI (β: −0.28; 95% CI: −0.45, −0.10) and WC (β:−0.68 cm; 95% CI: −1.22, −0.14 cm), and had a positive
146S Supplement

TABLE 2 Correlation between diet quality scores and nutrient intake in Mexican women1
24-h recall (n = 2545) FFQ (n = 4975)
GDQS GDQS+ GDQS− AHEI-2010 MDD-W GDQS GDQS+ GDQS− AHEI-2010 MDD-W
Overall nutrient adequacy2 0.273 0.163 0.233 0.143 0.23 3 0.373 0.363 0.044 0.093 0.373
Calcium, mg/d 0.173 0.02 0.243 0.073 0.173 0.293 0.143 0.233 0.054 0.203
Folate, μg/d 0.253 0.243 0.083 0.253 0.173 0.333 0.333 0.01 0.253 0.283
Iron, mg/d 0.093 0.093 0.03 0.103 0.083 0.213 0.163 0.073 0.153 0.163
Vitamin A, μg RAE/d 0.173 0.153 0.083 0.054 0.293 0.293 0.313 − 0.034 0.163 0.353
Vitamin B-12, μg/d 0.054 − 0.04 4 0.123 − 0.233 0.183 0.113 0.113 0.01 − 0.193 0.223
Zinc, mg/d 0.243 0.103 0.243 0.03 0.163 0.293 0.183 0.173 0.054 0.223
Fiber, g/d 0.383 0.313 0.213 0.493 0.173 0.343 0.203 0.223 0.563 0.073
Protein, g/d 0.293 0.203 0.213 0.04 0.213 0.353 0.313 0.073 − 0.054 0.333
MUFA, g/d − 0.143 − 0.073 − 0.133 − 0.253 − 0.01 − 0.03 0.083 − 0.163 − 0.203 0.123
PUFA, g/d 0.173 0.263 − 0.073 0.233 0.093 0.01 0.093 − 0.143 0.233 0.03Total fat, g/d − 0.064 − 0.054 − 0.03 − 0.183 0.04 0.034 0.113 − 0.123 − 0.123 0.143
SFA, g/d − 0.163 − 0.213 0.00 − 0.303 0.01 0.00 0.01 − 0.02 − 0.243 0.113
Added sugar, g/d − 0.373 − 0.173 − 0.383 − 0.363 − 0.093 − 0.383 − 0.213 − 0.283 − 0.403 − 0.133
Values are Spearman correlation coefficients between the dietary scores and the energy-adjusted intake of nutrients.1AHEI-2010, Alternate Healthy Eating Index-2010; GDQS, Global Diet Quality Score; GDQS+, Global Diet Quality Score positive submetric; GDQS–, Global Diet Quality Scorenegative submetric; MDD-W, Minimum Dietary Diversity for Women; RAE, retinol activity equivalents.2Summary measure for the intake of calcium, fiber, folate, iron, protein, vitamin A, vitamin B-12, and zinc.3Spearman’s P value < 0.001.4Spearman’s P value < 0.05.
association with serum triglycerides (β: 5.03 mg/dL; 95% CI:0.14, 9.93 mg/dL) only using FFQ data. The MDD-W had apositive association with serum folate (β: 0.37 ng/mL; 95% CI:0.16, 0.58 ng/mL), LDL cholesterol (β: 2.09 mg/dL; 95% CI:0.60, 3.57 mg/dL), HDL cholesterol (β: 0.73 mg/dL; 95% CI:0.23, 1.23 mg/dL), and total cholesterol (β: 2.28 mg/dL; 95%CI: 0.41, 4.15 mg/dL) in the 24-h data set and was inverselyassociated with insulin concentrations (β: −0.45 μU/mL; 95%CI: −0.84, −0.06 μU/mL) in the FFQ data set.
We present the significant interactions across age groups forthe GDQS in Figure 1, for the AHEI-2010 in SupplementalFigure 1, and for the MDD-W in Supplemental Figure 2. Therewas a significant interaction between the GDQS and age groupsfor WC and HDL cholesterol in the 24-h recall data set, andfor BMI and serum cholesterol in the FFQ data set (P forinteraction < 0.10). The associations between the GDQS andWC, BMI, and HDL cholesterol were statistically significantonly in women aged 40–49 y, and with serum cholesterol onlyin women aged ≥30 y. The AHEI-2010 showed a significantinteraction between age groups for its association with BMI andWC in both data sets, with HDL cholesterol in the 24-h recall,and with LDL cholesterol and MetS in the FFQ data, with asignificant inverse association with HDL cholesterol in womenaged 15–29 y and with BMI and WC in women aged 30 y andabove (Supplemental Figure 1). The MDD-W had a significantinteraction between age groups for its association with BMIand LDL cholesterol for the 24-h recall data, and with serumcholesterol, HDL cholesterol, and triglycerides for the FFQ data,with a significant inverse association with total cholesterol andtriglycerides only in women 30–39 y, and with HDL cholesterolonly in women 40–49 y, and a positive association with LDLcholesterol in women 30–39 y (Supplemental Figure 2).
Discussion
We used dietary data from 2 national Mexican surveys toevaluate the performance of the GDQS with nutrition andhealth outcomes in NPNL women of reproductive age. We
found that the GDQS was associated with the intake of keynutrients relevant for their public health implications in LMICsand was also associated with health parameters related to therisk of NCDs (29–32).
The GDQS was positively correlated with nutrient adequacyand, with the exception of fat intake in the FFQ data set, corre-lated with the intake of nutrients involved in the developmentof NCDs. The weak correlation between the GDQS and theintake of all types of fats observed in the FFQ data set couldbe the result of difficulty in disaggregating individual foodsfrom the items included in the questionnaire. For this analysis,we used standard recipes to disaggregate complex dishes butdid not separate individual foods from simple preparations(i.e. fried beans and fried eggs, which were counted in thegroups of legumes and eggs, respectively), resulting in healthycomponents of the GDQS positively correlated with fat intake.Moreover, the nutritional composition assigned to the fooditems in the FFQ does not account for the variation in thenutritional profile of the individual foods that would normallydiffer between individuals; therefore, the detailed informationprovided in the 24-h recall allows for a more accurate estimationof individual nutrient intake (11, 33). In the case of MUFA, webelieve the unexpected results had to do with the low intakeof nuts and seeds and liquid oils with a high content of MUFAin our population. Hence, red and processed meat become animportant source of MUFA.
The GDQS and the MDD-W showed a comparablecorrelation with overall nutrient adequacy but the GDQS wasmore strongly correlated with the intake of added sugar andfiber, and using 24-h recall data was inversely correlated withthe intake of total fat and SFA, whereas the MDD-W had apositive correlation with these fats in both data sets. The GDQSand MDD-W were positively associated with serum folateconcentrations only in the 24-h recall data set. Evidence suggeststhat serum folate can take weeks to respond to increased intake(34, 35), which contradicts the association found with the24-h recall and the lack of association observed using an FFQ.However, our results are consistent with other studies that havefound a stronger correlation between folate intake and serum
Performance of the GDQS in Mexican women 147S

TAB
LE3
Ass
ocia
tion
betw
een
diet
qual
itysc
ores
and
heal
thm
arke
rsin
Mex
ican
wom
en1
24-h
reca
llFF
Q
GDQS
GDQS
+GD
QS−
AHEI
-201
0M
DD-W
GDQS
GDQS
+GD
QS−
AHEI
-201
0M
DD-W
Seru
mfe
rritin
,μg/
L0.
80(−
3.54
,1.9
3)−
0.10
(−2.
73,2
.54)
−1.
19(−
3.95
,1.5
7)−
0.19
(−2.
99,2
.61)
−0.
10(−
2.58
,2.7
8)−
2.84
(−5.
52,−
0.17
)2−
3.42
(−6.
07,−
0.76
)20.
96(−
1.69
,3.6
2)−
1.72
(−4.
74,1
.30)
−3.
39(−
5.99
,−0.
79)2
Seru
mfo
late
,ng/
mL
0.22
(0.0
1,0.
43)2
0.20
(−0.
01,0
.41)
0.08
(−0.
13,0
.29)
0.02
(−0.
20,0
.24)
0.37
(0.1
6,0.
58)2
−0.
18(−
0.40
,0.0
3)−
0.06
(−0.
28,0
.15)
−0.
18(−
0.39
,0.0
3)−
0.12
(−0.
37,0
.14)
−0.
09(−
0.30
,0.1
3)M
etS
com
pone
nts
−0.
05(−
0.10
,0.0
1)−
0.04
(−0.
09,0
.01)
−0.
02(−
0.08
,0.0
4)−
0.03
(−0.
08,0
.03)
−0.
01(−
0.06
,0.0
4)−
0.03
(−0.
07,0
.01)
−0.
03(−
0.07
,0.0
1)−
0.01
(−0.
04,0
.04)
−0.
03(−
0.07
,0.0
1)−
0.02
(−0.
06,0
.02)
BMI,
kg/m
2−
0.06
(−0.
28,0
.16)
−0.
10(−
0.32
,0.1
1)0.
04(−
0.17
,0.2
6)−
0.10
(−0.
32,0
.12)
−0.
03(−
0.25
,0.1
8)−
0.25
(−0.
41,−
0.08
)2−
0.19
(−0.
35,−
0.03
)2−
0.09
(−0.
25,0
.07)
−0.
28(−
0.45
,−0.
10)2
−0.
09(−
0.25
,0.0
8)W
aist
circ
umfe
renc
e,cm
−0.
19(−
0.97
,0.5
9)−
0.13
(−0.
88,0
.62)
−0.
13(−
0.93
,0.6
6)−
0.57
(−1.
36,0
.22)
0.24
(−0.
50,0
.99)
−0.
81(−
1.31
,−0.
31)2
−0.
67(−
1.17
,−0.
17)2
−0.
22(−
0.74
,0.2
9)−
0.68
(−1.
22,−
0.14
)2−
0.50
(−1.
01,0
.01)
Tota
lcho
lest
erol
,mg/
dL0.
98(−
0.95
,2.9
0)1.
30(−
0.58
,3.1
8)−
0.21
(−2.
15,1
.73)
0.37
(−1.
60,2
.35)
2.28
(0.4
1,4.
15)2
−2.
91(−
4.65
,−1.
16)2
−2.
17(−
3.93
,−0.
41)2
−1.
39(−
3.25
,0.4
7)−
1.22
(−3.
05,0
.60)
−1.
73(−
3.56
,0.1
0)LD
L-C,
mg/
dL0.
65(−
0.88
,2.1
8)1.
15(−
0.34
,2.6
5)−
0.55
(−2.
09,0
.99)
0.46
(−1.
11,2
.02)
2.09
(0.6
0,3.
57)2
−1.
29(−
2.46
,−0.
12)2
−0.
82(−
1.99
,0.3
5)−
0.73
(−1.
91,0
.44)
−0.
89(−
2.12
,0.3
4)−
0.44
(−1.
61,0
.73)
HDL-
C,m
g/dL
0.32
(−0.
20,0
.83)
0.49
(−0.
01,0
.99)
−0.
16(−
0.68
,0.3
6)−
0.40
(−0.
93,0
.13)
0.73
(0.2
3,1.
23)2
−0.
26(−
0.64
,0.1
3)−
0.09
(−0.
47,0
.29)
−0.
27(−
0.65
,0.1
2)−
0.10
(−0.
51,0
.31)
−0.
29(−
0.67
,0.1
0)Tr
igly
cerid
es,m
g/dL
0.70
(−4.
97,6
.38)
−1.
60(−
7.14
,3.9
4)3.
42(−
2.30
,9.1
3)2.
07(−
3.75
,7.8
9)−
1.97
(−7.
49,3
.54)
1.53
(−2.
97,6
.03)
0.71
(−3.
78,5
.20)
1.29
(−3.
23,5
.81)
5.03
(0.1
4,9.
93)2
−0.
27(−
4.76
,4.2
2)In
sulin
,μU/
mL
−0.
16(−
0.66
,0.3
5)0.
16(−
0.33
,0.6
6)−
0.49
(−1.
00,0
.02)
−0.
18(−
0.70
,0.3
4)0.
06(−
0.43
,0.5
5)−
0.25
(−0.
65,0
.14)
−0.
37(−
0.76
,0.0
2)0.
19(−
0.20
,0.5
9)−
0.11
(−0.
49,0
.28)
−0.
45(−
0.84
,−0.
06)2
Gluc
ose,
mg/
dL−
0.41
(−1.
84,1
.01)
−0.
59(−
1.98
,0.8
0)0.
15(−
1.28
,1.5
9)−
0.84
(−2.
31,0
.62)
0.43
(−0.
96,1
.81)
0.51
(−0.
82,1
.83)
0.12
(−1.
20,1
.44)
0.62
(−0.
72,1
.95)
−0.
56(−
2.0,
0.88
)0.
08(−
1.24
,1.4
0)
Valu
esar
ech
ange
[β(9
5%C
I)]pe
r1
SD
ofth
edi
etqu
ality
scor
esad
just
edby
age,
area
ofre
side
nce
(urb
an/ru
ral),
and
SE
S.1A
HE
I-201
0,A
ltern
ate
Hea
lthy
Eat
ing
Inde
x-20
10;G
DQ
S,G
loba
lDie
tQ
ualit
yS
core
;GD
QS+,
Glo
balD
iet
Qua
lity
Sco
repo
sitiv
esu
bmet
ric;G
DQ
S−,
Glo
balD
iet
Qua
lity
Sco
rene
gativ
esu
bmet
ric;M
DD
-W,M
inim
umD
ieta
ryD
iver
sity
for
Wom
en;M
etS,
met
abol
icsy
ndro
me;
SE
S,so
cioe
cono
mic
stat
us.
2t-T
est
Pva
lue
<0.
05.O
rigin
alto
this
man
uscr
ipt.
folate when assessing diet using a 24-h recall compared withan FFQ (36). This could be explained because the 24-h recall isbetter suited to reflect nutrient intake for its ability to capturea wide range of foods and get more precise quantity estimates,whereas the FFQ is limited by the amount of food items includedin the instrument.
The positive associations observed between the MDD-W andserum cholesterol, HDL cholesterol, and LDL cholesterol in the24-h recall data set could be explained because, as an indicatorof dietary diversity, the MDD-W might reflect an increasedintake of unhealthy foods as well as healthy foods, which is alsoconsistent with its positive correlation with the intake of totalfat and SFA (although only statistically significant in the FFQdata). The AHEI-2010 showed a stronger correlation than theGDQS with the intake of fiber and all types of fat but had a lowor inverse correlation with the intake of micronutrients and wasassociated with fewer health parameters than the GDQS.
In the evaluation of interaction by age groups, we founda significant association between the GDQS and BMI, WC,serum HDL cholesterol, and total cholesterol only amongolder women. In the same way, the AHEI-2010 was inverselyassociated with BMI and WC only among women aged 30 y andabove. Studies that have evaluated the influence of age on theresponse of blood lipids and body weight to dietary exposuresshow mixed results, with very few focused on the differencesamong women of reproductive age (37–42). However, somestudies have found a stronger effect of dietary interventions onplasma cholesterol, LDL cholesterol, and on weight loss amongolder compared with younger individuals (40–42), which couldbe explained by the age-related deterioration of the biologicalmechanisms that help mitigate the deleterious effects of diet,particularly on lipid metabolism (40, 43).
The overall performance of the GDQS to measure bothdimensions of diet quality was better than the performanceof the GDQS+ and GDQS– submetrics. The correlation ofthe submetrics with nutrient intake was generally weakercompared with the GDQS and both were associated with fewerhealth parameters. Interestingly, the GDQS− showed a strongercorrelation than the GDQS+ with overall nutrient adequacy,vitamin B-12, and zinc using 24-h recall data and with calciumin both data sets. This could be explained because the highfat dairy and red meat groups in the GDQS– are scored ina nonlinear way, increasing its score as intake increases andreceiving low scores only with very high or very low intakes.In the case of high fat dairy, <2% of women consume very highintakes (data not shown) and therefore, this group would be forthe most part positively correlated with the intake of nutrientsprovided by this food group. These results also highlight therole of these food groups to contribute to micronutrient intakein women from resource-limited countries such as Mexico.
The mean values for the GDQS+ and the GDQS−submetrics were higher among older women compared withtheir younger counterparts, following a pattern that wasconsistent across data sets for all evaluated metrics. TheGDQS− and the AHEI-2010 were distributed in the same wayacross urban/rural area and SES. In contrast, the distributionof the GDQS+ among subpopulations differed across dietaryinstruments, following the same pattern as the MDD-W onlyfor the FFQ data. Even though the distribution of the GDQSsubmetrics across subpopulations showed similarities to theAHEI-2010 and the MDD-W that are consistent with theirintended purpose to reflect each aspect of dietary quality,the submetrics offered the advantage of providing usefulinformation for the characterization of the intake of healthy
148S Supplement
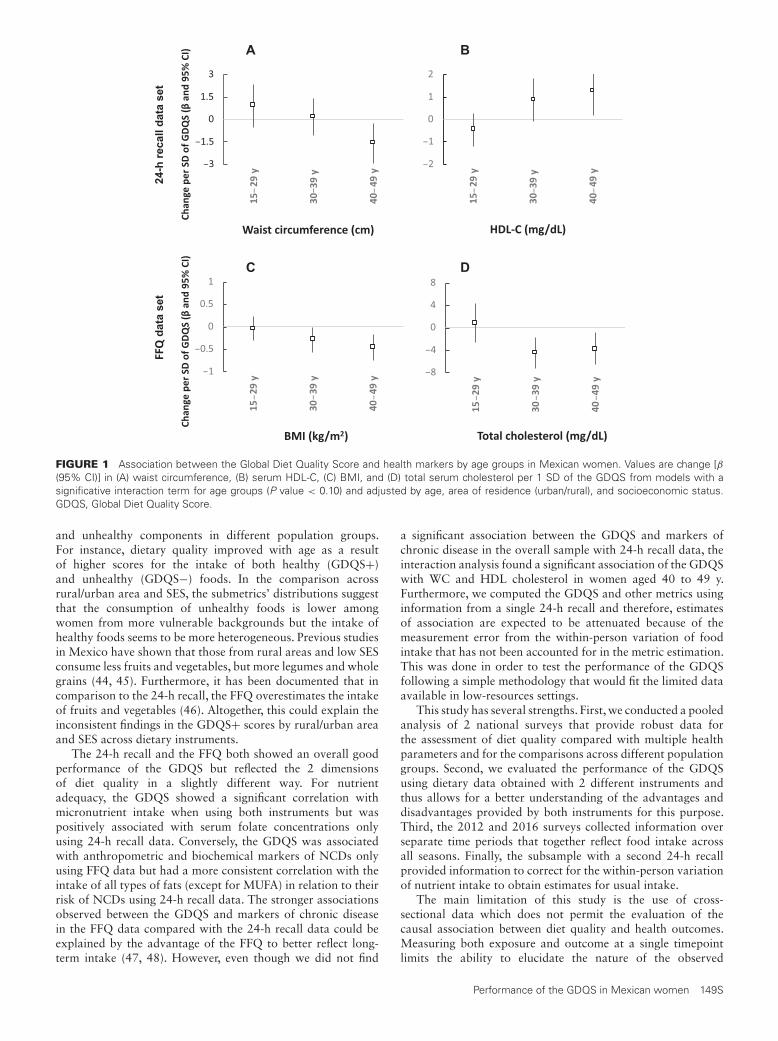
BA
DC
data
set
24-h
reca
ll da
ta s
et
FIGURE 1 Association between the Global Diet Quality Score and health markers by age groups in Mexican women. Values are change [β(95% CI)] in (A) waist circumference, (B) serum HDL-C, (C) BMI, and (D) total serum cholesterol per 1 SD of the GDQS from models with asignificative interaction term for age groups (P value < 0.10) and adjusted by age, area of residence (urban/rural), and socioeconomic status.GDQS, Global Diet Quality Score.
and unhealthy components in different population groups.For instance, dietary quality improved with age as a resultof higher scores for the intake of both healthy (GDQS+)and unhealthy (GDQS−) foods. In the comparison acrossrural/urban area and SES, the submetrics’ distributions suggestthat the consumption of unhealthy foods is lower amongwomen from more vulnerable backgrounds but the intake ofhealthy foods seems to be more heterogeneous. Previous studiesin Mexico have shown that those from rural areas and low SESconsume less fruits and vegetables, but more legumes and wholegrains (44, 45). Furthermore, it has been documented that incomparison to the 24-h recall, the FFQ overestimates the intakeof fruits and vegetables (46). Altogether, this could explain theinconsistent findings in the GDQS+ scores by rural/urban areaand SES across dietary instruments.
The 24-h recall and the FFQ both showed an overall goodperformance of the GDQS but reflected the 2 dimensionsof diet quality in a slightly different way. For nutrientadequacy, the GDQS showed a significant correlation withmicronutrient intake when using both instruments but waspositively associated with serum folate concentrations onlyusing 24-h recall data. Conversely, the GDQS was associatedwith anthropometric and biochemical markers of NCDs onlyusing FFQ data but had a more consistent correlation with theintake of all types of fats (except for MUFA) in relation to theirrisk of NCDs using 24-h recall data. The stronger associationsobserved between the GDQS and markers of chronic diseasein the FFQ data compared with the 24-h recall data could beexplained by the advantage of the FFQ to better reflect long-term intake (47, 48). However, even though we did not find
a significant association between the GDQS and markers ofchronic disease in the overall sample with 24-h recall data, theinteraction analysis found a significant association of the GDQSwith WC and HDL cholesterol in women aged 40 to 49 y.Furthermore, we computed the GDQS and other metrics usinginformation from a single 24-h recall and therefore, estimatesof association are expected to be attenuated because of themeasurement error from the within-person variation of foodintake that has not been accounted for in the metric estimation.This was done in order to test the performance of the GDQSfollowing a simple methodology that would fit the limited dataavailable in low-resources settings.
This study has several strengths. First, we conducted a pooledanalysis of 2 national surveys that provide robust data forthe assessment of diet quality compared with multiple healthparameters and for the comparisons across different populationgroups. Second, we evaluated the performance of the GDQSusing dietary data obtained with 2 different instruments andthus allows for a better understanding of the advantages anddisadvantages provided by both instruments for this purpose.Third, the 2012 and 2016 surveys collected information overseparate time periods that together reflect food intake acrossall seasons. Finally, the subsample with a second 24-h recallprovided information to correct for the within-person variationof nutrient intake to obtain estimates for usual intake.
The main limitation of this study is the use of cross-sectional data which does not permit the evaluation of thecausal association between diet quality and health outcomes.Measuring both exposure and outcome at a single timepointlimits the ability to elucidate the nature of the observed
Performance of the GDQS in Mexican women 149S

association, including the possibility of reverse causality. Thiscould be partially mitigated by the use of an instrument suchas the FFQ. Moreover, self-reported intake is susceptible tomeasurement error and it is well known that energy intakeis differentially misreported according to factors such as BMIand education (49–52). Mexico is a country with a highburden of obesity (4), a factor known to be associated withunderreporting energy intake; making dietary data obtainedfrom our population more prone to error than others.Nevertheless, a clear association was observed between the dietquality metrics with nutrient intake and health outcomes thatis consistent with what we expected given the characteristics ofeach metric. It is important to note that we have evaluated theperformance of the GDQS using data collected with validatedinstruments that collect detailed information and may notreflect the performance of the GDQS when using the GDQSapp, which was designed to provide a low-cost and easy-to-usealternative when more robust instruments are not available butmay also provide less precise estimates, although this shouldbe evaluated first. Lastly, results presented here are limited toNPNL women of reproductive age and therefore, it is unclear ifour findings would be applicable to other demographic groups.
In conclusion, the GDQS was associated with the intake ofkey nutrients and with health parameters related to the risk ofchronic disease in Mexican women of reproductive age. TheGDQS is a simple metric that is easy to tabulate and does notrequire a high input of data, such as food composition tables.In Mexican NPNL women of reproductive age it was robustenough to reflect the 2 main dimensions of diet quality that areusually evaluated separately, with a performance comparable tothe MDD-W to evaluate nutrient adequacy and to the AHEI-2010 to reflect risk of chronic disease when using dietarydata collected with a 24-h recall or a past-week FFQ. Bothinstruments for data collection were useful to evaluate theperformance of the GDQS, but the 24-h recall seems to bemore appropriate for population-level descriptive studies for itsability to capture absolute nutrient intake, whereas the FFQmay be more appropriate for analytical studies that prioritizethe evaluation of long-term intake. The submetrics derived fromthe GDQS (GDQS+ and GDQS–) had an overall performanceinferior to the GDQS but were helpful for the characterizationacross subpopulations of the intake of healthy and unhealthydietary components in relation to overall dietary quality, whichcan provide useful information for targeting interventions.Further evaluations should include the evaluation of the GDQSin other demographic groups and the use of longitudinal datato reduce the risk of bias and provide a better understanding ofthe nature of these associations.
Acknowledgments
The authors’ contributions were as follows—AC-G, WW, CB,SNB, TTF, YL, SB, and MD: designed the research; SR-R: provided essential materials; AC-G: analyzed data; CB:provided technical guidance and supervised analyses; AC-G andCB: wrote the manuscript; all authors: revised and providedsubstantial feedback to the manuscript; AC-G and CB: hadprimary responsibility for final content; and all authors: readand approved the final manuscript.
References1. GBD 2017 Diet Collaborators. Health effects of dietary risks in 195
countries, 1990–2017: a systematic analysis for the Global Burdenof Disease Study 2017. Lancet North Am Ed 2019;393(10184):1958–72.
2. Popkin BM, Corvalan C, Grummer-Strawn LM. Dynamics of the doubleburden of malnutrition and the changing nutrition reality. Lancet NorthAm Ed 2020;395(10217):65–74.
3. Rivera JA, Barquera S, González-Cossío T, Olaiz G, Sepúlveda J.Nutrition transition in Mexico and in other Latin American countries.Nutr Rev 2004;62(7 Pt 2):S149–57.
4. Instituto Nacional de Salud Pública. Encuesta Nacional de Salud yNutrición de Medio Camino 2016. Informe de resultados. México;2016, p. 46, 68–72.
5. Rojas-Martínez R, Basto-Abreu A, Aguilar-Salinas CA, Zárate-RojasE, Villalpando S, Barrientos-Gutiérrez T. Prevalencia de diabetespor diagnóstico médico previo en México [Prevalence of previouslydiagnosed diabetes mellitus in Mexico]. Salud Pública de México2018;60:224–32.
6. Campos-Nonato I, Hernández-Barrera L, Pedroza-Tobías A, Medina C,Barquera S. Hipertensión arterial en adultos mexicanos: prevalencia,diagnóstico y tipo de tratamiento. Ensanut MC 2016 [Hypertension inMexican adults: prevalence, diagnosis and type of treatment. EnsanutMC 2016]. Salud Pública de México 2018;60:233–43.
7. Ramírez-Silva I, Rodríguez-Ramírez S, Barragán-Vázquez S,Castellanos-Gutiérrez A, Reyes-García A, Martínez-Piña A, Pedroza-Tobías A. Prevalence of inadequate intake of vitamins and mineralsin the Mexican population correcting by nutrient retention factors,ENSANUT 2016. Salud Publica Mex 2020;62(5):521–31.
8. Arimond M, Deitchler M. Measuring diet quality for women ofreproductive age in low- and middle-income countries: towards newmetrics for changing diets. Washington (DC): Intake – Center forDietary Assessment/FHI 360; 2019.
9. Kipnis V, Subar AF, Midthune D, Freedman LS, Ballard-Barbash R,Troiano RP, Bingham S, Schoeller DA, Schatzkin A, Carroll RJ. Structureof dietary measurement error: results of the OPEN biomarker study. AmJ Epidemiol 2003;158(1):14–21.
10. Burrows TL, Ho YY, Rollo ME, Collins CE. Validity of dietaryassessment methods when compared to the method of doubly labeledwater: a systematic review in adults. Frontiers in Endocrinology2019;10:850.
11. Naska A, Lagiou A, Lagiou P. Dietary assessment methods inepidemiological research: current state of the art and future prospects.F1000Research 2017;6:926.
12. Moursi M, Deitchler M, Bromage S, Fung TT, Isanaka S, Matsuzaki M,Batis C, Castellanos-Gutiérrez A, Angulo E, Birk N, et al. There’s anapp for that: development of a mobile application to operationalize theGlobal Diet Quality Score. J Nutr 2021;151(Suppl 10):176S–84S.
13. Chiuve SE, Fung TT, Rimm EB, Hu FB, McCullough ML, Wang M,Stampfer MJ, Willett WC. Alternative dietary indices both stronglypredict risk of chronic disease. J Nutr 2012;142(6):1009–18.
14. Women’s Dietary Diversity Project (WDDP) Study Group. Developmentof a dichotomous indicator for population-level assessment of dietarydiversity in women of reproductive age. Curr Dev Nutr 2017;1(12).PMID: 29955691; PMCID: PMC5998796.
15. López-Olmedo N, Carriquiry AL, Rodríguez-Ramírez S, Ramírez-SilvaI, Espinosa-Montero J, Hernández-Barrera L, Campirano F, Martínez-Tapia B, Rivera JA. Usual intake of added sugars and saturated fatsis high while dietary fiber is low in the Mexican population. J Nutr2016;146(9):1856S–65S.
16. Bromage S, Batis C, Bhupathiraju SN, Fawzi WF, Fung TT,Li Y, Deitchler M, Angulo E, Birk N, Castellanos-GutiérrezA, et al. Development and validation of a novel food-basedGlobal Diet Quality Score (GDQS). J Nutr 2021;151(Suppl 10):75S–92S.
17. Lohman TG, Roche AF, Martorell R. Anthropometric standardizationreference manual. Champaign (IL): Human Kinetics Publishers; 1988.
18. Habicht JP. [Standardization of quantitative epidemiological methodsin the field]. Bol Oficina Sanit Panam 1974;76(5):375–84.
19. World Health Organization. Iron deficiency anemia. Assessment,prevention and control. A guide for program managers. Geneva(Switzerland): WHO; 2001.
20. Friedewald WT, Levy RI, Fredrickson DS. Estimation of theconcentration of low-density lipoprotein cholesterol in plasma, withoutuse of the preparative ultracentrifuge. Clin Chem 1972;18(6):499–502.
21. National Cholesterol Education Program (NCEP). Expert Panel onDetection, Evaluation, and Treatment of High Blood Cholesterol in
150S Supplement

Adults (Adult Treatment Panel III). Third Report of the NationalCholesterol Education Program (NCEP) Expert Panel on Detection,Evaluation, and Treatment of High Blood Cholesterol in Adults (AdultTreatment Panel III) final report. Circulation 2002;106(25):3143–421.
22. Instituto Nacional de Salud Pública. Bases de datos del valor nutritivode los alimentos. Compilación del Instituto Nacional de Salud Pública.Cuernavaca (México): Instituto Nacional de Salud Pública; 2012.
23. Sánchez-Pimienta TG, Batis C, Lutter CK, Rivera JA. Sugar-sweetenedbeverages are the main sources of added sugar intake in the Mexicanpopulation. J Nutr 2016;146(9):1888S–96S.
24. Nusser SM, Carriquiry A, Dodd KW, Fuller WA. A semiparametrictransformation approach to estimating usual daily intake distributions.J Am Statist Assoc 1996;91(436):1440.
25. Willett W, Stampfer MJ. Total energy intake: implications forepidemiologic analyses. Am J Epidemiol 1986;124(1):17–27.
26. Institute of Medicine. Dietary Reference Intakes. The essential guideto nutrient requirements. Washington (DC): National Academies Press;2006.
27. International Zinc Nutrition Consultative Group (IZiNCG), BrownKH, Rivera JA, Bhutta Z, Gibson RS, King JC, Lönnerdal B, RuelMT, Sandtröm B, Wasantwisut E, Hotz C. International Zinc NutritionConsultative Group (IZiNCG) technical document #1. Assessment ofthe risk of zinc deficiency in populations and options for its control.Food Nutr Bull 2004;25(1 Suppl 2):S99–203.
28. Institute of Medicine (US) Subcommittee on Interpretation and Usesof Dietary Reference Intakes; Institute of Medicine (US) StandingCommittee on the Scientific Evaluation of Dietary Reference Intakes.DRI Dietary Reference Intakes: applications in dietary assessment.Washington (DC): National Academies Press (US); 2000.
29. Allen LH. Multiple micronutrients in pregnancy and lactation: anoverview. Am J Clin Nutr 2005;81(5):1206S–12S.
30. Popkin BM, Hawkes C. Sweetening of the global diet, particularlybeverages: patterns, trends, and policy responses. The Lancet Diabetes& Endocrinology 2016;4(2):174–86.
31. Mattiuzzi C, Sanchis-Gomar F, Lippi G. Worldwide burden ofLDL cholesterol: implications in cardiovascular disease. Nutr MetabCardiovasc Dis 2020;30(2):241–4.
32. Xu H, Cupples LA, Stokes A, Liu CT. Association of obesity withmortality over 24 years of weight history: findings from the FraminghamHeart Study. JAMA Network Open 2018 Nov 2;1(7):e184587. Erratumin: JAMA Netw Open. 7 Dec, 2018;1(8):e186657.
33. Park Y, Dodd KW, Kipnis V, Thompson FE, Potischman N,Schoeller DA, Baer DJ, Midthune D, Troiano RP, Bowles H,Subar AF. Comparison of self-reported dietary intakes from theAutomated Self-Administered 24-h recall, 4-d food records, and food-frequency questionnaires against recovery biomarkers. Am J Clin Nutr2018;107(1):80–93.
34. Brämswig S, Prinz-Langenohl R, Lamers Y, Tobolski O, WintergerstE, Berthold HK, Pietrzik K. Supplementation with a multivitamincontaining 800 microg of folic acid shortens the time to reach thepreventive red blood cell folate concentration in healthy women. IntJ Vitam Nutr Res 2009;79(2):61–70.
35. Truswell A, Kounnavong S. Quantitative responses of serum folate toincreasing intakes of folic acid in healthy women. Eur J Clin Nutr1997;51(12):839–45.
36. Park JY, Vollset SE, Melse-Boonstra A, Chajès V, Ueland PM,Slimani N. Dietary intake and biological measurement of folate: aqualitative review of validation studies. Mol Nutr Food Res 2013;57(4):562–81.
37. Jin H, Nicodemus-Johnson J. Gender and age stratified analysesof nutrient and dietary pattern associations with circulating lipidlevels identify novel gender and age-specific correlations. Nutrients2018;10(11):1760.
38. Wu L, Ma D, Walton-Moss B, He Z. Effects of low-fat diet on serumlipids in premenopausal and postmenopausal women: a meta-analysisof randomized controlled trials. Menopause 2014;21(1):89–99.
39. Liu FX, Flatt SW, Nichols JF, Pakiz B, Barkai HS, Wing DR, HeathDD, Rock CL. Factors associated with visceral fat loss in response toa multifaceted weight loss intervention. Journal of Obesity & WeightLoss Therapy 2017;07(04):346.
40. Clifton PM, Nestel PJ. Influence of gender, body mass index, and age onresponse of plasma lipids to dietary fat plus cholesterol. Arteriosclerosisand Thrombosis: A Journal of Vascular Biology 1992;12(8):955–62.
41. Barnard ND, Levin SM, Yokoyama Y. A systematic review and meta-analysis of changes in body weight in clinical trials of vegetarian diets.Journal of the Academy of Nutrition and Dietetics 2015;115(6):954–69.
42. Mumford SL, Schisterman EF, Siega-Riz AM, Gaskins AJ, Wactawski-Wende J, VanderWeele TJ. Effect of dietary fiber intake on lipoproteincholesterol levels independent of estradiol in healthy premenopausalwomen. Am J Epidemiol 2011;173(2):145–56.
43. Uranga RM, Keller JN. Diet and age interactions with regards tocholesterol regulation and brain pathogenesis. Current Gerontology andGeriatrics Research 2010;2010:1.
44. Aburto TC, Pedraza LS, Sánchez-Pimienta TG, Batis C, Rivera JA.Discretionary foods have a high contribution and fruit, vegetables, andlegumes have a low contribution to the total energy intake of theMexican population. J Nutr 2016;146(9):1881S–7S.
45. Batis C, Aburto TC, Sánchez-Pimienta TG, Pedraza LS, Rivera JA.Adherence to dietary recommendations for food group intakes is lowin the Mexican population. J Nutr 2016;146(9):1897S–906S.
46. Denova-Gutiérrez E, Tucker KL, Salmerón J, Flores M, Barquera S.Relative validity of a food frequency questionnaire to identify dietarypatterns in an adult Mexican population. Salud Publica de Mexico2016;58(6):608–16.
47. Eck LH, Klesges RC, Hanson CL, Slawson D, Portis L, Lavasque ME.Measuring short-term dietary intake: development and testing of a 1-week food frequency questionnaire. J Am Diet Assoc 1991;91(8):940–5.
48. Eck LH, Klesges LM, Klesges RC. Precision and estimated accuracy oftwo short-term food frequency questionnaires compared with recallsand records. J Clin Epidemiol 1996;49(10):1195–200.
49. Freedman LS, Commins JM, Moler JE, Arab L, Baer DJ, Kipnis V,Midthune D, Moshfegh AJ, Neuhouser ML, Prentice RL, et al. Pooledresults from 5 validation studies of dietary self-report instruments usingrecovery biomarkers for energy and protein intake. Am J Epidemiol2014;180(2):172–88.
50. Tooze JA, Subar AF, Thompson FE, Troiano R, Schatzkin A, KipnisV. Psychosocial predictors of energy underreporting in a large doublylabeled water study. Am J Clin Nutr 2004;79(5):795–804.
51. Novotny JA, Rumpler WV, Riddick H, Hebert JR, Rhodes D, JuddJT, Baer DJ, McDowell M, Briefel R. Personality characteristics aspredictors of underreporting of energy intake on 24-hour dietary recallinterviews. J Am Diet Assoc 2003;103(9):1146–51.
52. Hébert JR, Peterson KE, Hurley TG, Stoddard AM, Cohen N, FieldAE, Sorensen G. The effect of social desirability trait on self-reporteddietary measures among multi-ethnic female health center employees.Ann Epidemiol 2001;11(6):417–27.
Performance of the GDQS in Mexican women 151S

The Journal of NutritionSupplement
Changes in the Global Diet Quality Score,Weight, and Waist Circumference in MexicanWomenErick Angulo,1 Dalia Stern,2 Analí Castellanos-Gutiérrez,1 Adriana Monge,3 Martín Lajous,3,4
Sabri Bromage,5 Teresa T Fung,5 Yanping Li,5 Shilpa N Bhupathiraju,5 Megan Deitchler,6 Walter C Willett,5
and Carolina Batis7
1Health and Nutrition Research Center, National Institute of Public Health, Cuernavaca, Mexico; 2CONACYT—Center for Research onPopulation Health, National Institute of Public Health, Cuernavaca, Mexico; 3Center for Research on Population Health, NationalInstitute of Public Health, Cuernavaca, Mexico; 4Department of Global Health and Population, Harvard TH Chan School of PublicHealth, Boston, MA, USA; 5Department of Nutrition, Harvard TH Chan School of Public Health , Boston, MA, USA; 6Intake—Center forDietary Assessment, FHI Solutions, Washington, DC, USA; and 7CONACYT—Health and Nutrition Research Center, National Institute ofPublic Health, Cuernavaca, Mexico
ABSTRACTBackground: Evidence on concurrent changes in overall diet quality and weight and waist circumference in women of
reproductive age from low- and middle-income countries is limited.
Objectives: We examined the associations of changes in the Global Diet Quality Score (GDQS) and each GDQS food
group with concurrent weight and waist circumference change in Mexican women.
Methods: We followed prospectively 8967 nonpregnant nonlactating women aged 25–49 y in the Mexican Teachers’
Cohort between 2006 and 2008. We assessed diet using an FFQ of the previous year and anthropometric measures
were self-reported. Regression models were used to examine 2-y changes in the GDQS and each food group (servings/d)
with weight and waist circumference changes within the same period, adjusting for demographic and lifestyle factors.
Results: Compared with those with little change in the GDQS (−2 to 2 points), women with the largest increase in
the GDQS (>5 points) had less weight (β: −0.81 kg/2 y; 95% CI: −1.11, −0.51 kg/2 y) and waist circumference gain (β:
−1.05 cm/2 y; 95% CI: −1.62, −0.48 cm/2 y); likewise, women with the largest decrease in the GDQS (<−5 points) had
more weight (β: 0.36 kg/2 y; 95% CI: 0.06, 0.66 kg/2 y) and waist circumference gain (β: 0.71 cm/2 y; 95% CI: 0.09,
1.32 cm/2 y). Increased intake of dark green leafy vegetables, cruciferous vegetables, deep orange vegetables, citrus
fruits, and fish and shellfish was associated with less weight gain. In addition, deep orange vegetables, low fat and high
fat dairy, whole grains, and fish were associated with less waist circumference gain within the 2-y period.
Conclusions: Improvements in diet quality over a 2-y period reflected by an increase in the GDQS and changes in
consumption of specific components of the GDQS were associated with less weight and waist circumference gain in
Mexican women. J Nutr 2021;151:152S–161S.
Keywords: diet quality, diet quality metrics, dietary diversity, GDQS, weight change, waist circumference change,
Mexican women
IntroductionExcessive weight gain is an important determinant for thedevelopment of noncommunicable diseases (NCDs) such asdiabetes mellitus (1), cardiovascular diseases (2), and varioustypes of cancers (3). In Mexico, the prevalence of obesity inadults has increased from 25.1% in 2000 to 35.6% in 2018 andthe increase has been larger in women than in men (from 30.1%to 39.3% among women, and from 19.7% to 30.6% amongmen) (4). Several risk factors have been identified that contributeto the development of obesity. Evidence from epidemiologicalstudies has shown that the most important environmentalfactors that contribute to weight gain are poor diet quality,
physical inactivity, and an obesogenic built environment (5).Mexico has faced changes in dietary patterns, from a traditionaldiet characterized by maize foods, fruits, and vegetables to aWestern diet characterized by sugar-sweetened beverages (SSBs),white bread, fast food, sweets, and snacks (6–8). However,evidence in Mexico on the association between dietary qualityand weight or waist circumference change is still limited.
To assess diet quality in a population, a priori dietarypatterns or indices are commonly used (9). These metricsmeasure the adherence to specified dietary patterns or dietaryguidelines, or reflect the risk gradient for major diet-relatedchronic diseases (10). A number of longitudinal studies haveshown a favorable association between overall diet quality
C© The Author(s) 2021. Published by Oxford University Press on behalf of the American Society for Nutrition. This is an Open Access article distributed under theterms of the Creative Commons Attribution License (http://creativecommons.org/licenses/by/4.0/), which permits unrestricted reuse, distribution, and reproduction
in any medium, provided the original work is properly cited.Manuscript received March 6, 2021. Initial review completed April 28, 2021. Revision accepted May 6, 2021.
First published online October 1, 2021; doi: https://doi.org/10.1093/jn/nxab171.152S

and body weight. For instance, in the Nurses’ Health StudyII, an increase in the Alternate Healthy Eating Index-2010(AHEI-2010) was associated with less weight gain (11);likewise, women from Australia who improved their diet qualityaccording to the Australian Recommended Food Score (ARFS)gained significantly less weight (12). Until now, several dietquality indices have been developed, but overall they aredesigned for a particular geographic area or population and aparticular nutritional need (e.g., nutrient adequacy or chronicdiseases) (13). Furthermore, most diet quality metrics have beendeveloped for high-income countries (14).
Given the importance of diet quality as one of the largestthreats to global public health and the usefulness of diet qualitymetrics to capture this exposure, a global metric (inclusive oflow- and middle-income countries) capable of capturing dietaryrisk in relation to nutrient adequacy as well as chronic diseaseand body weight is needed. To fill this gap, the Global DietaryQuality Score (GDQS) is proposed. In this study, we focusedon 1 of the outcomes the GDQS aims to capture. Our aim wasto evaluate the association between the GDQS and weight andwaist circumference change in Mexican women of reproductiveage. To better understand the performance of the GDQS in ouroutcome of interest and in this population, we also evaluated theindependent association of each of the food groups included inthe GDQS. Finally, we compared the performance of the GDQSwith 2 other established dietary indices, the AHEI-2010 andMinimum Dietary Diversity for Women (MDD-W) indicator.
MethodsPopulationThe Mexican Teachers’ Cohort (MTC) is a prospective study of>115,000 female teachers aged 25 y or older. The cohort was initiatedin 2006 among women from 2 states (Jalisco and Veracruz) and in2008 these women completed their first follow-up; at the same time,the cohort was expanded to include women from 10 additional statesacross Mexico. The average enrollment rate was 64%, and the median
Funding for the research was provided by FHI Solutions, recipient of aBill & Melinda Gates Foundation grant to support Intake–Center for DietaryAssessment.Author disclosures: TTF is an Associate Editor for the Journal of Nutrition andplayed no role in the Journal’s evaluation of the manuscript. All other authorsreport no conflicts of interest.Supplemental Table 1 is available from the “Supplementary data” link in theonline posting of the article and from the same link in the online table of contentsat https://academic.oup.com/jn/.Published in a supplement to The Journal of Nutrition. Publication costs for thissupplement were funded by the Bill & Melinda Gates Foundation in conjunctionwith FHI Solutions, recipient of a Bill & Melinda Gates Foundation grant tosupport Intake—Center for Dietary Assessment. The opinions expressed in thispublication are those of the authors and are not attributable to the sponsorsor the publisher, Editor, or Editorial Board of The Journal of Nutrition. TheSupplement Coordinators for the supplement publication were Megan Deitchler,Intake—Center for Dietary Assessment at FHI Solutions, Washington, DC; andSabri Bromage, Harvard TH Chan School of Public Health, Boston, MA.The GDQS research initiative was launched by Intake – Center for DietaryAssessment. The research was led by Harvard T.H. Chan School of Public Health,Department of Nutrition and carried out in collaboration with researchers at theNational Public Health Institute (INSP), Mexico. Funding for the research wasprovided by FHI Solutions, recipient of a Bill & Melinda Gates Foundation grantto support Intake – Center for Dietary Assessment.Address correspondence to CB (e-mail: [email protected]).Abbreviations used: AHEI-2010, Alternative Healthy Eating Index-2010; ARFS,Australian Recommended Food Score; GDQS, Global Diet Quality Score;GDQS+, Global Diet Quality Score positive submetric; GDQS−, Global DietQuality Score negative submetric; MDD-W, Minimum Dietary Diversity forWomen; MET, metabolic equivalent task; MTC, Mexican Teachers’ Cohort;NCD, noncommunicable disease; SEP, socioeconomic position; SSB, sugar-sweetened beverage.
age at enrollment was 44 y (15). In each wave (2006, 2008, and2011), participants responded to questionnaires on sociodemographiccharacteristics, reproductive history, lifestyle, and medical conditions.A diet questionnaire was only included in 2006 and 2008, therefore forthis analysis we only included women from Jalisco and Veracruz thatparticipated in both 2006 and 2008. Of the 27,979 female teachers thatwere enrolled in 2006 from Veracruz and Jalisco, 19,130 completeda follow-up questionnaire in 2008. We included 13,419 women whoin both 2006 and 2008 were 49 y old or younger, not pregnant, andnot lactating; and who in 2006 did not report diabetes, cancer, or heartdisease. We excluded women with inadequate dietary information ineither 2006 or 2008 [energy intake <500 or >3500 kcal/d, missingresponse to ≥70 items on the dietary questionnaire, or any missing dataon the staple grains section (because of their important contribution toenergy intake); n = 3382]. We also excluded women with missing heightand/or weight (n = 1070), thus our analytical sample was 8967 womenin the weight change analysis. For waist circumference, 1379 womenhad missing values, thus our analytical sample was 7588 women in thewaist circumference change analysis.
Diet assessment and diet quality score computationDiet was measured using a 139-item semiquantitative FFQ derivedfrom a previously validated 116-item FFQ in Mexico City. Correlationcoefficients in the previous validation analysis for total energy,carbohydrate, protein, and total fat intakes between the FFQ and four4-d 24-h recalls were 0.52, 0.57, 0.32, and 0.63, respectively (16).Informed by National Nutrition Surveys, 23 food items were addedto the MTC FFQ to capture regional differences and secular changesin food consumption, and to include other foods such as low-calorieoptions and different food varieties (e.g., lean fish or fatty fish).
For each food item, women were asked to specify how often, onaverage, they had consumed a specified commonly used unit or portionsize of the food or beverage over the previous year. Ten multiple-choicefrequencies of consumption were possible: ≥6/d, 4–5/d, 2–3/d, 1/d, 5–6/wk, 2–4/wk, 1/wk, 2–3/mo, ≤1/mo, and never. We converted foodfrequency responses of each food item to servings per day and then tograms per day using specified portion sizes. Energy and nutrient intakeswere estimated using a food composition table derived from a databasedeveloped by the National Institute of Nutrition and Medical Sciencesin Mexico and the USDA nutrient database (17).
The GDQS is a food-based dietary quality score modified from thePrime Diet Quality Score (18) to assess nutrient adequacy and study theassociation between chronic diseases in a global context. The GDQSincludes 25 food groups in total: 16 healthy food groups (citrus fruits,deep orange fruits, other fruits, dark green leafy vegetables, cruciferousvegetables, deep orange vegetables, other vegetables, deep orange tubers,legumes, nuts and seeds, whole grains, liquid oils, fish and shellfish,poultry and game meat, low fat dairy, and eggs), 2 unhealthy groupswhen consumed in excess (high fat dairy and red meat), and 7 unhealthyfood groups (processed meat, refined grains and baked goods, sweetsand ice cream, SSBs, juice, white roots and tubers, and purchased deepfried foods) (19).
We classified 125 food items from the MTC FFQ into 23 foodgroups because the MTC FFQ does not ask for any food that couldbe included in the groups for liquid oils or deep orange tubers. All ofthese food groups include 3 categories of consumption quantity whichare used in the scoring of the metric, except for high fat dairy whichincludes 4 categories. For the healthy food groups, the higher the intakethe higher the score, whereas for unhealthy food groups, the lowerthe intake the higher the score. In the case of high fat dairy and redmeat, the score is amount-dependent (i.e., moderate consumption getsthe highest score) owing to the food’s potential contribution to nutrientintake at modest amounts of consumption, while also recognizing itspotential contribution to NCD risk associated with higher amounts ofconsumption. Two submetrics can be estimated from the GDQS. Thepositive submetric, the GDQS+, is obtained by summing only the pointvalues for healthy food groups, whereas the negative submetric, theGDQS−, is obtained by summing only the point values for unhealthyfood groups (red meat and high fat dairy included). The original GDQShas a range from 0 to 49, but in our study, the range was 0 to 46.5
Changes in the GDQS and anthropometric measures 153S

because of the 2 food groups that were not captured in our FFQ. We alsoestimated the servings per day of each food group included in the GDQSto evaluate their contribution to weight and waist circumference change.
We compared the performance of the GDQS with 2 other indices:the AHEI-2010 and the MDD-W. The AHEI-2010 includes foodsand nutrients that have been shown to lower or raise the risk ofmajor chronic disease (20). The AHEI-2010 awards points for higherconsumption of vegetables, fruits, whole grains, nuts and legumes, long-chain n–3 FAs, and n–6 polyunsaturated fat; for lower consumption ofSSBs and fruit juices, red/processed meat, sodium, and trans fat; and formoderate alcohol consumption. Each component has a range of 0–10points, with a maximum overall score of 110 points (11). The MDD-Wwas developed by the Food and Nutrition Technical Assistance Projectand the FAO of the UN. It is based on 10 food groups that predictedmicronutrient intake adequacy in women of reproductive age from low-income countries (21). The food groups included are grains, white roots,and tubers; legumes; nuts and seeds; dairy; meat, poultry, and fish; eggs;dark green leafy vegetables; vitamin A–rich fruits and vegetables; othervegetables; and other fruits. To compute the MDD-W score, we usedan intake of ≥1 serving/d as the cutoff to assign 1 point for each foodgroup, otherwise we gave a score of 0. The MDD-W total score rangesfrom 0 to 10 points (18).
Diet quality scores were computed for each individual in 2006 and2008. However, to calculate diet quality scores in 2006, we imputedthe egg consumption from 2008 to 2006, because this was not asked inthe 2006 FFQ. Evidence suggests that egg consumption does not changemuch over time (22).
Weight and waist circumference assessmentOn the 2006 and 2008 questionnaires, participants self-reportedheight (cm) and weight (kg) and were provided a plastic measuringtape and instructions to assess their waist circumference (cm). Aprevious study evaluated the reproducibility and validity of self-reported anthropometry in a subset of 3413 participants. Standardizedtechnician measurements were well correlated with self-reported weight(r = 0.92), height (r = 0.86), and waist circumference (r = 0.78) (23).We calculated changes in weight and waist circumference by subtractingself-reported measures in 2008 from those in 2006.
Assessment of covariatesThe 2006 and 2008 questionnaires included participant characteristicssuch as age, marital status, education, household assets, and typeof health insurance (public, private, and other); lifestyle habits suchas smoking status, alcohol consumption, and physical activity; andany recent physician-diagnosed disease. Physical activity was assessedthrough a self-report of the average hours spent each week over theprior year doing any of the following activities using 8 responsecategories ranging from 0 to >10 h/wk: walking, moderate physicalactivity at work, moderate recreational physical activity, vigorousphysical activity at work, and vigorous recreational physical activity.To quantify the intensity of physical activities, each specific activitywas assigned a metabolic equivalent task (MET) score based on acompendium of physical activities (24). Total physical activity wasdefined as the sum of specific MET-hours per week for each reportedactivity and we categorized it into tertiles (low, medium, and high).The correlation between this physical activity questionnaire and theInternational Physical Activity Questionnaire was 0.64 for moderateand vigorous physical activity (Pearson correlation coefficient: 0.64;95% CI: 0.54, 0.97; Intraclass correlation coefficient: 0.77; 95% CI:0.64, 0.86) (unpublished results).
We used the number of household assets, including car, telephone,cell phone, microwave, vacuum, computer, and internet, to create asocioeconomic position (SEP) score (25) and categorized it into tertiles(lowest, medium, and highest).
Statistical analysisChanges in diet quality scores (GDQS, GDQS+, GDQS−, AHEI-2010,and MDD-W), food groups, weight, and waist circumference werecalculated by subtracting 2008 values from 2006 values. Participants
with changes <1st percentile or >99th percentile of the distributionwere assigned the value at the 1st or 99th percentile, accordingly, tominimize the influence of extreme values. Participants with missing datain categorical covariates were assigned into a missing category and werenot excluded from the analysis; this was the case for 2% of the samplefor health insurance, 5% for alcohol drinking, 6% for smoking, and12% for education.
We categorized 2-y changes in GDQS as largest decrease (<−5points), small decrease (−5 to <−2 points), little change (−2 to 2points), small increase (>2 to 5 points), and largest increase (>5 points).These cutoffs were chosen because these were close to the quintiles’cutoffs, but are easier to compare across populations and studies; forinstance, these cutoffs were also used in the Nurses’ Health Study(26). We estimated means and proportions of the GDQS, weight, waistcircumference, and covariates by the categorical change in GDQS.We ran linear regression models to examine the associations betweencategorical 2-y change in the GDQS and continuous 2-y change ofweight and waist circumference. Our reference group was little change(−2 to 2 points) in the GDQS. Similarly, we ran linear regression modelsto examine the association between change in the GDQS+ and GDQS−submetrics, which were categorized in quintiles using quintile 3 (littlechange) as the reference group. In this case, we used the exact cutoffs ofthe quintiles because the distribution was very specific to our populationand to each submetric. A test for linear trend across categories wasperformed by assigning the median value to each category and modelingit as a single continuous variable. We also explored the linear associationbetween change in consumption of each food group of the GDQS(servings/d) and 2-y change in weight and waist circumference using alinear regression model, where all food groups were mutually adjusted.
To compare the performance of the GDQS with the AHEI-2010and the MDD-W, we examined the association with weight and waistcircumference change per 1-SD increase in each diet quality index overthe 2-y period. We modeled a 1-SD increase in each diet quality indicatorat a time, and in a model with the GDQS plus each of the otherdiet quality indicators in the same regression model to test for thedifference in weight and waist circumference change between the 2 dietquality scores with the Wald test. Finally, given the large prevalenceof overweight and obesity and to understand if our results differedby baseline BMI we tested the interaction between changes in dietquality indices as continuous variables and baseline BMI (in kg/m2; <25compared with ≥25), with changes in weight and waist circumferenceas the dependent variables.
All models were adjusted for the following potential confounders:baseline age (continuous), state (Jalisco, Veracruz), change in energyintake (continuous), baseline GDQS (continuous), 2006 and 2008physical activity (tertiles: low, middle, high; we were unable to calculatechanges in recreational physical activity because of differences in the2006 assessment compared with the 2008 assessment), baseline maritalstatus (single, living together, married, separated, widow), baselineeducation (none, high school or less, undergraduate degree, graduatedegree or above), baseline household assets (tertiles: lowest, medium,highest), and health insurance (public, private, other). We also adjustedfor baseline BMI (<25, 25–30, and ≥30) because it can be associatedwith changes in both weight and diet quality (e.g., women withoverweight or obesity may have improved their diet as a treatmentof weight loss at the initial stage). We also adjusted for change insmoking status [baseline past smoker, starters (change from never orformer to current smoker), quitters (change from current to formersmoker), nonsmokers (stayed former or never smoker), smokers (stayedsmoker)] and change in alcohol drinking [baseline nondrinker, starters(change from nondrinker to drinker), quitters (change from drinkerto nondrinker), nondrinkers (stayed nondrinker), drinkers (stayeddrinker)]. All analyses were conducted using SAS version 7.1 (SASInstitute).
ResultsThe mean ± SD age at baseline was 41.4 ± 3.1 y, the mean ± SDBMI was 26.8 ± 4.3, and 63% of the sample was overweight
154S Supplement
or obese. Mean ± SD weight and waist circumference changeover 2 y of follow-up was 1.1 ± 4.0 kg and 0.99 ± 7.1 cm,respectively. Mean ± SD GDQS change was an increase of0.18 ± 4.0 points. The proportion of teachers who weresmokers and alcohol drinkers in 2006 and stayed as such in2008 was 5.7% and 53.4%, respectively (data not shown).Compared with women with the largest decrease in GDQS,women with the largest increase in GDQS were more likelyto be obese and less likely to be in the highest SEP andphysical activity categories at baseline and were more likely toremain nonsmokers and nondrinkers in 2008. The GDQS waspositively associated with energy intake; for instance, womenwith higher GDQS at baseline had higher energy intake, andwomen with the largest increase in GDQS also had an increasein energy intake. Therefore, subsequent analyses were adjustedfor energy intake (Table 1).
After adjusting for potential confounders, compared withwomen with little change in their GDQS, women with thelargest increase in their GDQS had less weight gain (β:−0.81 kg/2 y; 95% CI: −1.11, −0.51 kg/2 y), whereas womenwith the largest decrease in their GDQS had more weight gain(β: 0.50 kg/2 y; 95% CI: 0.19, 0.81 kg/2 y) within the 2-y period. Likewise, we observed an association between anincrease in GDQS and waist circumference change. Comparedwith women with little change in their GDQS, those withthe largest increase had less waist circumference gain (β:−1.05 cm/2 y; 95% CI: −1.62, −0.48 cm/2 y) and those withthe largest decrease had more waist circumference gain (β:0.71 cm/2 y; 95% CI: 0.09, 1.32 cm/2 y) within the 2-y period(Table 2).
We examined the associations between change in the GDQSsubmetric scores and weight and waist circumference change.Compared with women with little change, the largest increase inGDQS+ score was associated with less weight (β: −0.52 kg/2 y;95% CI: −0.79, −0.24 kg/2 y) and waist circumference (β:−0.79 cm/2 y; 95% CI: −1.32, −0.27 cm/2 y) gain, whereasthe largest decrease in the GDQS+ was not associated withweight and waist circumference change. Furthermore, thelargest decrease in GDQS− score was associated with moreweight (β: 0.36 kg/2 y; 95% CI: 0.10, 0.62 kg/2 y) and waistcircumference (β: 0.98 cm/2 y; 95% CI: 0.47, 1.48 cm/2 y) gain,whereas the largest increase in the GDQS− was not associatedwith weight and waist circumference change within the 2-yperiod (Table 2).
With regards to the healthy and unhealthy food groupsincluded in the GDQS, a 1-serving increase per day of healthyfoods was inversely associated with weight gain for citrus fruits(−0.13 kg), dark green leafy vegetables (−0.21 kg), cruciferousvegetables (−0.61 kg), deep orange vegetables (−0.33 kg), andfish and shellfish (−0.71 kg) (P < 0.05). A 1-serving increase perday of unhealthy foods was positively associated with weightgain for red meat (0.40 kg), refined grains (0.08 kg), SSBs(0.18 kg), and purchased deep fried foods (0.80 kg) (P < 0.05)(Figure 1A). In the case of waist circumference, we foundinverse associations with increased consumption of deep orangevegetables (−0.83 cm), fish and shellfish (−1.05 cm), wholegrains (−0.38 cm), and low fat dairy (−0.28 cm), and positiveassociations with sweets and ice cream (0.23 cm) and purchaseddeep fried foods (1.14 cm) (P < 0.05) (Figure 1B).
When comparing the strength of association with weightand waist circumference change of the GDQS, the AHEI-2010,and the MDD-W (unadjusted by each other), we found that 1-SD increases in all 3 scores were associated with less weightgain (GDQS: β: −0.37 kg/2 y; 95% CI: −0.47, −0.27 kg/2 y;
AHEI-2010: β: −0.33 kg/2 y; 95% CI: −0.44, −0.22 kg/2 y;MDD-W: β: −0.26 kg/2 y; 95% CI: −0.37, −0.14 kg/2 y)and waist circumference gain (GDQS: β: −0.52 cm/2 y; 95%CI: −0.71, −0.33 cm/2 y; AHEI-2010: β: −0.24 cm/2 y; 95%CI: −0.45, −0.03 cm/2 y; MDD-W: −0.42 cm/2 y; 95% CI:−0.63, −0.20 cm/2 y). When adjusting by each other theGDQS and AHEI-2010 were significantly associated with lessweight, whereas the MDD-W was not associated. For waistcircumference gain, only the GDQS was significantly associated.Comparing the strength of the coefficients, the GDQS andMDD-W coefficients were statistically significantly different(Wald test P = 0.008) for weight gain and the GDQS andAHEI-2010 (Wald test P = 0.006) for waist circumference(Table 3).
We also tested if there was an interaction between the dietquality indices (GDQS, AHEI-2010, and MDD-W) and baselineBMI on weight and waist circumference change. The onlystatistically significant interaction was with the GDQS in theweight change model. A 1-SD increase in GDQS was associatedwith −0.46 kg weight change among women with BMI ≥25 andwith −0.21 kg weight change among women with BMI <25 (P-interaction = 0.004) (Supplemental Table 1).
Discussion
In this longitudinal analysis of nonpregnant, nonlactatingwomen of reproductive age, we found that participants whohad the largest increase in GDQS gained less weight andwaist circumference over a 2-y period. Likewise, women withthe largest decrease in GDQS gained more weight and waistcircumference than did women who had little change in theirGDQS within a 2-y period. In addition, we observed that theGDQS had a stronger association than the MDD-W with weightgain, and a stronger association than the AHEI-2010 with waistcircumference gain.
Previous studies evaluating the association between dietaryquality indices and weight change reported results that areconsistent with our findings. A systematic review that included16 longitudinal studies showed that improvement in dietquality was associated with less weight gain; however, mostof the studies were from high-income countries (27). Besides,Australian women participating in a randomized controlled trialwho improved the Dietary Guideline Index in the interventiongroup had less weight gain than the control group (28).Longitudinal studies in women have found associations withless weight gain for the Alternate Mediterranean Diet, AHEI-2010, and Dietary Approaches to Stop Hypertension (in theUnited States) and for the ARFS (in Australia) (11, 12).Although we cannot compare between diet quality indicesbecause of the differences in their components or cutoffs,adherence to a healthy dietary pattern was associated with lessweight gain in these different populations.
We found an inverse association between change in theGDQS and waist circumference change. Few previous studieshave assessed the relation between overall diet quality and waistcircumference in women, and these did not find an association(29–32). These null results could be explained by the cross-sectional design or the assessment of diet only at baseline inlongitudinal analysis, or by the use of a single 24-h recall, whichdoes not capture usual intake.
We found that multiple GDQS food groups were indepen-dently associated with weight change. For example, an increasein 1 serving/d of citrus fruits, dark green leafy vegetables,
Changes in the GDQS and anthropometric measures 155S

TABLE 1 Sample characteristics by change in GDQS: Mexican Teachers’ Cohort, 2006–20081
Largest decrease(<−5) (n = 865)
Small decrease (−5to <−2) (n = 1709)
Little change (−2 to2) (n = 3661)
Small increase (>2to 5) (n = 1722)
Largest increase(>5) (n = 1010)
Age, baseline, y 41.4 ± 3.1 41.3 ± 3.1 41.4 ± 3.2 41.3 ± 3.1 41.2 ± 3.2GDQS, baseline 26.7 ± 3.7 24.9 ± 3.9 22.9 ± 4.0 21.1 ± 3.8 18.9 ± 3.8GDQS, 2-y change − 7.0 ± 1.3 − 3.5 ± 0.8 0.0 ± 1.2 3.5 ± 0.8 7.1 ± 1.6Weight, baseline, kg 65.8 ± 11.3 66.2 ± 11.5 66.2 ± 11.6 66.5 ± 12.0 66.7 ± 11.6Weight, 2-y change, kg 1.5 ± 4.2 1.4 ± 3.9 1.2 ± 4.0 0.8 ± 4.1 0.5 ± 4.1WC, baseline, cm 85.4 ± 11.0 86.2 ± 10.5 86.0 ± 10.3 86.5 ± 10.4 87.3 ± 10.7WC, 2-y change, cm 1.5 ± 7.4 1.3 ± 7.2 1.1 ± 6.9 0.5 ± 7.2 0.2 ± 7.2Energy intake, baseline, kcal 2038 ± 630 1915 ± 620 1837 ± 639 1739 ± 607 1647 ± 619Energy intake, 2-y change, kcal − 402 ± 676 − 206 ± 609 − 60 ± 583 86 ± 591 288 ± 664Baseline BMI, kg/m2
<25 38.6 38.3 37.2 36.7 34.5≥25 61.3 62.0 62.6 63.2 65.3
SmokingBaseline past smoker 15.0 13.5 12.2 12.1 11.9Starter 3.8 1.8 2.4 2.4 2.8Quitter 1.9 1.8 2.0 1.8 2.1Stayed smoker 6.7 5.5 5.7 5.7 4.9Stayed nonsmoker 72.3 77.2 77.5 77.6 78.1
Alcohol drinkingBaseline nondrinker 2.0 1.4 1.3 1.3 1.6Starter 7.5 7.1 7.1 6.9 7.2Quitter 9.2 11.3 9.8 10.1 11.3Stayed drinker 54.5 53.1 54.5 52.0 51.9Stayed nondrinker 26.5 27.0 27.0 29.5 27.8
Physical activityLow, baseline 35.5 37.7 37.2 39.5 39.3Middle, baseline 27.9 28.2 28.0 27.8 30.4High, baseline 36.4 33.9 34.6 32.6 30.2Low, 2008 38.0 33.8 34.4 29.9 31.8Middle, 2008 31.8 33.7 33.4 32.5 32.9High, 2008 30.0 32.4 32.1 37.5 35.2
Household assets, baselineLowest 38.3 37.2 37.8 41.5 45.7Medium 35.9 37.1 35.6 33.4 32.9Highest 25.6 25.6 26.4 25.0 21.2
Education, 2008None 2.2 1.1 2.1 1.4 1.6High school or less 7.7 7.0 7.8 7.2 7.5Undergraduate degree 79.0 79.1 81.1 82.6 80.7Graduate degree or above 11.0 12.6 8.9 8.6 10.0
Marital status, baselineSingle 14.2 15.7 16.4 14.4 15.0Living together 9.4 9.5 10.0 10.5 11.2Married 66.0 64.3 63.1 64.6 63.4Separated 8.9 9.2 8.6 9.1 8.6Widow 1.4 1.1 1.6 1.2 1.5
Health insurance, baselinePublic 76.0 77.8 78.3 79.6 79.2Private 20.8 19.4 19.0 17.6 17.8Other 3.1 2.7 2.6 2.7 2.9
1n = 8967. Values are means ± SDs or percentages. Household assets comprised phone, car, computer, vacuum cleaner, microwave oven, cell phone, and internet. Missingdata: smoking, n = 569; alcohol drinking, n = 456; physical activity 2006, n = 33; physical activity 2008, n = 95; education, n = 1139; marital status, n = 78; health insurance,n = 204. GDQS, Global Diet Quality Score; WC, waist circumference.
cruciferous vegetables, deep orange vegetables, and fish andshellfish was associated with less weight gain. Evidence fromlongitudinal studies is consistent with our results. Studies in 3cohorts in the United States found that a 1-serving/d increaseof vegetables, fruits, whole grains, and nuts was associated
with less weight gain long-term (33, 34). Furthermore, in ouranalysis, a 1-serving/d increase of red meat, refined grains,SSBs, and purchased deep fried foods was associated with moreweight gain. Results from a systematic review support thatgreater consumption of SSBs is associated with weight gain and
156S Supplement

TABLE 2 Association between change in GDQS and weight and waist circumference change within a 2-y period: Mexican Teachers’Cohort1
Largest decrease Small decrease Little change Small increase Largest increase P-trend2
Total GDQS change <−5 −5 to <−2 −2 to 2 >2 to 5 >5Weight change, kg
Age- and state-adjusted 0.36 (0.06, 0.66) 0.24 (0.01, 0.47) Reference − 0.39 (−0.62, −0.15) − 0.70 (−0.98, −0.41) <0.0001Multivariable-adjusted3 0.50 (0.19, 0.81) 0.33 (0.09, 0.57) Reference − 0.43 (−0.67, −0.20) − 0.81 (−1.11, −0.51) <0.0001
Waist circumference change, cmAge- and state-adjusted 0.54 (0.04, 1.12) 0.24 (−0.19, 0.69) Reference − 0.49 (−0.93, −0.05) − 0.99 (−1.53, −0.45) <0.0001Multivariable-adjusted3 0.71 (0.09, 1.32) 0.32 (−0.12, 0.77) Reference − 0.49 (−0.94, −0.04) − 1.05 (−1.62, −0.48) <0.0001
GDQS+ score change <−2.7 −2.0 to <−0.2 0 to 1.7 >2.0 to 4.0 >4.2Weight change, kg
Age- and state-adjusted4 0.22 (−0.04, 0.49) 0.11 (−0.15, 0.37) Reference − 0.19 (−0.45, 0.07) − 0.50 (−0.76, −0.23) <0.0001Multivariable-adjusted3,4 0.22 (−0.04, 0.50) 0.10 (−0.16, 0.36) Reference − 0.21 (−0.47, 0.05) − 0.52 (−0.79, −0.24) <0.0001
Waist circumference change, cmAge- and state-adjusted4 0.30 (−0.19, 0.81) 0.10 (−0.41, 0.61) Reference − 0.21 (−0.72, 0.29) − 0.81 (−1.32, −0.30) 0.0002Multivariable-adjusted3,4 0.32 (−0.19, 0.84) 0.10 (−0.41, 0.61) Reference − 0.22 (−0.73, 0.28) − 0.79 (−1.32, −0.27) <0.0001
GDQS− score change <−2.0 −1.0 0 1.0 >2.0Weight change, kg
Age- and state-adjusted4 0.36 (0.10, 0.62) 0.10 (−0.17, 0.39) Reference − 0.25 (−0.53, 0.02) − 0.32 (−0.59, −0.06) <0.0001Multivariable-adjusted3,4 0.36 (0.10, 0.62) 0.14 (−0.14, 0.42) Reference − 0.20 (−0.48, 0.07) − 0.25 (−0.51, 0.01) <0.0001
Waist circumference change, cmAge- and state-adjusted4 0.95 (0.46, 1.45) 0.78 (0.24, 1.32) Reference 0.45 (−0.08, 0.99) − 0.14 (−0.64, 0.35) 0.0143Multivariable-adjusted3,4 0.98 (0.47, 1.48) 0.80 (0.25, 1.34) Reference 0.49 (−0.04, 1.03) − 0.07 (−0.57, 0.43) 0.0082
1Values are β coefficients (95% CIs). n = 8967 women were included in the weight change analysis; n = 7588 women were included in the waist circumference analysis.GDQS+ and GDQS− scores were categorized in quintiles. GDQS, Global Diet Quality Score; GDQS+, Global Diet Quality Score positive submetric; GDQS−, Global DietQuality Score negative submetric.2Medians were fitted in a multivariate model to estimate P-trend.3Values were adjusted for baseline age (continuous); change in energy (continuous); state (Jalisco, Veracruz); baseline GDQS (continuous); 2006 and 2008 physical activity (low,medium, high); baseline marital status (single, living together, married, separated, widow); baseline education (none, high school or less, undergraduate degree, graduatedegree or above); baseline household assets (lowest, medium, highest); baseline health insurance (public, private, other); baseline BMI (<25, 25–29.9, >30 kg/m2); andchanges in smoking status (baseline past smokers, stayed nonsmokers, stayed smokers, quitters, starters) and alcohol consumption (baseline nondrinkers, stayed nondrinkers,stayed drinkers, quitters, starters).4Mutually adjusted for subscores.
obesity (35). Also, prospective and cross-sectional studies haveshown that meat consumption (36, 37) and fried foods intake(38) are related to weight gain.
In this analysis, we found an inverse association with waistcircumference change for fish, deep orange vegetables, lowfat and high fat dairy, and whole grains. These findings areconsistent with previous longitudinal studies in which thehigher intake of whole grains, vegetables, fruits, and high fatdairy products was associated with less waist circumferencegain (39, 40). Contrary to our results, evidence from asystematic review and meta-analysis, and studies in womenfrom a European cohort, found no association of low fatdairy and fish intakes with waist circumference change (41–43).Furthermore, we found positive associations between sweetsand ice cream and purchased deep fried foods intakes andwaist circumference gain. In a few previous longitudinal studies,greater consumption of sweets (44) and fried foods (45) wasassociated with abdominal obesity or waist circumference gain.Despite differences in the classification of sweets and fried foodsbetween our analysis and the aforementioned cited studies,the nutritional composition of these foods, rich in addedsugars, SFAs, and trans fat, could contribute to fat storage.In addition, in this study, pan dulce (sweetened breads) wasincluded in sweets and ice cream, and antojitos mexicanos(Mexican deep fried foods) were classified in purchased deepfried foods. These particular foods have an important rolein the Mexican diet and could explain the strong associationbetween these 2 GDQS components and waist circumferencegain.
Several mechanisms may explain the association betweenoverall diet quality and obesity. An increase in the score of dietquality indices is related to increased consumption of healthyfoods. For instance, foods with a low glycemic index have abetter metabolic response, characterized by lower blood glucoseconcentrations, lower postprandial insulin secretion followedby a lower energy intake in subsequent meals, and satiety (46,47). Also, healthy foods tend to have higher amounts of dietaryfiber that lead to an inhibition of hunger (48). In addition, thelow energy density of some plant-based foods or fish has beenlinked to lower weight gain. Despite the relatively high caloricdensity of nuts, nuts surprisingly are not associated with weightgain and are associated with reduced body weight and waistcircumference (49). Unhealthy or high-glycemic foods with highenergy density promote rapid digestion and absorption, relatedto increased insulin secretion and fat storage or body weightgain (50). Some of these mechanisms are independent of higherenergy intake, and in our analysis, we adjusted for change inenergy intake. In theory, energy intake is in the causal pathwayfrom increasing dietary quality, to lowering energy intake, togaining less weight. However, in our data, women with thelargest increase in GDQS also had the largest increase in energyintake. Individuals consuming higher amounts of food overallmight score higher in the GDQS because for healthy foodgroups a larger amount consumed would result in a higherscore, although the opposite would be true for the unhealthyfood groups, in that unhealthy food groups make a lowercontribution to the total GDQS. For this reason, we evaluatedthe change in GDQS on weight and waist circumference change
Changes in the GDQS and anthropometric measures 157S

-1.5
-1.0
-0.5
0
0.5
1.0
1.5
Citr
us fr
uits
Dee
p or
ange
frui
tsO
ther
frui
tsD
ark
gree
n le
afy
vege
tabl
esC
ruci
fero
us v
eget
able
sD
eep
oran
ge v
eget
able
sO
ther
veg
etab
les
Legu
mes
Nut
s an
d se
eds
Who
le g
rain
sFi
sh a
nd s
hellf
ish
Poul
try a
nd g
ame
mea
tLo
w fa
t dai
ryH
igh
fat d
airy
Red
mea
tPr
oces
sed
mea
tR
efin
ed g
rain
s an
d ba
ked
good
sSw
eets
and
ice
crea
mSS
BsJu
ice
Whi
te ro
ots
and
tube
rsPu
rcha
sed
deep
frie
d fo
ods
Bod
yw
eigh
tcha
nge,
kg/
2 y
-2.5
-2.0
-1.5
-1.0
-0.5
0
0.5
1.0
1.5
2.0
2.5
Citr
us fr
uits
Dee
p or
ange
frui
tsO
ther
frui
tsD
ark
gree
n le
afy
vege
tabl
esC
ruci
fero
us v
eget
able
sD
eep
oran
ge v
eget
able
sO
ther
veg
etab
les
Legu
mes
Nut
s an
d se
eds
Who
le g
rain
sFi
sh a
nd s
hellf
ish
Poul
try a
nd g
ame
mea
tLo
w fa
t dai
ryH
igh
fat d
airy
Red
mea
tPr
oces
sed
mea
tR
efin
ed g
rain
s an
d ba
ked
good
sSw
eets
and
ice
crea
mSS
BsJu
ice
Whi
te ro
ots
and
tube
rsPu
rcha
sed
deep
frie
d fo
ods
Wai
stci
rcum
fere
nce
chan
ge, c
m/2
yChange in food groups’ intake, servings/d
Healthy groupsUnhealthy groups
A B
Change in food groups’ intake, servings/d
FIGURE 1 Relation between change in consumption of food groups (servings/d) and weight (A) and waist circumference (B) change within a 2-y period: Mexican Teachers’ Cohort. Values were adjusted for baseline age (continuous); change in energy (continuous); state (Jalisco, Veracruz);2006 and 2008 physical activity (low, medium, high); marital status (single, living together, married, separated, widow); education (none, highschool or less, undergraduate degree, graduate degree or above); baseline household assets (lowest, medium, highest); health insurance (public,private, other); baseline BMI (<25, 25–29.9, >30 kg/m2); and changes in smoking status (baseline past smokers, stayed nonsmokers, stayedsmokers, quitters, starters) and alcohol consumption (baseline nondrinkers, stayed nondrinkers, stayed drinkers, quitters, starters). The modelwas mutually adjusted for other food groups. SSB, sugar-sweetened beverage.
independently of the change in energy intake. Regardless,analyses without adjusting for change in energy intake gaveslightly weaker associations, but in general the results weresimilar (data not shown).
We compared the performance of the GDQS with theAHEI-2010 and the MDD-W. We found that the GDQS hada stronger association than the MDD-W with weight gain,and a stronger association than the AHEI-2010 with waistcircumference gain, although the differences in absolute valueswere small. It was not surprising that the GDQS had a stronger
association with weight gain than the MDD-W; previous studiesfound that dietary diversity was not associated with obesity(51, 52). Dietary diversity is focused on capturing nutritionaladequacy through dietary variety disregarding other nutritionalcharacteristics (e.g., all grains are considered irrespective ofwhether these are refined or whole). Furthermore, the dietarydiversity score does not include other unhealthy food groupsthat affect measures of body adiposity such as SSBs anddesserts. On the other hand, it was interesting that the AHEI-2010 was outperformed by the GDQS for waist circumference,
TABLE 3 Association between change in diet quality indices (1-SD increase) and weight and waist circumference change within a2-y period: Mexican Teachers’ Cohort1
GDQS AHEI-2010 MDD-W Wald test
Weight change, kgUnadjusted for another score − 0.37 (−0.47, −0.27) − 0.33 (−0.44, −0.22) − 0.26 (−0.37, −0.14)Adjusted for GDQS − 0.28 (−0.40, −0.16) − 0.18 (−0.31, −0.05) — 0.383Adjusted for GDQS − 0.36 (−0.47, −0.24) — − 0.08 (−0.21, 0.04) 0.008
Waist circumference change, cmUnadjusted for another score − 0.52 (−0.71, −0.33) − 0.24 (−0.45, −0.03) − 0.42 (−0.63, −0.20)Adjusted for GDQS − 0.54 (−0.78, −0.31) 0.04 (−0.20, 0.30) — 0.006Adjusted for GDQS − 0.43 (−0.65, −0.21) — − 0.22 (−0.47, 0.01) 0.300
1Values are β coefficients (95% CIs). Values were adjusted for baseline age (continuous); change in energy (continuous); baseline scores (continuous); state (Jalisco, Veracruz);2006 and 2008 physical activity (low, medium, high); marital status (single, living together, married, separated, widow); education (none, high school or less, undergraduatedegree, graduate degree or above); baseline household assets (lowest, medium, highest); health insurance (public, private, other); baseline BMI (<25, 25–29.9, >30 kg/m2); andchanges in smoking status (baseline past smokers, stayed nonsmokers, stayed smokers, quitters, starters) and alcohol consumption (baseline nondrinkers, stayed nondrinkers,stayed drinkers, quitters, starters). AHEI-2010, Alternate Healthy Eating Index-2010; GDQS, Global Diet Quality Score; MDD-W, Minimum Dietary Diversity for Women.
158S Supplement

particularly considering that the GDQS aims to balance nutrientadequacy and chronic disease risk, whereas the AHEI-2010 isonly focused on chronic disease risk. However, the AHEI-2010was not developed specifically to capture obesity risk (20), andit does not include some dietary components that have beenstrongly associated with adiposity such as refined grains, sweets,and deep fried foods. Moreover, we found that many foodgroups included in the GDQS that are not considered in theAHEI-2010 were of particular importance in our population,such as fish, refined grains, sweets and ice cream, high fat dairy,and purchased deep fried foods.
A major strength of this analysis is the availability ofrepeated measurements of diet and anthropometric measuresin a large sample of women of reproductive age from alow- and middle-income country. Slight changes in perceivedweight could cause individuals to modify their dietary habitsor lifestyle. For example, persons who are gaining weightmight reduce their intake of SSBs and sweets or increasetheir consumption of vegetables, leading to reverse causation.Hence, analyses of changes in diet with concurrent changesin weight, such as the one we performed in our study,are preferable because this more closely approximates anintervention (53). Several studies have only included baselinedietary measurements and have not found an association withweight and waist circumference change (31, 54).
This study has its limitations. We had detailed lifestyle andsociodemographic information and we were able to controlfor many potential confounders. Nonetheless, because thisis an observational study, residual confounding cannot becompletely ruled out. Furthermore, anthropometric measuresand dietary intakes were self-reported. However, previousvalidation studies in a subsample of the cohort suggested thatthese self-reported anthropometric measures have high validity,and diet was previously validated in Mexican women (16, 23).Also, our results might not be generalizable to all Mexicanwomen. This cohort is composed of teachers and they havea higher education level and lower prevalence of overweightand obesity than the general population of women in Mexico.However, it is unlikely that the biological mechanisms ofdiet quality on weight and waist circumference change differgreatly by these characteristics. For instance, we found a strongassociation between changes in diet quality and weight andwaist circumference regardless of baseline BMI (SupplementalTable 1). Furthermore, the distribution of important risk factorsfor obesity is comparable with that in the general population,and in a cross-sectional analysis of the Mexican NationalNutrition Survey a negative association of the GDQS with BMIand waist circumference was reported (55). Finally, our follow-up period was short (2 y). However, results would likely besimilar even with a longer follow-up. An analysis of womenfrom the Nurses’ Health Study that examined 4-y changes inthe GDQS and body weight found results in the same directionas ours using the same cutoffs for categories of change in theGDQS, but the change observed was approximately double thechange we observed (26).
In conclusion, we found that improvement in diet qualityover a 2-y period, reflected by an increase in the GDQS,was associated with less weight and waist circumferencegain. Food groups that were key in driving this associationincluded increased consumption of dark green leafy vegetables,cruciferous vegetables, deep orange vegetables, citrus fruits, lowfat and high fat dairy, whole grains, and fish and decreasedconsumption of refined grains, SSBs, red meat, sweets andice cream, and purchased deep fried foods. These findings
are encouraging because they suggest that a dietary qualitymetric developed to capture both nutrient adequacy and chronicdisease risk in the global context predicts weight and waistcircumference change in Mexican women. These results alsoemphasize the importance of improving diet quality as part ofefforts to control the global obesity pandemic.
Acknowledgments
We thank the Servicio Profesional Docente at the MexicanMinistry of Education, with special thanks to Victor Sastré,Director of Promotion in Service. We thank Dr. MargaritaBlanco Cornejo and ISSSTE’s (Institute of Security and SocialServices for State Workers) Medical Directorate staff for tech-nical and administrative support. The authors’ responsibilitieswere as follows—EA, WCW, CB, SNB, TTF, YL, SB, AC-G, andMD: designed the research; AM and ML: provided essentialmaterials; EA: analyzed the data; DS and CB: provided technicalguidance and supervised the analyses; EA and CB: wrote thepaper and had primary responsibility for the final content; andall authors: revised and provided substantial feedback to themanuscript and read and approved the final manuscript.
References1. Abdullah A, Peeters A, de Courten M, Stoelwinder J. The magnitude
of association between overweight and obesity and the risk of diabetes:a meta-analysis of prospective cohort studies. Diabetes Res Clin Pract2010;89(3):309–19.
2. Czernichow S, Kengne A-P, Stamatakis E, Hamer M, Batty GD. Bodymass index, waist circumference and waist–hip ratio: which is the betterdiscriminator of cardiovascular disease mortality risk? Evidence froman individual-participant meta-analysis of 82864 participants from ninecohort studies. Obes Rev 2011;12(9):680–7.
3. Lauby-Secretan B, Scoccianti C, Loomis D, Grosse Y, Bianchini F, StraifK. Body fatness and cancer — viewpoint of the IARC Working Group.N Engl J Med 2016;375(8):794–8.
4. Barquera S, Hernández-Barrera L, Trejo B, Shamah T, Campos-Nonato I, Rivera-Dommarco J. Obesidad en México, prevalencia ytendencias en adultos. Ensanut 2018-19. Salud Publica Mex 2020;62(6):682–92.
5. Hruby A, Manson JAE, Qi L, Malik VS, Rimm EB, Sun Q, Willett WC,Hu FB. Determinants and consequences of obesity. Am J Public Health2016;106(9):1656–62.
6. Flores M, Macias N, Rivera M, Lozada A, Barquera S, Rivera-Dommarco J, Tucker KL. Dietary patterns in Mexican adultsare associated with risk of being overweight or obese. J Nutr2010;140(10):1869–73.
7. Rivera JA, Barquera S, González-Cossío T, Olaiz G, Sepúlveda J.Nutrition transition in Mexico and in other Latin American countries.Nutr Rev 2004;62:S149–57.
8. Aburto TC, Pedraza LS, Sánchez-Pimienta TG, Batis C, Rivera JA.Discretionary foods have a high contribution and fruit, vegetables, andlegumes have a low contribution to the total energy intake of theMexican population. J Nutr 2016;146(9):1881S–7S.
9. Kant AK. Dietary patterns: biomarkers and chronic disease risk. ApplPhysiol Nutr Metab 2010;35(2):199–206.
10. Wirt A, Collins CE. Diet quality – what is it and does it matter? PublicHealth Nutr 2009;12(12):2473–92.
11. Fung TT, Pan A, Hou T, Chiuve SE, Tobias DK, Mozaffarian D,Willett WC, Hu FB. Long-term change in diet quality is associatedwith body weight change in men and women. J Nutr 2015;145(8):1850–6.
12. Aljadani HM, Patterson AJ, Sibbritt DW, Taylor RM, Collins CE.Improving diet quality over nine-years is associated with less weight gainin mid-age Australian women: a cohort study. Nutr Metab CardiovascDis 2020;30(2):223–32.
Changes in the GDQS and anthropometric measures 159S

13. Burggraf C, Teuber R, Brosig S, Meier T. Review of a priori dietaryquality indices in relation to their construction criteria. Nutr Rev2018;76(10):747–64.
14. Trijsburg L, Talsma EF, De Vries JHM, Kennedy G, KuijstenA, Brouwer ID. Diet quality indices for research in low- andmiddle-income countries: a systematic review. Nutr Rev 2019;77(8):515–40.
15. Lajous M, Ortiz-Panozo E, Monge A, Santoyo-Vistrain R, García-AnayaA, Yunes-Díaz E, Rice MS, Blanco M, Hernández-Ávila M, WillettWC, et al. Cohort profile: the Mexican Teachers’ Cohort (MTC). IntJ Epidemiol 2017;46(2):e10.
16. Hernández-Avila M, Romieu I, Parra S, Hernández-Avila J, MadrigalH, Willett W. Validity and reproducibility of a food frequencyquestionnaire to assess dietary intake of women living in Mexico City.Salud Publica Mex 1998;40(2):133–40.
17. USDA Agricultural Research Service (ARS). Methods and Applicationof Food Composition Laboratory[Internet]. Beltsville, MD: USDA ARS;2020[cited 6 February, 2020]. Available from: http://www.ars.usda.gov/nea/bhnrc/mafcl.
18. Fung TT, Isanaka S, Hu FB, Willett WC. International food group–baseddiet quality and risk of coronary heart disease in men and women. AmJ Clin Nutr 2018;107(1):120–9.
19. Bromage S, Batis C, Bhupathiraju SN, Fawzi WW, Fung TT,Li Y, Deitchler M, Angulo E, Birk N, Castellanos-GutiérrezA, et al. Development and validation of a novel food-basedGlobal Diet Quality Score (GDQS). J Nutr 2021;151(Suppl 10):75S–92S.
20. Chiuve SE, Fung TT, Rimm EB, Hu FB, McCullough ML, WangM, Stampfer MJ, Willett WC. Alternative dietary indices bothstrongly predict risk of chronic disease. J Nutr 2012;142(6):1009–18.
21. Food and Nutrition Technical Assistance III Project (FANTA).Measuring the quality of women’s diets: consensus on a global indicatorfor women’s dietary diversity. Washington (DC): FHI 360/FANTA;2015.
22. Conrad Z, Johnson LK, Roemmich JN, Juan W, Jahns L. Timetrends and patterns of reported egg consumption in the U.S. bysociodemographic characteristics. Nutrients 2017;9(4):333.
23. Ortiz-Panozo E, Yunes-Díaz E, Lajous M, Romieu I, Monge A, López-Ridaura R. Validity of self-reported anthropometry in adult Mexicanwomen. Salud Publica Mex 2017;59(3):266–75.
24. Ainsworth BE, Haskell WL, Herrmann SD, Meckes N, Bassett DR,Tudor-Locke C, Greer JL, Vezina J, Whitt-Glover MC, Leon AS.Compendium of Physical Activities: a second update of codes and METvalues. Med Sci Sports Exerc 2011;43(8):1575–81.
25. Hirko KA, Lajous M, Ortiz-Panozo E, Lopez-Ridaura R,Christine PJ, Lê-Scherban F, Rice MS, Barrientos-Gutierrez T.Socioeconomic position and markers of adiposity among femaleteachers in Mexico. J Epidemiol Community Health 2017;71(10):999–1004.
26. Fung TT, Li Y, Bromage S, Bhupathiraju SN, Batis C, Fawzi W, HolmesMD, Stampfer M, Hu FB, Deitchler M, et al. Higher Global Diet QualityScore is associated with less 4-year weight gain in US women. J Nutr2021;151(Suppl 10):162S–7S.
27. Aljadani H, Patterson A, Sibbritt D, Collins CE. Diet quality and weightchange in adults over time: a systematic review of cohort studies. CurrNutr Rep 2015;4(1):88–101.
28. Martin JC, Moran LJ, Teede HJ, Ranasinha S, Lombard CB, HarrisonCL. Diet quality in a weight gain prevention trial of reproductive agedwomen: a secondary analysis of a cluster randomized controlled trial.Nutrients 2019;11(1):49.
29. Li Y, Roswall N, Ström P, Sandin S, Adami HO, Weiderpass E.Mediterranean and Nordic diet scores and long-term changes in bodyweight and waist circumference: results from a large cohort study. Br JNutr 2015;114(12):2093–102.
30. Arabshahi S, van der Pols JC, Williams GM, Marks GC, LahmannPH. Diet quality and change in anthropometric measures: 15-yearlongitudinal study in Australian adults. Br J Nutr 2012;107(9):1376–85.
31. López-Olmedo N, Popkin BM, Mendez MA, Taillie LS. The associationof overall diet quality with BMI and waist circumference byeducation level in Mexican men and women. Public Health Nutr2019;22(15):2777–92.
32. Agnoli C, Sieri S, Ricceri F, Giraudo MT, Masala G, Assedi M,Panico S, Mattiello A, Tumino R, Giurdanella MC, et al. Adherenceto a Mediterranean diet and long-term changes in weight and waistcircumference in the EPIC-Italy cohort. Nutr Diabetes 2018;8(1):22.
33. Bertoia ML, Mukamal KJ, Cahill LE, Hou T, Ludwig DS, MozaffarianD, Willett WC, Hu FB, Rimm EB. Changes in intake of fruits andvegetables and weight change in United States men and women followedfor up to 24 years: analysis from three prospective cohort studies. PLoSMed 2015;12(9):e1001878.
34. Mozaffarian D, Hao T, Rimm EB, Willett WC, Hu FB. Changes in dietand lifestyle and long-term weight gain in women and men. N Engl JMed 2011;364(25):2392–404.
35. Malik VS, Schulze MB, Hu FB. Intake of sugar-sweetened beveragesand weight gain: a systematic review. Am J Clin Nutr 2006;84(2):274–88.
36. Vergnaud A-C, Norat T, Romaguera D, Mouw T, May AM, Travier N,Luan J, Wareham N, Slimani N, Rinaldi S, et al. Meat consumption andprospective weight change in participants of the EPIC-PANACEA study.Am J Clin Nutr 2010;92(2):398–407.
37. Wang Y, Beydoun MA. Meat consumption is associated with obesityand central obesity among US adults. Int J Obes 2009;33(6):621–8.
38. Sayon-Orea C, Bes-Rastrollo M, Basterra-Gortari FJ, Beunza JJ,Guallar-Castillon P, de la Fuente-Arrillaga C, Martinez-Gonzalez MA.Consumption of fried foods and weight gain in a Mediterraneancohort: the SUN project. Nutr Metab Cardiovasc Dis 2013;23(2):144–50.
39. Sawicki C, Rogers G, Jacques P, Livingston K, McKeown N. Wholegrain intake is prospectively associated with lower gain in abdominalobesity over 18 years of follow-up (OR33-04-19). Curr Dev Nutr2019;3(Suppl 1):1533.
40. Halkjær J, Tjønneland A, Overvad K, Sørensen TIA. Dietarypredictors of 5-year changes in waist circumference. J Am Diet Assoc2009;109(8):1356–66.
41. Schwingshackl L, Hoffmann G, Schwedhelm C, Kalle-Uhlmann T,Missbach B, Knüppel S, Boeing H. Consumption of dairy products inrelation to changes in anthropometric variables in adult populations:a systematic review and meta-analysis of cohort studies. PLoS One2016;11(6):e0157461.
42. Jakobsen MU, Due KM, Dethlefsen C, Halkjaer J, Holst C, ForouhiNG, Tjønneland A, Boeing H, Buijsse B, Palli D, et al. Fish consumptiondoes not prevent increase in waist circumference in European womenand men. Br J Nutr 2012;108(5):924–31.
43. Romaguera D, Ängquist L, Du H, Jakobsen MU, Forouhi NG,Halkjær J, Feskens EJM, van der A DL, Masala G, Steffen A,et al. Food composition of the diet in relation to changes in waistcircumference adjusted for body mass index. PLoS One 2011;6(8):e23384.
44. Konieczna J, Romaguera D, Pereira V, Fiol M, Razquin C, Estruch R,Asensio EM, Babio N, Fitó M, Gómez-Gracia E, et al. Longitudinalassociation of changes in diet with changes in body weight and waistcircumference in subjects at high cardiovascular risk: the PREDIMEDtrial. Int J Behav Nutr Phys Act 2019;16(1):139.
45. Guallar-Castillón P, Rodríguez-Artalejo F, Fornés NS, Banegas JR,Etxezarreta PA, Ardanaz E, Barricarte A, Chirlaque M-D, IraetaMD, Larrañaga NL, et al. Intake of fried foods is associatedwith obesity in the cohort of Spanish adults from the EuropeanProspective Investigation into Cancer and Nutrition. Am J Clin Nutr2007;86(1):198–205.
46. Ludwig DS. Dietary glycemic index and obesity. J Nutr2000;130(2):280S–3S.
47. Juanola-Falgarona M, Salas-Salvadó J, Ibarrola-Jurado N, Rabassa-Soler A, Díaz-López A, Guasch-Ferré M, Hernández-Alonso P, BalanzaR, Bulló M. Effect of the glycemic index of the diet on weightloss, modulation of satiety, inflammation, and other metabolic riskfactors: a randomized controlled trial. Am J Clin Nutr 2014;100(1):27–35.
48. Slavin J, Green H. Dietary fibre and satiety. Nutr Bull 2007;32(s1):32–42.
49. Najjar RS, Feresin RG. Plant-based diets in the reduction ofbody fat: physiological effects and biochemical insights. Nutrients2019;11(11):2712.
160S Supplement

50. Brand-Miller JC, Holt SHA, Pawlak DB, McMillan J. Glycemic indexand obesity. Am J Clin Nutr 2002;76(1):281S–5S.
51. Vadiveloo M, Dixon LB, Parekh N. Associations between dietary varietyand measures of body adiposity: a systematic review of epidemiologicalstudies. Br J Nutr 2013;109(9):1557–72.
52. Salehi-Abargouei A, Akbari F, Bellissimo N, Azadbakht L. Dietarydiversity score and obesity: a systematic review and meta-analysis of observational studies. Eur J Clin Nutr 2016;70(1):1–9.
53. Smith JD, Hou T, Hu FB, Rimm EB, Spiegelman D, Willett WC,Mozaffarian D. A comparison of different methods for evaluating diet,
physical activity, and long-term weight gain in 3 prospective cohortstudies. J Nutr 2015;145(11):2527–34.
54. Aljadani HMA, Sibbritt D, Patterson A, Collins C. The AustralianRecommended Food Score did not predict weight gain in middle-agedAustralian women during six years of follow-up. Aust N Z J PublicHealth 2013;37(4):322–8.
55. Castellanos-Gutiérrez A, Rodríguez-Ramírez S, Bromage S, Fung TT,Yanping L, Bhupathiraju SN, Deitchler M, Willett WC, Batis C.Performance of the Global Dietary Quality Score with nutritionand health outcomes in Mexico with 24-hr and FFQ data. J Nutr2021;151(Suppl 10):143S–51S.
Changes in the GDQS and anthropometric measures 161S

The Journal of NutritionSupplement
Higher Global Diet Quality Score Is Associatedwith Less 4-Year Weight Gain in US WomenTeresa T Fung,1,2 Yanping Li,2 Sabri Bromage,2 Shilpa N Bhupathiraju,2,3 Carolina Batis,4 Wafaie Fawzi,5
Michelle D Holmes,3,6 Meir Stampfer,3,6 Frank B Hu,2,3 Megan Deitchler,7 and Walter C Willett2,3
1Department of Nutrition, Simmons University, Boston, MA, USA; 2Department of Nutrition, Harvard TH Chan School of Public Health,Boston, MA, USA; 3Channing Division of Network Medicine, Department of Medicine, Brigham and Women’s Hospital, Harvard MedicalSchool, Boston, MA, USA; 4CONACYT—Health and Nutrition Research Center, National Institute of Public Health, Cuernavaca, Mexico;5Department of Global Health and Population, Harvard TH Chan School of Public Health, Boston, MA, USA; 6Department ofEpidemiology, Harvard TH Chan School of Public Health, Boston, MA, USA; and 7Intake—Center for Dietary Assessment, FHI Solutions,Washington, DC, USA
ABSTRACTBackground: We have developed a simple and globally applicable tool, the Global Diet Quality Score (GDQS), to
measure diet quality.
Objectives: To test the utility of the GDQS, we examined the associations of the GDQS with weight change and risk
of obesity in US women.
Methods: Health, lifestyle, and diet information were collected from women (n = 68,336) in the Nurses’ Health Study
II (aged 27–44 y in 1991) through repeated questionnaires (1991–2015). The GDQS has 25 food groups (maximum = 49
points) and scoring higher points reflects a healthier diet. The association between GDQS change in 4-y intervals and
concurrent weight change was computed with linear models adjusted for confounders.
Results: Mean ± SD weight gain across 4-y periods was 1.68 ± 6.26 kg. A >5-point improvement in GDQS was
associated with −1.13 kg (95% CI: −1.19, −0.77 kg) weight gain compared with a score change of <±2 points. For
each 5-point increase, weight gain was 0.83 kg less for age <50 y compared with 0.71 kg less for age ≥50 y (P-
interaction < 0.05). A >5-point score decrease was associated with 1.13 kg (95% CI: 1.04, 1.22 kg) more weight gain
in women aged <50 y and 0.81 kg more (95% CI: 0.63, 0.98 kg) in women aged ≥50 y. Compared with little change
in score, obesity RR was 0.77 (95% CI: 0.74, 0.81) for a >5-point increase and 1.32 (95% CI: 1.26, 1.37) for a >5-point
decrease. Risk of obesity did not differ by age. Compared with other diet quality scores, the Alternate Healthy Eating
Index-2010 had somewhat stronger associations than the GDQS (P < 0.05) but the GDQS had stronger associations
than the Minimum Dietary Diversity for Women score (P < 0.05).
Conclusions: Improvement of diet quality as measured by the GDQS was associated with less weight gain and risk
of obesity in US women. The association was stronger for women aged <50 y. Associations similar in direction and
magnitude were observed between the GDQS and obesity across age groups. J Nutr 2021;151:162S–167S.
Keywords: diet quality, weight, women, obesity, epidemiology
Introduction
Obesity is a global health problem. In 2017 the mortalityattributed to high BMI was estimated to be 2.4 million (and 77million disability-adjusted life years) globally (1). Overweightand obesity in early adulthood has also been associated withhigher risks of obesity-related cancer (2), diabetes (3), andcardiovascular mortality (4, 5). Weight gain in adulthood ≥5 kghas also been associated with higher risks of all-cause mortality(6), cardiovascular disease (7), and obesity-related cancers (8).Countries with the highest obesity-related mortality rates spanacross the range of economic development levels with NorthAmerica, North Africa, the Middle East, Eastern Europe, andCentral Asia at the top (1).
In observational studies, better diet quality (9) orimprovement of diet quality was associated with less weightgain (10), especially in younger adults (11). In addition,improvement of diet quality was also shown to preventweight gain in a randomized trial among reproductive-agedwomen (12). Healthy diets tended to be higher in fiber andproportionally higher in minimally processed carbohydratesthan in refined carbohydrates. Combined, these 2 characteristicsmay limit the surge in glycemic response (13) and, hence, areless likely to stimulate hunger (14). Consequently, a healthydiet may prevent overeating.
In order to monitor diet quality globally in a consistentmanner, a universal metric is a necessity. The need for a rapiddietary screening tool for clinical settings has also been raised
C© The Author(s) 2021. Published by Oxford University Press on behalf of the American Society for Nutrition. This is an Open Access article distributed under theterms of the Creative Commons Attribution License (http://creativecommons.org/licenses/by/4.0/), which permits unrestricted reuse, distribution, and reproduction
in any medium, provided the original work is properly cited.Manuscript received February 26, 2021. Initial review completed April 21, 2021. Revision accepted May 5, 2021.
First published online October 1, 2021; doi: https://doi.org/10.1093/jn/nxab170.162S

by the American Heart Association (15). To be suitable foruse in regions of different economic development stages, thismetric needs to be sensitive enough to both reflect nutrientadequacy and predict common chronic disease risk. We havedeveloped the Global Diet Quality Score (GDQS) based onthe Prime Diet Quality Score (16). The GDQS is associatedwith nutrient adequacy and lower odds of a low hemoglobinconcentration in low- and middle-income countries (17) (seeelsewhere in this Supplement). As part of evaluating the utility ofthe GDQS in high-income countries, we assessed its associationswith weight gain and obesity in a cohort of US women. Inthis analysis, we specifically examined concurrent changes inthe GDQS and body weight because weight change can occurrapidly in response to changes in diet. Moreover, the prospectiveapproach that uses past diet to predict future weight changecannot capture the relevant time frame effectively. As a result,we examined the relation between 4-y change in GDQS andconcurrent weight change, as well as risk of obesity, in womenof reproductive age and older.
MethodsThe Nurses’ Health Study II (NHS II) is an ongoing prospective cohortstudy that began in 1989 with 116,430 US female Registered Nursesaged 25–42 y (18). Every 2 y, the nurses provided lifestyle, health,and medication information through a self-reported questionnaire. Avalidated self-administered FFQ was completed every 4 y beginning in1991. For this analysis, we used 1991 as the beginning of follow-up withthe first administration of the FFQ and concluded follow-up in 2015.We excluded women with a history of cancer, diabetes, myocardialinfarction, or stroke, because these diseases may cause weight changeand change in dietary intake. In addition, we also excluded thosewith missing weight status at baseline. Those who did not completeadditional questionnaires beyond baseline and those who reportedimplausible energy intake (<500 or >3500 kcal/d) were also excluded.A total of 68,336 women were included in this analysis and loss tofollow-up was ∼10% during the study period. This study was approvedby the institutional review boards of Brigham and Women’s Hospitaland Harvard TH Chan School of Public Health. Completion of the self-administered questionnaire was considered as implied consent.
Funding for the research was provided by FHI Solutions, recipient of a Bill& Melinda Gates Foundation grant to support Intake—Center for DietaryAssessment and by NIH grant U01 CA176726.The content is solely the responsibility of the authors and does not necessarilyrepresent the official views of the NIH.Author disclosures: TTF is an Associate Editor for the Journal of Nutrition andplayed no role in the Journal’s evaluation of the manuscript. All other authorsreport no conflicts of interest.Published in a supplement to The Journal of Nutrition. Publication costs for thissupplement were funded by the Bill & Melinda Gates Foundation in conjunctionwith FHI Solutions, recipient of a Bill & Melinda Gates Foundation grant tosupport Intake—Center for Dietary Assessment. The opinions expressed in thispublication are those of the authors and are not attributable to the sponsorsor the publisher, Editor, or Editorial Board of The Journal of Nutrition. TheSupplement Coordinators for the supplement publication were Megan Deitchler,Intake—Center for Dietary Assessment at FHI Solutions, Washington, DC; andSabri Bromage, Harvard TH Chan School of Public Health, Boston, MA.The GDQS research initiative was launched by Intake – Center for DietaryAssessment. The research was led by Harvard T.H. Chan School of Public Health,Department of Nutrition and carried out in collaboration with researchers at theNational Public Health Institute (INSP), Mexico. Funding for the research wasprovided by FHI Solutions, recipient of a Bill & Melinda Gates Foundation grantto support Intake – Center for Dietary Assessment.Address correspondence to TTF (e-mail: [email protected]).Abbreviations used: AHEI-2010, Alternate Healthy Eating Index-2010; GDQS,Global Diet Quality Score; MDD-W, Minimum Dietary Diversity for Women;MET, metabolic equivalent; NHS, Nurses’ Health Study.
Diet assessmentUsual dietary intake was assessed every 4 y using a validatedsemiquantitative FFQ that included ∼135 items (19). For each fooditem, a standard portion size was specified with 9 frequency choicesfrom “never or less than once per month” to “≥6 times per day.” TheGDQS is a diet quality score comprised solely of food groups that wasmodified from the Prime Diet Quality Score (20). It was designed toreflect nutrient adequacy and predict major noncommunicable diseasesglobally (17) (see elsewhere in this Supplement). There are 16 healthyfood groups (dark green leafy vegetables, cruciferous vegetables, deeporange vegetables, deep orange fruits, deep orange tubers, citrus fruits,other vegetables, other fruits, legumes, nuts and seeds, poultry and gamemeat, fish and shellfish, whole grains, liquid oils, low fat dairy, eggs)and 7 unhealthy food groups (white roots and tubers, processed meats,refined grains and baked goods, sugar-sweetened beverages, sweets andice cream, juices, purchased deep fried foods). Intake was categorizedinto <1/wk, 1 to <4/wk, and ≥4/wk. Healthy food groups were givenpoints between 0 and 4 for each category of intake depending on thefood group. Unhealthy food groups were given 2, 1, and 0 points forthe same 3 intake levels with lower intake receiving more points. Inaddition, the GDQS also includes a red meat group and a full-fat dairygroup that are scored differently. Red meat was given 0, 1, and 0 pointsfor intake at the same 3 levels, respectively, and full-fat dairy was given0, 1, 2, and 0 points for intake of <1/wk, 1 to <4/wk, ≥4/wk to <3/d,and ≥3/d, respectively. This accounts for nutrient contribution withmoderate intake but does not reward high intake that may contributeto the risk of chronic diseases. The full GDQS has 25 food groupsand a score range of 0–49 points, with a higher score representinga healthier diet. The healthy portion of the GDQS (GDQS+) rangesfrom 0 to 32 (21) (see elsewhere in this Supplement). For this analysis,we included red meat and full-fat dairy as part of the unhealthysubscore (GDQS−) which has a range of 0–17, with a higher scorerepresenting lower intake of unhealthy foods and hence healthier foodchoices.
In this analysis, the GDQS was compared with 2 other diet qualityscores: the Alternate Healthy Eating Index-2010 (AHEI-2010) (22) andthe Minimum Dietary Diversity for Women (MDD-W) indicator (20).These were computed for each participant using the same FFQ data. TheAHEI-2010 consists of 11 food and nutrient groups. Points were givenfor higher intakes of healthy groups (vegetables, whole fruits, nuts andlegumes, whole grains, polyunsaturated fat, and long-chain n–3 fattyacids) and lower intakes of unhealthy groups (red and processed meats,sugar-sweetened beverages and fruit juice, trans fat, and sodium). Pointswere also given for moderate intake of alcohol. Each component rangesfrom 0 to 10 points with the total possible score ranging from 0 to 110points.
The MDD-W has 10 food groups: grains and starchy vegetables,pulses, nuts and seeds, dairy, animal flesh, eggs, dark green leafyvegetables, vitamin A–rich vegetables and fruits, other vegetables, andother fruits. To adapt the original scoring method based on 24-h recalldata to our FFQ data, we assigned 1 point for each food group withintake ≥1 serving/d and 0 for less. The MDD-W has a range of 0–10points (23).
Outcome assessmentWeight was updated with each biennial questionnaire and self-reported.We calculated 4-y weight change in the same years the FFQ wasadministered. BMI (in kg/m2) was calculated using height collected atbaseline and weight reported at each questionnaire cycle. The validity ofself-reported weight was assessed in a subsample of women (n = 184)via actual weighing 6–12 mo after questionnaire administration. Thecorrelation coefficient between the 2 weights was 0.97 (24).
CovariatesAge and height were obtained from the baseline questionnaire. Bodyweight, cigarette smoking (including the number of cigarettes/d),daily number of hours sleeping, weekly number of hours spent onTV watching, menopausal status and postmenopausal hormone use,oral contraceptive use, and pregnancy were self-reported in each
GDQS and weight change 163S

TABLE 1 Age-standardized characteristics in the Nurses’ Health Study II population at 1991 baseline and average 4-y change bychange of GDQS over the period 1991–20151
4-y change, points
1991(n = 68,336)
<−5(decrease)
−5 to <−2(decrease)
−2 to 2(little change)
>2 to 5(increase)
>5(increase)
Age, y 36.3 ± 4.6Current weight, kg 66.6 ± 154-y weight change, kg 3.0 ± 7.0 2.4 ± 6.2 1.7 ± 6.0 1.4 ± 6.1 0.7 ± 6.5BMI, kg/m2 24.5 ± 5.3 1.1 ± 2.5 0.9 ± 2.3 0.6 ± 2.2 0.5 ± 2.2 0.3 ± 2.4Physical activity, METs/wk 20.7 ± 27 − 0.7 ± 30.1 − 0.4 ± 27.8 − 0.5 ± 27.9 0.2 ± 27.8 0.2 ± 27.6Current smokers 11.9Sleep, h/d 5.9 ± 1.0 5.9 ± 1.1 5.9 ± 1.0 5.9 ± 1.0 5.9 ± 1.0 5.9 ± 1.0TV watching, h/wk 8.9 ± 8.5 0.3 ± 9.0 0.3 ± 8.5 0.2 ± 7.6 0.2 ± 8.5 0.3 ± 8.6Alcohol, g/d 3.2 ± 6.1 0.4 ± 7.0 0.6 ± 6.9 0.5 ± 6.6 0.8 ± 6.6 0.9 ± 6.7Total calories, kcal/d 1776 ± 534 − 153 ± 509 − 77 ± 491 − 17 ± 479 73 ± 482 147 ± 505GDQS 21.6 ± 5.1 − 7.4 ± 1.8 − 3.4 ± 0.9 0.0 ± 1.2 3.5 ± 0.9 7.8 ± 2.2GDQS+ (healthy) score 13 ± 4.6 − 5.7 ± 2.7 − 2.9 ± 2.6 0.0 ± 2.8 2.7 ± 2.5 5.8 ± 2.9GDQS− (unhealthy) score 8.6 ± 2.5 − 1.7 ± 2.4 − 0.8 ± 2.3 0.2 ± 2.3 1.0 ± 2.3 2.1 ± 2.5MDD-W 4.2 ± 1.5 − 1.0 ± 1.4 − 0.5 ± 1.4 0.0 ± 1.4 0.4 ± 1.4 0.9 ± 1.4AHEI-2010 48 ± 10.8 − 5.5 ± 8.4 − 1.7 ± 8.2 2.0 ± 8.2 5.8 ± 8.2 10.4 ± 8.9
1Values are means ± SDs for continuous variables and percentages for categorical variables. AHEI-2010, Alternate Healthy Eating Index-2010; GDQS, Global Diet Quality Score;MDD-W, Minimum Dietary Diversity for Women; MET, metabolic equivalent.
biennial questionnaire. Data on leisure-time physical activity werecollected every 2 y with 10 questions covering common exerciseand recreational activities and their weekly duration. Total physicalactivity was expressed as metabolic equivalents (METs) per week(25).
Statistical analysisThe association between 4-y change in GDQS and concurrent 4-y weight change between 1991 and 2015 was examined usingmultivariable linear models with an unstructured correlation matrixto account for within-person repeated measures. Four-year change inGDQS was categorized into >5 points decrease, >2 to 5 points decrease,±2 points (considered as no change in score), >2 to 5 points increase,and >5 points increase. Person-years from time periods with missingweight data were excluded. In addition, we censored person time afterage 65 y to minimize weight loss and muscle loss associated with aging.Change in GDQS+ was classified into the same categories but change inGDQS− was classified into >2 points decrease, ±2 points (consideredas no change in score), and >2 points increase owing to the narrow scorerange. To minimize the influence of outliers, score changes >99.5%percentile or <0.05% percentile were recoded to values of those specificpercentiles.
Participants re-entered the analysis when weight was again reportedin subsequent questionnaire cycles. In addition, if pregnancy wasreported in a questionnaire period, person-time during that period wasexcluded.
Multivariable models were adjusted for known confounders forweight change and obesity (26). We included age, menopausal status(pre- or postmenopausal), hormone therapy use (never, past, or current),hours of sleep, BMI at the start of each 4-y interval, and concurrent4-y changes in lifestyle factors: smoking status (never, former, current:1–14, 15–24, or ≥25 cigarettes/d), physical activity (METs/wk), hoursof sitting per week, and alcohol intake; and BMI and GDQS at thestart of each 4-y period. We did not adjust for energy intake becauseit could be on the causal pathway between GDQS and weight change.We further used Poisson regression to examine 4-y risk of ≥2-kg and≥5-kg weight gain, and the risk of becoming obese (BMI ≥ 30.0,among nonobese participants), with 4-y change in GDQS, GDQS+,and GDQS−. Separate analyses were conducted for women <50 y oldand for women ≥50 y old. Furthermore, we also explored differencesin weight change by GDQS comparing those with BMI < 25.0 andthose with BMI ≥ 25.0. Interaction with age or BMI was examined bymodeling a multiplicative term of GDQS and age or BMI in the model
and the likelihood ratio test comparing models with and without theinteraction term.
To compare the amount of weight change from changes in GDQSwith other diet quality scores, we first standardized 4-y difference inthe GDQS, AHEI-2010, and MDD-W and modeled 1 SD in the changeof each score. Regression coefficients from the linear model were thencompared using the Wald test. All analyses were conducted using SASversion 9.4 (SAS Institute).
Results
In this cohort of female nurses, the mean ± SD weight gainin all 4-y periods was 1.68 ± 6.26 kg. Women with anincrease in GDQS over 4-y periods tended to also increase theirphysical activity and alcohol consumption, whereas those witha decrease in score also decreased their physical activity level(Table 1).
After adjusting for potential confounders, women with >5-point increases in GDQS gained less weight (−1.13 kg; 95%CI: −1.19, −1.06 kg) than women with little change in score(Table 2). Those with >5-point decreases in GDQS gained1.03 kg (95% CI: 0.94, 1.11 kg) more than those with littlechange in score. The association was stronger for women aged<50 y (−1.24 kg; 95% CI: −1.31, −1.16 kg) than for thoseaged ≥50 y (−0.96 kg; 95% CI: −1.08, −1.84 kg) for >5-pointincreases (P-interaction < 0.05). Among those with a scoredecrease of >5 points, younger women gained 1.13 kg (95% CI:1.04, 1.22 kg) compared with 0.81 kg (95% CI: 0.63, 0.98 kg)in older women. The GDQS was more strongly associatedwith weight change in women with BMI ≥ 25 than with BMI< 25 (P-interaction < 0.05 for each age group) (SupplementalTable 1). Among women aged <50 y with BMI < 25, each 5-point increase was associated with −0.38 kg (95% CI: −0.41,−0.35 kg) less weight gain. But among younger women withBMI ≥ 25, weight gain was −1.41 kg less (95% CI: −1.47,−1.35 kg) for each 5-point increase in GDQS. Similarly, amongwomen aged ≥50 y, the GDQS had a stronger association withless weight gain among those with higher BMI (−1.00 kg; 95%CI: −1.07, −0.92 kg) than among leaner individuals (−0.31 kg;95% CI: −0.37, −0.26 kg).
164S Supplement

TABLE 2 Four-year weight change by different amounts of 4-y change in GDQS in Nurses’ Health Study II participants1
GDQS change, points
<−5(decrease)
−5 to <−2(decrease)
−2 to 2(little change)
>2 to 5(increase)
>5(increase)
Per 5-pointincrease
All womenAge adjusted 0.92 (0.84, 1.00) 0.43 (0.36, 0.49) Reference − 0.41 (−0.47, −0.35) − 1.06 (−1.13, −1.00) − 0.70 (−0.73, −0.68)Multivariable2 1.03 (0.94, 1.11) 0.47 (0.41, 0.54) Reference − 0.44 (−0.50, −0.38) − 1.13 (−1.19, −1.06) − 0.77 (−0.80, −0.75)
Women <50 y oldAge adjusted 1.05 (0.96, 1.14) 0.41 (0.34, 0.48) Reference − 0.45 (−0.52, −0.38) − 1.16 (−1.24, −1.09) − 0.75 (−0.78, −0.72)Multivariable2 1.13 (1.04, 1.22) 0.45 (0.38, 0.53) Reference − 0.49 (−0.56, −0.42) − 1.24 (−1.31, −1.16) − 0.83 (−0.86, −0.80)
Women ≥50 y oldAge adjusted 1.00 (0.83, 1.17) 0.76 (0.63, 0.88) Reference − 0.05 (−0.16, 0.05) − 0.55 (−0.66, −0.44) − 0.55 (−0.59, −0.50)Multivariable2 0.81 (0.63, 0.98) 0.54 (0.41, 0.67) Reference − 0.43 (−0.54, −0.31) − 0.96 (−1.08, −0.84) − 0.71 (−0.76, −0.66)
1Values are weight changes (95% CIs) in kg. GDQS, Global Diet Quality Score.2Adjusted for age, time period, change in smoking, oral contraceptive use, menopausal status and postmenopausal hormone use (“all women” analysis only), change in sitting,change in physical activity, change in alcohol intake, baseline GDQS, and sleep duration.
Increase in the GDQS was also associated with a lower riskof gaining 2 kg (Supplemental Table 2) or 5 kg in a 4-y period(Supplemental Table 3). The RR for 2-kg and 5-kg weight gainfor a >5-point decrease in GDQS, compared with little changein score, was slightly but significantly (P-interaction < 0.05)stronger for women aged ≥50 y than for those aged <50 y.Specifically, RR for 2-kg gain was 1.18 compared with 1.14 andfor 5-kg gain was 1.41 compared with 1.28.
When we explored the healthy (GDQS+) and unhealthy(GDQS−) submetrics of the GDQS, we found that both wereassociated with weight change (Supplemental Table 4). Each 3-point increase in the GDQS+ was associated with −0.19 kg(95% CI: −0.20, −0.17 kg) less weight gain. This associationwas stronger among women aged <50 y (−0.22 kg; 95% CI:−0.24, −0.20 kg) than among women aged ≥50 y (−0.14 kg;95% CI: −0.17, −0.11 kg) (P-interaction < 0.05). Each 3-point increase was associated with a lower risk of a 2-kg weightgain (RR: 0.97; 95% CI: 0.97, 0.98) and a 5-kg weight gain(RR: 0.95; 95% CI: 0.94, 0.96), with no significant differencebetween younger and older women (Supplemental Table 5).
On the other hand, a >2-point decrease in GDQS−(representing increased intake of unhealthy foods), comparedwith little change, was associated with 1.23 kg more weight gain(95% CI: 1.16, 1.29 kg) (Supplemental Table 4). The associationwas stronger, however, for women aged ≥50 y (1.33 kg; 95%CI: 1.21, 1.46 kg) than for women aged <50 y (1.19 kg; 95%
CI: 1.12, 1.27 kg) (P-interaction < 0.05). The association of a>2-point decrease in GDQS− and risk of weight gain was alsostronger in older than in younger women for 2 kg and 5 kgweight gain (P-interaction < 0.05 for both): for 2 kg, RR was1.20 compared with 1.13; and for 5 kg, RR was 1.43 comparedwith 1.24 (Supplemental Table 5).
Increase in the GDQS was associated with a lower risk ofdeveloping obesity in a 4-y period (Table 3). The RR for each5-point increase was 0.84 (95% CI: 0.82, 0.95). No significantinteraction was observed with age. Similarly, the GDQS+ wasassociated with a lower risk of obesity (RR for 3 points increase:0.95; 95% CI: 0.94, 0.96), with no apparent difference by age(Supplemental Table 5). However, the GDQS− had a strongerassociation with the risk of obesity among older women (RRfor >2 points decrease: 1.53; 95% CI: 1.42, 1.66) than amongyounger women (RR for >2 points decrease: 1.29; 95% CI:1.25, 1.35) (P-interaction < 0.05).
When we compared the GDQS with the AHEI-2010 andMDD-W, we observed significant associations between all 3 dietquality scores and weight change (Figure 1A), risks of 2-kg and5-kg weight gain (Supplemental Table 6), and risk of obesity(Figure 1B). In pairwise comparisons, all associations weresignificantly stronger for AHEI-2010 than GDQS, and strongerfor GDQS than MDD-W (all P values < 0.05). However, thedifference between the AHEI-2010 and GDQS for RR forobesity was small (0.80 compared with 0.85 for all women),
TABLE 3 RRs (95% CIs) of developing obesity in 4 y by different amounts of 4-y change in GDQS in Nurses’ Health Study IIparticipants1
GDQS change, points
<−5(decrease)
−5 to <−2(decrease)
−2 to 2(little change)
>2 to 5(increase)
>5(increase)
Per 5-pointincrease
All womenAge adjusted 1.40 (1.34, 1.46) 1.13 (1.09, 1.18) 1.00 (reference) 0.93 (0.90, 0.97) 0.84 (0.81, 0.88) 0.85 (0.84, 0.86)Multivariable2 1.32 (1.26, 1.37) 1.13 (1.08, 1.17) 1.00 (reference) 0.89 (0.86, 0.93) 0.77 (0.74, 0.81) 0.84 (0.82, 0.85)
Women <50 y oldAge adjusted 1.43 (1.36, 1.51) 1.10 (1.05, 1.16) 1.00 (reference) 0.89 (0.85, 0.94) 0.79 (0.75, 0.83) 0.82 (0.81, 0.84)Multivariable2 1.31 (1.25, 1.37) 1.08 (1.03, 1.13) 1.00 (reference) 0.88 (0.84, 0.92) 0.76 (0.72, 0.80) 0.83 (0.82, 0.85)
Women ≥50 y oldAge adjusted 1.47 (1.30, 1.66) 1.28 (1.16, 1.41) 1.00 (reference) 0.99 (0.90, 1.08) 0.91 (0.83, 1.00) 0.85 (0.82, 0.89)Multivariable2 1.38 (1.23, 1.55) 1.26 (1.15, 1.38) 1.00 (reference) 0.93 (0.85, 1.01) 0.80 (0.73, 0.88) 0.83 (0.80, 0.86)
1GDQS, Global Diet Quality Score.2Adjusted for age, time period, change in smoking, oral contraceptive use, menopausal status and postmenopausal hormone use (“all women” analysis only), change in sitting,change in physical activity, change in alcohol intake, baseline GDQS, and sleep duration.
GDQS and weight change 165S

-0.70 -0.75-0.63
-1.02 -1.08-0.94
-0.23 -0.26-0.19
-1.2
-1.0
-0.8
-0.6
-0.4
-0.2
0.0All Age < 50 y Age ≥50 y
4-y
wei
ght c
hang
e, k
g
GDQS AHEI-2010 MDDW
A
0.85 0.85 0.85
0.80 0.80 0.79
0.93 0.920.95
0.75
0.80
0.85
0.90
0.95
1.00All Age < 50 y Age ≥50 y
RR
GDQS AHEI-2010 MDDW
B
FIGURE 1 Multivariable-adjusted 4-y weight change (A) or 4-y riskof obesity (B) by concurrent 1-SD increase in diet quality scores(adjusted for the same variables as in Table 2) in Nurses’ Health StudyII participants. (A) Weight change (kg) (P values comparing GDQS withAHEI-2010 or with MDD-W were <0.05). (B) RR for obesity (P valuescomparing GDQS with AHEI-2010 or with MDD-W were <0.05). AHEI-2010, Alternate Healthy Eating Index-2010; GDQS, Global Diet QualityScore; MDD-W, Minimum Dietary Diversity for Women.
and the difference for weight change was 0.32 kg among allwomen.
Discussion
In this analysis of US women, increase in the GDQS over 4-y periods was associated with less concurrent weight gain andlower risk of obesity. The association for weight change wasstronger among women aged <50 y, but there was no agedifference for the risk of obesity.
A number of prospective observational studies from Europe(9, 27), Australia (10, 28), and the United States (29), includingAfrican-American women (30), have found inverse associationbetween healthy diets and weight change or risk of overweightand obesity. Adherence was commonly measured with dietquality indexes (10, 28, 29) or from derived dietary patterns(30) and included various Mediterranean diet scores (9, 27).Although the characteristics of the metrics vary, they generallyemphasized higher intakes of fruits, vegetables, whole grains,and fish and lower intakes of refined grains, red and processedmeats, and added sugar. In addition, a randomized trial amongreproductive-age women in Australia showed an improvementin diet quality was associated with less weight gain (12). Theseresults suggest that dietary characteristics that favor weightmanagement can have a fair amount of variation within somegeneral principles.
A number of mechanisms may explain the associationbetween healthy diets and weight change. Diets high in fruitsand vegetables tend to be lower in energy density relative
to their volume and therefore promote satiety and hence lessenergy intake per meal (31). Moreover, the lower glycemicload of minimally processed carbohydrates does not producelarge postprandial fluctuations in insulin concentrations andthus could sustain satiation (13). A plant-rich diet containsmore fermentable fibers and leads to higher concentrations ofabsorbable SCFAs produced by gut microbes (32). These SCFAsare capable of crossing the blood–brain barrier and regulateappetite (33). Therefore, healthy dietary patterns with theirfocus on minimally processed plant foods may modulate weightchange trajectories.
This analysis has several strengths. Examining weight changein 4-y periods avoided short-term weight fluctuations causedby diet changes that were not sustained. The large samplesize allowed for adequate power to examine both women ofreproductive age (<50 y) and older women (≥50 y). We hadrepeated data on numerous potential confounders to minimizeconfounding. However, because data were obtained from self-report, some amount of measurement error was unavoidable.Because members of the NHS II were nurses, their knowledgeand awareness of their health-related behaviors would likelyresult in less reporting error than among the general public.
The GDQS was constructed to capture dietary characteristicsthat would predict both nutrient adequacy and risk of chronicdisease–related outcomes. Therefore, it would be expectedto have a stronger association with weight change than theMDD-W, which was constructed to reflect only micronutrientadequacy in low-income countries. On the other hand, othermetrics could capture dietary characteristics that are morestrongly associated with weight change and could performbetter than the GDQS. As observed in this analysis, a 1-SDincrease in the AHEI-2010 was more strongly associated withweight change than a 1-SD increase in the GDQS. Nevertheless,our analysis showed that an achievable amount of improvementin the GDQS was associated with significantly less weight gainof a meaningful magnitude. In addition, unlike the AHEI-2010,the GDQS does not require sophisticated dietary collection andanalysis technology, and hence can be used in a wider range ofsettings. Also, the GDQS is a metric that is useful in the globalcontext and has the advantage of comparability across globalstudies. Therefore, results from this analysis adequately supportusing the GDQS as a metric to gauge diet quality for the purposeof weight management. Although environmental sustainabilitywas not a primary focus in constructing the GDQS, its emphasison plant foods and minimally processed foods does encompasssustainable eating habits to a considerable extent.
In conclusion, improvement in diet quality as measured bythe GDQS was associated with less weight gain in US women,with the association stronger for those of reproductive age. Aninverse association was also observed between the GDQS andrisk of obesity with similar magnitude across age groups.
Acknowledgments
The authors’ responsibilities were as follows—TTF, YL, andSB: designed the research; TTF: analyzed the data, wrote thepaper, and had primary responsibility for the final content;WCW, MS, FBH, CB, MDH, WF, SNB, and MD: provided studyoversight and advice; and all authors: read and approved thefinal manuscript.
References1. Dai H, Alsalhe TA, Chalghaf N, Riccò M, Bragazzi NL, Wu J. The global
burden of disease attributable to high body mass index in 195 countries
166S Supplement

and territories, 1990–2017: an analysis of the Global Burden of DiseaseStudy. PLoS Med 2020;17:e1003198.
2. Bjørge T, Häggström C, Ghaderi S, Nagel G, Manjer J, Tretli S, UlmerH, Harlid S, Rosendahl AH, Lang A, et al. BMI and weight changes andrisk of obesity-related cancers: a pooled European cohort study. Int JEpidemiol 2019;48:1872–85.
3. Owen CG, Kapetanakis VV, Rudnicka AR, Wathern AK, Lennon L,Papacosta O, Cook DG, Wannamethee SG, Whincup PH. Body massindex in early and middle adult life: prospective associations withmyocardial infarction, stroke and diabetes over a 30-year period: theBritish Regional Heart Study. BMJ Open 2015;5:e008105.
4. Guo Y, Yue X-J, Li H-H, Song Z-X, Yan H-Q, Zhang P, Gui Y-K,Chang L, Li T. Overweight and obesity in young adulthood and therisk of stroke: a meta-analysis. J Stroke Cerebrovasc Dis 2016;25:2995–3004.
5. Schmidt M, Bøtker HE, Pedersen L, Sørensen HT. Young adulthoodobesity and risk of acute coronary syndromes, stable angina pectoris,and congestive heart failure: a 36-year cohort study. Ann Epidemiol2014;24:356–61.e1.
6. Chen C, Ye Y, Zhang Y, Pan X-F, Pan A. Weight change acrossadulthood in relation to all cause and cause specific mortality:prospective cohort study. BMJ 2019;367:l5584.
7. Jayedi A, Rashidy-Pour A, Soltani S, Zargar MS, Emadi A, Shab-BidarS. Adult weight gain and the risk of cardiovascular disease: a systematicreview and dose–response meta-analysis of prospective cohort studies.Eur J Clin Nutr 2020;74:1263–75.
8. Wakamatsu M, Sugawara Y, Zhang S, Tanji F, Tomata Y, Tsuji I. Weightchange since age 20 and incident risk of obesity-related cancer in Japan:a pooled analysis of the Miyagi Cohort Study and the Ohsaki CohortStudy. Int J Cancer 2019;144:967–80.
9. Lassale C, Fezeu L, Andreeva VA, Hercberg S, Kengne AP, Czernichow S,Kesse-Guyot E. Association between dietary scores and 13-year weightchange and obesity risk in a French prospective cohort. Int J Obes2012;36:1455–62.
10. Aljadani HM, Patterson AJ, Sibbritt DW, Taylor RM, Collins CE.Improving diet quality over nine-years is associated with less weight gainin mid-age Australian women: a cohort study. Nutr Metab CardiovascDis 2020;30:223–32.
11. Vinke PC, Navis G, Kromhout D, Corpeleijn E. Age- and sex-specificanalyses of diet quality and 4-year weight change in nonobese adultsshow stronger associations in young adulthood. J Nutr 2020;150:560–7.
12. Martin JC, Moran LJ, Teede HJ, Ranasinha S, Lombard CB, HarrisonCL. Diet quality in a weight gain prevention trial of reproductive agedwomen: a secondary analysis of a cluster randomized controlled trial.Nutrients 2019;11:49.
13. Ludwig DS. Dietary glycemic index and obesity. J Nutr 2000;130:280S–3S.
14. Howarth NC, Saltzman E, Roberts SB. Dietary fiber and weightregulation. Nutr Rev 2001;59:129–39.
15. Vadiveloo M, Lichtenstein AH, Anderson C, Aspry K, Foraker R,Griggs S, Hayman LL, Johnston E, Stone NJ, Thorndike AN. Rapiddiet assessment screening tools for cardiovascular disease risk reductionacross healthcare settings: a scientific statement from the AmericanHeart Association. Circ Cardiovasc Qual Outcomes 2020;13:e000094.
16. Rifas-Shiman SL, Willett WC, Lobb R, Kotch J, Dart C, GillmanMW. PrimeScreen, a brief dietary screening tool: reproducibility andcomparability with both a longer food frequency questionnaire andbiomarkers. Public Health Nutr 2001;4:249–54.
17. Bromage S, Batis C, Bhupathiraju SN, Fung TT, Li Y, Fawzi WW,Deitchler M, Stampfer MJ, Willett WC. Introducing the Global DietQuality Score: a novel food-based metric for assessing diet quality inlow- and middle-income countries. J Nutr 2021;151(Suppl 10):75S–92S.
18. Bao Y, Bertoia ML, Lenart EB, Stampfer MJ, Willett WC, Speizer FE,Chavarro JE. Origin, methods, and evolution of the three Nurses’ HealthStudies. Am J Public Health 2016;106:1573–81.
19. Feskanich D, Rimm EB, Giovannucci EL, Colditz GA, Stampfer MJ,Litin LB, Willett WC. Reproducibility and validity of food intakemeasurements from a semiquantitative food frequency questionnaire.J Am Diet Assoc 1993;93:790–6.
20. Fung TT, Isanaka S, Hu FB, Willett WC. International food group–baseddiet quality and risk of coronary heart disease in men and women. AmJ Clin Nutr 2018;107:120–9.
21. Fung TT, Li Y, Bhupathiraju SN, Bromage S, Batis C, Holmes MD,Stampfer MJ, Hu FB, Deitchler M, Willett WC. Higher global dietquality score is inversely associated with risk of type 2 diabetes in U.S.women. J Nutr 2021;151(Suppl 10):168S–75S.
22. Chiuve SE, Fung TT, Rimm EB, Hu FB, McCullough ML, Wang M,Stampfer MJ, Willett WC. Alternative dietary indices both stronglypredict risk of chronic disease. J Nutr 2012;142:1009–18.
23. Gicevic S, Gaskins AJ, Fung TT, Rosner B, Tobias DK, Isanaka S, WillettWC. Evaluating pre-pregnancy dietary diversity vs. dietary qualityscores as predictors of gestational diabetes and hypertensive disordersof pregnancy. PLoS One 2018;13:e0195103.
24. Manson JE, Willett WC, Stampfer MJ, Colditz GA, Hunter DJ,Hankinson SE, Hennekens CH, Speizer FE. Body weight and mortalityamong women. N Engl J Med 1995;333:677–85.
25. Ainsworth BE, Haskell WL, Whitt MC, Irwin ML, Swartz AM, StrathSJ, O’Brien WL, Bassett DR, Jr, Schmitz KH, Emplaincourt PO, et al.Compendium of Physical Activities: an update of activity codes andMET intensities. Med Sci Sports Exerc 2000;32:S498–504.
26. Hruby A, Hu FB. The epidemiology of obesity: a big picture.Pharmacoeconomics 2015;33:673–89.
27. Romaguera D, Norat T, Vergnaud A-C, Mouw T, May AM, AgudoA, Buckland G, Slimani N, Rinaldi S, Couto E, et al. Mediterraneandietary patterns and prospective weight change in participants of theEPIC-PANACEA project. Am J Clin Nutr 2010;92:912–21.
28. Olstad DL, Lamb KE, Thornton LE, McNaughton SA, Crawford DA,Minaker LM, Ball K. Prospective associations between diet qualityand body mass index in disadvantaged women: the Resilience forEating and Activity Despite Inequality (READI) study. Int J Epidemiol2017;46:1433–43.
29. Zamora D, Gordon-Larsen P, Jacobs DR, Jr, Popkin BM. Diet qualityand weight gain among black and white young adults: the CoronaryArtery Risk Development in Young Adults (CARDIA) Study (1985–2005). Am J Clin Nutr 2010;92:784–93.
30. Boggs DA, Palmer JR, Spiegelman D, Stampfer MJ, Adams-CampbellLL, Rosenberg L. Dietary patterns and 14-y weight gain in AfricanAmerican women. Am J Clin Nutr 2011;94:86–94.
31. Rolls BJ. Dietary energy density: applying behavioural science to weightmanagement. Nutr Bull 2017;42:246–53.
32. Aoun A, Darwish F, Hamod N. The influence of the gut microbiome onobesity in adults and the role of probiotics, prebiotics, and synbioticsfor weight loss. Prev Nutr Food Sci 2020;25:113–23.
33. Alexander C, Swanson KS, Fahey GC, Jr, Garleb KA. Perspective:physiologic importance of short-chain fatty acids from nondigestiblecarbohydrate fermentation. Adv Nutr 2019;10:576–89.
GDQS and weight change 167S

The Journal of NutritionSupplement
Higher Global Diet Quality Score Is InverselyAssociated with Risk of Type 2 Diabetes in USWomenTeresa T Fung,1,2 Yanping Li,2 Shilpa N Bhupathiraju,2,3 Sabri Bromage,2 Carolina Batis,4 MichelleD Holmes,3,5 Meir Stampfer,3,5 Frank B Hu,2,3 Megan Deitchler,6 and Walter C Willett2,3
1Department of Nutrition, Simmons University, Boston, MA, USA; 2Department of Nutrition, Harvard TH Chan School of Public Health,Boston, MA, USA; 3Channing Division of Network Medicine, Department of Medicine, Brigham and Women’s Hospital, Harvard MedicalSchool, Boston, MA, USA; 4CONACYT—Health and Nutrition Research Center, National Institute of Public Health, Cuernavaca, Mexico;5Department of Epidemiology, Harvard TH Chan School of Public Health, Boston, MA, USA; and 6Intake—Center for Dietary Assessment,FHI Solutions, Washington, DC, USA
ABSTRACTBackground: We have developed a diet quality metric intended for global use. To assess its utility in high-income
settings, an evaluation of its ability to predict chronic disease is needed.
Objectives: We aimed to prospectively examine the ability of the Global Diet Quality Score (GDQS) to predict the risk
of type 2 diabetes in the United States, examine potential differences of association by age, and compare the GDQS
with other diet quality scores.
Methods: Health, lifestyle, and diet information was collected from women (n = 88,520) in the Nurses’ Health Study
II aged 27–44 y at baseline through repeated questionnaires between 1991 and 2017. The overall GDQS consists of 25
food groups. Points are awarded for higher intake of healthy groups and lower intake of unhealthy groups (maximum
of 49 points). Multivariable HRs were computed for confirmed type 2 diabetes using proportional hazards models. We
also compared the GDQS with the Minimum Diet Diversity score for Women (MDD-W) and the Alternate Healthy Eating
Index-2010 (AHEI-2010).
Results: We ascertained 6305 incident cases of type 2 diabetes during follow-up. We observed a lower risk of diabetes
with higher GDQS; the multivariable HR comparing extreme quintiles of the GDQS was 0.83 (95% CI: 0.76, 0.91; P-
trend < 0.001). The magnitude of association was similar between women aged <50 y and those aged ≥50 y. An
inverse association was observed with lower intake of unhealthy components (HR comparing extreme quintiles of the
unhealthy submetric: 0.76; 95% CI: 0.69, 0.84; P-trend < 0.001) but was not with the healthy submetric. The inverse
association for each 1-SD increase in the GDQS (HR: 0.93; 95% CI: 0.91, 0.96) was stronger (P < 0.001) than for the
MDD-W (HR: 1.00; 95% CI: 0.94, 1.04) but was slightly weaker (P = 0.03) than for the AHEI-2010 (HR: 0.91; 95% CI:
0.88, 0.94).
Conclusions: A higher GDQS was inversely associated with type 2 diabetes risk in US women of reproductive age
or older, mainly from lower intake of unhealthy foods. The GDQS performed nearly as well as the AHEI-2010. J Nutr
2021;151:168S–175S.
Keywords: diet quality, diabetes, epidemiology, women, nutrition
Introduction
Several diet quality indices have been developed and evaluatedfor their association with risk of chronic diseases (1). Theseindices typically were based on recommendations for a healthydiet (2–4) or reflections of regional dietary habits (5–7). Manyinclude nutrient components and therefore require the use ofa food composition database (2–4), or a scoring algorithm thatis based on population-specific intake levels (5, 8). Evidencefrom prospective studies is consistent that adherence tothese diet quality indices is associated with a lower risk of
several chronic diseases, including cardiovascular disease anddiabetes (1).
To apply these diet quality indices in clinical and publichealth settings to guide individual dietary choices and publichealth surveillance, the metric must be simple and quick toadminister. In addition, a metric that is valid and practical foruse across different parts of the world and different economicdevelopment levels would have the additional advantage ofenabling global comparisons. Therefore, indices that involve afood composition database or use population-specific scoringwould be difficult to implement across regions. To circumvent
C© The Author(s) 2021. Published by Oxford University Press on behalf of the American Society for Nutrition. This is an Open Access article distributed under theterms of the Creative Commons Attribution License (http://creativecommons.org/licenses/by/4.0/), which permits unrestricted reuse, distribution, and reproduction
in any medium, provided the original work is properly cited.Manuscript received February 27, 2021. Initial review completed March 29, 2021. Revision accepted May 25, 2021.
First published online October 1, 2021; doi: https://doi.org/10.1093/jn/nxab195.168S

these limitations, we previously developed the Prime DietQuality Score (PDQS) that only consists of food groups. It isinversely associated with cardiovascular disease and gestationaldiabetes in US men and women (9, 10).
To provide a metric that is usable in regions wherenutritional adequacy is a concern, we have further modifiedthe PDQS and tested it for association with nutritionalmarkers relevant to middle- and lower-income countries. Ourfinal metric, the Global Diet Quality Score (GDQS), uses acombination of healthy and unhealthy food groups. It hasreasonable correlation with measures of nutrient adequacy (11).
Because the GDQS has several differences from the PDQS,we assessed its utility in a higher-income setting by testing itsability to predict the risk of type 2 diabetes in US women.We chose type 2 diabetes because the incidence is increasingglobally, with a projected increase from >400 million affected in2019 to ∼700 million by 2045 (12). In the United States, it wasestimated that 12% of adult women and 14% of adult men wereliving with diabetes in 2013–2016 (13). Although a plethora ofmedications are available (14), there is no cure in most casesand successful management requires adequate compliance andregular access to health care (15). Therefore, prevention throughlifestyle, and especially diet, continues to be an importantapproach. In this analysis, we prospectively examined the asso-ciation between the GDQS and the risk of type 2 diabetes amongUS women, and explored potential differences in association byage. To understand the function of the GDQS, we also exploredhow the healthy and unhealthy components would drive any ob-served association. We hypothesized that the overall GDQS andthe healthy components (GDQS+ submetric) would be inverselyassociated with diabetes risk, whereas lower intake of the un-healthy components (GDQS− submetric) would have an inverseassociation. For the GDQS to be a useful nutrition metric topredict noncommunicable diseases, it must also perform at leastsimilarly as other established diet quality indices. Therefore,we also compared it with the Minimum Diet Diversity scorefor Women (MDD-W) and the Alternate Healthy Eating Index-2010 (AHEI-2010) for prediction of type 2 diabetes.
Funding for the research was provided by FHI Solutions, recipient of a Bill& Melinda Gates Foundation grant to support Intake—Center for DietaryAssessment and by NIH grant U01 CA176726.Author disclosures: TTF is an Associate Editor for the Journal of Nutrition andplayed no role in the Journal’s evaluation of the manuscript. All other authorsreport no conflicts of interest.The content is solely the responsibility of the authors and does not necessarilyrepresent the official views of the NIH.Supplemental Tables 1–5 are available from the “Supplementary data” link inthe online posting of the article and from the same link in the online table ofcontents at https://academic.oup.com/jn.Published in a supplement to The Journal of Nutrition. Publication costs for thissupplement were funded by the Bill & Melinda Gates Foundation in conjunctionwith FHI Solutions, recipient of a Bill & Melinda Gates Foundation grant tosupport Intake—Center for Dietary Assessment. The opinions expressed in thispublication are those of the authors and are not attributable to the sponsorsor the publisher, Editor, or Editorial Board of The Journal of Nutrition. TheSupplement Coordinators for the supplement publication were Megan Deitchler,Intake—Center for Dietary Assessment at FHI Solutions, Washington, DC; andSabri Bromage, Harvard TH Chan School of Public Health, Boston, MA.The GDQS research initiative was launched by Intake – Center for DietaryAssessment. The research was led by Harvard T.H. Chan School of Public Health,Department of Nutrition and carried out in collaboration with researchers at theNational Public Health Institute (INSP), Mexico. Funding for the research wasprovided by FHI Solutions, recipient of a Bill & Melinda Gates Foundation grantto support Intake – Center for Dietary Assessment.Address correspondence to TTF (e-mail: [email protected]).Abbreviations used: AHEI-2010, Alternate Healthy Eating Index-2010; GDQS,Global Diet Quality Score; MDD-W, Minimum Diet Diversity score for Women;MET, metabolic equivalent hour; PDQS, Prime Diet Quality Score.
MethodsParticipantsThe Nurses’ Health Study II (NHS II) is an ongoing prospective cohortstudy that is comprised of 116,430 US female Registered Nursesbetween 25 and 42 y old at inception in 1989 (16). Information onlifestyle practices and incidence of type 2 diabetes was collected every 2 yby self-reported questionnaires. Diet was assessed every 4 y beginning in1991 using a validated FFQ. Women with diabetes, gestational diabetes,cancer, or cardiovascular disease or who died before the first dietaryassessment were excluded. We also excluded those who did not completeadditional questionnaires beyond baseline and those who reportedimplausible energy intakes (<500 or >3500 kcal/d) at baseline. If aparticipant reported being pregnant in a questionnaire period, person-time during that 2-y period was excluded. A total of 88,520 womenwere included in this analysis and loss to follow-up was ∼10% duringthe study period. This study was approved by the institutional reviewboards of Brigham and Women’s Hospital and the Harvard TH ChanSchool of Public Health.
Diet assessmentA validated semiquantitative FFQ was self-administered every 4 y, eachcontaining ∼135 items (17). For each food item, a standard portionsize was provided with 9 intake frequency choices ranging from “neveror less than once per month” to “≥6 times per day.” The GDQSwas modified based on the PDQS (9) to capture food groups thatwould reflect nutrient adequacy and predict major noncommunicablediseases in both lower- and high-income countries globally. It consistsof 16 healthy food groups (dark green leafy vegetables, cruciferousvegetables, deep orange vegetables, other vegetables, deep orange fruits,deep orange tubers, citrus fruits, other fruits, legumes, nuts and seeds,poultry and game meats, fish and shellfish, whole grains, liquid oils, lowfat dairy, eggs) and 7 unhealthy food groups (white roots and tubers,processed meats, refined grains and baked goods, sugar-sweetenedbeverages, sweets and ice cream, juices, purchased deep fried foods)(Supplemental Table 1). Intake of each food group was classified into<1/wk, 1 to <4/wk, and ≥4/wk. For healthy food groups, pointsbetween 0 and 4 were given to each level of intake depending on thefood group. For unhealthy food groups, 2, 1, and 0 points were givenfor the same 3 intake levels so lower intake would receive more points.In addition to the aforementioned food groups, the GDQS also has a redmeat group and a full-fat dairy group with different scoring to accountfor their contribution to nutrient adequacy in low- to middle-incomecountries. Red meat was given 0, 1, and 0 points for intake of the same3 intake levels as for the other unhealthy food groups, and full-fat dairywas given 0, 1, 2, and 0 points for intake of <1/wk, 1 to <4/wk, ≥4/wkto <3/d, and ≥3/d, respectively. The full GDQS has 25 food groups anda score range of 0–49 points, with higher points representing a healthierdiet. The healthy portion of the GDQS (GDQS+) has a range of 0–32.For the purpose of this analysis, we included red meat and full-fat dairyas part of the unhealthy portion (GDQS−), which has a range of 0–17,with a higher score representing lower intake of unhealthy foods andhence healthier food choices.
To compare the GDQS with other established diet quality indices,we also computed the AHEI-2010 (2) and the MDD-W (18) for eachparticipant. The AHEI-2010 consists of 11 food and nutrient groups.High points are given for higher intakes of healthy groups (vegetables,whole fruits, nuts and legumes, whole grains, polyunsaturated fat,and long-chain n–3 fatty acids) and lower intakes of unhealthygroups (red and processed meats, sugar-sweetened beverages and fruitjuice, trans fat, and sodium). Points are also given for moderateintake of alcohol. Each component ranges from 0 to 10 pointswith the total possible score ranging from 0 to 110 points. It haspreviously been shown to be inversely associated with diabetes risk inwomen (2).
The MDD-W, originally developed as a proxy indicator for nutrientadequacy, consists of 10 food groups: grains and starchy vegetables,pulses, nuts and seeds, dairy, animal flesh, eggs, dark green leafyvegetables, vitamin A–rich vegetables and fruits, other vegetables, andother fruits (18). The scoring method for the original MDD-W is based
GDQS and diabetes risk 169S

on intake collected by 24-h recall. To adapt it for the FFQ, we assigned1 point for each food group with intake ≥1 serving/d and 0 for less (9).The MDD-W has a range of 0–10 points.
Outcome assessmentIncident type 2 diabetes was first reported through the biennial ques-tionnaires and confirmed with a validated supplemental questionnairebased on National Diabetes Data Group criteria. This included ≥1 ofthe following: ≥1 classic symptom (excessive thirst, polyuria or frequenturination, weight loss, hunger), fasting plasma glucose concentrations≥7.8 mmol/L, or random plasma glucose concentrations ≥11.1 mmol/L(19). In the case of a lack of symptoms, diabetes was consideredconfirmed with ≥2 elevated plasma glucose concentrations on differentoccasions (fasting plasma glucose concentrations ≥7.8 mmol/L, randomconcentrations ≥11.1 mmol/L, and/or 2-h blood glucose concentrations≥11.1 mmol/L during oral-glucose-tolerance testing); or treatmentwith hypoglycemic medications (insulin or oral hypoglycemic agent).For cases reported after 1998, criteria from the American DiabetesAssociation were used in which the threshold for fasting plasma glucosechanged from 7.8 mmol/L to 7.0 mmol/L (20). The supplementalquestionnaire was validated by a review of medical reports (21). Ina random sample of 62 cases in the Nurses’ Health Study that wereconfirmed by the supplementary questionnaire, 61 (98%) cases werereconfirmed after medical records were reviewed by an endocrinologistblinded to the supplementary questionnaire.
Covariate assessmentInformation on age, race, and height was collected at cohort inception.Body weight, cigarette smoking (including the number of cigarettesper day), physical activity, menopausal status and postmenopausalhormone use, oral contraceptive use, family history of diabetes, historyof hypercholesterolemia, and high blood pressure were collected in eachbiennial questionnaire. BMI (in kg/m2) was calculated using heightcollected at baseline and weight reported at each questionnaire cycle.Alcohol intake and supplemental vitamin and mineral use were collectedwith FFQs.
Statistical analysisFor this analysis, follow-up duration in person-years was calculatedfrom the date of return of the 1991 questionnaire to the date of diabetesdiagnosis, last questionnaire returned, or 30 June, 2017. We computedcumulative averages of diet quality scores to reduce within-personvariation and represent long-term intake (22). We used time-dependentCox proportional hazards regression models to compute HRs of type2 diabetes for quintiles of the GDQS, GDQS+, and GDQS−. Eggs areincluded in the GDQS+ because of their protein and vitamin content,but they also contain substantial amounts of cholesterol. Hence, we inaddition computed an alternate GDQS+ without the egg component forsensitivity analysis. We tested for the proportional hazards assumptionby including an interaction term of GDQS and age (which reflectstime) and used the likelihood ratio test. The P value for the chi-square distribution was >0.05, hence it did not show a violation of theproportional hazards assumption.
All models were adjusted by age (mo) at the start of follow-upfor each woman and the calendar year of each questionnaire cycle.Multivariable models were adjusted for race (white/nonwhite), familyhistory of diabetes, smoking (never, past, 1–14 cigarettes/d, 15–24cigarettes/d, ≥25 cigarettes/d), alcohol intake (none, <5 g/d, 5 to<10 g/d, ≥10 g/d), energy intake (quintiles), coffee intake (continuous),physical activity [<3 metabolic equivalent hours (METs)/wk, 3 to<9 METs/wk, 9 to <18 METs/wk, 18 to <27 METs/wk, ≥27METs/wk], BMI (<23, 23 to < 25, 25 to <30, 30 to <35, ≥35),multivitamin use (yes/no), menopausal status and menopausal hormonetherapy (premenopausal, no hormone use, past use, current use), oralcontraceptive use (never, past, current), history of hypertension atbaseline, and history of hyperlipidemia at baseline. We used restrictedcubic spline regression to assess potential nonlinear association. Toaccess potential differential association of the GDQS with diabetesby age, we conducted analyses stratified by age. We also stratified
the analysis by BMI status and physical activity. To examine thepotential influence of pregnancy on the association between theGDQS and diabetes, we ran regression models separately for womenbased on pregnancy history, and among ever-pregnant women byhistory of gestational diabetes. Tests for 2-way interaction betweenthe GDQS and each of the stratified factors were conducted using thelikelihood ratio test comparing regression models with and without aninteraction term. Analysis was conducted using SAS version 9.4 (SASInstitute Inc.).
To compare the strength of association between the GDQS and theAHEI-2010 and MDD-W, we standardized each score and modeled each1 SD of the scores in the same model. Differences in the regressioncoefficients were compared using the Wald test.
Results
In ≤26 y of follow-up, we ascertained 6305 incident cases oftype 2 diabetes, of which 2266 were women younger than 50y old and 4039 were women ≥50 y old. Women with a higherGDQS tended to be leaner, more physically active, less likelyto be current smokers, and consumed more alcohol and coffee(Table 1).
We observed a lower risk of diabetes with higher GDQS(multivariable HR comparing extreme quintiles: 0.83; 95%CI: 0.76, 0.91; P-trend < 0.001) (Table 2). The associationfor women age <50 y was 0.85 (95% CI: 0.73, 0.98; P-trend < 0.001) and for age ≥50 y was 0.82 (95% CI: 0.74,0.91, P-trend < 0.001) with no significant interaction. We alsoseparately examined the submetrics of the GDQS representinghealthy (GDQS+) and unhealthy (GDQS−) food components.These 2 submetrics were only weakly correlated (Spearman r= −0.06, P < 0.001). The healthy components of the GDQS(GDQS+) were not associated with diabetes risk (Table 3). Onthe other hand, higher GDQS−, which represents lower intakeof the unhealthy components, showed an inverse association(multivariable HR comparing extreme quintiles: 0.76; 95% CI:0.69, 0.84; P-trend < 0.001). There was no apparent differencein association by age. Spline regression did not detect significantdeparture from linearity for the overall GDQS, GDQS+,or GDQS− (data not shown). In the sensitivity analysis inwhich we excluded the egg component from the GDQS+,the null association persisted in the remaining portion of theGDQS+.
The GDQS was inversely associated with diabetes in bothwomen ever or never pregnant (Supplemental Table 2). Al-though the magnitude of association did not differ substantiallyfor pregnancy history, the trend appeared to be more consistentfor never-pregnant women (P-interaction = 0.06). Amongwomen who had been pregnant, an inverse association withthe GDQS was only observed for those without a historyof gestational diabetes (multivariable HR comparing extremequintiles: 0.83; 95% CI: 0.75, 0.91; P-trend < 0.001). Wealso stratified the analysis by BMI and physical activity(Supplemental Table 3). The inverse association was significantregardless of BMI status; however, it was stronger amongleaner women (P-interaction < 0.001). On the other hand,although the association between the GDQS and diabetesappeared stronger among those with physical activity abovethe median, the P value for interaction did not reach statisticalsignificance.
We also compared the magnitude of association of the GDQSwith 2 other diet quality scores: the AHEI-2010 and MDD-W.The Spearman correlation coefficient between the GDQS andthe AHEI-2010 was 0.74 (P < 0.001); it was 0.64 (P < 0.001)
170S Supplement

TABLE 1 Age-standardized baseline characteristics by quintiles of GDQS in the Nurses’ Health Study II1
Q1 Q2 Q3 Q4 Q5
BMI 24.8 ± 5.8 24.6 ± 5.5 24.4 ± 5.1 24.3 ± 5.0 24.2 ± 4.8Physical activity, METs 14.5 ± 21.2 17.8 ± 24.1 20.4 ± 26.2 23.5 ± 28.7 29.1 ± 34.0Current smoker, % 18 14 12 11 9GDQS 14.3 ± 2.2 18.7 ± 0.9 21.5 ± 0.8 24.4 ± 0.9 28.8 ± 2.2Unhealthy GDQS components 7.1 ± 2.3 8.2 ± 2.4 8.6 ± 2.4 9.1 ± 2.4 10.1 ± 2.2Healthy GDQS components 7.3 ± 2.8 10.7 ± 2.5 12.9 ± 2.5 15.3 ± 2.4 18.7 ± 2.7MDD-W 3.0 ± 1.3 3.6 ± 1.3 4.1 ± 1.3 4.6 ± 1.2 5.4 ± 1.2AHEI-2010 37.8 ± 7.6 43.7 ± 7.7 47.8 ± 7.9 52.0 ± 8.3 58.8 ± 8.8Energy intake, kcal/d 1641 ± 536 1689 ± 537 1743 ± 532 1831 ± 530 1990 ± 529Fiber, g/d 14.3 ± 3.6 16.5 ± 4.0 18.2 ± 4.8 20.0 ± 5.2 22.7 ± 5.8Alcohol, g/d 2.4 ± 5.7 3.0 ± 6.3 3.3 ± 6.2 3.5 ± 6.1 3.9 ± 6.5Processed meats, servings/d 0.31 ± 0.33 0.26 ± 0.28 0.22 ± 0.25 0.19 ± 0.23 0.15 ± 0.20Red meats, servings/d 0.67 ± 0.43 0.60 ± 0.41 0.55 ± 0.38 0.52 ± 0.37 0.44 ± 0.34Vegetables, servings/d 1.8 ± 1.0 2.5 ± 1.3 3.0 ± 1.5 3.8 ± 1.7 5.1 ± 2.4Fruit, servings/d 1.2 ± 1.0 1.5 ± 1.1 1.8 ± 1.2 2.1 ± 1.3 2.6 ± 1.6Nuts and seeds, servings/d 0.04 ± 0.08 0.05 ± 0.10 0.06 ± 0.11 0.07 ± 0.16 0.11 ± 0.21Legumes, servings/d 0.16 ± 0.16 0.20 ± 0.18 0.24 ± 0.23 0.29 ± 0.26 0.41 ± 0.35Coffee, servings/d 1.4 ± 1.7 1.5 ± 1.7 1.6 ± 1.7 1.7 ± 1.7 1.8 ± 1.7
1n = 88,520. Values are means ± SDs unless otherwise indicated. AHEI-2010, Alternate Healthy Eating Index-2010; GDQS, Global Diet Quality Score; MDD-W, Minimum DietDiversity score for Women; MET, metabolic equivalent hour; Q, quintile.
with the MDD-W. The AHEI-2010 was inversely associatedwith diabetes (multivariable HR comparing extreme quintiles:0.62; 95% CI: 0.56, 0.68; P-trend < 0.001) and there was noappreciable difference by age (Supplemental Table 4). However,no association was observed with the MDD-W (SupplementalTable 5). When we compared the association of the GDQS withdiabetes pairwise with the AHEI-2010 and the MDD-W, theassociation for each SD increase in the AHEI-2010 was slightlystronger than for the GDQS (HR: 0.91 compared with 0.93,P for difference = 0.03) (Figure 1). On the other hand, theassociation for the GDQS was clearly stronger than for theMDD-W (P for difference < 0.001).
Discussion
In this analysis, we observed an inverse association between adiet quality score designed for global use and risk of type 2 dia-betes among US women. The association appeared to be drivenby lower intakes of unhealthy foods. The GDQS compared wellwith the AHEI-2010 which showed a strong inverse associationwith diabetes in a cohort of middle-aged nurses (23). The lowerdiabetes risk with a higher GDQS was similar between womenof reproductive age and those who were older.
Prospective studies from the United States (24), Europe (6),and Asia (25, 26) have shown adherence to healthy eating
TABLE 2 HRs (95% CI) for type 2 diabetes according to quintiles of the Global Diet Quality Score in the Nurses’ Health Study II1
Q1 Q2 Q3 Q4 Q5 P-trend
All womenMedian score 15.8 19.5 21.9 24.4 27.8Cases, n 1647 1309 1262 1112 975Person-years 365,779 364,667 365,382 373,363 364,174Age- and kcal-adjusted 1 0.76 (0.71, 0.82) 0.71 (0.66, 0.76) 0.59 (0.55, 0.64) 0.48 (0.44, 0.52) <0.001Multivariable2 1 0.91 (0.84, 0.97) 0.94 (0.87, 1.01) 0.87 (0.80, 0.94) 0.83 (0.76, 0.91) <0.001
Women < age 50 yMedian score 15.3 18.9 21.3 23.8 27.3Cases, n 634 456 459 395 322Person-years 210,566 202,881 198,185 201,222 184,898Age- and kcal-adjusted 1 0.72 (0.64, 0.82) 0.73 (0.65, 0.83) 0.61 (0.53, 0.69) 0.50 (0.44, 0.58) <0.001Multivariable2 1 0.86 (0.76, 0.98) 1.00 (0.88, 1.13) 0.90 (0.79, 1.02) 0.85 (0.73, 0.98) 0.02
Women age ≥ 50 yMedian score 16.7 20.3 22.8 25.0 28.1Cases, n 1013 853 803 717 653Person-years 155,214 161,786 167,196 172,140 179,276Age- and kcal-adjusted 1 0.79 (0.72, 0.86) 0.70 (0.63, 0.76) 0.58 (0.53, 0.64) 0.47 (0.43, 0.52) <0.001Multivariable2 1 0.93 (0.85, 1.02) 0.91 (0.82, 1.00) 0.85 (0.77, 0.94) 0.82 (0.74, 0.91) <0.001
1n = 88,520. Q, quintile.2Adjusted for age, BMI, energy intake, smoking, family history of diabetes, oral contraceptive use, menopausal status and postmenopausal hormone use (“all women” analysisonly), physical activity, alcohol intake, and multivitamin use.
GDQS and diabetes risk 171S

TABLE 3 HRs (95% CI) for type 2 diabetes according to quintiles of the healthy (GDQS+) and unhealthy (GDQS−) submetrics of theGDQS in the Nurses’ Health Study II1
Q1 Q2 Q3 Q4 Q5 P-trend
GDQS+ submetric (max = 32)All women
Median score 8.0 11.3 13.6 15.8 18.8Cases, n 1441 1290 1188 1232 1154Person-years 366,057 365,828 368,066 366,408 367,005Age- and kcal-adjusted 1 0.83 (0.77, 0.90) 0.70 (0.64, 0.76) 0.67 (0.62, 0.73) 0.54 (0.49, 0.59) <0.001Multivariable2 1 1.00 (0.92, 1.08) 0.98 (0.90, 1.07) 1.05 (0.96, 1.14) 1.00 (0.91, 1.10) 0.86
Women < age 50 yMedian score 7.5 10.8 13.2 15.4 18.5Cases, n 554 459 403 443 407Person-years 205,773 202,984 200,220 197,583 191,192Age- and kcal-adjusted 1 0.79 (0.69, 0.89) 0.64 (0.56, 0.73) 0.67 (0.58, 0.76) 0.55 (0.47, 0.64) <0.001Multivariable2 1 0.96 (0.84, 1.09) 0.92 (0.80, 1.06) 1.04 (0.90, 1.20) 1.00 (0.85, 1.17) 0.97
Women age ≥ 50 yMedian score 8.6 11.9 14.1 16.2 19.1Cases, n 887 831 785 789 747Person-years 160,284 162,845 167,846 168,825 175,813Age- and kcal-adjusted 1 0.86 (0.78, 0.94) 0.74 (0.67, 0.82) 0.68 (0.61, 0.76) 0.54 (0.48, 0.60) <0.001Multivariable2 1 1.02 (0.92, 1.13) 1.03 (0.92, 1.14) 1.05 (0.94, 1.18) 1.01 (0.89, 1.14) 0.77
GDQS− submetric (max = 14) (high score = less unhealthy)All women
Median score 5.5 7.2 8.5 9.6 11.0Cases, n 1701 1446 1151 1050 957Person-years 374,851 354,527 367,116 359,807 377,063Age- and kcal-adjusted 1 0.84 (0.78, 0.90) 0.66 (0.61, 0.71) 0.56 (0.51, 0.61) 0.47 (0.43, 0.51) <0.001Multivariable2 1 0.96 (0.89, 1.04) 0.85 (0.78, 0.92) 0.80 (0.73, 0.88) 0.76 (0.69, 0.84) <0.001
Women < age 50 yMedian score 5.3 7.0 8.0 9.5 11.0Cases, n 661 517 394 375 319Person-years 219,316 190,611 202,692 190,611 194,521Age- and kcal-adjusted 1 0.86 (0.76, 0.97) 0.69 (0.60, 0.79) 0.61 (0.53, 0.70) 0.52 (0.44, 0.61) <0.001Multivariable2 1 0.96 (0.85, 1.09) 0.87 (0.76, 1.00) 0.83 (0.72, 0.97) 0.81 (0.68, 0.95) <0.001
Women age ≥ 50 yMedian score 5.8 7.5 8.7 9.8 11.2Cases, n 1040 929 757 675 638Person-years 155,535 163,915 164,424 169,196 182,542Age- and kcal-adjusted 1 0.82 (0.75, 0.90) 0.64 (0.58, 0.71) 0.54 (0.48, 0.60) 0.45 (0.40, 0.50) <0.001Multivariable2 1 0.96 (0.87, 1.05) 0.83 (0.75, 0.92) 0.78 (0.70, 0.88) 0.74 (0.65, 0.83) <0.001
1n = 88,520. GDQS, Global Diet Quality Score; Q, quintile.2Adjusted for age, BMI, energy intake, smoking, family history of diabetes, oral contraceptive use, menopausal status and postmenopausal hormone use (“all women” analysisonly), physical activity, alcohol intake, multivitamin use, and mutually adjusted for the other submetric.
guidelines, as reflected by higher diet quality indices, to beassociated with lower risk of type 2 diabetes. Although differentdiet quality indices were used in these studies, such as theHealthy Diet Score, the Healthy Eating Index, the AlternateHealthy Eating Index, and some form of Mediterranean dietscore, the common features among them were higher intakesof fruits, vegetables, whole grains, and lean protein and lowerintakes of red and processed meats, added sugar, and refinedgrains. The number of components ranged from 6 in the HealthyNordic Food Index (6) to 11 in the Alternate Healthy EatingIndex (24). The GDQS features similar food groups, but inmore refined categories and hence a total of 25 food groups. Wehave chosen the approach of using more specific food groups tobetter specify nutrients, such as vitamin C and provitamin Acarotenoids that are nutrients of concern in some parts of theworld.
In our analysis, lower intakes of foods in the unhealthy sub-metric of the GDQS (GDQS−) were more strongly associatedwith a lower diabetes risk than was the healthy submetric of theGDQS (GDQS+). Among the foods in the GDQS−, high intakesof red and processed meats (27), refined grains (28), sugar-sweetened beverages (28), and potatoes, especially as Frenchfries (29), have previously been shown to be directly associatedwith higher risk of type 2 diabetes. In addition, fried foodshave also been shown to increase risk of type 2 diabetes (30)or gestational diabetes (31) in US women. Fried foods may bea risk factor for diabetes owing to the high energy content orthe increase in lipid oxidation products (32) and trans fat (33)created in the process of frying. Red and processed meat may beinvolved in the pathogenesis of type 2 diabetes through inducingproinflammatory advanced glycation end products (34) andpancreatic injury due to oxidative stress from heme iron (35).
172S Supplement
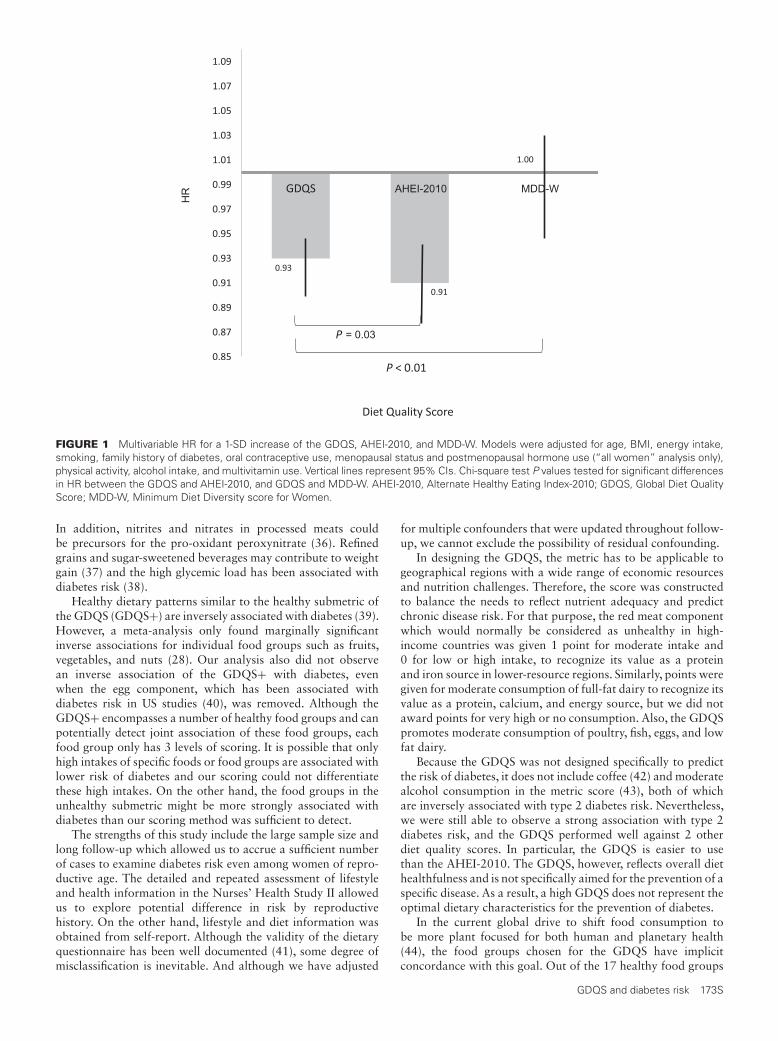
HR AHEI-2010 MDD-W
= 0.03
FIGURE 1 Multivariable HR for a 1-SD increase of the GDQS, AHEI-2010, and MDD-W. Models were adjusted for age, BMI, energy intake,smoking, family history of diabetes, oral contraceptive use, menopausal status and postmenopausal hormone use (“all women” analysis only),physical activity, alcohol intake, and multivitamin use. Vertical lines represent 95% CIs. Chi-square test P values tested for significant differencesin HR between the GDQS and AHEI-2010, and GDQS and MDD-W. AHEI-2010, Alternate Healthy Eating Index-2010; GDQS, Global Diet QualityScore; MDD-W, Minimum Diet Diversity score for Women.
In addition, nitrites and nitrates in processed meats couldbe precursors for the pro-oxidant peroxynitrate (36). Refinedgrains and sugar-sweetened beverages may contribute to weightgain (37) and the high glycemic load has been associated withdiabetes risk (38).
Healthy dietary patterns similar to the healthy submetric ofthe GDQS (GDQS+) are inversely associated with diabetes (39).However, a meta-analysis only found marginally significantinverse associations for individual food groups such as fruits,vegetables, and nuts (28). Our analysis also did not observean inverse association of the GDQS+ with diabetes, evenwhen the egg component, which has been associated withdiabetes risk in US studies (40), was removed. Although theGDQS+ encompasses a number of healthy food groups and canpotentially detect joint association of these food groups, eachfood group only has 3 levels of scoring. It is possible that onlyhigh intakes of specific foods or food groups are associated withlower risk of diabetes and our scoring could not differentiatethese high intakes. On the other hand, the food groups in theunhealthy submetric might be more strongly associated withdiabetes than our scoring method was sufficient to detect.
The strengths of this study include the large sample size andlong follow-up which allowed us to accrue a sufficient numberof cases to examine diabetes risk even among women of repro-ductive age. The detailed and repeated assessment of lifestyleand health information in the Nurses’ Health Study II allowedus to explore potential difference in risk by reproductivehistory. On the other hand, lifestyle and diet information wasobtained from self-report. Although the validity of the dietaryquestionnaire has been well documented (41), some degree ofmisclassification is inevitable. And although we have adjusted
for multiple confounders that were updated throughout follow-up, we cannot exclude the possibility of residual confounding.
In designing the GDQS, the metric has to be applicable togeographical regions with a wide range of economic resourcesand nutrition challenges. Therefore, the score was constructedto balance the needs to reflect nutrient adequacy and predictchronic disease risk. For that purpose, the red meat componentwhich would normally be considered as unhealthy in high-income countries was given 1 point for moderate intake and0 for low or high intake, to recognize its value as a proteinand iron source in lower-resource regions. Similarly, points weregiven for moderate consumption of full-fat dairy to recognize itsvalue as a protein, calcium, and energy source, but we did notaward points for very high or no consumption. Also, the GDQSpromotes moderate consumption of poultry, fish, eggs, and lowfat dairy.
Because the GDQS was not designed specifically to predictthe risk of diabetes, it does not include coffee (42) and moderatealcohol consumption in the metric score (43), both of whichare inversely associated with type 2 diabetes risk. Nevertheless,we were still able to observe a strong association with type 2diabetes risk, and the GDQS performed well against 2 otherdiet quality scores. In particular, the GDQS is easier to usethan the AHEI-2010. The GDQS, however, reflects overall diethealthfulness and is not specifically aimed for the prevention of aspecific disease. As a result, a high GDQS does not represent theoptimal dietary characteristics for the prevention of diabetes.
In the current global drive to shift food consumption tobe more plant focused for both human and planetary health(44), the food groups chosen for the GDQS have implicitconcordance with this goal. Out of the 17 healthy food groups
GDQS and diabetes risk 173S

to emphasize in the diet, only 4 were from animal origin. Andout of the 9 unhealthy food groups to minimize intake, 3were animal protein, and 1 (sweets and ice cream) often hasingredients from animal origin. Therefore, a diet that scores highon the GDQS would tend to be correlated with diets that arerelatively more plant-based.
Health metrics that have specific cutoffs are useful for riskassessment and setting treatment targets. Clinically relevantcutoffs can be identified if there are inflection points in therelation of the GDQS and risk of diabetes. Cutoffs can alsobe set by assigning a priori categories. However, this latterapproach requires somewhat arbitrary decisions and also needsto consider other outcomes and diverse populations. In ourresults, there was no departure from linearity in the GDQS.Because our results point toward a progressively lower riskof diabetes with higher GDQS, there is no strong premise tosupport specific cutoffs for the GDQS in this cohort of USwomen.
In conclusion, the GDQS was inversely associated with type2 diabetes in both reproductive-age and older women in a high-income country. It performed well compared with the AHEI-2010 in predicting diabetes risk and our results showed thatlower intake of unhealthy foods appeared to be more importantthan higher intake of healthy foods. Further testing of theGDQS in other populations is needed to confirm its usefulnessin a broad range of populations to predict noncommunicablediseases.
Acknowledgments
The authors’ responsibilities were as follows—TTF, SNB, andSB: designed the research; TTF: analyzed the data, wrote thepaper, and had primary responsibility for the final content;WCW, MS, CB, MDH, FBH, YL, and MD: provided studyoversight and advice; and all authors: read and approved thefinal manuscript.
References1. Schulze MB, Martínez-González MA, Fung TT, Lichtenstein AH,
Forouhi NG. Food based dietary patterns and chronic diseaseprevention. BMJ 2018;361:k2396.
2. Chiuve SE, Fung TT, Rimm EB, Hu FB, McCullough ML, Wang M,Stampfer MJ, Willett WC. Alternative dietary indices both stronglypredict risk of chronic disease. J Nutr 2012;142:1009–18.
3. Kaluza J, Harris HR, Håkansson N, Wolk A. Adherence to theWCRF/AICR 2018 recommendations for cancer prevention and riskof cancer: prospective cohort studies of men and women. Br J Cancer2020;122:1562–70.
4. Kirkpatrick SI, Reedy J, Krebs-Smith SM, Pannucci TE, Subar AF,Wilson MM, Lerman JL, Tooze JA. Applications of the healthyeating index for surveillance, epidemiology, and intervention research:considerations and caveats. J Acad Nutr Diet 2018;118:1603–21.
5. Hernández-Ruiz A, García-Villanova B, Guerra Hernández EJ, AmianoP, Azpiri M, Molina-Montes E. Description of indexes based on theadherence to the Mediterranean dietary pattern: a review. Nutr Hosp2015;32:1872–84.
6. Lacoppidan SA, Kyrø C, Loft S, Helnæs A, Christensen J, HansenCP, Dahm CC, Overvad K, Tjønneland A, Olsen A. Adherence to ahealthy Nordic Food Index is associated with a lower risk of type-2diabetes—the Danish Diet, Cancer and Health cohort study. Nutrients2015;7:8633–44.
7. Puaschitz NG, Assmus J, Strand E, Karlsson T, Vinknes KJ, Lysne V,Drevon CA, Tell GS, Dierkes J, Nygård O. Adherence to the HealthyNordic Food Index and the incidence of acute myocardial infarctionand mortality among patients with stable angina pectoris. J Hum NutrDiet 2019;32:86–97.
8. Fung TT, Chiuve SE, McCullough ML, Rexrode KM, Logroscino G, HuFB. Adherence to a DASH-style diet and risk of coronary heart diseaseand stroke in women. Arch Intern Med 2008;168:713–20.
9. Fung TT, Isanaka S, Hu FB, Willett WC. International food group–baseddiet quality and risk of coronary heart disease in men and women. AmJ Clin Nutr 2018;107:120–9.
10. Gicevic S, Gaskins AJ, Fung TT, Rosner B, Tobias DK, Isanaka S, WillettWC. Evaluating pre-pregnancy dietary diversity vs. dietary qualityscores as predictors of gestational diabetes and hypertensive disordersof pregnancy. PLoS One 2018;13:e0195103.
11. Bromage S, Batis C, Bhupathiraju SN, Fawzi WW, Fung TT, LiY, Deitchler M, Angulo E, Birk N, Castellanos-Gutíerrez A, et al.Development and validation of a novel food-based Global Diet QualityScore (GDQS). J Nutr 2021;151(Suppl 10):75S–92S.
12. Saeedi P, Petersohn I, Salpea P, Malanda B, Karuranga S, Unwin N,Colagiuri S, Guariguata L, Motala AA, Ogurtsova K, et al. Globaland regional diabetes prevalence estimates for 2019 and projectionsfor 2030 and 2045: results from the International Diabetes FederationDiabetes Atlas, 9th edition. Diabetes Res Clin Pract 2019;157:107843.
13. CDC. National Diabetes Statistics Report, 2020. Atlanta, GA: CDC, USDepartment of Health and Human Services; 2020.
14. American Diabetes Association. 9. Pharmacologic approaches toglycemic treatment: Standards of Medical Care in Diabetes — 2020.Diabetes Care 2020;43:S98–S110.
15. American Diabetes Association. 5. Facilitating behavior change andwell-being to improve health outcomes: Standards of Medical Care inDiabetes — 2020. Diabetes Care 2020;43:S48–65.
16. Bao Y, Bertoia ML, Lenart EB, Stampfer MJ, Willett WC, Speizer FE,Chavarro JE. Origin, methods, and evolution of the three Nurses’ HealthStudies. Am J Public Health 2016;106:1573–81.
17. Feskanich D, Rimm EB, Giovannucci EL, Colditz GA, Stampfer MJ,Litin LB, Willett WC. Reproducibility and validity of food intakemeasurements from a semiquantitative food frequency questionnaire.J Am Diet Assoc 1993;93:790–6.
18. Women’s Dietary Diversity Project (WDDP) Study Group. Developmentof a dichotomous indicator for population-level assessment ofdietary diversity in women of reproductive age. Curr Dev Nutr2017;1:cdn.117.001701.
19. National Diabetes Data Group. Classification and diagnosis ofdiabetes mellitus and other categories of glucose intolerance. Diabetes1979;28:1039–57.
20. The Expert Committee on the Diagnosis and Classification of DiabetesMellitus. Report of the Expert Committee on the Diagnosis andClassification of Diabetes Mellitus. Diabetes Care 1997;20:1183–97.
21. Manson JE, Stampfer MJ, Colditz GA, Willett WC, Rosner B,Hennekens CH, Speizer FE, Rimm EB, Krolewski AS. Physical activityand incidence of non-insulin-dependent diabetes mellitus in women.Lancet 1991;338:774–8.
22. Hu FB, Stampfer MJ, Rimm E, Ascherio A, Rosner BA, Spiegelman D,Willett WC. Dietary fat and coronary heart disease: a comparison ofapproaches for adjusting for total energy intake and modeling repeateddietary measurements. Am J Epidemiol 1999;149:531–40.
23. Fung TT, McCullough M, van Dam RM, Hu FB. A prospective studyof overall diet quality and risk of type 2 diabetes in women. DiabetesCare 2007;30:1753–7.
24. Cespedes EM, Hu FB, Tinker L, Rosner B, Redline S, Garcia L, HingleM, Van Horn L, Howard BV, Levitan EB, et al. Multiple healthfuldietary patterns and type 2 diabetes in the Women’s Health Initiative.Am J Epidemiol 2016;183:622–33.
25. Chen G-C, Koh W-P, Neelakantan N, Yuan J-M, Qin L-Q, van DamRM. Diet quality indices and risk of type 2 diabetes mellitus: theSingapore Chinese Health Study. Am J Epidemiol 2018;187:2651–61.
26. Yu D, Zheng W, Cai H, Xiang Y-B, Li H, Gao Y-T, Shu X-O. Long-termdiet quality and risk of type 2 diabetes among urban Chinese adults.Diabetes Care 2018;41:723–30.
27. Micha R, Michas G, Mozaffarian D. Unprocessed red and processedmeats and risk of coronary artery disease and type 2 diabetes –an updated review of the evidence. Curr Atheroscler Rep 2012;14:515–24.
28. Schwingshackl L, Hoffmann G, Lampousi A-M, Knüppel S, Iqbal K,Schwedhelm C, Bechthold A, Schlesinger S, Boeing H. Food groups andrisk of type 2 diabetes mellitus: a systematic review and meta-analysisof prospective studies. Eur J Epidemiol 2017;32:363–75.
174S Supplement

29. Schwingshackl L, Schwedhelm C, Hoffmann G, Boeing H. Potatoes andrisk of chronic disease: a systematic review and dose–response meta-analysis. Eur J Nutr 2019;58:2243–51.
30. Cahill LE, Pan A, Chiuve SE, Sun Q, Willett WC, Hu FB, Rimm EB.Fried-food consumption and risk of type 2 diabetes and coronary arterydisease: a prospective study in 2 cohorts of US women and men. Am JClin Nutr 2014;100:667–75.
31. Osorio-Yáñez C, Gelaye B, Qiu C, Bao W, Cardenas A, EnquobahrieDA, Williams MA. Maternal intake of fried foods and risk of gestationaldiabetes mellitus. Ann Epidemiol 2017;27:384–90.e1.
32. Gupta MK. Frying oils. In: Shahidi F, editor. Baileys’ industrial oil andfat products. Hoboken, NJ: John Wiley & Sons; 2005.
33. Yang M, Yang Y, Nie S, Xie M, Chen F. Analysis and formation of transfatty acids in corn oil during the heating process. J Am Oil Chem Soc2012;89:859–67.
34. Uribarri J, Woodruff S, Goodman S, Cai W, Chen X, Pyzik R, YongA, Striker GE, Vlassara H. Advanced glycation end products in foodsand a practical guide to their reduction in the diet. J Am Diet Assoc2010;110:911–16.e12.
35. Rajpathak SN, Crandall JP, Wylie-Rosett J, Kabat GC, Rohan TE, HuFB. The role of iron in type 2 diabetes in humans. Biochim Biophys Acta2009;1790:671–81.
36. Pacher P, Beckman JS, Liaudet L. Nitric oxide and peroxynitrite inhealth and disease. Physiol Rev 2007;87:315–424.
37. Malik VS, Hu FB. Sweeteners and risk of obesity and type 2 diabetes: therole of sugar-sweetened beverages. Curr Diab Rep 2012;12:195–203.
38. Ludwig DS. The glycemic index: physiological mechanisms relating toobesity, diabetes, and cardiovascular disease. JAMA 2002;287:2414–23.
39. Jayedi A, Soltani S, Abdolshahi A, Shab-Bidar S. Healthy and unhealthydietary patterns and the risk of chronic disease: an umbrella review ofmeta-analyses of prospective cohort studies. Br J Nutr 2020;124:1133–44.
40. Djoussé L, Khawaja OA, Gaziano JM. Egg consumption and risk oftype 2 diabetes: a meta-analysis of prospective studies. Am J Clin Nutr2016;103:474–80.
41. Yuan C, Spiegelman D, Rimm EB, Rosner BA, Stampfer MJ, BarnettJB, Chavarro JE, Subar AF, Sampson LK, Willett WC. Validityof a dietary questionnaire assessed by comparison with multipleweighed dietary records or 24-hour recalls. Am J Epidemiol 2017;185:570–84.
42. Carlström M, Larsson SC. Coffee consumption and reduced risk ofdeveloping type 2 diabetes: a systematic review with meta-analysis. NutrRev 2018;76:395–417.
43. Knott C, Bell S, Britton A. Alcohol consumption and the risk of type 2diabetes: a systematic review and dose-response meta-analysis of morethan 1.9 million individuals from 38 observational studies. DiabetesCare 2015;38:1804–12.
44. Willett W, Rockström J, Loken B, Springmann M, Lang T, VermeulenS, Garnett T, Tilman D, DeClerck F, Wood A, et al. Food in theAnthropocene: the EAT–Lancet Commission on healthy diets fromsustainable food systems. Lancet 2019;393:447–92.
GDQS and diabetes risk 175S

The Journal of NutritionSupplement
There’s an App for That: Development of anApplication to Operationalize the Global DietQuality ScoreMourad Moursi,1 Sabri Bromage,2 Teresa T Fung,2 Sheila Isanaka,2 Mika Matsuzaki,3 Carolina Batis,4
Analí Castellanos-Gutiérrez,4 Erick Angulo,4 Nick Birk,5 Shilpa N. Bhupathiraju,2,6 Yuna He,7 Yanping Li,2
Wafaie Fawzi,2,8 Armen Danielyan,9 Sachit Thapa,9 Liseteli Ndiyoi,10 Marieke Vossenaar,1
Alexandra Bellows,3 Joanne E Arsenault,1 Walter C Willett,2,6,8 and Megan Deitchler1
1Intake – Center for Dietary Assessment, FHI Solutions, Washington DC, USA; 2Department of Nutrition, Global Health and Population,and Epidemiology, Harvard TH Chan School of Public Health, Boston, MA, USA; 3Department of International Health, Johns HopkinsBloomberg School of Public Health, Baltimore, MD, USA; 4Health and Nutrition Research Center, National Institute of Public Health,Cuernavaca, Mexico; 5Department of Biostatistics, Harvard TH Chan School of Public Health, Boston, MA, USA; 6Channing Division ofNetwork Medicine, Department of Medicine, Brigham and Women’s Hospital, Harvard Medical School, Boston, MA, USA; 7NationalInstitute for Nutrition and Health, Chinese Center for Disease Control and Prevention, Beijing, China; 8Department of Epidemiology,Harvard TH Chan School of Public Health, Boston, MA, USA; 9Digital Development, FHI 360, Washington DC, USA; and 10Independentconsultant, Lusaka, Zambia
ABSTRACTBackground: The global diet quality score (GDQS) is a simple, standardized metric appropriate for population-based
measurement of diet quality globally.
Objectives: We aimed to operationalize data collection by modifying the quantity of consumption cutoffs originally
developed for the GDQS food groups and to statistically evaluate the performance of the operationalized GDQS relative
to the original GDQS against nutrient adequacy and noncommunicable disease (NCD)-related outcomes.
Methods: The GDQS application uses a 24-h open-recall to collect a full list of all foods consumed during the previous
day or night, and automatically classifies them into corresponding GDQS food group. Respondents use a set of 10 cubes
in a range of predetermined sizes to determine if the quantity consumed per GDQS food group was below, or equal to
or above food group-specific cutoffs established in grams. Because there is only a total of 10 cubes but as many as 54
cutoffs for the GDQS food groups, the operationalized cutoffs differ slightly from the original GDQS cutoffs.
Results: A secondary analysis using 5 cross-sectional datasets comparing the GDQS with the original and
operationalized cutoffs showed that the operationalized GDQS remained strongly correlated with nutrient adequacy
and was equally sensitive to anthropometric and other clinical measures of NCD risk. In a secondary analysis of a
longitudinal cohort study of Mexican teachers, there were no differences between the 2 modalities with the beta
coefficients per 1 SD change in the original and operationalized GDQS scores being nearly identical for weight gain
(-0.37 and -0.36, respectively, P < 0.001 for linear trend for both models) and of the same clinical order of magnitude for
waist circumference (-0.52 and -0.44, respectively, P < 0.001 for linear trend for both models).
Conclusion: The operationalized GDQS cutoffs did not change the performance of the GDQS and therefore are
recommended for use to collect GDQS data in the future. J Nutr 2021;151:176S–184S.
Keywords: GDQS, operationalization, data collection, application, sensitivity analysis
IntroductionPoor-quality diet is a leading cause of adverse health outcomesrelated to both undernutrition and overnutrition (1). Althoughmany diet quality metrics have been developed and used, thereis still not a widely used, relatively simple, and validatedmetric to measure diet quality [defined as both adequate innutrients and protective against diet-related noncommunicabledisease (NCD) risk outcomes] in population-based surveys insettings across the country (2). The Global Diet Quality Score(GDQS) was designed to fill this absence, thereby providing a
simple, standardized metric appropriate for population-basedmeasurement of diet quality globally. Following the successin developing and validating the GDQS (3), we sought tooperationalize the metric and develop the necessary tools tocollect GDQS data in a reliable and practical way in the contextof large-scale surveys globally.
To facilitate the integration of GDQS in global monitoringframeworks and routine surveys in low- and middle-incomecountries (LMICs), the GDQS data collection tools shouldideally: 1) be easy to administer among low-literacy populations
C© The Author(s) 2021. Published by Oxford University Press on behalf of the American Society for Nutrition. This is an Open Access article distributed under theterms of the Creative Commons Attribution License (http://creativecommons.org/licenses/by/4.0/), which permits unrestricted reuse, distribution, and reproduction
in any medium, provided the original work is properly cited.Manuscript received March 1, 2021. Initial review completed April 19, 2021. Revision accepted May 25, 2021.
First published online October 1, 2021; doi: https://doi.org/10.1093/jn/nxab196.176S

in LMICs; 2) take no more than an average of 10 minper respondent to complete; and 3) not require extensive orspecialized training of enumerators. With these principles, weidentified 2 central challenges to the operationalization of theGDQS. Since the GDQS was designed for global application,the first challenge was to determine how to ask about foodsand beverages consumed in the previous day or night andclassify them into the GDQS food groups in a quick and easymanner while requiring little adaptation to countries or regions.The classification of foods, beverages, and ingredients of mixeddishes represents a substantial burden on the respondent and/orthe enumerator, which could affect not only the validityof collected data but also the comparability of the GDQSglobally. The second challenge was determining how to collectinformation regarding quantity consumed in grams at the foodgroup level to apply the GDQS’ group-specific cutoffs.
To address the first challenge, we developed a data collectionapplication for collecting the GDQS data. For the secondchallenge and the inherent difficulty in collecting accurate in-formation on the quantity of food consumed from respondents,we developed a simplified method for assessing the quantity ofGDQS food group consumed by the respondent. The simplifiedmethod entails using a standard set of 10 3D cubes as visualaids to enable the respondent to easily classify the quantity ofconsumption per food group into the quantity of consumptioncategories (defined in grams) per GDQS food group.
To our knowledge, this is the first time that an applicationfor global use has been developed for the collection of adiet quality metric that also captures the amounts of foodgroups consumed. The instrument used to collect the MinimalDiet Diversity Score for Women (MDD-W) excludes verysmall amounts of food (defined as <15 g, which representsfor many foods ∼1 tablespoon) but otherwise does notattempt to estimate quantities consumed (4). The Diet QualityQuestionnaire (DQ-Q) uses dichotomous yes/no questions toask about the consumption of distinct food groups (5) andthe parent instrument of the GDQS, called the Prime Diet
Funding for the research was provided by a Bill & Melinda Gates Foundationgrant to FHI Solutions to support Intake – Center for Dietary Assessment.Author disclosures: TTF is an Associate Editor on the Journal of Nutrition andplayed no role in the Journal’s evaluation of the manuscript. All other authorsreport no conflict of interest.Published in a supplement to the Journal of Nutrition. Publication costs for thissupplement were funded by the Bill & Melinda Gates Foundation in conjunctionwith FHI Solutions, recipient of a Bill & Melinda Gates Foundation grant tosupport Intake – Center for Dietary Assessment. The opinions expressed in thispublication are those of the authors and are not attributable to the sponsorsor the publisher, Editor, or Editorial Board of the Journal of Nutrition. TheSupplement Coordinators for the supplement publication were Megan Deitchler,Intake – Center for Dietary Assessment at FHI Solutions, Washington, DC; andSabri Bromage, Harvard T.H. Chan School of Public Health, Boston, MA.Supplemental Figure 1 and Supplemental Table 1 are available from the“Supplementary data” link in the online posting of the article and from the samelink in the online table of contents at https://academic.oup.com/jn.The GDQS research initiative was launched by Intake – Center for DietaryAssessment. The research was led by Harvard T.H. Chan School of Public Health,Department of Nutrition and carried out in collaboration with researchers at theNational Public Health Institute (INSP), Mexico. Funding for the research wasprovided by FHI Solutions, recipient of a Bill & Melinda Gates Foundation grantto support Intake – Center for Dietary Assessment.Address correspondence to MM (e-mail: [email protected]).Abbreviations used: DQ-Q, Diet Quality Questionnaire; GDQS, Global DietQuality Score; HIC, high income country; LMIC, low- and middle-incomecountry; MDD-W, Minimal Dietary Diversity score for Women; MVP, MillenniumVillages Project; NCD, noncommunicable disease; PDQS, Prime Diet QualityScore.
Quality Score (PDQS), uses frequency data and does not directlyestimate quantities consumed (6).
This paper describes the methods used to operationalize theGDQS and addresses the following questions: 1) How doesthe application classify foods and beverages into the GDQSfood groups? 2) How was an average density value (g/cm3) foreach of the GDQS food groups derived to translate the cutoffsinto volumes to allow the use of cubes as visual aids? and 3)Is the performance of the GDQS affected by the use of theoperationalized cutoffs?
MethodsThe application frameworkThe GDQS application was developed using an open-source Expo (7)framework, which is a set of tools and services built around ReactNative (8) used for the development, building, and deployment ofapplications. Although the GDQS application has only been tested todate on Android devices, the Expo framework allows compiling thesource code of the application to work on iOS devices.
Classification of foods and beverages into the GDQSfood groupsThe application proceeds in 7 steps to collect the GDQS data, witheach step corresponding a different phase of the interview with therespondent (Figure 1). A video demonstration of the application isavailable at https://vimeo.com/515733474/8aa55d9350.
In the first step, the enumerator will obtain a list of all foodsand beverages consumed during the preceding 24-h period by askingthe respondent open-ended questions. To avoid underreporting andomission of foods, emphasis is put on the pattern of eating, going fromone eating occasion to the next, including snacks in-between majoreating occasions. This first part of the GDQS interview corresponds tothe conventional first pass of a multipass 24-h recall (9).
Many foods reported are in the form of mixed dishes, which aretypically defined as foods with a specific culinary name and preparedusing ≥2 ingredients. In the GDQS application, when respondentsreport consuming a mixed dish, they are asked to list the foods thatmake up the mixed dish (i.e., the ingredients). If unable to recall thelist of all ingredients of the mixed dish, they are asked to list only themain ingredients. There are some exceptions such as foods like breadand cakes, which are prepared with multiple ingredients but are treatedas single foods rather than mixed dishes. The application is designed tocapture all the information on reported foods or mixed dishes quicklyand efficiently. Although the application allows for free text entry, it isdesigned to limit the need for free text by including a master databaseof foods, beverages, and mixed dishes compiled from food compositiontables of West Africa (10), ASEAN (11), Kenya (12), Malawi (13), andIndia (14). In addition, the database includes foods and beverages in theFAO and Food and Nutrition Technical Assistance III Project MDD-Wmeasurement guide (4). The master database currently has about 2700entries of single foods and beverages with more entries to be added aswe continue to prepare the GDSQ application for global release. Thedatabase is maintained in an Excel spreadsheet and can be edited toadd missing foods and beverages in the upload of the database intothe application before data collection in any setting begins. During theinterview, the enumerator has the option to either select the food namefrom a drop-down menu, which can narrow choices down based onthe first few letters typed in using approximate string matching (fuzzysearch), or enter the food name in free text (if the food is missing fromthe master database).
Each food and beverage in the application master databaseis preclassified into its corresponding GDQS food group and theapplication uses that information to classify the foods, beverages, andingredients of mixed dishes into the correct GDQS food group. Ifa food or ingredient is missing from the master database and theenumerator entered it using free text, the enumerator is responsible
The GDQS app 177S

FIGURE 1 Data collection steps of the GDQS application. GDQS, Global Diet Quality Score.
for manually classifying into 1 of the GDQS food groups displayedby the application before proceeding to the next step. As the masterfood database continues to grow, we anticipate that this will be anexceedingly rare occurrence.
Some foods, such as grains (whole or refined), dairy (high or lowfat), and others may require more detailed information to be classified.The master database was therefore designed to include 2 additionalfields with descriptors which are used dynamically by the applicationas probing questions. For example, the food “bread” in the list hasan additional descriptor of either “white” or “brown.” The applicationuses that information to prompt the enumerator to ask the respondent ifthe bread reported as consumed was white or brown and the applicationthen classifies the food accordingly either in the refined or whole grainsGDQS food group.
The next step in the application asks about whether any of thefoods reported as consumed were deep fried foods, with follow-upquestions about whether these were purchased deep fried foods or were
deep fried at home using pourable oil. There is an additional questionasking whether the respondent poured oil on their food or used it toprepare foods. This step is followed by probing questions on the useof caloric sweeteners, which can be easily forgotten by respondentswhen reporting foods and beverages consumed. At the end of the stepsdescribed above, all foods and beverages will have been classified intotheir respective GDQS food groups.
GDQS food group average density calculationIn its metric scoring approach, the GDQS assigns point values based onbroad ranges of quantity of consumption (in g/d) at the food group level(3). Accounting for the quantity of consumption per GDQS food groupposes a significant challenge for the respondent: to recall a reliable andvalid estimate of the quantity is an extremely difficult mental exercise,especially at the food group level.
TABLE 1 24-h dietary recall datasets used to compute average food group density1
Country/dataset name Region Year Level
Mexico/ENSANUT Latin America and the Caribbean 2016 NationalEthiopia Sub-Saharan Africa 2019 NationalUganda HarvestPlus/A2Z Sub-Saharan Africa 2006–2007 NationalZambia/HarvestPlus Sub-Saharan Africa 2009 2 rural regionsBurkina Faso/IRD Sub-Saharan Africa 2010 2 rural regionsIndia/HarvestPlus South Asia region 2009–2011 Rural regions in the
states of Punjab,Maharajtra andGujarat
Bangladesh/BIHS South Asia region 2016 NationalPhilippines South-East Asia region 2013 NationalLaos/PDR South-East Asia region 2016–2017 NationalChina East Asia 2010–2012 NationalUSA/NHANES North America 2017–2018 National
1BIHS, Bangladesh Integrated Household Survey; ENSANUT, Encuesta Nacional de Salud y Nutrición; IRD, Institut de Recherchepour le Développement; PDR, People Democratic Republic.
178S Moursi et al.

TABLE 2 Foods and beverages chosen to represent GDQS food groups and the corresponding mean food group density1
GDQS food group Full list of foods and beverages chosen to represent the food groupMean density
(g/cm3)
Whole grains Maize on cob, whole grain bread, whole maize grains, whole-grain tortilla, whole wheat roti/chapati, oats,whole flour injera, nshima, pearl millet roti/chapati
0.65
Refined grains and baked goods White rice, white bread, pasta, biscuits, wheat roti/chapati, tortilla, sweet bread, refined flour injera, ugali,fritters
0.62
Deep orange tubers Orange sweet potato 0.65White roots and tubers Potatoes, french fries, white sweet potatoes, plantain, cassava, yam, ginger, taro, yam bean 0.78Legumes Cowpeas, lentils, soybean, kidney beans, soymilk, peas, mung beans, black beans, pinto beans, chickpeas 0.80Nuts and seeds Peanuts/groundnuts, sesame seeds, peanut butter, almonds, sunflower seeds, jackfruit seeds, cowpea seeds,
cacao seeds, Job’s tears, cumin seeds0.68
Fish and shellfish Tilapia, tuna, catfish, carp, mullet, perch, mackerel, orangefin barb, sea fish, unspecified fish 0.57Poultry and game meat Chicken average cut, chicken leg, chicken breast, chicken wings, duck, fowl, buffalo, rat, chicken thigh, donkey 0.83Red meat Beef, pork, goat, mutton, liver, beef/goat stomach, beef entrails, pork ribs, lamb, pork organs 0.87Processed meat Smoked/dried beef, ham, pork sausage, turkey ham, burger meat, turkey sausage, dried pork, smoked/dried
goat meat, chorizo, bratwurst0.81
Eggs Chicken eggs 0.6High fat dairy: hard cheese Hard cheese (unspecified), cheddar cheese 0.84High fat dairy: other Whole milk, sour milk, buffalo milk, whole-milk yogurt, curd, whole-milk drinkable yogurt, Oaxaca cheese, soft
cheese1.02
Low fat dairy Low fat milk, low fat yogurt, skimmed buffalo milk, low fat curd, low fat cream cheese, low fat cheese spread 0.96Deep orange fruits Mango, papaya, cantaloupe, nanche, persimmon, tree tomato 0.73Citrus fruits Orange, lemon, tangerine, pomelo, grapefruit 0.71Other fruits Banana, watermelon, apple, avocado, jack fruit, grapes, green papaya, guava, pineapple 0.78Dark green leafy vegetables Spinach, sweet potato leaves, pumpkin leaves, cowpea leaves, amaranth leaves, kale, baobab leaves, moringa
leaves, jute mallow leaves0.70
Deep orange vegetables Carrot, pumpkin 0.85Cruciferous vegetables Cabbage, broccoli, cauliflower, Chinese cabbage 0.67Other vegetables Tomato, onion, eggplant, water gourd, cucumber, okra, sweet peppers, fresh chili, zucchini, shallots 0.68Liquid oils NA NAJuice Orange juice, apple juice, grape juice, fruit juice (unspecified), lemon juice, bissap, pineapple juice, cranberry
juice, blackberry juice, roselle drink1.05
Sugar-sweetened beverages Soda/cola drink, sweet flavored water, energy drink, sports drink, industrial juice, flavored/chocolate milk,ovaltine, zoom komm, lassi
1.07
Sweets and ice cream Sugar, cake, ice cream, sugarcane, honey, hard candy, jelly, cookies, sorghum cane, jaggery 0.70Purchased deep fried foods French fries, deep fried doughnuts, fritters, fried onion, chips, churro, fried chicken, deep fried spring roll, fried
fish, fried cake0.46
1GDQS, Global Diet Quality Score; NA, not applicable.
To address this challenge, data collection with the GDQS applicationentails the use of a set of 10 hollow 3D cubes in a range of predeterminedsizes (Supplemental Figure 1). These cubes are used as visual aids forthe respondent. The respondent is asked to visualize the quantity ofall food items consumed within a GDQS food group and to indicatewhich cube size best represents the quantity consumed (i.e., volume).The application facilitates this process by instructing the enumerator toread back to the respondent the list of foods and beverages reportedas consumed per GDQS food group. For example, if a person atea banana in the morning and some watermelon in the evening, theenumerator would read those foods back to the respondent (bothautomatically classified under “other fruits” in the application) and askthe respondent to think about the combined volume of the banana andpieces of watermelon and choose the cube size which comes closest tothe visualized volume.
This method of quantity estimation applies to all food groups exceptfor “liquid oils” because, in most cases, it is unrealistic to expectrespondents to recall the amount of liquid oils consumed. For thisreason, the categorization of the amount of oil is inferred with the useof an algorithm that classifies the respondent above the highest rangeof oil consumption if 1) they consumed deep fried foods prepared withliquid oil at home; 2) they have had ≥2 mixed dishes; or 3) they answeryes to the question of pouring liquid oil on their food or using it in
food preparation. If the respondent has consumed only 1 mixed dish,the amount is classified in the middle range of oil consumption.
To operationalize this idea of using cubes as visual aids, we had toidentify the size of the cube that is correct to associate with the givenconsumption cutoff (in grams) of a GDQS food group. For example,the original GDQS quantity cutoffs for red meat were <12, 12–48,and >48 g. In this case, the cutoffs of 12 and 48 g were used to helpinform the sizes of the cubes. Converting a gram quantity consumptioncutoff into a cube requires information on “average food group density.”To estimate the average food group densities, we used quantitative24-h recall dietary datasets, prioritizing data from 10 LMICs giventhe focus on operationalizing the GDQS for use in these settings. Inaddition, we included 1 high-quality quantitative 24-h recall dietarydataset from a high-income country (HIC), to allow for the potentialfor the GDQS to also be used in HICs. The datasets used for thisanalysis are presented in Table 1. The choice of these datasets wasdriven by a combination of an established reputation for high quality,ease of accessibility, and representativeness of different regions of theworld. The preference was to include nationally representative datasets,but we recognized that such data were not available in many LMICs.Therefore, we also included some datasets with a more limited statisticalrepresentativeness—often at the level of a few rural regions—that areknown to be high quality. All the identified datasets included data on
The GDQS app 179S

TABLE 3 Original and operationalized GDQS cutoffs and cube size, by food group1
GDQS food group Cutoff range Cube numberCube side size
(mm)Original cutoff
(g)Operationalized
cutoff (g)
No group (cube added at thebeginning)
NA 1 18 NA NA
Whole grains Low/middle 2 22 4 8Nuts and seeds Low/middle 2 22 4 7Processed meat Low/middle 2 22 8 9Refined grains and baked goods Low/middle 2 22 7 7Eggs Low/middle 2 22 7 6Deep orange vegetables Low/middle 2 22 10 9Legumes Low/middle 2 22 10 9Red meat Low/middle 2 22 12 9High fat dairy: hard cheese Low/middle 2 22 35 9Dark green leafy vegetables Low/middle 3 27 10 13Poultry and game meat Low/middle 3 27 12 16Sweets and ice cream Low/middle 3 27 11 13Cruciferous vegetables Low/middle 3 27 11 13Deep orange tubers Low/middle 3 27 14 12Purchased deep fried foods Low/middle 3 27 10 9Fish and shellfish Low/middle 3 27 16 14Whole grains Middle/high 3 27 16 13Nuts and seeds Middle/high 3 27 16 13Citrus fruits Low/middle 4 32 18 24White roots and tubers Low/middle 4 32 25 27Juice Low/middle 4 32 35 36Other fruits Low/middle 4 32 26 27Processed meat Middle/high 4 32 31 30High fat dairy: hard cheese Middle/high 4 32 140 28High fat dairy: other Low/middle 4 32 35 35Low fat dairy Low/middle 4 32 35 33Other vegetables Low/middle 4 32 26 23Deep orange fruits Low/middle 4 32 28 25Refined grains and baked goods Middle/high 5 38 28 33Deep orange vegetables Middle/high 5 38 39 45Eggs Middle/high 5 38 28 32Sugar sweetened beverage Low/middle 5 38 52 57Legumes Middle/high 5 38 39 42Red meat Middle/high 5 38 48 46Dark green leafy vegetables Middle/high 5 38 39 37Poultry and game meat Middle/high 5 38 48 44Sweets and ice cream Middle/high 5 38 45 37Cruciferous vegetables Middle/high 5 38 44 36Fish and shellfish Middle/high 6 46 63 71Purchased deep fried foods Middle/high 6 46 40 45Deep orange tubers Middle/high 6 46 57 63Citrus fruits Middle/high 6 46 74 69White roots and tubers Middle/high 7 52 100 107Juice Middle/high 7 52 141 144Other fruits Middle/high 7 52 106 107Low fat dairy Middle/high 7 52 139 132High fat dairy: hard cheese High/very high 7 52 734 114High fat dairy: other Middle/high 7 52 140 143Other vegetables Middle/high 8 55 106 114Deep orange fruits Middle/high 8 55 114 123Sugar sweetened beverage Middle/high 8 55 207 180High fat dairy: other High/very high 9 89 734 734No group (cube added at the end) NA 10 100 NA NA
1When using the application, respondents use a set of 10 cubes in a range of predetermined sizes as visual aids to determine if the quantity consumedper GDQS food group was below, equal to, or above food group–specific cutoffs established in grams. Because there is only a total of 10 cubes (forpractical reasons) but as many as 54 cutoffs for the GDQS food groups, the operationalized cutoffs differ slightly from the original GDQS cutoffspresented for the validation of the metric (3). For operationalization purposes, the high fat dairy group was divided into “hard cheese” and “other”, with“other” including mainly milk, yogurt, and soft cheese. This means that in practice, during data collection, the number of GDQS food groups temporarilyincreases to 26 and that of cutoffs to 54. The application asks about the consumed volume of hard cheese and other high fat dairy separately, but the 2are combined again when reporting the GDQS results to align with the metric as originally validated with 25 food groups. GDQS, Global Diet QualityScore; NA, not applicable.2For each GDQS food group, the values below the smallest cutoff in grams were defined as “low”, values falling in between the smallest and largestcutoffs were defined as “middle”, and values above the largest cutoff were defined as “high”. The high fat dairy group had an additional cutoff comparedwith the rest of the food groups and value above the largest cutoff in grams were defined as very high. See Table 3 in Bromage et al (3).
180S Moursi et al.

women of reproductive age (15–49 y of age) which were the referenceage group for this analysis.
Though the GDQS metric was validated for nonpregnant andnonlactating women, we also used food consumption data for pregnantand lactating women to broaden the source of foods and increase samplesize. We used only the first 24-h recall when >1 was available perindividual.
In each dataset, foods were classified into 1 of the GDQS foodgroups, except for purchased deep fried foods. The deep fried foods,such as fried chicken, were classified in both their original group (inthis example “poultry and game meat”) and in the purchased “deepfried foods” group. The “liquid oils” food group was excluded becausethe GDQS application does not directly ask about oil consumption. Thepercentage gram contribution of each individual food to the total of thefood group was computed by dividing the gram sum of each individualfood across all women by the total gram sum of the GDQS food group.Datasets contained primarily the amounts of raw foods and ingredientsconsumed from mixed dishes, which coincides with the way ingredientsof mixed dishes are reported. For each dataset, we identified the top5 foods in terms of percentage gram contribution to each GDQS foodgroup and assigned ranks from 1 to 5. This resulted in a list of up to55 foods having been identified per food group across all datasets (5from each of 11 datasets). To keep the number of foods manageablefor density compilation and computation, we narrowed down the listto a maximum of 10 foods for each food group by computing meanranks for all identified foods and selecting the 10 foods with the lowestmean ranks across the 11 datasets (with 1 being the best rank). Those10 foods with the lowest mean ranks were considered as the foodsrepresenting each GDQS food group globally (Table 2). For some GDQSfood groups, such as deep orange tubers or eggs, there were <10 uniquefoods reported as consumed to be found across all datasets.
We compiled the density data using the FAO/INFOODS DensityDatabase version 2.0 (15), the 2018 New Zealand food compositiontable (16), conversion factor databases associated with the datasetswe used (Uganda, Burkina Faso, and India), and limited primarydata collection with food items bought in stores. For each GDQSfood group, the food group average density was computed usinga simple mean of the densities of the foods representing thegroup.
Bearing in mind the purpose and kind of use the GDQS will beput to, the densities of foods within a given GDQS food group weredeemed close enough to use simple means and in doing so, strike acompromise between ease of use and data precision. However, thehigh fat dairy group was the 1 exception where the densities of hardcheese and milk were so different that no reasonable compromisecould be reached. Therefore, for operationalization purposes, we splitthe high fat dairy group into “hard cheese” and “other,” with otherincluding mainly milk, yogurt, and soft cheese. This means that inpractice, during data collection, the number of GDQS food groupstemporarily increases to 26 and that of cutoffs to 54. The applicationasks about the consumed volume of hard cheese and other high fat dairyseparately, but the 2 are combined again when reporting the GDQSresults to align with the metric as originally validated with 25 foodgroups and 51 cutoffs. To combine them, the amount of hard cheeseestimated using the cubes is multiplied by 6.1 (17) to convert it to milkequivalents.
Food group quantity estimation and sensitivityanalysisUsing the food group average densities, we converted the original 54cutoffs of the 26 GDQS food groups (Table 3) into volumes of cubes.We produced plastic hollow 3D cubes using a 3D printer, with eachcube representing an exact cutoff in grams. Given that using 54 cubes isnot practical in field conditions, and because some differences in cubesize were barely perceptible to the naked eye, we reduced the number ofcubes to a total of 8 by grouping subsets of cubes that were similar insize and averaging their sizes. Two cubes, the smallest one and the largestone (both corresponding to no cutoffs), were added at each end of theset of 8 cubes to smooth out the visual representation of size increase
and protect against a potential respondent desire to either report ornot report the smallest or largest cube size, thus giving us a total of10 cubes.
Because there is only a total of 10 cubes but as many as 54cutoffs for the 25 GDQS food groups, the operationalized cutoffs differslightly from the original cutoffs presented for the validation of themetric. The operationalized and the original cutoffs are presented inTable 3.
It is important to note that sometimes the size of given cubecould correspond to the exact cutoff of a GDQS food group. In thoseborderline cases where the respondent reports consuming an amount(i.e., select a cube size) that corresponds to the exact cutoff, theapplication is programmed to prompt her with a follow-up questionasking if the amount visualized for the food group is “as big or bigger”or “smaller” than the designated cube, as a way of confirming theinformation.
We conducted a sensitivity analysis comparing the performance ofGDQS using the operationalized and original cutoffs on the followingcross-sectional datasets used in the original GDQS validation research(3): Ethiopia, China, Mexico, India, and the Millennium Villages Project(MVP). One longitudinal cohort study dataset used in the originalGDQS validation research (3), the Mexican Teachers Cohort (MTC),was also used. We compared covariate-adjusted associations betweenthe metrics and energy-adjusted aggregate measures of protein, fiber,calcium, iron, zinc, vitamin A, folate, and vitamin B12 adequacy. Inall cross-sectional datasets except China, nutrient adequacy was usedas a continuous variable and estimated marginal means are presented.In China, nutrient (in)adequacy was defined as the mean probabilityof adequacy for the 9 nutrients presented below 50%, and the OR ispresented. For cross-sectional data, regression models present changesin nutrient adequacy and NCD-risk outcomes per 1-SD increase inthe GDQS score and associated P values for linear trends acrossquintiles of the GDQS metrics. Analyses with cohort data from MTCpresent the results of the association of 2-y change in metrics and 2-y change in weight and waist circumference using generalized linearmodels. We conducted Wald tests between the original GDQS and theoperationalized GDQS to detect any statistically significant differencesin performance between the 2 metrics.
Results
Select results that were representative of the performancedifference between the 2 metrics in predicting energy-adjustednutrient adequacy and NCD outcomes are presented in Table 4for the cross-sectional data and Table 5 for the cohort data. Thefull results are available in Supplemental Table 1. Overall, therewere no differences in performance between the 2 metrics. In thecross-sectional datasets, the operationalized GDQS remainedstrongly correlated with nutrient adequacy. The largest observeddifference between the original and operationalized GDQSin the coefficient of estimated marginal means of nutrientadequacy per 1 SD of GDQS score was 0.07 in the Mexico cross-sectional data but it was not statistically significant (P = 0.12).Compared with the original GDQS, the operationalized GDQSwas equally sensitive to clinical measures of NCD risk andanthropometry with no change in the OR coefficients per 1SD of the GDQS score for metabolic syndrome (China), BMI(kg/m2) ≥25 (Ethiopia and MVP), total cholesterol (Mexico),or HDL cholesterol ≤50 mg/dL (India). In an analysis ofthe longitudinal MTC, the 2 metrics performed equally wellwith the beta coefficients per 1-SD change in the originaland operationalized scores being nearly identical for weightgain (-0.37 and -0.36, respectively) and of the same clinicalorder of magnitude for waist circumference (-0.52 and -0.44,respectively) over a period of 2 y.
The GDQS app 181S

TAB
LE4
Sel
ect
oper
atio
naliz
edco
mpa
red
with
orig
inal
GD
QS
asso
ciat
ions
with
outc
ome
cate
gorie
sof
nutr
ient
adeq
uacy
and
mea
sure
sof
NC
Dris
kus
ing
cros
sse
ctio
nald
ata1
Data
set
Outc
ome
Stat
istic
nGD
QSβ
coef
ficie
ntpe
r1SD
(95%
CI)
Pva
lue,
trend
2
Pva
lue,
diffe
renc
e3
Nut
rient
adeq
uacy
4
Ethi
opia
Nut
rient
adeq
uacy
Mea
n16
04Op
erat
iona
lized
/orig
inal
0.28
(0.2
1,0.
35)/0
.32
(0.2
5,0.
39)
<0.
001/
<0.
001
0.08
Mex
ico
Nut
rient
adeq
uacy
Mea
n24
67Op
erat
iona
lized
/orig
inal
2.17
(1.8
1,2.
52)/2
.24
(1.8
9,2.
59)
<0.
001/
<0.
001
0.12
Chin
aN
utrie
ntin
adeq
uacy
OR14
,938
Oper
atio
naliz
ed/o
rigin
al0.
38(0
.36,
0.40
)/0.4
1(0
.39,
0.44
)<
0.00
1/<
0.00
1N
A5
Indi
aN
utrie
ntad
equa
cyM
ean
3041
Oper
atio
naliz
ed/o
rigin
al0.
25(0
.21,
0.28
)/0.2
8(0
.25,
0.31
)<
0.00
1/<
0.00
10.
29M
VPN
utrie
ntad
equa
cyM
ean
1624
Oper
atio
naliz
ed/o
rigin
al0.
46(0
.39,
0.53
)/0.5
1(0
.45,
0.58
)/<
0.00
1/<
0.00
10.
17N
CDris
kEt
hiop
iaBM
I≥25
OR15
96Op
erat
iona
lized
/orig
inal
1.20
(1.0
2,1.
41)/1
.19
(1.0
2,1.
40)
0.00
8/0.
054
0.28
Mex
ico
Tota
lcho
lest
erol
(mg/
dL)
Mea
n15
13Op
erat
iona
lized
/orig
inal
−2.
81(−
4.55
,−1.
07)/−
2.91
(−4.
65,−
1.16
)0.
006/
0.00
30.
38Ch
ina
Met
abol
icsy
ndro
me
OR11
,148
Oper
atio
naliz
ed/o
rigin
al0.
87(0
.82,
0.92
)/0.8
8(0
.83,
0.93
)<
0.00
1/<
0.00
1N
A5
Indi
aHD
Lch
oles
tero
l≤50
mg/
dLOR
3041
Oper
atio
naliz
ed/o
rigin
al1.
16(1
.07,
1.26
)/1.1
2(1
.04,
1.22
)0.
001/
0.00
20.
62M
VPBM
I≥25
OR45
1Op
erat
iona
lized
/orig
inal
0.99
(0.7
7,1.
27)/1
.06
(0.8
2,1.
36)
0.72
/0.7
40.
80
1D
ata
pres
ente
dfo
rE
thio
pia,
Indi
a,an
dM
VP
are
FFQ
data
;Mex
ico
and
Chi
naar
e24
-hre
call
data
.GD
QS,
Glo
balD
iet
Qua
lity
Sco
re;M
VP,
Mill
enni
umV
illag
esPr
ojec
t;N
A,n
otap
plic
able
;NC
D,n
onco
mm
unic
able
dise
ase.
2P
valu
e,tr
end
ispr
esen
ted
for
quin
tile
anal
ysis
.3W
ald
test
resu
ltsfo
rdi
ffere
nce
betw
een
orig
inal
and
oper
atio
naliz
edG
DQ
S.4N
utrie
ntad
equa
cyis
anE
stim
ated
Ave
rage
Req
uire
men
t–ba
sed,
ener
gy-a
djus
ted
aggr
egat
em
easu
reof
prot
ein,
fiber
,cal
cium
,iro
n,zi
nc,v
itam
inA
,fol
ate,
and
vita
min
B12
.In
alld
atas
ets
exce
ptC
hina
,nut
rient
adeq
uacy
was
used
asa
cont
inuo
usva
riabl
ean
des
timat
edm
argi
nalm
eans
are
pres
ente
d.In
Chi
na,n
utrie
ntin
adeq
uacy
was
defin
edas
the
mea
npr
obab
ility
ofad
equa
cyfo
rth
e9
nutr
ient
spr
esen
ted
belo
w50
%an
dO
Ris
pres
ente
d.5In
the
Chi
nada
tase
t,th
esc
ores
for
the
oper
atio
naliz
edan
dor
igin
alG
DQ
Sw
ere
soco
linea
rth
atit
was
not
poss
ible
tode
rive
am
eani
ngfu
ltes
tfo
rdi
ffere
nce
betw
een
the
2sc
ores
.
Discussion
The GDQS application includes a global database of 2700foods from all regions of the world where foods and beveragesare preclassified into corresponding GDQS food groups. Thisstandardization helps to address some of the key challengesthat have been reported with other methods commonly usedfor collecting data for food-based indicators in LMICs. Theseinclude the difficulty of adapting a list-based food groupquestionnaire to appropriately reflect the foods and beveragescommonly consumed in the survey area, the difficulty ofrespondents to correctly report and classify foods and beveragesconsumed into the food groups included in a list-basedfood group questionnaire, and the difficulty of enumeratorsor other survey staff to appropriately classify foods andbeverages reported as consumed into the correct correspondingfood group when an open-recall method (as opposed toa list-based food group questionnaire) is used for datacollection.
The use of this newly developed application does not requireenumerators to have specific training or expertise in nutritionor food preparation in a given context to collect high-qualitydata to tabulate the GDQS and its submetrics, and that in-depthcountry-specific adaptation of the data collection instrumentshould not be required. Using enumerators to conduct theinterviews with the help of the application facilitates datacollection in contexts where targeted respondents may havea low level of literacy. However, in contexts with widespreadhigh literacy and where personal ownership of tablet computersand phones is quite common, a self-administered version of theapplication may also be possible.
Use of the application also has the benefit of promotingstandardized data collection and standardized classification offoods and beverages into the correct GDQS food group acrossall countries where data are collected. In addition, the open-recall method used for data collection allows for the individualfoods and beverages reported as consumed by respondentsto be retained as a rich source of data available for furtheranalyses and use—a possibility pre-empted by the use of alimited list-based food group questionnaire. The collection ofthe quantity of consumption data needed to tabulate the GDQSwill also be facilitated by use of the application. Because theapplication automatically classifies each food and beveragereported as consumed into the correct GDQS food group,enumerators will be equipped to read back to the respondentthe list of foods and beverages consumed per GDQS foodgroup when collecting information about the total quantityof foods and beverages consumed (in grams) by GDQS foodgroup.
The main limitation of this work is that none of the toolsand solutions developed have yet been tested in a field setting.Although 3D models such as wooden spheres or cubes havebeen used to estimate amounts of single foods and mixeddishes consumed in 24-h recall surveys, to our knowledge,they have not been used to estimate the aggregate amountsat the food group level. Whether respondents can successfullyvisualize amounts at the group level requires further testingand validation. This may be especially challenging when severaldifferent foods are consumed within a food group and whenshared plate eating is widespread. In preparation for the globalrelease of GDQS, validation studies to confirm the potential ofthese different options and tools to facilitate the collection ofhigh-quality GDQS data and to estimate their ease of use andcost relative to other methods are needed.
182S Moursi et al.

TAB
LE5
Bet
aco
effic
ient
sfo
rth
eas
soci
atio
nof
oper
atio
naliz
edan
dor
igin
alG
DQ
Sw
ithw
eigh
tch
ange
and
wai
stci
rcum
fere
nce
chan
gein
the
Mex
ican
Teac
hers
Coh
ort1
Larg
estd
ecre
ase
Smal
ldec
reas
eLi
ttle
chan
geSm
alli
ncre
ase
Larg
esti
ncre
ase
Per1
SDW
ald
test
2P-
trend
3
GDQS
scor
ech
ange
−5−5
to−2
−2to
+2>
+2to
+5>
+5W
eigh
tcha
nge,
kgGD
QS0.
50(0
.19,
0.81
)0.
33(0
.09,
0.57
)Re
fere
nce
−0.
43(−
0.67
,−0.
20)
−0.
81(−
1.11
,−0.
51)
−0.
37(−
0.47
,−0.
27)
0.19
<0.
001
Oper
atio
naliz
edGD
QS0.
31(0
.01,
0.60
)0.
36(0
.12,
0.60
)Re
fere
nce
−0.
33(−
0.57
,−0.
09)
−0.
72(−
1.01
,−0.
43)
−0.
36(−
0.46
,−0.
26)
<0.
001
Wai
stci
rcum
fere
nce
chan
ge,c
mGD
QS0.
54(0
.04,
1.12
)0.
24(−
0.19
,0.6
9)Re
fere
nce
−0.
49(−
0.93
,−0.
05)
−0.
99(−
1.53
,−0.
45)
−0.
52(−
0.71
,−0.
33)
0.91
<0.
001
Oper
atio
naliz
edGD
QS0.
64(0
.06,
1.22
)0.
32(−
0.13
,0.7
8)Re
fere
nce
−0.
27(−
0.73
,0.1
7)−
1.04
(−1.
59,−
0.49
)−
0.44
(−0.
63,−
0.25
)<
0.00
1
1Va
lues
are
beta
coef
ficie
nts
(95%
CI)
for
wei
ght
and
wai
stci
rcum
fere
nce
chan
geov
er2
y.G
DQ
S:8
967
wom
enw
ere
incl
uded
inw
eigh
tch
ange
anal
ysis
;758
8w
omen
wer
ein
clud
edin
wai
stci
rcum
fere
nce
anal
ysis
.Bet
aco
effic
ient
sw
ere
adju
sted
for
base
line
age
(con
tinuo
us);
chan
gein
ener
gy(c
ontin
uous
);st
ate
(Jal
isco
,Ver
acru
z);b
asel
ine
GD
QS
scor
e(c
ontin
uous
);20
06an
d20
08ph
ysic
alac
tivity
(low
,med
ium
,hig
h);b
asel
ine
mar
itals
tatu
s(s
ingl
e,liv
ing
toge
ther
,mar
ried,
sepa
rate
d,w
idow
);ba
selin
eed
ucat
ion
(non
e,≤h
igh
scho
ol,u
nder
grad
uate
degr
ee,≥
grad
uate
degr
ee);
base
line
hous
ehol
das
sets
(low
,mid
dle,
high
);ba
selin
ehe
alth
insu
ranc
e(p
ublic
,priv
ate,
othe
r);b
asel
ine
BM
I(<
25,2
5–29
.9,>
30);
and
chan
ges
insm
okin
gst
atus
(bas
elin
epa
stsm
oker
,sta
yed
nons
mok
er,s
taye
dsm
oker
s,qu
itter
s,st
arte
rs)a
ndal
coho
lcon
sum
ptio
n(b
asel
ine
nond
rinke
rs,s
taye
dno
ndrin
kers
,sta
yed
drin
kers
,qui
tter
s,st
arte
rs).
GD
QS,
Glo
balD
iet
Qua
lity
Sco
re.
2W
ald
test
resu
ltsbe
twee
nG
DQ
San
dop
erat
iona
lized
GD
QS.
3M
edia
nsw
ere
fitte
din
am
ultiv
aria
tem
odel
toes
timat
eP-
tren
d.
The application will be made freely available for globalpublic use and integration into existing electronic data collec-tion systems, to ensure that the collection of the data requiredfor the GDQS can be easily incorporated into population-based surveys globally. The application user interface is alreadyavailable in English and French with more languages to come.There is currently no precise estimate of how much timeper respondent is required to complete the interview, butpreliminary internal testing indicated that the application couldrequire approximately 10 min per respondent to complete, withthe time required for data collection per respondent largelydependent on the pace of the interview and the complexity ofthe diet on the reference day of recall.
Acknowledgments
The authors’ responsibilities were as follows—MM, SB, TTF, SI,MM, CB, ACG, EA, NB, SNB, YH, YL, WF, MV, AB, JA, WCW,MD: provided input on the design of the application; AB, MM,MV, JA, MD: analyzed data for inclusion in the application;AD, ST, LN, MM, MD: designed the application; SB, TTF, SI,MM, CB, ACG, EA, NB, SNB, YH, YL: conducted the sensitivityanalysis; MM, MD: wrote the paper; and all authors: read andapproved the manuscript.
References1. GBD 2016 Risk Factors Collaborators. Global, regional, and national
comparative risk assessment of 84 behavioural, environmental andoccupational, and metabolic risks or clusters of risks, 1990–2016: asystematic analysis for the Global Burden of Disease Study 2016. Lancet2017;390:1345–422.
2. Miller V, Webb P, Micha R, Mozaffarian D, Global Dietary Database.Defining diet quality: a synthesis of dietary quality metrics and theirvalidity for the double burden of malnutrition. Lancet Planet Health2020;4:e352–70.
3. Bromage S, Batis C, Bhupathiraju SN, Fawzi WW, Fung TT, LiY, Deitchler M, Angulo E, Birk N, Castellanos-Gutiérrez A, et al.Development and validation of a novel food-based Global Diet QualityScore (GDQS). J Nutr 2021;151(Suppl 10):75S–92S.
4. FAO and FHI360. Minimum dietary diversity for women: a guide formeasurement. Rome: FAO; 2016.
5. Herforth A, Martínez-Steele E, Calixto G, Sattamini I, Olarte D,Ballard T, Monteiro C. Development of a diet quality questionnairefor improved measurement of dietary diversity and other dietquality indicators. Curr Dev Nutr 2019;nzz036.P13–018-19. DOI:10.1093/cdn/nzz036.P13-018-19
6. Gicevic S, Mou Y, Bromage S, Fung TT, Willet W. Development of dietquality screener for global use: evaluation in a sample of US women. JAcad Nutr Diet 2021; 121(5):854–871.e6.
7. Expo. Framework and platform for universal React applications.[Internet]. 2020; [cited 2020 March 10]. Available from https://expo.io/.
8. React Native. A framework for building native apps using React.[Internet]. 2020;[cited 2020 March 10]. Available from https://reactnative.dev/.
9. Gibson RS, Ferguson EL. An interactive 24-hour recall for assessing theadequacy of iron and zinc intakes in developing countries. HarvestPlusTechnical Monograph 8. Washington, DC, and Cali, Colombia:International Food Policy Research Institute and International Centerfor Tropical Agriculture; 2008.
10. FAO/INFOODS. Food Composition Table for Western Africa.[Internet]. 2019; [cited 2020 July 1]. Available from http://www.fao.org/3/ca7779b/CA7779B.PDF.
11. ASEAN. Food Composition Database Electronic version 1. Thailand:Institute of Nutrition, Mahidol University. [Internet]. 2014; [cited 2020
The GDQS app 183S

July 1]. Available from http://www.inmu.mahidol.ac.th/aseanfoods/composition_data.html.
12. FAO/Government of Kenya. Kenya Food Composition Tables.[Internet]. 2018; [cited 2020 July 1]. Available from http://www.fao.org/3/I8897EN/i8897en.pdf.
13. MAFOODS. Malawian Food Composition Table, 1st Edition.[Internet]. 2019; [cited 2020 July 1]. Available from https://dl.tufts.edu/downloads/g158bw806?filename=d217r336d.pdf.
14. Longvah T, Ananthan R, Bhaskarachary K, Venkaiah K. Indian FoodComposition Tables [Internet]. 2017; [cited 2020 July 1]. Available fromhttp://www.ifct2017.com.
15. Charrondiere R, Haytowitz D, Stadlmayr B. FAO/INFOODSDensity Database Version 2.0. [Internet]. 2012; [cited 2020 August20]. Available from http://www.fao.org/docrep/017/ap815e/ap815e.pdf.
16. The New Zealand Institute for Plant and Food Research Limited andMinistry of Health. The Concise New Zealand Food CompositionTable, 13th Edition. [Internet]. 2018; [cited 2020 August 20]. Availablefrom https://www.foodcomposition.co.nz/downloads/concise-13-edition.xlsx.
17. Willet WC, Ludwig DS. Milk and health. N Engl J Med 2020;382:644–54.
184S Moursi et al.