The isotopic composition of Cadmium in the water column of the South China Sea
12
The isotopic composition of Cadmium in the water column of the South China Sea Shun-Chung Yang a,b,c , Der-Chuen Lee a,⇑ , Tung-Yuan Ho b a Institute of Earth Sciences, Academia Sinica, Taipei, Taiwan b Research Center for Environmental Changes, Academia Sinica, Taipei, Taiwan c Department of Geosciences, National Taiwan University, Taipei, Taiwan Received 26 April 2012; accepted in revised form 13 September 2012; Available online 21 September 2012 Abstract We determined the Cd isotopic composition of seawater and sinking particles collected in the deep basin of the northern South China Sea (SCS) to investigate the controlling mechanisms on the Cd isotopic composition in the water column. The isotopic composition in the water column decreased with depth, with e 114/110 Cd values (e 114/110 Cd = [( 114 Cd/ 110 Cd) sample / ( 114 Cd/ 110 Cd) JMC Cd Mu ¨ nster 1] 10 4 ) ranging from +8.7 to +9.9 in the top 80 m, from +4.6 to +5.5 between 100 and 150 m, decreasing from +5.5 to +3.6 at depths from 150 to 1000 m, and remaining at +3.4 ± 0.5 from 1000 to 3500 m. The isotopic composition and concentrations of Cd observed in the deep waters of the SCS are similar to the values that were previously reported in the North Pacific Ocean. In the thermocline, the variations in the Cd isotopic composition and con- centrations were consistent with the relative volumetric percentages of the subsurface water, the intermediate water, and the deep water in the water column, indicating that water mixing is the dominant process determining the isotopic composi- tion in the thermocline. Comparable to the isotopic composition value in the seawater of the mixed layer, the e 114/110 Cd in the sinking particles collected at 30 m was +9.3 ± 0.9. Because our previous studies demonstrated that the particulate Cd was predominantly biogenic organic matter, the comparable isotopic composition between the surface seawater and the sinking particles indicates that net biological isotopic fractionation on Cd in the surface water was insignificant. The result indicates that phytoplankton do not necessarily take up relatively light Cd in the oceanic surface waters. It is necessary to directly and systematically investigate how marine phytoplankton fractionate Cd isotopes. Ó 2012 Elsevier Ltd. All rights reserved. 1. INTRODUCTION Cadmium is biologically cycled in the marine water col- umn, taken up by phytoplankton in the surface waters and subsequently regenerated and recycled in the water column. The vertical distribution pattern of Cd is identical to those of major nutrients in the oceans (Boyle et al., 1976; Bru- land, 1980). Horizontally, the Cd/P ratios in global deep waters are relatively consistent among various oceans, with- out significant changes with the age of seawater. In addi- tion, Cd/P ratios in the water column are fairly close to the averaged ratio in phytoplankton assemblages, which has been obtained through both field and laboratory cul- ture studies (Ho et al., 2003; Ho, 2006). The comparable re- sults between various field and laboratory culture studies indicate that particulate Cd in the ocean is largely intracel- lular (Ho, 2006). Based on these close, linear correlations, Cd concentrations have been considered an analog of phos- phate concentrations in ancient seawater (Boyle, 1988). Consequently, Cd/Ca ratios in foraminiferal fossil shells have been proposed as a proxy to evaluate phosphate con- centrations in the paleo-oceans (Boyle, 1988; Elderfield and Rickaby, 2000). Compared to other essential trace metals, the cycling of Cd exhibits several unique features. Particulate Cd in the 0016-7037/$ - see front matter Ó 2012 Elsevier Ltd. All rights reserved. http://dx.doi.org/10.1016/j.gca.2012.09.022 ⇑ Corresponding author. Address: 128, Sec. 2, Academia Rd, Nankang, Taipei 115, Taiwan. Tel.: +886 2 27839910x617. E-mail address: [email protected] (D.-C. Lee). www.elsevier.com/locate/gca Available online at www.sciencedirect.com Geochimica et Cosmochimica Acta 98 (2012) 66–77
-
Upload
independent -
Category
Documents
-
view
1 -
download
0
Transcript of The isotopic composition of Cadmium in the water column of the South China Sea
Available online at www.sciencedirect.com
www.elsevier.com/locate/gca
Geochimica et Cosmochimica Acta 98 (2012) 66–77
The isotopic composition of Cadmium in the water columnof the South China Sea
Shun-Chung Yang a,b,c, Der-Chuen Lee a,⇑, Tung-Yuan Ho b
a Institute of Earth Sciences, Academia Sinica, Taipei, Taiwanb Research Center for Environmental Changes, Academia Sinica, Taipei, Taiwan
c Department of Geosciences, National Taiwan University, Taipei, Taiwan
Received 26 April 2012; accepted in revised form 13 September 2012; Available online 21 September 2012
Abstract
We determined the Cd isotopic composition of seawater and sinking particles collected in the deep basin of the northernSouth China Sea (SCS) to investigate the controlling mechanisms on the Cd isotopic composition in the water column. Theisotopic composition in the water column decreased with depth, with e114/110Cd values (e114/110Cd = [(114Cd/110Cd)sample/(114Cd/110Cd)JMC Cd Munster � 1] � 104) ranging from +8.7 to +9.9 in the top 80 m, from +4.6 to +5.5 between 100 and150 m, decreasing from +5.5 to +3.6 at depths from 150 to 1000 m, and remaining at +3.4 ± 0.5 from 1000 to 3500 m.The isotopic composition and concentrations of Cd observed in the deep waters of the SCS are similar to the values that werepreviously reported in the North Pacific Ocean. In the thermocline, the variations in the Cd isotopic composition and con-centrations were consistent with the relative volumetric percentages of the subsurface water, the intermediate water, andthe deep water in the water column, indicating that water mixing is the dominant process determining the isotopic composi-tion in the thermocline. Comparable to the isotopic composition value in the seawater of the mixed layer, the e114/110Cd in thesinking particles collected at 30 m was +9.3 ± 0.9. Because our previous studies demonstrated that the particulate Cd waspredominantly biogenic organic matter, the comparable isotopic composition between the surface seawater and the sinkingparticles indicates that net biological isotopic fractionation on Cd in the surface water was insignificant. The result indicatesthat phytoplankton do not necessarily take up relatively light Cd in the oceanic surface waters. It is necessary to directly andsystematically investigate how marine phytoplankton fractionate Cd isotopes.� 2012 Elsevier Ltd. All rights reserved.
1. INTRODUCTION
Cadmium is biologically cycled in the marine water col-umn, taken up by phytoplankton in the surface waters andsubsequently regenerated and recycled in the water column.The vertical distribution pattern of Cd is identical to thoseof major nutrients in the oceans (Boyle et al., 1976; Bru-land, 1980). Horizontally, the Cd/P ratios in global deepwaters are relatively consistent among various oceans, with-out significant changes with the age of seawater. In addi-
0016-7037/$ - see front matter � 2012 Elsevier Ltd. All rights reserved.
http://dx.doi.org/10.1016/j.gca.2012.09.022
⇑ Corresponding author. Address: 128, Sec. 2, Academia Rd,Nankang, Taipei 115, Taiwan. Tel.: +886 2 27839910x617.
E-mail address: [email protected] (D.-C. Lee).
tion, Cd/P ratios in the water column are fairly close tothe averaged ratio in phytoplankton assemblages, whichhas been obtained through both field and laboratory cul-ture studies (Ho et al., 2003; Ho, 2006). The comparable re-sults between various field and laboratory culture studiesindicate that particulate Cd in the ocean is largely intracel-lular (Ho, 2006). Based on these close, linear correlations,Cd concentrations have been considered an analog of phos-phate concentrations in ancient seawater (Boyle, 1988).Consequently, Cd/Ca ratios in foraminiferal fossil shellshave been proposed as a proxy to evaluate phosphate con-centrations in the paleo-oceans (Boyle, 1988; Elderfield andRickaby, 2000).
Compared to other essential trace metals, the cycling ofCd exhibits several unique features. Particulate Cd in the
S.-C. Yang et al. / Geochimica et Cosmochimica Acta 98 (2012) 66–77 67
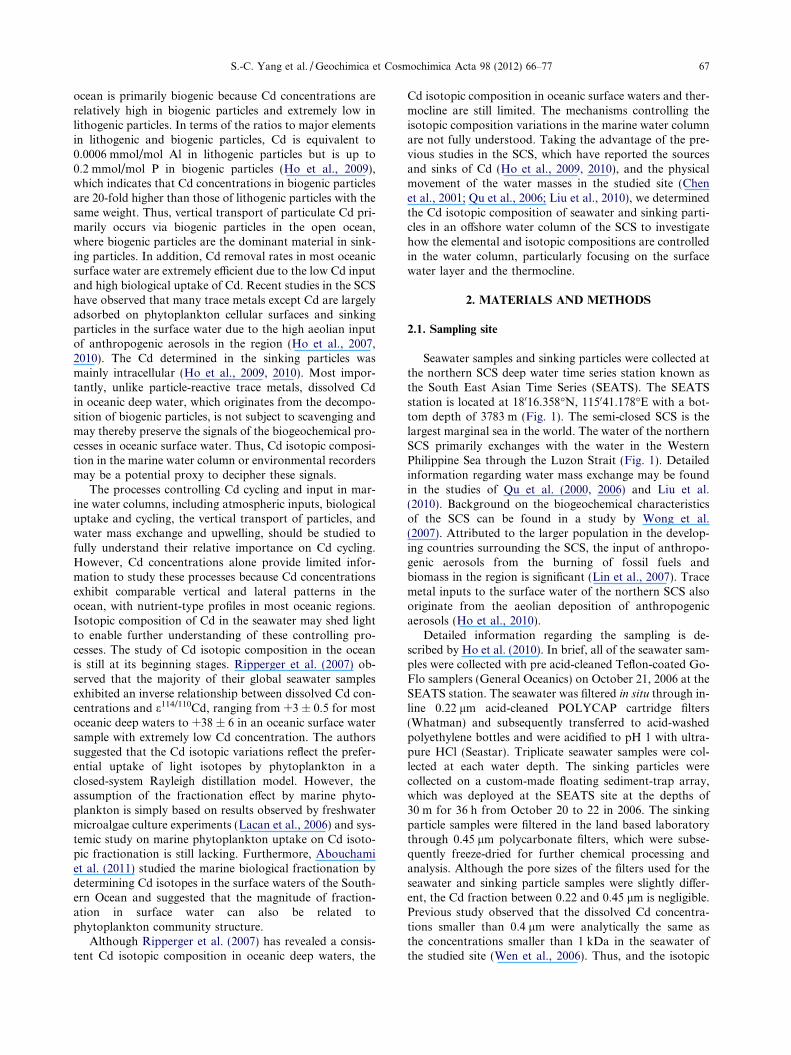
ocean is primarily biogenic because Cd concentrations arerelatively high in biogenic particles and extremely low inlithogenic particles. In terms of the ratios to major elementsin lithogenic and biogenic particles, Cd is equivalent to0.0006 mmol/mol Al in lithogenic particles but is up to0.2 mmol/mol P in biogenic particles (Ho et al., 2009),which indicates that Cd concentrations in biogenic particlesare 20-fold higher than those of lithogenic particles with thesame weight. Thus, vertical transport of particulate Cd pri-marily occurs via biogenic particles in the open ocean,where biogenic particles are the dominant material in sink-ing particles. In addition, Cd removal rates in most oceanicsurface water are extremely efficient due to the low Cd inputand high biological uptake of Cd. Recent studies in the SCShave observed that many trace metals except Cd are largelyadsorbed on phytoplankton cellular surfaces and sinkingparticles in the surface water due to the high aeolian inputof anthropogenic aerosols in the region (Ho et al., 2007,2010). The Cd determined in the sinking particles wasmainly intracellular (Ho et al., 2009, 2010). Most impor-tantly, unlike particle-reactive trace metals, dissolved Cdin oceanic deep water, which originates from the decompo-sition of biogenic particles, is not subject to scavenging andmay thereby preserve the signals of the biogeochemical pro-cesses in oceanic surface water. Thus, Cd isotopic composi-tion in the marine water column or environmental recordersmay be a potential proxy to decipher these signals.
The processes controlling Cd cycling and input in mar-ine water columns, including atmospheric inputs, biologicaluptake and cycling, the vertical transport of particles, andwater mass exchange and upwelling, should be studied tofully understand their relative importance on Cd cycling.However, Cd concentrations alone provide limited infor-mation to study these processes because Cd concentrationsexhibit comparable vertical and lateral patterns in theocean, with nutrient-type profiles in most oceanic regions.Isotopic composition of Cd in the seawater may shed lightto enable further understanding of these controlling pro-cesses. The study of Cd isotopic composition in the oceanis still at its beginning stages. Ripperger et al. (2007) ob-served that the majority of their global seawater samplesexhibited an inverse relationship between dissolved Cd con-centrations and e114/110Cd, ranging from +3 ± 0.5 for mostoceanic deep waters to +38 ± 6 in an oceanic surface watersample with extremely low Cd concentration. The authorssuggested that the Cd isotopic variations reflect the prefer-ential uptake of light isotopes by phytoplankton in aclosed-system Rayleigh distillation model. However, theassumption of the fractionation effect by marine phyto-plankton is simply based on results observed by freshwatermicroalgae culture experiments (Lacan et al., 2006) and sys-temic study on marine phytoplankton uptake on Cd isoto-pic fractionation is still lacking. Furthermore, Abouchamiet al. (2011) studied the marine biological fractionation bydetermining Cd isotopes in the surface waters of the South-ern Ocean and suggested that the magnitude of fraction-ation in surface water can also be related tophytoplankton community structure.
Although Ripperger et al. (2007) has revealed a consis-tent Cd isotopic composition in oceanic deep waters, the
Cd isotopic composition in oceanic surface waters and ther-mocline are still limited. The mechanisms controlling theisotopic composition variations in the marine water columnare not fully understood. Taking the advantage of the pre-vious studies in the SCS, which have reported the sourcesand sinks of Cd (Ho et al., 2009, 2010), and the physicalmovement of the water masses in the studied site (Chenet al., 2001; Qu et al., 2006; Liu et al., 2010), we determinedthe Cd isotopic composition of seawater and sinking parti-cles in an offshore water column of the SCS to investigatehow the elemental and isotopic compositions are controlledin the water column, particularly focusing on the surfacewater layer and the thermocline.
2. MATERIALS AND METHODS
2.1. Sampling site
Seawater samples and sinking particles were collected atthe northern SCS deep water time series station known asthe South East Asian Time Series (SEATS). The SEATSstation is located at 18016.358�N, 115041.178�E with a bot-tom depth of 3783 m (Fig. 1). The semi-closed SCS is thelargest marginal sea in the world. The water of the northernSCS primarily exchanges with the water in the WesternPhilippine Sea through the Luzon Strait (Fig. 1). Detailedinformation regarding water mass exchange may be foundin the studies of Qu et al. (2000, 2006) and Liu et al.(2010). Background on the biogeochemical characteristicsof the SCS can be found in a study by Wong et al.(2007). Attributed to the larger population in the develop-ing countries surrounding the SCS, the input of anthropo-genic aerosols from the burning of fossil fuels andbiomass in the region is significant (Lin et al., 2007). Tracemetal inputs to the surface water of the northern SCS alsooriginate from the aeolian deposition of anthropogenicaerosols (Ho et al., 2010).
Detailed information regarding the sampling is de-scribed by Ho et al. (2010). In brief, all of the seawater sam-ples were collected with pre acid-cleaned Teflon-coated Go-Flo samplers (General Oceanics) on October 21, 2006 at theSEATS station. The seawater was filtered in situ through in-line 0.22 lm acid-cleaned POLYCAP cartridge filters(Whatman) and subsequently transferred to acid-washedpolyethylene bottles and were acidified to pH 1 with ultra-pure HCl (Seastar). Triplicate seawater samples were col-lected at each water depth. The sinking particles werecollected on a custom-made floating sediment-trap array,which was deployed at the SEATS site at the depths of30 m for 36 h from October 20 to 22 in 2006. The sinkingparticle samples were filtered in the land based laboratorythrough 0.45 lm polycarbonate filters, which were subse-quently freeze-dried for further chemical processing andanalysis. Although the pore sizes of the filters used for theseawater and sinking particle samples were slightly differ-ent, the Cd fraction between 0.22 and 0.45 lm is negligible.Previous study observed that the dissolved Cd concentra-tions smaller than 0.4 lm were analytically the same asthe concentrations smaller than 1 kDa in the seawater ofthe studied site (Wen et al., 2006). Thus, and the isotopic

Fig. 1. Location of the sampling sites in the South China Sea. The samples of seawater and sinking particles were collected at SEATS site.
68 S.-C. Yang et al. / Geochimica et Cosmochimica Acta 98 (2012) 66–77
composition in the fraction less than 0.22 lm is representa-tive for dissolved fraction.
2.2. Pretreatment and column chemistry
The double spike technique used in this study was mod-ified from the method of Ripperger and Rehkamper (2007).Approximately one liter of seawater was used for isotopiccomposition analysis. Seawater samples were treated witha 110Cd–111Cd double spike containing 171.42 ppb Cd witha 111Cd/110Cd of 0.58847 to achieve a spike to sample ratioof approximately 4. The spiked seawater samples were sub-sequently acidified to achieve a final HCl concentration of0.7 N. All of the spiked seawater samples were incubatedfor at least 3 days to reach a full sample-spike equilibrationbefore the performance of chemical separation procedures.
The sinking particle samples and their blank filters weresoaked in a mixture of 1.8 mL of super-pure nitric acid and0.2 mL of super-pure hydrofluoric acid in 10 mL clean Tef-lon vials and were subsequently digested in a microwaveoven (MARS, CEM) at 180 �C for 15 min with a 10-minramp from room temperature to 180 �C. After completedigestion, the samples were evaporated to near dryness onthe hot plate at 80 �C under a trace-metal clean hood.The particle samples were also spiked with a 110Cd–111Cddouble spike, following the same procedures as those usedfor the seawater samples. The spiked samples were evapo-rated to dryness on hot plates at 120 �C and subsequentlyre-dissolved with 0.2 mL super-pure hydrochloric acid.The samples were evaporated to dryness again and werere-dissolved with 1.4 mL of 0.7 N HCl for further columnchemistry treatment.
A three-stage column chemistry that was adapted fromthe study of Ripperger and Rehkamper (2007) was used.Anion resin AG1X8 (Biorad) was applied in the first andthe second stages to preconcentrate Cd in the samplesand remove major elements, e.g., Na, Mg, and Ca. Another
anion resin, TRU (Eichrom), was applied in the third stageto further remove Mo and Sn to avoid isobaric interferencewith Cd. The purified Cd samples were evaporated to dry-ness, and 0.2 mL of super-pure nitric acid was added. Thesamples were evaporated to dryness again and were re-dis-solved with 2% HNO3 to achieve a final sample concentra-tion of approximately 5 ppb Cd. The recovery of Cd wasgreater than 90%. Any Cd contamination from the sam-pling and the column chemistry procedures was negligible.The column chemistry blank was at 57 ± 15 picogram(pg) (1SD, n = 3), which is equivalent to 1.5% of the Cdin the purified surface water and sinking particle samplesand equivalent to 0.1% of the Cd in the purified deep watersamples. The filter blank for sinking particles was approxi-mately 23 pg (n = 3), which is equivalent to 0.5% of the Cdin the samples.
This method requires only 2.5–5.0 nanogram (ng) ofunspiked Cd to reach analytical precision ranging from±0.7 to ±2.9 e114/110Cd (2SD; Table 1). Some other meth-ods may provide slightly better analytical precision but re-quire much larger sample sizes, e.g., the TIMS methodrequires hundreds of ng of unspiked Cd for each analysis.Similarly, although the method developed by Xue et al.(2011) obtained the precision down to ±0.5 e114/110Cd(2SD), the natural Cd mass per analysis required 20–30 ng to reach the precision.
2.3. Mass spectrometry analysis
All of the Cd isotopic measurements were performedusing a multi-collector ICPMS (Nu Instruments) with adesolvator nebulizer as a sample introduction system (CE-TAC Aridus I) at the Institute of Earth Sciences, AcademicSinica. Four Cd isotopes, 110, 111, 112, and 114, weresimultaneously measured in each analysis, and potentialisobaric interferences from 112Sn and 114Sn were correctedwithin-run by simultaneously monitoring 118Sn. Further-
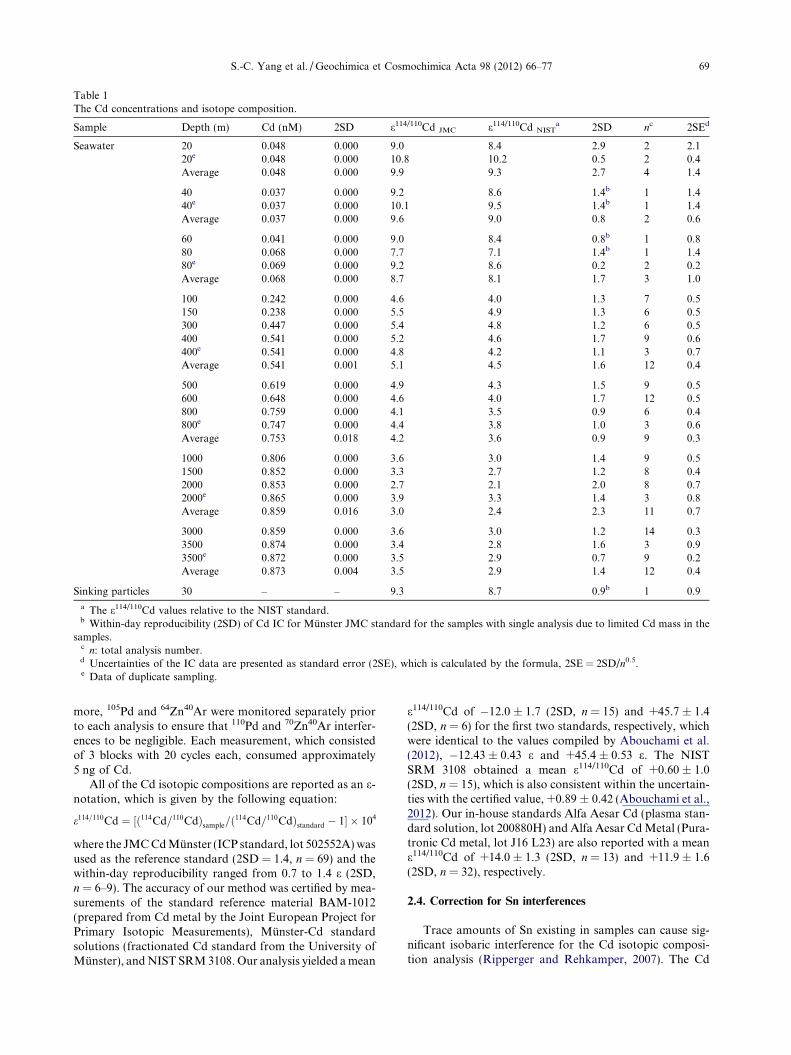
Table 1The Cd concentrations and isotope composition.
Sample Depth (m) Cd (nM) 2SD e114/110Cd JMC e114/110Cd NISTa 2SD nc 2SEd
Seawater 20 0.048 0.000 9.0 8.4 2.9 2 2.120e 0.048 0.000 10.8 10.2 0.5 2 0.4Average 0.048 0.000 9.9 9.3 2.7 4 1.4
40 0.037 0.000 9.2 8.6 1.4b 1 1.440e 0.037 0.000 10.1 9.5 1.4b 1 1.4Average 0.037 0.000 9.6 9.0 0.8 2 0.6
60 0.041 0.000 9.0 8.4 0.8b 1 0.880 0.068 0.000 7.7 7.1 1.4b 1 1.480e 0.069 0.000 9.2 8.6 0.2 2 0.2Average 0.068 0.000 8.7 8.1 1.7 3 1.0
100 0.242 0.000 4.6 4.0 1.3 7 0.5150 0.238 0.000 5.5 4.9 1.3 6 0.5300 0.447 0.000 5.4 4.8 1.2 6 0.5400 0.541 0.000 5.2 4.6 1.7 9 0.6400e 0.541 0.000 4.8 4.2 1.1 3 0.7Average 0.541 0.001 5.1 4.5 1.6 12 0.4
500 0.619 0.000 4.9 4.3 1.5 9 0.5600 0.648 0.000 4.6 4.0 1.7 12 0.5800 0.759 0.000 4.1 3.5 0.9 6 0.4800e 0.747 0.000 4.4 3.8 1.0 3 0.6Average 0.753 0.018 4.2 3.6 0.9 9 0.3
1000 0.806 0.000 3.6 3.0 1.4 9 0.51500 0.852 0.000 3.3 2.7 1.2 8 0.42000 0.853 0.000 2.7 2.1 2.0 8 0.72000e 0.865 0.000 3.9 3.3 1.4 3 0.8Average 0.859 0.016 3.0 2.4 2.3 11 0.7
3000 0.859 0.000 3.6 3.0 1.2 14 0.33500 0.874 0.000 3.4 2.8 1.6 3 0.93500e 0.872 0.000 3.5 2.9 0.7 9 0.2Average 0.873 0.004 3.5 2.9 1.4 12 0.4
Sinking particles 30 – – 9.3 8.7 0.9b 1 0.9
a The e114/110Cd values relative to the NIST standard.b Within-day reproducibility (2SD) of Cd IC for Munster JMC standard for the samples with single analysis due to limited Cd mass in the
samples.c n: total analysis number.d Uncertainties of the IC data are presented as standard error (2SE), which is calculated by the formula, 2SE = 2SD/n0.5.e Data of duplicate sampling.
S.-C. Yang et al. / Geochimica et Cosmochimica Acta 98 (2012) 66–77 69
more, 105Pd and 64Zn40Ar were monitored separately priorto each analysis to ensure that 110Pd and 70Zn40Ar interfer-ences to be negligible. Each measurement, which consistedof 3 blocks with 20 cycles each, consumed approximately5 ng of Cd.
All of the Cd isotopic compositions are reported as an e-notation, which is given by the following equation:
e114=110Cd ¼ ½ð114Cd=110CdÞsample=ð114Cd=110CdÞstandard � 1� � 104
where the JMC Cd Munster (ICP standard, lot 502552A) wasused as the reference standard (2SD = 1.4, n = 69) and thewithin-day reproducibility ranged from 0.7 to 1.4 e (2SD,n = 6–9). The accuracy of our method was certified by mea-surements of the standard reference material BAM-1012(prepared from Cd metal by the Joint European Project forPrimary Isotopic Measurements), Munster-Cd standardsolutions (fractionated Cd standard from the University ofMunster), and NIST SRM 3108. Our analysis yielded a mean
e114/110Cd of �12.0 ± 1.7 (2SD, n = 15) and +45.7 ± 1.4(2SD, n = 6) for the first two standards, respectively, whichwere identical to the values compiled by Abouchami et al.(2012), �12.43 ± 0.43 e and +45.4 ± 0.53 e. The NISTSRM 3108 obtained a mean e114/110Cd of +0.60 ± 1.0(2SD, n = 15), which is also consistent within the uncertain-ties with the certified value, +0.89 ± 0.42 (Abouchami et al.,2012). Our in-house standards Alfa Aesar Cd (plasma stan-dard solution, lot 200880H) and Alfa Aesar Cd Metal (Pura-tronic Cd metal, lot J16 L23) are also reported with a meane114/110Cd of +14.0 ± 1.3 (2SD, n = 13) and +11.9 ± 1.6(2SD, n = 32), respectively.
2.4. Correction for Sn interferences
Trace amounts of Sn existing in samples can cause sig-nificant isobaric interference for the Cd isotopic composi-tion analysis (Ripperger and Rehkamper, 2007). The Cd

70 S.-C. Yang et al. / Geochimica et Cosmochimica Acta 98 (2012) 66–77
isotopic composition in the standard JMC Cd Munsterdoped with various quantities of Sn was determined to eval-uate whether the isobaric interference of 112Sn and 114Sn atmass 112 and 114 can be adequately corrected by simulta-neously monitoring 118Sn. Fig. 2a demonstrates that Sninterferences can be satisfactorily corrected when the iso-baric contribution is less than 0.3% for 112Sn at mass 112and 0.2% for 114Sn at mass 114. The 112Sn and 114Sn inthe purified samples of this study accounted for 0.003–0.11% at mass 112 and 0.002–0.06% at mass 114, respec-tively, which is within the satisfactorily correctable level(Fig. 2a).
Fig. 2. Evaluation of Sn interference correction, TRU resin matrix,and seawater matrix on Cd IC analysis. The error bars representstandard errors (2SD) of each analysis. (a) The Cd IC of the AlfaAesar Cd Metal standards doped with various amounts of Sn. (b)The Cd IC of 5–100 ng Cd of Alfa Aesar Cd Metal standardspurified by TRU resins. (c) The Cd IC of the JMC Cd Munsterstandards added with various amounts of trace metal free artificialseawater.
2.5. Evaluation of the matrix effects
The AG1-X8 and TRU resins used in the column chem-istry can release organic matter into purified samples (Shielet al., 2009), which may cause a matrix effect or molecularinterferences with the analysis of Cd isotopic composition.The Cd isotopic composition of our in-house Cd standardspurified by either AG1-X8 or TRU resins was determinedto estimate whether the organic matrix influences the preci-sion and accuracy of isotopic composition measurements.In addition to organic matter, the major ions in seawater,e.g., Na, Mg, and Ca that remain in purified Cd samplesmay potentially influence the precision and accuracy ofthe determination of Cd isotopic composition. The Cd iso-topic composition of the JMC Cd Munster standard sam-ples, which were added with different trace amounts oftrace metal free artificial seawater, were determined to eval-uate this effect (Fig. 2c).
Approximately 70 ng of Alfa Aesar Cd was added to 1 lof trace metal clean nature seawater and double-spiked andpurified using the first and second column procedures de-scribed previously. The eluent for the purified Cd fractionwas collected and evaporated to dryness. The dried sampleswere supplemented with 0.2 mL of super-pure nitric acidand were evaporated to dryness again. The dried sampleswere re-dissolved with 2% HNO3 to achieve final total con-centrations of approximately 25 ppb. Our analysis yielded amean e114/110Cd of +13.0 ± 0.4 (2SD, n = 3) for the puri-fied standard, which is analytically the same as the e114/
110Cd of +14.0 ± 1.3 in the original standard solution, indi-cating that the matrix from the AG1-X8 does not signifi-cantly influence Cd isotopic measurements.
Previous studies (Shiel et al., 2009; Gault-Ringold andStirling, 2012) have reported that significant amounts of or-ganic matter are released from TRU resin in column proce-dures. The organic matter in a purified sample matrix maycause large and anomalous shifts for Cd isotopic composi-tion. The solution of the standard Alfa Aesar Cd metal con-taining 5–100 ng of Cd was double-spiked and purified bythe TRU column procedure to evaluate the influence ofthe organic matter on Cd isotopic composition analysis.The Cd eluent was processed in the same manner as the ma-trix effect study for the AG1-X8 resin. Fig. 2b shows thatthe isotopic composition of the standards with the sameamount of Cd but different amounts of TRU matrix solu-tion were statistically similar, demonstrating that the influ-ence of the TRU matrix on the analysis of Cd isotopiccomposition is also negligible.
Fig. 2c shows that the isotopic composition of the JMCCd Munster standards, which are enriched with variousamounts of trace metal clean natural seawater, purified byChelex-100 resin (Pai et al., 1990). The results were similarto the value of the original standard when sodium concen-trations were within 100 ppb. The isotopic measurementswere precise within 1.5 e (2SD, n = 3–6). Because Na con-centrations in purified samples were generally less than1 ppb, this confirms that the remaining major elements inthe purified samples did not significantly influence the accu-racy and precision of the Cd isotopic analysis.

S.-C. Yang et al. / Geochimica et Cosmochimica Acta 98 (2012) 66–77 71
3. RESULTS AND DISCUSSION
3.1. Cd isotopic composition in the seawater and sinking
particles
The Cd concentration and isotopic composition in thewater column at the SEATS station are shown in Table 1and Fig. 3. The vertical variations of the Cd concentrationsexhibited a typical nutrient-type profile (Fig. 3a). As for theCd isotopic composition, the e114/110Cd ranged between +9and +10 in the top 80 m and decreased to between +5 to +6from 100 to 150 m (Fig. 3d). The e114/110Cd linearly de-creased with depth in the thermocline, from +5.5 at150 m to +3.6 at 1000 m (Fig. 3b). In the deep water, from1000 to 3500 m, the e114/110Cd remained constant atapproximately +3.4 ± 0.5 (Fig. 3b), which is consistentwith the global deep ocean value (Ripperger et al., 2007).The e114/110Cd in the sinking particles was +9.3 ± 0.9(2SD), which is similar to the seawater at the top 80 mand is significantly heavier than the seawater from 100 to3500 m (Fig. 3d).
3.2. A box model for Cd cycling
We established a box model to investigate how particletransport and physical mixing influence Cd cycling in theSCS. The SCS has been intensively studied for physicalmixing and particle transports, which include the sourcesand sinks of Cd in the water column (Ho et al., 2009,2010, 2011), the vertical mixing of water masses (Qu,2001; Chen et al., 2001; Wong et al., 2007), and horizontaladvection (Qu et al., 2006; Liu et al., 2010). These studiesprovided a quantitative background to evaluate the relativeimportance of the processes in the box model. The 3500-mdeep water column is separated into 4 boxes based on itsbiological and physical features. The first layer is the top100 m zone, where the uptake of phytoplankton on Cd ismost active in the water column (Fig. 4a). Based on theT–S plot, there are 3 major water masses in the water col-
Fig. 3. The vertical profiles of Cd concentration and IC (a) Cd concentratin the top 150 m. The solid circle symbol stands for the IC in the sinkirepresent standard errors (2SE) of each analysis.
umn (Figs. 4b and 6a), including the 100–150 m subsurfacewater mass, the 400–500 m middle layer water mass and the2000–3500 m deep water mass. Because the three watermasses originate from the North Pacific Tropical Water,the North Pacific Intermediate Water, and the West Philip-pine Sea deep water (Qu et al., 2000, 2006; Liu et al., 2010),we separated the water column below the surface layer into3 boxes, including 100–250 m subsurface box, the 250–850 m thermocline box, and the 850–3500 m deep waterbox (Fig. 4b). Based on the concentration data obtainedin this study, the averaged Cd concentration in each boxis used to calculate the inventory of Cd in each box, whichis 0.07, 0.28, 0.62, and 0.85 nM in the boxes from top tobottom, respectively. The primary information concerningthe vertical flux and flow rates are shown in Fig. 5a.
3.2.1. The vertical transport of sinking particles
Ho et al. (2009, 2010) has studied and reported the ver-tical fluxes of Cd at different depths in the water column.Downward Cd fluxes generally follow an exponential de-crease with depth. The annually averaged flux was12 nmol/m2/d at 100 m, decreased to 4.2 nmol/m2/d at250 m, 1.7 nmol/m2/d at 850 m, and 0.7 nmol/m2/d (Hoet al., 2009, 2010) at 3500 m. The difference between any2 depths may represent the decomposed vertical Cd fluxesin the box. Because anthropogenic aerosols are known tobe the dominant Cd source in surface water (Ho et al.,2010), the decomposed Cd flux in the surface layer maybe estimated by the difference between the aerosol deposi-tion fluxes and the sinking particle fluxes at 100 m. A studyby Ho et al. (2010) observed that the Cd fluxes at DongshaAtoll (Fig. 1) in the SCS originated from aerosol input thatranged from 24 to 160 nmol/m2/d with an average value of92 nmol/m2/d from July to October in 2007. The differencesare 80, 7.8, 2.5, and 1 nmol/m2/d, for the boxes 0–100 m,100–250 m, 250–850 m, and 850–3500 m, respectively.Assuming steady state condition for the Cd mass in eachbox, the residence time can be estimated by dividing the to-tal Cd inventory by the Cd flux. The results indicate that
ion. (b) Cd IC. (c) The concentrations in the top 150 m (d) the Cd ICng particles. The error bars for the Cd concentrations and the IC

Fig. 4. (a) The vertical profile of chlorophyll a concentration in the top 150 m. (b) T–S diagram of the whole water column at the samplingsite. The diagram shows that there are three major water masses, the SCS subsurface water at 100–150 m, the SCS intermediate water at 400–500 m, and the SCS deep water at 200–3500 m.
Fig. 5. (a) Box model for Cd cycling in different water columns of the SCS. Annually averaged particle fluxes at 100 and 3500 m are from thestudies of sediment traps deployed at these depths (Ho et al., 2009, 2010), and the fluxes at 250 and 850 m are estimated values, for lack ofdirect observation. It has found that the particle fluxes decrease with depths exponentially, thus we obtained the best regression function forthe actual data at 100, 160, 600, and 3500 m depths to estimate the fluxes at 250 and 850 m. Other estimate about concentrations, bottom-upfluxes and turnover times of Cd, see the discussions in 4.1. (b) Regression of Cd fluxes versus water depths.
72 S.-C. Yang et al. / Geochimica et Cosmochimica Acta 98 (2012) 66–77
the residence time in the four boxes from top to the bottomare 0.2, 15, 410, and 6100 years, respectively, simply due tothe exponential decrease in the vertical particulate Cd inputwith depth and the significant increase in the total Cdinventory in the deeper layers. The relatively short Cd res-idence time in the top two layers indicates that the verticaltransport of the sinking particles may be the dominant pro-cess in controlling Cd cycling in the layers.
3.2.2. Upwelling and horizontal advection
Vertical upwelling and horizontal advection also controlthe transport of Cd among different boxes. The bottom-up
transport rates were evaluated and reported by physical andchemical parameters in the studied site, including the use ofthe mass balance between nutrient supply and the net pri-mary production (Wong et al., 2007), the use of the massbalance between salinity and the water masses (Chenet al., 2001), or the use of physical parameters to estimatewater mass upwelling rates (Qu, 2001). The upwelling ratesestimated by these studies are similar. Chen et al. (2001) re-ported that the average upwelling velocity in the SCS is55 m/year. Wong et al. (2007) found the upward transportvelocity to be 41 m/year in the mixing layer, and Qu (2001)reported seasonal upwelling, with 32 m/year in June and

S.-C. Yang et al. / Geochimica et Cosmochimica Acta 98 (2012) 66–77 73
95 m/year in October. Based on these studies, we used55 m/year as the averaged upwelling velocity in this boxmodel, which results in upward transport with a flux of128 nmol/m2/d from the deep box to the thermocline box,93 nmol/m2/d from the thermocline box to the subsurfacewater, and 43 nmol/m2/d flux from the subsurface box tothe surface layer (Fig. 5a). Assuming the steady state ofthe Cd mass balance in these boxes and the upwelling asthe dominant physical vertical mixing process, the residencetimes are 0.4, 1.3, 8, and 48 years from top to the bottom,respectively.
In terms of the horizontal transport, it is reported thatthe water mass in the West Philippine Sea (WPS) passesthrough the Luzon strait and enters the SCS basin (Gonget al., 1992; Qu et al., 2006). Based on the mass balanceof water masses and salinity, the vertical transport velocityhas been estimated in previous studies. Qu et al. (2006) re-ported that the residence time of the deep water in thenorthern SCS basin was roughly around 30 years, similarto the value estimated by Liu et al. (2010), which was50 years. Liu et al. (2010) also estimated the residence timein the subsurface layer and surface layer, which were 3.8and 1.5 years, respectively. Based on the comparison ofthe residence time determined for the vertical transport ofsinking particles, upwelling, and horizontal advection, weconclude that the dominant process for controlling Cd cy-cling in the surface box is particle sinking, and transportof water masses is the primary controlling process in thethree deeper boxes.
3.3. The variability in the deep water and the thermocline
The Cd concentration and e114/110Cd in water deeperthan 850 m are 0.8–0.9 nM and +3.5 ± 0.2 (1SD), whichare similar to the values in the Northern Pacific Ocean,0.8–1.0 nM and +3.2 ± 0.5 (Ripperger et al., 2007), andthe values in the deep water of the WPS, 0.8–0.9 nM and+3.2 ± 0.7 (unpublished data). The similarity between theSCS and the WPS is expected because the SCS deep water
Fig. 6. (a) The vertical profiles of potential temperature (dotted line) and scontribution of the subsurface water (black line), the intermediate water (g(c) Calculated Cd concentration data (gray line) in a mixing-model andisotope data with 95% confidence level (gray line) in a mixing-model and
originates from the deep water of the WPS (Gong et al.,1992; Qu et al., 2006). Thus, the residence time of Cd wouldbe similar to the residence time of the deep water in theSCS, which is approximately 30–50 years (Qu et al., 2006;Liu et al., 2010). Compared to the input of water transport,the contribution of sinking particles to the dissolved Cd isinsignificantly in the deep water of the SCS (Fig. 5a). Theaveraged residence time estimated via the decompositionof sinking particles was about six thousand years in thedeep water column, considerably longer than the residencetime of the deep water.
The thermocline and subsurface water, ranging from 850to 100 m, primarily originates from the horizontal advec-tion of WPS seawater, with a residence time of less than4 years (Liu et al., 2010). The residence time is also muchshorter than the turnover times estimated by the decompo-sition of sinking particles, which are 410 and 15 years,respectively. In terms of upwelling in the water column,the turnover time in the thermocline and subsurface layersare 8 and 1.3 years, respectively, which are comparable toor slightly longer than the turnover time by horizontaladvection. Thus, the Cd isotopic composition reflects themixing effect between bottom-up upwelling water of theSCS and the thermocline water of the WPS through hori-zontal advection (Gong et al., 1992; Chao et al., 1996).
The T–S diagram shows that the water column below100 m is composed of three major water masses (Figs. 4band 6a), including the bottom water mass deeper than2200 m, the mid-layer near 400–500 m, and the subsurfacelayer, ranging from 100 to 150 m. Using these three watermasses as end members, the relative mixing ratio at differentdepths may be estimated by the following equations:
rh;mixed ¼ V1% � rh;1 þ V2% � rh;2
V1%þ V2% ¼ 100%
where rh,mixed represents the density of water at differentdepths, rh,1 and rh,2 represent the densities of water masses1 and 2, respectively, and V1% and V2% represent the rela-
alinity (black line) in the SCS water column. (b) Relative volumetricray line), and the deep water (dotted line) in the SCS water column.actual Cd concentration data (open diamonds). (d) Calculated Cd
actual Cd isotope data (open diamonds).
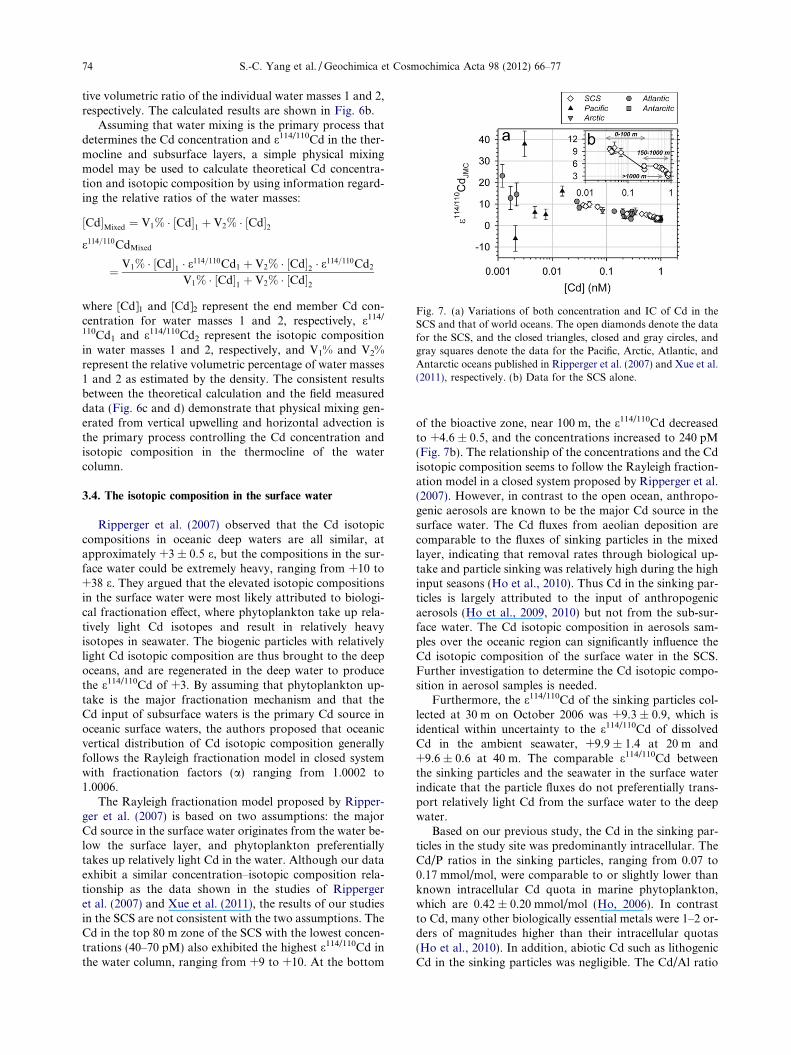
Fig. 7. (a) Variations of both concentration and IC of Cd in theSCS and that of world oceans. The open diamonds denote the datafor the SCS, and the closed triangles, closed and gray circles, andgray squares denote the data for the Pacific, Arctic, Atlantic, andAntarctic oceans published in Ripperger et al. (2007) and Xue et al.(2011), respectively. (b) Data for the SCS alone.
74 S.-C. Yang et al. / Geochimica et Cosmochimica Acta 98 (2012) 66–77
tive volumetric ratio of the individual water masses 1 and 2,respectively. The calculated results are shown in Fig. 6b.
Assuming that water mixing is the primary process thatdetermines the Cd concentration and e114/110Cd in the ther-mocline and subsurface layers, a simple physical mixingmodel may be used to calculate theoretical Cd concentra-tion and isotopic composition by using information regard-ing the relative ratios of the water masses:
½Cd�Mixed ¼ V1% � ½Cd�1 þ V2% � ½Cd�2e114=110CdMixed
¼ V1% � ½Cd�1 � e114=110Cd1 þ V2% � ½Cd�2 � e114=110Cd2
V1% � ½Cd�1 þ V2% � ½Cd�2
where [Cd]1 and [Cd]2 represent the end member Cd con-centration for water masses 1 and 2, respectively, e114/
110Cd1 and e114/110Cd2 represent the isotopic compositionin water masses 1 and 2, respectively, and V1% and V2%represent the relative volumetric percentage of water masses1 and 2 as estimated by the density. The consistent resultsbetween the theoretical calculation and the field measureddata (Fig. 6c and d) demonstrate that physical mixing gen-erated from vertical upwelling and horizontal advection isthe primary process controlling the Cd concentration andisotopic composition in the thermocline of the watercolumn.
3.4. The isotopic composition in the surface water
Ripperger et al. (2007) observed that the Cd isotopiccompositions in oceanic deep waters are all similar, atapproximately +3 ± 0.5 e, but the compositions in the sur-face water could be extremely heavy, ranging from +10 to+38 e. They argued that the elevated isotopic compositionsin the surface water were most likely attributed to biologi-cal fractionation effect, where phytoplankton take up rela-tively light Cd isotopes and result in relatively heavyisotopes in seawater. The biogenic particles with relativelylight Cd isotopic composition are thus brought to the deepoceans, and are regenerated in the deep water to producethe e114/110Cd of +3. By assuming that phytoplankton up-take is the major fractionation mechanism and that theCd input of subsurface waters is the primary Cd source inoceanic surface waters, the authors proposed that oceanicvertical distribution of Cd isotopic composition generallyfollows the Rayleigh fractionation model in closed systemwith fractionation factors (a) ranging from 1.0002 to1.0006.
The Rayleigh fractionation model proposed by Ripper-ger et al. (2007) is based on two assumptions: the majorCd source in the surface water originates from the water be-low the surface layer, and phytoplankton preferentiallytakes up relatively light Cd in the water. Although our dataexhibit a similar concentration–isotopic composition rela-tionship as the data shown in the studies of Rippergeret al. (2007) and Xue et al. (2011), the results of our studiesin the SCS are not consistent with the two assumptions. TheCd in the top 80 m zone of the SCS with the lowest concen-trations (40–70 pM) also exhibited the highest e114/110Cd inthe water column, ranging from +9 to +10. At the bottom
of the bioactive zone, near 100 m, the e114/110Cd decreasedto +4.6 ± 0.5, and the concentrations increased to 240 pM(Fig. 7b). The relationship of the concentrations and the Cdisotopic composition seems to follow the Rayleigh fraction-ation model in a closed system proposed by Ripperger et al.(2007). However, in contrast to the open ocean, anthropo-genic aerosols are known to be the major Cd source in thesurface water. The Cd fluxes from aeolian deposition arecomparable to the fluxes of sinking particles in the mixedlayer, indicating that removal rates through biological up-take and particle sinking was relatively high during the highinput seasons (Ho et al., 2010). Thus Cd in the sinking par-ticles is largely attributed to the input of anthropogenicaerosols (Ho et al., 2009, 2010) but not from the sub-sur-face water. The Cd isotopic composition in aerosols sam-ples over the oceanic region can significantly influence theCd isotopic composition of the surface water in the SCS.Further investigation to determine the Cd isotopic compo-sition in aerosol samples is needed.
Furthermore, the e114/110Cd of the sinking particles col-lected at 30 m on October 2006 was +9.3 ± 0.9, which isidentical within uncertainty to the e114/110Cd of dissolvedCd in the ambient seawater, +9.9 ± 1.4 at 20 m and+9.6 ± 0.6 at 40 m. The comparable e114/110Cd betweenthe sinking particles and the seawater in the surface waterindicate that the particle fluxes do not preferentially trans-port relatively light Cd from the surface water to the deepwater.
Based on our previous study, the Cd in the sinking par-ticles in the study site was predominantly intracellular. TheCd/P ratios in the sinking particles, ranging from 0.07 to0.17 mmol/mol, were comparable to or slightly lower thanknown intracellular Cd quota in marine phytoplankton,which are 0.42 ± 0.20 mmol/mol (Ho, 2006). In contrastto Cd, many other biologically essential metals were 1–2 or-ders of magnitudes higher than their intracellular quotas(Ho et al., 2010). In addition, abiotic Cd such as lithogenicCd in the sinking particles was negligible. The Cd/Al ratio

Table 2The Al and P normalized elemental ratios in the sinking particle sample.
Elemental ratios (mmol/mol)a Fe Mn Zn Co Cd Pb
Relative to Al 752 14 47 0.88 0.28 35(Crustal ratio)b (252) (5.7) (0.54) (0.18) (0.0006) (0.043)Relative to P 177 3.4 11 0.21 0.07 8(Intercellular ratio)c (3.6–7.4) (0.3–1.6) (0.8–3.0) (0.10–0.19) (0.07–0.54) –
a Calculated from the data published in Ho et al. (2010).b Calvert et al. (1993).c Ho (2006).
S.-C. Yang et al. / Geochimica et Cosmochimica Acta 98 (2012) 66–77 75
in the sinking particle sample analyzed in this study,0.28 mmol/mol, was 2 orders of magnitude higher thanthe Cd ratio in lithogenic particles, 0.0006 mmol/mol (Ta-ble 2), indicating that the contribution of lithogenic Cd inthe sinking particles is less than 0.2% of total Cd in the sink-ing particles.
The vertical concentration gradients of organic carbonand phosphorus fluxes in the euphotic zone of the study siteprovide us the other approach to further quantitatively esti-mate the contribution of biogenic Cd in the sinking particle(Ho et al., 2010). The vertical variations of Cd fluxes insinking particles were linearly proportional to the varia-tions of organic C and P fluxes (Ho et al., 2010). Basedon the flux difference of Cd or organic matter between 30and 160 m, about 90% of particulate Cd and organic matterat 30 m was remineralized through microbial degradationonce the particles reached 160 m (Ho et al., 2010). TheCd to P ratios in the sinking particles at 160 m, rangingfrom 0.06 to 0.12 mmol/mol, still remained close to orslightly lower than known intracellular quotas in phyto-plankton (Ho et al., 2010). Thus, the Cd in the sinking par-ticles at 160 m was still dominantly biogenic. Overall, morethan 99% of Cd in the sinking particles collected at 30 mwas biogenic, and the contribution of other abiotic particles(e.g., lithogenic and anthropogenic particles) was negligible.
The adsorption of Cd on the sinking particles mightinfluence the isotopic composition in the sinking particles.However, no Cd adsorption behavior was observed in thesurface water. Theoretically, Cd adsorption on sinking par-ticles would increase Cd to P ratios in the particles.Although the Cd concentrations increased from 40 to240 pM between 30 and 150 m, the Cd to P ratios in thesinking particles still remained consistent from 30 to150 m (Ho et al., 2010). The Cd to P ratios in various sizesof phytoplankton and plankton, which possessed differentarea to volume ratios, were statistically identical (Hoet al., 2009). Moreover, the Cd concentrations in the top60 m mixed layer were fairly consistent (Wen et al., 2006),indicating that no significant net dissolution effect occurredout of sinking particles from the surface water to 30 m.
Because the Cd in the sinking particles was predomi-nantly intracellular, the comparable isotopic compositionbetween the sinking particles and the seawater in the sur-face water indicates that there was no significant net biolog-ical fractionation in the surface water (Fig. 3d). Overallbiological activities in the surface water do not seem topreferentially take up relatively light Cd from the surfacewater.
Ripperger et al. (2007) proposed that the uptake of light-er Cd by phytoplankton may be attributed to Zn depletionin seawater. Analyzing the Cd isotopic composition in thesurface water of the Weddell Gyre and the Antarctic Cir-cumpolar Current, Abouchami et al. (2011) observed thatphytoplankton had different Cd isotopic fractionation ef-fects in the two oceanic regions, with fractionation factorsto be 1.0002 and 1.0004, respectively. The authors proposedthat the fractionation may be attributed to the phytoplank-ton community structure or the availability of the associ-ated metals like Zn or Mn. It should be noted thatextracellular membrane transporters can play critical roleson controlling the isotopic composition of trace metals(John et al., 2007), and the property of the transporterscan be influenced by various environmental factors, suchas the bioavailability of Mn, Zn, and Fe (Sunda and Hunts-man, 2000; Lane et al., 2009). It is possible that the bio-availability of these associated metals can influence thefractionation effect of phytoplankton on Cd.
In the SCS, our previous studies have shown that tracemetal input to the surface water is high due to elevatedanthropogenic aerosol deposition in the oceanic region.Phytoplankton adsorb a significant amount of trace metalsoriginating from anthropogenic aerosols (Ho et al., 2007,2009, 2010). The Zn and Mn extracellularly adsorbed byphytoplankton were approximately one order of magnitudehigher than their averaged intracellular quotas (Ho et al.,2003). Thus, Zn and Mn are unlikely to be limiting factorsfor phytoplankton growth in the surface water. The insig-nificant difference in the Cd isotopic composition betweenthe surface water and the biogenic particles suggests thatphytoplankton in the water did not significantly fractionateCd isotopic composition under sufficient trace metal avail-ability. Further laboratory culture experiments are neededto demonstrate the biological fractionation effect on Cd iso-topes by using specific phytoplankton under depleted or re-plete conditions of the associated trace metals.
4. CONCLUSIONS
The Cd isotopic composition and concentrations ob-served in the water column of the SCS exhibit similar trendsas those reported in a previous study (Ripperger et al.,2007), showing a nearly linear relationship between the iso-topic composition and log scale concentrations. However,the variations of the isotopic composition and concentra-tions of Cd in the thermocline and the deep water were rel-atively conservative, closely following the relative

76 S.-C. Yang et al. / Geochimica et Cosmochimica Acta 98 (2012) 66–77
volumetric contribution of water masses in different layers.In addition, the e114/110Cd of the seawater and sinking par-ticles in the surface water ranged from +9 to +10, withoutsignificant difference. Both observations indicate that netbiological fractionation of the e114/110Cd is not significantin the surface water, and the Rayleigh distillization modelmay not apply to explain the vertical variability of the Cdisotopic composition in the ocean at least in the SCS. Be-cause our previous study demonstrated that the surfacewater of the SCS is trace metal replete, the heavy Cd isoto-pic composition observed in the seawater and sinking par-ticles in the surface water may be attributed to the inputof anthropogenic aerosols in the oceanic region.
ACKNOWLEDGMENTS
We thank Jason Jiun-San Shen for his pioneer work in estab-lishing the double spike method at the Institute of Earth Sciences,Wen-Yu Hsu for instrumental support, Hsu-Han Yang for tracemetal clean seawater sampling, Wen-Chen Chou, the personnelof the RV Ocean Research 1 for seawater and sinking particle sam-pling, and Dr. Frank Wombacher for providing Cd standards JMCCd Munster, BAM-1012 and Munster-Cd. This research was sup-ported by Taiwan National Science Counsel Grant Nos. 98-2628-M-001-004 and 99-2628-M-001-003.
APPENDIX A. SUPPLEMENTARY DATA
Supplementary data associated with this article can befound, in the online version, at http://dx.doi.org/10.1016/j.gca.2012.09.022.
REFERENCES
Abouchami W., Galer S. J. G., de Baar H. J. W., Alderkamp A. C.,Middag R. and Laan P. (2011) Modulation of the SouthernOcean cadmium isotope signature by ocean circulation andprimary productivity. Earth Planet. Sci. Lett. 305, 83–91.
Abouchami W., Galer S. J. G., Horner T. J., Rehkamper M.,Wombacher F., Xue Z., Lambelet M., Gault-Ringold M.,Stirling C. H., Schonbachler M., Shiel A. E., Weis D. andHoldship P. F. (2012) A common reference material for cadmiumisotope studies – NIST SRM 3108. Geostand. Geoanal. Res.
http://dx.doi.org/10.1111/j.1751-908X.2012.00175.x.Boyle E. A., Sclater F. and Edmond J. M. (1976) Marine
geochemistry of cadmium. Nature 263, 42–44.
Boyle E. A. (1988) Cadmium: chemical tracer of deep-waterpaleoceanography. Paleoceanography 3, 471–490.
Bruland K. W. (1980) Oceanographic distributions of cadmium,zinc, nickel, and copper in the North Pacific. Earth Planet. Sci.
Lett. 47, 176–198.
Calvert S. E., Pedersen T. F. and Thunell R. C. (1993) Geochem-istry of the surface sediments of the Sulu and South China Seas.Mar. Geol. 114, 207–231.
Chao S. Y., Shaw P. T. and Wu S. Y. (1996) Deep water ventilationin the South China Sea. Deep-Sea Res. Oceanogr. 43, 445–466.
Chen C. T. A., Wang S. L., Wang B. J. and Pai S. C. (2001)Nutrient budgets for the South China Sea basin. Mar. Chem.
75, 281–300.
Elderfield H. and Rickaby R. E. M. (2000) Oceanic Cd/P ratio andnutrient utilization in the glacial Southern Ocean. Nature 405,
305–310.
Gault-Ringold M. and Stirling C. H. (2012) Anomalous isotopicshifts associated with organic resin residues during cadmiumisotopic analysis by double spike MC-ICPMS. J. Anal. At.
Spectrom. 27, 449–459.
Gong G. C., Liu K. K., Liu C. T. and Pai S. C. (1992) The chemicalhydrography of the South China Sea West of Luzon and acomparison with the West Philippine Sea. TAO 3, 587–602.
Ho T. Y., Quigg A., Finkel Z. V., Milligan A. J., Wyman K.,Falkowski P. G. and Morel F. M. M. (2003) The elementalcomposition of some marine phytoplankton. J. Phycol. 39,
1145–1159.
Ho T. Y. (2006) The trace metal composition of marine microalgaein cultures and natural assemblages. In Algal Cultures:
Analogues of Blooms and Applications (ed. D. V. Subba Rao).Science Pub. Inc., New Hampshire, USA, pp. 271–299.
Ho T. Y., Wen L. S., You C. F. and Lee D. C. (2007) The trace-metal composition of size-fractionated plankton in the SouthChina Sea: biotic versus abiotic sources. Limnol. Oceanogr. 52,
1776–1788.
Ho T. Y., You C. F., Chou W. C., Pai S. C., Wen L. S. and Sheu D.D. (2009) Cadmium and phosphorus cycling in the watercolumn of the South China Sea: the roles of biotic and abioticparticles. Mar. Chem. 115, 125–133.
Ho T. Y., Chou W. C., Wei C. L., Lin F. J., Wong G. T. F. and LinH. L. (2010) Trace metal cycling in the surface water of theSouth China Sea: vertical fluxes, composition, and sources.Limnol. Oceanogr. 55, 1807–1820.
John S. G., Geis R. W., Saito M. A. and Boyle E. A. (2007) Zincisotope fractionation during high-affinity and low-affinity zinctransport by the marine diatom. Thalassiosira oceanica. Limnol.
Oceanogr. 52(6), 2710–2714.
Lacan F., Francois R., Ji Y. C. and Sherrell R. M. (2006) Cadmiumisotopic composition in the ocean. Geochim. Cosmochim. Acta
70, 5104–5118.
Lane E. S., Semeniuk D. M., Strzepek R. F., Cullen J. T. andMaldonado M. T. (2009) Effects of iron limitation on intracel-lular cadmium of cultured phytoplankton: implications forsurface dissolved cadmium to phosphate ratios. Mar. Chem.
115, 155–162.
Lin I. I., Chen J. P., Wong G. T. F., Huang C. W. and Lien C.C. (2007) Aerosol input to the South China Sea: results fromthe MODerate resolution Imaging Spectro-radiometer, thequick scatterometer, and the measurements of pollution inthe troposphere sensor. Deep-Sea Res. Oceanogr. 54, 1589–
1601.
Liu K. K., Tseng C. M., Wu C. R. and Lin I. I. (2010) The SouthChina Sea. In Carbon and Nutrient Fluxes in Continental
Margins: A Global Synthesis (eds. K. K. Liu, L. Atkinson, R.Quinones and L. Talaue-McManus), pp. 464–482. IGBP Book
Series. Springer, Berlin.
Pai S. C., Fang T. H., Chen A. C. T. and Jeng K. L. (1990) Alow contamination Chelex-100 technique for shipboard pre-concentration of heavy metals in seawater. Mar. Chem. 29,
295–306.
Qu T. D. (2001) Role of ocean dynamics in determining the meanseasonal cycle of the South China Sea surface temperature. J.
Geophys. Res. 106. http://dx.doi.org/10.1029/2000JC000479.
Qu T. D., Girton J. B. and Whitehead J. A. (2006) Deepwateroverflow through Luzon Strait. J. Geophys. Res. 111. http://
dx.doi.org/10.1029/2005JC003139.
Qu T. D., Mitsudera H. and Yamagata T. (2000) Intrusion of theNorth Pacific waters into the South China Sea. J. Geophys. Res.
105. http://dx.doi.org/10.1029/1999JC900323.
Ripperger S. and Rehkamper M. (2007) Precise determination ofcadmium isotope fractionation in seawater by double spikeMC-ICPMS. Geochim. Cosmochim. Acta 71, 631–642.

S.-C. Yang et al. / Geochimica et Cosmochimica Acta 98 (2012) 66–77 77
Ripperger S., Rehkamper M., Porcelli D. and Halliday A. N.(2007) Cadmium isotope fractionation in seawater – asignature of biological activity. Earth Planet. Sci. Lett. 261,
670–684.
Shiel A. E., Barlin J., Orians K. J. and Weis D. (2009) Matrixeffects on the multi-collector inductively coupled plasma massspectrometric analysis of high-precision cadmium and zincisotope ratios. Anal. Chim. Acta 633, 29–37.
Sunda W. G. and Huntsman S. A. (2000) Effect of Zn, Mn, and Feon Cd accumulation in phytoplankton: implications for oceanicCd cycling. Limnol. Oceanogr. 45(7), 1501–1516.
Wen L. S., Jiann K. T. and Santschi P. H. (2006) Physicochemicalspeciation of bioactive trace metals (Cd, Cu, Fe, Ni) in theoligotrophic South China Sea. Mar. Chem. 101, 104–129.
Wong G. T. F., Tseng C. M., Wen L. S. and Chung S. W. (2007)Nutrient dynamics and N-anomaly at the SEATS station.Deep-Sea Res. Oceanogr. 54, 1528–1545.
Xue Z., Rehkamper M., Schonbachler M., Statham P. J. and ColesB. J. (2011) A new methodology for precise cadmium isotopeanalyses of seawater. Anal. Bioanal. Chem.. http://dx.doi.org/10.1007/s00216-011-5487-0.
Associate editor: Derek Vance