The Inner Segment/Outer Segment Border Seen on Optical Coherence Tomography Is Less Intense in...
7
The Inner Segment/Outer Segment Border Seen on Optical Coherence Tomography Is Less Intense in Patients with Diminished Cone Function Donald C. Hood, 1,2 Xian Zhang, 1 Rithambara Ramachandran, 1 Christine L. Talamini, 1 Ali Raza, 1 Jonathan P. Greenberg, 2 Jerome Sherman, 3 Stephen H. Tsang, 2 and David G. Birch 4,5 PURPOSE. The integrity of the inner segment ellipsoid (ISe) band, previously called the inner segment/outer segment (IS/OS) bor- der, seen on optical coherence tomography (OCT) scans is of clinical significance. To better understand the influence of cones on the appearance of this band, the intensity of its signal in patients with diminished cone function was examined. METHODS. Horizontal line scans through the fovea of 30 healthy controls, 10 patients with achromatopsia (A), and six with cone dystrophy (CD) were obtained with frequency domain (fd) OCT. The fdOCT borders were segmented with a computer- aided manual technique. The ISe was divided into regions 60.1 m wide and 19.5 m deep. The relative ISe intensity of each region was defined as its intensity divided by the intensity of a local region, which extended in depth from the choroid to the retinal ganglion cell/retinal nerve fiber layer. RESULTS. Except for the central fovea, all patients had a clear ISe band across the region studied, 3 mm from the foveal center. However, the relative ISe intensity was significantly lower (P 0.0001) in patients (A: 1.14 0.14; CD: 1.27 0.14), than in controls (1.61 0.16). There were no differences in the relative intensity of the other retinal layers. CONCLUSIONS. Although present, the intensity of this ISe band is lower in patients with diminished cone function than it is in healthy controls. This is consistent with the hypothesis that both rod and cone receptors must be absent or damaged for the ISe band to be missing. (Invest Ophthalmol Vis Sci. 2011; 52:9703–9709) DOI:10.1167/iovs.11-8650 W ith frequency domain optical coherence tomography (fdOCT), it is now possible to visualize the outer retinal layers of the human retina in vivo. One structure of particular clinical importance is the so-called inner segment (IS)/outer seg- ment (OS) border. The IS/OS border is a highly reflective band clearly visible on fdOCT scans (see Fig. 1A). Because the IS/OS border is missing and/or disrupted in diseases of the outer ret- ina, 1–7 the integrity of this border is being used clinically as a sign of disease of the receptors and/or choroid. Further, because the edge of the IS/OS border appears to coincide with the edge of the visual field in patients with retinitis pigmentosa (RP), 8 it has been suggested as an endpoint in clinical trials. Given the clinical relevance of the IS/OS border, it is important to understand the origin of this fdOCT signal. A recent report by Spaide and Curcio 9 provides a summary of the evidence against the IS/OS border being the source of this fdOCT signal. In addi- tion, they designed an anatomic model of the outer retina based on published histology. By quantitatively comparing the bands seen on fdOCT to this model, they concluded that the band typically called the IS/OS border aligns with the ellipsoids of the IS. An earlier study by Ferna ´ndez et al. 10 came to a similar con- clusion based on a qualitative comparison of retinal anatomy to fdOCT images obtained with adaptive optics and high resolution fdOCT. Thus, we will refer to the heretofore IS/OS border as the IS ellipsoid (ISe) band. While the general location of the ISe band now appears to be established, the role played by the rod and cone receptors in generating this fdOCT signal is less clear. Ferna ´ndez et al. 10 sug- gested that they were visualizing individual cone ISe regions, which formed the band visualized on the fdOCT image. In par- ticular, they proposed that the ISe band was due to light scattered by the mitochondria in the ellipsoids situated in the distal portion of the IS. As the ellipsoids are considerably larger in cones than rods, they suggested that the signal is largely due to the cone ellipsoids. Spaide and Curcio 9 do not discuss the relative contri- butions of the rods and cones, although figure 7 in their report implies the participation of both. A recent study by Birch et al. 11 suggests that both rods and cones contribute to the ISe band. For example, a prominent ISe band was seen in patients with cone dystrophy even in regions with little or no cone activity, as long as rod sensitivity was within 10 dB or so of normal. However, if the ISe band depends on the cones, even in part, it should not be normal in patients with little or no cone function. To better understand the influence of the cones on the appearance of the ISe band, we examined the intensity of the signal from the ISe band in patients with diminished cone function. METHODS Subjects We used OCT scans from one eye of 30 control subjects (35.7 14.0 years) with normal healthy vision, 10 patients (33.8 15.3 years) with From the Departments of 1 Psychology and 2 Ophthalmology, Co- lumbia University, New York, New York; 3 SUNY College of Optome- try, New York, New York; 4 Retina Foundation of the Southwest, Dallas, Texas; and the 5 Department of Ophthalmology, UT Southwestern Medical Center, Dallas, Texas. Supported by National Eye Institute Grants R01-EY-09076 (DCH), EY-018213 (SHT), and P30-EY-019007; Foundation Fighting Blindness; and an unrestricted grant to the Department of Ophthalmology, Co- lumbia University, from Research to Prevent Blindness. Submitted for publication September 23, 2011; revised October 27, 2011; accepted October 28, 2011. Disclosure: D.C. Hood, Topcon, Inc. (F); X. Zhang, Topcon, Inc. (C); R. Ramachandran, None; C.L. Talamini, None; A. Raza, None; J.P. Greenberg, None; J. Sherman, Optovue (F), Zeiss (F), Topcon, Inc. (F); S.H. Tsang, None; D.G. Birch, None Corresponding author: Donald C. Hood, Department of Psychol- ogy, 406 Schermerhorn Hall, Columbia University, New York, NY 10027; [email protected]. Retina Investigative Ophthalmology & Visual Science, December 2011, Vol. 52, No. 13 Copyright 2011 The Association for Research in Vision and Ophthalmology, Inc. 9703
-
Upload
retinafoundation -
Category
Documents
-
view
0 -
download
0
Transcript of The Inner Segment/Outer Segment Border Seen on Optical Coherence Tomography Is Less Intense in...
The Inner Segment/Outer Segment Border Seen onOptical Coherence Tomography Is Less Intense inPatients with Diminished Cone Function
Donald C. Hood,1,2 Xian Zhang,1 Rithambara Ramachandran,1 Christine L. Talamini,1
Ali Raza,1 Jonathan P. Greenberg,2 Jerome Sherman,3 Stephen H. Tsang,2
and David G. Birch4,5
PURPOSE. The integrity of the inner segment ellipsoid (ISe) band,previously called the inner segment/outer segment (IS/OS) bor-der, seen on optical coherence tomography (OCT) scans is ofclinical significance. To better understand the influence of coneson the appearance of this band, the intensity of its signal inpatients with diminished cone function was examined.
METHODS. Horizontal line scans through the fovea of 30 healthycontrols, 10 patients with achromatopsia (A), and six withcone dystrophy (CD) were obtained with frequency domain (fd)OCT. The fdOCT borders were segmented with a computer-aided manual technique. The ISe was divided into regions 60.1�m wide and 19.5 �m deep. The relative ISe intensity of eachregion was defined as its intensity divided by the intensity of alocal region, which extended in depth from the choroid to theretinal ganglion cell/retinal nerve fiber layer.
RESULTS. Except for the central fovea, all patients had a clear ISeband across the region studied, � 3 mm from the foveal center.However, the relative ISe intensity was significantly lower (P �0.0001) in patients (A: 1.14 � 0.14; CD: 1.27 � 0.14), than incontrols (1.61 � 0.16). There were no differences in therelative intensity of the other retinal layers.
CONCLUSIONS. Although present, the intensity of this ISe band islower in patients with diminished cone function than it is inhealthy controls. This is consistent with the hypothesis thatboth rod and cone receptors must be absent or damaged forthe ISe band to be missing. (Invest Ophthalmol Vis Sci. 2011;52:9703–9709) DOI:10.1167/iovs.11-8650
With frequency domain optical coherence tomography(fdOCT), it is now possible to visualize the outer retinal
layers of the human retina in vivo. One structure of particular
clinical importance is the so-called inner segment (IS)/outer seg-ment (OS) border. The IS/OS border is a highly reflective bandclearly visible on fdOCT scans (see Fig. 1A). Because the IS/OSborder is missing and/or disrupted in diseases of the outer ret-ina,1–7 the integrity of this border is being used clinically as a signof disease of the receptors and/or choroid. Further, because theedge of the IS/OS border appears to coincide with the edge of thevisual field in patients with retinitis pigmentosa (RP),8 it has beensuggested as an endpoint in clinical trials.
Given the clinical relevance of the IS/OS border, it is importantto understand the origin of this fdOCT signal. A recent report bySpaide and Curcio9 provides a summary of the evidence againstthe IS/OS border being the source of this fdOCT signal. In addi-tion, they designed an anatomic model of the outer retina basedon published histology. By quantitatively comparing the bandsseen on fdOCT to this model, they concluded that the bandtypically called the IS/OS border aligns with the ellipsoids of theIS. An earlier study by Fernandez et al.10 came to a similar con-clusion based on a qualitative comparison of retinal anatomy tofdOCT images obtained with adaptive optics and high resolutionfdOCT. Thus, we will refer to the heretofore IS/OS border as theIS ellipsoid (ISe) band.
While the general location of the ISe band now appears to beestablished, the role played by the rod and cone receptors ingenerating this fdOCT signal is less clear. Fernandez et al.10 sug-gested that they were visualizing individual cone ISe regions,which formed the band visualized on the fdOCT image. In par-ticular, they proposed that the ISe band was due to light scatteredby the mitochondria in the ellipsoids situated in the distal portionof the IS. As the ellipsoids are considerably larger in cones thanrods, they suggested that the signal is largely due to the coneellipsoids. Spaide and Curcio9 do not discuss the relative contri-butions of the rods and cones, although figure 7 in their reportimplies the participation of both.
A recent study by Birch et al.11 suggests that both rods andcones contribute to the ISe band. For example, a prominent ISeband was seen in patients with cone dystrophy even in regionswith little or no cone activity, as long as rod sensitivity waswithin �10 dB or so of normal. However, if the ISe banddepends on the cones, even in part, it should not be normal inpatients with little or no cone function. To better understand theinfluence of the cones on the appearance of the ISe band, weexamined the intensity of the signal from the ISe band in patientswith diminished cone function.
METHODS
Subjects
We used OCT scans from one eye of 30 control subjects (35.7 � 14.0years) with normal healthy vision, 10 patients (33.8 � 15.3 years) with
From the Departments of 1Psychology and 2Ophthalmology, Co-lumbia University, New York, New York; 3SUNY College of Optome-try, New York, New York; 4Retina Foundation of the Southwest, Dallas,Texas; and the 5Department of Ophthalmology, UT SouthwesternMedical Center, Dallas, Texas.
Supported by National Eye Institute Grants R01-EY-09076 (DCH),EY-018213 (SHT), and P30-EY-019007; Foundation Fighting Blindness;and an unrestricted grant to the Department of Ophthalmology, Co-lumbia University, from Research to Prevent Blindness.
Submitted for publication September 23, 2011; revised October27, 2011; accepted October 28, 2011.
Disclosure: D.C. Hood, Topcon, Inc. (F); X. Zhang, Topcon, Inc.(C); R. Ramachandran, None; C.L. Talamini, None; A. Raza, None;J.P. Greenberg, None; J. Sherman, Optovue (F), Zeiss (F), Topcon,Inc. (F); S.H. Tsang, None; D.G. Birch, None
Corresponding author: Donald C. Hood, Department of Psychol-ogy, 406 Schermerhorn Hall, Columbia University, New York, NY10027; [email protected].
Retina
Investigative Ophthalmology & Visual Science, December 2011, Vol. 52, No. 13Copyright 2011 The Association for Research in Vision and Ophthalmology, Inc. 9703
achromatopsia, and six with cone dystrophy (44.3 � 20.3 years). Allcontrol subjects and patients with cone dystrophy were tested at theRetina Foundation of the Southwest; the 10 achromats were tested atthe Department of Ophthalmology, Columbia University. All were partof previous studies (Chen RWS, et al. IOVS 2011;52:ARVO E-Abstract5008).11 The patients with cone dystrophy had clear evidence ofprogressive cone loss, severely depressed or nondetectable cone ERGs,and normal or near-normal rod ERG amplitudes.11 All but one of the 10achromats had full-field ERG tests; all nine showed a normal rodresponse, while the cone response was nondetectable (Chen RWS, etal. IOVS 2011;52:ARVO E-Abstract 5008).
The tenets of the Declaration of Helsinki were followed and writteninformed consent was obtained from all participants. Consent proce-dures were approved by the Institutional Review Board of UT South-western Medical Center and the Committee of the Institutional Boardof Research Associates of Columbia University.
OCT Testing
All individuals were scanned with a spectral-domain OCT confocalscanning laser ophthalmoscope (Spectralis HRA�OCT; Heidelberg
Engineering, Vista, CA) using the eye-tracking feature (ART). A9-mm line scan along the horizontal meridian, and centered on thefovea, was obtained as previously described (see Fig. 1A).12 Whenscans of both eyes were available, the better OCT image wasselected.
Analysis of the ISe Band (Formerly IS/OS Border)
A manual segmentation procedure, aided by a computer program,(MATLAB, ver. 7.4; Mathworks, Natick, MA), was used to segment sixborders, as previously described.12,13 These borders are labeled Athrough F in Figure 1. The ISe band (Fig. 1E) is the focus of this study.The other borders used to define regions serving as controls in theanalysis are: the vitreous/RNFL, RNFL/RGC, IPL/INL, INL/OPL, andBM/choroid borders.
To obtain a measure of the intensity of the ISe band:
1. All scans were resized to have a lateral spatial resolution of 6.1�m per pixel, and the vertical resolution was 3.87 �m per pixel;
2. The center of the fovea was marked by hand and all imagesaligned at their centers;
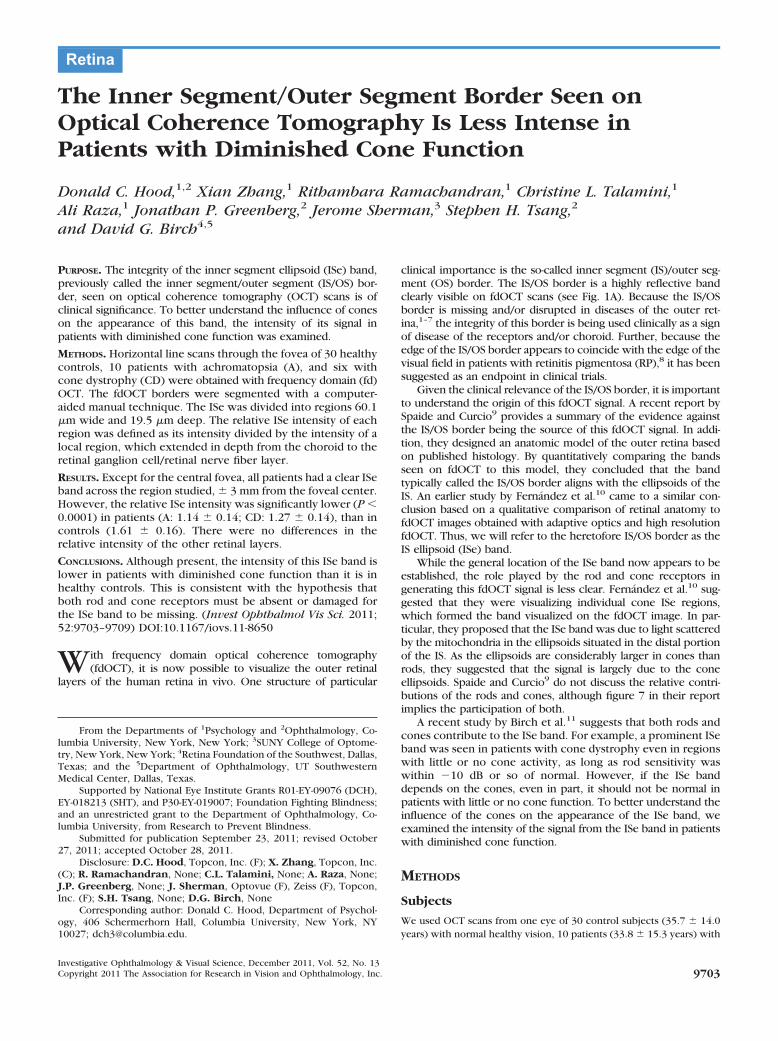
FIGURE 1. An fdOCT horizontal scanthrough the fovea of a healthy controlsubject. The layers and bands manuallysegmented are indicated. Inset, the ISeband is shown without the segmenta-tion line. BM, Bruch’s membrane; INL,inner nuclear layer; IPL, inner plexi-form layer; OPL, outer plexiform layer;RGC, retinal ganglion cell; RNFL, reti-nal nerve fiber layer.
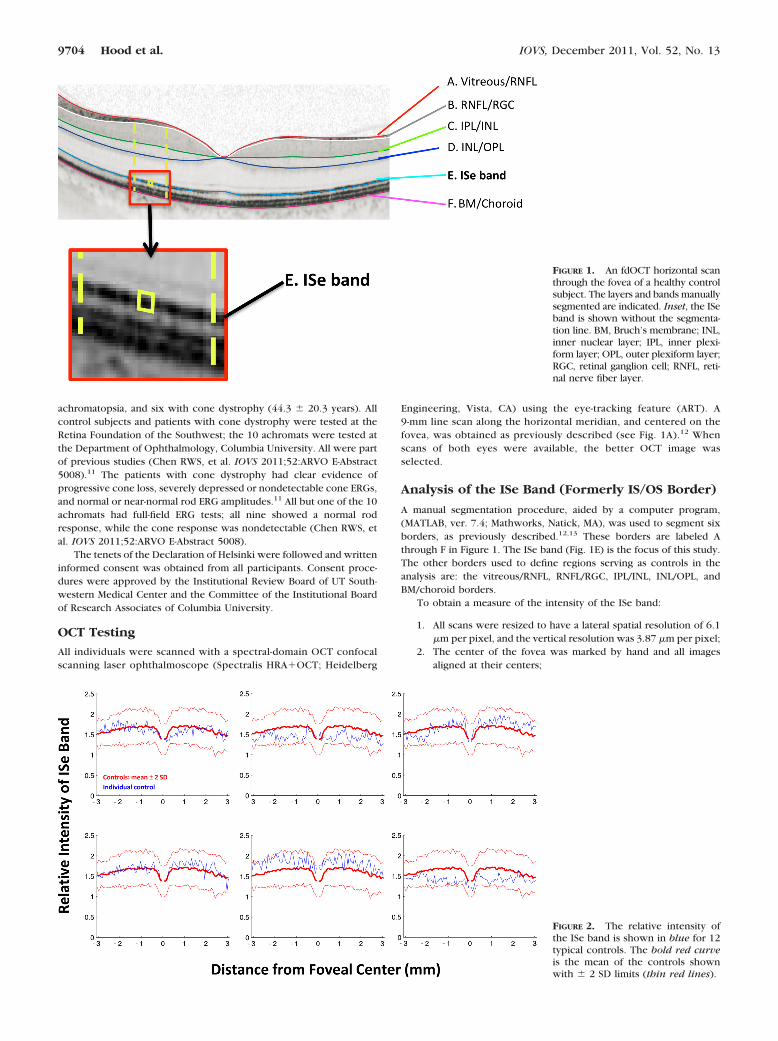
FIGURE 2. The relative intensity ofthe ISe band is shown in blue for 12typical controls. The bold red curveis the mean of the controls shownwith � 2 SD limits (thin red lines).
9704 Hood et al. IOVS, December 2011, Vol. 52, No. 13
3. The ISe band was divided into segments 5 pixels (19.5 �m) indepth and 10 pixels (60.1 �m) in width (yellow box in Fig. 1inset); and
4. A “local region” of an ISe segment (between yellow dashed linesin Fig. 1) was defined as the area between the BM/choroid andthe RNFL/RGC border (between B and F in Fig. 1) and extend-ing � 275 �m in width.
Based on these definitions, the “relative intensity of an ISe segment”was taken as the average intensity of the ISe segment divided by theaverage intensity of the local region.
Note that the depth (5 pixels) of the ISe segment was chosen toencompass the thickest ISe band seen. Therefore, technically thisanalysis cannot distinguish between a less intense versus thinner ISeband. In any case, making the ISe segment smaller (3 pixels indepth) actually slightly increased the differences between groups.
RESULTS
The average relative intensity of the ISe band for the 30 healthycontrol subjects is shown as the bold red curve in Figure 2. On
average, the relative intensity in the center of the fovea, � 375�m (approximately � 1.3°), is lower than outside the centralfovea, where the ISe intensity is relatively constant acrossthe � 3 mm, about � 10.4°, shown. However, the relative ISeintensity exhibits considerable variability among controls ascan be seen in Figure 2 where the thin red lines are the � 2 SDlimits and the blue curves show the results for six representa-tive controls.
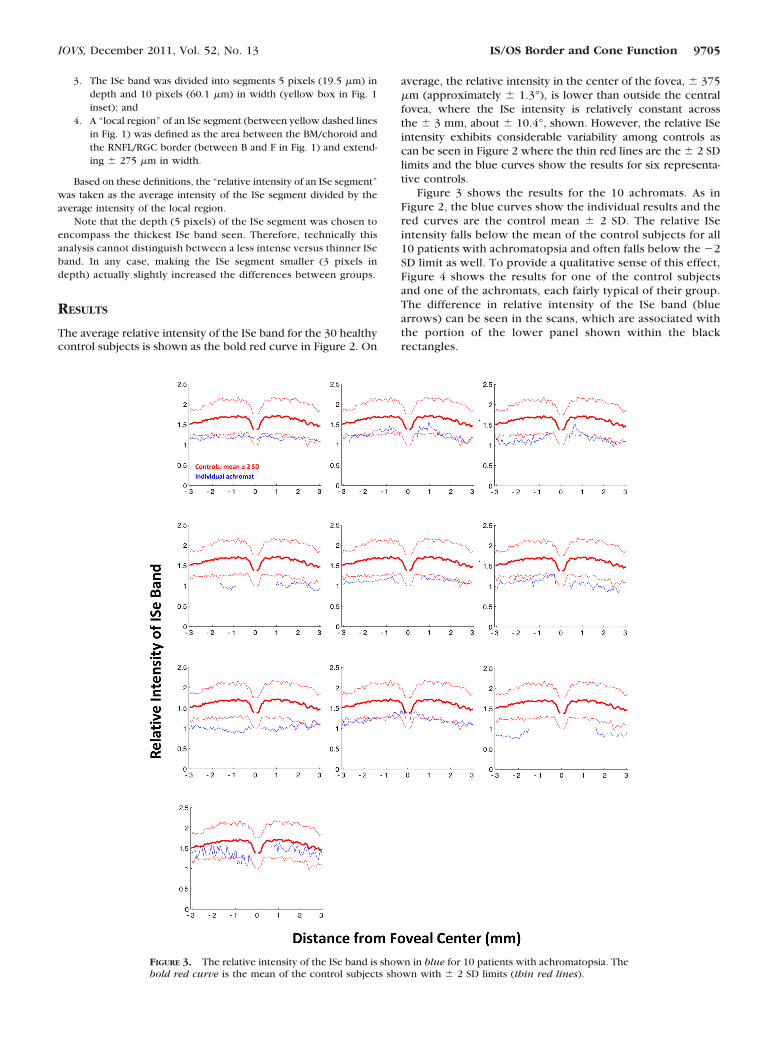
Figure 3 shows the results for the 10 achromats. As inFigure 2, the blue curves show the individual results and thered curves are the control mean � 2 SD. The relative ISeintensity falls below the mean of the control subjects for all10 patients with achromatopsia and often falls below the �2SD limit as well. To provide a qualitative sense of this effect,Figure 4 shows the results for one of the control subjectsand one of the achromats, each fairly typical of their group.The difference in relative intensity of the ISe band (bluearrows) can be seen in the scans, which are associated withthe portion of the lower panel shown within the blackrectangles.
FIGURE 3. The relative intensity of the ISe band is shown in blue for 10 patients with achromatopsia. Thebold red curve is the mean of the control subjects shown with � 2 SD limits (thin red lines).
IOVS, December 2011, Vol. 52, No. 13 IS/OS Border and Cone Function 9705
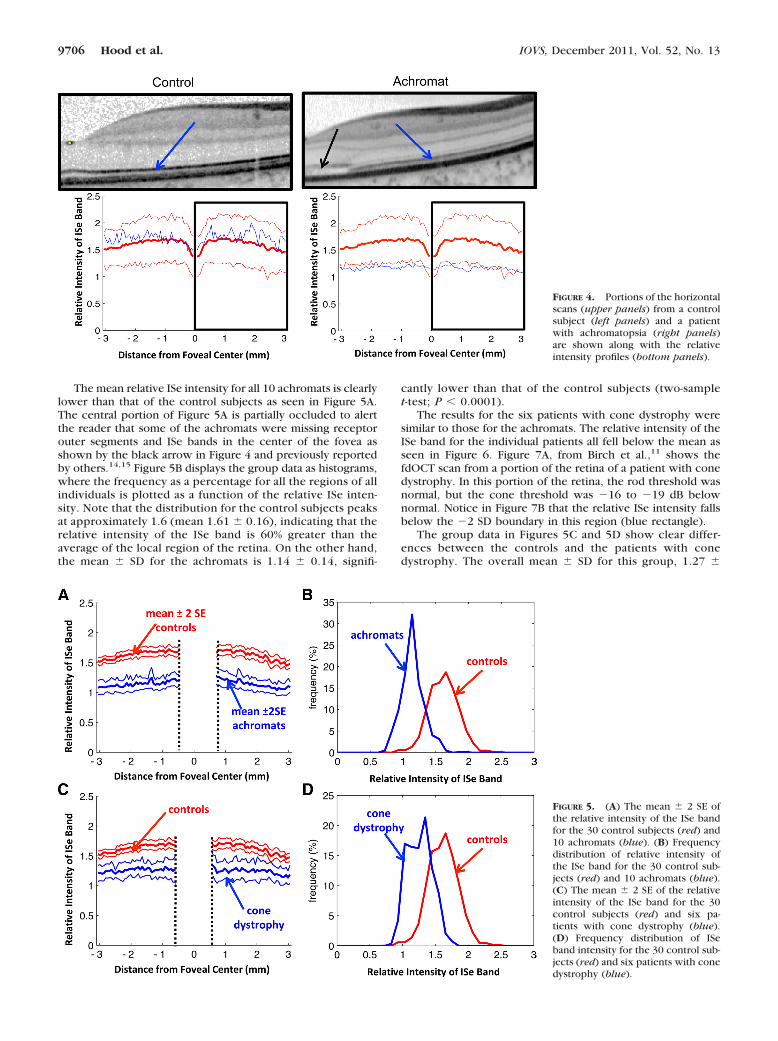
The mean relative ISe intensity for all 10 achromats is clearlylower than that of the control subjects as seen in Figure 5A.The central portion of Figure 5A is partially occluded to alertthe reader that some of the achromats were missing receptorouter segments and ISe bands in the center of the fovea asshown by the black arrow in Figure 4 and previously reportedby others.14,15 Figure 5B displays the group data as histograms,where the frequency as a percentage for all the regions of allindividuals is plotted as a function of the relative ISe inten-sity. Note that the distribution for the control subjects peaksat approximately 1.6 (mean 1.61 � 0.16), indicating that therelative intensity of the ISe band is 60% greater than theaverage of the local region of the retina. On the other hand,the mean � SD for the achromats is 1.14 � 0.14, signifi-
cantly lower than that of the control subjects (two-samplet-test; P � 0.0001).
The results for the six patients with cone dystrophy weresimilar to those for the achromats. The relative intensity of theISe band for the individual patients all fell below the mean asseen in Figure 6. Figure 7A, from Birch et al.,11 shows thefdOCT scan from a portion of the retina of a patient with conedystrophy. In this portion of the retina, the rod threshold wasnormal, but the cone threshold was �16 to �19 dB belownormal. Notice in Figure 7B that the relative ISe intensity fallsbelow the �2 SD boundary in this region (blue rectangle).
The group data in Figures 5C and 5D show clear differ-ences between the controls and the patients with conedystrophy. The overall mean � SD for this group, 1.27 �
FIGURE 4. Portions of the horizontalscans (upper panels) from a controlsubject (left panels) and a patientwith achromatopsia (right panels)are shown along with the relativeintensity profiles (bottom panels).
FIGURE 5. (A) The mean � 2 SE ofthe relative intensity of the ISe bandfor the 30 control subjects (red) and10 achromats (blue). (B) Frequencydistribution of relative intensity ofthe ISe band for the 30 control sub-jects (red) and 10 achromats (blue).(C) The mean � 2 SE of the relativeintensity of the ISe band for the 30control subjects (red) and six pa-tients with cone dystrophy (blue).(D) Frequency distribution of ISeband intensity for the 30 control sub-jects (red) and six patients with conedystrophy (blue).
9706 Hood et al. IOVS, December 2011, Vol. 52, No. 13

0.14, was slightly higher than that of the group with achro-matopsia, but still clearly smaller than controls (two-samplet-test; P � 0.0001).
To assure that the change in relative intensity was unique tothe ISe band, a similar analysis was performed on the INL,RGC�IPL, and RNFL. For all three regions, and both patientpopulations, the patient group was nearly identical with thecontrol group. An example of this can be seen in Figure 8 forthe INL. (The central region is blanked out in Figs. 8A and 8Cbecause there is little or no INL in the very center of the foveain control subjects or patients.)
DISCUSSION
Based on recent work, what has been called the “IS/OS border”appears to be located in the ellipsoid region of the IS.9,10 Tobetter understand the influence of the cones on the appear-ance of the ISe band, we examined the intensity of the signalfrom the ISe band in patients with diminished cone function.The relative intensity of the ISe band was significantly lower inpatients with achromatopsia or cone dystrophy, conditionsknown to decrease the number of functioning cones. Thus,cone photoreceptors are necessary for an ISe border of normalintensity.
Clinical Implication
There are two clinical implications. First, while an abnormalappearing ISe band undoubtedly indicates outer retinal prob-lems, patients with a relatively normal appearing band onvisual inspection can have abnormal cone function. Only witha quantification of the relative intensity of this band was anabnormality detected. For example, the patient in Figure 7showed a decrease in cone sensitivity of between 16 and 19 dB(1.6 to 1.9 log units) in the region shown in the blue rectangle.The ISe band appeared normal in this region, but the relativeintensity clearly was below normal. The second implicationconcerns the agreement recently reported between the edgeof the ISe band and the edge of the visual field in patients withRP.8 The visual fields are largely dependent on the cones, butwe have shown that the ISe band does not disappear unlessboth rods and cones are affected. However, this does notdiminish the usefulness of the ISe contour for clinical trialswith RP patients, as the effects on the rods in RP are typicallygreater than, or equal to, the effects on the cones. Because theloss of the ISe band implies a loss of both rod and conefunction, there should be, as there is,8 a good correspondencebetween the edge of the cone driven visual field sensitivity andthe ISe contour.
FIGURE 6. The relative intensity of the ISe band is shown in blue for six patients with cone dystrophy.The bold red curve is the mean of the control subjects shown with � 2 SD limits (thin red lines).
FIGURE 7. (A) Portion of an fdOCThorizontal scan of a cone dystrophypatient (from Ref. 11). (B) The rela-tive intensity of the ISe band in (A) isshown as the blue curve within theblue rectangle.
IOVS, December 2011, Vol. 52, No. 13 IS/OS Border and Cone Function 9707

Caveat and Unanswered Questions
First, this study does not speak to the proximal source of theISe signal. The role mitochondria, as well as other structures inthis region,16 play in producing this signal is still to be deter-mined. Second, as mentioned in Methods, our measurementdoes not distinguish between bands of lower reflectance ver-sus thinner bands. However, our analyses with thinner ISesegments and visual inspection clearly indicate that while thepatients’ ISe bands may be thinner, they are also less intense.Third, we cannot be sure that residual cones are not contrib-uting to the ISe band seen in the achromats and cone dystro-phy patients. Many achromats have some functioning cones,while patients with cone dystrophy can maintain some conefunction as well, although we have shown that the ISe band ispresent even when cone thresholds are markedly elevated.11
Fourth, and related to this point, we do not know if the ISeband would have a normal relative intensity if a patient lost allrod receptors, but maintained normal cone function. We haveseen a lower relative ISe intensity in regions of the retina in RP.However, we cannot be sure the cones are functioning nor-mally in these regions without further work with two-colorthreshold measurements.11 Finally, it remains to be seen if theintensity of the ISe band is affected under other conditions. Forexample, we are particularly interested in patients with clearfunctional loss as documented on visual fields and multifocalERGs, but who have reasonably normal appearing fdOCTscans.17,18
Summary
The ISe band, previously called the IS/OS border, appearsintact in patients with achromatopsia and cone dystrophy.However, the intensity of this ISe band is lower in thesepatients with diminished cone function than it is in healthycontrol subjects.
References
1. Chang LK, Koizumi H, Spaide RF. Disruption of the photoreceptorinner segment-outer segment junction in eyes with macular holes.Retina. 2008;28:969–975.
2. Spaide RF, Koizumi H, Freund KB. Photoreceptor outer segmentabnormalities as a cause of blind spot enlargement in acute zonaloccult outer retinopathy-complex diseases. Am J Ophthalmol.2008;146:111–120.
3. Wang NK, Chou CL, Lima LH, et al. Fundus autofluorescence incone dystrophy. Doc Opthalmol. 2009;119:141–144.
4. Oh J, Smiddy WE, Flynn HW Jr, Gregori G, Lujan B. Photoreceptorinner/outer segment defect imaging by spectral domain OCT andvisual prognosis after macular hole surgery. Invest Ophth Vis Sci.2010;51:1651–1658.
5. Inoue M, Morita S, Watanabe Y, et al. Inner segment/outer seg-ment junction assessed by spectral-domain optical coherence to-mography in patients with idiopathic epiretinal membrane. Am JOphthalmol. 2010;150:834–839.
6. Hood DC, Lazow MA, Locke KG, Greenstein VC, Birch DG. Thetransition zone between healthy and diseased retina in patientswith retinitis pigmentosa. Invest Ophthalmol Vis Sci. 2011;52:101–108.
7. Kitaguchi Y, Kusaka S, Yamaguchi T, Mihashi T, Fujikado T. De-tection of photoreceptor disruption by adaptive optics fundusimaging and fourier-domain optical coherence tomography in eyeswith occult macular dystrophy. Clin Ophthalmol. 2011;5:345–351.
8. Hood DC, Ramachandran R, Holopigian K, Lazow MA, Birch DG,Greenstein VS. Method for deriving visual field boundaries fromOCT scans of patients with retinitis pigmentosa. Biomed Opt Exp.2011;2:1106–1114.
9. Spaide RF, Curcio CA. Anatomical correlates to the bands seen inthe outer retina by optical coherence tomography. Retina. 2011;31:1609–1619.
10. Fernandez EJ, Hermann B, Povazay B, et al. Ultrahigh resolutionoptical coherence tomography and pancorrection for cellular im-aging of the living human retina. Opt Exp. 2008;16:11083–11094.
FIGURE 8. Same as Figure 5 for ananalysis of the relative intensity ofthe INL.
9708 Hood et al. IOVS, December 2011, Vol. 52, No. 13

11. Birch DG, Wen Y, Locke K, Hood DC. Rod sensitivity, conesensitivity and photoreceptor layer thickness in retinal degenera-tive diseases. Invest Ophthalmol Vis Sci. 2011;52:7141–7147.
12. Hood DC, Lin CE, Lazow MA, Locke KG, Zhang X, Birch DG.Thickness of receptor and post-receptor retinal layers in patientswith retinitis pigmentosa measured with frequency-domain opticalcoherence tomography. Invest Ophthalmol Vis Sci. 2009;50:2328–2336.
13. Hood DC, Cho J, Raza AS, Dale EA, Wang M. Reliability of acomputer-aided manual procedure for segmenting optical coher-ence tomography scans. Optom Vis Sci. 2011;88:113–123.
14. Varsanyi B, Somfai GM, Lesch B, Vamos R, Farkas A. Opticalcoherence tomography of the macula in congenital achromatop-sia. Invest Ophthalmol Vis Sci. 2007;48:2249–2253.
15. Barthelmes D, Sutter FK, Kurz-Levin MM, et al. Quantitative anal-ysis of OCT characteristics in patients with achromatopsia andblue-cone monochromatism. Invest Ophthalmol Vis Sci. 2006;47:1161–1166.
16. Jonnal RS, Besecker JR, Derby JC, et al. Imaging outer segmentrenewal in living human cone photoreceptors. Opt Exp. 2010;18:5257–5270.
17. Dale EA, Hood DC, Greenstein VC, Odel JG. A comparison ofmultifocal ERG and frequency domain OCT changes in patientswith abnormalities of the retina. Doc Ophthalmol. 2009;120:175–186.
18. Talamini CL, Raza AS, Dale EA, Greenstein VC, Odel JG, Hood DC.Abnormal multifocal ERG findings in patients with normal-appear-ing retinal anatomy. Doc Ophthalmol. 2011;123:187–192.
IOVS, December 2011, Vol. 52, No. 13 IS/OS Border and Cone Function 9709