the influence of selected marketing mix strategies on - CORE
250
THE INFLUENCE OF SELECTED MARKETING MIX STRATEGIES ON BUSINESS PERFORMANCE OF SMALL FAMILY AND NON-FAMILY BUSINESSES IN THE EASTERN CAPE J.A. DE LANGE 2017
-
Upload
khangminh22 -
Category
Documents
-
view
0 -
download
0
Transcript of the influence of selected marketing mix strategies on - CORE

THE INFLUENCE OF SELECTED MARKETING MIX STRATEGIES ON
BUSINESS PERFORMANCE OF SMALL FAMILY AND NON-FAMILY
BUSINESSES IN THE EASTERN CAPE
J.A. DE LANGE
2017

THE INFLUENCE OF SELECTED MARKETING MIX STRATEGIES ON BUSINESS
PERFORMANCE OF SMALL FAMILY AND NON-FAMILY BUSINESSES IN THE
EASTERN CAPE
By
JUANRÉ ANTON DE LANGE
Dissertation submitted in fulfilment of the requirements for the degree of
MASTERS OF COMMERCE
in the
Faculty of Business and Economic Sciences
to be awarded at the
Nelson Mandela Metropolitan University
April 2017
Supervisor: Prof E. Venter
Co-Supervisor: Prof S. Perks

i
DECLARATION
I, Juanré Anton de Lange (210032332), hereby declare that the dissertation, “The
influence of selected marketing mix strategies on business performance of small
family and non-family businesses in the Eastern Cape” for the degree Masters of
Commerce, is my own work and that it has not previously been submitted for
assessment or completion of any postgraduate qualification to another university or
for another qualification, and that all the sources I have used or quoted have been
indicated and acknowledged as complete references.
______________________________
Juanré Anton de Lange (210032332)
Port Elizabeth
January 2017
ii
ACKNOWLEDGEMENTS
The completion of this study would not have been possible without the contributions
and support of certain individuals. I would like to express my sincerest appreciation
and gratitude to:
My supervisors, Prof. Elmarie Venter and Prof. Sandra Perks, for their
motivation, sincere interest, guidance, and constructive criticism.
My family and friends, for their love, support and encouragement.
All the small business owners and managers who participated in this study, for
their valuable contributions and time sacrificed.

iii
ABSTRACT
Despite the fact that small family and non-family businesses in South Africa are
important contributors to economic and social development, their failure rates are still
high globally. Major contributing factors to this high failure rate are the lack of
marketing skills and ineffective marketing practices. Therefore, the primary objective
of this study was to establish what marketing mix strategies are used by small family
and non-family businesses in the Eastern Cape and the influence of these strategies
on Perceived business performance.
The literature review dealt with the nature and importance of marketing, and the
traditional marketing mix strategies were elaborated on from a small family and non-
family business perspective. The traditional marketing mix strategies (4Ps) identified
as influencing the Perceived business performance of small family and non-family
businesses, were classified as Product-, Pricing-, Place-, and Promotion strategies.
From the literature review, it was evident that the traditional marketing mix strategies
have been criticised by a number of studies as not reflecting the holistic marketing
concept within the 21st century. Yet, despite its simplicity various studies still find the
traditional 4P framework to be a strong staple of the marketing mix.
In this study, a quantitative research design was adopted and an exploratory and
descriptive research approach of a cross-sectional nature were undertaken. A
convenience sampling technique was used owing to the inaccessibility of a small
family and non-family business database. The sample size in this study consisted of
195 small family-owned businesses and 145 small non-family businesses operating
within the borders of the Eastern Cape. The primary data in this study was gathered
by means of a structured, self-administered questionnaire. The measuring instrument
was developed by sourcing items from several existing studies. Small family and
non-family businesses were approached by fieldworkers and asked to participate in
this study. In total 400 questionnaires were distributed, of which 340 were usable for
further statistical analyses. Therefore, an effective response rate of 85% was
achieved in this study. The validity and reliability of the measuring instrument were
confirmed by means of an exploratory factor analysis (EFA) and by the calculation of
Cronbach„s alpha (CA) coefficients.
iv
The five usable factors that were extracted from the EFA were identified as Pricing
strategies, Competitive distribution strategies, Communication process strategies,
Low cost promotion strategies and Perceived business performance. The CA
coefficient for Pricing strategies indicated that the scale measuring this factor was not
reliable due to it falling below the accepted norm of 0.6 and, therefore it was
disregarded from further analysis. The CA coefficients returned for the remaining
usable factors extracted from the EFA were greater than 0.6, thus indicating the
scales measuring these variables provided satisfactory evidence of validity and
reliability.
The findings of the descriptive statistics showed that the highest mean score reported
was for the independent variable Competitive distribution strategies, followed by
Communication process strategies and Low cost promotion strategies. Based on the
mean, respondents indicated that they often utilise Competitive distribution strategies
and Communication process strategies, and seldom utilise Low cost promotion
strategies. Pearson‟s product moment correlations revealed that all the marketing
mix strategies, for both small family and non-family businesses, investigated were
found to be significantly and positively correlated with the dependent variable
Perceived business performance, and amongst themselves.
The findings of the MRA showed that utilising Competitive distribution strategies have
a significant positive influence on the Perceived business performance of small family
businesses. The finding implies that the more small family businesses in this study
provide high-quality and competitive products through distributions process methods
by setting timing objectives, using distributions selection criteria and changing the
distribution channel when needed to continuously satisfy customers‟ needs, the more
likely the business is to experience growth in profit and sales and having loyal
customers who make regular purchases and recommend the business to others. This
study found no relationship between Competitive distribution strategies and the
Perceived business performance of small non-family businesses, as well as between
Communication Process strategies and Low cost promotion strategies and Perceived
business performance of small family and non-family businesses.

v
The results of the t-tests revealed that no statistically significant relationship was
found between the Type of small business ownership and any of the three
independent variables, Competitive distribution-, Communication Process-, and Low
cost promotion strategies. Furthermore, the results of the Chi-square test for
independence reported no statistically significant difference between using the family
name as a marketing or branding tool and the size of the small business in this study.
The results, however, indicated that as the business size increases, the more small
businesses use their family name as a marketing- or branding tool. From the 18 sets
of null hypotheses that were formulated, to explore whether the demographical
variables had an influence on the marketing mix strategies utilised by the small family
and non-family businesses, only 11 multivariant analysis of variance (MANOVA)
relationships could be established as being statistically significant. These include the
Gender of the business owner/manager, Age of the business owner/manager,
Management qualifications of the business owner/manager, Ethnicity of the business
owner/manager, Position in the small business, Years small business is in existence,
Working experience of the business owner/manager, Management working
experience of the business owner/manager, Form of business ownership, Area of
business premises and Target market of the small business.
This study has addressed a gap in the current literature regarding the influence of
marketing mix strategies on business performance among small family and non-
family businesses in a developing economy such as South Africa. This study has
furthermore attempted to enlarge the body of knowledge available on marketing,
especially concerning Communication Process, Competitive distribution strategies
and Low cost promotion strategies. The results of the study differ somewhat from
existing literature, and therefore add to the body of knowledge on marketing.
Furthermore, the findings of this study show that small family businesses utilising
Competitive distribution strategies have a significant positive influence on their
Perceived business performance, and in doing so makes a small contribution
towards increasing the success rate of these small family businesses and in return
positively contribute to the economic growth and development of South Africa.
KEYWORDS: Small business, Small family business, Marketing, Marketing mix
strategies, Perceived business performance

vi
TABLE OF CONTENTS
PAGE
DECLARATION i
ACKNOWLEDGEMENTS ii
ABSTRACT iii
TABLE OF CONTENTS vi
LIST OF FIGURES xiv
LIST OF TABLES xv
LIST OF ANNEXURES xviii
CHAPTER 1
INTRODUCTION, PROBLEM STATEMENT AND
DEMARCATION OF THE STUDY
1.1 INTRODUCTION AND BACKGROUND TO THE STUDY 1
1.2 PROBLEM STATEMENT 4
1.3 PURPOSE OF THE STUDY 5
1.4 RESEARCH OBJECTIVES 5
1.4.1 PRIMARY RESEARCH OBJECTIVE 5
1.4.2 SECONDARY RESEARCH OBJECTIVES 6
1.4.3 METHODOLOGICAL RESEARCH OBJECTIVES 6
1.5 PROPOSED HYPOTHESISED MODEL, RESEARCH QUESTIONS
AND HYPOTHESES 7
1.5.1 PROPOSED HYPOTHESISED MODEL 7
1.5.2 RESEARCH QUESTIONS 8
1.5.3 RESEARCH HYPOTHESES 8
1.6 RESEARCH DESIGN AND METHODOLOGY 9
1.6.1 LITERATURE REVIEW (SECONDARY RESEARCH) 9
1.6.2 EMPIRICAL INVESTIGATION (PRIMARY RESEARCH) 9
1.6.2.1 Research paradigm and methodology 10
1.6.2.2 Population, sampling and data collection 10
1.6.2.3 Design of the measuring instrument 11
1.6.2.4 Data analysis 12

vii
TABLE OF CONTENTS (CONTINUED)
PAGE
1.7 SCOPE AND DEMARCATION OF THE STUDY 13
1.8 CONTRIBUTIONS OF THE STUDY 14
1.9 DEFINITION OF KEY CONCEPTS 14
1.9.1 SMEs 14
1.9.2 SMALL BUSINESS 15
1.9.3 SMALL FAMILY BUSINESS 15
1.9.4 MARKETING 15
1.9.5 MARKETING MIX STRATEGIES 15
1.9.6 PRODUCT STRATEGIES 15
1.9.7 PRICING STRATEGIES 16
1.9.8 PLACE STRATEGIES 16
1.9.9 PROMOTION STRATEGIES 16
1.9.10 PERCEIVED BUSINESS PERFORMANCE 16
1.10 STRUCTURE OF THE STUDY 17
CHAPTER 2
NATURE AND IMPORTANCE OF SMALL AND MEDIUM-
SIZED (SMEs) FAMILY AND NON-FAMILY BUSINESSES
2.1 INTRODUCTION 19
2.2 OVERVIEW OF SMEs 19
2.2.1 DEFINING SMEs 19
2.2.2 IMPORTANCE OF SMEs 21
2.2.3 CHALLENGES FACING SMEs 23
2.3 OVERVIEW OF FAMILY BUSINESSES 26
2.3.1 DEFINING FAMILY BUSINESSES 26
2.3.2 FAMILY VERSUS NON-FAMILY BUSINESSES 28
2.3.3 IMPORTANCE OF FAMILY BUSINESSES 31
2.3.4 CHALLENGES FACING FAMILY BUSINESSES 33
2.4 SUMMARY 36

viii
TABLE OF CONTENTS (CONTINUED)
PAGE
CHAPTER 3
NATURE AND IMPORTANCE OF MARKETING IN SMALL
FAMILY AND NON-FAMILY BUSINESSES
3.1 INTRODUCTION 37
3.2 CONTEXTUALISING MARKETING 37
3.2.1 DEFINING MARKETING 37
3.2.2 THE MARKETING PROCESS MODEL 39
3.2.3 THE MARKETING CONCEPT 40
3.2.4 MARKETING AS AN IMPORTANT BUSINESS FUNCTION 42
3.2.5 MARKETING ACTIVITIES AND DECISIONS 44
3.3 CONTEXTUALISING MARKETING MIX STRATEGIES 45
3.3.1 PRODUCT STRATEGIES 46
3.3.1.1 Product concept 46
3.3.1.2 Product mix 48
3.3.1.3 Product branding 49
3.3.1.4 Product development 49
3.3.1.5 Product lifecycle 50
3.3.2 PRICING STRATEGIES 51
3.3.2.1 Price skimming strategy 54
3.3.2.2 Penetration pricing strategy 54
3.3.2.3 Psychological pricing strategy 55
3.3.2.4 Cost-plus pricing strategy 55
3.3.2.5 Other product mix pricing strategies 55
3.3.3 PLACE STRATEGIES 56
3.3.3.1 Direct distribution channel strategy 58
3.3.3.2 Indirect distribution channel strategy 59
3.3.4 PROMOTION (MARKETING COMMUNICATION) STRATEGIES 60
3.3.4.1 Advertising 61
3.3.4.2 Public relations 62
3.3.4.3 Sales promotion 63

ix
TABLE OF CONTENTS (CONTINUED)
PAGE
3.3.4.4 Personal selling 65
3.3.4.5 Direct marketing 66
3.3.4.6 Online marketing/social media 67
3.4 MARKETING IN SMALL AND MEDIUM-SIZED BUSINESSES (SMEs) 68
3.4.1 MARKETING DIFFERENCES BETWEEN SMEs AND LARGE
BUSINESSES 68
3.4.2 MARKETING PROBLEMS EXPERIENCED BY SMALL AND
MEDIUM-SIZED BUSINESSES (SMEs) 70
3.4.3 ENTREPRENEURIAL MARKETING BY SMEs 70
3.4.4 MARKETING MIX STRATEGIES USED BY SMEs 71
3.4.4.1 Product strategies used by SMEs 72
3.4.4.2 Pricing strategies used by SMEs 74
3.4.4.3 Place strategies used by SMEs 76
3.4.4.4 Promotion (marketing communication) strategies used by SMEs 77
3.4.5 MARKETING MIX STRATEGIES USED BY FAMILY BUSINESSES 79
3.4.5.1 Family preservation strategy 79
3.4.5.2 Family enrichment strategy 82
3.4.5.3 Family subordination strategy 83
3.4.5.4 Summary of family business marketing branding strategies according
to dimensions 84
3.5 SUMMARY 85
CHAPTER 4
PROPOSED HYPOTHESISED MODEL OF THE
RELATIONSHIPS BETWEEN MARKETING MIX STRATEGIES
AND BUSINESS PERFORMANCE
4.1 INTRODUCTION 87
4.2 THE HYPOTHESISED MODEL 87
4.3 PERCEIVED BUSINESS PERFORMANCE 88
4.4 MARKETING MIX STRATEGIES AND BUSINESS PERFORMANCE 91
x
TABLE OF CONTENTS (CONTINUED)
PAGE
4.4.1 PRODUCT STRATEGIES AND BUSINESS PERFORMANCE 93
4.4.2 PRICING STRATEGIES AND BUSINESS PERFORMANCE 95
4.4.3 PLACE STRATEGIES AND BUSINESS PERFORMANCE 98
4.4.4 PROMOTION (MARKETING COMMUNICATION) STRATEGIES
AND BUSINESS PERFORMANCE 100
4.5 SUMMARY 103
CHAPTER 5
RESEARCH DESIGN AND METHODOLOGY
5.1 INTRODUCTION 104
5.2 RESEARCH DESIGN, PARADIGMS AND METHODOLOGIES 104
5.2.1 RESEARCH PARADIGMS AND METHODOLOGIES 105
5.2.1.1 Interpretivism paradigm and qualitative methodology 105
5.2.1.2 Positivism paradigm and quantitative methodology 105
5.2.1.3 Differences between quantitative and qualitative research 106
5.2.1.4 Research paradigm and methodology used in this study 107
5.2.2 QUANTITATIVE RESEARCH APPROACHES 109
5.2.2.1 Exploratory research 109
5.2.2.2 Explanatory research 110
5.2.2.3 Experimental research 110
5.2.2.4 Descriptive research 110
5.2.2.5 Research approach used in this study 111
5.3 DATA COLLECTION 111
5.3.1 SECONDARY RESEARCH (LITERATURE REVIEW) 111
5.3.2 PRIMARY RESEARCH (EMPIRICAL INVESTIGATION) 112
5.3.2.1 Population 112
5.3.2.2 Sample and sampling techniques 113
5.3.2.2.1 Probability sampling 113
5.3.2.2.2 Non-probability sampling 114
5.3.2.2.3 Sampling technique used in this study 116

xi
TABLE OF CONTENTS (CONTINUED)
PAGE
5.3.2.3 Sample size 116
5.3.2.4 Data collection 118
5.3.2.4.1 Measuring instrument development 118
5.3.2.4.2 Qualifying criteria 119
5.3.2.4.3 Scale development and operationalisation 120
5.3.3 ADMINISTRATION OF THE MEASURING INSTRUMENT AND
ETHICAL CONSIDERATIONS 123
5.3.4 MISSING DATA 125
5.3.5 METHODS OF DATA ANALYSIS 126
5.3.5.1 Validity of the measuring instrument 127
5.3.5.2 Reliability of the measuring instrument 129
5.3.5.3 Descriptive statistics 129
5.3.5.4 Inferential statistics 130
5.4 SUMMARY 131
CHAPTER 6
EMPIRICAL RESULTS
6.1 INTRODUCTION 133
6.2 DEMOGRAPHIC INFORMATION 134
6.3 RESULTS OF THE VALIDITY AND RELIABILITY ANALYSES 137
6.3.1 PERCEIVED BUSINESS PERFORMANCE 139
6.3.2 PRICING STRATEGIES 140
6.3.3 COMPETITIVE DISTRIBUTION STRATEGIES 140
6.3.4 COMMUNICATION PROCESS STRATEGIES 142
6.3.5 LOW COST PROMOTION STRATEGIES 143
6.4 REVISED HYPOTHESISED MODEL AND HYPOTHESES 144
6.5 EMPIRICAL RESULTS OF THE DESCRIPTIVE AND
INFERENTIAL STATISTICS 146
6.5.1 DESCRIPTIVE STATISTICS 146
6.5.2 PEARSON‟S PRODUCT MOMENT CORRELATIONS 147
xii
TABLE OF CONTENTS (CONTINUED)
PAGE
6.5.3 MULTIPLE REGRESSION ANALYSIS 149
6.5.4 DIFFERENCE BETWEEN FAMILY AND NON-FAMILY
BUSINESSES 154
6.5.5 THE INFLUENCE OF DEMOGRAPHIC VARIABLES ON
MARKETING MIX STRATEGIES 156
6.5.5.1 Gender of the business owner/manager’s influence on the
marketing mix strategies 158
6.5.5.2 Age of the business owner/manager’s influence on the
marketing mix strategies 160
6.5.5.3 Management qualification of the business owner/manager’s
influence on the marketing mix strategies 161
6.5.5.4 Ethnicity of the business owner/manager’s influence on the
marketing mix strategies 162
6.5.5.5 Position in the small business’ influence on the marketing mix
strategies 164
6.5.5.6 Years small business is in existence’s influence on the
marketing mix strategies 154
6.5.5.7 Working experience of the business owner/manager’s
influence on the marketing mix strategies 167
6.5.5.8 Management working experience of the business
owner/manager’s influence on the marketing mix strategies 168
6.5.5.9 Form of business ownership’s influence on the marketing mix
strategies 170
6.5.5.10 Area of business premises’ influence on the marketing mix
strategies 171
6.5.5.11 Target market of the small business’ influence on the
marketing mix strategies 172
6.6 SUMMARY 173

xiii
TABLE OF CONTENTS (CONTINUED)
PAGE
CHAPTER 7
SUMMARY, CONCLUSIONS AND RECOMMENDATIONS
7.1 INTRODUCTION 175
7.2 OVERVIEW OF THE STUDY 175
7.3 DISCUSSION OF RESULTS, CONCLUSIONS AND
RECOMMENDATIONS 187
7.3.1 SIGNIFICANT RELATIONSHIP: COMPETITIVE DISTRIBUTION
STRATEGIES 187
7.3.2 INSIGNIFICANT RELATIONSHIPS 191
7.3.3 DIFFERENCE BETWEEN FAMILY AND NON-FAMILY
BUSINESSES 192
7.3.4 THE INFLUENCE OF DEMOGRAPHIC VARIABLES ON
MARKETING MIX STRATEGIES 192
7.3.4.1 Competitive distribution strategies 193
7.3.4.2 Communication process strategies 194
7.3.4.3 Low cost promotion strategies 195
7.4 CONTRIBUTIONS OF THE STUDY 196
7.5 LIMITATIONS OF THE STUDY AND RECOMMENDATIONS FOR
FUTURE RESEARCH 197
7.6 CONCLUDING REMARKS 199
REFERENCE LIST 200

xiv
LIST OF FIGURES
PAGE
Figure 1.1: Proposed hypothesised model: The relationship between
the marketing mix strategies performed by small family and
non-family businesses and Perceived business performance 7
Figure 3.1: The marketing process model 39
Figure 3.2: Marketing within the eight business functions 43
Figure 3.3: Marketing mix strategy decisions 45
Figure 3.4: Three levels of a product 47
Figure 3.5: Product lifecycle 51
Figure 3.6: The price setting process 52
Figure 3.7: Distribution channel process 57
Figure 3.8: Product development and growth options 73
Figure 3.9: The process of generating the aggregated theoretical
dimensions for the family preservation strategy 81
Figure 3.10: The process of generating the aggregated theoretical
dimensions for the family enrichment strategy 82
Figure 3.11: The process of generating the aggregated theoretical
dimensions for the family subordination strategy 84
Figure 3.12: Marketing branding strategies in family businesses 85
Figure 4.1: Proposed hypothesised model: The relationships between
the marketing mix strategies and perceived business
performance of small family and non-family businesses 88
Figure 6.1: Proposed hypothesised model: The relationships between
the marketing mix strategies and Perceived business
performance of small family and non-family businesses 145
Figure 7.1: Summary of significant relationships of small family
businesses 182
Figure 7.2: Summary of significant relationships of small non- family
businesses 182

xv
LIST OF TABLES
PAGE
Table 2.1: Quantitative criteria used for classifying small and medium-
sized businesses in South Africa 20
Table 2.2: Schedule of the size standards for the definition of SMEs in
South Africa 20
Table 2.3: Summary of SME challenges in their internal and external
business environment 24
Table 2.4: The differences between family and non-family businesses 29
Table 3.1: Marketing as a set of activities and decisions 44
Table 3.2: Product mix pricing strategies 56
Table 5.1: Differences between qualitative and quantitative research 107
Table 5.2: Response Rate 117
Table 5.3: Operationalisation of perceived business performance 121
Table 5.4: Operationalisation of product strategies 121
Table 5.5: Operationalisation of pricing strategies 122
Table 5.6: Operationalisation of place strategies 122
Table 5.7: Operationalisation of promotion (marketing communication)
strategies 123
Table 5.8: Types of ethical considerations 124
Table 6.1: Biographical profile of respondents (n=340) 134
Table 6.2: Demographic information pertaining to the business (n=340) 136
Table 6.3: Factor structure 138
Table 6.4: Validity and reliability of perceived business performance 139
Table 6.5: Validity and reliability of pricing strategies 140
Table 6.6: Validity and reliability of competitive distribution strategies 141
Table 6.7: Validity and reliability of communication process strategies 142
Table 6.8: Validity and reliability of low cost promotion strategies 143
Table 6.9: Reformulated operational definitions 144
Table 6.10: Descriptive statistics of dependent variable (N = 340) 146
Table 6.11: Descriptive statistics of independent variables (N = 340) 146
Table 6.12: Pearson’s correlations coefficients of small family
businesses 148
xvi
LIST OF TABLES (CONTINUED)
PAGE
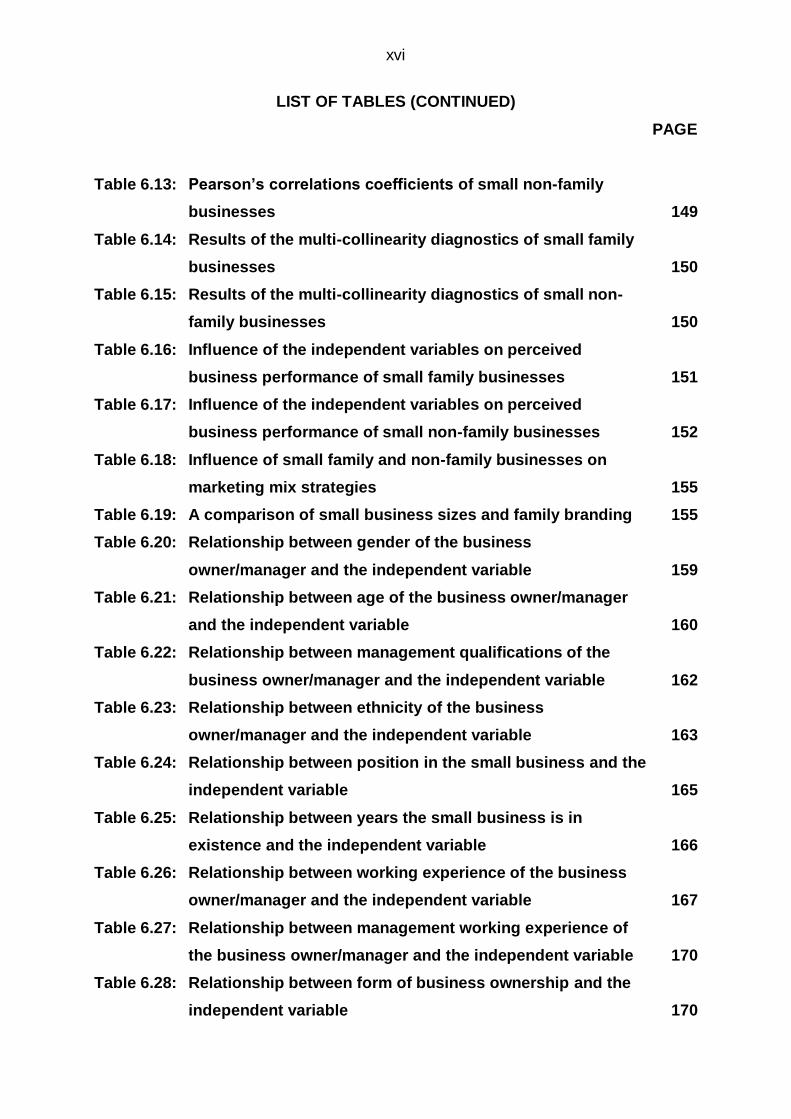
Table 6.13: Pearson’s correlations coefficients of small non-family
businesses 149
Table 6.14: Results of the multi-collinearity diagnostics of small family
businesses 150
Table 6.15: Results of the multi-collinearity diagnostics of small non-
family businesses 150
Table 6.16: Influence of the independent variables on perceived
business performance of small family businesses 151
Table 6.17: Influence of the independent variables on perceived
business performance of small non-family businesses 152
Table 6.18: Influence of small family and non-family businesses on
marketing mix strategies 155
Table 6.19: A comparison of small business sizes and family branding 155
Table 6.20: Relationship between gender of the business
owner/manager and the independent variable 159
Table 6.21: Relationship between age of the business owner/manager
and the independent variable 160
Table 6.22: Relationship between management qualifications of the
business owner/manager and the independent variable 162
Table 6.23: Relationship between ethnicity of the business
owner/manager and the independent variable 163
Table 6.24: Relationship between position in the small business and the
independent variable 165
Table 6.25: Relationship between years the small business is in
existence and the independent variable 166
Table 6.26: Relationship between working experience of the business
owner/manager and the independent variable 167
Table 6.27: Relationship between management working experience of
the business owner/manager and the independent variable 170
Table 6.28: Relationship between form of business ownership and the
independent variable 170
xvii
LIST OF TABLES (CONTINUED)
PAGE
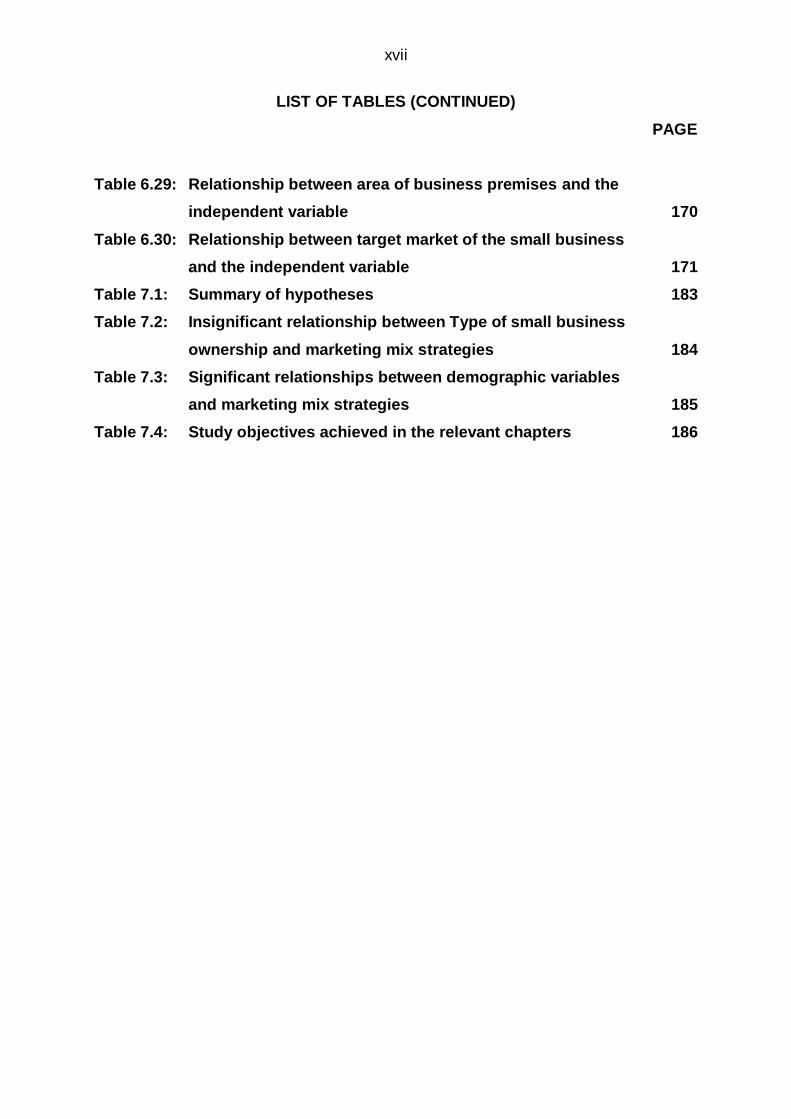
Table 6.29: Relationship between area of business premises and the
independent variable 170
Table 6.30: Relationship between target market of the small business
and the independent variable 171
Table 7.1: Summary of hypotheses 183
Table 7.2: Insignificant relationship between Type of small business
ownership and marketing mix strategies 184
Table 7.3: Significant relationships between demographic variables
and marketing mix strategies 185
Table 7.4: Study objectives achieved in the relevant chapters 186

xviii
LIST OF ANNEXURES
PAGE
ANNEXURE A: QUESTIONNAIRE 223
ANNEXURE B: ETHICAL CLEARANCE 228
1
CHAPTER 1
INTRODUCTION, PROBLEM STATEMENT AND DEMARCATION OF THE STUDY
1.1 INTRODUCTION AND BACKGROUND TO THE STUDY
Through technical innovations and job creation, small and medium-sized enterprises
(SMEs), regardless whether family owned or not, are globally recognised for their
important contribution to economic growth and development (Harvie & Lee,
2012:368; Olawale & Garwe, 2010:729; Visser & Chiloane-Tsoka, 2014:427). SMEs
represent 99.7% of businesses globally while presenting between 60 and 80% of the
new employment positions worldwide (Hlatshwayo, 2012:1). In South Africa, SMEs
comprise over 90% of businesses (Cant & Wiid, 2016:65; Van Scheers, 2011:1),
contribute over 50% to economic growth and Gross Domestic Product (GDP) (Cant,
Wiid & Kallier, 2015:621; Fishman, 2009:2), and employ approximately 60% of the
country‟s labour force (Cant & Wiid, 2016:65; Olawale and Garwe, 2010:729).
A less well-known fact is that the majority of SMEs, especially small businesses, are
often regarded as family businesses (Dynes, 2010:1; Farrington, 2009:1; Venter,
Boshoff & Maas, 2005:283; Ward, 2011:18). According to Farrington (2009:2),
approximately 80 to 90% of all SMEs in the world are family-owned or controlled. As
elsewhere in the world, Venter (2003:32-34) indicates that the vast majority of South
African SMEs are also family-owned or controlled. These South African family
businesses account for approximately 30% of the country‟s GDP and between 50
and 60% of its labour force (Tanzwani, 2010:1).
Despite the importance that SMEs are displaying in economic growth, Ladzani and
Van Vuuren (2002:155) highlight that 50% of new SMEs in South Africa fail, whereas
research by Olawale and Garwe (2010:730) indicate that the percentage of SMEs
failing can even be as high as 75%, rating South African SMEs failure as one of the
highest in the world. Olawale and Garwe (2010:730) and Venter (2003:32-34) are of
the opinion that approximately 65% of SMEs failing within South Africa are family-
owned.
2
Brenes, Madrigal and Molina-Navarro (2006:373) highlight the dilemma of long-term
survival that family businesses face. The survival rate of family businesses beyond
the founder‟s generation is reported to be extremely low (Ibrahim, McGuire &
Soufani, 2009:1), as it is often stated that 30% of family businesses survive to the
second generation and a mere 10% to the third (Eybers, 2010:2; Maas, Van Der
Merwe & Venter, 2005:18; Nieman, 2006:40; Stalk & Foley, 2012:1). Research
specifically undertaken in South Africa indicates that only 25% of family businesses
proceed to the second generation, and a mere 10% to the third (Hugo, 1996:8).
Furthermore, statistics show that the majority of family businesses are to fail within
the first five years of operation (Tanzwani, 2010:2). Sharma (2015:1), however,
raises caution when interpreting these failure rates as exiting a family business
through sale, public offering or closing are often assumed as failures rather than
signs of successful transitions.
Reasons for such high failure rates among SMEs have been researched extensively
during the past two decades. It has been suggested that the high SME failure rates
could be a result of, amongst others, poor leadership and succession planning
(Beaver, 2003:177-183; De Witt, 2015:2-42; Deakins & Freel, 2012:230; Morck &
Yeung, 2003:368; Schwarz, 2003); the lack of goal implementation and achievement
(Barker, Rimler, Moreno & Kaplan, 2004:305; De Lange & Scheepers, 2013:12-85);
lack of working capital, poor business knowledge and management, inadequate
planning and inexperience (Anderson, 2011:57; Bowen, Morara & Mureithi, 2009:21;
Megginson, Byrd & Megginson, 2003:15; Wang, Walker & Redmond, 2007:1-4); lack
of strategic planning (Cant et al., 2015:622; Hormozi, Sutton, McMinn & Lucio,
2002:755); poor management practices and limited access to technology and credit
facilities (CTA, 2000:1).
As family businesses represent the majority of SMEs, it can be assumed that family
businesses face the same challenges as non-family owned SMEs. In addition, family
businesses face unique challenges, such as transition failure, personal family related
issues and conflict such as sibling rivalry and nepotism (Jorissen, Laveren, Martens
& Reheul, 2005:229). Klee (2015:30) indicates that a lack of entrepreneurship has also
been recognised as a major challenge facing family businesses. Besides these causes
of failure, a major contributing factor to SME and family business failure is the lack of
3
marketing and marketing skills (Cant, 2012:1107; Farrington & Venter, 2011:1;
Nieman & Nieuwenhuizen, 2009:35; Olawale & Garwe, 2010:731; Radipere & Van
Scheers, 2005:402; Van Scheers, 2011:5048).
Various authors have indicated that the initial cost of starting and running an SME
are so high that not much priority is given to marketing (Dockel & Ligthelm, 2002:2;
Cant, 2012:1107; Cant & Lightelm, 2002:1; Kroon & Moolman, 2007; Van Scheers,
2011:5048). Kotler and Keller (2012:25-26), however, emphasise that financial
success often depends on a business‟s marketing ability and that finance would not
really matter without sufficient demand for products and services so that the business
can make a profit. Kotler and Keller (2012:26) in fact argue that a positive
relationship between marketing and job creation exists, hence providing economic
growth and development.
Cant (2012:1109) advises that in order to develop marketing strategies for SMEs, the
SME owners need to ensure that they have a clear understanding of the marketing
factors that can and will influence their business. Brink and Berndt (2010:3), Kotler
and Armstrong (2010:62) and Lee Gio (2009:1) propose the use of the traditional
marketing mix to develop long-term marketing strategies, which in return can
contribute to the business performance and success of SMEs. McCarthy (1964)
developed this marketing mix, often referred to as the 4Ps, which include product,
price, place and promotion. Brink and Brendt (2010:4) and Lee Gio (2009:2) further
highlight that finding an optimal mix that gets a superior response in the market,
creates profits, and ultimately contribute to business performance and success. The
marketing mix strategies used by family and non-family SMEs will vary according to
their own circumstances, resources, market conditions and changing needs of their
customers. Cant (2012:1107) and Radipere and Van Scheers (2005:402) further
indicate that the lack of performing certain marketing mix strategies, needed to
operate SMEs, could have a negative impact on their business performance,
success, viability and development.
Therefore, it is important to understand the marketing mix strategies to be performed
by SMEs as it will eventually determine their success in the long run (Van Scheers,
2011:5049). Ahmand and Saber (2015:3) further stress the fact the SMEs are

4
required to perform these marketing mix strategies in spite of its severe resource and
financial constraints. Different forms of businesses whether family-owned or not,
however, have different approaches to marketing and have different ways on how
they adapt these marketing mix strategies given their unique needs and resources
(Jones & Rowley, 2011:26; Lee Gio, 2009:2).
This chapter will commence by highlighting the problem statement, purpose and
research objectives of the study, followed by the research model, questions and
hypotheses. Thereafter, the research design and methodology, the scope and
demarcation, as well as the significance of this research study will be described. The
chapter will conclude with the definition of key concepts used in this study and
structure of the remaining chapters.
1.2 PROBLEM STATEMENT
Despite the growing importance of family and non-family SMEs to the economies of
countries, the failure rate of SMEs can be as high as 75% in South Africa, with 40%
failing within the first year of operation, 60% within the second year and 90% within
10 years of operation (Cant et al., 2015:622; Olawale & Garwe, 2010:730; Van
Scheers, 2011:5048).
It seems there are numerous challenges responsible for the high failure rate of family
and non-family SMEs in South Africa. Various authors identified one of these
challenges as the lack of marketing skills and in some instances improper marketing
conducted by SMEs (Bateman & Snell, 2006; Cant, 2012:1107; Lee Gio, 2009:1).
Brink and Brendt (2010:3) and Lee Gio (2009:1) identified the main problem as
finding the optimal mix of marketing strategies. The lack of such marketing mix
strategies has a negative impact on SMEs business performance, hence indicating
that these marketing skills should be considered a prerequisite to secure long-term
success (Cant, 2012:1107; Nieman & Nieuwenhuizen, 2009:35; Olawale & Garwe,
2010:731; Radipere & Scheers, 2005:402; Van Scheers, 2011:5048).
5
In order to reduce SME failure, it has become increasingly important to understand
and analyse the relationship between the marketing mix strategies used by SMEs
and their business performance and success, whether family-owned or not (Van
Scheers, 2011:5048). Despite the fact that a vast amount of literature on marketing in
SMEs exists, very little is still known about the marketing activities and strategies
used by family and non-family SMEs, especially in the Eastern Cape. Furthermore,
research regarding the importance and contribution of the marketing mix strategies
towards business performance and success of SMEs, whether family- owned or not,
are also limited, hence indicating a need for further investigation (Abrahams &
Carelsen, 2012:3; Jones & Rowley, 2011:26).
1.3 PURPOSE OF THE STUDY
The purpose of the study is to contribute to the business performance and ultimately
the success of small family and non-family businesses by investigating the
relationship between the marketing mix strategies performed by these businesses
and the influence of these strategies on their business performance. The study will
also focus on how small family and non-family businesses adapt these marketing mix
strategies to suit their unique needs and limited resources.
1.4 RESEARCH OBJECTIVES
The primary, secondary and methodological objectives of this study will be discussed
in the sub-sections below.
1.4.1 PRIMARY RESEARCH OBJECTIVE
In line with the problem statement, the primary objective of this study is to investigate
the use of selected marketing mix strategies among small family and non-family
businesses in the Eastern Cape.
6
1.4.2 SECONDARY RESEARCH OBJECTIVES
The secondary objectives (SO) of this study are:
SO1 To determine the level of importance placed on each marketing mix strategy;
SO2 To establish the influence of marketing mix strategies on the Perceived
business performance of small family and non-family businesses;
SO3 To establish whether there are differences between small family and non-
family businesses concerning the marketing mix strategies adopted.
1.4.3 METHODOLOGICAL RESEARCH OBJECTIVES
To give effect to the primary and secondary objective of this study, the following
methodological research objectives (MO) have been identified:
MO1 To conduct a literature review on the nature and importance of small and
medium-sized family and non-family businesses;
MO2 To conduct a literature review on the nature and importance of marketing and
marketing mix strategies used by small family and non-family businesses;
MO3 To propose a hypothesised model to investigate the relationship between the
independent variables (marketing mix strategies) and the dependent variable
(Perceived business performance) of small family and non-family businesses;
MO4 To determine the appropriate research methodology to address the identified
research problem;
MO5 To develop an appropriate measuring instrument that will be used to
empirically test the influence of the marketing mix strategies, used by small
family and non-family businesses, on their Perceived business performance;
MO6 To collect primary data from a pre-determined small business sample (family
and non-family businesses) in the Eastern Cape, and to statistically analyse
the data, as well as test the proposed hypotheses;
MO7 To provide pertinent conclusions on the findings of the study and to make
recommendations to small family and non-family business owners on how to
improve marketing within their businesses and ultimately business
performance.
7
1.5 PROPOSED HYPOTHESISED MODEL, RESEARCH QUESTIONS
AND HYPOTHESES
The proposed hypothesised model, research questions and hypotheses that this
study aims to address are presented below.
1.5.1 PROPOSED HYPOTHESISED MODEL
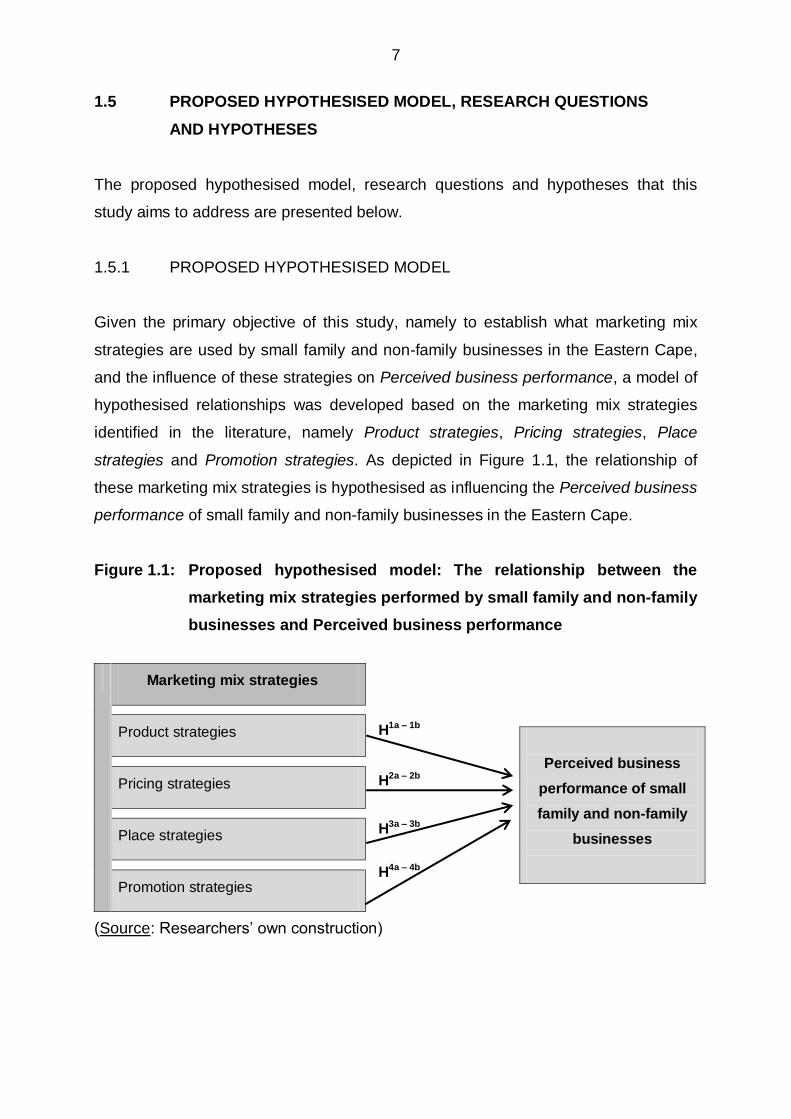
Given the primary objective of this study, namely to establish what marketing mix
strategies are used by small family and non-family businesses in the Eastern Cape,
and the influence of these strategies on Perceived business performance, a model of
hypothesised relationships was developed based on the marketing mix strategies
identified in the literature, namely Product strategies, Pricing strategies, Place
strategies and Promotion strategies. As depicted in Figure 1.1, the relationship of
these marketing mix strategies is hypothesised as influencing the Perceived business
performance of small family and non-family businesses in the Eastern Cape.
Figure 1.1: Proposed hypothesised model: The relationship between the
marketing mix strategies performed by small family and non-family
businesses and Perceived business performance
H1a – 1b
H2a – 2b
H3a – 3b
H4a – 4b
(Source: Researchers‟ own construction)
Marketing mix strategies
Product strategies
Pricing strategies
Place strategies
Promotion strategies
Perceived business
performance of small
family and non-family
businesses
8
1.5.2 RESEARCH QUESTIONS
Given the purpose and the primary objective of this study, the following research
questions are presented to determine the marketing mix strategies used by small
family and non-family businesses, as well as to establish the influence thereof on the
Perceived business performance of small family and non-family businesses:
i) What are the marketing mix strategies used by small family and non-family
business owners?
ii) To what extent do small family and non-family businesses utilise product
strategies?
iii) Does the utilisation of product strategies influence business performance of
small family and non-family businesses?
iv) To what extent do small family and non-family businesses utilise pricing
strategies?
v) Does the utilisation of pricing strategies influence business performance of
small family and non-family businesses?
vi) To what extent do small family and non-family businesses utilise place
strategies?
vii) Does the utilisation of place strategies influence business performance of
small family and non-family businesses?
viii) To what extent do small family and non-family businesses utilise promotion
strategies?
ix) Does the utilisation of promotion strategies influence business performance
of small family and non-family businesses?
1.5.3 RESEARCH HYPOTHESES
The following directional hypotheses have been formulated to test the relationships
proposed in the hypothesised model depicted in Figure 1.1.
9
H1a – 1b: There is a positive relationship between Product strategies and the
Perceived business performance of small family and non-family businesses.
H2a – 2b: There is a positive relationship between Pricing strategies and the
Perceived business performance of small family and non-family businesses.
H3a – 3b: There is a positive relationship between Place strategies and the Perceived
business performance of small family and non-family businesses.
H4a – 4b: There is a positive relationship between Promotion strategies and the
Perceived business performance of small family and non-family businesses.
1.6 RESEARCH DESIGN AND METHODOLOGY
To achieve the objectives of this study and to test the hypotheses formulated, the
research is divided into two categories, namely secondary and primary research.
1.6.1 LITERATURE REVIEW (SECONDARY RESEARCH)
A comprehensive literature review will be conducted to determine the nature and
importance of family and non-family SMEs, as well as the nature and importance of
marketing and marketing mix strategies used by these businesses. The literature
review is given in Chapters Two and Three.
Both international and national data sources available through the Nelson Mandela
Metropolitan University Library will be considered to identify books and journals from
reputable authors. Search engines such as Google, Google Scholar and databases
such as the Family Business Review and EBSCO host will be used in order to
identify various literature sources.
1.6.2 EMPIRICAL INVESTIGATION (PRIMARY RESEARCH)
The primary research involves several components, namely: identifying the most
suitable research paradigm and methodology, identifying the population, sample and
sampling technique, as well as collecting the data, and lastly an analysis of the
collected data.
10
1.6.2.1 Research paradigm and methodology
Taylor, Kermode and Roberts (2007:5), as well as Weaver and Olson (2006:460), are
of the opinion that a research paradigm is an extensive standpoint on something, and
that research can be changed and steered in a certain direction by the paradigm
chosen.
According to Collis and Hussey (2014:11), research paradigms can either be
classified as an interpretivism paradigm or a positivism paradigm. An interpretivism
paradigm is often associated with qualitative methodologies, whereas a positivism
paradigm is often associated with quantitative methodologies (Collis & Hussey,
2014:43). According to Zikmund, Babin, Carr and Griffin (2013:132-134), quantitative
research can bring about objectives, whereas qualitative research cannot. Qualitative
research addresses one‟s objectives with methods, enabling the researcher to
provide an elaborative understanding of the issue under investigation, without having
to depend on numerical values. Quantitative research is business research which
addresses one‟s research objectives through empirical measures, involving
numerical values and analysis approaches. This research method is more able to be
used on its own, seeing that it requires less interpretation (Zikmud et al., 2013:132-
134).
Given the objectives of this study, a positivistic research paradigm and quantitative
research methodology are adopted for the purpose of this study. According to Nykiel
(2007:56), quantitative research has two distinct advantages. Firstly, the results are
statistically reliable and secondly the results are projectable to the population.
Quantitative research enables the researcher to gather data with an objective
approach and then report on the phenomenon that occurs. This allows the
researcher to scientifically select the instrument to be used and gather data without
becoming emotionally involved with the respondents (Terry, 2012:68).
1.6.2.2 Population, sampling and data collection
According to Zikmund et al. (2013:385), in research the population is referred to as a
group of entities who have similar characteristics. For the purpose of this study, the
11
population refers to all small family and non-family businesses operating within the
borders of the Eastern Cape Province of South Africa. Zikmund et al. (2013:385)
further states that researchers usually do not look at the entire population, but rather
choose a smaller number of entities, which is referred to as a sample. According to
Bryman (2012:187), a sample refers to the subset of the population under
investigation.
For the purpose of this study, convenience sampling was used to identify the
sampling units, as no formal database for the small family and non-family businesses
in South Africa or the Eastern Cape currently exists. Sampling units are the limited
members of the population selected for a study‟s sample (Panneerselvam,
2004:191). Convenience sampling is a non-probability sampling method and is used
in investigative research where the researcher is only concerned with an
approximation of the truth. As the name quite obviously states, it is based on
convenience which means that the sample consists of people that are conveniently
available (Zikmund et al., 2013:392).
1.6.2.3 Design of the measuring instrument
The respondents were required to complete a structured self-administered
questionnaire which was used as the basis of the data collection. The questionnaire
consisted of a cover letter and three sections. The cover letter introducing the
respondent to the study included a detailed explanation regarding the purpose of the
study and the type of information requested from the respondent and the business of
the respondent. Section A requested the demographic information of both the
respondent and the business of the respondent. Section B measured Perceived
business performance and Section C measured the frequency with which the
respondent carries out the marketing mix strategies, and whether small family-owned
businesses use the family name as a marketing/branding tool.
In both Section B and C, a five-point Likert-type scale was implemented. In Section B
the possible responses had the following values: strongly disagree a value of 1,
disagree a value of 2, neither agree nor disagree a value of 3, agree a value of 4,
and strongly agree a value of 5. In Section C the possible responses had the
12
following values: never a value of 1, seldom a value of 2, sometimes a value of 3,
often a value of 4, and always a value of 5. According to Vanek (2012:1), a Likert-
type scale sums the responses to several Likert items, which are the statements
being evaluated. A good Likert scale is balanced on both sides of a neural option. A
detailed discussion of the research design and methodology is given in Chapter Five.
1.6.2.4 Data analysis
Firstly, the validity and the reliability of the measuring instrument will be assessed.
According to Zikmund et al. (2013:303) validity refers to the extent to which a score
truthfully represents a concept. According to Morgan, Gliner and Harmon (2008:129-
130), the extent to which a test measures what it is designed to measure, can be
referred to as the validity of a measure. In order to assess the validity of the
measuring instrument used in this study, an exploratory factor analysis (EFA) was
conducted. An EFA can be defined as a statistical technique one would use to cluster
a large number of items into a more controllable set of variables, which will then be
referred to as factors (Catalyst, 2005:41). Items that load onto their corresponding
factors at a level of 0.30 and 0.40 are considered significant for sample sizes of 350
and 200 respectively (Hair, Black, Babin, Anderson & Tatham, 2006:117). Factor
loadings of greater than 0.40 were considered significant in this study.
Reliability is the extent to which measures remain consistent (Zikmund et al.,
2013:301). Reliability refers to the accuracy of data measurements and in order for a
measurement to be regarded as reliable, it needs to provide the same results
repeatedly (Bayens & Roberson, 2011:85). Cronbach‟s alpha (CA) coefficients were
used to assess the reliability of the measuring instrument used in this study. The CA
is a coefficient used to measure the internal consistency of the items in a test. The
coefficient is represented by a number between 0 and 1. If a test has a strong
internal consistency most measurement experts agree that the result will be between
0.70 and 0.90 (Cooper & Schindler, 2013:322). However, in certain circumstances,
like a smaller sample size for instance, a scale with a Cronbach‟s alpha coefficient of
0.60 are regarded as acceptable (Breat, 2009:436; Leimeister, 2010:140), and was,
therefore, adopted in this study.

13
Several descriptive statistics such as the mean, standard deviation and frequency
distributions will be calculated to summarise the sample data. Pearson‟s product
moment correlation coefficient was used to measure the relationships between the
factors under investigation. The Pearson correlation coefficients represent the simple
linear relationship between variables that are being measured in a specific sample.
The Pearson‟s correlation coefficient is denoted by r and ranges between -1 and +1.
When r is close to +1 there is a strong positive relationship between the variables,
whereas conversely an r close to -1 represents a strong negative relationship
between the variables (Khattar, 2008:200-201).
In order to determine the relationship between the various marketing mix strategies
investigated in this study on the dependent variable, Perceived business
performance of family and non-family businesses, a multiple regression analysis
(MRA) was undertaken. Before undertaking an MRA, the existence of multi-
collinearity was assessed. Variance inflation factors (VIF) were calculated to assess
multi-collinearity. MRA is a statistical tool used to predict one dependent variable by
means of several independent variables, as well as between two dependent
variables as proposed in this model (Bajpai, 2010:563). Lastly, T-tests were
undertaken to determine whether the differences in the mean scores returned by the
small family and non-family business sample groups for the marketing mix strategies
under investigation, are significantly different from each other. A t-test is a technique
used to test whether the mean score for a variable is significantly different for two
independent samples (Zikmund et al, 2013:518). In order to determine if differences
are statistically significant between the use of family brand and small business size, a
Chi-square test for independence was conducted.
1.7 SCOPE AND DEMARCATION OF THE STUDY
Given their significance in terms of economic growth as well as their contribution to
job creation and the distribution of wealth, the focus of this study will be on small
businesses only. Due to their accessibility the empirical research will be restricted to
owner-managers of small businesses situated in the Eastern Cape only. In addition,
only small businesses which do not employee more than 50 full-time employees and
small family-owned businesses where at least two family members are actively
14
involved in the management and operation of the business and where the family
owns more than 51% of the business and does not employ more than 50 full-time
employees, will be approached to participate in the study.
Although numerous factors have been identified as influencing the business
performance of small businesses, the specific focus of this study is on the marketing
mix strategies and activities used by small family and non-family businesses. The
marketing mix strategies identified for this study include Product strategies, Pricing
strategies, Place strategies and Promotion strategies. It is these marketing mix
strategies only that constitute the focus of both the literature study and the empirical
investigation.
1.8 CONTRIBUTIONS OF THE STUDY
This study aims to add to the existing body of knowledge on the small family and
non-family businesses, specifically given the shortage of previous research relating
to the marketing strategies used in small family and non-family businesses. Past
research on this topic has mainly focused on marketing in large organisations. Given
the little knowledge currently available on the issue at hand, as well as to reduce the
high failure rate of small family and non-family businesses, this study aims to provide
insight into the marketing mix strategies utilised by small family and non-family
businesses and improving their business performance.
1.9 DEFINITION OF KEY CONCEPTS
The concepts to follow require clarification in this study.
1.9.1 SMEs
In this study, the concepts “small business” and “SMEs” are used interchangeably
and are considered synonymous for the purpose of describing the nature and
importance of small businesses.
15
1.9.2 SMALL BUSINESS
For the purpose of this study, a small business is one that does not employ more
than 50 full-time employees, the business should have been in operation for at least
one year and the owner must be actively involved in the business.
1.9.3 SMALL FAMILY BUSINESS
For the purpose of this study, a family business is a business where at least two
family members are actively involved in the management and operation of the
business and where the family owns more than 51% of the business and does not
employee more than 50 full time employees.
1.9.4 MARKETING
For the purpose of this study, marketing is the process of creating, distributing,
promoting and pricing goods, services and ideas to facilitate satisfying exchange
relationships with customers and develop and maintain favourable relationships with
stakeholders in a dynamic environment.
1.9.5 MARKETING MIX STRATEGIES
For the purpose of this study, a marketing mix strategy refers to the performing of
marketing activities that form part of a business‟s marketing function, which include
those defined under 1.9.6 to 1.9.9.
1.9.6 PRODUCT STRATEGIES
For the purpose of this study, Product strategies refer to strategies that small family
and non-family businesses perform concerning the product or service in terms of
providing an up-to-date, need-satisfying benefit to their target market that is
distinguishable from competitors. Product strategies include supplying the target
market with products containing the minimum basics and relevant features, as well
as identifying the product/service with certain brand associations.
16
1.9.7 PRICING STRATEGIES
For the purpose of this study, Pricing strategies refer to the pricing tactics that small
family and non-family businesses perform in order to attract and retain customers,
such as setting a price to cover total costs related to demand for products, quality
and value expected by and delivered to customers, or to be competitive.
1.9.8 PLACE STRATEGIES
For the purpose of this study, Place strategies refer to distribution process methods
employed by small family and non-family businesses such as setting delivery
objectives, using distribution channel selection criteria based on image, reputation
and ensuring product availability, and changing the distribution channel when needed
to sell directly to customers or in the most cost effective way.
1.9.9 PROMOTION STRATEGIES
For the purpose of this study, Promotion strategies refer to the process of developing
marketing communication strategies that small family and non-family businesses use
which includes setting marketing communication objectives, selecting a target market
to convey the message via various written, digital and mobile communication media
and techniques which could reach both current and potential customers.
1.9.10 PERCEIVED BUSINESS PERFORMANCE
For the purpose of this study, Perceived business performance refers to the small
family or non-family business experiencing growth in profit, sales and number of
employees over the last two years, as well as the business having loyal customers
who make regular purchases and who recommend the business to others.

17
1.10 STRUCTURE OF THE STUDY
The structure of the study will be as follows:
An introduction and background to the study is provided in Chapter One. This
chapter makes reference to the problem statement, the purpose and the research
objectives, including primary, secondary and methodological objectives, of the study.
A hypothesised model is then proposed which forms the basis for the generation of
several research questions and hypotheses. The secondary and primary research is
introduced within the research design and methodology. The primary research
includes the research paradigm, sampling and data collection, and data analysis.
Thereafter, the scope and demarcation as well as the significance of the study are
explained. This is followed by defining the most important concepts used in the study
and concluding with the structure of the remaining chapters in this study.
Chapter Two provides a literature review including an overview of SMEs and family
businesses. The importance of each will be highlighted. The chapter will start off by
defining SMEs before discussing their importance and challenges facing these
businesses within the South African context. The same discussion will be followed for
contextualising family businesses including the differences between family and non-
family SMEs.
Chapter Three will make reference to the nature and importance of marketing and
the marketing mix strategies that could be used by family and non-family SMEs, with
specific focus on their adaption of these mix strategies.
In Chapter Four a hypothesised model will be presented which hypothesise positive
relationships between marketing mix strategies used by family and non-family SMEs
and the Perceived business performance of these SMEs. The independent and
dependent variables, which form the basis of the theoretical model, as well as the
resulting hypothesised relationships and evidence supporting these relationships, are
discussed in this chapter.
18
Chapter Five will describe the research design and methodology chosen for this
study, including the research paradigm, the population, the sample and sampling
method. The discussion will further include a description of the method of data
collection, administration of the measuring instrument, ethical considerations, missing
data, and method of data analysis. The data analysis describes the methods used to
assess the validity and reliability of the measuring instrument as well as various
descriptive and inferential statistical techniques used to analyse and describe the
data.
Chapter Six will present the empirical findings of this study. This will include the
demographical data describing the sample, the results of the validity and reliability
assessment of the measuring instrument, the revised hypothesised model and
hypotheses, as well as the empirical results. The empirical results will include the
descriptive statistics relating to the marketing mix strategies under investigation and
Perceived business performance, inferential statistics regarding the correlations
between the marketing mix strategies and Perceived business performance, as well
as the results of the multiple regression analysis. Furthermore, t-tests will be
presented, indicating whether the differences in the mean scores returned by the
small family and non-family business sample groups for the marketing mix strategies
under investigation, are significantly different from each other. In order to determine if
differences are statistically significant between the family brand and small business
size, a Chi-square test for independence will be conducted.
Chapter Seven will provide an overview, on the preceding chapters, interpretations
of the empirical results and recommendations, contributions of the study, and
limitations of the study and recommendations for future research. The study will end
off with concluding remarks based on the research conducted.
19
CHAPTER 2
NATURE AND IMPORTANCE OF SMALL AND MEDIUM-SIZED (SMEs) FAMILY
AND NON-FAMILY BUSINESSES
2.1 INTRODUCTION
The main focus of this study is on the influence of selected marketing mix strategies
on the perceived business performance of family and non-family Small and Medium-
sized Enterprises (SMEs). According to Visser and Chiloane-Tsoka (2014:427), the
economic importance of family and non-family SMEs are globally recognised and,
therefore, it is important to understand the nature and importance of both types of
businesses. However, as highlighted in Chapter 1, most family businesses are
considered to be SMEs. Hence, this chapter attempts to differentiate between family
and non-family SMEs by investigating their nature and importance. Differentiating
between these businesses could highlight how the application of marketing mix
strategies vary between them.
In this chapter, SMEs are defined and their importance, as well as the challenges
they face, are highlighted. Thereafter, family businesses are defined, followed by the
differences between family and non-family businesses, concluding with a discussion
on the importance of family businesses and the challenges they face.
2.2 OVERVIEW OF SMEs
To follow, is a discussion on the definition, importance and challenges of SMEs.
2.2.1 DEFINING SMEs
Various sources indicate that there is no agreed upon definition for SMEs and
forming this definition is regarded as a difficult and burdensome task (Farrington,
2009:30; Longenecker, Moore, Petty & Palich, 2006:86; OECD, 2005:17). Numerous
criteria are, however, used to identify SMEs, varying from quantitative to qualitative
criteria (Ayyagari, Beck & Demirguc-Kunt, 2003:4; Du Toit, Erasmus & Strydom,
2007:49; Volkmann, Tokarski & Grünhagen, 2010:28). Some authors indicate that

20
quantitative criteria such as size, age (Anand & Singh, 2011:8255; Rahman,
2001:35), number of employees, total net assets, sales and investment level
(Ayyagari et al., 2003:4; Du Toit et al., 2007:49), could be used to define SMEs.
Tables 2.1 and 2.2 below highlight common quantitative criteria used for defining
SMEs, as provided by Bosch, Tait and Venter (2011:579) and the Republic of South
Africa, National Small Business Act No. 102 of 1996 (2003:1).
Table 2.1: Quantitative criteria used for classifying small and medium-sized
businesses in South Africa
Industry in accordance with the Standard Industry Classification
Size/Class Total full-time equivalent of paid employees Less than:
Annual sales turnover Less than:
Agriculture Small
Medium 50
100 R 3m R 5m
Manufacturing Small
Medium 50
200 R 13m R 51m
Retail, motor industry Small
Medium 50
200 R 19m R 39m
Wholesale trade, commercial agents and allied services
Small Medium
50 200
R 32m R 64m
Finance and business services Small
Medium 50
200 R 13m R 26m
(Source: Adapted from Bosch et al., 2011:579)
According to Table 2.1 the definition of SMEs is often based on quantitative criteria,
including the number of employees and annual sales turnover. These differ according
to standard industry classification.
Table 2.2: Schedule of the size standards for the definition of SMEs in South
Africa
Type of firm Employees Turnover
Small 1 - 49 Max R 13m
Medium 51 - 200 Max R 51m
(Source: Government Gazette of the Republic of South Africa, 2003:1)
As indicated in Table 2.2, South Africa‟s National Small Business Act also formed a
summation of definitions, in terms of quantitative criteria, including the employment
level for the different enterprise sizes.
21
However, it is often difficult to obtain data concerning the exact turnover of many
SMEs. Therefore, the quantitative criteria used for defining an SME in this study will
focus on the number of employees. Employment level has been found to be the most
convenient and useful discriminator in the context of management research (Levy &
Powell, 2004:20; OECD, 2005:36).
Volkmann et al. (2010:28), however, regard the entrepreneur‟s personality, the type
of contract between management and staff, the degree of formalisation and hierarchy
level as important qualitative criteria that should be used to define SMEs. Bosch et al.
(2011:578) indicate that these qualitative criteria are more difficult to measure and
further highlight the management structure as a distinctive qualitative criterion that
can be used to identify or define an SME. In SMEs, the owner is often involved in the
daily running of the business, as well as the management of business duties (Bosch
et al., 2011:578). For the purpose of this study, the qualitative criteria used for
defining an SME will focus on the owner being actively involved in the business.
In this study, the concepts “small business” and “SMEs” are used interchangeably
and are considered synonymous as the study focuses specifically on the small
business section of SMEs. Hence, for the purpose of this study, a small business is
one that does not employ more than 50 full-time employees, the business should
have been in operation for at least one year and the owner must be actively involved
in the business. More specifically, small businesses within the Eastern Cape of South
Africa that meet the aforementioned criteria will be targeted to participate in this
study.
2.2.2 IMPORTANCE OF SMEs
SMEs are globally recognised for their importance as a result of their ability to create
employment, reduce poverty and contribute to economic wealth and development
(Byrd & Megginson, 2013:35; Harvie & Lee, 2012:368; Urban & Naidoo, 2012:146;
Visser & Chiloane-Tsoka, 2014:427). It is estimated that SMEs in South Africa,
comprise over 90% of businesses and contribute to over 50% of South African
employment, economic growth and GDP (Cant et al., 2015:621; Fishman, 2009:2;

22
Van Scheers, 2010:1). Moreover, Cant and Wiid (2016:65) assert that more than
60% of South Africans are employed in the small business sector.
In addition, Nager, Swanepoel and Van Der Merwe (2008:37) are of the opinion that
governments should focus on SME development which should be an essential
component of all reconstruction and development initiatives as they have the
potential to economically empower the majority of a country‟s people. FinMark Trust
(2006) further argues that one of the best ways to address unemployment is to
leverage the potential of SME employment creation and to promote their
development. Olawale and Garwe (2010:729) note that governments throughout the
world have been focusing on the development of the SME sector, as it contributes to
the economic success of a country (Olawale & Garwe, 2010:729). Furthermore,
Bhaktawar (2011:138) states that the South African government acknowledges the
importance and contribution that SMEs make to the country‟s economy and has
developed policies and programmes to support SME development and to encourage
their long-term growth.
There are, however, different ways in which SMEs could contribute to South Africa‟s
economic development. Various authors are of the opinion that SMEs contribute to
both rural and urban employment, enable growth in the labour force and provide
sought-after sustainability and innovation needed in the economy (Hlonitshwayo,
2012:1; Eybers, 2010:19; Kongolo, 2010:2291). According to Olawale and Garwe
(2010:729) new SMEs introduce new products and develop new technologies. As a
significant source of innovation, new SMEs also bring a competitive pressure to
established ones. Without the creation of new SMEs, South Africa risks economic
stagnation, given the fact that the creation and sustainability of new SMEs is vital to
the economic prosperity of South Africa (Olawale & Garwe, 2010:729).
Employees in SMEs often require limited or no skills, or training; and for this reason
have a greater capacity for job creation because of the unskilled and untrained
workers they employ (Bosch et al., 2011:580; Mwobobia, 2012:88). Bosch et al.
(2011:580) further state that employees in SMEs work closely with their employers,
thus they learn the necessary skills on the job. Hence, SMEs can be regarded as
having potential training opportunities for employees to develop management skills

23
(Madhani, 2012:7). Murphy (1996:5) also states that SMEs create opportunities for
social inequalities to be readressed by serving as an expression of meritocracy and
opportunity. To clarify, workers are appointed on the basis of demonstrated talent
and abilities, instead of family ties, wealth, class privilege, friends, seniority,
popularity or other determinants of social position and political power.
Megginson et al. (2003:13) and Nieman (2006:12) further state that the small size
and simplicity of SMEs allow them to achieve flexibility and adaptability to changes in
demand and production techniques, over their larger counterparts. Kongolo
(2010:2289) corroborates this by stating that, in times of recession, SMEs are able to
adapt their service offering more easily than their larger counterparts due to their size
and flexibility. For this reason, SMEs also have a strong potential to benefit from
advances in information and communication technologies, and the adaption of new
business modes of operation (Fatoki, 2010:193). Walsh and Lipinski (2009:570) also
indicate that the size of SMEs place them in a position to identify opportunities and to
operate in niche markets that are otherwise overlooked by larger firms. Du Toit et al.
(2007:49) further highlight that the communication channels utilised by SMEs are
often short and efficient, with fewer rules and regulations, allowing rapid decision-
making. Moreover, SMEs often have the ability to make exceptions for customers,
therefore, providing a more personalised service.
Hence, it is evident that the importance of SMEs cannot be undervalued as it is
essential to the country‟s growth and has the potential to alleviate many of the
country‟s economic problems (Abrahams & Carelsen, 2012:21; Farrington, 2009:33).
Despite SMEs‟ contribution to economic growth in South Africa, they are faced with
various challenges that inhibit their development and growth. The following section
will discuss the challenges that SMEs face globally and in South Africa.
2.2.3 CHALLENGES FACING SMEs
Despite the major role SMEs play in economic development, Cant et al. (2015:1107)
indicate that attention should be given to the high SME failure rate, as SMEs will not
be the solution to South Africa‟s economic problems unless they are well-managed
and assisted with overall management actions. Olawale and Garwe (2010:730)

24
indicate in their research that the failure rate of SMEs can be as high as 75% in
South Africa, which is rated as one of the highest in the world.
Beck and Demirguc-Kunt (2006:2931) argue that for SMEs to grow and contribute to
economic development, it is important to address both the internal and external
challenges they face in their respective business environments. Table 2.3
summarises some of the challenges SMEs face, both in their internal and external
business environment.
Table 2.3: Summary of SME challenges in their internal and external business
environment
Internal environment
Access to finance Herrington, Kew & Kew, 2009; Finmark Trust, 2006; Cassar, 2004; Foxcroft, Wood, Kew, Herrington & Segal, 2002; Stilglitz & Weiss, 1981
Management skills
Hellriegel, Slocum, Jackson, Louw, Staude, Amos, Klopper, Louw, Oosthuizen, Perks, Zindiye, 2008; Martin & Staines, 2008; Herrington & Wood, 2003
Location Ngoc, Le & Nguyen, 2009
Networking Dahl & Sorenson, 2007; Shane and Cable, 2002
Investment in information technology Phillips & Wade, 2008
Cost of production Smallbone, Leig, & North, 2003
External environment
Economic variables The Economist, 2009
Market access Ehlers & Lazenby, 2007; Zahra, Neubaum & El-Hagrassey, 2002
Crime and corruption
Standard Bank and Fujistu Siemens Computers, 2009; South African Police Service Crime Statistics, 2009; Transparency International, 2008; United Nations Office of Drugs and Crime, 2007; World Bank, 2005
Labour, infrastructure and regulations Kalra, 2009; Mahadea, 2008; Maas and Herrington, 2006; Hashi, 2001
(Source: Constructed from Bosch et al., 2011:594; Olawale & Garwe, 2010:731-732)
From Table 2.3 it is evident that the challenges SMEs face in their internal
environment include, amongst others: lack of access to finance (the financial
resources required to start trading and to fund SME growth), lack of managerial skills
of the owner (the knowledge, skills, behaviours and attitudes required to contribute to

25
the survival and growth of SMEs), improper location (geographical proximity required
for positive impact on market potential and growth opportunities for SMEs), lack of
networking (interaction required to increase the SMEs legitimacy for support from key
stakeholders and the general public), lack of investment in information technology
(keeping up with information technology required for the development and
maximisation of opportunities in SMEs) and lack of monitoring the cost of production
(monitoring the production costs required to reduce wastage and determine the most
efficient means of production in SMEs).
The external environment poses systemic challenges, largely uncontrollable by
SMEs, which include economic variables (fiscal and monetary policies of the
government, inflation, interest rates and foreign exchange rates influencing the
demand for goods and services and hence the growth of SMEs), market access
(extent of competition and potential entrants into the market increasing the dynamics
of competition and influencing business performance), crime and corruption
(increasing expenditure and investment in security measures), and labour,
infrastructure and regulations (difficulty and the high costs associated with hiring
skilled workers, quality infrastructure, and registration licenses and taxes).
According to Van Scheers (2011:5049) the greatest problem that should be
addressed is the lack of finance. This is supported by various authors, indicating that
SMEs suffering from a lack of capital have a diminished chance of survival (Fatoki,
2010:128; Herrington, Kew & Kew, 2009:1; Megginson et al., 2003:15; Nieman &
Nieuwenhuizen, 2009:3; Pitman, 2010:84; Roberts, 2010:1). In addition, SMEs face
difficulties obtaining credit, hence adding to this financial pressure (Bankseta, 2008:1;
CTA, 2000:1; Monks, 2010:25). Monks (2010:25) indicates that financial institutions
restrict credit to SMEs due to the high risk, limited credit history, inadequate financial
statements and high failure rate associated with SMEs. The Global Entrepreneurship
Monitor South African Report of 2002, Foxcroft, Wood, Kew, Herrington and Segal
(2002) found that 75% of new SME credit applicants in South Africa are rejected,
suggesting that new SMEs without finance may not be able to grow and survive.
Various authors (Analoui & Karami, 2003:36; Anderson, 2011:57; Bankseta, 2008:1;
Bosch et al., 2011:664; Martin & Staines, 2008:1; Milosevic, Miletica & Stefanovic,
26
2009:127; Pitman, 2010:84) indicate that the lack of managerial experience and skills
is another reason for the high failure rate of SMEs in South Africa. Many SME
managers and owners are associated with poor managerial skills, restricted business
knowledge and experience, and are, therefore, unable to plan effectively resulting in
SME failure (Milosevic et al., 2009:127; Pitman, 2010:84).
It is evident from the results of an empirical investigation conducted by Radipere and
Van Scheers (2005:1) that SME owners lack certain managerial skills, including
marketing skills, needed to operate their business successfully. Their study revealed
that a lack of marketing and managerial skills contributes to the failure rate of SMEs
and thus have a negative impact on the success, viability and development of SMEs.
The findings further confirmed that SMEs are in need of support systems such as
financial assistance (Radipere & Van Scheers, 2005:1-7). Other marketing scholars
such as Cant (2012:1107), Kroon and Moolman (2007) and Van Scheers
(2011:5048) support these findings and further add that the high start-up costs and
other financial difficulties facing SMEs, contribute to the fact that priority is not given
to marketing. As marketing performed by SMEs is the focus of this study, it will be
discussed in more detail in Chapter 3.
As the empirical investigation of the study focuses on both small non-family and
family businesses, as well as the fact that the SME sector in various countries
includes a preponderance of family businesses, family businesses will be discussed
in the following section (Nordqvist & Merlin, 2012:211).
2.3 OVERVIEW OF FAMILY BUSINESSES
The following subsections will attempt to define family businesses, and highlight their
importance and the challenges they face.
2.3.1 DEFINING FAMILY BUSINESSES
Since the inception of family business studies, researchers have struggled with a
need to define family business boundaries and its source of distinctiveness
(Farrington, 2009:35; Offerman, 2010:12). As in the case of SMEs, family business

27
has many meanings and applications, making it difficult to have a globally recognised
definition (Astrachan, Klein & Smyrnios, 2002:45; Flören, 2002:25; Mandi, 2008:13;
Pérez & Raposo, 2007:460; Visser & Chiloane-Tsoka, 2014:428).
According to Maas and Diederichs (2007:4), a family business is a business that is
owned and directly influenced by members of the same family, all of whom share the
same intention of generating wealth for future generations. Van Duijn, Breunesses
and Malindz (2007:11) also define a family business as being a business that is
owned, controlled and operated by the members of one or several families.
Longenecker, Petty, Palich and Hoy (2011:138) further state that a family business is
a business where important strategic matters are controlled by the persons who
started or purchased the business or the descendants of the previous owner.
Poza (2014:2) summarises that a family business is a unique synthesis of:
Ownership control (51% or higher) by two or more members of a family or a
partnership of families;
Strategic influence by family members on the management of the firm,
whether by being active in management, by serving as advisors or board
members, or by being active shareholders;
Concern for family relationships; and
The dream, or possibility, of continuity across generations.
Bosch et al. (2011:639) assert that family influence and control are at the heart of
many definitions. Family involvement in a business is what distinguishes a family
business from that of a non-family one. Without family control, family influences and
other challenges discussed in Section 2.3.5, such as conflicts and the problem of
succession, would not occur as it would be no different from any other type of
business (Bosch et al., 2011:639).
Despite the numerous definitions of family business that exist, there are common
elements in most definitions. Various researchers believe that the most common
characteristics include ownership, management, family involvement, interdependent
subsystems and generational transfer (Farrington, 2009:35; Flören, 2002:25;
28
Habbershon, Williams & McMillan, 2003:451; Horowitz, 2014; Kelly, Athanassiou &
Crittenden, 2000:28; Scheller, 2013; Westhead & Cowling, 1999:31).
Although the majority of family-owned businesses can be categorised as small, it is
important to note that various well-known examples of large family businesses do
exist and contribute significantly to economic development (Caselli & Gatti, 2005:1;
Farrington, 2009:33; Lee, 2006:103). The vast majority of family businesses do,
however, appear to be small (Lee, 2006:104; Longenecker et al., 2006:86). In this
study a small family business will be referred to as a business where at least two
family members are actively involved in the management and operation of the
business and where the family owns more than 51% of the business and does not
employ more than 50 full-time employees.
2.3.2 FAMILY VERSUS NON-FAMILY BUSINESSES
Identifying differences between family and non-family businesses constitutes one of
the basic goals of family business research (Gallo, Tappies & Cappuyns, 2004:303;
Letele-Matabooe, 2012:26). Gallo et al. (2004:303), however, assert that despite
advanced improvements in research in this regard, there are still instances where the
differences between family and non-family businesses have not been adequately
explained.
Various studies suggest that the overlap and interaction between the family and the
business is what makes the family business unique. The interaction between family
and business systems cause the strategies of family businesses to differ from those
of non-family businesses (Basco & Rodriguez, 2009:83; Ibrahim et al., 2009:2;
Jorissen et al., 2005:230).
Various researchers have attempted to distinguish between family and non-family
businesses using numerous criteria, some of which are summarized in Table 2.4
below.

29
Table 2.4: The differences between family and non-family businesses
Platform Family business Non-family business
Job security
Family members in managerial positions are employed for longer term/indefinite career horizons. Likelihood of termination is low.
Salaried managers are employed for shorter term career horizons. Likelihood (or perception) of termination is greater.
Business failure
Business failure has dramatic personal and career implications for family members, especially those in senior management positions.
Business failure has relatively less personal impact on managers.
Rewards
Rewards are based on ascription and nepotism. Organisation performance tends to be correlated with managerial compensation.
Rewards are based on achievement and merit. Organisational performance tends to be less directly correlated with what a particular manager earns.
Decision-making Decision-making tends to be more centralised, although this may lessen across generations.
Decision-making is often more participative and team-based.
Management
Management is often autocratic, emotional, and intuitive. Innovation is stifled and managers are rent-seeking.
Management delegates tasks to professionals. They have a tendency to be rational, analytical, innovative, and follow formalised systems.
(Source: Adapted from Bosch et al., 2011:640; Steward & Hitt, 2009:60)
From Table 2.4, it is evident that a manager in a business that is not family controlled
may be expected to rely on shorter time horizons; less job security; to be less
personally impacted by business failure; and to be motivated more by traditional
personal reward. Businesses that are family-controlled frequently have more
centralised, less formalised decision-making processes and control systems,
although this usually changes across generations. Management in family businesses
also tends to be more of an autocratic and emotional nature in comparison with their
non-family counterparts. However, despite these comparative studies to improve
one‟s understanding of the differences between family and non-family businesses,
there is still no set of distinct variables available to identify and separate these
businesses (Gallo et al., 2004:303; Price, Stoica & Boncella, 2013:5; Sharma,
2004:5).
Moreover, various authors argue that the intermeshing of “family” and “business”
introduces an inherently unique identity within family firms, which consequently
distinguishes them from non-family firms (Aldrich & Cliff, 2003:573; Anderson &
Reeb, 2003:1301; Chua, Chrisman & Sharma, 1999:19; Micelotta & Raynard,
2011:200). Expanding on the notion of distinctiveness, research drawing on the

30
resource-based view of the business, proposes that strategic advantages can be
conquered from leveraging the “familiness” of the business, or the bundle of
resources that are distinctive to the firm, resulting from family involvement (Carrigan
& Buckley, 2008:656; Habbershon & Williams,1999:1; Micelotta & Raynard,
2011:200; STEP Academic Information Packet 2013). Section 3.4.4 examines these
potential strategic advantages from a marketing perspective.
Considerable evidence suggests that family businesses generally outperform non-
family businesses on a number of financial and non-financial metrics (Craig, Dibrell &
Davis, 2008:353; Dibrell & Craig, 2006:275; Hutcheson, 2015:2; McConaughy,
Matthews & Fiaklo, 2001:31). In terms of financial metrics, the European Family
Businesses (EFB, 2012:1) state that family businesses are more profitable than non-
family businesses over the long term. Some of the most common non-financial
metrics are (Hutcheson, 2015:2):
It is their business; therefore, they care more about it.
Since their name is on the marquee, they have a lot to lose personally by
“messing up”.
They take the long-term view.
Since there is a strong level of trust, the business runs more efficiently and
effectively.
Consequently, it is evident that family business research and literature is highly
influenced by the fact that the interaction of the family unit, the business entity and
individual members creates a distinctive set of features and characteristics that
influences the performance and continuity of the family business social system
(Habbersonet al. 2003:451; Micelotta & Raynard, 2011:197; Olsen, Zuiker, Danes,
Stafford, Heck & Ducan, 2003:639; Villalonga & Amit, 2003:385). Although some
scholars argue that the salience and interdependence between family and business
identities creates further difficulties for businesses (Albert & Whetten, 1985:263;
Milton, 2008:1063; Parsons, 1956:63), others have proposed that the inextricable
intertwining of these parties (Aldrich & Cliff, 2003:573) creates a unique business
specific resource (Milton, 2008:1064; Sundaramurthy & Kreiner, 2008:415). The latter
perspective suggests that businesses can strategically deploy their family identity to
31
gain a competitive advantage over non-family businesses, given the positive
characteristics such as trust, commitment and a customer-orientated focus, which
are typically accompanying family-owned businesses (Miller & Le Breton-Miller,
2003:127).
Despite this acknowledgement, there is a scarcity of research examining how family
firms incorporate and communicate their identities as “family business” in their
marketing activities, and how these differ from non-family business. To address this
gap, the next chapter draws on marketing and the marketing mix strategies employed
in family and non-family businesses.
2.3.3 IMPORTANCE OF FAMILY BUSINESSES
Family businesses have been identified as critical contributors to the success of the
global economy (Van Der Merwe, 2009:51), as they are key sources of innovation
and employment (Ackerman, 2012; Modise, 2011:19; Sweet & Lebo, 2010:1). They
are rapidly becoming the dominant form of business enterprise in both developed
and developing countries as their importance is recognised throughout the world.
Hence, their impact and numbers can be expected to significantly increase in the
near future (Nieman & Nieuwenhuizen, 2009:217; Venter et al., 2005:283-284).
Furthermore, various authors indicate that this substantial growth could be attributed
to the diminishing process taking place in various large companies, as well as the
incapacity of formal and public sectors to create new jobs (Bosch et al., 2011:643;
Van der Merwe, Venter & Ellis, 2009:2).
In South Africa, no reliable statistics pertaining to the number of family businesses
exists. However, estimates indicate that family businesses are also becoming the
most predominant form of business enterprise among SMEs in South Africa. They
comprise approximately 80 to 90% of all South African businesses, while 60% of
these businesses are listed on the Johannesburg Stock Exchange (JSE). (Maas &
Diederichs, 2007:101; Van Der Merwe, 2009:51; Venter, 2003:1). Berndtson (2015:1)
and Fishman (2009:2) further highlights that family businesses account for 50% of
economic growth in South Africa, while Tanzwani (2010:1) indicates that they
contribute 30% of South Africa‟s GDP. Bodi (2012:1) goes on to say that they

32
generate approximately 60% of the country‟s employment and 78% of all new job
creations.
With specific regard to South Africa‟s high unemployment rate, currently 26.7% for
the second quarter of 2016, the highest level since 2003 (30%) (News24, 2015;
Trading Economics, 2016), various authors have stressed the importance of
developing successful family businesses that will assist families in providing job
opportunities for their members and sustain wealth creation over generations, to
assist in the reduction of unemployment (Eybers, 2010:25; Maas & Diederichs,
2007:4; Muske & Fitzgerald, 2006:194).
Hence, the increasingly important role family businesses play in employment creation
and the growth, of the South African economy, cannot be underestimated (Van Duijn
et al., 2007:11). Family businesses can, therefore, offer powerful opportunities for
further economic growth in South Africa (Van der Merwe et al., 2009:2; Venter,
2003:1). Nieman and Nieuwenhuizen (2009:217) have indicated that the focus has
shifted to family businesses in the small business sector since they have the potential
to solve the economic and social problems facing South Africa, as large businesses
and the public sector have proven their inability to solve these problems.
McAfee, Clydesdale and Shaw (2014:1) and Nieman and Nieuwenhuizen (2009:217),
however, indicate that the significance of family businesses is not only recognised by
their supportive role to promote economic growth and development, but also their
important contribution towards the social stability of South Africa. Gallo et al.
(2004:318) further stress the non-economic importance of family businesses, with
emphasise placed on the role family businesses play in their local communities and
numerous social activities such as education and environmental awareness and
protection.
Based on the above information, the contribution of family businesses to socio-
economic growth is clear, and therefore, public policy holders should place more
attention on improving the health, prosperity and longevity of family businesses in
South Africa (Maas, 2014:235; Farrington, 2009:65). The challenges that should be
addressed by family businesses are discussed in the following section.
33
2.3.4 CHALLENGES FACING FAMILY BUSINESSES
According to Nieman (2006:40) and Stanislaw (2014:1) only a mere 30% of family
businesses survive to the second generation, and only 10% to the third. The lack of
longevity and challenges pertaining to family businesses is a cause for concern, as
these threats influence the growth, success and survival of family businesses
(Ibrahim et al., 2009:1; McCann, 2005:16; Visser & Chiloane-Tsoka, 2014:429).
Various reasons for the high failure rate of family businesses exist.
PricewaterhouseCoopers (PWC) (2013:7) reported various internal and external
challenges facing family businesses in South Africa. The internal challenges
highlighted the lack of skilled talent, financial assistance and cash flow, whereas the
external challenges included adverse foreign exchange, fierce competition,
exportation into foreign markets and the deterioration of infrastructure (PWC,
2013:7). Van Duijn et al. (2007:12) also contend that lack of talent, skills and
capabilities are considered major challenges faced by family businesses.
Maas and Diederichs (2007:2), Venter (2003:72) and Visser and Chiloane-Tsoka
(2014:429), argue that South African family businesses commonly do not engage in
succession planning. Inadequate succession planning is seen as a challenge which
contributes to their high failure rate (Jorissen et al., 2005:229; Letele-Matabooe,
2012:35; Stanislaw, 2014:1). The increasing complexity across generations in
change of ownership, governance and management can have repercussions for the
family business. The family will start to lose cohesiveness when the nuclear family
threshold is surpassed, since an increased number of shareholders leads to
differences regarding personal goals, values and commitment to the business.
(Lambrecht & Lievens, 2008:297). In order to address this challenge, Zellweger,
Nanson, and Nordqvist (2011:1) suggest that researchers should investigate the
entrepreneurial longevity of successful business families across generations to
understand the factors that drive their success.
Sharma (2015:1) further indicates that most research on succession in family
businesses focuses on leadership transfer from one generation of family members to
the next. If a family business went public, was sold or closed down, it was not
34
considered a “successful generational transition” as the business did not get passed
from one generation to the next of the founding family (Sharma, 2015:1). Instead,
Sharma (2015:1) argues that exiting a family business through sale, public offering or
closing may be signs of successful transitions rather than failure, as assumed in the
past. Furthermore, Sharma (2015:1) states that family business researchers have
become progressively more interested in understanding the mutual themes and
practices that exist among family businesses globally, which enables them to survive
across generations of leadership, and through industrial and societal changes. One
way, among others, to understand the common themes which exist in
transgenerational families is to use the STEP project (Klee, 2015:15).
The STEP research framework explores the factors that contribute to the
entrepreneurial performance and the effective transgenerational potential and
success of family businesses globally. The STEP project outlines a research
framework which involves investigating certain components within the context of
family businesses which include transgenerational potential, entrepreneurial
performance, the external mediating factors influencing family businesses,
Entrepreneurial Orientation (EO) and the Resource Based View (RBV) of familiness
resource pools (Klee, 2015:33-52; STEP Academic Information Packet 2013).
Conflict and sibling rivalry in family businesses have been identified as another
challenge facing family businesses (Borg-Cardona, 2008:6; Jorissen et al.,
2005:229). Sibling rivalry within the business can have a negative impact on the
growth of the business to the extent that it may inevitably destroy the business (Borg-
Cardona, 2008:6). Nieman (2006:41) indicates that the family business system is
emotion-based in nature, while the business system itself is not, resulting in conflict
between the family, ownership and business systems.
Nepotism is generally the biggest challenge that non-employees face working in a
family business (Letele-Matabooe, 2012:93). Katz and Green (2014:177) argue that
family businesses need to control this human resource management challenge by
striking a balance between nepotism (selecting and promoting people based on
family ties) and meritocracy (selecting and promoting people solely on them being
the most capable persons for the job and managing privilege). Ceja and Tápies
35
(2009:13) highlight the negative consequences of nepotism towards employees, and
suggest that the practise of nepotism in family businesses should be well-controlled.
Lubathin, Schulze, Ling and Dino (2005:20) emphasise the disadvantage that
nepotism places on family businesses, with regard to attracting qualified non-family
members into the business.
In a recent study, Miller (2015:1), however, argues against the perceptions that family
nepotism towards loved ones may alienate outside investors, and thereby, deprive
families of start-up capital. Miller (2015:1) contends that the reality is that most start-
up businesses are internally funded and outsiders have little, if any, role to play.
Furthermore, Miller (2015:2) indicates that family businesses that are said to be too
concerned with family matters, expenses and demands to be able to invest their
resources in growing their business, is nothing more than myth. Miller (2015:2)
indicates that family businesses have long-term orientations as they invest
generously in the business to ensure the financial well-being of current and future
generations. Family businesses also behave with external stakeholders in a way that
builds reputation with customers, suppliers and the community at large, all of which
help a family business to grow (Miller, 2015:2).
Maas (2014:2) further highlights the lack of managerial skills in family businesses,
which is a result of the majority of family businesses that are not trained to manage
their businesses successfully. As family businesses represent the majority of SMEs,
it can be assumed that family businesses face the same challenges as non-family
owned SMEs, in addition to the unique challenges they face as discussed above.
Hence, as part of managerial skills, SMEs, including family businesses, lack the
necessary marketing skills which are, in essence, contributing to their failure rate
(Cant, 2012:1107; Farrington & Venter, 2011:1; Van Scheers, 2011:5048). Murphy
(2006) states that if SMEs, whether family-owned or not, do not possess the required
marketing skills, do not have knowledge regarding marketing issues, and do not
know how to apply these skills and knowledge, it can and will lead to the demise of
the (family) business, or at best, it will not become as profitable as it could have.
36
2.4 SUMMARY
The main focus of this chapter was to examine the nature and importance of both
SMEs and family businesses. In order to achieve this objective, the nature and
importance of both SMEs and family businesses were investigated. As no
international agreed-upon definition of an SME could be found, and as this study
focuses specifically on the small business section of SMEs, the concepts “small
business” and “SMEs” are used interchangeably and are considered synonymous for
the purpose of describing the nature and importance of small businesses. Therefore,
for the purpose of this study, a small business is defined as, “a business that does
not employ more than 50 full-time employees, the business should have been in
operation for at least one year and the owner must be actively involved in the
business”. As in the case of defining small businesses/SMEs, no clear or concise
definition for a family business could be found. Therefore, for the purpose of this
study, a family business is defined as, “a business where at least two family
members are actively involved in the management and operation of the business and
where the family owns more than 51% of the business and does not employee more
than 50 full-time employees”.
Despite the important role family and non-family SMEs play in the economy, their
survival rate remains a major concern. Hence, this chapter further investigated the
challenges facing both SMEs and family businesses. It was highlighted that family
businesses face additional challenges due to their unique nature and the overlapping
of family and business relationships. To enhance the understanding of the unique
nature of family and non-family businesses the chapter included a discussion on how
family businesses differ from non-family businesses.
A lack of marketing skills has been identified as a major challenge facing both family
and non-family SMEs. As evidence indicates, family and non-family SME managers
don‟t possess the required marketing skills, knowledge regarding marketing issues,
and don‟t know how to apply these skills and knowledge. Chapter 3 will focus on
marketing, the marketing mix strategies, and how family and non-family businesses
could adapt these strategies to reduce their failure rate and improve their business
performance and success.
37
CHAPTER 3
NATURE AND IMPORTANCE OF MARKETING
3.1 INTRODUCTION
The nature and importance of small family and non-family businesses was discussed
in Chapter 2. Several challenges facing these businesses were highlighted, often
leading to their high failure rate and lack of longevity. One of the main reasons for
these failures is that SMEs, whether family-owned or not, lack the necessary
marketing skills to achieve the business performance required to be successful
(Cant, 2012:1107; Murphy, 2006; Van Scheers, 2011:5048).
This chapter will therefore commence by contextualising marketing through defining
marketing, discussing the marketing process model, marketing concept, marketing
function, marketing activities and marketing decisions. Thereafter, the chapter
investigates the marketing mix strategies, namely product, pricing, place and
promotion strategies available to businesses. The chapter will conclude by
investigating the similarities and differences in how small family and non-family
businesses apply marketing and marketing mix strategies within their businesses.
3.2 CONTEXTUALISING MARKETING
The following subsections will attempt to contextualise marketing by defining and
investigating the nature thereof.
3.2.1 DEFINING MARKETING
Marketing is about identifying and meeting human and social needs (Kotler & Keller,
2012:27) who go as far as to say that one of the shortest definitions of marketing is
“meeting needs profitably”. The American Marketing Association (AMA) (2008:28)
offers a more comprehensive definition stating that marketing is the activities, set of
institutions, and processes for creating, communicating, delivering and exchanging
offerings that have value for customers, clients, partners and society at large. Hatten
(2016:291) also highlights that marketing involves all the activities that occur from the
38
time of creating the product until the product reaches the customer. Consistent with
AMA, Ferrell and Pride (2013:4) define marketing as the process of creating,
distributing, promoting, and pricing goods, services and ideas to facilitate satisfying
exchange relationships with customers and develop and maintain favourable
relationships with stakeholders in a dynamic environment.
The Chartered Institute of Marketing (CIM) (2009:2) also highlights marketing as a
key management discipline that enables the producers of goods and services to
interpret customer wants, needs and desires; and match or exceed them, in delivery
to their target customers. Lamb, Hair, McDaniel, Boshoff, Terblanche, Elloit and
Klopper (2012:5) and Reijonen (2010:280) further state that marketing provides the
business with opportunities to satisfy the needs of customers more effectively than its
competitors, which in turn can secure a competitive advantage for the business.
This customer and relationship-centred definition, as mentioned above, has however
evolved considerably from its production and sales orientation in earlier decades.
Marketers have started to place more emphasis on building long-term relationships
with customers. It has also been proven that interaction is more efficient than one-
way communication, and that marketing is not just the responsibility of the marketing
department but rather of the whole business, which is further discussed in Section
3.2.4 (Awan & Hashmi, 2014:11; Grönroos, 2006:317; Reijonen, 2010:280).
Nonetheless, Kotler et al. (2016:4) argue that some managers within the 21st century
still think of marketing as the art of selling products, while Kotler, Armstrong and Tait
(2010:16) assert that the aim of marketing in the 21st century should still be to create
value for the customers and value in return for the business. Kotler et al. (2016:5)
further state that selling and advertising form only the tip of the marketing “iceberg”,
and are only part of the larger marketing mix (explained in Section 3.3.4), which is a
set of tools that work together to satisfy customer needs and build customer
relationships.
For the purpose of this study, the definition of marketing is based on that provided by
Hult et al. (2013:4), in line with the American Marketing Association (2008:28), which
defines marketing as the process of creating, distributing, promoting and pricing
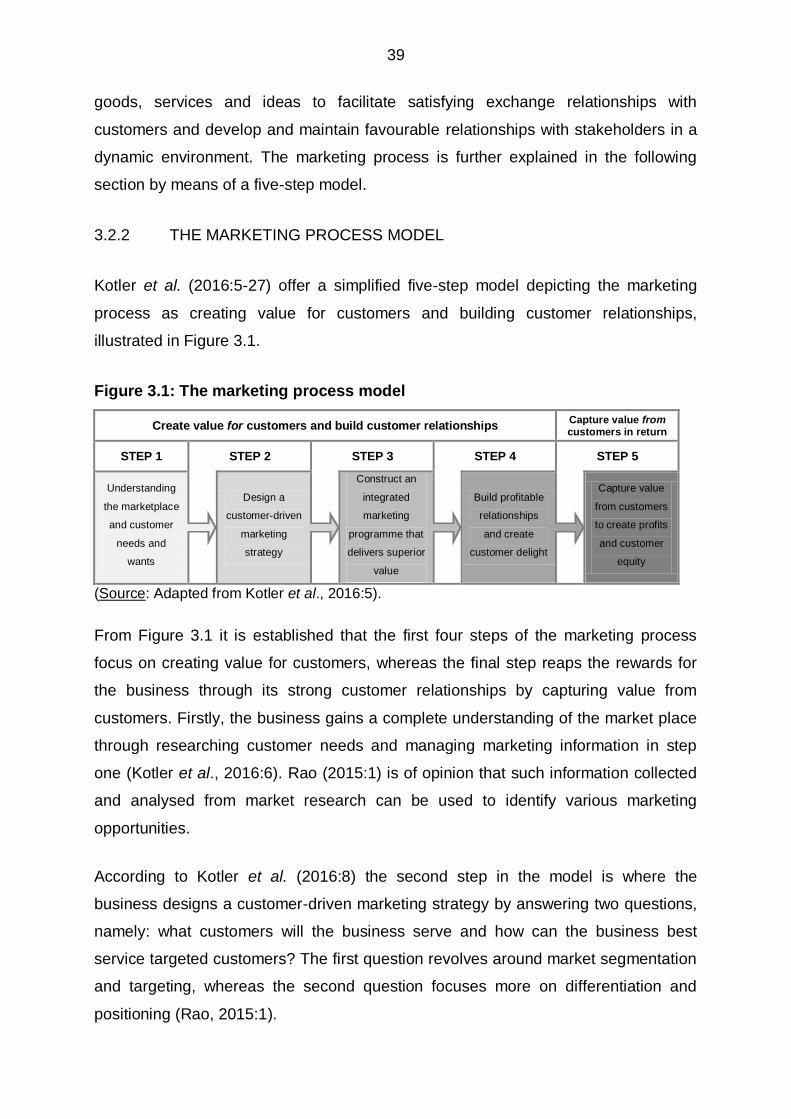
39
goods, services and ideas to facilitate satisfying exchange relationships with
customers and develop and maintain favourable relationships with stakeholders in a
dynamic environment. The marketing process is further explained in the following
section by means of a five-step model.
3.2.2 THE MARKETING PROCESS MODEL
Kotler et al. (2016:5-27) offer a simplified five-step model depicting the marketing
process as creating value for customers and building customer relationships,
illustrated in Figure 3.1.
Figure 3.1: The marketing process model
Create value for customers and build customer relationships Capture value from customers in return
STEP 1 STEP 2 STEP 3 STEP 4 STEP 5
Understanding
the marketplace
and customer
needs and
wants
Design a
customer-driven
marketing
strategy
Construct an
integrated
marketing
programme that
delivers superior
value
Build profitable
relationships
and create
customer delight
Capture value
from customers
to create profits
and customer
equity
(Source: Adapted from Kotler et al., 2016:5).
From Figure 3.1 it is established that the first four steps of the marketing process
focus on creating value for customers, whereas the final step reaps the rewards for
the business through its strong customer relationships by capturing value from
customers. Firstly, the business gains a complete understanding of the market place
through researching customer needs and managing marketing information in step
one (Kotler et al., 2016:6). Rao (2015:1) is of opinion that such information collected
and analysed from market research can be used to identify various marketing
opportunities.
According to Kotler et al. (2016:8) the second step in the model is where the
business designs a customer-driven marketing strategy by answering two questions,
namely: what customers will the business serve and how can the business best
service targeted customers? The first question revolves around market segmentation
and targeting, whereas the second question focuses more on differentiation and
positioning (Rao, 2015:1).

40
After the marketing strategy has been decided, Kotler et al. (2016:12-13) assert that
the business will construct an integrated marketing programme, indicated as step 3 in
the marketing process model. This step consists of a blend of the four marketing-mix
strategies (which will be comprehensively discussed in Section 3.3), known as the
4Ps, which transform the marketing strategy of step 2 into real value for customers
(Rao, 2015:1).
Step 4 in the marketing process involves building value-laden, profitable relationships
with target markets. The business can, however, not do this alone and must work
closely with marketing partners within and outside of the business and throughout the
marketing system. In the final step the business creates highly satisfied customers,
which in turn helps the business to capture customer lifetime value that results in
increased long-term customer equity for the business (Kotler et al., 2016:13-21).
This study will, however, focus more on the second and third step of the marketing
process as illustrated in Figure 3.1, namely designing marketing strategies and
constructing marketing programmes consisting of a blend of the four marketing mix
elements that transform marketing strategies into real value for customers. In
designing customer-driven marketing strategies for businesses, Kotler et al.
(2016:10) propose the following marketing concept to design and carry out their
marketing strategies. The following section will address the marketing concept and
the elements it consists of.
3.2.3 THE MARKETING CONCEPT
The idea of viewing the marketing concept, which was developed in the 1950s, as a
business philosophy or culture was adopted by various scholars later in the 1990s
and viewed as the recognition and understanding of customer wants as the starting
point of business operations (Hinson & Mahmoud, 2011:36; Romano & Rathatunga,
1995:11; Reijonen, 2010:280; Stokes, 2000:47). Hinson and Mahmoud (2011:36)
assert that this philosophy is based upon a business-wide acceptance of the need for
customer orientation as well as profit orientation, with the recognition of the important
role of marketing in communicating the needs of the market to all the relevant
departments in the business.
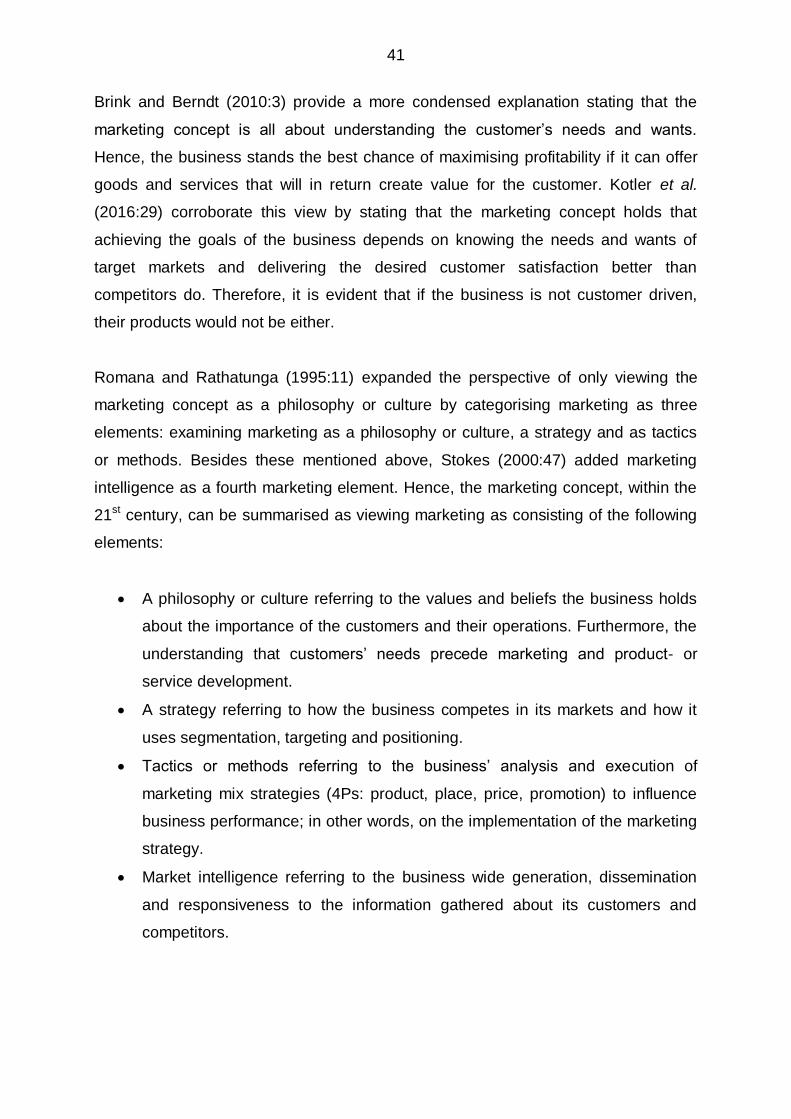
41
Brink and Berndt (2010:3) provide a more condensed explanation stating that the
marketing concept is all about understanding the customer‟s needs and wants.
Hence, the business stands the best chance of maximising profitability if it can offer
goods and services that will in return create value for the customer. Kotler et al.
(2016:29) corroborate this view by stating that the marketing concept holds that
achieving the goals of the business depends on knowing the needs and wants of
target markets and delivering the desired customer satisfaction better than
competitors do. Therefore, it is evident that if the business is not customer driven,
their products would not be either.
Romana and Rathatunga (1995:11) expanded the perspective of only viewing the
marketing concept as a philosophy or culture by categorising marketing as three
elements: examining marketing as a philosophy or culture, a strategy and as tactics
or methods. Besides these mentioned above, Stokes (2000:47) added marketing
intelligence as a fourth marketing element. Hence, the marketing concept, within the
21st century, can be summarised as viewing marketing as consisting of the following
elements:
A philosophy or culture referring to the values and beliefs the business holds
about the importance of the customers and their operations. Furthermore, the
understanding that customers‟ needs precede marketing and product- or
service development.
A strategy referring to how the business competes in its markets and how it
uses segmentation, targeting and positioning.
Tactics or methods referring to the business‟ analysis and execution of
marketing mix strategies (4Ps: product, place, price, promotion) to influence
business performance; in other words, on the implementation of the marketing
strategy.
Market intelligence referring to the business wide generation, dissemination
and responsiveness to the information gathered about its customers and
competitors.

42
This study will, however, investigate marketing by examining it as a strategy and as
tactics or methods. Furthermore, the marketing mix strategies implemented by small
family and non-family SMEs will be investigated. The marketing mix strategies will be
discussed in Section 3.3, its theoretical application to family and non-family SMEs in
Section 3.4 and its empirical investigation in Chapter 6. Kotler et al. (2016:11)
summarise the marketing concept as taking an “outside-in perspective”, starting with
a well-defined market, focuses on customer needs and integrates all the marketing
activities that affect customers. As a result Kotler et al. (2016:11) assert that the
business should not have a marketing function or department but rather a customer
function or department. The following section further addresses marketing as an
important business function.
3.2.4 MARKETING AS AN IMPORTANT BUSINESS FUNCTION
The daily managerial activities performed by the business within the constantly
changing environment are known as the business functions. The eight business
function model, developed by Henri Fayol in the early 1900s, is recognised as
general and strategic-, human resource-, production/operations-, purchasing/inbound
logistics-, public relations/business communications-, information-, financial-, and
marketing management (Bosch et al., 2011:15; Du Toit, Du Plessis & Nortje,
2014:25; Strydom, Antonites & De Beer, 2009:31). Farrington and Venter (2011:192)
state that these business functions must be coordinated together for the business to
achieve its vision, mission, key values, goals and objectives.
The marketing function is regarded as the study of market forces and factors and the
development of the business‟s position to optimise its benefit from them. In essence,
it comprises a combination of the activities concerned with studying customer needs
and wants, product development, the determination of selling prices, the choice of
distribution, and marketing communication, amongst others (Bosch et al., 2011:29;
CIM, 2009:2; Du Toit et al., 2014:25). CIM (2009:2) further describe the marketing
function as the activities for getting the right product or service to the customer, at the
right price, in the right place, at the right time. Both business history and current
practise emphasise that without marketing the businesses cannot get close to
customers and satisfy their needs.
43
Customer
Human Resources
Production
Public Relations
Information
Financial
Purchasing
Farrington and Venter (2011:197) state that the marketing function is concerned with
generating income for the business, and for this reason its importance cannot be
refuted when compared to the other business functions. As depicted in Figure 3.2 the
marketing function is the closest link to the customers of the business and should as
a result, be the centre of all business activities or functions (Bosch et al., 2011:15;
Reijonen, 2010:280).
Figure 3.2: Marketing within the eight business functions
Marketing
(Source: Adapted from Bosch et al., 2011:15; Reijonen, 2010:280)
In support of Figure 3.2, Reijonen (2010:280) further stresses the importance of
viewing the responsibility of the marketing function not just in its own department but
also the responsibility of all the other departments in the business. Marketing should
be included in all decision making and should also have a buy-in from top
management.
This section briefly highlighted the business functions and gave a brief indication of
marketing as an important business function. Apart from the fact that marketing
should be viewed as a business effort, the following section attempts to further
address those activities and decisions that need to be performed specifically within
the marketing function of the business.

44
3.2.5 THE MARKETING ACTIVITIES AND DECISIONS
A popular objective for many businesses is to become marketing driven, which is the
main force behind every set of marketing activities and decisions (Jenson, 2015:3).
Jenson (2015:2) and Kotler et al. (2016:288) assert that marketing can be considered
as a series of activities and decisions carried out by the business to manage a
customer-driven strategy and the marketing mix. Table 3.1 gives an overview of
many of these activities and decisions.
Table 3.1: Marketing as a set of activities and decisions
Marketing activity/decision Nature of marketing activity/decision
Market research Researching the marketplace and the customer.
Market strategy The overall direction of the marketing for the business and its objectives.
Market planning and management The planning and managing necessary to reach the business‟s objectives.
Pricing management The assessment of the right pricing structure for the product or service.
Channel management Developing a cost effective way of reaching the final customer which might include physical distribution, retailers and wholesalers.
Communication management Developing advertising and promotional vehicles to communicate to selected audiences.
Sales management Directing and organising the sales force.
Service management Developing both the service and the quality side of the business‟s output.
Product management Developing new products and managing the existing products.
(Source: Adapted from Jenson, 2015:2; Kotler et al., 2016:288-291)
Table 3.1 gives an overview of the marketing activities and decisions a business
should be taking into consideration when designing the marketing mix strategies,
whether it is for example launching a new product, reviewing an old one or starting
an entrepreneurial venture (Jenson, 2015:3; Kotler et al., 2016:288). Jenson (2015:3)
and Kotler et al. (2016:288-291) contend that a series of business marketing
activities and decisions, in relation to the market, must also be made when starting a
business. The following section addresses four specific marketing strategies and
decisions as listed in Table 3.1, which is the main focus of this study and can be
referred to as the marketing mix strategies.

45
3.3 CONTEXTUALISING MARKETING MIX STRATEGIES
According to various marketing scholars (Brink & Berndt, 2010:3; Ehmke, Fulton &
Lusk, 2015:2; Kotler & Armstrong, 2010:688; Singh, 2012:40) the marketing mix,
often referred to as the “4Ps”, includes product, price, place and promotion. Lee Goi
(2009:1) refers to the marketing mix not as a scientific theory, but merely a
conceptual framework that identifies the main decisions marketers make in
configuring their offering to meet their customers‟ needs. Hult et al. (2013:5) further
emphasise that these main decisions are the primary goal of a marketing manager‟s
job which is creating and maintaining the right mix of these main decisions to satisfy
customers‟ needs for a general product type.
Singh (2012:40-41) suggests that the marketing mix is a set of controllable strategies
that the business can use to influence the customers‟ responses to buying their
products. These controllable strategies are said to be the combination of different
marketing decisions being used by the business to market its goods and services.
These marketing decisions included in the marketing mix strategies, as shown in step
3 of Figure 3.1, are depicted in Figure 3.3.
Figure 3.3: Marketing mix strategy decisions
(Source: Constructed from Bosch et al., 2011:390-402; Kotler et al., 2016:224-441; Shimp &
Andrews, 2014:7-694; Singh, 2012:41-45)
• Advertising
• Public relations
• Sales promotion
• Personal selling
• Direct marketing
• Online marketing / social media
• Skimming
• Penetration
• Psychological
• Cost-plus
• Other product mix pricing strategies
• Direct distribution
channel
• Indirect distribution
channel
• Product concept
• Product mix
• Product branding
• Product development
• Product lifecycle
PRODUCT PLACE
PROMOTIONPRICE
TARGET
MARKET
46
Figure 3.3 illustrates the main marketing mix strategy decisions, amongst others, that
businesses should consider. The marketing decisions within each of these marketing
mix strategies will be discussed in the relevant sections that follow. It is, however,
before commencing with the discussion on the marketing mix strategies that the main
problem with using the marketing mix has been highlighted as finding an optimal mix
that gets a superior response in the market, creates profits and ultimately contributes
to the business performance and success of the business (Brink & Brendt, 2010:4;
Ehmke et al., 2015:2; Hingston, 2001:12). Furthermore, the concept of the 4Ps has
been criticised by a number of authors highlighting some shortcomings and
dissatisfaction with the marketing mix framework (Fakeideas, 2008; Möller, 2006:439;
Popovic, 2006:260). Despite its deficiencies, limitations and simplicity, the traditional
4P framework remains a strong staple of the marketing mix as many marketing
textbooks still discuss it (Hult et al., 2013:42; Kent & Brown, 2006:145; Lee Gio,
2009:1).
In the following sections the nature of the marketing mix strategies, in general, will be
discussed and the application thereof in SMEs and family businesses in Sections
3.4.4 and 3.4.5, respectively.
3.3.1 PRODUCT STRATEGIES
The product strategy comprises of decisions about the product concept, mix,
branding, development and lifecycle (Bosch et al., 2011:390; Kotler et al., 2016:224-
441; Singh, 2012:41-45).
3.3.1.1 Product concept
According to Albaum and Duerr (2008:376), a product can be defined as the sum of
all the physical and psychological satisfactions that a customer receives as a
consequence of the buying and consumption process. Others authors (Ehmke et al.,
2015:1; Macleod & Terblanche; 2004:64) further define the product as the
assortment of items that will be made or the service that will be offered to customers.
The product can include tangible or intangible products or services and is the result
of the business‟s effort to satisfy their customers‟ needs (Kotler et al., 2016:224;
Lamb, Hair, McDaniel, Boshoff & Terblanche, 2008:206; Singh, 2012:41).

47
Hult et al. (2013:296) and Lamb et al. (2012:239) support these definitions but further
add to the product definition, referring to it as a concept, philosophy, image or issue
that provides the psychological stimulation that supports in solving problems or
adjusting to the environment. Ehmke et al. (2015:1) further emphasise that product
decisions are associated with the product‟s appearance, function and support
needed. Emhke et al. (2015:1) explain that for a business to offer a product that will
appeal to customers and prevent making costly mistakes, they should expand their
knowledge of the target market as well as of their competitors.
Kotler, Armstrong, Wong and Saunders (2008:348) and Bosch et al. (2011:390) state
that when considering the product concept the core, actual and augmented levels of
a product must be taken into consideration. Kotler et al. (2016:225) summarise these
product levels in Figure 3.4.
Figure 3.4: Three levels of a product
(Source: Adapted from Kolter et al., 2015:225)
1. Core product
2. Actual product:Brand name
Features
Quality level
Design
Packaging
3. Augmented product:Delivery and credit
After sale service
Installation
Warranty

48
As indicated in Figure 3.4 the three levels of a product include (Bosch et al.,
2011:390; Hult et al., 2013:296; Kotler et al., 2010:226; Lamb et al., 2012:239):
The core product which refers to the core benefit or service a customer
receives when buying the product. The core benefit is directly linked to the
most basic or fundamental need that the customer wants to satisfy.
The actual product which refers to the brand name, features, quality level,
design and packaging. The product planners should turn the core benefit into
an actual product.
The augmented product which refers to exceeding customers‟ desires and
expectations with delivery and credit, after sale service, installation and
warranties. The product planner should build an augmented product around
the core and actual product by offering the additional aforementioned
customer services and benefits.
Kotler et al. (2016:226) assert that when businesses develop products, they must first
identify the core customer needs the product will satisfy, then design the actual
product and find ways to augment it in order to create a bundle of benefits that will
provide the most satisfying customer experience. The following section addresses
product strategy decisions regarding the product mix.
3.3.1.2 Product mix
The product mix of the business, as the second part of the product strategy, is the
total range of products, which includes all the product items and lines the business
has to offer for sale to its customers (Bosch et al., 2011:391; Hult et al., 2013:245;
Lamb et al., 2012:303):
A product item refers to a specific version of a product that can be designated
as a distinct offering among the business‟s products offered to the customers
within the product line, which are similar in one or more ways. Such varieties
are based on colour, size, price, quality, capacity, performance, amongst
others.

49
A product line refers to a group of closely related product items that are
considered to be a unit because of marketing, technical or end-use
considerations. A good strategy for the business is to try to grow and develop
their business by adding to its existing product line since customers are more
likely to purchase products from brands which they are already familiar with.
The product strategy decisions about product branding are discussed in the following
section.
3.3.1.3 Product branding
Product branding, the third part of the product strategy by Bosch et al. (2011:391)
refers to a symbol, name, term, design or a combination thereof that identifies the
business‟s products or services and differentiates them from competitors‟ products
(Bosch et al., 2011:391). Singh (2012:43) corroborated this stating that these
elements usually assure high or at least consistent quality and, hence, encourage
repeat purchasing.
Some authors (Kotler & Armstong, 2012:247; Lamb et al., 2012:253) place more
emphasis on product branding strategies as many businesses often face complex
branding decisions. Lamb et al. (2012:253) assert that one of the essential decisions
for maintaining and growing a brand is consistency in the brand positioning and the
communication of the brand. Kotler and Armstrong (2012:247) support this by
explaining that the major branding decisions involve brand positioning, brand name
selection, brand sponsorship and brand development. The following section
addresses product strategy decisions about the product development.
3.3.1.4 Product development
Lamb et al. (2012:269) stress the importance of product development, the fourth part
of the product strategy, as forces in the rapidly changing environment continually
compel businesses to re-evaluate and reconsider their current product mix. Bosch et
al. (2011:392) assert that product development may refer to a new product that
replaces an old one, opens up a new market, or broadens an existing market and
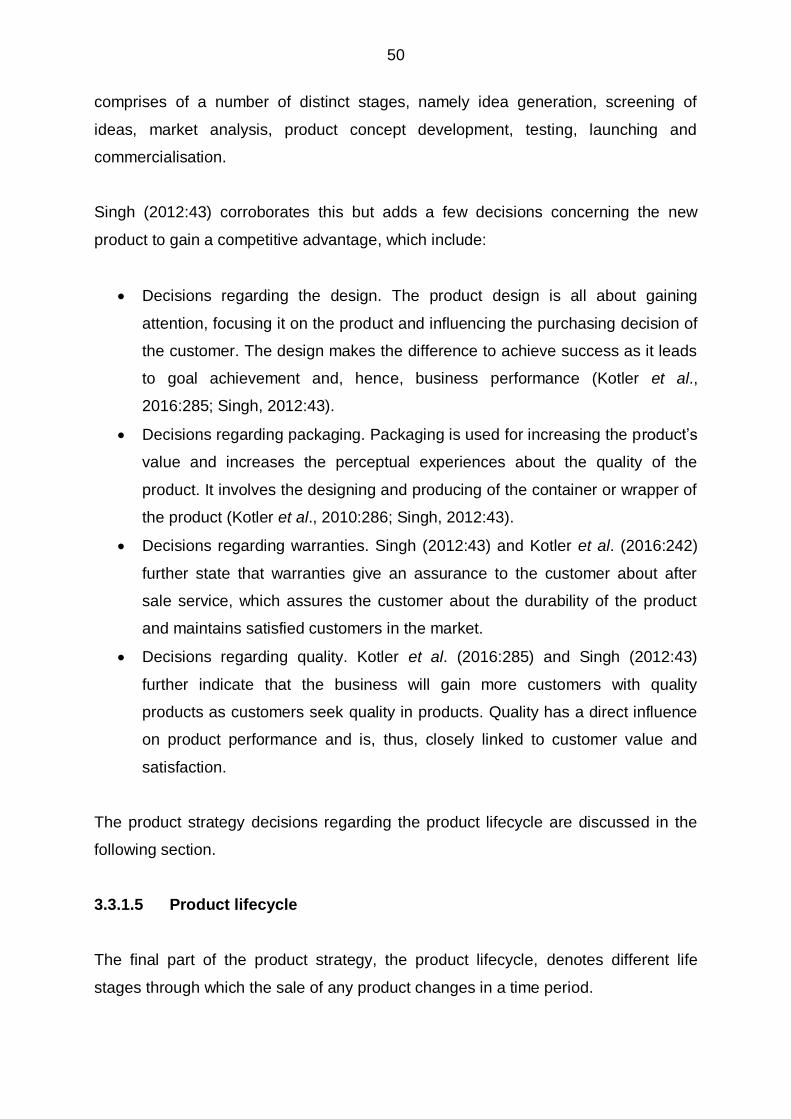
50
comprises of a number of distinct stages, namely idea generation, screening of
ideas, market analysis, product concept development, testing, launching and
commercialisation.
Singh (2012:43) corroborates this but adds a few decisions concerning the new
product to gain a competitive advantage, which include:
Decisions regarding the design. The product design is all about gaining
attention, focusing it on the product and influencing the purchasing decision of
the customer. The design makes the difference to achieve success as it leads
to goal achievement and, hence, business performance (Kotler et al.,
2016:285; Singh, 2012:43).
Decisions regarding packaging. Packaging is used for increasing the product‟s
value and increases the perceptual experiences about the quality of the
product. It involves the designing and producing of the container or wrapper of
the product (Kotler et al., 2010:286; Singh, 2012:43).
Decisions regarding warranties. Singh (2012:43) and Kotler et al. (2016:242)
further state that warranties give an assurance to the customer about after
sale service, which assures the customer about the durability of the product
and maintains satisfied customers in the market.
Decisions regarding quality. Kotler et al. (2016:285) and Singh (2012:43)
further indicate that the business will gain more customers with quality
products as customers seek quality in products. Quality has a direct influence
on product performance and is, thus, closely linked to customer value and
satisfaction.
The product strategy decisions regarding the product lifecycle are discussed in the
following section.
3.3.1.5 Product lifecycle
The final part of the product strategy, the product lifecycle, denotes different life
stages through which the sale of any product changes in a time period.
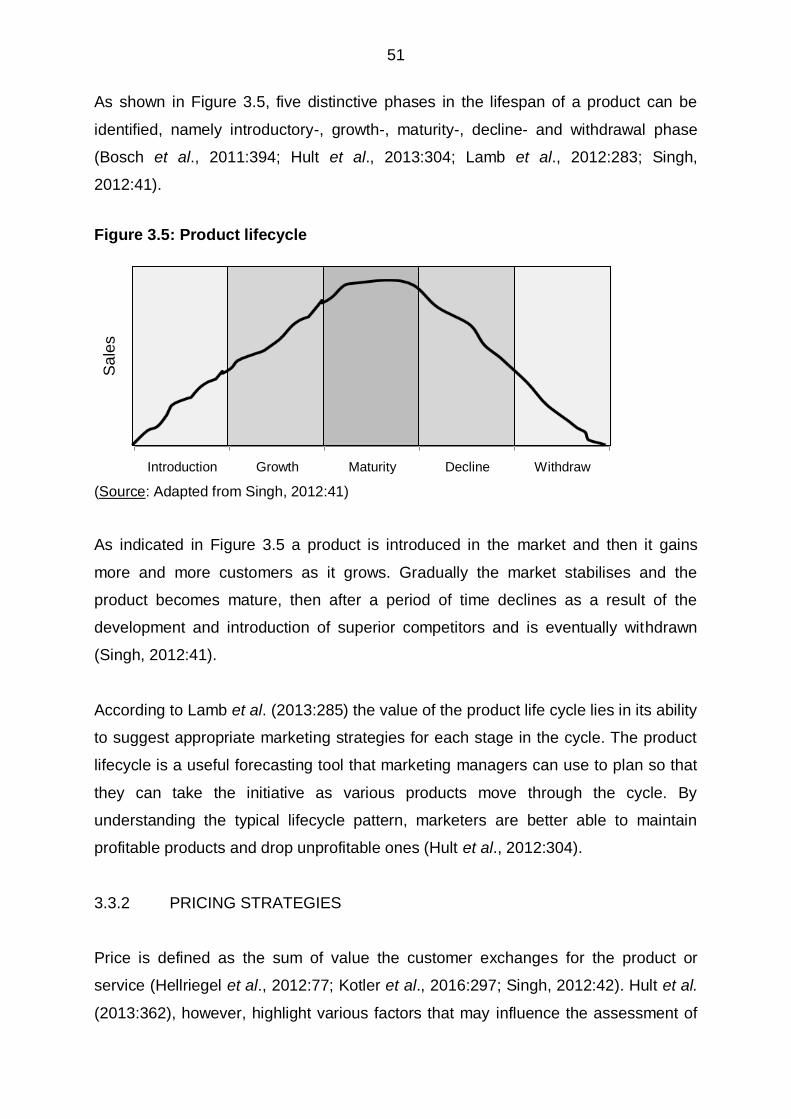
51
Introduction Growth Maturity Decline Withdraw
As shown in Figure 3.5, five distinctive phases in the lifespan of a product can be
identified, namely introductory-, growth-, maturity-, decline- and withdrawal phase
(Bosch et al., 2011:394; Hult et al., 2013:304; Lamb et al., 2012:283; Singh,
2012:41).
Figure 3.5: Product lifecycle
(Source: Adapted from Singh, 2012:41)
As indicated in Figure 3.5 a product is introduced in the market and then it gains
more and more customers as it grows. Gradually the market stabilises and the
product becomes mature, then after a period of time declines as a result of the
development and introduction of superior competitors and is eventually withdrawn
(Singh, 2012:41).
According to Lamb et al. (2013:285) the value of the product life cycle lies in its ability
to suggest appropriate marketing strategies for each stage in the cycle. The product
lifecycle is a useful forecasting tool that marketing managers can use to plan so that
they can take the initiative as various products move through the cycle. By
understanding the typical lifecycle pattern, marketers are better able to maintain
profitable products and drop unprofitable ones (Hult et al., 2012:304).
3.3.2 PRICING STRATEGIES
Price is defined as the sum of value the customer exchanges for the product or
service (Hellriegel et al., 2012:77; Kotler et al., 2016:297; Singh, 2012:42). Hult et al.
(2013:362), however, highlight various factors that may influence the assessment of
Sa
les
52
value, including time constraints, price levels, perceived quality and motivations to
use available information about prices. Lamb et al. (2012:407) add that, from a
marketing perspective, pricing is often used to establish a competitive advantage,
especially where differentiation based on the product or service itself is difficult.
Ehmke et al. (2015:1) confirm that the pricing strategy selected by the business will
vary depending on how they choose to sell their product. Despite what the price
might be, the business needs to make sure that the price ultimately covers business
costs, contributes to the image of the business by communicating the perceived
value of its product, counters the competition‟s offer, and avoids deadly price wars.
Ehmke et al. (2015:1) and Kotler et al. (2016:297) further state that the pricing
strategy is the one marketing mix strategy that generates revenue, while the other
three strategies incur costs. Lamb et al. (2012:406) corroborate that the price is key
to revenue, which, in turn is key to the business‟s profit. Therefore, effective pricing is
important to the performance and success of the business. Pricing should, however,
not be viewed in isolation and should be blended with the other strategies of the
marketing mix to create a perception of exceptional value. Ehmke et al. (2015:2)
further assert that the business‟s pricing approach should reflect the appropriate
positioning of the product in the market and result in a price that covers the cost per
item and includes a profit margin.
According to Bosch et al. (2011:396) and Hellriegel et al. (2012:77) setting the right
price on a product includes a four-step process, as illustrated in Figure 3.6.
Figure 3.6: The price setting process
PRICE SETTING PROCESS
STEP 1 STEP 2 STEP 3 STEP 4
Establish
pricing
objectives
Estimate
demand, costs
and profits
Choose a
pricing
strategy
Fine-tune the
base price with
pricing tactics
(Source: Adapted from Hellriegel et al., 2012:77).
53
The four step price setting process, as depicted in Figure 3.6, can be summarised as
follows (Bosch et al., 2011:396; Hellriegel et al., 2012:77):
Firstly, the business needs to establish pricing objectives which are profit-
orientated (setting prices so that the total revenue is as large as possible
relative to costs), sales-orientated (setting prices mainly focused on
maximising sales) or status quo objectives (setting prices that maintain prices
or meet competition‟s prices) derived from the business‟s overall objectives.
The second step is to estimate demand, cost and profits whereby the
managers should estimate total revenue at different prices, determine
corresponding costs for each price and estimate profit to be made to
determine which price can best meet the pricing objective.
Choosing a pricing strategy is the third step which defines the initial price and
gives direction for price movements over the length of the product lifecycle as
discussed in Section 3.3.1.5.
The final step to set a price on a product is to fine-tune the base price with
pricing tactics to adjust for competition in certain markets, meet ever-changing
governmental regulations, take advantage of special demand situations, and
meet advertising and positioning objectives.
From Step 3 of the price setting process above, businesses can choose various
pricing strategies as these decisions are coordinated with the type of product (such
as those discussed in Section 3.3.1), the environment and distribution in which it is
involved (such as those discussed in Section 3.3.3) and promotional decisions (such
as those discussed in Section 3.3.4) to form an integrated marketing program as
explained in Step 3 of Figure 3.1 in Section 2.2.2, which is the main focus of this
study. Hence, various authors differentiate between the multiple methods of pricing
strategies available to businesses depending on the type of business and the
characteristics of the other marketing mix strategies. Corroborated by various
sources choosing a pricing strategy can include skimming-, penetration-,
psychological-, cost plus- and lost-leader pricing, as set out in the following sections,
amongst various other pricing strategies (Bosch et al., 2011:396; Hellriegel et al.,
2012:77; Lamb et al., 2012:426; Singh, 2012:43).
54
3.3.2.1 Price skimming strategy
Price skimming is a pricing strategy whereby the business prices the new product
relatively high in comparison to similar commodities or brands (Bosch et al.,
2011:396; Hellriegel et al., 2012:77; Singh, 2012:43). Lamb et al. (2012:426) assert
that businesses often use this strategy for new products when the product is
perceived by the target market as having unique advantages and innovative features
over the competition. As the product progresses through its lifecycle (as illustrated in
Figure 3.5), the business then gradually reduces the price to reach larger market
segments successfully and further allows the business to recover its costs rapidly by
maximising its sales revenue (Hellriegel, et al., 2012:77; Lamb, et al., 2012:426;
Singh, 2012:43). Prices that are set based on criteria of specific stages in the
lifecycle that the product is in, also often referred to as product lifecycle pricing
(Abrahams & Carelsen, 2012:44). The following section addresses the penetration
pricing strategy.
3.3.2.2 Penetration pricing strategy
Penetration pricing is also a pricing strategy for new products which includes a policy
whereby the business fixes the price of the product comparatively lower to similar
goods assuming that it will capture a wider market and thus will allow the business to
raise the price of the product (Bosch et al., 2011:396; Hellriegel et al., 2012:77;
Singh, 2012:43). Lamb et al. (2012:426) support this stating that penetration pricing
strategy is the optimal decision if the marketing manager has determined that the
business‟s pricing objectives should be to obtain a large market share. This is
however considered a dangerous short-term strategy that needs to be supported by
a robust range of products to leverage against (Bosch et al., 2011:396; Hellriegel, et
al., 2012:77; Lamb et al., 2012:426; Singh, 2012:43). The psychological pricing
strategy is addressed in the following section.

55
3.3.2.3 Psychological pricing strategy
According to Singh (2012:43) psychological pricing is a popular price adjustment
strategy whereby marketers believe certain prices look better or are more appealing
than others. This psychological pricing strategy is used by retailers pricing products
or services such as R9.99, where they do not round the price off to the nearest rand
(Singh, 2012:43). Kotler et al. (2016:376) further emphasise this pricing strategy as
one that considers the psychology of prices and not simply the economics; the price
is used to say something about the product. Psychological pricing also tends to
include reference pricing, which are prices that are set in the customers‟ minds and
which they refer to when they look at a given product of the business (Kotler et al.,
2016:376; Singh, 2012:43). The following section addresses the cost-plus pricing
strategy.
3.3.2.4 Cost-plus pricing strategy
The cost-plus pricing, a cost based pricing strategy, allows businesses to try to
maximise their profits by adding a standard percentage of profit (mark-up) above the
cost of producing a product (Abrahams & Carelsen, 2012:43; Singh, 2012:44). The
mark-up simply refers to the difference between the selling and the cost price as a
percentage of the selling price or cost (Kotler et al., 2016:364; Singh, 2012:44). Singh
(2012:44) asserts that the cost-plus pricing strategy adds all costs associated with
offering the product in the market, including the expenses related to the production,
transportation, distribution and marketing of the product. Other product mix pricing
strategies are addressed in the following section.
3.3.2.5 Other product mix pricing strategies
According to Kotler et al. (2016:331) the strategy for setting a product‟s price often
has to be changed when the product is part of a product mix and therefore the
business looks for a set of prices that maximises its profits on the total product mix,
which can include the following pricing strategies as illustrated in Table 3.2.

56
Table 3.2: Product mix pricing strategies
Pricing situation Description
Product line pricing
Setting the price steps between various products in a product line, based on cost differences between the products, customer evaluations of different features and the competitors‟ pricing.
Optional product pricing Pricing of optional or accessory products sold with the main product
Captive product pricing Pricing products that must be used with the main product
By-product pricing Pricing low-value by-products to get rid of or make money from them
Product bundle pricing Pricing strategy used to combine several products and offering the bundle of the products at a reduced rate, thus leveraging the entire range of products.
(Source: Adapted from Kotler et al., 2016:373-374)
Table 3.2 took a closer look at the other product mix pricing strategies as product-mix
pricing is complex as each product has different costs and levels of demand and face
varying degrees of competitions.
3.3.3 PLACE STRATEGIES
Place represents the location where a product can be purchased, and is often
referred to as the distribution channel which represents the process of making goods
or services available to customers (Bosch et al., 2011:398; Ehmke et al., 2015:3;
Hellriegel et al., 2012:78). Place utility, therefore, refers to the physical distribution of
goods and services that are provided (Bosch et al., 2011:398). Macleod and
Terblanche (2004:64) assert that the location of the business, as well as whether the
business has the capacity to deliver the products themselves, would assist in
determining the need for a place or distribution strategy. Chaston and Mangles
(2002:193) and Singh (2012:42) further explain place strategies as those relating to
moving goods cost-effectively from production to the final customer.
Singh (2012:42) stresses the importance of distribution as it has a significant affect
on the profitability of the business. Therefore, the business should have an excellent
supply chain and logistics management plan for distribution. Kotler et al. (2016:371),
however, indicate that businesses often pay too little attention to distribution channels
which may have damaging results. Hellriegel et al. (2012:78), also argue that the
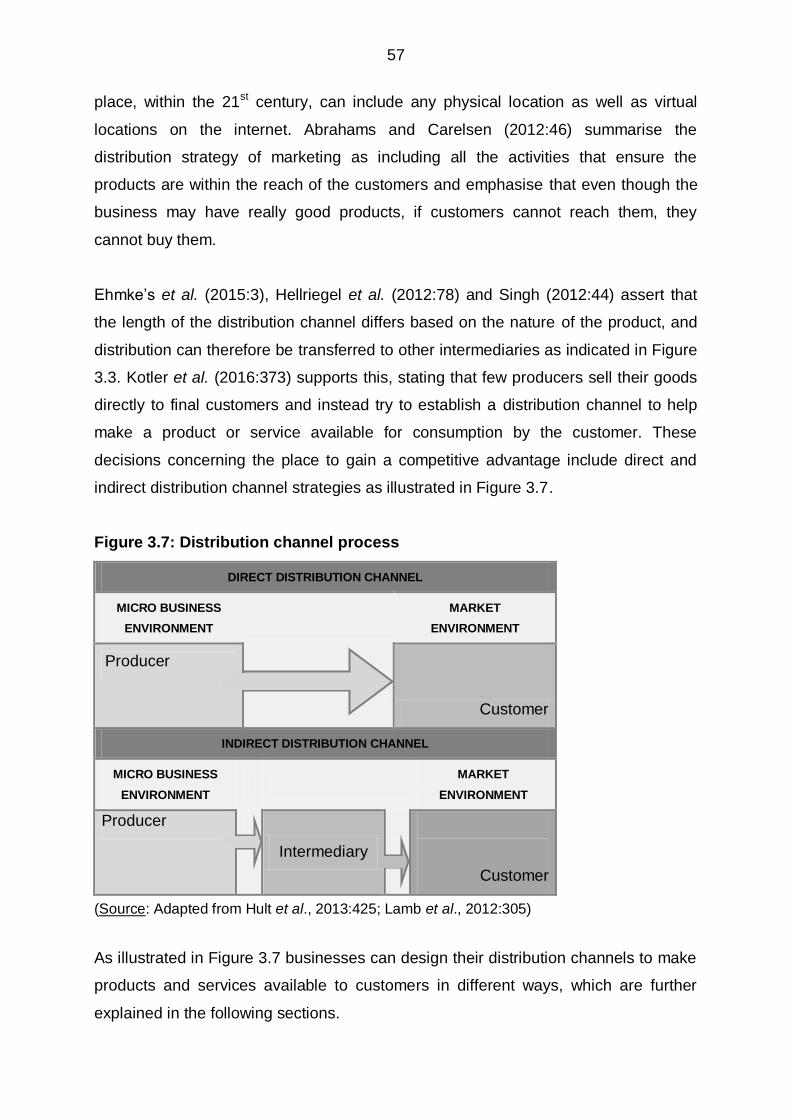
57
place, within the 21st century, can include any physical location as well as virtual
locations on the internet. Abrahams and Carelsen (2012:46) summarise the
distribution strategy of marketing as including all the activities that ensure the
products are within the reach of the customers and emphasise that even though the
business may have really good products, if customers cannot reach them, they
cannot buy them.
Ehmke‟s et al. (2015:3), Hellriegel et al. (2012:78) and Singh (2012:44) assert that
the length of the distribution channel differs based on the nature of the product, and
distribution can therefore be transferred to other intermediaries as indicated in Figure
3.3. Kotler et al. (2016:373) supports this, stating that few producers sell their goods
directly to final customers and instead try to establish a distribution channel to help
make a product or service available for consumption by the customer. These
decisions concerning the place to gain a competitive advantage include direct and
indirect distribution channel strategies as illustrated in Figure 3.7.
Figure 3.7: Distribution channel process
DIRECT DISTRIBUTION CHANNEL
MICRO BUSINESS
ENVIRONMENT
MARKET
ENVIRONMENT
Producer
Customer
INDIRECT DISTRIBUTION CHANNEL
MICRO BUSINESS
ENVIRONMENT
MARKET
ENVIRONMENT
Producer
Intermediary
Customer
(Source: Adapted from Hult et al., 2013:425; Lamb et al., 2012:305)
As illustrated in Figure 3.7 businesses can design their distribution channels to make
products and services available to customers in different ways, which are further
explained in the following sections.

58
3.3.3.1 Direct distribution channel strategy
A direct channel allows selling directly to customers without a distributor or
intermediary, hence providing direct communication with customers (see Figure 3.7).
The advantage of direct sales would be the contact the business gains by meeting
the customers face-to-face. With this sales contact the business can easily detect
market demand changes that occur and adapt accordingly. Furthermore, the
business has complete control over their product range, how it is sold and at what
price (Ehmke et al., 2015:3; Hellriegel et al., 2012:78; Hult et al., 2013:425; Singh,
2012:44). Legal advice given by attorneys and insurance companies performing
telemarketing and selling directly via telephone or internet are typical examples of a
direct distribution channel (Hult et al., 2013:425; Kotler et al., 2016:373).
Singh (2012:44) asserts that an internet distribution channel allows selling online to
customers. The main benefit customers receive for buying products online is that
niche products reach a wider population with low entry barriers as set-up costs are
comparatively low. As a result there is an epitome shift in commerce and
consumption via the internet, leading to a significant growth in e-commerce. Hult et
al. (2013:425) further indicate that direct marketing via the internet has become a
critically important part of some businesses‟s distribution strategies, often as a
complement to their products being sold in traditional retail stores. Lamb et al.
(2012:305) indicate that this channel has forced many businesses to develop a
specific strategy with an appropriate balance between the number of intermediaries.
Another direct distribution channel that has an important impact on businesses
includes peer-to-peer distribution channels which simply refer to a form of Word-of-
Mouth (WOM). If the product is admired by customers, they convey the message to
peer groups (Singh, 2012:44). In the 21st century, online systems and electronic-
Word-of-Mouth (eWOM), as a marketing channel for the digital marketplace, helps
customers make informed decisions about the product. eWOM is often referred to
internet based peer-to-peer communication of a message or information whereby
customers can reach many others in a one-to-many manner with cascading effects
similar to that of mass media.
59
Furthermore, eWOM is written, therefore more formal and insightful that traditional
WOM and is accessible to other customers at any time, even when the creator of the
information is absent (Sharma, Morales-Arroyo and Pandey, 2012:44). The indirect
distribution channel strategy is addressed in the following section.
3.3.3.2 Indirect distribution channel strategy
An indirect channel allows selling indirectly to customers with a distributor or
intermediary, such as retailers, wholesalers or multi-distributors (see Figure 3.7).
A retail distribution channel allows selling through an intermediary such as retailers,
who resell the business‟s product to customers. Retailers provide stronger
relationships with customers since they keep several products of different brands
which as a result expose the customers to many products (Ehmke et al., 2015:3;
Hellriegel et al., 2012:78; Singh, 2012:44). Hult et al. (2013:425) assert that this
strategy is a frequent choice for large retailers since it allows them to buy in quantity
from manufacturers. New automobiles and new university textbooks are typical
examples that are sold through this type of marketing channel (Hult, et al., 2013:425).
In a similar fashion to a retail distribution channel, a wholesale distribution channel
allows selling through an intermediary such as wholesalers, who sell to retailers, who
sell to customers. Wholesalers can often sell products at a lower price than retailers
and therefore customers are generally satisfied to buy the product from them. The
advantage of using both retailers and wholesalers will provide the business with a
wider distribution system than selling direct, while decreasing the pressure of
managing its own distribution system. Furthermore, most often wholesalers and
retailers have customer connections that direct sales do not have (Ehmke et al.,
2015:3; Hellriegel et al., 2012:78; Singh, 2012:44). Hult et al. (2013:425) assert that
this strategy is practical for producers that sell to hundreds of thousands of
customers though thousands of retailers. For example, manufacturers of tobacco
products, some home appliances, hardware and many convenience goods sell their
products to wholesalers, which then sell to retailers, which in turn do business with
individual customers.
60
A multi-distribution channel refers to a distribution system in which a single business
sets up two or more marketing channels to reach one or more customer segments
(Kotler et al., 2016:441; Singh, 2012:44). Hult et al. (2013:427) are also of the opinion
that manufacturers often uses multiple-distribution channels when the same product
is directed to both consumers and business customers, for example sauces being
sold in supermarkets for household use and sauces being sold to restaurants. This
strategy is also often referred to as a dual distribution if two or more marketing
channels are used to distribute the same products to the same target markets. An
example of dual distribution is for instance a cereal business that sells cereal directly
to large grocery chains and to food wholesalers that, in turn, sell the cereal to
retailers (Hult et al., 2013:427; Lamb et al., 2012:306).
3.3.4 PROMOTION (MARKETING COMMUNICATION) STRATEGIES
Promotion represents the marketing communications that a marketer may use in the
marketplace to inform and educate customers about the products and services the
business has to offer (Hellriegel et al., 2012:79; Lamb et al., 2012:338). According to
Lamb et al. (2012:338) the aim of marketing communications is to convince
customers of the product‟s benefits above those of competitors, whereas Hellriegel et
al. (2012:79) assert that the aim is to create profit or service awareness and to
generate customer interest that might lead to a transaction taking place between a
buyer and a seller. The purpose of promotion strategies is explained as to
communicate and persuade the target market to buy the business‟s products, by
getting them to understand what the product is, what they can use it for, and why
they should want it (Ehmke‟s et al, 2015:4; Singh, 2012:44). Lamb et al. (2012:338)
further state that marketing communications is employed by marketers to inform,
persuade and remind potential buyers of a product in order to influence their opinion
or elicit a response. Ehmke et al. (2015:4) add that the promotional message of the
business must be consistent with their overall marketing image, get their target
market‟s attention and elicit the response the business desires, whether it is to
purchase the product or to form an opinion.
61
Hult et al. (2013:496) assert that integrated marketing communications furthermore
allow synchronisation of promotional elements and can improve the efficiency and
effectiveness of promotional budget. Hence, this approach fosters not only long-term
customer relationships but also the efficient use of promotional resources. In
accordance with the previous discussion, Shimp and Andrews (2014:7) confirm that
marketing communications is a critical aspect of a business‟s overall marketing
mission and major determinant of business success or failure.
According to various secondary sources (Bosch et al., 2011:401-402; Ehmke‟s et al,
2015:4; Hellriegel et al., 2012:79; Lamb et al., 2008:295-303; Shimp & Andrews;
2014:7; Singh, 2012:44-45), marketers usually make use of a combination of
marketing promotional mix strategies to meet customers‟ needs and move them
towards action. Shimp and Andrews (2014:8) assert that the blend of these primary
promotional strategies has evolved over time and currently include advertising, public
relations, sales promotion, personal selling, direct marketing and online
marketing/social media.
3.3.4.1 Advertising
Emke et al. (2015:4) and Shimp and Andrews (2014:8) identify advertising as any
form of non-personal communication, whether ideas, goods or services by an
identified sponsor, that is paid for in which the business is identified. According to
Hult et al. (2013:505) advertising is extremely cost-efficient when it reaches a vast
number of people at a low cost per person, and can add value to the product and
business‟s image. Advertising is furthermore used to create awareness and transmit
information in order to gain customers from the target market through various forms
of traditional mass media advertising strategies, some of which include (Bosch et al.,
2011:401-402; Ehmke‟s et al, 2015:4; Hellriegel et al., 2012:79; Lamb et al.,
2012:339; Shimp & Andrews, 2014:8; Singh, 2012:44-45):
Television, as an advertising medium, is uniquely personal and demonstrative,
allowing access to regional or national audiences, yet it is also expensive and
subject to considerable competitive clutter.

62
Radio advertisements, a nearly ubiquitous medium, are relatively inexpensive
ways to inform potential customers about the business and its products, locally
and nationally.
Newspapers, historically leading advertising medium have been surpassed by
television and radio advertising and therefore have started to expand their
readership with digital subscriptions for access on smartphones and tablets.
Magazine advertising appeals to audiences that manifest specific interests
and lifestyles which allow the business to explain what, when, where and why
customers should buy from the business.
Out-of-home, or outdoor advertising, a supplementary advertising medium,
encompasses a variety of modes including billboards, bus shelters, shopping-
mall displays, airports etc. reaching customers with ad messages outside their
homes in contrast to those mediums mentioned above.
The following section addresses the promotion strategies surrounding public
relations.
3.3.4.2 Public relations
According to various authors (Bosch et al., 2011:401-402; Ehmke‟s et al, 2015:4;
Hellriegel et al., 2012:79; Lamb et al., 2012:344; Singh, 2012:44-45) public relations
is communication that is not directly paid for, but is important if the focus is on
creating a favourable business image. Hult et al. (2013:507) further explain public
relations to be a broad set of communication efforts used to create and maintain
favourable relationships between the business and its stakeholders. Maintaining
positive relationships with these stakeholders can affect the business‟s current sales
and profits, as well as long term survival.
Some components of a good public relations program include being a good
“neighbour”, being involved in the community and providing open house days by
which press releases and sponsorships can be secured (Ehmke‟s et al, 2015:4;
Singh, 2012:44-45).
63
Shimp and Andrews (2014:8), however, highlight that the primary focus of public
relations in integrated marketing communications should be with marketing-
orientated strategies of communication with publics, some of which include:
Publicity, like advertising, is a non-personal communication strategy to a mass
audience, but unlike advertising, is not paid for by the business and usually
comes in the form of news items or editorial comments about the business‟s
products or services.
Product releases, a proactive public relations strategy, announce new
products, provide relevant information about product features and benefits,
and inform interested listeners and readers how to obtain additional
information, often published in the product section of trade magazines and
general business publications.
Handling rumours, often referred to as negative publicity can be handled by
following various reactive strategies such as to stay alert, evaluate its effects
and to launch a media campaign to combat it.
Sales promotion as a promotional strategy is addressed in the following section.
3.3.4.3 Sales promotion
Sales promotion is communication through adding intrinsic, tangible value to a
product or service (Ehmke‟s et al, 2015:4; Singh, 2012:44-45). It can be seen as an
activity or material that acts as direct inducement, offering added value or incentive
for the product to resellers, salespeople or customers (Hult et al., 2013:509).
According to Lamb et al. (2012:346) many marketers use sales promotion as a short-
run strategy to stimulate immediate increases in demand, whereas others often use it
as a strategy to improve the effectiveness of the other marketing communication mix
elements, especially advertising and personal selling. Shimp and Andrews (2014:8),
however, summarise sales promotion as communication attempting to stimulate
short-term buyer behaviour, hence to promote immediate sales.
64
Examples of sales promotion can include special offers, free samples, user trails,
discounts, coupons, contests, competitions, incentives, loyalty programs, prices and
rebates (Bosch et al., 2011:401-402; Ehmke‟s et al, 2015:4; Hellriegel et al., 2012:79;
Lamb et al., 2012:346; Singh, 2012:44-45). Shimp and Andrews (2014:8-9), however,
state that sales promotion is directed at the trade (wholesalers/distributors and
retailers), customers and at times towards the business‟s own sales force. Hence,
the aforementioned examples can be classified mainly under trade sales promotion
strategies and customer sales promotion strategies. Sales promotion aimed at the
business‟s own sales forces might focus on motivation techniques (e.g., sales
contest, bonuses and meetings in attractive locations) and/or training tools (e.g.,
sales aids, training materials and point-of-purchase displays).
According to Shimp and Andrews (2014:8) trade sales promotion strategies that can
be used to activate wholesaler and retailer responses, can include, amongst others:
Display allowance is an additional amount of money that a manufacturer pays
retailers extra to have its products put in a position in a store where the
customer will easily see them, yield high volumes and are easy to assemble.
Quantity discounts is used as an incentive that is offered to a customer that
results in a decreased cost per unit of goods when they purchase in bulk.
Visual merchandise aims to make the product more visible, encouraging
customers to make an impulse purchase or to choose a specific brand over a
competitor, e.g. to devote more shelf space to the specific product or offering
specially packaged products.
Shimp and Andrews (2014:8) further identify that customer sales promotion
strategies, to stimulate short-term behavioural responses, can include, amongst
others:
Coupons are a promotional device that rewards customers for purchasing the
coupon-offering brand by providing rands-off savings, including various
distribution methods such as point-of-purchase couponing, mail- and media-
delivered coupons, in- and on-pack coupons and online and social group
couponing.
65
Premiums are articles of merchandise or services (e.g., travel) manufacturers
offer as a form of gift to induce action on the part of the customer and possibly
also retailers and the sales force, which includes several forms such as free-
with-purchase premiums, mail-in and online offers, in-, on-, and near-pack
premiums, and self-liquidating offers.
Free samples include any method (e.g., direct mail, newspapers and
magazines, door-to-door, high traffic locations and online sampling) used to
deliver an actual- or trial-sized product to customers.
The following section addresses the promotion strategies surrounding personal
selling.
3.3.4.4 Personal selling
Personal selling is communication between a sales person and a customer, in an
attempt to influence the customer in a purchase situation. Salespeople can tailor
communication to customers and are very important, but a costly tool in building
relationships (Bosch et al., 2011:401-402; Ehmke‟s et al, 2015:4; Hellriegel et al.,
2012:79; Lamb et al., 2012:342; Singh, 2012:44-45). Lamb et al. (2012:342) indicates
that buyers and sellers, in this two-sided encounter, have contrasting objectives to
accomplish. The former may need to minimise cost or gain assurance of a quality
product, whereas the latter may need to maximise revenue and profits.
From a seller point of view, personal selling‟s role in the promotion mix include
educating customers, encouraging product usage and marketing assistance, and
providing after-sale service and support to the buyer. Depending on the situation,
personal selling outreach efforts can range from face-to-face communication to
telephone sales to online contacts (Shimp & Andrews, 2014:9). According to Shimp
and Andrews (2014:692-694) a contingency model of the selling process is
presented to explain that salesperson performance and effectiveness are dependent
on a variety of strategies, including resources of the salesperson, characteristics of
the customer‟s buying task, and the salesperson-customer relationship. Specific
determinants of sales person performance have been identified to include aptitude,
skill level, motivational level, role perceptions, personal characteristics and
adaptability (Shimp & Andrews, 2014:692-694).
66
Direct marketing as a promotional strategy is addressed in the following section.
3.3.4.5 Direct marketing
Direct marketing represents an interactive system of marketing which uses one or
more advertising media to effect a measurable response and/or transaction at any
location (Kotler et al., 2016:455; Shimp & Andrews, 2014:402). Hence, direct
marketing entails personalised communication between the marketer and the
prospect that is easily measurable since purchase responses to direct marketing are
typically more immediate than responses to mass-media advertising and can be
tracked to specific customers in response to specific marketing efforts. Primary
strategies of direct marketing include direct response advertising, direct selling,
telemarketing and the use of database marketing techniques (Shimp & Andrews,
2014:402-403).
Direct response advertising, a major form of direct marketing, involves the use
of any of several media to transmit messages that encourage buyers to
purchase directly from the advertiser, such as television, direct mail, print and
online efforts.
Direct selling is the use of sales representatives to sell directly to the final
customer which often uses multi-level marketing (sales representatives that
are remunerated for selling and for sales made by the people they recruit) as
opposed to single-level marketing (sales representatives that are remunerated
only for sales they make themselves).
Telemarketing includes outbound calls from telephone salespersons and
handling inbound orders, inquiries and complaints from present or prospective
customers.
Database marketing is a process in which businesses collect information
about customers, analyse it to predict who will buy and then develop tailored
marketing messages to those customers. Typical examples include
behavioural data (past purchase details) and other types of information such
as demographic, geographic and psychological data.

67
The following section addresses the promotion strategies surrounding online
marketing/social media.
3.3.4.6 Online marketing/social media
Online marketing is the promotion of product and services over the Internet (e.g.,
search engine marketing, banner ads, mobile advertising and location-based apps),
whereas social media marketing represents forms of electronic communication
through which user-generated content, such as information, ideas and videos, can be
shared within the user‟s social network. The use of marketing communication
strategies through social media networks, including Facebook, Twitter and YouTube,
amongst others, has literally exploded and has changed the entire marketing
communications industry (Shimp & Andrews, 2014:9). Some strategies for successful
online/social media campaigns include (Kozinets, de Valck, Wojnicki & Wilner,
2010:71-89; Shimp & Andrews, 2014:390-391):
The business should encourage or elicit storytelling about their brand. Such
storytelling has been found to be quite effective when advertisers and brands
are congruent with the social media site in allowing for co-production of
messages and meanings, rather than forced amplification of marketer themes.
The business should step into the real world by trying to connect and engage
customers though empathy, understanding and openness with real-life issues
in social media campaigns.
The business should evolve with their customers in being social and human,
by admitting mistakes at times and accepting criticism on social networking
sites, which can enhance trustworthiness for source credibility.
Nonetheless, ethical issues abound in the use of these online marketing and social
media as marketing strategies. Shimp and Andrews (2014:103) assert that the
invasion of customer‟s privacy has received a considerable amount of attention as
online marketers are collecting voluminous information about potential customers
personal characteristics, online shopping behaviour and use of information, making it
easy to invade individual‟s privacy rights by selling information to other sources and
divulging confidential information.
68
Another major ethical violation relates to the use of blogs and tweets where
businesses are unethical when these blogs and tweets include positive testimonials
from falsified customers, or where the business pays individuals to write positive
evaluations of the business‟s products (Shimp & Andrews; 2014:103).
An effective marketing mix strategy requires the right combination of components.
The following section addresses marketing in SMEs.
3.4 MARKETING STRATEGIES IN SMALL AND MEDIUM-SIZED
BUSINESSES (SMEs)
As was discussed in Section 3.2.4 it is important for all businesses, including family
and non-family SMEs to manage the marketing function and choose appropriate
marketing mix strategies to attract the intended market (Bosch et al., 2011:382).
Understanding marketing and the marketing skills required in the environment of a
SME determines whether the SME will be successful in the long term as it influences
their overall success (Cant, 2012:1108; Lamb et al., 2008:5, Van Scheers,
2011:5049). The development and performance of SMEs are fundamentally reliant
on marketing and being competent in marketing is considered a key factor in the
success of SMEs (Reijonen, 2010:282).
The following sections investigate how marketing is different in smaller businesses
compared to that of their larger counterparts, marketing in SMEs, entrepreneurial
marketing and the marketing mix strategies used by SMEs and family businesses.
3.4.2 DIFFERENCES BETWEEN SMEs AND LARGE BUSINESSES
Researchers widely agree that marketing conducted in SMEs is fundamentally
different from that in larger businesses, as they face different challenges. SMEs as a
start-up business are relatively unknown in the marketplace compared to their larger
counterparts and therefore need to advertise and promote in order to gain recognition
for their product that can boost their sales, revenue growth and reputation (Exforsys,
2009:1).

69
Cant (2012:1108) is of the opinion that it should be common sense to SMEs that if
their customers are not aware of what they have to offer, where they are located, or
what their total product offering includes, compared to that of their larger well-known
counterparts, they cannot support the SME. Hilton and Hultman (2006:219) indicate
in their research that while marketing in general has focused on understanding the
practices and processes of large corporations, there is a growing interest and body of
knowledge on the marketing practises and entrepreneurial behaviour of SME. SMEs
have the tendency to use unconventional and specific forms of marketing, and have
a unique way of conceptualising and implementing marketing efforts, as opposed to
their larger counterparts (Hills, Hultman & Miles, 2008:99; Morris, Schindehutte &
LaForge, 2002:2).
Stokes and Wilson (2006:359-361) indicate that SMEs have their own distinctive
marketing style compared to that of their larger counterparts, which is indicated by
the following characteristics:
SMEs do not follow formal processes but rather informal processes in reaction
to activity in the market place;
SMEs do not make use of expensive marketing campaigns due to the
restriction based on their size;
SMEs do not follow a sophisticated approach but rather more basic and
simplistic marketing methods;
SMEs place more emphasis on developing competitive pricing and products
as opposed to promotional activities; and
SMEs drive a marketing strategy influenced by the owner‟s personality and
experience.
The following section will address the marketing problems experienced by SMEs.
70
3.4.2 MARKETING PROBLEMS EXPERIENCED BY SMALL AND MEDIUM-
SIZED BUSINESSES (SMEs)
Despite the importance of marketing to SMEs, it is often an overwhelming concept as
many struggle to employ it effectively (Cant & Wiid, 2013:709; Van Scheers, 2012).
Marketing factors such as competition, low demand for products, not being able to
meet customer needs, wrong pricing strategies, lack of knowledge, poor location,
product variety and branding, all have a negative impact on SMEs (Cant & Wiid,
2013:209). The exchange processes for creating, communicating, delivering and
exchanging valuable offerings for customers also require a considerable amount of
marketing skills, which SMEs, whether family owned or not, often do not have (Cant,
2012:1107; Farrington & Venter, 2011:1; Olawale & Garwe, 2010:731; Van Scheers,
2011:5048).
Cant and Wiid (2013:209) further indicate that SMEs undertake little marketing
activities as they have difficulties managing the various marketing challenges stated
above. Cant and Wiid (2013:709) also indicate that SME owners‟ perception of
marketing related challenges is that they lack time or funds to invest in research to
establish their target market, customer trends and marketing in general. Cant
(2012:1107) and Radipere and Van Scheers (2005:402) further indicate that the lack
of certain marketing skills needed to operate SMEs, has a negative impact on their
success, viability and development.
The preceding discussion on marketing in SMEs can be linked to the entrepreneurial
marketing perspective explained in the following section.
3.4.3 ENTREPRENEURIAL MARKETING BY SMEs
The entrepreneurial marketing perspective proposes that the core marketing
processes of creating and delivering value are augmented by innovative, opportunity-
driven, entrepreneurial approaches (Fiore, Niehm, Hurst, Son & Sadachar, 2013:64;
Morrish, Miles & Deacon, 2010:303). This approach will allow for market value
through innovation in new products, services, experiences and strategies that satisfy
customer needs. SMEs that conduct this entrepreneurial approach in a superior
71
fashion may be in a better position to achieve a sustainable competitive advantage
(Morris et al., 2002:3).
Most definitions of entrepreneurial marketing focus on marketing undertaken in
unconventional ways (Frederick, Kuratho & Hodgetts, 2007:269). While Morris et al.
(2002:4) view entrepreneurial marketing as an opportunity driven way of thinking and
acting with regards to marketing, Bjerke and Hultman (2002:15) propose
entrepreneurial marketing to be marketing of SMEs growing through
entrepreneurship. According to Carson (2005:5), entrepreneurial marketing can also
be categorised as traditional marketing theories applied to SMEs. Others also
support this by describing entrepreneurial marketing as marketing performed by SME
entrepreneurs in their ventures using unconventional tactics to attract new business
(Reijonen, 2010:280; Stokes, 2000:6).
Cant (2012:1109) advises that in order to develop contemporary marketing strategies
for SMEs, the SME owners need to ensure that they have a clear understanding of
the marketing factors that can and will influence the SME. Despite some criticism of
deficiencies, limitations and simplicity, as discussed in Section 3.3, Kotler et al.
(2016:51), Brink and Berndt (2010:3) and Lee Gio (2009:1) still propose the
traditional marketing mix as a strong staple to develop long-term marketing strategies
in the 21st century, such as those needed in family and non-family SMEs to improve
business performance.
Research regarding marketing and marketing mix strategies employed in non-family
and family SMEs, are however restricted. The purpose of this study is to address this
research gap. The following section will address the application of the marketing mix
strategies specifically to SMEs and family businesses.
3.4.4 MARKETING MIX STRATEGIES USED BY SMEs
This section delves deeper into entrepreneurial marketing by SMEs by focusing
specifically on how SME owners use the marketing mix strategies in response to their
often limited resources and specific needs.
72
3.4.4.1 Product strategies used by SMEs
According to Gilmore (2011:139) an appropriate product strategy must be set before
any of the other marketing mix strategies, as SMEs are often established as a result
of the owner having a product or services they wish to offer to a niche market.
Gilmore (2011:140) indicates that the development of products by SME owners is
often highly specialised to meet the unique needs of their niche market. Hatten
(2016:293) further indicates the SME marketers need to manage these product
developments for niche markets through the stages of their lifecycle, as discussed in
Section 3.3.1.5, as trends like increased global competition and rapidly changing
customer needs have shortened product lifecycles and increased the need for new
products. The product strategies employed by SMEs are greatly influenced by the
owner‟s personality, experience and ideas. As a result new products are often not
created using thorough marketing principles (Hatten, 2016:293). Various authors,
however, argue that SMEs can add dynamism to the market place as they have the
potential to be leaders in product innovation, technological advancement and
specialisation in niche markets (Cronin-Gimore, 2012:96; Gilmore, 2011:140, Stokes
& Wilson, 2010:112).
Chaston and Mangles (2002:8) state that the most important aspect of product
strategies is product innovation as it allows the SMEs‟s continuation and to stay
ahead of competitors. To develop a product strategy for SMEs, these business
owners need to establish the needs of their target market which in return will enable
them to develop a satisfying product that can secure them a competitive position in
the marketplace (Chaston & Mangles, 2002:8). Smit (2004:39) further emphasises
the competitive advantage SMEs can achieve over that of their larger counterparts as
their size allows them flexibility in terms of their product offering and adaptability to
customers‟ ever-changing needs.
Bressler (2012:3-4) suggests that SMEs should employ a product differentiation
strategy which can be achieved through product appearance and providing products
and service offerings that other larger businesses may not offer or not provide
effectively. These services could include product delivery and installation, repair or
warranty work and even customer training.
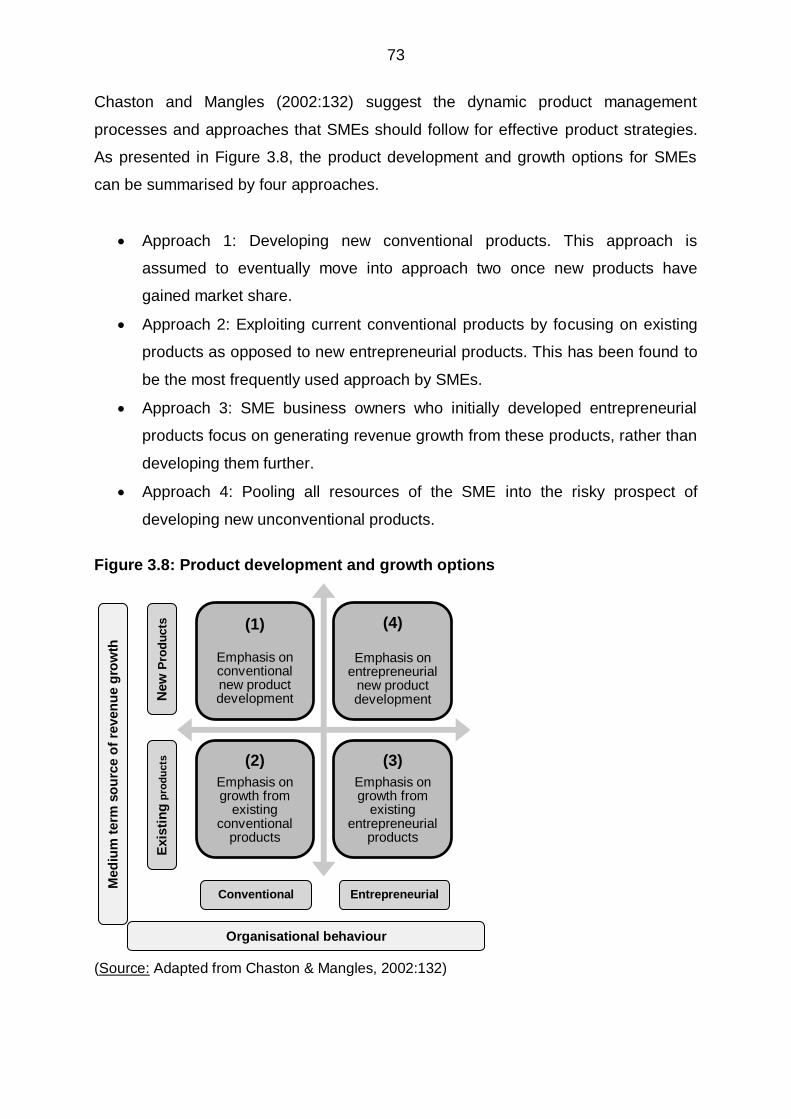
73
Chaston and Mangles (2002:132) suggest the dynamic product management
processes and approaches that SMEs should follow for effective product strategies.
As presented in Figure 3.8, the product development and growth options for SMEs
can be summarised by four approaches.
Approach 1: Developing new conventional products. This approach is
assumed to eventually move into approach two once new products have
gained market share.
Approach 2: Exploiting current conventional products by focusing on existing
products as opposed to new entrepreneurial products. This has been found to
be the most frequently used approach by SMEs.
Approach 3: SME business owners who initially developed entrepreneurial
products focus on generating revenue growth from these products, rather than
developing them further.
Approach 4: Pooling all resources of the SME into the risky prospect of
developing new unconventional products.
Figure 3.8: Product development and growth options
(Source: Adapted from Chaston & Mangles, 2002:132)
(1)
Emphasis on conventional new product development
(4)
Emphasis on entrepreneurial
new product development
(2)
Emphasis on growth from
existing conventional
products
(3)
Emphasis on growth from
existing entrepreneurial
products
New
Pro
du
cts
E
xis
tin
g p
rod
ucts
Conventional Entrepreneurial
Med
ium
term
so
urc
e o
f re
ven
ue g
row
th
Organisational behaviour
74
Chaston and Mangles (2002:132), however, caution that developing new products,
whether conventional or unconventional, has been found a risky approach to be
followed by SMEs. The safer approach for SMEs is to grow revenue through existing
products. Hatten (2016:297), however, warns that SMEs are more vulnerable to
product obsolescence since they depend on fewer key products; have fewer
resources to develop new ones; and face fierce larger, low-cost competitors that lure
customers away from niche markets. Hence, the optimal solution for SMEs would be
to develop a steady stream of new products to replace existing ones as they pass
through the product lifecycle (Hatten, 2016:297).
3.4.4.2 Pricing strategies used by SMEs
According to Hingston (2001:31), SMEs should determine a pricing method which will
reflect their overall business strategy, as well as reduce their cost, increase their
prices and/or boost sales to maximise profits. Stokes and Wilson (2006:420),
however, indicate that SMEs, when compared to larger businesses, find it
challenging to understand the costs that they incur, such as differentiating between
fixed- and variable costs. Hatten (2016:347) corroborates this, stating SME owners
make poor pricing decisions, despite its importance to the SMEs success.
To develop a pricing strategy for SMEs, these business owners need to place more
focus on the internal and external factors influencing the price of a product, as SMEs
often undercharge for their products and services (Macleod & Terblanche, 2004:66).
Hatten (2016:355) asserts that if SMEs price their products too low, major problems
may arise since all costs, both fixed and variable, may not be covered. The internal
factors, influencing the price of the product, include direct costs of production, indirect
cost such as overheads, as well as the profit margin to be made. The external factors
that also affect a pricing strategy include legislation, exchange rates, the economy,
availability of supplies and suppliers (Macleod & Terblanche, 2004:66).

75
Juul (2006:32) asserts that the following questions must be answered when setting a
pricing strategy for SMEs:
What are the choices available to the customers?
Who are the competitors in the market?
What prices are competitors charging?
What prices are customers willing to pay?
What are the profit targets?
What fluctuations are expected in the cost price?
In line with these questions stated above, Hatten (2016:347) summarises the
important economic factors to consider that are involved in how much a SME can
charge for their products as competition, customer demand and costs. Although there
have been a number of value propositions presented in literature, Bressler (2012:3)
suggests that SMEs could find the greatest likelihood for business success by
competing with high prices and offering customers better value. Offering customers
greater value could be provided with increased levels of customer service, superior
product knowledge, or developing key locations, including going to the customer.
Customers will often pay significantly higher prices for better service, better quality,
preferred brand or image and customer convenience (Bressler, 2012:3). Other
authors corroborate that SMEs can make use of non-pricing competition by providing
customers with value for their money, better quality products and outstanding
customer service (Gilmore, 2014:140; Smit 2004:111).
Since SMEs have the flexibility to customise products for niche customers, they thus
have the ability to customise their pricing strategy accordingly. As a result, it is
established that SMEs would not be best suited to compete in a cost leadership
competition strategy with their larger counterparts. The most common form of pricing
strategy suitable for SMEs includes following a cost plus approach, where SMEs
determine their total costs and add their required mark-up (Hatten, 2016:258;
Abrahams & Carelsen, 2012:43-46). Hatten (2016:258), however, cautions SMEs
using this internal orientated pricing strategy to make sure that they do not price their
products out of the marketplace as customers do not care what costs SMEs incur,
but rather about the value they receive.

76
3.4.4.3 Place strategies used by SMEs
To develop a place strategy for SMEs, these business owners need to consider the
benefits of using intermediaries, such as those also discussed in Section 3.3.3, as
they have local knowledge and contacts, they can lower distribution costs through
using an agent as they can reduce the SMEs stockholding by shifting to a distributor
(Stokes & Wilson, 2006:384). Rather than selling directly, which can be more cost-
intensive than using a distributor, Hingston (2001:42) asserts that SMEs can make
use of wholesalers, retailers, sales agents and joint ventures, each with their own
varying profit margin. Hingston (2001:42), therefore, states that the best distribution
channel for SMEs is a strategy that is dependable with a reasonable margin and can
hold a practical amount of goods.
Bressler (2012:3) corroborates this and further states that SMEs can compete
against larger businesses by developing long-term relationships with customers,
providing exceptional services and creating and exploiting economies of scale
through joining alliances such as those mentioned above. Hatten (2016:31) further
states that efficiencies in distribution channels not only allow SMEs to offer goods
more efficiently and profitably, but also provide opportunities to start new businesses.
By increasing the efficiency of an existing distribution channel, SMEs are providing a
much needed service, hence identifying a basis for a good business.
SME owners thus have multiple strategies in selecting distribution channels; however
the costs involved, such as those added to the final selling price of the product if the
SMEs should decide to use an intermediary in the distribution channel, are often the
most important factor to consider (Juul, 2006:32). Chaston and Mangles (2002:95)
further emphasise the challenges SMEs face in convincing larger intermediaries to
stock their products, as they perceive SMEs to have a limited range of products.
Gilmore (2011:140) also states that SMEs need to keep to delivery promises, as
failure to do so will damage long term relationships with their customers, and thus
influence its business performance and success.
Furthermore, Chaston and Mangles (2002:195) stress the way e-commerce is
changing the way in which SMEs traditionally utilised distribution channels, while

77
Gilmore (2011:141) highlights the opportunities SMEs have where the internet allows
for online marketing with low entry barriers. SMEs are now able to eliminate
distribution channels by making use of e-commerce and sell directly to their
customers over the internet (Chaston & Mangles, 2002:95). SMEs adapt place
strategies to suit their limited resources by making use of the internet as a
replacement for traditional distribution methods, allowing for a more level playing field
between SMEs and their larger counterparts (Abrahams & Carelsen, 2012:49).
In the 21st century, with an epitome shift in e-commerce, the decision concerning the
place for SMEs to gain a competitive advantage, focuses more on the advantages of
using a direct distribution channel as opposed to the traditional indirect distribution
channels (Abrahams & Carelsen, 2012:49). This is as a result of the internet allowing
niche products to reach a wider population with low entry barriers in a cost-effective
manner as discussed in Section 3.3.3 (Abrahams & Carelsen, 2012:49; Sing,
2012:44).
3.4.4.4 Promotion (marketing communication) strategies used by SMEs
SMEs can only make use of certain marketing promotional mix strategies to meet
their customers‟ needs, due to their limited resources (Chaston & Mangles,
2002:148). The promotional advertising strategies predominantly followed by SMEs
focus on local media rather than mass media, as promotional channels such as TV
and magazines are often unaffordable for SMEs (Chaston & Mangles, 2002:148).
Macleod and Terblanche (2004:74) assert that SMEs frequently choose newspaper
or radio as cheaper advertising strategies to get their promotional messages across.
Since public relations are a strategy that is not directly paid for, SMEs tend to focus
on creating a favourable business image though word-of-mouth communication.
Reijonen (2012:282) and Chaston and Mangles (2002:153) assert that word-of-
mouth communications are seen as one of the most influential ways of promotion for
SMEs, as it fits in well with their limited resources and supports a slow build-up, in
that it does not attract so many customers at once. For example, South African
websites, such as Hellopeter.com and womf.co.za, are forums by which customers
exchange opinions by means of word-of-mouth marketing (Abrahams & Carelsen,
78
2012:52). As a result, SMEs should be consistent with their customer standards or
run the risk of being reported on these forums.
SMEs can also differentiate their promotional strategies from that of larger
businesses by offering more promotional programs, or promotions more visible to
potential customers. Many sales promotions by SMEs go unnoticed by their target
market either through poor timing, poor promotional choices or not linking the
promotion to other marketing activities. Integrated marketing links with public
relations, advertising, direct marketing and other marketing activities in a coordinated
fashion. SMEs can also coordinate their business promotions with local events which
might include festive seasons or other holiday events (Bressler, 2012:5; Hatten,
2016:364-372).
Gilmore (2011:140) highlights that due to the limited funding of SMEs to spend on
expensive promotional strategies, they should rely on non-financial bearing methods
like building customer relationships between employees and customers. Chaston
(2000:63) suggests that SME owners need to form business networks, alliances and
create a collective voice to overcome the financial challenges SMEs face in
developing a promotion strategy.
As a result of limited resources, SMEs are also more likely to rely on personal
contact to improve business performance through networking, telecommunications,
and the internet (Bressler, 2012:4; Gilmore, 2011:141; Stokes & Wilson, 2010:375;
Walsh & Lipinski, 2009:572). Gilmore (2011:142) further stresses the importance of
SME networking as it is an informal, opportunistic and fundamental strategy of doing
business by collaborating with peers and business contacts.
Abrahams and Carelsen (2012:53) assert that SMEs are also in a better position than
their larger counterparts to use mobile marketing for customer engagement. As
SMEs have a smaller customer base compared to larger companies, they are able to
more actively engage with them and easily see how their customers respond to
mobile campaigns (Abrahams & Carelsen, 2012:53; Probert, 2011:12). With the
growing reliance on smartphones, enormous opportunities emerge for SMEs to
engage with customers as applications allow customers to earn loyalty cards,
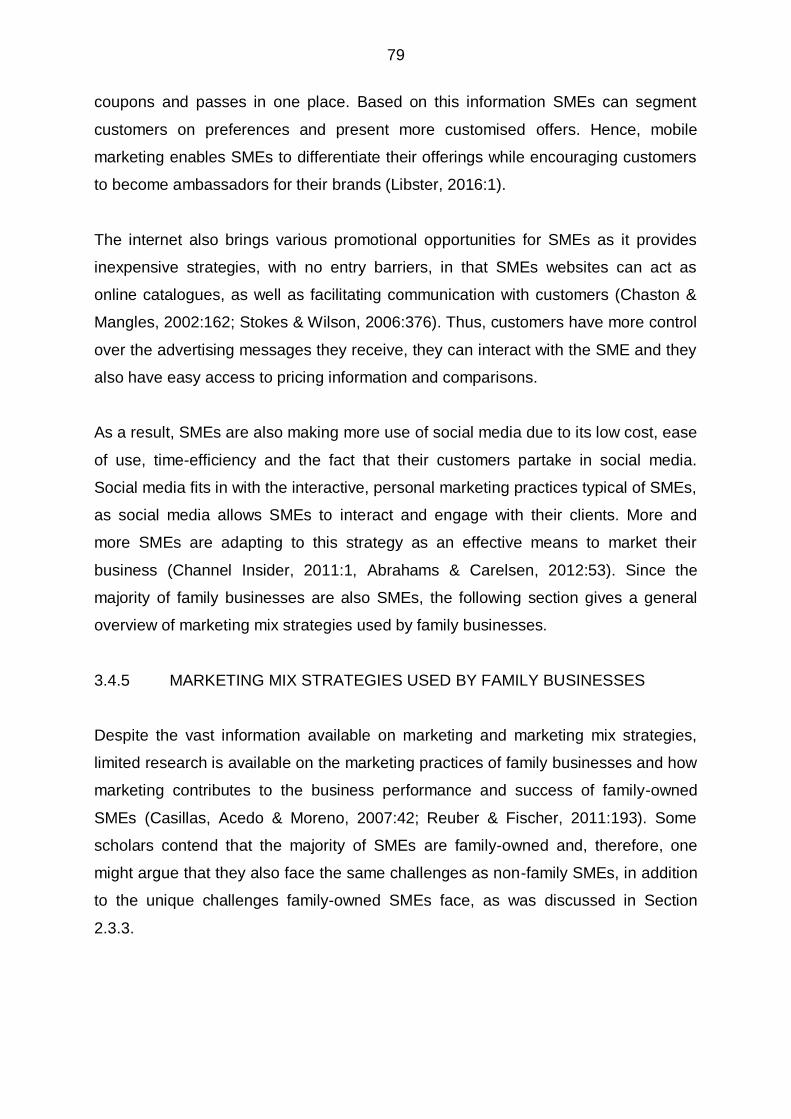
79
coupons and passes in one place. Based on this information SMEs can segment
customers on preferences and present more customised offers. Hence, mobile
marketing enables SMEs to differentiate their offerings while encouraging customers
to become ambassadors for their brands (Libster, 2016:1).
The internet also brings various promotional opportunities for SMEs as it provides
inexpensive strategies, with no entry barriers, in that SMEs websites can act as
online catalogues, as well as facilitating communication with customers (Chaston &
Mangles, 2002:162; Stokes & Wilson, 2006:376). Thus, customers have more control
over the advertising messages they receive, they can interact with the SME and they
also have easy access to pricing information and comparisons.
As a result, SMEs are also making more use of social media due to its low cost, ease
of use, time-efficiency and the fact that their customers partake in social media.
Social media fits in with the interactive, personal marketing practices typical of SMEs,
as social media allows SMEs to interact and engage with their clients. More and
more SMEs are adapting to this strategy as an effective means to market their
business (Channel Insider, 2011:1, Abrahams & Carelsen, 2012:53). Since the
majority of family businesses are also SMEs, the following section gives a general
overview of marketing mix strategies used by family businesses.
3.4.5 MARKETING MIX STRATEGIES USED BY FAMILY BUSINESSES
Despite the vast information available on marketing and marketing mix strategies,
limited research is available on the marketing practices of family businesses and how
marketing contributes to the business performance and success of family-owned
SMEs (Casillas, Acedo & Moreno, 2007:42; Reuber & Fischer, 2011:193). Some
scholars contend that the majority of SMEs are family-owned and, therefore, one
might argue that they also face the same challenges as non-family SMEs, in addition
to the unique challenges family-owned SMEs face, as was discussed in Section
2.3.3.
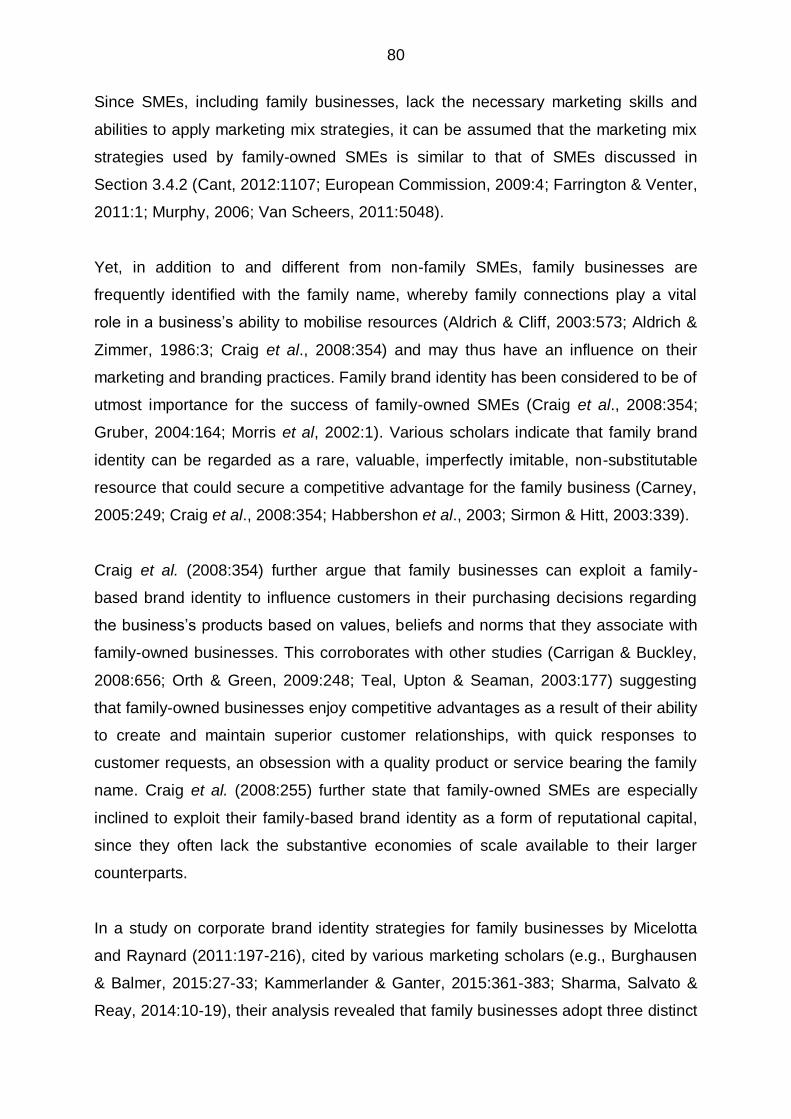
80
Since SMEs, including family businesses, lack the necessary marketing skills and
abilities to apply marketing mix strategies, it can be assumed that the marketing mix
strategies used by family-owned SMEs is similar to that of SMEs discussed in
Section 3.4.2 (Cant, 2012:1107; European Commission, 2009:4; Farrington & Venter,
2011:1; Murphy, 2006; Van Scheers, 2011:5048).
Yet, in addition to and different from non-family SMEs, family businesses are
frequently identified with the family name, whereby family connections play a vital
role in a business‟s ability to mobilise resources (Aldrich & Cliff, 2003:573; Aldrich &
Zimmer, 1986:3; Craig et al., 2008:354) and may thus have an influence on their
marketing and branding practices. Family brand identity has been considered to be of
utmost importance for the success of family-owned SMEs (Craig et al., 2008:354;
Gruber, 2004:164; Morris et al, 2002:1). Various scholars indicate that family brand
identity can be regarded as a rare, valuable, imperfectly imitable, non-substitutable
resource that could secure a competitive advantage for the family business (Carney,
2005:249; Craig et al., 2008:354; Habbershon et al., 2003; Sirmon & Hitt, 2003:339).
Craig et al. (2008:354) further argue that family businesses can exploit a family-
based brand identity to influence customers in their purchasing decisions regarding
the business‟s products based on values, beliefs and norms that they associate with
family-owned businesses. This corroborates with other studies (Carrigan & Buckley,
2008:656; Orth & Green, 2009:248; Teal, Upton & Seaman, 2003:177) suggesting
that family-owned businesses enjoy competitive advantages as a result of their ability
to create and maintain superior customer relationships, with quick responses to
customer requests, an obsession with a quality product or service bearing the family
name. Craig et al. (2008:255) further state that family-owned SMEs are especially
inclined to exploit their family-based brand identity as a form of reputational capital,
since they often lack the substantive economies of scale available to their larger
counterparts.
In a study on corporate brand identity strategies for family businesses by Micelotta
and Raynard (2011:197-216), cited by various marketing scholars (e.g., Burghausen
& Balmer, 2015:27-33; Kammerlander & Ganter, 2015:361-383; Sharma, Salvato &
Reay, 2014:10-19), their analysis revealed that family businesses adopt three distinct
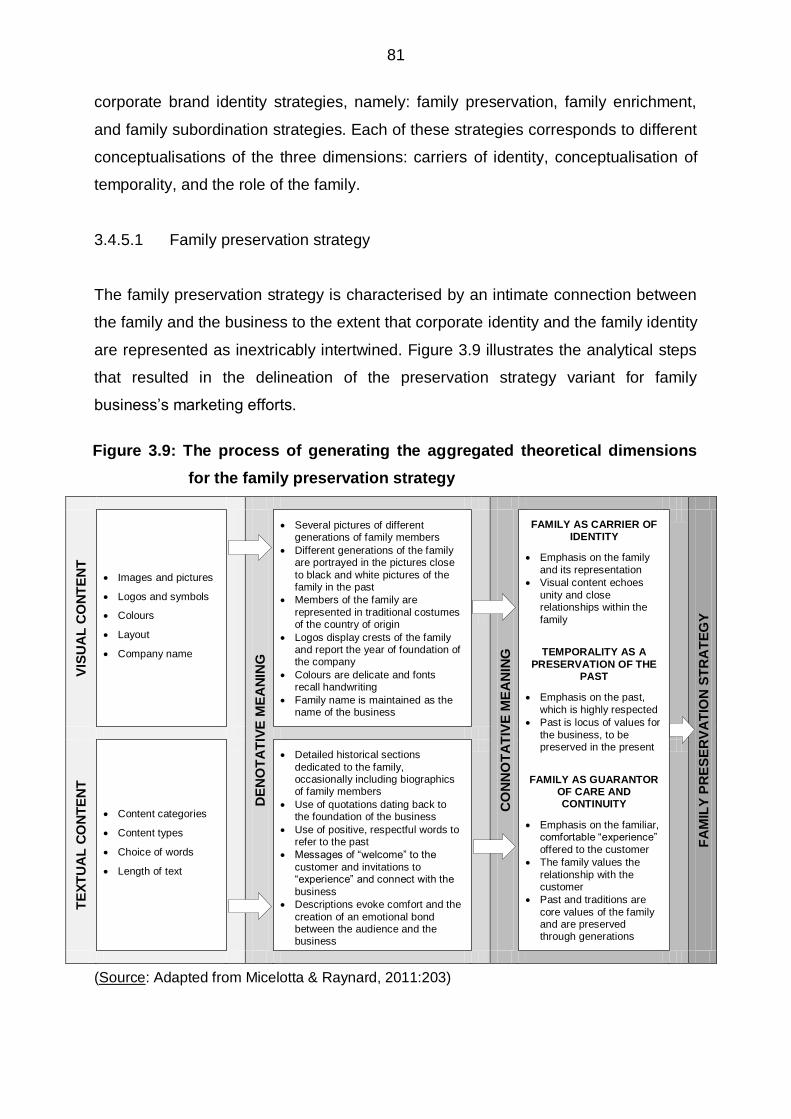
81
corporate brand identity strategies, namely: family preservation, family enrichment,
and family subordination strategies. Each of these strategies corresponds to different
conceptualisations of the three dimensions: carriers of identity, conceptualisation of
temporality, and the role of the family.
3.4.5.1 Family preservation strategy
The family preservation strategy is characterised by an intimate connection between
the family and the business to the extent that corporate identity and the family identity
are represented as inextricably intertwined. Figure 3.9 illustrates the analytical steps
that resulted in the delineation of the preservation strategy variant for family
business‟s marketing efforts.
Figure 3.9: The process of generating the aggregated theoretical dimensions
for the family preservation strategy
VIS
UA
L C
ON
TE
NT
Images and pictures
Logos and symbols
Colours
Layout
Company name
DE
NO
TA
TIV
E M
EA
NIN
G
Several pictures of different generations of family members
Different generations of the family are portrayed in the pictures close
to black and white pictures of the family in the past
Members of the family are
represented in traditional costumes of the country of origin
Logos display crests of the family and report the year of foundation of the company
Colours are delicate and fonts recall handwriting
Family name is maintained as the name of the business
CO
NN
OT
AT
IVE
ME
AN
ING
FAMILY AS CARRIER OF IDENTITY
Emphasis on the family
and its representation
Visual content echoes
unity and close relationships within the
family
TEMPORALITY AS A
PRESERVATION OF THE PAST
Emphasis on the past,
which is highly respected
Past is locus of values for
the business, to be preserved in the present
FAMILY AS GUARANTOR OF CARE AND CONTINUITY
Emphasis on the familiar, comfortable “experience”
offered to the customer
The family values the
relationship with the customer
Past and traditions are
core values of the family and are preserved through generations
FA
MIL
Y P
RE
SE
RV
AT
ION
ST
RA
TE
GY
TE
XT
UA
L C
ON
TE
NT
Content categories
Content types
Choice of words
Length of text
Detailed historical sections
dedicated to the family, occasionally including biographics of family members
Use of quotations dating back to the foundation of the business
Use of positive, respectful words to refer to the past
Messages of “welcome” to the
customer and invitations to “experience” and connect with the
business
Descriptions evoke comfort and the
creation of an emotional bond between the audience and the business
(Source: Adapted from Micelotta & Raynard, 2011:203)
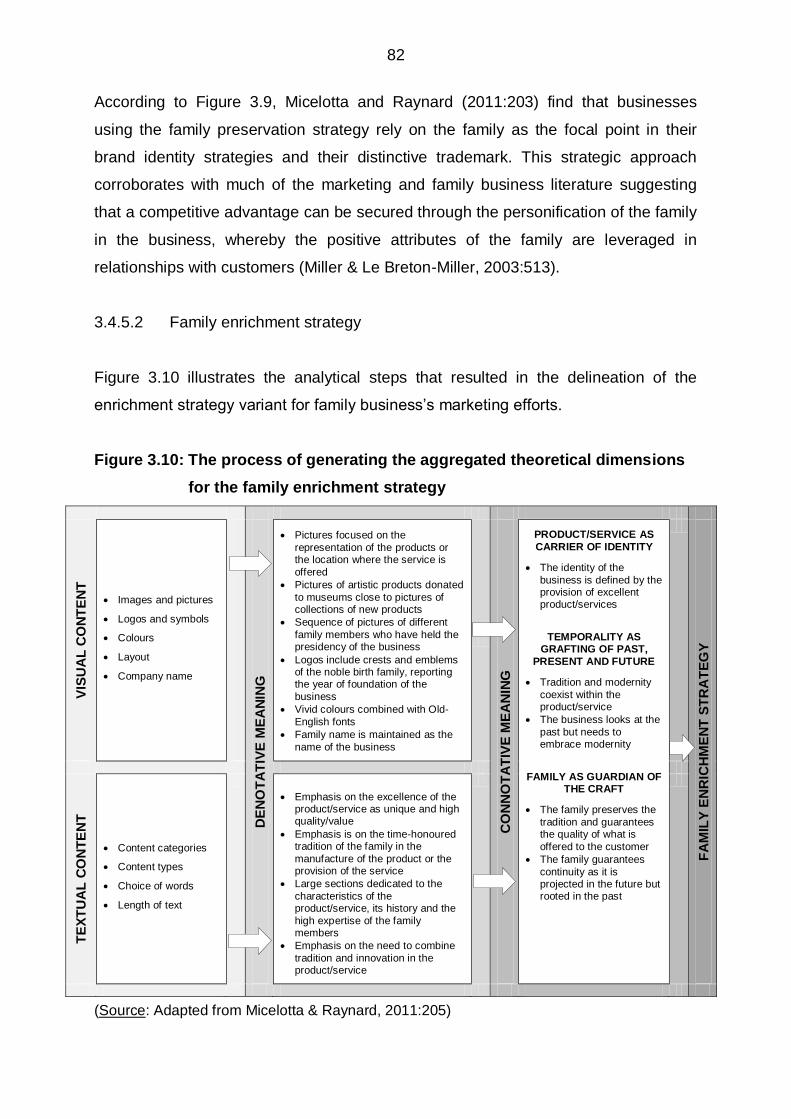
82
According to Figure 3.9, Micelotta and Raynard (2011:203) find that businesses
using the family preservation strategy rely on the family as the focal point in their
brand identity strategies and their distinctive trademark. This strategic approach
corroborates with much of the marketing and family business literature suggesting
that a competitive advantage can be secured through the personification of the family
in the business, whereby the positive attributes of the family are leveraged in
relationships with customers (Miller & Le Breton-Miller, 2003:513).
3.4.5.2 Family enrichment strategy
Figure 3.10 illustrates the analytical steps that resulted in the delineation of the
enrichment strategy variant for family business‟s marketing efforts.
Figure 3.10: The process of generating the aggregated theoretical dimensions
for the family enrichment strategy
VIS
UA
L C
ON
TE
NT
Images and pictures
Logos and symbols
Colours
Layout
Company name
DE
NO
TA
TIV
E M
EA
NIN
G
Pictures focused on the
representation of the products or the location where the service is
offered
Pictures of artistic products donated
to museums close to pictures of collections of new products
Sequence of pictures of different
family members who have held the presidency of the business
Logos include crests and emblems of the noble birth family, reporting the year of foundation of the
business
Vivid colours combined with Old-
English fonts
Family name is maintained as the
name of the business
CO
NN
OT
AT
IVE
ME
AN
ING
PRODUCT/SERVICE AS
CARRIER OF IDENTITY
The identity of the
business is defined by the provision of excellent product/services
TEMPORALITY AS GRAFTING OF PAST,
PRESENT AND FUTURE
Tradition and modernity
coexist within the product/service
The business looks at the
past but needs to embrace modernity
FAMILY AS GUARDIAN OF THE CRAFT
The family preserves the
tradition and guarantees the quality of what is
offered to the customer
The family guarantees
continuity as it is projected in the future but rooted in the past
FA
MIL
Y E
NR
ICH
ME
NT
ST
RA
TE
GY
TE
XT
UA
L C
ON
TE
NT
Content categories
Content types
Choice of words
Length of text
Emphasis on the excellence of the product/service as unique and high quality/value
Emphasis is on the time-honoured tradition of the family in the
manufacture of the product or the provision of the service
Large sections dedicated to the
characteristics of the product/service, its history and the
high expertise of the family members
Emphasis on the need to combine
tradition and innovation in the product/service
(Source: Adapted from Micelotta & Raynard, 2011:205)
83
From Figure 3.10, using the family enrichment strategy, emphasis on the family is
retained in the promotion of the business‟s products and services, but are depicted
as enriched over time as new features are added and old ones are modified
(Micelotta & Raynard, 2011:205). Burghausen and Balmer (2015:27-33) also place
emphasis on shaping a corporate brand identity that intimately links the business‟s
products and services with the heritage of the family. The products and services are
portrayed as being continuously enriched over time, as cumulative know-how and
skills are passed from one generation of the family to the next (Burghausen &
Balmer, 2015:27-33; Micelotta & Raynard, 2011:205).
3.4.5.3 Family subordination strategy
Figure 3.11 illustrates the analytical steps that resulted in the delineation of the
subordination strategy variant for family business‟s marketing efforts.
According to Figure 3.11 and based on Micelotta and Raynard (2011:208), when
employing a family subordination strategy, the familial component of the business is
downplayed, whereas the business components are highlighted in this strategy. The
majority of the visual and textual marketing content focuses on the business, its
history, achievements and visions for the future. Businesses following this strategy
portray themselves as businesses in their own right as opposed to simply extensions
of the family.
Therefore, it is evident that the family‟s role is not as central as in the preservation
and enrichment strategies. By downplaying the centrality of the family, the
businesses may potentially seek to distance themselves from their family origin along
with the connotative meanings typically associated with being a “family business”.

84
Figure 3.11: The process of generating the aggregated theoretical dimensions
for the family subordination strategy
VIS
UA
L C
ON
TE
NT
Images and pictures
Logos and symbols
Colours
Layout
Company name
DE
NO
TA
TIV
E M
EA
NIN
G
Images focus on impersonal
objects, e.g. buildings, facilities, manufacturing systems
There are no pictures of the family, but only of representatives of the
family in their role of managers, e.g. President
Pictures are very formal, e.g.
business attire and poses
Logos are simple and stylised, and
do not include family crests or emblems. Foundation year is usually reported
Use of bright colours and business fonts
Family names are either extended to the group or disappear from the name of the business
CO
NN
OT
AT
IVE
ME
AN
ING
BUSINESS AS CARRIER
OF IDENTITY
The business has an
identity of its own which is separated from the family
TEMPORALITY AS A DISCONNECTION FROM
THE PAST AND
PROJECTION INTO THE FUTURE
Emphasis on the changes
and evolution of the business over time
Emphasis on growth, innovation and vision of the future
FAMILY AS MEMBER OF A TEAM
The family represents a starting point
Members of the family are “employees”, serving
the business
The family contributes to the business‟s success
along with other stakeholders
FA
MIL
Y S
UB
OR
DIN
AT
ION
ST
RA
TE
GY
TE
XT
UA
L C
ON
TE
NT
Content categories
Content types
Choice of words
Length of text
Emphasis on the growth and
achievements of the business, as well as the challenges for the future
Acknowledgement of the participation of various stakeholders to the success of the
business, e.g. customers, suppliers
Acknowledgement of the long
history of the business
Emphasis on the temporal
separation between the origin of the business and the business in the present
Emphasis on dynamism and change as fundamental elements of success
Use of managerial and business language, e.g. office, headquarter,
marketing, careers, opportunities
(Source: Adapted from Micelotta & Raynard, 2011:208)
The following section provides a summary of the dimensions in marketing branding
strategies of family businesses.
3.4.5.4 Summary of family business marketing branding strategies according to
dimensions
Micelotta and Raynard‟s (2011:197-216) results show that family businesses can
employ each of these strategies to differentiate themselves from their competitors
and achieve a better business performance through different combinations of the
three dimensions (Knapp, Smith, Kreiner, Sundaramurthy & Barton, 2013; Reuber &
Fischer, 2011:193).

85
The marketing branding strategies as proposed by Micelotta & Raynard (2011:197-
216) is summarised in Figure 3.12.
Figure 3.12: Marketing branding strategies in family businesses
(Source: Adapted from Micelotta & Raynard, 2011:197-216)
Family-owned SMEs can, therefore, evaluate their marketing decisions against this
framework (Figure 3.12) to adopt a marketing branding strategy that is most suitable
in their context and best aligned with their business objectives to achieve better
business performance.
3.5 SUMMARY
The main focus of this chapter was on examining the nature and importance of
marketing and marketing mix strategies in family and non-family owned SMEs.
Based on the literature, no formal and agreed-upon definitions of marketing could be
found, therefore for the purpose of this study, marketing is defined as the process of
creating, distributing, promoting, and pricing goods, services and ideas to facili tate
satisfying exchange relationships with customers and develop and maintain
favourable relationships with stakeholders in a dynamic environment.
DIMENSIONS
FAMILY PRESERVATION
STRATEGY
FAMILY ENRICHMENT
STRATEGY
FAMILY SUBORDINATION
STRATEGY
Carrier of
identity
Family
Products or
services
Business
Temporality
Preservation
of the past
Grafting of
past, present,
and future
Break from the
past and projection into
future
Role of the
family
Family as
guarantor of care and
continuity
Family as
guardian of
the craft
Family as
member of a
team

86
The different marketing mix strategies were discussed, namely: product, price, place
and promotion strategies. Despite the considerable evolvement of academic and
industry attention to marketing, it has been found that the traditional marketing mix
framework remains a strong staple to develop marketing strategies for SMEs. Finding
an optimal mix that achieves a superior response in the market can create profits,
and ultimately contribute to the business performance and success of SMEs. The
marketing mix strategies used by family and non-family SMEs will, however, vary
according to their own circumstances, resources, market conditions and changing
needs of their customers. Hence, the marketing mix strategies in SMEs and family
businesses were also discussed.
Chapter 4 deals with the relationship between marketing mix strategies and
perceived business performance. The marketing mix strategies that are identified in
Chapter 3, namely: product, price, place and promotion strategies will form the
independent variables of the theoretical model. The chapter will also investigate the
dependent variable namely, Perceived business performance, as well as the
influence that the marketing mix strategies have on Perceived business performance.
87
CHAPTER 4
PROPOSED HYPOTHESISED MODEL OF THE RELATIONSHIPS BETWEEN
MARKETING MIX STRATEGIES AND BUSINESS PERFORMANCE
4.1 INTRODUCTION
Various marketing mix strategies are used by business owners, which have been
identified and discussed in Chapter 3. In this study, the marketing mix strategies
investigated are Product, Place, Price and Promotion strategies. This chapter
presents a model which hypothesises positive relationships between these marketing
mix strategies and the Perceived business performance of small family and non-
family businesses. The independent and dependent variables, forming the basis of
the hypothesised model, as well as the resulting hypothesised relationships and
evidence supporting these relationships, are discussed in this chapter.
4.2 THE HYPOTHESISED MODEL
The marketing mix strategies, namely Product, Pricing, Place and Promotion
strategies, serve as the independent variables and the Perceived business
performance of small family and non-family businesses as the dependent variable in
this study. The proposed hypothesised model and hypothesised relationships are
depicted in Figure 4.1.
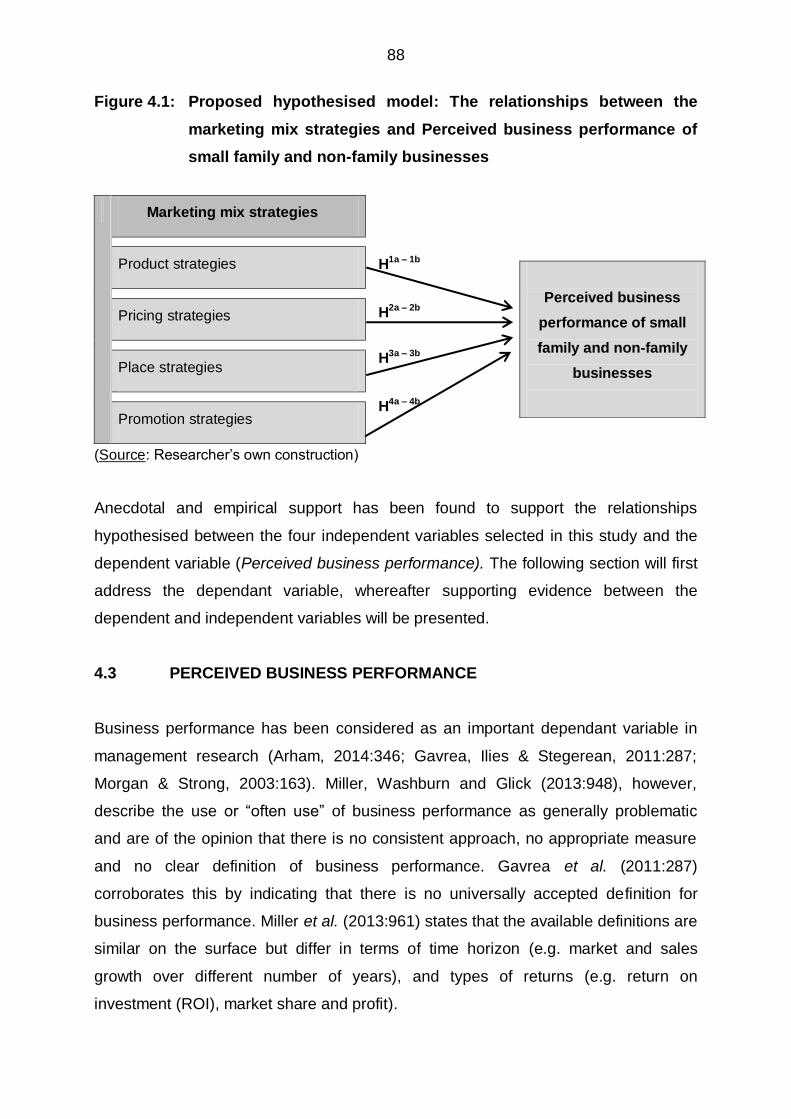
88
Figure 4.1: Proposed hypothesised model: The relationships between the
marketing mix strategies and Perceived business performance of
small family and non-family businesses
H1a – 1b
H2a – 2b
H3a – 3b
H4a – 4b
(Source: Researcher‟s own construction)
Anecdotal and empirical support has been found to support the relationships
hypothesised between the four independent variables selected in this study and the
dependent variable (Perceived business performance). The following section will first
address the dependant variable, whereafter supporting evidence between the
dependent and independent variables will be presented.
4.3 PERCEIVED BUSINESS PERFORMANCE
Business performance has been considered as an important dependant variable in
management research (Arham, 2014:346; Gavrea, Ilies & Stegerean, 2011:287;
Morgan & Strong, 2003:163). Miller, Washburn and Glick (2013:948), however,
describe the use or “often use” of business performance as generally problematic
and are of the opinion that there is no consistent approach, no appropriate measure
and no clear definition of business performance. Gavrea et al. (2011:287)
corroborates this by indicating that there is no universally accepted definition for
business performance. Miller et al. (2013:961) states that the available definitions are
similar on the surface but differ in terms of time horizon (e.g. market and sales
growth over different number of years), and types of returns (e.g. return on
investment (ROI), market share and profit).
Marketing mix strategies
Product strategies
Pricing strategies
Place strategies
Promotion strategies
Perceived business
performance of small
family and non-family
businesses
89
Arham (2014:346) and Flören (2002:25) confirm that financial performance measures
such as growth in market share, financial results, profitability and number of
employees are often used to measure business performance. Furthermore,
Abrahams and Carelsen (2012:71) and Van Scheers (2011:5048-5056) indicate that
growth in sales, employees and profits over a two year period should be used as
financial measures to define business performance. Other authors (Cura, 2014:58;
Mahapatro, 2010:272) indicate that business performance is concerned with non-
financial measures such as the ability of the business to fulfil its mission through
sound management, strong governance and a persistent dedication to achieve
results leading to job, employee and customer satisfaction, as well as goal
achievement. Morgan (2012:113) places more emphasis on customer loyalty as a
non-financial measure of business performance, stating that realised positional
advantages capturing how the business‟s value offering is viewed by target
customers and the cost to the business of achieving this position are the immediate
pre-cursers to business performance.
Various researchers (Cura, 2014:58; Eid & Elgohary, 2013:45; Gavrae et al.,
2011:287; Obiwuru, Okwu, Akpa & Nwankwere, 2011:101) emphasise that business
performance is a multidimensional construct and, therefore, a combination of both
financial and non-financial measures should be used when measuring business
performance. Obiwuru et al. (2011:101) indicate that business performance is not
only the ability of the business to achieve high profits, a large market share and good
financial results, but also the ability to achieve quality products, business growth,
development and survival at a pre-determined time using strategic actions. Van
Scheers (2011:5050) and Cant (2012:1110) also highlight common financial and non-
financial measures of business performance, such as focusing on profitability,
perceived success, growth in the customer base and customer, employee and owner
satisfaction.
Arham (2014:346) is of the opinion that growth in SME‟s employee size and
customer base has been considered an important measure for business performance
as it is a more precise and easily accessible measure compared to accounting
indicators, and as such provides a more superior indicator of business performance.
90
Arham (2014:346), however, stresses that non-financial measures for business
performance should not be viewed in complete isolation as profitability is also an
important measure for business performance in SMEs as it is unlikely that business
growth can be sustained without profit contributions.
As family businesses represent the majority of SMEs, it can be assumed that
business performance of family businesses are measured using the same financial
and non-financial indicators as those discussed above. In addition, some studies
indicate other non-financial measures important for business performance of family-
owned SMEs. Memili, Eddleston, Kellermanns, Zellweger and Bernett (2010:201)
and Craig, Dibrell and Davis (2008:357) indicate that the family business‟s image and
brand identity, discussed in Section 3.4.5 of Chapter 3, positively contributes to the
business performance of a family business by establishing a business‟s family
heritage and reputation in the community. Evidence suggests that the image of family
businesses has a significant positive relationship with business performance in terms
of relative growth in sales and market share compared to competitors (Memili et al.,
2010:201). Zellweger, Kellermanns, Eddleston and Memili (2012:241) also suggest
that a positive relationship between family business image and business
performance exists as family brand identity positively contributes to the growth and
profitability of the family business due to its influence on customer-centred values.
Hence, family businesses that promote a family business image may be able to
capitalise on customers‟ positive perception of family businesses since these
businesses are seen as trustworthy.
Numerous studies (Gavrae et al., 2011:287; Lebans & Euske, 2006:1; Zulkiffi &
Perera, 2011:3), however, caution that objective performance should not be confused
with perceived business performance. Objective performance measures can obscure
the relationships between independent variables and business performance;
whereas perceived business performance measures are influenced by personal
judgement and performance may thus be understood differently depending on the
person involved in the assessment of business performance (Gavrae et al.,
2011:287; Lebans & Euske, 2006:1; Zulkiffi & Perera, 2011:3). Song, Droge,
Hanvanich and Calantone (2005:262) are of the opinion that perceived business
performance is the most effective way to examine business performance as it allows
91
comparisons across businesses and contexts, including industry type, time horizons,
cultures and economic conditions.
Therefore, for the purpose of this study, Perceived business performance will be
measured in terms of both financial and non-financial measures and refers to the
small family or non-family business experiencing growth in profit, sales and number
of employees over the last two years, as well as the business having loyal customers
who make regular purchases and who recommend the business to others.
The relationships between the marketing mix strategies and Perceived business
performance and evidence supporting these relationships will be discussed in the
sections that follow.
4.4 MARKETING MIX STRATEGIES AND BUSINESS PERFORMANCE
The role of marketing in explaining business performance has received significant
attention throughout the history of the marketing discipline. Nonetheless, academics
and managers have struggled for many years to understand and delineate the role of
marketing in explaining business performance differences between businesses
(Morgan, 2012:102). Business performance, specifically in a marketing context, has
been measured using various integrated performance indicators namely: gaining new
sales, gaining new customers, gaining new markets and reduction of sales cost (Eid
& El-Gohary, 2013:45). Simpson, Padmore, Taylor and Frecknall-Hughes (2006:368)
point out studies that have consistently shown that businesses that were marketing
orientated performed better in terms of return on investment (ROI), market share and
profit. Simpson et al. (2006:368), however, still caution, in the case of marketing, not
to only use financial measures for business performance, as ROI can be affected by
operational changes and the business‟s choices regarding pay policy on
remuneration and the way they run their operations can reduce their profit and,
therefore, their tax obligation.

92
Several empirical studies have reported significant positive relationships between
marketing in general and business performance. Simpson et al. (2006:366) highlight
studies that have consistently shown that businesses which are marketing orientated,
or competent practitioners of marketing, have better business performance in ROI
and market share. Research by Hinson and Mahmoud (2011:35) and Perry (2014:97)
corroborates the preceding findings which indicate that businesses that successfully
implement marketing or are marketing orientated enjoy superior business
performance.
Research investigating the competitive advantage of SMEs, whether family-owned or
not, has consistently emphasised the importance of marketing as a key factor in
business survival and growth, as measurements of business performance (Walsh &
Lipinski, 2009:570). Berthon (2008:27-45) shows how strategic marketing practices,
such as knowledge of current market conditions and customer needs, are positively
related to the business performance of SMEs. Simpson et al. (2006:366) reported
that marketing positively contributes to the business performance and business
success of SMEs and their ability to think strategically. SMEs showing a better
business performance, in terms of profit, sales volume, market share and ROI, give a
higher priority to marketing, particularly strategic marketing planning, than other
business functions in their overall approach to business. Walsh and Lipinski
(2009:571) also indicate that although marketing activities in SMEs may be different
from that of their larger counterparts, the marketing function in SMEs also contributes
positively to their business success.
Mintz and Currim (2013:25) specifically highlight the relationships between marketing
mix strategies and business performance. They assert that the activities or decisions
made regarding the marketing mix strategies are crucial as they play a significant
role in enhancing customer satisfaction, customer loyalty and growing market share
through financial outcomes, such as sales, profitability and ROI. Hence, performing
the optimum marketing mix activities and decisions, by integrating both financial and
non-financial measures of business performance, as suggested by the preceding
researchers and consistent with Perceived business performance defined in this
study, can lead to improved business performance.
93
Recent advances in the marketing interface have begun to provide more empirical
evidence of the impact of specific marketing mix strategies on business performance
(Morgan, 2012:102). Singh (2012:40) states that the marketing mix strategies offer
an optimum combination of all marketing ingredients so that the business can realise
its goals, such as profit, sales volume, market share and ROI, to achieve superior
business performance.
The following sections provide anecdotal and empirical evidence supporting the
relationships between the four marketing mix strategies, which form the independent
variables in this study, and business performance.
4.4.1 PRODUCT STRATEGIES AND BUSINESS PERFORMANCE
Ehmke et al. (2015:1) and Kotler et al. (2016:276) emphasise that product strategies
include decisions and activities that are associated with the product‟s appearance,
function and support needed. Morgan (2012:106) and Singh (2012:40-43) provide
anecdotal evidence suggesting that product marketing mix strategies have a positive
influence on business performance if the decisions and activities, such as those
mentioned above, relate to the product concerns the necessary process of adapting,
maintaining and delivering product and service offerings to satisfy customer needs.
Singh (2012:40-43) further indicates that product strategies are controllable variables
that the business can used to influence customer responses and satisfaction. Making
the appropriate decisions and exercising the correct activities will allow goal
achievement in terms of the measurements, such as profit, sales, market share and
ROI as previously explained, for achieving improved business performance (Singh,
2012:40-43). Appropriate decisions and activities, for example the usefulness of the
product to satisfy customer needs, providing high quality products, offering extra
value and suitable branding can all positively influence the financial bottom line of the
business, as well as the performance of the business as a whole (Singh, 2012:40-
43).
Morgan (2012:106) contends that businesses who produce and deliver valuable and
appealing product offerings with well-developed business routines for evaluating
product performance and are adapting existing product offerings to match changing
94
customer requirements and competitive imperatives, will in turn have a positive
influence on levels of performance in the business. In addition, the product strategies
that focus attention on understanding the needs of customers within targeted
segments have a desired relationship with business performance (Morgan,
2012:106).
An empirical study by Mintz and Currim (2013:17-40), among 439 businesses in the
United States of America, have found that product strategies have a positive
influence on business performance, both in terms of financial and non-financial
measures. Mintz and Currim (2013:20-24) indicate that product strategies that focus
on the development of product offerings, to keep up with customers ever-changing
needs, will result in improved business performance. Visnjic, Wiengarten and Neely
(2016:36-52) also found product innovation strategies to have a positive impact on
business performance.
Despite the fact that a vast amount of anecdotal and empirical studies on product
strategies exists, very little empirical research has been conducted on the influence
of product marketing activities and strategies specifically used by SMEs and its
influence on business performance, whether family-owned or not (Abrahams &
Carelsen, 2012:3; Jones & Rowley, 2011:26). Some empirical studies (e.g.
Abrahams & Carelsen, 2012:115-119; Neneh & van Zyl, 2013:112) have found that
SMEs which create and provide a product that satisfies their target customers have a
significant positive influence on the business success and growth of the SME. SMEs
that ensure their product offering is current, by generating ideas for new products that
are different from competitors, which is something their customers actually want on a
recurring basis, will lead to improved business performance (Abrahams & Carelsen,
2012:115-119; Neneh & van Zyl, 2013:112).
As explained in Chapter 3, Section 3.4.5, in addition to and different from non-family
SMEs, family-owned SMEs and their products or services are often identified or
associated with the family name and thus have an influence on their product
branding, a primary decision for a product strategy as explained in Chapter 3,
Section 3.3.1.3 (Aldrich & Cliff, 2003:573; Craig et al., 2008:354; Micelotta &
Raynard, 2011:200). Anecdotal evidence (Gruber, 2004:164; Micelotta & Raynard,
95
2011:200; Morris, Schindehutte & Laforge, 2002:1) suggests that family brand
identity has a positive influence on business performance and the success of family-
owned SMEs. Empirical evidence (Craig et al., 2008:354; Zellweger, Nanson &
Nordqvist, 2011:241) also indicates that family-based product brand identity
positively contributes to the business performance of family-owned SMEs through
growth and sales via a customer-centric orientation and not a product-centric
approach.
For the purpose of this study, Product strategies refers to strategies that small family
and non-family businesses perform concerning the product or service in terms of
providing an up-to-date, need-satisfying benefit to their target market that is
distinguishable from competitors. Product strategies include supplying the target
market with products containing the minimum basics and relevant features, as well
as identifying the product/service with certain brand associations.
Given the discussion above, the following hypothesis is formulated and subjected to
empirical testing in this study:
H1a – 1b: There is a positive relationship between Product strategies and the
Perceived business performance of small family and non-family businesses.
4.4.2 PRICING STRATEGIES AND BUSINESS PERFORMANCE
Several authors (Ehmke et al., 2015:1; Hellriegel et al., 2012:77; Kotler et al.,
2016:276) emphasise that price strategies include decisions and activities that are
associated with covering business costs, contribute to the image of the business by
communicating the perceived value of its product, counter the competition‟s offer,
and avoid deadly price wars. Ehmke et al. (2015:1) and Kotler et al. (2016:297) state
that pricing is the one marketing mix strategy that generates revenue, while the other
three strategies incur costs. Hence, pricing strategies are critical for revenue and
business profits, which are, as previously explained, important measures for
achieving business performance (Lamb et al., 2012:406).
96
Anecdotal evidence (Singh, 2012:40-44; Morgan, 2012:106) suggests that price
marketing mix strategies have a positive influence on business performance if the
decisions and activities, such as those mentioned above related to pricing, concerns
customers perceptions of value and attaining a competitive advantage in the market.
Morgan (2012:106) contends that businesses with strong pricing strategies, who are
knowledgeable about the impact product pricing has on customer value perceptions,
and competitors‟ current and planned pricing decisions and activities, will in turn have
a positive influence on the levels of performance in the business. Hence, businesses
that utilise this knowledge to develop appropriate pricing strategies will experience a
positive influence on business performance.
Mintz and Currim (2013:17-40) empirically found that pricing strategies for
businesses, in terms of financial measures, have a positive influence on business
performance. Mintz and Currim (2013:22) indicate that businesses employ more
financial measures, as opposed to non-financial measures, when making pricing
strategies such as margin, target volume, ROI and price elasticity. Their evidence
also suggests that if businesses should increase the use of both financial and non-
financial measures in making pricing marketing-mix decisions and strategies, better
business performance will be experienced (Mintz & Currim, 2013:28).
Despite a vast majority of anecdotal research, limited empirical research has been
conducted on the influence of pricing strategies specifically used by SMEs and its
influence on business performance (Abrahams & Carelsen, 2012:3; Jones & Rowley,
2011:26). Anecdotal evidence (Bressler, 2012:3; Gilmore, 2011:140) suggests that
SMEs could find the greatest likelihood for superior business performance and
success by competing with high prices and offering customers better value.
Customers will often pay significantly higher prices for offering extra value to exceed
their expectations, better service and quality, preferred brand or image and
convenience (Bressler, 2012:3; Gilmore, 2011:140). In contrast, an empirical study
(Keh, Nguyen & Ng, 2007:592-611), conducted among Singaporean SMEs, found a
non-significant relationship between pricing strategies and business performance,
which may be explained by the characteristics of the SME sample, being mainly from
the retail and service industry, with 41% of the SME sample having five or fewer
employees. Keh et al. (2007:608) assert that SMEs are usually the price-takers in the
97
industry, and, therefore, they have no capacity to actively change their price level for
specific product categories. Consequently, SMEs are often price followers in the
market, by keeping in line with the pricing strategies of their larger counterparts or
market leaders as a defensive measure to avoid the aggressive tactics of larger
competitors (Keh et al., 2007:608). In the same manner, Abrahams and Carelsen
(2012:35) found no empirical support for the relationship between pricing strategies
and the business performance of SMEs in South Africa. Abrahams and Carelsen
(2012:35) concluded that SMEs seldom set prices that cover business costs based
on estimated demand in order to maximise current profits.
No substantial empirical research has been conducted specifically on the influence of
pricing strategies used by family-owned SMEs and their business performance. As
explained in Chapter 3 Section 3.4.2, it can be assumed that the pricing strategies
used by family-owned SMEs are similar to that of non-family SMEs. In addition,
family-owned SMEs are frequently identified with the family name, whereby family
connections play a vital role in a business‟s ability to mobilise resources (Aldrich &
Cliff, 2003:573; Aldrich & Zimmer, 1986:3; Craig et al., 2008:354) and may thus have
an influence on their pricing marketing mix strategies. Family-owned SMEs and their
products or services are often identified or associated with the family name and thus
have an influence on their product branding (Aldrich & Cliff, 2003:573; Craig et al.,
2008:354; Micelotta & Raynard, 2011:200). Thus, it can be assumed, from an
anecdotal research viewpoint, that customers of family-owned SMEs may be willing
to pay higher prices for a preferred brand associated with the family name. However,
no viable research exists on whether pricing strategies of family-owned SMEs have a
positive influence on business performance.
For the purpose of this study, Pricing strategies refers to the pricing tactics that small
family and non-family businesses perform in order to attract and retain customers,
such as setting a price to cover total costs related to demand for products, quality
and value expected by and delivered to customers, or to be competitive.
98
Based on the preceding discussion, the following hypothesis has been formulated,
and is subjected to empirical testing:
H2a – 2b: There is a positive relationship between Pricing strategies and the
Perceived business performance of small family and non-family businesses.
4.4.3 PLACE STRATEGIES AND BUSINESS PERFORMANCE
Chaston and Mangles (2002:193) and Singh (2012:42) explain that place strategies
include decisions and activities that are associated with moving goods cost-
effectively from production to the final customer. Abrahams and Carelsen (2012:46)
further summarise the place/distribution marketing strategy as including all the
activities that ensure the products are within the reach of the customers. Morgan
(2012:107) and Singh (2012:42-44) provide anecdotal evidence suggesting that
place marketing mix strategies have a positive relationship with business
performance. If the decisions and activities regarding place strategies add significant
value to end-user customers, improved business performance can be experienced as
a result (Morgan, 2012:107). Appropriate decisions and activities, such as efficiently
and effectively managing and supporting channel intermediaries‟ efforts for
developing beneficial relationships, can all positively influence business performance
(Morgan, 2012:107).
Singh (2012:42) asserts that place strategies have a significant impact on the
profitability of the business, an important financial measure for business
performance. Therefore, businesses with excellent supply chain and logistics
management plans for distribution enjoy superior business performance. Singh
(2012:42) further stresses that all four marketing mix strategies are interconnected.
Thus, by increasing the price of the product, the demand for the product may
decrease and, therefore, fewer distribution points may be required. Hence, if no
significant relationship between price strategies and business performance exists,
the same may be expected for place strategies as decisions and activities for one
market mix strategy may have a snowball effect on others (Singh, 2012:42). Mintz
and Currim (2013:17-40) contend that place/distribution decisions and activities are
more readily tied to financial measures such as channel margins, target volume,

99
inventory, number of distributors and net profit. Mintz and Currim (2013:17-40),
however, empirically found no support for the positive relationship between
place/distribution strategies for businesses, in terms of financial measures, and
business performance.
Anecdotal evidence (Bressler, 2012:4; Abrahams & Carelsen, 2012:115) suggests
that place strategies have a positive influence on the business performance of SMEs.
Bressler (2012:4) asserts that SMEs who effectively leverage their place decisions
and activities of their marketing mix through superior distribution, by the effective use
of location variables, enjoy improved business performance. SMEs usually obtain a
competitive advantage over larger businesses through joining alliances, developing
long term relationships with customers and providing exceptional services such as
keeping delivery promises and exploiting economies of scale (Abrahams & Carelsen,
2012:115; Bressler, 2012:4; Gilmore, 2011:140). Abrahams and Carelsen (2012:115)
further indicate that distribution can be beneficial to the business performance of
SMEs in terms of lowering costs through inventory stockholding on their behalf by
agents or using the internet as a distribution channel to reach previously unattainable
markets.
An empirical study (Keh et al., 2007:592-611), conducted among Singaporean SMEs,
found a positive relationship between place strategies and business performance.
Empirical evidence indicated that these SMEs channel their limited marketing
resources towards greater place/distribution strategies, as opposed to product and
price strategies, where they have more control. Therefore, these SMEs pay more
attention to location and distribution issues, which affect customer convenience and
accessibility, to improve business performance (Keh et al., 2007:608). In contrast,
Abrahams and Carelsen (2012:115) found no empirical support for the positive
relationship between place strategies of South African SMEs and business
performance.
As previously assumed, place strategies used by family-owned SMEs are similar to
that of non-family SMEs, in addition to family-owned SMEs being frequently identified
with the family name (Aldrich & Cliff, 2003:573; Aldrich & Zimmer, 1986:3; Craig et
al., 2008:354). An empirical study (Micelotta & Raynard, 2011:210) on using an

100
internet distribution channel found that family-owned SMEs use a family preservation
strategy, that relies on the family as the focal point of their corporate brand identity
strategies and their distinctive family trademark, which contributes positively to their
business performance. Empirical findings by Micelotta and Raynard (2011:210) are
consistent with anecdotal findings by Craig et al. (2008:354) contending that family-
owned SMEs may be especially inclined to leverage their distinctive family name as a
means to differentiate themselves from their larger counterparts in terms of place
strategies, and hence improve business performance.
For the purpose of this study, Place strategies refers to distribution process methods
employed by small family and non-family businesses such as setting delivery
objectives, using distribution channel selection criteria based on image, reputation
and ensuring product availability, and changing the distribution channel when needed
to sell directly to customers or in the most cost effective way.
Given the discussion above, the following hypothesis has been formulated, and is
subjected to empirical testing:
H3a – 3b: There is a positive relationship between Place strategies and the Perceived
business performance of small family and non-family businesses.
4.4.4 PROMOTION (MARKETING COMMUNICATION) STRATEGIES AND
BUSINESS PERFORMANCE
Hellriegel et al. (2012:79) and Lamb et al. (2012:338) emphasise that promotion
strategies include marketing communication decisions and activities that a marketer
may use in the marketplace to inform and educate customers about the products and
services the business has to offer. Morgan (2012:107) and Singh (2012:44) suggest
that effective communication with customers and prospects is an essential marketing
capability associated with customer value delivery which will lead to improved
business performance. Morgan (2012:107) further indicates that communicating the
benefits of the business‟s new products and services to potential customers,
reminding present customers about product benefits and availability, and reinforcing
the purchase decision to reduce cognitive dissonance are essential promotion
101
strategies to be performed in order to possess strong marketing communication
capabilities that will lead to improved business performance. An empirical study by
Mintz and Currim (2013:17-40) among American businesses, has found that
promotion strategies, including traditional marketing, internet advertising and direct-
to-customer marketing, have a positive influence on business performance, in terms
of financial measures.
Anecdotal evidence conducted in the SME sector (Abrahams & Carelsen, 2012:49;
Bressler, 2012:5) suggests a positive relationship between promotion strategies of
SMEs and business performance. Bressler (2012:5) asserts that promotional
strategies of SMEs that are more visible to potential customers, that gain the
attention of the public either through good timing, suitable promotion choices, and
linked to other promotions, will lead to improved business performance. Hence,
SMEs that understand promotion strategies as part of the integrated marketing
campaign experience improved business performance (Bressler, 2012:5). Abrahams
and Carelsen (2012:49) further indicate that SMEs who find innovative ways of
communicating their promotion strategy message to customers, due to limited
resources and restriction in terms of promotions, are more likely to experience
improved business performance.
Several empirical studies (Abrahams & Carelsen, 2012:115-119; Dzisi & Ofosu,
2014:108; Keh et al., 2007:608; Resrick & Cheng, 2011:4) have found a significant
positive relationship between certain promotional strategies and business
performance of SMEs. Resrick and Cheng‟s (2011:4) empirical findings among SMEs
in England indicated that traditional promotional activities such as advertising were
not considered to contribute to the business performance of SMEs, whereas word-of-
mouth communication and an on-going dialogue with both existing and potential new
customers have a positive influence on business performance. Dzisi and Ofosu
(2014:105-108) found a positive relationship between traditional and non-traditional
promotional strategies and business performance of SMEs in Ghana. Traditional
promotional strategies are, however, found to be more positively related to the
business performance of SMEs than non-traditional promotion strategies. The
empirical results indicated that SMEs mostly use traditional forms of promotional
strategies, mainly television and radio, newspaper and magazine, banners and

102
billboards to attract the attention of prospective customers. Few SMEs followed non-
traditional promotion strategies such as utilising technology in reaching their
customers. Social media, such as Facebook, was, however, the most frequently used
promotion platform rather than emails and websites (Dzisi & Ofosu, 2014:105-108).
Abrahams and Carelsen (2012:119) empirically found that when SMEs in South
Africa follow a marketing process in their communication strategies to the target
market, they will reap the benefits of improved business performance. The
implication of this empirical finding is that the business performance of SMEs can be
achieved by designing marketing communication strategies such as identifying a
target audience, developing objectives and an effective communication message to
reach them, and evaluating the message for effectiveness. Thus, current and
potential customers must be made aware of what the offering is and how to find it,
which must be communicated via this message (Abrahams & Carelsen, 2012:119).
As previously explained family-owned SMEs and their products or services are often
identified or associated with the family name and thus have an influence on their
promotion strategies (Aldrich & Cliff, 2003:573; Craig et al., 2008:355; Micelotta &
Raynard, 2011:200). Considerable anecdotal evidence suggests that family-owned
SMEs benefit from incorporating their unique family-based identity in their promotion
strategies (Craig et al., 2008:355). Craig et al. (2008:355) assert that family-owned
SMEs that focus their promotion strategies on promoting the fact that they are a
socially responsible family business and focus on public relations in creating a
favourable business image, experience improved business performance. Memili et al.
(2010:201) and Zellweger et al. (2012:241-243) corroborate these findings by
empirically proving that the family business‟s image contributes to its business
performance by parlaying a business‟s family heritage and favourable established
reputation in the community through public relation strategies. Therefore, the
perception of how external stakeholders view the business is expected to influence
their business image and thus business performance. Further empirical evidence
(Micelotta & Raynard, 2011:212), investigating the extent to which family-owned
business‟s leverage on the familial component of their business in their promotion
strategies involving online communication strategies, found a positive relationship
with its business performance.
103
For the purpose of this study, Promotion strategies refers to the process of
developing marketing communication strategies that small family and non-family
businesses use which includes setting marketing communication objectives,
selecting a target market to convey the message via various written, digital and
mobile communication media and techniques which could reach both current and
potential customers.
Given the preceding discussion, the following hypothesis has been formulated and is
subjected to empirical testing in this study:
H4a – 4b: There is a positive relationship between Promotion strategies and the
Perceived business performance of small family and non-family businesses.
4.5 SUMMARY
In this chapter, the proposed hypothesised model was presented and four
hypotheses formulated. For the purpose of this study, four independent variables
influencing the Perceived business performance of small family and non-family SMEs
were identified. These variables were identified as Product, Price, Place and
Promotion strategies. The aforementioned marketing mix strategies were
hypothesised as influencing the Perceived business performance of small family and
non-family SMEs.
Chapter 5 will present the research design and methodology adopted to achieve the
objectives of the study. Specific attention will be given to describing the research
design, paradigms and methodologies adopted in this study, as well as the data
collection including the population, sample, sampling technique and the data
collection method. Furthermore, the administration of the measuring instrument and
ethical considerations, missing data and methods of data analysis including the
validity and reliability of the measuring instrument, and the statistical techniques
employed to analyse the data in this study, will be discussed.
104
CHAPTER 5
RESEARCH DESIGN AND METHODOLOGY
5.1 INTRODUCTION
The primary objective of this study is to establish what marketing mix strategies are
used by small family and non-family businesses in the Eastern Cape, and the
influence of these strategies on Perceived business performance. In the previous
chapter, the proposed hypothesised model of the relationships between the four
marketing mix strategies and Perceived business performance was discussed. This
chapter will provide an overview of the research design and methodology used in this
study to achieve the primary objective.
More specifically, the research design, paradigms and methodologies available and
adopted in this study are explained and justified. Thereafter, the research
approaches available and adopted in this study are discussed. Next, the data
collection process and methods are explained referring to, amongst others, the
population studied, as well as a description of the sampling techniques, the sampling
technique used in this study and sample size. The data collection, including the
operationalisation of the independent and dependent variables and an explanation of
how the measuring instrument was developed and administered, will follow. Ethical
considerations are also to be conveyed. Missing data will be discussed, following the
methods employed to assess the validity and reliability of the measuring instrument.
Finally, a brief description of the descriptive and inferential statistics applicable to this
study is provided.
5.2 RESEARCH DESIGN, PARADIGMS AND METHODOLOGIES
A research design is the specification of methods and procedures for attaining the
necessary information for a study (Acharyulu & Reddy, 2009:33; Zikmund et al.,
2013:64). Bellamy (2011:20) and Zikmund et al. (2013:64) further describe a
research design as a framework or plan which identifies the methods and procedures
to be followed in order to create, collect, construct, code, analyse and interpret data
relevant to a study. Such a framework or plan is fundamental to ensure that the
105
research problem is effectively addressed (Labaree, 2013:2; Zikmund et al.,
2013:64). Therefore, a research design is often referred to as the blueprint of a study,
which includes the collection, measurement and analysis of data to scientifically
accomplish the objectives of the study (Du Plessis & Rousseau, 2009:19, Yocam,
2008:42, Yin, 2011:75). Collis and Hussey (2014:11) are of the opinion that the first
step in the research design is determining the research paradigm of the study. The
following section will present the two main research paradigms available to
researchers, as well as the methodologies often associated with these paradigms.
The discussion on why the positivistic research paradigm and a quantitative
methodology was chosen for this study will be provided.
5.2.1 RESEARCH PARADIGMS AND METHODOLOGIES
A theme running through discussions of research methods, as discussed in the
previous section, is the contrast between research paradigms (Hakim, 2012:9; Collis
& Hussey, 2014:11). Several authors (Collis & Hussey, 2014:11; Johnson &
Christensen, 2012:31) assert that a research paradigm reflects the perspectives and
beliefs of researchers based on their assumptions, concepts, values and practises,
which are imperative to provide guidance on how the research should be conducted.
Collis and Hussey (2014:43) refer to these research paradigms or approaches as
being mainly interpretivistic or positivistic in nature. In turn, an interpretivism
paradigm is often associated with qualitative methodologies, while a positivism
paradigm is often associated with quantitative methodologies (Collis & Hussey,
2014:43).
5.2.1.1 Interpretivism paradigm and qualitative methodology
According to Collis and Hussey (2014:44-46) an interpretivism paradigm involves
qualitative, subjective, humanist and phenomenological research. Various
researchers (Bryman & Bell, 2011:24; Collis & Hussey, 2014:46), however, indicate
that an interpretivism paradigm is qualitative in nature as it is often associated with
qualitative research methodologies. More specifically, an interpretivism paradigm,
involves developing theories which are highly subjective in order to understand the
behaviour of people from the respondents„ perspective (Struwig & Stead 2013:6;
106
Zikmund et al., 2013:137). Qualitative researchers approach the world in an
interpretive and naturalistic sense by studying things in their natural setting, which
involves the identification of how people personally experience a particular situation,
concept or phenomenon through the study of a small sample of participants (Collis &
Hussey, 2014:44).
In other words, to understand the social and cultural context within which people live,
qualitative researchers are interested in how people make sense of their world and
their experiences in the world (Denzin & Lincoln, 2005:3; Merriam, 2009:13). Nkwi,
Nyamongo and Ryan (2001:1) and Zikmund et al. (2013:133) related qualitative
research to qualities and non-numerical attributes to examine perceptions that will
enable a researcher to understand human behaviour better. Furthermore, Denzin
and Lincoln (2005:3) state that qualitative research consists of a set of interpretive
material practices that transform and make the world visible. The defining criterion
that turns the world into a series of representations, include field notes, interviews,
conversations, photographs, recordings, and self-addressed memos.
The preceding discussion addressed the interpretivism research paradigm and
qualitative methodology. The following section addresses the positivism paradigm
and quantitative methodology.
5.2.1.2 Positivism paradigm and quantitative methodology
According to Collis and Hussey (2014:44-46) a positivism paradigm involves
quantitative, objective, scientific and traditionalist research. Various researchers
(Bryman & Bell, 2011:24; Collis & Hussey, 2014:46), however, indicate that a
positivism paradigm is quantitative in nature as it is often associated with quantitative
research methodologies. More specifically, a positivistic paradigm addresses
research objectives by means of empirical assessments, which include numerical
measurement and statistical analysis approaches. In addition, Muijs (2004:1)
indicates that quantitative research explains phenomena by means of numerical data
collections that are analysed using mathematically based methods.
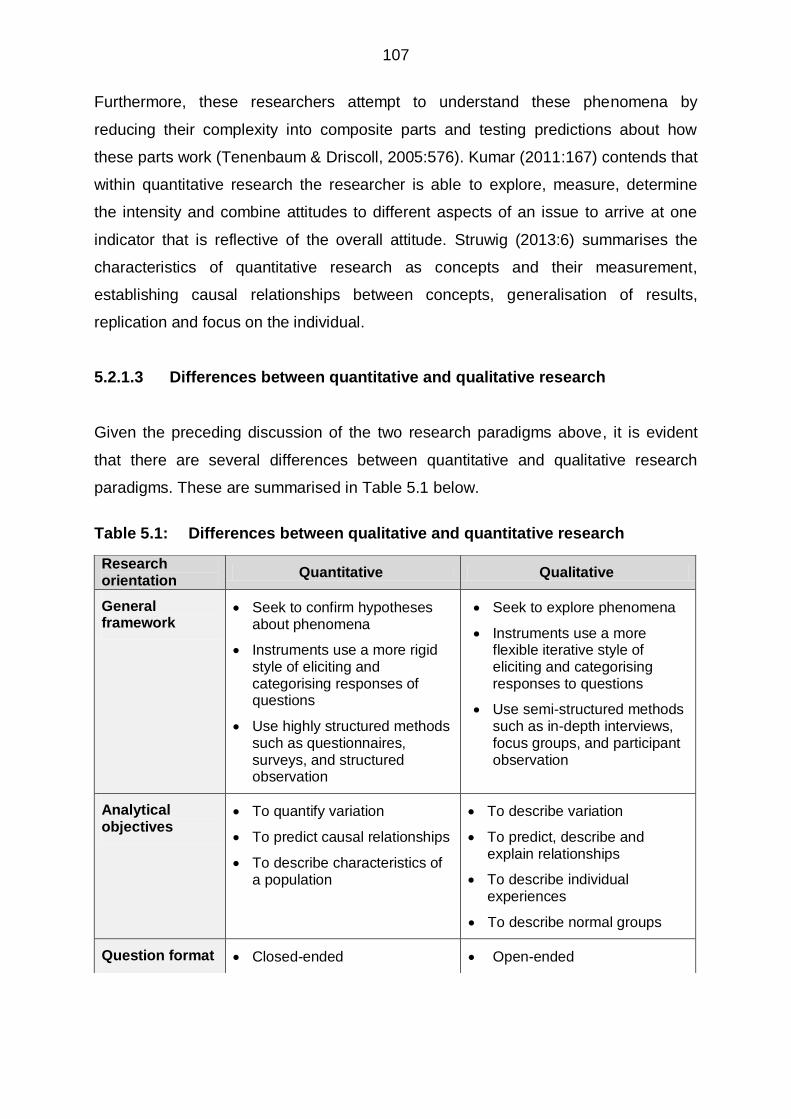
107
Furthermore, these researchers attempt to understand these phenomena by
reducing their complexity into composite parts and testing predictions about how
these parts work (Tenenbaum & Driscoll, 2005:576). Kumar (2011:167) contends that
within quantitative research the researcher is able to explore, measure, determine
the intensity and combine attitudes to different aspects of an issue to arrive at one
indicator that is reflective of the overall attitude. Struwig (2013:6) summarises the
characteristics of quantitative research as concepts and their measurement,
establishing causal relationships between concepts, generalisation of results,
replication and focus on the individual.
5.2.1.3 Differences between quantitative and qualitative research
Given the preceding discussion of the two research paradigms above, it is evident
that there are several differences between quantitative and qualitative research
paradigms. These are summarised in Table 5.1 below.
Table 5.1: Differences between qualitative and quantitative research
Research orientation
Quantitative Qualitative
General framework
Seek to confirm hypotheses about phenomena
Instruments use a more rigid style of eliciting and categorising responses of questions
Use highly structured methods such as questionnaires, surveys, and structured observation
Seek to explore phenomena
Instruments use a more flexible iterative style of eliciting and categorising responses to questions
Use semi-structured methods such as in-depth interviews, focus groups, and participant observation
Analytical objectives
To quantify variation
To predict causal relationships
To describe characteristics of a population
To describe variation
To predict, describe and explain relationships
To describe individual experiences
To describe normal groups
Question format Closed-ended Open-ended

108
(Source: Collis & Hussey, 2014:50; Mack, Woodsong, MacQueen, Guest & Namey,
2005:3)
From Table 5.1 it is evident that quantitative and qualitative research differs primarily
in their analytical objectives, the types of questions they pose, the type of data
collection instruments they use, the forms of data they produce, the degree of
flexibility, sample size, purpose and trustworthiness built into the study design.
Therefore, it is imperative that the researcher should be well acquainted with the
paradigm and research methodology of the study in order to determine the research
approach most suitable for the study.
5.2.1.4 Research paradigm and methodology used in this study
Given both the aim and the nature of this study, a positivistic research paradigm and
quantitative methodology was considered to be most suitable to achieve the
Research orientation
Quantitative Qualitative
Data format Numerical (obtained by assigning numerical values to responses)
Textual (obtained from audiotapes, videotapes, and field notes)
Flexibility in study design
Study design is stable from beginning to end
Participant responses do not influence or determine how and which questions researchers ask next
Study design is subject to statistical assumptions and conditions
Some aspects of the study are flexible (for example, the addition, exclusion, or wording of particular interview questions)
Participant responses affect how and which questions researchers ask next
Study design is iterative, that is, data collection and research questions are adjusted according to what is learned
Samples Make use of large samples Make use of small samples
Common purpose
Primarily concerned with testing hypotheses
Is concerned with generating theories
Trustworthiness Produce results with high reliability, but a low validity
Produce results with low reliability, but a high validity
109
objectives of this study. The advantage of quantitative research is that it allows for
meaningful comparisons of responses across respondents. Quantitative research will
allow the researcher to ask all respondents identical questions, with “closed ended”
or “fixed” response categories, in the same order in the form of surveys or
questionnaires (Collis & Hussey, 2014:50; Mack et al., 2005:3). Therefore, statistical
data can be collected from a relatively large sample of respondents, which will
explain and predict actions and/or events, to achieve the research objectives of this
study.
The following section addresses the approaches that can be adopted when using a
quantitative research methodology.
5.2.2 QUANTITATIVE RESEARCH APPROACHES
According to Collis and Hussey (2014:3-5) the most common quantitative research
approaches are exploratory, descriptive, explanatory and experimental research.
Each of these quantitative research approaches will be discussed in the sections to
follow.
5.2.2.1 Exploratory research
An exploratory research approach is conducted when situations are unclear and a
limited amount of information is known about the specific subject area
(Krishnaswamy, Sivakumar & Mathirajan, 2009:161; Struwig & Stead, 2013:7;
Zikmund et al., 2013:52). Thus, clarity is needed regarding ambiguous situations and,
therefore, researchers want to develop primary ideas about a phenomenon/area that
has not been researched before (Struwig & Stead, 2013:7; Zikmund et al., 2013:52).
Collis and Hussey (2014:341) assert that the main purpose of an exploratory
approach is to provide researchers with formal guidance on which topics need to be
further researched, finding patterns, developing propositions and gaining insights.
Similarly, Struwig and Stead (2013:7) indicate that the main purpose is to develop
new ideas, hypotheses and questions from a large quantity of information generated
from relatively small samples, to provide clarity on given situations.

110
5.2.2.2 Explanatory research
Explanatory research, also known as causal research, both describes features of a
researched phenomenon, as well as identifies the cause-and-effect relationships in
an attempt to clarify how and why the variables of a specific study relate to one
another (Collis & Hussey, 2014:5; Zikmund et al., 2013:54). Other researchers
(Blumberg, Cooper & Schindler, 2011:9; Gratton & Jones, 2004:7) further indicate
that an explanatory research approach requires the researcher to make use of
theories and hypotheses to enable the researcher to justify the forces that cause a
certain phenomenon to occur.
5.2.2.3 Experimental research
Labaree (2013:6) and Struwig and Stead (2013:9) explain experimental research to
be a process that enables the researcher to maintain control over the relationships
between the variables under investigation. Grove, Burns and Gray (2013:26)
corroborate this by stating that the experimental research approach is used to predict
and control a specific phenomenon. Other authors (Collis & Hussey, 2014:60;
Struwig & Stead, 2013:9) assert that this research approach is utilised to establish to
what degree the independent variable affects the dependent variable.
5.2.2.4 Descriptive research
Struwig and Stead (2013:8) contend that descriptive research is conducted when the
aim is to describe a particular phenomenon in the most accurate and complete
manner. This is done by testing hypotheses, exploring causes of specific results and
obtaining specific data in terms of frequencies, percentages and descriptive statistics
such as means and standard deviations (Hinkel, 2011:192; Kolb, 2008:25). Zikmund
et al. (2013:56) assert that the main purpose of descriptive research is to tie
influencing variables together in order to paint a single picture of the current situation
and develop conclusions that prove the stated hypotheses. Struwig and Stead
(2013:8) and Zikmund et al. (2013:57) further explain that unlike exploratory
research, the descriptive research approach is conducted after the researcher has
gained a significant grasp of the phenomenon of the research topic under

111
investigation. Labaree (2013:8) and Zikmund et al. (2013:57) distinguish between two
types of descriptive research approaches, namely cross-sectional and longitudinal.
Cross-sectional descriptive research samples various segments of the population
where the data is collected at a single moment in time, whereas longitudinal
descriptive research uses the same sample over time, making repeat observations to
track changes over time (Labaree, 2013:8; Zikmund et al., 2013:57).
5.2.2.5 Research approach used in this study
Within a positivistic research paradigm and quantitative methodology adopted in this
study, an exploratory and descriptive research approach of a cross-sectional nature
will be utilised. These research approaches are in accordance with the purpose and
research objectives of this study, allowing for developing and testing new ideas and
hypotheses by exploring causes of specific results. As various segments of the
population are sampled and data collected at a single moment in time, conducting
cross-sectional, descriptive research is relatively fast and inexpensive.
5.3 DATA COLLECTION
Data collection involves the process of gathering and measuring information of a
factual phenomenon in order to answer research questions, test hypotheses and
evaluate results (Behera, 2012:21; Zikmund et al, 2013:196). Two main data
collection categories, namely secondary and primary data collection, will be
discussed in the sections to follow.
5.3.1 SECONDARY RESEARCH (LITERATURE REVIEW)
Zikmund et al. (2013:160) define secondary data as data which the researcher does
not personally acquire for the study but rather by consulting various sources already
available. Furthermore, secondary data refers to data originally collected for some
other purpose, but is relevant for a specific research project (Hair, Black, Babin &
Anderson, 2014:137; Rothman, Greenland & Lash, 2008:481).
112
Secondary research in this study involved undertaking an in-depth literature review in
Chapter Two, Three and Four to establish the nature and importance of small family
and non-family businesses, to identify the various marketing mix strategies which
they can use, and how these strategies can contribute to their business performance.
The secondary data sources which were utilised included both international and
national data sources available through the Nelson Mandela Metropolitan University
Library, books and accredited academic journal articles from reputable authors.
Search engines such as Google, Google Scholar and databases such as the Family
Business Review and EBSCO host were used in order to identify various literature
sources.
5.3.2 PRIMARY RESEARCH (EMPIRICAL INVESTIGATION)
Collis and Hussey (2014:196), as well as Zikmund et al. (2013:63) contend that
primary research is the process whereby new data is collected and analysed by the
researcher specifically for the purpose of the study at hand. Various
methods/techniques are available to collect and analyse new data, which is often
time-consuming and costly (Robbins, 2009:65). The following sections will discuss
the collection of data and will highlight the population, the sample and sampling
technique, as well as the research instrument used to collect primary data in this
study.
5.3.2.1 Population
Sekaran and Bougie (2010:262) and Zikmund et al. (2013:385) define a population
as a complete group of people, events, or things of interest relevant to a research
purpose. In other words, it is the group of people or businesses of interest for which
the researcher wants to make inferences from which results are gained and will be
generalised upon (Dahlberg & McCraig, 2010:173; Robbins, 2009:84). The
population, for the purpose of this study, refers to all the small family and non-family
businesses operating within the borders of the Eastern Cape. In this study, however,
the population or total number of owner-managers of small family and non-family
businesses in the Eastern Cape was not available. As a result it was required to draw
a sample of the population which is discussed in the following sections.
113
5.3.2.2 Sample and sampling techniques
Zikmund et al. (2013:385) state that researchers usually do not look at the entire
population, as described above, but rather choose a smaller number of entities,
which is referred to as a sample. A sample refers to the subset of the population that
is selected for investigation (Bryman, 2012:187; Cooper & Schindler, 2013:239;
Kumar, 2010:164). In other words, those few selected from a bigger group to
represent the basis for predicting or estimating the prevalence regarding an unknown
piece of information, situation or outcome regarding the bigger group (Kumar,
2010:164). According to Bryman (2012:187), a representative sample is a sample
that represents the population accurately so that it is a microcosm of the population.
Jackson (2011:100) indicates that with a representative sample the researcher can
be fairly confident that the results found based on the sample can be generalised to
the population as a whole. For the purpose of this study, the sampling units consisted
of small family and non-family businesses operating within the borders of the Eastern
Cape.
Bryman (2012:187) and Jackson (2011:100) assert that there are two ways to
sample individuals from a population, namely probability and non-probability
sampling. The following sections address these techniques.
5.3.2.2.1 Probability sampling
Probability sampling occurs when each unit in the population has a known probability
of being selected to be part of the sample, since the selection was made using
random selection. Furthermore, it is generally assumed, that when this method is
employed, a representative sample is likely to be the outcome and sampling errors
are kept to a bare minimum (Bryman, 2012:187; Struwig & Stead, 2013:114).
Probability sampling includes techniques such as simple random, cluster, systematic
and stratified sampling (Gratton & Jones, 2010:111; Panneerselvam, 2004:192;
Struwig & Stead, 2013:118).
Simple random sampling is the most basic form of probability sampling, where each
unit of the population has an equal probability of being included in the sample
114
(Bryman, 2012:190; Zikmund et al., 2013:396). Panneerselvam (2004:192) argues
that there are two ways of performing simple random sampling, namely simple
random sampling with replacement of units and simple random sampling without
replacement of units.
Cluster sampling is often used when the population is too large for random sampling
of any sort (Jackson, 2011:101). It is a technique in which the population is separated
into different clusters so that the members within each cluster are heterogeneous in
terms of their features, but different clusters are similar to each other (Gratton &
Jones, 2010:112; Panneerselvam, 2004:199).
Systematic sampling is a variation on the simple random sampling and involves
selecting units directly from the sampling frame, without resorting to a table of
random numbers (Bonds-Raaacke & Raacke, 2012:141; Bryman, 2012:191).
Panneerselvam (2004:194) asserts that with this method, the selection of the first unit
of the sample from the population is based on randomisation, whereas the remaining
units are selected from the population at a fixed interval of the sample size.
Stratified sampling is an improvised sampling method to simple random and
systematic sampling (Panneerselvam, 2004:195). This sampling technique takes into
account the different subgroups of people in the population, and ensures that these
strata are fairly represented (Gratton & Jones, 2010:112; Jackson, 2011:101; Struwig
& Stead, 2013:123). Panneerselvam (2004:195) asserts that each stratum is
homogeneous when compared to the population.
5.3.2.2.2 Non-probability sampling
Bryman (2012:201) claims that non-probability sampling is basically an umbrella
term, meaning to capture all types of sampling that are not conducted according to
the canons of probability sampling. Since judgement, biases and convenience of the
interviewers are considered to be criteria for the selection of sample units, instances
where certain units of the population have a zero probability of selection may occur
(Panneerselvam, 2004:192). Cohen, Manion and Morrison (2007:113) state that non-
probability sampling techniques only attempt to represent itself or instances of itself
115
in a similar population, instead of attempting to represent the whole, undifferentiated
population. These techniques include convenience sampling, judgemental sampling,
quota sampling, and snowball sampling (Gratton & Jones, 2010:113;
Panneerselvam, 2004:200; Struwig & Stead, 2013:118).
Convenience sampling is a non-probability sampling method and is used in
investigative research, where the researcher is only concerned with an approximation
of the truth (Zikmund et al., 2013:329). Convenience sampling is one that is
conveniently available to the researcher by virtue of its accessibility (Bryman,
2012:201; Cohen et al., 2007:113-114; Gratton & Jones, 2010:113; Jackson,
2011:102; Struwig & Stead, 2013:118; Zikmund et al., 2013:329). Cohen et al.
(2007:113-114) also state that this technique involves choosing individuals in close
proximity to serve as respondents and continuing the process until the required
sample size has been obtained. Thus, researchers simply need to choose the
sample from those they have easy access to.
Judgemental (Purposive) sampling is used where sampling units are selected on
either the advice of an expert or by utilising the intuition of the researcher himself
(Panneerselvam, 2004:201; Struwig & Stead, 2013:121). Panneerselvam (2004:201)
indicates that when using this sampling method there is a high chance of personal
bias. Judgemental sampling is also referred to as purposive sampling, since the
sampling units are identified from the population, which in turn prevents the inclusion
of other sampling units in the sample (Zikmund et al., 2013:393).
Quota sampling aims to produce a sample that replicates a population in terms of the
relative proportions of people in different categories required to fill a quota (Bryman,
2012:203; Panneerselvam, 2004:201). According to Kumar (2010:178), the main
consideration with this design is the researcher‟s ease of access to the sample
population. Furthermore, the researcher is guided by some visible characteristics,
such as the gender or race of the population that is being studied.
Snowball sampling is a non-probability sampling method where the researcher
makes initial contact with a small group of people who are significant to the research
topic and then uses them to establish contacts with others, hence the term “snowball”
116
(Bryman, 2012:202; Cohen et al., 2007:116). Panneerselvam (2004:201) explains
that snowball sampling is a restrictive multi-stage sampling technique in which an
initial number of sampling units are randomly selected, and thereafter further
sampling units are selected based on a referral process.
5.3.2.2.3 Sampling technique used in this study
Although probability sampling provides better accuracy in terms of the confidence
level of the inferences of a study, there are many practical difficulties in fully
executing probability sampling (Panneerselvam, 2004:200). Probability sampling
involves a lot of preparation and is frequently avoided, because of the difficulty and
cost involved (Bryman, 2012:202; Panneerselvam, 2004:200). Researchers resorted
to convenience sampling to overcome such difficulties (Panneerselvam, 2004:200).
Non-probability sampling techniques, such as convenience sampling, are less
complicated to set up, considerably less expensive and can provide perfectly
adequate respondents, where researchers do not tend to generalise findings beyond
the sample under investigation (Cohen et al., 2007:113; Jackson 2011:101).
As no database currently exists in South Africa or in the Eastern Cape of small family
and non-family businesses from which a probability sample can be drawn,
convenience sampling will be adopted to identify sampling units in this study. Two
sampling units have participated in this study, namely small family business owner-
managers and small non-family business owner-managers operating their
businesses within the borders of the Eastern Cape Province.
5.3.2.3 Sample size
Hair et al. (2014:176) contend that the determination of the sample size is not a
simple process, since various factors have to be taken into consideration
simultaneously. To obtain a balance between these factors is, however, challenging.
These factors include time availability, high cost involved, as well as the required
estimation precision (Hair et al., 2014:176; Murthy & Bhojanna, 2008:38-39;
Swanson & Holton, 2005:123). Swanson and Holton (2005:123) furthermore highlight
that researchers should also consider the expected effect size and power
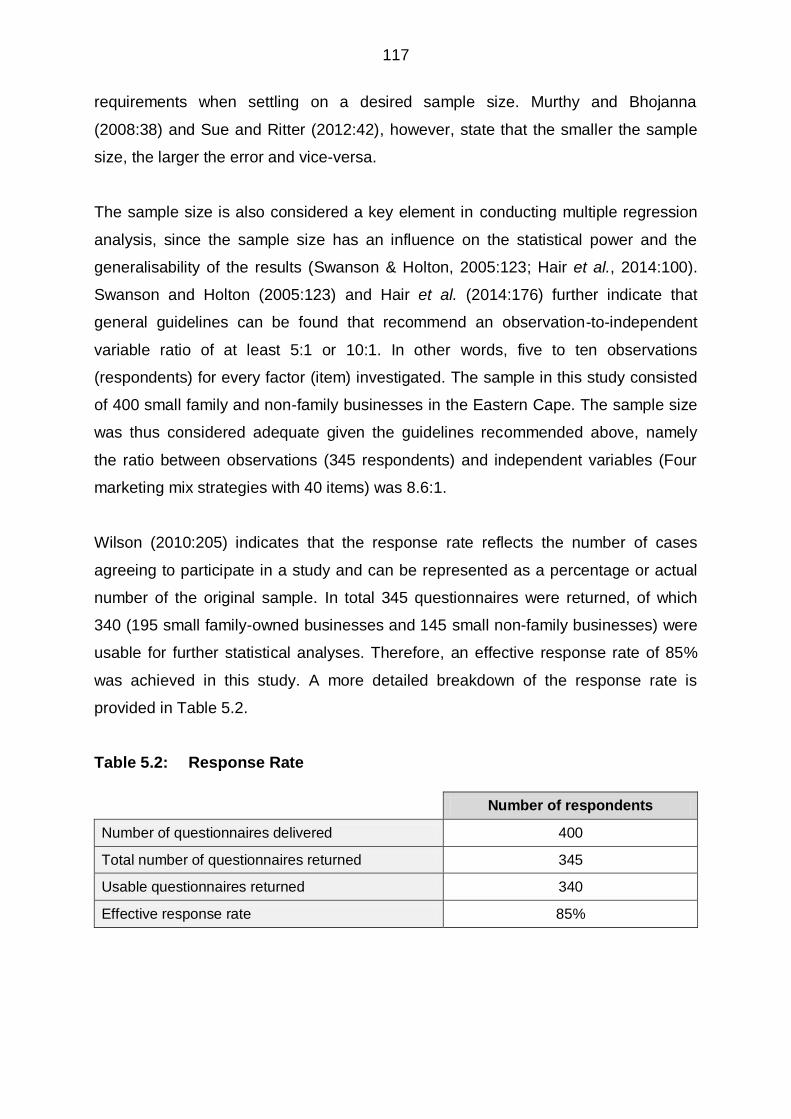
117
requirements when settling on a desired sample size. Murthy and Bhojanna
(2008:38) and Sue and Ritter (2012:42), however, state that the smaller the sample
size, the larger the error and vice-versa.
The sample size is also considered a key element in conducting multiple regression
analysis, since the sample size has an influence on the statistical power and the
generalisability of the results (Swanson & Holton, 2005:123; Hair et al., 2014:100).
Swanson and Holton (2005:123) and Hair et al. (2014:176) further indicate that
general guidelines can be found that recommend an observation-to-independent
variable ratio of at least 5:1 or 10:1. In other words, five to ten observations
(respondents) for every factor (item) investigated. The sample in this study consisted
of 400 small family and non-family businesses in the Eastern Cape. The sample size
was thus considered adequate given the guidelines recommended above, namely
the ratio between observations (345 respondents) and independent variables (Four
marketing mix strategies with 40 items) was 8.6:1.
Wilson (2010:205) indicates that the response rate reflects the number of cases
agreeing to participate in a study and can be represented as a percentage or actual
number of the original sample. In total 345 questionnaires were returned, of which
340 (195 small family-owned businesses and 145 small non-family businesses) were
usable for further statistical analyses. Therefore, an effective response rate of 85%
was achieved in this study. A more detailed breakdown of the response rate is
provided in Table 5.2.
Table 5.2: Response Rate
Number of respondents
Number of questionnaires delivered 400
Total number of questionnaires returned 345
Usable questionnaires returned 340
Effective response rate 85%

118
5.3.2.4 Data collection
The most common method of generating primary data in quantitative research is
through surveys (Bowling & Ebrahim, 2005:190; Zikmund et al., 2013:185). A survey
is a systematic and standardised method for collecting primary data based on
communications with a representative sample of individuals (Michie, 2013:1366;
Struwig & Stead, 2013:89; Zikmund et al., 2013:185). Zikmund et al. (2013:186)
associate surveys with quantitative findings, since survey research is descriptive
research. Surveys also provide a quick, inexpensive, efficient and accurate means of
assessing information about a population (Connaway & Powell, 2010:107; Zikmund
et al., 2013:186). Connaway and Powell (2010:107) associate questionnaires and
interviews (including focus group and telephone interviews) as techniques commonly
used for collecting survey data. Self-administered questionnaires, common in a
positivistic paradigm, are surveys in which the respondent takes the responsibility for
reading and answering the questions (Collis & Hussey, 2009:66; Zikmund et al.,
2013:217). The primary data in this study was gathered by means of a structured,
self-administered questionnaire. Primary data relating to the frequency small family
and non-family businesses carry out selected marketing mix strategies based on their
unique needs and limited resources, and the influence of these strategies on their
Perceived business performance, was collected. The questionnaire was made
available to respondents, through personal delivery, by fieldworkers from NMMU,
who were briefed on the requirements for inclusion in the sample. The development
of the measuring instrument, qualifying criteria and the operationalisation of the
independent and dependent variables investigated in this study, are described in the
sub-sections that follow.
5.3.2.4.1 Measuring instrument development
The measuring instrument consisted of a cover letter and three sections (See
Annexure A). The cover letter, which introduced the respondent to the study,
included a detailed explanation of the purpose of the study and the type of
information being requested from the respondents participating in this study. The
cover letter also included the assurance of confidentiality and instructions on how the
questionnaire should be completed and returned.
119
In Section A of the questionnaire demographic information relating to the respondent,
and the business of the respondent, was requested. Section B of the questionnaire
consisted of five statements (items) describing measures of business performance. A
5-point Likert-type scale (1 = Strongly Disagree and 5 = Strongly Agree) was
employed. Each respondent (i.e. owner or manager) was requested to indicate the
extent to which they agreed or disagreed with each statement. Section C of the
questionnaire consisted of two subsections. Sub-section 1 consisted of 40
statements (items), describing fundamental marketing mix strategies necessary in a
business. A 5-point Likert-type scale (1 = Never and 5 = Always) was employed.
Each respondent was requested to indicate the frequency with which they carry out
the specific marketing mix strategy. Sub-section 2 requested respondents of a family-
owned business to indicate whether they use the family name as a
marketing/branding tool.
5.3.2.4.2 Qualifying criteria
To ensure that the respondent is qualified to participate in the study, the cover letter
included criteria that required the respondents to verify that their business qualified to
participate in the study. The criteria for qualifying were as follows:
The business had to be a small family or non-family owned business;
A small business, whether family-owned or not, is one that does not employ
more than 50 full-time employees;
A small family business is a business where at least two family members are
actively involved in the management and operation of the business;
A small family business is also a business where the family owns more than
51% of the business;
The business had to have been in operation for at least one year;
The respondent had to be either the owner or manager of the business; and
The owner respondent had to be actively involved in the daily running and
management of the business.
Due to the preceding qualifying criteria, it was possible to minimise response error.
120
5.3.2.4.3 Scale development and operationalisation
Operationalisation is a process where one can either create an operational definition
or simply specify the specific operations needed to measure a variable (Csiernik,
Birnbaum & Pierce, 2010:55). Rubin and Babbie (2011:89) contend that for a concept
to be referred to as a variable the concept must be chosen for investigation in a
research study and it needs to be characterised by more than one attribute. When
dealing with quantitative research the concept also needs to be translated into
observable terms, which are referred to as the operational definition (Rubin & Babbie,
2011:89). An operational definition can be seen as the operations used to describe
all the attributes observed concerning the concept under investigation (Rubin &
Babbie, 2011:89). Hair et al. (2011:735) assert that an operational definition is an
explanation of the attributes of observable measures that are used to decide whether
the measure represents an occurrence of the conceptual variable.
The scales developed to measure the various marketing mix strategies and
Perceived business performance in this study are described in the tables that follow.
For each of the marketing mix strategies investigated in this study, the number of
items used, the sources of these items, as well as the operationalisation thereof are
provided. In order to measure the dependant variable Perceived business
performance, a five item scale was largely self-developed and in part based on the
scale used by Van Scheers (2011). Table 5.3 provides the operationalisation of the
dependant variable.
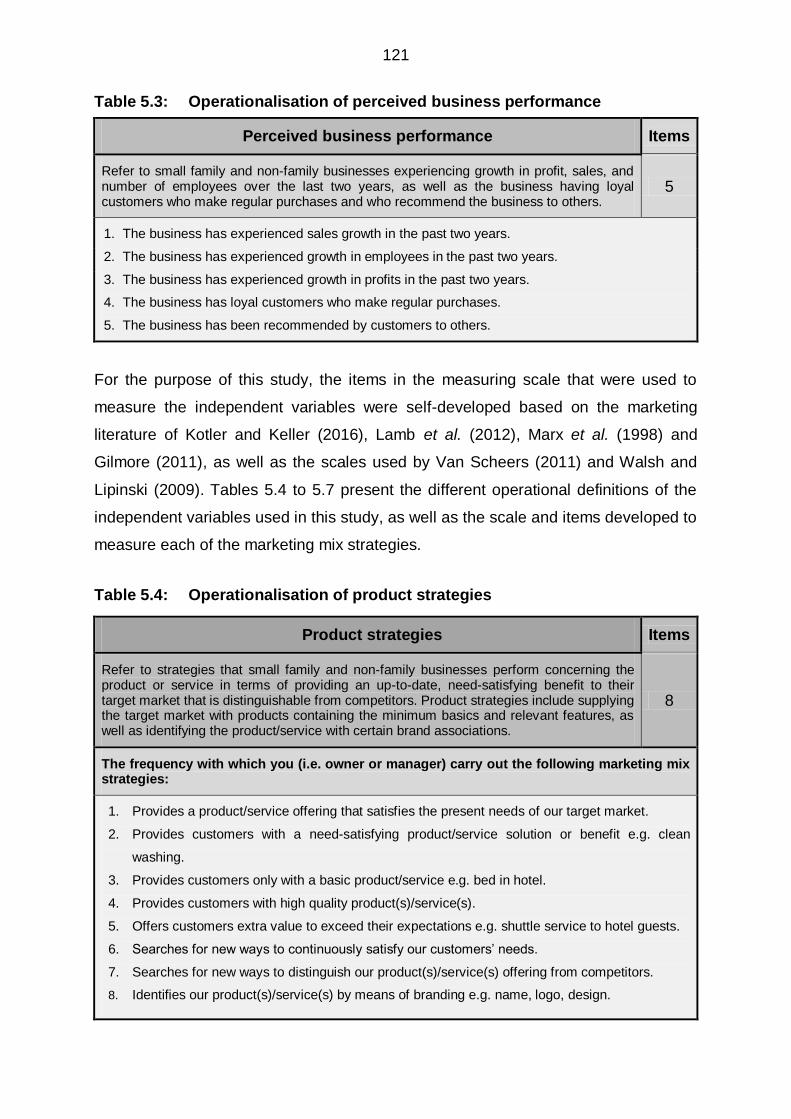
121
Table 5.3: Operationalisation of perceived business performance
Perceived business performance Items
Refer to small family and non-family businesses experiencing growth in profit, sales, and number of employees over the last two years, as well as the business having loyal customers who make regular purchases and who recommend the business to others.
5
1. The business has experienced sales growth in the past two years.
2. The business has experienced growth in employees in the past two years.
3. The business has experienced growth in profits in the past two years.
4. The business has loyal customers who make regular purchases.
5. The business has been recommended by customers to others.
For the purpose of this study, the items in the measuring scale that were used to
measure the independent variables were self-developed based on the marketing
literature of Kotler and Keller (2016), Lamb et al. (2012), Marx et al. (1998) and
Gilmore (2011), as well as the scales used by Van Scheers (2011) and Walsh and
Lipinski (2009). Tables 5.4 to 5.7 present the different operational definitions of the
independent variables used in this study, as well as the scale and items developed to
measure each of the marketing mix strategies.
Table 5.4: Operationalisation of product strategies
Product strategies Items
Refer to strategies that small family and non-family businesses perform concerning the product or service in terms of providing an up-to-date, need-satisfying benefit to their target market that is distinguishable from competitors. Product strategies include supplying the target market with products containing the minimum basics and relevant features, as well as identifying the product/service with certain brand associations.
8
The frequency with which you (i.e. owner or manager) carry out the following marketing mix strategies:
1. Provides a product/service offering that satisfies the present needs of our target market.
2. Provides customers with a need-satisfying product/service solution or benefit e.g. clean
washing.
3. Provides customers only with a basic product/service e.g. bed in hotel.
4. Provides customers with high quality product(s)/service(s).
5. Offers customers extra value to exceed their expectations e.g. shuttle service to hotel guests.
6. Searches for new ways to continuously satisfy our customers‟ needs.
7. Searches for new ways to distinguish our product(s)/service(s) offering from competitors.
8. Identifies our product(s)/service(s) by means of branding e.g. name, logo, design.

122
Table 5.5: Operationalisation of pricing strategies
Pricing strategies Items
Refer to the pricing tactics that small family and non-family businesses perform in order to attract and retain customers, such as setting a price to cover total costs, related to demand for products, quality and value expected by and delivered to customers, or to be competitive.
8
The frequency with which you (i.e. owner or manager) carry out the following marketing mix strategies:
1. Sets prices in relation to the value delivered.
2. Sets prices in relation to the value perceived by our customers.
3. Sets prices higher than the value customers expect to receive.
4. Sets prices that cover our total costs.
5. Sets prices that to enable me to stay in business.
6. Sets prices based on an estimation of customer demand.
7. Sets prices lower than our competitors to maximise sales volume of our offering.
8. Sets prices higher than our competitors as our offering is of superior quality.
Table 5.6: Operationalisation of place strategies
Place strategies Items
Refer to distribution process methods employed by small family and non-family businesses such as setting delivery objectives, using distribution channel selection criteria based on image, reputation and ensuring product availability, and changing the distribution channel when needed to sell directly to customers or in a most cost effective way.
7
The frequency with which you (i.e. owner or manager) carry out the following marketing mix strategies:
1. Sets distribution objectives to ensure timely delivery to our customers.
2. Selects appropriate distribution channels that fit in with our business image.
3. Distributes our product(s) cost effectively to our customers.
4. Uses specific evaluation criteria to select an appropriate distribution channel e.g. reputation.
5. Selects a distribution channel(s) that ensures our product(s) is/are available to customers.
6. Seeks a new distribution channel(s) to replace the current channel if becoming necessary.
7. Sells our product(s)/service(s) directly to customers.
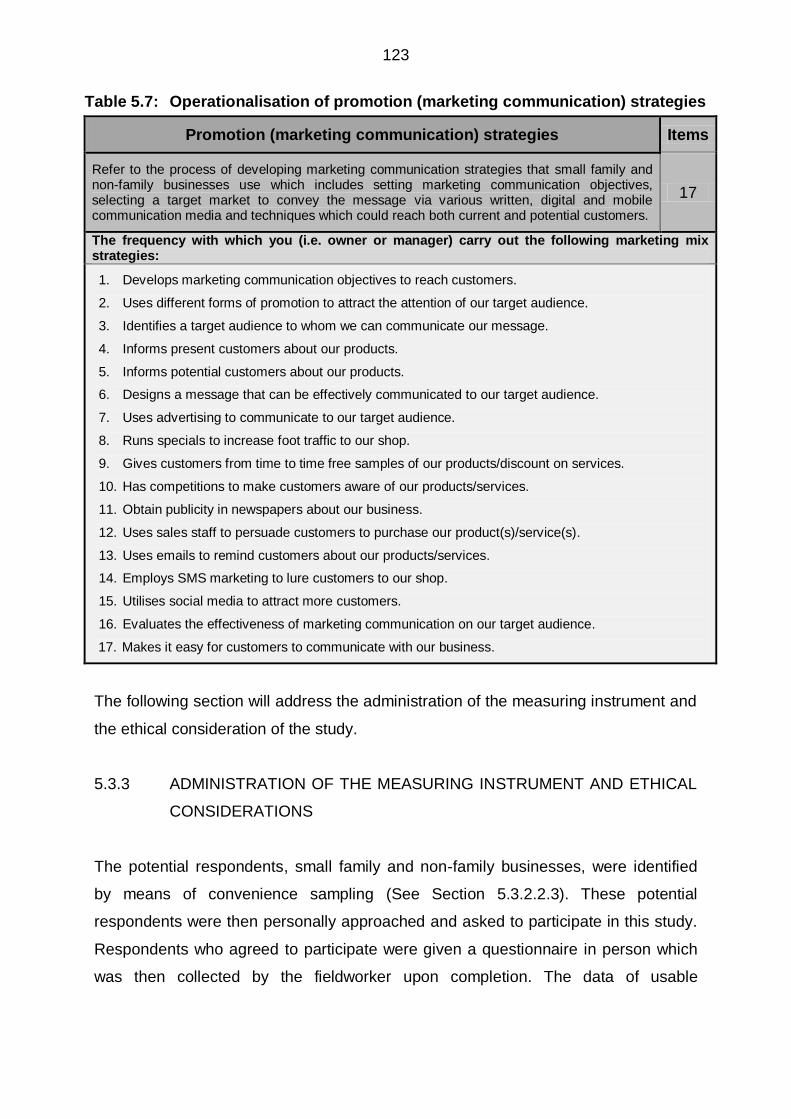
123
Table 5.7: Operationalisation of promotion (marketing communication) strategies
Promotion (marketing communication) strategies Items
Refer to the process of developing marketing communication strategies that small family and non-family businesses use which includes setting marketing communication objectives, selecting a target market to convey the message via various written, digital and mobile communication media and techniques which could reach both current and potential customers.
17
The frequency with which you (i.e. owner or manager) carry out the following marketing mix strategies:
1. Develops marketing communication objectives to reach customers.
2. Uses different forms of promotion to attract the attention of our target audience.
3. Identifies a target audience to whom we can communicate our message.
4. Informs present customers about our products.
5. Informs potential customers about our products.
6. Designs a message that can be effectively communicated to our target audience.
7. Uses advertising to communicate to our target audience.
8. Runs specials to increase foot traffic to our shop.
9. Gives customers from time to time free samples of our products/discount on services.
10. Has competitions to make customers aware of our products/services.
11. Obtain publicity in newspapers about our business.
12. Uses sales staff to persuade customers to purchase our product(s)/service(s).
13. Uses emails to remind customers about our products/services.
14. Employs SMS marketing to lure customers to our shop.
15. Utilises social media to attract more customers.
16. Evaluates the effectiveness of marketing communication on our target audience.
17. Makes it easy for customers to communicate with our business.
The following section will address the administration of the measuring instrument and
the ethical consideration of the study.
5.3.3 ADMINISTRATION OF THE MEASURING INSTRUMENT AND ETHICAL
CONSIDERATIONS
The potential respondents, small family and non-family businesses, were identified
by means of convenience sampling (See Section 5.3.2.2.3). These potential
respondents were then personally approached and asked to participate in this study.
Respondents who agreed to participate were given a questionnaire in person which
was then collected by the fieldworker upon completion. The data of usable

124
questionnaires was then captured on an Excel sheet and prepared for statistical
analysis.
According to Goddard and Meville (2004:49), ethical considerations are of utmost
importance when conducting research among participants, such as those described
above. Ethical considerations are considered to be moral values or principles that
constitute the general code of conduct for conducting research in an ethical manner
(Collis & Hussey, 2014:30). Blumberg et al. (2011:116) further assert that ethics
addresses how to conduct research in a morally responsible manner. Van Zyl
(2014:85) iterates that researchers must acknowledge and protect the rights of
human beings who participate in the research, regardless of the outcomes of the
study.
Literature denotes the three most common ethical considerations that must be taken
into account when conducting research, including informed consent, privacy and
anonymity/confidentiality. Table 5.8 provides a description for these three
considerations along with the application thereof in this study.
Table 5.8: Types of ethical considerations
Ethical consideration Informed consent
Description The participants understand exactly what the researcher requires from them. The participant knowingly, voluntarily, intelligently, and in a clear manner, provides the researcher with their consent to participate in the study.
References Blumberg et al., 2011:118; Buchanan, 2004:138; Collis & Hussey,
2014:33; Fouka & Mantzorou 2011:4; Mertens & Ginsberg, 2009:482; Zikmund et al., 2013:100
Application to this study
The purpose and objectives of the study were provided to the participants in the cover letter of the questionnaire, and their informed consent was obtained. Participation was voluntary and they could withdraw from the process of completing the questionnaire at any stage.
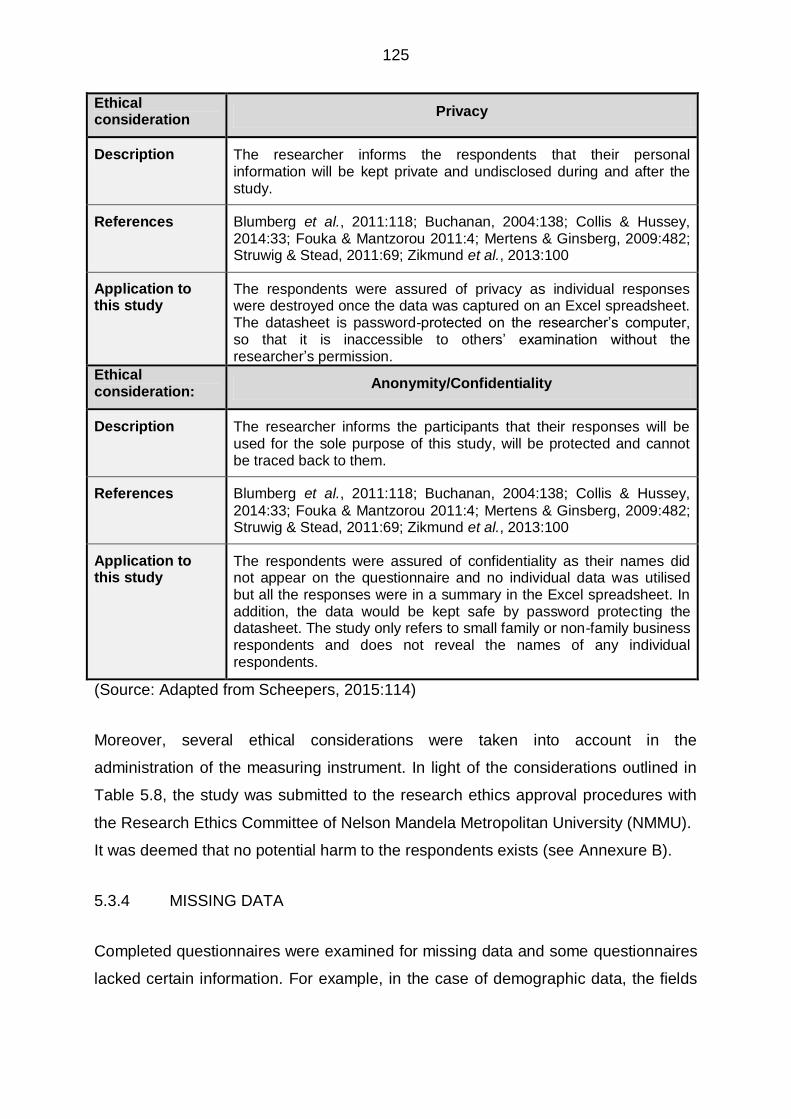
125
Ethical consideration
Privacy
Description The researcher informs the respondents that their personal information will be kept private and undisclosed during and after the study.
References Blumberg et al., 2011:118; Buchanan, 2004:138; Collis & Hussey, 2014:33; Fouka & Mantzorou 2011:4; Mertens & Ginsberg, 2009:482; Struwig & Stead, 2011:69; Zikmund et al., 2013:100
Application to this study
The respondents were assured of privacy as individual responses were destroyed once the data was captured on an Excel spreadsheet. The datasheet is password-protected on the researcher‟s computer, so that it is inaccessible to others‟ examination without the researcher‟s permission.
Ethical consideration:
Anonymity/Confidentiality
Description The researcher informs the participants that their responses will be used for the sole purpose of this study, will be protected and cannot be traced back to them.
References Blumberg et al., 2011:118; Buchanan, 2004:138; Collis & Hussey,
2014:33; Fouka & Mantzorou 2011:4; Mertens & Ginsberg, 2009:482; Struwig & Stead, 2011:69; Zikmund et al., 2013:100
Application to this study
The respondents were assured of confidentiality as their names did not appear on the questionnaire and no individual data was utilised but all the responses were in a summary in the Excel spreadsheet. In addition, the data would be kept safe by password protecting the datasheet. The study only refers to small family or non-family business respondents and does not reveal the names of any individual respondents.
(Source: Adapted from Scheepers, 2015:114)
Moreover, several ethical considerations were taken into account in the
administration of the measuring instrument. In light of the considerations outlined in
Table 5.8, the study was submitted to the research ethics approval procedures with
the Research Ethics Committee of Nelson Mandela Metropolitan University (NMMU).
It was deemed that no potential harm to the respondents exists (see Annexure B).
5.3.4 MISSING DATA
Completed questionnaires were examined for missing data and some questionnaires
lacked certain information. For example, in the case of demographic data, the fields

126
were left blank. However, in the case of missing responses to statements, if less than
three values were missing, the mean-substitution approach was used.
The mean-substitution approach replaces all missing values of the variable with a
mean value. The mean value is calculated from all the valid responses of that
specific variable (Hair & Anderson, 2010:53). The mean-substitution approach is the
most common method used for the assertion of missing values, because of the
simplicity of the approach, as well as the fact that by using the mean value, the
variance in the variable becomes reduced (Kunapuli, 2008:91). However, the mean-
substitution approach is only the most appropriate method when the missing values
are moderately low (Hair et al., 2014:63).
5.3.5 METHODS OF DATA ANALYSIS
Data analysis is the process of interpreting and making sense of data that is collected
from participants in a study, which is transformed into useful information to identify
patterns and make conclusions (Cooper & Schindler, 2013:90; Cresswell, 2009:185).
STATISTICA, a statistical programme, was used to undertake all the statistical
analysis in this study, each of which will be elaborated on in the paragraphs that
follow. Before descriptive and inferential statistics could be conducted, the validity
and reliability of the measuring instrument first needed to be assessed. In order to
assess the validity of the measuring instrument used in this study, an exploratory
factor analysis was conducted, while Cronbach‟s alpha (CA) coefficients were
calculated to assess the reliability of the measuring instrument.
Thereafter, descriptive statistics including the mean, standard deviation and
frequency distributions were then calculated to summarise the sample data.
Thereafter, Pearson‟s product moment correlations were calculated to establish the
relationships between the various marketing mix strategies under investigation, as
well as between the various marketing mix strategies and Perceived business
performance. Variance inflation factors (VIF) were also calculated in order to
determine whether multi-collinearity existed. Multiple regression analysis (MRA) was
used to determine whether any relationships existed between the marketing mix
strategies and Perceived business performance of small family and non-family

127
owned businesses. The aforementioned data analysis methods will be discussed in
more detail in the sections to follow.
5.3.5.1 Validity of the measuring instrument
According to Morgan et al. (2008:129-130), Sue and Ritter (2012:228) and Zikmund
et al. (2013:307), the extent to which a test measures the variable that it is designed
to measure, can be referred to as the validity of a measure and can be divided into
internal and external validity. Internal validity refers to the strength and soundness of
the measure and external validity refers to the extent to which the results can be
generalised to the population, setting or any other variables attracting interest
(Gravetter & Forzano, 2010:78; Morgan et al., 2008:130). Salkind (2010:152) and
Zikmund et al. (2013:304-305) differentiate between three categories of validity,
namely content, criterion and construct validity.
According to Aamodt (2013:210) and Salkind (2010:152) content validity is the
property of a test such that the test items sample the universe of items for which the
test is designed. Gravetter and Forzano (2010:83) describe criterion validity as a high
correlation existing between the scores collected from the questionnaire and other
sources from various accepted tests of more or less the same performance.
Construct validity is the most theoretical of all the validity types and can be defined
as the extent to which a test measures what it was intended to measure (Aamodt,
2013:210; Zikmund et al., 2013:308). Furthermore, construct validity is concerned
with assumptions about test scores from hypothetical construct measures (Ary,
Jacobs, Sorensen & Razavieh, 2010:291; Zikmund et al., 2013:304). In this study,
construct validity was used to determine if the measuring instrument measured that
for which it was designed.
Construct validity consists of two main types, namely convergent and discriminant
validity (Cooper & Schindler, 2013:320; Vogel, Maas & Gebauer, 2011:341).
Convergent validity refers to a strong relationship between the scale under
investigation and another validated scale measuring the same construct (Cooper &
Schindler, 2013:320; Dmitrienko, Chuang-Stein & D‟Agostino, 2007:377).
Discriminant validity, also called divergent validity, refers to a situation no relationship

128
exists between the scale under investigation and another validated scale measuring
the same construct (Dmitrienko, Chuang-Stein & D‟Agostino, 2007:377). Cooper and
Schindler (2013:320) also refer to discriminant validity as the extent to which each
construct is separated or distinct from other constructs in the theory or related theory.
According to Leech, Barrett and Morgan (2008:58) there are two methods to assess
the validity of the independent variables in a research study, namely confirmatory
factor analysis (CFA) and exploratory factor analysis (EFA). According to Cooper and
Schindler (2013:430) and Suhr (2003:1), a CFA enables a researcher to test the
hypothesis, to determine whether that specific relationship between the experimental
variables and the underlying construct exists. A CFA is used to confirm a specific
pattern of relationships predicted on the basis of previous analytic or theoretical
results (DeVellis, 2012:151; Cooper & Schindler, 2013:430).
According to Catalyst (2005:41) and Leech et al. (2008:58), EFA can be defined as a
statistical technique one would use to cluster a large number of items into a more
controllable set of variables, which will then be referred to as factors. Furthermore,
Fulco, Liverman and Sox (2000:44) and Nugroho and Wihandoyo (2009:221) agree,
stating that an EFA is a technique used to identify a small number of correlated
variables from amongst a bigger number of observed variables. Catalyst (2005:41)
also states that this technique is based on how certain items correlate with one
another. This is because the researcher does not specify which items will be grouped
together, rather the factors are determined according to the correlations of the items.
Factor loadings can be referred to as the correlations between the factor and the
item. If factor loadings are high it means that the items are strongly influenced by the
factor (Burns & Burns, 2008:444). According to Hair et al. (2006:128), factor loadings
of 0.30 and 0.40 are considered significant for sample sizes of 350 and 200
respectively.
This study sets out to determine the number of common factors influencing a set of
measures, as well as the strength of the relationship between each factor.
Furthermore, this study does not test hypotheses to confirm a specific pattern of
relationships predicted on the basis of previous analytic or theoretical results. As a
result, an EFA was undertaken in this study to assess the validity of the scales
129
measuring the various factors. A principle component analysis with a varimax raw
rotation was specified as the extraction and rotation method. Items displaying no
cross-loadings and comprising factor loadings of greater than 0.4, are considered
significant in this study, thereby serving as evidence of construct and discriminant
validity for the measuring instrument (Mustakallio et al., 2002:214).
5.3.5.2 Reliability of the measuring instrument
Reliability refers to the accuracy of data measurements. In order for a measurement
to be regarded as reliable, it needs to provide the same results repeatedly (Bayens &
Roberson, 2011:85; Zikmund et al., 2013:301) However, the main purpose of
reliability is to ensure that the same set of data will provide the same results no
matter how many times it is measured (Bayens & Roberson, 2011:85; Sue & Ritter,
2012:227). Linn, Howard and Miller (2012:124) further explain that the reliability of an
instrument is the degree to which the measurement is error-free and will produce
consistent results from one testing session to another.
According to Hartas (2010:74), there are two methods to calculate reliability, namely
Cronbach‟s alpha and split-half reliability. Both these methods are concerned with
internal consistency which occurs when the items within a study are measuring the
same construct (Lewis & Zibarras, 2013:306). Cooper and Schindler (2013:322)
further state that Cronbach‟s alpha is based on the average correlation of variables
within a specific set of items measuring a construct. Cronbach‟s alpha coefficients
were calculated in this study to measure the reliability of the measuring instrument
used. Normally a Cronbach‟s alpha coefficient of 0.70 or higher will be regarded as
significant to ascertain that a scale is reliable. However, in certain circumstances, like
a smaller sample size for instance, a scale with a Cronbach‟s alpha coefficient of
0.60 would be regarded as acceptable (Breat, 2009:436; Leimeister, 2010:140).
5.3.5.3 Descriptive statistics
According to Jackson (2011:116), descriptive statistics are numerical measures that
describe a distribution by providing information on the central tendency, the width,
and the shape of the distribution. Descriptive statistics reduce what could potentially
130
be a great deal of data into a simpler summary (Jackson, 2011:116). In this study,
descriptive statistics such as the mean scores, the standard deviation, and frequency
distributions were calculated to summarise the data collected. Zikmund et al.
(2013:652-658) assert that the mean of the data signifies the central tendency or
arithmetic average, the standard deviation is a quantitative index of a distribution„s
spread, and frequency distribution is a set of organised data produced by
summarising the frequency with which a certain value of a variable occurs.
5.3.5.4 Inferential statistics
According to Creswell (2009:172) and Taylor (2014:1), inferential statistics infer
something from the sample to the population and determine the probability of
characteristics of the population based on the characteristics of the sample. In
addition, inferential statistics help assess the strength of the relationship between the
independent variables and the dependent variable.
Pearson‟s product moment correlation was calculated in this study to establish the
relationships or associations between the various factors under investigation.
Jackson (2011:159) describes the Pearson‟s product moment correlation as a
parametric technique that is most commonly used to measure the strength of
association between two different variables or bivariate data that are linearly related.
The Pearson‟s product moment correlation coefficient, referred to as r, indicates the
relationship between two variables and varies from -1 to +1. The variables increase
and decrease together when r is positive (Cooper & Schindler, 2013:493; Jackson,
2011:159).
A Pearson‟s product moment correlation coefficient can be interpreted as follows
(Van Zyl, 2014:208):
Values from 0.0 to 0.2 reflect a very weak positive association;
Values from 0.2 to 0.4 reflect a weak positive association;
Values from 0.4 to 0.6 reflect a moderate positive association;
Values from 0.6 to 0.8 reflect a strong positive association; and
Values from 0.8 to 1.0 reflect a very strong positive association.
131
Multi-collinearity occurs when one or more predictor variables in a multiple regression
analysis (MRA) are highly correlated. Thus, the results of the MRA for the individual
predictor/independent variables may be inaccurate (StatSoft, Inc. 2014). To establish
whether multi-collinearity provides problems in a study, variance inflation factors
(VIF) are calculated. VIFs provide the estimate variance of the nth regression
coefficient that is increased above what it would be if R2n equalled zero (O‟Brien,
2007:674). VIFs were calculated to assess the existence of multi-collinearity in this
study. A VIF of 10 or even one as low as 4 (equivalent to a tolerance level of 0.10
and 0.25 respectively) have been used to indicate excessive or serious multi-
collinearity.
A MRA was then used in this study to determine the influence of the independent
variables under investigation on the dependent variable Perceived business
performance. According to Rubin (2010:231), a MRA enables the researcher to
predict the value of a dependent variable based on the values of a set of at least two
independent variables. Rubin (2010:231) also states that a MRA is used to identify
the variables, in a larger set of variables, which mostly influence another variable.
Furthermore, a multiple regression calculates a beta statistic referred to as β. The
larger the beta weight, the greater the influence a variable has in explaining the
variation in the dependent variable, given however that the other variables are
controlled (Rubin & Babbie, 2011:559). Similarly, Jackson (2011:161) contends that it
is also important to calculate the coefficient of determination which is calculated by
R2 (correlation coefficient). R2 describes the variation proportion that the two
variables have in common.
5.4 SUMMARY
In this chapter, the research design and methodology adopted for the study were
discussed. The differences between interpretivism and positivism paradigms and
qualitative and quantitative research methodologies were discussed and the research
paradigm and methodology adopted for this study motivated. The various quantitative
research approaches were also explained, as well as the reasons for adopting the
exploratory and descriptive research approaches in this study. The data collection,
including secondary and primary research, was then discussed. The population to be

132
studied, the sampling techniques, reasons for adopting the convenience sampling
technique in this study and sampling size were also explained.
The method of data collection was then discussed. More specifically, the
development of the measuring instrument and qualifying criteria were explained. The
factors being studied were operationalised by means of clear definitions, and the
development of the scales measuring these various factors was also explained. In
addition, the process of administering the questionnaires, ethical considerations, as
well as dealing with missing data was elaborated on. The methods used to assess
the validity and reliability of the measuring instrument were then described and
discussed. To assess the validity of the scales measuring the independent and
dependent variables an EFA was undertaken. To assess the reliability of the
measuring scales, CA coefficients were calculated. The techniques adopted to
analyse the data, namely descriptive statistics, Pearson‟s product moment
correlations, VIF, MRA and MANOVA were described. Descriptive statistics were
used to summarise the sample data. Pearson‟s product moment correlations were
established to assess the relationship between the various factors under
investigation. VIF were calculated to determine whether multi-collinearity existed and
the MRA was undertaken to determine the influence of the various independent
variables on Perceived business performance. Chapter 6 will present and discuss the
empirical findings of implementing these various statistical analyses.

133
CHAPTER 6
EMPIRICAL RESULTS
6.1 INTRODUCTION
In Chapter 5 the research design and methodology used for this study was
discussed. Moreover, the research paradigm, sample size, sample technique, data
collection process, various statistical techniques employed to assess the validity and
reliability of the measuring instrument, and descriptive and inferential statistics to
analyse the data, were discussed.
In Chapter 6 the empirical results are presented, beginning with a summary of the
demographic information collected from the respondents participating in this study.
The demographic information collected related to both the respondents and the
businesses surveyed. An exploratory factor analysis (EFA) confirmed the measuring
instrument's validity and calculating Cronbach‟s alpha coefficients (CA) confirmed its
reliability. Based on the results of these assessments the hypotheses and
hypothesised model, proposed in Chapter 4, were revised.
Descriptive statistics, including the mean, standard deviation, and frequency
distributions were calculated to describe the sample data. The Pearson‟s product
moment correlations results were then presented. Thereafter, the variance inflation
factors (VIF) and multiple regression analysis (MRA) results were established. T-tests
were undertaken to determine whether the differences in the mean scores returned
by the small family and non-family business sample groups for the marketing mix
strategies under investigation, were significantly different from each other. In order to
determine if differences were statistically significant between the family brand and
small business size, a Chi-square test for independence was conducted. Lastly, the
results of the multivariant analysis of variance (MANOVA) determined the
relationships between selected demographic variables and the independent
variables. Moreover, the post-hoc Scheffé tests were completed to identify significant
differences between the mean scores of the various categories within each
demographic variable. Cohen‟s d values were conducted to test the practical
significance of these mean differences.
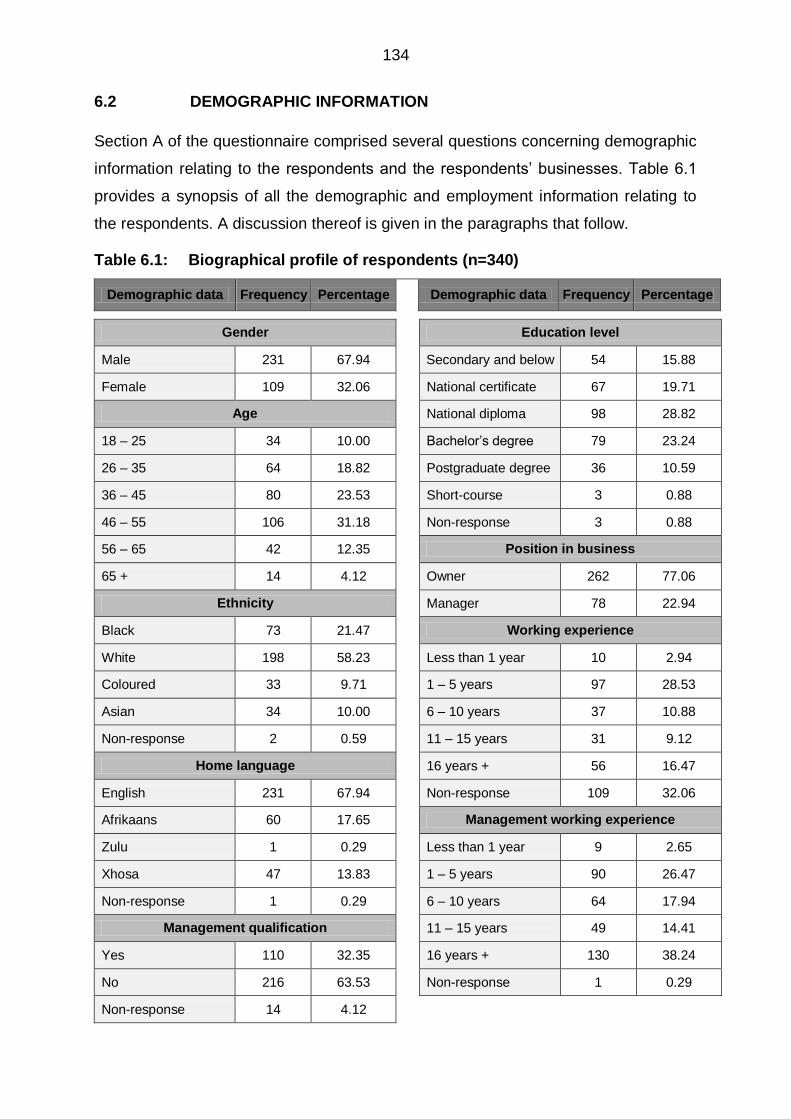
134
6.2 DEMOGRAPHIC INFORMATION
Section A of the questionnaire comprised several questions concerning demographic
information relating to the respondents and the respondents‟ businesses. Table 6.1
provides a synopsis of all the demographic and employment information relating to
the respondents. A discussion thereof is given in the paragraphs that follow.
Table 6.1: Biographical profile of respondents (n=340)
Demographic data Frequency Percentage Demographic data Frequency Percentage
Gender
Male 231 67.94
Female 109 32.06
Age
18 – 25 34 10.00
26 – 35 64 18.82
36 – 45 80 23.53
46 – 55 106 31.18
56 – 65 42 12.35
65 + 14 4.12
Ethnicity
Black 73 21.47
White 198 58.23
Coloured 33 9.71
Asian 34 10.00
Non-response 2 0.59
Home language
English 231 67.94
Afrikaans 60 17.65
Zulu 1 0.29
Xhosa 47 13.83
Non-response 1 0.29
Management qualification
Yes 110 32.35
No 216 63.53
Non-response 14 4.12
Education level
Secondary and below 54 15.88
National certificate 67 19.71
National diploma 98 28.82
Bachelor‟s degree 79 23.24
Postgraduate degree 36 10.59
Short-course 3 0.88
Non-response 3 0.88
Position in business
Owner 262 77.06
Manager 78 22.94
Working experience
Less than 1 year 10 2.94
1 – 5 years 97 28.53
6 – 10 years 37 10.88
11 – 15 years 31 9.12
16 years + 56 16.47
Non-response 109 32.06
Management working experience
Less than 1 year 9 2.65
1 – 5 years 90 26.47
6 – 10 years 64 17.94
11 – 15 years 49 14.41
16 years + 130 38.24
Non-response 1 0.29

135
From Table 6.1 it is evident that the majority of respondents (67.94%) were male,
while 32.06% were female. Respondents were aged between 46 and 55 years
(31.18%), followed by respondents between the ages of 36 and 45 years (23.53%),
26 and 35 years (18.82%), 56 and 65 years (12.35%), 18 and 25 years (10%) and
older than 65 years (4.12%). More than half of the respondents were White (58.23%),
followed by Black (21.47%), Asian (10%) and Coloured (9.71%). Most respondents
(67.94%) reported speaking English as their home language, followed by Afrikaans
(17.65%), Xhosa (13.83%) and Zulu (0.29%). The majority of the respondents
(82.36%) indicated that they have a tertiary education with only 10.59% having
completed a postgraduate degree. Most respondents (65.53%), however, indicated
that they do not possess a management qualification. Only 15.88% of respondents
indicated they have an educational qualification at a secondary level and below.
Furthermore, the majority of respondents (77.06%) indicated they are the owner of
the small business, while the remaining respondents (22.94%) indicated they are the
manager of the small business. Respondents had between 1 and 5 years (28.53%)
working experience, 16 years and more (16.47%), 6 and 10 years (10.88%), 11 and
15 years (9.12%) and less than one year (2.94%), whereas 38.24% of the
respondents indicated they have more than 16 years management experience.
Furthermore, 32.06% of the respondents did not indicate how many years working
experience they have.
From Table 6.2, which provides demographic information relating to the respondents‟
businesses, it is evident that most of the small businesses interviewed are family-
owned (57.35%). Most of these businesses are well established as 67.35% have
been in existence for more than 5 years. Furthermore, it is evident that the small
businesses were found to operate within several different industries. Some small
businesses (21.67%) operate in the retail and wholesale industries and 17.65% in the
catering and accommodation industries, with most (54.41%) respondents indicating
services as their main business activity. Approximately a third of the respondents
indicated the small business to be a close corporation (32.94%), followed by sole
traders (28.24%). The small businesses employed between one and five people
(43.83%), followed by between six and 20 (42.35%), and 21 and 50 (13.53%) people
in their business, hence indicating these businesses to be micro, very small and
small, respectively.

136
Table 6.2: Demographic information pertaining to the business (n=340)
Demographic data Frequency Percentage Demographic data Frequency Percentage
Family business
Yes 195 57.35
No 145 42.65
Years in existence
Less than 1 year 6 1.77
1 – 5 years 102 30.00
6 – 10 years 71 20.88
11 – 15 years 48 14.11
16 years + 110 32.36
Non-response 3 0.88
Business sector
Education 6 1.76
Health 12 3.53
Agriculture 5 1.47
Financial and insurance 5 1.47
Communication 6 1.76
Real estate 11 3.24
Mining 10 2.94
Catering and accommodation
60 17.65
Transport and traveling 12 3.53
Leisure and entertainment 31 9.12
Tourism 5 1.47
Construction and engineering
40 11.76
Medical 1 0.29
Sport 5 1.47
Social services 2 0.59
Retail and wholesale 74 21.76
Service 31 9.12
Manufacturing 15 4.41
Fishing 2 0.59
Non-response 7 2.06
Number of employees
1 – 5 149 43.83
6 – 20 144 42.35
21 – 50 46 13.53
Business activity
Manufacturing 24 7.06
Retail 112 32.94
Service 185 54.41
Manufacturing, retail and service
10 2.94
Retail and service 3 0.88
Retail and manufacturing 2 0.59
Service and manufacturing
2 0.59
Non-response 2 0.59
Form of ownership
Sole trader 96 28.24
Partnership 51 15.00
Close corporation 112 32.94
Private company 64 18.82
Public company 5 1.47
Trust 11 3.24
Non-response 1 0.29
Area of business premises
Central Business District 102 30.00
Residential area 137 40.30
Major shopping complex 18 5.29
Small shopping complex 48 14.12
A combination of the above
13 3.82
Industrial 13 3.82
Home-based 4 1.18
University 2 0.59
Casino and entertainment complex
2 0.59
Non-response 1 0.29
Target market
General public 131 38.53
Businesses 35 10.29
A combination of the above
170 50.00
Non-response 4 1.18

137
From Table 6.2, it is also evident that 40.30% of the small businesses are situated in
a residential area (not home-based), 30% in the central business district and 14.12%
in a small shopping complex. Half of the respondents indicated that both businesses
and the general public are their target markets, whereas 38.53% specifically
indicated their target market to be only the general public and 10.29% indicated only
businesses as their target market of choice.
The following section will address the results of the validity and reliability analyses in
this study.
6.3 RESULTS OF THE VALIDITY AND RELIABILITY ANALYSES
In this study, an EFA was undertaken to assess the validity of the measuring
instrument used. Validity indicates the extent to which a measuring instrument‟s
results correspond with that which it was intended to measure, for example, validity
shows how adequately the questions included in the measuring instrument reflects
the overall purpose (Chapman, Hanson, Dettori & Norvell, 2007:20; Sue & Ritter,
2012:228; Zikmund et al. 2013:307). Items that load onto their corresponding factors
at a level of 0.30 and 0.40 are considered significant for sample sizes of 350 and 200
respectively. Factor loadings of greater than 0.40 were considered significant (Hair et
al. 2006:117) in this study and only the factors with three or more items loaded onto
them were considered for further statistical analysis (Yong & Pearce, 2013:86).
CA coefficients were calculated to assess the reliability of the measuring instrument
used in this study. Reliability refers to the degree to which the same measuring
instrument can be used repeatedly, by either the same or different researchers, and
consistently delivers the same results (Gravetter & Forzano, 2010:85; Bühlmann,
2006:55). According to Bryman and Bell (2007:162-163) and Slaughter (2009:114),
CA coefficients of 0.70 or above generally suggest good reliability of a measuring
scale while a coefficient of between 0.60 and 0.70 is acceptable if the other factors or
the model‟s construct validity are good (Hair et al. 2010:778). In this study a cut-off
point of 0.60 for the CA coefficient was accepted and considered reliable. The results
of the validity and reliability assessments are presented below.
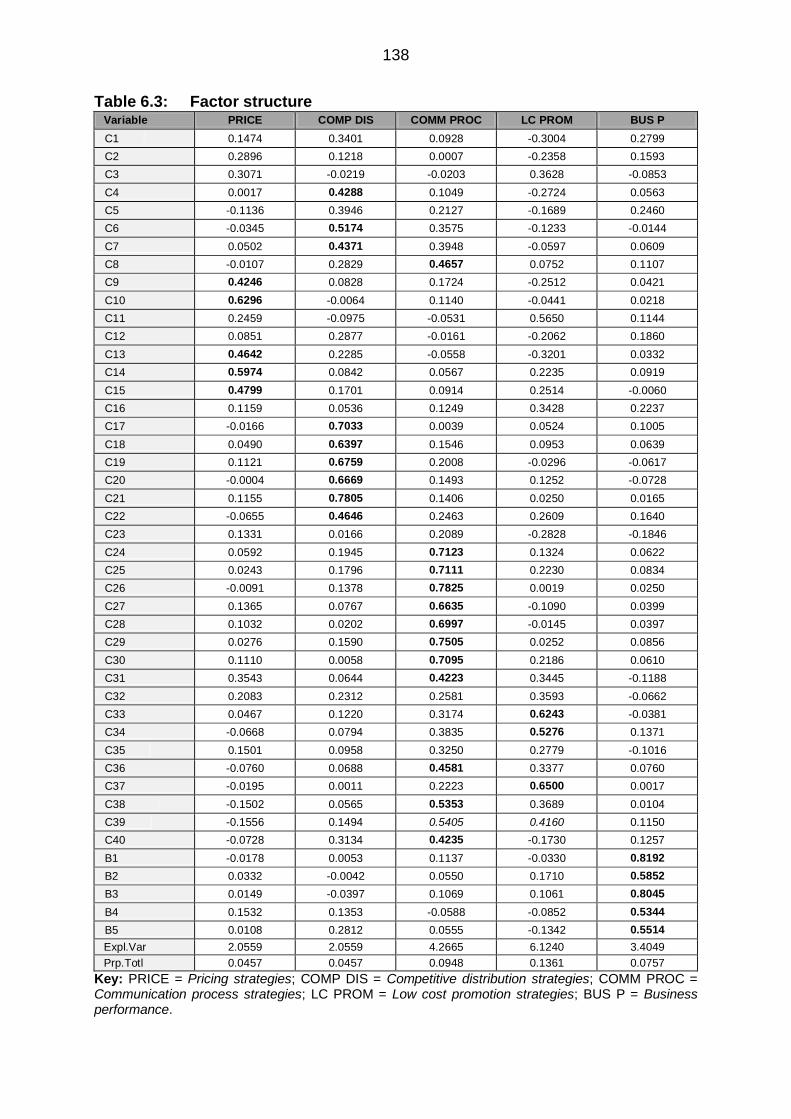
138
Table 6.3: Factor structure Variable PRICE
COMP DIS
COMM PROC
LC PROM
BUS P
C1
0.1474 0.3401 0.0928 -0.3004 0.2799
C2
0.2896 0.1218 0.0007 -0.2358 0.1593
C3
0.3071 -0.0219 -0.0203 0.3628 -0.0853
C4
0.0017 0.4288 0.1049 -0.2724 0.0563
C5
-0.1136 0.3946 0.2127 -0.1689 0.2460
C6
-0.0345 0.5174 0.3575 -0.1233 -0.0144
C7
0.0502 0.4371 0.3948 -0.0597 0.0609
C8
-0.0107 0.2829 0.4657 0.0752 0.1107
C9
0.4246 0.0828 0.1724 -0.2512 0.0421
C10
0.6296 -0.0064 0.1140 -0.0441 0.0218
C11
0.2459 -0.0975 -0.0531 0.5650 0.1144
C12
0.0851 0.2877 -0.0161 -0.2062 0.1860
C13
0.4642 0.2285 -0.0558 -0.3201 0.0332
C14
0.5974 0.0842 0.0567 0.2235 0.0919
C15
0.4799 0.1701 0.0914 0.2514 -0.0060
C16
0.1159 0.0536 0.1249 0.3428 0.2237
C17
-0.0166 0.7033 0.0039 0.0524 0.1005
C18
0.0490 0.6397 0.1546 0.0953 0.0639
C19
0.1121 0.6759 0.2008 -0.0296 -0.0617
C20
-0.0004 0.6669 0.1493 0.1252 -0.0728
C21
0.1155 0.7805 0.1406 0.0250 0.0165
C22
-0.0655 0.4646 0.2463 0.2609 0.1640
C23
0.1331 0.0166 0.2089 -0.2828 -0.1846
C24
0.0592 0.1945 0.7123 0.1324 0.0622
C25
0.0243 0.1796 0.7111 0.2230 0.0834
C26
-0.0091 0.1378 0.7825 0.0019 0.0250
C27
0.1365 0.0767 0.6635 -0.1090 0.0399
C28
0.1032 0.0202 0.6997 -0.0145 0.0397
C29
0.0276 0.1590 0.7505 0.0252 0.0856
C30
0.1110 0.0058 0.7095 0.2186 0.0610
C31
0.3543 0.0644 0.4223 0.3445 -0.1188
C32
0.2083 0.2312 0.2581 0.3593 -0.0662
C33
0.0467 0.1220 0.3174 0.6243 -0.0381
C34
-0.0668 0.0794 0.3835 0.5276 0.1371
C35
0.1501 0.0958 0.3250 0.2779 -0.1016
C36
-0.0760 0.0688 0.4581 0.3377 0.0760
C37
-0.0195 0.0011 0.2223 0.6500 0.0017
C38
-0.1502 0.0565 0.5353 0.3689 0.0104
C39
-0.1556 0.1494 0.5405 0.4160 0.1150
C40
-0.0728 0.3134 0.4235 -0.1730 0.1257
B1
-0.0178 0.0053 0.1137 -0.0330 0.8192
B2
0.0332 -0.0042 0.0550 0.1710 0.5852
B3
0.0149 -0.0397 0.1069 0.1061 0.8045
B4
0.1532 0.1353 -0.0588 -0.0852 0.5344
B5
0.0108 0.2812 0.0555 -0.1342 0.5514
Expl.Var 2.0559 2.0559 4.2665 6.1240 3.4049
Prp.Totl 0.0457 0.0457 0.0948 0.1361 0.0757
Key: PRICE = Pricing strategies; COMP DIS = Competitive distribution strategies; COMM PROC = Communication process strategies; LC PROM = Low cost promotion strategies; BUS P = Business performance.
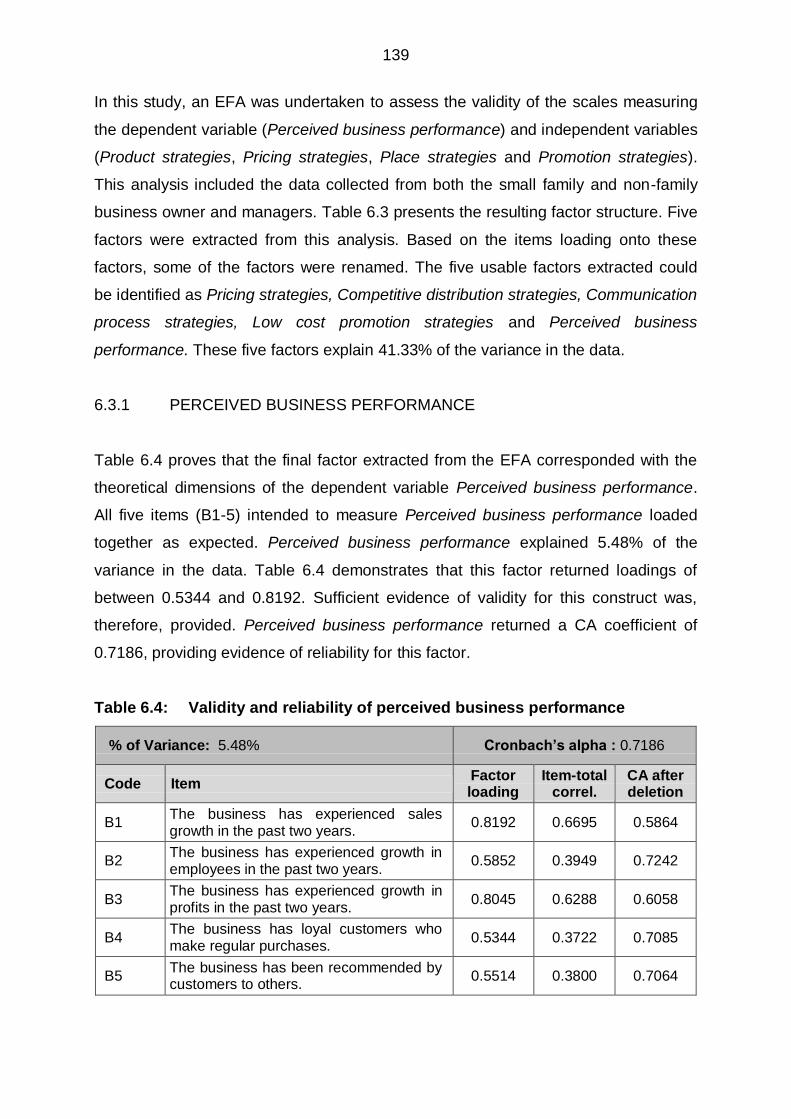
139
In this study, an EFA was undertaken to assess the validity of the scales measuring
the dependent variable (Perceived business performance) and independent variables
(Product strategies, Pricing strategies, Place strategies and Promotion strategies).
This analysis included the data collected from both the small family and non-family
business owner and managers. Table 6.3 presents the resulting factor structure. Five
factors were extracted from this analysis. Based on the items loading onto these
factors, some of the factors were renamed. The five usable factors extracted could
be identified as Pricing strategies, Competitive distribution strategies, Communication
process strategies, Low cost promotion strategies and Perceived business
performance. These five factors explain 41.33% of the variance in the data.
6.3.1 PERCEIVED BUSINESS PERFORMANCE
Table 6.4 proves that the final factor extracted from the EFA corresponded with the
theoretical dimensions of the dependent variable Perceived business performance.
All five items (B1-5) intended to measure Perceived business performance loaded
together as expected. Perceived business performance explained 5.48% of the
variance in the data. Table 6.4 demonstrates that this factor returned loadings of
between 0.5344 and 0.8192. Sufficient evidence of validity for this construct was,
therefore, provided. Perceived business performance returned a CA coefficient of
0.7186, providing evidence of reliability for this factor.
Table 6.4: Validity and reliability of perceived business performance
% of Variance: 5.48% Cronbach’s alpha : 0.7186
Code Item Factor loading
Item-total correl.
CA after deletion
B1 The business has experienced sales growth in the past two years.
0.8192 0.6695 0.5864
B2 The business has experienced growth in employees in the past two years.
0.5852 0.3949 0.7242
B3 The business has experienced growth in profits in the past two years.
0.8045 0.6288 0.6058
B4 The business has loyal customers who make regular purchases.
0.5344 0.3722 0.7085
B5 The business has been recommended by customers to others.
0.5514 0.3800 0.7064
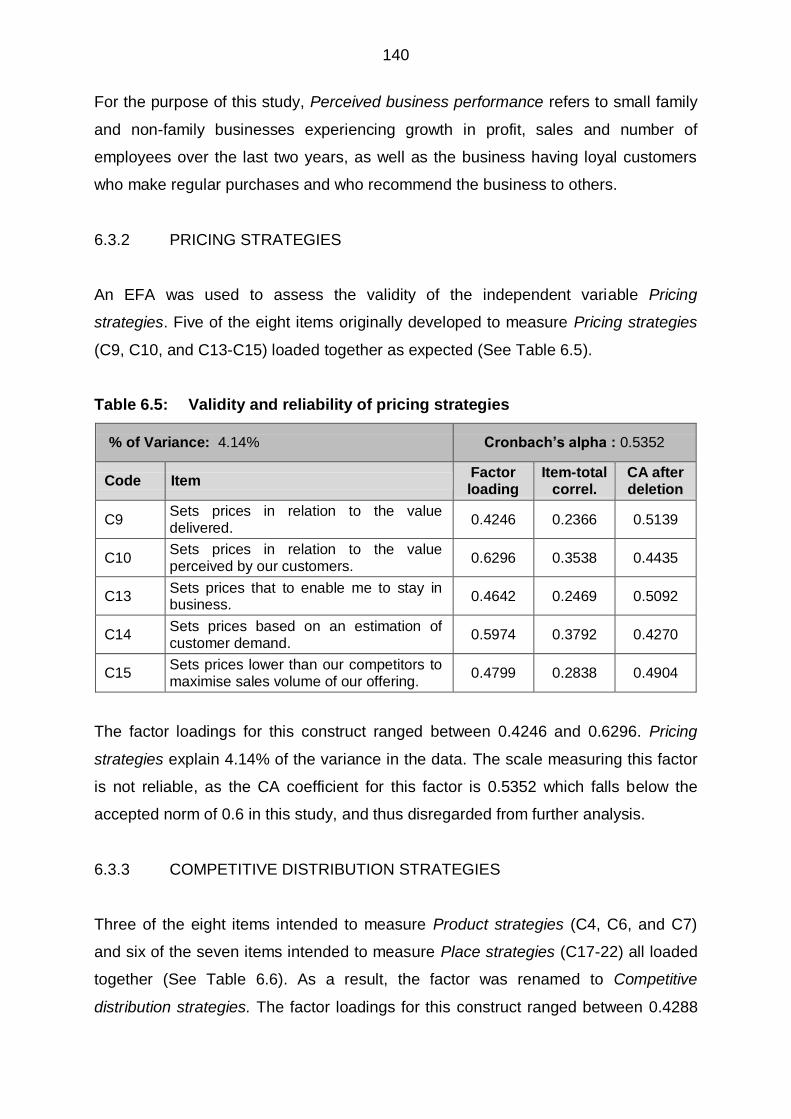
140
For the purpose of this study, Perceived business performance refers to small family
and non-family businesses experiencing growth in profit, sales and number of
employees over the last two years, as well as the business having loyal customers
who make regular purchases and who recommend the business to others.
6.3.2 PRICING STRATEGIES
An EFA was used to assess the validity of the independent variable Pricing
strategies. Five of the eight items originally developed to measure Pricing strategies
(C9, C10, and C13-C15) loaded together as expected (See Table 6.5).
Table 6.5: Validity and reliability of pricing strategies
% of Variance: 4.14% Cronbach’s alpha : 0.5352
Code Item Factor loading
Item-total correl.
CA after deletion
C9 Sets prices in relation to the value delivered.
0.4246 0.2366 0.5139
C10 Sets prices in relation to the value perceived by our customers.
0.6296 0.3538 0.4435
C13 Sets prices that to enable me to stay in business.
0.4642 0.2469 0.5092
C14 Sets prices based on an estimation of customer demand.
0.5974 0.3792 0.4270
C15 Sets prices lower than our competitors to maximise sales volume of our offering.
0.4799 0.2838 0.4904
The factor loadings for this construct ranged between 0.4246 and 0.6296. Pricing
strategies explain 4.14% of the variance in the data. The scale measuring this factor
is not reliable, as the CA coefficient for this factor is 0.5352 which falls below the
accepted norm of 0.6 in this study, and thus disregarded from further analysis.
6.3.3 COMPETITIVE DISTRIBUTION STRATEGIES
Three of the eight items intended to measure Product strategies (C4, C6, and C7)
and six of the seven items intended to measure Place strategies (C17-22) all loaded
together (See Table 6.6). As a result, the factor was renamed to Competitive
distribution strategies. The factor loadings for this construct ranged between 0.4288
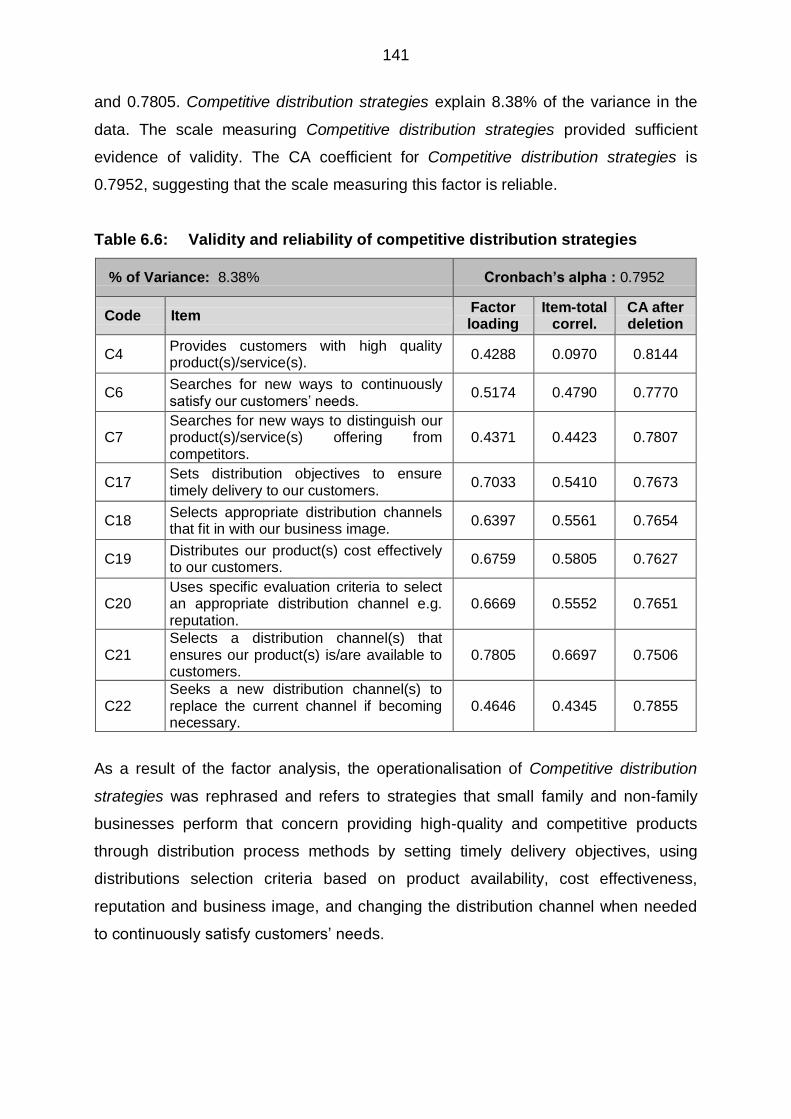
141
and 0.7805. Competitive distribution strategies explain 8.38% of the variance in the
data. The scale measuring Competitive distribution strategies provided sufficient
evidence of validity. The CA coefficient for Competitive distribution strategies is
0.7952, suggesting that the scale measuring this factor is reliable.
Table 6.6: Validity and reliability of competitive distribution strategies
% of Variance: 8.38% Cronbach’s alpha : 0.7952
Code Item Factor loading
Item-total correl.
CA after deletion
C4 Provides customers with high quality product(s)/service(s).
0.4288 0.0970 0.8144
C6 Searches for new ways to continuously satisfy our customers‟ needs.
0.5174 0.4790 0.7770
C7 Searches for new ways to distinguish our product(s)/service(s) offering from competitors.
0.4371 0.4423 0.7807
C17 Sets distribution objectives to ensure timely delivery to our customers.
0.7033 0.5410 0.7673
C18 Selects appropriate distribution channels that fit in with our business image.
0.6397 0.5561 0.7654
C19 Distributes our product(s) cost effectively to our customers.
0.6759 0.5805 0.7627
C20 Uses specific evaluation criteria to select an appropriate distribution channel e.g. reputation.
0.6669 0.5552 0.7651
C21 Selects a distribution channel(s) that ensures our product(s) is/are available to customers.
0.7805 0.6697 0.7506
C22 Seeks a new distribution channel(s) to replace the current channel if becoming necessary.
0.4646 0.4345 0.7855
As a result of the factor analysis, the operationalisation of Competitive distribution
strategies was rephrased and refers to strategies that small family and non-family
businesses perform that concern providing high-quality and competitive products
through distribution process methods by setting timely delivery objectives, using
distributions selection criteria based on product availability, cost effectiveness,
reputation and business image, and changing the distribution channel when needed
to continuously satisfy customers‟ needs.
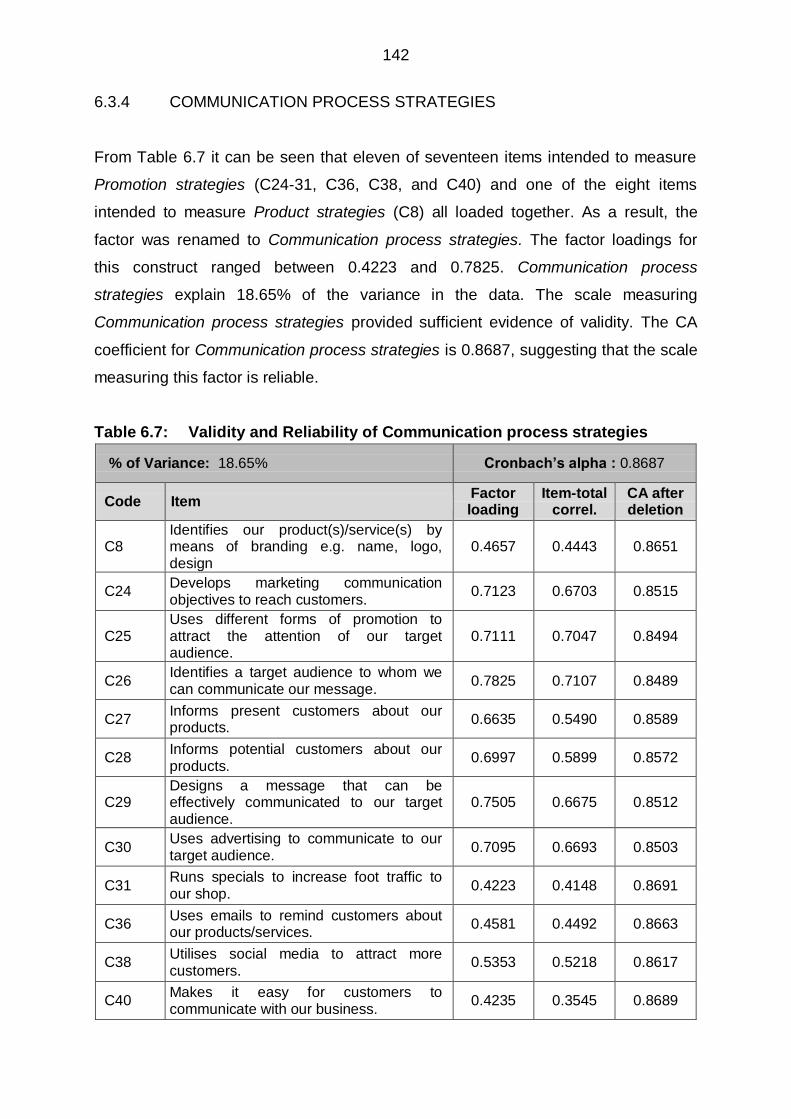
142
6.3.4 COMMUNICATION PROCESS STRATEGIES
From Table 6.7 it can be seen that eleven of seventeen items intended to measure
Promotion strategies (C24-31, C36, C38, and C40) and one of the eight items
intended to measure Product strategies (C8) all loaded together. As a result, the
factor was renamed to Communication process strategies. The factor loadings for
this construct ranged between 0.4223 and 0.7825. Communication process
strategies explain 18.65% of the variance in the data. The scale measuring
Communication process strategies provided sufficient evidence of validity. The CA
coefficient for Communication process strategies is 0.8687, suggesting that the scale
measuring this factor is reliable.
Table 6.7: Validity and Reliability of Communication process strategies
% of Variance: 18.65% Cronbach’s alpha : 0.8687
Code Item Factor loading
Item-total correl.
CA after deletion
C8 Identifies our product(s)/service(s) by means of branding e.g. name, logo, design
0.4657 0.4443 0.8651
C24 Develops marketing communication objectives to reach customers.
0.7123 0.6703 0.8515
C25 Uses different forms of promotion to attract the attention of our target audience.
0.7111 0.7047 0.8494
C26 Identifies a target audience to whom we can communicate our message.
0.7825 0.7107 0.8489
C27 Informs present customers about our products.
0.6635 0.5490 0.8589
C28 Informs potential customers about our products.
0.6997 0.5899 0.8572
C29 Designs a message that can be effectively communicated to our target audience.
0.7505 0.6675 0.8512
C30 Uses advertising to communicate to our target audience.
0.7095 0.6693 0.8503
C31 Runs specials to increase foot traffic to our shop.
0.4223 0.4148 0.8691
C36 Uses emails to remind customers about our products/services.
0.4581 0.4492 0.8663
C38 Utilises social media to attract more customers.
0.5353 0.5218 0.8617
C40 Makes it easy for customers to communicate with our business.
0.4235 0.3545 0.8689
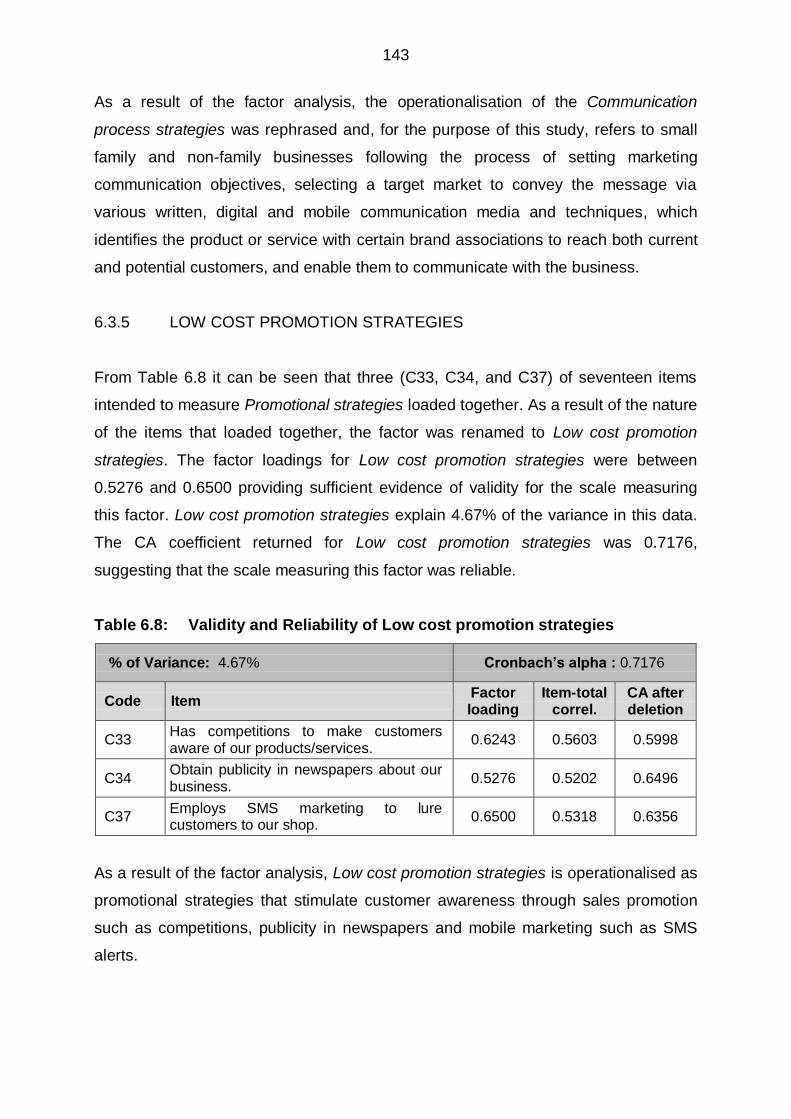
143
As a result of the factor analysis, the operationalisation of the Communication
process strategies was rephrased and, for the purpose of this study, refers to small
family and non-family businesses following the process of setting marketing
communication objectives, selecting a target market to convey the message via
various written, digital and mobile communication media and techniques, which
identifies the product or service with certain brand associations to reach both current
and potential customers, and enable them to communicate with the business.
6.3.5 LOW COST PROMOTION STRATEGIES
From Table 6.8 it can be seen that three (C33, C34, and C37) of seventeen items
intended to measure Promotional strategies loaded together. As a result of the nature
of the items that loaded together, the factor was renamed to Low cost promotion
strategies. The factor loadings for Low cost promotion strategies were between
0.5276 and 0.6500 providing sufficient evidence of validity for the scale measuring
this factor. Low cost promotion strategies explain 4.67% of the variance in this data.
The CA coefficient returned for Low cost promotion strategies was 0.7176,
suggesting that the scale measuring this factor was reliable.
Table 6.8: Validity and Reliability of Low cost promotion strategies
% of Variance: 4.67% Cronbach’s alpha : 0.7176
Code Item Factor loading
Item-total correl.
CA after deletion
C33 Has competitions to make customers aware of our products/services.
0.6243 0.5603 0.5998
C34 Obtain publicity in newspapers about our business.
0.5276 0.5202 0.6496
C37 Employs SMS marketing to lure customers to our shop.
0.6500 0.5318 0.6356
As a result of the factor analysis, Low cost promotion strategies is operationalised as
promotional strategies that stimulate customer awareness through sales promotion
such as competitions, publicity in newspapers and mobile marketing such as SMS
alerts.

144
6.4 REVISED HYPOTHESISED MODEL AND HYPOTHESES
Based on the EFA undertaken, the operationalisation of certain constructs was
reformulated, and the hypothesised framework (see Figure 6.1) and hypotheses were
revised. Table 6.9 summarises the operational definitions and Figure 6.1 illustrates
the reformulated hypotheses.
Table 6.9: Reformulated operational definitions
Factor Operationalisation
Perceived business performance
Refer to small family and non-family businesses experiencing growth in profit, sales, and number of employees over the last two years, as well as the business having loyal customers who make regular purchases and who recommend the business to others.
Competitive distribution strategies
Refer to strategies that small family and non-family businesses perform that concerns providing high-quality and competitive products through distribution process methods by setting timely delivery objectives, using distributions selection criteria based on product availability, cost effectiveness, reputation and business image, and changing the distribution channel when needed to continuously satisfy customers‟ needs.
Communication process strategies
Refer to small family and non-family businesses following the process of setting marketing communication objectives, selecting a target market to convey the message via various written, digital and mobile communication media and techniques, which identifies the product or service with certain brand associations to reach both current and potential customers, and enable them to communicate with the business.
Low cost promotion strategies
Refer to promotional strategies that stimulate customer awareness through sales promotion such as competitions, publicity in newspapers and mobile marketing such as SMS alerts.
According to Figure 6.1, the independent variables Product strategies and Pricing
strategies were eliminated from the hypothesised framework (See Figure 1.1). In
addition, the other marketing mix strategies, Place strategies and Promotion
strategies required regrouping and were renamed and thus the hypothesised
framework and hypotheses had to be reformulated. The dependent variable,
however, remains unchanged.

145
The reformulated hypotheses are as follows:
H1.1a: Competitive distribution strategies of small family businesses influence their
Perceived business performance.
H1.1b: Competitive distribution strategies of small non-family businesses influence
their Perceived business performance.
H2.1a: Communication process strategies of small family businesses influence their
Perceived business performance.
H2.1b: Communication process strategies of small non-family businesses influence
their Perceived business performance.
H3.1a: Low cost promotion strategies of small family businesses influence their
Perceived business performance.
H3.1b: Low cost promotion strategies of small non-family businesses influence their
Perceived business performance.
Figure 6.1: Proposed hypothesised model: The relationships between the
marketing mix strategies and Perceived business performance of
small family and non-family businesses
H1.1a – 1.1b
H2.1a – 2.1b
H3.1a – 3.1b
(Source: Researchers‟ own construct)
The following section will address the empirical results of the descriptive and
inferential statistics in this study.
Marketing mix strategies
Competitive distribution strategies
Communication process strategies
Low cost promotion strategies
Perceived business
performance of small
family and non-family
businesses
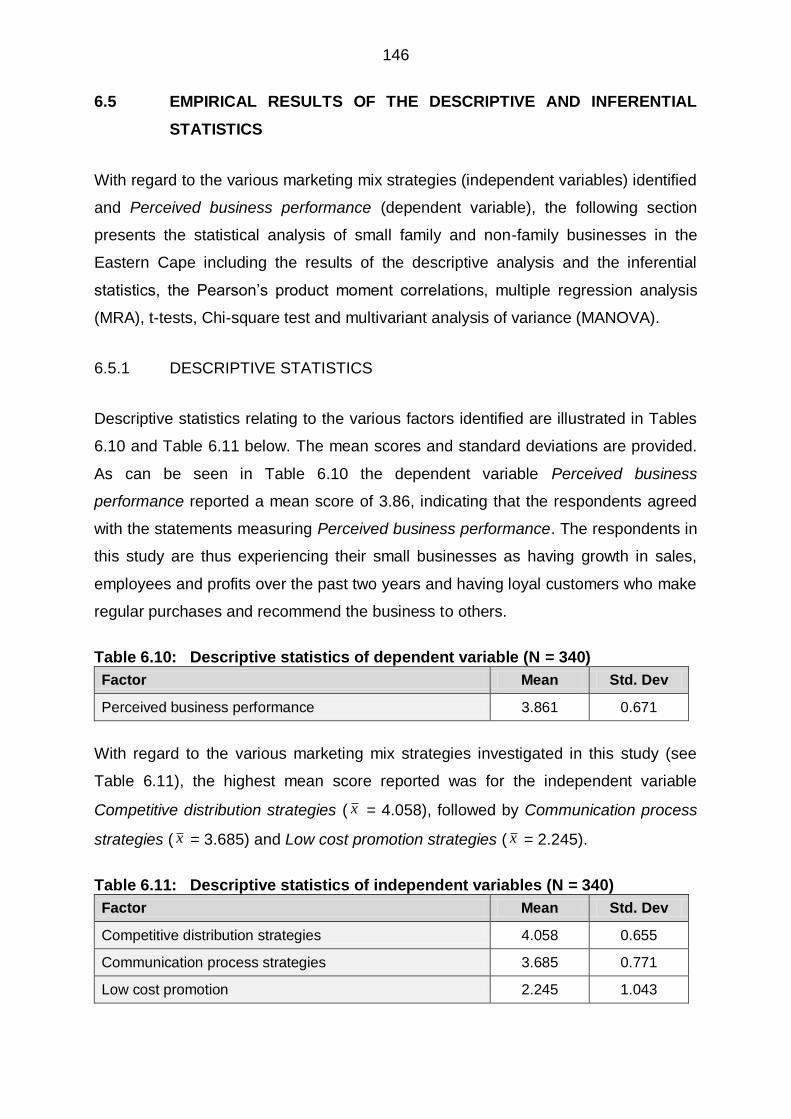
146
6.5 EMPIRICAL RESULTS OF THE DESCRIPTIVE AND INFERENTIAL
STATISTICS
With regard to the various marketing mix strategies (independent variables) identified
and Perceived business performance (dependent variable), the following section
presents the statistical analysis of small family and non-family businesses in the
Eastern Cape including the results of the descriptive analysis and the inferential
statistics, the Pearson‟s product moment correlations, multiple regression analysis
(MRA), t-tests, Chi-square test and multivariant analysis of variance (MANOVA).
6.5.1 DESCRIPTIVE STATISTICS
Descriptive statistics relating to the various factors identified are illustrated in Tables
6.10 and Table 6.11 below. The mean scores and standard deviations are provided.
As can be seen in Table 6.10 the dependent variable Perceived business
performance reported a mean score of 3.86, indicating that the respondents agreed
with the statements measuring Perceived business performance. The respondents in
this study are thus experiencing their small businesses as having growth in sales,
employees and profits over the past two years and having loyal customers who make
regular purchases and recommend the business to others.
Table 6.10: Descriptive statistics of dependent variable (N = 340)
Factor Mean Std. Dev
Perceived business performance 3.861 0.671
With regard to the various marketing mix strategies investigated in this study (see
Table 6.11), the highest mean score reported was for the independent variable
Competitive distribution strategies ( x = 4.058), followed by Communication process
strategies ( x = 3.685) and Low cost promotion strategies ( x = 2.245).
Table 6.11: Descriptive statistics of independent variables (N = 340)
Factor Mean Std. Dev
Competitive distribution strategies 4.058 0.655
Communication process strategies 3.685 0.771
Low cost promotion 2.245 1.043

147
Based on the mean, respondents indicated that they often carry out Competitive
distribution strategies. In other words, respondents in this study perceived their
Competitive distribution strategies as concerned with providing high-quality and
competitive products through distribution process methods by setting timely delivery
objectives, using distributions selection criteria based on product availability, cost
effectiveness, reputation and business image, and changing the distribution channel
when needed to continuously satisfy customers‟ needs. Similarly, respondents tend
to often carry out Communication process strategies, namely setting marketing
communication objectives, selecting a target market to convey the message via
various written, digital and mobile communication media and techniques, which
identifies the product or service with certain brand associations to reach both current
and potential customers, and enable them to communicate with the business.
However, with a reported mean of 2.245, respondents in this study perceived that
they seldom carried out Low cost promotion strategies, by making customers aware
of their product/service offerings through sales promotion such as competitions,
publicity in newspapers and mobile marketing SMS alerts. However, with a reported
standard deviation of 1.043, the most variation in responses was for Low cost
promotion strategies.
6.5.2 PEARSON‟S PRODUCT MOMENT CORRELATIONS
A Pearson‟s product moment correlations analysis was undertaken to establish the
relationships between the various marketing mix strategies under investigation, as
well as between the various marketing mix strategies and Perceived business
performance. Cooper and Schindler (2013:439) assert that correlations range from
+1 to -1, where a correlation of +1 indicates perfect positive correlation; a correlation
of -1 indicates a perfect inverse or negative relationship between variables, and a
correlation of 0 indicates that no relationship exists between variables. More
specifically, a Pearson‟s product moment correlation coefficient with values from 0.0
to 0.2 reflects a very weak positive association; 0.2 to 0.4 reflects a weak positive
association; 0.4 to 0.6 reflects a moderate positive association; 0.6 to 0.8 reflects a
strong positive association; and 0.8 to 1.0 reflects a very strong positive association
(Van Zyl, 2014:208).
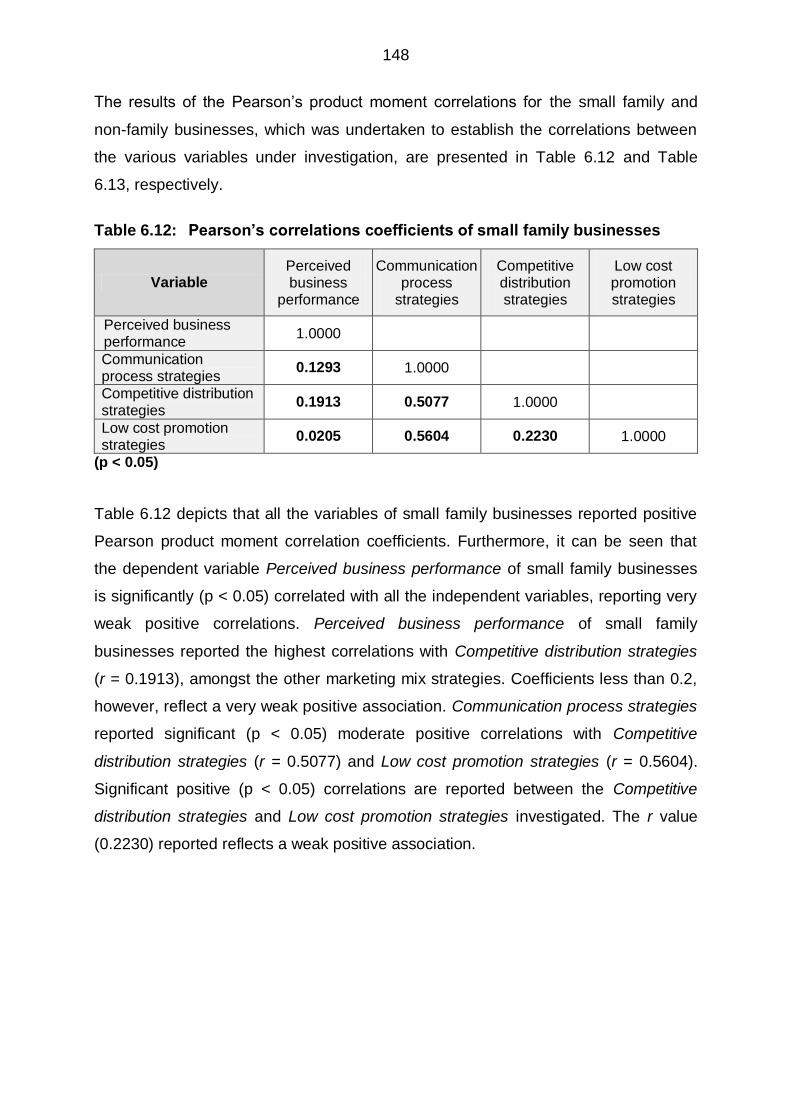
148
The results of the Pearson‟s product moment correlations for the small family and
non-family businesses, which was undertaken to establish the correlations between
the various variables under investigation, are presented in Table 6.12 and Table
6.13, respectively.
Table 6.12: Pearson’s correlations coefficients of small family businesses
Variable Perceived business
performance
Communication process
strategies
Competitive distribution strategies
Low cost promotion strategies
Perceived business performance
1.0000
Communication process strategies
0.1293 1.0000
Competitive distribution strategies
0.1913 0.5077 1.0000
Low cost promotion strategies
0.0205 0.5604 0.2230 1.0000
(p < 0.05)
Table 6.12 depicts that all the variables of small family businesses reported positive
Pearson product moment correlation coefficients. Furthermore, it can be seen that
the dependent variable Perceived business performance of small family businesses
is significantly (p < 0.05) correlated with all the independent variables, reporting very
weak positive correlations. Perceived business performance of small family
businesses reported the highest correlations with Competitive distribution strategies
(r = 0.1913), amongst the other marketing mix strategies. Coefficients less than 0.2,
however, reflect a very weak positive association. Communication process strategies
reported significant (p < 0.05) moderate positive correlations with Competitive
distribution strategies (r = 0.5077) and Low cost promotion strategies (r = 0.5604).
Significant positive (p < 0.05) correlations are reported between the Competitive
distribution strategies and Low cost promotion strategies investigated. The r value
(0.2230) reported reflects a weak positive association.
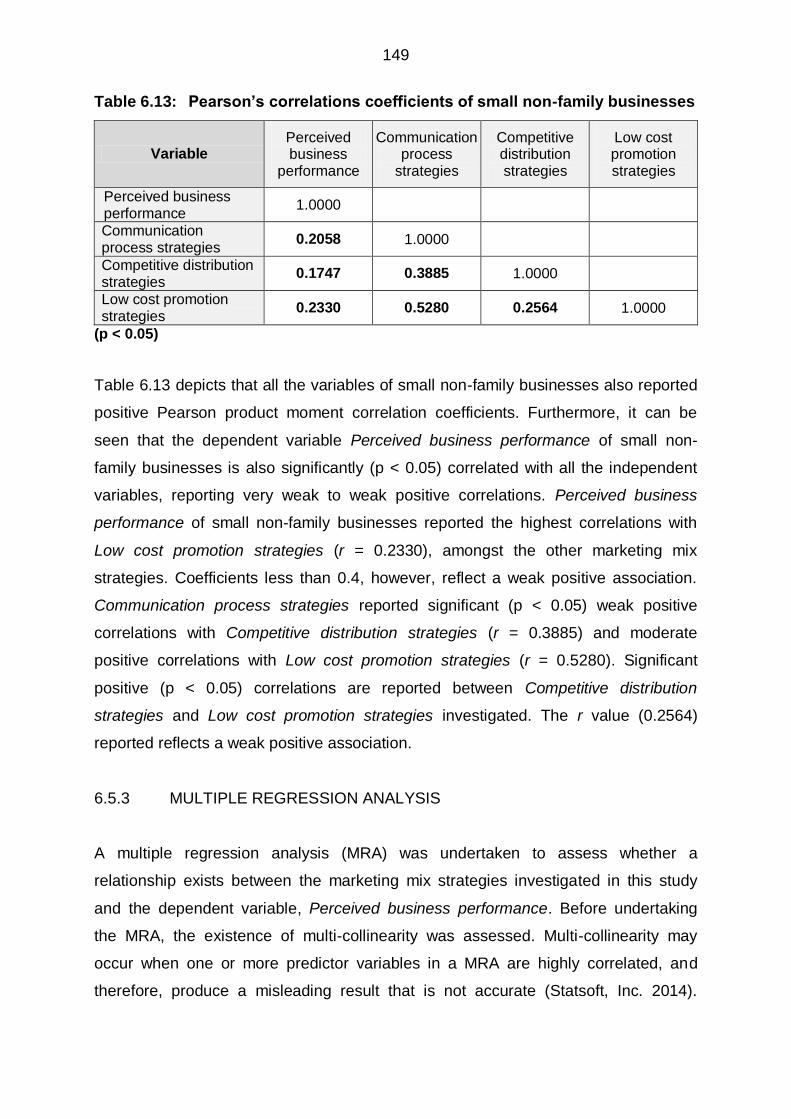
149
Table 6.13: Pearson’s correlations coefficients of small non-family businesses
Variable Perceived business
performance
Communication process
strategies
Competitive distribution strategies
Low cost promotion strategies
Perceived business performance
1.0000
Communication process strategies
0.2058 1.0000
Competitive distribution strategies
0.1747 0.3885 1.0000
Low cost promotion strategies
0.2330 0.5280 0.2564 1.0000
(p < 0.05)
Table 6.13 depicts that all the variables of small non-family businesses also reported
positive Pearson product moment correlation coefficients. Furthermore, it can be
seen that the dependent variable Perceived business performance of small non-
family businesses is also significantly (p < 0.05) correlated with all the independent
variables, reporting very weak to weak positive correlations. Perceived business
performance of small non-family businesses reported the highest correlations with
Low cost promotion strategies (r = 0.2330), amongst the other marketing mix
strategies. Coefficients less than 0.4, however, reflect a weak positive association.
Communication process strategies reported significant (p < 0.05) weak positive
correlations with Competitive distribution strategies (r = 0.3885) and moderate
positive correlations with Low cost promotion strategies (r = 0.5280). Significant
positive (p < 0.05) correlations are reported between Competitive distribution
strategies and Low cost promotion strategies investigated. The r value (0.2564)
reported reflects a weak positive association.
6.5.3 MULTIPLE REGRESSION ANALYSIS
A multiple regression analysis (MRA) was undertaken to assess whether a
relationship exists between the marketing mix strategies investigated in this study
and the dependent variable, Perceived business performance. Before undertaking
the MRA, the existence of multi-collinearity was assessed. Multi-collinearity may
occur when one or more predictor variables in a MRA are highly correlated, and
therefore, produce a misleading result that is not accurate (Statsoft, Inc. 2014).

150
Variance inflation factors (VIF) were calculated to establish whether multi-collinearity
is a problem in this study. Tolerance values of more than 0.1, and VIF values of less
than four indicate that multi-collinearity is not a problem (O‟Brien, 2007:674). Table
6.14 and Table 6.15 indicate the results of the multi-collinearity diagnostics analysis
test performed for small family and non-family businesses, respectively.
Table 6.14: Results of the multi-collinearity diagnostics of small family
businesses
Dependent variable: Perceived business performance
Independent variables
Multi-collinearity statistics
Tolerance value VIF
Communication process strategies 0.532 1.880
Competitive distribution strategies 0.737 1.357
Low cost promotion strategies 0.681 1.468
From Table 6.14 the findings show tolerance values varying from 0.532 to 0.737,
which are much higher than the lowest limit of 0.1, and VIF factors of less than 4 for
all predictor variables. Therefore, no collinearity problems occurred during the multi-
collinearity diagnostics analysis for small family businesses, indicating that the
predictor variables are not highly correlated amongst themselves.
Table 6.15: Results of the multi-collinearity diagnostics of small non-family
businesses
Dependent variable: Perceived business performance
Independent variables
Multi-collinearity statistics
Tolerance value VIF
Communication process strategies 0.653 1.531
Competitive distribution strategies 0.846 1.182
Low cost promotion strategies 0.719 1.391
From Table 6.15 the findings show tolerance values varying from 0.653 to 0.846,
which are much higher than the lowest limit of 0.1, and VIF factors of less than 4 for
all predictor variables. Therefore, no collinearity problems occurred during the multi-
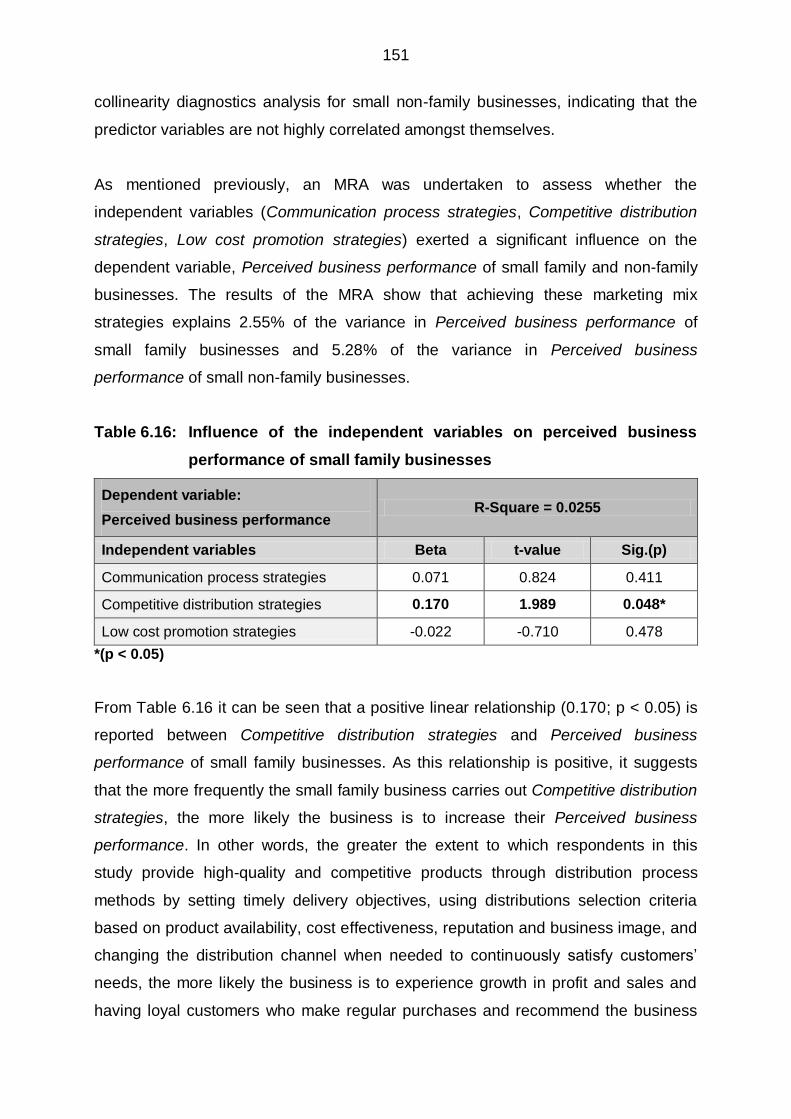
151
collinearity diagnostics analysis for small non-family businesses, indicating that the
predictor variables are not highly correlated amongst themselves.
As mentioned previously, an MRA was undertaken to assess whether the
independent variables (Communication process strategies, Competitive distribution
strategies, Low cost promotion strategies) exerted a significant influence on the
dependent variable, Perceived business performance of small family and non-family
businesses. The results of the MRA show that achieving these marketing mix
strategies explains 2.55% of the variance in Perceived business performance of
small family businesses and 5.28% of the variance in Perceived business
performance of small non-family businesses.
Table 6.16: Influence of the independent variables on perceived business
performance of small family businesses
Dependent variable:
Perceived business performance R-Square = 0.0255
Independent variables Beta t-value Sig.(p)
Communication process strategies 0.071 0.824 0.411
Competitive distribution strategies 0.170 1.989 0.048*
Low cost promotion strategies -0.022 -0.710 0.478
*(p < 0.05)
From Table 6.16 it can be seen that a positive linear relationship (0.170; p < 0.05) is
reported between Competitive distribution strategies and Perceived business
performance of small family businesses. As this relationship is positive, it suggests
that the more frequently the small family business carries out Competitive distribution
strategies, the more likely the business is to increase their Perceived business
performance. In other words, the greater the extent to which respondents in this
study provide high-quality and competitive products through distribution process
methods by setting timely delivery objectives, using distributions selection criteria
based on product availability, cost effectiveness, reputation and business image, and
changing the distribution channel when needed to continuously satisfy customers‟
needs, the more likely the business is to experience growth in profit and sales and
having loyal customers who make regular purchases and recommend the business
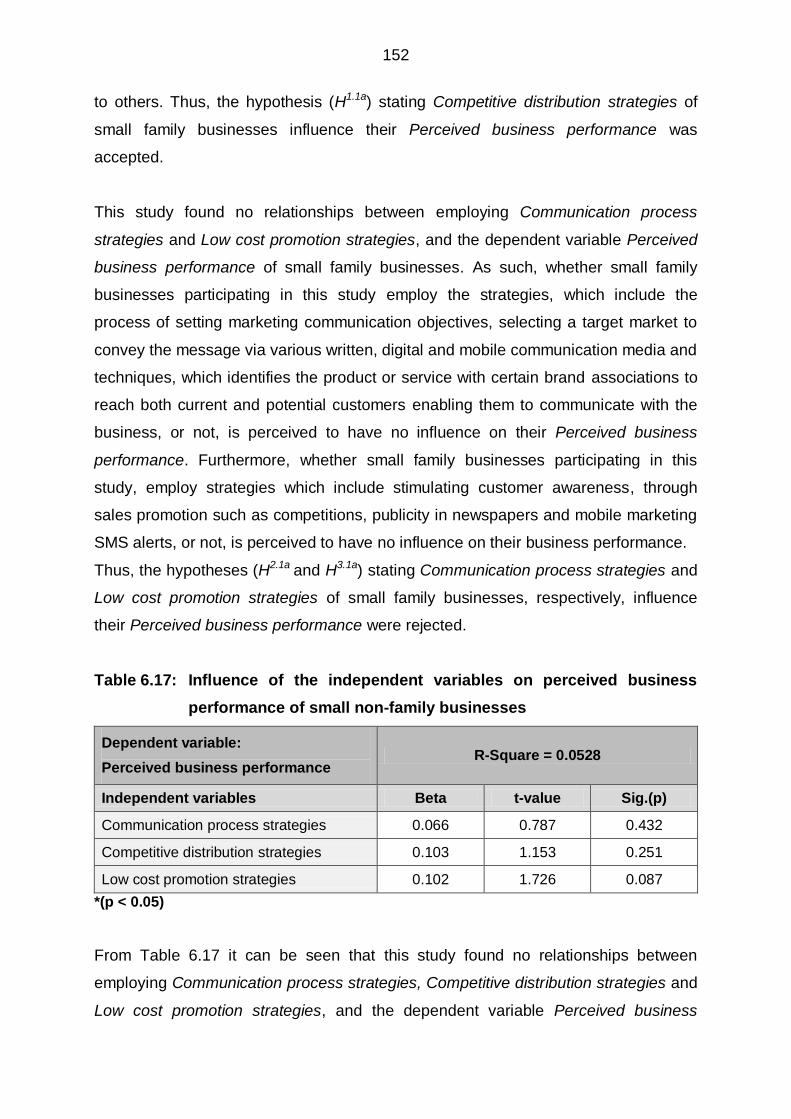
152
to others. Thus, the hypothesis (H1.1a) stating Competitive distribution strategies of
small family businesses influence their Perceived business performance was
accepted.
This study found no relationships between employing Communication process
strategies and Low cost promotion strategies, and the dependent variable Perceived
business performance of small family businesses. As such, whether small family
businesses participating in this study employ the strategies, which include the
process of setting marketing communication objectives, selecting a target market to
convey the message via various written, digital and mobile communication media and
techniques, which identifies the product or service with certain brand associations to
reach both current and potential customers enabling them to communicate with the
business, or not, is perceived to have no influence on their Perceived business
performance. Furthermore, whether small family businesses participating in this
study, employ strategies which include stimulating customer awareness, through
sales promotion such as competitions, publicity in newspapers and mobile marketing
SMS alerts, or not, is perceived to have no influence on their business performance.
Thus, the hypotheses (H2.1a and H3.1a) stating Communication process strategies and
Low cost promotion strategies of small family businesses, respectively, influence
their Perceived business performance were rejected.
Table 6.17: Influence of the independent variables on perceived business
performance of small non-family businesses
Dependent variable:
Perceived business performance R-Square = 0.0528
Independent variables Beta t-value Sig.(p)
Communication process strategies 0.066 0.787 0.432
Competitive distribution strategies 0.103 1.153 0.251
Low cost promotion strategies 0.102 1.726 0.087
*(p < 0.05)
From Table 6.17 it can be seen that this study found no relationships between
employing Communication process strategies, Competitive distribution strategies and
Low cost promotion strategies, and the dependent variable Perceived business
153
performance of small non-family businesses. As such, whether small non-family
businesses participating in this study employ the strategies, which include process of
setting marketing communication objectives, selecting a target market to convey the
message via various written, digital and mobile communication media and
techniques, which identifies the product or service with certain brand associations to
reach both current and potential customers enabling them to communicate with the
business, or not, is perceived to have no influence on their Perceived business
performance. Moreover, the extent to which respondents of small non-family
businesses provide high-quality and competitive products through distribution
process methods by setting timely delivery objectives, using distributions selection
criteria based on product availability, cost effectiveness, reputation and business
image, and changing the distribution channel when needed to continuously satisfy
customers‟ needs, has no influence on their Perceived business performance.
Furthermore, whether small non-family businesses participating in this study employ
the strategies, which include stimulating customer awareness through sales
promotion such as competitions, publicity in newspapers and mobile marketing SMS
alerts, or not, it is perceived to have no influence on their Perceived business
performance.
Thus, the hypotheses (H1.1b, H2.1b and H3.1b) stating Communication process
strategies, Competitive distribution strategies and Low cost promotion strategies of
small non-family businesses, respectively, influence their Perceived business
performance were rejected.
As only one statistically significant relationship was found between Competitive
distribution strategies and Perceived business performance of small family
businesses it was decided to further explore whether the demographic variables have
an influence on the valid and reliable marketing mix strategies utilised by the small
family and non-family businesses. It is, therefore, hypothesised in the Section 6.5.4
that demographical variables would have no influence on the marketing mix utilised
by the small family and non-family businesses.
154
6.5.4 DIFFERENCES BETWEEN SMALL FAMILY AND NON-FAMILY
BUSINESSES
Given the third secondary objective (SO3), to establish whether there are differences
between small family and non-family businesses concerning the marketing mix
strategies adopted, t-tests were undertaken to determine whether the differences in
the mean scores returned by the small family and non-family business sample
groups for the marketing mix strategies under investigation, were significantly
different from each other.
According to Zikmund and Babin (2010:518) and Quinlan (2011:401), a t-test is a
technique used to test whether the mean score for a variable is significantly different
for two independent samples. The null hypothesis is that there is no difference
between the two samples. If the result of the t-test is significant (p < 0.05), there is
evidence to reject the null hypothesis stating there is no difference between the two
groups (Collis & Hussey, 2014:264).
One set of t-tests was performed on the three independent variables (Competitive
distribution strategies, Communication process strategies and Low cost promotion
strategies), that had been established as valid and reliable, and the first demographic
variable. The following set of null-hypotheses was formulated:
H01.1-1.3: There is no relationship between Type of small business ownership and
the independent variables.
The results of the t-tests are reported in Table 6.18 and revealed no significant
difference between the mean scores returned by the small family and non-family
businesses with regard to their usage of Communication process strategies,
Competitive distribution strategies and Low cost promotion strategies. As such, the
manner in which small family businesses utilise these marketing mix strategies does
not differ from those used by small non-family businesses.

155
Table 6.18: Influence of small family and non-family businesses on marketing
mix strategies
Independent variables SFB Mean
SNFB Mean
t-value Sig.(p) Hypotheses
Communication process strategies
3.741 3.609 -1.561 0.119 H01.1 Accepted
Competitive distribution strategies
4.073 4.038 -0.491 0.624 H01.2 Accepted
Low cost promotion strategies
2.195 2.313 1.030 0.304 H01.3 Accepted
*(p < 0.05)
(SFB = Small family businesses; SNFB = Small non-family businesses)
Moreover, the hypotheses (H01.1-1.3) stating there is no relationship between the
demographic variable Type of small business ownership and the Communication
process strategies, Competitive distribution strategies and Low cost promotion
strategies of the small family and non-family businesses were accepted.
Furthermore, it was deemed important to determine whether the family name was
utilised by small family businesses as a marketing or branding tool (see Section B in
the questionnaire). From the 195 small family-owned businesses that participated in
this study, 63 respondents (32.13%) indicated that their small family-owned business
used their family name as a marketing or branding tool. In order to determine if
differences were statistically significant between the family brand and business size
(micro, very small and small), a Chi-square test (Chi2) for independence was
conducted.
Table 6.19: A comparison of small business size and family branding
Business Size
Family Branding Yes
Family Branding No
f % f %
Micro 22 28.95% 54 71.05%
Very small 28 33.33% 56 66.67%
Small 13 41.94% 18 58.06%
*(p < 0.05)
Chi2 = 1.69, p = 0.43 (not statistically significant),
(f = frequency)
156
From Table 6.19 it is evident that no statistically significant difference (Chi2 = 1.69; p
= 0.43) is reported between using the family name as a marketing or branding tool
and the size of the small business in this study as the Chi-square value is more than
0.05. It can, however, be noted that as the business size increases, the more small
businesses use their family name as a marketing or branding tool. Furthermore, there
is less variation in the use of family name branding with small businesses (42% vs
58%), than with very small (33% vs 67%) and micro (29% vs 71%) businesses.
6.5.5 THE INFLUENCE OF DEMOGRAPHIC VARIABLES ON MARKETING
MIX STRATEGIES
As only one statistically significant relationship was found in the MRA, a multivariant
analysis of variances (MANOVAs) was undertaken in order to establish whether
statistically significant relationships exist between the remaining seventeen selected
demographic variables and the three valid and reliable marketing mix strategies
(Competitive distribution strategies, Communication process strategies and Low cost
promotion strategies).
MANOVA is a statistical technique similar to the analysis of variance (ANOVA), but
the main distinguishing feature is that MANOVA explores whether statistically
significant relationships exist between several variables and two or more dependent
variables (Adeleke, Yahya & Usman, 2014:2). As such, Karris (2003:193) and Fred,
Filipe and Gamboa (2010:27) assert that MANOVA is used to determine whether
statistically significant differences exist between the means of several data sets. The
test statistic for MANOVA is the F ratio. If the null hypothesis is true, there should be
no difference between the population means, and the F ratio should be close to 1. If
the population means are not equal, the F ratio should be greater than 1 (Cooper &
Schindler 2013:516-517; Zikmund & Babin 2013:541). If a MANOVA test reveals an
F-value of statistical significance, it is essential to calculate the post-hoc Scheffé test
where the mean differences exist. The post-hoc Scheffé test identifies significant
differences between the mean scores of the various categories within each
demographic variable (Cooper & Schindler 2013:516-517; Zikmund & Babin
2010:541). If mean differences are powerful enough, the Cohen‟s d-value could be
calculated to establish if there is practical significance.
157
Cohen‟s d-values can be interpreted in the following ways (Walker, 2008:1):
Values of between 0.2 and 0.5 reflect a small practical significance;
Values of between 0.5 and 0.8 reflect an average practical significance; and
Values of greater than 0.8 reflect a large practical significance.
Seventeen separate sets of MANOVAs were performed on the three independent
variables (Communication process strategies, Competitive distribution strategies, and
Low cost promotion strategies), that had been established as valid and reliable, and
the remaining 17 demographic variables. The following 17 sets of null-hypotheses
were formulated:
H02.1-2.3: There is no relationship between Gender of the business owner/manager
and the independent variables.
H03.1-3.3: There is no relationship between Age of the business owner/manager and
the independent variables.
H04.1-4.3: There is no relationship between Education level of the business
owner/manager and the independent variables.
H05.1-5.3: There is no relationship between Home language of the business
owner/manager and the independent variables.
H06.1-6.3: There is no relationship between Management qualification of the
business owner/manager and the independent variables.
H07.1-7.3: There is no relationship between Ethnicity of the business owner/manager
and the independent variables.
H08.1-8.3: There is no relationship between Position in the small business and the
independent variables.
H09.1-9.3: There is no relationship between Years small business is in existence and
the independent variables.
H010.1-10.3: There is no relationship between Years employed as a manager in a small
business and the independent variables.
H011.1-11.3: There is no relationship between Working experience of the business
owner/manager and the independent variables.
H012.1-12.3: There is no relationship between Management working experience of the
business owner/manager and the independent variables.
158
H013.1-13.3: There is no relationship between Business sector and the independent
variables.
H014.1-14.3: There is no relationship between Business activity and the independent
variables.
H015.1-15.3: There is no relationship between Form of business ownership and the
independent variables.
H016.1-16.3: There is no relationship between Number of employees in a small
business and the independent variables.
H017.1-17.3: There is no relationship between Area of business premises and the
independent variables.
H018.1-18.3: There is no relationship between Target market of the small business and
the independent variables.
No statistically significant MANOVA relationships were found between six of the
preceding 17 hypotheses, Education level of the business owner/manager (H04.1-4.3),
Home language of the business owner/manager (H05.1-5.3), Years employed as a
manager in a small business (H010.1-10.3), Business sector (H013.1-13.3), Business
activity (H014.1-14.3) and Number of employees in a small business (H016.1-16.3) and any
of the independent variables.
In the following sections, Tables 6.20 to 6.30 present the results of the eleven
significant MANOVA relationships.
6.5.5.1 Gender of the business owner/manager’s influence on the marketing
mix strategies
Table 6.20 portrays the multivariant analysis of variance (MANOVA) results between
the demographical variable Gender of the business owner/manager and the three
independent variables. It is evident that a statistically significant positive relationship
exists between the demographic variable Gender of the business owner/manager
and Low cost promotion strategies (0.016; p < 0.05). Therefore, the hypothesis
(H02.3) stating there is no relationship between the demographic variable Gender of
the business owner/manager and the Low cost promotion strategies of the small
family and non-family businesses was rejected. Moreover, the hypotheses (H02.1-2.2)

159
stating there are no relationships between the demographic variable Gender of the
business owner/manager and the Communication process strategies and
Competitive distribution strategies of the small family and non-family businesses
were thus accepted.
Table 6.20: Relationship between gender of the business owner/manager and
the independent variables
Grouping variable: Gender
Independent variables F-value Sig.(p) Hypotheses
Communication process strategies 3.862 0.050 H02.1 Accepted
Competitive distribution strategies 2.780 0.096 H02.2 Accepted
Low cost promotion strategies 5.890 0.016* H02.3 Rejected
*(p < 0.05)
The post-hoc Scheffé test for the relationship between Gender of the business
owner/manager and Low cost promotion strategies revealed a significant mean
difference at (p < 0.05) between the mean scores for males ( x = 2.152) and females
( x = 2.443). Therefore, it is evident that female respondents from the small family and
non-family business are more likely at times to utilise Low cost promotion strategies,
such as competitions, publicity in newspapers and mobile SMS marketing, than male
respondents. The Cohen‟s d-value was 0.271 which presented a small practical
significance.
According to McMohan (2016:1), female respondents may tend to utilise Low cost
promotion strategies more as various sales promotion campaigns are targeting the
female gender on the assumption that doing so will attract more women, especially
when offering discounts or free items. Hence, females may tend to utilise Low cost
promotion strategies more due to the popularity of businesses gender-based sales
promotion campaigns, discounts and free offerings (McMohan, 2016:1).
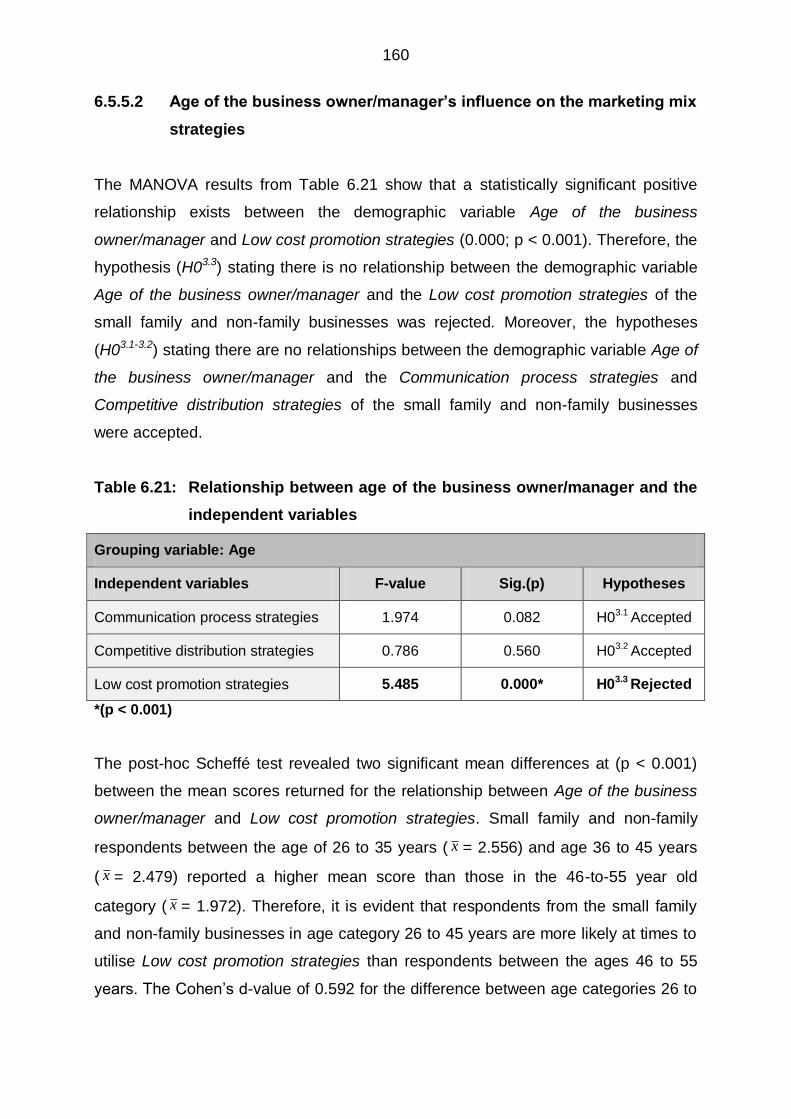
160
6.5.5.2 Age of the business owner/manager’s influence on the marketing mix
strategies
The MANOVA results from Table 6.21 show that a statistically significant positive
relationship exists between the demographic variable Age of the business
owner/manager and Low cost promotion strategies (0.000; p < 0.001). Therefore, the
hypothesis (H03.3) stating there is no relationship between the demographic variable
Age of the business owner/manager and the Low cost promotion strategies of the
small family and non-family businesses was rejected. Moreover, the hypotheses
(H03.1-3.2) stating there are no relationships between the demographic variable Age of
the business owner/manager and the Communication process strategies and
Competitive distribution strategies of the small family and non-family businesses
were accepted.
Table 6.21: Relationship between age of the business owner/manager and the
independent variables
Grouping variable: Age
Independent variables F-value Sig.(p) Hypotheses
Communication process strategies 1.974 0.082 H03.1 Accepted
Competitive distribution strategies 0.786 0.560 H03.2 Accepted
Low cost promotion strategies 5.485 0.000* H03.3 Rejected
*(p < 0.001)
The post-hoc Scheffé test revealed two significant mean differences at (p < 0.001)
between the mean scores returned for the relationship between Age of the business
owner/manager and Low cost promotion strategies. Small family and non-family
respondents between the age of 26 to 35 years ( x = 2.556) and age 36 to 45 years
( x = 2.479) reported a higher mean score than those in the 46-to-55 year old
category ( x = 1.972). Therefore, it is evident that respondents from the small family
and non-family businesses in age category 26 to 45 years are more likely at times to
utilise Low cost promotion strategies than respondents between the ages 46 to 55
years. The Cohen‟s d-value of 0.592 for the difference between age categories 26 to

161
35 years and 46 to 55 years presents an average practical significance, whereas the
Cohen‟s d-value of 0.485 for the difference between age categories 36 to 45 years
and 46 to 55 years, presents a small practical significance.
Perhaps an obvious reason for this is that younger people (Millennials) tend to be
more technology savvy, growing up being more familiar with more recent low cost
sales promotion strategies such as SMS marketing, obtaining publicity in
newspapers and launching competitions, amongst others. Younger people also
tend to find themselves more “plugged-in” being on their cell/smartphones and
social media 24/7, and it is, therefore, not surprising that younger
owners/managers of small businesses tend to utilise Low cost promotion strategies
more often than their older counterparts. Baber (2015:1) confirms the tendency of
younger people, such as those between the ages of 26 to 35 years, to utilise
more sale promotion strategies, as opposed to older people, such as those older
than 45 years.
6.5.5.3 Management qualification of the business owner/manager’s influence
on the marketing mix strategies
Table 6.22 portrays the MANOVA results between the demographical variable
Management qualifications of the business owner/manager and the three
independent variables. It is evident that a statistically significant positive relationship
exists between the demographic variable Management qualifications of the business
owner/manager and Communication process strategies (0.042; p < 0.05) and Low
cost promotion strategies (0.016; p < 0.05). Therefore, the hypotheses (H06.1 and
H06.3) stating there is no relationship between the demographic variable Management
qualification of the business owner/manager and the Communication process
strategies and Low cost promotion strategies of the small family and non-family
businesses were rejected. Moreover, the hypothesis (H06.2) stating there are no
relationships between the demographic variable Management qualification of the
business owner/manager and the Competitive distribution strategies of the small
family and non-family businesses was accepted.
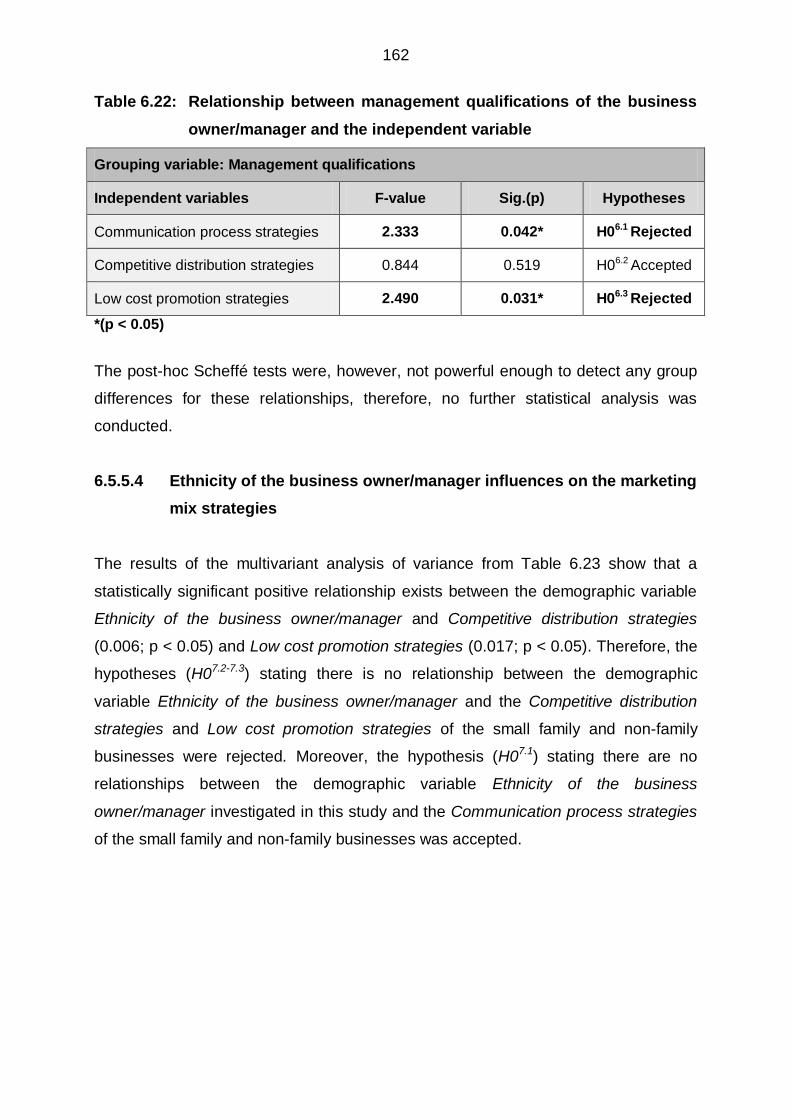
162
Table 6.22: Relationship between management qualifications of the business
owner/manager and the independent variable
Grouping variable: Management qualifications
Independent variables F-value Sig.(p) Hypotheses
Communication process strategies 2.333 0.042* H06.1 Rejected
Competitive distribution strategies 0.844 0.519 H06.2 Accepted
Low cost promotion strategies 2.490 0.031* H06.3 Rejected
*(p < 0.05)
The post-hoc Scheffé tests were, however, not powerful enough to detect any group
differences for these relationships, therefore, no further statistical analysis was
conducted.
6.5.5.4 Ethnicity of the business owner/manager influences on the marketing
mix strategies
The results of the multivariant analysis of variance from Table 6.23 show that a
statistically significant positive relationship exists between the demographic variable
Ethnicity of the business owner/manager and Competitive distribution strategies
(0.006; p < 0.05) and Low cost promotion strategies (0.017; p < 0.05). Therefore, the
hypotheses (H07.2-7.3) stating there is no relationship between the demographic
variable Ethnicity of the business owner/manager and the Competitive distribution
strategies and Low cost promotion strategies of the small family and non-family
businesses were rejected. Moreover, the hypothesis (H07.1) stating there are no
relationships between the demographic variable Ethnicity of the business
owner/manager investigated in this study and the Communication process strategies
of the small family and non-family businesses was accepted.

163
Table 6.23: Relationship between ethnicity of the business owner/manager
and the independent variable
Grouping variable: Ethnicity
Independent variables F-value Sig.(p) Hypotheses
Communication process strategies 1.799 0.147 H07.1 Accepted
Competitive distribution strategies 4.232 0.006* H07.2 Rejected
Low cost promotion strategies 3.424 0.017* H07.3 Rejected
*(p < 0.05)
The post-hoc Scheffé test revealed a significant mean difference at (p < 0.05)
between the mean scores returned for the relationship between Ethnicity of the
business owner/manager and Competitive distribution strategies. Small family and
non-family respondents of a White ethnic affiliation returned a higher mean score ( x
= 4.145) than respondents of a Black ethnic affiliation ( x = 3.858). Therefore, it is
evident that small family and non-family business respondents of a White affiliation
more often utilise Competitive distributions strategies than those of a Black ethnic
affiliation. The Cohen‟s d-value was 0.416 which presented a small practical
significance. The post-hoc Scheffé test also revealed a significant mean difference at
(p < 0.05) between the mean scores returned for Low cost promotion strategies.
Small family and non-family respondents of a Coloured affiliation returned a higher
mean score ( x = 2.677) than respondents of a White affiliation ( x = 2.130).
Therefore, it is evident that small family and non-family business respondents of a
Coloured affiliation more often utilise Low cost promotion strategies than respondents
of a White ethnic affiliation. The Cohen‟s d-value was 0.511 which presented an
average practical significance.
Various authors (Badenhorst-Weiss & Cilliers, 2014:2; Brink, Cant & Ligthelm,
2003:1; Nkosi, Bounds & Goldman, 2013:9) indicate that Black small business
owners operating their businesses in townships experience problems with low
demand and insufficient knowledge of their competitors and new competitors
entering the market. Furthermore, these authors suggest that these small business
owners very seldom conduct market research on their competitors and needs of their
164
customers and thus unable to formulate strategies, such as setting timely delivery
objectives, amongst others, to exploit their competitive advantages. Small business
customers in townships can also still be regarded as price sensitive (customers‟
responses to price changes either upwards or downwards)(Lamb, Hair, McDaniel,
Boshoff, Terblanche, Elliot & Klopper, 2010:414) and/or price conscious, implying
customers strive to pay low prices (Pride & Ferrell, 2010:567). As a result, these
might be possible reasons why Black respondents less often utilise Competitive
distribution strategies and more often utilise Low cost promotion strategies.
Perhaps another reason for utilising Low cost promotion strategies is that small
businesses lack access to finance and the financial resources required to start
trading and to fund small business growth (Olawale & Garwe, 2010:731-732).
According to Van Scheers (2011:5049), the greatest challenge that small businesses
face is the lack of finance. This is supported by various authors indicating that small
businesses suffering from a lack of capital have a diminished chance of survival
(Fatoki, 2010:128; Herrington et al., 2009:1; Pitman, 2010:84) and, therefore, they
might more often utilise Low cost promotion strategies due to their limited resources.
6.5.5.5 Position in the small business’ influence on the marketing mix
strategies
Table 6.24 portrays the MANOVA results between the demographical variable
Position in the small business and the three independent variables. It is evident that a
statistically significant positive relationship exists between the demographic variable
Position in the small business and Low cost promotion strategies (0.040; p < 0.05).
Therefore, the hypothesis (H08.3) stating there is no relationship between the
demographic variable Position in the small business and the Low cost promotion
strategies of the small family and non-family businesses was rejected. Moreover, the
hypotheses (H08.1-8.2) stating there are no relationships between the demographic
variable Position in the small business investigated in this study and the
Communication process strategies and Competitive distribution strategies of the
small family and non-family businesses were accepted.
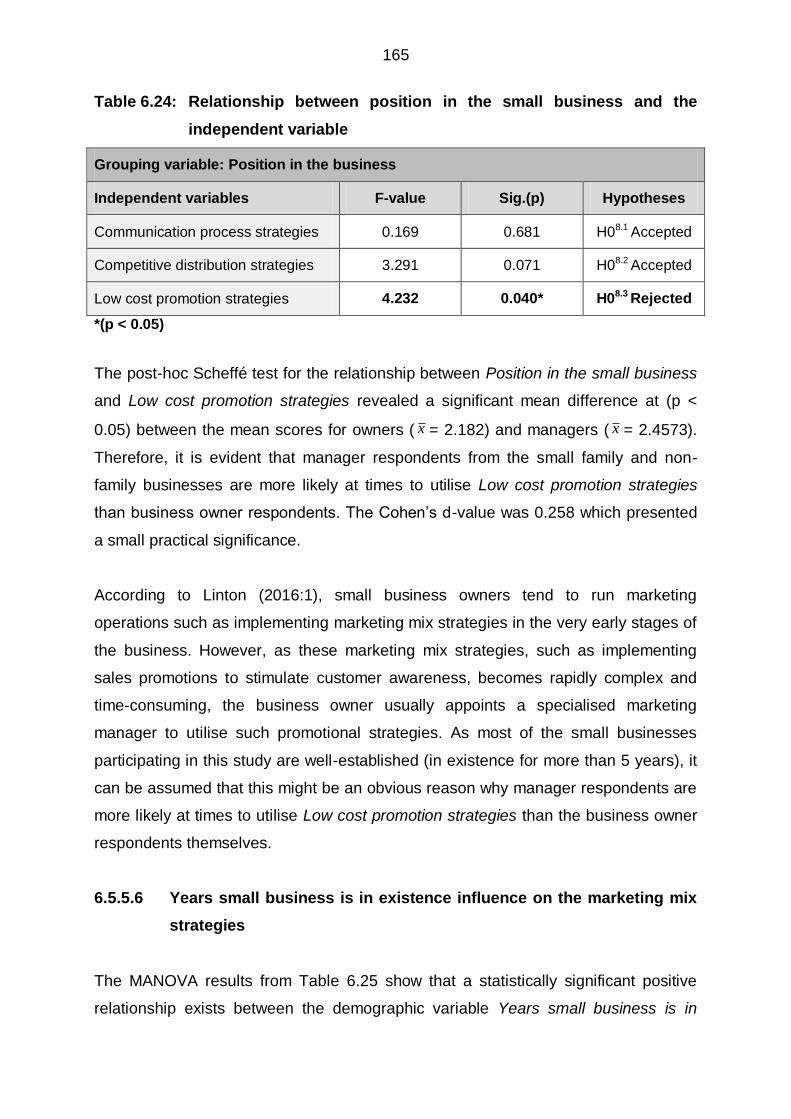
165
Table 6.24: Relationship between position in the small business and the
independent variable
Grouping variable: Position in the business
Independent variables F-value Sig.(p) Hypotheses
Communication process strategies 0.169 0.681 H08.1 Accepted
Competitive distribution strategies 3.291 0.071 H08.2 Accepted
Low cost promotion strategies 4.232 0.040* H08.3 Rejected
*(p < 0.05)
The post-hoc Scheffé test for the relationship between Position in the small business
and Low cost promotion strategies revealed a significant mean difference at (p <
0.05) between the mean scores for owners ( x = 2.182) and managers ( x = 2.4573).
Therefore, it is evident that manager respondents from the small family and non-
family businesses are more likely at times to utilise Low cost promotion strategies
than business owner respondents. The Cohen‟s d-value was 0.258 which presented
a small practical significance.
According to Linton (2016:1), small business owners tend to run marketing
operations such as implementing marketing mix strategies in the very early stages of
the business. However, as these marketing mix strategies, such as implementing
sales promotions to stimulate customer awareness, becomes rapidly complex and
time-consuming, the business owner usually appoints a specialised marketing
manager to utilise such promotional strategies. As most of the small businesses
participating in this study are well-established (in existence for more than 5 years), it
can be assumed that this might be an obvious reason why manager respondents are
more likely at times to utilise Low cost promotion strategies than the business owner
respondents themselves.
6.5.5.6 Years small business is in existence influence on the marketing mix
strategies
The MANOVA results from Table 6.25 show that a statistically significant positive
relationship exists between the demographic variable Years small business is in
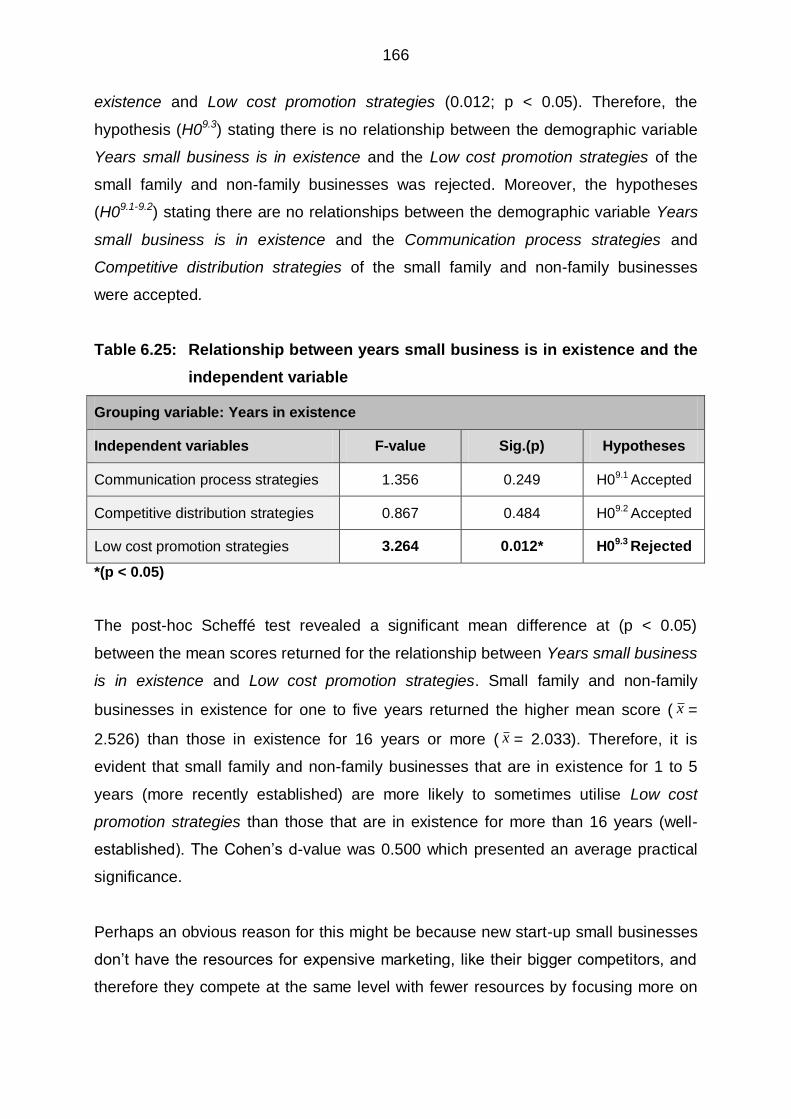
166
existence and Low cost promotion strategies (0.012; p < 0.05). Therefore, the
hypothesis (H09.3) stating there is no relationship between the demographic variable
Years small business is in existence and the Low cost promotion strategies of the
small family and non-family businesses was rejected. Moreover, the hypotheses
(H09.1-9.2) stating there are no relationships between the demographic variable Years
small business is in existence and the Communication process strategies and
Competitive distribution strategies of the small family and non-family businesses
were accepted.
Table 6.25: Relationship between years small business is in existence and the
independent variable
Grouping variable: Years in existence
Independent variables F-value Sig.(p) Hypotheses
Communication process strategies 1.356 0.249 H09.1 Accepted
Competitive distribution strategies 0.867 0.484 H09.2 Accepted
Low cost promotion strategies 3.264 0.012* H09.3 Rejected
*(p < 0.05)
The post-hoc Scheffé test revealed a significant mean difference at (p < 0.05)
between the mean scores returned for the relationship between Years small business
is in existence and Low cost promotion strategies. Small family and non-family
businesses in existence for one to five years returned the higher mean score ( x =
2.526) than those in existence for 16 years or more ( x = 2.033). Therefore, it is
evident that small family and non-family businesses that are in existence for 1 to 5
years (more recently established) are more likely to sometimes utilise Low cost
promotion strategies than those that are in existence for more than 16 years (well-
established). The Cohen‟s d-value was 0.500 which presented an average practical
significance.
Perhaps an obvious reason for this might be because new start-up small businesses
don‟t have the resources for expensive marketing, like their bigger competitors, and
therefore they compete at the same level with fewer resources by focusing more on
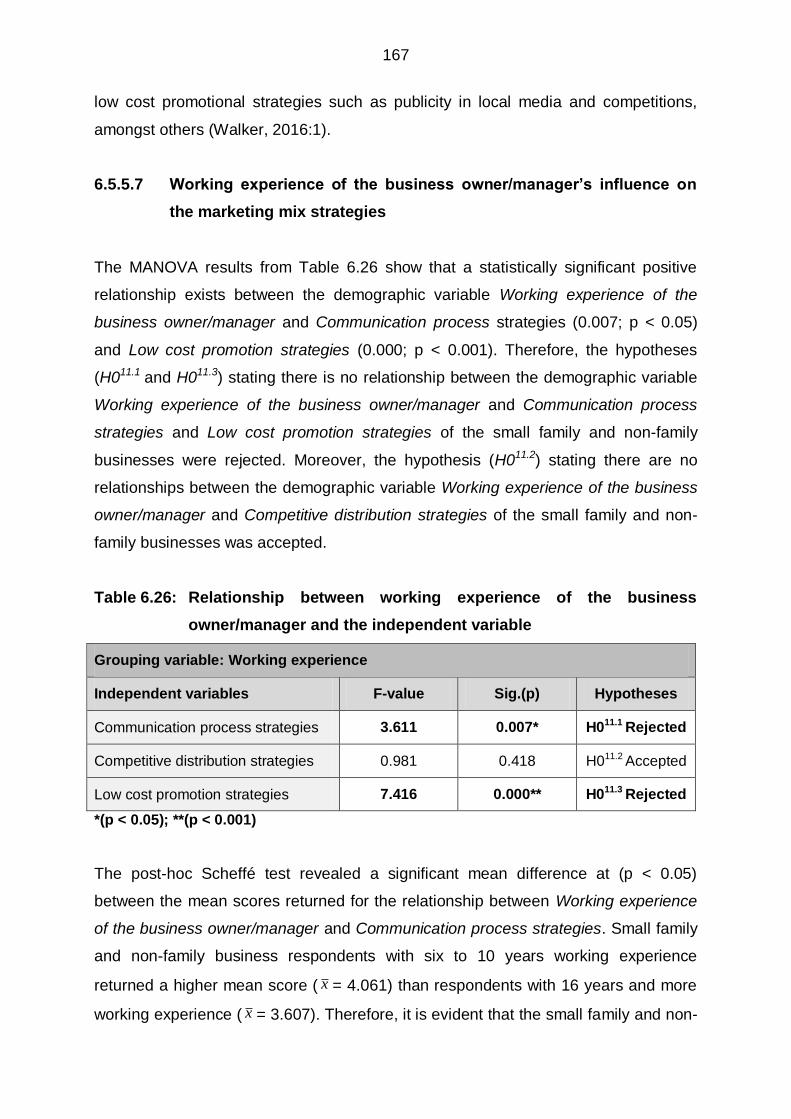
167
low cost promotional strategies such as publicity in local media and competitions,
amongst others (Walker, 2016:1).
6.5.5.7 Working experience of the business owner/manager’s influence on
the marketing mix strategies
The MANOVA results from Table 6.26 show that a statistically significant positive
relationship exists between the demographic variable Working experience of the
business owner/manager and Communication process strategies (0.007; p < 0.05)
and Low cost promotion strategies (0.000; p < 0.001). Therefore, the hypotheses
(H011.1 and H011.3) stating there is no relationship between the demographic variable
Working experience of the business owner/manager and Communication process
strategies and Low cost promotion strategies of the small family and non-family
businesses were rejected. Moreover, the hypothesis (H011.2) stating there are no
relationships between the demographic variable Working experience of the business
owner/manager and Competitive distribution strategies of the small family and non-
family businesses was accepted.
Table 6.26: Relationship between working experience of the business
owner/manager and the independent variable
Grouping variable: Working experience
Independent variables F-value Sig.(p) Hypotheses
Communication process strategies 3.611 0.007* H011.1 Rejected
Competitive distribution strategies 0.981 0.418 H011.2 Accepted
Low cost promotion strategies 7.416 0.000** H011.3 Rejected
*(p < 0.05); **(p < 0.001)
The post-hoc Scheffé test revealed a significant mean difference at (p < 0.05)
between the mean scores returned for the relationship between Working experience
of the business owner/manager and Communication process strategies. Small family
and non-family business respondents with six to 10 years working experience
returned a higher mean score ( x = 4.061) than respondents with 16 years and more
working experience ( x = 3.607). Therefore, it is evident that the small family and non-
168
family business respondents with six to 10 years working experience more often
utilise Communication process strategies than respondents with more than 16 years
working experience. The Cohen‟s d-value was 0.640 which presented an average
practical significance. The post-hoc Scheffé test also revealed a significant mean
difference (p < 0.001) between the mean scores returned for Low cost promotion
strategies. Small family and non-family business respondents with six to 10 years
working experience returned a higher mean score ( x = 2.776) than respondents with
more than 16 years working experience ( x = 2.019). Therefore, it is evident that small
family and non-family business respondents with six to 10 years working experience
are more likely at times to utilise Low cost promotion strategies than those that have
working experience of more than 16 years. The Cohen‟s d-value was 0.743 which
presented an average practical significance.
The results of the relationships between Working experience of the business
owner/manager and the independent variables were not surprising as one would
expect younger respondents to utilise Communication process strategies and Low
cost promotion strategies more often, than compared to the older respondents with
more than 16 years working experience, as they are more familiar with
communication media and techniques in the 21st century to convey the message to
the selected target market. McIntyre (2013:1) corroborates these findings, indicating
that the way businesses communicate with customers, changes for younger
generation owners/managers since they are more familiar with the rise in internet
marketing and thus more often utilise digital and mobile communication media and
techniques to convey a message. Moreover, younger generation respondents with
less working experience, such as those with six to 10 years working experience, are
also more attuned to use the latest and cheapest technology in their businesses,
compared to older generation respondents, such as those with more than 16 years
working experience (McIntyre, 2013:1).
6.5.5.8 Management working experience of the business owner/manager’s
influence on the marketing mix strategies
The MANOVA results from Table 6.27 show that a statistically significant positive
relationship exists between the demographic variable Management working
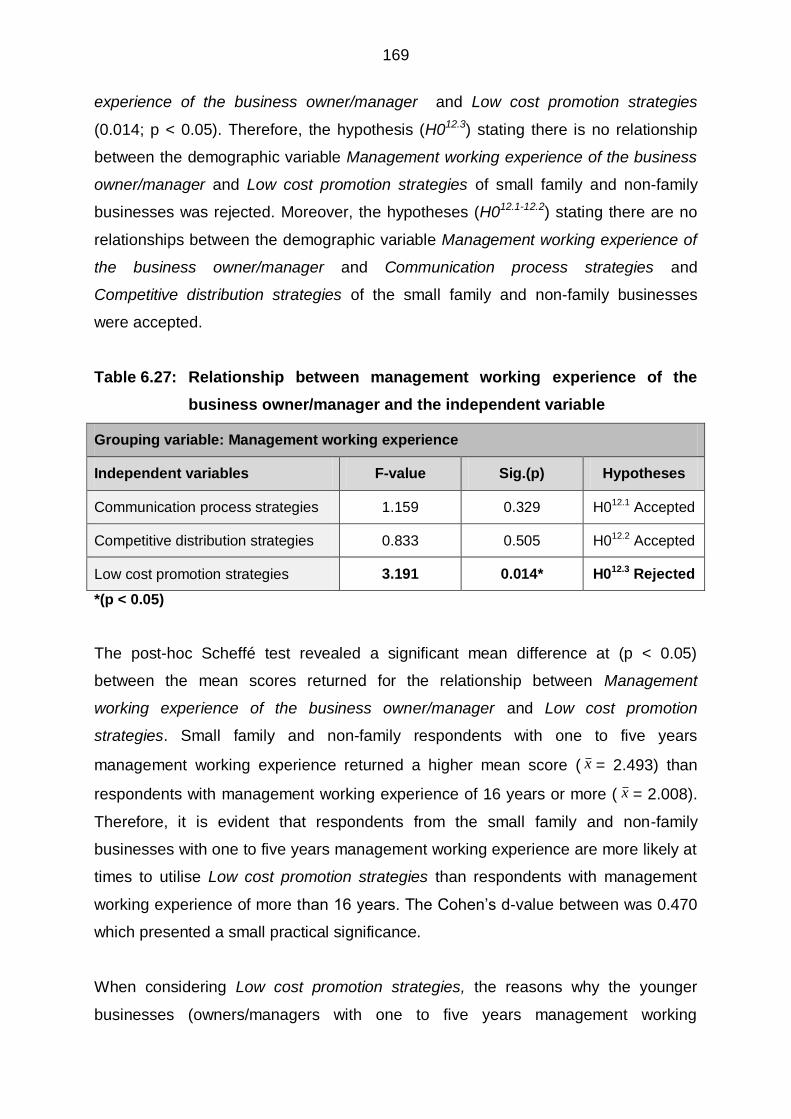
169
experience of the business owner/manager and Low cost promotion strategies
(0.014; p < 0.05). Therefore, the hypothesis (H012.3) stating there is no relationship
between the demographic variable Management working experience of the business
owner/manager and Low cost promotion strategies of small family and non-family
businesses was rejected. Moreover, the hypotheses (H012.1-12.2) stating there are no
relationships between the demographic variable Management working experience of
the business owner/manager and Communication process strategies and
Competitive distribution strategies of the small family and non-family businesses
were accepted.
Table 6.27: Relationship between management working experience of the
business owner/manager and the independent variable
Grouping variable: Management working experience
Independent variables F-value Sig.(p) Hypotheses
Communication process strategies 1.159 0.329 H012.1 Accepted
Competitive distribution strategies 0.833 0.505 H012.2 Accepted
Low cost promotion strategies 3.191 0.014* H012.3 Rejected
*(p < 0.05)
The post-hoc Scheffé test revealed a significant mean difference at (p < 0.05)
between the mean scores returned for the relationship between Management
working experience of the business owner/manager and Low cost promotion
strategies. Small family and non-family respondents with one to five years
management working experience returned a higher mean score ( x = 2.493) than
respondents with management working experience of 16 years or more ( x = 2.008).
Therefore, it is evident that respondents from the small family and non-family
businesses with one to five years management working experience are more likely at
times to utilise Low cost promotion strategies than respondents with management
working experience of more than 16 years. The Cohen‟s d-value between was 0.470
which presented a small practical significance.
When considering Low cost promotion strategies, the reasons why the younger
businesses (owners/managers with one to five years management working
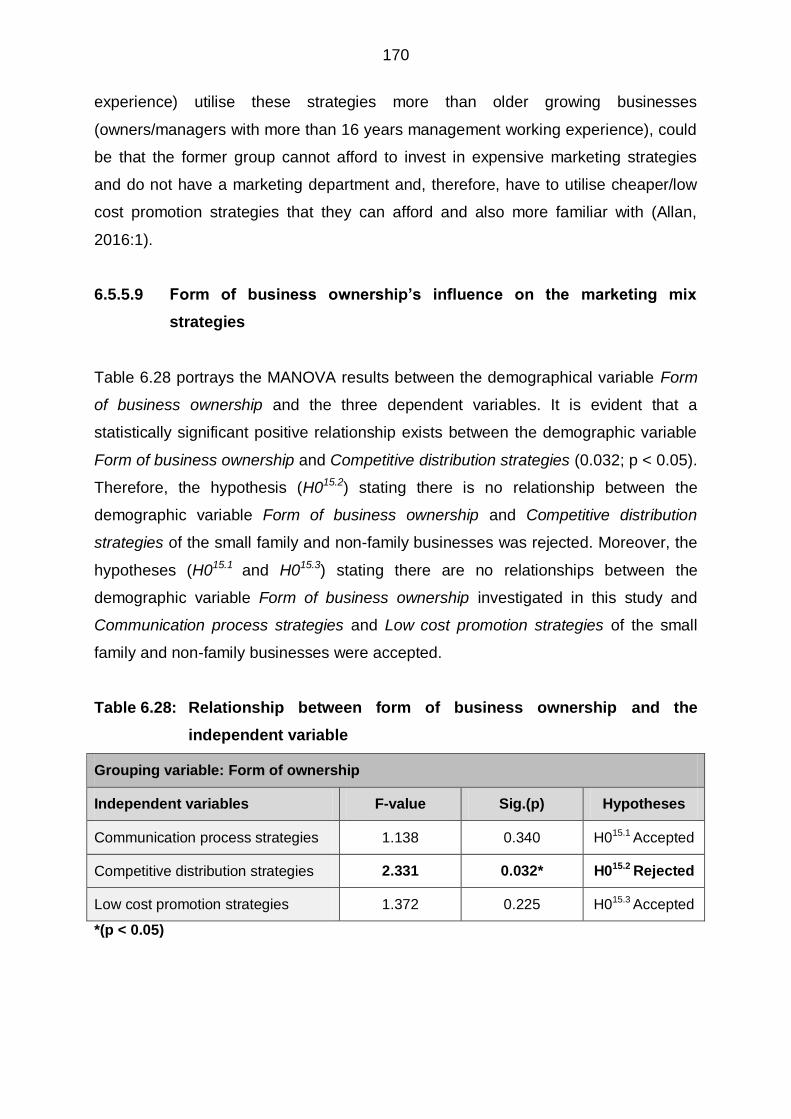
170
experience) utilise these strategies more than older growing businesses
(owners/managers with more than 16 years management working experience), could
be that the former group cannot afford to invest in expensive marketing strategies
and do not have a marketing department and, therefore, have to utilise cheaper/low
cost promotion strategies that they can afford and also more familiar with (Allan,
2016:1).
6.5.5.9 Form of business ownership’s influence on the marketing mix
strategies
Table 6.28 portrays the MANOVA results between the demographical variable Form
of business ownership and the three dependent variables. It is evident that a
statistically significant positive relationship exists between the demographic variable
Form of business ownership and Competitive distribution strategies (0.032; p < 0.05).
Therefore, the hypothesis (H015.2) stating there is no relationship between the
demographic variable Form of business ownership and Competitive distribution
strategies of the small family and non-family businesses was rejected. Moreover, the
hypotheses (H015.1 and H015.3) stating there are no relationships between the
demographic variable Form of business ownership investigated in this study and
Communication process strategies and Low cost promotion strategies of the small
family and non-family businesses were accepted.
Table 6.28: Relationship between form of business ownership and the
independent variable
Grouping variable: Form of ownership
Independent variables F-value Sig.(p) Hypotheses
Communication process strategies 1.138 0.340 H015.1 Accepted
Competitive distribution strategies 2.331 0.032* H015.2 Rejected
Low cost promotion strategies 1.372 0.225 H015.3 Accepted
*(p < 0.05)

171
The post-hoc Scheffé test was, however, not powerful enough to detect any group
differences for this relationship and therefore, no further statistical analysis was
conducted.
6.5.5.10 Area of business premises’ influence on the marketing mix strategies
Table 6.29 portrays the MANOVA results between the demographical variable Area
of business premises and the three independent variables. It is evident that
significant positive relationships exist between the demographic variable Area of
business premises and Communication process strategies (0.036; p < 0.05),
Competitive distribution strategies (0.021; p < 0.05) and Low cost promotion
strategies (0.012; p < 0.05). Therefore, the hypotheses (H017.1-17.3) stating there are
no relationships between the demographic variable Area of business premises and
the Communication process strategies, Competitive distribution strategies and Low
cost promotion strategies of the small family and non-family businesses were
rejected.
Table 6.29: Relationship between area of business premises and the
independent variable
Grouping variable: Area of business premises
Independent variables F-value Sig.(p) Hypotheses
Communication process strategies 2.024 0.036* H017.1 Rejected
Competitive distribution strategies 2.215 0.021* H017.2 Rejected
Low cost promotion strategies 2.413 0.012* H017.3 Rejected
*(p < 0.05)
The post-hoc Scheffé tests were, however, not powerful enough to detect any mean
differences for these relationships, therefore, no further statistical analysis was
conducted.
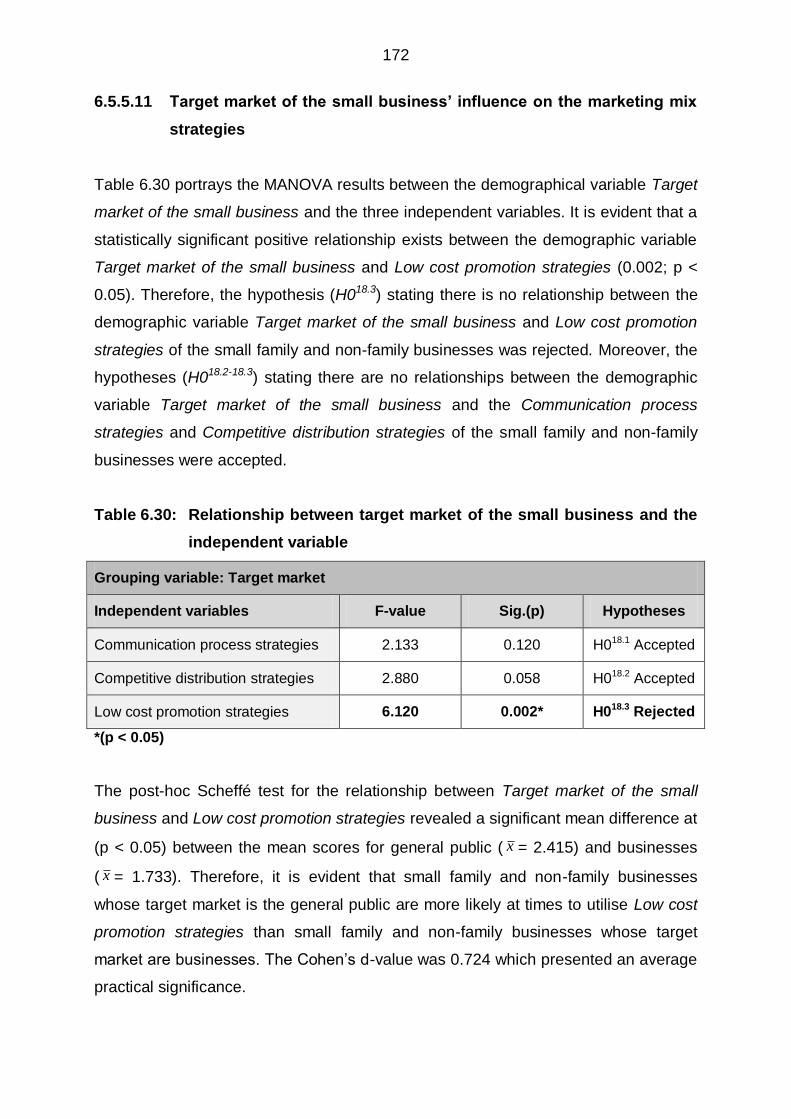
172
6.5.5.11 Target market of the small business’ influence on the marketing mix
strategies
Table 6.30 portrays the MANOVA results between the demographical variable Target
market of the small business and the three independent variables. It is evident that a
statistically significant positive relationship exists between the demographic variable
Target market of the small business and Low cost promotion strategies (0.002; p <
0.05). Therefore, the hypothesis (H018.3) stating there is no relationship between the
demographic variable Target market of the small business and Low cost promotion
strategies of the small family and non-family businesses was rejected. Moreover, the
hypotheses (H018.2-18.3) stating there are no relationships between the demographic
variable Target market of the small business and the Communication process
strategies and Competitive distribution strategies of the small family and non-family
businesses were accepted.
Table 6.30: Relationship between target market of the small business and the
independent variable
Grouping variable: Target market
Independent variables F-value Sig.(p) Hypotheses
Communication process strategies 2.133 0.120 H018.1 Accepted
Competitive distribution strategies 2.880 0.058 H018.2 Accepted
Low cost promotion strategies 6.120 0.002* H018.3 Rejected
*(p < 0.05)
The post-hoc Scheffé test for the relationship between Target market of the small
business and Low cost promotion strategies revealed a significant mean difference at
(p < 0.05) between the mean scores for general public ( x = 2.415) and businesses
( x = 1.733). Therefore, it is evident that small family and non-family businesses
whose target market is the general public are more likely at times to utilise Low cost
promotion strategies than small family and non-family businesses whose target
market are businesses. The Cohen‟s d-value was 0.724 which presented an average
practical significance.

173
Perhaps an obvious reason for this is that Low cost promotion strategies, as defined
in this study, are more aimed at stimulating customer awareness through sale
promotion platforms such as competitions, publicity in newspapers and mobile
marketing. According to Lake (2016:1) sales promotion platforms used for stimulating
awareness from a business-to-business marketing perspective will differ quite
substantially to those sale promotion platforms of business-to-consumer marketing
that are more based on emotion and less on the logic of the product.
6.6 SUMMARY
Chapter 6 presented the empirical results of this study. The chapter started by
providing demographic information pertaining to the respondents as individuals, as
well as information about their businesses. Thereafter, the validity and reliability of
the measuring instrument were assessed and reported on. Exploratory factor
analysis (EFA) was undertaken to assess the validity of the measuring instrument,
while the reliability of the measuring instrument was assessed by calculating
Cronbach‟s alpha (CA) coefficients. Based on the results of the exploratory factor
analysis, four factors were extracted. Three were identified as the marketing mix
strategies under investigation and one as the dependent variable Perceived business
performance. The marketing mix strategies extracted were renamed Competitive
distribution strategies, Communication Process strategies and Low cost promotion
strategies. Thus, the proposed hypothesised model was revised, and the
operationalisation of factors and hypotheses were reformulated.
Descriptive statistics such as the mean, standard deviation and frequency
distributions were calculated to summarise the sample data. The results of the
Pearson„s product moment correlations were then presented. These correlations
were established to assess the relationships between the marketing mix strategies
under investigation and between the marketing mix strategies and the Perceived
business performance of the small family and non-family businesses. The variance
inflation factors (VIF) were calculated to determine whether multi-collinearity existed.
The results of the multiple regression analysis (MRA) were presented, which
established whether any relationships existed between the marketing mix strategies
and Perceived business performance of the small family and non-family businesses.
174
Based on the results, it was decided to further explore whether the demographic
variables have an influence on the marketing mix strategies utilised by the small
family and non-family businesses. In order to determine if differences were
statistically significant between the family brand and business size, a Chi-square test
for independence was conducted. The chapter concluded with the results of the
multivariant analysis of variance (MANOVA), which were used to determine the
relationships between selected demographic variables and the three independent
variables. Post-hoc Scheffé tests were completed to identify any significant
differences between the mean scores of the various categories within each
demographic variable. Cohen„s d was calculated to determine the practical
significance of these differences.
In the final chapter, Chapter 7, a brief summary of the various chapters in this study
will be provided. Thereafter, the empirical results will be interpreted and implications
and recommendations for the small family and non-family businesses will be put
forward. The contributions and limitations of the study will then be highlighted. The
chapter will conclude with possible recommendations for future research.
175
CHAPTER 7
SUMMARY, CONCLUSIONS AND RECOMMENDATIONS
7.1 INTRODUCTION
In Chapter Six, the empirical results were presented. Chapter Seven is the final
chapter of this study. This chapter will provide an overview of the study, a summary
of the most significant findings and will propose recommendations to small family and
non-family businesses. The contributions of this study will be highlighted, the
limitations of the study will be addressed and recommendations for future research
will be put forward. Lastly, concluding remarks will be provided.
7.2 OVERVIEW OF THE STUDY
Chapter One introduced the study by providing an introduction and background on
the topic being researched. In addition, the problem statement, the purpose of the
study and the research objectives was presented. Given the importance of small
businesses with regards to the economic growth of South Africa, and the fact that
their high failure rates have a negative impact on the South African economy, the
problem statement revolved around the ineffective marketing practices and marketing
mix strategies utilised amongst small family and non-family businesses. Furthermore,
limited information is available about the marketing mix strategies utilised by the
small family and non-family businesses and the influence thereof on their Perceived
business performance, as past research mainly focused on large businesses.
Perceived business performance was defined as small family or non-family
businesses experiencing growth in profit, sales and number of employees over the
last two years, as well as the business having loyal customers who make regular
purchases and who recommend the business to others. Given the fact that the lack
of proper marketing contributes significantly to small business failure rate in South
Africa, the primary objective of this study was to investigate the use of selected
marketing mix strategies among small family and non-family businesses in the
Eastern Cape.
176
In order to address the primary objective of this study, the following secondary
research objectives (SO) were formulated:
SO1 To determine the use of each marketing mix strategy;
SO2 To establish the influence of marketing mix strategies on the Perceived
business performance of small family and non-family businesses;
SO3 To establish whether there are differences between small family and non-
family businesses concerning the marketing mix strategies adopted.
To give effect to the primary and secondary objective of this study, the following
methodological research objectives (MO) have been identified:
MO1 To conduct a literature review on the nature and importance of small and
medium-sized family and non-family businesses;
MO2 To conduct a literature review on the nature and importance of marketing and
marketing mix strategies used by small family and non-family businesses;
MO3 To propose a hypothesised model to investigate the relationship between the
independent variables (marketing mix strategies) and the dependent variable
(Perceived business performance) of small family and non-family businesses;
MO4 To determine the appropriate research methodology to address the identified
research problem;
MO5 To develop an appropriate measuring instrument that will be used to
empirically test the influence of the marketing mix strategies, used by small
family and non-family businesses, on their Perceived business performance;
MO6 To collect primary data from a pre-determined small business sample (family
and non-family businesses) in the Eastern Cape, and to statistically analyse
the data, as well as test the proposed hypotheses;
MO7 To provide pertinent conclusions on the findings of the study and to make
recommendations to small family and non-family business owners on how to
improve marketing within their businesses and ultimately business
performance.
In Chapters Two and Three, an in-depth literature study was presented. Hence, the
first and second methodological research objectives (MO1 and MO2) were achieved.
177
In Chapter Two, the nature of small and medium-sized family and non-family
businesses was discussed. Family and non-family SMEs were defined and their
important contributions and challenges highlighted. In this study, the concepts “small
business” and “SMEs” were used interchangeably and was considered synonymous
even though the study focused specifically on the small business section of SMEs.
Therefore, for the purpose of this study, a small business was defined as a business
that does not employ more than 50 full-time employees, the business should have
been in operation for at least one year and the owner must be actively involved in the
business. A small family business was defined as a business where at least two
family members are actively involved in the management and operation of the
business and where the family owns more than 51% of the business and does not
employee more than 50 full-time employees. SMEs in South Africa were highlighted
as important contributors of economic and social development, but also as having
one of the highest failure rates in the world.
The lack of marketing skills and implementation of marketing mix strategies has been
identified as a major challenge facing both family and non-family SMEs, contributing
to many of them failing. Previous research indicated that family and non-family SME
owners and managers do not have the required marketing skills, knowledge
regarding marketing issues, and do not know how to apply these skills and
knowledge when utilising marketing mix strategies and as a result could lead to weak
business performance. Evidence further suggested that family businesses face
additional challenges due to their unique nature and the overlapping of family and
business relationships. To enhance the understanding of the unique nature of family
and non-family businesses the chapter included a discussion on how family
businesses differ from non-family businesses.
Chapter Three examined the nature and importance of marketing and marketing mix
strategies in family and non-family owned SMEs. Based on the literature, no formal
and agreed upon definitions of marketing could be found, therefore for the purpose of
this study, marketing was defined as the process of creating, distributing, promoting
and pricing goods, services and ideas to facilitate satisfying exchange relationships
with customers and develop and maintain favourable relationships with stakeholders
in a dynamic environment. The different marketing mix strategies were discussed,

178
namely product, price, place and promotion strategies. Despite the considerable
evolvement of academic and industry attention to marketing, it has been found that
the traditional marketing mix framework remains a strong staple to develop marketing
strategies for SMEs. Finding an optimal mix that gets a superior response in the
market can create profits, and ultimately contribute to the business performance and
success of SMEs. The marketing mix strategies used by family and non-family SMEs
will, however, vary according to their own circumstances, resources, market
conditions and changing needs of their customers. Hence, the marketing mix
strategies in SMEs and family businesses were also discussed.
In Chapter Four, the proposed hypothesised model was presented and several
hypotheses formulated. For the purpose of this study, four independent variables
influencing the Perceived business performance of small family and non-family
businesses were identified. These variables were identified as Product, Price, Place
and Promotion strategies. Both anecdotal and empirical evidence to support the
hypothesised relationships was presented. The third methodological research
objective (MO3) was thus achieved in Chapter Four.
In Chapter Five the research design and methodology used in this study was
discussed. A positivistic paradigm and quantitative research methodology was
adopted given its advantage that allows for meaningful comparisons of responses
across participants. Furthermore, an exploratory and descriptive research approach
of a cross-sectional nature were utilised in this study. Convenience sampling was
considered the most appropriate sampling method for this study. In total 400
questionnaires were distributed, of which 340 were usable for further statistical
analyses. The final sample consisted of 195 small family-owned businesses and 145
small non-family businesses operating within the borders of the Eastern Cape
Province. Therefore, an effective response rate of 85% was achieved in this study.
The method of data collection as well as the development of the measuring
instrument and qualifying questions was then discussed. In addition, the
operationalisation of the independent and dependent variables and an explanation of
how the measuring instrument was developed and administered, as well as its ethical
considerations, were provided. An exploratory factor analysis (EFA) was undertaken
to assess the validity of the scales measuring the independent and dependent
179
variables. Cronbach‟s alpha (CA) coefficients were calculated to assess the reliability
of the measuring scales. The statistical techniques adopted to analyse the data,
included descriptive and inferential statistics, Pearson‟s product moment correlations
and MRA. Descriptive statistics were calculated to summarise the sample data, while
Pearson„s product moment correlations were used to assess the associations
between the variables under investigation. In order to assess the relationships
between the independent variables and the dependent variable Perceived business
performance, the main inferential statistical method adopted was that of the MRA.
The fourth and fifth methodological research objective (MO4 and MO5) was thus
achieved in Chapter Five.
In Chapter Six, the three secondary objectives (SO1-3) and sixth methodological
research objective (MO6) was achieved by presenting the findings of the statistical
analyses. The chapter started by providing a summary of the demographic
information collected relating to both the respondent, as well as information about the
business of the respondent. The majority of the respondents were male and the
owner of the business, with most being between the ages of 46 and 55 years. More
than half of the respondents were White, followed by Black, Asian and Coloured.
Most respondents also reported speaking English as their home language, while the
majority have a tertiary qualification and most indicating it not to be a management
qualification. Most businesses were family-owned, operated in the service or
retail/wholesale industries, and situated in a residential area. Most respondents also
indicated that the business was well-established as it has been in operation for more
than five years, while almost half employing between one and five people.
An EFA was performed to confirm the validity of the dependent variable and
independent variables. Factor loadings of greater than 0.40 were considered
significant and only the factors with three or more items loading onto them were
considered for further statistical analysis in this study. Several items originally
intended to measure the marketing mix strategies investigated in this study did not
load as expected. As a result new factors (marketing mix strategies) emerged and
some had to be renamed. For example, items originally intended to measure the
Product and Place strategies loaded together. As a result of the nature of these
items, the marketing mix strategy was renamed to Competitive distribution strategies.
180
Eight of seventeen items intended to measure the Promotion strategies and one of
the eight items intended to measure the Product strategies all loaded together. As a
result, the factor was renamed to Communication process strategies. In a similar
manner, three of the seventeen items originally developed to measure Promotion
strategies loaded together. As a result of the nature of the items that loaded together,
the marketing mix strategy was renamed to Low cost promotion strategies. As all five
items originally developed to measure the dependent variable Perceived business
performance loaded together as expected, the name of the dependent variable
remained Perceived business performance.
CA coefficients were used to assess the reliability of the measuring instrument. Hair
et al. (2010:778) and Leimeister (2010:140) assert that CA coefficients with a lower
limit of 0.70 are necessary for a scale to be considered reliable, however, a
coefficient of 0.60 is acceptable, and therefore adopted in this study. Both the
dependent and independent variables, except Pricing strategies, provided
satisfactory evidence of validity and reliability. The CA coefficient for Pricing
strategies fell below the accepted norm of 0.6, indicating that the scale measuring
this factor was not reliable. Hence, Pricing strategies was excluded from further
statistical analysis. Factor loadings reported for the independent and other
dependent variables were all greater than 0.4.
The CA coefficient returned for Perceived business performance was 0.7186, and for
the independent variables Competitive distribution strategies, Communication
process strategies and Low cost promotion strategies, 0.7952, 0.8687 and 0.7176,
respectively. The scales measuring these independent and dependant variables thus
provided satisfactory evidence of validity and reliability. Based on the results of these
validity and reliability assessments, the operationalisation of the factors was
rephrased and the hypotheses were reformulated. In addition, the hypothesised
model was revised to account for three independent variables, namely Competitive
distribution strategies, Communication process strategies, and Low cost promotion
strategies, and one dependent variable, Perceived business performance.
Descriptive statistics were calculated to summarise the sample data, whereby the
mean scores and standard deviation were reported. The dependent variable
181
Perceived business performance returned a mean score of 3.861, with the majority of
respondents agreeing that they experienced their business as having growth in sales,
employees and profits over the past two years and having loyal customers who make
regular purchases and recommend the business to others. The independent
variables, Competitive distribution strategies, Communication process strategies, and
Low cost promotion strategies, returned mean scores of 4.058, 3.685 and 2.245,
respectively, with most of the respondents agreeing that the marketing mix strategies
investigated were utilised in their business. Thus, the majority of the respondents in
this study perceived that they were often concerned with providing high-quality and
competitive products through distributions process methods by setting timing
objectives, using distributions selection criteria and changing the distribution channel
when needed to continuously satisfy customers‟ needs, as well as setting marketing
communication objectives, selecting a target market to convey the message via
various communication media and techniques which identify the product or service
with certain brand associations that reach both current and potential customers. Low
cost promotion strategies were, however, seldom performed by respondents, namely
that they were occasionally stimulating customer awareness through sales promotion
such as competitions, publicity in newspapers and mobile marketing such as SMS
alerts.
Pearson‟s product moment correlations for small family and non-family businesses
was undertaken to assess the associations between the various factors under
investigation. All the marketing mix strategies, for both the small family and non-
family businesses, were found to be significantly and positively correlated with the
dependent variable Perceived business performance. Furthermore, significant
positive correlations were reported between all the independent variables
themselves, for the small family and non-family businesses.
An MRA was undertaken to investigate the influence of utilising the various marketing
mix strategies investigated in this study on the levels of Perceived business
performance of small family and non-family businesses. Before undertaking an MRA,
the existence of multi-collinearity was assessed. Variance inflation factors (VIF) were
calculated to assess multi-collinearity. The results illustrated that VIFs of less than 4
were reported for all predictor variables and, therefore, multi-collinearity was not
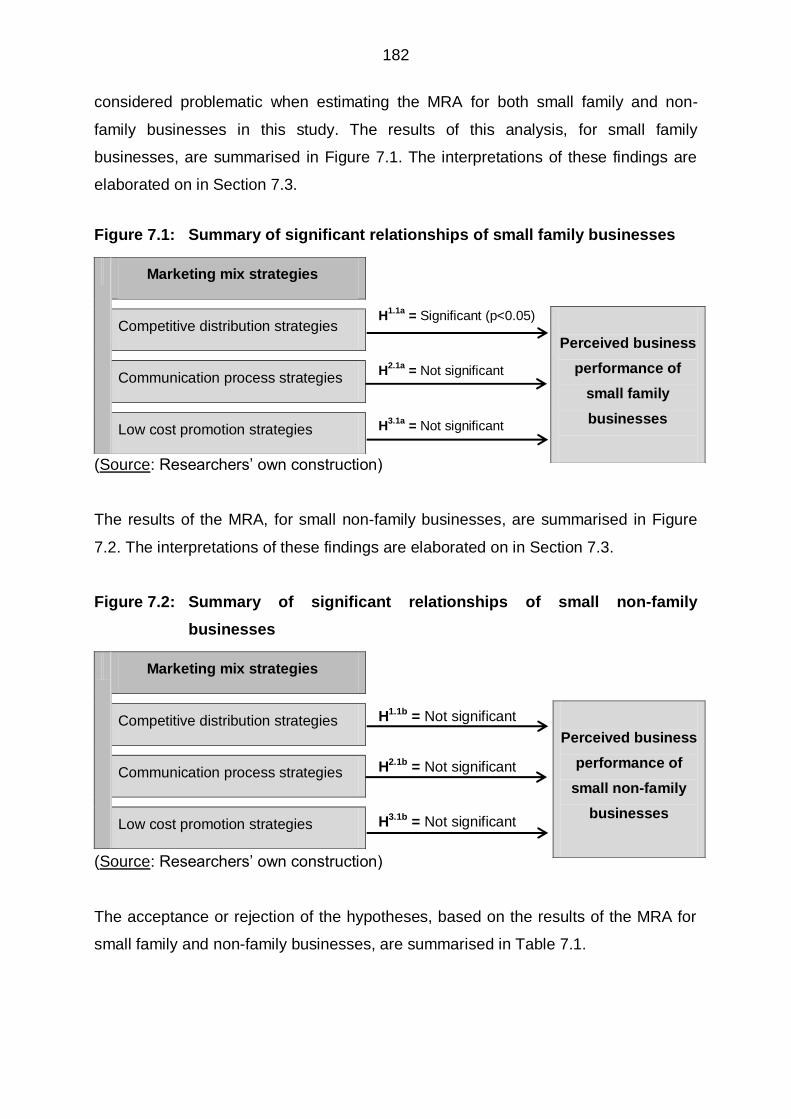
182
considered problematic when estimating the MRA for both small family and non-
family businesses in this study. The results of this analysis, for small family
businesses, are summarised in Figure 7.1. The interpretations of these findings are
elaborated on in Section 7.3.
Figure 7.1: Summary of significant relationships of small family businesses
H1.1a
= Significant (p<0.05)
H2.1a
= Not significant
H3.1a
= Not significant
(Source: Researchers‟ own construction)
The results of the MRA, for small non-family businesses, are summarised in Figure
7.2. The interpretations of these findings are elaborated on in Section 7.3.
Figure 7.2: Summary of significant relationships of small non-family
businesses
H1.1b = Not significant
H2.1b = Not significant
H3.1b = Not significant
(Source: Researchers‟ own construction)
The acceptance or rejection of the hypotheses, based on the results of the MRA for
small family and non-family businesses, are summarised in Table 7.1.
Marketing mix strategies
Competitive distribution strategies
Communication process strategies
Low cost promotion strategies
Perceived business
performance of
small family
businesses
Marketing mix strategies
Competitive distribution strategies
Communication process strategies
Low cost promotion strategies
Perceived business
performance of
small non-family
businesses
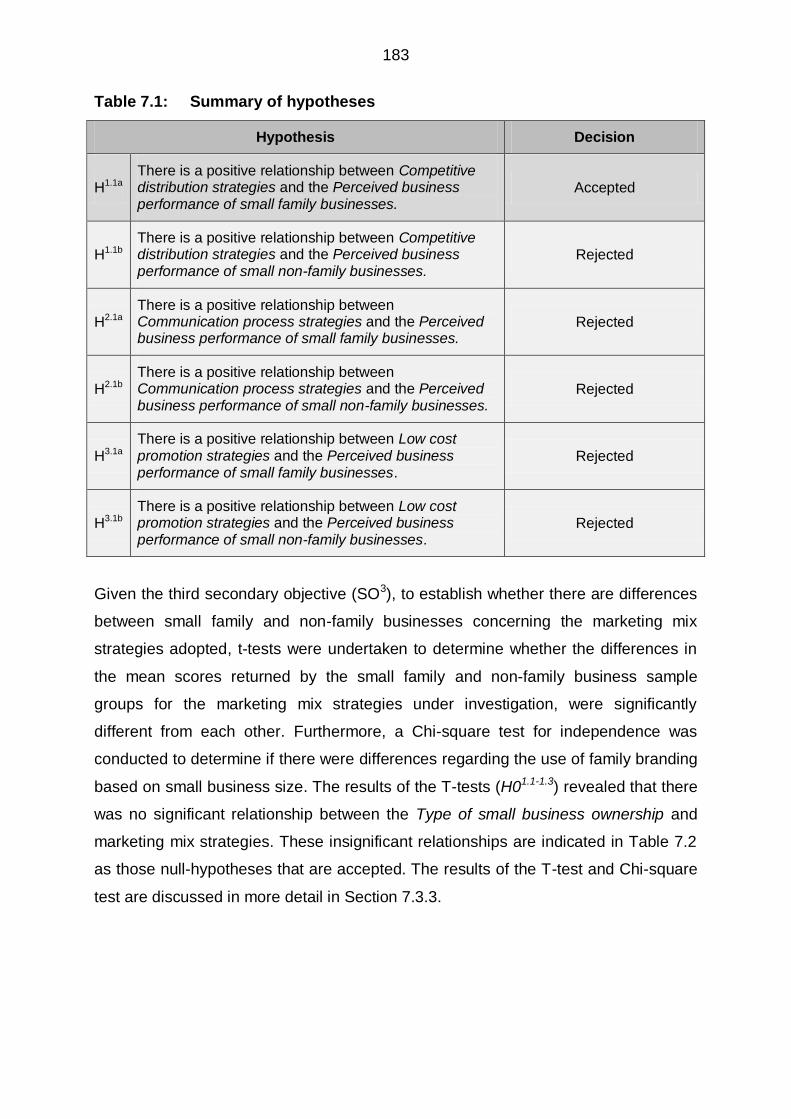
183
Table 7.1: Summary of hypotheses
Hypothesis Decision
H1.1a There is a positive relationship between Competitive distribution strategies and the Perceived business performance of small family businesses.
Accepted
H1.1b There is a positive relationship between Competitive distribution strategies and the Perceived business performance of small non-family businesses.
Rejected
H2.1a There is a positive relationship between Communication process strategies and the Perceived business performance of small family businesses.
Rejected
H2.1b There is a positive relationship between Communication process strategies and the Perceived business performance of small non-family businesses.
Rejected
H3.1a There is a positive relationship between Low cost promotion strategies and the Perceived business performance of small family businesses.
Rejected
H3.1b There is a positive relationship between Low cost promotion strategies and the Perceived business performance of small non-family businesses.
Rejected
Given the third secondary objective (SO3), to establish whether there are differences
between small family and non-family businesses concerning the marketing mix
strategies adopted, t-tests were undertaken to determine whether the differences in
the mean scores returned by the small family and non-family business sample
groups for the marketing mix strategies under investigation, were significantly
different from each other. Furthermore, a Chi-square test for independence was
conducted to determine if there were differences regarding the use of family branding
based on small business size. The results of the T-tests (H01.1-1.3) revealed that there
was no significant relationship between the Type of small business ownership and
marketing mix strategies. These insignificant relationships are indicated in Table 7.2
as those null-hypotheses that are accepted. The results of the T-test and Chi-square
test are discussed in more detail in Section 7.3.3.
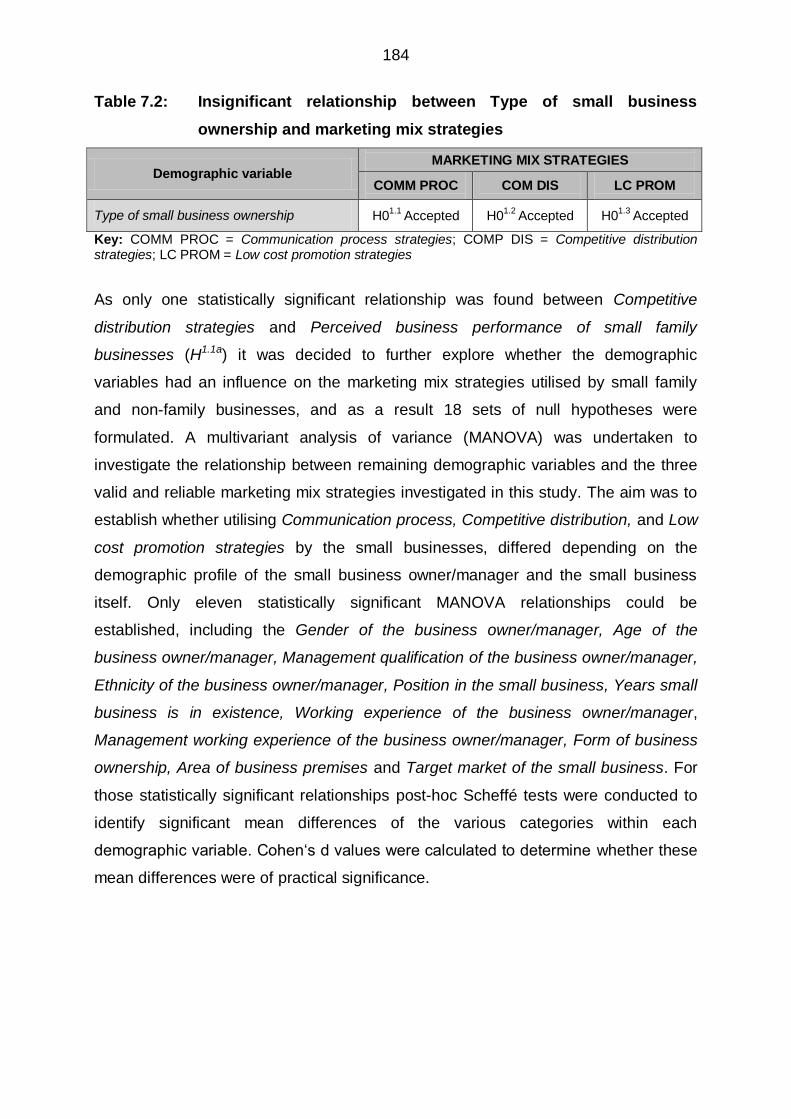
184
Table 7.2: Insignificant relationship between Type of small business
ownership and marketing mix strategies
Demographic variable
MARKETING MIX STRATEGIES
COMM PROC
COM DIS
LC PROM
Type of small business ownership H01.1
Accepted H01.2
Accepted H01.3
Accepted
Key: COMM PROC = Communication process strategies; COMP DIS = Competitive distribution strategies; LC PROM = Low cost promotion strategies
As only one statistically significant relationship was found between Competitive
distribution strategies and Perceived business performance of small family
businesses (H1.1a) it was decided to further explore whether the demographic
variables had an influence on the marketing mix strategies utilised by small family
and non-family businesses, and as a result 18 sets of null hypotheses were
formulated. A multivariant analysis of variance (MANOVA) was undertaken to
investigate the relationship between remaining demographic variables and the three
valid and reliable marketing mix strategies investigated in this study. The aim was to
establish whether utilising Communication process, Competitive distribution, and Low
cost promotion strategies by the small businesses, differed depending on the
demographic profile of the small business owner/manager and the small business
itself. Only eleven statistically significant MANOVA relationships could be
established, including the Gender of the business owner/manager, Age of the
business owner/manager, Management qualification of the business owner/manager,
Ethnicity of the business owner/manager, Position in the small business, Years small
business is in existence, Working experience of the business owner/manager,
Management working experience of the business owner/manager, Form of business
ownership, Area of business premises and Target market of the small business. For
those statistically significant relationships post-hoc Scheffé tests were conducted to
identify significant mean differences of the various categories within each
demographic variable. Cohen„s d values were calculated to determine whether these
mean differences were of practical significance.

185
The results of the MANOVAS (H02.1-18.3) revealed that there were significant
relationships between selected demographic variables and certain marketing mix
strategies. Significant relationships are indicated in Table 7.3 as those null-
hypotheses that are rejected.
Table 7.3: Significant relationships between demographic variables and
marketing mix strategies
Demographic variable
MARKETING MIX STRATEGIES
COMM PROC
COM DIS
LC PROM
Gender of the business owner/manager H02.1
Accepted H02.2
Accepted H02.3
Rejected
Age of the business owner/manager H03.1
Accepted H03.2
Accepted H03.3
Rejected
Education level of the business owner/manager
H04.1
Accepted H04.2
Accepted H04.3
Accepted
Home language of the business owner/manager
H05.1
Accepted H05.2
Accepted H05.3
Accepted
Management qualification of the business owner/manager
H06.1
Rejected H06.2
Accepted H06.3
Rejected
Ethnicity of the business owner/manager H07.1
Accepted H07.2
Rejected H07.3
Rejected
Position in the small business H08.1
Accepted H08.2
Accepted H08.3
Rejected
Years small business is in existence H09.1
Accepted H09.2
Accepted H09.3
Rejected
Years employed as a manager in a small business
H010.1
Accepted H010.2
Accepted H010.3
Accepted
Working experience of the business owner/manager
H011.1
Rejected H011.2
Accepted H011.3
Rejected
Management working experience of the business owner/manager
H012.1
Accepted H012.2
Accepted H012.3
Rejected
Business sector H013.1
Accepted H013.2
Accepted H013.3
Accepted
Business activity H014.1
Accepted H014.2
Accepted H014.3
Accepted
Form of business ownership H015.1
Accepted H015.2
Rejected H015.3
Accepted
Number of employees in a small business H016.1
Accepted H016.2
Accepted H016.3
Accepted
Area of business premises H017.1
Rejected H017.2
Rejected H017.3
Rejected
Target market of the small business H018.1
Accepted H018.2
Accepted H018.3
Rejected
Key: COMM PROC = Communication process strategies; COMP DIS = Competitive distribution strategies; LC PROM = Low cost promotion strategies
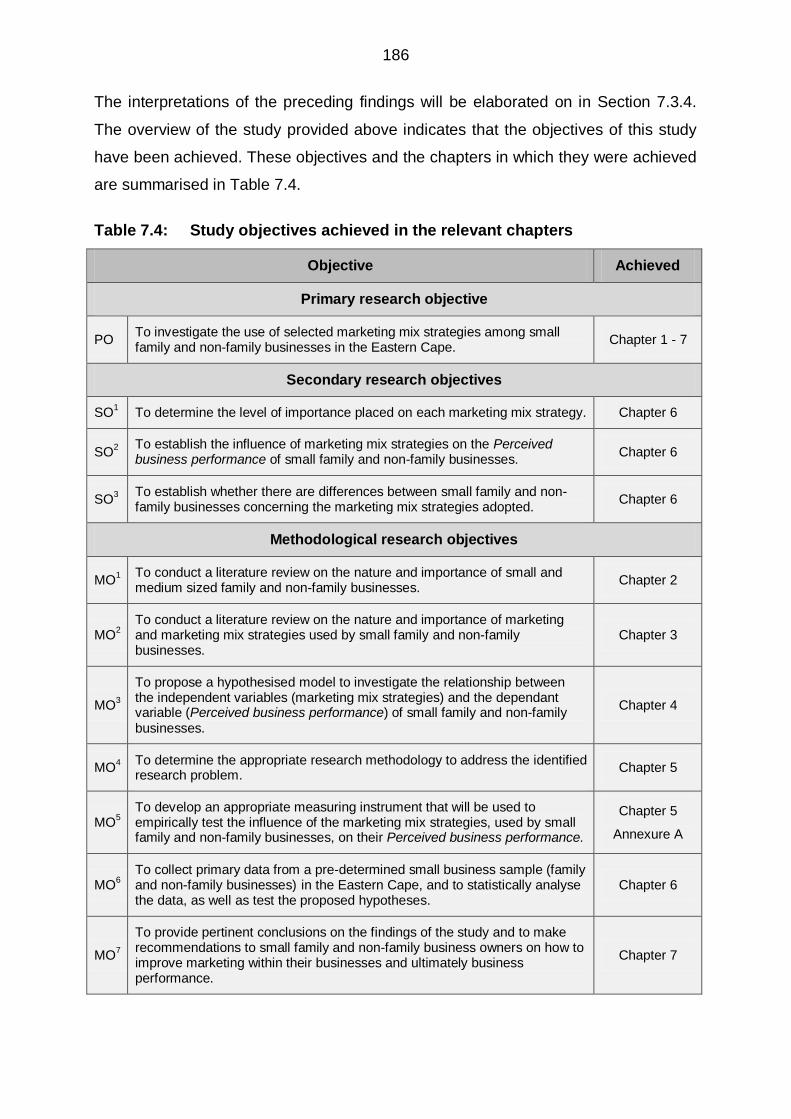
186
The interpretations of the preceding findings will be elaborated on in Section 7.3.4.
The overview of the study provided above indicates that the objectives of this study
have been achieved. These objectives and the chapters in which they were achieved
are summarised in Table 7.4.
Table 7.4: Study objectives achieved in the relevant chapters
Objective Achieved
Primary research objective
PO To investigate the use of selected marketing mix strategies among small
family and non-family businesses in the Eastern Cape. Chapter 1 - 7
Secondary research objectives
SO1
To determine the level of importance placed on each marketing mix strategy. Chapter 6
SO2 To establish the influence of marketing mix strategies on the Perceived
business performance of small family and non-family businesses. Chapter 6
SO3 To establish whether there are differences between small family and non-
family businesses concerning the marketing mix strategies adopted. Chapter 6
Methodological research objectives
MO1 To conduct a literature review on the nature and importance of small and
medium sized family and non-family businesses. Chapter 2
MO2
To conduct a literature review on the nature and importance of marketing and marketing mix strategies used by small family and non-family businesses.
Chapter 3
MO3
To propose a hypothesised model to investigate the relationship between the independent variables (marketing mix strategies) and the dependant variable (Perceived business performance) of small family and non-family businesses.
Chapter 4
MO4
To determine the appropriate research methodology to address the identified research problem.
Chapter 5
MO5
To develop an appropriate measuring instrument that will be used to empirically test the influence of the marketing mix strategies, used by small family and non-family businesses, on their Perceived business performance.
Chapter 5
Annexure A
MO6
To collect primary data from a pre-determined small business sample (family and non-family businesses) in the Eastern Cape, and to statistically analyse the data, as well as test the proposed hypotheses.
Chapter 6
MO7
To provide pertinent conclusions on the findings of the study and to make recommendations to small family and non-family business owners on how to improve marketing within their businesses and ultimately business performance.
Chapter 7

187
As such, the primary objective of this study, being to establish what marketing mix
strategies are used by small family and non-family businesses in the Eastern Cape,
and the influence of these strategies on Perceived business performance, was
achieved.
7.3 DISCUSSION OF RESULTS, CONCLUSIONS AND
RECOMMENDATIONS
In Chapter Six, the utilisation of various marketing mix strategies was reported as
having either a significant or non-significant influence on Perceived business
performance of small family and non-family businesses. These relationships have
been summarised in Figure 7.1. In the sections to follow, the significant relationship
will be interpreted and recommendations will be made. In addition, the non-significant
relationships identified by the MRA will also be discussed. The final methodological
research objective (MO7) of this study will, therefore, be achieved. In addition, the
results of the difference between family and non-family businesses regarding the use
of marketing mix strategies and family name as branding, as well as the influence of
the selected demographic variables on the use of marketing mix strategies, will be
discussed.
7.3.1 SIGNIFICANT RELATIONSHIP: COMPETITIVE DISTRIBUTION
STRATEGIES
Competitive distribution strategies of small family businesses were found to be the
only marketing mix strategy to have a positive influence on Perceived business
performance (H1.1a). The findings of this study show that utilising Competitive
distribution strategies has a significant positive influence on the Perceived business
performance of small family businesses. In other words, the more the respondents of
small family businesses in this study provide high-quality and competitive products,
set timely objectives, use distributions selection criteria and change the distribution
channel when needed to continuously satisfy customers‟ needs, the more likely the
business is to experience growth in profit and sales and having loyal customers who
make regular purchases and recommend the business to others.
188
Various authors (Chaston & Mangles, 2002:8; Gilmore, 2011:140; Hatten, 2016:31)
indicate that small businesses are more likely to achieve improved business
performance if their product strategies incorporate product innovation and quality
products, that allows the business to stay ahead of competitors, and that are
distributed through efficient and profitable channels that allow timely delivery of such
products to customers. As in the case of small family businesses, Micelotta and
Raynard‟s (2011:197-216) corroborate that family businesses can employ each of
these strategies, in addition to using the family name as a branding strategy, to
differentiate themselves from their competitors and achieve a better business
performance.
As a result the following recommendations are put forward:
Small businesses, whether family owned or not, should constantly innovate and
uncover new product development ideas for providing quality and competitive
products through efficient distribution process methods to ensure that they
progress and dominate market share to competitors. A practical example that
can improve such supply chain and logistics management strategies is for small
businesses to interview their current and potential customers, family and friends,
through an informal survey, to discover a better understanding of their needs
when developing new products and which distributions channels they mostly
prefer, find most efficient and think are most cost effective for them, for example
direct-, indirect-, or virtual online distribution channels.
When utilising competitive distribution strategies small family businesses need to
find new ways to distinguish themselves from competitors to gain a competitive
advantage. These new ways must include distribution decisions such as activities
of adapting, maintaining and delivering product and service offerings of high
quality to satisfy customer needs. For example, small family businesses can
adapt existing product offerings when needed whilst deciding on which direct- or
indirect distribution channel will be most suitable to match customers ever
changing needs as outdated product and service offerings will lead to a decrease
in the product demand and, therefore, fewer distribution points may be required.
189
Small family businesses should offer extra value and make use of suitable
branding through their distribution channels that fits in with the business‟ image.
Therefore, it is recommended that small family businesses incorporate their
family name in their marketing strategies throughout their distribution channels by
making their family-name a focal point in their corporate brand identity as this can
give them a distinctive trademark to differentiate themselves from competitors
and larger counterparts. Small family businesses can enjoy competitive
advantages when incorporating the family name given the positive characteristics
and values such as trust, commitment and a customer orientated focus, which
are typically accompanying family businesses and their ability to create and
maintain superior customer relationships, with quick responses to customer
requests.
Small family businesses should utilise a distribution channel that are most cost
effective from production to the final customer as this has a major impact on
profitability and ultimately business performance. As a result, small family
businesses should take the time to decide on the length of the distribution
channel, in terms of intermediaries, and their cost implications as such indirect
distribution strategies add to the final selling price of the product. This may vary
from business to business based on the nature of the product. Specific strategies
should be developed to find an appropriate balance between the number of
intermediaries. If small family businesses decide to distribute their products
through intermediaries they should mobilise their resources by networking via
family connections to obtain new distribution channels through their local
knowledge and contacts and effectively develop and manage beneficial long term
relationships with such intermediaries that will in return help them to keep
delivery promises and exploit economies of scale.
If the small family business should decide on a direct distribution channel they
should take advantage of their face-to-face contact with customers as they can
then easily detect market demand changes that occur and adapt accordingly and
as such find new ways to continuously satisfy customers‟ needs.
Although the family history and core values should be preserved through
generations, small family businesses need to make sure that traditional and
modern approaches coexist within their products and services, whereby the
family business must not live in the past, but embrace modern approaches and
190
the opportunities that technology in the 21st century presents. Thus, it is
recommended that small family businesses preserve the tradition, but guarantee
the quality of what is offered to the customer and provide security for continuation
as it is projected in the future but rooted in the past. As a result it is also
recommended that small family businesses add new distribution channel
strategies and modify old ones when necessary. The family business must make
sure that their distribution channel strategies are continuously improved over
time, and that cumulative know-how and skills are passed from one generation of
the family to the next.
Due to their limited resources and the significant growth of e-commerce in the
21st century, small family businesses need to remain current on new marketing
principles and trends relating to the product and distribution channel. Therefore,
they should consider the advantages of virtual locations on the internet, such as
reaching and stimulating customer awareness on a larger scale with low entry
barriers in a simplistic and cost-effective manner, by selling online to customers
24 hours a day. Online and social media distribution channels can be used as a
complementary strategy, rather than a replacement to traditional distribution
methods. For example, small family businesses can employ online distribution
through their website, and create links on social media to drive traffic to their
corporate website. This can be done through postings on blogs; starting a
Facebook presence by creating a business page or groups; networking on
Twitter by following potential target markets and entering „hash tags‟ before
popular keywords that will be linked to the small family business, amongst others.
Small family businesses should utilise direct-, indirect-, and/or online distribution
channels that fit their unique circumstances and limited resources, to have
greater access to a niche market which is sometimes ignored by larger
businesses. As many small businesses feel that online distribution is
complicated, they should be trained on how to utilise such online distribution
strategies that can contribute to their business performance and extend their
longevity. These online distribution strategies can also break the barrier to
international marketing and make it possible for small businesses to reach a
global audience at a lower cost.
191
7.3.2 INSIGNIFICANT RELATIONSHIPS
No relationships were reported between the independent variable Competitive
distribution strategies of small non-family businesses (H1.1b), as well as
Communication process strategies and Low cost promotion strategies of small family
and non-family businesses (H2.1a-2.1b and H3.1a-3.1b) and the dependent variable
Perceived business performance. In other words, whether or not small family or non-
family businesses utilise these marketing mix strategies has no influence on their
business performance. More specifically, whether the small family and non-family
businesses utilise the strategies which include the process of setting marketing
communication objectives, selecting a target market to convey the message via
various communication media and techniques which identifies the product or service
with certain brand associations, and reach both current and potential customers, and
stimulating customer awareness through sales promotion such as competitions,
publicity in newspapers and mobile marketing such as SMS alerts, or not, has no
influence on the performance of the small business, whether family-owned or not.
These findings however contradict those of several other empirical studies
(Abrahams & Carelsen, 2012:115-119; Dzisi & Ofosu, 2014:108; Keh et al.,
2007:608; Resrick & Cheng, 2011:4) which reported significant positive relationships
between certain promotional strategies and business performance of small
businesses. For example, Resrick and Cheng‟s (2011:4) found word-of-mouth
communication and an ongoing dialogue with both existing and potential new
customers to have a positive influence on business performance. Furthermore, Dzisi
and Ofosu (2014:105-108) found a positive relationship between both traditional and
non-traditional promotional strategies and business performance of small
businesses. According to Abrahams and Carelsen (2012:115-117) the small
businesses in their sample achieve improved business performance by identifying a
target audience, developing objectives and an effective communication message to
reach them, and evaluating the message for effectiveness. Thus, informing current
and potential customers through these various communication techniques, of what
the offering is and how to find it is more likely to result in improved business
performance.
192
7.3.3 DIFFERENCE BETWEEN FAMILY AND NON-FAMILY BUSINESSES
Given the third secondary objective (SO3), to establish whether there are differences
between small family and non-family businesses concerning the marketing mix
strategies, t-tests were undertaken. As was indicated in Table 7.2, the results of t-
tests revealed that there were no statistically significant relationships found between
the Type of small business ownership (small family or non-family business) and their
utilisation of Competitive distribution strategies, Communication process strategies,
and Low cost promotion strategies. Therefore, the manner in which small family
businesses utilise these marketing mix strategies do not differ from those used by
small non-family businesses.
Furthermore, it was deemed important to determine whether the family name was
utilised by small family businesses as a marketing or branding tool. Most small
family-owned businesses that participated in this study indicated that their small
family-owned business do not use their family name as a marketing or branding tool.
The Chi-square test for independence was conducted to determine if differences
were statistically significant between the family brand and business size (micro, very
small and small). The results of the Chi-square test for independence reported no
statistically significant difference between using the family name as a marketing or
branding tool and the size of the small business in this study. It can, however, be
noted that as the business size increases, the more small businesses use their family
name as a marketing- or branding tool.
7.3.4 THE INFLUENCE OF DEMOGRAPHIC VARIABLES ON MARKETING
MIX STRATEGIES
MANOVAs (H02.1-18.3) were performed to assess the influence of selected
demographical variables on the independent variables in this study. Only eleven
statistically significant MANOVA relationships could be established, as indicated in
Table 7.3. For these statistically significant relationships, post-hoc Scheffé tests were
conducted to identify significant mean differences of the various categories within
each demographical variable. The results of the Cohen‟s d-value established that

193
there were practical significant relationships between eight demographical variables
and certain marketing mix strategies.
7.3.4.1 Competitive distribution strategies
The null-hypotheses stating there is no relationship between the demographic
variables Ethnicity of the business owner/manager (H07.2), Form of business
ownership (H015.2) and Area of business premises (H017.2) and the Competitive
distributions strategies of small family and non-family businesses were rejected,
indicating statistically significant relationships between these variables. The Cohen‟s
d-value indicated a practical significant relationship between Ethnicity of the business
owner/manager (H07.2) and the Competitive distributions strategies of small family
and non-family businesses. It was evident that small family and non-family business
respondents of a White affiliation more often utilise Competitive distributions
strategies than those of a Black ethnic affiliation.
As a result the following recommendations are put forward:
As Black small business owners operating their businesses in townships
experience problems with low demand and limited knowledge they should be
informed by conducting market research on their existing competitors and new
competitors entering the same market and geographical area that uses the same
or similar distribution strategies which in turn can help them to gain a competitive
advantage.
These Black small business owners should furthermore conduct market research
on their customer base to develop optimal competitive distribution strategies,
such as setting timely delivery objectives, as customers in townships tend to
strive to pay low prices that could result in Black small business owners placing
more emphasis on Low cost promotion strategies and less on Competitive
distribution strategies.
These small businesses can conduct this market research by going beyond a
simple Google search and viewing their competitor‟s website. They can use
„apps‟ and websites such as SpyFu and Google Alerts, do some reporting, tap
into social media by monitoring „tweets‟, Facebook posts, blogs and other current
194
media mentions of their competitors. Even if the competition or the small
business itself isn‟t social media „savvy‟, these small business owners and
managers need to sign up for their competitors newsletters to get the latest news
and updates on their new products, what they are introducing and what events
they might be attending.
7.3.4.2 Communication process strategies
The null-hypotheses stating there is no relationship between the demographic
variables Management qualifications of the business owner/manager (H06.1), Working
experience of the business owner/manager (H011.1) and Area of business premises
(H017.1) and the Communication process strategies of small family and non-family
businesses were rejected, indicating statistically significant relationships between
these variables. The Cohen‟s d-value indicated a practical significant relationship
between Working experience of the business owner/manager (H011.1) and the
Communication process strategies of small family and non-family businesses. It was
evident that small family and non-family business respondents with 6 to 10 years
working experience more often utilise Communication process strategies than
respondents with more than 16 years working experience.
As a result the following recommendations are put forward:
Older small business owners and managers, with more working experience,
should ensure that they continuously up skill themselves in terms of
communication media and techniques in the 21st century used to convey a
message to a selected target market.
They should familiarise themselves with the rise in internet marketing and more
often utilise modern approaches, such as digital and online marketing, in the
utilisation of their Communication process strategies.
These small businesses can attend various free online courses covering the key
aspects of current communication media and online digital marketing to generate
tangible opportunities. Online courses such as ALISON Diploma in Social Media
Marketing and PPC (pay-per-click) University, offer excellent training in this area
taking into account the limited financial resources of small businesses.
195
7.3.4.3 Low cost promotion strategies
The null-hypotheses stating there is no relationship between the demographic
variables Gender of the business owner/manager (H02.3), Age of the business
owner/manager (H03.3), Management qualifications of the business owner/manager
(H06.3), Ethnicity of the business owner/manager (H07.3), Position in the small
business (H08.3), Years small business is in existence (H09.3), Working experience of
the business owner/manager (H011.3), Management working experience of the
business owner/manager (H012.3), Area of business premises (H017.3) and Target
market of the small business (H018.3) and the Low cost promotion strategies of small
family and non-family businesses were rejected, indicating statistically significant
relationships between these variables. The Cohen‟s d-value indicated practical
significant relationships between Gender of the business owner/manager (H02.3), Age
of the business owner/manager (H03.3), Ethnicity of the business owner/manager
(H07.3), Position in the small business (H08.3), Years small business is in existence
(H09.3), Working experience of the business owner/manager (H011.3), Management
working experience of the business owner/manager (H012.3) and Target market of the
small business (H018.3) and the Low cost promotion strategies of small family and
non-family businesses.
It was found that female respondents from small family and non-family business are
more likely at times to utilise Low cost promotion strategies, such as competitions,
publicity in newspapers and mobile SMS marketing, than male respondents. The
results indicated that respondents from small family and non-family businesses in
age category 26 to 45 years are more likely at times to utilise Low cost promotion
strategies than respondents between the ages 46 to 55 years. Furthermore, it was
found that respondents of a Coloured affiliation more often utilise Low cost promotion
strategies than respondents of a White ethnic affiliation; manager respondents are
more likely at times to utilise Low cost promotion strategies than business owner
respondents; small family and non-family businesses that are in existence for 1 to 5
years are more likely to sometimes utilise Low cost promotion strategies than those
that are in existence more than 16 years; respondents with 6 to 10 years working
experience are more likely at times to utilise Low cost promotion strategies than
those that have working experience of more than 16 years; respondents with 1 to 5

196
years management working experience are more likely at times to utilise Low cost
promotion strategies than respondents with management working experience of
more than 16 years; and small family and non-family businesses whose target
market are the general public are more likely at times to utilise Low cost promotion
strategies than those whose target market are businesses.
As a result the following recommendations are put forward:
These small businesses, including older owners, managers and businesses;
Black owners and managers in townships; and those with more working and
management experience, should deploy more modern written, digital and mobile
communication media-based promotional strategies of a low-cost nature in
reaching and stimulating customer awareness that fits in with their unique
circumstances and limited resources. Such strategies can eliminate traditional
barriers to business relationships and between geographies, allowing diverse
constituents to access information, resources and services in the most efficient
and advantageous manner.
These small businesses should resort to social media as a complementary
strategy due to its simplicity and being relatively inexpensive. They can create a
live chat room to ensure interactivity with their customers and drive traffic to their
website and business. They can also utilise the usage of mobiles and adopt
mobile marketing where text, photo and video-based advertising contents can be
sent directly to users mobile phones to influence their purchase decisions as
mobile advertising has a strong influence on the purchase decision of customers.
As many small businesses feel that online marketing is complicated, they should
be trained on how to utilise such online marketing strategies that can contribute
to their business performance and extend their longevity.
7.4 CONTRIBUTIONS OF THE STUDY
This study expanded on the empirical body of knowledge relating to both the
utilisation of marketing mix strategies and the SME sector. The study has addressed
the current research gap of the influence that marketing mix strategies has on
business performance among small businesses, whether family owned or not, in a
developing country such as South Africa.
197
As far as can be established, no other study has investigated the relationship
between marketing mix strategies and business performance of small family and
non-family businesses in South Africa. Past research on this topic has mainly
focused on marketing in large organisations. The results of the study also differ
somewhat from existing literature, and therefore add to the body of knowledge on
marketing in small family and non-family businesses.
Given the little knowledge currently available on the issue at hand, as well as to
reduce the high failure rate of small family and non-family businesses, this study
provided insight into the marketing mix strategies utilised by small family and non-
family businesses and improving their business performance. Through investigating
these relationships, insights and recommendations were provided to small
businesses on the utilisation of the optimal mix of marketing strategies that can
contribute to their business performance and success.
In this study, the scales to measure the marketing mix strategies investigated were
developed by combining items developed by various authors and testing them in a
small family and non-family business context. As such, the study contributed to the
literature in terms of scale development and validation.
7.5 LIMITATIONS OF THE STUDY AND RECOMMENDATIONS FOR
FUTURE RESEARCH
Despite the contributions of this study some limitations should be pointed out and be
taken into consideration when interpreting the results of this study. Several
opportunities for future research are also presented.
Convenience sampling involves using the most conveniently available people for a
study. Although convenience sampling is the weakest method to use for sampling, as
it may create bias results, it is also the most commonly used method in numerous
studies (Polit & Beck, 2013:178). Due to the use of convenience sampling in this
study, the sample does not represent the population as a whole and the
generalisability of the results is limited to the owner-managers of small family and
non-family businesses in the Eastern Cape Province only. Future research should
198
attempt to create a more comprehensive database from which probability samples
can be drawn and may be advantageous to expand the study to include other areas
of the Eastern Cape to gain a provincial perspective.
The data for this study was collected by means of a structured, self-administered
questionnaire which is susceptible to various errors, such as coverage and non-
response. Marsden and Wright (2010:30) indicate that five major error components
exist in such questionnaires, namely specification, frame, non-response,
measurement and processing errors. The responses in this study were based on the
individual responses of the small family and non-family business owners and
managers, and were thus based on personal perceptions and on one-time self-report
measures. Self-report questionnaires are vulnerable to social desirability bias, and
the results are often inflated owing to respondents‟ tendencies to answer in a more
socially acceptable way. According to Kim and Kim (2013:1) and De Jong (2010:42-
44) social desirability bias is a problem, as it compromises the validity and quality of
data and as a result could be a factor that has influenced the results of this study.
Future research could incorporate other methods such as interviews or focus groups.
Several items measuring marketing mix strategies investigated did not load together
as expected when undertaking the exploratory factor analysis. As a result Product
strategies and Place strategies were investigated as a single construct. Pricing
strategies were eliminated from further empirical analysis, and several new marketing
mix strategies were identified. In future studies, the scales measuring the various
marketing mix strategies should be reconsidered and redeveloped to ensure that the
influence of Product strategies can also be assessed as a separate construct, and
the influence of Pricing strategies, that were eliminated, to also be assessed.
Another limitation of this study is that it focused only on the traditional 4Ps known as
the marketing mix strategies. However, in the post “dot-com” boom, small businesses
faced a whole host of new marketing elements that have emerged from the online
world of the internet. As marketing has become a more sophisticated discipline within
the 21st century, having new perspectives that are revolutionary, perhaps the
traditional marketing mix are worthy of a new characterisation into an “e-marketing
mix” or the “e-marketing delta”. In addition, the results of the MRA show that
199
achieving these marketing mix strategies explains only 2.55% of the variance in
Perceived business performance of small family businesses and only 5.28% of the
variance in Perceived business performance of small non-family businesses. This
implies that numerous other factors contribute significantly to the levels of Perceived
business performance experienced by the respondents in this study. Researchers
should consider these other factors when conducting future studies. Although many
argue that the traditional 4Ps remain a strong staple of the marketing mix, perhaps
the time has come to build on this foundation with a next-generation marketing mix
that will help small businesses create and capture value within the realities of the 21st
century marketplace as the traditional marketing mix might not necessarily be fitting
for small businesses as they utilise unique strategies within the 21st century.
Despite these limitations, the results of this study make a contribution to the existing
body of knowledge on marketing mix strategies and Perceived business
performance. Several opportunities are revealed for future research into marketing
mix strategies, perceived business performance and small family and non-family
businesses.
7.6 CONCLUDING REMARKS
Given the importance of small businesses to the economies of countries,
investigating the marketing mix strategies that could possibly improve their business
performance is significant. The findings of this study show how utilising Competitive
distribution strategies of small family businesses results in improved business
performance, and in doing so makes small contributions towards the success rate of
these businesses. The study found no relationship between the marketing mix
strategies, Competitive distribution strategies and the Perceived business
performance of small non-family businesses, as well as no relationship between
Communication process strategies and Low cost promotion strategies and Perceived
business performance of small family and non-family businesses. Despite these
findings sufficient empirical and anecdotal evidence was provided to support these
relationships. Therefore, if small family and non-family owners and managers
implement an optimal mix of marketing strategies in their businesses, improved
business performance should be experienced.
200
REFERENCE LIST
Aamodt, M.G. 2013. Industrial/Organisational psychology: An applied approach. Canada:
Cengage Learning. Abrahams, B. & Carelsen, M. 2012. An investigation into the marketing tasks of small
business owners in the Nelson Mandela Bay Metropole. Unpublished Honours Treatise.
Nelson Mandela Metropolitan University, Port Elizabeth, South Africa. Acharyulu, G.V.R.K. & Reddy, P.N. 2009. Marketing research. New Delhi: Excel Books.
Ackerman, G. 2012. SA needs more family businesses. [Online]. Available:
http://www.picknpay.co.za/picknpay/content/en/news?oid=272149&sn=Detail&pid=10563 [Accessed 28 February 2015].
Ahmad, S.A. & Saber, H. 2015. Understanding marketing strategies with particular reference
to small-and medium-sized hotel businesses in the United Arab Emirates. Tourism and Hospitality Research, 1(1):1-15.
Albaum, G. & Duerr, E. 2008. International marketing and export management. New Jersey:
Prentice Hall. Albert, S. & Whetten, D.A. 1985. Organizational identity. Research in organizational
behaviour, 7(1):263-295.
Aldrich, H.E. & Cliff, J.E. 2003. The pervasive effects of family on entrepreneurship: Toward
a family embeddedness perspective. Journal of Business Venturing, 18(1):573-596.
Aldrich, H. E. & Zimmer, C. 1986. Entrepreneurship through social networks, IN The Art and
Science of Entrepreneurship. Edited by Sexton, D. & Smilor, R. New York: Ballinger, 3-23.
American Marketing Association. 2008. Definition of marketing. [Online]. Available:
www.marketingpower.com/AboutAMA/Pages/DefinitionofMarketing.aspx [Accessed 28 February 2015].
Analoui, F. & Karami, A. 2003. Strategic management in small and medium enterprises.
London: Thomson Learning. Anand, A. & Singh, M.D. 2011. Knowledge management implementation steps for Indian
small and medium sized enterprises. International Journal of Engineering Science and Technology, 3(12):8255-8261.
Anderson, K.J. 2011. Entrepreneurship and small business management collection:
Understating the family business. New York: Business Expert Press.
Anderson, R.C. & Reeb, D.M. 2003. Founding-family ownership and firm performance:
Evidence from the S&P 500. Journal of Finance, 58(1):1301-1328.
Arham, A.F. 2014. Leadership and performance: The case of Malaysian SMEs in the
services sector. International Journal of Asian Social Science, 4(3):343-355.
Ary, D., Jacobs, L.C., Sorensen, C. & Razavieh, A. 2010. Introduction to research in
education. 8th ed. Canada: Cengage Learning.

201
Astrachan, J.H., Klein, S.B. & Smyrnios, K.X. 2002. The F-PEC scale of family influence: A proposal for solving the family business definition problem. Family Business Review,
XV(1):45-58. Awan, A.G. & Hashmi, S. 2014. Marketing practises of small and medium size enterprises: A
case study of SMEs in Multan District. European Journal of Business and Innovation Research, 2(6):9-20.
Ayyagari, M., Beck, T. & Demirguc-Kunt, A. 2003. Small and medium enterprises across the
globe: A new database. Washington, DC: World Bank. Baber, H. 2015. Thought leader series: How to appeal to your demographic via text
messaging. [Online]. Available: https://www.firetext.co.uk/blog/thought-leader-series-how-
to-appeal-to-your-demographic-via-text-messaging/. [Accessed 13 July 2016]. Badenhorst-Weiss, J.A. & Cilliers, J.O. 2014. Competitive advantage of independent small
businesses in Soweto. Southern African Business Review, 18(3):1-21. Bajpai, N. 2010. Business statistics. India: Dorling Kindersley.
Bankseta. 2008. Small and micro enterprises brochure. [Online]. Available:
http://www.bankseta.org.za/downloads/Small_and_Micro_Enterprises_Brochure.pdf [Accessed 21 May 2015].
Barker, R.T., Rimler, G.W., Moreno, E. & Kaplan, T.E. 2004. Family business members‟
narrative perceptions: Values, succession, and commitment. Journal of Technical Writing & Communication, 34(4):291-320.
Basco, R. & Rodriguez, M.J.P. 2009. Studying the family enterprise holistically:
Evidence for integrated family and business systems. Family Business Review, 22(1):82-
95. Bateman, T.S. & Snell, S.A. 2006. Management: Building competitive advantage. 3rd ed.
Chicago: Irwin. Bayens, G.J. & Roberson, C. 2011. Criminal justice research methods: Theory and practice.
2nd ed. USA: CRC Press. Beaver, G. 2003. Small firms: Owners and entrepreneurs. Strategic Change. 12(4):177-183.
Beck, T. & Demirguc-Kunt, A. 2006. Small and medium size enterprise: Access to finance as
a growth constraint. Journal of Banking and Finance, 30(1): 2931-2943.
Behera, S. 2012. Explanation of behaviour among children in the family context. Unpublished
masters dissertation, National Institute of Technology, Odisha. Bellamy, C. 2011. Principles of methodology: Research design in social science. London:
Sage. Berndtson, O. 2015. Family owned business. [Online]. Available:
http://www.odgersberndtson.co.za/za/industries-functions/specialty-practices/family-owned-business/ [Accessed 28 February 2015].
Berthon, P., Ewing, M.T. & Napoli, J. 2008. Brand management in small to medium sized
enterprises. Journal of Small Business Management, 46(1):27-45.
202
Bhaktawar, N. 2011. South African yearbook. 18th ed. Pretoria: GCIS.
Bjerke, B. & Hultman, C. 2002. Entrepreneurial marketing: The growth of small firms in the
new economic era. Cheltenham: Edward Elgar. Blumberg, B., Cooper, D.R. & Schindler, P.S. 2011. Business research methods. 3rd ed.
Berkshire: McGraw-Hill Education. Bodi, A. 2012. Outstanding family business statistics you should know about. [Online].
Available: http://www.businessbewareshow.com/2012/02/20/family-business/ [Accessed 28 February 2015].
Bonds-Raacke, J. & Raacke, J. 2012. Research methods: Are you equipped? Cape Town:
Pearson. Borg-Cardona, N. 2008. Overview of family business relevant issues. Europa: Europa
Research and Consultancy Services. Bosch, J.K., Tait, M. & Venter, E. 2011. Business management: An entrepreneurial
perspective. 2nd ed. Port Elizabeth: Lectern. Bowen, M., Morara, M. & Mureithi, S. 2009. Management of business challenges among
small and micro enterprises in Nairobi-Kenya. KCA Journal of Business Management,
2(1):16-31. Bowling, A. & Ebrahim, S. 2005. Handbook of health research methods: Investigation,
measurement and analysis. England: Open University Press. Breat, J. 2009. The proceedings of the 4th European conference on entrepreneurship and
innovation. Belgium: The University of Antwerp.
Brenes, E.R., Madrigal, K. & Morlina-Navarro, G.E. 2006. Family structure and succession:
Critical topics in Latin American experience. Journal of Business Research, 59(3)372-374.
Bressler, M.S. 2012. How small businesses master the art of competition through superior
competitive advantage. Journal of Management and Marketing Research, 11(1):2–9.
Brink, A. & Berndt, A. 2010. Relationship marketing & customer relationship management.
Juta: Landsdowne. Brink, A., Cant, M. & Ligthelm, A. 2003, 28 September – 1 October. Problems experienced
by small businesses in South Africa. Paper delivered at 16th Annual Conference of the
Small Enterprise Association of Australia and New Zealand. Ballarat, Australia Bryman, A. 2012. Social research methods. 4th ed. New York: Oxford University Press.
Bryman, A. & Bell, E. 2007. Business research methods. 2nd ed. New York: Oxford University
Press. Buchanan, E.A. 2004. Readings in virtual research ethics: Issues and controversies. USA:
Information Science Publishing. Bühlmann, B. 2006. Need to manage a virtual team? Theory and practice in a nutshell.
Switzerland: Cuvillier Verlag.

203
Burghausen, M. & Balmer, J.M.T. 2015. Corporate heritage identity stewardship: A corporate marketing perspective. European Journal of Marketing, 49(1):22-61.
Burns, R.B. & Burns, R.A. 2008. Business research methods and statistics using SPSS. UK:
Sage. Byrd, M.J. & Megginson, L.C. 2013. Small business management: An entrepreneur’s
guidebook. 7th ed. New York: McGraw-Hill/Irwin.
Cant, M.C. 2012. Challenges faced by SME‟s in South Africa: Are marketing skills needed?
International Business & Economics Research Journal, 11(10):1107-1116.
Cant, M.C. & Lightelm, A. 2002. Small business problems in the South African context: a
proactive entrepreneurial approach. [Online]. Available: http://iceb.nccu.edu.tw/proceedings/APDSI/2002/papers/paper233.pdf [Accessed 20 February 2015].
Cant, M.C. & Wiid, J.A. 2016. The use of traditional marketing tools by SMEs in an emerging
economy: A South African perspective. Problems and Perspectives in Management, 14(1):
64-70. Cant, M.C. & Wiid, J.A. 2013. Establishing the challenges affecting South African SMEs.
International Business & Economics Research Journal, 12(6):707-715.
Cant, M.C., Wiid, J.A. & Kallier, S.M. 2015. Product strategy: Factors that influence product
strategy decisions of SMEs in South Africa. The Journal of Applied Business Research,
31(2):621-630. Caselli, S. & Gatti, S. 2005. Banking for family business: A New Challenge for Wealth
Management. New York: Springer.
Cassar, G. 2004. The financing of business start-ups. Journal of Business Venture, 19(2):
261-283. Carney, M. 2005. Corporate governance and competitive advantage in family controlled
firms. Entrepreneurship Theory and Practice, 29(3):249–263.
Carrigan, M. & Buckley, J. 2008. „What‟s so special about family businesses?‟ An exploratory
study of UK and Irish consumer experiences of family businesses. International Journal of Consumer Studies, 32(1):656-666.
Carson, D. 2005. Towards a research agenda – January 2005. Paper discussed at UK
Academy of Marketing/Entrepreneurship Interface SIG, Southampton, UK.
Casillas, J.C., Acedo, F.J. & Moreno, A.M. 2007. International entrepreneurship in family
businesses. USA: Edward Elgar.
Catalyst. 2005. Beyond a reasonable doubt: Creating opportunities for better balance.
Canada: Catalyst. Ceja, L. & T`apies, J. 2009. Attracting talent to family-owned businesses: The perceptions
of MBA students. Unpublished Masters Dissertation. University of Navarra, Spain.
204
Channel Insider. 2011. Small business engaging in more social media marketing. [Online].
Available: http://www/channelinsider.com/c/a/SMB-Partner/Social-Media-Marketing-Grows-Among-Small-Businesses-498539/ [Accessed 19 February 2016].
Chapman, J.R., Hanson, B.P., Dettori, J.R. & Norvell, D.C. 2007. Spine outcomes measures
and instruments. New York: AO Publishing.
Chaston, I. 2000. Entrepreneurial marketing: Competing by challenging convention.
Hampshire: Macmillan Press. Chaston, I. & Mangles, T. 2002. Small business marketing management. New York:
Palgrave. Choo, C.W. & Bontis, N. 2002. The strategic management of intellectual capital and
organisational knowledge. New York: Oxford University Press Inc.
Chua, J.H., Chrisman, J.J. & Sharma, P. 1999. Defining the family business by behavior.
Entrepreneurship Theory and Practice, 23(1):19-40.
CIM. 2009. Marketing and the 7Ps: A brief summary of marketing and how it works. [Online].
Available: www.cim.co.uk/files/7ps.pdf [Accessed on 4 July 2015]. Cohen, L., Manion, L. & Morrison, K.R.B. 2007. Research methods in education. 6th ed. USA:
Routledge. Collis, J. & Hussey, R. 2014. Business research: A practical guide for undergraduate and
postgraduate students. 4th ed. London: Palgrave Macmillan. Connaway, L.S. & Powell, R.R. 2010. Basic research methods for librarians. USA:
Greenwood. Cooper, D.R. & Schindler, P.S. 2013. Business research methods. 12th ed. New York:
McGraw-Hill. Craig, J.B., Dibrell, C. & Davis, P.S. 2008. Leveraging family-based brand identity to
enhance firm competitiveness and performance in family businesses. Journal of Small Business Management, 46(3):351–371.
Creswell, J.W. 2003. Research design: qualitative, quantitative and mixed methods
approaches. 2nd ed. California: SAGE.
Cronin-Gilmore, J. 2012. Exploring marketing strategies in small businesses. Journal of
Marketing Development and Competitiveness, 6(1):96-107.
Csiernik, R., Birnbaum, R. & Pierce, B.D. 2010. Practising social work research: Case
studies for learning. Toronto: University of Toronto.
CTA. 2000. Determinants and impact of ICT use for African SMEs: Implications for rural
South Africa. [Online]. Available:
http://www.tanzaniagateway.org/docs/Determinants_and_Impact_of_ICT_use_for_African_SMEs.pdf [Accessed 20 February 2015].
Cura, F. 2014. Effect of employee commitment on organisational performance: Analysis of
Northern Iraq private and public banks. International Journal of Social Sciences & Educational Studies, 1(2):55-66.
205
Dahl, M.S. & Sorenson, O. 2007. Home sweet home? Social capital and location decisions.
[Online]. Available: http://www.druid.dk/fileadmin/images/dokumenter/sorenson.pdf [Accessed 27 February 2015].
Dahlberg, L & McCaig, C. 2010. Practical research and evaluation: A start-to-finish guide for
practitioners. London: SAGE.
Deakins, D. & Freel, M. 2012. Entrepreneurship and small firms. 6th ed. Berkshire: McGraw-
Hill Higher Education. De Jong, K. 2010. Rules of engagement. Research World, 42-44.
De Lange, J.A. & Scheepers, J. 2013. The influence of goal achievement on the job
satisfaction of small and medium-sized business owner-managers in the Eastern Cape. Unpublished Honours Treatise. Nelson Mandela Metropolitan University, Port Elizabeth, South Africa.
De Witt, A. 2015. Influence of leadership styles on the business performance of family
businesses in the Eastern Cape. Unpublished Masters Dissertation. Nelson Mandela
Metropolitan University, Port Elizabeth, South Africa. Denzin, N. & Lincoln, Y. 2005. Handbook of qualitative research. 3rd ed. Thousand Oaks:
SAGE. DeVellis, R.F. 2012. Scale development: Theory and application. 3rd ed. New Delhi: Sage
Publications. Dibrell, C. & Craig, J.B. 2006. The natural environment, innovation, and firm performance: A
comparative study. Family Business Review, 19(1):275–288.
Dmitrienko, A., Chuang-Stein, C. & D‟Agostino, R. 2007. Pharmaceutical statistics using
SAS: A practical guide. USA: SAS Institute. Dockel, J.A. & Lightelm, A.A. 2002. Factors that contribute to small business survival.
Business Review, 6(2):1-7.
Du Toit, C.M., Du Plessis, A.P & Nortje, J.D. 2014. Fundamental business economics. 2nd ed.
Butterworth: Heinemann. Du Toit, G.S., Erasmus, B.J. & Strydom, J.W. 2007. Introduction to business management.
7th ed. Cape Town: Oxford University Press. Du Plessis, P.J. & Rousseau, G.G. 2009. Buyer behaviour: Understanding consumer
psychology and marketing. 4th ed. Cape Town: Oxford. Dynes, M. 2010. Keeping it in the family. [Online]. Available:
http://www.africainvestor.com/article.asp?id=7949 [Accessed 20 February 2015]. Dzisi, S. & Ofosu, D. 2014. Marketing strategies and the performance of SMEs in Ghana.
European Journal of Business and Management, 6(5):102-111.
EFB. 2012. Family business statistics. [Online]. Available:
http://www.europeanfamilybusinesses.eu/documents/Family%20Business%20Statistics.pdf [Accessed 18 June 2015].

206
Ehlers, T. & Lazenby, K. 2007. Strategic management. South African concept and cases. 2nd
ed. Van Schaik, Pretoria. Ehmke, C., Fulton, J. & Lusk, J. 2015. Marketing’s four P’s: First steps for new
entrepreneurs. [Online]. Available: www.entrepreneuriallab.com/wp-
content/uploads/2013/07ec-730.pdf [Accessed on 7 July 2015]. Eid, R. & El-Gohary, H. 2013. The impact of E-marketing use on small business enterprises‟
marketing success. The Services Industries Journal, 33(1):31-50.
European Commission. 2009. Overview of family-business-relevant issues: Research,
networks, policy measures and existing studies. Europe: European Commission.
Exforsys, 2009. Importance of marketing. [Online]. Available:
http://www.exforsys.com/career-centre/marketing-management/importance-of-marketing.html [Accessed 20 February 2015].
Eybers, C. 2010. Copreneurships in South African small and medium-sized family
businesses. Unpublished Masters Dissertation. Nelson Mandela Metropolitan University,
Port Elizabeth, South Africa. Fakeideas. 2008. Revision: Reviewing the marketing mix. [Online]. Available:
http://fakeideas.co.uk/2008/03/07/revision-reviewing-the-marketing-mix. [Accessed 20 February 2015].
Farrington, S.M. 2009. Sibling partnerships in South African small and medium-sized family
businesses. Unpublished Doctoral Thesis. Nelson Mandela Metropolitan University, Port Elizabeth, South Africa.
Farrington, S.M. & Venter, E. 2011. Starting and managing your own business. 2nd ed.
Lecturn: Port Elizabeth. Fatoki, O. 2010. Which new small and medium enterprises in South Africa have access to
bank credit? International Journal of Business Management, 5(10):128-136. Fatoki, O & Odeyemi, A. 2010. Which new small and medium enterprises in South Africa
have access to bank credit? International Journal of Business Management, 5(10):128-136. Ferrell, O.C. & Pride, W.M. 2013. Marketing. U.S.A: Cengage South-Western. FinMark Trust. 2006. FinScope small business survey report. [Online]. Available:
http://www.finmarktrust.org.za [Accessed 20 February 2015]. Fiore, A., Niehm, L.S., Hurst, J.L., Son, J. & Sadachar, A. 2013. Entrepreneurial marketing:
Scale validation with small, independently-owned businesses. Journal of Marketing Development and Competitiveness, 7(4):63-86.
Fishman, A. 2009. When business is kept in the family. Sunday Times Newspaper. 13
December. 2. Flören, R.H. 2002. Crown princes in the clay. Assen, The Netherlands: Royal Van Gorcum. Fouka, G. & Mantzorou, M. 2011. What are the major ethical issues in conducting research?
Is there a conflict between the research ethics and the nature of nursing? Health Science Journal. 5(1):314.
207
Foxcroft, M., Wood, W., Kew, K., Herrington, M. & Segal, N. 2002. Global entrepreneurship monitor South African report. [Online]. Available:
http://www.gbs.nct.ac.za/gbswebb/userfiles/gemsouthafrica2000.pdf [Accessed 27 February 2015].
Fred, A., Filipe, J. & Gamboa, H. 2010. Proceedings of the international joint conference on biomedical engineering systems and technologies. Spain: INSTICC Press.
Frederick, H.H., Kuratko, D.F. & Hodgetts, R.M. 2007. Entrepreneurship: Theory, process,
practice. South Melbourne Victoria, Australia: Cengage Learning. Fulco, C.E., Liverman, T.C. & Sox, H.C. 2000. Gulf and health: depleted uranium,
pyridostigmine bromide, sarin and vaccines. USA: National Academies Press.
Gallo, M.A., Tapies, J. & Cappuyns, K. 2004. Comparison of family and nonfamily business:
Financial logic and personal preferences. Family Business Review. XVII(4):303-318.
Gavrea, C., Ilies, L. & Stegerean, R. 2011. Determinants of organizational performance: The
case of Romania. Management & Marketing Challenges for the Knowledge Society,
6(2):285-300. Gilmore, A. 2011. Entrepreneurial and SME marketing. Journal of Research in Marketing and
Entrepreneurship, 13(2):137-145.
Goddard, G. & Melville, S. 2004. Research methodology: An introduction. 2nd ed.
Lansdowns: Juta & Co Ltd. Government Gazette of the Republic of South Africa. 2003. National small business
amendment act. [Online] Available: http//www.info.gov.za/gazette/acts/2003/a26-03.pdf
[Accessed 20 February 2015]. Gratton, C. & Jones, I. 2004. Research methods for sport studies. London: Routledge.
Gravetter, F.J. & Forzano, L.B. 2010. Research methods for the behavioural sciences. USA:
Cengage Learning. Grönroos, C. 2006. Adopting a service for logic marketing. Marketing theory, 6(3):317-333. Grove, S.K., Burns, N. & Gray, J.R. 2013. The practice of nursing research: Appraisal,
synthesis and generation of evidence. 7th ed. Missouri: Elsevier Health Sciences.
Gruber, M. 2004. Marketing in new ventures: Theory and empirical evidence. Schmalenbach
Business Review, 56(2):164–199.
Habbershon, T.G. & Williams, M.L. 1999. A resource-based framework for assessing the
strategic advantages of family firms. Family Business Review, 12(1):1-25.
Habbershon, T.G., Williams, M.L. & MacMillan, I. 2003. Familiness: A unified systems theory
of family business performance. Journal of Business Venturing, 18(1):451-465.
Hair, J.F. & Anderson, R.E. 2010. Multivariate data analysis. New York: Prentice Hall Higher
Education. Hair, J.F., Black, W.C., Babin, B.J. & Anderson, R.E. 2014. Multivariate data analysis. 7th ed.
New Jersey: Pearson.

208
Hair, J.F., Black, W.C., Babin, B.J. & Anderson, R.E. 2010. Multivariate data analysis. New
Jersey: Pearson. Hair, J.F., Black, W.C., Babin, J.F., Anderson, R.E. & Tatham, R.L. 2006. Multivariate data
analysis. 6th ed. Upper Saddle River, New Jersey: Pearson/Prentice Hall.
Hakim, C. 2012. Research design: Successful designs for social economics research. Oxon:
Routledge. Harvie, C. & Lee, B. 2012. The role of SMEs in national economies in East Asia. UK: Edward
Elgar. Hartas, D. 2010. Educational research and inquiry: qualitative and quantitative approaches.
London: Cintinuum International Publishing Group. Hashi, I. 2001. Financial and institutional barriers to SME growth in Albania: Results of an
enterprise survey. Economic Policy in Transitional Economies, 11(3): 221-238. Hatten, T.S. 2016. Small business management: Entrepreneurship and beyond. Boston,
USA: Cengage Learning. Hellriegel, D., Slocum, J., Jackson, S.E., Louw, L., Staude, G., Amos, T., Klopper, H.B.,
Louw, M., Oosthuizen, T., Perks, S. & Zindiye, S. 2012. Management. 4th South African ed.
Cape Town: Oxford University Press. Herrington, M. & Wood, E. 2003. Global entrepreneurship monitor, South
African report. [Online] Available: http://www.gbs.nct.ac.za/gbswebb/userfiles/gemsouthafrica2000.pdf [Accessed 27 February 2015].
Herrington, M., Kew, J. & Kew, P. 2009. Global entrepreneurship monitor,
South African report. [Online]. Available:
http://www.gbs.nct.ac.za/gbswebb/userfiles/gemsouthafrica2000.pdf [Accessed 27 February 2015].
Hills, G.H., Hultman, C.M. & Miles, M.P. 2008. The evolution and development of
entrepreneurial marketing. Journal of Small Business Management, 46(1):99-112. Hingston, P. 2001. Effective marketing. London: Dorling Kindersley.
Hinkel, E. 2011. Handbook of research in second language teaching and learning. 2nd ed.
New York: Routledge. Hinson, R.E. & Mahmoud, M.A. 2011. Qualitative insights into market orientation in small
Ghanaian businesses. International Journal of Marketing Studies, 3(1):35-44.
Hlatshwayo. D. 2012. The role of SMEs in job creation. [Online]. Available:
http://www.rsdi.co.za/Role+of+SMEs [Accessed 20 February 2015]. Hormozi, A. M., Sutton, G. S., McMinn, R.D. & Lucio, W. 2002. Business plans for new
or small businesses: Paving the path to success. Management Decision, 40 (8):755-763. Horowitz, S. 2014. Frishkoffs: Communication is key. [Online]. Available:
http://www.umass.edu/fambiz/articles/resolving_conflict/how_to_make.html [Accessed 27 February 2015].
209
Hugo, P.F. 1996. The alternative business entities. MBA treatise, Graduate School of
Business, University of Stellenbosch, South Africa. Hutcheson, H. 2015. Tout the family ties as part of the brand. [Online]. Available:
http://ffipractitioner.org/2015/04/29/tout-the-family-ties-as-part-of-the-brand/ [Accessed 18 June 2015].
Ibrahim, A.B., McGuire, J. & Soufani, K. 2009. An empirical investigation of factors
contributing to longevity of small family firms. Global Economy and Finance Journal. 2(2):1-
21. Jackson, S.L. 2011. Research methods and statistics: A critical thinking approach. United
States of America: Wadsworth Cengage Learning. Jenson, K.B. 2015. Marketing strategy for small business. [Online]. Available:
www.ryerson.ca/marketing/chapter1 [Accessed on 4 July 2015]. Johnson, B. & Christensen, L. 2012. Educational research: Quantitative, qualitative and
mixed Approaches. 4th ed. California: SAGE.
Jones, R. & Rowley, J. 2011. Entrepreneurial marketing in small businesses: a conceptual
exploration. International Small Business Journal, 29(1):25-27.
Jorissen, A., Laveren, E., Martens, R. & Reheul, A. 2005. Real versus sample-based
differences in comparative family business research. Family Business Review, 18(3):229-
252. Juul, I. 2006. The small business survival handbook. 2nd ed. Cape Town: Spearhead.
Kalra, S.C. 2009. SMEs in India: The challenges ahead. [Online]. Available:
http://cc.iift.ac.in/smefewa [Accessed 27 February 2015].
Kammerlander, N. & Ganter, M. 2015. An attention‐based view of family firm adaptation to discontinuous technological change: Exploring the role of family CEOs' noneconomic goals. Journal of Product Innovation Management, 32(3):361-383.
Karris, S.T. 2003. Mathematics for business, science, and technology. 2nd ed. California:
Orchard Publications. Katz, J. and Green, R. 2014. Entrepreneurial small business. 4th ed. United States of
America: McGraw-Hill/Irwin. Keh, H.T., Nguyen, T.T.M. & Ng, H.P. The effects of entrepreneurial orientation and
marketing information on the performance of SMEs. Journal of Business Venturing, 22(1):592-611.
Kelly, L.M., Athanassiou, N. & Crittenden, W.F. 2000. Founder centrality and the strategic
behaviour in the family-owned firm. Entrepreneurship Theory and Practice, 25(2):27-42. Kent, T. & Brown, R. B. 2006. Erotic retailing in the UK (1963-2003) - The view from the
marketing mix. Journal of Management History, 12(2):199-211. Khattar, D. 2008. The Pearson guide to quantitative aptitude for professional-course
examinations. India: Dorling Kindersley.
210
Kim, S.H. & Kim, S. 2013. National culture and social desirability bias in measuring public service motivation. [Online]. Available:
http://aas.sagepub.com/content/early/2013/08/30/0095399713498749.abstract [Accessed 16 June 2016].
Klee, R. 2015. The influence of family business resources on transgenerational success: a
family business case study. Unpublished Masters Dissertation. Nelson Mandela Metropolitan University, Port Elizabeth, South Africa.
Knapp, J.R, Smith, B.R, Kreiner, G.E, Sundaramurthy, C. & Barton, S.L. 2013. Managing boundaries through identity work: The role of individual and organisational identity tactics. Family Business Review, 26(4):333-355.
Kohli, A. & Jaworski, B. 1990. Market orientation: The construct, research propositions, and
managerial implication. Journal of Marketing, 54(2):1-18.
Kolb, B. 2008. Marketing research: A practical approach. Los Angeles: Sage. Kongolo, M. 2010. Job creation versus job shedding and the role of SMEs in economic
development. African Journal of Business Management, 4(11):2288-2291. Kotler, P. & Armstrong, G. 2016. Global and Southern African Perspective: Principles of
Marketing. 2nd ed. South Africa: Pearson Education. Kotler, P. & Armstrong, G. 2010. Principles of marketing. 12th ed. Cape Town: Pearson
Education. Kotler, P., Armstrong, G. & Tait, M. 2010. Principles of marketing: Global and Southern
African perspectives. South Africa: Pearson Prentice Hall.
Kotler, P., Armstrong, G., Wong, W., & Saunders, J. 2008. Principles of marketing. London:
Prentice Hall Kotler, P. & Keller, K.L. 2012. Marketing management. 14th ed. England: Pearson Education. Kozinets, R.V., de Valck, K., Wojnicki, A.C., & Wilner, S.J.S. 2010. Networked Narratives:
Understanding Word-of-Mouth Marketing in Online Communities. Journal of Marketing, 74(1):71-89.
Krishnaswamy, K.N., Sivakumar, A.I. & Mathirajan, M. 2009. Management research
methodology: Integration of methods and techniques. India: Pearson. Kroon, J. & Moolman, P.L. 2007. Entrepreneurship. Pretoria: Kagiso Publishers.
Kumar, R. 2011. Research Methodology: A step-by-step guide for beginners. 3rd ed. New
Delhi: SAGE. Kunapuli, G. 2008. A bilevel optimization approach to machine learning. USA: ProQuest.
Labaree, R. 2013. Types of research designs. [Online]. Available:
http://libguides.usc.edu/content.php?pid=830093sid=818072 [Accessed 02 June 2016]. Ladzani, W.M. & Van Vuuren, J.J. 2002. Entrepreneurship training for emerging SMMEs in
South Africa. Journal of Small Business Management, 40(2):154–161.
211
Lake, L. 2016. Understanding the difference between B2B and B2C marketing. [Online].
Available: https://www.thebalance.com/b2b-vs-b2c-marketing-2295828 [Accessed 13 July 2016].
Lamb, C.W., Hair, J.F., McDaniel, C., Boshoff, C., Terblanche, N.S., Elliott, R. & Klopper,
H.B. 2012. Marketing. 4th ed. Cape Town: Oxford University Press.
Lamb, C.W., Hair, J.F., McDaniel, C., Boshoff, C., Terblanche, N., Elliot, R. & Klopper, H.B.
2010. Marketing. 4th ed. Cape Town: Oxford. Lamb, C.W., Hair, J.F., McDaniel, C., Boshoff, C. & Terblanche, N.S. 2008. Marketing. 3rd
edition. Cape Town: Oxford University Press. Lambrecht, J. & Lievens, J. 2008. Pruning the family tree: an unexplored path to family
business continuity and family harmony. Family Business Review, 21(4):295-313.
Lebans, M., Euske, K. 2006. A conceptual and operational delineation of performance.
Business Performance Measurement, Cambridge University Press.
Lee, J. 2006. Family firm performance: Further evidence. Family Business Review,
XIX(2):103-113. Lee Goi, C. 2009. A review of marketing mix: 4Ps or more? International Journal of
Marketing Studies, 1(1):1-14. Leech, N.L., Barrett, K.C. & Morgan, G.A. 2008. SPSS for intermediate statistics: Use and
interpretation. 3rd ed. USA: Taylor & Francis Group. Leimeister, S. 2010. IT outsourcing governance: Client types and their management
strategies. Germany: German National Library.
Letele-Matabooe, M.J. 2012. An investigation into the factors influencing the levels of job
satisfaction and organisational commitment of non-family employees working in family businesses. Unpublished Masters Dissertation. Nelson Mandela Metropolitan University, Port Elizabeth, South Africa.
Levy, M. & Powell, P. 2004. Strategies for growth in SMEs: The role of information and
information systems. Burlington, MA: Elsevier Butterworth-Heinemann.
Lewis, R. & Zibarras, L. 2013. Work and occupational psychology: Integrating theory and
practice. Washington DC: SAGE. Libster, C.M. 2016. Why mobile marketing is made for small business. [Online].
Available:https://www.americanexpress.com/us/small-business/openforum/articles/ why-mobile-marketing-is-made-for-small-business/ [Accessed 19 February 2016].
Linn, P.L., Howard, A. & Miller, E. 2012. Handbook for research in cooperative education and
internships. New Jersey: Taylor & Francis e-Library.
Linton, I. 2016. Hiring a marketing manager vs. a firm. [Online]. Available:
http://smallbusiness.chron.com/hiring-marketing-manager-vs-firm-34346.html [Accessed 28 August 2016].
Longenecker, J.G., Moore, C.W., Petty, J.W. & Palich, L.E. 2006. Small business
management: An entrepreneurial emphasis. Mason: Thomson South-Western.
212
Longenecker, J.G., Petty, J.W., Palich, L.E. & Hoy, F. 2011. Small business management: Launching and growing entrepreneurial ventures. 16th ed. USA: Cengage Learning.
Maas, G. 2014. Entering the family. Pretoria: Van Schaik Publishers. Maas, G. & Diederichs, A. 2007. Manage family in your business. Northcliff: Frontrunner
Publishing. Maas, G. & Herrington, M. 2006. Global entrepreneurship monitor South African executive
report. [Online]. Available: http://www.gbs.nct.ac.za/gbswebb/userfiles/gemsouthafrica2000.pdf [Accessed 27 February 2015].
Maas, G.J.P., Van Der Merwe, S.P. & Venter, E. 2005. Family businesses in South Africa: A
practical governance guide. Stellenberg: Content Solutions.
Mack, N., Woodsong, C., MacQueen, K.A., Guest, G. & Namey, E. 2005. Qualitative
research methods: A data collector’s field guide. North Carolina: Family Health
International. Macleod, G. & Terblanche, B. 2004. Starting your own business in South Africa. 10th ed.
Cape Town: Oxford University Press. Madhani, P.M. 2012. SMEs as growth driver of Indian economy: Strategic HR issues and
perspectives. [Online]. Available: http://dx/doi.org/10.2139/ssrn.2004826 [Accessed on 16
June 2015]. Mahadea, D. 2008. The environmental context for SMME entrepreneurship in Kwazulu-Natal,
IN Proceedings of the University of Cape Town, School of Economics Development Policy Research Unit Conference. Cape Town. 2 – 24.
Mahapatro, B.B. 2010. Human Resource Management. New Delphi: New Age International.
Marsden, P.V. & Wright, J.D. 2010. Handbook of survey research. 2nd ed. USA: Emerald
Group Publishing Limited. Martin, G. & Staines, H. 2008. Managerial competencies in small firm. [Online]. Available:
http://www.emeraldinsight.com/insight/viewcontentitem.do?contenttype [Accessed 27 February 2015].
Marx, S., Van Rooyen, D.C., Bosch, J.K. & Reynders, H.J.J. 1998. Business management.
2nd ed. Pretoria: Van Schaik. McAfee, P., Clydesdale, A. & Shaw, M. 2014. Family business programme at Queen’s
University to help keep it in the family. [Online]. Available:
http://www.belfasttelegraph.co.uk/business/news/family-business-programme-at-queens-university-to-help-keep-it-in-the-family-30306042.html [Accessed on 14 April 2015].
McCann, G. 2005. Part of the plan: a holistic approach to leading in a family business.
Leadership in Action, 24(6):16-18.
McCarthy, E.J. 1964. Basic marketing. IL: Richard D. Irwin.
McConaughy, D.L., Matthews, C.H. & Fialko, A.S. 2001. Founding family controlled firms:
Performance, risk, and value. Journal of Small Business Management, 39(1): 31–42.
213
McMohan, P.J. 2016. Gender-based sales promotions: Good business or unlawful discrimination? [Online]. Available: http://www.lexology.com/library/detail.aspx?g=
1d643b5e-68c1-4bf9-a5df-5d4fe1feeead [Accessed 13 July 2016]. Megginson, L.C., Byrd, M.J. & Megginson, W.L. 2003. Small business management: An
entrepreneur’s guidebook. 4th ed. New York: McGraw-Hill/Irwin.
Memili, E., Eddleston, K.A., Kellermanns, F.W., Zellweger, T.M. & Barnett, T. 2010. The
critical path to family firm success through entrepreneurial risk taking and image. Journal of Family Business Strategy, 1:200-209.
Merriam, S. 2009. Qualitative research: A guide to design and implementation. San
Francisco: Jossey-Bass. Mertens, D.M. & Ginsberg, P.E. 2009. The Handbook of Social Research Ethics. California:
Sage. Micelotta, E.R. & Raynard, M. 2011. Concealing or revealing the family? Corporate brand
identity strategies in family firms. Family Business Review, 24(3):196-216.
Michie, J. 2013. Reader’s guide to the social sciences. New York: Routledge.
Miller, C.C., Washburn, N.T. & Glick, W.H. 2013. The myth of firm performance.
Organisational Science, 24(3):948-964. Miller, D. 2015. Family firms and entrepreneurship: A different point of view. [Online].
Available: http://ffipractitioner.org/2015/03/25/family-firms-and-entrepreneurship-a-different-point-of-view/ [Accessed 18 June 2015].
Miller, D. & Le Breton-Miller, I. 2003. Challenge versus advantage in family business.
Strategic Organization, 1(1):127-134. Milosevic, S.D., Miletica, S. & Stefanovic, I. 2009. Significance and development problems of
SMEs in contemporary market economy. Serbian Journal of Management, 4(1):127-136. Milton, L.P. 2008. Unleashing the relationship power of family firms: Identity confirmation as
a catalyst for performance. Entrepreneurship Theory and Practice, 32(1):1063-1081. Mintz, O. & Currim, I.S. 2013. What drives managerial use of marketing and financial metrics
and does metric use affect performance of marketing-mix activities? American Marketing Association, 77:17-40.
Modise, M. 2011. The role of succession planning in the sustainability of family owned agri-
businesses in South Africa. Unpublished MBA Dissertation. Gordon Institute of Business Science, Pretoria, South Africa.
Möller, K. 2006. The marketing mix revisited: Towards the 21st century marketing by E.
Constantinides. Journal of Marketing Management, 22(3), 439-450.
Monks, P.G.S. 2010. Sustainable growth in SMEs. Unpublished MBA Dissertation. Nelson
Mandela Metropolitan University, Port Elizabeth, South Africa. Morck, R. & Yeung, B. 2004. Family control and the rent seeking society. Entrepreneurship
Theory and Practice, 28(4):391-409.
214
Morgan, G.A., Gliner, J.A. & Harmon, R.J. 2008. Understanding and evaluating research in applied and clinical settings. New Jersey: Lawrence Erlbaum Associates.
Morgan, N.A. 2012. Marketing and business performance. Journal of the Academy of
Marketing Science, 40:102-119.
Morgan, R. & Strong, C.A. 2003. Business performance and dimensions of strategic
orientation. Journal of Business Research, 56:163-176.
Morris, S.C., Miles, M.P. & Deacon, J.H. 2010. Entrepreneurial marketing: Acknowledging
the entrepreneurial and customer-centric interrelationship. Journal of Strategic Marketing,
18(4):303-316. Morris, M.H., Schindehutte, M. & LaForge, R.W. 2002. Entrepreneurial marketing: A
construct for integrating emerging entrepreneurship and marketing perspectives. Journal of Marketing Theory and Practice, 10(4):1-19.
Murphy, M. 2006. Small business management. London: Financial Times and Pitman
Publishing. Muske, G. & Fitzgerald, M.A. 2006. A panel study of copreneurs in business: Who enters,
continues, and exits? Family Business Review, 19(3):193-205.
Mustakallio, M., Autio, E. & Zahra, A. 2002. Relational and contractual governance in family
firms: Effects on strategic decision making. Family Business Review, 15(3):205-222.
Muijs, D. 2004. Doing quantitative research in education: With SPSS. London: SAGE. Murphy, M. 1996. Small business management. London: Pitman Publishing.
Murthy, S.N. & Bhojanna, U. 2008. Business research methods. 2nd ed. India: Excel Books. Mustakallio, M., Autio, E. & Zahra, A. 2002. Relational and contractual governance in family
firms: Effects on strategic decision making. Family Business Review, 15(3):205-222. Mwobobia, F.M. 2012. Empowering of small– micro and medium enterprises (SMMEs): A
case of Botswana. Business and Management Research, 1(4):88-99. Myers, M.D. 2009. Qualitative research in business & management. London: SAGE.
Nager, T., Swanepoel, E. & Van Der Merwe, M.A. 2008. Introduction to entrepreneurship and
small business management. Pretoria: UNISA Press.
Neneh, N.B. & van Zyl, J.H. 2013. Achieving optimal business performance through business
practices: Evidence from SMEs in selected areas in South Africa. Southern African Business Review, 16(3):118-144.
News24.com. 2015. SA’s unemployment rate hits 12-year high. [Online]. Available:
http://m.news24.com/fin24/Economy/SAs-unemployment-rate-hits-12-year-high-20150526 [Accessed 18 June 2015].
Ngoc, T.B., Le, T. & Nguyen, T.B. 2009. The impact of networking on bank financing: The
case of small and medium enterprises in Vietnam. Entrepreneurship Theory and Practice,
33(4): 867-887.

215
Nieman, G. 2006. Small business management: A South African approach. South Africa:
Van Schaik Publishers. Nieman, G. & Nieuwenhuizen, C. 2009. Entrepreneurship: A South African perspective. 2nd
edition. South Africa: Van Schaik Publishers. Nisha, N. 2013. How has technology changed the role of marketing in the past ten years, and
how do you see it changing in the next five. [Online]. Available: http://www.mba-
exhange.com/candidates/How-Has-Technology-Changed-The -Role-Of-Marketing-In-The-Past-Ten-Years,-And-How-Do-You-See-It-Changing-In-The-Next-Five-285-session- [Accessed 13 September 2016].
Nkosi, E., Bounds, M. & Goldman, G. 2013. Skills required for the management of black-
owned small enterprises in Soweto. Acta Commercii, 13(1):1-10. Nkwi, P., Nyamongo, I. & Ryan, G. 2001. Field research into socio-cultural issues:
Methodological guidelines. Yaounde, Cameroon, Africa: International Centre for Applied Social Sciences, Research, and Training/UNFPA.
Nordqvist, M. & Merlin, L. 2010. Entrepreneurial families and family firms. Entrepreneurship
and Regional Development, 22(3-4):211-239.
Nugroho, W.A. & Wihandoyo, L.S. 2009. Consumer‟s perceived value and buying behaviour
of store brands: An empirical investigation. Journal of Business Strategy and Execution, 1(2):216-238.
Nykiel, R.A. 2007. Handbook of marketing research methodologies for hospitality and
tourism. USA: Routledge
Obiwuru, T.C., Okwu, A.T., Akpa, V.O. & Nwankwere, I.A. 2011. Effects of leadership on
organizational performance: A survey of selected small scale enterprises in Ikosi-Ketu council development area of Lagos State, Nigeria. Australian Journal of Business and Management Research. 1(7):100-111.
O‟Brien, R.M. 2007. A caution regarding rules of thumb for variance inflation factors. Quality
& Quantity. 41:673-690.
OECD. 2005. OECD SME and entrepreneurship outlook. Paris:OECD
Offerman, J.L. 2010. The role of governance in the Offerman family business. Unpublished
Masters Dissertation. Nelson Mandela Metropolitan University, Port Elizabeth, South Africa. Olawale, F. & Garwe, D. 2010. Obstacles to the growth of new SMEs in South Africa: A
principal component analysis approach. African Journal of Business Management, 4(5):729-738.
Orth, U.R. & Green, M.T. 2009. Consumer loyalty to family versus non-family business: The
roles of store image, trust and satisfaction. Journal of Retailing and Consumer Services,
16(1):248-259.
Panneerselvam, R. 2004. Research methodology. New Delhi: PHI Learning Pvt. Ltd. Parsons, T. 1956. Suggestions for a sociological approach to the theory of organizations.
Administrative Science Quarterly, 1(1):63-85.
216
Pérez, P.F. & Raposo, N.P. 2007. Bonsais in a wild forest? A historical interpretation of the longevity of large Spanish family firms. Journal of Iberian and Latin American Economic History, 25(3):459-498.
Perry, M. 2014. Market Orientation in Small Businesses: Creative or Lacking? The Marketing
Management Journal, 24(1):96-107.
Phillips, P.A. & Wade, M.A. 2008. Performance implications of capital structure: Evidence
from quoted U.K organisations with hotel interests. Service Industries Journal, 24(5):31-51.
Pitman, J. 2010. A snapshot of entrepreneurship in South Africa. Entrepreneur Magazine.
May. 84-86. Polit, D.F. & Beck, C.T. 2013. Essentials of nursing research: Appraising evidence for
nursing practice. 8th ed. China: Lippincott Williams & Wilkins. Popovic, D. 2006. Modelling the marketing of high-tech start-ups. Journal of Targeting,
Measurement and Analysis for Marketing, 14(3):260-276.
Poza, D. 2014. Family business. 4th ed. United States of America: South-Western Cengage
Learning. Price, D.P., Stoica, M. & Boncella, R.J. 2013. The relationship between innovation,
knowledge and performance in family and non-family firms: An analysis of SMEs. Journal of Innovation and Entrepreneurship, 2(14):1-20.
Pride, W.M. & Ferrell, O.C. 2010. Marketing. 15th ed. Mason, OH: South-Western Cengage. Probert, J. 2011. Premission please. Marketing Mix: measurable marketing insight,
29(7/8):12. PWC. 2013. The future is now: Family business survey. [Online]. Available:
http://www.pwc.co.za/en_ZA/za/assets/pdf/family-business-survey-2013.pdf [Accessed 28 February 2015].
Quinlan, C. 2011. Business research methods. Andover, Hampshire, UK: South-Western
Cengage Learning. Radipere, S. & Van Scheers, L. 2005. Investigating whether a lack of marketing and
managerial skills is the main cause of business failure in South Africa. South African Journal of Economic and Management Science, 8(4):1-10.
Rahman, S. 2001. A comparative study of TQM practice and organisational performance of
SMEs with and without ISO 9000 certification. International Journal of Quality & Reliability Management, 18(1):35-49.
Rao, N. 2015. Management Theory Review. [Online]. Available:
http://nraomtr.blogspot.co.za/2011/12/marketing-strategy-marketing-process.html [Accessed 07 April 2016].
Reijonen, H. 2010. Do all SMEs practise same kind of marketing? Journal of Small Business
and Enterprise Development, 17(2):279-282.
217
Republic of South Africa. 2003. Department of Trade and Industry. National Small Business Act No. 102 of 1996. [Online]. Available: http://www.info.gov.za/acts/1996/a102-96.pdf
[Accessed 2 March 2015]. Resrick, S. & Cheng, R. 2011, 5-7 July. Marketing in SMEs: A proposed ‘4Ps’ model.
Academy of Marketing Conference: University of Liverpool Management School. Reuber, A.R. & Fischer, E. 2011. Marketing (in) the family firm. Family Business Review,
24(3):193-196. Robbins, D. 2009. Understanding research methods: A guide for the public and nonprofit
manager. New York: CRC Press.
Roberts, J. 2010. Small business failure 63% in first two years. [Online]. Available:
http://www.businesslive.co.za/southafrica/sa_companies/2010/11/16/small-business-failure-rate-63-in-first-two-years [Accessed 27 February 2015].
Romano, C. & Ratnatunga, J. 1995. The role of marketing: Its impact on small enterprise
research. European Journal of Marketing, 29(2):9-30.
Rothman, K.J., Greenland, S. & Lash, T.L. 2008. Modern epidemiology. 3rd ed. USA:
Lippincott Williams & Wilkins. Rubin, A. 2010. Statistics for evidence-based practice and evaluation. 2nd ed. USA: Cengage
Learning. Rubin, A. & Babbie, E. 2011 Essential research methods for social work. 3rd ed. UK:
Cengage Learning. Salkind, N.J. 2010. Encyclopedia of research design. USA: Sage Publications.
Scheller, J. 2013. Definition of family business/entrepreneurial families. [Online]. Available:
http://www.wifu.de/en/research/definition-of-family-business/ [Accessed 28 February 2015]. Scheepers, J. 2015. The meaning of success: Perspectives of family business owners using
word associations. Unpublished Masters Dissertation, Nelson Mandela Metropolitan
University. Port Elizabeth. South Africa. Schwarz, T.V. 2003. Family business management: taking care of the family business and
the business of the family. Executive Seminar.
Sekaran, U. & Bougie, R. 2010. Research methods for business: A skill building approach.
5th ed. New Jersey: John Wiley & Sons. Shane, S. & Cable, D. 2002. Network ties, reputation and the financing of new ventures.
Management Sciences, 48(3): 364-381.
Sharma, P. 2015. Evolution in thinking about generational transition in family enterprises.
[Online]. Available: http://ffipractitioner.org/2014/06/11/evolution-in-thinking-about-generational-transition-in-family-enterprises/ [Accessed 18 June 2015].
Sharma, P., Salvato, C. & Reay, T. 2014. Temporal dimensions of family enterprise
research. Family Business Review, 27(1):10-19.

218
Sharma, P. 2004. An overview of the field of family business studies: Current status and directions for the future. Family Business Review, 17(1):1-36.
Sharma, S.R., Morales-Arroyo, M. & Pandey, T. 2012. The Emergence of Electronic Word-
of-Mouth as a Marketing Channel for the Digital Marketplace. Journal of Information Technology, and Organizasions, 6(1):41-61.
Shimp, T.A. & Andrews, J.A. 2014. Advertising promotion and other aspects of integrated
marketing communications. U.S.A: Cengage Learning.
Simpson, M., Padmore, J., Taylor, N., & Frecknall-Hughes, J. 2006. Marketing in small and
medium sized enterprises. International Journal of Entrepreneurial Behaviour & Research,
12(6):361-387. Singh, R.K., Garg, S.K. & Deshmukh, S.G. 2008. Strategy development by SMEs for
competitiveness: A review. Benchmarking: An International Journal, 15(5):525-547.
Sirmon, D.G. & Hitt, M.A. 2003. Managing resources: Linking unique resources,
management, and wealth creation in family firms. Entrepreneurship Theory and Practice,
27(4):339–358. Slaughter, W.S. 2009. An exploratory study of the determinants of family harmony in family
business. Unpublished Masters mini-dissertation. North-West University of Potchefstroom,
South Africa. Smallbone, D., Leig, R. & North, D. 2003. The characteristics and strategies of high growth
SMEs. International Journal of Entrepreneurial Behavior & Research, 1(3):44-62. Smit, L. 2004. Entrepreneurship and Business Management: Starting your own business. 5th
ed. Cape Town: CLS Publishers. Song, M., Droge, C., Hanvanich, S. & Calantone, R. 2005. Marketing and technology
resource complementarily: An analysis of their interaction effect in two environmental contexts. Strategic Management Journal. 26(3):259-276.
South African Police Service. 2009. Crime statistics. [Online] Available:
http://www.saps.co.za [Accessed 27 February 2015]. Stalk, G. & Foley, H. 2012. Avoid the traps that can destroy family businesses. [Online].
Available: http://hbr.org/2012/01/avoid-the-traps-that-can-destroy-family-businesses/ar/1 [Accessed 20 February 2015].
Standard Bank and Fujistu Siemens Computer. 2009. SMME survey 2008 [Online].
Available: http://www.smesurvey.co.za/content [Accessed 27 February 2015]. Stanislaw, D.P. 2014. Family business succession planning. [Online]. Available:
http://www.stanislawconsulting.com/family-business-solutions/family-business-succession-planning/ [Accessed 28 February 2015].
StatSoft, Inc. 2014. Statistica (Data analysis software system). Version 11. [Online].
Available: http://www.statsoft.com [Accessed 09 June 2016]. STEP Academic Information Packet. 2013. STEP Summit Reports and Resources, Paper 6.
[Online]. http://digitalknowledge.babson.edu/sumrep/6. [Accessed 20 September 2015].
219
Stewart, A. & Hitt, M.A. 2009. Why can‟t family business be more like nonfamily business? Modes of professionalization in family firms. Family Business Review, 25(1):58-
86. Stiglitz, J. & Weiss, A. 1981. Credit rationing in markets with imperfect information. The
American Economic Review, 71(3): 393-410.
Stokes, D. 2000. Entrepreneurial marketing: a conceptualisation from qualitative research.
Qualitative Market Research: An International Journal, 3(1):47-54.
Stokes, D. & Wilson, N. 2006. Small business management and entrepreneurship. 5th ed.
London: Thompson. Struwig, F.W. 2013. Introducing business research. Handout provided during honours
lecture. Port Elizabeth, Nelson Mandela Metropolitan University. Struwig, F.W. & Stead, G.B. 2013. Planning, designing and reporting research. Cape Town:
Pearson Education. Strydom, J., Antonites, A. & De Beer, A. 2009. Entrepreneurship and how to establish your
own business. 3rd ed. Cape Town: Juta.
Sue, V.M. & Ritter, L.A. 2012. Conducting online surveys. 2nd ed. London: Sage.
Suhr, D.D. 2003. Exploratory or confirmatory factor analysis? Greeley: University of Northern
Colorado. Sundaramurthy, C., & Kreiner, G.E. 2008. Governing by managing identity boundaries: The
case of family business. Entrepreneurship Theory and Practice, 32(1):415-436.
Swanson, R.A. & Holton, E.F. 2005. Research in organisations: Foundations and methods of
inquiry. San-Francisco: Berrett-Koehler Publishers.
Sweet, D. & Lebo, B. 2010. The Importance of Family Owned Businesses. [Online].
Available: http://vitalgrowthllc.com/2010/11/the-importance-of-family-owned-businesses/ [Accessed 28 February 2015].
Tanzwani, M. 2010. An investigation of management succession planning in black-owned
family businesses in selected areas in South Africa. Potchefstroom: North-West University.
Taylor, C 2014. Differences in descriptive and inferential statistics. [Online]. Available:
http://statistics.about.com/od/Descriptive-Statistics/a/Differences-In-Descriptive-And-Inferential-Statistics.htm [Accessed 09 June 2016].
Taylor, E., Kermode, T. & Roberts, A. 2007. Research in nursing and health care: Evidence
for practice. 3rd ed. Australia: Thomson.
Teal, E.J., Upton, N. & Seaman, S.E. 2003. Comparative analysis of strategic marketing
practices of high-growth U.S. family and non-family firms. Journal of Developmental Entrepreneurship, 8(1):177-195.
Tenenbaum, G. & Driscoll, M.P. 2005. Methods of research in sport sciences: Quantitative
and qualitative approaches. Johannesburg: Meyer & Meyer Verlag.
220
Terry, A.J. 2012. Clinical Research for the Doctor of Nursing Practice. Canada: Jones &
Barlett Publishers. The Economist. 2009. South Africa in recession. Repo rate down to 7.5%. [Online].
Available: http//www.economist.org.uk [Accessed 27 February 2015]. Trading Economics. 2016. South Africa unemployment rate. [Online]. Available:
http://www.tradingeconomics.com/south-africa/unemployment-rate [Accessed 13 July 2016].
Transparency International Global Corruption Report. 2008. Transparency.
[Online].Available: http://www.transparency.org/news-room/inform/ 2008/gcr2008 [27 February 2015].
United Nations Office of Drug and Crime. 2007. Drug and Crime. [Online]. Available:
http//www.un.org.za [Accessed 27 February 2015]. Urban, B. & Naidoo, R. 2012. Business sustainability: Empirical evidence on operational
skills in SMEs in South Africa. Journal of Small Business and Enterprise Development,
19(1):146-163. Vanek, C. 2012. Likert Scale – What is it? When to Use it? How to Analyze it? [Online].
Available: http://www.surveygizmo.com/survey-blog/likert-scale-what-is-it-how-to-analyze-it-and-when-to-use-it/ [Accessed 7 April 2014].
Van der Merwe, S.P. 2009. Determinants of family employee work performance and
compensation in family businesses. South African Journal of Business Management. 40(1):51-63.
Van der Merwe, S., Venter, E. and Ellis, S.M. 2009. An exploratory study of some of the
determinants of management succession planning in family businesses. Management Dynamics, 18 (4): 1-17.
Van Duijn, C.W.J., Breunesse, J.J., & Malindz, M. 2007. BEE in family businesses.
Unpublished report presented during the Entrepreneurship and Small Business Management Course. Nelson Mandela Metropolitan University, Port Elizabeth, South Africa.
Van Scheers, L. 2011. SMEs‟ marketing skills challenges in South Africa. African Journal of
Business Management, 5(13):5048-5056.
Van Zyl, L.E. 2014. Research methodology for the economic and management sciences. 8th
ed. Edinburgh: Pearson Education. Venter, E. 2003. The succession process in small and medium-sized family businesses in
South Africa. Unpublished D.Comm Thesis. University of Port Elizabeth, Port Elizabeth,
South Africa. Venter, E., Boshoff, C. & Maas, G. 2005. The influence of successor-related factors on the
succession process in small and medium-sized family businesses. Family Business Review, 18(4):283-303.
Villalonga, B. & Amit, R. 2006. How do family ownership, control and management affect firm
value? Journal of Financial Economics, 80(1):385-417.
221
Visnjic, I., Wiengarten, F. & Neely, A. 2016. Only the Brave: Product Innovation, Service Business Model Innovation, and Their Impact on Performance. Journal of Production Innovation Management, 33(1):36-52.
Visser, T. & Chiloane-Tsoka, E. 2014. An exploration into family business and SMEs in
South Africa. Problems and Perspectives in Management, 12(4):427:432.
Vogel, H.G., Maas, J. & Gebauer, A. 2011. Drug discovery and evaluation: Methods in
clinical pharmacology. New York: Springer.
Volkmann, C.K., Tokarski, K.O. & Grünhagen, M. 2010. Entrepreneurship in a European
Perspective: Concepts for the Creation and Growth of New Ventures. Germany: Springer.
Walker, I. 2008. Null hypothesis testing and effect sizes. [Online]. Available:
http://staff.bath.ac.uk/pssiw/stats2/page2/page14/page14.html [Accessed 22 June 2016]. Walsh, M. & Lipinski, J. 2009. The role of the marketing function in small and medium sized
enterprises. Journal of Small Business and Enterprise Development, 16(4):570.
Wang, C., Walker, E. & Redmond, J. 2007. Explaining the lack of strategic planning in SMEs:
The importance of owner motivation. International Journal of Organisational Behaviour,
12(1):1-16. Ward, J.L. 2011. Keeping the family business healthy: How to plan for continuing growth,
profitability and family leadership. New York: Macmillan.
Westhead, P. & Cowling, M. 1999. Family firm research: The need for a methodological
rethink. Entrepreneurship Theory and Practice, 23(1): 31-56.
Weaver, K. & Olson, J.K. 2006. Understanding paradigms used for nursing research. Journal
of Advanced Nursing, 53(4):459-469. Wilson, J. 2010. Essentials of business research: A guide to doing your research project. Los
Angeles: Sage. World Bank. 2005. The country report for South Africa. [Online]. Available:
http://siteresource.worldbank.org/GILDSOUTHAFRICA/insolvency%20law [Accessed 27 February 2015].
Yin, R.K. 2011. Qualitative research from start to finish. New York: The Guilford
Press. Yocam, E.W. 2008. The extent to which a board of director’s celebrity status affects the
shareholder wealth maximisation. Phoenix: ProQuest. Yong, A.G. & Pearce, S. 2013. A beginner‟s guide to factor analysis: Focusing on exploratory
factor analysis. Tutorials in Quantitative Methods for Psychology, 9(2):79-94. Zahra, S.A., Neubaum, D.O. & El-Hagrassey, G.M. 2002. Competitive analysis and new
venture performance: Understanding the impact of strategic uncertainty and venture origin. Entrepreneurship Theory Practice, 27(1):1-28.
Zellweger, T.M., Kellermanns, F.W., Eddleston, K.A. & Memili, E. 2012. Building a family firm
image: How family firms capitalize on their family ties. Journal of Family Business Strategy, 3:239:250.

222
Zellweger, T.M., Nanson, R.S. & Nordqvist, M. 2011. From longevity of firms to transgenerational entrepreneurship of families: Introducing family entrepreneurial orientation. Family Business Review, 20(10):1-20.
Zikmund, W.G., Babin, J.B., Carr, J.C. & Griffin, M. 2013. Business research methods. 9th ed.
Canada: South-Western Cengage Learning. Zulkiffi, S.N.A. & Perera, N. 2011. A literature analysis on business performance for SMES –
Subjective or objective measures? Sydney Business School – Papers. 1-9.

223
ANNEXURE A
QUESTIONNAIRE

224
Unit for Applied Business Management Summerstrand South Campus
DEPARTMENT OF BUSINESS MANAGEMENT
Tel. +27 (0)41 5042875 Fax. +27 (0)41 5042014
Dear Respondent AN INVESTIGATION INTO THE MARKETING MIX STRATEGIES USED BY SMALL FAMILY AND NON-FAMILY BUSINESSES IN NELSON MANDELA BAY I am a Masters student in Business Management at the Nelson Mandela Metropolitan University (NMMU) and currently conducting a research project, which investigates the marketing mix strategies used by small family and non-family businesses. The objective of this research is to investigate the frequency with which small family and
non-family business owners perform selected basic marketing tasks that enable them to win and retain customers and thereby ensure repeat business. For the purpose of this research project, a small business is one that does not employ more than 50 full-time employees. The business should have been in operation for at least one year and the owner must be actively involved in the business. A small family business is a business where at least two family members are actively involved in the management and operation of the business and where the family owns more than 51% of the business and does not employ more than 50 full-time employees. It would be greatly appreciated if you could respond to the following questions so as to assist in the completion of this research. All information will be treated in the strictest confidence. Please note that the information obtained will be used for research purposes
only. Yours faithfully, JA DE LANGE PROF S PERKS & PROF E VENTER (RESEARCHER) (SUPERVISORS)
• PO Box 77000 • Nelson Mandela Metropolitan University
• Port Elizabeth • 6031 • South Africa
• http://www.nmmu.ac.za/busman
•
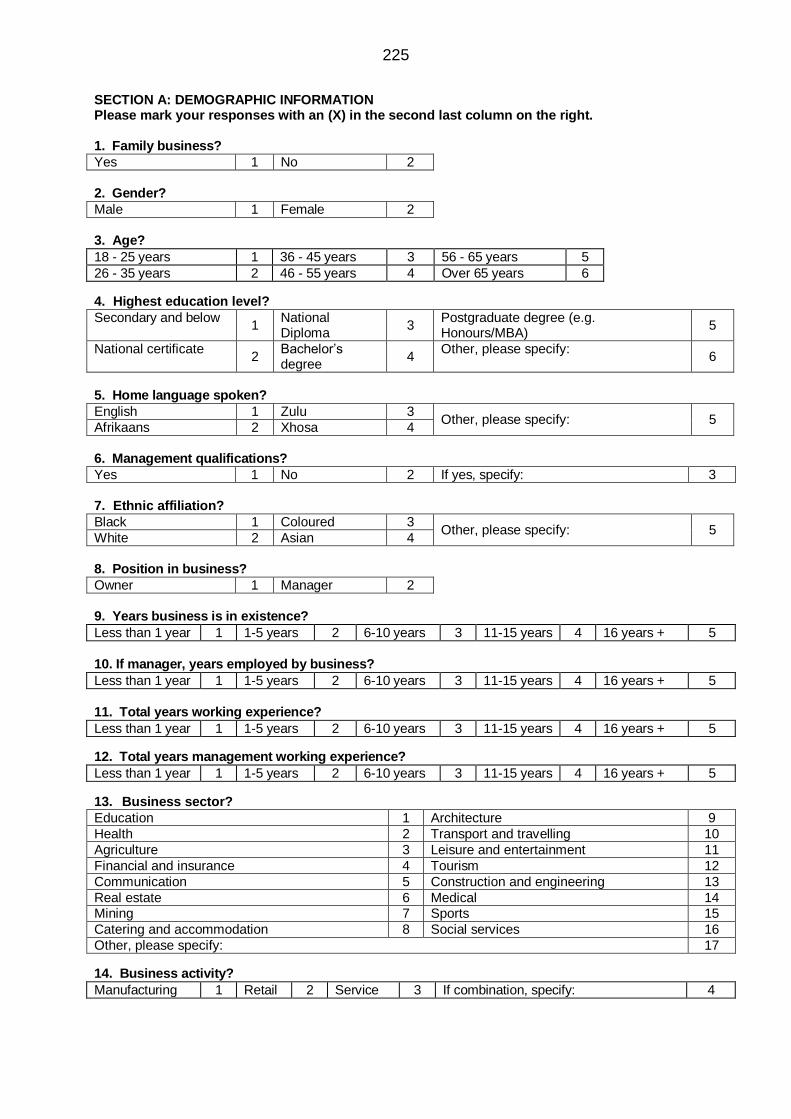
225
SECTION A: DEMOGRAPHIC INFORMATION Please mark your responses with an (X) in the second last column on the right. 1. Family business?
Yes 1 No 2
2. Gender?
Male 1 Female 2
3. Age?
18 - 25 years 1 36 - 45 years 3 56 - 65 years 5
26 - 35 years 2 46 - 55 years 4 Over 65 years 6
4. Highest education level?
Secondary and below 1
National Diploma
3 Postgraduate degree (e.g. Honours/MBA)
5
National certificate 2
Bachelor‟s degree
4 Other, please specify:
6
5. Home language spoken?
English 1 Zulu 3 Other, please specify: 5
Afrikaans 2 Xhosa 4 6. Management qualifications?
Yes 1 No 2 If yes, specify: 3
7. Ethnic affiliation?
Black 1 Coloured 3 Other, please specify: 5
White 2 Asian 4 8. Position in business?
Owner 1 Manager 2 9. Years business is in existence?
Less than 1 year 1 1-5 years 2 6-10 years 3 11-15 years 4 16 years + 5
10. If manager, years employed by business?
Less than 1 year 1 1-5 years 2 6-10 years 3 11-15 years 4 16 years + 5
11. Total years working experience?
Less than 1 year 1 1-5 years 2 6-10 years 3 11-15 years 4 16 years + 5
12. Total years management working experience?
Less than 1 year 1 1-5 years 2 6-10 years 3 11-15 years 4 16 years + 5
13. Business sector?
Education 1 Architecture 9
Health 2 Transport and travelling 10
Agriculture 3 Leisure and entertainment 11
Financial and insurance 4 Tourism 12
Communication 5 Construction and engineering 13
Real estate 6 Medical 14 Mining 7 Sports 15
Catering and accommodation 8 Social services 16
Other, please specify: 17
14. Business activity?
Manufacturing 1 Retail 2 Service 3 If combination, specify: 4

226
15. Form of ownership?
Sole trader 1 Close corporation 3 Public company 5
Partnership 2 Private company 4 Other, please specify: 6 16. Number of employees including owner?
1-5 1 6-20 2 21-50 3
17. Area that business premises are situated?
Central Business District 1 Major shopping complex 3 If combination, specify: 5
Residential area 2 Small shopping complex 4 If other, specify: 6
18. Who are your target market?
General public 1 Businesses 2 Both general public and businesses 3
SECTION B: BUSINESS PERFORMANCE Please indicate with an (X) to what extent you agree or disagree with the following statements regarding the current status of your business.
Please indicate with an (X) to what extent you agree or disagree with the following statements. The business has … S
tro
ng
ly D
isag
ree
Dis
ag
ree
Neit
her
ag
ree/
dis
ag
ree
Ag
ree
Str
on
gly
Ag
ree
1 Experienced sales growth in the past two years 1 2 3 4 5
2 Experienced growth in employees in the past two years 1 2 3 4 5
3 Experienced growth in profits in the past two years 1 2 3 4 5
4 Loyal customers who make regular purchases 1 2 3 4 5
5 Been recommended by customers to others 1 2 3 4 5
SECTION C: FUNDAMENTAL MARKETING MIX STRATEGIES NECESSARY IN A BUSINESS Please indicate with an (X) the frequency with which you (owner/manager) carry out the marketing mix strategies listed below.
1. Indicate the frequency with which you (i.e. owner or manager) carry out the following marketing mix strategies.
Our business …. N
ever
Seld
om
So
meti
mes
Oft
en
Alw
ays
1 Provides a product/service offering that satisfy the present needs of our target market 1 2 3 4 5
2 Provides customers with a need-satisfying product/service solution or benefit e.g. clean washing
1 2 3 4 5
3 Provides customers only with a basic product/service e.g. bed in hotel 1 2 3 4 5
4 Provides customers with high quality product(s)/service(s) 1 2 3 4 5
5 Offers customers extra value to exceed their expectations e.g. shuttle service to hotel guests 1 2 3 4 5
6 Searches for new ways to continuously satisfy our customers‟ needs 1 2 3 4 5
7 Searches for new ways to distinguish our product(s)/service(s) offering from competitors 1 2 3 4 5
8 Identifies our product(s)/service(s) by means of branding e.g. name, logo, design 1 2 3 4 5
9 Sets prices in relation to the value delivered 1 2 3 4 5
10 Sets prices in relation to the value perceived by our customers 1 2 3 4 5
11 Sets prices higher than the value customers expect to receive 1 2 3 4 5
12 Sets prices that cover our total costs 1 2 3 4 5
13 Sets prices that to enable me to stay in business 1 2 3 4 5
14 Sets prices based on an estimation of customer demand 1 2 3 4 5
15 Sets prices lower than our competitors to maximise sales volume of our offering 1 2 3 4 5
16 Sets prices higher than our competitors as our offering is of superior quality 1 2 3 4 5
17 Sets distribution objectives to ensure timely delivery to our customers 1 2 3 4 5
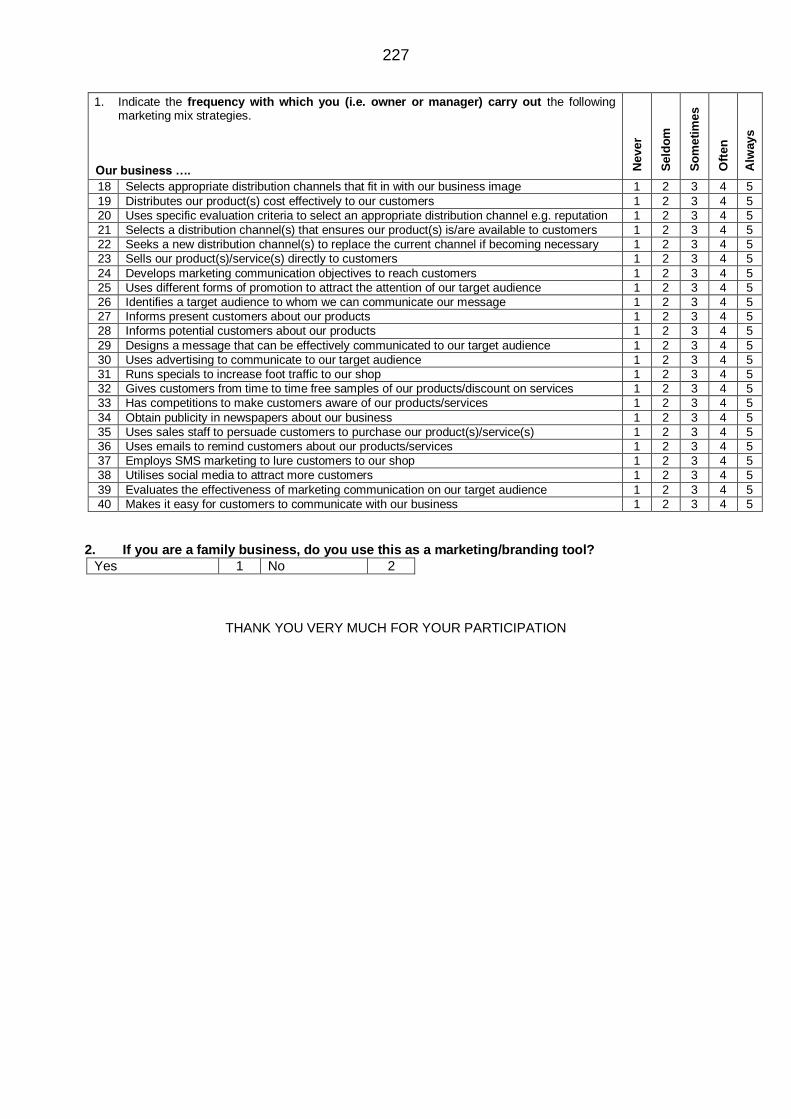
227
1. Indicate the frequency with which you (i.e. owner or manager) carry out the following marketing mix strategies.
Our business …. N
ever
Seld
om
So
meti
mes
Oft
en
Alw
ays
18 Selects appropriate distribution channels that fit in with our business image 1 2 3 4 5
19 Distributes our product(s) cost effectively to our customers 1 2 3 4 5
20 Uses specific evaluation criteria to select an appropriate distribution channel e.g. reputation 1 2 3 4 5
21 Selects a distribution channel(s) that ensures our product(s) is/are available to customers 1 2 3 4 5
22 Seeks a new distribution channel(s) to replace the current channel if becoming necessary 1 2 3 4 5
23 Sells our product(s)/service(s) directly to customers 1 2 3 4 5
24 Develops marketing communication objectives to reach customers 1 2 3 4 5
25 Uses different forms of promotion to attract the attention of our target audience 1 2 3 4 5
26 Identifies a target audience to whom we can communicate our message 1 2 3 4 5
27 Informs present customers about our products 1 2 3 4 5
28 Informs potential customers about our products 1 2 3 4 5
29 Designs a message that can be effectively communicated to our target audience 1 2 3 4 5
30 Uses advertising to communicate to our target audience 1 2 3 4 5
31 Runs specials to increase foot traffic to our shop 1 2 3 4 5
32 Gives customers from time to time free samples of our products/discount on services 1 2 3 4 5
33 Has competitions to make customers aware of our products/services 1 2 3 4 5
34 Obtain publicity in newspapers about our business 1 2 3 4 5
35 Uses sales staff to persuade customers to purchase our product(s)/service(s) 1 2 3 4 5
36 Uses emails to remind customers about our products/services 1 2 3 4 5
37 Employs SMS marketing to lure customers to our shop 1 2 3 4 5
38 Utilises social media to attract more customers 1 2 3 4 5
39 Evaluates the effectiveness of marketing communication on our target audience 1 2 3 4 5
40 Makes it easy for customers to communicate with our business 1 2 3 4 5
2. If you are a family business, do you use this as a marketing/branding tool?
Yes 1 No 2
THANK YOU VERY MUCH FOR YOUR PARTICIPATION

228
ANNEXURE B
ETHICAL CLEARANCE

229

230