The influence of oceanic basins on drought and ecosystem dynamics in Northeast Brazil
9
This content has been downloaded from IOPscience. Please scroll down to see the full text. Download details: IP Address: 128.146.135.118 This content was downloaded on 05/02/2015 at 15:06 Please note that terms and conditions apply. The influence of oceanic basins on drought and ecosystem dynamics in Northeast Brazil View the table of contents for this issue, or go to the journal homepage for more 2014 Environ. Res. Lett. 9 124013 (http://iopscience.iop.org/1748-9326/9/12/124013) Home Search Collections Journals About Contact us My IOPscience
Transcript of The influence of oceanic basins on drought and ecosystem dynamics in Northeast Brazil
This content has been downloaded from IOPscience. Please scroll down to see the full text.
Download details:
IP Address: 128.146.135.118
This content was downloaded on 05/02/2015 at 15:06
Please note that terms and conditions apply.
The influence of oceanic basins on drought and ecosystem dynamics in Northeast Brazil
View the table of contents for this issue, or go to the journal homepage for more
2014 Environ. Res. Lett. 9 124013
(http://iopscience.iop.org/1748-9326/9/12/124013)
Home Search Collections Journals About Contact us My IOPscience
The influence of oceanic basins on droughtand ecosystem dynamics in Northeast Brazil
Marcos Paulo Santos Pereira1,5, Flavio Justino1,Ana Claudia Mendes Malhado2, Humberto Barbosa3 and José Marengo4
1Department of Agricultural and Environmental Engineering, Federal University of Viçosa (UFV), Av. P.H. Rolfs, s/n Campus Universitário, 36570-000, Viçosa, Minas Gerais, Brazil2
Institute of Biological Sciences and Health, Federal University of Alagoas (UFAL), Av. Lourival MeloMota, s/n, Tabuleiro do Martins, 57072-900, Maceió, AL, Brazil3 Instituto de Ciências Atmosféricas—ICAT, Universidade Federal de Alagoas—UFAL, Campus A. C.Simões, BR 104 Norte Tabuleiro do Martins, 57072-970, Maceió, AL, Brazil4 Centro de Ciência do Sistema Terrestre, Instituto Nacional de Pesquisas Espaciais (CCST INPE), RodoviaDutra km 40, 12630-000, Cachoeira Paulista, São Paulo, Brazil
E-mail: [email protected], [email protected], [email protected],[email protected] and [email protected]
Received 8 April 2014, revised 21 November 2014Accepted for publication 21 November 2014Published 15 December 2014
AbstractThe 2012 drought in Northeast Brazil was the harshest in decades, with potentially significantimpacts on the vegetation of the unique semi-arid caatinga biome and on local livelihoods. Here,we use a coupled climate–vegetation model (CCM3-IBIS) to: (1) investigate the role of thePacific and Atlantic oceans in the 2012 drought, and; (2) evaluate the response of the caatingavegetation to the 2012 climate extreme. Our results indicate that anomalous sea surfacetemperatures (SSTs) in the Atlantic Ocean were the primary factor forcing the 2012 drought,with Pacific Ocean SST having a larger role in sustaining typical climatic conditions in theregion. The drought strongly influenced net primary production in the caatinga, causing areduction in annual net ecosystem exchange indicating a reduction in amount of CO2 released tothe atmosphere.
Keywords: extreme climate, tropical dry ecosystems, sea surface temperature
1. Introduction
Drought events can strongly affect population dynamics andbiodiversity (e.g. Reichstein et al 2013), even in arid areaswhere the fauna and flora are adapted to low precipitationregimes. One such area, the semi-arid region of NortheastBrazil (NEB), has been observed to undergo periodicdroughts of varying intensity and duration (Mares et al 1985).Until recently, the 1877 drought was considered the mostdevastating. This drought lasted 3 yr and affected all of
Brazil’s Northeastern states. It is estimated that 500 000people died during this drought, equivalent to half of thepopulation of the semi-arid region at that time. At the presenttime, NEB is the most populated semi-arid region on Earth.
NEB is dominated by two biomes with distinct char-acteristics: the Atlantic forest and the caatinga. The Atlanticforest is primarily confined to the continental margins, whilethe caatinga extends inland. The Atlantic forest containsvarious vegetation types including coastal/dune forests, tro-pical moist forest, and montane moist forest. The caatinga, incontrast, is characterized by xeric shrubland and sparse forestsof deciduous thorny trees. Despite its harsh climate, thecaatinga contains a great variety of landscapes, a high numberof endemic species (Moura et al 2013) and relatively highbiodiversity (Pennington et al 2004). Moreover, to date therehave been very few studies that focus on the link between theclimate and the ecosystem resilience of the caatinga.
Environmental Research Letters
Environ. Res. Lett. 9 (2014) 124013 (8pp) doi:10.1088/1748-9326/9/12/124013
5 Author to whom any correspondence should be addressed.
Content from this work may be used under the terms of theCreative Commons Attribution 3.0 licence. Any further
distribution of this work must maintain attribution to the author(s) and thetitle of the work, journal citation and DOI.
1748-9326/14/124013+08$33.00 © 2014 IOP Publishing Ltd1
The 2012 drought appears to have been mainly caused byanomalous patterns of sea surface temperature (SST) in thePacific and Atlantic Oceans (Marengo et al 2013). Specifi-cally, lower SST concentrated in the central Pacific may havebeen sufficient to significantly alter precipitation regimes inthe NEB in 2012 (Rodrigues and McPhaden 2014). It is wellknown that climate in NEB is strongly dependent on SST inthe Pacific and Atlantic (Nobre and Shukla 1996, Kayano andCapistrano 2013) with several studies indicating that droughtsin this region are associated with El Nino events and a warmer(cooler) than normal North (South) tropical Atlantic Ocean(Covey and Hastenrath 1978, Moura and Shukla 1981,Chiang et al 2002).
SST patterns control the latitudinal position of theinter-tropical convergence zone (ITCZ) and thus influenceNEB rainfall between the 10S–2S latitudinal belt (Has-tenrath 2006). The negative (positive) SST anomalies in theequatorial Atlantic reinforce the El Niño (La Niña) in thetropical Pacific through an anomalous Atlantic Walker cir-culation. As a consequence, the ENSO-related precipitationanomalies over South America are more intense andhomogeneous when the coupling between the tropicalAtlantic and Pacific Oceans is stronger (Kayano andCapistrano 2013).
Events such as the 2012 drought have the potential toaffect the integrity of the natural vegetation of the caatingaand to significantly reduce the productivity/viability of agri-culture. Previous studies indicate that an extended seasonalcycle with longer dry spells can increase soil moisture stressand decrease primary productivity in arid areas (Thomeyet al 2011, Rohr et al 2013). The majority of people living inthe caatinga rely on subsistence agriculture, and extremeclimatic events are therefore very likely to cause widespreadfood insecurity.
Here, we investigate the role of distinct forcing in theextreme 2012 drought in NEB. Specifically, we use coupledclimate–vegetation models to: (1) evaluate the role of thePacific and Atlantic oceans in the 2012 drought, and; (2)quantify the response of the caatinga vegetation.
2. Model description and experiment design
Modeling experiments were performed using the NationalCenter for Atmospheric Research Community Climate ModelVersion 3 (CCM3, Kiehl et al 1998), with spatial resolutionT42 (2.81° × 2.81°), 18 vertical levels in the atmosphere, anda hybrid sigma-pressure coordinate system. A time stepinterval of 15 min was applied. CCM3 was coupled with anupdated version of the land surface model integrated bio-sphere simulator (IBIS) (Foley et al 1996). IBIS is a dynamicglobal vegetation model that simulates changes in the com-position and structure of vegetation in response to environ-mental conditions (detailed specification in Delire et al 2002).Most significantly, IBIS provides a representation of vegeta-tion dynamics appropriate for global ecosystem modeling.Net primary productivity (NPP) is calculated by integratingprimary production through the year discounting maintenance
respiration and the carbon loss due to growth respiration. Themodel parameters in the IBIS phenology module were mod-ified from calibrated results for the caatinga (Cunhaet al 2013).
2.1. Experimental modeling design
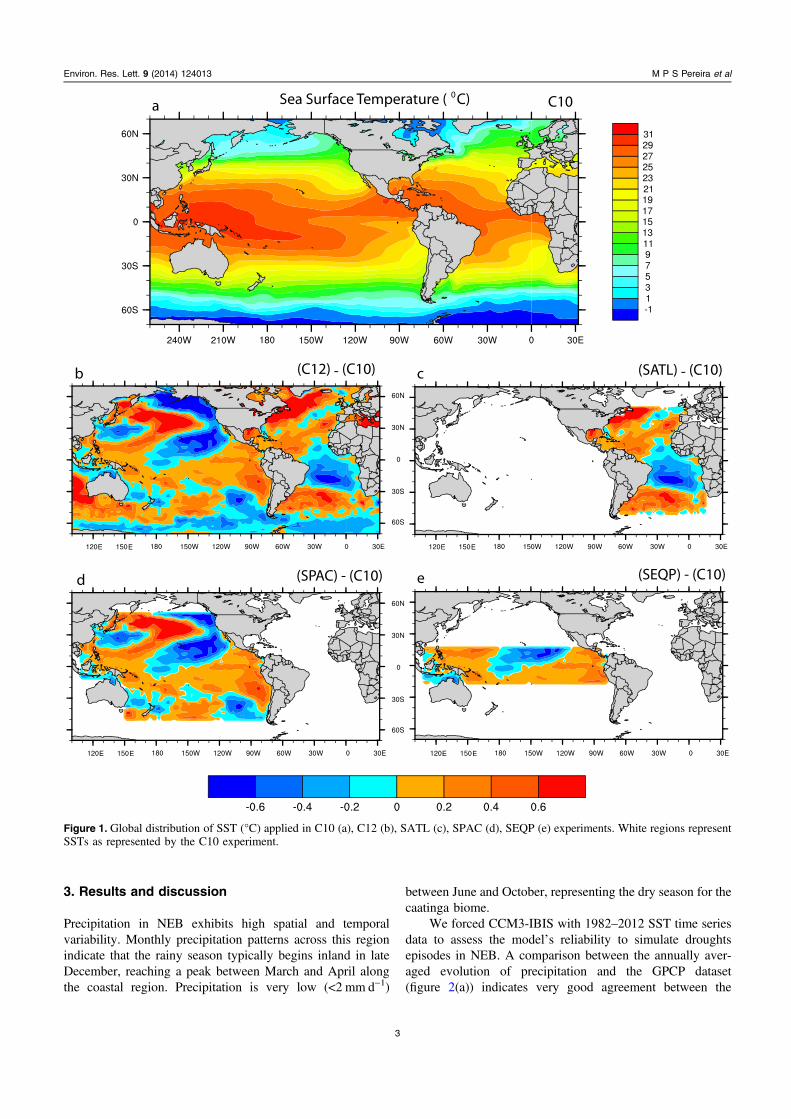
Initially two simulations were conducted with observed glo-bal SST (www.cdc.noaa.gov/data/gridded/data.noaa.oisst.v2.html) for two time periods: 1982–2011 and 2012 (namely,experiments C10 and C12). The first is run with the 12months of climatology computed over the period(1982–2011), and C12 applies observed SSTs for the 12months in the year 2012 (figures 1(a)–(b)). These experimentstherefore simulate the mean climate in Northeastern Braziland the extreme climate of the year 2012.
Strictly speaking, two groups of climate simulations areevaluated. Experiments forced by observed SST maintainingthe global distribution (C10 and C12 experiments), andsimulations forced by modifying SST for different oceanbasins (SATL, SPAC and SEQP). Blended SST patterns areused in each simulation (figure 1). A brief description of theSST forcing is provided in table 1.
The SATL, SPAC and SEQP are based on a combinationof 1982–2011 climatological SSTs (C10) and the observedSSTs pattern for 2012 (C12). To avoid discontinuity, arelaxation factor was applied to the interface between theSSTs according to a sine function. These simulations wererun for 50 yr. The influence of three different regions thatstrongly affect the NEB climate can be evaluated: (1) theAtlantic Ocean experiment (SATL) is defined as SST changesbetween 50°N–50°S and 15°E–92°W (figure 1(c)); (2) PacificOcean experiment (SPAC) in the region from 50°N to 50°Sand from 74°W to 110°E (figure 1(d)). (3) The equatorialPacific (SEQP) from 18°N to 18°S and from 77°W to 110°E(figure 1(e)).
To obtain a more realistic representation of the vegetationand climate, modeling output were analyzed for the last 40 yrof each simulation—the first 10 yr of each simulation arerequired for the model to approach an equilibrium state,specifically with respect to soil moisture. In all simulations,atmospheric CO2 concentrations were set to 390 ppmv.
However, it interesting to evaluate the model capabilityto reproduce the inter-annual variability of the precipitationfield in the NEB. In this sense, a simulation forced withmonthly observed globally SST for the period between 1982and 2012 has also been conducted (C82 experiment). Theperformance of CCM3-IBIS in simulating the regional pre-cipitation of the caatinga (in box, 6–17S and 38–47W) is,therefore, compared to the Global Precipitation ClimatologyProject (GPCP, www.esrl.noaa.gov/psd/, Adler et al 2003).The comparison between the sensitivity experiments and theclimatological simulations (C10 and C12) allows the identi-fication of the SST pattern that most strongly induced theextreme drought of 2012.
2
Environ. Res. Lett. 9 (2014) 124013 M P S Pereira et al
3. Results and discussion
Precipitation in NEB exhibits high spatial and temporalvariability. Monthly precipitation patterns across this regionindicate that the rainy season typically begins inland in lateDecember, reaching a peak between March and April alongthe coastal region. Precipitation is very low (<2 mm d−1)
between June and October, representing the dry season for thecaatinga biome.
We forced CCM3-IBIS with 1982–2012 SST time seriesdata to assess the model’s reliability to simulate droughtsepisodes in NEB. A comparison between the annually aver-aged evolution of precipitation and the GPCP dataset(figure 2(a)) indicates very good agreement between the
Figure 1. Global distribution of SST (°C) applied in C10 (a), C12 (b), SATL (c), SPAC (d), SEQP (e) experiments. White regions representSSTs as represented by the C10 experiment.
3
Environ. Res. Lett. 9 (2014) 124013 M P S Pereira et al
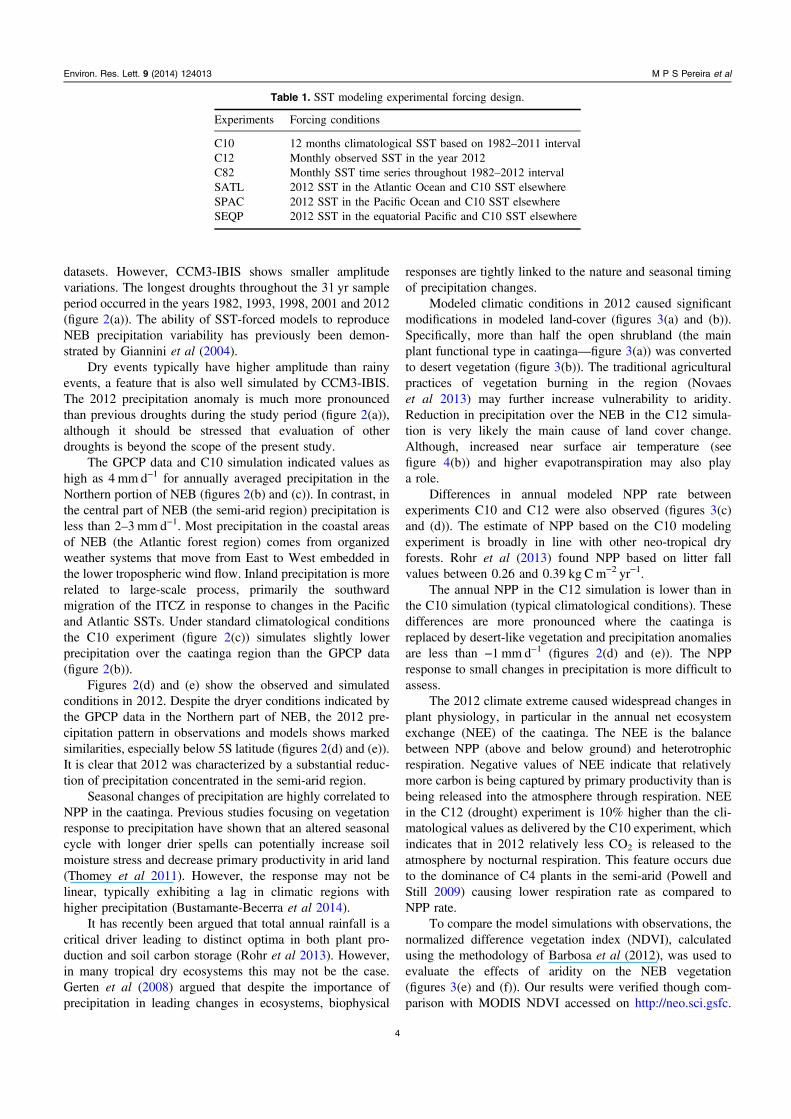
datasets. However, CCM3-IBIS shows smaller amplitudevariations. The longest droughts throughout the 31 yr sampleperiod occurred in the years 1982, 1993, 1998, 2001 and 2012(figure 2(a)). The ability of SST-forced models to reproduceNEB precipitation variability has previously been demon-strated by Giannini et al (2004).
Dry events typically have higher amplitude than rainyevents, a feature that is also well simulated by CCM3-IBIS.The 2012 precipitation anomaly is much more pronouncedthan previous droughts during the study period (figure 2(a)),although it should be stressed that evaluation of otherdroughts is beyond the scope of the present study.
The GPCP data and C10 simulation indicated values ashigh as 4 mm d−1 for annually averaged precipitation in theNorthern portion of NEB (figures 2(b) and (c)). In contrast, inthe central part of NEB (the semi-arid region) precipitation isless than 2–3 mm d−1. Most precipitation in the coastal areasof NEB (the Atlantic forest region) comes from organizedweather systems that move from East to West embedded inthe lower tropospheric wind flow. Inland precipitation is morerelated to large-scale process, primarily the southwardmigration of the ITCZ in response to changes in the Pacificand Atlantic SSTs. Under standard climatological conditionsthe C10 experiment (figure 2(c)) simulates slightly lowerprecipitation over the caatinga region than the GPCP data(figure 2(b)).
Figures 2(d) and (e) show the observed and simulatedconditions in 2012. Despite the dryer conditions indicated bythe GPCP data in the Northern part of NEB, the 2012 pre-cipitation pattern in observations and models shows markedsimilarities, especially below 5S latitude (figures 2(d) and (e)).It is clear that 2012 was characterized by a substantial reduc-tion of precipitation concentrated in the semi-arid region.
Seasonal changes of precipitation are highly correlated toNPP in the caatinga. Previous studies focusing on vegetationresponse to precipitation have shown that an altered seasonalcycle with longer drier spells can potentially increase soilmoisture stress and decrease primary productivity in arid land(Thomey et al 2011). However, the response may not belinear, typically exhibiting a lag in climatic regions withhigher precipitation (Bustamante-Becerra et al 2014).
It has recently been argued that total annual rainfall is acritical driver leading to distinct optima in both plant pro-duction and soil carbon storage (Rohr et al 2013). However,in many tropical dry ecosystems this may not be the case.Gerten et al (2008) argued that despite the importance ofprecipitation in leading changes in ecosystems, biophysical
responses are tightly linked to the nature and seasonal timingof precipitation changes.
Modeled climatic conditions in 2012 caused significantmodifications in modeled land-cover (figures 3(a) and (b)).Specifically, more than half the open shrubland (the mainplant functional type in caatinga—figure 3(a)) was convertedto desert vegetation (figure 3(b)). The traditional agriculturalpractices of vegetation burning in the region (Novaeset al 2013) may further increase vulnerability to aridity.Reduction in precipitation over the NEB in the C12 simula-tion is very likely the main cause of land cover change.Although, increased near surface air temperature (seefigure 4(b)) and higher evapotranspiration may also playa role.
Differences in annual modeled NPP rate betweenexperiments C10 and C12 were also observed (figures 3(c)and (d)). The estimate of NPP based on the C10 modelingexperiment is broadly in line with other neo-tropical dryforests. Rohr et al (2013) found NPP based on litter fallvalues between 0.26 and 0.39 kg C m−2 yr−1.
The annual NPP in the C12 simulation is lower than inthe C10 simulation (typical climatological conditions). Thesedifferences are more pronounced where the caatinga isreplaced by desert-like vegetation and precipitation anomaliesare less than −1 mm d−1 (figures 2(d) and (e)). The NPPresponse to small changes in precipitation is more difficult toassess.
The 2012 climate extreme caused widespread changes inplant physiology, in particular in the annual net ecosystemexchange (NEE) of the caatinga. The NEE is the balancebetween NPP (above and below ground) and heterotrophicrespiration. Negative values of NEE indicate that relativelymore carbon is being captured by primary productivity than isbeing released into the atmosphere through respiration. NEEin the C12 (drought) experiment is 10% higher than the cli-matological values as delivered by the C10 experiment, whichindicates that in 2012 relatively less CO2 is released to theatmosphere by nocturnal respiration. This feature occurs dueto the dominance of C4 plants in the semi-arid (Powell andStill 2009) causing lower respiration rate as compared toNPP rate.
To compare the model simulations with observations, thenormalized difference vegetation index (NDVI), calculatedusing the methodology of Barbosa et al (2012), was used toevaluate the effects of aridity on the NEB vegetation(figures 3(e) and (f)). Our results were verified though com-parison with MODIS NDVI accessed on http://neo.sci.gsfc.
Table 1. SST modeling experimental forcing design.
Experiments Forcing conditions
C10 12 months climatological SST based on 1982–2011 intervalC12 Monthly observed SST in the year 2012C82 Monthly SST time series throughout 1982–2012 intervalSATL 2012 SST in the Atlantic Ocean and C10 SST elsewhereSPAC 2012 SST in the Pacific Ocean and C10 SST elsewhereSEQP 2012 SST in the equatorial Pacific and C10 SST elsewhere
4
Environ. Res. Lett. 9 (2014) 124013 M P S Pereira et al
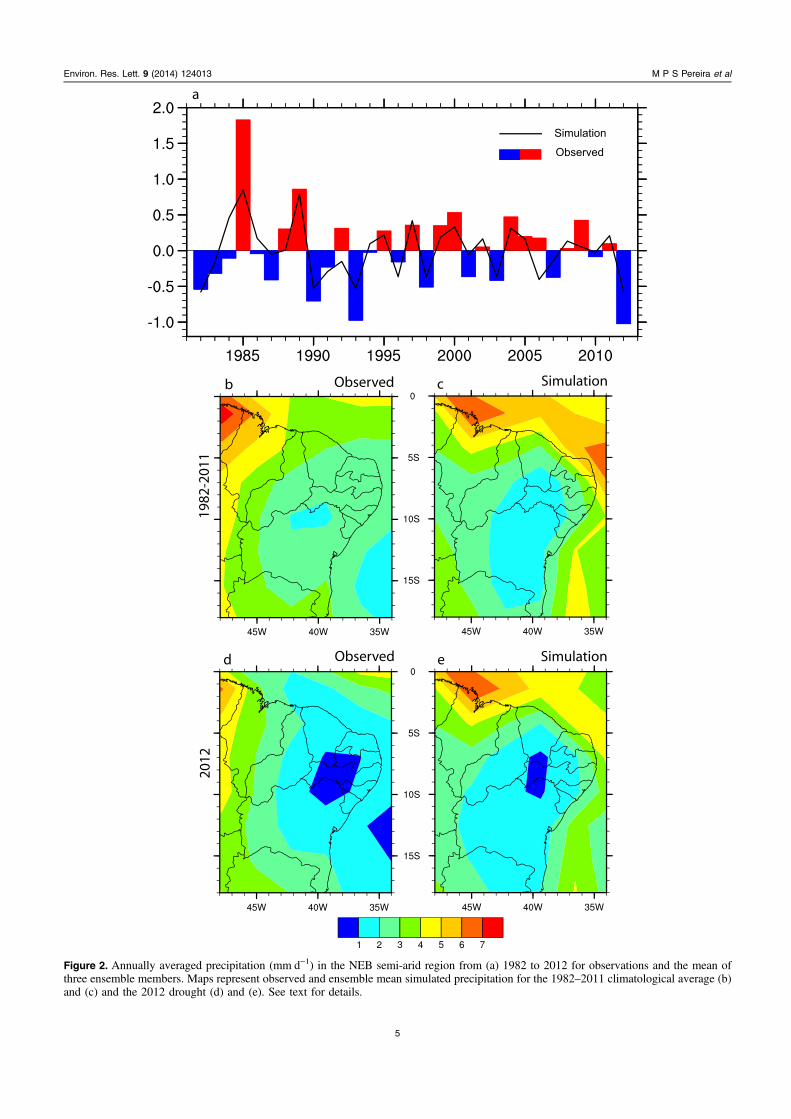
Figure 2. Annually averaged precipitation (mm d−1) in the NEB semi-arid region from (a) 1982 to 2012 for observations and the mean ofthree ensemble members. Maps represent observed and ensemble mean simulated precipitation for the 1982–2011 climatological average (b)and (c) and the 2012 drought (d) and (e). See text for details.
5
Environ. Res. Lett. 9 (2014) 124013 M P S Pereira et al
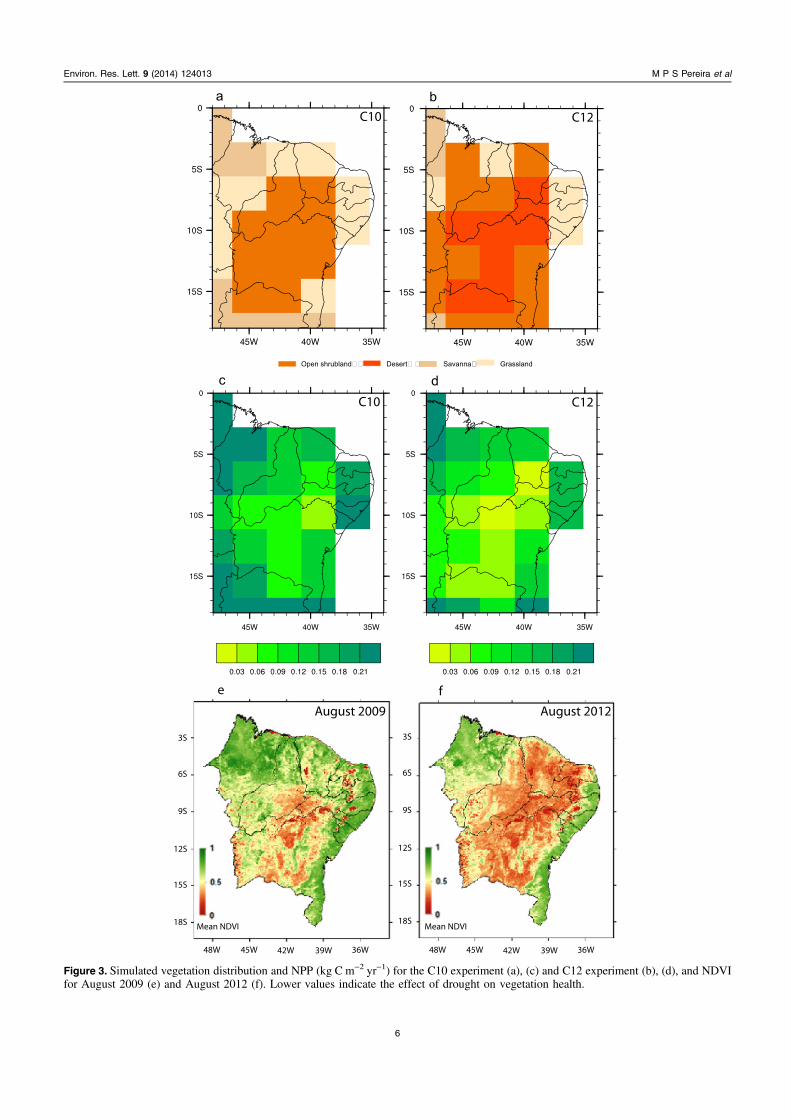
Figure 3. Simulated vegetation distribution and NPP (kg C m−2 yr−1) for the C10 experiment (a), (c) and C12 experiment (b), (d), and NDVIfor August 2009 (e) and August 2012 (f). Lower values indicate the effect of drought on vegetation health.
6
Environ. Res. Lett. 9 (2014) 124013 M P S Pereira et al
nasa.gov/view.php?datasetId=MOD13A2_M_NDVI. NDVIcan also be thought of as an indicator of vegetation health inrelation to precipitation variability (Barbosa et al 2006).
Maps of mean NDVI were constructed for 2012 and2009 (a very wet year). The effects of variations of aridity areclear (figures 3(e) and (f)) with the severe drought of 2012characterized by considerably reduced areas of green bio-mass. More generally, the NDVI maps of 2009 and 2012 arein broad agreement with our model results with respect tovegetation changes (figure 3).
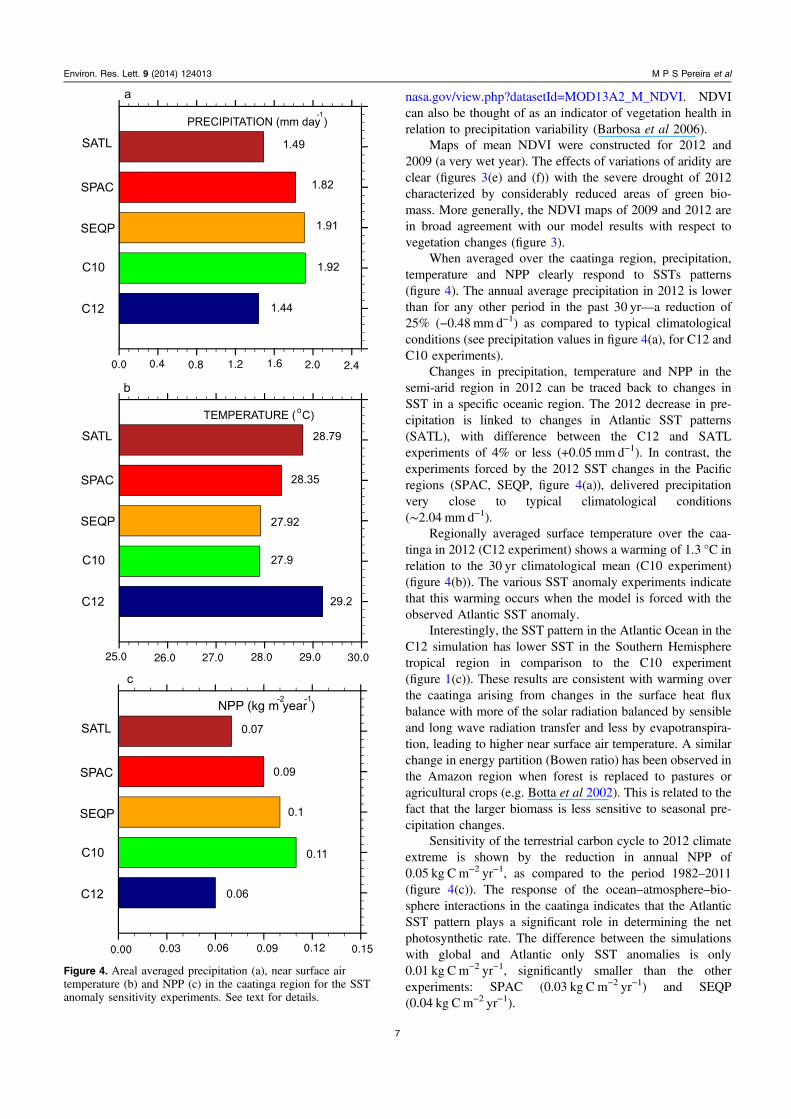
When averaged over the caatinga region, precipitation,temperature and NPP clearly respond to SSTs patterns(figure 4). The annual average precipitation in 2012 is lowerthan for any other period in the past 30 yr—a reduction of25% (−0.48 mm d−1) as compared to typical climatologicalconditions (see precipitation values in figure 4(a), for C12 andC10 experiments).
Changes in precipitation, temperature and NPP in thesemi-arid region in 2012 can be traced back to changes inSST in a specific oceanic region. The 2012 decrease in pre-cipitation is linked to changes in Atlantic SST patterns(SATL), with difference between the C12 and SATLexperiments of 4% or less (+0.05 mm d−1). In contrast, theexperiments forced by the 2012 SST changes in the Pacificregions (SPAC, SEQP, figure 4(a)), delivered precipitationvery close to typical climatological conditions(∼2.04 mm d−1).
Regionally averaged surface temperature over the caa-tinga in 2012 (C12 experiment) shows a warming of 1.3 °C inrelation to the 30 yr climatological mean (C10 experiment)(figure 4(b)). The various SST anomaly experiments indicatethat this warming occurs when the model is forced with theobserved Atlantic SST anomaly.
Interestingly, the SST pattern in the Atlantic Ocean in theC12 simulation has lower SST in the Southern Hemispheretropical region in comparison to the C10 experiment(figure 1(c)). These results are consistent with warming overthe caatinga arising from changes in the surface heat fluxbalance with more of the solar radiation balanced by sensibleand long wave radiation transfer and less by evapotranspira-tion, leading to higher near surface air temperature. A similarchange in energy partition (Bowen ratio) has been observed inthe Amazon region when forest is replaced to pastures oragricultural crops (e.g. Botta et al 2002). This is related to thefact that the larger biomass is less sensitive to seasonal pre-cipitation changes.
Sensitivity of the terrestrial carbon cycle to 2012 climateextreme is shown by the reduction in annual NPP of0.05 kg Cm−2 yr−1, as compared to the period 1982–2011(figure 4(c)). The response of the ocean–atmosphere–bio-sphere interactions in the caatinga indicates that the AtlanticSST pattern plays a significant role in determining the netphotosynthetic rate. The difference between the simulationswith global and Atlantic only SST anomalies is only0.01 kg Cm−2 yr−1, significantly smaller than the otherexperiments: SPAC (0.03 kg C m−2 yr−1) and SEQP(0.04 kg Cm−2 yr−1).
Figure 4. Areal averaged precipitation (a), near surface airtemperature (b) and NPP (c) in the caatinga region for the SSTanomaly sensitivity experiments. See text for details.
7
Environ. Res. Lett. 9 (2014) 124013 M P S Pereira et al
4. Conclusions
Our investigation aimed to identify the drivers of the 2012NEB drought and the associated biophysical responses ofthe caatinga biome. We demonstrate that precipitation andvegetation productivity in the caatinga is highly sensitive toalterations in SST. The 2012 drought resulted in lowerannual NPP and intensified NEE values (net uptake of CO2
by plants). This is associated with the fact the plantrespiration is extremely reduced as compared to the loss ofNPP. Moreover, we demonstrate that variations in tropicalAtlantic SST were primarily responsible for the extremedrought of 2012.
The results presented here strongly indicate the need forefforts to protect native vegetation and people to from miti-gate the impacts of natural climate variability or humaninduced climate changes. For example, the effects ofincreased aridity can be gradually reduced through nativespecies restoration. However, such programs will only besuccessful if they are implemented in parallel with socialprograms that improve the economic conditions of ruralhouseholds who rely on land resources. Future researchshould focus on untangling the complex ocean–atmosphere–biosphere interactions, and more precisely forecasting theimpacts of future droughts on vegetation cover and associatedclimatic feedbacks (Ladle et al 2011).
Acknowledgments
We thank the Brazilian agencies CAPES and CNPq forfinancial support.
References
Adler R F et al 2003 The version 2 global precipitation climatologyproject (gpcp) monthly precipitation analysis (1979–Present)J. Hydrometeor 4 1147–67
Barbosa H A, Ertük A G and Silva L R M 2012 Using the meteosat-9 images to the detection of deep convective systems in BrazilJ. Hyperspectral Remote Sens. 2 69–82
Barbosa H A, Huete A and Baethgen W 2006 A 20-year study ofNDVI variability over the Northeast region of Brazil J. AridEnviron. 67 288–307
Botta A, Ramankutty N and Foley J A 2002 Long-term variations ofclimate and carbon fluxes over the Amazon basin Geophys.Res. Lett. 4 29
Bustamante-Becerra J A, Carvalho S and Ometto J P 2014 Influenceof the rainfall seasonal variability in the caatinga vegetation ofNE Brazil by the use of time-series J. Hyperspectral RemoteSens. 4 31
Chiang J C H, Kushnir Y and Giannini A 2002 DeconstructingAtlantic ITCZ variability: influence of the local cross-equatorial SST gradient, and remote forcing from the Easternequatorial Pacific J. Geophys. Res. 107 4004
Covey D C and Hastenrath S 1978 The Pacific El Niño phenomenonand the Atlantiv circulation Mon. Weather Rev. 106 1280–7
Cunha A P M A, Alvalá R C S, Sampaio G, Shimizu M H andCosta M H 2013 Calibration and validation of the integrated
biosphere simulator (IBIS) for a Brazilian semiarid regionJ. Appl. Meteorol. Climatol. 52 2753–70
Delire C, Levis S L, Bonan G, Foley J A, Coe M T and Vavrus S2002 Comparison of the climate simulated by the CCM3coupled to two different land-surface models Clim. Dyn. 19657–69
Foley J A, Prentice I C, Ramankutty N, Levis S, Pollard D,Sitch S and Haxeltine A 1996 An integrated biosphere modelof land surface processes, terrestrial carbon balance, andvegetation dynamics Glob. Biogeochem. Cycles 10 603–28
Gerten D et al 2008 Modelled effects of precipitation, on ecosystemcarbon and water dynamics in different climatic zones Glob.Change Biol. 14 1–15
Giannini A, Saravanan R and Chang P 2004 The preconditioningrole of tropical Atlantic variability in the development of theENSO teleconnection: implications for the prediction ofNordeste rainfall Clim. Dyn. 22 839–55
Hastenrath S 2006 Circulation and teleconnection mechanisms ofNortheast Brazil droughts Prog. Oceanogr. 70 407–15
Kayano M T and Capistrano V B 2013 How the Atlanticmultidecadal oscillation (AMO) modifies the ENSO influenceon the South American rainfall Int. J. Climatol. 34 162–78
Kiehl J T, Hack J J, Bonan G B, Boville B A, Williamson D L andRasch P J 1998 The national center for atmospheric researchcommunity climate model: CCM3 J. Clim. 11 1131–49
Ladle R J, Malhado A C M and Costa M H 2011 Coupledatmosphere-biosphere models as a tool for conservationplanning and policy Nat. Conservacão 9 145–51
Marengo J A, Alves L M, Soares W R, Rodriguez D A, Camargo H,Riveros M P and Pabló A D 2013 Two contrasting severeseasonal extremes in tropical South America in 2012: floods inAmazonia and drought in Northeast Brazil J. Clim. 269137–54
Mares M A, Willig M R and Lacher T E Jr 1985 The Braziliancaatinga in South American zoogeography: tropical mammalsin a dry region J. Biogeog. 12 5769
Moura A D and Shukla J 1981 On the dynamics of droughts inNortheast Brazil: observations, theory and numericalexperiments with a general circulation model J. Atmos. Sci. 382653–75
Moura F B P, Malhado A C M and Ladle R J 2013 Nursing thecaatinga back to health J. Arid Environ. 90 67–8
Nobre P and Shukla J 1996 Variations of sea surface temperature,wind stress, and rainfall over the tropical Atlantic and SouthAmerica J. Clim. 9 2464–79
Novaes R L M, Felix S and Souza R F 2013 Brazil: save caatingafrom drought disaster Nature 498, p 170
Pennington R T, Lavin M, Prado D E, Pendry C A, Pell S andButterworth C A 2004 Historical climate change andspeciation: neotropical seasonally dry forest plants showpatterns of both tertiary and quaternary diversification Philos.Trans. R. Soc. B 359 515–38
Powell R L and Still C J 2009 Biogeography of C3 and C4vegetation in South America An. XIV Simpósio BrasileiroSensoriamento Remoto 14 2935–42
Reichstein M et al 2013 Climate extremes and the carbon cycleNature 500 287–95
Rodrigues R R and McPhaden M J 2014 Why did the 2011–2012 LaNiña cause a severe drought in the Brazilian Northeast?Geophys. Res. Lett. 41 1012–8
Rohr T, Manzoni S, Feng X, Menezes R S C and Porporato A 2013Effect of rainfall seasonality on carbon storage in tropical dryecosystems J. Geophys. Res. Biogeosci. 118 1156–67
Thomey M L, Collins S L, Vargas R, Johnson J E, Brown R F,Natvig D O and Friggens M T 2011 Effect of precipitationvariability on net primary production and soil respiration in aChihuahuan Desert grassland Glob. Change Biol. 17 1505–15
8
Environ. Res. Lett. 9 (2014) 124013 M P S Pereira et al