![The English spelling book [microform] - Wikimedia Commons](https://static.fdokumen.com/doc/165x107/63330d936950993727020d98/the-english-spelling-book-microform-wikimedia-commons.jpg)
The influence of microform bed roughness elements on flow and sediment transport in gravel bed...
12
EARTH SURFACE PROCESSES AND LANDFORMS, VOL. 15,739-750 (1990) THE INFLUENCE OF MICROFORM BED ROUGHNESS ELEMENTS ON FLOW AND SEDIMENT TRANSPORT IN GRAVEL BED RIVERS MARWAN A. HASSANI AND IAN REID Birkbeck College, University of London, Malet St.. London WClE 7HX, U.K. Received I9 October 1989 Revised 8 June 1990 ABSTRACT Pebble clusters are reported widely as characteristic of gravel river beds and are known to influence the initial entrainment of bedload. A field assessment suggests that their distribution is not ubiquitous, favouring channel bars, but also reveals a tendency towards a preferred streamwise spacing. A series of laboratory flume experiments shows that flow resistance rises to, and falls from, a peak value as the longitudinal spacing of pebble clusters decreases, in a manner similar to that shown by others for strip roughness, isolated blocks, and simulated ripples and dunes. The experiments also reveal a strong inverse relationship between bedload flux rates and the flow resistance induced by the concentration of pebble clusters. It is concluded that pebble cluster spacing tends towards an equilibrium that is regulated by a feedback process involving sediment transport rates and that the spatial concentration of these microforms will adjust to the point where they induce maximum flow resistance. KEY WORDS Equilibrium bedforms Flow resistance Pebble Clusters Bedload Gravel bed rivers INTRODUCTION Sediment transport as bedload in gravel bed rivers remains unpredictable. Field data consistently reveal a wide scatter in the relationship between hydraulic force and sediment flux even under conditions of steady flow (Gomez and Church, 1989). Several factors have been identified as causing this scatter, including the partial disruption of the armour layer (Jackson and Beschta, 1982; Parker et al., 1982), the progressive construction of the armour layer during waning flood flows (Proffitt and Sutherland, 1983; Gomez, 1983), variable cementation of the gravel framework by interstitial matrices (Frostick et al., 1984), the changing availability of transportable material (Hayward, 1979; Newson and Leeks, 1987), and the pulsing nature of sediment flux (Reid et al., 1985; Gomez et al., 1989). In addition to these factors, the entrainment of individual clasts depends upon their relative exposure and this is largely controlled by river bed microform (Laronne and Carson, 1976; Fenton and Abbott, 1977). Brayshaw (1984, 1985) has drawn attention to the most prevalent type microform-the pebble cluster (Figure 1). However, while clusters have been shown to delay entrainment (Reid et al., 1984), there is no information about their continuing affect on bedload flux rates once the initial transport threshold has been exceeded. * Present address: Department of Geography, University of British Columbia, Vancouver, British Columbia, Canada. 0 1 97-9 33 7/90/080739- 1 2$06.OO 0 1990 by John Wiley & Sons, Ltd.
-
Upload
independent -
Category
Documents
-
view
6 -
download
0
Transcript of The influence of microform bed roughness elements on flow and sediment transport in gravel bed...
EARTH SURFACE PROCESSES AND LANDFORMS, VOL. 15,739-750 (1990)
THE INFLUENCE OF MICROFORM BED ROUGHNESS ELEMENTS ON FLOW AND SEDIMENT TRANSPORT
IN GRAVEL BED RIVERS
MARWAN A. HASSANI AND IAN REID
Birkbeck College, University of London, Malet St.. London WClE 7HX, U.K.
Received I9 October 1989 Revised 8 June 1990
ABSTRACT
Pebble clusters are reported widely as characteristic of gravel river beds and are known to influence the initial entrainment of bedload. A field assessment suggests that their distribution is not ubiquitous, favouring channel bars, but also reveals a tendency towards a preferred streamwise spacing. A series of laboratory flume experiments shows that flow resistance rises to, and falls from, a peak value as the longitudinal spacing of pebble clusters decreases, in a manner similar to that shown by others for strip roughness, isolated blocks, and simulated ripples and dunes. The experiments also reveal a strong inverse relationship between bedload flux rates and the flow resistance induced by the concentration of pebble clusters. It is concluded that pebble cluster spacing tends towards an equilibrium that is regulated by a feedback process involving sediment transport rates and that the spatial concentration of these microforms will adjust to the point where they induce maximum flow resistance.
KEY WORDS Equilibrium bedforms Flow resistance Pebble Clusters Bedload Gravel bed rivers
INTRODUCTION
Sediment transport as bedload in gravel bed rivers remains unpredictable. Field data consistently reveal a wide scatter in the relationship between hydraulic force and sediment flux even under conditions of steady flow (Gomez and Church, 1989).
Several factors have been identified as causing this scatter, including the partial disruption of the armour layer (Jackson and Beschta, 1982; Parker et al., 1982), the progressive construction of the armour layer during waning flood flows (Proffitt and Sutherland, 1983; Gomez, 1983), variable cementation of the gravel framework by interstitial matrices (Frostick et al., 1984), the changing availability of transportable material (Hayward, 1979; Newson and Leeks, 1987), and the pulsing nature of sediment flux (Reid et al., 1985; Gomez et al., 1989).
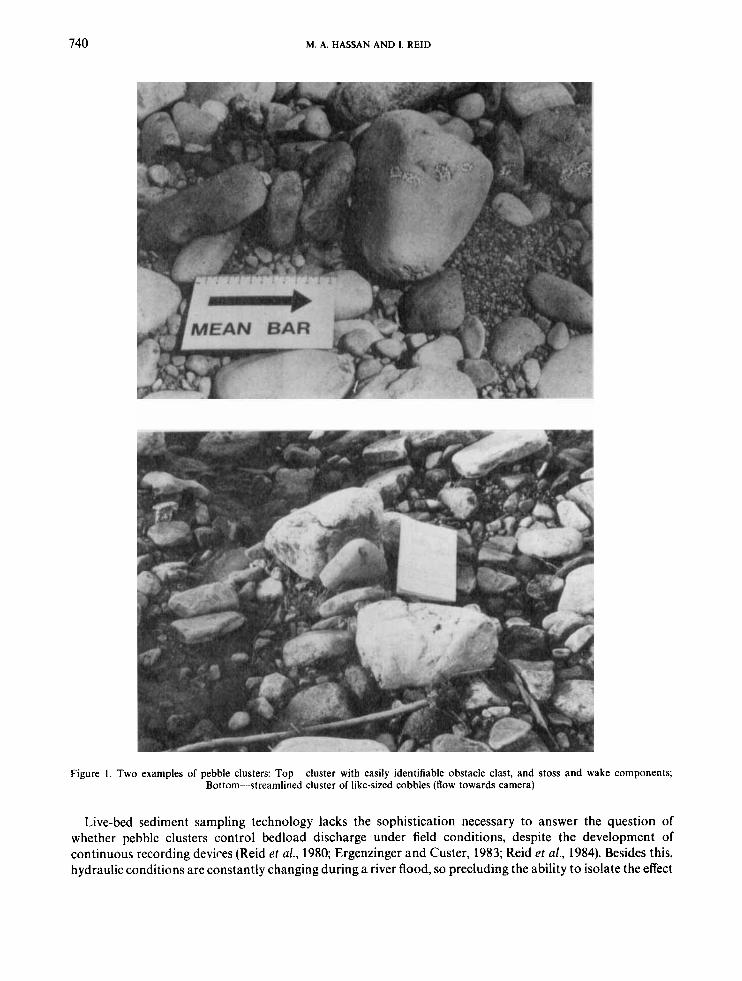
In addition to these factors, the entrainment of individual clasts depends upon their relative exposure and this is largely controlled by river bed microform (Laronne and Carson, 1976; Fenton and Abbott, 1977). Brayshaw (1984, 1985) has drawn attention to the most prevalent type microform-the pebble cluster (Figure 1). However, while clusters have been shown to delay entrainment (Reid et al., 1984), there is no information about their continuing affect on bedload flux rates once the initial transport threshold has been exceeded.
* Present address: Department of Geography, University of British Columbia, Vancouver, British Columbia, Canada.
0 1 97-9 3 3 7/90/080739- 1 2$06.OO 0 1990 by John Wiley & Sons, Ltd.
740 M. A. HASSAN AND 1. REID
Figure I . Two examples of pebble clusters: Top-cluster with easily identifiable obstacle clast, and stoss and wake components; Bottom--streamlined cluster of like-sized cobbles (flow towards camera)
Live-bed sediment sampling technology lacks the sophistication necessary to answer the question of whether pebble clusters control bedload discharge under field conditions, despite the development of continuous recording devices (Reid et al., 1980; Ergenzinger and Custer, 1983; Reid et al., 1984). Besides this, hydraulic conditions are constantly changing during a river flood, so precluding the ability to isolate the effect

SEDIMENT TRANSPORT IN RIVERS 74 1
of cluster bedforms on sediment transport. In order to overcome these difficulties, a set of laboratory flume experiments was devised in which the impact of an increasing density of pebble clusters on both flow resistance and bedload flux could be determined while holding other factors constant.
LABORATORY FLUME SIMULATION O F CLUSTERS
A bed material consisting of flint gravel and quartz sand was mixed for insertion in a 7.5 m tilting, glass-sided, recirculating flume that has a channel width of 0.3 m. A full-width bedload slot sampler with removable tray was fitted 5.5 m from the flume entrance. Water discharge was measured with an orifice gauge in the supply pipe; flow depth was continuously monitored with two twin-wire resistance probes set 2 m apart along a test section; water velocity profiles were obtained with miniature propellor current meters; and water temperature was recorded using a thermistor.
The flume sediment was intended to emulate that of Turkey Brook-the field site of much previous work on pebble cluster dynamics-but at half the size (Figure 2). Generally, this flint gravel is ovate and falls on the boundary between ‘rods’ and ‘spheres’ in Zingg’s (1935) shape classification. Its sphericity [gc>/;;iT averages 0.75. The largest clasts (98 percentile of the size distribution and above) were removed from the bed mixture and set aside for use as the nuclei-the obstacle clasts-of potential clusters. For each run, the bed material minus the obstacles was homogenized and planed flat. Apart from the four runs of Exp. 1, where an uncluttered plane bed provided ‘control’ conditions, each successive experiment of four runs involved an increased concentration of obstacle particles. These were spaced at regular streamwise intervals that ranged from 1 m to 0-2 m (Figure 3) and replaced the surface clasts at each implant position. In order to keep each obstacle out of the wake zone of its immediate upstream counterpart but also to avoid the flume wall, they were staggered along two ‘streamlines’, at 0.4 and 0.6 of the flume width.
A water depth of 0.13m was set, as was a water surface slope of 0-0064. Minor adjustments to water discharge were used to compensate for the affect of changes in bed roughness between experiments. Flow conditions and sedimentary parameters are summarized in Table I.
Following Kuhnle and Southard (1988), bedload was cumulated over 1 h intervals in order to establish mean transport rates and to avoid random fluctuations. A set of trial runs had shown that a ‘steady state’
100
0 0.06 0.25 1 4 16 64 256
particle size, mm
Figure 2. Bed material size distributions of Turkey Brook and the laboratory flume

742 M. A. HASSAN AND 1. REID
4 FLOW
fixed bed * mobile bed + bedload
slot
Figure 3. Schematic diagram of the experimental design used in the laboratory flow channel
Table I. Flow and sediment parameters
0.13 0.0064 0.79 0.70 1.3 x lo5 0,008 0.043 0.75
transport rate would be achieved fairly consistently after 3 h (Figure 4) as the flume bed changed from ‘normally loose’ to ‘consolidated’ (Church’s 1978 terminology). Because of this, the bedload samples of the last 3 h of a 6 h run were averaged to give the bedload flux rate of each run. Altogether, there were twenty four runs.
IMPACT OF CLUSTERS ON FLOW CONDITIONS
During each run except those of Exp. 1 (when plane bed conditions were maintained), the obstacle clasts acted as bluff bodies against which a stoss component would imbricate. Less obvious was the development of the other cluster component-the wake tail-and in some cases it was absent.
The affect of the clusters on flow conditions can be seen by examining the changes brought about in the parameters of the velocity profile (Figure 5A). The roughness length ( y o ) reaches maximum when the ratio between the downstream spacing and the height of the obstacle clasts, L/h, approaches 20. Using a different measure to describe roughness-the roughness element concentration, C, which is defined as the sum plan area occupied by obstacle clasts per unit bed area-roughness length reaches maximum levels when C approaches 0.01. Of considerable interest is the fact that, as L/h decreases to a value of 11 (concentration increases to 0016), roughness length falls to a level similar to that established for the plane bed case in which the seeded obstacle clasts are absent.
This pattern of rise and fall in roughness length is consistent with those established by others for conditions of increasing boundary roughness using a variety of artificial and pseudonatural roughness elements (Figure 5). The apparently greater scatter in the case of the pebble clusters has several possible causes. First, the obstacle clasts only occupied 0.28 of the channel width, while the wooden battens used by Johnson and

SEDIMENT TRANSPORT IN RIVERS
60 -
40 -
743
i b- 4 5fO.416
r = -0.43
n/A =O.O, 3.3,4.4,6.7,11.1,16.7 n/A = 3.3
i b- 4 5fO.416
r = -0.43
El
0 200 400 0
time, minutes
200 400
0 203 400
n/A = 6.7 -0.745 i,= 135t
20 40i 40
20
0 0 200 400
R 0 , I
I I 1 1 0 200 400
Figure 4. Bedload flux rates (subaerial mass) and least-squares fitted curves for experimental runs with different obstacle clast densities, niA
LeRoux (1946; Figure 5B) were channel wide, as were the model ripples and dunes of Davies (1980; Figure 5C). Second, the natural clasts used here are not uniformly shaped and, in the main, are variably round edged so that the temporal and spatial patterns of vortices shed along the shear layers enveloping separated flows in their lee might vary considerably from run to run. Third, the bed was deliberately 'live' so leading to subtle arrangement and rearrangement of the bed surface. Indeed, small subsidiary clusters were observed to form and break up continually during the course of a run. Fourth, notwithstanding careful preparation, there is always the problem of obtaining an accurate definition of the bed reference level where it consists of coarse grains. However, with the exception of Exp . 5 in which the obstacle clast spacing was 0.2 m, all the velocity profiles-located as they were at the centre of the channel and midway between obstacle clasts-onformed well with a straight-line semilogarithmic relationship, so reducing the likelihood of variance from this source.
Despite these points, it is encouraging that the comparatively chaotic arrangement of natural stream bed materials generates a pattern of rising and falling flow resistance with increasing roughness element concentration that mimics those derived for artificial and well-organized fixed beds.
Of interest is the fact that the triangular and sharp-crested ripples of Davies (and those of Vittal et al., 1977 not shown in Figure 5 ) generated maximum flow resistance when L/h= 10, while the equivalent value for Davies' flat-crested dunes is L/h= 18 (Figure 5C). In a similar fashion, the value of L/h associated with maximum relative roughness appears to shift from 12 to 15 as the flat tops of Johnson and LeRoux' battens are increased in length relative to their height (Figure 5B). No obstacle clast shape changes were built into the

744 M. A. HASSAN A N D 1. REID
A
rn
002? . I . 1 ’ 1 0
0 2 0 4 0 0
roughness element spacingtheight, L/h
C - _ O o 4 1 C
0 2 0 4 0
B
3 .
I
20
L /h
D
4 0
0
0 D
20 4 0 1
L /h L /h
Figure 5. Flow resistance as a function of roughness element concentration: A-pebble clusters, this study; &sharp, square-edged wooden battens, Johnson and LeRoux 1946 C-pseudoripples and pseudodunes, Davies 1980; S L e g o T M blocks, Nowell and Church
1979
current experiment. However, it might be speculated that, since lithology exercises considerable influence over clast shape, the value of L / h = 20 associated with maximum roughness length might only apply to the ovate bed material used here. Clasts generally come to rest with their a axis lying perpendicular to the streamline and with their c axis more or less vertical. Because of this, it might be reasonable to assume that L/h will vary with a change in the b/c axial ratio. This will become important when we come to discuss the implications of cluster spacing in natural channels with differing clast lithology.
Morris (1955) provides a rationale for the changes in flow resistance that occur as roughness element density increases. He identifies three types of flow which he dubbs: isolated roughness [element], wake- interference, and skimming. The highest values of resistance are associated with intermediate densities of the roughness elements because vortex generation and dissipation in the lee of one element is not complete before the next element is met by the flow. At high densities, a quasistable vortex develops between the closely spaced in-line elements. The upper limb of this vortex acts as a roof and the free stream skims over the tops of the elements, so producing a quasismooth flow with lower resistance. Nowell and Church (1979) confirmed Morris’ flow types using increasing densities (but unspecified patterns) or sharp-edged LegoTM blocks.
For the pebble clusters developed in the current experiments, it would seem that a streamwise spacing of 1 m ( L / h = 35.7, C =0.005) produces ‘isolated roughness’ flow; that ‘wake-interference’ flow is fully developed at a spacing of ca. 0.5 m ( L / h = 17.9, C=O.Ol); and that ‘skimming’ flow follows quickly as spacing is reduced to 0.3 m ( L / h = 107, C =0.016). It should be noted, however, that the density of roughness elements at which

SEDIMENT TRANSPORT IN RIVERS 145
wake-interference appears to maximize flow resistence is an order of magnitude lower than in the case reported by Nowell and Church.
BED ROUGHNESS AND BEDLOAD TRANSPORT
From the outset, one of the primary interests in conducting these experiments had been to detect the impact that pebble clusters have on bedload transport rates. To this end, a fixed-bed had been avoided, and preference had been given to modelling conditions as close to the field prototype as possible by using a mobile bed of natural flint gravel. However, the use of a mobile bed makes it more difficult to maintain steady state conditions in an artificial flow channel. One factor of particular importance is the question of sediment supply. Trial runs had indicated that use of a sediment feed system brought grain size segregation and preferential transport rates that distorted the bedload data.
Other runs of more than 20 h had showed that the upstream 1.5 m of bed could be used as a passive sediment source without prejudicing conditions in the major part of the working section of the flume. As a result, it was decided to lay a homogenized bed and allow it to adjust itself to equilibrium conditions without recourse to sediment feed. The remarkable reproducibility of the ‘steady state’ bedload flux from run to run within each experiment (Figure 4) may be sufficient vindication of this decision.
It might be expected that the increase in energy dissipation that results from an increase in roughness and which manifests itself as an increase in measured flow resistance would be accompanied by a reduction in bedload flux rates. Figure 6 supports this hypothesis. Although there is an inevitability about the amount of scatter in the cross-plot, if only because of the spasmodic nature of bedload transport rates at a number of timescales (Reid et al., 1984; Gomez et al., 1989), there is a well-defined trend to lower bedload flux rates as roughness length increases.
The reasons for scatter about the trend can be clarified by taking the ratios of the averaged results of the cluster experiments (Exps. 2-6) with that of the plane bed case (Exp. 1) (Table 11). As expected, bedload falls to a minimum as flow resistance increases to a maximum (i.e. when L/h= 17-9). However, it then increases as
.1 a .- I log ib = -3.0926 - 0.8068 log yo
r = -0.6 D
.001 f I -I .01 .1 1
roughness length, y o, cm
Figure 6. Bedload flux rates as a function of roughness length. Roughness length is controlled by the concentration of seeded obstacle clasts and their attendant clusters of pebbles
746 M. A. HASSAN A N D I. REID
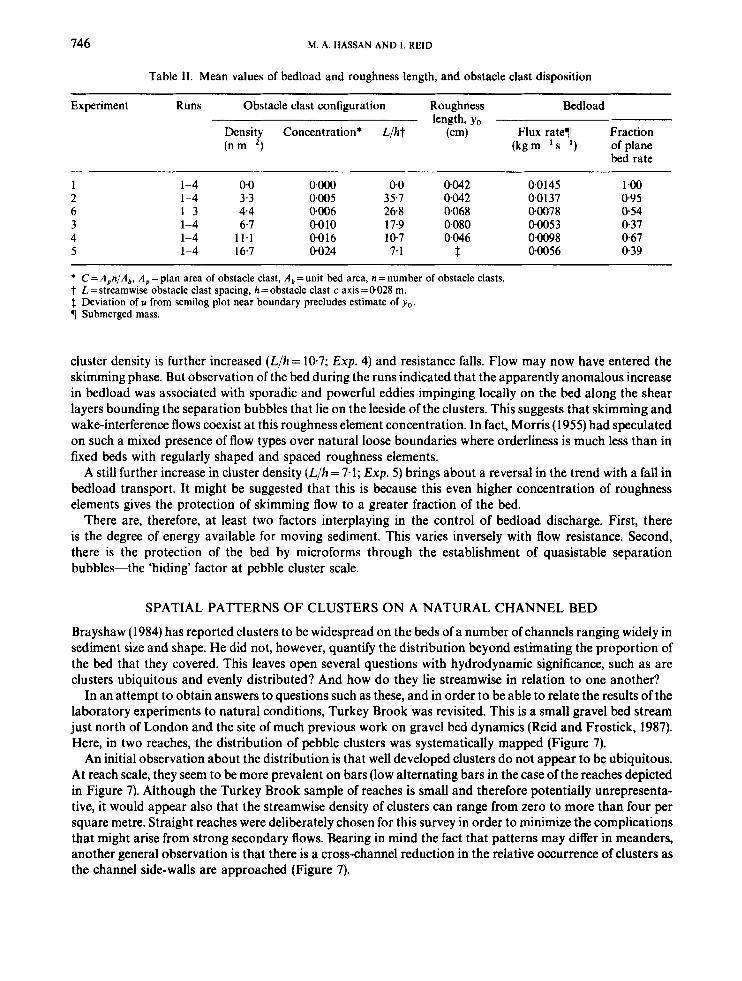
Table 11. Mean values of bedload and roughness length, and obstacle clast disposition
Experiment Runs Obstacle clast configuration Roughness Bedload length, yo
Density Concentration* L/ht (cm) Flux rate7 Fraction (nm-2) (kg m-l s-’) of plane
bed rate
1 1-4 0.0 OOOO 0.0 0.042 0.0145 1 .00 2 1-4 3.3 0.005 35.7 0.042 0.0137 0.95 6 1-3 4.4 0.006 26.8 0068 00078 0.54 3 1-4 6.7 0.010 17.9 0.080 00053 0.37 4 1-4 11.1 0.0 16 10.7 0.046 0.0098 0.67 5 1-4 16.7 0024 7.1 $ 0.0056 0.39
* C = A,n/A,, A, = plan area of obstacle clast, A, = unit bed area, n = number of obstacle clasts. t L=streamwise obstacle clast spacing, h=obstacle clast c axis=0.028 m. 1 Deviation of u from semilog plot near boundary precludes estimate of yo. 7 Submerged mass.
cluster density is further increased (L/h = 10.7; Exp. 4) and resistance falls. Flow may now have entered the skimming phase. But observation of the bed during the runs indicated that the apparently anomalous increase in bedload was associated with sporadic and powerful eddies impinging locally on the bed along the shear layers bounding the separation bubbles that lie on the leeside of the clusters. This suggests that skimming and wake-interference flows coexist at this roughness element concentration. In fact, Morris (1955) had speculated on such a mixed presence of flow types over natural loose boundaries where orderliness is much less than in fixed beds with regularly shaped and spaced roughness elements.
A still further increase in cluster density (L/h= 7-1; Exp. 5) brings about a reversal in the trend with a fall in bedload transport. It might be suggested that this is because this even higher concentration of roughness elements gives the protection of skimming flow to a greater fraction of the bed.
There are, therefore, at least two factors interplaying in the control of bedload discharge. First, there is the degree of energy available for moving sediment. This varies inversely with flow resistance. Second, there is the protection of the bed by microforms through the establishment of quasistable separation bubbles-the ‘hiding’ factor at pebble cluster scale.
SPATIAL PATTERNS OF CLUSTERS ON A NATURAL CHANNEL BED
Brayshaw (1984) has reported clusters to be widespread on the beds of a number of channels ranging widely in sediment size and shape. He did not, however, quantify the distribution beyond estimating the proportion of the bed that they covered. This leaves open several questions with hydrodynamic significance, such as are clusters ubiquitous and evenly distributed? And how do they lie streamwise in relation to one another?
In an attempt to obtain answers to questions such as these, and in order to be able to relate the results of the laboratory experiments to natural conditions, Turkey Brook was revisited. This is a small gravel bed stream just north of London and the site of much previous work on gravel bed dynamics (Reid and Frostick, 1987). Here, in two reaches, the distribution of pebble clusters was systematically mapped (Figure 7).
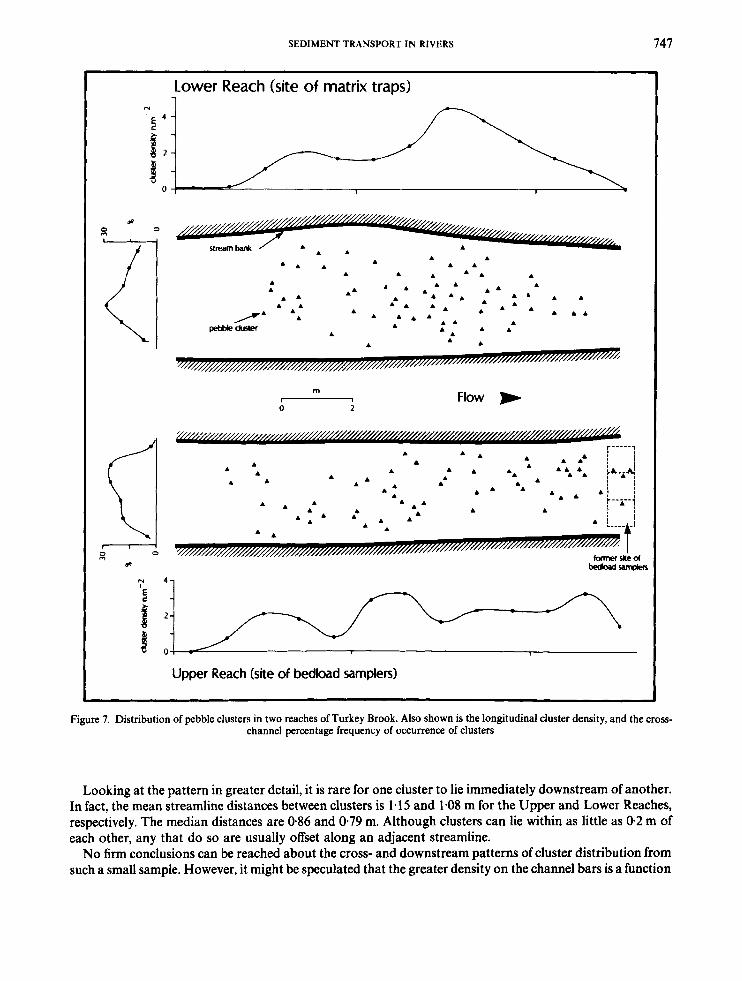
An initial observation about the distribution is that well developed clusters do not appear to be ubiquitous. At reach scale, they seem to be more prevalent on bars (low alternating bars in the case of the reaches depicted in Figure 7). Although the Turkey Brook sample of reaches is small and therefore potentially unrepresenta- tive, it would appear also that the streamwise density of clusters can range from zero to more than four per square metre. Straight reaches were deliberately chosen for this survey in order to minimize the complications that might arise from strong secondary flows. Bearing in mind the fact that patterns may differ in meanders, another general observation is that there is a cross-channel reduction in the relative occurrence of clusters as the channel side-walls are approached (Figure 7).
SEDIMENT TRANSPORT IN RIVERS 747
Lower Reach (site of matrix traps) 1
B 0 0
A
N 4 1
Upper Reach (site of bedload samplers)
Figure 7. Distribution of pebble clusters in two reaches of Turkey Brook. Also shown is the longitudinal cluster density, and the cross- channel percentage frequency of occurrence of clusters
Looking at the pattern in greater detail, it is rare for one cluster to lie immediately downstream of another. In fact, the mean streamline distances between clusters is 1.15 and 1.08 m for the Upper and Lower Reaches, respectively. The median distances are 0.86 and 0-79 m. Although clusters can lie within as little as 0.2 m of each other, any that do so are usually offset along an adjacent streamline.
No firm conclusions can be reached about the cross- and downstream patterns of cluster distribution from such a small sample. However, it might be speculated that the greater density on the channel bars is a function
748 M. A. HASSAN AND I. REID
of shallower local water depth. This would entail greater relative exposure of the large, potential obstacle clasts which would, itself, encourage transport of them into these zones. In fact, Hudson (1983) has shown that sediment may be in motion on bar surfaces while static in the adjacent thalweg despite the higher shear stress of the deeper flow. The deposition of the obstacle clasts on the bars might reflect a complicated interaction between the form drag associated with the bar and the positive feedback of a highly localized and progressive increase in total flow resistance as each cluster develops. In a similar way, the fall-off in cluster frequency towards the channel walls may reflect the fact that the rapid reduction of shear stress in these regions (Knight and Macdonald, 1979) would not encourage the inward migration of large obstacle clasts, so that few clusters would form here.
CLUSTERS AS EQUILIBRIUM MICRO BEDFORMS?
Several fluvial geomorphologists have sought an explanation of river forms in terms of an equilibrium between sediment transport and flow conditions at scales ranging from sand bed microforms to meander systems (Allen, 1968; Davies and Sutherland, 1980; Dury, 1965; Kirkby, 1977; Koster, 1978; Hickin and Nanson, 1984; Richards, 1976; and Whittaker and Jaeggi, 1982).
Davies (1980) showed a remarkable coincidence between the streamwise spacing of ripples at maximum flow resistance using artificial bedforms in a flume study and the spacing reported for live-bed natural channels. His results for dunes are less convincing but nevertheless quite good. He argued that these small- scale sand bed forms develop to the point where they maximize their influence on the flow. Under- or overdevelopment reduces flow resistance, so increasing the energy available for sediment transport and encouraging form development. Ripples and dunes might therefore be seen as an optimized bedform (under appropriate flow conditions). Nowell and Church (1979) have argued similarly that clast spacing might adjust to a point where flow resistance is maximized in gravel bed rivers, though they have no field data to complement their laboratory flume experiments.
It would be interesting to conjecture that pebble clusters on gravel beds might be analogous as roughness elements to the ripple and dune microforms of sand beds. In order to test this, a comparison was made of the field and laboratory data. The flume experiments suggested that flow resistance was maximized at a cluster spacing to height ratio, L/h, of ca. 20. In assessing the field data, Brayshaw’s (1983) average value for the Turkey Brook obstacle clast c axes of 0037 m was used as a value for h. The streamline spacing, L, was derived from the mapped distributions of clusters (Figure 7). However, given the uncertainty of defining a streamline in a natural channel during spate and given also that clusters have a cross-channel width and influence proportional to the size of the obstacle clast (Naden and Brayshaw, 1987), L was defined as the distance to the nearest cluster lying within a downstream track having an arbitrary width. Since clusters in Turkey Brook have an average width of 0-09 m, but range up to 0.13 m (Brayshaw, 1984), the track width was set at 0.25 m.
The frequency distributions for L are positively skewed, so that median values are more appropriate than arithmetic means. This produced values for L,,/h of 23 and 21 for the Upper and Lower Reaches, respectively. The closeness of these values to that of the flume experiments at maximum flow resistance (L/h = 20) is as remarkable as the equivalent closeness reported by Davies for his sand bed microforms.
The fact that the field data is derived from only two reaches of one river means that conclusions have to be tentative. However, there is every reason to suspect that feedback optimizes the relationship between form and flow at microscale in gravel bed rivers through erosion or deposition in a fashion that is loosely analogous to that which maintains the microforms on sand beds. It is tempting, therefore, to conclude that pebble clusters represent an equilibrium small-scale bedform. However, following Johnson and LeRoux’ (1 946) suggestion that the value of L/h generating maximum flow resistance may shift as the roughness elements’ streamwise length to height ratio, t/h, increases, the spacing of clusters might reasonably be expected to vary according to the lithologically controlled shape of the obstacle clasts that form the cluster nuclei. So, for example, clusters composed of platey lithotypes such as slate, where the c/b axial ratio is low might have larger streamwise spacing than the median values of 0.86 and 0.79 m given here for the ovate gravel of Turkey Brook (where c/b = 065).
SEDIMENT TRANSPORT IN RIVERS 749
CONCLUSIONS
It has been shown that an increasing concentration of pebble clusters leads first to an increase then to a decrease in flow resistance. This is in keeping with patterns established by others for various types of roughness element of both artificial and pseudonatural forms. It has also been shown that bedload flux rates are inversely related to the cluster induced flow resistance. However, it should be remembered that these results were derived under steady flow conditions in an attempt to isolate the influence of pebble clusters. Bathurst (1982) and Carling (1983), among others, demonstrate substantial reductions in gross flow resistance with rising water stage in gravel bed rivers. So, the relative impact of microform roughness may vary considerably with flow depth. Nevertheless, we conclude that these microforms not only cause a delay in the entrainment threshold, as has been demonstrated under field conditions, but that they continue to have a strong influence on bedload transport during the course of a flood.
An analysis of the streamwise spacing of pebble clusters reveals a remarkable coincidence between the values derived from a limited number of river reaches and that associated with maximum flow resistance as measured in a laboratory flume. It is tentatively concluded that this indicates an equilibrium spacing and that pebble clusters may be seen as a gravel bed analogue for the better understood ripple and dune microforms of sand bed streams.
A a b C
D
Fr 9 H h
k L n n' r Re S t U
C
ib
Y Y #
NOTATION
Area, m. Subscripts denote: plan area of obstacle clasts (p) and unit bed area (b). Clast long axis, m. Clast intermediate axis, m. Obstacle clast concentration, A,tt/Ab, m2 m-*. Clast short axis, m. Clast diameter, m. Subscripts denote: median of size distribution (50); and obstacle clast (obs). Bar indicates mean. Froude Number, dimensionless. Gravitational acceleration. Velocity profile shape factor (Nowell and Church, 1979). Protrusion of obstacle clast above plane bed, m. Bedload flux rate, kg m-' s-'. Submerged or subaerial mass as designated. Nikuradse equivalent sand roughness. Streamwise spacing of obstacle clasts, m. Number of obstacle clasts. Resistance coefficient, 29 YS/U2 Correlation coefficient. Reynolds Number, dimensionless. Water surface slope, m m-l Streamwise length of obstacle clast, m; time, minutes. Water velocity, m s-'. Bar denotes mean. Water depth, m. Vertical height above the bed in the water column, m. Subscript o denotes roughness length. Clast sphericity, $/&$?.
ACKNOWLEDGEMENTS
We are indebted to the British Council for funds that supported MAH during his visit to Birkbeck College.
REFERENCES
Allen, J. R. L. 1968. Current Ripples, Elsevier Nord-Holland, Amsterdam, 433 pp. Bathurst, J. C. 1982.'Theoretical aspects of flow resistance', in Hey, R. D., Bathurst, J. C., and Thorne, C. R. (Eds), Gravel-bed Rivers, John
Wiley & Sons, Chichester, 83-108.
750 M. A. HASSAN A N D I. REID
Brayshaw, A. C. 1983. Bed microtopography and bedload transport in coarse-grained alluvial channels, Unpublished Ph.D. Thesis,
Brayshaw, A. C. 1984. ‘Characteristics and origin of cluster bedforms in coarse-grained alluvial channels’, Memoir Canadian Society
Brayshaw, A. C. 1985. Bed microtopography and entrainment thresholds in gravel-bed rivers, Geological Society America Bulletin, 96,
Carling, P. A. 1983. Threshold ofcoarse sediment transport in broad and narrow natural streams, Earth Surface Processes and Landforms,
Church, M. 1978. ‘Palaeohydrological reconstructions from a Holocene valley fill’, in Miall, A. D. (Ed.), Fluvial Sedimentology. Memoir
Davies, T. R. H. 1980. ‘Bedform spacing and flow resistance’, Journal Hydraulics Division, ASCE, 106,423-433. Davies, T. R. and Sutherland, A. J. 1980. ‘Resistance to flow past deformable.boundaries’, Earth Surface Processes and Landforms, 5,
Dury, G. H. 1965. ‘Theoretical implications of underfit streams’, Professional Paper U.S. Geological Survey, 452C. Ergenzinger, P. J. and Custer, S. G. 1983. ‘Determination of bedload transport using naturally magnetic tracers: first experiences at
Fenton, J. D. and Abbott, J. E. 1977. ‘Initial movement of grains on a stream bed the effect of relative protrusion’, Proceedings Royal
Frostick, L. E., Lucas, P. M., and Reid, I. 1984. ‘The infiltration of fine matrices into coarse-grained alluvial sediments and its implications
Gomez, B. 1983. ‘Temporal variations in bedload transport rates: the effect of progressive bed armouring’, Earth Surface Processes and
Gomez, B. and Church, M. 1989. ‘An assessment of bed load sediment transport formulae for gravel bed rivers’, Water Resources
Gomez, B., Naff, R. L., and Hubbell, D. W. 1989. ‘Temporal variations in bedload transport rates associated with the migration of
Hayward, J. A. 1979. ‘Mountain stream sediments’, in Murray, D. L. and Ackroyd, P. (Eds), Physical Hydrology, New Zealand
Hickin, E. J. and Nanson, G. C. 1984. ‘Lateral migration rates of river bends’, Journal Hydraulic Engineering, ASCE, 110, 1557-1567. Hudson, H. R. 1983. ‘Bedload and size distribution in paved gravel-bed streams: discussion’, Journal of Hydraulic Engineering, ASCE,
Jackson, W. L. and Beschta, R. L. 1982. ‘A model of two-phase bedload transport in an Oregon Coast Range stream’, Earth Surface
Johnson, J. W. and LeRoux, E. A. 1946. ‘Discussion of “Flow in a channel of definite roughness”’, Transactions American Society Civil
Kirkby, M. J. 1977. ‘Maximum sediment efficiency as a criterion for alluvial channels’, in Gregory, K. J. (Ed.), River Channel Changes,
Knight, D. W. and Macdonald, J. A. 1979. ‘Open channel flow with varying bed roughness’, Journal Hydraulics Division, ASCE, 105,
Koster, E. H. 1978. ‘Transverse ribs: their characteristics, origin and palaeohydraulic significance’, in Miall, A. D. (Ed.), Fluvial
Kuhnle, R. A. and Southard, I. B. 1988. ‘Bed load transport fluctuations in a gravel bed laboratory channel’, Water Resources Research,
Laronne, J. B. and Carson, M. A. 1976. ‘Interrelationships between bed morphology and bed material transport for a small gravel-bed
Morris, H. M. 1955. ‘Flow in rough conditions’, Transactions American Society Civil Engineers, 120, 373-398. Naden, P. S. and Brayshaw, A. C. 1987. ‘Small- and medium-scale bedforms in gravel-bed rivers’, in Richards, K. S. (Ed.), River Channel
Newson, M. D. and Leeks, G. J. 1987. ‘Transport processes at the catchment scale’, in Thorne, C. R., Bathurst, J. C., and Hey, R. D. (Eds),
Nowell, A. R. M. and Church, M. 1979. ‘Turbulent flow in a depth-limited boundary layer’, Journal Geophysical Research, 84.48164824. Parker, G., Klingeman, P. C., and McLean, D. G. 1982. ‘Bedload and size distribution in paved gravel-bed streams’, Journal Hydraulics
Proffitt, G. T. and Sutherland, A. J. 1983. ‘Transport of non-uniform sediments’, Journal Hydraulic Research, 21, 33-43. Reid, I. and Frostick, L. E. 1987. ‘Towards a better understanding of bedload transport’, in Ethridge, F. G., Flores, R. M., and Harvey,
M. D. (Eds), Recent Developments in Fluvial Sedimentology. Society of Economic Paleontologists and Mineralogists Special Publication,
Reid, I., Brayshaw, A. C., and Frostick, L. E. 1984. ‘An electromagnetic device for automatic detection of bedload motion and its field
Reid, I., Frostick, L. E., and Layman, J. T. 1985. ‘The incidence and nature of bedload transport during flood flows in coarse-grained
Reid, I., Layman, J. T., and Frostick, L. E. 1980. ‘The continuous measurement of bedload discharge’, Journal Hydraulic Research, 18,
Richards, K. S. 1976. ‘The morphology of riffle-pool sequences’, Earth Surface Processes, 1, 71-88. Vittal, N., Ranga Raju, K. G., and Garde, R. J. 1977. ‘Resistance of two dimensional triangular roughness’, Journal Hydraulic Research,
Whittaker, J. G. and Jaeggi, M. N. R. 1982. ‘Origin of steppool systems in mountain streams’, Journal Hydraulics Division, ASCE, 108,
Zingg, T. 1935. ‘Beitrage zur Schotteranalyse’, Schweizerische Mineralogische Petrographische Mittelungen, 15, 39-140.
University of London, 415 pp.
Petroleum Geologists, 10, 77-85.
2 18-223.
8, 1-18.
Canadian Society Petroleum Geologists, 5, 743-772.
175-179.
Squaw Creek, Gallatin County, Montana’, Water Resources ‘Research, 19, 187-193.
Society London, 352A, 523-537.
for stratigraphical interpretation’, Journal Geological Society London, 141, 955-965.
Landforms, 8, 41 -54.
Research, 25, 1161-1186.
bedforms’, Earth Surface Processes and Landforms, 14, 135-156.
Hydrological Society, Wellington, 193-212.
109, 789-791.
Processes and Landforms, 1, 517-527.
Engineers, 111, 555-559.
John Wiley & Sons, Chichester.
1167-1183.
Sedimentology. Memoir Canadian Society Petroleum Geologists, 5 , 161-186.
24,247-260.
channel’, Sedimentology, 23, 67-85.
Environment and Process. Special Publication Institute British Geographers, 253-271.
Sediment Transport in Gravel-bed Rivers, John Wiley & Sons, Chichester, 187-218.
Division, ASCE, 108, 544-571.
39, 13-19.
applications’, Sedimentology, 31, 269-276.
alluvial channels’, Earth Surface Processes & Landforms, 10, 33-44.
243-249.
15, 19-36.
758-773.

![The lost world [microform]](https://static.fdokumen.com/doc/165x107/6328d632051fac18490eebfd/the-lost-world-microform.jpg)


![Monumenta historica Carmelitana [microform]](https://static.fdokumen.com/doc/165x107/6325a8045c2c3bbfa8034c6a/monumenta-historica-carmelitana-microform.jpg)

![Bibliotheca americana vetustissima [microform]](https://static.fdokumen.com/doc/165x107/6332978da20c543f370c0e95/bibliotheca-americana-vetustissima-microform.jpg)


![O Guarany [microform] : romance brazileiro](https://static.fdokumen.com/doc/165x107/6327cce86d480576770d743e/o-guarany-microform-romance-brazileiro.jpg)

