the influence of capital structure on firms' performance: a case ...
86
1 THE INFLUENCE OF CAPITAL STRUCTURE ON FIRMS’ PERFORMANCE: A CASE OF SELECTED FIRMS’ LISTED IN NAIROBI SECURITIES EXCHANGE ,KENYA By MARIETTA MUTHEU STEPHEN A RESEARCH PROJECT REPORT SUBMITTED IN PARTIAL FULFILMENT OF THE REQUIREMENTS FOR THE AWARD OF MASTER OF ARTS DEGREE IN PROJECT PLANNING AND MANAGEMENT , UNIVERSITY OF NAIROBI 2012
-
Upload
khangminh22 -
Category
Documents
-
view
5 -
download
0
Transcript of the influence of capital structure on firms' performance: a case ...

1
THE INFLUENCE OF CAPITAL STRUCTURE ON FIRMS’
PERFORMANCE: A CASE OF SELECTED FIRMS’
LISTED IN NAIROBI SECURITIES EXCHANGE ,KENYA
By
MARIETTA MUTHEU STEPHEN
A RESEARCH PROJECT REPORT SUBMITTED IN PARTIAL
FULFILMENT OF THE REQUIREMENTS FOR THE AWARD OF
MASTER OF ARTS DEGREE IN PROJECT PLANNING AND
MANAGEMENT , UNIVERSITY OF NAIROBI
2012

i
DECLERATION
This research project is my work. It has not been presented for a degree in any other University.
Signature…………………………….. Date…………………
Marietta M Stephen
Reg. No.L50/78482/2009
This research project has been submitted for examination with my approval as a University
Supervisor.
Signature…………………………….. Date…………………………
Dr. Christopher Gakuu
Senior Lecturer
Department of Extra-Mural Studies
Nairobi University

ii
DEDICATION
To my family members who were my best friends and supporters, who enriched my life and
enlarged my capacity for living, for their encouragement and support during the difficult
moments as I did the project.

iii
ACKNOWLEDGEMENT
My special gratitude goes to all the people who have contributed towards the completion of this
project. It was not possible for me to have completed this project without their support .
I wish to sincerely register my gratitude and appreciation to my supervisor Dr. Gakuu
Christopher whose countless support, guidance and patience has contributed so immensely to
the completion of this proposal.
To all the Lecturers who guided us through the proposal and project development during the
proposal writing seminar held at Nairobi University from 10th
-13th
December, 2010 I highly
recognize your support.
iv
TABLE OF CONTENTS
Page
DECLARATION---------------------------------------------------------------------------------------------i
DEDICATION-----------------------------------------------------------------------------------------------ii
ACKNOWLEDGEMENT--------------------------------------------------------------------------------iii
TABLE OF CONTENTS----------------------------------------------------------------------------------iv
APPENDICES---------------------------------------------------------------------------------------------- vii
LIST OF FIGURES---------------------------------------------------------------------------------------viii
LIST OF TABLES ---------------------------------------------------------------------------------------- ix
LIST OF ABBREVIATIONS-----------------------------------------------------------------------------x
ABSTRACT--------------------------------------------------------------------------------------------------xi
CHAPTER ONE----------------------------------------------------------------------------------------------1
INTRODUCTION--------------------------------------------------------------------------------------------1
1.1 Background of the Study--------------------------------------------------------------------------- 1
1.2 Problem Statement-----------------------------------------------------------------------------------3
1.3 Purpose of the Study. -------------------------------------------------------------------------------5
1.4 Objectives of the Study------------------------------------------------------------------------------5
1.5 Research Questions----------------------------------------------------------------------------------5
1.6 Significance of the Study.---------------------------------------------------------------------------6
1.7 Justification of the Study----------------------------------------------------------------------------6
1.8 The Scope of the Study------------------------------------------------------------------------------6
1.9 Limitations of the Study-----------------------------------------------------------------------------7
1.10 Basic Assumptions of the Study--------------------------------------------------------------------7
1.11 Definition of Significant Terms------------------------------------------------------------------7
1.12 Summary----------------------------------------------------------------------------------------------8
CHAPTER TWO----------------------------------------------------------------------------------------------9
LITERATURE REVIEW----------------------------------------------------------------------------------9

v
2.0 Introduction-------------------------------------------------------------------------------------------9
2.1 Theoretical Issues of the Research----------------------------------------------------------------9
2.2 Capital Structure and its Theories --------------------------------------------10
2.3.0 Capital Structure Theories------------------------------------------------------------------------10
2.3.1 The Traditional View------------------------------------------------------------------------------10
2.3.2 Modigliani and Miller Theory ( 1958)-----------------------------------------------------------11
2.3.3 Agency Costs Theory------------------------------------------------------------------------------12
2.3.4 Static Trade-Off Theory---------------------------------------------------------------------------13
2.3.5 The Pecking Order Theory------------------------------------------------------------------------13
2.3.6 Signalling Theory----------------------------------------------------------------------------------15
2.3.7 Life stage theory------------------------------------------------------------------------------------16
2.4.0 Capital Structure-----------------------------------------------------------------------------------16
2.4.1 Debt---------------------------------------------------------------------------------------------------17
2.4.2 Equity-------------------------------------------------------------------------------------------------18
2.5.0 Factors Determining Capital Structure-----------------------------------------------------------19
2.5.1 Growth Opportunities-----------------------------------------------------------------------------20
2.5.2 Size---------------------------------------------------------------------------------------------------21
2.5.3 Profitability------------------------------------------------------------------------------------------22
2.5.4 Collaterals--------------------------------------------------------------------------------------------22
2.5.5 Operating Risk--------------------------------------------------------------------------------------23
2.5.6 Taxes-------------------------------------------------------------------------------------------------23
2.5.8 Management Style ---------------------------------------------------------------------------------24
2.5.9 Growth Rate-----------------------------------------------------------------------------------------24
2.6 .0 Firm Performance-----------------------------------------------------------------------------------25
2.6.1 Return on Equity (ROE)--------------------------------------------------------------------------26
2.6.2 Return on Assets (ROA)---------------------------------------------------------------------------26
2.6.3 Stock Return-----------------------------------------------------------------------------------------27
2.7 Conceptual Frame Work --------------------------------------------------------------------------28
2.8 Summary --------------------------------------------------------------------------------------------29

vi
CHAPTER THREE----------------------------------------------------------------------------------------31
RESEARCH METHODOLOGY-----------------------------------------------------------------------31
3.1 Introduction-----------------------------------------------------------------------------------------31
3.2 Research Design------------------------------------------------------------------------------------31
3.3 Target Population ---------------------------------------------------------------------------------31
3.4 Data Collection--------------------------------------------------------------------------------------32
3.5.0 Validity and Reliability ---------------------------------------------------------------------------32
3.5.1 Validity-----------------------------------------------------------------------------------------------32
3.5.2 Reliability--------------------------------------------------------------------------------------------33
3.6 Data Analysis----------------------------------------------------------------------------------------33
3.7 Conceptual Model----------------------------------------------------------------------------------33
3.8 Operationalization of Variables-------------------------------------------------------------------35
CHAPTER FOUR------------------------------------------------------------------------------------------37
DATA ANALYSIS AND INTERPRETATION------------------------------------------------------37
4.1 Introduction-----------------------------------------------------------------------------------------37
4.2 Data Analysis---------------------------------------------------------------------------------------38
4.3.0 Research Findings----------------------------------------------------------------------------------38
4.3.1 Relationship Between Equity and Firms Performance----------------------------------------38
4.3.2 Relationship Between Debt and Firms Performance ------------------------------------------41
4.3.3 Relationship Between Firms Age and its Performance----------------------------------------43
4.4 Trend Analysis for Performance------------------------------------------------------------------44
CHAPTER FIVE--------------------------------------------------------------------------------------------46
SUMMARY FINDINGS, DISCUSSION, CONCLUSION AND RECOMENDATIONS ---------------46
5.1 Introduction ----------------------------------------------------------------------------------------46
5.2 Summary Findings and Conclusion--------------------------------------------------------------46

vii
5.3 Discussions----------------------------------------------------------------------------------------48
5.4 Conclusions----------------------------------------------------------------------------------------52
5.5 Recommendations----------------------------------------------------------------------------------54
5.6 Suggestions for further Research---------------------------------------------------------------- 56
REFERENCE------------------------------------------------------------------------------------------------57
APPENDICES
Appendix 1. List of Companies under Study.------------------------------------------------------------61
Appendix 2 Firms Ratio Computations -----------------------------------------------------------------63

viii
LIST OF FIGURES Page
2.1 Conceptual Frame Work-------------------------------------------------------------------------------29
3.1 Operationalization of Variables-----------------------------------------------------------------------35
4.3.1 Trend of Measures of Performance-----------------------------------------------------------------43

ix
LIST OF TABLES Page
4.1 Number of firms included in the study between 2001 and 2010--------------------------------- 39
4.3.1 Correlation Matrix of Variables-------------------------------------------------------------------- 39
4.3.3 ANOVA Analysis------------------------------------------------------------------------------------40
4.3.4 Regression Model ------------------------------------------------------------------------------------40

x
LIST OF ABBREVIATIONS
ROE Return on Equity
ROA Return on Assets
NSE Nairobi Securities Exchange
EPS Earnings Per Share
SPSS Statistical Package for Social Science

xi
Abstract
Corporate finance literature suggests that the capital structure decision plays a critical role in
determining the performance of a firm. This study investigated the relationship between capital
structure and corporate performance of 27 selected companies listed within the Nairobi
Securities exchange ( NSE) excluding banks during the period 2001-2010. In this study, the
capital structure is considered in terms Debt and Equity. The relationship between capital
structure and corporate performance is one that has received considerable attention in the finance
literature. This is because it represents one of the most controversial issues in the field of finance.
Its in this respect the researcher carried the study in the Kenyan Nairobi Securities Exchange
market. The objective of the study was to assess the relationship between debt and firms
performance for the selected firms in NSE, to assess the relationship between Equity and firms
performance for the selected firms in NSE and to assess the relationship between Age and firms
performance for the selected firms the Nairobi Securities exchange. The study used financial
ratios such as , Return on Equity (ROE), Return on Assets ( ROA), as measures of firm
performance. The study also used debt/equity ratios, profitability, to analyze the relationship
between capital structure and firms performance. Secondary data from Nairobi Securities
Exchange hand book was collected for the period of 10years ( 2001-2010). It comprised of
Audited financial statements, daily share prices including open and closing prices were obtained
basically from the NSE for ten years, and outstanding shares, profits, total assets, daily market
prices , equity. Data obtained was analyzed into useful information using a statistical package for
Social science ( SPSS), MS-excel. Multiple regression analysis was used since it is the best
suited for providing a means of establishing quantitative association between variables. The
result of the research explains a significantly positive relationship between Equity and ROE and
ROA as measures of firm performance, while Debt and firms age has a negative correlation with
Return on Equity (ROE ) and Return on Asset (ROA).

1
CHAPTER ONE
INTRODUCTION
1.1 Background of the Study
An efficient economic system calls for a dependable mechanism to allocate its resources and
optimized leadership of land, labour and Capital. In a market economy, this allocation process
consists largely of a set of private decisions, which are directed by a network of free markets and
flexible prices. Important among these decisions are capital investments decisions that are vital at
two levels for the future operability of the individual firm making the investment, and for the
economy of the nation as a whole. At the firm level, capital investment decisions have
implications for many aspects of operations, and often exert a crucial impact on survival,
profitability and growth. At the national level, the proper planning and allocation of capital
investment are essential to an efficient utilization of other resources, poorly placed investment
reduces the productivity of labour and materials and sets a lower ceiling on the economy’s
potential output.
There have always been controversies among finance scholars when it comes to the subject of
capital structure. So far, researchers have not yet reached a consensus on the optimal capital
structure of firms. The ability of companies to carry out their stakeholders’ needs is tightly
related to capital structure. Therefore, this derivation is an important fact that we cannot omit.
Capital structure is one of the popular topics among the scholars in finance field which aims to
resource allocation. The capital structure of a firm is very important since it related to the ability
of the firm to meet the needs of its stakeholders. The theory of the capital structure is an
important reference theory in enterprise's financing policy. It refers to the firm’s financial
framework. Its a financial term means the way a firm finances their assets through the
combination of equity, debt, or hybrid securities (Saad, 2010). In short, capital structure is a
mixture of a company's debts (long-term and short-term), common equity and preferred equity.

2
i.e its essential on how a firm finances its overall operations and growth by using different
sources of funds. Whether or not an optimal capital structure exists is one of the most important
and complex issues in cooperate finance.
Modigliani-Miller (MM) theorem is the broadly accepted capital structure theory because is it
the origin theory of capital structure theory which had been used by many researchers. The
prediction of the Modigliani and Miller model that in a perfect capital market the value of the
firm is independent of its capital structure, and hence debt and equity are perfect substitutes for
each other, is widely accepted. However, once the assumption of perfect capital markets is
relaxed, the choice of capital structure becomes an important value-determining factor. This
paved the way for the development of alternative theories of capital structure decision and their
empirical analysis. Although it is now recognised that the choice between debt and equity
depends on firm-specific characteristics, the empirical evidence is mixed and often difficult to
interpret.
An appropriate capital structure is a critical decision for any business organization. Financing
decisions is one of the important areas in financial management to increase shareholder’s wealth.
To determine the extend managers achieve this object, we can relate it to the performance
measurement of company.. The decision is important not only because of the need to maximize
returns to various organizational constituencies, but also because of the impact such a decision
has on an organization’s ability to deal with its competitive environment. Financial managers are
difficult to exactly determine the optimal capital structure. A firm has to issue various securities
in a countless mixture to come across particular combinations that can maximum its overall
value which means optimal capital structure. Although optimal capital structure is a topic that
had widely done in many researches, we cannot find any formula or theory that decisively
provides optimal capital structure for a firm. If irrelevant of capital structure to firm value in
perfect market, then imperfections that exist in reality may cause of its relevancy. In practice,
firm managers who are able to identify the optimal capital structure are rewarded by minimizing
a firm’s cost of finance thereby maximizing the firm’s revenue. If a firm’s capital structure
influences a firm’s performance, then it is reasonable to expect that the firm’s capital structure
would affect the firm’s health and its likelihood of default. From a creditor’s point view, it is

3
possible that the debt to equity ratio aids in understanding banks’ risk management strategies and
how banks determine the likelihood of default associated with financially distressed firms. In
short, the issue regarding the capital structure and firm performance are important for both
academics and practitioners.
Capital structure is closed link with corporate performance (Tian and Zeitun, 2007). Corporate
performance can be measured by variables which involve productivity, profitability, growth or,
even, customers’ satisfaction. These measures are related among each other. Financial
measurement is one of the tools which indicate the financial strengths, weaknesses, opportunities
and threats. Those measurements are return on investment (ROI), residual income (RI), earning
per share (EPS), dividend yield, price earnings ratio, growth in sales, market capitalization etc
(Barbosa & Louri, 2005). Much of the theory in corporate sector is based on the assumption that
the goal of firm should be to maximize the wealth of its current shareholders. One of the major
cornerstones of determining this goal is financial ratio. Financial ratios are commonly used to
measure firm performance. Generally, corporations include them in their annual reports to
stakeholders. Investment analysts provide them for investors who are considering the purchase of
a firm’s securities. Financial ratios represent an attempt to standardize financial information to
facilitate meaningful comparisons. It provides the basis for answering some very important
questions concerning the financial well being of the firm. Its objectives are to determine the
firm’s financial strengths and to identify its weaknesses.
The essence of financial management is the creation of shareholder value. According to Ehrhard
and Bringham (2003), the value of a business based on the going concern expectation is the
present value of all the expected future cash flows to be generated by the assets,
1.2 Statement of the Problem
For many years the link between capital structure and the financial performance of the firm has
been the subject of intense global debate and research and yet there is insufficient evidence to
support this argument. After more than fifty years of studies, economists have not reached an
agreement on how and to which extent the capital structure of firms’ impacts on their value,

4
performance. However, the studies and empirical findings of the last decades have at least
demonstrated that capital structure has more importance than in the simple Modigliani-Miller
model.
The relationship between capital structure and corporate performance is one that has received
considerable attention in the finance literature. This is because it represents one of the most
controversial issues in the field of finance. The inconclusive controversy was sparked off by
modiglian and miller ( 1958) argument, that there is no optimal capital structure and therefore
capital structure decisions are of no value to the firm. This ignited a lot of contributions from
many scholars who include: Stigliz 1969 miller 1977 Ross 1977 Jesens and Meckling 1980
Myers 1984 Rajan 1995 Myers 2001 among others.
Based on Ebaid (2009) research, capital structure has weak-to-no influence on the financial
performance of listed firms in Egypt. By using three accounting-based measurement of financial
performance which is Return On Asset (ROA), Return On Equity (ROE), and Gross Margin
(GM), the empirical tests come put with the result that capital structure (particularly short-term
debt and total debt) which is measure by ROA have a negative impact on an organization’s
performance. Apart from that, capital structure (including short-term debt, long-term debt and
total debt) which is measure by ROE and GM have no significant impact on an organization’s
performance. Tian and Zeitun (2007) find out that firm’s capital structure have a significant and
negative impact on the firm’s performance measures in both the accounting and market
measures. Indeed, a well attribution of capital structure will lead to the success of firms. As a
result, the issues of capital structure which may influence the corporate performance have to be
solved. A deeper research on this field will be an advantage for future wellbeing.
Professor Stewart Myers, when he first presented the pecking order theory of capital structure in
1984, referred to the conflict among the different theories of capital structure as “the capital
structure puzzle”. The puzzle has over the years been compounded by the difficulty of coming up
with conclusive tests of the competing theories. Various theories have been advocated by
researchers on this subject. The theories lead to such different, and in some ways opposed
5
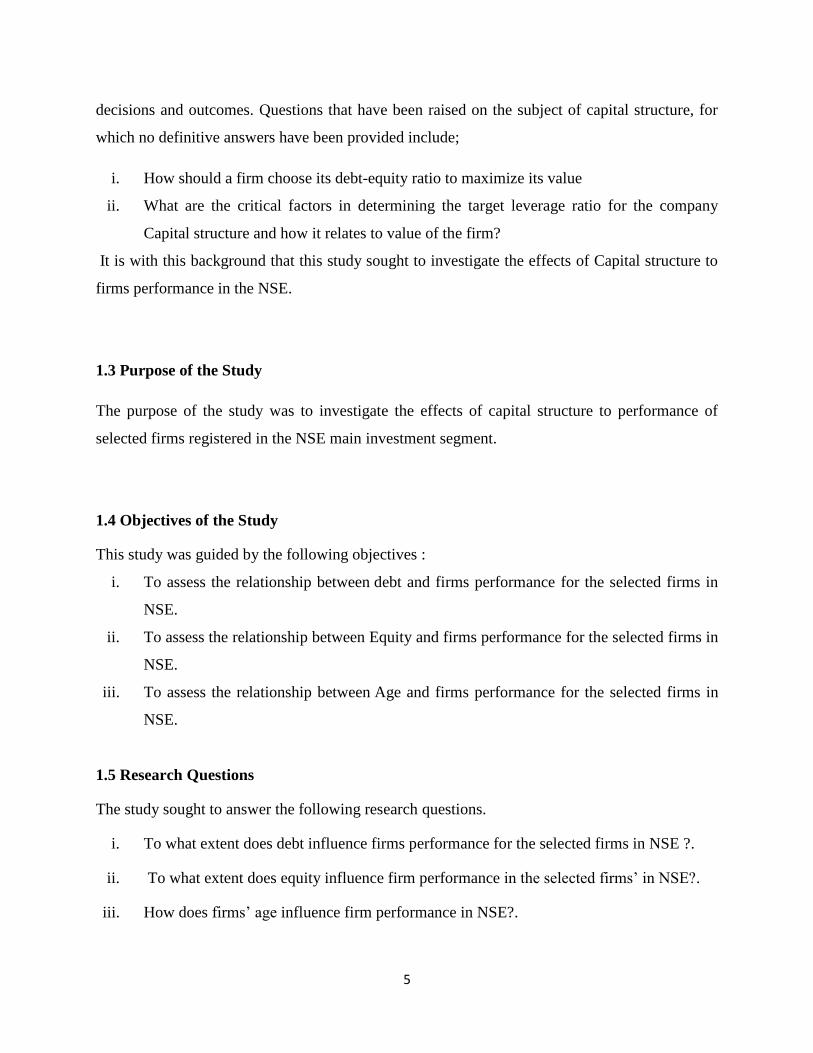
decisions and outcomes. Questions that have been raised on the subject of capital structure, for
which no definitive answers have been provided include;
i. How should a firm choose its debt-equity ratio to maximize its value
ii. What are the critical factors in determining the target leverage ratio for the company
Capital structure and how it relates to value of the firm?
It is with this background that this study sought to investigate the effects of Capital structure to
firms performance in the NSE.
1.3 Purpose of the Study
The purpose of the study was to investigate the effects of capital structure to performance of
selected firms registered in the NSE main investment segment.
1.4 Objectives of the Study
This study was guided by the following objectives :
i. To assess the relationship between debt and firms performance for the selected firms in
NSE.
ii. To assess the relationship between Equity and firms performance for the selected firms in
NSE.
iii. To assess the relationship between Age and firms performance for the selected firms in
NSE.
1.5 Research Questions
The study sought to answer the following research questions.
i. To what extent does debt influence firms performance for the selected firms in NSE ?.
ii. To what extent does equity influence firm performance in the selected firms’ in NSE?.
iii. How does firms’ age influence firm performance in NSE?.

6
1.6 Significance of the Study
Performance measurement is the base of investing and financing decisions. The study will be of
great use to the following:
Debt holders : To evaluate performance of the firm for credit facilities. Investors, on the other
hand are interested in evaluating the performance, to have knowledge on success of management
in applying their capital. To help investors to recognize the link between capital structure and
financial performance and choosing appropriate capital mix.
Investment practitioners: This study will be of great use to security analysis stockholders
investors and other parties whose knowledge of the relationship between capital structure and
firm value is required in making various decisions.
Academic and researchers: This study will act as a base of further research , a point of
reference for investigation on relationship between capital structure and other measures
(variables) of firm performance.
Regulation and policy matters: This study will be useful by regulators and policy makers in
coming up with policies which protect the minority shareholders against expropriation by the
large shareholders such as stating the numbers of shares that can be held by individual and other
parties.
1.7 Justification of the Study
There is very little research which has been carried out in this field in the Nairobi Securities
Exchange. The research will give an inside on the relationship between Capital Structure and
firms performance in the Nairobi Securities Exchange.
1.8 The scope of the Study
The analysis of this paper concentrated on 27 selected firms listed in Nairobi Securities
Exchange. The main purpose of this study was to examine if there is a relationship between
capital structure and firm performance among listed selected companies on the Nairobi
Securities Exchange ( NSE ) for a period of 10 years between 2001-2010. This paper used
comparisons of debt/equity ratios as a proxy for capital structure and analyze its relationship with
financial performance that will be measured by Return On Assets ( ROA) and Return On Equity

7
(ROE). The study was based on secondary data which is available in the Nairobi Securities
Exchange market and also Capital market Authority. The data comprised of audited financial
statements which are circulated for public consumption. This made the study assignment more
easy and the data is very reliable.
1.9 Limitations of the Study
The period of study for 10years was long for many factors to have affected the Nairobi Securities
Exchange in different dimensions. Factors such as economical and political might have affected
the study outcome.
This study used sample data from the NSE . Companies which choose to be listed on NSE are
mainly in the category of best performers in the country hence the study suffered a sample
selection bias.
The limitation of this study is that the samples are only focus on selected firms in the NSE and
others were not included in the study. Therefore, the result may not represent the result of all
firms listed in the NSE.
There is also a problem with the firms in the sample have different period for annual closing
account . Different firms have different financial calendar therefore for comparison purposes this
will affect the results.
Total debt being the sum short-term and long-term was used this is because some firms do not
separate short-term debt and long term debt hence affecting the outcome of the research.
1.10 Basic assumptions of the Study.
The outcome of the research depended on the information collected. It therefore assumed data
provided is accurate free from any error or omissions. The main assumption was that the
population under study gave the overall picture of the nature of relationship between capital
structure and firms performance in the Nairobi Securities Exchange market. It also assumed that
firms in the main investment segment have one commonality in the Nairobi Securities Exchange
and are affected by factors in the same direction.

8
1.11 Definition of Significant Terms
Capital Structure
A mix of a company's long-term debt, specific short-term debt, common equity and preferred
equity. The capital structure is how a firm finances its overall operations and growth by using
different sources of funds.
Equity
In this study the research defines equity as Shareholders' equity (or stockholders' equity,
shareholders' funds, shareholders' capital or similar terms) which represents the remaining
interest in assets of a company, spread among individual shareholders of common or preferred
stock, reserves.
Debt
Its any financial obligation owed to an individual, company, or other organization. Its payable
after an agreed period of time. Debt can either be short-term or long-term debt.
Performance
Performance refers to the accomplishment of a given task measured against preset known
standards of accuracy, completeness, cost, and speed. Performance refers to the extent to which
organization goals and objectives are achieved effectively and efficiently.
1.12 Summary of the Chapter
This chapter discussed the background of the study and brought out the need to the study . The
chapter also stated the problem statement which guided the study. The objectives of the study as
envisaged by the researcher has been outlined and the research questions enumerated. The
significance of the study and benefits of identifying and addressing the factors that affect the
study were discussed. The chapter concluded by giving the definition of operational terms and
terminologies used in the study so that they are interpreted and understood the same way by the
readers.

9
CHAPTER TWO
LITERATURE REVIEW
2.0 Introduction
This chapter reviews some of the studies that have evolved over the past years on development.
It presents the reviewed literature relevant to the effects of capital structure on firms
performance. It draws literature from empirical studies that have been done globally. Particular
emphasis is laid on dealing with capital structure theories and factors that influence the capital
structure of a firm.
2.1 Theoretical Issues of the Research
Capital structure has always been one of the main topics among the studies of finance scholars.
Its importance derives from the fact that capital structure is tightly related to the ability of firms
to fulfil the needs of various stakeholders. The last century has witnessed a continuous
developing of new theories on the optimal debt to equity ratio. The first milestone on the issue
was set by Modigliani and Miller (1958), whose model argued on the Irrelevance of the capital
structure in determining firms’ value and future performance. However, many authors have
successively proved that a relationship between capital structure and firm value actually exists (
Lubatkin and Chatterjee, 1994). The same Modigliani and Miller (1963) asserted that their model
was not effective anymore if tax was taken into consideration. Determination of an appropriate
Long-term source of finance is what the capital structure decision is all about. This task
according to Brealley and Mayers ( 1988) is difficult for management and their words
“we cannot say that debt is better …….. better in some
case and in others worse. "How do firms choose their capital
structures?" Again, the answer is, "We don't know." By contrast,
we know very little about capital structure. We do not know how
firms choose the debt, equity or hybrid securities they issue.
We have only recently discovered that capital structure changes
convey information to investors’’.

10
2.2 Capital Structure and its Theories
Capital Structure is a mix of securities and financing sources used by corporations to finance real
investments ( Myers 2001) . The capital structure is the mix of debt, preferred stock and
common equity with which the firm tends to increase capital. The firm needs to make the
investments in order to at least remain in business and also display some growth.
Capital structure is also referred as financial structure of a firm. The capital structure of a firm is
very important since it related to the ability of the firm to meet the needs of its stakeholders. One
of the cornerstones of the modern corporate finance theory is the capital structure irrelevancy
proposition (Modigliani-Miller 1958). Modigliani and Miller (1958) conclude that the market
value of any firm is independent of its capital structure, given the assumptions of capital markets
are “perfect”, which means arbitrage-free, competitive and efficient, no tax distortions and no
bankruptcy. After tax is introduced into their model, tax shield and bankruptcies costs add more
complications to the optimal capital structure decision-making process. It is observed that the
optimal capital structure are closely related to the growth potential of the firms (McConnel &
Servaes1995; Jung, Kim, & Stulz 1996) and some other variables, such as: the size and the
industry characteristics (Titman & Wessels1988). Capital structure is related to ability of the firm
to meet the needs of its stakeholders (Boodhoo Roshan January 2009).Capital structure of
any firm can be determined by factors such as tax benefit variables, size, profitability,
growth, collateral value of assets and uniqueness (Kathleen M.kahle and kudleep
shastri 2002).
2.3 Capital Structure Theories
Corporate financing decisions are quite complex processes and existing theories can at best
explain only certain facets of the diversity and complexity of financing choices. Since
Modigliani and Miller published their seminal paper in 1958, capital structure has generated
great interest among financial researchers.
2.3.1 The Traditional View
Before the work of Modigliani and Miller, the traditional wisdom was that some leverage was
beneficial and by leveraging, a firm increased the return on equity. The traditional position held

11
that increasing leverage resulted in lower weighted-average cost of capital because an increase in
the cost of equity, if at all, is not proportionate to the increase in leverage. The traditional view
therefore implied that:
The expected return on equity does not increase with increase in firm’s borrowing.
The weighted-average cost of capital declines at first, as the debt-equity ratio increases, and then
rises. This is because debt capital is cheaper than equity capital within reasonable or acceptable
limits of debt.
There is an optimal Debt to Equity ratio that exists, that is, where the cost of capital is lowest.
This optimal ratio minimizes the overall cost of capital and maximizes the value of the firm.
2.3.2 Modigliani and Miller Theory ( 1958)
Modigliani and Miller were the first to theorize the issue of capital structure. In their seminal
paper, ‘The Cost of Capital, Corporation Finance and the Theory of Investment, American
Economic Review, (June 1958), they stated their capital structure irrelevance proposition that
capital structure has no predictable material effect on corporate market values in a perfect capital
market. Modigliani-Miller provides the basis for modern thinking on capital structure and was
for the first time introduces the concept of capital structure. Their theory states that without
taxes, bankruptcy costs and systematic information and in an efficient market, the firm’s value is
not affected in which way the firm is financed.
They argued that in efficient markets the debt-equity choice is irrelevant to the value of the firm
and benefits of using debts will compensate with decrease of companies stock. Prior to MM
theory, conventional perspective believed that using financial leverage increases company’s
value. In this respect, there is an optimized capital structure that minimizes capital costs. In a
subsequent paper, Modigliani and Miller (1963) eased the conditions and showed that under
capital market imperfection where interest expenses are tax deductible, firm value will increase
with higher financial leverage. Models based on impact of tax, suggest that profitable companies
should have more debts these firms have more need for tax management in corporation’s profit.
However, increasing debt results in an increased probability of bankruptcy. Hence, the optimal

12
capital structure represents a level of leverage that balances bankruptcy costs and benefits of debt
finance.
2.3.3 Agency Costs Theory
Agency costs rose from separation of ownership and control and conflicts of interest between
categories of agents. One of the problems that cause conflict between managers and shareholders
is free cash flows. Jensen (1986) and Williamson (1988) define debt as a disciplinary tool to
ensure that managers give preference to wealth creation for the equity-holders. Thus, in the
companies that have high cash flow and profitability , increasing of debts can be used as a tool of
reducing the scope for managers until resources of company may not be waste as a result of their
individual purposes. Opinion of the most researchers is that choices of capital structure may help
mitigate the agency cost ( Papa and Speciale 2007), Richardson 2005), Douglas 2002). High
leverage reduces agency cost by constraining or encouraging managers to act more responsibly
in the interest of the shareholders by reducing cash flows available for spending to managers.
Therefore we expect high earnings where debt ratios are high .
The other conflicting problem is that managers may not receive all the benefits of their activities.
This is seen when manager’s share in ownership of company is low. When the manager’s
increase stock is high, this inefficiency decreases. Therefore, it is appropriate that by increasing
debts instead of stock issuance prevent from decreasing of manager’s share of ownership interest
(Huang, Song, 2005). Stulz (1990) like Jensen believes that debts payment decreases cash flows
available for managers. But, on the other hand, he states that this decrease will decrease the
opportunities of profitable investing. Thus, companies with less debt, have more opportunities
for investment and in comparison with other active firms in industry, have more liquidity. The
contribution of agency cost theory is that leverage firms are better foe shareholders as debt level
can be used for monitoring the mangers ( Boodhoo, 2009). Thus high leverage is expected to
lower agency cost , reduce inefficiency, and thereby lead to improvement in firms performance .
( Akintoye, 2008)

13
2.3.4 Static Trade-Off Theory
Jensen and Meckling (1976) suggest that the firm’s optimal capital structure will involve the
tradeoff among the effects of corporate and personal taxes, bankruptcy costs and agency costs,
etc.The trade of theory defines the capital structure that how much debt and equity finance
should be chosen by the company to use by balancing the costs and benefits. (Frank and Goyal,
2009).the capital structured can also sometimes leads to the bankruptcy and has a negative and
adverse affect on the performance of the firm if properly not utilizes. A firm is the algamation of
assets with one owner that link with other assets to produce and sells merchandise “If firm
performance affect the choice of capital structure, then failure to take this reverse causality into
account may result in regression of a firm performance on a measure of leverage may confound
the effects of capital structure on performance with the effect of performance on capital
structure” A firm’s capital structure refers to the mix of its financial liabilities. As financial
capital is an uncertain but critical resource for all firms, suppliers of finance are able to exert
control over firms (Rahul Kuchhar, fall 1997).
2.3.5 The Pecking Order Theory
This theory is based on the premise that companies have a preferred hierarchy for financing
decisions and maximize value by systematically choosing to finance new investments using the
‘cheapest available’ source of funds.
Managers therefore prefer internally generated funds (retained earnings) to external funding, and
if necessary, prefer debt to equity because of lower information costs associated with debt issues.
Myers (1984) in ‘The Capital Structure Puzzle,” Journal of Finance, suggests that companies
would only issue equity as a last resort when their debt capacity has been exhausted. Worth
noting is that internal funds incur no floatation costs and require no additional disclosure of
proprietary financial information that could lead to more severe market discipline and a possible
loss of competitive advantage. If a firm must use external funds, the preference is to use the
following order of financing sources: debt, convertible securities, preferred stock, and common
stock (Myers, 1984). This order reflects the motivations of the financial manager to retain control
of the firm (since only common stock has a “voice” in management), reduce the agency costs of

14
equity, and avoid the seemingly inevitable negative market reaction to an announcement of a
new equity issue. (Hawawini & Viallet, 1999)
Managers in comparison to investors have more information about operation. Myers and Majluf
(1984) believe that this causes that pricing the stock with investors be understate. In this
condition that there is asymmetric information, companies prefer financing by internal sources to
stock issuance and where there is not adequate internal sources, they refer to borrowing.
Consequently asymmetric information is the base of choice – pecking order theory of financing.
The main conclusion drawn from the asymmetric information theories is that there is a hierarchy
of firm preferences with respect to the financing of their investments (Myers & Majluf, 1984).
This hierarchy of preferences suggests that firms finance their investments first using internally
available funds, followed by debt, and finally through external equity. Dimitrov and Jain (2003)
with operational performance of firms proposed another theory . They argued that if manager
have access to private information about becoming worse in future operational performance they
will be increase debt.
Thus, increasing the leverage is a negative sign and demonstrates poor forward performance.
Rajan and Zingales (1995) argue that larger firms tend to disclose more information to outside
investors than smaller ones. Overall, larger firms with less asymmetric information problems
should tend to have more equity than debt and thus have lower leverage. However, larger firms
are often more diversified and have more stable cash flow; the probability of bankruptcy for
large firms is smaller compared with smaller ones.
The firm’s optimal capital structure will involve the conflicting theoretical arguments. Recent
findings of Titman and Wessels (1988), Harris and Ravive (1991) and Rujan and Zingales (1995)
confirmed the results of Mayers that believed increase of leverage will decrease profitability.
But, Janson, unlike Mayers, predicts a positive link between financial leverage and profitability
in efficient market and if the market be inefficient, there will be a negative relationship between
them. In 1988, Rajan and zingales confirmed this theory. Bradly (1984) demonstrated that the
firms with less operational profits, also have less leverage. Cai and Zhang (2005) by studing this

15
concept, found that incorporate with high leverage, converse link between leverage changes and
return on stock is stronger (Rajan, Zingales, 1995). Wald (1999) believed that the link between
profitability and debt-asset ratio is positive and signifiicant. Profitabiliy was definding in the
form of earnings before interest and tax (EBIT) (Rajan, Zingales, 1995).
2.3.6 Signalling Theory
This can be explained through the use of two hypotheses:
(a) Implied Cash Flow Hypothesis
This hypothesis is premised on the idea that managers know more than investors do. It claims
that financing decisions are designed primarily to communicate management’s confidence in the
firm’s prospects and, in cases where management thinks the firm is undervalued, to increase the
value of the shares. Increasing leverage has been suggested as one potentially effective signaling
device. Debt obligates the firm to make a fixed set of cash payments over the term of the debt
security, with potentially serious consequences on default. Issuing more debt capital can
therefore serve as a credible signal of higher expected future cash flows.
On the other hand, raising additional equity by a firm signals that the net operating cash flows of
current operations are disappointing. Investors associate relatively large issues of equity with
more severe cash flow changes, resulting in more severe price reactions and therefore firm value.
(b) Information Asymmetry Hypothesis
Here, Myers and Majluf (1984) assumed that the firm’s managers have superior information
about the true value of the company. If management have favorable information that is not yet
reflected in market prices, the release of such information will cause a larger increase in stock
than in bond prices. To avoid diluting the value of existing shareholders, managers that believe
their shares to be undervalued will choose to issue debt rather than equity. Conversely, managers
will time a new equity issue if the market price exceeds their own assessment of the stock value,
i.e. if the stocks are overvalued by the market. This well known propensity of companies to
“time” their stock offerings helps explain the market’s systematically negative response to
announcements of such offerings.

16
2.4.0 Capital Structure
Capital structure refers to the firm's financial framework which consists of the debt and equity
used to finance the firm. Capital structure is one of the popular topics among the scholars in
finance field. The ability of companies to carry out their stakeholders’ needs is tightly related to
capital structure. Therefore, this derivation is an important fact that we cannot omit. Capital
structure in financial term means the way a firm finances their assets through the combination of
equity, debt, or hybrid securities (Saad, 2010). In short, capital structure is a mixture of a
company's debts (long-term and short-term), common equity and preferred equity. Capital
structure is essential on how a firm finances its overall operations and growth by using different
sources of funds. According to Myers (2001), “there is no universal theory of the debt- equity
choice, and no reason to expect one”. However, there are several useful conditional theories3,
each of which helps to understand the debt-to-equity structure that firms choose.
Based on Ebaid (2009) research, capital structure has weak-to-no influence on the financial
performance of listed firms in Egypt. By using three accounting-based measurement of financial
performance which is Return On Asset (ROA), Return On Equity (ROE), and Gross Margin
(GM), the empirical tests come put with the result that capital structure (particularly short-term
debt and total debt) which is measure by ROA have a negative impact on an organization’s
performance. Apart from that, capital structure (including short-term debt, long-term debt and
total debt) which is measure by ROE and GM have no significant impact on an organization’s
performance. Zeitun and Tian (2007) find out that firm’s capital structure have a significant and
negative impact on the firm’s performance measures in both the accounting and market
measures.
Capital Structure is a mix of securities and financing sources used by corporations to finance real
investments. ( Myers 2001) . The capital structure is the mix of debt, preffered stock and
common equity with which the firm tends to increase capital. The firm needs to make the
investments in order to at least remain in business and also display some growth . Capital
structure is also referred as financial structure of a firm. The capital structure of a firm is very
important since it related to the ability of the firm to meet the needs of its stakeholders.

17
Both debt and equity financing are important ways for businesses to obtain capital to fund their
operations. Deciding which to use or emphasize, depends on the long-term goals of the business
and the amount of control managers wish to maintain. Ideally, experts suggest that businesses
use both debt and equity financing in a commercially acceptable ratio. This ratio, known as the
debt-to-equity ratio, is a key factor analysts use to determine whether managers are running a
business in a sensible manner. Although debt-to-equity ratios vary greatly by industry and
company, a general rule of thumb holds that a reasonable ratio should fall between 1:1 and 1:2.
2.4.1 Debt
Debt financing is basically money that you borrow to run your business. Debt financing refers to
the borrowing of funds in order to finance a purchase, acquisition or expansion. For businesses
and corporations debt financing often involves the selling of notes, bonds, mortgages or other
debt instruments. The individuals and financial institutions which provide the debt financing
become creditors. Since debt financing involves borrowed funds, debt financing must be repaid,
typically in installments and with interest. The interest that must be paid on debt financing is
determined by the creditworthiness of the borrower, the intended use of the funds, and by the
current financial climate. Businesses and corporations find debt financing attractive because the
interest paid is tax deductible.
You can think of debt financing as being divided into two categories, based on the type of loan
you are seeking, long term debt financing and short term debt financing. Long Term Debt
Financing usually applies to assets your business is purchasing, such as equipment, buildings,
land, or machinery. With long term debt financing, the maturity period is normally beyond 5
years. Medium-term normally have a maturity period of 1-5 years. Short Term Debt
Financing usually applies to money needed for the day-to-day operations of the business, such
as purchasing inventory, supplies, or paying the wages of employees. Short term financing is
referred to as an operating loan or short term loan because scheduled repayment takes place in
less than one year. A line of credit is an example of short term debt financing.
Loan capital may be obtained from a bank or finance company as long-term loans, or from debt-
equity investors in the form of debentures or preferred stock (preference shares), and is usually

18
secured by a fixed and/or floating charge on the company's assets. Unlike debt capital, it does not
include short-term loans (such as overdraft). Also called borrowed capital.
There are many variables in a capital structure choice and structure of debt maturity which will
affect a company’s performance. Debt maturity will influence a company’s option in investing.
In the case of this, examine the impact of capital structure’s variables base on company’s
performance will present prove for a company’s performance due to the effect of capital
structure (Tian & Zeitun, 2007). A study had been done by Abor (2005) on the influence of
capital structure on profitability of listed companies on the Ghana Stock Exchange during a five-
year period. He found out that there is significant positively interrelated between short-term debt
and ROE and shows that firms which earn a lot use more short-term debt to finance their
business. In other words, short-term debt is an essential source of financing in favor of Ghanaian
companies, by representing 85 percent of total debt financing. Yet, the results showed the
adverse relation between long-term debt and ROE. The regression output showed that there is
positive relationship between Debt and ROE which measure the relationship between total debt
and profitability,. This indicates that firms which earn a lot are depending on debt as their key
financing option. The opposite of debt financing is equity financing
2.4.2 Equity
Equity financing takes the form of money obtained from investors in exchange for an ownership
share in the business. Such funds may come from friends and family members of the business
owner, wealthy "angel" investors, or venture capital firms. An equity investment generally refers
to the buying and holding of shares of stock on a stock market by individuals and firms in
anticipation of income from dividends and capital gains, as the value of the stock rises. It may
also refer to the acquisition of equity (ownership) participation in a private (unlisted) company or
a startup company. When the investment is in infant companies, it is referred to as venture
capital investing and is generally understood to be higher risk than investment in listed going-
concern situations. Equity Capital represents the personal investment of the owner(s) in the
business. Is called risk capital because investors assume the risk of losing their money if the

19
business fails. Does not have to be repaid with interest like a loan does. Means that an
entrepreneur must give up some ownership in the company to outside investors.
In accounting and finance, equity is the residual claim or interest of the most junior class of
investors in assets, after all liabilities are paid. If liability exceeds assets, negative equity exists.
In an accounting context, Shareholders' equity (or stockholders' equity, shareholders' funds,
shareholders' capital or similar terms) represents the remaining interest in assets of a company,
spread among individual shareholders of common or preferred stock.
At the start of a business, owners put some funding into the business to finance operations. This
creates a liability on the business in the shape of capital as the business is a separate entity from
its owners. Businesses can be considered to be, for accounting purposes, sums of liabilities and
assets; this is the accounting equation. After liabilities have been accounted for, the positive
remainder is deemed the owner's interest in the business. Thus owners' equity can be reduced to
zero. Ownership equity is also known as risk capital or liable capital.
In financial accounting, equity capital is the owners' interest on the assets of the enterprise after
deducting all its liabilities. It appears on the balance sheet / statement of financial position, one
of the four primary financial statements. Accounts listed under ownership equity include
(example),
i. Share capital (common stock)
ii. Preferred stock
iii. Capital surplus
iv. Retained earnings
v. Reserve
2.4.3 Firms Age
As firms get older, they might become less productive if they become increasingly inert and
inflexible. Barron et al. (1994) argue that old firms are prone to suffer from a liability of
obsolescence because they do not fit in well to the changing business environment and also a

20
liability of senescence according to which they become ossified by accumulated rules, routines
and organizational structures.
Age can have adverse effects on performance because of the organizational rigidities and
inertia it brings about (Hannan and Freeman, 1984; Leonard-Barton, 1992) and because it
impairs firms’ ability to perceive valuable signals. The root of the problem is the tendency of
firms to codify their success with organizational measures, rules of conduct, and best practice.
This behavior often makes sense, because it helps firms focus on their core competences and
raise reliability and accountability. By stressing the good to prevent the bad, however,
codification makes it hard to recognize, accept, and implement change when doing so would be
appropriate.
Frielinguaus Mostert and Firer ( 2005) , states that a firm is similar to a life of a human being. Its
passes from birth to death. Aging is a process associated with a general decline in the physical
functioning of the human body, such as the ability to remember, react, move, and hear. By
analogy, firms should weaken over time and lose their ability to compete. However this should
not be the case to firms. At the early stage the firm tents to incur more debt than at the old stage/
death stage. This enables them raise capital for investment.
As firms age advance this could actually help firms become more efficient. Over time, firms
discover what they are good at and learn how to do things better (Arrow, 1962; Jovanovic, 1982;
Ericson and Pakes,1995). They specialize and find ways to standardize, coordinate, and speed
up their production processes, as well as to reduce costs and improve quality. Old age, however,
may also make knowledge, abilities, and skills obsolete and induce organizational decay
(Agarwal and Gort, 1996 and 2002). This is mainly in situations where organizations are not
very sensitive to the environment they working in and also they do not empress research and
development. Pastor and Veronesi (2003) in their research found that profitability and market-
to-book ratios decline with firm age as investors learn and uncertainty declines. Consistent with
that, the variability of stock returns is negatively related with incorporation age (Adams,
Almeida, and Ferreira, 2005) and with listing age (Cheng, 2008).

21
Aging is a process associated with a general decline in the physical functioning of the human
body, such as the ability to remember, react, move, and hear. By analogy, firms should weaken
over time and lose their ability to compete. Age could actually help firms become more efficient.
Over time, firms discover what they are good at and learn how to do things better (Arrow, 1962;
Jovanovic, 1982; Ericson and Pakes,1995). They specialize and find ways to standardize,
coordinate, and speed up their production processes, as well as to reduce costs and improve
quality. Old age, however, may also make knowledge, abilities, and skills obsolete and induce
organizational decay (Agarwal and Gort, 1996 and 2002).
Pastor and Veronesi (2003) in their research found that profitability and market-to-book ratios
decline with firm age as investors learn and uncertainty declines. Consistent with that, the
variability of stock returns is negatively related with incorporation age (Adams, Almeida, and
Ferreira, 2005) and with listing age (Cheng, 2008). Agarwal and Gort,1996 and 2002 in their
research on comparison of productive efficiency of firms at different ages. They concluded that
older firms could lose their competitive edge hence affecting their performance. This is because
old firms are more rigid , their operating expenses increase , they experience decline in market
share and therefore a relative decline in sales growth Frielinguaus Mostert and Firer ( 2005) ,
states that a firm is similar to a life of a human being. Its passes from birth to death. At the early
stage the firm tents to incur more debt than at the old stage/ death stage.
2.5 .0 Factors Determining Capital Structure
As Harris and Raviv (1991), state: “Several studies shed light on the specific characteristics of
firms and industries that determine leverage ratios. These studies generally agree that leverage
increases with fixed assets, non-debt tax shields, growth opportunities, and firm size and
decreases with volatility, advertising expenditures, research and development expenditures,
bankruptcy probability, profitability and uniqueness of the product.” However, the results of both
theoretical and empirical studies are not always unambiguous. Based on the data availability, the

22
following determinants of capital structure are analysed in this paper: size, profitability,
tangibility, growth opportunities, tax, non-debt tax shields, volatility, and industry classification.
Theorists of finance have postulated a large number of possible determinants of capital structure.
The difficulty lies in testing their impact, since it is difficult to find suitable proxies for them and
even more difficult to isolate the effect of one from that of others. However, empirical work on
the determinants of capital structure has been going on for some time. Some of the factors
determining capital structure of any firm include the following.
2.5.1 Growth Opportunities
For companies with growth opportunities, the use of debt is limited as in the case of bankruptcy,
the value of growth opportunities will be close to zero. Jung et al. (1996) postulates that firms
should use equity to finance their growth because such financing reduces agency costs between
shareholders and managers, whereas firms with less growth prospects should use debt because it
has a disciplinary role (Jensen, 1986; Stulz, 1990). Myers (1977) argues that firms with growth
opportunities may invest sub-optimally, and therefore creditors will be more reluctant to lend for
long horizons. This problem can be solved by short-term financing (Titman and Wessels, 1988)
or by convertible bonds (Jensenand Meckling, 1976; Smith and Warner, 1979). From a pecking
order theory perspective, growth firms with strong financing needs will issue securities less
subject to informational asymmetries, i.e. short-term debt. If these firms have very close
relationships with banks, there will be less informational asymmetry problems, and they will be
able to have access to long term debt financing as well. As mentioned by Hovakimian et al.
(2001), large stock price increases are usually associated with improved growth opportunities,
leading to a lower debt ratio.
Empirically, there is much controversy about the relationship between growth rate and level of
leverage. According to pecking order theory hypothesis, a firm will use first internally generated
funds which may not be sufficient for a growing firm. And next options for the growing firms is
to use debt financing which implies that a growing firm will have a high leverage (Drobetz and
Fix 2003). On the other hand, agency costs for growing firms are expected to be higher as these
firms have more flexibility with regard to future investments. The reason is that bondholders fear
that such firms may go for risky projects in future as they have more choice of selection between

23
risky and safe investment opportunities. Deeming their investments at risk in future, bondholders
will impose higher costs at lending to growing firms. Growing firms, thus, facing higher cost of
debt will use less debt and more equity. Congruent with this, Titman and Wessels (1988),
Barclay et al. (1995) and Rajan and Zingales (1995) all find a negative relationship between
growth opportunities and leverage. Initially we expect that firms with higher growth
opportunities will have lower level of leverage. Different research studies have used different
measures of growth; like market to book value of equity, research expenditure to total sales
measure and annual percentage increase in total assets (Titman and Wessels, 1988).
According to Myers (1977), firms with high future growth opportunities should use more equity
financing, because a higher leveraged company is more likely to pass up profitable investment
opportunities. As Huang and Song (2002, p. 9) claim: “Such an investment effectively transfers
wealth from stockholders to debtholders.” Therefore a negative relation between growth
opportunities and leverage is predicted. As market-to-book ratio is used in order to proxy for
growth opportunities, there is one more reason to expect a negative relation – as Rajan and
Zingales (1995, p. 1455) point out: “The theory predicts that firms with high market-to-book
ratios have higher costs of financial distress, which is why we expect a negative correlation.”
2.5.2 Size
Large size companies tend to be more diversified, and hence their cash flows are less volatile.
Size may then be inversely related to the probability of bankruptcy (Titman and Wessels, 1988;
Rajan and Zingales, 1995). Ferri and Jones (1979) suggest that large firms have easier access to
the markets and can borrow at better conditions. For small firms, the conflicts between creditors
and shareholders are more severe because the managers of such firms tend to be large
shareholders and are better able to switch from one investment project to another (Grinblatt and
Titman, 1998). However, this problem may be mitigated with the use of short term debt,
convertible bonds, as well as long term bank financing. Most empirical studies report indeed a
positive sign for the relationship between size and leverage (Rajan and Zingales, 1995; Frank
and Goyal, 2002; Booth et al., 2001). Less conclusive results are reported by other authors
(Kremp et al., 1999; Ozkan, 2001). Zeitun and Tian (2007) also come out with the result that
firm size has a positive impact on a firm’s performance, as large firms have low bankruptcy

24
costs. In other words, bankruptcy costs increases when firm size decreases, therefore, bankruptcy
costs have negative effect on firm’s performance.
2.5.3 Profitability
One of the main theoretical controversies concerns the relationship between leverage and
profitability of the firm. According to the pecking order theory, firms prefer using internal
sources of financing first, then debt and finally external equity obtained by stock issues. All
things being equal, the more profitable the firms are, the more internal financing they will have,
and therefore we should expect a negative relationship between leverage and profitability. This
relationship is one of the most systematic findings in the empirical literature (Harris and Raviv,
1991; Rajan and Zingales, 1995; Booth et al., 2001). In a trade-off theory framework, an
opposite conclusion is expected. When firms are profitable, they should prefer debt to benefit
from the tax shield. In addition, if past profitability is a good proxy for future profitability,
profitable firms can borrow more as the likelihood of paying back the loans is greater. Dynamic
theoretical models based on the existence of a target debt-to-equity ratio show:
that there are adjustment costs to raise the debt-to-equity ratio towards the target .
that debt can easily be reimbursed with excess cash provided by internal sources.
This leads firms to have a pecking order behavior in the short term, despite the fact that they aim
at increasing their debt-to-equity ratio (Fischer et al., 1989; Leland, 1998).
2.5.4 Collaterals
Tangible assets are likely to have an impact on the borrowing decisions of a firm because they
are less subject to informational asymmetries and usually they have a greater value than
intangible assets in case of bankruptcy. Additionally, the moral hazard risks are reduced when
the firm offers tangible assets as collateral, because this constitutes a positive signal to the
creditors who can request the selling of these assets in the case of default. As such, tangible
assets constitute a good collateral for loans. According to Scott (1977), a firm can increase the
value of equity by issuing collateralized debt when the current creditors do not have such
guarantee. Hence, firms have an incentive to do so, and one would expect a positive relation

25
between the importance of tangible assets and the degree of leverage. Based on the agency
problems between managers and shareholders, Harris and Raviv (1990) suggest that firms with
more tangible assets should take more debt. This is due to the behaviour of managers who refuse
to liquidate the firm even when the liquidation value is higher than the value of the firm as a
going concern. Indeed, by increasing the leverage, the probability of default will increase which
is to the benefit of the shareholders.
From a pecking order theory perspective, firms with few tangible assets are more sensitive to
informational asymmetries. These firms will thus issue debt rather than equity when they need
external financing (Harris and Raviv, 1991), leading to an expected negative relation between
the importance of intangible assets and leverage. Most empirical studies conclude to a positive
relation between collaterals and the level of debt (Rajan and Zingales, 1995; Kremp et al., 1999;
Frank and Goyal, 2002). Inconclusive results are reported for instance by Titman and Wessels
(1988).
2.5.5 Operating Risk
Many authors have included a measure of risk as an explanatory variable of the debt level
(Titman and Wessels, 1988; Kremp et al., 1999; Booth et al., 2001). Leverage increases the
volatility of the net profit. Firms that have high operating risk can lower the volatility of the net
profit by reducing the level of debt where else firms that have low business risk can afford to
take on more financial risk hence increase their debt ratios, on average.
2.5.6 Taxes
Debt payments are tax deductible. As such, if a company's tax rate is high, using debt as a means
of financing a project is attractive because the tax deductibility of the debt payments protects
some income from taxes. The impact of taxation on leverage is twofold. On the one hand,
companies have an incentive to take debt because they can benefit from the tax shield. On the
other hand, since revenues from debt are taxed more heavily than revenues from equity, firms
also have an incentive to use equity rather than debt. As suggested by Miller (1977), the financial
structure decisions are irrelevant given that bankruptcy costs can be neglected in equilibrium.
DeAngelo and Masulis (1980) show that if non-debt tax shields exist, then firms are likely not to

26
use fully debt tax shields. In other words, firms with large non-debt tax shields have a lower
incentive to use debt from a tax shield point of view, and thus may use less debt.
2.5.7 Management Style
Management styles range from aggressive to conservative. The more conservative a
management's approach is, the less inclined it is to use debt to increase profits. An aggressive
management may try to grow the firm quickly, using significant amounts of debt to ramp up the
growth of the company's earnings per share (EPS). Firms with risk-averse managers are likely to
have less debt in their capital structures while those with very risk-tolerant managers are more
likely to have more debt. In some growing companies where there is a controlling shareholder,
there may be a preference to finance growth by using mostly debt rather than equity because the
controlling shareholder does not want to lose controlling interest.
2.5.8 Growth Rate
A study by Barclay and Smith (1995) provides evidence that large firms and firms with low
growth rates prefer to issue long-term debt. Another study by Stohs and Mauer (1996) suggested
that larger and less risky firms usually make greater use of long-term debt. Firms that are in the
growth stage of their cycle typically finance that growth through debt, borrowing money to grow
faster. The conflict that arises with this method is that the revenues of growth firms are typically
unstable and unproven. As such, a high debt load is usually not appropriate. More stable and
mature firms typically need less debt to finance growth as its revenues are stable and proven.
These firms also generate cash flow, which can be used to finance projects when they arise.
According to Stulz (1990), McConnell & Servaes (1995), Jung, Kim, Stulz (1996), the influences
of the debt on the firms value depending on the presence of growth opportunities. For firms
facing low growth opportunities, the debt ratios are positively related to the firm value. For firms
facing high growth opportunities, the debt ratios are negatively related to the firm value. In this
context, we will try to empirically test the relationship between capital structure and the
company value given the presence of different growth opportunities.

27
2.6.0 Firm Performance
Performance refers to the extent to which organization goals and objectives are achieved
effectively and efficiently. A perennial question that plagued the previous studies concerning
capital structure and performance is as regards the choice of measure of performance. Which is
the appropriate measure of firm performance? The concept of performance is a controversial
issue in finance largely due to its multidimensional meanings. Research on firm performance
emanates from organization theory and strategic management (Murphy et al., 1996).
Performance can take many forms depending on who and what the measure for. Different
stakeholders require different performance indicators to enable them make informed decisions.
The content , format and frequency of the report depends on who needs the information and for
what purpose. Shareholders will want to be certain about the viability, growth, profitability,
return on investment and continued financial sustainability of the firm ( Brown, et al 2003).
Financial performance measures include analyzing the financial statement of the organizations.
Financial statements provide information to the management on the available resources, how
they were financed and what the company accomplishes with them. Financial statement seeks to
evaluate the performance of management. They can be grouped as liquidity, operating and
profitability, risk growth and market values ( Reill and Brown 1997). Return on asset (ROA) is
used by Chen (2004) and Cronqvist and Nilsson (2002), while return on equity (ROE) is used by
Han et al (1999) among others as measures of firms performance. In this study the researcher
will use ROE and ROA as performance measures. Cross-sectional Analysis - ratios will be used
and compared between several firms of in order to draw conclusions about an entity's
profitability and financial performance.
In summary, a firm's performance could be affected by the capital structure choice and by the
structure of debt maturity. Debt maturity affects a firm's investment options. Also, the tax rate is
expected to have an impact on a firm's performance. So, investigating the impact of capital
structure variables on a firm's performance will provide evidence of the effect of capital structure
on firm performance.

28
2.6.1 Return on Equity (ROE)
Return on Equity measures the benefits that the shareholders enjoy from their investments on the
firm. Its also referred to as , Return on average common equity, return on net worth, Return on
ordinary shareholders' funds, measures the rate of return on the ownership interest (shareholders'
equity) of the common stock owners. It is a function of a combination of the profitability assets
utilization efficiency as well as the level of gearing ( Firer et al , 2004). It measures a firm's
efficiency at generating profits from every unit of shareholders' equity. ROE shows how well a
company uses investment funds to generate earnings growth. ROE is calculated by taking the net
result over shareholders’ equity for each specified year. ROE represents what return the company
is making on the shareholders’ funds invested in the company. A business that has a high return
on equity is said to be one that is capable of generating cash internally (Ross et al, 2002). Any
change in capital structure also have significant impact on ROE which might be a true reflection
of firms performance.( De Wet, 2004)
ROE =Net Income after tax
Share holder’s Equity
i.e ROE= Profit after tax
Total number of Ordinary Shares in issue
2.6.2 Return on Assets (ROA)
Return on Assets ratio is a measure of the effectiveness of the firm in generating profits i.e the
return achieved on a company's total assets. ( Firer et al, 2004). The return is taken to be the
attributable profit (i.e. profit after tax, minority interests and preference dividends, attributable to
ordinary shareholders). ROA is calculated by taking the net result over assets for each specified
year. ROA measures how efficiently the company’s assets are used to generate profit. This ratio
is often used by investors and potential investors to evaluate a company's leadership. ROA is
best used when comparing returns between different industries. Just as for ROE, ROA can be

29
calculated in many different ways, i.e. one can apply results before taxes and interest instead of
net results. However the net result is used frequently and since it is more accessible we decided
to use the net results and not consider taxes, interest as well as extraordinary items.
ROA=Profit after tax
Total Assets
ROA tells you what earnings were generated from invested capital (assets). ROA for public
companies can vary substantially and will be highly dependent on the industry.
According to a reach condunted by Gleason, Muthur amd Murthur (2000), he found that firms
capital structure has a negative and significant impact on firms performance as measured by
ROA.
2.6.3 Stock Return
The other performance measure used is the geometric average stock return. According to the
Journal of Finance, expected return and cashflow news are identified as drivers of stock returns
(Vuolteenaho, 2002). Hence, stock return is partly a profitability measure but also considers
future expectations. Stock return is an important performance measure since it actually shows the
fluctuations that have occurred throughout the year and whether or not the stock has increased or
fallen in value. We will look at the stock return over a five-year period. This is motivated by the
fact that short-term stock returns are too volatile to be used as a reliable measure of corporate
performance (Han and Suk, 1998).
2.7 Conceptual Frame Work
The conceptual framework is a representation of figures showing the inter-relationship of
variables . The conceptual framework illustrates the effects of capital structure on firms
performance. The independent variables are : Capital structure Debt and equity.
Short-term
Long-term

30
Equity comprises of:
Ordinary Shares
Preferences shares
The dependent variable is firms performance. Performance variables include:
Return on Equity
Level of profit.
financial ratios
stock market returns
Independent Variables Extraneous Variables
Intervening Variables Dependent Variables
Dependent Variable
Moderating Variables
FIGURE 2.I Conceptual Frame work
Government policies
Capital Market
Authority Policies
Capital Structure
Debt
Time frame
Short-term
Long-term
Equity
Composition of equity
Ordinary Shares
Preferences shares
Reserves
Other Factors
Size of the firm
Age of the firm
Ownership Structure
Management
Economic performance
Political factors
Firms’ Performance
Return on Equity
Return on Assets
Level of profit.
Nature of
industry-
Agricultural,
Financial etc
Governance

31
2.8 Summary of the Chapter
This chapter presents the reviewed literature relevant to the effects of capital structure on firms
performance. It draws literature from empirical studies that have been done globally .The chapter
starts with introduction, theoretical issues in the research, optimal capital structure capital
structure theories factors determining capital and the operational

32
CHAPTER THREE
RESEARCH METHODOLOGY
3.1 Introduction
This chapter outlines the methodology used in carrying out the study. Aspects covered included
research design, population, data collection methods, validity, reliability and data analysis
method,. The objective of this study was to investigate whether capital structure has significant
effect on the performance of publicly listed companies in Kenya. The study examined financial
data for a period 10yrs ( 2001-2010).
3.2 Research Design
In order carry out the research assignment the researcher used descriptive research design which
aimed at testing associations of relationships. The study also used survey design, correlation
study and longitudinal design approach. The researcher did not visit individual firms under study
to administer any questioner but instead used secondary data from the Nairobi Securities
Exchange handbook, published financial statements for the firms under study. The firms selected
which traded in the Nairobi Securities Exchange (NSE) for the period under consideration were
evaluated. Variables such as profits, totals assets, market price per share, debt and equity were
analyzed for a period of 10 years to understand their trends and behaviors. The researcher used
descriptive research design both qualitative and quantitative research design ( descriptive ) were
used to address the research question to establish if there is any relationship in the variables.
3.3 Target Population
The population consisted of 27 selected firms on the main investment market segment ( MIMS)
of the NSE for the period of 10 years (2001-2010 ). Banks and other financial companies were
eliminated because they are special in a way due to their daily close supervision by the Central
Bank of Kenya. According to Gomez-Meija et al (1987) pooling performance over a five-year
time span reduces variability and provides a better long term indicator. In addition, it provides a

33
more reliable and valid measure of firm performance than annual measures. Several researchers
within the area such as Demsetz and Villalonga (2001) used a ten-year period for the data set.
Also the researcher wanted a sample period that represented long term conditions implied in the
chosen time period is 2001-2010.
This study was limited to companies listed to in the NSE because of greater availability and
reliability of data than those not listed companies.
3.4 Data Collection
Secondary data from NSE covering 10 year period from 2001-2010 was used. The NSE is the
ideal for carrying out the study based on the availability, accessibility and reliability of the data
that was used. This period is considered long enough to provide sufficient variables to ascertain
the strength of the relationship.
The secondary data obtained included, audited annual financial statement from NSE and CMA ,
the daily trading data from NSE handbook i.e share prices including open and closing prices
were obtained basically from the NSE for 10 years, and outstanding shares, profits, total assets ,
total expenses for the year, long and short-term liabilities at the end of each year, daily market
share prices and equity.
The researcher used firm age since the date of listing. This is in conformity with Shumway
(2001) asserts that the economically most meaningful measure of age is the number of years
since listing. Fama and French (2004), and Chun, Kim, Morck, and Yeung (2008), measured age
in the same way. Performance slows down, regardless of whether firms age is measured from
the time of listing or the time of incorporation.
3.5 Validity and reliability.
Patton ( 2001) argues that reliability and validity are two factors which any qualitative
researcher should be concerned about while defining a study , analyzing results and judging the
quality of the study . White ,( 2002) emphases that the need to build into the research design the

34
concept of validity and reliability. This was achieved by use of audited financial report from the
Nairobi Securities Exchange.
3.5.1 Validity.
Is the degree to which a tool measures what purports to measure ( Barg & Gall 1989). It
concerned with on whether the findings are relay about what its a measure . Its the accuracy and
mean fullness of inferences, which are based on the research results. It the degree to which
results obtained from the analysis of the data actually represents the phenomenon under study.
(Mugenda and mugenda (2003). The research used audited financial report for the firms under
study making this study very valid.
3.5.2 Reliability
Reliability referrers to the stability, accuracy and precision of measurement. The quality of a
research depends on the way the research is conducted and the reliability of the process .
According to Mugenda and Mugenda, (2003), reliability is a means of the degree to which the
research instrument yields consistent results after the data repeated trials.
3.6 Data analysis.
Data obtained was analyzed into useful information using descriptive statistics which include
both qualitative and quantitative methods. Quantitatively the researcher presented the
information by use of tables, line graphs. Various financial ratios were used to analyze the data
since financial ratios summarize large quantities of data can be used to perform a comparison of
performance over time. Firm performance ratios used are, Return on Equity (ROE) and Return
on Assets (ROA).
3.7 Conceptual Model
The study used the following regression model to conceptualize if capital structure has some
effect to the firms performance listed in NSE. Regression model was used since the study has
more than two independent variables.

35
Y=a + b1x1+b2x2+b3x3….
Where: Y= performance variables.
A =Y-intercept of the regression equation.
b1, b2, b3 =are the slope of the regression
x1,x2,x3 = are the dependent variables
Analytical model: To establish the effects of capital structure to firms performance listed in NSE,
the study will use the following regression model.
Y ( performance) =0+ 1 Indo i,t,+ Instoi,t,+ age i,t ,+ i,t , Where: Y =ROE, ROA, Performance variables.
0 =Y-intercept of the regression equation
1, = are the slope of the regression Indo i,t, = Institutional debt . Insto i,t, =Institutional Equity. Firms Size,age =Control variables
= error term

36
3.8 Operationalization of Variables
This is the framework that shows how objectives are manifested and measured as well as how data is to be collected and analyzed.
This framework is shown in the following figure.
Objective Variable Indicator(s) Measurement(s) Measuring
Scale
Data
Collection
Method
Data
Analysis
1. To establish if there is
any relationship between
equity and firms
performance firms in
from the selected firms
trading in the NSE.
Independent variable
Equity
Composition of equity
Ordinary shares
Preference shares
Retained earnings
Reserves
Quantity / Numbers
Value (Kshs)
Ordinal
Ratio
Secondary
Data
Descriptive
statistic
Dependent Variable
Firm performance
Level of profitability
ROA, ROE , P/E ratio
Level of Profit
(High/Low)
Total Assets (Value)
Ordinary shares
(No./Value)
Market price per
share(Value)
Ordinal
Ratio
Multiple
Regression

37
2. To establish if there is
any relationship between
debt and firms
performance firms in
from the selected firms
trading in the NSE
Independent variable
Debt
Time Horizon-
Long-Term debt ,
Short-term Debt
Length of term (Years)
Value (Kshs)
Ordinal
Ratio
Secondary
Data
Descriptive
statistic
Dependent Variable
Firm performance
Level of profitability
ROA, ROE , P/E ratio
Level of Profit
(High/Low)
Total Assets (Value)
Ordinary shares
(No./Value)
Market price per
share(Value)
Ordinal
Ratio
Multiple
Regression
3. To establish if there is
any relationship between
age of the firm and its
performance from the
selected firms trading in
the NSE
Independent variable
Age
Number of years since
incorporation
Number of years Ordinal
Secondary
Data
Descriptive
statistic
Dependent Variable
Firm performance
Level of profitability
ROA, ROE , P/E ratio
Level of Profit
(High/Low)
Total Assets (Value)
Ordinary shares
(No./Value)
Market price per
share(Value)
Ordinal
Ratio
Multiple
Regression
FIGURE 3.1 Operationalization of Variables

38
CHAPTER FOUR
DATA ANALYSIS,PRESENTATION AND INTERPRETATION
4.1 Introduction
The objective of this study was to investigate whether capital structure has significant effect on
the performance of the selected listed companies in Nairobi Securities Exchange Market (NSE) .
Data consisted of all the selected quoted companies which traded in the NSE between 2001-
2010. Capital structure was analyzed in terms of debt and equity. Performance measure used in
the data analyses included ROE and ROA. Age of the firm as another factor affecting
performance was also considered in this study. Secondary data from NSE covering a ten year
period from 2001-2010 comprising of audited financial statements was used. Data was analyzed
using Statistical Package for Social Science (SPSS) and correlation and regression analyses were
used as a means of establishing quantitative association and relationship between firm
performance and its capital structure. The researcher selected 27 ( Appendix 1) firms from the
NSE for the purpose of the study.
4.2 Data Analysis
In the study the researcher used ROE and ROA as measures of performance. Secondary data
used included, audited annual financial statement from NSE. Financial statements were
extracted from the NSE handbook, firm profits, total assets and equity and debt were obtained
from the Balance sheet and Profit and loss statement obtained basically from the NSE for ten
years ( 2001-2010).During the research work, the researcher used descriptive research method.
Quantitatively the researcher cross tabulated the information and analyzed the data using t-taste.
Data was analyzed using Statistical Package for Social Science (SPSS) and correlation and
regression analyses were used as a means of establishing quantitative association and
relationship between firm performance and its capital structure. To establish the effects of capital
structure on a firms performance, the study applied the following regression model.
Y ( performance) =0+ 1 Indo i,t,+ Instoi,t,+ age i,t ,+ i,t , Where:

39
Y =ROE, ROA, Performance variables.
0 =Y-intercept of the regression equation
1, = are the slope of the regression Indo i,t, = Institutional debt . Insto i,t, =Institutional Equity. Firms Size,age =Control variables
= error term
4.3.0 Research Findings.
During the study the researchers was interested in finding the relationship between equity, debt
and firms age to firms performance as measured by ROA and ROE.
4.3.1 Relationship between equity and firms Performance.
Equity Capital represents the personal investment of the owner(s) in the business. Is called risk
capital because investors assume the risk of losing their money if the business fails. It does not
have to be repaid with interest like a loan does. Equity capital is capital raised from owners in
the company. During the research the researcher used Share capital (common stock),preferred
stock, Retained earnings and Reserve as measures of equity.
The table below shows total equity and performance indicators
Table 4.3.1
Total equity and performance indicators Return on Equity and Return on Assets
Year Total Equity ROE ROA
2001 2 587 945 0.12 0.02
2002 2 604 353 0.06 0.04
2003 2 615 889 -0.03 0.04
2004 3 428 528 0.15 0.08
2005 3 927 791 0.17 0.08
2006 4 697 241 0.17 0.07
2007 5 283 846 0.17 0.08
2008 6 101 570 0.14 0.07
2009 5 780 702 0.15 0.08
2010 8 003 335 0.15 0.07
Total 45 031 201 1.25 0.64
Average 4 503 120 0.13 0.06

40
From the research objectives the researcher tested the relationship between Equity and firms
performance measured by Return on Equity (ROE ) and Return on Assets (ROA)
Table 4.3.2
Correlation Matrix of the variables used in the study
Total Equity
Total Debt AGE ROE ROA
Total Equity Pearson Correlation 1 .688** .188** .162** .228**
Sig. (2-tailed) 0 0.002 0.008 0
Total Debt Pearson Correlation .688** 1 0.09 -0.064 -.127*
Sig. (2-tailed) 0 0.139 0.295 0.037
AGE Pearson Correlation .188** 0.09 1 -0.09 -0.041
Sig. (2-tailed) 0.002 0.139 0.141 0.499
ROE Pearson Correlation .162** -0.064 -0.09 1 .462**
Sig. (2-tailed) 0.008 0.295 0.141 0
ROA Pearson Correlation .228** -.127* -0.041 .462** 1
Sig. (2-tailed) 0 0.037 0.499 0
**. Correlation is significant at the 0.01 level (2-tailed). *. Correlation is significant at the 0.05 level (2-tailed).
Table 4.4.2 below shows Correlation Matrix which was constructed to check for the possibility
of closely related variables. To test for the existence of a linear relationship between the
dependent and the independent variables, According to table 4.4.2 above there exist a
significantly positive correction between ROE and total equity (Pearson Correlation
Coefficient=0.162, p-value=0.008<0.05), . This implies that as Equity increases the performance
of the firm measured by ROE increases. This is due to the fact that the cost associated with
equity as a source of capital is low hence has a positive effect on firms’ performance.

41
Higher level of equity leads to higher ROA and ROE. The findings is in conformity with pecking
order theory which postulates that firms prefer spending equity and to be more precise retained
earnings first before resorting to debt . The pecking order theory assumes that managers act the
best interest of the shareholders (Myres, 2001).
Table 4.3.3
Model Summary (R-square)
R R Square Adjusted R Square Durbin-Watson
0.321 0.103 0.093 2.102
The R-square value according to the table 4.3.3 above is 0.321 while the adjusted R-square is
given as 0.103 implying that the regression model explains only 9.3% of the dependent variable
(ROE). This implies that firms performance is determined by other factors than equity which is
represented by 90.7 %
To test for the existence of a linear relationship between the equity and firms performance
variables, Analysis of Variance was employed. The results from the analysis of variance as per
table 4.3.4 below shows that the regression relationship between ROE and the independent
variables is statistically significant at 5% level of significance (F=10.211, p-value=0.000<0.05).
Table 4.3.4
Analysis of Variance (ANOVA)
Sum of Squares df Mean Square F Sig.
Regression 3.251 3 1.084 10.211 0
Residual 28.228 266 0.106
Total 31.479 269

42
The results in table 4.3.5 below show the test of significance of individual regression parameters.
The results show that all the regression parameters are statistically significantly and positively
related to the Return on Equity at 5% level of significance. The coefficient of the regression
parameters for Total Equity is zero implying that there is no linear relationship to Return on
Equity
Table 4.3.5
Regression Model (General)
Coefficients t P-value
(Constant) 0.207 3.577 0
Total
Equity 0 5.225 0
Total Debt 0 -4.286 0
AGE -0.002 -2.339 0.02
The resultant regression equation based on the findings in table 5 can then be expressed
as;
0.002Ageebt.000TotalD0lEquity.0.000Tota0207.0ROE
4.3.2 Relationship between debt and firms Performance
Debt financing refers to the borrowing of funds from outsiders in order to finance a purchase,
acquisition or expansion . Since debt financing involves borrowed funds, it must be repaid,
typically in installments and with interest. The interest that must be paid on debt financing is
determined by the creditworthiness of the borrower, the intended use of the funds, and by the
current financial climate. Businesses and corporations find debt financing attractive because the
interest paid is tax deductible. The researcher used total debt because firms financial statement
had combined short-term and long-term debt as indicated in table 4.3.5 below.

43
Table 4.3.5
Total Debt and performance indicators.
Year Total Debt ROE ROA
2001 2 083 082 0.12 0.02
2002 3 260 848 0.06 0.04
2003 3 684 093 -0.03 0.04
2004 3 664 970 0.15 0.08
2005 4 460 724 0.17 0.08
2006 5 901 481 0.17 0.07
2007 6 559 935 0.17 0.08
2008 7 843 068 0.14 0.07
2009 9 308 664 0.15 0.08
2010 10 753 403 0.15 0.07
Total 57 520 268 1.25 0.64
Average 5 752 027 0.13 0.06
The researcher also tested the effects of debt to firms’ performance. Some firms reported their
debt value as one block figure without separating it into short-term and long-term debt. This
necessitated the researcher to use total debt to determine its effects on firms’ performance. The
results as per table 4.3.2 indicated that there exists a significant and negative correlation
between total debt and ROA (Pearson Correlation Coefficient=-0.127, p-value=0.037<0.05) and
ROE (Pearson Correlation Coefficient=-0.064, p-value=0.295<0.05) , implying that highly
performing firms have lower value of total debt this is because they can finance their firms
requirements from the internally generated funds. Also it means that as debt increases the
performance of the firm declines. Hence loss of profitability. This is in conformity with Zeitun
and Tian (2007) who found t firm’s capital structure have a significant and negative impact on
the firm’s performance measures in both the accounting and market measures. Stulz (1990) like
Jensen believes that debts payment decreases cash flows available for firm growth/ expansion.
This findings showed that debt exposes firms into risk. Although Interest paid on debt is tax
deductable but the principle repayment and interest deny the firm funds which could otherwise
be used for expansion purposes.

44
4.3.3 Relationship between firms age and its performance.
As firms get older, they might become less productive if they become increasingly inert and
inflexible. Barron et al. (1994) argue that old firms are prone to suffer from a liability of
obsolescence because they do not fit in well to the changing business environment and also a
liability of senescence according to which they become ossified by accumulated rules, routines
and organizational structures.
Table 4.3.6 Firms age and Performance indicators -Return on Equity
and Return on Assets
Year AGE ROE ROA
2001 48.96 0.12 0.02
2002 49.96 0.06 0.04
2003 50.96 -0.03 0.04
2004 51.96 0.15 0.08
2005 52.96 0.17 0.08
2006 53.96 0.17 0.07
2007 54.96 0.17 0.08
2008 55.96 0.14 0.07
2009 56.96 0.15 0.08
2010 57.96 0.15 0.07
Total 534.63 1.25 0.64
Average 53.46 0.13 0.06
The researcher also tested the effects of firms’ age to its performance. Age of the firm was
calculated based on the date of registration of the firm with the register of companies up to the
date of this research. The results also indicate that there is a negative correlation between ROE
and ROA as measures of firms performance and firms age being ( Pearson Coefficient= -0.090,
p-value=0.141<0.05),and ( Pearson Coefficient= -0.041, p-value=0.499<0.05),respectively. This
implies that old firms need not be performing well . As firm grow old holding other things
constant can find themselves being smoked out business if they do not cope with changes in
technology to increase their performance. Also firms tend to attract high operational cost as the
advance in age. These high operational cost reduces the firms profitability

45
Agarwal and Gort,1996 and 2002 in their research on comparison of productive efficiency of
firms at different ages, they concluded that older firms could lose their competitive edge hence
affecting their performance. This is because old firms are more rigid , their operating expenses
increase , they experience decline in market share market share and therefore a relative decline
in sales growth. They encounter reduced R&D and investment activities. The reason for this
prediction is that there is only limited scope for improvement of the firm’s current production
technology and its products. The researcher used firm age since the date of listing. This is in
conformity with. Shumway (2001) asserts that the economically most meaningful measure of
age is the number of years since listing. Fama and French (2004), and Chun, Kim, Morck, and
Yeung (2008), measure age in the same way. Performance slows down, regardless of whether
firms age is measured the time of listing or the time of incorporation.
4.4 Trend analysis for performance
The table below shows the trend of Return on Equity and Return on Assets for 10yrs.
Generally firms performance was low in 2003 and stabilized there after.
Table 4.4.1
Firms performance trend
Year
Y 2001 Y 2002 Y 2003 Y 2004 Y 2005 Y 2006 Y 2007 Y 2008 Y 2009 Y 2010
ROE 0.1179 0.0561 -0.0307 0.1495 0.171 0.1658 0.1718 0.1443 0.1533 0.1535
ROA 0.0248 0.0424 0.0405 0.0803 0.081 0.0727 0.0777 0.0747 0.0771 0.0707

46
Figure 4.4.1 Trend of Measures of Performance
Source: Generated from analysis using SPSS
The figure above shows the trend of ROA and ROE for the 10years period of study. From the
figure above is quite clear that both ROA and ROE as measures of firms performance
experienced a major decline in 2003 and then started increasing steadily and declined again in
2008, where they started increasing in 2009. This trend is attributable to political factors. The
2002 and 2007 national election affected firms performance for subsequent year. Its evidenced
that during the year after of the national election firms performance is low and starts to improve
after the National elections. This indicates that national elections have a negative effect on the
returns of firms as measured by ROA and ROE . Also the decline in performance in 2008 can be
attributable to the financial crisis or economic melt-down which started in 2007 lead to a
slowdown of global economy. Business were all affected resulted to poor profits . Shares
performance in the NSE was very low hence discouraged investors in investing in equity and
directed their resources into other securities such as bonds and unit trust. This is evidenced by
the trough on the ROA tread.
-.0500
.0000
.0500
.1000
.1500
.2000
Y2001 Y2002 Y2003 Y2004 Y2005 Y2006 Y2007 Y2008 Y2009 Y2010
ROE ROA

47
CHAPTER FIVE
SUMMARY OF FINDINGS, DISCUSSION, CONCLUSION AND RECOMENDATIONS
5.1 Introduction
This chapter presents the summary of findings , discussion of results, conclusion and
recommendations with areas of further research on effects of capital structure on firms
performance. The objective of this paper was to examine the effects of capital structure on firm
performance . Specifically this paper examined the effects of Equity and Debt to firms
performance as measured by ROE and ROA . Debt was reported as a block figure by some firms
and should be separated in short-term and long-term since debt maturity date will have different
effects on firms’ performance. The researcher considered Equity as comprised by both ordinary ,
preference shares, reserves and retained earnings. The findings showed varying results in the
relationship between the effects of debt, equity and age on ROA, ROE as measures of
performance.
5.2 Summary of Findings
Its imperative that firms performance is affected by capital structure either positively or
negatively. The researcher was trying the establish the effects of capital structure to firms
performance. Age was used as a proxy to firms performance. The findings can be summarized in
the table below.
Table 5.1 summary findings and recomendations
Objectives Findings Recommendations
1. To establish if there is
any relationship between
equity and firms
performance firms in
from the selected firms
trading in the NSE.
The results of the analysis showed
that there exist a significantly positive
correction between ROE and total
equity (Pearson Correlation
Coefficient=0.162, p-
value=0.008<0.05), and This implies
The findings is in
conformity with pecking
order theory which
postulates that firms prefer
spending equity and to be
more precise retained

48
that as Equity increases the
performance of the firm measured by
ROE increases.
earnings first before
resorting to debt . The
pecking order theory
assumes that managers act
the best interest of the
shareholders (Myres, 2001).
Therefore firms should first
utilize internal equity before
the use debt as a source of
financing
2. To establish if there is
any relationship between
debt and firms
performance firms in
from the selected firms
trading in the NSE
Results indicate that there exists a
significant and negative correlation
between total debt and ROA (Pearson
Correlation Coefficient=-0.127, p-
value=0.037<0.05) and ROE
(Pearson Correlation Coefficient=-
0.064, p-value=0.295<0.05)
Firms should explore other
funding sources which does
not have a negative impact
of forms performance such
as equity,
3. To establish if there is
any relationship between
age of the firm and its
performance from the
selected firms trading in
the NSE
Results indicate that there exist a
negative correlation between ROE
and ROA as measures of firms
performance and firms age being (
Pearson Coefficient= -0.090, p-
value=0.141<0.05),and ( Pearson
Coefficient= -0.041, p-
value=0.499<0.05),respectively
As firms age , management
should be very keen on the
capital structure and also
embrace technology which
can improve firms
performance,.

49
5.3 Discussion of the Findings
Based on the findings of the study the following discussions can be deducted.
The Relationship between equity and firms performance.
Firm performance was measured using Return on Assets (ROA) and Return on Equity ( ROE).
Equity used is the sum of the value of Ordinary shares, preference shares, retained earnings and
reserves. The results of the analysis showed that there exist a significantly positive correction
between ROE and total equity (Pearson Correlation Coefficient=0.162, p-value=0.008<0.05),
and this implies that as Equity increases the performance of the firm measured by ROE
increases. From the report it was evidenced that Total Equity, had a positive relationship between
firms performance as measured by both ROA and ROE. The main argument behind this is that
equity as a source of capital is less costly as opposed to other external sources of capital. Myres
(2001) postulates that firms tend prefer retained earnings first before they resort to debt. Retained
earnings unless re-invested into the firm may not give high returns to the shareholders.
Meziane (2007) explains that two main compensations of debt financing are taxation and
discipline. He contends that, interests are paid before tax payments but dividends are paid after
taxation, so the cost of debt is significantly less than that of equity. Normally, due to bankruptcy,
managers remain cautious and issue a given amount of debt that will not lead the company into
problems of default in payment of interest. External equity also has its shortcomings. Although,
dividend declaration and payment is not mandatory, it is an incentive to potential investors and
may lead to increase in share price. However, it has the problem of dilution of ownership and
principal-agency conflicts.
Based on empirical evidence, options have been made available on how a firm could finance its
operations. Fluck (1999) reveals that the preliminary and following decisions of financing should
follow a pattern. Companies will float external equity and bonds initially and afterwards, use
retained earnings, long term debts and external equity for subsequent financial requirements.
Stenbacka and Tombak (2002) largely agree with Fluck’s assertion but not the other of
financing. They recommend that small companies should issue debt first to generate retained
earnings and as it accumulates, managers should concurrently obtain both debt and new equity.

50
Meziane (2009) postulates a slightly different view. start ups should be financed with owners’
capital, expanding companies with venture capital or private equity while mature companies
should use internal financing, more debt and equity. These options are suggested but managers
should choose which one to follow in accordance with prevailing circumstances in their
companies.
The Relationship between firms debt and its performance.
The researcher used total debt ( Long term and short term) for each of the firim in the sample .
The secondary data used could not separate the two.
The results of the regression analysis shows that there exists a significant and negative
correlation between total debt and performance measures ROA (Pearson Correlation
Coefficient=-0.127, p-value=0.037<0.05) implying that highly performing firms have lower
value of total debt. Debt ratio will determine the financial health of companies. This ratio helps
investors to identify risk rate for companies. The company that has a high debt ratio will have a
negative impact on firm performance and value. Companies can reduce debt ratio and increase
profitability thus improved ROA and ROE measures. This could indicates this issue, the
companies that have high debt ratio (DR) due to borrowing, are incurred costs as the financial
costs which reduce net income and in contrast, return on assets (ROA) and return on equity
(ROE) will reduce.
The results are therefore in conformity with pecking order theory which argues that managers
therefore prefer internally generated funds (retained earnings) to external funding, and if
necessary, prefer debt to equity because of lower information costs associated with debt issues.
Many measures of firm performance, such as a firm’s profitability, are negatively correlated with
financial leverage. This result can be interpreted in this way that high leverages companies woud
have less profitability. Also the negative relationship of debt to firms performance can be due to
agency conflicts, Mangers tend to have conflicting interest as opposed to those of shareholders,
hence over-leverage firms , thus affecting their performance negatively. This is in consistence
with the findings of Mathur and Mathur (2000). Myers ( 2002) made a fundamental observation
that there is no universal theory of capital structure as each vary with firm and environmental
conditions prevailing at any given time. For example Welch ( 2004) argued that performance of a
firm share price will affects the capital structure. When inflation is high firms tent to high debt (

51
Frank & goyal , 2004). Krishnan and Moyer, (1997) found a negative and significant impact of
total debt on firms return as measured by return on equity (ROE). Abor (2005) reports a
positive relation between capital structure, which measured by total debt ( short –term and long
term debt), and performance over the period 1998-2002 in the Ghanian firms. Stulz (1990)
argued that debt can have both a positive and a negative effect on firm performance and
presumably both effects are present in all firms.
Ross (1977), Heinkel (1982) and Noe (1988) suggest that increasing leverage, by acquiring debt
should have positive implications for firm value and performance. Furthermore, this result is also
supported by Hadlock and James (2002) where they concluded that companies prefer debt (loan)
financing because they anticipate a higher. Min Tsung Cheng (2009) studied the relative effects
of debt and equity financing on the operating performance. Findings in this study show that apart
from high cash flow firm, debt finance and debt financing have significantly negative
consequence for operating performance. Hence, these findings suggest that it is dangerous for
firms to rely or depend entirely on either debt or equity for raising capital but it is much safer and
better to raise finance by both methods, with each working together, at the same time. Thus, this
finding suggests firms to try whenever possible to raise finance by using both methods
simultaneously, with the advantages of the one method offsetting the difficulties of the other and
vice versa. This support the findings by Krivogorsky et.al (2009) when the findings had found a
negative association between debt to equity and performance hence confirming prior research
findings that companies with high debt to equity ratios are usually perceived as being risky
investments and possibly affecting wealth transfer from debt holders to share holders.
Gleason et.al (2000), found total debt to be negatively related to return on assets and this result is
consistent with Min-Tsung Chen (2009) who found that the anticipated debt ratio has
significantly negative effects on operating performance. Besides that, Johnny Jermias (2008) also
had found a negative relationship between financial leverage and return on equity. Thus, a
negative relationship is hypothesized between total debts and profitability.

52
The Relationship between firms age and its performance.
The researcher used firm age since the date of listing. This is in conformity with Shumway
(2001) asserts that the economically most meaningful measure of age is the number of years
since listing. Fama and French (2004), and Chun, Kim, Morck, and Yeung (2008), measure age
in the same way. Performance slows down, regardless of whether firms age is measured the
time of listing or the time of incorporation.
The researcher found that Firms age had a negative relationship in both ROE and ROA. This
agrees with Frielinguaus Mostert and Firer ( 2005) research outcome, where he found a negative
relationship between firma age and firms performance, Another study by Gleason, Mathur and
Mathur, (2000) found that firms capital structure has a negative and significant impact on firms
performance measures return on assets (ROA), Age could be a proxy for other drivers of
performance, for instance, financial constraints.
The aging phenomenon could be the expression of organizational rigidities and inertia that
make it difficult for the firm to recognize, accept, and implement innovation signals from the
market. Consistent with that, costs and overhead expenses go up with age, margins thin, and
growth slows down. Perhaps more important, aging could also be associated with an inability to
design incentive mechanisms to prevent managerial quiet lives and rent-seeking behavior as
firms grow older. They concluded that older firms could lose their competitive edge hence
affecting their performance. This is because old firms are more rigid , their operating expenses
increase , they experience decline in market share and therefore a relative decline in sales
growth.
Since firms are organizations that can be restructured as needs evolve, there is no a priori reason
why they should age. In fact, as they mature, firms should be able to learn. They can learn by
doing or by investing in research and development; they can hire human capital and train their
employees; and they can learn from other firms in the same and in other industries should also
discover what they are good at (Jovanovic, 1982). Consistent with this prior belief, various
studies in the industrial organization literature report that life expectancy increases with age
(Dunne, Roberts, and Samuelson, 1989), and better firms survive (Baker and Kennedy, 2002).

53
Hopenhayn (1992) shows that, under plausible assumptions, older firms enjoy higher profits and
value. As experience is perceived to be a contributing factor towards the enhancement of firm
performance, older firms are hypothesized to perform better than newer firms. However,
research has shown mixed results in the relationship between age of a firm and performance.
Ketokivi and Schroeder (2004) and Morgan et al.
5.4 Conclusion
Firm’s level of debt does not only affect corporate performance and failure but also its debt
maturity structure (Barclay and Smith, 1995 and Ozkan, 2002). Schiantarelli and Sembenelli
(1999) investigated the effects of firms’ debt maturity structure on profitability on firms in Italy
and the United Kingdom and found a positive relationship between initial debt maturity and
medium term performance. Furthermore, there are other factors, besides capital structure, that
may influence firm performance such as firm size, age, growth, risk, tax rate, factors specific to
the sector of economic activity, and factors specific to macroeconomic environment of the
country. In summary, a firm’s performance could be affected by the capital structure choice and
by the structure of debt maturity. Debt maturity affects a firm’s investment options. Also, the tax
rate is expected to have an impact on a firm’s performance. So, investigating the impact of
capital structure variables on a firm’s performance will provide evidence of the effect of capital
structure on firm performance.
There are other measures of performance called market performance measures, such as price per
share to the earnings per share (P/E) (Abdel Shahid, 2003), market value of equity to book value
of equity (MBVR), and Tobin’s Q. Tobin’s Q mixes market value with accounting value and is
used to measure the firm's value in many studies (e.g., Morck, Shleifer, and Vishny, 1988,
McConnel and Serveas, 1990, and Zhou, 2001). The results of this report gives an inconclusive
information on effects of capital structure on firms performace.
Firm performance may also affect the capital structure choice ( Berger and Bonaccorsi di Patti,
2006). This reverse causality effect is in essence a feature of theories linking agency costs
(Jensen and Meckling, 1976; Myers, 1977; Harris and Raviv, 1990), corporate control issues

54
(Harris and Raviv 1988), and in particular, asymmetric information (Myers and Majluf, 1984;
Myers, 1984) and taxation (DeAngelo and Masulis, 1980; Bradley et al., 1984) with the value of
the firm.
Since firms are organizations that can be restructured as needs evolve, there is no a priori
reason why they should age. In fact, as they mature, firms should be able to learn. They can
learn by doing or by investing in research and development, they can hire human capital and
train their employees, and they can learn from other firms in the same and in other industries
(see, for example, Bahk and Gort, 1993, and the vast literature cited therein). Over time, firms
should also discover what they are good at (Jovanovic, 1982).
Capital structure literature has shown conflicting results among researchers. Some studies have
shown that capital structure has significant impact on firm performance while others have shown
no impact. Generally, researchers agree that an association between capital structure and firm
performance exist (Hung, et. al.2002). While some studies have concluded that the relationship
between capital structure and firm performance is both positive and negative Abor, 2005. Others
concluded that the relationship is negative (Narendar, et. al. 2007). Yet, other studies have
documented a positive relationship (Akintoye, 2008). With these mixed and conflicting results,
the quest for examining the relationship between capital structure and firm performance has
remained a puzzle and empirical study continues.
Based on the analysis, one may argue that firm’s financing decision is influenced by many
factors, and explaining that decision by one theory (trade-off or pecking order) may be short of
providing a complete diagnosis of that decision. In fact, each capital structure theory works
under its own assumptions and so does not offer a complete explanation of financial decisions.
This means that searching for an optimal capital structure is not one-way to go (Myers, 2001;
Eldomiaty, 2007). This could explain the mixed and contradictory results of the studies that
empirically tested the predictions of these theories (i.e. relationship between leverage and firm’s
profitability)
According to Gleason et al. (2000), the utilization of different levels of debt and equity in the
firm’s capital structure is one such firm-specific strategy used by managers in the search for

55
improved performance. Hence, most firms have strived to achieve an optimal capital structure in
order to minimize the cost of capital or to maximize the firm value, thereby improving its
competitive advantage in the marketplace through a mixture of debt and equity financing. Thus,
selecting the right type of debt is an equally important issue as opting for an appropriate debt to
equity ratio. However, as noted by Myer (2001), each theory works under its own assumptions
and propositions, hence, none of the theories can give a complete picture of the practice of
capital structure.
5.5 Recommendation
In the study the researcher assumed all financial year ended 31st December in every year of
analysis. Firms in Kenya have different financial calendars some ending in March, June,
September and Decembers. Firms should be categorized in terms of financial year and analyzed
to enable a reliable conclusion. Firms should explore other funding sources which does not have
a negative impact of forms performance such as equity, As firms age management should be
very keen on the capital structure and also embrace technology which can improve firms
performance, Gleason, Mathur, and Mathur (2000), found that Firm size has a positive and
significant impact on firm performance ROA, The economic environment , organizational
policy and risk will affect firms’ performance
Firms performance tread analysis done by the researched noted that, immediately after the
Kenya national election ( 5yr term) , firms performance tends to be quite low during the year of
election and improves after election. This can be attributable to investor panics in their
investment decisions. Many firms tend to slow down production during election period.
To understand how companies finance their operations, it is necessary to examine the
determinants of their financing or capital structure decisions. Company financing decisions
involve a wide range of policy issues. At the private, they have implications for capital market
development, interest rate and security price determination, and regulation. At the private, such
decisions affect capital structure, corporate governance and company development (Green,
Murinde and Suppakitjarak, 2002).

56
Capital Market Authority should encourage firms to separate short-term and long-term debt in
the financial statement.
5.6 Suggestions for Further Research.
This study focuses on the firms listed in the NSE Main Investment Market Segment. During the
course of this study several ideas and potential research areas have crossed my mind. The
purpose of this section is to serve as a source of inspiration for further researchers who want to
write research papers within this area of work.
Issues of industry context need to be examined. This means a study need to be done on industry
basis hence a conclusion be made. One interesting idea is to separate companies according to
size, same financial year-end for generalized comparison. In this study large companies that in
general represent maturing industries are associated with better performance regarding stock
return and accounting profitability and analyzed together with the small young firms and need to
be separated.
Another interesting aspect would be to use other performance measures and also non financial
performance measures should be incorporated in the analysis. In this study we have only applied
standard forms of performance measures such as ROE and ROA. A more precise measure of
performance such as EVA that shows the economic value added would give a more reliable
performance measure.
Its important to separate short-term and long-term debt since they affect performance of firms
differently. Debt maturity should be disclosed by firms in their financial presentation . Debt
maturity can be used as an independent variable for study, since the age of debt will affect firms
performance differently.
Firms performance vary in size, companies need to be studied in terms of their size .
Debt maturity affect firms performance differently. Long-term debt attract high capital cost
before its maturity as opposed to short –term debt. Debt should therefore be structured based on
their maturity period.

57
REFERENCE
Abor, J. (2005). The effect of capital structure on firm performance: an empirical analysis of
listed firms in Ghana, Journal of Risk Finance, Vol. 2,pp438-447.
Abor, J. (2005).1. Journal of Risk Finance, Emerald Group Publishing, 6(5),438-445.
Akintoye, I. R. (2008). Sensitivity of Performance to Capital Structure. European Journal of
Social Science , 7(1),.
Akintoye,I.R (2008). Effects of capital structure on firms performance the Nigerian experience
European journal of economics , Finance and administration Science.
Barbosa, N., & Louri, H. (2005). Corporate Performance: Does Ownership Matter? A
Comparison of Foreign- and Domestic-Owned Firms in Greece and Portugal. Review of
Industrial Organization , 27(1),73-102.
Berenson, I. and Levine, M.(1999). Basic Business Statistics: Concepts and Applications.
London, Seventh Edition, Prentice Hall, Inc.
Booth, L., V. Aivazian, A. Demirguc-Kunt, and V. Maksmivoc, (2001), “Capital structures in
developing countries,” Journal of Finance Vol. 56, 87-130
Boodhoo, R. (2009) Capital structure and ownership structure , a review of literature the journal
of on lin education January edition,
Eldomiaty, T. (2007). Determinants of corporate capital structure: evidence from an emerging
economy, International Journal of Commerce and Management, Vol. 17,pp25-43.
Ebaid, I. E. (2009).The Impact of Capital-Stucture Choice on Firm Performance: Empirical
Evidence from Egypt. The Journal of Risk Finance, 10(5),477-487.
Ehrhardt, M. and Brigham, E.( 2003). “Corporate finance - A focused approach,” 1st Edition,
Mason, Thomson.
Fama, E. and French, K. R. (2002). Testing trade- off and pecking order predictions about
dividends and debt, Review of Financial Studies, Vol. 15,133-139.
Fluck, Z. (1999). The dynamics of the management-stakeholders conflict, Review of Economic
Studies.pp 31-35

58
Frank, M. Z. and Goyal, V. K. (2003). Testing the pecking order theory of capital structure,
Journal Financial Economics, Vol. 8, pp217-248.
Frank, M. Z. and Goyal, V. K. (2005). Trade-off and pecking order theories of debt, Journal of
Financial Economics, Vol. 5,pp 35-41.
Frielinghaus, A., Mostert, B. and Frier , C ( 2005) Capital Structure and Firm’s Life Stage .
South African Journal of Business Management
Foo, S. M. (2002). An Investigation Of The Relationship Between Capital Structure And
Corporate Performance In The Trading/Services and Plantation Sector. MBA Project
Paper .
Gleason, K. C., Mathur, L. K. & Mathur, I. (2000). The Interrelationship between Culture,
Capital Structure, and Performance: Evidence from European Retailers. Journal of
Business Research, 50(2), 185-191.
Graham, J. and Harvey, C. (2001). The theory and practice of corporate finance: evidence from
the field, Journal of Financial Economics, Vol. 50,pp187-243.
Green, C.J., V. Murinde and J. Suppakitjarak. ( 2002). Corporate Financial Structure in India.
Harris, M. and A. Raviv. (1990). “Capital Structure and the Informational Role of Debt, Journal
of Finance" Vol. 45, pp.321-349.
Harris, M., and A. Raviv, (1991). “The theory of capital structure,” Journal of Finance, Vol. 46,.
pp.297-355
Hatfield, G., Cheng, L., Davidson, W., (1994). “The determination of optimal capital structure:
The effect of firm and industry debt ratios on market value,” Journal of Financial And
Strategic Decisions,Vol.7, No3, pp.1-14.
Huang, S. G. – Song, F. M. (2002): The Determinants of Capital Structure: Evidence from
China. Hong Kong Institute of Economics and Business Strategy, Working Paper, 2002,
no. 1042.
Johannes v H de We; Kivesh Dhanraj, (2007). “Unlocking shareholder value by moving closer to

59
the optimal capital structure,” Accountancy SA, Accounting and Tax Predictions, pp.28-
32.
Jensen, M. (1986). “Agency costs of free cash flow, corporate finance and takeovers. American
Economic Review", Vol. 76 no.2, pp.323-329.
Kathleen M. Kahle and Shastri, Kuldeep. ( 2002). Firm Performance, Capital Structure and the
Tax Benefits of Employee Stock Options .
Kinsman, M. and Newman, J., (1998). “Debt tied to lower firm performance: Finding calls for
review of rise in debt use,”Pepperdine University.
King, M. R., & Santor, E. (2008). Family Values: Ownership Structure, Performance and Capital
Structure of Canadian Firms. Journal of Banking and Financial , 32,2423-2432.
Kochhar, R., (1997). “Strategic assets, capital structure, and firm performance,” Journal of
Financial and Strategic Decisions,Vol.10, No3, pp.23-36.
Leland, H. and Pyle, H., (1977). “Informational asymmetries, financial structure, and financial
intermediation,” Journal of Finance, Vol.32, No2, pp.371-87.
Lubatkin, M. and Chatterjee, S. (1994). Extending modern portfolio theory into the domain.
of corporate diversification: Does it apply?. Academy of Management Journal, 37, pp.
109-136
Marsh, P. (1982): The Choice between Equity and Debt: An Empirical Study. Journal of
Finance,vol. 37, 1982, pp. 121–144.
Modigliani, F. and Miller, M.H. (1958). “The cost of capital, corporation finance and the theory
of investment, American Economic Review", Vol.48, pp. 261 -297
Myers, S., and N. Majluf. (1984). “Corporate financing and investment decisions when firms
have information investors do not have, Journal of Financial Economics", Vol. 13,
pp.187-222.
Myers, S. C. (1984): The Capital Structure Puzzle. Journal of Finance, vol. 39, 1984,
pp. 581–582.
Myers, S. C. (2001): Capital Structure. Journal of Economic Perspectives, vol. 15, 2001,

60
pp. 81–102.
Masulis, R.,( 1983). “The impact of capital structure change on firm value: Some estimates,” The
Journal of Finance, 38 (1),pp.107-26.
McConnel, J. and Servaes, H.,( 1995). “Equity ownership and the two faces of debt, ” Journal of
Financial Economics, Vol.39, pp.131-57.
Messbacher, U.( 2004). “Does capital structure influence firms value?”, University of Ulster.
Miller, M. (1977). “Debt and tax,” Journal of Finance, Vol. 32, pp.261-75.
Modigliani, F., and Miller, M.,( 1963). “Corporate income taxes and the cost of capital: A
correction,” American Economic Review, Vol.53, pp.433-43.
Myers S, Majluf N.( 1984). Corporate Financing and investment decisions when firms have
information that investors do not have. Journal of Financial Economics 13: 187–221.
Mugenda and Mugenda (2003). Research Methods – Quantitative & Qualitative Approaches
Pandey, I. M. (1999). Financial Management, New Delhi, 7th edition: Vikas Publishing House
Pvt Ltd.
Ross, S, (1977). “The determination of financial structure: The incentive signalling approach,”
Bell Journal of Economics, 8, pp.23–40.
Rajan, R. and Zingales, L.( 1995). “What do we know about capital structure? Some evidence
from international data”, Journal of Finance, Vol. 50, pp. 1421- 1460 Shah & Khan 282
Shah, A. and T. Hijazi.( 2004). “The determinants of capital structure of stock exchange-listed
non-financial firms in Pakistan, Pakistan Development Review", Vol. 43, pp 605-618
Stultz, R.( 1990). “Managerial discretion and optimal financing policies, Journal of Financial
Economics", Vol. 26, pp. 3-27
Saad, N. M. (2010). Corporate Governance Cpmpliance and the Effects to capital Structure.
International Journal of Economics and Financial , 2(1),105-114.
61
Suhaila, Kila, M., Mahmood, W., & Mansor, W. (2008, April 23). Capital Structure and Firm
Characteristics: Some Evidence from Malaysian Companies
Titman, S. (1984). “The effect of capital structure on the firm’s liquidation decision, Journal of
Financial Economics", Vol. 13, pp. 137-151
Titman, S. and Wessels, R. (1988). “The determinants of capital structure choice, Journal of
Finance", Vol. 43, pp. 1-19
Tian, G. G., & Zeitun, R. (2007). Capital structure and corporate performance: evidence from
Jordan. Australian Accounting Bussiness and Finance Journal ,
Ofek, E. (1993). Capital Structure and Response to Poor Performance: An Empirical Analysis. .
Journal of Financial Economics ,
Williamson .( 1988) . Corporate finance and corporate governance. Journal of Finance
43(3):567– 91.

62
Appendix 1. List of Companies under study.
1. Sasini Tea and Coffee Limited
2. Kakuzi Limited
3. Rea Vipingo Plantations Ltd
4. Kenya Airways Limited
5. Car and General (Kenya) Limited
6. Marshalls
7. Nation Media Group Limited
8. CMC Holdings Limited
9. TPS (Tourism Promotion Services) Eastern Africa Limited (Serena Hotels)
10. Centum Investment Company ( ICDCI)
11. Housing Finance Company Limited
12. Jubilee Holdings Limited
13. Pan Africa Insurance Company Limited
14. British American Tobacco Kenya Limited
15. Bamburi Cement Company Limited
16. Crown‐Berger Kenya Limited
17. Kenya Oil Company Limited
18. Total Kenya Ltd
19. Unga Group Limited
20. Athi‐River Mining Limited
21. Olympia Capital Holdings Limited
22. East African Cables Limited
23. East African Breweries Limited
24. The Kenya Power & Lighting Co. Ltd
25. East African Portland Cement Company
26. Sameer Africa Limited
27. Mumias Sugar Company Ltd

63
Appendix 2 Firms Ratio Computation
Ratio Computation 2001
Name of Company Total Equity Total Debt
Debt/Equity Ratio AGE ROE ROA
1 Sasini Tea and Coffee Limited 1,841,719 217,933 0.12 50 0.01 0.01
2 Kakuzi Limited 1,789,366 446,501 0.25 75 -0.03 -0.02
3 Rea Vipingo Plantations Ltd 436,122 416,813 0.96 7 1.96 0.00
4 Kenya Airways Limited 7,925,000 1,544,400 0.19 25 0.17 0.06
5 Car and General (Kenya) Limited 313,779 305,424 0.97 66 -0.02 -0.01
6 Marshalls E.A Ltd 351,252 904,028 2.57 55 -0.88 -0.25
7 Nation Media Group Limited 2,081,600 816,700 0.39 40 0.13 0.09
8 CMC Holdings Limited 2,045,653 2,058,062 1.01 54 0.04 0.02
9 TPS (Tourism Promotion Services) Eastern
Africa Limited (Serena Hotels) 761,831 745,664 0.98 34 0.13 0.05
10 Centum Investment Company ( ICDCI) 2,149,806 237,919 0.11 35 0.01 0.01
11 Housing Finance Company Limited 901,502 10,729,052 11.90 37 -0.21 -0.02
12 Jubilee Holdings Limited 1,327,936 3,895,017 2.93 65 0.09 0.02
13 Pan Africa Insurance Company Limited 886,499 2,091,837 2.36 56 0.18 0.06
14 British American Tobacco Kenya Limited 9,760,207 2,530,801 0.26 50 0.06 0.09
15 Bamburi Cement Company Limited 10,067,000 4,511,000 0.47 51 1.91 0.05
16 Crown‐Berger Kenya Limited 527,837 359,810 0.68 44 0.04 0.03
17 Kenya Oil Company Limited 1,708,367 1,782,218 1.04 43 0.23 0.11
18 Total Kenya Ltd 2,436,140 4,985,275 2.05 47 -0.09 -0.03
19 Unga Group Limited 1,199,495 1,730,976 -0.04 94 1.09 -0.06
20 Athi‐River Mining Limited 833,312 427,481 0.51 29 0.04 0.03
21 Olympia Capital Holdings Limited 77,473 62,758 0.81 32 0.21 0.16
22 East African Cables Limited 274,435 53,879 0.20 37 0.06 0.05
23 East African Breweries Limited 10,038,231 1,230,027 0.12 80 0.15 0.10
24 The Kenya Power & Lighting Co. Ltd 1,085,786 5,274,396 4.86 80 -2.65 -0.10
25 East African Portland Cement Company 1,934,552 5,570,473 2.88 72 0.38 0.10
26 Sameer Africa Limited 2,054,510 769,842 0.37 33 0.16 0.12
27 Mumias Sugar Company Ltd 5,065,115 2,544,928 0.50 31 0.01 0.01
Totals 39.46 3.18 0.67
Average 1.46 0.12 0.02 Source: survey Data

64
Ratio Computation 2002
Name of Company Total Equity Total Debt Debt/Equity Ratio AGE ROE ROA
1 Sasini Tea and Coffee Limited 1,754,912 373,995 0.21 51 -0.01 -0.01
2 Kakuzi Limited 1,797,252 1,026,570 0.57 76 0.00 0.00
3 Rea Vipingo Plantations Ltd 451,391 371,662 0.82 8 0.05 0.03
4 Kenya Airways Limited 7,663,000 14,507,000 1.89 26 0.11 0.04
5 Car and General (Kenya) Limited 318,068 278,303 0.87 67 0.02 0.01
6 Marshalls E.A Ltd 1,005,216 854,221 0.85 56 0.03 0.02
7 Nation Media Group Limited 2,326,900 1,281,800 0.55 41 0.16 0.10
8 CMC Holdings Limited 2,196,912 2,258,759 1.03 55 0.07 0.03
9 TPS (Tourism Promotion Services) Eastern
Africa Limited (Serena Hotels) 1,021,130 1,101,662 1.08 35 0.10 0.05
10 Centum Investment Company ( ICDCI) 2,405,687 143,543 0.06 36 0.10 0.10
11 Housing Finance Company Limited 957,353 9,420,530 9.84 38 0.06 0.01
12 Jubilee Holdings Limited 1,484,322 4,566,507 3.08 66 0.11 0.03
13 Pan Africa Insurance Company Limited 887,692 2,265,026 2.55 57 -0.02 -0.01
14 British American Tobacco Kenya Limited 4,110,810 2,202,986 0.54 51 0.20 0.13
15 Bamburi Cement Company Limited 9,877,000 4,688,000 0.47 52 0.13 0.09
16 Crown‐Berger Kenya Limited 555,952 317,299 0.57 45 0.10 0.06
17 Kenya Oil Company Limited 2,149,225 4,160,796 1.94 44 0.21 0.10
18 Total Kenya Ltd 3,122,512 2,688,802 0.86 48 0.12 0.06
19 Unga Group Limited 1,124,371 1,171,419 1.04 95 -0.10 -0.03
20 Athi‐River Mining Limited 862,802 552,352 0.64 30 0.07 0.04
21 Olympia Capital Holdings Limited 79,365 129,319 1.63 33 0.06 0.02
22 East African Cables Limited 246,017 84,522 0.34 38 -0.02 -0.02
23 East African Breweries Limited 11,171,841 6,852,543 0.61 81 0.21 0.13
24 The Kenya Power & Lighting Co. Ltd 3,516,168 17,704,461 5.04 81 -0.53 -0.06
25 East African Portland Cement Company 1,888,111 5,517,542 2.92 73 0.07 0.02
26 Sameer Africa Limited 1,989,431 559,251 0.28 34 0.12 0.15
27 Mumias Sugar Company Ltd 5,354,095 2,964,028 0.55 32 0.09 0.05
Totals 40.85 1.51 1.15
Average 1.51 0.06 0.04 Source: survey Data

65
Ratio Computation 2003
Name of Company Total Equity Total Debt Debt/Equity Ratio AGE ROE ROA
Sasini Tea and Coffee Limited 2,401,308 485,752 0.20 52 -0.03 -0.02
Kakuzi Limited 1,007,295 1,147,713 1.14 77 -0.01 -0.01
Rea Vipingo Plantations Ltd 464,731 406,985 0.88 9 0.01 0.00
Kenya Airways Limited 7,349,000 15,997,000 2.18 27 0.06 0.02
Car and General (Kenya) Limited 354,816 207,811 0.59 68 0.17 0.11
Marshalls E.A Ltd 290,909 768,170 2.64 57 0.08 0.02
Nation Media Group Limited 2,760,900 1,167,700 0.42 42 0.21 0.15
CMC Holdings Limited 2,302,311 2,680,720 1.16 56 0.08 0.04
TPS (Tourism Promotion Services) Eastern Africa Limited (Serena Hotels) 1,003,660 386,893 0.39 36 0.02 0.01
Centum Investment Company ( ICDCI) 2,702,550 218,926 0.08 37 0.06 0.05
Housing Finance Company Limited 1,009,200 9,755,333 9.67 39 0.05 0.00
Jubilee Holdings Limited 2,029,205 5,449,403 2.69 67 0.12 0.03
Pan Africa Insurance Company Limited 902,334 2,138,054 2.37 58 -0.03 -0.01
British American Tobacco Kenya Limited 4,200,831 2,155,238 0.51 52 0.27 0.18
Bamburi Cement Company Limited 11,030,000 3,870,000 0.35 53 0.10 0.07
Crown‐Berger Kenya Limited 593,706 334,617 0.56 46 0.10 0.06
Kenya Oil Company Limited 2,398,935 2,188,651 1.66 45 0.12 0.04
Total Kenya Ltd 4,122,404 3,737,625 0.91 49 0.12 0.07
Unga Group Limited 1,435,753 1,488,386 1.04 96 -0.02 -0.01
Athi‐River Mining Limited 913,408 611,293 0.67 31 0.11 0.06
Olympia Capital Holdings Limited 96,082 129,559 1.35 34 0.28 0.10
East African Cables Limited 249,009 106,892 0.43 39 0.04 0.03
East African Breweries Limited 11,086,296 4,706,515 0.42 82 0.18 0.11
The Kenya Power & Lighting Co. Ltd 997,475 30,409,486 30.49 82 -3.06 -0.10
East African Portland Cement Company 2,151,656 6,529,791 3.03 74 0.11 0.02
Sameer Africa Limited 1,909,581 573,252 0.30 35 0.08 0.06
Mumias Sugar Company Ltd 4,865,654 1,818,756 0.37 33 -0.04 -0.02
Totals 66.50 -0.83 1.09
Average 2.46 -0.03 0.04 Source: survey Data

66
Ratio Computation 2004
Name of Company Total Equity Total Debt
Debt/Equity Ratio AGE ROE ROA
1 Sasini Tea and Coffee Limited 3,138,077 812,259 0.26 53 0.25 0.19
2 Kakuzi Limited 1,090,350 1,055,029 0.97 78 0.08 0.04
3 Rea Vipingo Plantations Ltd 575,807 452,854 0.79 10 0.22 0.13
4 Kenya Airways Limited 8,420,000 20,970,000 2.49 28 0.15 0.04
5 Car and General (Kenya) Limited 398,442 343,837 0.86 69 0.09 0.05
6 Marshalls E.A Ltd 224,635 733,483 3.27 58 0.10 0.02
7 Nation Media Group Limited 2,900,200 1,192,500 0.41 43 0.20 0.15
8 CMC Holdings Limited 2,735,401 3,568,440 1.30 57 0.10 0.04
9 TPS (Tourism Promotion Services) Eastern Africa Limited (Serena Hotels) 1,091,639 962,880 0.88 37 0.12 0.06
10 Centum Investment Company ( ICDCI) 2,996,541 257,638 0.09 38 0.08 0.07
11 Housing Finance Company Limited 1,069,176 8,391,456 7.85 40 0.06 0.01
12 Jubilee Holdings Limited 2,093,796 7,384,270 3.53 68 0.13 0.03
13 Pan Africa Insurance Company Limited 1,096,145 2,554,476 2.33 59 -0.01 0.00
14 British American Tobacco Kenya Limited 3,761,025 2,360,862 0.63 53 0.32 0.20
15 Bamburi Cement Company Limited 9,863,000 4,326,000 0.44 54 0.19 0.13
16 Crown‐Berger Kenya Limited 612,251 487,856 0.80 47 0.08 0.05
17 Kenya Oil Company Limited 3,392,935 2,841,871 0.84 46 0.25 0.13
18 Total Kenya Ltd 4,085,088 6,026,038 1.48 50 0.14 0.05
19 Unga Group Limited 1,332,814 2,254,953 1.69 97 -0.09 -0.03
20 Athi‐River Mining Limited 986,188 986,764 1.00 32 0.12 0.06
21 Olympia Capital Holdings Limited 137,121 112,540 0.82 35 0.29 0.13
22 East African Cables Limited 317,042 175,174 0.55 40 0.39 0.25
23 East African Breweries Limited 13,544,510 5,511,917 0.41 83 0.35 0.23
24 The Kenya Power & Lighting Co. Ltd 17,491,216 14,803,862 9.30 83 0.29 0.01
25 East African Portland Cement Company 1,802,463 5,667,834 3.14 75 -0.15 -0.04
26 Sameer Africa Limited 2,012,290 974,154 0.48 36 0.14 0.09
27 Mumias Sugar Company Ltd 5,402,105 3,745,232 0.69 34 0.15 0.07
Totals 47.29 4.04 2.17
Average 1.75 0.15 0.08 Source: survey Data

67
Ratio Computation 2005
Name of Company Total Equity Total Debt
Debt/Equity Ratio AGE ROE ROA
1 Sasini Tea and Coffee Limited 2,697,425 655,518 0.24 54 -0.14 -0.11
2 Kakuzi Limited 910,218 1,153,288 1.27 79 -0.08 -0.04
3 Rea Vipingo Plantations Ltd 619,239 425,988 0.69 11 0.20 0.12
4 Kenya Airways Limited 12,329,000 32,482,000 2.63 29 0.24 0.07
5 Car and General (Kenya) Limited 603,385 557,709 0.92 70 0.32 0.17
6 Marshalls E.A Ltd 288,461 700,394 2.43 59 0.15 0.04
7 Nation Media Group Limited 3,289,800 1,196,000 0.36 44 0.21 0.16
8 CMC Holdings Limited 3,035,218 4,015,507 1.32 58 0.11 0.05
9 TPS (Tourism Promotion Services) Eastern Africa Limited (Serena Hotels) 2,098,523 2,635,478 1.26 38 0.01 0.00
10 Centum Investment Company ( ICDCI) 3,752,213 340,996 0.09 39 0.08 0.07
11 Housing Finance Company Limited 1,220,964 8,640,114 7.08 41 0.05 0.01
12 Jubilee Holdings Limited 2,370,417 8,962,076 3.78 69 0.23 0.05
13 Pan Africa Insurance Company Limited 1,228,340 2,764,724 2.25 60 -0.02 -0.01
14 British American Tobacco Kenya Limited 3,893,063 2,353,378 0.60 54 0.36 0.22
15 Bamburi Cement Company Limited 10,679,000 4,051,000 0.38 55 0.20 0.14
16 Crown‐Berger Kenya Limited 646,669 612,152 0.95 48 0.05 0.03
17 Kenya Oil Company Limited 4,015,844 4,357,304 1.09 47 0.23 0.11
18 Total Kenya Ltd 4,616,349 6,156,647 1.33 51 0.12 0.05
19 Unga Group Limited 1,407,401 3,061,780 2.18 98 0.09 0.03
20 Athi‐River Mining Limited 1,162,219 2,028,695 1.75 33 0.17 0.06
21 Olympia Capital Holdings Limited 122,808 97,561 0.79 36 0.19 0.08
22 East African Cables Limited 457,642 463,084 1.01 41 0.47 0.20
23 East African Breweries Limited 15,346,633 5,733,203 0.37 84 0.38 0.25
24 The Kenya Power & Lighting Co. Ltd 18,898,179 16,939,304 5.65 84 0.42 0.04
25 East African Portland Cement Company 2,252,835 5,465,045 2.43 76 0.27 0.08
26 Sameer Africa Limited 2,028,470 1,176,060 0.58 37 0.10 0.17
27 Mumias Sugar Company Ltd 6,080,035 3,414,539 0.56 35 0.21 0.14
Totals 43.99 4.62 2.19
Average 1.63 0.17 0.08 Source: survey Data

68
Ratio Computation 2006
Name of Company Total Equity Total Debt
Debt/Equity Ratio AGE ROE ROA
1 Sasini Tea and Coffee Limited 2,936,955 799,987 0.27 55 0.08 0.06
2 Kakuzi Limited 1,043,269 1,252,598 1.20 80 0.13 0.06
3 Rea Vipingo Plantations Ltd 652,372 414,339 0.64 12 0.17 0.11
4 Kenya Airways Limited 17,257,000 53,475,000 3.10 30 0.28 0.05
5 Car and General (Kenya) Limited 730,729 698,475 0.96 71 0.19 0.10
6 Marshalls E.A Ltd 333,161 751,310 2.26 60 0.13 0.04
7 Nation Media Group Limited 3,587,900 1,795,300 0.50 45 0.21 0.14
8 CMC Holdings Limited 3,542,025 4,271,663 1.21 59 0.11 0.05
9 TPS (Tourism Promotion Services) Eastern Africa
Limited (Serena Hotels) 3,361,485 2,734,537 0.81 39 0.10 0.05
10 Centum Investment Company ( ICDCI) 6,188,498 240,786 0.04 40 0.10 0.09
11 Housing Finance Company Limited 1,322,013 7,811,818 5.91 42 0.08 0.01
12 Jubilee Holdings Limited 3,393,040 11,740,111 3.46 70 0.16 0.04
13 Pan Africa Insurance Company Limited 1,381,001 3,425,267 2.48 61 -0.01 0.00
14 British American Tobacco Kenya Limited 4,194,485 3,581,556 0.85 55 0.29 0.15
15 Bamburi Cement Company Limited 13,017,000 4,777,000 0.37 56 0.22 0.15
16 Crown‐Berger Kenya Limited 770,953 763,788 0.99 49 0.08 0.04
17 Kenya Oil Company Limited 4,672,903 8,677,704 1.86 48 0.18 0.06
18 Total Kenya Ltd 4,665,064 10,688,392 2.29 52 0.10 0.03
19 Unga Group Limited 1,537,296 1,304,461 0.85 99 0.04 0.02
20 Athi‐River Mining Limited 1,324,776 2,879,836 2.17 34 0.20 0.06
21 Olympia Capital Holdings Limited 130,451 189,973 1.46 37 0.18 0.03
22 East African Cables Limited 694,227 1,102,647 1.59 42 0.41 0.15
23 East African Breweries Limited 16,891,530 6,198,127 0.37 85 0.38 0.26
24 The Kenya Power & Lighting Co. Ltd 20,560,405 18,168,507 3.90 85 0.35 0.04
25 East African Portland Cement Company 3,076,933 5,975,274 1.94 77 0.13 0.05
26 Sameer Africa Limited 1,850,986 1,459,080 0.79 38 -0.01 -0.01
27 Mumias Sugar Company Ltd 7,709,049 4,162,457 0.54 36 0.20 0.13
Totals 42.79 4.48 1.96
Average 1.58 0.17 0.07 Source: survey Data

69
Ratio Computation 2007
Name of Company Total Equity Total Debt
Debt/Equity Ratio AGE ROE ROA
1 Sasini Tea and Coffee Limited 2,868,149 870,412 0.30 56 -0.01 -0.01
2 Kakuzi Limited 1,232,912 1,107,765 0.90 81 0.16 0.08
3 Rea Vipingo Plantations Ltd 709,165 457,420 0.65 13 0.16 0.10
4 Kenya Airways Limited 21,640,000 55,647,000 2.57 31 0.19 0.05
5 Car and General (Kenya) Limited 881,941 1,155,808 1.31 72 0.20 0.09
6 Marshalls E.A Ltd 462,982 793,073 1.71 61 0.09 0.03
7 Nation Media Group Limited 3,823,800 2,162,600 0.57 46 0.28 0.18
8 CMC Holdings Limited 4,061,844 5,262,877 1.30 60 0.15 0.07
9 TPS (Tourism Promotion Services) Eastern Africa Limited (Serena Hotels) 3,678,411 3,102,605 0.84 40 0.11 0.06
10 Centum Investment Company ( ICDCI) 8,348,430 73,226 0.01 41 0.13 0.13
11 Housing Finance Company Limited 1,395,521 8,973,734 6.43 43 0.05 0.00
12 Jubilee Holdings Limited 3,606,401 14,079,690 3.90 71 0.18 0.04
13 Pan Africa Insurance Company Limited 1,316,335 4,585,128 3.48 62 -0.02 0.00
14 British American Tobacco Kenya Limited 4,693,250 4,576,636 0.98 56 0.30 0.15
15 Bamburi Cement Company Limited 14,229,000 5,645,000 0.40 57 0.27 0.18
16 Crown‐Berger Kenya Limited 813,869 712,041 0.87 50 0.09 0.05
17 Kenya Oil Company Limited 4,984,434 8,285,007 1.66 49 0.12 0.04
18 Total Kenya Ltd 4,751,591 7,761,162 1.63 53 0.11 0.04
19 Unga Group Limited 1,407,401 1,398,380 0.99 100 0.09 0.04
20 Athi‐River Mining Limited 1,734,766 2,732,693 1.58 35 0.24 0.09
21 Olympia Capital Holdings Limited 130,451 189,973 1.46 38 0.18 0.03
22 East African Cables Limited 934,451 2,107,354 2.26 43 0.45 0.13
23 East African Breweries Limited 18,802,668 10,255,419 0.55 86 0.40 0.24
24 The Kenya Power & Lighting Co. Ltd 22,249,400 25,072,464 3.95 86 0.27 0.04
25 East African Portland Cement Company 3,607,097 5,331,475 1.48 78 0.21 0.09
26 Sameer Africa Limited 1,961,922 1,200,051 0.61 39 0.06 0.04
27 Mumias Sugar Company Ltd 8,337,660 3,579,242 0.43 37 0.17 0.12
Totals 42.81 4.64 2.10
Average 1.59 0.17 0.08 Source: survey Data

70
Ratio Computation 2008
Name of Company
Total Equity Total Debt
Debt/Equity Ratio AGE ROE ROA
1 Sasini Tea and Coffee Limited 4,595,434 2,079,001 0.45 57 0.19 0.13
2 Kakuzi Limited 1,487,290 1,094,886 0.74 82 0.19 0.11
3 Rea Vipingo Plantations Ltd 875,166 439,271 0.50 14 0.19 0.10
4 Kenya Airways Limited 25,873,000 50,907,000 1.97 32 0.15 0.05
5 Car and General (Kenya) Limited 1,120,991 623,733 0.56 73 0.19 0.08
6 Marshalls E.A Ltd 241,078 969,022 4.02 62 -0.70 -0.14
7 Nation Media Group Limited 4,327,700 2,304,100 0.53 47 0.30 0.20
8 CMC Holdings Limited 4,834,894 7,188,600 1.49 61 0.19 0.08
9 TPS (Tourism Promotion Services) Eastern Africa
Limited (Serena Hotels) 3,750,925 2,756,071 0.73 41 0.06 0.03
10 Centum Investment Company ( ICDCI) 8,078,129 67,721 0.01 42 0.11 0.11
11 Housing Finance Company Limited 3,601,666 10,692,702 2.97 44 0.04 0.01
12 Jubilee Holdings Limited 2,871,223 16,998,236 5.92 72 0.25 0.04
13 Pan Africa Insurance Company Limited 1,005,441 4,908,183 4.88 63 -0.02 0.00
14 British American Tobacco Kenya Limited 4,893,645 5,413,959 1.11 57 0.35 0.16
15 Bamburi Cement Company Limited 15,496,000 11,613,000 0.75 58 0.22 0.12
16 Crown‐Berger Kenya Limited 821,952 1,126,329 1.37 51 0.04 0.02
17 Kenya Oil Company Limited 10,915,860 16,792,732 1.54 50 0.11 0.04
18 Total Kenya Ltd 5,017,822 9,508,962 1.90 54 0.14 0.05
19 Unga Group Limited 2,045,061 1,797,482 0.88 101 0.18 0.08
20 Athi‐River Mining Limited 2,127,531 4,224,935 1.99 36 0.24 0.08
21 Olympia Capital Holdings Limited 546,661 414,301 0.76 39 0.06 0.03
22 East African Cables Limited 1,148,420 1,676,754 1.46 44 0.40 0.15
23 East African Breweries Limited 19,980,780 11,137,405 0.56 87 0.46 0.28
24 The Kenya Power & Lighting Co. Ltd 23,881,922 35,930,200 4.50 87 0.22 0.03
25 East African Portland Cement Company 4,026,749 5,046,596 1.25 79 0.13 0.06
26 Sameer Africa Limited 2,135,566 940,582 0.44 40 0.07 0.05
27 Mumias Sugar Company Ltd 9,041,497 5,111,079 0.57 38 0.13 0.09
Totals 43.83 3.90 2.02
Average 1.62 0.00 0.14 0.07 Source: survey Data

71
Ratio Computation 2009
Name of Company Total Equity Total Debt Debt/Equity Ratio AGE ROE ROA
1 Sasini Tea and Coffee Limited 5,530,299 2,336,411 0.42 58 0.10 0.07
2 Kakuzi Limited 1,758,587 908,646 0.50 83 0.25 0.16
3 Rea Vipingo Plantations Ltd 975,450 438,634 0.45 15 0.15 0.11
4 Kenya Airways Limited 17,176,000 58,803,000 3.42 33 -0.24 -0.05
5 Car and General (Kenya) Limited 1,288,858 1,902,696 1.48 74 0.15 0.06
6 Marshalls E.A Ltd 477,234 956,736 2.00 63 -0.25 -0.08
7 Nation Media Group Limited 4,076,100 1,858,700 0.40 48 0.24 0.17
8 CMC Holdings Limited 1,514,906 677,063 0.45 62 0.36 0.25
9 TPS (Tourism Promotion Services) Eastern Africa Limited (Serena Hotels) 2,559,250 2,931,806 1.09 42 0.14 0.05
10 Centum Investment Company ( ICDCI) 5,859,392 537,906 0.09 43 0.05 0.05
11 Housing Finance Company Limited 4,022,626 14,216,733 3.53 45 0.06 0.01
12 Jubilee Holdings Limited 3,231,341 19,942,274 5.88 73 0.27 0.02
13 Pan Africa Insurance Company Limited 973,504 6,238,952 6.41 64 -0.02 0.00
14 British American Tobacco Kenya Limited 2,494,210 5,715,061 1.62 58 0.42 0.14
15 Bamburi Cement Company Limited 19,507,000 11,171,000 0.57 59 0.36 0.22
16 Crown‐Berger Kenya Limited 807,284 1,021,509 1.22 52 0.10 0.05
17 Kenya Oil Company Limited 10,976,306 19,834,229 1.73 51 0.11 0.04
18 Total Kenya Ltd 6,742,291 22,566,005 2.52 55 0.05 0.02
19 Unga Group Limited 2,166,974 2,419,154 1.12 102 0.09 0.03
20 Athi‐River Mining Limited 4,128,930 4,667,383 1.13 37 0.16 0.05
21 Olympia Capital Holdings Limited 470,327 230,167 0.49 40 0.11 0.07
22 East African Cables Limited 1,490,411 1,882,603 1.26 45 0.20 0.08
23 East African Breweries Limited 16,233,005 12,178,737 0.59 88 0.42 0.24
24 The Kenya Power & Lighting Co. Ltd 25,125,204 43,800,362 4.00 88 0.29 0.05
25 East African Portland Cement Company 5,997,862 5,939,115 0.97 80 0.30 0.15
26 Sameer Africa Limited 2,143,396 722,807 0.32 41 0.07 0.05
27 Mumias Sugar Company Ltd 8,352,218 7,436,246 0.89 39 0.19 0.09
Totals 44.57 4.14 2.08
Average 1.65 0.15 0.08 Source: survey Data

72
Ratio Computation 2010
Name of Company Total Equity Total Debt
Earnings per Share
Debt/Equity Ratio AGE ROE ROA
1 Sasini Tea and Coffee Limited 6,392,643 2,759,648 4.36 0.43 59 0.16 0.11
2 Kakuzi Limited 1,995,179 1,036,299 3.93 0.52 84 0.19 0.12
3 Rea Vipingo Plantations Ltd 7,461,099 717,917 0.22 0.10 16 0.01 0.04
4 Kenya Airways Limited
19,923,000
53,290,000 0.88 2.67 34 0.10 0.03
5 Car and General (Kenya) Limited 1,536,764 2,315,387 2.14 1.51 75 0.16 0.06
6 Marshalls E.A Ltd 732,987 993,695 4.79 1.36 64 0.47 0.31
7 Nation Media Group Limited 5,360,200 2,553,100 3.92 0.48 49 0.29 0.19
8 CMC Holdings Limited 5,454,979 9,212,728 1.40 1.69 63 0.07 0.03
9 TPS (Tourism Promotion Services)
Eastern Africa Limited (Serena Hotels)
22,859,172 4,426,752 3.48 0.19 43 0.02 0.04
10 Centum Investment Company (
ICDCI) 7,856,167 505,565 3.98 0.06 44 0.14 0.13
11 Housing Finance Company Limited 4,206,657 25,020,98
9 0.33 5.95 46 0.09 0.01
12 Jubilee Holdings Limited 5,113,540 25,114,01
9 7.43 4.91 74 0.36 0.06
13 Pan Africa Insurance Company Limited 1,832,521 8,839,100 2.46 4.82 65 0.32 0.06
14 British American Tobacco Kenya Limited 5,114,312 6,007,249 1.77 1.17 59 0.35 0.16
15 Bamburi Cement Company Limited
20,165,000 9,615,000 2.92 0.48 60 0.26 0.16
16 Crown‐Berger Kenya Limited 902,365 1,069,992 0.77 1.19 53 0.10 0.05
17 Kenya Oil Company Limited
12,705,512
19,511,118 24.14 1.54 52 0.14 0.06
18 Total Kenya Ltd 9,579,853 20,795,82
4 0.19 2.17 56 0.10 0.03
19 Unga Group Limited 1,504,435 1,699,700 0.34 1.13 103 0.09 0.03
20 Athi‐River Mining Limited 4,662,168 11,921,29
7 1.60 2.56 38 0.17 0.05
21 Olympia Capital Holdings Limited 473,047 375,915 0.03 0.79 41 0.01 0.01
22 East African Cables Limited 1,836,406 2,272,136 1.82 1.24 46 0.10 0.04
23 East African Breweries Limited
20,811,961
14,468,065 0.56 0.70 89 0.04 0.02
24 The Kenya Power & Lighting Co. Ltd
28,740,877
51,472,593 2.35 4.01 89 0.29 0.05
25 East African Portland Cement
Company 5,701,201 6,336,364 -0.65 1.11 81 -0.05 -0.02
26 Sameer Africa Limited 2,168,142 677,165 0.04 0.31 42 0.03 0.02
27 Mumias Sugar Company Ltd
10,999,852 7,334,258 1.02 0.67 40 0.14 0.09
Totals 76.22 43.75 4.14 1.91
Average 2.82 1.62 0.15 0.07 Source: survey Data

73
THE INFLUENCE OF CAPITAL STRUCTURE ON FIRMS’
PERFORMANCE: A CASE OF SELECTED FIRMS’
LISTED IN NAIROBI SECURITIES EXCHANGE ,KENYA
By
MARIETTA MUTHEU STEPHEN
A RESEARCH PROJECT REPORT SUBMITTED IN PARTIAL
FULFILMENT OF THE REQUIREMENTS FOR THE AWARD OF
MASTER OF ARTS DEGREE IN PROJECT PLANNING AND
MANAGEMENT , UNIVERSITY OF NAIROBI
2012

74