A Novel Clathrin Adaptor Complex Mediates Basolateral Targeting in Polarized Epithelial Cells
Upload
khangminh22Category
view
0download
0
International Journal of
Molecular Sciences
Article
The Inflammasome Adaptor Protein ASC in MildCognitive Impairment and Alzheimer’s Disease
Xavier O. Scott 1, Marisa E. Stephens 2, Marie C. Desir 2 , W. Dalton Dietrich 2,3,4,Robert W. Keane 1,2,4 and Juan Pablo de Rivero Vaccari 2,3,4,*
1 Department of Physiology and Biophysics, University of Miami Miller School of Medicine,Miami, FL 33136, USA; [email protected] (X.O.S.); [email protected] (R.W.K.)
2 Department of Neurological Surgery and The Miami Project to Cure Paralysis, University of Miami MillerSchool of Medicine, Miami, FL 33136, USA; [email protected] (M.E.S.);[email protected] (M.C.D.); [email protected] (W.D.D.)
3 Center for Cognitive Neuroscience and Aging, University of Miami Miller School of Medicine,Miami, FL 33136, USA
4 InflamaCORE, LLC. Miami, FL 33156, USA* Correspondence: [email protected]; Tel.: +1-305-243-1252
Received: 11 June 2020; Accepted: 29 June 2020; Published: 30 June 2020�����������������
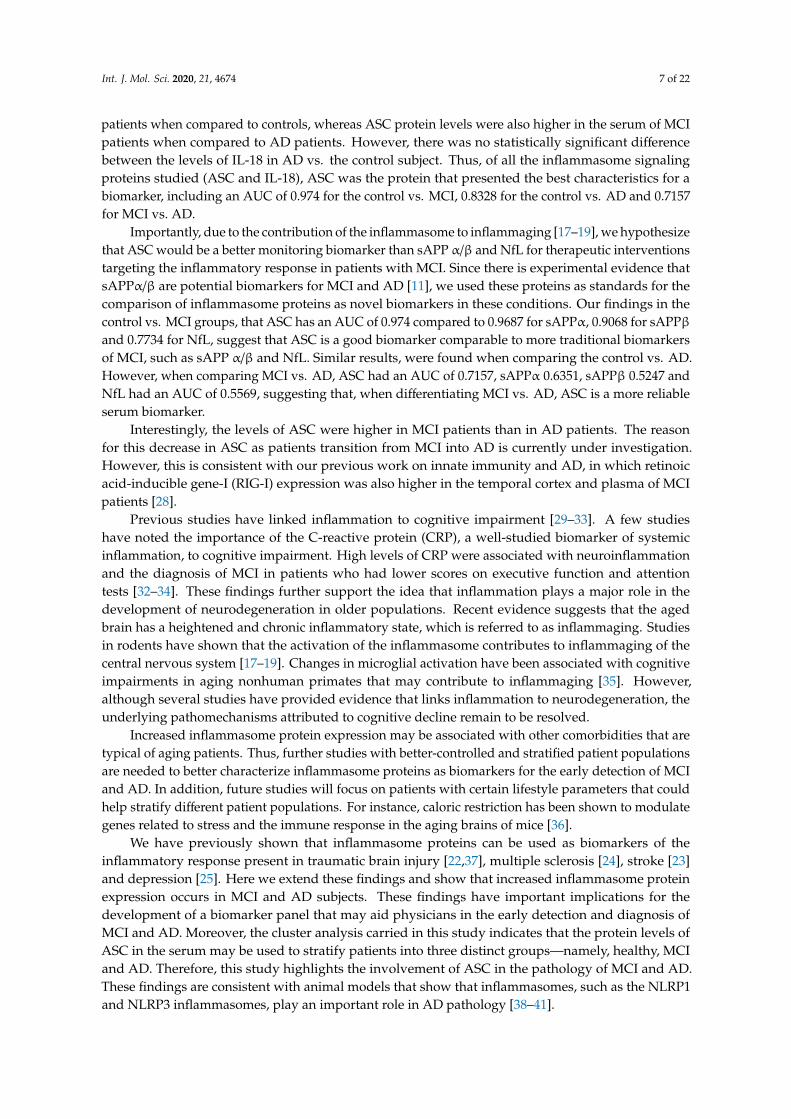
Abstract: Mild cognitive impairment (MCI) is characterized by memory loss in the absence ofdementia and is considered the translational stage between normal aging and early Alzheimer’sdisease (AD). Patients with MCI have a greater risk of advancing to AD. Thus, identifying earlymarkers of MCI has the potential to increase the therapeutic window to treat and manage thedisease. Protein levels of the inflammasome signaling proteins apoptosis-associated speck-like proteincontaining a caspase recruitment domain (ASC) and interleukin (IL)-18 were analyzed in the serumof patients with MCI, AD and healthy age-matched donors as possible biomarkers, as well as levelsof soluble amyloid precursor proteins α/β (sAPP α/β) and neurofilament light (NfL). Cut-off pointsand positive and negative predictive values, as well as receiver operator characteristic (ROC) curves,likelihood ratios and accuracy were determined for these proteins. Although the levels of ASC werehigher in MCI and AD than in age-matched controls, protein levels of ASC were higher in MCI thanin AD cases. For control vs. MCI, the area under the curve (AUC) for ASC was 0.974, with a cut-off
point of 264.9 pg/mL. These data were comparable to the AUC for sAPP α and β of 0.9687 and 0.9068,respectively, as well as 0.7734 for NfL. Moreover, similar results were obtained for control vs. AD andMCI vs. AD. These results indicate that ASC is a promising biomarker of MCI and AD.
Keywords: mild cognitive impairment; Alzheimer’s disease; serum biomarkers; inflammaging;inflammasome; ASC; neurodegeneration
1. Introduction
Alzheimer’s disease (AD) is a neurodegenerative disorder characterized by cognitive and memorydecline that worsens over time [1]. The transitional stage between normal aging and early AD isreferred to as mild cognitive impairment (MCI) [2]. MCI is characterized by memory impairment in theabsence of dementia [3]. Patients with MCI are at greater risk of progressing to AD [4,5]. As a result, itis imperative to identify early markers of MCI that may be used in the monitoring and diagnosis ofthese patients prior to the development of AD. It is possible that early identification of AD, potentiallyat the MCI stage, has the benefit to increase therapeutic efficacy when compared to more advancedAD cases.
Cerebrospinal fluid (CSF) amyloid-β (Aβ (1-42)) is a promising biomarker for MCI and AD with aspecificity and sensitivity above 80% [6]. Aβ (1-42) is present at moderately low levels in cases of Lewy
Int. J. Mol. Sci. 2020, 21, 4674; doi:10.3390/ijms21134674 www.mdpi.com/journal/ijms

Int. J. Mol. Sci. 2020, 21, 4674 2 of 22
body dementia [7] and decreased in vascular dementia [8]. Similarly, mean Total (T)-tau levels arethree times higher in the CSF of AD patients than in controls, with a sensitivity of 82% and a specificityof 88% [9]. Moreover, patients with MCI that develop AD present with high levels of T-tau, with 90%sensitivity and 100% specificity [10]. In addition, soluble amyloid precursor proteins (sAPP) α and β
have been shown to be potentially effective biomarkers that may be used in the care of patients withMCI and AD [11].
Neurofilament light chain (NfL) is a cytoskeletal protein and biomarker of axonal damage. NfLlevels in the blood (serum and plasma) are correlated with CSF NfL levels [12]. Additionally, plasmaNfL levels were shown to be positively correlated with raised cortical microglial activity in brainregions commonly associated with MCI and AD [13]. Moreover, higher plasma and CSF NfL levelscorrelate with hypometabolism in brain regions consistent with AD [14]. Thus, it appears that NfLlevels, combined with additional neuroinflammatory proteins levels, would increase the accuracy ofbiomarkers to monitor and treat cognitive decline.
Neuroinflammatory responses have been shown to contribute to the underlying pathology ofneurodegenerative diseases like MCI, AD and Parkinson’s disease [15]. An inflammatory response asa result of aging is referred to as inflammaging. It has been previously shown that the inflammasomecontributes to the naturally occurring process of inflammaging, which likely represents the initialstages of cognitive impairment and neurodegeneration [16–19]. The inflammasome is a multiproteincomplex responsible for the production of interleukin (IL)-1β and IL-18 upon activation of inflammatorycaspase-1 [20]. Inflammasome proteins are secreted and play a role in the spread of the inflammatoryresponse. [21] Therefore, secreted inflammasome proteins are promising biomarkers of inflammation.Accordingly, inflammasome proteins have been shown to serve as biomarkers of brain injury [22],stroke [23], multiple sclerosis [24] and depression [25]. Moreover, the inflammasome adaptor proteinapoptosis-associated speck-like protein containing a caspase recruitment domain (ASC) has been shownto have prionoid properties, and after secretion, ASC contributes to the spread of inflammation [21].In addition, ASC forms an aggregate complex with Aβ, which promotes inflammation and pyroptosisin the microglia of mice. [26,27] Thus, the inflammasome is a key contributor to the inflammatoryresponse in AD pathology.
Here, we extend our previous studies to investigate the potential of inflammasome proteins asbiomarkers of MCI and AD. We calculated cut-off points, receiver operator characteristic (ROC) curveswith associated sensitivity and specificity calculations for the inflammasome proteins ASC and IL-18.In addition, we performed similar analyses for soluble APPα and β (sAPPα/β) and serum NfL toevaluate whether inflammasome proteins serve as more reliable markers for MCI and AD [11].
2. Results
2.1. ASC and IL-18 Are Elevated in the Serum of Patients with MCI and AD
To investigate if inflammasome signaling proteins could serve as biomarkers of MCI and AD,we analyzed serum samples from patients with MCI, AD and aged-matched donors for the expressionof ASC (Figure 1A) and IL-18 (Figure 1B). Protein levels of ASC and IL-18 were significantly higher inthe MCI than in the control group. In addition, serum levels of ASC were found to be significantlyhigher in MCI than AD patients (Figure 1A). However, there was no statistically significant differencebetween the serum levels of IL-18 in the MCI vs. AD groups (Figure 1B), suggesting a biomarker rolefor ASC in the pathology of MCI and AD and IL-18 in MCI.

Int. J. Mol. Sci. 2020, 21, 4674 3 of 22Int. J. Mol. Sci. 2020, 21, 4674 3 of 22
Figure 1. Apoptosis-associated speck-like protein containing a caspase recruitment domain (ASC)
and interleukin (IL)-18 are elevated in the serum of patients with mild cognitive impairment (MCI) and
Alzheimer’s disease (AD). Protein levels in pg/mL for ASC (A) and (B) IL-18 in the serum from patients
with MCI, AD and controls. ASC: n = 66 control, 32 MCI and 31 AD. IL-18: n = 69 control, 31 MCI and
32 AD. Box and whiskers are shown for the 5th and 95th percentiles.
2.2. ASC Is a Promising Serum Biomarker of MCI and AD
To determine if inflammasome signaling proteins may be used as biomarkers of MCI and AD, we
determined the area under the curve (AUC) for the control vs. MCI, MCI vs. AD and control vs. AD
(Tables 1 and 2) for ASC and IL-18. For the control vs. MCI, of the inflammasome signaling proteins
analyzed, ASC presented the highest AUC of 0.974 (p < 0.0001), and IL-18 had an AUC of 0.6896 (p =
0.0025) (Table 1); the cut-off point for ASC was 264.9 pg/mL with 100% sensitivity and 74% specificity,
whereas IL-18 had a cut-off point of 213.9 pg/mL with 74% sensitivity and 58% specificity (Table 2). For
the control vs. AD, the AUC for ASC was 0.8328 (p < 0.0001) (Table 1), with a cut-off point of 258.7
pg/mL with 81% sensitivity and 71% specificity (Table 2). Finally, for MCI vs. AD, the AUC for ASC
was 0.7157 (p = 0.0033) (Table 1), with a cut-off point of < 560 pg/mL and a 71% sensitivity and a 63%
specificity (Table 2).
Table 1. Area under the curve. MCI: mild cognitive impairment, AD: Alzheimer’s disease, IL:
interleukin, sAPP: soluble amyloid precursor proteins and NfL: neurofilament light.
BIOMARKER AREA STD. ERROR 95% C.I. p-VALUE
Control vs. MCI
ASC 0.974 0.01301 0.9485 to 0.9995 <0.0001
IL-18 0.6896 0.06086 0.5703 to 0.8089 0.0025
sAPPα 0.9687 0.0216 0.9263 to 1.011 <0.0001
sAPPβ 0.9068 0.03784 0.8327 to 0.981 <0.0001
NfL 0.7734 0.05821 0.6594 to 0.8875 0.0002
Control vs. AD
ASC 0.8328 0.05053 0.7338 to 0.9319 <0.0001
IL-18 0.6105 0.06124 0.4905 to 0.7305 0.0749
sAPPα 0.9563 0.02490 0.9074 to 1.005 <0.0001
sAPPβ 0.9185 0.03592 0.8481 to 0.9889 <0.0001
NfL 0.7165 0.06817 0.5829 to 0.8501 0.0040
MCI vs. AD
ASC 0.7157 0.06472 0.5889 to 0.8426 0.0033
IL-18 0.5847 0.07332 0.441 to 0.7284 0.2482
sAPPα 0.6351 0.07146 0.4950 to 0.7752 0.0654
Figure 1. Apoptosis-associated speck-like protein containing a caspase recruitment domain (ASC) andinterleukin (IL)-18 are elevated in the serum of patients with mild cognitive impairment (MCI) andAlzheimer’s disease (AD). Protein levels in pg/mL for ASC (A) and (B) IL-18 in the serum from patientswith MCI, AD and controls. ASC: n = 66 control, 32 MCI and 31 AD. IL-18: n = 69 control, 31 MCI and32 AD. Box and whiskers are shown for the 5th and 95th percentiles.
2.2. ASC Is a Promising Serum Biomarker of MCI and AD
To determine if inflammasome signaling proteins may be used as biomarkers of MCI and AD,we determined the area under the curve (AUC) for the control vs. MCI, MCI vs. AD and controlvs. AD (Tables 1 and 2) for ASC and IL-18. For the control vs. MCI, of the inflammasome signalingproteins analyzed, ASC presented the highest AUC of 0.974 (p < 0.0001), and IL-18 had an AUC of0.6896 (p = 0.0025) (Table 1); the cut-off point for ASC was 264.9 pg/mL with 100% sensitivity and 74%specificity, whereas IL-18 had a cut-off point of 213.9 pg/mL with 74% sensitivity and 58% specificity(Table 2). For the control vs. AD, the AUC for ASC was 0.8328 (p < 0.0001) (Table 1), with a cut-off pointof 258.7 pg/mL with 81% sensitivity and 71% specificity (Table 2). Finally, for MCI vs. AD, the AUC forASC was 0.7157 (p = 0.0033) (Table 1), with a cut-off point of < 560 pg/mL and a 71% sensitivity and a63% specificity (Table 2).
Table 1. Area under the curve. MCI: mild cognitive impairment, AD: Alzheimer’s disease, IL:interleukin, sAPP: soluble amyloid precursor proteins and NfL: neurofilament light.
Biomarker Area Std. Error 95% C.I. p-Value
Control vs. MCI
ASC 0.974 0.01301 0.9485 to 0.9995 <0.0001
IL-18 0.6896 0.06086 0.5703 to 0.8089 0.0025
sAPPα 0.9687 0.0216 0.9263 to 1.011 <0.0001
sAPPβ 0.9068 0.03784 0.8327 to 0.981 <0.0001
NfL 0.7734 0.05821 0.6594 to 0.8875 0.0002
Control vs. AD
ASC 0.8328 0.05053 0.7338 to 0.9319 <0.0001
IL-18 0.6105 0.06124 0.4905 to 0.7305 0.0749
sAPPα 0.9563 0.02490 0.9074 to 1.005 <0.0001
sAPPβ 0.9185 0.03592 0.8481 to 0.9889 <0.0001
NfL 0.7165 0.06817 0.5829 to 0.8501 0.0040

Int. J. Mol. Sci. 2020, 21, 4674 4 of 22
Table 1. Cont.
Biomarker Area Std. Error 95% C.I. p-Value
MCI vs. AD
ASC 0.7157 0.06472 0.5889 to 0.8426 0.0033
IL-18 0.5847 0.07332 0.441 to 0.7284 0.2482
sAPPα 0.6351 0.07146 0.4950 to 0.7752 0.0654
sAPPβ 0.5247 0.07514 0.3774 to 0.6720 0.7401
NfL 0.5569 0.07502 0.4099 to 0.7040 0.4498
Table 2. Sensitivity and specificity. PPV: positive predictive values and NPV: negative predictive values.
Biomarker Cut-Off Point(pg/mL)
Sensitivity(%)
Specificity(%)
PPV(%)
NPV(%)
LikelihoodRatio
Accuracy(%)
Control vs. MCI
ASC >264.9 100 74 65 100 3.882 83
IL-18 >213.9 74 58 44 83 1.765 63
sAPPα >1.39 (ng/mL) 97 74 81 95 3.763 86
sAPPβ >0.2639 (ng/mL) 90 78 78 90 4.065 84
NfL >24.15 72 75 71 75 2.875 74
Control vs. AD
ASC >258.7 81 71 57 89 2.801 74
IL-18 >196.5 72 42 37 76 1.24 51
sAPPα >2.573 (ng/mL) 91 91 92 90 10.57 91
sAPPβ >0.2906 (ng/mL) 83 81 80 85 4.5 82
NfL >21.48 64 56 56 64 1.469 60
MCI vs. AD
ASC <560.0 71 63 65 69 1.892 67
IL-18 >290.3 72 48 59 63 1.393 60
sAPPα <8.846 (ng/mL) 72 55 64 63 1.592 64
sAPPβ >0.6364 (ng/mL) 60 45 49 56 1.094 52
NfL <33.92 71 44 53 64 1.27 57
2.3. MCI, AD and sAPPα/sAPPβ
APP protein levels have been shown to be consistent with the pathology of AD and MCI; thus,it appears that APP is also a promising biomarker for these conditions [11]. Thus, to compare ourfindings with other more established biomarkers of MCI and AD, we compared the serum proteinlevels of ASC and sAPPα/sAPPβ for the ability to distinguish between MCI, AD and the controls.In our study, the protein levels of sAPPα (Figure 2A) and sAPPβ (Figure 2B) were higher in MCI andAD patients than in the control subjects. In addition, for the control vs. MCI, the AUC for these twoproteins was 0.9687 and 0.9068, respectively (Figure 3 and Table 1), whereas, for the control vs. AD, theAUC were 0.9563 and 0.9185, respectively. In addition, for MCI vs. AD, the AUC were 0.6351 and0.5247 (Figure 3 and Table 1). For the control vs. MCI, the cut-off point for sAPPα was 1.39 ng/mLand 0.2639 ng/mL for sAPPβ (Table 1). For the control vs. AD, for sAPPα was 2.573 ng/mL and0.2906 ng/mL for sAPPβ (Table 1). For MCI vs. AD, for sAPPα was 8.846 ng/mL and 0.6364 ng/mL forsAPPβ (Table 1).

Int. J. Mol. Sci. 2020, 21, 4674 5 of 22Int. J. Mol. Sci. 2020, 21, 4674 5 of 22
Figure 2. Soluble amyloid precursor proteins (APP) (α and β) and neurofilament light chains were
elevated in the serum of MCI and AD patients compared to the control. Protein levels in pg/mL for (A)
sAPPα, (B) sAPPβ and (C) neurofilament light (NfL). Soluble (s)APPα: n = 35 control, 31 MCI and 32
AD. sAPPβ: n = 27 control, 31 MCI and 30 AD. NfL: n = 32 control, 32 MCI and 28 AD. Box and whiskers
are shown for the 5th and 95th percentiles.
Figure 3. ASC is a promising serum biomarker of MCI. Receiver operator characteristic (ROC) curves
for NfL (green), sAPPβ (orange), sAPPα (blue) and ASC (black). (A) Control vs. MCI, (B) control vs. AD
and (C) MCI vs. AD.
In comparison, for the control vs. MCI, the cut-off point for ASC was 264.9 pg/mL with 100%
sensitivity and 74% specificity, while sAPPα had a cut-off point of 1.39 ng/mL with 97% sensitivity and
74% specificity, and sAPPβ had a cut-off point of 0.2639 ng/mL with 90% sensitivity and 78% specificity
(Table 2).
For the control vs. AD, the cut-off point for ASC was 258.7 pg/mL with 81% sensitivity and 71%
specificity, while sAPPα had a cut-off point of 2.573 ng/mL with 91% sensitivity and 91% specificity,
and sAPPβ had a cut-off point of 0.2906 ng/mL with 83% sensitivity and 81% specificity (Table 2).
For MCI vs. AD, the cut-off point for ASC was 560.0 pg/mL with 71% sensitivity and 63%
specificity, while sAPPα had a cut-off point of 8.846 ng/mL with 72% sensitivity and 55% specificity,
and sAPPβ had a cut-off point of 0.6364 ng/mL with 60% sensitivity and 45% specificity (Table 2).
2.4. MCI, AD and NfL
Additionally, we compared the serum protein levels of ASC to NfL. When comparing the levels
of NfL in the control and MCI patients, we found that the protein levels of NfL were higher in MCI
patients than in the control subjects (Figure 2). The AUC for NfL was 0.7734 (Figure 3 and Table 1),
whereas, for ASC, it was 0.974, as above stated (Table 1). The cut-off point for NfL was 24.15 pg/mL,
with a sensitivity of 72% and a specificity of 75% (Table 2). In comparison, for the control vs. AD, the
AUC for NfL was 0.7165, and the cut-off point was 21.48 pg/mL, with 64% sensitivity and 56%
Figure 2. Soluble amyloid precursor proteins (APP) (α and β) and neurofilament light chains wereelevated in the serum of MCI and AD patients compared to the control. Protein levels in pg/mL for(A) sAPPα, (B) sAPPβ and (C) neurofilament light (NfL). Soluble (s)APPα: n = 35 control, 31 MCI and32 AD. sAPPβ: n = 27 control, 31 MCI and 30 AD. NfL: n = 32 control, 32 MCI and 28 AD. Box andwhiskers are shown for the 5th and 95th percentiles.
Int. J. Mol. Sci. 2020, 21, 4674 5 of 22
Figure 2. Soluble amyloid precursor proteins (APP) (α and β) and neurofilament light chains were
elevated in the serum of MCI and AD patients compared to the control. Protein levels in pg/mL for (A)
sAPPα, (B) sAPPβ and (C) neurofilament light (NfL). Soluble (s)APPα: n = 35 control, 31 MCI and 32
AD. sAPPβ: n = 27 control, 31 MCI and 30 AD. NfL: n = 32 control, 32 MCI and 28 AD. Box and whiskers
are shown for the 5th and 95th percentiles.
Figure 3. ASC is a promising serum biomarker of MCI. Receiver operator characteristic (ROC) curves
for NfL (green), sAPPβ (orange), sAPPα (blue) and ASC (black). (A) Control vs. MCI, (B) control vs. AD
and (C) MCI vs. AD.
In comparison, for the control vs. MCI, the cut-off point for ASC was 264.9 pg/mL with 100%
sensitivity and 74% specificity, while sAPPα had a cut-off point of 1.39 ng/mL with 97% sensitivity and
74% specificity, and sAPPβ had a cut-off point of 0.2639 ng/mL with 90% sensitivity and 78% specificity
(Table 2).
For the control vs. AD, the cut-off point for ASC was 258.7 pg/mL with 81% sensitivity and 71%
specificity, while sAPPα had a cut-off point of 2.573 ng/mL with 91% sensitivity and 91% specificity,
and sAPPβ had a cut-off point of 0.2906 ng/mL with 83% sensitivity and 81% specificity (Table 2).
For MCI vs. AD, the cut-off point for ASC was 560.0 pg/mL with 71% sensitivity and 63%
specificity, while sAPPα had a cut-off point of 8.846 ng/mL with 72% sensitivity and 55% specificity,
and sAPPβ had a cut-off point of 0.6364 ng/mL with 60% sensitivity and 45% specificity (Table 2).
2.4. MCI, AD and NfL
Additionally, we compared the serum protein levels of ASC to NfL. When comparing the levels
of NfL in the control and MCI patients, we found that the protein levels of NfL were higher in MCI
patients than in the control subjects (Figure 2). The AUC for NfL was 0.7734 (Figure 3 and Table 1),
whereas, for ASC, it was 0.974, as above stated (Table 1). The cut-off point for NfL was 24.15 pg/mL,
with a sensitivity of 72% and a specificity of 75% (Table 2). In comparison, for the control vs. AD, the
AUC for NfL was 0.7165, and the cut-off point was 21.48 pg/mL, with 64% sensitivity and 56%
Figure 3. ASC is a promising serum biomarker of MCI. Receiver operator characteristic (ROC) curvesfor NfL (green), sAPPβ (orange), sAPPα (blue) and ASC (black). (A) Control vs. MCI, (B) control vs.AD and (C) MCI vs. AD.
In comparison, for the control vs. MCI, the cut-off point for ASC was 264.9 pg/mL with 100%sensitivity and 74% specificity, while sAPPα had a cut-off point of 1.39 ng/mL with 97% sensitivity and74% specificity, and sAPPβ had a cut-off point of 0.2639 ng/mL with 90% sensitivity and 78% specificity(Table 2).
For the control vs. AD, the cut-off point for ASC was 258.7 pg/mL with 81% sensitivity and 71%specificity, while sAPPα had a cut-off point of 2.573 ng/mL with 91% sensitivity and 91% specificity,and sAPPβ had a cut-off point of 0.2906 ng/mL with 83% sensitivity and 81% specificity (Table 2).
For MCI vs. AD, the cut-off point for ASC was 560.0 pg/mL with 71% sensitivity and 63%specificity, while sAPPα had a cut-off point of 8.846 ng/mL with 72% sensitivity and 55% specificity,and sAPPβ had a cut-off point of 0.6364 ng/mL with 60% sensitivity and 45% specificity (Table 2).
2.4. MCI, AD and NfL
Additionally, we compared the serum protein levels of ASC to NfL. When comparing the levelsof NfL in the control and MCI patients, we found that the protein levels of NfL were higher in MCIpatients than in the control subjects (Figure 2). The AUC for NfL was 0.7734 (Figure 3 and Table 1),whereas, for ASC, it was 0.974, as above stated (Table 1). The cut-off point for NfL was 24.15 pg/mL,with a sensitivity of 72% and a specificity of 75% (Table 2). In comparison, for the control vs. AD,the AUC for NfL was 0.7165, and the cut-off point was 21.48 pg/mL, with 64% sensitivity and 56%specificity (Table 2). However, no significant difference regarding NfL was found between MCI and AD.

Int. J. Mol. Sci. 2020, 21, 4674 6 of 22
2.5. Cluster Analysis Using ASC Protein Levels in Control, MCI and AD Patients
Since ASC protein levels are present in the serum of control, MCI and AD patients, we pooled allthe concentrations of ASC into one group and performed a cluster analysis. Accordingly, we foundthree different clusters using a Gaussian Mixture Modeling method (Figure 4A) consistent with thethree different cohorts of patients present (control, MCI and AD). In addition, a cluster dendrogramwas obtained using hierarchical clustering, in which three groups were also identified (Figure 4B),which was further corroborated in a coordinate plot (Figure 4C). Thus, these findings indicate that ASCprotein levels in the serum can be used to stratify patients among the control, MCI and AD cohorts.
Int. J. Mol. Sci. 2020, 21, 4674 6 of 22
specificity (Table 2). However, no significant difference regarding NfL was found between MCI and
AD.
2.5. Cluster Analysis Using ASC Protein Levels in Control, MCI and AD Patients
Since ASC protein levels are present in the serum of control, MCI and AD patients, we pooled all
the concentrations of ASC into one group and performed a cluster analysis. Accordingly, we found
three different clusters using a Gaussian Mixture Modeling method (Figure 4A) consistent with the
three different cohorts of patients present (control, MCI and AD). In addition, a cluster dendrogram
was obtained using hierarchical clustering, in which three groups were also identified (Figure 4B),
which was further corroborated in a coordinate plot (Figure 4C). Thus, these findings indicate that ASC
protein levels in the serum can be used to stratify patients among the control, MCI and AD cohorts.
Figure 4. Clustering analysis based on serum ASC protein levels. Clustering using Gaussian Mixture
Modeling (A), cluster dendrogram using hierarchical clustering (B) and coordinate plot (C).
Figure 4. Clustering analysis based on serum ASC protein levels. Clustering using Gaussian MixtureModeling (A), cluster dendrogram using hierarchical clustering (B) and coordinate plot (C).
3. Discussion
In this study, we provide evidence that the inflammasome signaling protein ASC may serve asa biomarker of MCI and AD. ASC and IL-18 were both significantly elevated in the serum of MCI
Int. J. Mol. Sci. 2020, 21, 4674 7 of 22
patients when compared to controls, whereas ASC protein levels were also higher in the serum of MCIpatients when compared to AD patients. However, there was no statistically significant differencebetween the levels of IL-18 in AD vs. the control subject. Thus, of all the inflammasome signalingproteins studied (ASC and IL-18), ASC was the protein that presented the best characteristics for abiomarker, including an AUC of 0.974 for the control vs. MCI, 0.8328 for the control vs. AD and 0.7157for MCI vs. AD.
Importantly, due to the contribution of the inflammasome to inflammaging [17–19], we hypothesizethat ASC would be a better monitoring biomarker than sAPP α/β and NfL for therapeutic interventionstargeting the inflammatory response in patients with MCI. Since there is experimental evidence thatsAPPα/β are potential biomarkers for MCI and AD [11], we used these proteins as standards for thecomparison of inflammasome proteins as novel biomarkers in these conditions. Our findings in thecontrol vs. MCI groups, that ASC has an AUC of 0.974 compared to 0.9687 for sAPPα, 0.9068 for sAPPβand 0.7734 for NfL, suggest that ASC is a good biomarker comparable to more traditional biomarkersof MCI, such as sAPP α/β and NfL. Similar results, were found when comparing the control vs. AD.However, when comparing MCI vs. AD, ASC had an AUC of 0.7157, sAPPα 0.6351, sAPPβ 0.5247 andNfL had an AUC of 0.5569, suggesting that, when differentiating MCI vs. AD, ASC is a more reliableserum biomarker.
Interestingly, the levels of ASC were higher in MCI patients than in AD patients. The reasonfor this decrease in ASC as patients transition from MCI into AD is currently under investigation.However, this is consistent with our previous work on innate immunity and AD, in which retinoicacid-inducible gene-I (RIG-I) expression was also higher in the temporal cortex and plasma of MCIpatients [28].
Previous studies have linked inflammation to cognitive impairment [29–33]. A few studieshave noted the importance of the C-reactive protein (CRP), a well-studied biomarker of systemicinflammation, to cognitive impairment. High levels of CRP were associated with neuroinflammationand the diagnosis of MCI in patients who had lower scores on executive function and attentiontests [32–34]. These findings further support the idea that inflammation plays a major role in thedevelopment of neurodegeneration in older populations. Recent evidence suggests that the agedbrain has a heightened and chronic inflammatory state, which is referred to as inflammaging. Studiesin rodents have shown that the activation of the inflammasome contributes to inflammaging of thecentral nervous system [17–19]. Changes in microglial activation have been associated with cognitiveimpairments in aging nonhuman primates that may contribute to inflammaging [35]. However,although several studies have provided evidence that links inflammation to neurodegeneration, theunderlying pathomechanisms attributed to cognitive decline remain to be resolved.
Increased inflammasome protein expression may be associated with other comorbidities that aretypical of aging patients. Thus, further studies with better-controlled and stratified patient populationsare needed to better characterize inflammasome proteins as biomarkers for the early detection of MCIand AD. In addition, future studies will focus on patients with certain lifestyle parameters that couldhelp stratify different patient populations. For instance, caloric restriction has been shown to modulategenes related to stress and the immune response in the aging brains of mice [36].
We have previously shown that inflammasome proteins can be used as biomarkers of theinflammatory response present in traumatic brain injury [22,37], multiple sclerosis [24], stroke [23]and depression [25]. Here we extend these findings and show that increased inflammasome proteinexpression occurs in MCI and AD subjects. These findings have important implications for thedevelopment of a biomarker panel that may aid physicians in the early detection and diagnosis ofMCI and AD. Moreover, the cluster analysis carried in this study indicates that the protein levels ofASC in the serum may be used to stratify patients into three distinct groups—namely, healthy, MCIand AD. Therefore, this study highlights the involvement of ASC in the pathology of MCI and AD.These findings are consistent with animal models that show that inflammasomes, such as the NLRP1and NLRP3 inflammasomes, play an important role in AD pathology [38–41].

Int. J. Mol. Sci. 2020, 21, 4674 8 of 22
Moreover, despite ASC being an important marker of the inflammatory component in a variety ofdiseases or conditions, such as multiple sclerosis, [24] stroke, [23] depression [25] or brain injury [37],how much of an inflammatory component is present in a disease differs among diseases. We believethat the degree in the inflammatory component is marked by the difference in ASC levels betweenhealthy and affected individuals. Thus, the greater the difference, the greater the contribution of ASCto a particular disease. In this study, the difference in ASC protein levels between the control andMCI is greater than between the control and AD. Thus, we hypothesize that ASC is a more significantinflammatory contributor to the pathology of MCI than AD. Moreover, future studies will look at thebiomarker role of ASC on other neurodegenerative diseases, such as Parkinson’s disease.
It is important to consider that samples used in this study came from patients that presentedseveral comorbidities that could also contribute to the heightened inflammatory response presentedhere. Thus, in future studies, we will analyze patients with less comorbidities that could interfere withthe analysis. However, despite the comorbidities, since this study was powered for a prevalence ofAD and MCI and not the comorbidities, we were able to identify a difference between MCI and ADpatients. Furthermore, we carried a binomial logistic regression model to test the odds of patientshaving MCI or AD based on the levels of ASC, and we determined that the odds of patients havingMCI (estimate: 0.022628, p = 0.000105) or AD (estimate: 0.011559, p = 1.28 × 10⁻⁵) increased with higherlevels of ASC in the serum, thus supporting the involvement of ASC in MCI and AD in this study,regardless of the comorbidities that patients presented. In addition, due to the challenges of diagnosingpatients with AD, it is possible that some patients identified as MCI may actually have had AD. Thus,future studies will use better-stratified patients and will aim to correlate the levels of inflammasomeproteins with disease severity. These studies will also include a more thorough characterization of thecohort of patients using a battery of neuropsychological tests, as well as magnetic resonance imaging,where the degree of brain atrophy can be quantified and then correlated with the protein levels of ASC.In addition, we will measure the protein levels of ASC, Aβ, T-tau and phospho-tau in the CSF to betterunderstand the relationship between ASC and Aβ, since these two proteins form a complex that isdetrimental in mice [26,27]. Furthermore, we will determine whether isolated ASC specks are betterbiomarkers of AD pathology.
We have previously shown that, in healthy individuals, ASC and IL-18 are higher in the serumof humans over the age of 45 years old. In addition, we have shown that the levels of ASC werehigher in Caucasians than in Blacks and Hispanics. Moreover, the protein levels of IL-18 were alsohigher in Caucasians than in Blacks [19]. In the present investigation, similar numbers of males andfemales were used for all groups, and the way race was reported in the MCI group did not allow forcomparison between races and the diagnoses of MCI/AD. In this study, all patients were above the ageof 50 in the control and MCI groups and 47 in the AD group. Thus, since no changes in the serumsof patients above the age of 45 have been found for ASC and IL-18 in healthy subjects, we do notanticipate that the effects seen in this study are the result of age, but are, instead, due to the results ofMCI/AD pathology. However, logistic regression analyses that included age and the levels of ASC inthe serum indicated that, as age and ASC levels increased, so did the odds of developing MCI andAD (data not shown). Therefore, since AD tends to occur later in life than MCI, current studies arelooking into the effects of these proteins, with careful standards for patient selection, including patientswith MCI and AD that are in the same age range and patients with AD in which the disease severityis known. Unfortunately, in this study, the samples available were not characterized with regards todisease severity but based on physicians’ diagnoses of AD.
Importantly, it has been shown that ASC fibrils bind to Aβ and that microglia recognize thisASC/Aβ complex, resulting in pyroptotic cell death. In addition, extracellular ASC specks may be takenup by microglia, leading to NLRP3 inflammasome activation [26]. Thus, it is possible that the levels ofASC present in the serum play a key role in the pathology of AD by binding to Aβ, further contributingto the deleterious effects associated with neuroinflammation in AD. In addition, the neutralization ofASC with a monoclonal antibody resulted in decreased Aβ pathology in a mouse model of AD [27],

Int. J. Mol. Sci. 2020, 21, 4674 9 of 22
an approach that previously has been shown to improve outcomes following CNS injuries [42–47].Thus, current studies are underway to identify which form(s) of ASC (monomer, ASC fibril and ASCspeck) is present in the serum of MCI and AD patients and to determine if any of these ASC forms arebound to Aβ. In summary, our study demonstrates that ASC may be used to differentiate inflammationlinked to MCI and AD from age-associated inflammation in the elderly population and show that ASCis a promising biomarker for the diagnosis of these neurodegenerative conditions.
4. Materials and Methods
4.1. Participants
Samples were purchased from BioIVT (Hicksville, NY, USA). Sample donors were enrolled inthe study Prospective Collection of Samples for Research sponsored by SeraTrials, LLC, with IRBnumber 20170439. Samples were obtained after informed consent. Here, we analyzed serum samplesfrom 72 normal male (36 donors) and female (36) donors in the age range of 50 to 70. Normal donorspresented no comorbidities. In addition, we analyzed the serum from 32 male (16 donors) and female(16) patients diagnosed with MCI in the age range of 50 to 91 (Table 3) and with AD (22 males and10 females) in the age range of 47 to 87 (Table 4). In the control group, 20 patients were Caucasian,32 were Black, 19 were Hispanic and 1 was reported as Other. In the MCI group, 31 patients werereported as Caucasian, and 1 was reported as Caucasian/Japanese. In the MCI group, no distinctionor stratification was done between Hispanics and Caucasians. In the AD group, 20 patients wereCaucasian, 8 were Black and 4 were Hispanic (some Hispanics were also reported as Caucasians).Patients were classified according to their Atherosclerosis Risk in Communities magnetic resonanceimaging (ARIC MRI) cognitive function scores. The scale was developed as part of the AtherosclerosisRisk in Communities (ARIC) study that recruited middle-aged individuals who underwent magneticresonance imaging (MRI) to evaluate the risk factors of vascular problems in these individuals [48].Cognitive testing was evaluated using the Delayed Word Recall Test, the Digit Symbol Subtest of theWechsler Adult Intelligence Scale-Revised (WAIS-R) test and the Controlled Oral Word Association(or Word Fluency) Test of the Multilingual Aphasia Examination [49].
4.2. Simple Plex Assay
Analysis of inflammasome proteins (ASC and IL-18) and NfL protein concentration in the serumsamples from MCI, AD and controls were performed using the Ella System (Protein Simple, San Jose,CA, USA), as described in [24,50].
4.3. MSD Multi-SPOT sAPPα/sAPPβ Assay
Protein levels of soluble APPα and β (sAPPα/sAPPβ) were measured using the MSD 96-wellMulti-Spot sAPPα/sAPPβ Assay according to the manufacturer’s instructions (Meso Scale Discovery,Rockville, MD, USA) and read on the MESO Quickplex SQ 120 instrument (Meso Scale Discovery,Rockville, MD, USA). Briefly, the plate was coated with Blocker A solution prior to adding the samplesand calibrators, followed by addition of the detection antibody and, ultimately, the reading of the platein the MESO Quickplex SQ 120 instrument.
Int. J. Mol. Sci. 2020, 21, 4674 10 of 22
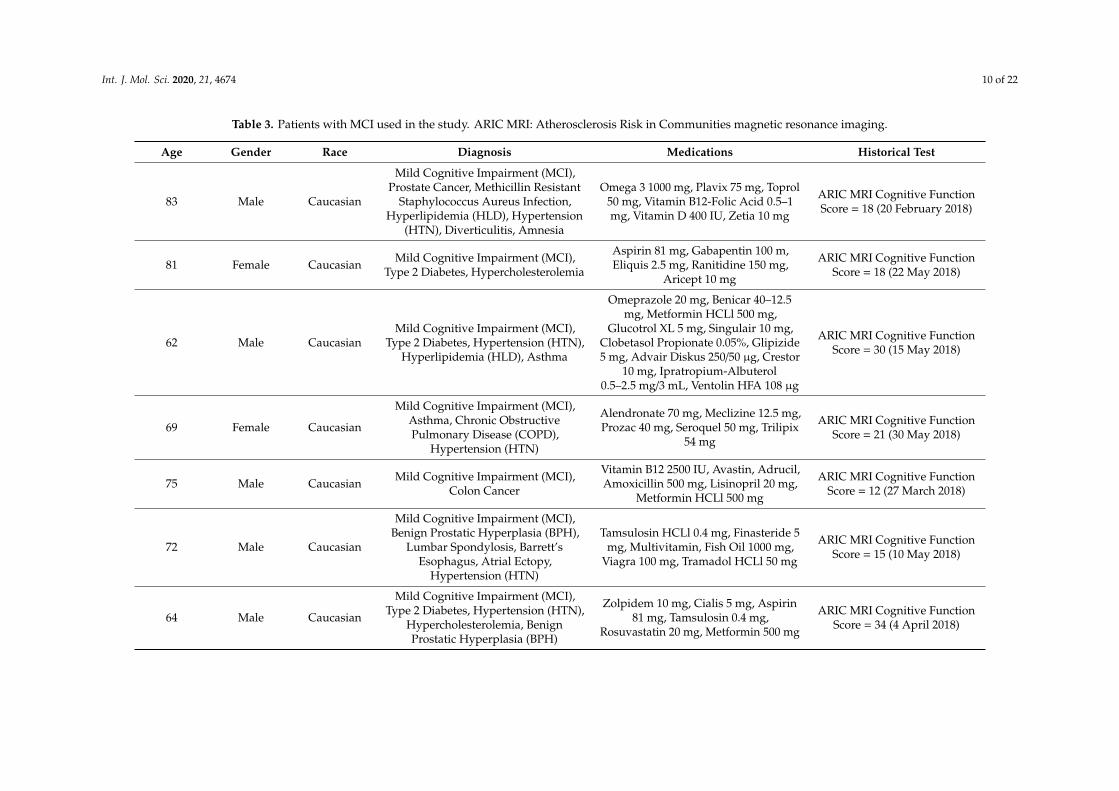
Table 3. Patients with MCI used in the study. ARIC MRI: Atherosclerosis Risk in Communities magnetic resonance imaging.
Age Gender Race Diagnosis Medications Historical Test
83 Male Caucasian
Mild Cognitive Impairment (MCI),Prostate Cancer, Methicillin Resistant
Staphylococcus Aureus Infection,Hyperlipidemia (HLD), Hypertension
(HTN), Diverticulitis, Amnesia
Omega 3 1000 mg, Plavix 75 mg, Toprol50 mg, Vitamin B12-Folic Acid 0.5–1mg, Vitamin D 400 IU, Zetia 10 mg
ARIC MRI Cognitive FunctionScore = 18 (20 February 2018)
81 Female Caucasian Mild Cognitive Impairment (MCI),Type 2 Diabetes, Hypercholesterolemia
Aspirin 81 mg, Gabapentin 100 m,Eliquis 2.5 mg, Ranitidine 150 mg,
Aricept 10 mg
ARIC MRI Cognitive FunctionScore = 18 (22 May 2018)
62 Male CaucasianMild Cognitive Impairment (MCI),
Type 2 Diabetes, Hypertension (HTN),Hyperlipidemia (HLD), Asthma
Omeprazole 20 mg, Benicar 40–12.5mg, Metformin HCLl 500 mg,
Glucotrol XL 5 mg, Singulair 10 mg,Clobetasol Propionate 0.05%, Glipizide5 mg, Advair Diskus 250/50 µg, Crestor
10 mg, Ipratropium-Albuterol0.5–2.5 mg/3 mL, Ventolin HFA 108 µg
ARIC MRI Cognitive FunctionScore = 30 (15 May 2018)
69 Female Caucasian
Mild Cognitive Impairment (MCI),Asthma, Chronic ObstructivePulmonary Disease (COPD),
Hypertension (HTN)
Alendronate 70 mg, Meclizine 12.5 mg,Prozac 40 mg, Seroquel 50 mg, Trilipix
54 mg
ARIC MRI Cognitive FunctionScore = 21 (30 May 2018)
75 Male Caucasian Mild Cognitive Impairment (MCI),Colon Cancer
Vitamin B12 2500 IU, Avastin, Adrucil,Amoxicillin 500 mg, Lisinopril 20 mg,
Metformin HCLl 500 mg
ARIC MRI Cognitive FunctionScore = 12 (27 March 2018)
72 Male Caucasian
Mild Cognitive Impairment (MCI),Benign Prostatic Hyperplasia (BPH),
Lumbar Spondylosis, Barrett’sEsophagus, Atrial Ectopy,
Hypertension (HTN)
Tamsulosin HCLl 0.4 mg, Finasteride 5mg, Multivitamin, Fish Oil 1000 mg,
Viagra 100 mg, Tramadol HCLl 50 mg
ARIC MRI Cognitive FunctionScore = 15 (10 May 2018)
64 Male Caucasian
Mild Cognitive Impairment (MCI),Type 2 Diabetes, Hypertension (HTN),
Hypercholesterolemia, BenignProstatic Hyperplasia (BPH)
Zolpidem 10 mg, Cialis 5 mg, Aspirin81 mg, Tamsulosin 0.4 mg,
Rosuvastatin 20 mg, Metformin 500 mg
ARIC MRI Cognitive FunctionScore = 34 (4 April 2018)

Int. J. Mol. Sci. 2020, 21, 4674 11 of 22
Table 3. Cont.
Age Gender Race Diagnosis Medications Historical Test
84 Female Caucasian
Mild Cognitive Impairment (MCI),Hypertension (HTN), Psychoses,
Cellulitis, Mitral Valve Prolapse (MVP),Hyperlipidemia (HLD)
Simvastatin 20 mg, Potassium Chloride10 mEq, Amlodipine Besylate 2.5 mg,
Dutasteride 0.5 mg, LosartanPotassium 100 mg, Aspirin 81 mg,
Furosemide 20 mg, Potassium Chloride10 mEq, Avodart 0.4 mg, Amlodipine
Besylate 2.5 mg, Ramipril 10 mg
ARIC MRI Cognitive FunctionScore = 8 (10 May 2018)
68 Female Caucasian Mild Cognitive Impairment (MCI),Multiple Sclerosis Tysabri, Lexapro, Gabapentin ARIC MRI Cognitive Function
Score = 15 (6 April 2018)
69 Female Caucasian
Mild Cognitive Impairment (MCI),Hypercholesterolemia, Hypertension(HTN), Type 2 Diabetes, Premature
Ventricular Contraction
Crestor 5 mg, Omega 3, ZolpidemTartrate 5 mg, Glucosamine 1500 mg,Fiber, Calcium, Multivitamin, Zyrtec,
Chlordiazepoxide-Clidinium 2.5–5 mg,Valacyclovir 500 mg, Lisinopril 10 mg,
Janumet 50–500 mg, MetoprololSuccinate 25 mg, Levothyroxine
Sodium 100 µg, Rosuvastatin Calcium5 mg, Omega 3-Acid Ethyl Esters 1 g,
Trazodone 50 mg
ARIC MRI Cognitive FunctionScore = 33 (1 May 2018)
50 Female Caucasian Mild Cognitive Impairment (MCI),Hypercholesterolemia None ARIC MRI Cognitive Function
Score = 30 (24 April 2018)
78 Male Caucasian Mild Cognitive Impairment (MCI)
Zaleplon 10 mg, Lorazepam 1 mg,Plavix 75 mg, Aspirin, Allopurinol 300
mg, Levothyroxine Sodium 125mcg,Atorvastatin Calcium 20 mg,
Metformin HCLl 1000 mg,Pantoprazole Sodium 40 mg
ARIC MRI Cognitive FunctionScore = 24 (27 April 2018)
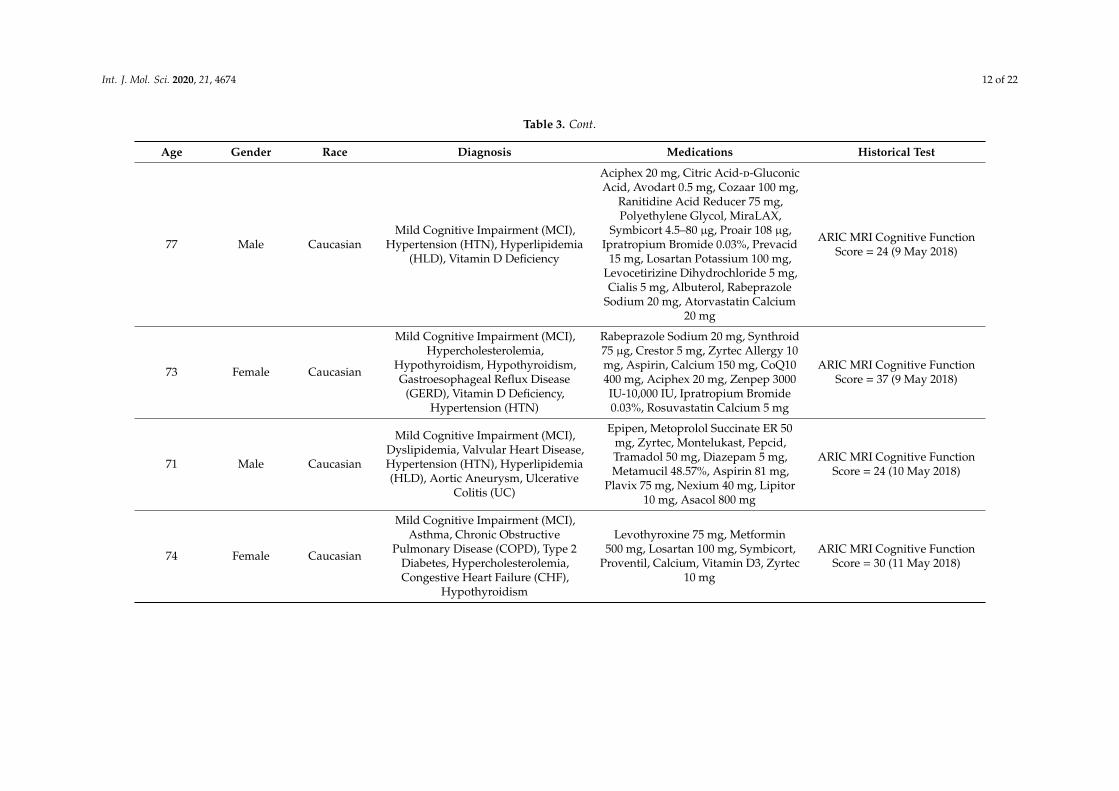
Int. J. Mol. Sci. 2020, 21, 4674 12 of 22
Table 3. Cont.
Age Gender Race Diagnosis Medications Historical Test
77 Male CaucasianMild Cognitive Impairment (MCI),
Hypertension (HTN), Hyperlipidemia(HLD), Vitamin D Deficiency
Aciphex 20 mg, Citric Acid-d-GluconicAcid, Avodart 0.5 mg, Cozaar 100 mg,
Ranitidine Acid Reducer 75 mg,Polyethylene Glycol, MiraLAX,
Symbicort 4.5–80 µg, Proair 108 µg,Ipratropium Bromide 0.03%, Prevacid
15 mg, Losartan Potassium 100 mg,Levocetirizine Dihydrochloride 5 mg,Cialis 5 mg, Albuterol, Rabeprazole
Sodium 20 mg, Atorvastatin Calcium20 mg
ARIC MRI Cognitive FunctionScore = 24 (9 May 2018)
73 Female Caucasian
Mild Cognitive Impairment (MCI),Hypercholesterolemia,
Hypothyroidism, Hypothyroidism,Gastroesophageal Reflux Disease
(GERD), Vitamin D Deficiency,Hypertension (HTN)
Rabeprazole Sodium 20 mg, Synthroid75 µg, Crestor 5 mg, Zyrtec Allergy 10mg, Aspirin, Calcium 150 mg, CoQ10400 mg, Aciphex 20 mg, Zenpep 3000IU-10,000 IU, Ipratropium Bromide0.03%, Rosuvastatin Calcium 5 mg
ARIC MRI Cognitive FunctionScore = 37 (9 May 2018)
71 Male Caucasian
Mild Cognitive Impairment (MCI),Dyslipidemia, Valvular Heart Disease,Hypertension (HTN), Hyperlipidemia(HLD), Aortic Aneurysm, Ulcerative
Colitis (UC)
Epipen, Metoprolol Succinate ER 50mg, Zyrtec, Montelukast, Pepcid,Tramadol 50 mg, Diazepam 5 mg,Metamucil 48.57%, Aspirin 81 mg,
Plavix 75 mg, Nexium 40 mg, Lipitor10 mg, Asacol 800 mg
ARIC MRI Cognitive FunctionScore = 24 (10 May 2018)
74 Female Caucasian
Mild Cognitive Impairment (MCI),Asthma, Chronic Obstructive
Pulmonary Disease (COPD), Type 2Diabetes, Hypercholesterolemia,Congestive Heart Failure (CHF),
Hypothyroidism
Levothyroxine 75 mg, Metformin500 mg, Losartan 100 mg, Symbicort,
Proventil, Calcium, Vitamin D3, Zyrtec10 mg
ARIC MRI Cognitive FunctionScore = 30 (11 May 2018)
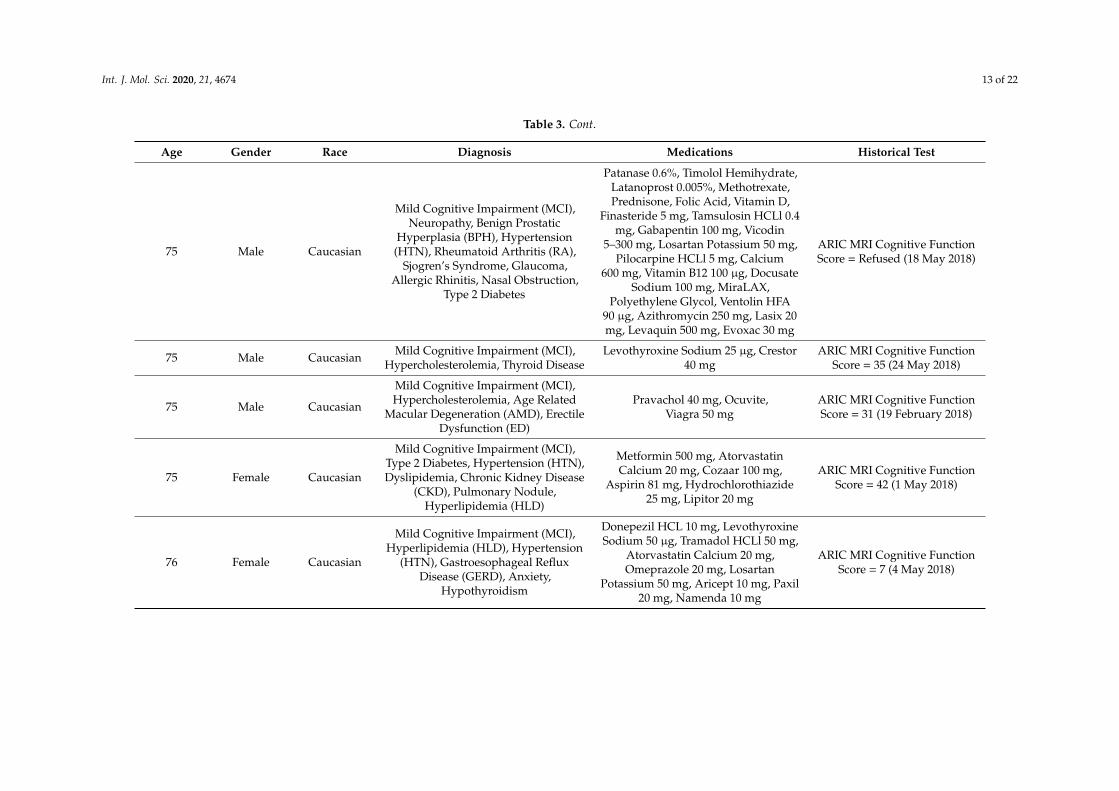
Int. J. Mol. Sci. 2020, 21, 4674 13 of 22
Table 3. Cont.
Age Gender Race Diagnosis Medications Historical Test
75 Male Caucasian
Mild Cognitive Impairment (MCI),Neuropathy, Benign Prostatic
Hyperplasia (BPH), Hypertension(HTN), Rheumatoid Arthritis (RA),
Sjogren’s Syndrome, Glaucoma,Allergic Rhinitis, Nasal Obstruction,
Type 2 Diabetes
Patanase 0.6%, Timolol Hemihydrate,Latanoprost 0.005%, Methotrexate,Prednisone, Folic Acid, Vitamin D,
Finasteride 5 mg, Tamsulosin HCLl 0.4mg, Gabapentin 100 mg, Vicodin
5–300 mg, Losartan Potassium 50 mg,Pilocarpine HCLl 5 mg, Calcium
600 mg, Vitamin B12 100 µg, DocusateSodium 100 mg, MiraLAX,
Polyethylene Glycol, Ventolin HFA90 µg, Azithromycin 250 mg, Lasix 20mg, Levaquin 500 mg, Evoxac 30 mg
ARIC MRI Cognitive FunctionScore = Refused (18 May 2018)
75 Male Caucasian Mild Cognitive Impairment (MCI),Hypercholesterolemia, Thyroid Disease
Levothyroxine Sodium 25 µg, Crestor40 mg
ARIC MRI Cognitive FunctionScore = 35 (24 May 2018)
75 Male Caucasian
Mild Cognitive Impairment (MCI),Hypercholesterolemia, Age Related
Macular Degeneration (AMD), ErectileDysfunction (ED)
Pravachol 40 mg, Ocuvite,Viagra 50 mg
ARIC MRI Cognitive FunctionScore = 31 (19 February 2018)
75 Female Caucasian
Mild Cognitive Impairment (MCI),Type 2 Diabetes, Hypertension (HTN),Dyslipidemia, Chronic Kidney Disease
(CKD), Pulmonary Nodule,Hyperlipidemia (HLD)
Metformin 500 mg, AtorvastatinCalcium 20 mg, Cozaar 100 mg,
Aspirin 81 mg, Hydrochlorothiazide25 mg, Lipitor 20 mg
ARIC MRI Cognitive FunctionScore = 42 (1 May 2018)
76 Female Caucasian
Mild Cognitive Impairment (MCI),Hyperlipidemia (HLD), Hypertension
(HTN), Gastroesophageal RefluxDisease (GERD), Anxiety,
Hypothyroidism
Donepezil HCL 10 mg, LevothyroxineSodium 50 µg, Tramadol HCLl 50 mg,
Atorvastatin Calcium 20 mg,Omeprazole 20 mg, Losartan
Potassium 50 mg, Aricept 10 mg, Paxil20 mg, Namenda 10 mg
ARIC MRI Cognitive FunctionScore = 7 (4 May 2018)

Int. J. Mol. Sci. 2020, 21, 4674 14 of 22
Table 3. Cont.
Age Gender Race Diagnosis Medications Historical Test
76 Male Caucasian
Mild Cognitive Impairment (MCI),Hypertension (HTN), Type 2 Diabetes,
Peripheral Polyneuropathy, BenignProstatic Hyperplasia (BPH)
Novolog, Lantus 100 U/mL, MetoprololSuccinate 25 mg, Tacrolimus, TerazosinHCLL 10 mg, CellCept 250 mg, Aspirin
81 mg, Allopurinol 150 mg,Atorvastatin Calcium 10 mg, Losartan
Potassium 100 mg
ARIC MRI Cognitive FunctionScore = 28 (15 May 2018)
67 Female Caucasian Mild Cognitive Impairment (MCI),Asthma, Hypercholesterolemia Crestor 40 mg, Omeprazole 20 mg ARIC MRI Cognitive Function
Score = 40 (7 May 2018)
56 Female Caucasian/Japanese Mild Cognitive Impairment (MCI) Daily Vitamins, Aspirin 81 mg ARIC MRI Cognitive Function
Score = 41 (8 May 2018)
58 Female Caucasian Mild Cognitive Impairment (MCI),Hyperlipidemia (HLD)
Simvastatin 20 mg, Caltrate 600mg-Vitamin D 800 IU, Vitamin D 2000IU, Ibuprofen 800 mg, Prolia 60 mg/mL
ARIC MRI Cognitive FunctionScore = 42 (8 May 2018)
75 Female CaucasianMild Cognitive Impairment (MCI), AF,
Dyslipidemia, Hypertension (HTN),Hypothyroidism
Crestor 10 mg, Armour Thyroid 60 mg,Ramipril 5 mg, Hydrochlorothiazide 25mg, Promethium 200 mg, Augmentin
125–875 mg, Rosuvastatin Calcium10 mg
ARIC MRI Cognitive FunctionScore = 31 (11 May 2018)
84 Female Caucasian
Mild Cognitive Impairment (MCI),Venous Insufficiency, Hyperlipidemia(HLD), Hypothyroidism, Parkinson’sDisease (PD), Mitral Valve Prolapse
(MVP), Anxiety
Cipro 500 mg, Ibuprofen 800 mg,Xanax 0.5 mg, Fluconazole 150 mg,Carbidopa-Levodopa 25–100 mg,
Potassium Chloride 20 mEq,Simvastatin 20 mg, Furosemide 40 mg,Levothyroxine Sodium 75 µg, Atenolol
25 mg, Lasix, Aspirin 81 mg,Acetaminophen 500 mg
ARIC MRI Cognitive FunctionScore = 19 (11 May 2018)
88 N/A Caucasian
Mild Cognitive Impairment (MCI),Hyperlipidemia (HLD), Peripheral
Vascular Disease, Hypertension (HTN),Hyperlipidemia, Mild Intermittent
Asthma, Hypercholesterolemia,Type 2 Diabetes
Cozaar 100 mg, Crestor 10 mg, Aspirin,Prilosec 20 mg, Amlodipine Besylate 5
mg, D3 1000 IU, Vitamin C 100 mg,Multi for Him, Omeprazole 20 mg
ARIC MRI Cognitive FunctionScore = 8 (22 May 2018)

Int. J. Mol. Sci. 2020, 21, 4674 15 of 22
Table 3. Cont.
Age Gender Race Diagnosis Medications Historical Test
71 Male Caucasian
Mild Cognitive Impairment (MCI),Hypertension (HTN),
Hypercholesterolemia, Chronic KidneyDisease (CKD), Palsy of Conjugate
Gaze, Short Term Memory,Hyperlipidemia, Cervical Spondylosis,
Basal Cell Cancer (BCC), ComplexPartial Epileptic Seizure, ChronicTremor, Lumbosacral Radiculitis,
Allergic Rhinitis, Lumbar Arthritis,Arthritis, Bilateral Hearing Loss
Aspirin 81 mg, Brimonidine 0.15%,Cialis 20 mg, Dexamethasone 4 mg/mL,Donepezil 5 mg, Fexofenadine 180 mg,Lamotrigine 200 mg, Lisinopril 5 mg,Meloxicam 15 mg, Pramipexole 0.25
mg, Simvastatin 40 mg, Virtussin10–100 mg/5 mL
ARIC MRI Cognitive FunctionScore = 44 (24 May 2018)
86 Male Caucasian
Mild Cognitive Impairment (MCI),Hypertensive Heart and Renal Disease
with Congestive Heart Failure, Cystand Pseudocyst of Pancreas, BenignProstatic Hyperplasia (BPH), Type 2Diabetes, Chronic Kidney Disease
(CKD), Hypokalemia, Chronic SystolicHeart Disease, Mitral Valve Prolapse
(MVP), Atrial Fibrillation (AF),Hyperlipidemia, Sensorineural
Hearing Loss, Left Bundle BranchBlock, Pulmonary Hypertension
(HTN), Hyperparathyroidism
Amlodipine 5 mg, Glimepiride 1 mg,Nitroglycerin 0.2 mg, PotassiumChloride 20 mEq, Warfarin 2 mg
ARIC MRI Cognitive FunctionScore = 48 (17 May 2018)
91 Female Caucasian
Mild Cognitive Impairment (MCI),Type 2 Diabetes, Hypertension (HTN),Hypercholesterolemia, Benign ProstateHyperplasia (BPH), Abdominal Aortic
Aneurysm, Atrial Fibrillation (AF)
Amlodipine Besylate 5 mg,Atorvastatin Calcium 40 mg,
Coumadin, Plavix 75 mg, Toprol 50 mg
ARIC MRI Cognitive FunctionScore = 31 (13 March 2018)
88 Male Caucasian
Mild Cognitive Impairment (MCI),Hypercholesterolemia, Melanoma,
Depression, Squamous Cell Carcinoma,GERD, Hemorrhoids, TIA
Trintellix 10 mg, Aripiprazole 2.5 mg,Rosuvastatin 20 mg, Modafinil 200 mg,Amphetamine 20 mg, Namenda 28 mg,
Esomeprazole 20 mg, Lutein 5 mg,Vitamin D3 1000 IU, Aspirin 81 mg,
Vitamin B12
ARIC MRI Cognitive FunctionScore = 16 (21 February 2018)

Int. J. Mol. Sci. 2020, 21, 4674 16 of 22
Table 4. Patients with AD used in this study.
Gender Age Race Diagnosis Medications
Male 82 Caucasian
Alzheimer’s Disease (AD), GastroesophagealReflux Disease (GERD), Benign Prostatic
Hyperplasia (BPH), Sleep Apnea, Malignant BasalCell Neoplasm of Skin, Depression, Dermatitis,
Osteoarthritis (OA), Thrombocytopenia
Aricept 10 mg, B Complex 100 0.4 mg,Doxazosin 8 mg, Finasteride 5 mg, Melatonin
10 mg, Multivitamin 9 mg, Omeprazole 20 mg,Sertraline, Simvastatin 80 mg, Vitamin D3 2000
IU, Voltaren 1%
Male 87 Caucasian Alzheimer’s Disease (AD), Hypertension (HTN),Hyperlipidemia, Dementia
Cartia XT 120 mg, Prilosec 20 mg, Namenda28XL, Exelon Patch 9.5 mg, Paxil 20 mg
Female 84 CaucasianHypertension (HTN), Vitamin D Deficiency,
Hyperlipidemia (HLD), Skin Cancer, Anemia,Alzheimer’s Disease (AD)
Cerefolin NAC 6–200 mg, ClopidogrelBisulfate 75 mg, Multivitamin, Galantamine
Hydrobromide ER 16 mg, MemantineHCLHCL 10 mg, Vitamin D3, Zolpidem
Tartrate 5 mg, Iron 325 mg, Remeron 15 mg,Plavix 75 mg
Female 76 CaucasianHyperlipidemia (HLD), Hypertension (HTN),
Gastroesophageal Reflux Disease (GERD), Anxiety,Alzheimer’s Disease (AD), Hypothyroidism
Donepezil HCLHCL 10 mg, LevothyroxineSodium 50 µg, Tramadol HCLHCL50 mg,
Atorvastatin Calcium 20 mg, Omeprazole 20mg, Losartan Potassium 50 mg, Aricept 10 mg,
Paxil 20 mg, Namenda 10 mg
Male 47 Caucasian Alzheimer’s Disease (AD) Donepezil 10 mg
Male 67 African Alzheimer’s Disease (AD) Rivastigmine 3 mg, Multivitamin
Male 61 Caucasian Alzheimer’s Disease (AD), Type 2 Diabetes,Hypertension (HTN), Hypercholesterolemia
Atorvastatin 40 mg, Gabapentin 300 mg,Aspirin 81 mg, Razadyne 16 mg, Metformin
500 mg
Female 60 African Alzheimer’s Disease (AD), Hypertension (HTN) Clonidine 0.3 mg, Ambien, Quetiapine 300 mg
Male 47 N/A Alzheimer’s Disease (AD), Asthma, Anxiety Gabapentin 300 mg
Male 60 African Alzheimer’s Disease (AD), Type 2 Diabetes Donepezil, Metformin, Humalog
Male 74 Caucasian Alzheimer’s Disease (AD), Hypertension (HTN),Hypercholesterolemia
Aspirin 80 mg, Plavix 75 mg, Lisinopril 25 mg,Simvastatin 10 mg, Digoxin 30 mg, Metoprolol
50 mg, Razadyne 24 mg

Int. J. Mol. Sci. 2020, 21, 4674 17 of 22
Table 4. Cont.
Gender Age Race Diagnosis Medications
Male 50 African Alzheimer’s Disease (AD), Seizures Keppra 500-750 mg, Exelon Patch
Male 67 African Alzheimer’s Disease (AD), Hypertension (HTN) Aspirin 81 mg, Lisinopril 5 mg, MetoprololSuccinate 500 mg
Male 59 Mixed Race Alzheimer’s Disease (AD), Type 2 Diabetes,Hypertension (HTN), Anxiety
Metoprolol 50 mg, Amlodipine/Benazepril10–40 mg, Seroquel 50 mg, Aricept 23 mg,
Creon 36000 IU, Gabapentin 600 mg, Prandin 2mg, Metformin 1000 mg
Male 54 African Alzheimer’s Disease (AD), HTN Donepezil 10 mg, Multivitamin,Atenolol 50 mg
Female 58 N/AAlzheimer’s Disease (AD), Asthma, Hypertension
(HTN), Hypercholesterolemia, RheumatoidArthritis (RA), Type 2 Diabetes
Combivent 103 µg, Symbicort 160 µg,Budesonide 0.5 mg, Singulair 10 mg, Prandin
2 mg, Metoprolol 50 mg, Lotrel 20 mg, Janumet1000 mg, Donepezil 10 mg, Maxzide 37.5 mg
Male 75 Caucasian
Osteomyelitis, Type 2 Diabetes, Chronic KidneyDisease (CKD), Dyslipidemia, Hypertension
(HTN), Erectile Dysfunction (ED), Atherosclerosis,Alzheimer’s Disease (AD)
Hydrochlorothiazide 25 mg, Humalog100 U/mL, Lantus 100 U/mL, Metformin
HCLHCL 1000 mg, Testosterone Cypionate 200mg/mL, Amlodipine Besylate 10 mg, VentolinHFA 108 µg, Carvedilol 25 mg, Lipitor 20 mg,
Benazepril HCLHCL 40 mg, Azithromycin250 mg, Proair 108 µg
Female 75 Caucasian Alzheimer’s Disease (AD), Allergy (Seasonal)Aricept 10 mg, Namenda 10 mg, Calcitrate
200 mg, Centrum Silver, Cetirizine 10 mg, FolicAcid 400 µg, Magnesium 250 mg
Female 73 CaucasianAlzheimer’s Disease (AD), Type 2 Diabetes,
Hypercholesterolemia, Coronary Artery Disease(CAD)
Vitamin D6, Folic Acid, Warfarin 5 mg,Losartan/Hydrochlorothiazide 50 mg/12.5 mg,
Metformin 500 mg, Aricept 10 mg
Male 55 N/A Alzheimer’s Disease (AD), Hypertension (HTN),Bilateral Carpal Tunnel
Losartan/Hydrochlorothiazide 50 mg/12.5 mg,Meloxicam 15 mg, Norvasc 10 mg
Male 84 Caucasian Hypertension (HTN), Hypercholesterolemia,Alzheimer’s Disease (AD)
Metoprolol 25 mg, Atorvastatin 40 mg, Aspirin81 mg, Theragran

Int. J. Mol. Sci. 2020, 21, 4674 18 of 22
Table 4. Cont.
Gender Age Race Diagnosis Medications
Male 51 African Alzheimer’s Disease (AD), Hypertension (HTN),Hypercholesterolemia Hydrochlorothiazide 25 mg, Razadyne 16 mg
Male 64 N/A Alzheimer’s Disease (AD), Hypertension (HTN),Hypercholesterolemia, Type 2 Diabetes
Exelon 6 mg, Metformin 500 mg, Atorvastatin40 µg, Ramipril 10 mg, Lantus 100 U/mL
Female 84 CaucasianHypertension (HTN), Hallucinations, Psychoses,
Cellulitis, Dementia, Mitral Valve Prolapse (MVP),Hyperlipidemia (HLD), Alzheimer’s Disease (AD)
Simvastatin 20 mg, Potassium Chloride10 mEq, Amlodipine Besylate 2.5 mg,
Dutasteride 0.5 mg, Losartan Potassium100 mg, Aspirin 81 mg, Furosemide 20 mg,
Potassium Chloride 10 mEq, Avodart 0.4 mg,Amlodipine Besylate 2.5 mg, Ramipril 10 mg
Female 62 Caucasian Sporadic Alzheimer’s Disease (AD), Asthma
Topamax 150 mg, Vesicare 5 mg, Prozac 60 mg,Levoxyl 75 mg, Xarelto 20 mg,
Hydrocodone-Acetaminophen 5–325 mg,Butran Patch 15 mg, Gabapentin 600 mg,
Celebrex 200 mg, Breo 100 mg, ProAir, Bentyl20 mg, Pantoprazole 40 mg
Male 68 Caucasian
Alzheimer’s Disease (AD), Type 2 Diabetes,Hypertension (HTN), Hypercholesterolemia,
Cerebrovascular Accident (CVA), Parkinsonism,Peripheral Neuropathy, Hypothyroidism, BenignProstatic Hyperplasia (BPH), Depression, Anxiety,
Glaucoma, Hernia
NamEnda 5 mg, Tamsulosin HCLHCL 0.4 mg,Atorvastatin 40 mg, Valsartan 320 mg, Zetia
10 mg, Carvedilol 25 mg, Aspirin 325 mg,Bupropion HCLl ER 200 mg, Venlafaxine ER150 mg, Finasteride 5 mg, Synthroid 50 µg,Zolpidem 10 mg, Novolog 100 units/mL,
Lantus 100 units/mL, Latanoprost 0.005%,Azelastine 0.15%, Glucagon 1 mg
Male 72 Caucasian Hypertension (HTN), Hypercholesterolemia,Alzheimer’s Disease (AD)
Omega-3 Fatty acids/Docosahexanoicacid/EPA/Fish oil 350 mg/235 mg/90 mg/597
mg, CoQ10 100 mg, Vitamin B Complex,Aspirin 81 mg, Pravastatin 20 mg, Losartan
50 mg, Namenda XR 28 mg, Donepezil 10 mg,Crenizumab

Int. J. Mol. Sci. 2020, 21, 4674 19 of 22
Table 4. Cont.
Gender Age Race Diagnosis Medications
Male 79 CaucasianAsthma, Hypertension (HTN),
Hypercholesterolemia, Basal Cell Cancer (BCC),Alzheimer’s Disease (AD)
Aspirin 81 mg, Amlodipine/Benazepril 10mg/20 mg, Terazosin 2 mg,
Hydrochlorothiazide 25 mg, Atenolol 50 mg,Multivitamin, Calcium, Vitamin D,
Atorvastatin 40 mg
Female 77 Caucasian
Hypertension (HTN), Allergic Rhinitis, Hematuria,Chronic Kidney Disease (CKD), Hypertensive
Nephropathy, Hypercholesterolemia, Menopausal,Osteopenia, Gastroesophageal Reflux Disease
(GERD), Large Hiatal Hernia, Gastritis,Esophagitis, Basal Cell Cancer (BCC),
Degenerative Joint Disease, Rosacea, Alzheimer’sDisease (AD), Obesity, Dyspepsia
Vitamin D 2000 IU, Omeprazole 20 mg, Tylenol
Male 71 Caucasian
Atrial Fibrillation, End Stage Renal Disease(ESRD), Congestive Heart Failure (CHF), CoronaryArtery Disease (CAD), Hyperlipidemia, Chronic
Obstructive Pulmonary Disease (COPD),Gastroesophageal Reflux Disease (GERD),
Hyperparathyroidism, Alzheimer’s Disease (AD)
Lanthanum Carbonate 1000 mg, Midodrine 10mg, Sensipar 30 mg, Pantoprazole 40 mg,
Pravastatin 40 mg, Ventolin 90 µg,Warfarin 3 mg
Female 82 Caucasian
Type 2 Diabetes, Hypothyroidism, CoronaryArtery Disease (CAD), Atrial Fibrillation (AF),
Hypertension (HTN), Alzheimer’s Disease (AD),Hyperlipidemia (HLD), Depression, Irritable
Bowel Syndrome (IBS), Cerebrovascular Accident(CVA), Coronary Artery Disease (CAD),
Vertigo, Anemia
Digoxin 125 µg, Potassium Chloride 20 mEq,Metoprolol Succinate 200 mg, Furosemide 20mg, Levothyroxine Sodium 88 µg, Lipitor 20mg, Memantine HCL 5 mg, Lisinopril 10 mg,Xarelto 15 mg, Amlodipine Besylate 2.5 mg,
Zoloft 50 mg, Aricept 10 mg, Metformin HCL500 mg
Male 78 Caucasian
Chronic Kidney Disease (CKD), DiabeticNephropathy, Diabetic Neuropathy, CoronaryArtery Disease (CAD), History Of Myocardial
Infarction, Hyperlipidemia (HLD), Type 1Diabetes, Depression, Age Related Macular
Degeneration (AMD), Alzheimer’s Disease (AD),Dementia, Acute Renal Failure (ARF)
Humalog Mix 100 IU, Aspirin 81 mg, CentrumSilver, l-Glutamine, Metoprolol Succinate 50
mg, Lipitor 20 mg, Novolog, Humulin N,Gabapentin 100 mg, Alprazolam 0.5 mg,
Fluticasone Propionate Cream, CitalopramHydrobromide 20 mg, Cartia XT 120 mg,
Aricept 5 mg, CitalopramHydrobromide 20 mg

Int. J. Mol. Sci. 2020, 21, 4674 20 of 22
4.4. Biomarker Analyses
Data obtained by the Simple Plex assay were analyzed with Prism 8 software (GraphPad Software,San Diego, CA, USA). First, outliers were removed, and receiver operating characteristics (ROC) werecalculated, thus obtaining a 95% confidence interval, a standard deviation and a p-value. A cut-off
point was then obtained for a range of different specificities and sensitivities and their respectivelikelihood ratio, as well as positive (PPV) and negative predictive values (NPV) and accuracy [24,50].
4.5. Statistical Analyses
Normality was tested by the Shapiro-Wilk normality test, and statistical difference betweengroups was tested by a one-way ANOVA, followed by a Kruskal-Wallis test for multiple comparisons.p-value of significance was considered at less than 0.05. In addition, clustering was carried out usinghierarchical clustering and Gaussian Mixture Modeling using RStudio software with the followinglibraries: cluster, caret, factorextra, magrittr, ggplot2 and mclust. Binomial logistic regressions for theoutcome of having either MCI or AD were carried out using RStudio software with the followinglibraries: ggplot2, MASS, dplyr, broom and car.
Author Contributions: J.P.d.R.V., R.W.K., W.D.D., X.O.S., M.E.S. and M.C.D. conceived or designed the study.J.P.d.R.V., X.O.S., M.E.S. and M.C.D. were responsible for data collection. J.P.d.R.V. and X.O.S. contributed to dataanalyses and interpretation. All authors have read and agreed to the published version of the manuscript.
Funding: This research was funded by the 2019 Stanley J. Glaser Foundation Research Award to J.P.d.R.V. and anR01 grant from the NIH/NINDS to R.W.K. and J.P.d.R.V. (R01NS113969-01).
Conflicts of Interest: J.P.d.R.V., R.W.K. and W.D.D. are cofounders and managing members of InflamaCORE, LLCand have licensed patents on inflammasome proteins as biomarkers of injury and disease, as well as on targetinginflammasome proteins for therapeutic purposes. J.P.d.R.V., R.W.K. and W.D.D. are Scientific Advisory BoardMembers of ZyVersa Therapeutics. All other authors declare that there are no conflicts of interest. Data presentedin this manuscript is protected under US Patent Application: 62/696,549 (Method for Detecting InflammasomeProteins as Biomarkers of Neurological Disorders).
References
1. Padovani, A.; Borroni, B.; Colciaghi, F.; Pettenati, C.; Cottini, E.; Agosti, C.; Lenzi, G.L.; Caltagirone, C.;Trabucchi, M.; Cattabeni, F.; et al. Abnormalities in the pattern of platelet amyloid precursor protein forms inpatients with mild cognitive impairment and Alzheimer disease. Arch. Neurol. 2002, 59, 71–75. [CrossRef]
2. Petersen, R.C. Aging, mild cognitive impairment, and Alzheimer’s disease. Neurol. Clin. 2000, 18, 789–806.[CrossRef]
3. Petersen, R.C.; Smith, G.E.; Waring, S.C.; Ivnik, R.J.; Tangalos, E.G.; Kokmen, E. Mild cognitive impairment:Clinical characterization and outcome. Arch. Neurol. 1999, 56, 303–308. [CrossRef] [PubMed]
4. Bozoki, A.; Giordani, B.; Heidebrink, J.L.; Berent, S.; Foster, N.L. Mild cognitive impairments predict dementiain nondemented elderly patients with memory loss. Arch. Neurol. 2001, 58, 411–416. [CrossRef] [PubMed]
5. Morris, J.C.; Storandt, M.; Miller, J.P.; McKeel, D.W.; Price, J.L.; Rubin, E.H.; Berg, L. Mild cognitiveimpairment represents early-stage Alzheimer disease. Arch. Neurol. 2001, 58, 397–405. [CrossRef]
6. Blennow, K.; Hampel, H. CSF markers for incipient Alzheimer’s disease. Lancet Neurol. 2003, 2, 605–613.[CrossRef]
7. Kanemaru, K.; Kameda, N.; Yamanouchi, H. Decreased CSF amyloid beta42 and normal tau levels indementia with Lewy bodies. Neurology 2000, 54, 1875–1876. [CrossRef]
8. Sjogren, M.; Minthon, L.; Davidsson, P.; Granerus, A.K.; Clarberg, A.; Vanderstichele, H.; Vanmechelen, E.;Wallin, A.; Blennow, K. CSF levels of tau, beta-amyloid(1-42) and GAP-43 in frontotemporal dementia, othertypes of dementia and normal aging. J. Neural Transm. (Vienna) 2000, 107, 563–579.
9. Andreasen, N.; Sjogren, M.; Blennow, K. CSF markers for Alzheimer’s disease: Total tau, phospho-tau andAbeta42. World J. Biol. Psychiatry 2003, 4, 147–155. [CrossRef]
10. Terajima, M.; Arai, H.; Itabashi, S.; Higuchi, M.; Zhu, C.; Kosaka, Y.; Nakagawa, T.; Sasaki, H. Elevatedcerebrospinal fluid tau levels: Implications for the early diagnosis of Alzheimer’s disease. J. Am. Geriatr. Soc.1996, 44, 1012–1013. [CrossRef]

Int. J. Mol. Sci. 2020, 21, 4674 21 of 22
11. Araki, W.; Hattori, K.; Kanemaru, K.; Yokoi, Y.; Omachi, Y.; Takano, H.; Sakata, M.; Yoshida, S.; Tsukamoto, T.;Murata, M.; et al. Re-evaluation of soluble APP-alpha and APP-beta in cerebrospinal fluid as potentialbiomarkers for early diagnosis of dementia disorders. Biomark Res. 2017, 5, 28. [CrossRef] [PubMed]
12. Zetterberg, H. Neurofilament Light: A Dynamic Cross-Disease Fluid Biomarker for Neurodegeneration.Neuron 2016, 91, 1–3. [CrossRef] [PubMed]
13. Parbo, P.; Madsen, L.S.; Ismail, R.; Zetterberg, H.; Blennow, K.; Eskildsen, S.F.; Vorup-Jensen, T.; Brooks, D.J.Low plasma neurofilament light levels associated with raised cortical microglial activation suggestinflammation acts to protect prodromal Alzheimer’s disease. Alzheimers Res. Ther. 2020, 12, 3–7. [CrossRef][PubMed]
14. Mayeli, M.; Mirshahvalad, S.M.; Aghamollaii, V.; Tafakhori, A.; Abdolalizadeh, A.; Rahmani, F. PlasmaNeurofilament Light Chain Levels Are Associated With Cortical Hypometabolism in Alzheimer DiseaseSignature Regions. J. Neuropathol. Exp. Neurol. 2019, 78, 709–716. [CrossRef]
15. Pawelec, G.; Goldeck, D.; Derhovanessian, E. Inflammation, ageing and chronic disease. Curr. Opin. Immunol.2014, 29, 23–28. [CrossRef] [PubMed]
16. Aden, K.; Rosenstiel, P. The Dark Age(ing) of the Inflammasome. Immunity 2017, 46, 173–175. [CrossRef]17. Latz, E.; Duewell, P. NLRP3 inflammasome activation in inflammaging. Semin. Immunol. 2018, 40, 61–73.
[CrossRef]18. Mawhinney, L.J.; de Rivero Vaccari, J.P.; Dale, G.A.; Keane, R.W.; Bramlett, H.M. Heightened inflammasome
activation is linked to age-related cognitive impairment in Fischer 344 rats. BMC Neurosci. 2011, 12, 123.[CrossRef]
19. Mejias, N.H.; Martinez, C.C.; Stephens, M.E.; de Rivero Vaccari, J.P. Contribution of the inflammasome toinflammaging. J. Inflamm. (Lond) 2018, 15, 23. [CrossRef]
20. Platnich, J.M.; Muruve, D.A. NOD-like receptors and inflammasomes: A review of their canonical andnon-canonical signaling pathways. Arch. Biochem. Biophys. 2019, 670, 4–14. [CrossRef]
21. Franklin, B.S.; Bossaller, L.; De Nardo, D.; Ratter, J.M.; Stutz, A.; Engels, G.; Brenker, C.; Nordhoff, M.;Mirandola, S.R.; Al-Amoudi, A.; et al. The adaptor ASC has extracellular and ‘prionoid’ activities thatpropagate inflammation. Nat. Immunol. 2014, 15, 727–737. [CrossRef]
22. Kerr, N.; Lee, S.W.; Perez-Barcena, J.; Crespi, C.; Ibanez, J.; Bullock, M.R.; Dietrich, W.D.; Keane, R.W.; deRivero Vaccari, J.P. Inflammasome proteins as biomarkers of traumatic brain injury. PLoS ONE 2018, 13,e0210128. [CrossRef]
23. Kerr, N.; Garcia-Contreras, M.; Abbassi, S.; Mejias, N.H.; Desousa, B.R.; Ricordi, C.; Dietrich, W.D.;Keane, R.W.; de Rivero Vaccari, J.P. Inflammasome Proteins in Serum and Serum-Derived ExtracellularVesicles as Biomarkers of Stroke. Front. Mol. Neurosci. 2018, 11, 309. [CrossRef] [PubMed]
24. Keane, R.W.; Dietrich, W.D.; de Rivero Vaccari, J.P. Inflammasome Proteins As Biomarkers of MultipleSclerosis. Front. Neurol. 2018, 9, 135. [CrossRef] [PubMed]
25. Syed, S.A.; Beurel, E.; Loewenstein, D.A.; Lowell, J.A.; Craighead, W.E.; Dunlop, B.W.; Mayberg, H.S.;Dhabhar, F.; Dietrich, W.D.; Keane, R.W.; et al. Defective Inflammatory Pathways in Never-Treated DepressedPatients Are Associated with Poor Treatment Response. Neuron 2018, 99, 914–924.e3. [CrossRef] [PubMed]
26. Friker, L.L.; Scheiblich, H.; Hochheiser, I.V.; Brinkschulte, R.; Riedel, D.; Latz, E.; Geyer, M.; Heneka, M.T.beta-Amyloid Clustering around ASC Fibrils Boosts Its Toxicity in Microglia. Cell Rep. 2020, 30, 3743–3754.e6.[CrossRef] [PubMed]
27. Venegas, C.; Kumar, S.; Franklin, B.S.; Dierkes, T.; Brinkschulte, R.; Tejera, D.; Vieira-Saecker, A.; Schwartz, S.;Santarelli, F.; Kummer, M.P.; et al. Microglia-derived ASC specks cross-seed amyloid-beta in Alzheimer’sdisease. Nature 2017, 552, 355–361. [CrossRef] [PubMed]
28. De Rivero Vaccari, J.P.; Brand, F.J., III; Sedaghat, C.; Mash, D.C.; Dietrich, W.D.; Keane, R.W. RIG-1 receptorexpression in the pathology of Alzheimer’s disease. J. Neuroinflamm 2014, 11, 67. [CrossRef]
29. Brubaker, A.L.; Palmer, J.L.; Kovacs, E.J. Age-related Dysregulation of Inflammation and Innate Immunity:Lessons Learned from Rodent Models. Aging Dis. 2011, 2, 346–360.
30. Liu, D.; Cao, B.; Zhao, Y.; Huang, H.; McIntyre, R.S.; Rosenblat, J.D.; Zhou, H. Soluble TREM2 changes duringthe clinical course of Alzheimer’s disease: A meta-analysis. Neurosci. Lett. 2018, 686, 10–16. [CrossRef]
31. Lynch, M.A. Age-related neuroinflammatory changes negatively impact on neuronal function. Front. AgingNeurosci. 2010, 1, 6. [CrossRef]

Int. J. Mol. Sci. 2020, 21, 4674 22 of 22
32. Calabrese, V.; Giordano, J.; Signorile, A.; Laura Ontario, M.; Castorina, S.; De Pasquale, C.; Eckert, G.;Calabrese, E.J. Major pathogenic mechanisms in vascular dementia: Roles of cellular stress response andhormesis in neuroprotection. J. Neurosci. Res. 2016, 94, 1588–1603. [CrossRef] [PubMed]
33. Singhal, G.; Jaehne, E.J.; Corrigan, F.; Toben, C.; Baune, B.T. Inflammasomes in neuroinflammation andchanges in brain function: A focused review. Front. Neurosci. 2014, 8, 315. [CrossRef]
34. Weinstein, G.; Lutski, M.; Goldbourt, U.; Tanne, D. C-reactive protein is related to future cognitive impairmentand decline in elderly individuals with cardiovascular disease. Arch. Gerontol. Geriatr. 2017, 69, 31–37.[CrossRef]
35. Sloane, J.A.; Hollander, W.; Moss, M.B.; Rosene, D.L.; Abraham, C.R. Increased microglial activation andprotein nitration in white matter of the aging monkey. Neurobiol. Aging 1999, 20, 395–405. [CrossRef]
36. Prolla, T.A. DNA microarray analysis of the aging brain. Chem. Senses 2002, 27, 299–306. [CrossRef]37. Adamczak, S.; Dale, G.; de Rivero Vaccari, J.P.; Bullock, M.R.; Dietrich, W.D.; Keane, R.W. Inflammasome
proteins in cerebrospinal fluid of brain-injured patients as biomarkers of functional outcome: Clinical article.J. Neurosurg. 2012, 117, 1119–1125. [CrossRef]
38. Yap, J.K.Y.; Pickard, B.S.; Chan, E.W.L.; Gan, S.Y. The Role of Neuronal NLRP1 Inflammasome in Alzheimer’sDisease: Bringing Neurons into the Neuroinflammation Game. Mol. Neurobiol. 2019, 56, 7741–7753.[CrossRef]
39. Yin, J.; Zhao, F.; Chojnacki, J.E.; Fulp, J.; Klein, W.L.; Zhang, S.; Zhu, X. NLRP3 Inflammasome InhibitorAmeliorates Amyloid Pathology in a Mouse Model of Alzheimer’s Disease. Mol. Neurobiol. 2018, 55,1977–1987. [CrossRef]
40. Saco, T.; Parthasarathy, P.T.; Cho, Y.; Lockey, R.F.; Kolliputi, N. Inflammasome: A new trigger of Alzheimer’sdisease. Front. Aging Neurosci. 2014, 6, 80. [CrossRef]
41. Tan, M.S.; Yu, J.T.; Jiang, T.; Zhu, X.C.; Tan, L. The NLRP3 inflammasome in Alzheimer’s disease. Mol. Neurobiol.2013, 48, 875–882. [CrossRef] [PubMed]
42. De Rivero Vaccari, J.P.; Dietrich, W.D.; Keane, R.W. Therapeutics targeting the inflammasome after centralnervous system injury. Transl. Res. 2016, 167, 35–45. [CrossRef]
43. De Rivero Vaccari, J.P.; Lotocki, G.; Alonso, O.F.; Bramlett, H.M.; Dietrich, W.D.; Keane, R.W. Therapeuticneutralization of the NLRP1 inflammasome reduces the innate immune response and improves histopathologyafter traumatic brain injury. J. Cereb. Blood Flow Metab. 2009, 29, 1251–1261. [CrossRef] [PubMed]
44. De Rivero Vaccari, J.P.; Lotocki, G.; Marcillo, A.E.; Dietrich, W.D.; Keane, R.W. A molecular platform inneurons regulates inflammation after spinal cord injury. J. Neurosci. 2008, 28, 3404–3414. [CrossRef] [PubMed]
45. Desu, H.L.; Plastini, M.; Illiano, P.; Bramlett, H.M.; Dietrich, W.D.; de Rivero Vaccari, J.P.; Brambilla, R.;Keane, R.W. IC100: A novel anti-ASC monoclonal antibody improves functional outcomes in an animalmodel of multiple sclerosis. J. Neuroinflamm. 2020, 17, 143. [CrossRef]
46. Kerr, N.A.; de Rivero Vaccari, J.P.; Abbassi, S.; Kaur, H.; Zambrano, R.; Wu, S.; Dietrich, W.D.;Keane, R.W. Traumatic Brain Injury-Induced Acute Lung Injury: Evidence for Activation and Inhibition of aNeural-Respiratory-Inflammasome Axis. J. Neurotrauma 2018, 35, 2067–2076. [CrossRef]
47. Lee, S.W.; de Rivero Vaccari, J.P.; Truettner, J.S.; Dietrich, W.D.; Keane, R.W. The role of microglialinflammasome activation in pyroptotic cell death following penetrating traumatic brain injury. J. Neuroinflamm.2019, 16, 27. [CrossRef]
48. Knopman, D.S.; Penman, A.D.; Catellier, D.J.; Coker, L.H.; Shibata, D.K.; Sharrett, A.R.; Mosley, T.H., Jr.Vascular risk factors and longitudinal changes on brain MRI: The ARIC study. Neurology 2011, 76, 1879–1885.[CrossRef]
49. Cerhan, J.R.; Folsom, A.R.; Mortimer, J.A.; Shahar, E.; Knopman, D.S.; McGovern, P.G.; Hays, M.A.; Crum, L.D.;Heiss, G. Correlates of cognitive function in middle-aged adults. Atherosclerosis Risk in Communities(ARIC) Study Investigators. Gerontology 1998, 44, 95–105. [CrossRef]
50. Brand, F.J., 3rd; Forouzandeh, M.; Kaur, H.; Travascio, F.; de Rivero Vaccari, J.P. Acidification changes affectthe inflammasome in human nucleus pulposus cells. J. Inflamm. (Lond) 2016, 13, 29. [CrossRef]
© 2020 by the authors. Licensee MDPI, Basel, Switzerland. This article is an open accessarticle distributed under the terms and conditions of the Creative Commons Attribution(CC BY) license (http://creativecommons.org/licenses/by/4.0/).
Copyright © 2022 FDOKUMEN