Michele Canzio e le scene per i "balli"al Carlo Felice di Genova (1838-1850)

DELLPLAIN LATIN AMERICAN STUDIES, 1
Editor
David J. Robinson
Syracuse University
Advisory Editorial Committee
David A. Brading University of Cambridge
Daniel Raposo Cordeiro Syracuse University
William M. Denevan University of Wisconsin
John H. Galloway University of Toronto
John Lynch University of London
William Mangin Syracuse University
Social Fabric and Spatial Structure in
Colonial Latin America
~
..., "
~~ --·· ...
Edited by David J. Robinson ·
Published for Department of Geography
Syracuse University by
University Microfilms International . 1979
Table of Contents
List of Figures
List of Tables
Preface
Introduction to Themes and Scales
DAVID J. ROBINSON
ix
xiii
xvii
1
1 Chibcha Settlement under Spanish Rule: 1537-1810 25
JUAN A. VILLAMARIN AND JUDITH E. VILLAMARIN
2 Disasters and Population Change in Central 85 Highland Ecuador, 1778-1825
ROSEMARY D. F. BROMLEY
3 The Spatial Dimensions of a Social Process: Marriage 117 and Mobility in Late Colonial Northern Mexico
MICHAEL M. SWANN '"' "'-
~
4 Clans, the Militi~and Territorial Government: The 181 Articulation of Kinship with Polity in Eighteenth-Century Sao Paulo
ELIZABETH ANNE KUZNESOF
5 Spatial Dimensions of the Credit Market in 227 Eighteenth-Century Nueva Galicia
LINDA L. GREENOW
6 Colonization and Modernization in Eighteenth- 281 Century Brazi~
ROBERTA MARX DELSON
(vii)
7
8
9
10
11
The Impact of the Crisis in Nineteenth-Century Mining on Regional Economies: The Example of the Bolivian Yungas, 1786-1838
HERBERT S. KLEIN
Population and Space in Eighteenth-Century Buenos Aires · LYMAN L. JOHNSON AND SUSAN MIGDEN SOCOLOW
Provincial Urban Problems: Trujillo, Peru, 1600-1784
KATHARINE COLEMAN
A Case History of the Transition from Precolonial to the Colonial Period in Mexico: Santiago Tejupan
WOODROW BORAH AND SHERBURNE F. COOK
The Rise of Caracas as a Primate City
JOHN V. LOMBARDI
Index
(viii)
315
339
369
409
433
473
1-1
1-2
1-3
2-1
2-2
2-3
2-4
3-1
3-2
3-3
3-4
3-5
3-6
3-7
List of Figures
The Sabana de Bogota and Valley of Ubate
Indian Pueblos of the Sabana de Bogota and Valley of Ubate at the End of the · Sixteenth Century
The Sabana de Bogota and Valley of Ubate in the ~arly Nineteenth Century
The Central Highland of Ecuador: Towns and Parish Centers in the Eighteenth Century
The Distribution and Ethnic Composition of the Population in the Central Highlands of Ecuador, 1778-81 to 1814
Population Change in the Central Highlands of Ecuador, 1778-81 to 1814
Schematic Representation of the Causes of Population De~line ~n the Central Highlands bf Ecuador, 1778-1825
Location of the Study Area, Northern Central Mexico:~ ~
Detail of t~e Study Area, Northern Central Mexico
~~ Origins of Migrants to San Miguel de Mezquital (A), and San Jose del Parral (B), 1777
Origins of Marriage Partners Migrating to San Juan del Rio, 1769-1779
Origins of Marriage Partners M1grating to Santiago Papasquiaro, 1769-1779
Sea.sonal Distribution of Marriages, 1769-1779
Seasonal Distribu~ion of Mean Marriage Migration Distances, 1769-1779
(ix)
2
3
7
8
9
9
11
12
l~
1~
14
IL
IL
IL
}
7 The Impact of the Crisis in Nineteenth Century Mining on Regional Economies:. The Example of the Bolivian Yungas, 1786-1838
Herbert S. Klein*
The relative decline of an .export sector in an underdeveloped economy is usually thought to have ·an adverse effect
on the local and regional economies which are linked to this export industry. As the ¢1.ynamic sector declines, its back-
ward ties loosen and without an alternative market there is
usually stagnation and possibly even a return to subsistence
economies at the local level. To properly measure this changing relationship, indices
of production, consumptio.,n, markets and employment are required. Yet in most undeveloped societies such indices are
totally lacking and it·i~ ext:remely d:lfficult to analyze the
performance of natio.,~al markets not directly engaged in the export of goods to i:al,ternational markets. Thus the existence of material on any on: of these factors for an underdeveloped
economy, however partial, provides important insights into national and regional developments otherwise inaccessible to
previous scholarship. For this reason, the Indian tax censuses of colonial and
early republican Bolivia provide a unique opportunity to measure the impact of th.e economic crisis in the well documented
silver mining export sector .on the little known regional agricultural economies of the heavily Indian areas which were
dependent on trade_ with the mining enclave. Whereas few use
ful national trade statistics exist for Bolivia in this
*The author is Professor of History, Columbia University.

316
period of its early civil wars and weakened central govern
ment, there does exist a surprisingly complete body of census
information on the rural Indian population and its land ten
ure arrangements, which allow us to measure to some extent
the changing fortunes of the local economies, as seen in some
demographic and land tenure indices. I have chosen to study this regional-export sector rela
tionship through an analysis of the changes in the Indian
populations of the coca-growing pueblos of the district of
Chulumani, also known as the Yungas, in the province of La
Paz. Coca was the primary crop of the Yungas from the eigh
teenth century to the present and the region has always been
considered the premiere coca-growing zone in all of Bolivia.
Coca exports from the valleys went predominantly to the alti
plano (high plateau) silver mines of Oruro and Potosi in the eighteenth and nineteenth centuries, there to be consumed as
a basic necessity by the Indian miners. Thus, for example,
in the total taxable imports into Potosi in the period 1777-1778, some 17 percent was made up of coca imports alone, with
all of this coming from within the confines of Alto-Peru (Bo
livia) and most of it coming from the Yungas. 1 Equally, in
an analysis of the coca exports from the pueblo of Chulumani
and a few surrounding pueblos of the Yungas district in the
year 1790, it was equally evident that almost half (or 49 percent) of this areq's export was destined to the altiplano
mine centers. 2
1of the almost two million pesos worth of goods imported into the city of Potosf in these two years, coca (the second most valuable commodity after aguardiente) accounted for some 332,000 pesos, which amounted to approximately 39,000 cestos of coca leaf. Calculated from the Manuales de Alcabala (caminos de arriba y de abajo) of Potosi for 1777-1778, to be found in the Archivo General de la Naci6n, Buenos Aires (hereafter cited as AGN): Sala XIII, 6-4-5, leg. 23, libros 4 and 5; and 13-6-5-1, leg. 24, libro 3. '
2In 1790 the Chulumani Manuales de A!cabala listed some 65,000 cestos of coca for the year--which probably represented a third of total Yungas
317
Given this intimate relationship between the two econom
ies, what impact would the decline of the mining industry,
beginning in the first years of the nineteenth century, have
on this seemingly dependent economy? What was to happen to
the organization of work in the vall~ys, to the patterns of migration, to the number of economically viable units and to
the total population as a whole? This is the basic problem,
and some of the key areas of concern that I will attempt to
analyze through th·e use of a series of demographic and land
tenure indices derived primarily from the padrones de indios
(or revisitas), which were the Indian head tax censuses.
I have selected the four most complete censuses which
encompass the period 1786 to 1838 (these are the padrones of
1786, 1803, 1829 and 1838), which coincide with a key period
of crisis in the history of Bolivian silver exports and pr9-
duction. 3 Following the end of the.first spectacular boom of
output--of which 28, 1577 cestos (or 44 percent) were shipped to Potosf alone. Adding the shipments to other altiplano mines brings the total exports to the silver industry t(t·51,4Q4. cestos (or 48 percent). Calculated from the Manuales, to be found in AGN, ~-6, leg. 66, libros llfand 2. The 200,000 cestos production estimate comes from a royal survey carried out in 1796 and found in Ar~hivo General de Indias (Sevilla): Audiencia de Buenos Aires, leg. 513, cfi:tted La Paz, 17 May 1796. If these various estimates are correct, then it can be assumed that Potosf alone absorbed between 20~40,000 cestos of coca per annum from the Yungas, or between 10 and 20 percent of total output. With the addition of the other mining districts of Alto Peru, this figure may have gone as high as one-third of total output. All of these figures mean that the estimations _provided by one royal official in 1793 of annual Potosf imports of Yungas coca at only 96,000 pesos are too modest. See the report in Real Academia de Historia (Madrid), Colecci6n Mata Linhares, Torno XXVII, fol. 368 (9-9-3 1692). 1692).
3The four unpublished censuses are found in the following archives: 1786 in AGN, 13-17-6-5, leg. 24, libro 2 ("Secci6n Contadurfa, Padrones - La Paz•i); 1803 iii AGN, 13-17-9-4, leg. 36, libro 4; 1829 in Archi vo Nacional de Bolivia (Sucre), Archivos del Tribunal Nacional de Cuentas, no. 166 (hereafter cited as ANB/ATNC); and 1838 in ANB/ATNC, no. 177. These four censuses were _the earliest complete population listings available for the Yungas (known alternatively as the province of Chulumani). Though officially required to be taken every five years, there was no census taken
·of the region in the 1790s, and the 1803 is the first one available after

318
the sixteenth and early seventeenth century, there had been a long period of decline in silver production. Output had
revived at Potosi by the 1750s, however, and by the 1780s it had reached a peak in this second wave of colonial prosperi
ty. It was in fact in association with this mining revival in the mid-eighteenth century, that the previously minor Yungas coca zones had come into full development and achieved their predominant position for the first time. Thus in recognition of their new importance, the towns of the Chulumani district were separated from the province of Sicasica and were organized into a separate proyince by the Crown in 1786. Their first independent Indian census was taken in that same
year. But having reached peak levels of production by the
1780s, the mining economy of the altiplano began to decline in the following decades, a decline that turned into a long term secular trend of decadence by the first decade of the nineteenth century (Figure 7-1). 4 This secular downward
1786. There were censuses taken in 1817 and 1828, but these listed only the male tributarios, and no other groups. Thus 1829 is the first complete padr6n after 1803. There again appears to have been no census taken in the decade of the 1840s, which makes the 1838 census the next available one after 1829, and the last one before the 1852 and 1857 censuses. By this decade Suri was eliminated from the district, as well as several of the other marginal towns, which makes comparison difficult. Also the available figures on mine production are considered of less value following 1850. Finally the major epidemic of 1855/56 seriously influences demographic patterns. in the region, making it difficult to isolate the economic from the disease factors influencing population change. On this impact, see Nicolas Sanchez-Albornoz, Indios y tributarios en el Alto Peru (Lima, 1978), pp. 35-36; and Erwin P. Greishaber, "Survival of Indian Communities in Nineteenth-Century Bolivia," (Ph.D. dissertation, Department of History, University of North Carolina, 1977), p. 178.
4The data for Figure 7-1 are found in Ernesto Ruck, Gu1'.a general de Bolivia, Primer ano (Sucre, 1865), pp. 170~171. I have double checked Ruck's numbers against the original Banco de Rescate manuscripts for the period 1810-1820, and they vindicate the accuracy of the printed figures. See Archivo de la Casa Nacional de la Moneda (Potosf), Banco de San Carlos, nos. 19, 113·.
00 0 00 0 00 0 00 o· "' "' "' (') (') (')
..... ·~
"
0 0 0 0 o. 0. 0 0 0 "' (') N
J&l\l!S j.O so:uew
319
0
"' ~ "' ... ~ 0 ... ~
"' (')
~ 0 (')
~
"' 0
N l.l'l
~ co ,...., 0 I N l.l'l ~ l.l'l ...... "'
,...., §
d 0 0 § ....
.µ
"' ~ 0 ~
0 0 !-< 0 0.. ~
"' !-< Q)
~ ;,. ,...., 0 .... "' en t::
"' ,....,
"' I t:: ...... 0 Q)
"' !-< t:: ::s "'
b.ll .... .... t:: "'"' 0 .... t::
"' "' t:: 0
"' t::
"' "' 0 O" 0 o-0
0 0 0 0 0 0.
0 :e ~ 0 N
320
trend reached its lowest point in the 1830s when production,
as measured by government minerals purchases (an exclusive
monopoly), were just half of what they had been in the peak
1780s decade. The four censuses which I have chosen to analyze were
all based on the late eighteenth-century standard model of a padron de indios, and are all identical in the types of in
formation generated. They prov1de a detailed listing of all
taxable male Indians and their families by type of landholding upon which they resided. Both in the colonial period and
in the republican era to the 1880s (when this taxation system
came to an end), all Indians aged 18 to SO years were re-
quired to pay a tax in specie to the central government
(called a tributo in the colonial period and a contribucion indigena after 182S). The rate of the tax differed among Indians and was based on the economic and legal conditions of
the particular Indian community to which the Indian male belonged, and on his status in the community. If the land was
rich and the taxpayer had direct access to it, he paid one
rate. If he was a member of a free community but had less
direct access to land ownership or use, he paid another and
lower rate. Finally, if he lived on a hacienda of a non-In
dian as a landless laborer he paid a standard lowest rate tax. The Crown and Republican governments thus divided the Indian_s into three group,s: original members of the free In
dian community with the most complete access to land (origi
nario ~ tierra), later community arrivals with less land rights than the original founders (agregados or forasteros), and finally "landless" peons living on the estates of Span
iards and mestizos or cholos (called yanaconas).s
5The only Republican .addition (which only began in 1838) to the colonial formula is the category of vagos, who were listed for both ayllus and ha haciendas. While there is no clear definition of what· distinguished a vago from an agregado on an ayllu or a yanacona on a hacienda, their
321
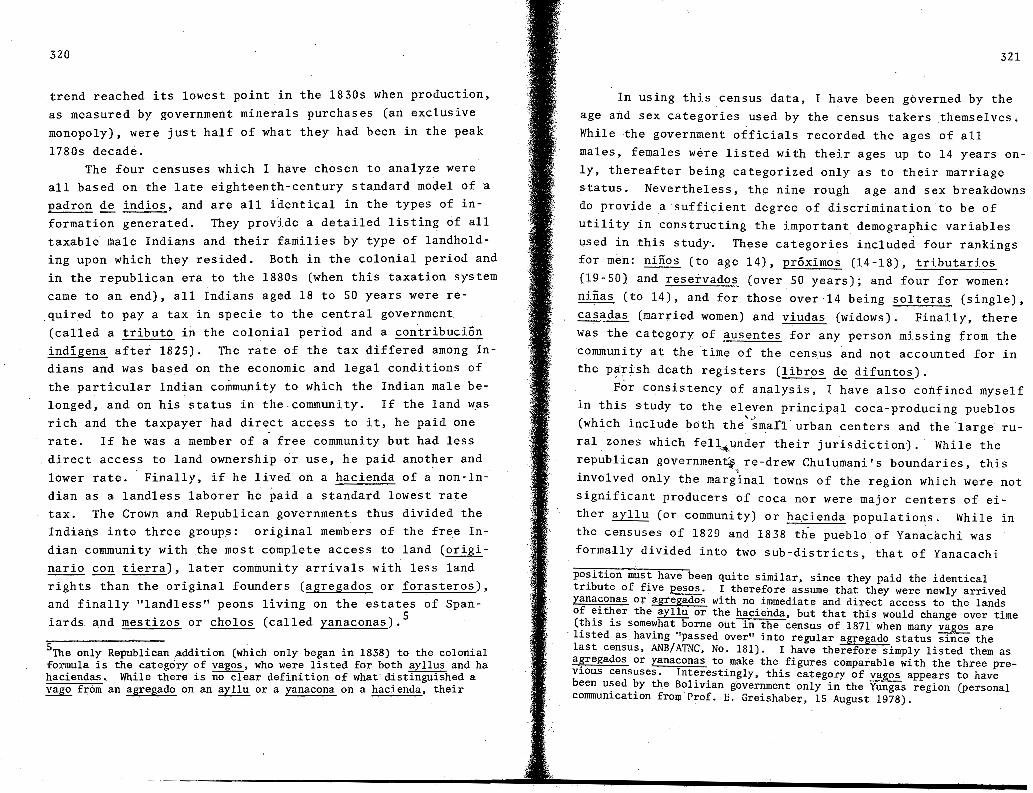
In using this census data, I have been governed by the
age and sex categories used by the census takers themselves.
While the government officials recorded the ages of all
males, females were listed with their ages up to 14 years on
ly, thereafter being categorized only as to their marriage status. Nevertheless, the nine rough age and sex breakdowns do provide a sufficient degree of discrimination to be of
utility in constructing the important demographic variables l1sed in this study·. These categories included four rankings
for men: nines (to age 14), proximos (14-18), tributaries (19-SO) and reservados (over SO years); and four for women:
ninas (to 14), and for those over 14 being solteras (single),
casadas (married women) and viudas (widows). Finally, there
was the category of ausentes for any person missing from the community at the time of the census and not accounted for in the P'.irish death registers (libros de difuntos).
For consistency of analysis, I have also confined myself in this study to the eleven principal coca-producing pueblos (which include both the··-smal"l urban centers and the large ru
ral zones which fell._,,.under their jurisdiction). While the
republican governmen~ re-drew Chulumani's boundaries, this ~
involved only the marginal towns of the region which were not
significant producers of coca nor were major centers of either ayllu (or community) or hacienda populations. While in the censuses of 1829 and 1838 the pueblo of Yanacachi was
formally divided into two sub-districts, that of Yanacachi
position must have been quite similar, since they paid the identical tribute of five pesos. I therefore assume that they were newly arrived yanaconas or agregados with no immediate and direct access to the lands of ei.ther the ayllu or the hacienda, but that this would change over time (this is somewhat borne out in the census of 187l'when many vagos are
· listed as having "passed over" into regular agregado status since the last census, ANB/ATNC, No. 181). I have therefore simply listed them as agregados or yanaconas to make the figures comparable with the three previous censuses. Interestingly, this category of vagos appears to have been used by the Bolivian government only in the Yungas region (personal communication from.Prof. E. Greishaber, 15 August 1978).
322
proper and the vice-canton of Milluhuaya, I have counted it
as one undivided pueblo in all the following Tables. Also,
I have eliminated from all calculations the small number of
taxable Indians listed as resident in the urban centers of
the pueblos (abecinado en el pueblo), or the even smaller number exempted from taxation because they were working on
local parish church lands which maintained the religious in
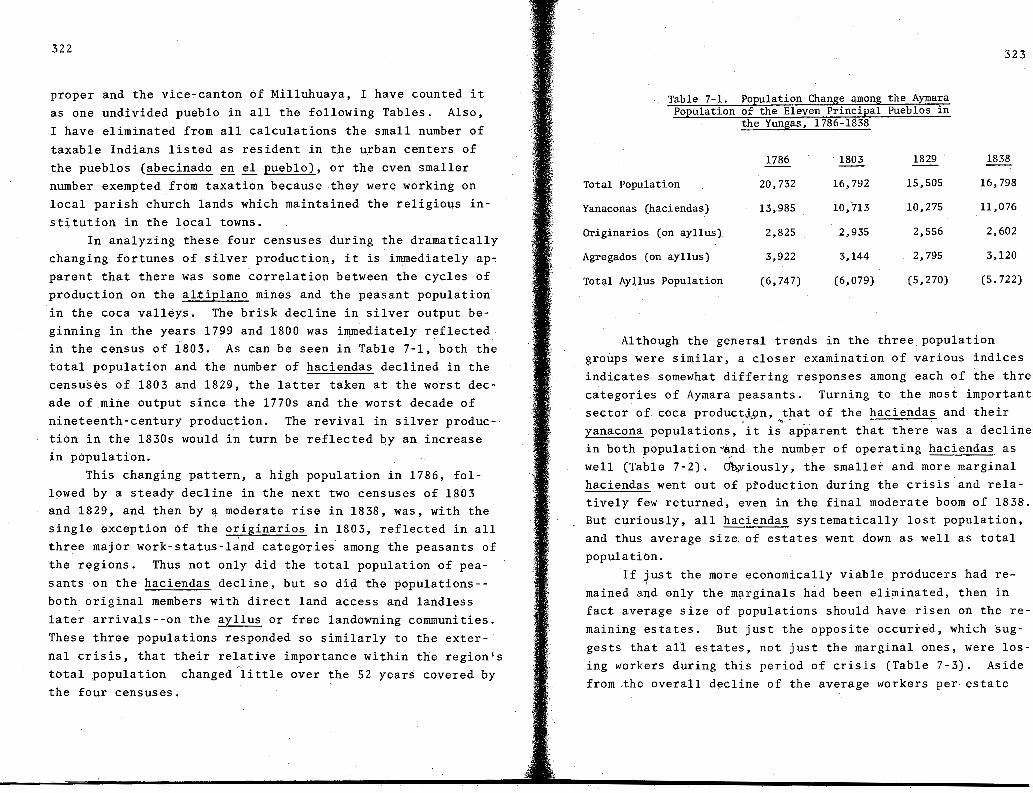
stitution in the local towns. In analyzing these four censuses during the dramatically
changing fortunes of silver production, it is immediately ap~ parent that there was some correlation between the cycles of
production on the altiplano mines and the peasant population
in the coca valleys. The brisk decline in silver output beginning in the years 1799 and 1800 was immediately reflected in the census of 1803. As can be seen in Table 7-1, both the total population and the number of haciendas declined in the
censuses of 1803 and 1829, the latter taken at the worst decade of mine output since the 1770s and the worst decade of
nineteenth-century production. The revival in silver production in the 1830s would in turn be reflected by an increase in population.
This changing pattern, a high population in 1786, followed by a steady decline in the next two censuses of 1803 and 1829, and then by ~ moderate rise in 1838, was, with the single exception of the o~iginarios in 1803, reflected in all three major work-status-land categories among the peasants of
the regions. Thus not only did the total population of pea
sants on the haciendas decline, but so did the populations-both original members with direct land access and landless
later arrivals--on the ayllus or free landowning communities.
These three populations responded so similarly to the exter
nal crisis, that their relative importance within the region's
total population changed little over the 52 years covered by the four censuses.
·y
,1j
Table 7-1. Population Change among the Aymara Population of the Eleven Principal Pueblos in
the Yungas, 1786-1838
1786 1803 1829
Total Population 20,732 16,792 15,505
Yanaconas (haciendas) 13,985 10,.713 10,275
Originarios (on ayllus) 2,825 2,935 2,556
Agregados (on ayllus) 3,922 3,.144 2, 795
Total Ayllus Population (6, 747) (6,079) (5,270)
323
1838
16,798
11,076
2,602
3,120
(5. 722)
Although the general trends in the three_population groups were similar, a closer examination of various indices
indicates somewhat differing responses among each of the thre
categories of Aymara peasants. Turning to the most important sector of coca product~9n, that of the haciendas and their . ~- -
yanacona populations, it is ~pparent that there was a decline in both population-~nd the number of operating haciendas as well (Table 7-2). <JbNiously, the smaller and more marginal
haciendas went out of production during the crisis and relatively few returned, even in the final moderat~ boom of 1838. But curiously, all haciendas systematically lost population, and thus average size of estates went down as well as total
population. If ~ust the more economically viable producers had re
mained and only the marginals had been eliminated, then in fact average size of populations should have risen on the re
maining estates. But just the opposite occuri~d, which ~ug
gests that all estates, not just the marginal ones, were losing workers during this period of crisis (Table 7-3). Aside
from .the overall decline of the average workers per estate

324
Table 7-2. PoEulation Change on the Haciendas of the Yungas, 1786-1838
1786 1803 1829 1838
No. of haciendas 276 236 235 231
Average Pop. per unit 51 46 44 48
Average Tributarios per unit 15 12 13 15
Leading ToE 10% of Haciendas No. of. haciendas 28 24 24 23
Total Population 5,500 4,112 4,185 4,293
No. of Tributarios 1,510 1,020 1,197 1,282
% of Total Pop. 39.3% 38.4% 40.9% 38.8%
% of Total Tributarios 37.3% 36.1% 39.1% 37.8%
Average Pop. per unit 196 171 174 186
Standard Deviation 103 59 57 67
Coefficient of Variation .52 .34 .33 .36
Table 7-3. Number of Haciendas and their Average PoEulation and Average Number of Tributarios, hr Pueblo,
the Yungas, 1786-1838
1786 1803 1829 1838
p~ Trib(Hac)~ Trib(Hac)~ Trib(Hac)~ Trib(Hac)~
1. Chulumani 15 ·(18) 52 8 (11) 38 6 (12) 18 7 (12) 23
2. Irupana 5 (43) 15 4 (31) 12 5 (31) 14 7 (25) 17
3. Laza 13 (13) 45 10 (11) 36 7 ( 8) 23 5 (12) 16
4. Suri 6 (20) 22 5 (21) 14 3 (12) 10 5 (12) 13
5. Ocabaya 9 ( 8) 30 4 ( ·9) 16 6 ( 5) 25 7 ( 5) 19
6. Chirca 15 (31) 43 9 ·(22) 42 8 (28) 24 8 (27) 26
7. Pacallo 12 (27) 48 10 (22) 38 11 (21) 40 14 (21) 44
8. Coroico 18 (69) 67 19 (56) 72 20 (63) 68 22 (58) 75
9. Coripata· 28 ·(34) 98 17 (41) 67 23 (37) 77 28 (35) 92
10. Chupe 13 ( 9) 40 9 ( 9) 32 7 (14) 20 6 (17) 22
11. Yanacachi 20 ( 4) 78 H ( 4) 66 22 ( 4) 64 16 ( 7) 52
Total 15 (276) 67 12 (237) 45 13 (235) 44 15 (231) 48
.
325
figure, there is also the evidence from the leading 10 percen
of the haciendas (Table 7-2). These major haciendas change~
their relative control over the Yungas' yanacona population little during the period of the fol}r censuses. Moreover we
can see a progressive narrowing of the dispersi.on around the
mean figure--as measured in the coefficient of variation-which shows that all estates were moving to a more common lower holding of yanaconas than previously.
This phenomenon of general declining populations on all estates raises some interesting quest.~ons about the little known relationship between hacendado and yanacona--or landless peon--on the Yungas estates. It is traditionally as
sumed that the standard means of payment for Indian laborers
on the haciendas was the granting to them of usufruct lands for their own use. In examining numerous land sales of Yun
gas coca haciendas, I have never found any listing of yana
~ in the sales, nor any monetary evaluation given to them. Nor have I seen any indication of wages being paid-
though it is s ti 11 unclear "as to how yanaconas were attract
ed initially to carJ:_y out the very time-consuming task of terracing which was {equired for almost all the coca hacien
das. That is during tha period when no land was available for use by either the hacendado or the Indians. But once such fields were cleared, all sources seem to agree that nei
ther food, seed, tools, nor wages were provided by the land
owner. Thus there appears no incentive for a hacendado to
expel workers from his cleared fields during times of crises.
Given this fact, the resulting mobility of the yanaconas in
times of crises, would seem to suggest that these workers
were not as tied down to the haciendas by non-market mecha
nisms, as has traditionally been assumed. That is, that it
was primarily the availability of land and the possibility of
selling their production in the coca markets (yanaconas in a
1796 survey of coca production in the valley produced 25

326
percent, or some 50,000 cestos, of the region's coca output)
which provided the key incentives and constraints for workers
living on the haciendas. 6 Once the retrenchment of the coca
market occurred, these haciendas no longer became such attractive places for work and voluntary out-migration occurred.
Although the mean number of workers per estate declined
in most estates .and in most regions, the pace of that decline
was not identical, and in fact there occurred some changes in
the relative importance of production among the various pueb
los. It is clear that in the crisis years of 1803 and 1829,
there was a systematic drop in the relative number of yana
~ in all districts of the Yungas, except for the two
leading centers of production--Coroico and Coripata--and the
small zones of Chupe and Yanacachi. With the revival of 1838,
some of this trend toward increasing concentration of yana
~ population was reversed, though the patterns of distri
bution did not return to pre-crisis levels. Such areas as
Chulumani, Laza, Suri, Ocabaya and even the formerly third
ranked Pacallo, all continued to decline in relative impor
tance and were unable to recover their former significance.
On the other hand Coripata and Coroico, the two leading pop
ulation zones for yanaconas, increased their relative impor
tance census after census, and went from 57 percent of the total population in 1786 to 68 percent of the total yanaconas
in 1838 (Table 7-4). This change occurred despite the fact
that there was little change.during all of these censuses in
their relative number of haciendas--which stood at only two
fifths of.the total of all estates or in the average number
of yanaconas per hacienda. Thus while average population de
clined in most areas and generally across the board from
6Herbert $. Klein, "Hacienda and Free Community in Eighteenth-Century Alto Peru: A Demographic Study~of the Aymara Population of the Districts of Chulumani and Pacajes in 1786," Journal of Latin American Studies, Vol. 7, No. 2 (November, 1975), p. 215.
·:;:;
~\
327
Table 7-4. Percentage of Yanac9na PoEulation by Pueblo, the Yungas, 1786-1838
Pueblo 1786 1803 1829 1838
1. Chulumani 5.9 3.9 2.1 2.5
2. Irupana 4.6 3.4 4.1 3.9
3. Laza 4.1 3.7 1.8 1. 7
4. Suri 3.2 2.7 1.2 1.4
5. Ocabaya. 1. 7 1.3 1.2 0.9
6. Chirca 9.6 8.6 6.6 6.3
7. Pacallo 9.2 7.9 8.1 8.3
8. Coroico 33.0 37.7 41. 7 39.1
9. Coripata 23.9 25.7 27.8 29.2
10. Chupe 2.6 2.7 2.7 3.4
11. Yanacachi 2.2 2.5 2.5 3.3
larger and smaller estates, some zones clearly lost a very
significant share of ·~heir"'·Jia.cienda populations as a result . ' of the crisis. ·'*
Just as there ~as a corresponding decline in the number " of haciendas and their .overall populations, there seems to
have occurred the same phenomenon on the free community land~
of the Aymara peasants. Their overall ayllu populations re
sponded in the same manner as the yanaconas On the haciendas,
losing populations in the census of 1803, suffering further
losses in 1829 and recovering in 1838. Thus their percentagE
import'ance within the Yungas changed little from census to
census.
There were, however, some important internal differen
ces--as might be expected--between the two major groupings or
the ayllus: the more wealthy and stable originarios who had
direct access to lands, and the less favored and more recent
ly arrived agregados who more often than not worked for the
=·
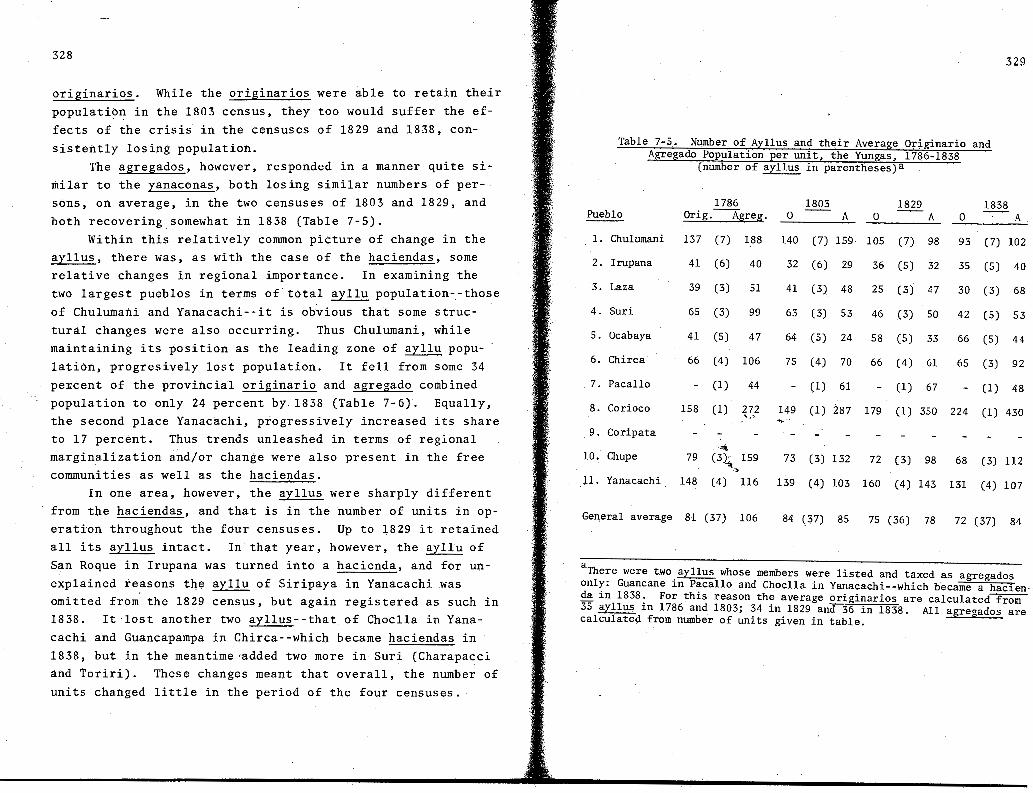
328
originarios. While the originarios were able to retain their
population in the 1803 census, they too would suffer the ef
fects of the crisis in the censuses of 1829 and 1838, con
sistently losing population. The agregados, however, responded in a manner quite si
milar to the yanaconas, both losing similar numbers of per
sons, on average, in the two censuses of 1803 and 1829, and
both recovering somewhat in 1838 (Table 7-5).
Within this relatively common picture of change in the ayllus, there was, as with the case of the haciendas, some
relative changes in regional importance. In examining the two largest pueblos in terms of total ayllu population--those
of Chulumani and Yanacachi--it is obvious that some struc
tural changes were also occurring. Thus Chulumani, while maintaining its position as the leading zone of ayllu popu
lation, progresively lost population. It fell from some 34
pe:i;cent of the provincial originario and agregado combined population to only 24 percent by 1838 (Table 7-6). Equally,
the second place Yanacachi, progressively increased its share to 17 percent. Thus trends unleashed in terms of regional marginalization and/or change were also present in the free communities as well as the haciendas.
In one area, however, the ayllus were sharply different from t:i).e haciendas, and that is in the number of uni ts in op
eration throughout the four censuses. Up to 1829 it retained
all its ayllus intact. In that year, however, the ayllu of San Roque in Irupana was turned into a hacienda, and for un
explained re:1sons the ayllu of Siripaya in Yanacachi was omitted from the 1829 census, but again registered as such in 1838. It lost another two ayllus--that of Choclla in Yana
cachi and Guancapampa in Chirca--which became haciendas in
1838, but in the meantime•added two more in Suri (Charapacci and Toriri). These changes meant that overall, the number of
units changed little in the period of the four censuses.
329
Table 7-5. Number of Ayllus and their Average Originario and Agregado Population per unit, the Yungas, 1786-1838
(number of ayllus in parentheses)a
Pueblo 1786
Orig. -----P:greg. 1803
0 -- A 1829 1838
0 --A 0 A
1. Chulumani 137 (7) 188 140 (7) 159 105 (7) 98 93 (7) 102
2. Irupana
3. Laza
4. Suri
5. Ocabaya
6. Chirca
. 7. Pacallo
8. Corioco
9. Coripata
10. Chupe
11. Yanacachi
41 (6)
39 (3)
40
51
65 (3) 99
41 (5) 47
66 (4) 106
158
79
148
(1)
(1)
"-'* (3)_;,
(4)
44
272 ,, .. :~
159
" 116
General average 81 (37) 106
32 (6) 29 36 (5) 32 35 .(5) 40
41 (3) 48 25 (3) 47 30 (3) 68
63 (3) 53 46 (3) so 42 (5) 53
64 (5) 24 58 (5) 33 66 (5) 44
75 (4) 70 66 (4) 61 65 (3) 92
(1) 61
149 (1) 287 179
(1) 67
(1) 350 224
(1) 48
(1) 430 ...
73
139
(3) 132 72
(4) 103 160
(3) 98
( 4) 143
68
131
(3) 112
(4) 107
84 (37) 85 75 (36) 78 72 (37) 84
aThere were two ayllus whose members were listed and taxed as agregados only: Guancane in Pacallo and Choclla in Yanacachi--which became a hacienda in 1838. For this reason the average originarios are calculated from 35 ayllus in 1786 and 1803; 34 in 1829 and 36 in 1838. All agregados are calculated from number of units given in table.

330
Table 7-6. Percentage of Originario and Agregado Population by Pueblo, the Yungas, 1786-1838
1786 1803 1829 1838
Pueblo Orig. ~· Orig. ~· Orig. ~· Orig. ~· 1. Chulumani 33.9 33.5 33.3 35.4 -28.8 24.5 25.0 22.9
2. Irupana 8.6 6.2 6.6 5.5 7.0 5.8 6.7 6.4
3. Laza 4.2 3.9 4.2 4.6 2.9 5.1 3.5 6.5
4. Suri 6.9 7.5 6.5 5.1 5.4 5.3 8.0 8.5
5. Ocabaya 7.3 6.0 10.9 3.8 11.3 5.9 12.6 7.0
6. Chirca 9.3 10.8 10.3 8.9 10.4 8.8 7.5 8.9
7. Pacallo - 1.1 - 1.9 - 2.4 - 1.5
8. Coroico 5.6 6.9 5.1 9.1 7.0 12.5 8.6 13.8
9. Coripata 10. Chupe 8.4 12.2 7.5 12.6 8.5 10.5 7.8 10.8
11 . ·Yanacachi 15.8 11.8 15.7 13.l 18.8 19.2 20.2 13.7
C!early, the ayllus, with their more mixed economies and
poorer quality coca leaf production did not simply go out of business, as did the haciendas, but found alternative opportunities for their populations either in shifting to subsis
tence agriculture or other products desired in barter or mar
ket exchanges by the highland peasant communities. This may explain the persistence of the original landed
members of the community, ~ut not of the agregados. In com
paring Chulumani with the poorer highland province of Pacajes in 1786, I noted in a previous study that the greater im
portance 0£ the agregados in the ayllus of Chulumani reflect
ed that zone's ability to attract the migrant laborers.7
How
then, after the crisis had set in, could the Chulumani region
ayllus maintain that· attraction? The reason for this
7Ibid., pp. 203-204.
••
331
stability may be related to extra-Yungas conditions, and in fact may reflect the still relatively positive conditions of
the Yungas ayllus in relati~nship to the rest of the ayllus
in the entire region of Alto Peru, for the Yungas communi
ties were still the most highly taxed and evaluated by the
Crown of any free commµnities throughout Alto Peru, and their access to rich semi-tropical lands producing citrus crops, bananas, and other products not available to the majority of
al tiplano communi t-fes meant that these communities still were
important poles of attraction for free but landless Indian peasants and their fa!'lilies. Thus, while coca income m·igh t
decline, 'other goods were available for barter in the alti
plano. Equally, their production of lesser quality coca leaf, compared to the suppo~edly higher quality product grown on
the haciendas, probably meant that their coca output was less influenced by the mining decline than the haciendas', for
the miners could afford to buy the best quality products, while ayllus produced poorer quality coca which probably went
primarily to traditiona~·aglticu1tural peasants on the altiplano, a market that seems to have held steady during the mining crisis. ~
While there was Q'tviously an important impact then, of
the crisis of mine produ~tion and its coca consumption on the
coca plantations of theYungas valleys of the Chulumani district, it is also clear that this impact was not catastrophic. Evid_ently the Yungas coca producers, both haciendas and
ayllus, were able to find a source for the majority of the
coca that was formerly consumed by the altiplano miners.
Where the cash for purchasing the coca harvests for the Yungas came from, however, is difficult to determine given the
general decline of mining and its overall impact on the rest
of the economy. The fact that the Yungas had always sent
some output to the southern Peruvian Andean area, which had a
mining boom in this period, could have been one alternative

332
market. Equally, it might be that the decline of the domina-
ting impact of mining on Bolivian agriculture may have permitted the development of a more complex barter and marketing system among the Indians, exclusive of the normal government taxes and exploitations, thereby permitting a greater possibility of savings on the altiplano communities and haciendas and their consequent increased ability to purchase coca.
However much these new and altered markets may have compensated local producers, it was evident that the miners were still the most desirable market. The increase in population, and presumably of coca output, by 1838, was clearly a reflection of the returning prosperity of the mines of the altiplano. The fact that the region could respond so positively and quickly to the increasing mine production meant that unused capacity existed in the Yungas despite the existence of alternative markets, and that even though these alternative markets may have been reasonably developed, they could not . fully compensate for the older but more remunerative mining markets for coca.
Aside from determining the nature and ext.ent of the impact of- the altiplano silver mining crisis on the Yungas coca zones, an analysis of these four censuses provides an opportunity to re-examine the demographic variables which I previously studied in a synchronic study of the census of 1786 and the two districts of Chulumani and Pacajes. From the perspective of these 52 years, what were the significant continuities and changes in the gross demographic and economic indices which.we have examined?
To begin with, it seems quite clear that the group with the least access to land rights and stability, the agregados on ,the ayllus, showed demographic indices most closely associated with a migrant population. Consistently the agregados (except in 182g) had the highest ratio of males to females of
all three groups (Table 7-7). Equally, their working adult
Table 7-7. Sex Ratios and Estimates of Economically Active Population among the Aymara Population,
the Yungas, 1786-1838
1786
I. Sex Ratios
Yanaconas 121.5
Originarios 110. 7
Agregados 134.3
(Total Ayllu) (123.8)
Total Prov. a 122.3
II. % Tributarios
Yanaconas 29.0
Originarios 30.7 · Agregados 36.6
(Total Ayllu) (34.1) ., ___ .,..
Total Prov. 30:6
~
III. % Economically ~tive
" Yanaconas 60.1 ~
Originarios 59.0 Agregados 66.0
(Total Ayllu) (62. 7)
Total Prov. 60.7
1803
122 •. 7
118.2
133.2
(125. 7)
123.8
26.4
30.9
36.0
(33.5)
"'· 29,0
57.2
59. 7
63.6
(61. 7)
58.8
1829
119.5
134.9
131.6
(134.0)
124.2
29.9
34.3
36.6
(35.7)
31.9
58.0
61.2
65.4
(62.8)
59.6
1838
125.6
132.7
152.0
(142 .9)
131.2
30.7
32.2
39.7
(36.3)
32.6
59.8
59.2
64.5
(62.1)
60.6
aThis total provincial figure includes only the eleven comparable pueblos.
bThis consists of all adults between approximately 14-50 years and is made up of solteras, casadas, tributarios, and pr6ximos.
333

334
population both for all adults (14-50) and men (18-50) was
consistently higher than the other two categories of workers
as well. Clearly these were indices of a population strongly
influenced by recent migration.
In examining the usually less reliable child/women ra
tio, which consists of all children under 14 years of age
(ninos and ninas categories) per 100 women over 14 years of age (solteras, casadas and viudas), it is also evident that the agregados had fewer young children than any other group.
Again, this finding strongly supports the well-known patterns among the traditionally migrating populations (Table 7-8).
Otherwise an examination of this ratio shows that it has lit
tle clearly perceived relationship with changes in overall population trends or with the impact of the decline of mining.
This corroborates its lack of predictive power when measured
in its relationship to poverty and wealth in a comparative
analysis of Pacajes and Chulumani in 1786. Moreover, whereas I had assumed the higher child/women ratios among originarios indicated the possibility of higher standards of living for
the originarios, in fact, this was not a consistent finding in the later censuses of the Yungas.
In this diachronic study of the wealthy coca-producing district of Chulumani in the period running from the end of Spanish colonial domination to the early decades of the new
Bolivian Republic, certain basic factors are clearly delineated by the revisitas. The tributary population of the Yun
gas, whether working on the haciendas, or living on the free
communities, all responded in some fashion to the restriction of coca markets as a result of the severe and relatively sustained early nineteenth-century crises of altiplano
silver mining. All three population categories of peasants~
yanaconas, originarios and forasteros, lost population in the crisis years of 1803 and 1829, and all recovered popula
tion losses somewhat in the moderate boom period of 1838.
\
335
Table 7-8. Child/Women Ratios for the Yungas, 1786-1838
1786 1803 1829 1838 Yanaconas 108.4 128.0 141.3 126.7 Originarios 124. 7 124.0 141.1 146.8 Agregados 87.5 119.0 119.2 134.6 (Total Ayllu) (103.0) (121. 5) (129.7): (140. 2)
Thus their relative positions within the province changed
little despite impressive population losses. Moreover, that
population loss spread evenly among the largest· and· smallest coca plantations- -whether haciendas or ayllus - ~which also
meant that the population responded relative!~ freely to market incentives, no matter what its relationship was to the
land. Though all groups.,_expe""'rienced changes, it was in fact the originarios, with most direct access to land, who were less influenced by th~_ general economic crises. But the
landless, whether on tie estates or the communities, did migrate out of the zone during times of crisis for coca production and returned during the time of its improvement.
The fact that all units lost population resulted, as we have seen, in the paradoxical outcome that there was both a loss of haciendas and a loss of average population size per
unit. In this respect, of course, the ayllus just lost population, but by and large retained their number of units of production and ownership intact. It was only in the area of
regional production, where the crises engendered some long
term changes, more sharply developed among the hacienda populations than among the ayllu peoples, though evident in both. Regions such as Chulumani lost importance in both hacienda
and ayllu populations, while Coripata and to a iesser extent
336
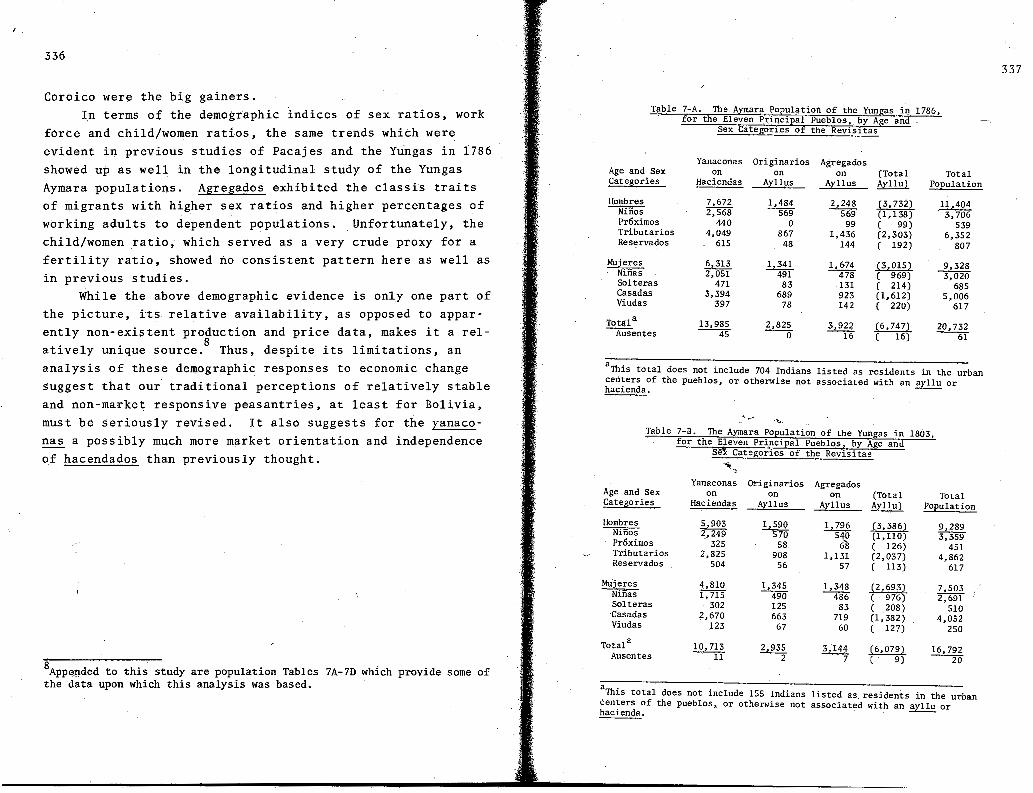
Coroico were the big gainers. I_n terms of the demographic indices of sex ratios, work
force and child/women ratios, the same trends which were. evident in previous studies of Pacajes and the Yungas in 1786
showed up as well in the longitudinal study of the Yungas Aymara populations. Agregados exhibited the classis traits of migrants with higher sex ratios and higher percentages of working adults to dependent populations. Unfortunately, the child/women ratio; which served as a very crude proxy for a fertility ratio, showed no consistent pattern here as well as in previous studies.
While the above demographic evidence is only one part of the picture, i·ts relative availability, as opposed to apparently non-existent production and price data, makes it a relatively unique source.
8 Thus, despite its limitations, an
analysis of these demographic responses to economic change suggest that our traditional perceptions of relatively stable and non-market responsive peasantries, at least for Bolivia, must be seriously revised. It also suggests for the yanaco~ a possibly much more market orientation and independence of hacendados than previously thought.
8Appe.t).ded to this study are population Tables 7A-7D which provide some of the data upon which this analysis was based.
/
Table 7-A. The Aymara PoEulation of the Yungas in 1786, for the Eleven Principal Pueblos, by Age and
Sex Categories of the Revisitas
Yanaconas Originarios Agregados Age and Sex on on on (Total Total Categories Haciendas Ayllus A~llus Ayllu) PoEulation
Hombres 7,672 1,484 2,248 (3,732) 11,404 Niiios 2,568 569 569 (1, 138) . 3, 706 Pr6ximos 440 0 99 ( 99) 539 Tributarios 4,049 867 1,436 (2, 303) 6,352 Reservados 615 48 144 ( 192) 807
Mujeres 6,313 1,341 1,674 (3,015) 9,328 Niiias 2,051 li9l ~ ( 969) 3,020 Solteras 471 83 131 ( 214) 685 Casadas 3,394 689 923 (l,612) 5,006 Viudas 397 78 142 ( 220) 617
Total a 13,985 2,825 3,922 (6, 747) 20,732 Ausentes ---;rs --0 ---i:-6 ( 16) ---rr
aThis total does not include 704 Indians listed as residents in the urban centers of the pueblos, or otherwise not associated with an ayllu or hacienda. ~~-
"-..:·' ""· Table 7-B. The Aymara Population of the Yungas in 1803,
for the E!even PrinciEal Pueblos, by Age and S~ Categories of the Revisitas
""i;~
Yanaconas Originarios Agregados Age and Sex on on on (Total Total Categories Haciendas Ayllus Ayllus Ayllu) Population
Hombres 5,903 1,590 1,796 (3,386) 9,289 Ninos 2,249 570 540 (l,110) 3,359 Pr6ximos 325 58 68 ( 126) 451 Tributarios 2,825 908 1,131 (2, 037) 4,862 Reservados 504 56 57 ( 113) 617
Mtijeres 4,810 1,345 1,348 (2,693) 7,503 Ninas 1,715 490 486 ( 976) 2,691 Solteras 302 125 83 ( 208) 510 Casadas 2,670 663 719 (l,382) 4,052 Viudas 123 67 60 ( 127) 250
Total a 10, 713 2,935 3,144 ~ 16,792 Ausentes --1-1 --2 7 ( 9) ----w
aThis total does not include 155 Indians listed as. residents in the urban centers of the pueblos, or otherwise not associated with an ayllu or hacienda. ~~-
337

338
Table 7-.C. The Aymara Population of the Yungas in 1829, for the Eleven Principal Pueblos, by Age and
Sex Cate~f the Revisitasa
Yanaconas Originarios Agregados Age and Sex on on on (Total Total Categories Haciendas Ayllus Ayllus Ayllu) Po2ulation
Hombres 5,573 1,468 1,588 (3,018) 8,591 Ninos 2,041 ---s20 -m ( 946) 2,987 PrOximos 209 46 46 ( 92) 301 Tributarios 3,065 877 1,033 (1,883) 4,948 Reservados 258 25 72 ( 97) 355
Mujeres 4,662 1,088 1,207 (2, 252) 6,914 Nii!as 1,884 421 ~ ( 860) 2,744 Solteras 205 64 38 ( 100) 305 Casadas 2,462 577 683 (1, 237) 3,699 Viudas 111 26 29 ( 55) 166
Totalb. 10,235 2,556 2,795 (5, 270) 15,505 Ausentes n.g. n.g. n.g. n.g. n.g.
aln this and the subsequent census of 1838, the vice-canton of Milluhuaya has been reassigned to the pueblo of Yanacachi, as it had existed in censuses prior to this date.
bThis total does not include 252 Indians listed as residents in the urban certters of the pueblos, or otherwise not associated with an ayllu or hacienda. No ausentes were listed in this census. --- --
Table 7-0. The A):'.!!!ara Po2ulation·of the Yungas in 1838, for the.Eleven Princi2al Pueblos, b):'. Age and
Sex Categories of the Revisitas
Yanaconas Originarios Agregados a
Age and Sex on on on (Total Total Categories Haciendas Ayllus A):'.llUS Ayllu) Po2ulation
Hombres 6,167 1,484 1,882 (3,366) 9,533 Nifios 2,064 49T --sso (1, 041) 3,105 PrOxirnos 395 91 48 ( 139) 534 Tributarios 3,395 839 1,239 (2,078) 5,473 Reservados 313 63 45 ( 108) 421
Mujeres 4,909 i,118 1,238 (2,356) 7,265 Nifias 1,833 466 476 ( 942) 2,775 Solteras 397 107 69 ( 176) 573 Casadas 2,437 \ 503 655 (1,158) 3,595 Viudas 242 42 38 ( 80) 322
Totalb 11,076 2,602 3,120 (5, 722) 16,798 """"AiiSen tes 34 --4 --rr (19) --5-3
al have grouped the vagos, a category first used in this census, with the agregados. For my justification, see Note 5.
bThis total does not include 371 Indians listed as residents in the urban centers of the pueblos, or otherwise not associated with an ayllu or hacienda. --- --
8 Population and Space in Eighteenth Century Buenos Aires
Lyman L. Johnson and Susan Migden Socolow*
During the eighteenth century Buenos Aires became a major city in Spain's American empire. Beginning in the first decades, and continuing unabated throughout the century
trade, both legal and contraband, and increased mi~itary activity in the Rio de la Plata gave a new economic and strat
egic importance to the city. Gradually Buenos Aires was
transformed from a backwater of Empire to a thriving bureaucratic and commercial center.
This study, part of ongo.ing research on the nature and growth of colonial Buenos Aires, concentrates on the two most important aspects of the ··c-lty~s urban growth--the numerical
or demographic patterns of that growth, and the reflection of . ""' incre.ased numbers in t~ geographical or spatial patterns in
-;
which inhabitants of the city lived and worked. Our future research will, we believe, present a more c.omplete description and analysis of the development of the colonial population and society. Below we present a general discussion of the develo.pment of the city, based on census data and pub
lished studies.
The city of Buenos Aires was .founded on the banks of the Rio de la Plata, a broad, shallow estuary of the Parana Riv
er, where the lower reaches of the Matanza River, the Ria
chuelo, entered the larger waterway. Geographically the site
*The authors are Assistant Professors of History at the University of North Carolina at Charlotte and Emory University, Atlanta, respectively. Thanks is given to the UNCC Foundation and the Tinker Foundation for the their support of this research.
Copyright © 2022 FDOKUMEN