The impact of supply chain relationships and automatic data communication and registration on...
16
The impact of supply chain relationships and automatic data communication and registration on forecast information quality Patrik Jonsson and Mattias Gustavsson Division of Logistics and Transportation, Department of Technology Management and Economics, Chalmers University of Technology, Gothenburg, Sweden Abstract Purpose – The purpose of this paper is to explain the effects of the customer-supplier relationship and of automatic forecast data communication and registration on the perceived information quality of forecasts. Design/methodology/approach – A conceptual model and three hypotheses are derived. The empirical analysis is based on survey data from 219 Swedish manufacturing companies. Findings – Findings show that the customer-supplier relationship and automatic data communication and registration have significant impact on the perceived quality of forecast information received from a downstream customer in the supply chain. The reliability and timeliness of the forecast information are affected to about the same extent by both the relationship type and the data communication and registration strategy. Credibility is correlated with the relationship type, while the completeness, validity and conciseness of the received forecast are operative issues depending mainly on the communication strategy. Research limitations/implications – Using single informants, focal customers and some single-item constructs in research design. Practical implications – The paper explains how various dimensions of forecast information quality are affected by different factors, thus guiding how to differentiate information quality improvement work in diverse situations. Originality/value – Detailed empirical studies of supply chain information exchange, especially focusing on explaining causes of high-quality information exchange, are lacking in the literature and demanded in industry. Keywords Communication technologies, Forecasting, Supply chain management, Channel relationships, Sweden Paper type Research paper Introduction Several scholars have emphasized the importance of sharing forecast data between customers and suppliers in order to decrease suppliers’ planning uncertainty (Cachon and Fisher, 2000; Kelle and Akbulut, 2005). But, forecasts that are communicated upstream in a supply chain often have quality defects, such as being delayed, difficult to understand, incorrect, etc. (Petersen et al., 2005; Gustavsson and Jonsson, 2007). Such quality deficiencies decrease the usefulness of information and may have negative performance impact (McCarthy and Golicic, 2002; van der Vorst and Beulens, 2002). To improve the information quality when exchanging forecasts, it is necessary to understand the causes of the deficiencies. Causes can be related to the customer-supplier The current issue and full text archive of this journal is available at www.emeraldinsight.com/0960-0035.htm IJPDLM 38,4 280 Received August 2007 Revised February 2008 Accepted February 2008 International Journal of Physical Distribution & Logistics Management Vol. 38 No. 4, 2008 pp. 280-295 q Emerald Group Publishing Limited 0960-0035 DOI 10.1108/09600030810875382
Transcript of The impact of supply chain relationships and automatic data communication and registration on...

The impact of supply chainrelationships and automatic datacommunication and registrationon forecast information quality
Patrik Jonsson and Mattias GustavssonDivision of Logistics and Transportation,
Department of Technology Management and Economics,Chalmers University of Technology, Gothenburg, Sweden
Abstract
Purpose – The purpose of this paper is to explain the effects of the customer-supplier relationshipand of automatic forecast data communication and registration on the perceived information quality offorecasts.
Design/methodology/approach – A conceptual model and three hypotheses are derived. Theempirical analysis is based on survey data from 219 Swedish manufacturing companies.
Findings – Findings show that the customer-supplier relationship and automatic data communicationand registration have significant impact on the perceived quality of forecast information received from adownstream customer in the supply chain. The reliability and timeliness of the forecast information areaffected to about the same extent by both the relationship type and the data communication and registrationstrategy. Credibility is correlated with the relationship type, while the completeness, validity andconciseness of the received forecast are operative issues depending mainly on the communication strategy.
Research limitations/implications – Using single informants, focal customers and somesingle-item constructs in research design.
Practical implications – The paper explains how various dimensions of forecast informationquality are affected by different factors, thus guiding how to differentiate information qualityimprovement work in diverse situations.
Originality/value – Detailed empirical studies of supply chain information exchange, especiallyfocusing on explaining causes of high-quality information exchange, are lacking in the literature anddemanded in industry.
Keywords Communication technologies, Forecasting, Supply chain management,Channel relationships, Sweden
Paper type Research paper
IntroductionSeveral scholars have emphasized the importance of sharing forecast data betweencustomers and suppliers in order to decrease suppliers’ planning uncertainty (Cachonand Fisher, 2000; Kelle and Akbulut, 2005). But, forecasts that are communicatedupstream in a supply chain often have quality defects, such as being delayed, difficultto understand, incorrect, etc. (Petersen et al., 2005; Gustavsson and Jonsson, 2007).Such quality deficiencies decrease the usefulness of information and may havenegative performance impact (McCarthy and Golicic, 2002; van der Vorst and Beulens,2002).
To improve the information quality when exchanging forecasts, it is necessary tounderstand the causes of the deficiencies. Causes can be related to the customer-supplier
The current issue and full text archive of this journal is available at
www.emeraldinsight.com/0960-0035.htm
IJPDLM38,4
280
Received August 2007Revised February 2008Accepted February 2008
International Journal of PhysicalDistribution & Logistics ManagementVol. 38 No. 4, 2008pp. 280-295q Emerald Group Publishing Limited0960-0035DOI 10.1108/09600030810875382
relationship (Forslund and Jonsson, 2007), i.e. the level of trust and the type ofcommunication and cooperation, between the information sender (customer company)and information receiver (supplying company). If the information sender understandshow the receiver is using the information, and if they have a trustworthy and continuousdialogue, there is a greater possibility for the sender to provide information that isperceived by the receiver to have high quality when used in its planning processes.Causes of high-information quality can also be related to the data communication andregistration, i.e. communication technology used and level of standardization andautomatic interface in the process of generating, transferring and registering theinformation. For example, standardized electronic data interchange (EDI)communication significantly reduces time delays in the transferred information (Fengand Yuan, 2006).
There are, consequently, logical causes of different information quality levels, butthere is a lack of knowledge about the levels of significant information quality impactfrom various causes. No identified study has explained the impact of the customersupplier relationship or of automatic communication and registration of forecast data, orthe interaction effect between the relationship and automatic data communication andregistration on information quality dimensions. This should be important to know forcompanies in order to focus the improvement effort on the right activities. The presentpaper attempts to fill some of these gaps and thereby extend the knowledge about how toexchange high-quality information in supply chains. The purpose is to explain theeffects of the customer-supplier relationship and of automatic communication andregistration of forecast data on the perceived forecast information quality. The focus ison forecast information generated by an external customer and communicated to andused in a supplying company. The study takes the perspective of the supplyingcompany, i.e. the receiver and user of the data, and analyzes the supplier’s perception ofthe information quality.
The theoretical basis and hypotheses, and a conceptual model for the study, arepresented in the next section of the paper. This is followed by a methodology sectiondescribing the design and collection of empirical survey data in Swedish manufacturingcompanies. The last sections of the paper present the empirical findings, hypothesestesting, discussion and conclusions.
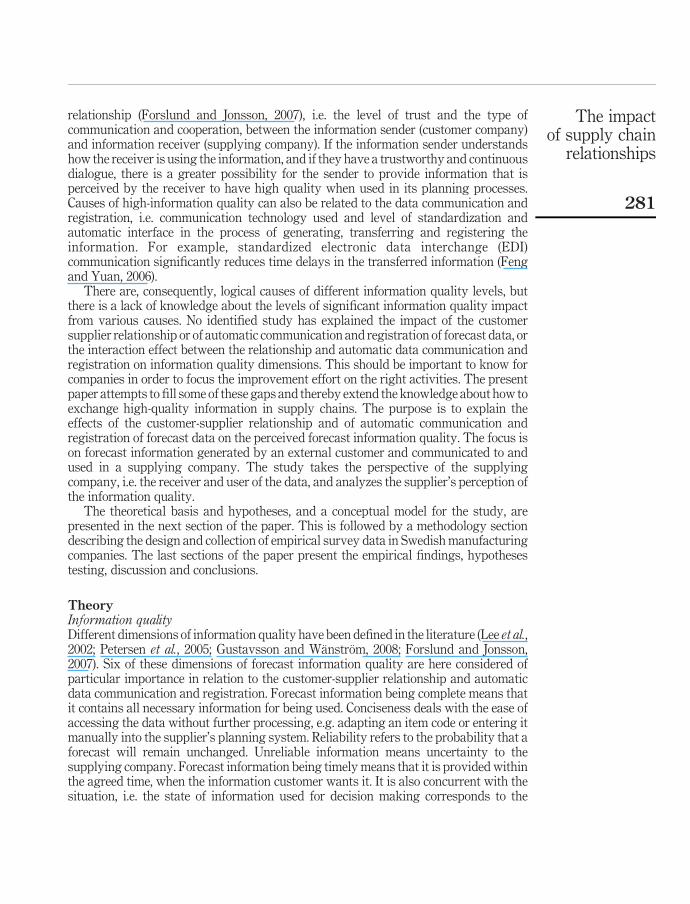
TheoryInformation qualityDifferent dimensions of information quality have been defined in the literature (Lee et al.,2002; Petersen et al., 2005; Gustavsson and Wanstrom, 2008; Forslund and Jonsson,2007). Six of these dimensions of forecast information quality are here considered ofparticular importance in relation to the customer-supplier relationship and automaticdata communication and registration. Forecast information being complete means thatit contains all necessary information for being used. Conciseness deals with the ease ofaccessing the data without further processing, e.g. adapting an item code or entering itmanually into the supplier’s planning system. Reliability refers to the probability that aforecast will remain unchanged. Unreliable information means uncertainty to thesupplying company. Forecast information being timely means that it is provided withinthe agreed time, when the information customer wants it. It is also concurrent with thesituation, i.e. the state of information used for decision making corresponds to the
The impactof supply chain
relationships
281
situation, so the data represented are not time-phased with regard to when they wereregistered and presented. Validity concerns the degree to which the information senderand receiver use the same definitions and measures of the information exchanged.Credibility measures the perceived trust in the forecast from the user’s perspective.Credible forecasts are important to avoid speculation. Credibility is in the long runinfluenced by the other dimensions.
The criticality of the forecast information quality can be expected to differ betweendimensions. The reliability dimension has been shown to be especially critical forforecast information (Forslund and Jonsson, 2007) but previous studies have alsoidentified conciseness, timeliness and credibility as important dimensions (Gustavssonand Jonsson, 2007).
Collaborative relationshipA successful customer-supplier relationship is often defined as a collaborativerelationship, characterized by a high level of trust, commitment, shared values,communication, adaptation, positive bases of power, cooperation, relationship bondsand dependence (Zineldin, 1998; Narasimhan and Nair, 2005; Petersen et al., 2005).
Trust is often emphasized as the most important issue for managing long-termrelationships and cooperation, but it is also a result of long-term relationships betweenparties (Spekman et al., 1998; Min and Mentzer, 2000). Moorman et al. (1993) define trustas “a willingness to rely on an exchange partner in whom one has confidence” andAnderson and Narus (1990) focus on the perceived outcomes of trust when defining it as:
[. . .] the firm’s belief that another company will perform actions that will result in positiveoutcomes for the firm as well as not take unexpected actions that will result in negativeoutcomes.
Trust consequently exists when one party has confidence in a collaborative exchangepartner’s reliability and integrity (Zineldin and Jonsson, 2000).
Cooperation is possible also without trust (Mayer et al., 1995) but communication isalways necessary. Spekman et al. (1998) highlight communication processes,characterized by high frequency and high level of contact between the partners, asone of the most important supply chain management themes. An important part ofcommunication is information sharing. Especially, a lack of forecastinformation-sharing is often emphasized as a common cause of uncertainty in supplychain planning (Kwon and Suh, 2005). Both the content of, and participation in, theinformation exchange are considered significant for determining the degree to which theparties understand each other’s goals and are able to coordinate their efforts to achievethose goals (Mohr and Spekman, 1994; Zailani and Rajagopal, 2005). For forecastinformation, the communication content is, for example, early information aboutproduct changes, expected future demand changes not yet visible in the official forecastdata, and changed batch sizes. Participation concerns the extent and frequency ofpersonnel involvement in the customer-supplier communication (Mohr and Spekman,1994), For example, in terms of site visits, time is spent on getting to know the otherorganization’s staff, involving the other party in strategic work, collaborative planningand workshop discussions.
Trust, communication content and participation in information-sharingshould consequently be important issues for achieving collaborative
IJPDLM38,4
282

customer-supplier relationships. Trust, communication content and participation ininformation-sharing could also be expected to impact the information quality. Previousresearch indicates that high levels of information quality are associated with high levelsof collaborative customer-supplier relationships (Li and Lin, 2006). Thecustomer-supplier relationship should affect the understanding of each other’s needsand requirements and the possibility to come to agreements and joint definitions(Lohman et al., 2004), i.e. to attain information quality validity. It is logical to believe thata more developed collaborative relationship, characterized by frequent and opencommunication and trust, also enables the received information to be consideredtrustworthy (i.e. credible), containing all necessary information and easy to understandand use (i.e. complete and concise), received within the right time and regarded asreliable. The collaborative relationship between the information sender and receivercould consequently be expected to have a great impact on several information qualitydimensions. The impact may, however, vary for different relationship types anddimensions. Several links between the relationship type and quality dimensions areindirect, making it difficult but essential to explain the importance of the relationship forthe perceived forecast information quality. Thus, the following hypothesis is generated:
H1. There is a positive relationship between increased collaborative relationshipand perceived forecast information quality.
Automatic data communication and registrationAutomatic data communication and registration comprise a second cause ofhigh-information quality. Different information communication technologies shouldhave different impact on timeliness. For example, mail, fax and e-mail always result insome time delays, while online or frequent batch communication using internet/web, EDI,etc. could be considered free from time delays (Lim and Prashant, 2001; Feng and Yuan,2006). Lack of communication standards using the different technologies, such asunstructured e-mail or phone messages instead of standardized EDI messages, is anothersource of information quality deficiencies, with possible impact on the completeness andconciseness of information quality. Manual interpretation and registration instead ofautomatic registration of information, using, e.g. EDI, web-EDI, web portal, etc. in thesupplier’s system can also result in information quality deficiencies, by causing both timedelay and registration errors reducing the reliability (Lindau, 1995). Previous studies showhow the use of EDI results in generally better delivery performance (Ahmad andSchroeder, 2001), higher productivity, better financial performance, more informationexchange and a higher level of trust between customer and supplier (Rassameethes et al.,2000). EDI usage also improves information quality in terms of data reliability (Mackayand Rosier, 1996). The increased use of different internet services such as web portals canalso help in driving the supply chain members toward an integrated set of standards(Garcia-Dastugue and Lambert, 2003). Automatic data communication and registration ofstandardized information should consequently have positive impact on informationquality. Defee and Stank (2005), for example, propose that high levels of standardization ofdata coding and order notation communication across supply chain entities are importantfor adopting supply chain strategies. In alignment with previous findings about advancedtechnology use (Boyer et al., 1997), it may be assumed that the possible information qualitybenefits of automatic data communication and registration cannot be achieved withoutfirst developing a collaborative relationship (Zineldin, 1998) between the sending and
The impactof supply chain
relationships
283

receiving parts. Both strong collaborative relationships and automatic datacommunication and registration are consequently considered necessary for theinformation receiver to perceive the information quality to be high. The followinghypotheses can thus be generated:
H2. There is a positive relationship between automatic data communication andregistration and high-perceived forecast information quality.
H3. The interaction effect between collaborative relationship and automatic datacommunication and registration is positively correlated with high-perceivedforecast information quality.
Control variables and conceptual modelThe perceptions of information quality may be affected by other issues than thecustomer-supplier relationship and automatic data communication and registration(Figure 1). Issues with positive impact on the information quality may be proactiveinformation management, such as information process management and informationlife-cycle management (Fisher et al., 2006). Information process management concernsinformation mapping to improve the information management process, regularreviews of what the information requirements are in the internal processes and at thesuppliers, and confronting information producers with information quality deficienciesto get to the root of problems. Information life-cycle management relates tomaintaining the basic data quality by cleaning out old and redundant data from theinformation system and frequently updating existing data (APICS, 2007).
MethodologySurvey instrumentFour groups of variables were included in the survey (Table I). The six perceivedinformation quality dimensions were defined in accordance with Gustavsson andWanstrom (2008) and measured on seven-point single- and multiple-item scales. Aninformation quality index, measured as the average of the six individual informationquality indexes, was also developed. The collaborative relationships contained thevariables of trust, communication and participation, measured with seven-pointmultiple-item scales derived from Zineldin (1998) and Zineldin and Jonsson (2000).
Figure 1.Conceptual model
Collaborative relationship
- Trust- Communication- Participation
Automatic data communication and registration
- Communication technology
- Automatic registration
- Complete- Concise- Reliable
- Timely- Valid- Credible
Forecastinformation qualityH1
H2
H3
IJPDLM38,4
284

A. Information quality – all questions on seven-point Likert scales anchored by “I do not agree for thisinformation type” and “I agree fully regarding this information type”. For constructs with twomeasures, the mean of these measures is used
Factor loadings a,bA1. Complete: (a) The information includes all necessary values.(b) The information includes all necessary explanations of thevalues (summated scale: complete ¼ (ðA1a þ A1bÞ=2) 0.73
A2. Concise: the information can be used directly, without reworking 0.67A3. Reliable: the forecast error is low and the forecast reflects
true demand 0.76A4. Timely: the information is received in time for the planning task 0.73A5. Valid: the customer uses the same measures as your company 0.49A6. Credible: the information contains few errors, i.e. the forecast error
is low and the forecast reflects the real demand well 0.73IQ index: ðA1 þ A2 þ A3 þ A4 þ A5 þ A6Þ=6, Cronbach’s a 0.78B. Data communication and registration – (automatic data communication and registration ¼ (B1dor B1e) and (B2b or B2c))B1. Communication technology used (a. phone, b. fax, c. mail, d. e-mail, e. EDI)B2. Automatic registration of data (a. manually typed in our ERP system, b. automatically up-loaded
in our ERP system, c. customer registers in our ERP system)C. Collaborative relationship – all questions on seven-point Likert scales from “I do not agree” and“I fully agree”C1. Trust, mean (SD) 4.46 (1.30), Cronbach’s a 0.86 Factor loadings a
(a) Our interests are included in the customers’ decision making 0.71(b) The customer is always honest and sincere in our communication 0.87(c) Our staff trusts the customers’ organization 0.87(d) The success of our company is important to the customer 0.81(e) The customer spends enough amounts of time and involvement
on the relationship 0.8C2. Communication, mean (SD) 4.58 (1.50), Cronbach’s a 0.87
(a) The customer keeps us informed on product changes 0.84(b) The customer keeps us informed on future demand changes 0.91(c) The customer keeps us informed on changes in batch sizes 0.91
C3. Participation, mean (SD) 4.15 (1.37), Cronbach’s a 0.84(a) The customer visits us frequently 0.84(b) We visit the customer frequently 0.66(c) The customer spends a lot of time on getting to know our staff 0.81(d) The customer frequently discusses new possibilities with us 0.81(e) The customer involves us in strategic work and collaborative
planning to improve overall performance 0.81D. Control variablesD1. Information process management, mean (SD) 4.12 (1.36),
Cronbach’s a 0.82. Seven-point Likert scales anchored by “We donot use this at all” and “This is a frequently used routine orpractice for us”
Factor loadings a
(a) We use information mapping to improve our informationmanagement 0.87
(b) We do regular reviews of what the information requirementsare in the internal processes 0.86
(c) We do regular reviews of what the information requirements areat the suppliers 0.82
(d) We confront information producers with IQ deficiencies to getto the root of the problem 0.68
(continued )
Table I.Defining informational
relationship, informationquality and control
variables
The impactof supply chain
relationships
285

The variable of communication measures the content of the communication, and thevariable of participation measures the personnel involvement in the communication inaccordance with Mohr and Spekman (1994) and Spekman et al. (1998). The threerelationship variables were adjusted to relate to exchange of forecast information.
Automatic data communication and registration of forecast information weremeasured as two variables on nominal scales. The first asked the respondents aboutthe communication technologies used, with the following five response alternatives:phone, fax, mail, e-mail and EDI. E-mail and EDI were coded as automaticcommunication. The second asked about the way of registering the data, with thefollowing alternatives: manually, automatically, and by customer register in oursystem. Automatically and customer register in our system were coded as automaticregistration. The variable “automatic data communication and registration” is coded asa binary variable, measuring whether both automatic communication and automaticregistration of data are conducted at the same time. Those with both automatic datacommunication and automatic registration were coded as having “automaticdata communication and registration”. The others were coded as not havingautomatic data communication and registration.
The two control variables, information process management and informationlife-cycle management, were operationalised in accordance with Fisher et al. (2006) andmeasured with seven-point multiple-item scales.
Factor analysis with principal component analysis and varimax rotation andinter-item reliability test using Cronbach’s a were used for the variables based onmultiple-item scales. All variables loaded on single factors and showed reliable avalues. The information quality index contained one variable (valid) with a factorloading of 0.5. This variable was kept in the index because it should be an importantdimension of the index and because of its high-a value. Table I defines andsummarizes means, standard deviations and as for the variables.
Data collectionThe population of the study was manufacturing companies in all types of industrieswith an own production facility, with more than 50 employees. A total of 900 e-mailaddresses were selected from the Swedish address database (PAR), 60 of these did nothave production and where thereby excluded. An e-mail with a link to a web surveywas distributed to all these addresses in March 2007. A total of 219 full responses werereceived, which corresponds to a response rate of 26 per cent. Two e-mail reminderswere sent out to the population and 276 non-response companies were contacted andasked for the reasons of not responding. The majority of the 276 (63 per cent) either
D2. Information life-cycle management, mean (SD) 4.60 (1.43),Cronbach’s a 0.71. Seven-point Likert scales anchored by “We donot use this at all” and “This is a frequently used routine orpractice for us” Factor loadings a
(a) We clean out old data from our informationsystems 0.83
(b) We clean our information systems from duplicates 0.83(c) We regularly update our ERP data 0.73
Notes: aPrincipal component factor analysis (Varimax rotation); bIQ indexTable I.
IJPDLM38,4
286
asked for a new e-mail and promised to answer or gave us a new contact person at thecompany to whom the web survey was sent. Five companies (2 per cent) claimed thatthey did not have the knowledge to answer the questions, another five worked atcompanies without a production facility and 92 (33 per cent) did not have the time.Most non-responses are thus considered relevant for the population and should beincluded in the response rate calculation.
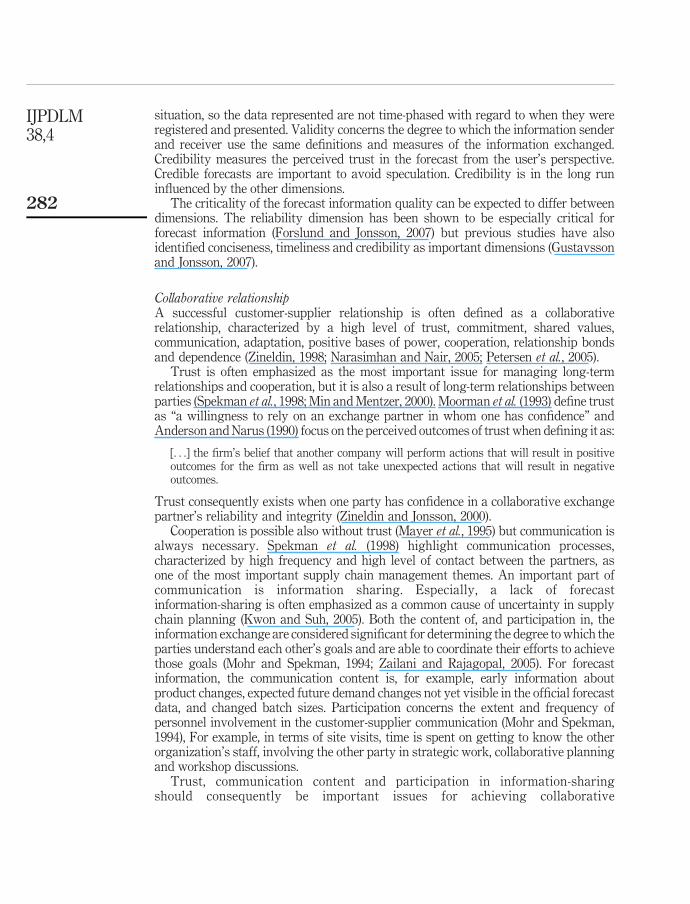
Company size and customer specifics of the respondents are described in Table II,showing that the respondents represent a wide spread of different company types.
The non-response bias was analysed by comparing the industry affiliation andcompany sizes of the respondents and the entire selection (Table III). x 2 tests could notreveal any difference between respondents and the full selection, regarding industry.There is a significant bias towards medium-sized companies among the respondents.This bias is however not considered to impact the findings, because there is no clearbias towards large or small companies.
FindingsThe analysis contains three parts, one related to each of the hypotheses.
Collaborative relationships and information qualityTable IV shows correlations between the collaborative relationship variables and theinformation quality dimensions. Timeliness and credibility are significantly correlatedwith all three relationship variables. Reliability and completeness are significantlycorrelated with two of the relationship variables on the p , 0.01 levels. A collaborativerelationship allows a dialogue about the importance of forecasts, and may also increase
Variable No. of respondents (percentage of all 219)
Fewer than 100 employees 120 (55)Turnover larger than e60M 60 (27)Main customer stands for .25 per cent of turnover 45 (21)Distance to main customer .100 km 86 (39)Respondent is an OEM, not a supplier 50 (23)Items delivered to the main customer arecustomer-specific 58 (26)
Table II.Respondents’ company
and customercharacteristics
Selection(No.)
Selection(per cent)
Responses(No.)
Responses(per cent)
IndustryMechanical engineering and textile industries 696 77 148 68Process type industries (food, chemistry, paper) 209 23 71 32Size (turnover),e10M 196 22 42 19e10-50M 394 44 117 53.e50 315 35 60 27
Table III.Industries and sizes of
selection and respondents
The impactof supply chain
relationships
287

the general focus on the forecasting process, which may explain why reliability andtimeliness are correlated with the relationship variables. The relationship withcompleteness could also be explained by the dialogue, because it allows the customerfirm to understand the information needs of the supplier. Credibility measures to whatextent the supplier trusts the received forecast. This dimension has an obviouscorrelation with the relationship variables. It is also highly correlated (and significantp , 0.01) with the reliability dimension. Two variables were significantly correlatedwith conciseness, but only on the p , 0.05 levels. The relationships are expected, sincea collaborative relationship should make it more possible for the sender to prepare datathat are easy for the receiver to use. However, the characteristics of the communicationstrategy should have a more direct effect on conciseness. Communication, butespecially participation, allows synchronization of definitions and discussionabout what forecast information to communicate and how to communicate it. It issomewhat surprising that the participation variable is significantly correlated withonly two of the six information quality dimensions. However, participation is animportant cause of trust (Zineldin and Jonsson, 2000), so there should at least be astrong indirect relationship between participation and forecast information quality. Totrust the customer and the customer communicating planning-related informationseem to be the relationship variables with most important information quality impact.Trust is often considered by far the most important variable for managing supplychain strategies and achieving supply chain performance (Spekman et al., 1998; Fyneset al., 2005; Narasimhan and Nair, 2005). This is consequently also the way to achievehigh-quality information exchange in supply chains. No relationship variable wassignificantly correlated with forecast information validity. A reason for this could bethat forecast information details may not be discussed in the customer-suppliercommunication. Another possible reason is that validity was the dimension with thehighest mean among all information quality dimensions, and was therefore notconsidered as critical as the other quality dimension (Gustavsson and Jonsson, 2007).H1 was consequently verified for all information quality variables except for validity,especially for the trust and communication variables.
Data communication and registration and information qualityThe five alternatives for forecast communication and the three for forecast dataregistration were used to identify two groups of respondents, those with and those withoutautomatic data communication and registration, respectively. Those using e-mail or EDIin combination with automatic registration or customer registration in the supplier’ssystem were coded as having “automatic data communication and registration”. Theothers were coded as not having it. The group without automatic data communication and
Forecast information quality by dimensionCollaborative relationship Complete Concise Reliable Timely Valid Credible
Trust 0.22 * * 0.19 * 0.24 * * 0.29 * * 20.03 0.32 * *
Communication 0.22 * * 0.18 * 0.23 * * 0.18 * 0.02 0.23 * *
Participation 0.09 0.01 0.06 0.20 * 0.06 0.28 * *
Notes: Two-tailed significances at the *p , 0.05 and * *p , 0.01 levels, respectively
Table IV.Pearson correlationsbetween collaborativerelationship andinformation quality
IJPDLM38,4
288
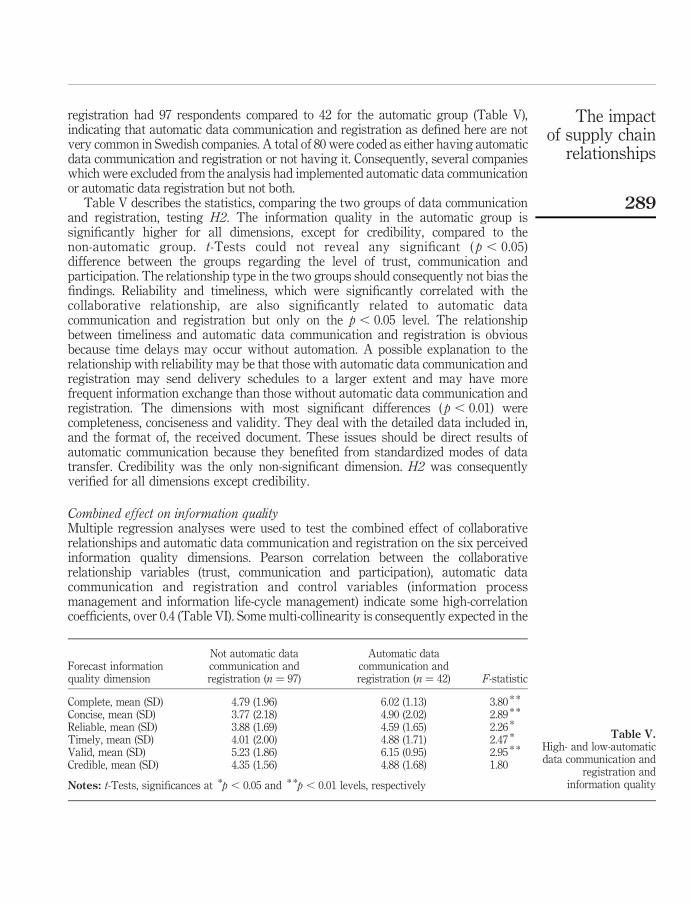
registration had 97 respondents compared to 42 for the automatic group (Table V),indicating that automatic data communication and registration as defined here are notvery common in Swedish companies. A total of 80 were coded as either having automaticdata communication and registration or not having it. Consequently, several companieswhich were excluded from the analysis had implemented automatic data communicationor automatic data registration but not both.
Table V describes the statistics, comparing the two groups of data communicationand registration, testing H2. The information quality in the automatic group issignificantly higher for all dimensions, except for credibility, compared to thenon-automatic group. t-Tests could not reveal any significant ( p , 0.05)difference between the groups regarding the level of trust, communication andparticipation. The relationship type in the two groups should consequently not bias thefindings. Reliability and timeliness, which were significantly correlated with thecollaborative relationship, are also significantly related to automatic datacommunication and registration but only on the p , 0.05 level. The relationshipbetween timeliness and automatic data communication and registration is obviousbecause time delays may occur without automation. A possible explanation to therelationship with reliability may be that those with automatic data communication andregistration may send delivery schedules to a larger extent and may have morefrequent information exchange than those without automatic data communication andregistration. The dimensions with most significant differences ( p , 0.01) werecompleteness, conciseness and validity. They deal with the detailed data included in,and the format of, the received document. These issues should be direct results ofautomatic communication because they benefited from standardized modes of datatransfer. Credibility was the only non-significant dimension. H2 was consequentlyverified for all dimensions except credibility.
Combined effect on information qualityMultiple regression analyses were used to test the combined effect of collaborativerelationships and automatic data communication and registration on the six perceivedinformation quality dimensions. Pearson correlation between the collaborativerelationship variables (trust, communication and participation), automatic datacommunication and registration and control variables (information processmanagement and information life-cycle management) indicate some high-correlationcoefficients, over 0.4 (Table VI). Some multi-collinearity is consequently expected in the
Forecast informationquality dimension
Not automatic datacommunication andregistration (n ¼ 97)
Automatic datacommunication andregistration (n ¼ 42) F-statistic
Complete, mean (SD) 4.79 (1.96) 6.02 (1.13) 3.80 * *
Concise, mean (SD) 3.77 (2.18) 4.90 (2.02) 2.89 * *
Reliable, mean (SD) 3.88 (1.69) 4.59 (1.65) 2.26 *
Timely, mean (SD) 4.01 (2.00) 4.88 (1.71) 2.47 *
Valid, mean (SD) 5.23 (1.86) 6.15 (0.95) 2.95 * *
Credible, mean (SD) 4.35 (1.56) 4.88 (1.68) 1.80
Notes: t-Tests, significances at *p , 0.05 and * *p , 0.01 levels, respectively
Table V.High- and low-automaticdata communication and
registration andinformation quality
The impactof supply chain
relationships
289

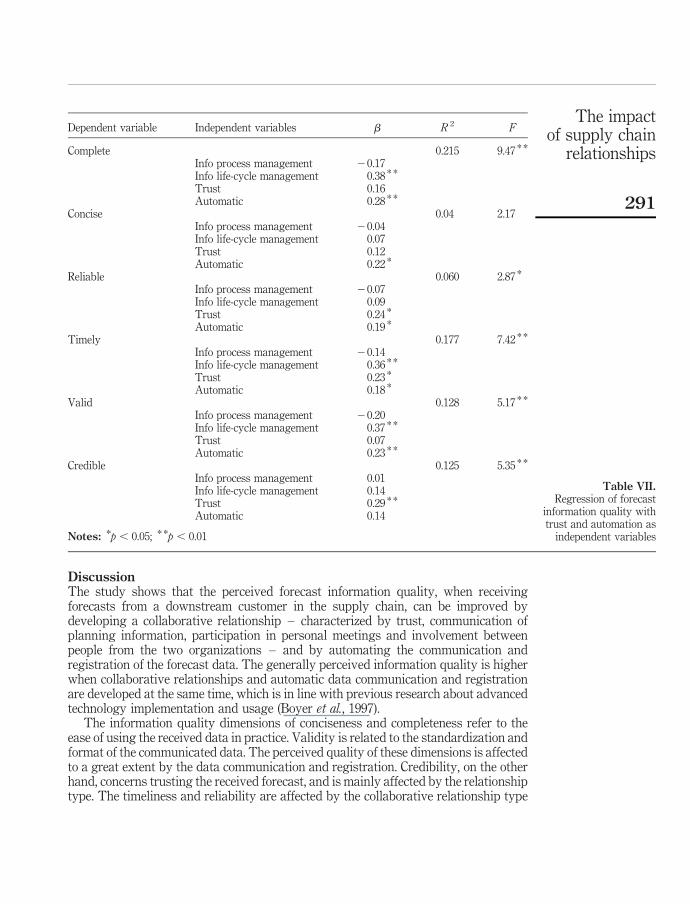
regression models. In order to minimize the multi-collinearity, only the collaborativerelationship variable having the highest correlation with the information quality indexwas included in the regression models. Six regression models were developed, with therespective information quality dimension as dependent variable and trust, andautomatic data communication and registration, information process management andinformation life-cycle management as independent variables. Table VII shows b, R 2
and F-statistics for the six regression models.All regression models had significant ( p , 0.05) F-values, except for the one with
concise information as dependent variable. The four models with complete, timely,valid and credible, respectively, as dependent variables had highest R 2 figures, in the0.125 to 0.215 range.
Information process management was not significant in any of the models.Information life-cycle management, however, was significant in the models measuringcomplete, timely and valid information. Focusing on and actively working with thebasic data files and maintaining them are, consequently, important for ensuringcommunication of complete, timely and valid information. Information life-cyclemanagement was the most significant independent variable in these three models.However, R 2 increased significantly from 0.096 to 0.215 for complete, from 0.092 to0.177 for timely, and from 0.069 to 0.128 for valid when including the trust andautomatic data communication and registration variables.
Trust and automatic data communication and registration have positive impact onR 2 in all six regression models. Trust but not automatic data communication andregistration is significant in the model of credible information. Automatic datacommunication and registration but not trust is significant in the models of complete,concise and valid, while both trust and automatic data communication and registrationare significant in the models of reliable and timely.
This third analysis consequently verifies that it is not enough only to havecollaborative relationships or automatic data communication and registration; acombination of both variables is sometimes necessary for high-perceived informationquality. This was especially true for reliable and timely information. Hence, weconclude that H3 is verified for several of the information quality dimensions.
Trust Communication Participation AutomationInfo processmanagement
Info life-cyclemanagement
IQindex
Trust – 0.62 * * 0.52 * * 20.03 0.25 * * 0.22 * * 0.26 * *
Communication – 0.49 * * 0.02 0.19 * * 0.09 0.25 * *
Participation – 0.07 0.16 * 0.16 * 0.14Automation – 0.19 * 0.13 * 0.34 * *
Info processmanagement – 0.44 * * 0.20 *
Info life-cyclemanagement – 0.31 * *
IQ index –
Notes: *p , 0.05; * *p , 0.01
Table VI.Spearman correlationsbetween variables
IJPDLM38,4
290
DiscussionThe study shows that the perceived forecast information quality, when receivingforecasts from a downstream customer in the supply chain, can be improved bydeveloping a collaborative relationship – characterized by trust, communication ofplanning information, participation in personal meetings and involvement betweenpeople from the two organizations – and by automating the communication andregistration of the forecast data. The generally perceived information quality is higherwhen collaborative relationships and automatic data communication and registrationare developed at the same time, which is in line with previous research about advancedtechnology implementation and usage (Boyer et al., 1997).
The information quality dimensions of conciseness and completeness refer to theease of using the received data in practice. Validity is related to the standardization andformat of the communicated data. The perceived quality of these dimensions is affectedto a great extent by the data communication and registration. Credibility, on the otherhand, concerns trusting the received forecast, and is mainly affected by the relationshiptype. The timeliness and reliability are affected by the collaborative relationship type
Dependent variable Independent variables b R 2 F
Complete 0.215 9.47 * *
Info process management 20.17Info life-cycle management 0.38 * *
Trust 0.16Automatic 0.28 * *
Concise 0.04 2.17Info process management 20.04Info life-cycle management 0.07Trust 0.12Automatic 0.22 *
Reliable 0.060 2.87 *
Info process management 20.07Info life-cycle management 0.09Trust 0.24 *
Automatic 0.19 *
Timely 0.177 7.42 * *
Info process management 20.14Info life-cycle management 0.36 * *
Trust 0.23 *
Automatic 0.18 *
Valid 0.128 5.17 * *
Info process management 20.20Info life-cycle management 0.37 * *
Trust 0.07Automatic 0.23 * *
Credible 0.125 5.35 * *
Info process management 0.01Info life-cycle management 0.14Trust 0.29 * *
Automatic 0.14
Notes: *p , 0.05; * *p , 0.01
Table VII.Regression of forecast
information quality withtrust and automation as
independent variables
The impactof supply chain
relationships
291
and by data communication and registration to about the same extent. Consequently,the status of some information quality dimensions is primarily a result of the type anddegree of collaborative relationship between sending and receiving parts.Other dimensions are mainly affected by how the data are communicated andregistered, while some also depend appreciably on the type of relationship. In order toimprove the forecast information quality, it is consequently first necessary tounderstand which information quality dimension is to be improved, because the causesof deficiencies are different for different dimensions.
It has thus emerged that automatic data communication and registration of forecastinformation between the customer’s and supplier’s planning systems and developing acollaborative relationship are both important for achieving high-information quality.The existence of a collaborative relationship, not only exchange of high-qualityinformation, is identified as important for managing most supply chain strategies(Spekman et al., 1998). There are also several other potentially positive effects ofautomatic data communication and registration (Ahmad and Schroeder, 2001), forexample the importance of deciding and defining which data to communicate and howto communicate them in a standardized way. The majority of companies had developedcollaborative relationships. However, this and other studies show that only a fewcompanies have developed automatic data communication and registration (Straube,2006), which should consequently impact the generally perceived forecast informationquality and the possibility of developing successful supply chain strategies. Only aminority of the respondents were found to have automatic data communication andregistration at the same time as a highly collaborative relationship.
ConclusionsThe analysis concludes that a customer-supplier collaborative relationship andautomatic data communication and registration have significant impact on theperceived information quality of forecasts received from a downstream customer in thesupply chain. The reliability and timeliness of the forecast are affected to about the sameextent by both the relationship type and the type of data communication and registration.Credibility depends primarily on the relationship type, while the conciseness and validityof the received forecast are operative attributes resulting mainly from the type of datacommunication and registration. Completeness is mainly affected by automatic datacommunication and registration, but relationship type is also significantly correlatedwith completeness. The conclusions explaining how various dimensions of forecastinformation quality are affected by different factors are thus a guide on how todifferentiate information quality improvement work in different situations.
The existence of a collaborative relationship and of automatic data communicationand registration impacts the perceived information quality for all quality dimensions inpositive ways. Numerous companies have not implemented supply chain strategiescharacterized by both collaborative relationships and automatic data communicationand registration. This implies a large potential for improvement in industry. Studieshave shown generally positive effects of supply chain integration. There is, however, alack of studies explaining the performance effect of high-information quality exchange.Such studies will be necessary in order to understand how much effort to spend onimproving the forecast information quality in supply chains.
IJPDLM38,4
292

References
Ahmad, S. and Schroeder, R.G. (2001), “The impact of electronic data interchange on deliveryperformance”, Production and Operations Management, Vol. 10 No. 1, pp. 16-30.
Anderson, J. and Narus, J. (1990), “A model of distributor-firm and manufacturer-firm workingpartnership”, Journal of Marketing, Vol. 54 No. 1, pp. 42-58.
APICS (2007), “Using information technology to enable supply chain management”, APICSCertified Supply Chain Professional Learning System, APICS, Alexandria, Module 4.
Boyer, K., Leong, K., Ward, P. and Krajewski, L. (1997), “Unlocking the potential of advancedmanufacturing technologies”, Journal of Operations Management, Vol. 15 No. 4, pp. 331-47.
Cachon, G.P. and Fisher, M. (2000), “Supply chain inventory management and the value of sharedinformation”, Management Science, Vol. 46 No. 8, pp. 1032-48.
Defee, C. and Stank, T. (2005), “Applying the strategy-structure-performance paradigm to thesupply chain environment”, International Journal of Logistics Management, Vol. 16 No. 1,pp. 28-50.
Feng, C-M. and Yuan, C-Y. (2006), “The impact of information and communication technologieson logistics management”, International Journal of Management, Vol. 23 No. 4, pp. 909-44.
Fisher, C., Lauria, E., Chengalur-Smith, S. and Wang, R. (2006), Introduction to InformationQuality, MIT, Boston, MA, M.I.T. Information Quality Program Publications.
Forslund, H. and Jonsson, P. (2007), “The impact of forecast information quality on supply chainperformance”, International Journal of Operations & Production Management, Vol. 27No. 1, pp. 90-107.
Fynes, B., Voss, C. and de Burca, S. (2005), “The impact of supply chain dynamics onmanufacturing performance”, International Journal of Operations & ProductionManagement, Vol. 25 No. 1, pp. 6-19.
Garcia-Dastugue, S. and Lambert, D. (2003), “Internet-enabled coordination in the supply chain”,Industrial Marketing Management, Vol. 32 No. 3, pp. 251-63.
Gustavsson, M. and Jonsson, P. (2007), “Information quality deficiencies and consequences insupply chain information exchange”, Proceedings of the Annual NOFOMA Conference2007.
Gustavsson, M. and Wanstrom, C. (2008), “Assessing information quality in manufacturingplanning and control processes”, Internal Publishing Series, Division of Logistics &Transportation, Chalmers University of Technology, Goteborg.
Kelle, P. and Akbulut, A. (2005), “The role of ERP tools in supply chain information sharing,cooperation and cost optimizing”, International Journal of Production Economics,Vol. 93/94, pp. 41-52.
Kwon, I-W. and Suh, T. (2005), “Trust, commitment and relationships in supply chainmanagement: a path analysis”, Supply Chain Management: An International Journal,Vol. 10 No. 1, pp. 26-33.
Lee, Y., Strong, D., Kahn, B. and Wang, R. (2002), “AIMQ: a methodology for information qualityassessment”, Information & Management, Vol. 40 No. 2, pp. 133-46.
Li, S. and Lin, B. (2006), “Accessing information sharing and information quality in supply chainmanagement”, Decision Support Systems, Vol. 42 No. 3, pp. 1641-56.
Lim, D. and Prashant, C.P. (2001), “EDI in strategic supply chain: impact on customer service”,International Journal of Information Management, Vol. 21, pp. 193-211.
Lindau, R.A. (1995), “The impact of high-quality information on performance in manufacturing”,Doctoral thesis, Chalmers University of Technology, Goteborg.
The impactof supply chain
relationships
293

Lohman, C., Fortuin, L. and Wouters, M. (2004), “Designing a performance measurement system:
a case study”, European Journal of Operational Research, Vol. 156, pp. 267-86.
McCarthy, T. and Golicic, S. (2002), “Implementing collaborative forecasting to improve supply
chain performance”, International Journal of Physical Distribution & Logistics
Management, Vol. 32 No. 6, pp. 431-54.
Mackay, D. and Rosier, M. (1996), “Measuring organizational benefits of EDI diffusion – a case of
the Australian automotive industry”, International Journal of Physical Distribution &
Logistics Management, Vol. 26 No. 10, pp. 60-78.
Mayer, R., Davis, J. and Schoorman, F. (1995), “An integrative model of organizational trust”,
Academy of Management Review, Vol. 29 No. 3, pp. 709-34.
Min, S. and Mentzer, J. (2000), “The role of marketing in supply chain management”,
International Journal of Physical Distribution and Logistics Management, Vol. 30 No. 9,
pp. 765-87.
Mohr, J. and Spekman, R. (1994), “Characteristics of partnership success: partnership attitudes,
communication behaviour, and conflict resolution techniques”, Strategic Management
Journal, Vol. 15 No. 2, pp. 135-52.
Moorman, C., Deshpande, R. and Zaltman, G. (1993), “Factor affecting trust in market research
relationships”, Journal of Marketing, Vol. 57 No. 1, pp. 81-101.
Narasimhan, R. and Nair, A. (2005), “The antecedent role of quality, information sharing and
supply chain proximity on strategic alliance formation and performance”, International
Journal of Production Economics, Vol. 96, pp. 301-13.
Petersen, K., Ragatz, G. and Monczka, R. (2005), “An examination of collaborative planning
effectiveness and supply chain performance”, The Journal of Supply Chain Management,
Vol. 41 No. 2, pp. 14-25.
Rassameethes, B., Susumu, K. and LeBlanc, L.J. (2000), “EDI performance in the automotive
supply chain”, International Journal of Technology Management, Vol. 20 Nos 3/4,
pp. 287-303.
Spekman, R., Kamauff, J. and Myhr, N. (1998), “An empirical investigation into supply chain
management: a perspective on partnership”, Supply Chain Management: An International
Journal, Vol. 3 No. 2, pp. 53-67.
Straube, F. (Ed.) (2006), Trends and Strategies in Logistics – Agenda for Logistics Management in
2010, German Logistics Ass., Bremen.
van der Vorst, J. and Beulens, A. (2002), “Identifying sources of uncertainty to generate supply
chain redesign strategies”, International Journal of Physical Distribution & Logistics
Management, Vol. 32 No. 6, pp. 409-30.
Zailani, S. and Rajagopal, P. (2005), “Supply chain integration and performance: US versus East
Asian companies”, Supply Chain Management: An International Journal, Vol. 10 No. 5,
pp. 379-93.
Zineldin, M. (1998), “Towards an ecological collaborative relationship management”, European
Journal of Marketing, Vol. 32 Nos 11/12, pp. 1138-64.
Zineldin, M. and Jonsson, P. (2000), “An examination of the main factors affecting
trust/commitment in supplier-dealer relationships: an empirical study of Swedish wood
industry”, The TQM Magazine, Vol. 12 No. 4, pp. 245-65.
IJPDLM38,4
294

Further reading
Closs, D.J., Goldsby, T.J. and Clinton, S.R. (1997), “Information technology influences on worldclass logistics capability”, International Journal of Physical Distribution & LogisticsManagement, Vol. 27 No. 1, pp. 4-17.
Daugherty, P.J., Myers, M.B. and Autry, C.W. (1999), “Automatic replenishment programs:an empirical examination”, Journal of Business Logistics, Vol. 20 No. 2, pp. 63-82.
About the authorsPatrik Jonsson is a Professor of Supply Chain Management at the Department of TechnologyManagement and Economics at Chalmers University of Technology in Gothenburg, Sweden. Heholds a PhD in Production Management from Lund University, Sweden, and is CFPIM and CSCPcertified at APICS. His research interests are within supply chain management, manufacturingplanning and control, enterprise resource planning, advanced planning systems andperformance management. He has published textbooks in logistics and supply chainmanagement and materials and production management and several articles in journals suchas Journal of Operations Management, International Journal of Operations & ProductionManagement, International Journal of Production Economics, International Journal of ProductionResearch, Supply Chain Management: An International Journal and International Journal ofPhysical Distribution & Logistics Management. He primarily teaches on MSc and PhDprogrammes at Chalmers and in executive courses. Patrik Jonsson is the corresponding authorand can be contacted at: [email protected]
Mattias Gustavsson is a PhD student at the Department of Technology Management andEconomics at Chalmers University of Technology in Gothenburg, Sweden. His research focuseson information quality in manufacturing planning and control.
The impactof supply chain
relationships
295
To purchase reprints of this article please e-mail: [email protected] visit our web site for further details: www.emeraldinsight.com/reprints


![Automatic landmark detection for cervical image registration validation [6514-101]](https://static.fdokumen.com/doc/165x107/63349e3325325924170024f8/automatic-landmark-detection-for-cervical-image-registration-validation-6514-101.jpg)