The Impact of Presentation Form, Entrepreneurial Passion ...
27
Article The Impact of Presentation Form, Entrepreneurial Passion, and Perceived Preparedness on Obtaining Grant Funding Craig S. Galbraith 1 , Bruce C. McKinney 2 , Alex F. DeNoble 3 , and Sanford B. Ehrlich 4 Abstract This study investigates important questions for any emerging high- technology firm attempting to obtain funding: Does the design of the pre- sentation and the perceived passion and preparedness of the presenter influence expert reviewers’ assessment of the merits of the firm’s proposal? The authors analyzed 22 videotaped presentations to reviewer panels at a U.S. Department of Defense technology transfer consortium and compared 1 Department of Management, Cameron School of Business, University of North Carolina Wilmington, Wilmington, NC, USA 2 Department of Communication Studies, University of North Carolina Wilmington, Wilmington, NC, USA 3 Department of Management, College of Business Administration, San Diego State University, San Diego, CA, USA 4 TVPage, San Diego, CA, USA Corresponding Author: Craig S. Galbraith, Department of Management, Cameron School of Business, University of North Carolina Wilmington, 601 South College Road, Wilmington, NC 28403, USA. E-mail: [email protected] Journal of Business and Technical Communication 2014, Vol. 28(2) 222-248 ª The Author(s) 2013 Reprints and permission: sagepub.com/journalsPermissions.nav DOI: 10.1177/1050651913513902 jbtc.sagepub.com at PENNSYLVANIA STATE UNIV on September 16, 2016 jbt.sagepub.com Downloaded from
-
Upload
khangminh22 -
Category
Documents
-
view
1 -
download
0
Transcript of The Impact of Presentation Form, Entrepreneurial Passion ...

Article
The Impact ofPresentation Form,EntrepreneurialPassion, and PerceivedPreparedness on ObtainingGrant Funding
Craig S. Galbraith1, Bruce C. McKinney2,Alex F. DeNoble3, and Sanford B. Ehrlich4
AbstractThis study investigates important questions for any emerging high-technology firm attempting to obtain funding: Does the design of the pre-sentation and the perceived passion and preparedness of the presenterinfluence expert reviewers’ assessment of the merits of the firm’s proposal?The authors analyzed 22 videotaped presentations to reviewer panels at aU.S. Department of Defense technology transfer consortium and compared
1 Department of Management, Cameron School of Business, University of North Carolina
Wilmington, Wilmington, NC, USA2 Department of Communication Studies, University of North Carolina Wilmington, Wilmington,
NC, USA3 Department of Management, College of Business Administration, San Diego State University,
San Diego, CA, USA4 TVPage, San Diego, CA, USA
Corresponding Author:
Craig S. Galbraith, Department of Management, Cameron School of Business, University of
North Carolina Wilmington, 601 South College Road, Wilmington, NC 28403, USA.
E-mail: [email protected]
Journal of Business and TechnicalCommunication
2014, Vol. 28(2) 222-248ª The Author(s) 2013
Reprints and permission:sagepub.com/journalsPermissions.nav
DOI: 10.1177/1050651913513902jbtc.sagepub.com
at PENNSYLVANIA STATE UNIV on September 16, 2016jbt.sagepub.comDownloaded from
the panels’ assessments of the presenting firms’ proposals both before andafter the formal presentations. The data showed that, on average, higherlevels of perceived entrepreneurial passion and presenter preparedness andpresentation designs that effectively captured the audiences’ attentionresulted in higher ratings by decision makers on the firm’s technology merit,management ability, and commercial potential.
Keywordsentrepreneurial passion, presentation design, high technology, early-stagefunding, grant proposals
Technology development is expensive and early-stage technology firms
need access to funding from a variety of different sources. Wong (2002)
found that 69% of private equity funds from angel groups go to high-
technology firms in prerevenue phases of development, and research by the
Kaufman Foundation (2009) indicated that the majority of high technology
start-ups need an average of $140,000 of external capital in their first year
of operation with additional infusions of capital in following years. It is not
surprising that financing problems are consistently cited by early-stage
firms as a major area of stress (Bruno & Tybee, 1985; Graves, 2011; Gundry
& Welsch, 2001; Sapienza & De Clercq, 2000; Shane & Stuart, 2002).
Obtaining early-stage funding, particularly in high-technology sectors, is
highly competitive and inevitably requires presenting business and techno-
logical arguments to various funding entities, such as private equity inves-
tors, government grant agencies, banking institutions, or potential corporate
partners, in the most persuasive manner possible.
These funding entities oftentimes use a sequential process of decision
making. The process typically begins with a fairly quick screening, or
‘‘down-select’’ process, in which a number of written business plans, pro-
posals, or applications are formally reviewed and sorted (e.g., Ajamian &
Koen, 2002; Galbraith, De Noble, Ehrlich, & Kline, 2007; Linton, Walsh, &
Morabito, 2002; Ozer, 1999; Shepard, Zacharakis, & Baron, 2003). Although
this initial screening process provides useful information (Galbraith, De
Noble, & Ehrlich, 2009, 2012; Payne & Macarty, 2002), funders often require
another screening phase in which a select group of the original applicants are
allowed to personally present to a panel of decision makers who then vote on
the merits of the proposal. This presentation phase provides the reviewers with
not only much more detailed data about the applicant’s technology and
Galbraith et al. 223
at PENNSYLVANIA STATE UNIV on September 16, 2016jbt.sagepub.comDownloaded from

business strategy but also a chance to personally see the entrepreneur in action.
While a few studies have provided general descriptions of this presentation
phase (e.g., Payne & Macarty, 2002; Sudek, 2007), few, if any, research studies
have empirically measured the perceptual changes that occur during these
funding presentations.
Incorporating panel presentations into the funding process stems from a
key premise that groups will generally make better decisions than individ-
uals will because of the superior informational resources that arise from the
nuances of an oral presentation and the opportunity to exchange information
between panel members (Bunderson & Sutcliffe, 2002; Jehn & Shah, 1997;
Priem, Harrison, & Muir, 1995; Rothstein & Jackson, 1980; Stasser, 1992;
Stasser & Titus, 1985; Steiner, 1982). Panel members must analyze and
interpret the different informational cues that are being presented and con-
sider how these cues may predict future commercial success. For early-
stage technology firms, questions often arise as to which factors, such as
market readiness, technology readiness, commercial readiness, or manage-
ment readiness, are the best success predictors (Heslop, McGregor, & Grif-
fith, 2001). Because cues and information can be interpreted differently,
granting agencies, private equity investor groups, and other funding organi-
zations tend to construct reviewer panels made up of experts with diverse
backgrounds.
Persuasive Speech and Entrepreneurial Funding
In the following subsections, we provide a background for our study. In par-
ticular, we examine several issues that may affect the entrepreneurial fund-
ing process, such as the relationship between persuasive speech and
credibility, the impact of entrepreneurial passion and presenter preparation
on the ability to obtain funding, and how certain design elements of the for-
mal presentation may affect the perceptions that reviewers have about the
entrepreneur.
Persuasive Speech and Credibility
Historically, the ability to persuade an audience is often associated with
the concept of ‘‘delivery’’ (Cicero, 1960; Kennedy, 1991; Newman,
2001; Sproule, 2012). For example, five canons of rhetoric are identified
in Aristotle’s Rhetoric: invention (the ability to locate the best evidence),
arrangement (the organization of the speech), style (the ability to use the
best language), memory (having a firm grasp of the material of the
224 Journal of Business and Technical Communication 28(2)
at PENNSYLVANIA STATE UNIV on September 16, 2016jbt.sagepub.comDownloaded from

speech), and delivery (the performance of the speaker). When asked which
canon was the most important aspect in public speaking, the great Greek
orator Demosthenes responded that delivery was first, second, and third
(Brooks, 1971, p. 161). In their investigation of the relationship between
speech delivery and speech effectiveness, Gunderson and Hopper (1976)
concluded that the effectiveness of presentations depended on their com-
position and delivery. They identified six effective delivery behaviors that
have been cited by authors of the most popular public speaking texts:
vocal volume, rate of speech, voice quality, posture, gesture, and body
movement. In other words, while content and organization are both impor-
tant, a poorly delivered message will usually negatively affect the persua-
siveness of the speaker (e.g., Arnold, 2007; Osborn & Osborn, 2012). As
Caputo and Yount (1993) noted, for speakers to be persuasive they must
speak from the heart, and their speech should be accompanied with the
‘‘corresponding looks, and gestures, which naturally result from a man
speaking in earnest’’ (p. 4).
Recent empirical studies have suggested that the perceived credibility of
an entrepreneur is a key to obtaining funding (e.g., Chen, Yao, & Kotha,
2009; Galbraith et al., 2009; Sudek, 2007, 2009). This argument actually
has a long historical context. With respect to Aristotle’s three persuasive
arguments—logos (logic), pathos (emotion), and ethos (credibility)—ethos,
or credibility, is most associated with delivery. For speakers to appear per-
suasive, they must also appear credible; to appear credible, they must have
an effective delivery. And as Pornpitakpan (2004) noted, high source cred-
ibility has a direct effect on behavioral compliance. This is a common
theme in both scholarly research and modern communication textbooks
(e.g., Beebe & Beebe, 2012; Dillard, Weber, & Vail, 2007; O’Keefe,
2002; Tindale, 2011; Winterbottom, Bekker, Conner, & Mooney, 2008).
Speaker credibility has also been related to the notion of a ‘‘powerful
voice.’’ Erickson, Lind, Johnson, and O’Barr (1978) concluded that a deliv-
ery exhibiting a ‘‘powerful’’ speech style is more credible and therefore
more persuasive than a delivery with a powerless style. Likewise, Bradac
and Street (1990) viewed a powerful speech style as a global construct that
is evaluated positively because we perceive the people using it as powerful,
and in turn, powerful people are capable of controlling the behavior of oth-
ers. Bradac, Hemphill, and Tardy (1981) found that speakers who had a
powerful speech delivery were seen as more competent in their speaking
ability whereas Wright and Hosman (1983) and Hosman and Wright
(1987) discovered that if a speaker frequently used hedges and hesitations,
they were perceived to be less credible, less authoritative, and less
Galbraith et al. 225
at PENNSYLVANIA STATE UNIV on September 16, 2016jbt.sagepub.comDownloaded from

attractive. And Hosman and Siltanen (1994) concluded that powerful speak-
ers are perceived to have both more self-control and the ability to exert more
control over others (see also Hosman, Huebner, & Siltanen, 2002; Hos-
man & Siltanen, 2006).
In an extensive analysis on the nonverbal aspects of delivery, Burgoon,
Birk, and Pfau (1990) posited that nonverbal behaviors that are most asso-
ciated with delivery are kinesic–proxemic cues and vocal cues. In their
analysis, they identified five key nonverbal behaviors that had significant
correlations with the persuasiveness of a message: competence, sociability,
character, composure, and dynamism. They concluded that ‘‘it may be rea-
sonable to assume . . . that credibility and persuasiveness are simultaneous
outcomes both of which are directly influenced by nonverbal variables’’
(p. 164). In other words, the nonverbal aspect of a presentation is also sig-
nificantly related to credibility and thus persuasion. This impact that non-
verbal aspects of speech have on persuasion has been subsequently
examined in a variety of contexts (e.g., Mason, Tatkow, & Macrae,
2005; Smith & Shaffer, 1995; Yokoyama & Daibo, 2012).
Presentation and Entrepreneurial Passion
The importance of entrepreneurial passion has been recognized in business
literature for several decades (Baum & Locke, 2004; Baum, Locke, &
Smith, 2001; Bird, 1989; Cardon, Wincent, & Singh, 2009; Cardon, Ziets-
man, Saparito, Matherne, & Davis, 2005; Carland, Hoy, Boulton, & Car-
land, 1984; Shane, Locke, & Collins, 2003). Entrepreneurial passion has
often been referred to as the ‘‘fire in the belly’’ that emerges when ‘‘one has
the freedom and opportunity to pursue one’s dream’’ (Smilor, 1997, p. 342).
Timmons (2000) noted that it is this fire in the belly that allows entrepre-
neurs to deal with the uncertainty associated with running a fledging busi-
ness. Cardon, Wincent, and Singh (2009) identified three basic aspects of
entrepreneurial passion: It is intense, it is motivating, and it is targeted
toward a venture-related opportunity. Some researchers have classified
passion within a work environment as being either ‘‘harmonious’’ or
‘‘obsessive’’ (e.g., Amiot, Vaqllerand, & Blanchard, 2006; Vallerand
et al., 2003). Obsessive passion comes from job pressures and the need to
achieve an outcome whereas harmonious passion is a self-motivating emotion
that stems from the voluntary internalization of work. Entrepreneurial passion
is most directly related to the notion of harmonious passion, and this type of
passion has often been associated with entrepreneurial success (Foo, Uy, &
Baron, 2009).
226 Journal of Business and Technical Communication 28(2)
at PENNSYLVANIA STATE UNIV on September 16, 2016jbt.sagepub.comDownloaded from

Researchers have also noted the importance of the ‘‘communicated
vision’’ within an entrepreneurial setting (Baum & Locke, 2004; Baum,
Locke, & Kirkpatrick, 1998; Tichy & Devanna, 1986). Communicated
vision refers to both the content of what is communicated and how the com-
munication takes place, such as with pep talks or formal presentations
(Tichy & Devanna, 1986). Cardon (2008), in fact, argued that entrepreneur-
ial passion can be directly transferred both to the internal organization and
to the external stakeholders by these different modes of communication.
Baum and Locke (2004) even suggested that the entrepreneur’s communi-
cated vision may be as important for motivating high venture performance
as the vision itself.
The importance of entrepreneurial personality and communicated vision is
starting to be examined within the specific context of funding opportunities.
Sudek (2007, 2009) found that the perception of entrepreneurs’ ‘‘trustworthi-
ness’’ significantly influenced investors’ interest during formal presentations
to a private equity group. Using a series of laboratory experiments and a field
study of presentations during a business plan competition, Chen, Yao, and
Kotha (2009) discovered that a panel’s perception of an entrepreneur’s pre-
paredness significantly influenced the scoring of business plans during the
formal presentation whereas entrepreneurial passion did not significantly
influence the panel’s scoring. One possible explanation for this finding is that
the raters in Chen et al.’s study were participating in a student business plan
competition and not making real funding decisions. For example, Sudek, Mit-
teness, and Cardon (2010) examined actual videotaped presentations to a
large private equity group and found that, indeed, the investors’ perception
of entrepreneurial passion (using Chen et al.’s ‘‘passion and preparedness’’
scale) was significantly correlated with their ratings of the investment oppor-
tunity. Sudek’s (2007, 2009), Chen et al.’s (2009), and Sudek et al.’s (2010)
studies used only a postpresentation research design, however. Using just a
postpresentation research design rather than both a prepresentation and a
postpresentation research design makes it difficult to separate the impact that
the presentation had on the panel’s overall rating from that of the content of
the business plan since many panel members probably had not read the busi-
ness plans prior to the formal presentation.
Finally, some examinations of presentations, particularly those using
PowerPoint, have shown that audiences get ‘‘distracted’’ by the overuse
of visual material (e.g., Goldstein, 2003). Dannels (2003) suggested that
technical audiences, such as scientists and engineers, are particularly nega-
tively disposed to ‘‘showboating’’ components of a technical presentation,
focusing instead on the content aspects.
Galbraith et al. 227
at PENNSYLVANIA STATE UNIV on September 16, 2016jbt.sagepub.comDownloaded from

The Technical Aspects of Presentations
With advances in presentation software, there is increasing evidence sug-
gesting that the design and sequencing of a technical presentation will sig-
nificantly influence the audience’s perception of the underlying project’s
potential (e.g., Alley & Neeley, 2005; Caricato, 2000; Dannels, 2003; Farkas,
2005). The underlying argument is that audiences will interpret the different
cues based to some degree on its technical aspects, as well as on the presen-
ter’s personality and the actual content of the presentation. According to Rude
(2009), this argument raises an important question as to ‘‘how texts (print,
digital, multimedia, visual, verbal) and related communication practices med-
iate knowledge, values, and action’’ (p. 176). One approach to examining this
broad issue of presentation technology is to focus on the process of encoding
or decoding imbedded messages (e.g., Hall, 1980; Terranova, 2004). Other
scholars have examined the theoretical problem of how audiences separate
presentation design from presentation content (e.g., Clark, 2008).
A technical presentation by its very nature often needs to communicate a
combination of scientific, engineering, and other highly detailed data. How
a presentation starts has received particular attention. Andeweg, de Jong,
and Hoeken (1998) argued that a well-designed introductory component
within a technical presentation makes audiences more willing to listen to
the later, more detailed information. Osborn and Osborn (2012) described
three functions of the introduction: capturing attention, establishing cred-
ibility, and previewing the topic. Verderber (1994), on the other hand,
discussed four functions: getting attention, setting the tone, creating good-
will (similar to credibility), and leading into content. Several researchers
(e.g., Andeweg, de Jong, & Hoeken, 1998; Gerritsen & Wannet, 2005;
McCroskey, 2001) have suggested examining presentations, particularly
with respect to introductions, using the triad developed by the Sophists and
Cicero (see Andeweg et al., 1998, p. 272; Gerritsen & Wannet, 2005, p. 195;
Van De Mieroop, de Jong, & Andeweg, 2008)—that is, gaining attention
and establishing the willingness of the audience for the subject (attentum
facere), increasing the ability to listen and giving information (docile
facere), and establishing the speaker’s creditability (benevolum facere).
Our Research Questions
The majority of funding for early-stage high-technology enterprises gener-
ally comes from a combination of two sources: private equity investors and
government-sponsored research grants. Regardless of their source of
228 Journal of Business and Technical Communication 28(2)
at PENNSYLVANIA STATE UNIV on September 16, 2016jbt.sagepub.comDownloaded from

funding, entrepreneurs seeking capital must focus on those persuasive fac-
tors in their presentation that will capture the audience’s interest and influ-
ence their decision to fund the project.
Such factors have only started to be empirically examined within the
context of private equity investors (Chen et al., 2009; Sudek, 2007, 2009;
Sudek, Mitteness, & Cardon, 2010). Few, if any, empirical studies have
examined this question within the context of grant funding, however. Our
study of entrepreneurs’ presentations to a consortium sponsored by the
U.S. Department of Defense adds to this emerging literature by examining
the following research questions:
1. Does presenter behavior, such as the perceived passion of the entre-
preneur, influence the review panel’s assessment of the merits of the
proposal?
2. Does the presentation form and style influence the review panel’s
assessment of the merits of the proposal?
3. Does the impact of presentation form and presenter behavior differ
depending on the panel reviewers’ vocational backgrounds?
Method
Our study examined a sample of proposals that were presented to a granting
and technology commercialization agency sponsored by the U.S. Depart-
ment of Defense. This particular agency has a specific mission of funding
homeland security, medical, and other first responder technologies that
have been developed by small businesses and government research labora-
tories with high commercialization potential.
The agency publishes a call for proposals two or three times per year.
After receiving the applications, the agency starts a typical two-phased
screening process. In the first phase, the detailed written applications are
reviewed and scored, eliminating about 85% of the original applications.
Since the primary mission of this particular agency is commercializing new
technologies, the application is modeled after the detailed business plan
summaries often presented to private equity investor groups. Each applica-
tion is approximately 12–15 pages in length and includes specific sections
on the target market, the technology’s advantages, strategies for commer-
cialization, previous funding, the nature of the competition, and the back-
grounds of the management and scientific team.
In the second phase, the remaining applicants are invited to formally
present their business plan proposals to a panel of experts organized by the
Galbraith et al. 229
at PENNSYLVANIA STATE UNIV on September 16, 2016jbt.sagepub.comDownloaded from

granting agency. The applicants each make a formal 20- to 30-minute pre-
sentation to a panel consisting of four to seven members (called panel
reviewers here), which is then followed by a final scoring process. For this
agency, the different panels were formed based on the nature of the technol-
ogy (e.g., biotechnology, instrumentation, or software), so generally the
same panel reviewers were assigned to all the presentations within their
respective technology class. All the panel reviewers held graduate degrees.
By design, each panel contained reviewers from different vocations, such as
scientists or engineers, consultants, entrepreneurs, government technical
program administrators, and private equity investors. Regardless of their
current vocation, however, each panel reviewer had significant experience
in the type of technology to which they were assigned. The particular
agency funds approximately 65% of the applicants who make it to this sec-
ond, presentation phase.
Our study examined 22 different technology presentations during two
different funding cycles within a 1-year period. The technologies presented
were considered to be highly advanced middle-stage solutions, generally
with a technology readiness level classification of five to seven. The presen-
ters were seeking funding that was specifically targeted to advancing the
technology to the next phase of commercial development. All but one of the
presentations analyzed in this study were from small businesses with fewer
than 25 employees; the other was from a government laboratory. In all
cases, the technology presented was the primary technology or product
being developed by the business. The senior executive for each enterprise
(called entrepreneur presenters in this study) was the formal presenter
before the review panel.
Variables for the Panel Reviewer Assessments
Prior to the formal presentation, each of the panel reviewers read every
application in their assigned technology group and then formally scored
them on a number of dimensions. This prepresentation review was based
solely on the detailed business plan summary in the application. If a panel
reviewer had not thoroughly read the proposal beforehand, they were asked
to not respond to the prepresentation assessment. Less than 5% of the panel
reviewers did not fill out the prepresentation assessment, and these
reviewers were excluded from our analysis. After the presentation, the panel
reviewers again individually evaluated the proposal using the same scoring
instrument—thus, we had a prepresentation and postpresentation metric by
reviewer for each technology along the same assessment dimensions.
230 Journal of Business and Technical Communication 28(2)
at PENNSYLVANIA STATE UNIV on September 16, 2016jbt.sagepub.comDownloaded from

Panel reviewers scored the project on eight different assessment
variables that generally corresponded to the key dimensions used by
Heslop, McGregor, and Griffith (2001); Astebro (2004); and Galbraith,
De Noble, and Ehrlich (2009). The panel reviewers used an 11-point
Likert-type scale to score each variable. Within the group decision-
making literature, the panel reviewers’ decisions would therefore be consid-
ered ‘‘non-discrete’’ quantitative judgments similar to those examined within
the social judgment scheme model (Davis, 1996; Ohtsubo, Masuchi, &
Nakanishi, 2002).
Although the 8-item total score was the most important factor influen-
cing the final funding decision, the assessment form included a couple ques-
tions directly related to the applicability of the proposal to the granting
agency’s requirements and not specifically related to the merits of the tech-
nology or business. Therefore, for this study, we also examined three of the
variables that the reviewers scored that were more business and technology
oriented: the panel’s assessment of the ‘‘technical merit,’’ ‘‘commercial
potential,’’ and ‘‘ability of the management/project team to execute plan.’’
Variables for the Assessments of the Videotaped Presentations
We videotaped each of the presentations. These videos were then separately
examined by two independent evaluators who rated the various aspects of the
presentation. Both evaluators were pretrained on using the specific question-
naire that they used for assessing the videos. So that the video evaluators
would focus on the behavior of the presenters and not be influenced by the
technical content of the presentation, we chose evaluators who were
advanced industrial psychology majors who had no formal engineering or sci-
entific training.
For the video analysis, the entrepreneur presenters’ ‘‘passion’’ and ‘‘pre-
paredness’’ were measured using the 11-item scale developed by Chen et al.
(2009). In our sample, the calculated Cronbach’s a reliability for the 6-item
passion subscale was .96, and the calculated Cronbach’s a reliability for the
5-item preparedness subscale was .79, scores very similar to those reported
by Chen et al. Following Caricato (2000) and Sudek (2007, 2009), we mea-
sured the perception of entrepreneur presenter’s ethical and trustworthiness
behaviors by 2 items, ‘‘the presenter appeared trustworthy’’ and the ‘‘pre-
senter appeared ethical.’’ Perceptions of the introduction consisted of
6 items that we modified from the Gerritsen and Wannet’s (2005) scale: The
introduction ‘‘was boring,’’ ‘‘made me curious about the rest of the presen-
tation,’’ ‘‘gave a good impression of expertise of team/firm,’’ ‘‘was
Galbraith et al. 231
at PENNSYLVANIA STATE UNIV on September 16, 2016jbt.sagepub.comDownloaded from

convincing,’’ ‘‘lacked structure,’’ and ‘‘was difficult to follow.’’ In addition,
we measured what is often called ‘‘visual style’’ (King, 2008). Our ques-
tionnaire included 2 items about the visual style of the presentation: whether
the presentation was ‘‘attractive’’ (see King, 2008, for a discussion of the
‘‘aesthetic’’ in technical presentations) and whether the presentation used
a lot of ‘‘visuals’’ (e.g., examples, displays, and props). The videotape eva-
luators measured all the items on a 5-point Likert-type scale.
We measured the interrater agreement by the intraclass correlation coef-
ficient (ICC), using the two-way mixed model for the various subscales and
items in our questionnaire. The ICC was .78 for the 6-item presenter-
passion construct, .64 for the 5-item presenter-preparedness construct, .53
for the presenter-trustworthiness question, .73 for the presenter appearing
ethical question, .72 for the 2-item visual-style construct, and .64 for the
6-item presentation-introduction questions. All of these subscale interclass
correlations were statistically significant (p < .05) and indicated moderate
to strong agreement between the two video evaluators.
Examples of Presentation Behaviors: High VersusLow Passion
Since the perception of entrepreneurial passion is one of the key issues in
the entrepreneurial funding literature, we wanted to examine whether or not
there are certain objective behavioral measures of the presentation that
might be related to the video reviewers’ perception of entrepreneurial pas-
sion. We therefore compared the two presentations that the video evaluators
ranked the lowest (2.16 and 2.33) on Chen et al.’s (2009) passion scale with
the two presentations that they ranked the highest (4.33 and 4.50) on the
passion scale.
We used nine different objective measures in this comparison, six of
which were adapted from a study by Burgoon et al. (1990), who classified
a number of different ‘‘nonverbal’’ behaviors related to speaker credibility
and persuasion. From their ‘‘vocalic’’ category, we selected pitch, pitch
variety, and tempo. Although in-depth studies of speaker’s pitch and pitch
variety usually employ sophisticated software for frequency smoothing that
measures a speaker’s pitch as a fundamental frequency based on sound fre-
quency, or hertz (Hz), and pitch variety as a standard deviation around the
fundamental frequency (e.g., Hincks & Edlund, 2009; Ladd & Morton,
1997; Shriberg, Ladd, Terken, & Stolke, 1996), we estimated these vari-
ables using a handheld hertz-based tuning meter. Using two 30-second seg-
ments, we estimated the speaker’s average pitch and the variation above the
232 Journal of Business and Technical Communication 28(2)
at PENNSYLVANIA STATE UNIV on September 16, 2016jbt.sagepub.comDownloaded from
average pitch in terms of hertz. Using the same two 30-second segments,
we also performed a word count to determine tempo. From Burgoon
et al.’s ‘‘kinesics–proxemics’’ classification, we selected hand gestures (dis-
tinct hand movements above the waist), presenter movement, and distance
orientation (from the audience and the front screen), measuring these fac-
tors using a 10-minute segment during the middle of each presentation.
In addition, the appropriate structure of PowerPoint slides for technical
presentations, including the importance of images and slide duration, has
received increased attention within the communication literature although
empirical research in this area still remains somewhat rare (Alley & Neeley,
2005; Farkas, 2006; Thielsch & Perabo, 2012). We therefore also measured
whether or not a demonstration was made of the technology (e.g., the tech-
nology was shown in a video embedded in the slides or handed out to the
review panel), the percentage of slides that had graphics (charts, pictures,
graphs), and the average time duration for an individual slide (see Table 1).
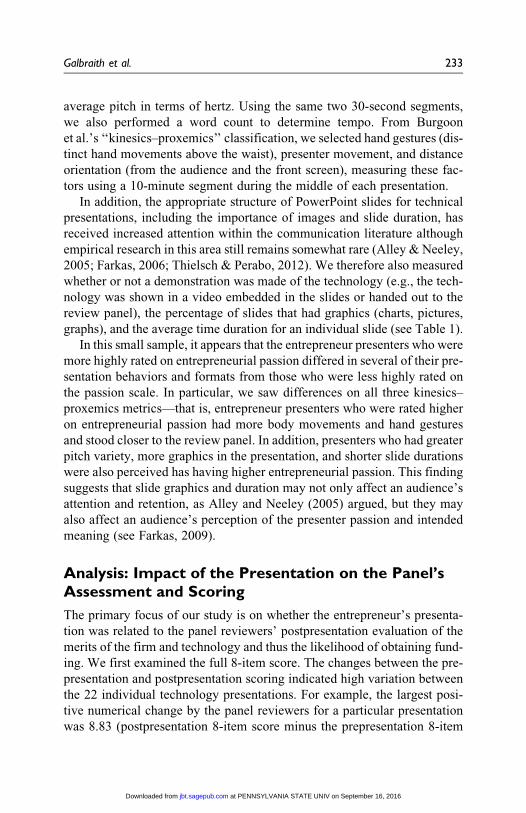
In this small sample, it appears that the entrepreneur presenters who were
more highly rated on entrepreneurial passion differed in several of their pre-
sentation behaviors and formats from those who were less highly rated on
the passion scale. In particular, we saw differences on all three kinesics–
proxemics metrics—that is, entrepreneur presenters who were rated higher
on entrepreneurial passion had more body movements and hand gestures
and stood closer to the review panel. In addition, presenters who had greater
pitch variety, more graphics in the presentation, and shorter slide durations
were also perceived has having higher entrepreneurial passion. This finding
suggests that slide graphics and duration may not only affect an audience’s
attention and retention, as Alley and Neeley (2005) argued, but they may
also affect an audience’s perception of the presenter passion and intended
meaning (see Farkas, 2009).
Analysis: Impact of the Presentation on the Panel’sAssessment and Scoring
The primary focus of our study is on whether the entrepreneur’s presenta-
tion was related to the panel reviewers’ postpresentation evaluation of the
merits of the firm and technology and thus the likelihood of obtaining fund-
ing. We first examined the full 8-item score. The changes between the pre-
presentation and postpresentation scoring indicated high variation between
the 22 individual technology presentations. For example, the largest posi-
tive numerical change by the panel reviewers for a particular presentation
was 8.83 (postpresentation 8-item score minus the prepresentation 8-item
Galbraith et al. 233
at PENNSYLVANIA STATE UNIV on September 16, 2016jbt.sagepub.comDownloaded from

Tab
le1.
Exam
ple
softh
eD
iffer
ence
sin
Pre
senta
tion
Beh
avio
rs:H
igh
Ver
sus
Low
Entr
epre
neu
rial
Pas
sion.
Low
Score
son
Pas
sion
Hig
hSc
ore
son
Pas
sion
Pre
senta
tion
Beh
avio
rsExam
ple
1(O
ptica
lH
ardw
are)
Exam
ple
2(V
ideo
Map
pin
g)Exam
ple
3(W
ater
Tes
tK
it)
Exam
ple
4(V
acci
ne
Adju
vant)
Move
men
tan
ddis
tance
ori
enta
tion
(10-m
inute
sam
ple
per
iod)
Nev
erm
ove
dfr
om
3fo
ot
radiu
snea
rco
mpute
r,6
feet
tosi
de
offr
ont
scre
en
For
whole
pre
senta
tion
stood
beh
ind
podiu
m,6
feet
tosi
de
offr
ont
scre
en
Move
dar
ound
the
front,
stood
close
toau
die
nce
and
2fe
etto
side
offr
ont
scre
en
Move
dar
ound
front,
stood
bet
wee
n2
feet
from
scre
enan
d1
foot
infr
ont
ofsc
reen
Han
dge
sture
s(1
0-
min
ute
sam
ple
per
iod)
Less
than
5dis
tinct
han
dge
sture
sper
min
Less
than
1dis
tinct
han
dge
sture
per
min
Gre
ater
than
10
dis
tinct
han
dge
sture
sper
min
Han
dge
sture
sab
ove
wai
st95%
oftim
e
Voca
lpitch
and
vari
ety
(tw
ora
ndom
30-
seco
nd
per
iods)
Mal
epre
sente
r(130
Hz
pitch
aver
age)
—lo
wva
riat
ion,
gener
ally
less
than
30
Hz
vari
atio
n
Fem
ale
pre
sente
r(1
80
Hz
pitch
aver
age)
—lo
wva
riat
ion,le
ssth
an30
Hz
vari
atio
n
Mal
epre
sente
r(1
25
Hz
pitch
aver
age)
—w
ide
vari
atio
n,
grea
ter
than
30
Hz
vari
atio
n
Fem
ale
pre
sente
r(1
70
Hz
pitch
aver
age)
—w
ide
vari
atio
n,
grea
ter
than
30
Hz
vari
atio
n
Spee
dofvo
caliz
atio
n(t
wo
random
30-
seco
nd
per
iods)
Fast
(>140
word
s/m
in)
Med
ium
(120–140
word
s/m
in)
Fast
(>140
word
s/m
in)
Med
ium
(120–140
word
s/m
in)
Tec
hnolo
gydem
onst
ration
Yes
,1
exam
ple
No
Yes
,2
exam
ple
sN
o
Slid
egr
aphic
s(p
ictu
res,
char
ts,an
dgr
aphs)
Smal
lpri
nt,
less
than
25%
slid
esw
ith
grap
hic
sSm
allp
rint,
less
than
25%
slid
esw
ith
grap
hic
sLa
rger
pri
nt,
grea
ter
than
75%
slid
esw
ith
grap
hic
sLa
rge
pri
nt,
50%
ofsl
ides
with
grap
hic
sSl
ide
dura
tion
Gre
ater
than
2m
inute
sper
slid
e1
to2
min
ute
sper
slid
eLe
ssth
an1
min
ute
per
slid
eLe
ssth
an1
min
ute
per
slid
e
Not
e.A
vera
gevo
calp
itch
det
erm
ined
from
met
erpla
ced
3in
ches
from
video
spea
ker;
pitch
vari
atio
nca
tego
ryw
asju
dge
dby
one
oft
he
auth
ors
.Pitch
vari
atio
nm
easu
rem
ent
by
the
met
erw
asdiff
icult
and
can
only
be
consi
der
eda
rough
estim
ate.
234
at PENNSYLVANIA STATE UNIV on September 16, 2016jbt.sagepub.comDownloaded from

score) whereas the largest negative numerical change for a presentation was
�6.25. Because all of the panel reviewers had read and scored the detailed
application prior to the presentation, this variation indicates that the entre-
preneurs’ formal presentation before the review panel helped some firms’
chances to obtain funding but hurt other firms’ chances.
There was also similar variation in the differences between the prepre-
sentation and postpresentation scores for the panel reviewers’ assessment
of the specific dimensions of technical merit, commercial potential, and
management ability. In about a third of the sample, the change in panel
reviewers’ assessment of technical merit from before the presentation to
after the presentation moved in the opposite direction from the change in
panel reviewers’ assessment of both commercial potential and management
ability.
Three Presentation Factors
We analyzed the scoring of the two independent evaluators of the presenta-
tion videos. Our preliminary factor analysis indicated that one of Chen
et al.’s (2009) items for measuring preparedness (‘‘the presenter articulated
the relationship between the proposal and broader context’’) was not highly
correlated with the other preparedness items. Instead, this item was more
directly associated with some of the questions that we adapted from Gerrit-
sen and Wannet’s (2005) study. We therefore used only the 4 remaining
preparedness items in our perceived entrepreneurial-presenter preparedness
scale. Since all six of Chen et al.’s questions for measuring passion loaded
on the same factor, we used the full 6-item entrepreneurial passion scale.
We then performed a final factor analysis using the 6 items we adapted from
Gerritsen and Wannet’s study, the single item ‘‘the presenter articulated the
relationship between the proposal and broader context,’’ and the 2 items
‘‘the presenter appeared trustworthy’’ and ‘‘presenter appeared ethical.’’
From this second factor analysis, we extracted three factors (eigenva-
lues > 1.0) that accounted for about 77.1% of the total variation. The first
factor combined the items ‘‘introduction was boring’’ (negative loading),
‘‘introduction made me curious about the rest of the presentation,’’ ‘‘intro-
duction was convincing,’’ and ‘‘the presenter articulated the relationship
between the proposal and broader context.’’ This factor corresponds to the
concept of attentum facere or gaining attention (labeled attention for our
analysis). The second factor combined the items ‘‘introduction lacked
structure’’ and ‘‘introduction was difficult to follow.’’ This factor gener-
ally corresponds to the idea of docile facere (negatively coded) or
Galbraith et al. 235
at PENNSYLVANIA STATE UNIV on September 16, 2016jbt.sagepub.comDownloaded from

increasing the ability to listen and preparing the listeners for content
(labeled difficulty for our analysis). The final factor combined the 2 items
‘‘the presenter appeared trustworthy’’ and ‘‘presenter appeared ethical.’’
This factor (labeled credibility for our analysis) corresponds to the con-
cept of benevolem facere, or establishing the speaker’s creditability
(Andeweg et al., 1998; Gerritsen & Wannet, 2005; McCroskey, 2001). Our
calculations for the Cronbach’s a (using the items that loaded on the different
factors) in our sample were .80 for attention, .76 for difficulty, and .82 for
credibility, similar to those reported in Gerritsen and Wannet (2005, p. 199).
The Effect of Presentation and Entrepreneurial Passion onReviewers’ Assessment
To analyze how a presentation influenced the panel reviewers’ assessment
of the merits of the applicant firm’s technology and business model, we
used a t-test for mean differences. The seven presentation variables, as
scored by the two independent video evaluators, were (a) the perceived
entrepreneurial passion score (using the 6-item passion scale from Chen
et al., 2009), (b) the perceived entrepreneurial preparedness score (using
4-items from the 5-item preparedness scale from Chen et al., 2009), (c) the
attention factor score, (d) the difficulty factor score, (e) the credibility factor
score, (f) the single-item question about presentation attractiveness, and (g)
the single-item question about use of visuals in the presentation. For each of
these presentation variables, we separated the sample into categories of high
versus low, using the mean value of that particular presentation variable as
the dividing point. We then performed a t-test for the mean differences of
the changes between the panel reviewers’ prepresentation and postpresenta-
tion scores for technology merit, commercial potential, and management
ability and for the mean difference in the change in the total evaluation
score for the 8-item assessment (see Table 2).
We found statistically significant differences for the presentation variables
of perceived entrepreneurial passion, perceived entrepreneurial preparedness,
the attention factor score, and presentation attractiveness.1 Higher scores for
perceived entrepreneurial passion, perceived entrepreneurial preparedness,
presentation attention, and presentation attractiveness were related to higher
postpresentation scores on one or more of the panel-reviewer assessment
variables, or in other words, presentation does appear to matter. We found
no statistical differences in the presentation difficulty factor score, the presen-
tation credibility factor score, and the use of visuals variable, so these are not
reported in the table.
236 Journal of Business and Technical Communication 28(2)
at PENNSYLVANIA STATE UNIV on September 16, 2016jbt.sagepub.comDownloaded from

Tab
le2.
Mea
nD
iffer
ence
sin
the
Chan
geBet
wee
nPre
pre
senta
tion
and
Post
pre
senta
tion
for
the
Pan
el-R
evie
wer
s’A
sses
smen
tofth
ePro
-posa
lfo
rPre
senta
tions
With
Hig
hor
Low
Pas
sion,
Hig
hor
Low
Pre
par
ednes
s,H
igh
or
Low
Att
ention,
and
Hig
hor
Low
Pre
senta
tion
Att
ract
iven
ess.
Pas
sion
Pre
par
ednes
sA
tten
tion
Att
ract
iven
ess
Dim
ensi
on
asse
ssed
by
pan
elre
view
ers
Hig
hLo
wH
igh
Low
Hig
hLo
wH
igh
Low
Tec
hnolo
gym
erit
0.1
60.0
10.3
5�
0.2
4*
0.3
4�
0.1
30.2
8�
0.3
5*
Com
mer
cial
pote
ntial
0.4
7�
0.4
2**
*0.3
2�
0.4
3**
*0.2
9�
0.2
7**
0.1
7�
0.4
2**
Man
agem
ent
abili
ty0.0
00.0
40.2
5�
0.2
40.3
3�
0.2
3**
0.1
8�
0.3
2*
Tota
lev
aluat
ion
1.7
10.1
72.2
1�
0.7
2**
2.1
2�
0.1
6*
1.7
8�
0.2
1*
Not
e.Si
gnifi
cance
for
t-te
st,*p
<0.1
0.**
p<
0.0
5.**
*p<
0.0
1.
237
at PENNSYLVANIA STATE UNIV on September 16, 2016jbt.sagepub.comDownloaded from

The result on perceived entrepreneurial passion is of particular interest to
the entrepreneurship literature. We found that presentations with high per-
ceived entrepreneurial passion were associated with a statistically signifi-
cant increase in the panel reviewers’ rating of commercial potential in the
postpresentation assessment. According to Chen et al. (2009), the passion
scale attempts to measure those components in a presentation that create
an ‘‘intense affective state accompanied by cognitive and behavioral man-
ifestations of high personal value’’ (p. 201). And as we found in our study,
perceived entrepreneurial passion within a presentation can be expressed
through body language, vocal pitch and tone, and gestures. Passion, how-
ever, was not significantly related to the panel reviewers’ assessment of
technology merit. This finding is not surprising because when the panel
reviewers assess commercial potential, they are likely to place more weight
on their perception of the entrepreneur’s ability to market or sell the tech-
nology (which requires passion) whereas they are likely to assess technical
merit based more on the scientific or engineering content of the presentation
than on the passion of the presenting entrepreneur.
We also performed a series of regression analyses to measure the
changes between the four prepresentation and postpresentation panel
reviewer assessments as the dependent variables. Due to potential multicol-
linearity issues related to the relatively small sample size and the high sig-
nificant correlations between the different potential explanatory variables
(i.e., passion–attention, r ¼ .48; passion–attractiveness, r ¼ .46; passion–
use of visuals, r ¼ .47; preparedness–attention, r ¼ .63), for our regression
analyses, we use as explanatory variables the three dimensions derived from
our factor analysis: attention, difficulty, and credibility (see Table 3).
We found that two of the regression equations were statistically signifi-
cant, indicating relatively high explanatory power. The technology merit
equation resulted in an R2 of .271 whereas the commercialization potential
equation had an R2 of .399. While the statistical significance of the individ-
ual variables was somewhat limited, it appears that the attention factor
score, in particular, was positively related to an improvement in the panel
reviewers’ assessment after the presentation.
The Effect of the Panel-Reviewers’ Background
Given the advanced nature of the technologies examined in this study, we
were interested in whether or not the vocational background of the panel
reviewers had any effect. Lester (1998) suggested, for example, that techni-
cal communication provokes an ‘‘intellectual response’’ whereas persuasive
238 Journal of Business and Technical Communication 28(2)
at PENNSYLVANIA STATE UNIV on September 16, 2016jbt.sagepub.comDownloaded from

communication provokes an ‘‘emotional response.’’ Dannels (2003)
observed in her research regarding engineering presentations that techni-
cally oriented audiences may want to be ‘‘talked to like an engineer’’ and
may actually be distracted by the ‘‘cute’’ components of the presentation
(pp. 157–160).
Although the vast majority of the panel reviewers had technical back-
grounds, because of Dannels’s (2003) observation, we performed an addi-
tional analysis on the assessments for those panel reviewers who
currently worked as managers, consultants, or investors (we labeled these
reviewers as business experienced) versus those panel reviewers who cur-
rently worked in engineering, science, or laboratory jobs (we labeled these
reviewers as technically active). It is reasonable to expect, for example, that
reviewers who have additional business-related experience might view the
presentations differently in their assessment of commercial potential and
management ability because these reviewers had more personal and profes-
sional experience in these areas.
Of the 22 presentations, 17 had panel reviewers who could be classified
as technically active. For these 17 technologies, we calculated the change in
the four assessment variables between the prepresentation and postpresen-
tation scores for the subsample of technically active panel reviewers and
compared these results to the subsample of just business-experienced panel
reviewers. Overall, we found few significant differences between the tech-
nically active and business-experienced subsamples, with the one signifi-
cant difference related to the impact of perceived entrepreneurial passion.
For the technically active subsample of panel reviewers, high entrepreneur-
ial passion was actually associated with lower average postpresentation
Table 3. Regression Analysis for the Mean Differences in the Change BetweenPrepresentation and Postpresentation for the Panel Reviewers’ Assessment of theProposal.
VariablesTechnology
MeritCommercial
PotentialManagement
AbilityTotal
Assessment
Constant 0.080 �0.020 0.024 0.875Attention 0.286* 0.471*** 0.300** 1.612**Difficulty �0.348** �0.014 �0.145 �0.205Credibility �0.211 �0.064 0.056 �0.195R2 .271 .399 .186 .196F-Stat 3.226** 3.979** 1.368 1.460
Note. Significance for estimated regression coefficients, *p < 0.10. **p < .05. ***p < .01.
Galbraith et al. 239
at PENNSYLVANIA STATE UNIV on September 16, 2016jbt.sagepub.comDownloaded from

scores on all four assessment variables, with the downward difference in the
technical merit score statistically significant (p < .10). But we found the
opposite relationship for the business-experienced subsample. With
the business-experienced subsample, high perceived entrepreneurial pas-
sion was associated with higher postpresentation scores on all four assessment
variables, with statistically significant differences for commercial potential (p
< .01) and total evaluation (p < .10). These findings provide empirical support
for Dannels’s (2003) observation that a highly technical audience may, in fact,
be negatively affected by passionate-sounding presentations if they interpret it
as showboating whereas a more business-oriented audience may see the pas-
sion exhibited during a presentation as the positive entrepreneurial character-
istic of harmonious passion, or the classic fire in the belly.
Conclusion
Within the areas of technology transfer, entrepreneurship, and private
equity markets, there has been increasing interest in understanding the
important role that presentation style, technique, and format have on deci-
sions about funding. Many times the process of obtaining funding involves
a screening process in which a select number of entrepreneurs are invited to
present their proposals to a panel of decision makers.
We analyzed 22 videotaped proposals that were presented to a Depart-
ment of Defense granting and technology transfer consortium. Our analysis
is somewhat unique for several reasons. First, we examined a real-life fund-
ing decision; second, the presenters were all entrepreneurs of early-stage
high-technology firms; third, unlike prior research, we used both prepresen-
tation and postpresentation assessments by reviewers; and fourth, we
focused on presentation behavior and style by using independent evaluators
to assess the videos of the presentation.
From this analysis, we identified two noteworthy findings. First, we
found that presentation behavior, form, and style did, in fact, appear to
influence the reviewer panel’s postpresentation assessment of the technol-
ogy’s merit, the firm’s commercial potential, and the ability of the manage-
ment team. In particular, perceived entrepreneurial passion, perceived
entrepreneurial preparedness, keeping attention, and presentation attractive-
ness were all statistically significant in influencing the reviewers’ assess-
ment of the proposal. Second, we found differences in the impact of
certain presentation behaviors depending on the backgrounds of the review
panel. In particular, reviewers with real-life business experience appeared
240 Journal of Business and Technical Communication 28(2)
at PENNSYLVANIA STATE UNIV on September 16, 2016jbt.sagepub.comDownloaded from

to be much more positively influenced by entrepreneurial passion than were
reviewers who were currently working as scientists or engineers.
Our research offers several important lessons for entrepreneurs who are pre-
senting to funding groups, whether private equity investors or government
granting agencies. First, the way the proposal is presented does matter, and
it appears to matter a lot. For an emerging firm in a high-technology sector,
it is important to understand that a good technology alone may not be sufficient
to obtain funding. After all, technical merit is only one component that funding
groups examine. Investors and grant reviewers also assess the emergent firm’s
commercial potential and the ability of the management team to successfully
guide the organization. Our research suggests that decision makers use the
behaviors they see in the formal presentation as a vehicle to assess these fac-
tors. Second, entrepreneurs need to develop a presentation style that includes
tonal variety, body movement, and hand gestures in order to enhance the fund-
ing-decision makers’ perceptions of entrepreneurial passion and preparedness.
The presentation also needs to include techniques that encourage the listener to
better absorb the presented information. Third, entrepreneurs must make sure
that the presentation is attractive in terms of its visual content, but they also
need to understand that there is a fine line when presenting to certain audiences.
Not only can the technical aspects of presentation slides affect audience atten-
tion and retention, but these devices may also have a deeper psychological
impact by influencing an audience’s perception of presenter passion and
intended meaning. But at some point, the perceived passion of the presenter
may be seen more as showboating, which, in turn, could have a negative
impact, particularly if the audience is more technically oriented.
This study must be considered exploratory and somewhat limited by
sample size. The sample size of our study, however, is consistent with other
recent experiments, such as Chen et al.’s (2009) well-cited study.2 More
important, however, is that our study is based on videotapes of real presen-
tations—with real panels of decision makers—that resulted in real financial
outcomes to the entrepreneurs. Analysis of real presentations made under
such circumstances is rare in the literature.
Declaration of Conflicting Interests
The authors declared no potential conflicts of interest with respect to the research,
authorship, and/or publication of this article.
Funding
The authors received no financial support for the research, authorship, and/or pub-
lication of this article.
Galbraith et al. 241
at PENNSYLVANIA STATE UNIV on September 16, 2016jbt.sagepub.comDownloaded from

Notes
1. In research with relatively small sample sizes using real data that allow for addi-
tional noise (as in medical experiments), a less restrictive statistical significance
of p < .10 for t-tests and regressions is often used (e.g., Paulssen & Bagozzi,
2009; Yang & Churchill, 2007).
2. The often-cited Chen et al. (2009) study used a relatively large sample size to
develop their passion and preparedness scale (which we used in our study), but
their analysis of entrepreneurial passion and preparedness during a presentation
was based on only 31 presentations before judges during a university business-plan
competition. From these judges, there were 159 completed postpresentation eva-
luations. Our study had 22 presentations resulting in 112 prepresentation evalua-
tions and 112 postpresentation evaluations. Since Chen et al.’s sample was
based on a student business competition, few, if any, of the business plans were
likely to be high technology in nature.
References
Ajamian, G., & Koen, P. (2002). Technology stage gate: A structured process for
managing high risk, new technology projects. In P. Belliveau, A. Griffin, & S.
Sorermeyer (Eds.), PDMA toolbook for new product development (pp. 267–295).
New York, NY: John Wiley.
Alley, M., & Neeley, K. (2005). Rethinking the design of presentation slides: A case
for sentence headlines and visual evidence. Technical Communication, 52,
417–426.
Amiot, C., Vaqllerand, R., & Blanchard, C. (2006). Passion and psychological
adjustment: A test of the person-environment fit hypothesis. Personality and
Social Psychology Bulletin, 32, 220–229.
Andeweg, B., de Jong, J., & Hoeken, H. (1998). ‘‘May I have your attention?’’ Exor-
dial techniques in informative oral presentations. Technical Communication
Quarterly, 7, 271–284.
Arnold, C. (2007). Oral rhetoric, rhetoric, and literature. Philosophy and Rhetoric,
40, 170–187.
Astebro, T. (2004). Key success factors for technological entrepreneurs’ R&D proj-
ects. IEEE Transactions on Engineering Management, 51, 314–321.
Baum, J., & Locke, E. (2004). The relationship of entrepreneurial traits, skill, and
motivation to subsequent venture growth. Journal of Applied Psychology, 89,
587–598.
Baum, J., Locke, E., & Kirkpatrick, S. (1998). A longitudinal study of the relation of
vision and vision communication to venture growth in entrepreneurial firms.
Journal of Applied Psychology, 83, 43–54.
242 Journal of Business and Technical Communication 28(2)
at PENNSYLVANIA STATE UNIV on September 16, 2016jbt.sagepub.comDownloaded from

Baum, J., Locke, E., & Smith, K. (2001). A multi-dimensional model of venture
growth. Academy of Management Journal, 44, 292–303.
Bebee, A., & Bebee, S. (2012). Public speaking: An audience–centered approach
(8th ed.). Boston, MA: Pearson Education.
Bird, B. (1989). Entrepreneurial behavior. Glenview, IL: Scott Foresman.
Bradac, J., Hemphill, M., & Tardy, C. (1981). Language style on trial: Effects of
‘‘powerful’’ and ‘‘powerless’’ speech upon judgments of victims and villains.
Western Journal of Speech Communication, 45, 327–341.
Bradac, J., & Street, R. (1990). Powerful and powerless styles of talk: A theoretical
analysis of language and impression formation. Research on Language and
Social Interaction, 22, 195–242.
Brooks, W. D. (1971). Speech communication. Dubuque, IA: Brown.
Bruno, A., & Tybee, T. (1985). The entrepreneur’s search for capital. Journal of
Business Venturing, 1, 61–74.
Bunderson, J., & Sutcliffe, K. (2002). Comparing alternative conceptualizations of
functional diversity in management teams: Process and performance effects.
Academy of Management Journal, 45, 875–893.
Burgoon, J. K., Birk, T., & Pfau, M. (1990). Nonverbal behaviors, persuasion, and
credibility. Human Communication Research, 17, 140–169.
Caputo, J. D., & Yount, M. (1993). Foucault and the critique of institutions. Univer-
sity Park: Pennsylvania State University Press.
Cardon, M. (2008). Is passion contagious? The transference of entrepreneurial
passion to employees. Human Resource Management Review, 18, 77–86.
Cardon, M., Wincent, J., & Singh, J. (2009). The nature and experience of entrepre-
neurial passion. Academy of Management Review, 34, 511–532.
Cardon, M., Zietsman, C., Saparito, P., Matherne, B., & Davis, C. (2005). A tale
of passion: New insights into entrepreneurship from a parenthood metaphor.
Journal of Business Venturing, 20, 23–45.
Carland, J., Hoy, F., Boulton, W., & Carland, J. (1984). Differentiating entrepre-
neurs from small business owners: A conceptualization. Academy of Manage-
ment Review, 9, 354–359.
Caricato, J. (2000). Visuals for speaking presentations: An analysis of the presen-
ter’s perspective of audience as a partner in visual design. Technical Communi-
cation, 47, 496–514.
Chen, X., Yao, X., & Kotha, S. (2009). Entrepreneur passion and preparedness in
business plan presentations: A persuasion analysis of venture capitalists’ funding
decisions. Academy of Management Journal, 52, 199–214.
Cicero, M. T. (1960). De Oratore (E. W. Sutton & H. Rackham, Trans.). Cambridge,
MA: Harvard University Press.
Galbraith et al. 243
at PENNSYLVANIA STATE UNIV on September 16, 2016jbt.sagepub.comDownloaded from

Clark, D. (2008). Content management and the separation of presentation and con-
tent. Technical Communication Quarterly, 17, 35–60.
Dannels, D. (2003). Teaching and learning design presentations in engineering.
Journal of Business and Technical Communication, 17, 139–169.
Davis, J. (1996). Group decision making and quantitative judgments: A consensus
model. In E. Witte & J. Davis (Eds.), Understanding group behavior: Consen-
sual action by small groups (pp. 35–59). Mahwah, NJ: Lawrence Erlbaum.
Dillard, J., Weber, K., & Vail, R. (2007). The relationship between the perceived
and actual effectiveness of persuasive messages: A meta-analysis with implica-
tions for formative campaign research. Journal of Communication, 57, 613–631.
Erickson, B., Lind, E. A., Johnson, B. C., & O’Barr, W. M. (1978). Speech style and
impression formation in a court setting: The effects of ‘‘powerful’’ and ‘‘power-
less’’ speech. Journal of Experimental Social Psychology, 14, 266–279.
Farkas, D. (2005). Explicit structure in print and on-screen documents. Technical
Communication Quarterly, 14, 9–30.
Farkas, D. (2006). Toward a better understanding of PowerPoint deck design. Infor-
mation Design Journal, 14, 162–171.
Farkas, D. (2009). Managing three mediation effects that influence PowerPoint deck
authoring. Technical Communication, 56, 28–38.
Foo, M., Uy, M., & Baron, R. (2009). How do feelings influence effort? An empiri-
cal study of entrepreneurs’ affect and venture effort. Journal of Applied Psychol-
ogy, 94, 1086–1094.
Galbraith, C., DeNoble, A., & Ehrlich, S. (2009). The use and content of formal rat-
ing systems in angel group investment initial screening stages. Journal of Small
Business Strategy, 20, 61–79.
Galbraith, C., DeNoble, A., & Ehrlich, S. (2012). Predicting the commercialization
progress of early stage technologies: An ex-ante analysis. IEEE Transactions in
Engineering Management, 59, 213–225.
Galbraith, C., DeNoble, A., Ehrlich, S., & Kline, D. (2007). Can experts really
assess future technology success? A neural network and Bayesian analysis of
early stage technology proposals. Journal of High Technology Management
Research, 17, 125–137.
Gerritsen, M., & Wannet, E. (2005). Cultural differences in the appreciation of intro-
ductions of presentations. Technical Communication, 52, 194–208.
Goldstein, M. (2003, February). It’s alive! The audience, that is, but some presenters
don’t seem to know it. Successful Meetings, 52, 20.
Graves, W. (2011). The Southern culture of risk capital. Southeastern Geographer,
51, 49–68.
Gunderson, D. K., & Hopper, R. (1976). Relationship between speech delivery and
speech effectiveness. Communication Monographs, 43, 158–165.
244 Journal of Business and Technical Communication 28(2)
at PENNSYLVANIA STATE UNIV on September 16, 2016jbt.sagepub.comDownloaded from

Gundry, L., & Welsch, H. (2001). The ambitious entrepreneur: High growth
strategies of women-owned enterprises. Journal of Business Venturing, 16,
453–470.
Hall, S. (1980). Encoding/decoding, in culture, language, media. In S. Hall,
D. Hobson, A. Lowe, & P. Willis (Eds.), Working papers in cultural studies,
1972-1979 (pp. 128–138). London, England: Routledge.
Heslop, L., McGregor, E., & Griffith, M. (2001). Development of a technology
readiness assessment measure: The cloverleaf model of technology transfer.
Journal of Technology Transfer, 26, 369–384.
Hincks, R., & Edlund, J. (2009). Promoting increased pitch variation in oral presen-
tations with transient visual feedback. Language Learning & Technology, 13,
32–50.
Hosman, L., Huebner, T., & Siltanen, S. (2002). The impact of power-of-speech
style, argument strength, and need for cognition on impression formation, cog-
nitive responses, and persuasion. Journal of Language and Social Psychology,
21, 361–379.
Hosman, L. A., & Siltanen, S. A. (1994). The attributional and evaluative conse-
quences of powerful and powerless speech styles: An examination of the ‘‘control
over others’’ and ‘‘control of self’’ explanations. Language & Communication, 14,
287–298.
Hosman, L., & Siltanen, S. (2006). Powerful and powerless language forms: Their
consequences for impression formation, attributions of control of self and control
of others, cognitive responses, and message memory. Journal of Language and
Social Psychology, 25, 33–46.
Hosman, L. A., & Wright, J. W. (1987). The effects of hedges and hesitations on
impression formation in a simulated courtroom context. Western Journal of
Speech Communication, 51, 173–188.
Jehn, K. A., & Shah, P. (1997). Interpersonal relationships and task performance:
An examination of mediating processes in friendship and acquaintance groups.
Journal of Personality and Social Psychology, 72, 775–790.
Kaufman Foundation. (2009). Sources of financing for new technology firms:
A comparison by gender. Retrieved from http://www.kauffman.org/uploaded-
Files/ResearchAndPolicy/Sources%20of%20Financing%20for%20New%20Tec
hnology%20Firms.pdf
Kennedy, G. A. (Ed.). (1991). Aristotle on rhetoric: A theory of civic discourse.
Boston, MA: Pearson Education.
King, D. (2008). Content management and the separation of presentation and
content. Technical Communication Quarterly, 17, 35–60.
Ladd, D., & Morton, R. (1997). The perception of intonational emphasis: Continu-
ous or categorical. Journal of Phonetics, 25, 313–342.
Galbraith et al. 245
at PENNSYLVANIA STATE UNIV on September 16, 2016jbt.sagepub.comDownloaded from

Lester, M. (1998). Communicating technical ideas persuasively. Journal of Man-
agement in Engineering, 14, 17–20.
Linton, J., Walsh, S., & Morabito, J. (2002). Analysis, ranking and selection of R&D
projects in a portfolio. R&D Management, 32, 139–148.
Mason, M., Tatkow, E., & Macrae, C. (2005). The look of love: Gaze shifts and per-
son perception. Psychological Science, 16, 236–239.
McCroskey, J. (2001). An introduction to rhetorical communication: The theory and
practice of public speaking. Englewood Cliffs, NJ: Prentice Hall.
Newman, S. (2001). Aristotle’s definition of rhetoric in the ‘‘Rhetoric’’: The meta-
phors and their message. Written Communication, 18, 3–25.
Ohtsubo, Y., Masuchi, A., & Nakanishi, D. (2002). Majority influence process in
group judgment: Test of the social judgment scheme model in a group polariza-
tion context. Group Processes & Intergroup Relations, 5, 249–261.
O’Keefe, D. (2002). Persuasion: Theory and research (2nd ed.). Thousand Oaks,
CA: Sage.
Osborn, R., & Osborn, S. (2012). Public speaking: Finding your voice (9th ed.).
Boston, MA: Pearson Education.
Ozer, M. (1999). A survey of new product evaluation models. Journal of Product
Innovation Management, 16, 77–94.
Paulssen, M., & Bagozzi, R. (2009). Customer coping in response to relationship
transgressions: An attached theoretic approach. In D. J. Macinnis, C. W. Park,
& J. W. Priester (Eds.), Handbook of brand relationships (pp. 358–376). New
York, NY: Sharpe.
Payne, W. H., & Macarty, M. J. (2002). The anatomy of an angel investing network:
Tech coast angels. Venture Capital, 4, 331–336.
Pornpitakpan, C. (2004). The persuasiveness of source credibility: A critical review
of five decades’ evidence. Journal of Applied Social Psychology, 34, 243–281.
Priem, R., Harrison, D., & Muir, N. (1995). Structured conflict and consensus out-
comes in group decision making. Journal of Management, 21, 691–710.
Rothstein, M., & Jackson, D. (1980). Decision-making in the employment inter-
view: An experimental approach. Journal of Applied Psychology, 65, 271–283.
Rude, C. D. (2009). Mapping the research questions in technical communication.
Journal of Business and Technical Communication, 23, 174–215.
Sapienza, H., & De Clercq, D. (2000). Venture capitalist–entrepreneur relations in
technology-based ventures. Enterprise & Innovation Management Studies, 1,
57–71.
Shane, S., Locke, E., & Collins, C. (2003). Entrepreneurial motivations. Human
Resource Management Review, 13, 257–279.
Shane, S., & Stuart, T. (2002). Organizational endowments and the performance of
university start-ups. Management Science, 48, 154–170.
246 Journal of Business and Technical Communication 28(2)
at PENNSYLVANIA STATE UNIV on September 16, 2016jbt.sagepub.comDownloaded from

Shepard, D., Zacharakis, A., & Baron, R. (2003). VCs decision processes: Evidence
suggesting more experience may not always be better. Journal of Business Ven-
turing, 18, 381–401.
Shriberg, E., Ladd, D., Terken, J., & Stolcke, A. (1996). Modeling pitch range var-
iation within and across speakers: Predicting F0 targets when ‘‘speaking up.’’
International Conference on Spoken Language Processing (Vol. 4, pp. 1–4;
proceedings addendum). Philadelphia, PA
Smilor, R. (1997). Entrepreneurship: Reflections on a subversive activity. Journal of
Business Venturing, 12, 341–346.
Smith, S., & Shaffer, D. (1995). Speed of speech and persuasion: Evidence
for multiple effects. Personality and Social Psychology Bulletin, 21, 1051–
1060.
Sproule, J. (2012). Inventing public speaking: Rhetoric and the speech book,
1730-1930. Rhetoric and Public Affairs, 15, 563–608.
Stasser, G. (1992). Information salience and the discovery of hidden profiles by
decision-making groups: A ‘‘thought’’ experiment. Organizational Behavior and
Human Decision Processes, 52, 156–181.
Stasser, G., & Titus, W. (1985). Pooling of unshared information in group decision
making: Biased information sampling during discussion. Journal of Personality
and Social Psychology, 48, 1467–1478.
Steiner, I. D. (1982). Heuristic models of groupthink. In M. Brandstatter, J. H. Davis, &
G. Stocker-Krichgauer (Eds.), Group decision making, (pp. 503–524), New York,
NY: Academic Press.
Sudek, R. (2007). Angel investment criteria. Journal of Small Business Strategy, 17,
89–103.
Sudek, R. (2009). The impact of entrepreneur personality, business attributes, and
perceived trustworthiness on the angel investment process. Paper presented at
the 2009 USASBE Conference, Anaheim, CA.
Sudek, R., Mitteness, C., & Cardon, M. (2010, August 10). The impact of displayed
and perceived entrepreneurial passion on angel investing. Paper presented at the
2010 Academy of Management Conference, Montreal, Canada.
Terranova, T. (2004). Communication beyond meaning. Social Text, 22, 51–73.
Thielsch, M., & Perabo, I. (2012). Use and evaluation of presentation software.
Technical Communication, 59, 112–123.
Tichy, N., & Devanna, M. (1986). The transformational leader. New York, NY:
John Wiley.
Timmons, J. (2000). New venture creation: Entrepreneurship 2000 (5th ed.). Home-
wood, IL: Irwin.
Tindale, C. (2011). Character and knowledge: Learning from the speech of experts.
Argumentation, 25, 341–353.
Galbraith et al. 247
at PENNSYLVANIA STATE UNIV on September 16, 2016jbt.sagepub.comDownloaded from
Vallerand, R., Blanchard, C., Mageau, G., Koestner, R., Ratelle, C., Leonard,
M., . . . Marsolais, J. (2003). Les passions de l’ame: On obsessive and harmo-
nious passion. Journal of Personality and Social Psychology, 85, 756–767.
Van De Mieroop, D., de Jong, J., & Andeweg, B. (2008). I want to talk about . . . A
rhetorical analysis of the introductions of 40 speeches about engineering. Jour-
nal of Business and Technical Communication, 22, 186–210.
Verderber, R. (1994). The challenge of effective speaking (9th ed.). Belmont, CA:
Wadsworth.
Winterbottom, A., Bekker, H., Conner, M., & Mooney, A. (2008). Does narrative
information bias individual’s decision making? A systematic review. Social Sci-
ence and Medicine, 67, 2079–2088.
Wong, A. (2002). Angel finance: The other venture capital. Retrieved September 1,
2008, from http://www.angelcapitalassociation.org/data/Documents/Resources/
AngelGroupResarch/1d%20-%20Resources%20-%20Research/2%20Research_
AndrewWong.pdf
Wright, J. W., II, & Hosman, L. A. (1983). Language style and sex bias in the court-
room: The effects of male and female use of hedges and intensifiers on impres-
sion information. Southern Journal of Communication, 48, 137–152.
Yang, H., & Churchill, G. (2007). Estimating p-values in small microarray experi-
ments. Bioinformatics, 23, 38–43.
Yokoyama, H., & Daibo, I. (2012). Effects of gaze and speech rate on receivers
evaluations of persuasive speech. Psychological Reports, 110, 663–676.
Author Biographies
Craig S. Galbraith is a professor of entrepreneurship and technology management
at the University of North Carolina, Wilmington. He received his PhD from Purdue
University and has worked extensively with various technology transfer offices of
the Departments of Defense and Homeland Security.
Bruce C. McKinney received his graduate degrees from the Pennsylvania State
University. He is a professor of communication studies at the University of North
Carolina, Wilmington. He has taught throughout Vietnam and has worked with the
U.S. Marine Corps Special Operation Command.
Alex F. DeNoble is the director of the Lavin Entrepreneurship Center at San Diego
State University. He publishes in the areas of entrepreneurship and technology man-
agement and teaches regularly in Mexico and Europe.
Sanford B. Ehrlich is an Emeritus Professor of management at San Diego State
University and past executive director of the entrepreneurship center. He is currently
vice president of Strategic Development for TVPage Corporation.
248 Journal of Business and Technical Communication 28(2)
at PENNSYLVANIA STATE UNIV on September 16, 2016jbt.sagepub.comDownloaded from