The Impact of Plastic Money Use on VAT Compliance
38
Georgia State University Georgia State University ScholarWorks @ Georgia State University ScholarWorks @ Georgia State University ICEPP Working Papers International Center for Public Policy 3-1-2020 The Impact of Plastic Money Use on VAT Compliance: Evidence The Impact of Plastic Money Use on VAT Compliance: Evidence from EU Countries from EU Countries Amakoe D. Alognon Georgia State University, [email protected] Antonios M. Koumpias [email protected] Jorge Martinez-Vazquez Georgia State University, [email protected] Follow this and additional works at: https://scholarworks.gsu.edu/icepp Recommended Citation Recommended Citation Alognon, Amakoe D.; Koumpias, Antonios M.; and Martinez-Vazquez, Jorge, "The Impact of Plastic Money Use on VAT Compliance: Evidence from EU Countries" (2020). ICEPP Working Papers. 132. https://scholarworks.gsu.edu/icepp/132 This Article is brought to you for free and open access by the International Center for Public Policy at ScholarWorks @ Georgia State University. It has been accepted for inclusion in ICEPP Working Papers by an authorized administrator of ScholarWorks @ Georgia State University. For more information, please contact [email protected].
-
Upload
khangminh22 -
Category
Documents
-
view
3 -
download
0
Transcript of The Impact of Plastic Money Use on VAT Compliance
Georgia State University Georgia State University
ScholarWorks @ Georgia State University ScholarWorks @ Georgia State University
ICEPP Working Papers International Center for Public Policy
3-1-2020
The Impact of Plastic Money Use on VAT Compliance: Evidence The Impact of Plastic Money Use on VAT Compliance: Evidence
from EU Countries from EU Countries
Amakoe D. Alognon Georgia State University, [email protected]
Antonios M. Koumpias [email protected]
Jorge Martinez-Vazquez Georgia State University, [email protected]
Follow this and additional works at: https://scholarworks.gsu.edu/icepp
Recommended Citation Recommended Citation Alognon, Amakoe D.; Koumpias, Antonios M.; and Martinez-Vazquez, Jorge, "The Impact of Plastic Money Use on VAT Compliance: Evidence from EU Countries" (2020). ICEPP Working Papers. 132. https://scholarworks.gsu.edu/icepp/132
This Article is brought to you for free and open access by the International Center for Public Policy at ScholarWorks @ Georgia State University. It has been accepted for inclusion in ICEPP Working Papers by an authorized administrator of ScholarWorks @ Georgia State University. For more information, please contact [email protected].
In
International Center for Public Policy
Working Paper 20-04
March 2020
The Impact of Plastic Money Use on VAT
Compliance: Evidence from EU Countries
Amakoe D. Alognon
Antonios M. Koumpias
Jorge Martinez-Vazquez
INTERNATIONAL
CENTER FOR
PUBLIC POLICY

International Center for Public Policy Working Paper 20-04
The Impact of Plastic Money Use on VAT Compliance: Evidence from EU Countries Amakoe D. Alognon
Antonios M. Koumpias Jorge Martinez-Vazquez March 2020
International Center for Public Policy Andrew Young School of Policy Studies Georgia State University Atlanta, Georgia 30303 United States of America Phone: (404) 413-0235 Fax: (404) 651-4449 Email: [email protected] Website: http://icepp.gsu.edu/ Copyright 2020, the Andrew Young School of Policy Studies, Georgia State University. No part of the material protected by this copyright notice may be reproduced or utilized in any form or by any means without prior written permission from the copyright owner.

International Center for Public Policy Andrew Young School of Policy Studies The Andrew Young School of Policy Studies was established at Georgia State University with the objective of promoting excellence in the design, implementation, and evaluation of public policy. In addition to four academic departments, including economics and public administration, the Andrew Young School houses eight leading research centers and policy programs, including the International Center for Public Policy. The mission of the International Center for Public Policy (ICePP) at the Andrew Young School of Policy Studies is to provide academic and professional training, applied research, and technical assistance in support of sound public policy and sustainable economic growth in developing and transitional economies. ICePP is recognized worldwide for its efforts in support of economic and public policy reforms through technical assistance and training around the world. This reputation has been built serving a diverse client base, including the World Bank, the U.S. Agency for International Development (USAID), the United Nations Development Programme (UNDP), finance ministries, government organizations, legislative bodies, and private sector institutions. The success of ICePP reflects the breadth and depth of its in-house technical expertise. The Andrew Young School's faculty are leading experts in economics and public policy and have authored books, published in major academic and technical journals, and have extensive experience in designing and implementing technical assistance and training programs. Andrew Young School faculty have been active in policy reform in over 40 countries around the world. Our technical assistance strategy is not merely to provide technical prescriptions for policy reform, but to engage in a collaborative effort with host governments and donor agencies to identify and analyze the issues at hand, arrive at policy solutions, and implement reforms. ICePP specializes in four broad policy areas: Fiscal policy (e.g., tax reforms, public expenditure reviews) Fiscal decentralization (e.g., reform, intergovernmental transfer systems, urban finance) Budgeting and fiscal management (e.g., local, performance-based, capital, and multi-
year budgeting) Economic analysis and revenue forecasting (e.g., micro-simulation, time series
forecasting) For more information about our technical assistance activities and training programs, please visit our website at icepp.gsu.edu or contact us at [email protected].

The Impact of Plastic Money Use on VAT Compliance:
Evidence from EU Countries
Amakoe D. Alognon1, Antonios M. Koumpias2*, and Jorge Martinez-Vazquez3
March 2020
Abstract
In recent decades, several countries around the world have implemented cash
restriction policies to incentivize the use of electronic means of payments with the
aim to combat money laundering, terrorism financing, and tax evasion. This paper
examines the impact of the proliferation in credit and debit card usage on
consumption tax compliance using annual national level data for 26 European
Union (EU) member states from 2000 to 2016. We measure consumption tax
compliance using estimated Value-Added Tax (VAT) gaps, defined as the
difference between the theoretical VAT liability according to the law and actual
VAT collections. We exploit variation in time and space of credit and debit card
usage across 26 EU member states from 2000-16 using panel data and instrumental
variable techniques and find that plastic money use significantly reduces tax
evasion while cash withdrawals appear to noticeably widen the compliance gap.
This paper contributes to the literature on the effect of modern means of payment
on tax compliance by using a more adequate measure of the VAT compliance gap
compared to earlier works and by accounting for potential confounders such as tax
policy choices and ex ante enforcement capacity of tax administrations to curb the
gap.
Keywords: cash restriction policies, credit and debit card use, plastic money,
VAT compliance gap, tax administrations
JEL classification: H26, K42
* Corresponding Author 1 Alognon: International Center for Public Policy, Department of Economics, Andrew Young School of Policy
Studies, Georgia State University; [email protected] 2 Koumpias: Department of Social Sciences, University of Michigan-Dearborn & Population Studies Center,
Institute for Social Research, University of Michigan, 4901 Evergreen Rd, SSB 2300, Dearborn, MI 48128 USA; +1
(313) 583-6555, [email protected] 3 Martinez-Vazquez: International Center for Public Policy, Department of Economics, Andrew Young School of
Policy Studies, Georgia State University; [email protected]
Acknowledgements: The authors are grateful to Jose M. Duran-Cabre and Alejandro Esteller-More for generously
sharing their data. All errors remain our own.
1
Introduction
In recent decades, several countries around the world have introduced policies to limit
cash use and incentivize the use of electronic means of payments in order to combat money
laundering, terrorism financing, and tax evasion. From 2005 to date, an increasing number of
European countries have introduced upper limits to cash payments. These cash restrictions range
from EUR 500 in Greece to EUR 15,000 in Poland. In Turkey, payments exceeding TL 8,000
and any rental payments over TL 500 must be made through the banking system or postal
offices. The most recent restriction is implemented by Spain, which has just lowered the limit of
cash payments from EUR 2,500 (enacted in 2012) to EUR 1,000. In the absence of express cash
restrictions, some countries require special reporting of cash payments. A marked example is the
Form 8300 system in the United States, which requires that any person engaged in a trade or
business who receives more than $10,000 in one transaction or several related transactions must
file a cash payment report to the Internal Revenue Service (IRS). This system is supposedly used
by the government to track tax evaders and individuals profiting from criminal activities.
Given all these examples of cash restriction policies, it is of paramount importance to
evaluate whether the belief that limiting cash transactions reduces tax evasion through increased
use of electronic means of payments holds empirically. Has the proliferation in credit and debit
card usage, or the use of other electronic forms of payments (“plastic money,” hereafter),
contributed to increased compliance with the consumption tax in the European Union (EU)? The
link between VAT compliance and plastic money is justified by the fact that plastic money is the
primary substitute to cash, and because plastic money transactions are traceable by tax
authorities, they are less prone to tax evasion than cash transactions. The question deserves
attention since the shift in norms and preferences regarding forms of payments presents an
2
excellent opportunity for tax administrations to close the consumption tax compliance gap either
directly by bringing previously unreported transactions into the tax net or by using newly
generated third-party information (Kleven et al., 2011).
Between 2000 and 2016, the average share of transactions cleared via plastic money in
the 26 EU countries increased from EUR 34.6 billion to EUR 111.9 billion. In terms of nominal
GDP, this represents a growth from 9.3% to 19.5%. At the same time, tax administrations in the
EU, indeed around the world, have implemented a number of innovations aiming to capture
“hard-to-tax” tax bases, which would appear have improved overall tax compliance but which
have also confounded the potential impact of the shift in consumer preference in favor of plastic
money. Therefore, up to now it remains unclear how important the role of plastic money has
been in narrowing the observed tax compliance gap in the EU. Obtaining an answer to this
question would be helpful also to other countries, especially developing countries, struggling
with tax enforcement issues.
The seminal paper by Pomeranz (2015) on the importance of third-party information in
the context of the VAT establishes the first-order deterrence effect of the paper trail generated by
transactions between firms in Chile. Some other works also investigated this research question.
First, Madzharova (2014) studied the impact of cash and card transactions on VAT collection
efficiency in the European Union (EU) member states from 2000 to 2010 and found no
statistically significant effect of card payments on tax revenue performance. Second,
Hondroyiannis and Papaoikonomou (2018) analyzed the effect of card payments on VAT
revenue in 19 European Monetary Union (EMU) countries using panel quarterly information
from 2003 to 2016. These authors find that a larger share of card payments in private
consumption expenditure increases VAT revenue in the EU as a whole. Finally, Immordino and

3
Russo (2018) find some evidence of a positive effect of credit and debit card payments on VAT
compliance while they show that ATM cash withdrawals increase VAT evasion.
The first contribution of this study, relative to Madzharova (2014) and Hondroyiannis
and Papaoikonomou (2018), lies in the use of a less broad measure of VAT gap that is much
more closely related to tax compliance. First, the dependent variable or observed outcome in our
analysis is the VAT compliance gap as opposed to the VAT Revenue Ratio (VRR) and VAT
revenue used in pre-existing literature. This is computed as the difference between expected and
realized tax revenues and may be interpreted as foregone tax revenues net of parameters that
determine expected tax revenues such as tax rates.1 The VAT compliance gap is less susceptible
to the inclusion or exclusion of observable factors that can be accounted for (manipulation bias)
as well as unobservable confounding variation from other factors that influence revenue
collection, such as changes in tax administration quality or enforcement capacity, which we may
fail to capture fully (omitted variable bias), or partly (measurement error). The fact that our
outcome is pre-determined by the reports of the Directorate General for Taxation and Customs
Unions (DG TAXUD) safeguards against the arbitrary choice of explanatory variables that
would introduce manipulation bias into our results. Furthermore, even observable factors such as
exemptions and zero-rates cannot be easily accounted for when using aggregate (national) level
data. In the prior literature, these correlations had been relegated to the error term leading to
omitted variable bias, whereas in our study, they are captured by the outcome variable by
definition. Even though Immordino and Russo (2018) employ appropriate measures of VAT
1 The estimated VAT gaps are defined as the difference between expected VAT revenues according to the law and
actual VAT collections. This includes “foregone VAT revenue from to tax fraud, tax evasion and tax avoidance.
Moreover, the tax gap also incorporates revenues losses from bankruptcies, financial insolvency and errors.”
(source: https://ec.europa.eu/taxation_customs/business/tax-cooperation-control/vat-gap_en)
4
compliance gap, they estimate the effect of one means of payment at a time without accounting
for variations in the other means of transactions. Besides, they do not control for public
authorities’ efforts toward reducing the gap, which may blur their estimates. These potential
causes of omitted variable bias can cloud their estimates. Finally, with the availability of more
recent data, it seems necessary to assess whether their findings are stable over time since the last
observation in their analysis dates back to 2012.
We exploit variation in time and space of credit and debit card usage across 26 EU
member states from 2000-16 using panel data and instrumental variable techniques to identify
the effect of plastic money on VAT compliance. We find that an increase in the share of plastic
money used for consumption expenditures is associated with a significant decrease in the VAT
gap. The policy implications of our results are twofold. First, they highlight the role that supply-
side innovations such as the use of plastic money can play in assisting the compliance efforts of
tax administrations around the world with limited capacity. Second, they demonstrate the
limitations of some forms of third party reporting in improving consumption tax compliance.
The remainder of the paper is organized as follows. The next section succinctly reviews
the broad literature on the determinants of VAT compliance as well as the specific literature on
the effect of plastic money on VAT compliance. The third section describes the data, provides
some key summary statistics and delineates the empirical framework. The fourth section presents
and discusses the results, while the last section concludes.
Literature Review
Several studies have empirically examined the economic, social and institutional
determinants of VAT compliance. While some studies analyzed the determinants of VAT
revenues rather than measures of VAT non-compliance, per se, one needs to be cautious in
5
comparing the results of these two groups of studies because VAT revenues and VRR reflect not
only the effect of non-compliance but also the impact of policy choices on tax structure such as
exemptions, reduced rates on certain transactions, etc. We first review studies on the
determinants of VAT compliance gap to circumscribe the universe of potential control variables
and then focus on papers that investigate the effect of card payments on VAT revenue or
measures of VAT efficiency.
In a pioneering work, albeit limited in statistical power and econometric methodology
from the present perspective, Agha and Haughton (1996) constructed an index of VAT
compliance for a cross-section of 17 OECD countries in 1987 and regressed it on characteristics
of the countries and their VAT rates. The index was set as the ratio of actual VAT to potential
VAT, analogous to the VRR. They find that a higher VAT rate is associated with lower
compliance, and that compliance is considerably lower with multiple VAT rates. The study also
suggests that VAT compliance increases the longer VAT has been introduced.
Studying the factors that determine VAT fraud in Italy from 1982 to 2001, Otranto,
Pisano and Polidoro (2003) find that VAT evasion is positively affected by variables such as the
GDP, the share of the fiscal burden, and the ratio of gross profits over value added. However, it
is negatively associated with the number of taxpayers audited in the previous year by public
authorities. Christie and Holzner (2006) examine data for 29 European countries over the period
2000-2003. Their analysis reveals that higher VAT rates reduce VAT compliance whereas
greater judicial and legal effectiveness improve compliance.
Another seminal study devised to quantify and analyze the VAT gap was the one
commissioned by the Directorate General for Taxation and Customs Unions (DG TAXUD) of
the European Commission and executed by Reckon (2009). Investigating the relationship

6
between the estimated VAT compliance gap and some economic and institutional variables, the
report reveals that VAT gaps were significantly higher in countries with higher perceived levels
of corruption. However, the study does not find robust statistical evidence of an association
between the compliance gap and economic variables such as the sectoral composition of the
economy, the GDP per capita, the level of taxation (VAT standard rate and theoretical VAT
liability as a proportion of GDP), etc. One methodological issue with the Reckon report is that it
relies on a random effect estimator, which assumes that unobserved country-specific differences
that determine taxpayer compliance are random and thus uncorrelated to the explanatory
variables of interest. This approach may suffer from omitted variable bias and is therefore
unlikely to produce reliable estimates of the determinants of the VAT gap. Aware of this possible
limitation, the recent study commissioned by the DG TAXUD and conducted by the Center for
Social and Economic Research (CASE) used a fixed effect estimation technique to quantify and
analyze the drivers of the VAT compliance in European countries. The final report released in
2018 suggests that the productive structure of the economy affects the VAT compliance gap with
the biggest effect due to the retail sector. This means that the larger the share of the retail sale
sector in the economy, the larger is the gap. It also reveals a positive correlation between
unemployment as a proxy of liquidity constraints and the level of the compliance gap. However,
the report does not find a consistent effect of the scale of the tax administration on the VAT
compliance gap. From the regressions that include subsets of the explanatory variables, the
authors find that higher administration costs lead to lower compliance gaps. However, once all
the explanatory variables are introduced in the regression analysis, the study finds a positive, U-
shaped association between the scale of the tax administration and the compliance gap,
suggesting that higher administration expenditures hinder tax compliance up to a certain

7
threshold and then become productive. This last finding seems counterintuitive and will be tested
in this study.
Turning to studies that examined the effect of card payments on VAT revenue or VAT
efficiency measures, a few works closer to this paper are those by Madzharova (2014),
Hondroyiannis and Papaoikonomou (2017, 2018), and Immordino and Russo (2018).
Hondroyiannis and Papaoikonomou (2017) analyze the effect of card payments on VAT revenue
after Greek authorities imposed restrictions on cash withdrawals in July 2015. They find that a 1-
percentage point increase in the share of credit card payments in private consumption results in
approximately 1-percent increase in VAT revenue. In their 2018 paper, the authors examine the
relationship using quarterly panel data for the 19 Euro area economies from 2003-16 and find
that increasing the share of credit card payments in private consumption expenditure improves
VAT revenue in the area. Moreover, they show that gains from increased credit card use are
decreasing in baseline card use and revenue efficiency levels while increasing in the share of
self-employed individuals in the labor force. The largest gains are reported for Greece and Italy.
Earlier on, Madzharova (2014) investigates the impact of cash and card transactions on VAT
collection efficiency in the European Union member states from 2000 to 2010 and finds no
statistically significant effect of card payments on tax revenue performance but shows that cash
usage has a consistent negative effect on VAT efficiency. A serious potential concern with those
studies is that they use observed VAT revenue or VRR as their measure of tax revenue efficiency
without controlling in their estimations for contemporaneous tax policy changes such as
exemptions, reduced rates or zero-rates on certain transactions, the enforcement capacity of the
tax administration, etc. Some of these factors cannot even be easily accounted for when using
aggregate (national) level data. This situation can lead to omitted variable bias in the estimates
8
reported in these papers. In fact, tax fraud and tax evasion account for only a fraction of the
entire VAT gap. The remaining portion of the total gap is due to tax structure policy decisions –
the legal gap – which varies widely across space and time. In a nutshell, by using improper
measures of tax compliance efficiency, these studies are limited in tracing out the effect of
plastic money on tax compliance since the policy gap varies widely within a country and across
countries. In this respect, Madzharova herself acknowledges that, ideally, one should use the
compliance ratio. She however noted that this “entails the calculation of the theoretical tax
revenue from actual tax law, or VAT revenue under full compliance, which is a daunting task,
inevitably prone to error.” That said, the present paper has the comparative advantage of using
VAT compliance gaps computed through the joint effort of a dozen research institutions in the
framework of the study commissioned by the DG TAXUD in 2015 on the VAT gap in the EU
member states. The latest paper that investigates this question is from Immordino and Russo
(2018). Even though these authors use appropriate measures of VAT compliance gap, the fact
that they evaluate the effect of one means of payments (either cash or card) at a time while
abstracting from the other means of transactions can pose the problem of omitting a relevant
regressor given that the two types of transactions are strongly correlated. In fact, economic
agents do not perform only card payments or only cash transactions. The majority of agents does
both, and both are present at the same time in the economy and are related (complements or
substitutes). Hence, the effect of the use of one means of payments on the compliance gap should
be conditional on the use of the other one. That said, this study can also suffer from omitted
variable bias even if it analyzes the right outcomes. Moreover, the authors also fail to account for
ex ante efforts made by public authorities to reduce the VAT gap, which can cast doubt on their
estimates. For example, stronger tax administrations may advocate in favor of severe cash
9
restriction policies in order to curb the gap. This can lead, once again, to omitted variable bias
issue in their analysis. Finally, our study provides a robustness check of Immordino and Russo
(2018) by extending the sample size to more recent country observations.
Data and Empirical Analysis
This section first describes the data utilized in this study and presents some key summary
statistics on VAT compliance gap and plastic money use in the EU. Then it discusses the
methodology employed to tease out the effect of plastic money use on the compliance gap.
Data
The data utilized in this study stem from several sources and cover the period 2000 to
2016. Our empirical exercise focuses on the effect of proliferation in credit and debit card use on
consumption tax compliance, namely VAT compliance. The measures of VAT gap utilized are
the VAT gap in EUR, the VAT gap as share of GDP, and the VAT gap as share of Value-Added
Total Tax Liability (VTTL), which proceed from the 2013 and 2018 final reports on the VAT gap
in the European Union member states (TAXUD, 2018). These data are available for all the 26
countries from 2000 to 2016.
Our first key explanatory variable is the value of card transactions by all cards issued in
the reporting country as a share of GDP. Card payments cover the period 2000-16 for all the
countries but Bulgaria, Luxembourg, and Slovakia for which they are available from 2001, and
Spain where they stem from 2002. The second main regressor is the ratio of cash withdrawals to
GDP. The GDP data proceed from Eurostat database, while card payments and cash transactions
are drawn from the European Central Bank (ECB) data warehouse. A more precise proxy for
cash transactions would be the sum of the value of automatic teller machine (ATM), over-the-
10
counter (OTC), and point-of-sale (POS) cash withdrawals. However, there are a lot of missing
values on these variables for each country at different points in time. Hence, the total cash
transactions constructed as the sum of ATM, OTC, and POS withdrawals may not be a good
proxy for cash transactions. Therefore, we use ATM cash withdrawals (pertaining to cards issued
in the reporting country), which have less missing observations to approximate cash transactions.
We also obtain from the ECB information on the number of ATM per million inhabitants.
Expected efforts made by the tax administration to close the VAT gap ex ante can also
have a deterrent effect on private agents’ tax compliance behavior. These efforts can be driven
by the scale of the tax administration (measured as the ratio of total administrative costs over
GDP), the share of information and technology expenditures in total administrative costs, as well
as the level of public indebtedness measured by the ratio of public deficit to GDP. We therefore
account for these 3 variables to proxy the effect of the tax administration on voluntary tax
compliance, controlling for them in a lagged form to reflect expectations. The data on the scale
of the tax administration and IT expenditures stem from the OECD data bank while the ratio of
public deficit to GDP comes from Eurostat.
One factor supposed to shape tax morale, and thus potentially tax compliance, is age
structure. In fact, the literature on tax morale finds that older people exhibit higher tax morale,
which is commonly explained as they being more aware of the benefits of adopting a prosocial
behavior (Leonardo et al., 2016). The variable used to proxy tax morale is the share of people
over 50 years old in the population obtained from Eurostat database. In addition, the less
effective use of public resources by the government, the perception of private economic agents
about the poor performance of public authorities, and liquidity constraints can create incentives
to free ride and avoid tax payment (Godin and Hindriks, 2015). To account for the quality of

11
government, this paper utilizes the World Bank’s government effectiveness indicator. Besides,
we control for the unemployment rate obtained from Eurostat to proxy for liquidity constraints
and the business cycle. We also account for over time cross-country differences in payment
habits that depend on the level of economic development by controlling for the GDP per capita.
Tax evasion can also depend on the productive structure of the economy in the sense that some
sectors (like wholesale and retail trade) may be more prone to tax evasion than others (like real
estate). Therefore, we control for the percentage share of the following sectors in the gross value-
added (VA): wholesale and retail trade, transport, accommodation and food service activities
(probably the key sector subject to tax evasion), as well as real estate, construction, industry,
information and communication, and art and entertainment. Sectors that are exempted from
VAT, namely health, education, or financial services, are excluded. These series as well as those
on GDP per capita and population size are obtained from the Eurostat data bank. Finally, private
agents’ tax compliance behavior can be affected by prevailing VAT rates. However, VAT rates
do not change very often. Hence, their impact on the compliance gap would be subsumed in
country-specific heterogeneities. Following the 2018 TAXUD report, we control instead for the
dispersion of tax rates (within a country), which provide incentives and opportunities for
evasion, and the information for which was generously provided by the authors of the 2018
TAXUD report. Some of the control variables also record missing values for some countries in
specific years. Given all that, our dataset is an unbalanced panel covering the period 2000-16.
12
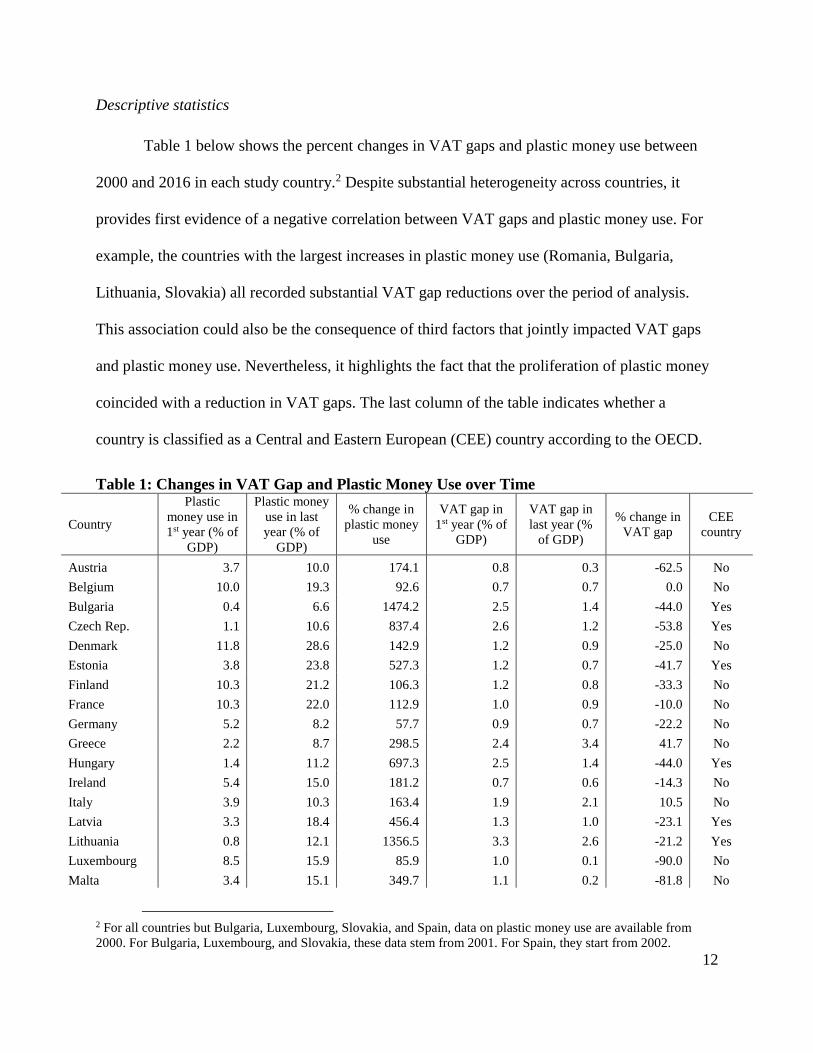
Descriptive statistics
Table 1 below shows the percent changes in VAT gaps and plastic money use between
2000 and 2016 in each study country.2 Despite substantial heterogeneity across countries, it
provides first evidence of a negative correlation between VAT gaps and plastic money use. For
example, the countries with the largest increases in plastic money use (Romania, Bulgaria,
Lithuania, Slovakia) all recorded substantial VAT gap reductions over the period of analysis.
This association could also be the consequence of third factors that jointly impacted VAT gaps
and plastic money use. Nevertheless, it highlights the fact that the proliferation of plastic money
coincided with a reduction in VAT gaps. The last column of the table indicates whether a
country is classified as a Central and Eastern European (CEE) country according to the OECD.
Table 1: Changes in VAT Gap and Plastic Money Use over Time
Country
Plastic
money use in
1st year (% of
GDP)
Plastic money
use in last
year (% of
GDP)
% change in
plastic money
use
VAT gap in
1st year (% of
GDP)
VAT gap in
last year (%
of GDP)
% change in
VAT gap
CEE
country
Austria 3.7 10.0 174.1 0.8 0.3 -62.5 No
Belgium 10.0 19.3 92.6 0.7 0.7 0.0 No
Bulgaria 0.4 6.6 1474.2 2.5 1.4 -44.0 Yes
Czech Rep. 1.1 10.6 837.4 2.6 1.2 -53.8 Yes
Denmark 11.8 28.6 142.9 1.2 0.9 -25.0 No
Estonia 3.8 23.8 527.3 1.2 0.7 -41.7 Yes
Finland 10.3 21.2 106.3 1.2 0.8 -33.3 No
France 10.3 22.0 112.9 1.0 0.9 -10.0 No
Germany 5.2 8.2 57.7 0.9 0.7 -22.2 No
Greece 2.2 8.7 298.5 2.4 3.4 41.7 No
Hungary 1.4 11.2 697.3 2.5 1.4 -44.0 Yes
Ireland 5.4 15.0 181.2 0.7 0.6 -14.3 No
Italy 3.9 10.3 163.4 1.9 2.1 10.5 No
Latvia 3.3 18.4 456.4 1.3 1.0 -23.1 Yes
Lithuania 0.8 12.1 1356.5 3.3 2.6 -21.2 Yes
Luxembourg 8.5 15.9 85.9 1.0 0.1 -90.0 No
Malta 3.4 15.1 349.7 1.1 0.2 -81.8 No
2 For all countries but Bulgaria, Luxembourg, Slovakia, and Spain, data on plastic money use are available from
2000. For Bulgaria, Luxembourg, and Slovakia, these data stem from 2001. For Spain, they start from 2002.
13
Netherlands 9.4 17.8 89.5 0.7 0.3 -57.1 No
Poland 1.3 11.8 806.5 1.4 1.9 35.7 Yes
Portugal 11.3 38.0 236.7 0.3 1.0 233.3 No
Romania 0.1 6.3 9357.6 4.6 3.6 -21.7 Yes
Slovakia 1.2 15.5 1148.2 2.6 2.3 -11.5 Yes
Slovenia 7.5 12.9 70.9 0.3 0.7 133.3 Yes
Spain 9.5 13.2 39.5 0.4 0.2 -50.0 No
Sweden 8.8 22.9 158.8 0.5 0.1 -80.0 No
UK 15.9 45.6 187.2 0.9 1.0 11.1 No
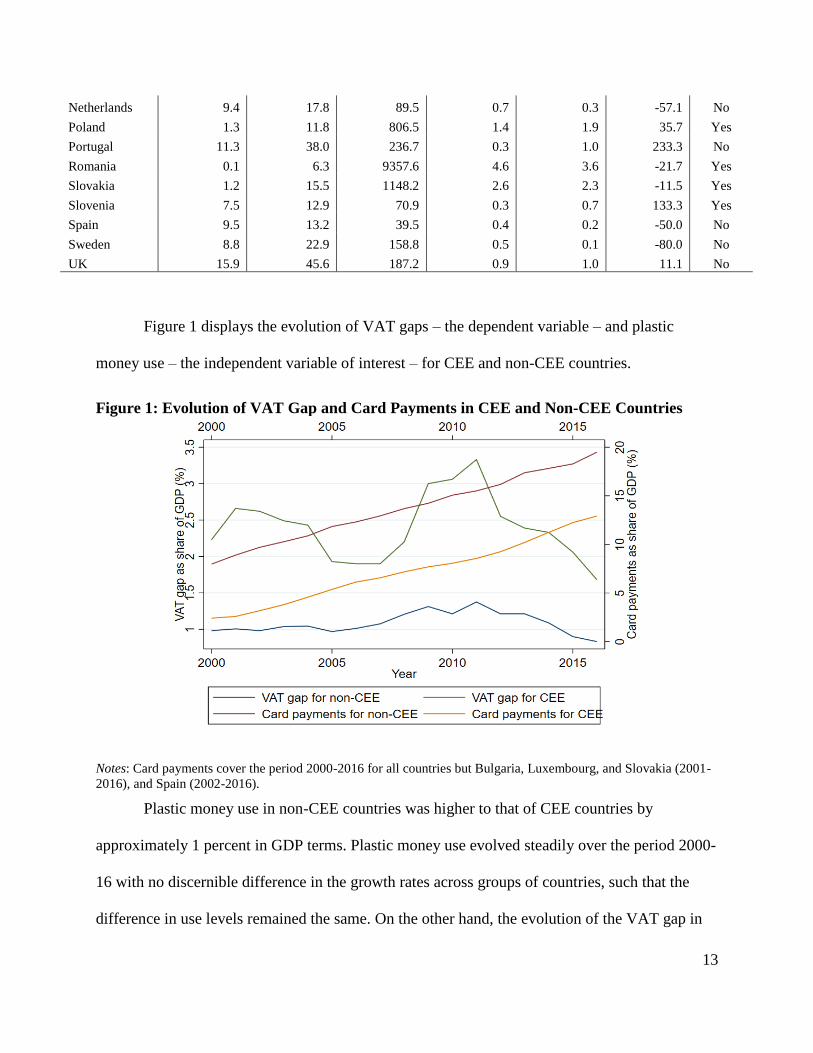
Figure 1 displays the evolution of VAT gaps – the dependent variable – and plastic
money use – the independent variable of interest – for CEE and non-CEE countries.
Figure 1: Evolution of VAT Gap and Card Payments in CEE and Non-CEE Countries
Notes: Card payments cover the period 2000-2016 for all countries but Bulgaria, Luxembourg, and Slovakia (2001-
2016), and Spain (2002-2016).
Plastic money use in non-CEE countries was higher to that of CEE countries by
approximately 1 percent in GDP terms. Plastic money use evolved steadily over the period 2000-
16 with no discernible difference in the growth rates across groups of countries, such that the
difference in use levels remained the same. On the other hand, the evolution of the VAT gap in

14
percentage of GDP exhibited more variance, as VAT gap recorded sizable increases from 2008-
11 and which were more exaggerated in CEE countries. This coincided with the EU public debt
crisis that might have put pressure on tax administrations toward increasing tax revenues. Thus,
the subsequent steep decline in VAT gap could be interpreted as the response to the public debt
crisis by governments around the EU in the form of stronger tax enforcement. This is a potential
confounder of our estimation results. Our regression model therefore controls for changes in
public deficits as well as ex-ante endeavors of tax administrations to curb the compliance gap.
The sample of CEE countries also recorded an increase in the VAT gap in 2001, which could be
linked to contagion effects from the 2001 financial crisis in Russia and also contribute to blur the
estimation results. In the econometric framework, we account for this by including in the
regressions year fixed heterogeneities that differentially affect CEE countries relative to their
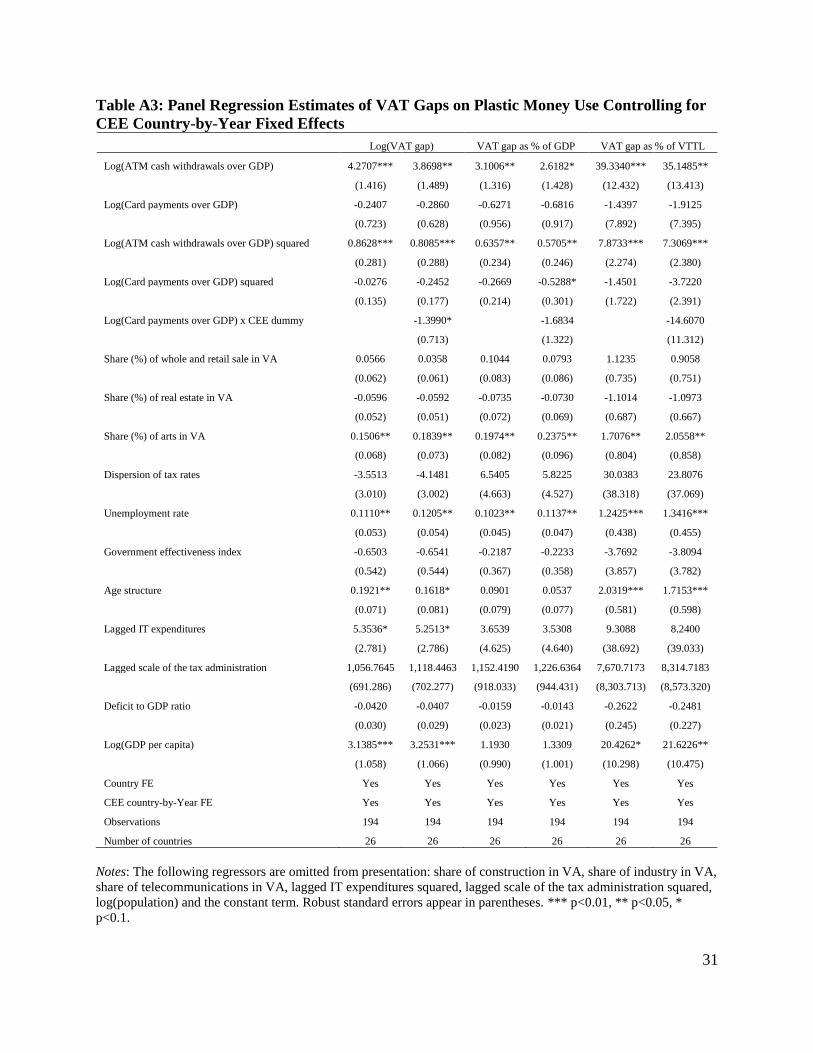
non-CEE counterparts. Table A3 in the Appendix shows that our regression results are robust to
the inclusion of CEE country-by-year fixed effects.
Empirical strategy
To identify the effect of plastic money on VAT compliance, this study exploits
spatiotemporal variations in credit/debit card usage over time across different EU member states
in a fixed effect (FE) panel regression framework. An advantage of the FE estimation technique
is that it allows country-specific time-invariant unobservables to be correlated with the
explanatory variables. The econometric model can be specified as follows:
𝑌𝑖𝑡 = 𝛽0 + 𝛽1𝑊1𝑖𝑡+𝛽2𝑊2𝑖𝑡 + 𝛽3𝑊1𝑖𝑡2 + 𝛽4𝑊2𝑖𝑡
2 + 𝑋𝑖𝑡𝜶 + 𝜇𝑖 + 𝜏𝑡 + 𝜖𝑖𝑡 (1)
where 𝑖 denotes the country, and 𝑡 represents the year; 𝑌𝑖𝑡 represents the outcome (VAT gap,
VAT gap as share of GDP, and VAT gap as share of VTTL); 𝑊1𝑖𝑡 is the main explanatory
15
variable, defined as the logged total value of residents’ card payments as share of GDP; 𝑊2𝑖𝑡
represents the logged ATM cash withdrawals as share of GDP; 𝑋𝑖𝑡 denotes the set of control
variables (incentives created by the tax administration, government effectiveness, productive
structure of the economy, tax morale, GDP per capita, etc.) discussed above in the next
subsection. We include these regressors as they have been pre-identified as determinants of VAT
gaps in the literature (TAXUD, 2018). Some control variables, namely cash withdrawals as share
of GDP, population and GDP per capita, enter the model in their logarithm form. We test for a
non-linear relationship between some regressors (cash withdrawals over GDP, card payments
over GDP, scale of the tax administration, and IT expenditures) and the outcomes by including
their quadratic terms in the models. However, for brevity, only some control variables are shown
in the regression tables. (The full regression results are available upon request.) To reflect
expectations, the scale of the tax administration and IT expenditures are lagged. The term
𝜇𝑖 captures time-invariant country-specific heterogeneities that affect tax compliance, while 𝜏𝑡
accounts for year-specific effects such as macroeconomic factors that affect indifferently tax
compliance in the European economies under study; 𝜖𝑖𝑡 represents the idiosyncratic disturbance,
while 𝛽1 and 𝛽2 identify respectively the effect of plastic money use and cash transactions on tax
compliance.
A potential concern with the model specified by equation (1) is that the choice to use a
specific means of transactions may be endogenous to tax evasion. In fact, as noted by Immordino
and Russo (2017, 2018), the seller might offer a price discount to the buyer in exchange for
paying cash, which incentivizes tax evasion. Therefore, we should observe more cash
transactions where this form of collaborative tax evasion is more widespread (see Immordino
and Russo, 2017). To overcome this potential threat to identification, we resort to an

16
instrumental variable (IV) approach. Following these authors, we instrument card and cash
payments by the number of ATM per capita and the number of fixed broadband internet
connections per inhabitant. In fact, these variables can easily be thought as determining card and
cash transactions without directly affecting tax evasion. We refer the reader to Immordino and
Russo (2018) for any theoretical justification regarding the relevance of these instruments. We
consider as additional instrument the interaction term of these two instruments. Once again, a
major difference with Immordino and Russo (2018) lies in the fact that the authors considered
one means of payments at a time, yet both can be endogenous. Hence, in the first stage, both the
logged card payments and cash withdrawals as share of GDP are regressed on the set of
instruments and control variables (excluding scale of the tax administration and IT expenditures
but including country and year unobserved heterogeneities).
For the IV technique to be valid, a battery of tests needs to be performed. First, one needs
to test if the instruments are valid, i.e., if they are uncorrelated with the error process in the
structural equation. A rejection of the null hypothesis of the Hansen J statistic of
overidentification test casts doubt on the validity of the instruments. Second, we need to check if
the instruments are relevant, i.e., if they are sufficiently strong in predicting the endogenous
regressors. This is obtained through the test of weak identification which compares a Wald-type
F statistic to critical values tabulated by Stock-Yogo (2005). A rejection of the null hypothesis
suggests that the model is not weakly identified. Since we allow for heteroskedastic errors, the
Cragg-Donald Wald F statistic is no longer valid, and one needs to use instead the Kleibergen-
Paap Wald rank F statistic. This test is important because in the presence of weak instruments,
the loss of precision is severe, and IV estimates may even perform more poorly than the ones
obtained via Ordinary Least Squares (OLS). Hence, third, we need to assess whether the
17
potentially endogenous regressors should be treated as exogenous given the instruments. Under
homoskedasticity, this is equivalent to the Hausman test of IV estimates versus OLS estimates.
To account for possible bias in conventional estimated standard errors of regression
coefficients, we compute robust standard errors, which allow for serial within-country
correlation in the data.
Results
Data show a strong correlation between card payments and cash withdrawals. Therefore,
as stressed earlier, Immordino and Russo (2018) potentially suffers an omitted variable bias issue
since the effect of one means of payments on tax compliance is estimated without accounting for
the other means. We then examine a regression model that accounts for both means of
transactions as well as tax enforcement endeavors of public administrations. Table 2 below
displays the results of the cross-country fixed effect panel regressions. We consider three
different variations of the outcome, VAT gap. In columns (1)-(2), (3)-(4), and (5)-(6), the
dependent variables are respectively the logarithm of the VAT gap, the VAT gap as percent of
GDP and the VAT gap as percent of VTTL. Our preferred outcome variable is the VAT gap as
share of GDP since we can similarly normalize the key independent variable by GDP. Columns
(2), (4), and (6) report the estimates of regressions that include the size of the shadow economy
rather than ATM cash withdrawals. Table A2 in the Appendix shows the regression results when
we include an indicator for CEE countries and its interaction with card payment transactions as
additional explanatory variables. Note that the CEE dummy is absent from the reported results
since it is perfectly subsumed in country fixed effects.
18
Table 2: Fixed-effect Panel Regression Estimates of VAT gap on Plastic Money Use and All
the Control Variables
Log(VAT gap) VAT gap as % of GDP VAT gap as % of VTTL
(1) (2) (3) (4) (5) (6)
Log(Card payments over GDP) -0.0553 -1.1755 -0.4587 -0.6961 2.3568 -7.7430
(0.529) (0.708) (0.776) (0.913) (7.270) (6.695)
Log(Card payments over GDP) squared 0.0297 -0.1339 -0.2489 -0.2233 -0.4717 -2.0233
(0.117) (0.122) (0.167) (0.186) (1.721) (1.393)
Log(ATM cash withdrawals over GDP) 3.4765** 2.7128** 35.0636**
(1.505) (1.241) (12.613) Log(ATM cash withdrawals over GDP)
squared 0.7002** 0.5783** 7.0499***
(0.296) (0.220) (2.297)
Size of the shadow economy -0.1153* -0.0414 -0.9555
(0.057) (0.062) (0.563)
Share (%) of whole and retail sale in VA 0.0137 -0.0320 0.0917 0.0540 0.8464 0.4568
(0.064) (0.045) (0.082) (0.074) (0.703) (0.641)
Share (%) of real estate in VA -0.0899* -0.1063** -0.0730 -0.1217 -1.2876* -1.3382*
(0.050) (0.051) (0.072) (0.082) (0.684) (0.716)
Share (%) of arts in VA 0.1086 0.1701** 0.2372*** 0.2507*** 1.4238* 2.0410**
(0.074) (0.075) (0.060) (0.071) (0.743) (0.733)
Dispersion of tax rates -2.8626 -0.4246 3.4746 4.2930 16.2539 31.0421
(2.527) (2.378) (4.352) (4.206) (32.814) (34.862)
Unemployment rate (15-74 years) 0.0693 0.0948** 0.0988** 0.1256*** 1.0172*** 1.2157***
(0.042) (0.037) (0.036) (0.033) (0.318) (0.319)
Government effectiveness index -0.5951 -0.8134 -0.1988 -0.4402 -3.9275 -6.7699
(0.546) (0.526) (0.394) (0.341) (4.188) (4.003)
Age structure 0.0374 -0.0578 0.1356* 0.0185 1.2861* 0.3272
(0.080) (0.083) (0.076) (0.084) (0.709) (0.835)
Lagged IT expenditures 3.3629 2.5666 -0.6248 -1.3459 -21.3207 -34.7636
(2.362) (2.677) (3.488) (3.122) (29.015) (28.229)
Lagged scale of the tax administration 891.3981 -111.4967 905.6849 53.4335 6,220.1269 -205.3619
(646.483) (136.244) (827.461) (170.491) (7,180.280) (1,680.717)
Deficit to GDP ratio -0.0301 -0.0363 -0.0155 -0.0201 -0.1598 -0.2859
(0.035) (0.023) (0.023) (0.019) (0.254) (0.192)
Log(GDP per capita) 2.6903** 2.3090** 0.6824 17.4242 12.1635
(1.219) (0.999) (0.970) (10.661) (9.623)
Country FE Yes Yes Yes Yes Yes Yes
Year FE Yes Yes Yes Yes Yes Yes
R-squared 0.461 0.405 0.486 0.408 0.516 0.438
Observations 194 190 194 190 194 190
Number of countries 26 26 26 26 26 26
Notes: The following regressors are omitted from presentation: share of construction in VA, share of industry in VA,
share of telecommunications in VA, lagged IT expenditures squared, lagged scale of the tax administration squared,
log(population) and the constant term. Robust standard errors appear in parentheses. *** p<0.01, ** p<0.05, *
p<0.1.

19
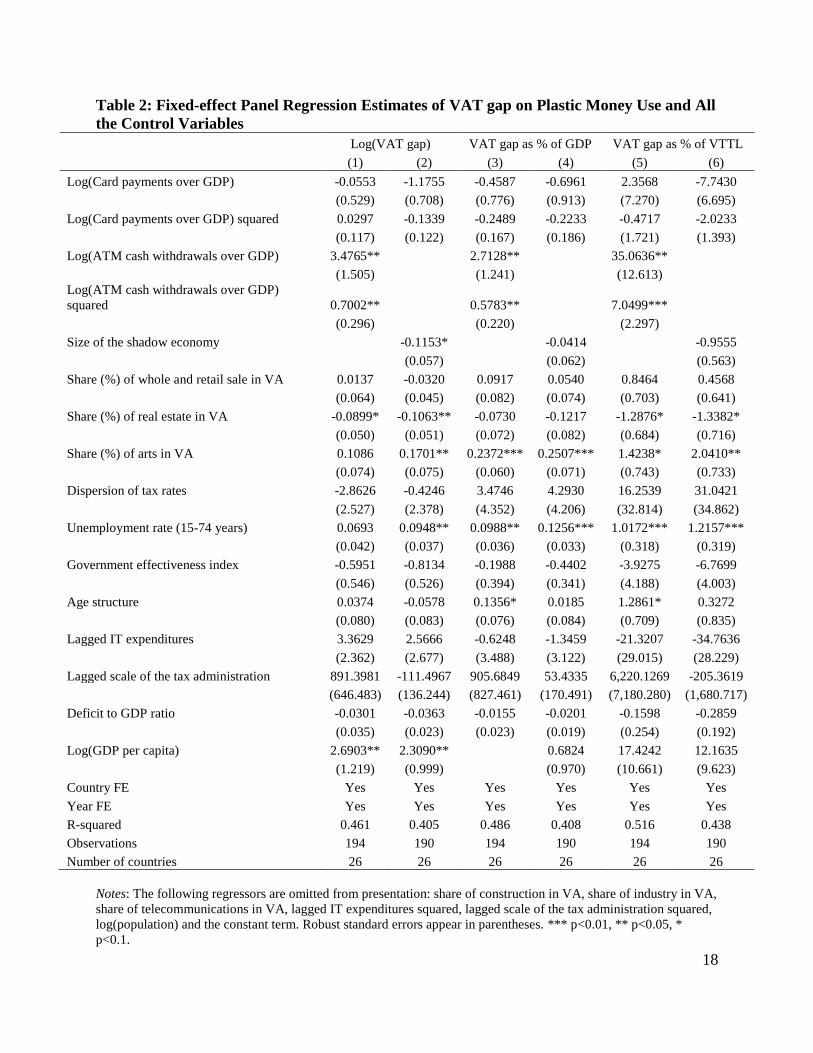
The estimates suggest a non-linear negative relationship between the VAT gap and
plastic money use, but one that is not precisely estimated. Increased use of card payment means
is associated with lower VAT gaps which are reduced at a decreasing rate. Specifically, the
estimated coefficients of logged total card payments by GDP have the expected negative sign
across almost all the specifications but are not statistically significant. This overall result is
consistent with Madzharova (2014) and the OLS results of Immordino and Russo (2018) who
find no impact of card payments on VAT collection efficiency. However, this result is not in line
with Hondroyiannis and Papaoikonomou (2018) who find that the share of card payments in
private consumption expenditure improves VAT tax compliance in the 19 Euro area economies.
In addition, we find that ATM cash withdrawals contribute to increased VAT gaps, as
expected, in a statistically significant way. These results are robust to all three measures of VAT
gap employed, i.e., logarithm of VAT gap, VAT gap as a percentage of GDP and VAT gaps as a
percentage of VTTL. This result also corroborates Madzharova (2014) and Immordino and
Russo (2018) who show that VAT revenue collection decreases with increase in cash use.
However, as extensively discussed earlier, our findings are not directly comparable to these
previous works because they were interested in the effect of card payments on broader measures
of VAT revenue collection efficiency rather than VAT compliance gap per se or because the
underlying model differs from ours.
It also appears that the productive structure of the economy is a key determinant of tax
compliance. In fact, the OLS estimates show that an increased share of the real estate sector in
the total value added of the economy is associated with lower VAT gaps or VAT gaps as a
percentage of VTTL. This could be explained by the fact that real estate transactions typically
involve substantial amount of money in which case the use of cash is nearly prohibitive, if not
20
actually outlawed. Moreover, those transactions involve extensive paper trail in the form of
contracts and land registration. On the other hand, an increased share of the arts industry in the
total value added of the economy translates into higher VAT gaps. Following the same
reasoning, this is also expected given that this industry is comprised of self-employed individuals
and does not necessarily generate a significant paper trail, if any. Moreover, art purchases are a
customary avenue for tax evasion and money laundering; so much so that the European
Parliament issued regulations that would gradually eliminate the system of “freeports” (venues
that store art and other valuable tax-free) in its efforts to combat tax evasion (Korver, 2018).3
Next, we find that the unemployment rate has a large, positive and very precise
association with all measures of VAT gap. Again, this is not surprising given that the
unemployment rate is directly related to the size of the shadow economy which has been
typically found to increase tax evasion and thus the tax compliance gap. Lastly, the naïve OLS
estimates suggest a positive and somehow statistically significant relationship between the GDP
per capita and the level VAT gap. However, this is not confirmed when using the VAT gap as
share of VTTL. It is not immediately obvious why; a potential explanation might be that
increased per capita income would lead to more consumption spending and, thus, to increased
opportunities to evade a consumption tax such as the VAT. Nevertheless, this striking finding
needs to be documented by future research.
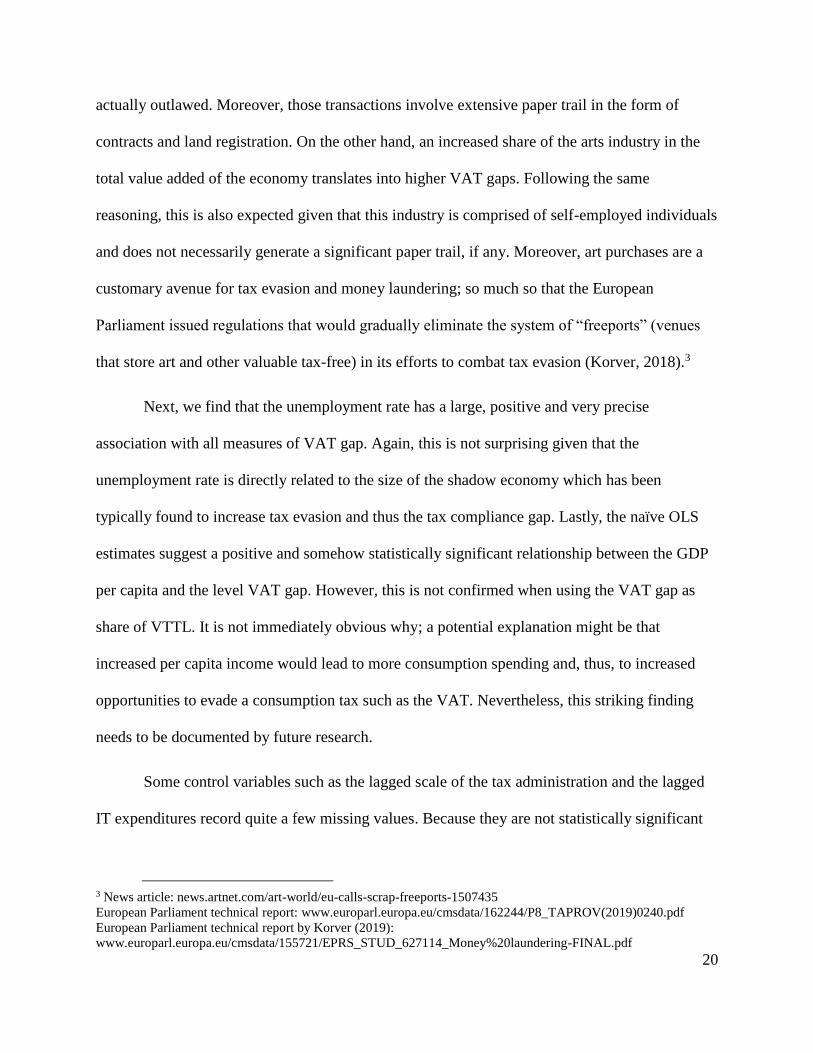
Some control variables such as the lagged scale of the tax administration and the lagged
IT expenditures record quite a few missing values. Because they are not statistically significant
3 News article: news.artnet.com/art-world/eu-calls-scrap-freeports-1507435
European Parliament technical report: www.europarl.europa.eu/cmsdata/162244/P8_TAPROV(2019)0240.pdf
European Parliament technical report by Korver (2019):
www.europarl.europa.eu/cmsdata/155721/EPRS_STUD_627114_Money%20laundering-FINAL.pdf

21
(Table 2), we drop them from the list of regressors and estimate a nearly balanced panel
regression model to improve the sample size, hence the precision of the estimates. Table 3 shows
the results of this exercise.
Table 3: Fixed-effect Panel Regression Estimates of VAT Gap on Plastic Money Use and a
Subset of Control Variables
Log(VAT gap) VAT gap as % of GDP
VAT gap as % of
VTTL
(1) (2) (3) (4) (5) (6)
Log(Card payments over GDP) 0.3060 -0.1540 1.0818* 0.8290 11.2173* 9.9840
(0.466) (0.482) (0.607) (0.720) (5.546) (6.726)
Log(Card payments over GDP) squared 0.0343 -0.0337 0.1189 0.0708 1.3982 1.0624
(0.075) (0.075) (0.107) (0.110) (0.989) (1.034)
Log(ATM cash withdrawals over GDP) 3.3494*** 2.7061** 30.7088***
(0.897) (1.041) (9.131) Log(ATM cash withdrawals over GDP)
squared 0.6909*** 0.5454*** 6.4030***
(0.185) (0.184) (1.634)
Size of the shadow economy -0.1065** -0.0063 -0.2105
(0.047) (0.044) (0.460)
Share (%) of whole and retail sale in VA -0.0148 -0.0463 -0.0642 -0.0807 -0.0178 -0.2735
(0.036) (0.033) (0.046) (0.048) (0.319) (0.334)
Share (%) of real estate in VA -0.0978 -0.0878 -0.0610 -0.0486 -0.6798 -0.5288
(0.068) (0.063) (0.062) (0.064) (0.561) (0.598)
Share (%) of arts in VA -0.0893 -0.0439 -0.0091 0.0215 -0.4700 -0.0887
(0.062) (0.056) (0.047) (0.056) (0.481) (0.539)
Dispersion of tax rates -2.7909 -2.0648 0.3384 1.5624 -2.3190 8.5301
(1.856) (1.735) (2.191) (2.054) (20.669) (19.479)
Unemployment rate 0.0334* 0.0539** 0.0616* 0.0606* 0.5874** 0.5928**
(0.018) (0.021) (0.031) (0.031) (0.244) (0.253)
Age structure 0.1116* 0.0558 0.2041*** 0.1606*** 1.5998** 1.2173**
(0.062) (0.045) (0.058) (0.056) (0.581) (0.519)
Deficit to GDP ratio -0.0343* -0.0256 -0.0381* -0.0330 -0.3628* -0.3158
(0.019) (0.018) (0.020) (0.020) (0.188) (0.189)
Log(GDP per capita) 1.1575*** 0.6318 5.1300 0.0172
(0.402) (0.599) (4.319) (6.124)
Country FE Yes Yes Yes Yes Yes Yes
Year FE Yes Yes Yes Yes Yes Yes
R-squared 0.366 0.348 0.380 0.306 0.372 0.275
Observations 371 364 371 364 371 364
Number of countries 25 26 25 26 25 26
22
Notes: The following regressors are omitted from presentation: share of construction in VA, share of industry in VA,
share of telecommunications in VA, log(population) and the constant term. Robust standard errors appear in
parentheses. *** p<0.01, ** p<0.05, * p<0.1.
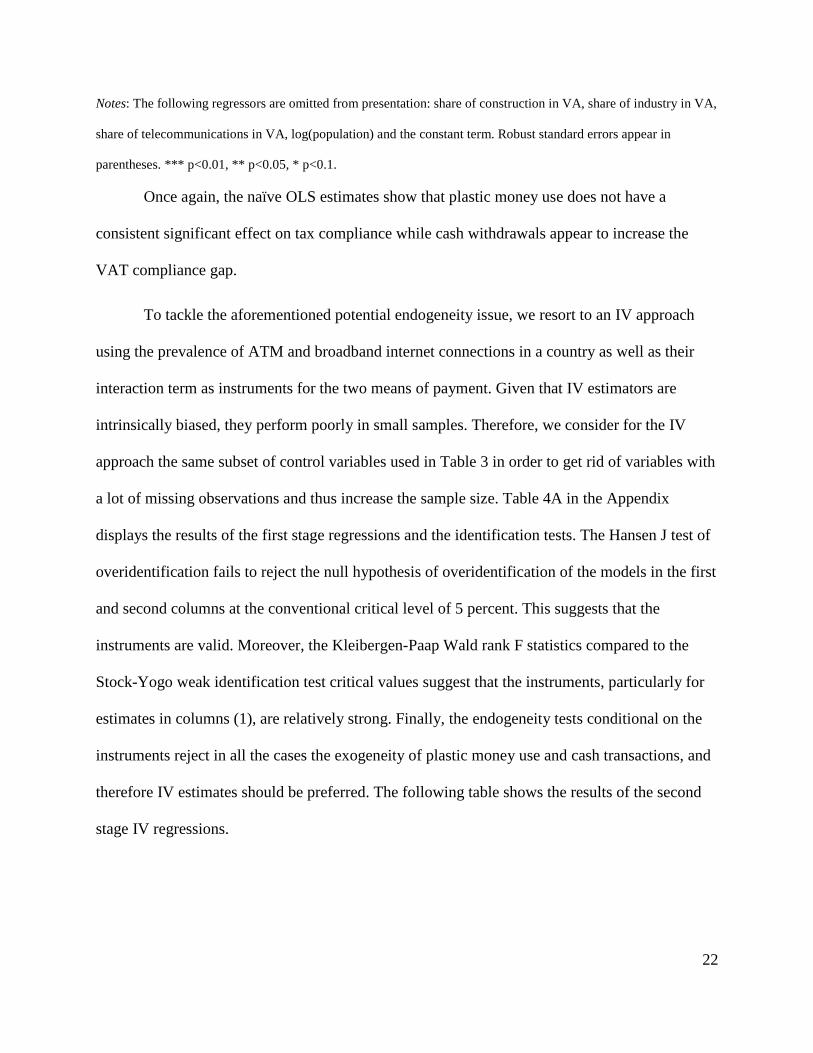
Once again, the naïve OLS estimates show that plastic money use does not have a
consistent significant effect on tax compliance while cash withdrawals appear to increase the
VAT compliance gap.
To tackle the aforementioned potential endogeneity issue, we resort to an IV approach
using the prevalence of ATM and broadband internet connections in a country as well as their
interaction term as instruments for the two means of payment. Given that IV estimators are
intrinsically biased, they perform poorly in small samples. Therefore, we consider for the IV
approach the same subset of control variables used in Table 3 in order to get rid of variables with
a lot of missing observations and thus increase the sample size. Table 4A in the Appendix
displays the results of the first stage regressions and the identification tests. The Hansen J test of
overidentification fails to reject the null hypothesis of overidentification of the models in the first
and second columns at the conventional critical level of 5 percent. This suggests that the
instruments are valid. Moreover, the Kleibergen-Paap Wald rank F statistics compared to the
Stock-Yogo weak identification test critical values suggest that the instruments, particularly for
estimates in columns (1), are relatively strong. Finally, the endogeneity tests conditional on the
instruments reject in all the cases the exogeneity of plastic money use and cash transactions, and
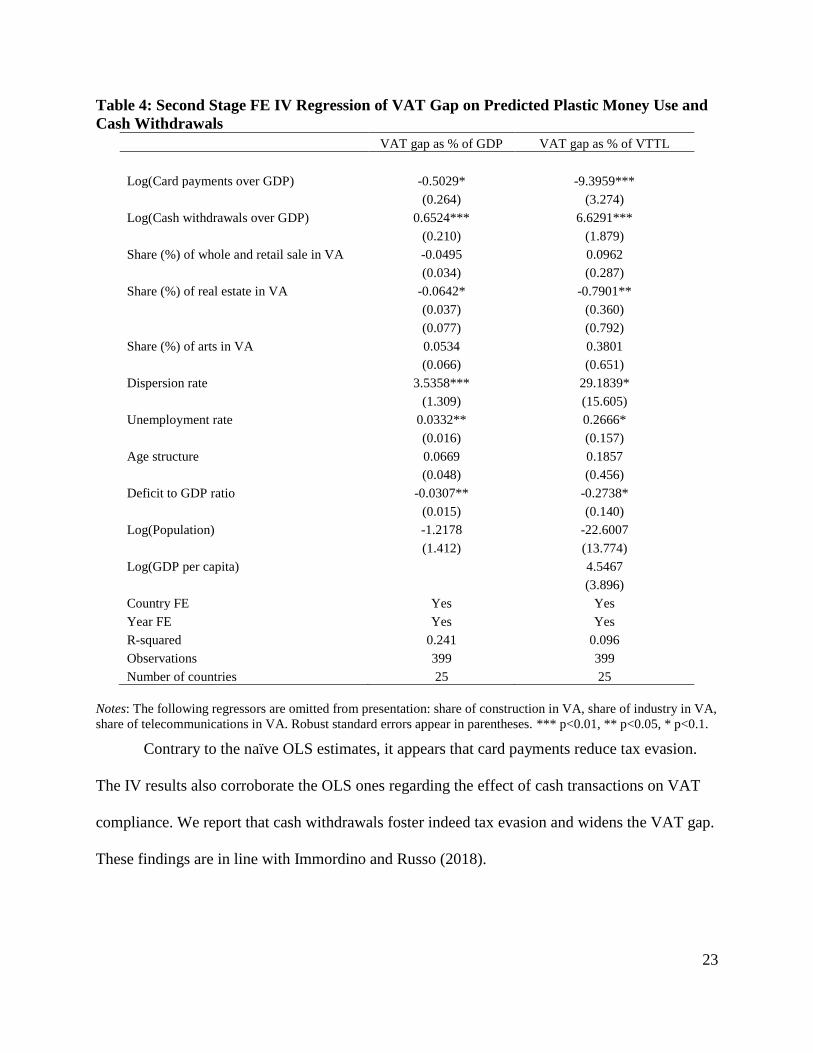
therefore IV estimates should be preferred. The following table shows the results of the second
stage IV regressions.
23
Table 4: Second Stage FE IV Regression of VAT Gap on Predicted Plastic Money Use and
Cash Withdrawals
VAT gap as % of GDP VAT gap as % of VTTL
Log(Card payments over GDP) -0.5029* -9.3959***
(0.264) (3.274)
Log(Cash withdrawals over GDP) 0.6524*** 6.6291***
(0.210) (1.879)
Share (%) of whole and retail sale in VA -0.0495 0.0962
(0.034) (0.287)
Share (%) of real estate in VA -0.0642* -0.7901**
(0.037) (0.360)
(0.077) (0.792)
Share (%) of arts in VA 0.0534 0.3801
(0.066) (0.651)
Dispersion rate 3.5358*** 29.1839*
(1.309) (15.605)
Unemployment rate 0.0332** 0.2666*
(0.016) (0.157)
Age structure 0.0669 0.1857
(0.048) (0.456)
Deficit to GDP ratio -0.0307** -0.2738*
(0.015) (0.140)
Log(Population) -1.2178 -22.6007
(1.412) (13.774)
Log(GDP per capita) 4.5467
(3.896)
Country FE Yes Yes
Year FE Yes Yes
R-squared 0.241 0.096
Observations 399 399
Number of countries 25 25
Notes: The following regressors are omitted from presentation: share of construction in VA, share of industry in VA,
share of telecommunications in VA. Robust standard errors appear in parentheses. *** p<0.01, ** p<0.05, * p<0.1.
Contrary to the naïve OLS estimates, it appears that card payments reduce tax evasion.
The IV results also corroborate the OLS ones regarding the effect of cash transactions on VAT
compliance. We report that cash withdrawals foster indeed tax evasion and widens the VAT gap.
These findings are in line with Immordino and Russo (2018).
24
Conclusion
There is evidence that card payments’ traceability could enhance VAT compliance by
increasing the perceived probability of detection by the tax authorities, which enhances the
VAT’s deterrence effect (Pomeranz, 2015). This paper investigates the effect of payment
methods on valued-added tax compliance in EU countries. It differs from the earlier works first
by considering a more appropriate measure of the compliance gap that nets out the policy gap;
that is, the entire gap is not made up of tax fraud or evasion. Therefore, a concern with these
previous studies is the use of VAT revenue or VRR as a measure of tax revenue efficiency
without controlling in the regressions for the effect of policy choices on tax structure, the
enforcement capacity of the tax administration, etc. Some of these factors cannot even be easily
accounted for when using aggregate level data, possibly leading to omitted variable bias issue in
the estimates of these papers. Second, even though one of the previous works used the
appropriate measures of VAT gap, it examines the effect of one means of payment at a time, a
potential for omitted variable bias. In addition, using adequate measures of VAT compliance gap
along with more recent data enables us to obtain updated estimates of the relationship between
plastic money use and tax compliance.
Using a fixed effects panel data estimation and IV techniques on 26 EU countries from
2000 to 2016, we find that card payments statistically positively affect tax revenue collection
efficiency. At the antipodes of Hondriayiannis and Papaiokonomou (2018), the OLS result
confirms Madzharova (2014) and Immordino and Russo (2018), who find that plastic money use
does translate into more VAT revenue collection in a naïve OLS regression. Besides, this study
corroborates Madzharova (2014) and Immordino and Russo’s (2018) finding that ATM cash
transactions are associated with a significant reduction in VAT revenue collected. We argue that
25
our approach provides a more adequate assessment of the relationship between plastic money use
and VAT compliance gap by dealing simultaneously with both means of payments. We also
explore a potential endogeneity problem inherent to the choice of a specific means of
transactions, which could bias our cross-country analysis. In line with Immordino and Russo
(2018), we find evidence of the effect of credit and debit card payments on VAT compliance
gap. These results suggest that the increased use of plastic money led to gains in consumption tax
compliance.
To completely close the debate on this topic, a future research program would require
micro-level data or administrative records. In other fields, it has been documented that
aggregate-level analyses might be limited in power to estimate statistically significant effects
(Black et al., 2019). In addition, it would be interesting to explore the impact of the spike in the
use of electronic forms of payments due to the exogenous shift in norms in response to COVID-
19 that imposes confinement and social distancing. To investigate this, updated VAT gap
estimates are needed once member countries’ national administrations release their respective
end-of-year estimates.
26
References
Agha A. and Haughton J. (1996) “Designing VAT Systems: Some Efficiency Considerations,”
Review of Economics and Statistics, 78 (2): 303-08.
Allingham M. G. and Sandmo A. (1972), Income tax evasion: A theoretical analysis, Journal of
Public Economics, 1, 323-38.
Aizenman J. and Jinjarak Y., 2008, “The collection efficiency of the Value Added Tax: Theory
and international evidence,” Journal of International Trade and Development, Vol. 17,
pp.391-410.
Barbone L., Belkindas, M., Bettendorf L., Bird R., Bonch-Osmolovskiy, M., Smart, M. (2013),
Study to quantify and analyse the VAT Gap in the EU-27 Member States, Final Report of
project TAXUD/2012/DE/316.
Barbone L., Bonch-Osmolovskiy M., Poniatowski G. (2014), 2012 Update Report to the Study to
quantify and analyse the VAT Gap in the EU-27 Member States, Report of project
TAXUD/2013/DE/321.
Barbone L., Bonch-Osmolovskiy M., Poniatowski G. (2015), 2013 Update Report to the Study to
quantify and analyse the VAT Gap in the EU Member States, Report of project
TAXUD/2013/DE/321.
Black N., Stockings E., Campbell G., Tran L. T., Zadic D., Hall W. D., Farrell M., Degenhardt L.
(2019), Cannabinoids for the Treatment of Mental Disorders and Symptoms of Mental
Disorders: A Systematic Review and Meta-Analysis, Lancet Psychiatry. 2019;6(12):995–
1010.
Edward, C. and Holzner M. (2006), “What Explains Tax Evasion? An Empirical Assessment based
on European Data,” wiiw Working Papers 40.
FISCALIS Tax Gap Project Group. 2016, “The Concept of Tax Gaps; Report on VAT Gap
Estimations”, FPG/041, Directorate General for Taxation and Customs Union (TAXUD).
Godin M. and Hindriks J. (2015), A Review of critical issues on tax design and tax administration
in a global economy and developing countries, CRED-UNamur, Working Paper 7.
27
Hondroyiannis G. and Papaoikonomou D. (2017), The effect of card payments on VAT revenue:
New evidence from Greece, Economics Letters 157 (2017) 17–20.
Hondroyiannis G. and Papaoikonomou D. (2018), Fiscal structural reforms: the effect of card
payments on VAT revenue in the euro area, Bank of Greece’s Working Paper 249.
Immordino G. and Russo F. F. (2018), Cashless payments and tax evasion, European Journal of
Political Economy 55 (2018) 36–43.
Keen M. (2013), The Anatomy of the VAT, IMF Working Paper WP/13/111.
Keen M. and Smith S. (2006), VAT Fraud and Evasion: What Do We Know and What Can Be
Done?, National Tax Journal, Vol. LIX, No. 4.
Kleven, H. J., Knudsen, M. B., Kreiner, C. T., Pedersen, S., & Saez, E. (2011). Unwilling or unable
to cheat? Evidence from a tax audit experiment in Denmark. Econometrica, 79(3), 651-
692.
Leonardo, G. and Martinez-Vazquez, J., 2016. Politicians, bureaucrats, and tax morale: What
shapes tax compliance attitudes. International Studies Program Working Paper 16-08.
Madzharova B. (2014), The impact of cash and card transactions on VAT collection efficiency,
Proceedings of the 2014 International Cash Conference.
Medina L. and Schneider F. (2017), Shadow Economies Around the World: What Did We Learn
Over the Last 20 Years?, IMF Working Paper WP/18/17.
OECD (2017), Tax Administration 2017: Comparative Information on OECD and Other
Advanced and Emerging Economies, OECD Publishing, Paris.
Otranto E., Pisani S. and Polidoro F. (2003), Un modello statistico per comprendere le
determinanti dell’evasione in R. Convenevole and S. Pisani “Le basi imponibili IVA
Un’analisi del periodo 1982-2001”, Working paper 2003/1 of Agenzia Entrate, Ministerio
dell’Economia e della Finanze, Italy.
Pomeranz, D. (2015). No taxation without information: Deterrence and self-enforcement in the
value added tax. American Economic Review, 105(8), 2539-69.
28
Poniatowski G., Bonch-Osmolovskiy M., Durán-Cabré J. M., Esteller-Moré A. (2018), Study and
Reports on the VAT Gap in the EU-28 Member States: 2018 Final Report, Report of project
TAXUD/2015/CC/131.
Reckon (2009), Study to Quantify and Analyse the VAT Gap in the EU-25 Member States, Report
of project TAXUD.
Schneider F. (2012), “The Shadow Economy and Tax Evasion: What Do We (Not) Know?”
CESifo Forum, 13 (2): 3-12.
29
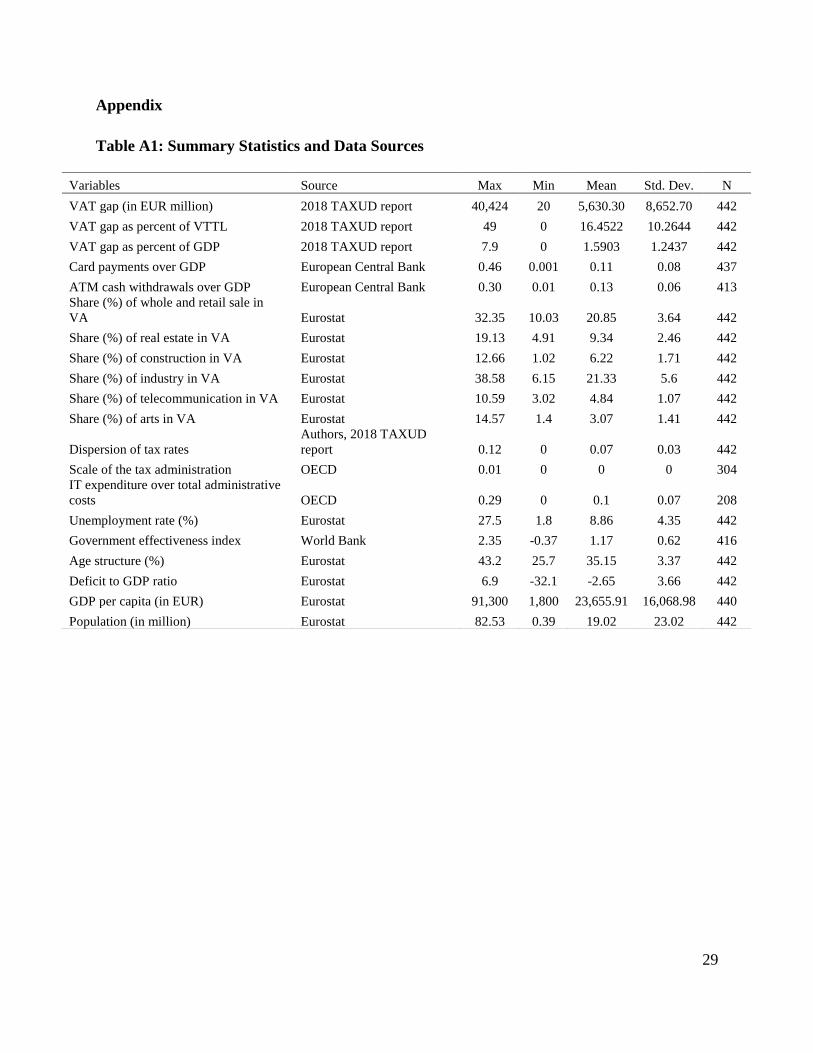
Appendix
Table A1: Summary Statistics and Data Sources
Variables Source Max Min Mean Std. Dev. N
VAT gap (in EUR million) 2018 TAXUD report 40,424 20 5,630.30 8,652.70 442
VAT gap as percent of VTTL 2018 TAXUD report 49 0 16.4522 10.2644 442
VAT gap as percent of GDP 2018 TAXUD report 7.9 0 1.5903 1.2437 442
Card payments over GDP European Central Bank 0.46 0.001 0.11 0.08 437
ATM cash withdrawals over GDP European Central Bank 0.30 0.01 0.13 0.06 413
Share (%) of whole and retail sale in
VA Eurostat 32.35 10.03 20.85 3.64 442
Share (%) of real estate in VA Eurostat 19.13 4.91 9.34 2.46 442
Share (%) of construction in VA Eurostat 12.66 1.02 6.22 1.71 442
Share (%) of industry in VA Eurostat 38.58 6.15 21.33 5.6 442
Share (%) of telecommunication in VA Eurostat 10.59 3.02 4.84 1.07 442
Share (%) of arts in VA Eurostat 14.57 1.4 3.07 1.41 442
Dispersion of tax rates
Authors, 2018 TAXUD
report 0.12 0 0.07 0.03 442
Scale of the tax administration OECD 0.01 0 0 0 304
IT expenditure over total administrative
costs OECD 0.29 0 0.1 0.07 208
Unemployment rate (%) Eurostat 27.5 1.8 8.86 4.35 442
Government effectiveness index World Bank 2.35 -0.37 1.17 0.62 416
Age structure (%) Eurostat 43.2 25.7 35.15 3.37 442
Deficit to GDP ratio Eurostat 6.9 -32.1 -2.65 3.66 442
GDP per capita (in EUR) Eurostat 91,300 1,800 23,655.91 16,068.98 440
Population (in million) Eurostat 82.53 0.39 19.02 23.02 442
30
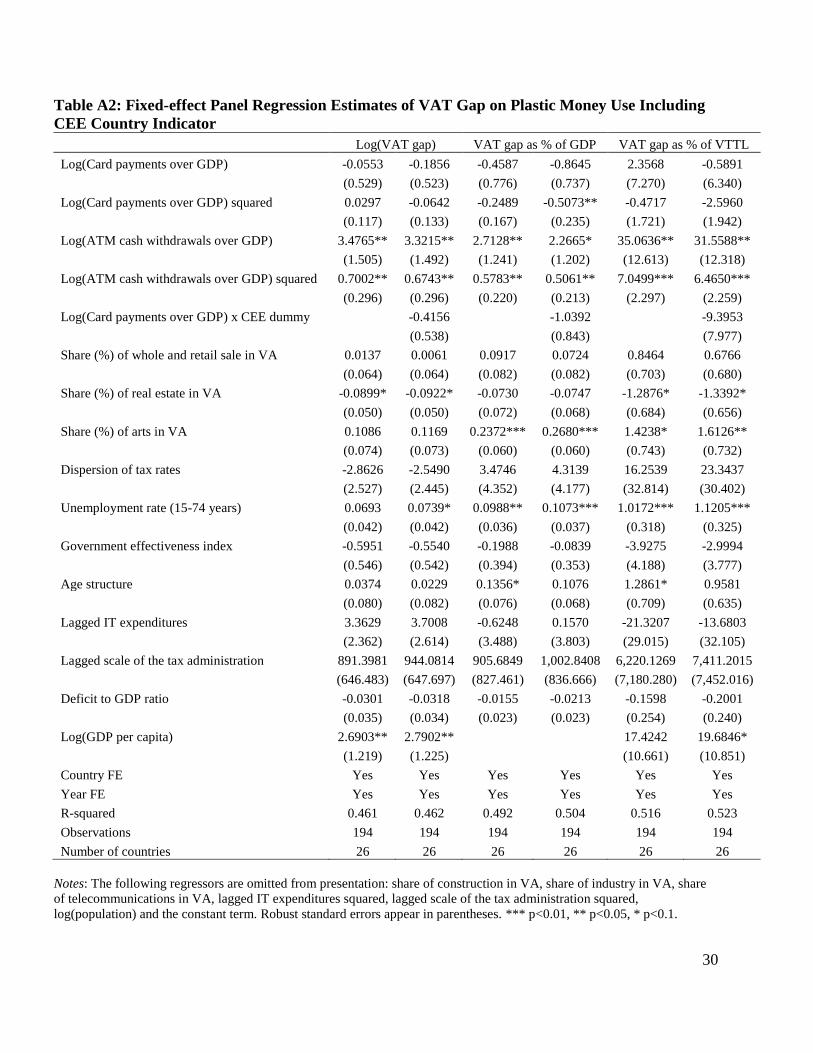
Table A2: Fixed-effect Panel Regression Estimates of VAT Gap on Plastic Money Use Including
CEE Country Indicator
Log(VAT gap) VAT gap as % of GDP VAT gap as % of VTTL
Log(Card payments over GDP) -0.0553 -0.1856 -0.4587 -0.8645 2.3568 -0.5891
(0.529) (0.523) (0.776) (0.737) (7.270) (6.340)
Log(Card payments over GDP) squared 0.0297 -0.0642 -0.2489 -0.5073** -0.4717 -2.5960
(0.117) (0.133) (0.167) (0.235) (1.721) (1.942)
Log(ATM cash withdrawals over GDP) 3.4765** 3.3215** 2.7128** 2.2665* 35.0636** 31.5588**
(1.505) (1.492) (1.241) (1.202) (12.613) (12.318)
Log(ATM cash withdrawals over GDP) squared 0.7002** 0.6743** 0.5783** 0.5061** 7.0499*** 6.4650***
(0.296) (0.296) (0.220) (0.213) (2.297) (2.259)
Log(Card payments over GDP) x CEE dummy -0.4156 -1.0392 -9.3953
(0.538) (0.843) (7.977)
Share (%) of whole and retail sale in VA 0.0137 0.0061 0.0917 0.0724 0.8464 0.6766
(0.064) (0.064) (0.082) (0.082) (0.703) (0.680)
Share (%) of real estate in VA -0.0899* -0.0922* -0.0730 -0.0747 -1.2876* -1.3392*
(0.050) (0.050) (0.072) (0.068) (0.684) (0.656)
Share (%) of arts in VA 0.1086 0.1169 0.2372*** 0.2680*** 1.4238* 1.6126**
(0.074) (0.073) (0.060) (0.060) (0.743) (0.732)
Dispersion of tax rates -2.8626 -2.5490 3.4746 4.3139 16.2539 23.3437
(2.527) (2.445) (4.352) (4.177) (32.814) (30.402)
Unemployment rate (15-74 years) 0.0693 0.0739* 0.0988** 0.1073*** 1.0172*** 1.1205***
(0.042) (0.042) (0.036) (0.037) (0.318) (0.325)
Government effectiveness index -0.5951 -0.5540 -0.1988 -0.0839 -3.9275 -2.9994
(0.546) (0.542) (0.394) (0.353) (4.188) (3.777)
Age structure 0.0374 0.0229 0.1356* 0.1076 1.2861* 0.9581
(0.080) (0.082) (0.076) (0.068) (0.709) (0.635)
Lagged IT expenditures 3.3629 3.7008 -0.6248 0.1570 -21.3207 -13.6803
(2.362) (2.614) (3.488) (3.803) (29.015) (32.105)
Lagged scale of the tax administration 891.3981 944.0814 905.6849 1,002.8408 6,220.1269 7,411.2015
(646.483) (647.697) (827.461) (836.666) (7,180.280) (7,452.016)
Deficit to GDP ratio -0.0301 -0.0318 -0.0155 -0.0213 -0.1598 -0.2001
(0.035) (0.034) (0.023) (0.023) (0.254) (0.240)
Log(GDP per capita) 2.6903** 2.7902** 17.4242 19.6846*
(1.219) (1.225) (10.661) (10.851)
Country FE Yes Yes Yes Yes Yes Yes
Year FE Yes Yes Yes Yes Yes Yes
R-squared 0.461 0.462 0.492 0.504 0.516 0.523
Observations 194 194 194 194 194 194
Number of countries 26 26 26 26 26 26
Notes: The following regressors are omitted from presentation: share of construction in VA, share of industry in VA, share
of telecommunications in VA, lagged IT expenditures squared, lagged scale of the tax administration squared,
log(population) and the constant term. Robust standard errors appear in parentheses. *** p<0.01, ** p<0.05, * p<0.1.
31
Table A3: Panel Regression Estimates of VAT Gaps on Plastic Money Use Controlling for
CEE Country-by-Year Fixed Effects
Log(VAT gap) VAT gap as % of GDP VAT gap as % of VTTL
Log(ATM cash withdrawals over GDP) 4.2707*** 3.8698** 3.1006** 2.6182* 39.3340*** 35.1485**
(1.416) (1.489) (1.316) (1.428) (12.432) (13.413)
Log(Card payments over GDP) -0.2407 -0.2860 -0.6271 -0.6816 -1.4397 -1.9125
(0.723) (0.628) (0.956) (0.917) (7.892) (7.395)
Log(ATM cash withdrawals over GDP) squared 0.8628*** 0.8085*** 0.6357** 0.5705** 7.8733*** 7.3069***
(0.281) (0.288) (0.234) (0.246) (2.274) (2.380)
Log(Card payments over GDP) squared -0.0276 -0.2452 -0.2669 -0.5288* -1.4501 -3.7220
(0.135) (0.177) (0.214) (0.301) (1.722) (2.391)
Log(Card payments over GDP) x CEE dummy -1.3990* -1.6834 -14.6070
(0.713) (1.322) (11.312)
Share (%) of whole and retail sale in VA 0.0566 0.0358 0.1044 0.0793 1.1235 0.9058
(0.062) (0.061) (0.083) (0.086) (0.735) (0.751)
Share (%) of real estate in VA -0.0596 -0.0592 -0.0735 -0.0730 -1.1014 -1.0973
(0.052) (0.051) (0.072) (0.069) (0.687) (0.667)
Share (%) of arts in VA 0.1506** 0.1839** 0.1974** 0.2375** 1.7076** 2.0558**
(0.068) (0.073) (0.082) (0.096) (0.804) (0.858)
Dispersion of tax rates -3.5513 -4.1481 6.5405 5.8225 30.0383 23.8076
(3.010) (3.002) (4.663) (4.527) (38.318) (37.069)
Unemployment rate 0.1110** 0.1205** 0.1023** 0.1137** 1.2425*** 1.3416***
(0.053) (0.054) (0.045) (0.047) (0.438) (0.455)
Government effectiveness index -0.6503 -0.6541 -0.2187 -0.2233 -3.7692 -3.8094
(0.542) (0.544) (0.367) (0.358) (3.857) (3.782)
Age structure 0.1921** 0.1618* 0.0901 0.0537 2.0319*** 1.7153***
(0.071) (0.081) (0.079) (0.077) (0.581) (0.598)
Lagged IT expenditures 5.3536* 5.2513* 3.6539 3.5308 9.3088 8.2400
(2.781) (2.786) (4.625) (4.640) (38.692) (39.033)
Lagged scale of the tax administration 1,056.7645 1,118.4463 1,152.4190 1,226.6364 7,670.7173 8,314.7183
(691.286) (702.277) (918.033) (944.431) (8,303.713) (8,573.320)
Deficit to GDP ratio -0.0420 -0.0407 -0.0159 -0.0143 -0.2622 -0.2481
(0.030) (0.029) (0.023) (0.021) (0.245) (0.227)
Log(GDP per capita) 3.1385*** 3.2531*** 1.1930 1.3309 20.4262* 21.6226**
(1.058) (1.066) (0.990) (1.001) (10.298) (10.475)
Country FE Yes Yes Yes Yes Yes Yes
CEE country-by-Year FE Yes Yes Yes Yes Yes Yes
Observations 194 194 194 194 194 194
Number of countries 26 26 26 26 26 26
Notes: The following regressors are omitted from presentation: share of construction in VA, share of industry in VA,
share of telecommunications in VA, lagged IT expenditures squared, lagged scale of the tax administration squared,
log(population) and the constant term. Robust standard errors appear in parentheses. *** p<0.01, ** p<0.05, *
p<0.1.

32
Table 4A: First Stage IV Regression Results
Log(Card payments over GDP) Log(ATM cash withdrawals over GDP)
Log(# ATM per inhabitant) 0.4780*** 0.8318***
(0.132) (0.147)
Broadband 0.0588** -0.0271
(0.026) (0.035)
Log(# ATM per inhabitant)*Broadband -0.0112** 0.0029
(0.004) (0.006)
R-squared 0.833 0.590
Observations 406 399
Number of countries 25 25
Country FE Yes Yes
Year FE Yes Yes
Cragg-Donald Wald F 19.76 13.27
Kleibergen-Paap rank Wald F 16.50 8.184
Hansen J 0.0747 0.326
Prob > J 0.785 0.568
C test of endogeneity 18.35 26.75
Prob > C 0.0001 0.0000
Notes: The following regressors are omitted from presentation: share of whole and retail sale in VA, share of real
estate in VA, share of construction in VA, share of industry in VA, share of telecommunications in VA, share of arts,
dispersion rate, unemployment rate, age structure, deficit to GDP ratio, log(population), log(GDP per capita), and the
constant term. Robust standard errors appear in parentheses. *** p<0.01, ** p<0.05, * p<0.1