Effective combination therapies in preclinical endocrine ...
Upload
khangminh22Category
view
0download
0
THE IMPACT OF PLASMA-DERIVED THERAPIES IN EUROPEThe health and economic case for ensuring sustainable supply
June 2021
Foreword
The material in this presentation has been prepared by Copenhagen Economics on behalf of Takeda Pharmaceutical Company (“Takeda”). No copy or use of this presentation should occur without the permission of Copenhagen Economics.
Any opinions expressed in this presentation and on the following slides are solely those of Copenhagen Economics and not necessarily those of Takeda, its affiliates or their employees. The information contained herein is of a general nature and Takeda is not responsible for, nor does it guarantee, the
accuracy or reliability of the information provided herein and expressly disclaims liability for errors and omissions in its content. No one should act on such information or otherwise place reliance on it without appropriate professional advice after a thorough examination of their particular situation.
Contributors to the analysis
Source: Copenhagen Economics
.
The report is carried out by Copenhagen Economics.
.
The report uses the sources above for data, information, and/or interviews as well as a comprehensive amount of academic, institutional, and industry literature.
The report is commissioned by Takeda Pharmaceutical Company.
2
European Directorate for
Quality of Medicines and Healthcare

3
EXECUTIVE SUMMARY 4
GLOSSARY AND ABBREVIATIONS 6
CHAPTER 1
VALUE FOR PATIENTS FROM PLASMA-DERIVED THERAPIES 8
1.1 What are plasma-derived therapies and how do they benefit patients? 10
1.2 How many people benefit from plasma-derived therapies in Europe? 14
1.3 Case examples on the counterfactual scenario if plasma-derived therapies were not available 18
1.4 How does plasma donation affect donors? 21
1.5 What therapy alternatives exist and to what extent do they meet patient needs? 23
CHAPTER 2
VALUE OF THE PLASMA-DERIVED THERAPIES INDUSTRY 31
2.1 Plasma economics, the market for plasma-derived therapies, and implications for the plasma market 33
2.2 What is the economic value of the plasma-derived therapies industry? 41
CHAPTER 3
OUTLOOK FOR THE PLASMA-DERIVED THERAPIES INDUSTRY AND SCENARIOS GOING FORWARD 47
3.1 The current trends shaping the plasma-derived therapies industry 49
3.2 The means used to increase donation rates today 55
3.3 Framework for finding an ethically acceptable way to increase donation rates 58
3.4 What are the most promising means to increase donation rates? 63
APPENDIX AND REFERENCES 68
Appendix 69
References 76
Table of contents

Executive summary (1/2)
Plasma-derived therapies are therapies derived from human plasma. They are manufactured using a fractionation process where the relevant proteins in plasma are separated out. Plasma is the single largest component of human blood and contains water, salts, enzymes, antibodies, and other proteins.Plasma-derived therapies are used to treat a wide range of (rare) diseases from bleeding disorders and inhibitor deficiencies to primary and secondary immunodeficiencies.
The number of patients affected by diseases that can be treated by plasma-derived therapies is large and increasing. At the same time, there are concerns over the supply of the raw material in the longer term, and in particular Europe’s heavy reliance on plasma imports from the US.
Against this background, Takeda commissioned Copenhagen Economics (CE) to inform the debate by investigating the value of plasma-derived therapies to patients and the wider economy, and on policy options to secure the supply of plasma in the future. We focus on three main questions:1. How do plasma-derived therapies benefit
patients?2. How does the plasma-derived therapies industry
contribute to the economy?3. How to secure a sustainable supply across
Europe that keeps pace with the growth in therapies demanded by patients?
PLASMA-DERIVED THERAPIES BENEFIT LARGE NUMBERS OF PATIENTS The number of patients that can benefit from plasma-derived therapies is not insignificant. There are between 5,000 and 8,000 rare diseases, affecting approximately 30 million Europeans. We estimate
that more than 1 million patients in Europe suffer from the 12 most well-known rare diseases, which can all be treated with plasma-derived therapies, such as haemophilia and primary immunodeficiency disease (PID). The diseases that can be treated with plasma-derived therapies are not limited to these rare diseases.
Patients benefit from plasma-derived therapies through two primary channels: a better management of their disease with an associated increase in life expectancy, and increased quality of life. These better outcomes also affect society in general since well-treated patients are more able to contribute to society through, for example, labour market participation.
For some of these rare diseases treated with plasma-derived therapies alternative therapies also exist. These are often recombinant therapies that do not rely on human plasma and are instead manufactured using animal or other living cells.
Plasma-derived therapies continue to be key to proper disease management for patients with rare diseases despite the existence of some alternative recombinant therapies for two reasons. First, there are rare diseases for which no alternatives to plasma-derived therapies exist. Second, even if a recombinant alternative exists for a specific condition, it does not mean it will be available in all markets. When both plasma-derived and recombinant therapies are available, patients with the same disease still use different treatments. Doctors prefer a range of therapies in the toolbox to be able to tailor an optimal treatment based on patient needs. The widespread use and co-existence of both plasma-derived and recombinant factor VIII is an example of this. There are thus no one-size-fits-all therapies for rare diseases, and the more therapy
alternatives available to patients, the better.There is an ongoing debate on potential adverse effects on both donors of plasma and patients receiving plasma-derived therapies. We found limited evidence to suggest that plasma-derived therapies had adverse side-effects on patients or donors. On patient safety, the risk of pathogen transmission cases is minimised within the plasma-derived therapies industry. Through diligent quality control process, companies adhere to regulatory requirements and industry voluntary standards. Furthermore, few adverse effects have been found for plasma donors, as, e.g., even relatively frequent donors have protein levels above reference values.
THE PLASMA-DERIVED THERAPIES INDUSTRY SUPPORTS THE EUROPEAN ECONOMYThe plasma-derived therapies industry supports the European economy through direct, indirect, and induced effects. The direct economic effects relate to production within the plasma-derived therapies industry. The indirect effects derive from sub-contractors to the plasma-derived therapies industry, e.g., at plasma collection centres, cleaning companies, or IT solution providers. The induced effects represent the value created for employees, both in the industry and its sub-contractors. To understand the order of magnitude, we derived indicative estimates of the three types of impact. The direct impacts alone can amount to over 3 billion EUR, with indirect and induced effects increasing the total economic contribution around threefold. Our indicative analysis suggests that the overall magnitude of the three types of impact could be around 9.7 billion EUR.
Continues on the following page
4

Executive summary (2/2)
Furthermore, the spending of donor compensation supports an estimated 76 million EUR per year of the induced effect, and 1,100 full-time equivalent jobs, from compensations to plasma donors in Germany, Austria, the Czech Republic, and Hungary.
Plasma donation centres can themselves have further positive effects on the local community through a number of different channels such as employing staff, using local contractors, employees spending their income and collaborative partnerships.
THERE IS A RISK THAT THE SUPPLY OF PLASMA WILL NOT KEEP PACE WITH THE INCREASING DEMAND FOR PLASMA-DERIVED THERAPIES The demand for plasma-derived therapies is increasing. This drives an increase in the demand for plasma for fractionation despite the existence of recombinant and other alternatives.
When demand for plasma-derived therapies increases, the industry cannot scale up immediately due to a fixed production capacity in the short term. More fundamentally, the industry is constrained due to the scarcity of donated human plasma. This potentially hinders the delivery of life-saving and quality-of-life-improving therapies to patients with rare diseases.
Thus far, Europe has relied heavily on imported plasma. Europe imported 38% of its plasma need for fractionation and is reliant on plasma imports from the US. The value of plasma for all purposes imported by the five largest importing countries (Germany, Austria, Spain, Sweden, and Belgium) was 1.936 billion EUR, which is around
2.5% of the total imports of medicinal and pharmaceutical products to EU-28 in 2017.
Plasma donations in Europe are not clearly differentiated from blood donations and are governed by the principle of voluntary and unpaid donations (VUD). However, what constitutes an unpaid donation varies from one Member State to another. In most European countries it is not possible to affect donation rates by other means than small tokens, refreshments, and similar. Only four countries in Europe allow for monetary compensation of donors and for plasma collection by private entities: Germany, the Czech Republic, Austria, and Hungary.
The functioning of the plasma-derived therapy industry is further shaped by reimbursement and procurement policies which vary across countries. An important development, which we refer to as ‘commoditisation’, means that therapies with different properties are treated as homogenous, undifferentiated products and therefore procured and priced as such.
There can be risks of over commoditisation for plasma-derived therapies which can stem from reimbursement approaches together with the finite budgets available for healthcare systems. For example, different patient groups need immunoglobulin therapies with different characteristics. Reimbursement policies can vary depending on immunoglobulin therapy, and in some countries only one specific type of products is reimbursed. This can lead to patients using a suboptimal therapy for their specific medical need, even if more optimal ones would be available.
THERE IS A STRONG CASE FORCONSIDERING ALTERNATIVE WAYS TO SECURE THE SUPPLY OF PLASMA IN EUROPE While some of the market issues surrounding the industry could be alleviated through more effective procurement, a re-evaluation of donation schemes would be needed to secure European plasma supply. We reviewed a range of options recognizing the relevant ethical considerations.
Reimbursement of donors’ incurred expenses associated with the donation is ethically acceptable, compatible with the principle of VUD, and in line with European legislation. That notwithstanding, such reimbursements are not available in all European Member States. Monetary and non-monetary compensation to mitigate disincentives associated with donations is also ethically acceptable and compatible with the principle of VUD, insofar as the compensation does not incentivise individuals to donate who would otherwise not have chosen to do so.
Overall, there appears to be a case for revisiting donation schemes and securing the supply of plasma in Europe. A paradigm shift in the compensation of plasma donors in Europe that includes a small monetary or non-monetary compensation will be ethically acceptable, significantly increase donations, and make the European supply of plasma-derived therapies more resilient to shocks in the supply chain. At the same time, such compensations will ensure that plasma used for fractionation in Europe abides to the principle of voluntary and unpaid donations.
5

CIDPChronic inflammatory demyelinating polyneuropathy
ECEuropean Commission
EDQMEuropean Directorate for the Quality of Medicines & HealthCare
EUEuropean Union
GAO(US) Government Accountability Office
HAEHereditary angioedema
HIVHuman immunodeficiency virus
HR-QoLHealth-related quality of life
IGImmunoglobulin
IPFAInternational Plasma and Fractionation Association
ITPImmune thrombocytopenic purpura
IVIGIntravenous immunoglobulin
KDKawasaki disease
MNNMultifocal motor neuropathy
MRBMarketing Research Bureau
PIDPrimary immunodeficiency
PPTAPlasma Proteins Therapeutics Association
QoLQuality of life
SCIGSubcutaneous immunoglobulin
SIDSecondary immunodeficiency
UDUnpaid donation(s)
VNRVoluntary and non-remunerated
VUDVoluntary and unpaid donation(s)
vWDvon Willebrand disease
6
Abbreviations

CHAPTER 1 CHAPTER 2
CHAPTER 3
Value for patients of plasma-derived therapies / p. 8
Value of the plasma-derived therapies industry / p. 31
Outlook for the plasma-derived therapies industry and scenarios going forward / p. 47
Appendix and references/ p. 68

CHAPTER 1VALUE FOR PATIENTS FROM PLASMA-DERIVED THERAPIES
1.1 WHAT ARE PLASMA-DERIVED THERAPIES AND HOW DO THEY BENEFIT PATIENTS? /P. 10
1.2 HOW MANY PEOPLE BENEFIT FROM PLASMA-DERIVED THERAPIES IN EUROPE? / P. 14
1.3 CASE EXAMPLES ON THE COUNTERFACTUAL SCENARIO IF PLASMA-DERIVED THERAPIES WERE NOT AVAILABLE / P. 18
1.4 HOW DOES PLASMA DONATION AFFECT DONORS? / P.21
1.5 WHAT THERAPY ALTERNATIVES EXIST AND TO WHAT EXTENT DO THEY MEET PATIENT NEEDS? / P. 23
Chapter 1 – Main conclusions
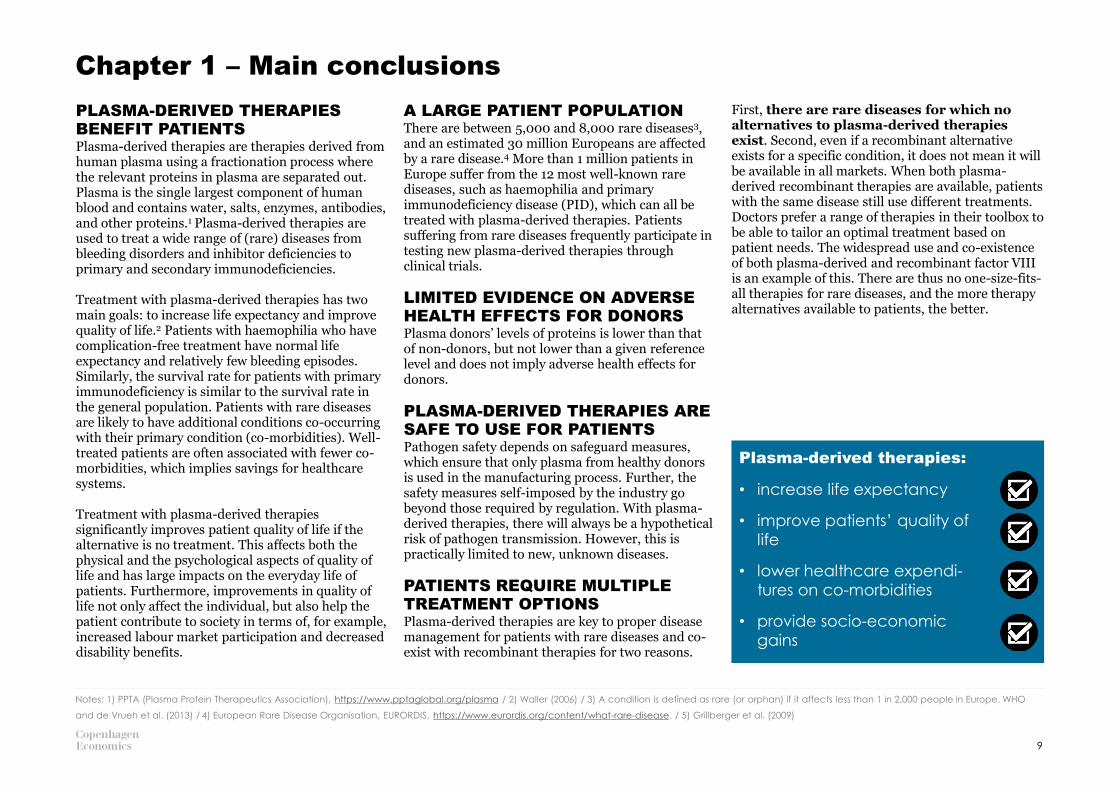
PLASMA-DERIVED THERAPIES BENEFIT PATIENTSPlasma-derived therapies are therapies derived from human plasma using a fractionation process where the relevant proteins in plasma are separated out. Plasma is the single largest component of human blood and contains water, salts, enzymes, antibodies, and other proteins.1 Plasma-derived therapies are used to treat a wide range of (rare) diseases from bleeding disorders and inhibitor deficiencies to primary and secondary immunodeficiencies.
Treatment with plasma-derived therapies has two main goals: to increase life expectancy and improve quality of life.2 Patients with haemophilia who have complication-free treatment have normal life expectancy and relatively few bleeding episodes. Similarly, the survival rate for patients with primary immunodeficiency is similar to the survival rate in the general population. Patients with rare diseases are likely to have additional conditions co-occurring with their primary condition (co-morbidities). Well-treated patients are often associated with fewer co-morbidities, which implies savings for healthcare systems.
Treatment with plasma-derived therapies significantly improves patient quality of life if the alternative is no treatment. This affects both the physical and the psychological aspects of quality of life and has large impacts on the everyday life of patients. Furthermore, improvements in quality of life not only affect the individual, but also help the patient contribute to society in terms of, for example, increased labour market participation and decreased disability benefits.
A LARGE PATIENT POPULATIONThere are between 5,000 and 8,000 rare diseases3, and an estimated 30 million Europeans are affected by a rare disease.4 More than 1 million patients in Europe suffer from the 12 most well-known rare diseases, such as haemophilia and primary immunodeficiency disease (PID), which can all be treated with plasma-derived therapies. Patients suffering from rare diseases frequently participate in testing new plasma-derived therapies through clinical trials.
LIMITED EVIDENCE ON ADVERSE HEALTH EFFECTS FOR DONORSPlasma donors’ levels of proteins is lower than that of non-donors, but not lower than a given reference level and does not imply adverse health effects for donors.
PLASMA-DERIVED THERAPIES ARE SAFE TO USE FOR PATIENTSPathogen safety depends on safeguard measures, which ensure that only plasma from healthy donors is used in the manufacturing process. Further, the safety measures self-imposed by the industry go beyond those required by regulation. With plasma-derived therapies, there will always be a hypothetical risk of pathogen transmission. However, this is practically limited to new, unknown diseases.
PATIENTS REQUIRE MULTIPLE TREATMENT OPTIONSPlasma-derived therapies are key to proper disease management for patients with rare diseases and co-exist with recombinant therapies for two reasons.
First, there are rare diseases for which no alternatives to plasma-derived therapies exist. Second, even if a recombinant alternative exists for a specific condition, it does not mean it will be available in all markets. When both plasma-derived recombinant therapies are available, patients with the same disease still use different treatments. Doctors prefer a range of therapies in their toolbox to be able to tailor an optimal treatment based on patient needs. The widespread use and co-existence of both plasma-derived and recombinant factor VIII is an example of this. There are thus no one-size-fits-all therapies for rare diseases, and the more therapy alternatives available to patients, the better.
9
Notes: 1) PPTA (Plasma Protein Therapeutics Association), https://www.pptaglobal.org/plasma / 2) Waller (2006) / 3) A condition is defined as rare (or orphan) if it affects less than 1 in 2,000 people in Europe. WHO
and de Vrueh et al. (2013) / 4) European Rare Disease Organisation, EURORDIS, https://www.eurordis.org/content/what-rare-disease. / 5) Grillberger et al. (2009)
Plasma-derived therapies:
• increase life expectancy
• improve patients’ quality of
life
• lower healthcare expendi-
tures on co-morbidities
• provide socio-economic
gains

1.1WHAT ARE PLASMA-DERIVED THERAPIES AND HOW DO THEY BENEFIT PATIENTS?

Plasma enables the development and manufacturing of plasma-derived therapies
WHAT IS PLASMA?Plasma is the single largest component of human blood and contains water, salts, enzymes, antibodies, and other proteins. In particular, 7% of plasma consists of proteins like immunoglobulins, clotting factors, C1 esterase inhibitor, and alpha-1 proteinase inhibitor.
Plasma is collected using either source plasma from plasmapheresis donations or recovered plasma from whole blood donations. During plasmapheresis, plasma is separated from red blood cells and other cellular components of blood, which are then
returned to the donor during the plasma donation process.1
WHAT ARE PLASMA-DERIVED THERAPIES?Plasma-derived therapies are treatments derived from human plasma. The relevant proteins in plasma are separated out in the fractionation process that enables the production of therapies to treat specific diseases and conditions. For example, separating out C1 esterase inhibitor from plasma in the fractionation process is part of the process to develop therapies used to treat hereditary angioedema, and
precipitating out von Willebrand factor is part of the process to manufacture therapies to treat von Willebrand disease.
The patient need for plasma-derived therapies is the driver of the demand for plasma components. Furthermore, the demand for plasma is affected by the composition of plasma (as shown in the figure below), as the number of donations needed to treat one patient for one year differs a lot between diseases. For example, 130 donations are required to treat a patient with primary immunodeficiency for one year, whereas 1,200 donations are required to treat a patient with haemophilia A.2
Composition of blood and plasma
Note: IgG = immunoglobulin G, alpha-1 = alpha-1 antitrypsin, vWF = von Willebrand factor, FVII/FVIII = factor VII/VIII. The category ‘Other’ includes fibrinogen, prothrombin, alpha-2 macro, FIX, FXI, and more. 1) White blood cells and platelets.
Source: PPTA (2020a) and Burnouf (2008)
11
Per cent of components that a litre of blood consists of
Notes: 1) PPTA, https://www.pptaglobal.org/plasma / 2) PPTA (2020a)
Albumin IgG
20.29%
2.54%
64.25%
Alpha-1 C-1 inhi-bitor
0.34%
FVII
<0.01%
vWF
12.27%<0.01%
FVIII Other Total
0.02%0.29%
Anti-thrombin
100.00%
55% plasma
44% red blood cells
1% white blood cells1
92% water
1% other solutions
7% proteins
Blood Plasma

Plasma-derived therapies offer life-saving treatments to patients who suffer from rare diseases and other conditions
12
Notes: 1) Aledort (2016) / 2) These were available from 1994 and onwards, Powell (2009) / 3) Joshi et al. (2009) / 4) Abdou et al. (2009), Routes et al. (2016), and Modell et al. (2017) / 5) Boyle and Scalchunes (2008) /
6) Mendez et al. (2005)
Plasma donation
Manufacturing
INCREASE LIFE EXPECTANCY
IMPROVE QUALITY OF LIFE
PROVIDE ECONOMIC GAINS AND
HEALTHCARE SAVINGS
TREAT MORE THAN PATIENTS
WITH RARE DISEASES
Treatment of haemophilia is a useful
example of the impact of plasma-derived therapies due to the amount of research available and the long-term use of these treatments. Today, patients with haemophilia, who are treated appropriately from infancy and do not develop inhibitors, have a normal life expectancy and relatively few bleeding episodes thanks to plasma-derived and recombinant factor VIII.1 Recombinant factor VIII became widely available after the completion of clinical trials in 1994. Even before then, a Swedish study found that median life expectancy for patients with severe haemophilia increased from 11 years during 1831-1920 to 56.8 years during 1961-1980.2
Another example of increased life expectancy is seen in patients with primary immunodeficiencies: the proportion of patients with primary immunodeficiencies who are alive10 years after diagnosis is 93.5%, which is similar to the survival rate in the general population. 3
Significant improvements in health-related quality of life (HR-QoL) have been found. For example, patients with primary immunodeficiencies have significantly higher quality of life when treated with IVIG
for a 12-month period compared to a 3-month period with no treatment.4
Improvements in quality of life not only affect the individual, but also society more broadly through: 1) potential lower healthcare expenditures from hospitalization, and 2) socio-economic gains such as increased labour market participation. 57% of patients with primary immunodeficiencies were hospitalised prior to being diagnosed and treated with IVIG, whereas the hospitalization rate after being treated dropped to 25%.5 Similarly, the number of sick days for these patients dropped from 20 to 5 days with IVIG treatment.
In addition to treating rare diseases, plasma-derived therapies are used to treat critical illnesses. Albumin is commonly used for hypovolemia or shock, burns, hypoalbuminemia, surgery or trauma,
cardiopulmonary bypass, acute respiratory distress syndrome, haemodialysis, and more.6
PLASMA-DERIVED THERAPIES ARE
VITAL TO PATIENTS BECAUSE
THEY…
Vital to patients
Collection
centres
The plasma-derived therapies value chain starts and ends with people
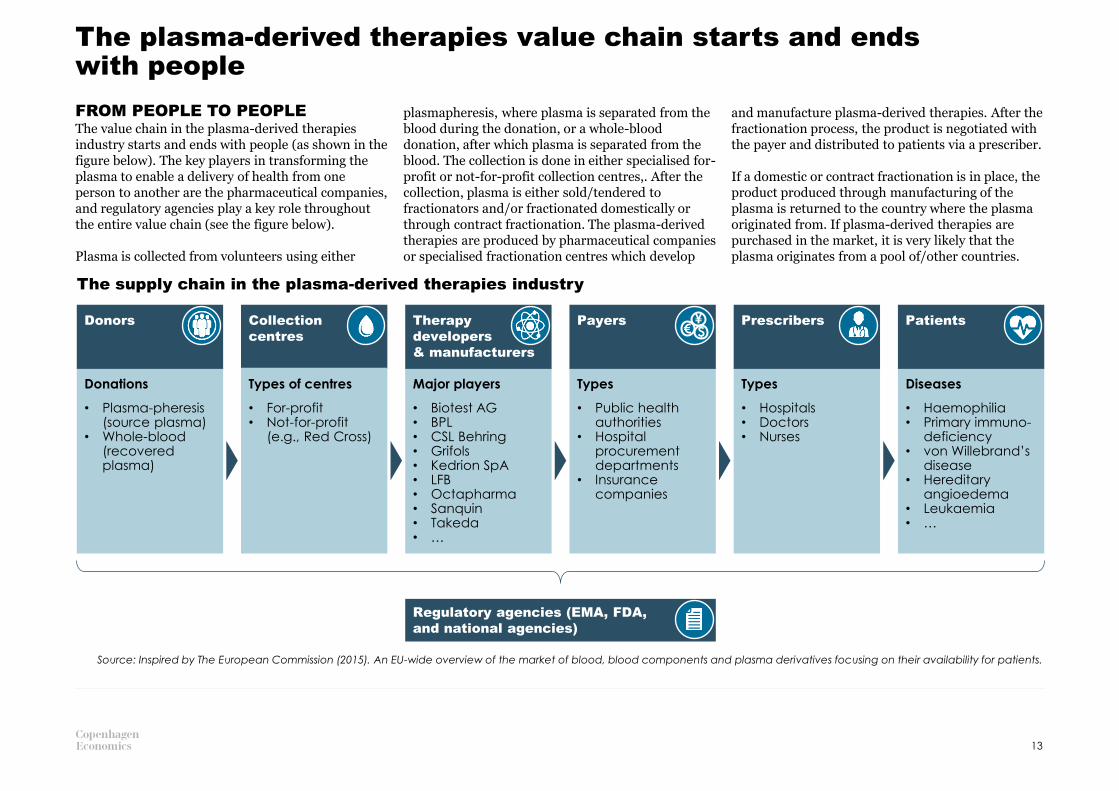
FROM PEOPLE TO PEOPLEThe value chain in the plasma-derived therapies industry starts and ends with people (as shown in the figure below). The key players in transforming the plasma to enable a delivery of health from one person to another are the pharmaceutical companies, and regulatory agencies play a key role throughout the entire value chain (see the figure below).
Plasma is collected from volunteers using either
plasmapheresis, where plasma is separated from the blood during the donation, or a whole-blood donation, after which plasma is separated from the blood. The collection is done in either specialised for-profit or not-for-profit collection centres,. After the collection, plasma is either sold/tendered to fractionators and/or fractionated domestically or through contract fractionation. The plasma-derived therapies are produced by pharmaceutical companies or specialised fractionation centres which develop
and manufacture plasma-derived therapies. After the fractionation process, the product is negotiated with the payer and distributed to patients via a prescriber.
If a domestic or contract fractionation is in place, the product produced through manufacturing of the plasma is returned to the country where the plasma originated from. If plasma-derived therapies are purchased in the market, it is very likely that the plasma originates from a pool of/other countries.
The supply chain in the plasma-derived therapies industry
Donations
• Plasma-pheresis (source plasma)
• Whole-blood (recovered plasma)
Diseases
• Haemophilia• Primary immuno-
deficiency• von Willebrand’s
disease• Hereditary
angioedema • Leukaemia• …
Types of centres
• For-profit• Not-for-profit
(e.g., Red Cross)
Major players
• Biotest AG• BPL• CSL Behring• Grifols• Kedrion SpA• LFB• Octapharma• Sanquin• Takeda• …
Types
• Hospitals• Doctors• Nurses
Types
• Public health authorities
• Hospital procurement departments
• Insurance companies
13
Source: Inspired by The European Commission (2015). An EU-wide overview of the market of blood, blood components and plasma derivatives focusing on their availability for patients.
Therapy
developers
& manufacturers
Payers Prescribers PatientsDonors$€¥
Regulatory agencies (EMA, FDA,
and national agencies)

1.2HOW MANY PEOPLE BENEFIT FROM PLASMA-DERIVED THERAPIES IN EUROPE?

We estimate that around 1 million European patients are affected by rare diseases that could potentially be treated with plasma-derived therapiesA LARGE PATIENT POPULATIONWe estimate that 1 million Europeans are affected by one of the 12 most common (groups of) rare diseases that can be treated with plasma-derived therapies. An overview of disease prevalence and the estimated number of patients in Europe is shown to the right. Using prevalence estimates implies that both patients who are diagnosed and people who are not diagnosed are included in the numbers. The table includes bleeding disorders such as haemophilia A and von Willebrand disease, primary immunodeficiency, and immune thrombocytopenic purpura. A condition is defined as rare (or orphan) if it affects less than 1 in 2,000 people in Europe.1 There are between 5,000 and 8,000 rare diseases, and an estimated 27-36 million Europeans are affected by a rare disease.2
The patient population in Europe suffering from one of the 12 most common rare diseases is significant. For example, it is around two and a half times larger than the incidence of breast cancer in EU-28 in 2018 of 404,920 individuals.3 Unlike cancer, full recovery is not possible for patients suffering from an rare disease. To ensure their survival and quality of life, on-going treatment is required.
In addition to rare diseases, plasma-derived therapies are used to treat a number of critical conditions such as severe burns, leukaemia, and paediatric HIV. Furthermore, the therapies are also used to treat secondary immunodeficiencies or as part of cancer therapy. In 2018 alone, there were 3.9 million new cases of cancer in Europe.3 The appendix contains a table with critical conditions and the plasma-derived therapies used to treat them.
15
Notes: 1) European Parliament and the Council (2000), Regulation (EC) No. 141/2000,, Article 3.1.a. / 2) The European Commission; Rare diseases:
https://ec.europa.eu/health/non_communicable_diseases/rare_diseases_en 3) Ferlay et al. (2018)
Condition
Prevalence estimate
(interval in
parenthesis)
Number of patients in
Europe
Haemophilia A (factor VIII deficiency) 3.2 in 50,000 [1.7-4.7] 38,4001
Haemophilia B (factor IX deficiency) 0.67 in 50,000 [0.27-1.075] 8,1002
von Willebrand disease (vWD) 2.27 in 50,000 [Na] 27,2003
Other factor deficiencies (e.g., factor
I, II, V, V+VIII, VII, X, XI, and XIII)
Na (observation study) 9,7004
Antithrombin III deficiency 13.33 in 50,000 [10-16.67] 160,0005
Alpha-1 antitrypsin deficiency 10 in 50,000 [Na] 120,0006
Hereditary angioedema (HAE), types 1
and 2
1 in 50,000 [0.5-4.5] 12,0007
Primary immunodeficiency disease
(PID)
43.15 in 50,000 [25.5-60.75] 517,8008
Chronic inflammatory demyelinating
polyneuropathy (CIDP)
1.405 in 50,000 [0.79-2.195] 16,9009
Immune thrombocytopenic purpura
(ITP)
8.275 in 50,000 [4.75-11.8] 99,30010
Multifocal motor neuropathy (MMN) 0.675 in 50,000 [0.15-1.5] 8,10011
Kawasaki disease (KD) 3.75 in 50,000 [2.5-5] 40012
Total 1,017,900
Note: 1) List obtained from PPTA, https://www.pptaglobal.org/plasma-protein-therapies, and industry experts. All patient numbers are rounded to nearest 100. Other studies use lower patient populations for some conditions (see, e.g. Vintura
(2020) on PID) by relying on estimates based on registry data on diagnosed patients. Our PID estimate is based on survey data to include both diagnosed and undiagnosed patients. References 1-12 on prevalence estimates, European
populations, and more are available in the appendix.
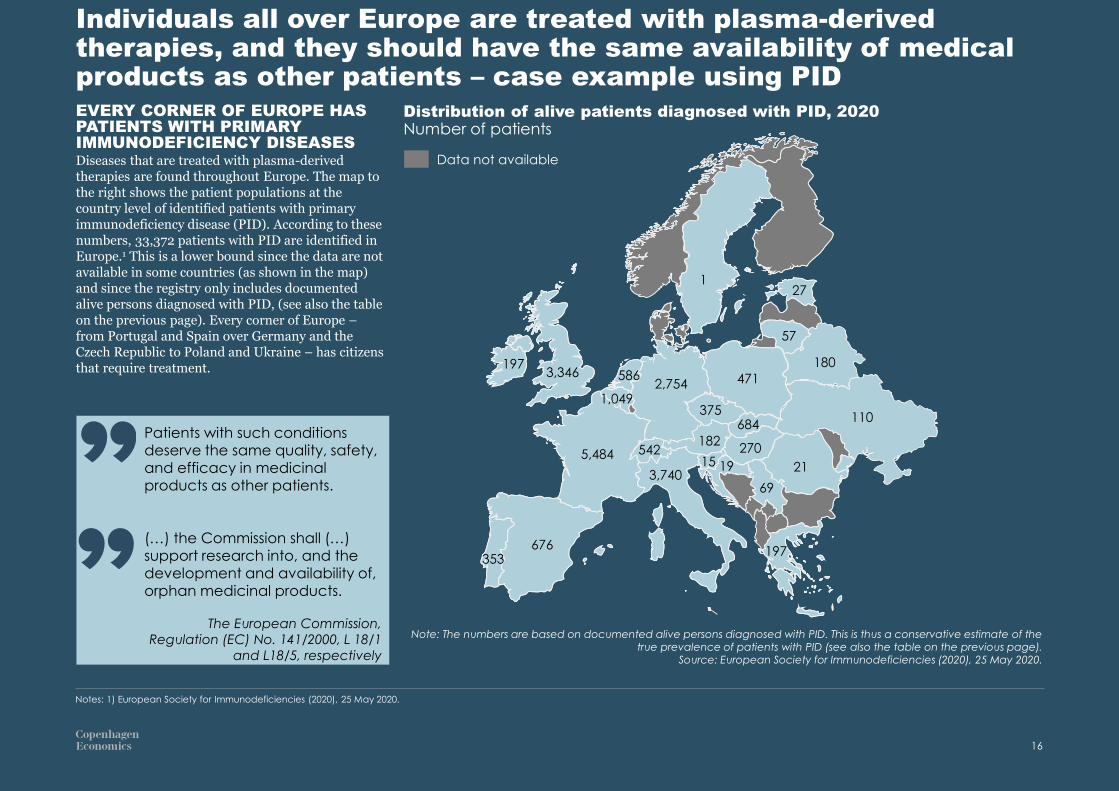
Individuals all over Europe are treated with plasma-derived therapies, and they should have the same availability of medical products as other patients – case example using PID
16
Notes: 1) European Society for Immunodeficiencies (2020), 25 May 2020.
Data not available
1
EVERY CORNER OF EUROPE HAS PATIENTS WITH PRIMARY IMMUNODEFICIENCY DISEASESDiseases that are treated with plasma-derived therapies are found throughout Europe. The map to the right shows the patient populations at the country level of identified patients with primary immunodeficiency disease (PID). According to these numbers, 33,372 patients with PID are identified in Europe.1 This is a lower bound since the data are not available in some countries (as shown in the map) and since the registry only includes documented alive persons diagnosed with PID, (see also the table on the previous page). Every corner of Europe –from Portugal and Spain over Germany and the Czech Republic to Poland and Ukraine – has citizens that require treatment.
Note: The numbers are based on documented alive persons diagnosed with PID. This is thus a conservative estimate of the true prevalence of patients with PID (see also the table on the previous page).
Source: European Society for Immunodeficiencies (2020), 25 May 2020.
Patients with such conditions deserve the same quality, safety, and efficacy in medicinal products as other patients.
(…) the Commission shall (…) support research into, and the development and availability of, orphan medicinal products.
The European Commission,
Regulation (EC) No. 141/2000, L 18/1
and L18/5, respectively
197
197
15
Distribution of alive patients diagnosed with PID, 2020Number of patients
3,3462,754
676353
5,484
471
27
57
180
110375
586
1,049
542
3,740
182
684
270
21
69
19

PATIENTS HELP DEVELOP AND TEST NEW TREATMENTSThe industry is investing in R&D to develop plasma-derived therapies and recombinant alternatives for patients with rare diseases.
Patients with rare diseases are actively involved in helping researchers develop and test new treatments. To showcase how many patients are actively involved, we have estimated the total number of patients involved in clinical trials in the 2010s (see the table on the right). These clinical trials are related to the 12 specific rare disease, but may be related to the development and testing of either plasma-derived therapies or recombinant alternatives.
There were 283 clinical trials with the 12 (groups of) conditions to the right in Europe in the period 1 January 2010 to 30 April 2019. An estimated 7,864 Europeans participated in a clinical trial in the period, and 16,869 individuals participated world-wide (including Europe).
For all rare diseases, there were a total of more
than 2,000 clinical trials in Europe in 2016.1
These all rely on the willingness and goodwill of patients to participate.
An estimated 7,800 people from Europe participated in clinical trials involving the 12 most common rare diseases in the 2010s
Notes: 1) Pugatch Consilium (2019). This study finds that “Some 2.37 million patients were enrolled to clinical trials on rare diseases in the EU-5 countries alone between 2006 and 2016.“ The number of trials identified
with their source (clinical trials.gov) is similar (though somewhat lower) than the number of trials found in the ECTR. However, is not possible to obtain the number of participants in Europe on clinical trials.gov.
Condition
Number of clinical trials
Partici-pants in the EEA, actual1
Partici-pants world-wide, actual1
Partici-pants in the EEA, extra-polated2
Partici-pants world-wide, extra-polated2
Haemophilia A (factor VIII deficiency)
136 1,615 3,943 3,601 8,791Haemophilia B (factor IX deficiency)
von Willebrand disease (vWD) 15 87 165 218 413
Other factor deficiencies (e.g., factor I, II, V, V+VIII, VII, X, XI, and XIII)
18 56 145 126 326
Antithrombin III deficiency Na Na Na Na Na
Alpha-1 antitrypsin deficiency 5 26 35 65 88
Hereditary angioedema (HAE), types 1 and 2
28 227 718 530 1,675
Primary immunodeficiency disease (PID)
20 184 277 409 616
Chronic inflammatory demyelinating polyneuropathy (CIDP)
18 338 504 1,521 2,268
Immune thrombocytopenic purpura (ITP)
37 466 922 1,326 2,624
Multifocal motor neuropathy (MMN)
3 23 23 69 69
Kawasaki disease (KD) 3 Na Na Na Na
Total 283 3,022 6,732 7,864 16,869
Note: Number of clinical trials and participants relates to the period 1 January 2010 to 30 April 2019. 1) Only including clinical trials where participant numbers are available / 2) Including all clinical trials. In the case of missing participant numbers, the
condition-specific mean participant number is used.Source: The European Clinical Trial Register (ECTR, https://www.clinicaltrialsregister.eu/ctr-search/search).
17

1.3CASE EXAMPLES OF THE COUNTERFACTUAL SCENARIO IF PLASMA-DERIVED THERAPIES WERE NOT AVAILABLE
Case: Patients with primary immunodeficiency treated with immunoglobulin have significantly better health and quality of life
19
Notes: 1) Wood et al. (2007) / 2) Self-assessed health is measured by simply asking respondents how they rate their own health. Due to the unethical aspect of randomizing treatment with immunoglobulin and
placebo, very few studies exist on the benefits of treatment with immunoglobulin compared to no treatment. / 3) Even though both treatment with IVIG and SCIG yield higher quality of life in patients with primary
immunodeficiency, there are indications that SCIG improves QoL compared to IVIG, see, e.g., Gardulf et al. (2008), Berger et al. (2010), and Haddad et al. (2012).
81%
27%
11%
29%
28%
16%4%
Year before
diagnosis
4%
100%
While receiving
treatment1
100%
Very good
Excelent Good
Worse than good
Self-assessed health in patients with primary immunodeficiency
Share of patients
Note: Self-reported health. 1) In the year of the study or the
last year the patient was receiving immunoglobulin.
Source: Boyle and Scalchunes (2008).
Note: Differences are not statistically significant , which is
likely due to small sample size. Differences are larger than
“minimally important differences” (MID), see Maruish (2011).
Source: Routes et al. (2016).
Quality of life by component
Score on the SF-36
36.9
43.246.0
49.0
Physical
component score
Mental
component score
+25%+13%
Baseline
12 months after IgG treatment
Primary immunodeficiency (PI) includes multiple genetic defects of the immune system that cause increased susceptibility to infections
that are often chronic, persistent, recurring, debilitating, and in some cases, fatal. Infections might include bronchitis, pneumonia, thrush,
skin abscesses, ear infections, and sinus infections, but other related conditions may present as autoimmune diseases, anemia, allergies,
skin rashes, and chronic inflammatory disease.
Modell et al. (2017)
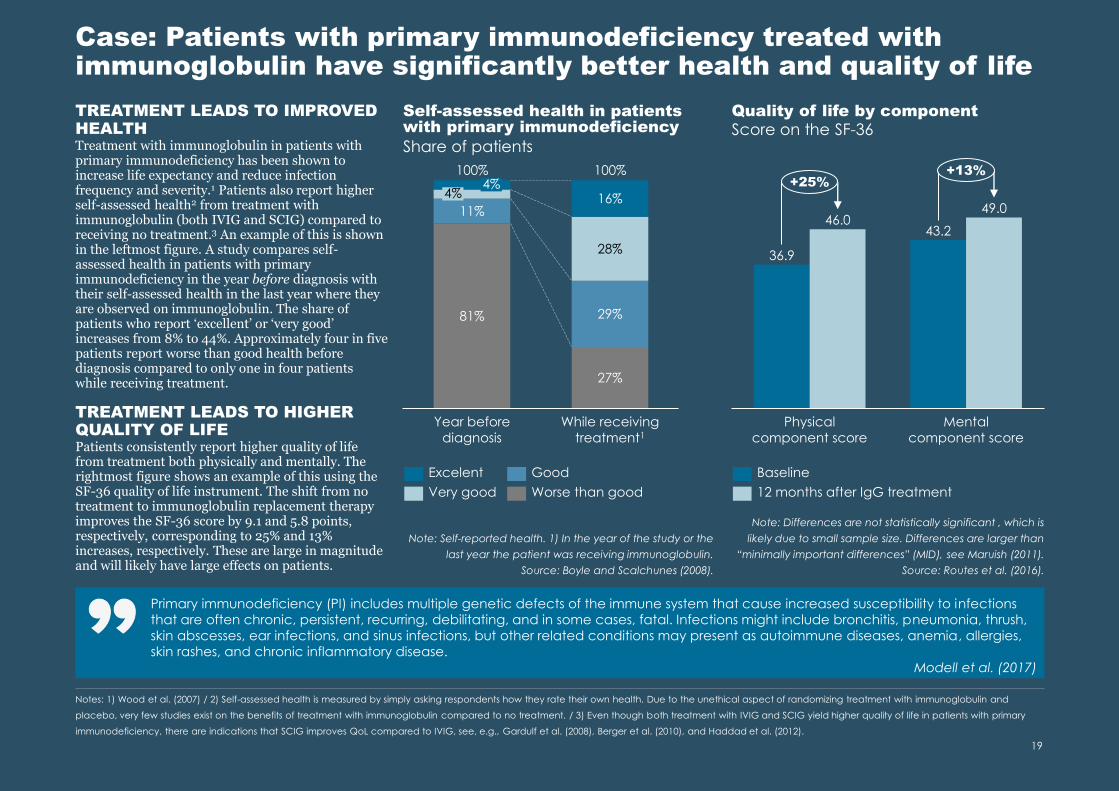
TREATMENT LEADS TO IMPROVED HEALTHTreatment with immunoglobulin in patients with primary immunodeficiency has been shown to increase life expectancy and reduce infection frequency and severity.1 Patients also report higher self-assessed health2 from treatment with immunoglobulin (both IVIG and SCIG) compared to receiving no treatment.3 An example of this is shown in the leftmost figure. A study compares self-assessed health in patients with primary immunodeficiency in the year before diagnosis with their self-assessed health in the last year where they are observed on immunoglobulin. The share of patients who report ‘excellent’ or ‘very good’ increases from 8% to 44%. Approximately four in five patients report worse than good health before diagnosis compared to only one in four patients while receiving treatment.
TREATMENT LEADS TO HIGHER QUALITY OF LIFEPatients consistently report higher quality of life from treatment both physically and mentally. The rightmost figure shows an example of this using the SF-36 quality of life instrument. The shift from no treatment to immunoglobulin replacement therapy improves the SF-36 score by 9.1 and 5.8 points, respectively, corresponding to 25% and 13% increases, respectively. These are large in magnitude and will likely have large effects on patients.

Case: Treatment with immunoglobulin yields significant socio-economic gains and reductions in healthcare expenditures – an illustration with research from the USAREDUCTIONS IN HEALTHCARE EXPENDITURESProper treatment of patients is associated with healthcare savings since well-treated patients are less likely to have co-morbidities and as such are less likely to require treatment for these. By way of illustration, the figure below shows how treating patients with primary immunodeficiency with immunoglobulin reduces the expenditures to the treatment of co-morbidities with 28,021 USD per patient per year. In addition, reductions in the number of days a patient is hospitalised, the number of physician and ER visits, and the cost of other medicines (in particular antibiotics) yield a significant reduction as well. These amount to
81,009 USD per patient per year.
SOCIO-ECONOMIC GAINSWell-treated patients are better able to participate in activities that benefit both themselves and society. Examples of such activities are increased labour market participation and productivity, reduced absence from school or work, and more. The socio-economic gain from a well-treated patient is 4,875 USD per patient per year when only considering absence.
NET BENEFITS Adding up the total benefits yields 85,884 USD per patient per year, and using a cost of immunoglobulin of 30,000 USD per patient per year, the net benefits amount to 55,882 USD per patient per year. This is likely a lower bound for two reasons:• A number of socio-economic benefits are not
included, e.g., labour market participation• The patients’ quality of life (see previous page) is
not monetarised and included
While this builds on research conducted in the USA and serves as an illustration, there appears to be a need to undertake similar research in other areas (e.g. Europe) to broaden the evidence base further.
Benefits and cost of treating patients with primary immunodeficiency with IgG compared to no treatment
Note: Data is from the US. Costs of procedures is based on hospital billings. The cost of IgG is similar to that found in Boyle and Scalchunes (2008). Health conditions include persistent otitis media, serious sinus and upper respiratory infections, viral infections, acute bronchitis, bacterial pneumonias, chronic obstructive pulmonary disease, and bronchiectasis.
Source: derived by Copenhagen Economics from results in Modell et al. (2017) on the costs of treating a patient with immunoglobulin and the cost of not treating a patient.
20
Savings in USD per patient per year
28,021
85,884
41,416
10,638 30,000
55,882
934
Health conditions Days on
antibiotics
Hospitalization
days
4,875
Physician/ER visits School/work
days missed
Total benefits Cost of IgG Net benefits
Healthcare savings = 81,009 Socio-economic gains

1.4HOW DOES PLASMA DONATION AFFECT DONORS?

Current recommendations [for donation of plasma] are made in the absence of conclusivestudies of outcomes from different regimes of volumes and frequencies of plasmapheresis.
European Directorate for the Quality
of Medicines & HealthCare (2017)
No adverse effects from plasma donations have been shown
22
Notes: 1) Ritter et al. (2008) / 2) EDQM (2017), page 142 / 3) Donation volume is weight dependent. See Weinstein (2017) / 4) Council of Europe (2006), page 47 / 5) Fundacio Víctor Grífos i Lucas (2018) / 6) EDQM
(2017), page 145. / 7) Tran-Mi et al. (2004) / 8) EDQM (2017) / 9) Tran-Mi et al. (2004)
75
46
11
67
43
8
Total protein Albumin IgG
Non-donor Donor Reference value
Protein levels for donors and non-donorsgram/litre
Note: Averages of all type of donors. Reference value represents the lowest point considered normal. Schulzki et al. (2006) find similar donor values (total protein and IgG).
Source: Tran-Mi et al. (2004)
66
33
6
PLASMA DONORS DONATE MORE THAN WHOLE-BLOOD DONORSPlasma donation is different from whole-blood donation as the same donor can donate plasma more frequently than whole-blood donors. In Germany, an average whole-blood donor donated 1.9 times a year, while an average plasma donor donated plasma around 11.9 times a year.1 Blood donation is not recommended more frequently than every 12 weeks and not more often than three times a year for women and four times a year for men in the EU, as it reduces haemoglobin and iron stores.2 Regulation on plasma donation varies between countries; in the US donors can donate 625-800 ml of plasma twice weekly which translates to 83 litres per year3, while the Council of Europe recommends a maximum of 600 ml per donation and 15 litres in total per year.4
European countries differ as well; the maximum amount is 15 litres in Spain, 29-38 in Germany, 35 in Austria, and 25 in the Czech Republic.5
MODERATE PLASMA DONATION DOES NOT HARM DONORSThe frequency of plasma donation does not seem to affect blood values, and donating up to 45 litres of plasma per year appears to be as safe as more moderate donating. This is based on a study that compared blood values for three different donation intensity groups within the last 12-month period: Council of Europe recommendation levels (11-23 donations), German guidelines (15-36 donations), and Intensified plasmapheresis (35-38 donations). With increased donation frequency, there was no further lowering of blood protein levels, and no other risk factors emerged.6
NO CONCLUSIVE EVIDENCE OF ADVERSE EFFECTS FROM PLASMA DONATION ON DONORSWhen anything is removed or extracted from a human body, there is always the question of how this affects the donor. With plasma, a healthy person will always produce more of it, and donation in itself is not harmful. Reproducing the plasma still requires some time (usually less than 24 hours5) and there has been a theoretical concern that intensive plasmapheresis can lead to plasma protein loss and increased risk of cardiovascular diseases.7 However, these concerns have remained theoretical, as there is no conclusive evidence of adverse health effects from plasma donation, or even frequent donations.8 There is thus a need for more scientific and evidence-based recommendations (see also the quote to the right).
PLASMA DONORS HAVE NON-HARMING PROTEIN LEVELSPlasma donors have lower protein levels than non-donors, but these levels are still above threshold values and thus not harmful to donors. This was found in a study comparing donors to non-donors on total serum protein, albumin, IgG, cellular immunity, red cell and iron levels, and cardiovascular risk. The protein levels were lower for donors than non-donors. However, the levels were still within reference values for 90-100% of donors, depending on which protein was studied and the frequency of donation. Additionally, regular plasmapheresis was not found to have influence on cholesterol values or other risk factors for cardiovascular disease. Furthermore, both donors and non-donors had normal cellular immunity, which is an immune response unrelated to antibodies.9

1.5WHAT THERAPY ALTERNATIVES EXIST AND TO WHAT EXTENT DO THEY MEET PATIENT NEEDS?
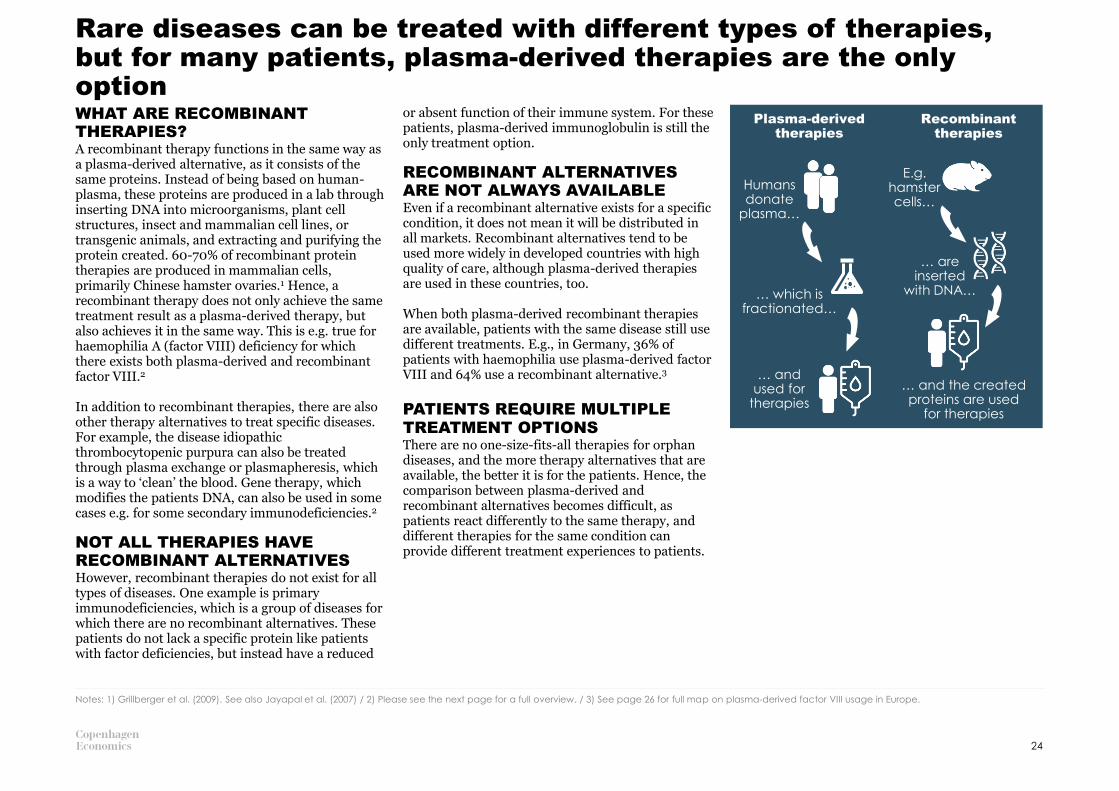
Rare diseases can be treated with different types of therapies, but for many patients, plasma-derived therapies are the only optionWHAT ARE RECOMBINANT THERAPIES?A recombinant therapy functions in the same way as a plasma-derived alternative, as it consists of the same proteins. Instead of being based on human-plasma, these proteins are produced in a lab through inserting DNA into microorganisms, plant cell structures, insect and mammalian cell lines, or transgenic animals, and extracting and purifying the protein created. 60-70% of recombinant protein therapies are produced in mammalian cells, primarily Chinese hamster ovaries.1 Hence, a recombinant therapy does not only achieve the same treatment result as a plasma-derived therapy, but also achieves it in the same way. This is e.g. true for haemophilia A (factor VIII) deficiency for which there exists both plasma-derived and recombinant factor VIII.2
In addition to recombinant therapies, there are also other therapy alternatives to treat specific diseases. For example, the disease idiopathic thrombocytopenic purpura can also be treated through plasma exchange or plasmapheresis, which is a way to ‘clean’ the blood. Gene therapy, which modifies the patients DNA, can also be used in some cases e.g. for some secondary immunodeficiencies.2
NOT ALL THERAPIES HAVE RECOMBINANT ALTERNATIVESHowever, recombinant therapies do not exist for all types of diseases. One example is primary immunodeficiencies, which is a group of diseases for which there are no recombinant alternatives. These patients do not lack a specific protein like patients with factor deficiencies, but instead have a reduced
or absent function of their immune system. For these patients, plasma-derived immunoglobulin is still the only treatment option.
RECOMBINANT ALTERNATIVES ARE NOT ALWAYS AVAILABLEEven if a recombinant alternative exists for a specific condition, it does not mean it will be distributed in all markets. Recombinant alternatives tend to be used more widely in developed countries with high quality of care, although plasma-derived therapies are used in these countries, too.
When both plasma-derived recombinant therapies are available, patients with the same disease still use different treatments. E.g., in Germany, 36% of patients with haemophilia use plasma-derived factor VIII and 64% use a recombinant alternative.3
PATIENTS REQUIRE MULTIPLE TREATMENT OPTIONSThere are no one-size-fits-all therapies for orphan diseases, and the more therapy alternatives that are available, the better it is for the patients. Hence, the comparison between plasma-derived and recombinant alternatives becomes difficult, as patients react differently to the same therapy, and different therapies for the same condition can provide different treatment experiences to patients.
24
Notes: 1) Grillberger et al. (2009). See also Jayapal et al. (2007) / 2) Please see the next page for a full overview. / 3) See page 26 for full map on plasma-derived factor VIII usage in Europe.
Plasma-derived therapies
Recombinant therapies
Humans donate
plasma…
… and used for
therapies
E.g. hamster cells…
… are inserted
with DNA…
… and the created proteins are used
for therapies
… which is fractionated…
Which diseases have a recombinant treatment alternative?
25
High ------------------------------------------- Low
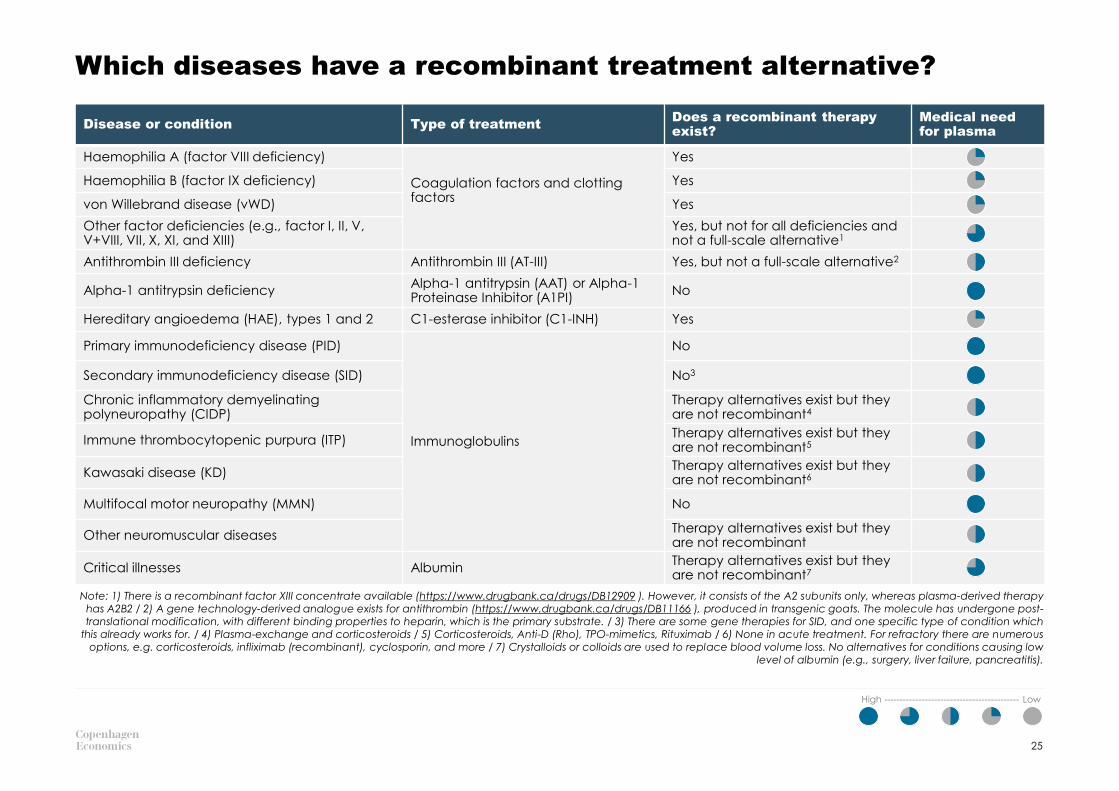
Disease or condition Type of treatmentDoes a recombinant therapy exist?
Medical need for plasma
Haemophilia A (factor VIII deficiency)
Coagulation factors and clotting factors
Yes
Haemophilia B (factor IX deficiency) Yes
von Willebrand disease (vWD) Yes
Other factor deficiencies (e.g., factor I, II, V, V+VIII, VII, X, XI, and XIII)
Yes, but not for all deficiencies and not a full-scale alternative1
Antithrombin III deficiency Antithrombin III (AT-III) Yes, but not a full-scale alternative2
Alpha-1 antitrypsin deficiencyAlpha-1 antitrypsin (AAT) or Alpha-1 Proteinase Inhibitor (A1PI)
No
Hereditary angioedema (HAE), types 1 and 2 C1-esterase inhibitor (C1-INH) Yes
Primary immunodeficiency disease (PID)
Immunoglobulins
No
Secondary immunodeficiency disease (SID) No3
Chronic inflammatory demyelinating polyneuropathy (CIDP)
Therapy alternatives exist but they are not recombinant4
Immune thrombocytopenic purpura (ITP)Therapy alternatives exist but they are not recombinant5
Kawasaki disease (KD)Therapy alternatives exist but they are not recombinant6
Multifocal motor neuropathy (MMN) No
Other neuromuscular diseasesTherapy alternatives exist but they are not recombinant
Critical illnesses AlbuminTherapy alternatives exist but they are not recombinant7
Note: 1) There is a recombinant factor XIII concentrate available (https://www.drugbank.ca/drugs/DB12909 ). However, it consists of the A2 subunits only, whereas plasma-derived therapy has A2B2 / 2) A gene technology-derived analogue exists for antithrombin (https://www.drugbank.ca/drugs/DB11166 ), produced in transgenic goats. The molecule has undergone post-translational modification, with different binding properties to heparin, which is the primary substrate. / 3) There are some gene therapies for SID, and one specific type of condition which
this already works for. / 4) Plasma-exchange and corticosteroids / 5) Corticosteroids, Anti-D (Rho), TPO-mimetics, Rituximab / 6) None in acute treatment. For refractory there are numerous options, e.g. corticosteroids, infliximab (recombinant), cyclosporin, and more / 7) Crystalloids or colloids are used to replace blood volume loss. No alternatives for conditions causing low
level of albumin (e.g., surgery, liver failure, pancreatitis).

PLASMA-DERIVED THERAPIES ARE USED THROUGHOUT EUROPE –ALSO FOR CONDITIONS WHERE RECOMBINANT ALTERNATIVES EXISTThe use of plasma-derived therapies varies within Europe, but even for plasma-derived therapies where recombinant alternatives exist, plasma-derived therapies are still widely used. In the map to the right, we have depicted the share of plasma-derived factor VIII compared to recombinant factor VIII used to treat haemophilia by European country. The share of plasma-derived factor VIII ranges from 5% (Sweden) to 96% (Poland).
Plasma-derived therapies are used the most in Central and Eastern Europe. In particular, the Baltics, Poland, Slovakia, Ukraine, and Hungary rely on plasma-derived factor VIII with shares of total use above 50%. Northern and Western Europe, use less plasma-derived therapies.1
Countries with higher standard of care tend to use more recombinant alternatives, even though plasma-derived therapies are not inferior to their recombinant counterparts. One reason for this is the poor reputation plasma-derived therapies acquired during the late 20th century when viruses like HIV spread – especially to patients with haemophilia. Thanks to diligent quality control, plasma-derived therapies are safe today, see pages 27 and 28. Another reason is the uncertainty of supply, which is the Achilles’ heel of the plasma-derived therapies industry and a key reason to increased production of recombinant alternatives.
The use of plasma-derived therapies is widespread throughout Europe – case example using haemophilia A
26
Notes: 1) Especially Norway, Sweden, Finland, the United Kingdom, and Ireland.
36%6%
9%
8%
5%
13%
70%
58%
73%
96%
20%
37%
66%45%83%
62%
50%
15%
15%
Note: IU = International Units.1 IU is defined as the concentration of coagulation factor in 1 ml of normal pooled plasma, see Fijnvandraat et al. (2012).
Source: Based on calculation from World Federation of Hemophilia (2018).
Data not available
Use of plasma-derived factor VIII, 2017Share of total use of factor VIII (IU)

Quality control during every step of the process minimises the risk of pathogens being transmitted to patients (1/2)
Pathogen safety depends on safeguard measures, which ensure that only plasma from healthy donors is used in the manufacturing process. Further, the safety measures self-imposed by the industry go beyond those required by regulation. With plasma-derived therapies, there will always be a hypothetical risk of pathogen transmission. However, this is practically limited to newly emerging diseases.
In 2009, a study found that since 1997, there have been no new cases of disease transmissions.1 This is due to new industry protocols and guidelines as well as improved manufacturing processes. Today, blood and plasma donations are safer than ever before. 2,3
The plasma used for plasma-derived therapies is a substance of human origin and donated by human individuals. Humans carry infectious agents like viruses and bacteria, which means using any product with human protein will carry a risk of pathogen transmission. Additionally, according to industry experts, each therapy could be made out of up to around 60,000 separate plasma donations from different human individuals, increasing the potential risks.
There have unfortunately been cases of disease transmission through plasma-derived therapies in the past. Especially patients with haemophilia were affected during the 1980s and 1990s with both HIV and hepatitis C.4 In the Mid 80s, large proportions of haemophilia patients in the US were infected by HIV and with hepatitis C.1
THE QUALITY CONTROL PROCESS IS HIGHLY DILIGENTToday, the quality control process for plasma-derived therapies is diligent and highly regulated. It is noteworthy that the industry itself has imposed additional regulations and certifications in addition to those required by international and national authorities.5 The best practice is summarised in three steps6:1. Donors are screened according to strict rules by
health authorities. The rules relate to e.g. travel or specific behaviour that increases risk of carrying infectious agents.
2. The plasma from each donor is carefully tested for viruses such as HIV and the hepatitis C virus. Any plasma even suspected of having traces of infectious agents is discarded.
3. The plasma components for medical use are purified and potential contaminants are inactivated or removed.
Due to strict regulation of the manufacturing and pathogen reduction processes, the risks have been minimised for all known diseases. A theoretical risk of transmission exists still today, but this is very small and is true for all biotechnology products and many recombinant therapy alternatives (something we will discuss in greater detail on the following page).7
27
Notes: 1) Grillberger et al. (2009) / 2) The European Medicines Agency published in 1999 a document on testing and evaluating viral safety of biotechnology products derived from both human and animal origin, see
EMEA (1999) / 3) GAO (US Government Accountability Office) (1997) / 4) Rosendaal et al. (1991) / 5) See PPTAs IQPP certification program description (PPTA 2012) and PPTAs QSEAL voluntary standards program
(PPTA 2020c). / 6) https://primaryimmune.org/treatment-information/immunoglobulin-therapy / 7) See also Barone et al. (2020)
Donor screening
1
Quality control of plasma-derived therapies in three steps
Testing plasma for
infectious agents
2
Inactivate or remove
contaminants
3

THE RISK IS PRIMARILY FOR NEW, UNKNOWN DISEASESThe risk for transmitting pathogenic agents ispractically limited to new, previously unknown disease agents, as tests do no yet exist for these diseases and current inactivation and removal techniques have not been tested to be effective against the new virus. Indeed, studies on pathogen inactivation and removal demonstrate effectiveness against a broad range of virus types. Likewise, new viruses – e.g. West Nile Virus, SARS virus – have not been transmitted through plasma derivatives in the past two decades. 1 Manufacturers cannot, however, be sure to remove or inactivate a virus they are unaware of. This was the case e.g. with HIV in the 1980s: little was known about the disease and how it was transmitted from person to person. Now the disease is understood, and new donor screening mechanisms as well as antibody tests, heat treatments, and solvent-detergent washing processes have been introduced to inactivate and remove HIV as well as other pathogens.2 For example, 100% of plasma donations in Germany in 2013 were screened for HIV1+2, hepatitis B and C, syphilis, Chagas disease, malaria, and HTLV I/II.3
Today, the quality control process is much more effective than in the 1980s and has provided protection even against some newly emerging diseases. This has been confirmed for several viral agents, also after the recent emergence of Covid-19. It is concluded that Covid-19 is not a concern for the safety margins of plasma-derived therapies manufactured by PPTA member companies due to current procedures.4
PLASMA IS ALSO SAFE WHEN DONORS ARE COMPENSATEDThe risk of pathogen transmission for plasma-derived therapies depends on the risk of donors carrying pathogenic agents. Hence, donor selection and screening is of key importance to ensure patient safety.
One concern with plasma safety relates to the compensation of donors. The concern is that monetary compensation for plasma donations could potentially attract individuals at elevated risk of carrying a virus.5
Through donor screening, high risk people like intravenous drug users are excluded from donating.6
While there is some evidence in the literature to suggest that paid donors have a higher frequency of blood-borne infections than unpaid ones7, these studies are also criticised by others both for technical faults as well as being too narrow in their scope of what determines transmission safety.8
More importantly, even when pathogens cannot be detected, e.g., if the donors donate in a period when blood-borne viruses are not detectable by screening tests, “[…] the preparation, purification and viral-inactivation procedures employed in the production of derivatives of pooled human plasma may render the difference between the safety of paid and unpaid donors for plasma products irrelevant”.9
RECOMBINANT ALTERNATIVES ARE NOT PATHOGEN RISK-FREERecombinant alternatives are also biological
products, and hence have pathogen transmission risks just like plasma-derived therapies. 10 Both require diligent production chain supervision, which ensures high quality and safety of the product. Additionally, both can have risks from the raw material, which for plasma-derived therapies is plasma, and for recombinant alternatives the type of cells they are cultivated in.
The recombinant cells are created through cultivating and can be contaminated by bacteria and viruses during the process. The contamination risk depends on which cells the recombinant alternative is cultivated in. Especially, if the production process includes human plasma in some part of the process, the risks are the same as for plasma-derived therapies. There are recombinant alternatives produced without animal proteins, but 60-70% are produced in mammalian cells, primarily Chinese hamster ovaries.11 Only in recombinant alternatives that are produced without human or animal proteins can the pathogen risk be mostly eliminated.12
(…) the advantage of recombinant over plasma-derived clotting factors regarding risk of disease transmission is marginal, and should no longer be the basis for clinical decision making.
Industry expert
Quality control during every step of the process minimises the risk of pathogens being transmitted to patients (2/2)
28
Notes: 1) Kreil et al. (2003), Barone et al. (2020), Kreil et al. (2007), Leybold et al (2012), Farcet et al. (2016), Farcet et al. (2017) 2) GAO (1997) / 3) WHO (2016), p. 107 / 4) PPTA (2020b) and ECDC (2020). / 5) High risk
individuals, e.g. intravenous drug users or prostitutes. See GAO (1997) / 6) GAO (1997) / 7) Meta study by Poel at al. (2002) on 28 data sets / 8) Offergeld and Burger (2003) / 9) Poel et al. (2002), p. 292 / 10) Barone et
al. (2020) / 11) Grillberger et al. (2009). See also Jayapal et al. (2007) / 12) Grillberger et al. (2009)
Plasma-derived therapies require a tailored approach (1/2)
Unlike many traditional pharmaceutical products, plasma-derived therapies are usually not interchangeable for a given patient. A patient treated with a particular plasma-derived therapy does not necessarily respond well to another therapy alternative approved for the same condition. Additionally, some therapy alternatives are better optimised for patient welfare than others and can improve the patients treatment experience. Which qualities are appreciated differs from patient to patient, and the decision to change therapy should therefore be left to medical experts and patients.
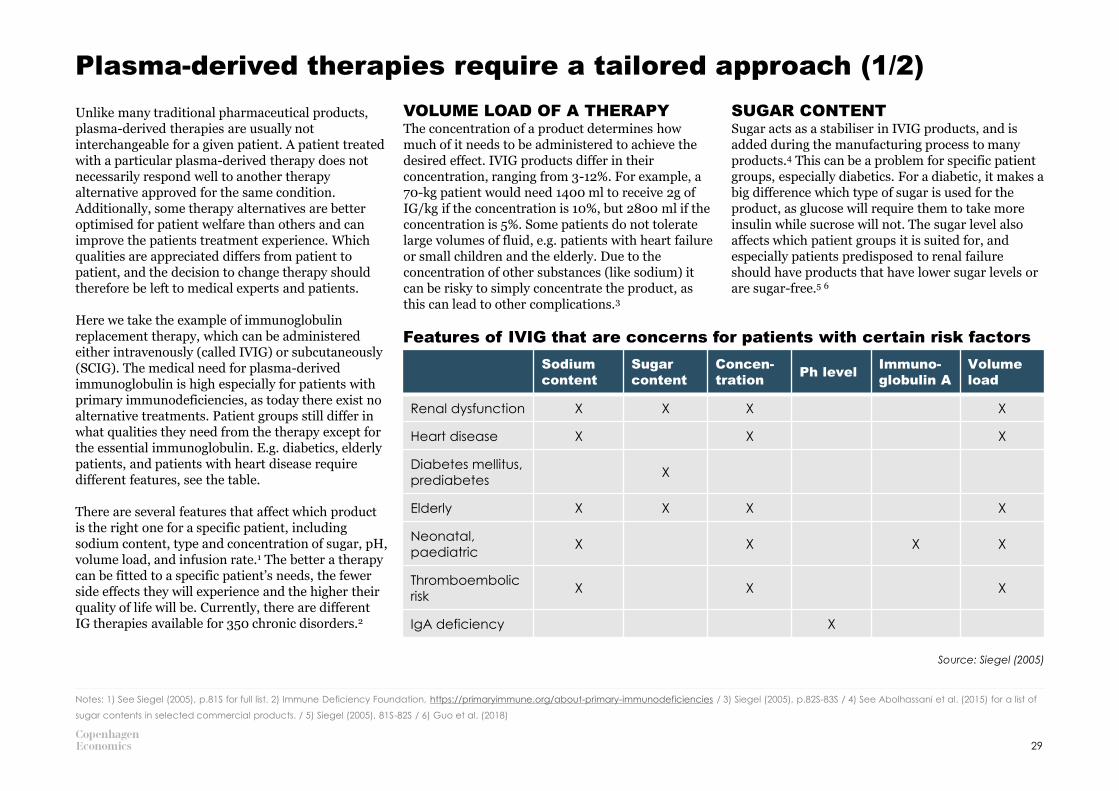
Here we take the example of immunoglobulin replacement therapy, which can be administered either intravenously (called IVIG) or subcutaneously (SCIG). The medical need for plasma-derived immunoglobulin is high especially for patients with primary immunodeficiencies, as today there exist no alternative treatments. Patient groups still differ in what qualities they need from the therapy except for the essential immunoglobulin. E.g. diabetics, elderly patients, and patients with heart disease require different features, see the table.
There are several features that affect which product is the right one for a specific patient, including sodium content, type and concentration of sugar, pH, volume load, and infusion rate.1 The better a therapy can be fitted to a specific patient’s needs, the fewer side effects they will experience and the higher their quality of life will be. Currently, there are different IG therapies available for 350 chronic disorders.2
VOLUME LOAD OF A THERAPYThe concentration of a product determines how much of it needs to be administered to achieve the desired effect. IVIG products differ in their concentration, ranging from 3-12%. For example, a 70-kg patient would need 1400 ml to receive 2g of IG/kg if the concentration is 10%, but 2800 ml if the concentration is 5%. Some patients do not tolerate large volumes of fluid, e.g. patients with heart failure or small children and the elderly. Due to the concentration of other substances (like sodium) it can be risky to simply concentrate the product, as this can lead to other complications.3
SUGAR CONTENTSugar acts as a stabiliser in IVIG products, and is added during the manufacturing process to many products.4 This can be a problem for specific patient groups, especially diabetics. For a diabetic, it makes a big difference which type of sugar is used for the product, as glucose will require them to take more insulin while sucrose will not. The sugar level also affects which patient groups it is suited for, and especially patients predisposed to renal failure should have products that have lower sugar levels or are sugar-free.5 6
29
Notes: 1) See Siegel (2005), p.81S for full list. 2) Immune Deficiency Foundation, https://primaryimmune.org/about-primary-immunodeficiencies / 3) Siegel (2005), p.82S-83S / 4) See Abolhassani et al. (2015) for a list of
sugar contents in selected commercial products. / 5) Siegel (2005), 81S-82S / 6) Guo et al. (2018)
Sodium
content
Sugar
content
Concen-
trationPh level
Immuno-
globulin A
Volume
load
Renal dysfunction X X X X
Heart disease X X X
Diabetes mellitus,
prediabetesX
Elderly X X X X
Neonatal,
paediatricX X X X
Thromboembolic
riskX X X
IgA deficiency X
Features of IVIG that are concerns for patients with certain risk factors
Source: Siegel (2005)

CONVENIENCE OF THERAPYThe convenience of therapies is important for patients as well as healthcare personnel. This is especially true for the patients, as it relates to the time they need to spend to receive their medication. Product concentration as well as infusion rate affect the perceived convenience of the patient.
The IVIG products come in various different package sizes, which means the product can be tailored to match the patients needs. Another convenience factor is that the product can come in either liquid form, which is directly usable but needs to be refrigerated – and lyophilised form, which does not need to be refrigerated but must be reconstructed before use.1
Additionally, IVIG and SCIG both have their own benefits and drawbacks, presented in the table. IVIG needs to be administered less often (half-life of 30-40 days) but leads to a peak in immunoglobulin levels after infusion. SCIG is absorbed more slowly, which eliminates peaks but also means it needs to be injected more often.2 One patient might not be able to inject themselves and hence prefers IVIG, as it needs to be injected only every 3-4 weeks and with the help of a healthcare professional. Another patient might enjoy the flexibility and freedom of using SCIG, as even if the treatment needs to be injected at least once a week, they can do it in the comfort of their own home.
SCIG is a preferred method especially for children, as
it is easier to self-administer either by the child or caregiver, which gives greater freedom and increases quality of life.3
Unfortunately, immunoglobulin, like any therapy, has side effects for some patients. The majority of side effects are mild, e.g. headache, fever or chills, and pass quickly. However, some side effects are severe, including aseptic meningitis, renal impairment, thrombosis, and haematologic disorders. The severe side effects are rare, affect less than 1% of patients, and are associated with individual differences as well as specific immunoglobulin preparations. Switching to SCIG can help with side effects, both for patients who are currently experiencing side effects or for patients at high risk of developing them.4 There are several studies comparing side effects between the two treatment types, but sample sizes are small. A meta-analysis on eight studies of in total 138 patients with CIDP showed that the risk of moderate and/or systemic adverse effects was 28% lower in the SCIG group.5
The product is no longer a commodity, and the challenge physicians and pharmacists face is selecting the appropriate formulation for a particular patient.
Siegel (2005)
Plasma-derived therapies provide different value to different patients (2/2)
30
Notes: 1) Siegel (2005), p.83S. / 2) Krivan et al. (2017). 3) Kobayashi et al. (2019) / 4) Guo et al. (2018) / 5) Guo et al. (2018), based on Racosta et al. (2017)
Advantages and disadvantages for the patient of intravenous and subcutaneous immunoglobulin
Intravenous IG Subcutaneous IG
Advanta
ges
• Less frequent
dosing due to
higher volume
(every 3-4
weeks)
• Allow for high
doses
• Shorter infusion
times
• Less involvement
of the patient
• Home-based
therapy gives
greater
independence
• Flexibility for e.g.
travel or work
• Low risk of
systemic side
effects
Dis
advanta
ges
• Requires trained
personnel
• Severe side-
effects (less
frequent with
new highly
purified IVIG)
• Frequent dosing
(min. 1 per
week)
• Requires patient
involvement,
reliability and
compliance
• Local side
effects (swelling,
local
inflammation,
itch)
Source: Krivan et al. (2017)

CHAPTER 2VALUE OF THE PLASMA-DERIVED THERAPIES INDUSTRY
2.1 PLASMA ECONOMICS, THE MARKET FOR PLASMA-DERIVED THERAPIES, AND IMPLICATIONS FOR THE PLASMA MARKET / P. 33
2.2 WHAT IS THE ECONOMIC VALUE OF THE PLASMA-DERIVED THERAPIES INDUSTRY? / P. 41

Chapter 2 – Main conclusions
INCREASING DEMAND FOR PLASMA-DERIVED THERAPIESDemand for plasma-derived therapies is increasing, which drives an increase in the demand for plasma for fractionation. This is the case despite the existence of recombinant and other alternatives. Not all conditions have alternatives to plasma-derived therapies and patients differ in their need for treatment. This explains the co-existence of plasma-derived and other therapies.
DEMAND FOR PLASMA IS DRIVEN BY THERAPY IN HIGHEST DEMANDThe protein which requires the largest amount of plasma based on the patient needs and how much of this protein plasma contains, is the key in determining the demand for plasma. Today, the protein with the highest demand is immunoglobulin. Hence, immunoglobulin has to bear a large share of raw material costs.
PRODUCTION PROCESS OF PLASMA-DERIVED THERAPIES IS LONGER AND MORE EXPENSIVEThe production process of plasma-derived therapies is much longer and more expensive than production of traditional pharmaceuticals. Production of plasma-derived therapies can require 7-12 months from donation to delivery of the therapy to patients, compared with around 2-3 months for traditional pharmaceuticals. Furthermore, raw material costs are the primary cost component for plasma-derived therapies, while for traditional pharmaceuticals the largest cost component is sales and marketing.
RISKS FOR SUPPLY IF TENDERS ARE NOT CAREFULLY DESIGNEDThe large share of the total costs from raw materials lowers the flexibility for developers and manufacturers of plasma-derived therapies in setting prices. This is especially true for immunoglobulin, which has to bear a large share of the raw material costs. Hence, tender specifications and pricing can have large effects on ability to supply. There are examples of tendering practices leading to therapy shortages (e.g. the UK and Romania).
THE PLASMA-DERIVED THERAPIES INDUSTRY SUPPORTS THE EUROPEAN ECONOMYThe plasma-derived therapies industry supports the European economy through direct, indirect, and induced effects. The direct economic effects relate to production within the plasma-derived therapies industry. The indirect effects estimate the value created by sub-contractors to the plasma-derived therapies industry, e.g. at plasma collection centres, cleaning companies, or IT solution providers. The induced effects represent the value created when employees, both in the industry and its sub-contractors, spend their income. Our indicative analysis suggests that the order of magnitude of these types of impact could be 9.7 billion EUR.
DONOR COMPENSATION TO INCREASE PLASMA SUPPLY ALSO SUPPORTS THE ECONOMY AND EMPLOYMENTThe spending of donor compensation supports an estimated 76 million EUR per year of the induced
effect and 1,100 full-time equivalent jobs from compensations to plasma donors in Germany, Austria, the Czech Republic, and Hungary.
PLASMA DONATION CENTRES HAVE POSITIVE EFFECTS ON THE LOCAL COMMUNITYPlasma donation centres can themselves have positive effects on the local community through a number of different channels such as employing staff, using local contractors, employees spending their income, collaborative partnerships, and by being a gathering point in the local community.
32
Notes: 1) USD value = 2,271,541,537, conversion rate 2017 average from the European Central Bank = 0.8968. / 2) Office of the United States Trade Representative, https://ustr.gov/countries-regions/europe-middle-
east/europe/european-union. Exports worth 575 USD, conversion rate as in note 1. / 3) Of the importing countries, only Switzerland and Norway are not members of the EU. / 4) Eurostat,
https://ec.europa.eu/eurostat/statistics-explained/index.php/International_trade_in_medicinal_and_pharmaceutical_products
Plasma-derived therapies:
• are increasing in demand
• are at risk of shortages due to
the scarce availability of
European donated plasma
• support the European
economy directly from the
industry through indirect and
induced effects
• 76 million EUR and the indirect
effect are supported by
donor compensation, which
also supports 1,100 jobs
2.1PLASMA ECONOMICS, THE MARKET FOR PLASMA-DERIVED THERAPIES, AND IMPLICATIONS FOR THE PLASMA MARKET
How demand for plasma is driven by the plasma-derived therapy with the highest demand
The plasma-derived therapies industry exhibits certain features that make it different from many other pharmaceuticals, and have implications for how plasma-derived therapies are produced and procured. We start by explaining how plasma demand is derived and what this could mean for healthcare systems. We then review the key determinants of plasma production costs and examine how manufacturers are trying to keep production costs down. Finally, drawing on examples and experiences of industry experts, we explain what challenges the cost characteristic means for national players procuring plasma-derived therapies.
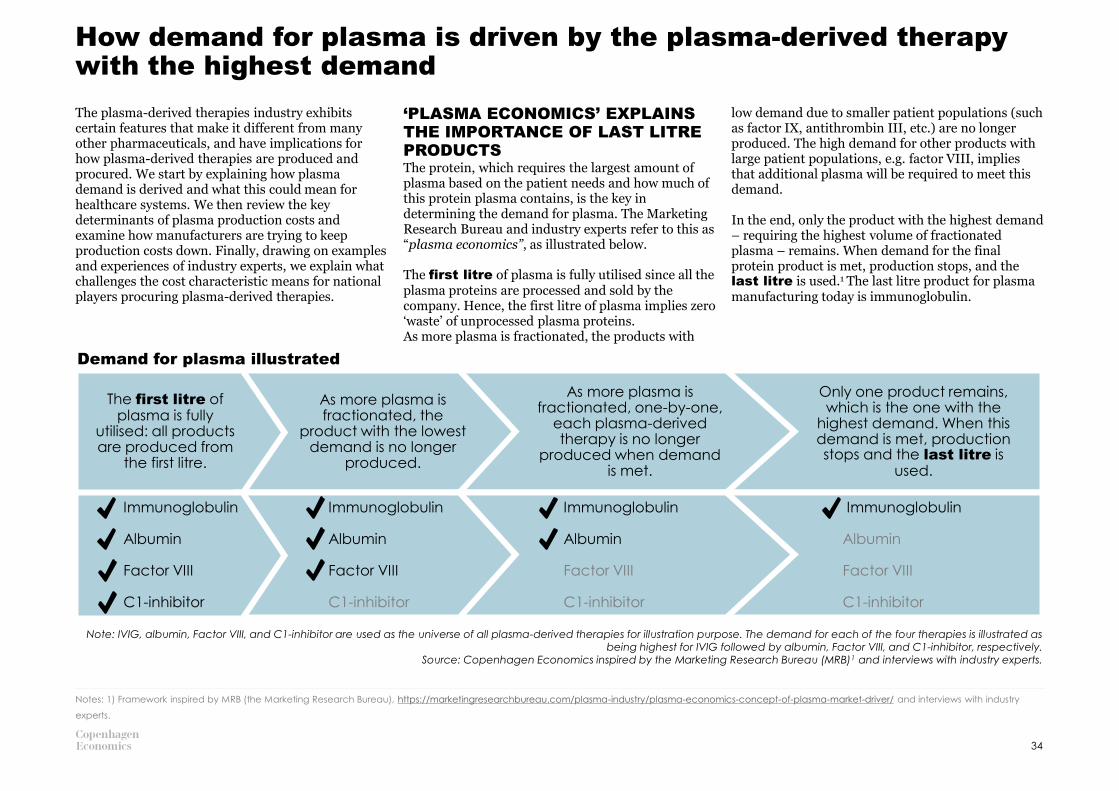
‘PLASMA ECONOMICS’ EXPLAINS THE IMPORTANCE OF LAST LITRE PRODUCTSThe protein, which requires the largest amount of plasma based on the patient needs and how much of this protein plasma contains, is the key in determining the demand for plasma. The Marketing Research Bureau and industry experts refer to this as “plasma economics”, as illustrated below.
The first litre of plasma is fully utilised since all the plasma proteins are processed and sold by the company. Hence, the first litre of plasma implies zero ‘waste’ of unprocessed plasma proteins. As more plasma is fractionated, the products with
low demand due to smaller patient populations (such as factor IX, antithrombin III, etc.) are no longer produced. The high demand for other products with large patient populations, e.g. factor VIII, implies that additional plasma will be required to meet this demand.
In the end, only the product with the highest demand – requiring the highest volume of fractionated plasma – remains. When demand for the final protein product is met, production stops, and the last litre is used.1 The last litre product for plasma manufacturing today is immunoglobulin.
Demand for plasma illustrated
Note: IVIG, albumin, Factor VIII, and C1-inhibitor are used as the universe of all plasma-derived therapies for illustration purpose. The demand for each of the four therapies is illustrated as being highest for IVIG followed by albumin, Factor VIII, and C1-inhibitor, respectively.
Source: Copenhagen Economics inspired by the Marketing Research Bureau (MRB)1 and interviews with industry experts.
34
Notes: 1) Framework inspired by MRB (the Marketing Research Bureau), https://marketingresearchbureau.com/plasma-industry/plasma-economics-concept-of-plasma-market-driver/ and interviews with industry
experts.
The first litre of plasma is fully
utilised: all products are produced from
the first litre.
As more plasma is fractionated, the
product with the lowest demand is no longer
produced.
As more plasma is fractionated, one-by-one,
each plasma-derived therapy is no longer
produced when demand is met.
Only one product remains, which is the one with the
highest demand. When this demand is met, production stops and the last litre is
used.
Immunoglobulin
Albumin
Factor VIII
C1-inhibitor
Immunoglobulin
Albumin
Factor VIII
C1-inhibitor
Immunoglobulin
Albumin
Factor VIII
C1-inhibitor
Immunoglobulin
Albumin
Factor VIII
C1-inhibitor

The industry has minimised costs to a large extent, which enables them to deliver plasma-derived therapies at a lower cost than would otherwise be possible. A firm operating in a competitive market will seek to minimise the costs of its production process conditional on product quality and a number of other key aspects. The consolidation in the late 1990s and early 2000s is a concrete example of how this has been manifested in the plasma-derived therapies industry. In 1996 there were 42 fractionation plants in Europe. In 2004, that number had decreased to 28 fractionation plants and remained largely unchanged until 2015 (26 fractionation plants). In 2018, the number of fractionation plants dropped to 21 due to five non-profit fractionation plants closing down.
Average plant capacity has increased in the same period from 287,000 litres per year in 1996 to 1,407,000 litres in 2018. A very likely explanation for this consolidation is economics of scale. Given the complexity of the production process of plasma-derived therapies, including the rigid quality control needed, manufacturing requires large investments. It will be much cheaper to produce an additional unit of output for a company which has already done this investment than for a company that has not.
In addition, the industry may have been able to minimise costs by exploiting economies of scopeas a consequence of using the same raw material to produce multiple products. If a given manufacturer is producing a therapy using immunoglobulin, the added cost of also producing albumin will be lower as, due to the composition of plasma, the manufacturer already has the required raw material.
Number of fractionation plants in Europe
Source: MRB (2015) and MRB (2018a).
35
Number of fractionation plants
42
33 32
2825 26 27 26
21
2004 200720021996 1999 2010 2012 2015 2018
Average plant capacity for fractionation plants in Europe
1,000 litres of plasma
287392
465 500
660726 758
1,066
1,407
20101996 2015200720041999 2002 2012 2018
Source: MRB (2015) and MRB (2018a).
The plasma-derived therapies industry has sought to minimise the cost of their production process

More effective utilisation of the raw material to meet unmet patient needs can reduce unit costs of plasma-derived therapies
PLASMA IS UNDERUTILISEDAs some protein fractions and plasma-derived therapies are in higher demand than others, the plasma collected for fractionation today is underutilised. This is because of the features of ‘plasma economics’ described on page 34.1
DEMAND FOR PLASMA-DERIVED THERAPIES COULD BE HIGHERThere is production capacity available, as there is raw material, but there is no demand from payers (hospitals, health procurement bodies) for all the proteins derived from plasma today.2 The lower demand stems largely from limited patient needs for many of the ‘first litre’ therapies. However, there could be unmet needs and further patients that could benefit from these therapies.
First, some patients with rare diseases never receive the correct diagnosis.3 Other patients experience diagnosis delay, and the average delay is around 4.8 years from symptom onset to an accurate diagnosis of a rare disease.4 This can have severe consequences for patients.
A HIGHER UTILISATION WILL IMPLY A LOWER COST PER UNITThe economies of scale and scope that characterise the plasma-derived therapies industry (as outlined above) mean that higher utilisation of the raw material comes with lower unit costs. More specifically, the manufacturing cost of the therapies in highest demand, i.e., the last-litre products immunoglobulin and albumin5, will be lower if the use of first-litre products increases. Cost savings can enable a wider use of plasma derived therapies –
especially in countries that rely on plasma-derived last litre products, such as albumin.
FURTHER RESEARCH APPEARS NECESSARYWhile this conceptual framework makes economic sense, we have not found empirical evidence to substantiate it. Hence, further research appears necessary to establish the causal effect from a more effective utilisation of plasma to unit costs and eventually prices and utilisation.
Source: Copenhagen Economics.
36
Notes: 1) Framework inspired by MRB (the Marketing Research Bureau), https://marketingresearchbureau.com/plasma-industry/plasma-economics-concept-of-plasma-market-driver/ and interviews with industry
experts. / 2) Based on interviews with industry experts / 3) See, e.g., de Serres (2002) for an example with Alpha-1 antitrypsin deficiency. / 4) Global Commission to End the Diagnostic Odyssey for Children with a Rare
Disease (2020a). / 5) Demand is centred around immunoglobulin and albumin, see page 37.
The more effectively plasma is utilised for
wider sets of treatments where there are unmet
needs…
…the lower the unit cost of all therapies
given the economies of scale
and scope…
…and the greater the number of
patients that can benefit from treatments.
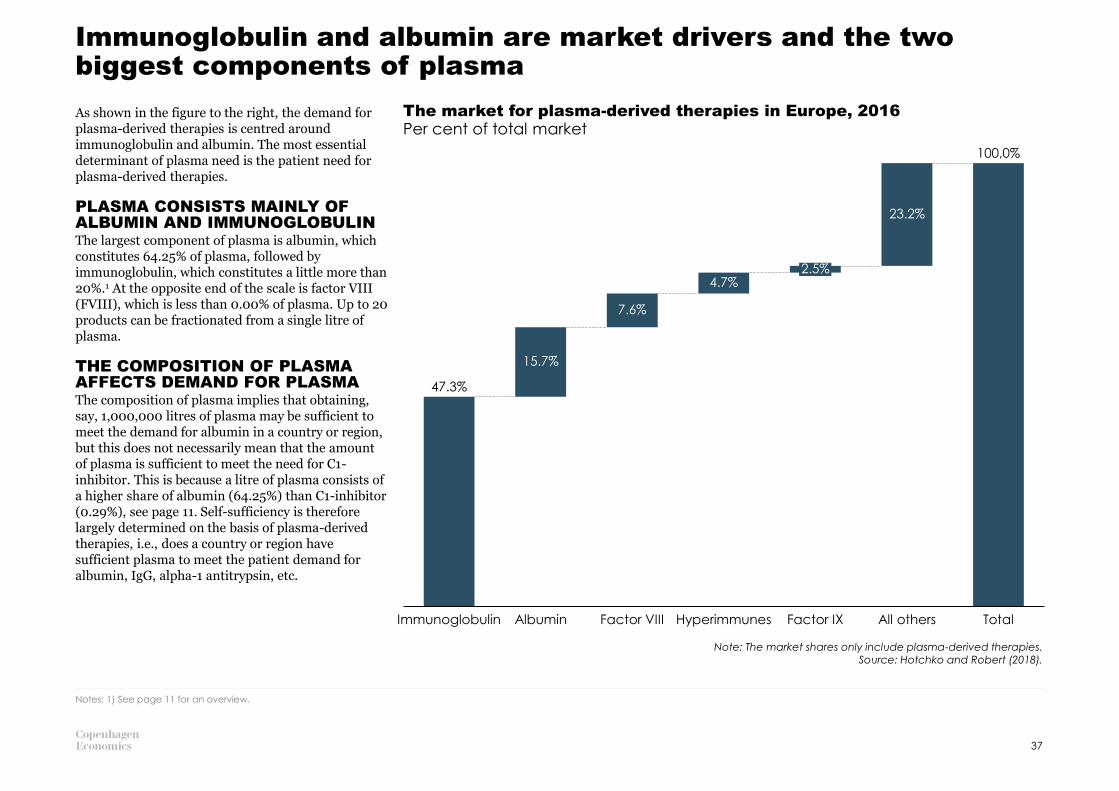
Immunoglobulin and albumin are market drivers and the two biggest components of plasma
As shown in the figure to the right, the demand for plasma-derived therapies is centred around immunoglobulin and albumin. The most essential determinant of plasma need is the patient need for plasma-derived therapies.
PLASMA CONSISTS MAINLY OF ALBUMIN AND IMMUNOGLOBULINThe largest component of plasma is albumin, which constitutes 64.25% of plasma, followed by immunoglobulin, which constitutes a little more than 20%.1 At the opposite end of the scale is factor VIII (FVIII), which is less than 0.00% of plasma. Up to 20 products can be fractionated from a single litre of plasma.
THE COMPOSITION OF PLASMA AFFECTS DEMAND FOR PLASMAThe composition of plasma implies that obtaining, say, 1,000,000 litres of plasma may be sufficient to meet the demand for albumin in a country or region, but this does not necessarily mean that the amount of plasma is sufficient to meet the need for C1-inhibitor. This is because a litre of plasma consists of a higher share of albumin (64.25%) than C1-inhibitor (0.29%), see page 11. Self-sufficiency is therefore largely determined on the basis of plasma-derived therapies, i.e., does a country or region have sufficient plasma to meet the patient demand for albumin, IgG, alpha-1 antitrypsin, etc.
The market for plasma-derived therapies in Europe, 2016
Note: The market shares only include plasma-derived therapies.Source: Hotchko and Robert (2018).
Per cent of total market
Notes: 1) See page 11 for an overview.
7.6%
Immunoglobulin
15.7%
Albumin Factor VIII Hyperimmunes
4.7%2.5%
Factor IX
23.2%
All others Total
47.3%
100,0%
37

The manufacturing process makes plasma-derived therapies more costly to manufacture than traditional pharmaceutical products
MANUFACTURING PLASMA-DERIVED THERAPIES IS COMPLEX AND TIME-CONSUMINGManufacturing of plasma-derived therapies can require 7-12 months from donation to delivery of the therapy to patients, compared with around 2-3 months for traditional pharmaceuticals.1 This necessarily makes the manufacturing of plasma-derived therapies more costly than traditional pharmaceuticals.
The manufacturing of traditional pharmaceuticals requires few steps: compound mixing and capsule filling/tableting2, after which the product is ready for packaging and distribution.
The manufacturing of plasma-derived therapies requires plasma collection from human donors, testing, fractionation, purification, and filling before the therapy is ready for packaging and distribution. A similar process is undertaken for many other biological pharmaceuticals.
The differences in the manufacturing processes are due to the use of human plasma as a raw material. The use of plasma requires manufacturers to follow protocols diligently and also a withdrawal period between collection and fractionation. In addition, the use of human plasma requires a number of testing procedures and purification to avoid the transmission of pathogens (see pages 27 and 28), which further increases the length of the production process.
Duration of delivering plasma-derived therapies versus traditional pharmaceuticals to patients
Source: Pharmaceutical Commerce (2016).
38
Notes: 1) Pharmaceutical Commerce (2016) / 2) Traditional pharmaceuticals can in some cases require more complicated modes of administration than tablets/capsules, e.g., intravenous or subcutaneous
administration.
Plasma collection Testing Fractionation Purification Filling Administration to patients
Packaging and distribution
Start 3 months 6 months 9 months
Packaging and distribution
Compound mixing
Capsule filling/tableting
Plasma-derived
therapies
Traditional pharma-ceuticals

Unlike the traditional pharmaceutical industry, the majority of costs in the plasma-derived therapies industry come from manufacturing and raw materialsThe majority of the costs associated with plasma-derived therapies are from manufacturing and raw materials. The figure below shows that 57% of the total cost of producing plasma-derived therapies is from manufacturing costs and raw materials. Another source estimates that 50% of the total cost
of producing plasma-derived therapies is from raw materials alone, which aligns with the 57% in the figure used for manufacturing and raw materials.1
This is in contrast to the traditional pharmaceutical industry where this number is estimated to be 14%, i.e., 43%-points lower than in the plasma-derived
therapies industry. The most important input factor – plasma – is thus a key component in both production of the final product and in terms of the share of costs.
Cost structure of producing plasma-derived therapies and traditional pharmaceutical products
Note: The pharmaceutical industry is based on chemical-based pharmaceuticals.Source: Industry Report and Estimations (2011)
39
Per cent of total costs
Notes: 1) MRB, https://marketingresearchbureau.com/plasma-industry/plasma-economics-concept-of-plasma-market-driver/
General administrationResearch and developmentManufacturing costs
and raw materials
Sales and marketing Other
57%
10%
14%
30%
9%
25%
10%
6%
14%
25%
43%-point lower
Pharmaceutical industry
Plasma-derived therapies industry

High costs for raw materials and plasma economics provide risks for supply if tenders are not carefully specified
LIMITED PRODUCTION CAPACITIES
MEAN MANUFACTURERS NEED TO
PRIORITISE SUPPLYThe supply of plasma-derived therapies is limited due to limited production capabilities in the short term, the long manufacturing process1 and, critically, the limited supply of the raw material. Due to limited production capacity manufacturers have to prioritise supply. This is necessary to keep supply stable in countries with contracts in place. Unfortunately, currently, it also means not all patients can have access to all therapies.
EFFECTS OF PRICING AND
TENDERS ON SUPPLYThe large share of the total costs from raw materials2
lowers the flexibility for developers and manufacturers of plasma-derived therapies in setting prices. This is especially true for immunoglobulin, which, as it is the last litre product3, has to bear a large share of the raw material costs. Hence, tender specifications and pricing can have a major impact on ability to supply. In the worst case, tendering practices can lead to therapy shortages, as has been the case in, e.g., the UK and Romania (see examples on the right).
The problems can arise if 1) prices are driven so low in tendering processes that no manufacturers are able to supply, or 2) if demand is higher than forecasted and the manufacturers are not able to supply more at the tender price, or they are unable to scale up production in time. If these problems are properly addressed, tenders can be designed to account for them (see example from Poland on the right).
40
Notes: 1) See page 38. / 2) See page 39. / 3) 1) Framework inspired by MRB (the Marketing Research Bureau), https://marketingresearchbureau.com/plasma-industry/plasma-economics-concept-of-plasma-market-
driver/ and interviews with industry experts. / 4) Primary Immunodeficiency UK (patient organization), http://www.piduk.org/advocacy/instabilityinimmunoglobulinsupply / 5) International patient organization for
primary immunodeficiencies, https://e-news.ipopi.org/romania-immunoglobulin-shortage-affects-pid-patients/ /
Prices are driven too lowLower prices mean savings for payers and
therefore benefits to patients and taxpayers.
Payers, however, need to ensure that
manufacturers can recover their costs and
have an incentive to maximise the
effectiveness of plasma-derived therapies.
High cost of raw material is problematic if
Example: Therapy shortages due
to low tender pricesIn 2018, there were severe shortages of
immunoglobulin in Romania. The reasons for
this included low tender prices, national pricing
policies, and a newly introduced clawback tax
that increased the costs of therapy providers.
This led to all manufacturing companies
discontinuing the supply to Romania. Even
though an exemption to the tax was soon put
in place, it took months for the therapy supply
to get back to normal.5
Example: Securing supply with effective tenderingIn 2019, Poland set up an immunoglobulin tendering agreement for a longer time period and with
a higher list price than before. This followed after manufacturers had raised awareness about the
importance of immunoglobulin for patients and made Poland aware that it could face reduced
access to supply if the pricing is too low given that demand is higher than supply globally and
manufacturing is complex.
Example: Therapy shortages due
to problems with forecasting
demandIn 2018, the NHS in the UK suddenly needed
more immunoglobulin than they had originally
forecasted and tendered for. The tender was
specified to a certain contractual amount,
which the contracted companies had already
supplied. When the NHS asked for supply
above this amount, the companies were
reluctant to supply more because of the low
prices in the tender which were not matched
by prices elsewhere.4
Demand is higher than forecastedThe supplier may not be able to meet
additional demand of tender if the price is set
low but raw material costs have increased
during the tender period.
Source: Copenhagen Economics.
2.2WHAT IS THE ECONOMIC VALUE OF THE PLASMA-DERIVED THERAPIES INDUSTRY?

The plasma-derived therapies industry has a wide geographic footprint and creates value throughout the European economy
A SPECIALISED INDUSTRY THAT
CREATES VALUE TO THE EUROPEAN
ECONOMYThe largest contribution of the plasma-derived therapies industry is the health and quality of life benefits it brings to patients. The societal contribution of the industry is not, however, limited to patient benefits but extends to economic impacts. We sought to examine the types of economic contributions the plasma industry can have on the wider economy.
The economic footprint of an industry or company is calculated through looking at the direct, indirect, and induced (or wage) effects, as depicted in the chart. The plasma-derived therapies industry has a geographically wide footprint, contributing to the economy not only in the European countries where fractionation centres are located, but also around those countries. Collection centres, for example, are spread out to attract as many donors as possible. The economic compensations that are used in the Czech Republic, Austria, Germany, and Hungary also add to the local footprints. Finally, the products are spread all over the world.
A COMPLETE ECONOMIC FOOTPRINT
ANALYSIS REQUIRES LARGE
AMOUNTS OF SENSITIVE DATAA fully-fledged footprint analysis requires large amounts of sensitive company-specific data. It has not been possible to obtain such information from all manufacturers of plasma-derived therapies in Europe. Since we do not have the detailed data to undertake a traditional footprint analysis, we have used available evidence to assess the order of magnitude of the economic footprint of the plasma industry. The approach is outlined below.
Direct effects Jobs created and
purchases of inputs
needed for
production
Induced
effectsWage effect as
employees spend
their income
Indirect
effects Jobs created and
purchases of input
needed for
production at
suppliers
The therapy developers & manufacturers create direct economic value
through employment and purchase of production materials needed for
research & development, fractionation, quality control, and distribution
of plasma-derived therapies. Direct effects also arise from plasma
collection centres owned by the therapy developers & manufacturers.
€
€
For production, the therapy developers & manufacturers also need
many products and services they do not provide themselves. These are
bought from suppliers that need to employ workers and purchase inputs
to run their services. This includes, e.g., IT services, security, cleaning, and
transportation services. Additionally, 3rd party plasma sourcing also falls
under this category.
All the employees at the therapy developers & manufacturers as well as
their suppliers receive wages from their employers. When these wages
are spent on groceries, clothes, housing etc., this creates additional
economic activity. Furthermore, in countries where plasma donations are
monetarily compensated, this additional wage also creates an effect
when donors spend their income.
42
Therapy developers & manufacturers
Suppliers
Wages

Methodology description: our approach to obtain an indicative estimate of the economic contribution of the industry
WE USE THE WORLD INPUT OUTPUT DATABASEAs with a standard economic footprint analysis, we estimate the effects of the plasma-derived therapies industry in Europe by using so-called multipliers. These multipliers express the effects that investments by the plasma-derived therapies industry have on other parts of the European economy.
We calculate our multipliers from the Input-Output tables from the World Input Output Database.1 This database covers 43 countries and 56 sectors.2 These tables represent the supply and use relationships in USD millions between the 56 sectors and 43 countries for the year 2014. As we are interested in the European-wide effects, we used an aggregate table of the EU28 countries. From this table we are able to calculate direct, indirect, and induced (consumer spending) multipliers for GDP (industry and donor centres) and employment (donor centres only) effects.
THE EFFECTS SUPPORTED BY THE PLASMA-DERIVED THERAPIES INDUSTRYThe data we used are based on the total global sales made in the plasma industry in 2016 in USD.3 Of the total global sales, we allocate 37 per cent to Europe.4
We expect that this number does not correspond precisely to the countries included in the Input Output EU28 aggregation, although it should be highly correlated. Furthermore, we assume that the peripheral European countries would be unlikely to differ substantially in supply and use structure to the EU28. Nonetheless, this is reason to interpret the
approximation with care.
Given an approximation of the total sales attributed to Europe, we used the multipliers for industry classification ‘C21 - Manufacture of basic pharmaceutical products and pharmaceutical preparations’. This classification corresponds to ISIC revision 4 sector C. 2100, which includes the processing of blood, amongst other processes.5 As this is a broad sector, however, the multipliers should only be seen as a rough approximation for the plasma-derived therapies industry. This is because the structure of the plasma-derived therapies industry itself varies considerably with the average EU sector classification. Due to this variation in sectoral structure caution should be exercised when interpreting our approximation.
The multipliers are then multiplied by the share of the total sales produced in Europe to give the economic effect. As a final note, we translate the economic impacts on GDP from USD to EUR using the average 2017 exchange rate from the European Central Bank.6
THE EFFECTS SUPPORTED BY DONOR COMPENSATIONIn addition to the aggregated EU28 WIOD table, we use three primary sources of data to estimate the economic impact of donation centres.1) Total plasma collected in 2018 by country (in
litres)7
2) The average volume per donation by country8
3) Compensation per donor by country9
We collect this data for the four countries in the EU
where compensation to donors is possible (Germany, Austria, the Czech Republic, and Hungary). Using these three data sources, we can estimate the total compensation given in each of the four countries individually. We use the following calculation for each country, c, to do so:
We use the sum of the results to arrive at a total of compensations of just under 80 million EUR. As this is pure compensation, we calculate induced effects alone. This effect describes how income is spent in the wider economy. To do this, we calculate the multipliers for ‘households’. This is done in the same way as it would be for any other sector. The result is an induced multiplier that describes the spending of money by households.
As we calculate individual country multipliers, the induced GDP and employment effect only captures the domestic consumption. As a result, spending in other countries and on imports is not captured in our estimates. Therefore, our estimations should be interpreted as a conservative approximation.
Furthermore, as we are considering compensation alone, our estimation is unlikely to capture all the economic dynamics. This is because the compensation offered is unlikely to cover the full economic cost incurred in travelling and donating plasma.10 This is further reason to interpret out estimation with care.10
43
Notes: 1) WIOD (2016) / 2) Based on the ISIC rev. 4, see United Nations (2008), revision 4. / 3) Hotchko and Robert (2018). According to https://marketingresearchbureau.com/plasma-industry/a-look-to-the-future/, this
is approximately the same total sales as in 2017. / 4) MRB (2020), at EBA-IPFA 2020. / 5) United Nations (2008), revision 4, p. 115. / 6) European Central Bank, (2020) / 7) European Plasma Alliance (2019) / 8) Estimated
based on EDQM (2019), day 2 / 9) European Commission (2016) / 10) See, e.g., Platz et al. (2019)
𝑇𝑜𝑡𝑎𝑙 𝐶𝑜𝑚𝑝𝑒𝑛𝑠𝑎𝑡𝑖𝑜𝑛 𝑐
=𝑇𝑜𝑡𝑎𝑙 𝑝𝑙𝑎𝑠𝑚𝑎 𝑐𝑜𝑙𝑙𝑒𝑐𝑡𝑒𝑑𝑐
𝑉𝑜𝑙𝑢𝑚𝑒/𝑑𝑜𝑛𝑎𝑡𝑖𝑜𝑛𝑐× 𝐶𝑜𝑚𝑝./𝑑𝑜𝑛𝑜𝑟𝑐

The plasma-derived therapies industry makes a substantial contribution to the European economy
THE PLASMA-DERIVED THERAPIES INDUSTRY SUPPORTS THE EUROPEAN ECONOMYBased on existing evidence, we obtain an indicative estimate that the plasma-derived therapies industry supports approximately 9.7 billion EUR throughout Europe (per annum).
These estimates indicate the gross value added by the plasma-derived therapies through three different effects (as shown in the box to the right and explained in detail on page 42).
1. Around 3.4 billion EUR of the total value is supported directly from the value added by the industry through employment and purchase of production materials needed for research & development, fractionation, quality control, and distribution of plasma-derived therapies.
2. Around 2.5 billion EUR of the total value is supported through the supply chain to those industries supplying the plasma-derived therapies industry. This includes everyone from the IT professionals to the construction industry, and all medical appliances and supplies in between.
3. Around 3.8 billion EUR of the total value is supported via spending of wages, i.e. induced effects in the plasma-derived therapies industry and supporting sectors. This spending effect supports, among others, the retail, hospitality, and utilities sectors.
THE ESTIMATION IS BASED ON A NUMBER OF ASSUMPTIONS AND SHOULD BE INTERPRETED WITH CARE As mentioned on page 43, we do not have the detailed data to undertake a traditional footprint analysis. Instead, we have used existing evidence to assess the order of magnitude.
The estimates are derived from a total market value of plasma-derived therapies worldwide of around 18.7 billion EUR2 and an estimated share produced in Europe of 37% based on the share of plasma fractionated in Europe.3
Our estimation is based on the assumption that the plasma-derived therapies industry is similar in production structure to the industry ‘C21 –Manufacture of basic pharmaceutical products and pharmaceutical preparations’. This is a strong assumption (see, e.g., page 39 for the an illustration on the difference in cost structure). However, we assume that the plasma-derived therapies industry would likely contribute more value added to the economy. Therefore, our estimates should be seen as conservative estimates of the true economic contribution.
As explained above (page 43), the estimates should be interpreted with care, as they are indicative estimates of the value supported by the plasma-derived therapies industry.
GDP supported by the plasma-derived therapies industry in Europe – indicative estimates
Note: Based on data from 2017 and 2016. Source: Copenhagen Economics based on Input-Output data
from WIOD (2016), market value of plasma-derived therapies from Hotchko and Robert (2018), and
production share in Europe from MRB (EBA-IPFA 2020).
44
Billion EUR, per annum
Notes: 1) Vintura (2020) use disability-adjusted life years (DALYs) and value of statistical life year (VOLY) to estimate the socio-economic impact of plasma-derived therapies. They find a health value of approximately
1 billion EUR for a patient population of 44,000 individuals with primary immunodeficiencies eligible for immunoglobulin. Similarly, they find a health value of approximately 1 billion EUR per year for a patient
population of 47,000 individuals with severe haemophilia. / 2) 21.174 billion USD from Hotchko and Robert (2018), average exchange rate in 2017 of 1.1297 USD per EUR from the European Central Bank (2020). The
market value does not include recombinant products. / 3) Share from MRB (EBA-IPFA 2020). We use this share as a proxy for the share of the total market value that is produced in Europe.
InducedIndirect TotalDirect
3.4
2.5
3.8 9.7
The estimates of the value supported by the
entire industry indicate the gross value added
calculated as the sum of
• Direct effects = jobs created and
purchases of inputs needed for production
• Indirect effects = jobs created and
purchases of input needed for production
at suppliers
• Induced effects = wage effect as
employees spend their income
Source: Copenhagen Economics.
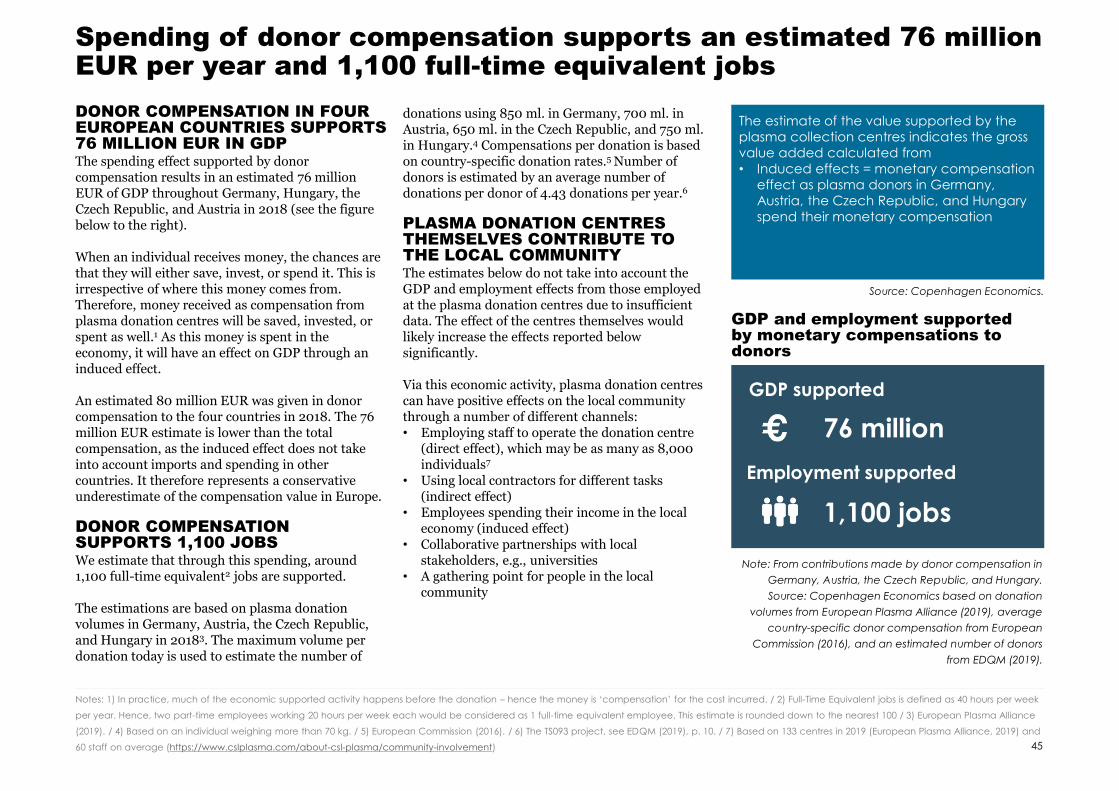
DONOR COMPENSATION IN FOUR EUROPEAN COUNTRIES SUPPORTS 76 MILLION EUR IN GDPThe spending effect supported by donor compensation results in an estimated 76 million EUR of GDP throughout Germany, Hungary, the Czech Republic, and Austria in 2018 (see the figure below to the right).
When an individual receives money, the chances are that they will either save, invest, or spend it. This is irrespective of where this money comes from. Therefore, money received as compensation from plasma donation centres will be saved, invested, or spent as well.1 As this money is spent in the economy, it will have an effect on GDP through an induced effect.
An estimated 80 million EUR was given in donor compensation to the four countries in 2018. The 76 million EUR estimate is lower than the total compensation, as the induced effect does not take into account imports and spending in other countries. It therefore represents a conservative underestimate of the compensation value in Europe.
DONOR COMPENSATION SUPPORTS 1,100 JOBSWe estimate that through this spending, around 1,100 full-time equivalent2 jobs are supported.
The estimations are based on plasma donation volumes in Germany, Austria, the Czech Republic, and Hungary in 20183. The maximum volume per donation today is used to estimate the number of
donations using 850 ml. in Germany, 700 ml. in Austria, 650 ml. in the Czech Republic, and 750 ml. in Hungary.4 Compensations per donation is based on country-specific donation rates.5 Number of donors is estimated by an average number of donations per donor of 4.43 donations per year.6
PLASMA DONATION CENTRES THEMSELVES CONTRIBUTE TO THE LOCAL COMMUNITYThe estimates below do not take into account the GDP and employment effects from those employed at the plasma donation centres due to insufficient data. The effect of the centres themselves would likely increase the effects reported below significantly.
Via this economic activity, plasma donation centres can have positive effects on the local community through a number of different channels:• Employing staff to operate the donation centre
(direct effect), which may be as many as 8,000 individuals7
• Using local contractors for different tasks (indirect effect)
• Employees spending their income in the local economy (induced effect)
• Collaborative partnerships with local stakeholders, e.g., universities
• A gathering point for people in the local community
Spending of donor compensation supports an estimated 76 million EUR per year and 1,100 full-time equivalent jobs
45
Notes: 1) In practice, much of the economic supported activity happens before the donation – hence the money is ‘compensation’ for the cost incurred. / 2) Full-Time Equivalent jobs is defined as 40 hours per week
per year. Hence, two part-time employees working 20 hours per week each would be considered as 1 full-time equivalent employee. This estimate is rounded down to the nearest 100 / 3) European Plasma Alliance
(2019). / 4) Based on an individual weighing more than 70 kg. / 5) European Commission (2016). / 6) The TS093 project, see EDQM (2019), p. 10. / 7) Based on 133 centres in 2019 (European Plasma Alliance, 2019) and
60 staff on average (https://www.cslplasma.com/about-csl-plasma/community-involvement)
GDP and employment supported by monetary compensations to donors
Note: From contributions made by donor compensation in
Germany, Austria, the Czech Republic, and Hungary.
Source: Copenhagen Economics based on donation
volumes from European Plasma Alliance (2019), average
country-specific donor compensation from European
Commission (2016), and an estimated number of donors
from EDQM (2019).
GDP supported
76 million
Employment supported
1,100 jobs
The estimate of the value supported by the
plasma collection centres indicates the gross
value added calculated from
• Induced effects = monetary compensation
effect as plasma donors in Germany,
Austria, the Czech Republic, and Hungary
spend their monetary compensation
Source: Copenhagen Economics.

The plasma-derived therapies industry also creates value through other channels which are not estimated here
In addition to the economic footprint based on direct, indirect, and induced effects, the plasma-derived therapies industry also creates economic value through several other channels throughout the value chain. We do not quantify these here, which makes our estimation conservative.
BETTER CARE EXTENDS LIFE-EXPECTANCY AND INCREASES PARTICIPATIONWhen patients get better care they live longer and healthier lives. Proper care increases labour market participation and the income of the state, as we showed in chapter 1.3. An example of increased life expectancy are patients with haemophilia who had a life expectancy of less than 13 years in the early 20th
century.1 Now the life expectancy is approaching normal and is only 10 years lower than that of an average person.2
BETTER HEALTH FOR PATIENTSPlasma-derived therapies increase the quality of life for patients with rare diseases. For some, they are the only treatments option. This extends their life-expectancy and allows them to lead a fuller life with less focus on thinking about their disease. Quantifying the value of this is difficult, but the example with life-expectancy for haemophilia patients provides an idea. European males with
haemophilia would have an additional 52 years to live, which would translate to over 2,6 million euro if we assume an added year is worth €100,000.3
INVESTMENTS IN HEALTHCARE THROUGH EDUCATION AND CLINICAL TRIALSThe plasma-derived therapies industry invests in the standard of the healthcare system through educating personnel as well as developing and testing new drugs in clinical trials. The clinical trials are also a way in which the patients support the development of new therapies. Clinical trials increase the productivity and standard of the healthcare system, which benefits society as a whole. Our study on the economic impact of clinical trials by pharmaceutical companies in Denmark found that one clinical trial improved GDP by 902,000 Danish kroner, or around €120,800.4 This is likely an upper bound for the value of rare disease clinical trials, as the number of participants and people involved are fewer than in other clinical trials.
INVESTMENTS IN NEW, BETTER PRODUCTS CAN DECREASE HEALTH CARE SPENDINGNew and better products are created to optimise production, e.g. maximise plasma utilisation and increase patient welfare. Additionally, new products
can save health care costs. An example is moving to SCIG from IVIG. SCIG can be self-administered, which saves both hospital and physician costs. A study from the US found that hospital costs decreased from $4,187 to $1,836 when moving to SCIG, and physician costs from $744 to $84.5 Hence, moving to SCIG could both lower healthcare costs and improve care capacity.
TECHNOLOGY SPILLOVERS TO OTHER INDUSTRIESThe plasma-derived therapies industry does continuing research to improve both manufacturing equipment and therapy delivery devices for the benefit of patients using the therapies. Furthermore, the research can also benefit patients on other therapies and the healthcare industry at large through technology spillovers. One example is BAXJECT®, which allows haemophilia patients to prepare their medication without using sharp needles and is safer, faster, and easier than previously existing application methods. This method can also be used for other types of treatments.6 Another example is the Flexbumin GALAXY® container, which is a container that has been developed for albumin but is used extensively by pharmaceutical products. The container is safe from contamination thanks to a four-layer system, and is also free of harmful plastic substances.7
46
Notes: 1) National Hemophilia Foundation, https://www.hemophilia.org/Bleeding-Disorders/History-of-Bleeding-Disorders. / 2) Hemophilia News Today, https://hemophilianewstoday.com/hemophilia-prognosis-life-
expectancy/. / 3) Average life expectancy for men in Europe today is 75 years, so patients with haemophilia can expect 65 years (75 minus 10 years lower life expectancy). The estimates on the value of a statistical
life year vary significantly. We have decided to use an average of two studies: an IOM (2011) report suggesting €50,000 as a lower bound and Schlander et al. of €158,000. As a euro tomorrow is not as much as one
today, we have discounted future payments with 3% discount rate. / 4) Copenhagen Economics (2017). The exchange is 1 EUR = 7,46 DKK. / 5) Fu et al (2018) / 6) EurekAlert,
https://www.eurekalert.org/pub_releases/2002-05/pn-bib052102.php/ 7) Shire, http://www.albumintherapy.com/
DonorsCollection
centres
Therapy
developers &
manufacturers
PatientsPrescribersPayers
CHAPTER 3OUTLOOK FOR THE PLASMA-DERIVED THERAPIES INDUSTRY AND SCENARIOS GOING FORWARD
3.1 THE CURRENT TRENDS SHAPING THE PLASMA-DERIVED THERAPIES INDUSTRY / P. 49
3.2 THE MEANS USED TO INCREASE DONATION RATES TODAY / P. 55
3.3 FRAMEWORK FOR FINDING AN ETHICALLY ACCEPTABLE WAY TO INCREASE DONATION RATES / P. 58
3.4 WHICH MEANS TO INCREASE DONATIONS ARE MOST PROMISING? / P. 63

Chapter 3 – Main conclusions
There is an increasing demand for plasma overall. There is an increase in the use of especially immunoglobulin, but a decrease in use of products with recombinant alternatives. Today, Europe is reliant on plasma imports from the US, which so far has been able to supply sufficient amounts to meet European demand.
RISKS WITH THE ‘AS-IS’ SCENARIOIf the industry continues in an As-Is scenario, there are a number of potential threats to the supply of plasma.
• Immunoglobulin needs to bear almost the full cost of plasma collection and fractionation, which may not be sustainable for the industry as a whole.
• The European supply of plasma-derived therapies is very sensitive to shocks in the supply of plasma from the US. Europe’s exposure to the US supply of plasma is exacerbated due to the increasing demand for plasma-derived therapies.
• Relying on plasma obtained from monetarily compensated donors in the US, while not allowing monetary compensation of European donors, appears contradictory.
THERE ARE CONCERNS OVER ‘COMMODITISATION’Based on interviews with experts in the plasma-derived therapies industry, there is a risk of over commoditisation in the industry, i.e., a situation where products that are distinguishable and differ in terms of product characterization end up being viewed as a simple commodity.
THERE ARE SEVERAL MEANS OF COMPENSATING DONORS There are two broad classes of donor compensation available: monetary and non-monetary. These compensations both seek to mitigate the disincentives associated with the donation, as they do not exceed the loss incurred. Monetary compensation and reimbursement include reimbursement of travel costs and compensation using discounts and tax reliefs. Non-monetary compensation includes small gifts, health checks, or time off work. If any transfer to donors exceeds the loss incurred from the donation and thus provides an incentive to donate for those who would otherwise not have chosen to do so, it is a payment or a reward. These are both illegal in the EU, ethically problematic, and are not considered relevant.
MONETARY COMPENSATION IS IN LINE WITH VOLUNTARY AND UNPAID DONATIONSFirstly, a reimbursement of incurred expenses such as travel costs is not providing an incentive to donate for those who are not already inclined to do so. It is therefore ethically acceptable to reimburse incurred expenses since doing so abides with the principle of voluntary and unpaid donations and is in line with European legislation.
A further monetary compensation is consistent with voluntary and unpaid donations insofar as it does not exceed the loss incurred.1 These are, however, viewed as controversial by many, likely due to the difficulty in defining when a monetary transfer is a payment and when it constitutes compensation.
Non-monetary compensation is also consistent with an altruistic focus given that it does not exceed the loss incurred.1 There is, for example, research to suggest that non-monetary compensation can be used to attract donors leading to a 15-20 per cent increase in donations.2
A PARADIGM SHIFT IS REQUIREDA paradigm shift in the compensation of plasma in Europe that includes a small monetary or non-monetary compensation will be ethically acceptable, significantly increase donations, make the European supply of plasma-derived therapies more resilient to shocks in the supply of plasma, and ensure that plasma used for fractionation in Europe comes from voluntary and unpaid donors. In addition, the ethical considerations should take on the patient perspective as well as the donor perspective and ask, if it is ethically acceptable to limit the treatment options for patients suffering from rare diseases.
Notes: 1) Nuffield Council on Bioethics (2011) and Platz et al. (2019) / 2) Lacetera et al. (2012)
Availability of plasma can and
should be increased by mitigating
disincentives to donate using:
• reimbursements
dddddddddddddddddd
• monetary compensation
dddddddddddddddddd
• non-monetary compensation
48

3.1THE CURRENT TRENDS SHAPING THE PLASMA-DERIVED THERAPIES INDUSTRY
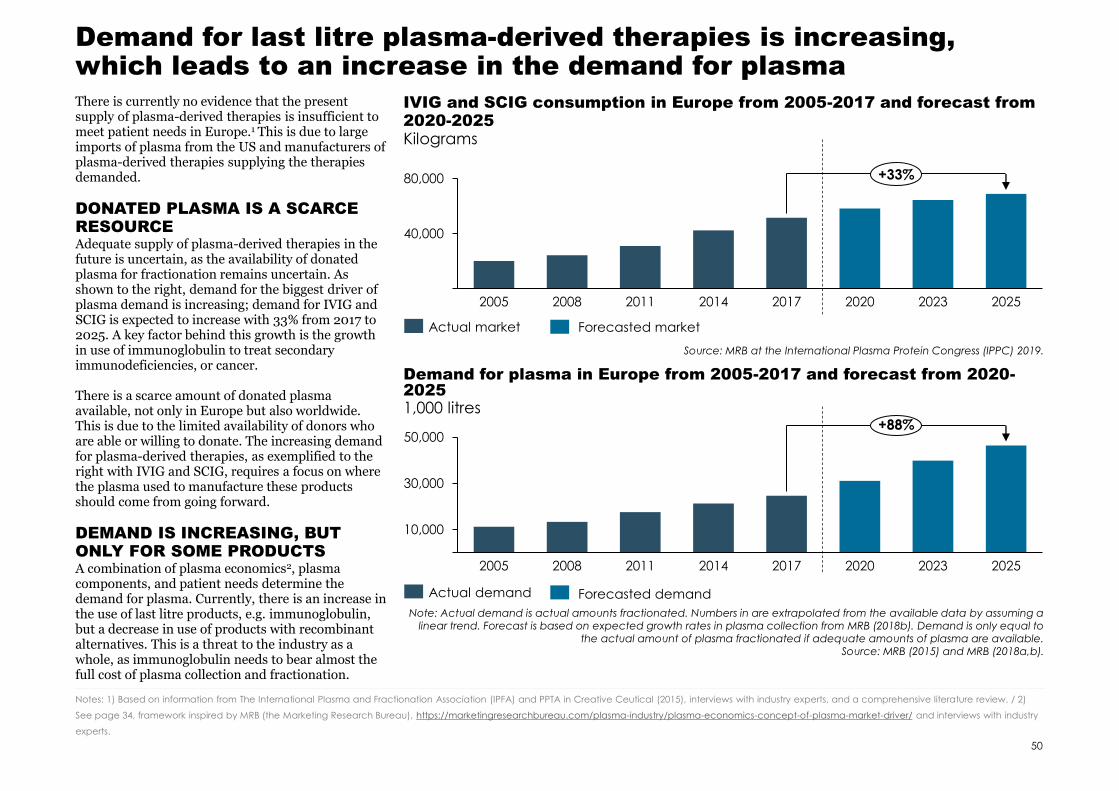
Demand for last litre plasma-derived therapies is increasing, which leads to an increase in the demand for plasma
There is currently no evidence that the present supply of plasma-derived therapies is insufficient to meet patient needs in Europe.1 This is due to large imports of plasma from the US and manufacturers of plasma-derived therapies supplying the therapies demanded.
DONATED PLASMA IS A SCARCE RESOURCEAdequate supply of plasma-derived therapies in the future is uncertain, as the availability of donated plasma for fractionation remains uncertain. As shown to the right, demand for the biggest driver of plasma demand is increasing; demand for IVIG and SCIG is expected to increase with 33% from 2017 to 2025. A key factor behind this growth is the growth in use of immunoglobulin to treat secondary immunodeficiencies, or cancer.
There is a scarce amount of donated plasma available, not only in Europe but also worldwide. This is due to the limited availability of donors who are able or willing to donate. The increasing demand for plasma-derived therapies, as exemplified to the right with IVIG and SCIG, requires a focus on where the plasma used to manufacture these products should come from going forward.
DEMAND IS INCREASING, BUT ONLY FOR SOME PRODUCTSA combination of plasma economics2, plasma components, and patient needs determine the demand for plasma. Currently, there is an increase in the use of last litre products, e.g. immunoglobulin, but a decrease in use of products with recombinant alternatives. This is a threat to the industry as a whole, as immunoglobulin needs to bear almost the full cost of plasma collection and fractionation.
IVIG and SCIG consumption in Europe from 2005-2017 and forecast from 2020-2025
Source: MRB at the International Plasma Protein Congress (IPPC) 2019.
50
Kilograms
Notes: 1) Based on information from The International Plasma and Fractionation Association (IPFA) and PPTA in Creative Ceutical (2015), interviews with industry experts, and a comprehensive literature review. / 2)
See page 34, framework inspired by MRB (the Marketing Research Bureau), https://marketingresearchbureau.com/plasma-industry/plasma-economics-concept-of-plasma-market-driver/ and interviews with industry
experts.
40,000
80,000
20112005 2008 2014 2017 2020 2023 2025
+33%
Actual market
10,000
30,000
50,000
20252005 2008 2011 2014 2017 2020 2023
+88%
Actual demand
Note: Actual demand is actual amounts fractionated. Numbers in are extrapolated from the available data by assuming a linear trend. Forecast is based on expected growth rates in plasma collection from MRB (2018b). Demand is only equal to
the actual amount of plasma fractionated if adequate amounts of plasma are available. Source: MRB (2015) and MRB (2018a,b).
Demand for plasma in Europe from 2005-2017 and forecast from 2020-20251,000 litres
Forecasted market
Forecasted demand
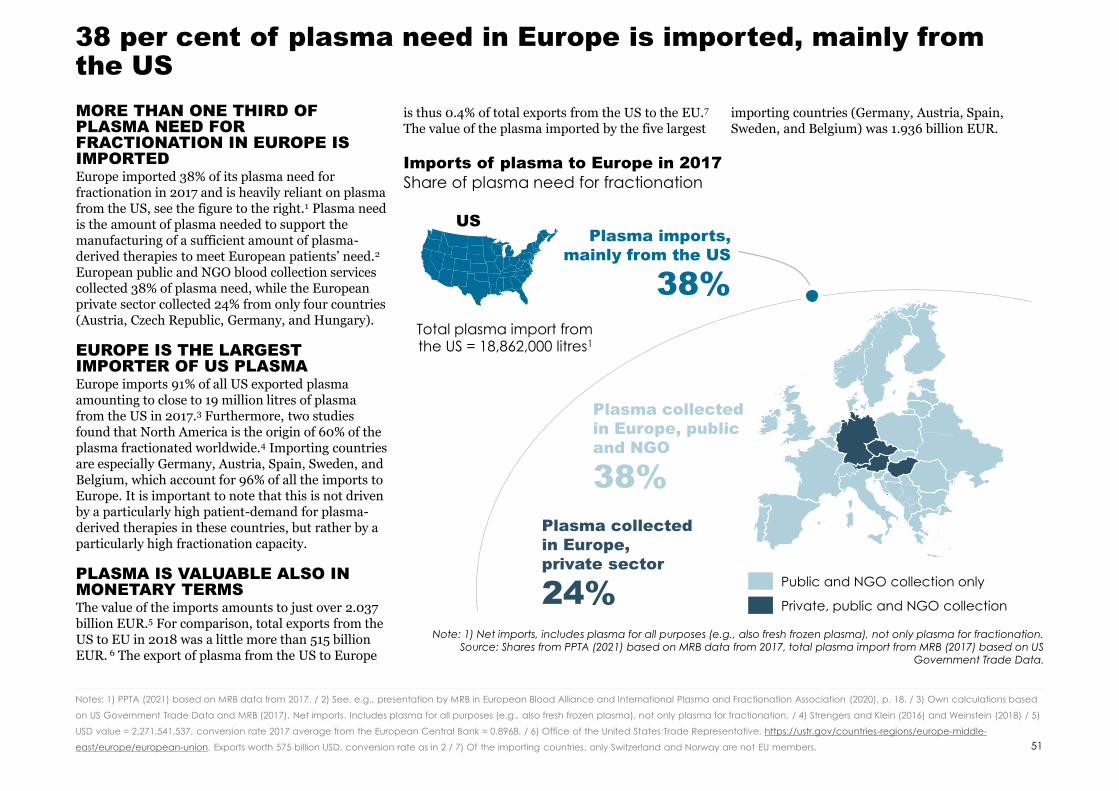
MORE THAN ONE THIRD OF PLASMA NEED FOR FRACTIONATION IN EUROPE IS IMPORTEDEurope imported 38% of its plasma need for fractionation in 2017 and is heavily reliant on plasma from the US, see the figure to the right.1 Plasma need is the amount of plasma needed to support the manufacturing of a sufficient amount of plasma-derived therapies to meet European patients’ need.2
European public and NGO blood collection services collected 38% of plasma need, while the European private sector collected 24% from only four countries (Austria, Czech Republic, Germany, and Hungary).
EUROPE IS THE LARGEST IMPORTER OF US PLASMA Europe imports 91% of all US exported plasma amounting to close to 19 million litres of plasma from the US in 2017.3 Furthermore, two studies found that North America is the origin of 60% of the plasma fractionated worldwide.4 Importing countries are especially Germany, Austria, Spain, Sweden, and Belgium, which account for 96% of all the imports to Europe. It is important to note that this is not driven by a particularly high patient-demand for plasma-derived therapies in these countries, but rather by a particularly high fractionation capacity.
PLASMA IS VALUABLE ALSO IN MONETARY TERMSThe value of the imports amounts to just over 2.037 billion EUR.5 For comparison, total exports from the US to EU in 2018 was a little more than 515 billion EUR. 6 The export of plasma from the US to Europe
is thus 0.4% of total exports from the US to the EU.7
The value of the plasma imported by the five largestimporting countries (Germany, Austria, Spain, Sweden, and Belgium) was 1.936 billion EUR.
Imports of plasma to Europe in 2017
Share of plasma need for fractionation
US
Public and NGO collection only
38 per cent of plasma need in Europe is imported, mainly from the US
51
Notes: 1) PPTA (2021) based on MRB data from 2017. / 2) See, e.g., presentation by MRB in European Blood Alliance and International Plasma and Fractionation Association (2020), p. 18. / 3) Own calculations based
on US Government Trade Data and MRB (2017). Net imports. Includes plasma for all purposes (e.g., also fresh frozen plasma), not only plasma for fractionation. / 4) Strengers and Klein (2016) and Weinstein (2018) / 5)
USD value = 2,271,541,537, conversion rate 2017 average from the European Central Bank = 0.8968. / 6) Office of the United States Trade Representative, https://ustr.gov/countries-regions/europe-middle-
east/europe/european-union. Exports worth 575 billion USD, conversion rate as in 2 / 7) Of the importing countries, only Switzerland and Norway are not EU members.
Note: 1) Net imports, includes plasma for all purposes (e.g., also fresh frozen plasma), not only plasma for fractionation. Source: Shares from PPTA (2021) based on MRB data from 2017, total plasma import from MRB (2017) based on US
Government Trade Data.
38%
Plasma imports,
mainly from the US
38%
Plasma collected
in Europe, public
and NGO
24%
Plasma collected
in Europe,
private sector
Total plasma import from the US = 18,862,000 litres1
Private, public and NGO collection
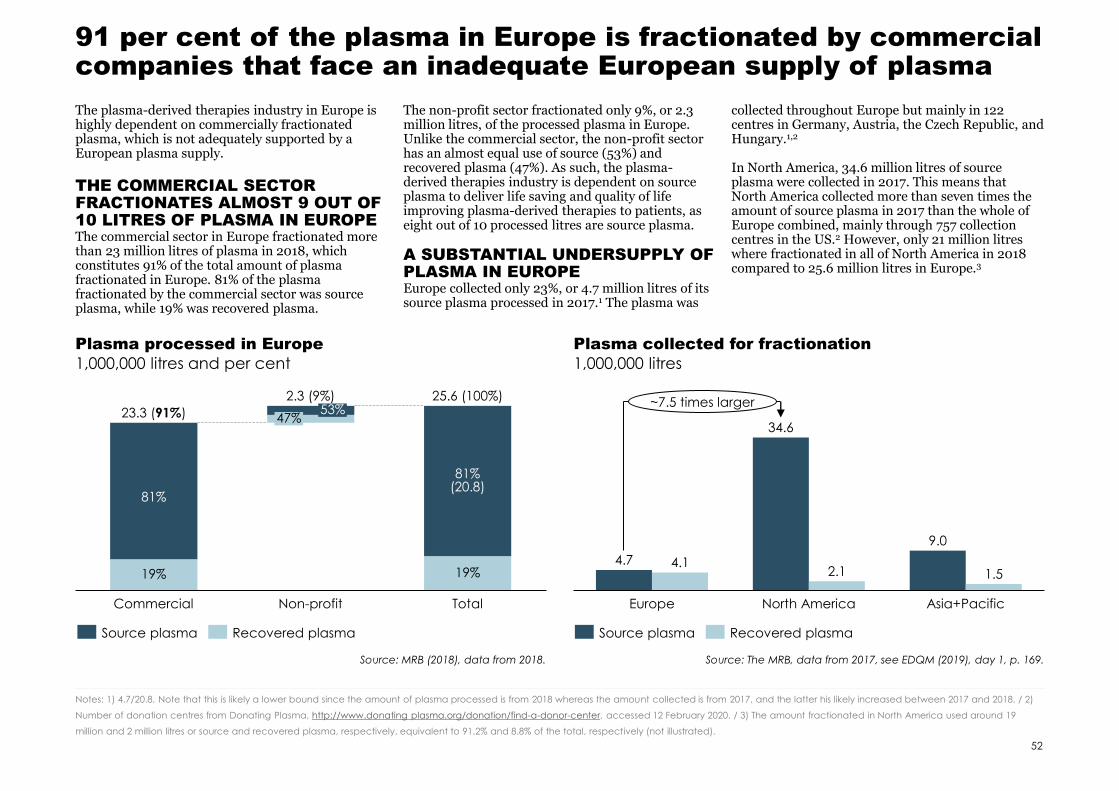
91 per cent of the plasma in Europe is fractionated by commercial companies that face an inadequate European supply of plasma
The plasma-derived therapies industry in Europe is highly dependent on commercially fractionated plasma, which is not adequately supported by a European plasma supply.
THE COMMERCIAL SECTOR FRACTIONATES ALMOST 9 OUT OF 10 LITRES OF PLASMA IN EUROPEThe commercial sector in Europe fractionated more than 23 million litres of plasma in 2018, which constitutes 91% of the total amount of plasma fractionated in Europe. 81% of the plasma fractionated by the commercial sector was source plasma, while 19% was recovered plasma.
The non-profit sector fractionated only 9%, or 2.3 million litres, of the processed plasma in Europe. Unlike the commercial sector, the non-profit sector has an almost equal use of source (53%) and recovered plasma (47%). As such, the plasma-derived therapies industry is dependent on source plasma to deliver life saving and quality of life improving plasma-derived therapies to patients, as eight out of 10 processed litres are source plasma.
A SUBSTANTIAL UNDERSUPPLY OF PLASMA IN EUROPEEurope collected only 23%, or 4.7 million litres of its source plasma processed in 2017.1 The plasma was
collected throughout Europe but mainly in 122 centres in Germany, Austria, the Czech Republic, and Hungary.1,2
In North America, 34.6 million litres of source plasma were collected in 2017. This means that North America collected more than seven times the amount of source plasma in 2017 than the whole of Europe combined, mainly through 757 collection centres in the US.2 However, only 21 million litres where fractionated in all of North America in 2018 compared to 25.6 million litres in Europe.3
Plasma processed in Europe
52
1,000,000 litres and per cent
Notes: 1) 4.7/20.8. Note that this is likely a lower bound since the amount of plasma processed is from 2018 whereas the amount collected is from 2017, and the latter his likely increased between 2017 and 2018. / 2)
Number of donation centres from Donating Plasma, http://www.donating plasma.org/donation/find-a-donor-center, accessed 12 February 2020. / 3) The amount fractionated in North America used around 19
million and 2 million litres or source and recovered plasma, respectively, equivalent to 91.2% and 8.8% of the total, respectively (not illustrated).
81%
19%
Commercial
53%
Non-profit
81%(20.8)
47%
19%
Total
23.3 (91%)
2.3 (9%) 25.6 (100%)
Plasma collected for fractionation
1,000,000 litres
Europe
4.7
North America Asia+Pacific
34.6
4.12.1
9.0
1.5
~7.5 times larger
Source plasma Recovered plasma Source plasma Recovered plasma
Source: MRB (2018), data from 2018. Source: The MRB, data from 2017, see EDQM (2019), day 1, p. 169.
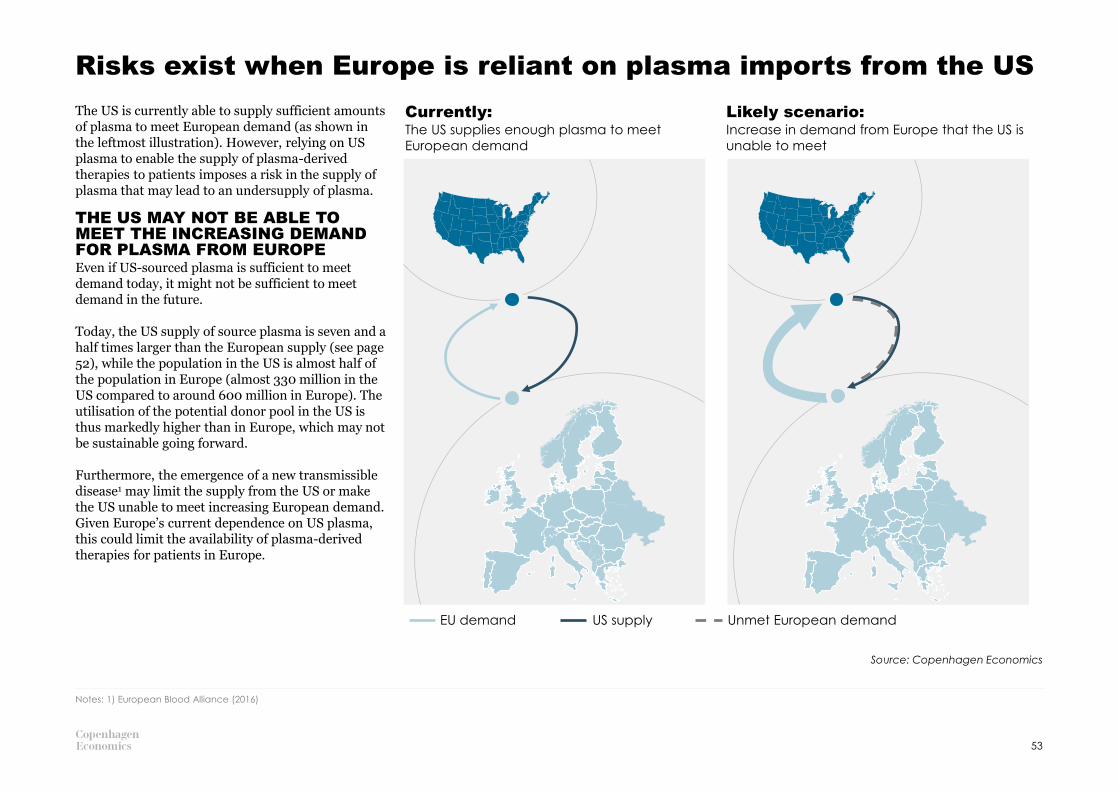
Risks exist when Europe is reliant on plasma imports from the US
The US is currently able to supply sufficient amounts of plasma to meet European demand (as shown in the leftmost illustration). However, relying on US plasma to enable the supply of plasma-derived therapies to patients imposes a risk in the supply of plasma that may lead to an undersupply of plasma.
THE US MAY NOT BE ABLE TO MEET THE INCREASING DEMAND FOR PLASMA FROM EUROPE Even if US-sourced plasma is sufficient to meet demand today, it might not be sufficient to meet demand in the future.
Today, the US supply of source plasma is seven and a half times larger than the European supply (see page 52), while the population in the US is almost half of the population in Europe (almost 330 million in the US compared to around 600 million in Europe). The utilisation of the potential donor pool in the US is thus markedly higher than in Europe, which may not be sustainable going forward.
Furthermore, the emergence of a new transmissible disease1 may limit the supply from the US or make the US unable to meet increasing European demand. Given Europe’s current dependence on US plasma, this could limit the availability of plasma-derived therapies for patients in Europe.
Source: Copenhagen Economics
53
Notes: 1) European Blood Alliance (2016)
Currently: The US supplies enough plasma to meet
European demand
Likely scenario: Increase in demand from Europe that the US is
unable to meet
EU demand US supply Unmet European demand

There are risks of commoditising plasma-derived therapies that have intrinsic value in being heterogeneous
COMMODITISATION OF PRODUCTS CAN HAVE UNINTENDED CONSEQUENCESThe design of reimbursements policies and pharmaceutical tenders is very important for the delivery of plasma-derived therapies, and ultimately for patient health. Viewing heterogeneous products as a single commodity will not match heterogeneous patient needs.
Commoditisation is an industry change which is characterised by increase in product homogeneity. When products are standardised, the customer cost of switching from one product to another is lowered. This makes customers more price sensitive and tends to drive down consumer prices.1 An example of a therapy where patients have benefitted from commoditisation is factor VIII. Even if the plasma-derived and recombinant productsavailable are not identical, they have similar properties. When recombinant alternatives entered
the market, prices were driven down. Now all factor VIII therapies are cheaper, which is beneficial for patients and healthcare systems. Even so, the market does not function perfectly for all patients. The prices for the plasma-derived VIII have to be low to remain competitive with the recombinant alternatives. This leaves other plasma-derived therapies to carry a higher share of the cost of plasma, placing the interests of one patient group against the interests of another.
Commoditisation can, however, have unwanted side effects for some product groups, especially if there is an intrinsic value in a product being heterogeneous. Examples of products that can be problematic to treat as commodities include high-risk medical procedures, complex diagnostics, and specialty pharmaceuticals2, where plasma-derived therapies belong to the latter category.
Immunoglobulin therapies are a useful example of the value heterogeneity of products can bring to patients, as we have explained in detail in chapter 1, as different patient groups need therapies with different concentration, sugar content, or pH level.
THERE ARE RISKS OF OVER COMMODITISATION FOR PLASMA-DERIVED THERAPIESThere can be risks of commoditisation for plasma-derived therapies today, which can stem from reimbursement approaches together with the finite budgets available for healthcare systems.For example, reimbursement policies vary depending on immunoglobulin therapy and in some countries only one product is reimbursed.3 Treatment with
both intravenous or subcutaneous immunoglobulin G is covered by the national healthcare system in most European countries, but both are not consistently available in lower- or mid-income regions of the world even though the treatments are not always substitutes for an individual patient. This can lead to patients using a suboptimal therapy for their specific medical need, even if more optimal ones would be available in the same price range.
Similarly, tender practices can also lead to the risk of commoditisation. If tendering is based solely on price, there is a risk of missing other valuable qualities therapies have, e.g. providing different quality of life to patients. In the worst case, pushing down prices in tenders can even lead to supply shortages (see example from Romania on page 40).
Notes: 1) Reimann et al. (2010) / 2) Agwunobi and London (2009) / 3) Bousfiha et al. (2017) / 4) Reimann et al. (2010)
The importance of personalised treatment is all the more relevant given that many different Ig therapies are available, differing in terms of their ingredients and production, and individuals can respond differently to each of them.
Bousfiha, Duff, and Hsieh (2017), p. 2
Commoditisation of an industry is
characterised by
• increasing homogeneity of
products
• higher price sensitivity among
customers
• lower switching costs
• greater industry stability4
54
Source: Copenhagen Economics

3.2THE MEANS USED TO INCREASE DONATION RATES TODAY

A long list of initiatives to increase plasma donations is available
NUMEROUS MEANS OF COMPENSATING AND INCENTIVIZING DONORSTo increase donation rates a wide range of compensations and incentives have been proposed in the academic literature and/or implemented in real life (see box to the right).
The use of money to compensate donors for the disutility associated with their donation is often proposed. Others favour vouchers, discounts, and tax reliefs as means of compensating donors without having to rely on a monetary transfer. Some researchers propose donating an amount to a charity organization (possibly of the donor’s choice) instead of transferring the amount directly to the donor.
Some researchers advocate an unregulated market for donations where the price is determined by demand and supply. This is not considered relevant in the present report since it is in direct violation with the view of voluntary and unpaid donations (VUD) – also referred to as voluntary and non-remunerated (VNR) donations – by the European Union. It is thus not considered policy relevant.
All Member States follow the principle of voluntary and unpaid donations, but the view on what constitutes an unpaid donation varies. Reimbursement of incurred costs associated with the donation is proposed by many and used in several European Member States. Small gifts and tickets to movies, concerts, and more have also been proposed and is used in several European Member States. Some propose health checks, time off work, and
reciprocity as means of compensating donors. On page 57 we provide an overview by European Member State.
AWARENESS AND INFORMATION ARE PRE-REQUISITES BUT MORE EVIDENCE IS NEEDED ON THE EFFECTIVENESS OF DONOR INFORMATION CAMPAIGNSThe need for adequate information of the benefits of donating is often stressed. Campaigns with that goal have been carried out in numerous countries in Europe.
There is limited evidence on the effectiveness of campaigning. One example is a field experiment from Argentina, where potential donors were provided with information on donations.1,2 This did not increase donation rates compared to the control group (where people were only asked to participate).
In all, the evidence is scant and it is not possible to draw firm conclusions about the effectiveness of raising awareness and ‘nudging’ people to donate through information sharing. Further research would therefore seem important.
DIGITAL CHANNELS AND CONTEXTUALISED ADVERTISING ARE NEW AND PROMISING WAYSDigital platforms like social media provide a direct link between recipients of plasma-derived therapies, donation centres, and donors. This can and should be utilised to narrow the distance between donor and recipient with stories about how donations help. The
links between recipients and donors are often provided on donation centres’ webpages, but there may be prospects in further exploring this path.
Contextualised advertising provides means to target marketing to relevant customers. This, too, is a path worth exploring in more detail.
Notes: 1) Iajya et al. (2013) / 2) An alternative group were provided with ‘social recognition’, in terms of being mentioned in a newspaper article. This did not increase donation rates either.
Examples of compensations and
incentives
• Monetary compensation
• Cash payment
• Travel cost reimbursement
• Charity donation
• Vouchers
• Discounts
• Tax relief
• Gifts: T-shirts, key rings, pens, bags,
sweatbands, blankets, mugs, jackets,
coolers, umbrellas, hats
• Tickets: Concert, movie, lottery/raffle ticket
or ticket to donor-exclusive event
• Health check: Blood pressure, blood test
for cholesterol, laboratory test for HIV
• Donor appreciation: Certificate, plaque,
badge/pins, stickers, award ceremony,
media recognition
• Time off: Time of work/school
• Reciprocity: Community service credit,
blood credit
Source: Based on list in Chell et al. (2018) but updated with
the terminology from page 61.
56

What constitutes an unpaid donation varies from one Member State to another
There is no clear definition of what an unpaid donation means in practice, leading to differences in implementation between countries and, as stated in a report for the Commission, “it is therefore difficult to distinguish voluntary and unpaid from voluntary and paid donations”. 1In most cases, the same or similar initiatives are offered to both plasma and whole-blood donors.
To give an overview of differences within the EU, we have mapped out different initiatives available for donors in the map to the right. In addition to these initiatives, some countries also offer food vouchers, free physical check-ups, and reimbursement of medical costs. Most countries offer refreshments.2
Seven countries offer a fixed sum of money per donation in the range of 5-30 euros, while an additional three offer compensation relating to loss of earnings or inconvenience. Sixteen countries offer time off from work, and in ten countries the time off is at least a full day.
Initiatives viewed as supporting voluntary and unpaid donations by Member State
Note: 1) Both public and private sector except for Austria, Greece, and Croatia where only public sector gets time off.
Source: European Commission (2016) p. 8-9.
57
Notes: 1) Creative Ceutical (2015) / 2) Countries not offering refreshments are Luxemburg, Latvia, and Romania.
Compensation related either to
loss of earnings or inconvenience
Fixed sum of money per
donation
Reimbursement of
travel cost
Time off work1
Small token
Both initiatives
Both initiatives
Member States have taken different approaches to interpreting what VUD means. […] [A] measure is considered a
“compensation” in one country and is viewed as an “incentive” in another.
European Commission working
document of 10 October 2019
None of the specified
initiatives
None of the
specified initiatives

3.3FRAMEWORK FOR FINDING AN ETHICALLY ACCEPTABLE WAY TO INCREASE DONATION RATES
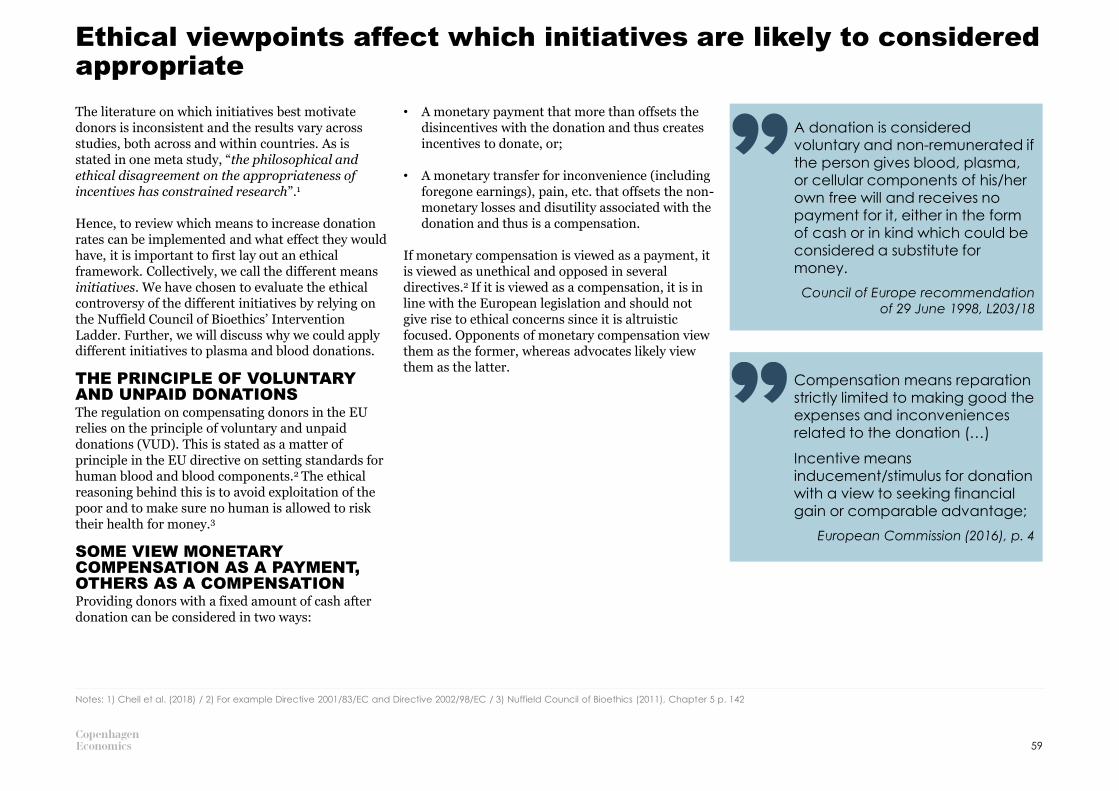
The literature on which initiatives best motivate donors is inconsistent and the results vary across studies, both across and within countries. As is stated in one meta study, “the philosophical and ethical disagreement on the appropriateness of incentives has constrained research”.1
Hence, to review which means to increase donation rates can be implemented and what effect they would have, it is important to first lay out an ethical framework. Collectively, we call the different means initiatives. We have chosen to evaluate the ethical controversy of the different initiatives by relying on the Nuffield Council of Bioethics’ Intervention Ladder. Further, we will discuss why we could apply different initiatives to plasma and blood donations.
THE PRINCIPLE OF VOLUNTARY AND UNPAID DONATIONSThe regulation on compensating donors in the EU relies on the principle of voluntary and unpaid donations (VUD). This is stated as a matter of principle in the EU directive on setting standards for human blood and blood components.2 The ethical reasoning behind this is to avoid exploitation of the poor and to make sure no human is allowed to risk their health for money.3
SOME VIEW MONETARY COMPENSATION AS A PAYMENT, OTHERS AS A COMPENSATIONProviding donors with a fixed amount of cash after donation can be considered in two ways:
• A monetary payment that more than offsets the disincentives with the donation and thus creates incentives to donate, or;
• A monetary transfer for inconvenience (including foregone earnings), pain, etc. that offsets the non-monetary losses and disutility associated with the donation and thus is a compensation.
If monetary compensation is viewed as a payment, it is viewed as unethical and opposed in several directives.2 If it is viewed as a compensation, it is in line with the European legislation and should not give rise to ethical concerns since it is altruistic focused. Opponents of monetary compensation view them as the former, whereas advocates likely view them as the latter.
Ethical viewpoints affect which initiatives are likely to considered appropriate
59
Notes: 1) Chell et al. (2018) / 2) For example Directive 2001/83/EC and Directive 2002/98/EC / 3) Nuffield Council of Bioethics (2011), Chapter 5 p. 142
A donation is considered voluntary and non-remunerated if the person gives blood, plasma, or cellular components of his/her own free will and receives no payment for it, either in the form of cash or in kind which could be considered a substitute for money.
Council of Europe recommendation
of 29 June 1998, L203/18
Compensation means reparation strictly limited to making good the expenses and inconveniences related to the donation (…)
Incentive means inducement/stimulus for donation with a view to seeking financial gain or comparable advantage;
European Commission (2016), p. 4
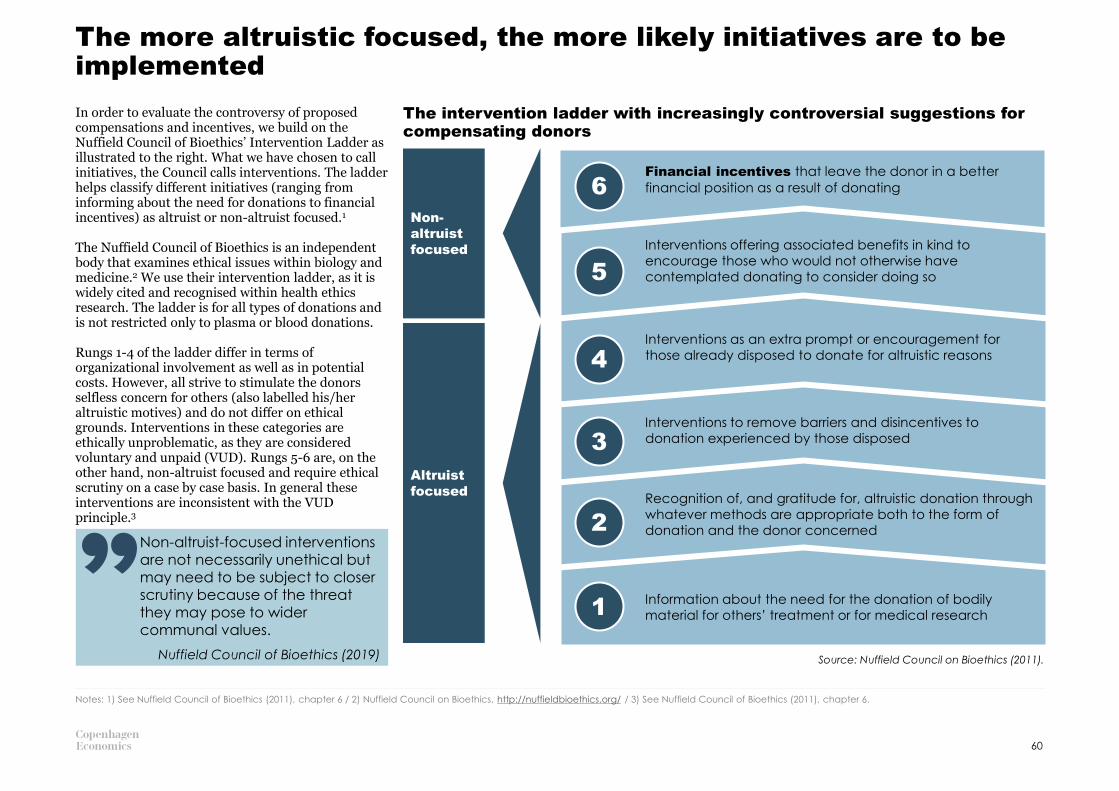
The more altruistic focused, the more likely initiatives are to be implemented
Notes: 1) See Nuffield Council of Bioethics (2011), chapter 6 / 2) Nuffield Council on Bioethics, http://nuffieldbioethics.org/ / 3) See Nuffield Council of Bioethics (2011), chapter 6.
Information about the need for the donation of bodily
material for others’ treatment or for medical research
Recognition of, and gratitude for, altruistic donation through
whatever methods are appropriate both to the form of
donation and the donor concerned
Interventions offering associated benefits in kind to
encourage those who would not otherwise have
contemplated donating to consider doing so
Financial incentives that leave the donor in a better
financial position as a result of donating
Interventions as an extra prompt or encouragement for
those already disposed to donate for altruistic reasons
Interventions to remove barriers and disincentives to
donation experienced by those disposed
6
5
1
2
3
4
Non-
altruist
focused
Altruist
focused
The intervention ladder with increasingly controversial suggestions for compensating donors
Source: Nuffield Council on Bioethics (2011).
In order to evaluate the controversy of proposed compensations and incentives, we build on the Nuffield Council of Bioethics’ Intervention Ladder as illustrated to the right. What we have chosen to call initiatives, the Council calls interventions. The ladder helps classify different initiatives (ranging from informing about the need for donations to financial incentives) as altruist or non-altruist focused.1
The Nuffield Council of Bioethics is an independent body that examines ethical issues within biology and medicine.2 We use their intervention ladder, as it is widely cited and recognised within health ethics research. The ladder is for all types of donations and is not restricted only to plasma or blood donations.
Rungs 1-4 of the ladder differ in terms of organizational involvement as well as in potential costs. However, all strive to stimulate the donors selfless concern for others (also labelled his/her altruistic motives) and do not differ on ethical grounds. Interventions in these categories are ethically unproblematic, as they are considered voluntary and unpaid (VUD). Rungs 5-6 are, on the other hand, non-altruist focused and require ethical scrutiny on a case by case basis. In general these interventions are inconsistent with the VUD principle.3
Non-altruist-focused interventions are not necessarily unethical but may need to be subject to closer scrutiny because of the threat they may pose to wider communal values.
Nuffield Council of Bioethics (2019)
60

It is important to distinguish between initiatives incentivizing or removing disincentives to donate plasma
It is important to distinguish between initiatives that create incentives and can make someone donate
who would otherwise not have donated, and those that merely mitigate the disincentives
associated with the donation. 1 The first is a payment or reward and is labelled non-altruistic focused, while the second is only a compensation for ,e.g., time spent and is altruist focused. Compensations will not make an individual donate in the absence of altruism or selfless concern for the wellbeing of others if the level of compensation does not exceed the loss incurred from the donation.
FIVE CATEGORIES OF INITIATIVESWe distinguish between five categories of initiatives as illustrated in the figure. If a monetary transfer is made to offset a monetary cost incurred by the donor, it is labelled a reimbursement (A). If a
monetary transfer is made to offset a non-monetary loss associated with the donation, it is labelled a monetary compensation (B). Non-monetary
losses includes pain, inconvenience, and more. If the monetary transfer is larger than monetary costs and non-monetary losses incurred, it is a payment (C).
If a non-monetary transfer is offered to a donor to offset a non-monetary loss associated with the donation, this is labelled a non-monetary
compensation (D). If the non-monetary transfer
is larger than the non-monetary losses incurred, it is a reward (E).
In section 3.4, we discuss potential compensation schemes in light of this framework. We refer to the appendix for a more detailed analysis of each category.
Framework for initiatives
Note: The letters to the left are used on the four pages in the appendix where each of the initiatives is described in further detail, see pages 73-76.
Source: Builds on Platz et al. (2019).
61
Notes: 1) Framework by Platz et al. (2019). The authors use the framework to explain why many existing proposals (including monetary compensation) to raise donation rates are seen as controversial, and conclude
that compensation beyond the reimbursement of incurred monetary costs should itself be non-monetary for living donations viewed as a whole, i.e., including, for example, kidney donations. This is based on
potential concerns about overlapping spheres when combining living donations (i.e., health) and monetary compensations. / 2) Unless these have an economic value, there is a market for them and they are
transferable, which would make them a substitute for money, see, e.g., Council Recommendation of 29 June 1998.
Reimbursement
Compensating monetary
costs incurred by the donor
Monetary compensation
Compensating non-
monetary losses incurred
by the donor
Non-monetary
compensation
Compensating non-
monetary losses incurred
by the donor
Payment
Making the donor better
off after the donation
Reward
Making the donor better
off after the donation
Non-altruist
focused
Creating incentives
Altruist
focused
Removing or
mitigating
disincentives
A
B D
Monetary Non-monetary
C E
Theoretically
different but
difficult to
separate in
practice
COMPENSATION
A transfer to the donor to compensate an
incurred loss. This will not make an individual
donate who is not already inclined to do so
because the compensation merely offsets any
inconvenience associated with the donation.
INCENTIVE
A transfer to the donor that goes beyond the
incurred loss. This will leave the donor better off
after the donation and may make an
individual donate who would not otherwise
have donated.
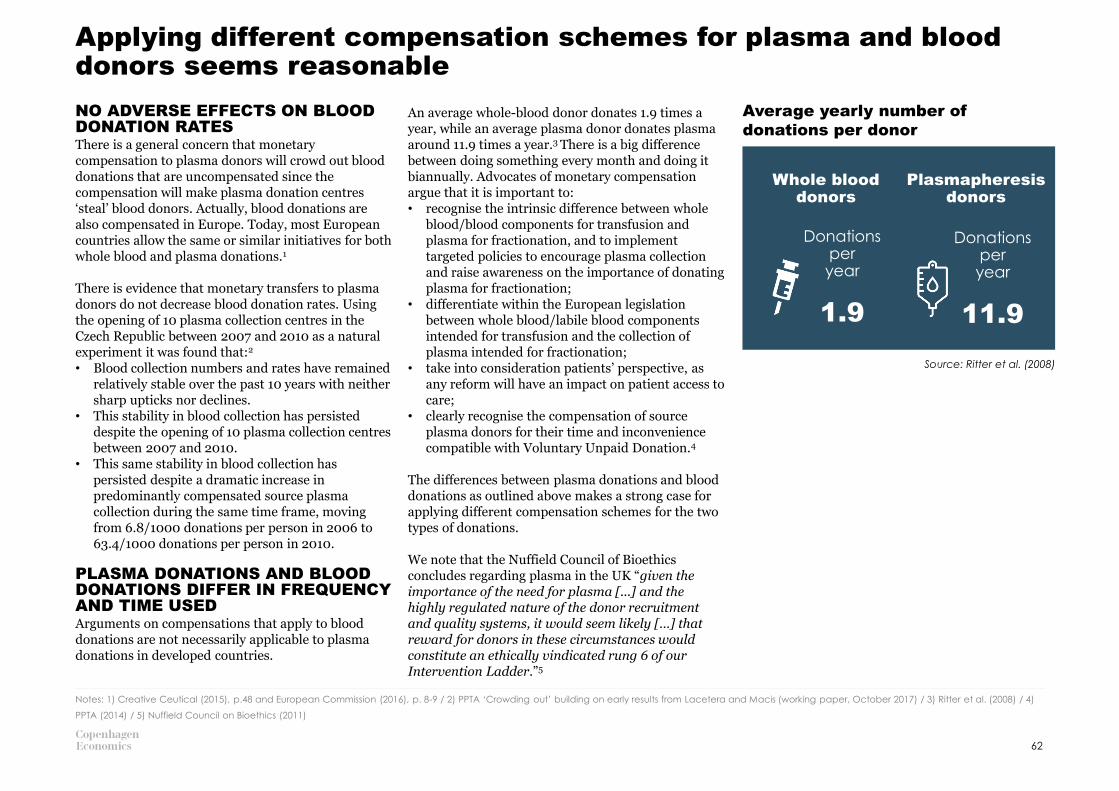
Applying different compensation schemes for plasma and blood donors seems reasonable
NO ADVERSE EFFECTS ON BLOOD DONATION RATESThere is a general concern that monetary compensation to plasma donors will crowd out blood donations that are uncompensated since the compensation will make plasma donation centres ‘steal’ blood donors. Actually, blood donations are also compensated in Europe. Today, most European countries allow the same or similar initiatives for both whole blood and plasma donations.1
There is evidence that monetary transfers to plasma donors do not decrease blood donation rates. Using the opening of 10 plasma collection centres in the Czech Republic between 2007 and 2010 as a natural experiment it was found that:2
• Blood collection numbers and rates have remained relatively stable over the past 10 years with neither sharp upticks nor declines.
• This stability in blood collection has persisted despite the opening of 10 plasma collection centres between 2007 and 2010.
• This same stability in blood collection has persisted despite a dramatic increase in predominantly compensated source plasma collection during the same time frame, moving from 6.8/1000 donations per person in 2006 to 63.4/1000 donations per person in 2010.
PLASMA DONATIONS AND BLOOD DONATIONS DIFFER IN FREQUENCY AND TIME USEDArguments on compensations that apply to blood donations are not necessarily applicable to plasma donations in developed countries.
An average whole-blood donor donates 1.9 times a year, while an average plasma donor donates plasma around 11.9 times a year.3 There is a big difference between doing something every month and doing it biannually. Advocates of monetary compensation argue that it is important to:• recognise the intrinsic difference between whole
blood/blood components for transfusion and plasma for fractionation, and to implement targeted policies to encourage plasma collection and raise awareness on the importance of donating plasma for fractionation;
• differentiate within the European legislation between whole blood/labile blood components intended for transfusion and the collection of plasma intended for fractionation;
• take into consideration patients’ perspective, as any reform will have an impact on patient access to care;
• clearly recognise the compensation of source plasma donors for their time and inconvenience compatible with Voluntary Unpaid Donation.4
The differences between plasma donations and blood donations as outlined above makes a strong case for applying different compensation schemes for the two types of donations.
We note that the Nuffield Council of Bioethics concludes regarding plasma in the UK “given the importance of the need for plasma [...] and the highly regulated nature of the donor recruitment and quality systems, it would seem likely […] that reward for donors in these circumstances would constitute an ethically vindicated rung 6 of our Intervention Ladder.”5
Notes: 1) Creative Ceutical (2015), p.48 and European Commission (2016), p. 8-9 / 2) PPTA ‘Crowding out’ building on early results from Lacetera and Macis (working paper, October 2017) / 3) Ritter et al. (2008) / 4)
PPTA (2014) / 5) Nuffield Council on Bioethics (2011)
Source: Ritter et al. (2008)
62
Whole blood donors
Plasmapheresis donors
Donations per year
1.9
Donations per year
11.9
Average yearly number of
donations per donor

3.4WHAT ARE THE MOST PROMISING MEANS TO INCREASE DONATION RATES?
Notes: 1) Titmuss (1970) / 2) From centering around whole blood donations, these considerations have been considered for all types of donations. E.g., see discussion in Nuffield Council of Bioethics (2011), Chapter 5
p.142. / 3) Mellström and Johannesson (2008) and Lacetera and Macis (2010) / 4) Le Grand (2003) / 5) Chell et al. (2018) based on Glynn et al. (2003) and Sanchez et al. (2001) / 6) Lacetera et al. (2012), Goette &
Stutzer (April 2019), and Iajya et al. (2013) / 7) Sadler et al. (2018) / 8) European Commission (2006) / 9) GAO (1997)
Compensation of donors will likely increase the total number of donations without increasing the risk of pathogen transmission
RISKS ASSOCIATED WITH COMPENSATION OF DONORSIn one of the most seminal papers on blood donation, Titmuss proposed the theoretical idea that introducing monetary transfers for blood donations would ‘crowd out’ altruistic donations, potentially lowering the total number of donations.1 In addition, he proposed that it would lead to increased risk of pathogen transmission since less healthy individuals would donate. Even though his thoughts were centred around blood donations, the concerns apply to plasma donations as well.2
NO CLEAR EVIDENCE ON A CROWDING OUT EFFECT FROM MONETARY COMPENSATIONThe idea of a crowding out effect when monetary transfers are made has been partially supported by recent works in blood donations.3 However, the authors find no evidence of a crowding out effect when the monetary transfer is instead made to a charitable organization or given in the form of vouchers. Another author suggests that there might be a threshold level, such that smaller payments relative to costs are considered compensation (and a recognition of one’s sacrifice) that may positively
affect the supply, whereas payments that are too large and that fully or even excessively compensate for costs and losses could reduce the supply, since the altruistic utility from the action is reduced.4
A study found that introducing compensations were considered mildly to moderately encouraging for donation (range, 9.7%-65.5% of different donor segments were encouraged by different compensations). Fewer donors reported compensations as discouraging (range, 0.7%-12.2%). The overall net benefit was positive, implying that introducing compensation will likely lead to increases in the number of donations.5 Similarly, three studies using natural experiments on non-monetary blood donor compensation find that the use of compensation increases the total amount of donations.6
A recent study looked at whether respondents are willing to accept initiatives (both monetary and non-monetary such as paid leave, blood screening or small gift) in exchange for donating blood. The study was done in both the US and Germany, and a major part responded positively to the initiatives.7
MIXED EVIDENCE OF LESS HEALTHY INDIVIDUALS DONATING PLASMAThe use of an ‘expense allowance’ for plasma donations in Germany has not shown any indication of an effect on prevalence and incidence data relating to the groups of donors.8 There is some evidence, dated back in 1990s though, that test-positive rates for commercial plasma donors are substantially higher than those of volunteer whole blood donors, ranging from about 2 to 20 times higher on the
different tests.9 Three studies using natural experiments on non-monetary blood donor compensation find that the use of compensation and the economic value of the compensation do not increase the share of ineligible subjects or the share of unusable donations.6
The quality control process when producing plasma-derived therapies is very comprehensive (see pages 27 and 28). If a person infected by, say, HIV tries to donate plasma, current donor screening processes are likely to flag the donor as unfit to donate. If this should fail – if the donor is untruthful about his/her medical state, for example, the testing of pathogens will flag the donated plasma as unfit to process. As such, though it is theoretically problematic to have less healthy donors, the quality control makes it less of an issue in practice.
There is research to suggest that compensation (monetary or non-monetary) of plasma donors is likely to increase the total number of donations, and unlikely to increase pathogen transmissions and crowd out blood donations.
However, we note here that this [that altruistic donations ensure quality of supply] does not
appear to be an especially compelling consideration: even to the extent that it is correct, the remedy surely lies in an effective system of monitoring and quality control to be required whatever the regime of donation in order to ensure that only materials of an appropriate quality are made available to recipients.
Nuffield Council of Bioethics (2011),
chapter 5, p. 142
64

Monetary compensation is ethically justifiable, effective, easy to administer, and can significantly increase donation rates
REAL-WORLD EVIDENCE SHOWS A CLEAR PATTERNOn the face of it, monetary compensations appear to be associated with higher donation rates. All countries that have implemented such compensations have significantly higher amounts of source plasma. The academic literature is, however, scarce and inconclusive.1
One study used the introduction of monetary compensation in the Czech Republic and shows an increase in donation rates from 6.8/1,000 to 63.4/1,000 between 2006 and 2010, i.e., almost a ten-fold increase.2 In general, donation rates of plasma in the four European countries where monetary compensation is implemented are far greater than in other European Member States. For example, plasmapheresis donation rates were 30.4/1,000 and 58.8 in 2012 in Germany and the Czech Republic, respectively. For comparison, the highest donation rates in the same year in countries without monetary compensation were 19.2/1,000 in the Netherlands, 9.4/1,000 in Belgium, and 7.5/1,000 in France. In the low end, donation rates were 0.6/1,000 in Denmark, 0.5/1,000 in Spain, and 0.2/1,000 in Greece.3
THERE IS A STIGMA FOR MONETARY COMPENSATION OF ALL BODY PARTSThere is a strong stigma on exchanging any human body parts, including plasma, for money. This makes monetary compensations politically problematic, even it would be only as a compensation and not as an incentive.4
More specifically, there are concerns that the EU Blood Directive (2002) does not sufficiently consider the needs of plasma for fractionation. On the other hand, the 2004 EU Tissues and Cells Directive (2004/23/EC, article 12.1) allows compensation of donors for time and efforts spent.
Given the difficulties in Europe to achieve a sufficient amount of plasma without monetary compensations, it appears reasonable to nevertheless consider the different variants of monetary compensations in line with the 2004 approach to the EU Tissues and Cells Directive.
A MONETARY COMPENSATION IS NOT A PAYMENTA monetary transfer is not equivalent to a payment if it does not constitute a financial gain or comparative advantage. Importantly, the 2004 Directive notes that donors may receive compensation, given that it “(…) is strictly limited to making good the expenses and inconvenience related to the donation”.5,6 In Germany, an expense allowance of 27 EUR is given to plasma donors. For comparison, the minimum wage in Germany in 2019 is 9.19 EUR per hour.7
SOME POLICIES ARE IN PLACE WITH A VALUE FAR GREATER THAN A SMALL MONETARY COMPENSATIONAn interesting example is time off work in relation to a plasmapheresis donation. A total of 16 (57%) European Member States provide time off work for employees in the public sector. The corresponding number for employees in the private sector is 13
(46%).8 As an example, Italy introduced one full day off work for blood and plasma donors in 1967, which is still in place today.9 In fact, 10 of the 16 countries that provide time off work (public sector) give at least one full day off work.8 Italy does not have a national minimum wage that can be used as a proxy for the minimum value of a day off. Moreover, compensating time off from work is also considered over-compensation if it exceeds “other than that reasonably needed for the donation and travel”. Given that a donation takes approximately one and a half hours plus travel time, a full day off may be an overcompensation. The acceptance of such policies (i.e., incentives) while still opposing monetary compensations with lesser monetary value seems contradictory.
Notes: 1) Chell et al. (2018) / 2) Lacetera and Macis (working paper, October 2017) / 3) Creative Ceutical (2015) / 4) See discussion in White (2015) regarding payment for plasma donations in Canada. / 5) European
Parliament and the Council (2004) / 6) European Commission (2016), p. 8. / 7) WSI Tarifarchiv (2019) / 8) European Commission (2016). Per cent based on 28 Member States. / 9) Footnote 1, Lacetera and Macis
(2012), and AVIS (2019).
The policy of some countries is to meet identified patient need for PDMPs [plasma-derived medicinal products] by importing PDMPs produced from compensated donations while at the same time advocating a seemingly contradictory policy of prohibiting donor compensation within their own borders.
Skinner, Hoppe, Grabowski, Manning,
Tachdjian, Crone, and Younger
(2016), p. 2892
65

Non-monetary compensation can be an alternative to monetary compensation, but it is less effective and difficult to administer
MONETARY COMPENSATION MAY NOT BE FEASIBLEThe effectiveness and ease of administration in monetary compensation makes it a first best solution, as reviewed on the previous page. However, the current legislation and the resistance to monetary compensation throughout Europe makes it unclear whether a system with monetary compensation of plasma-donors can be implemented.
NON-MONETARY COMPENSATION MAY BE VIEWED AS MORE ETHICALThere is also some degree of aversion to monetary compensation in the general population; a study found that respondents were more reluctant to receive pure cash than vouchers for blood donations.1 A theoretical study explains in the framework of political philosophy why non-monetary compensation is likely to be viewed as more ethical than monetary compensation.2
NON-MONETARY COMPENSATION WILL LIKELY AFFECT DONATION RATESThe donor demotivation from monetary compensation can potentially lead to a so-called crowding out effect from monetary rewards on blood or plasma supply, as the altruistic individual does not favour cash.3 This is examined in Costa et al. for blood donations in 15 European countries which finds a crowding out effect for monetary compensation but not for non-monetary compensation.4 Hence, using non-monetary rewards
would still leave the altruistic donor with the feeling of doing something for the common good, and not crowd out these donors.
However, in systems where cash payment incentives have been introduced, a majority of donors see this as a key motivator to donate and, hence, indicate they would stop donating if the incentive were removed.5
Offering a cash payment within a VUD system can potentially demotivate donors, as some current donors in a VUD system might stop donating if cash incentives are introduced, and new paid donors may stop donating when the incentive is removed. Hence, “the middle ground of noncash incentives must be considered to cut across the dichotomy of altruistic donation versus paid donation”.6
A study from the US among blood donors using a natural experiment among 14,000 American Red Cross blood drives and 500,000 blood donations shows that donations increased by 15-20% on average when compensation was offered.7 The effect increased with the economic value of the compensation, but a substantial proportion of the increase in donations is explained by donors leaving neighbouring drives without compensation to attend drives with compensation. This displacement also increases with the economic value of the incentive.
LARGER ADMINISTRATIVE BURDENRelying on non-monetary compensation rather than monetary compensation would imply a larger administrative burden for donation centres. This will
make the total cost of using such non-monetary compensations greater than the cost of the compensation itself. This – together with possible concerns about the effectiveness of such donations in increasing donation rates – reduce the cost effectiveness of non-monetary compensations. Notwithstanding the administrative burden, non-monetary compensations may be viewed as more appropriate from an ethical and (therefore) political perspective.
Notes: 1) Lacetera and Macis (2010b) / 2) Platz et al. (2019) / 3) Titmuss (1970) / 4) Costa et al. (2013). The authors use the term ‘rewards’, which has been changed to ‘compensation’ for consistency with the
framework on page 61. / 5) Lacetera and Macis (2010b) / 6) Chell et al. (2018) / 7) Lacetera, Macis, and Slonim (2012)
(…) altruistic behaviour could be motivated by non-monetary means and thus nudge individuals to act in a manner that provides collective benefit
Costa et al. (2013)
(…) an ethically acceptable solution to the problem of donor compensation could be to provide donors with non-monetary compensation for the non-monetary disutilities associated with living donations,
Platz et al. (2019)
66

Reimbursement of incurred monetary costs associated with the donation should always be done to remove disincentives
REIMBURSEMENT IS LEGAL AND ABIDES WITH THE PRINCIPLES OF DONATIONReimbursements are compatible with the European legislation, the principle of voluntary and unpaid donations, and the principle of an altruistic focus. Besides the administrative burden, there is nothing that precludes reimbursements from being made and no immediate ethical concerns should arise.
THERE APPEARS TO BE A NEED FOR AN INCREASED FOCUS ON SUFFICIENT REIMBURSEMENTReimbursement of travel costs is a straightforward example of a reimbursement that appears justified under any circumstances. If such a reimbursement is not used, it may hinder a donation because the out-of-pocket transportation expense incurred by the donor is greater than the altruistic gain from the donation.
Nevertheless, reimbursements are often not made in various EU countries, which creates disincentives to donate. An illustration of the number of Member States that provide specific reimbursements is provided in the figure. For example, transportation costs to donors via apheresis donation is only reimbursed in 13 (46%) European Member States.1
Only four Member States (14%) have free or reimbursement of medical costs associated with the donation (e.g., additional medication).1
EU Member States that provide reimbursements for plasmapheresis donations
Note: Free physical check-up is beyond what is required by the donation.Source: European Commission (2016).
Share of EU Member States
Notes: 1) European Commission (2016). Per cent based on 28 Member States.
14%18%
46%
57%
46%
4%
86%82%
54%
43%
54%
96%
Time off work
(public sector)
Free physical
check-up
Free or
reimbursement
of medical
costs
Reimbursement
of travel costs
Time off work
(private sector)
Other forms
67
Not provided Provided
APPENDIX AND REFERENCES
APPENDIX / P. 69
REFERENCES / P. 76

Appendix: Additional conditions that can be treated with plasma-derived therapies
Condition Plasma-derived therapy
Burns
Albumin
Cardiopulmonary bypass
Cirrhosis complications
Major surgery
Shock
Trauma
Plasma exchange treatments
Acute Respiratory Distress Syndrome
Bleeding/trauma
Coagulation factorsLiver disease
Anticoagulant overdose
Acute Inflammatory Demyelinating Polyneuropathy (Guillain–Barre)
Immunoglobulins
B-Cell Chronic Lymphocytic Leukaemia
Multiple Myeloma
Cytomegalovirus
Hepatitis A, B
Organ and bone-marrow transplants
Paediatric HIV
Rabies
Rh disease
Tetanus
Varicella
AAT deficiency Protease inhibitors
Source: Grabowski and Manning (2016).
69

Appendix: Notes to table on diseases that are treated with plasma-derived therapies (1/2)
All prevalence estimates are gender neutral and per 50,000 individuals. All estimates are based on a European population of 600 million individuals, except for Kawasaki Disease, which is based on 6 million children between 0 and 5 years.
1. Source: Stonebraker, J. S., BOLTON‐MAGGS, P. H., Michael Soucie, J., Walker, I., & Brooker, M. (2010). A study of variations in the reported haemophilia A prevalence around the world. Haemophilia, 16(1), 20-32 and an estimated prevalence of 12.8 in 100,000 males (range: 6.8 to 18.8). The gender distribution in Europe is assumed to bed 50/50.
2. Source: Stonebraker, J. S., BOLTON‐MAGGS, P. H., Michael Soucie, J., Walker, I., & Brooker, M. (2012). A study of variations in the reported haemophilia B prevalence around the world. Haemophilia, 18(3), e91-e94 and an estimated prevalence of 2.69 in 100,000 males (range 1.08-4.3).
3. Source: Bowman, M., Hopman, W. M., Rapson, D., Lillicrap, D., & James, P. (2010). The prevalence of symptomatic von Willebrand disease in primary care practice. Journal of Thrombosis and Haemostasis, 8(1), 213-216 and 14,600 patients with severe vWD in the US. Scaled to the European population.
4. Source: World Federation of Hemophilia (2018). Report on the Annual Global Survey 2017, table 16. Link: http://www1.wfh.org/publications/files/pdf-1714.pdf. Data from 24 European countries (not all countries report on all factor deficiencies). Does not include Bosnia and Herzegovina,
Bulgaria, Croatia, Germany, Iceland, Kosovo, Macedonia, Switzerland, Spain, the Netherlands, Austria, and Finland.
5. Source: https://www.ema.europa.eu/en/documents/scientific-guideline/note-guidance-clinical-investigation-plasma-derived-antithrombin-products_en.pdf using an estimated prevalence of 13.33 in 50,000 (range: 1 in 5,000 to 1 in 3,000 which is scaled to an interval of 10 in 50,000 to 16.67 in 50,000 and ) and a European population of 600 million.
6. Estimate from https://www.ema.europa.eu/en/medicines/human/orphan-designations/eu3151605 using a prevalence of 10 in 50,000 (2 in 10,000) an a European population of 600 million. Similar estimate can be found in https://www.orpha.net/orphacom/cahiers/docs/GB/Prevalence_of_rare_diseases_by_alphabetical_list.pdf.
7. Estimate from a prevalence of 1:50,000 (https://haei.org/hae/what-is-hae/) and a European population of approximately 600 million. Lower bound of 1 in 100,000 obtained from Roche, O., Blanch, A., Caballero, T., Sastre, N., Callejo, D., & López-Trascasa, M. (2005). Hereditary angioedema due to C1 inhibitor deficiency: patient registry and approach to the prevalence in Spain. Annals of Allergy, Asthma & Immunology, 94(4), 498-503. Upper bound of 9 in 100,000 obtained from https://www.orpha.net/consor/cgi-bin/OC_Exp.php?lng=EN&Expert=91378.
8. Based on prevalence estimate in Boyle, J. M., &
Buckley, R. H. (2007). Population prevalence of diagnosed primary immunodeficiency diseases in the United States. Journal of clinical immunology, 27(5), 497-502. Lower bound estimate (95% confidence interval), point estimate, and upper bound estimate amount to 151,769, 256,588, and 361,408 individuals out of the US population (297,386,040). While several papers use prevalence estimates based on registries, these are generally seen as being underestimates of the true patient population since only diagnosed cases are included in such registries, see, e.g., Gathmann, B., Grimbacher, B., Beauté, J., Dudoit, Y., Mahlaoui, N., Fischer, A., ... & Kindle, G. (2009). The European internet‐based patient and research database for primary immunodeficiencies: results 2006–2008. Clinical & Experimental Immunology, 157, 3-11 and Modell, V., Knaus, M., Modell, F., Roifman, C., Orange, J., & Notarangelo, L. D. (2014). Global overview of primary immunodeficiencies: a report from Jeffrey Modell Centers worldwide focused on diagnosis, treatment, and discovery. Immunologic research, 60(1), 132-144.
70

Appendix: Notes to table on diseases that are treated with plasma-derived therapies (2/2)
9. Based on pooled prevalence rates from a literature review at 2.81 in 100,000 and a European population of approximately 600 million. Broers, M. C., Bunschoten, C., Nieboer, D., Lingsma, H. F., & Jacobs, B. C. (2019). Incidence and Prevalence of Chronic Inflammatory Demyelinating Polyradiculoneuropathy: A Systematic Review and Meta-Analysis. Neuroepidemiology, 52(3-4), 161-172. A prevalence of 3.7 in 100,000 is found in https://www.orpha.net/orphacom/cahiers/docs/GB/Prevalence_of_rare_diseases_by_alphabetical_list.pdf, which yields an estimate of 22,200 individuals affected.
10. Source: Abrahamson, P. E., Hall, S. A., Feudjo‐Tepie, M., Mitrani‐Gold, F. S., & Logie, J. (2009). The incidence of idiopathic thrombocytopenic purpura among adults: a population‐based study and literature review. European journal of haematology, 83(2), 83-89 using the a prevalence rate of 16.55 in 10,000 (range: 9.5 in 100,000 to 23.6 in 100,000).
11. Source: Lawson, V. H., & Arnold, W. D. (2014). Multifocal motor neuropathy: a review of pathogenesis, diagnosis, and treatment. Neuropsychiatric disease and treatment, 10, 567 using a prevalence of 1.35 in 100,000 based on a range of estimates between 0.3 and 3 in 100,000.
12. Source: Salo E. (2017) Kawasaki Disease Epidemiology in Europe. In: Saji B., NewburgerJ., Burns J., Takahashi M. (eds) Kawasaki Disease. Springer, Tokyo using an estimated prevalence of 7.5 in 100,000 children younger
than 5 years (range: 5 in 100,000 to 10 in 100,000) and a population in the European Union 28 of 31 million (source: Eurostat, http://appsso.eurostat.ec.europa.eu/nui/submitViewTableAction.do). The estimated prevalence is supported by an incidence of 5.4, 7.4, and 11.4 per 100,000 children < 5 years in Norway, Sweden, and Finland, respectively (Salo, E., Griffiths, E. P., Farstad, T., Schiller, B., Nakamura, Y., Yashiro, M., ... & Burns, J. C. (2012). Incidence of Kawasaki disease in northern European countries. PediatricsInternational, 54(6), 770-772).
European countries include the following countries in 20191:Albania, Austria, Belarus, Belgium, Bosnia and Herzegovina2, Bulgaria, Croatia, Cyprus, the Czech Republic, Denmark, Estonia, Finland, France, Germany, Greece, Hungary, Iceland, Ireland, Italy, Kosovo, Latvia, Lichtenstein, Lithuania, Luxembourg, Macedonia, Malta3, Moldova4, Monaco5, Montenegro, the Netherlands, Norway, Poland, Portugal, Romania, Switzerland, Serbia, Slovakia, Slovenia, Spain, Sweden, Ukraine, and the United Kingdom.
42 countries in total with a total population of 600,050,605 individuals. Total population aged 0 to 5 years is 5,955,297 in EU28.1
71
Notes: 1) Data from Eurostat, see http://appsso.eurostat.ec.europa.eu/nui/show.do?dataset=demo_pjan&lang=en. / 2) Data from 2012. / 3) Source: National Statistics Office, Malta, see
https://nso.gov.mt/en/News_Releases/View_by_Unit/Unit_C5/Population_and_Migration_Statistics/Documents/2018/News2018_107.pdf. / 4) Data from 2017. / 5) Source: Monaco Statistics, see
https://www.monacostatistics.mc/Population-and-employment

High ------------------------------------------- Low
WHAT ARE THE EFFECTS?Reimbursement is largely uncontroversial since it is easy to ensure that no donor is in a better financial position after the donation compared to before. A donor who is required to, say, take the bus to a donation centre at a price of 2 EUR and is reimbursed exactly 2 EUR is not financially better or worse off compared to if (s)he did not donate.
This will only have an effect on the marginal donor, those who are close to donating but face out-of-pocket expenses high enough to offset the altruistic utility they receive from the donation. As the donor receives no extra benefits, the reimbursement does not attract a person to donate who would not otherwise have considered doing so.
EUROPEAN LEGISLATIONReimbursement of monetary costs associated with plasma donations is in line with the European legislation. Monetary costs could include travel costs, forgone earnings, and medical care. The terms of reimbursement are, however, left to the European Member States:
NUFFIELD COUNCIL ON BIOETHICSA reimbursement is consistent with rung 3 on the Nuffield Council on Bioethics’ Intervention Ladder since it is an “Intervention[s] to remove barriers and disincentives to donation experienced by those disposed”. The focus is thus altruistic and donations are driven by donors’ intrinsic motivation to donate even if reimbursements for incurred costs are given.
Appendix: A) There is a strong case for monetary reimbursement of incurred costs
72
(…) reimbursements of direct travel costs are compatible with voluntary non-remunerated donations.
Council recommendation of 29 June
1998, L203/18
72
Checklist:
• In line with the European
legislation
• Voluntary
ffffffffffffffffffffffffffffffffff
• Unpaid ffffffffffffffffffffffffffffffffff
• Altruistic focused
ffffffffffffffffffffffffffffffffff
• Corresponds to rung
CONTROVERSY OF
MONETARY
REIMBURSEMENT
3

WHAT ARE THE EFFECTS?A recent study found that perceived blood transfusion safety and personal motivations may play a larger role in willingness to donate than receiving certain compensations and incentives. Specifically, potential willingness to donate was neither related nor negatively related to positive attitudes toward receiving cash1 The study is based on data received from 27,868 participants from 28 EU countries. Interviews, from which the data are gathered, are related to blood donation and took place in 2014. Interviews sought to catch participants’ willingness to donate and identify willingness motivators, and were conducted as face-to-face interviews. The study uses logistical multilevel regression. There are two drawbacks of the study:
• It relies on hypothetical scenarios of donating rather than actual donors.
• Something considered a moral or ethical issue is asked in a face-to-face interview.
In a field experiment in Argentina, individuals received flyers with an invitation to donate blood. Each group received a different initiative, ranging from information on the importance of donations to supermarket vouchers. There were three different groups receiving vouchers: the first received $20 (approximately equal to the wage of 1.5 hours), the second $60 (4.5 hours) and the third $100 (1 day). Of these, at least the first category can be seen as a monetary compensation of the time spent donating. In this case, the lowest level of compensation did not increase donations compared to only providing information or giving a complementary T-shirt.2
However, several other studies have found positive effects from monetary compensation. One study used the introduction of monetary compensation in the Czech Republic and shows an increase in donation rates from 6.8/1,000 to 63.4/1,000 between 2006 and 2010, i.e., almost a ten-fold increase.3 In general, donation rates of plasma in the four European countries where monetary compensation is implemented are far greater than in other European Member States. For example, plasmapheresis donation rates where 30.4/1,000 and 58.8 in 2012 in Germany and the Czech Republic, respectively. For comparison, the highest donation rates in the same year in countries without monetary compensation were 19.2/1,000 in the Netherlands, 9.4/1,000 in Belgium, and 7.5/1,000 in France. In the low end, donation rates were 0.6/1,000 in Denmark, 0.5/1,000 in Spain, and 0.2/1,000 in Greece.4
EUROPEAN LEGISLATION.Monetary compensation for inconvenience associated with the donation is in line with European legislation. However, monetary compensation is only considered legal when: 1) the amount of money compensates the inconvenience associated with the donation, but without 2) over-compensating so as to create an incentive to donate. Compensating time off from work is also considered over-compensation if it exceeds “other than that reasonably needed for the donation and travel”.5.
NUFFIELD COUNCIL ON BIOETHICS.A monetary compensation is, just like a reimbursement, consistent with rung 3 on the
Nuffield Council on Bioethics’ Intervention Laddersince it is an “Intervention[s] to remove barriers and disincentives to donation experienced by those disposed”. The focus is thus altruistic and donations are driven by donors’ intrinsic motivation to donate even if monetary compensation of inconvenience associated with the donation is given.
Appendix: B) Monetary compensation can be effective as a means of decreasing disincentives associated with the donation
73
Notes: 1) Huis in ´t Veld et al. (2019) / 2) Iajya et al (2013). In fact, all forms of initiatives except for $60 and $100 coupons attracted zero donors. /
3) Lacetera and Macis (working paper, October 2017) / 4) Creative Ceutical (2015) / 5) Council Recommendation of 29 June 1998
High ------------------------------------------- Low
Checklist:
• In line with the European
legislation
• Voluntary
ffffffffffffffffffffffffffffffffff
• Unpaid ffffffffffffffffffffffffffffffffff
• Altruistic focused
ffffffffffffffffffffffffffffffffff
• Corresponds to rung
CONTROVERSY OF
MONETARY
COMPENSATION TO
OFFSET LOSSES
3

Appendix: C) and E) Monetary compensation does not seem advisable when viewed as a payment that creates incentives for donors who would otherwise not donate WHAT ARE THE EFFECTS?According to the literature, monetary payments and rewards increase donation rates. E.g., in the Argentinian field experiment mentioned previously, a $60 voucher increase turnout from 0% to 0.43%, and a $100 voucher further to 0.83%. Furthermore, offering $100 instead of $60 more than doubled the number of usable donations.1 Additionally, both initiatives also affected people who had not been contacted, with total turnout increasing to 0.5% and 1.1% if these donors are included.2 As these initiatives compensate more than the time needed for donation, we categorise them either as a payment or reward, depending on whether the coupon could be sold and exchanged directly for cash.
However, there is some evidence for a crowding out effect on altruistically motivated donors when monetary compensation is introduced. This idea was first introduced by Titmuss (1971). The crowding out would potentially reduce the amount of donations following an introduction of a payment or reward.
EUROPEAN LEGISLATIONThe European legislation has a principle to encourage voluntary and unpaid donations of both blood and plasma.
Hence, the EU does not consider any type of payment or reward for donated human components to be legal or ethically acceptable. Small tokens, refreshments, and reimbursements of travel costs are the only compatible initiatives.
NUFFIELD COUNCIL ON BIOETHICSA reward is consistent with rung 5 on the Nuffield Council on Bioethics’ Intervention Ladder since it offers a benefit to the donor and tries to encourage people to donate who would not otherwise have done so. Similarly, a payment is consistent with rung 6, as it equates to: “Financial incentives that leave the donor in a better financial position as a result of donating”.
Hence, both these initiatives are non-altruistic and require ethical scrutiny according to the Council. To determine if a non-altruistic initiative can be justified, the following factors should be examined:• The welfare of the donor; • The welfare of other closely concerned
individuals;• The potential threat to the common good; • The professional responsibilities of the health
professionals involved; and • The strength of the evidence on all these factors.
The Nuffield Council on Bioethics states that plasma may constitute an ethically justifiable rung 6 of the intervention ladder due to the importance of plasma.3
74
Notes: 1) Iajya et al (2013). All the results presented in the text are statistically significant. / 2) Only the increase in the £100 group is statistically significant. /
3) Nuffield Council on Bioethics (2011). This is in a UK context, but likely applicable to the rest of Europe.
High ------------------------------------------- Low
Checklist:
• In line with the European
legislation
• Voluntary
ffffffffffffffffffffffffffffffffff
• Unpaid ffffffffffffffffffffffffffffffffff
• Altruistic focused
ffffffffffffffffffffffffffffffffff
• Corresponds to rung
(payment)
• Corresponds to rung
(reward)
CONTROVERSY OF
MONETARY
COMPENSATION AS AN
INCENTIVE
6
5

WHAT ARE THE EFFECTS?Non-monetary compensation can be any type of object like a T-shirt, cap, or umbrella. Additionally, it can be a voucher to redeem an object given that this voucher cannot be exchanged for cash. If it can be exchanged for cash, it becomes a monetary compensation.
In the above-mentioned Argentinian field experiment, one group was promised a T-shirt if they turned up to donate within three weeks. Interestingly, this did not attract any more people than just providing information on the usefulness of donations.1 In fact, both groups had 0 donors when over 2,000 flyers were distributed.
A meta study finds that “certain incentives2, specifically discounts and tickets (that are non-transferable/redeemable for cash), gifts, and paid time off work have the strongest evidence base for potential use within a [voluntary non-remunerated] VNR system”. These types of initiatives are likely to attract young and/or first-time donors and will be more successful in retaining new and infrequent donors. On the other hand, older donors to a larger extent claim not to be interested in initiatives. This exemplifies the conclusion in the study that there are no initiatives that would be favoured by all donors and nondonors alike.3
The effect of non-monetary compensations on donations is mixed in the literature, but with strong indications of an effect.4 Overall, this appears to be the best way forward within a voluntary and unpaid (VUD) system – sometimes referred to as voluntary
and non-remunerated (VNR) – like the one recognised in all European Member States and mandatory or encouraged in 25 Member States.5
EUROPEAN LEGISLATIONNon-monetary compensation for inconvenience associated with the donation is in line with European legislation, just as monetary compensation described earlier. Here, too, it is important not to over-compensate so as not to give a reward to the donor and incentives for him/her to donate.
NUFFIELD COUNCIL ON BIOETHICSA non-monetary compensation is, just like a monetary compensation and a reimbursement, consistent with rung 3 on the Nuffield Council on Bioethics’ Intervention Ladder since it is an “Intervention[s] to remove barriers and disincentives to donation experienced by those disposed”. The focus is thus altruistic and donations are driven by donors’ intrinsic motivation to donate even if non-monetary compensation of inconvenience associated with the donation is given.
75
Notes: 1) Iajya et al (2013) / 2) Here, we would use the word ‘initiative’ instead, as all the mentioned initiatives are what we would call compensations. /
3) Chell et al. (2018) / 4) Lacetera et al. (2013) / 5) European Commission (2016)
High ------------------------------------------- Low
(…) altruistic behaviour could be motivated by non-monetary means and thus nudge individuals to act in a manner that provides collective benefit
Costa et al. (2013)
Checklist:
• In line with the European
legislation
• Voluntary
ffffffffffffffffffffffffffffffffff
• Unpaid ffffffffffffffffffffffffffffffffff
• Altruistic focused
ffffffffffffffffffffffffffffffffff
• Corresponds to rung
CONTROVERSY OF NON-
MONETARY
COMPENSATION
3
Appendix: D) Non-monetary compensations viewed as a means of reducing disincentives associated with the donation

References (1/6)
Abdou, N. I., Greenwell, C. A., Mehta, R., Narra, M., Hester, J. D., & Halsey, J. F. (2009). Efficacy of intravenous gammaglobulin for immunoglobulin G subclass and/or antibody deficiency in adults. International archives of allergy and immunology, 149(3), 267-274.
Abolhassani H., Asgardoon M.H., Rezaei N., Hammarstrom L., Aghamohammadi A. Different brands of intravenous immunoglobulin for primary immunodeficiencies: how to choose the best option for the patient? Expert Rev. Clin. Immunol., 11 (2015), pp. 1229-1243
Agwunobi, J., & London, P. A. (2009). Removing costs from the health care supply chain: lessons from mass retail. Health affairs, 28(5), 1336-1342.
Aledort, L. (2016). The evolution of comprehensive haemophilia care in the United States, perspectives from the frontline. Haemophilia, 22(2), 676-683.
Aledort, L. , Carpenter, S. L., Cuker, A. , Kulkarni, R., Recht, M. , Young, G. and Leissinger, C. (2019), Why plasma‐derived factor VIII?. Haemophilia, 25: e183-e185.
AVIS (2019). Association of Voluntary Italian Blood Donors (Italian: Associazione Volontari ItalianiSangue, AVIS), see https://www.avis.it/unisciti-a-noi/become-a-donor/.
Barone, P.W., Wiebe, M.E., Leung, J.C. et al. (2020). Viral contamination in biologic manufacture and implications for emerging therapies. Nature Biotechnology, 38. 563–572.
Berger, M., Murphy, E., Riley, P., & Bergman, G. E. (2010). Improved quality of life, immunoglobulin G levels, and infection rates in patients with primary immunodeficiency diseases during self-treatment with subcutaneous immunoglobulin G. Southern medical journal, 103(9), 856-863.
Bousfiha, A. A., Duff, C., & Hsieh, E. (2017). Ensuring Access to Immunoglobulin Therapies for People with Primary Immunodeficiency: A Need to Improve Individuals’ Quality of Life and the Sustainability of Health-care Systems. Frontiers in Immunology, 8, 1165.
Boyle, M. L., & Scalchunes, C. (2008). Impact of intervenous immunoglobulin (IVIG) treatment among patients with primary immunodeficiency diseases. Pharmaceuticals Policy and Law, 10(1-4), 133-146.Burnouf, T. (2008). Current status of fractionated plasma products. Hématologie, 14(1), 36-47.
Chell, K., Davison, T. E., Masser, B., & Jensen, K. (2018). A systematic review of incentives in blood donation. Transfusion, 58(1), 242-254.Copenhagen Economics (2017). The value of clinical trials in Denmark (Danish title: Værdien af kliniskeforsøg i Danmark)
Costa‐Font, J. , Jofre‐Bonet, M. and Yen, S. T. (2013), Not All Incentives Wash Out the Warm Glow. Kyklos, 66: 529-551.
Council of Europe (2006). Guide to the preparation, use and quality assurance of blood components. 12th
Edition.
Creative Ceutical (2015). An EU-wide overview of the market of blood, blood components and plasma derivatives focusing on their availability for patients.Creative Ceutical Report, revised by the Commissionto include stakeholders’ comments, see https://ec.europa.eu/health/sites/health/files/blood_tissues_organs/docs/20150408_cc_report_en.pdf.
de Serres, F. J. (2002). Worldwide racial and ethnic distribution of α1-antitrypsin deficiency: summary of an analysis of published genetic epidemiologic surveys. Chest, 122(5), 1818-1829.
ECDC (2020). European Centre for Disease Prevention and Control. Coronavirus disease 2019 (COVID-19) and supply of substances of human origin in the EU/EEA, see https://www.ecdc.europa.eu/sites/default/files/documents/covid-19-supply-substances-human-origin.pdf.
EDQM (2017). European Directorate for the Quality of Medicines & HealthCare. Guide to the preparation, use and quality assurance of blood components. 19th Edition.
EDQM (2019). European Directorate for the Quality of Medicines & HealthCare. International Symposium on ‘Plasma Supply Management’, see https://www.edqm.eu/en/projects#Project%20TS093%20-%20Plasma%20Supply%20Management.
76

References (2/6)
European Blood Alliance (2016). EBA fact sheet on European self-sufficiency for blood components and plasma for fractionation, see https://europeanbloodalliance.eu/wp-content/uploads/2016/11/EBA_Pos_Paper-EU_self_sufficiency-1.pdf.
European Blood Alliance and International Plasma and Fractionation Association (2020). Plasma-Derived Medicinal Products (PDMPs) and Plasma Supply into the Future, see https://europeanbloodalliance.eu/wp-content/uploads/2020/01/1_5_ROBERT-Robert_IPFA-EBA_January14_Dispatch.pptx-FINAL-READY-FOR-PUBLICATION.pdf.
European Commission (2006). Report from the commission to the Council and the European Parliament. Report on the promotion by Member States of voluntary unpaid blood donations. Brussels, 17.5.2006. COM(2006) 217 final.
European Commission (2016). Commission Staff Working Document on the implementation of the principle of voluntary and unpaid donation for human blood and blood components as foreseen in Directive 2002/98/EC on setting standards of quality and safety for the collection, testing, processing, storage, and distribution of human blood and blood components and amending Directive 2001/83/ECBrussels, 21.4.2016. SWD(2016) 130 final.
European Central Bank (2020). Statistics, ECB/Eurosystem policy and exchange rates, Euro foreign exchange reference rates, period 1 January
2017 to 31 December 2017, see https://www.ecb.europa.eu/stats/policy_and_exchange_rates/euro_reference_exchange_rates/html/eurofxref-graph-usd.en.html.
European Medicines Agency (1999) Q5A(R1). Viral safety evaluation of biotechnology products derived from cell lines of human or animal origin Q5A(R1) Step4. Ich (1999).
European Medicines Agency (2018). CHMP position statement on Creutzfeld-Jakob disease and plasma-derived and urine-derived medical products.
European Parliament and the Council (2000), Regulation (EC) No. 141/2000. Regulation (EC) No 141/2000 of the European Parliament and of the Council of 16 December 1999 on orphan medicinal products. OJ L 18, 22.1.2000
European Parliament and the Council (2004), Directive 2004/23/EC. Directive 2004/23/EC of the European Parliament and of the Council of 31 March 2004 on setting standards of quality and safety for the donation, procurement, testing, processing, preservation, storage and distribution of human tissues and cells.
European Plasma Alliance (2019). European Plasma Alliance at the Plasma Proteins and TheraputicsAssociation’s 2019 Business Forum.
European Society for Immunodeficiencies (2020). Reporting and statistics, see https://cci-reporting.uniklinik-freiburg.de/#/. Data from 25 May 2020.
Farcet, M.R., Kreil, T.R. (2016). Zika virus is not thermostable: very effective virus inactivation during heat treatment (pasteurization) of human serum albumin. Transfusion, 57 (3pt2), 797-801.
Farcet, M.R., Lackner, C., Antoine, G., Rabel, P.O., Wieser, A., Flicker. A., Unger, U., Mo-drof, J., Kreil, T.R. (2015). Hepatitis E virus and the safety of plasma products: investigations into the reduction capacity of manufacturing processes. Transfusion, 56 (2), 383-391.
Ferlay, J., Colombet, M., Soerjomataram, I., Dyba, T., Randi, G., Bettio, M., Gavin, A., Visser, O., & Bray, F. (2018). Cancer incidence and mortality patterns in Europe: Estimates for 40 countries and 25 major cancers in 2018. European Journal of Cancer, Volume 103, 356 – 387.
Fijnvandraat, K., Cnossen, M. H., Leebeek, F. W., & Peters, M. (2012). Diagnosis and management of haemophilia. British Medical Journal, 344, e2707.
Fu, L.W., Song, S., Isaranuwatchai, W., & Betschel, S. (2018). Home-based subcutaneous immunoglobulin therapy vs hospital-based intravenous immunoglobulin therapy: A prospective economic analysis. Annals of Allergy, Asthma & Immunology, 120(2), 195-199. Fundacio Vìctor Grífos I Lucas (2018). Ethics and plasma donation: an overview. Monographs of the Víctor Grífols i Lucas Foundation, No. 47.
77

References (3/6)
GAO (US Government Accountability Office). June 1997. Blood Safety: Enhancing SafeguardsWould Strengthen the Nation’s Blood Supply, see https://www.gao.gov/archive/1997/he97143t.pdf.
Gardulf, A., Borte, M., Ochs, H. D., Nicolay, U., & Vivaglobin Clinical Study Group. (2008). Prognostic factors for health-related quality of life in adults and children with primary antibody deficiencies receiving SCIG home therapy. Clinical Immunology, 126(1), 81-88.
Global Commission to End the Diagnostic Odyssey for Children with a Rare Disease (2020a). Takeda, Microsoft, and EURORDIS. What is the “diagnostic odyssey?”, see https://www.globalrarediseasecommission.com/AboutUs.
Global Commission to End the Diagnostic Odyssey for Children with a Rare Disease (2020b). Takeda, Microsoft, and EURORDIS. It takes far too long for a rare disease to be diagnosed. Here's how that can change, see https://www.weforum.org/agenda/2020/02/it-takes-far-too-long-for-a-rare-disease-to-be-diagnosed-heres-how-that-can-change/.
Glynn, S. A., Williams, A. E., Nass, C. C., Bethel, J., Kessler, D., Scott, E. P., ... & Retrovirus Epidemiology Donor Study. (2003). Attitudes toward blood donation incentives in the United States: implications for donor recruitment. Transfusion, 43(1), 7-16.
Grabowski, H. G., & Manning, R. L. (2016). An economic analysis of global policy proposals to
prohibit compensation of blood plasma donors. International Journal of the Economics of Business, 23(2), 149-166.
Goette, L. & Stutzer, A. (April 2019). Blood Donations and Incentives: Evidence from a Field Experiment. CEPR Discussion Paper No. DP13677, see https://ssrn.com/abstract=3376608
Grillberger, L., Kreil, T. R., Nasr, S., & Reiter, M. (2009). Emerging trends in plasma-free manufacturing of recombinant protein therapeutics expressed in mammalian cells. Biotechnology journal, 4(2), 186–201.
Guo, Y., Tian, X., Wang, X., & Xiao, Z. (2018). Adverse Effects of Immunoglobulin Therapy. Frontiers in immunology, 9, 1299. Haddad, É., Barnes, D., & Kafal, A. (2012). Home therapy with subcutaneous immunoglobulins for patients with primary immunodeficiency diseases. Transfusion and Apheresis Science, 46(3), 315-321.
Hotchko, M., & Robert, P. (2018). Recent market status and trends of fractionated plasma products. Ann Blood, 3(2), 1-6.
Huis in ‘t Veld, E. M., de Kort, W. L., & Merz, E. M. (2019). Determinants of blood donation willingness in the European Union: a cross‐country perspective on perceived transfusion safety, concerns, and incentives. Transfusion, 59(4), 1273-282.
Iajya, V., Lacetera, N., Macis, M., & Slonim, R. (2013). The effects of information, social and financial incentives on voluntary undirected blood donations: Evidence from a field experiment in
Argentina. Social Science & Medicine, 98, 214-223.Institute of Occupational Medicine (IOM) Research project (2011). Methodology for valuing health impacts on the SHEcan project.
Jayapal K. P., Wlaschin K. F., Hu W. S. & Yap M. G. S. (2007). Recombinant protein therapeutics from Cho Cells - 20 years and counting. CHO Consortium: SBE Special Edition 40–47.
Joshi, A. Y., Iyer, V. N., Hagan, J. B., Sauver, J. L. S., & Boyce, T. G. (2009, January). Incidence and temporal trends of primary immunodeficiency: a population-based cohort study. In Mayo Clinic Proceedings (Vol. 84, No. 1, pp. 16-22). Elsevier.
Kobayashi, R. H., Gupta, S., Melamed, I., Mandujano, J. F., Kobayashi, A. L., Ritchie, B., … Litzman, J. (2019). Clinical Efficacy, Safety and Tolerability of a New Subcutaneous Immunoglobulin 16.5% (Octanorm [Cutaquig®]) in the Treatment of Patients With Primary Immunodeficiencies.
Kreil, T.R., Berting, A., Kistner, O., Kindermann, J. (2003). West Nile virus and the safety of plasma derivatives: verification of high safety margins, and the validity of predictions based on model virus data. Transfusion, 43 (8), 1023-1028.
Kreil, T.R., Unger, U., Orth, S.M., Petutschnig, G,. Kistner, O., Poelsler, G., Berting A. (2007). H5N1 influenza virus and the safety of plasma products. Transfusion, 47 (3), 452-459. Kretschmer, V., Weippert-Kretschmer, M., Slonka, J., Karger, R., & Zeiler, T. (2005). Perspectives of paid whole and plasma donation. Developments in biologicals, 120, 101-111.
78
References (4/6)
Krivan, G., Jolles, S., Granados, E. L., Paolantonacci, P., Ouaja, R., Cissé, O. A., & Bernatowska, E. (2017). New insights in the use of immunoglobulins for the management of immune deficiency (PID) patients. American journal of clinical and experimental immunology, 6(5), 76–83.
Lacetera, N., & Macis, M. (2010a). Social image concerns and prosocial behavior: Field evidence from a nonlinear incentive scheme. Journal of Economic Behavior & Organization, 76(2), 225-237.
Lacetera, N., & Macis, M. (2010b). Do all material incentives for pro-social activities backfire? The response to cash and non-cash incentives for blood donations. Journal of Economic Psychology, 31(4), 738-748.
Lacetera, N., & Macis, M. (2012). Time for blood: the effect of paid leave legislation on altruistic behavior. The Journal of Law, Economics, & Organization, 29(6), 1384-1420.
Lacetera, N., & Macis, M. (working paper, October 2017). Do paid plasma centers crowd out altruistic donation? Evidence from a natural experiment in the Czech Republic. October 2017.
Lacetera, N., Macis, M., & Slonim, R. (2012). Will there be blood? Incentives and displacement effects in pro-social behavior. American Economic Journal: Economic Policy, 4(1), 186-223.
Lacetera, N., Macis, M., & Slonim, R. (2013). Economic rewards to motivate blood donations. Science, 340(6135), 927-928.
Leydold, S.M., Farcet, M.R., Kindermann, J., Modrof, J., Pölsler, G., Berting, A., Howard, M.K., Barrett, P.N., Kreil, T.R. (2012). Chikungunya virus and the safety of plasma products. Transfusion, 52 (10), 2122-2130.
MRB (2014). Marketing Research Bureau. The plasma proteins market in Europe – 2014, see https://marketingresearchbureau.com/list-of-reports/the-plasma-proteins-market-in-europe-2014/.
MRB (2015). Marketing Research Bureau. International directory of plasma fractionators –2015, see https://marketingresearchbureau.com/list-of-reports/plasma-fractionation-directory/.
MRB (2017). Marketing Research Bureau The plasma proteins market in Europe – 2017, see https://marketingresearchbureau.com/list-of-reports/the-plasma-proteins-market-in-europe-2017/.
MRB (2018a). Marketing Research Bureau International directory of plasma fractionators –2018, see https://marketingresearchbureau.com/list-of-reports/plasma-fractionation-directory/.
MRB (2018b). Marketing Research Bureau Forecast of the plasma fractionation capacities and throughputs of the organizations listed in the international directory of plasma fractionators –from 2018-2030, see https://marketingresearchbureau.com/list-of-
reports/plasma-fractionation-directory/.
MRB (2020). Marketing Research Bureau at EBA-IPFA 2020. Presentation by Patrick Robert, Plasma Derived Medicinal Products (PDMPs) and plasma supply into the future, see https://ipfa.nl/events/ipfa-eba-workshop-on-plasma-collection/.
Mellström, C., & Johannesson, M. (2008). Crowding out in blood donation: was Titmuss right?. Journal of the European Economic Association, 6(4), 845-863.
Mendez, C. M., McClain, C. J., & Marsano, L. S. (2005). Albumin therapy in clinical practice. Nutrition in clinical practice, 20(3), 314-320.
Modell, V., Quinn, J., Ginsberg, G., Gladue, R., Orange, J., & Modell, F. (2017). Modeling strategy to identify patients with primary immunodeficiency utilizing risk management and outcome measurement. Immunologic research, 65(3), 713-720.
Nuffield Council on Bioethics (2011). Human Bodies: Donation for Medicine and Research.Nuffield Council on Bioethics, London, see https://www.nuffieldbioethics.org/assets/pdfs/Human-bodies-donation-report.pdf.
Offergeld, R. and Burger, R. (2003), Remuneration of blood donors and its impact on transfusion safety. Vox Sanguinis, 85: 49-49.
79

References (5/6)
Pharmaceutical Commerce (2016). Immunoglobulin (IG) drives the blood-plasma therapeutics market, see https://pharmaceuticalcommerce.com/brand-marketing-communications/immunoglobulin-ig-drives-the-blood-plasma-therapeutics-market/.
Platz, T. T., Siersbæk, N., & Østerdal, L. P. (2019). Ethically Acceptable Compensation for Living Donations of Organs, Tissues, and Cells: An Unexploited Potential?. Applied health economics and health policy, 17(1), 1-14.
Powell, J. S. (2009). Recombinant factor VIII in the management of hemophilia A: current use and future promise. Therapeutics and clinical risk management, 5, 391.
PPTA (2012). Plasma Protein Therapeutics Association. International Quality Plasma Program (IQPM), certification program description, implemented 1991, revised 2012, version 2.1, see https://www.pptaglobal.org/images/IQPP_ProgramDescription_v2_1.pdf.
PPTA (2014). Plasma Protein Therapeutics Association. The PPTA vision on the plasma protein therapies sector for the next decade in Europe. 10 April 2014, see https://www.pptaglobal.org/images/patientaccess/eu/DGSANCO14003bis_-_PPTA_vision_paper.pdf.
PPTA (2020a). Plasma Protein Therapeutics Association. Plasma protein therapies – uniquely saving lives, see https://www.pptaglobal.org/images/Communication__Advocacy/PPTs_-_Uniquely_Saving_Lives/Europe/PPTA_Uniquely_
Saving_Lives.pdf.
PPTA (2020b). Plasma Protein Therapeutics Association. 2019 Novel Coronavirus (2019-nCoV) and Plasma Protein Therapies, see https://www.pptaglobal.org/media-and-information/ppta-statements/1055-2019-novel-coronavirus-2019-ncov-and-plasma-protein-therapies.
PPTA (2020c). Quality Standards of Excellence, Assurance and Leadership (QSEAL), see https://www.pptaglobal.org/safety-quality/standards/qseal.
PPTA (2021). Europe needs to collect more plasma, see https://www.pptaglobal.org/images/patientaccess/eu/EU_position_paper_Europe_needs_to_collect_more_plasma.pdf.
Racosta, J. M., Sposato, L. A., & Kimpinski, K. (2017). Subcutaneous versus intravenous immunoglobulin for chronic autoimmune neuropathies: A meta‐analysis. Muscle & nerve, 55(6), 802-809.
Reimann, M., Schilke, O., & Thomas, J. S. (2010). Toward an understanding of industry commoditization: Its nature and role in evolving marketing competition. International Journal of Research in Marketing, 27(2), 188-197.
Rosendaal, F. R., Smit, C., & Briet, E. (1991). Hemophilia treatment in historical perspective: a review of medical and social developments. Annals of hematology, 62(1), 5-15.
Routes, J., Costa-Carvalho, B. T., Grimbacher, B., Paris, K., Ochs, H. D., Filipovich, A., ... & Ye, X. (2016). Health-related quality of life and health resource utilization in patients with primary immunodeficiency disease prior to and following 12 months of immunoglobulin G treatment. Journal of clinical immunology, 36(5), 450-461.
Sadler A, Shi L, Bethge S, Mühlbacher A: Incentives for Blood Donation: A Discrete Choice Experiment to Analyze Extrinsic Motivation. Transfus Med Hemother 2018;45:116-124.
Sanchez, A. M., Ameti, D. I., Schreiber, G. B., Thomson, R. A., Lo, A., Bethel, J., ... & Retrovirus Epidemiology Donor Study. (2001). The potential impact of incentives on future blood donation behavior. Transfusion, 41(2), 172-178.
Schlander, M., Schaefer, R., & Schwartz, O. (2017). Empirical Studies On The Economic Value Of A Statistical Life Year (VSLY) In Europe: What Do They Tell US? Value in Health, 20(9), A666.
Schulzki, T., Seidel, K., Storch, H., Karges, H., Kiessig, S., Schneider, S., ... & Zeisner, M. (2006). A prospective multicentre study on the safety of long‐term intensive plasmapheresis in donors (SIPLA). Vox sanguinis, 91(2), 162-173.
Siegel, J. (2005) The product: All intravenous immunoglobulins are not equivalent Pharmacotherapy 2005(25) (11 Pt 2), 78S–84S.
80
References (6/6)
Skinner, M. W., Hoppe, P. A. H., Grabowski, H. G., Manning, R., Tachdjian, R., Crone, J. F., & Youngner, S. J. (2016). Risk-based decision making and ethical considerations in donor compensation for plasma-derived medicinal products. Transfusion, 56(811), 2889-2894.
Strengers, P.F. and Klein, H. (2016). Plasma is a strategic resource. Transfusion 56, p. 3133-3137
Stuckler, D., Reeves, A., & Mckee, M. (2017). Social and economic multipliers: What they are and why they are important for health policy in Europe. Scandinavian journal of public health, 45(18_suppl), 17-21.
Titmuss, R. M. (1970). The gift relationship: from human blood to social policy. London: Allen Unwin.
United Nations (2008). International Standard Industrial Classification of All Economic Activities, Revision 4. Department of Economic and Social Affairs, Statistical Division. Statistical Papers, Series M, No. 4/Rev. 4, see https://unstats.un.org/unsd/publication/seriesM/seriesm_4rev4e.pdf. Van Der Poel, C. L., Seifried, E. and Schaasberg, W. P. (2002), Paying for blood donations: still a risk?. Vox Sanguinis, 83: 285-293.
Vintura (2020). White paper: key economic and value considerations for plasma-derived medicinal products (PDMPs) in Europe, see https://www.vintura.com/en/life-science-consulting/publications/white-paper-key-economic-value-considerations-plasma-derived-medicinal-
products-pdmps-europe/?utm_source=Socialmedia&utm_medium=Posts&utm_campaign=PPTA. The paper was commissioned by Plasma Protein Therapeutics Association (PPTA)
Waller, C. (2006). Historical perspective on blood & plasma products, the. Blood, Plasma, and Plasma Proteins: A Unique Contribution to Modern Healthcare, 7(2005), 7-19 Weinstein, M. (2018). Regulation of plasma for fractionation in the United States. Annals of Blood, 3(1).
White, L. (2015). Does remuneration for plasma compromise autonomy?. In HEC forum (Vol. 27, No. 4, pp. 387-400). Springer Netherlands.
WHO and de Vrueh, R., E. R. F. Baekelandt, & J. M. H. de Haan (2013). Background Paper 6.19Rare Diseases. Priority Medicines for Europe and the World - A Public Health Approach to Innovation, see https://www.who.int/medicines/areas/priority_medicines/BP6_19Rare.pdf.
Wood, P., Stanworth, S., Burton, J., Jones, A., Peckham, D. G., Green, T., ... & UK Primary Immunodeficiency Network. (2007). Recognition, clinical diagnosis and management of patients with primary antibody deficiencies: a systematic review. Clinical & Experimental Immunology, 149(3), 410-423.
World Federation of Hemophilia (2018). Report on the Annual Global Survey 2017, table 16, see http://www1.wfh.org/publications/files/pdf-
1714.pdf.
WOID (2016). World Input-Output Database, see http://www.wiod.org/home.
WSI Tarifarchiv (2019). Institute of Economic and Social Research, Hans-Böckler-Foundation (German: Wirtschafts- und SozialwissenschaftlicheInstitut, WSI, der Hans-Böckler-Stiftung), see https://www.boeckler.de/wsi-tarifarchiv_43610.htm.
81

THE IMPACT OF PLASMA-DERIVEDTHERAPIES IN EUROPEThe health and economic case for ensuring sustainable supply
About Copenhagen Economics
Copenhagen Economics is one of the leading economics firms in Europe. Founded
in 2000, we currently employ more than 90 staff operating from our offices in
Copenhagen, Stockholm, Helsinki, and Brussels. The Global Competition Review
(GCR) lists Copenhagen Economics among the Top-20 economic consultancies in
the world and has done so since 2006.
www.copenhageneconomics.com
Om Copenhagen Economics
Christian Jervelund, Managing PartnerTuomas Haanperä, Managing EconomistNikolaj Siersbæk, Economist, PhD
AUTHORS
82
Copyright © 2022 FDOKUMEN