The Impact of Nutrient State and Lake Depth on Top-down Control in the Pelagic Zone of Lakes: A...
13
O RIGINAL A RTICLES The Impact of Nutrient State and Lake Depth on Top-down Control in the Pelagic Zone of Lakes: A Study of 466 Lakes from the Temperate Zone to the Arctic Erik Jeppesen, 1,2 * Jens Peder Jensen, 1 Claus Jensen, 1 Bjørn Faafeng, 3 Dag O. Hessen, 4 Martin Søndergaard, 1 Torben Lauridsen, 1 Pa ˚l Brettum, 3 and Kirsten Christoffersen 5 1 Department of Freshwater Ecology, National Environmental Research Institute, Vejlsøvej 25, DK-8600 Silkeborg, Denmark; 2 Department of Botanical Ecology, University of Aarhus, Nordlandsvej 68, DK-8240 Risskov, Denmark; 3 Norwegian Institute for Water Research, P.O. Box 173, Kjelsa ˚ s, N-0411, Oslo, Norway; 4 Department of Biology, University of Oslo, P.O. Box 1027, Blindern, N-0316 Oslo, Norway; 5 Freshwater Biological Laboratory, University of Copenhagen, Helsingørsgade 51, DK-3400 Hillerød, Denmark ABSTRACT Using empirical data from 466 temperate to arctic lakes covering a total phosphorus (TP) gradient of 2–1036 gL –1 , we describe how the relative con- tributions of resource supply, and predator control change along a nutrient gradient. We argue that (a) predator control on large-bodied zooplankton is unimodally related to TP and is highest in the most nutrient-rich and nutrient-poor lakes and generally higher in shallow than deep lakes, (b) the cascading effect of changes in predator control on phyto- plankton decreases with increasing TP, and (c) these general patterns occur with significant varia- tions—that is, the predation pressure can be low or high at all nutrient levels. A quantile regression revealed that the median share of the predator- sensitive Daphnia to the total cladoceran biomass was significantly related unimodally to TP, while the 10% and 90% percentiles approached 0 and 100%, respectively, at all TP levels. Moreover, deep lakes (more than 6 m) had a higher percentage of Daphnia than shallow (less than 6 m) lakes. The median percentage of Daphnia peaked at 0.15 mg L –1 in shallow lakes and 0.09 mg L –1 in deep lakes. The assumption that fish are responsible for the unimodality was supported by data on the abun- dance of potential planktivorous fish (catch net 1 night –1 gill nets with the different mesh sizes [CPUE]). To elucidate the potential cascading effect on phytoplankton, we examined the zooplankton phytoplankton biomass ratio. Even though this ra- tio was inversely related to CPUE at all TP levels, we found an overall higher ratio in oligotrophic lakes that declined toward low values (typically below 0.2) in hypertrophic lakes. These results suggest that planktivorous fish have a more limited effect on the grazing control of phytoplankton in oligo- trophic lakes than in eutrophic lakes, despite similar predator control of large-bodied zooplankton. Ac- cordingly, the phytoplankton yield, expressed as the chlorophyll a–TP ratio, did not relate to CPUE at low TP, but it increased significantly with CPUE at high TP. We conclude that the chances of imple- menting a successful restoration program using bi- Received 19 February 2002; accepted 30 August 2002; published online May 6, 2003. *Corresponding author; e-mail: [email protected] Ecosystems (2003) 6: 313–325 DOI: 10.1007/s10021-002-0145-1 ECOSYSTEMS © 2003 Springer-Verlag 313
-
Upload
independent -
Category
Documents
-
view
0 -
download
0
Transcript of The Impact of Nutrient State and Lake Depth on Top-down Control in the Pelagic Zone of Lakes: A...

O R I G I N A L A R T I C L E S
The Impact of Nutrient State andLake Depth on Top-down Control inthe Pelagic Zone of Lakes: A Studyof 466 Lakes from the Temperate
Zone to the Arctic
Erik Jeppesen,1,2* Jens Peder Jensen,1 Claus Jensen,1 Bjørn Faafeng,3
Dag O. Hessen,4 Martin Søndergaard,1 Torben Lauridsen,1 Pal Brettum,3
and Kirsten Christoffersen5
1Department of Freshwater Ecology, National Environmental Research Institute, Vejlsøvej 25, DK-8600 Silkeborg, Denmark;2Department of Botanical Ecology, University of Aarhus, Nordlandsvej 68, DK-8240 Risskov, Denmark; 3Norwegian Institute for
Water Research, P.O. Box 173, Kjelsas, N-0411, Oslo, Norway; 4Department of Biology, University of Oslo, P.O. Box 1027,Blindern, N-0316 Oslo, Norway; 5Freshwater Biological Laboratory, University of Copenhagen, Helsingørsgade 51, DK-3400
Hillerød, Denmark
ABSTRACTUsing empirical data from 466 temperate to arcticlakes covering a total phosphorus (TP) gradient of2–1036 �g L–1, we describe how the relative con-tributions of resource supply, and predator controlchange along a nutrient gradient. We argue that (a)predator control on large-bodied zooplankton isunimodally related to TP and is highest in the mostnutrient-rich and nutrient-poor lakes and generallyhigher in shallow than deep lakes, (b) the cascadingeffect of changes in predator control on phyto-plankton decreases with increasing TP, and (c)these general patterns occur with significant varia-tions—that is, the predation pressure can be low orhigh at all nutrient levels. A quantile regressionrevealed that the median share of the predator-sensitive Daphnia to the total cladoceran biomasswas significantly related unimodally to TP, whilethe 10% and 90% percentiles approached 0 and100%, respectively, at all TP levels. Moreover, deeplakes (more than 6 m) had a higher percentage of
Daphnia than shallow (less than 6 m) lakes. Themedian percentage of Daphnia peaked at 0.15 mgL–1 in shallow lakes and 0.09 mg L–1 in deep lakes.The assumption that fish are responsible for theunimodality was supported by data on the abun-dance of potential planktivorous fish (catch net�1
night–1 gill nets with the different mesh sizes[CPUE]). To elucidate the potential cascading effecton phytoplankton, we examined the zooplanktonphytoplankton biomass ratio. Even though this ra-tio was inversely related to CPUE at all TP levels, wefound an overall higher ratio in oligotrophic lakesthat declined toward low values (typically below0.2) in hypertrophic lakes. These results suggestthat planktivorous fish have a more limited effecton the grazing control of phytoplankton in oligo-trophic lakes than in eutrophic lakes, despite similarpredator control of large-bodied zooplankton. Ac-cordingly, the phytoplankton yield, expressed asthe chlorophyll a–TP ratio, did not relate to CPUE atlow TP, but it increased significantly with CPUE athigh TP. We conclude that the chances of imple-menting a successful restoration program using bi-
Received 19 February 2002; accepted 30 August 2002; published onlineMay 6, 2003.*Corresponding author; e-mail: [email protected]
Ecosystems (2003) 6: 313–325DOI: 10.1007/s10021-002-0145-1 ECOSYSTEMS
© 2003 Springer-Verlag
313

omanipulation as a tool to reduce phytoplanktonbiomass increase progressively with increasing TP,but that success in the long term is most likelyachieved at intermediate TP concentrations.
Key words: top-down control; trophic cascade;arctic lakes; temperate lakes; fish; zooplankton;phytoplankton; biomanipulation.
INTRODUCTION
The debate over the factors regulating trophic struc-ture and interactions in the pelagic zone of lakes hasbeen ongoing for many years. Twenty to forty yearsago, most scientists, with a few exceptions (exam-ple, Hrbacek and others 1961; Brooks and Dodson1965; Brooks 1969) agreed that food webs wereregulated primarily via the available resources (re-source, or bottom-up, control, sensuMcQueen andothers 1986—that is, phytoplankton is regulated bynutrients and light, zooplankton by phytoplankton,etc. This view was the basis of the comprehensiveworldwide International Biological Program (IBP)investigations undertaken from 1965 to 1975 tostudy primary production and energy flow throughfood webs in limnetic systems. However, it hassince been shown that food web structure may bestrongly regulated by consumers (predator, or top-down, control), which implies that zooplankton areregulated by fish, phytoplankton by zooplankton,etc. (Carpenter and others 1985; Gulati and others1990; Carpenter and Kitchell 1993). Thus, regula-tion at the top of the food web can cascade down tothe phytoplankton level (trophic cascade, sensu Paceand others 1999). However, there is considerablevariation in the perception of how the relative in-fluences of resource and predator control can shiftalong a nutrient gradient.
Based on statistical analyses of lake studies andexperimental data, McQueen and others (1986,1989) concluded that bottom-up control is stron-gest at the bottom of the food web (for example,between nutrients and phytoplankton) and de-creases upward through the web; conversely, pred-ator control would be strongest at the top of theweb and then decreases downward. They furtherasserted that the cascading effect of changes inpredators on phytoplankton is high in nutrient-poor lakes and low in nutrient-rich lakes, partlybecause nutrient-rich lakes are often dominated bybluegreen algae that are not grazed efficiently byzooplankton. A meta-analysis of data derived fromfood web experiments in field enclosures (Brett andGoldman 1996) appeared to confirm the hypothe-sis. But Leibold (1989), Sarnelle (1992), and Pace
and others (1999) argued that changes in the bio-mass of zooplanktivorous fish produce the greatestcascading effect on phytoplankton in nutrient-richlakes, a contention that is supported by several foodweb experiments and numerous whole-lake bioma-nipulation experiments (Gulati and others 1990;Perrow and others 1997; Hansson and others 1998;Meijer and others 1999).
Advocates of yet another variation on food webtheory maintain that there is a stepwise shift in thebalance between resource and predator controlalong a total phosphorus (TP) gradient. Accordingto Persson and others (1988), the grazing pressureon phytoplankton depends on the number of foodweb links; in this view, it will be high in lakes withan even number of links (for example, lakes withonly zooplankton and phytoplankton or lakes withpredatory fish, zooplanktivorous fish, zooplankton,and phytoplankton) and low in lakes with an un-even number of links. They further suggested thatthere is a gradual increase in the number of foodweb links with increasing TP, going from one tro-phic level (phytoplankton) in the most nutrient-poor lakes to four levels (phytoplankton, zooplank-ton, planktivorous fish, and predatory fish) inmesotrophic lakes. In eutrophic lakes, the food webwill be reduced to three links because few predatoryfish are present. In accordance with the even–oddhypothesis, Carpenter and others (2001), using aset of experimental lakes, found that phytoplank-ton responded strongly to increasing nutrient load-ing in a three-level system, whereas comparativelyminor changes occurred in a four-level system. Yet,contrary to what the hypothesis of Persson andothers (1992) would predict, they found that thethree- and four-level systems established at the be-ginning of the experiment remained stablethroughout the 7-year study period, irrespective ofthe nutrient load of the system.
In studies focusing on zooplankton–phytoplank-ton interactions, Elser and Goldman (1990) andCarney and Elser (1990) developed the intermedi-ate-state hypothesis, which holds that the grazingpressure on phytoplankton is (a) low in nutrient-poor lakes, not only as a consequence of low nutri-ent availability, but also because the zooplanktonare dominated by copepods, which are not as effi-cient grazers as large-sized cladocerans; (b) high inintermediately nutrient-rich lakes in which thezooplankton are dominated by the efficient grazerDaphnia; and (c) low in nutrient-rich lakes, wherethe phytoplankton are dominated by grazing-resis-tant species, as also argued by McQueen and others(1986).
These hypotheses focused mainly on pelagic
314 E. Jeppesen and others

links. Yet most planktivorous fish are also benthi-vorous; indeed, recent studies using stable isotopeshave shown that the benthic–pelagic fish speciesrely to a large extent on benthic food sources inlakes (Vander Zanden and Vadeboncoeur 2002; Va-deboncoeur and others 2002), which may facilitatethe trophic cascade in the pelagic (Polis and others2000). In addition, benthic subsidies are an impor-tant factor in oligotrophic shallow lakes, becausemost consumer production (invertebrates) occursin the top sediment or on plant surfaces (Jeppesenand others 1997; Vadeboncoeur and Steinman2002). Benthic subsidies may also be important inhypertrophic shallow lakes because, due to lowerzooplankton grazing, a major portion of the phyto-plankton accumulates in the sediment and thenbecomes available as food for fish through benthicinvertebrates or as detritus rather than throughzooplankton (Jeppesen and others 1997). There-fore, facilitated top-down control could be high inoligotrophic and hypertrophic lakes and lower atintermediate TP concentrations.
This wide spectrum of differing opinions on therole of nutrients for predator and resource controlmay in part be a reflection of different study scales(time, nutrient levels, or lake depth) or limited dataset. Using empirical data from 466 temperate toarctic lakes covering a 500-fold gradient in TP, weexamined the changes in the relative contributionof resource supply and predator control in the pe-lagic zone along a broad nutrient gradient. In par-ticular, we set out to elucidate whether fish preda-tor control on large-bodied zooplankton isunimodally related to TP and, if so, whether theeffect on zooplankton is transferred to the phyto-plankton level, creating a trophic cascade.
MATERIALS AND METHODS
Study Areas
The study includes data collected in Greenland,Denmark, New Zealand, and Norway. The Green-
land (G) lakes are located near the coast in theZackenberg and Lake Store Sø valleys (74°N) innortheast Greenland and west Greenland on atransect from near the ice cap at Kangerlussuaq(67°N) to the coast. Sampling in New Zealand (NZ)was conducted on South Island (44°S) fromChristchurch to Dunedin. Sampling in Denmark(DK) (55°–57°N) and Norway (N) (65°–77°N) wasdone throughout the countries. The DK lakes weremainly eutrophic, whereas the lakes in N, NZ, and Granged from oligotrophic to mesotrophic (Table 1).
The methods of sampling and analyses used forthe DK lakes have been described in detail byJeppesen and others (2000a); for N lakes, byFaafeng and others (1990) and Hessen and others(1995a, 1995b); for NZ lakes, by Jeppesen and oth-ers (2000b); and for G lakes by Jeppesen and others(2002a) and Lauridsen and others (2001). A briefsummary is given here. In all lakes, sampling wasconducted during mid to late summer (July–Augustin DK, July–August and in a few lakes in earlySeptember in N, January–early February in NZ);thus, it was done outside the season when tempo-rary clearwater phases occur in lakes and during theseason of maximum predation effects by young-of-year (YOY) fish (Jeppesen and others 1997).
In N, chlorophyll a, TP, and zooplankton (10 L,more than 45 �m) were analyzed from depth-inte-grated samples over the trophogenic zone (twicethe Secchi depth; maximum 0–10 m, minimum0–2 m for chlorophyll a, TP, and phytoplankton;maximum 0–20 m for zooplankton). In DK, depth-integrated samples for chlorophyll a and waterchemistry were taken with a 3.31 Patalas sampler inthe photic zone; in NZ and G, samples were takenfrom the surface to the bottom. Densities of selectedzooplankton species in DK lakes were determinedon depth-integrated (surface to bottom) water sam-ples taken at one to three stations. Depending onthe trophic state, 4.5 or 9 L of the pooled samplewere filtered onto an 80-�m mesh net and fixed inacid Lugol’s iodine. NZ and G lakes were sampled
Table 1. Selected Physicochemical Variables for the Study Lakes
MaximumDepth
Total Phosphorus(mg PL–1)
Chlorophyll a(� g L–1) n
Denmark 6.8 (1.0–37.7) 0.268 (0.010–1.458) 98.7 (10–855) 57–75Norway 55.5 (0.7–516.0) 0.020 (0.001–0.627) 9.03 (0.5–137) 290Greenland 10.0 (0.2–67) 0.011 (0.002–0.032) 1.26 (0.2–5.4) 74–78New Zealand 3.6 (0.5–11) 0.029 (0.006–0.084) 3.65 (1.2–8.4) 22–23
Data given as mean (range)n � number of lakes included in the analyses
Top-down Control in Lakes and Biomanipulation 315

once during midsummer using a similar device andsimilar sampling techniques (depth-integrated fromtop to bottom). In these lakes, zooplankton weresampled at one to five stations placed along atransect running parallel to the shore in the deepestpart. A 12–20-L subsample (depending on the tro-phic state) of the pooled sample was filtered onto a20-�m mesh net. Length–weight relationships, ac-cording to Dumont and others (1975) and Bottrelland others (1976), were used to estimate biomass.The various mesh sizes (20–80-�m) used for zoo-plankton in the different countries have no effectson the cladoceran counts, because all are cladocer-ans retained; they have little effect on total zoo-plankton biomass because only a few rotifers andnauplii are able to pass through the most coarsefilter used.
Lake water TP was determined as molybdate-reactive phosphorus (Murphy and Riley 1972) afterpersulphate digestion (Koroleff 1970). Chlorophylla was determined spectrophotometrically after eth-anol (DK, G, NZ) or acetone (N) extraction. Toconvert chlorophyll a (�g L–1) to dry weight (�g),we multiplied by 67 (Jeppesen and others 1997).
The composition and relative abundance of thepelagic fish stock were determined in some of thelakes from DK, NZ, and G with multiple mesh–sizedgill nets (6.25, 8, 10, 12.5, 16.5, 22, 25, 30, 33, 38,43, 50, 60, 75 mm); the length and depth of eachsection were 3 and 1.5 m, respectively. In DK, fishsurveys were conducted according to a standardizedtest-fishing program (Mortensen and others 1990).Between six and 66 nets were used, depending onlake size and depth. The nets were set in late after-noon and left in place until the next morning (ap-proximately 18 h) in both the littoral zone and atthe bottom in the pelagic zone. Pelagic nets werealso used in deep lakes. Fishing was conducted be-tween 15 August and 15 September because previ-ous test-fishing had indicated that the distributionof the fish population was most even during thatperiod (Mortensen and others 1990). In NZ and G,four to 10 nets were used, depending on lake sizeand depth. In most of these lakes, the nets wereplaced in the littoral zone at a depth of 2 m and atthe bottom in the pelagic zone. In deep lakes, pe-lagic nets were also used; and in a few lakes, thefishing was restricted to the littoral zone. In alllakes, the nets were set in the late afternoon andretrieved the next morning. Average catch per uniteffort (CPUE) in terms of number of fish net–1
night–1 was calculated.We divided the lakes into two size classes, shal-
low and deep, defined as lakes with a maximumdepth of less than 6 m or 6 m or more. Maximum
depth was chosen because mean depth wasknown only for a subset of lakes. Before analysis,we first averaged the data from the different sta-tions for each sampling date, then averaged thedata per lake (one to three samplings per lake), toarrive at one data set per lake. Ratios were calcu-lated after averaging the numerators and denom-inators for the different sampling dates. To avoidinterference by acidification effects on zooplank-ton, only lakes with a pH higher than 6.5 wereincluded in the analysis. Biomanipulated lakeswere also excluded.
Statistics
For the statistical analyses, we performed a multipleregression with forward selection of variables. Inaddition, we performed quantile regressions (Cadeand others 1999), using the 10th, 50th, and 90thquantiles. Quantile regression is based on the min-imizing of least absolute deviations. Regressionquantiles extend the usual univariate concept ofquantiles to the linear model by defining a se-quence of lines that are above a proportion of ob-servations for different quantiles, R1, ranging from0.00 to 1.00. Estimates of regression quantiles wereobtained from a simplex linear programming solu-tion by minimizing an asymmetric loss function ofabsolute values of residuals, where positive residu-als are given weights equal to � and negative resid-uals are given weights equal to 1–�. Computer rou-tines written in S-Plus (Koenker and d’Orey 1987,1994) were used to estimate regression quantiles,test hypotheses about parameters, and computeconfidence intervals. We used the regression quan-tile rank-score test procedure implemented in S-Plus (Cade and others 1999). Coefficients of deter-mination for regression quantiles, R1, werecomputed by subtracting from 1 the weighted ab-solute deviations from the original model dividedby the weighted absolute deviations from a nullmodel (regression model without independent vari-ables). R1 is interpreted as the proportionate reduc-tion in variation between the simple quantile esti-mate of the dependent variable and the estimateconditioned on the independent variables. We usedthe following quadratic model:
Y � � � �1 � D � �2 � LTP � �3 � D � LTP
� �4 LTP2 � �5 � D � LTP2
where D is equal to 0 if the maximum depth is lessthan 6 m, else 1, LTP is loge-transformed TP, and D� LTP is the interaction between D and LTP, allowingfor different phosphorus slopes in shallow and deeplakes.
316 E. Jeppesen and others

First, we tested the hypotheses of no interactionbetween depth and TP, which is H1:�3 � �5 � 0. IfH1 could not be rejected, we tested for no differencein the level of Y between the shallow and the deeplakes, H2:�1 � 0, and for no effect of TP, H3:�2 � �4
� 0. All tests were conducted at a significance levelof 5%. Prior to the statistical analyses, the responsevariables were transformed to achieve a suitable
linear model �natural logarithmic, z � loge (y), or
the logistic z � loge
y
1 � y�.Back-transformation to
the original data scale was done by
Exp�z� or1
1 � Exp� � z�.
RESULTS AND DISCUSSION
Data from the N and DK lakes showed that theproportion of Daphnia in total cladoceran biomasswas unimodally related to TP and generally higherin deep lakes (Figures 1, 2 and Table 2). The con-tribution of Daphnia peaked at 0.15 mg P L–1 inshallow lakes and at 0.09 mg P L–1 in deep lakes(Figure 2 and Table 2). The decreasing percentagefrom medium to high TP has often been observed.Most frequently, it is attributed to the increase inabundance and the proportion of planktivorous fishin nutrient-rich lakes (Persson and others 1988;Jeppesen and others 2000a; Carpenter and others2001); this view has been confirmed by numerous
Figure 1. (A) Boxplot showing percentage of Daphnia for the total biomass of cladocerans along a gradient of totalphosphorus (TP) (all averages are for July–August) in 365 deep (more than 6 m) and shallow (less than 6 m) Danish andNorwegian lakes. Mean 25%, 75%, 10%, and 90% percentiles are shown. (B) (C) (D) (E) TP concentrations in the lakewater, chlorophylla–TP ratio (Chla:TP), and percentage of Daphnia versus total catch of planktivorous fish (CPUE, no. net–1
night–1) in multiple mesh-sized gill nets in Greenland, New Zealand, and Danish lakes with contrasting nutrientconcentrations. The lines connecting subplots B,C,D,E with subplot A point to the median TP levels of the lakes 10 topresented in each individual graph.
Top-down Control in Lakes and Biomanipulation 317

biomanipulation experiments (Hansson and others1998; Meijer and others 1999). Accordingly, aninverse relationship was found between the propor-tion of Daphnia and the abundance of planktivorousfish, expressed as CPUE in multimesh-sized gill netsfor DK lakes covering a TP gradient from 0.2 to 1.1mg P L–1 (Figure 1E). Unfortunately, only qualita-tive fish data, based on interviews and catch data,are available for N lakes. However, similar to thedata from DK lakes, the proportion of Daphnia in Nlakes declined in the more eutrophic, cyprinid-dominated lakes, whereas the pattern was less clearin the more oligotrophic lakes (Hessen and others1995b). The dominant planktivorous fish in eutro-phic European lakes, such as roach and particularlybream, are strongly benthivorous as well, whichmay allow strong, benthic-subsidized predator con-trol on zooplankton. This process is cumulative,because high predation on zooplankton translatesinto low grazing on phytoplankton and therefore,especially in shallow lakes, a high rate of phyto-plankton settling which in turn becomes a foodresource for benthic invertebrates and ultimatelyfor fish (Jeppesen and others 1997) (Table 3). Atintermediate TP, the control by piscivores on plank-tivorous fish is higher (Persson and others 1992;Carpenter and others 1997), thereby releasing pre-dation on zooplankton, which in turn leads to
higher grazing on phytoplankton and less fueling ofbenthic invertebrates by phytoplankton sedimenta-tion (Table 3).
The observed decrease in the percentage of Daph-nia with shifts from medium to low TP (Figures 1, 2and Table 2) has previously been observed in Nlakes and attributed to low calcium (Ca) and highcarbon–phosphorus (C:P) ratios (Hessen and others1995a, 1995b), because these parameters correlatedpositively with TP. The negative influence of low Caon Daphnia growth has been confirmed experimen-tally (Hessen and others 2000); and to the extentthat ambient TP is also positively correlated withfood C:P (that is, low P yields high C:P), this con-dition could also result in reduced growth in P-demanding species such as Daphnia (Hessen 1992;Sterner and Hessen 1994; Elser and others 2000).The extent to which such quality constraints maybe superimposed on food quantity constraints forDaphnia in nutrient-poor lakes is not yet clear. Al-though factors such as Ca concentration and ele-mental ratios of food and food quality may influ-ence the growth and survival of Daphnia in a diluteenvironment, several studies conducted in ultraoli-gotrophic lakes have shown that Daphnia are abun-dant in most fishless lakes and absent or restrictedto low densities or small Daphnia species in mostlakes with fish (Anderson 1982; Paul and others1995, Gliwicz and others 2001; Jeppesen and others2001; Lauridsen and others 2001). When fish pre-dation is low, Daphnia populations manage to over-come the growth constraints of the dilute environ-ment.
The strong influence exerted by fish in nutrient-poor lakes, despite low fish density, can be attrib-uted to several factors. First, zooplankton are ex-posed to these predators for a longer period of timeprior to reproduction because growth rates are lowdue to limited food availability (Dahl-Hansen1995); C:P ratios are frequently high and, for manyof the oligotrophic lakes, Ca concentrations are low.Second, the increasing clarity of the water at lowerTP enhances the risk of predation by visually hunt-ing fish in the pelagic zone. Third, the higher clarityalso enhances the proportion of benthic to pelagicprimary production and thus the share of benthosto the total production of consumers (Jeppesen andothers 1997; Vander Zanden and Vadebonceur2002; Vadebonceur and others 2002). Therefore, aslakes are transformed from mesotrophic to oligotro-phic, opportunistically feeding fish are increasinglysustained by benthos, which in turn may facilitatepredation on large-bodied zooplankton. Thus, thebenthic facilitation of predation on large-bodiedzooplankton may be high in both oligotrophic and
Figure 2. Percentage of Daphnia in the total populationof cladocerans in 365 Danish and Norwegian lakes di-vided into two size classes, maximum depth of less than6 m and greater than or equal to 6 m. Also shown are10%, 50%, and 90% quantiles obtained by quantile re-gression. The 50% quantile peaks at 0.09 mg P L–1 indeep lakes and 0.15 mg P L–1 in shallow lakes. For the50% model, see Table 2.
318 E. Jeppesen and others

Tab
le2.
Res
ult
sof
the
Qu
anti
leR
egre
ssio
nfo
rth
e50%
qu
anti
le(M
edia
n)
rela
tin
gth
ePer
cen
tage
of
Dap
hn
iain
the
Tota
lB
iom
ass
of
Cla
doce
ran
s(D
aph
nia
(%),
model
A)
and
the
Bio
mas
sR
atio
of
Zoopla
nkto
nto
Ph
ytopla
nkto
n(z
oo:p
hyt
,m
odel
B)
toTota
lPh
osp
horu
s(T
P)
and
Dep
th(T
wo
Siz
eC
lass
es)
�0
�1
�2
�3
�4
�5
R1
P
(A)
Dap
hn
ia(%
)E
stim
ate
(95%
CL)
0.0
6(–
0.2
2,0
.50)
1.1
4(0
.34,1
.65)
0.4
7(0
.28,0
.61)
ns.
–0.4
0(–
0.4
6,0
.34
)n
s.0
.13
0
.01
(B)
zoo:p
hyt
Est
imat
e(9
5%
CL)
–1.1
0(–
1.2
7,–
0.9
8)
–0.7
0(–
0.8
8,–
0.3
0)
–0.4
7(–
0.5
7,–
0.3
6)
0.1
9(0
.04
,0.3
6)
NS
NS
0.1
1
0.0
1Fin
alm
odel
(med
ian
):(A
)
6m
,D
aph
nia
(%)
�100/(
1�
exp
[0.0
6�
0.4
7LTP
�0.4
0(L
TP
2)]
�0.0
1)
(B)
6
m,
zoo:p
hyt
�ex
p[–
1.1
0–0
.47
LTP]
(A)
�6
m,
Dap
hn
ia(%
)�
100/(
1�
exp
[1.2
�0.4
7LTP
�0.4
0(L
TP
2)]
�0.0
1)
(B)
�6
m,
zoo:p
hyt
�ex
p[–
1.8
0–
0.2
8LTP]
CL
,co
nfid
ence
lim
it;
NS,
not
sign
ifica
nt
Mod
ello
ge(Z
)�
�0
��
1�
D�
�2
LT
P�
�3
D�
LT
P�
�3
LT
P2
��
5D
�L
TP
2,
wh
ere
Z�
y1/(
1�
y1),
y1�
Dap
hn
ia(%
)/10
0�
0.01
inm
odel
Aan
dZ
�zo
o:ph
ytin
mod
elB
.L
TP
�lo
ge(T
P)
�3,
wh
ich
mea
ns
that
the
x-ax
isre
ach
es0
ata
TP
ofap
prox
imat
ely
0.05
mg
PL
–1
�D
�0
ifm
axim
um
dept
his
less
than
6m
,ot
her
wis
e,D
�1.
Top-down Control in Lakes and Biomanipulation 319

Tab
le3.
Su
gges
ted
Ch
ange
sin
Top-d
ow
nC
on
trol
inth
ePel
agic
of
Lak
esan
dIm
plica
tion
sfo
rth
eU
seof
Bio
man
ipu
lati
on
asa
Res
tora
tion
Tec
hn
iqu
eB
ased
on
the
Pre
sen
tStu
dy
and
Som
eE
arlier
Stu
die
s
Oli
gotr
op
hic
Mes
otr
op
hic
–Sli
gh
tly
Eu
trop
hic
Eu
trop
hic
Sh
allo
wR
elat
ive
toD
eep
APis
civo
ryLow
-med
ium
1H
igh
1,2
Low
?B
Pro
port
ion
of
ben
thic
food
reso
urc
es(i
nve
rteb
rate
s,al
gae,
or
det
ritu
s)in
the
die
tof
pla
nkti
ben
thiv
oro
us
fish
Hig
hbe
cau
seof
hig
hbe
nth
icpri
mar
ypro
du
ctio
nre
lati
veto
ph
ytopla
nkto
npro
du
ctio
n1,2
Med
ium
,be
cau
seh
igh
erpis
civo
rou
sco
ntr
ol
(A)
of
pla
nkti
ben
thiv
oro
us
fish
mea
ns
hig
her
den
siti
esof
larg
e-bo
die
dzo
opla
nkto
n,
shif
tin
gin
par
tth
efo
cus
of
the
rem
ain
ing
fish
tow
ard
zoopla
nkto
n
Hig
h,
beca
use
of
low
zoopla
nk
ton
graz
ing
and
pro
po
rtio
nat
ely
hig
hse
dim
enta
tio
no
fph
yto
pla
nk
ton
,w
hic
hdir
ectl
yo
rin
dir
ectl
yvi
aco
nsu
mer
sbe
com
esav
aila
ble
asa
foo
dre
sou
rce
for
fish
Hig
her
insh
allo
wla
kes
,be
cau
seo
fp
rop
ort
ion
ally
hig
her
pro
du
ctio
no
fbe
nth
icin
vert
ebra
tes
than
zoo
pla
nk
ton
1,2
CTop-d
ow
nco
ntr
ol
of
larg
e-bo
die
dzo
opla
nkto
nH
igh
4,
beca
use
of
hig
hw
ater
clar
ity
and
hig
hbe
nth
icfa
cili
tati
on
(B)
Med
ium
4,
beca
use
of
hig
hpis
civo
rou
sco
ntr
ol
(A,
B)
and
insh
allo
wla
kes
beca
use
of
hig
hbi
om
ass
of
subm
erge
dpla
nts
Hig
h,2
beca
use
of
hig
hab
un
dan
ceo
fpla
nk
tivo
rou
sfi
shan
dh
igh
ben
thic
faci
lita
tio
n(B
),d
esp
ite
low
wat
ercl
arit
y
Hig
her
,be
cau
sea
hig
her
bio
mas
so
fp
lan
kti
voro
us
fish
can
bem
ain
tain
edd
ue
toh
igh
er2
,3be
nth
icin
vert
ebra
tep
rod
uct
ion
2,3
beca
use
of
hig
her
fish
abu
nd
ance
per
un
itvo
lum
e2
DZoopla
nkto
n–p
hyt
opla
nkto
nbi
om
ass
rati
oH
igh
4M
ediu
m4
Low
4H
igh
erp
eru
nit
of
m2
,3
EC
asca
din
gto
p-d
ow
nef
fect
sof
fish
on
ph
ytopla
nkto
nLow
,be
cau
seof
hig
hD
and
reso
urc
eco
ntr
ol
of
ph
ytopla
nkto
n
Med
ium
,be
cau
seof
med
ium
Dan
dm
ediu
mre
sou
rce
con
trol
of
ph
ytopla
nkto
n
Hig
h,
beca
use
of
low
Dan
dlo
wre
sou
rce
con
tro
lof
ph
yto
pla
nk
ton
Hig
her
,be
cau
seo
fC
,D
,an
dlo
wer
reso
urc
eco
ntr
ol
of
ph
yto
pla
nk
ton
(hig
her
inte
rnal
load
ing
du
rin
gsu
mm
er)
FSh
ort
-ter
msu
cces
sof
biom
anip
ula
tion
Low
,be
cau
seof
low
EM
ediu
m,
beca
use
of
med
ium
EH
igh
,be
cau
seo
fh
igh
EH
igh
er,
beca
use
of
hig
her
E
GLon
g-te
rmsu
cces
sof
biom
anip
ula
tion
Low
,be
cau
seof
low
EH
igh
,be
cau
seof
hig
hA
Low
,be
cau
seo
flo
wA
Mo
stli
kel
yh
igh
erw
hen
chan
ces
for
succ
ess
are
hig
h
1C
arpe
nte
ran
dot
her
s19
972Je
ppes
enan
dot
her
s19
973V
adeb
onco
eur
and
oth
ers
2002
4P
rese
nt
stu
dy
320 E. Jeppesen and others
hypertrophic lakes, although the C sources fuelingthe benthos are different (Table 3).
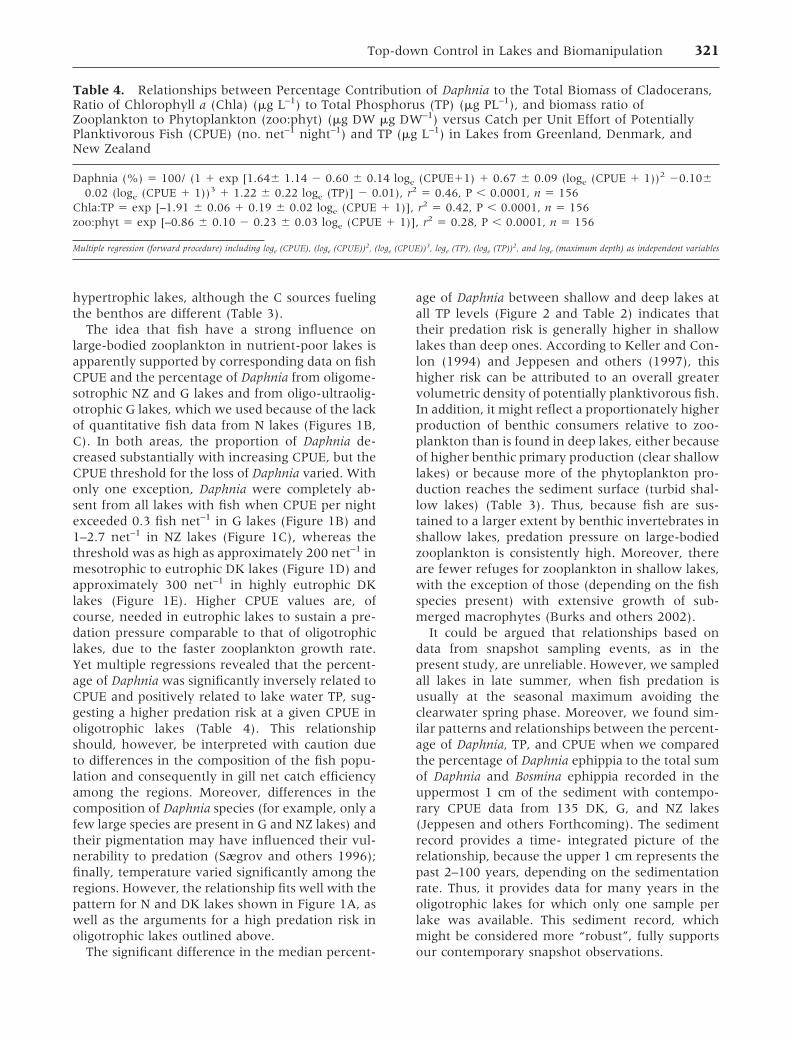
The idea that fish have a strong influence onlarge-bodied zooplankton in nutrient-poor lakes isapparently supported by corresponding data on fishCPUE and the percentage of Daphnia from oligome-sotrophic NZ and G lakes and from oligo-ultraolig-otrophic G lakes, which we used because of the lackof quantitative fish data from N lakes (Figures 1B,C). In both areas, the proportion of Daphnia de-creased substantially with increasing CPUE, but theCPUE threshold for the loss of Daphnia varied. Withonly one exception, Daphnia were completely ab-sent from all lakes with fish when CPUE per nightexceeded 0.3 fish net–1 in G lakes (Figure 1B) and1–2.7 net–1 in NZ lakes (Figure 1C), whereas thethreshold was as high as approximately 200 net–1 inmesotrophic to eutrophic DK lakes (Figure 1D) andapproximately 300 net–1 in highly eutrophic DKlakes (Figure 1E). Higher CPUE values are, ofcourse, needed in eutrophic lakes to sustain a pre-dation pressure comparable to that of oligotrophiclakes, due to the faster zooplankton growth rate.Yet multiple regressions revealed that the percent-age of Daphnia was significantly inversely related toCPUE and positively related to lake water TP, sug-gesting a higher predation risk at a given CPUE inoligotrophic lakes (Table 4). This relationshipshould, however, be interpreted with caution dueto differences in the composition of the fish popu-lation and consequently in gill net catch efficiencyamong the regions. Moreover, differences in thecomposition of Daphnia species (for example, only afew large species are present in G and NZ lakes) andtheir pigmentation may have influenced their vul-nerability to predation (Sægrov and others 1996);finally, temperature varied significantly among theregions. However, the relationship fits well with thepattern for N and DK lakes shown in Figure 1A, aswell as the arguments for a high predation risk inoligotrophic lakes outlined above.
The significant difference in the median percent-
age of Daphnia between shallow and deep lakes atall TP levels (Figure 2 and Table 2) indicates thattheir predation risk is generally higher in shallowlakes than deep ones. According to Keller and Con-lon (1994) and Jeppesen and others (1997), thishigher risk can be attributed to an overall greatervolumetric density of potentially planktivorous fish.In addition, it might reflect a proportionately higherproduction of benthic consumers relative to zoo-plankton than is found in deep lakes, either becauseof higher benthic primary production (clear shallowlakes) or because more of the phytoplankton pro-duction reaches the sediment surface (turbid shal-low lakes) (Table 3). Thus, because fish are sus-tained to a larger extent by benthic invertebrates inshallow lakes, predation pressure on large-bodiedzooplankton is consistently high. Moreover, thereare fewer refuges for zooplankton in shallow lakes,with the exception of those (depending on the fishspecies present) with extensive growth of sub-merged macrophytes (Burks and others 2002).
It could be argued that relationships based ondata from snapshot sampling events, as in thepresent study, are unreliable. However, we sampledall lakes in late summer, when fish predation isusually at the seasonal maximum avoiding theclearwater spring phase. Moreover, we found sim-ilar patterns and relationships between the percent-age of Daphnia, TP, and CPUE when we comparedthe percentage of Daphnia ephippia to the total sumof Daphnia and Bosmina ephippia recorded in theuppermost 1 cm of the sediment with contempo-rary CPUE data from 135 DK, G, and NZ lakes(Jeppesen and others Forthcoming). The sedimentrecord provides a time- integrated picture of therelationship, because the upper 1 cm represents thepast 2–100 years, depending on the sedimentationrate. Thus, it provides data for many years in theoligotrophic lakes for which only one sample perlake was available. This sediment record, whichmight be considered more “robust”, fully supportsour contemporary snapshot observations.
Table 4. Relationships between Percentage Contribution of Daphnia to the Total Biomass of Cladocerans,Ratio of Chlorophyll a (Chla) (�g L–1) to Total Phosphorus (TP) (�g PL–1), and biomass ratio ofZooplankton to Phytoplankton (zoo:phyt) (�g DW �g DW–1) versus Catch per Unit Effort of PotentiallyPlanktivorous Fish (CPUE) (no. net–1 night–1) and TP (�g L–1) in Lakes from Greenland, Denmark, andNew Zealand
Daphnia (%) � 100/ (1 � exp [1.64 1.14 � 0.60 0.14 loge (CPUE�1) � 0.67 0.09 (loge (CPUE � 1))2 �0.100.02 (loge (CPUE � 1))3 � 1.22 0.22 loge (TP)] � 0.01), r2 � 0.46, P 0.0001, n � 156
Chla:TP � exp [–1.91 0.06 � 0.19 0.02 loge (CPUE � 1)], r2 � 0.42, P 0.0001, n � 156zoo:phyt � exp [–0.86 0.10 � 0.23 0.03 loge (CPUE � 1)], r2 � 0.28, P 0.0001, n � 156
Multiple regression (forward procedure) including loge (CPUE), (loge (CPUE))2, (loge (CPUE))3, loge (TP), (loge (TP))2, and loge (maximum depth) as independent variables
Top-down Control in Lakes and Biomanipulation 321

We used the zooplankton–phytoplankton (zoo:phyt) biomass ratio as an indicator of the cascadingeffects on phytoplankton. This ratio decreased withincreasing TP in both shallow and deep lakes (Fig-ure 3 and Table 2) from a mean value of 0.35 in themost oligotrophic lakes to less than 0.1–0.2 in themost eutrophic lakes. Thus, the suggested high pre-dation pressure on large-bodied zooplankton in oli-gotrophic and eutrophic lakes seems to have thestrongest cascading effect on the zoo:phyt ratio (andmost likely also on the zooplankton grazing capac-ity) in the eutrophic lakes. Yet we found that fishhave a clear effect at all TP levels, since the zoo:phytratio was significantly negatively related to CPUE(both log-transformed) in G (P 0.0001, r2 � 0.65)(Figure 3B), NZ (P 0.001, r2 � 0.80) (Figure 3C),and DK lakes (P 0.004, r2 � 0.12) (Figure 3D andE). In a multiple regression of the pooled data set,CPUE but not TP contributed significantly and neg-
atively to the variation in the zoo:phyt ratio (Table4), suggesting that the higher predation risk forlarge-bodied zooplankton per unit of CPUE at lowTP is not transferred to the zoo:phyt ratio.
The chlorophyll a–TP (Chla:TP) ratio providesfurther evidence that fish have stronger cascadingeffects on phytoplankton at high TP (Figure 1B–E).Although this ratio was not related to CPUE in thenutrient-poor G lakes (P � 0.7) (Figure 1B), itincreased significantly in the slightly more nutrient-rich NZ lakes (P 0.04, r2 � 0.29) (Figure 1C) andin the eutrophic DK lakes (P 0.0001, r2 � 0.29)(Figure 1D and E), most likely reflecting a reductionin the impact exerted by zooplankton grazing onphytoplankton at increasing TP. Moreover, a recentstudy of 130 oligotrophic lakes in Greenland, 60%without fish, found no difference in the chlorophylla or the Chla:TP ratio between lakes with and with-out fish (E. Jeppesen and others unpublished).
Figure 3. (A) Boxplots showing the biomass ratio of zooplankton to phytoplankton (averages for July–August) in deep(more than 6 m) and shallow (less than 6 m) Danish and Norwegian lakes. (B) (C) (D) (E) The same ratio versus the totalcatch of planktivorous fish. The insets in B and D represent lakes with the same range of zooplankton–phytoplankton ratiosas in D and E. See also Figure 1.
322 E. Jeppesen and others

The zoo:phyt ratio did not differ markedly amongdeep and shallow lakes. This may, however, be aresult of our sampling strategy. Although zooplank-ton were sampled in the entire water column in DKlakes and at a depth of at least 20 m in N lakes, thephytoplankton sampling covered only the photiczone in both countries. If phytoplankton had beensampled in the same layer as zooplankton, the zoo:phyt ratio per square meter would have beenhigher in deeper lakes, as would be expected giventhe lower predation pressure in such lakes (Table3).
In accordance with the results of several otherstudies (see review by Pace and others 1999), ourresults indicate that the trophic cascade is highest innutrient-rich lakes (Table 3). Numerous bioma-nipulation experiments also support our results. Forexample, the mass removal of cyprinids in eutro-phic lakes often resulted in low chlorophyll a andhigh zoo:phyt ratios that exceeded 0.6–1 through-out the summer, as compared with a ratio of lessthan 0.2 in July–August before a biomanipulationscheme was implemented to control fish predation(Jeppesen and others 2002b). By contrast, but alsoin accordance with our data, several fish manipu-lation experiments conducted at low TP had onlyminimal cascading effects on phytoplankton bio-mass (Ramcharan and others 1995; Bizina 2000).Therefore, our results do not support the assertionthat the cascading effect of fish on phytoplankton ishigher in oligotrophic than in eutrophic lakes, assuggested by McQueen and others (1986, 1989)and Brett and Goldman (1997).
Our results, which showed that large-bodiedDaphnia exert the greatest influence at intermediateTP concentrations confirm in part the intermediate-state hypothesis of Carney and Elser (1990). How-ever, the potential zooplankton grazing pressure isapparently not low in oligotrophic lakes, as sug-gested by the hypothesis. The zoo:phyt ratio forthese types of lakes was high in our study, possiblybecause the zooplankton were subsidized by or-ganic matter from a terrestrial input or from thesediment, not least in systems where the contribu-tion of phytoplankton to the total particulate or-ganic input (whether externally derived or pro-duced in the lake) is low (Del Giorgio and Peters1993; Jeppesen and others 1997; Hessen and othersforthcoming).
Although our data are generally in accordancewith the food web theory (even–odd links) (Pers-son and others 1988) for mesotrophic and eutro-phic lakes, they deviate for oligotrophic lakes. Wefound a high risk of loss of Daphnia and a relativelylow cascading effect of fish on phytoplankton bio-
mass in lakes both with and without piscivores(four and three links, respectively) (E. Jeppesenand others unpublished) (Figures 1 and 3). Re-cently, Carpenter and others (2001) observed that aclearwater state mediated by the addition of pis-civorous fish could be maintained for a minimum of7 years irrespective of the loading, resulting in highgrazing effects on phytoplankton at all TP loads.Based on these results, the authors concluded thatthe piscivorous state can be maintained at a broadrange of nutrient loads. Our data support the ideathat large-bodied grazers, and consequently thegrazing pressure on phytoplankton, may be high atall TP levels (Figure 2). Yet they also strongly sug-gest that the most likely state in eutrophic lakes isone where small-bodied cladocerans are dominantand the grazing pressure on phytoplankton, as low,suggested by Persson and others (1988) andJeppesen and others (1997, 2000a).
Our findings have implications for the use ofbiomanipulation as a restoration tool (Table 3). Al-though predation release seems to affect the abun-dance of large-bodied zooplankton at all nutrientlevels, at high TP the most likely state is the turbidone, with low grazing of zooplankton phytoplank-ton. It is therefore likely that high-TP lakes will beresilient to fish manipulation—that is, the lake willreturn to the turbid state after a temporary clear-water state, as has been observed in several bioma-nipulation studies (Meijer and others 1999; Van DeBund and Van Donk 2002). At moderate eutrophi-cation, the cascading effect may be long-lasting,whereas in oligotrophic lakes fish manipulationmay have a strong impact on large-bodied zoo-plankton but low cascading effects on phytoplank-ton biomass.
In conclusion, we have provided evidence that(a) fish predation pressure on large-bodied clado-cerans is overall unimodally related to TP in bothshallow and deep lakes; (b) the effect generallycascades to the phytoplankton biomass level in eu-trophic lakes, but less significantly so in oligotrophiclakes; and (c) predator control of large-bodied zoo-plankton tends to be higher in shallow lakes than indeep lakes. However, our results also demonstratethat these general patterns occur over a broad spec-trum of possible alternatives. At both low and highTP, predator and grazer control ranged from high tolow in the lakes included in the analysis. We con-clude that in the short-term the probability thatbiomanipulation will prove successful in reducingphytoplankton biomass increases with TP, but thelikelihood of achieving a long-term effect is highestat intermediate TP levels.
Top-down Control in Lakes and Biomanipulation 323

ACKNOWLEDGMENTS
The assistance of the technical staff at the NationalEnvironmental Research Institute, Silkeborg, Den-mark, is gratefully acknowledged. Layout andmanuscript assistance was provided by K. Møgel-vang and A. M. Poulsen. This study was supportedby the Danish Natural Science Research Council(grant 9601711); the Danish research program onThe Role of Fish in Ecosystems 1999–2001, fundedby the Ministry of Agriculture, Fisheries, and Food;the North Atlantic Research Program 1998–2001;the Global Climate Change Program (grant9700195); the EU-funded ECOFRAME project(EVK1-CT-1999-00039); and the Danish NationalScience Research Council–funded research projecton Consequences of Weather and Climate Changesfor Marine and Freshwater Ecosystems: Conceptualand Operational Forecasting of the Aquatic Envi-ronment. Thanks go also to Romi L. Burks and twoanonymous reviewers for their valuable commentson the manuscript.
REFERENCES
Anderson RS. 1982. Zooplankton composition and change in analpine lake. Ver Int Verein Limnol 18:264–8.
Bizina EV. 2000. Interplay of “top-down” and “bottom-up” fac-tors in the regulation of plankton communities in freshwateroligotrophic ecosystems. Ver Int Verein Limnol 27:1752–6.
Bottrell HH, Duncan A, Gliwicz ZM, Grygierek E, Herzig A,Illbrich-Ilkowska A, Kurasawa H, Larsson P, Weglenska T.1976. A review of some problems in zooplankton productionstudies. Norw J Zool 24:419–56.
Brett MT, Goldman CR. 1996. Consumer versus resource controlin freshwater pelagic food webs. Science 275:384–6.
Brooks JL. 1969. Eutrophication and changes in the compositionof zooplankton. In: Eutrophication: causes, consequences, cor-rectives (Ed. Anon). National Academy of Sciences, Washing-ton D.C. p 236–55.
Brooks JL, Dodson SI. 1965. Predation, body size and composi-tion of plankton. Science 150:28–35.
Burks R, Lodge DM, Jeppesen E, Lauridsen TL. 2002. Diel hor-izontal migration of zooplankton: costs and benefits of inhab-iting littoral zones. Freshwat Biol 47:343–65.
Cade BS, Terrell JW, Schroeder RL. 1999. Estimating effects oflimiting factors with regression quantiles. Ecology 80:311–23.
Carney JJ, Elser JJ. 1990. The strength of zooplankton–phyto-plankton coupling in relation to trophic state. In: Tilzer MM,editor. Ecology of large lakes. New York: Springer-Verlag. p616–31.
Carpenter SR, Cole JJ, Hodgson JR, Kitchell JF, Pace ML, BadeD, Cottingham DL, Essington TE, Houser JN, Schindler DE.2001. Trophic cascades, nutrients, and lake productivity:whole-lake experiments. Ecol Monogr 71:163–86.
Carpenter SR, Kitchell JF. 1993. The trophic cascade in lakes.Cambridge (UK): Cambridge University Press. 385 p.
Carpenter SR, Kitchell JF, Hodgson JR. 1985. Cascading trophicinteractions and lake productivity. BioScience 35:634–9.
Carpenter SR, van Donk E, Wetzel RG. 1997. Nutrient loading
gradient in shallow lakes: report of the group discussion. In:Jeppesen E, Søndergaard M, Søndergaard M, Christoffersen K,editors. The structuring role of submerged macrophytes inlakes. New York: Springer Verlag. p 393–6.
Dahl-Hansen GAP. 1995. Long-term changes in crustacean zoo-plankton—the effects of a mass removal of arctic charr, Salveli-nus alpinus(L.), from an oligotrophic lake. J Plankton Res17:1819–33.
Del Giorgio PA, Peters RH. 1993. Balance between phytoplank-ton production and plankton respiration in lakes. Can J FishAquat Sci 50:282–9.
Dumont HJ, Van de Velde I, Dumont S. 1975. The dry weightestimate on a selection of cladocera, copepoda and rotiferesfrom the plankton, periphyton and benthos of continentalwaters. Oecologia 19:75–97.
Elser JJ, Fagan WF, Denno RF, Dobberfuhl DR, Folarin A, Hu-berty A, Interlandi S, Kilham SS, McCauley E, Schulz KL, andothers. 2000. Nutritional constraints in terrestrial and fresh-water food webs. Nature 408:578–80.
Elser JJ, Goldman CR. 1990. Zooplankton effects on phytoplank-ton in lakes of contrasting trophic status. Limnol Oceanogr36:64–90.
Faafeng B, Brettum P, Hessen DO. 1995. Landsomfattende un-dersøkelse av trofitilstanden i 355 innsjøer i Norge [in Norwe-gian]. Report nr 2355. Oslo: NIVA. 575 p.
Gliwicz ZM, Slusarczyk A, Slusarczyk M. 2001. Life-history syn-chronization in a long-lifespan single-cohort Daphniapopula-tion of an alpine lake free of fish. Oecologia 128:368–78.
Gulati RD, Lammens EHRR, Meijer M-L, Van Donk E, editors.1990. Biomanipulation—tools for water management. Hydro-biologia 200/201. 628 p.
Hansson L-A, Annadotter H, Bergman E, Hamrin SF, Jeppesen E,Kairesalo T, Luokkanen E, Nilsson P-A, Søndergaard M,Strand J. 1998. Biomanipulation as an application of foodchain theory: constraints, synthesis and recommendations fortemperate lakes. Ecosystems 1:558–74.
Hessen DO. 1992. Nutrient element limitation of zooplanktonproduction. Am Nat 140:799–814.
Hessen DO, Alstad NEW, Skardal L. 2000. Calcium limitation inDaphnia magna. J Plankton Res 22:553–68.
Hessen DO, Faafeng B, Andersen T. 1995a. Competition or nichesegregation between Holopediumand Daphnia;empirical lighton abiotic key parameters. Hydrobiologia 307:253–261.
Hessen DO, Faafeng B, Anderson T. 1995b. Replacement ofherbivore zooplankton species along gradients of ecosystemproductivity and fish predation pressure. Can J Fish Aquat Sci52:733–42.
Hessen DO, Faafeng B, Brettum P. Autotroph: herbivore biomassratios: carbon deficits judged from planktonic data. Hydrobio-logia. Forthcoming.
Hrbacek J, Dvorakova V, Korinek V, Prochazkova L. 1961. Dem-onstration of the effect of the fish stock on the species com-position of zooplankton and the intensity of metabolism of thewhole plankton association. Verh Int Verein Limnol 14:192–5.
Jeppesen E, Christoffersen K, Landkildehus F, Lauridsen TL,Amsinck SL, Riget F, Søndergaard M. 2001. Fish and crusta-ceans in northeast Greenland lakes with special emphasis oninteractions between arctic chart (Salvelinus alpinus), Lepidurusarcticusand benthic chydorids. Hydrobiologia 442:329–37.
Jeppesen E, Jensen JP, Lauridsen TL, Amsinck SL, ChristoffersenK, Mitchell SF. Sub-fossils of cladocerans in the surface sedi-ment of 135 lakes as proxies for community structure of
324 E. Jeppesen and others

zooplankton, fish abundance and lake temperature. Hydrobio-logia. Forthcoming.
Jeppesen E, Jensen JP, Søndergaard M. 2002. Response of phy-toplankton, zooplankton and fish to re-oligotrophication: an91-year study of 23 Danish lakes. Aquat Ecosys Health Man-age 5:31–43.
Jeppesen E, Jensen JP, Søndergaard M, Lauridsen TL, Landkil-dehus F. 2000a. Trophic structure, species richness and biodi-versity in Danish lakes: changes along a phosphorus gradient.Freshwat Biol 45:201–13.
Jeppesen E, Jensen JP, Søndergaard M, Lauridsen TL, PedersenLJ, Jensen L. 1997. Top-down control in freshwater lakes: therole of nutrients, submerged macrophytes and water depth.Hydrobiologia 342/345:151–64.
Jeppesen E, Lauridsen TL, Mitchell SF, Christoffersen K, BurnsCW. 2000b. Trophic structure in the pelagial of 25 shallowNew Zealand lakes: changes along nutrient and fish gradients.J Plankton Res 22:951–68.
Keller W, Conlon M. 1994. Crustacean zooplankton communi-ties and lake morphometry in Precambrian shield lakes. Can JFish Aquat Sci 51:2424–34.
Koenker R, d’Orey V. 1987. Computing regression quantiles.Appl Stat 36:245–54.
Koenker R, d’Orey V. 1994. A remark on Algorithm AS220:computing dual regression quantiles and regression rankscores. Appl Stat 43:410–4.
Koroleff F. 1970. Determination of total phosphorus in naturalwaters by means of persulphate oxidation. An Interlab. reportnr 3. Cons. Int. pour l’Exploration de la Mer.
Lauridsen TL, Jeppesen E, Landkildehus F, Søndergaard M.2001. Horizontal distribution of cladocerans in arctic Green-land lakes. Hydrobiologia 442:107–16.
Leibold MA. 1989. Resource edibility and the effects of predatorsand productivity on the outcome of trophic interactions. AmNat 134:922–49.
McQueen DJ, Johannes MRS, Post JR, Steward TJ, Lean DRS.1989. Bottom-up and top-down impacts on freshwater pelagiccommunity structure. Ecol Monogr 59:289–310.
McQueen DJ, Post JR, Mills EL. 1986. Trophic relationships infreshwater pelagic ecosystems. Can J Fish Aquat Sci 43:1571–81.
Meijer M-L, de Boois I, Scheffer M, Portielje R, Hospe H. 1999.Biomanipulation in the Netherlands: an evaluation of 18 casestudies in shallow lakes. Hydrobiologia 408/409:13–30.
Mortensen E, Jensen HJ, Muller JP, Timmermann M. 1990.Fiskeundersøgelser i søer: Øvervagningsprogram. Undersø-gelsesprogram, fiskeredskaber og metoder [in Danish]:Teknisk anvisning nr 3. Silkeborg (Denmark): DanmarksMiljøundersøgelser. 60 p.
Murphy J, Riley JR. 1972. A modified single solution method forthe determination of phosphate in natural waters. AnalytChim Acta 27:21–6.
Pace M, Cole JJ, Carpenter SR, Kitchell JF. 1999. Trophic cas-cades revealed in diverse ecosystems. Trends Ecol Evol 14:483–8.
Paul AJ, Leavitt PR, Schindler DW, Hardie AK. 1995. Direct andindirect effects of predation by a calanoid copepod (subgenus:Hesperodiaptomus) and of nutrients in a fishless alpine lake.Can J Fish Aquat Sci 52:2628–38.
Perrow MR, Meijer M-L, Dawidowicz P, Coops H. 1997. Bioma-nipulation in shallow lakes: state of the art. Hydrobiologia342/343:355–65.
Persson L, Anderson G, Hamrin SF, Johanson L. 1988. Predatorregulation and primary production along the productivity gra-dient of temperate lake ecosystems. In: Carpenter SR, editor.Complex interactions in lake communities. New York: Spring-er-Verlag. p 45–65.
Persson L, Diehl S, Johansson L, Andersson G, Hamrin SF. 1992.Trophic interactions in temperate lake ecosystems: a test offood chain theory. Am Nat 140:59–84.
Polis GA, Sears ALW, Huxel GR, Strong DR, Maron J. 2000.When is a trophic cascade a trophic cascade? Trends Ecol Evol15:473–5.
Ramcharan CW, McQueen DJ, Demers E, Popiel SA, Rocchi AM,Yan ND, Wong AH, Hughes KD. 1995. A comparative ap-proach to determining the role of fish predation in structuringlimnetic ecosystems. Arch Hydrobiol 133:389–416.
Sægrov H, Hobæk A, Labe-Lund HH. 1996. Vulnerability ofmelanic Daphniato brown trout predation. J Plankton Res18:2113–8.
Sarnelle O. 1992. Nutrient enrichment and grazer effects ofphytoplankton in lakes. Ecology 73:551–60.
Sterner RW, Hessen DO. 1994. Algal nutrient limitation andthe nutrition of aquatic herbivores. Annu Rev Ecol Syst25:1–29.
Vadeboncoeur Y, Steinman AD. 2002. Periphyton function inlake ecosystems. Sci World 2:1449–68.
Vadeboncoeur Y, Vander Zanden MJ, Lodge D. 2002. Putting thelake back together: reintegrating benthic pathways into lakefood web models. BioScience 52:44–54.
Van De Bund WJ, Van Donk E. Short-term and long-term effectsof zooplanktivorous fish removal in a shallow lake: a synthesisof 15 years of data from Lake Zwemlust. Freshwat Biol. Forth-coming.
Vander Zanden MJ, Vadebonceur Y. 2002. Fish as integrators ofbenthic and pelagic food webs in lakes. Ecology 83:2152–2161.
Top-down Control in Lakes and Biomanipulation 325