The Impact of Different Types of Resource Transfers on Individual Wellbeing: An Analysis of Quality...
19
The Impact of Different Types of Resource Transfers on Individual Wellbeing: An Analysis of Quality of Life Using CASP-12 Victoria Ateca-Amestoy • Arantza Ugidos Accepted: 16 June 2011 Ó Springer Science+Business Media B.V. 2011 Abstract This paper uses data for Spain from the Survey of Health, Ageing and Retirement in Europe (release 2.3.1) to model the determinants of the quality of life of the elderly, paying special attention to their intergenerational relations. The aim is to study CASP-12 (a social functional index) and explore the effect of interdependency in terms of the transfer of the resources of time and money between the elderly and other family members. To do so, we estimate a latent class model to explore the determinants of wellbeing. This allows us to distinguish between two different subpopulations, whose quality of life is modeled in different ways and who potentially would require different types of public care policies. Keywords Survey of Health, Ageing and Retirement in Europe (SHARE) CASP-12 Ageing Interdependency Latent class models 1 Introduction Life expectancy has lengthened in European countries and the ageing process presents new needs for long-term care in order to guarantee the quality of life of an increasingly large segment of the population. Some of those needs may be catered for within the family, but some of them should be considered by public institutions. Today, any policy designed to increase the wellbeing of the elderly needs to consider several specific features of that age group. In this work, we explicitly focus on two of them: the heterogeneity of the demo- graphic group (defined as those aged 50?), and the significance of the interdependence between different family generations. The purpose of this paper is to determine the effect intergenerational transfers between family members has on the quality of life of old people. We will explore the characteristics of these transfers involving time and money, as well as V. Ateca-Amestoy A. Ugidos (&) Fundamentos del Ana ´lisis Econo ´mico II, University of the Basque Country, Avda. Lehendakari Aguirre, 83, 48015 Bilbao, Spain e-mail: [email protected] V. Ateca-Amestoy e-mail: [email protected] 123 Soc Indic Res DOI 10.1007/s11205-011-9968-5
Transcript of The Impact of Different Types of Resource Transfers on Individual Wellbeing: An Analysis of Quality...

The Impact of Different Types of Resource Transferson Individual Wellbeing: An Analysis of Qualityof Life Using CASP-12
Victoria Ateca-Amestoy • Arantza Ugidos
Accepted: 16 June 2011� Springer Science+Business Media B.V. 2011
Abstract This paper uses data for Spain from the Survey of Health, Ageing and Retirement in
Europe (release 2.3.1) to model the determinants of the quality of life of the elderly, paying
special attention to their intergenerational relations. The aim is to study CASP-12 (a social
functional index) and explore the effect of interdependency in terms of the transfer of the
resources of time and money between the elderly and other family members. To do so, we
estimate a latent class model to explore the determinants of wellbeing. This allows us to
distinguish between two different subpopulations, whose quality of life is modeled in different
ways and who potentially would require different types of public care policies.
Keywords Survey of Health, Ageing and Retirement in Europe (SHARE) � CASP-12 �Ageing � Interdependency � Latent class models
1 Introduction
Life expectancy has lengthened in European countries and the ageing process presents new
needs for long-term care in order to guarantee the quality of life of an increasingly large
segment of the population. Some of those needs may be catered for within the family, but
some of them should be considered by public institutions. Today, any policy designed to
increase the wellbeing of the elderly needs to consider several specific features of that age
group. In this work, we explicitly focus on two of them: the heterogeneity of the demo-
graphic group (defined as those aged 50?), and the significance of the interdependence
between different family generations. The purpose of this paper is to determine the effect
intergenerational transfers between family members has on the quality of life of old people.
We will explore the characteristics of these transfers involving time and money, as well as
V. Ateca-Amestoy � A. Ugidos (&)Fundamentos del Analisis Economico II, University of the Basque Country, Avda. LehendakariAguirre, 83, 48015 Bilbao, Spaine-mail: [email protected]
V. Ateca-Amestoye-mail: [email protected]
123
Soc Indic ResDOI 10.1007/s11205-011-9968-5

other determinants of quality of life, by using data for Spain taken from the Survey of
Health, Ageing and Retirement in Europe (SHARE) for 2004.
Intergenerational transfers within the family are to be considered if we seek to improve
our understanding of the potentially different influences on quality of life of publicly
provided care and family care. We need to take into account the relevance of social
relations to wellbeing, specifically, of intra-family transfers of time and money in order to
explain quality of life. Those transfers can either be studied by using a unidirectional
approach (upstream, i.e. from children to parents, or downstream, i.e. from parents to
children), or a bidirectional one (for instance, considering the net result of the transfers
done in each direction), which is the one that we model. Given that the cost of long-term
care is expected to increase dramatically (around 149% in Spain between 2000 and 2050 in
some projections), intra-family and intergenerational transfers may have a major impact on
public finances. There is no consensus on the definition of quality of life, nor on the
determinants of a high standard of living. Indeed, quality of life and wellbeing are complex
concepts, built upon several aspects of a very different nature. They incorporate objective
and subjective aspects, as well as social arrangements and individual characteristics.
Researchers focusing on the particular social group comprising the elderly have high-
lighted the changing characteristics of the people included in the ‘‘senior’’ group.
We have used the information recorded in the SHARE, to describe the intra-family structure
of transfers and the effect of interdependence on the quality of life of the elderly people. It
appears to be a suitable tool, since the survey identifies determinants of wellbeing that are
specific to this age group. We conduct the analysis for the 2004 Spanish subsample in release
2.3.1 of the survey. We use a functional indicator of quality of life, the CASP-12, which is a self-
report index consisting of 12 Likert scale items. This measure has been theoretically developed
at a time when ‘‘changing social, economic and demographic circumstances of people in early
old age… required a rethink of the concept of what is to be ‘‘old’’ (Wiggis et al. 2008)’’. We
model the interdependency of our target group in terms of the transfer of the resources of time
and money between the elderly and other family members. In order to do so, we focus on the
different time and money transfers an individual receives from and gives to other members of
the family. We propose the concept of a person as a ‘‘net donor’’ or ‘‘net recipient’’ of money
transfers, based on the money the person gives or receives. For time transfers we consider four
alternative situations that represent interdependence based on whether a person does or does not
give or receive time regarding another member of the family. We study the influence those
intergenerational interactions have on the quality of life of the elderly, as measured by the
CASP-12 index.
The structure of the paper is as follows: the next section provides an overview of recent
research on the quality of life of the elderly and its determinants. Section 3 presents the
dataset, as well as certain descriptive statistics on our dependent variable and on the
typology of intergenerational transfers that we use. Section 4 presents the estimation
methods: ordered probit regression is taken as the benchmark and the option of using a
finite mixture model (FMM) is discussed. The results of the models’ estimation are pre-
sented in Sect. 5, and Sect. 6 concludes.
2 Literature Review and the Alternative Approaches to the Measurementof Well-Being
The literature on economics has paid increasing attention to subjective wellbeing (or
happiness, or life satisfaction), and has used mostly hedonic measures to characterize the
V. Ateca-Amestoy, A. Ugidos
123
determinants of individual quality of life (either by asking individuals to assess their life as
a whole, or evaluate some particular area of their lives). The fact that we can closely relate
that approach to welfare with the economic concept of utility partially explains this bur-
geoning literature. Many of those contributions have sought to explain the impact several
socioeconomic factors have on individual satisfaction with life, or on one or other life
‘‘domain’’ or even some ‘‘subdomain’’ (financial satisfaction, job satisfaction, satisfaction
with job flexibility, and so on). The major socioeconomic surveys on living conditions,
such as the European Community Household Panel (ECHP), the British Household PanelSurvey (BHPS), or the German Socio-Economic Panel (GSOEP), use hedonic measures to
characterize individual quality of life.
Eudemonic measures have been used mostly in other social disciplines. Eudemonic
wellbeing is typically measured by means of questions regarding autonomy, determination,
interest and sense of fulfilment. Sociology literature, for instance, posits that eudemonia
captures the functional dimensions of welfare, so it plays a complementary—albeit dif-
ferent—role regarding the hedonic component of welfare (i.e. happiness or life satisfac-
tion). Round 3 of the European Social Survey included measures of how people feel (in
terms of happiness, satisfaction and pleasure) and included measures of how well people
perform (Huppert et al. 2009).
When focusing on the social group that is the object of our analysis, Walter (2005)
proposes up to eight models of quality of life that he finds particularly suitable for
explaining quality of life amongst the elderly. These are the following: (1) objective social
indicators on quality of life (mostly referred to income, health, mortality and morbidity);
(2) human needs fulfilment (measured as individual subjective satisfaction with the degree
of accomplishment of those needs); (3) subjective social indicators such as satisfaction
with life, psychological wellbeing, and happiness; (4) Social capital in terms of personal
resources, social networks, support, participation in activities, and integration in the
community; (5) resources in the environment regarding the crime rate; (6) health and
functionality, especially physical ability or disability, or the wider approaches to health
status; (7) psychological models of cognitive competence and autonomy, control and
adaptation; and (8) hermeneutics approaches that highlight the individuals’ values, inter-
pretation and perceptions.
One of the clear benefits of using the SHARE is that it provides a wide range of
measurements of wellbeing that relies on many of those different perspectives and
approaches. Some of those measures, such as the individual’s self-reported health status,
rely on directly measured individual assessments and have already been widely used in the
social sciences literature. However, others are wellbeing measures that have been partic-
ularly developed for the elderly and have to be constructed by means of synthetic indexes
that gather information from different questions in the survey. As indicated in Gwozdz and
Sousa-Poza (2009), we can broadly consider two families of domains and models of
quality of life, namely, subjective social indicators of life satisfaction and psychological
wellbeing, and health and functioning models. Most of the discussion that follows presents
the advantages of using the latter type of measures, some of which have yet to be incor-
porated in the economic approach of wellbeing.
The analysis is conducted using an alternative measure to life satisfaction, by using the
CASP-12 index, in an attempt to study the effect of interdependency relationships on
quality of life. Certain previous studies have set out to explain the individual health by
using the subjective self-assessed health status of the individual as an approach to their
wellbeing, whereas some others have used subjective health status as one of the main
predictors of quality of life. Gwozdz and Sousa-Poza (2009) focus on people over the age
The Impact of Different Types of Resource Transfers
123
of 75 and combine evidence from GSOEP and from SHARE. They conclude that
‘‘objective’’ health status measurements, such as objective impeding conditions, do not
have a major impact on the subjective wellbeing of that segment of the population, whereas
a ‘‘subjective’’ health condition, i.e. self-assessed, is significant in determining wellbeing.
They provide several explanations for this puzzle, relying on previous gerontological
findings: either (1) those objective health measures only influence social participation with
some time lag, so they do not influence straightforward subjective wellbeing, or (2) as a
question of low expectations for this age group, defined as the survivors of a segment
characterized by high morbidity and dependency.
For some authors, such as Wiggis et al. (2004), that variable has several drawbacks: as it
is subjective and self-assessed, it can be considered, at the most, a ‘‘proxy’’ for real quality
of life. The main argument relies on the impossibility of being at the same time both the
explanation and the definition of quality of life. For those authors, the CASP index has a
solid theoretical grounding and respects the property by which any measurement of quality
of life must be clearly different from the factors that determine quality of life itself. In
Wiggis et al. (2004), the authors have found that good predictors of the quality of life of
old people are: the quality and density of their social networks, the loss of dearest ones, the
lack of retirement benefits that determine a difficult financial situation, and living in a
degraded neighbourhood.
As a first approach, Von dem Knesebeck, Hyde, Higgs, Kupfer and Siegrist (in Borsch-
Supan et al. 2005), chose a eudemonic index to model the quality of life of our focus
group: CASP-19. They assume that the degree to which each old person can fulfil their
needs is a measure of their quality of life. By using CASP-19, they consider that the degree
of fulfilment is especially relevant in the following domains: control (i.e. the ability for
active performance in the environment), autonomy (i.e. the right to be free of undesired
interferences), self-fulfilment, and pleasure. Wiggis et al. (2008) argue that CASP-19 is
‘‘well supported by a strong theoretical argument for the basis measuring quality of life in
the context of ageing’’. SHARE proposes that those four domains should be treated equally
(without hierarchies): the information is provided in order to build an abridged version of
the index that accounts for 12 ordered variables. The CASP-12 index is therefore built
using the answers to 12 questions measured in Likert ascending scales, each of which
measures the following theoretical dimensions of quality of life: control, autonomy, self-
realization and pleasure. We will in due course report the values for each of the four
theoretical dimensions of CASP-12 in the sample that we are going to use for our analysis.
Some previous studies on quality of life have used data from SHARE to construct the CASP
index (Von dem Knesebeck et al. in Borsch-Supan et al. 2005). Several geographical patterns
have been described, determined by a North–South gradient. There are significant differences
between the low levels of Mediterranean countries (Greece, Italy and Spain), and the higher
levels recorded for Northern European countries (Netherlands and Denmark, notably). That
pattern also applies for the study of each of the four different dimensions measured in this index.
According to those previous studies, although there are negligible and non-significant gender
differences, there are generational differences. Those differences between the quality of life of
the young and elderly in this analysis are broader for Southern European countries. This means,
therefore, that the negative impact of age is more prevalent in Southern Europe, as in the case of
Spain, as we will discuss later (both in the descriptive section, when we present the distribution
of CASP-12 in terms of age groups and in the results section, as we will introduce age as an
explanatory variable in the two estimated models).
Wahrendorf et al. (2006), use SHARE data to determine the positive effects of social
productivity on the wellbeing of the elderly. These authors define social productivity in terms of
V. Ateca-Amestoy, A. Ugidos
123

any activity previously agreed and continuous over time that generates goods or services that
are either socially or economically valuable to the recipients, even if they are not provided
through a formal contract. They consider the significance of time transfers, just as we do, but in a
broader sense. In fact, they consider the possibility of transferring time by means of charitable or
voluntary activities. Thus, they consider up to three types of time-transfers involving activities:
(1) voluntary or charity work, (2) care of sickly or disabled adults and, (3) the provision of
informal help to family, friends or neighbours. To measure the wellbeing of the elderly, they use
two indicators: CASP-12 and CES-D. This last measure captures the depressive condition that
reflects the reduction of emotional wellbeing. The authors use other alternative measures to
check the consistency of those measures (for instance, they use the self-assessed health status).
They do not only investigate the determinants of outbound time transfers, since they also control
for the inbound ones received by the elderly. The objective of their work is to test the hypothesis
on the positive effect of ‘‘reciprocity’’ on wellbeing. This implies lower levels of wellbeing for
those people whose social interaction is determined by non-reciprocal exchange, with respect to
people that enjoy a more balanced situation between efforts and rewards. They conclude that the
‘‘quality’’ of the interchange is the key variable for wellbeing. Accordingly, the relationship
between social productivity and wellbeing is modulated by the reciprocity of the interchange.
An alternative view on the relationship between social participation and health condi-
tion is researched in Sirven and Debrand (2008). They also use data from SHARE and
explore and quantify the positive contribution of high social participation in the self-
reported health status measurement. They also find evidence for the country gradient in the
efficiency of the production of good health by using social capital as an input.
By using this same database, Von dem Knesebeck et al. (2007) analyze the association
between the quality of life of European old people and an array of socioeconomic status
indicators for different European countries. Their aim is to determine whether the relative
importance of socioeconomic status changes with age. They study the correlation between
this eudemonic measure of interest, CASP-12, and five measures of relative position that
determine socioeconomic status: income, education, household tenure, net wealth and
ownership of a car. They use multivariate analysis to estimate certain models and conclude
that even if there are positive correlations, the results vary by country. They also find that
the impacts those factors have are different before and after retirement. Overall, the house
tenure regime is the one with the weakest relationship with quality of life.
With UK data from the English Longitudinal Study of Aging (ELSA), Nevuteli et al.
(2006) determine that quality of life is reduced by depression, by the perception of a
difficult financial situation, by limitations in mobility and undertaking daily activities, and
by impeding chronic diseases. On the other hand, quality of life increases with trusting
relationships in the family and social networks, frequent contacts with friends, living in a
good neighbourhood and having more material goods. They only find slight differences by
age groups and by gender. Based on these results, they conclude that any policy designed
to increase the quality of life of the elderly should seek to alleviate financial difficulties and
limiting health conditions, and improve the conditions of aged neighbourhoods and the
density of the social relationships of old people.
Another interesting source of information for the measurement and analysis of wellbeing is
the Gallup World Poll, since it contains data for 132 countries. Deaton (2007) uses data from the
2006 survey in a cross-country empirical exercise to analyze the relationship between financial
situation, ageing, health and wellbeing (this latter is measured as happiness or life satisfaction
and as health satisfaction). Average happiness is related with national per capita income. This
effect holds true for every society analyzed, and it is an interesting new finding. Improvements
in life expectancy determine that a person is more likely to be happy, but the measure of life
The Impact of Different Types of Resource Transfers
123

expectancy has no effect by itself. Age does not determine a clear and common pattern around
the world. For rich countries, it seems that the typical U shape fits; for the old subsamples, there
is a positive correlation between age and reported happiness. However, for poor countries, there
seems to be evidence supporting the opposite.
There is sufficient evidence in the literature about intergenerational transfers of income
and wealth (see Arrondel and Masson 2001, 2002; Laferrere and Wolf 2006, for instance).
Less attention has been paid to the transfer of time from one generation to another. Time
transfers may also have a major impact on the wellbeing of the agents involved. They
imply that some commodities can be produced inside the family, without having to buy
certain services on the market. For instance, some generations of European women take
care of their grandchildren and/or their parents (for this latter case, see for instance the
analysis by Crespo and Mira 2008). Bonsang (2009) considers the family as the traditional
source of care provision for the frail and older individuals. This author contends that
informal intergenerational care will only lessen long-term expenditure if the informal care
provided is an effective substitute for formal care. He concludes that it is indeed a sub-
stitute only if the needs of the elderly are low and require unskilled care.
Overall, we have found few items of research that consider the effect of interdepen-
dence on the wellbeing of the oldest members of population. Even though Bonsang (2009)
states that transfers between children and parents are important and should be considered
when evaluating population welfare, very few studies have addressed that question. Katz
(2009) uses data for people 75? in five countries to determine the effect of different family
relations (solidarity, conflict and ambivalence) on three alternative measurements of
individual wellbeing (life satisfaction, positive affects and negative affects). This author
finds a different impact on the three dependent variables, concluding the pertinence of
using multiple measurements for the outcome variable. All in all, among that scarce
literature, there is common agreement on two facts: (1) the need for longitudinal data to
fully characterize the impact of any change in the interdependence variables on the evo-
lution of individual conditions (since by using cross-sectional data, only static situations
can be evaluated), and (2) the importance of social participation on wellbeing.
3 Data Description
We use data for Spain from the first release of the SHARE, in its 2.3.1 version, as
coordinated by the Mannheim Research Institute for the Economics of Aging. It is a
multidisciplinary dataset that provides detailed information on health conditions, socio-
economic status and social and family networks of people aged over 50. These data were
collected in 2004 for 11 countries.
The data include health variables (for instance, self-assessed health status in the
European version of the scale, as well as objective gerontological measures of health
conditions), psychological variables (e.g. mental health, life satisfaction), economic vari-
ables (e.g. labour status, characteristics of the job, job opportunities after retirement,
sources and amount of current income, wealth and consumption), social variables (edu-
cation and housing conditions) and social support variables (e.g. family support, transfers
of income and assets, social networks, charity activities). As well as the variables directly
recorded in the survey, the SHARE dataset includes the variables and indicators generated
by AMANDA-IDT in EU FP5. Those variables and indicators include recoded variables,
as well as harmonisations (for instance, into Euros by using exchange rates and parities for
2004) that enable international comparisons to be made. All this information is provided in
V. Ateca-Amestoy, A. Ugidos
123

19 modules. Some of these collect information on the household and family that is pro-
vided by the person in the family chosen as the reference person of the family. The target
population of individuals is defined as ‘‘All individuals born in 1954 or earlier, speaking
the official language of the country and not living abroad or in an institution such as a
prison during the duration of the field work, and their spouses/partners independent of
age’’.
3.1 CASP-12 and Quality of Life
As indicated, there is no a clear consensus on the most suitable measurement of wellbeing
and of quality of life. SHARE contains several measurements of this concept. For this
work, we have chosen CASP-12. CASP-12 measures the degree to which the old person
has his need covered. This degree is measured over four dimensions: control, autonomy,
self-realization and pleasure. For each of the dimensions, three questions are asked, and
each one of the answers for those 12 questions is rated by an ascending 1–4 scale.1 Thus,
the total value of the indicator records scores ranging from 12 to 48 points. A higher value
is related to better quality of life. SHARE reports the values recorded for each of those
dimensions (Borsch-Supan et al. 2005).
The average values by country range from 33.32 in Greece to 40.48 in Switzerland. The
average score for the whole sample (all countries) is 37.37. In Spain, the average value is
35.57. Average values for Spain are lower in every dimension of the index than the average
when the complete sample is considered (Table 1).
3.2 Description of Interdependence: Time and Money Transfers
Since we are particularly interested in determining the effect of intra-family transfers on
individual’s welfare, we consider that a person can be in four different situations regarding
the transfer of time and in three different situations regarding money transfers at an intra-
family level. All this information is transformed from the original database. We introduce
the potential influence by means of a set of dummy variables.
Regarding time, the survey provides information, for each individual in the sample,
about help received from family members from outside and inside the household and help
given to a family member from outside and inside the household regarding personal care
(i.e. dressing, bathing or showering, eating, getting in or out of bed, using the toilet,
including getting up or down), practical household help (e.g. with home repairs, gardening,
transportation, shopping, household chores) and help with paperwork (such as filling out
forms, settling financial or legal matters). The individuals in the sample are also asked if
they have looked after their grandchildren without the presence of the parents.
Table 1 Quality of life by country
Country Control Autonomy Self-realization Pleasure CASP-12 Obs.
Spain 8.53 (2.49) 8.28 (1.94) 10.11 (2.01) 8.65 (2.26) 35.57 (6.70) 1,485
All countries 8.79 (2.16) 8.75 (1.89) 10.43 (1.78) 9.39 (2.15) 37.37 (6.10) 17,320
CASP-12 average values
Source: SHARE 2004, Release 2.3.1
1 The questions for each of the dimensions used to build the CASP-12 index are shown in ‘‘Appendix 1’’.
The Impact of Different Types of Resource Transfers
123

Time transfers are defined on the basis of that information as dummy variables and
include any kind of help that involves time spent with a family member. It may be the case
that the person neither gives nor receives time (NGNR dummy variable), and this will be a
baseline category in our regressions. It may also be the case that this person does not give
time to anyone, but instead receives time (NGYR). The opposite can happen, not receiving
but giving time (YGNR). Finally, there may be the case in which the person not only gives
but receives time (YGYR).
For money, the reference category for our analysis will be the person that neither gives
money nor receives it (NGNR money). An alternative one captures the situation in which
the old person gives more money than they receive (Net money giver). The third category
includes people that receive more money than they give (Net money receiver).
We first look at the distribution of CASP-12 by transfer regimes. The Fig. 1 summarize
the results of a mean-difference test run to test for the equality of means for different
categories of resource transfers (James 1954). The test results show that the means of the
quality of life measure (CASP-12) are statistically different across transfer regimes, being
those who do not give time but receive time and those net recipients of money who report a
significant lower quality of life.
Regarding the characterization of our sample in terms of the transfer regimes, results for
our Spanish subsample by age group are represented in Table 2.
The other explanatory variables are described in Table 3. We consider gender, where
41.33% of the sample are men; the average age is 66.13 years (ranging from 50 to 99). We
also control for the number of years of education (with an average duration of 6.55 years),
household income, whether the person is living with a partner (74.33% does) and
household size. Self-reported health status has been criticized as a valid measure of an
individual’s objective health condition. Instead, we use one of the alternative measures, the
Global Activity Limitation Indicator (GALI). This indicator refers to long-standing activity
limitations (i.e. with a duration of at least 6 months), considers the presence of a general
health problem (thus, including both physical and/or mental health) and the activities
people usually do and it is not preceded by a screening question on health problems to
avoid selection. 44.10% of the individuals have some limitation on performing daily
activities according to this measurement.
To account for possible institutional differences, we also control for the region of
residence (NUTS1).2
4 Estimation Method
CASP-12 is an ordered discrete variable, whose total value lies in a range from 12 to 48
points. As we have said, it is constructed so that a higher value is related to better quality of
life. When interpreting the estimated coefficients, a positive sign will identify a positive
partial effect on the dependent variable.
We explore two distinct estimation methods: an ordinary least squares regression model
(OLS) and a finite mixture regression model (FMM). The former, though not the standard
approach when the dependent variable is an ordered outcome, provides robust results that
are to be compared with the ones derived from the FMM model.3 The latter approach has
2 ‘‘Appendix 2’’ shows the definitions of the variables used.3 For a review of the implications of using different estimation methods and the estimation of subjectivewell-being models, see Ferrer-i-Carbonell and Frijters (2004).
V. Ateca-Amestoy, A. Ugidos
123

been increasingly used in Health Economics because it allows the researcher to deal with
the problem of unobserved heterogeneity in relatively easy way.
One of the assumptions underlying the OLS estimation method is that all the elderly
belong to a homogenous population. Thus, since all individuals come from the same
population, we assume a common residual error. However, the increase in life expectancy
has contributed to a much more heterogeneous group of elderly people. Many people in
this demographic group enjoy reasonably good health (both physical and mental), and
actively exchange time and money with other members of their families. Many others
suffer from severe health conditions and are net recipients of special care. This means that
we may be facing two or more behaviourally different subgroups amongst the elderly. Our
research investigates this possibility by extending the model to include a finite mixture of
distributions of reported CASP-12 outcomes. We study the quality of life of the elderly
taking into account this potentially significant heterogeneity in their underlying behaviour
and allowing for the existence of two or more kinds of elderly people.
As we have already mentioned, the demographic group we are studying is a growing
segment of the population and, as a consequence of this increase in number, one of its main
NGNR
YGNR
YGYR
NGYR3233
3435
3637
38
Time Transfers (dotted line = overall mean)
a
b
Means of CASP12 by Time Transfers Regimes
Net money giver
NGNR money
Net money receiver
3233
3435
3637
38
Money Transfers (dotted line = overall mean)
Means of CASP12 by Money Transfers Regimes
Fig. 1 CASP-12 mean values by time (a) and money (b) transfer regimes
The Impact of Different Types of Resource Transfers
123

characteristics is precisely the ever greater heterogeneity within it and we, the researchers,
do not have the sufficient information to control for this, so we face a potential problem of
heavy unobserved heterogeneity. We deal with this problem by assuming that there are a
finite number of unobserved subpopulations, each with a different behaviour. In our
estimations, we will try to capture the existence of different subgroups, each of them
having a different valuation function of their quality of life.
A FMM allows people’s underlying behaviour to be different, in the sense that there is a
mixing process that determines that the observed behaviour is informed by the existence of
a finite number of distinct but homogenous subpopulations. Accordingly, we let the effect
of the explanatory variables differ for each of the empirically and optimally determined
number of subgroups, which may be regarded as a type. Both the determinants of
belonging to one subgroup or another (determining the probability of being characterized
as a type) as well as the corresponding behavioural models (each process is estimated by
OLS) are estimated simultaneously.
In the FMM, the random variable of interest (CASP-12 in our case) is assumed to be a
draw from a population that is an additive mixture of distinct subpopulations or classes (c)
Table 2 Time and money transfers regimes in Spain by age group
Age groups Total row % Obs.
50–64 65–74 75?
Time
NGNR 24.15 12.53 10.55 47.22 1,097
NGYR 2.45 2.67 7.02 12.14 282
YGNR 16.01 12.01 4.52 32.54 756
YGYR 3.31 2.54 2.24 8.09 188
Money
NGNR money 37.84 26.09 21.48 85.41 1,984
Net money giver 6.33 2.80 1.46 10.59 246
Net money receiver 1.76 0.86 1.33 3.96 92
Total column % 45.93 29.75 24.28 100 2,322
Source: SHARE 2004, Release 2.3.1
Table 3 Descriptive statistics
Variable Mean SD Min. Max
Male 41.33 0.493 0 1
Age 66.13 10.379 50 99
Years of schooling 6.55 4.193 0 17
Household income (log) 9.74 1.457 0 15.68
Living with partner 74.33 0.4317 0 1
Household size 2.71 1.271 1 9
Limited with daily activities—GALI 44.10 0.497 0 1
Source: SHARE 2004, Release 2.3.1
V. Ateca-Amestoy, A. Ugidos
123

in proportions pc wherePC
c¼1 pc ¼ 1; pc [ 0 �8c ¼ 1; 2; . . .C. For CASP-12, the mix-
ture density can be described in general by
gðCASP-12jHÞ ¼ p1g1ðCASP-12jH1Þ þ p2g2ðCASP-12jH2Þ þ � � � þ pcgcðCASP-12jHcÞ;
where the class densities, gc(CASP-12|Hc), are assumed to be normals, i.e.
gc CASP-12jHcð Þ ¼ 1ffiffiffiffiffiffiffiffiffiffi2pr2
c
p exp � 1
2r2c
ðCASP-12� XHcÞ2� �
The regression coefficients, Hc, and the standard deviation, rc, vary across classes. Note
that the mixing probabilities, pc, (which in our exercise are going to depend on long-
standing activity limitations index, gender and age) are jointly estimated with the class-
specific regression coefficients and standard deviations. This model is estimated by
maximum likelihood, where the log likelihood function for the data is given by:
lðCASP-12jHÞ ¼XN
i¼1
log gi CASP12ijHð Þð Þ
Research on health economics has benefited from the use of this estimation method
(Conway and Deb 2005). One of the best examples of this approach to the study of the
determinants of subjective wellbeing is the study of financial satisfaction in the paper by
Clark et al. (2005). Evidence shows that a FMM better predicts the actual distributions of
the endogenous variable.
A FMM allows the researcher to use the whole sample to study the determinants of
quality of life, taking into account the unobserved heterogeneity among the elderly by
dividing the sample between two or more types of respondents. In fact, each observation
may have a non-zero probability of belonging to each one of the classes, so all the
observations are used to estimate the FMM model. This is done by distinguishing between
distinct classes of individuals (reporters): considering the different behaviour underlying
their reported quality of life measurement (heterogeneity). Our results will allow us to see
whether CASP-12 outcomes (reported quality of life) can be differentiated in such a way
and, if so, whether intergenerational time and money transfers and other factors have
differing effects on them. Indeed, our estimates reveal the existence of two statistically
different subgroups of elderly people.
5 Results
Our dependent variable is CASP-12, an ordered categorical variable that can have values
from 12 to 48. The higher the value of CASP-12 the better the quality of life. Therefore,
positive estimated coefficients are interpreted as the corresponding variable positively
affecting the quality of life of the elderly. Our reference group is a woman who does not
give or receive either time transfers or money transfers, she is retired, with no partner and
lives in the south of Spain.
We start discussing the results obtained by estimating the model by OLS. These results
are shown in the first two columns in Table 4.4 According to the estimated model, there are
no significant differences by gender. Age has a negative and significant negative effect.
4 An ordered probit model was also estimated, in order to check the results.
The Impact of Different Types of Resource Transfers
123

The years of education have a significant positive effect. Significant differences by labour
market status are found, with employed individuals being more likely to report a higher
quality of life than those retired; whereas those unemployed, on permanent sick leave or
disabled and housewives have a higher probability of being worse off.
Household income has a positive and significant effect, but money transfers have no
significant effect on the reported quality of life. However, time transfers do have a sig-
nificant effect. Ceteris paribus, those who do not give or receive time transfers enjoy a
better quality of life than those who receive but do not give, and than those who give but do
not receive. There are no significant differences between those who do not give and do not
receive and those who give and receive time transfers. These last results may suggest that
reciprocity is an important determinant of quality of life.
Table 4 Estimation results
CASP-12 OLS Finite mixture model
Subgroup 1 Subgroup 2 Mixingprobabilitiesequation
Coef. SE Coef. SE Coef. SE Coef. SE
Male 0.546 0.449 0.250 0.896 -0.584 0.803 -0.602 0.509
Age -0.093*** 0.025 -0.045 0.034 -0.048 0.042 0.018 0.016
Education 0.193*** 0.048 0.146** 0.074 0.144** 0.061
Employed 1.222** 0.592 2.119* 1.087 -0.080 0.979
Unemployed -1.901** 0.963 -1.758 1.222 -1.837 1.348
Disabled -4.493*** 1.048 -3.391*** 1.061 4.523* 2.381
Housework -1.220** 0.551 -1.674** 0.709 -0.015 0.948
Household income 0.312** 0.125 0.676*** 0.225 0.184 0.151
Living with partner 0.726 0.443 -0.218 0.632 1.769** 0.820
Household size -0.022 0.143 0.296 0.220 -0.257 0.246
Net money giver 0.701 0.527 0.540 0.790 0.874 0.820
Net moneyreceiver
0.048 0.909 1.163 1.486 -1.889 2.309
NGYR -2.956*** 0.668 -2.979*** 0.706 1.754 1.715
YGNR -0.664* 0.386 -0.772 0.587 -0.435 0.586
YGYR -0.964 0.671 -1.615* 0.932 -0.390 0.926
Northwest -0.850 0.663 -0.964 0.831 -0.212 1.064
Northeast 3.071*** 0.591 3.763*** 0.847 1.477* 0.761
Madrid 1.303** 0.635 2.568** 1.203 -1.506 1.083
Center -1.377** 0.677 -1.364 1.021 -3.036*** 0.739
East -0.223 0.467 1.220* 0.722 -2.678*** 0.635
Canary Islands -0.403 0.861 1.571 1.779 -1.995 4.422
GALI 3.179*** 0.740
Constant 25.636*** 2.388 16.029*** 3.791 29.238*** 3.706 -1.570 1.059
R2 0.238
/lnsigma1 1.709*** 0.041
/lnsigma2 1.267*** 0.074
*** p \ 0.01; ** p \ 0.05; * p \ 0.1
V. Ateca-Amestoy, A. Ugidos
123

We find significant differences by region of residence. Those living in the northeast
(Basque Country, Navarre, La Rioja and Aragon) report a significantly better quality of life
than those living in the south (Andalusia, Murcia, Ceuta and Melilla). On the other hand,
those living in the central region (Castilla y Leon, Castilla-La Mancha and Extremadura)
report a significantly lower quality of life.
Before presenting the results of the FMM, we would like to recall that we have jointly
estimated a mixing probability equation (ruled by a logit process) and the parameters of the
behavioural equation for the potential latent subpopulations (each process is estimated by
OLS). Our FMM yields two sets of coefficient estimates that characterize two types: one
that corresponds to subgroup 1, and one to subgroup 2. It also yields an estimated prob-
ability of belonging to subgroup 1 (the proportion of the population classified in the first
type is 56.8%). We propose to parameterize the mixing probability as a function of three
observables: age, sex and GALI. However, only this last variable is statistically significant
in the determination of the finite typology. Both age and sex have a non-significant effect
on the determination of the probabilities of the types. This finding has, at least, the
following implication: most of the policy measures designed to ensure the quality of life of
old people rely on some age criterion (being above some threshold). However, our results
seem to suggest that this age variable has no impact on the determination of the indi-
vidual’s type. Instead, the observed variable that classifies individuals into each one of the
types is the existence or otherwise of limitations in the pursuit of daily activities. We
control for age given that the distribution of the values of the CASP-12 index and the
scores for each of the four dimensions measured in the index seem to be dependent on age.
Looking at the estimated effect of our explanatory variables we see significant differ-
ences by subgroup. In fact, the majority of the characteristics found to affect reported
quality of life in the OLS model (labour market status and income) affect primarily the
reported quality of life of subgroup 1. Living with a partner, however, only affects the
quality of life of subgroup 2, and does so positively. Education increases quality of life in
both subgroups, although the effect seems to be more intense in the first group. Time
transfers have a negative effect on quality of life only for the first type: receiving time
transfers (in the form of help) has a negative effect, regardless of whether the individual
also gives help (-1.615 negative coefficient, smaller intensity) or if the individual does not
transfer time (negative and greater intensity, -2.979).
Region of residence has a significant impact on the two subgroups, probably due to the
fact that institutional arrangements and publicly provided care have a different effect
depending on the individual’s type. For both subgroups, the elderly living in the northeast
region of Spain (Basque Country, Navarre, La Rioja and Aragon) report a significantly
higher quality of life than the others. For subgroup 2, the elderly living in the Central or
eastern regions (Castilla-La Mancha, Castilla-Leon, Extremadura, Catalonia, Community
of Valencia and the Balearic Isles) are worse off.
Our model predicts the following distribution of CASP-12 scores across types (Fig. 2).
Once we have jointly estimated the types and the behavioural equation, we would like to
know more about the composition of each of the types for which we have characterized the
determinants of their quality of life. For a more detailed description of the estimated types,
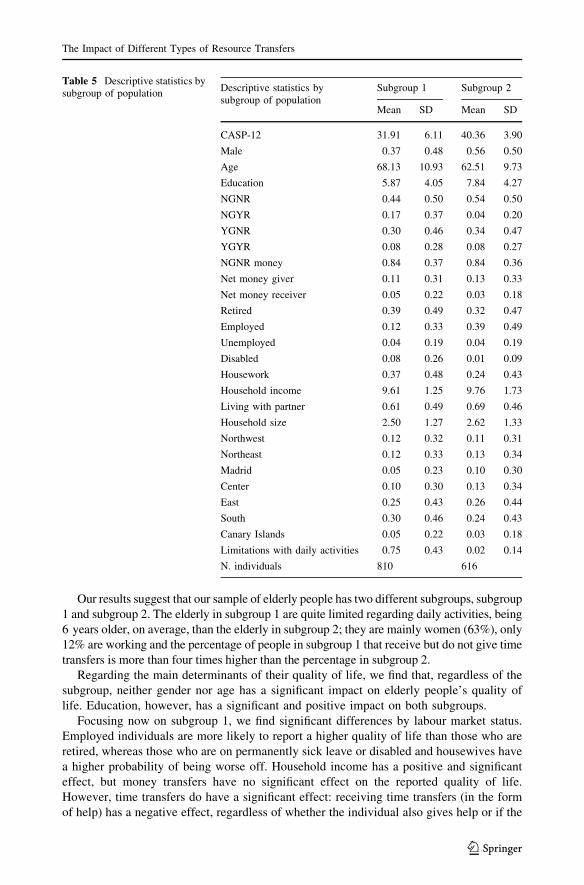
we will discuss the results summarized in Table 5.
According to our results, the population of elderly people has two different subgroups,
subgroup 1 and subgroup 2. The average reported quality of life of subgroup 1 is 31.91,
about 8 points (in a range from 12 to 48) lower than the average reported by subgroup 2
(40.36). This finding is quite consistent with the type of elderly people assigned to each
subgroup.
The Impact of Different Types of Resource Transfers
123

The elderly in subgroup 1 are quite limited for daily activities. 75% of them have some
limitation for performing daily activities, while only 2% of the elderly in subgroup 2 have
such limitations. The elderly in subgroup 1 are 6 years older, on average, than their
counterparts in subgroup 2 (68 years old vs. 62); they are mainly women (63% of them are
women), 25% of them receive time transfers, compared to 12% in subgroup 2. With respect
to labour market status, the main difference is that 39% of the elderly in subgroup 2 are
working, while in subgroup 1 this figure drops to 12%. The percentage of people in
subgroup 1 that receives time transfers but do not give is more than four times higher than
the percentage in subgroup 2.
Our results suggest that the main variable for classifying people into subgroup 1 and
subgroup 2 is the one that describes their limited performance of daily activities.
6 Overall Conclusions
This paper has analyzed the effect of different transfer regimes on the quality of life of the
Spanish subsample of those 50? contained in the first wave of the SHARE study. We have
characterized an individual in terms of the situation of interdependence from other gen-
erations of the same family. Accordingly, we have provided a classification in four cate-
gories regarding time transfers (helps to and from family members outside the household)
and three for money transfers. We use a functional indicator of quality of life, CASP-12,
and we propose two alternative estimation methods: the first one is the traditional ordered
approach and the second one allows for high unobserved heterogeneity and seeks to
capture the underlying behaviour of a finite number of different subpopulations.
0.0
5.1
.15
.2
Den
sity
20 25 30 35 40 45 50
Subgroup 1
0.0
5.1
.15
.2
Den
sity
20 25 30 35 40 45 50
Subgroup 2
Predicted CASP12 distribution by subgroup
Fig. 2 CASP-12 predicted distribution by subgroup of population
V. Ateca-Amestoy, A. Ugidos
123
Our results suggest that our sample of elderly people has two different subgroups, subgroup
1 and subgroup 2. The elderly in subgroup 1 are quite limited regarding daily activities, being
6 years older, on average, than the elderly in subgroup 2; they are mainly women (63%), only
12% are working and the percentage of people in subgroup 1 that receive but do not give time
transfers is more than four times higher than the percentage in subgroup 2.
Regarding the main determinants of their quality of life, we find that, regardless of the
subgroup, neither gender nor age has a significant impact on elderly people’s quality of
life. Education, however, has a significant and positive impact on both subgroups.
Focusing now on subgroup 1, we find significant differences by labour market status.
Employed individuals are more likely to report a higher quality of life than those who are
retired, whereas those who are on permanently sick leave or disabled and housewives have
a higher probability of being worse off. Household income has a positive and significant
effect, but money transfers have no significant effect on the reported quality of life.
However, time transfers do have a significant effect: receiving time transfers (in the form
of help) has a negative effect, regardless of whether the individual also gives help or if the
Table 5 Descriptive statistics bysubgroup of population
Descriptive statistics bysubgroup of population
Subgroup 1 Subgroup 2
Mean SD Mean SD
CASP-12 31.91 6.11 40.36 3.90
Male 0.37 0.48 0.56 0.50
Age 68.13 10.93 62.51 9.73
Education 5.87 4.05 7.84 4.27
NGNR 0.44 0.50 0.54 0.50
NGYR 0.17 0.37 0.04 0.20
YGNR 0.30 0.46 0.34 0.47
YGYR 0.08 0.28 0.08 0.27
NGNR money 0.84 0.37 0.84 0.36
Net money giver 0.11 0.31 0.13 0.33
Net money receiver 0.05 0.22 0.03 0.18
Retired 0.39 0.49 0.32 0.47
Employed 0.12 0.33 0.39 0.49
Unemployed 0.04 0.19 0.04 0.19
Disabled 0.08 0.26 0.01 0.09
Housework 0.37 0.48 0.24 0.43
Household income 9.61 1.25 9.76 1.73
Living with partner 0.61 0.49 0.69 0.46
Household size 2.50 1.27 2.62 1.33
Northwest 0.12 0.32 0.11 0.31
Northeast 0.12 0.33 0.13 0.34
Madrid 0.05 0.23 0.10 0.30
Center 0.10 0.30 0.13 0.34
East 0.25 0.43 0.26 0.44
South 0.30 0.46 0.24 0.43
Canary Islands 0.05 0.22 0.03 0.18
Limitations with daily activities 0.75 0.43 0.02 0.14
N. individuals 810 616
The Impact of Different Types of Resource Transfers
123

individual does not transfer time. When unobserved heterogeneity is controlled for we do
not find evidence of reciprocity being an important determinant of quality of life. We find
significant differences by region of residence. Those living in the northeast (Basque
country, Navarre, La Rioja and Aragon) and Madrid report a significantly better quality of
life than those living in the south (Andalusia, Murcia, Ceuta and Melilla).
The determinants of the quality of life of the elderly in subgroup 2 are education, living with a
partner and the region of residence. Education and living with a partner have a significant and
positive effect on the quality of life of this subgroup. Neither time transfers nor money transfers
has a significant effect. Region of residence is also important, but those subgroups living in the
eastern and central regions (Catalonia, Community of Valencia, Balearic Isles, Castilla y Leon,
Castilla-La Mancha and Extremadura) record a lower quality of life than those living in the
south. It is likely that institutional arrangements and publicly provided care have a different
effect depending on the individual’s type.
We find that both age and sex have a non-statistically effect on the probability of
belonging to either subgroup 1 or subgroup 2. The main variable for classifying people into
subgroup 1 or subgroup 2 is the one that describes their limitations regarding daily
activities. This finding may suggest that policies designed to improve the quality of life of
individuals over the age of 50 should not be based on age but on the existence or otherwise
limitations in the performance of daily activities. Our results show that labour market
status and income affect primarily the reported quality of life of subgroup 1. Living with a
partner, however, only affects the quality of life of subgroup 2, and does so positively.
Education increases quality of life in both subgroups. Time transfers have a negative effect
on quality of life only for the first subgroup.
We can draw two main implications from our work. The first one is a methodological
one; it concerns with the suitability of the FMMs when unobserved heterogeneity is a
relevant factor to be considered to characterize the behaviour of a population. FMM
models have been applied to analyze life satisfaction in a group of different countries (such
as the ECHP in Clark et al. 2005). In our paper we study just one country and the source of
heterogeneity is mainly unobserved. We argue that our population (Spaniards 50?) is
formed by different subpopulations and that the effect that time and money transfers have
on their well-being is different, depending on the types. Our results back up that FMM
models are also suitable when considering a group of population which members differ in
both observed and unobserved characteristics, as it is the case of our elderly Spanish
population.
The second implication concerns with the main variable to be considered when
designing target groups by policy makers, in order to promote the quality of life of the
elderly in Spain. The results of the estimated model show that limitations performing daily
activities turn to be the variable that better separates the elderly population in Spain into
two homogeneous subgroups of people. More specifically, it determines different effects of
the explanatory variables in the determination of good quality of life, as measured by the
CASP-12 index. Thus, the existence of a limiting condition could be a good candidate
when choosing a variable to determine eligibility criteria to receive special public
attention.
Acknowledgments We would like to acknowledge the invaluable research assistance of Clara Velasquezand the financial support of Spain’s Ministry of Work and social Affairs (IMSERSO) and Ministry ofScience and Technology ‘‘ECO2009-10818’’, and the Basque Government ‘‘IT241-07’’. Arantza Ugidosalso wants to thank the members of the Labotatoire d’Economie d’Orleans for their comments and theirhospitality during her stay. All errors are solely ours. This paper uses data from SHARE, Wave 1, Release2.3.1.
V. Ateca-Amestoy, A. Ugidos
123

Appendix 1
CASP-12 is a measurement of how well people function. In this measurement, quality of
life refers to four conceptual domains of individual needs that are particularly relevant in
early old age: control (C), autonomy (A), self realization (S), and pleasure (P). Items
measuring the four respective domains (three items per domain) assess the degree to which
these aspects are perceived as being satisfied on a four-point Likert scale. Therefore the
total value of the CASP-12 indicator can take 37 different values ranging from 12 to 48.
The first letter of each domain and its 12 items create the acronym. The wording in the
questionnaire is in Fig. 3.
Appendix 2
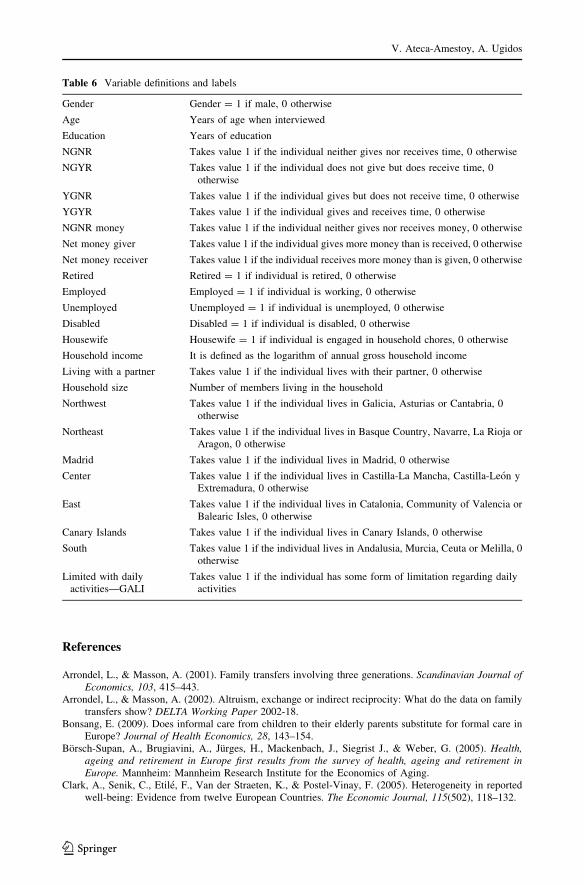
The variables we use are defined in Table 6.
Fig. 3 CASP-12 measurement
The Impact of Different Types of Resource Transfers
123
References
Arrondel, L., & Masson, A. (2001). Family transfers involving three generations. Scandinavian Journal ofEconomics, 103, 415–443.
Arrondel, L., & Masson, A. (2002). Altruism, exchange or indirect reciprocity: What do the data on familytransfers show? DELTA Working Paper 2002-18.
Bonsang, E. (2009). Does informal care from children to their elderly parents substitute for formal care inEurope? Journal of Health Economics, 28, 143–154.
Borsch-Supan, A., Brugiavini, A., Jurges, H., Mackenbach, J., Siegrist J., & Weber, G. (2005). Health,ageing and retirement in Europe first results from the survey of health, ageing and retirement inEurope. Mannheim: Mannheim Research Institute for the Economics of Aging.
Clark, A., Senik, C., Etile, F., Van der Straeten, K., & Postel-Vinay, F. (2005). Heterogeneity in reportedwell-being: Evidence from twelve European Countries. The Economic Journal, 115(502), 118–132.
Table 6 Variable definitions and labels
Gender Gender = 1 if male, 0 otherwise
Age Years of age when interviewed
Education Years of education
NGNR Takes value 1 if the individual neither gives nor receives time, 0 otherwise
NGYR Takes value 1 if the individual does not give but does receive time, 0otherwise
YGNR Takes value 1 if the individual gives but does not receive time, 0 otherwise
YGYR Takes value 1 if the individual gives and receives time, 0 otherwise
NGNR money Takes value 1 if the individual neither gives nor receives money, 0 otherwise
Net money giver Takes value 1 if the individual gives more money than is received, 0 otherwise
Net money receiver Takes value 1 if the individual receives more money than is given, 0 otherwise
Retired Retired = 1 if individual is retired, 0 otherwise
Employed Employed = 1 if individual is working, 0 otherwise
Unemployed Unemployed = 1 if individual is unemployed, 0 otherwise
Disabled Disabled = 1 if individual is disabled, 0 otherwise
Housewife Housewife = 1 if individual is engaged in household chores, 0 otherwise
Household income It is defined as the logarithm of annual gross household income
Living with a partner Takes value 1 if the individual lives with their partner, 0 otherwise
Household size Number of members living in the household
Northwest Takes value 1 if the individual lives in Galicia, Asturias or Cantabria, 0otherwise
Northeast Takes value 1 if the individual lives in Basque Country, Navarre, La Rioja orAragon, 0 otherwise
Madrid Takes value 1 if the individual lives in Madrid, 0 otherwise
Center Takes value 1 if the individual lives in Castilla-La Mancha, Castilla-Leon yExtremadura, 0 otherwise
East Takes value 1 if the individual lives in Catalonia, Community of Valencia orBalearic Isles, 0 otherwise
Canary Islands Takes value 1 if the individual lives in Canary Islands, 0 otherwise
South Takes value 1 if the individual lives in Andalusia, Murcia, Ceuta or Melilla, 0otherwise
Limited with dailyactivities—GALI
Takes value 1 if the individual has some form of limitation regarding dailyactivities
V. Ateca-Amestoy, A. Ugidos
123

Conway, K. S., & Deb, P. (2005). Is prenatal care really ineffective? Or, is the ‘‘devil’’ in the distribution?Journal of Health Economics, 24, 489–513.
Crespo, L., & Mira, P. (2008). Caring for parents and employment status of European Mid-life women. In A.Borsch-Supan, A. Brugiavini, H. Jurges, A. Kapteyn, J. Mackenbach, J. Siegrist, & G. Weber (Eds.),Health, ageing and retirement in Europe (2004–2007). Starting the longitudinal dimension. Mann-heim: Mannheim Research Institute for the Economics of Aging (MEA).
Deaton, A. (2007). Income, aging, health and wellbeing around the world: Evidence from the Gallup worldpoll. NBER Working Paper No. 13317.
Ferrer-i-Carbonell, A., & Frijters, P. (2004). How important is methodology for the estimates of thedeterminants of happiness? Economic Journal, 114, 641–659.
Gwozdz, W., & Sousa-Poza, A. (2009). Ageing, health and life satisfaction of the oldest old: An analysis forGermany. IZA DP No 4053.
Huppert, F. A., Marks, N., Clark, A., Siegrist, J., Stutzer, A., Vitterso, J., et al. (2009). Measuring well-beingacross Europe: Description of the ESS well-being module and preliminary findings. Social IndicatorsResearch, 91, 301–315.
James, G. S. (1954). Test of linear hypothesis in univariate and multivariate analysis when the ratios of thepopulation variance are unknown. Biometrika, 41, 19–43.
Katz, R. (2009). Intergenerational family relations and subjective well-being in old age: A cross-nationalstudy. European Journal of Ageing, 6(2), 79–90.
Laferrere, A., & Wolf, F. C. (2006). Microeconomic models of family transfers. In S. C. Kolm & J. Mercier-Ytier (Eds.), Handbook on the economics on giving, reciprocity and altruism (Vol. 2, pp. 889–969).North-Holland.
Nevuteli, G., Wiggins, R. D., Hildon, Z., Montgomey, S. M., & Blane, D. (2006). Quality of life at olderages evidence from the English longitudinal study of aging (Wave 1). Journal of Epidemiology andCommunity Health, 60, 357–363.
Sirven, N., & Debrand, T. (2008). Social participation and healthy ageing: An international comparisonusing SHARE date. Social Science and Medicine, 67, 2017–2026.
Von dem Knesebeck, O., Wahrendorf, M., Hyde, M., & Siegrist, J. (2007). Socio-economic position andquality of life among older people in 10 European countries: Results of the SHARE study. Ageing &Society, 27, 269–284.
Wahrendorf, M., Von dem Knesebeck, O., & Siegrist, J. (2006). Social productivity and well-being of olderpeople: Baseline results from the SHARE study. European Journal of Ageing, 3, 67–73.
Walter, A. (2005). A European perspective on quality of life in old age. European Journal of Ageing, 2,2–12.
Wiggis, R. D., Higgs, P. F. D., Hyde, M., & Blane, D. B. (2004). Quality of life in the third age: Keypredictors of the CASP-19 measure. Aging & Society, 24, 693–708.
Wiggis, R. D., Netuveli, G., Hyde, M., Higgs, P., & Blane, D. B. (2008). The evaluation of a self-enumerated scale of quality of life (CASP-19) in the context of research on ageing: A combination ofexploratory and confirmatory approaches. Social Indicators Research, 89, 61–77.
The Impact of Different Types of Resource Transfers
123