The Home Environments of Children in the United States Part II: Relations with Behavioral...
24
Child Development, November/December 2001, Volume 72, Number 6, Pages 1844–1867 The Home Environments of Children in the United States Part I: Variations by Age, Ethnicity, and Poverty Status Robert H. Bradley, Robert F. Corwyn, Harriette Pipes McAdoo, and Cynthia García Coll Although measures of the home environment have gained wide acceptance in the child development litera- ture, what constitutes the “average” or “typical” home environment in the United States, and how this differs across ethnic groups and poverty status is not known. Item-level data from the National Longitudinal Survey of Youth on four age-related versions of the Home Observation for Measurement of the Environment–Short Form (HOME-SF) from five biennial assessments (1986–1994) were analyzed for the total sample and for four major ethnic groups: European Americans, Asian Americans, African Americans, and Hispanic Americans. The percentages of homes receiving credit on each item of all four versions of the HOME-SF are described. For the majority of items at all four age levels differences between poor and nonpoor families were noted. Differ- ences were also obtained among African American, European American, and Hispanic American families, but the magnitude of the effect for poverty status was greater than for ethnicity, and usually absorbed most of the ethnic group effects on HOME-SF items. For every item at every age, the effects of poverty were proportional across European American, African American, and Hispanic American groups. INTRODUCTION Over the past 4 decades, the home environment has be- come a central focus of inquiry in human develop- ment. Debates have arisen concerning the extent to which children affect their environments (Bell & Chap- man, 1986; Scarr & McCartney, 1983), whether experi- ences during any particular period of development (mostly earlier experiences) have a lasting effect on developmental course (Clarke & Clarke, 1976; Lewis, 1997), and whether the observed correlation between measures of the environment and measures of chil- dren’s development solely represent environmental effects or are partially mediated by genetic factors (Plomin & Bergeman, 1991). Despite these debates, there is near-universal agreement on the value of un- derstanding the dynamic interplay between child and environment (Ford & Lerner, 1992; Magnusson, 1995; Wachs, 1992, 2000). Accordingly, there continues to be interest in constructing and using measures of the home environment for both research and applied pur- poses in human development. It has, indeed, become commonplace to include measures of the home envi- ronment as part of large-scale surveys (e.g., the Panel Study of Income Dynamics, the National Longitudinal Survey of Youth [NLSY], the National Household Ed- ucation Survey, the Early Childhood Longitudinal Study), multisite naturalistic investigations (e.g., the National Institute of Child Health and Human Devel- opment Study of Early Child Care), and multisite inter- vention studies (e.g., evaluations of Early Head Start, the Job Opportunities and Basic Skills program, and the Infant Health and Development Program). Despite the widespread use of both broad- and narrow-gauge home environment measures, relatively little is known about how often children actually en- counter the kinds of experiences reflected in such mea- sures, be they particular caregiver behaviors, objects, or events. The information available (especially for members of minority groups) has typically been ob- tained from relatively small convenience samples at single geographic locations. As a result, researchers, policy makers, parents, and professionals who are in- terested in children’s well-being lack the kind of de- tailed framework needed to maximally interpret in- formation about children and their environments. Knowing what is common—or not so common—in children’s experience can provide useful contextual information for research on the relation between en- vironment and development. It can also aid in under- standing the impact of interventions. For example, suppose a person is interested in whether early liter- acy experiences are related to reading comprehension in the third grade. If there is evidence that the vast majority of 4- and 5-year-old children have at least 50 books in the home and also have parents who read to them at least three times a week, then an interpreta- tion of a modest correlation between these kinds of experiences and third-grade reading performance may be different than if the average number of books in the home is less than 15 and fewer than 30% of par- ents read to their children even once a week. Indeed, researchers’ approach to further study of the issue of early literacy experiences may be quite different under © 2001 by the Society for Research in Child Development, Inc. All rights reserved. 0009-3920/2001/7206-0015
-
Upload
independent -
Category
Documents
-
view
1 -
download
0
Transcript of The Home Environments of Children in the United States Part II: Relations with Behavioral...

Child Development, November/December 2001, Volume 72, Number 6, Pages 1844–1867
The Home Environments of Children in the United StatesPart I: Variations by Age, Ethnicity, and Poverty Status
Robert H. Bradley, Robert F. Corwyn, Harriette Pipes McAdoo, and Cynthia García Coll
Although measures of the home environment have gained wide acceptance in the child development litera-ture, what constitutes the “average” or “typical” home environment in the United States, and how this differsacross ethnic groups and poverty status is not known. Item-level data from the National Longitudinal Surveyof Youth on four age-related versions of the Home Observation for Measurement of the Environment–ShortForm (HOME-SF) from five biennial assessments (1986–1994) were analyzed for the total sample and for fourmajor ethnic groups: European Americans, Asian Americans, African Americans, and Hispanic Americans.The percentages of homes receiving credit on each item of all four versions of the HOME-SF are described. Forthe majority of items at all four age levels differences between poor and nonpoor families were noted. Differ-ences were also obtained among African American, European American, and Hispanic American families, butthe magnitude of the effect for poverty status was greater than for ethnicity, and usually absorbed most of theethnic group effects on HOME-SF items. For every item at every age, the effects of poverty were proportionalacross European American, African American, and Hispanic American groups.
INTRODUCTION
Over the past 4 decades, the home environment has be-come a central focus of inquiry in human develop-ment. Debates have arisen concerning the extent towhich children affect their environments (Bell & Chap-man, 1986; Scarr & McCartney, 1983), whether experi-ences during any particular period of development(mostly earlier experiences) have a lasting effect ondevelopmental course (Clarke & Clarke, 1976; Lewis,1997), and whether the observed correlation betweenmeasures of the environment and measures of chil-dren’s development solely represent environmentaleffects or are partially mediated by genetic factors(Plomin & Bergeman, 1991). Despite these debates,there is near-universal agreement on the value of un-derstanding the dynamic interplay between child andenvironment (Ford & Lerner, 1992; Magnusson, 1995;Wachs, 1992, 2000). Accordingly, there continues to beinterest in constructing and using measures of thehome environment for both research and applied pur-poses in human development. It has, indeed, becomecommonplace to include measures of the home envi-ronment as part of large-scale surveys (e.g., the PanelStudy of Income Dynamics, the National LongitudinalSurvey of Youth [NLSY], the National Household Ed-ucation Survey, the Early Childhood LongitudinalStudy), multisite naturalistic investigations (e.g., theNational Institute of Child Health and Human Devel-opment Study of Early Child Care), and multisite inter-vention studies (e.g., evaluations of Early Head Start,the Job Opportunities and Basic Skills program, and theInfant Health and Development Program).
Despite the widespread use of both broad- and
narrow-gauge home environment measures, relativelylittle is known about how often children actually en-counter the kinds of experiences reflected in such mea-sures, be they particular caregiver behaviors, objects,or events. The information available (especially formembers of minority groups) has typically been ob-tained from relatively small convenience samples atsingle geographic locations. As a result, researchers,policy makers, parents, and professionals who are in-terested in children’s well-being lack the kind of de-tailed framework needed to maximally interpret in-formation about children and their environments.Knowing what is common—or not so common—inchildren’s experience can provide useful contextualinformation for research on the relation between en-vironment and development. It can also aid in under-standing the impact of interventions. For example,suppose a person is interested in whether early liter-acy experiences are related to reading comprehensionin the third grade. If there is evidence that the vastmajority of 4- and 5-year-old children have at least 50books in the home and also have parents who read tothem at least three times a week, then an interpreta-tion of a modest correlation between these kinds ofexperiences and third-grade reading performancemay be different than if the average number of booksin the home is less than 15 and fewer than 30% of par-ents read to their children even once a week. Indeed,researchers’ approach to further study of the issue ofearly literacy experiences may be quite different under
© 2001 by the Society for Research in Child Development, Inc.All rights reserved. 0009-3920/2001/7206-0015

Bradley et al. 1845
the two scenarios. If the prevalence of a large numberof books in the home is high (and likewise, the preva-lence of parents reading to their children is multipletimes a week), then the strategy may be to focus onfiner-grained nuances of literacy experiences, such aswhether parents actually spend time teaching theirchildren sound–symbol associations and letter recog-nition. If the prevalence is low, then the strategy maybe to look at other relatively gross indicators of homeliteracy experience (e.g., the amount of TV watched) oreven literacy experiences that occur outside the home(e. g., whether the child has attended preschool). Like-wise, under the two scenarios, approaches to early in-tervention with children who are at increased risk forreading failure may be different. Under the first sce-nario, the approach may be on activities aimed at im-proving specific reading skills. Under the second sce-nario, the approach may be more on simple exposureto printed materials. The purpose here is not to dis-cuss the merits of particular approaches to develop-ing reading competence or doing research on literacy,but to illustrate why detailed knowledge of children’sexperiences is valuable for framing the issues. More-over, if, as Magnusson (1995) argues, the total processof environment–development relations cannot be un-derstood by studying one aspect after another in iso-lation from other simultaneously operating elements,it will be useful to know the general frequency withwhich the full array of elements tends to occur. For ex-ample, when it comes to fourth-grade achievement inlanguage arts, parents’ reading to 3- and 4-year-oldsmay be less potent—or, alternatively, more salient—inthe absence of enriching out-of-home experiences thanin the presence of such experiences.
Knowing more about how frequently children en-counter certain experiences is particularly important inmaking comparisons. García Coll and colleagues (Gar-cía Coll et al., 1996; García Coll & Magnusson, 1999)have offered a compelling argument about the dangersof making group comparisons in the absence of aframework that links those differences to macro-levelsocial, political, and economic factors. Observed groupdifferences in patterns of correlations between mea-sures of the environment and measures of developmentmay reflect the fact that in one group certain experi-ences occur much more frequently than is the case forthe second group. In effect, group differences in pat-terns of correlations may not reflect different underly-ing environmental processes at work, but rather the factthat in one group, particular processes rarely have achance to operate (i.e., too few children actually havethe experience and/or children are simultaneously ex-periencing inhibitory processes within the home or inthe broader social environment). Group differences
could also reflect the fact that nearly everyone in a par-ticular group has the experience (i.e., there is little vari-ance, and the process transpires for almost everyone).
Having information on how frequently children indifferent groups (ethnic, social class) encounter particu-lar actions, objects, and events can be especially helpfulin mapping the relations between various dimensionsof the environment and developmental processes acrossgroups. Granting the complexity of environment–development relations (Bronfenbrenner, 1995; Wachs,1992, 2000), most ecological–developmental theoriesstipulate the same basic relation between particular di-mensions of the environment and the course of devel-opment for all groups (good examples include parentalresponsiveness and exposure to a variety of learningmaterials; see, e.g., Bornstein, 1989; Ford & Lerner, 1992;Kagan, 1984). Nonetheless, clarifying the relations oftenrequires examining the details with which certain pro-cesses are enacted, including their frequency of occur-rence, within each group (Bornstein et al., 1992).
The majority of studies that have examined partic-ular dimensions of the home environment have notfocused on individual indicators of those dimensionsas part of the analysis. Rather the analyses have beenperformed on summary-type scores. Accordingly,very little is known about the prevalence of each indi-cator within most groups, and even less is knownabout group differences with respect to particular in-dicators of environmental dimensions. If such indica-tors represent the actual processes presumed to affectdevelopment, then more needs to be known about thefrequency of occurrence of particular indicators in or-der to advance understanding about environmental“effects.” According to Hui and Triandis (1985, p. 136),“the continuum of universality-cultural difference of aconstruct closely parallels the construct’s level of ab-straction.” In other words, item-level analysis tends tobe more precise in detecting group differences. For ex-ample, a review of uses of the Home Observation forMeasurement of the Environment (HOME) Invento-ries (Caldwell & Bradley, 1984) outside the United Statesproduced evidence of several items that did not seemappropriate in certain cultures (Bradley, Corwyn,& Whiteside-Mansell, 1997): “parent introduces inter-viewer to child,” and “child has free access to musicalinstrument” were considered inappropriate for Carib-bean households (Durbrow, Jones, Bozoky, & Adam,1996), and African and Asian researchers questioned thevalidity of items used to assess socioemotional supportbecause these cultures have characteristically differentparenting styles (Aina, Agiobu-Kemmer, Etta, Zeitlin, &Setiloane, 1993; Nihira, Tomiyasu, & Oshio, 1987).
The value of having detailed information aboutparticular indicators in specific groups becomes even

1846 Child Development
clearer when considering both the type and numberof indicators that compose most measures of thehome environment. To be more specific, home en-vironment measures generally contain cause—noteffect—indicators; that is, the indicators of particularenvironmental dimensions are selected not becausethey are assumed to reflect some specific underlyingcause, but because they are presumed to produce a par-ticular effect (for a discussion of this distinction, seeBollen & Lennox, 1991). Accordingly, since all the in-dicators of a particular environmental dimension—unlike trait characteristics in humans—are not pre-sumed to derive from a single, underlying commoncause, it is not appropriate to assume that they are essen-tially fungible. Whereas a relatively small number of in-dicators of a human trait may well be sufficient to repre-sent the trait because all the indicators are presumed toderive from that trait, it is critical that environmentalmeasures include a broad enough census of indicatorsof each dimension to assure adequate representation ofthe dimension (i.e., the actions, objects, or events thatcompose a dimension may emanate from a variety ofdifferent sources or for a variety of different reasons).
The purpose of the present study was twofold: (1) toprovide detailed information on the frequency withwhich children in the United States experience thekinds of actions, objects, and events that are found incommonly used measures of the home environment(Part 1); and (2) to examine the relation between fre-quently studied dimensions of the environment andseveral aspects of children’s well-being for differentethnic and income groups from infancy through ado-lescence (Part 2; Bradley, Corwyn, Burchinal, McAdoo,& García Coll, 2001). In both parts, Ethnic Group
�
Poverty Status analyses were conducted, becausein each ecological niche there are characteristicways of adapting to the demands of the environment,a unique set of affordances, and traditional ap-proaches to accomplishing the goals of childrearing(Harkness & Super, 1995; Masten, 1999). Thus, there isstrong reason to believe that what children experi-ence in their homes will vary across ecological niches.The research on economic status indicates that eco-nomic hardship (poverty) means less access to certainmaterial goods and services, less access to potentiallyenhancing experiences, and greater exposure topotentially debilitating substances and experiences(Bradley & Whiteside-Mansell, 1997; Duncan & Brooks-Gunn, 1997; Huston, McLoyd, & García Coll, 1994).The difference in what poor children versus nonpoorchildren experience in their home environments isboth a direct function of not having enough moneyto access goods and services and an indirect functionof where children live and how their parents cope
with the stress connected with economic hardship(Luster & McAdoo, 1996; McLoyd, 1990). Ethnicityalso provides a frame for what children experienceat home. Childrearing goals and socialization prac-tices also vary from culture to culture (García Coll,1995; Greenfield, 1994; Hui & Triandis, 1985; Parke &Buriel, 1997). Ethnicity shapes what parents do, whatchildren have, how children and adults spend theirtime, and the types of exchanges between familymembers. For even basic caregiving activities, suchas soothing a baby, there are characteristic differ-ences in the strategies used in different ethnicgroups (Bornstein et al., 1992; McAdoo, 1997). For mi-nority cultures living within a dominant majority cul-ture, the childrearing goals and socialization practicescan become even more complicated, particularly ifthe minority culture is subjected to discrimination(McLoyd, 1999). As Greenfield (1994, p. 25) argues,“Culture not only is context; it has context as well.”For every culture, there is a cultural frame of refer-ence that “refers to the correct or ideal way to behavewithin the culture” (Ogbu, 1994, p. 375). These idealsguide parenting practices. For example, Boykin andToms (1985) specified that for African Americans, fam-ilies must teach their children to deal with three differ-ent realms of experience: mainstream American, Afri-can American cultural heritage, and the oppressedexperience of people of color. García Coll and col-leagues (García Coll, Meyer, & Britten, 1995) identifiedissues of acculturation and racial socialization as majorinfluences on parenting practices. These processes maycontribute to individual differences among membersof any particular ethnic group, as well as to differ-ences across ethnic groups.
Our primary purpose in Part 1 of this study was todescribe what occurs in the home environments ofchildren in the United States with regard to the typesof indicators found in widely used home environ-ment measures. The relative effects of ethnicity andpoverty status on children’s home environments werealso investigated. To accomplish this, we used datafrom the NLSY. Although families in the NLSY werenot fully representative of the current U.S. population(U.S. Department of Commerce, 2001), the familiesmore closely approximated the U.S. population thanwas the case for most other studies. The originalNLSY sample included 6,283 women who were be-tween the ages of 14 and 21 in 1979. The sample wasselected to be nationally representative; however, therewas deliberate oversampling of African Americans,Hispanic Americans, and poor European Americans toallow separate analyses of these three major culturalsubgroups. Data from this sample has been collectedevery year. Beginning in 1986, the NLSY also included

Bradley et al. 1847
a child supplement, which contained information bothabout the children and their environments.
One advantage of the NLSY is that it includes ashort form of the HOME Inventory (HOME-SF) aspart of the child supplement. The HOME is one ofthe most widely used of the broad-scale measures of thehome environment (Caldwell & Bradley, 1984). Thereare four versions of HOME: the Infant–Toddler HOME(IT-HOME) for children under age 3, the Early Child-hood HOME (EC-HOME) for children ages 3 to 5, theMiddle-Childhood HOME (MC-HOME) for children6 to 9, and the Early Adolescent HOME (EA-HOME)for children 10 to 14. Each version of the HOME hasundergone a rather extensive norming and standard-ization process and has acquired considerable valida-tion as applied in a wide array of studies throughoutthe world (for reviews, see Bradley, 1994; Bradley,Corwyn, & Whiteside-Mansell, 1996). In general, theHOME inventories have shown patterns of relationswith developmental, parental, and other environmen-tal measures that are in line with theoretical expecta-tions. For example, the inventories have consistentlyshown moderate associations with family demo-graphic characteristics and with social and cognitivedevelopment in children. Research also indicates thatthe HOME is related to theoretically relevant parentalcharacteristics like IQ, depression, and drug use, as wellas children’s health status (Bradley, 1994). Importantly,for our purposes, items on the HOME-SF are typical ofthe kinds of home environment indicators used in de-velopmental research and program evaluation.
In sum, we hoped to reveal the “lay of the land”with regard to the kinds of indicators found in com-monly used measures of the home environment, tocreate a kind of topography of children’s experiencesconnected to their home life. Although our basic pur-pose was to describe children’s experience within eachgroup, we examined the size of the difference in per-formance on each HOME-SF among ethnic groups toprovide an additional perspective on within-groupfindings. These comparative analyses were limited tothree of the four major ethnic groups because therewas insufficient information on Asian Americans toallow for meaningful comparisons. Likewise, we ex-amined the size of the difference in performance oneach item for families living in poverty and familiesliving above the poverty line. It is well documentedthat persistent poverty and its co-factors induce stress,and that stress decreases the likelihood that parentswill provide responsive and stimulating care (Bradley& Whiteside-Mansell, 1997; Conger, Conger, & Elder,1997; Luster & McAdoo, 1996; McLoyd, 1990; Slaughter,1988). It is also well documented that poverty is con-founded with minority status (Huston, McLoyd, &
García Coll, 1994), that not all the relation betweeneconomic status and children’s development is medi-ated through what parents do (Duncan & Brooks-Gunn, 1997; García Coll et al., 1996), and that relationsbetween measures of the home environment and chil-dren’s development vary as a function of socioeco-nomic status (Bradley et al., 1989). For example, fam-ily economic conditions determine the disciplinarypractices of parents (Kelley, Power, & Wimbush, 1992;McLoyd, 1990): Spanking is one approach to disciplinethat has been cited as being more prevalent in poorand ethnic minority families in the United States (Day,Peterson, & McCracken, 1998; Giles-Sims, Straus, &Sugarman, 1995). Economic factors however, explainonly a small percentage of the variance in spankingbehaviors (Erlanger, 1974; Giles-Sims et al., 1995;Portes, Dunham, & Williams, 1986). The collective in-fluence of these variations in discipline techniqueshas not been studied extensively.
METHODS
Sample
Data for this study came from five biennial NLSYchild data files from 1986–1994 (see Center for HumanResource Research [CHRR], 1995, 1997b). The sampleconsisted of those women from the 6,283 originallyrecruited as part of the NLSY who had at least onechild born prior to the 1994 biennial assessment. Be-ginning with the 1990 survey, however, data were nolonger collected from most of the women (
N
�
456)who were either in the military or part of the over-sampling of “poor” European Americans (
N
�
901).This left 4,944 of the original sample eligible to be in-terviewed in 1994. Ninety-one percent of those eligi-ble were interviewed, and about 77% (3,464) weremothers. These women had 7,089 children in 1994, ofwhich 6,109 were younger than 15 years of age and,therefore, eligible to receive HOME-SF assessments.Over 93% of eligible children (5,715) received HOME-SFscores in 1994. The number of children assessed inprior years was 4,971 in 1986, 6,266 in 1988, 5,803in 1990, and 6,509 in 1992. The 29,264 child assessments,less those with missing values and questionable eth-nic group membership, were analyzed in the presentstudy. Because ethnicity was a key variable in thisstudy, cross-tabulated validations of agreement be-tween respondent’s self-reported ethnicity and the in-terviewer’s assessment of ethnicity were conductedfor all five assessment periods. Cases with a discrep-ancy between the interviewer’s and respondent’s clas-sification of ethnicity were dropped from the study.Three dummy variables were created for ethnic group

1848 Child Development
comparisons: Hispanic Americans versus other, Euro-pean Americans versus other, and African Americansversus other. It should be noted, however, that theHispanic sample is somewhat diverse. Although themajority of NLSY Hispanic women were either Mexi-can Americans (40.1%) or Mexicans (20.9%), a signifi-cant percentage identified themselves as having PuertoRican (17.9%), Cuban (6.4%), other Hispanic (6.5%), andother Spanish (5.2%) origins. Those who were classifiedas Native Americans were left in the sample for analyticpurposes (e.g., European American versus other), butthe total number of Native Americans was too small topermit treating them as a unique ethnic group.
Table 1 displays a demographic breakdown of thesamples analyzed for each of the four age periods. Be-cause of the structure of the sampling process, the in-formation on older children was somewhat less re-presentative than was the information on youngerchildren. That is, the original NLSY cohort of womenwas between 29 and 36 years of age in 1994, most oftheir children had been born, but proportionallyfewer had reached the maximum age of children be-
ing investigated in the NLSY. Because age of motherat the birth of her first child is known to be associatedwith other demographic characteristics of the mother,the sample for older children was likely to be less re-presentative than the sample for younger children.Indeed, Table 1 indicates that children in the older agegroups were more likely to have younger motherswith less education, and were less likely to be livingwith their fathers.
Approach to Data Analysis
For a study that follows a single cohort longitudi-nally, such as the NLSY, data can be analyzed in twobasic ways: (1) the data collected during each waveof data collection can be analyzed separately (i.e., asa cross-section from a particular year, such as 1988);or (2) data can be combined across waves of data col-lection, and analysis done on the combined data set.We chose the latter strategy because it takes fuller ad-vantage of the original sampling in that it more fullyand faithfully represents the lives of children born to
Table 1 Percent of Participants within Various Demographic Categories by Ethnicity and HOME Inventory
European American African American
0–2 Years 3–5 Years 6–9 Years 10–14 Years 0–2 Years 3–5 Years 6–9 Years 10–14 Years
Mother’s education1–11 years 14.5 19.1 24.4 29.2 24.5 26.0 31.5 33.912–15 years 62.8 65.8 67.0 66.3 67.1 66.7 63.7 62.416 or more years 22.7 15.0 8.6 4.4 8.4 7.3 4.7 3.6
Father present 89.0 79.7 65.8 57.6 48.1 39.9 28.4 21.7
Age of mother at birth15–24 years 44.0 95.7 99.1 86.7 56.1 95.8 96.2 91.325–34 years 53.1 4.3 .9 13.3 41.6 4.2 3.8 8.735–44 years 2.9 — — — 2.2 — — —
Income below poverty 14.0 17.1 18.0 18.1 48.0 47.2 49.5 50.7
Hispanic American Asian American
0–2 Years 3–5 Years 6–9 Years 10–14 Years 0–2 Years 3–5 Years 6–9 Years 10–14 Years
Mother’s education1–11 years 38.2 40.9 48.7 54.0 15.2 16.3 35.9 53.312–15 years 55.4 54.2 47.7 43.1 65.2 74.4 59.8 46.716 or more years 6.4 4.9 3.6 2.8 19.6 9.3 4.3 —
Father present 79.3 70.4 56.1 48.1 92.3 83.7 70.7 63.3
Age of mother at birth15–24 years 52.6 96.6 99.2 91.3 38.9 100.0
a
100.0
a
85.7
a
25–34 years 43.7 3.0 .8 8.7 55.6 — — 14.335–44 years 3.8 .3 — — 5.6 — — —
Income below poverty 35.2 33.4 35.4 33.8 11.9 17.1 8.4 11.5
Note:
HOME
�
Home Observation for Measurement of the Environment.
a
10 or fewer cases with nonmissing values.

Bradley et al. 1849
the original cohort than would a cross-sectional anal-ysis done from any particular wave of the data. To bemore specific, to the extent that the original cohort offemale participants in the NLSY is representative,then their children will also be representative, butonly if all the children born to these women are in-cluded. Such a sample should include firstborns, sec-ondborns, thirdborns, and so on in proportion totheir representation in the population. Likewise, itshould include singletons, twins, and so on in properproportions; families of various sizes and age distri-butions in proper proportions; and so forth. Theoriginal cohort of women becomes a cohort of fami-lies, a cohort of extended families, and so forth. Allthings that emanate from the cohort will be represent-ative to the same degree as the original cohort, butonly over time after all members of a certain classhave reached whatever criterion age point is thesubject of investigation. In effect, what the NLSYsample can reveal about the home environments of6-year-old children can be most accurately deter-mined only after all the children that will ever be bornto the initial cohort of women have reached age 6.Otherwise, 6-year-olds of women who give birthlater in life, 6-year-olds who have multiple oldersiblings, and so forth will be underrepresented andthe information about the home environments of6-year-olds will be distorted to that degree. The find-ings will also underrepresent any demographicgroup that tends to start having children later in life.In fact, until all the children born to mothers in acohort reach some criterion age, the sample will un-derrepresent families who have larger numbers ofchildren. A secondary advantage of using the com-bined dataset is that it increases the numbers of per-sons available for analysis from small populationsthat are not oversampled (e.g., Asian Americans) and,thus, increases the accuracy of estimates from thesesamples. For example, the first wave of data (1986)consisted of 73 Asian children, only 14 of whom hadscores on the IT-HOME-SF, whereas the combinedfile contained 45 Asian children with scores on thatversion. The combined data also provide a morerepresentative look at the typical American family.It includes, for example, a more complete represen-tation of those women who had a first child late inlife and those who had multiple births. On theother hand, the dataset has shortcomings. It hasbeen estimated that the NLSY data collected through1994 represent only about two thirds of the childbear-ing years for mothers from the original cohort(CHRR, 1997b, p. 3). Thus, the data on older childrenare likely to be somewhat less representative thanare the data on younger children. Moreover, as is
the case with any cohort, the findings are represent-ative only of the period in history during which thedata were collected.
Measures
HOME-SF.
Experienced, specially trained interview-ers assessed the quality of the home environments ofchildren born to mothers participating in the NLSY.The home environment was measured using theHOME-SF. Like the original, full-length versions of theHOME (Caldwell & Bradley, 1984), the short form is acombination of observer ratings and mother’s reporton aspects of the environment. Unlike the HOME,however, which focuses on the child as a recipient ofobjects, events, and actions in the environment, twoitems in the HOME-SF (“How often does child read forenjoyment?”, and “How many hours does child watchTV on a typical weekday?”) were considered indicatorsof the child’s behavior rather than the home environ-ment, and were, therefore, not included in this study. Incontrast, the question, “How many hours is the TV onduring a typical weekday?” was considered an indi-cator of the environment and was, therefore, includedin this study. Finally, even though most of the itemswere available for all five assessment points, a few wereadded after 1986. For example, “Does child see father(figure) daily?” was added to the 1990 survey, and both“taking away allowances” and “taking away privi-leges in response to child’s tantrum” were added to the1988 survey.
Although items on the original HOME Inventorywere designed to be scored in a dichotomous fashion(yes or no), some of the items from the NLSY HOME-SFused three- or four-choice ordinal scoring (see Tables2–5). The percentage of families who fell into each re-sponse category on each item is displayed in Tables 2through 5. Before making comparisons between groups,however, the items were converted to the originalscoring metric by collapsing the ordinal categoriesinto the original dichotomous ones.
Caldwell and Bradley (1984) clustered items on theoriginal HOME scales into subscales based on a re-view of research and theory. They used factor analysisas an aid to form empirically distinct, psychometricallysound, conceptual subscales. In an effort to organizethe presentation of descriptive information on theHOME-SF and in preparation for examining key rela-tions between components of the home environmentand children’s well-being (see Part 2), items from theHOME-SF were clustered with the aid of factor analysis.Item-level data from each of the four forms of theHOME-SF were subjected to factor analysis (maximumlikelihood with varimax rotation). For the IT-HOME-SF,

1850 Child Development
Table 2 Percent Responses to HOME Items by Ethnic Group and Poverty Status: Homes of Children from Birth to 2 Years, 11 Months
HOME Items Coding
European American African American Hispanic AmericanAsian
AmericanNonpoor Poor Nonpoor Poor Nonpoor Poor
Observational items
N
�
2,568
N
�
431
N
�
716
N
�
663
N
�
578
N
�
309
N
�
45Parental responsiveness
(Mother/Guardian) Spontaneously spoke to child twice or more (excluding scolding) Yes 92.4 89.2 91.5 86.6 93.2 88.9 90.5
(Mother/Guardian) Responded verbally to child’s speech Yes 81.2
p
70.7
p
80.5
p
69.3
p
81.8 78.5 70.7
(Mother/Guardian) Caressed, kissed, or hugged child at least once Yes 86.5
p
73.4
p
79.7
p
64.3
p,e
85.3
p
75.8
p
83.3
(Mother/Guardian) Provided toys or interesting activities for child Yes 73.6
p,e
55.2
p,e
57.8
P
34.2
P,e
68.6
P
46.3
P,e
71.4
(Mother/Guardian) Kept child in view/could see child/looked at (him/her) often Yes 89.6 81.0 85.3 78.2 84.7 82.9 80.5
Other
(Mother/Guardian) Slapped or spanked child at least once Yes 3.2 8.3 8.8
e
13.6 4.8 8.1 4.8
(Mother/Guardian) Interfered with child’s actions or restricted child from exploring more than 3 times Yes 16.9 19.4 25.6 27.2 18.6 19.9 12.2
Child’s play environment is safe (no potentially dangerous health or structural hazards within a toddler’s or infant’s range) Yes 91.0
p
80.7
p
89.0
p
79.8
p
91.9
p
79.0
p
88.4
Interview items
N
�
2,707
N
�
438
N
�
774
N
�
713
N
�
594
N
�
331
N
�
45Learning stimulation
About how many children’s books does your child have of his/her own?
None 10.4
p,e
24.7
p,e
21.4
p,e
35.7
p
23.1
p
,e 41.1
p,e
24.41 or 2 books 8.3 13.0 18.1 17.0 17.2 19.6 20.03–9 books 18.2 20.5 27.5 27.7 23.2 23.3 15.610 or
�
books 63.1 41.8 33.0 19.7 36.5 16.0 40.0
How often do you get a chance to read stories to your child?
Never–several/year 14.7
p,e
28.0
p,e
24.0
p,e
32.0
p
27.8
p,e
39.9
p,e
27.9Several/month–
1/week18.6 27.1 32.2 36.3 30.3 35.0 27.9
3/week to daily 66.7 44.9 43.8 31.7 41.9 25.1 44.2
About how many, if any, cuddly, soft or role-playing toys (like a doll) does your child have (may be shared with sister or brother)?
0 .5
e
1.4
e
2.1
p,e
4.5
p,e
2.4
e
3.4 —1–4 6.7 10.9 16.0 24.6 12.2 19.4 11.15 or 6 10.9 11.1 14.8 18.4 15.1 15.4 13.37 or
�
81.9 76.6 67.1 52.5 70.3 61.7 75.6
About how many, if any, push or pull toys does your child have (may be shared with sister or brother)?
None 10.0
e
12.0
e
15.0
e
18.6 13.2
p
19.7
p
18.21 or 2 9.4 13.6 18.9 23.1 14.9 23.4 9.13–6 41.3 35.6 38.8 35.9 39.5 33.2 40.97–10 24.9 22.4 16.8 13.5 22.7 15.4 18.211 or
�
14.5 16.4 10.6 8.9 9.6 8.3 13.6
Spanking
Sometimes kids mind pretty well and sometimes they don’t. About how many times have you had to spank your child in the past week?
None 46.0
p
25.1
p
37.0 28.4 48.7 46.4
e
42.91 or 2 times 29.6 32.9 32.6 33.8 31.2 30.5 35.73 to 7 times 21.3 31.9 24.8 31.3 17.5 21.8 21.48 or
�
times 3.1 10.1 5.7 6.5 2.5 1.3 —
(
Continued
)

Bradley et al. 1851
Table 2
Continued
HOME Items Coding
European American African American Hispanic AmericanAsian
AmericanNonpoor Poor Nonpoor Poor Nonpoor Poor
Interview items, continuedOther
Some parents spend time teaching their children new skills while other parents believe children learn best on their own. Which of the following best describes your attitude?
Parent always teaches 44.2 55.0 65.7 69.9 59.4 59.2 45.5Parent usually teaches 48.9 39.6 28.9 26.2 34.6 33.6 50.0Usually learn on own 6.7 4.9 5.0 3.0 4.8 6.5 4.5Always learn on own .2 .5 .4 .9 1.2 .6 —
Does your child see his/her father or father figure on a daily basis? Yes 94.3
P,e
72.5
P
81.4
P,e
60.4
P,e
92.5
P
73.0
P
93.2
How often does your child eat a meal with both mother and father or father figure?
1/day or
�
74.1 65.3
e
59.9
p,e
36.7
p,E
75.9 67.5
e
81.8Several/week 14.1 10.2 14.6 19.6 9.1 9.8 11.41/week–1/month 4.5 6.8 12.3 16.4 4.4 7.5 2.3Never/no dad 7.3 17.8 13.2 27.3 10.7 15.3 4.5
Children seem to demand attention when their parents are busy, doing housework, for example. How often do you talk to your child while you are working?
Always talking 45.7
e
47.6
e
45.3
p,e
44.2
p,e
44.5
p
48.3
p
40.9Often talking 45.9 40.0 37.5 28.7 38.7 24.9 40.9Sometimes 7.2 11.0 14.7 21.1 13.6 18.8 15.9Rarely talk .6 .7 2.0 3.3 1.0 3.4 —Never talk .6 .7 .5 2.7 2.2 4.6 2.3
About how often does your child have a chance to get out of the house (either by himself/herself, or with an older person)?
1/month or
�
6.3 8.7 6.6
p
10.0
p
11.8
p,e
20.9
p,e
11.1Few/month–few/
week17.8 22.6 18.5 26.7 27.0 28.8 17.8
4 or
�
/week 75.9 68.7 74.9 63.3 61.1 50.3 71.1
About how often do you take your child to the grocery store?
2/week or
�
30.9 37.1 35.2
p
37.8
p,e
37.8 51.4
e
37.81/week 49.9 39.2 40.1 27.2 44.9 33.7 31.11/month 10.7 14.7 13.8 21.5 7.8 7.3 17.8Hardly ever 8.5 9.0 10.8 13.6 9.5 7.6 13.3
Note:
Asian Americans are combined nonpoor and poor because there were too few Asian Americans with incomes below poverty.HOME
�
Home Observation for Measurement of the Environment.
e
Ethnicity effect size above .20;
E
ethnicity effect size above .50;
p
poverty effect size above .20;
P
poverty effect size above .50.
five factors were retained, three of which were usedfor this report: learning stimulation (four items), pa-rental responsiveness (five items), and spanking (oneitem). For the EC-HOME-SF, seven factors were re-tained, five of which were used for this report: learningstimulation (six items), parental responsiveness (fouritems), spanking (one item), teaching (four items), andphysical environment (four items). For the MC-HOME-SF, seven factors were retained, four of which wereused for this report: learning stimulation (six items),parental responsiveness (four items), spanking (oneitem), and physical environment (four items). For theEA-HOME-SF, seven factors were retained, three ofwhich were used for this report: learning stimulation(seven items), parental responsiveness (two items), andspanking (one item). With one exception, factors wereretained if they were conceptually meaningful (includ-ing the fact that they closely paralleled subscales on theoriginal HOME) and technically sound. The exception
was spanking. Each version of the HOME-SF containedthe item, “How often was child spanked in the pastweek.” That item was considered meaningful on itsown. Items not contained in these clusters are pre-sented individually in the tables.
Poverty status.
The determination of “family pov-erty status” (i.e., “in poverty” versus “not in poverty”)was based on estimates made by the CHHR in 1986,and the official poverty income guidelines issued by theDepartment of Health and Human Services (DHHS)for the years 1988 through 1994 (CHRR, 1997a). Com-parable to the DHHS guidelines, the CHHR estimateswere determined by total family income, controllingfor family size, farm/nonfarm residence, and state ofresidence. The designation of poverty status for a fam-ily for a given assessment period does not carry with itthe assumption that the family is persistently poor. Itonly represents the family’s economic well-being atthe time of assessment.

1852 Child Development
Table 3 Percent Responses to HOME Items by Ethnic Group and Poverty Status: Homes of Children from 3 to 5 Years, 11 Months
HOME Items Coding
European American African American Hispanic AmericanAsian
AmericanNonpoor Poor Nonpoor Poor Nonpoor Poor
Observational items
N
�
2,472
N
�
498
N
�
865
N
�
766
N
�
704
N
� 348 N � 41Parental responsiveness
(Mother/Guardian) Spontaneously spoke to child twice or more (excluding scolding) Yes 94.9p 86.3p 91.4p 80.0p 92.6p 83.1p 97.5
(Mother/Guardian) Conversed with child at least twice (excluding scolding or suspicious comments) Yes 94.2p 87.0p 90.3p 80.6p 90.0 84.7 97.4
(Mother/Guardian) Answered child’s questions or requests verbally Yes 92.4p 82.5p 85.9p 77.0p 88.7 83.2 94.9
(Mother/Guardian) Caressed, kissed, or hugged child at least once Yes 63.2p,e 48.7p,e 46.2p,e 31.7p,e 59.3p 41.8p 57.9
Physical environmentChild’s play environment is safe (no
potentially dangerous structural or health hazards within a preschooler’s range) Yes 95.7p 84.0p 94.0p 87.3p 94.0p 87.6p 90.2
Interior of the home is dark or perceptually monotonous Yes 4.5p 15.5p 10.0p,e 23.8p 5.8p 15.0p 7.3
All visible rooms of house/apartment are reasonably clean Yes 95.3p 82.3p 94.9p 84.0p 96.5p 85.3p 90.2
All visible rooms of house/apartment are minimally cluttered Yes 83.8 77.2 86.2p 78.3p 87.6 81.9 82.5
Other(Mother/Guardian) Introduced
interviewer to child by name Yes 48.8p 33.9p 41.0p 28.4p 38.6p 29.1p 47.4
(Mother/Guardian) Physically restricted or (shook/grabbed) child Yes 6.8 10.8 7.9 8.5 10.2 10.3 5.1
(Mother/Guardian) Slapped or spanked child at least once Yes 3.5p 8.7p 5.7 5.8 3.1p 8.6p 2.6
Interview items N � 2,531 N � 523 N � 918 N � 827 N � 743 N � 367 N � 44Learning stimulation
About how often do you read stories to your child?
Never–few/year 4.0p,e 8.4p,e 11.5p,e 18.0p 12.9p,e 23.8p,e 6.8Few/month–1/week 24.6 36.1 43.6 48.7 38.4 46.4 31.83/week to daily 71.4 55.4 45.0 33.3 48.7 29.8 61.4
About how many children’s books does your child have of his/her own?
None .7P,E 1.7P,E 1.9P,e 5.8P,e 1.9P,e 12.8P,e 2.31 or 2 .7 6.5 5.4 18.2 8.0 20.4 4.53–9 5.3 17.2 24.9 36.1 22.1 28.9 31.810 or � 93.4 74.6 67.8 39.9 68.1 37.9 61.4
Does your child have the use of a record player or tape recorder here at home and at least 5 children’s records or tapes? (May be shared with sister or brother) Yes 82.6P,e 58.9P 73.5p 50.7p 71.5p,e 48.2p 77.3
How often does any family member get a chance to take your child on any kind of outing (shopping, park, picnic, drive-in, and so on)?
Few/year or � 4.6e 7.5e 10.2p 15.4p 11.0p 20.4p .0Once a month 6.9 10.8 11.0 15.7 10.5 10.2 15.92–3/month 23.0 32.3 30.9 36.8 30.1 26.4 36.4Several/week 50.3 40.2 39.6 26.6 41.0 36.9 36.4Once a day 15.2 9.2 8.3 5.5 7.4 6.1 11.4
How often has any family member taken or arranged to take your child to any type of museum (children’s, scientific, art, histori-cal, etc.) within the past year?
Never 29.6p 48.6p 29.9p 43.9p 38.2p 52.5p 34.11–several/year 62.1 45.4 56.6 45.4 53.0 39.3 59.1Monthly or � 8.3 6.0 13.5 10.8 8.8 8.5 6.8
(Continued)

Bradley et al. 1853Table 3 Continued
HOME Items Coding
European American African American Hispanic AmericanAsian
AmericanNonpoor Poor Nonpoor Poor Nonpoor Poor
SpankingSometimes kids mind pretty well
and sometimes they don’t. About how many times have you had to spank your child in the past week?
None 33.5p 20.0p 24.1 16.8 32.1p 22.7p 41.21 or 2 41.4 43.7 45.3 38.5 45.2 49.5 44.13–7 21.9 30.3 26.8 39.6 21.0 25.1 14.78 or � 3.2 6.0 3.8 5.2 1.6 2.7 .0
TeachingCircle the things that you (or
another adult or older child) are helping or have helped your child to learn here at home. (Circle all that apply)
Numbers 95.9 93.5e 92.9p 86.7p 93.1p 86.7p 95.5The alphabet 94.4p 87.5p 91.9 86.39 85.5p,e 74.8p,e 90.9Colors 96.8e 92.9e 91.1 85.4 92.1p 84.4p 88.4Shapes and sizes 87.9p,e 78.7p,e 77.0p 63.0p 73.2p,e 57.9p,e 83.7
OtherAbout how many magazines does
your family get regularly?None 14.6P,e 38.5P 25.3p,e 40.5p 31.1p,e 48.2p 20.51 17.9 21.7 21.4 16.7 19.7 16.2 25.02 or 3 44.9 30.0 36.8 29.3 36.6 25.5 45.54 or � 22.6 9.8 16.5 13.5 12.6 10.1 9.1
How much choice is your child allowed in deciding what foods he/she eats at breakfast and lunch?
Great deal 31.4e 35.8e 26.0e 22.2e 23.2p,e 20.1p 22.7Some 60.2 50.0 52.0 48.8 57.2 50.4 52.3Little or no 8.4 14.2 22.1 29.0 19.5 29.5 25.0
About how many hours is the TV on in your home each day?
None 2.3p 1.4p 3.0p,e 2.5p,e 2.7p 3.7p,e 4.71 or 2 hr 19.3 11.3 9.6 6.7 14.7 9.0 11.63–5 hr 45.1 35.8 40.5 26.6 49.9 39.4 58.16–8 hr 21.7 25.7 26.7 29.9 23.4 29.6 18.69–14 hr 11.6 25.9 20.2 34.1 9.3 18.3 7.0
Most children get angry at their par-ents from time to time. If your child got so angry that he/she hit you, what would you do? (Circle all that apply)
Hit him/her back 9.7p,e 17.7p 23.6e 25.3e 9.5 15.5 11.6Send him/her to his/
her room54.6e 46.3e 32.2e 29.3e 47.0 47.1e 52.3
Spank him/her 37.0e 43.9e 65.1E 64.5e 41.2 37.4e 40.9Talk to him/her 74.1 67.5 67.4p 56.4p,e 75.8 73.1e 84.1Ignore it 3.0 6.0 2.7 2.5 2.7 3.9 7.0Give him/her
household chore2.1 3.9 6.1 7.1 4.0 4.8 2.3
Take away his/her allowance
12.2 7.8 8.3 5.3 11.3 10.9 18.2
Hold child’s hands until he/she was calm
1.2 2.3 4.9 5.1 3.2 4.2 .0
Does your child see his/her father or father figure on a daily basis?
Yes90.3P,e 62.0P 76.4P,e 51.9P,e 86.8p 67.9p,e 88.1
How often does your child eat a meal with both mother and father or father figure?
Once/day or � 74.6p 57.7p 55.2p,e 37.0p,E 78.7p,e 66.9p,e 73.2Several/week–1/
week20.0 14.4 23.6 24.0 13.1 12.8 19.5
1/month or � 1.4 5.4 6.7 8.7 1.3 3.4 2.4Never 4.0 22.5 14.4 30.3 7.0 16.9 4.9
Note: Asian Americans are combined nonpoor and poor because there were too few Asian Americans with incomes below poverty.HOME � Home Observation for Measurement of the Environment.e Ethnicity effect size above .20; E ethnicity effect size above .50; p poverty effect size above .20; P poverty effect size above .50.
RESULTS
To provide data on the general frequency with whichchildren were exposed to the various actions, objects,events, and conditions cataloged by the HOME-SF,
the percentage of households receiving credit for eachitem at each of the four age periods was computed(Tables 2–5). Among the European Americans, AfricanAmericans, and Hispanic Americans, separate per-centages were computed for those not living in pov-

1854 Child DevelopmentTable 4 Percent responses to HOME Items by Ethnic Group and Poverty Status: Homes of Children from 6 to 9 Years, 11 Months
HOME Items Coding
European American African American Hispanic AmericanAsian
AmericanNonpoor Poor Nonpoor Poor Nonpoor Poor
Observational items N � 3,927 N � 881 N � 2,000 N � 1,973 N � 1,376 N � 758 N � 83Parental responsiveness
(Mother/Guardian) Encouraged child to contribute to the conversation Yes 77.6p 66.5p 74.6p 63.0p 73.8 67.7 71.4
(Mother/Guardian) Answered child’s questions or requests verbally Yes 91.3p,e 83.2p 82.7p 74.2p 83.8 79.9 92.4
(Mother/Guardian)’s voice conveyed positive feeling about this child Yes 94.9p,e 86.7p 89.0p 80.2p 90.2 85.5 90.4
(Mother/Guardian) Conversed with child excluding scolding or suspicious comments Yes 81.2p 67.5p 76.4p 65.2p 75.2 69.2 75.0
Physical EnvironmentInterior of the home is dark or
perceptually monotonous Yes 4.3p 11.2p,e 10.9p,e 22.0p,e 4.7p 11.2p,e 3.7
All visible rooms of the house/apartment are reasonably clean Yes 95.2p 85.7p 93.4p 86.0p 95.8p 85.2p 89.2
All visible rooms of the house/apartment minimally cluttered Yes 86.1 79.4 85.2 81.1 84.9 80.1 84.1
Building has no potentially dangerous structural or health hazards within a school-aged child’s range Yes 75.9 68.9 71.0 63.8 72.1 67.5 76.3
Other(Mother/Guardian) Introduced
interviewer to child by name Yes 54.0 54.9e 51.5 42.5 50.5 42.9 50.0
Interview items N � 2,599 N � 618 N � 1,198 N � 1,154 N � 844 N � 492 N � 58Learning stimulation
Is there a musical instrument (e.g., piano, drum, guitar, etc.) that your child can use here at home?
Yes 46.8p,e 28.4p 36.0p 23.1p 37.2p 25.7p 50.0
Does your family get a daily newspaper?
Yes 52.9p 30.8p 48.0p 36.0p 45.5p 30.1p 46.4
Do you or someone in the family encourage your child to start and keep doing hobbies?
Yes 92.5 88.3e 88.2 82.0 85.4p 75.7p,e 94.6
Does your child get special lessons or belong to any organization that en-courages activities such as sports, music, art, dance, drama, etc.?
Yes 61.0P,e 36.5P 44.7p,e 34.6p 43.2p,e 23.9p,e 46.4
How often has any family member taken or arranged to take your child to any type of museum (chil-dren’s, scientific, art, historical, etc.) within the past year?
Never 19.5p 33.8p 23.0p 38.7p 26.3p 43.9p 26.81–several/year 72.3 57.6 61.8 49.7 63.8 47.0 62.51/month or � 8.2 8.6 15.1 11.6 9.8 9.0 10.7
How often has any family member taken or arranged to take your child to any type of musical or theatrical performance within the past year?
Never 38.4p 50.4p 37.7p 50.7p 48.4p 60.9p 50.91–several/year 58.9 47.3 53.4 41.9 46.6 35.4 47.31/month or � 2.7 2.3 8.9 7.3 5.0 3.7 1.8
About how many books does your child have?
None .3 1.6e .6 5.0 .8 8.1 —1 or 2 .6 4.7 3.9 13.6 5.2 15.7 3.43–9 4.4 13.4 20.2 33.6 18.1 32.5 27.610 or � 94.7 80.3 75.3 47.8 75.8 43.7 69.0
(Continued)

Bradley et al. 1855Table 4 Continued
HOME Items Coding
European American African American Hispanic AmericanAsian
AmericanNonpoor Poor Nonpoor Poor Nonpoor Poor
About how often did/do you read stories to your child?
Several/year or � 15.2e 19.6e 19.1e 24.1 20.3 31.3 21.4Several/month–
1/week39.6 44.7 50.6 48.0 45.2 47.8 33.9
3/week–every day 45.2 35.7 30.3 28.0 34.5 20.9 44.6
SpankingSometimes kids mind pretty well and
sometimes they don’t. About how many times have you had to spank your child in the past week?
Never 61.8 45.8 49.8 38.0 57.4 53.7 68.81–2 times 26.7 32.5 35.3 38.1 31.4 31.5 18.83–7 times 10.4 18.0 13.1 20.7 9.7 14.5 12.58 or � times 1.0 3.7 1.8 3.3 1.5 .3 —
OtherHow often is your child expected to
make his/her own bed? � half the time 67.4 66.3 74.1 72.4 69.2 61.1 76.8
How often is your child expected to clean his/her own room? � half the time 88.8 85.3 86.8 81.5 82.0 72.1 89.3
How often is your child expected to clean up after spills? � half the time 89.2 87.5 94.3 91.0 90.9 85.7 92.9
How often is your child expected to bathe himself/herself? � half the time 95.5 94.5 96.7 94.8 95.0 93.5 98.2
How often is your child expected to pick up after himself/herself? � half the time 96.9 91.9 96.0 93.5 93.2 88.2 94.6
About how often does your whole family get together with relatives or friends?
1/year or � 2.5 5.7 8.3 9.0 3.8 9.9 10.7Few/year–1/month 32.2 35.0 35.1 33.7 30.8 36.3 25.02–3/month or � 65.3 59.3 56.6 57.3 65.4 53.8 64.3
Does your child ever see his or her father or father figure? Yes 98.1p,e 86.3p,e 91.7p,e 74.8p,e 93.2p 83.5p 96.4
About how often does your child spend time with his/her father or father figure?
1/day or � 77.9P,e 51.4P,e 57.0P,e 30.2P,e 71.8p 55.7p,e 76.81/week–1/day 16.4 24.8 24.6 32.7 17.2 22.4 16.1Few/year–1/month 4.7 18.1 14.0 26.8 7.9 14.7 5.4DK or no dad 1.0 5.6 4.4 10.3 3.1 7.2 1.8
About how often does your child spend time with his/her father or father figure in outdoor activities?
1/day or � 23.7p 23.9p 23.1e 14.8 29.3 32.5e 21.41/week–1/day 62.1 37.4 43.8 32.9 51.7 37.3 53.6Few/year–1/month 11.2 28.7 23.6 29.1 12.7 19.1 23.2DK or no dad 3.1 9.9 9.5 23.2 6.3 11.1 1.8
How often does your child eat a meal with both mother and father or father figure?
1/day or � 68.6p 51.9p,e 49.7p,e 28.0p,E 69.2p 58.0p,e 59.61/week–several/
week21.5 11.6 23.4 23.1 17.7 11.5 28.1
1/month or � 2.0 6.0 6.6 8.7 2.3 5.3 3.51/month or no dad 7.9 30.5 20.3 40.2 10.7 25.2 8.8
When your family watches TV together, do you or your child’s father or father figure discuss TV programs with him/her? Yes 89.6p,e 79.1p,e 79.0p,e 61.7p,e 81.5p 69.6p 87.7
Sometimes children get so angry at their parents that they say things like, “I hate you,” or swear in a temper tantrum. Please check which actions you would take if this happened. (Circle all that apply)
Grounding 30.7p 42.7p 38.8 38.5 33.8 39.8 33.3Spanking 27.2e 35.7 48.5e 50.0e 26.5 26.4e 24.6Talk with child 85.5 79.9e 74.9e 67.3e 83.5p 73.6p 87.7Give him/her
household chore9.1 11.1 13.7 15.8 11.1 16.9 15.8
Ignore it 10.1 9.4e 4.2e 2.8e 6.0 6.4 14.0Send to room for
more than 1 hr19.9 27.9 27.8 28.6 29.0 35.1 21.1
Take away his/her allowance
4.3 6.0 9.8 10.9 6.4 9.0 1.8
Take away TV or other privileges
30.8 29.5 34.2 30.3 34.8 37.9 31.6
Note: Asian Americans are combined nonpoor and poor because there were too few Asian Americans with incomes below poverty. HOME �Home Observation for Measurement of the Environment; Ok � don’t know.e Ethnicity effect size above .20; E ethnicity effect size above .50; p poverty effect size above .20; P poverty effect size above .50.

1856 Child Development
Table 5 Percent Responses to HOME Items by Ethnic Group and Poverty Status: Homes of Children from 10 to 14 Years, 11 Months
HOME Items Coding
European American African American Hispanic AmericanAsian
AmericanNonpoor Poor Nonpoor Poor Nonpoor Poor
Observational items N � 1,453 N � 318 N � 938 N � 963 N � 632 N � 322 N � 41Learning stimulation
About how many books does your child have of his/her own?
None .3p,E 3.5p,E 2.6p,e 9.2p,e 2.2P,e 10.2P,e —1 or 2 8.8 23.3 32.3 43.6 27.1 46.3 43.33–9 17.3 22.3 23.6 21.1 23.7 23.3 6.710 or � 73.5 50.9 41.6 26.1 47.0 20.2 50.0
Is there a musical instrument (e.g., piano, drum, guitar, etc.) that your child can use here at home? Yes 55.3p,e 41.8p,e 39.1p,e 24.8p 38.1p,e 23.1p 46.7
Does your family get a daily newspaper? Yes 52.6p 32.6p 44.4 35.3 44.8p 26.7p 50.0
Do you or someone in your family encourage your child to start and keep doing hobbies? Yes 95.1p 88.6p 91.2 86.0 91.5p 77.5p,e 96.7
Does your child get special lessons or belong to any organization that en-courages activities such as sports, music, art, dance, drama, etc.? Yes 68.7p,e 54.4p,e 60.3p 48.6p 54.5p,e 31.6p,e 56.7
How often has any family member taken or arranged to take your child to any type of museum (children’s, scientific, art, historical, etc.) within the past year?
Never 20.0p 32.0p,e 23.4p 42.4p 28.6p 46.7p 23.3Several/year or � 74.8 61.1 66.2 46.9 65.5 44.2 73.31/month or � 5.2 7.0 10.4 10.7 5.9 9.0 3.3
How often has a family member taken or arranged to take your child to any type of musical theatrical performance within the past year?
Never 41.4 46.4 35.5p 50.5p 44.0p 61.4p,e 63.3Several/year or � 56.4 50.2 57.5 41.1 52.4 32.1 33.31/month or � 2.1 3.5 7.0 8.4 3.7 6.5 3.3
OtherHow often is your child expected to
make his/her own bed? � half the time 84.4e 87.0 93.3e 88.9 91.3p 83.1p 100.0
How often is your child expected to clean his/her own room? � half the time 94.1 92.1 95.2 90.5 93.2p 86.4p 100.0
How often is your child expected to pick up after himself/herself? � half the time 96.1 94.6 96.4 92.5 95.9p 88.6p 100.0
How often is your child expected to help keep shared living areas clean and straight? � half the time 90.9 92.4 92.3 89.4 93.6 89.0 96.7
How often is your child expected to do routine chores such as mow the lawn, help with dinner, wash dishes, etc? � half the time 86.3 83.3 85.0 84.4 87.0p 77.5p 80.0
How often is your child expected to help manage his/her own time (get up on time, be ready for school, etc.)? � half the time 90.3 85.1 89.5 89.4 95.4p,e 89.0p 93.3
About how often does your whole family get together with relatives or friends?
1/year or � 4.6 8.9 7.7 8.0 4.9 9.1 13.31/month–few/year 37.2 36.4 39.7 35.5 33.7 36.0 36.72–3/month or � 58.2 54.7 52.6 56.5 61.4 54.9 50.0
Does your child ever see his or her father or father figure? Yes 96.8p,e 87.9p,e 89.7p,e 72.5p,e 92.5p 83.5p 97.6
(Continued)

Bradley et al. 1857
Table 5 Continued
HOME Items Coding
European American African American Hispanic AmericanAsian
AmericanNonpoor Poor Nonpoor Poor Nonpoor Poor
Interview items N � 1,422 N � 316 N � 922 N � 938 N � 626 N � 317 N � 41Parental responsiveness
Sometimes kids mind pretty well and sometimes they don’t. Sometimes they do things that make you feel good. How many times in the past week have you shown your child physical affection (kiss, hug, stroke hair, etc.)?
None 3.0p,e 5.1p,E 12.2E 15.1e 6.6p 17.7p 7.11 or 2 5.7 6.6 16.2 19.3 9.2 11.63–6 times 16.5 30.1 30.5 30.5 30.4 31.77–13 times 38.6 31.6 26.9 27.2 32.3 25.3 53.6� than 13 times 36.2 26.6 14.2 7.8 21.5 13.7 17.9
Sometimes kids mind pretty well and sometimes they don’t. Sometimes they do things that make you feel good. How many times in the past week have you praised your child for doing something worthwhile?
None 3.4e 6.7e 11.7e 18.5e 13.2 22.4 —1 or 2 times 17.6 19.2 30.6 27.3 25.3 31.6 35.73–6 times 42.8 42.8 39.3 35.3 40.1 26.5 32.1� than 6 times 31.3 31.3 18.4 18.9 21.4 19.4 32.1
SpankingSometimes kids mind pretty well
and sometimes they don’t. Sometimes they do things that make you feel good. How many times in the past week have you had to spank your child?
None 89.1p 81.4p 82.1p 73.6p 89.6p 76.1p 89.71–2 times 9.8 11.9 15.3 18.2 8.3 17.5 10.33–7 times 1.0 4.8 2.1 6.2 1.8 5.7 —8 or more times .1 1.9 .6 2.0 .3 .7 —
OtherAbout how often does your child
spend time with his/her father or father figure?
1/day or more 69.4p,e 45.9p,e 44.7p,e 24.0p,e 62.9p 41.3p,e 80.01–7 times/week 19.8 28.4 26.0 30.4 20.5 29.0 10.0Few/year–1/month 8.3 21.5 20.4 23.3 10.5 18.2 3.3DK or no dad 2.5 4.3 9.0 22.3 6.2 11.5 6.6
About how often does your child spend time with his/her father or father figure in outdoor activities?
1/day or more 17.7p,e 18.0p 14.8e 12.3e 21.5p 25.6p 10.01–7 times/wk 58.6 39.0 36.2 28.7 49.7 31.1 70.0Few/year–1/month 18.3 29.8 31.3 24.6 20.4 24.6 13.3DK or no dad 5.4 13.2 17.7 34.4 8.4 18.7 6.6
How often does your child eat a meal with both mother and father or father figure?
1/day or more 64.2p,e 51.0p,e 37.4p,E 25.7p,E 69.9p,e 48.2p,e 40.01–7 times/week 23.1 11.8 25.6 19.9 13.1 14.0 53.3Few/year–1/month 1.2 5.6 7.7 6.0 1.8 6.5 —DK or no dad 11.5 31.6 29.3 48.4 15.2 31.3 6.7
When your family watches TV together, do you or your child’s father or father figure discuss TV programs with him/her? Yes 89.0p,e 78.9p,e 72.3p,e 58.5p,e 77.0p 62.8p 96.7
Sometimes children get so angry at their parents that they say things like, “I hate you,” or swear in a temper tantrum. Please check which actions you would take if this happened. (Circle all that apply)
Grounding 49.9 49.7 52.2 54.4 48.2 48.7 36.7Spanking 17.1e 21.5e 35.8e 36.5e 12.0p,e 22.9p,e 16.7Talk with child 86.2e 85.2e 73.5e 72.3e 81.2 76.7 96.7Give him/her
household chore16.5 18.7 18.6 25.9 15.2 20.5 10.0
Ignore it 8.8 8.6 4.3 5.6 5.8 3.3 3.3Send to room for
more than 1 hr24.3 32.6 24.4 30.7 28.9 34.1 23.3
Take away his/her allowance
7.9e 11.3e 20.6e 26.4e 12.0 15.4 13.3
Take away TV, phone, or other privileges
47.0 37.7e 47.4 48.7 44.4 49.2 30.0
(Continued)

1858 Child Development
Table 5 Continued
Coding
European American African American Hispanic AmericanAsian
AmericanHOME Items Nonpoor Poor Nonpoor Poor Nonpoor Poor
Sometimes kids mind pretty well and sometimes they don’t. Sometimes they do things that make you feel good. How many times in the past week have you grounded your child?
Never 79.6 71.4e 72.4p 57.0p 75.6p 62.6p 82.8Once 15.4 15.2 17.4 17.6 16.9 13.1 13.82 or 3 times 4.4 7.9 7.5 17.4 5.7 16.5 3.4� than 3 times .6 5.4 2.8 8.1 1.8 7.7 —
Sometimes kids mind pretty well and sometimes they don’t. Sometimes they do things that make you feel good. How many times in the past week have you taken away your child’s privileges?
Never 79.3 74.4 77.5 69.3 76.5p 67.0p 92.9Once 14.9 13.9 13.3 12.8 13.1 13.8 7.12 or 3 times 4.9 7.6 6.5 12.3 8.0 12.5 —� than 3 times .9 4.1 2.7 5.6 2.3 6.7 —
Sometimes kids mind pretty well and sometimes they don’t. Sometimes they do things that make you feel good. How many times in the past week have you sent your child to his/her room?
Never 64.3 56.1 69.5 61.2 65.2 59.7 58.6Once 18.7 16.2 15.7 16.5 16.2 14.0 17.22 or 3 times 12.2 17.8 11.3 14.8 13.4 15.7 10.3� than 3 times 4.8 9.9 3.5 7.4 5.3 10.6 13.8
Sometimes kids mind pretty well and sometimes they don’t. Sometimes they do things that make you feel good. How many times in the past week have you taken away your child’s allowance?
Never 97.0p 91.0p,e 92.0p 82.2p 92.9p 87.0p 100.0Once 2.0 4.8 4.0 7.5 4.2 6.1 —2 or 3 times 1.0 4.2 3.9 10.3 3.0 6.8 —
Note: Asian Americans are combined nonpoor and poor because there were too few Asian Americans with incomes below poverty. HOME �Home Observation for Measurements of the Environment; Ok � don’t know.e Ethnicity effect size above .20; E ethnicity effect size above .50; p poverty effect size above .20; P poverty effect size above .50.
erty and those living in poverty. Because relativelyfew Asian American families were living in poverty,only percentages for the total group of Asian Ameri-cans are provided. Although analyses were done onthe total NLSY sample and on the combined povertyand nonpoverty subsamples within each ethnic group(except Asian Americans), the tables only report resultsfor the subsamples due to space limitations (results fromthe total sample and each ethnic group sample can beobtained from the authors). Results are described foreach of the HOME-SF item clusters described in theMethods section; specifically, learning stimulation, pa-rental responsiveness, spanking, teaching, and physi-cal environment. Results are also described for fatherinvolvement, although father involvement was notone of the home environment factors identified usingfactor analysis.
In an effort to provide a more comprehensiveframework for understanding children’s experiencesat home, Cohen’s h effect sizes were also computed(Cohen, 1987) for poverty and ethnicity. Specifically,for each of the six ethnic/poverty status groups (AsianAmericans were not analyzed due to limited sample
size and diversity) two effect sizes were calculated(tables containing the effect size for each ethnic/povertystatus group on all HOME-SF items can be obtainedfrom the first author): (1) a standardized differencebetween the proportion of families from the targetgroup receiving credit on a HOME-SF item and theproportion of all families from the same incomegroup but not the same ethnic group that receivedcredit on the item (an ethnic group effect size for thetarget group), and (2) a standardized difference be-tween the proportion of families from the target groupthat received credit on a HOME-SF item and the pro-portion of all families from the same ethnic group, butnot the same income group, that received credit on theitem (a poverty status effect size for the target group).Tables 2 through 5 display the six subgroups in whichthere was a small effect, .20 � h � .50, or a moderateeffect, h � .50; the values for h correspond to the criteriafor small and medium effects established by Cohen(1987). For poor families with children under 3 yearsof age, effect sizes for ethnicity ranged from nonsignif-icant to moderate, h � .51, with a mean of .17; for non-poor families, effect sizes ranged from nonsignificant

Bradley et al. 1859
to small, h � .45, with a mean of .16. For poor familieswith children ages 3 to 5, effect sizes for ethnicityranged from nonsignificant to moderate, h � .70, witha mean of .16; for nonpoor families, the effect sizesranged from nonsignificant to moderate, h � .64, witha mean of .17. For poor families with children ages 6to 9, effect sizes for ethnicity ranged from nonsignifi-cant to moderate, h � .55, with a mean of .12; for non-poor families effect sizes ranged from nonsignificantto small, h � .42, with a mean of .12. For poor familieswith children ages 10 to 14, effect sizes for ethnicityranged from nonsignificant to moderate, h � .52, with amean of .16; for nonpoor families, effect sizes rangedfrom nonsignificant to moderate, h � .56. The averageeffect sizes for poverty were greater than for ethnicity.Among European American, African American, andHispanic American families these were (1) .24, h � .62;.23, h � .47; and .21, h � .54, respectively, for childrenless than 3; (2) .29, h � .69; .23, h � .57; and .24, h � .61,respectively, for children 3 to 5; (3) .21, h � .56; .18, h �.55; and .18, h � .41, respectively, for children 6 to 9;and (4) .19, h � .48; .18, h � .45; and .25, h � .55, re-spectively, for children 10 and over.
Although we did not have an a priori hypothesisthat the effect of poverty would be proportional acrossethnic groups, additional analyses were conducted totest the interaction between ethnic group status andpoverty status for each item separately. After makingBonferroni adjustments in � levels for the total numberof statistical tests performed, no interaction effectswere found for any item at any age period. That is, al-though significant differences among ethnic groupsemerged on most HOME-SF items, the effect of pov-erty on the odds of receiving credit for an item was rel-atively proportional for European American, AfricanAmerican, and Hispanic American children.
Learning Stimulation
There were marked differences in the types of learn-ing materials American children had access to in theirhome places. Likewise, there were marked age-relateddifferences in the types of materials children had toplay with and learn from. Infants and adolescents hadfewer books than children in early and middle child-hood. Although over 90% of children in the two middle-age groups had three or more of their own books, fewerthan 70% of infants and adolescents had several books.Infants were more likely to have five or more cuddly orrole-playing toys (85.8%) than to have three or morepush toys (72.6%). Moreover, 3- to 5-year-old childrenwere more likely to have access to a tape or recordplayer (70.9%) than children ages 6 to 9 (36.2%) or 10 to14 (39.8%) were to have access to a musical instrument.
There were also ethnic group and poverty statusdifferences in children’s access to learning materials.In all four age categories, a higher percentage of Afri-can American and Hispanic American children hadno books, and a lower percentage had 10 or morebooks (Tables 2–5). Also, during middle childhoodand adolescence, these two ethnic groups were over10% less likely to have access to a musical instrumentthan European Americans or Asian Americans (Tables4–5). However, poverty status had a greater impacton access to learning materials than did ethnicity. Ingeneral, nonpoor children were far more likely thanpoor children to have three or more children’s books ininfancy (mean effect size � .37), early childhood (meaneffect size � .57), middle childhood (mean effect size �.25), and adolescence (mean effect size � .47). As a rule,nonpoor European American children were substan-tially more likely to have large numbers of books in thehome. Likewise, European American children weresubstantially more likely than other children to have ac-cess to other language and learning materials (e.g.,record or tape players). Conversely, both poor HispanicAmericans and poor African Americans were substan-tially less likely to own things such as tape players.
The majority of NLSY parents provided their chil-dren with a variety of enriching out-of-home experi-ences. Over 70% of infants got out of the house four ormore times a week, and over 75% were taken to thegrocery store at least once a week. The only age com-parisons that were possible indicate that 3- to 5-year-olds were not taken to the museum as much (63.8%)as either 6- to 9-year-olds (72.3%) or 10- to 14-year-olds (70.1%). In addition, the percentages of childrenin middle childhood and adolescence who were takento the theater were about the same (54.2% and 54.4%,respectively).
The percentage of infants who got out of the houseand who were taken to the grocery store was notmuch different across ethnic groups, except for His-panic Americans, who seldom got out of the houseand were least likely to get out of the house fre-quently (Table 2). The reverse was true of HispanicAmericans with regard to taking their children to thegrocery store. A relatively high percentage of HispanicAmerican infants were taken to the grocery store fre-quently. Few ethnic differences were observed withregard to how often children were taken to a museumand the theater, except that African American chil-dren were most likely to frequently go to a museumand theater in all age groups (effect sizes for ethnicitywere always � .20).
Poverty status had a relatively greater effect on thevariety of potentially enriching places and events thatchildren experienced. These differences were found in

1860 Child Development
all ethnic groups and at all age periods. For all ethnicgroups, nonpoor children were much more likely tobe taken to the museum as poor children (mean effectsize � .35). Nonpoor children were also more likely tobe taken to the theater than poor children during mid-dle childhood and late adolescence.
Parental Responsiveness
Most mothers in the NLSY sample spoke to theirchildren during the interview and encouraged their chil-dren to talk. For children birth to 2 and 3 to 5 yearsold, approximately 90% of mothers spoke to theirchildren during the home visit at least twice. Some-what fewer mothers of 6- to 9-year-olds were observedtalking to their child twice or more (74.4%). In responseto the child’s demands for attention, more mothersresponded verbally to 3- to 5-year-olds (87.1%) thanwas the case for infants (78.3%) or 6- to 9-year olds(83.9%). In effect, whereas mothers of infants weremore likely to spontaneously speak to the infants thanto respond to them verbally (78.3%), the pattern wasreversed for mothers of 6- to 9-year-olds. Few ethnicgroup differences emerged except that mothers of Af-rican American and Hispanic American 6- to 9-year-olds responded to their children relatively less often(Table 4). Across all ethnic groups, nonpoor motherswere more likely than poor mothers to speak to theirchildren twice or more or to respond to their childrenverbally during the visit.
Approximately 90% of mothers with children inearly childhood and middle childhood showed posi-tive feelings when talking about their children. Fewer3- to 5-year-olds were caressed, hugged, or kissed(52.7%) than infants (80.6%). In infancy and earlychildhood, African American children were less likelyto receive physical affection from their mothers. Thedifference among ethnic groups was greatest among3- to 5-year-olds. Across all ethnic groups and agegroups, more affluent mothers were more likely toshow both verbal and physical affection toward theirchildren. The added effects of poverty and ethnicitymeant that some subgroups of children were far morelikely than other subgroups to receive demonstrationsof affection. For example, more affluent Hispanic Amer-ican and European American mothers were about twiceas likely to show positive feelings and to caress, kiss,or hug their 3- to 5-year-olds than were poor AfricanAmerican mothers (Table 3).
Spanking
Observed spanking decreased as children grew older.Although mothers reported that approximately 29%
of infants and children 3- to 5-years of age had beenspanked three or more times in the past week, only15% of 6- to 9-year olds, and 4% of 10- to 14-year-oldswere reported to have received this amount of spank-ing. The decrease was also seen in the percentage ofmothers who physically restricted their children dur-ing the interview. Over 20% of infants were physicallyrestricted, and just over 8% of 3- to 5-year-olds werephysically restricted. For all four age periods, AfricanAmericans had the lowest percentage in the no spank-ing category. In the two middle categories of spankingfrequency, there was little evidence of ethnic group dif-ference once poverty status was taken into account.No Asian Americans reported spanking their childreneight or more times a week, whereas all other ethnicgroups reported some occurrences of high-frequencyspanking at all age levels. Parents living below thepoverty line were more likely to spank their childrenacross all age levels, and across all ethnic groups. Al-though a higher percentage of African American par-ents reported using spanking as a means of discipline,it was poor European Americans who most often re-ported spanking their children eight or more timesper week. The added effects of ethnic group statusand poverty status were most pronounced amongfamilies with children 10- to 14-years of age. For ex-ample, a higher percentage of poor African Americanparents (26.4%) and poor Hispanic American parents(23.1%) reported spanking their children three ormore times a week than other parents.
Teaching
Although just over one half of all mothers read totheir infants (51.6%), and 3- to 5-year- olds (55.0%) atleast three times a week, the percentage dropped whenthe children were between 6 and 9 years of age (35.6%).The pattern of increase from infancy to early childhoodwas followed by a decrease in middle childhood forall ethnic groups. However, from infancy to earlychildhood, the percentage of Asian Americans whoread to their child three or more times a week increasedconsiderably (17%) compared with Hispanic Ameri-cans (7%), European Americans (5%), and AfricanAmericans (2%). Whereas European Americans weremuch more likely to frequently read to infants (63.7%)than were Asian Americans (44.2%), African Americans(37.9%), and Hispanic Americans (34.9%), the dramaticincrease among Asian Americans closed the gap bythe time children went to school. At all three age levels,both African Americans and Hispanic Americans weresignificantly less likely to read to their children than Eu-ropean Americans and Asian Americans (Tables 2–4).
There were clear ethnic group and poverty status

Bradley et al. 1861
differences in the percentage of mothers who read totheir children, especially prior to school entry wheneffect sizes were typically in the .30 to .50 range. Dur-ing infancy and early childhood, and for each ethnicgroup separately, nonpoor mothers were twice as likelyto read to their children three or more times a weekthan were poor mothers. In middle childhood, althoughnonpoor mothers were still more likely to read to theirchildren than were poor mothers, the impact of pov-erty status subsided somewhat in middle childhood.Furthermore, the added effects of ethnicity and pov-erty status were more pronounced than either demo-graphic variable alone. For example, nonpoor Euro-pean Americans were more than twice as likely to readto their children at least three times a week during in-fancy and early childhood (about 70%) compared withpoor African Americans and Hispanic Americans (�⅓).
Approximately nine out of ten 3- to 5-year-oldswere helped by a family member to learn numbers,colors, and the alphabet. Just over 75% were helped tolearn shapes and sizes. Although there were not largedifferences among ethnic groups, h � .30, a lower per-centage of Hispanic American children were helpedwith the alphabet, and lower percentages of both His-panic American and African American children werehelped with shapes and sizes (Table 3). Once again, forall ethnic groups, and for each type of help from fam-ily members, those not in poverty were more likely tospend time helping their children learn.
For children in middle childhood and adolescence,mothers were asked if their child was encouraged tohave hobbies, if their child was provided special les-sons, and whether parents discussed TV programswith their child. For each age period, and for each eth-nic group, nonpoor families were roughly twice aslikely as poor families to provide these extras. A higherpercentage of children 10 years of age and older wereprovided with special lessons (56.6%) than were chil-dren ages 6 to 9 (46.1%). Approximately three quar-ters of the parents discussed TV programs at both agelevels, and approximately 90% of the children wereencouraged to have hobbies at both age levels. Atboth age periods a higher percentage of EuropeanAmericans and Asian Americans was credited for allthree of these questions than were either AfricanAmericans or Hispanic Americans (most effect sizeswere � .30). Nonpoor European American familieswere more likely than all other groups to discuss TVprograms at both age levels.
Physical Environment
A smaller percentage of 6- to 9-year-olds had a safeplay environment (71.0%) than did children in early
childhood (92.1%) and infancy (87.0%). There were nomeaningful ethnic group differences in safety haz-ards observed in the homes of children under age 6.Although not substantial, there were small ethnicgroup differences among homes of 6- to 9-year-olds,h � .30, with African American homes the least likelyto be safe (67.3%), and a higher percentage of AsianAmerican and European American homes judged tobe safe by the interviewer (76.3% and 74.4%, respec-tively). Poverty status appeared to have a greater ef-fect on home safety than did ethnic group. Across allethnic groups and across all three age groups assessed,those not in poverty were more likely to have a safehome environment than were those who were poor(mean effect size � .30). The effect of poverty statuson home safety was stronger during infancy andearly childhood than during middle childhood.
There were no meaningful differences in the aes-thetics of children’s home environments from earlychildhood to middle childhood: homes were essen-tially the same with regard to dark and monotonousinteriors (10.1% and 10.3%, respectively), clean interi-ors (91.6% and 91.3%, respectively), and minimallycluttered interiors (82.2% and 83.7%, respectively).There were also no noticeable ethnic group differ-ences in cleanliness and clutter for either age period.At both age periods, however, a considerably higherpercentage of African American homes were rateddark and monotonous (approximately 16.0%) thanany other ethnic group (Tables 3 and 4). However, thehomes of poor families were judged to be dark andmonotonous and unclean more often than the homesof nonpoor families (effect sizes ranged from .24–.43).They were also judged as having more clutter (effectsizes ranged from .11–.21). Although greater than 80%of poor homes in every ethnic group were judged to bereasonably clean, more than 90% of nonpoor homeswere judged to be clean. Nonpoor homes were alsothree to four times less likely to be judged dark andmonotonous than poor homes.
Father Involvement
Because there were variations in the HOME-SFitems that dealt with father involvement at each of thefour age periods assessed, the same items did not con-sistently emerge as a separate factor in the factor analy-ses done on HOME-SF items. Nonetheless, because ofthe presumed importance of paternal involvement inchildren’s lives, we decided to describe findings per-taining to the two questions asked concerning fathersat all four age periods: (1) Does child ever see father?and (2) How often does child eat with both motherand father? A lower percentage of children saw their
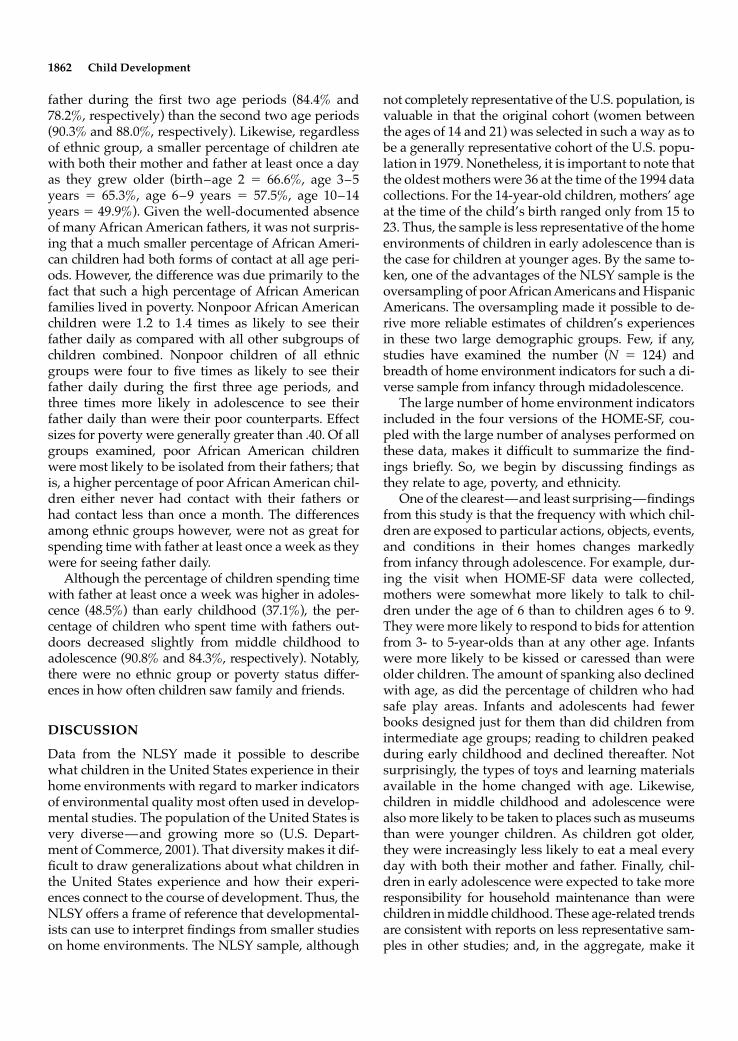
1862 Child Development
father during the first two age periods (84.4% and78.2%, respectively) than the second two age periods(90.3% and 88.0%, respectively). Likewise, regardlessof ethnic group, a smaller percentage of children atewith both their mother and father at least once a dayas they grew older (birth–age 2 � 66.6%, age 3–5years � 65.3%, age 6–9 years � 57.5%, age 10–14years � 49.9%). Given the well-documented absenceof many African American fathers, it was not surpris-ing that a much smaller percentage of African Ameri-can children had both forms of contact at all age peri-ods. However, the difference was due primarily to thefact that such a high percentage of African Americanfamilies lived in poverty. Nonpoor African Americanchildren were 1.2 to 1.4 times as likely to see theirfather daily as compared with all other subgroups ofchildren combined. Nonpoor children of all ethnicgroups were four to five times as likely to see theirfather daily during the first three age periods, andthree times more likely in adolescence to see theirfather daily than were their poor counterparts. Effectsizes for poverty were generally greater than .40. Of allgroups examined, poor African American childrenwere most likely to be isolated from their fathers; thatis, a higher percentage of poor African American chil-dren either never had contact with their fathers orhad contact less than once a month. The differencesamong ethnic groups however, were not as great forspending time with father at least once a week as theywere for seeing father daily.
Although the percentage of children spending timewith father at least once a week was higher in adoles-cence (48.5%) than early childhood (37.1%), the per-centage of children who spent time with fathers out-doors decreased slightly from middle childhood toadolescence (90.8% and 84.3%, respectively). Notably,there were no ethnic group or poverty status differ-ences in how often children saw family and friends.
DISCUSSION
Data from the NLSY made it possible to describewhat children in the United States experience in theirhome environments with regard to marker indicatorsof environmental quality most often used in develop-mental studies. The population of the United States isvery diverse—and growing more so (U.S. Depart-ment of Commerce, 2001). That diversity makes it dif-ficult to draw generalizations about what children inthe United States experience and how their experi-ences connect to the course of development. Thus, theNLSY offers a frame of reference that developmental-ists can use to interpret findings from smaller studieson home environments. The NLSY sample, although
not completely representative of the U.S. population, isvaluable in that the original cohort (women betweenthe ages of 14 and 21) was selected in such a way as tobe a generally representative cohort of the U.S. popu-lation in 1979. Nonetheless, it is important to note thatthe oldest mothers were 36 at the time of the 1994 datacollections. For the 14-year-old children, mothers’ ageat the time of the child’s birth ranged only from 15 to23. Thus, the sample is less representative of the homeenvironments of children in early adolescence than isthe case for children at younger ages. By the same to-ken, one of the advantages of the NLSY sample is theoversampling of poor African Americans and HispanicAmericans. The oversampling made it possible to de-rive more reliable estimates of children’s experiencesin these two large demographic groups. Few, if any,studies have examined the number (N � 124) andbreadth of home environment indicators for such a di-verse sample from infancy through midadolescence.
The large number of home environment indicatorsincluded in the four versions of the HOME-SF, cou-pled with the large number of analyses performed onthese data, makes it difficult to summarize the find-ings briefly. So, we begin by discussing findings asthey relate to age, poverty, and ethnicity.
One of the clearest—and least surprising—findingsfrom this study is that the frequency with which chil-dren are exposed to particular actions, objects, events,and conditions in their homes changes markedlyfrom infancy through adolescence. For example, dur-ing the visit when HOME-SF data were collected,mothers were somewhat more likely to talk to chil-dren under the age of 6 than to children ages 6 to 9.They were more likely to respond to bids for attentionfrom 3- to 5-year-olds than at any other age. Infantswere more likely to be kissed or caressed than wereolder children. The amount of spanking also declinedwith age, as did the percentage of children who hadsafe play areas. Infants and adolescents had fewerbooks designed just for them than did children fromintermediate age groups; reading to children peakedduring early childhood and declined thereafter. Notsurprisingly, the types of toys and learning materialsavailable in the home changed with age. Likewise,children in middle childhood and adolescence werealso more likely to be taken to places such as museumsthan were younger children. As children got older,they were increasingly less likely to eat a meal everyday with both their mother and father. Finally, chil-dren in early adolescence were expected to take moreresponsibility for household maintenance than werechildren in middle childhood. These age-related trendsare consistent with reports on less representative sam-ples in other studies; and, in the aggregate, make it

Bradley et al. 1863
clear how daily life experiences for children change asthey mature. There is a reasonable degree of consensusamong developmentalists that there is a dynamic in-terplay between children and their environments, butthere is some divergence of opinion regarding the de-gree to which children’s experiences affect the courseof development and the degree to which children de-termine the experiences they get. (For a discussion ofthese various points of view, see Lewis, 1997; Scarr &McCartney, 1983; Wachs, 2000.) Part 2 (Bradley et al.,2001) of this study examined relations among aspectsof the home environment and various components ofdevelopment from infancy through adolescence.)
Results with respect to poverty status and ethnicitymade two things abundantly clear: (1) there were dif-ferences in the likelihood that children would be ex-posed to particular experiences in the home environ-ment as a function of both their ethnicity and theirfamily’s economic circumstances, and (2) there wasvariability on each indicator examined in every majoreconomic and ethnic group. Diversity was greater onsome indicators than others (e.g., almost all childrenbetween 10 and 14 were expected to pick up afterthemselves more than one half of the time; whereasthe percentages of children expected to make theirown beds over one half of the time ranged from 84%for European American children to 100% for AsianAmerican families). However, variability was presentfor all indicators. Taken as a whole, this variability cor-roborates the assertion of García Coll and colleagues(1995, 1999) that measures of central tendency often be-lie the diversity present within demographic groups.
There are several ecological–developmental modelsthat link economic hardship to the quality of parent-ing children receive (Brody & Flor, 1998; Conger et al.,1997; McLoyd, 1990, 1999). According to these models,parents who experience the stresses connected to eco-nomic hardship often display less responsiveness totheir children and more harsh punishment. Resultsfrom this study both confirm and expand on thesepropositions. For example, poor mothers were lesslikely than nonpoor mothers to communicate effec-tively with their children and less likely to show bothverbal and physical affection toward their children.Nonpoor mothers tended to choose forms of disci-pline such as talking and ignoring, and were lesslikely to ground or spank their children, give them achore, send them to their room, or take away their al-lowance. At all age levels, and across all ethnic groups,parents living below the poverty level were morelikely to spank their children and less likely to moni-tor them. Nonpoor mothers were also more likely toexpect their children to perform a number of choresaround the house. Importantly, nonpoor children were
substantially more likely to have meaningful contactwith their fathers than were poor children. The absenceof fathers in the lives of poor children is noteworthy,both because of its generally negative consequencesfor child well-being and the fact that the impact ofpoverty on well-being is exacerbated in single-parenthomes (Cabrera, Tamis-LeMonda, Bradley, Hofferth,& Lamb, 2000; Hanson, McLanahan, & Thomson, 1997;Lamb, 1997). On the positive side, there were nopoverty status differences in how often children sawfamily and friends, except that more poor EuropeanAmericans reported being severely isolated (i.e., seeingfamily and friends less than once a year) than did non-poor European Americans (5.7% versus 2.5%). A simi-lar pattern emerged for Hispanics (9.9% versus 3.8%),but no such pattern emerged for African Americans.
There is a long history of research indicating thateconomic hardship equates to less access to materialgoods and services, fewer opportunities for stimulatingexperiences, and a greater likelihood of exposure to po-tentially damaging conditions (Bradley & Whiteside-Mansell, 1997; Huston et al., 1994). This study, likeothers before, shows that poverty decreases the likeli-hood that children will be exposed to developmen-tally enriching materials and experiences, both insideand outside of the home. Across all ethnic groups,nonpoor children were much more likely to have 10or more developmentally appropriate books thantheir poor counterparts. They were also much morelikely to have a family member read to them, teachthem school-related concepts, and provide them withspecial lessons to increase their skills. Likewise, for allethnic groups, nonpoor children were approximatelytwice as likely to be taken to the museum as poor chil-dren, and 1½ times as likely to be taken to the theater.Such findings are consistent with recent intensive in-vestigations on differences in the daily experiences ofchildren living in different socioeconomic strata (Hart& Risley, 1995).
Results from this study show that being poor af-fects nearly every aspect of children’s home lives.Poverty effects were prevalent in all six environmen-tal domains examined: from parental responsivenessto parental teaching, from the quality of the physicalenvironment to the level of stimulation for learningpresent, and from the likelihood of being spanked tothe likelihood of having significant contact with one’sfather. Indeed, of the 124 HOME-SF items examined,nonsignificant poverty effects were noted on only 15(or 12% of the total), even when adjusting � levelsfor the number of statistical tests conducted. More-over, poverty status made a difference irrespective ofwhether the mother reported on what happened athome or whether the home visitor obtained informa-

1864 Child Development
tion via direct observation. The mean effect size forpoverty status across all ethnic groups and all age pe-riods was small, h � .22, but on about one fourth ofthe indicators, the effect size was greater than .30. Itwas also proportional across ethnic groups for everyitem. Taken as a whole, these findings confirm, in a farmore detailed way, how different the daily lives ofpoor children tend to be than the daily lives of chil-dren who are more affluent (Bradley & Whiteside-Mansell, 1997; Duncan & Brooks-Gunn, 1997; Hustonet al., 1994).
Current theories about ethnic and racial differ-ences in how parents parent and how the home envi-ronments of one group differ from those of anothersuggest quite complex relations (Gjerde, 2000; Mas-ten, 1999). When predicting the impact of ethnicity onthe likelihood a child will be exposed to a particularaction, object, event, or condition, one is confrontednot only with differences that emerge from culture,but also with the fact that members of American mi-nority groups are playing out their cultural beliefsand traditions against a dominant majority culture,and ethnicity is confounded with socioeconomic sta-tus and (for some) issues connected with recency ofimmigration (García Coll et al., 1996, 1999). Resultsfrom this study show both similarities and differencesacross ethnic groups in terms of the percentage ofchildren who were exposed to various acts, events, ob-jects, and conditions within their home environments.For example, about 90% of all mothers (regardless ofgroup) spoke to their infants during the time of thevisit; and the immediate play environments of about85% to 90% of infants (regardless of group) appearedsafe. In addition, relatively few mothers (5% to 11%)restricted their preschoolers during the visit, between90% and 95% reported helping their children learnnumbers, about 70% of elementary school-age children(regardless of group) were encouraged to talk duringthe visit, and most homes (90%) in all groups werejudged to be reasonably clean. For children in earlyadolescence, there were few reported differences inthe frequency with which children were sent to theirrooms for breaking a family rule.
For most indicators, however, there was evidenceof ethnic group differences. There were indicators onwhich every group had a high percentage of familiesreceiving “credit” for the item, yet some groups wereeven higher than others (e.g., at least 70% of all fami-lies of elementary school-age children reported dis-cussing TV programs with their child, but nearly 88%of European Americans and Asian Americans reportedthis activity). There were other indicators for whichthe majority of families in every group did not receive“credit,” yet some groups were even lower than others
(e.g., 32% of poor Hispanic families reported thatfathers spent time outdoors with elementary school-age children every day, whereas �24% of families inthe other ethnic groups made this claim). Overall, Eu-ropean American families and Asian American fami-lies more often received credit on HOME-SF items thandid African American and Hispanic American fami-lies, within both poor and nonpoor groups. Sometimesthe differences were great; more often they were small(the mean effect for ethnicity was �.20 for all age pe-riods). For the most part, the differences observedamong ethnic groups reproduced differences re-ported in other studies. For example, African Ameri-can mothers displayed overt physical affection dur-ing the visit less often and reported using physicalpunishment more often (Kelley et al., 1992). EuropeanAmerican and Asian American households containedmaterials for learning and recreation more often. Eu-ropean American mothers also tended to read to theirchildren more often, albeit the percentage of AsianAmerican mothers who read to their children wasequal to European Americans after infancy. Fatherswere present in the homes of African American chil-dren less frequently than for the other three eth-nic groups. Group differences were less however, forseeing father at least once a week than for seeingfather daily.
One of the distinct advantages of the NLSY datasetwas that it made possible the examination of variabil-ity within ethnic groups and increased the likelihoodof separating effects due to ethnicity from effects dueto other demographic factors. The results with respectto spanking were interesting in this regard—in effect,they ran somewhat counter to the prevailing assump-tion that African American children are spanked morefrequently than children from other ethnic groups.Although a higher percentage of African Americanmothers reported spanking their children than was thecase for the other ethnic groups, for children ages 3 to5, poor African American mothers were actually ob-served hitting or restricting their children less often(5.8% and 8.5%, for children ages 3 to 5 and 6 to 9, re-spectfully) than poor European American (8.7% and10.8%, for children ages 3 to 5 and 6 to 9, respectively)or poor Hispanic American mothers (8.6% and 10.3%,for children ages 3 to 5 and 6 to 9, respectively). Thisfinding is significant in light of research showing neg-ative consequences of harsh punishment by Euro-pean American parents but not by African Americanparents (Deater-Deckard, Dodge, Bates, & Pettit,1996). Although it is true that African American fam-ilies, regardless of income, were more likely to usespanking as a means of discipline, they were no morelikely than European American families to spank their

Bradley et al. 1865
infants three or more times per week; and poor Euro-pean American families were the most likely to spankchildren eight or more times per week. The patternfor frequent spanking was similar, although not as ro-bust, for children ages 3 to 5. These results highlightthe advantage of using more precise estimates ofspanking frequency than simple yes or no options(Day et al., 1998).
Although in certain instances it can be useful to notedifferences among cultural (ethnic) groups, those dif-ferences may be “secondary to accounting for the rel-evance of the variables within a particular group”(Cocking, 1994, p. 402)—in effect, understanding themeaning within context. It is important to bear in mindthat the indicators on the HOME-SF, although care-fully drawn because of their presumed importancefor children’s development, have emerged in an his-torical/ethnic context that is dominated by modernWestern thought (see discussions by Berry, Poortina,Segall, & Dasen, 1992; García Coll et al., 1995, 1999).Moreover, a number of factors likely contribute tothe differences observed between ethnic groups onthe HOME-SF items, including differences in goals,beliefs, and practices that are part of ethnic legacy anddifferences in macro-level social and political forcesfacing certain groups, such as racism and other ele-ments of social stratification (García Coll et al., 1996).
For people of color, coping with discrimination andoppression from the dominant culture may also con-tribute to differences in parenting practices and envi-ronmental conditions within the home (McAdoo, 1993;Ogbu, 1994). Part of the ethnic group differences ob-served on the HOME-SF probably reflects family in-come and neighborhood of residence as well. Eventhough poverty status was controlled in the analysesexamining ethnic differences, poverty was enteredinto the analyses as a two-level variable (poor versusnonpoor). Within both the poor and the nonpoor lev-els, the average family income of African Americansand Hispanic Americans was lower than that of Euro-pean American families, leaving open the possibilitythat some additional small effects of income could beconnected to the observed ethnic group differences.Furthermore, greater percentages of these two groupslived in impoverished urban settings, a factor that hasa negative impact on parenting (Bradley & Whiteside-Mansell, 1997; Duncan & Brooks-Gunn, 1997; Hustonet al., 1994).
The primary purpose of this study was to provideinformation on how frequently children in the UnitedStates are exposed to the kinds of acts, objects, events,and conditions cataloged on widely used measures ofthe home environment. The results showed substan-tial diversity across families within every major eth-
nic and income group. There were both similaritiesand differences across ethnic groups, differences thatwe conceptualize as reflective of both historic ethniclegacies and current macro-level contextual condi-tions. The most pervasive differences were those re-lated to poverty. The findings, although generally inline with findings from previous studies, are valuablefor their breadth and for the fact that they are basedon thousands of cases, carefully drawn to representthe U.S. population. There are, however, limitationsin the sample, given the sampling frame for the NLSYand the fact that children of mothers who began givingbirth later in life had not yet reached age 14. Finally, asuseful as information from the NLSY is in describingthe family experiences of children in the United States,the HOME-SF contains only a limited census of indi-cators on the child’s total range of experiences in thehome. For example, relatively little attention is paidto experiences with siblings and extended family—experiences known to be associated with the course ofdevelopment (Dunn & Plomin, 1990). The census of in-dicators contained in the HOME-SF Inventories maybe more meaningful for some groups of families andless meaningful for others (Bradley et al., 1997). Corre-spondingly, it may be more predictive of children’s de-velopment for some groups than others (Bradley et al.,1989; Dubrow et al., 1996). Alternatively, as stipulatedby Wachs (2000), there may be great variability in childoutcomes for children who experience similar environ-ments. These issues were examined in Part 2 (Bradleyet al., 2001) of this study. Hopefully, the informationprovided by the HOME-SF is a useful first step in map-ping the topography of children’s experiences in thehome. A more complete understanding of the child’shome environment will require an even more detailedmapping of those exchanges and conditions.
ACKNOWLEDGMENTS
Funding for this research was received from the Officeof Educational Research and Improvement through agrant to the National Center for Early Learning andDevelopment. The authors wish to thank Frank Mottand Paula Baker for their assistance with the NLSYdataset. More detailed information on findings fromthis study can be obtained at http://www.ualr.edu/~HOME.
ADDRESSES AND AFFILIATIONS
Corresponding author: Robert H. Bradley, Center forApplied Studies in Education, University of Arkansasat Little Rock, 2801 S. University Avenue, Little Rock,

1866 Child Development
AR 72204; e-mail: [email protected]. Robert F. Cor-wyn is also at the University of Arkansas; HarriettePipes McAdoo is at Michigan State University, EastLansing, MI; and Cynthia García Coll is at BrownUniversity, Providence, RI.
REFERENCES
Aina, T. A., Agiobu-Kemmer, I., Etta, E. F., Zeitlin, M. F., &Setiloane, K. (1993). Early child care development and nutri-tion in Lagos State, Nigeria. Phase I survey results from thepositive deviance in nutrition research project producedby the Social Sciences Faculty, University of Lagos, andthe Tufts University School of Nutrition Science and Pol-icy for UNICEF, New York. Unpublished manuscript.
Bell, R. Q., & Chapman, M. (1986). Child effects in studiesusing experimental and brief longitudinal approaches tosocialization. Developmental Psychology, 22, 595–603.
Berry, J. W., Poortina, Y. H., Segall, M. H., & Dasen, P. R.(1992). Cross-cultural psychology research and applications.New York: Cambridge University Press.
Bollen, K., & Lennox, R. (1991). Conventional wisdom onmeasurement: A structural equation perspective. Psycho-logical Bulletin, 110, 305–314.
Bornstein, M. H. (1989). Maternal responsiveness: characteris-tics and consequences. San Francisco, CA: Jossey-Bass.
Bornstein, M. H., Tamis-LeMonda, C. S., Tal, H., Ludemann,P. I., Toda, S., Rahn, C. W., Pecheux, M., Asuma, H., &Vardi, D. (1992). Maternal responsiveness to infants inthree societies: The United States, France, and Japan.Child Development, 63, 808–821.
Boykin, A. W., & Toms, F. D. (1985). Black child socializa-tion: A conceptual framework. In H. P. McAdoo & J. L.McAdoo (Eds.), Black children (pp. 33–53). Beverly Hills,CA: Sage.
Bradley, R. H. (1994). The HOME Inventory: Review and re-flections. In. H. W. Reese (Ed.), Advances in child develop-ment and behavior (Vol. 25, pp. 241–288). San Diego, CA:Academic.
Bradley, R. H., Caldwell, B. M., Rock, S. L., Barnard, K.,Gray, C., Hammond, M., Mitchell, S., Siegel, L., Ramey,C., Gottfried, A., & Johnson, D. (1989). Home environ-ment and cognitive development in the first 3 years oflife: A collaborative study involving six sites and threecultural groups in North America. Developmental Psy-chology, 25, 217–235.
Bradley, R. H., Corwyn, R. F., Burchinal, M., McAdoo, H. P.,& García Coll, C. (2001). The home environments of chil-dren in the United States Part II: Relations with behav-ioral development through age thirteen. Child Develop-ment, 72, 1868–1886 .
Bradley, R. H., Corwyn, R., & Whiteside-Mansell, L. (1996).Life at home: Same time, different places. An examina-tion of the HOME Inventory in different cultures. EarlyDevelopment and Parenting, 5, 251–269.
Bradley, R. H., & Whiteside-Mansell, L. (1997). Children inpoverty. In R. T. Ammerman & M. Hersen (Eds.), Hand-
book of prevention and treatment with children and adoles-cents (pp. 13–58). New York: Wiley.
Brody, G. H., & Flor, D. L. (1998). Maternal resources,parenting practices, and child competence in rural, single-parent African American families. Child Development, 69,803–816.
Bronfenbrenner, U. (1995). The bioecological model from alife course perspective: Reflections of a participant ob-server. In P. Moen, G. H. Elder, & K. Luscher (Eds.), Ex-amining lives in context (pp. 599–618). Washington, DC:American Psychological Association.
Cabrera, N. J., Tamis-LeMonda, C. S., Bradley, R. H., Hof-ferth, S., & Lamb, M. E. (2000). Fatherhood in the 21stcentury. Child Development, 71, 127–136.
Caldwell, B., & Bradley, R. H. (1984). Home Observation forMeasurement of the Environment. Little Rock: Universityof Arkansas at Little Rock.
Center for Human Resource Research (CHRR). (1995).NLS user’s guide 1995. Columbus: The Ohio State Uni-versity.
Center for Human Resource Research (CHRR). (1997a).Mainfile codebook supplement, No. 2: total net family incomevariable creation 1979–1994. Columbus: Ohio State Uni-versity.
Center for Human Resource Research (CHRR). (1997b).1994 child and young adult data users guide. Columbus:Ohio State University.
Clarke, A. M., & Clarke, A. D. B. (1976). Early experiences:Myth and evidence. New York: Free Press.
Cocking, R. R. (1994). Ecologically valid frameworks of de-velopment: Accounting for continuities and discontinu-ities across contexts. In P. M. Greenfield & R. R. Cocking(Eds.), Cross-cultural roots of minority child development(pp. 393–410). Hillsdale, NJ: Erlbaum.
Cohen, J. (1987). Statistical power analysis for the behavioral sci-ences. Hillsdale, NJ: Erlbaum.
Conger, R. D., Conger, K. J., & Elder, G. H. (1997). Familyeconomic hardship and adolescent adjustment: Mediat-ing and moderating processes. In G. J. Duncan &J. Brooks-Gunn (Eds.), Consequences of growing up poor(pp. 288–310). New York: Russell Sage Foundation.
Day, R. D., Peterson, G. W., & McCracken, C. (1998). Predict-ing spanking of younger and older children by mothersand fathers. Journal of Marriage and Family, 60, 79–94.
Deater-Decker, K., Dodge, K. A., Bates, J. E., & Pettit, G. S.(1996). Physical discipline among African American andEuropean American mothers: Links to children’s external-izing behaviors. Developmental Psychology, 32, 1065–1072.
Duncan, G. J., & Brooks-Gunn, J. (1997). Consequences ofgrowing up poor. New York: Russell Sage Foundation.
Dunn, J., & Plomin, R. (1990). Separate lives: Why siblings areso different. New York: Basic.
Durbrow, E., Jones, E., Bozoky, S. J., & Adam, E. (1996, Au-gust). How well does the HOME Inventory predict Caribbeanchildren’s academic performance and behavior problems?Poster session presented at the XIVth biennial meetingof the International Society for the Study of BehavioralDevelopment, Quebec City, Canada.
Erlanger, H. S. (1974). Social class and corporal punishment

Bradley et al. 1867
in childrearing. A reassessment. American Sociological Re-view, 58, 131–144.
Ford, D. M., & Lerner, R. M. (1992). Developmental systemstheory. Newbury Park, CA: Sage.
García Coll, C. (1995). Ethnic and minority parenting. InM. H. Bornstein (Ed.), Handbook of parenting: Vol. 2. Bio-loty and ecology of parenting (pp. 189–210). Mahwah: NJ:Erlbaum.
García Coll, C., Lamberty, G., Jenkins, R., McAdoo, H. P.,Crnic, K., Wasik, B. H., & García, H. V. (1996). An integra-tive model for the study of developmental competenciesin minority children. Child Development, 67, 1891–1914.
García Coll, C., & Magnusson, K. (1999). Cultural influenceson child development: Are we ready for a paradigmshift? In A. S. Matsen (Ed.), Cultural processes in child de-velopment. The Minnesota Symposia on Child Psychology(Vol. 29, pp. 1–24). Mahwah, NJ: Erlbaum.
García Coll, C., Meyer, E., & Britten, S. (1995). Ethnic andminority parenting. In M. H. Bornstein (Ed.), Handbook ofparenting: Vol.2. Biology and ecology of parenting (pp. 189–210). Mahway, NJ: Erlbaum.
Gjerde, P. F., & Onishi, M. (2000). In search of theory: Thestudy of “ethnic groups” in developmental psychology.Journal of Research on Adolescence, 10, 289–297.
Giles-Sims, J., Straus, M. A., & Sugarman, D. B. (1995).Child, maternal and family characteristics associatedwith spanking. Family Relations, 44, 170–176.
Greenfield, P. M. (1994). Independence and interdepen-dence as developmental scripts: Implications for theory,research, and practice. In P. M. Greenfield & R. R. Cock-ing (Eds.), Cross-cultural roots of minority child development(pp. 1–37). Hillsdale, NJ: Erlbaum.
Hanson, T. L., McLanahan, S., & Thomson, E. (1997). Economicresources, parental practices, and children’s well-being. InG. L. Duncan & J. Brooks-Gunn (Eds.), Consequences ofgrowing up poor (pp. 190–238). New York: Russell Sage.
Harkness, S., & Super, C. M. (1995). Culture and parenting.In M. H. Bornstein (Ed.). Handbook of parenting: Vol. 2. Bi-ology and ecology of parenting (pp. 211–234). Mahwah, NJ:Erlbaum.
Hart, B., & Risley, T. (1995). Meaningful differences in the ev-eryday experience of young American children. Baltimore,MD: Brookes.
Hui, C. H., & Triandis, H. C. (1985). Measurement in cross-cultural psychology. Journal of Cross-Cultural Psychology,16, 131–153.
Huston, A. C., McLoyd, V. C., & García Coll, C. (1994). Chil-dren and poverty: Issues in contemporary research.Child Development, 65, 275–282.
Kagan, J. (1984). The nature of the child. New York: Basic.Kelley, M. L., Power, T. G., & Wimbush, D. D. (1992). Deter-
minants of disciplinary practices in low-income Blackmothers. Child Development, 63, 573–582.
Lamb, M. (Ed.). (1997). The role of the father in child develop-ment (3rd. ed.). New York: Wiley.
Lewis, M. (1997). Altering fate. New York: Guilford.Luster, T., & McAdoo, H. P. (1996). Family and child influ-
ences on educational attainment: A secondary analysisof the High/Scope Perry Preschool data. DevelopmentalPsychology, 32, 26–39.
Magnusson, D. (1995). Individual development: A holistic,integrated model. In P. Moen, G. H. Elder, & K. Luscher(Eds.), Examining lives in context (pp. 19–60). Washing-ton, DC: American Psychological Association.
Masten, A. S. (Ed.). (1999). Cultural processes in child develop-ment: Vol. 29. The Minnesota Symposia on Child Psychology.Mahwah, NJ: Erlbaum.
McAdoo, H. P. (1993). Ethnic families: Strength in diversity.Newbury Park, CA: Sage.
McAdoo, H. P. (1997). Black families (3rd. ed.). ThousandOaks, CA: Sage.
McLoyd, V. C. (1990). The impact of economic hardship onAfrican American families and children: Psychologicaldistress, parenting, and socioemotional development.Child Development, 61, 311–346.
McLoyd, V. C. (1999). Cultural influences in a multiculturalsociety: Conceptual and methodological issues. In A. S.Masten (Ed.), Cultural processes in child development. TheMinnesota Symposia on Child Psychology (Vol. 29, pp. 123–135). Mahwah, NJ: Erlbaum.
Nihira, K., Tomiyasu, Y., & Oshio, C. (1987). Homes of TMRchildren: Comparison between American and Japanesefamilies. American Journal of Mental Deficiency, 91, 486–495.
Ogbu, J. U. (1994). From cultural differences to differencesin cultural frame of reference. In P. M. Greenfield & R. R.Cocking (Eds.), Cross-cultural roots of minority child devel-opment (pp. 365–392). Hillsdale, NJ: Erlbaum.
Parke, R. D., & Buriel, R. (1997). Socialization in the family:Ethnic and ecological perspectives. In N. Eisenberg(Ed.), W. Damon (Series Ed.), Handbook of child psychol-ogy: Vol. 3. Social, emotional, and personality development(5th ed., pp. 463–552). New York: Wiley.
Plomin, R., & Bergeman, C. (1991). The nature of nurture:Genetic influence on “environmental” measures. Behav-ioral and Brain Sciences, 14, 373–427.
Portes, P. R., Dunham, R. M., & Williams, S. (1986). Assess-ing child-rearing style in ecological settings: Its relationto culture, social class, early age intervention and scho-lastic achievement. Adolescence, 21, 723–735.
Scarr, S., & McCartney, K. (1983). How people make theirown environments: A theory of genotype→environmenteffects. Child Development, 54, 424–435.
Slaughter, D. T. (1988). Black children and poverty: A develop-mental perspective. San Francisco: Jossey-Bass.
U.S. Department of Commerce. (2001). Overview of race andHispanic origin (U.S. Census Bureau, Publication No.C2KBR/01-1). Washington, DC: U.S. Government Print-ing Office.
Wachs, T. D. (1992). The nature of nurture. Newbury Park,CA: Sage.
Wachs, T. D. (2000). Necessary but not sufficient. Washington,DC: American Psychological Association.