Mixed scheme based multimodal medical image fusion using Daubechies Complex Wavelet Transform

The Haar Wavelet Transform of
The DNA Signal Representation
Abdelkader Magdy, Magdy Saeb, A. Baith Mohamed, Ahmed Khadragi
Computer Engineering Department,
Arab Academy for Science, Technology & Maritime Transport,
Alexandria, EGYPT.
Abstract— The Deoxyribonucleic Acid (DNA) is a double-stranded
helix of nucleotides consists of: Adenine (A), Cytosine (C), Guanine
(G) and Thymine (T). In this work, we convert this genetic code into
an equivalent digital signal representation. Applying a wavelet
transform, such as Haar wavelet, we will be able to extract details
that is not so clear in the original genetic code. We compare between
different organisms using the results of the Haar wavelet Transform.
This is achieved by using the trend part of the signal since the trend
part bears the most energy of the digital signal representation.
Consequently, we will be able to quantitatively reconstruct different
biological families.
Keywords— DNA, Haar wavelet, Digital Signal, nucleotides, Trend
part, Fluctuation part.
I. INTRODUCTION
ALL organisms on this planet are made of the same type of
genetic blueprint that is the deciding factor of organism
specifications. This is called Deoxyribonucleic Acid (DNA)
which is a double-stranded helix of nucleotides that carries the
genetic information of a cell. DNA is a combination of 4
nucleotides: Adenine (A), Cytosine (C), Guanine (G) and
Thymine (T).
The massive amounts of these combinations allow for the
multitude of differences between all living things on the planet
from the large scale (mammal versus plant), to the small scale
(blue eyes versus green eyes).
In this work, we compare between multi species DNA by
transferring the data stored in DNA from its biological space
in the signal space. Hence, the proposed approach will take
advantage of the techniques of signal processing. The signal
representation of DNA sequences will enable us to apply
wavelet transforms to the resulting signal [1].
The human is considered a member of the Ape family. There
are 193 living species of apes, 192 of them are covered with
hair. The exception is a naked ape self-named Homosapien
[2].
The recent publication of the complete chimp genome [3],
marked by a celebratory issue of the journal “Nature” recounts
that humans and chimps share 96 percent of the same genetic
material. The number of genetic differences between humans
and chimps is ten times smaller than that among mice and rats
[4].
In the following sections, we will discuss and explain how
we compare between different organisms by extracting
information from DNA code not so clear in the original
biological space. In section II, we present the binary and
quaternary representation of the DNA sequence and the length
of DNA code. In section III, the Haar wavelet is applied to the
resulting signal to enable us to extract information from DNA
code. In section IV, we compare between different species of
the same evolutionary space. In section V, we compare
between different species of different evolutionary families.
II. DNA SIGNAL REPRESENTATIONS
To deal with DNA code we must convert it into signal
space. That means taking the advantage of the signal
processing and hence can apply known signal processing
techniques to analyze genomic information.
A. DNA Binary and Quaternary Representations
Mapping the DNA sequences to binary representation is a
simple and a straightforward procedure. For most tasks, a flat
encoding of 2 bits/nucleotide, assigned in an alphabetical order
would be a sufficient starting point [5].
A = (00)2 or A = 0Q
C = (01)2 or C = 1Q
G = (10)2 or G = 2Q
T = (11)2 or T = 3Q
For example the DNA sequence:
ACTGGTTTAAACTC
will be represented in binary format as:
(00,01,11,10,10,11,11,11,00,00,00,01,11,01)2

It will be represented in quaternary format as:
(0,1,3,2,2,3,3,3,0,0,0,1,3,1)q
B. DNA Genomic Length
The length of the DNA sequence may reach millions of
bases. The DNA sequence of any organism can be downloaded
from the gene bank [6].
When the length of the DNA sequence increases, the
resulting resolution increases accordingly and vice versa.
These results are used to distinguish between different
organisms.
The following examples compare between three different
species such as Human, Shaping frog and Eurasian wolf in a
small and large DNA sequence.
1) Choose only 100 DNA sequences for each species
Applying Haar wavelets on the three strands, we get:
Human = 16.528621010235557520218208082952
Frog = 14.49568901432423118080805579666
Wolf = 17.235727791422103649665586999618
2) Choose only 5000 DNA sequences for each species
Applying Haar wavelets on the three strands, we get:
Human = 131.57710401797817212354857474566
Frog = 127.22397789629849285120144486427
Wolf = 119.2358809775816865794695331715
From the above results, when the number of the DNA
sequences decreases the results between Human and the two
other species are too close and the resultant resolution is not
clear. However, when the DNA sequence increases, the results
between Human and two other species are more separate.
The DNA of any organism contains millions of DNA
sequences. In our experiments we use only 5000 base pairs of
this DNA sequence to increase the resultant resolution and to
reduce execution time.
III. THE HAAR WAVELET
A wavelet is a function with some special properties.
Literally, the term “wavelet” means little wave [7]. The Haar
wavelet is the simplest type of wavelets [8], [9]. Usually it is
used for compressing signals and for removing noise.
The Haar transform decomposes signal into two half sub-
signals. The first half is called the "Trend" and the second half
is called the "Fluctuations”.
A. Haar Trend Part
The first trend sub-signal a1 = (a1, a2, . . . , aN/2), (define N)
for the signal f is computed by the general formula for the
values of a1 is
(1)
Where m = 1,2,3,……..,N/2.
The second value of the trend part is called a2. Similarities
on the other pairs to compute the other values of the trend part
(Do you mean here to define the trend’s second part, if so this
needs to be rewritten and what does a2 equal)[8].
B. The Haar Fluctuation Part
The first fluctuation sub-signal d1 = (d1, d2, . . . , dN/2), for
the signal f is computed by the general formula for the values
of d1
am = √ 2 * (f2m-1 – f2m)/ 2
(2)
Where m = 1,2,3,……..,N/2.
The second value of the trend part is called d2.Similarities
on the other pairs to compute the other values of the
fluctuation part [8].
C. Conservation of Energy
The Total energy of the original signal defined by
f = f12 + f2
2 + … + fN
2 (3)
Where, fN , represents the elements of the original signal.
The Haar transform redistributes the energy in a signal by
compressing most of the energy into the trend sub- signal [8].
So we can compute the energy of the original signal by
calculating energy of the total trends Nth
parts.
IV. METHODOLOGY
In this section, we compare between organisms DNA by
comparing the results extracted from DNA sequence; by
applying the Haar wavelet on the DNA code. The process is
repeated until the trend part becomes one term only. This term
has the most focused energy of the original signal. It can be
considered as a good approximation to the original signal [8].
A. Comparing DNA results for Mammal’s Family
Mammals are warm-blooded vertebrates which, with the
exception of a few notable species, nurse their young with milk
produced by the female’s mammary glands. They give birth to
live young, and have bodies insulated by hair [10].
Table I compares between different species of the
mammalian family.

TABLE I
THE NTH
TREND FOR DIFFERENT TYPES OF MAMMAL FAMILY
# Family Type Nth Trend
1
Car
niv
oro
us
Spectacled
Bear
124.50603620611269661822007037699
2 Sloth Bear
122.87085177461878515714488457888
3 Malayan Sun
Bear
122.67197799241004929626797093078
4 Asiatic Lion
118.78289069588404913702106568962
5 Snow Leopard
117.58964800263174765859730541706
6 Cheetah
115.21421115958318637240154203027
7 Amur Tiger
115.02638592083050639303110074252
8
Ho
ofe
d
Bactrian
Camel
118.92652176081256243378447834402
9
Eurasian Elk
116.38535676592341872037650318816
10
American
Bison
119.15854117338940909576194826514
11 Horse 114.15355098780338494179886765778
12
Ap
es
Human
131.57710401797817212354857474566
13 Chimpanzee
132.20687099497243366386101115495
14 Gorilla
119.22483243412564490881777601317
15
Western
Lowland
Gorilla
121.33510423422924873193551320583
16
Mo
nk
eys
Proboscis
Monkey
118.0315897408733434303940157406
17
Black Snub-
Nosed
Monkey
120.07557028024069722960120998323
18 Grivet
Monkey 114.05411409669900990593305323273
In this Table, we show the nth
trends for some mammal
species. Each species are indicated by a family type.
In the carnivorous part, all species of the same type are
close to each other like bears and tigers family.
We note that in the hoofed part, camel and bison are much
closer to each other, but at the other species they are
relatively close.
In the ape family, we found some apes are much closer to
each other. Human and chimpanzee DNA results are much
closer than any other species.
The last part is the monkey family, some of them are much
closer to each other.
B. Comparing DNA results for Reptiles Family
The Reptile family is a cold-blooded, scaly-skinned
vertebrates. Most reptiles reproduce by laying leathery eggs.
However, many lizards and snakes give birth to live young
[10].
Table II compares between different species of the reptile
family.
TABLE II
THE NTH
TREND FOR DIFFERENT TYPES OF REPTILES FAMILY
# Family Type Nth Trend
1
All
igat
ors
An
d
Cro
cod
iles
Nile
Crocodile
118.17522080580187093801214359701
2
American
Alligator
117.14770626439016609765531029552
3 Chinese
Alligator 118.78289069588404913702106568962
4
Sn
akes
Ball
Python
114.83856068207784062451537465677
5 king
cobra
115.58986163708856054199713980779
6
To
rto
ises
An
d T
urt
les
Vietname
se Big-
headed
Turtle
117.29133732931866518356400774792
7 Egyptian
Tortoise
112.02118210078768356652290094644
8 Annam
leaf turtle
113.68951216264969161784392781556
9
Ch
amel
eon
Parson’s
114.17564807471543986139295157045
10 spiny leaf 115.98760920150598963118682149798
In this Table, we present the nth
trends for some reptile
species. Each species is separated by a family type with a
horizontal line.
In the Alligator and Crocodile family, the results are close
to each other. The same is true at the snake and chameleon
families. However, in the Tortoises and Turtles some
results are close as Egyptian Tortoise and the Annam leaf
turtle.
C. Comparing DNA results for Amphibians Category
Amphibians include frogs, toads, newts, salamanders and
the curiously worm-like caecilians. Some of amphibians live
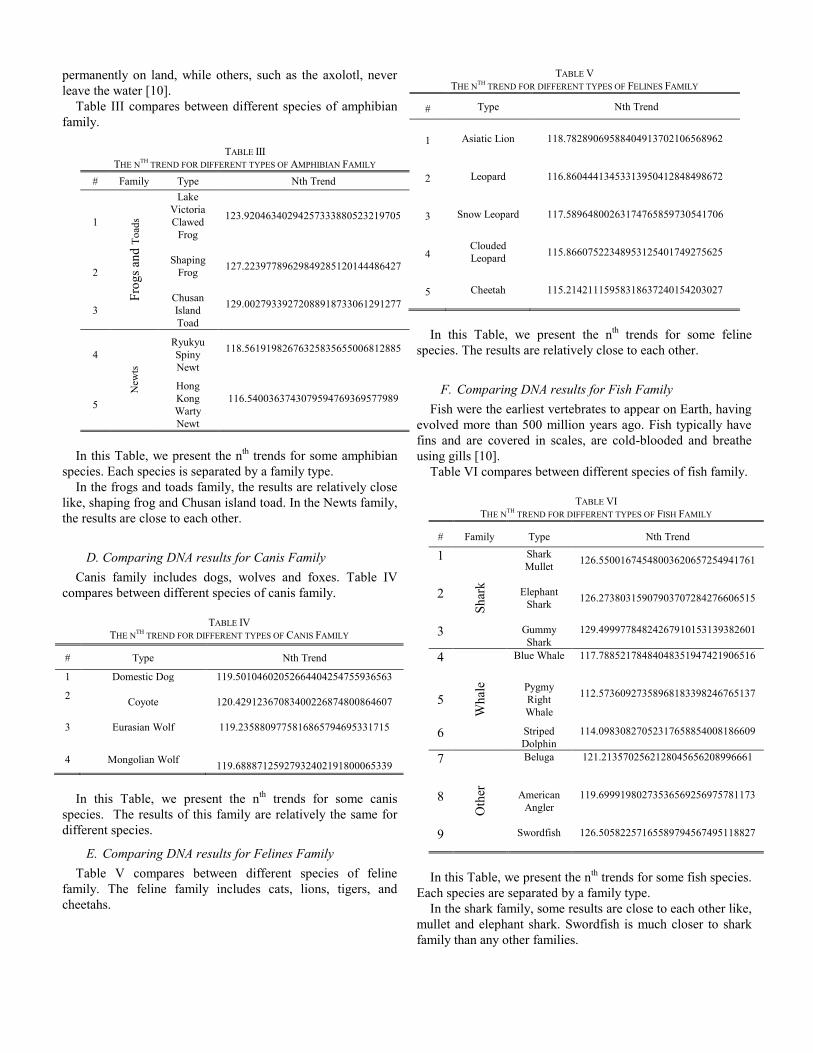
permanently on land, while others, such as the axolotl, never
leave the water [10].
Table III compares between different species of amphibian
family.
TABLE III
THE NTH
TREND FOR DIFFERENT TYPES OF AMPHIBIAN FAMILY
# Family Type Nth Trend
1
Fro
gs
and
To
ads
Lake
Victoria
Clawed
Frog
123.92046340294257333880523219705
2
Shaping
Frog
127.22397789629849285120144486427
3
Chusan
Island
Toad
129.00279339272088918733061291277
4
New
ts
Ryukyu
Spiny
Newt
118.56191982676325835655006812885
5
Hong
Kong
Warty
Newt
116.5400363743079594769369577989
In this Table, we present the nth
trends for some amphibian
species. Each species is separated by a family type.
In the frogs and toads family, the results are relatively close
like, shaping frog and Chusan island toad. In the Newts family,
the results are close to each other.
D. Comparing DNA results for Canis Family
Canis family includes dogs, wolves and foxes. Table IV
compares between different species of canis family.
TABLE IV
THE NTH
TREND FOR DIFFERENT TYPES OF CANIS FAMILY
# Type Nth Trend
1 Domestic Dog 119.50104602052664404254755936563
2 Coyote
120.42912367083400226874800864607
3 Eurasian Wolf
119.2358809775816865794695331715
4 Mongolian Wolf
119.68887125927932402191800065339
In this Table, we present the nth
trends for some canis
species. The results of this family are relatively the same for
different species.
E. Comparing DNA results for Felines Family
Table V compares between different species of feline
family. The feline family includes cats, lions, tigers, and
cheetahs.
TABLE V
THE NTH
TREND FOR DIFFERENT TYPES OF FELINES FAMILY
# Type Nth Trend
1 Asiatic Lion
118.78289069588404913702106568962
2 Leopard
116.86044413453313950412848498672
3 Snow Leopard
117.58964800263174765859730541706
4 Clouded
Leopard
115.86607522348953125401749275625
5 Cheetah
115.21421115958318637240154203027
In this Table, we present the nth
trends for some feline
species. The results are relatively close to each other.
F. Comparing DNA results for Fish Family
Fish were the earliest vertebrates to appear on Earth, having
evolved more than 500 million years ago. Fish typically have
fins and are covered in scales, are cold-blooded and breathe
using gills [10].
Table VI compares between different species of fish family.
TABLE VI
THE NTH
TREND FOR DIFFERENT TYPES OF FISH FAMILY
# Family Type Nth Trend
1
Sh
ark
Shark
Mullet
126.55001674548003620657254941761
2 Elephant
Shark
126.27380315907903707284276606515
3 Gummy
Shark
129.49997784824267910153139382601
4
Wh
ale
Blue Whale 117.78852178484048351947421906516
5 Pygmy
Right
Whale
112.57360927358968183398246765137
6 Striped
Dolphin
114.09830827052317658854008186609
7
Oth
er
Beluga 121.2135702562128045656208996661
8 American
Angler
119.69991980273536569256975781173
9 Swordfish 126.50582257165589794567495118827
In this Table, we present the nth
trends for some fish species.
Each species are separated by a family type.
In the shark family, some results are close to each other like,
mullet and elephant shark. Swordfish is much closer to shark
family than any other families.
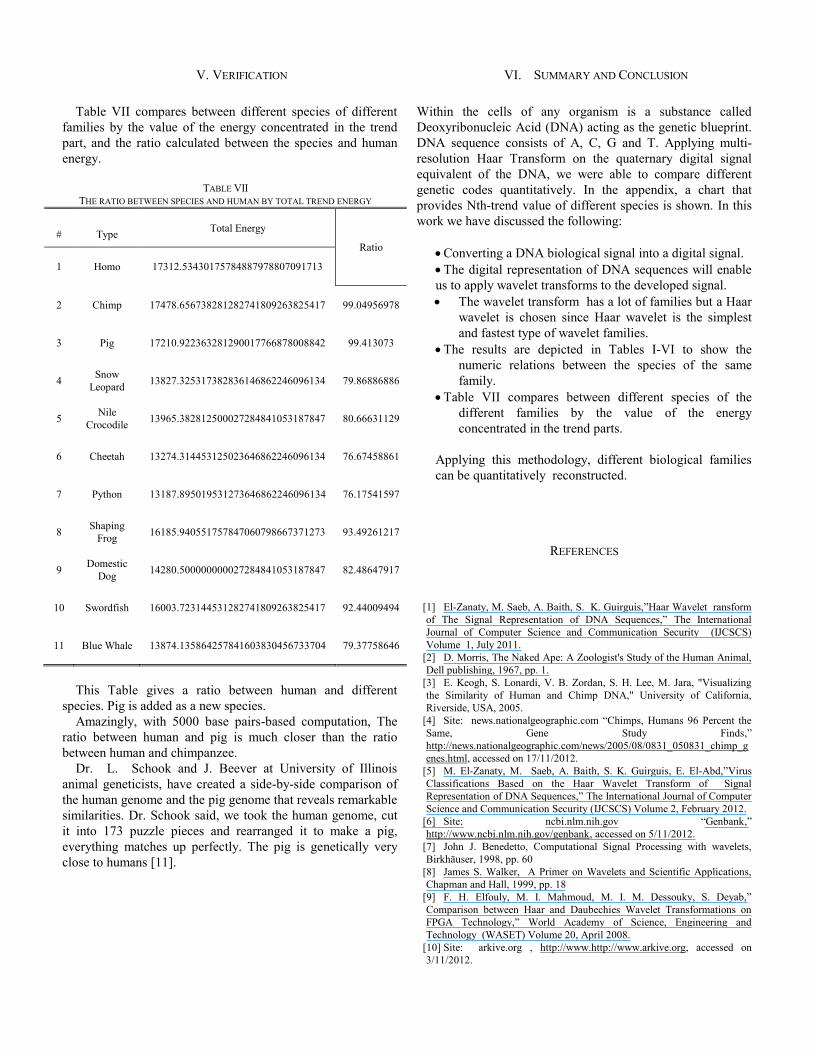
V. VERIFICATION
Table VII compares between different species of different
families by the value of the energy concentrated in the trend
part, and the ratio calculated between the species and human
energy.
TABLE VII
THE RATIO BETWEEN SPECIES AND HUMAN BY TOTAL TREND ENERGY
#
Type
Total Energy
Ratio
1 Homo
17312.53430175784887978807091713
2 Chimp
17478.656738281282741809263825417
99.04956978
3 Pig
17210.922363281290017766878008842
99.413073
4 Snow
Leopard
13827.325317382836146862246096134
79.86886886
5 Nile
Crocodile
13965.382812500027284841053187847
80.66631129
6 Cheetah
13274.314453125023646862246096134
76.67458861
7 Python
13187.895019531273646862246096134
76.17541597
8 Shaping
Frog
16185.940551757847060798667371273
93.49261217
9 Domestic
Dog
14280.500000000027284841053187847
82.48647917
10 Swordfish
16003.723144531282741809263825417
92.44009494
11 Blue Whale 13874.135864257841603830456733704
79.37758646
This Table gives a ratio between human and different
species. Pig is added as a new species.
Amazingly, with 5000 base pairs-based computation, The
ratio between human and pig is much closer than the ratio
between human and chimpanzee.
Dr. L. Schook and J. Beever at University of Illinois
animal geneticists, have created a side-by-side comparison of
the human genome and the pig genome that reveals remarkable
similarities. Dr. Schook said, we took the human genome, cut
it into 173 puzzle pieces and rearranged it to make a pig,
everything matches up perfectly. The pig is genetically very
close to humans [11].
VI. SUMMARY AND CONCLUSION
Within the cells of any organism is a substance called
Deoxyribonucleic Acid (DNA) acting as the genetic blueprint.
DNA sequence consists of A, C, G and T. Applying multi-
resolution Haar Transform on the quaternary digital signal
equivalent of the DNA, we were able to compare different
genetic codes quantitatively. In the appendix, a chart that
provides Nth-trend value of different species is shown. In this
work we have discussed the following:
Converting a DNA biological signal into a digital signal.
The digital representation of DNA sequences will enable
us to apply wavelet transforms to the developed signal.
The wavelet transform has a lot of families but a Haar
wavelet is chosen since Haar wavelet is the simplest
and fastest type of wavelet families.
The results are depicted in Tables I-VI to show the
numeric relations between the species of the same
family.
Table VII compares between different species of the
different families by the value of the energy
concentrated in the trend parts.
Applying this methodology, different biological families
can be quantitatively reconstructed.
REFERENCES
[1] El-Zanaty, M. Saeb, A. Baith, S. K. Guirguis,”Haar Wavelet ransform
of The Signal Representation of DNA Sequences,” The International
Journal of Computer Science and Communication Security (IJCSCS)
Volume 1, July 2011.
[2] D. Morris, The Naked Ape: A Zoologist's Study of the Human Animal,
Dell publishing, 1967, pp. 1.
[3] E. Keogh, S. Lonardi, V. B. Zordan, S. H. Lee, M. Jara, "Visualizing
the Similarity of Human and Chimp DNA," University of California,
Riverside, USA, 2005.
[4] Site: news.nationalgeographic.com “Chimps, Humans 96 Percent the
Same, Gene Study Finds,”
http://news.nationalgeographic.com/news/2005/08/0831_050831_chimp_g
enes.html, accessed on 17/11/2012.
[5] M. El-Zanaty, M. Saeb, A. Baith, S. K. Guirguis, E. El-Abd,”Virus
Classifications Based on the Haar Wavelet Transform of Signal
Representation of DNA Sequences,” The International Journal of Computer
Science and Communication Security (IJCSCS) Volume 2, February 2012.
[6] Site: ncbi.nlm.nih.gov “Genbank,”
http://www.ncbi.nlm.nih.gov/genbank, accessed on 5/11/2012.
[7] John J. Benedetto, Computational Signal Processing with wavelets,
Birkhäuser, 1998, pp. 60
[8] James S. Walker, A Primer on Wavelets and Scientific Applications,
Chapman and Hall, 1999, pp. 18
[9] F. H. Elfouly, M. I. Mahmoud, M. I. M. Dessouky, S. Deyab,”
Comparison between Haar and Daubechies Wavelet Transformations on
FPGA Technology,” World Academy of Science, Engineering and
Technology (WASET) Volume 20, April 2008.
[10] Site: arkive.org , http://www.http://www.arkive.org, accessed on
3/11/2012.

[11] Site: aces.uiuc.edu " Human to Pig Genome Comparison Complete, ”
http://www.aces.uiuc.edu/Discover/discover37.cfm, accessed on
12/11/2012.
BIOGRAPHY
Abdel-kader Magdy received the BSc. In Computer
Engineering, Alexandria Higher Institute of
Engineering & Technology (AIET), in 2010. He is a
Master degree student in Computer Engineering at
Arab Academy for Science, Technology & Maritime
Transport, Alexandria, Egypt; He is an instructor in
Computer Engineering at Alexandria Higher Institute of Engineering &
Technology (AIET).
Magdy Saeb received the BSEE, School of
Engineering, Cairo University, in 1974, the MSEE, and
Ph.D. degrees in Electrical & Computer Engineering,
University of California, Irvine, in 1981 and 1985,
respectively. He was with Kaiser Aerospace and
Electronics, Irvine California, and The Atomic Energy
Establishment, Anshas, Egypt. Currently, he is a professor and head of
the Department of Computer Engineering, Arab Academy for Science,
Technology & Maritime Transport, Alexandria, Egypt; He was on-leave
working as a principal researcher in the Malaysian Institute of
Microelectronic Systems (MIMOS). He holds five International Patents
in Cryptography. His current research interests include Cryptography,
FPGA Implementations of Cryptography and Steganography Data
Security Techniques, Encryption Processors, Mobile Agent Security and
Bioinformatics. www.magdysaeb.net.
A. Baith Mohamed, received the BSc. In Computer
Science, Vienna University, MSc. And Ph.D. in
Computer Science Vienna University, in 1992. He is a
Professor at the Arab Academy for Science and
Technology (AASTMT), Computer Engineering
Department. In addition, he holds the position of Vice
Dean for Training and Community Services, College of
Engineering and Technology. His research interests include computer and
Network Security, Bioinformatics, Steganography, cryptography, and
Genetic Algorithms. He was also a member of an International project
team in Europe, for design and implementation and maintenance of
subsystems in the environment of peripheral processor controls as part of
a large Public Switched Systems (EWSD) in SIEMENS, AG. Austria.
Also, he was a scientific researcher in the department of Information
Engineering, Seibersdorf Research Institute in Austria for design and
implementation of security software system in the domain of railway
automation project (VAX/VMS, DEC system), and Austria. He was also
a member of software testing for distribution points in an international
project in AEG, Vienna, Austria. He is a senior member of IEEE
Computer Society since 2001.
Ahmed Khadragi received the BSc. And MSc. in
Computer Engineering, College of Engineering and
Technology, The Arab Academy for Science,
Technology & Maritime Transport, Egypt, in 2000 and
2003 respectively. He received the PhD in Computer
Science, School of Computing, Science & Engineering,
College of Science & Technology, The University of Salford, UK, in
2011. In 2000 Ahmed started his academic career as a Graduate Teaching
Assistant in the Department of Computer Engineering, The Arab
Academy, Egypt. He was then promoted to an Assistant Lecturer in 2003.
Currently he is a lecturer in the same department. Through the study of
his PhD, he has acquired and built an advanced knowledge base in
computer engineering, microcontroller based system design, data
acquisition, modeling and animation. Dr. Khadragi has recently designed
and implemented a system that interprets and teaches sign language that
met a lot of success locally and internationally. He has constructed his
own hardware and software lab through assembling all the different
equipments and supporting materials from USA, Egypt, Italy, France and
UK. Currently his main research interests include intelligent systems
design, graphic modeling and animation, steganography and
cryptography.
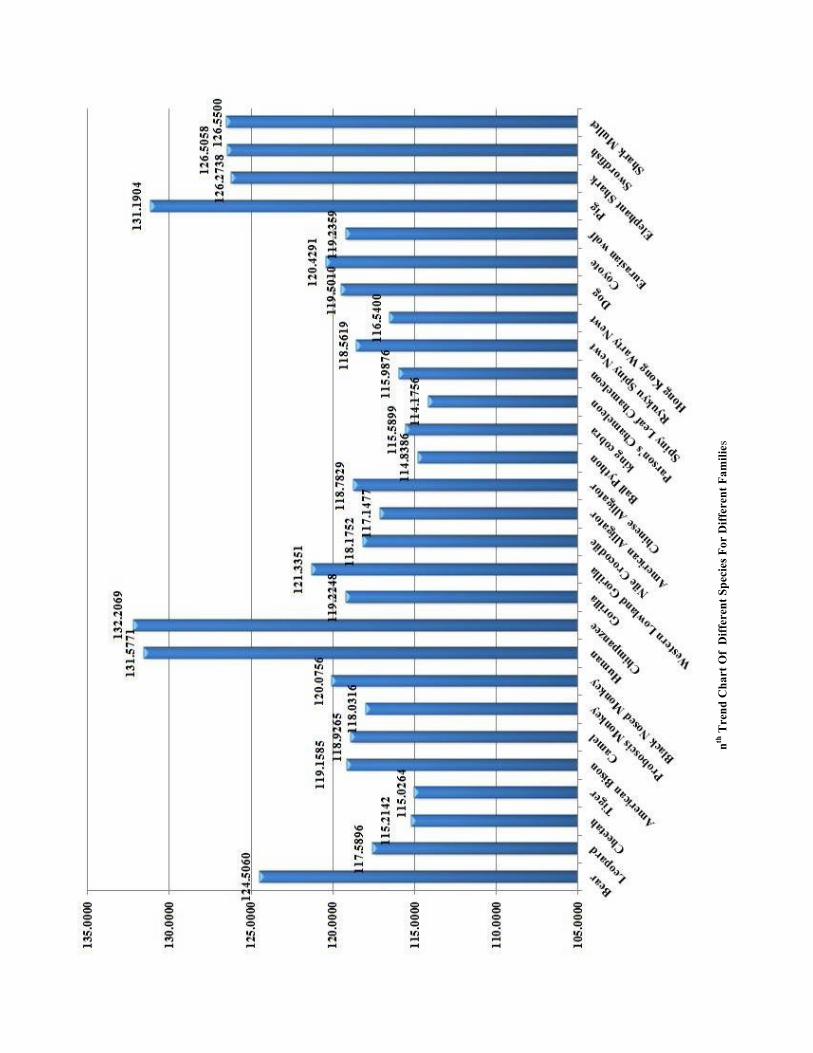
nth
Tre
nd
Ch
art
Of
Dif
fere
nt
Sp
ecie
s F
or
Dif
fere
nt
Fa
mil
ies
Copyright © 2022 FDOKUMEN