The global burden of selected occupational diseases and injury risks: Methodology and summary
19
AMERICAN JOURNAL OF INDUSTRIAL MEDICINE 48:400–418 (2005) The Global Burden of Selected Occupational Diseases and Injury Risks: Methodology and Summary Deborah Imel Nelson, PhD, 1,2 Marisol Concha-Barrientos, MD, DrPH, 3 Timothy Driscoll, MB, BS, PhD, 4 Kyle Steenland, PhD, 5 Marilyn Fingerhut, PhD, 1,6 Laura Punnett, ScD, 7 Annette Pru ¨ss-U ¨ stu ¨n, PhD, 1 James Leigh, MD, PhD, 8 and Carlos Corvalan, MPH, PhD 1 Background Around theglobe, work has a heavy impact on health. To better advise policy makers, we assessed the global burden of disease and injury due to selected occupational hazards. This article presents an overview, and describes the methodology employed in the companion studies. Methods Using the World Health Organization (WHO) Comparative Risk Assessment methodology, we applied relative risk measures to the proportions of the population exposed to selected occupational hazards to estimate attributable fractions, deaths, and disability-adjusted life years (DALYs). Numerous occupational risk factors had to be excluded due to inadequate global data. Results In 2000, the selected risk factors were responsible worldwide for 37% of back pain, 16% of hearing loss, 13% of chronic obstructive pulmonary disease (COPD), 11% of asthma, 8% of injuries, 9% of lung cancer, and 2% of leukemia. These risks at work caused 850,000 deaths worldwide and resulted in the loss of about 24 million years of healthy life. Needlesticks accounted for about 40% of Hepatitis B and Hepatitis C infections and 4.4% of HIV infections in health care workers. Conclusions Exposure to occupational hazards accounts for a significant proportion of the global burden of disease and injury, which could be substantially reduced through application of proven risk prevention strategies. Am. J. Ind. Med. 48:400 – 418, 2005. ß 2005 Wiley-Liss, Inc. KEY WORDS: burden of disease; occupational health; DALYs; comparative risk assessment; health impact assessment ȣ 2005 Wiley-Liss, Inc. The views expressed in this article are those of the authors and do not necessarily reflect the position of theWorld Health Organization. This work was performed at World Health Organization, Geneva. Funded by: WHO. *Correspondence to: Deborah Imel Nelson, Geological Society of America, P. O. 9140, Boulder, Colorado 80301-9140. E-mail: dnelson@geosociety.org Accepted 7 July 2005 DOI10.1002/ajim.20211. Published online in Wiley InterScience (www.interscience.wiley.com) 1 Protection of the Human Environment (PHE), World Health Organization, Geneva, Switzerland 2 Geological Society of America, Boulder, Colorado 3 Gerencia de Salud, Asociacio¤ n Chilena de Seguridad, Santiago, Chile 4 School of Public Health,University of Sydney, Sydney NSWAustralia; ELMATOMPty Ltd., Sydney, NSW, Australia 5 Emory University, Atlanta, Georgia 6 National Institute for Occupational Safety and Health,Washington, District of Columbia 7 University of Massachusetts, Lowell, Massachusetts 8 Centre for Occupational and Environmental Health, School of Public Health, University of Sydney, Sydney, NSW, Australia
-
Upload
independent -
Category
Documents
-
view
0 -
download
0
Transcript of The global burden of selected occupational diseases and injury risks: Methodology and summary

AMERICAN JOURNAL OF INDUSTRIAL MEDICINE 48:400–418 (2005)
The Global Burden of Selected OccupationalDiseases and Injury Risks:Methodology and Summary
Deborah Imel Nelson, PhD,1,2� Marisol Concha-Barrientos, MD, DrPH,3
Timothy Driscoll, MB, BS, PhD,4 Kyle Steenland, PhD,5 Marilyn Fingerhut, PhD,1,6
Laura Punnett, ScD,7 Annette Pruss-Ustun, PhD,1 James Leigh, MD, PhD,8
and Carlos Corvalan, MPH, PhD1
Background Around theglobe,work has a heavy impact on health. To better advise policymakers, we assessed the global burden of disease and injury due to selected occupationalhazards. This article presents an overview, and describes the methodology employed in thecompanion studies.Methods Using the World Health Organization (WHO) Comparative Risk Assessmentmethodology, we applied relative risk measures to the proportions of the populationexposed to selected occupational hazards to estimate attributable fractions, deaths, anddisability-adjusted life years (DALYs). Numerous occupational risk factors had to beexcluded due to inadequate global data.Results In 2000, the selected risk factors were responsible worldwide for 37% of backpain, 16% of hearing loss, 13% of chronic obstructive pulmonary disease (COPD), 11% ofasthma, 8% of injuries, 9% of lung cancer, and 2% of leukemia. These risks at work caused850,000 deaths worldwide and resulted in the loss of about 24 million years of healthy life.Needlesticks accounted for about 40% of Hepatitis B and Hepatitis C infections and 4.4%of HIV infections in health care workers.Conclusions Exposure to occupational hazards accounts for a significant proportion ofthe global burden of disease and injury, which could be substantially reduced throughapplication of proven risk prevention strategies. Am. J. Ind. Med. 48:400–418, 2005.� 2005 Wiley-Liss, Inc.
KEY WORDS: burden of disease; occupational health; DALYs; comparative riskassessment; health impact assessment
� 2005Wiley-Liss, Inc.
The views expressed in this article are those of the authors and do not necessarily reflectthe position of theWorld Health Organization.
This work was performed at World Health Organization, Geneva.Funded by: WHO.*Correspondence to: Deborah Imel Nelson, Geological Society of America, P. O. 9140,
Boulder, Colorado 80301-9140. E-mail: [email protected]
Accepted 7 July 2005DOI10.1002/ajim.20211. Published online inWiley InterScience
(www.interscience.wiley.com)
1Protection of the Human Environment (PHE), World Health Organization, Geneva,Switzerland
2Geological Society of America, Boulder, Colorado3Gerencia de Salud, Asociacio¤ n Chilena de Seguridad, Santiago, Chile4School of Public Health,University of Sydney, SydneyNSWAustralia; ELMATOMPty Ltd.,
Sydney, NSW, Australia5Emory University, Atlanta, Georgia6National Institute for Occupational Safety and Health,Washington, District of Columbia7University of Massachusetts, Lowell, Massachusetts8Centre for Occupational and Environmental Health, School of Public Health, University of
Sydney, Sydney, NSW, Australia

INTRODUCTION
Global Burden of Disease
The World Health Organization’s (WHO) ongoing
Global Burden of Disease (GBD) project provides the most
comprehensive and consistent estimates of mortality and
morbidity for more than 135 causes of disease and injury.
WHO recently conducted a Comparative Risk Assessment
(CRA) to estimate the global burden of disease and injuries
resulting from seven major categories of risk factors:
childhood and maternal under-nutrition, other diet-related
risk factors and physical inactivity, sexual and reproductive
health, addictive substances, environmental risks, selected
occupational risks, and other risks to health [WHO, 2002;
Ezzati et al., 2004]. These categories were comprised of 26
specific risk factors. A consistent WHO methodology was
used throughout the project so that the impacts of these risk
factors could be compared. The major purpose of the CRA
was to improve the evidence base on distribution and costs of
diseases and injuries by risk factor, to support rational health
policy decisions worldwide. All estimates were stratified by
age, gender, and WHO subregions. The GBD is thus a
summary of the health outcomes (death and disability),
estimated by age, gender, and WHO subregion. The CRA is
an estimate of these health outcomes owing to exposures to
the various risk factors, again estimated by age, gender, and
WHO subregion.
The 191 Member States are divided by WHO into six
geographical regions (Africa, Americas, Europe, Eastern
Mediterranean, Southeast Asia, and Western Pacific). These
regions have been further subdivided into five mortality strata
(A–E) on the basis of levels of child mortality under 5 years
of age and 15–59-year-old male mortality [WHO, 2002],
resulting in 14 epidemiological subregions (see Fig. 1). As an
example, America A, which consists of Canada, Cuba, and
the United States, has very low child and very low adult
mortality. This convention is used throughout WHO in cause
of death analyses, burden of disease analyses, and compara-
tive risk assessments.
Various measures have been developed to quantify
population health, but the most useful for the WHO GBD
studies are disability-adjusted life years (DALYs). This is a
summary measure, which calculates the years lost from ideal
lifespan due to morbidity and premature mortality. The
DALY thus represents the gap between the current situation,
and an ideal situation where everyone achieves standard life
expectancy (per the WHO standard, 82.5 years for women, 80
years for men) in perfect health. Use of the maximum average
lifespan seen globally for all countries also facilitates inter-
regional comparisons. A major benefit of calculating the
disease burden in terms of DALYs is that it combines
mortality and morbidity in a single measure, which considers
only age and gender, and is independent of economic
considerations, such as financial costs of disease or value of
human life.
Comparative Risk Assessment
The heart of CRA is determining the number of DALYs
and deaths attributable to exposure to the various risk factors,
in a manner that allows comparisons to be made. This
determination is based on attributable fractions, that is, the
proportion of the incidence of a given health outcome in a
given population that is identified as due to a given exposure
[Pruss-Ustun et al., 2003]. Attributable fractions of a health
outcome were calculated from estimates of the proportion of
a population exposed to a risk factor (at various levels, if
possible), combined with relative risks of disease or death
due to that health outcome resulting from that exposure. The
total number of deaths and/or DALYs attributable to the
given exposure was then determined by multiplying the
attributable fraction by the number of deaths and/or DALYs
estimated by WHO for the relevant health outcome in the
Global Burden of Disease analysis [e.g., WHO, 2004]. These
calculations were conducted by age, gender, and subregion.
This single method was used throughout WHO in attributing
the global burden of disease to the 26 risk factors under study
[Ezzati et al., 2004]. Use of a consistent methodology for all
risk factors allows comparisons and rankings to be made
among them, thus providing further guidance for policy
makers in weighing the merits of various interventions.
The resulting attribution of the global burden of disease,
quantified as the number of deaths and disability-adjusted life
years (DALYs) for each risk factor, by age, gender, and
subregion, is summarized in The World Health Report 2002:
Reducing Risks, Promoting Health Life [WHO, 2002], and
more fully described inComparative Quantification of Health
Risks: Global and Regional Burden of Disease Attributable to
Selected Major Risk Factors [Ezzati et al., 2004].
Previous Studies
Previous attempts have been made to quantify the burden
of occupational disease and injury on a state-wide [Oleinick
et al., 1993], national [e.g., Leigh et al., 1997, 2003;
Loewenson, 1999; Nurminen and Karjalainen, 2001; Steen-
land et al., 2003], or global level [e.g., Murray and Lopez,
1997; Leigh et al., 1999; Takala, 1999]. With few exceptions
[e.g., Nurminen and Karjalainen, 2001], these studies have
not been exposure-based. In 1999, Leigh et al. reported on a
WHO study of the 1994 global burden of occupational
disease and injury in which both direct and indirect methods
were utilized. In the direct approach, injuries and fatalities
were determined using all available published data. Where
Global Burden of Selected Occupational Risks 401

data were not available, estimates were made using
calculated injury or mortality rates for comparable countries
or groups of countries. Occupational disease incidence and
mortality in absolute terms were also determined from all
available published data, and where data were not available,
by applying mean rates from like groups of countries. In
the indirect approach, incidence rates for occupational dis-
ease from Finland were applied at the regional level; simi-
larly, injury rates were based on Australian incidence rates.
These rates were applied without adjustment for established
market economies and former socialist economies of Europe,
and were doubled for less developed economies. We are not
aware of any other exposure-based studies of the global
burden of occupational disease and injury.
Global Burden of Occupational Disease
Using the WHO CRA methodology, we assessed the
global burden of occupational disease and injury resulting
from four selected risk factors for which there were adequate
data: occupational carcinogens, airborne particulates, noise,
and ergonomic stressors. Owing to the lack of universal
data on exposure to occupational hazards, our exposure
assessment was based on national and regional data on the
participation of the population in the work force, where
people work, and the kinds of work they do. Risk estimates,
including relative risks and mortality rates, were derived
primarily from data from developed countries, adapted as
appropriate to developing countries. Attributable fractions
FIGURE 1. Regionalcountrygroupingsfor theWHOglobalburdenofdisease. aSource:Desaietal. [2004].bRegions:AFR,Africa;AMR,Amer-
icas;EMR,EasternMediterranean;EUR,Europe;SEAR,South-EastAsia;WPR,WesternPacific;A:Verylowchild,verylowadultmortality;B:Lowchild,
lowadultmortality;C:Lowchild,highadultmortality;D:Highchild,highadultmortality;E:Highchild,veryhighadultmortality.
402 Nelson et al.

for occupational diseases and injuries were calculated by age,
sex, and subregion, and were used to determine the number of
deaths and DALYs resulting from exposure to selected
occupational risk factors. Data limitations meant that two of
our additional occupational analyses—injuries, and infec-
tions due to needlestick injuries in health workers—could not
be based on the full CRA methodology.
Excluded Exposures and Outcomes
The criteria for selection of risk factors for this study
included widespread exposures, adequacy of exposure
information, applicability of health outcome data to all
regions of the globe, and the inclusion of the relevant health
outcomes in the GBD database of diseases and injuries
[Ezzati et al., 2004]. These strict criteria precluded analysis
of respiratory diseases other than chronic obstructive
pulmonary disease (COPD), asthma, and pneumoconioses;
some infectious diseases; less widespread cancers and
carcinogens; musculoskeletal disorders other than low back
pain; intentional injuries in the workplace; organ and
systemic diseases resulting from occupational exposure to
solvents, pesticides and heavy metals; maternal and perinatal
conditions resulting from occupational exposures; skin
disorders; coronary heart disease, and other outcomes asso-
ciated with work-related stress. Child labor could not be
considered due to the lack of consistent national definitions
for the youngest ages included in the labor force, as well as
lack of exposure and relative risk information on children.
Summary
This article describes the general methodology used to
assess the burden of disease and injury resulting from
exposure to selected occupational risk factors, and provides
overall results. The companion studies provide further detail
on the impacts of exposure to occupational carcinogens
[Driscoll et al., 2005a], airborne particulates [Driscoll et al.,
2005b], noise [Nelson et al., 2005], ergonomic stressors
[Punnett et al., 2005], risk factors for injuries [Concha-
Barrientos et al., 2005], and sharps injuries among health care
workers [Pruss-Ustun et al., 2005]. Driscoll et al. [2005c]
address the total impact of occupational hazards, including
factors that could not be considered in this study, and
compare our results with previous attempts to quantify the
global burden of occupational disease and injury.
MATERIALS AND METHODS
Comparative Risk AssessmentMethodology
The CRA sought to answer three questions: what is the
global burden of disease and injury, apportioned by age, sex,
and WHO subregion; what fraction of that burden is
attributable to exposure to specific risk factors, and how
much of that burden can be avoided by reducing exposures to
those risk factors. For further explanation of attributable
and avoidable burdens and DALYs, see Pruss-Ustun et al.
[2003].
Global burden of disease andinjury statistics
A ‘‘burden of disease’’ study estimates the gaps between
current population health and a normative goal for population
health, for a comprehensive set of disease and injury causes,
and for major risk factors. The World Health Organization
maintains statistics on deaths and DALYs for more than 135
diseases and injuries, apportioned by age, sex, and subregion,
which constituted the list of health outcomes that could
be included in the Comparative Risk Assessment study
[Mathers et al., 2002].
Disability adjusted life years (DALYs) are a function of
age of onset of a health effect or premature mortality, duration
of the disability or time lost due to premature mortality,
disability weighting, age-weighting corrections, and a dis-
count rate (see Murray [1994] for the full equation). These
latter terms account for the fact that societies seem to value a
healthy year of life of a young adult more than of a young child
or elderly person [Murray, 1996; Pruss-Ustun et al., 2003].
DALYs combine mortality and morbidity in a single term:
DALY ¼P
ðYLL and YLDÞ ð1Þ
where:
YLL¼years of life lost due to premature mortality, and
YLD¼ the (weighted) years lived with a disability.
The basic formula for calculating YLD is:
YLD ¼ 1 � DW � L ð2Þ
where:
I¼ the number of incident cases in the reference period,
DW¼ the disability weight (zero to 1), and
L¼ the average duration of disability in years [Mathers
et al., 2002].
WHO uses a wide range of data sources to estimate YLD
from various causes, including disease registers, population
surveys, epidemiological studies, and health facility data.
Disability weights are developed in collaboration with
Member States by methods including general and specific
population surveys.
Attributable fraction. Determining the fraction of the
burden attributable to specific risk factors requires input on
Global Burden of Selected Occupational Risks 403

current (or relevant past) exposures to the risk factor and on
the risk factor–disease relationships. To calculate the
attributable fraction (AF) of deaths or DALYs due to
exposure to a specific health risk factor, the estimates of the
proportion of a population (fi) exposed to the risk factor at k
levels of exposure, and the relative risks of morbidity and/or
mortality from a specific adverse health effect due to that
exposure (RRi) are combined in Equation 3. Although a CRA
analysis can be conducted with only two levels of exposure,
for example, ‘‘nonexposed’’ and ‘‘exposed,’’ smaller values
of k may compromise accuracy of the analysis.
AF ¼Pk
i¼0
fi RRi � 1
� �� Pk
i¼0
fi RRi
� �ð3Þ
The AF is then multiplied by the WHO estimates of deaths or
DALYs due to that health outcome, to determine the number
of deaths or DALYs attributable to the risk factor. These
estimates are made by gender and age, globally and within
each of the 14 WHO subregions.
Avoidable burden. Determining how much of the
burden can be avoided by reducing exposures to the risk
factors requires information on the counterfactual distribu-
tion of exposure, and on the rate of risk reversal once
exposure has ceased. The counterfactual distribution is a
WHO convention for an exposure distribution which will
result in the lowest rate of adverse health effects. WHO
assigns the term ‘‘theoretical minimum’’ exposure to the
exposure level that results in the minimum level of adverse
health outcome. The theoretical minima for each risk factor
are described in the companion articles.
The conduct of our CRA of occupational risk factors
thus required determining for 14 WHO subregions, by age
and gender, (a) the proportion of the population exposed to
each occupational risk factor under study, with a preference
for multiple levels of exposure, (b) the corresponding rela-
tive risk of adverse health outcome(s) resulting from those
exposures, and (c) the theoretical minimum exposure to the
risk factor. The full WHO CRA methodology was applied to
four occupational risk factors: occupational carcinogens,
airborne particulates, noise, and ergonomic stressors. A mo-
dified approach was used for occupational injuries, because
the lack of data in developing nations prevented estimation of
exposure levels and relative risks by occupation or economic
sector. The analysis of infections due to needlesticks was
conducted solely for health care workers.
Data Sources for the CRA ofOccupational Risk Factors
An exhaustive literature review was conducted to locate
studies that evaluated exposures or described relative risks in
such a way that they could be linked to a global assessment of
the risk factor.1
Estimating the Proportion of thePopulation Exposed to OccupationalHazards
As described above, determining the attributable frac-
tion requires estimates of the proportion of a population
exposed to occupational hazards (fi), and the relative risks of
those exposures. The model used for exposure prediction is
presented in the Appendix; coefficients included here relate
to this model.
The proportion of the population that is exposed to
occupational hazards (represented in the overall model as
‘‘PEP’’), and the levels of those exposures, is affected by a
number of factors. The proportion of the population that
works, where they work, and the kinds of jobs they do, and the
presence and effectiveness of exposure controls are the
primary factors. The basis of our exposure assessment was,
therefore, the distribution of the working population into
economic sectors and/or occupational categories, with refine-
ments as necessary. For example, some occupational diseases
have long latency periods, so it is necessary to know how
many people have ever had exposure to the relevant occu-
pational hazard. In these cases, the number of people who
have ever held a specific job (estimated by the rate of
occupational turnover) becomes important. Each of these
factors is discussed below, along with our approach to
obtaining subregion, gender, and age-specific estimates.
Economic Activity Rate (EAR)
The starting point for determining the proportion of the
population with exposure to occupational hazards was
the Economic Activity Rate (EAR). The EAR is calculated
as the number of economically active people (Economically
Active Population, or EAP) in a given age range, divided by
the total population in that age range. The EAP includes
people in paid employment, the self-employed, people who
work to produce goods and services for their own household
consumption, and the unemployed. It includes the majority of
1 Sources included Medline, PubMed, OSHROM (Occupational Safetyand Health—Read Only Memory, published by Croner’s Health andSafety), NIOSHTIC, Ovid Healthstar and the former HealthSTARdatabases, and databases of various organizations, as well as referencesidentified through the initial search, cited in secondary sources, orrecommended by referees and other experts. Keywords included:asbestos; asbestos and mesothelioma; asthmagens; chronic obstructivelung disease; cancer and diesel exhaust; arsenic; benzene and leukemia;ionizing radiation and leukemia; back (for low back pain); injury;accidents; ergonomics; and hearing impairment and noise.
404 Nelson et al.

the informal sector (most of whom are considered as
‘‘employed,’’ with the remainder as ‘‘unemployed’’) [ILO,
2002a], and, therefore, represents the most comprehensive
accounting of persons who may be exposed to occupational
hazards. While most workers could be counted in this
approach, we were unable to include some groups of working
women (e.g., some women who work on family farms), or
working children under 15 (due to wide variations in the
youngest age groups reported in country-level data). We
could not capture the increased risk of occupational hazards
faced by persons in precarious or contingent employment
[Quinlan, 2002].
The primary data source for determining subregional
values of EAR was the ILO Economically Active Population
1950–2010 (2002b), which uses a variety of sources to
project the EAP at the country level, by age and gender.
These data were compiled by subregion, and used to
calculate subregion-specific EARs (see Table I). Variations
between age groups reported by ILO and those used in the
GBD project required that EARs for 60–69-year-olds
be estimated from data for 60–64-year-olds. Data for
people �65 were applied to the 70–79 age group. The
�80 age group was estimated at one half of the rate for the
�65 age group (by comparison with country-level data,
which is reported by some countries for elderly workers)
[ILO, 2001a].
Most of our exposure assessments were based on the
distribution of the EAP �15 years of age into economic
sectors and/or occupations (see below). In contrast, the
exposed population for occupational injuries was based on
TABLE I. Economic Activity Rates byWHOSubregion, Sex, and Age Group
Subregion Sex
Age group (years)
15^29 30^44 45^59 60^69 70^79 �80 Total�15AFR-D Male 0.77 0.97 0.95 0.85 0.65 0.33 0.85
Female 0.50 0.61 0.62 0.48 0.28 0.14 0.53AFR-E Male 0.78 0.97 0.95 0.86 0.66 0.33 0.86
Female 0.64 0.72 0.69 0.54 0.36 0.18 0.65AMR-A (95%) Male 0.70 0.93 0.87 0.50 0.13 0.07 0.73
Female 0.64 0.81 0.71 0.32 0.07 0.04 0.59AMR-B Male 0.78 0.97 0.89 0.66 0.33 0.17 0.82
Female 0.46 0.53 0.39 0.20 0.07 0.04 0.42AMR-D Male 0.71 0.98 0.96 0.86 0.61 0.31 0.82
Female 0.38 0.48 0.39 0.29 0.17 0.09 0.39EMR-B (90%) Male 0.66 0.97 0.92 0.74 0.45 0.23 0.79
Female 0.33 0.37 0.26 0.18 0.09 0.05 0.31EMR-D (40%) Male 0.73 0.97 0.94 0.76 0.44 0.22 0.82
Female 0.37 0.43 0.37 0.25 0.12 0.06 0.37EUR-A Male 0.66 0.96 0.84 0.35 0.05 0.03 0.68
Female 0.59 0.74 0.56 0.14 0.02 0.01 0.47EUR-B Male 0.72 0.96 0.80 0.41 0.22 0.11 0.74
Female 0.56 0.77 0.59 0.23 0.12 0.06 0.54EUR-C Male 0.72 0.97 0.89 0.30 0.11 0.06 0.74
Female 0.61 0.94 0.74 0.17 0.05 0.03 0.58SEAR-B Male 0.74 0.98 0.94 0.73 0.44 0.22 0.83
Female 0.55 0.70 0.65 0.44 0.21 0.11 0.58SEAR-D (95%) Male 0.77 0.98 0.95 0.72 0.53 0.27 0.85
Female 0.45 0.57 0.50 0.32 0.16 0.08 0.47WPR-A Male 0.67 0.97 0.95 0.69 0.30 0.15 0.76
Female 0.57 0.70 0.67 0.36 0.13 0.07 0.52WPR-B (90%) Male 0.81 0.98 0.92 0.61 0.29 0.15 0.84
Female 0.77 0.89 0.67 0.29 0.09 0.05 0.71
Source: ILO [2002b].(a) When data were not available for all countries, the percent of subregional working age population (15þ years) represented by data is indicated. Some very small nations,for example, Grenada, were not included in these calculations.
Global Burden of Selected Occupational Risks 405
the total number of economically active persons aged �15 in
a subregion.
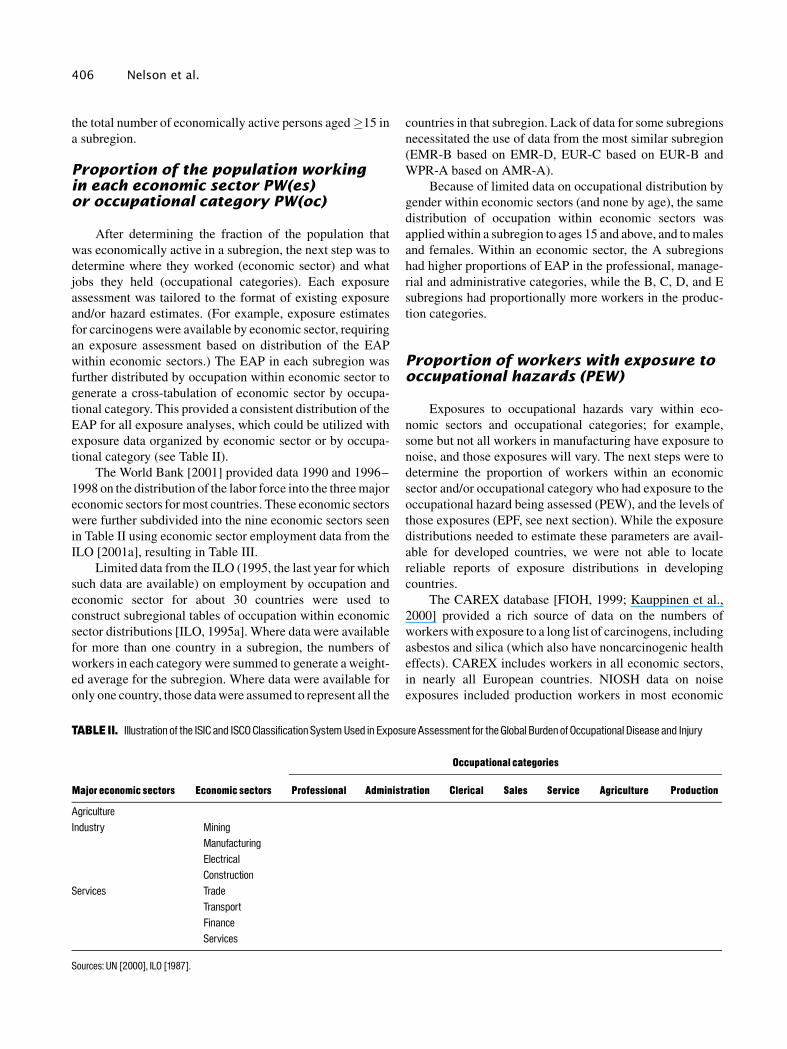
Proportion of the population workingin each economic sector PW(es)or occupational category PW(oc)
After determining the fraction of the population that
was economically active in a subregion, the next step was to
determine where they worked (economic sector) and what
jobs they held (occupational categories). Each exposure
assessment was tailored to the format of existing exposure
and/or hazard estimates. (For example, exposure estimates
for carcinogens were available by economic sector, requiring
an exposure assessment based on distribution of the EAP
within economic sectors.) The EAP in each subregion was
further distributed by occupation within economic sector to
generate a cross-tabulation of economic sector by occupa-
tional category. This provided a consistent distribution of the
EAP for all exposure analyses, which could be utilized with
exposure data organized by economic sector or by occupa-
tional category (see Table II).
The World Bank [2001] provided data 1990 and 1996–
1998 on the distribution of the labor force into the three major
economic sectors for most countries. These economic sectors
were further subdivided into the nine economic sectors seen
in Table II using economic sector employment data from the
ILO [2001a], resulting in Table III.
Limited data from the ILO (1995, the last year for which
such data are available) on employment by occupation and
economic sector for about 30 countries were used to
construct subregional tables of occupation within economic
sector distributions [ILO, 1995a]. Where data were available
for more than one country in a subregion, the numbers of
workers in each category were summed to generate a weight-
ed average for the subregion. Where data were available for
only one country, those data were assumed to represent all the
countries in that subregion. Lack of data for some subregions
necessitated the use of data from the most similar subregion
(EMR-B based on EMR-D, EUR-C based on EUR-B and
WPR-A based on AMR-A).
Because of limited data on occupational distribution by
gender within economic sectors (and none by age), the same
distribution of occupation within economic sectors was
applied within a subregion to ages 15 and above, and to males
and females. Within an economic sector, the A subregions
had higher proportions of EAP in the professional, manage-
rial and administrative categories, while the B, C, D, and E
subregions had proportionally more workers in the produc-
tion categories.
Proportion of workers with exposure tooccupational hazards (PEW)
Exposures to occupational hazards vary within eco-
nomic sectors and occupational categories; for example,
some but not all workers in manufacturing have exposure to
noise, and those exposures will vary. The next steps were to
determine the proportion of workers within an economic
sector and/or occupational category who had exposure to the
occupational hazard being assessed (PEW), and the levels of
those exposures (EPF, see next section). While the exposure
distributions needed to estimate these parameters are avail-
able for developed countries, we were not able to locate
reliable reports of exposure distributions in developing
countries.
The CAREX database [FIOH, 1999; Kauppinen et al.,
2000] provided a rich source of data on the numbers of
workers with exposure to a long list of carcinogens, including
asbestos and silica (which also have noncarcinogenic health
effects). CAREX includes workers in all economic sectors,
in nearly all European countries. NIOSH data on noise
exposures included production workers in most economic
TABLE II. Illustration of the ISIC and ISCO Classification SystemUsed in ExposureAssessment for the Global Burden of Occupational Disease and Injury
Major economic sectors Economic sectors
Occupational categories
Professional Administration Clerical Sales Service Agriculture Production
AgricultureIndustry Mining
ManufacturingElectricalConstruction
Services TradeTransportFinanceServices
Sources: UN [2000], ILO [1987].
406 Nelson et al.
sectors in the US. However, global data sources that provide
estimates of the proportion of workers exposed, by economic
sector and/or occupational category, are limited. Gaps in
exposure data for workers worldwide limited our ability to
establish the proportion of workers exposed to a specific risk
factor. Therefore, exposure data from developed countries
were usually applied to developing countries, and validated
where possible.
To check the validity of this assumption, the literature
was searched for estimates of the number of workers exposed
to silica and benzene, which were chosen as indicators be-
cause there are more data available for developing countries
than for other carcinogens. This search yielded a range of
types of studies, from rough estimates [Zou et al., 1997]
to studies in which air concentrations were measured in
workplaces [Yin et al., 1987]. Estimates of the number of
workers exposed to silica in China, Thailand, and Viet Nam,
and to benzene in China, were compared to the number of
persons employed, either in a specific economic sector or
overall, in that country. The results obtained were compared
with CAREX data. With few exceptions, the estimated
fraction of workers exposed to silica or benzene is equal to or
higher in these countries than indicated by the CAREX [Yin
et al., 1987; Juengprasert, 1997; Zou et al., 1997; NIEHS,
1999; Phan Hong et al., 1999; Nguyen and Hong, 2001]. For
example, the proportion of workers exposed to silica in
manufacturing in Viet Nam is 3.7%, as compared to the
CAREX estimate of 2.3%. Thus, the CAREX database was
utilized as a conservative underestimate of the fraction of
workers exposed to selected carcinogens world-wide.
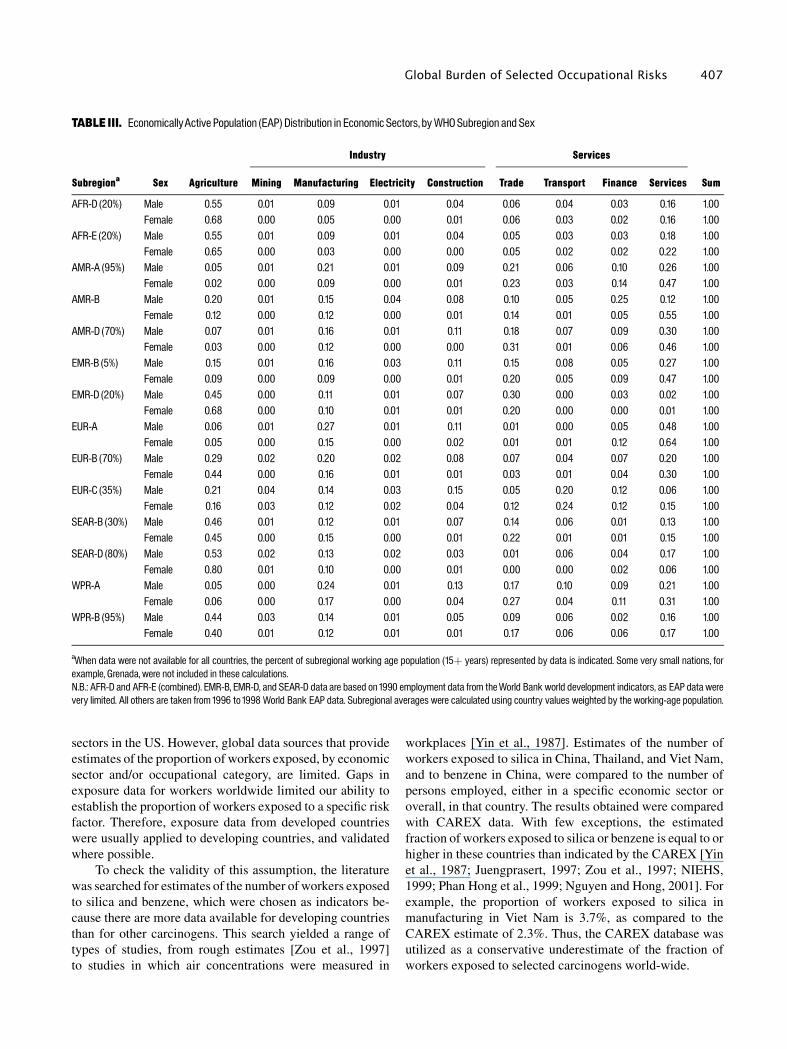
TABLE III. EconomicallyActive Population (EAP) Distribution in Economic Sectors, byWHOSubregion and Sex
Subregiona Sex Agriculture
Industry Services
SumMining Manufacturing Electricity Construction Trade Transport Finance Services
AFR-D (20%) Male 0.55 0.01 0.09 0.01 0.04 0.06 0.04 0.03 0.16 1.00Female 0.68 0.00 0.05 0.00 0.01 0.06 0.03 0.02 0.16 1.00
AFR-E (20%) Male 0.55 0.01 0.09 0.01 0.04 0.05 0.03 0.03 0.18 1.00Female 0.65 0.00 0.03 0.00 0.00 0.05 0.02 0.02 0.22 1.00
AMR-A (95%) Male 0.05 0.01 0.21 0.01 0.09 0.21 0.06 0.10 0.26 1.00Female 0.02 0.00 0.09 0.00 0.01 0.23 0.03 0.14 0.47 1.00
AMR-B Male 0.20 0.01 0.15 0.04 0.08 0.10 0.05 0.25 0.12 1.00Female 0.12 0.00 0.12 0.00 0.01 0.14 0.01 0.05 0.55 1.00
AMR-D (70%) Male 0.07 0.01 0.16 0.01 0.11 0.18 0.07 0.09 0.30 1.00Female 0.03 0.00 0.12 0.00 0.00 0.31 0.01 0.06 0.46 1.00
EMR-B (5%) Male 0.15 0.01 0.16 0.03 0.11 0.15 0.08 0.05 0.27 1.00Female 0.09 0.00 0.09 0.00 0.01 0.20 0.05 0.09 0.47 1.00
EMR-D (20%) Male 0.45 0.00 0.11 0.01 0.07 0.30 0.00 0.03 0.02 1.00Female 0.68 0.00 0.10 0.01 0.01 0.20 0.00 0.00 0.01 1.00
EUR-A Male 0.06 0.01 0.27 0.01 0.11 0.01 0.00 0.05 0.48 1.00Female 0.05 0.00 0.15 0.00 0.02 0.01 0.01 0.12 0.64 1.00
EUR-B (70%) Male 0.29 0.02 0.20 0.02 0.08 0.07 0.04 0.07 0.20 1.00Female 0.44 0.00 0.16 0.01 0.01 0.03 0.01 0.04 0.30 1.00
EUR-C (35%) Male 0.21 0.04 0.14 0.03 0.15 0.05 0.20 0.12 0.06 1.00Female 0.16 0.03 0.12 0.02 0.04 0.12 0.24 0.12 0.15 1.00
SEAR-B (30%) Male 0.46 0.01 0.12 0.01 0.07 0.14 0.06 0.01 0.13 1.00Female 0.45 0.00 0.15 0.00 0.01 0.22 0.01 0.01 0.15 1.00
SEAR-D (80%) Male 0.53 0.02 0.13 0.02 0.03 0.01 0.06 0.04 0.17 1.00Female 0.80 0.01 0.10 0.00 0.01 0.00 0.00 0.02 0.06 1.00
WPR-A Male 0.05 0.00 0.24 0.01 0.13 0.17 0.10 0.09 0.21 1.00Female 0.06 0.00 0.17 0.00 0.04 0.27 0.04 0.11 0.31 1.00
WPR-B (95%) Male 0.44 0.03 0.14 0.01 0.05 0.09 0.06 0.02 0.16 1.00Female 0.40 0.01 0.12 0.01 0.01 0.17 0.06 0.06 0.17 1.00
aWhen data were not available for all countries, the percent of subregional working age population (15þ years) represented by data is indicated. Some very small nations, forexample, Grenada, were not included in these calculations.N.B.: AFR-D and AFR-E (combined). EMR-B, EMR-D, and SEAR-D data are based on1990 employment data from theWorld Bank world development indicators, as EAP data werevery limited. All others are taken from1996 to1998 World Bank EAP data. Subregional averages were calculated using country values weighted by the working-age population.
Global Burden of Selected Occupational Risks 407
Levels of exposure(exposure partition factor, or EPF)
Levels of exposure to occupational hazards can vary
widely, even within similar job titles and economic sectors.
For example, not all production workers in manufacturing
will be exposed to the same levels of noise. For several
occupational hazards (carcinogens, particulates, and noise),
the proportion of the working population exposed at several
levels was determined. The U.S. Occupational Safety and
Health Administration (OSHA) Permissible Exposure
Levels (PELs) were used to classify exposures as low (below
the PEL) or high (above the PEL) exposures. Due to the
greater prevalence of occupational health and safety regula-
tory programs and infrastructure in the A subregions [Roach,
1992; Hewett, 1996], we estimated that a larger proportion of
workers was exposed at the lower levels in these subregions
than in the B, C, D, and E subregions. Indications of actual
exposure levels, such as contained in Pearce et al. [1994],
provided anecdotal evidence that exposure levels are higher
in BCDE countries. This is consistent with expectations,
given that very few of these countries have occupational
health programs. However, these data were not sufficient
to develop estimates for each occupation by economic sector
category, as needed for our model. Thus, we concluded that
the data from CAREX were indicative of exposures in
developed countries, but underestimates of exposures in
developing countries. It is not possible based on the current
state of knowledge to be more precise on a global level.
For carcinogens and the selected airborne particulates, it
was assumed that 90% of exposed workers in the A regions
had low exposures (below the relevant PELs) and 10% had
high exposures (above the relevant PELs). For the B, C, D,
and E subregions, it was assumed that half of the exposed
workers had low exposures, and half had high exposures [Yin
et al., 1987; Myers et al., 1989; Rees et al., 1992; Dosemeci
et al., 1995; Partanen et al., 1995; NIOSH, 1999; NIOSH,
2000]. Further, where it was necessary to specify an exposure
level, for example, to estimate lifetime cumulative exposure
to silica, or level of noise exposure, the exposures in the A
subregions were estimated to be lower than in the B, C, D, and
E subregions.
For exposures to agents leading to COPD, asthmagens,
and ergonomic stressors causing low back pain, exposures
were based on distribution of the work force into economic
sectors and/or occupational categories; therefore, it was not
necessary to partition exposures into low and high levels.
Regarding application of ergonomic data from developed
countries to less developed countries, Punnett et al. [2005]
explain that although the degree of mechanization, general
quality of working conditions, and ergonomic interventions
might each be less in developing regions, the very limited
evidence available shows no general trend according to
degree of development.
Details for particular exposures are provided in the
specific articles, which follow in this series.
Occupational turnover (OT)
Cancers and lung diseases have long latency periods and
once the disease process has begun the worker continues to be
at risk, even after exposure ceases. This means that persons
who were exposed to carcinogens or some airborne parti-
culates in the past must be considered as ever-exposed, even
if they are currently working in nonexposed jobs or have
retired. Occupational turnover (OT), which is the replace-
ment of workers by other workers in a specific job, increases
the number of persons ever exposed to an occupational risk.
A conservative value of 10% annual turnover rate (ATR) was
estimated, based on data from 12 countries representing the
A, B, D, and E subregions and a wide range of economic
sectors [e.g., Butler and Twaddle, 1979; EIU, 1995, 1996, and
2001; Johnson and Whyte, 1977; Koch and Rhodes, 1981;
Lucifora, 1998; Moffett, 2002].
An OT adjustment factor (noted as OT) to account for
turnover in jobs with exposure to occupational carcinogens or
to the selected respirable particulates (silica, asbestos, and
coal dust) was determined as follows:
Adjustment factor, OT¼ Pt/P0
¼ ½original workers þ new workers � deaths�=original workers ¼ fP0 þ ½P0 � ATR � t�� ½ðmortality rateÞ ðP0 þ ðP0 � ATR � tÞ�g=P0 ð4Þ
where:
Pt¼ the proportion who have ever been occupationally
exposed to dust, during a period of 40 years, still living;
P0¼ the proportion who are occupationally exposed to dust
at time t¼ 0
ATR¼ turnover/year, taken as 0.10;
t¼ time, taken as 40 years, a typical working lifetime; and
mortality rate¼ 20% of total cohort, based on published
death rates of about 5 deaths per thousand over a period of
40 years (USDHHS, 2001).
Equation 4 results in an adjustment factor of OT¼ 4 to
correct for occupational turnover during a 40-year period,
with a median exposure duration of 10 years based on cohort
modelling (Steenland and Driscoll, 2002, personal commu-
nication). The use of an OT factor is consistent with the
occupational experience of cohorts represented in the epide-
miological studies from which relative risks were taken.
In summary, the model which we used to estimate the
proportion of the population with exposure to occupational
hazards includes terms (as appropriate) for the proportion of
the population that was economically active, the distribution
of the economically active population into economic sectors
and/or occupational categories, the proportion of workers
408 Nelson et al.
within an economic sector and/or occupational category with
exposure to occupational hazards, the levels of those
exposures, and a factor to account for turnover of workers
within a job. Table IV includes a summary of the factors
considered for each of the occupational diseases and injuries
included in our analysis, along with the primary data sources
for exposure assessment.
Linking Occupational Exposures toHazard–Disease Relationships
Determining the fraction of the global burden of disease
and injuries that is attributable to occupational hazards
requires not only the estimation of the proportion of the
global population which is exposed, but also estimates of the
risk of morbidity and/or mortality of those exposures. Both
assessments had to be closely linked. Ideally, the linkage is
the causative agent itself, for example, exposure to asbestos
at known levels and the relative risk of asbestosis resulting
from those exposures. However, in some cases, data are not
available in this format. For example, neither exposure nor
relative risk data are available for the over 200 known
asthmagens. Occupational category served as a suitable
proxy for exposure to asthmagens, as relative risk data are
available for asthma by occupational category.
Risk measures (relative risks or mortality rates) for the
health outcomes resulting from exposures to the occupational
hazards considered in this study were determined primarily
from peer-reviewed, published studies. Adjustments were
made, as appropriate, to account for differences in levels of
exposure, exposure duration and/or age, sex, and subregion.
A brief summary of both exposure and risk estimates is
provided for each occupational hazard analyzed in the
companion studies.
Occupational carcinogens
Many of the 150 agents classified as known or probable
human carcinogens [IARC, 1994] are encountered in the
workplace. Although many different malignant conditions
can result, the main groups are relatively few—lung cancer,
leukemia, and malignant mesothelioma. The frequency and
risk of exposure, strength of evidence, and availability of data
determined the exposures that were selected for assessment
in this study. The exposure assessment for all occupational
carcinogens was based on the CAREX database [FIOH,
1999; Kauppinen et al., 2000].
A relative risk for all lung carcinogens was developed
using a method similar to that of Steenland et al. [1996] and
Nurminen and Karjalainen [2001], in which mean relative
risk for all exposures was determined by taking a weighted
average of the substance-specific relative risks, then weight-
ing the substance-specific relative risks by the proportion of
workers exposed to each substance. Relative risks were
weighted separately for each region, using the exposure
prevalence of the workforce in each region to weight the
exposure-specific risks. However, the resulting average rela-
tive risks were not meaningfully different between regions.
Based on exposure estimates for American workers of 90% at
or below the PEL, and 10% above the PEL, the mean relative
risk of 1.6 was partitioned into a value of 1.3 for low-level
exposures, and 1.9 for high-level exposures.
Similarly, for leukemogens the separate relative risks for
the relevant occupational agents were combined into single
summary relative risks, for low exposure and for high
exposure. Relative risks were available for low exposures
(1.86) and for high exposures (3.66), so it was not necessary
to partition the values determined from the literature [BEIR,
1990; IARC, 1994; Lynge et al., 1997; Steenland et al., 2003].
For lung cancer and leukemia, the attributable fractions
were calculated from the proportion of the population
exposed and the matching relative risks (see Equation 3).
These attributable fractions were then multiplied by the GBD
estimates of deaths and DALYs [Murray and Acharya, 1997]
for relevant causes of death in each subregion, to develop
estimates of deaths and DALYs arising from exposures to
lung carcinogens and leukemogens.
Malignant mesothelioma is almost exclusively an
occupational disease, probably occurring only in persons
who have had exposure to asbestos, and with most of the
asbestos exposure being occupational. Since it is therefore
not meaningful to calculate a relative risk, mortality rates
were calculated for various cumulative lifetime exposures at
low and high exposures in the A, and in the B, C, D, and E
subregions. The number of deaths was estimated by applying
these absolute risk estimates to estimates of absolute asbestos
exposures. An attributable fraction was estimated by
comparing the number of deaths from mesothelioma to the
total number of deaths in the WHO disease category for ‘‘other
neoplasms.’’ This fraction was multiplied by the number of
DALYs in the ‘‘other neoplasms’’ category (Global Burden of
Disease Code 77) to estimate the DALYS due to mesothe-
lioma. See Driscoll et al. [2005a] for further details.
Agents leading to COPD
Tobacco smoking is clearly the most important risk
factor for chronic obstructive pulmonary disease (COPD),
but many work-related exposures have been demonstrated to
cause COPD [Hendrick, 1996]. Worldwide data to support
exposure assessments to the main causative agents of COPD,
that is, nonspecific dust and fumes [Becklake, 1989] do not
exist. Work in specific economic sectors was, therefore, used
as a surrogate for dust exposure, based on the work of Korn
et al. [1987]. Their study provides a link between self-
reported exposure to dust (current and past exposure) and
some categories of economic activity among the currently
Global Burden of Selected Occupational Risks 409

TABLE
IV.SummaryofApproachforEvaluationofSelectedOccupationalRisk
FactorsfortheC
omparativeR
iskAssessment
Riskfactor
Healthoutcom
esExposureassessmenta
Proportionofpopulationexposedb
Hazardassessment
Riskestim
ates
cPrimarydatasourcesd
Occupationalcarcinogens
Trachea,bronchus,or
lungcancer
EAR,OT,EPF,PW(es),PEW
(es)
Lowexposure:0.019^
0.179
CompositeRR
values
fromtheliteraturee
Low:1.3
Yinetal.[1987];Pearceetal.[1994];
FIOH
[1999];Kauppinenetal.[2000]
Highexposure:0.006^0.173
High:1.9
Leukem
iaEAR,OT,EPF,PW(es),PEW
(es)
Lowexposure:0.003^0.0
29CompositeRR
values
fromtheliterature
Low:1.86
Yinetal.[1987];Pearceetal.[1994];
FIOH
[1999];Kauppinenetal.[2000]
Highexposure:0.003^0.016
High:3.66
Mesothelioma
EAR,OT,EPF,PW(es),PEW
(es)
Lowexposure:0.003^0.0
26Mortalityrates
�Yinetal.[1987];Pearceetal.[1994];
FIOH
[1999];Kauppinenetal.[2000]
Highexposure:0.001^0.0
250.0
00002^
0.003488
AgentsleadingtoCOPD
COPD
EAR,PW
(es),PEW
(es)
Lowexposure:0.0169^0.5086
RRbyeconom
icsector
1.0^1.8
Kornetal.[1987];Kauppinenetal.[2000]
Highexposure:0.0249^
0.2806
Asthmagens
Asthma
EAR,PW
(oc),PEW
(oc)
Lowriskoccupation(administration):0.0110^0.2058
Highriskoccupation(mining):0.0001^
0.0194
RRby
occupational
category
1.00^
1.95
ILO[1995a];Kogevinasetal.[1999];
Karjalainenetal.[2002]
Silica
Silicosis
EAR,OT,EPF,PW(es),PEW
(es)
0.002%to23%byoccupationalcategory
Mortalityrates
0.000004^
0.000143
Pearceetal.[1994];FIOH[1999];
NIOSH[1999];Kauppinenetal.[2000]
Asbestos
Asbestosis
EAR,OT,EPF,PW(es),PEW
(es)
0.016%to10%byoccupationalcategory
Mortalityrates
0.00000^0.0
0617
Pearceetal.[1994];FIOH[1999];
NIOSH[1999];Kauppinenetal.[2000]
Coaldust
Coalworkers’
pneumoconiosis
Numberofcoalminers,OT
10millionworkersworldwide
Mortalityrates
0.00001^0.0
0034
ILO[1995b];USEIA[2001]
Noise
Hearingloss
EAR,EPF,PW
(oc),PEW
(oc),
85^90
dBA:0.01^0.15
>90
dBA:0.0
0^0.10
RRbyeconom
icsector
andoccupationalcategory
1.00^
7.96
ILO[1995a];NIOSH[1998]
Ergonomicstressors
(com
binedphysicaland
psychosocial)
Lowbackpain
EARPW
(oc),PEW
(oc),
Occupationswith
Lowexposure:0.01
^0.24
Moderateexposure:0.01^
0.55
Highexposure:0.00^
0.53
RRby
occupational
category
Background:1.00
Low:1.38
Moderate:2.53
High:3.65
Leighand
Sheetz[1989];ILO[1995a]
Energy
Injuries
(unintentional)
EAP
Mortalityrates
Laborsta(ILO[2001b])
a EAR,economicactivity
rate;OT,occupationalturnover;EPF,exposurepartitioning
factor;PW(es),proportion
ofthelaborforcew
orking
inaspecificeconomicsector;PEW
(es),proportionofthew
orkforceinaspecificeconom
icsector
with
exposuretoan
occupationalhazard;PW
(oc),proportion
ofthelaborforceworking
inaspecificoccupationalcategory;PEW(oc),proportion
oftheworkforceinaspecificoccupationalcategorywith
exposuretoan
occupational
hazard;EAP,economicallyactivepopulation.Seetextandappendixforfurtherdetails.
b Inage,gender,and
subregionalgroupsunlessotherwise
noted.
c Thesenumbersrepresentrangesoftherelativeriskvalues
asdetermined
fromtheliterature.Whereitwaspossibletopartitiontherelativeriskintovaluesforlow
andhigh
exposure,ithasbeen
noted.
d ILO[2002b]and
WorldBank
[2001]used
forall.
e Forlung
cancerandleukemia,relativerisksw
erew
eightedseparatelyforeachsubregion,usingtheexposureprevalenceofthew
orkforceineachsubregiontoweighttheexposure-specificrisks.However,theresultingaveragerelative
risks
werenotm
eaningfullydifferentbetweensubregions,and
arenotpresentedhere.
410
employed, which were matched with our economic sector
distribution data.
Korn et al. [1987] used a strict definition of COPD and
determined relative risks for both men and women, based on a
large number of participants. We partitioned these relative
risks for high and low exposure categories, using slightly
different values for developed and developing countries to
take account of variations in the low exposure categories in
agriculture and industry. These relative risks and the
proportion of the population exposed were combined in
Equation 3 to estimate the attributable fraction. This value
was then multiplied by the number of deaths and DALYs in
the GBD disease category for COPD, resulting in estimates
of the number of deaths and DALYs attributable to occu-
pational exposures to agents leading to COPD.
The risk values used for COPD took into account current
and lifetime smoking history of the subjects on which the
odds ratios were based. We did not consider smoking rates in
individual countries, and to the extent that there may have
been interaction between occupational exposures and smok-
ing, we have not allowed for that over and above any
allowance that is inherent in the relative risk measures we
used. If there was more smoking, one could argue a larger
proportion of all smoking morbidity and mortality will be due
to factors other than occupational exposures. However, the
available data and the study design did not allow for further
analysis, and this factor probably would not have had any
important influence on the major estimates.
Asthmagens
Asthma, which is probably the most common work-
related respiratory disorder in industrialized countries
[Kogevinas et al., 1999], is a narrowing of the upper
respiratory passages resulting in difficult breathing and
wheezing. Many hundreds of biological and chemical agents,
found in a wide variety of workplaces, have been associated
with occupational asthma [Chan-Yeung and Malo, 1994;
Venables and Chang-Yeung, 1997; Balmes et al., 2003]. It
would not be possible to conduct exposure assessments and
to obtain relative risk data for all contributing factors,
especially since they often occur in combination, so we based
our approach on the work of Karjalainen et al. [2001, 2002]
and Kogevinas et al. [1999]. The study by Karjalainen et al.
2001, 2002 extended over 13 years and covered the entire
Finnish population, providing relative risks for a large
number of broad occupational categories. Kogevinas et al.
[1999] conducted a cross-sectional study of asthma involving
15,000 people in 12 European countries.
As the relative risks derived in those studies were based
on occupational categories, our exposure assessment was
based on distribution of the workforce in occupational
categories, matching our categories as closely as possible to
those identified by Karjalainen et al. 2001, 2002 for which
relative risk values were provided. Those not working and
those employed in administration were together considered
to be the nonexposed reference category (relative risk¼ 1).
The attributable fraction calculated from these relative
risks and the proportion of the population exposed were
applied to number of deaths and DALYs in the WHO disease
category for asthma, yielding estimates for the number of
deaths and DALYs resulting from occupational exposure to
asthmagens.
Silica and asbestos
Exposure to silica and asbestos can lead to the
development of silicosis and asbestosis, respectively. Assess-
ment of the proportion of workers exposed to silica and
asbestos was based on the distribution of the economically
active population by economic sector and the percentage of
workers exposed to these substances by economic sector. An
adjustment factor of four was used to account for turnover in
jobs with exposure to occupational silica and asbestos, as
described earlier.
The primary data source on the proportion of workers
exposed to silica and asbestos for each economic sector was
the CAREX database, as described earlier. The PELs were
used to classify exposures to silica and asbestos as low or high
level, with a larger proportion of workers in A subregions
assumed to have low exposure, and absolute exposure levels
assumed to be lower in A subregions.
Cumulative exposure estimates for workers of different
ages were determined by modeling of an artificial cohort to
estimate the average cumulative exposure for such a
representative cohort in steady state. Cumulative exposures
for asbestos took into account changes in the PELs for
asbestos during the years of interest to the current analysis.
Coal dust
Exposure to coal dust can lead to the development of coal
workers’ pneumoconiosis. Because the CAREX database
does not include data on exposure to coal dust, it was
necessary to use a different methodology for this exposure
than that used for silica and asbestos. The estimates of the
proportion of the population exposed to coal dust were based
on global coal production, but the approach to partitioning of
exposure into low/high categories was the same as described
for silica and asbestos. As for silica and asbestos, a turnover
factor of four was applied to account for persons not currently
working in coal mining but who had been exposed pre-
viously. The ‘‘PEL’’ used for coal was the United States Mine
Safety and Health Administration (MSHA) value of 2 mg/m3
[NIOSH, 1995].
For all three pneumoconioses, the attributable fraction
was assumed to be 100%, since virtually all exposure occurs
in an occupational setting. DALYs were estimated using the
Global Burden of Selected Occupational Risks 411

standard WHO approach based on the estimated number of
deaths. For further discussion of nonmalignant respiratory
disease due to occupational airborne particulates, see
Driscoll et al. [2005b].
Noise
Exposure to excessive noise is one of the most pervasive
occupational hazards, and may lead to elevated blood pres-
sure, sleeping difficulties, annoyance, and stress, and
interference with communications in the workplace. How-
ever, noise-induced hearing loss (NIHL) is the most serious
effect and is irreversible. The availability of noise exposure
data by occupations in the U.S. [NIOSH, 1998], and data on
the risk of hearing loss at various sound levels [Prince et al.,
1997], allowed us to use noise exposure levels as a direct
measure for the risk of developing NIHL. As global data on
the frequency of occurrence, duration, and intensity of noise
exposure do not exist, it was necessary to model this exposure
for workers in various occupational categories, based on the
U.S. NIOSH data, adjusted for differences in prevalence of
hearing conservation programs in developed and developing
countries. Three levels of exposure were estimated by
occupational category, and relative risk values were deter-
mined for each by comparing excess risk estimates for noise-
exposed workers with excess risk estimates for the back-
ground population [Davis, 1989]. The relative risk estimates
were adjusted to account for the different definition of NIHL
used by WHO (�41 decibels hearing loss at 0.5, 1, 2, and
4 kHz) compared to the more frequently used cut-off
(>25 decibels of hearing loss at 1, 2, 3 and 4 kHz). Com-
bining these relative risks with the proportions of the
population exposed to occupational noise yielded estimates
of the attributable fractions. Applying these attributable
fractions to the number of DALYs in the GBD disease
category for hearing loss (as deaths do not occur from noise
exposures) resulted in the number of DALYs occurring from
occupational exposures to noise. See Nelson et al. [2005] for
further details.
Ergonomic stressors leading tolow back pain
Pain in the soft tissues of the back is extremely common
among adults throughout the world, and is associated with
substantial financial costs and loss of quality of life. For
example, in Canada, Finland, and the United States, more
people are disabled from working as a result of musculoske-
letal disorders (MSDs)—especially back pain—than from
any other group of diseases [Pope et al., 1991; Badley et al.,
1994; Riihimðki, 1995]. The physical ergonomic features of
work that are most frequently cited as risk factors for MSDs
include rapid work pace and repetitive motion patterns;
insufficient recovery time; heavy lifting and other forceful
manual exertions; nonneutral body postures (either dynamic
or static); mechanical pressure concentrations; vibration
(both segmental and whole-body); and low temperature.
Since it is not possible to assess all relevant physical and
psycho-social exposures on a global basis, we used broad
occupational category as a proxy for exposure to the combined
stressors that produce excess risk of low back pain (LBP). As
per Leigh and Sheetz [1989], the reference group (background
risk) is comprised of professional and administrative workers.
Clerical and sales workers were considered to have low
exposures, and operators (production workers) and service
workers were considered to have moderate exposures. Farm-
ers were the only occupational category considered to have
high exposure. Relative risks for these occupational categories
ranged from 1.38 for clerical or sales workers, to 3.65 for
farmers. These relative risks and the proportion of the
population exposed were combined in Equation 3 estimate
attributable fractions, which were applied to the number of
DALYS in the GBD category for musculoskeletal disease (as
deaths do not occur from low back pain) to yield the number of
DALYs attributable to low back pain. Further discussion is
provided in Punnett et al. [2005].
Risk factors for injuries
Due to lack of globally quantifiable measures of risks for
unintentional injuries by occupation or economic sector, we
used the Economically Active Population (EAP) as a
surrogate of the population at risk for occupational injuries.
Country-level injury fatality rates for insured workers
were used to calculate WHO subregional rates, which were
applied to the subregional EAP to estimate deaths and
DALYs. Concha-Barrientos et al. [2005] provide a detailed
discussion.
Contaminated sharps leading toinfections in health care workers
Because occupational exposures to sharps injuries are a
substantial source of infections with bloodborne pathogens
among health-care workers, we estimated the global burden
of hepatitis B (HBV), hepatitis C (HCV), and human
immunodeficiency virus (HIV) infection due to percutaneous
injuries among health care workers (HCWs). We modeled the
incidence of infections attributable to percutaneous injuries
in 14 geographical subregions on the basis of the probability
of injury, the prevalence of infection, the susceptibility of the
worker and the percutaneous transmission potential.
RESULTS
Table Vand Figure 2 provide the attributable fraction in
DALYs for each of the selected occupational risk factors.
Tables VI and VII provide the details of the distribution by
412 Nelson et al.

gender. The companion studies provide a subregional
comparison of the morbidity and mortality of the selected
occupational risk factors.
The global burden of just these selected occupational
diseases and injuries in the year 2000 included 850,000
deaths and approximately 24 million years of healthy life
lost. Without correction for underestimation, these selected
occupational risk factors alone accounted for about 1.5% of
all mortality and about 1.6% of all DALYs in the world in the
year 2000. The leading occupational causes of death (Table
VI) were COPD (37%) and unintentional injuries (37%),
followed by trachea, bronchus, or lung cancer (12%).
Unintentional occupational injuries were the main cause of
years of healthy life lost (Table VII), with 44% of the burden
(10,531,000 DALYs). This was followed by hearing loss due
to occupational noise (18%) and COPD due to occupational
agents (16%). These three conditions accounted for nearly
80% of years of healthy life lost. Results for specific risk
factors, including results by subregion, gender, and age
group, are presented in the articles on individual risk factors.
Overall, the burden of disease due to occupational
exposures is greater in developing countries, and in males
than in females, reflecting differences in exposure, economic
sectors, and types of occupation. The burden was about five
times greater in males than in females, both for deaths
(706,000 vs. 144,000) and DALYs (19,656,000 vs.
4,038,000). Years of healthy life lost were higher for those
risk factors that particularly affected workers at younger
ages, whereas mortality was higher in older age groups.
Attributable fractions for the pneumoconioses (silicosis,
asbestosis, and coal workers’ pneumoconiosis) and for
mesothelioma were 100%, since these outcomes are virtually
TABLE V. Attributablea Fractions (%) forMortality andMorbidity (DALYs) Due to Selected Occupational Exposuresfor the Global Burden of Occupational Disease and Injury
Risk factor Outcome Males Females Total
Ergonomic stressors Low backpain 41 32 37Noise Hearing Loss 22 11 16Agents leading to COPD COPD 18 6 13Asthmagens Asthma 14 7 11Risk factors for injuries Unintentional injuries 12 2 8Beryllium, cadmium, chromium, dieselexhaust, nickel, arsenic, asbestos, silica
Trachea, bronchus, or lung cancer 10 5 9
Benzene, ethylene oxide, ionizing radiation Leukemia 2 2 2
aAttributable Fractions of 100% are not presented for mesothelioma, silicosis, asbestosis, and coal workers’ pneumoconiosis,because virtually all exposure is related to work.
FIGURE 2. Attributable fractions (%)ofmorbidityandmortality (DALYs) forselectedoccupational risks,2000.Note:SeealsoTableV.
Global Burden of Selected Occupational Risks 413
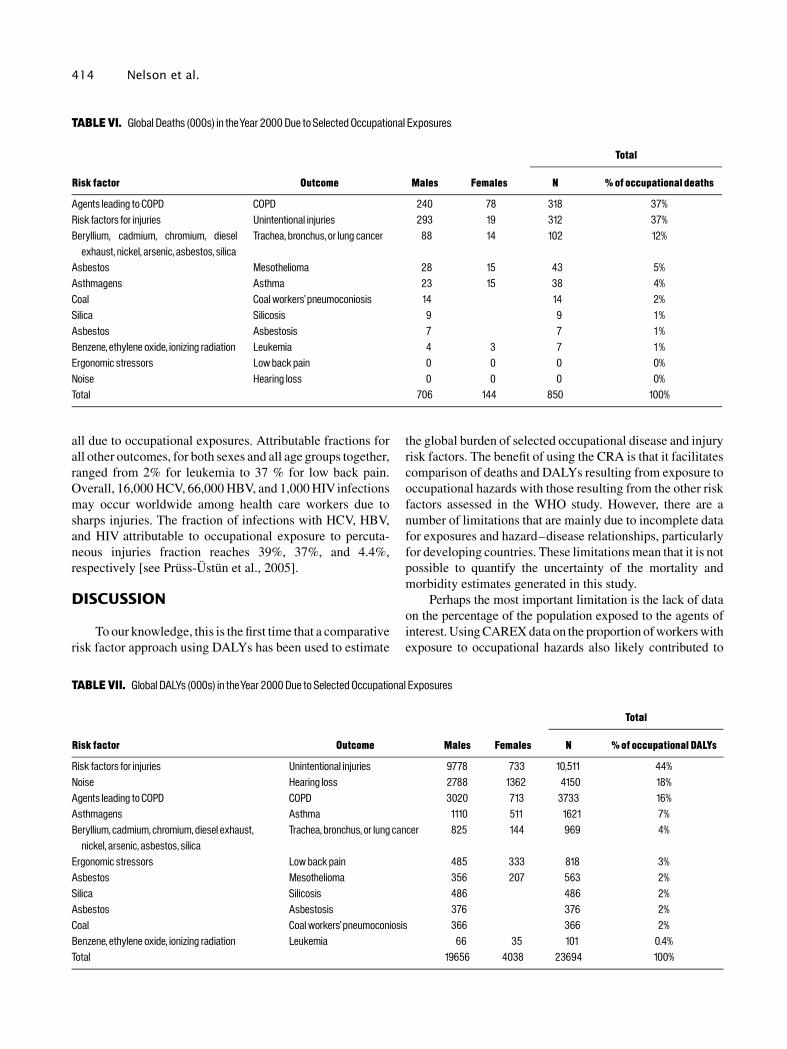
all due to occupational exposures. Attributable fractions for
all other outcomes, for both sexes and all age groups together,
ranged from 2% for leukemia to 37 % for low back pain.
Overall, 16,000 HCV, 66,000 HBV, and 1,000 HIV infections
may occur worldwide among health care workers due to
sharps injuries. The fraction of infections with HCV, HBV,
and HIV attributable to occupational exposure to percuta-
neous injuries fraction reaches 39%, 37%, and 4.4%,
respectively [see Pruss-Ustun et al., 2005].
DISCUSSION
To our knowledge, this is the first time that a comparative
risk factor approach using DALYs has been used to estimate
the global burden of selected occupational disease and injury
risk factors. The benefit of using the CRA is that it facilitates
comparison of deaths and DALYs resulting from exposure to
occupational hazards with those resulting from the other risk
factors assessed in the WHO study. However, there are a
number of limitations that are mainly due to incomplete data
for exposures and hazard–disease relationships, particularly
for developing countries. These limitations mean that it is not
possible to quantify the uncertainty of the mortality and
morbidity estimates generated in this study.
Perhaps the most important limitation is the lack of data
on the percentage of the population exposed to the agents of
interest. Using CAREX data on the proportion of workers with
exposure to occupational hazards also likely contributed to
TABLE VI. Global Deaths (000s) in theYear 2000Due to Selected Occupational Exposures
Risk factor Outcome Males Females
Total
N %of occupational deaths
Agents leading to COPD COPD 240 78 318 37%Risk factors for injuries Unintentional injuries 293 19 312 37%Beryllium, cadmium, chromium, dieselexhaust, nickel, arsenic, asbestos, silica
Trachea, bronchus, or lung cancer 88 14 102 12%
Asbestos Mesothelioma 28 15 43 5%Asthmagens Asthma 23 15 38 4%Coal Coal workers’pneumoconiosis 14 14 2%Silica Silicosis 9 9 1%Asbestos Asbestosis 7 7 1%Benzene, ethylene oxide, ionizing radiation Leukemia 4 3 7 1%Ergonomic stressors Lowbackpain 0 0 0 0%Noise Hearing loss 0 0 0 0%Total 706 144 850 100%
TABLE VII. Global DALYs (000s) in theYear 2000Due to Selected Occupational Exposures
Risk factor Outcome Males Females
Total
N %of occupational DALYs
Risk factors for injuries Unintentional injuries 9778 733 10,511 44%Noise Hearing loss 2788 1362 4150 18%Agents leading to COPD COPD 3020 713 3733 16%Asthmagens Asthma 1110 511 1621 7%Beryllium, cadmium, chromium, diesel exhaust,nickel, arsenic, asbestos, silica
Trachea, bronchus, or lung cancer 825 144 969 4%
Ergonomic stressors Lowbackpain 485 333 818 3%Asbestos Mesothelioma 356 207 563 2%Silica Silicosis 486 486 2%Asbestos Asbestosis 376 376 2%Coal Coal workers’pneumoconiosis 366 366 2%Benzene, ethylene oxide, ionizing radiation Leukemia 66 35 101 0.4%Total 19656 4038 23694 100%
414 Nelson et al.

underestimates, as the limited data available indicate higher
proportions of exposed workers in developing countries, who
are probably exposed to higher levels of airborne contami-
nants and noise than their counterparts in the developed
countries. Because of limitations in the available data on
Economic Activity Rates, we could not include working
children or certain categories of workers, such as some women
working on family farms, nor could we quantify the increased
risks facedbypersons inprecariousorcontingentemployment.
Specific, focused research on working children is needed to
quantifyexposures,health risks,and the resulting implications.
Another limitation is that the same risks were applied to
each subregion. Direct risk data are not available for the
exposures of interest in most regions, and there is virtually no
information available to allow the precise extent of any
possible differences to be determined for any of the exposure-
disease relationships of interest. The same risks were also
applied to males and females, and to all age groups.
We also did not attempt to take into account to what
extent the risk of developing occupational disorders
diminishes as a result of exposure ceasing. Unfortunately,
there are little published data that address this issue. Most
studies that provide information on risk consider people who
have highly variable periods between end of exposure and
end of follow-up, with periods varying between zero (still
exposed) and many decades.
Finally, a major factor leading to an underestimate of the
true burden of disease and injury due to occupational risk
factors is exclusion of many health conditions, including many
respiratory diseases, some infectious diseases; less wide-
spread cancers and carcinogens; most musculoskeletal dis-
orders, intentional injuries in the workplace; organ and
systemic diseases resulting from occupational exposure to
solvents, pesticides and heavy metals; reproductive health
impacts; skin disorders; coronary heart disease and other
outcomes associated with work-related stress. Available data
were inadequate to meet the strict criteria of the WHO project.
In a companion study in this series, Driscoll et al.
[2005c] have compared the results of this study with previous
global analyses of occupational disease and injury. They
concluded that these estimates are appropriate for the
occupational exposures and conditions included, but that
due to data limitations, the findings are a major underestimate
of the true burden of disease attributable to occupational
exposures, most likely by at least a factor of two. Therefore,
the true extent of the global burden of disease resulting from
occupational risk factors is likely to have been considerably
more than the estimated 1.7% of all morbidity and mortality
in 2000, probably as high as 3.4% [Driscoll et al., 2005c].
The magnitude of these numbers belies their significance.
The impacts of disease, injury, or death of workers extend
beyond the individuals affected to include family members,
employers, the wider community, and the economy. Further,
the rates of disease, injury, and death do not impact all
economic sectors and occupations equally. Certain industries,
such as agriculture, mining, and construction are far more
hazardous than others, such as provision of financial or
educational services. Contingent workers and those in the
informal sector face even higher risk than their counterparts in
secure employment in the formal sector.
While there are many uncertainties in our estimates due
to lack of global data on prevalence and level of exposures to
occupational risk factors, this project has established an
analytical framework for determining the impact of work on
human health. Because estimates of the burden of disease and
injury resulting from occupational exposures are used in the
allocation of resources, it is important that they be as accurate
as possible. Further work to increase data quality and
availability would serve to improve estimates of the burden
of occupational disease and injury. Since it is likely that our
findings underestimate the true extent of morbidity and
mortality due to occupational exposures, better data could
contribute to a stronger case supporting the critical need to
devote adequate resources to protecting worker health. It
would also help to ensure that resources that are available are
allocated appropriately.
CONCLUSION
Exposure to occupational hazards accounts for a
substantial portion of the global burden of disease and injury.
The impacts of these occupational deaths, diseases, and
injuries extend far beyond the statistics reported here, to
include reduced contributions by valuable employees in the
workplace, economic loss to families, employers, and to
nations, and untold human pain and suffering.
The majority of these deaths, diseases, and injuries need
not occur. The burden of occupational risk factors is largely
preventable, as many examples from different countries have
shown. Proven methods for reducing exposures are often
quite simple: use of wet methods to reduce silica exposures,
readjustment of work surfaces to reduce low back pain,
substitution of safer chemicals or processes, and attention to
electrical safety or machine guarding. We urge policy makers
to use the evidence developed by this study to focus efforts to
eliminate the preventable causes of occupational death,
disease and injury.
ACKNOWLEDGMENTS
The authors express their appreciation to Lucy School-
field of NIOSH, Cincinnati, for her generous help in locating
reference materials, and to Norrey Hopkins of WHO,
Geneva, for her assistance in preparing the manuscripts.
REFERENCES
Badley EM, Rasooly I, Webster GK. 1994. Relative importance ofmusculoskeletal disorders as a cause of chronic health problems,
Global Burden of Selected Occupational Risks 415

disability, and health care utilization: Findings from the 1990 OntarioHealth Survey. J Rheum 21(3):505–514.
Balmes J, Becklake M, Blanc P, Henneberger P, Kreiss K, Mapp C,Milton D, Schwartz D, Toren K, Viegi G. Environmental andOccupational Health Assembly, American Thoracic Society. 2003.American Thoracic Society Statement: Occupational contribution to theburden of airway disease. Am J Respir Crit Care Med 167(5):787–797.
Becklake M. 1989. Occupational exposures: Evidence for a causalassociation with chronic obstructive pulmonary disease. Am Rev RespirDis 140:S85–S91.
BEIR V (Committee on the Biological Effects of Ionizing Radiation).1990. Health effects of exposure to low levels of ionizing radiation:BEIR V. Washington, DC: National Academy Press.
Butler S, Twaddle S. 1979. Turnover in the restaurant industry: Astructural explanation. Mid-South Sociological Association. SociolAbstr 27(4).
Chan-Yeung M, Malo J. 1994. Aetiological agents in occupationalasthma. Eur Respir J 7:346–371.
Concha-Barrientos M, Nelson DI, Fingerhut M, Driscoll T, Leigh J.2005. The global burden due to occupational injury. Am J Ind Med48:470–481 (this issue).
Davis AC. 1989. The prevalence of hearing impairment and reportedhearing disability among adults in Great Britain. Int J Epidemiol18(4):911–917.
Desai MA, Mehta S, Smith KR. 2004. Indoor smoke from solid fuels:Assessing the environmental burden of disease at national and locallevel. WHO Environmental Burden of Disease Series, No. 4). WorldHealth Organization, Geneva.
Dosemeci M, McLaughlin J, Chen J, Hearl F, Chen R, McCawley M, WuZ, Peng K, Chen A, Rexing S, et al. 1995. Historical total and respirablesilica dust exposure levels in mines and pottery factories in China. ScandJ Work Environ Health 21:39–43.
Driscoll T, Steenland NK, Nelson DI, Leigh J, Concha-Barrientos M,Fingerhut M, Pruss-Ustun A. 2005a. The global burden of disease due tooccupational carcinogens. Am J Ind Med 48:419–431 (this issue).
Driscoll T, Steenland NK, Nelson DI, Leigh J, Concha-Barrientos M,Fingerhut M, Pruss-Ustun A. 2005b. The global burden of non-malignant respiratory disease due to occupational airborne exposures.Am J Ind Med 48:432–445 (this issue).
Driscoll T, Takala J, Steenland K, Corvalan C, Fingerhut M. 2005c.Review of estimates of the global burden of injury and illness due tooccupational exposures. Am J Ind Med 48:491–502 (this issue).
EIU. 1995. Business Operations Report India 4th Quarter, 1995.Shortage of managers.
EIU. 1996. China Hand. Ch. 13—Human Resources: Knowing whystaff leave. 1 Sept.
EIU. 2001. Country Forecast Africa. AIDS/Africa: Labour costs are setto increase substantially. 14 May.
Ezzati M, Lopez AD, Rodgers A, Murray CJL, editors. 2004.Comparative quantification of health risks: Global and regional burdenof disease attributable to selected major risk factors. Geneva: WorldHealth Organization.
Finnish Institute of Occupational Health (FIOH). 1999. CAREXdatabase.
Hendrick DJ. 1996. Occupational and chronic obstructive pulmonarydisease (COPD). Thorax 51(9):947–955.
Hewett P. 1996. Interpretation and use of occupational exposure limitsfor chronic disease agents. Occup Med: State of the Art Reviews11(3):561–590.
IARC (International Agency for Research on Cancer). 1994. Someindustrial chemicals. Lyon, France: IARC.
International Labour Organization. 1987. Resolutions adopted by theInternational Conference of Labour Statisticians. Annex 1. Major, sub-major, minor and unit group titles. Available at http://www.ilo.org/public/english/bureau/stat/download/res/isco.pdf.
International Labour Organization (ILO). 1995a. ILO Yearbook ofLabour Statistics 1995. 54th issue, Geneva.
International Labour Organization (ILO). 1995b. Sectoral ActivitiesProgramme, Recent Developments in the Coalmining Industry, CoalMines Committee , 13 th Session, Report I, Geneva.
International Labour Organization (ILO). 2001a. ILO Yearbook ofLabour Statistics 60th issue, Geneva.
International Labour Organization (ILO). 2001b. Laborsta, The LaborStatistics Database. Available at: http://laborsta.ilo.org/.
International Labour Organization (ILO). 2002a. The Interna-tional Labor Conference, Report VI, Decent Work and the InformalEconomy.
International Labour Organization (ILO). 2002b. Economically ActivePopulation 1950–2010, Fourth Edition, Rev. 2, Geneva.
Johnson AG, Whyte WF. 1977. The Mondragon system of workerproduction cooperatives. Ind Labor Relations Rev 11:18–30.
Juengprasert W. 1997. Towards elimination of silicosis in Thailand.Mineral dusts and prevention of silicosis. Asian-Pacific RegionalNetwork on Occupational Safety and Health Information (ASIA-OSH)4(2) September 1997.
Karjalainen A, Kurppa K, Martikanen R, Klaukka T, Krjalainen J. 2001.Work is related to a substantial portion of adult-onset asthma incidencein the Finnish population. Am J Respir Critical Care Med 164:565–568.
Karjalainen A, Kurppa K, Martikanen R, Karjalainen J, Klaukka T.2002. Exploration of asthma risk by occupation-extended analysis of anincidence study of the Finnish population. Scand J Work Environ Health28:49–57.
Kauppinen T, Toikkanen J, Pedersen D, Young R, Ahrens W, Boffetta P,Hansen J, Kromhout H, Maqueda Blasco J, Mirabelli D, de la Orden-Rivera V, Pannett B, Plato N, Savela A, Vincent R, Kogevinas M. 2000.Occupational exposure to carcinogens in the European Union. OccupEnviron Med 57:10–18.
Koch JL, Rhodes SR. 1981. Predictors of turnover of female factoryworkers. J Voc Beh 18(2):145–161.
Kogevinas M, Anto JM, Sunyer J, Tobias A, Kromhout H, Burney P.1999. Occupational asthma in Europe. Lancet 353:1750–1754.
Korn RJ, Dockery DW, Speizer FE, Ware JH, Ferris BG Jr. 1987.Occupational exposures and chronic respiratory symptoms: A popula-tion based study. Am Rev Respir Dis 136:298–304.
Leigh JP, Sheetz RM. 1989. Prevalence of back pain among full-timeUnited States Workers. Br J Ind Med 46:651–657.
Leigh JP, Markowitz SB, Fahs M, Shin C, Landrigan PJ. 1997.Occupational injury and illness in the United States. Estimates ofcosts, morbidity, and mortality. Arch Intern Med 157(14):1557–1568.
Leigh J, Macaskill P, Kuosma E, Mandryk J. 1999. Global burden ofdisease and injury due to occupational factors. Epidemiology 10(5):626–631.
Leigh JP, Yasmeen S, Miller TP. 2003. Medical costs of fourteenoccupational illnesses in the United States in 1999. Scand J WorkEnviron Health 29(4):304–313.
416 Nelson et al.
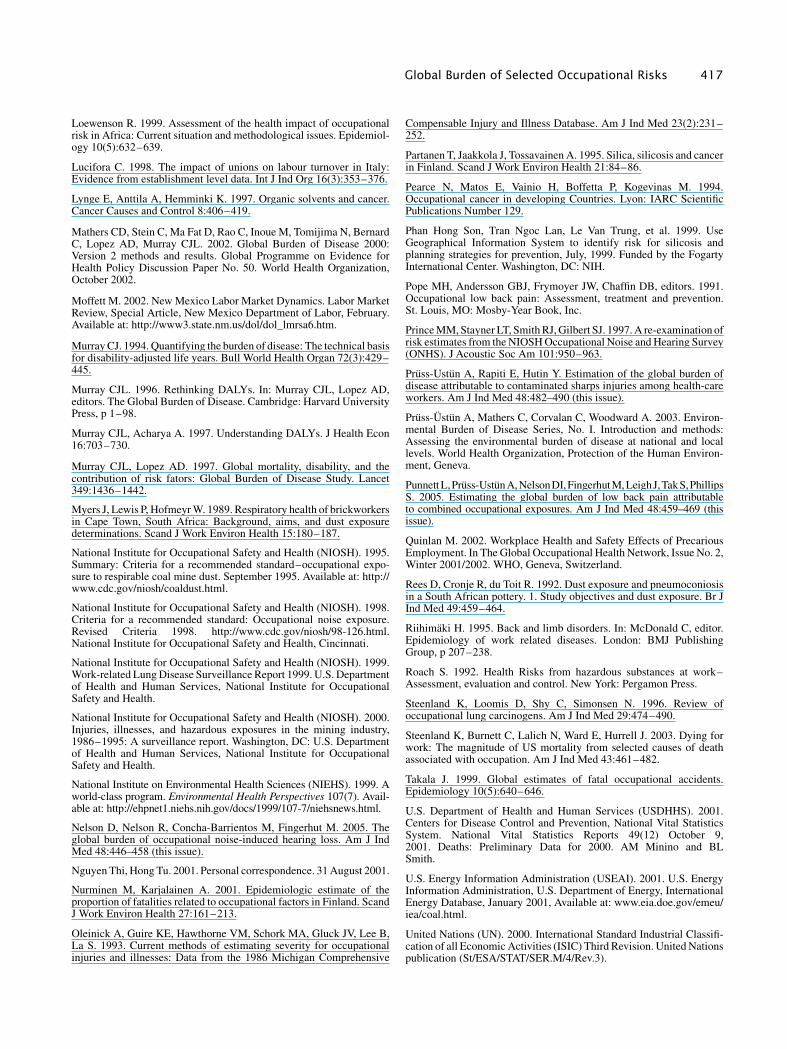
Loewenson R. 1999. Assessment of the health impact of occupationalrisk in Africa: Current situation and methodological issues. Epidemiol-ogy 10(5):632–639.
Lucifora C. 1998. The impact of unions on labour turnover in Italy:Evidence from establishment level data. Int J Ind Org 16(3):353–376.
Lynge E, Anttila A, Hemminki K. 1997. Organic solvents and cancer.Cancer Causes and Control 8:406–419.
Mathers CD, Stein C, Ma Fat D, Rao C, Inoue M, Tomijima N, BernardC, Lopez AD, Murray CJL. 2002. Global Burden of Disease 2000:Version 2 methods and results. Global Programme on Evidence forHealth Policy Discussion Paper No. 50. World Health Organization,October 2002.
Moffett M. 2002. New Mexico Labor Market Dynamics. Labor MarketReview, Special Article, New Mexico Department of Labor, February.Available at: http://www3.state.nm.us/dol/dol_lmrsa6.htm.
Murray CJ. 1994. Quantifying the burden of disease: The technical basisfor disability-adjusted life years. Bull World Health Organ 72(3):429–445.
Murray CJL. 1996. Rethinking DALYs. In: Murray CJL, Lopez AD,editors. The Global Burden of Disease. Cambridge: Harvard UniversityPress, p 1–98.
Murray CJL, Acharya A. 1997. Understanding DALYs. J Health Econ16:703–730.
Murray CJL, Lopez AD. 1997. Global mortality, disability, and thecontribution of risk fators: Global Burden of Disease Study. Lancet349:1436–1442.
Myers J, Lewis P, Hofmeyr W. 1989. Respiratory health of brickworkersin Cape Town, South Africa: Background, aims, and dust exposuredeterminations. Scand J Work Environ Health 15:180–187.
National Institute for Occupational Safety and Health (NIOSH). 1995.Summary: Criteria for a recommended standard–occupational expo-sure to respirable coal mine dust. September 1995. Available at: http://www.cdc.gov/niosh/coaldust.html.
National Institute for Occupational Safety and Health (NIOSH). 1998.Criteria for a recommended standard: Occupational noise exposure.Revised Criteria 1998. http://www.cdc.gov/niosh/98-126.html.National Institute for Occupational Safety and Health, Cincinnati.
National Institute for Occupational Safety and Health (NIOSH). 1999.Work-related Lung Disease Surveillance Report 1999. U.S. Departmentof Health and Human Services, National Institute for OccupationalSafety and Health.
National Institute for Occupational Safety and Health (NIOSH). 2000.Injuries, illnesses, and hazardous exposures in the mining industry,1986–1995: A surveillance report. Washington, DC: U.S. Departmentof Health and Human Services, National Institute for OccupationalSafety and Health.
National Institute on Environmental Health Sciences (NIEHS). 1999. Aworld-class program. Environmental Health Perspectives 107(7). Avail-able at: http://ehpnet1.niehs.nih.gov/docs/1999/107-7/niehsnews.html.
Nelson D, Nelson R, Concha-Barrientos M, Fingerhut M. 2005. Theglobal burden of occupational noise-induced hearing loss. Am J IndMed 48:446–458 (this issue).
Nguyen Thi, Hong Tu. 2001. Personal correspondence. 31 August 2001.
Nurminen M, Karjalainen A. 2001. Epidemiologic estimate of theproportion of fatalities related to occupational factors in Finland. ScandJ Work Environ Health 27:161–213.
Oleinick A, Guire KE, Hawthorne VM, Schork MA, Gluck JV, Lee B,La S. 1993. Current methods of estimating severity for occupationalinjuries and illnesses: Data from the 1986 Michigan Comprehensive
Compensable Injury and Illness Database. Am J Ind Med 23(2):231–252.
Partanen T, Jaakkola J, Tossavainen A. 1995. Silica, silicosis and cancerin Finland. Scand J Work Environ Health 21:84–86.
Pearce N, Matos E, Vainio H, Boffetta P, Kogevinas M. 1994.Occupational cancer in developing Countries. Lyon: IARC ScientificPublications Number 129.
Phan Hong Son, Tran Ngoc Lan, Le Van Trung, et al. 1999. UseGeographical Information System to identify risk for silicosis andplanning strategies for prevention, July, 1999. Funded by the FogartyInternational Center. Washington, DC: NIH.
Pope MH, Andersson GBJ, Frymoyer JW, Chaffin DB, editors. 1991.Occupational low back pain: Assessment, treatment and prevention.St. Louis, MO: Mosby-Year Book, Inc.
Prince MM, Stayner LT, Smith RJ, Gilbert SJ. 1997. A re-examination ofrisk estimates from the NIOSH Occupational Noise and Hearing Survey(ONHS). J Acoustic Soc Am 101:950–963.
Pruss-Ustun A, Rapiti E, Hutin Y. Estimation of the global burden ofdisease attributable to contaminated sharps injuries among health-careworkers. Am J Ind Med 48:482–490 (this issue).
Pruss-Ustun A, Mathers C, Corvalan C, Woodward A. 2003. Environ-mental Burden of Disease Series, No. I. Introduction and methods:Assessing the environmental burden of disease at national and locallevels. World Health Organization, Protection of the Human Environ-ment, Geneva.
Punnett L,Pruss-UstunA,NelsonDI,Fingerhut M,LeighJ,TakS,PhillipsS. 2005. Estimating the global burden of low back pain attributableto combined occupational exposures. Am J Ind Med 48:459–469 (thisissue).
Quinlan M. 2002. Workplace Health and Safety Effects of PrecariousEmployment. In The Global Occupational Health Network, Issue No. 2,Winter 2001/2002. WHO, Geneva, Switzerland.
Rees D, Cronje R, du Toit R. 1992. Dust exposure and pneumoconiosisin a South African pottery. 1. Study objectives and dust exposure. Br JInd Med 49:459–464.
Riihimaki H. 1995. Back and limb disorders. In: McDonald C, editor.Epidemiology of work related diseases. London: BMJ PublishingGroup, p 207–238.
Roach S. 1992. Health Risks from hazardous substances at work–Assessment, evaluation and control. New York: Pergamon Press.
Steenland K, Loomis D, Shy C, Simonsen N. 1996. Review ofoccupational lung carcinogens. Am J Ind Med 29:474–490.
Steenland K, Burnett C, Lalich N, Ward E, Hurrell J. 2003. Dying forwork: The magnitude of US mortality from selected causes of deathassociated with occupation. Am J Ind Med 43:461–482.
Takala J. 1999. Global estimates of fatal occupational accidents.Epidemiology 10(5):640–646.
U.S. Department of Health and Human Services (USDHHS). 2001.Centers for Disease Control and Prevention, National Vital StatisticsSystem. National Vital Statistics Reports 49(12) October 9,2001. Deaths: Preliminary Data for 2000. AM Minino and BLSmith.
U.S. Energy Information Administration (USEAI). 2001. U.S. EnergyInformation Administration, U.S. Department of Energy, InternationalEnergy Database, January 2001, Available at: www.eia.doe.gov/emeu/iea/coal.html.
United Nations (UN). 2000. International Standard Industrial Classifi-cation of all Economic Activities (ISIC) Third Revision. United Nationspublication (St/ESA/STAT/SER.M/4/Rev.3).
Global Burden of Selected Occupational Risks 417

Venables KM, Chang-Yeung M. 1997. Occupational asthma. Lancet349:1465–1469.
World Bank. 2001. World Development Indicators 2001. Available at:http://worldbank.com.
World Health Organization (WHO). 2002. The World Health Report:Reducing Risks, Promoting Healthy Life. Geneva.
World Health Organization (WHO). 2004. Global Burden of DiseaseEstimates. Available at http://www3.who.int/whosis/menu.cfm?path¼evidence,burden,burden_estimates&language¼english
Yin SN, Li Q, Liu Y, Tian F, Du C, Jin C. 1987. Occupational exposure tobenzene in China. Br J Ind Med 44:192–195.
Zou Changqi, Gao Yun, Ma Qingyan. 1997. Pneumoconiosis in China:Current situation and countermeasures. Mineral dusts and prevention ofsilicosis 4(2) September 1997. Asian-Pacific Regional Network onOccupational Safety and Health Information (ASIA-OSH). Availableat: http://www.ilo.org/public/english/region/asro/.
APPENDIX
The equation used to estimate the proportion of the
population exposed to occupational hazards and a brief ex-
planation of its terms is described in this Appendix. Equation
A.1 was used when exposure or risk data were available by
economic sector, and Equation A.2.was used when data were
available by occupational category.
PEPðr; g; aÞ ¼ EARðr; g; aÞxOTðrÞxEPFðrÞX9
i¼1
ðPWðesðr; gÞiÞxPEWðesðr; gÞiÞÞ ðA:1Þ
PEPðr; g; aÞ ¼ EARðr; g; aÞxOTðrÞxEPFðrÞX7
i¼1
ðPWðocðr; gÞiÞxPEWðocðr; gÞiÞÞ ðA:2Þ
where:
PEP (r,g,a)¼ proportion of the population occupa-
tionally exposed to a specific risk factor
in that subregion, by sex and age, at low
or high level;
EAR(r,g,a)¼ economic activity rate, by subregion,
sex and age;
OT(r)¼ occupational turnover, if applicable, to
account for workers exposed in the past,
by subregion;
EPF(r)¼ exposure partitioning factor, by subre-
gion, to delineate proportion exposed at
low or at high levels;
PW(es(r,g)i)¼ proportion of the population working in
economic sector (i), by subregion and
sex;
PEW(es(r,g)i)¼ proportion of workers in economic
sector (i) with exposure to the specific
risk factor, by subregion and sex;
PW(oc(r,g)i)¼ proportion of the population working in
occupational category (i), by subregion
and sex; and
PEW(oc(r,g)i)¼ proportion of workers in occupational
category (i) with exposure to the specific
risk factor, by subregion and sex.
418 Nelson et al.