The Genomics Education Partnership: Successful Integration of Research into Laboratory Classes at a...
15
Article The Genomics Education Partnership: Successful Integration of Research into Laboratory Classes at a Diverse Group of Undergraduate Institutions Christopher D. Shaffer, a Consuelo Alvarez, b Cheryl Bailey, c Daron Barnard, d Satish Bhalla, e Chitra Chandrasekaran, f Vidya Chandrasekaran, g Hui-Min Chung, h Douglas R. Dorer, i Chunguang Du, j Todd T. Eckdahl, k Jeff L. Poet, l Donald Frohlich, m Anya L. Goodman, n Yuying Gosser, o Charles Hauser, p Laura L.M. Hoopes, q Diana Johnson, r Christopher J. Jones, s Marian Kaehler, t Nighat Kokan, u Olga R. Kopp, v Gary A. Kuleck, w Gerard McNeil, x Robert Moss, y Jennifer L. Myka, z Alexis Nagengast, aa Robert Morris, bb Paul J. Overvoorde, cc Elizabeth Shoop, dd Susan Parrish, ee Kelynne Reed, ff E. Gloria Regisford, gg Dennis Revie, hh Anne G. Rosenwald, ii Ken Saville, jj Stephanie Schroeder, kk Mary Shaw, ll Gary Skuse, mm Christopher Smith, nn Mary Smith, oo Eric P. Spana, pp Mary Spratt, qq Joyce Stamm, rr Jeff S. Thompson, ss Matthew Wawersik, tt Barbara A. Wilson, uu Jim Youngblom, vv Wilson Leung, a Jeremy Buhler, ww Elaine R. Mardis, xx David Lopatto, yy and Sarah C.R. Elgin a a Department of Biology, Washington University in St. Louis, St. Louis, MO 63130; b Department of Biological and Environmental Sciences, Longwood University, Farmville, VA 23909; c Department of Biochemistry, University of Nebraska, Lincoln, NE 68588-0664; d Department of Biology, Worcester State College, Worcester, MA 01602; e Department of Computer Science and Engineering, Johnson C. Smith University, Charlotte, NC 28216; f Department of Biology, Texas Wesleyan University, Fort Worth, TX 76105; g Department of Biology, Saint Mary’s College of California, Moraga, CA 94556; h Department of Biology, University of West Florida, Pensacola, FL 32514; i Department of Biology, Hartwick College, Oneonta, NY 13820; j Department of Biology and Molecular Biology, Montclair State University, Montclair, NJ 07043; k Department of Biology, Missouri Western State University, Saint Joseph, MO 64507; l Department of Mathematics, Missouri Western State University, Saint Joseph, MO 64507; m Department of Biology, University of St. Thomas, Houston, TX 77006; n Department of Chemistry and Biochemistry, California Polytechnic State University, San Luis Obispo, CA 93407-0402; o Grove School of Engineering, The City College of New York, New York, NY 10031; p Department of Bioinformatics, St. Edward’s University, Austin, TX 78704; q Department of Biology, Pomona College, Claremont, CA 91711; r Department of Biological Sciences, The George Washington University, Washington, DC 20052; s Department of Biological Sciences, Moravian College, Bethlehem, PA 18018; t Department of Biology, Luther College, Decorah, IA 52101; u Department of Natural Sciences, Cardinal Stritch University, Milwaukee, WI 53217; v Department of Biology, Utah Valley University, Orem, UT 84058; w Department of Biology, Loyola Marymount University, Los Angeles, CA 90045-2659; x Department of Biology, York College– The City University of New York, Jamaica, NY 11451; y Department of Biology, Wofford College, Spartanburg, SC 29303-3663; z Science Department, Galen College of Nursing, Cincinnati, OH 45241; aa Department of Chemistry and Biochemistry, Widener University, Chester, PA 19013; bb Department of Biology and Biochemistry, Widener University, Chester, PA 19013; cc Department of Biology, Macalester College, St. Paul, MN 55105; dd Department of Mathematics and Computer Science, Macalester College, St. Paul, MN 55105; ee Department of Biology, McDaniel College, Westminster, MD 21157; ff Department of Biology, Austin College, Sherman, TX 75090-4400; gg Department of Biology, Prairie View A&M University, Prairie View, TX 77446; hh Department of Biology, California Lutheran University, Thousand Oaks, CA 91360; ii Department of Biology, Georgetown University, Washington, DC 20057; jj Department of Biology, Albion College, Albion, MI 49224; kk Department of Biology, Webster University, St. Louis, MO 63119; ll Department of Biology, New Mexico Highlands University, Las Vegas, NM 87701; mm Department of Biological Sciences, Rochester Institute of Technology, Rochester, NY 14623; nn Department of Biology, San Francisco State University, San Francisco, CA CBE—Life Sciences Education Vol. 9, 55– 69, Spring 2010 © 2010 by The American Society for Cell Biology 55
-
Upload
austincollege -
Category
Documents
-
view
3 -
download
0
Transcript of The Genomics Education Partnership: Successful Integration of Research into Laboratory Classes at a...
Article
The Genomics Education Partnership: SuccessfulIntegration of Research into Laboratory Classes at aDiverse Group of Undergraduate InstitutionsChristopher D. Shaffer,a Consuelo Alvarez,b Cheryl Bailey,c Daron Barnard,d
Satish Bhalla,e Chitra Chandrasekaran,f Vidya Chandrasekaran,g Hui-Min Chung,h
Douglas R. Dorer,i Chunguang Du,j Todd T. Eckdahl,k Jeff L. Poet,l
Donald Frohlich,m Anya L. Goodman,n Yuying Gosser,o Charles Hauser,p
Laura L.M. Hoopes,q Diana Johnson,r Christopher J. Jones,s Marian Kaehler,t
Nighat Kokan,u Olga R. Kopp,v Gary A. Kuleck,w Gerard McNeil,x Robert Moss,y
Jennifer L. Myka,z Alexis Nagengast,aa Robert Morris,bb Paul J. Overvoorde,cc
Elizabeth Shoop,dd Susan Parrish,ee Kelynne Reed,ff E. Gloria Regisford,gg
Dennis Revie,hh Anne G. Rosenwald,ii Ken Saville,jj Stephanie Schroeder,kk
Mary Shaw,ll Gary Skuse,mm Christopher Smith,nn Mary Smith,oo Eric P. Spana,pp
Mary Spratt,qq Joyce Stamm,rr Jeff S. Thompson,ss Matthew Wawersik,tt
Barbara A. Wilson,uu Jim Youngblom,vv Wilson Leung,a Jeremy Buhler,ww
Elaine R. Mardis,xx David Lopatto,yy and Sarah C.R. Elgina
aDepartment of Biology, Washington University in St. Louis, St. Louis, MO 63130; bDepartment of Biologicaland Environmental Sciences, Longwood University, Farmville, VA 23909; cDepartment of Biochemistry,University of Nebraska, Lincoln, NE 68588-0664; dDepartment of Biology, Worcester State College, Worcester,MA 01602; eDepartment of Computer Science and Engineering, Johnson C. Smith University, Charlotte, NC28216; fDepartment of Biology, Texas Wesleyan University, Fort Worth, TX 76105; gDepartment of Biology,Saint Mary’s College of California, Moraga, CA 94556; hDepartment of Biology, University of West Florida,Pensacola, FL 32514; iDepartment of Biology, Hartwick College, Oneonta, NY 13820; jDepartment of Biologyand Molecular Biology, Montclair State University, Montclair, NJ 07043; kDepartment of Biology, MissouriWestern State University, Saint Joseph, MO 64507; lDepartment of Mathematics, Missouri Western StateUniversity, Saint Joseph, MO 64507; mDepartment of Biology, University of St. Thomas, Houston, TX 77006;nDepartment of Chemistry and Biochemistry, California Polytechnic State University, San Luis Obispo, CA93407-0402; oGrove School of Engineering, The City College of New York, New York, NY 10031; pDepartmentof Bioinformatics, St. Edward’s University, Austin, TX 78704; qDepartment of Biology, Pomona College,Claremont, CA 91711; rDepartment of Biological Sciences, The George Washington University, Washington,DC 20052; sDepartment of Biological Sciences, Moravian College, Bethlehem, PA 18018; tDepartment ofBiology, Luther College, Decorah, IA 52101; uDepartment of Natural Sciences, Cardinal Stritch University,Milwaukee, WI 53217; vDepartment of Biology, Utah Valley University, Orem, UT 84058; wDepartment ofBiology, Loyola Marymount University, Los Angeles, CA 90045-2659; xDepartment of Biology, York College–The City University of New York, Jamaica, NY 11451; yDepartment of Biology, Wofford College, Spartanburg,SC 29303-3663; zScience Department, Galen College of Nursing, Cincinnati, OH 45241; aaDepartment ofChemistry and Biochemistry, Widener University, Chester, PA 19013; bbDepartment of Biology andBiochemistry, Widener University, Chester, PA 19013; ccDepartment of Biology, Macalester College, St. Paul,MN 55105; ddDepartment of Mathematics and Computer Science, Macalester College, St. Paul, MN 55105;eeDepartment of Biology, McDaniel College, Westminster, MD 21157; ffDepartment of Biology, Austin College,Sherman, TX 75090-4400; ggDepartment of Biology, Prairie View A&M University, Prairie View, TX 77446;hhDepartment of Biology, California Lutheran University, Thousand Oaks, CA 91360; iiDepartment of Biology,Georgetown University, Washington, DC 20057; jjDepartment of Biology, Albion College, Albion, MI 49224;kkDepartment of Biology, Webster University, St. Louis, MO 63119; llDepartment of Biology, New MexicoHighlands University, Las Vegas, NM 87701; mmDepartment of Biological Sciences, Rochester Institute ofTechnology, Rochester, NY 14623; nnDepartment of Biology, San Francisco State University, San Francisco, CA
CBE—Life Sciences EducationVol. 9, 55–69, Spring 2010
© 2010 by The American Society for Cell Biology 55
94132; ooDepartment of Biology, North Carolina A&T State University, Greensboro, NC 27411; ppDepartmentof Biology, Duke University, Durham, NC 27708-0001; qqDepartment of Biology, William Woods University,Fulton, MO 65251; rrDepartment of Biology, University of Evansville, Evansville, IN 47722; ssDepartment ofBiology, Denison University, Granville, OH 43023; ttDepartment of Biology, College of William and Mary,Williamsburg, VA 23187-8795; uuDepartment of Biology, Jackson State University, Jackson, MS 39217;vvDepartment of Biology, California State University, Stanislaus, Turlock, CA 95382; wwDepartment ofComputer Science and Engineering, Washington University in St. Louis, St. Louis, MO 63130; xxThe GenomeCenter, Department of Genetics, Washington University School of Medicine, St. Louis, MO 63108; andyyDepartment of Psychology, Grinnell College, Grinnell, IA 50112
Submitted November 30, 2009; Accepted January 4, 2010Monitoring Editor: Barbara Wakimoto
Genomics is not only essential for students to understand biology but also provides unprece-dented opportunities for undergraduate research. The goal of the Genomics Education Partner-ship (GEP), a collaboration between a growing number of colleges and universities around thecountry and the Department of Biology and Genome Center of Washington University in St.Louis, is to provide such research opportunities. Using a versatile curriculum that has beenadapted to many different class settings, GEP undergraduates undertake projects to bringdraft-quality genomic sequence up to high quality and/or participate in the annotation of thesesequences. GEP undergraduates have improved more than 2 million bases of draft genomicsequence from several species of Drosophila and have produced hundreds of gene models usingevidence-based manual annotation. Students appreciate their ability to make a contribution toongoing research, and report increased independence and a more active learning approach afterparticipation in GEP projects. They show knowledge gains on pre- and postcourse quizzes aboutgenes and genomes and in bioinformatic analysis. Participating faculty also report professionalgains, increased access to genomics-related technology, and an overall positive experience. Wehave found that using a genomics research project as the core of a laboratory course is rewardingfor both faculty and students.
INTRODUCTION
Genomics is a new and expanding field with an increasingimpact on biological research and studies of human health.Genomic approaches can provide new insight to many long-standing biological questions. Instead of studying a singlegene, biologists can now study entire genomes, or trackgenomic changes among related species. “Metagenomics” istaking this approach one step further to analyze the DNA ofwhole populations. Genome sequencing is constantly get-ting cheaper, and the “$1000 human genome” is withinsight, with profound consequences for the practice of med-icine (Pettersson et al., 2009). Full realization of the potentialof these new developments requires a broad effort to intro-duce genomic approaches and bioinformatics tools into theundergraduate curriculum.
Although presenting several challenges, genomic ap-proaches generate accessible and inexpensive researchopportunities for undergraduates. The importance of pro-viding undergraduate research experiences has been val-idated from several points of view. A recent report from theNational Academy of Sciences, “BIO 2010: TransformingUndergraduate Education for Future Research Biologists”(National Research Council, 2003), recommends that under-
graduate students learn current research methods and skillsas early as possible in their education. Data indicate that aresearch experience gives students confidence and a sense ofempowerment (BIO 2010). Bauer and Bennett (2003) reportpositive links between participation in undergraduate re-search and improved retention in science and the pursuit ofgraduate education. Doyle (2000) has found strong positivecorrelations between undergraduate research that leads topublications in refereed journals and the production of newscientists. In a 2004 study of 1135 undergraduates represent-ing 41 universities, 91% of the subjects reported that theirresearch experience sustained or increased their interest inpostgraduate education (Lopatto, 2004). Considering thequestion more broadly, Locks and Gregerman (2008) havefound that students who participate in research completetheir science programs in greater numbers than those whodo not.
The issue of retention is particularly important in over-coming minority underrepresentation in the sciences at allcareer levels, a major challenge for our nation. Researchersfind that all students, including at-risk and first-generationminority students, benefit from undergraduate research ex-periences (Elgren and Hensel, 2006; Lopatto, 2006; Goins etal., 2009). Undergraduate research can influence career path-ways for members of underrepresented groups by increas-ing the retention rate of minority undergraduates (Nagda etal., 1998) and by increasing their rate of participation ingraduate education (Hathaway et al., 2002).
DOI: 10.1187/cbe.09–11–0087Address correspondence to: Sarah C.R. Elgin ([email protected]).
C. D. Shaffer et al.
CBE—Life Sciences Education56
Colleges and universities, however, are not always able toprovide independent research experiences for the majorityof their students. The cost of equipment, supplies and lab-oratory space, and support for trained mentors on the scaleneeded, is beyond the budgets of many institutions. Thedifficulties are amplified at schools that have a high student-to-faculty ratio, who lack a pool of graduate students andpostdoctoral researchers who might serve as mentors, or aregenerally undercapitalized. Given that many institutionsshare these challenges, the BIO 2010 report supports re-search-based laboratory courses that are designed to encour-age independent or small group investigations as alterna-tives when individual research opportunities are limited.
We have developed the Genomics Education Partnership(GEP) to help incorporate genomics-based undergraduateresearch into the biology curriculum in colleges and univer-sities across the country. GEP has grown into a partnershipof diverse schools, including both primarily undergraduateinstitutions (PUIs) and research universities. Through theGEP project, faculty gain training and resources enablingthem to introduce students to research based on genomescience. Using computers and Internet access, students aregiven opportunities to make discoveries, learn researchmethods, observe the interdisciplinary nature of biologicalscience, appreciate the importance of collaboration, and un-derstand the connection between their classroom activitiesand the real world. The GEP has been designed from thebeginning to allow flexibility for faculty to offer research inthis field as either an independent experience or as a class-room activity, either as a stand-alone course or as part of thelaboratory in a broader course in genetics/genomics/molec-ular biology. This flexibility has allowed the program towork within very different curricula, serving diverse stu-dents in very different institutions.
The current genomics research goals of the GEP center onan investigation into the differences between heterochroma-tin and euchromatin by using a comparative genomics ap-proach. In particular, we are examining the properties andevolution of the distal portion of the dot chromosome (MullerF element) in Drosophila, a 1- to 2-Mb region that seems to beheterochromatic by many criteria but has a gene densityequal to standard euchromatic portions of the genome. Inaddition to the high-quality genome sequence of D. melano-gaster, there are draft sequences (of varying quality) cur-rently available for 11 species from the genus Drosophila(Clark et al., 2007), and eight additional species are beingsequenced at present (Piano and Cherbas, 2008). We areanalyzing the genomic differences between heterochromaticand euchromatic domains, as well as any differences in theevolution of these domains, by comparing the heterochro-matic dot chromosomes with a euchromatic region from thebase of chromosome 3L (Muller D element). To carry outsuch an analysis with confidence, we are improving thesequence of 1–2 Mb from both heterochromatin and euchro-matin domains as needed for several different Drosophilaspecies, including D. erecta, D. virilis, D. mojavensis, and D.grimshawi. The latter three species were chosen based ontheir evolutionary distance from D. melanogaster and theavailability of fosmid clones, which are required for theprocess of sequence improvement. The genes in these high-quality regions are then carefully annotated, generating verywell-characterized regions of both heterochromatin and eu-
chromatin. Comparative analysis is revealing significant dif-ferences in the genes found in these two contrasting do-mains, as well as different patterns of evolution (W. Leung,C. Shaffer, T. Cordonnier, J. Wong, M. Itano, E. Slawson Tempel,E. Kellman, D. Desruisseau, C. Cain, R. Carrasquillo, personalcommunication; Slawson et al., 2006).
Here, we describe the organization and growth of theGEP, as well as our analysis of the impact GEP participationhas had on both students and faculty. Although students aresometimes initially bewildered by the expectation of theirmaking a novel contribution, most have ultimately beenvery enthusiastic about this approach and have reportedmarked personal growth as a result of participation. Facultymembers also report that involvement with the GEP hasbeen an overall positive experience, helping both them andtheir institutions to move ahead in genomics.
MATERIALS AND METHODS
Technical InfrastructureThe entire system is organized around a pair of SUSE En-terprise Linux servers that host a variety of services used bythe GEP community. All services are available from themain website at http://gep.wustl.edu. Links from the mainsite allow access to information on the organization andmembership of the GEP, information on workshops, curric-ulum and teaching materials, access to research projects,examples of prior student work, as well as assessment andcommunication tools. The communication tools are a bulle-tin board system that provides a location for timely, infor-mal discussions, troubleshooting, and brainstorming, and awiki-based system that houses material of a more perma-nent nature. The wiki system includes course syllabi devisedby different GEP members, new curriculum materials pro-duced by members, working drafts of joint manuscripts, andother work in progress. The main server also acts as agateway to online tools that facilitate the distribution ofprojects to, and collection of student-generated analysesfrom, participating institutions. Additional tools that sup-port the students in their research, such as a web-basedprogram to check gene models for consistency and a web-based viewer for visualizing Basic Local Alignment SearchTool (BLAST) output, are also available.
Project CreationAll projects, whether for finishing or annotation, are com-pressed and uploaded to the GEP servers. Faculty membersparticipating in the GEP can then use the Project Manage-ment System to claim and download the project packagesfor their students. Faculty who claim projects in a givenacademic year submit back their students’ work each sum-mer so that projects can be assessed and either documentedas completed or (if necessary) placed back in the pipeline tobe claimed during the following academic year.
To minimize costs, we rely as much as possible on pub-licly available data, including published draft quality ge-nome assemblies (Clark et al., 2007) and the Trace Archive atthe National Center for Biotechnology Information (see www.ncbi.nlm.nih.gov/Traces). The region of a genome to be ana-lyzed is divided up into 40-kb projects, a work unit that we
Genomics Education Partnership
Vol. 9, Spring 2010 57
find can be handled by a single student or a small number ofstudents working together.
Sequence Improvement Projects (“Finishing”). For any re-gion of interest the files for the published draft sequences areconsulted to ascertain the positions of fosmid clones (gener-ally �40 kb) based on end sequence data. A “golden path”of overlapping clones is selected to cover the region (e.g., thedot chromosome, from the most proximal to the most distalgene), and these clones are procured from the DrosophilaGenomics Resource Center. The fosmids are purified andrestriction digests are prepared at the Washington Univer-sity Genome Center using four different enzymes.
The student packages are created by first collecting all ofthe sequencing traces produced in the whole-genome projectfor the species and region of interest from the Trace Archive.The trace files are renamed for compatibility with theConsed suite of finishing software using the St. Louis nam-ing standard (see Consed documentation; Gordon, 2003) andbundled together with the restriction digest data files andother support files. Each project is given a difficulty rankingbased on the number and type of gaps, density of repeats,and likelihood of misassemblies, based on an initial analysisusing Consed. The purified fosmid clones are retained atWashington University and used as templates for finishingreactions by using student-designed primers to obtain addi-tional sequence data. Students are asked to finish theirproject to the same standard as the mouse genome; thisrequires 1) a complete assembly (no gaps), 2) adequate cov-erage of all regions (ideally, sequence from both strands), 3)resolution of ambiguous results, and 3) high quality of se-quence data (Phred score of �30; The Genome Center atWashington University, 2004). As a final check, student fin-ishers compare an in silico restriction digest of their assem-blies with the results generated from the cloned DNA.
Annotation Projects. For regions of interest (either previ-ously finished GEP sequences or high-quality draft se-quences), we create overlapping projects that are between 40and 60 kb. We use the published computational gene predic-tions (Clark et al., 2007) to try to avoid splitting a single genebetween projects, but there are no guarantees. We analyzeeach project with various bioinformatic analysis algorithms(e.g., ab initio gene finders, repeat analysis, splice site pre-dictors, conservation analysis). Using the output, we rankthe difficulty of each project (on a scale of 1–3) based on thenumber of putative genes and the number of putative iso-forms per gene. We then create a custom installation of theUniversity of California, Santa Cruz, genome browser(Karolchik et al., 2008; see http://genome.ucsc.edu) that al-lows students to view the results applied to their projects(see below). Finally, the sequence of each section is bundledwith all the raw data files into a package and made availableon the GEP claim system. Students who are given projectsare asked to derive the best gene models, including a searchfor all isoforms documented in D. melanogaster, by usingmultiple sources of information, and to report their findingsto the GEP.
Surveys and StatisticsStudents in GEP courses were asked to complete two sets ofonline instruments. As their academic term began, students
completed an online 85-item survey to establish their previ-ous experience, attitudes toward science, and learning style.The survey is based on the Classroom Undergraduate Re-search Experience and Summer Undergraduate ResearchExperience surveys (SURE); see www.grinnell.edu/academic/psychology/faculty/dl/sure&cure),with additional itemsthat specifically target GEP course activities. Students com-pleted a similar survey (98 items) at the end of their coursein which they evaluated their learning gains on course- andresearch-related items, as well as giving an overall evalua-tion of the experience and their attitudes toward science. Inaddition, students were asked to voluntarily complete a testof knowledge, both pre- and postcourse. The test, designedby GEP faculty, covers basic knowledge of genes and ge-nomes (20-question annotation quiz) and basic knowledgeof sequencing reactions and data analysis (25-question fin-ishing quiz) in a multiple-choice format.
For analysis of the test data, participating students weredivided into two groups, students who had instruction inboth annotation and finishing and students who had in-struction in annotation only. In addition, GEP faculty re-cruited students at their institutions who had completed thesame prerequisites but were in courses that did not use GEPmaterial to serve as a comparison group. To encourageparticipation, students who completed the self-report surveysor the quizzes were given the opportunity to enter a raffle for$50 gift certificates redeemable at an online bookstore.
Course enrollment data supplied by faculty participantsfor 2008–2009 indicated that 472 students were enrolled inGEP-associated courses. Response rates for GEP students onthe various assessment instruments were 75% for the pre-course survey, 69% for the precourse quizzes, 49% for thepostcourse survey, and 45% for the postcourse quizzes. Inaddition, 61 students not involved with the GEP coursescompleted the quizzes, providing a comparison group.Within the larger group of GEP respondents, 192 partici-pants submitted complete data (all four items). These dataprovided the means for investigating the relationshipsamong the measures. Approval to conduct assessment ofstudent learning for scholarly purposes was obtained fromthe local Institutional Review Board (IRB) at each participat-ing institution.
GEP faculty partners completed a survey with 25 items toindicate which ones they emphasized in their courses. Inaddition, faculty provided enrollment information, esti-mates of time on task for annotation and finishing anddemographic information for their school. In late spring2009, participating faculty completed an additional surveyin which they evaluated their own experience with the GEP(Washington University IRB approval). In addition, teachingassistants (TAs) working with the GEP faculty suppliedpostcourse observations of the course and student learningduring the first year of implementation. During the 2008–2009 academic year, 46 institutions have had students par-ticipate in the GEP research-based activities (16 partnerschools did finishing and annotation, 30 did annotationonly). Overall, 47 schools provided institutional informa-tion, 26 institutions provided precourse student survey/quiz data, and 22 institutions provided postcourse studentsurvey/quiz data.
C. D. Shaffer et al.
CBE—Life Sciences Education58
RESULTS
Structure and Organization of the GEPThe GEP arose from the successful implementation of agenomics laboratory course at Washington University in St.Louis (Research Explorations in Genomics, Bio 4342), a col-laborative effort by members of the Genome Center, theDepartment of Computer Science, and the Department ofBiology (S. Elgin, C. Shaffer, J. Buhler, E. Mardis). We hadobserved many didactic benefits (discussed below) of takinglarge research projects and breaking them down into smaller“student-sized” work units that would allow each student totackle his/her own individual research problem, while con-tributing to a larger analysis. Initial studies, focusing on acomparative analysis of D. melanogaster and D. virilis dot chro-mosomes, have been published (Slawson et al., 2006); a secondmanuscript has been submitted (W. Leung, C. Shaffer, T. Cor-donnier, J. Wong, M. Itano, E. Slawson Tempel, E. Kellman, D.Desruisseau, C. Cain, R. Carrasquillo, personal communication).
This experience indicated that genomics is an excellentarea for introducing students to research thinking in theacademic year classroom. Advantages of in silico researchinclude the following:
• requires only a computer with Internet access; therefore,widely accessible, as wet bench lab space (often in shortsupply) is not required;
• lends itself to student/scientist partnerships—many smallcontributions can lead to interesting results;
• lends itself to peer instruction;• has no major lab safety issues;• is effective with a short time line—computational “exper-
iments” take minutes to run, allowing errors to be quicklyrecognized and experiments to be redesigned and rerunmore quickly than possible with most wet bench investi-gations; and
• is practical for a larger number of students than typicallycan be handled in a research lab; all students can be taughta common set of problem-solving techniques that they canthen apply to their own particular project.
The idea of a nationally distributed system was an obvi-ous outgrowth of the local success of the program; if morefaculty and students could be recruited, larger, more so-phisticated genomics projects would be possible. A na-tional distribution system could provide other institutionswith the means to provide their students with researchopportunities in genomics. Although most colleges anduniversities do not have convenient access to large ge-nome centers, they do have computer labs, and usingthese kinds of facilities students can become involved inlarge, genome-level projects.
The initial support and enthusiasm for a nationwideproject came about through a workshop at Washington Uni-versity where the system was demonstrated and the poten-tial benefits and outcomes of research-based curriculum cen-tered on computer-based genomic analysis were discussedwith a group of PUI faculty. Based on the recommendationsfrom that meeting, appropriate support features were de-signed, and an initial grant proposal was subsequently sub-mitted to and funded by the Howard Hughes Medical In-stitute (HHMI) Professors Program to establish the group
and provide the needed central sequencing, computer infra-structure, and technical support.
Several core concepts guided the initial stages of thegrowth and development of the GEP. These are based onprinciples of inclusion and flexibility. Our goals are to creatematerials to teach the needed software and strategies toundergraduates, train faculty and teaching assistants atworkshops in the use of these materials, and support GEPmembers as they incorporate this research-based curriculuminto their classes, giving their students the opportunity tojoin in an ongoing research project.
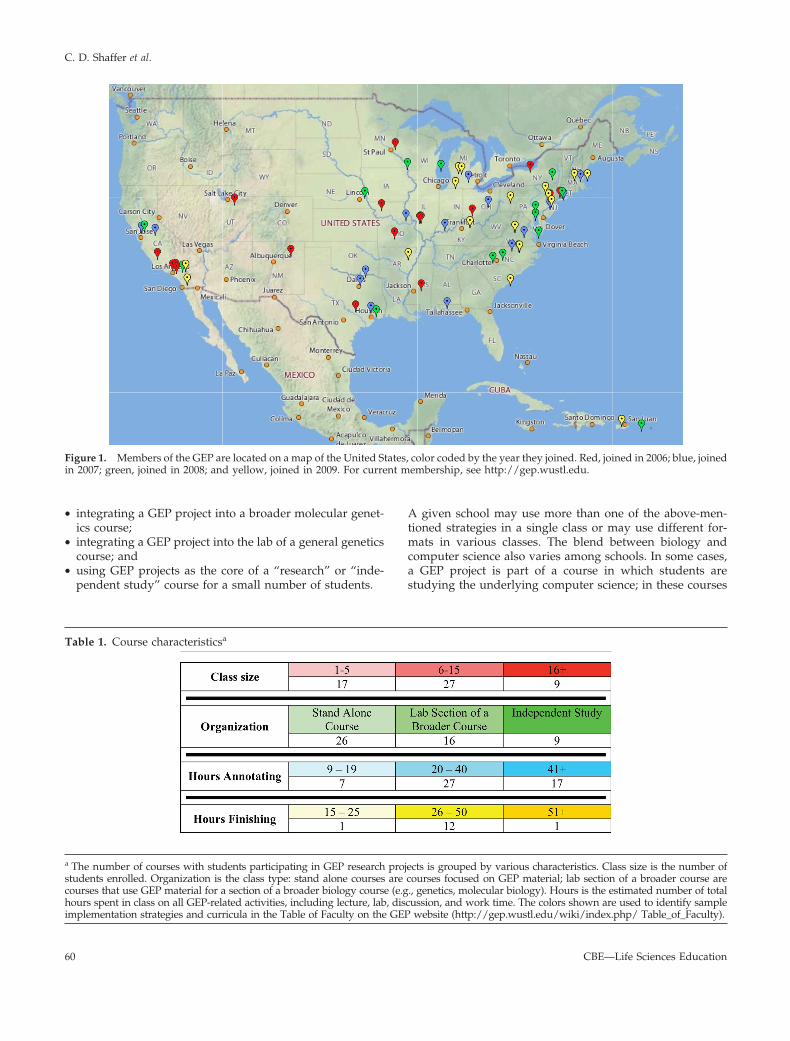
The GEP has grown by �15 schools each year for the past4 yr. Faculty join by attending a week-long workshop tolearn the software and bioinformatics tools in use, as well asgeneral strategies for implementation. All faculty are invitedto send one student for similar training; these studentsthen act as TAs to assist with initial implementation.Training workshops are scheduled in June for faculty, inAugust (just before the fall semester) for both faculty and TAs,and in January (just before spring semester) for TAs. There arecurrently 65 members in the partnership (Figure 1); approxi-mately 48 members contributed data to the analysis reportedhere (members joining in 2006, 2007, and 2008).
To obtain a better understanding of the variety of institu-tions in the GEP, we conducted a voluntary institutionalsurvey of the 28 private and 20 public institutions that hadjoined the GEP through 2008. A summary of the informationfrom the 47 schools that responded demonstrated the diver-sity of the GEP member institutions. For example, an anal-ysis of the students at GEP institutions reveals:
• 13 schools have �2000 students, whereas 10 schools have�10,000 students;
• 11 schools have �80% of students living on campus,whereas in 12 schools �90% commute;
• 13 schools have �5% nontraditional (�25-yr-old) students,whereas four schools have �40% nontraditional students;
• six schools have �40% first-generation students; and• 13 schools have �40% minority students.
Faculty use GEP materials in a variety of courses that aresummarized in Table 1. This table is based on the list offaculty with example curricula, syllabi, and commentsfound on the GEP wiki (http://gep.wustl.edu/wiki/index.php/Table_of_Faculty). Because this document is being con-stantly updated with new information as faculty extends andrevises his or her own courses, Table 1 represents a snapshot intime of the variety of course implementations using GEP ma-terial. The individual faculty members are free to choose thelevel of participation in the GEP. Some choose to use the freelyavailable practice problems (http://gep.wustl.edu/curriculum/course_materials0. php) to introduce their students to bioinfor-matics tools and analysis but do not participate in the ongoingresearch projects. Others choose to be involved in the sequenceimprovement and/or annotation projects. Members have useda variety of approaches in designing classes to implement GEPmaterial. Depending on local curriculum needs and the avail-ability of computer lab space, implementation strategies haveincluded the following:
• creating a new, semester-long upper-level lab coursebased on GEP projects;
Genomics Education Partnership
Vol. 9, Spring 2010 59
• integrating a GEP project into a broader molecular genet-ics course;
• integrating a GEP project into the lab of a general geneticscourse; and
• using GEP projects as the core of a “research” or “inde-pendent study” course for a small number of students.
A given school may use more than one of the above-men-tioned strategies in a single class or may use different for-mats in various classes. The blend between biology andcomputer science also varies among schools. In some cases,a GEP project is part of a course in which students arestudying the underlying computer science; in these courses
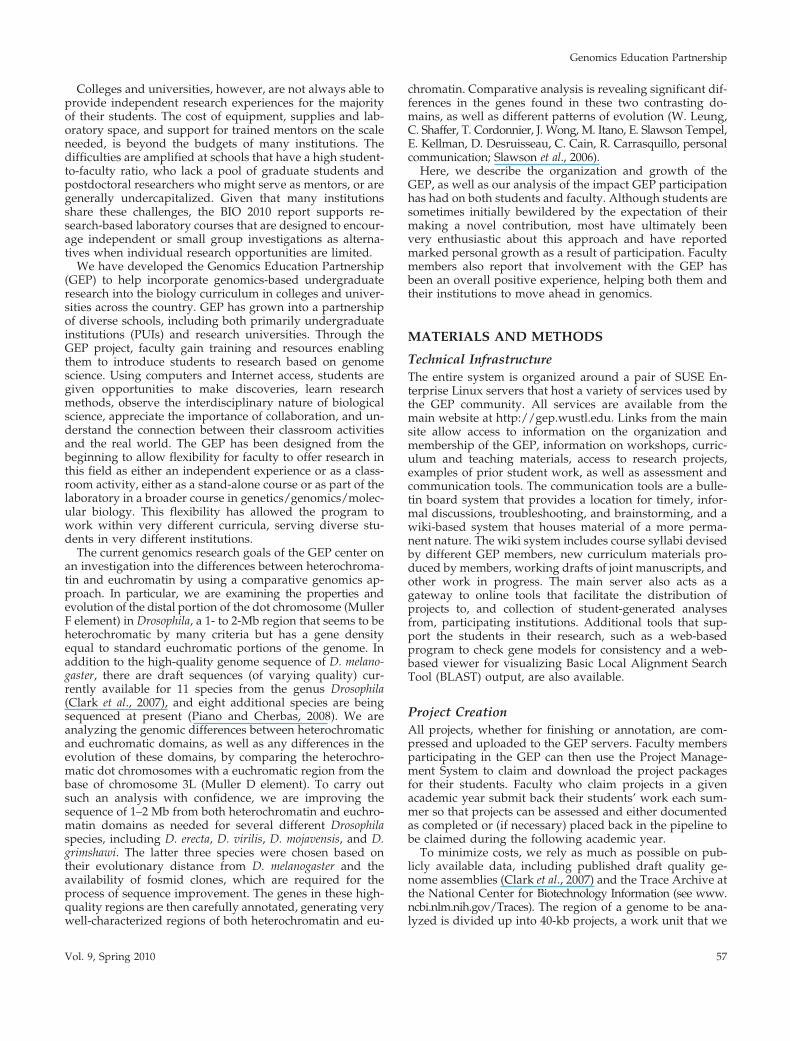
Figure 1. Members of the GEP are located on a map of the United States, color coded by the year they joined. Red, joined in 2006; blue, joinedin 2007; green, joined in 2008; and yellow, joined in 2009. For current membership, see http://gep.wustl.edu.
Table 1. Course characteristicsa
a The number of courses with students participating in GEP research projects is grouped by various characteristics. Class size is the number ofstudents enrolled. Organization is the class type: stand alone courses are courses focused on GEP material; lab section of a broader course arecourses that use GEP material for a section of a broader biology course (e.g., genetics, molecular biology). Hours is the estimated number of totalhours spent in class on all GEP-related activities, including lecture, lab, discussion, and work time. The colors shown are used to identify sampleimplementation strategies and curricula in the Table of Faculty on the GEP website (http://gep.wustl.edu/wiki/index.php/ Table_of_Faculty).
C. D. Shaffer et al.
CBE—Life Sciences Education60
students often write programs to organize and analyze theraw data provided in the project packages. More often,however, a GEP project is embedded in a biology course thatemphasizes an understanding of genes and genomes. Inthese cases, students use the genome browser and otheronline tools to collect data and analyze their projects.
Goals, Process, and OutcomesThe primary research goal of the GEP is to improve andannotate the draft quality sequence of large chromosomalregions with the aim of addressing a question using com-parative genomics. The current project focuses on the smalldot chromosomes from D. virilis, D. grimshawi, D. erecta, andD. mojavensis, as well as large (�1-Mb) regions from the longautosomal arms of D. erecta and D. mojavensis, selected aseuchromatic control regions. The annotation process uses anevidence-based approach for all the finished regions.
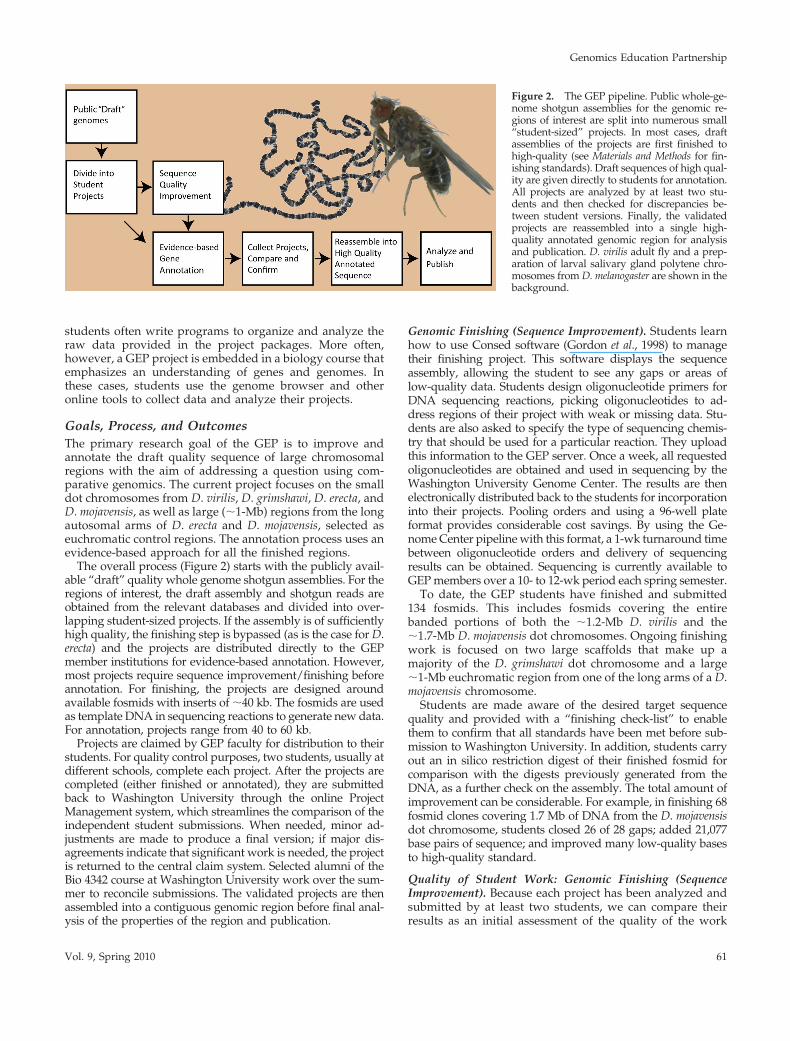
The overall process (Figure 2) starts with the publicly avail-able “draft” quality whole genome shotgun assemblies. For theregions of interest, the draft assembly and shotgun reads areobtained from the relevant databases and divided into over-lapping student-sized projects. If the assembly is of sufficientlyhigh quality, the finishing step is bypassed (as is the case for D.erecta) and the projects are distributed directly to the GEPmember institutions for evidence-based annotation. However,most projects require sequence improvement/finishing beforeannotation. For finishing, the projects are designed aroundavailable fosmids with inserts of �40 kb. The fosmids are usedas template DNA in sequencing reactions to generate new data.For annotation, projects range from 40 to 60 kb.
Projects are claimed by GEP faculty for distribution to theirstudents. For quality control purposes, two students, usually atdifferent schools, complete each project. After the projects arecompleted (either finished or annotated), they are submittedback to Washington University through the online ProjectManagement system, which streamlines the comparison of theindependent student submissions. When needed, minor ad-justments are made to produce a final version; if major dis-agreements indicate that significant work is needed, the projectis returned to the central claim system. Selected alumni of theBio 4342 course at Washington University work over the sum-mer to reconcile submissions. The validated projects are thenassembled into a contiguous genomic region before final anal-ysis of the properties of the region and publication.
Genomic Finishing (Sequence Improvement). Students learnhow to use Consed software (Gordon et al., 1998) to managetheir finishing project. This software displays the sequenceassembly, allowing the student to see any gaps or areas oflow-quality data. Students design oligonucleotide primers forDNA sequencing reactions, picking oligonucleotides to ad-dress regions of their project with weak or missing data. Stu-dents are also asked to specify the type of sequencing chemis-try that should be used for a particular reaction. They uploadthis information to the GEP server. Once a week, all requestedoligonucleotides are obtained and used in sequencing by theWashington University Genome Center. The results are thenelectronically distributed back to the students for incorporationinto their projects. Pooling orders and using a 96-well plateformat provides considerable cost savings. By using the Ge-nome Center pipeline with this format, a 1-wk turnaround timebetween oligonucleotide orders and delivery of sequencingresults can be obtained. Sequencing is currently available toGEP members over a 10- to 12-wk period each spring semester.
To date, the GEP students have finished and submitted134 fosmids. This includes fosmids covering the entirebanded portions of both the �1.2-Mb D. virilis and the�1.7-Mb D. mojavensis dot chromosomes. Ongoing finishingwork is focused on two large scaffolds that make up amajority of the D. grimshawi dot chromosome and a large�1-Mb euchromatic region from one of the long arms of a D.mojavensis chromosome.
Students are made aware of the desired target sequencequality and provided with a “finishing check-list” to enablethem to confirm that all standards have been met before sub-mission to Washington University. In addition, students carryout an in silico restriction digest of their finished fosmid forcomparison with the digests previously generated from theDNA, as a further check on the assembly. The total amount ofimprovement can be considerable. For example, in finishing 68fosmid clones covering 1.7 Mb of DNA from the D. mojavensisdot chromosome, students closed 26 of 28 gaps; added 21,077base pairs of sequence; and improved many low-quality basesto high-quality standard.
Quality of Student Work: Genomic Finishing (SequenceImprovement). Because each project has been analyzed andsubmitted by at least two students, we can compare theirresults as an initial assessment of the quality of the work
Figure 2. The GEP pipeline. Public whole-ge-nome shotgun assemblies for the genomic re-gions of interest are split into numerous small“student-sized” projects. In most cases, draftassemblies of the projects are first finished tohigh-quality (see Materials and Methods for fin-ishing standards). Draft sequences of high qual-ity are given directly to students for annotation.All projects are analyzed by at least two stu-dents and then checked for discrepancies be-tween student versions. Finally, the validatedprojects are reassembled into a single high-quality annotated genomic region for analysisand publication. D. virilis adult fly and a prep-aration of larval salivary gland polytene chro-mosomes from D. melanogaster are shown in thebackground.
Genomics Education Partnership
Vol. 9, Spring 2010 61
done. Any regions found to be discrepant between the twosequences were investigated further for errors in finishing.This comparison also allowed us to recognize commonerrors made by students to further improve the availabletraining materials. A recent analysis showed that of 58submitted projects, 43 (74%) projects were completelycongruent and acceptable, one project had only minorissues with the identification of putative polymorphisms,and 14 projects needed additional data. Most of the errorsmade by students involved giving undue value to low-quality data.
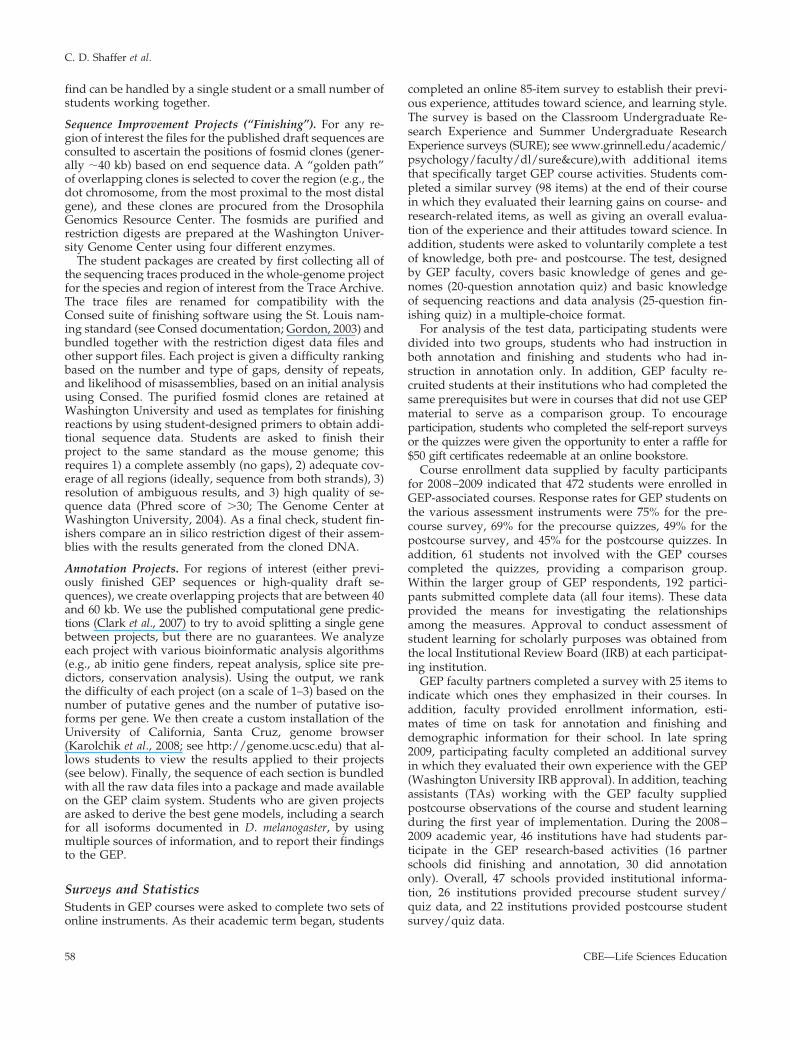
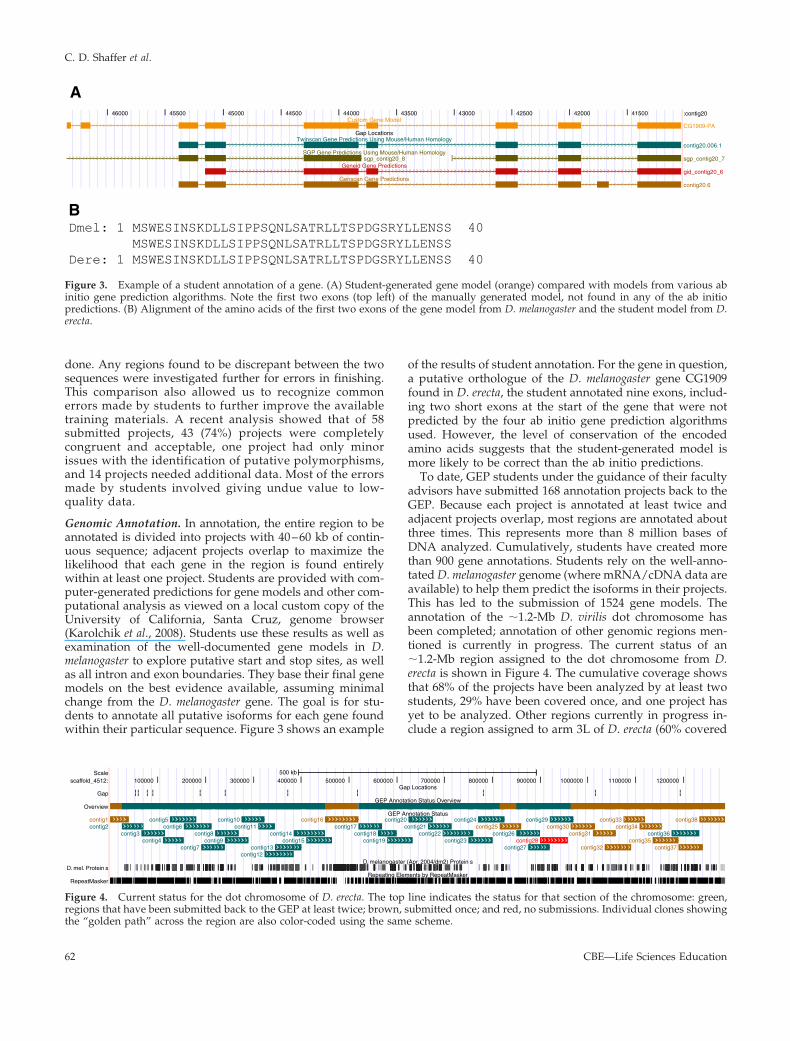
Genomic Annotation. In annotation, the entire region to beannotated is divided into projects with 40–60 kb of contin-uous sequence; adjacent projects overlap to maximize thelikelihood that each gene in the region is found entirelywithin at least one project. Students are provided with com-puter-generated predictions for gene models and other com-putational analysis as viewed on a local custom copy of theUniversity of California, Santa Cruz, genome browser(Karolchik et al., 2008). Students use these results as well asexamination of the well-documented gene models in D.melanogaster to explore putative start and stop sites, as wellas all intron and exon boundaries. They base their final genemodels on the best evidence available, assuming minimalchange from the D. melanogaster gene. The goal is for stu-dents to annotate all putative isoforms for each gene foundwithin their particular sequence. Figure 3 shows an example
of the results of student annotation. For the gene in question,a putative orthologue of the D. melanogaster gene CG1909found in D. erecta, the student annotated nine exons, includ-ing two short exons at the start of the gene that were notpredicted by the four ab initio gene prediction algorithmsused. However, the level of conservation of the encodedamino acids suggests that the student-generated model ismore likely to be correct than the ab initio predictions.
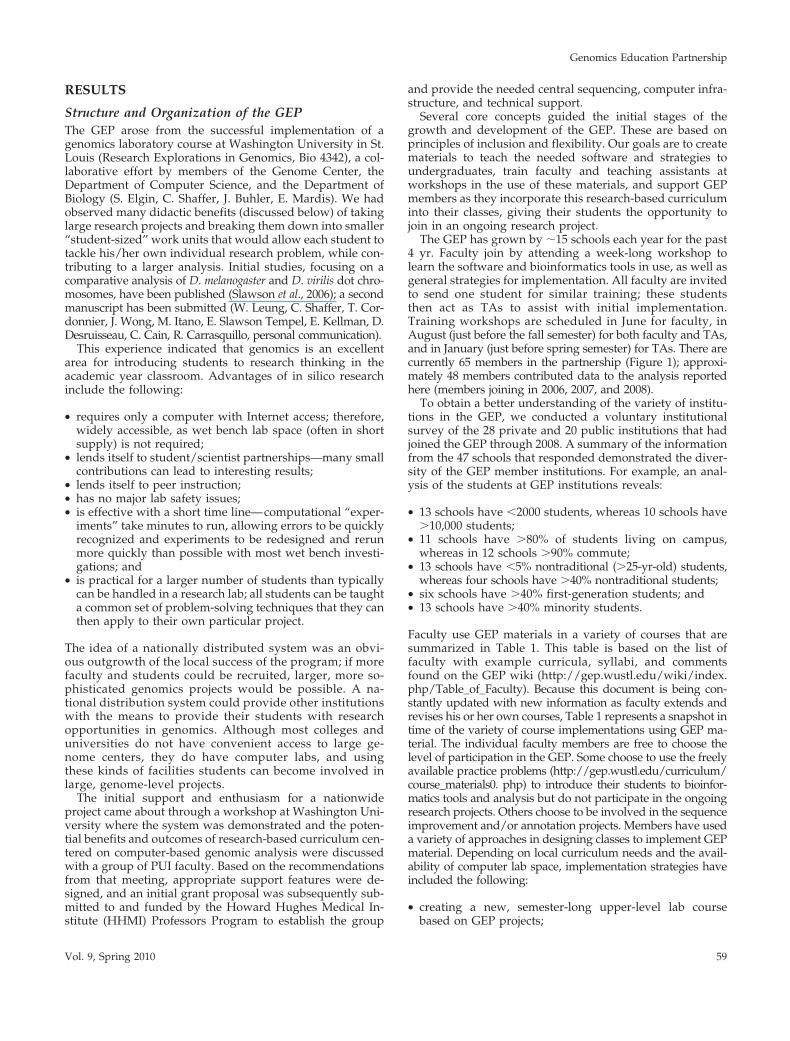
To date, GEP students under the guidance of their facultyadvisors have submitted 168 annotation projects back to theGEP. Because each project is annotated at least twice andadjacent projects overlap, most regions are annotated aboutthree times. This represents more than 8 million bases ofDNA analyzed. Cumulatively, students have created morethan 900 gene annotations. Students rely on the well-anno-tated D. melanogaster genome (where mRNA/cDNA data areavailable) to help them predict the isoforms in their projects.This has led to the submission of 1524 gene models. Theannotation of the �1.2-Mb D. virilis dot chromosome hasbeen completed; annotation of other genomic regions men-tioned is currently in progress. The current status of an�1.2-Mb region assigned to the dot chromosome from D.erecta is shown in Figure 4. The cumulative coverage showsthat 68% of the projects have been analyzed by at least twostudents, 29% have been covered once, and one project hasyet to be analyzed. Other regions currently in progress in-clude a region assigned to arm 3L of D. erecta (60% covered
:contig20
CG1909-PA
41500420004250043000435004400044500450004550046000Custom Gene Model
Gap LocationsTwinscan Gene Predictions Using Mouse/Human Homology
SGP Gene Predictions Using Mouse/Human Homology
Geneid Gene Predictions
Genscan Gene Predictions
contig20.006.1
sgp_contig20_7sgp_contig20_8
gid_contig20_6
contig20.6
BDmel: 1 MSWESINSKDLLSIPPSQNLSATRLLTSPDGSRYLLENSS 40 MSWESINSKDLLSIPPSQNLSATRLLTSPDGSRYLLENSSDere: 1 MSWESINSKDLLSIPPSQNLSATRLLTSPDGSRYLLENSS 40
A
Figure 3. Example of a student annotation of a gene. (A) Student-generated gene model (orange) compared with models from various abinitio gene prediction algorithms. Note the first two exons (top left) of the manually generated model, not found in any of the ab initiopredictions. (B) Alignment of the amino acids of the first two exons of the gene model from D. melanogaster and the student model from D.erecta.
Scalescaffold_4512:
Ga
Overview
D. mel. Protein s
Re eatMasker
500 kb100000 200000 300000 400000 500000 600000 700000 800000 900000 1000000 1100000 1200000
Gap Locations
GEP Annotation Status Overview
GEP Annotation Status
D. melanogaster (Apr. 2004/dm2) Protein s
Repeating Elements by RepeatMasker
contig1contig2
contig3contig4
contig5contig6
contig7
contig8contig9
contig10contig11
contig12contig13
contig14contig15
contig16contig17
contig18contig19
contig20contig21
contig22contig23
contig24contig25
contig26
contig27contig28
contig29contig30
contig31
contig32
contig33contig34
contig35contig36
contig37
contig38
p
p
Figure 4. Current status for the dot chromosome of D. erecta. The top line indicates the status for that section of the chromosome: green,regions that have been submitted back to the GEP at least twice; brown, submitted once; and red, no submissions. Individual clones showingthe “golden path” across the region are also color-coded using the same scheme.
C. D. Shaffer et al.
CBE—Life Sciences Education62
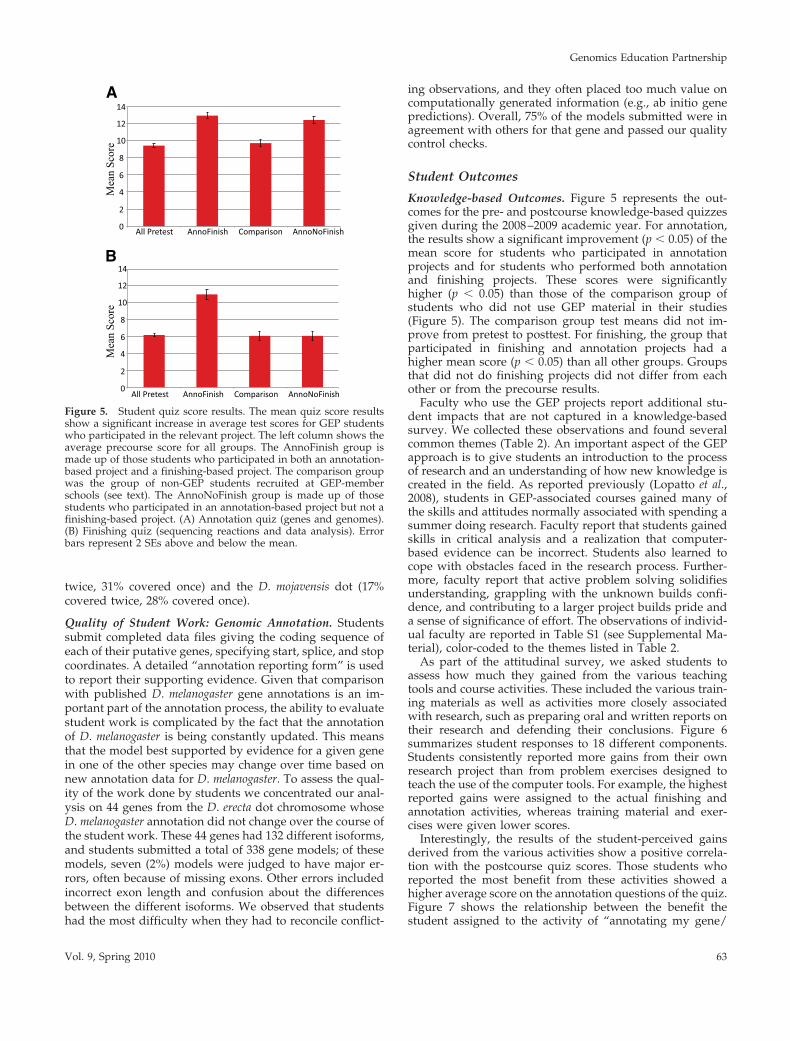
twice, 31% covered once) and the D. mojavensis dot (17%covered twice, 28% covered once).
Quality of Student Work: Genomic Annotation. Studentssubmit completed data files giving the coding sequence ofeach of their putative genes, specifying start, splice, and stopcoordinates. A detailed “annotation reporting form” is usedto report their supporting evidence. Given that comparisonwith published D. melanogaster gene annotations is an im-portant part of the annotation process, the ability to evaluatestudent work is complicated by the fact that the annotationof D. melanogaster is being constantly updated. This meansthat the model best supported by evidence for a given genein one of the other species may change over time based onnew annotation data for D. melanogaster. To assess the qual-ity of the work done by students we concentrated our anal-ysis on 44 genes from the D. erecta dot chromosome whoseD. melanogaster annotation did not change over the course ofthe student work. These 44 genes had 132 different isoforms,and students submitted a total of 338 gene models; of thesemodels, seven (2%) models were judged to have major er-rors, often because of missing exons. Other errors includedincorrect exon length and confusion about the differencesbetween the different isoforms. We observed that studentshad the most difficulty when they had to reconcile conflict-
ing observations, and they often placed too much value oncomputationally generated information (e.g., ab initio genepredictions). Overall, 75% of the models submitted were inagreement with others for that gene and passed our qualitycontrol checks.
Student Outcomes
Knowledge-based Outcomes. Figure 5 represents the out-comes for the pre- and postcourse knowledge-based quizzesgiven during the 2008–2009 academic year. For annotation,the results show a significant improvement (p � 0.05) of themean score for students who participated in annotationprojects and for students who performed both annotationand finishing projects. These scores were significantlyhigher (p � 0.05) than those of the comparison group ofstudents who did not use GEP material in their studies(Figure 5). The comparison group test means did not im-prove from pretest to posttest. For finishing, the group thatparticipated in finishing and annotation projects had ahigher mean score (p � 0.05) than all other groups. Groupsthat did not do finishing projects did not differ from eachother or from the precourse results.
Faculty who use the GEP projects report additional stu-dent impacts that are not captured in a knowledge-basedsurvey. We collected these observations and found severalcommon themes (Table 2). An important aspect of the GEPapproach is to give students an introduction to the processof research and an understanding of how new knowledge iscreated in the field. As reported previously (Lopatto et al.,2008), students in GEP-associated courses gained many ofthe skills and attitudes normally associated with spending asummer doing research. Faculty report that students gainedskills in critical analysis and a realization that computer-based evidence can be incorrect. Students also learned tocope with obstacles faced in the research process. Further-more, faculty report that active problem solving solidifiesunderstanding, grappling with the unknown builds confi-dence, and contributing to a larger project builds pride anda sense of significance of effort. The observations of individ-ual faculty are reported in Table S1 (see Supplemental Ma-terial), color-coded to the themes listed in Table 2.
As part of the attitudinal survey, we asked students toassess how much they gained from the various teachingtools and course activities. These included the various train-ing materials as well as activities more closely associatedwith research, such as preparing oral and written reports ontheir research and defending their conclusions. Figure 6summarizes student responses to 18 different components.Students consistently reported more gains from their ownresearch project than from problem exercises designed toteach the use of the computer tools. For example, the highestreported gains were assigned to the actual finishing andannotation activities, whereas training material and exer-cises were given lower scores.
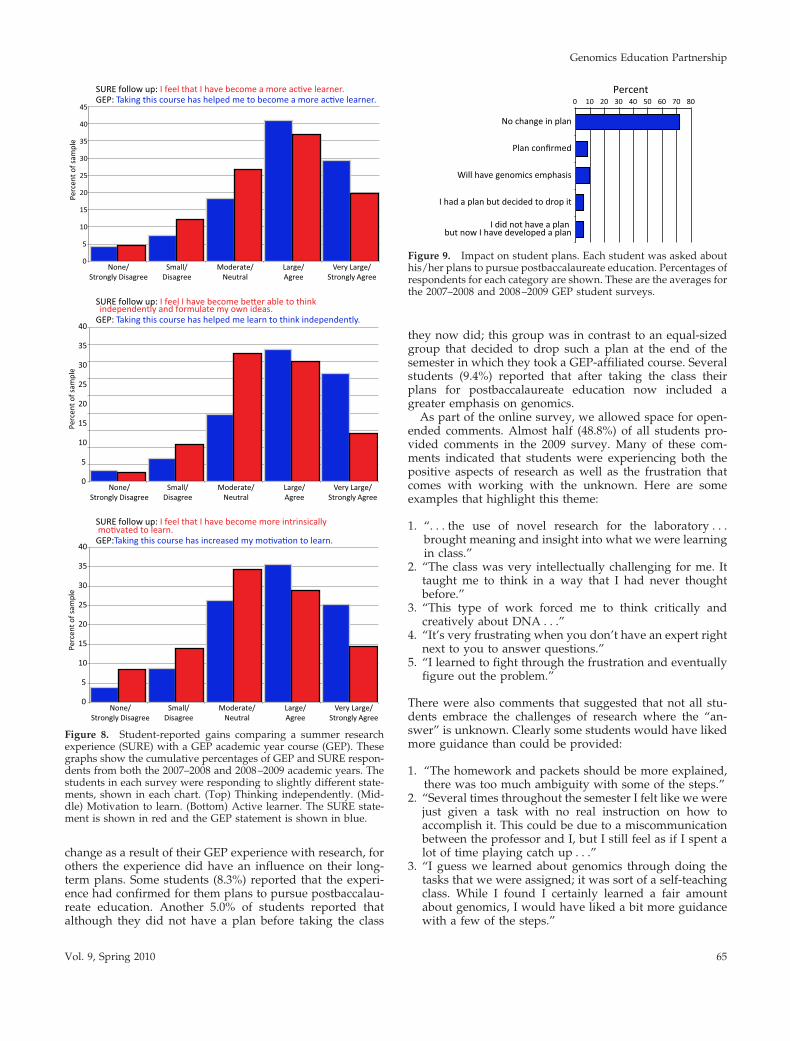
Interestingly, the results of the student-perceived gainsderived from the various activities show a positive correla-tion with the postcourse quiz scores. Those students whoreported the most benefit from these activities showed ahigher average score on the annotation questions of the quiz.Figure 7 shows the relationship between the benefit thestudent assigned to the activity of “annotating my gene/
B
Mea
n Sc
ore
Mea
n Sc
ore
A
0
2
4
6
8
10
12
14
All Pretest AnnoFinish Comparison AnnoNoFinish
0
2
4
6
8
10
12
14
All Pretest AnnoFinish Comparison AnnoNoFinish
Figure 5. Student quiz score results. The mean quiz score resultsshow a significant increase in average test scores for GEP studentswho participated in the relevant project. The left column shows theaverage precourse score for all groups. The AnnoFinish group ismade up of those students who participated in both an annotation-based project and a finishing-based project. The comparison groupwas the group of non-GEP students recruited at GEP-memberschools (see text). The AnnoNoFinish group is made up of thosestudents who participated in an annotation-based project but not afinishing-based project. (A) Annotation quiz (genes and genomes).(B) Finishing quiz (sequencing reactions and data analysis). Errorbars represent 2 SEs above and below the mean.
Genomics Education Partnership
Vol. 9, Spring 2010 63
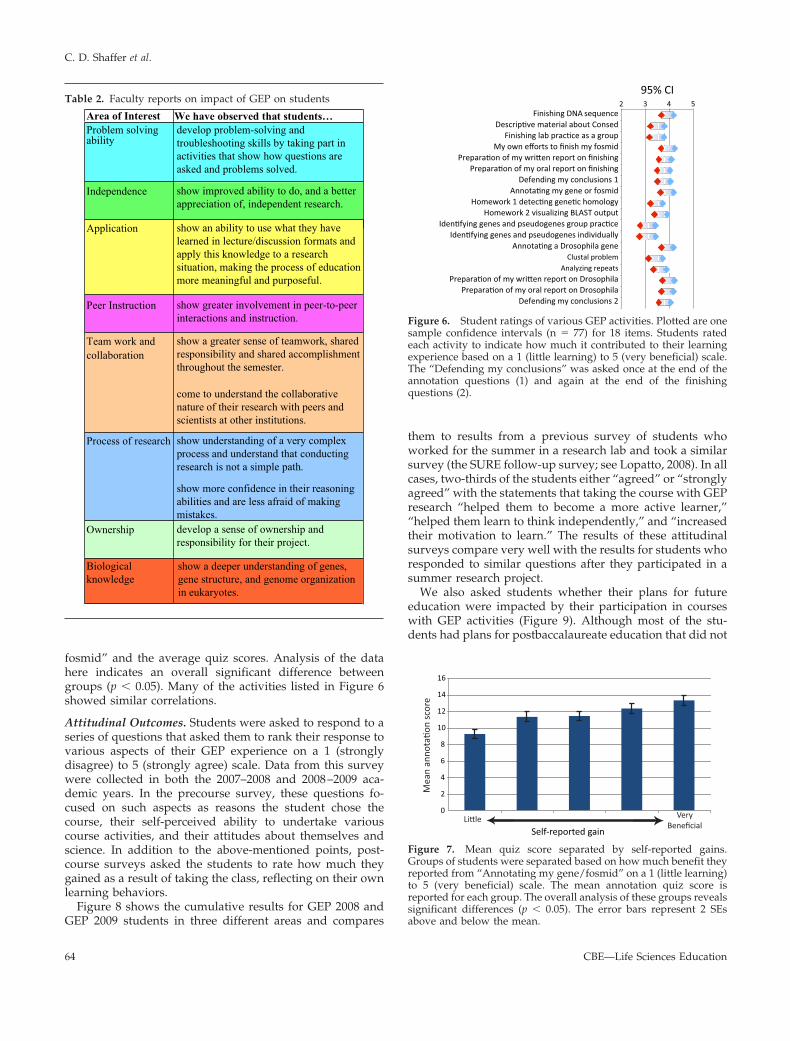
fosmid” and the average quiz scores. Analysis of the datahere indicates an overall significant difference betweengroups (p � 0.05). Many of the activities listed in Figure 6showed similar correlations.
Attitudinal Outcomes. Students were asked to respond to aseries of questions that asked them to rank their response tovarious aspects of their GEP experience on a 1 (stronglydisagree) to 5 (strongly agree) scale. Data from this surveywere collected in both the 2007–2008 and 2008–2009 aca-demic years. In the precourse survey, these questions fo-cused on such aspects as reasons the student chose thecourse, their self-perceived ability to undertake variouscourse activities, and their attitudes about themselves andscience. In addition to the above-mentioned points, post-course surveys asked the students to rate how much theygained as a result of taking the class, reflecting on their ownlearning behaviors.
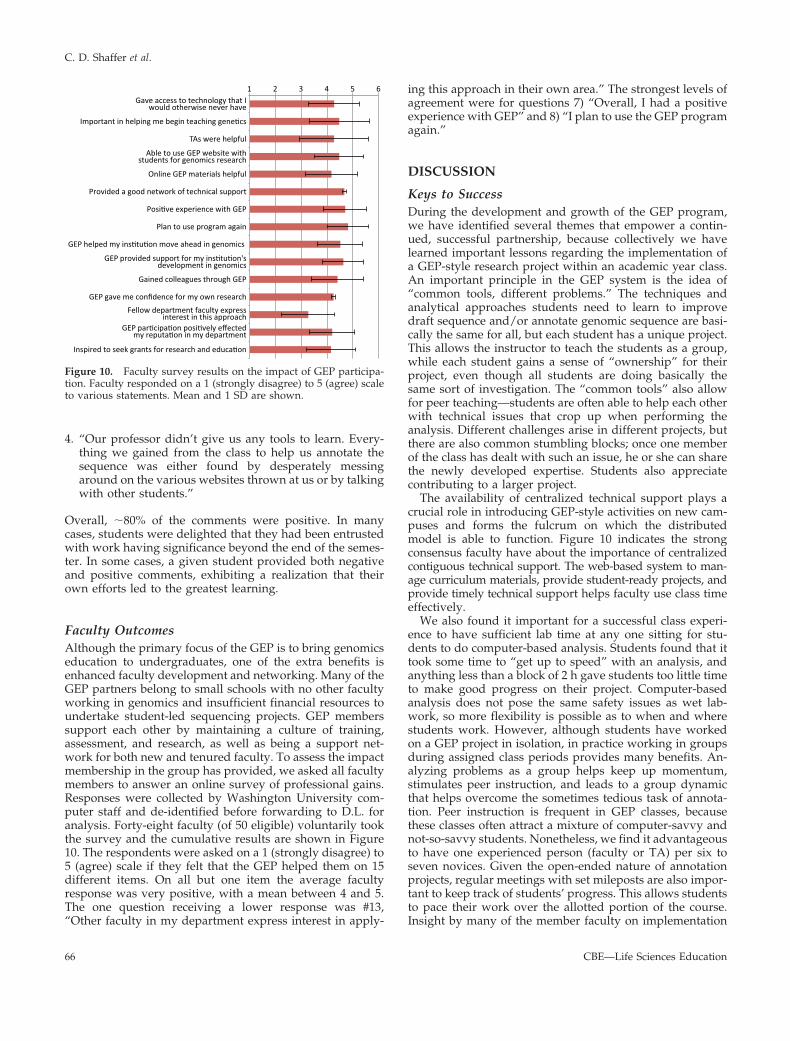
Figure 8 shows the cumulative results for GEP 2008 andGEP 2009 students in three different areas and compares
them to results from a previous survey of students whoworked for the summer in a research lab and took a similarsurvey (the SURE follow-up survey; see Lopatto, 2008). In allcases, two-thirds of the students either “agreed” or “stronglyagreed” with the statements that taking the course with GEPresearch “helped them to become a more active learner,”“helped them learn to think independently,” and “increasedtheir motivation to learn.” The results of these attitudinalsurveys compare very well with the results for students whoresponded to similar questions after they participated in asummer research project.
We also asked students whether their plans for futureeducation were impacted by their participation in courseswith GEP activities (Figure 9). Although most of the stu-dents had plans for postbaccalaureate education that did not
Finishing DNA sequence
95% CI
My own efforts to finish my fosmid
Defending my conclusions 1
Homework 2 visualizing BLAST output
Clustal problemAnalyzing repeats
Defending my conclusions 2
2 3 4 5
Figure 6. Student ratings of various GEP activities. Plotted are onesample confidence intervals (n � 77) for 18 items. Students ratedeach activity to indicate how much it contributed to their learningexperience based on a 1 (little learning) to 5 (very beneficial) scale.The “Defending my conclusions” was asked once at the end of theannotation questions (1) and again at the end of the finishingquestions (2).
Self-reported gain
16
14
12
10
8
6
4
2
0 VeryBeneficial
Figure 7. Mean quiz score separated by self-reported gains.Groups of students were separated based on how much benefit theyreported from “Annotating my gene/fosmid” on a 1 (little learning)to 5 (very beneficial) scale. The mean annotation quiz score isreported for each group. The overall analysis of these groups revealssignificant differences (p � 0.05). The error bars represent 2 SEsabove and below the mean.
Table 2. Faculty reports on impact of GEP on students
Area of InterestProblem solving ability
develop problem-solving and troubleshooting skills by taking part in activities that show how questions are asked and problems solved.
Independence show improved ability to do, and a better appreciation of, independent research.
Application show an ability to use what they have learned in lecture/discussion formats and apply this knowledge to a research situation, making the process of education more meaningful and purposeful.
Peer Instruction show greater involvement in peer-to-peer interactions and instruction.
Team work and collaboration
show a greater sense of teamwork, shared responsibility and shared accomplishment throughout the semester.
Process of research show understanding of a very complex process and understand that conducting research is not a simple path.
show more confidence in their reasoning abilities and are less afraid of making mistakes.
Ownership develop a sense of ownership and responsibility for their project.
Biological knowledge
show a deeper understanding of genes, gene structure, and genome organization in eukaryotes.
We have observed that students…
come to understand the collaborative nature of their research with peers and scientists at other institutions.
C. D. Shaffer et al.
CBE—Life Sciences Education64
change as a result of their GEP experience with research, forothers the experience did have an influence on their long-term plans. Some students (8.3%) reported that the experi-ence had confirmed for them plans to pursue postbaccalau-reate education. Another 5.0% of students reported thatalthough they did not have a plan before taking the class
they now did; this group was in contrast to an equal-sizedgroup that decided to drop such a plan at the end of thesemester in which they took a GEP-affiliated course. Severalstudents (9.4%) reported that after taking the class theirplans for postbaccalaureate education now included agreater emphasis on genomics.
As part of the online survey, we allowed space for open-ended comments. Almost half (48.8%) of all students pro-vided comments in the 2009 survey. Many of these com-ments indicated that students were experiencing both thepositive aspects of research as well as the frustration thatcomes with working with the unknown. Here are someexamples that highlight this theme:
1. “. . . the use of novel research for the laboratory . . .brought meaning and insight into what we were learningin class.”
2. “The class was very intellectually challenging for me. Ittaught me to think in a way that I had never thoughtbefore.”
3. “This type of work forced me to think critically andcreatively about DNA . . .”
4. “It’s very frustrating when you don’t have an expert rightnext to you to answer questions.”
5. “I learned to fight through the frustration and eventuallyfigure out the problem.”
There were also comments that suggested that not all stu-dents embrace the challenges of research where the “an-swer” is unknown. Clearly some students would have likedmore guidance than could be provided:
1. “The homework and packets should be more explained,there was too much ambiguity with some of the steps.”
2. “Several times throughout the semester I felt like we werejust given a task with no real instruction on how toaccomplish it. This could be due to a miscommunicationbetween the professor and I, but I still feel as if I spent alot of time playing catch up . . .”
3. “I guess we learned about genomics through doing thetasks that we were assigned; it was sort of a self-teachingclass. While I found I certainly learned a fair amountabout genomics, I would have liked a bit more guidancewith a few of the steps.”
SURE follow up: I feel that I have become a more ac�ve learner. GEP: Taking this course has helped me to become a more ac�ve learner.
0
5
10
15
20
25
30
35
40
45
Perc
ent o
f sam
ple
None/Strongly Disagree
Small/Disagree
Moderate/Neutral
Large/Agree
Very Large/Strongly Agree
SURE follow up: I feel I have become be�er able to think independently and formulate my own ideas.
GEP: Taking this course has helped me learn to think independently.
0
5
10
15
20
25
30
35
40
Perc
ent o
f sam
ple
None/Strongly Disagree
Small/Disagree
Moderate/Neutral
Large/Agree
Very Large/Strongly Agree
0
5
10
15
20
25
30
35
40
Perc
ent o
f sam
ple
SURE follow up: I feel that I have become more intrinsically mo�vated to learn.GEP:Taking this course has increased my mo�va�on to learn.
None/Strongly Disagree
Small/Disagree
Moderate/Neutral
Large/Agree
Very Large/Strongly Agree
Figure 8. Student-reported gains comparing a summer researchexperience (SURE) with a GEP academic year course (GEP). Thesegraphs show the cumulative percentages of GEP and SURE respon-dents from both the 2007–2008 and 2008–2009 academic years. Thestudents in each survey were responding to slightly different state-ments, shown in each chart. (Top) Thinking independently. (Mid-dle) Motivation to learn. (Bottom) Active learner. The SURE state-ment is shown in red and the GEP statement is shown in blue.
No change in plan
Plan confirmed
Will have genomics emphasis
I had a plan but decided to drop it
I did not have a plan but now I have developed a plan
Percent0 10 20 30 40 50 60 70 80
Figure 9. Impact on student plans. Each student was asked abouthis/her plans to pursue postbaccalaureate education. Percentages ofrespondents for each category are shown. These are the averages forthe 2007–2008 and 2008–2009 GEP student surveys.
Genomics Education Partnership
Vol. 9, Spring 2010 65
4. “Our professor didn’t give us any tools to learn. Every-thing we gained from the class to help us annotate thesequence was either found by desperately messingaround on the various websites thrown at us or by talkingwith other students.”
Overall, �80% of the comments were positive. In manycases, students were delighted that they had been entrustedwith work having significance beyond the end of the semes-ter. In some cases, a given student provided both negativeand positive comments, exhibiting a realization that theirown efforts led to the greatest learning.
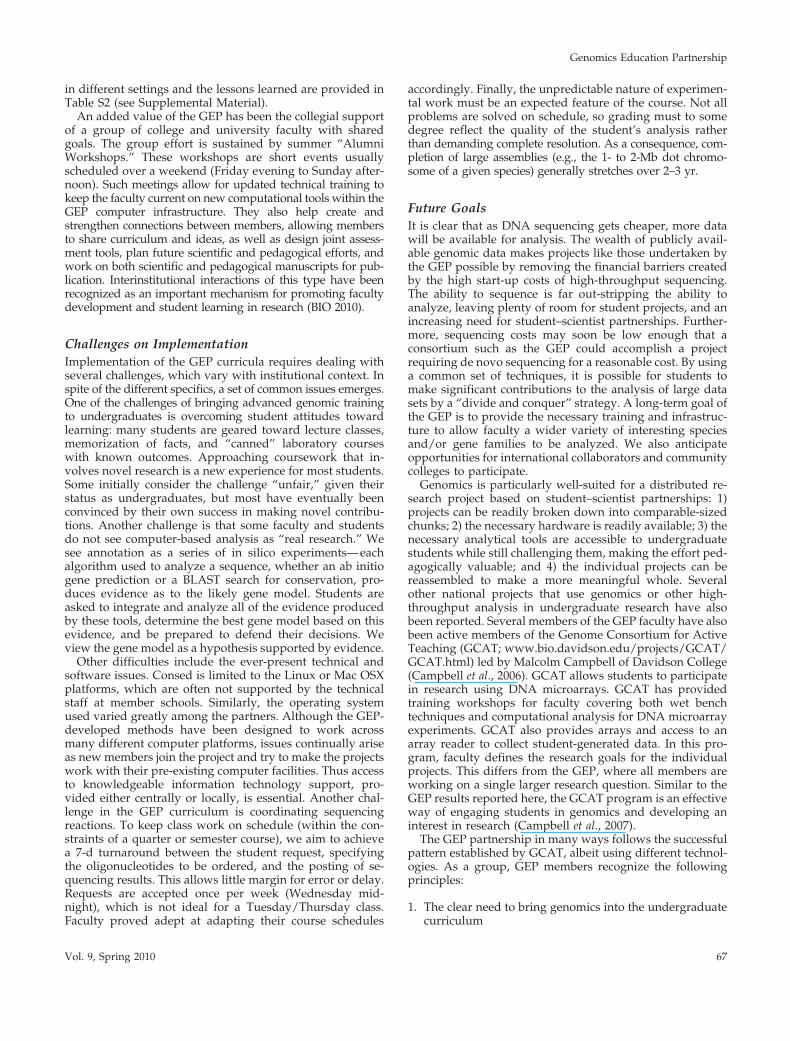
Faculty OutcomesAlthough the primary focus of the GEP is to bring genomicseducation to undergraduates, one of the extra benefits isenhanced faculty development and networking. Many of theGEP partners belong to small schools with no other facultyworking in genomics and insufficient financial resources toundertake student-led sequencing projects. GEP memberssupport each other by maintaining a culture of training,assessment, and research, as well as being a support net-work for both new and tenured faculty. To assess the impactmembership in the group has provided, we asked all facultymembers to answer an online survey of professional gains.Responses were collected by Washington University com-puter staff and de-identified before forwarding to D.L. foranalysis. Forty-eight faculty (of 50 eligible) voluntarily tookthe survey and the cumulative results are shown in Figure10. The respondents were asked on a 1 (strongly disagree) to5 (agree) scale if they felt that the GEP helped them on 15different items. On all but one item the average facultyresponse was very positive, with a mean between 4 and 5.The one question receiving a lower response was #13,“Other faculty in my department express interest in apply-
ing this approach in their own area.” The strongest levels ofagreement were for questions 7) “Overall, I had a positiveexperience with GEP” and 8) “I plan to use the GEP programagain.”
DISCUSSION
Keys to SuccessDuring the development and growth of the GEP program,we have identified several themes that empower a contin-ued, successful partnership, because collectively we havelearned important lessons regarding the implementation ofa GEP-style research project within an academic year class.An important principle in the GEP system is the idea of“common tools, different problems.” The techniques andanalytical approaches students need to learn to improvedraft sequence and/or annotate genomic sequence are basi-cally the same for all, but each student has a unique project.This allows the instructor to teach the students as a group,while each student gains a sense of “ownership” for theirproject, even though all students are doing basically thesame sort of investigation. The “common tools” also allowfor peer teaching—students are often able to help each otherwith technical issues that crop up when performing theanalysis. Different challenges arise in different projects, butthere are also common stumbling blocks; once one memberof the class has dealt with such an issue, he or she can sharethe newly developed expertise. Students also appreciatecontributing to a larger project.
The availability of centralized technical support plays acrucial role in introducing GEP-style activities on new cam-puses and forms the fulcrum on which the distributedmodel is able to function. Figure 10 indicates the strongconsensus faculty have about the importance of centralizedcontiguous technical support. The web-based system to man-age curriculum materials, provide student-ready projects, andprovide timely technical support helps faculty use class timeeffectively.
We also found it important for a successful class experi-ence to have sufficient lab time at any one sitting for stu-dents to do computer-based analysis. Students found that ittook some time to “get up to speed” with an analysis, andanything less than a block of 2 h gave students too little timeto make good progress on their project. Computer-basedanalysis does not pose the same safety issues as wet lab-work, so more flexibility is possible as to when and wherestudents work. However, although students have workedon a GEP project in isolation, in practice working in groupsduring assigned class periods provides many benefits. An-alyzing problems as a group helps keep up momentum,stimulates peer instruction, and leads to a group dynamicthat helps overcome the sometimes tedious task of annota-tion. Peer instruction is frequent in GEP classes, becausethese classes often attract a mixture of computer-savvy andnot-so-savvy students. Nonetheless, we find it advantageousto have one experienced person (faculty or TA) per six toseven novices. Given the open-ended nature of annotationprojects, regular meetings with set mileposts are also impor-tant to keep track of students’ progress. This allows studentsto pace their work over the allotted portion of the course.Insight by many of the member faculty on implementation
Gave access to technology that Iwould otherwise never have
Important in helping me begin teaching gene�cs
TAs were helpful
Able to use GEP website withstudents for genomics research
Online GEP materials helpful
Provided a good network of technical support
Posi�ve experience with GEP
Plan to use program again
GEP helped my ins�tu�on move ahead in genomics
GEP provided support for my ins�tu�on'sdevelopment in genomics
Gained colleagues through GEP
GEP gave me confidence for my own research
Fellow department faculty express interest in this approach
GEP par�cipa�on posi�vely effected my reputa�on in my department
Inspired to seek grants for research and educa�on
1 2 3 4 5 6
Figure 10. Faculty survey results on the impact of GEP participa-tion. Faculty responded on a 1 (strongly disagree) to 5 (agree) scaleto various statements. Mean and 1 SD are shown.
C. D. Shaffer et al.
CBE—Life Sciences Education66
in different settings and the lessons learned are provided inTable S2 (see Supplemental Material).
An added value of the GEP has been the collegial supportof a group of college and university faculty with sharedgoals. The group effort is sustained by summer “AlumniWorkshops.” These workshops are short events usuallyscheduled over a weekend (Friday evening to Sunday after-noon). Such meetings allow for updated technical training tokeep the faculty current on new computational tools within theGEP computer infrastructure. They also help create andstrengthen connections between members, allowing membersto share curriculum and ideas, as well as design joint assess-ment tools, plan future scientific and pedagogical efforts, andwork on both scientific and pedagogical manuscripts for pub-lication. Interinstitutional interactions of this type have beenrecognized as an important mechanism for promoting facultydevelopment and student learning in research (BIO 2010).
Challenges on ImplementationImplementation of the GEP curricula requires dealing withseveral challenges, which vary with institutional context. Inspite of the different specifics, a set of common issues emerges.One of the challenges of bringing advanced genomic trainingto undergraduates is overcoming student attitudes towardlearning: many students are geared toward lecture classes,memorization of facts, and “canned” laboratory courseswith known outcomes. Approaching coursework that in-volves novel research is a new experience for most students.Some initially consider the challenge “unfair,” given theirstatus as undergraduates, but most have eventually beenconvinced by their own success in making novel contribu-tions. Another challenge is that some faculty and studentsdo not see computer-based analysis as “real research.” Wesee annotation as a series of in silico experiments—eachalgorithm used to analyze a sequence, whether an ab initiogene prediction or a BLAST search for conservation, pro-duces evidence as to the likely gene model. Students areasked to integrate and analyze all of the evidence producedby these tools, determine the best gene model based on thisevidence, and be prepared to defend their decisions. Weview the gene model as a hypothesis supported by evidence.
Other difficulties include the ever-present technical andsoftware issues. Consed is limited to the Linux or Mac OSXplatforms, which are often not supported by the technicalstaff at member schools. Similarly, the operating systemused varied greatly among the partners. Although the GEP-developed methods have been designed to work acrossmany different computer platforms, issues continually ariseas new members join the project and try to make the projectswork with their pre-existing computer facilities. Thus accessto knowledgeable information technology support, pro-vided either centrally or locally, is essential. Another chal-lenge in the GEP curriculum is coordinating sequencingreactions. To keep class work on schedule (within the con-straints of a quarter or semester course), we aim to achievea 7-d turnaround between the student request, specifyingthe oligonucleotides to be ordered, and the posting of se-quencing results. This allows little margin for error or delay.Requests are accepted once per week (Wednesday mid-night), which is not ideal for a Tuesday/Thursday class.Faculty proved adept at adapting their course schedules
accordingly. Finally, the unpredictable nature of experimen-tal work must be an expected feature of the course. Not allproblems are solved on schedule, so grading must to somedegree reflect the quality of the student’s analysis ratherthan demanding complete resolution. As a consequence, com-pletion of large assemblies (e.g., the 1- to 2-Mb dot chromo-some of a given species) generally stretches over 2–3 yr.
Future GoalsIt is clear that as DNA sequencing gets cheaper, more datawill be available for analysis. The wealth of publicly avail-able genomic data makes projects like those undertaken bythe GEP possible by removing the financial barriers createdby the high start-up costs of high-throughput sequencing.The ability to sequence is far out-stripping the ability toanalyze, leaving plenty of room for student projects, and anincreasing need for student–scientist partnerships. Further-more, sequencing costs may soon be low enough that aconsortium such as the GEP could accomplish a projectrequiring de novo sequencing for a reasonable cost. By usinga common set of techniques, it is possible for students tomake significant contributions to the analysis of large datasets by a “divide and conquer” strategy. A long-term goal ofthe GEP is to provide the necessary training and infrastruc-ture to allow faculty a wider variety of interesting speciesand/or gene families to be analyzed. We also anticipateopportunities for international collaborators and communitycolleges to participate.
Genomics is particularly well-suited for a distributed re-search project based on student–scientist partnerships: 1)projects can be readily broken down into comparable-sizedchunks; 2) the necessary hardware is readily available; 3) thenecessary analytical tools are accessible to undergraduatestudents while still challenging them, making the effort ped-agogically valuable; and 4) the individual projects can bereassembled to make a more meaningful whole. Severalother national projects that use genomics or other high-throughput analysis in undergraduate research have alsobeen reported. Several members of the GEP faculty have alsobeen active members of the Genome Consortium for ActiveTeaching (GCAT; www.bio.davidson.edu/projects/GCAT/GCAT.html) led by Malcolm Campbell of Davidson College(Campbell et al., 2006). GCAT allows students to participatein research using DNA microarrays. GCAT has providedtraining workshops for faculty covering both wet benchtechniques and computational analysis for DNA microarrayexperiments. GCAT also provides arrays and access to anarray reader to collect student-generated data. In this pro-gram, faculty defines the research goals for the individualprojects. This differs from the GEP, where all members areworking on a single larger research question. Similar to theGEP results reported here, the GCAT program is an effectiveway of engaging students in genomics and developing aninterest in research (Campbell et al., 2007).
The GEP partnership in many ways follows the successfulpattern established by GCAT, albeit using different technol-ogies. As a group, GEP members recognize the followingprinciples:
1. The clear need to bring genomics into the undergraduatecurriculum
Genomics Education Partnership
Vol. 9, Spring 2010 67
2. A focus on research problems that can lead to scientificpublication
3. Development and sharing of teaching materials, therebymaintaining a flexible approach, so that all schools canparticipate
4. Development of a distributed community of faculty/stu-dent researchers
5. Making science education research (assessment) part ofour joint effort
There are other distributed undergraduate projects that in-volve finishing and/or annotation; most focus on prokary-otic systems. A program developed several years ago forundergraduates is being carried out at Hiram College,where course work has been designed around genomic anal-ysis and annotation of bacterial genomes (Goodner et al.,2003). Projects have included finishing and annotation of theAgrobacterium tumefaciens genome (Goodner et al., 2001). Asimilar program, the Undergraduate Genomics Research Ini-tiative, has flourished at University of California, Los Ange-les (Kerfeld and Simons, 2007). The Joint Genome Institutenow provides workshops focused on incorporating bioinfor-matics research into undergraduate education (see www.facultyprograms.org/page02a.shtml). The Joint Genome In-stitute runs an “adopt a GEBA genome” program in whichstudents can participate in annotation of a microbial genomethat has been sequenced as part of the Genomic Encyclo-pedia of Bacteria and Archaea (see www.jgi.doe.gov/education/genomeannotation). HHMI, through its Sci-ence Education Alliance, has undertaken another large-scale project. This program, based on the “phage hunters”effort originally developed by Graham Hatfull at the Uni-versity of Pittsburgh (Hatfull et al., 2006), has freshmenisolate and characterize mycobacteriaphage from theirlocal environment. For selected schools, HHMI providesboth the materials for the isolation and characterization ofthese phages, as well as the sequencing of one phagegenome per participating school. Once the genomic se-quence is available, students annotate and analyze thegenome of the phage they have isolated (see www.hhmi.org/grants/sea).
Fewer projects focus on eukaryotic genomes, whichpresent additional problems of data management, as well asbeing more challenging to annotate. The Dolan DNA Learn-ing Center, Cold Spring Harbor Laboratory, runs the Dy-namic Gene website at www.dynamicgene.org. This siteprovides students with tutorials on gene annotation and hasa web-based annotation system that students can use toannotate a region of the rice genome (Miklos et al., 2006;Hacisalihoglu et al., 2008). However, unlike the GEP systemthat is collecting the student work for eventual analysis andpublication, the Dynamic Gene website does not as yet seemto collate, check, and use the student work done on the ricegenome. Partnerships similar to the GEP could be createdfor a variety of model organisms. Projects amenable to thistype of distributed analysis could include any species forwhich draft sequence and mapped fosmids are available,where the scientific problem is of sufficient interest, andthe research community is tolerant of the slower pace ofanalysis.
In summary, the GEP has provided hundreds of studentsacross the country a means to engage in meaningful twenty-
first century research. The GEP has proved itself a flexiblepartnership, made up of a wide variety of institutions,whose members have succeeded in bringing genomics re-search experiences into the undergraduate curriculum. Thishas resulted in both documented benefits to our studentsand in bona fide scientific discoveries. Although advances insequencing technology continually force us to reconsiderhow best to incorporate these experiences into our teaching,we believe interaction among the GEP faculty and the fac-ulty and staff at Washington University will continue to bea fruitful source of ideas into the future. Clearly, the ongoingneed for annotation of new sequence data and the benefits ofpartnerships such as the GEP for students and the largerscientific community bode well for the continuation of sucha strategy.
ACKNOWLEDGMENTSWe appreciate the materials received through the DrosophilaGenomics Resource Center. We thank the staff of the WashingtonUniversity Genome Center for continuing assistance. Special thanksto Frances Thuet for managing the assessment web pages and toJeannette Wong for collecting data on common errors while recon-ciling student projects. This work was funded in part by HHMIgrant 52005780 and National Institutes of Health grant R0IGM068388.
REFERENCES
Bauer, K. W., and Bennett, J. S. (2003). Alumni perceptions used toassess undergraduate research experience. J. High. Educ. 2, 210–230.
Campbell, A. M., Eckdahl, T. T., Fowlks, E., Heyer, L. J., Hoopes,L.L.M., Ledbetter, M. L., and Rosenwald, A. G. (2006). GenomeConsortium for Active Teaching (GCAT). Science 311, 1103–1104.
Campbell, A. M., Ledbetter, M. L., Hoopes, L. L., Eckdahl, T. T.,Heyer, L. J., Rosenwald, A., Fowlks, E., Tonidandel, S., Bucholtz, B.,and Gottfried, G. (2007). Genome Consortium for Active Teaching:meeting the goals of BIO2010. CBE Life Sci. Educ. 2, 109–118.
Clark, A. G., et al. (2007). Evolution of genes and genomes on theDrosophila phylogeny. Nature 450, 203–218.
Doyle, M. P. (2000). Academic Excellence: The Role of Research inthe Physical Sciences at Undergraduate Institutions, Tucson, AZ:Research Corporation.
Elgren, T., and Hensel, N. (2006). Undergraduate research experi-ences: synergies between scholarship and teaching. Peer Rev. 1, 4.
Goins, G. D., White, C. D., Foushee, D. B., Smith, M. A., Whittaker,J. J., and Byrd, G. S. (2009). HBCUs Model for Success. SuccessfulModels for Effectively Retaining and Graduating Students at NorthCarolina A&T State University, New York: Thurgood Marshall Col-lege Fund Book.
Goodner, B. W., Wheeler, C. A., Hall, P. J., and Slater, S. C. (2003).Massively parallel undergraduates for bacterial genome finishing.ASM News 12, 584–585.
Goodner, B. W., et al. (2001). Genome sequence of the plant patho-gen and biotechnology agent Agrobacterium tumefaciens C58. Science294, 2323–2328.
Gordon, D. (2003). Viewing and editing assembled sequences usingConsed. Curr. Protoc. Bioinformatics, Unit 11.2.
Gordon, D., Abajian, C., and Green, P. (1998). Consed: a graphicaltool for sequence finishing. Genome Res. 3, 195–202.
C. D. Shaffer et al.
CBE—Life Sciences Education68
Hacisalihoglu, G., Hilgert, U., Nash, E. B., and Micklos, D. A. (2008).An innovative plant genomics and gene annotation program forhigh school, community college, and university faculty. CBE LifeSci. Educ. 3, 310–316.
Hatfull, G. F., et al. (2006). Exploring the mycobacteriophage metap-roteome: phage genomics as an educational platform. PLoS Genet.6, e92.
Hathaway, R., Nagda, B., and Gregerman, S. (2002). The relation-ship of undergraduate research participation to graduate and pro-fessional education pursuit: an empirical study. J. Coll. Stud. Dev. 5,614–631.
Karolchik, D., et al. (2008). The UCSC Genome Browser Database:2008 update. Nucleic Acids Res. Database issue, D773-9.
Kerfeld, C. A., and Simons, R. W. (2007). The undergraduate genom-ics research initiative. PloS Biol. 5, 980–983.
Locks, A. M., and Gregerman, S. R. (2008). Undergraduate researchas an institutional retention strategy: The University of Michiganmodel. In: Creating Effective Undergraduate Research Programs inScience, ed. R. Taraban and R. L. Blanton, New York: TeachersCollege Press, 11–32.
Lopatto, D. (2004). Survey of undergraduate research experiences(SURE): first findings. Cell Biol. Educ. 4, 270–277.
Lopatto, D. (2006). Undergraduate research experiences: undergrad-uate research as a catalyst for liberal learning. Peer Rev. 1, 1–7.
Lopatto, D. (2008). Exploring the benefits of undergraduate re-search: The SURE survey. In: Creating Effective Undergraduate
Research Programs in Science, ed. R. Taraban and R. L. Blanton,New York: Teachers College Press, 112–132.
Lopatto, D., et al. (2008). Undergraduate research: genomics educa-tion partnership. Science 322, 684–685.
Miklos, D., Ware, D., and Hilgert, U. (2006). Dynamic Gene. http://dynamicgene.dnalc.org/index.html (accessed 3 November 2009).
Nagda, B. A., Gregerman, S. R., Jonides, J., Von Hippel, W., andLerner, J. S. (1998). Undergraduate student-faculty research partner-ships affect student retention. Rev. High. Educ. 1, 55–72.
National Research Council (2003). Bio 2010, transforming under-graduate education for future research biologists, Washington DC:National Academies Press.
Pettersson, E., Lundeberg, J., and Ahmadian, A. (2009). Generationsof sequencing technologies. Genomics 2, 105–111.
Piano, F., and Cherbas, P. (2008). A Proposal for Comparative Genom-ics in Support the modENCODE Project. http://flybase.org/static_pages/news/articles/2008_10/ModEncWP.pdf (accessed 3November 2009).
Slawson, E. E., et al. (2006). Comparison of dot chromosomesequences from D. melanogaster and D. virilis reveals an enrich-ment of DNA transposon sequences in heterochromatic domains.Genome Biol. 2, R15.
The Genome Center at Washington University (2004). SequenceImprovement Mouse Finishing Rules. http://genome.wustl.edu/platforms/sequence_improvement/mouse_finishing_rules (accessed16 October 2009).
Genomics Education Partnership
Vol. 9, Spring 2010 69