The Genetic Structure of Domestic Rabbits
16
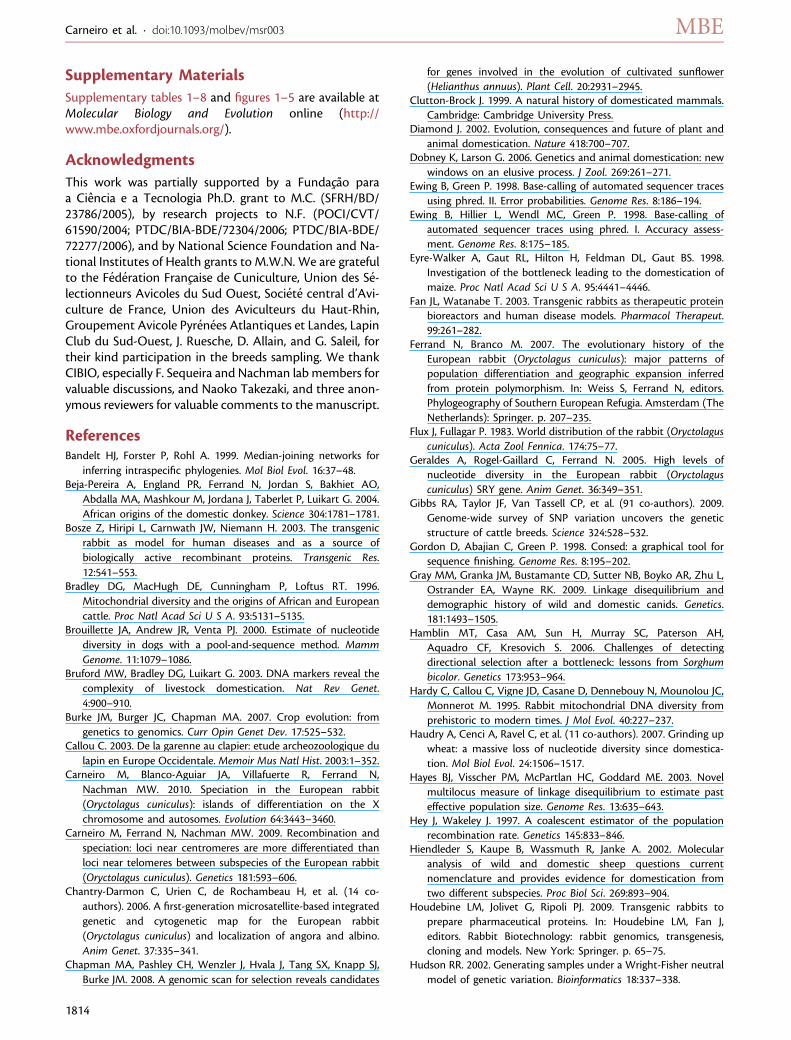
The Genetic Structure of Domestic Rabbits Miguel Carneiro,* ,1,2,3 Sandra Afonso, 1 Armando Geraldes, 4 Herve ´ Garreau, 5 Gerard Bolet, 5 Samuel Boucher, 6 Aure ´lie Tircazes, 5 Guillaume Queney, 7 Michael W. Nachman, 3 and Nuno Ferrand 1,2 1 CIBIO, Centro de Investigac xa ˜o em Biodiversidade e Recursos Gene ´ticos, Campus Agra ´rio de Vaira ˜o, Vaira ˜o 2 Departamento de Biologia da Faculdade de Cie ˆncias, Universidade do Porto, Porto, Portugal 3 Department of Ecology and Evolutionary Biology, University of Arizona 4 Department of Botany, University of British Columbia, Vancouver, British Columbia, Canada 5 Institut national de la recherche agronomique, UR 631 Station d’ame ´lioration ge ´ne ´tique des animaux, Castanet-Tolosan Cedex, France 6 Labovet Conseil, re ´seau Cristal, Les Herbiers, France 7 Antagene, Wildlife Genetics Laboratory, Limonest, Lyon, France *Corresponding author: E-mail: [email protected]. Associate editor: Naoko Takezaki Abstract Understanding the genetic structure of domestic species provides a window into the process of domestication and motivates the design of studies aimed at making links between genotype and phenotype. Rabbits exhibit exceptional phenotypic diversity, are of great commercial value, and serve as important animal models in biomedical research. Here, we provide the first comprehensive survey of nucleotide polymorphism and linkage disequilibrium (LD) within and among rabbit breeds. We resequenced 16 genomic regions in population samples of both wild and domestic rabbits and additional 35 fragments in 150 rabbits representing six commonly used breeds. Patterns of genetic variation suggest a single origin of domestication in wild populations from France, supporting historical records that place rabbit domestication in French monasteries. Levels of nucleotide diversity both within and among breeds were ;0.2%, but only 60% of the diversity present in wild populations from France was captured by domestic rabbits. Despite the recent origin of most breeds, levels of population differentiation were high (F ST 5 17.9%), but the majority of polymorphisms were shared and thus transferable among breeds. Coalescent simulations suggest that domestication began with a small founding population of less than 1,200 individuals. Taking into account the complex demographic history of domestication with two successive bottlenecks, two loci showed deviations that were consistent with artificial selection, including GPC4, which is known to be associated with growth rates in humans. Levels of diversity were not significantly different between autosomal and X-linked loci, providing no evidence for differential contributions of males and females to the domesticated gene pool. The structure of LD differed substantially within and among breeds. Within breeds, LD extends over large genomic distances. Markers separated by 400 kb typically showed r 2 higher than 0.2, and some LD extended up to 3,200 kb. Much less LD was found among breeds. This advantageous LD structure holds great promise for reducing the interval of association in future mapping studies. Key words: domestication, rabbit, nucleotide diversity, bottleneck, artificial selection, linkage disequilibrium. Introduction The domestication of both plants and animals is one of the most notable ‘‘experiments’’ ever conducted in biology. The modification of genomes under artificial selection rev- olutionized human societies and has attracted the atten- tion of biologists for two main reasons. First, the close association of domestic species and humans has motivated genetic and archaeological studies aimed at better under- standing the historical and cultural conditions, as well as the biological requirements, underlying the transformation of a wild species into its domesticated relative. Second, the immense phenotypic diversity that commonly segregates in domestic species provides exceptional opportunities to establish specific genotype/phenotype associations and to study the general mechanisms by which genetic var- iation governs phenotypic diversity. The domestic rabbit is one of the most recently domes- ticated species (most likely within the last 1,500 years; see below) and is characterized by an exceptionally high phenotypic diversity with more than 200 breeds recognized worldwide (Whitman 2004). Breeds vary extensively in weight, body conformation, fur type, coat color, and ear length, and this visible morphological variation dramati- cally exceeds the phenotypic diversity of their wild counter- parts (fig. 1). Size variation in domestic rabbits is greater than that in the entire Leporidae family. Rabbit breeds also differ extensively in litter size, growth rate, and behavior. This immense phenotypic diversity is reflected in a wide variety of commercial and laboratory uses (Weisbroth 1974; Lindsey and Fox 1994; Lebas et al. 1997; Bosze et al. 2003; Fan and Watanabe 2003; Houdebine et al. 2009; Rogel-Gaillard et al. 2009). Commercial uses include © The Author 2011. Published by Oxford University Press on behalf of the Society for Molecular Biology and Evolution. All rights reserved. For permissions, please e-mail: [email protected] Mol. Biol. Evol. 28(6):1801–1816. 2011 doi:10.1093/molbev/msr003 Advance Access publication January 7, 2011 1801 Research article
-
Upload
independent -
Category
Documents
-
view
3 -
download
0
Transcript of The Genetic Structure of Domestic Rabbits

The Genetic Structure of Domestic Rabbits
Miguel Carneiro,*,1,2,3 Sandra Afonso,1 Armando Geraldes,4 Herve Garreau,5 Gerard Bolet,5
Samuel Boucher,6 Aurelie Tircazes,5 Guillaume Queney,7 Michael W. Nachman,3 and Nuno Ferrand1,2
1CIBIO, Centro de Investigacxao em Biodiversidade e Recursos Geneticos, Campus Agrario de Vairao, Vairao2Departamento de Biologia da Faculdade de Ciencias, Universidade do Porto, Porto, Portugal3Department of Ecology and Evolutionary Biology, University of Arizona4Department of Botany, University of British Columbia, Vancouver, British Columbia, Canada5Institut national de la recherche agronomique, UR 631 Station d’amelioration genetique des animaux, Castanet-Tolosan Cedex,France6Labovet Conseil, reseau Cristal, Les Herbiers, France7Antagene, Wildlife Genetics Laboratory, Limonest, Lyon, France
*Corresponding author: E-mail: [email protected].
Associate editor: Naoko Takezaki
Abstract
Understanding the genetic structure of domestic species provides a window into the process of domestication and motivatesthe design of studies aimed at making links between genotype and phenotype. Rabbits exhibit exceptional phenotypicdiversity, are of great commercial value, and serve as important animal models in biomedical research. Here, we provide thefirst comprehensive survey of nucleotide polymorphism and linkage disequilibrium (LD) within and among rabbit breeds. Weresequenced 16 genomic regions in population samples of both wild and domestic rabbits and additional 35 fragments in 150rabbits representing six commonly used breeds. Patterns of genetic variation suggest a single origin of domestication in wildpopulations from France, supporting historical records that place rabbit domestication in French monasteries. Levels ofnucleotide diversity both within and among breeds were ;0.2%, but only 60% of the diversity present in wild populationsfrom France was captured by domestic rabbits. Despite the recent origin of most breeds, levels of population differentiationwere high (FST 5 17.9%), but the majority of polymorphisms were shared and thus transferable among breeds. Coalescentsimulations suggest that domestication began with a small founding population of less than 1,200 individuals. Taking intoaccount the complex demographic history of domestication with two successive bottlenecks, two loci showed deviations thatwere consistent with artificial selection, including GPC4, which is known to be associated with growth rates in humans. Levelsof diversity were not significantly different between autosomal and X-linked loci, providing no evidence for differentialcontributions of males and females to the domesticated gene pool. The structure of LD differed substantially within andamong breeds. Within breeds, LD extends over large genomic distances. Markers separated by 400 kb typically showed r2
higher than 0.2, and some LD extended up to 3,200 kb. Much less LD was found among breeds. This advantageous LDstructure holds great promise for reducing the interval of association in future mapping studies.
Key words: domestication, rabbit, nucleotide diversity, bottleneck, artificial selection, linkage disequilibrium.
IntroductionThe domestication of both plants and animals is one of themost notable ‘‘experiments’’ ever conducted in biology.The modification of genomes under artificial selection rev-olutionized human societies and has attracted the atten-tion of biologists for two main reasons. First, the closeassociation of domestic species and humans has motivatedgenetic and archaeological studies aimed at better under-standing the historical and cultural conditions, as well asthe biological requirements, underlying the transformationof a wild species into its domesticated relative. Second, theimmense phenotypic diversity that commonly segregatesin domestic species provides exceptional opportunitiesto establish specific genotype/phenotype associationsand to study the general mechanisms by which genetic var-iation governs phenotypic diversity.
The domestic rabbit is one of the most recently domes-ticated species (most likely within the last 1,500 years;see below) and is characterized by an exceptionally highphenotypic diversity with more than 200 breeds recognizedworldwide (Whitman 2004). Breeds vary extensively inweight, body conformation, fur type, coat color, and earlength, and this visible morphological variation dramati-cally exceeds the phenotypic diversity of their wild counter-parts (fig. 1). Size variation in domestic rabbits is greaterthan that in the entire Leporidae family. Rabbit breeds alsodiffer extensively in litter size, growth rate, and behavior.This immense phenotypic diversity is reflected in a widevariety of commercial and laboratory uses (Weisbroth1974; Lindsey and Fox 1994; Lebas et al. 1997; Boszeet al. 2003; Fan and Watanabe 2003; Houdebine et al.2009; Rogel-Gaillard et al. 2009). Commercial uses include
© The Author 2011. Published by Oxford University Press on behalf of the Society for Molecular Biology and Evolution. All rights reserved. For permissions, pleasee-mail: [email protected]
Mol. Biol. Evol. 28(6):1801–1816. 2011 doi:10.1093/molbev/msr003 Advance Access publication January 7, 2011 1801
Research
article

the production of meat, fur, wool, and therapeutic pro-teins, and numerous breeds are raised specifically as pets.Moreover, rabbits have many hereditary diseases commonto humans (e.g., aortic arteriosclerosis, cataracts, hyperten-sion, hypertrophic cardiomyopathy, epilepsy, spina bifida,osteoporosis, and many more), making them a valuablemodel in both biomedical and fundamental research.The rabbit is also commonly used in studies of in vitro fer-tilization, embryology, organogenesis, and toxicology.
The European rabbit (Oryctolagus cuniculus) is the singlerecognized progenitor of domestic rabbits. This species isnative to the Iberian Peninsula, where two subspecies thatdiverged ;1.8 Ma (Carneiro et al. 2009) are found: O. c.algirus is present in the southwestern Iberian Peninsula,whereas O. c. cuniculus is present in the northeastern Ibe-rian Peninsula and in France (supplementary fig. 1,Supplementary Material online). These subspecies are welldifferentiated genetically, although there is good evidencefor gene flow between them following secondary contactsince the Pleistocene, such that at some loci alleles from O.c. algirus are found in O. c. cuniculus and vice versa (e.g.,Carneiro et al. 2009). This secondary contact likely predatedthe domestication of rabbits by thousands of years. Francewas colonized through natural dispersal from NorthernSpain likely after the last glacial maximum (Queneyet al. 2001). Rabbits have also been introduced by peopleto many places throughout the world (Flux and Fullagar1983). Rabbits were first transported around the Mediter-ranean by Phoenician traders, later introduced in the Brit-ish Isles and other islands in the northeast Atlantic in themiddle ages, and worldwide after the 18th century (e.g.,
Australia, Chile, New Zealand, North America, and SouthAfrica). In spite of its recent domestication, conflicting his-torical records suggest different geographic origins for thedomestic rabbit. Some historical records indicate that rab-bits were first kept in captivity in the Iberian Peninsula dur-ing the Roman occupation in the first century BC, wherethey were maintained in large enclosures for meat produc-tion (Clutton-Brock 1999). Because no selective breedingwas apparently implemented, this might not be considereda true domestication. Other historical records, however,suggest that true domestication, including taming and se-lective breeding for traits of interest, likely began about AD600 in French monasteries, following a decree by PopeGregory the Great that new born rabbits were not consid-ered meat and so could be eaten during Lent (Clutton-Brock 1999; Callou 2003; Whitman 2004). Unlike manyother domesticated species (Bruford et al. 2003; Dobneyand Larson 2006), the availability of wild populations allowsa direct comparison with the domesticated population,and limited genetic evidence using mitochondrial DNA,Y chromosome, and microsatellite data, tentatively sug-gests a unique source for rabbit domestication in France(Hardy et al. 1995; Queney et al. 2002; Geraldes et al.2005; reviewed in Ferrand and Branco 2007). It is also clearfrom this small set of markers that domestic rabbits harborless genetic diversity than their wild counterparts. After therecorded initiation of the rabbit domestication in Frenchmonasteries, it was not until much later that most breedsoriginated. By the 16th century, several varieties of differentsizes and coat colors were recorded in France, Italy,Flanders, and England, but the development of the majority
FIG. 1. Phenotypic variation in domestic and wild rabbits. The bottom left picture shows the typical phenotype of a wild rabbit from thesubspecies O. c. cuniculus (kindly provided by P.C. Alves). All the other pictures illustrate the phenotypic diversity observed for numerous traitsin domestic rabbits (kindly provided by Francxois Lebas, http://www.cuniculture.info, and references therein).
Carneiro et al. · doi:10.1093/molbev/msr003 MBE
1802

of breeds dates back no further than 200 years (Lebas et al.1997; Whitman 2004).
Despite its scientific and economic value, large-scaleefforts to understand the impact of the domesticationprocess upon the rabbit genome are lacking. To fill thisgap, we provide the first comprehensive report on levelsand patterns of nucleotide polymorphism in domesticrabbits. We investigated the demographic history of do-mestication by comparing genetic variation between wildpopulations and a representative set of 14 breeds at mul-tiple autosomal and X-linked loci. To guide future map-ping studies, we also provide the first description ofthe scale of linkage disequilibrium (LD) in rabbits by re-sequencing 35 fragments in six different breeds. We focuson five main questions. 1) Where were rabbits domesti-cated? 2) What was the impact of the domestication pro-cess on levels and patterns of genetic variation within andamong domestic rabbit breeds? 3) What was the magni-tude of the domestication bottleneck and what propor-tion of the genetic variability present in wild rabbitswas captured by the rabbit domestication process? 4)Do patterns of variation at autosomal and X-linked locisuggest unequal contributions of males and females tothe domesticated gene pool? 5) What is the extent ofLD among and within rabbit domestic breeds?
Materials and Methods
Sampling StrategyOur sampling design was divided into two main parts. First,because this work was largely motivated by a comparisonbetween domestic and wild rabbits, a set of individuals wasselected to represent a broad range of the genetic diversityfound both in domestic and in wild populations. To max-imize genetic diversity among domestic rabbits and be-cause there is not enough genetic data to inferrelationships between breeds, we selected breeds that rep-resent a wide range of phenotypes and for which historicalrecords indicate an old and mostly unrelated origin. Therationale behind this choice is that 1) high phenotypic di-vergence may reflect higher genetic divergence and 2) olderbreeds may represent reservoirs of genetic diversity. In fact,recently created breeds were mostly developed throughcrosses between older breeds with subsequent selection(Whitman 2004). One or two individuals were sampledfor each of the following 14 breeds (supplementary table1, Supplementary Material online): Belgian Hare, Cham-pagne Silver, Chinchilla (standard), English Lop, EnglishSpot, Fauve de Bourgogne, French Angora, Flemish Giant,Himalayan, Hungarian Giant, New Zealand White, Polish,Thuringer, and Vienna White. By using a small numberof individuals for a set of old and phenotypically divergentbreeds, we expected to 1) approximate the ancestral ge-netic diversity present in domestic rabbits before modernbreeding practices were implemented and 2) sample line-ages that represent most of the genetic variation capturedin the early years of domestication. In the wild, we surveyeda total of 15 individuals from five localities in France
(supplementary table 1, Supplementary Material online),and we also combined published sequence data for repre-sentative samples of diverse geographic localities corre-sponding to the range of both rabbit subspecies in theIberian Peninsula and for a Lepus granatensis sample, whichwas used as outgroup in this study (supplementary fig. 1,Supplementary Material online; Carneiro et al. 2009;Carneiro et al. 2010). Thus, we compared four groups: Or-yctolagus cuniculus algirus (n 5 10, OCA), O. c. cuniculusfrom Iberian Peninsula (n 5 12, OCCIP), O. c. cuniculusfrom France (n 5 15, OCCFR), and domesticated rabbits(n 5 25, DOM).
Second, to investigate patterns of genetic variation andLD within and among rabbit breeds, we sampled 25 indi-viduals for each of six different breeds (supplementary table1, Supplementary Material online): Champagne Silver, En-glish Spot, French Angora, French Lop, New Zealand White(INRA 1077 strain), and Rex. To help guide future researchin rabbits, we included breeds that reflect the various usesof domestic rabbits and are among the most used breeds inagronomic and scientific research. Angora and Rex are pri-marily used for wool and fur. Champagne Silver, FrenchLop, and English Spot are used as pets or exhibition animals;however, the first two are dual-purpose breeds and are of-ten used for meat production. New Zealand White is themost widely used breed in laboratory research and inten-sive meat productions.
Selection of LociTo determine levels and patterns of nucleotide variation indomestic and French wild rabbits, we amplified and rese-quenced nine autosomal and seven X-linked introns(supplementary table 2, Supplementary Material online).These were chosen from a set of loci used in previousstudies on wild rabbits from the Iberian Peninsula (Carneiroet al. 2009; Carneiro et al. 2010), allowing direct comparisonof all four groups (OCA, OCCIP, OCCFR, and DOM).Loci were chosen without any a priori knowledge of func-tional relevance to domestication traits. Autosomal lociwere chosen from different chromosomes or far aparton the same chromosome (chromosomes 4 and 14). Onthe X, loci were chosen at regular intervals along thechromosome.
To study LD and to compare patterns of genetic varia-tion within and among breeds, we generated sequences forfive fragments in each of seven genomic regions for a totalof 35 fragments (supplementary table 2, SupplementaryMaterial online). Regions were selected on different chro-mosomes far from centromeric regions, where recombina-tion has been shown to be highly reduced for severalspecies (e.g., Kong et al. 2002). For each of the seven regions,five different segments of 250 bp to 700 bp in length weresequenced at distances of 50, 400, 1,200 and 3,200 kb in onedirection from the initial selected fragment. Primers weredesigned based on the sequence of the rabbit genome andare provided in supplementary table 3, Supplementary Ma-terial online, along with polymerase chain reaction condi-tions. Sequencing was carried out from both directions for
Polymorphism and LD in Domestic Rabbits · doi:10.1093/molbev/msr003 MBE
1803

the nine autosomal and seven X-linked loci and from a sin-gle direction for the LD study using an ABI 3700 automatedsequencer.
Data AnalysisResequencing Data SetSequence traces were base called, trimmed, assembled intocontigs, and scanned for heterozygotes using phred/phrap/consed/polyphred (Nickerson et al. 1997; Ewing and Green1998; Ewing et al. 1998; Gordon et al. 1998), together withauxiliary shell scripts and Perl programs provided by AugustWoerner. All traces and heterozygote calls were visually in-spected and edited when necessary. Sequence data havebeen submitted to GenBank (accession numbers:HM155112–HM155727 and HM454302–HM459434).
Haplotype Inference, Levels of Variation, Tests of Neutrality,
and Gene GenealogiesIntralocus haplotypes were inferred using the computerprogram PHASE 2.1 (Stephens et al. 2001; Stephens andDonnelly 2003). This Bayesian approach assumes a neutralcoalescent within a single unstructured population of con-stant size and accommodates recombination. We appliedthe algorithm independently for OCA, OCCIP, OCCFR, andDOM. For X-linked loci, we specified that the phase of malehaplotypes was known.
Most population genetic parameters were obtained us-ing the computer program SITES (Hey and Wakeley 1997).We estimated the number of segregating sites (S), numberof haplotypes (nhaps), Hudson’s minimum number of re-combination events (Rm, Hudson and Kaplan 1985), andthe neutral mutation parameter using Watterson’s hw
(Watterson 1975) and p (Nei 1987). We summarized thelevel of genetic differentiation between populations by es-timating the fixation index (FST, Hudson et al. 1992), the netnucleotide divergence (Da, Nei 1987), and the average pair-wise differences between populations (Dxy, Nei 1987).
Hardy–Weinberg equilibrium (HWE) was evaluated usingthe function ‘‘HWE.exact’’ implemented in the ‘‘genetics’’package (Warnes and Leisch 2005) in R statistical software(R Development Core Team 2009). The ‘‘diseq’’ functionwas used to estimate the within-population inbreeding co-efficient, which is defined as the correlation between alleleswithin an individual (Weir et al. 2004).
The frequency distribution of polymorphic sites was com-pared with neutral expectations using Tajima’s D (Tajima1989). To generate the null distribution of this statistic, weused coalescent simulations using DnaSP 4.50.3 (Rozas et al.2003). We ran 104 coalescent simulations of the standardneutral model conditioned on the sample size and theobserved estimates of hw. To detect deviations in the numberof observed haplotypes compared with the standard neutralmodel, we used Strobeck’s S statistic (Strobeck 1987). Theneutral prediction of a constant ratio of polymorphism todivergence was assessed with the Hudson–Kreitman–Aguade(HKA) test (Hudson et al. 1987). We performed multilocustests using the HKA program by Jody Hey.
Evolutionary relationships among alleles were estimatedusing median-joining networks (Bandelt et al. 1999), asimplemented in the software NETWORK 4.2.0.1.
Demographic Inference Using Coalescent SimulationsWe used computer simulations of the coalescent process toinvestigate the demographic history of domestic rabbits.The simulations were performed using the algorithm de-scribed by Hudson (1990) and implemented in the pro-gram ms (Hudson 2002). Statistics were computed usingmsstats (Thornton 2003).
Diagrams and parameters of the demographic modelsused in simulations are depicted in figure 2 and are similarto those applied to other domesticated species (Eyre-Walker et al. 1998; Tenaillon et al. 2004; Wright et al.2005; Haudry et al. 2007; Zhu et al. 2007). According tohistorical records and genetic evidence (see Introduction
FIG. 2. Schematic representation of the coalescent models used to represent the main events of the demographic history of French wild rabbits(left) and domestic rabbits (right). See Materials and Methods for a detailed description of all parameters and assumptions.
Carneiro et al. · doi:10.1093/molbev/msr003 MBE
1804

and Results and Discussion), domestic rabbits apparentlyoriginated from OCCFR; therefore, we assumed this pop-ulation as the source of DOM. The purpose of our simu-lations was to infer the severity of the domesticationbottleneck (kdom 5 Nbdom/ddom), where Nbdom is the sizeof the bottlenecked population and ddom the duration ofthe bottleneck in generations. Due to the recent coloniza-tion of France—likely after the last glacial maximum—andconsequent bottleneck (see Introduction and Results andDiscussion), we incorporated this demographic event inour simulations (kfr). The model mimicking the coloniza-tion of France consisted of two populations and approxi-mates a bottleneck event from a single source populationin which an ancestral population of constant size (Na) givesrise at time t2fr to a small founder population (Nbfr). Mor-e recently, the bottlenecked population at time t1fr (dfr 5
t2fr – t1fr) instantaneously expands into its current size(Npfr). The model used to estimate the severity of the bot-tleneck effect in the domestication event of DOM is similarand described by similar parameters (Nbdom, Npdom, ddom,and kdom) but included a third population (DOM) and in-corporated the estimated parameter kfr for the formationof the OCCFR population from the first model. This modelcan be briefly summarized as two consecutive bottlenecksfollowed by growth during the colonization of France bywild rabbits and at domestication. In both models, popu-lations remain isolated after the initial split.
We used a number of assumptions. First, neutral muta-tion rates were determined for each locus from the rela-tionship l 5 D/2T, where D is the estimated Dxy for theOryctolagus/Lepus comparison (values available in Carneiroet al. 2010) and T is the divergence time for the separationbetween the two genera, which is thought to have occurred11.8 Ma (Matthee et al. 2004). For UD14, we had no out-group sequence and l was calculated as the average amongthe other autosomal loci. Second, given the estimated neu-tral mutation rate, Na prior to the split between OCCIP andOCCFR was estimated for each locus from the populationmutation parameter (h) estimated for OCCIP. Note that h5 3Nel for X-linked loci and h5 4Nel for autosomal loci.Third, we assumed a split time between OCCIP/OCCFR andOCCFR/DOM of 10,000 (after the last glacial maximum)and 1,400 years (the initial domestication event), respec-tively (see Introduction). We assumed a generation timeof 1 year (Soriguer 1983). Although split times should beconsidered approximate, we performed additional simula-tions for a subset of the loci varying the split time 3-fold inboth directions and found that estimates of kfr and kdom foreach locus remained similar (data not shown). This resultalso indicates that slight uncertainties in mutation rate es-timates and generation time are not likely to change ourconclusions, which is not surprising because this is a shorttime scale for mutation to have a substantial impact.Fourth, similarly to Na, values of Npfr and Npdom were de-rived from the population mutation parameter. We furthervaried Npfr and Npdom by one order of magnitude in bothdirections and the results remained largely unaltered (datanot shown). Fifth, we included intragenic recombination in
all simulations. The population recombination parameter(q 5 4Ner) was estimated for each locus from the OCCIPdata using c (Hey and Wakeley 1997). c is a maximum like-lihood (ML) estimator developed using a coalescent modelfor a sample of four DNA sequences with recombination.Finally, it has been previously shown for similar protocolsthat the parameter k is a compound parameter and Nb
and d are positively correlated (Eyre-Walker et al. 1998;Tenaillon et al. 2004). This tendency was also observedin our simulations. For this reason, we present the resultsof dfr and ddom fixed at 500 generations for which weused several values of Nbfr and Nbdom so that the param-eters kfr and kdom ranged between 0.1 and 16 with aninterval of 0.1.
To condition the simulations on the observed data, weused rejection sampling based on three summary statistics:the average pairwise nucleotide divergence per sequence(p), the number of segregating sites (S), and the numberof haplotypes (nhaps). By conditioning the simulatedvalues on the observed data, we avoid biasing our esti-mates by features of the demographic history that arenot considered in our model. For the demographic sce-nario reproducing the colonization of France, we fittedthe simulated data to the observed sequence data of OC-CIP, whereas for the domestication model, we simulatedthe OCCIP as the ancestral population and forced the sim-ulations to the observed data of OCCFR. Simulations wererecorded if the values obtained were within 20% of theobserved values and run until 10,000 genealogies wereobtained.
To find the best-fitting parameter value of kfr and kdom,the likelihood value for each locus was estimated as theproportion of 10,000 simulations whose summary statistics(S, p, and nhaps) were contained within 20% of the ob-served values. The ML value for the global data set was es-timated only for kdom as the product of the likelihood foreach locus. We calculated 95% confidence intervals (CIs)around the ML estimate of kdom by determining the valuefor which the log-likelihood values were two log-likelihoodunits lower than the best estimate. Finally, we used themultilocus ML value of kdom to perform additional coales-cent simulations at each locus to investigate if some locideviated significantly from the neutral demographic modelinferred. We generated an empirical distribution with10,000 replicates and asked whether levels of diversityfor a specific locus, measured as S, p, and nhaps, were lowerthan what would be expected (P, 0.05) given the inferredmultilocus estimate of kdom.
LD AnalysisPolymorphic single nucleotide polymorphisms (SNPs) orinsertion and deletion (indel) markers having more than10% of missing data and/or minor allelic frequencies withina breed lower than 10% were excluded from the analysis. LDwas measured using the genotypic r2 (Weir et al. 2004),which does not rely on any assumption about the allelefrequencies in the sample. This statistic was computedfor all pairwise comparisons between markers using the
Polymorphism and LD in Domestic Rabbits · doi:10.1093/molbev/msr003 MBE
1805

‘‘LD’’ function as implemented in R ‘‘genetics’’ package(Warnes and Leisch 2005).
Historical effective population size estimates were ob-tained from the expectation of LD decay with genetic dis-tance using the model E(r2) 5 (1/4Ntcþ1) þ (1/n) (Sved1971), where E(r2) is the average of the r2 values betweenmarkers across the seven genomic regions for a given dis-tance, Nt is the effective population size at t generations inthe past, c is the genetic distance between markers in Mor-gans, and n is the number of chromosomes sampled. Weassumed t 5 1/(2c) (Hayes et al. 2003) and an average re-combination rate of 1 cM 5 1 Mb based on the total ge-netic map length in rabbits (2766.6 cM excludingchromosomes 20, 21, and X) and a genome size of approx-imately 3 Gb (Chantry-Darmon et al. 2006).
Results and Discussion
A Single Geographical Origin of DomesticationSeveral previous studies in both plants and animals havedocumented multiple centers of domestication for thesame species (Diamond 2002; Bruford et al. 2003). To ad-dress the origins of rabbit domestication, we resequencednine autosomal and seven X-linked introns varying inlength between 705 bp and 1,314 bp (supplementary table2, Supplementary Material online). In total, we obtained;16.1 kb of sequence per individual (;10.8 kb for auto-somal loci and ;5.3 kb for X-linked loci). Levels of differ-entiation and gene genealogies were contrasted betweennative range wild rabbits and a representative set of 14 do-mestic rabbit breeds (supplementary table 1, Supplemen-tary Material online). Throughout this study, we consideredfour populations: OCA, OCCIP, OCCFR, and DOM.
Various aspects of the data were consistent in revealinga closer relationship between OCCFR and DOM than be-tween DOM and wild rabbits from the Iberian Peninsula(OCA and OCCIP). First, genetic differentiation betweenDOM and OCCFR (FST 5 15.0%, Da 5 0.060%, Dxy 5
0.341%, fig. 3; supplementary table 4, Supplementary Ma-terial online) was significantly lower than that betweenDOM and OCA (FST 5 52.1%, Da 5 0.556%, Dxy 5
0.979%) or DOM and OCCIP (FST 5 25.6%, Da 5
0.142%, Dxy 5 0.547%) (P , 0.025 in all cases by Wilcoxonsigned-rank test). This accords with the findings for micro-satellites (Queney et al. 2002). Second, a simple visual in-spection of the gene genealogies in figure 4 also suggeststhat haplotypes in DOM are a subset of those in OCCFR.For example, 78.2% of the haplotypes detected in DOMwere shared with OCCFR, whereas only 49.1% and 18.2%were shared with OCCIP and OCA, respectively. In fact,of the 45 haplotypes detected in DOM that were sharedwith wild populations, a single haplotype in UD14 wasnot shared with OCCFR, but with OCCIP. Moreover, severalhaplotypes that were present in DOM were exclusivelyfound in OCCFR, and this was observed for multiple genes(ATP12A, CYTC, MGST3, STAG1, UD14, DIAPH2, andPGK1). These results remained unaltered when we re-stricted the haplotype analysis to PHASE confidence prob-ability thresholds higher than 0.8.
Our results further indicate that the subspecies O. c. cu-niculus appears to be the only direct source of all domesticrabbits (i.e., there is no evidence that domestic rabbits werederived directly from OCA). In agreement with previousstudies of mitochondrial and Y chromosome sequence var-iation (Hardy et al. 1995; Geraldes et al. 2005), no alleleswere shared by the subspecies at one autosomal (STAG1)and two X-linked loci (F9 and POLA1) in our data set, andin every case, all DOM haplotypes belong to the lineagetypically found in OCCIP and OCCFR (fig. 4). We note thatother taxa are also unlikely contributors to rabbit domes-tication because the European rabbit is the sole species inthe genus Oryctolagus and is almost certainly reproduc-tively isolated from other leporids. The most closely relatedgenera (Caprolagus, Bunolagus, and Pentalagus) arethought to have diverged from Oryctolagus at least 8.5Ma (Matthee et al. 2004).
Nonetheless, OCA was likely an indirect contributor tothe domestic rabbit gene pool through introgressive hy-bridization across the rabbit hybrid zone. For example,some gene genealogies illustrated in figure 4 (DIAPH2,KLHL4, LUM, and MAOA) consisted of two distinct hap-logroups separated by a long internal branch. These gene-alogies had a similar shape compared with genealogiesshowing no shared variation between subspecies but the
FIG. 3. Box plots depicting genetic differentiation between domestic rabbits and each of the wild rabbit populations considered in this study.Levels of genetic differentiation between domestic rabbits and wild rabbits were estimated using the fixation index (FST, A), the net nucleotidedivergence (Da, B), and the average pairwise differences between populations (Dxy, C). Levels of genetic differentiation suggest a closer proximitybetween domestic rabbits (DOM) and French wild rabbits (OCCFR).
Carneiro et al. · doi:10.1093/molbev/msr003 MBE
1806

FIG. 4. Median-joining haplotype networks representing the evolutionary relationships among alleles found in both domestic and wild rabbits.Individuals with missing data were excluded. Size of the circles is proportional to the frequency of each haplotype. Population groups aredenoted by black for OCA, white for OCCIP, blue for OCCFR, and red for DOM. Note the substantial haplotype sharing between DOM andOCCFR and the absence of OCA haplotypes in DOM for all genes showing fixed variation between subspecies.
Polymorphism and LD in Domestic Rabbits · doi:10.1093/molbev/msr003 MBE
1807

fact that both lineages showed no correspondence with ge-ography (i.e., shared between both subspecies) is suggestiveof extensive admixture after secondary contact for someregions of the genome. In fact, high levels of gene flow be-tween OCA and OCCIP for each of these loci has been in-ferred using an isolation-with-migration model (Carneiroet al. 2009; Carneiro et al. 2010). Interestingly, DOM andOCCFR harbor both divergent lineages in KLHL4 andMAOA offering strong evidence that at some loci OCAhaplotypes introgressed as far as France through naturalhybridization and were subsequently incorporated in thedomesticated gene pool. In other words, extensive geneflow between subspecies—probably after the last glacialmaximum but before domestication—resulted in high lev-els of introgression for some portions of the genome. Theseintrogressed regions were thus already present in wildrabbit populations before the advent of domestication.
Several observations suggest that rabbit domestication isunusual compared with most domesticated mammals.First, a single French origin for domestic rabbits seems likelyand is supported by a combination of historical records(Clutton-Brock 1999; Callou 2003; Whitman 2004) and ge-netic data from this and previous studies (reviewed inFerrand and Branco 2007). This simple domestication sce-nario stands in sharp contrast with most animal species(e.g., cattle, donkeys, goats, horses, pigs, and sheep) thatare characterized by independent domestication events ei-ther from multiple geographical regions or even from mul-tiple subspecies or species (Bradley et al. 1996; Vila et al.1997; Luikart et al. 2001; Hiendleder et al. 2002; Jansenet al. 2002; Beja-Pereira et al. 2004; Larson et al. 2005). Sec-ond, in contrast to many other domesticated species whosewild progenitors are thought to be extinct (e.g., horse andcattle) or for which the identity of all wild species that con-tributed genetically to the domesticated population is notclear (e.g., sheep, goat, and cat; Dobney and Larson 2006),rabbits have a known and extant progenitor species. Thethird important difference relates to the geographical areaof domestication. The rabbit is the only mammalian species
that has been exclusively domesticated in Western Europein contrast to most animal domestication events that oc-curred in three core areas: southwest Asia, eastern Asia, andthe Americas (Clutton-Brock 1999; Diamond 2002; Brufordet al. 2003). Finally, rabbit domestication was initiatedwithin the last 1,500 years (Clutton-Brock 1999; Callou2003; Whitman 2004). This is recent compared with mostother mammals that are thought to have been domesti-cated more than 5,000 years ago, and domestication ofdogs may have started as early as 14,000 years ago (Clut-ton-Brock 1999; Diamond 2002; Bruford et al. 2003). Themuch later date of rabbit domestication may have beenassociated with a more focused and deliberate effort to-ward domestication (Zeder 2006) and may in part explainwhy the rabbit domestication process is in several aspectsdistinct from other domesticated mammals (see below).
Levels of Genetic Variation, Strong Breed Structure,and Departures from Mutation-Drift EquilibriumLevels of nucleotide diversity (p) in DOM averaged 0.188%and 0.205% for autosomal and X-linked loci, respectively(table 1) but there was substantial heterogeneity amongloci with p ranging from 0% to 0.760% (supplementary ta-ble 5, Supplementary Material online). Although the aver-age values of p for DOM were similar to that in otherdomesticated species such as cattle (p 5 0.140–0.247%,Gibbs et al. 2009) and dogs (p 5 0.1%, Brouillette et al.2000), they were significantly lower than the correspondingvalues for each of the wild rabbit populations considered inthis study, for both the X chromosome and the autosomes(P , 0.025 in all cases by Wilcoxon signed-rank test; sup-plementary table 6, Supplementary Material online). Thesame was true for hw and for the number of haplotypes,as seen in the haplotype networks depicted in figure 4.The mean number of recombination events (Rm) was alsosubstantially lower in DOM than in OCA, OCCIP, andOCCFR (table 1). Consistent with the recent colonizationof France, genetic variation in OCCFR was largely a subsamplefrom OCCIP. Overall, diversity parameters in domestic rabbits
Table 1. Summary of the analyses of polymorphism, frequency spectrum tests of neutrality and recombination in OCA, OCCIP, OCCFR, andDOM for nine autosomal and seven X-linked loci.
Locus Population Mean p (%)a Mean uw (%)b Mean DTc Mean Rm
d
Autosomal OCA 0.721 0.850 20.645 3.1OCCIP 0.658 0.727 20.369 4.0OCCFR 0.348 0.375 20.368 2.1DOM 0.188 0.191 0.243 0.7
X-linked OCA 0.554 0.557 20.065 1.0OCCIP 0.581 0.596 20.236 1.1OCCFR 0.394 0.283 1.012 0.4DOM 0.205 0.131 1.164 0.0
Overall OCA 0.648 0.722 20.391 2.2OCCIP 0.625 0.670 20.311 2.8OCCFR 0.368 0.335 0.236 1.4DOM 0.195 0.165 0.612 0.4
NOTE.—Unweighted average values across 9 autosomal loci, 7 X-linked loci, or 16 combined loci are given in each row.a The average number of pairwise differences in a sample (Nei 1987).b The proportion of segregating sites in a sample (Watterson 1975).c Tajima’s D (1989).d Minimum number of recombination events in the history of the sample (Hudson and Kaplan 1985).
Carneiro et al. · doi:10.1093/molbev/msr003 MBE
1808

are consistent with a domestication bottleneck as observedfor numerous domesticated species (Wright et al. 2005; Ham-blin et al. 2006; Liu and Burke 2006; Haudry et al. 2007; Zhuet al. 2007; Muir et al. 2008; Gray et al. 2009). Importantly,levels of genetic diversity indicate that the ongoing SNP dis-covery projects for rabbits will result in a large collection ofpolymorphic SNPs likely to be associated with most genes inthe genome.
Next, we examined how genetic variation was organizedwithin and among breeds. We resequenced five fragmentsfrom each of seven genomic regions, for a total of 35 frag-ments of several hundred base pair each (see Methods).This design was implemented to ascertain the structureof LD, as described below. Twenty-five individuals were se-quenced in each of six breeds. Consistent with global levelsof diversity among breeds, mean levels of genetic diversitywithin breeds were high, with values of p varying between0.215% for English Spot and 0.313% for French Angora(summarized in supplementary table 7 and detailed in sup-plementary table 8, Supplementary Material online). Pair-wise FST values among breeds (averaged across loci) variedbetween 7.5% and 32.9% (table 2), indicating that most ofthe total genetic variation was within breeds as opposed tobetween breeds. However, despite the recent origin of mostbreeds, mean levels of population differentiation in pair-wise comparisons (FST 5 17.9%) were high, suggesting thatbreeds have been generally maintained as closed genepools. Of additional relevance for mapping studies, poly-morphisms exclusive to a single breed were rare (7.9% ofthe total number of markers excluding singletons), andthus most genetic markers should be informative andtransferable across breeds. As expected given this popula-tion structure, when all six breeds were considered together89.6% of the markers showed significant deviations fromHWE (P, 0.05; supplementary table 7, Supplementary Ma-terial online). In contrast, when we looked at each breedseparately, a much smaller percentage of loci showed de-viations from Hardy–Weinberg (HW) expectations. The in-breeding coefficient estimated from HW deviations andaveraged across markers was highly variable among breeds:0.25 for Champagne Silver, 0.18 for English Spot, �0.05 forFrench Angora, 0.16 for French Lop, 0.09 for New ZealandWhite, and 0.14 for Rex (supplementary table 7, Supple-mentary Material online).
Finally, we tested for departures from a neutral equilib-rium model in order to assess the impact of the domes-
tication process on patterns of genetic variation. Ourintent was not to detect selection at particular loci butto provide a preliminary assessment of population-levelchanges that may have accompanied the domesticationprocess and to guide the demographic modeling presentedbelow. We observed a large shift in the frequency distribu-tion of polymorphisms between wild and domestic rabbits(table 1). In wild populations from the Iberia Peninsula, theobserved mean values of Tajima’s D (D5 �0.391 for OCAand D 5 �0.311 for OCCIP) were negative indicatinga skew toward low-frequency variants, although not signif-icantly different from zero when compared with a multilo-cus simulated distribution (P . 0.1 in both cases). Incontrast, both OCCFR and DOM were characterized bythe opposite pattern. In OCCFR, Tajima’s D was slightlypositive but also not significantly different from zero(D 5 0.236, P . 0.1). Strikingly, the mean Tajima’s Dfor DOM was positive and significantly different from zero(D 5 0.612, P , 0.05), indicative of a paucity of low-fre-quency polymorphisms. This pattern is consistent witha population contraction because low-frequency variantsare quickly lost when a population undergoes a substantialreduction in size. Tajima’s D values for each locus rangedfrom �2.073 to 2.467 (supplementary table 5, Supplemen-tary Material online), with some loci showing significantskews in the allelic frequency spectrum for both positive(ATP12A and MGST3) and negative values (UD14, KLHL4,MAOA, and PGK1). Strobeck’s S indicates that fewer hap-lotypes were observed than expected under an equilibriummodel for four loci in DOM (LUM, PRL, KLHL4, andMAOA), but for only two loci in OCCFR (KLHL4 andMAOA), and none in both OCA and OCCIP (supplemen-tary table 5, Supplementary Material online). Likewise,multilocus HKA tests indicated departures from a neutralequilibrium model in DOM (P 5 0.000) and OCCFR (P 5
0.002) but not in OCA (P 5 0.761) or OCCIP (P 5 0.611;supplementary fig. 2, Supplementary Material online). InDOM, the sequential elimination of five loci (MAOA, AT-P12A, PRL, MGST3, and KLHL4) was necessary to producea data set that was not significantly different from neutralexpectations (P 5 0.05). Similar deviations from neutralitywere inferred from polymorphism within breeds (supple-mentary table 8, Supplementary Material online) demon-strating that breed structure alone cannot account forthese patterns.
Although the effects of selection cannot be discarded(see below), it is unlikely that all these regions have beenunder selection during rabbit domestication. Instead, manyof the observed deviations from a neutral equilibriummodel are likely the result of the effects of consecutive bot-tlenecks (the colonization of France, the initial stage of do-mestication, and subsequent establishment of breeds)coupled with ancient population structure in the wild pop-ulations from which domestic rabbits were derived. Thesefindings highlight the challenge of detecting signatures ofartificial selection in rabbits using classical tests of neutralitybased on equilibrium models. To circumvent this problem,we modeled the domestication process, as described below.
Table 2. Average pairwise FST values (%) among six breeds ofdomestic rabbits.
Breed CS ES FA FL NZ
CS —ES 19.4 —FA 10.8 22.0 —FL 10.4 10.8 14.1 —NZ 25.6 32.9 24.2 22.4 —RX 12.5 13.4 17.4 7.5 26.1
NOTE.—Unweighted average values across 35 fragments in seven genomic regions.Champagne Silver (CS), English Spot (ES), French Angora (FA), French Lop (FL),New Zealand White (NZ), and Rex (RX).
Polymorphism and LD in Domestic Rabbits · doi:10.1093/molbev/msr003 MBE
1809

Severe Bottleneck in the Early Stages ofDomestication, Small Effective Population SizesWithin Breeds and Detection of Artificial SelectionUsing a Nonequilibrium ModelWe quantified the amount of genetic diversity lost at theonset of rabbit domestication relative to the source pop-ulation of wild rabbits in France using the following quan-tities: 1�pDOM/pOCCFR and 1�hwDOM/hwOCCFR. The extentof loss of diversity varied greatly among loci (supplemen-tary fig. 3, Supplementary Material online). Removing GPC4and LUM, which deviate significantly from expected valuesgiven the magnitude of the domestication bottleneck (seebelow), domestic rabbits have lost 37.1% of genetic diver-sity based on p and 43.8% based on hw, on average. Theslight difference between the two values is likely explainedby the different sensitivity of the two estimators to low-fre-quency variants.
Rabbit domestication appears to have resulted ina greater loss of genetic diversity than seen in other domes-ticated mammals. For example, Gray et al. (2009) reporteda modest reduction of genetic diversity in dogs (5%), indi-cating that they probably underwent a smaller populationcontraction as a result of domestication. In a similar fash-ion, most studies in pigs have also suggested that domes-tication has not produced a detectable decrease invariability (Ojeda et al. 2006, 2008). Although evaluationof the amount of variation captured in most domesticatedanimals is hampered by the fact that wild progenitors areextinct or not readily available, the two available examplesdescribed above suggest that rabbit domestication led toa great loss of genetic diversity when compared with othermammals. A single origin of domestication in rabbits maycontribute to some of the observed differences in theamount of diversity captured from wild populations.The rabbit domestication process is in this regard moresimilar to several examples in plants for which comparablelosses of variability associated with domestication havebeen reported (e.g., Wright et al. 2005; Burke et al. 2007).
Given that multiple features of the data support a do-mestication bottleneck, we conducted simulations to esti-mate its severity, kdom 5 Nbdom/ddom, where Nbdom is thesize of the bottlenecked population and ddom is the dura-tion in generations of the initial bottleneck. Smaller valuesof kdom indicate more severe reductions in genetic diversity.In our model (fig. 2), the ancestral population undergoestwo consecutive bottlenecks, corresponding to those inthe postglacial colonization of France (kfr) and the initia-tion of domestication (kdom). Following each bottleneck,the model incorporates an instantaneous increase in pop-ulation size. We conducted coalescent simulations varyingkfr and kdom and used a goodness of fit analysis comparingsummary statistics computed on the observed data tothose computed on simulated data.
The number of segregating sites (S) and haplotypes(nhaps) produced nonflat unimodal likelihood distribu-tions for most loci, whereas for p we obtained somewhatflat curves on larger values of kdom and kfr (supplementary
figs. 4 and 5, Supplementary Material online). Because sin-gle summary statistics may fail to capture important as-pects of the data, we estimated the multilocus kdom
using a combination of all three statistics. To avoid biasingour estimates by loci that deviated significantly in levels ofdiversity from the expected values given the magnitude ofthe bottleneck, presumably due to selection, we performedadditional simulations and asked whether the observed lossof diversity for each locus was compatible with the multi-locus estimate of kdom. Loci that showed significant devia-tions at P, 0.05 were eliminated sequentially and kdom wasreestimated iteratively until no significant result was ob-tained. This procedure led to the removal of two loci(GPC4 and LUM), suggesting that these loci may be subjectto selection as discussed in more detail below. The ML es-timate of kdom for the remaining 15 loci was 2.8 (two log-likelihood support limits 5 1.6–6.6; fig. 5) and, as previouslyshown (Eyre-Walker et al. 1998; Tenaillon et al. 2004), ddom
and Nbdom were positively correlated with different combi-nations of values producing identical estimates (data notshown). Using historical records, we can put an upper limiton the duration of the domestication bottleneck. By the16th century, several varieties were recognized suggestingthat rabbit domestication was already finalized at this time.Given the relationship kdom 5 Nbdom/ddom, and assuminga maximum of 900 generations (one generation a year) forthe duration of the rabbit domestication bottleneck (ddom),we estimate that ;1,200 individuals (2,400 chromosomes)can explain the amount of genetic diversity captured in the
FIG. 5. Diagram representing the multilocus ML estimate for thestrength of the population bottleneck (k). Multilocus ML (y axis,logarithmic scale) of the parameter k (x axis) was estimated as theproduct of the likelihood for each locus. The best-fitting parametervalue of k for each locus was estimated as the proportion of 10,000simulations whose summary statistics (S, nhaps, and p) were within20% of the observed values. GPC4 and LUM were not included.
Carneiro et al. · doi:10.1093/molbev/msr003 MBE
1810

initial stages of rabbit domestication. Conversely, sequencediversity in domestic rabbits can be explained by a bottle-neck of a shorter duration and lower numbers of individ-uals. For example, assuming a bottleneck of 10 generations,as few as 14 individuals could, in principle, account for thegenetic diversity captured at rabbit domestication. Theseresults of simulation indicate that the domestication ofrabbits was accompanied by a fairly severe bottleneck of1,200 individuals or less, which is much smaller than theeffective populations size of wild rabbits in France (OCCFR,Ne 5 538,239) or in Northern Spain (OCCIP, Ne 5
1,043,467) inferred using a simple mutation-drift expecta-tion (h 5 4Nel, where h is the average hw value for all au-tosomal loci, l is the average mutation rate, and l 5
1.74 � 10-9 was obtained from the comparison betweenrabbits and Lepus).
We used the extent and magnitude of LD in seven ge-nomic regions as an additional tool for demographic infer-ence. Using a model that describes the expectation for theamount of LD as a function of genetic distance and effec-tive population size (Sved 1971; Hayes et al. 2003), we ex-plored the trend in effective population size change in timefrom r2 values at different genomic distances for six differ-ent breeds. Distance bins used in our sampling design,which ranged from 50 kb to 3,200 kb, corresponded toa time interval of ;15 to 1,000 generations in the past(see Methods). We inferred a decline in effective popula-tion size for all breeds in the time period considered(fig. 6). This decline seems to have been stronger in recentgenerations and the most recent effective population sizeestimates ranged from 28 individuals in the New ZealandWhite strain to 93 in the French Lop breed. The observationof strong breed structure achieved in a short period of timein rabbits concurs with this idea. Investigations of effectivepopulation size variation through time using LD informa-tion in other domestic species, such as cattle and chickens,
have also showed recent declines in effective sizes withinbreeds, suggesting this to be a common trend among do-mesticated animals (Gibbs et al. 2009; Megens et al. 2009).
We used the multilocus estimate of kdom to ask whetherthere has been a greater than expected loss of diversity inDOM relative to OCCFR for specific loci, a pattern consis-tent with positive selection. This method for identifying ge-nomic regions under selection does not rely on equilibriumconditions and looks for outliers against a null model thatspecifically incorporates the two bottlenecks depicted infigure 2. Levels of variation at most loci did not differ sig-nificantly from neutral expectations under this nonequilib-rium demographic model (table 3). However, GPC4 andLUM showed a greater reduction in diversity for all sum-mary statistics beyond what could be ascribed to the multi-locus estimate of kdom alone, suggesting that these regionsmay have been subject to selection during the domestica-tion process. GPC4 is of special interest because it is thesecond most variable locus in OCCFR but invariant inDOM. Moreover, GPC4 had the highest FST value betweenDOM and OCCFR (supplementary table 4, SupplementaryMaterial online). Mutations in GPC3 and GPC4, which arelocated next to each other, have been implicated in pre-and postnatal overgrowth in humans (Pilia et al. 1996),and regulatory variation in GPC3 is responsible for a greatdeal of the response to selection on growth in mice (Oliveret al. 2005). Interestingly, increased size was likely one of thefirst traits to be selected in domestic rabbits (Clutton-Brock1999), raising the intriguing possibility that GPC4 was itselfthe target of selection. Alternatively, it is also possible thatGPC4 was not the direct target of selection and that it isreflecting patterns of selection on linked genes.
This preliminary inquiry into the signature of artificialselection demonstrates the utility and power of nonequi-librium demographic models for identifying candidate‘‘domestication genes’’ (see Tenaillon and Tiffin 2008).
FIG. 6. Estimates of effective population size (Ne) over time from thepresent (generations). The relationship between effective popula-tion size (y axis) and generation time from the present (x axis) wasestimated from LD data using the model of Sved (1971).Champagne Silver (CS), English Spot (ES), French Angora (FA),French Lop (FL), New Zealand White (NZ), and Rex (RX).
Table 3. Proportion of simulations with lower values than theobserved data assuming the multilocus estimate of the magnitudeof the bottleneck (kdom 5 2.8).
Locus Sa nhapsb pc
ATP12A 0.663 0.938 0.096CYTC 0.746 0.842 0.588EXT1 0.436 0.555 0.532LUM 0.022 0.001 0.005MGST3 0.611 0.153 0.010PRL 0.755 0.611 0.706STAG1 0.714 0.850 0.437TIAM1 0.113 0.772 0.130UD14 0.211 0.986 0.606DIAPH2 0.875 0.295 0.751F9 0.865 0.868 0.441GPC4 0.003 0.003 0.003KLHL4 0.678 0.740 0.644MAOA 0.554 0.872 0.447PGK1 0.061 0.214 0.053POLA1 0.115 0.387 0.161
a Number of segregating sites.b Number of haplotypes.c Average number of pairwise differences in a sample (Nei 1987).
Polymorphism and LD in Domestic Rabbits · doi:10.1093/molbev/msr003 MBE
1811

Moreover, this preliminary screen suggests that artificial se-lection may have had a strong impact on levels of diversitythroughout a large fraction of the domestic rabbit genome(2/16 5 12.5%), in addition to the genome-wide effect ofthe domestication bottleneck. Future studies targetingmany genes throughout the genome will provide a powerfulmeans for identifying genes underlying the early pheno-typic transition from wild to domesticated forms. A num-ber of excellent studies in domesticated plants (Wrightet al. 2005; Yamasaki et al. 2005, 2007; Chapman et al.2008), and most recently in chickens (Rubin et al. 2010),have used similar approaches with great success.
Similar Contribution of Males and Females to theDomestic Rabbit Gene PoolTo ask whether males and females contributed differentlyto the domestic rabbit gene pool, we contrasted theamount of diversity captured from French wild rabbits be-tween autosomal and X-linked loci. Strong sex bias, withfewer males than females contributing genetically to thedomestication process and breed formation, has been sug-gested for domesticated species such as horses (Lindgrenet al. 2004; Lau et al. 2009) and dogs (Sundqvist et al.2006). If there was a higher contribution of females whendomestication started, then we should expect a relativelyhigher amount of genetic diversity captured for the X chro-mosome when compared with the autosomes. The oppo-site pattern should be expected if males had a highercontribution.
Neither pattern was observed. Levels of variation cap-tured during domestication (after excluding both GPC4and LUM; supplementary table 5, Supplementary Materialonline) were similar and not significantly different for lociresiding on the autosomes (pDOM/pOCCFR 5 65.1% andhDOM/hOCCFR 5 53.2%) compared with loci residing onthe X chromosome (pDOM/pOCCFR 5 60.0% and hDOM/hOCCFR 5 60.2%; P. 0.30 in both cases by Mann–WhitneyU test). We further compared the X chromosome and au-tosomes in two ways. First, we performed an HKA test(Hudson et al. 1987) using divergence to Lepus. Compari-son of polymorphism and divergence levels between X-linked and autosomal loci uncovered no significant differ-ence in levels of diversity (P5 0.81). Second, we comparedmultilocus estimates of kdom between autosomal and X-linked loci using the demographic model described above.The estimate for autosomal loci (kdom 5 2.8; two log-likeli-hood support limits 5 1.6–10.0) was slightly higher thanthat for X-linked loci (kdom 5 1.9; two log-likelihood sup-port limits 5 0.6–12.0), however, due to the low number ofgenes in each category, the two estimates have wide 95% CIand overlap considerably. Thus, there is no evidence inthese data for a highly unequal contribution of malesand females to the domestic rabbit gene pool. However,we cannot rule out the possibility of small differences inthe initial sex ratio with these data nor can we evaluateany potential sex ratio biases in the formation of individualbreeds.
Advantageous LD Structure for Genetic MappingTo characterize LD as a function of physical distance, weresequenced seven autosomal regions for 25 individualsfor each of six breeds. We resequenced five fragments atdistances of 50 kb, 400 kb, 1.2 Mb, and 3.2 Mb from thefragment initially selected for each region. The use of com-plete resequencing data has the advantage of avoiding as-certainment biases in the composition of SNPs towardcommon alleles. By sampling the total spectrum of muta-tions for each breed, we increased the probability of sam-pling markers whose patterns of LD will be representativeof the genome at large. We detected a total of 267 SNPs andindel markers and 74.5% had a minor allelic frequency of10% in at least one breed.
All breeds showed a decrease in r2 with distance (fig. 7).Within breeds, at distances of 50 kb r2 values ranged from0.48 to 0.70 (average across breeds 5 0.59), and at distancesof 400 kb ranged from 0.21 to 0.34 (average across breeds 50.25). Within breeds, the average distance at which r2 equals0.5 (i.e., ‘‘half-length of LD’’; Reich et al.2001) was ;98 kb. Insome breeds, moderately strong associations (r2 . 0.2) ex-tended well beyond 1 Mb. For example, in New ZealandWhite, most SNPs 1,200 kb apart showed r2 higher than0.3, consistent with a recent history of strong selection inthis strain. Notably, LD did not decline to background levelsin four of the six breeds (Champagne Silver, English Spot,French Angora, and New Zealand White) within the3,200 kb considered here �the results of Mann–WhitneyU test between marker pairs distancing 3,200 kb and markerpairs located on different chromosomes were significant atP, 0.001—indicating that residual associations can persistfor very long distances in some breeds. Given that the breedswere chosen to reflect the main uses of domestic rabbits, theoverall findings are likely to be extendable to most breeds.By extrapolating the extent of LD reported here to the wholegenome and assuming a threshold of 0.3 for r2, we predictthat less than 30,000 evenly spaced markers should sufficefor efficient LD screening within rabbit breeds.
In contrast, when all breeds are considered together, LDdecayed at a faster rate. Among breeds, LD had a ‘‘half-length’’ of ;20 kb, and at a distance of 400 kb r2 averagedonly 0.13 (fig. 7). The fact that we observed higher LDwithin rabbit breeds coupled with lower LD when differentbreeds were combined is indicative of low haplotype shar-ing across breeds and reflects the separation of the breedsfor dozens of generations. This important result suggeststhat using multiple breeds and a dense set of markers ina region of association holds great promise for interval re-duction in fine-scale mapping studies in rabbits. Sucha strategy has been applied with outstanding success indogs (Karlsson et al. 2007; Sutter et al. 2007; Parkeret al. 2009) and may help overcome the reduced resolutionthat results from extensive LD within rabbit breeds. More-over, rabbits are particularly amenable for laboratory rear-ing and a combination of linkage and LD mappingapproaches may help increase the power for finding genesunderlying complex traits (Payseur and Place 2007).
Carneiro et al. · doi:10.1093/molbev/msr003 MBE
1812

The results presented here demonstrate that domesticrabbits harbor considerable genetic variation both withinand among breeds. Moreover, the structure of this varia-tion is such that LD extends for considerable distanceswithin breeds yet decays more rapidly among breeds,a structure that may be advantageous for association map-ping studies. The remarkable phenotypic diversity segregat-ing in domestic rabbits makes this species well suited for
understanding the mechanisms underlying phenotypic di-versification. In addition, the expanding list of traits ofmedical interest also holds great promise for the continueddevelopment of the rabbit as a biomedical model. Our datasuggest that this species, which was first domesticated inFrance within the last 1,500 years, will be a useful resourcefor identifying genetic variants that directly affect functionin traits of both medical and agronomic interest.
FIG. 7. Plots of LD decay within and among domestic breeds for seven genomic regions. LD was measured using the genotypic r2 (y axis) and plottedagainst physical distance in kilobase pairs (x axis). The solid lines represent a logarithmic trend line fitting the mean of the means r2 values for eachregion and for each distance bin. The corresponding standard deviation is indicated by vertical bars. The dashed lines in each panel represent themean r2 values between unlinked markers. The first six panels show LD within breeds: Champagne Silver (CS), English Spot (ES), French Angora (FA),French Lop (FL), New Zealand White (NZ), and Rex (RX). The bottom panel shows LD considering all six breeds together.
Polymorphism and LD in Domestic Rabbits · doi:10.1093/molbev/msr003 MBE
1813
Supplementary MaterialsSupplementary tables 1–8 and figures 1–5 are available atMolecular Biology and Evolution online (http://www.mbe.oxfordjournals.org/).
AcknowledgmentsThis work was partially supported by a Fundacxao paraa Ciencia e a Tecnologia Ph.D. grant to M.C. (SFRH/BD/23786/2005), by research projects to N.F. (POCI/CVT/61590/2004; PTDC/BIA-BDE/72304/2006; PTDC/BIA-BDE/72277/2006), and by National Science Foundation and Na-tional Institutes of Health grants to M.W.N. We are gratefulto the Federation Francxaise de Cuniculture, Union des Se-lectionneurs Avicoles du Sud Ouest, Societe central d’Avi-culture de France, Union des Aviculteurs du Haut-Rhin,Groupement Avicole Pyrenees Atlantiques et Landes, LapinClub du Sud-Ouest, J. Ruesche, D. Allain, and G. Saleil, fortheir kind participation in the breeds sampling. We thankCIBIO, especially F. Sequeira and Nachman lab members forvaluable discussions, and Naoko Takezaki, and three anon-ymous reviewers for valuable comments to the manuscript.
ReferencesBandelt HJ, Forster P, Rohl A. 1999. Median-joining networks for
inferring intraspecific phylogenies. Mol Biol Evol. 16:37–48.Beja-Pereira A, England PR, Ferrand N, Jordan S, Bakhiet AO,
Abdalla MA, Mashkour M, Jordana J, Taberlet P, Luikart G. 2004.
African origins of the domestic donkey. Science 304:1781–1781.Bosze Z, Hiripi L, Carnwath JW, Niemann H. 2003. The transgenic
rabbit as model for human diseases and as a source of
biologically active recombinant proteins. Transgenic Res.
12:541–553.Bradley DG, MacHugh DE, Cunningham P, Loftus RT. 1996.
Mitochondrial diversity and the origins of African and European
cattle. Proc Natl Acad Sci U S A. 93:5131–5135.Brouillette JA, Andrew JR, Venta PJ. 2000. Estimate of nucleotide
diversity in dogs with a pool-and-sequence method. Mamm
Genome. 11:1079–1086.Bruford MW, Bradley DG, Luikart G. 2003. DNA markers reveal the
complexity of livestock domestication. Nat Rev Genet.
4:900–910.Burke JM, Burger JC, Chapman MA. 2007. Crop evolution: from
genetics to genomics. Curr Opin Genet Dev. 17:525–532.Callou C. 2003. De la garenne au clapier: etude archeozoologique du
lapin en Europe Occidentale. Memoir Mus Natl Hist. 2003:1–352.Carneiro M, Blanco-Aguiar JA, Villafuerte R, Ferrand N,
Nachman MW. 2010. Speciation in the European rabbit
(Oryctolagus cuniculus): islands of differentiation on the X
chromosome and autosomes. Evolution 64:3443–3460.Carneiro M, Ferrand N, Nachman MW. 2009. Recombination and
speciation: loci near centromeres are more differentiated than
loci near telomeres between subspecies of the European rabbit
(Oryctolagus cuniculus). Genetics 181:593–606.Chantry-Darmon C, Urien C, de Rochambeau H, et al. (14 co-
authors). 2006. A first-generation microsatellite-based integrated
genetic and cytogenetic map for the European rabbit
(Oryctolagus cuniculus) and localization of angora and albino.
Anim Genet. 37:335–341.Chapman MA, Pashley CH, Wenzler J, Hvala J, Tang SX, Knapp SJ,
Burke JM. 2008. A genomic scan for selection reveals candidates
for genes involved in the evolution of cultivated sunflower(Helianthus annuus). Plant Cell. 20:2931–2945.
Clutton-Brock J. 1999. A natural history of domesticated mammals.Cambridge: Cambridge University Press.
Diamond J. 2002. Evolution, consequences and future of plant andanimal domestication. Nature 418:700–707.
Dobney K, Larson G. 2006. Genetics and animal domestication: newwindows on an elusive process. J Zool. 269:261–271.
Ewing B, Green P. 1998. Base-calling of automated sequencer tracesusing phred. II. Error probabilities. Genome Res. 8:186–194.
Ewing B, Hillier L, Wendl MC, Green P. 1998. Base-calling ofautomated sequencer traces using phred. I. Accuracy assess-ment. Genome Res. 8:175–185.
Eyre-Walker A, Gaut RL, Hilton H, Feldman DL, Gaut BS. 1998.Investigation of the bottleneck leading to the domestication ofmaize. Proc Natl Acad Sci U S A. 95:4441–4446.
Fan JL, Watanabe T. 2003. Transgenic rabbits as therapeutic proteinbioreactors and human disease models. Pharmacol Therapeut.99:261–282.
Ferrand N, Branco M. 2007. The evolutionary history of theEuropean rabbit (Oryctolagus cuniculus): major patterns ofpopulation differentiation and geographic expansion inferredfrom protein polymorphism. In: Weiss S, Ferrand N, editors.Phylogeography of Southern European Refugia. Amsterdam (TheNetherlands): Springer. p. 207–235.
Flux J, Fullagar P. 1983. World distribution of the rabbit (Oryctolaguscuniculus). Acta Zool Fennica. 174:75–77.
Geraldes A, Rogel-Gaillard C, Ferrand N. 2005. High levels ofnucleotide diversity in the European rabbit (Oryctolaguscuniculus) SRY gene. Anim Genet. 36:349–351.
Gibbs RA, Taylor JF, Van Tassell CP, et al. (91 co-authors). 2009.Genome-wide survey of SNP variation uncovers the geneticstructure of cattle breeds. Science 324:528–532.
Gordon D, Abajian C, Green P. 1998. Consed: a graphical tool forsequence finishing. Genome Res. 8:195–202.
Gray MM, Granka JM, Bustamante CD, Sutter NB, Boyko AR, Zhu L,Ostrander EA, Wayne RK. 2009. Linkage disequilibrium anddemographic history of wild and domestic canids. Genetics.181:1493–1505.
Hamblin MT, Casa AM, Sun H, Murray SC, Paterson AH,Aquadro CF, Kresovich S. 2006. Challenges of detectingdirectional selection after a bottleneck: lessons from Sorghumbicolor. Genetics 173:953–964.
Hardy C, Callou C, Vigne JD, Casane D, Dennebouy N, Mounolou JC,Monnerot M. 1995. Rabbit mitochondrial DNA diversity fromprehistoric to modern times. J Mol Evol. 40:227–237.
Haudry A, Cenci A, Ravel C, et al. (11 co-authors). 2007. Grinding upwheat: a massive loss of nucleotide diversity since domestica-tion. Mol Biol Evol. 24:1506–1517.
Hayes BJ, Visscher PM, McPartlan HC, Goddard ME. 2003. Novelmultilocus measure of linkage disequilibrium to estimate pasteffective population size. Genome Res. 13:635–643.
Hey J, Wakeley J. 1997. A coalescent estimator of the populationrecombination rate. Genetics 145:833–846.
Hiendleder S, Kaupe B, Wassmuth R, Janke A. 2002. Molecularanalysis of wild and domestic sheep questions currentnomenclature and provides evidence for domestication fromtwo different subspecies. Proc Biol Sci. 269:893–904.
Houdebine LM, Jolivet G, Ripoli PJ. 2009. Transgenic rabbits toprepare pharmaceutical proteins. In: Houdebine LM, Fan J,editors. Rabbit Biotechnology: rabbit genomics, transgenesis,cloning and models. New York: Springer. p. 65–75.
Hudson RR. 2002. Generating samples under a Wright-Fisher neutralmodel of genetic variation. Bioinformatics 18:337–338.
Carneiro et al. · doi:10.1093/molbev/msr003 MBE
1814

Hudson RR. 1990. Gene genealogies and the coalescent process. In:Antonovics J, Futuyma D, editors. Oxford surveys in evolutionarybiology. Oxford: Oxford University Press. p. 1–44.
Hudson RR, Kaplan NL. 1985. Statistical properties of the number ofrecombination events in the history of a sample of DNAsequences. Genetics 111:147–164.
Hudson RR, Kreitman M, Aguade M. 1987. A test of neutralmolecular evolution based on nucleotide data. Genetics116:153–159.
Hudson RR, Slatkin M, Maddison WP. 1992. Estimation of levels ofgene flow from DNA sequence data. Genetics 132:583–589.
Jansen T, Forster P, Levine MA, Oelke H, Hurles M, Renfrew C,Weber J, Olek K. 2002. Mitochondrial DNA and the origins ofthe domestic horse. Proc Natl Acad Sci U S A. 99:10905–10910.
Karlsson EK, Baranowska I, Wade CM, et al. (20 co-authors). 2007.Efficient mapping of mendelian traits in dogs through genome-wide association. Nat Genet. 39:1321–1328.
Kong A, Gudbjartsson DF, Sainz J, et al. (16 co-authors). 2002. Ahigh-resolution recombination map of the human genome. NatGenet. 31:241–247.
Larson G, Dobney K, Albarella U, et al. (13 co-authors). 2005.Worldwide phylogeography of wild boar reveals multiple centersof pig domestication. Science. 307:1618–1621.
Lau AN, Peng L, Goto H, Chemnick L, Ryder OA, Makova KD. 2009.Horse domestication and conservation genetics of Przewalski’shorse inferred from sex chromosomal and autosomal sequences.Mol Biol Evol. 26:199–208.
Lebas F, Coudert P, Rouvier R, Rochambeau H. 1997. The rabbit:husbandry, health and production. Rome: FAO Animal Pro-duction and Health Series No 21, FAO Publications.
Lindgren G, Backstrom N, Swinburne J, Hellborg L, Einarsson A,Sandberg K, Cothran G, Vila C, Binns M, Ellegren H. 2004.Limited number of patrilines in horse domestication. Nat Genet.36:335–336.
Lindsey J, Fox R. 1994. The biology of the laboratory rabbit. In:Manning P, Ringler D, Newcomer C, editors. Inherited diseaseand variations. San Diego (CA): Academic Press. p. 293–319.
Liu A, Burke JM. 2006. Patterns of nucleotide diversity in wild andcultivated sunflower. Genetics 173:321–330.
Luikart G, Gielly L, Excoffier L, Vigne JD, Bouvet J, Taberlet P. 2001.Multiple maternal origins and weak phylogeographic structurein domestic goats. Proc Natl Acad Sci U S A. 98:5927–5932.
Matthee CA, van Vuuren BJ, Bell D, Robinson TJ. 2004. A molecularsupermatrix of the rabbits and hares (LEPORIDAE) allows for theidentification of five intercontinental exchanges during theMiocene. Syst Biol. 53:433–447.
Megens HJ, Crooijmans RP, Bastiaansen JW, et al. (12 co-authors).2009. Comparison of linkage disequilibrium and haplotypediversity on macro- and microchromosomes in chicken. BMCGenet. 10:86.
Muir WM, Wong GK, Zhang Y, et al. (16 co-authors). 2008.Genome-wide assessment of worldwide chicken SNP geneticdiversity indicates significant absence of rare alleles incommercial breeds. Proc Natl Acad Sci U S A. 105:17312–17317.
Nei M. 1987. Molecular evolutionary genetics. New York: ColumbiaUniversity Press.
Nickerson DA, Tobe VO, Taylor SL. 1997. PolyPhred: automating thedetection and genotyping of single nucleotide substitutionsusing fluorescence-based resequencing. Nucleic Acids Res.25:2745–2751.
Ojeda A, Huang LS, Ren J, Angiolillo A, Cho IC, Soto H, Lemus-Flores C,Makuza SM, Folch JM, Perez-Enciso M. 2008. Selection in themaking: a worldwide survey of haplotypic diversity arounda causative mutation in porcine IGF2. Genetics 178:1639–1652.
Ojeda A, Rozas J, Folch JM, Perez-Enciso M. 2006. Unexpected highpolymorphism at the FABP4 gene unveils a complex history forpig populations. Genetics 174:2119–2127.
Oliver F, Christians JK, Liu X, Rhind S, Verma V, Davison C,Brown SD, Denny P, Keightley PD. 2005. Regulatory variation atglypican-3 underlies a major growth QTL in mice. PLoS Biol.3:e135.
Parker HG, VonHoldt BM, Quignon P, et al. (17 co-authors). 2009.An expressed fgf4 retrogene is associated with breed-definingchondrodysplasia in domestic dogs. Science. 325:995–998.
Payseur BA, Place M. 2007. Prospects for association mapping inclassical inbred mouse strains. Genetics 175:1999–2008.
Pilia G, Hughes-Benzie RM, MacKenzie A, Baybayan P, Chen EY,Huber R, Neri G, Cao A, Forabosco A, Schlessinger D. 1996.Mutations in GPC3, a glypican gene, cause the Simpson-Golabi-Behmel overgrowth syndrome. Nat Genet. 12:241–247.
Queney G, Ferrand N, Weiss S, Mougel F, Monnerot M. 2001.Stationary distributions of microsatellite loci between divergentpopulation groups of the European rabbit (Oryctolaguscuniculus). Mol Biol Evol. 18:2169–2178.
Queney G, Vachot AM, Brun JM, Dennebouy N, Mullsant P,Monnerot M. 2002. Different levels of human intervention indomestic rabbits: effects on genetic diversity. J Heredity. 93:205–209.
R Development Core Team. 2009. R: a language and environmentfor statistical computing. Vienna (Austria): R Foundation forStatistical Computing. [cited 2009 April 10]. Available from:http://www.R-project.org
Reich DE, Cargill M, Bolk S, et al. (11 co-authors). 2001. Linkagedisequilibrium in the human genome. Nature 411:199–204.
Rogel-Gaillard C, Ferrand N, Hayes H. 2009. Rabbit. In: Cockett NE,Kole C, editors. Genome mapping and genomics in domesticanimals. Heidelberg: Springer. p. 165–230.
Rozas J, Sanchez-DelBarrio JC, Messeguer X, Rozas R. 2003. DnaSP,DNA polymorphism analyses by the coalescent and othermethods. Bioinformatics 19:2496–2497.
Rubin CJ, Zody MC, Eriksson J, et al. (19 co-authors). 2010. Whole-genome resequencing reveals loci under selection duringchicken domestication. Nature. 464:587–591.
Soriguer RC. 1983. El conejo: papel ecologico y estrategia de vida enlos ecosistemas mediterraneos. XV Congr Int Fauna Cinegetica ySilvestre Trujillo Spain. 517–542.
Stephens M, Donnelly P. 2003. A comparison of bayesian methodsfor haplotype reconstruction from population genotype data.Am J Hum Genet. 73:1162–1169.
Stephens M, Smith NJ, Donnelly P. 2001. A new statistical methodfor haplotype reconstruction from population data. Am J HumGenet. 68:978–989.
Strobeck C. 1987. Average number of nucleotide differences ina sample from a single subpopulation—a test for populationsubdivision. Genetics 117:149–153.
Sundqvist AK, Bjornerfeldt S, Leonard JA, Hailer F, Hedhammar A,Ellegren H, Vila C. 2006. Unequal contribution of sexes in theorigin of dog breeds. Genetics 172:1121–1128.
Sutter NB, Bustamante CD, Chase K, et al. (21 co-authors). 2007. Asingle IGF1 allele is a major determinant of small size in dogs.Science 316:112–115.
Sved JA. 1971. Linkage disequilibrium and homozygosity of chromo-some segments in finite populations. Theor Popul Biol. 2:125–141.
Tajima F. 1989. Statistical method for testing the neutral mutationhypothesis by DNA polymorphism. Genetics 123:585–595.
Tenaillon MI, Tiffin PL. 2008. The quest for adaptive evolution:a theoretical challenge in a maze of data. Curr Opin Plant Biol.11:110–115.
Tenaillon MI, U’Ren J, Tenaillon O, Gaut BS. 2004. Selection versusdemography: a multilocus investigation of the domesticationprocess in maize. Mol Biol Evol. 21:1214–1225.
Polymorphism and LD in Domestic Rabbits · doi:10.1093/molbev/msr003 MBE
1815

Thornton K. 2003. Libsequence: a Cþþ class library for evolutionarygenetic analysis. Bioinformatics 19:2325–2327.
Vila C, Savolainen P, Maldonado JE, Amorim IR, Rice JE, Honeycutt RL,Crandall KA, Lundeberg J, Wayne RK. 1997. Multiple and ancientorigins of the domestic dog. Science. 276:1687–1689.
Warnes G, Leisch F. 2005. Genetics: population genetics. R packageversion 1.2.0. [cited 2009 October 10]. Available from: http://cran.r-project.org
Watterson GA. 1975. On the number of segregating sites in geneticalmodels without recombination. Theor Popul Biol. 7:256–276.
Weir BS, Hill WG, Cardon LR. 2004. Allelic association patterns fora dense SNP map. Genet Epidemiol. 27:442–450.
Weisbroth SH. 1974. Neoplastic diseases. In: Weisbroth SH, Flatt RE,Krauss AL, editors. Biology of the laboratory rabbit. New York:Academic Press. p. 332–369.
Whitman BD. 2004. Domestic rabbits and their histories. Leawodd(Kansas): Leathers Publishing.
Wright SI, Bi IV, Schroeder SG, Yamasaki M, Doebley JF,McMullen MD, Gaut BS. 2005. The effects of artificial selectionon the maize genome. Science 308:1310–1314.
Yamasaki M, Tenaillon MI, Bi IV, Schroeder SG, Sanchez-Villeda H,Doebley JF, Gaut BS, McMullen MD. 2005. A large-scale screenfor artificial selection in maize identifies candidate agronomicloci for domestication and crop improvement. Plant Cell.17:2859–2872.
Yamasaki M, Wright SI, McMullen MD. 2007. Genomic screening forartificial selection during domestication and improvement inmaize. Ann Bot. 100:967–973.
Zeder MA. 2006. Central questions in the domestication of plantsand animals. Evol Anthropol. 15:105–117.
Zhu QH, Zheng XM, Luo JC, Gaut BS, Ge S. 2007. Multilocus analysisof nucleotide variation of Oryza sativa and its wild relatives:severe bottleneck during domestication of rice. Mol Biol Evol.24:875–888.
Carneiro et al. · doi:10.1093/molbev/msr003 MBE
1816