Comparison of domestic and wild channel catfish ( Ictalurus punctatus) populations provides no...
14
Comparison of domestic and wild channel catfish (Ictalurus punctatus) populations provides no evidence for genetic impact Micah Simmons, Kathryn Mickett, Huseyin Kucuktas, Ping Li, Rex Dunham, Zhanjiang Liu ⁎ Fish Molecular Genetics and Biotechnology Laboratory, 203 Swingle Hall, Department of Fisheries and Allied Aquacultures and Program of Cell and Molecular Biosciences, Aquatic Genomics Unit, Auburn University, Auburn, AL 36849, USA Received 26 January 2005; received in revised form 4 November 2005; accepted 4 November 2005 Abstract Genetic diversity of wild channel catfish (Ictalurus punctatus) populations was analyzed using AFLP markers and compared to that of domestic catfish populations to determine the genetic impact of domestic catfish on wild catfish populations. Fourteen wild populations within various watersheds of Alabama were analyzed using five AFLP primer combinations. A total of 396 polymorphic bands were detected from 269 individuals, with an expected mean heterozygosity of 0.16. The percentage of polymorphic bands varied greatly among populations, from 32.2% to 85.0%. The estimated level of population differentiation as measured by average F ST value across all loci was 0.36. The 14 tested wild populations were related with 88% similarity as revealed by Nei's (Nei, M., 1978. Estimation of average heterozygosity and genetic distance from a small number of individuals. Genetics 89, 583–590) unbiased population-wise identity measures. In order to analyze the interactions between domestic and wild populations of channel catfish, 191 polymorphic bands were used to evaluate 569 individuals from 31 populations. The wild populations exhibited higher levels of polymorphisms and heterozygosities than the domestic populations. Strong genetic structures were associated with the geographical distribution of samples, with all samples from a single watershed being closely related. The domestic populations were all related to one another, forming a single branch in the phylogenetic analysis, while all but the Tennessee River populations of many wild populations were more related to one another than to domestic populations. Genetic identities of wild fish from proximal and distal sites were similar, while both wild populations differed from the nearby domestic catfish populations, providing no molecular genetic evidence for apparent impact of domestic catfish on wild populations. © 2005 Elsevier B.V. All rights reserved. Keywords: Genetic resource; Fish; AFLP; Diversity; Polymorphism; Marker; Catfish; Population 1. Introduction Molecular markers are useful for population genetic studies to assess influences of various factors on genetic diversity and population structure, such as historic and demographic factors (Avise, 1994) anthropogenic stres- sors (Whitehead et al., 2003; Bagley et al., 2001; Anderson et al., 1994; Bickham and Smolen, 1994; Fox, 1995) and artificial stocking (McCracken et al., 1993; Englbrecht et al., 2000). Among many types of molecular markers (for a recent review, see Liu and Cordes, 2004), amplified fragment length polymor- phism (AFLP) and microsatellites have been demon- strated as useful tools for population genetic studies of fish (Whitehead et al., 2003; Liu, 2003). We selected Aquaculture 252 (2006) 133 – 146 www.elsevier.com/locate/aqua-online ⁎ Corresponding author. Fax: +1 334 844 9208. E-mail address: [email protected] (Z. Liu). 0044-8486/$ - see front matter © 2005 Elsevier B.V. All rights reserved. doi:10.1016/j.aquaculture.2005.11.006
-
Upload
independent -
Category
Documents
-
view
3 -
download
0
Transcript of Comparison of domestic and wild channel catfish ( Ictalurus punctatus) populations provides no...

2006) 133–146www.elsevier.com/locate/aqua-online
Aquaculture 252 (
Comparison of domestic and wild channel catfish (Ictaluruspunctatus) populations provides no evidence for genetic impact
Micah Simmons, Kathryn Mickett, Huseyin Kucuktas, Ping Li,Rex Dunham, Zhanjiang Liu ⁎
Fish Molecular Genetics and Biotechnology Laboratory, 203 Swingle Hall, Department of Fisheries and Allied Aquacultures and Program of Celland Molecular Biosciences, Aquatic Genomics Unit, Auburn University, Auburn, AL 36849, USA
Received 26 January 2005; received in revised form 4 November 2005; accepted 4 November 2005
Abstract
Genetic diversity of wild channel catfish (Ictalurus punctatus) populations was analyzed using AFLP markers and compared tothat of domestic catfish populations to determine the genetic impact of domestic catfish on wild catfish populations. Fourteen wildpopulations within various watersheds of Alabama were analyzed using five AFLP primer combinations. A total of 396polymorphic bands were detected from 269 individuals, with an expected mean heterozygosity of 0.16. The percentage ofpolymorphic bands varied greatly among populations, from 32.2% to 85.0%. The estimated level of population differentiation asmeasured by average FST value across all loci was 0.36. The 14 tested wild populations were related with 88% similarity asrevealed by Nei's (Nei, M., 1978. Estimation of average heterozygosity and genetic distance from a small number of individuals.Genetics 89, 583–590) unbiased population-wise identity measures. In order to analyze the interactions between domestic and wildpopulations of channel catfish, 191 polymorphic bands were used to evaluate 569 individuals from 31 populations. The wildpopulations exhibited higher levels of polymorphisms and heterozygosities than the domestic populations. Strong genetic structureswere associated with the geographical distribution of samples, with all samples from a single watershed being closely related. Thedomestic populations were all related to one another, forming a single branch in the phylogenetic analysis, while all but theTennessee River populations of many wild populations were more related to one another than to domestic populations. Geneticidentities of wild fish from proximal and distal sites were similar, while both wild populations differed from the nearby domesticcatfish populations, providing no molecular genetic evidence for apparent impact of domestic catfish on wild populations.© 2005 Elsevier B.V. All rights reserved.
Keywords: Genetic resource; Fish; AFLP; Diversity; Polymorphism; Marker; Catfish; Population
1. Introduction
Molecular markers are useful for population geneticstudies to assess influences of various factors on geneticdiversity and population structure, such as historic anddemographic factors (Avise, 1994) anthropogenic stres-
⁎ Corresponding author. Fax: +1 334 844 9208.E-mail address: [email protected] (Z. Liu).
0044-8486/$ - see front matter © 2005 Elsevier B.V. All rights reserved.doi:10.1016/j.aquaculture.2005.11.006
sors (Whitehead et al., 2003; Bagley et al., 2001;Anderson et al., 1994; Bickham and Smolen, 1994;Fox, 1995) and artificial stocking (McCracken et al.,1993; Englbrecht et al., 2000). Among many types ofmolecular markers (for a recent review, see Liu andCordes, 2004), amplified fragment length polymor-phism (AFLP) and microsatellites have been demon-strated as useful tools for population genetic studies offish (Whitehead et al., 2003; Liu, 2003). We selected

134 M. Simmons et al. / Aquaculture 252 (2006) 133–146
AFLP because it is easy, fast, inexpensive and robust. Inaddition, use of AFLP markers with the same primercombinations would allow comparison of results of thisstudy with previously published results regarding ge-netic diversity of domestic channel catfish Ictaluruspunctatus (Mickett et al., 2003). In spite of their occa-sional distribution in clusters in the catfish genome, thelarge numbers of AFLPs can provide good coverage ofthe genome (Liu et al., 2003) that would be otherwisecostly using other molecular marker systems (Liu andCordes, 2004). AFLP markers have been used to assessgenetic variation in Morone and Thunnus species (Hanand Ely, 2002) and in Asian arowana (Yue et al., 2002).They have also been used to study introgression andhybridization (Liu et al., 1998b; Rogers et al., 2001;Congiu et al., 2001; Young et al., 2001), maternalcontribution (Felip et al., 2000), and analysis of strains,morphotypes, and species (Chong et al., 2000; David etal., 2001; Kai et al., 2002) in various fish species.
Genetic diversity is of great importance to the sus-tainability of populations (Hamrick et al., 1991). Genet-ic variation within populations can be lost throughgenetic drift (Allendorf et al., 1987), a process intensi-fied when population size becomes small. Genetic var-iation among populations can be lost when previouslyrestricted gene flow between populations is increasedby stocking or removal of natural barriers, causingdifferentiation between populations to be lost as a resultof the homogenization of two previously distinct enti-ties (Altukhov and Salmenkova, 1987; Campton, 1987;Utter, 2003).
The primary two procedures for maintaining geneticdiversity have been the establishment of ex situ genebanks and maintenance of in situ natural geneticresources. However, conservation of genetic diversitythrough the use of gene banks has been hindered bymany factors including limited facilities, expense, anddifficulties involved in the preservation of femalegametes. While storage of sperm has been relativelystraightforward, cryopreservation of fish eggs has beendifficult due to their large sizes (Tiersch et al., 1994). Itis believed that sustainability of natural geneticresources is fundamentally important for the preserva-tion of genetic diversities.
The integrity of natural fish populations can be sig-nificantly affected by anthropogenic activities. Not onlyanthropogenic stressors can have a significant impact onpopulations (Palumbi, 2001), but also do routine humanactivities such as artificial stocking or accidental releaseof domestic populations into the wild environment. Di-rect genetic interactions between wild and hatchery fishhave been demonstrated in many studies, with the best
examples being from studies with salmon. Hatchery-propagated Atlantic salmon were found to compete di-rectly with native salmon for resources such as space,food or mates, alter predation regimes and transfer dis-eases and parasites (Fleming et al., 2000). The geneticimpact of cultured Atlantic salmon (Salmo salar) wasmanifested as a loss of genetic diversity among wildpopulations (Hindar, 2001). Hatchery-released chumsalmon (Oncorhynchus keta) account for the vast major-ity (90%) of salmon caught by Japanese fishermen.These hatchery fish also had much impact on the per-formance of the wild populations (Hindar, 2001). Riversheavily supplemented with hatchery salmon have showna steady decrease in egg size (Heath et al., 2003). Areduction in fecundity and productivity of wild popula-tions was also reported (Brodeur and Busby, 1998). Wildcoho salmon (Oncorhynchus kisutch) populations offthe Oregon coast have suffered reductions in productiv-ity and genetic diversity because of hatchery supplemen-tation (Dehart, 1999). Introgression of straying hatcherychinook salmon (Oncorhynchus tshawytscha) hasthreatened the spring-run population in the SacramentoRiver (Banks et al., 2000). These cases demonstratedproblems that may rise in other species as well (Utter,2003).
Channel catfish (I. punctatus) is the most importantaquaculture species in the United States, accounting formore than 60% of all aquaculture production (USDA,2001). It is also an important game fish (ranking withinthe top three sport fish), with a broad geographic rangeencompassing a variety of habitats (Dunham andSmitherman, 1984). Despite its economic and ecologi-cal importance, documentation of genetic diversity forthis species has been minimal. Early studies focused onits genetic variation using isozyme markers, and insome cases as it related to selection for body weight(Dunham and Smitherman, 1984; Hallerman et al.,1986; Carmichael et al., 1992). More recent studieshave demonstrated the applicability of several PCR-based markers, including microsatellites (Liu et al.,1999c; Serapion et al., 2004), random amplified poly-morphic DNA (RAPD) (Liu et al., 1998a, 1999a), andamplified fragment length polymorphism (AFLP) (Liuet al., 1998b, 1999b). In a recent study, we determinedthe level of genetic variation both within and amongpopulations of domestic channel catfish using AFLPmarkers (Mickett et al., 2003). While greater heterozyg-osities were found among aquaculture stocks than pre-viously reported, perhaps as a result of the greaterdifferentiating power of AFLP markers, most aquacul-ture stocks shared high genetic similarities, suggestingthat the domestic catfish stocks were narrow in genetic
135M. Simmons et al. / Aquaculture 252 (2006) 133–146
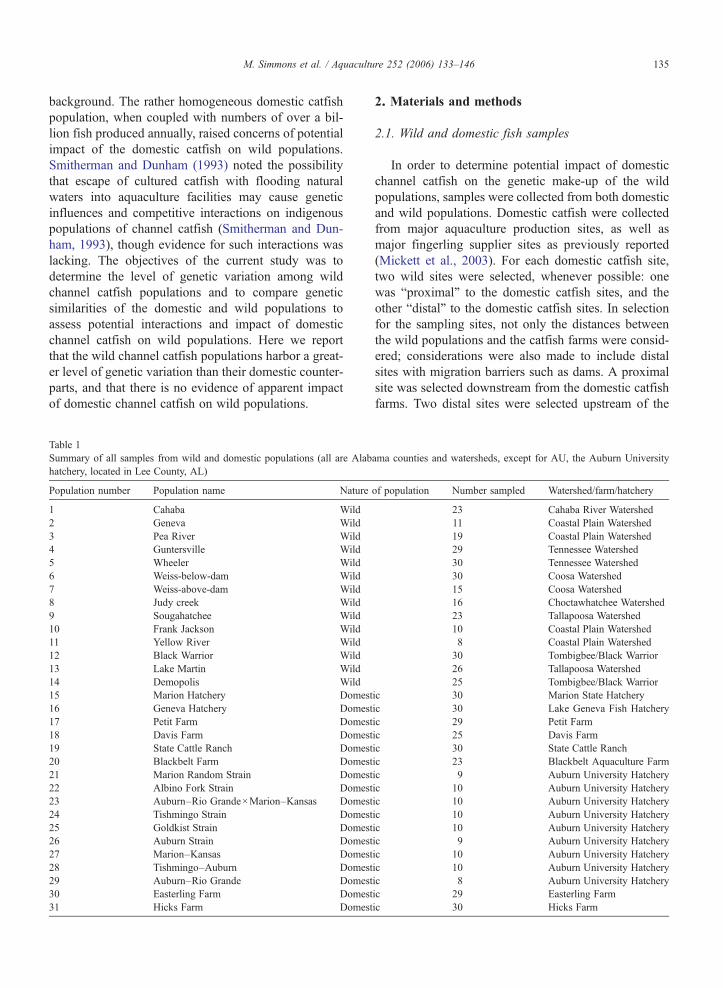
background. The rather homogeneous domestic catfishpopulation, when coupled with numbers of over a bil-lion fish produced annually, raised concerns of potentialimpact of the domestic catfish on wild populations.Smitherman and Dunham (1993) noted the possibilitythat escape of cultured catfish with flooding naturalwaters into aquaculture facilities may cause geneticinfluences and competitive interactions on indigenouspopulations of channel catfish (Smitherman and Dun-ham, 1993), though evidence for such interactions waslacking. The objectives of the current study was todetermine the level of genetic variation among wildchannel catfish populations and to compare geneticsimilarities of the domestic and wild populations toassess potential interactions and impact of domesticchannel catfish on wild populations. Here we reportthat the wild channel catfish populations harbor a great-er level of genetic variation than their domestic counter-parts, and that there is no evidence of apparent impactof domestic channel catfish on wild populations.
Table 1Summary of all samples from wild and domestic populations (all are Alabhatchery, located in Lee County, AL)
Population number Population name Nature
1 Cahaba Wild2 Geneva Wild3 Pea River Wild4 Guntersville Wild5 Wheeler Wild6 Weiss-below-dam Wild7 Weiss-above-dam Wild8 Judy creek Wild9 Sougahatchee Wild10 Frank Jackson Wild11 Yellow River Wild12 Black Warrior Wild13 Lake Martin Wild14 Demopolis Wild15 Marion Hatchery Domest16 Geneva Hatchery Domest17 Petit Farm Domest18 Davis Farm Domest19 State Cattle Ranch Domest20 Blackbelt Farm Domest21 Marion Random Strain Domest22 Albino Fork Strain Domest23 Auburn–Rio Grande×Marion–Kansas Domest24 Tishmingo Strain Domest25 Goldkist Strain Domest26 Auburn Strain Domest27 Marion–Kansas Domest28 Tishmingo–Auburn Domest29 Auburn–Rio Grande Domest30 Easterling Farm Domest31 Hicks Farm Domest
2. Materials and methods
2.1. Wild and domestic fish samples
In order to determine potential impact of domesticchannel catfish on the genetic make-up of the wildpopulations, samples were collected from both domesticand wild populations. Domestic catfish were collectedfrom major aquaculture production sites, as well asmajor fingerling supplier sites as previously reported(Mickett et al., 2003). For each domestic catfish site,two wild sites were selected, whenever possible: onewas “proximal” to the domestic catfish sites, and theother “distal” to the domestic catfish sites. In selectionfor the sampling sites, not only the distances betweenthe wild populations and the catfish farms were consid-ered; considerations were also made to include distalsites with migration barriers such as dams. A proximalsite was selected downstream from the domestic catfishfarms. Two distal sites were selected upstream of the
ama counties and watersheds, except for AU, the Auburn University
of population Number sampled Watershed/farm/hatchery
23 Cahaba River Watershed11 Coastal Plain Watershed19 Coastal Plain Watershed29 Tennessee Watershed30 Tennessee Watershed30 Coosa Watershed15 Coosa Watershed16 Choctawhatchee Watershed23 Tallapoosa Watershed10 Coastal Plain Watershed8 Coastal Plain Watershed30 Tombigbee/Black Warrior26 Tallapoosa Watershed25 Tombigbee/Black Warrior
ic 30 Marion State Hatcheryic 30 Lake Geneva Fish Hatcheryic 29 Petit Farmic 25 Davis Farmic 30 State Cattle Ranchic 23 Blackbelt Aquaculture Farmic 9 Auburn University Hatcheryic 10 Auburn University Hatcheryic 10 Auburn University Hatcheryic 10 Auburn University Hatcheryic 10 Auburn University Hatcheryic 9 Auburn University Hatcheryic 10 Auburn University Hatcheryic 10 Auburn University Hatcheryic 8 Auburn University Hatcheryic 29 Easterling Farmic 30 Hicks Farm

136 M. Simmons et al. / Aquaculture 252 (2006) 133–146
domestic catfish farm and, wherever possible, upstreamof a migration barrier. A total of 539 fish from 31populations were collected across the state of Alabamarepresenting eight watersheds and many of the majorsuppliers of channel catfish fingerlings within thesewatersheds. Of these fish samples, 295 were wild cat-fish and the remaining 244 were domestic catfish. Thedomestic catfish used in this study were those used foranalysis of genetic resources in aquaculture catfish(Mickett et al., 2003). The locations and the abbrevia-tions for the populations are listed in Table 1. Domesticfish were obtained from each of the seven major finger-ling suppliers located in Barbour, Cherokee, Covington,Geneva, and Hale counties. Nine domestic strain sam-ples were collected from each of the nine differentstrains at the Auburn University Hatchery: Auburn,Albino Fork, Auburn–Rio Grande, Auburn–RioGrande–Marion–Kansas, Goldkist, Marion–Kansas,Marion Random, Tishomingo, and Tishomingo–Auburn (Table 1). These research populations had allbeen selected for growth for up to 6 generations, withthe exception of two populations: Marion Random,which was randomly bred, and Albino Fork, whichwas selected for albinism.
Wild population samples were collected from eightmajor watersheds in Alabama (Table 1), and their geo-graphical relationships with the domestic sites areshown in Fig. 1. Sample numbers varied mainly dueto relative abundance in particular areas and samplinggear. Sampling gears used consisted of hook and line,hoop netting, backpack shocking, gillnetting, and boatshocking.
2.2. DNA isolation
Blood samples were collected from the caudal veinof each fish using 1-ml syringes. Each blood samplewas immediately transferred to a 50-ml centrifuge tubewith digestion buffer (Liu et al., 1998b) containingproteinase K at 100 μg/ml. The lysate was stored atroom temperature until isolation of DNA. DNA wasisolated using the Puregene® DNA Isolation Kit (Gen-tra Systems, Minneapolis, MN), following manufac-turer's instructions.
2.3. AFLP analysis
AFLP procedures were performed as described inthe Gibco BRL AFLP Protocol (Life Technologies),with some modifications according to Liu et al.(1998b, 1999b). Five primer combinations were used(E=EcoR1, M=Mse1): E-AAG/M-CAC, E-AAG/M-
CAT, E-ACA/M-CAG, E-ACA/M-CTC, and E-ACT/M-CTG (Liu et al., 1998b; Table 2). AFLP productswere analyzed on LI-COR automated DNA sequen-cers. Images were analyzed using AFLP-Quantar™-Pro 1.0 (KeyGene Products, Netherlands). Based on acomparison to manual scoring, parameters within theQuantarPro program were set so that fragments wereconsidered present (+) if the band ratio rb was suchthat rb≥0.25, and absent (−) if rbb0.09. Fragmentsthat did not fall within these parameters were consid-ered questionable data (?) and not used. The fragmentscoring was checked manually subsequent to computeranalysis.
2.4. Identification of potentially useful AFLP markersfor population identification
The robustness of AFLP allowed the generation ofseveral hundreds of bands for evaluation. In order toidentify AFLPs characteristic of certain populations,we initially attempted to identify fixed AFLP markerswithin the studied populations, i.e., the AFLPs specificto certain populations. It turned out that there were nosuch AFLPs among the several hundreds of AFLPbands evaluated. Therefore, we took a quantitativeapproach for the identification of highly differentialAFLPs. If matching AFLPs have highly differentialallele frequencies among populations, then they couldprove valuable for identification of the populations ifused in combination. We used two criteria for theidentification of potentially useful AFLPs: first, thehighest allele frequency of the AFLP in a populationmust be at least 0.5 among the 14 populations studied;and second, this allele frequency (≥0.5) should be atleast five times more frequent in this population thanin any other population, with an allowance for twoexceptions if two populations were collected from asingle watershed.
2.5. Data analysis
Fragment data were transferred from AFLP-Quan-tarPro to a binary (1/0) data matrix. The confidenceof branch support was then evaluated by way ofbootstrap analysis with 1000 replications, performedwith the PAUP software package (Swofford, 2001,version 4).
Average heterozygosities (H), percent polymorphicloci (P), and FST values were estimated using theTFPGA program (Miller, 1997). Average heterozygos-ity estimates were calculated for each locus and thenaveraged over loci according to Nei's unbiased
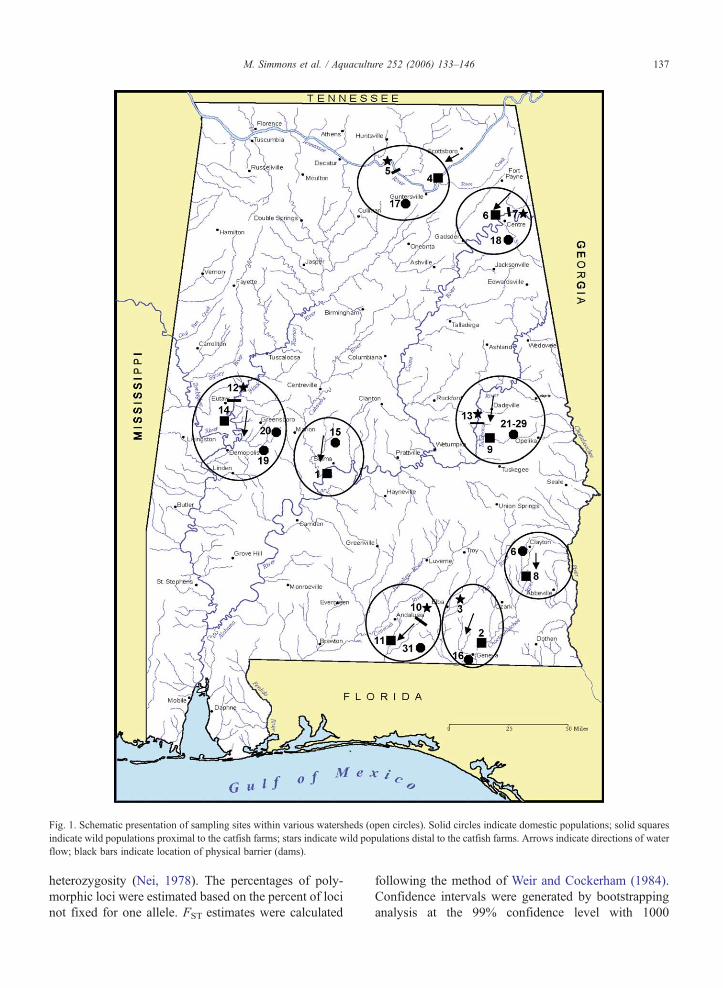
Fig. 1. Schematic presentation of sampling sites within various watersheds (open circles). Solid circles indicate domestic populations; solid squaresindicate wild populations proximal to the catfish farms; stars indicate wild populations distal to the catfish farms. Arrows indicate directions of waterflow; black bars indicate location of physical barrier (dams).
137M. Simmons et al. / Aquaculture 252 (2006) 133–146
heterozygosity (Nei, 1978). The percentages of poly-morphic loci were estimated based on the percent of locinot fixed for one allele. FST estimates were calculated
following the method of Weir and Cockerham (1984).Confidence intervals were generated by bootstrappinganalysis at the 99% confidence level with 1000
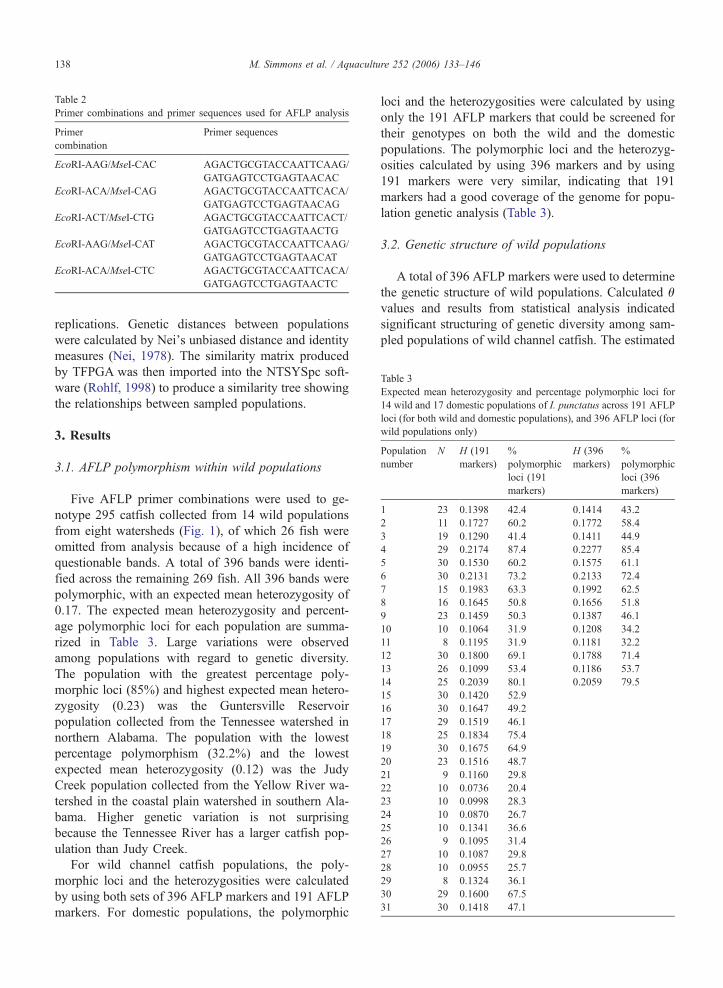
Table 3Expected mean heterozygosity and percentage polymorphic loci for14 wild and 17 domestic populations of I. punctatus across 191 AFLPloci (for both wild and domestic populations), and 396 AFLP loci (forwild populations only)
Populationnumber
N H (191markers)
%polymorphicloci (191markers)
H (396markers)
%polymorphicloci (396markers)
1 23 0.1398 42.4 0.1414 43.22 11 0.1727 60.2 0.1772 58.43 19 0.1290 41.4 0.1411 44.94 29 0.2174 87.4 0.2277 85.45 30 0.1530 60.2 0.1575 61.16 30 0.2131 73.2 0.2133 72.47 15 0.1983 63.3 0.1992 62.58 16 0.1645 50.8 0.1656 51.89 23 0.1459 50.3 0.1387 46.110 10 0.1064 31.9 0.1208 34.211 8 0.1195 31.9 0.1181 32.212 30 0.1800 69.1 0.1788 71.413 26 0.1099 53.4 0.1186 53.714 25 0.2039 80.1 0.2059 79.515 30 0.1420 52.916 30 0.1647 49.217 29 0.1519 46.118 25 0.1834 75.419 30 0.1675 64.920 23 0.1516 48.721 9 0.1160 29.822 10 0.0736 20.423 10 0.0998 28.324 10 0.0870 26.725 10 0.1341 36.626 9 0.1095 31.427 10 0.1087 29.828 10 0.0955 25.729 8 0.1324 36.130 29 0.1600 67.531 30 0.1418 47.1
Table 2Primer combinations and primer sequences used for AFLP analysis
Primercombination
Primer sequences
EcoRI-AAG/MseI-CAC AGACTGCGTACCAATTCAAG/GATGAGTCCTGAGTAACAC
EcoRI-ACA/MseI-CAG AGACTGCGTACCAATTCACA/GATGAGTCCTGAGTAACAG
EcoRI-ACT/MseI-CTG AGACTGCGTACCAATTCACT/GATGAGTCCTGAGTAACTG
EcoRI-AAG/MseI-CAT AGACTGCGTACCAATTCAAG/GATGAGTCCTGAGTAACAT
EcoRI-ACA/MseI-CTC AGACTGCGTACCAATTCACA/GATGAGTCCTGAGTAACTC
138 M. Simmons et al. / Aquaculture 252 (2006) 133–146
replications. Genetic distances between populationswere calculated by Nei's unbiased distance and identitymeasures (Nei, 1978). The similarity matrix producedby TFPGA was then imported into the NTSYSpc soft-ware (Rohlf, 1998) to produce a similarity tree showingthe relationships between sampled populations.
3. Results
3.1. AFLP polymorphism within wild populations
Five AFLP primer combinations were used to ge-notype 295 catfish collected from 14 wild populationsfrom eight watersheds (Fig. 1), of which 26 fish wereomitted from analysis because of a high incidence ofquestionable bands. A total of 396 bands were identi-fied across the remaining 269 fish. All 396 bands werepolymorphic, with an expected mean heterozygosity of0.17. The expected mean heterozygosity and percent-age polymorphic loci for each population are summa-rized in Table 3. Large variations were observedamong populations with regard to genetic diversity.The population with the greatest percentage poly-morphic loci (85%) and highest expected mean hetero-zygosity (0.23) was the Guntersville Reservoirpopulation collected from the Tennessee watershed innorthern Alabama. The population with the lowestpercentage polymorphism (32.2%) and the lowestexpected mean heterozygosity (0.12) was the JudyCreek population collected from the Yellow River wa-tershed in the coastal plain watershed in southern Ala-bama. Higher genetic variation is not surprisingbecause the Tennessee River has a larger catfish pop-ulation than Judy Creek.
For wild channel catfish populations, the poly-morphic loci and the heterozygosities were calculatedby using both sets of 396 AFLP markers and 191 AFLPmarkers. For domestic populations, the polymorphic
loci and the heterozygosities were calculated by usingonly the 191 AFLP markers that could be screened fortheir genotypes on both the wild and the domesticpopulations. The polymorphic loci and the heterozyg-osities calculated by using 396 markers and by using191 markers were very similar, indicating that 191markers had a good coverage of the genome for popu-lation genetic analysis (Table 3).
3.2. Genetic structure of wild populations
A total of 396 AFLP markers were used to determinethe genetic structure of wild populations. Calculated θvalues and results from statistical analysis indicatedsignificant structuring of genetic diversity among sam-pled populations of wild channel catfish. The estimated

0.86 0.90 0.93 0.96 1.00
1
6
7
12
14
9
13
11
10
4
5
2
3
8
100
87
100
96
100
86
98
100
100 Geneva
Weiss (below dam)
Weiss (above dam)
Guntersville
Cahaba
Black Warrior
Demopolis
Sougahatchee
Lake Martin
Yellow River
Frank Jackson
Pea River
Judy Creek
Wheeler
I, genetic identity
Fig. 2. Wild population-wise similarity tree revealed by UPGMA cluster analysis using the Nei (1978) unbiased genetic identity measure. Significantbootstrapping values are indicated.
139M. Simmons et al. / Aquaculture 252 (2006) 133–146
FST value averaged over all polymorphic loci was 0.36(99% C.I.; 0.39–0.32). A dendrogram reflecting geneticrelatedness is shown in Fig. 2. Populations from thesame watershed were more similar to one other than toother populations. For instance, populations 6 (Weisspopulation below dam) and 7 (Weiss population abovedam) were the most related populations. Similarly,populations 12 (Black Warrior River population) and14 (Demopolis population), populations 9 (Souga-hatchee Creek) and 13 (Lake Martin population), popu-lations 10 (Frank Jackson) and 11 (Yellow River),populations 4 (Guntersville) and 5 (Wheeler), and popu-lations 2 (Geneva) and 3 (Pea) were more related toeach other within than across watersheds. This findingsuggested the existence of population differentiationamong various watersheds. In almost all cases, the
Fig. 3. An example of AFLP markers with highly differential allele frequencithe right are 30 samples from population 12, separated by a vertical line. Thwas rare in other populations, with only population 14 shown here.
populations from the same watershed clustered togetherin the phylogenetic tree (Fig. 2).
3.3. Potential useful markers for populationidentification
No fixed AFLPs were found specific to any popula-tion. However, we observed AFLPs that had highlydifferential allele frequencies among various popula-tions (Fig. 3). Therefore, two criteria were used toqualify potentially useful AFLPs: (1) the AFLPs musthave an allele frequency of 50% in the characteristicpopulation, and (2) this allele frequency must be at leastfive times greater than those in any other populationwith an allowance for two exceptions. As summarizedin Table 4, 23 AFLPs met these criteria. Clearly, many
es. Shown on the left panel are 30 samples from population 14 and one AFLP band (F7-305) is frequent among fish from population 12 but

Table 4AFLPs with highly differential allele frequencies among 14 wild populations
Watershed Cahaba Coastal plain Tennessee Coosa Cho Tallapoosa Coastal plain Tombigbee
Locus 1 2 3 4 5 6 7 8 9 13 10 11 12 14
B2-70 0.000 0.051 0.000 0.068 0.000 0.039 0.000 0.000 0.000 0.099 0.000 0.500 0.035 0.000B2-176 0.000 0.106 0.030 0.022 0.000 0.000 0.000 0.000 0.000 0.065 0.000 0.646 0.000 0.000B4-240 0.000 0.000 0.000 0.100 0.000 0.000 0.000 0.622 0.000 0.061 0.000 0.065 0.000 0.101B2-63 0.000 0.000 0.030 0.045 0.018 0.039 0.036 0.080 0.000 0.032 0.000 0.646 0.053 0.097F7-305 0.000 0.000 0.000 0.045 0.000 0.039 0.036 0.000 0.000 0.000 0.000 0.000 0.778 0.000F7-173 0.000 0.397 0.657 0.045 0.000 0.019 0.000 0.000 0.000 0.000 0.000 0.000 0.000 0.039F7-218 0.000 0.574 0.358 0.091 0.017 0.060 0.036 0.000 0.000 0.000 0.000 0.000 0.000 0.039F7-354 0.000 0.047 0.030 0.068 0.034 0.060 0.074 0.635 0.000 0.000 0.000 0.000 0.051 0.191C3-360 0.000 0.000 0.000 0.639 0.342 0.038 0.036 0.000 0.000 0.000 0.000 0.000 0.087 0.077B4-70 0.000 0.478 1.000 0.049 0.017 0.000 0.000 0.000 0.000 0.030 0.000 0.000 0.017 0.060C3-189 0.000 0.047 0.000 0.068 0.000 0.019 0.000 0.000 0.000 0.030 0.074 0.000 0.817 0.728F7-226 0.000 0.000 0.000 0.045 0.000 0.060 0.000 0.000 0.074 0.000 0.000 0.000 0.817 0.804F7-127 0.000 0.047 0.030 0.022 0.000 0.019 0.036 0.184 0.000 0.000 0.000 0.000 1.000 0.723F7-199 0.000 0.000 0.000 0.068 0.000 0.039 0.000 0.034 0.000 0.000 0.000 0.000 1.000 1.000B4-379 0.000 0.000 0.000 0.100 0.000 0.020 0.039 0.000 0.074 0.030 0.000 0.000 1.000 1.000F7-283 0.000 0.000 0.000 0.705 1.000 0.191 0.114 0.034 0.000 0.000 0.000 0.000 0.144 0.191B4-83 0.000 1.000 1.000 0.000 0.017 0.000 0.000 0.036 0.000 0.030 0.244 0.000 0.034 0.060B2-232 0.024 0.293 0.657 0.091 0.000 0.060 0.155 1.000 0.000 0.065 0.000 0.000 0.053 0.097B4-79 0.000 0.699 1.000 0.049 0.034 0.000 0.000 0.000 0.000 0.030 0.622 0.000 0.069 0.080B4-168 0.000 0.000 0.000 0.000 0.000 0.000 0.000 0.000 0.782 0.160 1.000 0.646 0.000 0.000B4-218 0.000 1.000 1.000 0.100 0.000 0.000 0.039 0.402 0.074 0.000 0.000 0.065 0.051 0.060
The watersheds from which samples were collected are indicated in the first row: Cahaba, Cahaba River watershed; Coastal plain, Coastal plainwatershed; Tennessee, Tennessee watershed; Coosa, Coosa watershed; Cho, Choctawhatchee watershed; Tallapoosa, Tallapoosa watershed;Tombigbee, Tombigbee/Black Warrior watershed. The numbers indicate population numbers as detailed in Table 1.
140 M. Simmons et al. / Aquaculture 252 (2006) 133–146
of these 23 AFLPs are characteristic of certain popula-tions. For instance, seven AFLP markers had high allelefrequencies in populations 2 and 3, both of which werefrom the same watershed (Fig. 1). Two of the sevenAFLPs, F7-173 and F7-218, were produced by F7primer combination; four of the seven AFLPs, B4-70,B4-79, B4-83, and B4-218, were produced by B4 prim-er combination; and the remaining one AFLP, B2-232,was produced by B2 primer combination. Therefore, theprimer combinations of B2, B4, and F7 collectivelyshould produce AFLP fingerprints highly characteristicof populations from the Coastal plain watersheds. Sim-ilarly, AFLPs C3-360 and F7-283 were highly charac-teristic of populations 4 and 5; B4-240, F7-354, and B2-232 were characteristic of population 8; F7-305 wascharacteristic of population 12; and C3-189, F7-226,F7-127, F7-199, and B4-379 were highly characteristicof population 12 and 14, both of which were from theTombigbee/Black Warrior watershed. Hence, it appearsthat B2, B4, and F7 primer combinations are quiteuseful for the generation of AFLPs characteristic ofpopulations. Although these AFLPs were not popula-tion-specific markers, their differential allele frequencywould lend opportunity for potential use in combina-tions for the identification of populations from variouswatersheds.
3.4. Comparison of genetic similarities of domesticpopulations with their proximal and distal wildpopulations
In this study, the wild channel catfish populationswere found to contain significantly higher percent poly-morphic loci (31.9–87.4% vs. 25.7–75.4%, Pb0.05,Fig. 4) and expected mean heterozygosity values(0.1064–0.2131 vs. 0.087–0.1834, Pb0.05, Fig. 5)than the domestic populations (Table 3, Mickett et al.,2003). For the majority of watersheds, the wild popula-tions had equal or greater heterozygosities than theirdomestic counterparts (Fig. 5). The noticeable excep-tion was the Coastal plain watershed containing theHicks farm, where a greater heterozygosity was ob-served for the domestic population than for the wildpopulation. In the case of the Tallapoosa watershed,much lower percentages of polymorphic loci were ob-served with the domestic populations. However, muchof this lower heterozygosity was attributed to the re-search stocks of various strains at Auburn University,making the difference larger between the wild popula-tions and the domestic populations.
One of the objectives of this research was to pro-vide initial determination of the potential impact ofdomestic channel catfish on their wild populations.

0
10
20
30
40
50
60
70
80
90
100
Mar
ion
Hat
cher
yC
ahab
a
Gen
eva
Hat
cher
yG
enev
aP
ea R
iver
Pet
itG
unte
rsvi
lleW
heel
er
Dav
isW
eiss
pro
xim
alW
eiss
dis
tal
Eas
terli
ngJu
dy C
reek
AU
-Mar
ion
Alb
ino
AU
-RG
x M
-KT
ishm
ingo
Gol
dkis
tA
ubur
n R
ando
mA
U-M
KT
ishm
ingo
-AU
Aub
urn-
Rio
Gra
nde
Sou
gaha
tche
eLa
ke M
artin
Hic
ksY
ello
w R
iver
Fra
nk J
acks
on
Bla
ckbe
ltS
tate
Cat
tle R
anch
Dem
opol
isB
lack
War
rior
Populations
% P
olym
orph
ic
Fig. 4. Comparison of polymorphism rates of AFLPs (in percentage of polymorphic bands) of domestic catfish populations (solid bars) with thosefrom wild populations proximal (dotted bars) or distal (open bars) to the catfish farms. Details for the populations are as described in Table 1.
141M. Simmons et al. / Aquaculture 252 (2006) 133–146
Our hypothesis was that if large numbers of domesticcatfish were released as a result of intentional stock-ing, or of accidental release from flooding, then the
0.00
0.02
0.04
0.06
0.08
0.10
0.12
0.14
0.16
0.18
0.20
0.22
0.24
Ave
rage
Het
eroz
ygos
ity
Mar
ion
Hat
cher
yC
ahab
a
Gen
eva
Hat
cher
yG
enev
aP
ea R
iver
Pet
itG
unte
rsvi
lleW
heel
er
Dav
isW
eiss
pro
xim
alW
eiss
dis
tal
Eas
terli
ngJu
dy C
reek
Pop
Fig. 5. Comparison of heterozygosities of AFLPs of domestic catfish populbars) or distal (open bars) to the catfish farms. Details for the populations ar
wild catfish populations proximal to the catfish farm-ing centers should be genetically more similar to thedomestic populations than the wild catfish populations
AU
-Mar
ion
Alb
ino
AU
-RG
x M
-KT
ishm
ingo
Gol
dkis
tA
ubur
n R
ando
m
AU
-MK
Tis
hmin
go-A
UA
ubur
n-R
io G
rand
eS
ouga
hatc
hee
Lake
Mar
tin
Hic
ksY
ello
w R
iver
Fra
nk J
acks
on
Bla
ckbe
ltS
tate
Cat
tle R
anch
Dem
opol
isB
lack
War
rior
ulations
ations (solid bars) with those from wild populations proximal (dottede the same as described in Table 1.

142 M. Simmons et al. / Aquaculture 252 (2006) 133–146
distal to the farming centers; this should be especiallytrue if there is a physical barrier such as dams be-tween the distal wild populations and the domesticfish farms. Catfish can swim/flow downstream, butnot upstream against physical barriers such as damsunless they have navigation locks as in the Tombig-bee and Tennessee systems. A direct comparison of“distal” populations with “proximal” populations andthe domestic populations should reveal the degree ofsimilarities among them. A greater similarity of prox-imal wild populations to domestic populations woulddemonstrate impact of domestic fish on wild popula-tions; in contrast, if the proximal and distal popula-tions are similar, but different from the domestic fish,then there is no evidence to support a significantimpact of domestic fish on wild populations. Analysisof the AFLP bands produced by the five primercombinations indicated 191 bands shared by the do-
0.87 0.88 0.89 0.90 0.91 0.92 0.93 0.94 0.95 0.
58
89
86
65
70
I, genetic identity
Fig. 6. Similarity tree of domestic and wild channel catfish populations csimilarities. Details of the populations are the same as explained in Table 1.
mestic and wild populations. These frequencies ofthese bands were analyzed to determine the geneticrelatedness of both wild and domestic populations.
Two tests were conducted for the genetic similarityanalysis using 191 AFLP markers. The first was agenetic similarity analysis using Nei's genetic distancewith UPGMA method. As shown in Fig. 6, all thedomestic fish, regardless of their location within thewatershed, were clustered as a single clade (lower por-tion of figure), indicating their common origin from alimited number of stocks raised at the aquacultureoperations (Mickett et al., 2003). In contrast, the wildfish populations were clustered into clades more or lessaccording to their origin of watersheds, as already dis-cussed above. In the second approach, the Fisher'sexact test was conducted to test the significance ofgenotype and allele frequency differences. No signifi-cant differences in genotype and allele frequencies were
96 0.97 0.98 0.99 1.00
1 Cahaba
6 Weiss (below dam)
7 Weiss (above dam)
12 Black Warrior
14 Demopolis
9 Sougahatchee
13 Lake Martin
11 Yellow River
10 Frank Jackson
2 Geneva
3 Pea River
8 Judy Creek
4 Guntersville
5 Wheeler
15 Marion Hatchery
21 Marion Random
27 Marion -Kansas
16 Geneva Hatchery
18 Davis Farm
19 State Cattle Ranch
17 Petit Farm
20 Blackbelt Farm
25 Goldkist Strain
31 Hicks Farm
30 Easterling Farm
23 AU -Rio Grande x Marion-Kansas
29 Auburn-Rio Grande
26 Auburn Strain
24 Tishomingo Strain
28 Tishomingo _ Auburn
22 Albino Fork
100
99
96
100
100
9551
5256
92
63
onstructed by using 191 AFLP markers based on the Nei's genetic

0
0.05
0.1
0.15
0.2
0.25
0.3
0 25 50 75 100 125 150 175 200 225 250 275 300 325
Geographic distance (river miles)
Gen
etic
dis
tanc
e (D
NE
I'78)
Wild Populations
Domestic Populations
r=-0.0861P=0.99
Fig. 7. Plot of genetic distances (Y-axis) over geographical distances (X-axis).
143M. Simmons et al. / Aquaculture 252 (2006) 133–146
found between wild populations distal or proximal tothe domestic fish farming centers, but significant differ-ences were found between proximal wild populationsand domestic populations, as well as between the distalwild populations and the domestic populations. Resultsof these tests indicated that there are no statistical dif-ferences among pairs of wild populations within water-sheds, but differences between domestic and wildpopulations. We also conducted analyses of the rela-tionship between genetic and geographical distancesbetween all population pairs. This test is particularlymeaningful for population samples from a single water-shed. As shown in Fig. 7, there were no correlationsbetween genetic distances and the geographical dis-tances. Taken together, we conclude that there is noevidence for significant impact of domestic populationson wild populations.
4. Discussion
This research is the first using DNA markers for theanalysis of natural genetic resources in channel catfish.Although some initial analysis of genetic resourceswere conducted using allozyme markers among re-search strains of domestic catfish (Hallerman et al.,1986), and initial analysis of genetic resources amongdomestic catfish in Alabama using AFLP markers(Mickett et al., 2003), no previous research has beenconducted to address the issue of genetic diversityamong wild catfish populations.
We found a greater level of genetic diversity of wildcatfish populations than in domestic populations, anexpected but a novel result. An average heterozygosity
was found to be 0.16 among the tested watersheds. Agreater level of heterozygosity is likely if wider geo-graphical areas were included in the samples. Previousresearch already indicated significantly, different phe-notypes existed among various geographical areas(Mickett et al., 2003). As we previously reported (Mick-ett et al., 2003), the aquaculture stocks are quite narrowin genetic background. This research showed the addi-tional reservoir of genetic variability contained withinnatural populations, which may be useful for additionalgenetic/genomic input into aquaculture stocks.
Population genetic structure of the channel catfishpopulations as revealed by AFLPs supported both thehistoric and biogeographical hypotheses. In the wildpopulations, the genetic patterns were well explainedby biogeographical factors. Regardless of the distanceor presence of barriers to the domestic populations,samples collected from the same watershed shared ahigh level of genetic similarities, suggesting sufficientflow of genes among upstream and downstream popu-lations. The only noticeable exception was the wildchannel catfish population collected from the WheelerLake, which showed relatedness with the domesticchannel catfish from Marion Hatchery. A survey ofstocking history revealed that the domestic catfishfrom Marion Hatchery was used to stock WheelerLake (Maurice Jackson, Alabama Department of Con-servation, personal communications).
There were no significant differences in the levels ofheterozygosity between distal populations and proximalwild populations, even though a higher level of hetero-zygosity was observed in most distal populations. Sim-ilar results were found with Catostomus occidentalis in
144 M. Simmons et al. / Aquaculture 252 (2006) 133–146
western U.S. watersheds by Whitehead et al. (2003)using both AFLP and microsatellite markers, with Eu-ropean cyprinids using mitochondrial markers based onthe complete nucleotide sequence of cytochrome b gene(Zardoya and Doadrio, 1999), and with South AmericanHypostomus catfish using mitochondrial D-loop haplo-types (Montoya-Burgos, 2003). In comparison with thesituation of the wild populations, the similarity of do-mestic catfish populations was explained by historicfactors, as expected from known gene flow in breedinghistories of aquaculture stocks (Mickett et al., 2003).
The large number of loci (396 for the study of wildpopulations and 191 for the comparison of wild anddomestic populations) used in this study should helpreducing interlocus variance. While interlocus variancecan be reduced with increased number of loci, intralo-cus variance can only be reduced by increasing thenumber of individuals sampled. In this regard, the allelefrequency differences could be potentially over-estimat-ed or under-estimated in some populations because ofthe small sample sizes. For instance, only 8 fish werecollected from the Yellow River wild population; 10fish were collected from the Frank Jackson wild popu-lation; and 11 fish collected from the Geneva wildpopulation. Substantial effort was devoted to collectsamples; numerous fishing trips were made with theassistance of the Alabama State Department of Conser-vation, but we were unable to collect larger samples inseveral selected sampling sites. Our goal was to collect20–30 fish from each wild population, but this objectivewas not met as a result of scarceness of channel catfishin selected sites within certain watersheds. However, thesmall samples of several sites should not significantlyaffect our ability to obtain a reasonable estimation ofheterozygosities. As stated by Gorman and Renzi(1979), even a few individuals are sufficient for esti-mating H if the number of loci examined is large (Nei,1987). However, we recognize the effect of small sam-ple size on intralocus variation. For instance, 23 AFLPswere identified that have highly differential allele fre-quencies among certain populations. Potentially, theseAFLPs could represent highly differential AFLPs forpopulation identification, but additional research isneeded to determine their usefulness for this purpose.As the sample sizes increases, the frequency of allelescould change.
This research assessed the potential impact of thedomestic catfish industry on wild populations for thefirst time. Because of the large size of the catfish indus-try, with over one billion fish raised annually, the po-tential risks for accidental releases and subsequentgenetic impact could be tremendous, especially over
time. To date, there is no evidence showing significantimpact of the domestic catfish on wild populations inAlabama. This result may have implications for the useof non-indigenous or genetically improved strains ofcatfish in earthen ponds. Considering that the catfishindustry has been in large-scale production since themid-1980s, accidental release can be avoided, whateverthe mechanism. We believe that a number of factorsmay have made this success possible. The location ofearthen ponds distant from rivers may be the majorfactor. This is in great contrast of the situation forsalmon raised in net pens where significant geneticimpact has been reported (Hindar et al., 1991; Fleminget al., 2000).
Acknowledgements
This project was partially supported by a grant fromthe Alabama Department of Conservation (Projectnumber F-40-49), and partially by a grant from theUSDA NRI Animal Genome Basic Reagents andTools Program (USDA/NRICGP 2003-35205-12827).The authors thank Don Marley, Tommy Petit, DaveCline, George Free and the State Cattle Ranch, GregWhitis, Blackbelt Aquaculture, W.B. Easterling, andKen Hicks for their assistance in obtaining fish sam-ples. We are grateful to Stanley F. Cook and NickNichols for their support and discussions during theentire course of this study.
References
Allendorf, F., Ryman, N., Utter, F., 1987. Genetics and fisherymanagement: past, present, and future. In: Ryman, N., Utter, F.(Eds.), Population Genetics and Fishery Management. WashingtonSea Grant Publications/University of Washington Press, Seattle,pp. 1–19.
Altukhov, Y.P., Salmenkova, E.A., 1987. Stock transfer relative tonatural organization, management, and conservation of fishpopulations. In: Ryman, N., Utter, F. (Eds.), Population Geneticsand Fishery Management. Washington Sea Grant Publications/University of Washington Press, Seattle, pp. 333–343.
Anderson, S., Sadinski, W., Shugart, L., 1994. Genetic and molecularecotoxicology: a research framework. Napa Conference onGenetic and Molecular Ecotoxicology, 12–15 October, 1993;Yountville, CA, USAEnvironmental Health Perspectives, vol. 102,pp. 3–8.
Avise, J.C., 1994. Molecular Markers, Natural History and Evolution.Chapman and Hall, New York, USA. 511 pp.
Bagley, M.J., Anderson, S.L., May, B., 2001. Choice of methodologyfor assessing genetic impacts of environmental stressors: poly-morphism and reproducibility of RAPD and AFLP fingerprints.Ecotoxicology 10, 239–244.
Banks, M.A., Rashbrook, V.K., Calavetta, M.J., Dean, C.A., Hedge-cock, D., 2000. Analysis of microsatellite DNA resolves geneticstructure and diversity of Chinook salmon (Oncorhynchus
145M. Simmons et al. / Aquaculture 252 (2006) 133–146
tshawytscha) in California's Central Valley. Canadian Journal ofFisheries and Aquatic Sciences 57, 915–927.
Bickham, J.W., Smolen, M.J., 1994. Somatic and heritable effects ofenvironmental genotoxins and the emergence of evolutionarytoxicology. Environmental Health Perspectives 102, 25–28.
Brodeur, R.D., Busby, M.S., 1998. Occurrence of an Atlantic salmon(Salmo salar) in the Bering Sea. Alaska Fishery Research Bulletin5, 64–66.
Campton, D.E., 1987. Natural hybridization and introgression infishes: methods of detection and interpretation. In: Ryman, N.,Utter, F.M. (Eds.), Population Genetics and Fishery Management.Washington Sea Grant Program. University of Washington Press,Seattle, pp. 161–192.
Carmichael, G.J., Schmidt, M.E., Morizot, D.C., 1992. Electrophoreticidentification of genetic markers in channel catfish and blue catfishby use of low-risk tissues. Transactions of the American FisheriesSociety 121, 26–35.
Chong, L.K., Tan, S.G., Yusoff, K., Siraj, S.S., 2000. Identification andcharacterization of Malaysian river catfish, Mystus nemurus(C&V): RAPD and AFLP analysis. Biochemical Genetics 38,63–76.
Congiu, L., Dupanloup, I., Patarnello, T., Fontana, F., Rossi, R., Arlati,G., Zane, L., 2001. Identification of interspecific hybrids byamplified fragment length polymorphism: the case of sturgeon.Molecular Ecology 10, 2355–2359.
David, L., Rajasekaran, P., Fang, J., Hillel, J., Lavi, U., 2001.Polymorphism in ornamental and common carp strains (Cyprinuscarpio L.) as revealed by AFLP analysis and a new set ofmicrosatellite markers. Molecular Genetics and Genomics 266,353–362.
Dehart, D.A., 1999. Affidavit to State of Oregon, Case Number 99-6265-HO. Oregon Department of Justice, Salem, OR.
Dunham, R.A., Smitherman, R.O., 1984. Ancestry and Breeding ofCatfish in the United States, Cir. 273. Alabama AgriculturalExperiment Station, Auburn, AL.
Englbrecht, C.C., Freyhof, J., Nolte, A., Rassmann, K., Schliewen, U.,Tautz, D., 2000. Phylogeography of the bullhead Cottus gobio(Pisces: Teleostei: Cottidae) suggests a pre-Pleistocene origin ofthe major central European populations. Molecular Ecology 9,709–722.
Felip, A., Martinez-Rodriguez, G., Piferrer, F., Carrillo, M., Zanuy, S.,2000. AFLP analysis confirms exclusive maternal genomiccontribution of meiogynogenetic sea bass (Dicentrarchus labraxL.). Marine Biotechnology 2, 301–306.
Fleming, I.A., Hindar, K., Mjolnerod, I.B., Jonsson, B., Balstad, T.,Lamberg, A., 2000. Lifetime success and interactions of farmsalmon invading a native population. Proceedings of the RoyalSociety of London. B 267, 1517–1523.
Fox, G.A., 1995. Tinkering with the tinkerer: pollution versusevolution. Environmental Health Perspectives 103, 93–100.
Gorman, G.C., Renzi, J., 1979. Genetic distance and heterozygosityestimates in electrophoretic studies: effects of sample size. Copeia2, 242–249.
Hallerman, E.M., Dunham, R.A., Smitherman, R.O., 1986. Selectionor drift: isozyme allele frequency changes among channel catfishselected for rapid growth. Transactions of the American FisheriesSociety 115, 60–68.
Hamrick, J.L., Godt, M.J.W., Murawski, D.A., Loveless, M.D., 1991.Correlations between species traits and allozyme diversity:implications for conservation biology. In: Falk, D.A., Holsinger,K.E. (Eds.), Genetics and Conservation of Rare Plants. OxfordUniversity Press, Oxford, pp. 75–86.
Han, K., Ely, B., 2002. Use of AFLP analyses to assess geneticvariation in Morone and Thunnus species. Marine Biotechnology4, 141–145.
Heath, D., Heath, J., Bryden, C., Rachel, J., Charles, F., 2003. Rapidevolution of egg size in captive salmon. Science 299, 1738–1740.
Hindar, K., 2001. Interactions of cultured and wild species. In: Tlusty,M.F., et al. (Eds.), Marine Aquaculture and the Environment. CapeCod Press, Falmouth, MA, p. 50.
Hindar, K., Ryman, N., Utter, F., 1991. Genetic effects of cultured fishon natural fish populations. Canadian Journal of Fisheries andAquatic Sciences 48, 945–957.
Kai, Y., Nakayama, K., Nakabo, T., 2002. Genetic differences amongthree colour morphotypes of the black rockfish, Sebastes inermis,inferred from mtDNA and AFLP analyses. Molecular Ecology 11,2591–2598.
Liu, Z., 2003. A review of catfish genomics: progress andperspectives. Comparative and Functional Genomics 4, 259–265.
Liu, Z.J., Cordes, J., 2004. DNA marker technologies and theirapplications in aquaculture genetics. Aquaculture 238, 1–37.
Liu, Z., Li, P., Argue, B.J., Dunham, R.A., 1998a. Inheritance ofRAPD markers in channel catfish (Ictalurus punctatus), bluecatfish (I. furcatus) and their F1, F2 and backcross hybrids. AnimalGenetics 29, 58–62.
Liu, Z., Nichols, A., Li, P., Dunham, R.A., 1998b. Inheritance andusefulness of AFLP markers in channel catfish (Ictaluruspunctatus), blue catfish (I. furcatus) and their F1, F2 and backcrosshybrids. Molecular and General Genetics 258, 260–268.
Liu, Z., Li, P., Argue, B.J., Dunham, R.A., 1999a. Random amplifiedpolymorphic DNA markers: usefulness for gene mapping andanalysis of genetic variation of catfish. Aquaculture 174, 59–68.
Liu, Z., Li, P., Kucuktas, H., Nichols, A., Tan, G., Zheng, X.,Argue, B.J., Yant, R., Dunham, R.A., 1999b. Development ofamplified fragment length polymorphism (AFLP) markerssuitable for genetic linkage mapping of catfish. Transactions ofthe American Fisheries Society 128, 317–327.
Liu, Z., Tan, G., Li, P., Dunham, R.A., 1999c. Transcribeddinucleotide microsatellites and their associated genes fromchannel catfish Ictalurus punctatus. Biochemical and BiophysicalResearch Communications 259, 190–194.
Liu, Z.J., Karsi, A., Li, P., Cao, D., Dunham, R., 2003. An AFLP-based genetic linkage map of channel catfish (Ictalurus punctatus)constructed by using an interspecific hybrid resource family.Genetics 165, 687–694.
McCracken, G.F., Parker, C.R., Guffey, S.Z., 1993. Genetic differen-tiation and hybridization between stocked hatchery and nativebrook trout in Great SmokyMountains National Park. Transactionsof the American Fisheries Society 122, 533–542.
Mickett, K., Morton, C., Feng, J., Li, P., Simmons, M., Dunham, R.A.,Cao, D., Liu, Z.J., 2003. Assessing genetic diversity of domesticpopulations of channel catfish (Ictalurus punctatus) in Alabamausing AFLP markers. Aquaculture 228, 91–105.
Miller, M.P., 1997. Tools for Population Genetic Analysis (TFPGA),Version 1.3. A Windows Program for the Analysis of Allozymeand Molecular Population Genetic Data. Department of BiologicalSciences, Northern Arizona University, Flagstaff, AZ.
Montoya-Burgos, J.I., 2003. Historical biogeography of the catfishgenus Hypostomus (Siluriformes: Loricariidae), with implicationson the diversification of Neotropical ichthyofauna. MolecularEcology 12, 1855–1867.
Nei, M., 1978. Estimation of average heterozygosity and geneticdistance from a small number of individuals. Genetics 89,583–590.

146 M. Simmons et al. / Aquaculture 252 (2006) 133–146
Nei, M., 1987. Molecular Evolutionary Genetics. Columbia UniversityPress, New York.
Palumbi, S.R., 2001. Humans as the world's greatest evolutionaryforce. Science 293, 1786–1790.
Rogers, S.M., Campbell, D., Baird, S.J., Danzmann, R.G., Bernatchez,L., 2001. Combining the analyses of introgressive hybridisationand linkage mapping to investigate the genetic architecture ofpopulation divergence in the lake whitefish (Coregonus clupea-formis, Mitchill). Genetics 111, 25–41.
Rohlf, F.J., 1998. NTSYS, pc. Version 2.10p. Applied Biostatistics,Setauket, NY, http://www.exetersoftware.com/cat/ntsyspc/ntsyspc.html.
Serapion, J., Kucuktas, H., Feng, J., Liu, Z.J., 2004. Bioinformaticmining of type I microsatellites from expressed sequence tags ofchannel catfish (Ictalurus punctatus). Marine Biotechnology 6,364–377.
Smitherman, R.O., Dunham, R.A., 1993. Relationships amongcultured and naturally occurring populations of freshwater catfishin the United States. In: Marcia, R.C., James, P.M. (Eds.),Interactions Between Cultured Species And Naturally OccurringSpecies In The Environment: Proceedings of the Twenty-secondU.S.–Japan Aquaculture Panel Symposium, 21–22, August 1993,Homer, AlaskaUJNR Technical Report, vol. 22.
Swofford, D.L., 2001. PAUP*. Phylogenetic Analysis Using Parsi-mony (* and Other Methods) Version 4. Sinauer Associates,Sunderland, MA.
Tiersch, T.R., Sheryl, A.G., Carmichael, G.J., 1994. Cryopreservationof channel catfish sperm: storage in cryoprotectants, fertilization
trials, and growth of channel catfish produced with cryopreservedsperm. Transactions of the American Fisheries Society 123,580–586.
USDA, National Agricultural Statistics Service (NASS), 2001. CatfishProduction. U.S. Department of Agriculture, Washington, DC.
Utter, F., 2003. Genetic impacts of fish introductions. In: Hallerman, E.(Ed.), Population Genetics, Principles and Applications forFisheries Scientists. American Fisheries Society, Bethesda, MD,pp. 357–378.
Weir, B.S., Cockerham, C.C., 1984. Estimating F-statistics for theanalysis of population structure. Evolution 38, 1358–1370.
Whitehead, A., Anderson, S.L., Kuivila, K.M., Roach, J.L., May, B.,2003. Genetic variation among interconnected populations ofCatostomus occidentalis: implications for distinguishing impactsof contaminants from biogeographical structuring. MolecularEcology 12, 2817–2833.
Young, W.P., Ostberg, C.O., Keim, P., Thorgaard, G.H., 2001. Geneticcharacterization of hybridization and introgression betweenanadromous rainbow trout (Oncorhynchus mykiss irideus) andcoastal cutthroat trout (O. clarki clarki). Molecular Ecology 10,921–930.
Yue, G., Li, Y., Chen, F., Cho, S., Lim, L.C., Orban, L., 2002.Comparison of three DNA marker systems for assessing geneticdiversity in Asian arowana (Scleropages formosus). Electropho-resis 23, 1025–1032.
Zardoya, R., Doadrio, I., 1999. Molecular evidence on the evolution-ary and biogeographical patterns of European cyprinids. Journal ofMolecular Evolution 49, 227–237.